Recenzja Samsunga Galaxy Book3 Ultra 16: Wytrzymały 16-calowy ultrabook z RTX 4050

W modelu Galaxy Book 3 Ultra 16 firma Samsung wprowadza połączenie notebooka do gier, stacji roboczej i laptopa dla kreatywnych pracowników, stawiając na mobilność, ergonomię i niskie zużycie energii. Wysoka wydajność nie jest wymagana: procesorCore i7-13700H oraz GeForce RTX 4050 są spowalniane przez konserwatywne limity mocy, a mianowicie niski TGP (60 watów). Zasilacz o mocy 100 W pokrywa wszystkie wymagania sprzętowe.
Do konkurentów należą takie urządzenia jak np.Schenker Vision 16 Pro, the LG Gram 17, the Dell XPS 15 9520, Asus VivoBook Pro 16X OLED, Acer Swift X SFX16-52G oraz Lenovo ThinkBook 16p G3 ARH.
Potencjalni konkurenci w porównaniu
Ocena | Data | Model | Waga | Wysokość | Rozmiar | Rezolucja | Cena |
|---|---|---|---|---|---|---|---|
| 89.4 % v7 (old) | 04/2023 | Samsung Galaxy Book3 Ultra 16 i7-13700H, GeForce RTX 4050 Laptop GPU | 1.8 kg | 16.5 mm | 16.00" | 2880x1800 | |
| 87.8 % v7 (old) | 11/2022 | Schenker Vision 16 Pro RTX 3070 Ti i7-12700H, GeForce RTX 3070 Ti Laptop GPU | 1.7 kg | 17.1 mm | 16.00" | 2560x1600 | |
| 86.4 % v7 (old) | 03/2023 | LG Gram 17Z90Q-E.AD78G i7-1260P, GeForce RTX 2050 Mobile | 1.4 kg | 17.8 mm | 17.00" | 2560x1600 | |
| 87.9 % v7 (old) | 10/2022 | Lenovo ThinkBook 16p G3 ARH R9 6900HX, GeForce RTX 3060 Laptop GPU | 2.1 kg | 19.5 mm | 16.00" | 2560x1600 | |
| 89.5 % v7 (old) | Dell XPS 15 9520 RTX 3050 Ti i7-12700H, GeForce RTX 3050 Ti Laptop GPU | 1.9 kg | 18 mm | 15.60" | 3456x2160 | ||
| 83.7 % v7 (old) | 11/2022 | Asus VivoBook Pro 16X OLED N7600PC-L2026X i7-11370H, GeForce RTX 3050 4GB Laptop GPU | 2 kg | 18.9 mm | 16.00" | 3840x2400 | |
| 86.4 % v7 (old) | 11/2022 | Acer Swift X SFX16-52G-77RX i7-1260P, A370M | 1.8 kg | 21.2 mm | 16.00" | 2560x1600 |
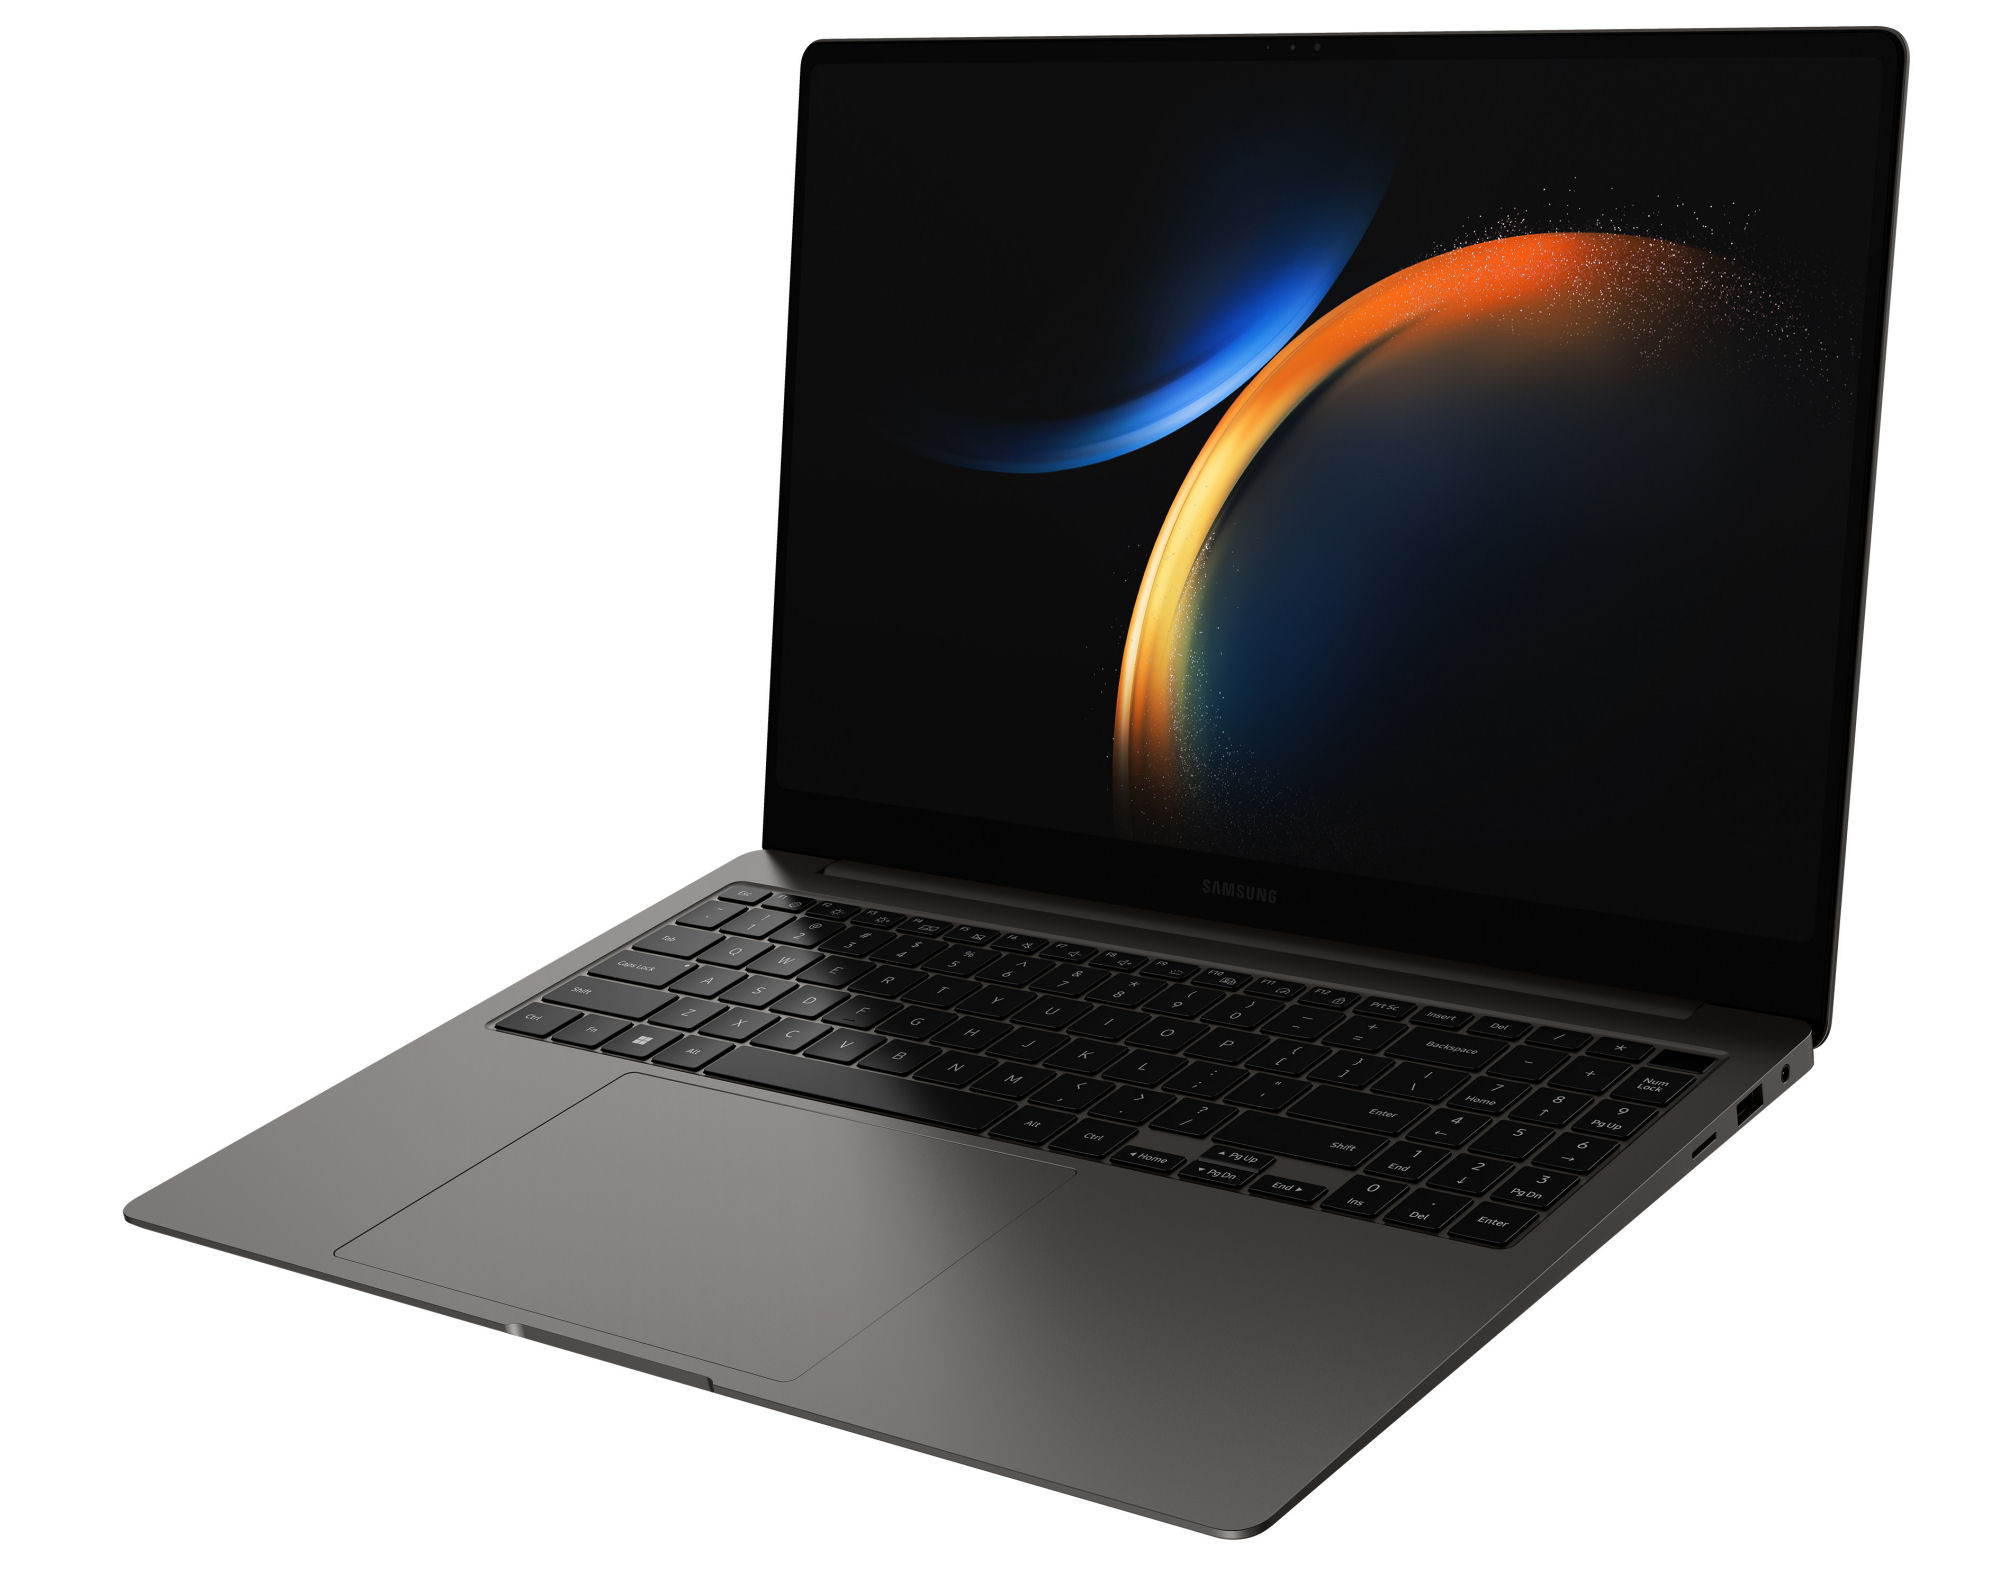
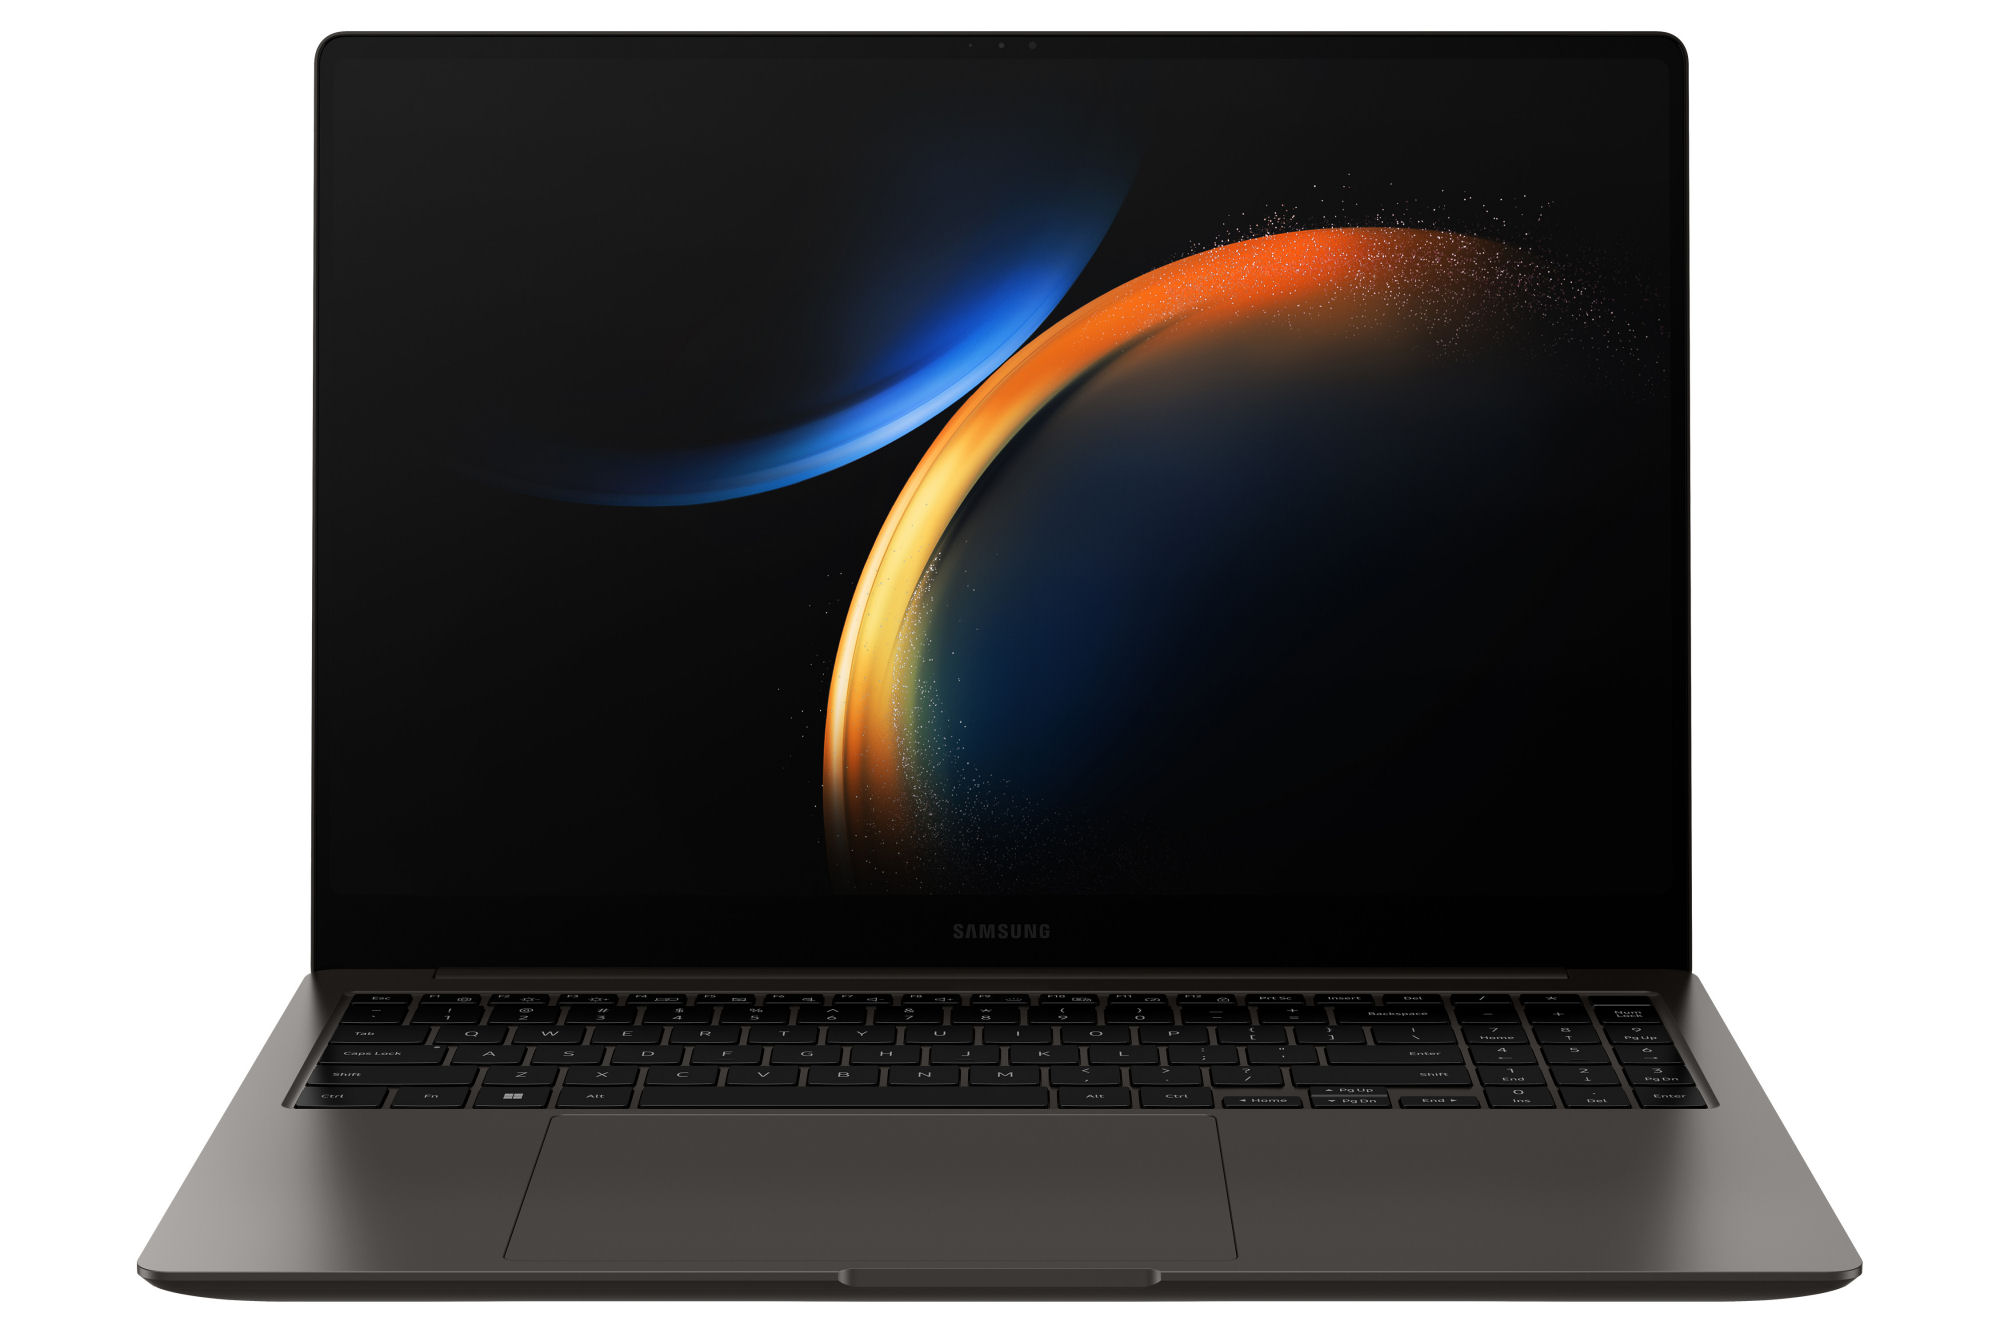
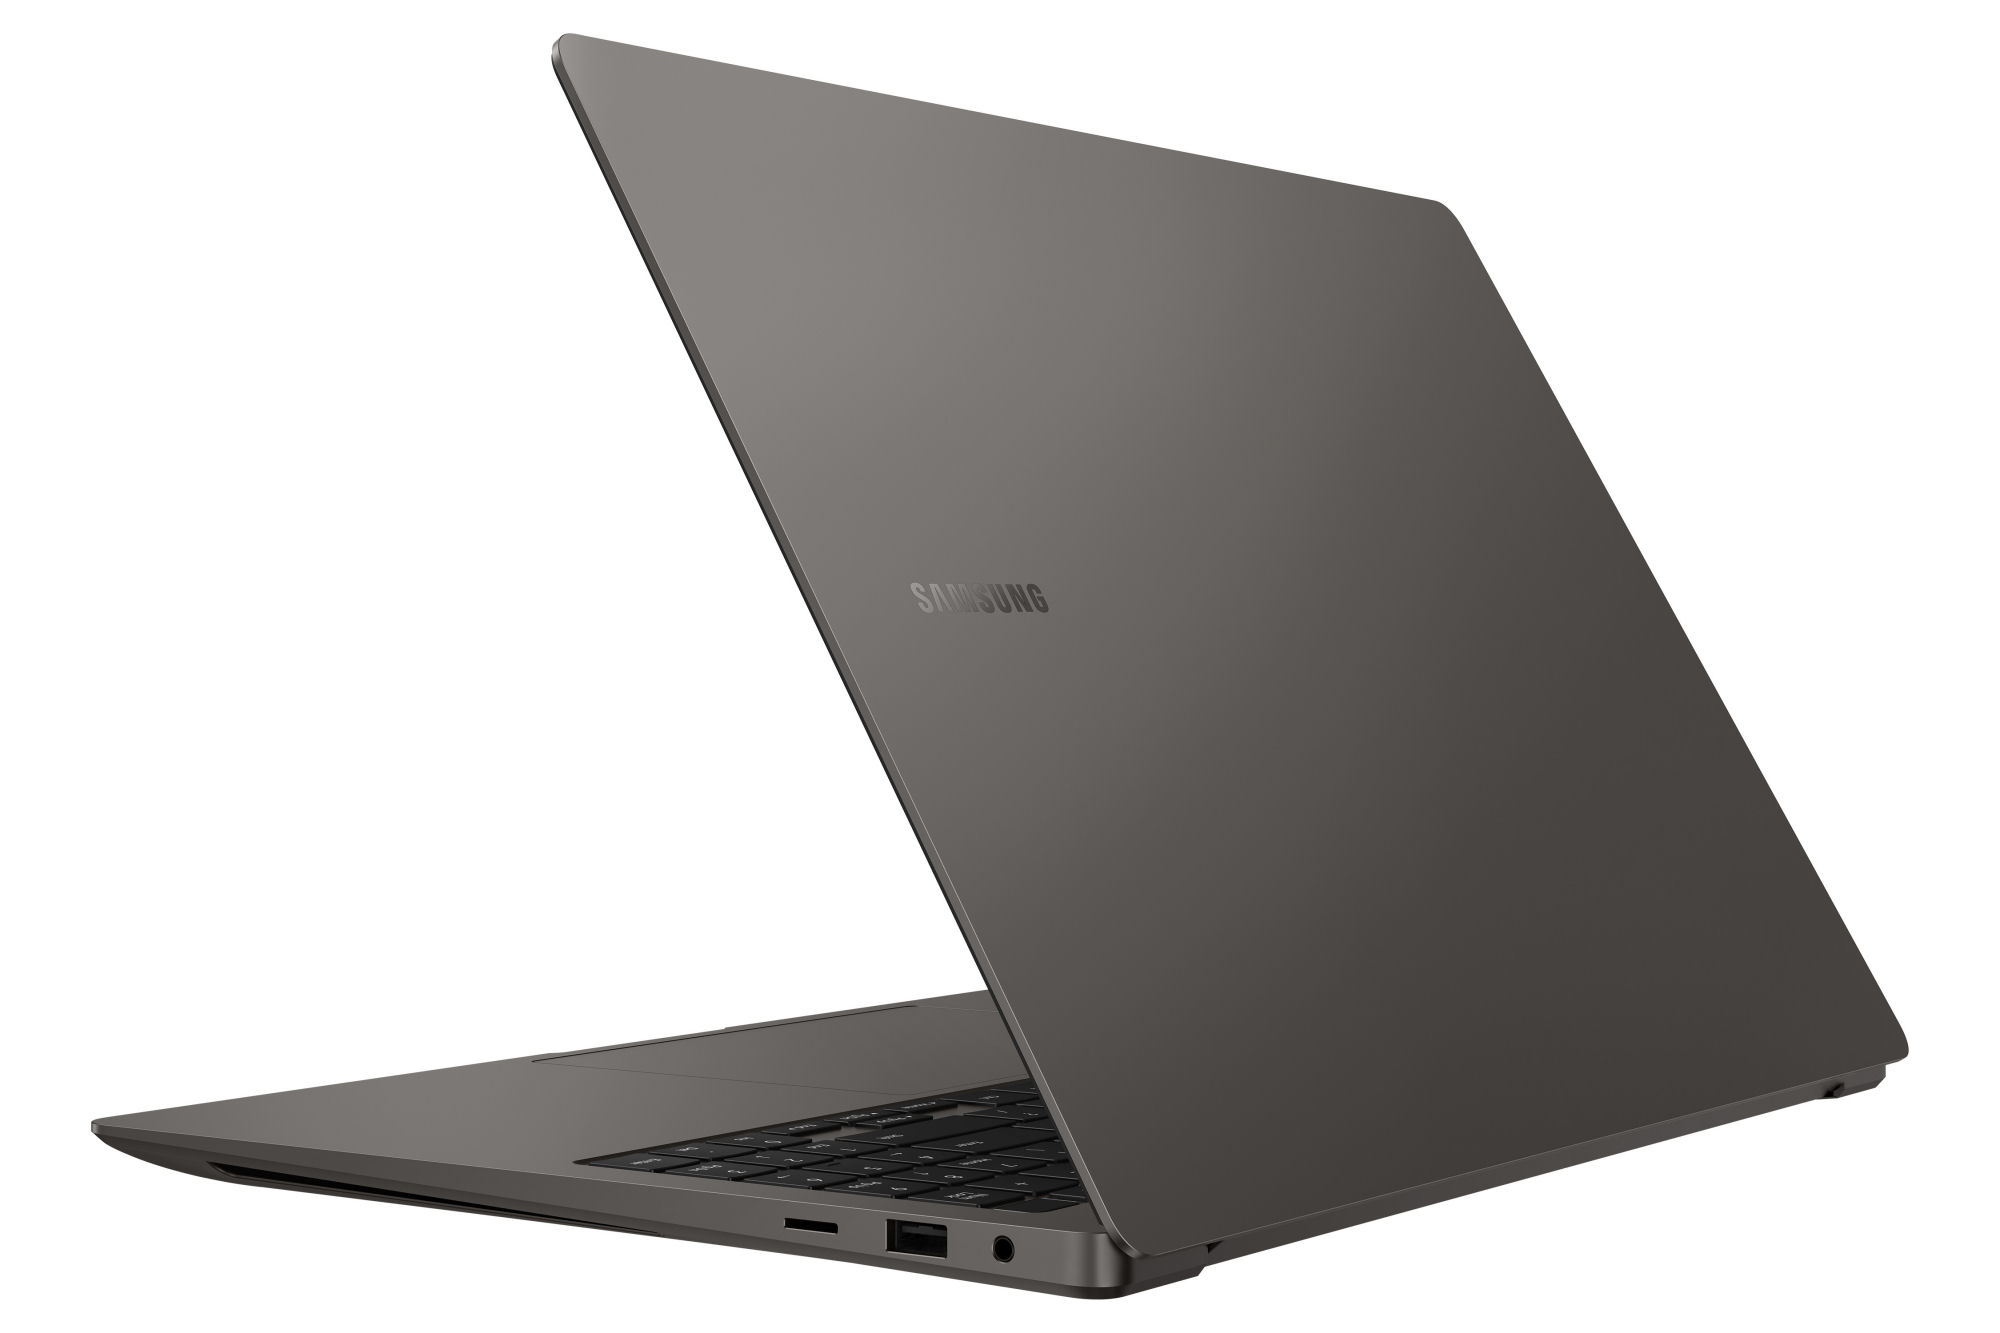
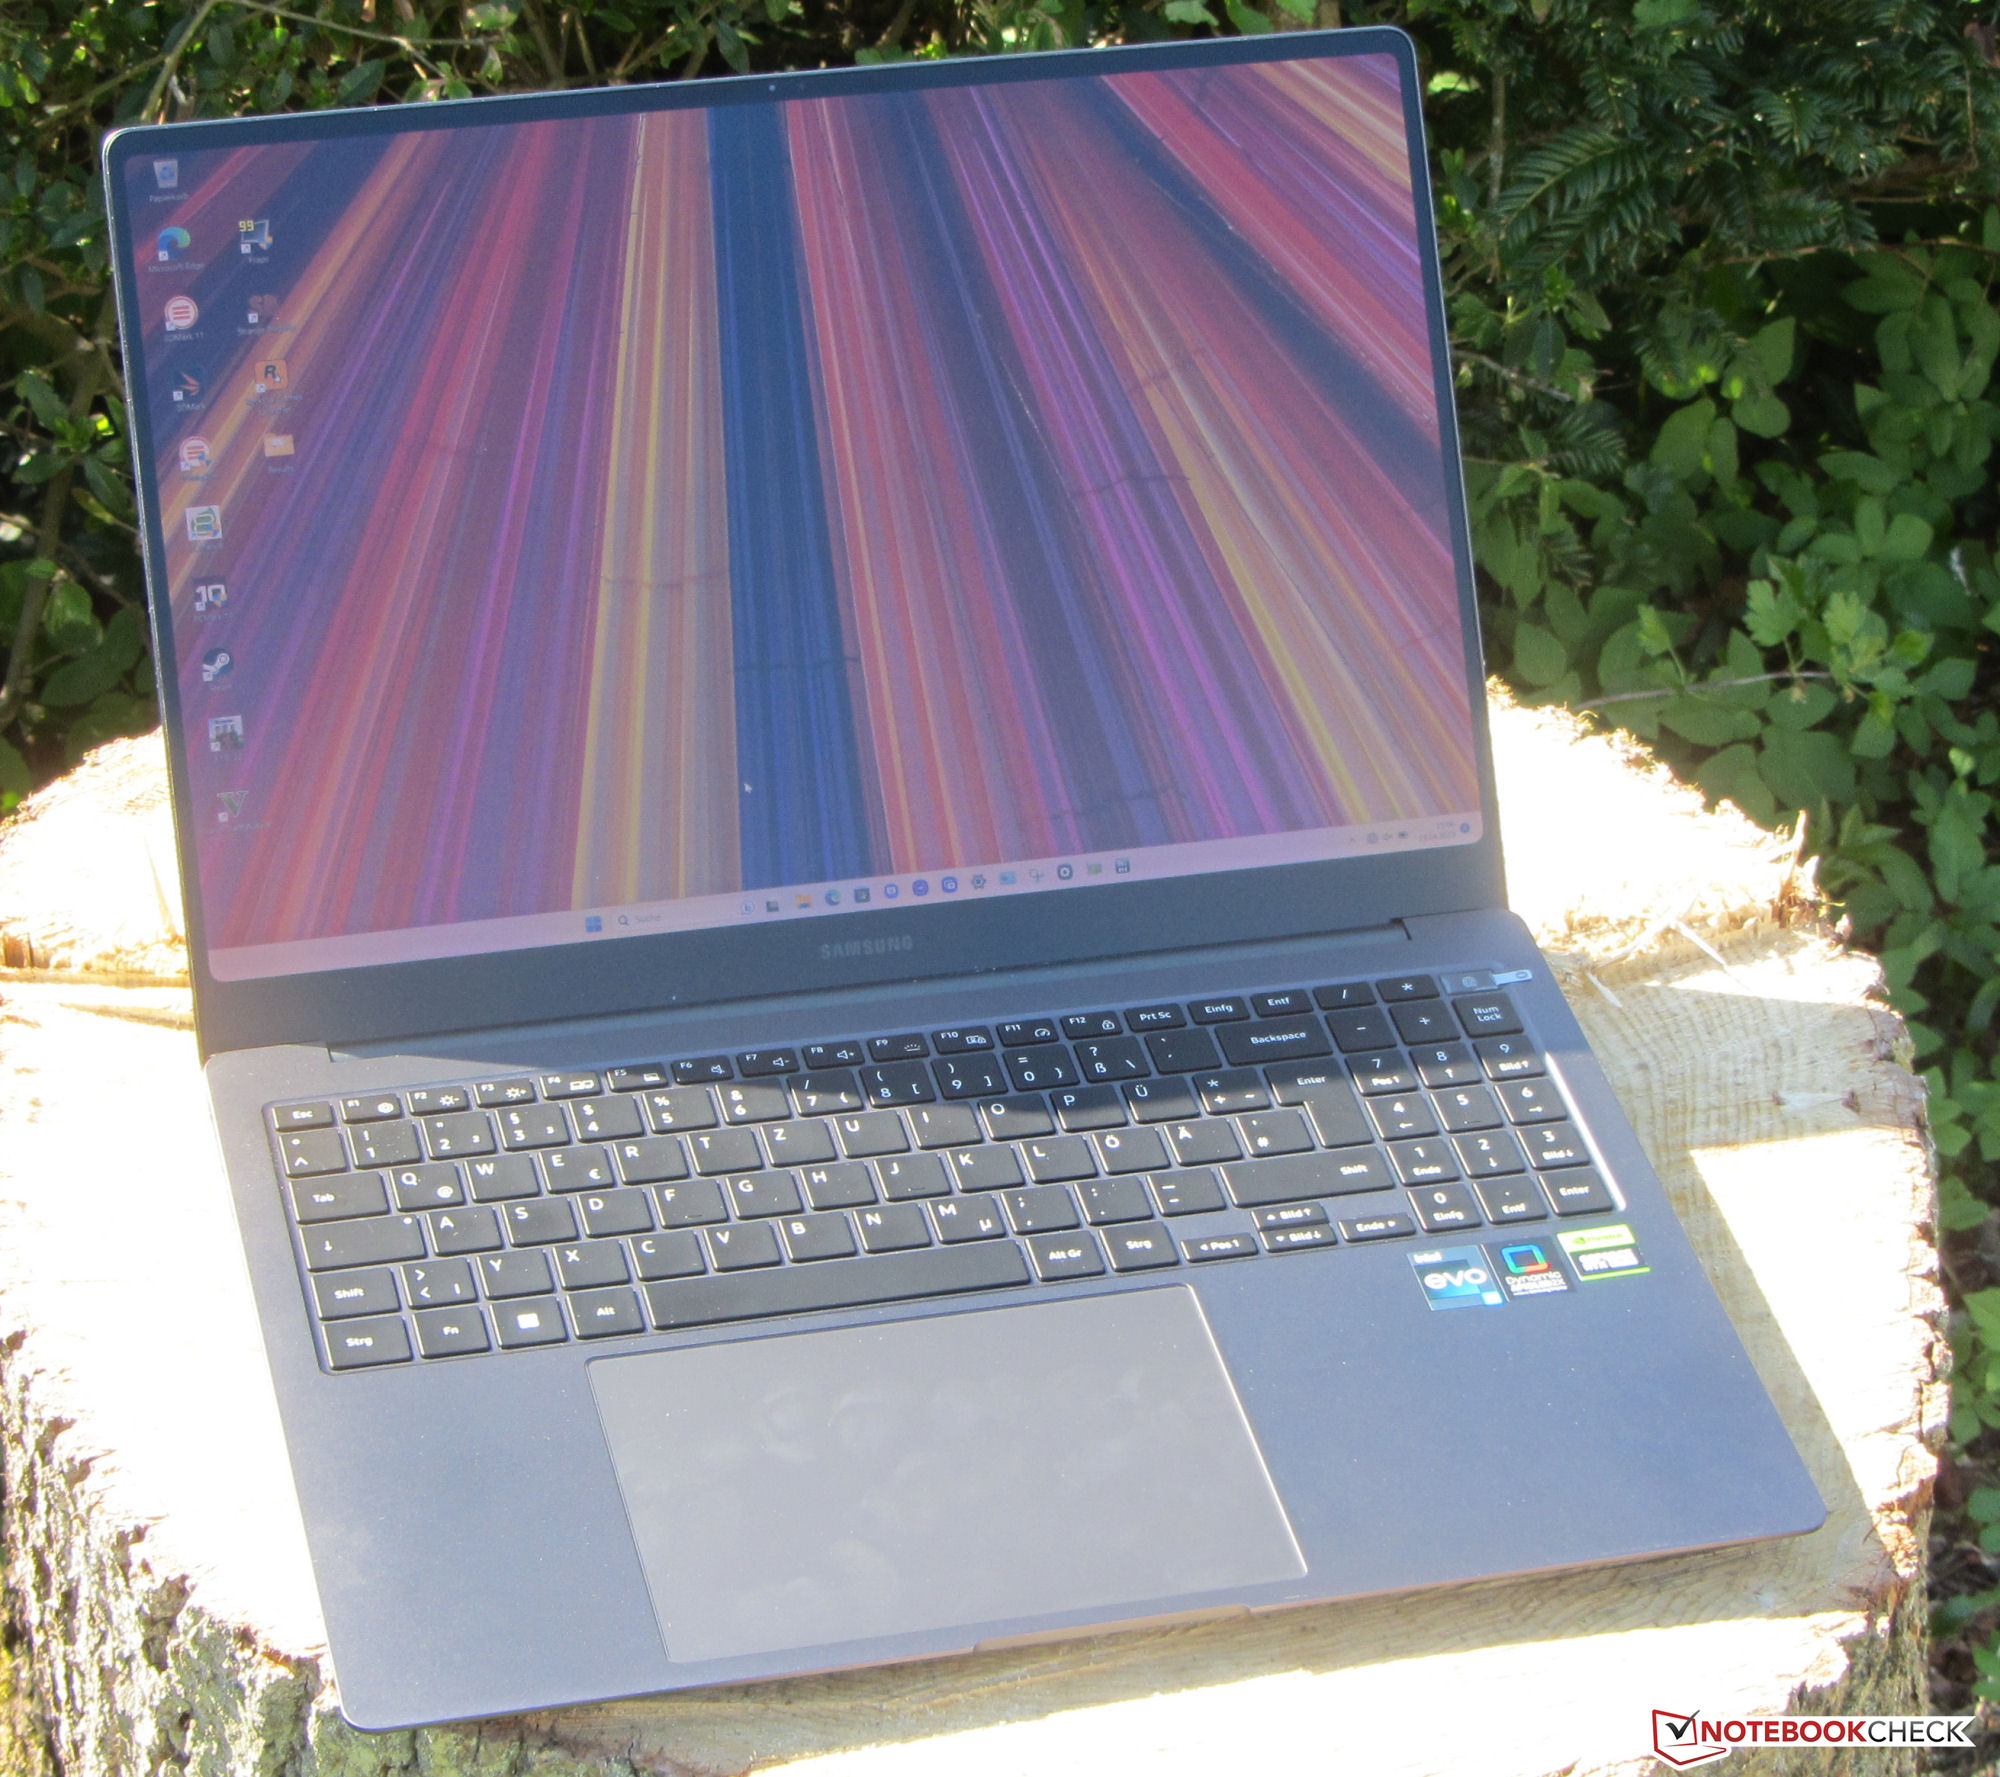
Case - Fantazyjna aluminiowa obudowa dla Galaxy
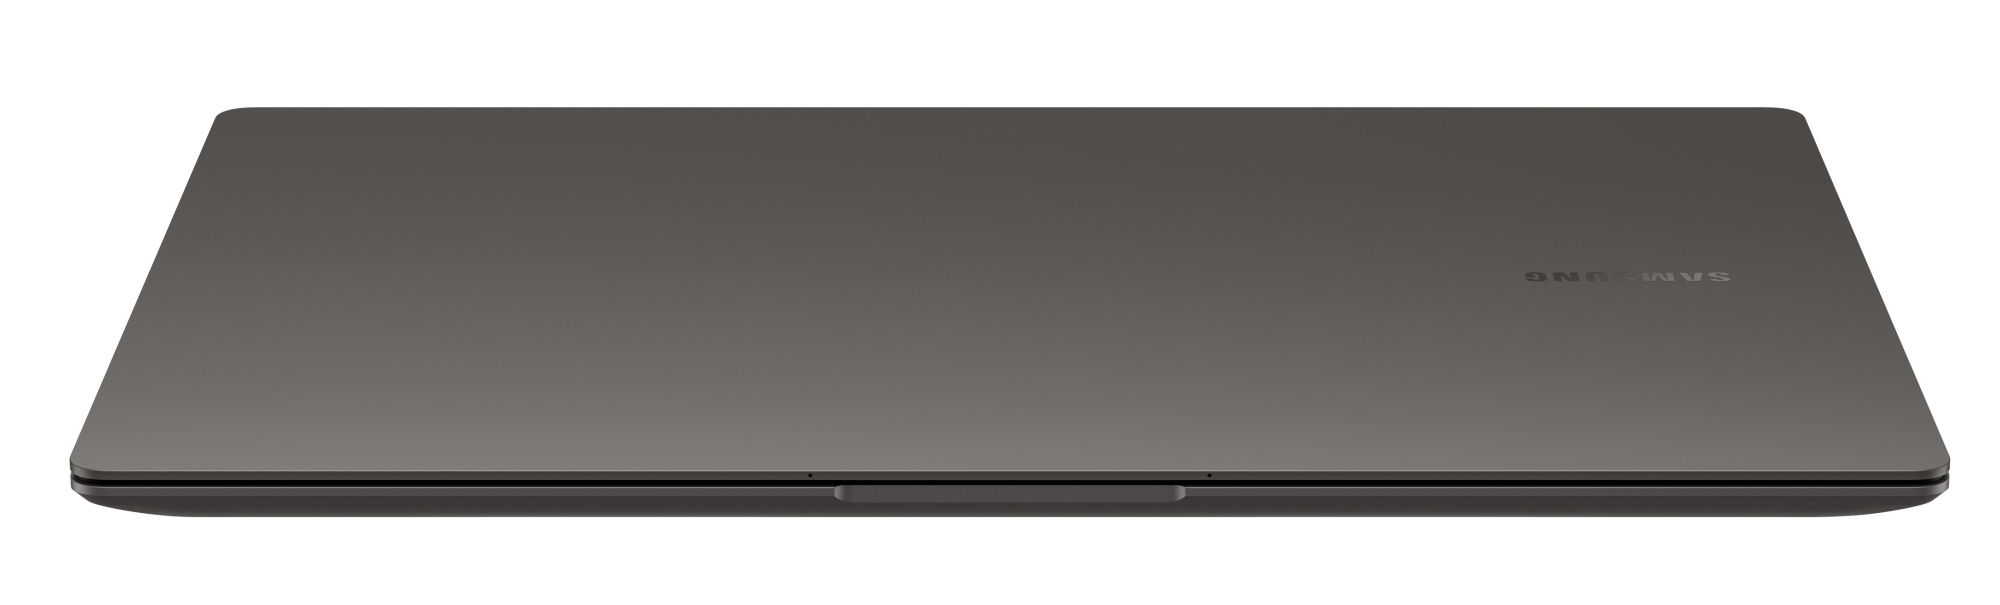
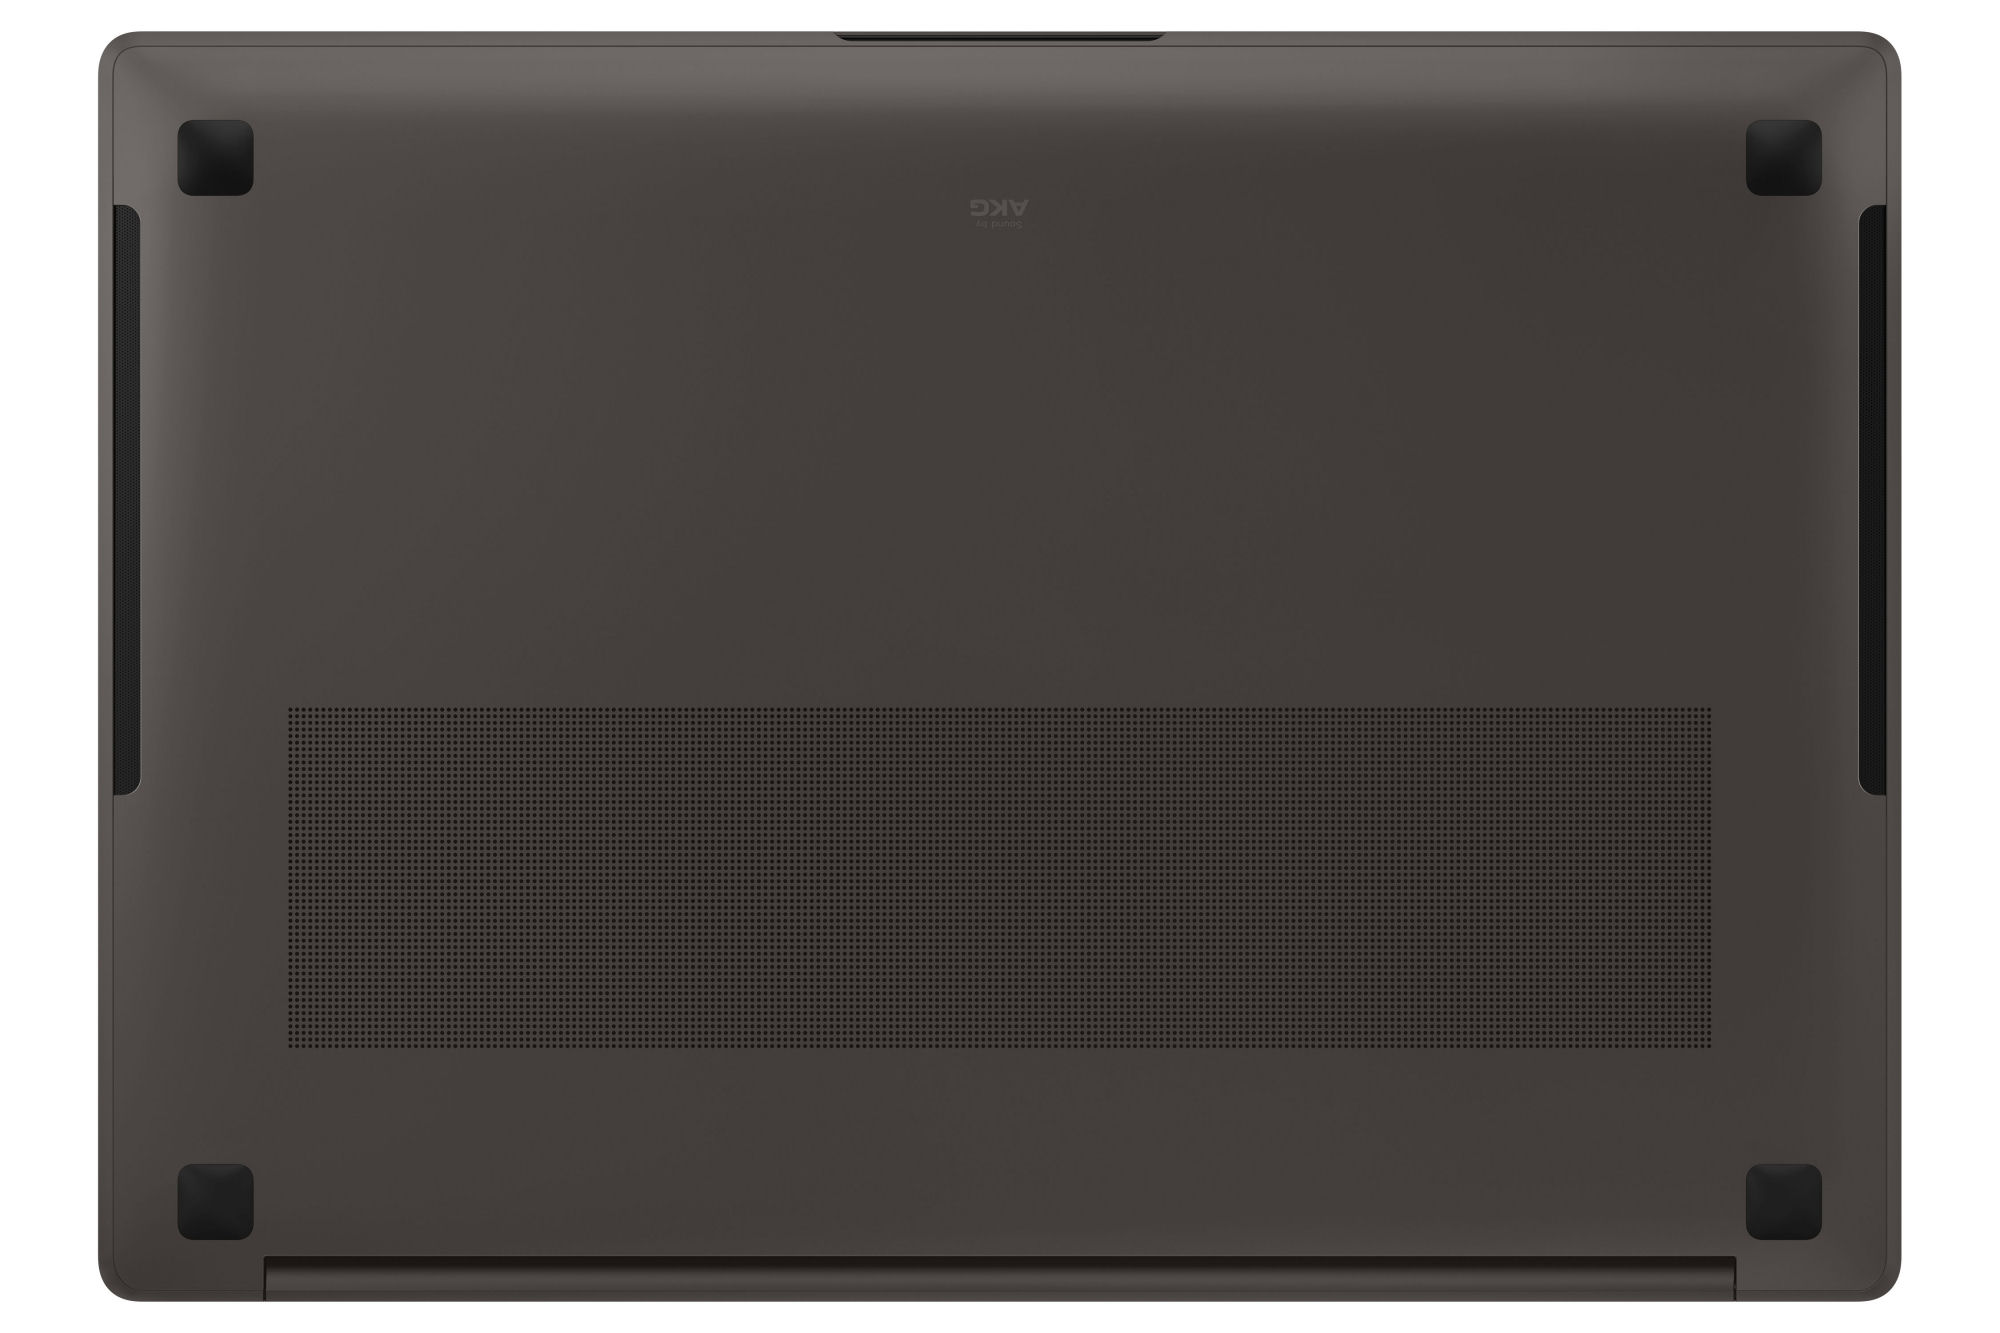
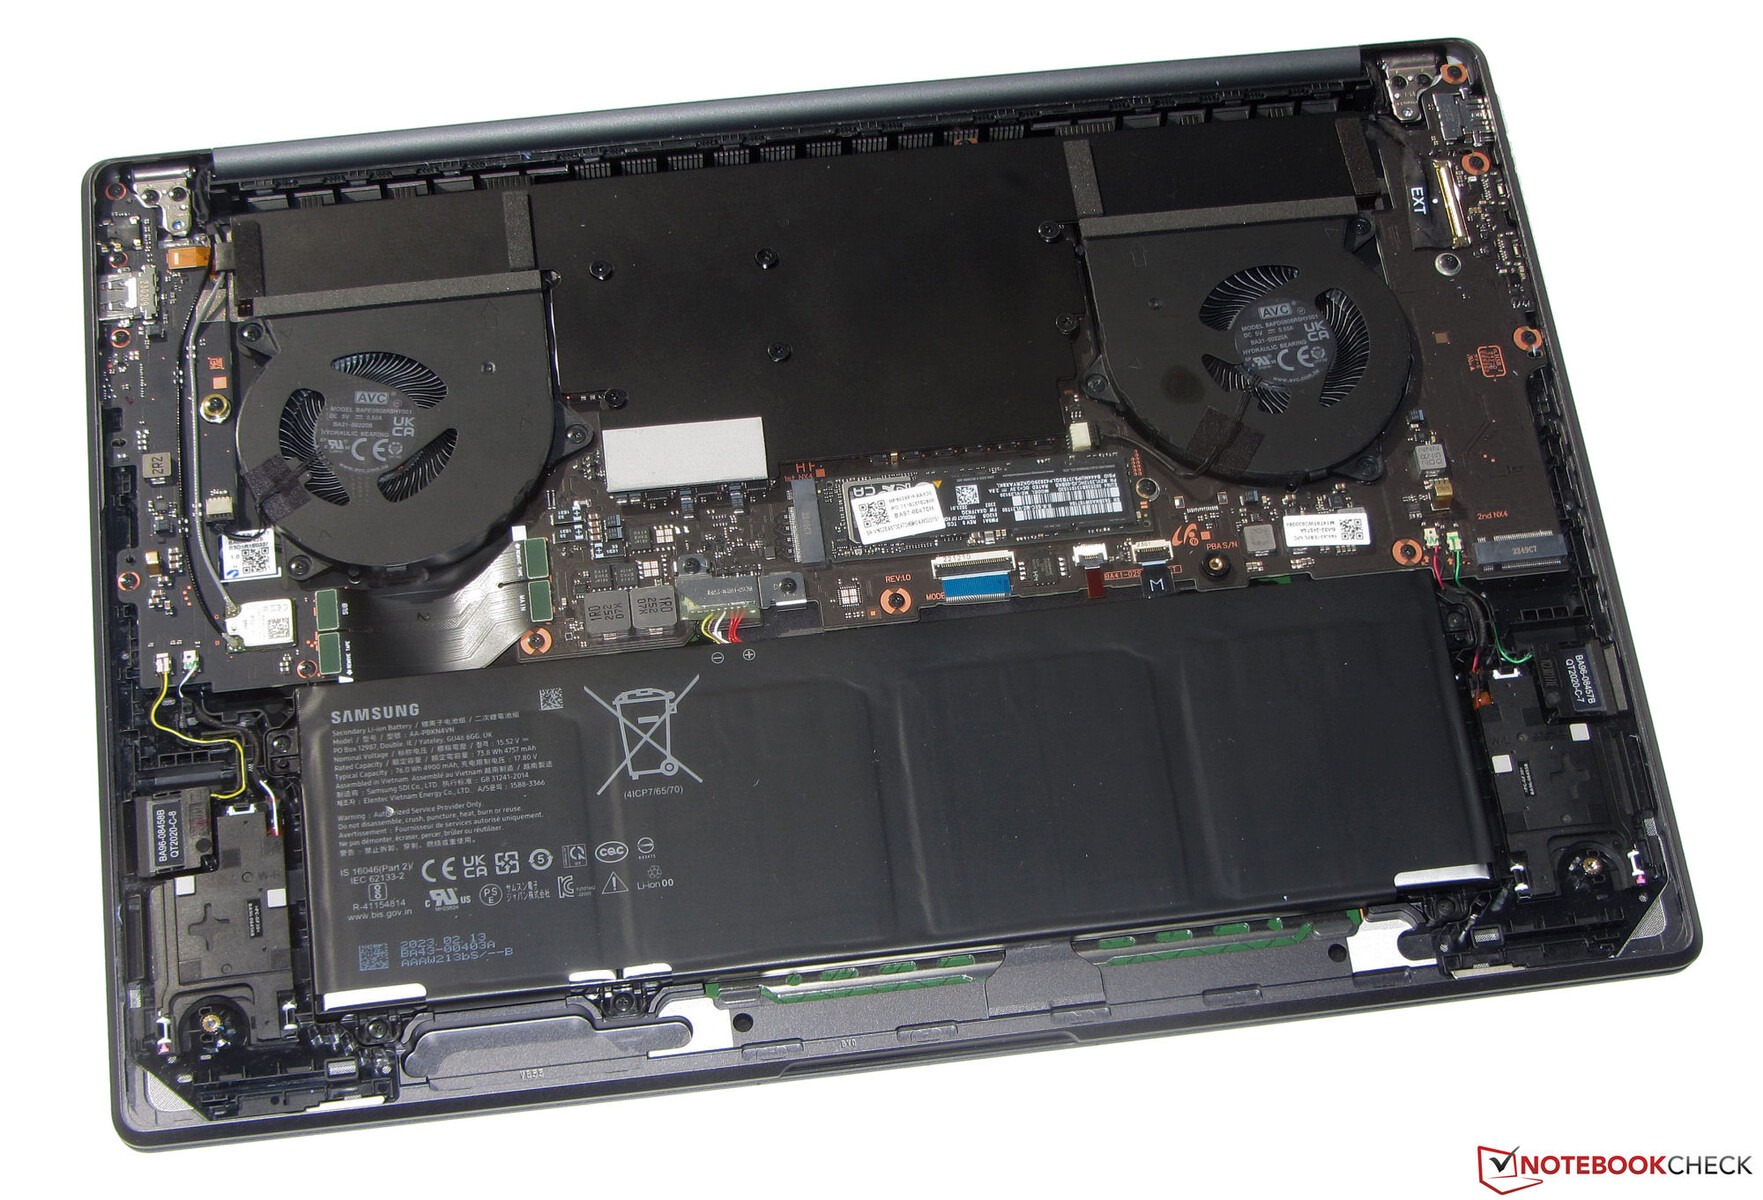
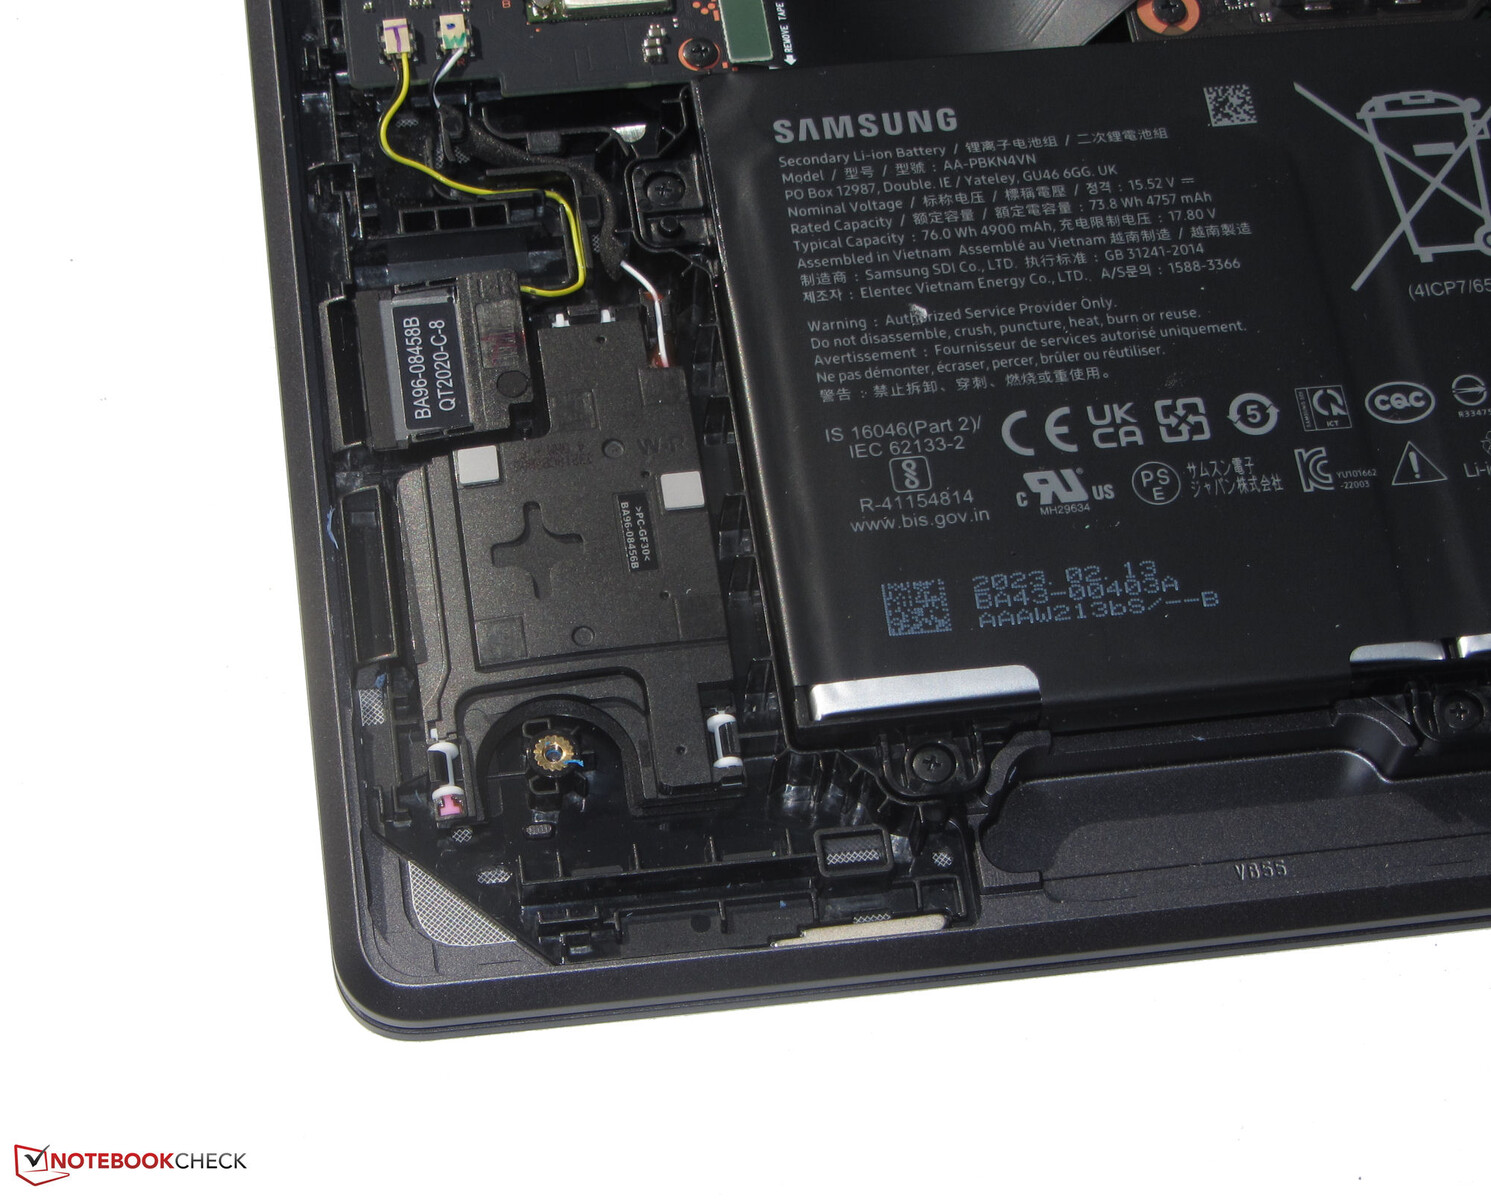
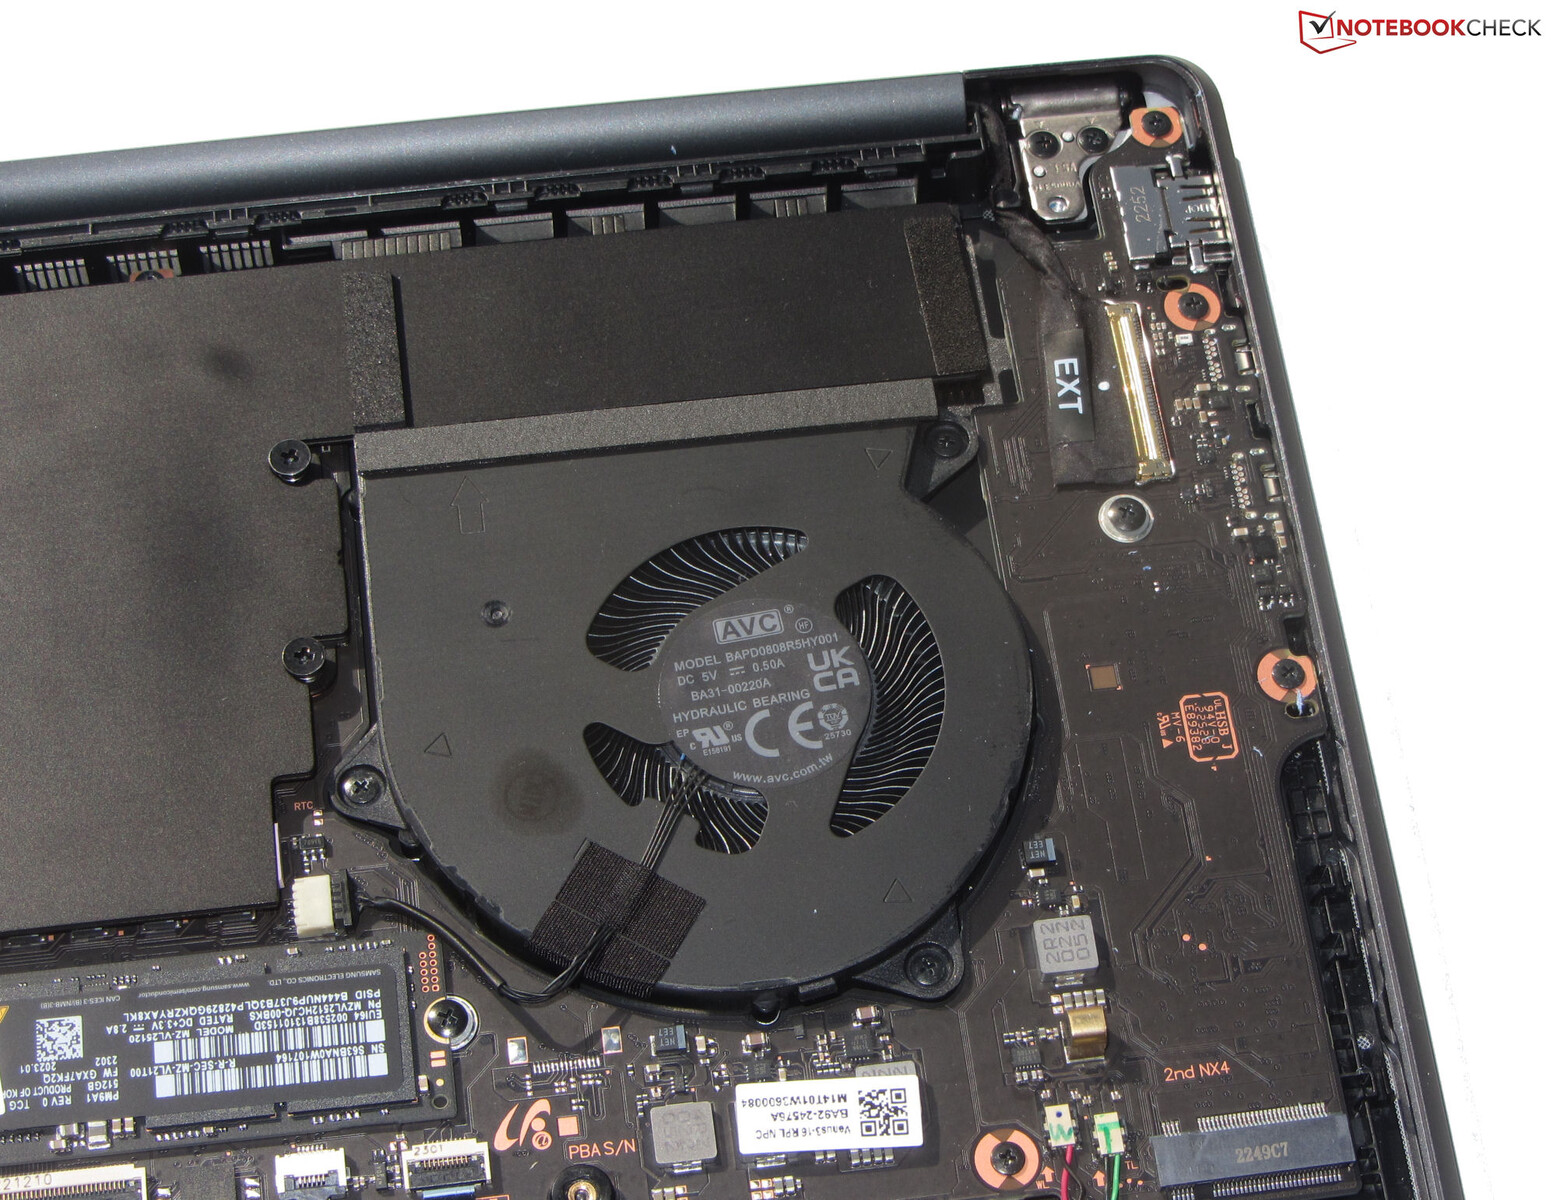
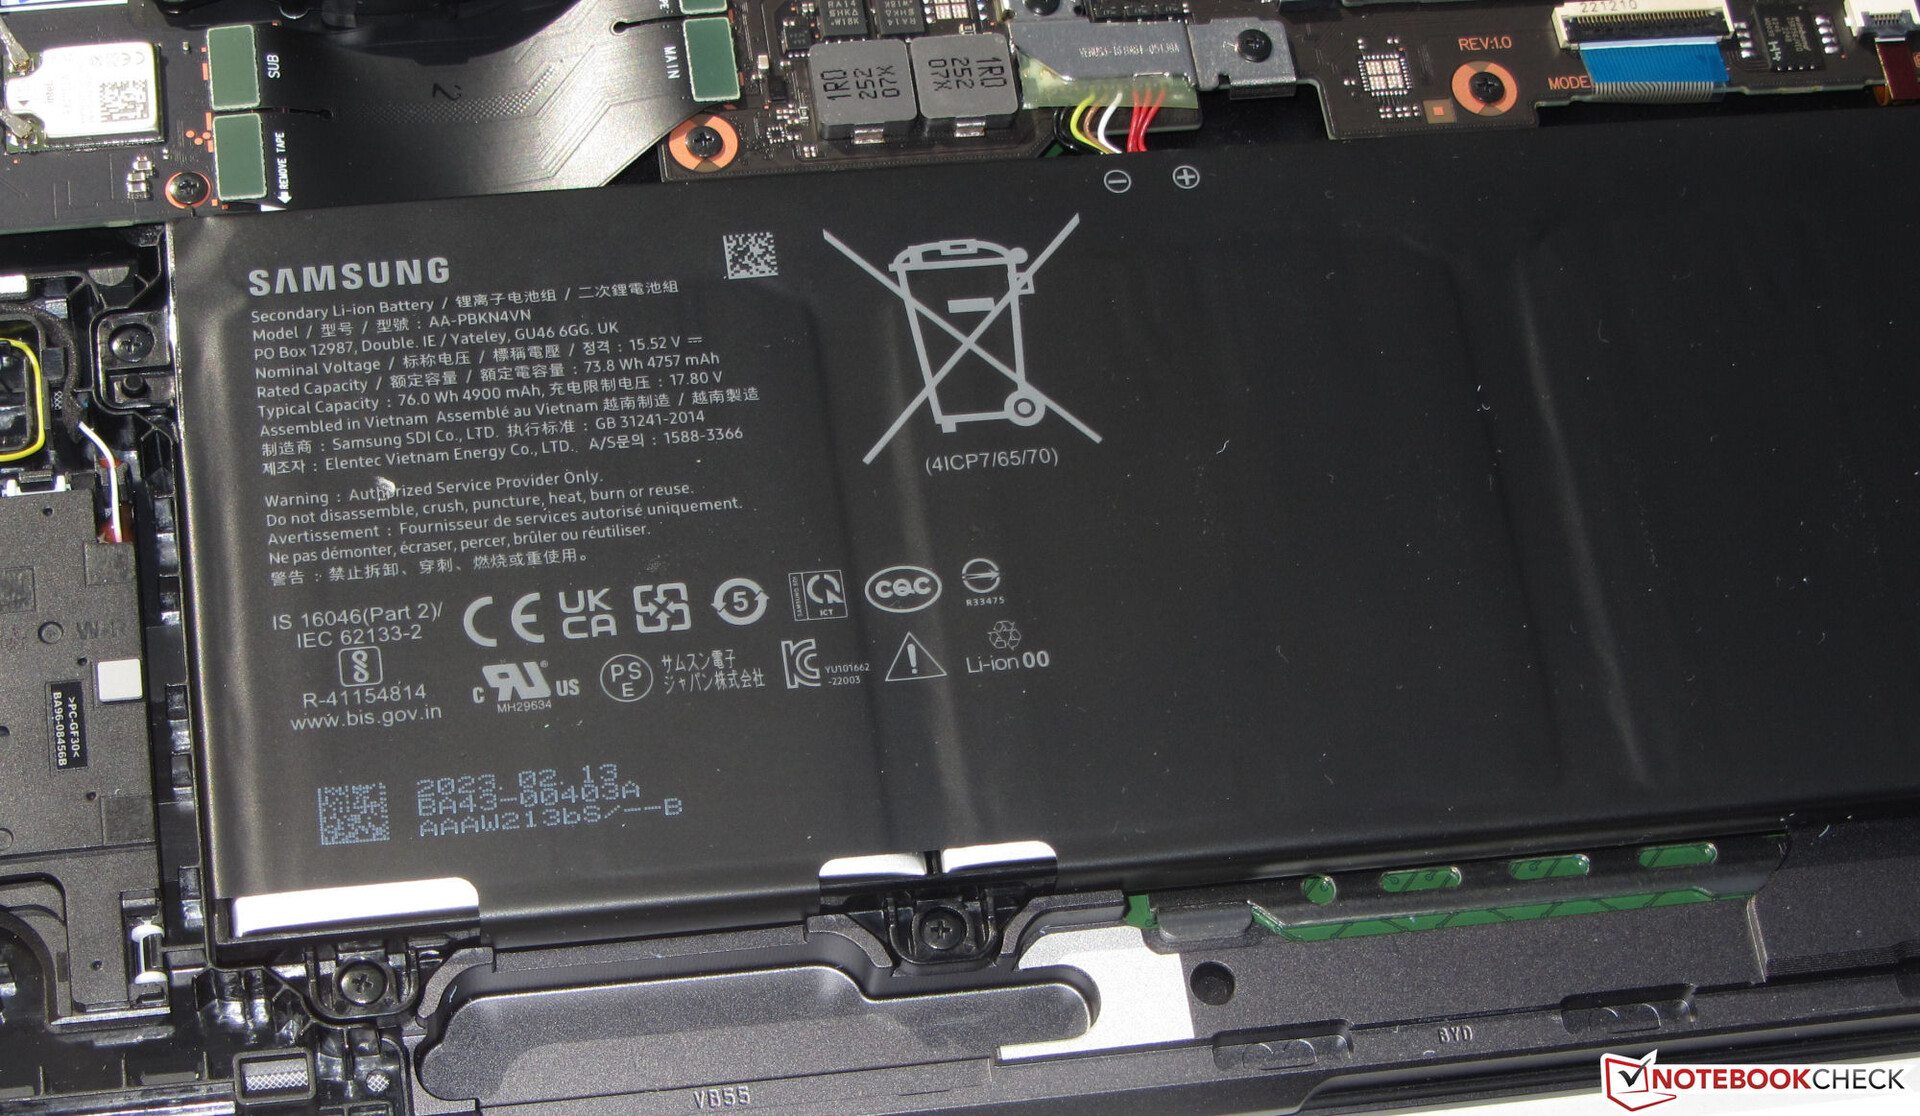
Samsung zastosował szaro-czarną (graphite) aluminiową obudowę o gładkich, matowych powierzchniach. Ten szykowno-elegancki komputer nie ma żadnych rzucających się w oczy cech konstrukcyjnych i też ich nie potrzebuje. Dostęp do akumulatora (przykręconego, a nie przyklejonego) i pozostałych elementów wewnętrznych jest możliwy po zdjęciu spodniej powłoki.
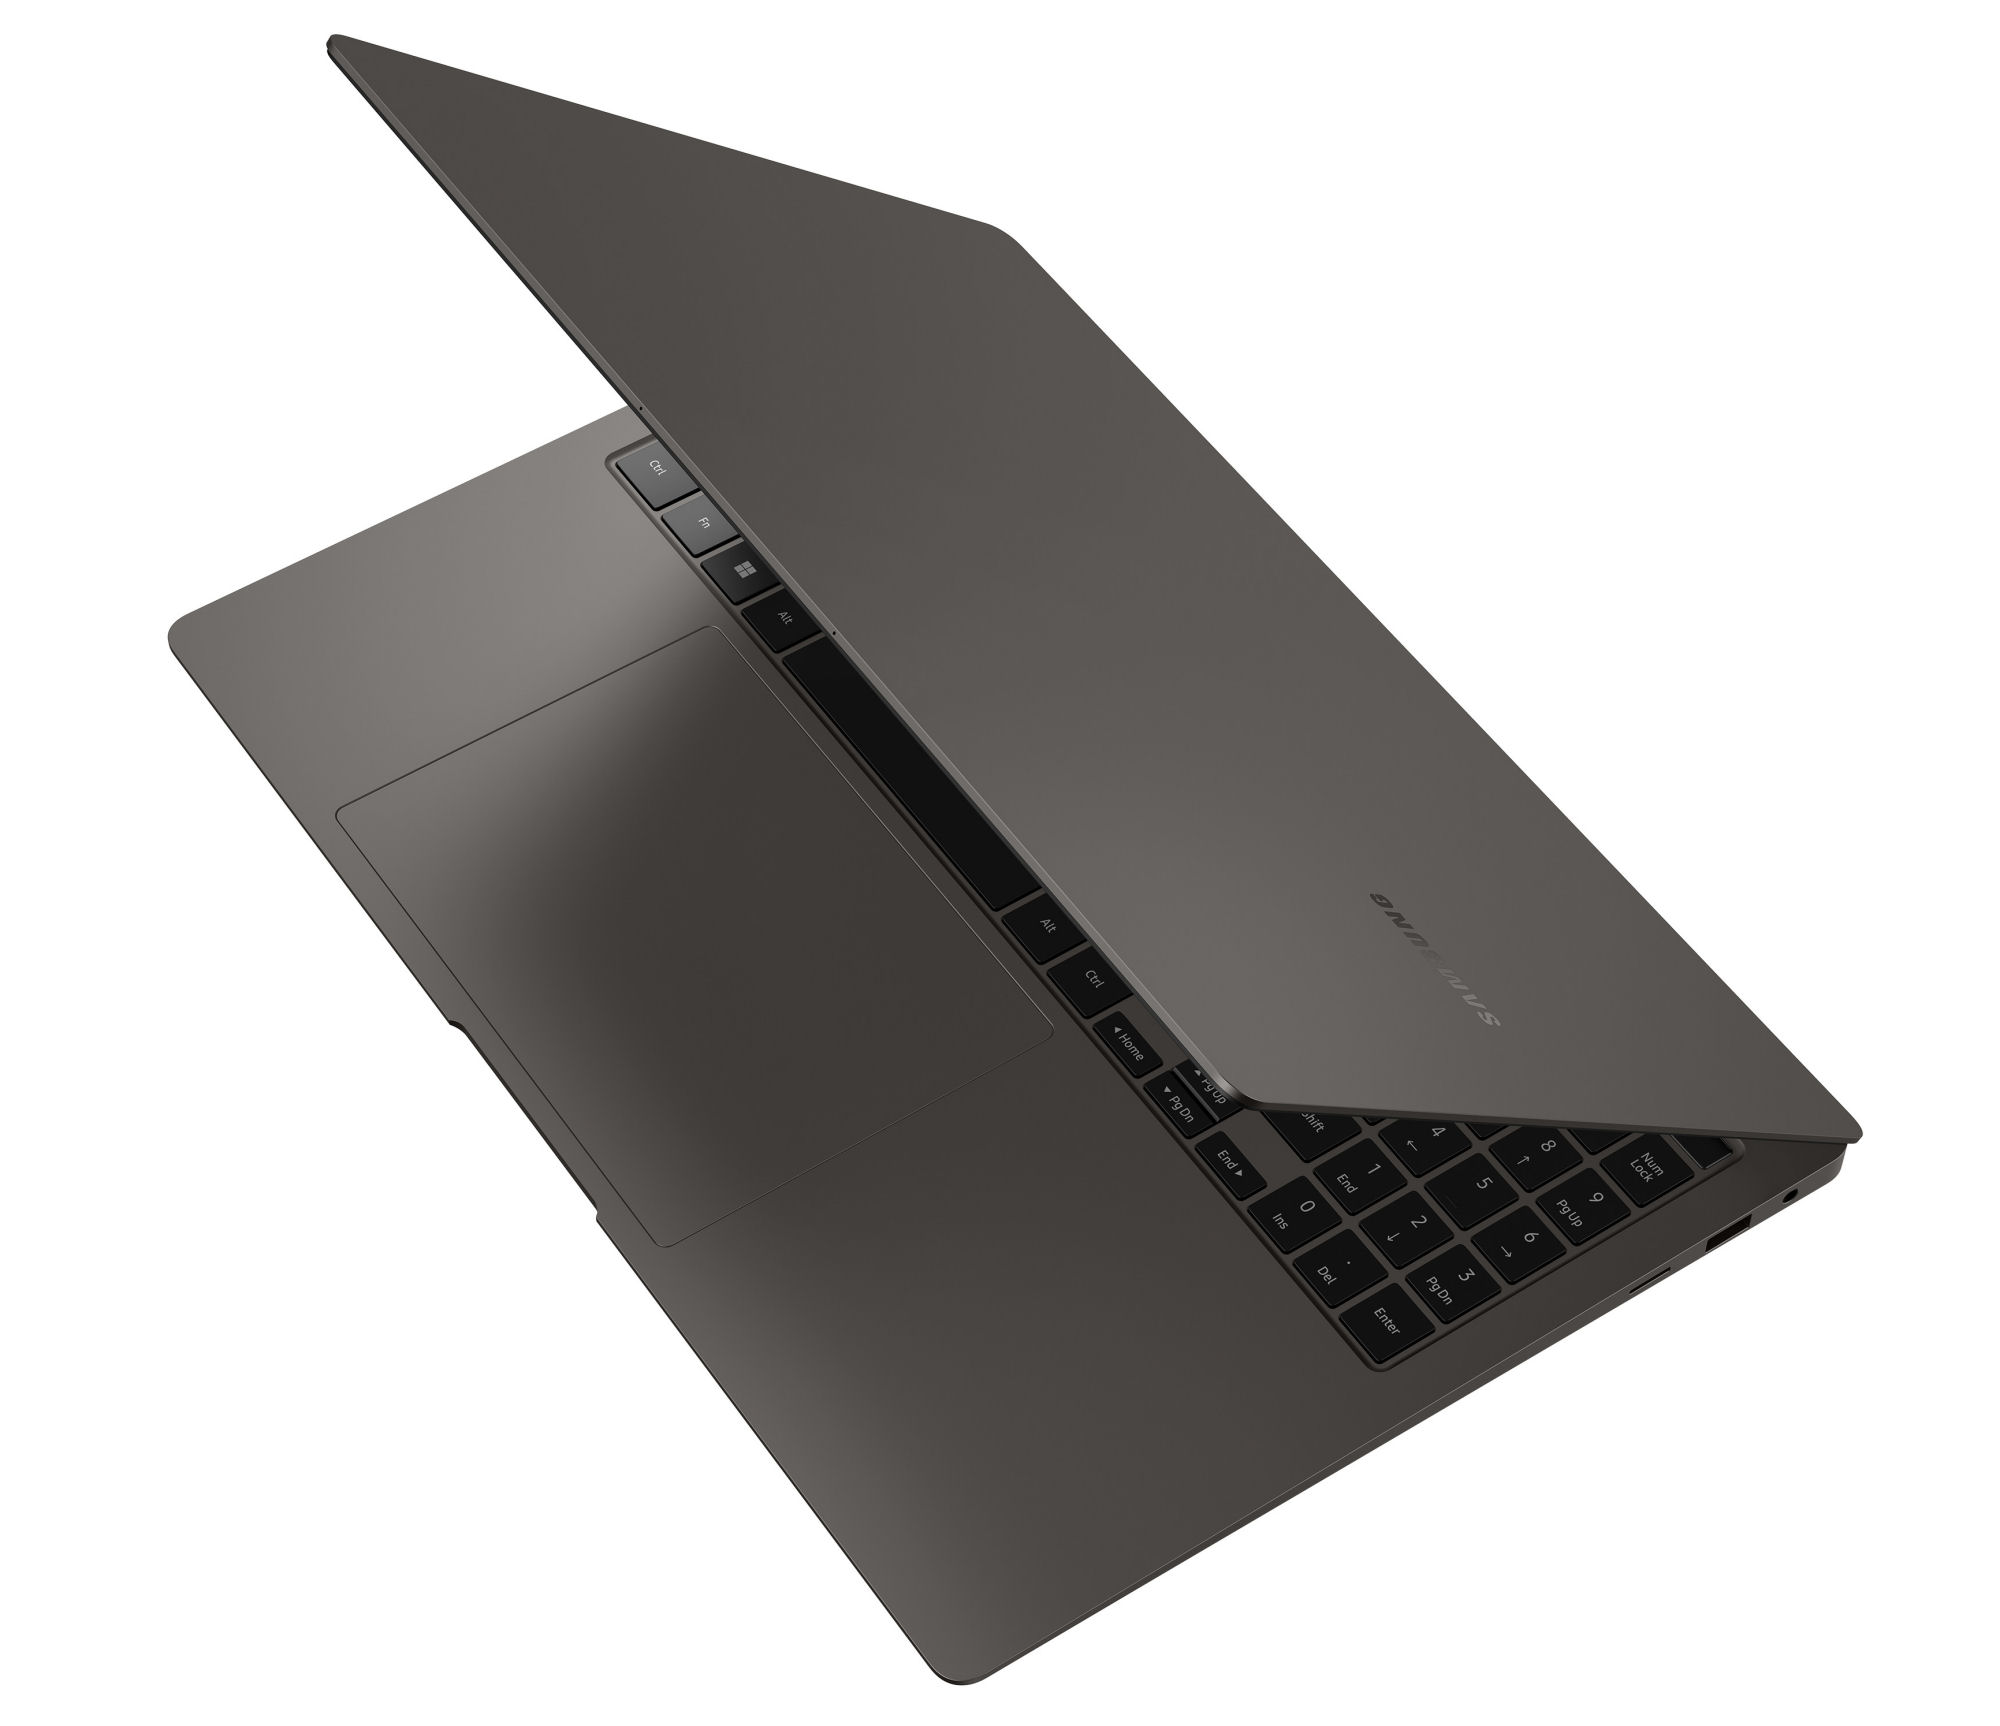
Notebook charakteryzuje się dobrą jakością wykonania. Wymiary luki są równe i nie można znaleźć żadnych wystających elementów materiałowych. Jednostkę zasadniczą i wieko można wykręcić tylko w bardzo niewielkim stopniu. Zawiasy mocno trzymają wieko, a maksymalny kąt otwarcia wynosi około 125 stopni. Możliwe jest otwieranie jedną ręką.

Galaxy Book3 zasadniczo należy do kategorii kompaktowych i lekkich notebooków. Ląduje jednak w środku pola porównawczego. Jego bezpośredni konkurent, tj Schenker Vision 16 Pro, jest nieco bardziej kompaktowy i lżejszy. Żaden laptop nie może się równać z niewielką wagą (1,4 kg) m.in LG Gram 17.
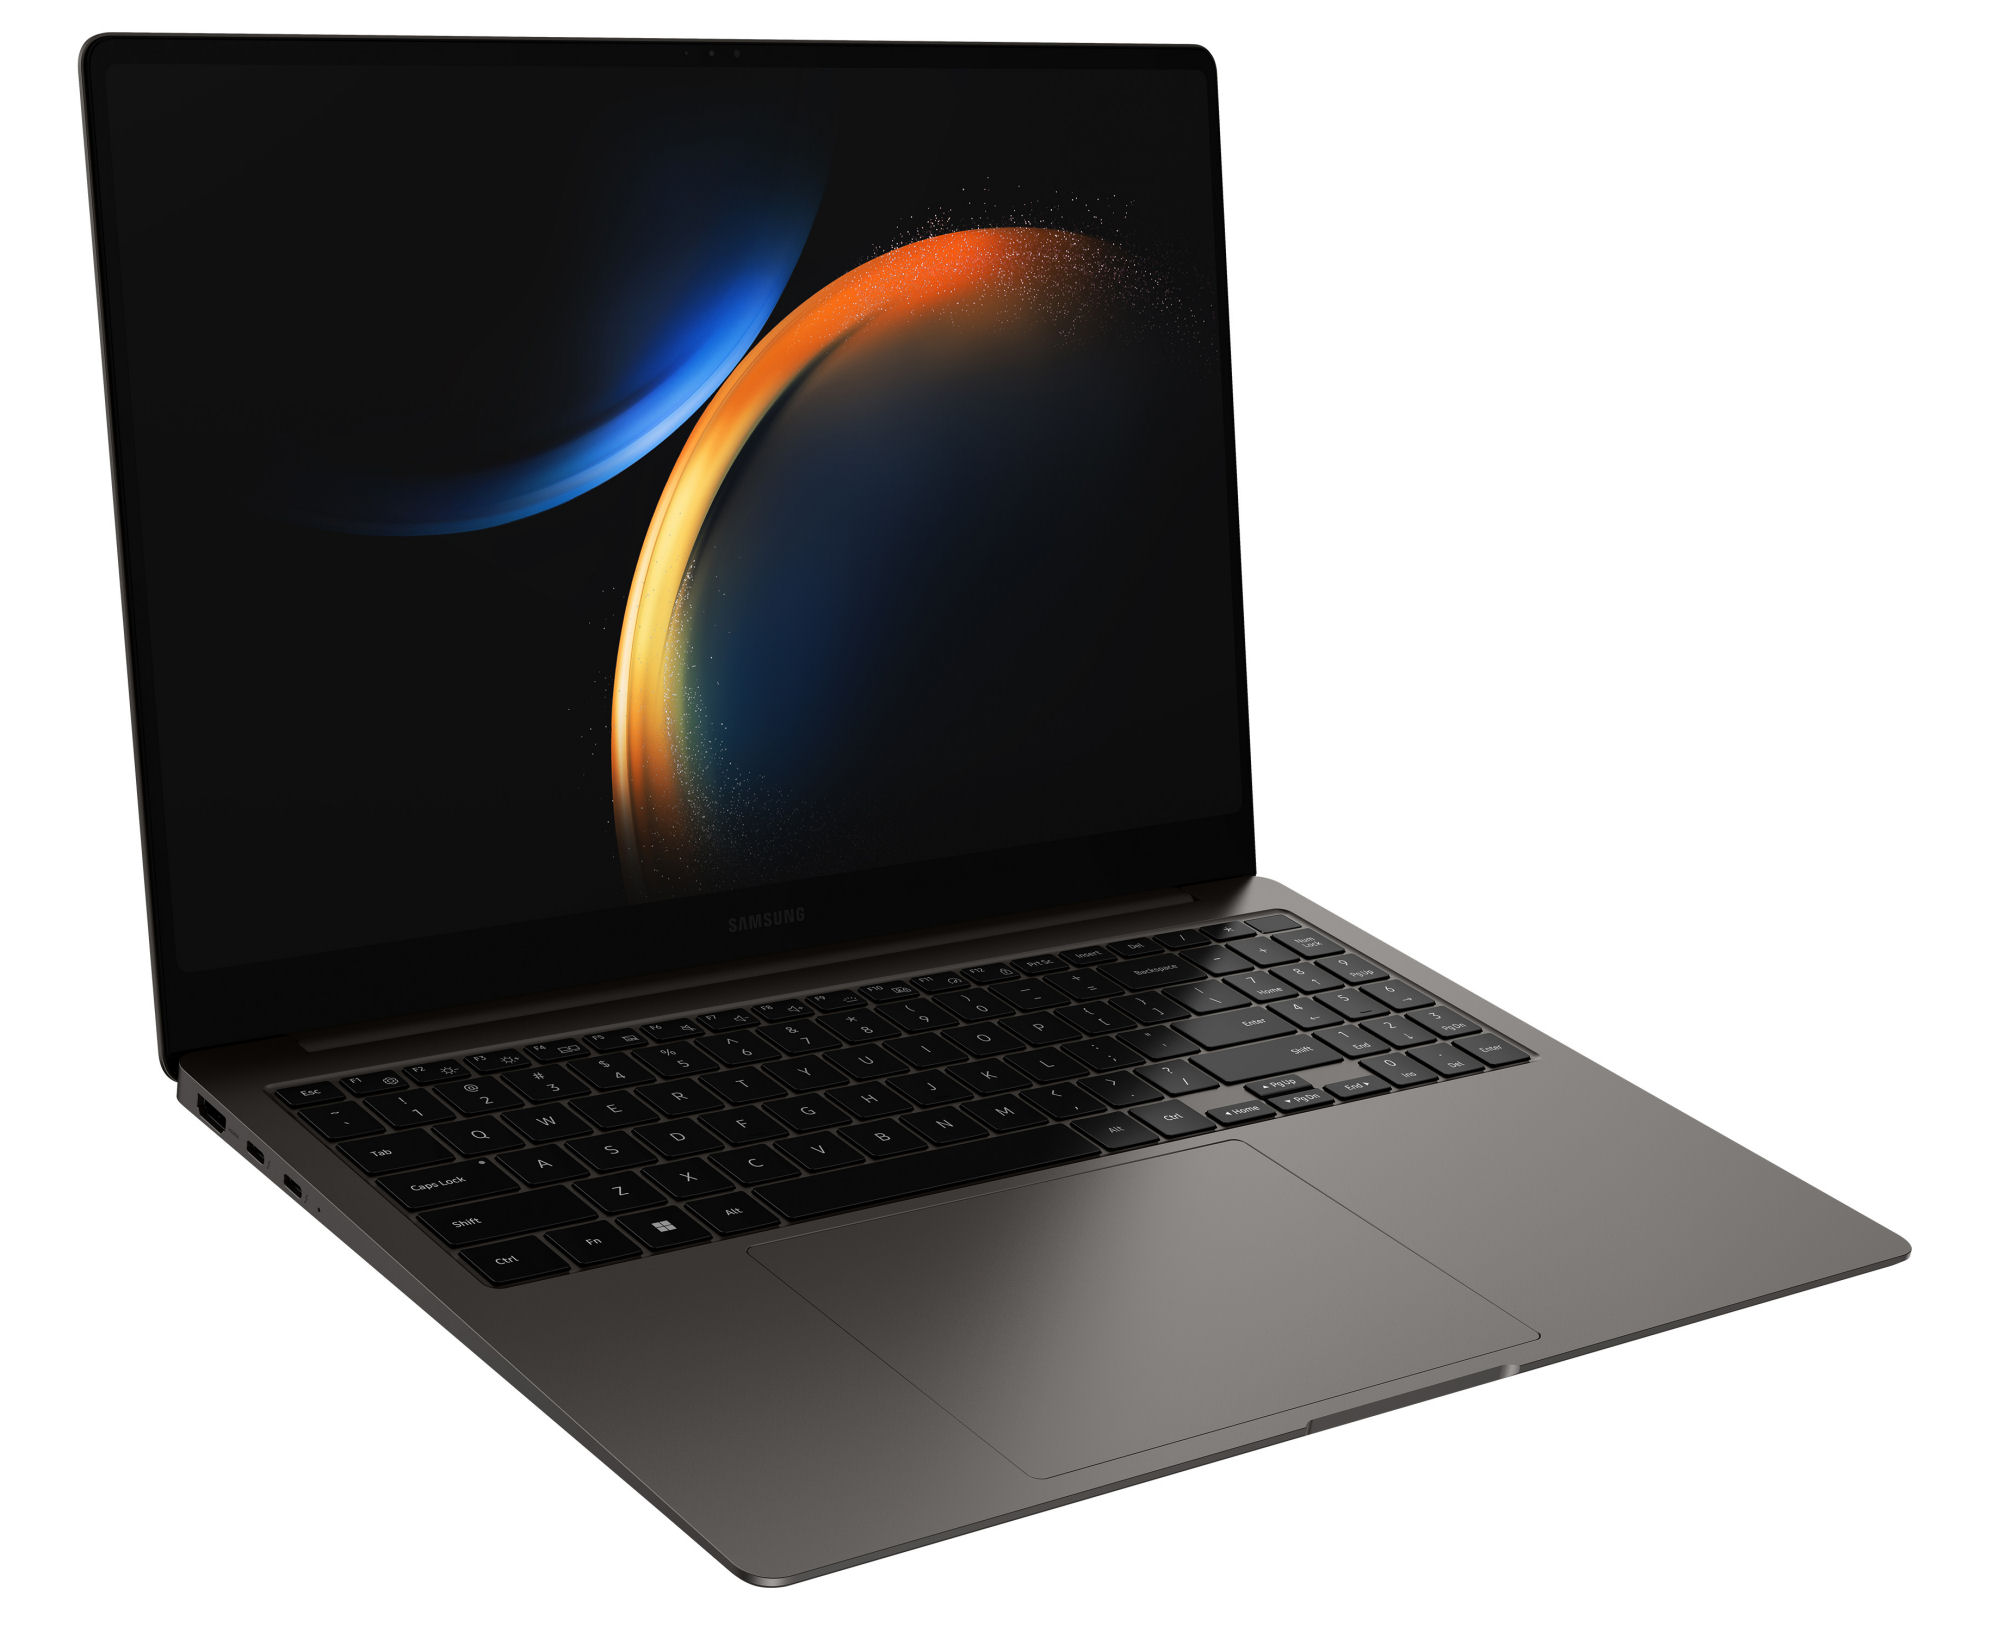
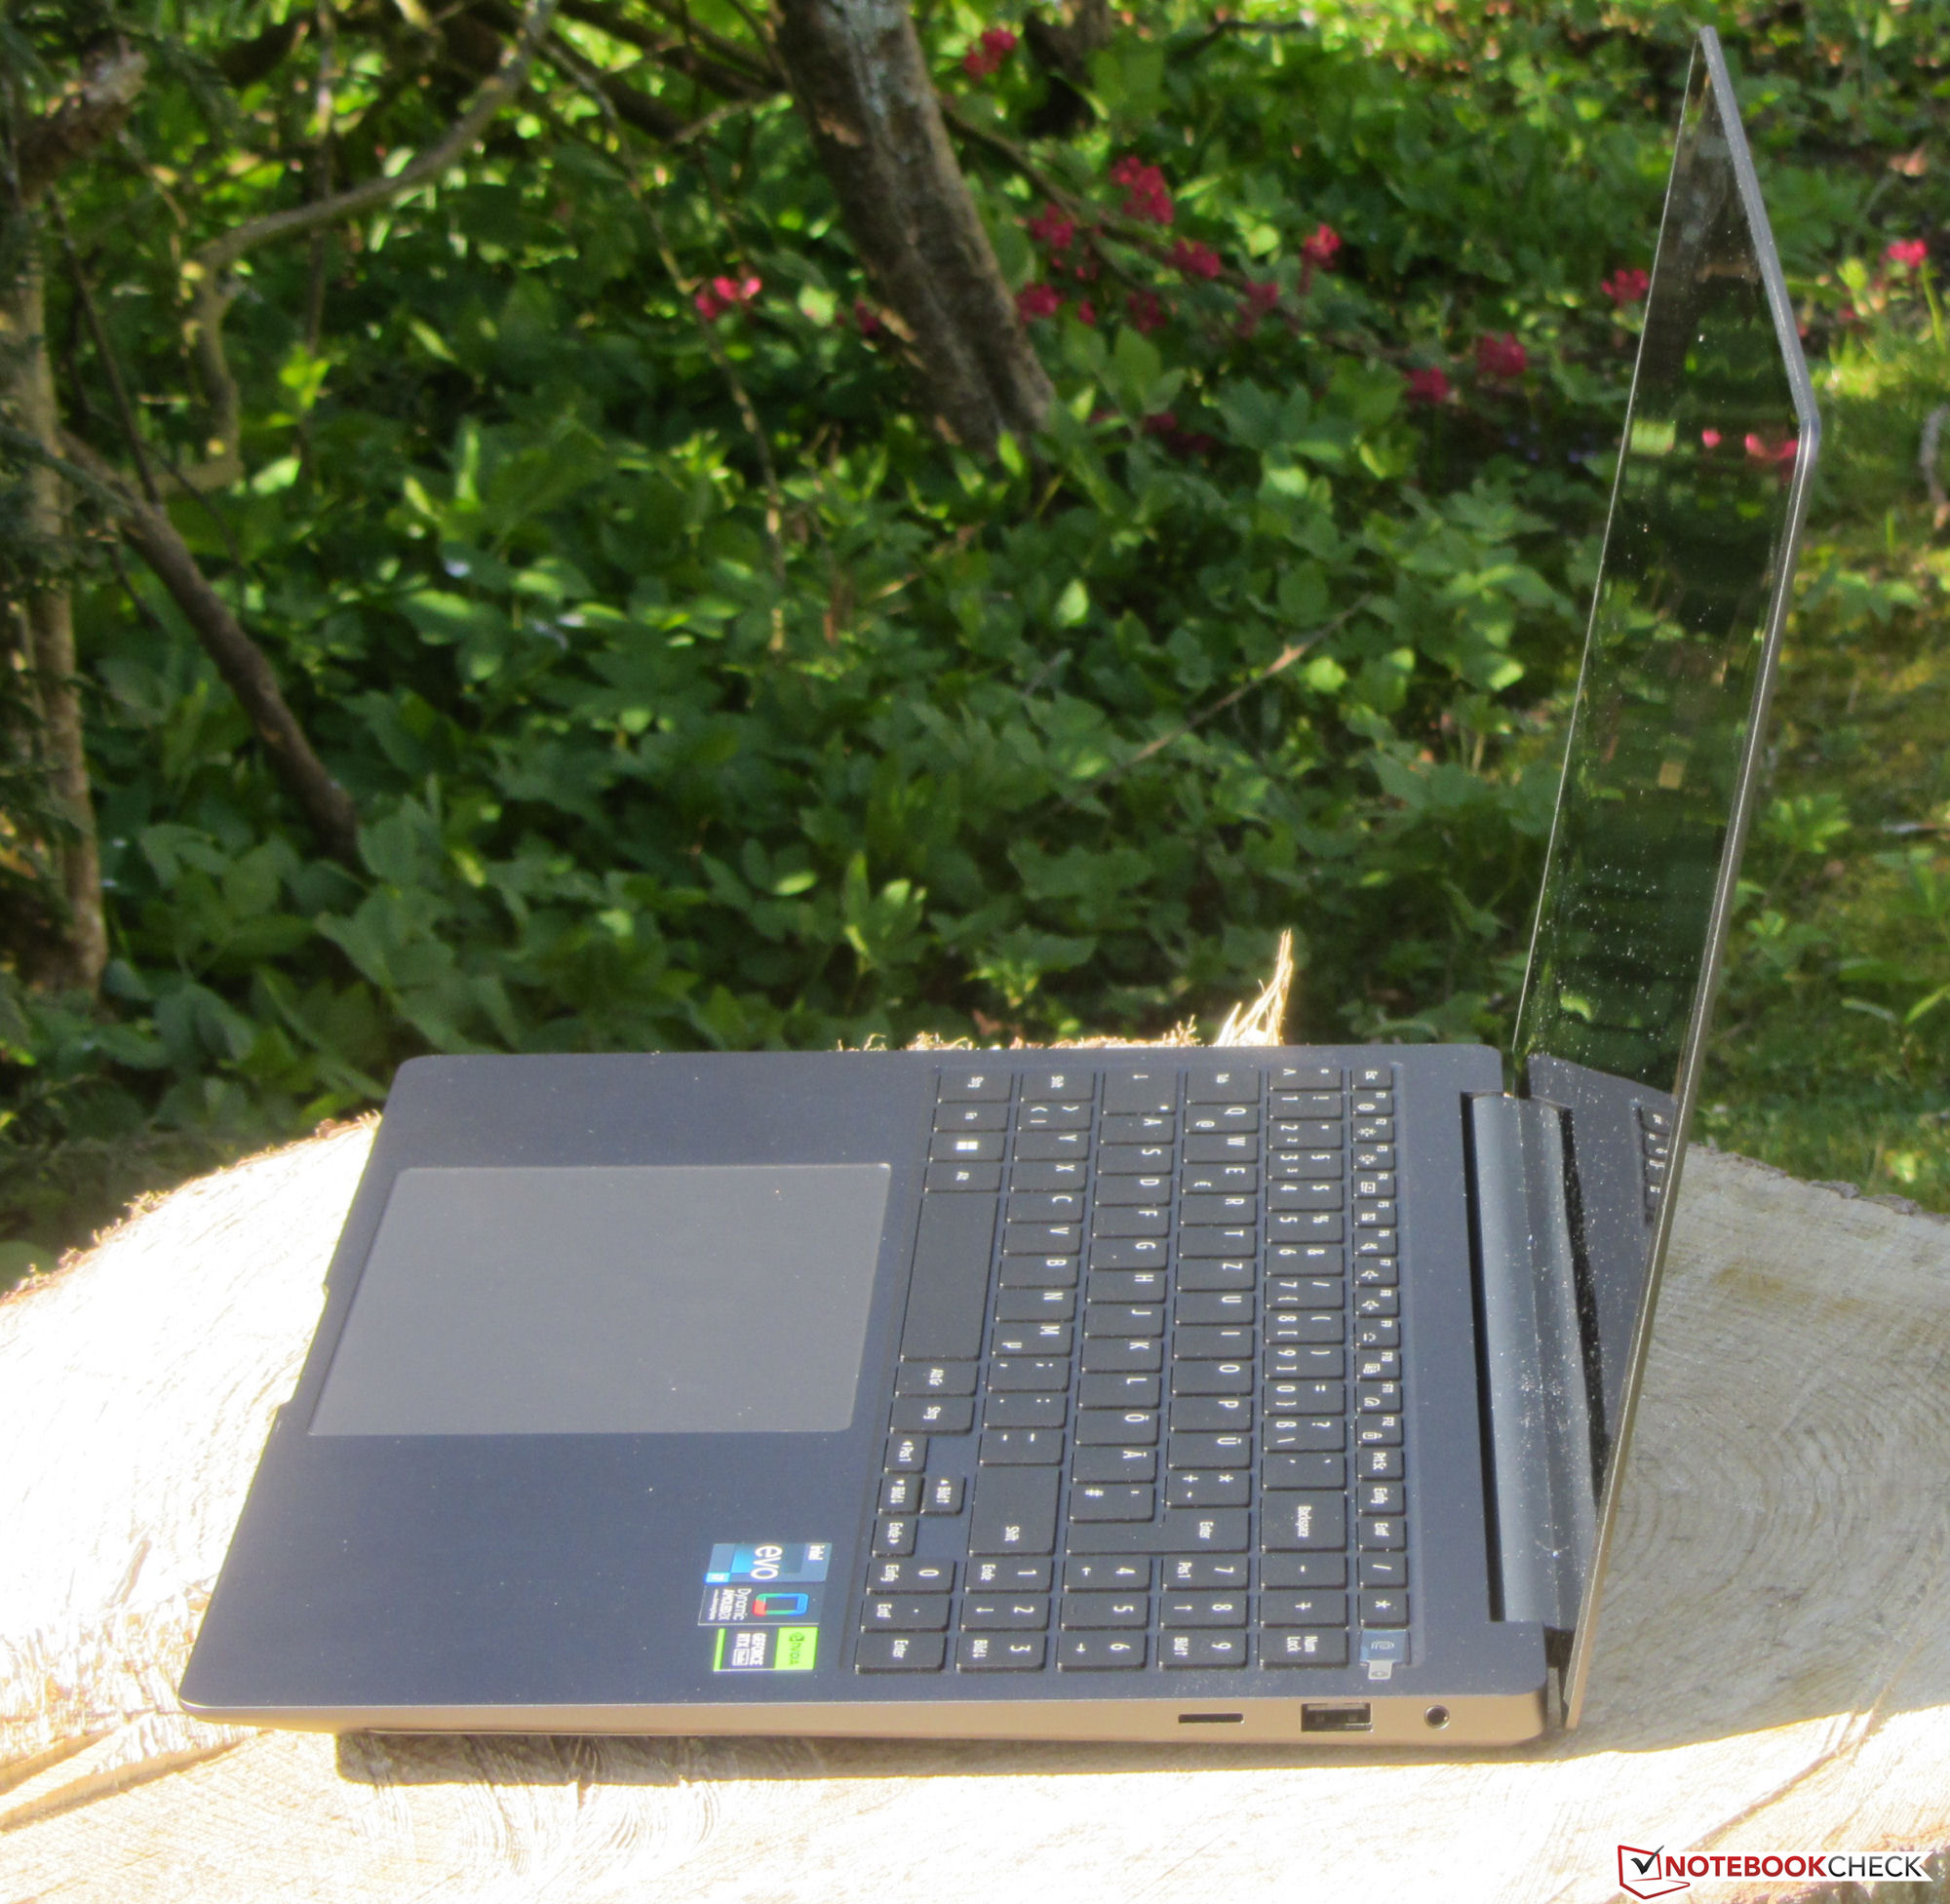
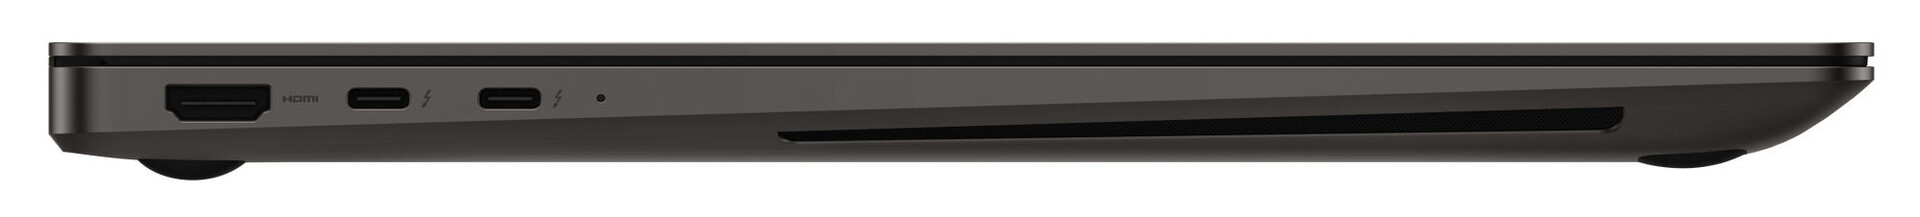
Sprzęt - Samsung instaluje Thunderbolt 4 w Ultra 16
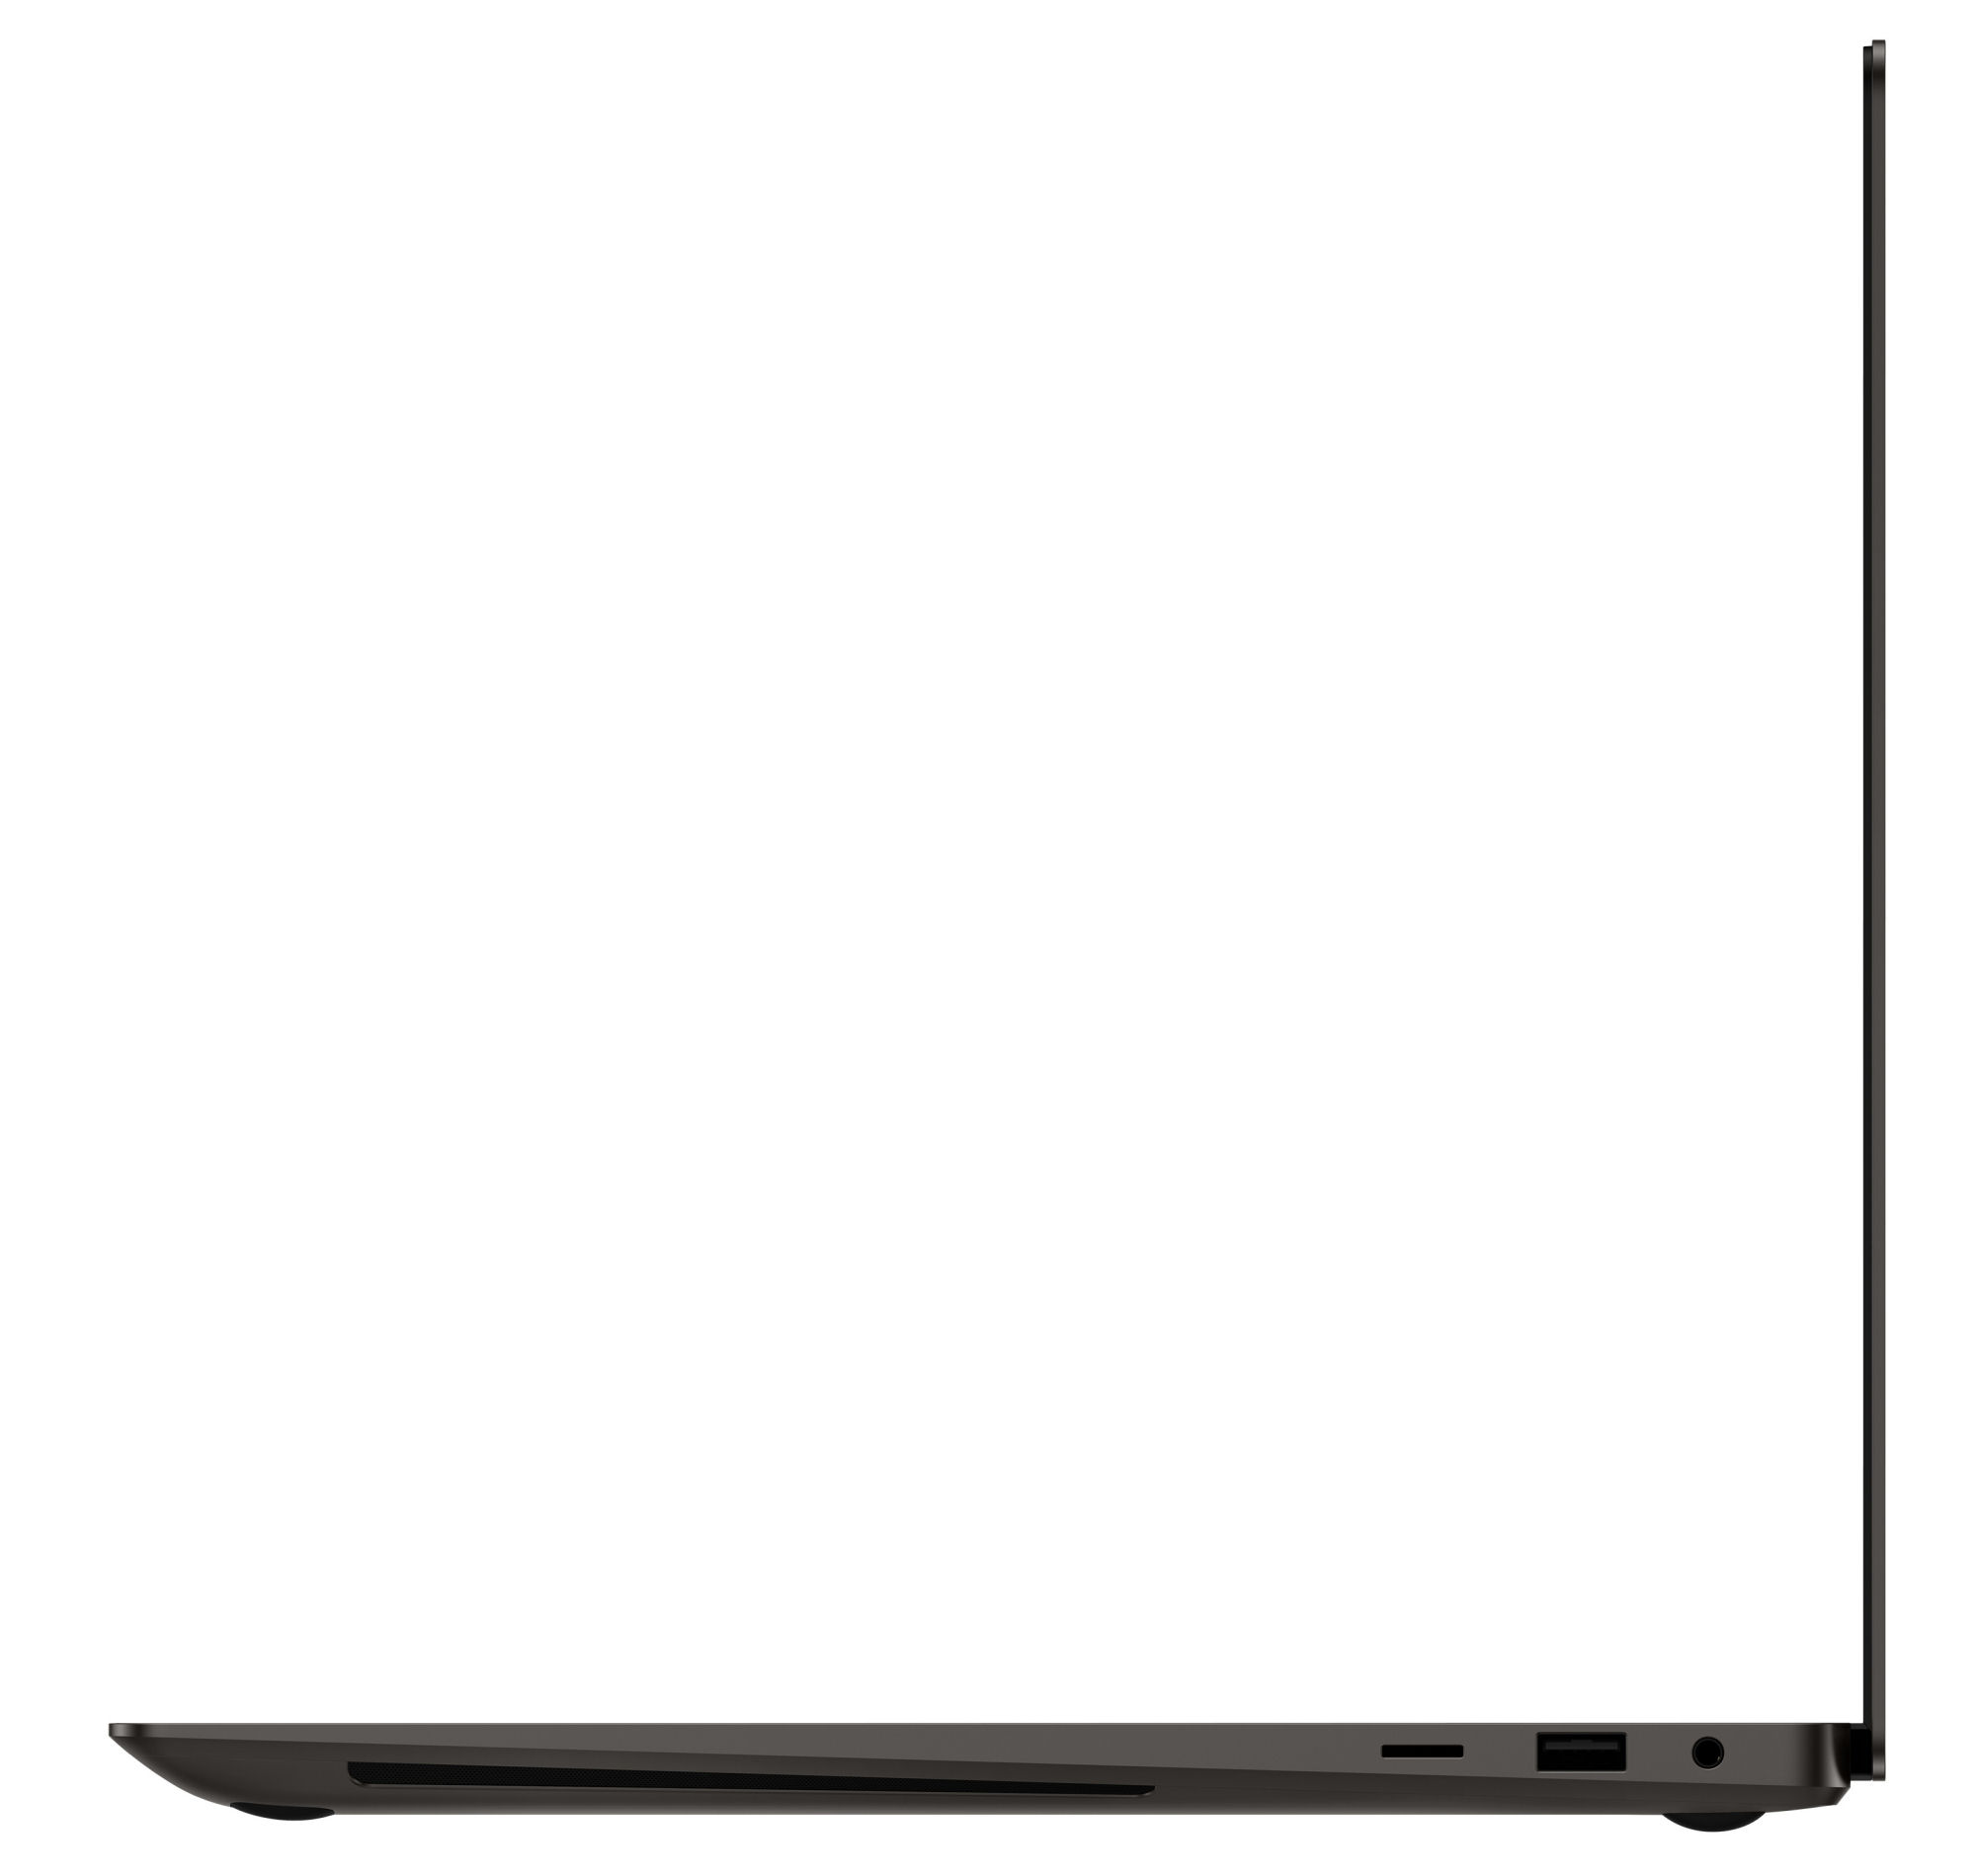
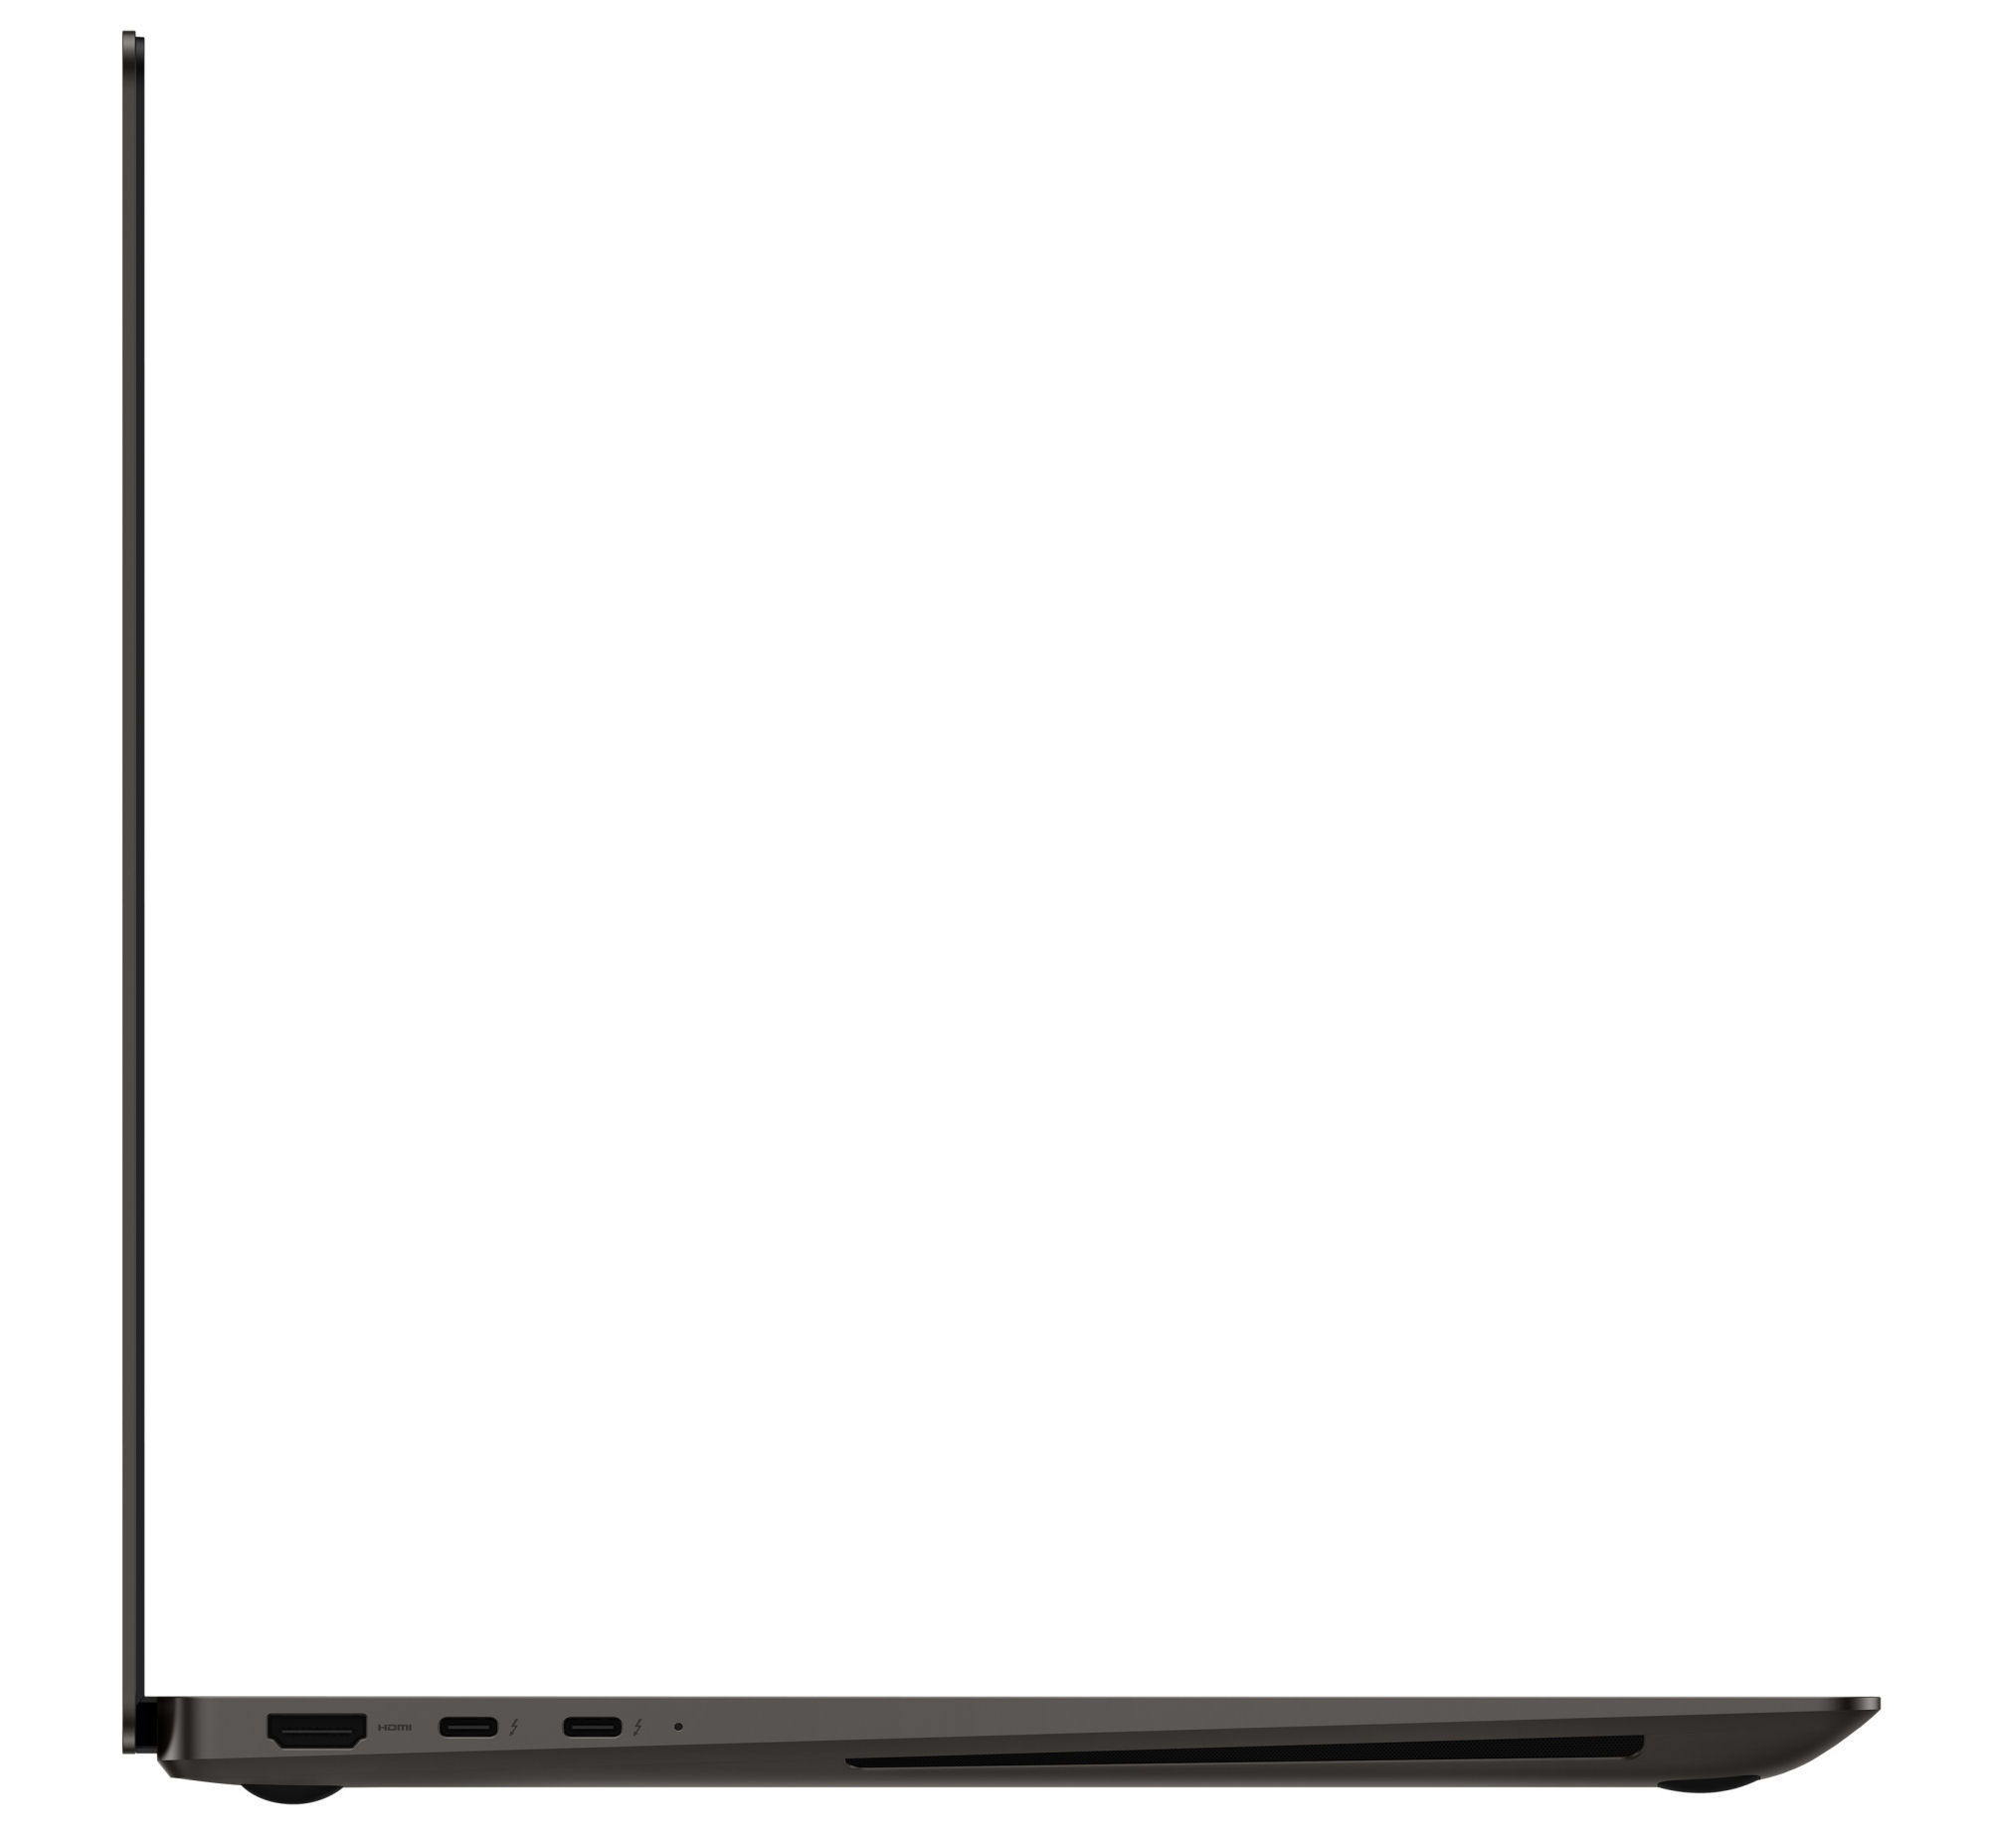
Laptop posiada jeden port USB-A (USB 3.2 Gen 1) i dwa porty USB-C (Thunderbolt 4). Ten ostatni może zasilać laptop w energię (Power Delivery) a także wyprowadzać DisplayPort. Łącznie są trzy wyjścia wideo (2x DP, 1x HDMI). Brakujące porty można dodać przy pomocy stacji dokującej.
Porty znajdują się w tylnych obszarach prawej i lewej strony, więc przestrzeń obok oparcia dłoni pozostaje wolna od kabli. Jeden minus: wszystkie wyjścia wideo i złącza zasilania znajdują się po lewej stronie. Zainstalowanie Thunderbolt 4 po obu stronach miałoby tu sens.
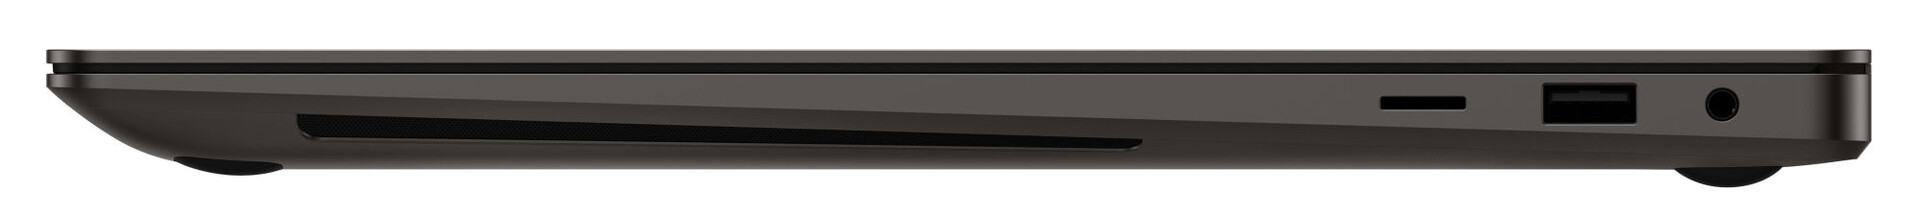
Czytnik kart SD
Czytnik kart pamięci microSD (karta referencyjna: AV PRO microSD 128 GB V60) zalicza się do średnio szybkich modeli z maksymalnym transferem 74 MB/s (transfer 250 plików graficznych jpg o wielkości około 5 MB każdy) i 83 MB/s (kopiowanie dużych bloków danych).
| SD Card Reader | |
| average JPG Copy Test (av. of 3 runs) | |
| Dell XPS 15 9520 RTX 3050 Ti (Toshiba Exceria Pro SDXC 64 GB UHS-II) | |
| Średnia w klasie Multimedia (23 - 531, n=42, ostatnie 2 lata) | |
| Schenker Vision 16 Pro RTX 3070 Ti (AV Pro V60) | |
| Lenovo ThinkBook 16p G3 ARH (AV PRO microSD 128 GB V60) | |
| LG Gram 17Z90Q-E.AD78G (AV Pro SD microSD 128 GB V60) | |
| Samsung Galaxy Book3 Ultra 16 (AV PRO microSD 128 GB V60) | |
| Asus VivoBook Pro 16X OLED N7600PC-L2026X | |
| maximum AS SSD Seq Read Test (1GB) | |
| Średnia w klasie Multimedia (37.3 - 1455, n=41, ostatnie 2 lata) | |
| Dell XPS 15 9520 RTX 3050 Ti (Toshiba Exceria Pro SDXC 64 GB UHS-II) | |
| LG Gram 17Z90Q-E.AD78G (AV Pro SD microSD 128 GB V60) | |
| Lenovo ThinkBook 16p G3 ARH (AV PRO microSD 128 GB V60) | |
| Samsung Galaxy Book3 Ultra 16 (AV PRO microSD 128 GB V60) | |
| Schenker Vision 16 Pro RTX 3070 Ti (AV Pro V60) | |
| Asus VivoBook Pro 16X OLED N7600PC-L2026X | |
Komunikacja
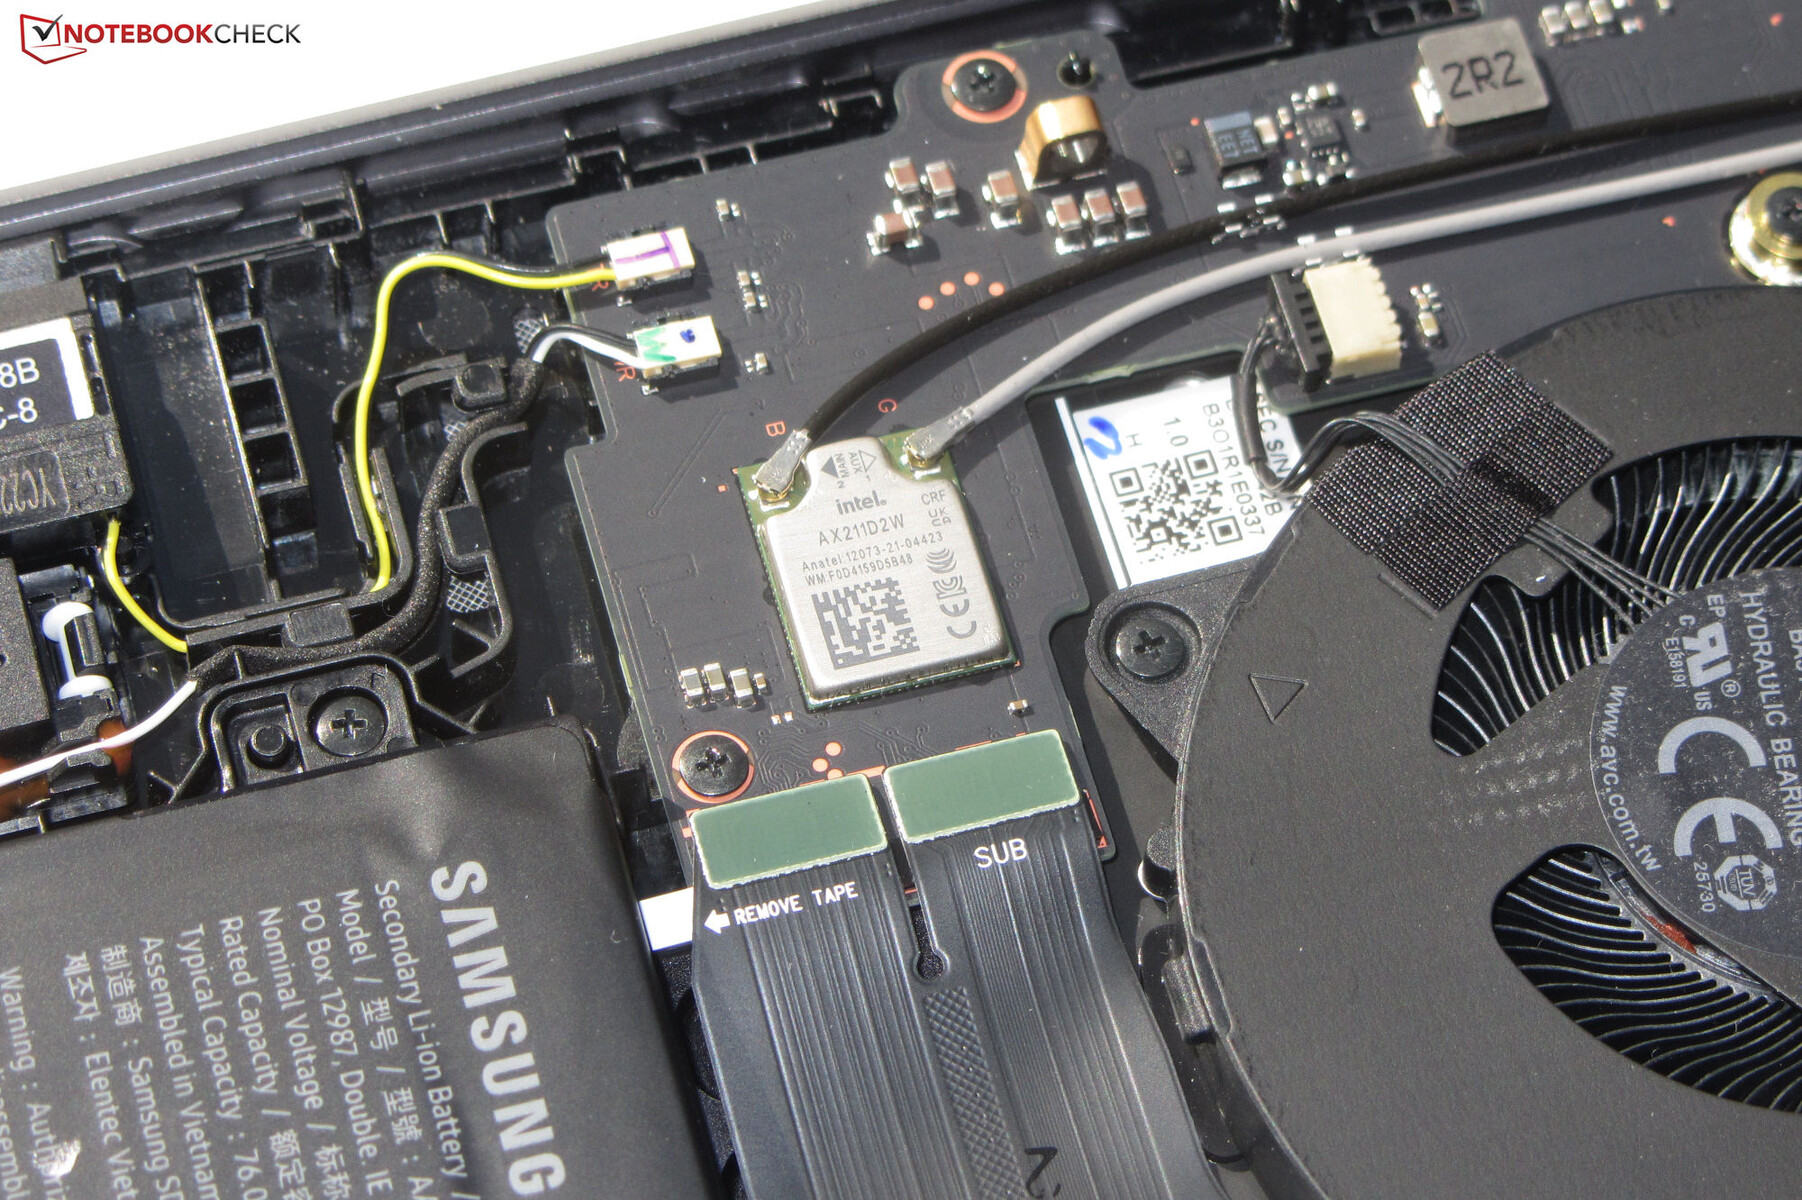
Doskonałe prędkości przesyłu danych WiFi są osiągane w optymalnych warunkach (brak urządzeń WLAN w najbliższym otoczeniu, niewielka odległość między laptopem a komputerem serwerowym). Notebook Samsunga ma na pokładzie układ WiFi 6E (Intel AX211). Gniazdo Ethernet nie jest dostępne.
Kamera internetowa
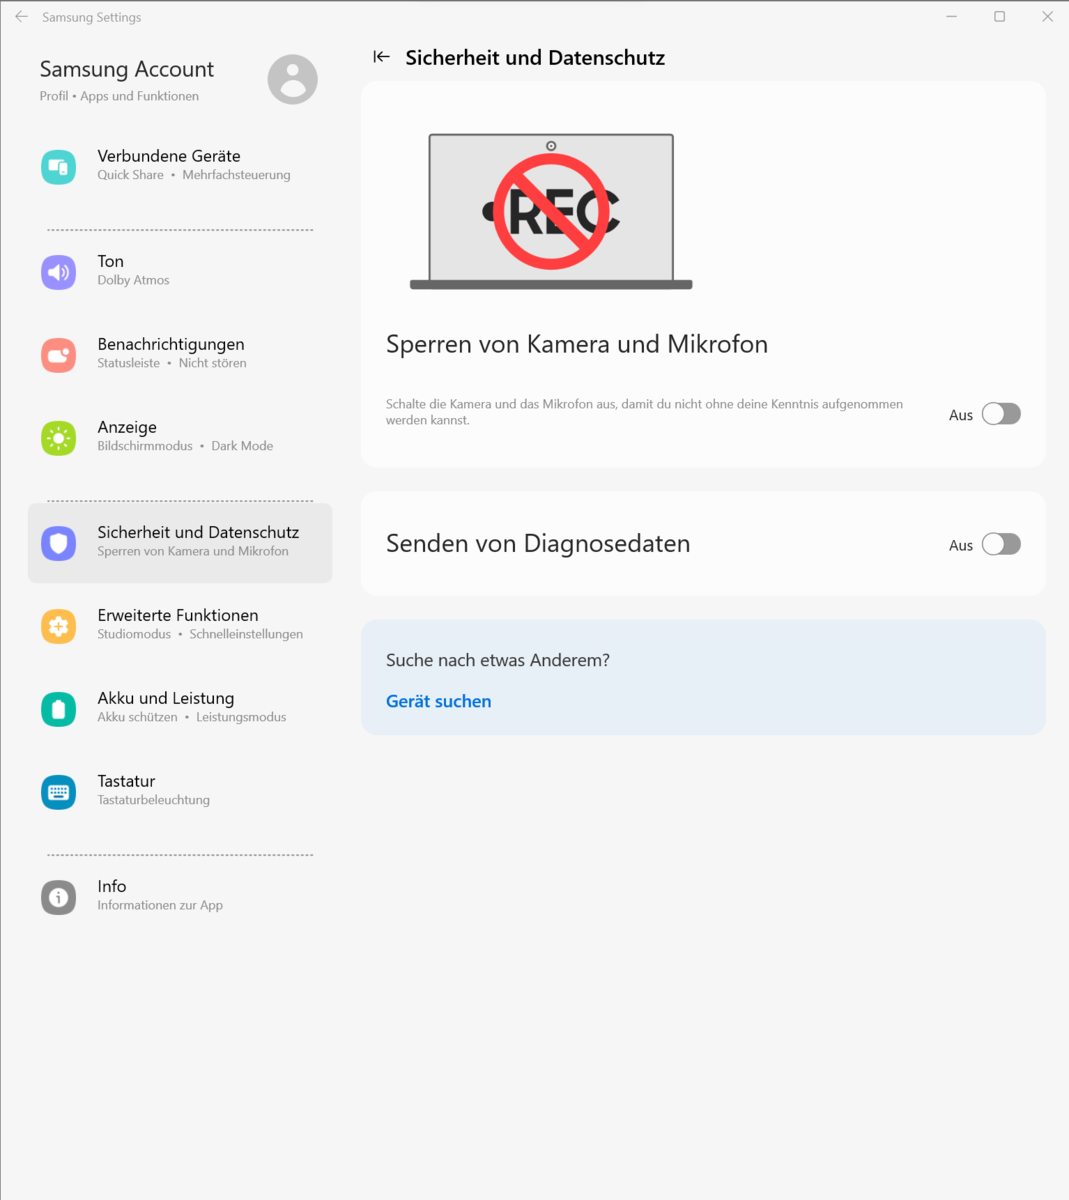
Kamera internetowa (2,1 MP, maks. 1 920 x 1 080) nie posiada mechanicznej migawki. Pod względem jakościowym zapewnia ona standardową jakość. Problemem jest dokładność kolorów, gdyż cel (DeltaE poniżej 3) nie został osiągnięty z odchyleniem kolorów wynoszącym prawie 8.


Akcesoria
Poza typowymi dokumentami (informacje o gwarancji, skrócona instrukcja obsługi) notebook nie jest dostarczany z żadnymi innymi akcesoriami.
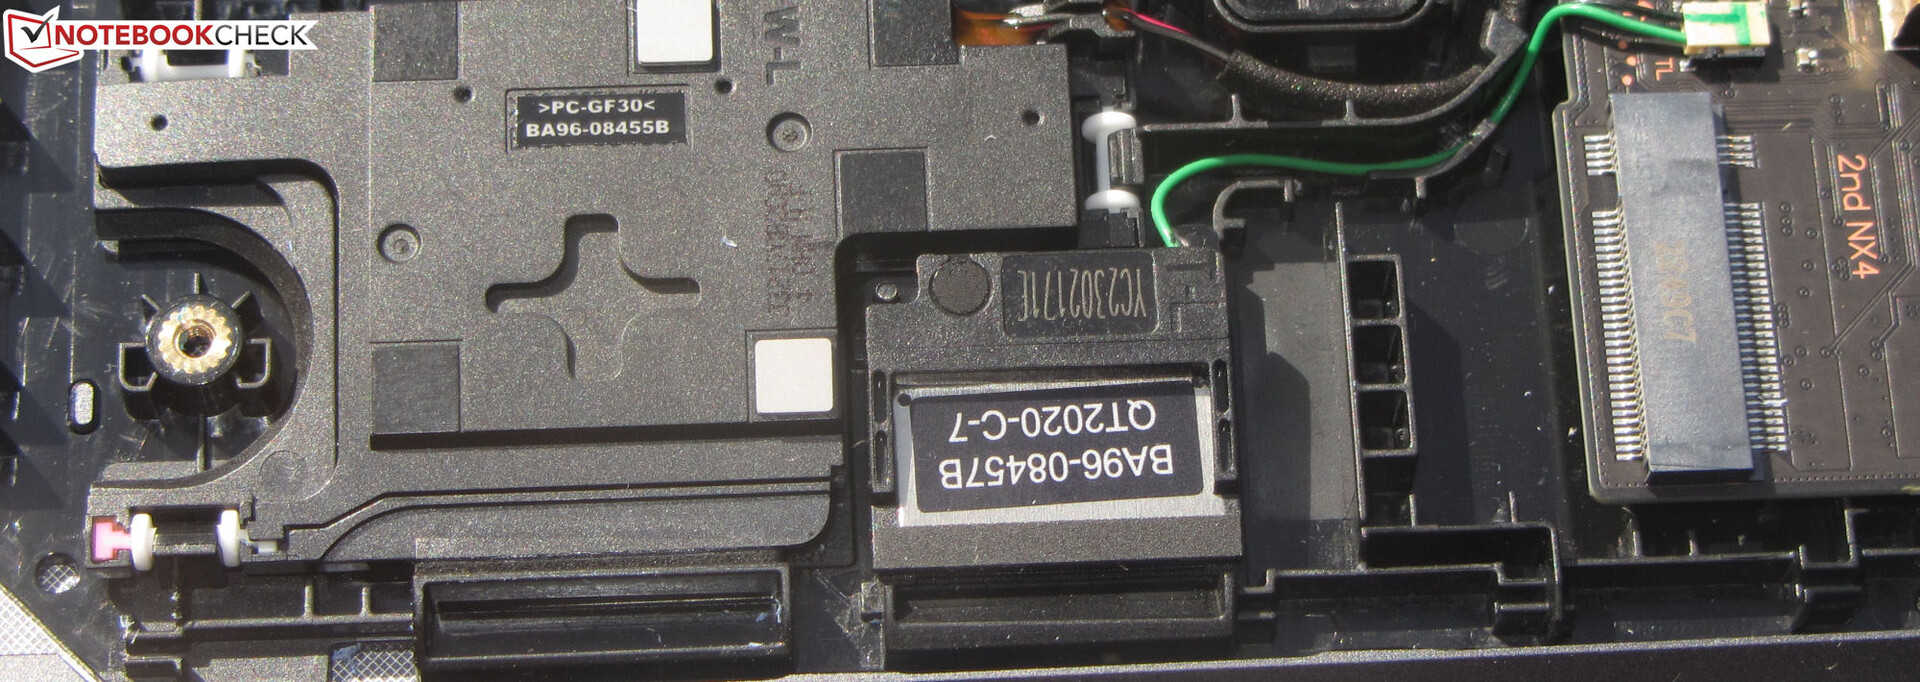
Konserwacja
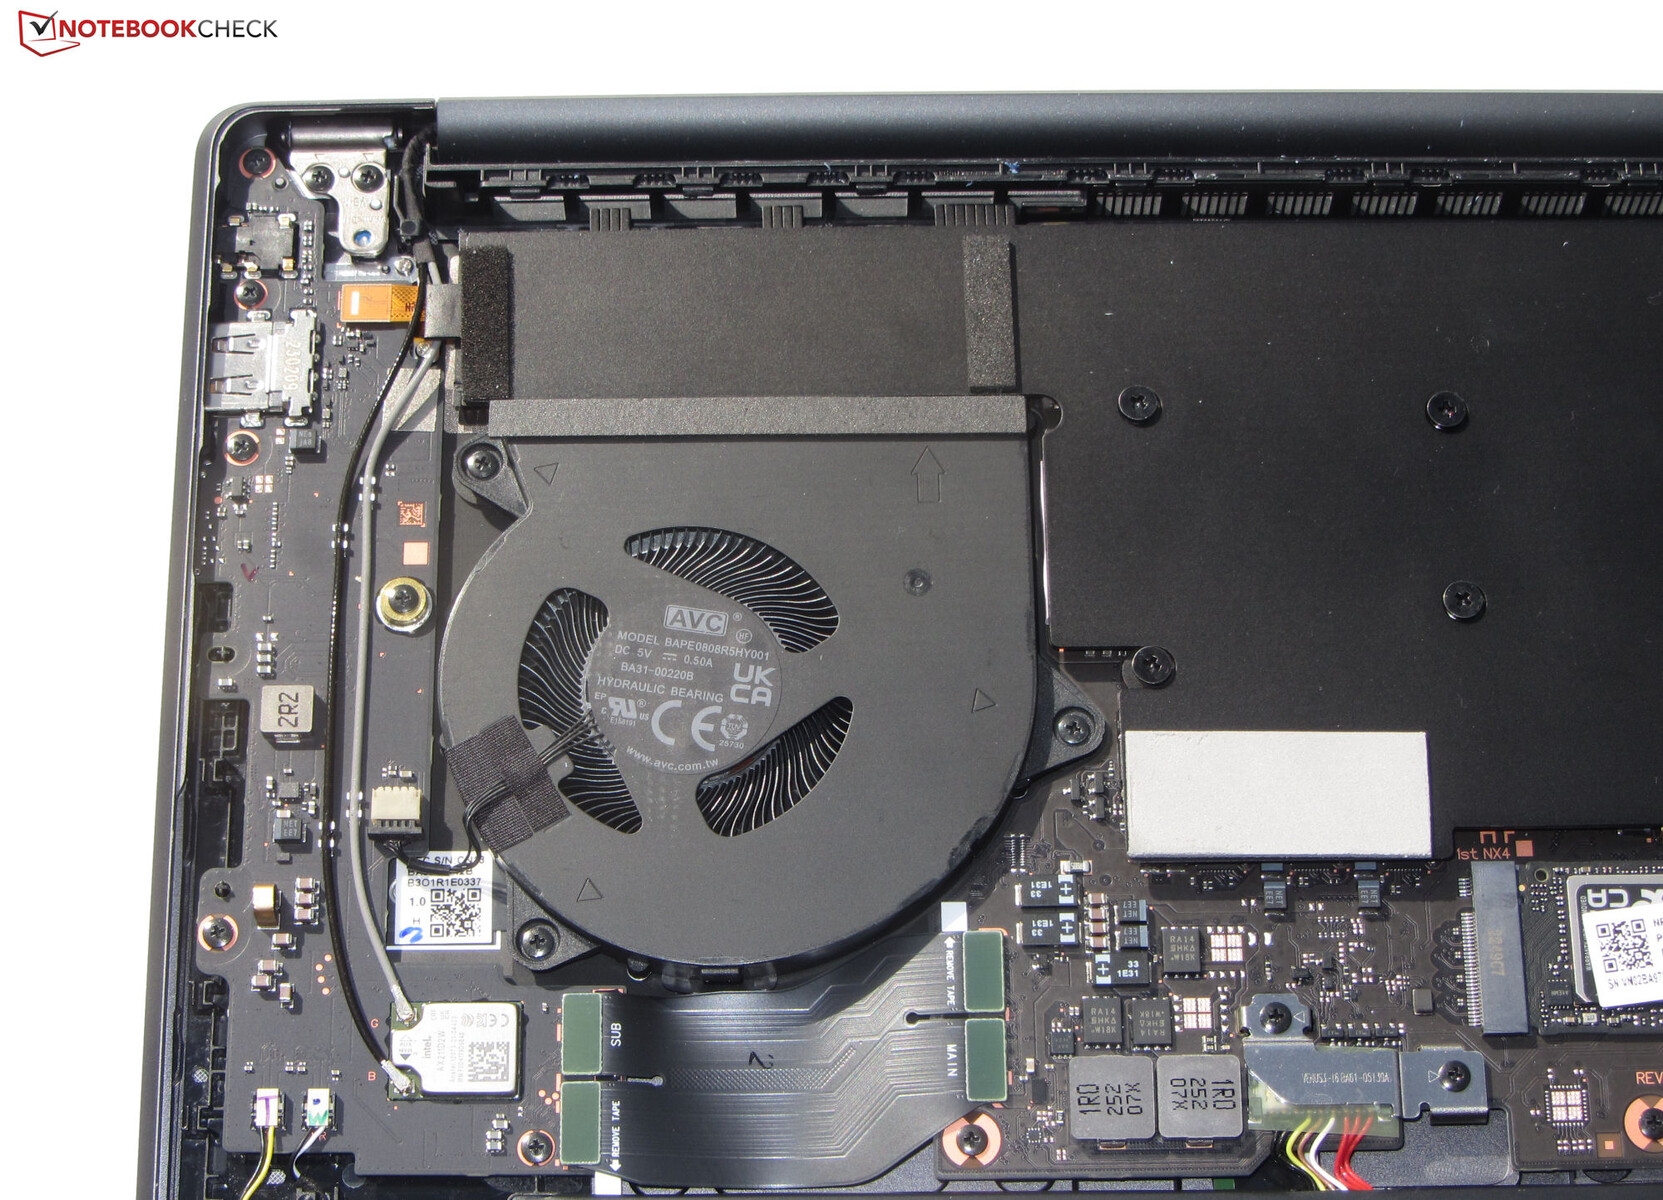
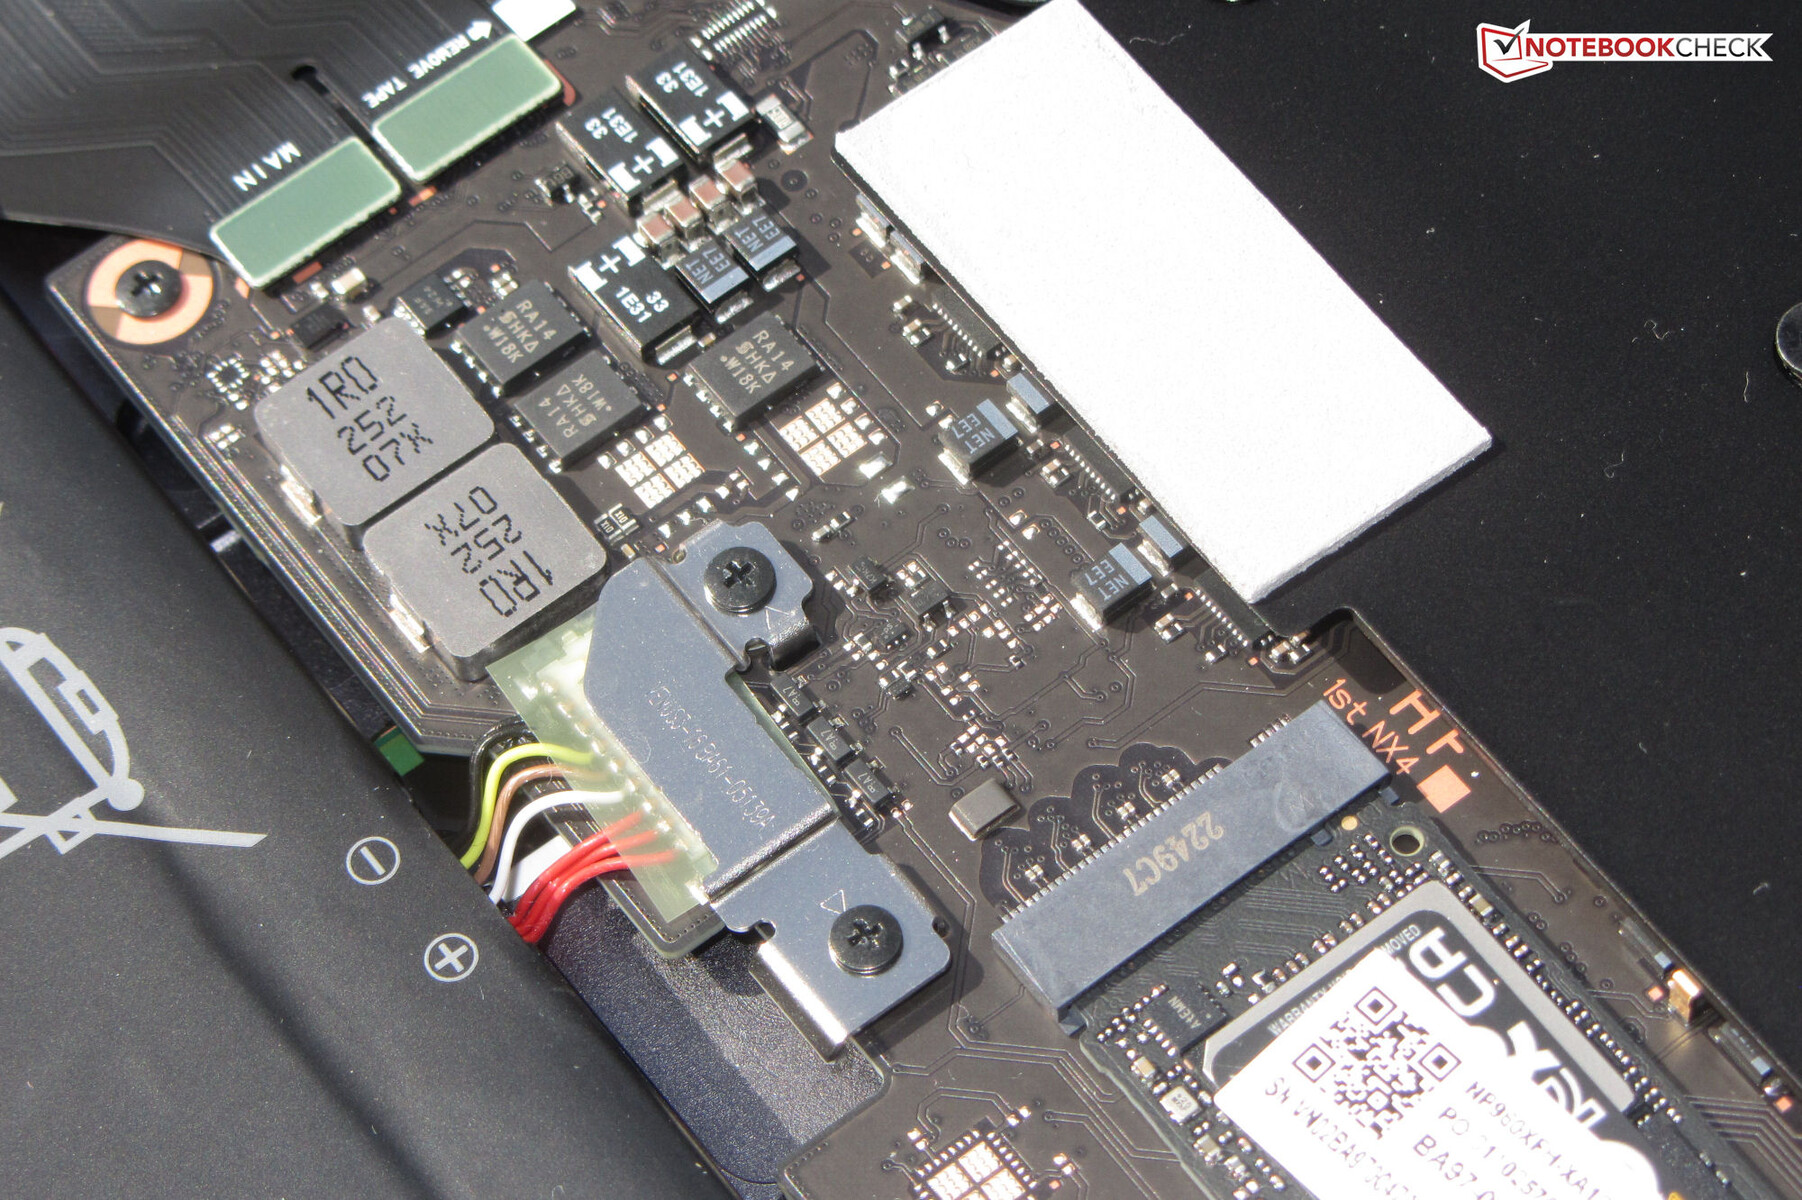
Demontaż dolnej pokrywy wymaga odkręcenia wszystkich śrub, które ukryte są pod czterema gumowymi nóżkami (włożonymi, a nie przyklejonymi). Następnie należy zachować ostrożność (!) przy zdejmowaniu dolnej pokrywy, która jest bardzo szczelna i można ją uszkodzić. Zalecamy użycie płaskiej szpatułki. Następnie można uzyskać dostęp do dysku SSD (PCIe 4, M.2-2280), drugiego gniazda SSD, wentylatorów, głośników i akumulatora.
Gwarancja
Samsung udziela na 16-calowca dwuletniej gwarancji w Niemczech. Przedłużenie o rok lub dwa lata kosztuje odpowiednio 79 i 149 euro. Warunki te mogą się różnić w innych krajach, więc kupujący powinni się dwukrotnie upewnić przed zakupem.
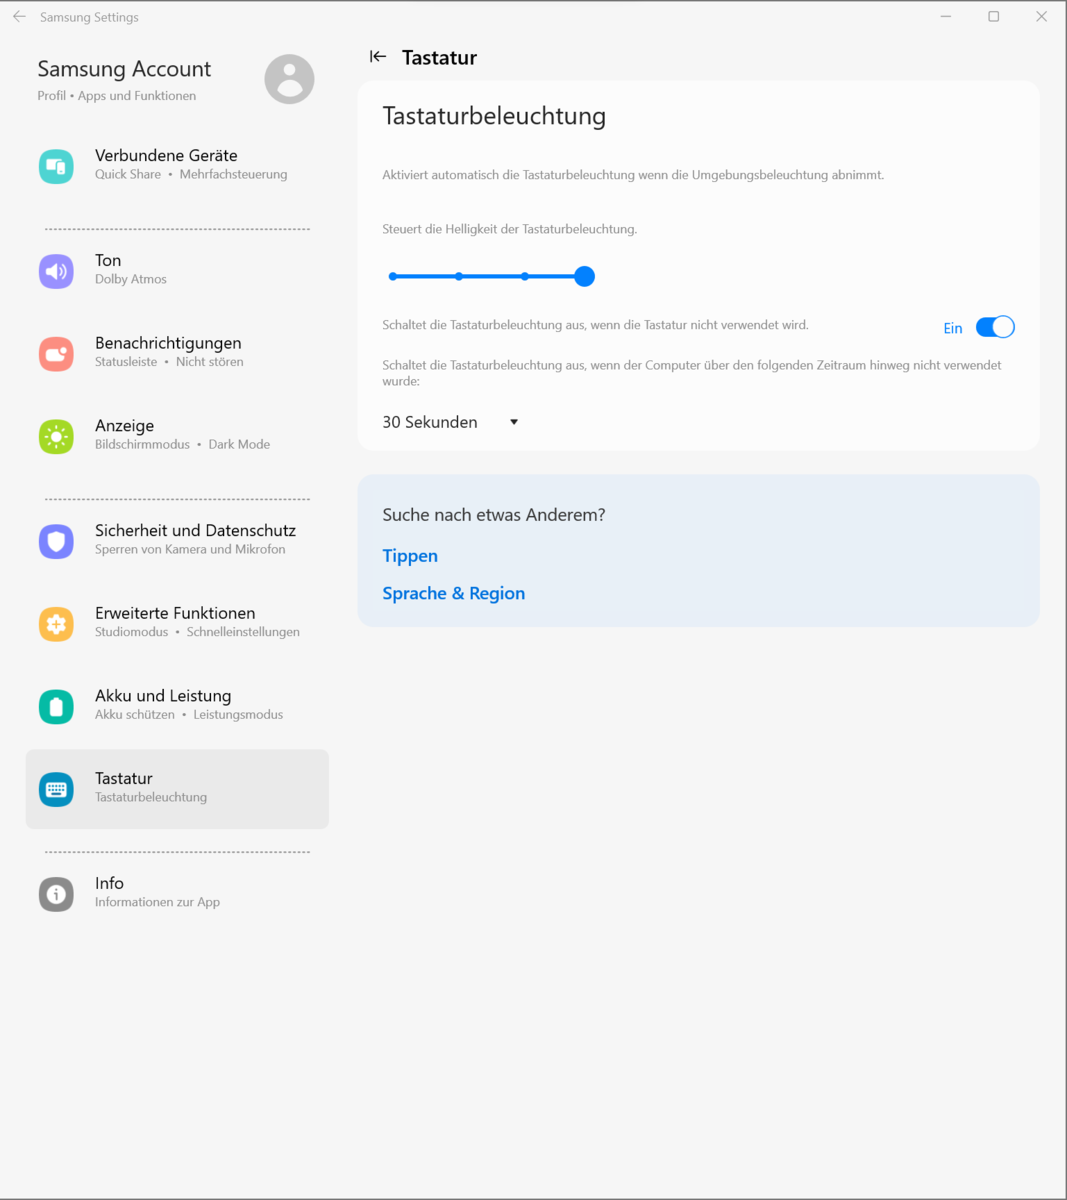
Urządzenia wejściowe - Galaxy Book3 oferuje podświetlaną klawiaturę
Klawiatura
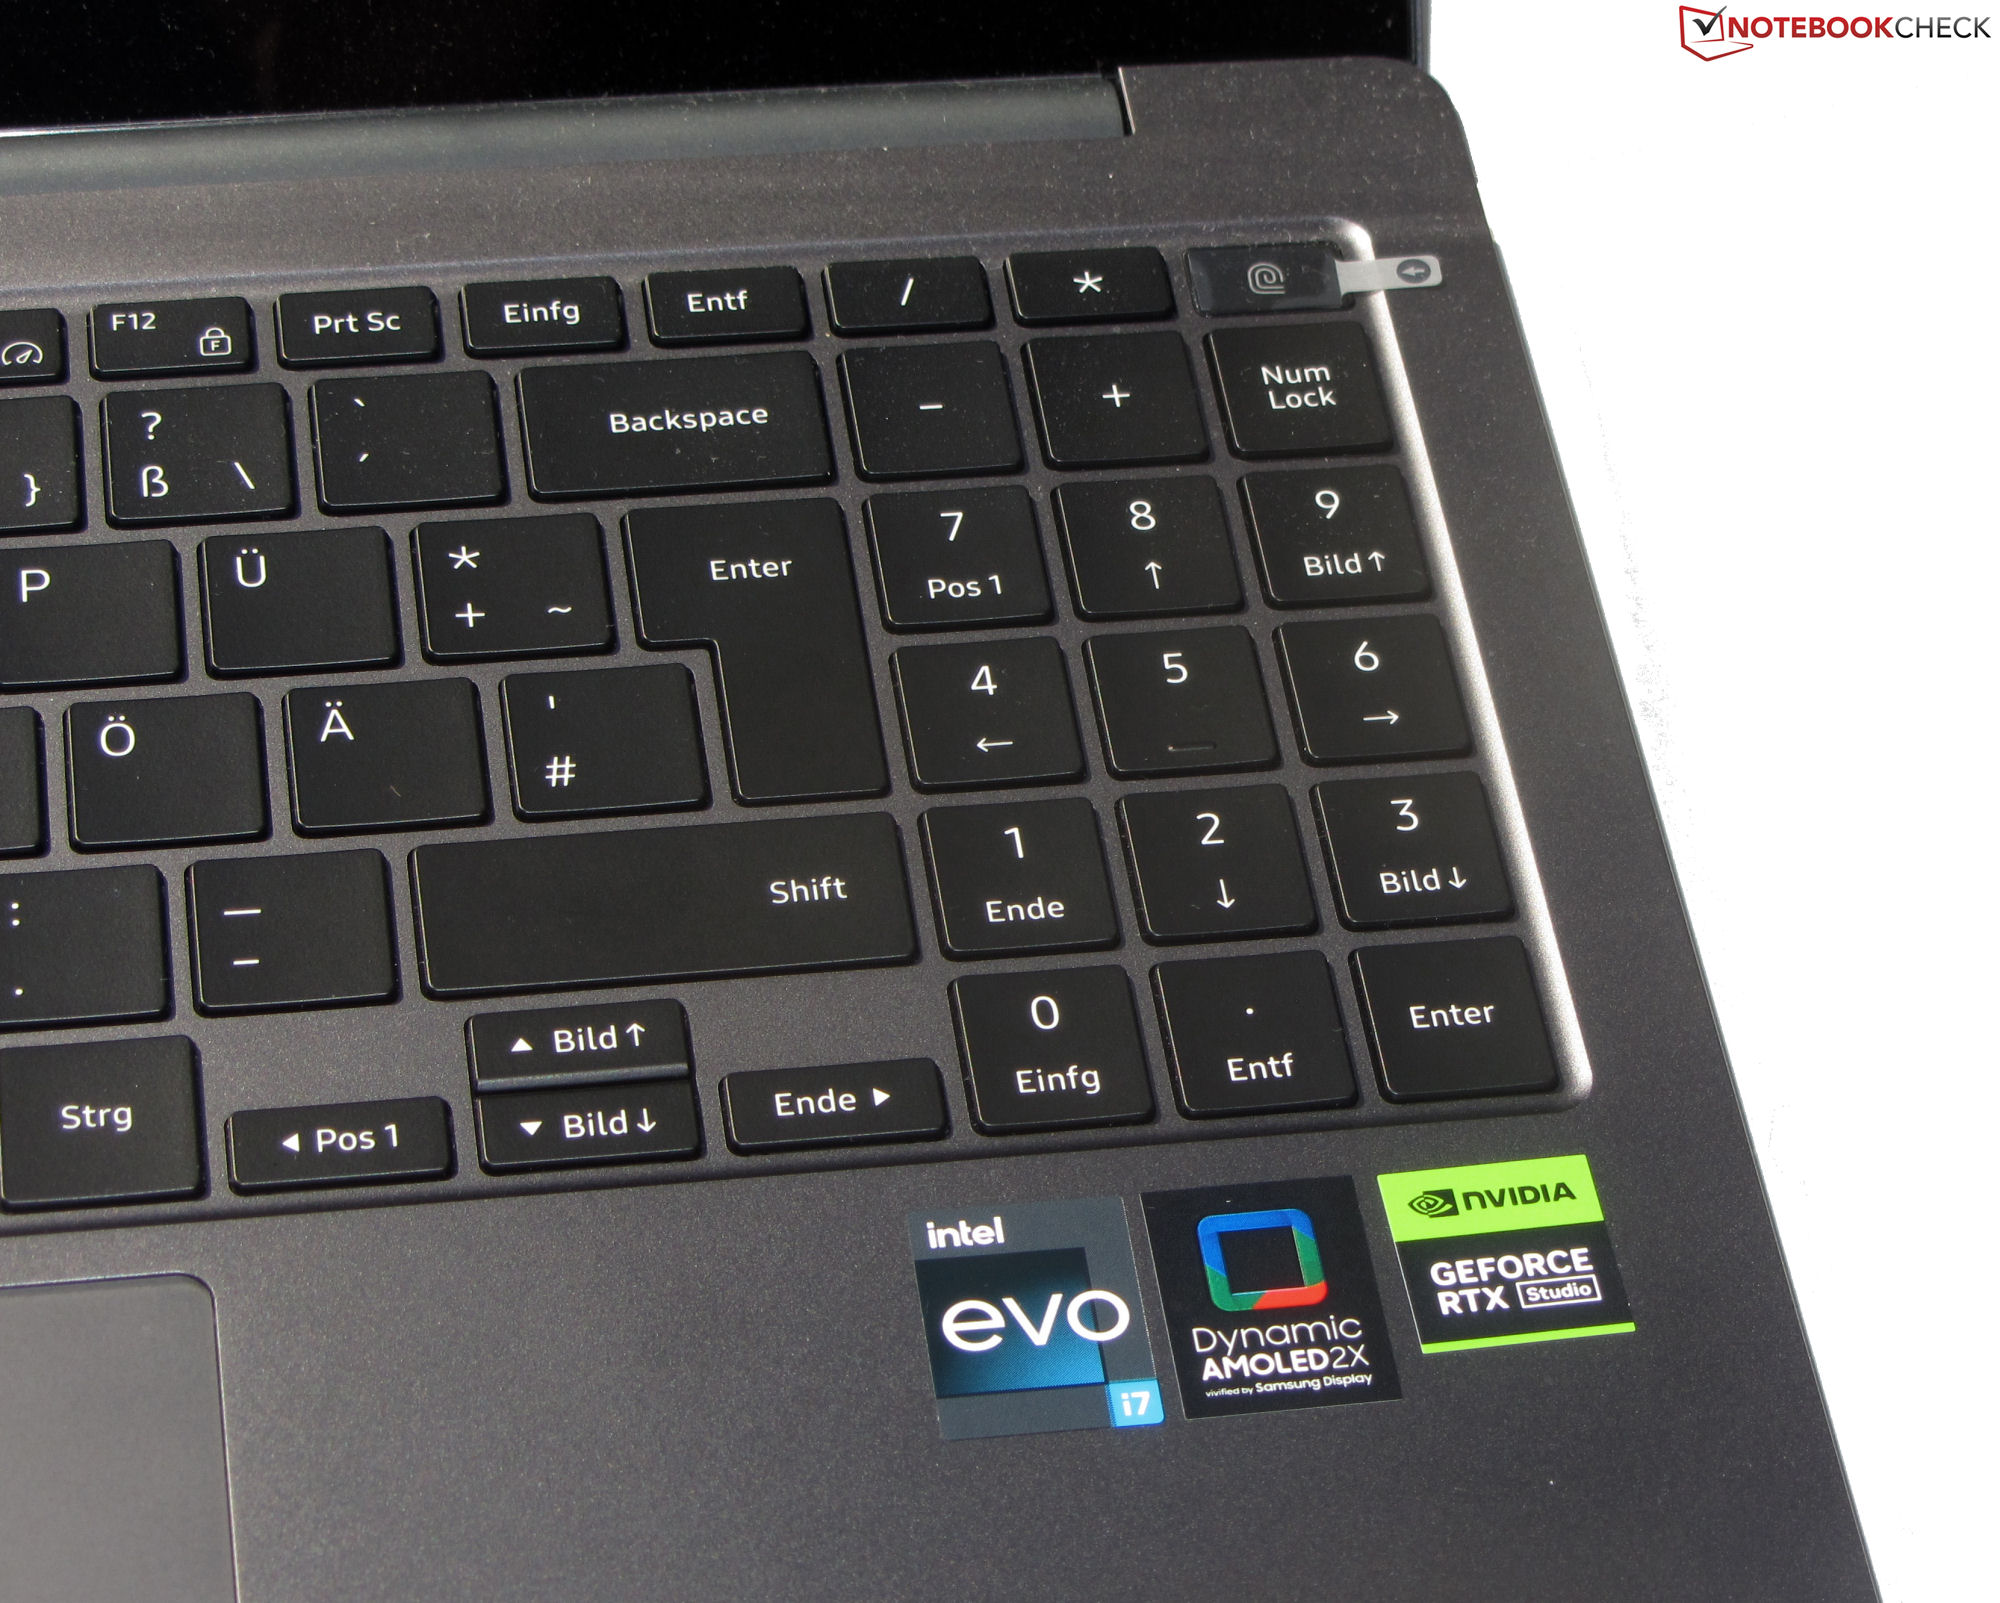
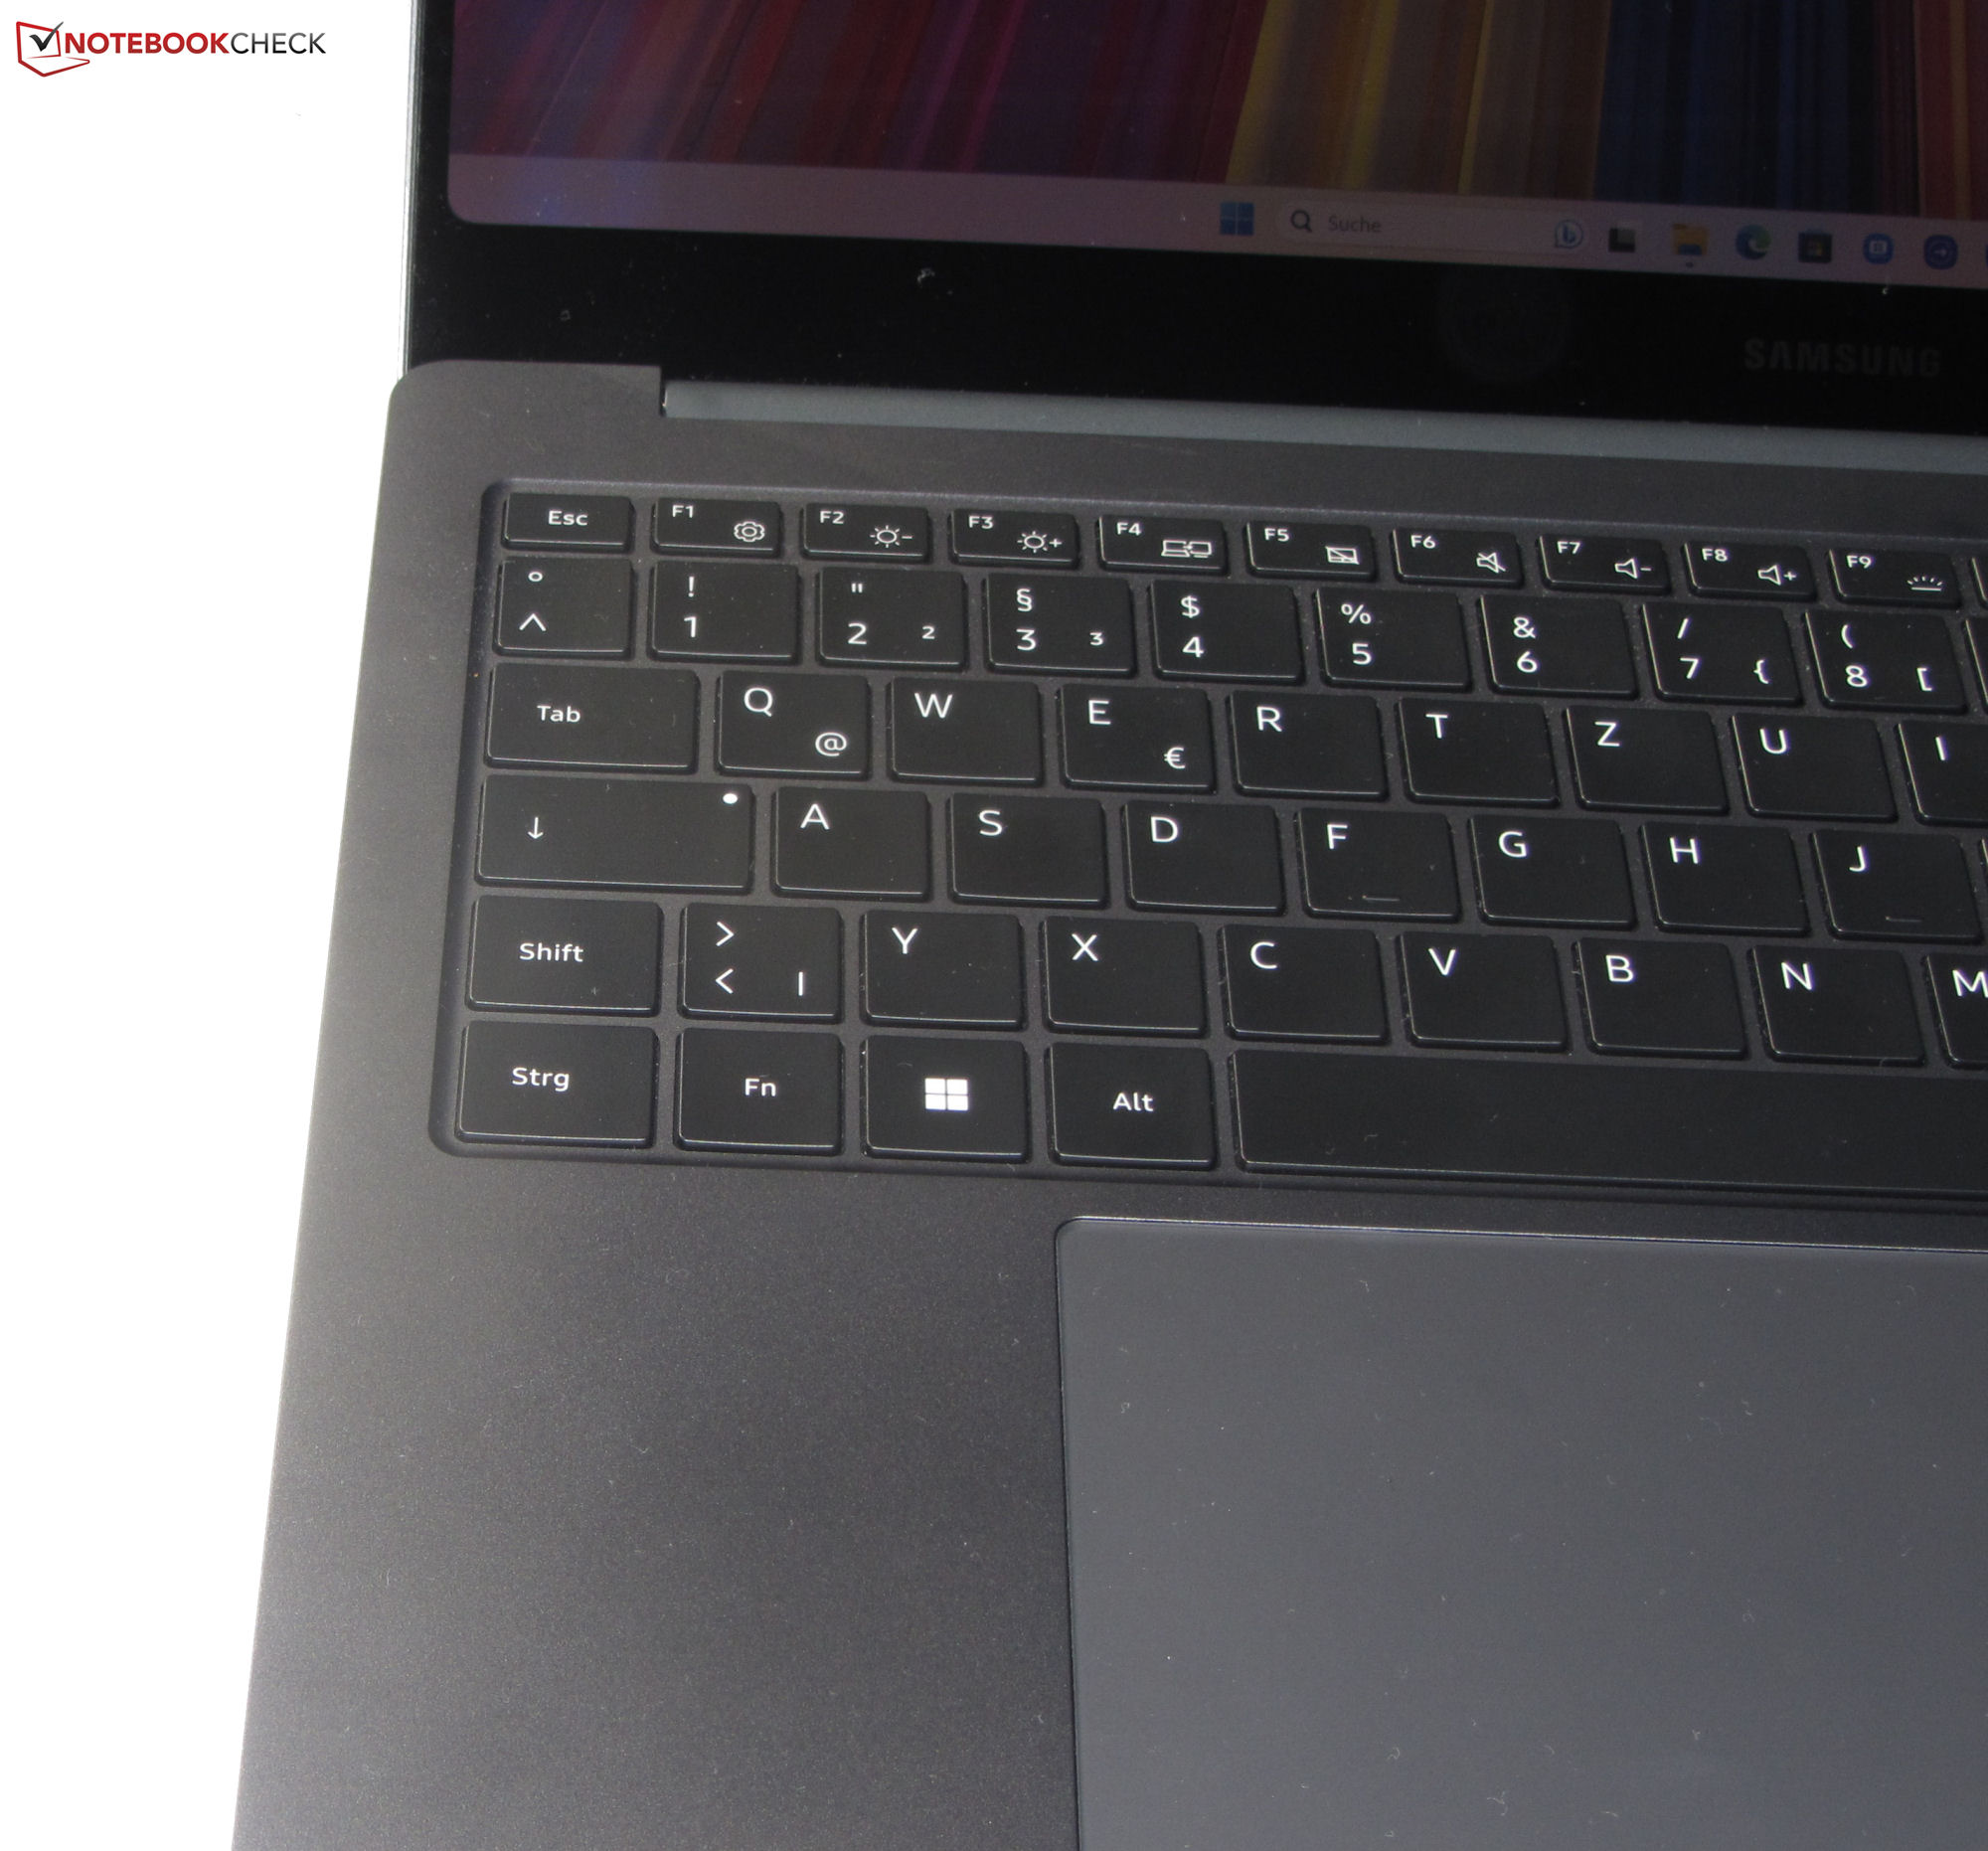
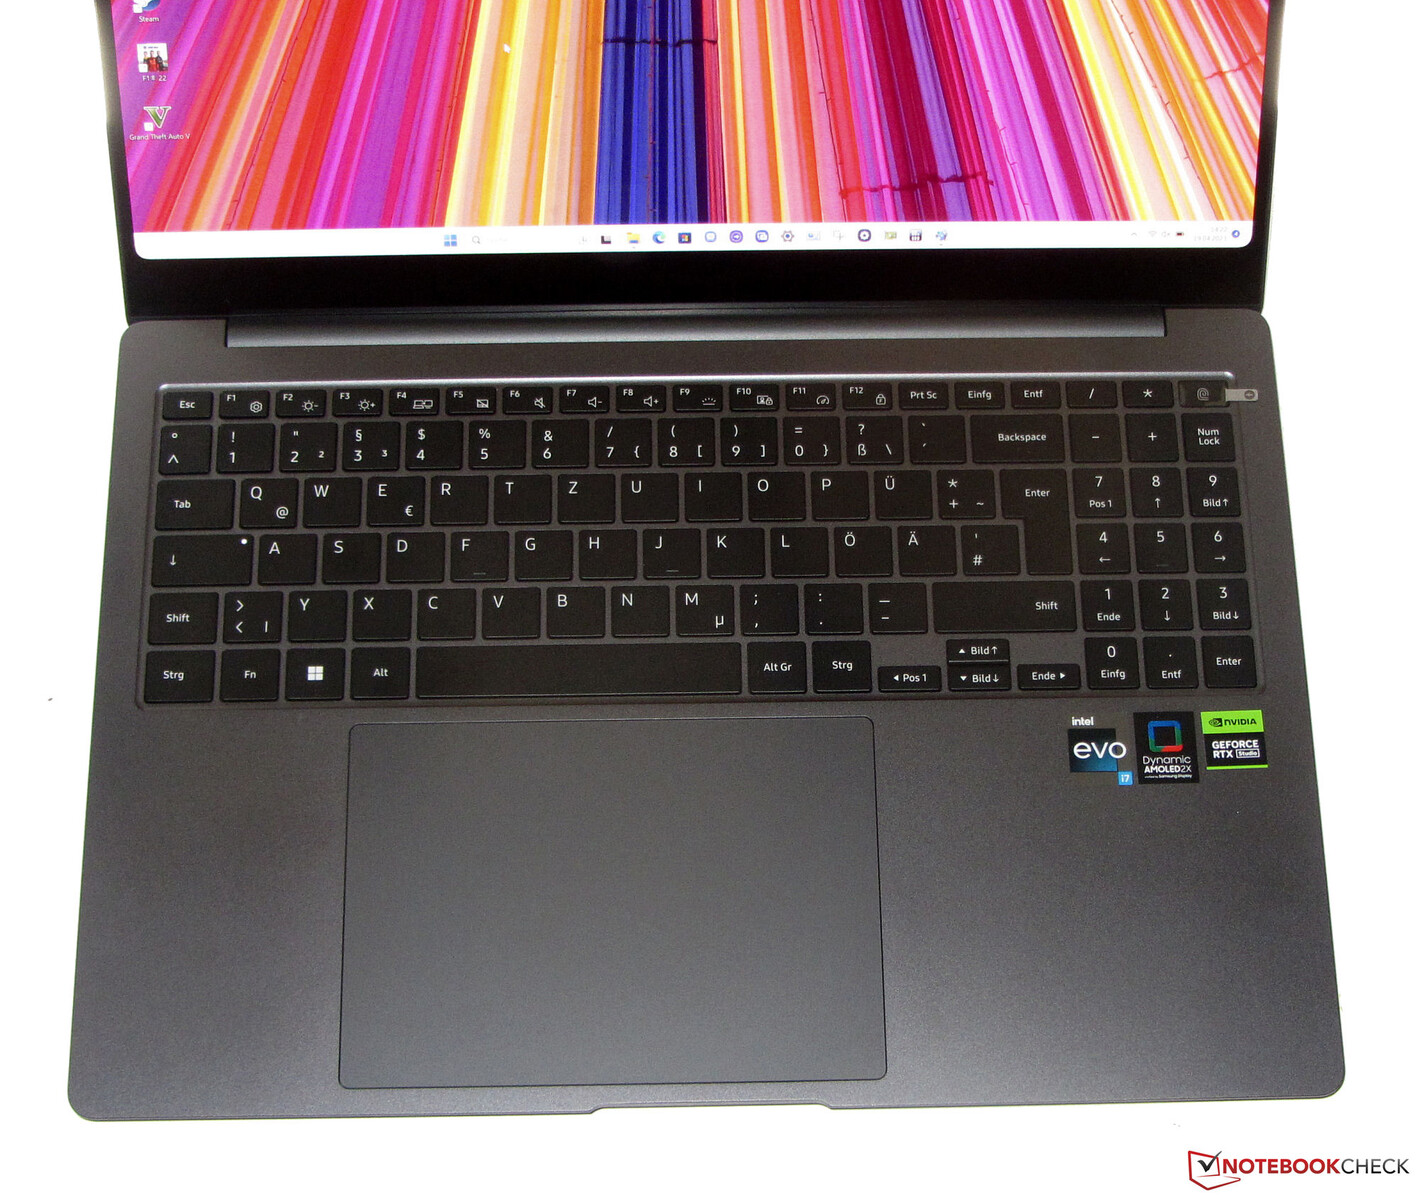
NP960XFH posiada podświetlaną klawiaturę typu chiclet wraz z numpadem. Gładkie, lekko wklęsłe klawisze oferują krótki skok i wyraźny punkt nacisku. Opór stawiany przez klawisze jest akceptowalny. Klawiatura ugina się nieco pod naciskiem, ale nie jest to powód do niepokoju. Trójstopniowe podświetlenie jest sterowane za pomocą klawisza funkcyjnego. Podsumowując, Samsung dostarcza klawiaturę nadającą się do codziennego użytku.
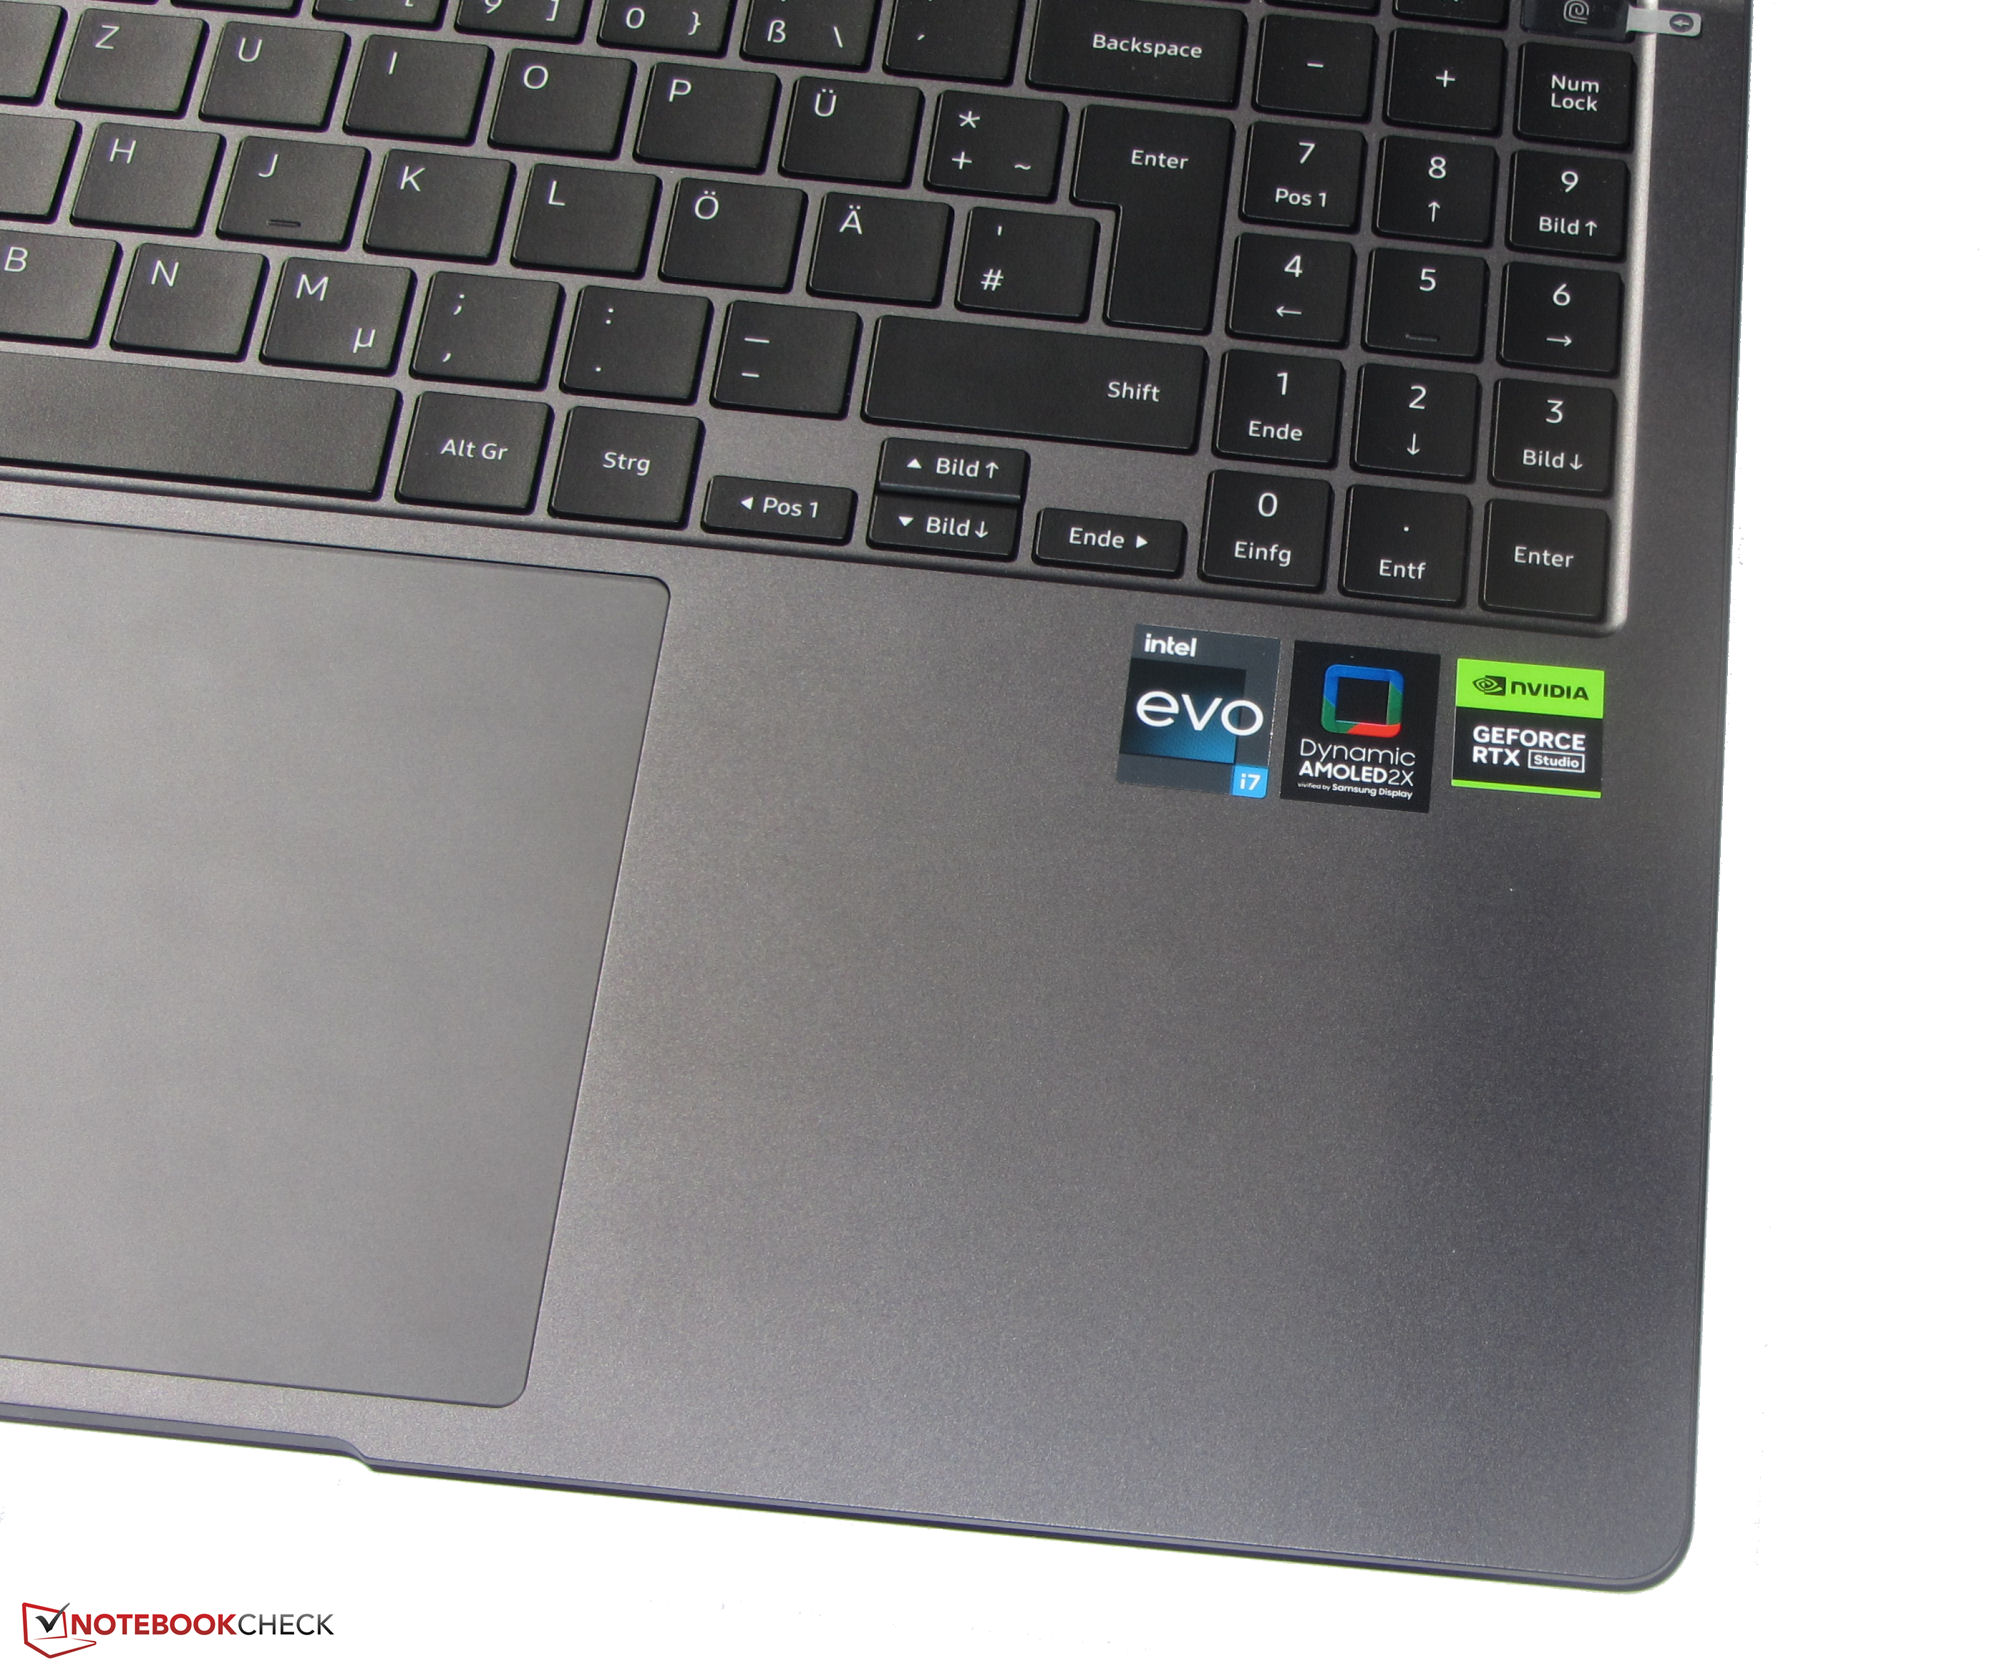
Touchpad
ClickPad ma wymiary około 15,1 x 10,8 cm. Wystarczyłby też jeden rozmiar mniejszy: Jeśli klawisze WASD są używane lewą ręką, cały kciuk spoczywa na podkładce. W takim przypadku należałoby więc wyłączyć tę ostatnią. Poza tym, gładka powierzchnia bardzo sprzyja przesuwaniu palców i machaniu. Reaguje na wejścia w narożnikach, oferuje krótki skok i wyraźny punkt nacisku.
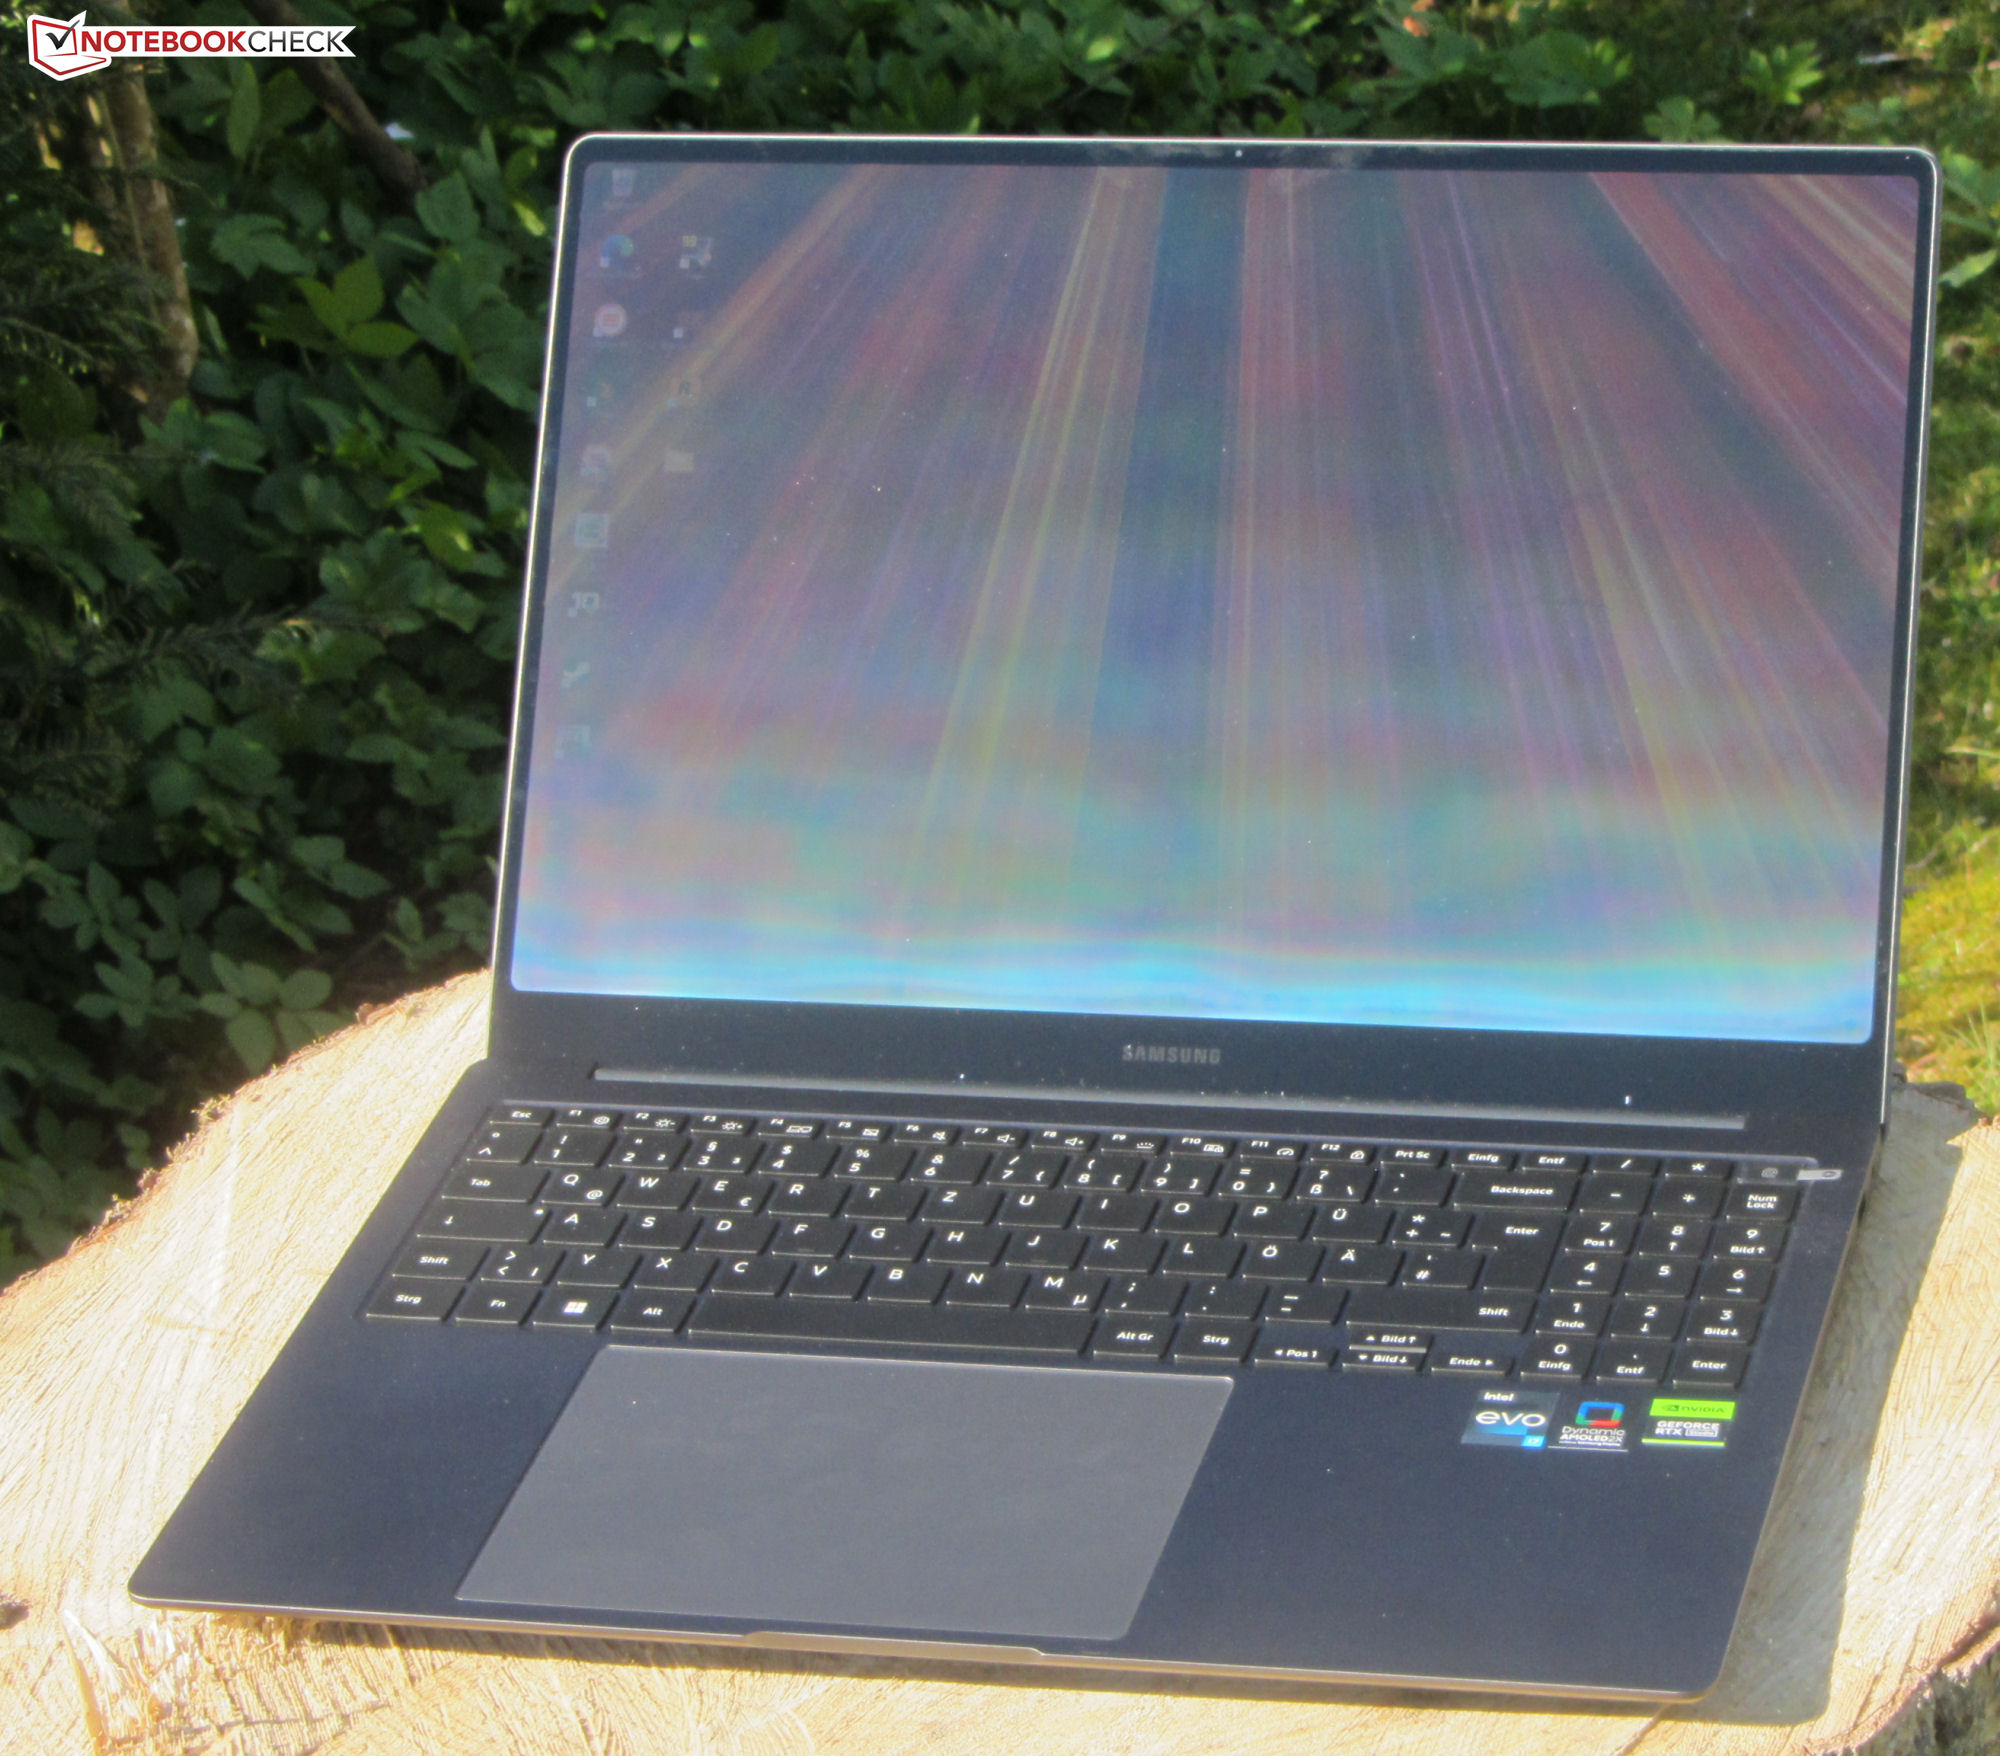
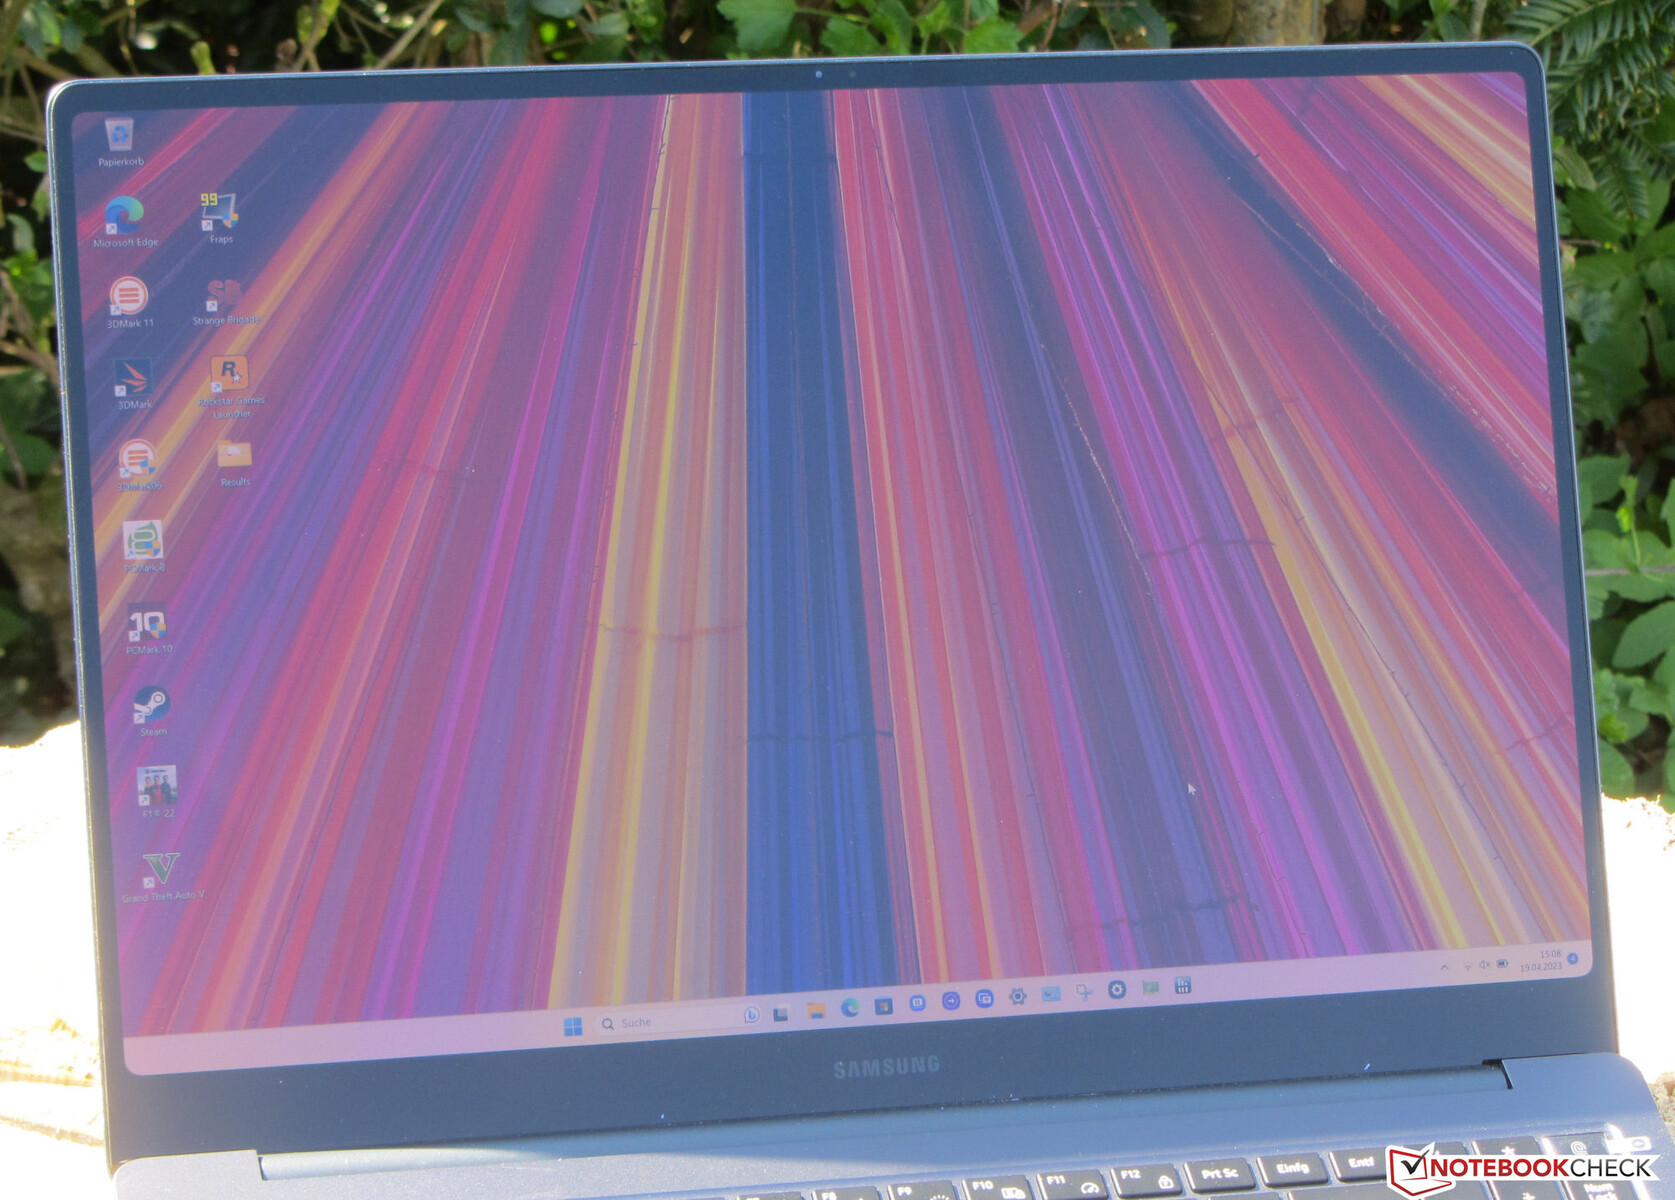
Wyświetlacz - AMOLED w formacie 16:10
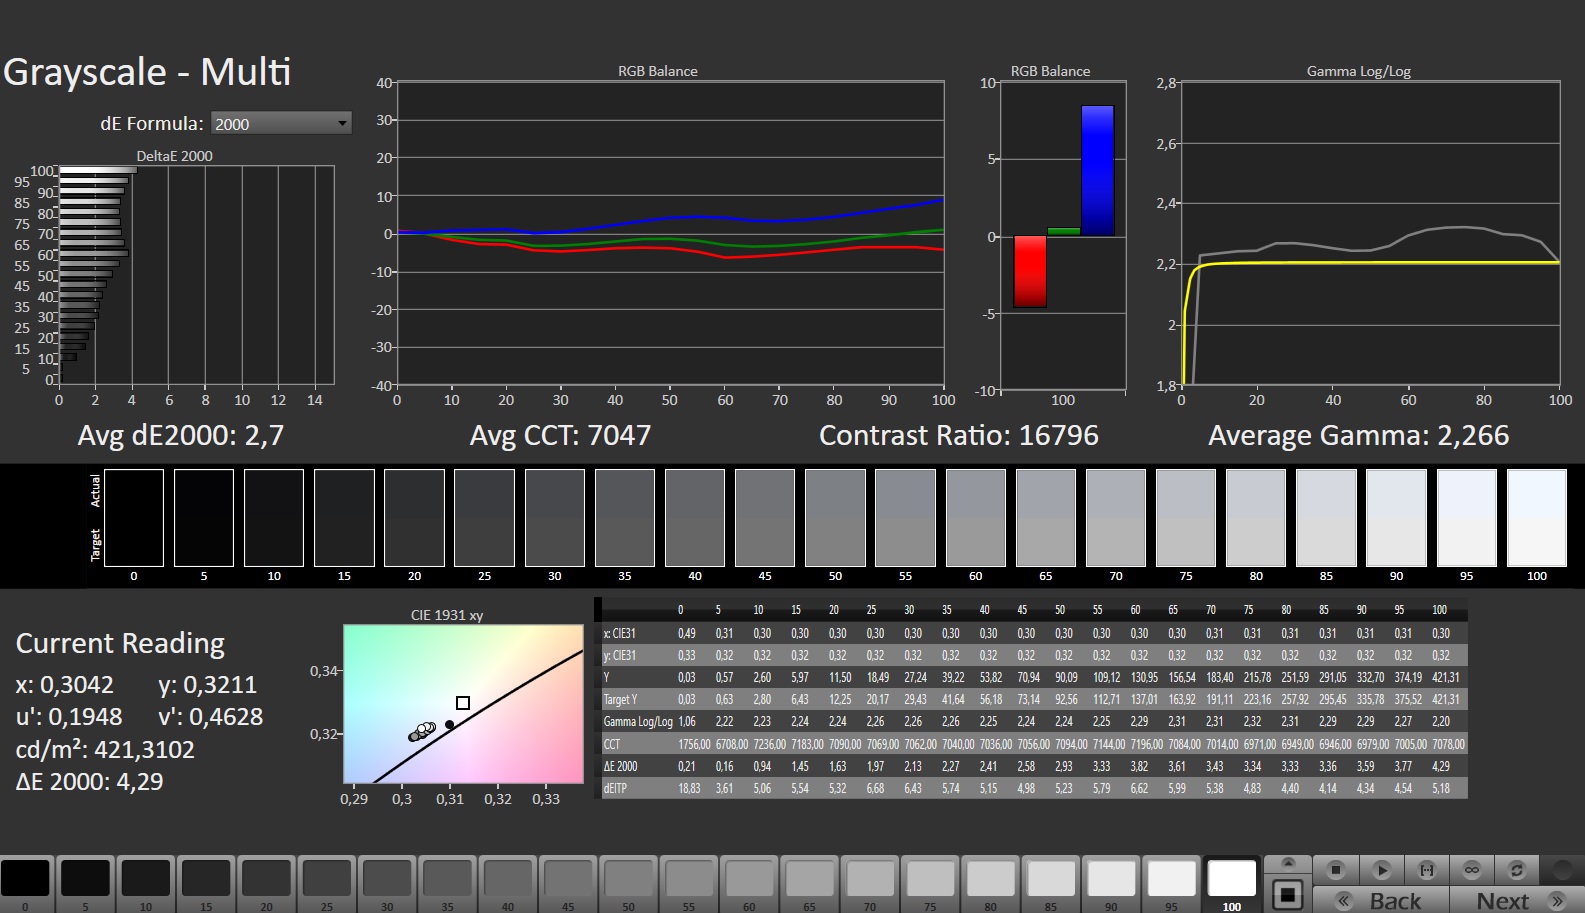
Duży 16-calowy ekran (2880x1800) w przyjaznym dla pracy formacie 16:10 oferuje doskonałą wartość czerni i krótki czas reakcji, co jest typowe dla diod OLED. Jasność wyświetlacza przekracza założony cel, choć m.in.ThinkBook 16p G3 ARH ma znacznie jaśniejszy wyświetlacz.
Słabe strony panelu OLED: ma on odblaskową powierzchnię i migocze na poziomie jasności ≤ 100 procent z częstotliwością 240 Hz. Migotanie jest związane z regulacją jasności panelu.
| |||||||||||||||||||||||||
rozświetlenie: 93 %
na akumulatorze: 400 cd/m²
kontrast: 13333:1 (czerń: 0.03 cd/m²)
ΔE ColorChecker Calman: 2.3 | ∀{0.5-29.43 Ø4.72}
calibrated: 1.66
ΔE Greyscale Calman: 2.7 | ∀{0.09-98 Ø4.97}
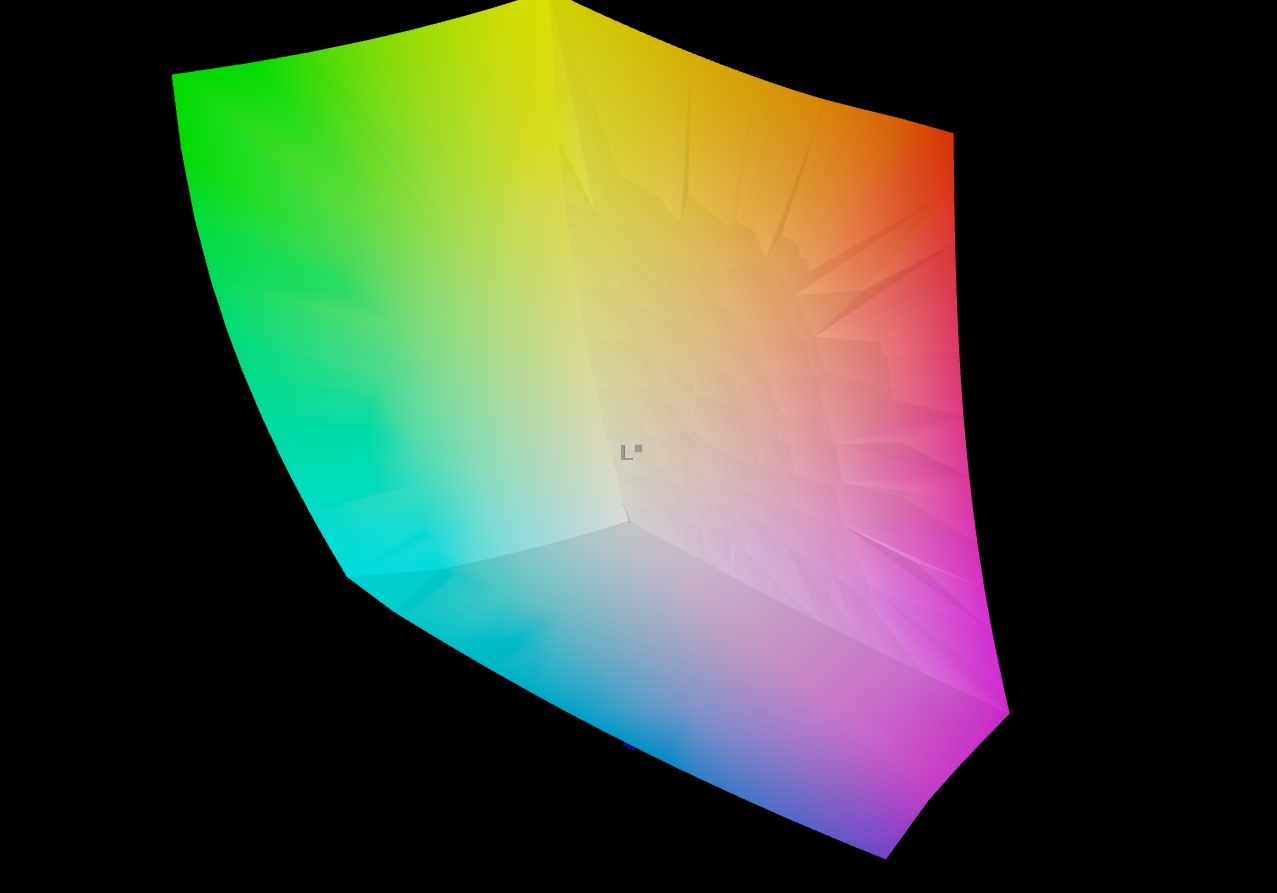
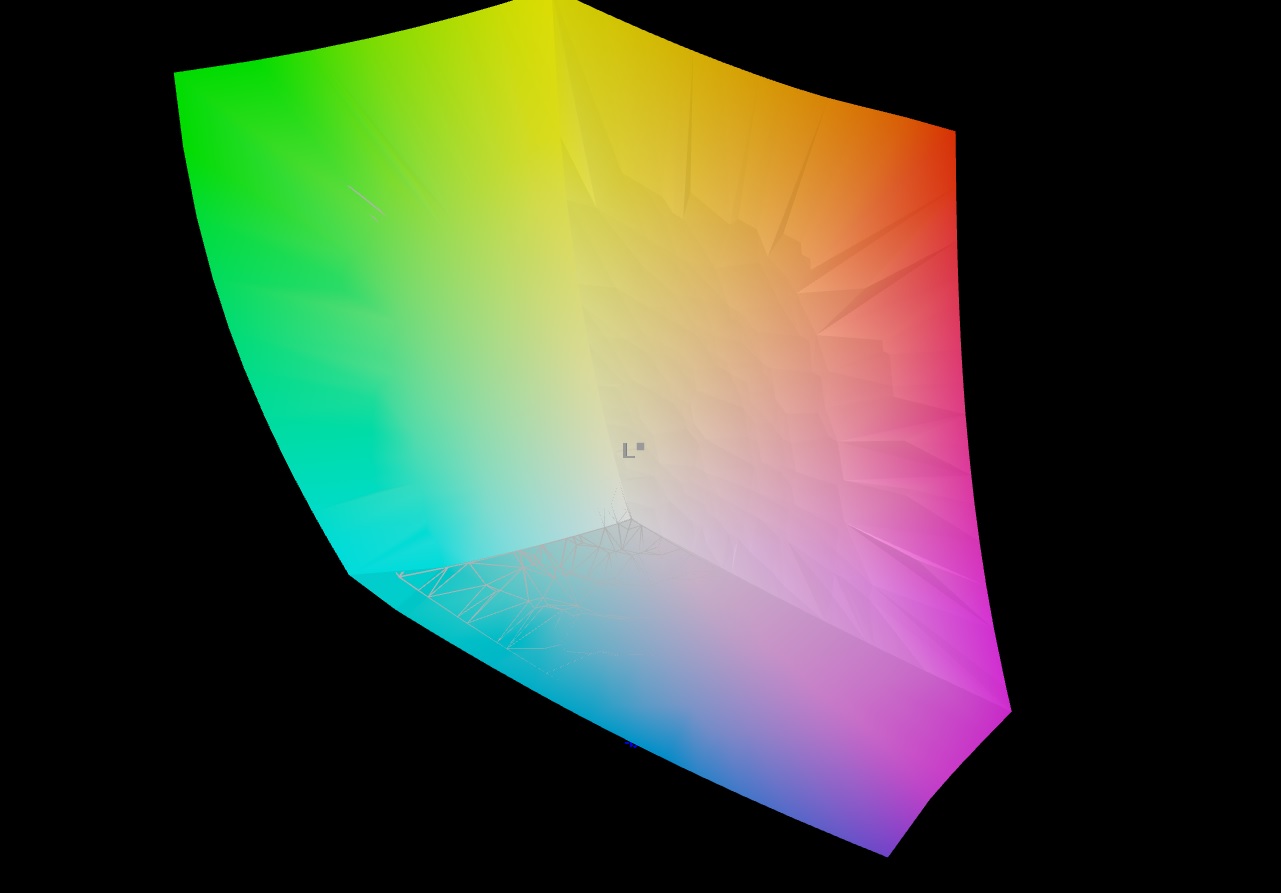
96.3% AdobeRGB 1998 (Argyll 3D)
100% sRGB (Argyll 3D)
99.9% Display P3 (Argyll 3D)
Gamma: 2.266
CCT: 7047 K
| Samsung Galaxy Book3 Ultra 16 Samsung ATNA60CL03-0, AMOLED, 2880x1800, 16" | Schenker Vision 16 Pro RTX 3070 Ti N160QDM-NZ1, IPS, 2560x1600, 16" | LG Gram 17Z90Q-E.AD78G LG Display LP170WQ1-SPF2, IPS, 2560x1600, 17" | Lenovo ThinkBook 16p G3 ARH BOE CQ NE160QDM-NY1, IPS, 2560x1600, 16" | Dell XPS 15 9520 RTX 3050 Ti Samsung 156XG01, OLED, 3456x2160, 15.6" | Asus VivoBook Pro 16X OLED N7600PC-L2026X Samsung ATNA60YV02-0, OLED, 3840x2400, 16" | Acer Swift X SFX16-52G-77RX B160QAN02.M, IPS-LED, 2560x1600, 16" | |
|---|---|---|---|---|---|---|---|
| Display | -20% | -8% | -19% | -4% | 1% | -15% | |
| Display P3 Coverage (%) | 99.9 | 68.7 -31% | 92.2 -8% | 69.8 -30% | 97.8 -2% | 99.9 0% | 76.4 -24% |
| sRGB Coverage (%) | 100 | 96.7 -3% | 98.66 -1% | 98.2 -2% | 99.9 0% | 100 0% | 100 0% |
| AdobeRGB 1998 Coverage (%) | 96.3 | 70 -27% | 82.98 -14% | 71.4 -26% | 86 -11% | 98.05 2% | 76.6 -20% |
| Response Times | -2021% | -3068% | -2354% | -240% | -156% | -4422% | |
| Response Time Grey 50% / Grey 80% * (ms) | 0.49 ? | 14.3 ? -2818% | 22 ? -4390% | 15.6 ? -3084% | 1.9 ? -288% | 1 -104% | 33 ? -6635% |
| Response Time Black / White * (ms) | 0.65 ? | 8.6 ? -1223% | 12 ? -1746% | 11.2 ? -1623% | 1.9 ? -192% | 2 ? -208% | 15 ? -2208% |
| PWM Frequency (Hz) | 240 ? | 59.52 ? | 247 ? | ||||
| Screen | -140% | -125% | -186% | -32% | 8% | -108% | |
| Brightness middle (cd/m²) | 400 | 364 -9% | 391 -2% | 532.8 33% | 381.4 -5% | 383 -4% | 411 3% |
| Brightness (cd/m²) | 399 | 347 -13% | 358 -10% | 519 30% | 384 -4% | 390 -2% | 378 -5% |
| Brightness Distribution (%) | 93 | 89 -4% | 84 -10% | 94 1% | 95 2% | 96 3% | 83 -11% |
| Black Level * (cd/m²) | 0.03 | 0.3 -900% | 0.29 -867% | 0.55 -1733% | 0.027 10% | 0.29 -867% | |
| Contrast (:1) | 13333 | 1213 -91% | 1348 -90% | 969 -93% | 14185 6% | 1417 -89% | |
| Colorchecker dE 2000 * | 2.3 | 3.3 -43% | 3.52 -53% | 1.32 43% | 4.34 -89% | 2.29 -0% | 2.18 5% |
| Colorchecker dE 2000 max. * | 4.15 | 6.6 -59% | 6.06 -46% | 3.97 4% | 9.24 -123% | 3.47 16% | 4.84 -17% |
| Colorchecker dE 2000 calibrated * | 1.66 | 2.5 -51% | 1.43 14% | 1.59 4% | 1.48 11% | ||
| Greyscale dE 2000 * | 2.7 | 5.2 -93% | 4.27 -58% | 1.8 33% | 2 26% | 1.84 32% | 2.68 1% |
| Gamma | 2.266 97% | 2.14 103% | 2.3 96% | 2.64 83% | 2.13 103% | 2.32 95% | 2.43 91% |
| CCT | 7047 92% | 6331 103% | 7203 90% | 6761 96% | 6210 105% | 6308 103% | 6717 97% |
| Całkowita średnia (program / ustawienia) | -727% /
-383% | -1067% /
-520% | -853% /
-460% | -92% /
-62% | -49% /
-19% | -1515% /
-704% |
* ... im mniej tym lepiej
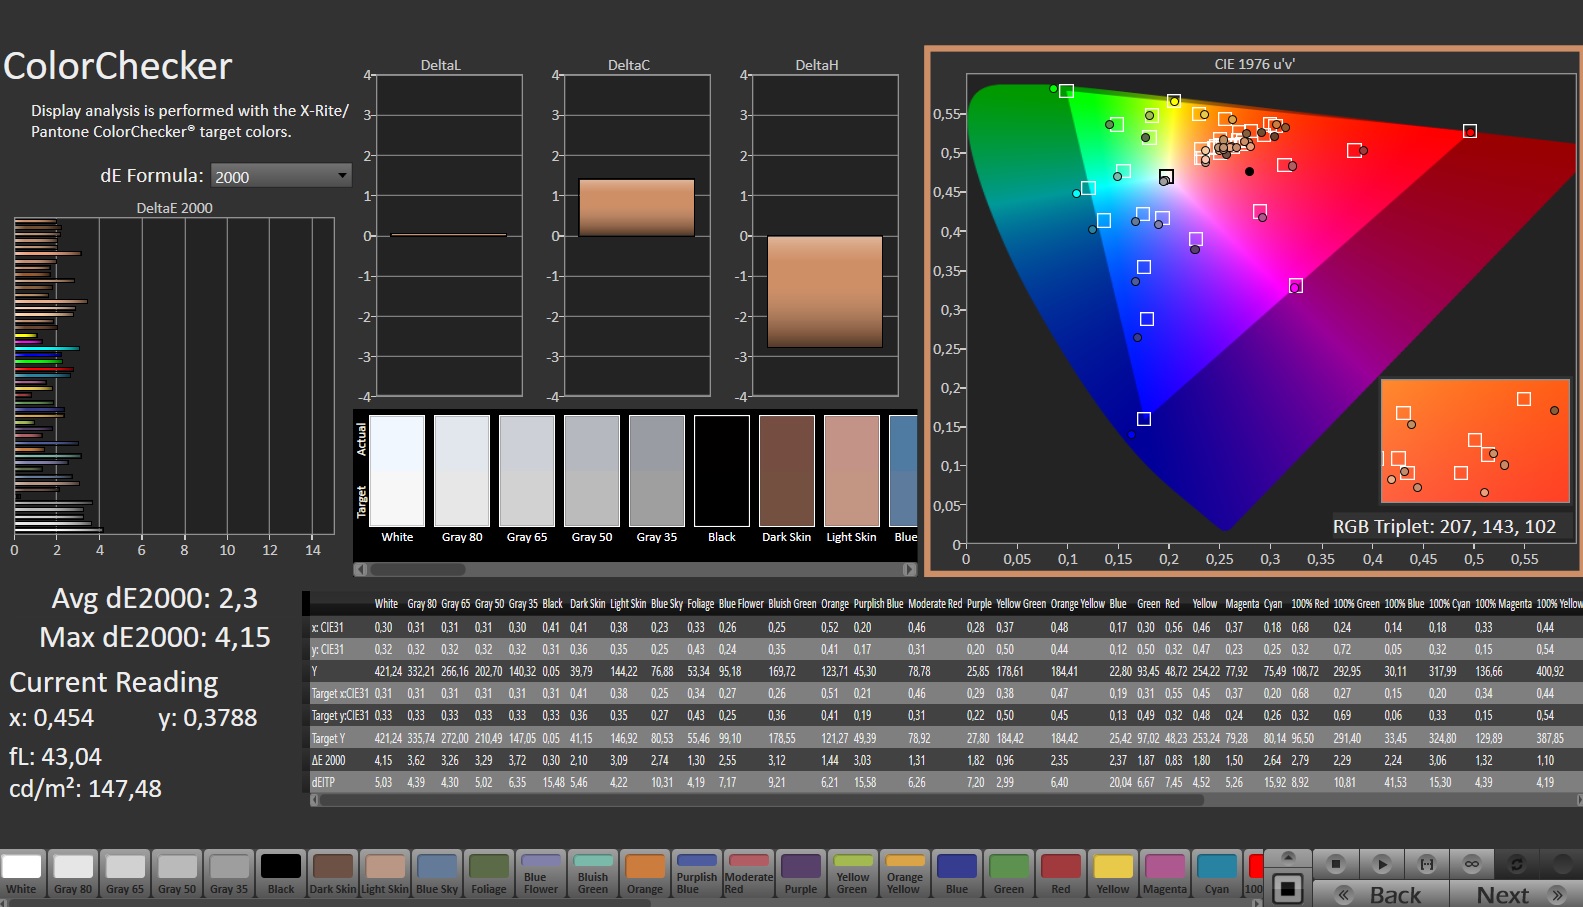
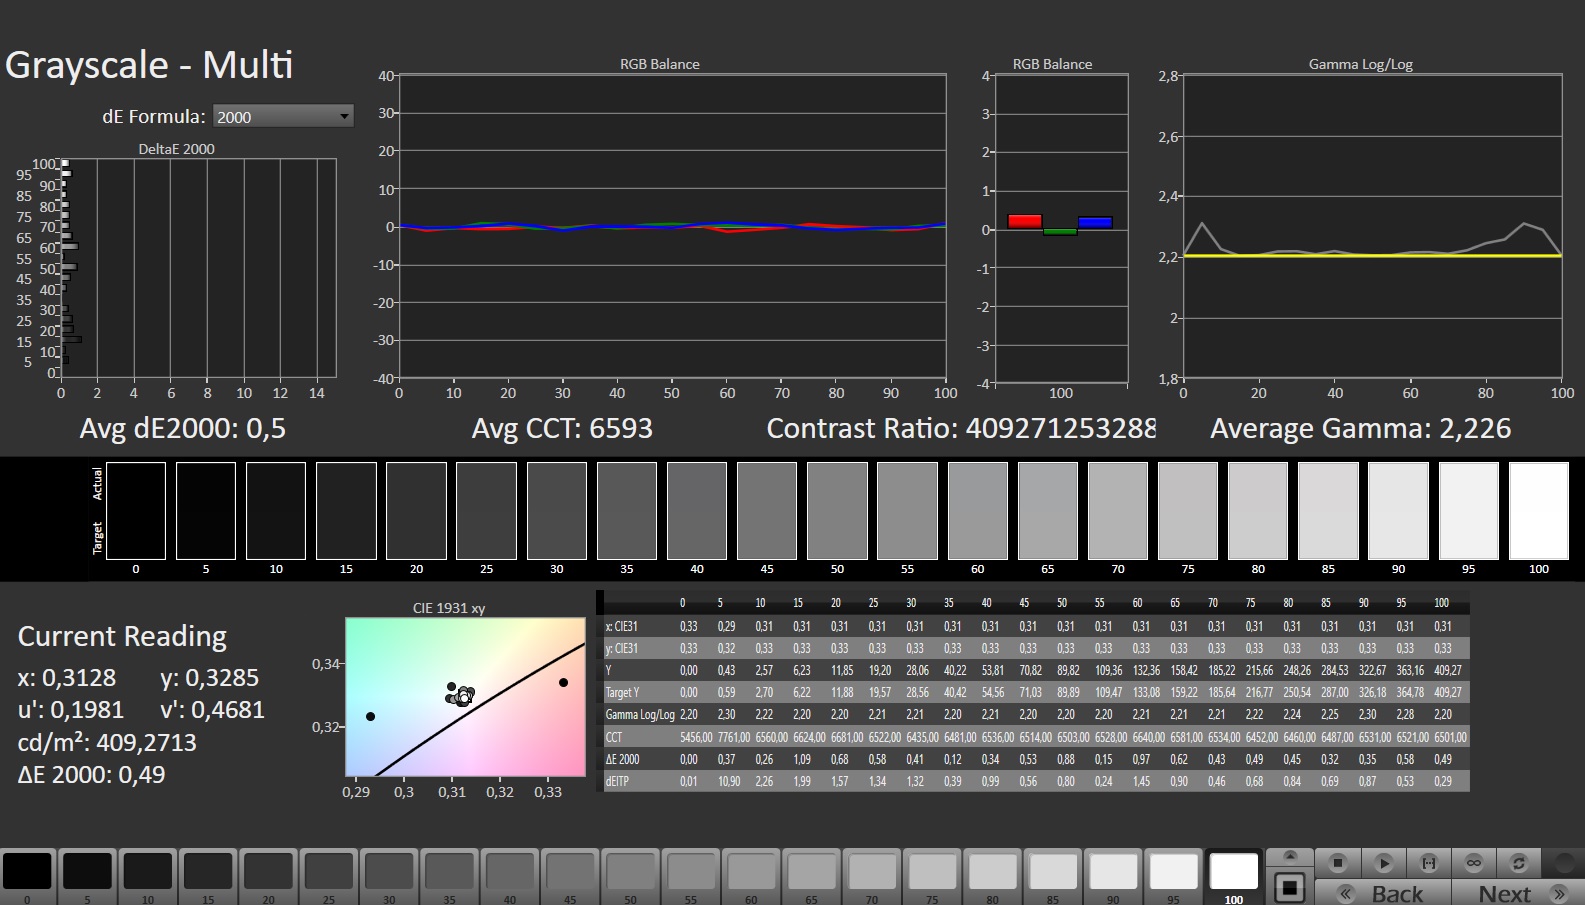
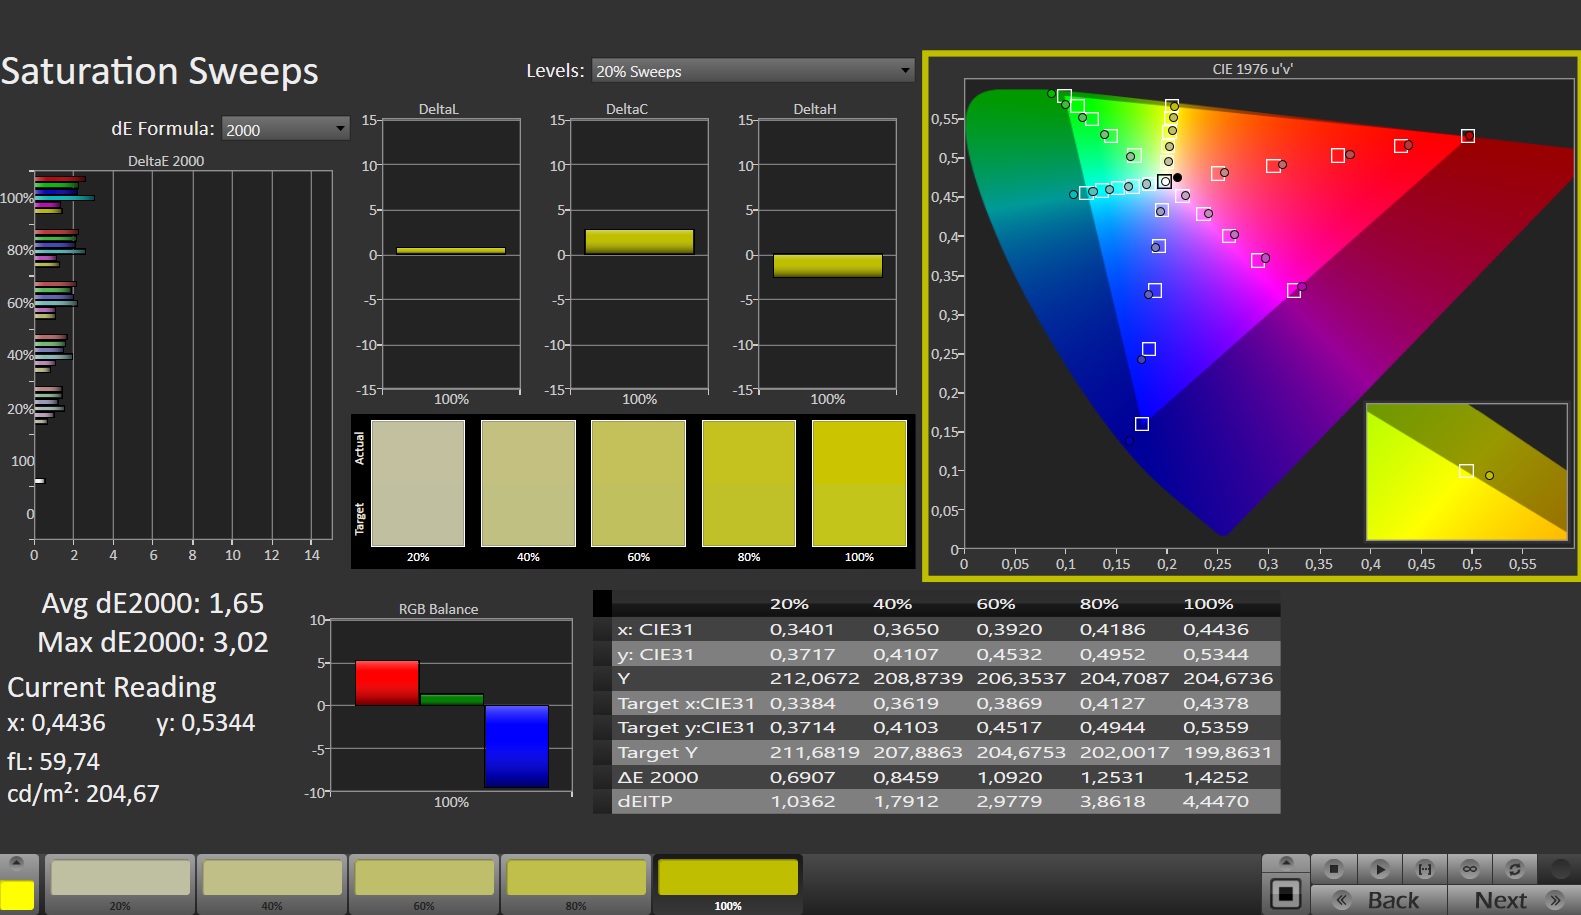
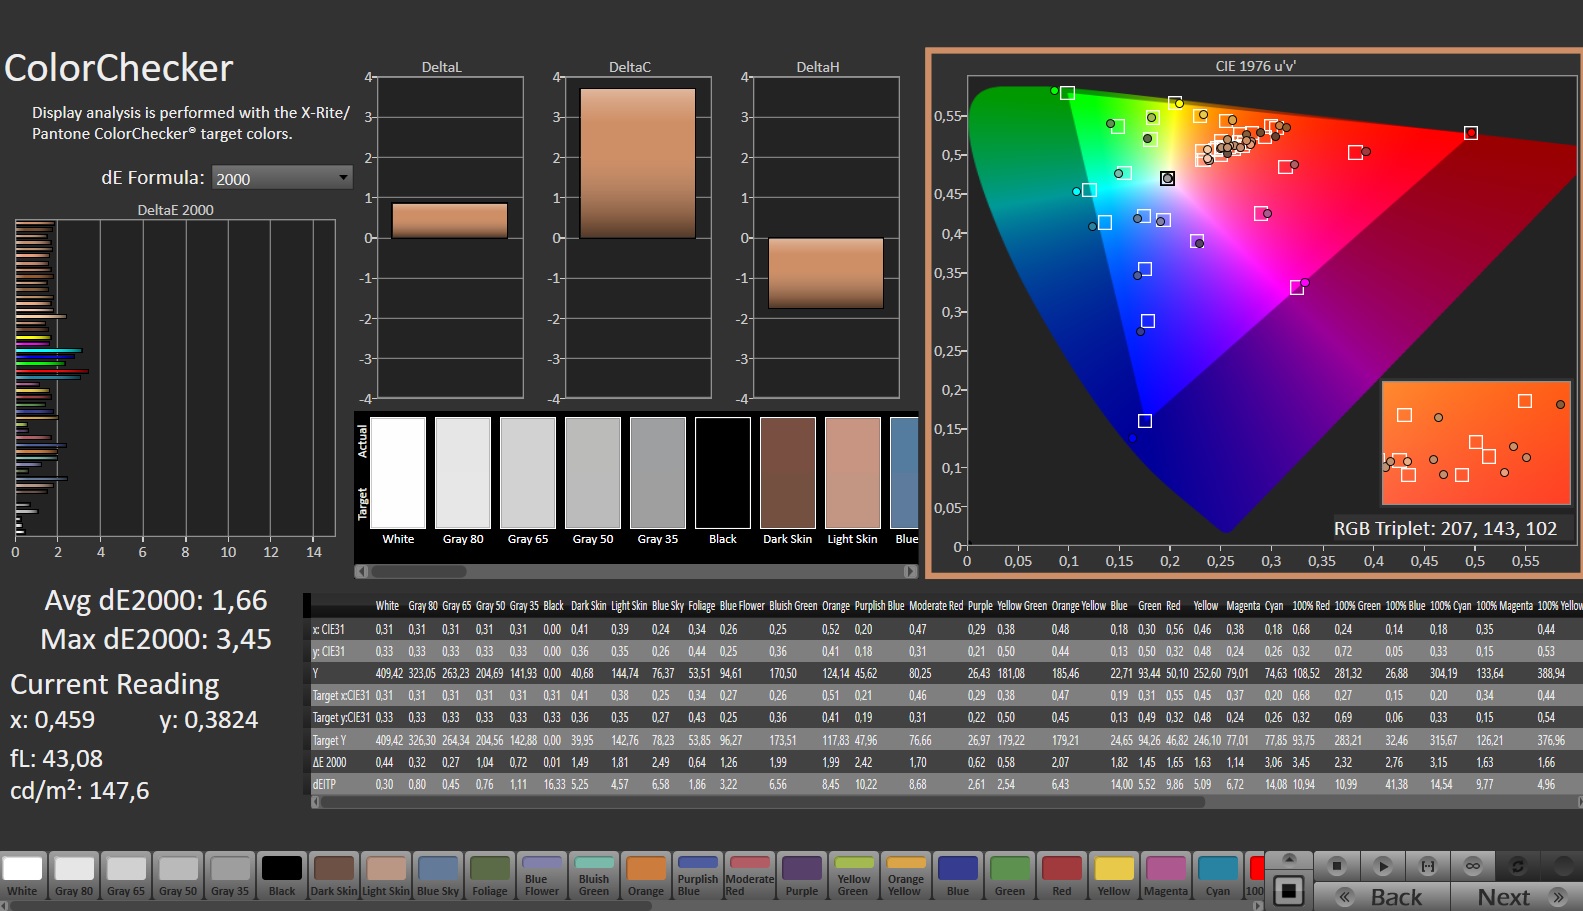
W stanie dostawy ekran ma już dobre odwzorowanie kolorów: Przy odchyleniu 2,3 spełniony jest cel (DeltaE < 3). Kalibracja zmniejsza tę wartość do 1,66 i zapewnia bardziej zrównoważone poziomy szarości
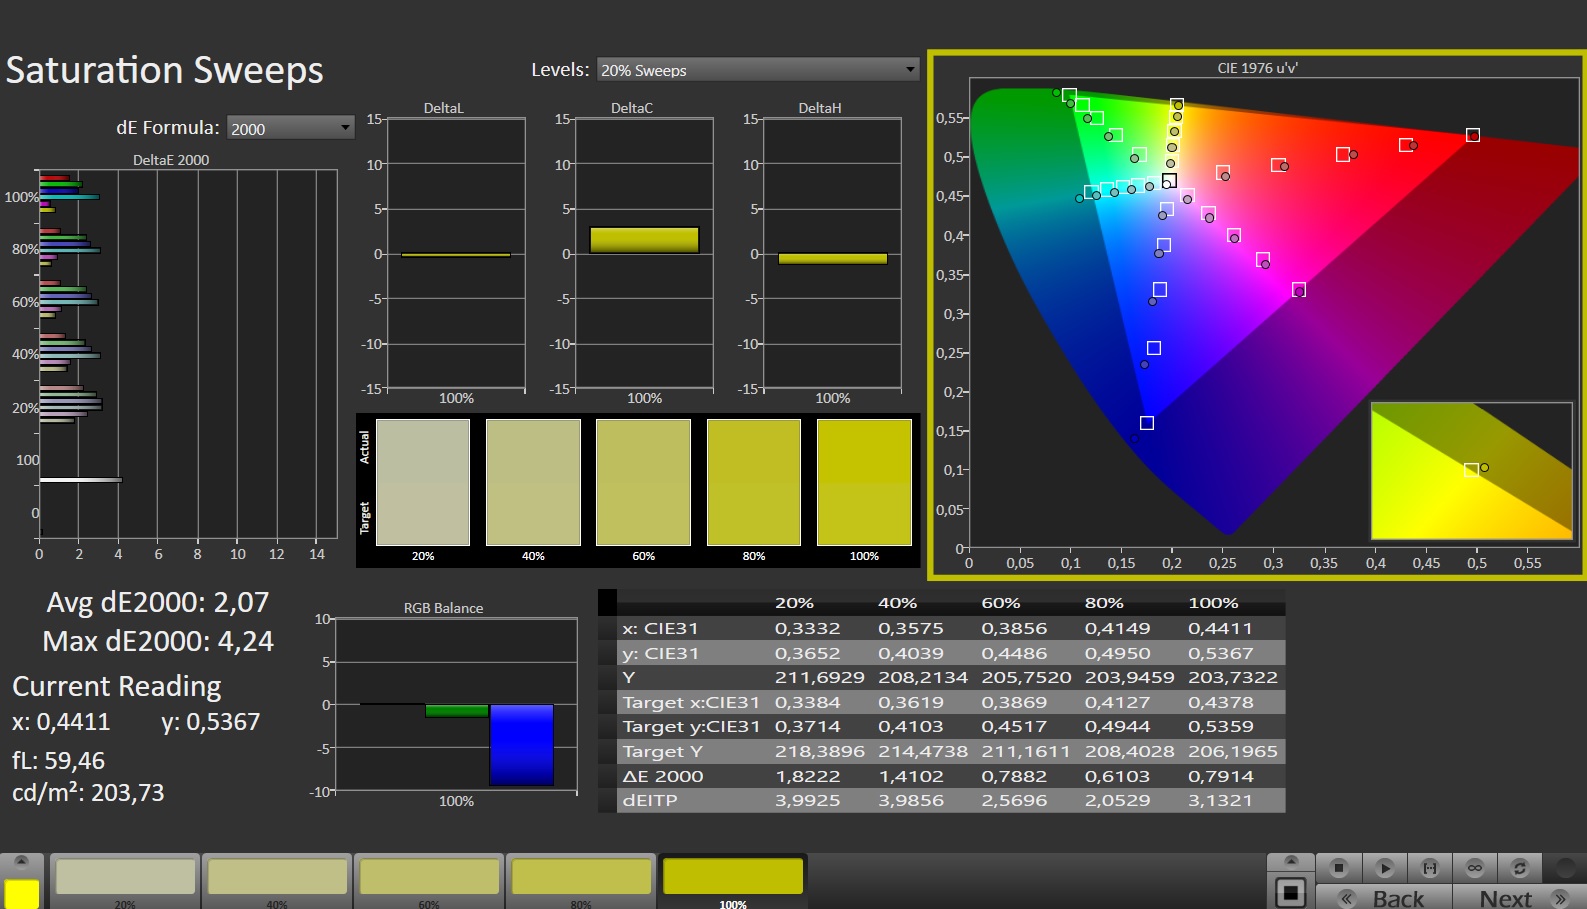
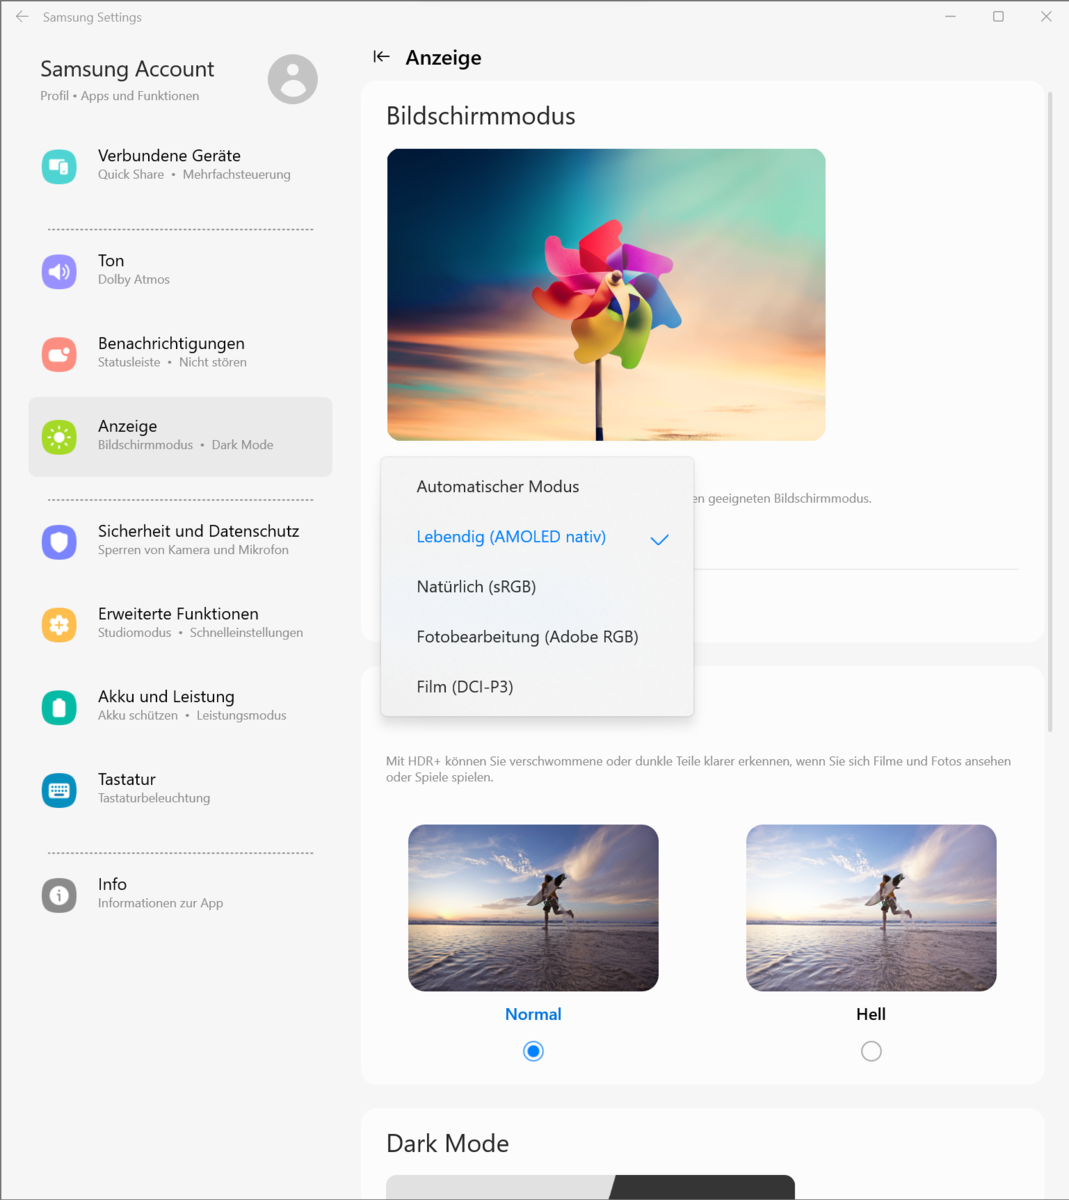
Wierność kolorów to oczywistość: przestrzeń kolorów sRGB i DCI-P3 są w pełni odwzorowane, a przestrzeń Adobe RGB prawie w całości. Wyświetlacz można dostosować do jednej z trzech przestrzeni za pośrednictwem preinstalowanych ustawień oprogramowania Samsunga. My zastosowaliśmy tutaj domyślne ustawienie "Vivid (AMOLED native)".

Wyświetl czasy reakcji
| ↔ Czas reakcji od czerni do bieli | ||
|---|---|---|
| 0.65 ms ... wzrost ↗ i spadek ↘ łącznie | ↗ 0.37 ms wzrost | 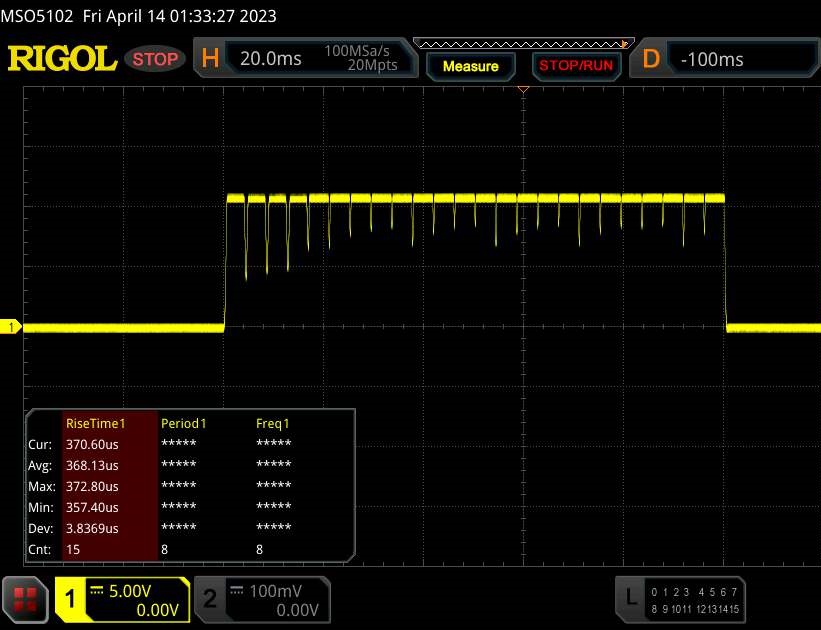 |
| ↘ 0.28 ms upadek | ||
| W naszych testach ekran wykazuje bardzo szybką reakcję i powinien bardzo dobrze nadawać się do szybkich gier. Dla porównania, wszystkie testowane urządzenia wahają się od 0.1 (minimum) do 240 (maksimum) ms. » 2 % wszystkich urządzeń jest lepszych. Oznacza to, że zmierzony czas reakcji jest lepszy od średniej wszystkich testowanych urządzeń (19.8 ms). | ||
| ↔ Czas reakcji 50% szarości do 80% szarości | ||
| 0.49 ms ... wzrost ↗ i spadek ↘ łącznie | ↗ 0.26 ms wzrost | 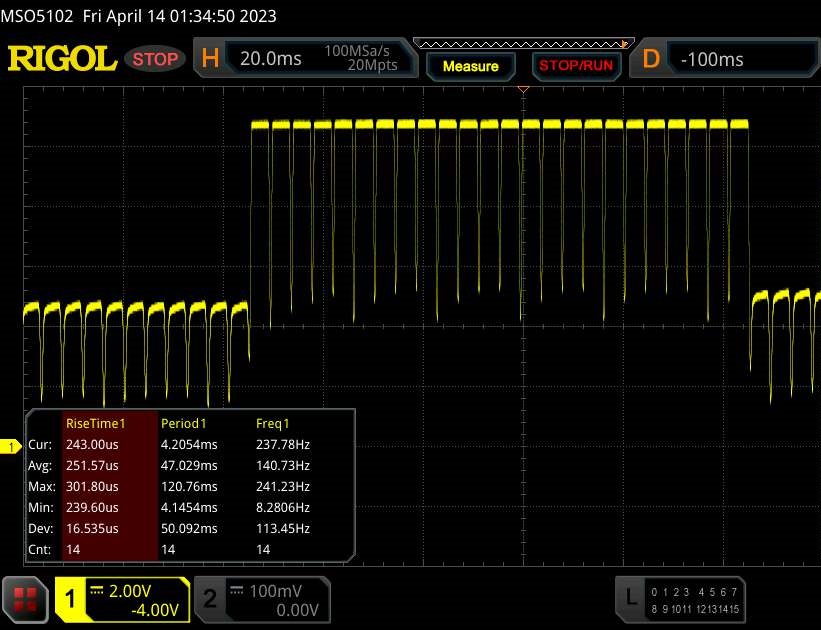 |
| ↘ 0.23 ms upadek | ||
| W naszych testach ekran wykazuje bardzo szybką reakcję i powinien bardzo dobrze nadawać się do szybkich gier. Dla porównania, wszystkie testowane urządzenia wahają się od 0.165 (minimum) do 636 (maksimum) ms. » 1 % wszystkich urządzeń jest lepszych. Oznacza to, że zmierzony czas reakcji jest lepszy od średniej wszystkich testowanych urządzeń (31 ms). | ||
Migotanie ekranu / PWM (modulacja szerokości impulsu)
| Wykryto migotanie ekranu/wykryto PWM | 240 Hz | ≤ 100 % ustawienia jasności | 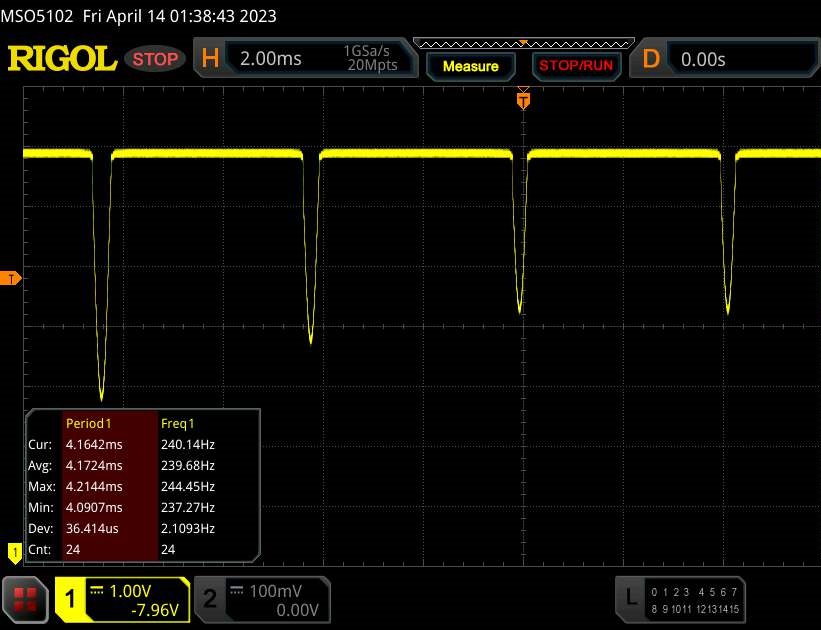 |
Podświetlenie wyświetlacza miga z częstotliwością 240 Hz (najgorszy przypadek, np. przy użyciu PWM) Wykryto migotanie przy ustawieniu jasności 100 % i poniżej. Powyżej tego ustawienia jasności nie powinno być żadnego migotania ani PWM. Częstotliwość 240 Hz jest stosunkowo niska, więc wrażliwi użytkownicy prawdopodobnie zauważą migotanie i odczują zmęczenie oczu przy podanym ustawieniu jasności i poniżej. Dla porównania: 52 % wszystkich testowanych urządzeń nie używa PWM do przyciemniania wyświetlacza. Jeśli wykryto PWM, zmierzono średnio 7753 (minimum: 5 - maksimum: 343500) Hz. | |||
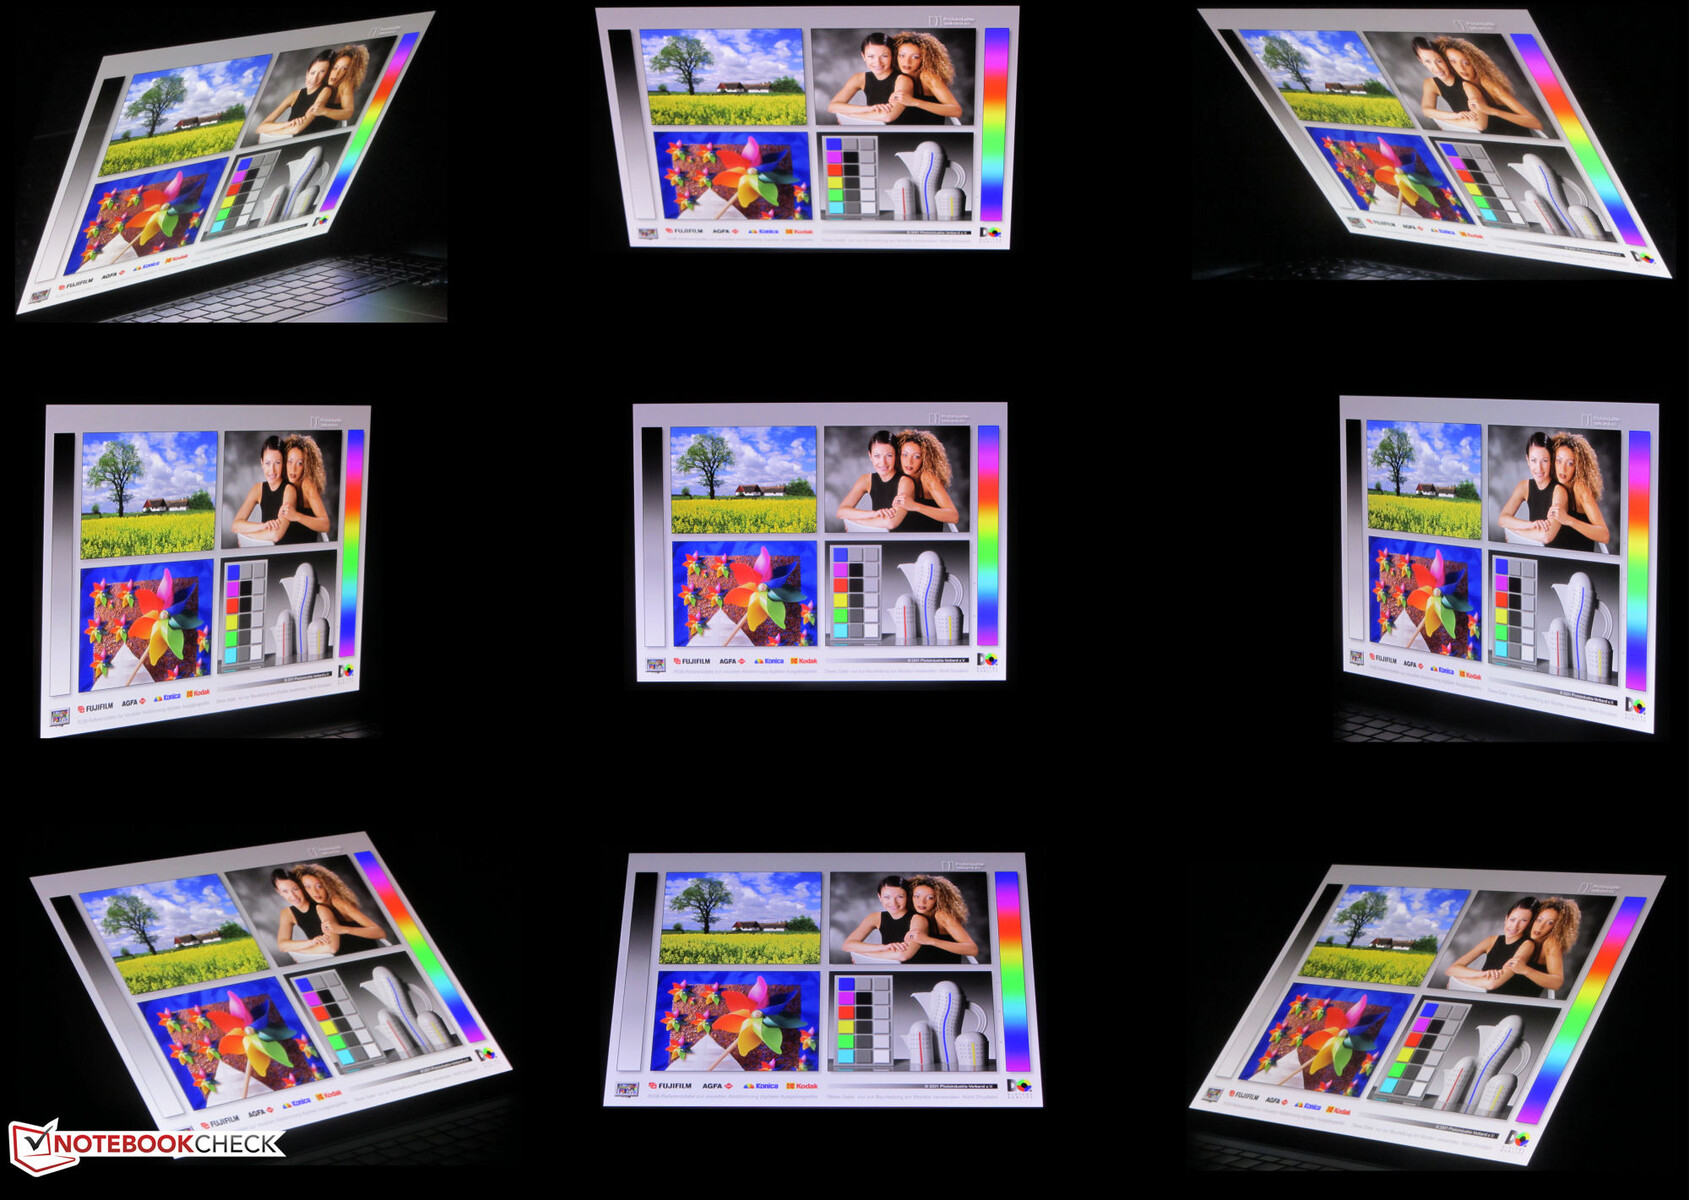
Stabilny pod względem kąta widzenia panel można odczytać z każdej pozycji. Czytanie na zewnątrz jest utrudnione ze względu na odblaskową powierzchnię wyświetlacza.
Performance - Alder Lake i Ada Lovelace na pokładzie
Wraz z modelami Galaxy Book3 Ultra 16 Samsung oferuje serię mobilnych notebooków dla graczy i kreatywnych pracowników. Certyfikat GeForce RTX Studio powinien gwarantować dużą moc obliczeniową, dostosowane sterowniki, dobrą obsługę oprogramowania i odpowiednie pokrycie przestrzeni barwnej wyświetlacza
Wykorzystywane są niskomocowe wersje GPU RTX 4050 lub RTX 4070, natomiast procesory pochodzą od Intela (Raptor Lake). Ten wariant bazuje na RTX 4050 i jest modelem podstawowym w cenie około 2400 USD.
Warunki badania
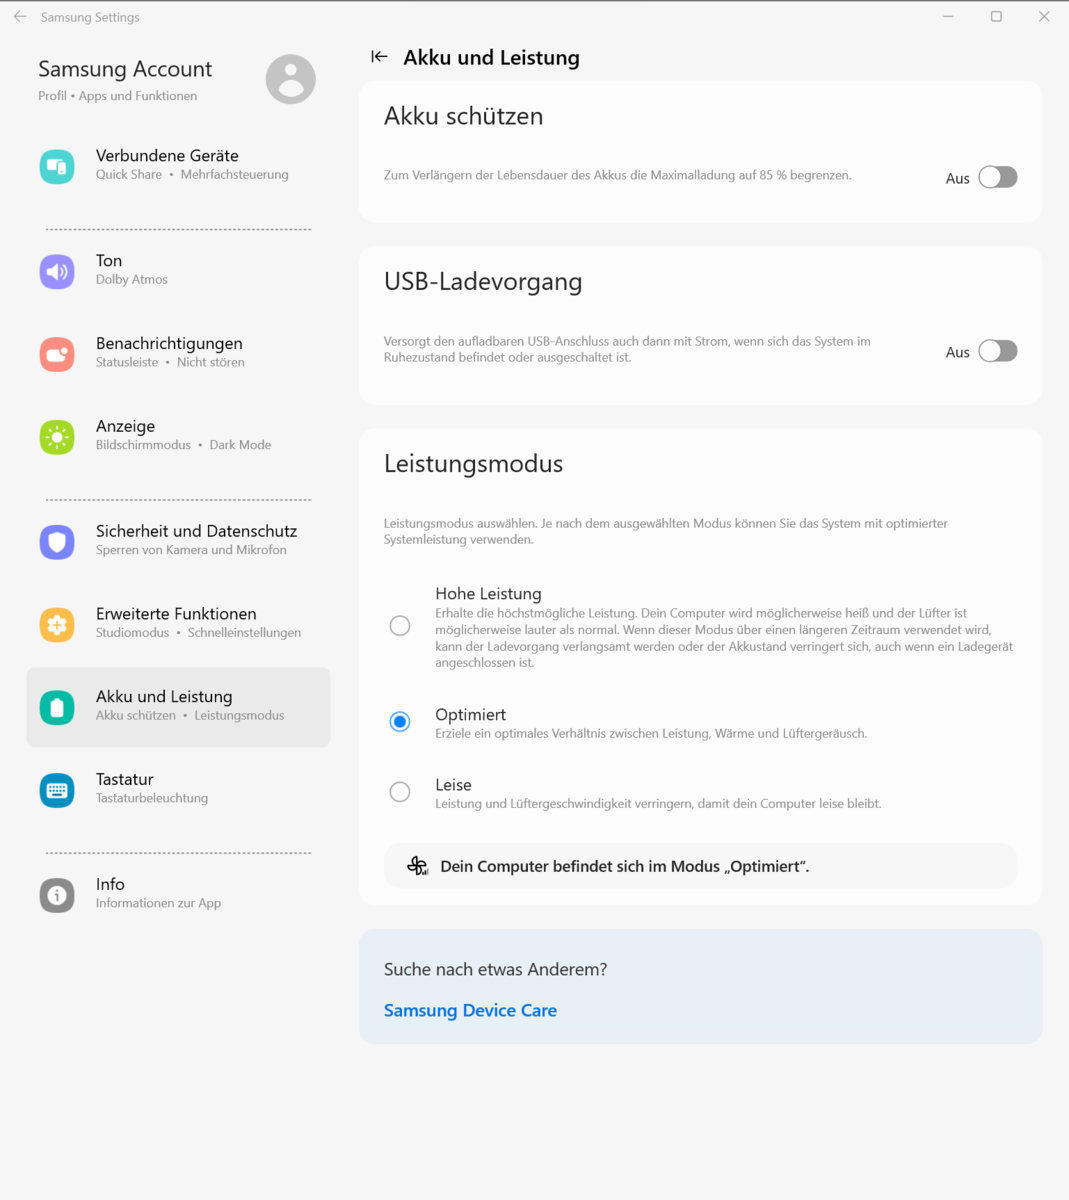
Notebook posiada trzy specyficzne dla producenta tryby wydajności (patrz tabela), między którymi można się przełączać za pomocą kombinacji klawiszy "Fn" + "F11" (lub poprzez ustawienia programowe Samsunga nad centrum sterowania laptopa). Wykorzystane zostały tryby "Optimized" (benchmarki) i "Silent" (testy na akumulatorze).
| Wysoka wydajność | Optymalizacja | Cisza | |
|---|---|---|---|
| Powerlimit 1 (HWInfo) | 70 watów | 45 watów | 30 watów |
| Powerlimit 2 (HWInfo) | 75 watów | 75 watów | 75 watów |
| TGP RTX 4050 | 60 watów | ~ 40 - 45 watów | 20 watów |
| Hałas (Witcher 3 ) | 48 dB(A) | 39 dB(A) | 34 dB(A) |
| Wydajność (Witcher 3 ) | ~ 73 fps | ~ 60 fps | ~ 20 fps |
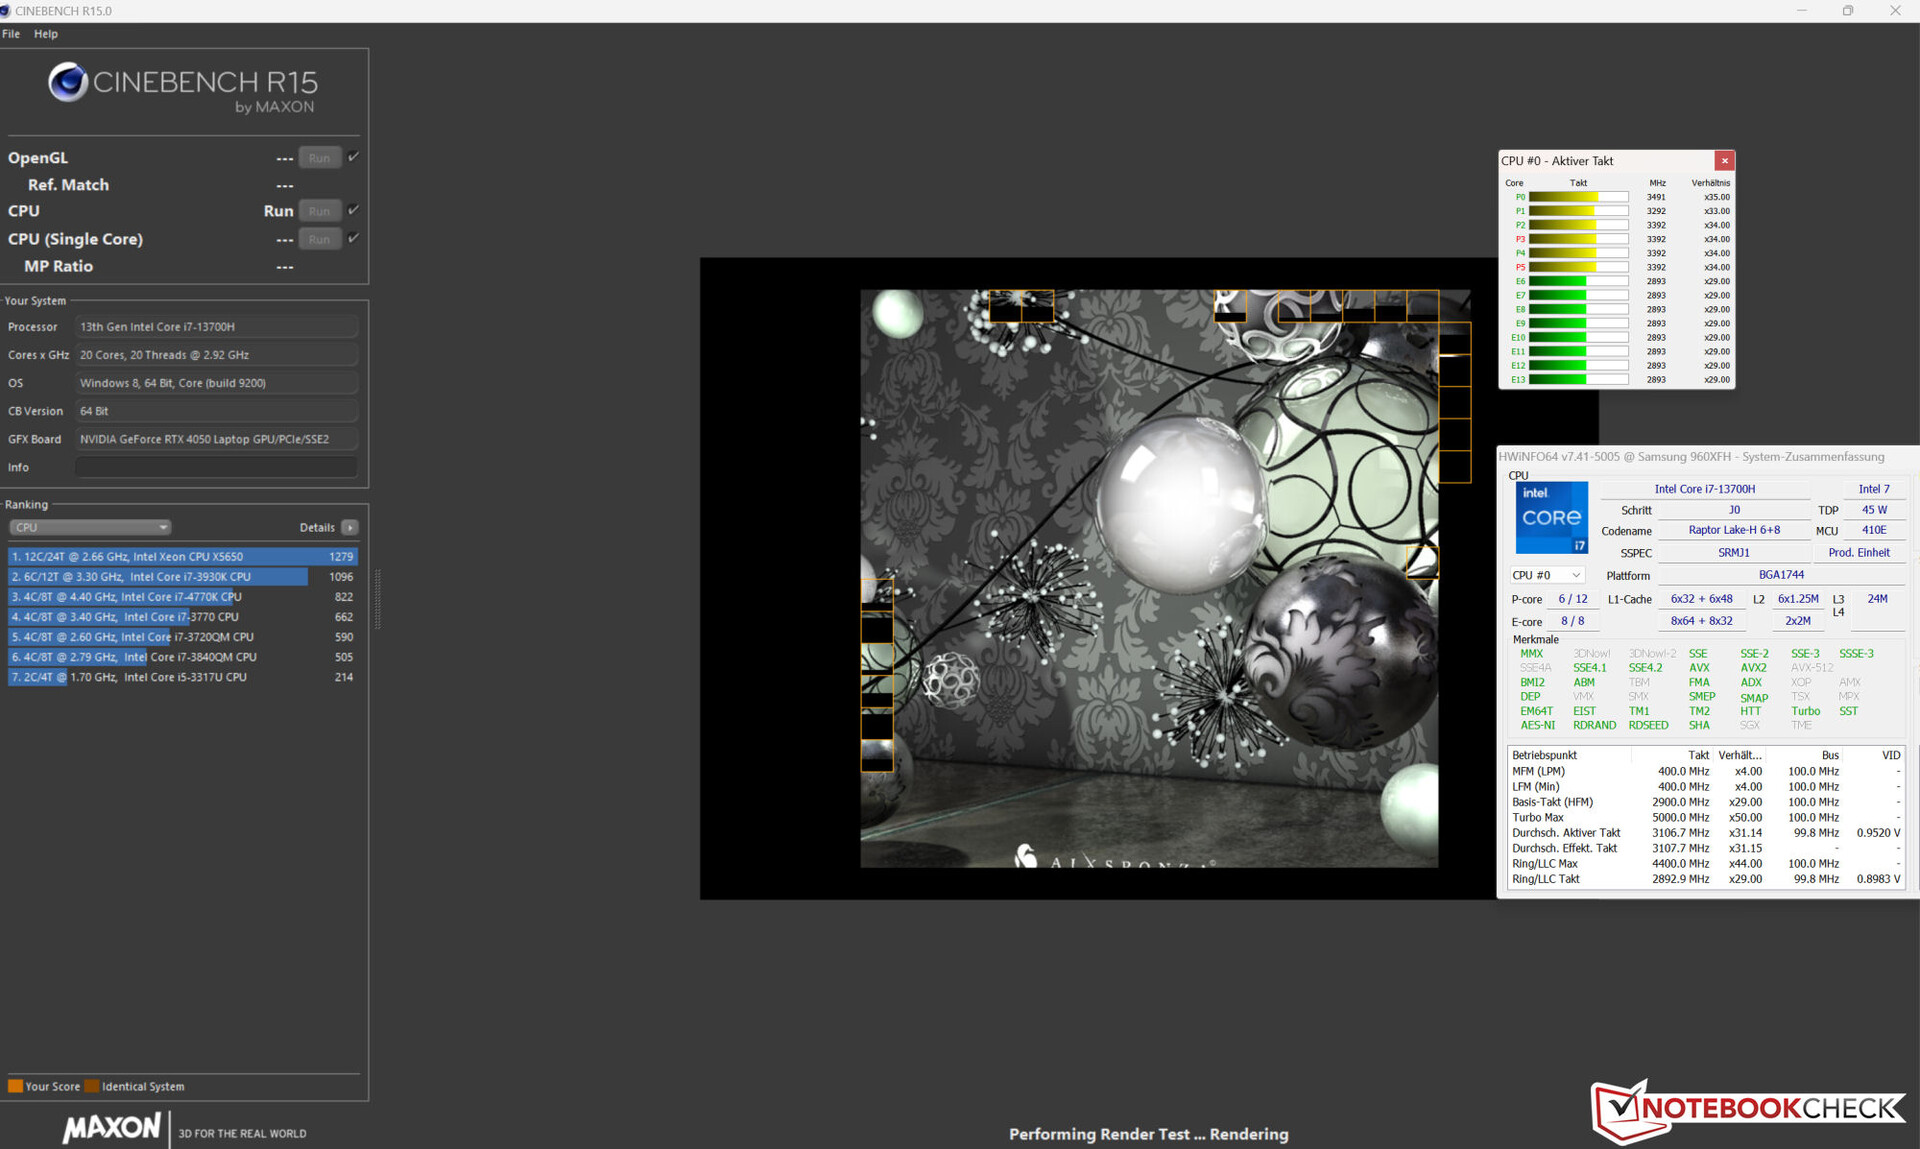
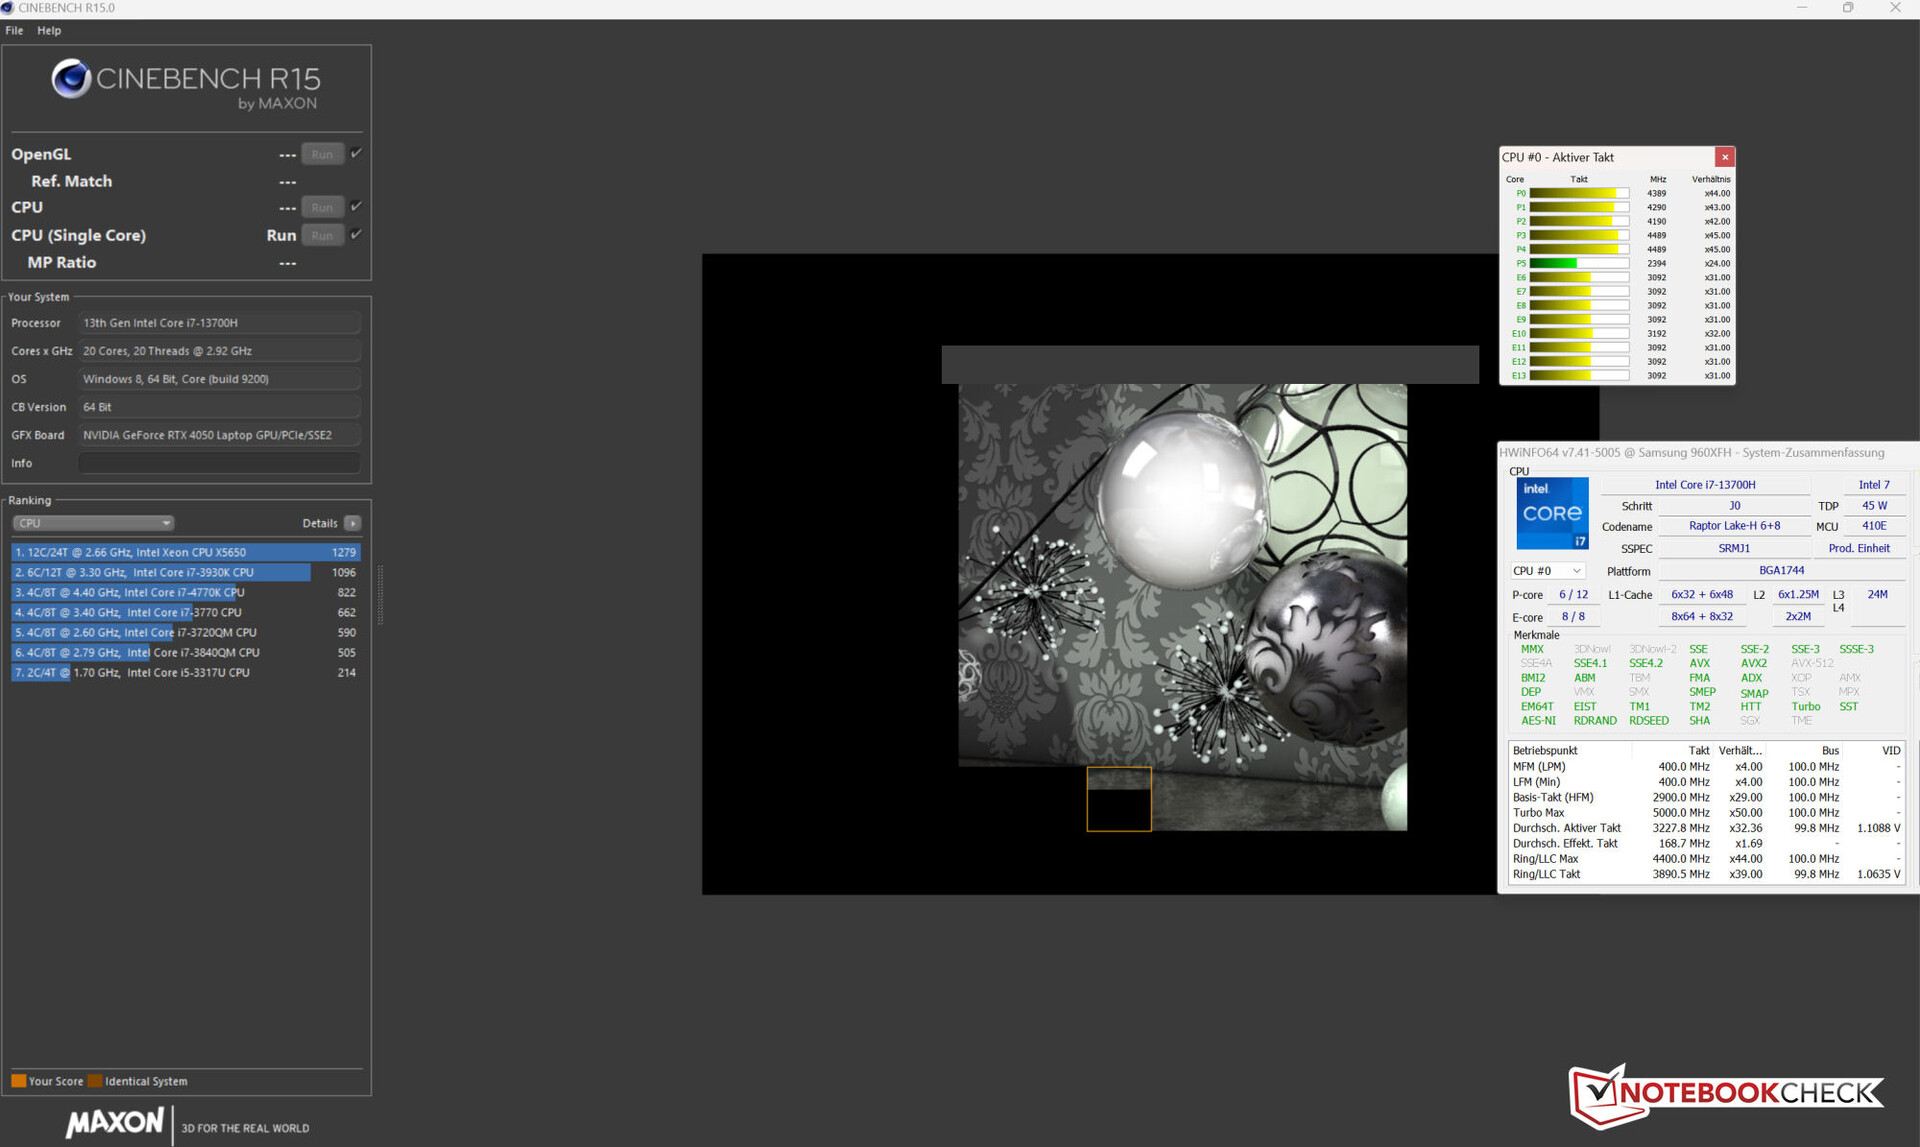
Procesor
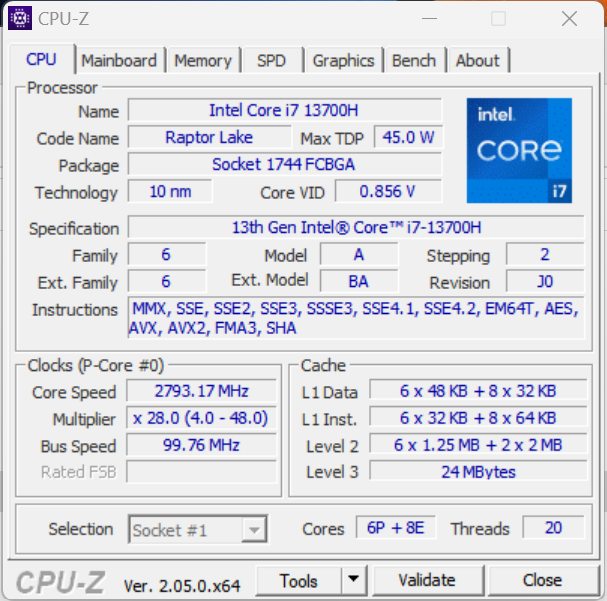
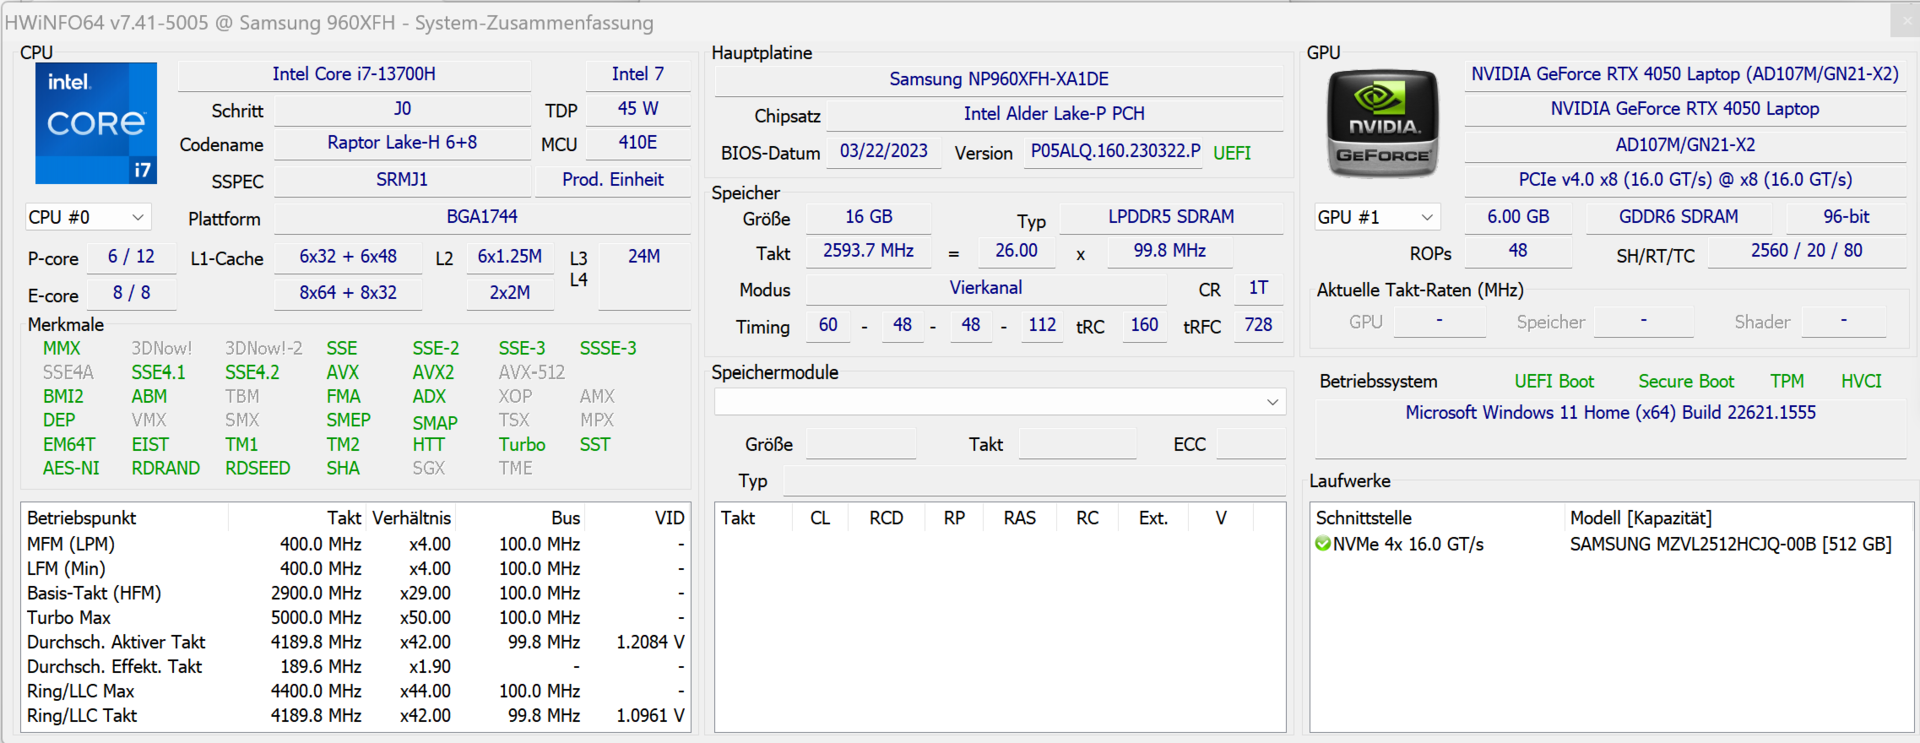
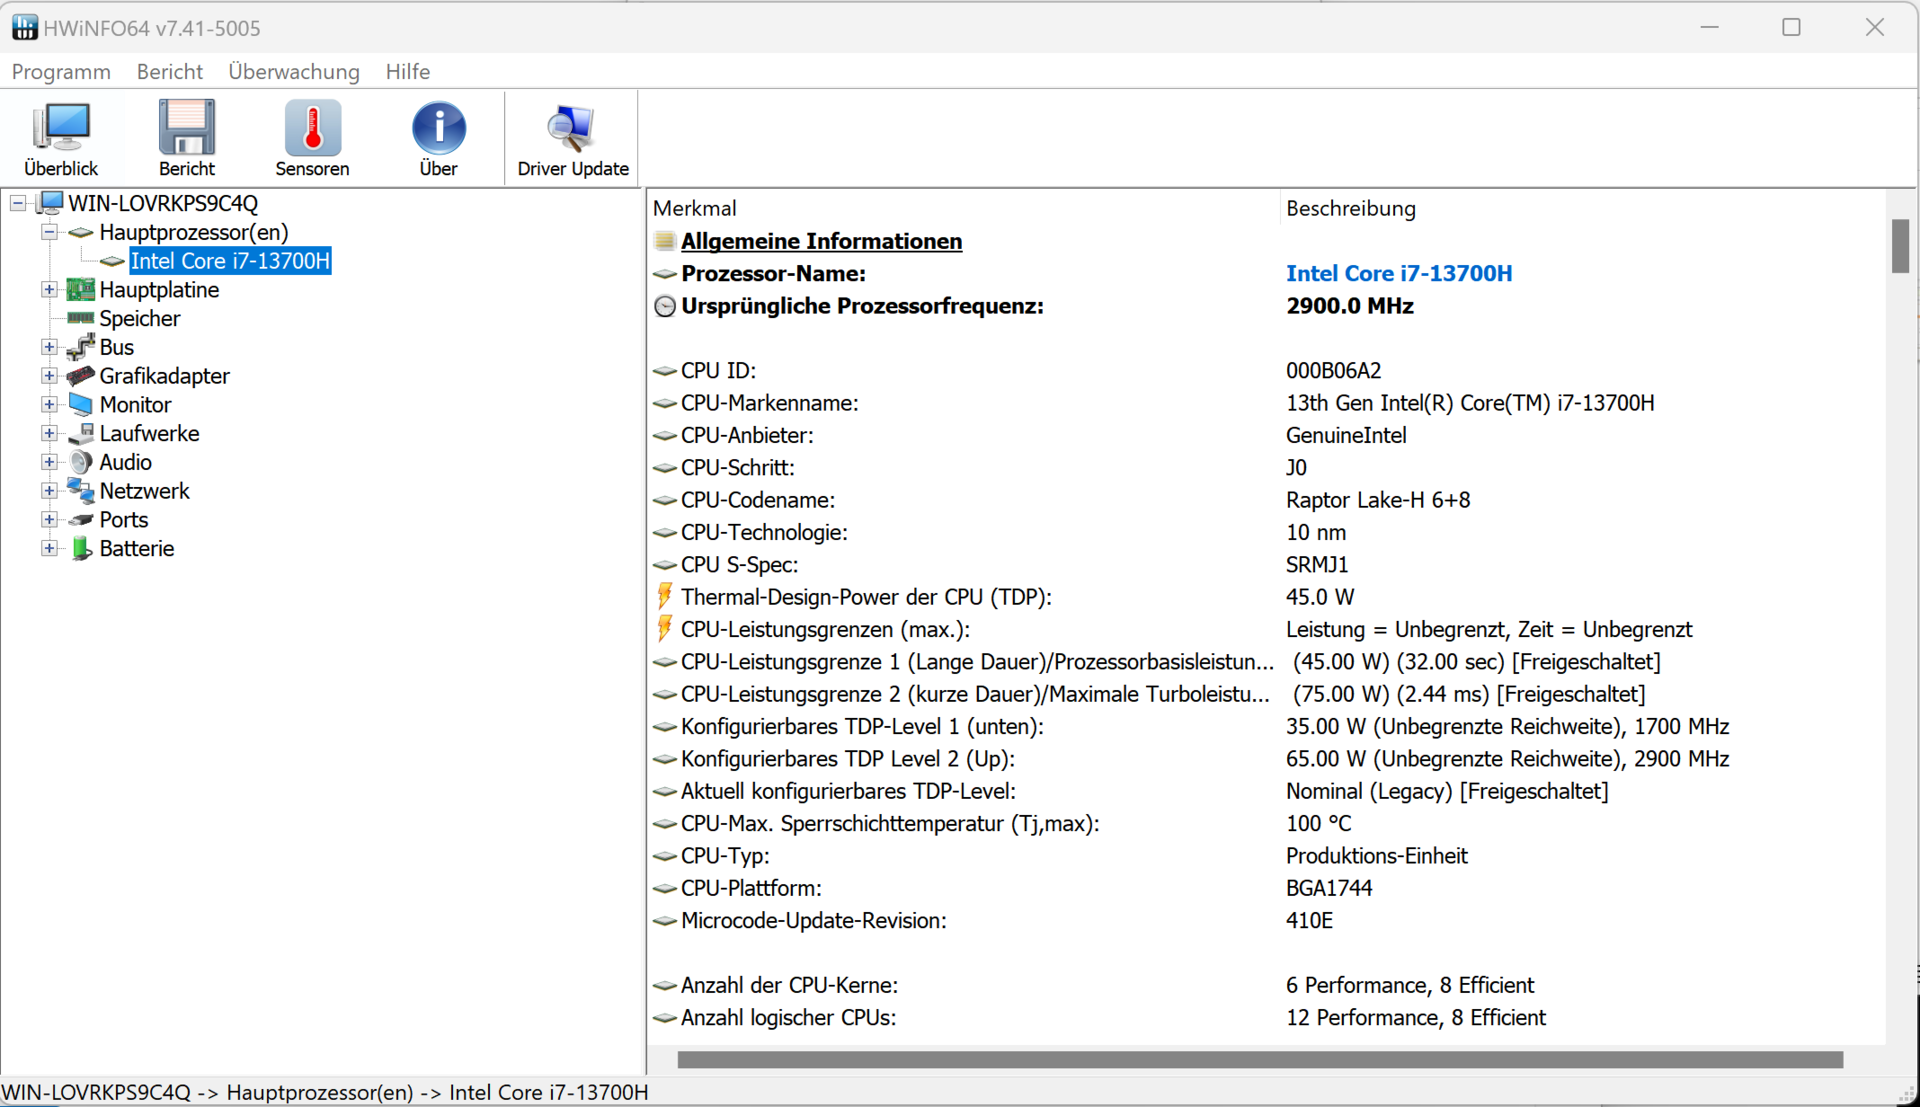
Na stronie Core i7-13700H (procesor Raptor Lake) składa się z ośmiu wydajnych rdzeni (bez hyperthreadingu, od 1,8 do 3,7 GHz) i sześciu rdzeni wydajnościowych (hyperthreading, od 2,4 do 5 GHz). W sumie daje to 20 logicznych rdzeni CPU.
Tryby wydajności "High Performance" i "Optimized" dostarczają wyników benchmarków, które są mniej więcej na poziomie ustalonej do tej pory średniej CPU. Profil "Silent" obniża te wartości, ale nadal zapewnia wydajność wystarczającą do codziennego użytku
Test pętli CB15 ujawnia, że ciągłe obciążenie wielowątkowe powoduje spadek taktowania turbo z każdym kolejnym uruchomieniem i wahania od ósmego uruchomienia. Nie można utrzymać stałego poziomu. Profil "High Performance" zapewnia wyższy średni zegar i mniejsze wahania.
Cinebench R15 Multi Sustained Load
| CPU Performance rating - Percent | |
| Średnia w klasie Multimedia | |
| Samsung Galaxy Book3 Ultra 16 | |
| Przeciętny Intel Core i7-13700H | |
| Dell XPS 15 9520 RTX 3050 Ti | |
| Samsung Galaxy Book3 Ultra 16 | |
| Schenker Vision 16 Pro RTX 3070 Ti | |
| Lenovo ThinkBook 16p G3 ARH | |
| Acer Swift X SFX16-52G-77RX | |
| Samsung Galaxy Book3 Ultra 16 | |
| LG Gram 17Z90Q-E.AD78G | |
| Asus VivoBook Pro 16X OLED N7600PC-L2026X | |
| Cinebench R23 | |
| Multi Core | |
| Średnia w klasie Multimedia (4861 - 33362, n=79, ostatnie 2 lata) | |
| Samsung Galaxy Book3 Ultra 16 | |
| Przeciętny Intel Core i7-13700H (5890 - 20034, n=29) | |
| Samsung Galaxy Book3 Ultra 16 (Hohe Leistung) | |
| Dell XPS 15 9520 RTX 3050 Ti | |
| Lenovo ThinkBook 16p G3 ARH | |
| Schenker Vision 16 Pro RTX 3070 Ti | |
| Samsung Galaxy Book3 Ultra 16 (Leise) | |
| Acer Swift X SFX16-52G-77RX | |
| LG Gram 17Z90Q-E.AD78G | |
| LG Gram 17Z90Q-E.AD78G | |
| Asus VivoBook Pro 16X OLED N7600PC-L2026X | |
| Single Core | |
| Średnia w klasie Multimedia (1128 - 2459, n=71, ostatnie 2 lata) | |
| Samsung Galaxy Book3 Ultra 16 (Hohe Leistung) | |
| Schenker Vision 16 Pro RTX 3070 Ti | |
| Przeciętny Intel Core i7-13700H (1323 - 1914, n=29) | |
| Dell XPS 15 9520 RTX 3050 Ti | |
| Acer Swift X SFX16-52G-77RX | |
| Samsung Galaxy Book3 Ultra 16 | |
| LG Gram 17Z90Q-E.AD78G | |
| Lenovo ThinkBook 16p G3 ARH | |
| Asus VivoBook Pro 16X OLED N7600PC-L2026X | |
| Samsung Galaxy Book3 Ultra 16 (Leise) | |
| Cinebench R20 | |
| CPU (Multi Core) | |
| Średnia w klasie Multimedia (1887 - 12912, n=62, ostatnie 2 lata) | |
| Samsung Galaxy Book3 Ultra 16 | |
| Przeciętny Intel Core i7-13700H (2322 - 7674, n=29) | |
| Samsung Galaxy Book3 Ultra 16 (Hohe Leistung) | |
| Dell XPS 15 9520 RTX 3050 Ti | |
| Lenovo ThinkBook 16p G3 ARH | |
| Schenker Vision 16 Pro RTX 3070 Ti | |
| Samsung Galaxy Book3 Ultra 16 (Leise) | |
| Acer Swift X SFX16-52G-77RX | |
| LG Gram 17Z90Q-E.AD78G | |
| Asus VivoBook Pro 16X OLED N7600PC-L2026X | |
| CPU (Single Core) | |
| Średnia w klasie Multimedia (425 - 853, n=62, ostatnie 2 lata) | |
| Samsung Galaxy Book3 Ultra 16 (Hohe Leistung) | |
| Schenker Vision 16 Pro RTX 3070 Ti | |
| Przeciętny Intel Core i7-13700H (508 - 741, n=29) | |
| Dell XPS 15 9520 RTX 3050 Ti | |
| Acer Swift X SFX16-52G-77RX | |
| Samsung Galaxy Book3 Ultra 16 | |
| LG Gram 17Z90Q-E.AD78G | |
| Lenovo ThinkBook 16p G3 ARH | |
| Asus VivoBook Pro 16X OLED N7600PC-L2026X | |
| Samsung Galaxy Book3 Ultra 16 (Leise) | |
| Cinebench R15 | |
| CPU Multi 64Bit | |
| Schenker Vision 16 Pro RTX 3070 Ti (Turbo) | |
| Schenker Vision 16 Pro RTX 3070 Ti | |
| Średnia w klasie Multimedia (856 - 5224, n=66, ostatnie 2 lata) | |
| Samsung Galaxy Book3 Ultra 16 | |
| Samsung Galaxy Book3 Ultra 16 (Hohe Leistung) | |
| Przeciętny Intel Core i7-13700H (905 - 2982, n=29) | |
| Samsung Galaxy Book3 Ultra 16 (Leise) | |
| Dell XPS 15 9520 RTX 3050 Ti | |
| Lenovo ThinkBook 16p G3 ARH | |
| Acer Swift X SFX16-52G-77RX | |
| LG Gram 17Z90Q-E.AD78G | |
| Asus VivoBook Pro 16X OLED N7600PC-L2026X | |
| CPU Single 64Bit | |
| Średnia w klasie Multimedia (184.8 - 326, n=64, ostatnie 2 lata) | |
| Samsung Galaxy Book3 Ultra 16 (Hohe Leistung) | |
| Schenker Vision 16 Pro RTX 3070 Ti | |
| Przeciętny Intel Core i7-13700H (213 - 278, n=29) | |
| Dell XPS 15 9520 RTX 3050 Ti | |
| Acer Swift X SFX16-52G-77RX | |
| Samsung Galaxy Book3 Ultra 16 | |
| Lenovo ThinkBook 16p G3 ARH | |
| Asus VivoBook Pro 16X OLED N7600PC-L2026X | |
| Asus VivoBook Pro 16X OLED N7600PC-L2026X | |
| LG Gram 17Z90Q-E.AD78G | |
| Samsung Galaxy Book3 Ultra 16 (Leise) | |
| Blender - v2.79 BMW27 CPU | |
| Asus VivoBook Pro 16X OLED N7600PC-L2026X | |
| LG Gram 17Z90Q-E.AD78G | |
| Acer Swift X SFX16-52G-77RX | |
| Samsung Galaxy Book3 Ultra 16 (Leise) | |
| Schenker Vision 16 Pro RTX 3070 Ti | |
| Średnia w klasie Multimedia (100 - 557, n=63, ostatnie 2 lata) | |
| Lenovo ThinkBook 16p G3 ARH | |
| Przeciętny Intel Core i7-13700H (169 - 555, n=29) | |
| Dell XPS 15 9520 RTX 3050 Ti | |
| Samsung Galaxy Book3 Ultra 16 | |
| Samsung Galaxy Book3 Ultra 16 (Hohe Leistung) | |
| 7-Zip 18.03 | |
| 7z b 4 | |
| Dell XPS 15 9520 RTX 3050 Ti | |
| Samsung Galaxy Book3 Ultra 16 | |
| Przeciętny Intel Core i7-13700H (27322 - 76344, n=29) | |
| Średnia w klasie Multimedia (26062 - 130368, n=60, ostatnie 2 lata) | |
| Samsung Galaxy Book3 Ultra 16 (Hohe Leistung) | |
| Lenovo ThinkBook 16p G3 ARH | |
| Schenker Vision 16 Pro RTX 3070 Ti | |
| Samsung Galaxy Book3 Ultra 16 (Leise) | |
| Acer Swift X SFX16-52G-77RX | |
| LG Gram 17Z90Q-E.AD78G | |
| Asus VivoBook Pro 16X OLED N7600PC-L2026X | |
| 7z b 4 -mmt1 | |
| Samsung Galaxy Book3 Ultra 16 (Hohe Leistung) | |
| Średnia w klasie Multimedia (3666 - 7545, n=61, ostatnie 2 lata) | |
| Przeciętny Intel Core i7-13700H (4825 - 6238, n=29) | |
| Schenker Vision 16 Pro RTX 3070 Ti | |
| Dell XPS 15 9520 RTX 3050 Ti | |
| Samsung Galaxy Book3 Ultra 16 | |
| Asus VivoBook Pro 16X OLED N7600PC-L2026X | |
| Acer Swift X SFX16-52G-77RX | |
| Lenovo ThinkBook 16p G3 ARH | |
| LG Gram 17Z90Q-E.AD78G | |
| Samsung Galaxy Book3 Ultra 16 (Leise) | |
| Geekbench 5.5 | |
| Multi-Core | |
| Średnia w klasie Multimedia (4652 - 20422, n=60, ostatnie 2 lata) | |
| Samsung Galaxy Book3 Ultra 16 (Hohe Leistung) | |
| Dell XPS 15 9520 RTX 3050 Ti | |
| Przeciętny Intel Core i7-13700H (6165 - 14215, n=29) | |
| Samsung Galaxy Book3 Ultra 16 | |
| Schenker Vision 16 Pro RTX 3070 Ti | |
| Acer Swift X SFX16-52G-77RX | |
| Samsung Galaxy Book3 Ultra 16 (Leise) | |
| Lenovo ThinkBook 16p G3 ARH | |
| LG Gram 17Z90Q-E.AD78G | |
| Asus VivoBook Pro 16X OLED N7600PC-L2026X | |
| Single-Core | |
| Średnia w klasie Multimedia (805 - 2974, n=60, ostatnie 2 lata) | |
| Samsung Galaxy Book3 Ultra 16 (Hohe Leistung) | |
| Schenker Vision 16 Pro RTX 3070 Ti | |
| Przeciętny Intel Core i7-13700H (1362 - 1919, n=29) | |
| Acer Swift X SFX16-52G-77RX | |
| Dell XPS 15 9520 RTX 3050 Ti | |
| Samsung Galaxy Book3 Ultra 16 | |
| LG Gram 17Z90Q-E.AD78G | |
| Lenovo ThinkBook 16p G3 ARH | |
| Asus VivoBook Pro 16X OLED N7600PC-L2026X | |
| Samsung Galaxy Book3 Ultra 16 (Leise) | |
| HWBOT x265 Benchmark v2.2 - 4k Preset | |
| Średnia w klasie Multimedia (5.26 - 36.1, n=61, ostatnie 2 lata) | |
| Samsung Galaxy Book3 Ultra 16 (Hohe Leistung) | |
| Lenovo ThinkBook 16p G3 ARH | |
| Samsung Galaxy Book3 Ultra 16 | |
| Przeciętny Intel Core i7-13700H (6.72 - 21.2, n=29) | |
| Dell XPS 15 9520 RTX 3050 Ti | |
| Schenker Vision 16 Pro RTX 3070 Ti | |
| Acer Swift X SFX16-52G-77RX | |
| Samsung Galaxy Book3 Ultra 16 (Leise) | |
| LG Gram 17Z90Q-E.AD78G | |
| Asus VivoBook Pro 16X OLED N7600PC-L2026X | |
| LibreOffice - 20 Documents To PDF | |
| LG Gram 17Z90Q-E.AD78G | |
| Lenovo ThinkBook 16p G3 ARH | |
| Acer Swift X SFX16-52G-77RX | |
| Asus VivoBook Pro 16X OLED N7600PC-L2026X | |
| Samsung Galaxy Book3 Ultra 16 (Leise) | |
| Średnia w klasie Multimedia (23.9 - 146.7, n=62, ostatnie 2 lata) | |
| Samsung Galaxy Book3 Ultra 16 | |
| Przeciętny Intel Core i7-13700H (31.3 - 62.4, n=29) | |
| Schenker Vision 16 Pro RTX 3070 Ti | |
| Dell XPS 15 9520 RTX 3050 Ti | |
| Samsung Galaxy Book3 Ultra 16 (Hohe Leistung) | |
| R Benchmark 2.5 - Overall mean | |
| Samsung Galaxy Book3 Ultra 16 (Leise) | |
| Asus VivoBook Pro 16X OLED N7600PC-L2026X | |
| LG Gram 17Z90Q-E.AD78G | |
| Lenovo ThinkBook 16p G3 ARH | |
| Samsung Galaxy Book3 Ultra 16 | |
| Samsung Galaxy Book3 Ultra 16 (Hohe Leistung) | |
| Acer Swift X SFX16-52G-77RX | |
| Przeciętny Intel Core i7-13700H (0.4308 - 0.607, n=29) | |
| Średnia w klasie Multimedia (0.3604 - 0.947, n=61, ostatnie 2 lata) | |
| Schenker Vision 16 Pro RTX 3070 Ti | |
| Dell XPS 15 9520 RTX 3050 Ti | |
* ... im mniej tym lepiej
AIDA64: FP32 Ray-Trace | FPU Julia | CPU SHA3 | CPU Queen | FPU SinJulia | FPU Mandel | CPU AES | CPU ZLib | FP64 Ray-Trace | CPU PhotoWorxx
| Performance rating | |
| Średnia w klasie Multimedia | |
| Lenovo ThinkBook 16p G3 ARH | |
| Samsung Galaxy Book3 Ultra 16 | |
| Przeciętny Intel Core i7-13700H | |
| Schenker Vision 16 Pro RTX 3070 Ti | |
| Dell XPS 15 9520 RTX 3050 Ti | |
| Acer Swift X SFX16-52G-77RX | |
| LG Gram 17Z90Q-E.AD78G | |
| Asus VivoBook Pro 16X OLED N7600PC-L2026X | |
| AIDA64 / FP32 Ray-Trace | |
| Średnia w klasie Multimedia (2214 - 50388, n=58, ostatnie 2 lata) | |
| Lenovo ThinkBook 16p G3 ARH (v6.75.6100) | |
| Samsung Galaxy Book3 Ultra 16 (v6.75.6100) | |
| Przeciętny Intel Core i7-13700H (4986 - 18908, n=29) | |
| Schenker Vision 16 Pro RTX 3070 Ti (v6.75.6100) | |
| Acer Swift X SFX16-52G-77RX (v6.70.6000) | |
| Dell XPS 15 9520 RTX 3050 Ti (v6.50.5800) | |
| Asus VivoBook Pro 16X OLED N7600PC-L2026X (v6.75.6100) | |
| LG Gram 17Z90Q-E.AD78G (v6.50.5800) | |
| AIDA64 / FPU Julia | |
| Lenovo ThinkBook 16p G3 ARH (v6.75.6100) | |
| Średnia w klasie Multimedia (12867 - 201874, n=59, ostatnie 2 lata) | |
| Przeciętny Intel Core i7-13700H (25360 - 92359, n=29) | |
| Samsung Galaxy Book3 Ultra 16 (v6.75.6100) | |
| Schenker Vision 16 Pro RTX 3070 Ti (v6.75.6100) | |
| Acer Swift X SFX16-52G-77RX (v6.70.6000) | |
| Dell XPS 15 9520 RTX 3050 Ti (v6.50.5800) | |
| Asus VivoBook Pro 16X OLED N7600PC-L2026X (v6.75.6100) | |
| LG Gram 17Z90Q-E.AD78G (v6.50.5800) | |
| AIDA64 / CPU SHA3 | |
| Średnia w klasie Multimedia (626 - 8623, n=59, ostatnie 2 lata) | |
| Lenovo ThinkBook 16p G3 ARH (v6.75.6100) | |
| Samsung Galaxy Book3 Ultra 16 (v6.75.6100) | |
| Przeciętny Intel Core i7-13700H (1339 - 4224, n=29) | |
| Schenker Vision 16 Pro RTX 3070 Ti (v6.75.6100) | |
| Dell XPS 15 9520 RTX 3050 Ti (v6.50.5800) | |
| Acer Swift X SFX16-52G-77RX (v6.70.6000) | |
| Asus VivoBook Pro 16X OLED N7600PC-L2026X (v6.75.6100) | |
| LG Gram 17Z90Q-E.AD78G (v6.50.5800) | |
| AIDA64 / CPU Queen | |
| Lenovo ThinkBook 16p G3 ARH (v6.75.6100) | |
| Samsung Galaxy Book3 Ultra 16 (v6.75.6100) | |
| Dell XPS 15 9520 RTX 3050 Ti (v6.50.5800) | |
| Przeciętny Intel Core i7-13700H (59324 - 107159, n=29) | |
| Schenker Vision 16 Pro RTX 3070 Ti (v6.75.6100) | |
| Acer Swift X SFX16-52G-77RX (v6.70.6000) | |
| Średnia w klasie Multimedia (13483 - 181505, n=46, ostatnie 2 lata) | |
| LG Gram 17Z90Q-E.AD78G (v6.50.5800) | |
| Asus VivoBook Pro 16X OLED N7600PC-L2026X (v6.75.6100) | |
| AIDA64 / FPU SinJulia | |
| Lenovo ThinkBook 16p G3 ARH (v6.75.6100) | |
| Samsung Galaxy Book3 Ultra 16 (v6.75.6100) | |
| Przeciętny Intel Core i7-13700H (4800 - 11050, n=29) | |
| Średnia w klasie Multimedia (886 - 28794, n=59, ostatnie 2 lata) | |
| Dell XPS 15 9520 RTX 3050 Ti (v6.50.5800) | |
| Schenker Vision 16 Pro RTX 3070 Ti (v6.75.6100) | |
| Acer Swift X SFX16-52G-77RX (v6.70.6000) | |
| LG Gram 17Z90Q-E.AD78G (v6.50.5800) | |
| Asus VivoBook Pro 16X OLED N7600PC-L2026X (v6.75.6100) | |
| AIDA64 / FPU Mandel | |
| Lenovo ThinkBook 16p G3 ARH (v6.75.6100) | |
| Średnia w klasie Multimedia (6395 - 105740, n=58, ostatnie 2 lata) | |
| Samsung Galaxy Book3 Ultra 16 (v6.75.6100) | |
| Przeciętny Intel Core i7-13700H (12321 - 45118, n=29) | |
| Schenker Vision 16 Pro RTX 3070 Ti (v6.75.6100) | |
| Acer Swift X SFX16-52G-77RX (v6.70.6000) | |
| Dell XPS 15 9520 RTX 3050 Ti (v6.50.5800) | |
| Asus VivoBook Pro 16X OLED N7600PC-L2026X (v6.75.6100) | |
| LG Gram 17Z90Q-E.AD78G (v6.50.5800) | |
| AIDA64 / CPU AES | |
| Dell XPS 15 9520 RTX 3050 Ti (v6.50.5800) | |
| Przeciętny Intel Core i7-13700H (28769 - 151254, n=29) | |
| Samsung Galaxy Book3 Ultra 16 (v6.75.6100) | |
| Średnia w klasie Multimedia (8171 - 126790, n=59, ostatnie 2 lata) | |
| Schenker Vision 16 Pro RTX 3070 Ti (v6.75.6100) | |
| Asus VivoBook Pro 16X OLED N7600PC-L2026X (v6.75.6100) | |
| Lenovo ThinkBook 16p G3 ARH (v6.75.6100) | |
| Acer Swift X SFX16-52G-77RX (v6.70.6000) | |
| LG Gram 17Z90Q-E.AD78G (v6.50.5800) | |
| AIDA64 / CPU ZLib | |
| Samsung Galaxy Book3 Ultra 16 (v6.75.6100) | |
| Średnia w klasie Multimedia (143.8 - 2022, n=59, ostatnie 2 lata) | |
| Przeciętny Intel Core i7-13700H (389 - 1215, n=29) | |
| Lenovo ThinkBook 16p G3 ARH (v6.75.6100) | |
| Schenker Vision 16 Pro RTX 3070 Ti (v6.75.6100) | |
| Dell XPS 15 9520 RTX 3050 Ti (v6.50.5800) | |
| Acer Swift X SFX16-52G-77RX (v6.70.6000) | |
| LG Gram 17Z90Q-E.AD78G (v6.50.5800) | |
| Asus VivoBook Pro 16X OLED N7600PC-L2026X (v6.75.6100) | |
| AIDA64 / FP64 Ray-Trace | |
| Średnia w klasie Multimedia (1014 - 26875, n=59, ostatnie 2 lata) | |
| Lenovo ThinkBook 16p G3 ARH (v6.75.6100) | |
| Samsung Galaxy Book3 Ultra 16 (v6.75.6100) | |
| Przeciętny Intel Core i7-13700H (2540 - 10135, n=29) | |
| Schenker Vision 16 Pro RTX 3070 Ti (v6.75.6100) | |
| Acer Swift X SFX16-52G-77RX (v6.70.6000) | |
| Dell XPS 15 9520 RTX 3050 Ti (v6.50.5800) | |
| Asus VivoBook Pro 16X OLED N7600PC-L2026X (v6.75.6100) | |
| LG Gram 17Z90Q-E.AD78G (v6.50.5800) | |
| AIDA64 / CPU PhotoWorxx | |
| Średnia w klasie Multimedia (8187 - 88154, n=59, ostatnie 2 lata) | |
| Samsung Galaxy Book3 Ultra 16 (v6.75.6100) | |
| Acer Swift X SFX16-52G-77RX (v6.70.6000) | |
| Schenker Vision 16 Pro RTX 3070 Ti (v6.75.6100) | |
| Przeciętny Intel Core i7-13700H (12872 - 52727, n=29) | |
| LG Gram 17Z90Q-E.AD78G (v6.50.5800) | |
| Dell XPS 15 9520 RTX 3050 Ti (v6.50.5800) | |
| Lenovo ThinkBook 16p G3 ARH (v6.75.6100) | |
| Asus VivoBook Pro 16X OLED N7600PC-L2026X (v6.75.6100) | |
Wydajność systemu
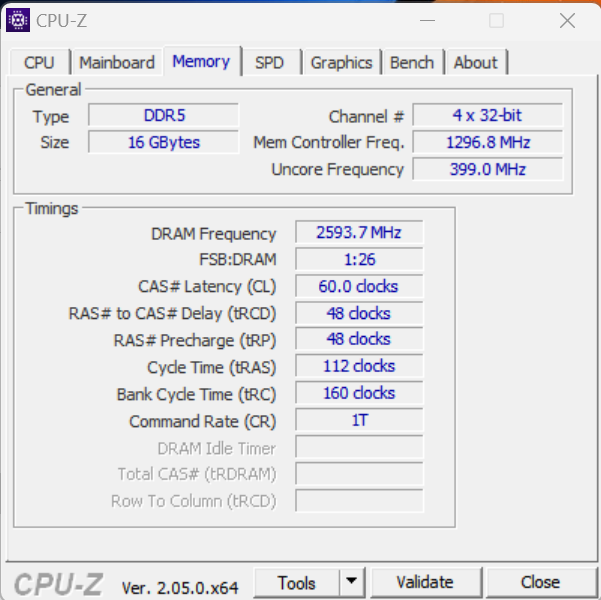
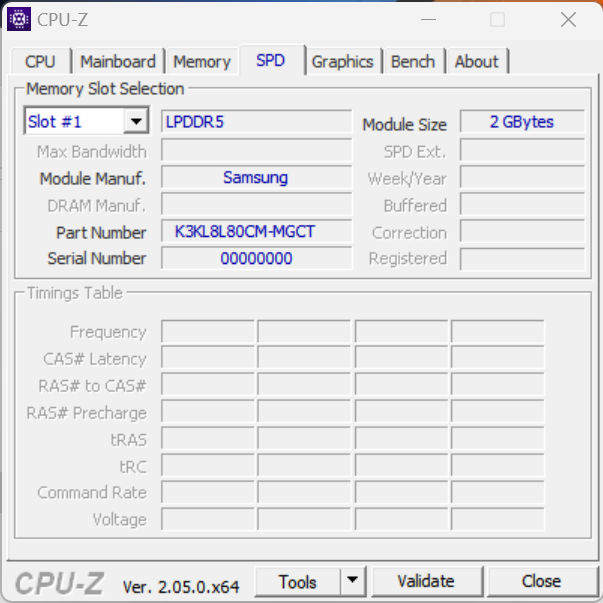
Płynnie działający system nie został zaprojektowany z myślą o maksymalnej wydajności. Celem jest tutaj kompromis pomiędzy kompaktowością, mobilnością, zużyciem energii i wydajnością. Mimo to laptop radzi sobie z wymagającymi aplikacjami, takimi jak renderowanie czy gry, co potwierdzają dobre wyniki w programie PCMark. Transfery pamięci RAM są na normalnym poziomie dla pamięci RAM LPDDR5-5200.
CrossMark: Overall | Productivity | Creativity | Responsiveness
| PCMark 10 / Score | |
| Średnia w klasie Multimedia (4325 - 10386, n=56, ostatnie 2 lata) | |
| Przeciętny Intel Core i7-13700H, NVIDIA GeForce RTX 4050 Laptop GPU (6822 - 7556, n=7) | |
| Dell XPS 15 9520 RTX 3050 Ti | |
| Lenovo ThinkBook 16p G3 ARH | |
| Samsung Galaxy Book3 Ultra 16 | |
| LG Gram 17Z90Q-E.AD78G | |
| Acer Swift X SFX16-52G-77RX | |
| Asus VivoBook Pro 16X OLED N7600PC-L2026X | |
| PCMark 10 / Essentials | |
| Dell XPS 15 9520 RTX 3050 Ti | |
| Przeciętny Intel Core i7-13700H, NVIDIA GeForce RTX 4050 Laptop GPU (10283 - 11549, n=7) | |
| Acer Swift X SFX16-52G-77RX | |
| Samsung Galaxy Book3 Ultra 16 | |
| Średnia w klasie Multimedia (8025 - 11664, n=55, ostatnie 2 lata) | |
| Lenovo ThinkBook 16p G3 ARH | |
| LG Gram 17Z90Q-E.AD78G | |
| Asus VivoBook Pro 16X OLED N7600PC-L2026X | |
| PCMark 10 / Productivity | |
| Średnia w klasie Multimedia (7323 - 18233, n=55, ostatnie 2 lata) | |
| Dell XPS 15 9520 RTX 3050 Ti | |
| LG Gram 17Z90Q-E.AD78G | |
| Przeciętny Intel Core i7-13700H, NVIDIA GeForce RTX 4050 Laptop GPU (8368 - 9836, n=7) | |
| Lenovo ThinkBook 16p G3 ARH | |
| Samsung Galaxy Book3 Ultra 16 | |
| Asus VivoBook Pro 16X OLED N7600PC-L2026X | |
| Acer Swift X SFX16-52G-77RX | |
| PCMark 10 / Digital Content Creation | |
| Średnia w klasie Multimedia (3651 - 16240, n=55, ostatnie 2 lata) | |
| Przeciętny Intel Core i7-13700H, NVIDIA GeForce RTX 4050 Laptop GPU (9527 - 10643, n=7) | |
| Samsung Galaxy Book3 Ultra 16 | |
| Lenovo ThinkBook 16p G3 ARH | |
| Dell XPS 15 9520 RTX 3050 Ti | |
| LG Gram 17Z90Q-E.AD78G | |
| Acer Swift X SFX16-52G-77RX | |
| Asus VivoBook Pro 16X OLED N7600PC-L2026X | |
| CrossMark / Overall | |
| Dell XPS 15 9520 RTX 3050 Ti | |
| Średnia w klasie Multimedia (866 - 2728, n=65, ostatnie 2 lata) | |
| Przeciętny Intel Core i7-13700H, NVIDIA GeForce RTX 4050 Laptop GPU (1205 - 1937, n=9) | |
| Acer Swift X SFX16-52G-77RX | |
| Schenker Vision 16 Pro RTX 3070 Ti | |
| Samsung Galaxy Book3 Ultra 16 | |
| Lenovo ThinkBook 16p G3 ARH | |
| LG Gram 17Z90Q-E.AD78G | |
| Asus VivoBook Pro 16X OLED N7600PC-L2026X | |
| CrossMark / Productivity | |
| Dell XPS 15 9520 RTX 3050 Ti | |
| Średnia w klasie Multimedia (931 - 2489, n=65, ostatnie 2 lata) | |
| Acer Swift X SFX16-52G-77RX | |
| Przeciętny Intel Core i7-13700H, NVIDIA GeForce RTX 4050 Laptop GPU (1158 - 1877, n=9) | |
| Schenker Vision 16 Pro RTX 3070 Ti | |
| Lenovo ThinkBook 16p G3 ARH | |
| Samsung Galaxy Book3 Ultra 16 | |
| LG Gram 17Z90Q-E.AD78G | |
| Asus VivoBook Pro 16X OLED N7600PC-L2026X | |
| CrossMark / Creativity | |
| Średnia w klasie Multimedia (907 - 3465, n=65, ostatnie 2 lata) | |
| Dell XPS 15 9520 RTX 3050 Ti | |
| Przeciętny Intel Core i7-13700H, NVIDIA GeForce RTX 4050 Laptop GPU (1293 - 2044, n=9) | |
| Schenker Vision 16 Pro RTX 3070 Ti | |
| Acer Swift X SFX16-52G-77RX | |
| Samsung Galaxy Book3 Ultra 16 | |
| LG Gram 17Z90Q-E.AD78G | |
| Lenovo ThinkBook 16p G3 ARH | |
| Asus VivoBook Pro 16X OLED N7600PC-L2026X | |
| CrossMark / Responsiveness | |
| Dell XPS 15 9520 RTX 3050 Ti | |
| Acer Swift X SFX16-52G-77RX | |
| Przeciętny Intel Core i7-13700H, NVIDIA GeForce RTX 4050 Laptop GPU (1097 - 1929, n=9) | |
| Średnia w klasie Multimedia (605 - 2024, n=65, ostatnie 2 lata) | |
| Samsung Galaxy Book3 Ultra 16 | |
| Schenker Vision 16 Pro RTX 3070 Ti | |
| Lenovo ThinkBook 16p G3 ARH | |
| LG Gram 17Z90Q-E.AD78G | |
| Asus VivoBook Pro 16X OLED N7600PC-L2026X | |
| PCMark 8 Home Score Accelerated v2 | 4564 pkt. | |
| PCMark 8 Work Score Accelerated v2 | 5090 pkt. | |
| PCMark 10 Score | 6822 pkt. | |
Pomoc | ||
| AIDA64 / Memory Copy | |
| Średnia w klasie Multimedia (11299 - 132135, n=59, ostatnie 2 lata) | |
| Samsung Galaxy Book3 Ultra 16 | |
| LG Gram 17Z90Q-E.AD78G | |
| Acer Swift X SFX16-52G-77RX | |
| Schenker Vision 16 Pro RTX 3070 Ti | |
| Przeciętny Intel Core i7-13700H (24334 - 78081, n=29) | |
| Dell XPS 15 9520 RTX 3050 Ti | |
| Lenovo ThinkBook 16p G3 ARH | |
| Asus VivoBook Pro 16X OLED N7600PC-L2026X | |
| AIDA64 / Memory Read | |
| Średnia w klasie Multimedia (11624 - 174586, n=59, ostatnie 2 lata) | |
| LG Gram 17Z90Q-E.AD78G | |
| Samsung Galaxy Book3 Ultra 16 | |
| Acer Swift X SFX16-52G-77RX | |
| Schenker Vision 16 Pro RTX 3070 Ti | |
| Przeciętny Intel Core i7-13700H (23681 - 79656, n=29) | |
| Dell XPS 15 9520 RTX 3050 Ti | |
| Lenovo ThinkBook 16p G3 ARH | |
| Asus VivoBook Pro 16X OLED N7600PC-L2026X | |
| AIDA64 / Memory Write | |
| Samsung Galaxy Book3 Ultra 16 | |
| Średnia w klasie Multimedia (11755 - 134998, n=59, ostatnie 2 lata) | |
| Przeciętny Intel Core i7-13700H (22986 - 99898, n=29) | |
| Schenker Vision 16 Pro RTX 3070 Ti | |
| LG Gram 17Z90Q-E.AD78G | |
| Acer Swift X SFX16-52G-77RX | |
| Dell XPS 15 9520 RTX 3050 Ti | |
| Lenovo ThinkBook 16p G3 ARH | |
| Asus VivoBook Pro 16X OLED N7600PC-L2026X | |
| AIDA64 / Memory Latency | |
| Średnia w klasie Multimedia (7 - 535, n=58, ostatnie 2 lata) | |
| Lenovo ThinkBook 16p G3 ARH | |
| Acer Swift X SFX16-52G-77RX | |
| LG Gram 17Z90Q-E.AD78G | |
| Dell XPS 15 9520 RTX 3050 Ti | |
| Samsung Galaxy Book3 Ultra 16 | |
| Przeciętny Intel Core i7-13700H (82.4 - 136.8, n=29) | |
| Schenker Vision 16 Pro RTX 3070 Ti | |
| Asus VivoBook Pro 16X OLED N7600PC-L2026X | |
* ... im mniej tym lepiej
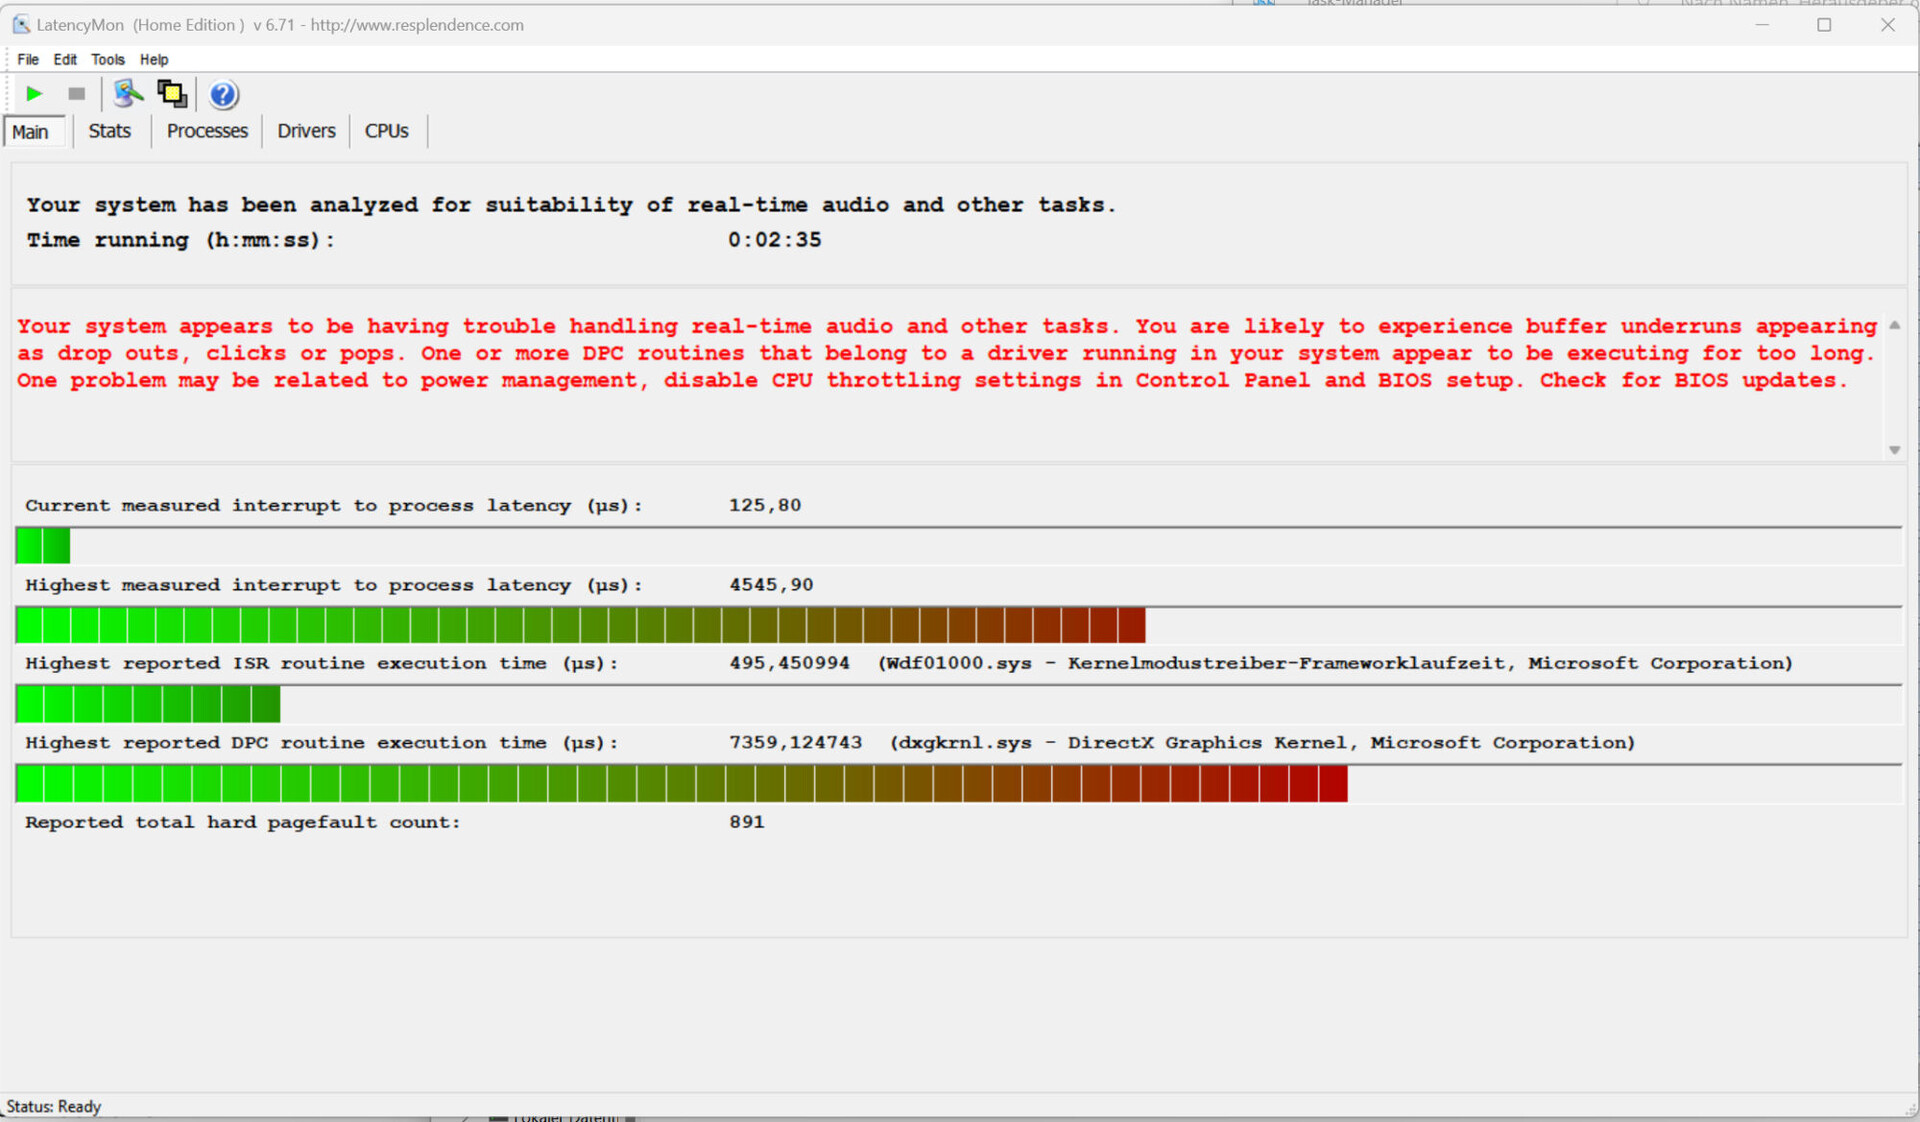
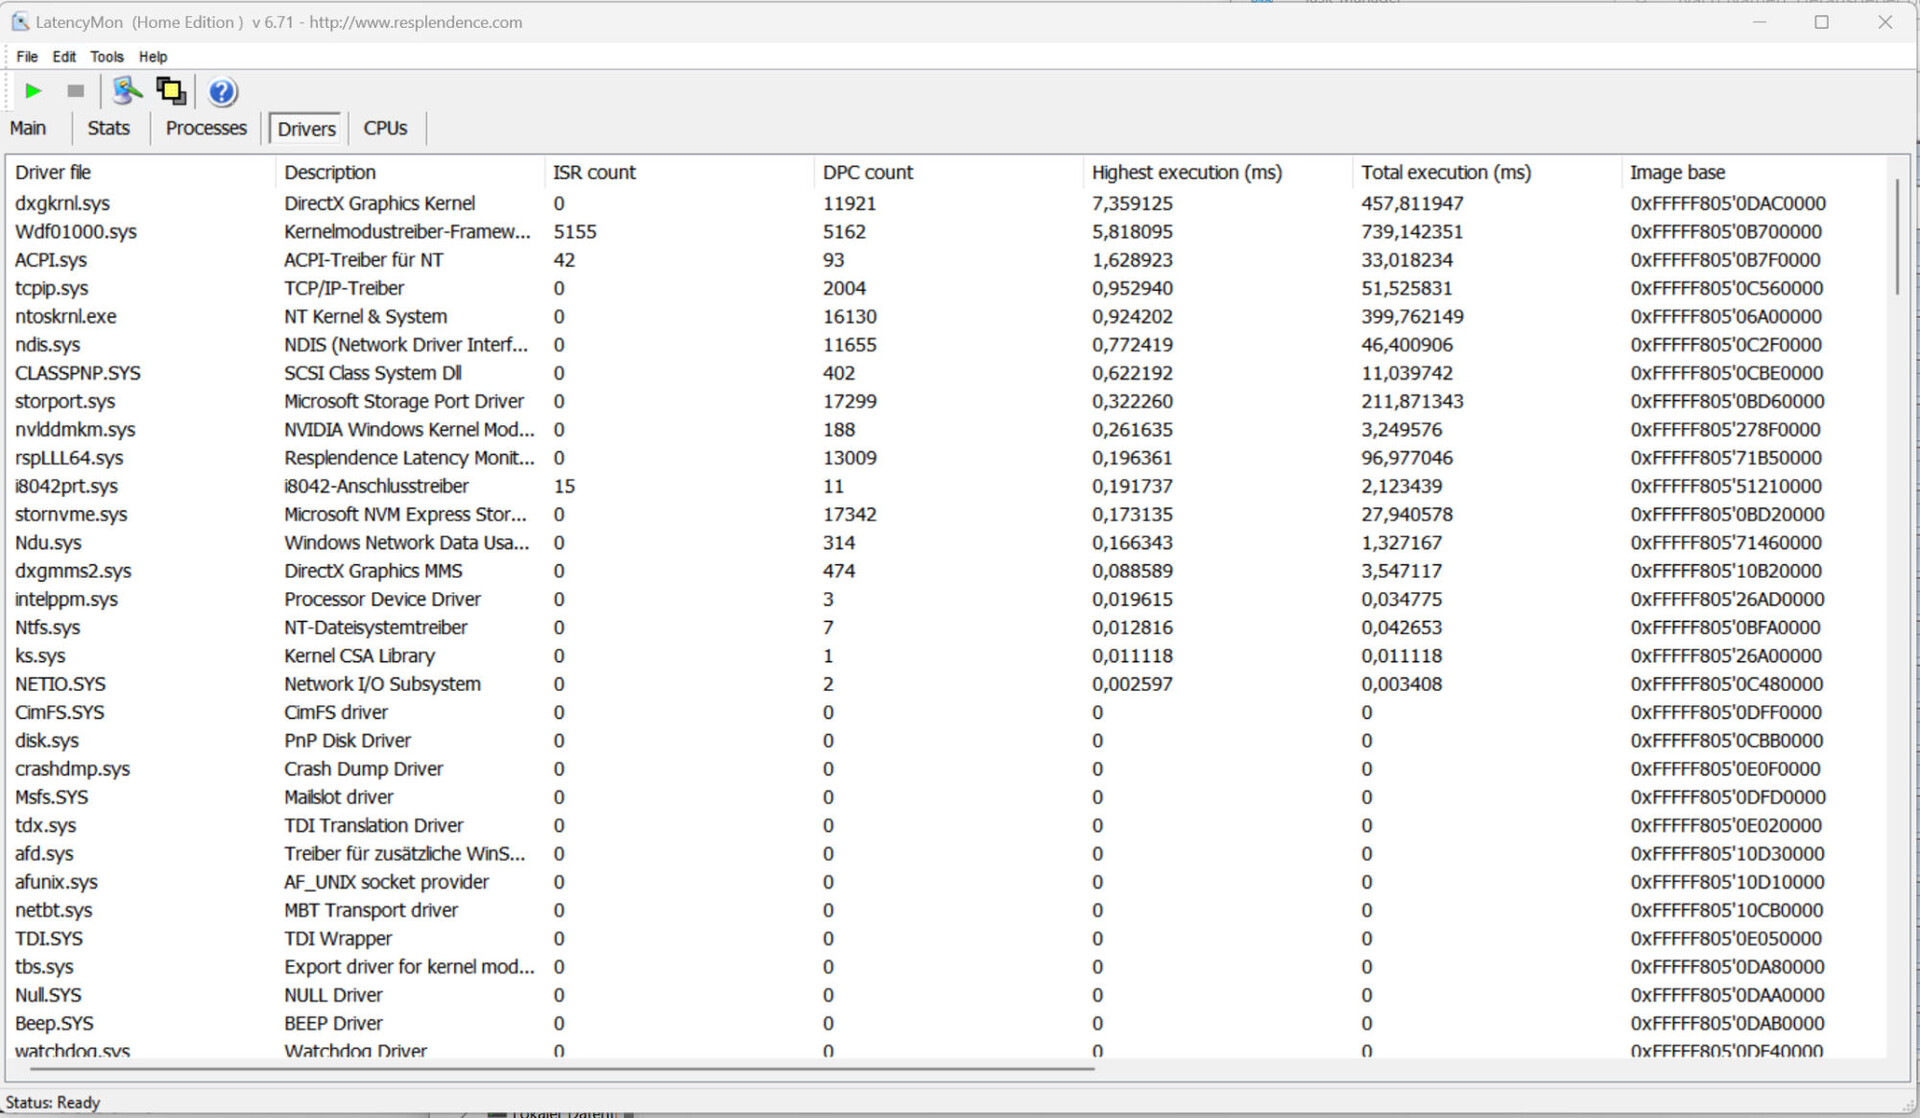
Opóźnienie DPC
Standardowy test monitora opóźnień (przeglądanie stron internetowych, odtwarzanie wideo w rozdzielczości 4k, wysokie obciążenie Prime95) wykazał nieprawidłowości, więc system nie wydaje się być odpowiedni do edycji wideo i audio w czasie rzeczywistym. Przyszłe aktualizacje oprogramowania mogą doprowadzić do poprawy lub nawet pogorszenia.
| DPC Latencies / LatencyMon - interrupt to process latency (max), Web, Youtube, Prime95 | |
| LG Gram 17Z90Q-E.AD78G | |
| Samsung Galaxy Book3 Ultra 16 | |
| Lenovo ThinkBook 16p G3 ARH | |
| Dell XPS 15 9520 RTX 3050 Ti | |
| Acer Swift X SFX16-52G-77RX | |
| Schenker Vision 16 Pro RTX 3070 Ti | |
| Asus VivoBook Pro 16X OLED N7600PC-L2026X | |
* ... im mniej tym lepiej
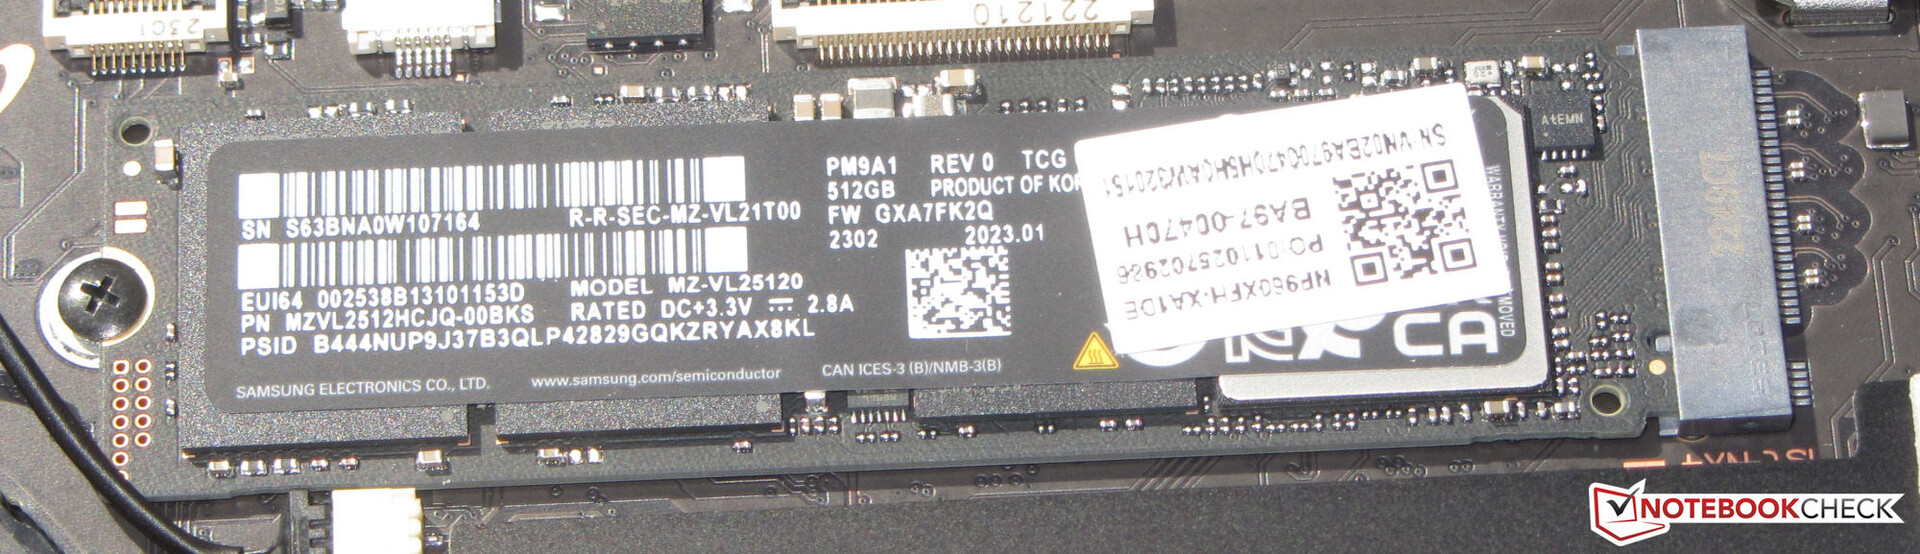
Urządzenia do przechowywania danych
Samsung jest skąpy, jeśli chodzi o przestrzeń dyskową, albowiem wbudowany dysk SSD PCIe 4 (M.2 2280) naszego urządzenia testowego ma tylko 512 GB - zbyt mało jak na laptop o wartości 2400 USD. Przynajmniej zapewnia on świetne prędkości przesyłu danych. Istnieje możliwość zainstalowania drugiego dysku SSD.

| Drive Performance rating - Percent | |
| Acer Swift X SFX16-52G-77RX | |
| Samsung Galaxy Book3 Ultra 16 | |
| Przeciętny Samsung PM9A1 MZVL2512HCJQ | |
| Dell XPS 15 9520 RTX 3050 Ti | |
| Schenker Vision 16 Pro RTX 3070 Ti | |
| Średnia w klasie Multimedia | |
| LG Gram 17Z90Q-E.AD78G | |
| Lenovo ThinkBook 16p G3 ARH | |
| Asus VivoBook Pro 16X OLED N7600PC-L2026X | |
* ... im mniej tym lepiej
Sustained Read Performance: DiskSpd Read Loop, Queue Depth 8
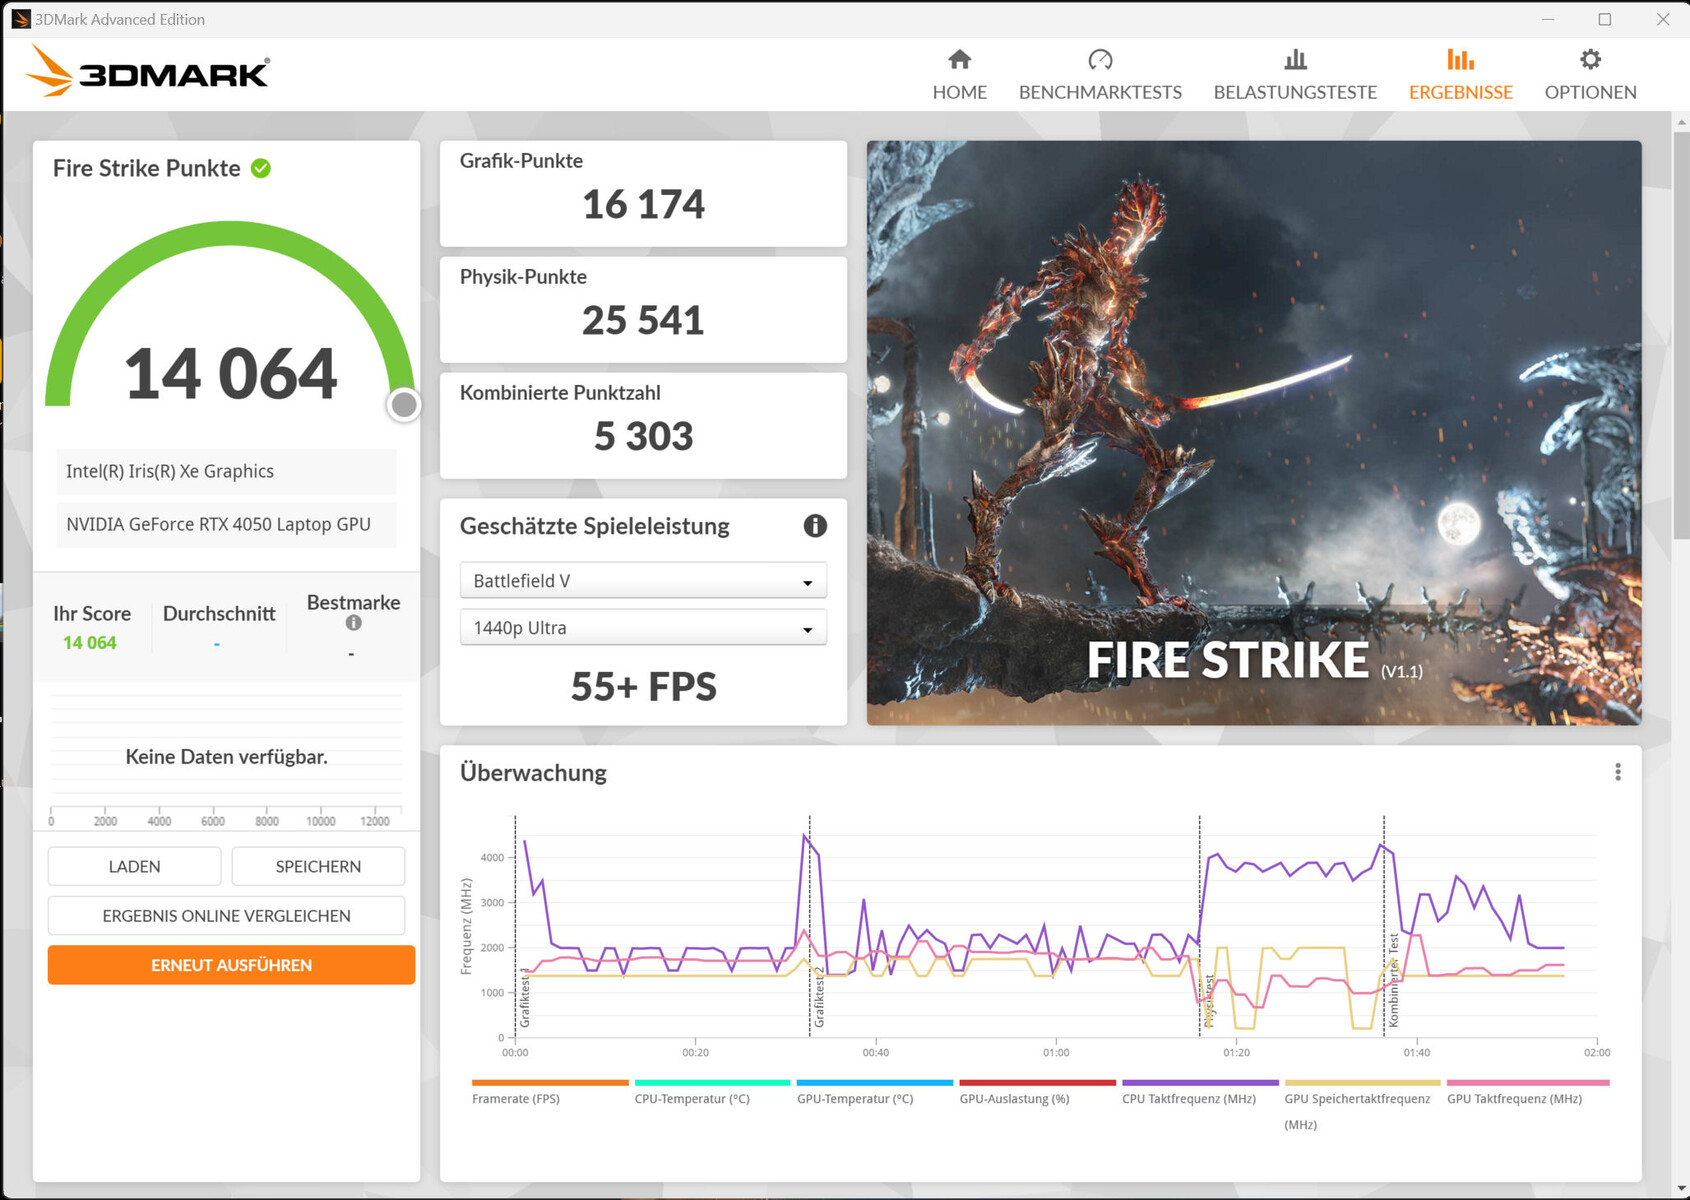
Karta graficzna
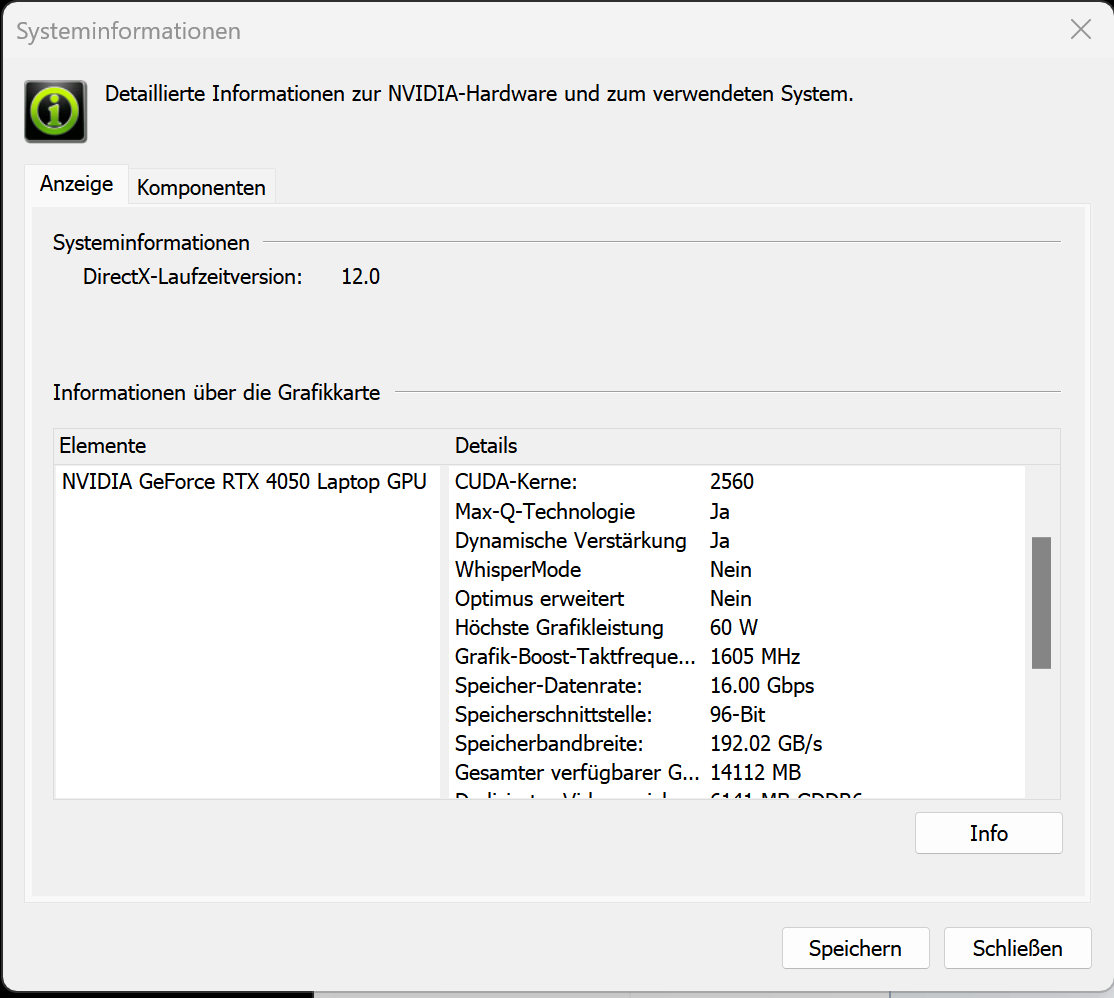
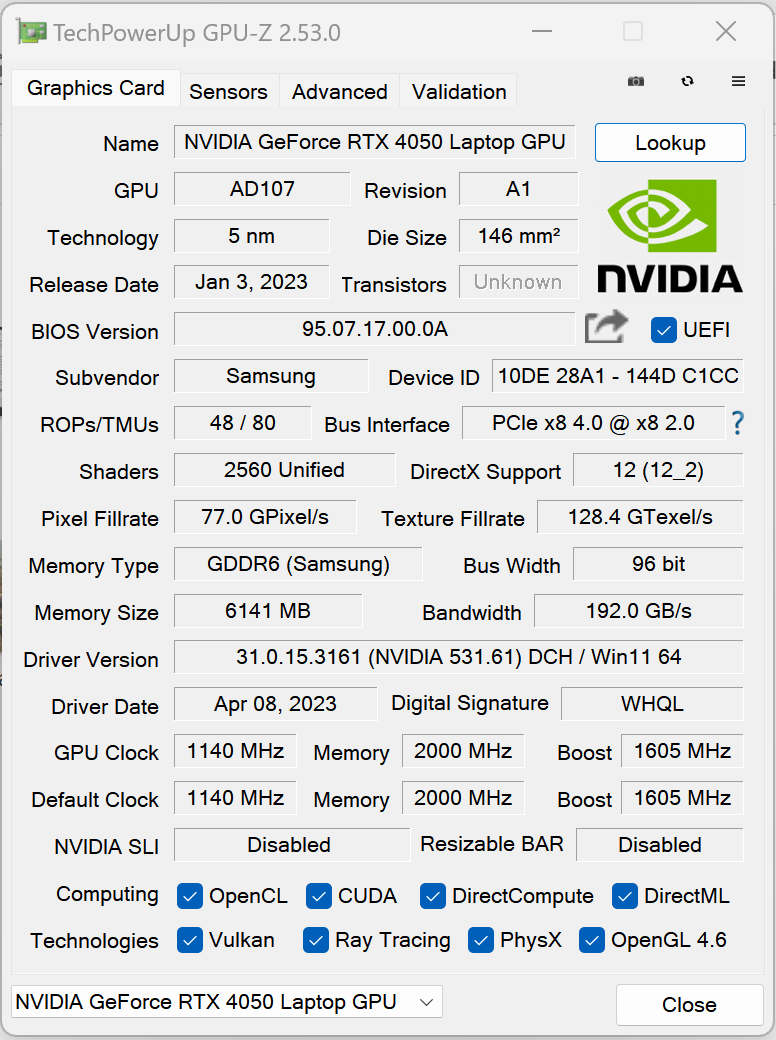
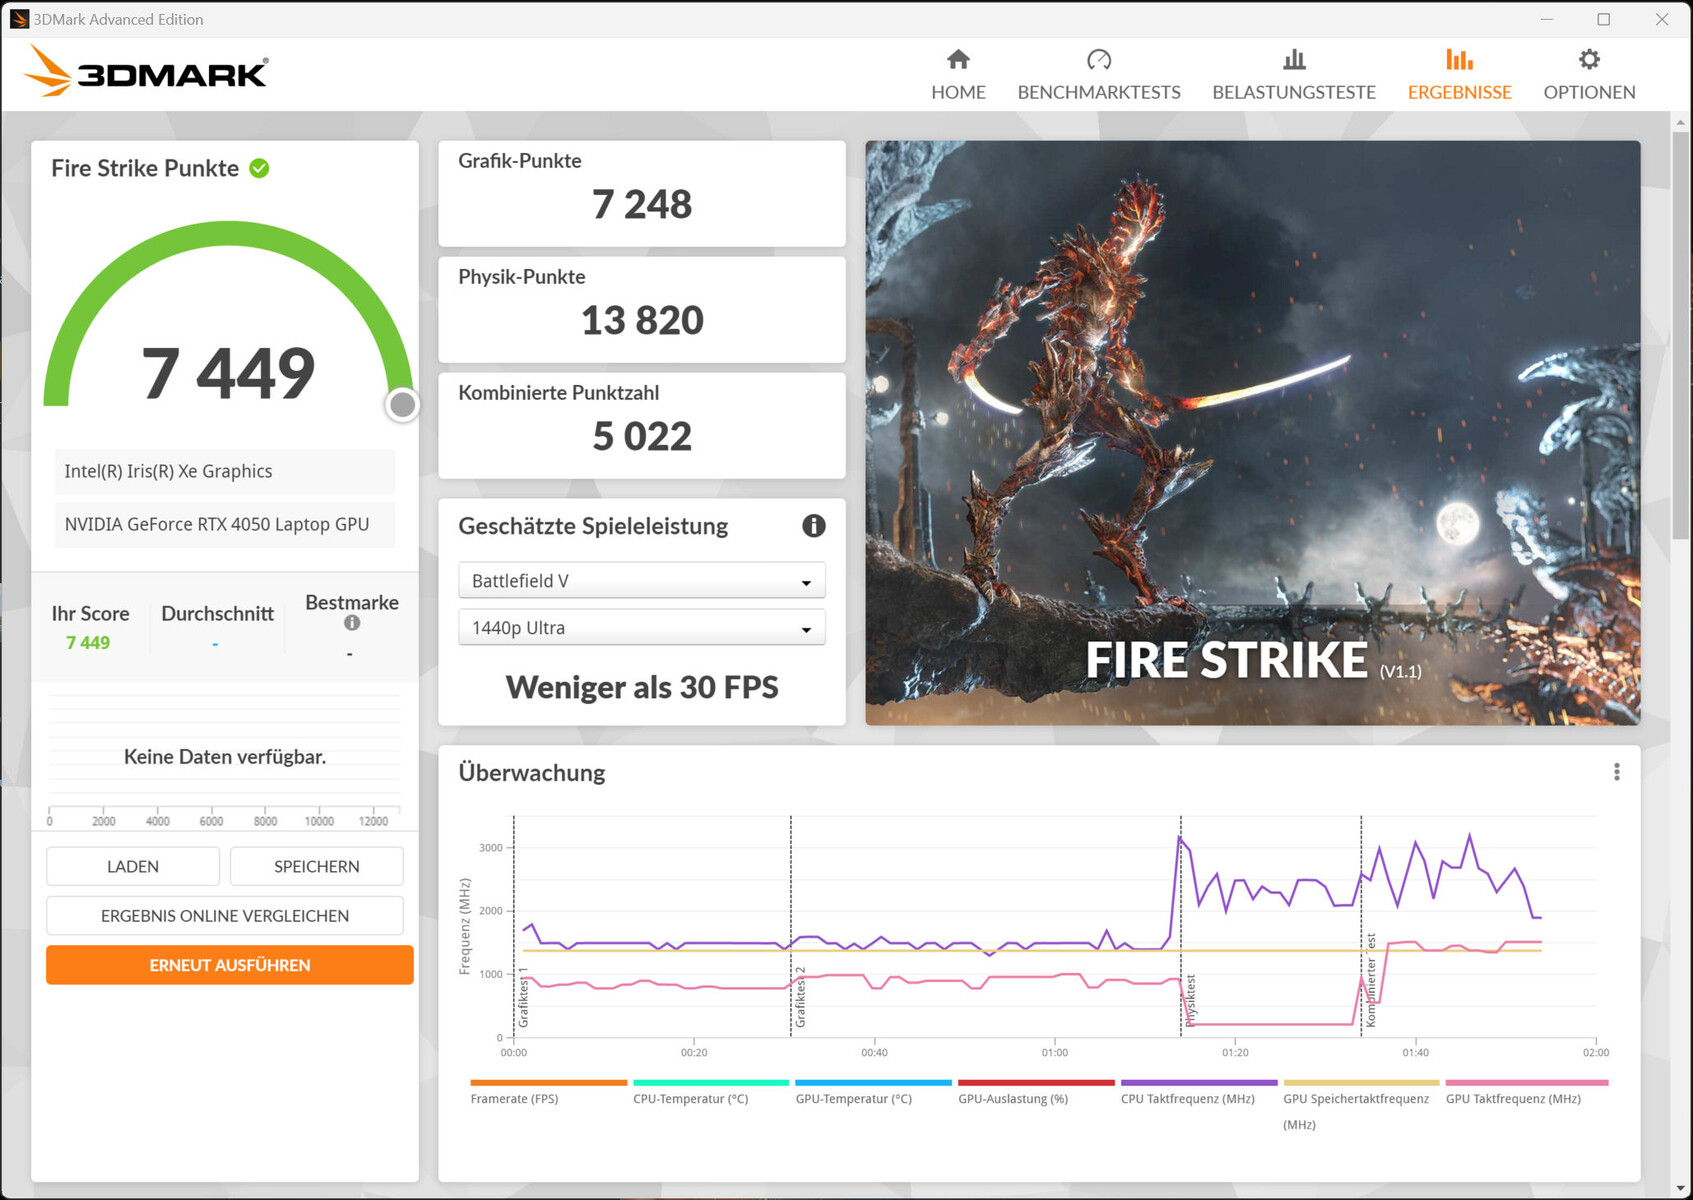
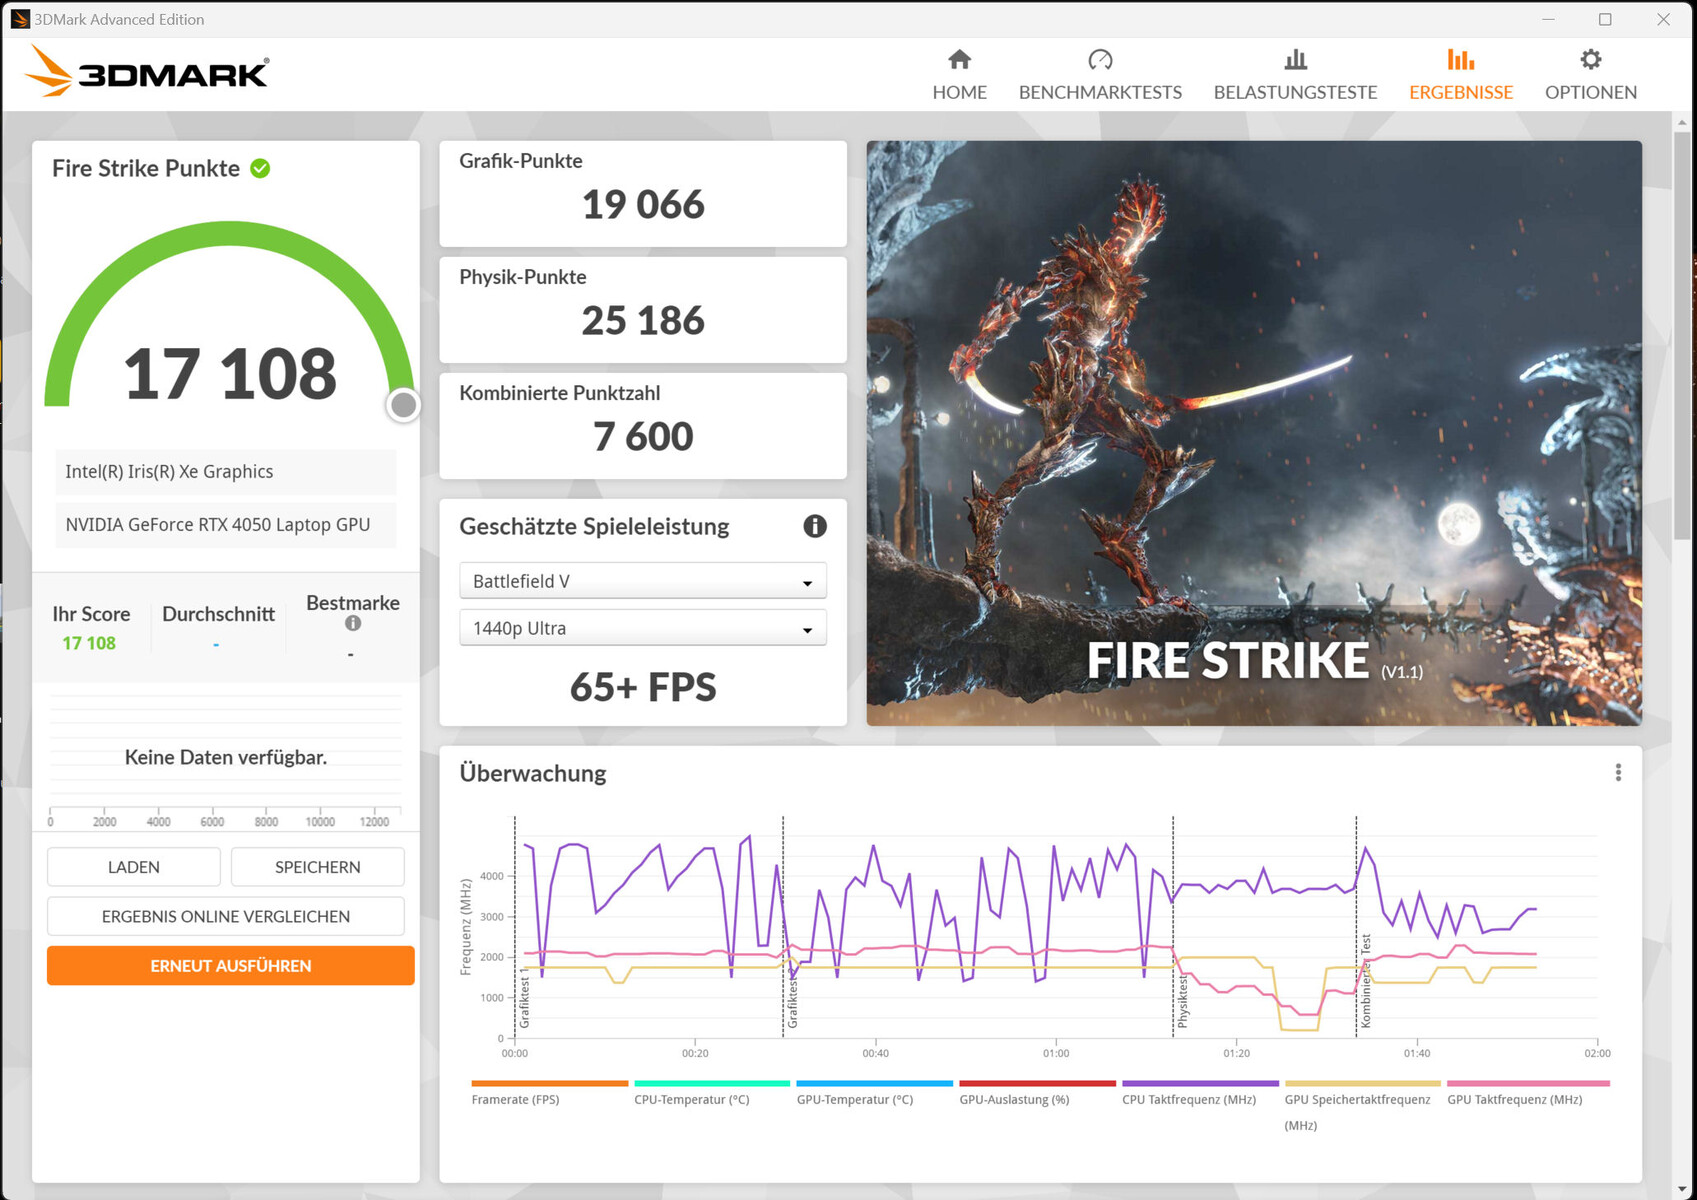
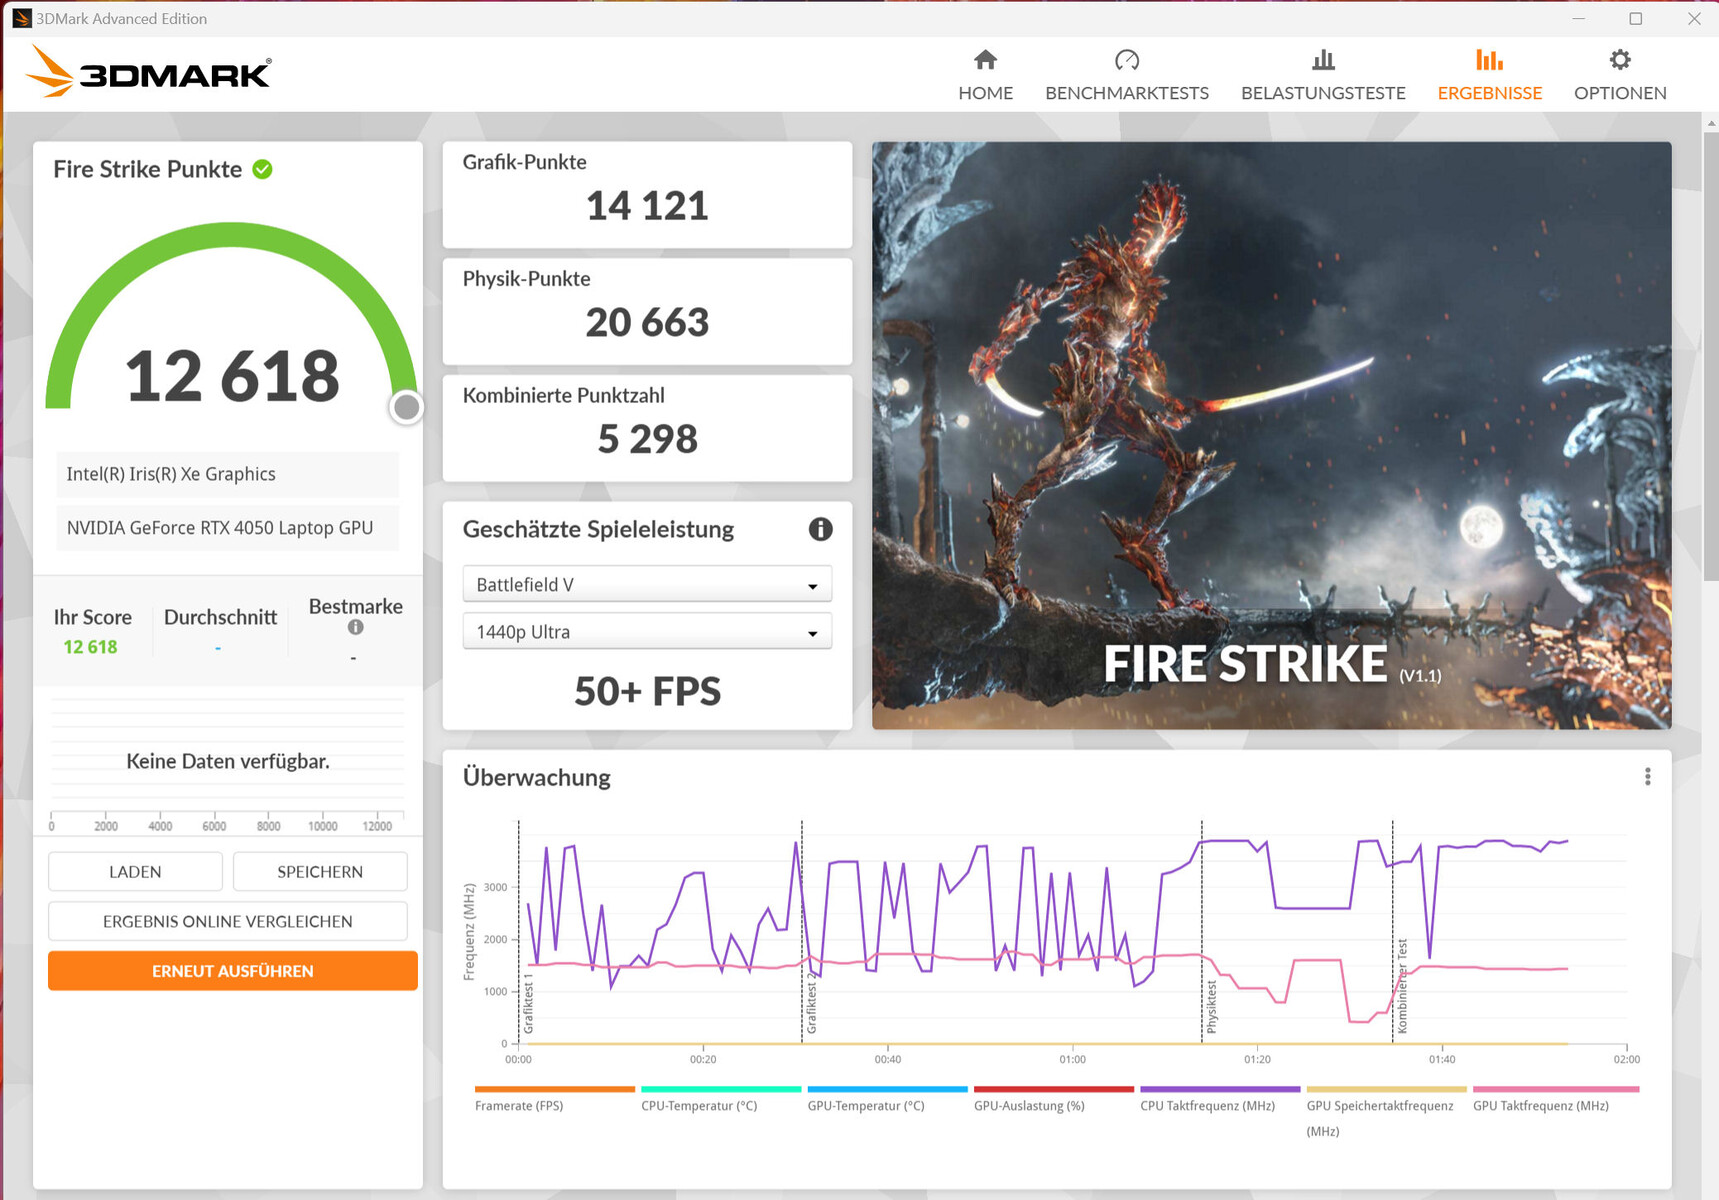
Na stronie GeForce RTX 4050 laptop oferuje 2560 shaderów, szynę o szerokości 96 bitów i szybką pamięć GDDR6 (6 144 MB). Samsung przyznaje mu TGP na poziomie 60 W (35 W + 25 W dynamicznie) - wartość na dolnej granicy możliwości. Według testu Witcher 3 TGP jest w pełni wykorzystywany - ale tylko wtedy, kiedy aktywny jest profil "High Performance". Notebook nie oferuje trybu dGPU.
Wyniki benchmarku zależą od wybranego profilu wydajności, ale zawsze są poniżej średniej dla RTX 4050. Zasadniczo RTX 4050 działa dość wydajnie przy niskim TGP, osiągając więcej punktów lub wyższą liczbę klatek na wat niż RTX 4050 z m.in MSI Katana 15 (TGP: 105 W).
| 3DMark Performance rating - Percent | |
| Schenker Vision 16 Pro RTX 3070 Ti -1! | |
| MSI Katana 15 B12VEK | |
| Przeciętny NVIDIA GeForce RTX 4050 Laptop GPU | |
| Lenovo ThinkBook 16p G3 ARH | |
| Samsung Galaxy Book3 Ultra 16 | |
| Samsung Galaxy Book3 Ultra 16 | |
| Średnia w klasie Multimedia | |
| Samsung Galaxy Book3 Ultra 16 | |
| Dell XPS 15 9520 RTX 3050 Ti | |
| Asus VivoBook Pro 16X OLED N7600PC-L2026X | |
| Acer Swift X SFX16-52G-77RX | |
| LG Gram 17Z90Q-E.AD78G | |
| 3DMark 11 - 1280x720 Performance GPU | |
| Schenker Vision 16 Pro RTX 3070 Ti | |
| MSI Katana 15 B12VEK | |
| Przeciętny NVIDIA GeForce RTX 4050 Laptop GPU (13339 - 32642, n=41) | |
| Samsung Galaxy Book3 Ultra 16 (Hohe Leistung) | |
| Lenovo ThinkBook 16p G3 ARH | |
| Samsung Galaxy Book3 Ultra 16 | |
| Średnia w klasie Multimedia (3749 - 60002, n=61, ostatnie 2 lata) | |
| Samsung Galaxy Book3 Ultra 16 (Leise) | |
| Asus VivoBook Pro 16X OLED N7600PC-L2026X | |
| Dell XPS 15 9520 RTX 3050 Ti | |
| Acer Swift X SFX16-52G-77RX | |
| LG Gram 17Z90Q-E.AD78G | |
| 3DMark 06 Standard Score | 45618 pkt. | |
| 3DMark 11 Performance | 18217 pkt. | |
| 3DMark Cloud Gate Standard Score | 41061 pkt. | |
| 3DMark Fire Strike Score | 14064 pkt. | |
| 3DMark Time Spy Score | 5784 pkt. | |
Pomoc | ||
| Blender | |
| v3.3 Classroom OPTIX/RTX | |
| LG Gram 17Z90Q-E.AD78G (3.3.2) | |
| Asus VivoBook Pro 16X OLED N7600PC-L2026X (3.3.0) | |
| Samsung Galaxy Book3 Ultra 16 (3.3.3, Leise) | |
| Średnia w klasie Multimedia (12 - 105, n=24, ostatnie 2 lata) | |
| Lenovo ThinkBook 16p G3 ARH (3.3.0) | |
| Samsung Galaxy Book3 Ultra 16 (3.3.3) | |
| Przeciętny NVIDIA GeForce RTX 4050 Laptop GPU (25 - 37, n=40) | |
| Samsung Galaxy Book3 Ultra 16 (3.3.3, Hohe Leistung) | |
| Schenker Vision 16 Pro RTX 3070 Ti (3.3.0) | |
| v3.3 Classroom CUDA | |
| LG Gram 17Z90Q-E.AD78G (3.3.2) | |
| Asus VivoBook Pro 16X OLED N7600PC-L2026X (3.3.0) | |
| Samsung Galaxy Book3 Ultra 16 (3.3.3, Leise) | |
| Samsung Galaxy Book3 Ultra 16 (3.3.3) | |
| Średnia w klasie Multimedia (20 - 186, n=24, ostatnie 2 lata) | |
| Lenovo ThinkBook 16p G3 ARH (3.3.0) | |
| Samsung Galaxy Book3 Ultra 16 (3.3.3, Hohe Leistung) | |
| Przeciętny NVIDIA GeForce RTX 4050 Laptop GPU (47 - 68, n=39) | |
| Schenker Vision 16 Pro RTX 3070 Ti (3.3.0) | |
| v3.3 Classroom oneAPI/Intel | |
| Średnia w klasie Multimedia (105 - 492, n=17, ostatnie 2 lata) | |
| Acer Swift X SFX16-52G-77RX | |
| Geekbench 5.5 | |
| OpenCL Score | |
| Schenker Vision 16 Pro RTX 3070 Ti | |
| Lenovo ThinkBook 16p G3 ARH | |
| Przeciętny NVIDIA GeForce RTX 4050 Laptop GPU (63538 - 90075, n=38) | |
| Samsung Galaxy Book3 Ultra 16 (Hohe Leistung) | |
| Samsung Galaxy Book3 Ultra 16 | |
| Samsung Galaxy Book3 Ultra 16 (Leise) | |
| Dell XPS 15 9520 RTX 3050 Ti | |
| Średnia w klasie Multimedia (11562 - 217159, n=60, ostatnie 2 lata) | |
| Asus VivoBook Pro 16X OLED N7600PC-L2026X | |
| LG Gram 17Z90Q-E.AD78G | |
| Acer Swift X SFX16-52G-77RX | |
| Vulkan Score 5.5 | |
| Lenovo ThinkBook 16p G3 ARH | |
| Przeciętny NVIDIA GeForce RTX 4050 Laptop GPU (23425 - 59879, n=14) | |
| Dell XPS 15 9520 RTX 3050 Ti | |
| Średnia w klasie Multimedia (9837 - 161655, n=53, ostatnie 2 lata) | |
| Acer Swift X SFX16-52G-77RX | |
| LG Gram 17Z90Q-E.AD78G | |
| V-Ray Benchmark Next 4.10 | |
| GPU | |
| Przeciętny NVIDIA GeForce RTX 4050 Laptop GPU (333 - 565, n=35) | |
| Schenker Vision 16 Pro RTX 3070 Ti (v4.10.07 ) | |
| Samsung Galaxy Book3 Ultra 16 (v4.10.07, Hohe Leistung) | |
| Samsung Galaxy Book3 Ultra 16 (v4.10.07 ) | |
| Samsung Galaxy Book3 Ultra 16 (v4.10.07, Leise) | |
| Średnia w klasie Multimedia (32 - 1191, n=57, ostatnie 2 lata) | |
| Asus VivoBook Pro 16X OLED N7600PC-L2026X (v4.10.07 ) | |
| LG Gram 17Z90Q-E.AD78G (v4.10.07 ) | |
| Acer Swift X SFX16-52G-77RX (v4.10.07 ) | |
| CPU | |
| Średnia w klasie Multimedia (4772 - 35165, n=57, ostatnie 2 lata) | |
| Samsung Galaxy Book3 Ultra 16 (v4.10.07, Hohe Leistung ) | |
| Przeciętny NVIDIA GeForce RTX 4050 Laptop GPU (5413 - 24181, n=35) | |
| Samsung Galaxy Book3 Ultra 16 (v4.10.07 ) | |
| Schenker Vision 16 Pro RTX 3070 Ti (v4.10.07 ) | |
| Samsung Galaxy Book3 Ultra 16 (v4.10.07, Leise) | |
| Acer Swift X SFX16-52G-77RX (v4.10.07 ) | |
| LG Gram 17Z90Q-E.AD78G (v4.10.07 ) | |
| Asus VivoBook Pro 16X OLED N7600PC-L2026X (v4.10.07 ) | |
* ... im mniej tym lepiej
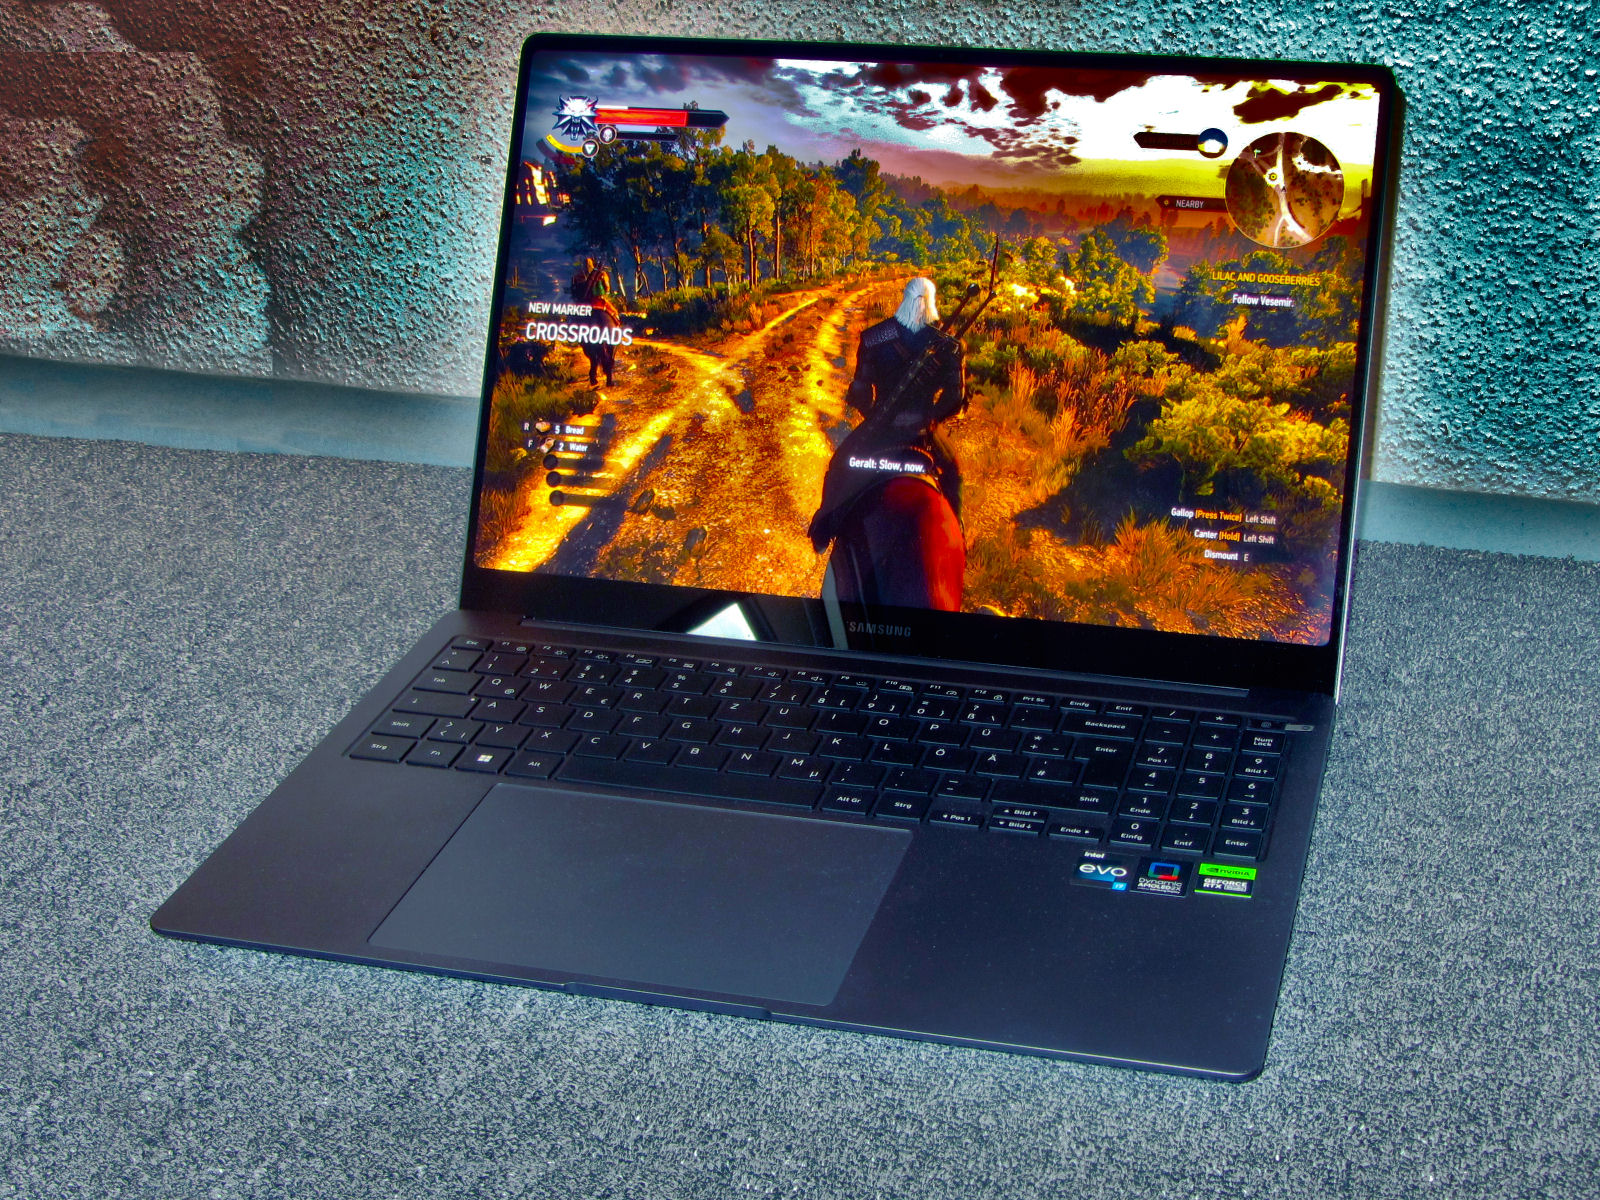
Wydajność w grach
Laptop radzi sobie z grami w rozdzielczości FHD na średnich i wysokich, czasem maksymalnych ustawieniach. Pełną świetność (2880x1800) ekranu OLED można wydobyć w obniżonych ustawieniach. Liczba klatek na sekundę zależy od zastosowanego trybu wydajności, ale zawsze są poniżej średniej dla RTX 4050. "High Performance" zapewnia około 20-30 procent wyższą liczbę klatek na sekundę niż "Optimized". Profil "Silent" nadaje się przede wszystkim do gier na poziomie HD.
| Performance rating - Percent | |
| Schenker Vision 16 Pro RTX 3070 Ti | |
| MSI Katana 15 B12VEK | |
| Przeciętny NVIDIA GeForce RTX 4050 Laptop GPU | |
| Samsung Galaxy Book3 Ultra 16 | |
| Lenovo ThinkBook 16p G3 ARH | |
| Samsung Galaxy Book3 Ultra 16 | |
| Dell XPS 15 9520 RTX 3050 Ti | |
| Średnia w klasie Multimedia | |
| Asus VivoBook Pro 16X OLED N7600PC-L2026X | |
| LG Gram 17Z90Q-E.AD78G | |
| Samsung Galaxy Book3 Ultra 16 | |
| Acer Swift X SFX16-52G-77RX | |
| The Witcher 3 - 1920x1080 Ultra Graphics & Postprocessing (HBAO+) | |
| Schenker Vision 16 Pro RTX 3070 Ti | |
| MSI Katana 15 B12VEK | |
| Przeciętny NVIDIA GeForce RTX 4050 Laptop GPU (18.5 - 94.7, n=40) | |
| Lenovo ThinkBook 16p G3 ARH | |
| Samsung Galaxy Book3 Ultra 16 (Hohe Leistung) | |
| Samsung Galaxy Book3 Ultra 16 | |
| Średnia w klasie Multimedia (11 - 121, n=11, ostatnie 2 lata) | |
| Asus VivoBook Pro 16X OLED N7600PC-L2026X | |
| Dell XPS 15 9520 RTX 3050 Ti | |
| LG Gram 17Z90Q-E.AD78G | |
| Acer Swift X SFX16-52G-77RX | |
| Samsung Galaxy Book3 Ultra 16 | |
| GTA V - 1920x1080 Highest AA:4xMSAA + FX AF:16x | |
| Schenker Vision 16 Pro RTX 3070 Ti | |
| MSI Katana 15 B12VEK | |
| Samsung Galaxy Book3 Ultra 16 (Hohe Leistung) | |
| Przeciętny NVIDIA GeForce RTX 4050 Laptop GPU (14.9 - 101.7, n=35) | |
| Lenovo ThinkBook 16p G3 ARH | |
| Samsung Galaxy Book3 Ultra 16 | |
| Średnia w klasie Multimedia (7.92 - 141.6, n=61, ostatnie 2 lata) | |
| Asus VivoBook Pro 16X OLED N7600PC-L2026X | |
| Dell XPS 15 9520 RTX 3050 Ti | |
| LG Gram 17Z90Q-E.AD78G | |
| Acer Swift X SFX16-52G-77RX | |
| Samsung Galaxy Book3 Ultra 16 (Leise) | |
| Final Fantasy XV Benchmark - 1920x1080 High Quality | |
| Schenker Vision 16 Pro RTX 3070 Ti (1.3) | |
| MSI Katana 15 B12VEK (1.3) | |
| Lenovo ThinkBook 16p G3 ARH (1.3) | |
| Przeciętny NVIDIA GeForce RTX 4050 Laptop GPU (15.5 - 122.3, n=39) | |
| Samsung Galaxy Book3 Ultra 16 (1.3, Hohe Leistung) | |
| Samsung Galaxy Book3 Ultra 16 (1.3) | |
| Średnia w klasie Multimedia (7.61 - 144.4, n=63, ostatnie 2 lata) | |
| Dell XPS 15 9520 RTX 3050 Ti (1.3) | |
| Asus VivoBook Pro 16X OLED N7600PC-L2026X (1.3) | |
| LG Gram 17Z90Q-E.AD78G (1.3) | |
| Acer Swift X SFX16-52G-77RX (1.3) | |
| Samsung Galaxy Book3 Ultra 16 (1.3, Leise) | |
| Strange Brigade - 1920x1080 ultra AA:ultra AF:16 | |
| Schenker Vision 16 Pro RTX 3070 Ti (1.47.22.14 D3D12) | |
| MSI Katana 15 B12VEK (1.47.22.14 D3D12) | |
| Przeciętny NVIDIA GeForce RTX 4050 Laptop GPU (21.2 - 156.6, n=38) | |
| Lenovo ThinkBook 16p G3 ARH (1.47.22.14 D3D12) | |
| Samsung Galaxy Book3 Ultra 16 (1.47.22.14 D3D12, Hohe Leistung) | |
| Samsung Galaxy Book3 Ultra 16 (1.47.22.14 D3D12) | |
| Średnia w klasie Multimedia (13.3 - 303, n=63, ostatnie 2 lata) | |
| Dell XPS 15 9520 RTX 3050 Ti (1.47.22.14 D3D12) | |
| Asus VivoBook Pro 16X OLED N7600PC-L2026X (1.47.22.14 D3D12) | |
| Acer Swift X SFX16-52G-77RX (1.47.22.14 D3D12) | |
| LG Gram 17Z90Q-E.AD78G (1.47.22.14 D3D12) | |
| Samsung Galaxy Book3 Ultra 16 (1.47.22.14 D3D12, Leise) | |
| Dota 2 Reborn - 1920x1080 ultra (3/3) best looking | |
| Schenker Vision 16 Pro RTX 3070 Ti | |
| MSI Katana 15 B12VEK | |
| Samsung Galaxy Book3 Ultra 16 (Hohe Leistung) | |
| Przeciętny NVIDIA GeForce RTX 4050 Laptop GPU (73.5 - 175.6, n=39) | |
| Samsung Galaxy Book3 Ultra 16 (Leise) | |
| Dell XPS 15 9520 RTX 3050 Ti | |
| Asus VivoBook Pro 16X OLED N7600PC-L2026X | |
| Lenovo ThinkBook 16p G3 ARH | |
| Średnia w klasie Multimedia (29 - 179.9, n=65, ostatnie 2 lata) | |
| Samsung Galaxy Book3 Ultra 16 | |
| Acer Swift X SFX16-52G-77RX | |
| LG Gram 17Z90Q-E.AD78G | |
| X-Plane 11.11 - 1920x1080 high (fps_test=3) | |
| Schenker Vision 16 Pro RTX 3070 Ti | |
| Dell XPS 15 9520 RTX 3050 Ti | |
| Samsung Galaxy Book3 Ultra 16 (Hohe Leistung) | |
| MSI Katana 15 B12VEK | |
| Przeciętny NVIDIA GeForce RTX 4050 Laptop GPU (55.5 - 117, n=40) | |
| Samsung Galaxy Book3 Ultra 16 (Leise) | |
| Samsung Galaxy Book3 Ultra 16 | |
| Asus VivoBook Pro 16X OLED N7600PC-L2026X | |
| Lenovo ThinkBook 16p G3 ARH | |
| LG Gram 17Z90Q-E.AD78G | |
| LG Gram 17Z90Q-E.AD78G | |
| Średnia w klasie Multimedia (16.9 - 141.1, n=59, ostatnie 2 lata) | |
| Acer Swift X SFX16-52G-77RX | |
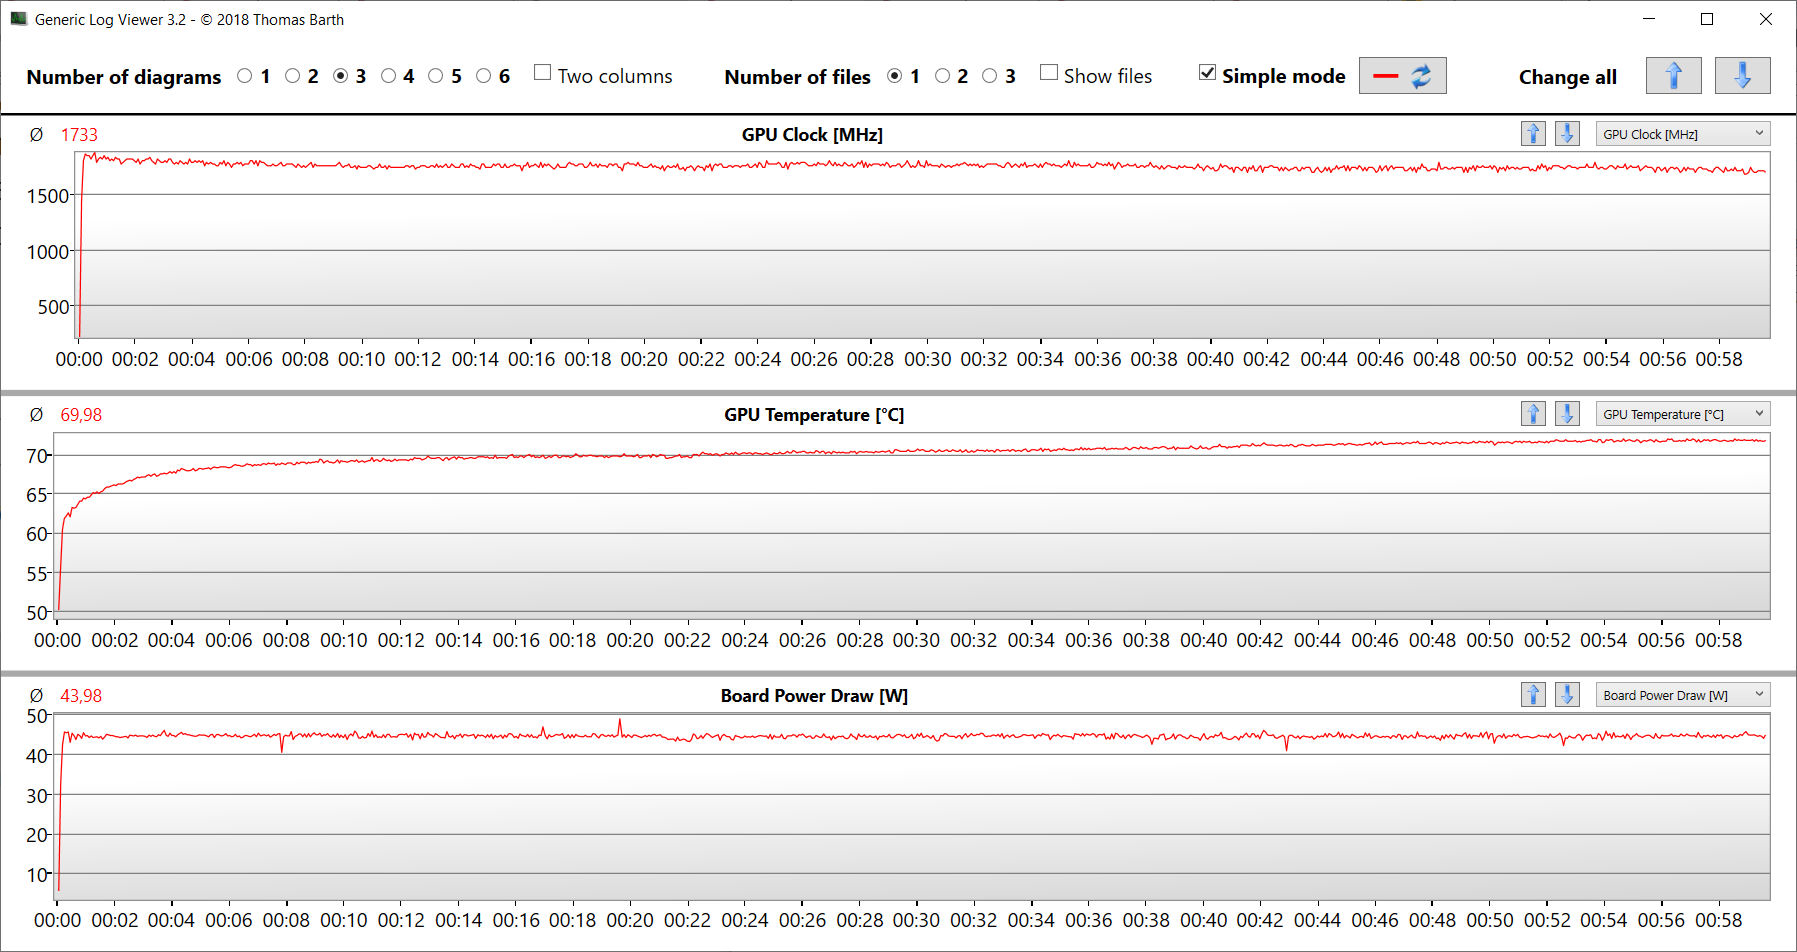
Aby sprawdzić, czy liczba klatek na sekundę pozostaje stała przez dłuższy czas, uruchomiliśmy "The Witcher 3" przez około 60 minut w rozdzielczości Full HD i przy maksymalnych ustawieniach jakości. Postać w grze nie była poruszana. Nie wykryto spadku liczby klatek na sekundę.
Witcher 3 FPS chart
| low | med. | high | ultra | QHD | |
|---|---|---|---|---|---|
| GTA V (2015) | 182.1 | 166.5 | 133.2 | 65.3 | 50.5 |
| The Witcher 3 (2015) | 268.5 | 184.1 | 107.1 | 60.1 | |
| Dota 2 Reborn (2015) | 161.8 | 138.7 | 79.2 | 73.5 | |
| Final Fantasy XV Benchmark (2018) | 105 | 77.2 | 56.9 | 41.5 | |
| X-Plane 11.11 (2018) | 143.6 | 88.2 | 79 | ||
| Far Cry 5 (2018) | 148 | 87 | 74 | 71 | 56 |
| Strange Brigade (2018) | 321 | 153.5 | 120.1 | 103.9 | 72.7 |
| The Division 2 (2019) | 130 | 83 | 69 | 53 | 35 |
| Doom Eternal (2020) | 228 | 135.6 | 124.7 | 114.3 | 82.5 |
| Gears Tactics (2020) | 268.5 | 141.8 | 95.2 | 64.8 | 44.8 |
| Flight Simulator 2020 (2020) | 107.2 | 57.6 | 40.5 | 30.6 | 22.9 |
| Crysis Remastered (2020) | 242 | 121.1 | 49.5 | 41.6 | 28.6 |
| Hitman 3 (2021) | 193.9 | 111.4 | 101 | 94.2 | 60.1 |
| Alan Wake Remastered (2021) | 161.5 | 98.3 | 86.7 | 63.2 | |
| Riders Republic (2021) | 138 | 72 | 67 | 63 | 44 |
| Forza Horizon 5 (2021) | 119 | 68 | 69 | 42 | 36 |
| Rainbow Six Extraction (2022) | 139 | 115 | 111 | 89 | 56 |
| Cyberpunk 2077 1.6 (2022) | 71 | 54.7 | 48 | 44.4 | 27.2 |
| Tiny Tina's Wonderlands (2022) | 104.5 | 93.4 | 63.3 | 49.8 | 33.6 |
| F1 22 (2022) | 135.3 | 127.4 | 97.5 | 36.2 | 23.1 |
| The Quarry (2022) | 91 | 68.8 | 57 | 44.6 | 28.5 |
| FIFA 23 (2022) | 94.3 | ||||
| A Plague Tale Requiem (2022) | 58.6 | 49 | 42.8 | 36.3 | 27.5 |
| Call of Duty Modern Warfare 2 2022 (2022) | 79 | 73 | 56 | 54 | 36 |
| Spider-Man Miles Morales (2022) | 72.9 | 67.1 | 56.9 | 51.5 | 42.5 |
| The Callisto Protocol (2022) | 74 | 62.5 | 59.3 | 41.4 | 29.5 |
| Need for Speed Unbound (2022) | 51.2 | 42.8 | 37 | 28.9 | 26.7 |
| High On Life (2023) | 104.9 | 78.1 | 65.3 | 57.3 | 35.7 |
| The Witcher 3 v4 (2023) | 113.4 | 82.5 | 43 | 38.1 | 23.8 |
| Dead Space Remake (2023) | 47.9 | 47.7 | 40.2 | 39.8 | 25.1 |
| Hogwarts Legacy (2023) | 92 | 74.2 | 59.6 | 51.9 | 23.9 |
| Returnal (2023) | 59 | 57 | 52 | 44 | |
| Atomic Heart (2023) | 95 | 76.1 | 47.8 | 37.8 | 28.2 |
| Company of Heroes 3 (2023) | 116.4 | 106.2 | 79 | 79.7 | 55.7 |
| Resident Evil 4 Remake (2023) | 81 | 57.7 | 53.4 | 36.8 | 23.8 |
Emisje - ultrabook Samsunga z umiarkowanym rozwojem hałasu
Hałas
Ogólnie rzecz biorąc, Samsung dość dobrze kontroluje rozwój hałasu. Profile notebooka oferują akceptowalną równowagę między hałasem a wydajnością. Maksymalna wartość 48 dB(A) została osiągnięta podczas testu Witcher 3 w trybie "High Performance". "Optimized" zapewnia umiarkowany poziom hałasu przy wciąż grywalnej liczbie klatek na sekundę. Profil "Silent" żyje zgodnie ze swoim imiennikiem. Z dwóch wentylatorów w stanie bezczynności i w codziennym użytkowaniu słychać niewiele, gdyż często stoją one w miejscu.
Hałas
| luz |
| 26 / 27 / 28 dB |
| obciążenie |
| 40 / 41 dB |
 | ||
30 dB cichy 40 dB(A) słyszalny 50 dB(A) irytujący |
||
min: | ||
| Samsung Galaxy Book3 Ultra 16 i7-13700H, GeForce RTX 4050 Laptop GPU | Schenker Vision 16 Pro RTX 3070 Ti i7-12700H, GeForce RTX 3070 Ti Laptop GPU | LG Gram 17Z90Q-E.AD78G i7-1260P, GeForce RTX 2050 Mobile | Lenovo ThinkBook 16p G3 ARH R9 6900HX, GeForce RTX 3060 Laptop GPU | Dell XPS 15 9520 RTX 3050 Ti i7-12700H, GeForce RTX 3050 Ti Laptop GPU | Asus VivoBook Pro 16X OLED N7600PC-L2026X i7-11370H, GeForce RTX 3050 4GB Laptop GPU | Acer Swift X SFX16-52G-77RX i7-1260P, A370M | |
|---|---|---|---|---|---|---|---|
| Noise | -2% | -10% | 5% | 10% | -22% | -0% | |
| wyłączone / środowisko * (dB) | 25 | 22.9 8% | 26 -4% | 22.7 9% | 22.8 9% | 25.15 -1% | 25 -0% |
| Idle Minimum * (dB) | 26 | 24.3 7% | 28 -8% | 23.1 11% | 22.9 12% | 30 -15% | 25 4% |
| Idle Average * (dB) | 27 | 24.3 10% | 28 -4% | 23.2 14% | 22.9 15% | 30 -11% | 25 7% |
| Idle Maximum * (dB) | 28 | 24.3 13% | 28.8 -3% | 23.6 16% | 22.9 18% | 30 -7% | 25 11% |
| Load Average * (dB) | 40 | 38.5 4% | 49.3 -23% | 30.6 23% | 30.9 23% | 57.6 -44% | 44.7 -12% |
| Witcher 3 ultra * (dB) | 39 | 51 -31% | 47.6 -22% | 37.8 3% | |||
| Load Maximum * (dB) | 41 | 51 -24% | 49.1 -20% | 47.5 -16% | 44.7 -9% | 62.9 -53% | 45.6 -11% |
* ... im mniej tym lepiej
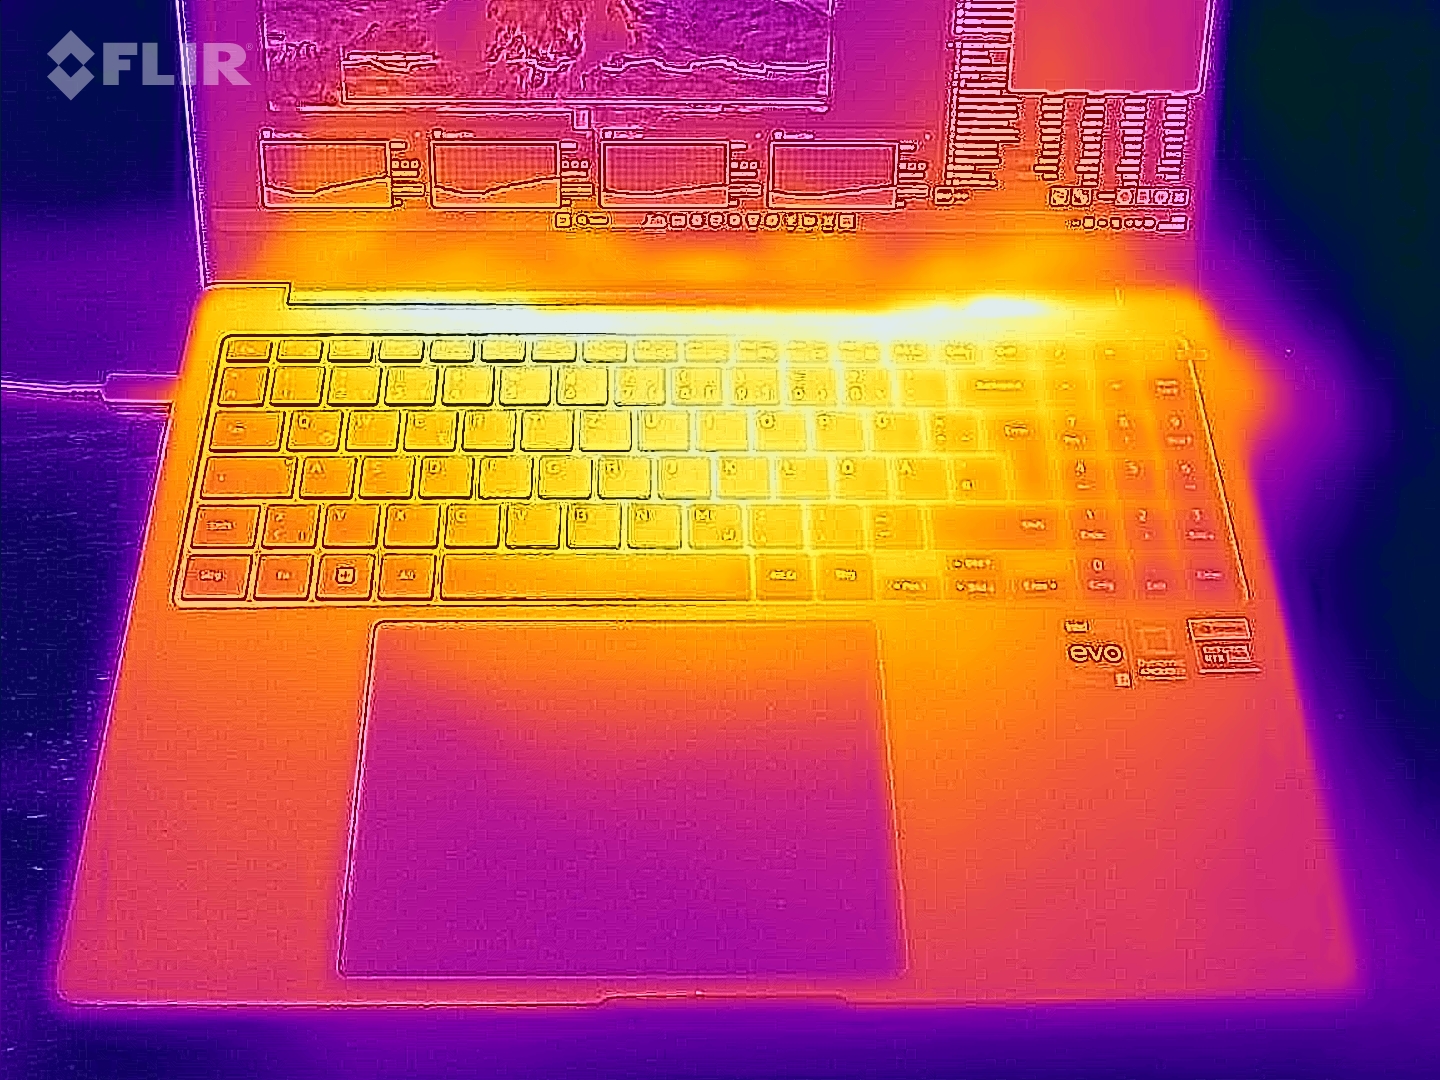
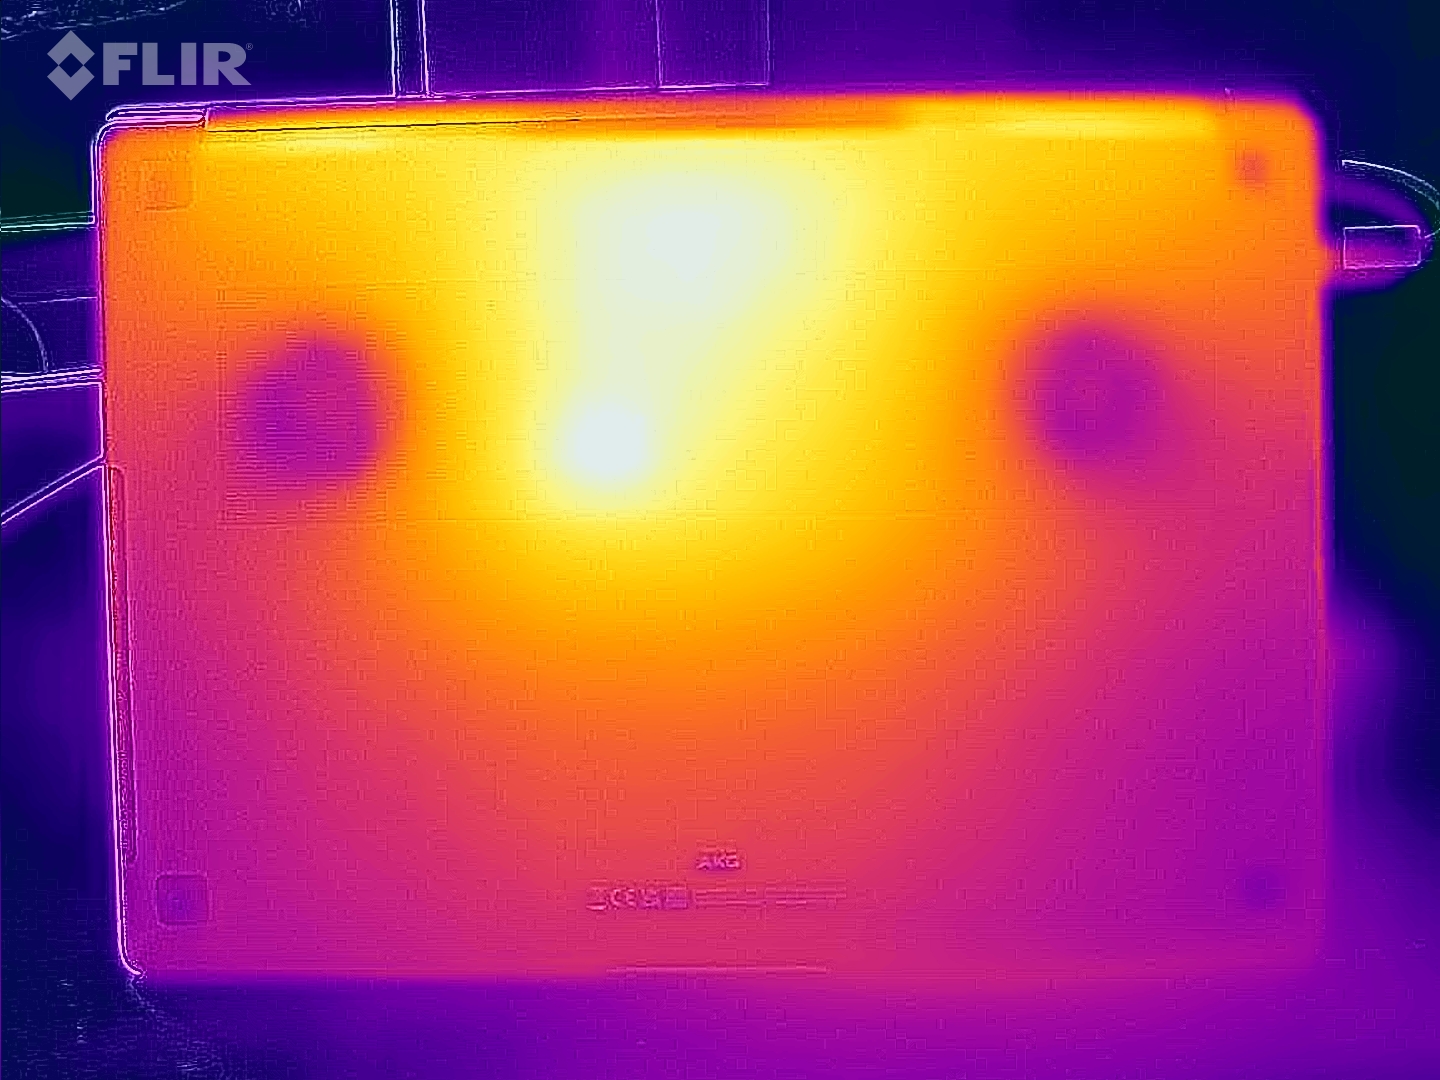
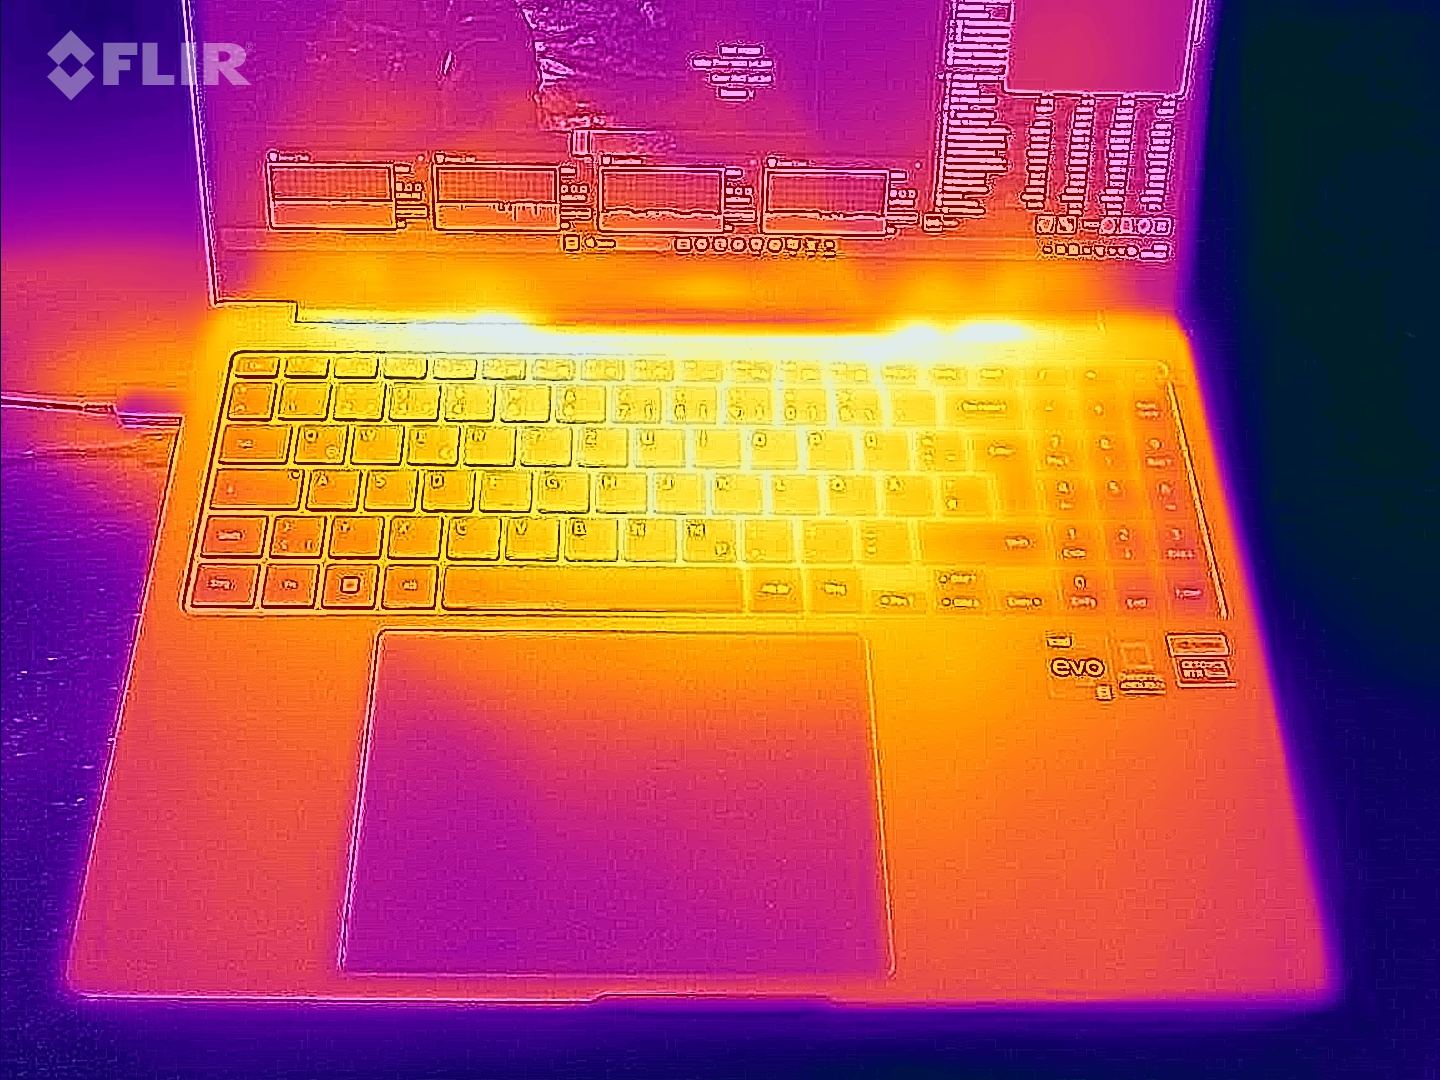
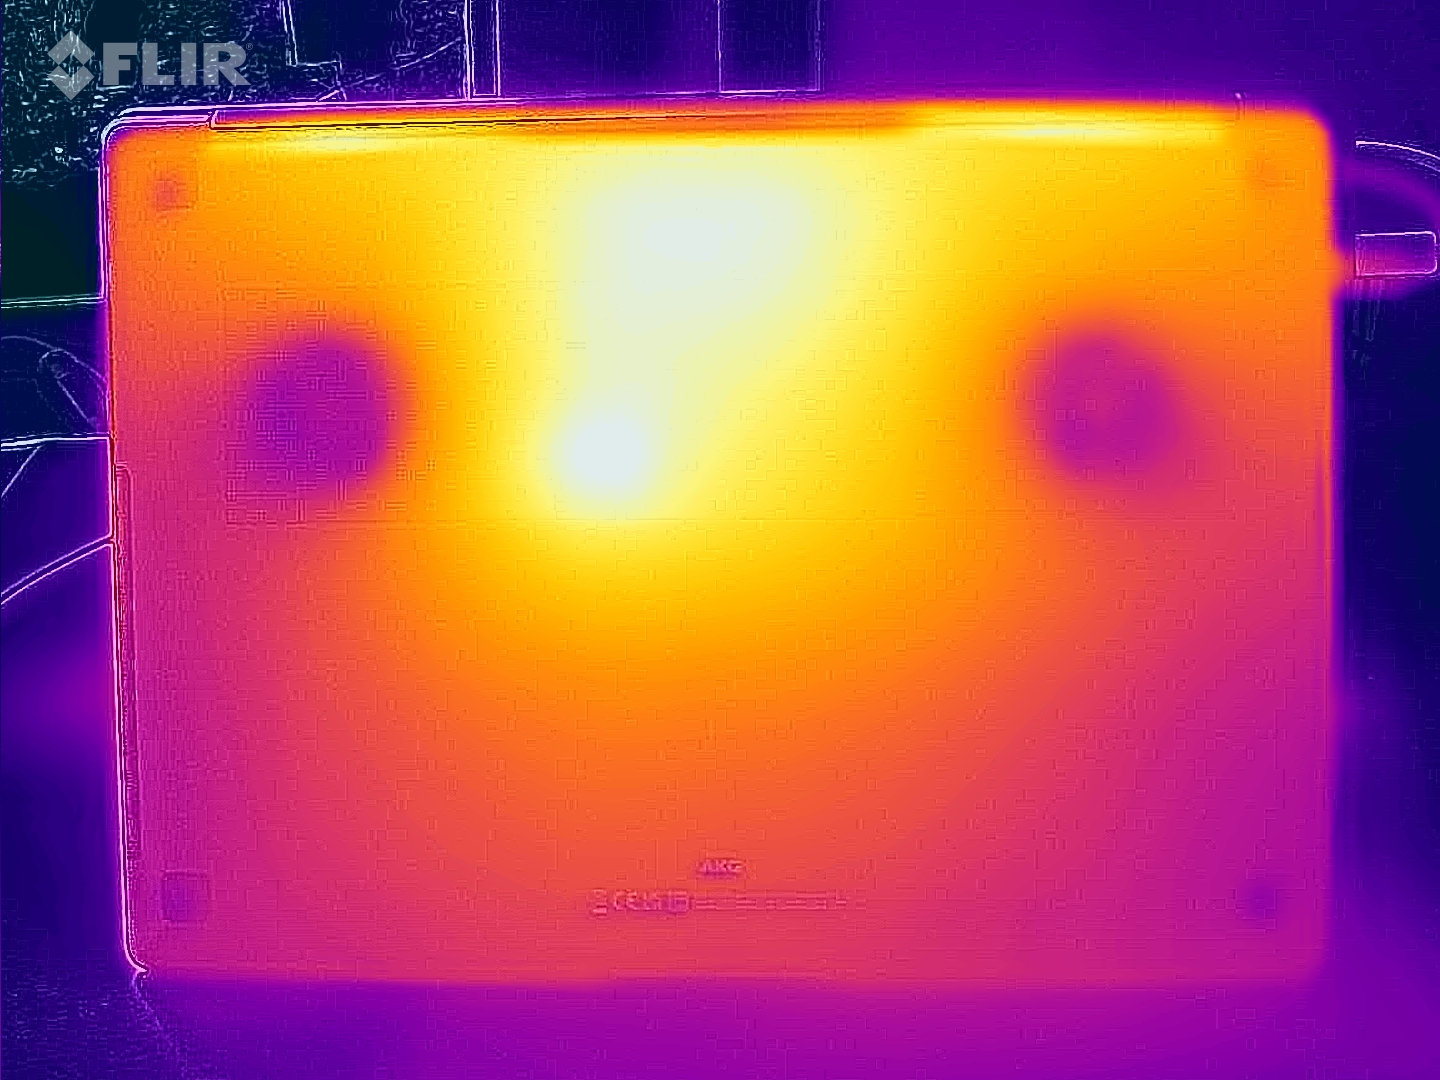
Temperatura
W codziennym użytkowaniu (biuro, internet) temperatury obudowy utrzymują się w zielonej strefie. Pod obciążeniem (stress test, Witcher 3 test) notebook nagrzewa się zauważalnie, ale nie nadmiernie. Temperatury procesora nie dają powodów do niepokoju.
(±) Maksymalna temperatura w górnej części wynosi 41 °C / 106 F, w porównaniu do średniej 36.8 °C / 98 F , począwszy od 21 do 71 °C dla klasy Multimedia.
(±) Dno nagrzewa się maksymalnie do 44 °C / 111 F, w porównaniu do średniej 39.1 °C / 102 F
(+) W stanie bezczynności średnia temperatura górnej części wynosi 22.9 °C / 73 F, w porównaniu ze średnią temperaturą urządzenia wynoszącą 31.3 °C / ### class_avg_f### F.
(-) Podczas gry w Wiedźmina 3 średnia temperatura górnej części wynosi 38.6 °C / 101 F, w porównaniu do średniej temperatury urządzenia wynoszącej 31.3 °C / ## #class_avg_f### F.
(+) Podparcia dłoni i touchpad osiągają maksymalną temperaturę skóry (35 °C / 95 F) i dlatego nie są gorące.
(-) Średnia temperatura obszaru podparcia dłoni w podobnych urządzeniach wynosiła 28.7 °C / 83.7 F (-6.3 °C / -11.3 F).
| Samsung Galaxy Book3 Ultra 16 Intel Core i7-13700H, NVIDIA GeForce RTX 4050 Laptop GPU | Schenker Vision 16 Pro RTX 3070 Ti Intel Core i7-12700H, NVIDIA GeForce RTX 3070 Ti Laptop GPU | LG Gram 17Z90Q-E.AD78G Intel Core i7-1260P, NVIDIA GeForce RTX 2050 Mobile | Lenovo ThinkBook 16p G3 ARH AMD Ryzen 9 6900HX, NVIDIA GeForce RTX 3060 Laptop GPU | Dell XPS 15 9520 RTX 3050 Ti Intel Core i7-12700H, NVIDIA GeForce RTX 3050 Ti Laptop GPU | Asus VivoBook Pro 16X OLED N7600PC-L2026X Intel Core i7-11370H, NVIDIA GeForce RTX 3050 4GB Laptop GPU | Acer Swift X SFX16-52G-77RX Intel Core i7-1260P, Intel Arc A370M | |
|---|---|---|---|---|---|---|---|
| Heat | -12% | -15% | -25% | -25% | -14% | -24% | |
| Maximum Upper Side * (°C) | 41 | 50.8 -24% | 50.3 -23% | 48.2 -18% | 51.4 -25% | 40.6 1% | 49.4 -20% |
| Maximum Bottom * (°C) | 44 | 46.3 -5% | 52.5 -19% | 49.6 -13% | 51 -16% | 53 -20% | 55.5 -26% |
| Idle Upper Side * (°C) | 23 | 27.2 -18% | 26.9 -17% | 31.8 -38% | 30 -30% | 29 -26% | 28.4 -23% |
| Idle Bottom * (°C) | 26 | 26.6 -2% | 26.5 -2% | 33.6 -29% | 33 -27% | 28.3 -9% | 32.6 -25% |
* ... im mniej tym lepiej
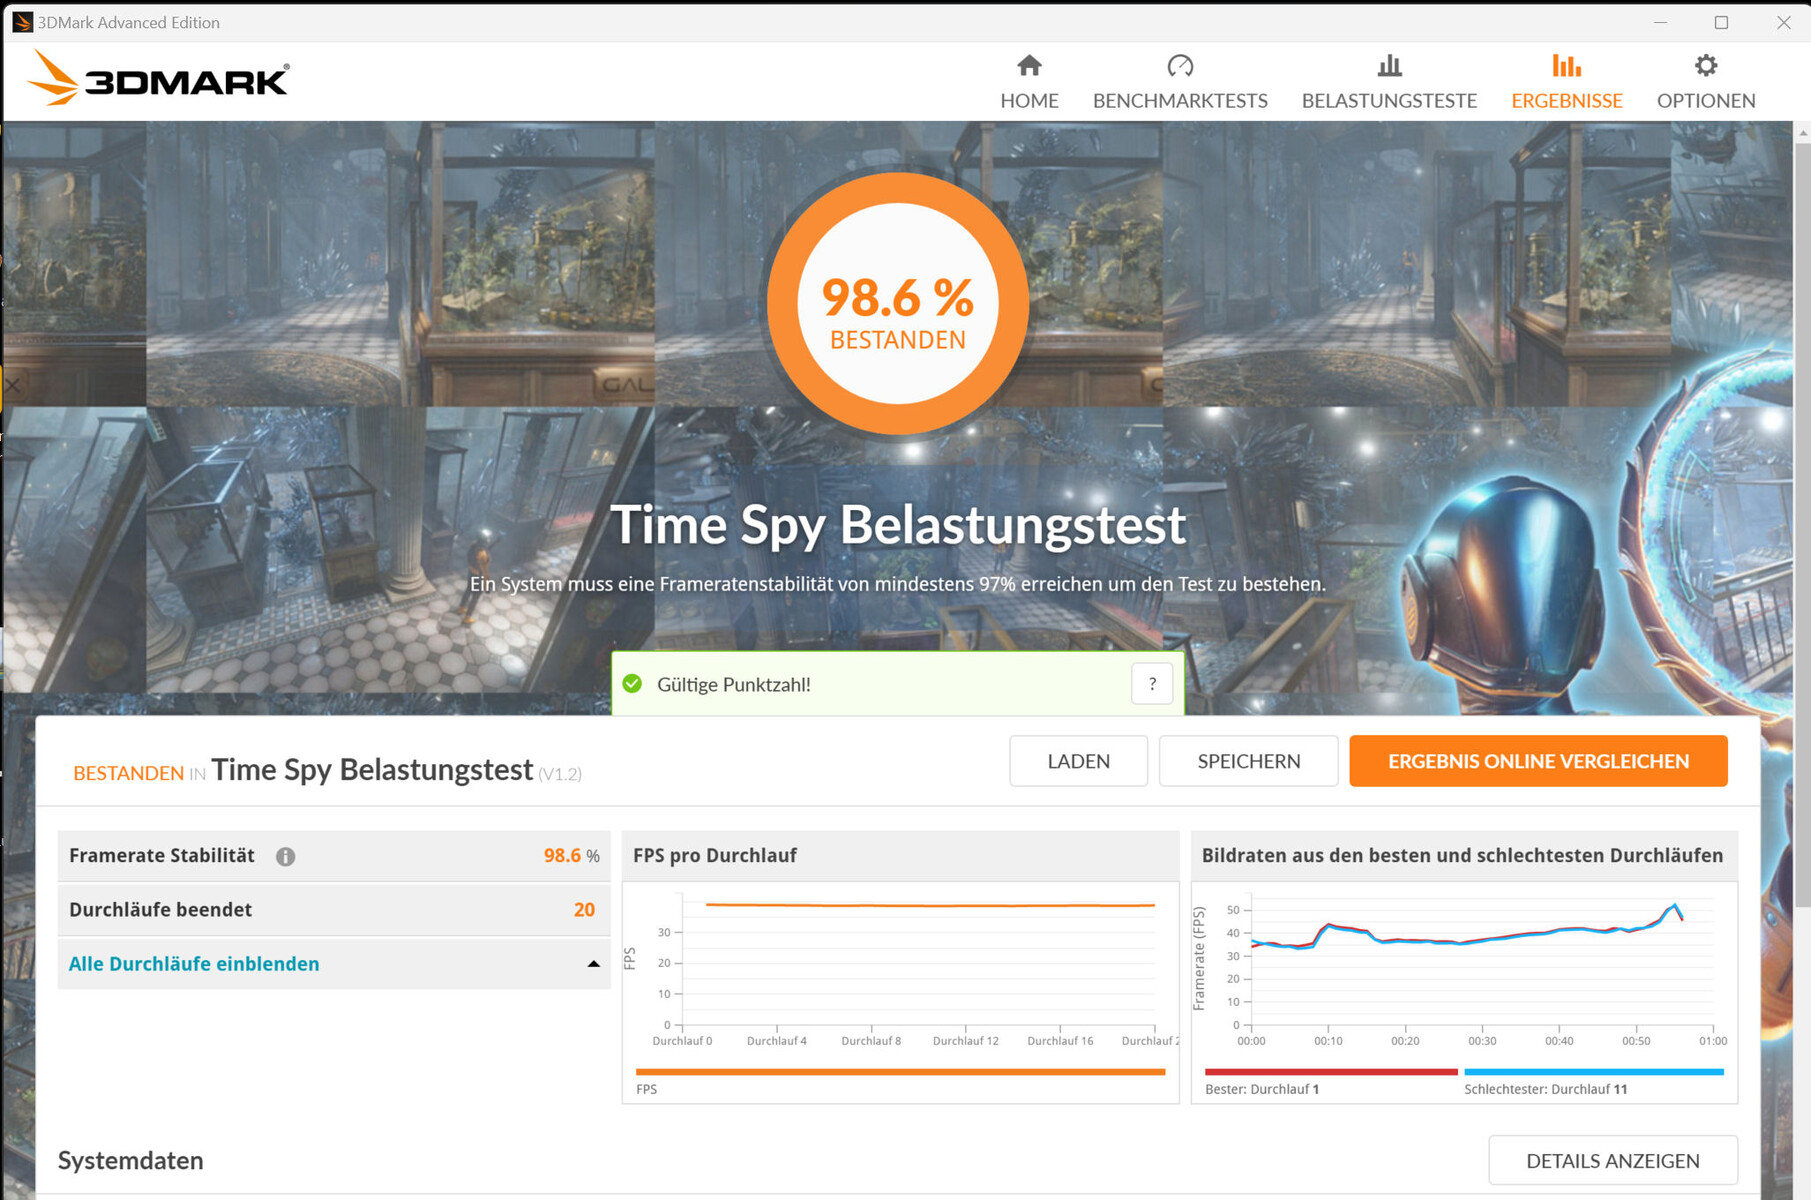
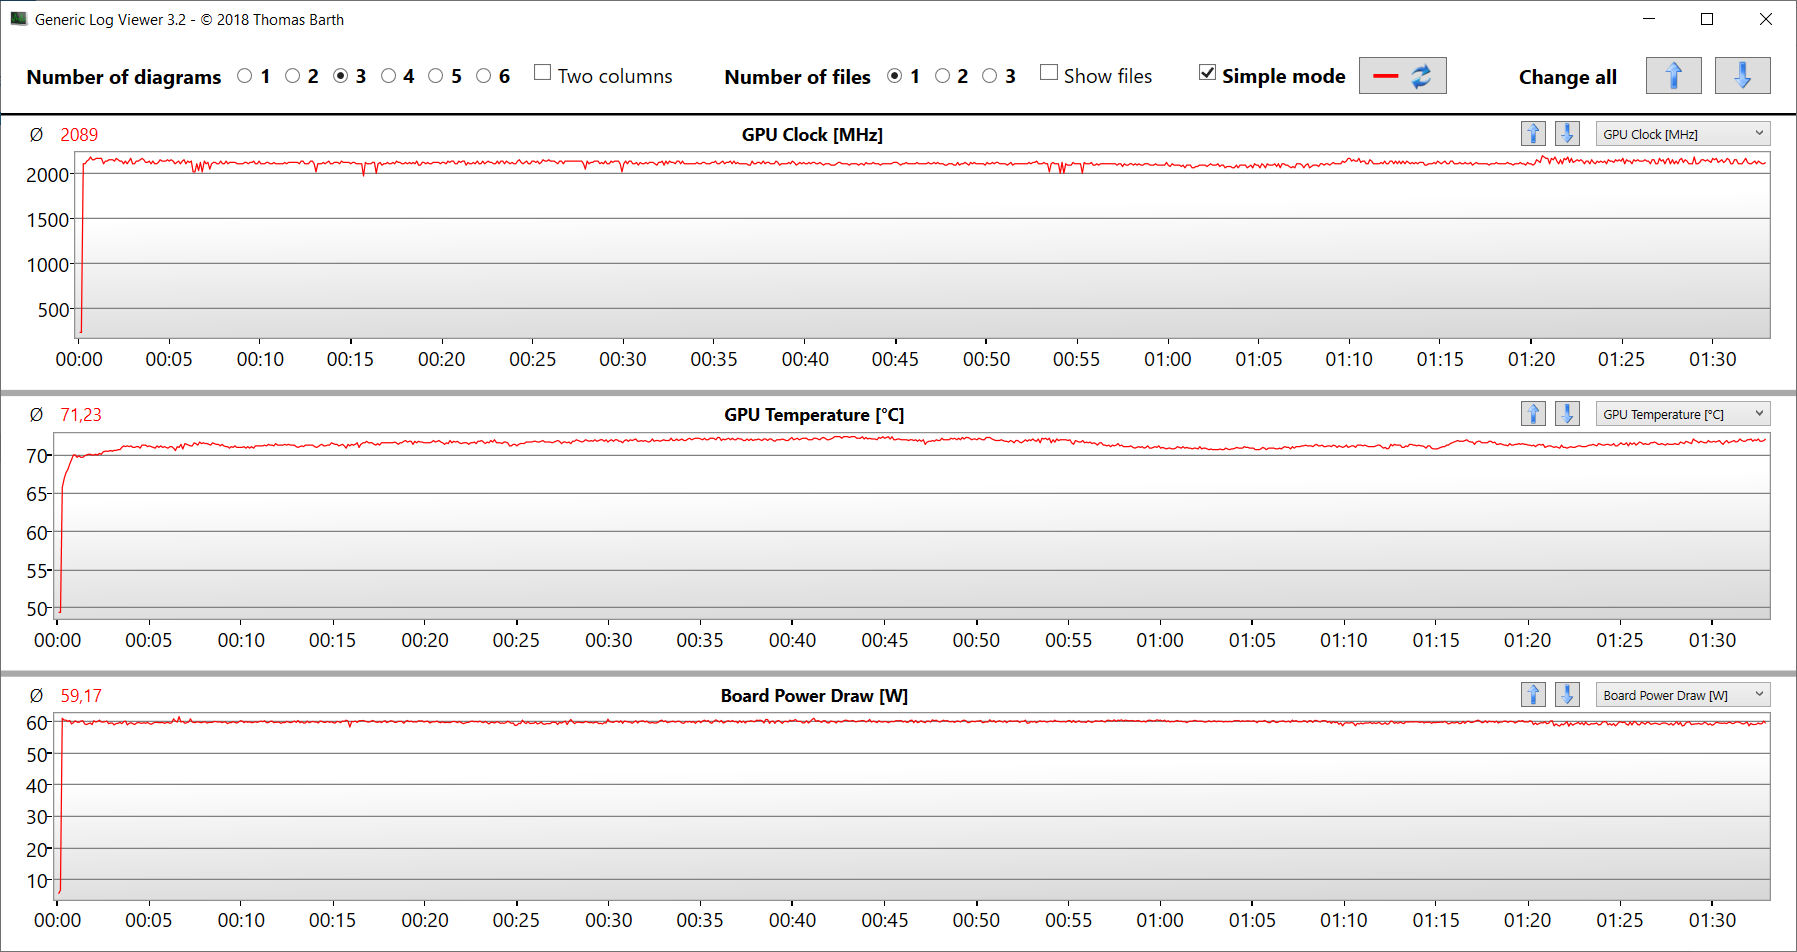
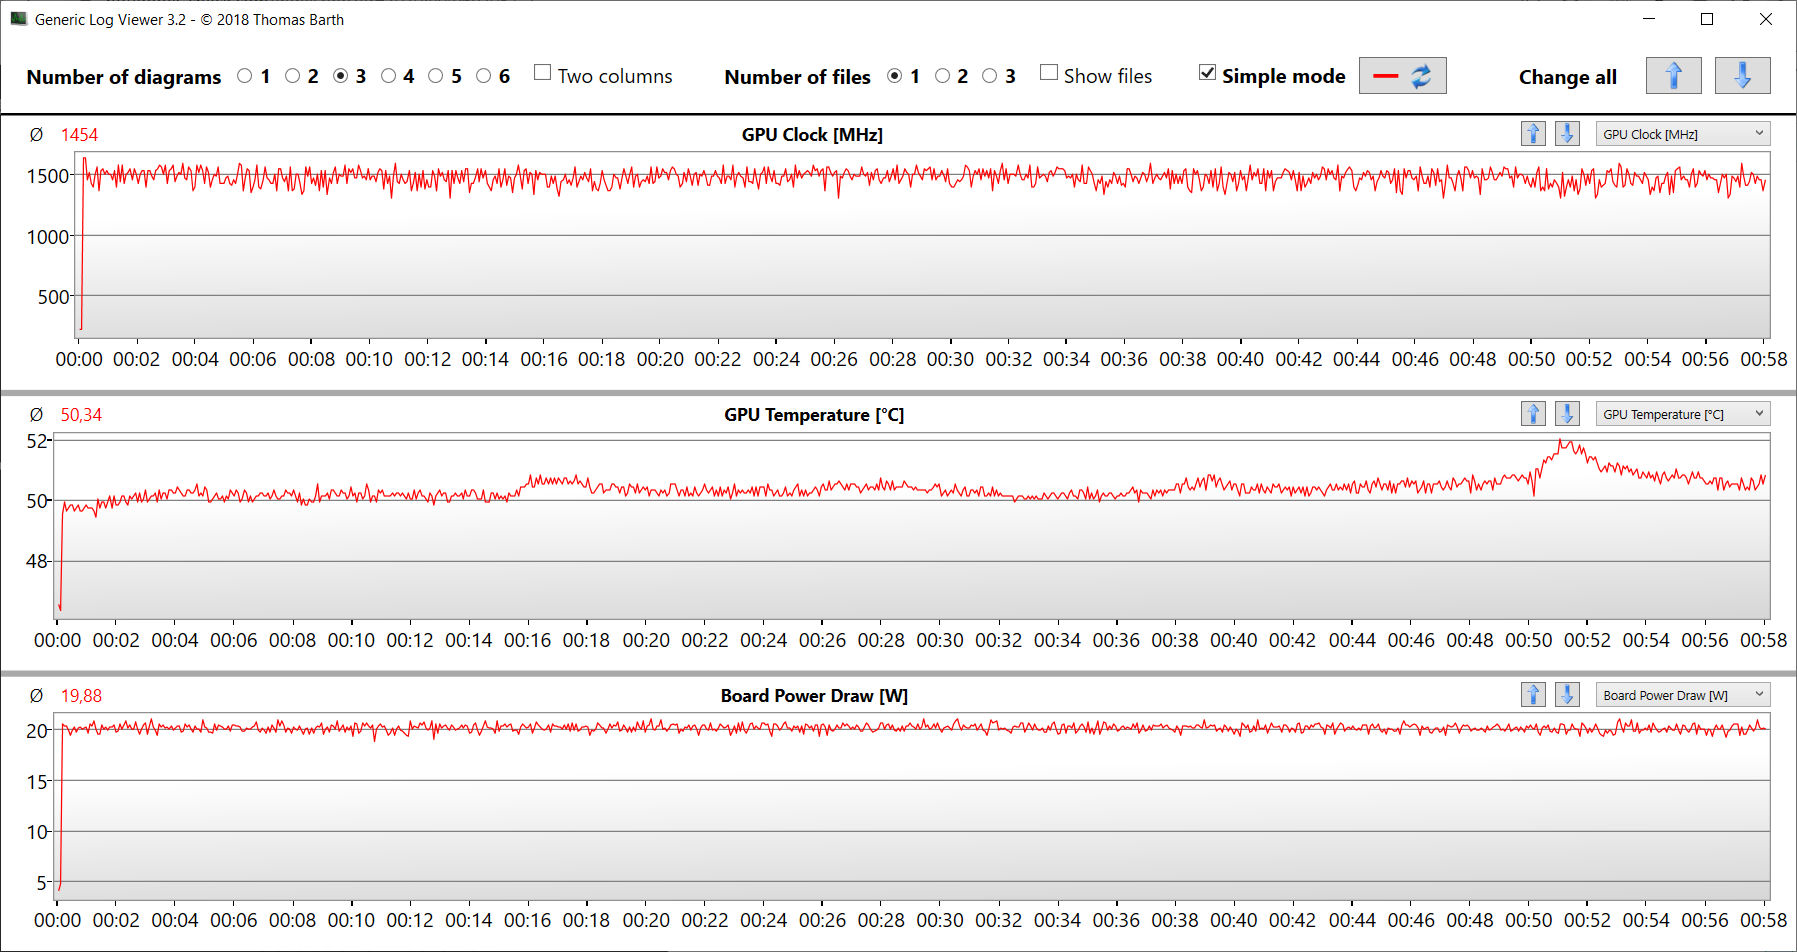
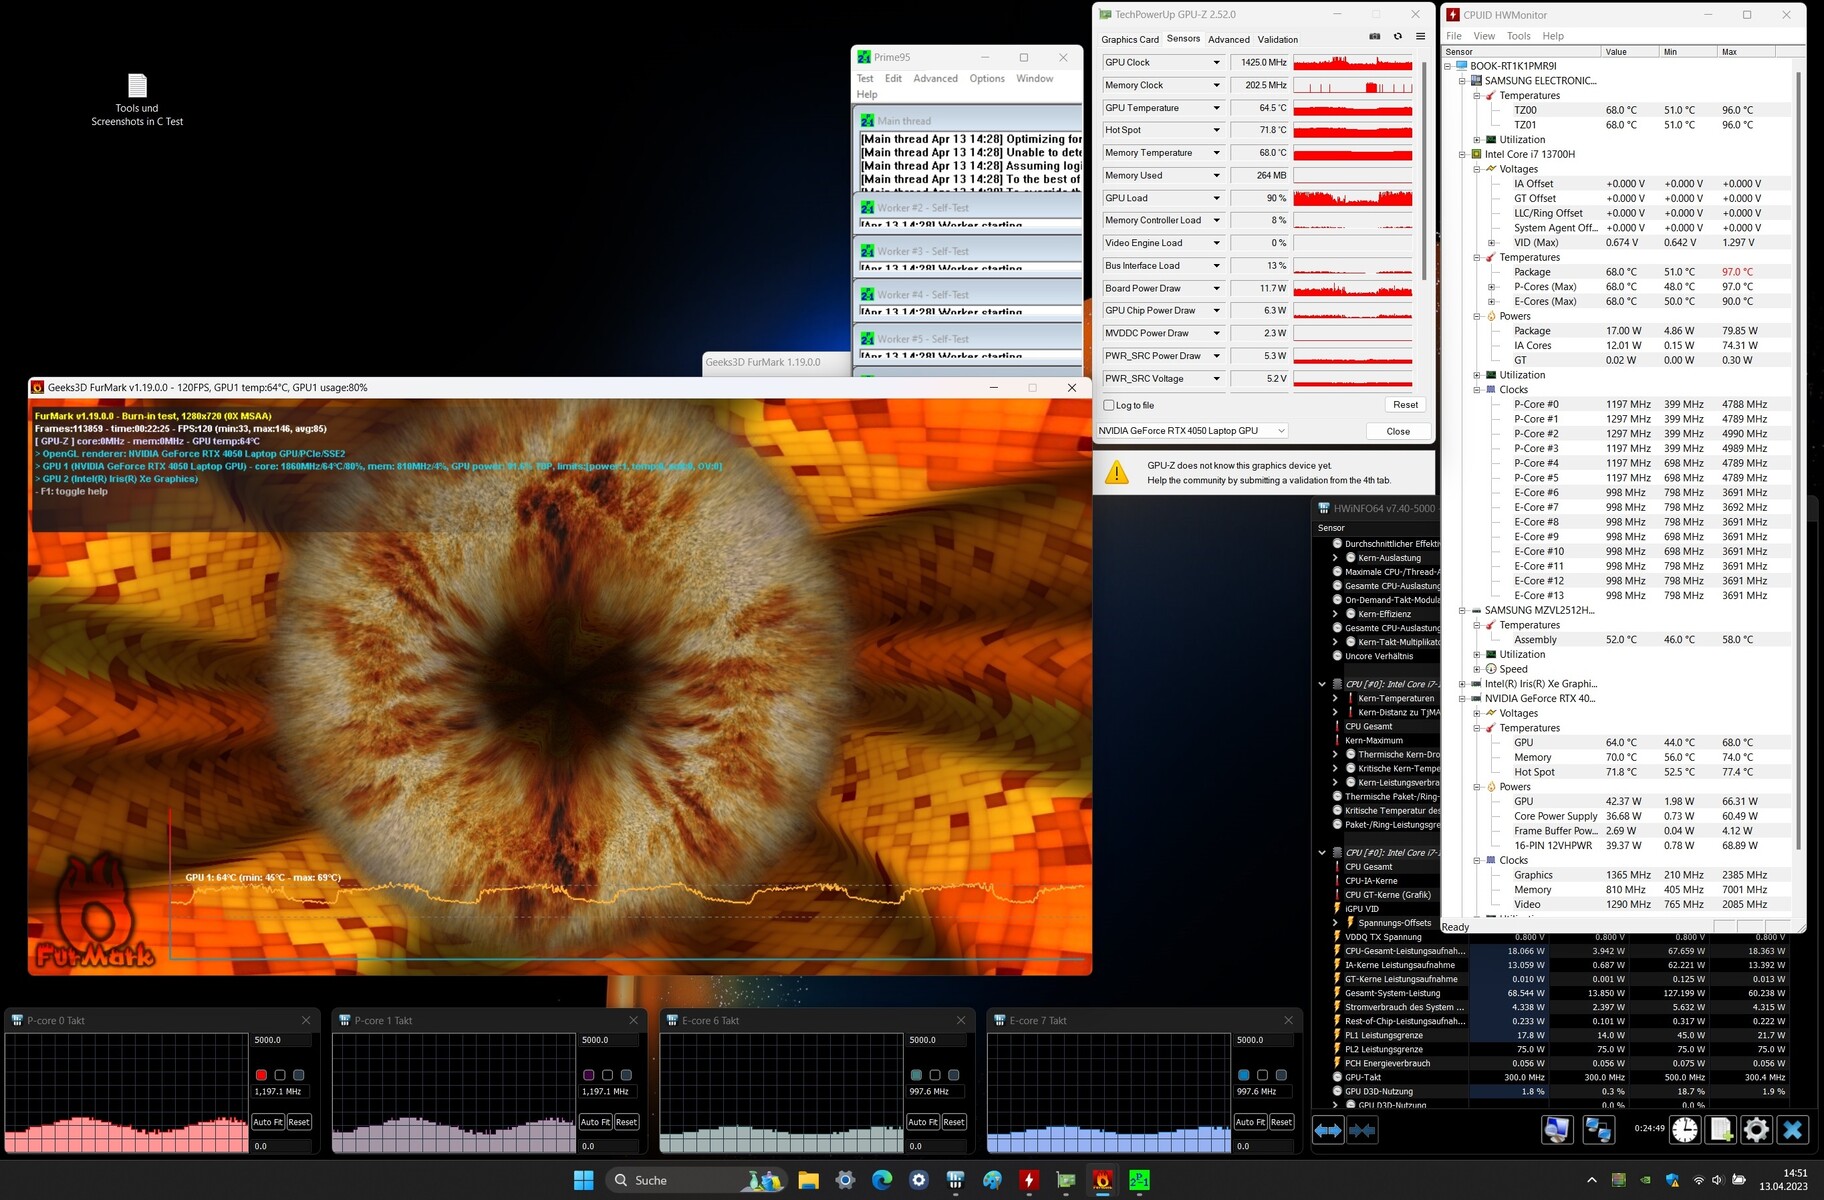
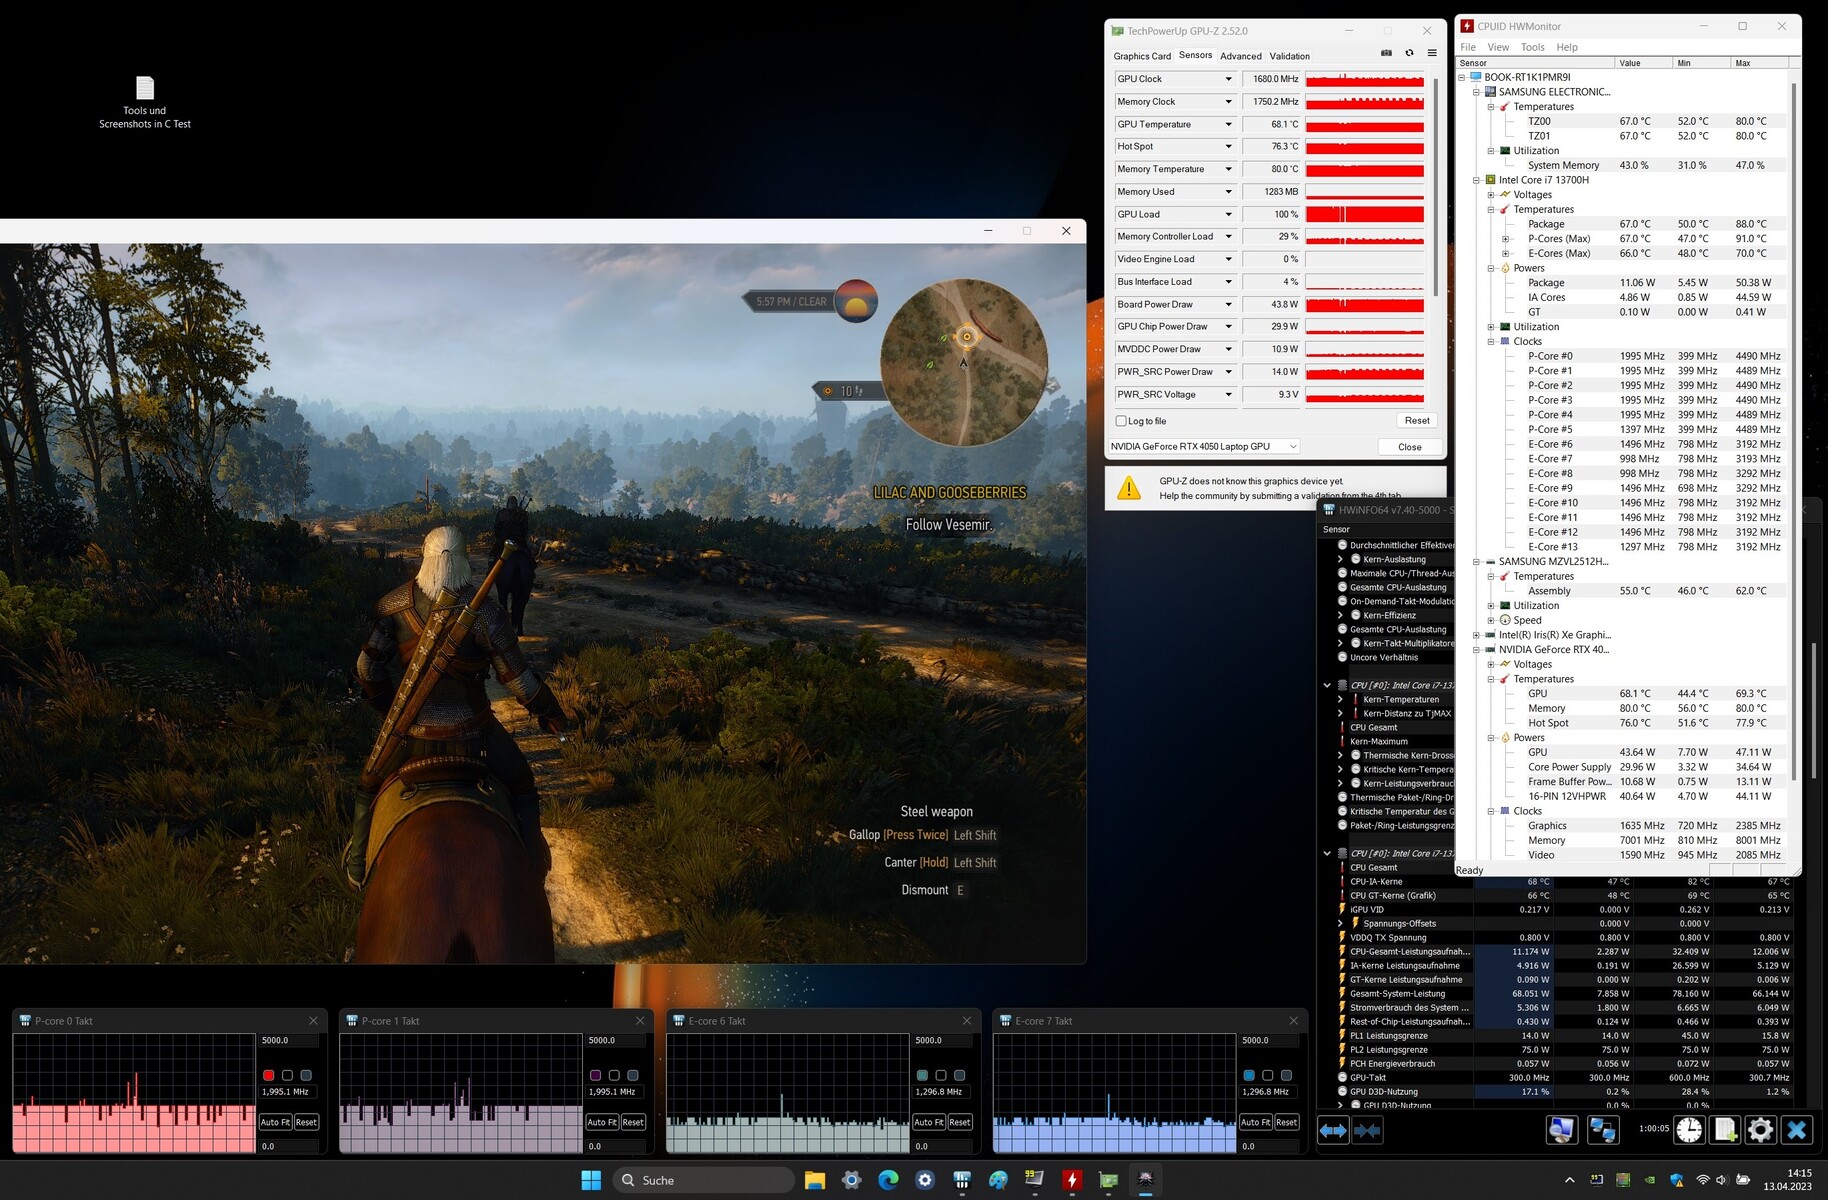
Stress Test
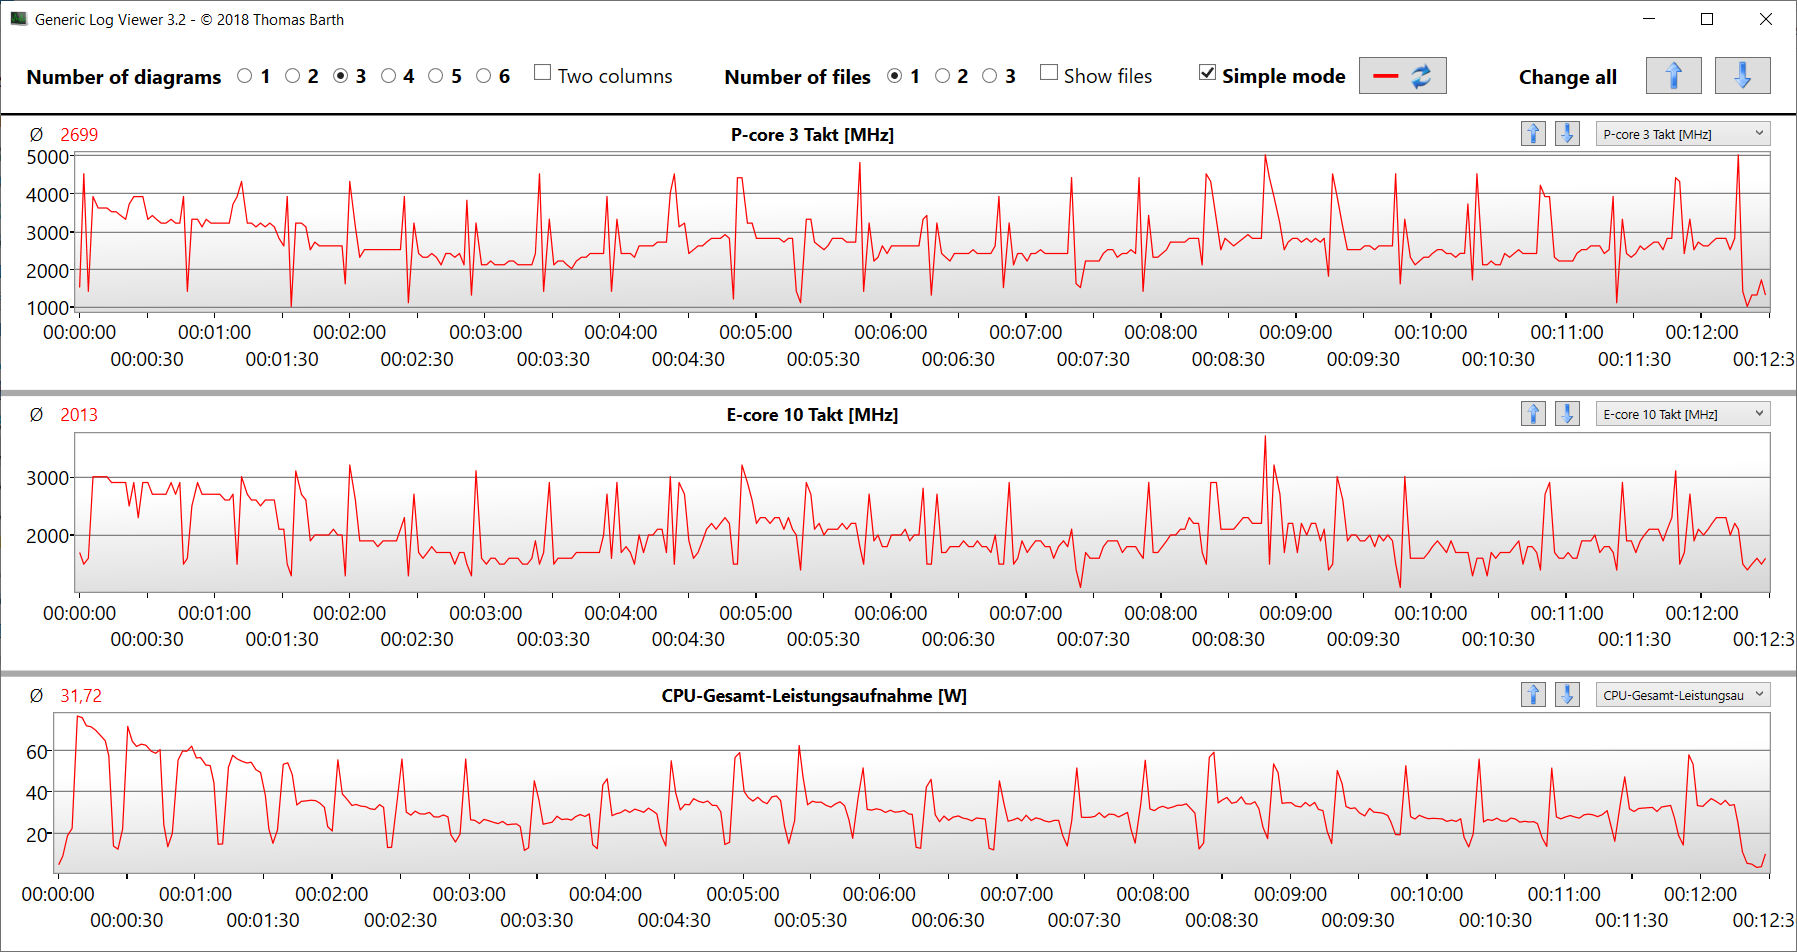
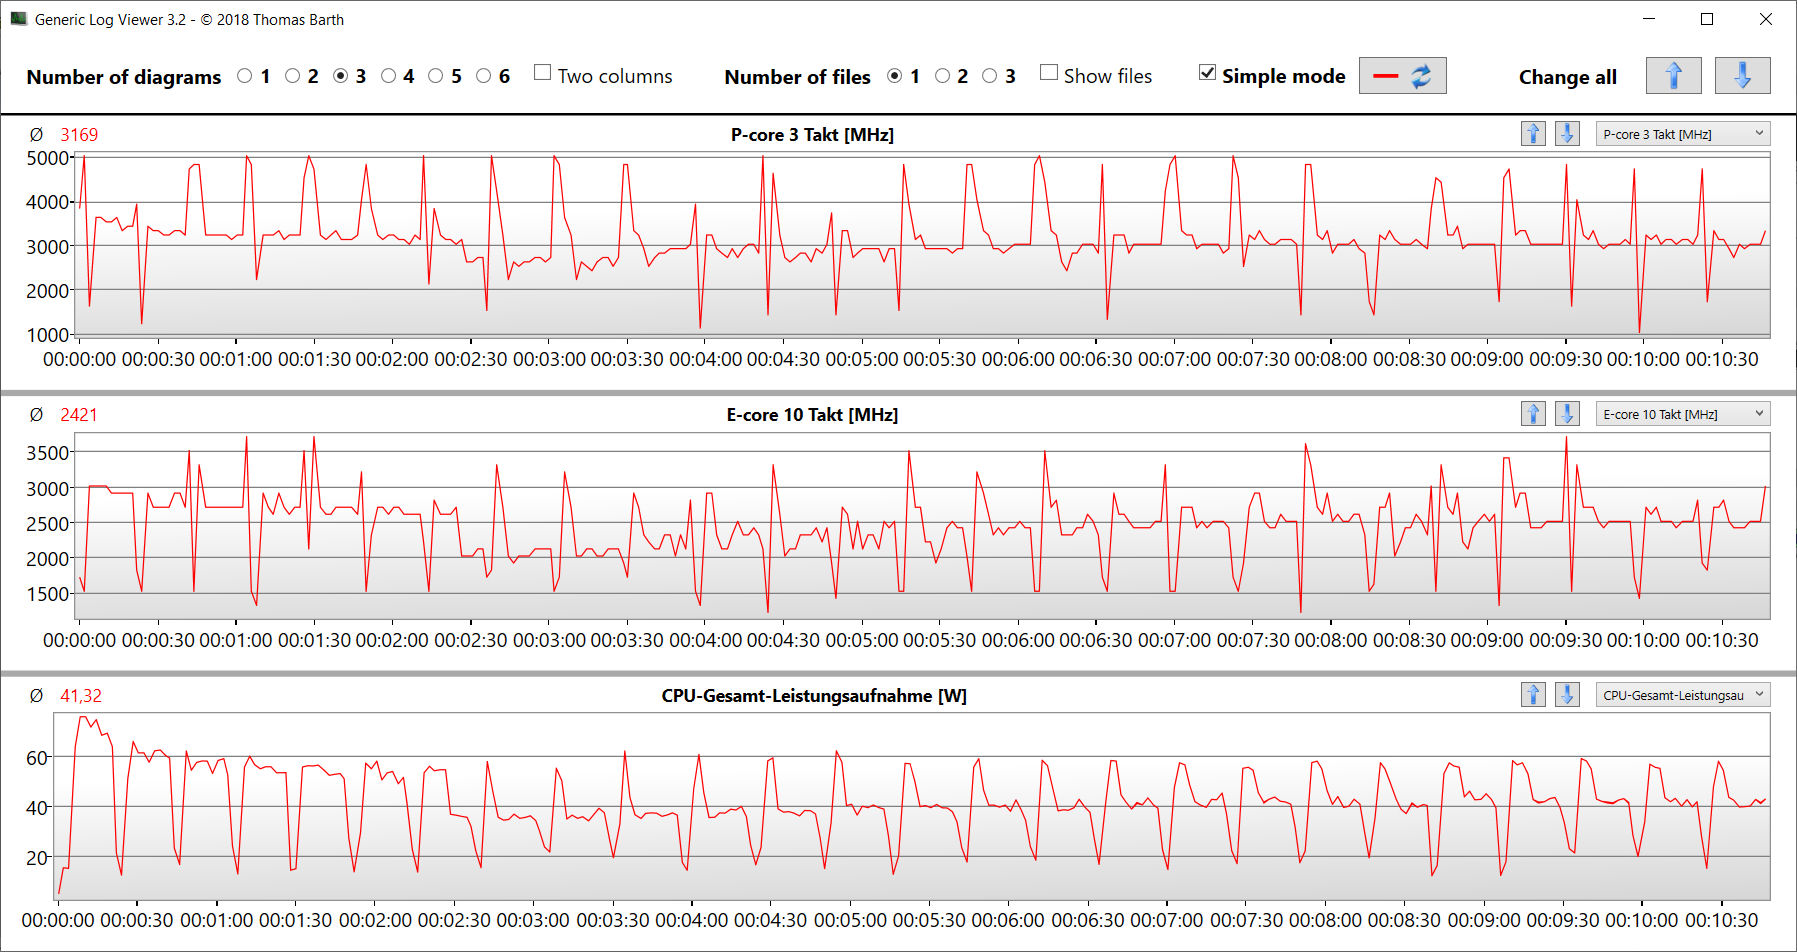
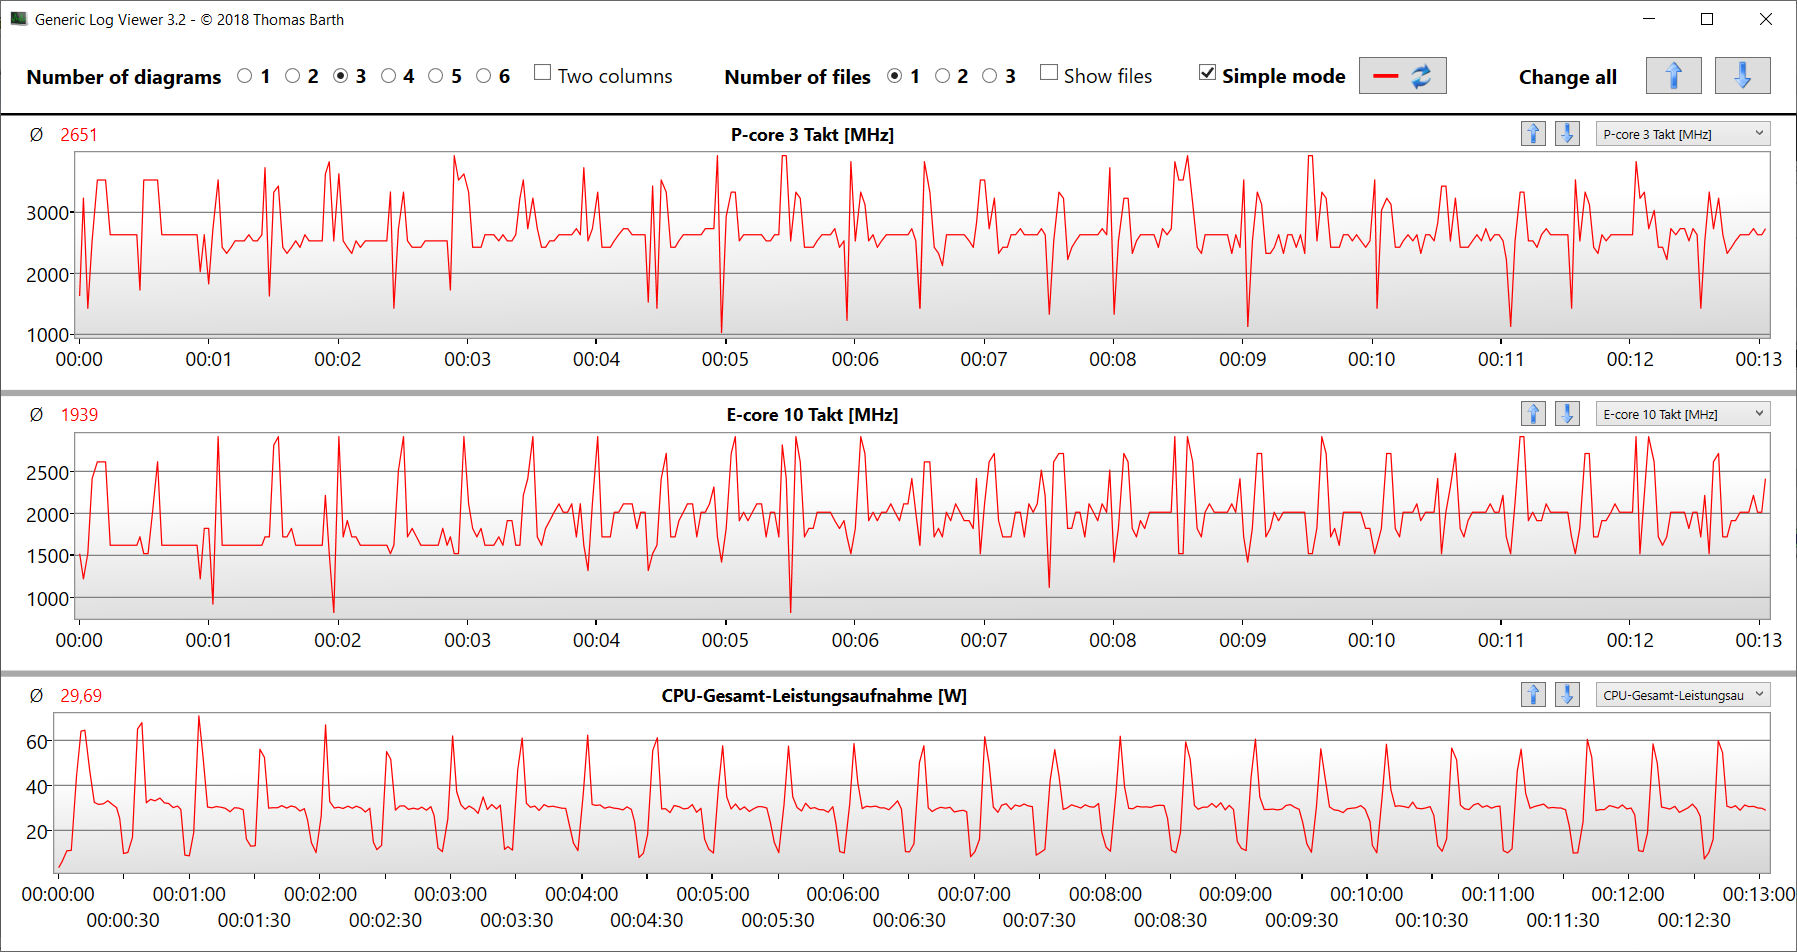
Test obciążeniowy (Prime95 i Furmark w trybie ciągłym) stanowi ekstremalny scenariusz sprawdzania stabilności systemu pod pełnym obciążeniem. CPU (P: 2,8 do 2,9 GHz, E: 2,3 do 2,4 GHz) i GPU (około 1100 MHz) rozpoczynają test z prędkościami zbliżonymi do bazowego poziomu taktowania, które w trakcie jego trwania znacznie spadają.
Mówcy
Głośniki stereo wytwarzają bardzo przyzwoity dźwięk, ale przydałoby się więcej basów. Dla lepszej jakości dźwięku zalecane są słuchawki lub głośniki zewnętrzne.
Samsung Galaxy Book3 Ultra 16 analiza dźwięku
(+) | głośniki mogą odtwarzać stosunkowo głośno (83 dB)
Bas 100 - 315 Hz
(±) | zredukowany bas - średnio 11.4% niższy od mediany
(±) | liniowość basu jest średnia (10.3% delta do poprzedniej częstotliwości)
Średnie 400 - 2000 Hz
(±) | wyższe średnie - średnio 5.4% wyższe niż mediana
(+) | średnie są liniowe (3% delta do poprzedniej częstotliwości)
Wysokie 2–16 kHz
(+) | zrównoważone maksima - tylko 1.6% od mediany
(+) | wzloty są liniowe (3.8% delta do poprzedniej częstotliwości)
Ogólnie 100 - 16.000 Hz
(+) | ogólny dźwięk jest liniowy (11.8% różnicy w stosunku do mediany)
W porównaniu do tej samej klasy
» 19% wszystkich testowanych urządzeń w tej klasie było lepszych, 4% podobnych, 76% gorszych
» Najlepszy miał deltę 5%, średnia wynosiła ###średnia###%, najgorsza wynosiła 45%
W porównaniu do wszystkich testowanych urządzeń
» 8% wszystkich testowanych urządzeń było lepszych, 3% podobnych, 89% gorszych
» Najlepszy miał deltę 4%, średnia wynosiła ###średnia###%, najgorsza wynosiła 134%
Schenker Vision 16 Pro RTX 3070 Ti analiza dźwięku
(±) | głośność głośnika jest średnia, ale dobra (77.6 dB)
Bas 100 - 315 Hz
(-) | prawie brak basu - średnio 17.9% niższa od mediany
(±) | liniowość basu jest średnia (12.2% delta do poprzedniej częstotliwości)
Średnie 400 - 2000 Hz
(+) | zbalansowane środki średnie - tylko 3.3% od mediany
(+) | średnie są liniowe (4.9% delta do poprzedniej częstotliwości)
Wysokie 2–16 kHz
(+) | zrównoważone maksima - tylko 2.8% od mediany
(+) | wzloty są liniowe (5.1% delta do poprzedniej częstotliwości)
Ogólnie 100 - 16.000 Hz
(±) | liniowość ogólnego dźwięku jest średnia (15.1% różnicy w stosunku do mediany)
W porównaniu do tej samej klasy
» 36% wszystkich testowanych urządzeń w tej klasie było lepszych, 4% podobnych, 60% gorszych
» Najlepszy miał deltę 5%, średnia wynosiła ###średnia###%, najgorsza wynosiła 45%
W porównaniu do wszystkich testowanych urządzeń
» 21% wszystkich testowanych urządzeń było lepszych, 4% podobnych, 75% gorszych
» Najlepszy miał deltę 4%, średnia wynosiła ###średnia###%, najgorsza wynosiła 134%
Zarządzanie energią - modelowi NP960XFH nie brakuje wytrzymałości
Pobór mocy
Ogólnie rzecz biorąc, laptop Samsunga zadowala się stosunkowo niewielką ilością energii. Zarówno w stanie spoczynku, jak i pod obciążeniem zapotrzebowanie na energię jest niższe niż u konkurencji, z wyjątkiem LG Gram. Test Witcher 3 i stress test przebiegły na względnie stałym poborze mocy. Pod koniec stress testu zapotrzebowanie nieco spada. Zasilacz USB-C (100 W) jest wystarczająco pojemny.
| wyłączony / stan wstrzymania | |
| luz | |
| obciążenie |
|
Legenda:
min: | |
| Samsung Galaxy Book3 Ultra 16 i7-13700H, GeForce RTX 4050 Laptop GPU | Schenker Vision 16 Pro RTX 3070 Ti i7-12700H, GeForce RTX 3070 Ti Laptop GPU | LG Gram 17Z90Q-E.AD78G i7-1260P, GeForce RTX 2050 Mobile | Lenovo ThinkBook 16p G3 ARH R9 6900HX, GeForce RTX 3060 Laptop GPU | Dell XPS 15 9520 RTX 3050 Ti i7-12700H, GeForce RTX 3050 Ti Laptop GPU | Asus VivoBook Pro 16X OLED N7600PC-L2026X i7-11370H, GeForce RTX 3050 4GB Laptop GPU | Acer Swift X SFX16-52G-77RX i7-1260P, A370M | Przeciętny NVIDIA GeForce RTX 4050 Laptop GPU | Średnia w klasie Multimedia | |
|---|---|---|---|---|---|---|---|---|---|
| Power Consumption | -105% | -7% | -126% | -39% | -63% | -12% | -123% | -39% | |
| Idle Minimum * (Watt) | 3 | 9 -200% | 4.1 -37% | 10.3 -243% | 5.5 -83% | 8.9 -197% | 3.7 -23% | 9.95 ? -232% | 5.65 ? -88% |
| Idle Average * (Watt) | 5 | 13.3 -166% | 9.8 -96% | 16 -220% | 7.2 -44% | 10.2 -104% | 7.6 -52% | 15.8 ? -216% | 10 ? -100% |
| Idle Maximum * (Watt) | 11 | 14.3 -30% | 12 -9% | 24 -118% | 16 -45% | 12 -9% | 11.1 -1% | 20.1 ? -83% | 12.3 ? -12% |
| Load Average * (Watt) | 72 | 107 -49% | 49.3 32% | 85.4 -19% | 91.8 -27% | 94 -31% | 70 3% | 88 ? -22% | 65.1 ? 10% |
| Witcher 3 ultra * (Watt) | 69.7 | 155.2 -123% | 49.3 29% | 132.2 -90% | 74.6 -7% | 93.1 -34% | 68.8 1% | ||
| Load Maximum * (Watt) | 108 | 172 -59% | 66 39% | 181.9 -68% | 134.7 -25% | 112 -4% | 108 -0% | 176.3 ? -63% | 112.5 ? -4% |
* ... im mniej tym lepiej
Power consumption Witcher 3 / Stress test
Power consumption with an external monitor
Czas pracy na baterii
W teście WLAN (wywoływanie stron internetowych przez skrypt) i teście wideo (krótki film Big Buck Bunny, kodowanie H.264, FHD, w pętli) 16-calowiec osiągnął odpowiednio 9:36 h i 13:23 h. Podczas obu testów funkcje oszczędzania energii w notebooku były wyłączone, a jasność wyświetlacza ustawiona na około 150 cd/m². Podczas testu wideo wyłączone były również moduły łączności bezprzewodowej.
| Samsung Galaxy Book3 Ultra 16 i7-13700H, GeForce RTX 4050 Laptop GPU, 76 Wh | Schenker Vision 16 Pro RTX 3070 Ti i7-12700H, GeForce RTX 3070 Ti Laptop GPU, 80 Wh | LG Gram 17Z90Q-E.AD78G i7-1260P, GeForce RTX 2050 Mobile, 90 Wh | Lenovo ThinkBook 16p G3 ARH R9 6900HX, GeForce RTX 3060 Laptop GPU, 71 Wh | Dell XPS 15 9520 RTX 3050 Ti i7-12700H, GeForce RTX 3050 Ti Laptop GPU, 86 Wh | Asus VivoBook Pro 16X OLED N7600PC-L2026X i7-11370H, GeForce RTX 3050 4GB Laptop GPU, 96 Wh | Acer Swift X SFX16-52G-77RX i7-1260P, A370M, 56 Wh | Średnia w klasie Multimedia | |
|---|---|---|---|---|---|---|---|---|
| Czasy pracy | -40% | 37% | -32% | 17% | -3% | -22% | 19% | |
| Reader / Idle (h) | 18.2 | 14.8 -19% | 11.1 -39% | 25.2 ? 38% | ||||
| H.264 (h) | 13.4 | 6.1 -54% | 10.4 -22% | 16.2 ? 21% | ||||
| WiFi v1.3 (h) | 9.6 | 6 -37% | 14.5 51% | 6.5 -32% | 8.8 -8% | 8.7 -9% | 9.1 -5% | 12 ? 25% |
| Load (h) | 1.8 | 1.3 -28% | 2.2 22% | 3.2 78% | 2.5 39% | 1.1 -39% | 1.669 ? -7% |
Za
Przeciw
Wniosek - udany kompromis
Galaxy Book3 Ultra 16 to dobry kompromis pomiędzy wydajnością, mobilnością i ergonomią. Na stronie Core i7-13700H i GeForce RTX 4050 laptopa działają ze zmniejszoną wydajnością, ale nadal zapewniają wystarczającą moc do gier i renderowania w rozdzielczości FHD.
Samsung dostarcza mobilny notebook dla graczy i kreatywnych pracowników w Galaxy Book3 Ultra 16. Jednak zbyt wysoka cena rzuca cień na skądinąd mocny charakter laptopa.
Kompaktowe urządzenie nie waży zbyt wiele - 1,8 kg. W połączeniu z praktycznym czasem pracy na baterii wynoszącym od 9 do 13 godzin mamy w rękach dość mobilne urządzenie. Hałas i wydzielanie ciepła są umiarkowane. Dwa gniazda USB-C (Thunderbolt 4) służą do zasilania i umożliwiają łatwą integrację z istniejącymi konfiguracjami miejsc pracy.
Duży, 16-calowy ekran (2 880 x 1 800, OLED) w przyjaznym dla pracy formacie 16:10 punktuje wysoką jasnością, doskonałym kontrastem, stabilnymi kątami widzenia, krótkimi czasami reakcji, świetnym odwzorowaniem kolorów i bardzo dobrym pokryciem przestrzeni barw. Minusy: panel ma odblaskową powierzchnię, a ponadto wykorzystuje PWM dla wszystkich poziomów jasności - urządzenie za 2399,99 USD powinno oferować tu więcej.
Pamięć RAM też jest trochę cienka przy 16 GB. Urządzenie z roszczeniem Galaxy Book powinno oferować tu 32 GB, zwłaszcza że pamięci (pokładowej) nie da się rozszerzyć. Dostępne są przynajmniej wyżej wycenione modele 32 GB.
Na stronie Schenker Vision 16 Pro można rozważyć jako alternatywę. Oferuje on większą wydajność graficzną i rozszerzalną pamięć RAM, ale jest w gorszej sytuacji pod względem czasu pracy i emisji. Na stronie Asus VivoBook Pro 16X OLED (około 1400 USD) oraz Acer Swift X 16 (ok. 1100 USD) to tańsze i słabsze alternatywy dla komputera Samsunga. Oferują mniejszą wydajność, okazjonalnie krótsze czasy pracy i wlutowaną na stałe pamięć roboczą.
Cena i dostępność
Konfiguracja naszego urządzenia testowego dostępna jest za pośrednictwem Amazon UK oraz Amazon Canada w cenie odpowiednio 2 449,00 GBP i 2 799,99 CAD. W USA, 1TB wydaje się być minimalną konfiguracją na stronie Samsunga, zaczynając od 2399,99 USD.
Samsung Galaxy Book3 Ultra 16
- 26/04/2023 v7 (old)
Sascha Mölck
Przezroczystość
Wyboru urządzeń do recenzji dokonuje nasza redakcja. Próbka testowa została udostępniona autorowi jako pożyczka od producenta lub sprzedawcy detalicznego na potrzeby tej recenzji. Pożyczkodawca nie miał wpływu na tę recenzję, producent nie otrzymał też kopii tej recenzji przed publikacją. Nie było obowiązku publikowania tej recenzji. Jako niezależna firma medialna, Notebookcheck nie podlega władzy producentów, sprzedawców detalicznych ani wydawców.
Tak testuje Notebookcheck
Każdego roku Notebookcheck niezależnie sprawdza setki laptopów i smartfonów, stosując standardowe procedury, aby zapewnić porównywalność wszystkich wyników. Od około 20 lat stale rozwijamy nasze metody badawcze, ustanawiając przy tym standardy branżowe. W naszych laboratoriach testowych doświadczeni technicy i redaktorzy korzystają z wysokiej jakości sprzętu pomiarowego. Testy te obejmują wieloetapowy proces walidacji. Nasz kompleksowy system ocen opiera się na setkach uzasadnionych pomiarów i benchmarków, co pozwala zachować obiektywizm.Price comparison

