Recenzja laptopa Dell Inspiron 16 Plus 7630: 60 W GeForce RTX 4060 nie jest taki zły

Dell Inspiron 16 Plus 7630 z 2023 roku jest następcą zeszłorocznego 2022 Inspiron 16 Plus 7620 ze zaktualizowanymi elementami wewnętrznymi i zewnętrznymi, mimo że model 2022 był już pełnym przeprojektowaniem 2021 Inspiron 16 Plus 7610. Rzadko zdarza się, aby seria przechodziła trzy duże przeprojektowania trzy lata z rzędu, ponieważ producenci częściej zmieniają wygląd zewnętrzny tylko raz na kilka lat. Podobnie jak inne laptopy multimedialne z 2023 roku, Inspiron 16 Plus 7630 zawiera procesory Intel 13. generacji Raptor Lake-H i procesory graficzne Nvidia Ada Lovelace.
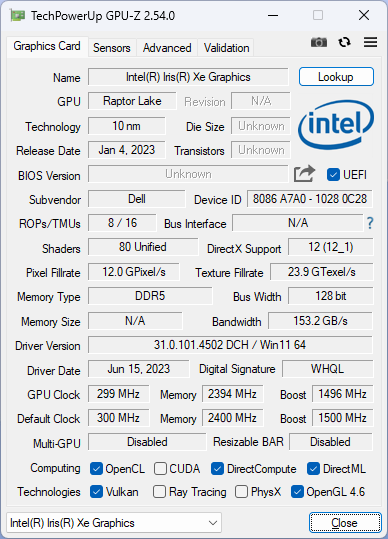
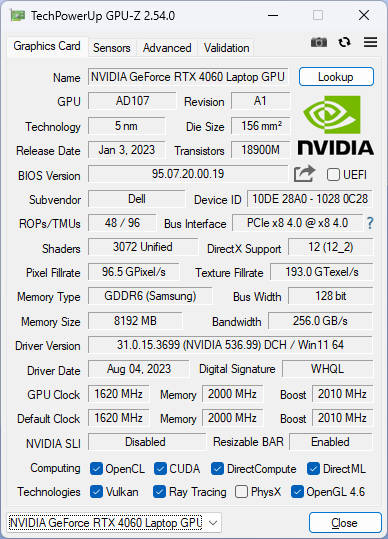
Nasza jednostka testowa to wysokiej klasy konfiguracja z procesorem Core i7-13700H, procesorem graficznym GeForce RTX 4060 i wyświetlaczem IPS 2560 x 1600 120 Hz za około 1250 USD. Mniejsze jednostki SKU z Core i5-13500H, zintegrowanym iris Xe, RTX 3050, RTX 4050 lub wyświetlaczem 1200p 60 Hz są w przygotowaniu. Planowane są również warianty AMD z procesorami Ryzen 5 7640HS i Ryzen 7 7840HS pod nazwą modelu Inspiron 16 Plus 7635.
Alternatywy dla Inspiron 16 Plus 7630 obejmują inne 16-calowe laptopy multimedialne, takie jak Lenovo Slim Pro 9i 16, Asus VivoBook Pro 16X, HP Envy 16 lub MSI Summit E16 Flip. Inspiron 16 Plus 7630 nie powinien być mylony ze standardowym wolniejszym Inspiron 16 lub Inspiron 16 Plus 7630 2-w-1, które mają bardzo różne specyfikacje i funkcje.
Więcej recenzji Dell:
Potencjalni konkurenci w porównaniu
Ocena | Data | Model | Waga | Wysokość | Rozmiar | Rezolucja | Cena |
|---|---|---|---|---|---|---|---|
| 87.1 % v7 (old) | 08/2023 | Dell Inspiron 16 Plus 7630 i7-13700H, GeForce RTX 4060 Laptop GPU | 2.2 kg | 19.95 mm | 16.00" | 2560x1600 | |
| 87.4 % v7 (old) | Dell Inspiron 16 Plus 7620 i7-12700H, GeForce RTX 3050 Ti Laptop GPU | 2.1 kg | 18.99 mm | 16.00" | 3072x1920 | ||
| 88 % v7 (old) | 08/2023 | Lenovo Slim Pro 9i 16IRP8 i9-13905H, GeForce RTX 4050 Laptop GPU | 2.2 kg | 18.2 mm | 16.00" | 3200x2000 | |
| 86.2 % v7 (old) | 07/2023 | Asus Vivobook Pro 16X K6604JV-MX016W i9-13980HX, GeForce RTX 4060 Laptop GPU | 2.1 kg | 22.8 mm | 16.00" | 3200x2000 | |
| 86.9 % v7 (old) | 09/2022 | HP Envy 16 h0112nr i7-12700H, GeForce RTX 3060 Laptop GPU | 2.3 kg | 19.8 mm | 16.00" | 3840x2400 | |
| 84.2 % v7 (old) | 10/2022 | MSI Summit E16 Flip A12UDT-031 i7-1280P, GeForce RTX 3050 Ti Laptop GPU | 1.9 kg | 16.85 mm | 16.00" | 2560x1600 |
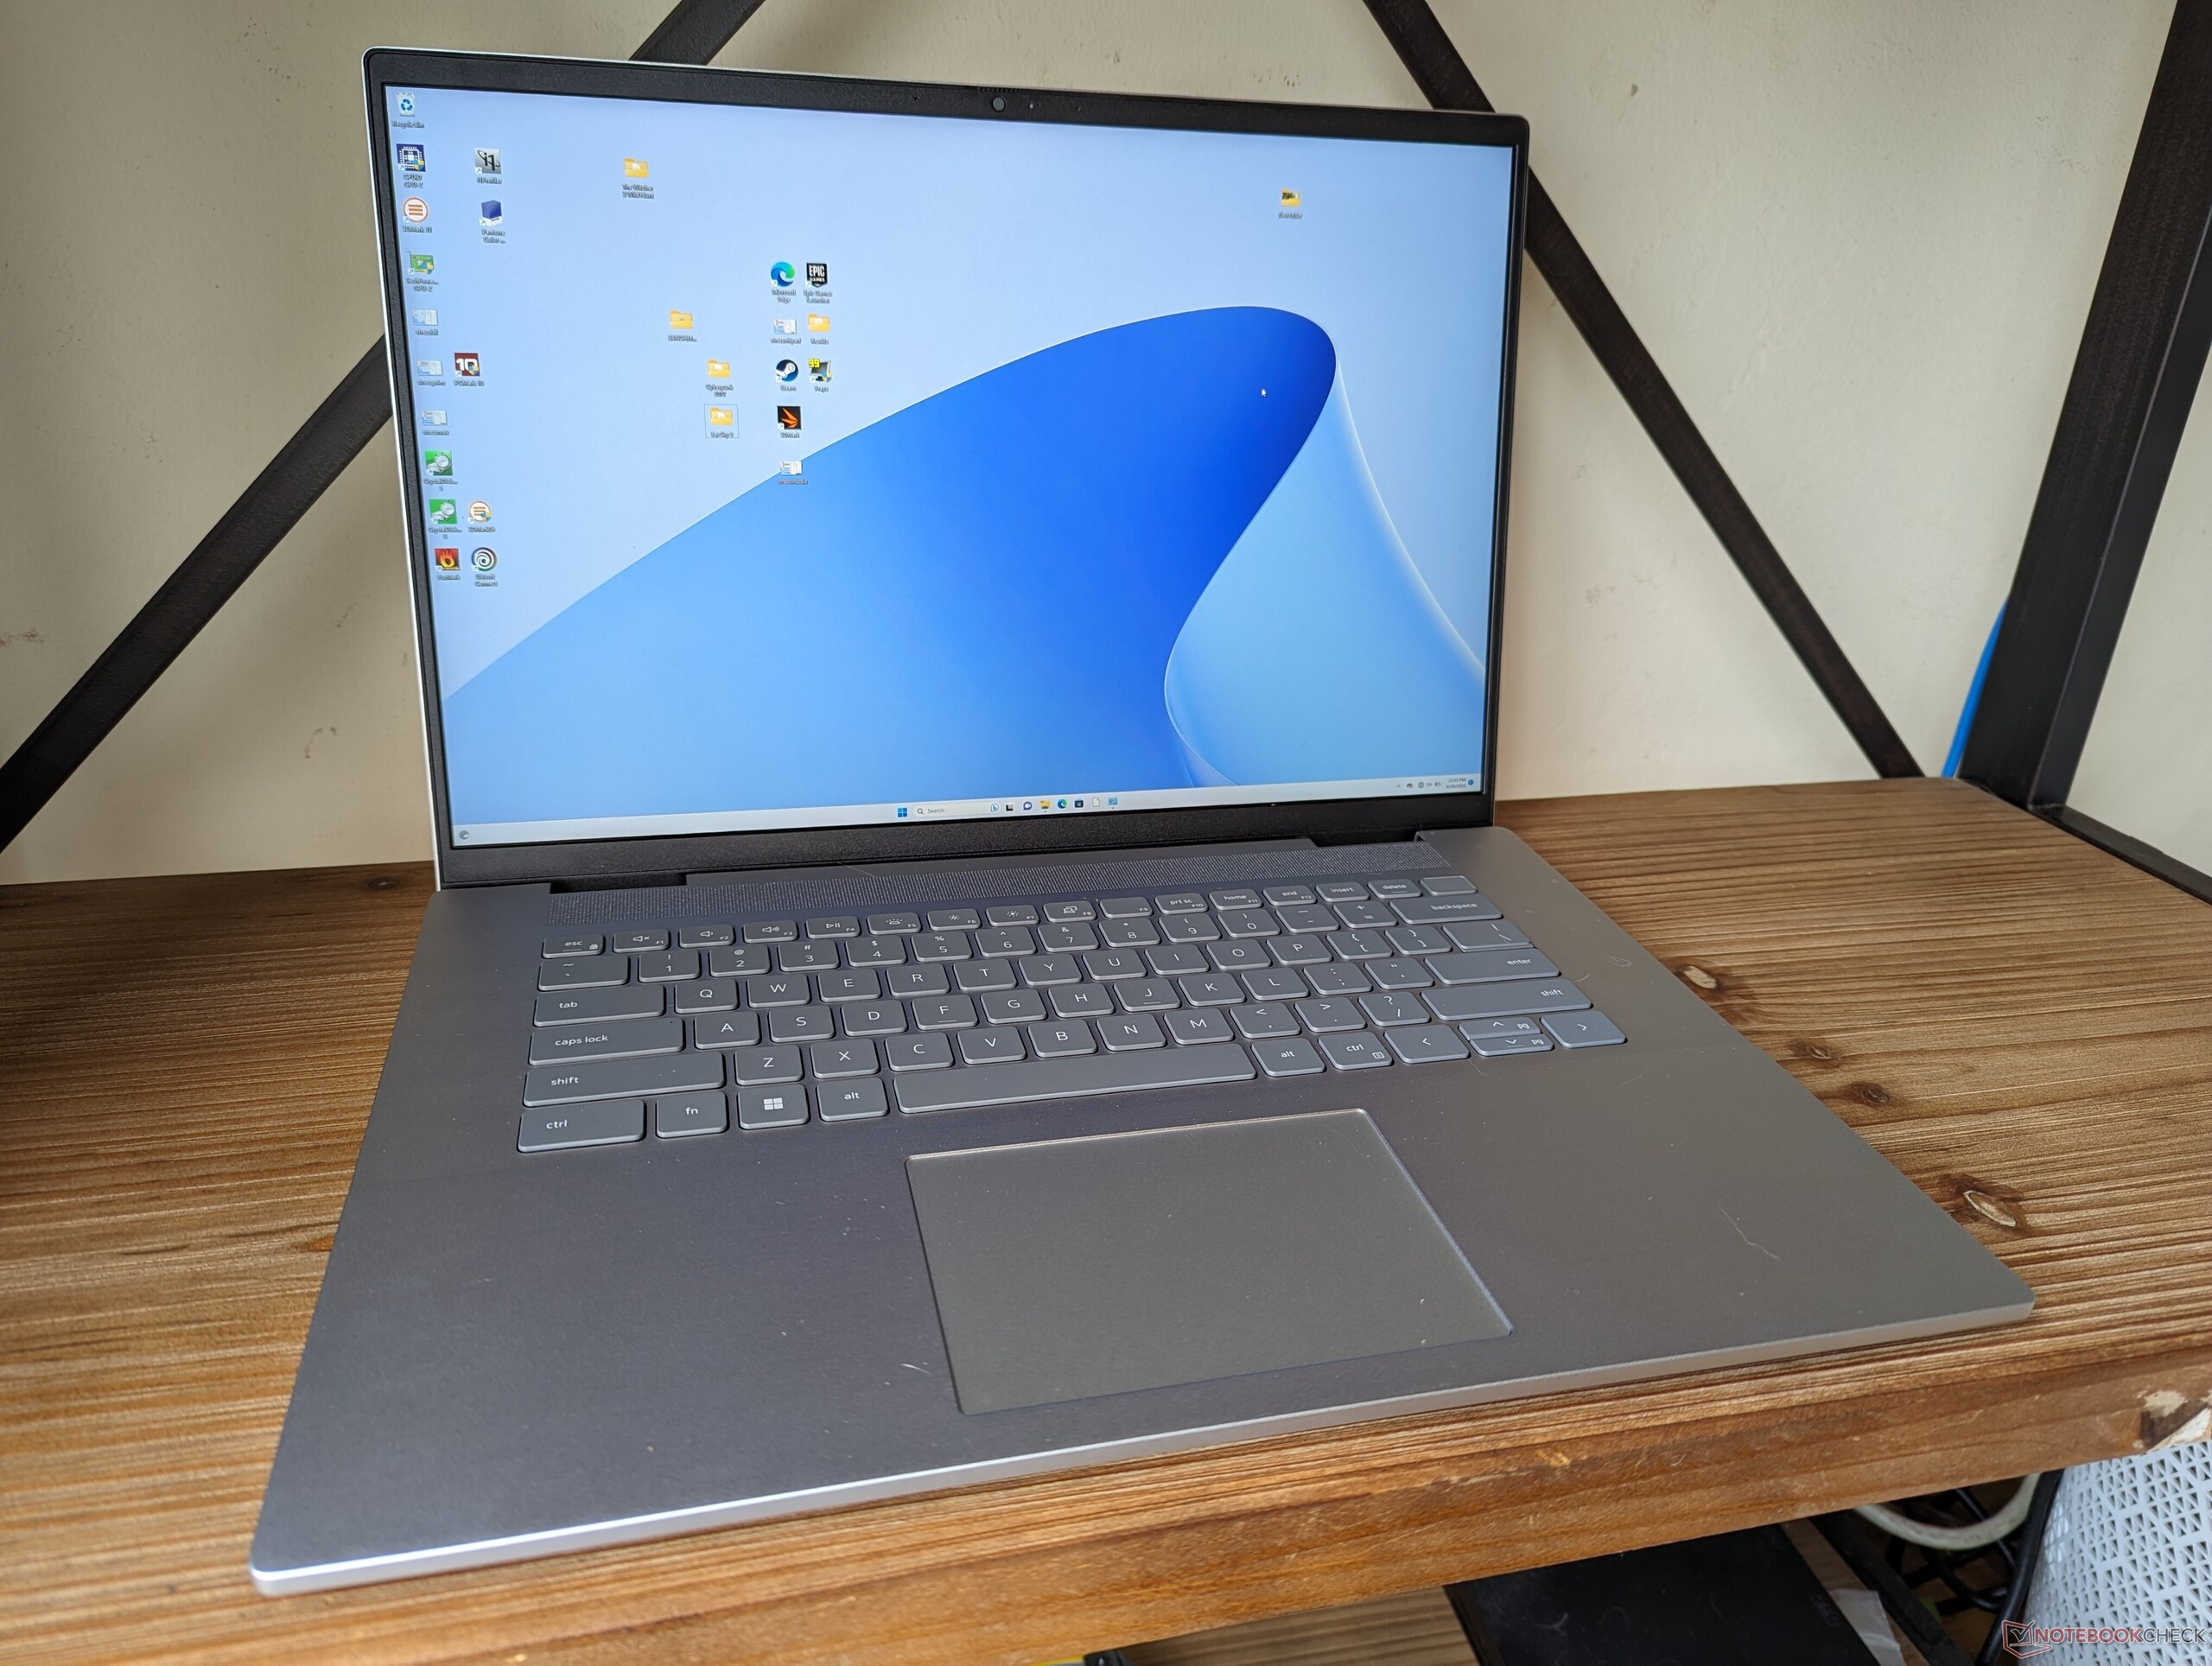
Case - Keeping It Simple
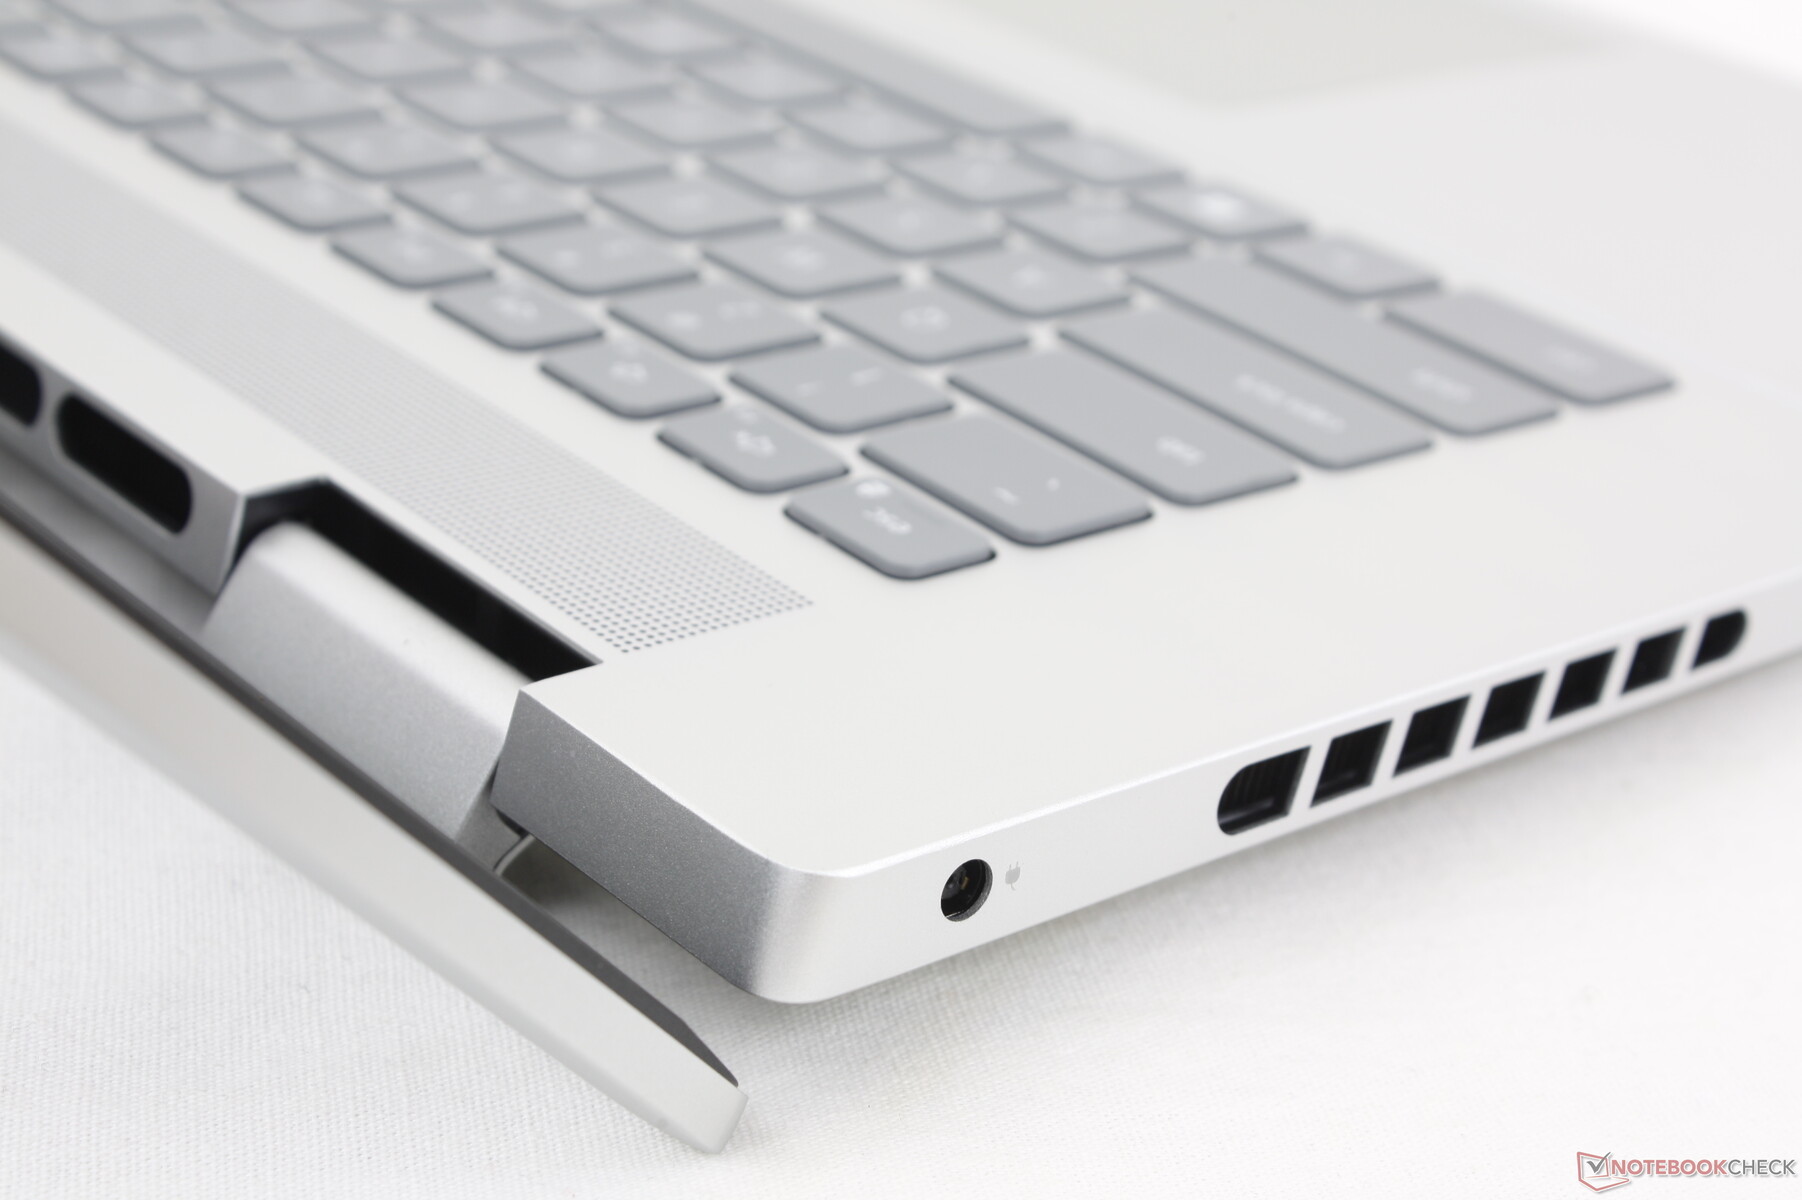
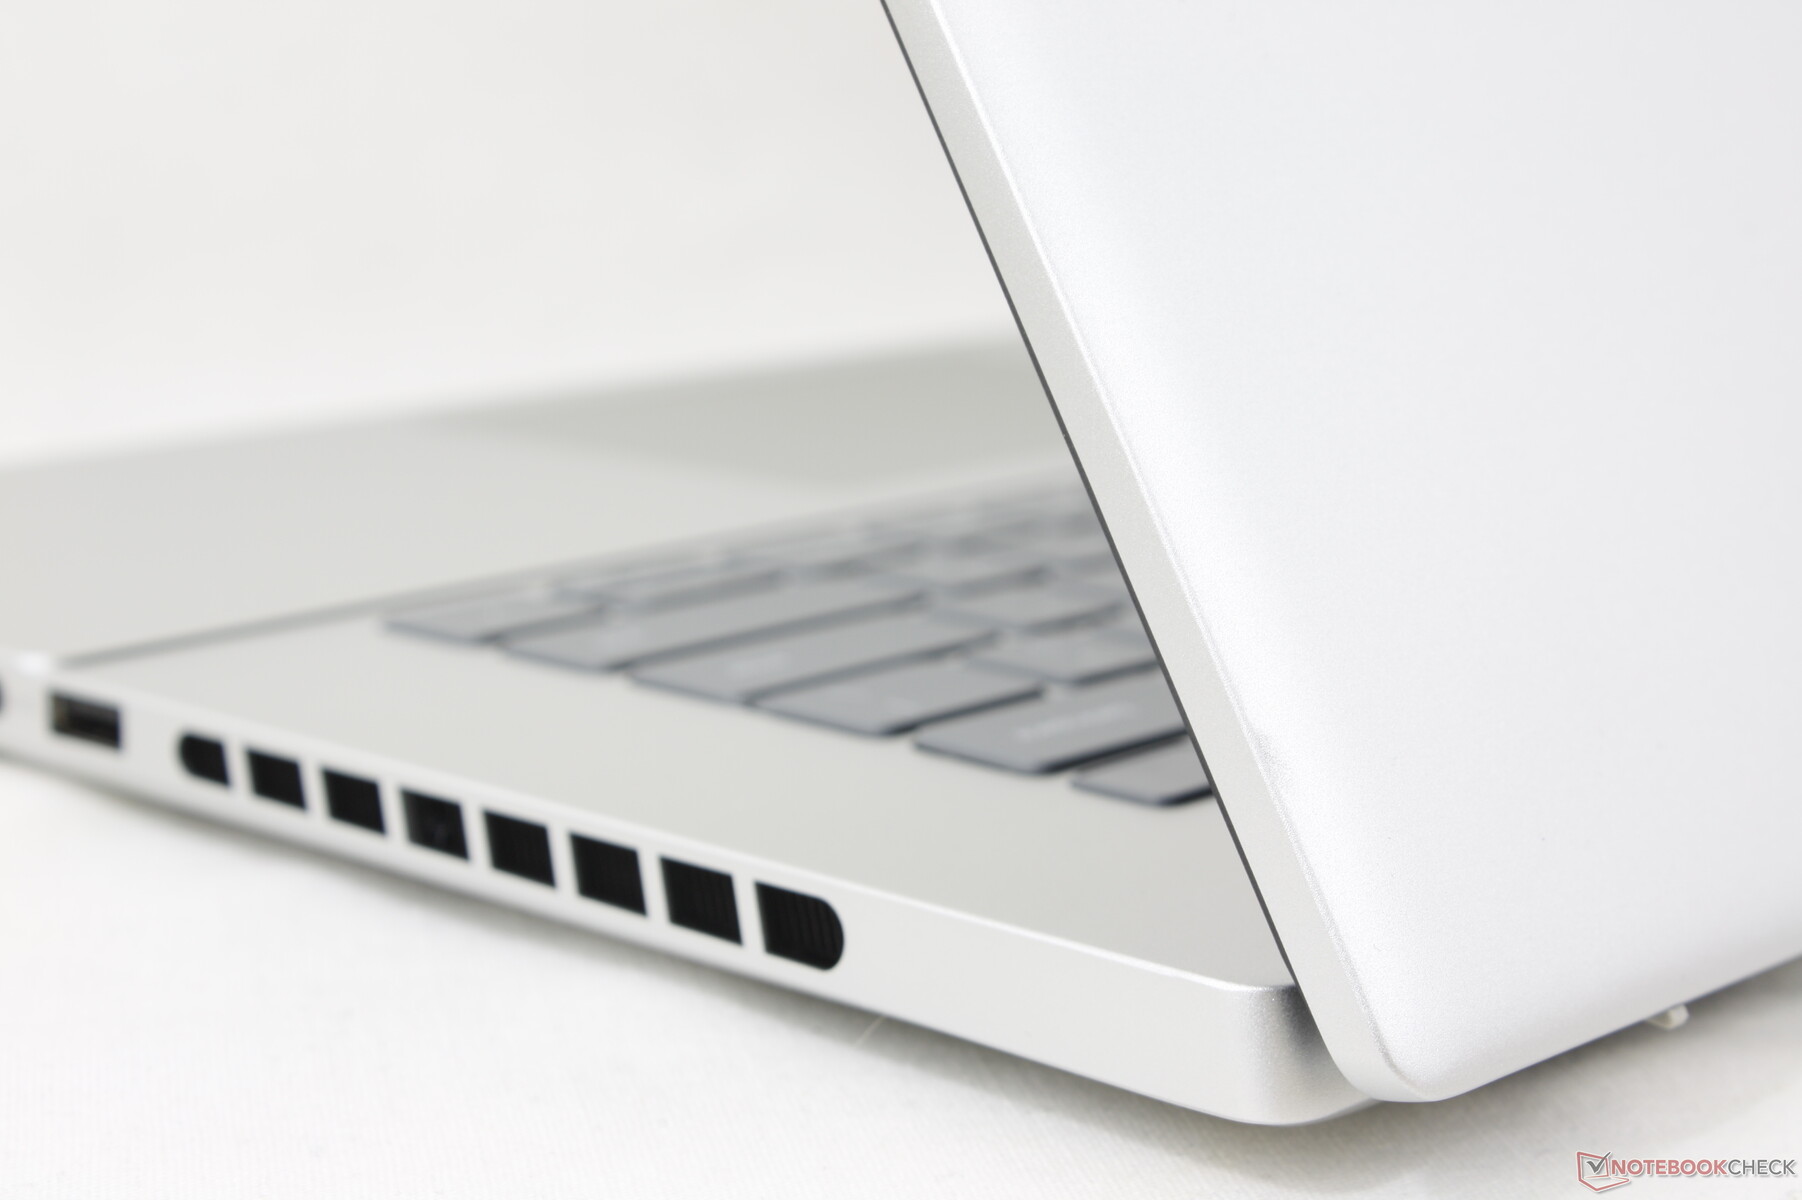
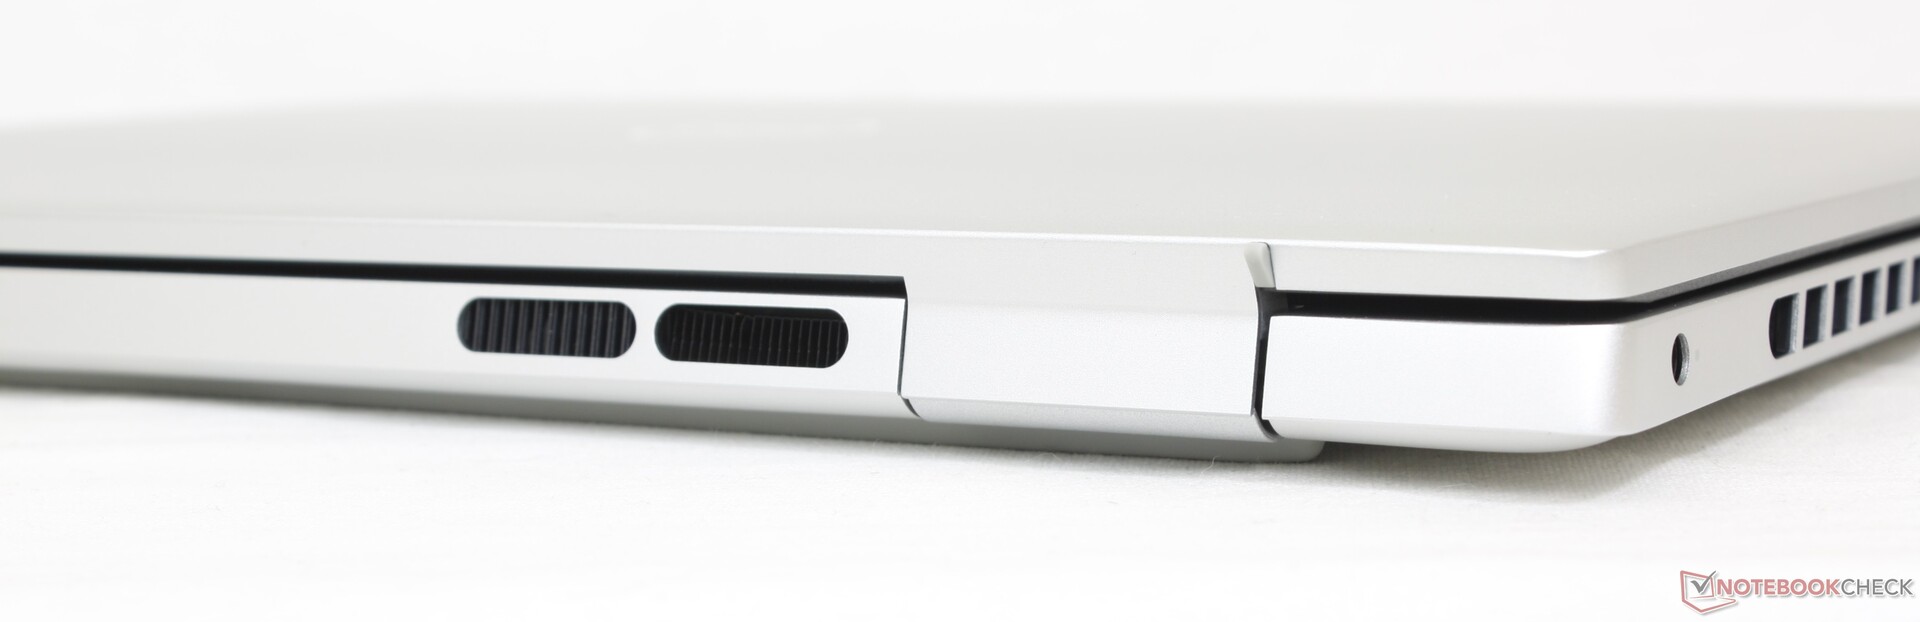
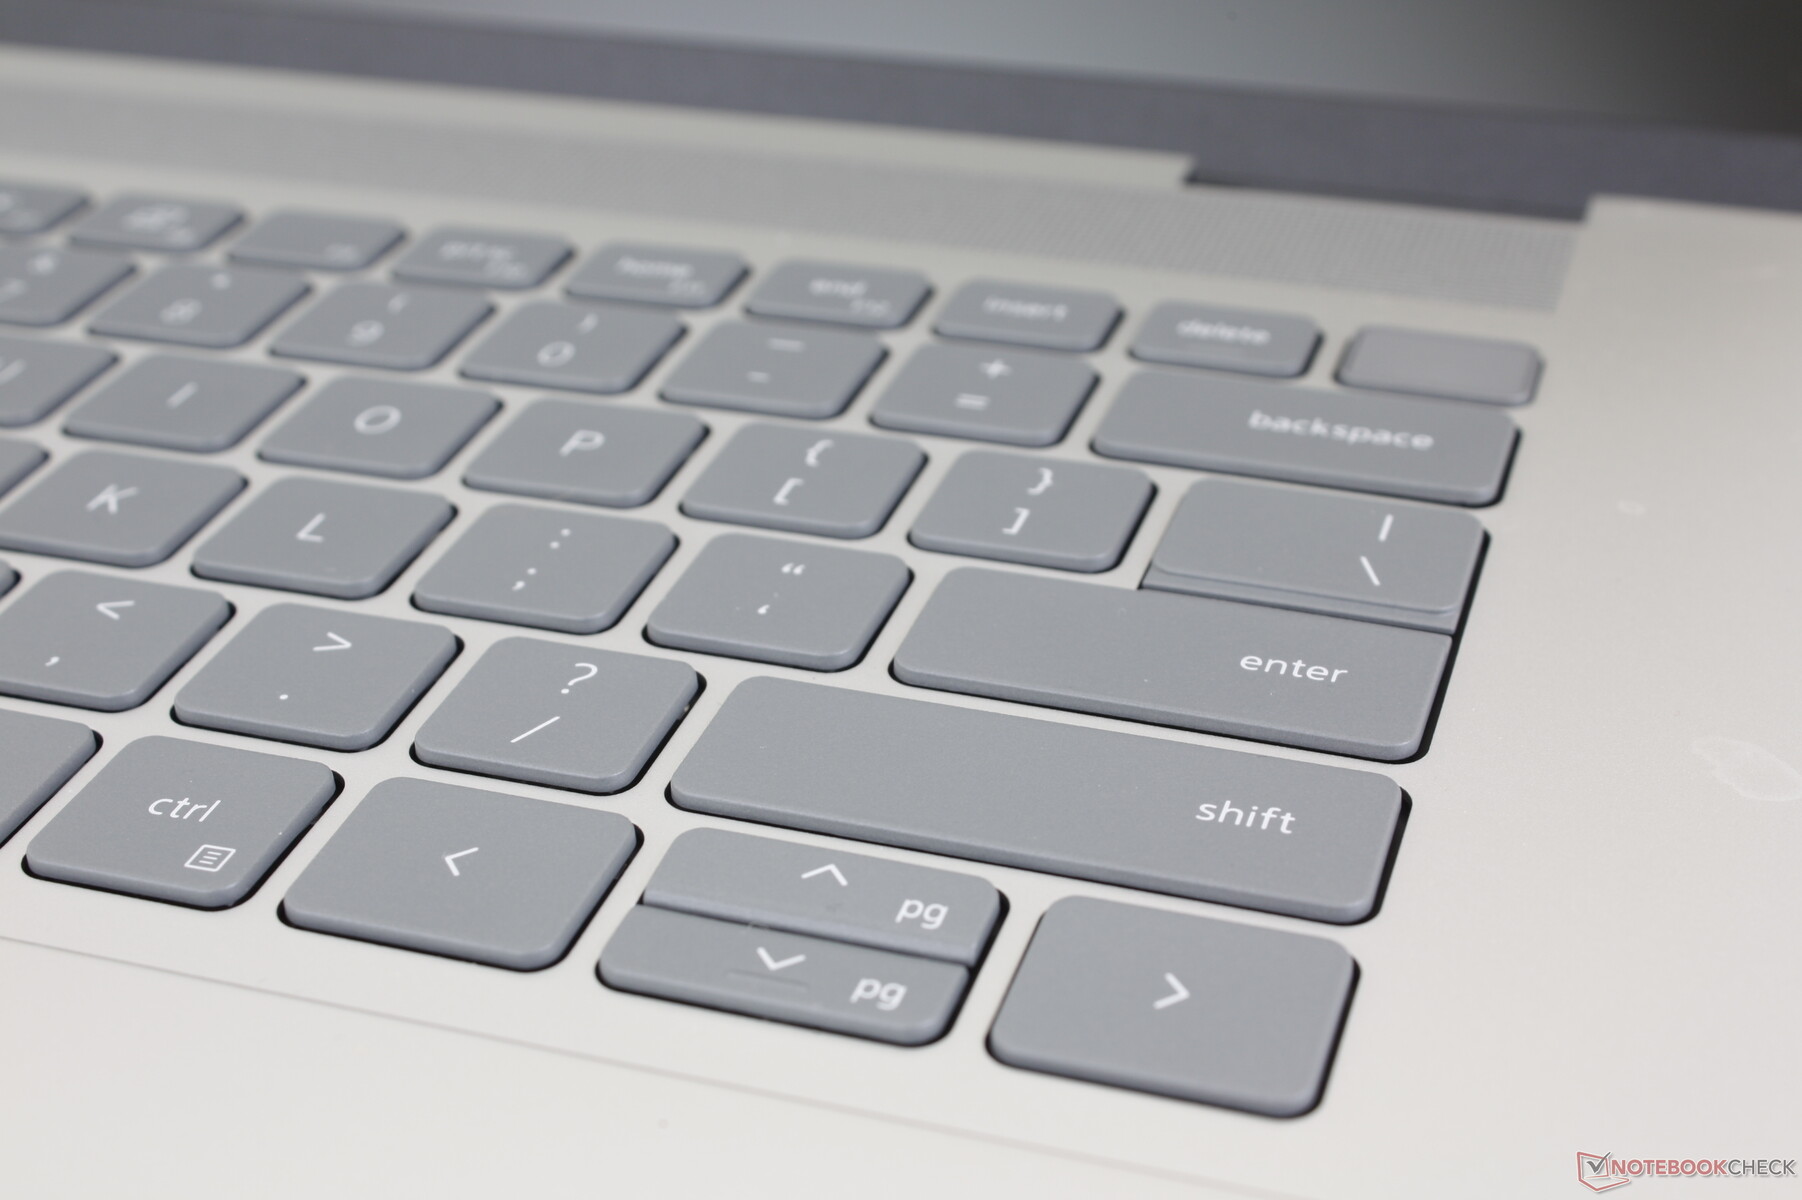
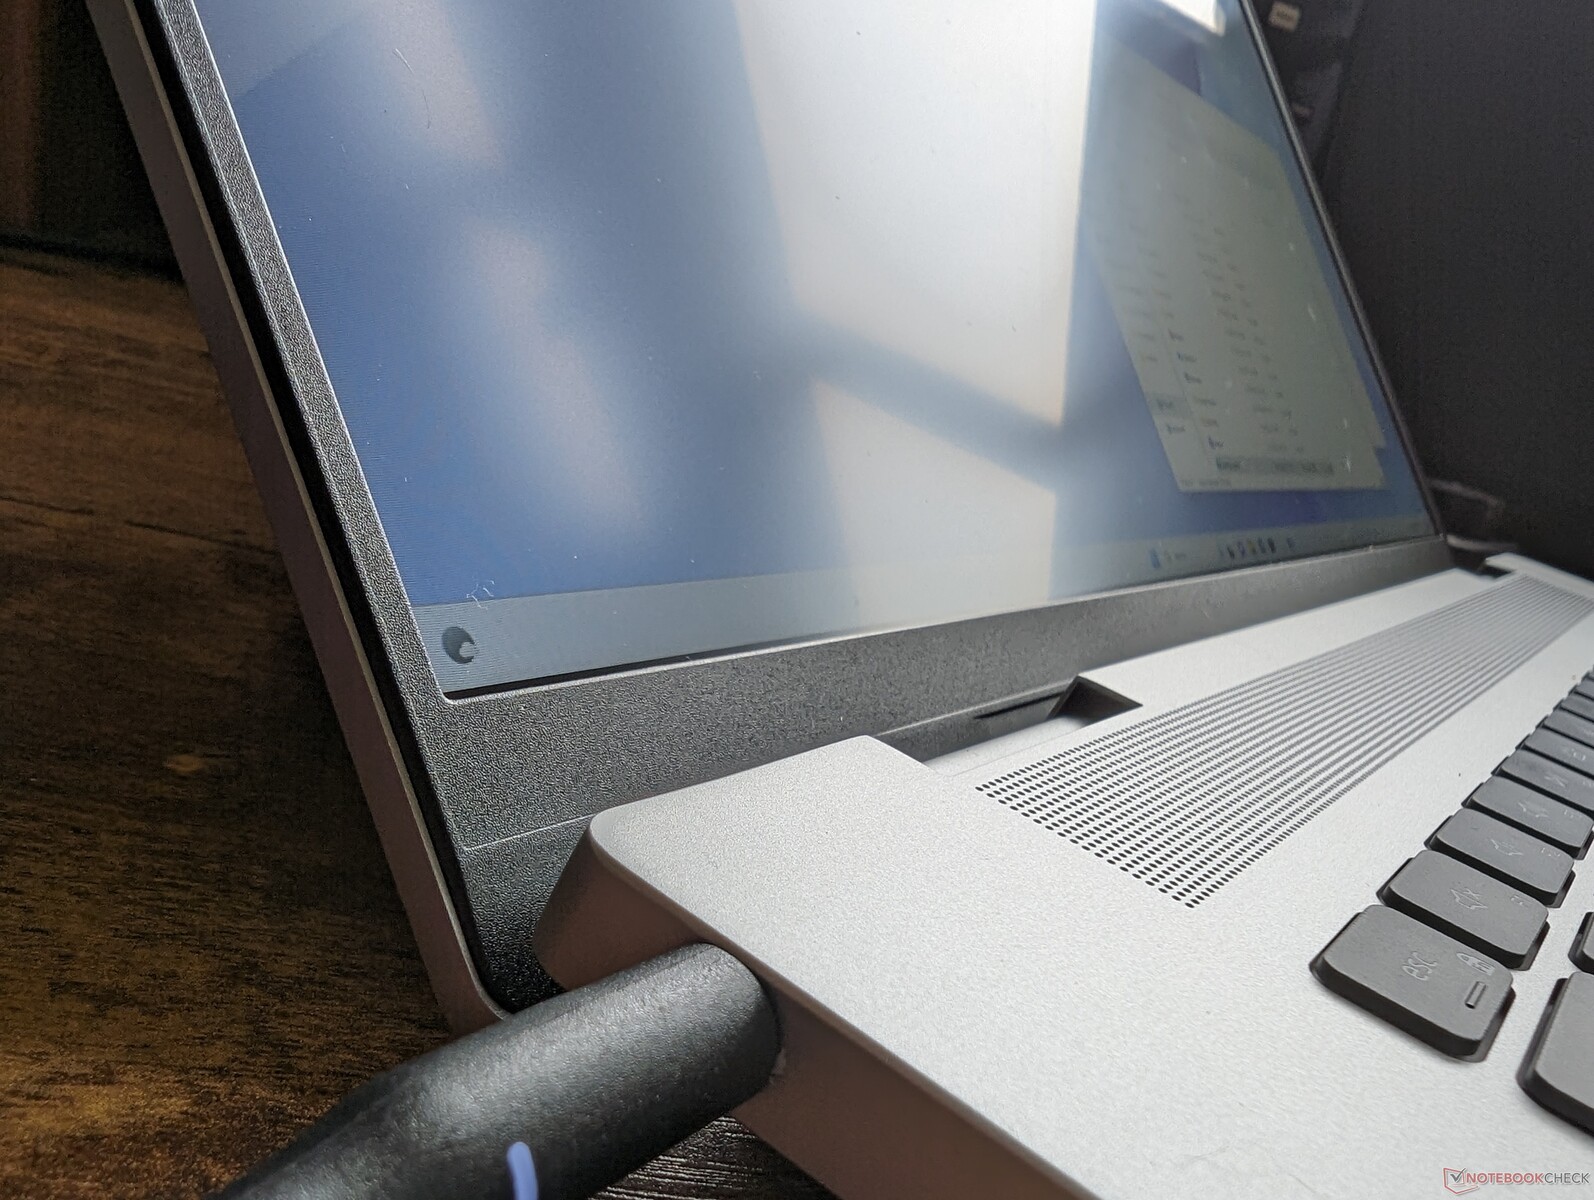
Inspiron 16 Plus 7630 posiada trzy znaczące zmiany zewnętrzne w stosunku do zeszłorocznego modelu. Po pierwsze i być może najważniejsze, zawiasy zostały przeprojektowane, aby były grubsze i mocniejsze niż wcześniej. Po drugie, wzdłuż krawędzi znajdują się teraz dodatkowe kratki wentylacyjne, które pomagają w chłodzeniu. I wreszcie, podpórki pod nadgarstki z Mylaru i clickpad zostały usunięte, podobnie jak w Inspiron 16 Plus 7635 2-w-1. W szczególności dwa pierwsze powinny, miejmy nadzieję, wydłużyć żywotność systemu, podczas gdy ostatni jest prawdopodobnie środkiem oszczędnościowym.
Ogólna sztywność obudowy jest mniej więcej taka sama jak w Inspiron 16 Plus 7620, ponieważ ich szkielety są wykonane z tych samych materiałów. Urządzenie jest mocne w dłoni, podobnie jak Envy 16ale z nieco słabszą pokrywą, ponieważ Dell nie ma żadnego wzmocnienia Gorilla Glass.
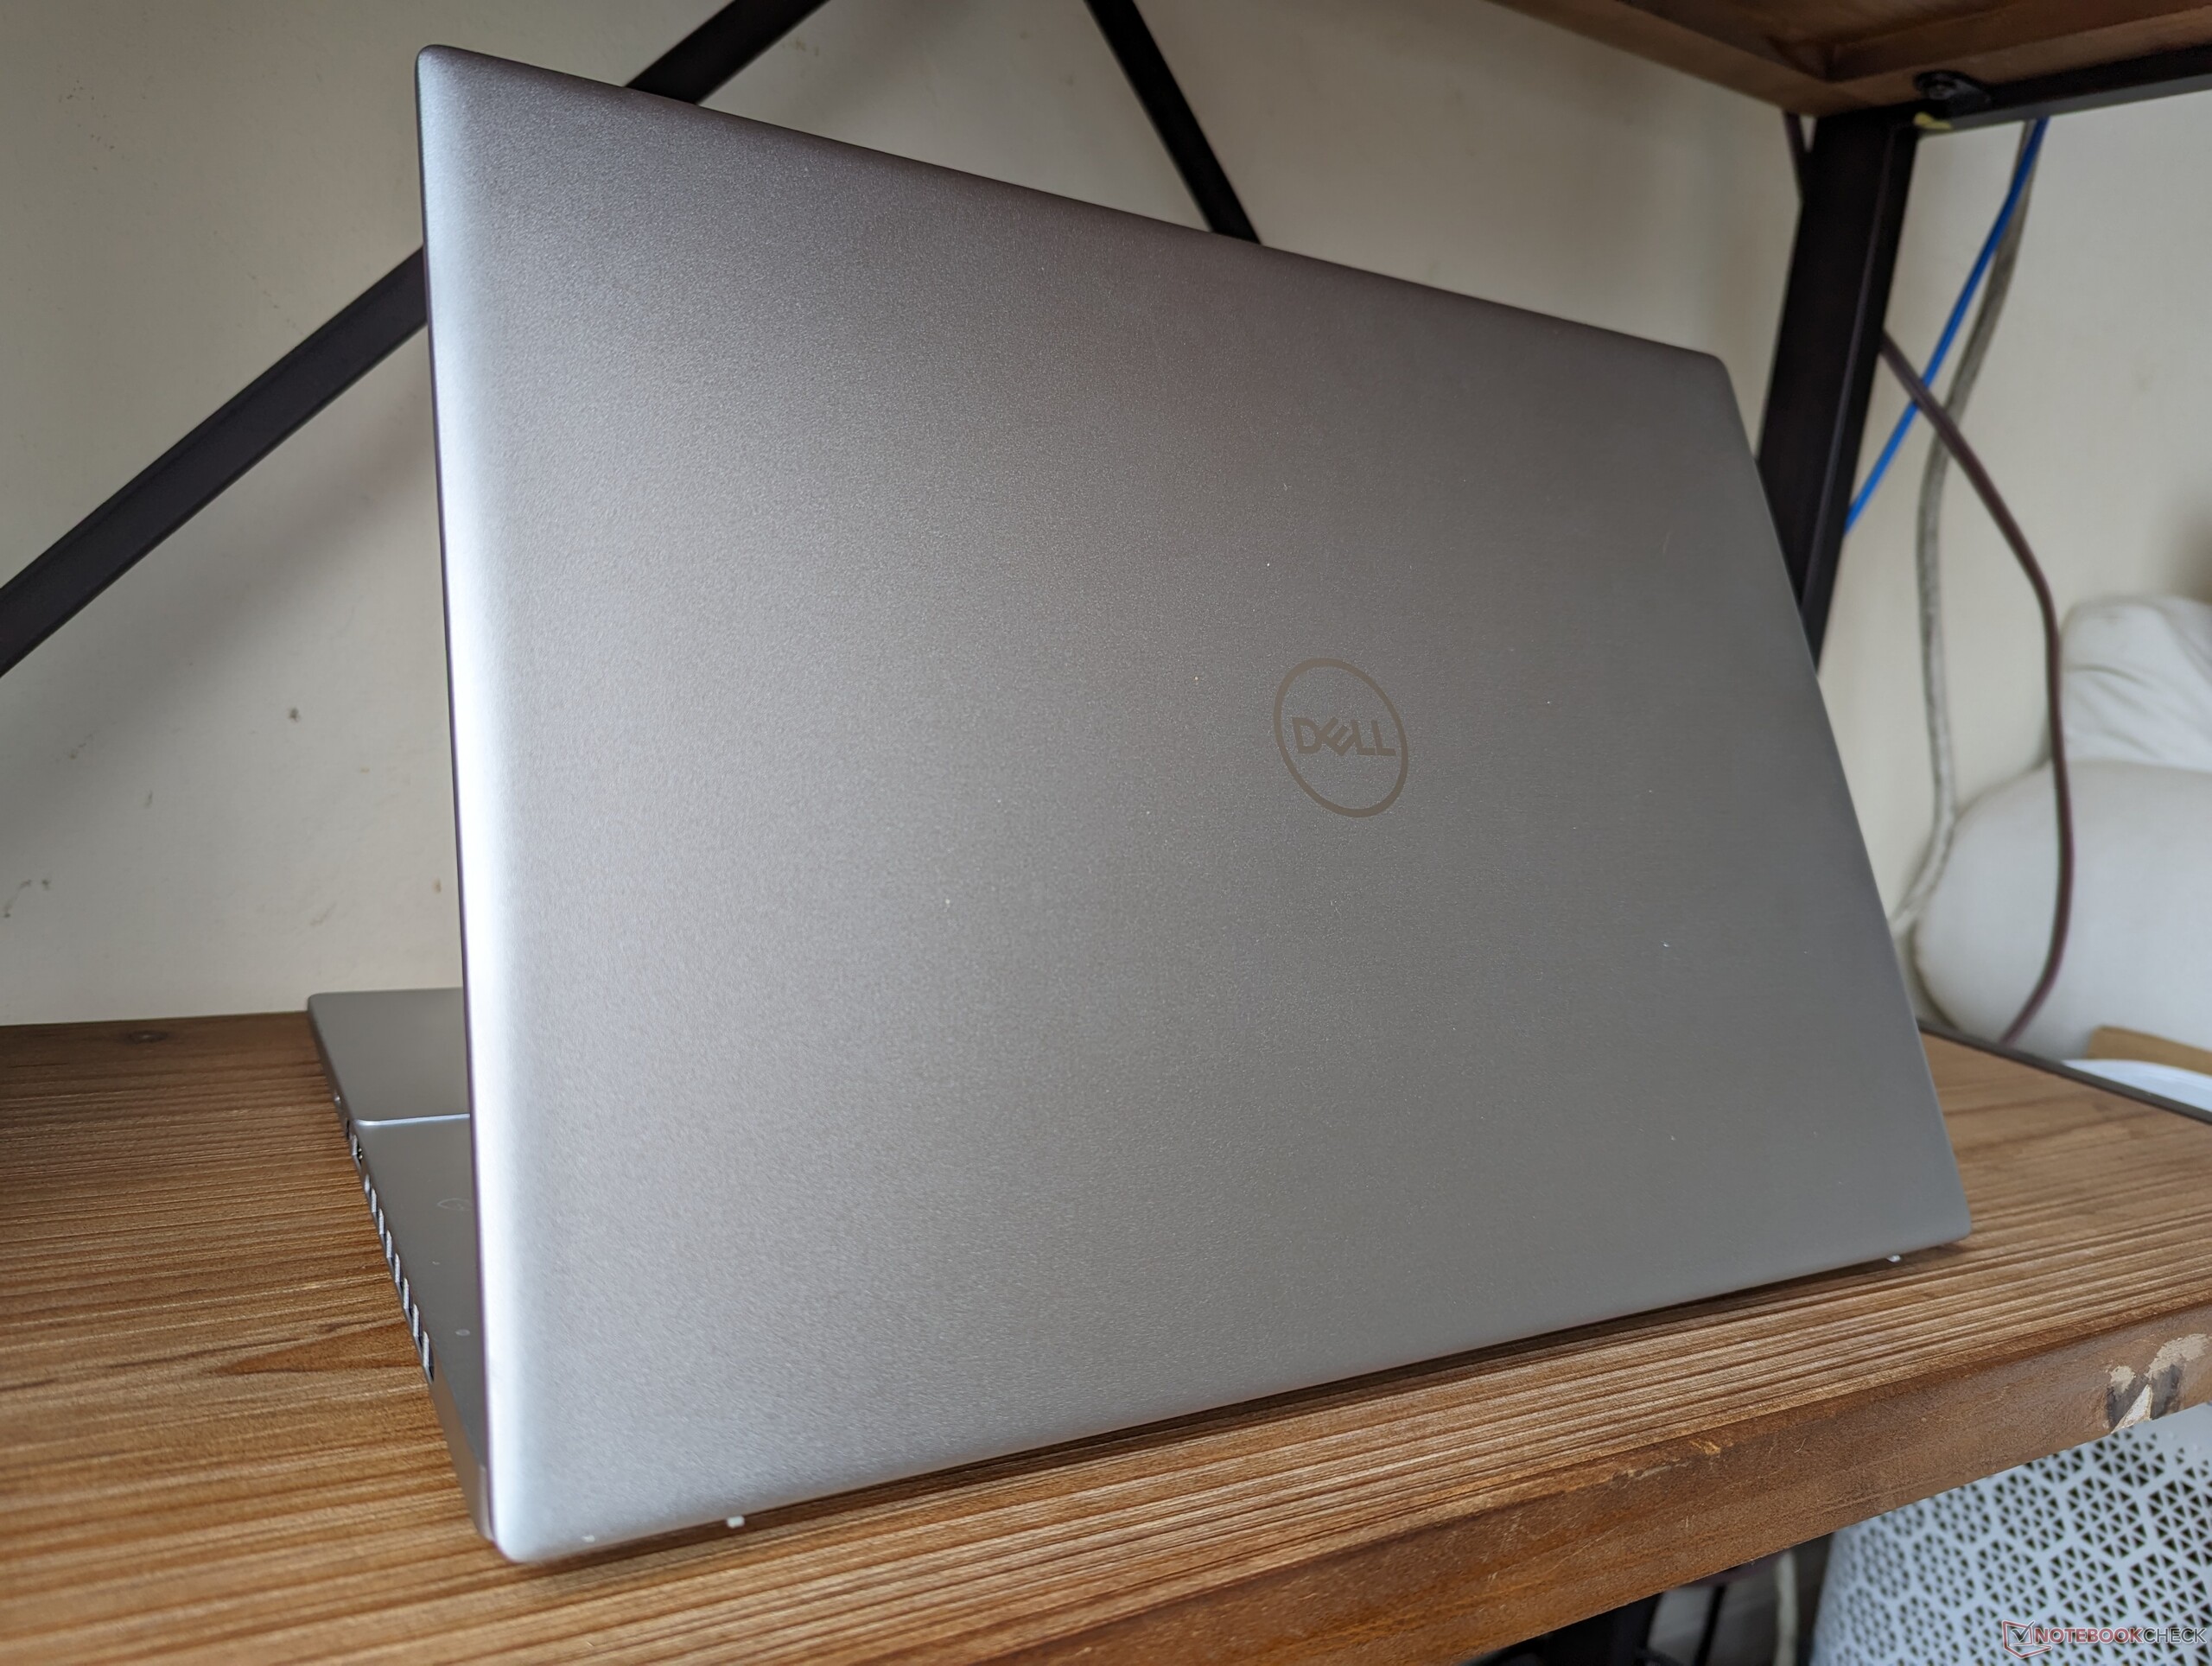
Wymiary i waga pozostają mniej więcej takie same jak w zeszłorocznym projekcie, jeśli nie nieco cięższe o około 100 g. Chociaż nie do końca lekki, Dell jest nadal porównywalny z alternatywami, takimi jak Slim Pro 9i 16 lub Envy 16 pod tym względem.
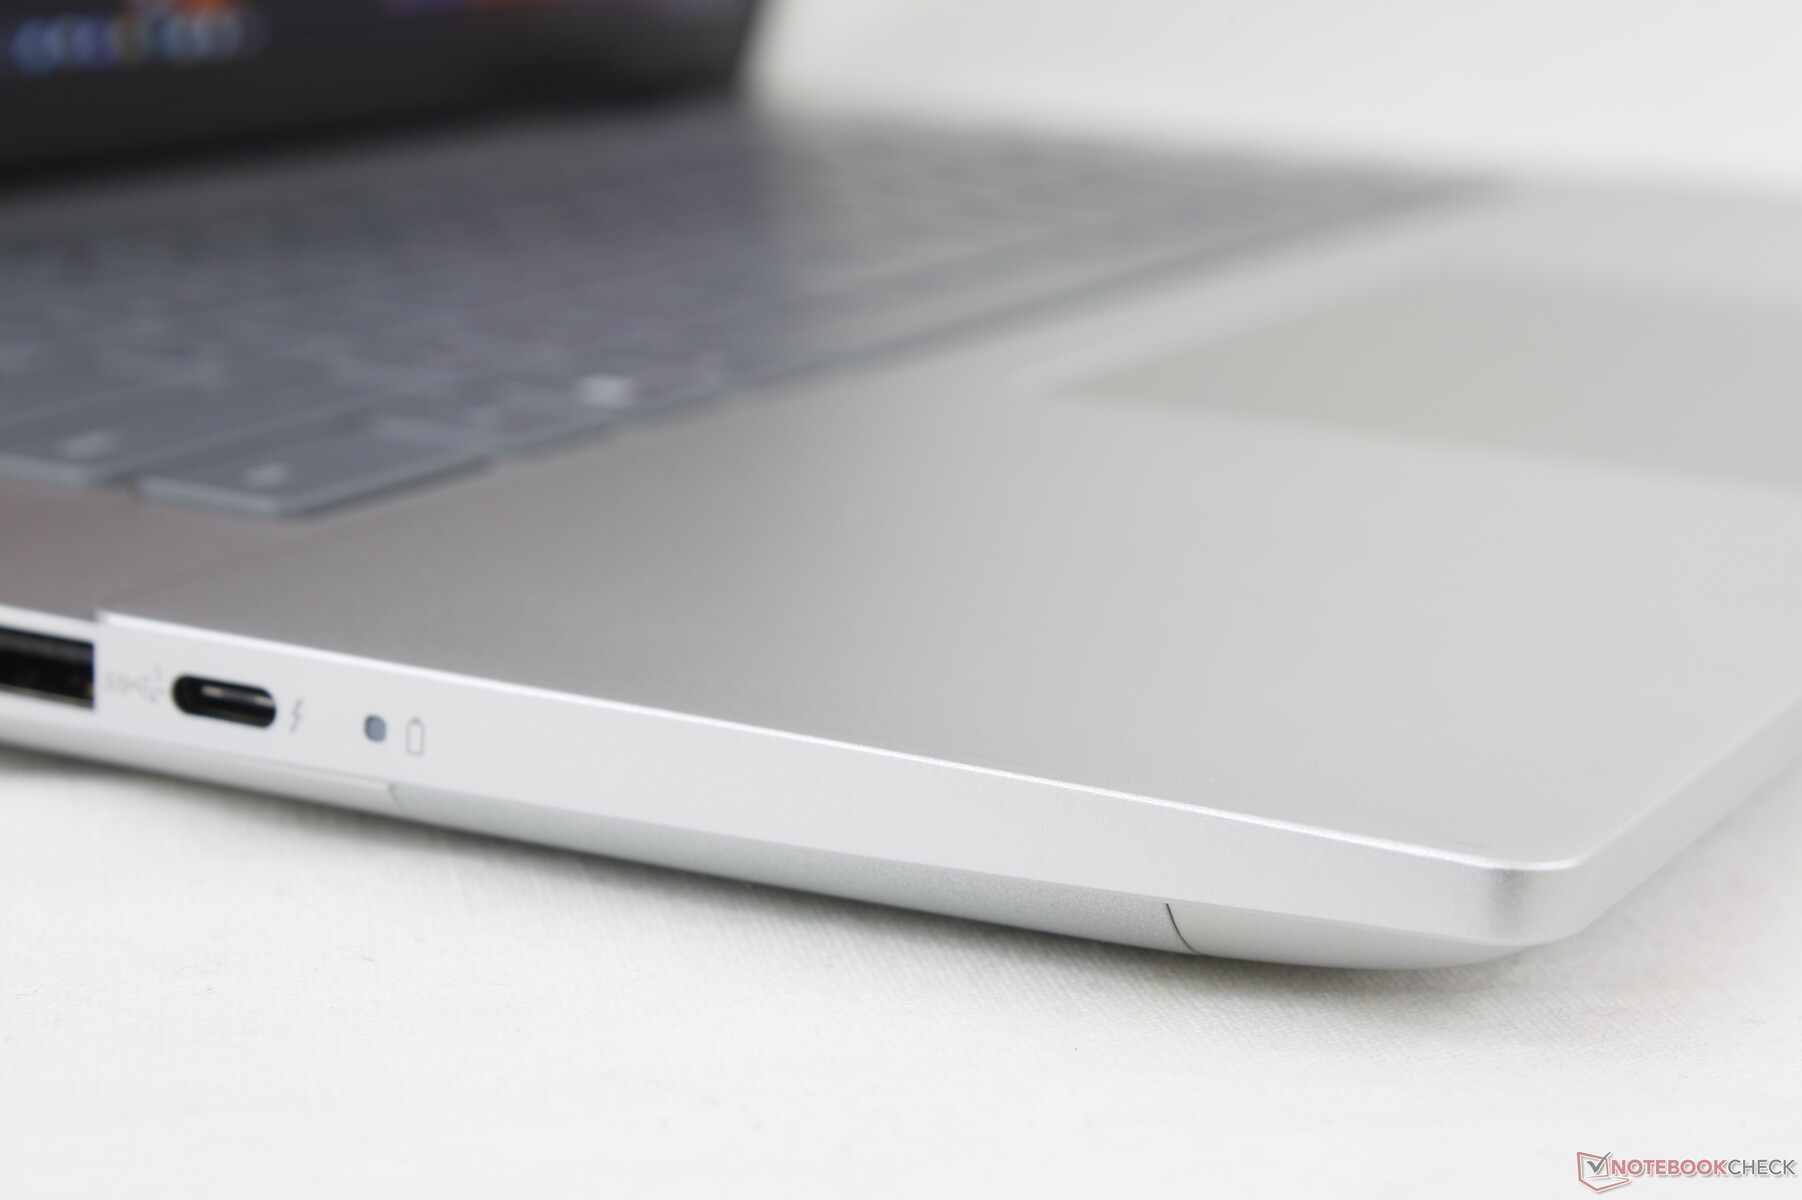
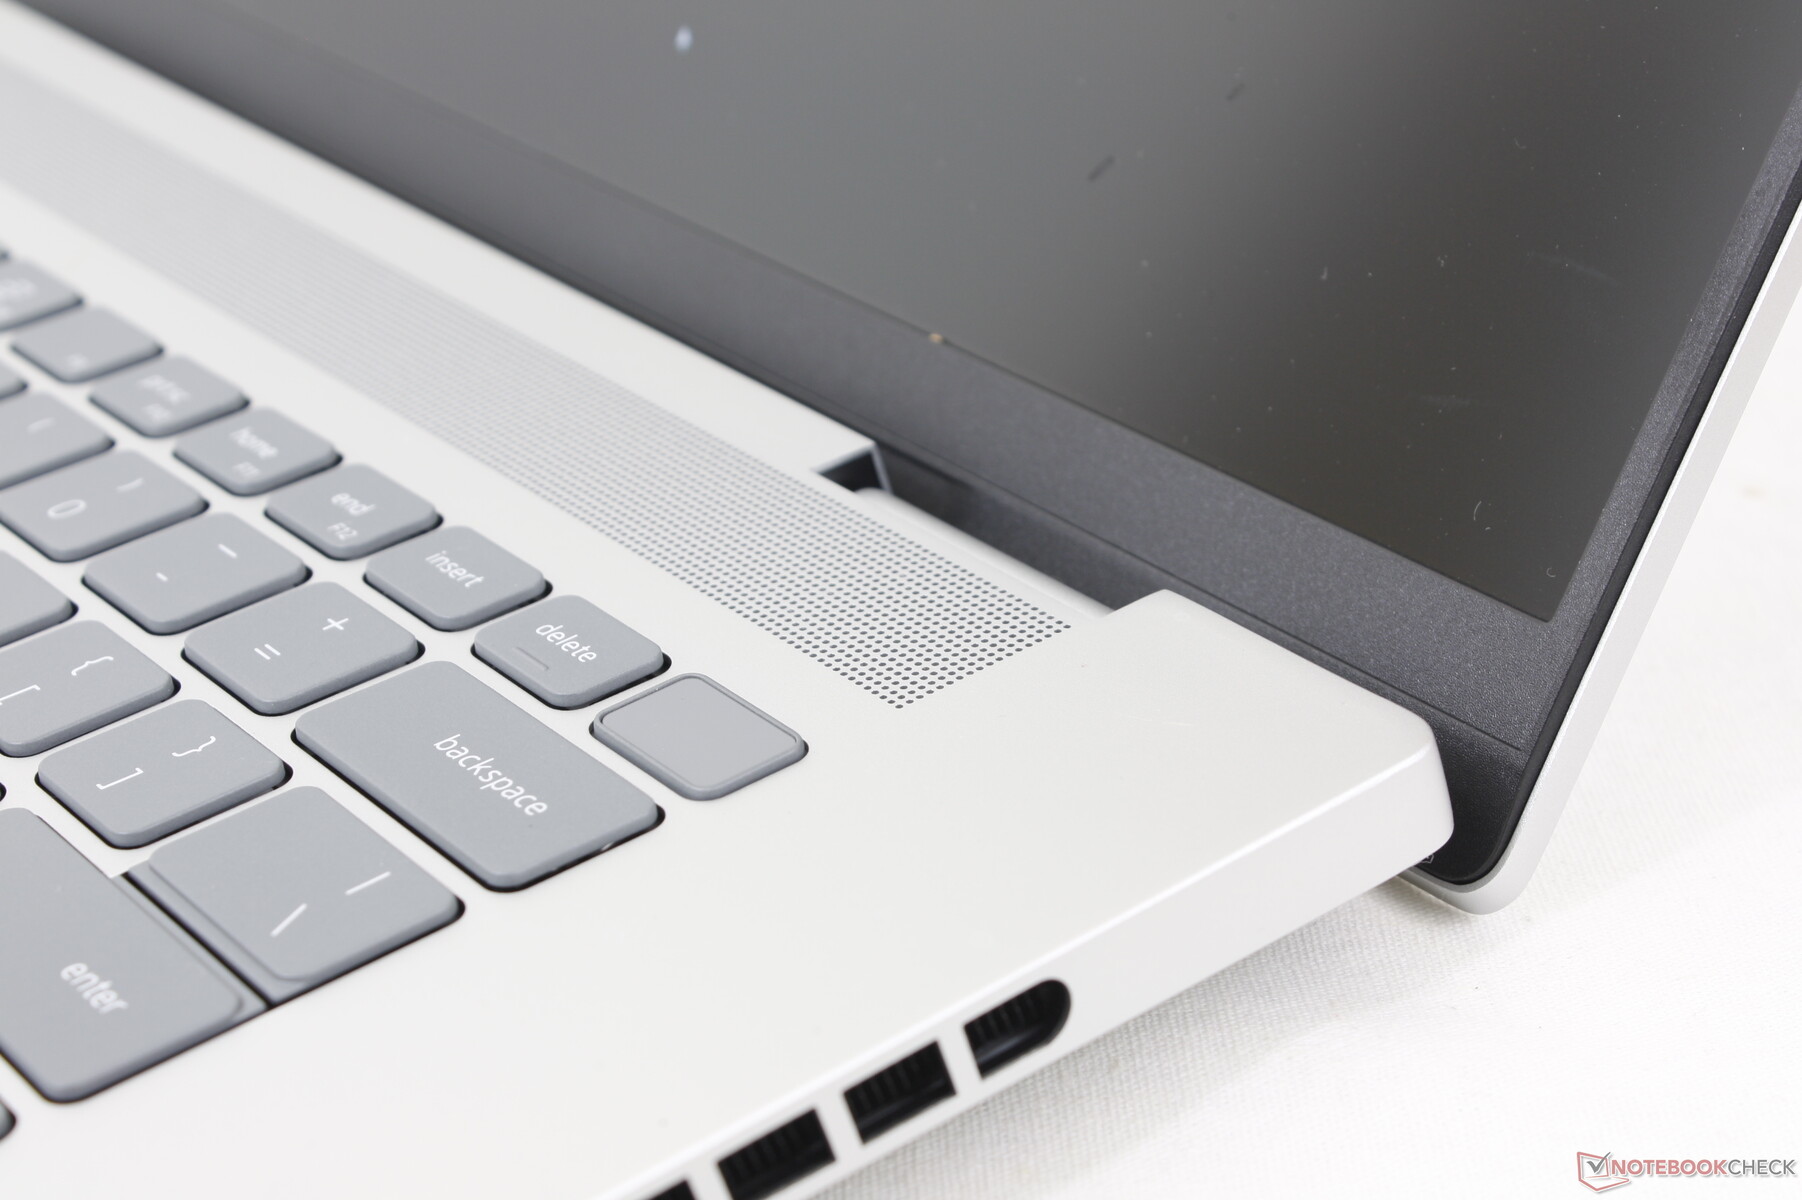
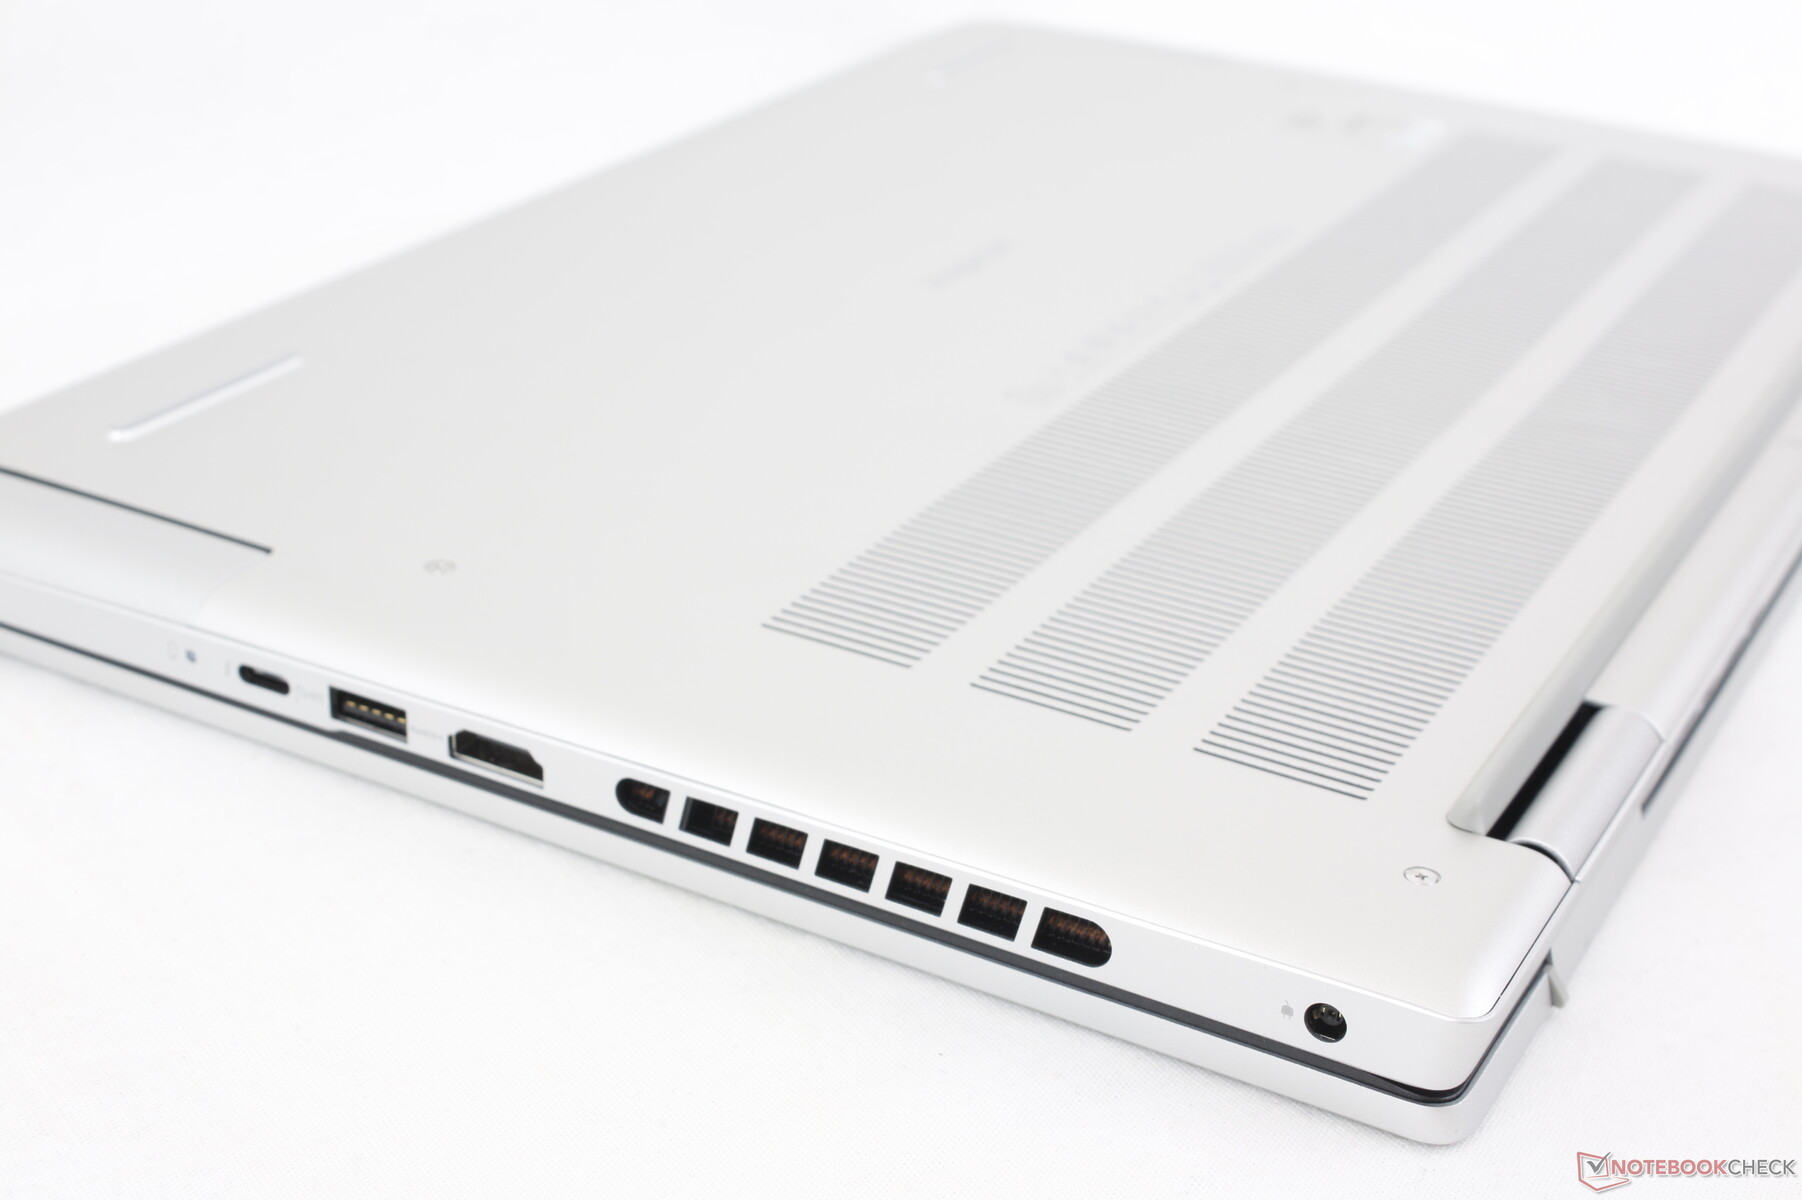
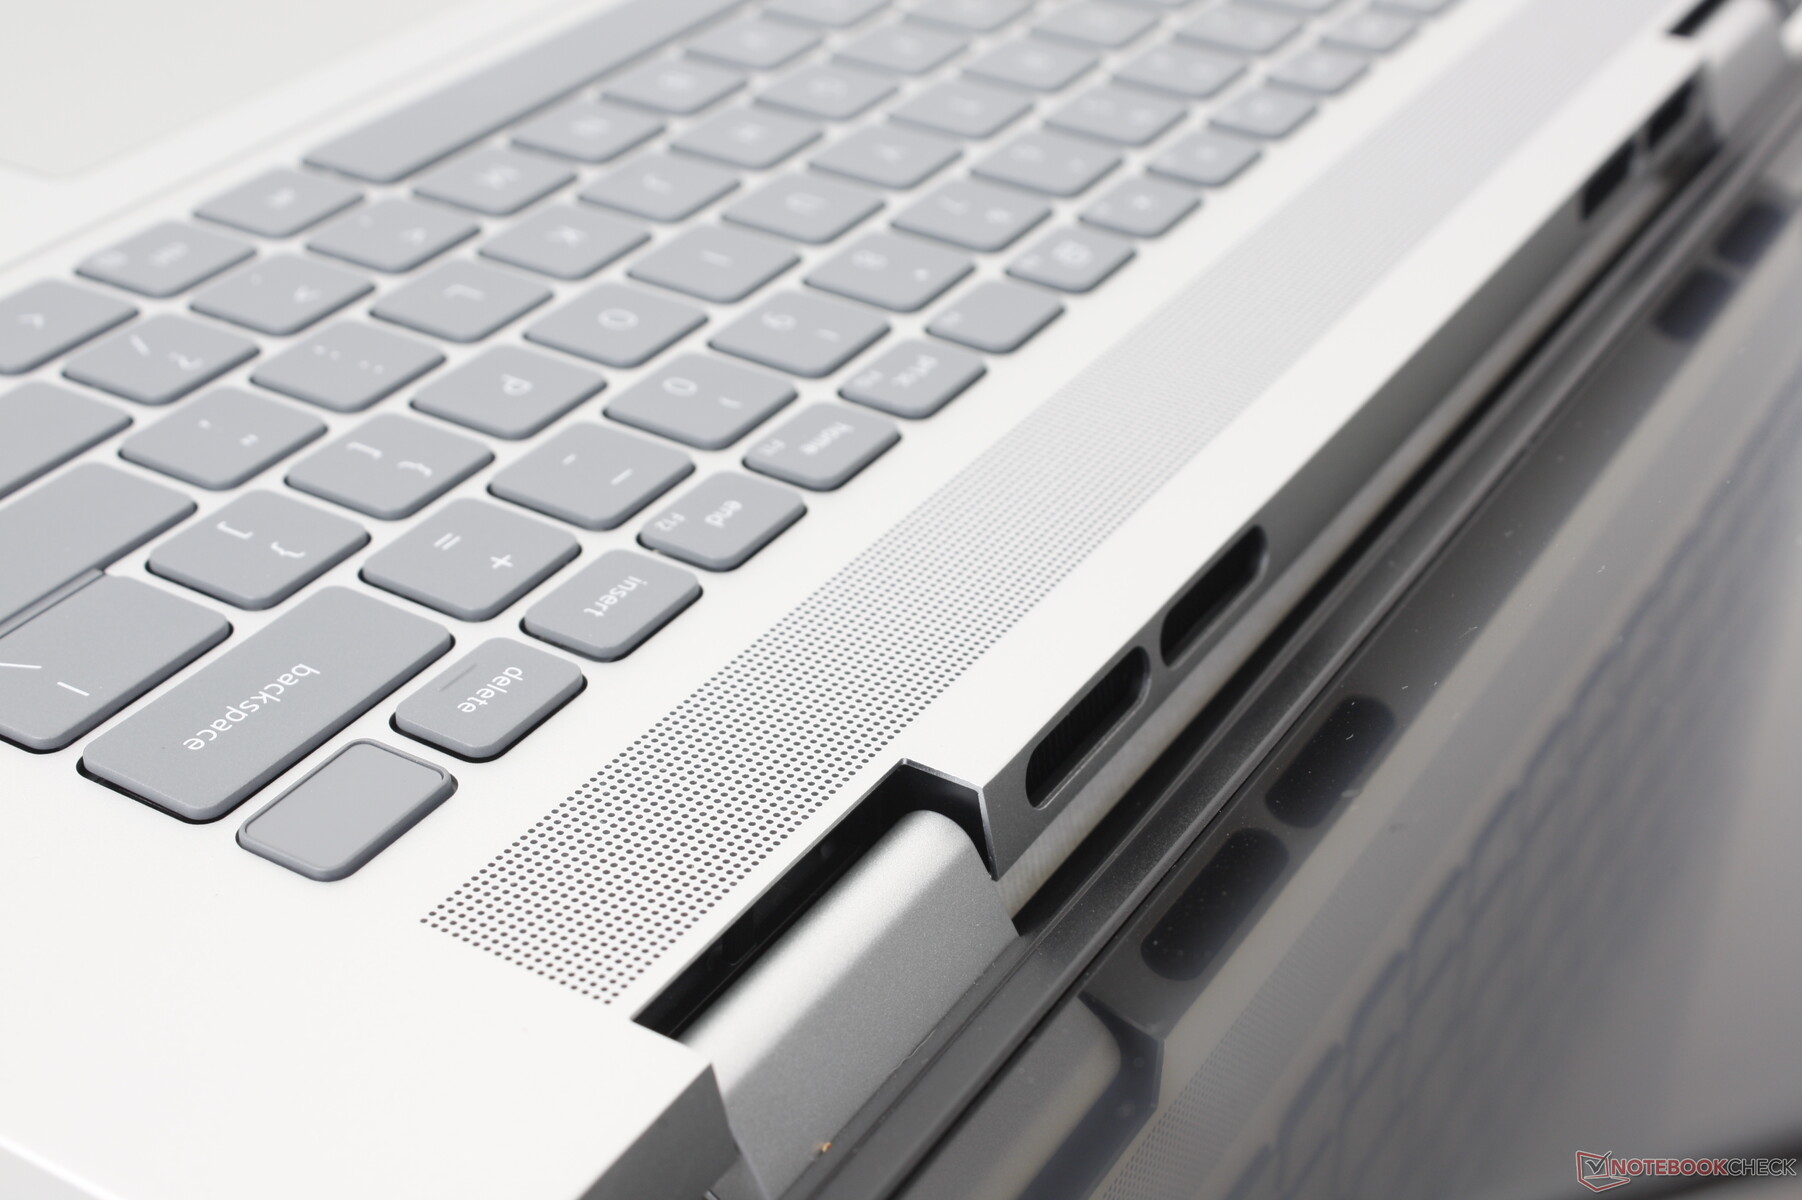
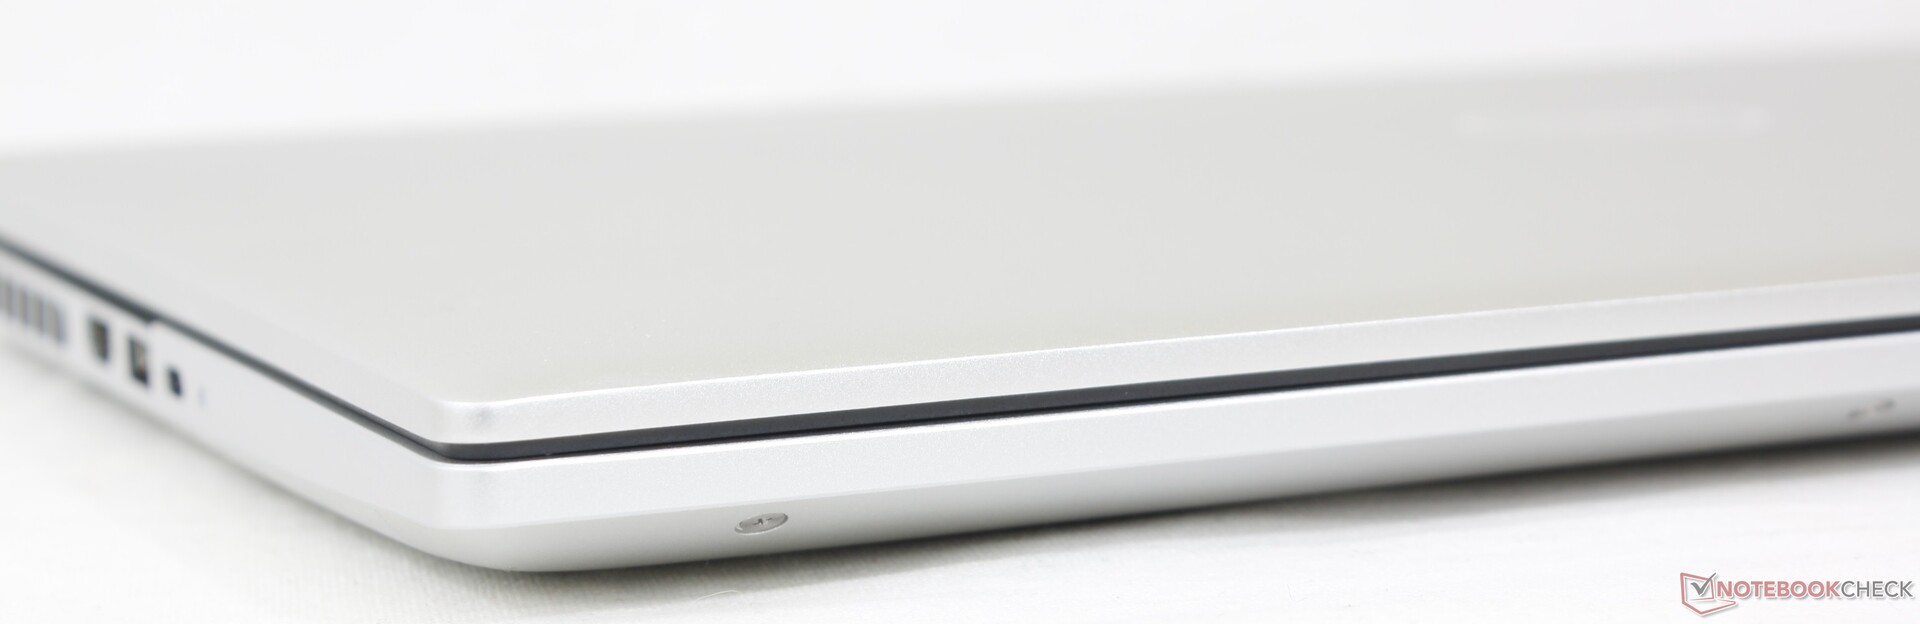
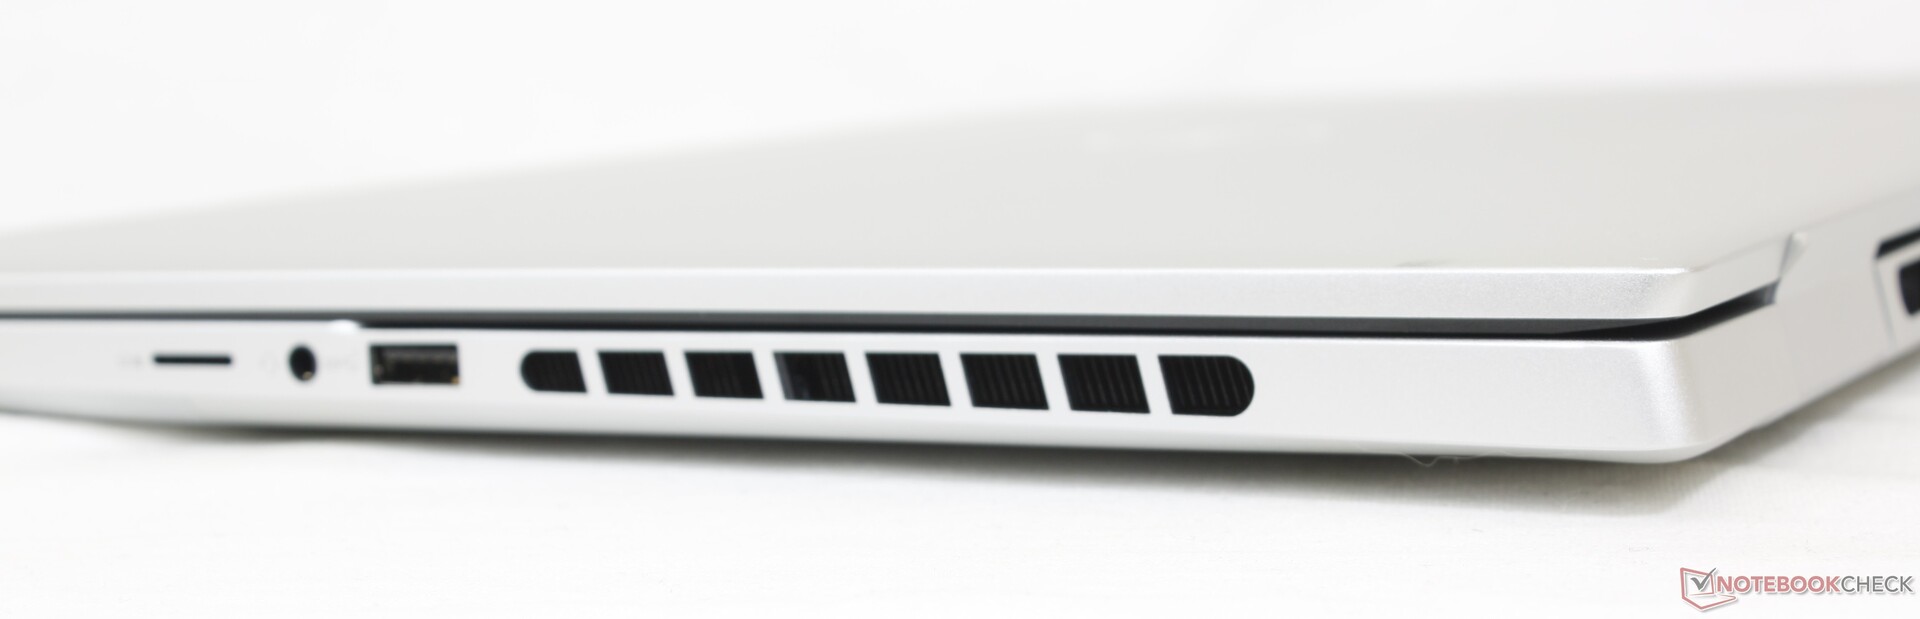
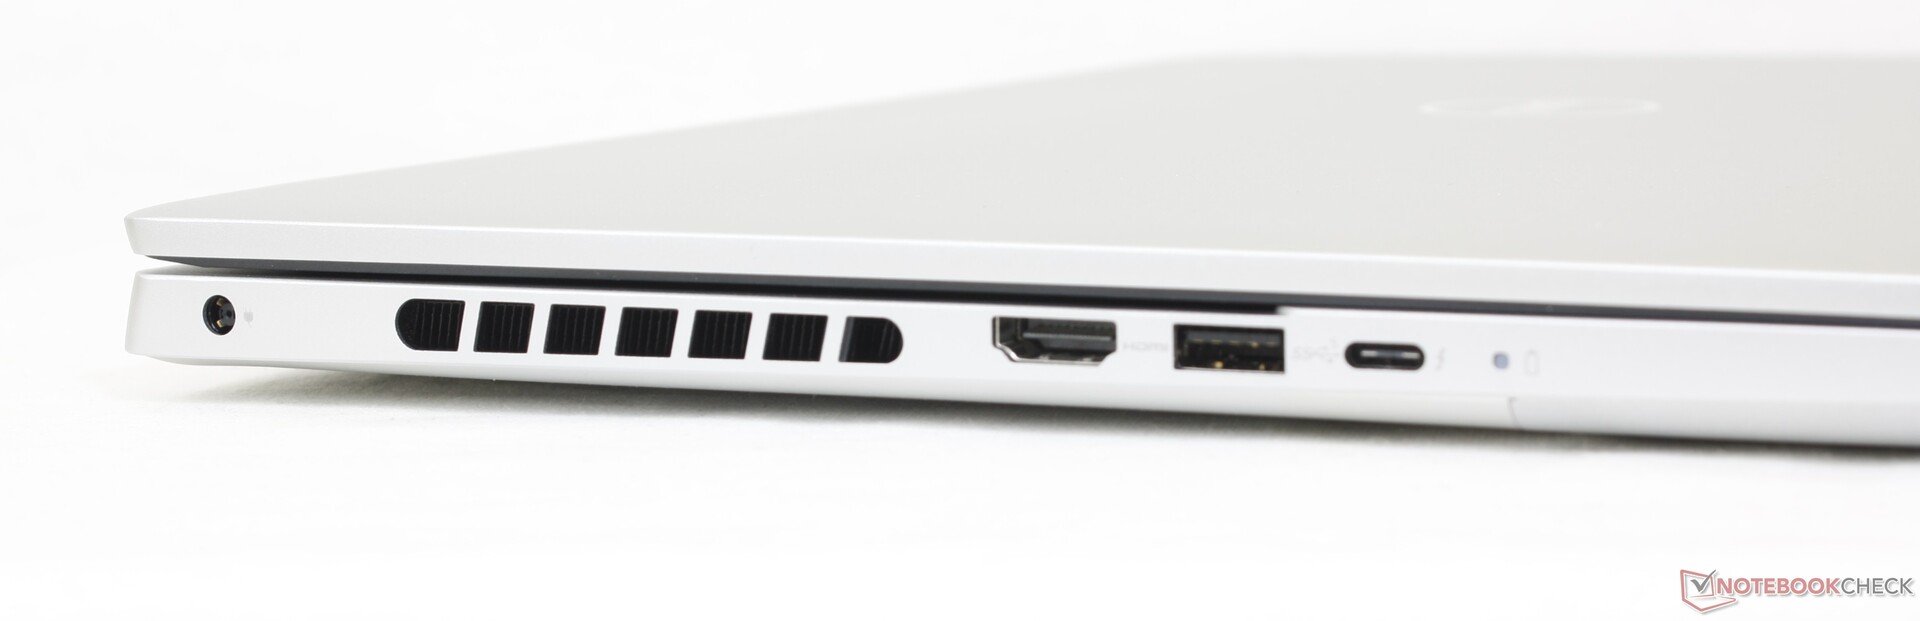
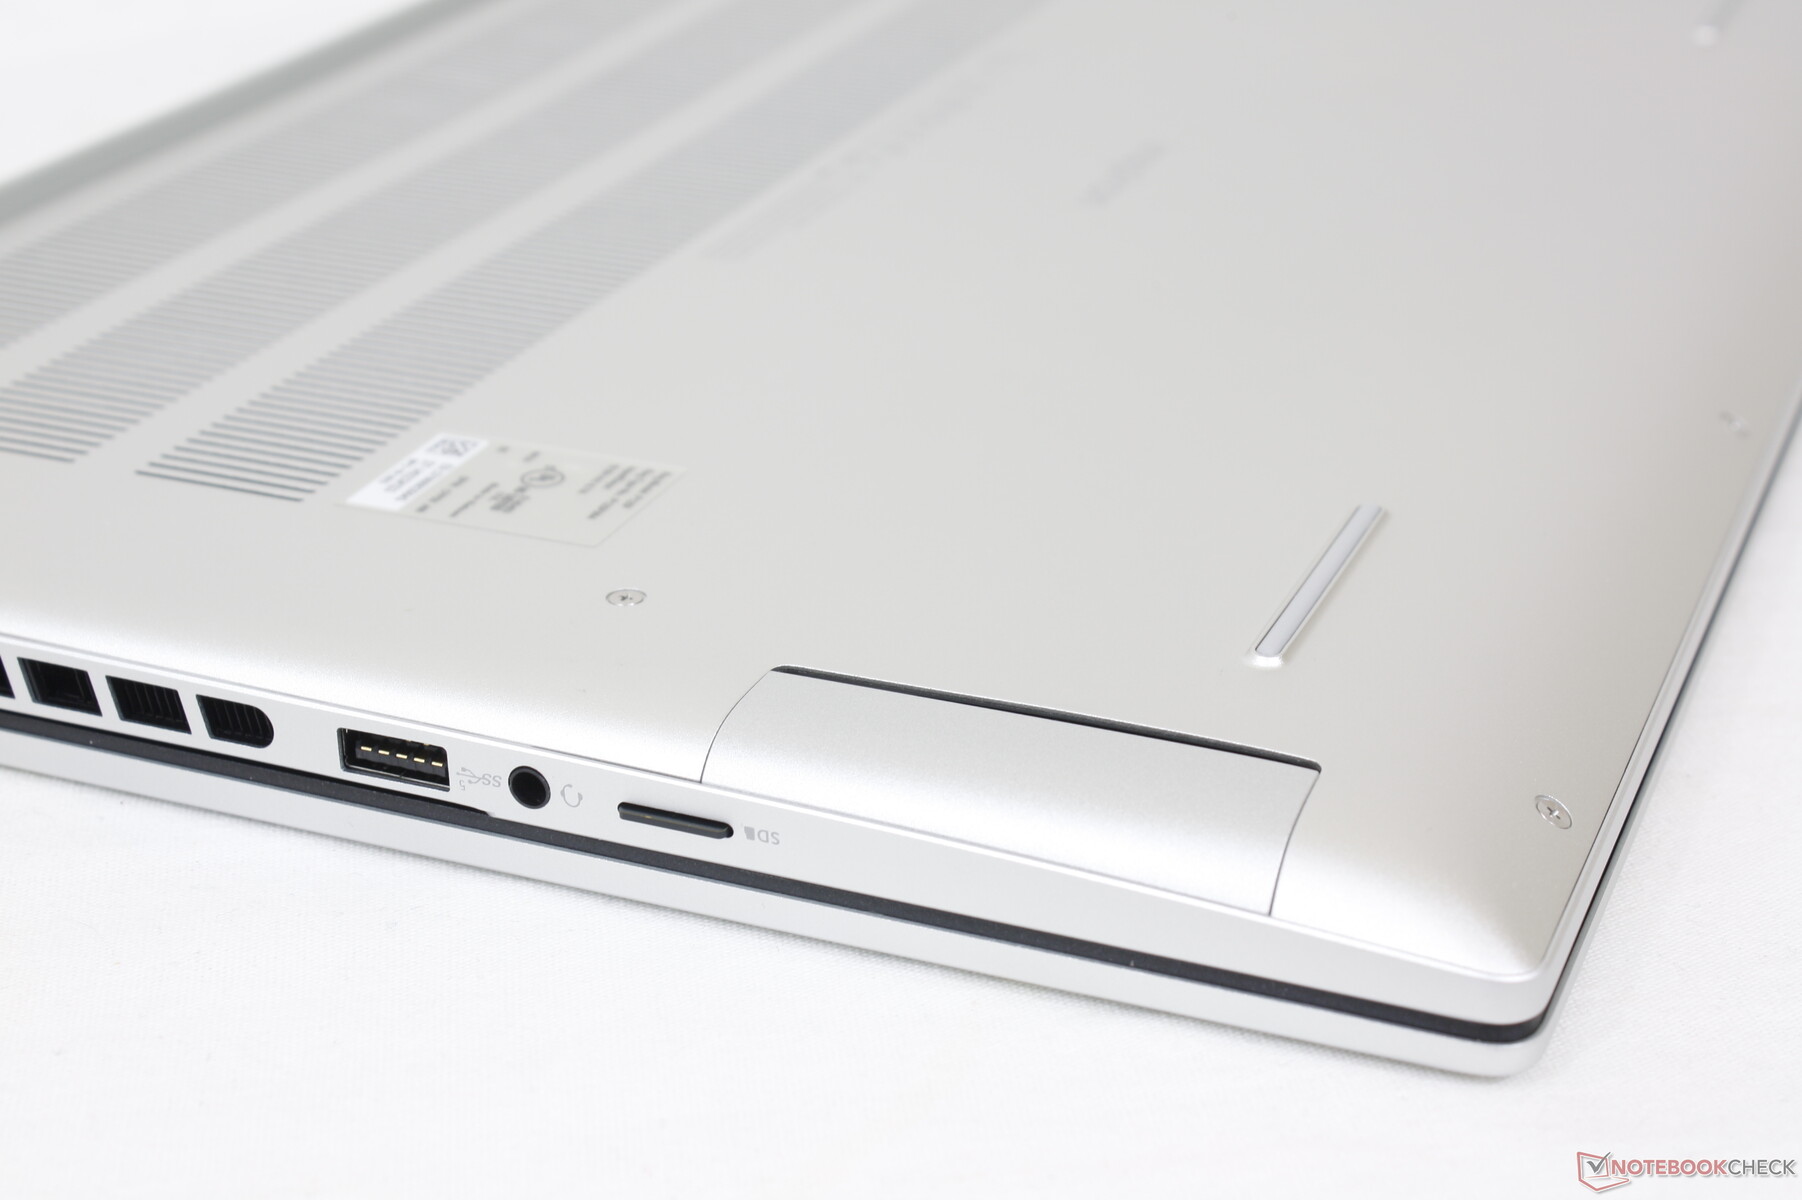
Łączność - przydałoby się więcej USB-C
Rozmieszczenie portów i opcje obejmują wszystko z zeszłorocznego modelu, ale z jednym znaczącym obniżeniem: pełnowymiarowy czytnik kart SD został usunięty na rzecz mniejszego czytnika microSD we wszystkich konfiguracjach RTX 4060. Alternatywy takie jak Envy 16 lub VivoBook Pro 16X integrują więcej portów USB-C niż nasz Dell lub mają pełnowymiarowe czytniki kart SD.
Chcielibyśmy również, aby przyszłe modele Inspiron porzuciły zastrzeżony port beczkowy zasilacza sieciowego na rzecz ładowania przez USB-C, podobnie jak w serii XPS 15 i XPS 17.
Czytnik kart SD
Podczas gdy seria XPS jest domem dla jednych z najszybszych czytników kart SD w każdym laptopie, seria Inspiron zawiera jedne z najwolniejszych. Przeniesienie 1 GB zdjęć z naszej karty testowej UHS-II na pulpit zajęłoby ponad 50 sekund w porównaniu do zaledwie 5 do 6 sekund na XPS 15 lub XPS 17.
| SD Card Reader | |
| average JPG Copy Test (av. of 3 runs) | |
| MSI Summit E16 Flip A12UDT-031 (AV Pro SD microSD 128 GB V60) | |
| Asus Vivobook Pro 16X K6604JV-MX016W | |
| Lenovo Slim Pro 9i 16IRP8 (PNY EliteX-Pro60 V60 256 GB) | |
| HP Envy 16 h0112nr (AV Pro SD microSD 128 GB V60) | |
| Dell Inspiron 16 Plus 7620 (Toshiba Exceria Pro SDXC 64 GB UHS-II) | |
| Dell Inspiron 16 Plus 7630 (AV Pro SD microSD 128 GB V60) | |
| maximum AS SSD Seq Read Test (1GB) | |
| MSI Summit E16 Flip A12UDT-031 (AV Pro SD microSD 128 GB V60) | |
| Asus Vivobook Pro 16X K6604JV-MX016W | |
| Lenovo Slim Pro 9i 16IRP8 (PNY EliteX-Pro60 V60 256 GB) | |
| HP Envy 16 h0112nr (AV Pro SD microSD 128 GB V60) | |
| Dell Inspiron 16 Plus 7620 (Toshiba Exceria Pro SDXC 64 GB UHS-II) | |
| Dell Inspiron 16 Plus 7630 (AV Pro SD microSD 128 GB V60) | |
Komunikacja
Intel AX211 jest standardowo wyposażony w łączność Wi-Fi 6E i Bluetooth 5.3. Doświadczyliśmy stabilnej i niezawodnej wydajności po sparowaniu z naszą siecią testową Asus AXE11000 6 GHz.
Moduł MediaTek jest dołączony zamiast tego, jeśli jest skonfigurowany z procesorem AMD.
| Networking | |
| iperf3 transmit AXE11000 | |
| Asus Vivobook Pro 16X K6604JV-MX016W | |
| MSI Summit E16 Flip A12UDT-031 | |
| Lenovo Slim Pro 9i 16IRP8 | |
| Dell Inspiron 16 Plus 7630 | |
| iperf3 receive AXE11000 | |
| Asus Vivobook Pro 16X K6604JV-MX016W | |
| MSI Summit E16 Flip A12UDT-031 | |
| Lenovo Slim Pro 9i 16IRP8 | |
| Dell Inspiron 16 Plus 7630 | |
| iperf3 transmit AXE11000 6GHz | |
| Dell Inspiron 16 Plus 7630 | |
| Asus Vivobook Pro 16X K6604JV-MX016W | |
| Lenovo Slim Pro 9i 16IRP8 | |
| HP Envy 16 h0112nr | |
| Dell Inspiron 16 Plus 7620 | |
| iperf3 receive AXE11000 6GHz | |
| Asus Vivobook Pro 16X K6604JV-MX016W | |
| Lenovo Slim Pro 9i 16IRP8 | |
| HP Envy 16 h0112nr | |
| Dell Inspiron 16 Plus 7630 | |
| Dell Inspiron 16 Plus 7620 | |
Kamera internetowa
Kamera internetowa 2 MP stała się standardem w większości laptopów multimedialnych. Droższe modele HP zawierają kamery internetowe 5 MP lub nawet 8 MP, jeśli jakość kamery internetowej jest priorytetem.
Fizyczny suwak zapewnia prywatność, ale podczerwień nie jest obsługiwana.


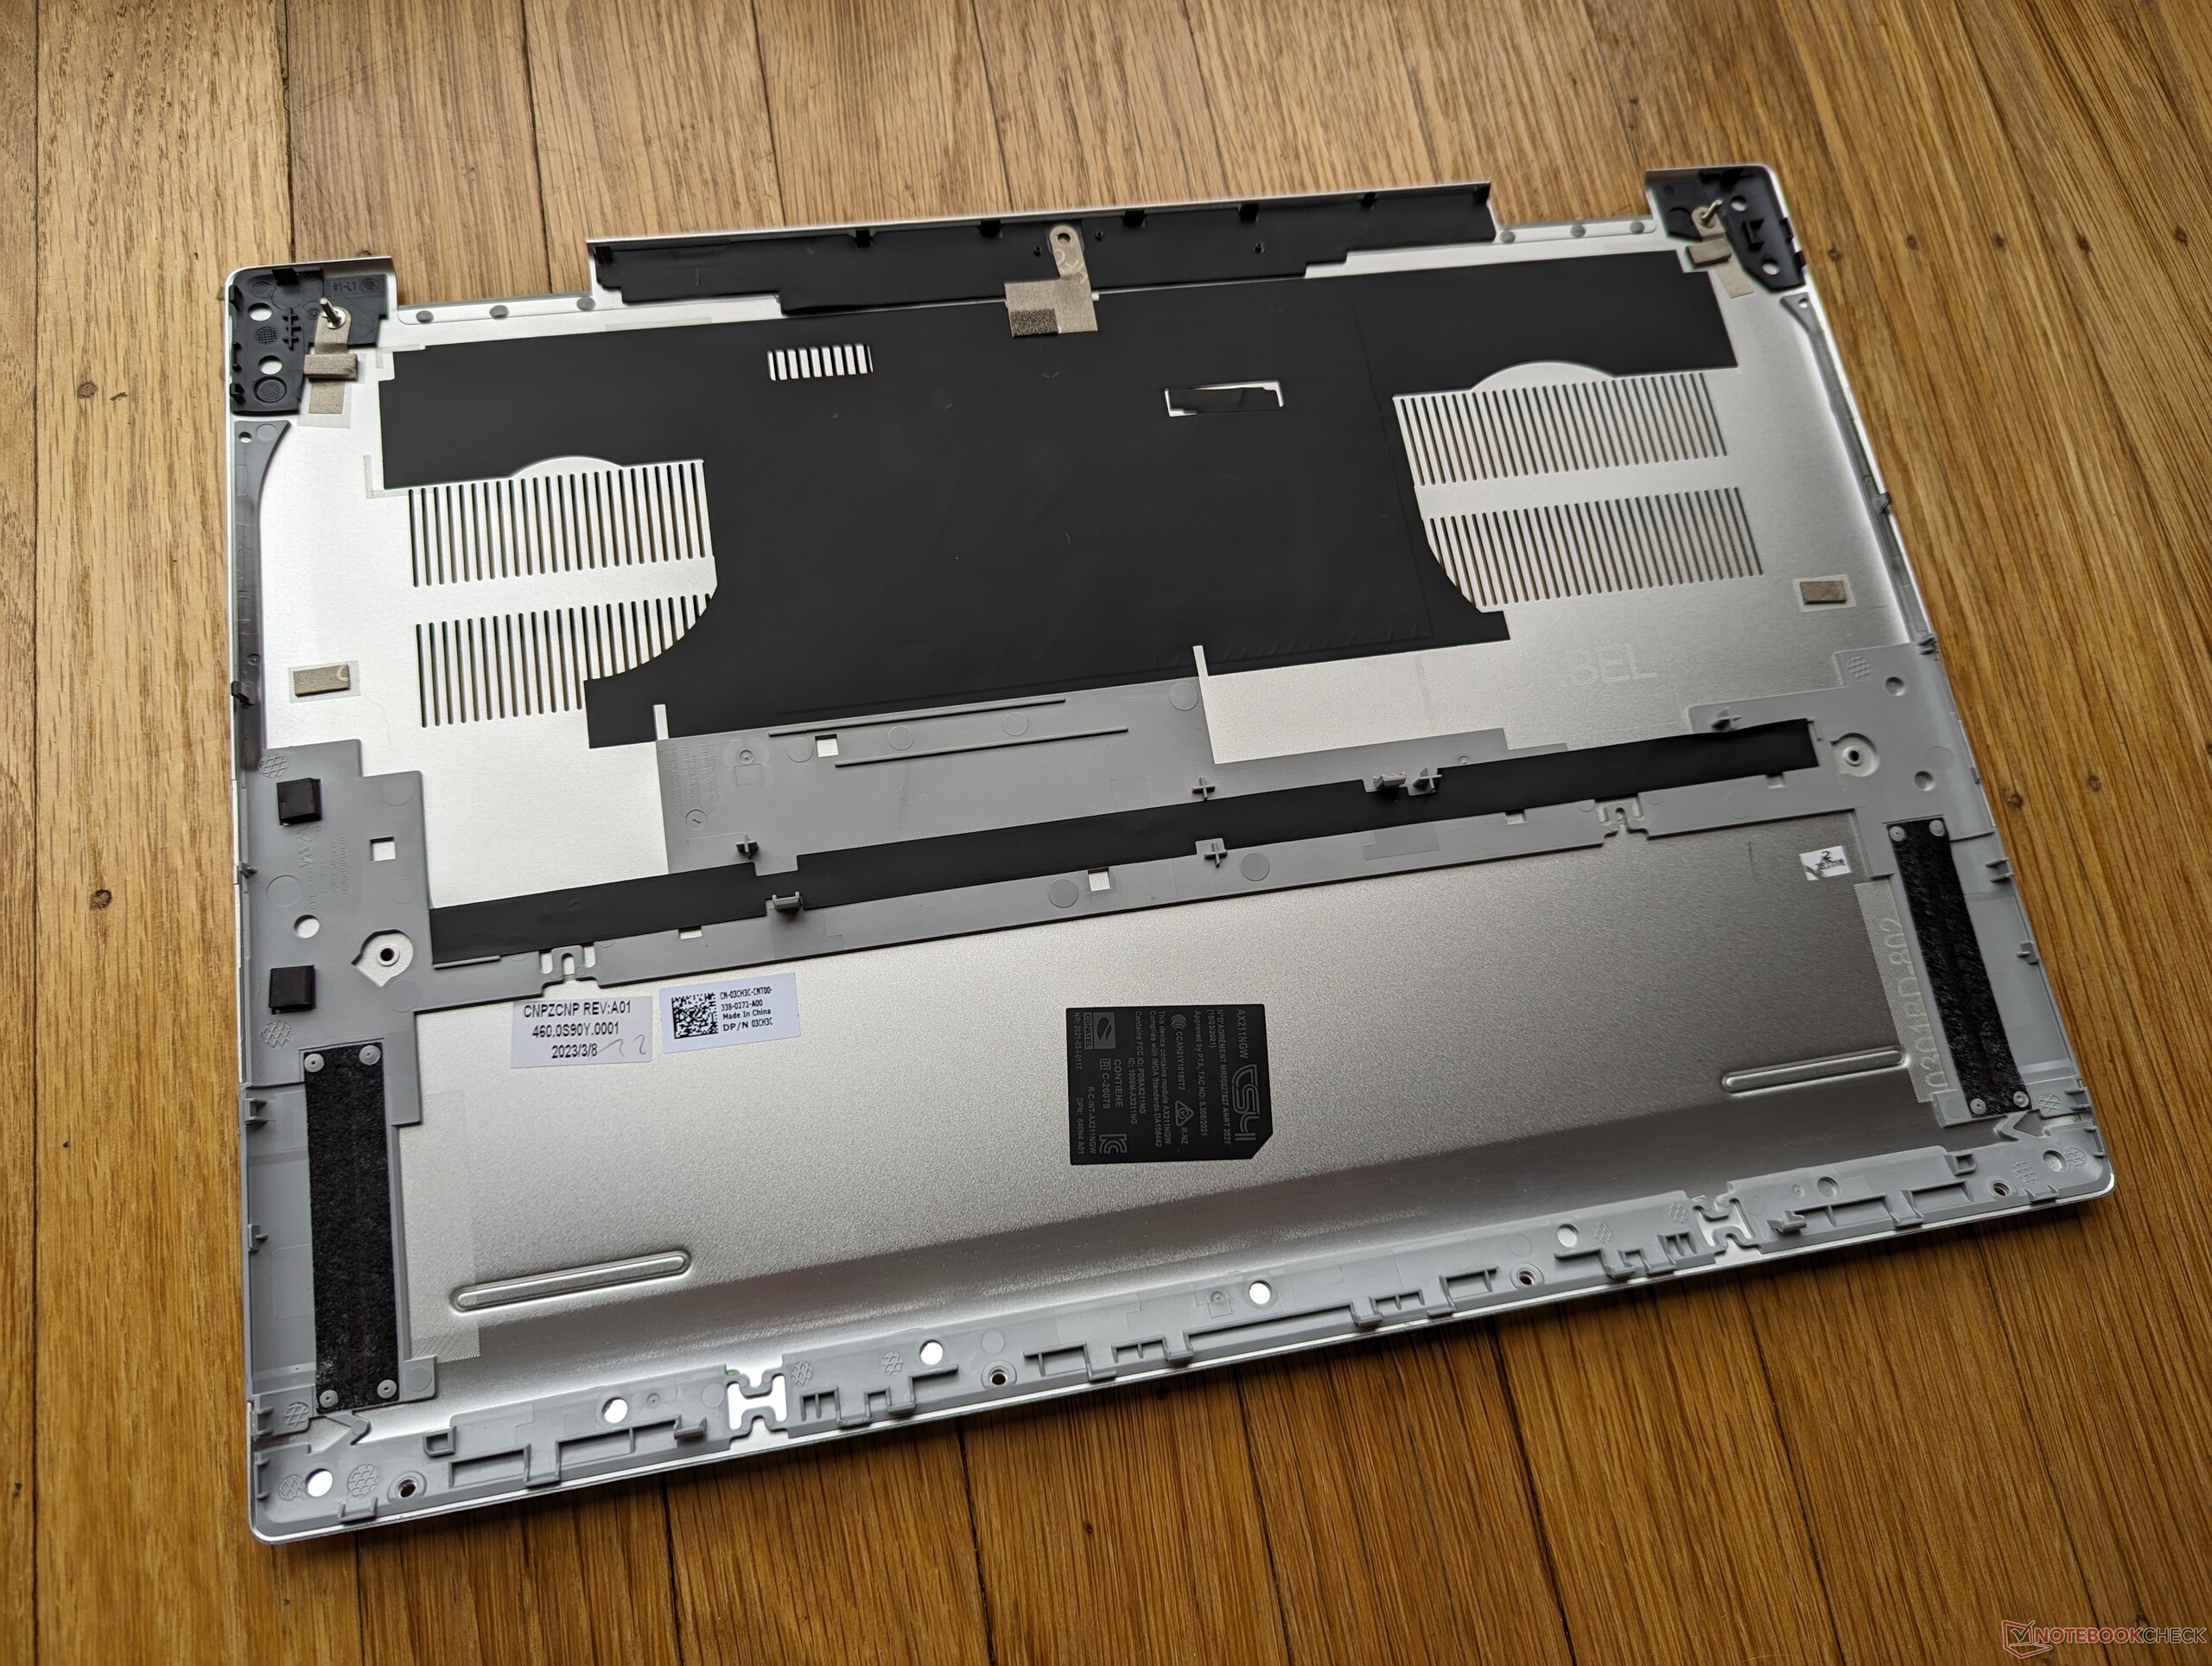
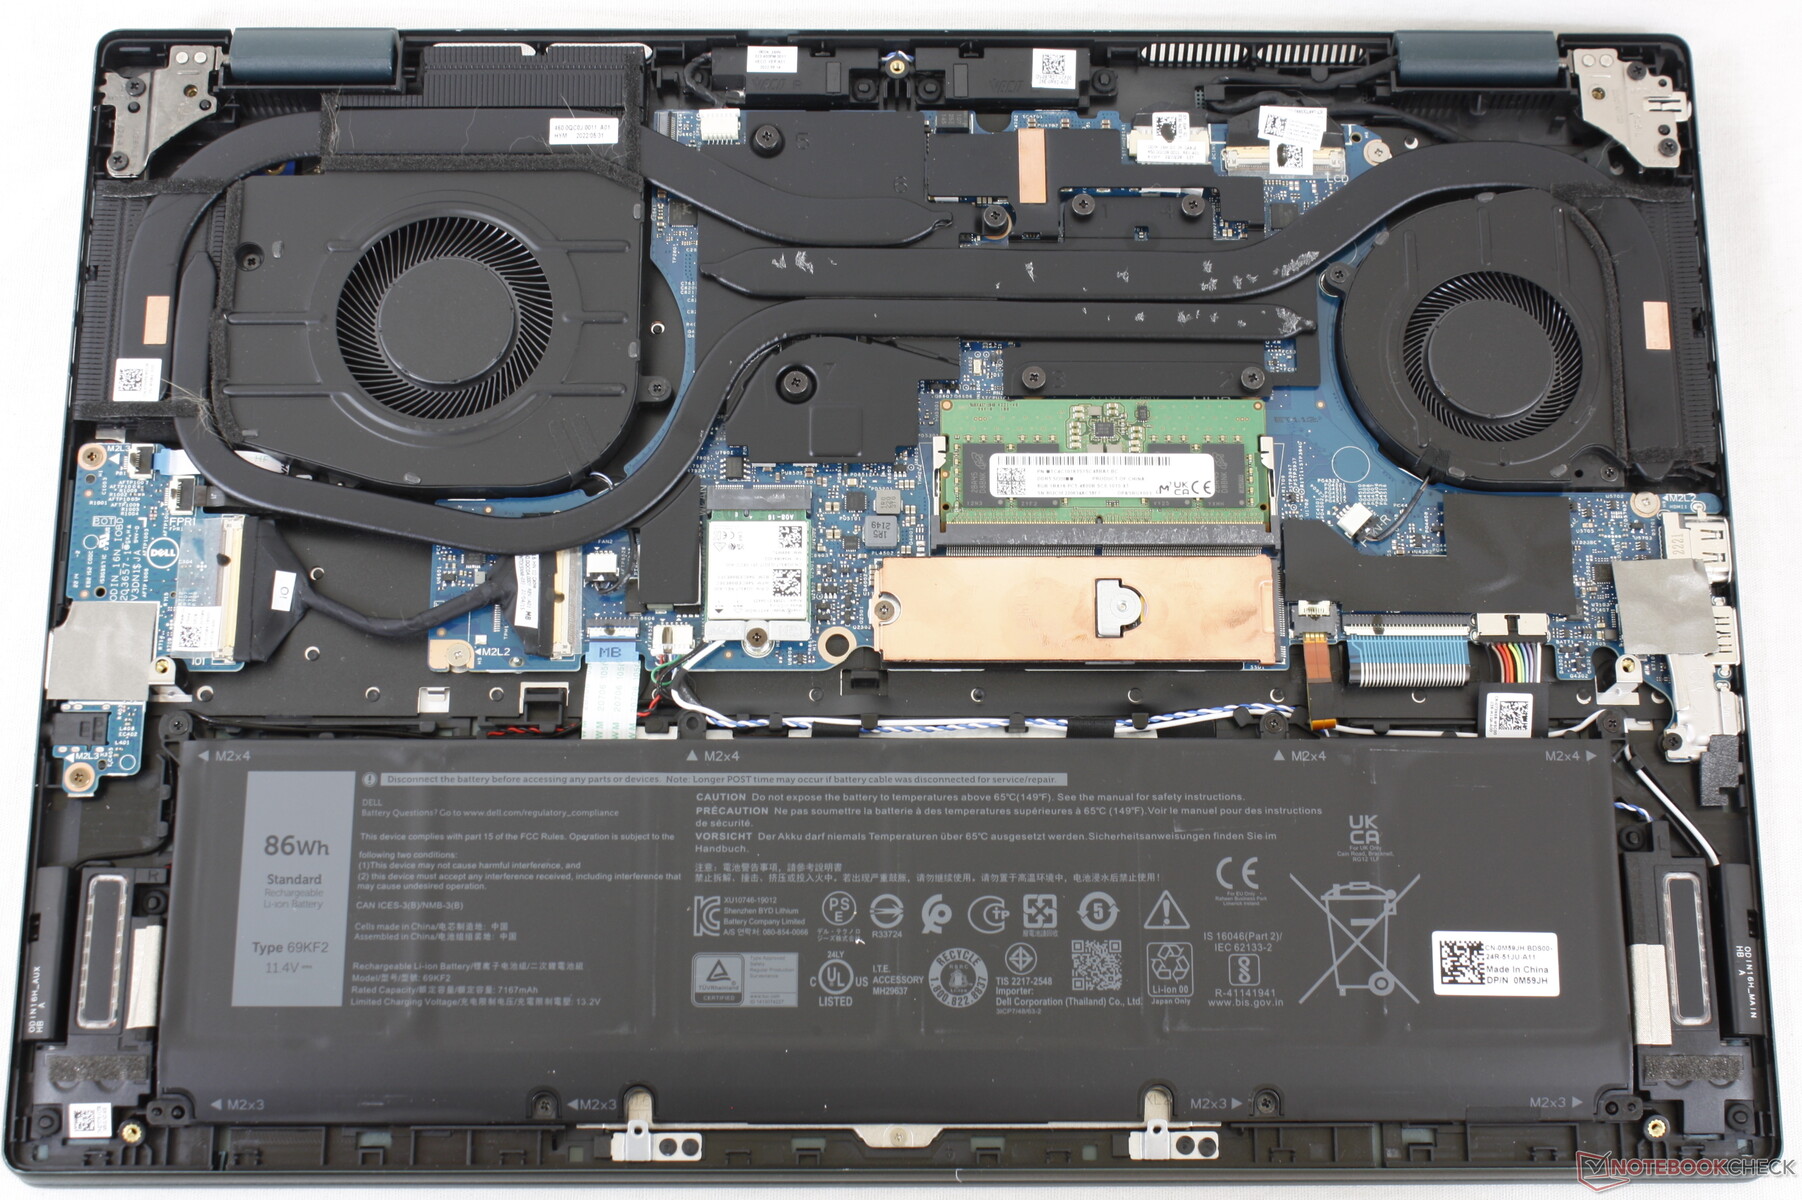
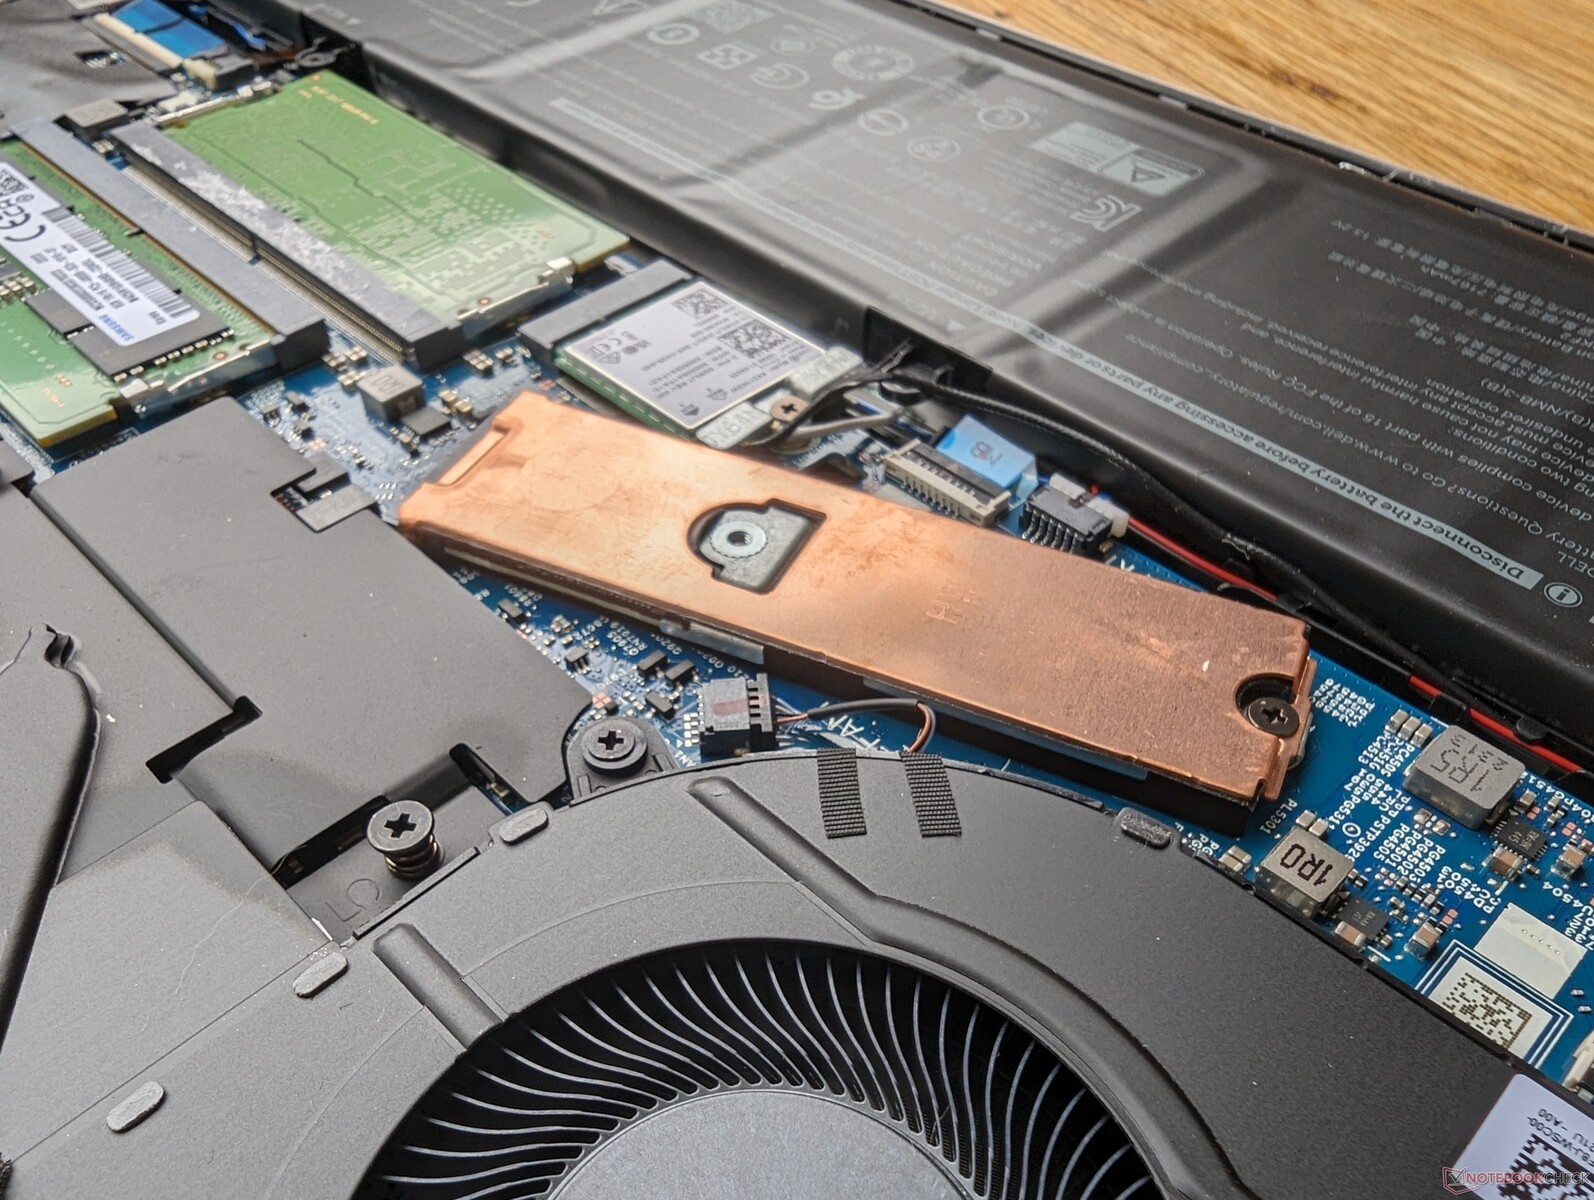
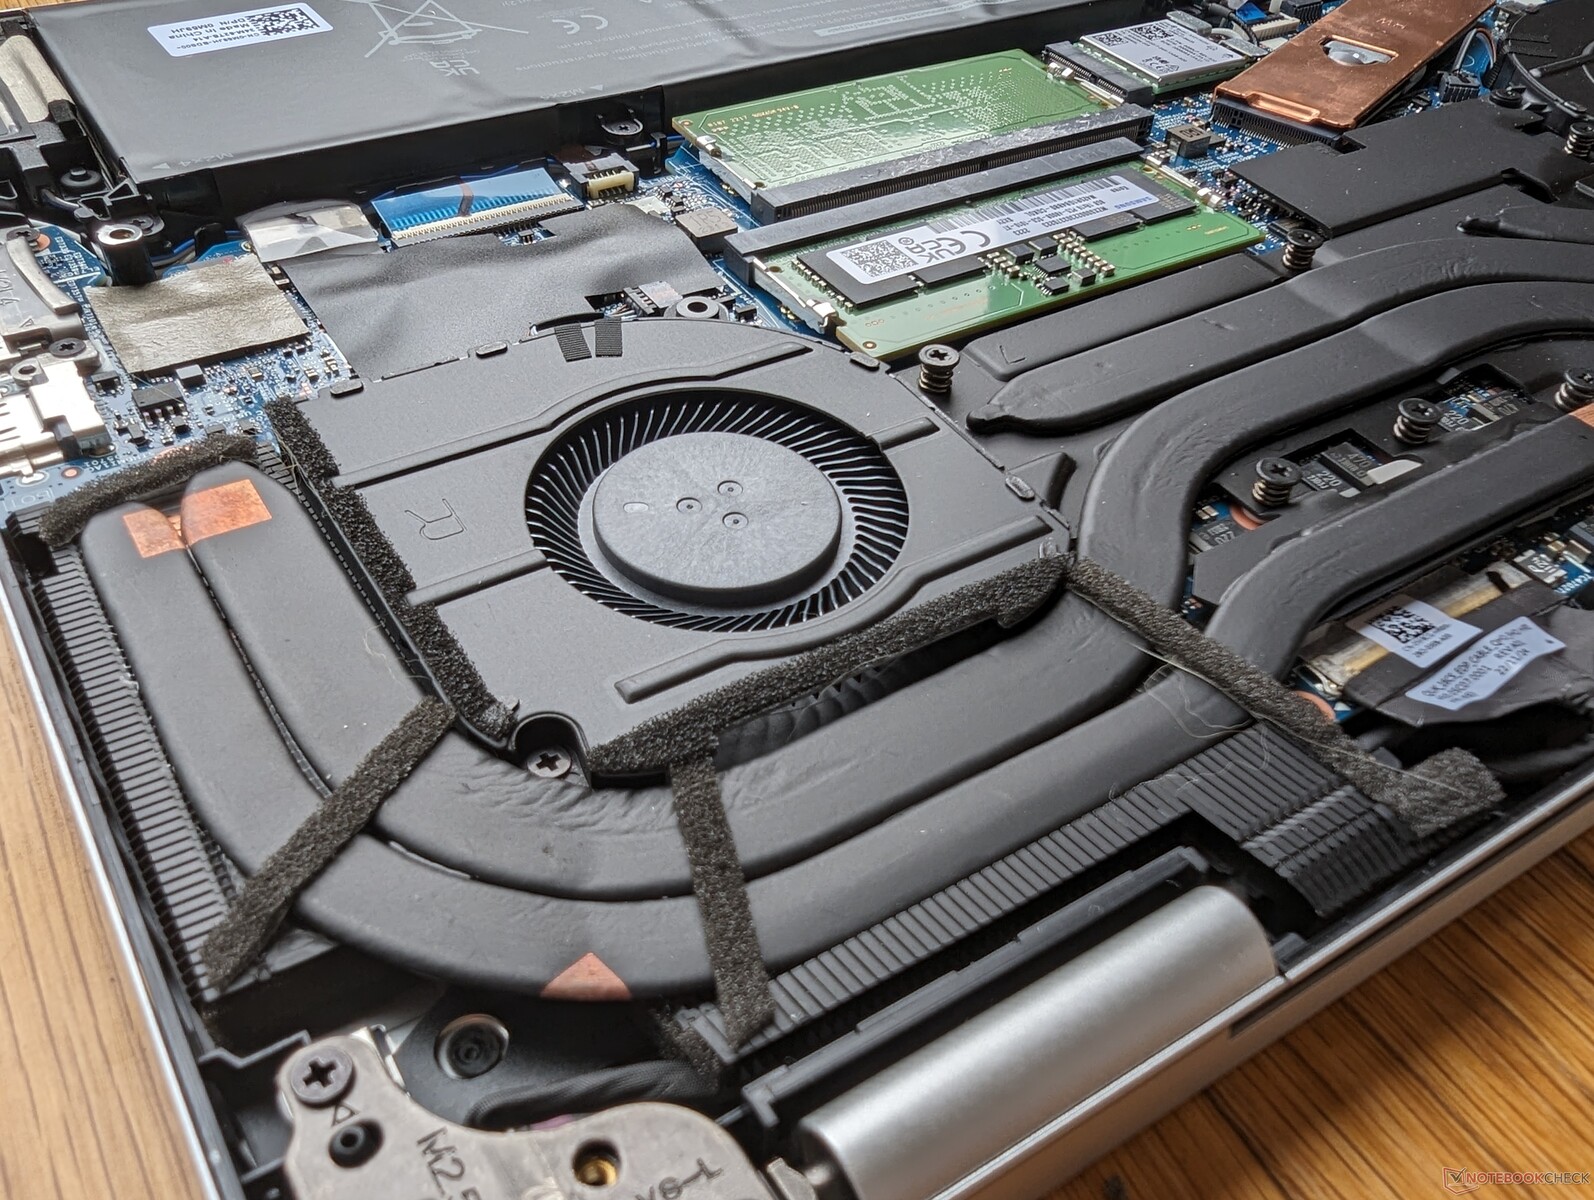
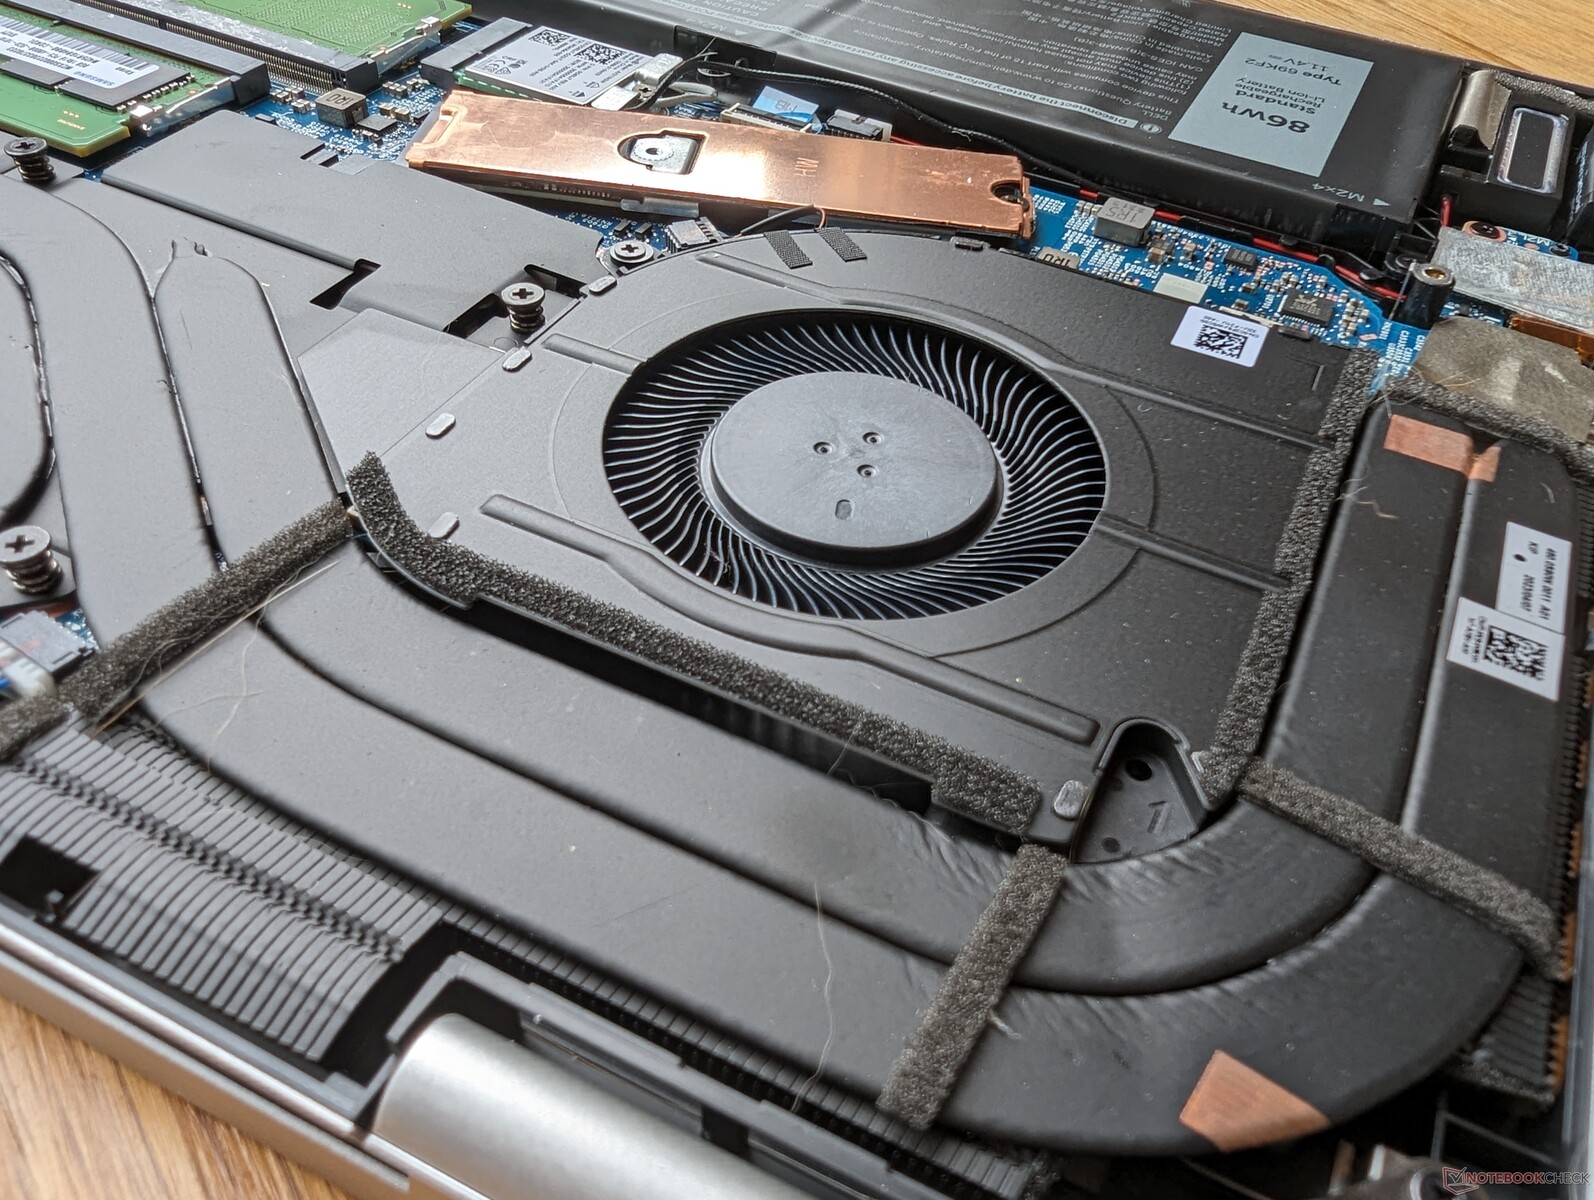
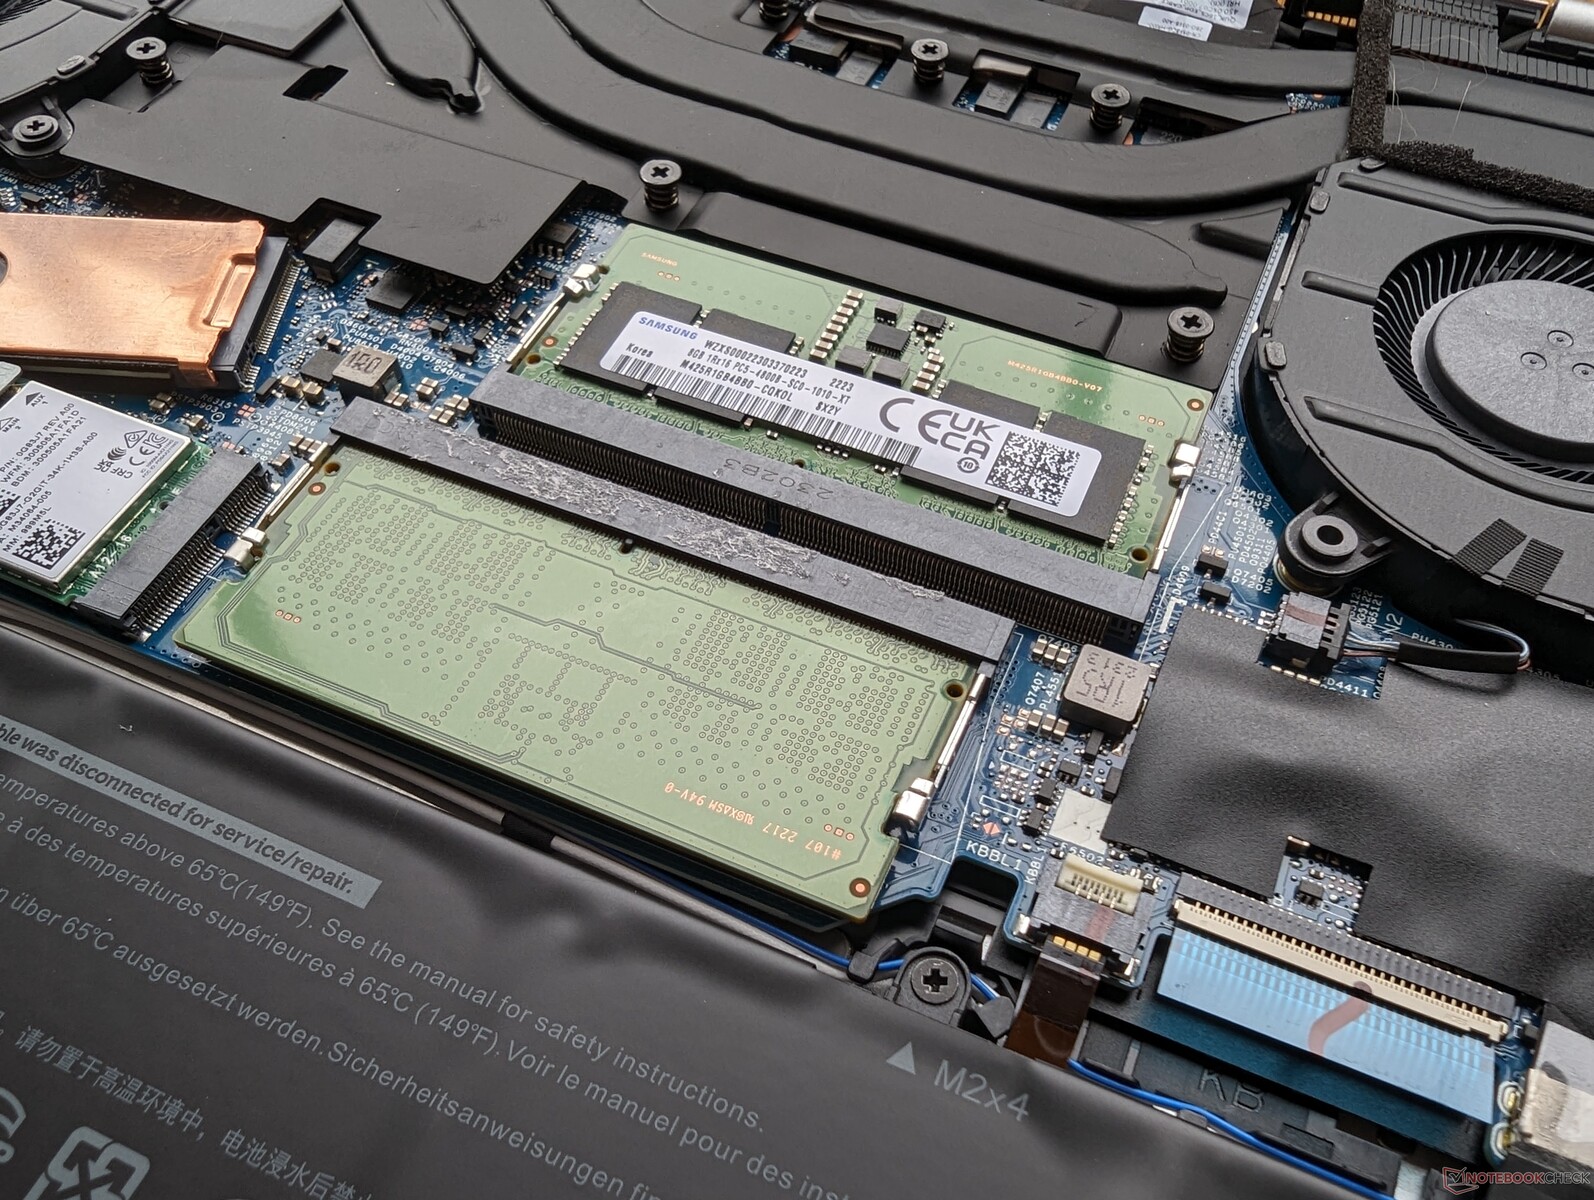
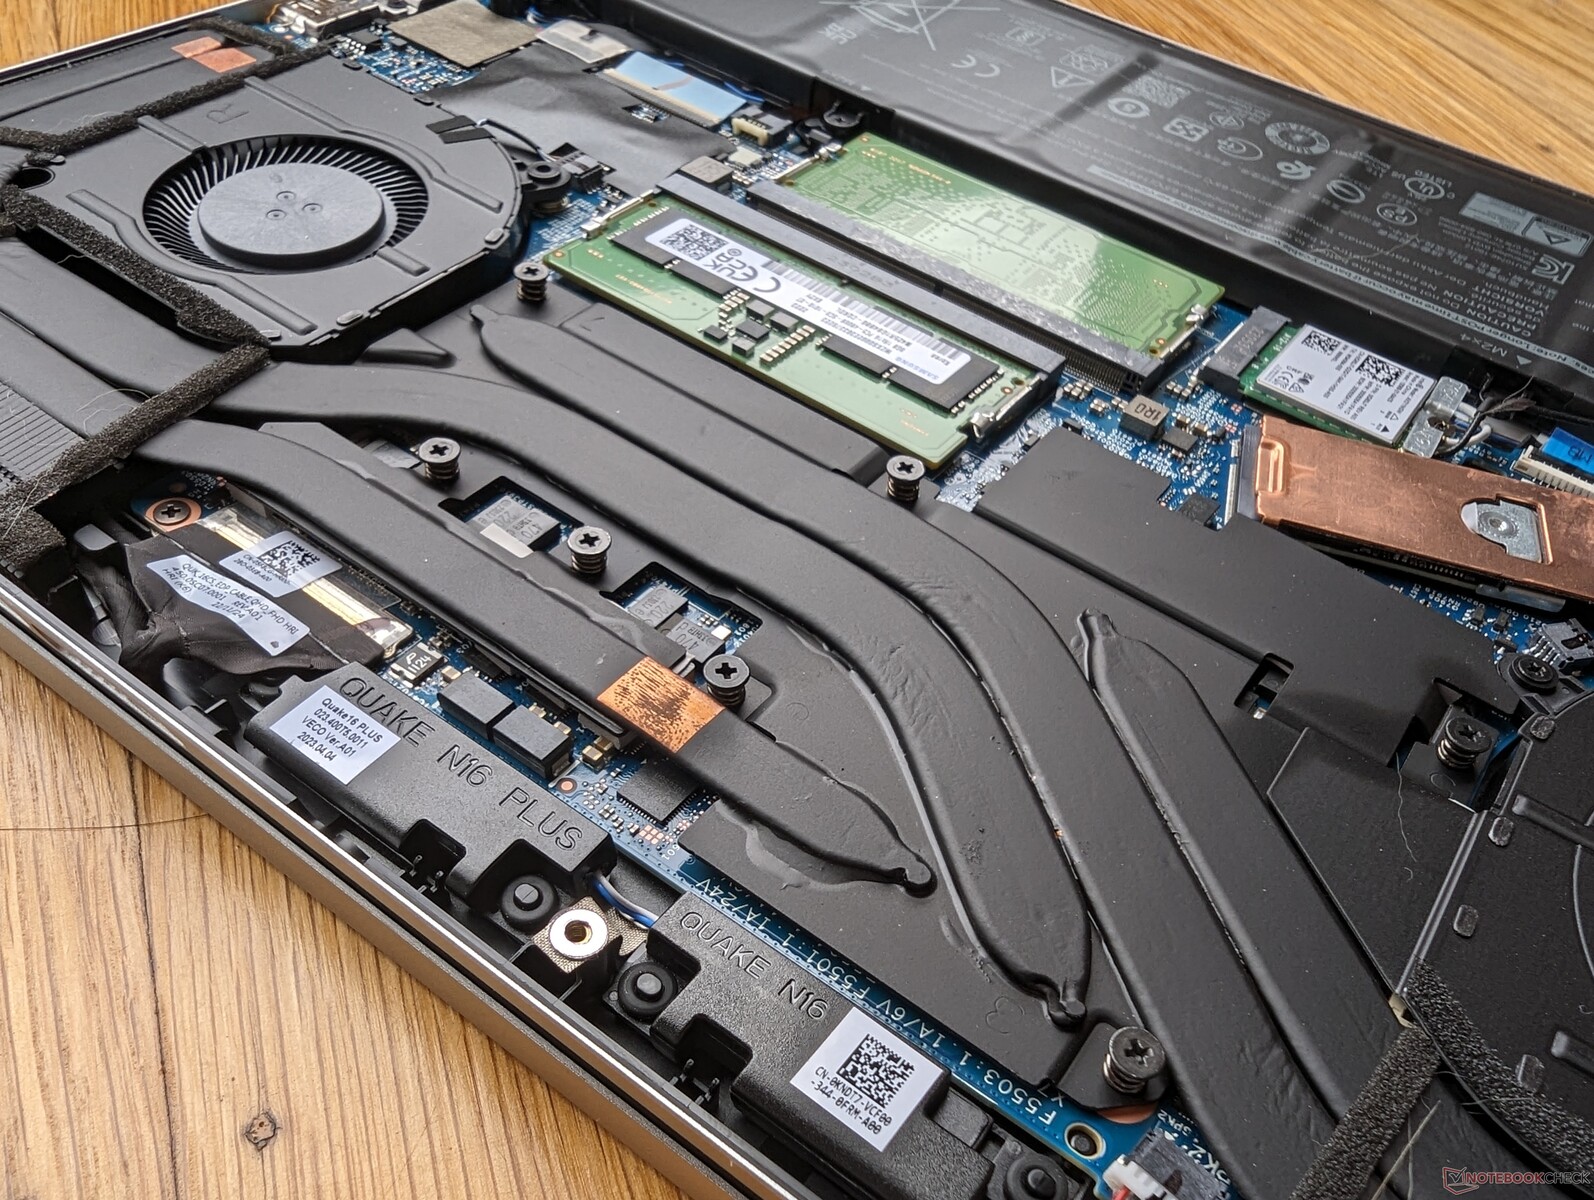
Konserwacja
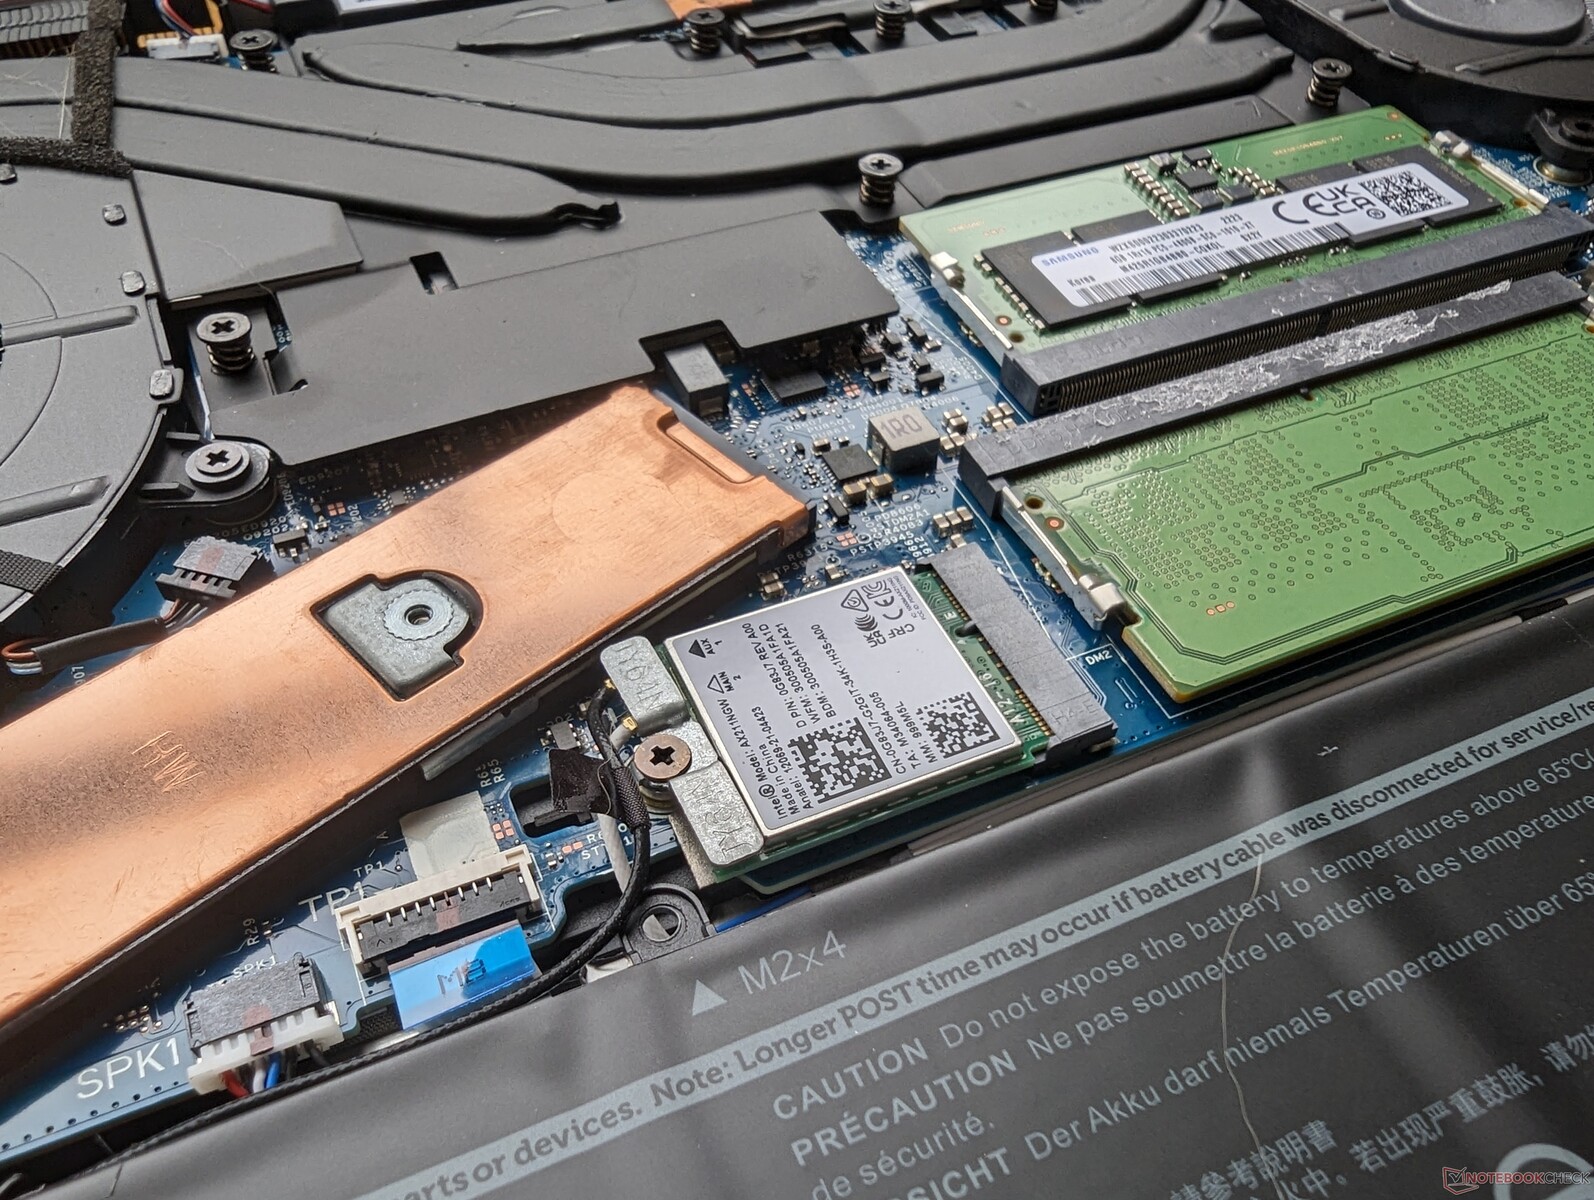
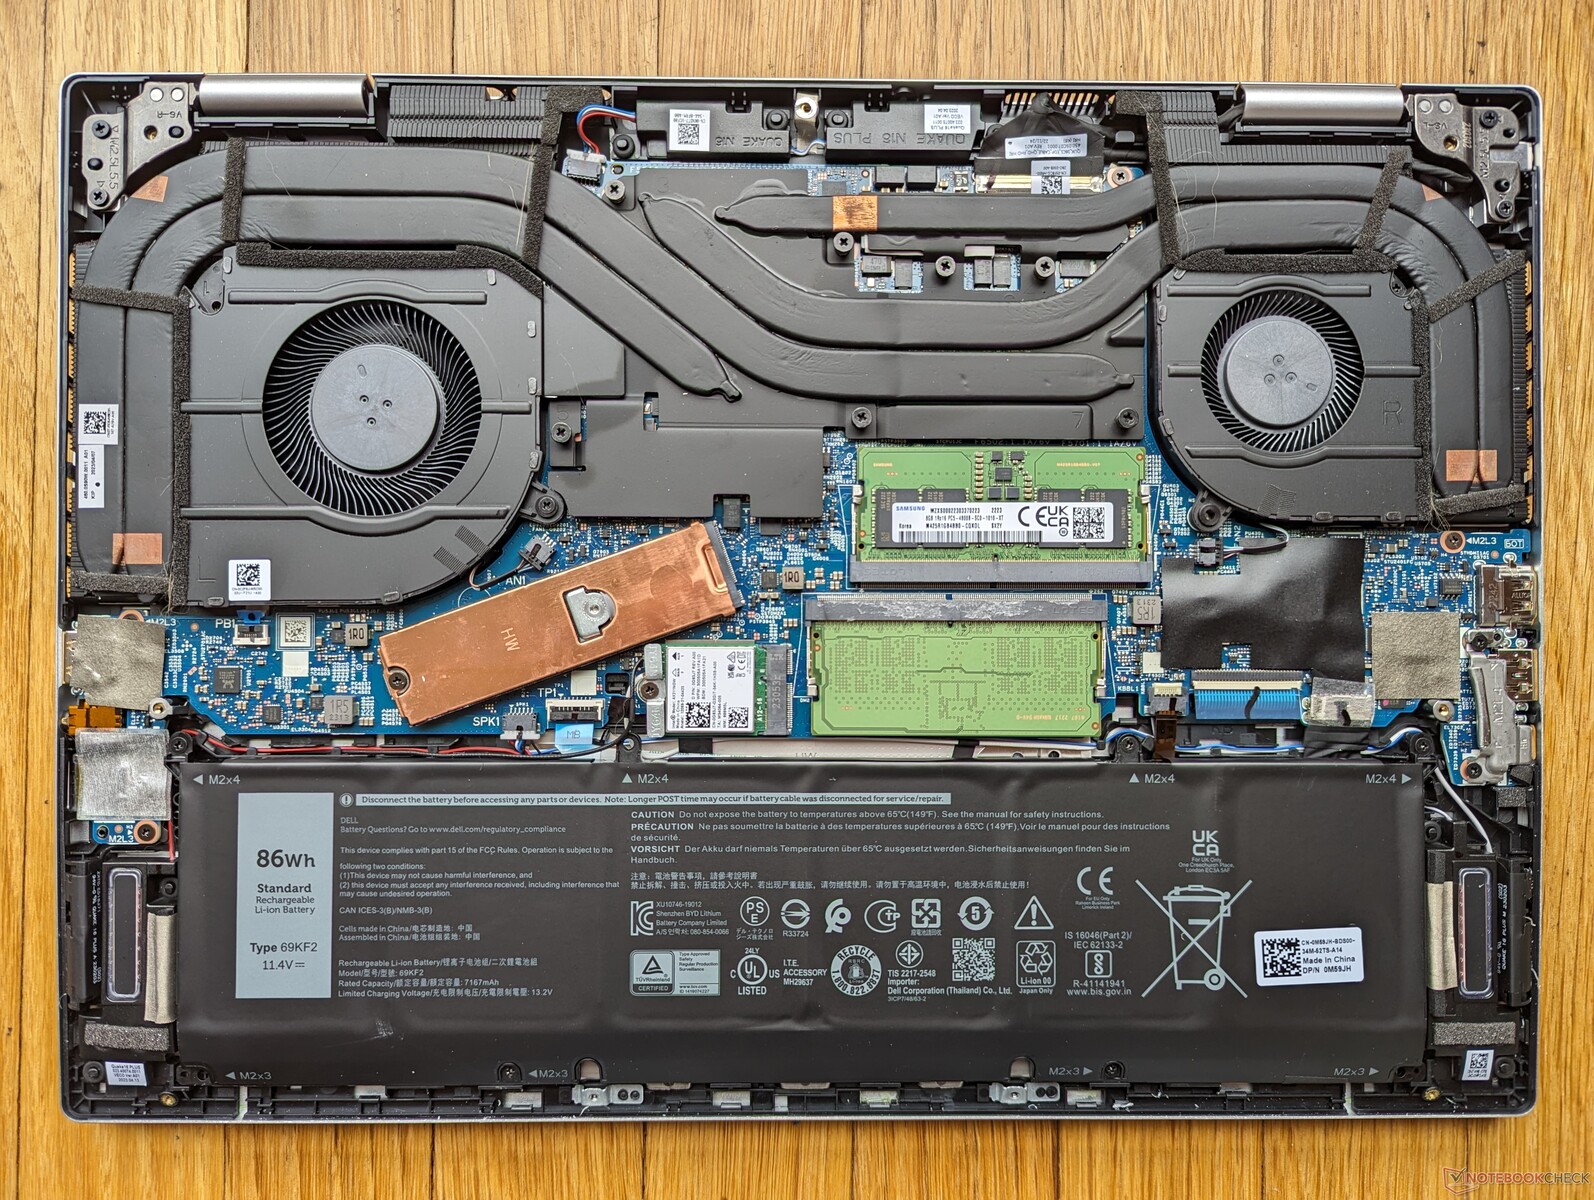
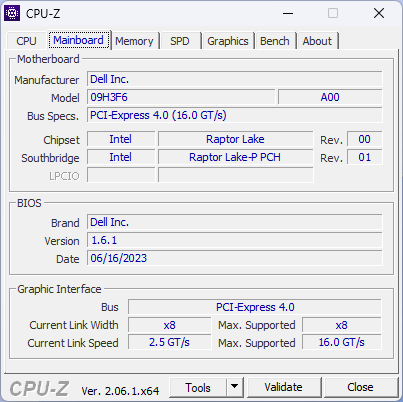
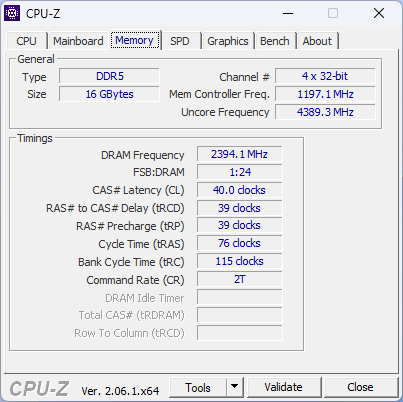
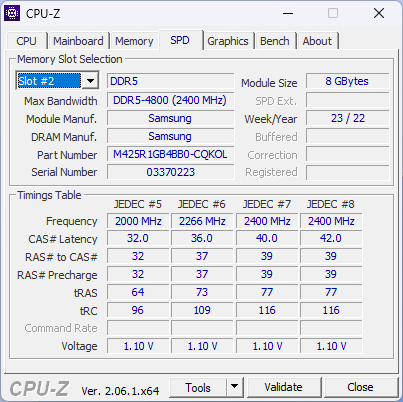
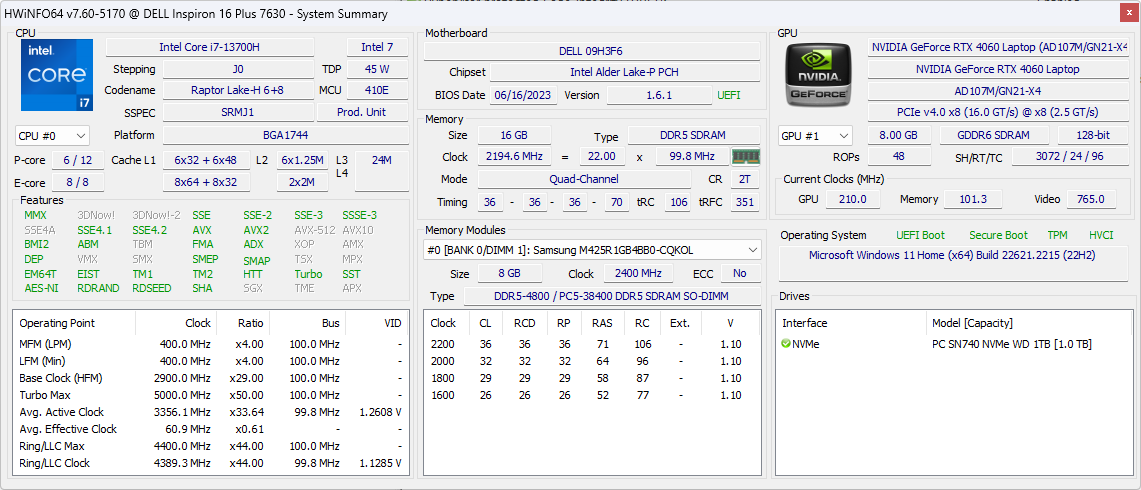
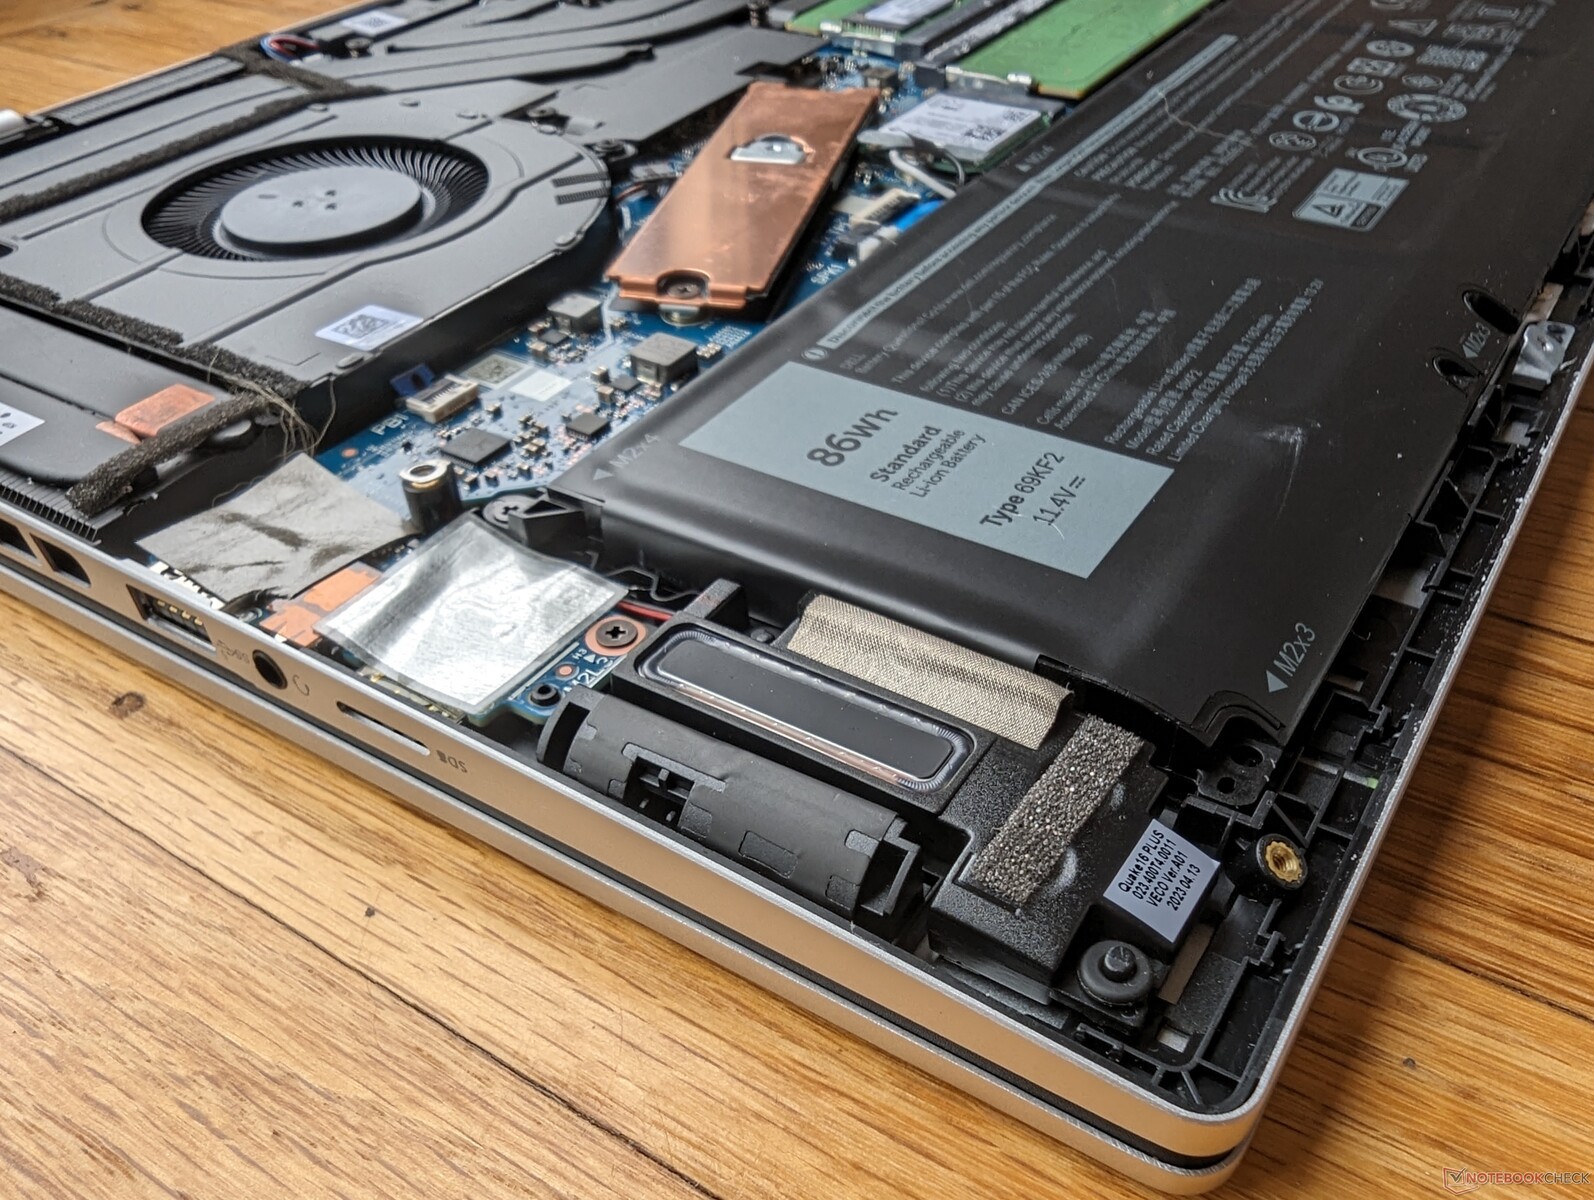
Dolny panel wymaga jedynie śrubokręta krzyżakowego i ostrej krawędzi do stosunkowo łatwego serwisowania. Właściciele mają bezpośredni dostęp do dysków SSD, WLAN i 2x slotów SODIMM, podczas gdy zeszłoroczny model był ograniczony tylko do 1x slotu SODIMM, co pokazują poniższe zdjęcia porównawcze. Wentylatory są tym razem również większe i wyposażone w grubsze miedziane rurki cieplne dla lepszego chłodzenia.
Należy zauważyć, że wersja AMD tego modelu wykorzystuje lutowaną pamięć RAM LPDDR5, w przeciwieństwie do w pełni rozszerzalnego podejścia 2x SODIMM w naszej wersji Intel.
Akcesoria i gwarancja
W pudełku nie ma żadnych dodatków poza zasilaczem sieciowym i dokumentacją. Zwykła roczna ograniczona gwarancja producenta ma zastosowanie w przypadku zakupu w USA.
Urządzenia wejściowe - znajome odczucia z Inspirona
Klawiatura
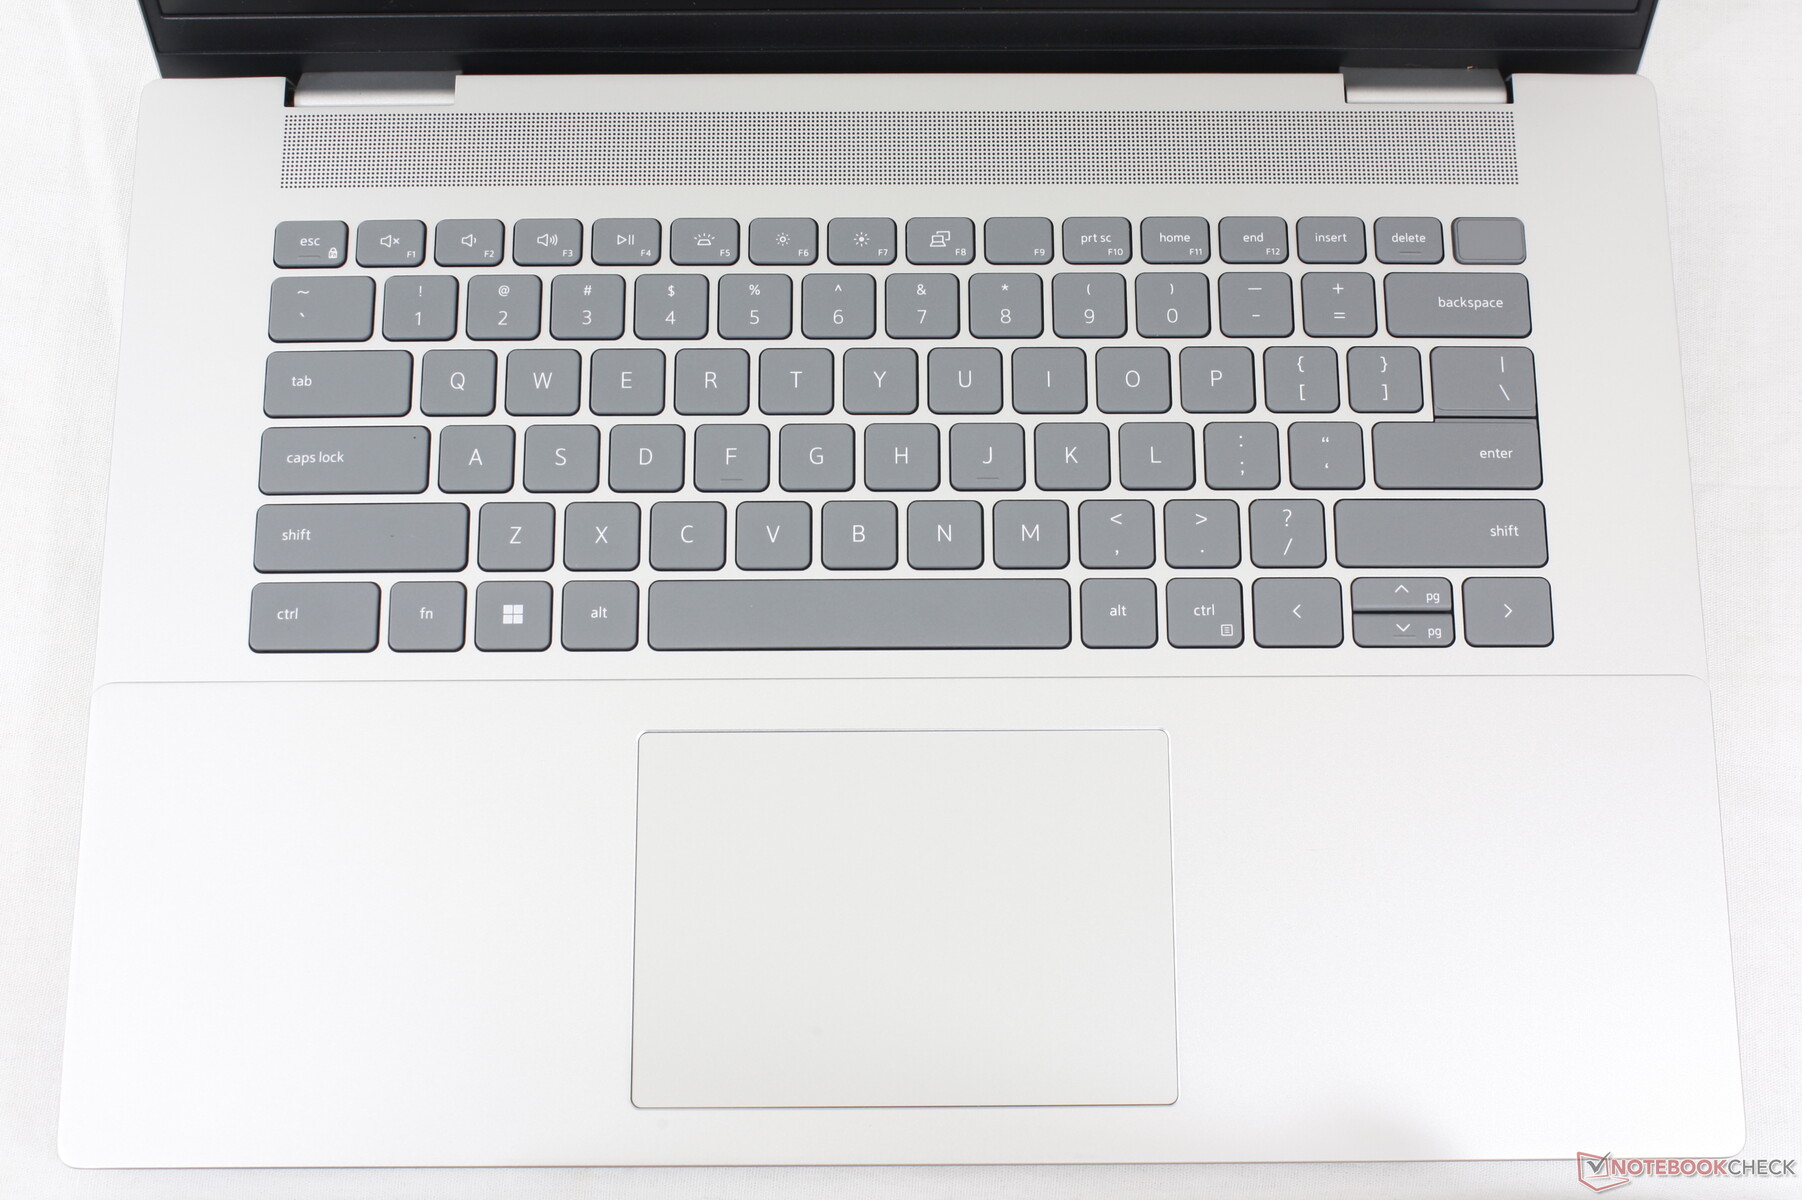
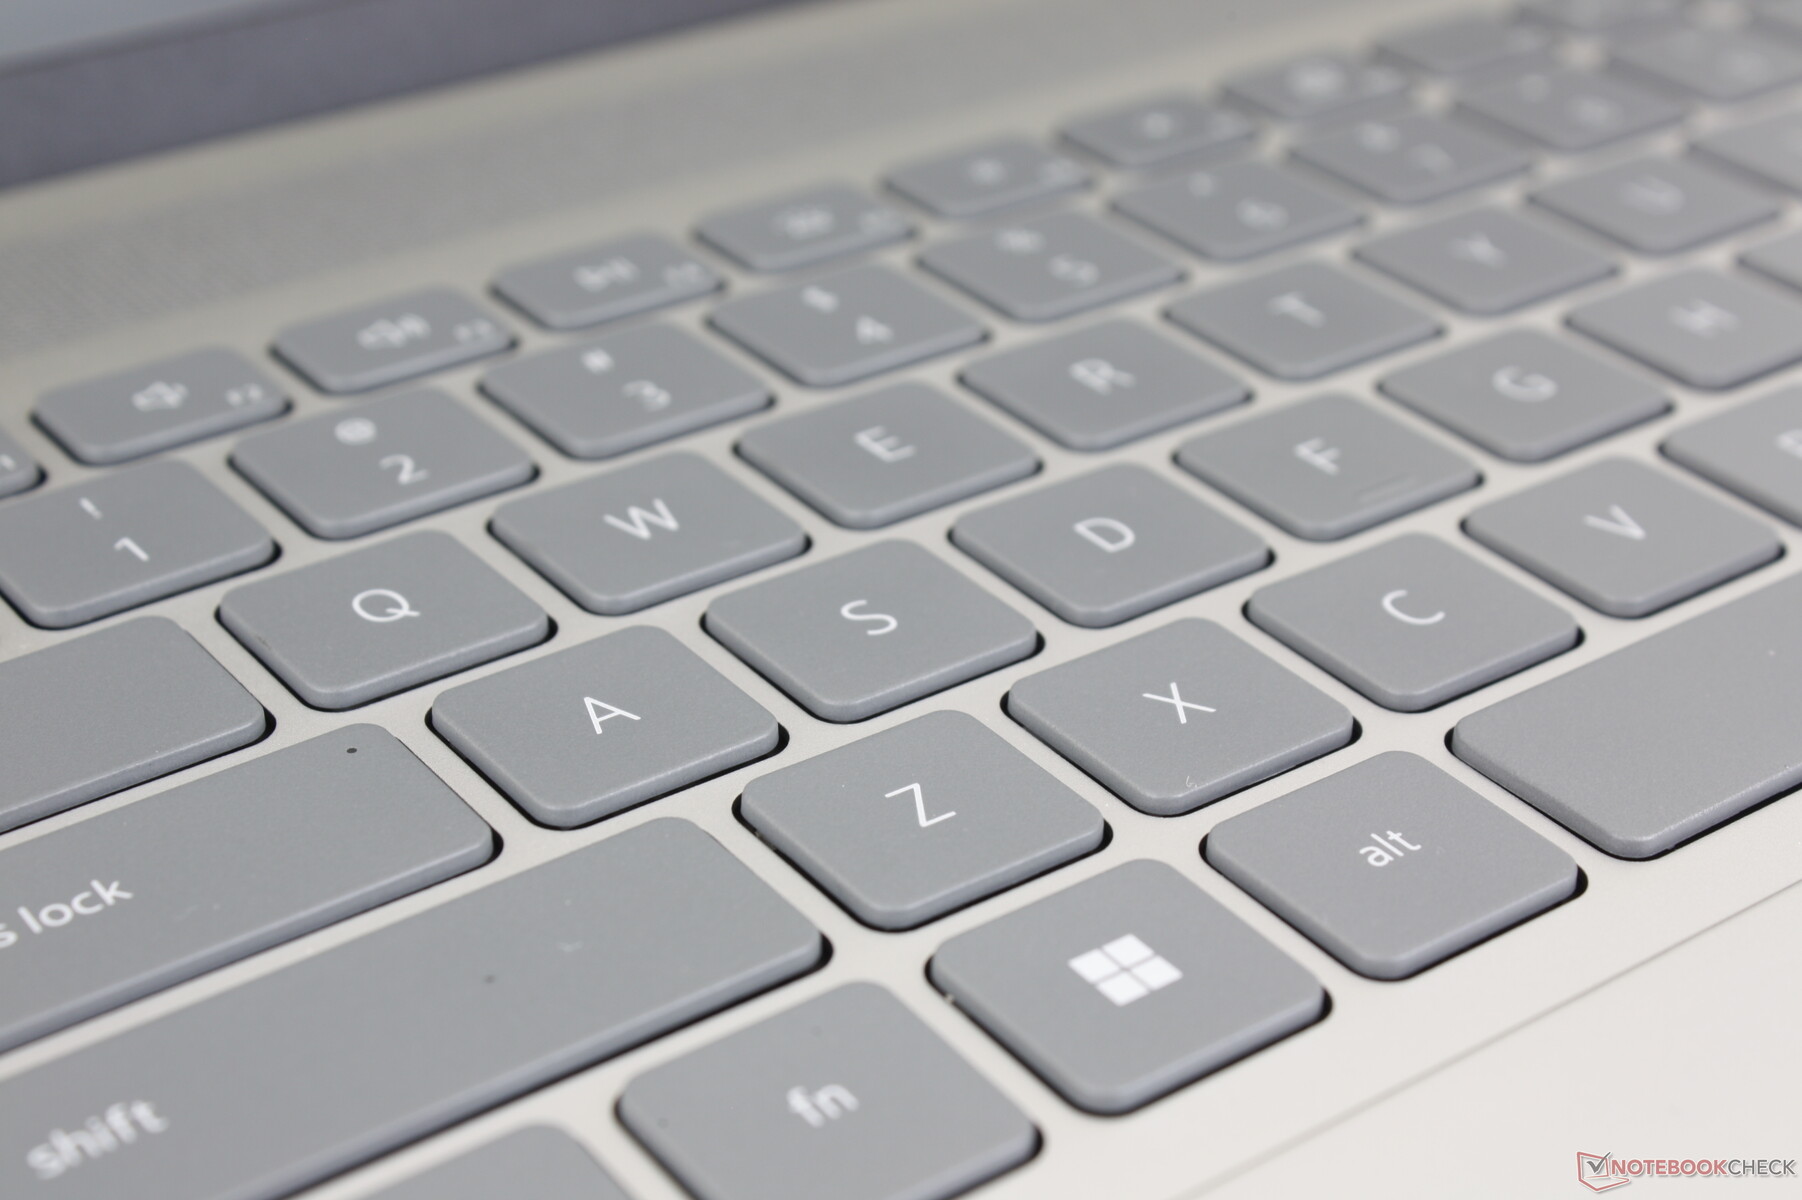
Doświadczenie pisania na klawiaturze pozostaje identyczne z Inspiron 16 Plus 7620 aż do każdego klawisza funkcyjnego i akcji drugorzędnej. Niekoniecznie jest to złe, ponieważ spójność między różnymi modelami Inspiron jest doceniana. Jednak inne laptopy multimedialne, takie jak LG Gram 16 lub HP Spectre x360 16 mają zauważalnie twardsze i wygodniejsze klawisze.
Touchpad
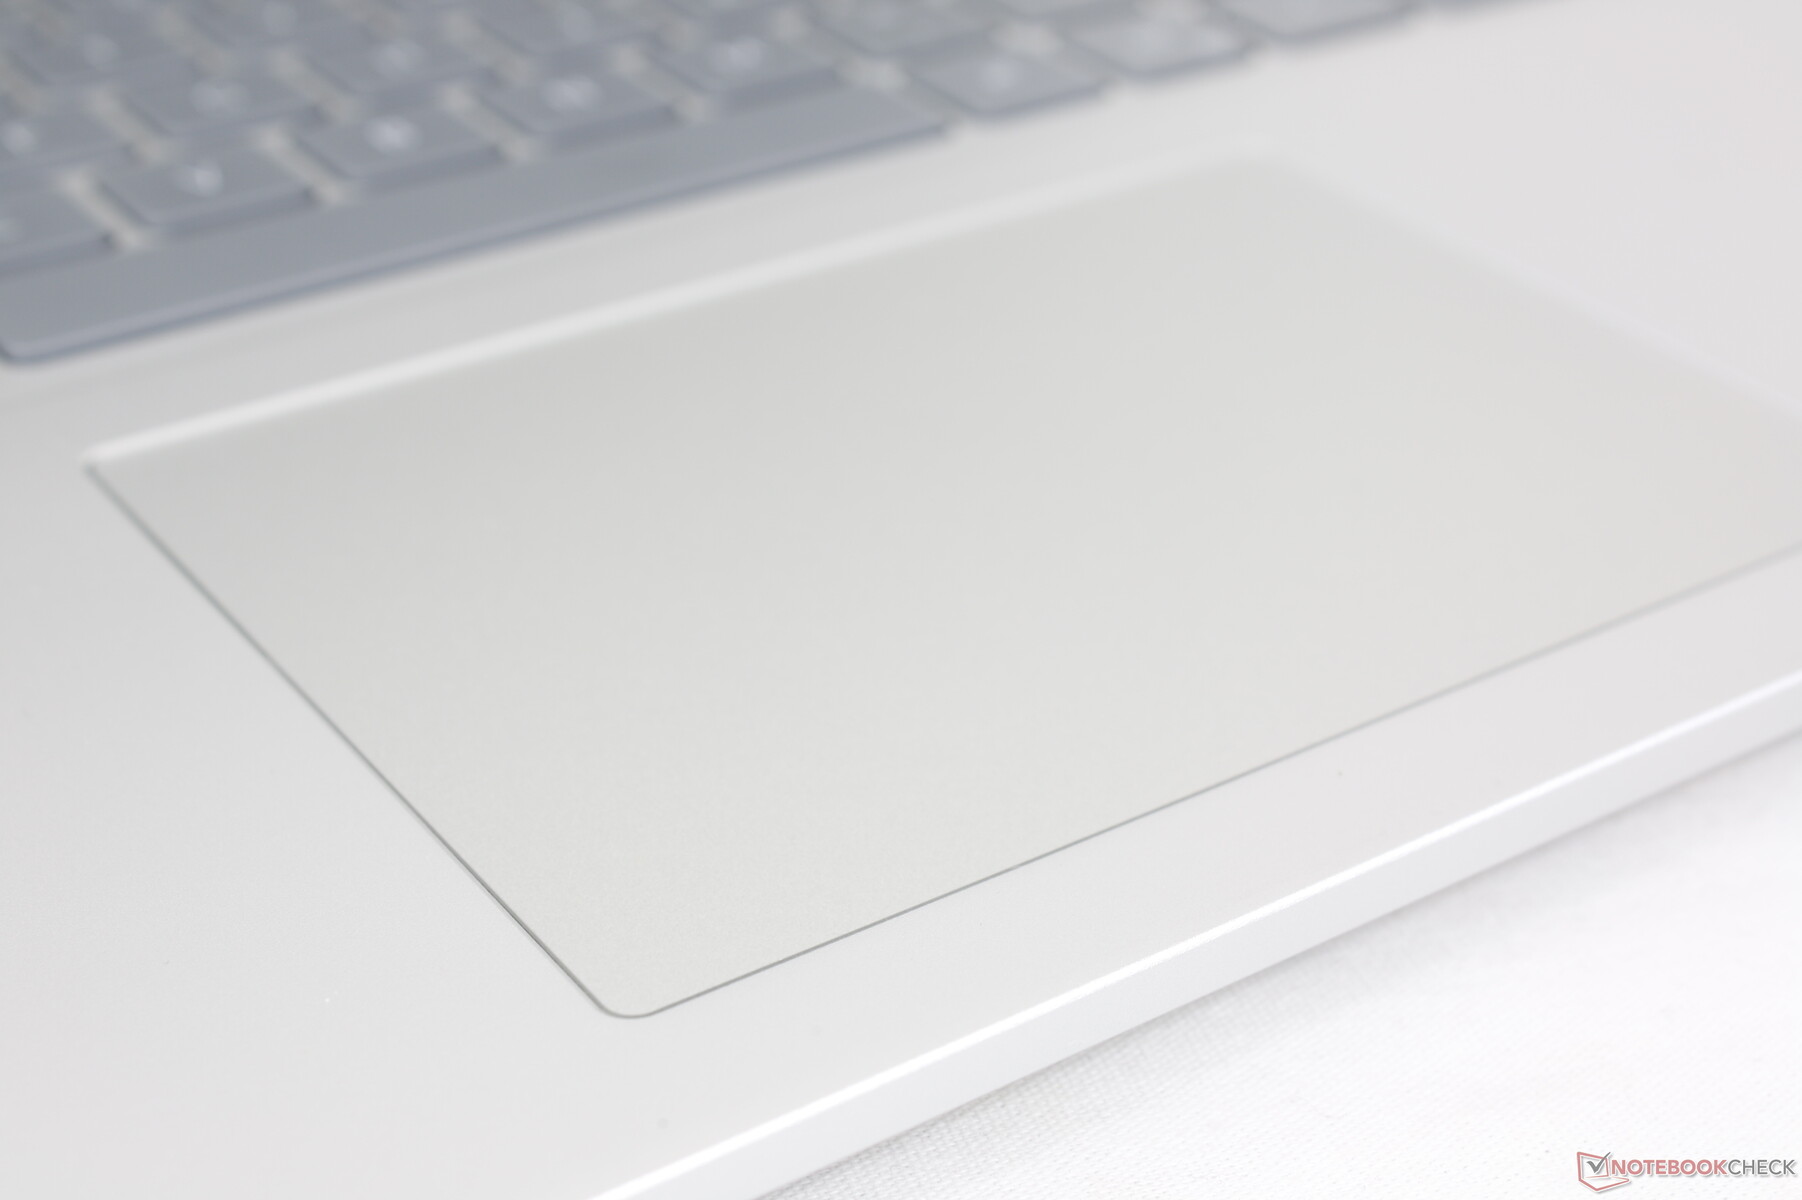
Klawiatura ma taki sam rozmiar jak w zeszłorocznym modelu (11,5 x 8 cm). Poślizg jest płynny z lekkim zacinaniem się przy wolniejszych prędkościach, co zapewnia dokładniejsze wprowadzanie danych. Sprzężenie zwrotne podczas naciskania na clickpad jest niestety po miękkiej stronie, pomimo głośnego kliknięcia.
Wyświetlacz - przyzwoity, ale ograniczone opcje
Opcje wyświetlania zmieniły się w stosunku do starszego modelu Inspiron 16 Plus 7620. Zniknął panel 3K 3072 x 1920 na rzecz tych dwóch nowych opcji:
- 2560 x 1600 (2,5K), 120 Hz
- 1920 x 1200, 60 Hz
Obie opcje są IPS i bezdotykowe i żadna z nich nie obsługuje G-Sync. Nasze poniższe pomiary odzwierciedlają tylko pogrubioną opcję 1600p.
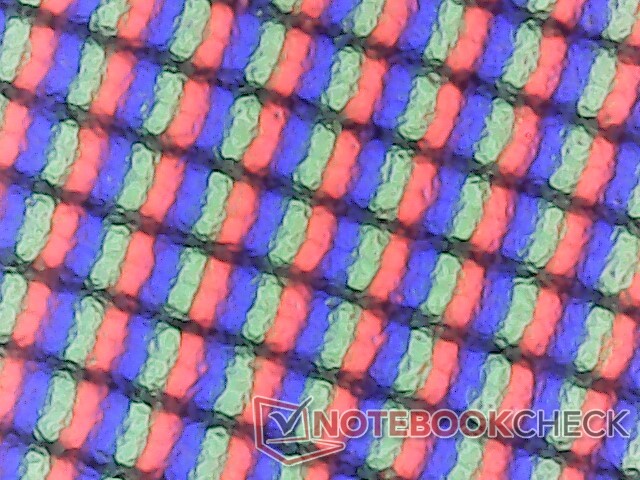
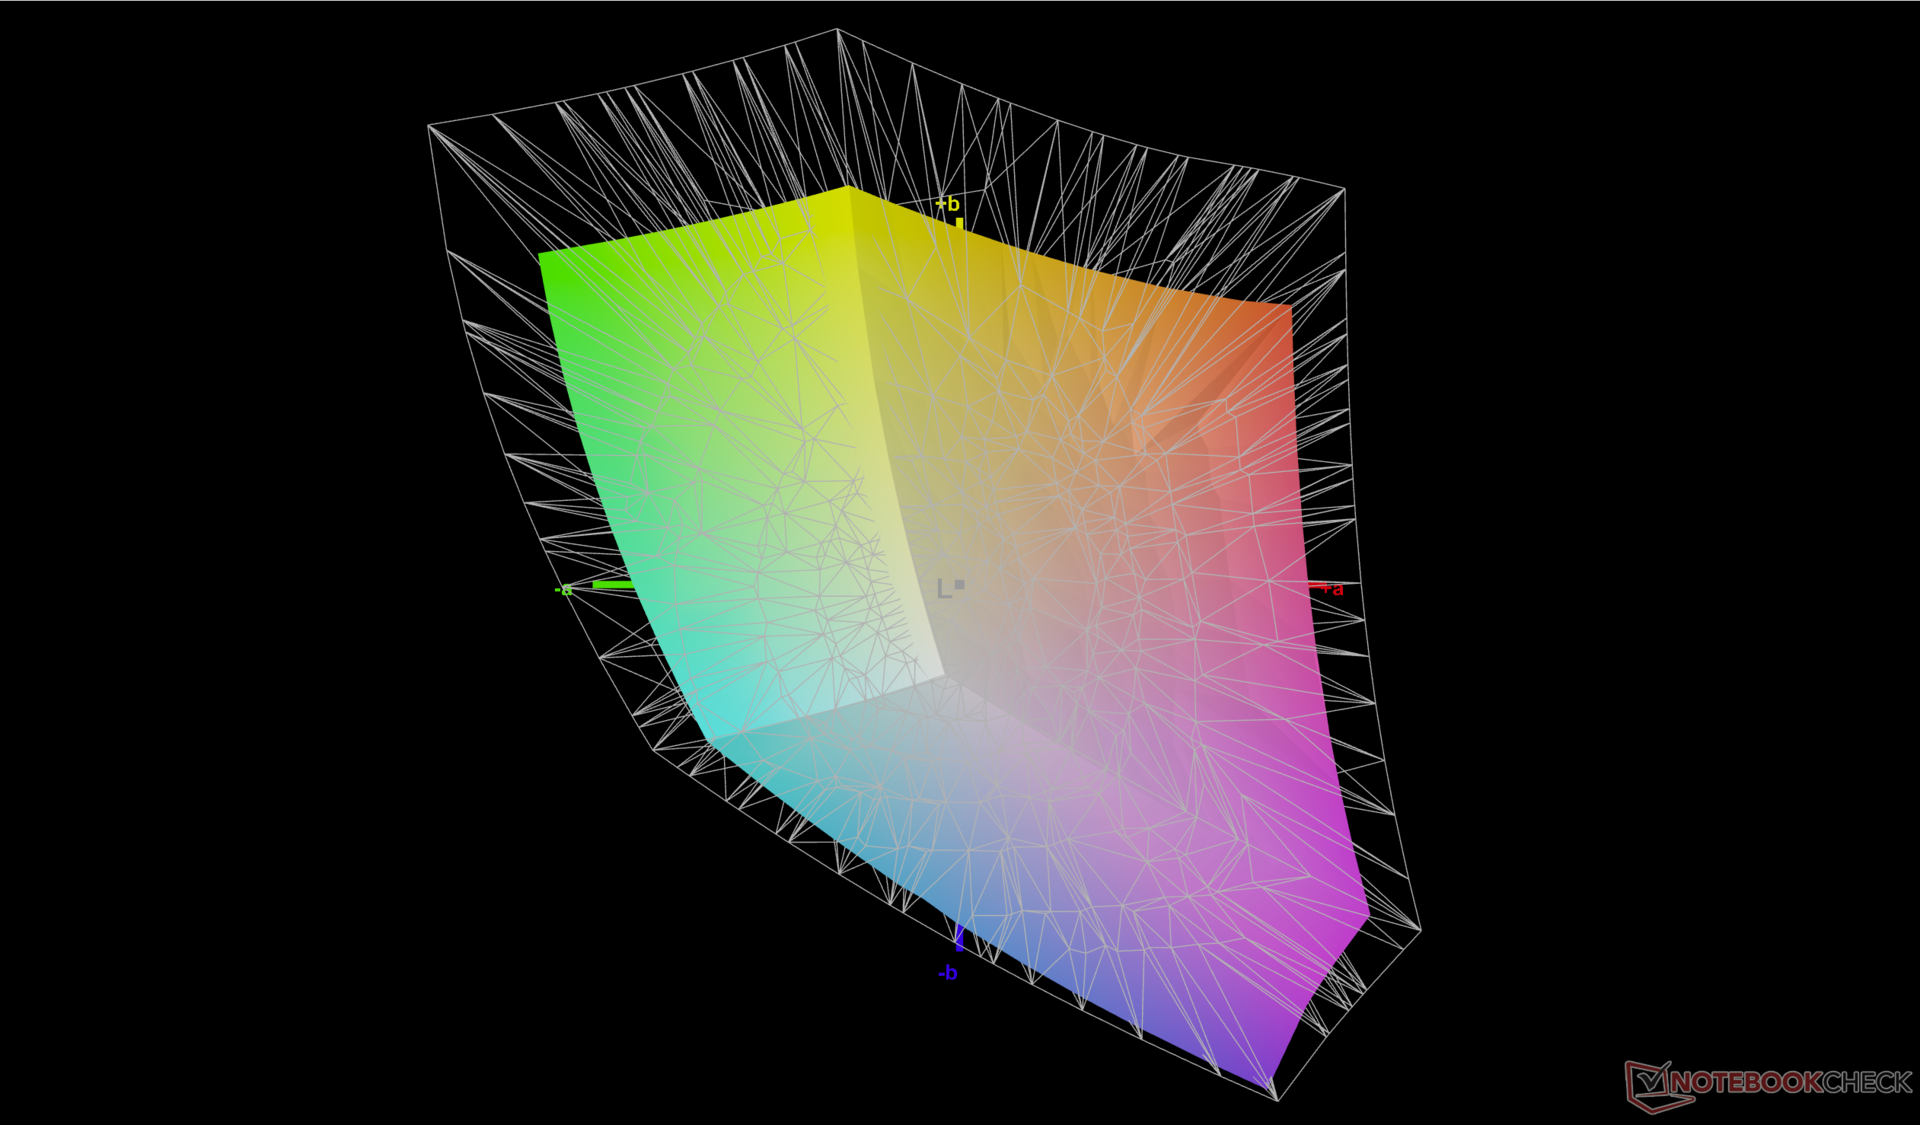
W porównaniu do zeszłorocznego panelu BOE 3K, nowy panel LG Philips 2.5K ma dwukrotnie wyższą natywną częstotliwość odświeżania kosztem niższej natywnej rozdzielczości. Pełne pokrycie sRGB, jasność 300 nitów, współczynnik kontrastu >1000:1 i średni czas reakcji są poza tym dość podobne między nimi. Niemniej jednak, konkurencyjne modele, takie jak Vivobook Pro 16X czy Envy 16 oferują wyższe rozdzielczości i głębsze kolory, które docenią twórcy treści. W rezultacie nasz panel LG Philips jest bardziej budżetowy.
| |||||||||||||||||||||||||
rozświetlenie: 92 %
na akumulatorze: 299.4 cd/m²
kontrast: 1426:1 (czerń: 0.21 cd/m²)
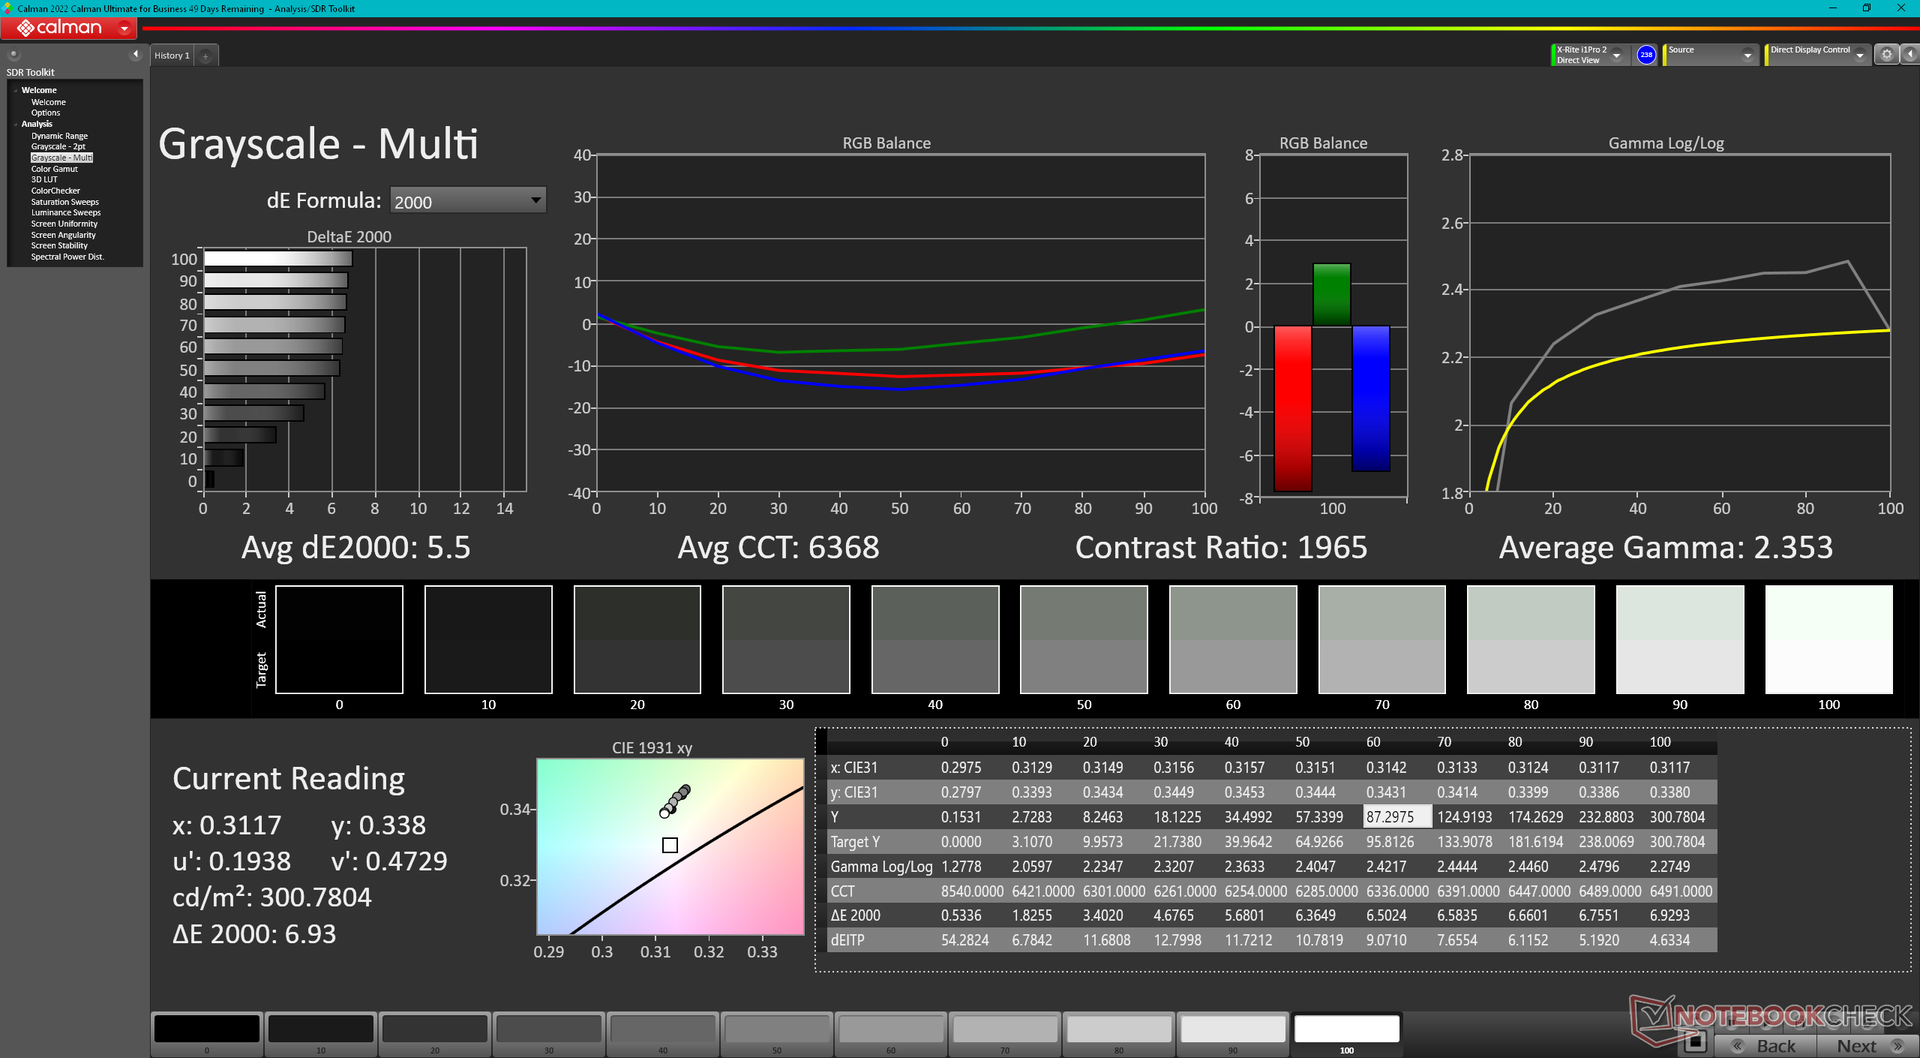
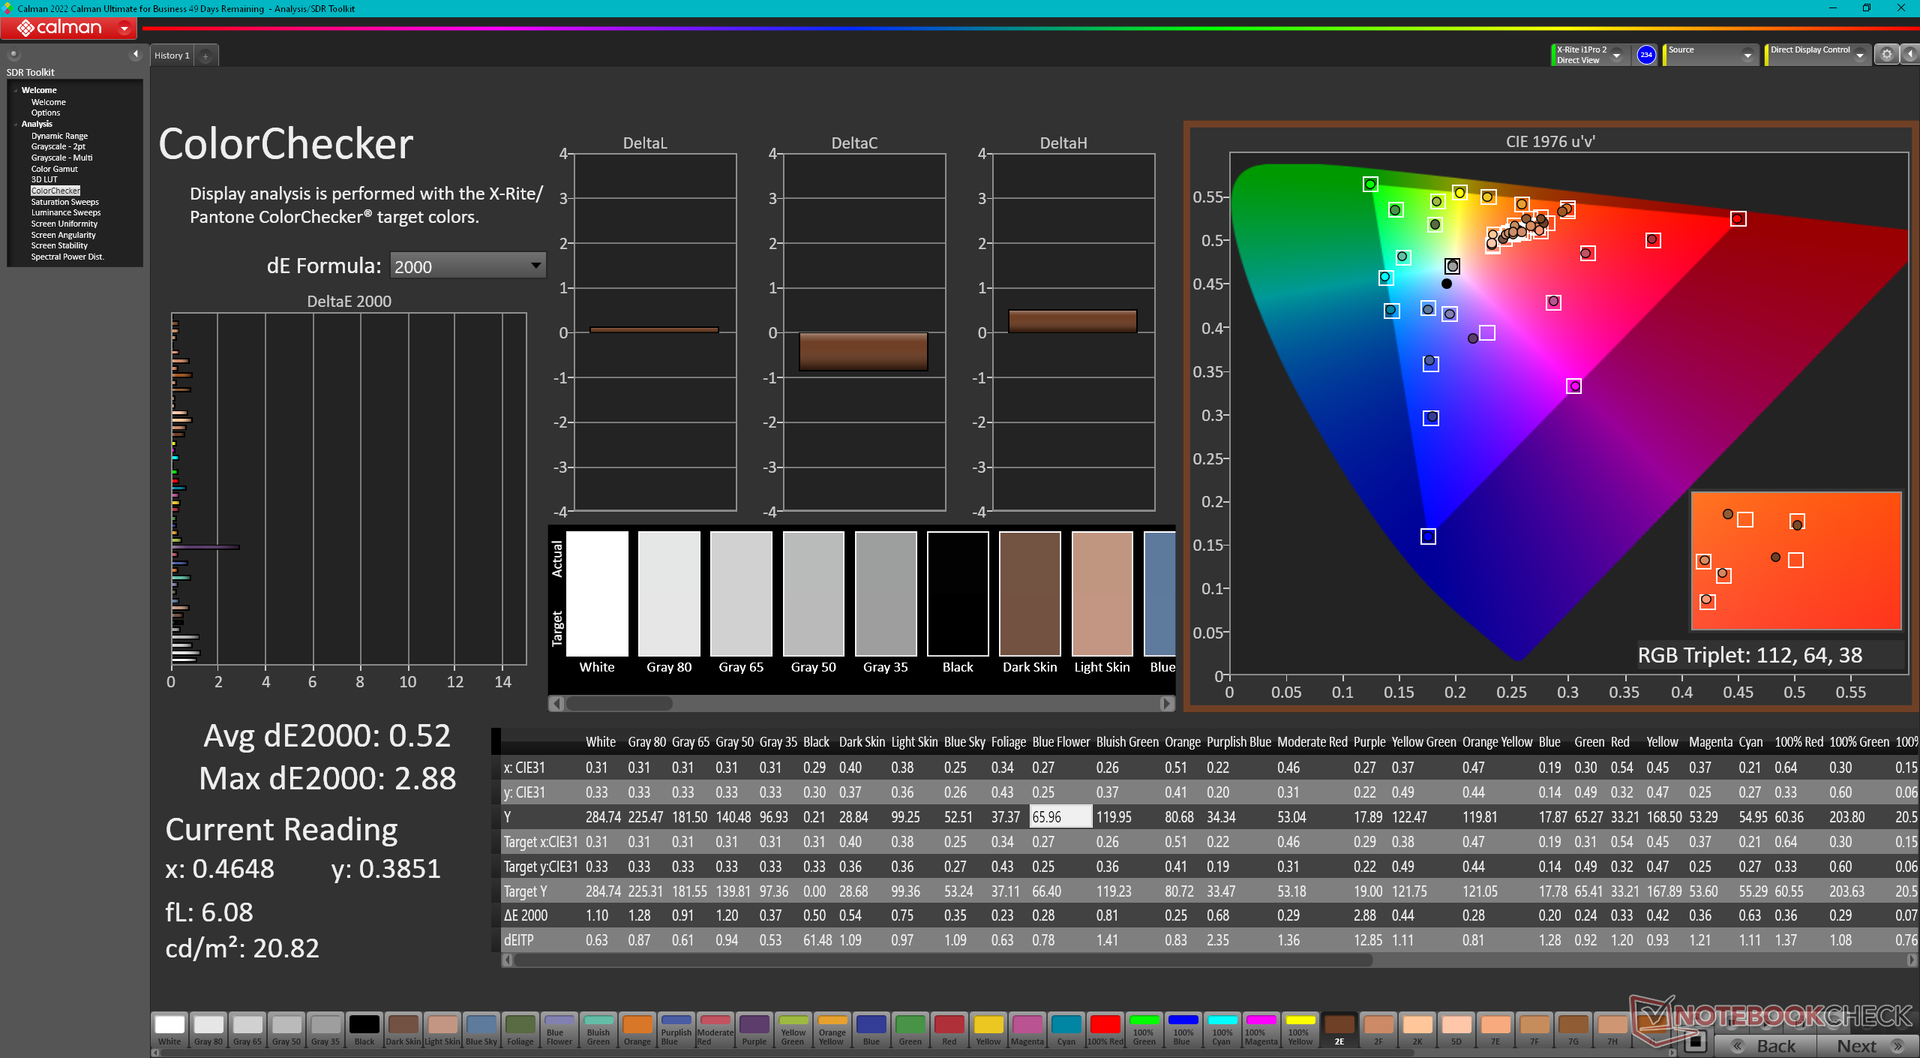
ΔE ColorChecker Calman: 4.25 | ∀{0.5-29.43 Ø4.72}
calibrated: 0.52
ΔE Greyscale Calman: 5.5 | ∀{0.09-98 Ø4.97}
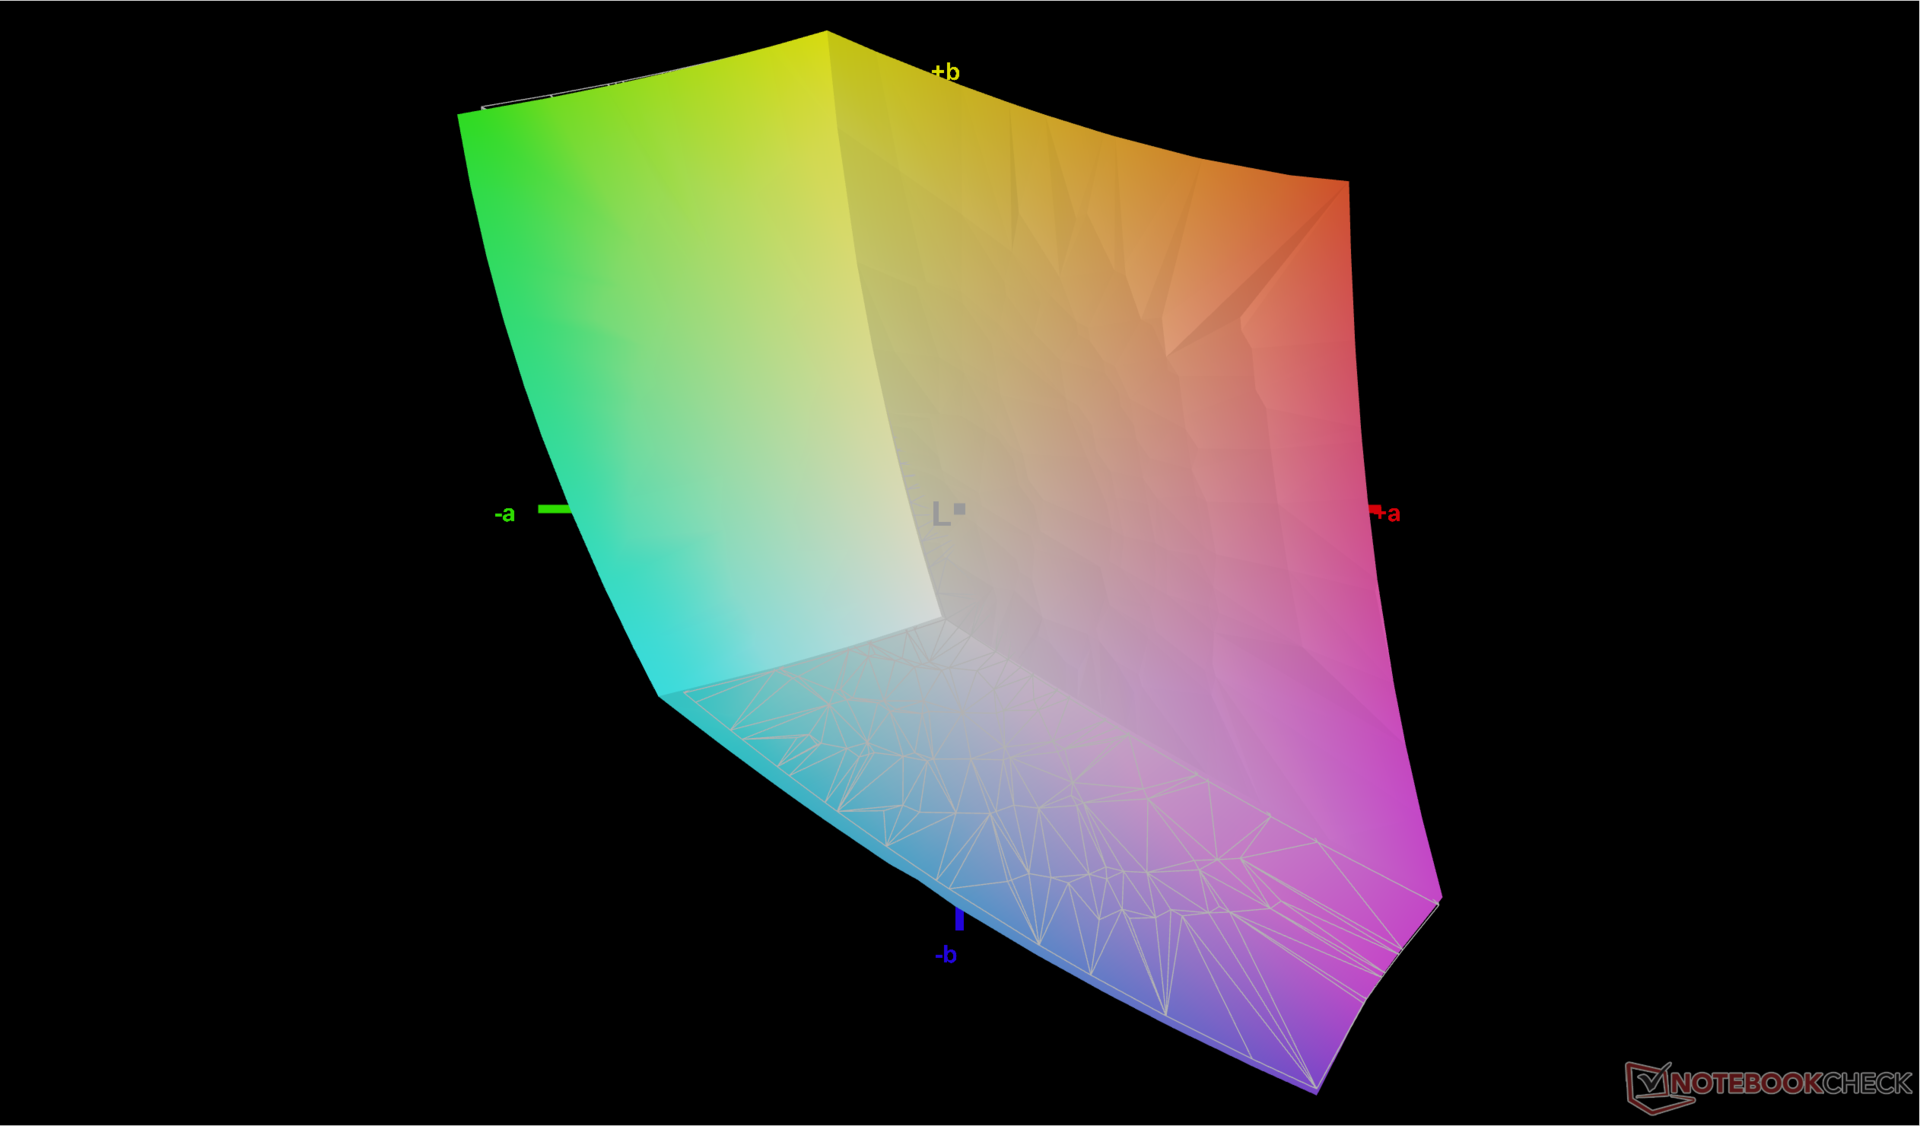
72.3% AdobeRGB 1998 (Argyll 3D)
99.6% sRGB (Argyll 3D)
70.1% Display P3 (Argyll 3D)
Gamma: 2.35
CCT: 6368 K
| Dell Inspiron 16 Plus 7630 LG Philips 160WQ2, IPS, 2560x1600, 16" | Dell Inspiron 16 Plus 7620 BOE NE16N41, IPS, 3072x1920, 16" | Lenovo Slim Pro 9i 16IRP8 LEN160-3.2K, Mini-LED, 3200x2000, 16" | Asus Vivobook Pro 16X K6604JV-MX016W Samsung SDC4178 ATNA60BX01-1, OLED, 3200x2000, 16" | HP Envy 16 h0112nr Samsung SDC4174, OLED, 3840x2400, 16" | MSI Summit E16 Flip A12UDT-031 AU Optronics B16QAN02.N, IPS, 2560x1600, 16" | |
|---|---|---|---|---|---|---|
| Display | 1% | 18% | 24% | 21% | 20% | |
| Display P3 Coverage (%) | 70.1 | 70.8 1% | 95.1 36% | 98.4 40% | 99.3 42% | 98.9 41% |
| sRGB Coverage (%) | 99.6 | 99.5 0% | 99.9 0% | 99.7 0% | 100 0% | 100 0% |
| AdobeRGB 1998 Coverage (%) | 72.3 | 73.2 1% | 84.6 17% | 95.8 33% | 88 22% | 86.5 20% |
| Response Times | -13% | 61% | 95% | 93% | 63% | |
| Response Time Grey 50% / Grey 80% * (ms) | 35 ? | 38 ? -9% | 14 ? 60% | 1.6 ? 95% | 2 ? 94% | 13 ? 63% |
| Response Time Black / White * (ms) | 24.2 ? | 28 ? -16% | 9.2 ? 62% | 1.4 ? 94% | 1.9 ? 92% | 9 ? 63% |
| PWM Frequency (Hz) | 5784 ? | 120 ? | 240.4 ? | |||
| Screen | 14% | -55% | 35% | 30% | -5% | |
| Brightness middle (cd/m²) | 299.4 | 288.9 -4% | 627.4 110% | 347 16% | 328.8 10% | 314 5% |
| Brightness (cd/m²) | 290 | 276 -5% | 618 113% | 346 19% | 332 14% | 294 1% |
| Brightness Distribution (%) | 92 | 92 0% | 95 3% | 97 5% | 97 5% | 89 -3% |
| Black Level * (cd/m²) | 0.21 | 0.26 -24% | 0.19 10% | 0.06 71% | 0.28 -33% | |
| Contrast (:1) | 1426 | 1111 -22% | 3302 132% | 5783 306% | 1121 -21% | |
| Colorchecker dE 2000 * | 4.25 | 1.88 56% | 5.84 -37% | 1.89 56% | 1.53 64% | 3.08 28% |
| Colorchecker dE 2000 max. * | 6.71 | 4.37 35% | 10.22 -52% | 3.26 51% | 6.04 10% | 5.49 18% |
| Colorchecker dE 2000 calibrated * | 0.52 | 0.42 19% | 4.45 -756% | 1.97 -279% | 0.88 -69% | |
| Greyscale dE 2000 * | 5.5 | 1.4 75% | 6.7 -22% | 1.55 72% | 1.3 76% | 3.99 27% |
| Gamma | 2.35 94% | 2.3 96% | 2.77 79% | 2.39 92% | 2.18 101% | 2.3 96% |
| CCT | 6368 102% | 6634 98% | 5795 112% | 6458 101% | 6362 102% | 6219 105% |
| Całkowita średnia (program / ustawienia) | 1% /
8% | 8% /
-23% | 51% /
41% | 48% /
39% | 26% /
10% |
* ... im mniej tym lepiej
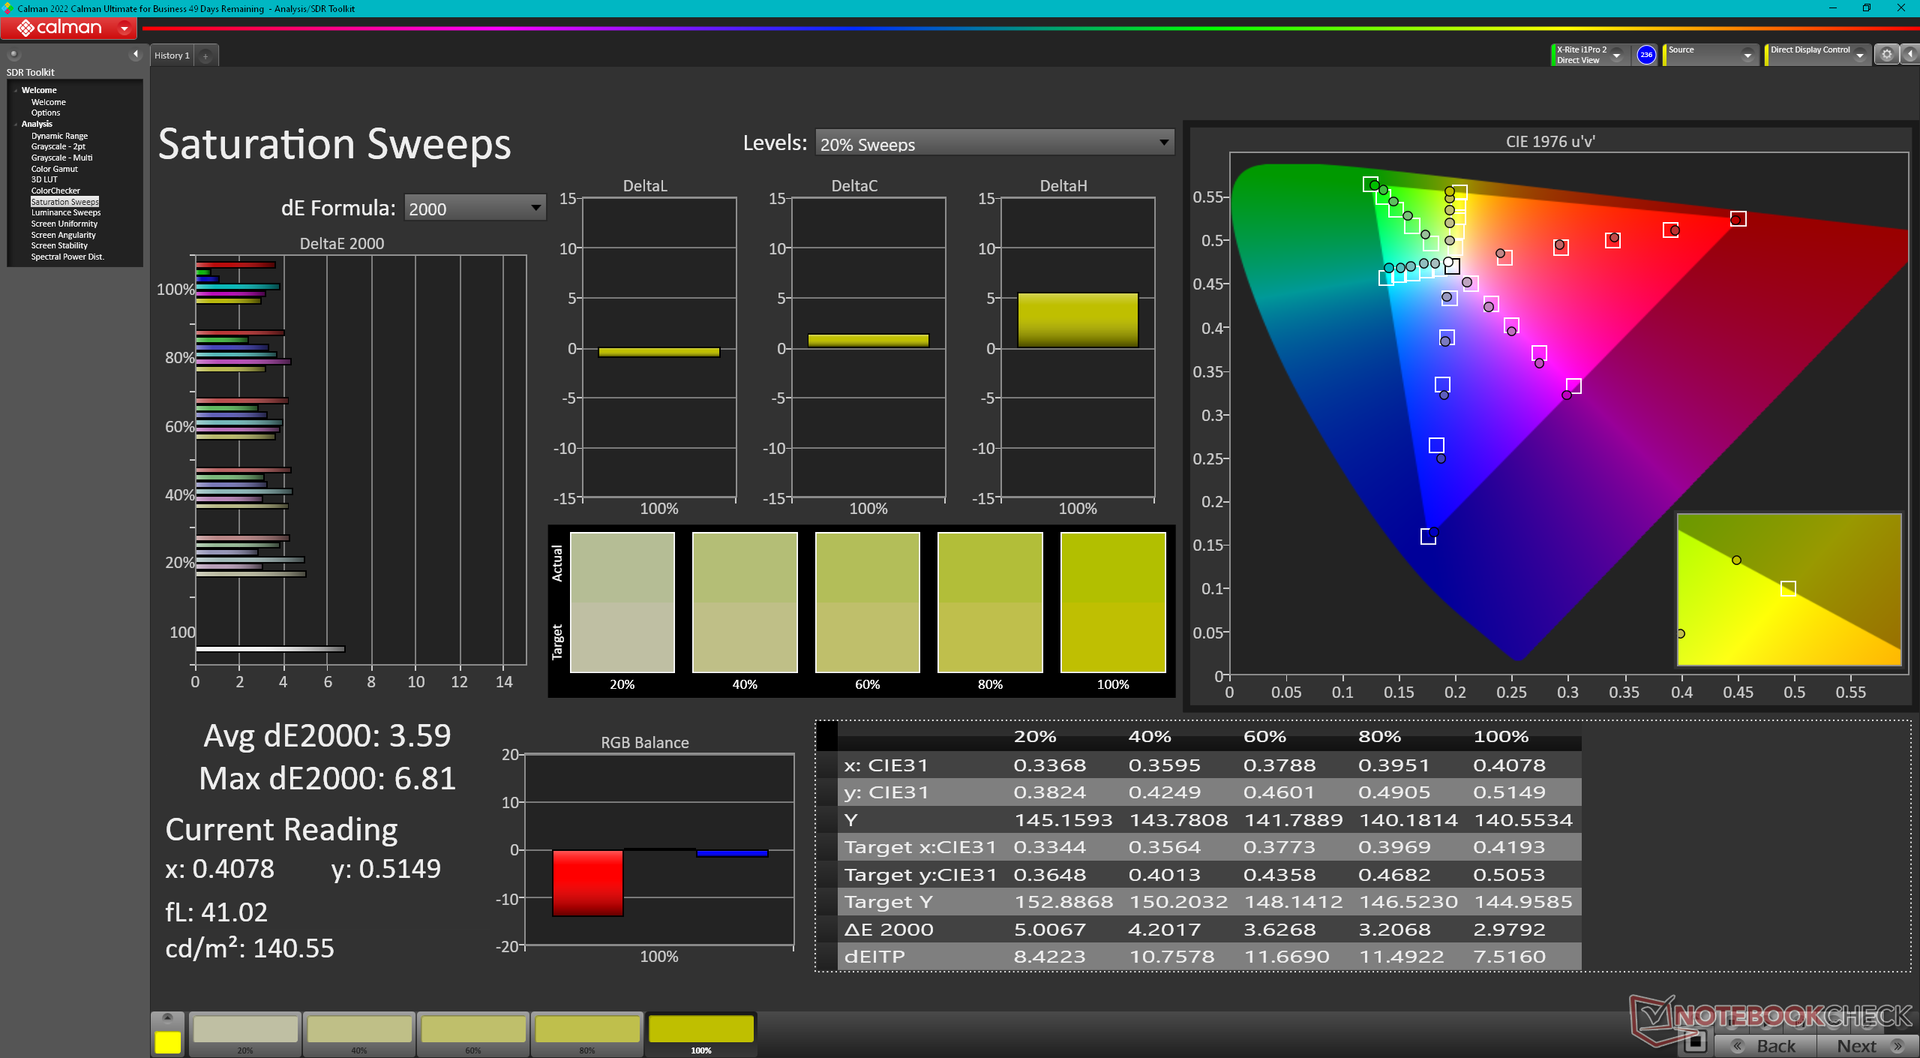
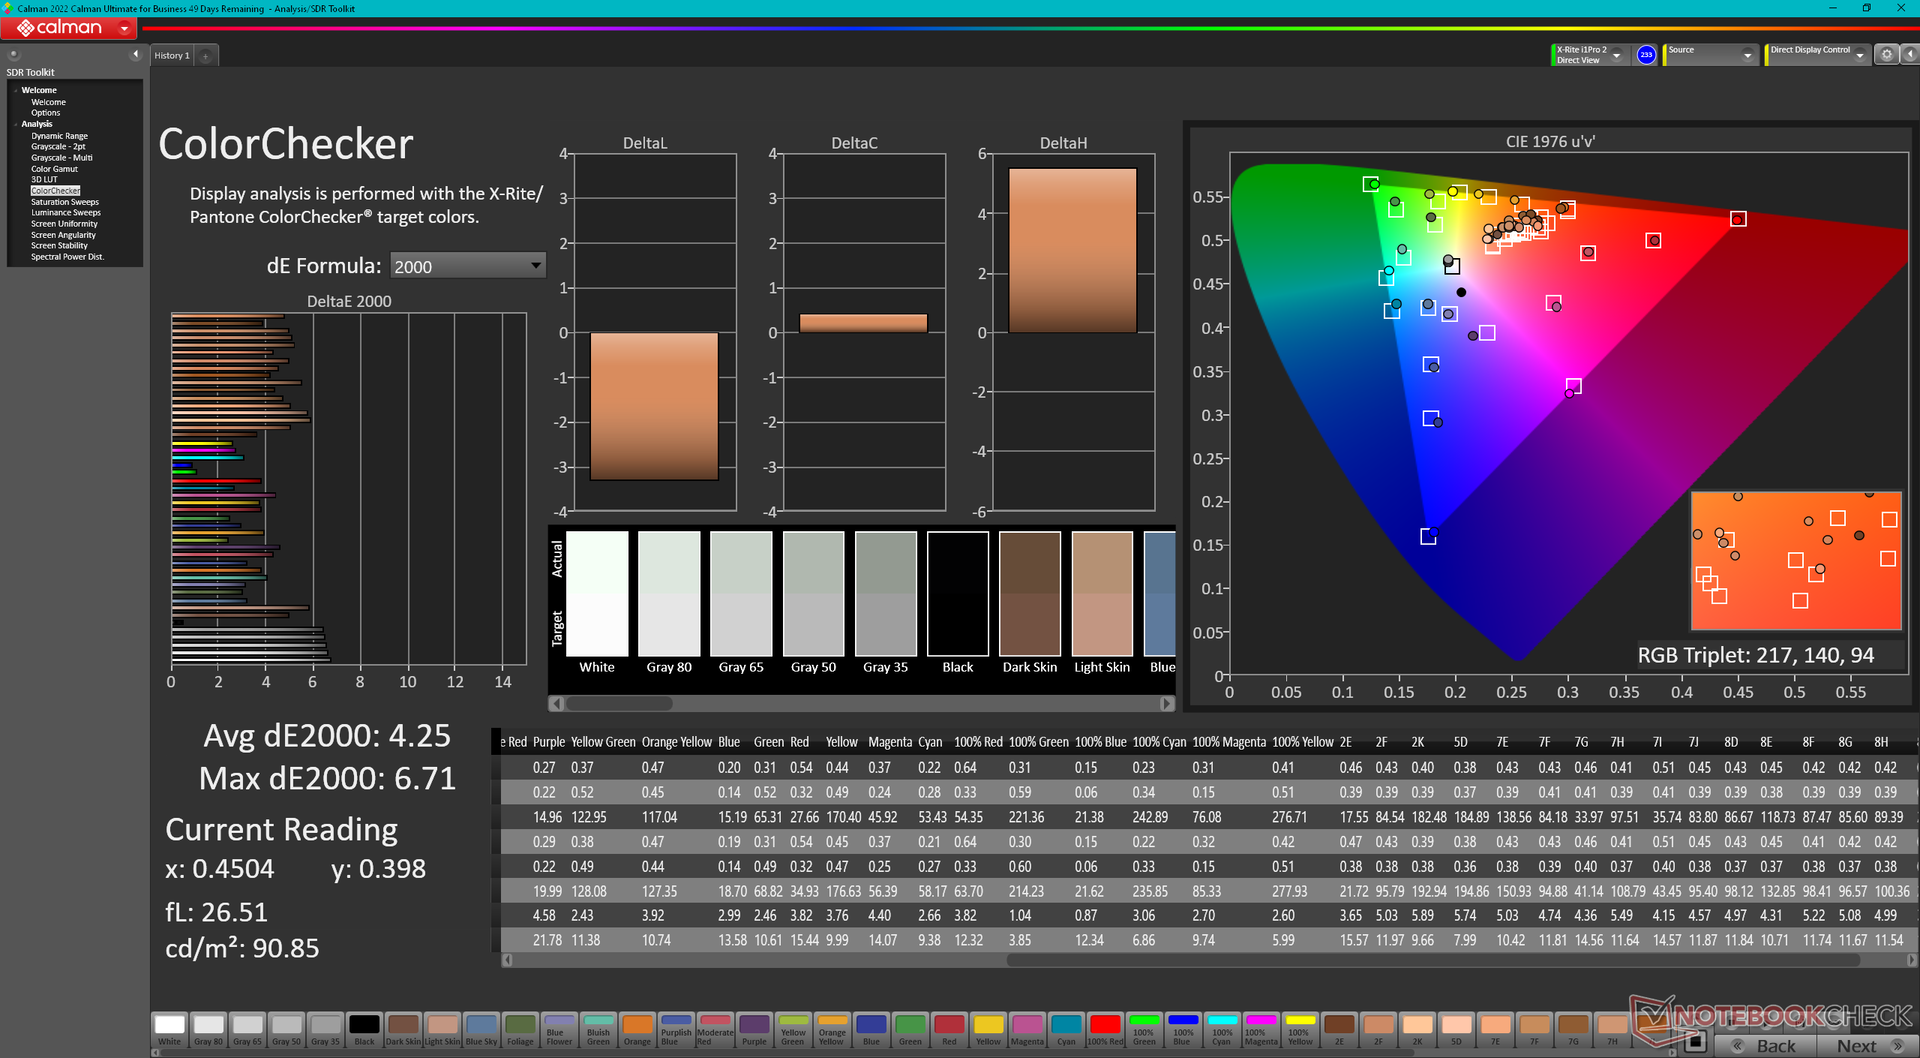
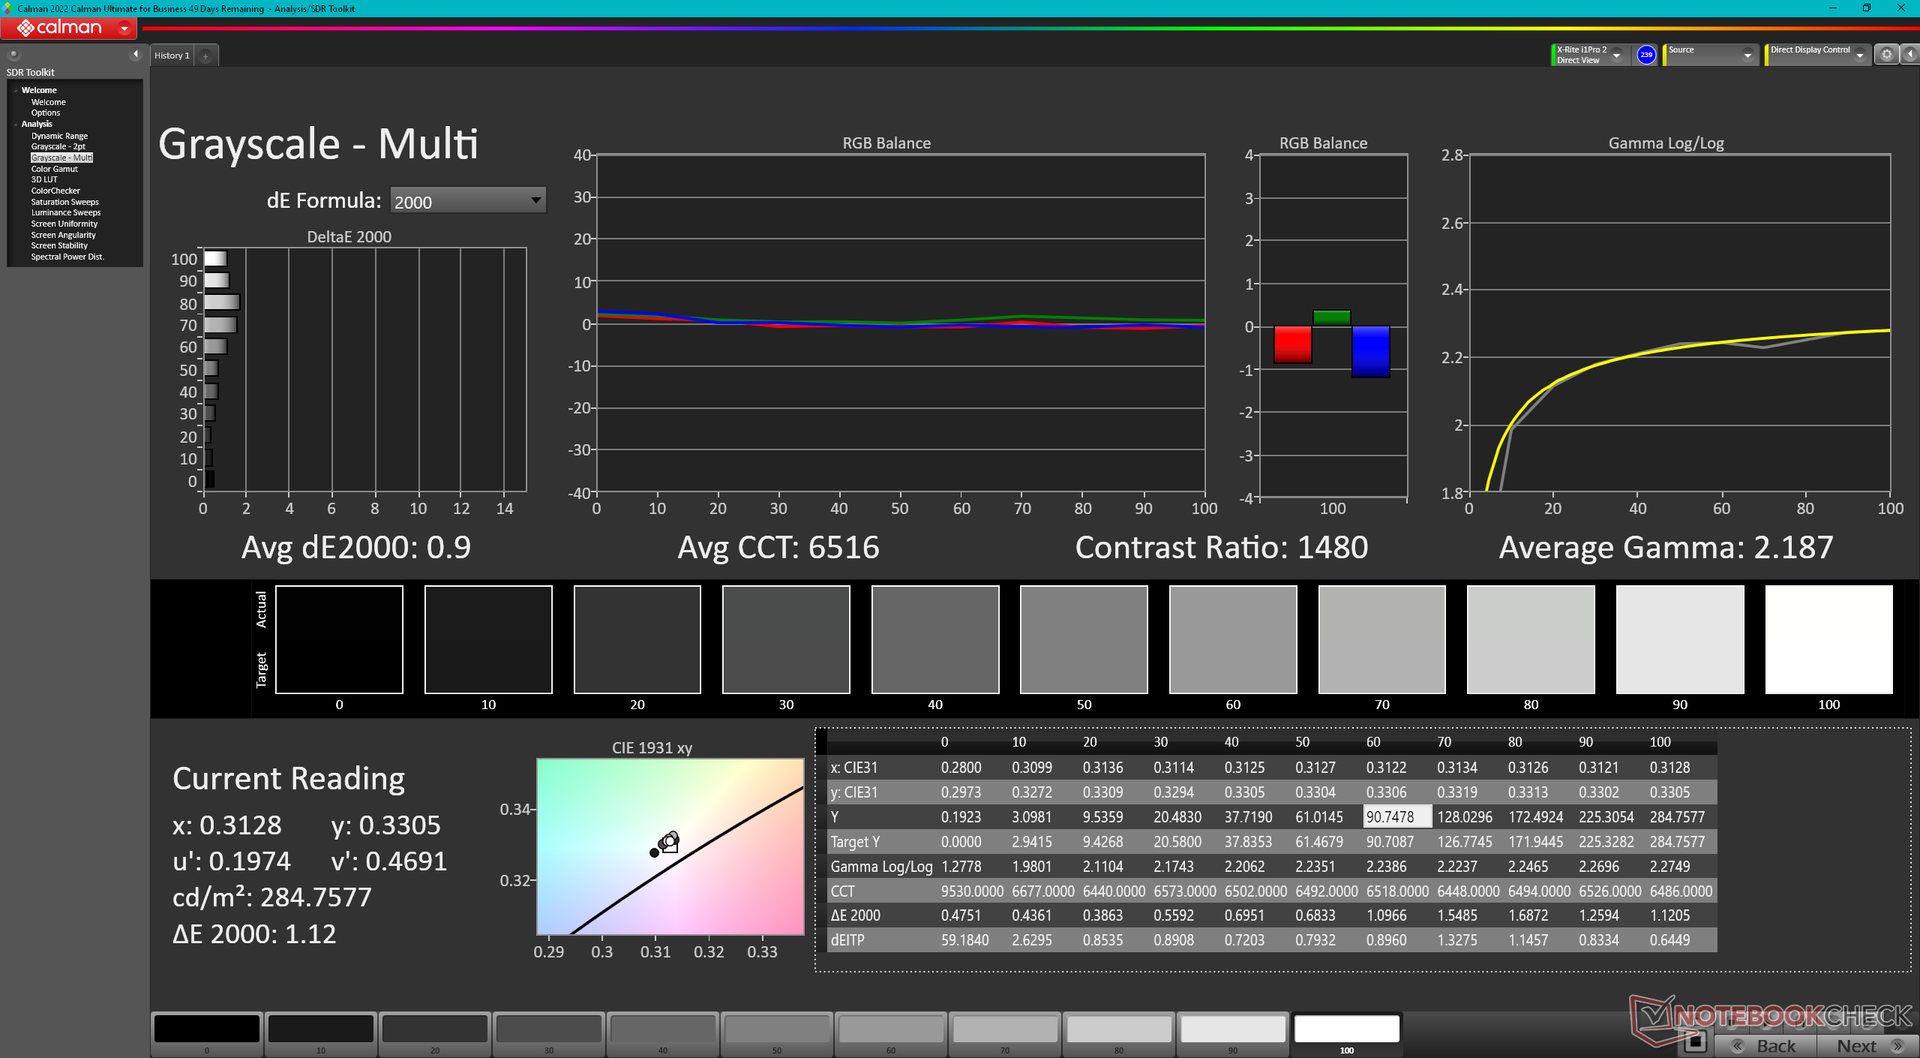
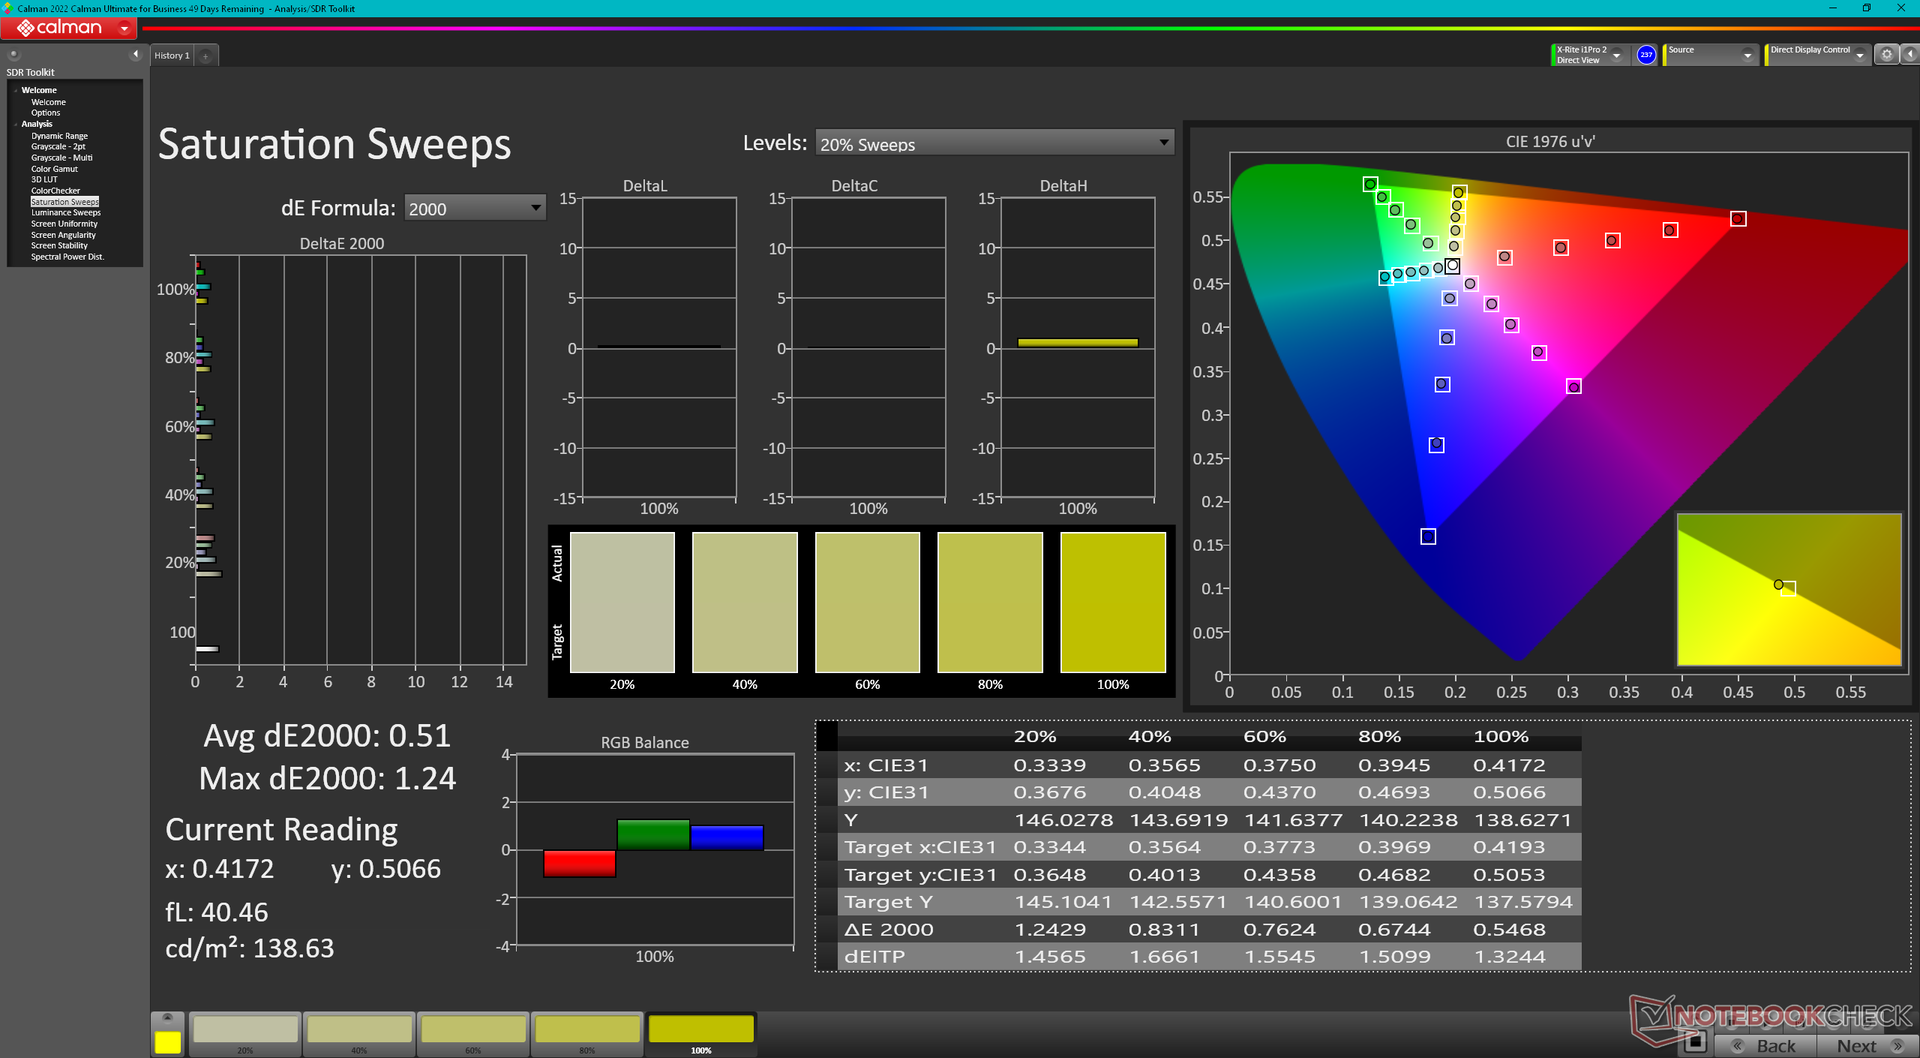
Wyświetlacz nie jest fabrycznie skalibrowany, a średnie wartości deltaE dla skali szarości i kolorów wynoszą odpowiednio 5,5 i 4,25. Temperatura kolorów jest również wyższa niż zwykle i wynosi 6368. Prawidłowa kalibracja za pomocą naszego kolorymetru X-Rite rozwiązałaby wszystkie te problemy, zapewniając zauważalnie dokładniejszy obraz, jak pokazują poniższe wyniki CalMAN. Nasz skalibrowany profil ICM jest dostępny do pobrania za darmo, jeśli właściciele nie mają własnych narzędzi kalibracyjnych.
Wyświetl czasy reakcji
| ↔ Czas reakcji od czerni do bieli | ||
|---|---|---|
| 24.2 ms ... wzrost ↗ i spadek ↘ łącznie | ↗ 10.8 ms wzrost | 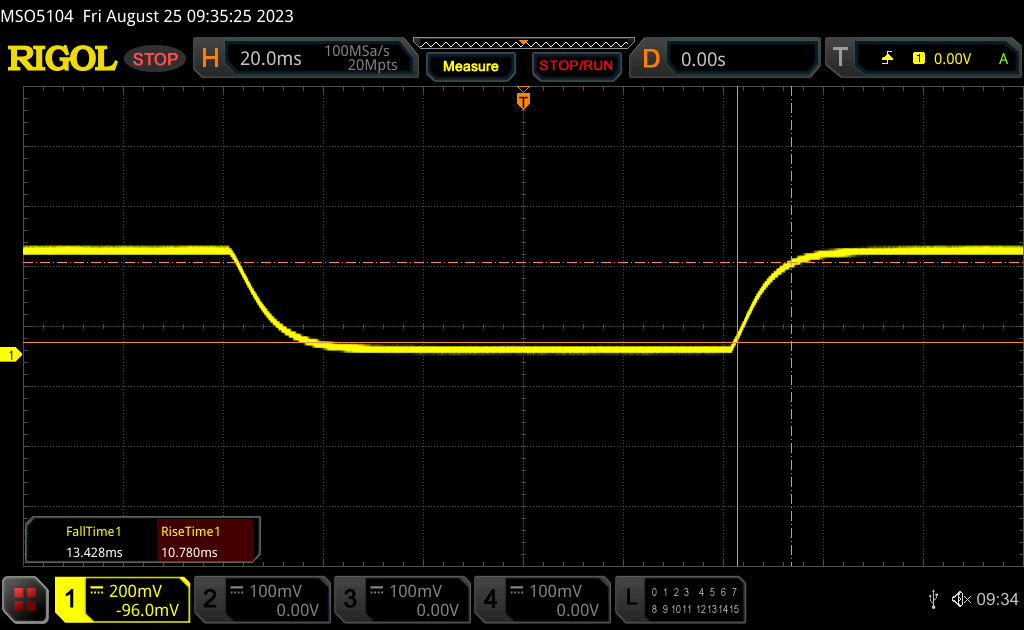 |
| ↘ 13.4 ms upadek | ||
| W naszych testach ekran wykazuje dobry współczynnik reakcji, ale może być zbyt wolny dla graczy rywalizujących ze sobą. Dla porównania, wszystkie testowane urządzenia wahają się od 0.1 (minimum) do 240 (maksimum) ms. » 57 % wszystkich urządzeń jest lepszych. Oznacza to, że zmierzony czas reakcji jest gorszy od średniej wszystkich testowanych urządzeń (19.8 ms). | ||
| ↔ Czas reakcji 50% szarości do 80% szarości | ||
| 35 ms ... wzrost ↗ i spadek ↘ łącznie | ↗ 15.7 ms wzrost | 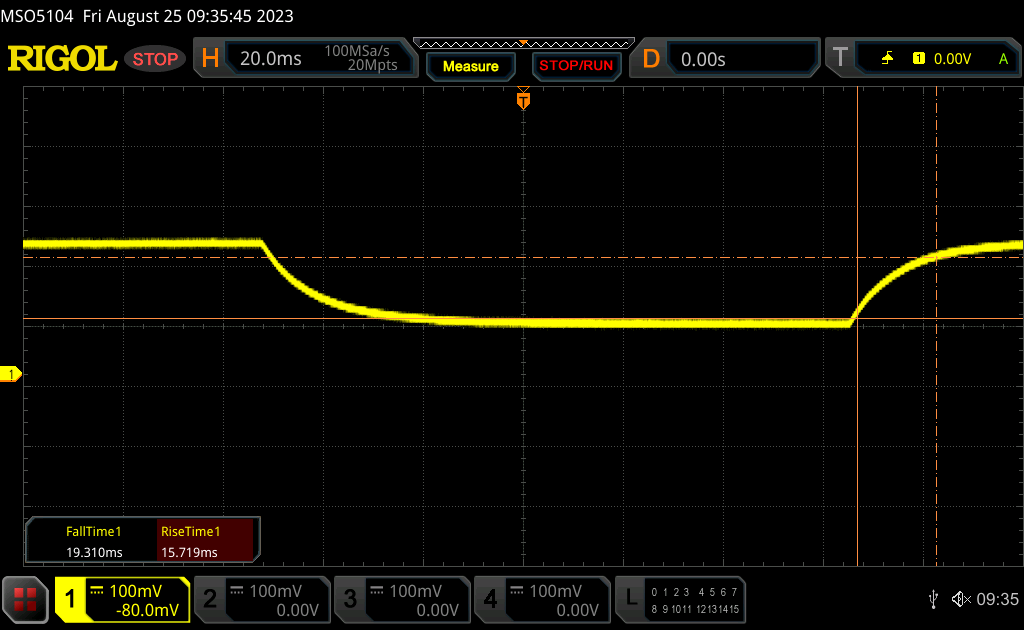 |
| ↘ 19.3 ms upadek | ||
| W naszych testach ekran wykazuje powolne tempo reakcji, co będzie niezadowalające dla graczy. Dla porównania, wszystkie testowane urządzenia wahają się od 0.165 (minimum) do 636 (maksimum) ms. » 49 % wszystkich urządzeń jest lepszych. Oznacza to, że zmierzony czas reakcji jest gorszy od średniej wszystkich testowanych urządzeń (31 ms). | ||
Migotanie ekranu / PWM (modulacja szerokości impulsu)
| Migotanie ekranu/nie wykryto PWM | 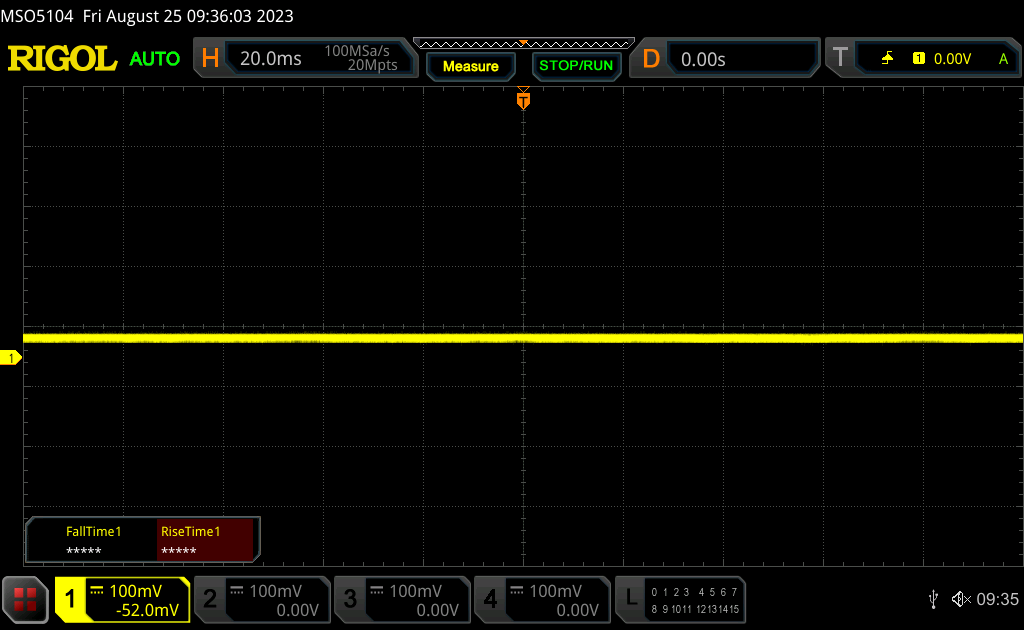 | ||
Dla porównania: 52 % wszystkich testowanych urządzeń nie używa PWM do przyciemniania wyświetlacza. Jeśli wykryto PWM, zmierzono średnio 7781 (minimum: 5 - maksimum: 343500) Hz. | |||
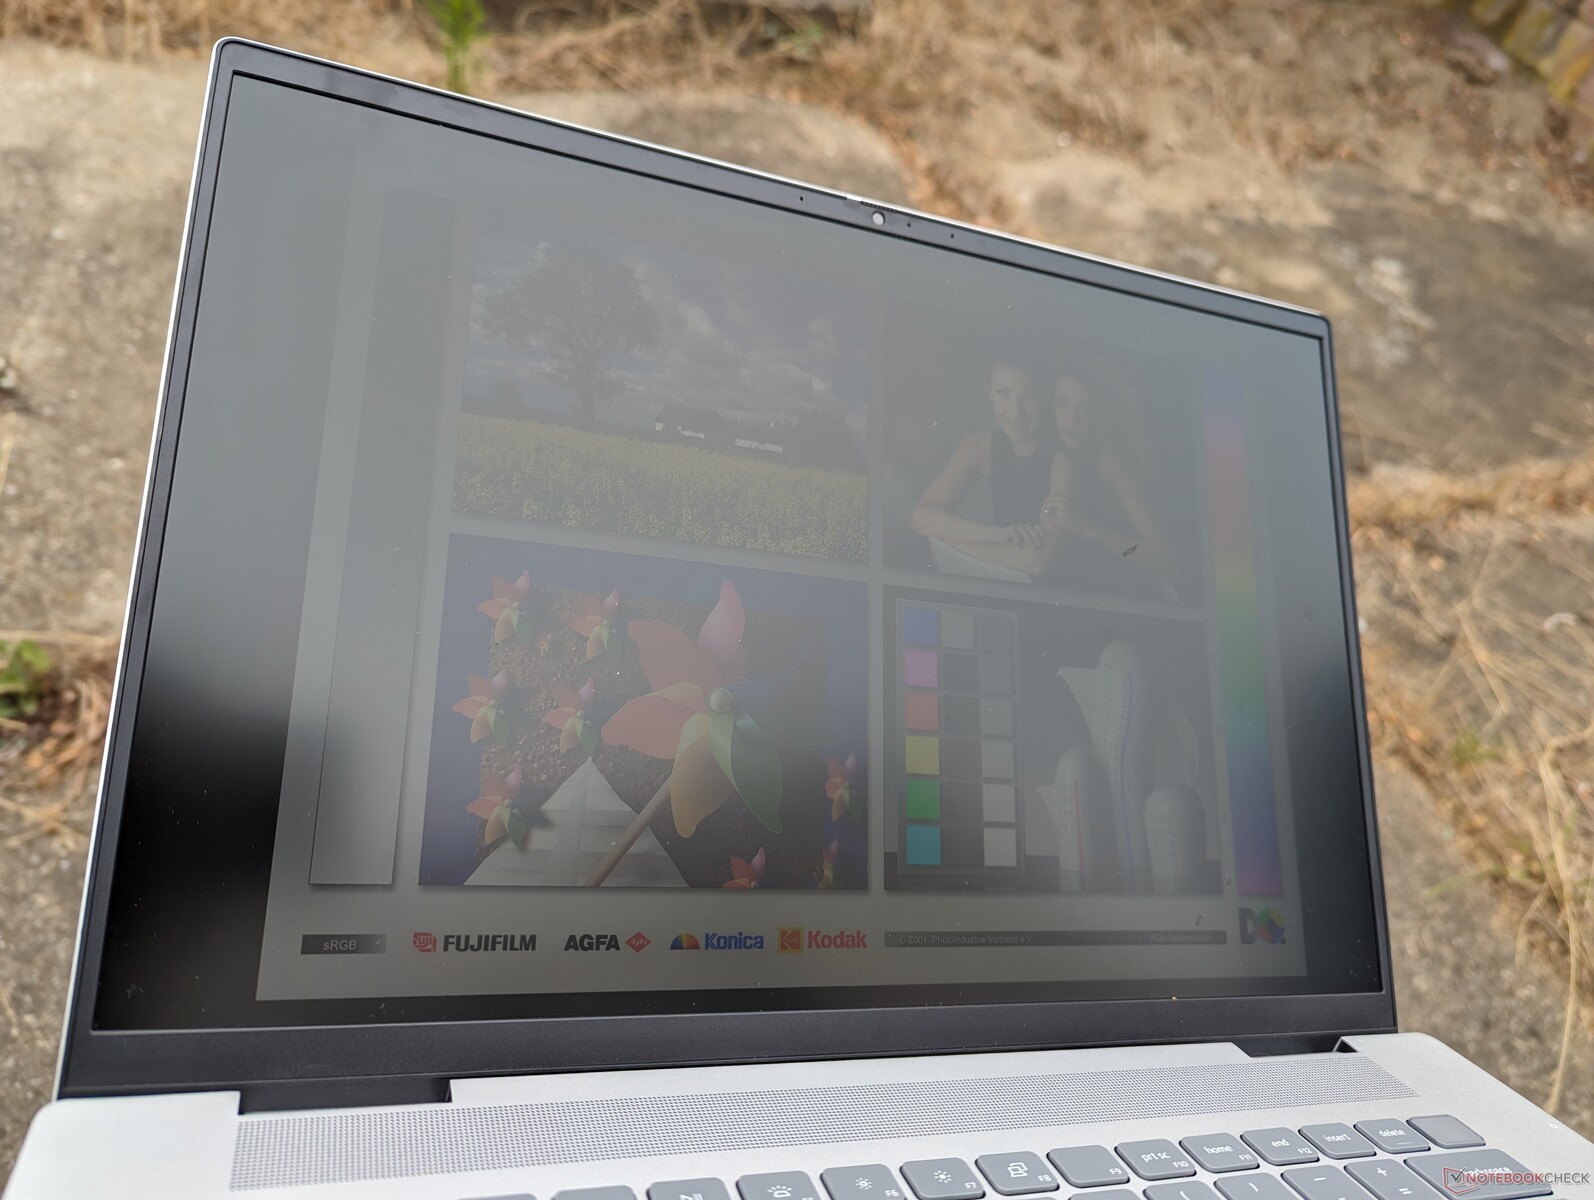
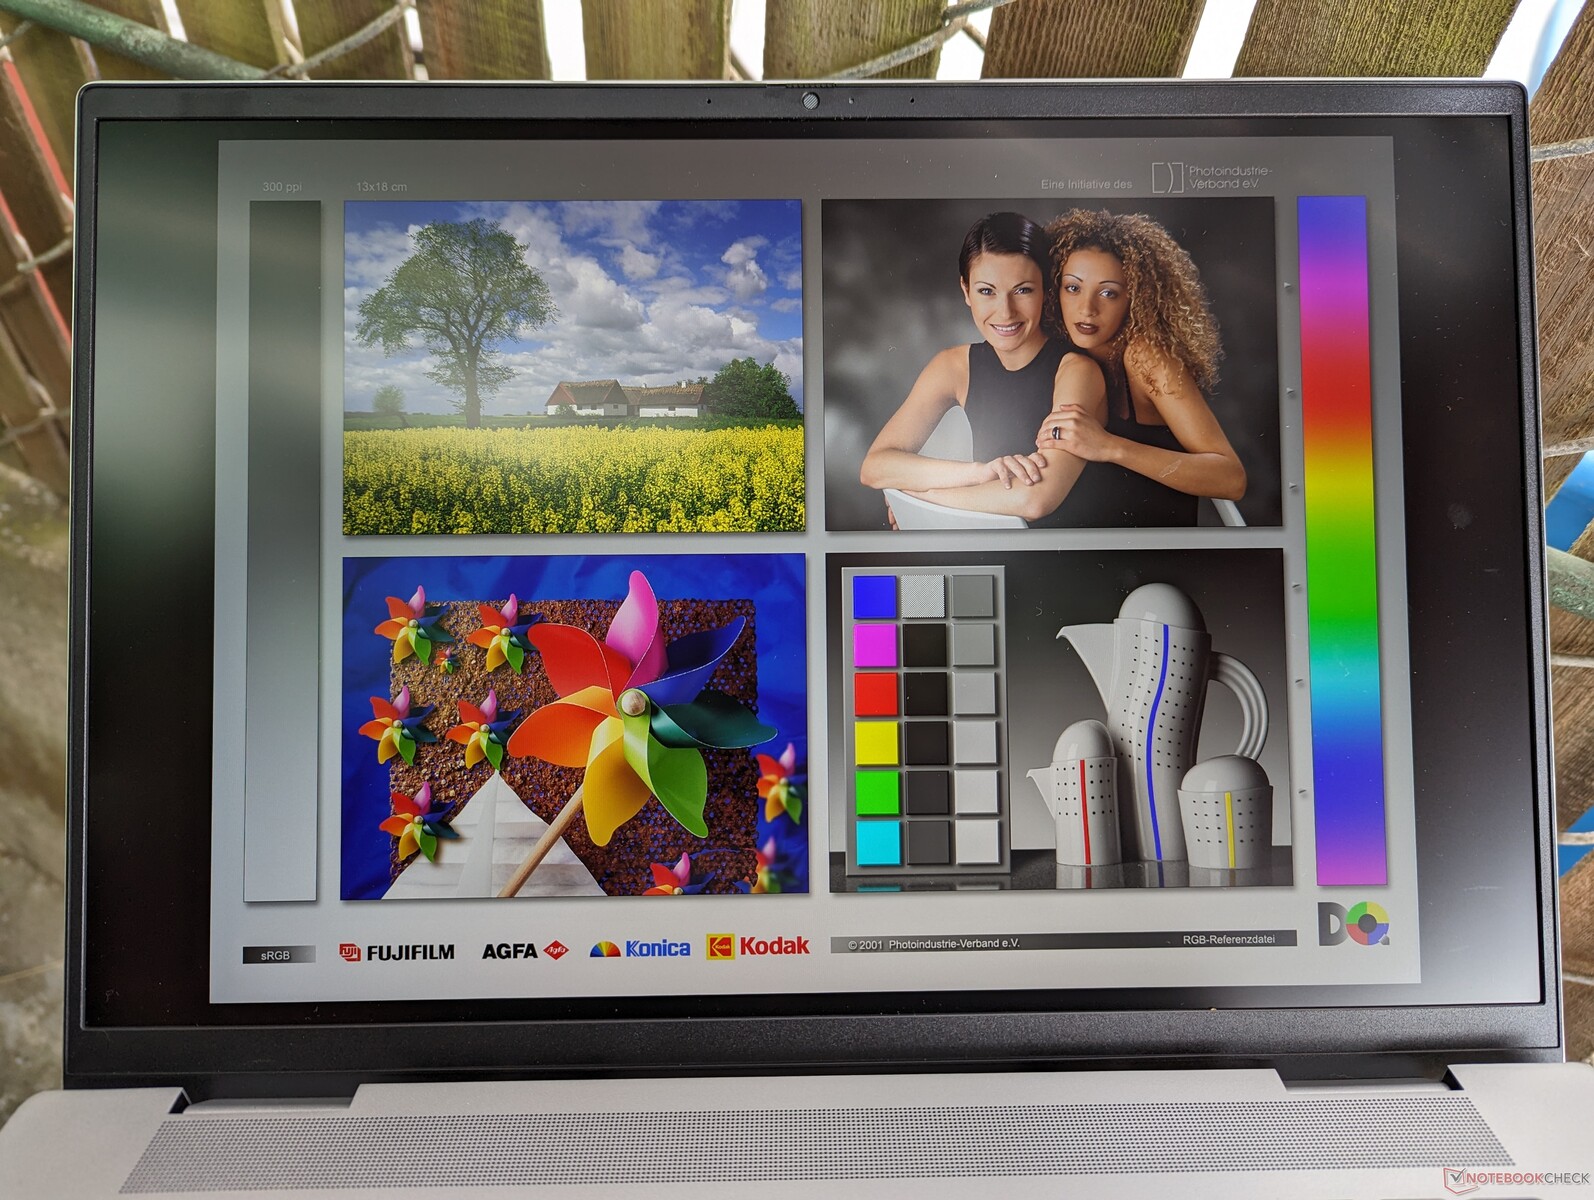
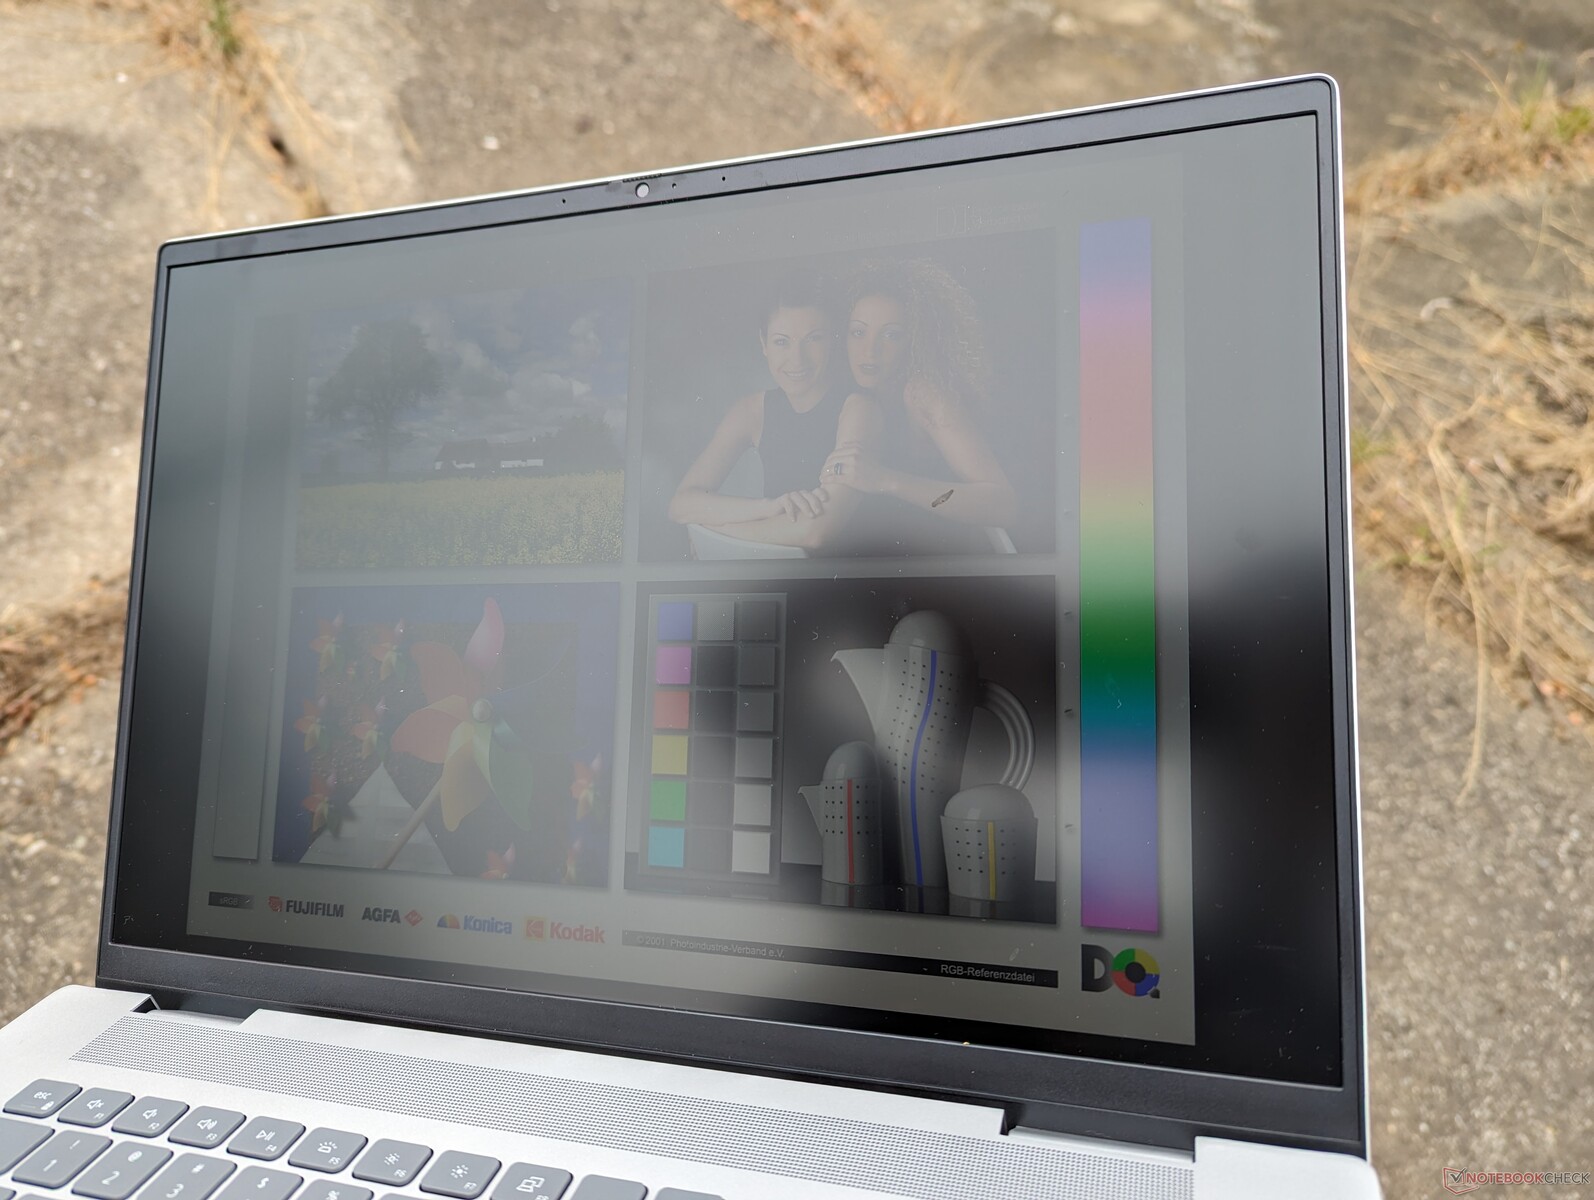
Widoczność na zewnątrz jest porównywalna z zeszłorocznym modelem i przyzwoita tylko w cieniu, aby zminimalizować odblaski. Inne 16-calowe laptopy z mini-LED lub OLED, takie jak Yoga 9i 16 lub Razer Blade 16 są zwykle jaśniejsze, co poprawia widoczność na zewnątrz, ale są też znacznie droższe niż nasz Dell.

Wydajność - Intel 13. generacji Raptor Lake-H
Warunki testowania
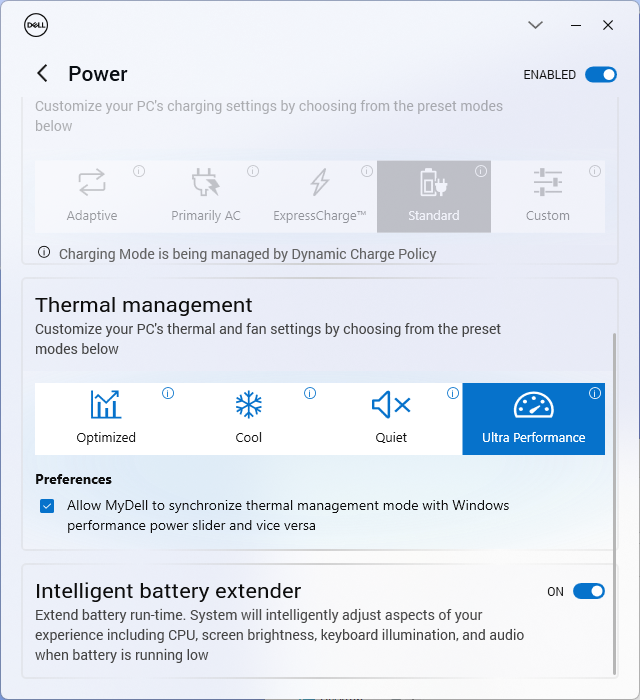
Przed przeprowadzeniem poniższych testów porównawczych ustawiliśmy nasze urządzenie w tryb wydajności za pomocą wstępnie zainstalowanego oprogramowania MyDell. Profile zasilania MyDell można zsynchronizować z profilami zasilania systemu Windows, aby zmniejszyć zamieszanie i uniknąć konfliktu ustawień.
Inspiron nie obsługuje Advanced Optimus ani MUX, które są za to powszechnymi funkcjami w dedykowanych modelach gamingowych z serii Dell G lub Alienware.
Procesor
Wydajność procesorów 13. generacji Core i7-13700H jest tylko do 10 procent szybszy niż 12. generacji Core i7-12700H w zeszłorocznym Inspironie 16 Plus 7620. Gdy jednak korzyści płynące z Turbo Boost zmaleją, różnice w wydajności stają się jeszcze mniejsze, co pokazują poniższe wyniki pętli CineBench R15 xT. Innymi słowy, Inspiron 16 Plus 7630 jest tylko nieznacznie szybszy od zeszłorocznego modelu, jeśli chodzi o wydajność procesora.
Przejście na procesor Core i5-13500H wpłynie na wydajność procesora tylko o około 10 procent w oparciu o nasze doświadczenia z Asus VivoBook 14X. W międzyczasie, oparty na AMD Ryzen 7 7840HS będzie w stanie dorównać naszemu Core i7-13700H.
Cinebench R15 Multi Loop
Cinebench R23: Multi Core | Single Core
Cinebench R20: CPU (Multi Core) | CPU (Single Core)
Cinebench R15: CPU Multi 64Bit | CPU Single 64Bit
Blender: v2.79 BMW27 CPU
7-Zip 18.03: 7z b 4 | 7z b 4 -mmt1
Geekbench 5.5: Multi-Core | Single-Core
HWBOT x265 Benchmark v2.2: 4k Preset
LibreOffice : 20 Documents To PDF
R Benchmark 2.5: Overall mean
| CPU Performance rating | |
| Asus Zephyrus Duo 16 GX650PY-NM006W | |
| HP Omen Transcend 16 | |
| Asus Vivobook Pro 16X K6604JV-MX016W | |
| Alienware m16 R1 AMD | |
| Lenovo Slim Pro 9i 16IRP8 | |
| Lenovo Legion Pro 5 16ARX8 | |
| Lenovo Legion Pro 5 16IRX8 | |
| Lenovo Legion Slim 5 16APH8 | |
| MSI Stealth 16 Studio A13VG | |
| Dell Inspiron 16 Plus 7630 | |
| Przeciętny Intel Core i7-13700H | |
| Dell Inspiron 16 Plus 7620 | |
| Lenovo Legion S7 16ARHA7 | |
| Asus VivoBook 14X K3405 | |
| Acer Nitro 16 AN16-41 | |
| HP Omen 16-n0033dx | |
| MSI Summit E16 Flip A12UDT-031 | |
| Lenovo IdeaPad 5 Pro 16IHU6 | |
| Cinebench R23 / Multi Core | |
| Asus Zephyrus Duo 16 GX650PY-NM006W | |
| Asus Vivobook Pro 16X K6604JV-MX016W | |
| Alienware m16 R1 AMD | |
| HP Omen Transcend 16 | |
| MSI Stealth 16 Studio A13VG | |
| Lenovo Slim Pro 9i 16IRP8 | |
| Lenovo Legion Pro 5 16IRX8 | |
| Lenovo Legion Pro 5 16ARX8 | |
| Lenovo Legion Slim 5 16APH8 | |
| Dell Inspiron 16 Plus 7630 | |
| Przeciętny Intel Core i7-13700H (5890 - 20034, n=29) | |
| MSI Summit E16 Flip A12UDT-031 | |
| Dell Inspiron 16 Plus 7620 | |
| Lenovo Legion S7 16ARHA7 | |
| Asus VivoBook 14X K3405 | |
| Acer Nitro 16 AN16-41 | |
| HP Omen 16-n0033dx | |
| Lenovo IdeaPad 5 Pro 16IHU6 | |
| Cinebench R23 / Single Core | |
| HP Omen Transcend 16 | |
| Lenovo Slim Pro 9i 16IRP8 | |
| Asus Zephyrus Duo 16 GX650PY-NM006W | |
| Dell Inspiron 16 Plus 7630 | |
| MSI Stealth 16 Studio A13VG | |
| Alienware m16 R1 AMD | |
| Lenovo Legion Pro 5 16ARX8 | |
| Asus Vivobook Pro 16X K6604JV-MX016W | |
| Przeciętny Intel Core i7-13700H (1323 - 1914, n=29) | |
| Lenovo Legion Slim 5 16APH8 | |
| Dell Inspiron 16 Plus 7620 | |
| Asus VivoBook 14X K3405 | |
| Lenovo Legion Pro 5 16IRX8 | |
| MSI Summit E16 Flip A12UDT-031 | |
| Lenovo Legion S7 16ARHA7 | |
| Acer Nitro 16 AN16-41 | |
| HP Omen 16-n0033dx | |
| Lenovo IdeaPad 5 Pro 16IHU6 | |
| Cinebench R20 / CPU (Multi Core) | |
| Asus Zephyrus Duo 16 GX650PY-NM006W | |
| Asus Vivobook Pro 16X K6604JV-MX016W | |
| Alienware m16 R1 AMD | |
| HP Omen Transcend 16 | |
| MSI Stealth 16 Studio A13VG | |
| Lenovo Slim Pro 9i 16IRP8 | |
| Lenovo Legion Pro 5 16ARX8 | |
| Lenovo Legion Pro 5 16IRX8 | |
| Lenovo Legion Slim 5 16APH8 | |
| Dell Inspiron 16 Plus 7630 | |
| Przeciętny Intel Core i7-13700H (2322 - 7674, n=29) | |
| Dell Inspiron 16 Plus 7620 | |
| Lenovo Legion S7 16ARHA7 | |
| Asus VivoBook 14X K3405 | |
| Acer Nitro 16 AN16-41 | |
| MSI Summit E16 Flip A12UDT-031 | |
| HP Omen 16-n0033dx | |
| Lenovo IdeaPad 5 Pro 16IHU6 | |
| Cinebench R20 / CPU (Single Core) | |
| HP Omen Transcend 16 | |
| Lenovo Slim Pro 9i 16IRP8 | |
| Asus Zephyrus Duo 16 GX650PY-NM006W | |
| Dell Inspiron 16 Plus 7630 | |
| MSI Stealth 16 Studio A13VG | |
| Alienware m16 R1 AMD | |
| Lenovo Legion Pro 5 16ARX8 | |
| Asus Vivobook Pro 16X K6604JV-MX016W | |
| Lenovo Legion Slim 5 16APH8 | |
| Przeciętny Intel Core i7-13700H (508 - 741, n=29) | |
| Dell Inspiron 16 Plus 7620 | |
| Asus VivoBook 14X K3405 | |
| Lenovo Legion Pro 5 16IRX8 | |
| MSI Summit E16 Flip A12UDT-031 | |
| Lenovo Legion S7 16ARHA7 | |
| Acer Nitro 16 AN16-41 | |
| HP Omen 16-n0033dx | |
| Lenovo IdeaPad 5 Pro 16IHU6 | |
| Cinebench R15 / CPU Multi 64Bit | |
| Asus Zephyrus Duo 16 GX650PY-NM006W | |
| Asus Vivobook Pro 16X K6604JV-MX016W | |
| Alienware m16 R1 AMD | |
| HP Omen Transcend 16 | |
| Lenovo Legion Pro 5 16IRX8 | |
| Lenovo Legion Pro 5 16ARX8 | |
| Lenovo Slim Pro 9i 16IRP8 | |
| MSI Stealth 16 Studio A13VG | |
| Lenovo Legion Slim 5 16APH8 | |
| Dell Inspiron 16 Plus 7620 | |
| Dell Inspiron 16 Plus 7630 | |
| Przeciętny Intel Core i7-13700H (905 - 2982, n=29) | |
| Lenovo Legion S7 16ARHA7 | |
| MSI Summit E16 Flip A12UDT-031 | |
| Acer Nitro 16 AN16-41 | |
| Asus VivoBook 14X K3405 | |
| HP Omen 16-n0033dx | |
| Lenovo IdeaPad 5 Pro 16IHU6 | |
| Cinebench R15 / CPU Single 64Bit | |
| Asus Zephyrus Duo 16 GX650PY-NM006W | |
| HP Omen Transcend 16 | |
| Alienware m16 R1 AMD | |
| Lenovo Legion Pro 5 16ARX8 | |
| Asus Vivobook Pro 16X K6604JV-MX016W | |
| Lenovo Slim Pro 9i 16IRP8 | |
| Lenovo Legion Slim 5 16APH8 | |
| MSI Stealth 16 Studio A13VG | |
| Lenovo Legion Pro 5 16IRX8 | |
| Dell Inspiron 16 Plus 7630 | |
| Przeciętny Intel Core i7-13700H (213 - 278, n=29) | |
| Lenovo Legion S7 16ARHA7 | |
| Dell Inspiron 16 Plus 7620 | |
| Asus VivoBook 14X K3405 | |
| Acer Nitro 16 AN16-41 | |
| HP Omen 16-n0033dx | |
| MSI Summit E16 Flip A12UDT-031 | |
| Lenovo IdeaPad 5 Pro 16IHU6 | |
| Blender / v2.79 BMW27 CPU | |
| Lenovo IdeaPad 5 Pro 16IHU6 | |
| MSI Summit E16 Flip A12UDT-031 | |
| Asus VivoBook 14X K3405 | |
| HP Omen 16-n0033dx | |
| Dell Inspiron 16 Plus 7620 | |
| Przeciętny Intel Core i7-13700H (169 - 555, n=29) | |
| Dell Inspiron 16 Plus 7630 | |
| Acer Nitro 16 AN16-41 | |
| Lenovo Legion S7 16ARHA7 | |
| Lenovo Legion Slim 5 16APH8 | |
| Lenovo Legion Pro 5 16ARX8 | |
| Lenovo Slim Pro 9i 16IRP8 | |
| MSI Stealth 16 Studio A13VG | |
| Lenovo Legion Pro 5 16IRX8 | |
| Asus Vivobook Pro 16X K6604JV-MX016W | |
| HP Omen Transcend 16 | |
| Alienware m16 R1 AMD | |
| Asus Zephyrus Duo 16 GX650PY-NM006W | |
| 7-Zip 18.03 / 7z b 4 | |
| Asus Zephyrus Duo 16 GX650PY-NM006W | |
| Alienware m16 R1 AMD | |
| HP Omen Transcend 16 | |
| Asus Vivobook Pro 16X K6604JV-MX016W | |
| Lenovo Legion Pro 5 16IRX8 | |
| MSI Stealth 16 Studio A13VG | |
| Lenovo Slim Pro 9i 16IRP8 | |
| Lenovo Legion Pro 5 16ARX8 | |
| Lenovo Legion Slim 5 16APH8 | |
| Lenovo Legion S7 16ARHA7 | |
| Acer Nitro 16 AN16-41 | |
| Przeciętny Intel Core i7-13700H (27322 - 76344, n=29) | |
| Dell Inspiron 16 Plus 7620 | |
| Dell Inspiron 16 Plus 7630 | |
| HP Omen 16-n0033dx | |
| Asus VivoBook 14X K3405 | |
| MSI Summit E16 Flip A12UDT-031 | |
| Lenovo IdeaPad 5 Pro 16IHU6 | |
| 7-Zip 18.03 / 7z b 4 -mmt1 | |
| Asus Zephyrus Duo 16 GX650PY-NM006W | |
| Lenovo Legion Pro 5 16ARX8 | |
| Alienware m16 R1 AMD | |
| Asus Vivobook Pro 16X K6604JV-MX016W | |
| HP Omen Transcend 16 | |
| Lenovo Legion Slim 5 16APH8 | |
| MSI Stealth 16 Studio A13VG | |
| Lenovo Legion S7 16ARHA7 | |
| Lenovo Slim Pro 9i 16IRP8 | |
| Przeciętny Intel Core i7-13700H (4825 - 6238, n=29) | |
| Lenovo Legion Pro 5 16IRX8 | |
| Dell Inspiron 16 Plus 7630 | |
| HP Omen 16-n0033dx | |
| Asus VivoBook 14X K3405 | |
| Acer Nitro 16 AN16-41 | |
| Dell Inspiron 16 Plus 7620 | |
| MSI Summit E16 Flip A12UDT-031 | |
| Lenovo IdeaPad 5 Pro 16IHU6 | |
| Geekbench 5.5 / Multi-Core | |
| Asus Zephyrus Duo 16 GX650PY-NM006W | |
| HP Omen Transcend 16 | |
| Asus Vivobook Pro 16X K6604JV-MX016W | |
| Alienware m16 R1 AMD | |
| Lenovo Slim Pro 9i 16IRP8 | |
| Lenovo Legion Pro 5 16IRX8 | |
| MSI Stealth 16 Studio A13VG | |
| Dell Inspiron 16 Plus 7630 | |
| Lenovo Legion Pro 5 16ARX8 | |
| Dell Inspiron 16 Plus 7620 | |
| Przeciętny Intel Core i7-13700H (6165 - 14215, n=29) | |
| Lenovo Legion Slim 5 16APH8 | |
| Lenovo Legion S7 16ARHA7 | |
| Acer Nitro 16 AN16-41 | |
| MSI Summit E16 Flip A12UDT-031 | |
| HP Omen 16-n0033dx | |
| Asus VivoBook 14X K3405 | |
| Lenovo IdeaPad 5 Pro 16IHU6 | |
| Geekbench 5.5 / Single-Core | |
| Asus Zephyrus Duo 16 GX650PY-NM006W | |
| HP Omen Transcend 16 | |
| Lenovo Legion Pro 5 16ARX8 | |
| Alienware m16 R1 AMD | |
| Asus Vivobook Pro 16X K6604JV-MX016W | |
| Lenovo Legion Slim 5 16APH8 | |
| Lenovo Slim Pro 9i 16IRP8 | |
| Dell Inspiron 16 Plus 7630 | |
| MSI Stealth 16 Studio A13VG | |
| Przeciętny Intel Core i7-13700H (1362 - 1919, n=29) | |
| Lenovo Legion Pro 5 16IRX8 | |
| Dell Inspiron 16 Plus 7620 | |
| Asus VivoBook 14X K3405 | |
| Lenovo Legion S7 16ARHA7 | |
| MSI Summit E16 Flip A12UDT-031 | |
| Acer Nitro 16 AN16-41 | |
| HP Omen 16-n0033dx | |
| Lenovo IdeaPad 5 Pro 16IHU6 | |
| HWBOT x265 Benchmark v2.2 / 4k Preset | |
| Asus Zephyrus Duo 16 GX650PY-NM006W | |
| Alienware m16 R1 AMD | |
| Asus Vivobook Pro 16X K6604JV-MX016W | |
| HP Omen Transcend 16 | |
| Lenovo Legion Pro 5 16IRX8 | |
| Lenovo Legion Pro 5 16ARX8 | |
| Lenovo Slim Pro 9i 16IRP8 | |
| Lenovo Legion Slim 5 16APH8 | |
| MSI Stealth 16 Studio A13VG | |
| Lenovo Legion S7 16ARHA7 | |
| Acer Nitro 16 AN16-41 | |
| Przeciętny Intel Core i7-13700H (6.72 - 21.2, n=29) | |
| HP Omen 16-n0033dx | |
| Dell Inspiron 16 Plus 7620 | |
| Dell Inspiron 16 Plus 7630 | |
| Asus VivoBook 14X K3405 | |
| MSI Summit E16 Flip A12UDT-031 | |
| Lenovo IdeaPad 5 Pro 16IHU6 | |
| LibreOffice / 20 Documents To PDF | |
| Asus Zephyrus Duo 16 GX650PY-NM006W | |
| HP Omen 16-n0033dx | |
| MSI Stealth 16 Studio A13VG | |
| Acer Nitro 16 AN16-41 | |
| MSI Summit E16 Flip A12UDT-031 | |
| Lenovo IdeaPad 5 Pro 16IHU6 | |
| Asus Vivobook Pro 16X K6604JV-MX016W | |
| Lenovo Legion S7 16ARHA7 | |
| Przeciętny Intel Core i7-13700H (31.3 - 62.4, n=29) | |
| Asus VivoBook 14X K3405 | |
| Dell Inspiron 16 Plus 7620 | |
| Dell Inspiron 16 Plus 7630 | |
| HP Omen Transcend 16 | |
| Lenovo Slim Pro 9i 16IRP8 | |
| Alienware m16 R1 AMD | |
| Lenovo Legion Slim 5 16APH8 | |
| Lenovo Legion Pro 5 16ARX8 | |
| Lenovo Legion Pro 5 16IRX8 | |
| R Benchmark 2.5 / Overall mean | |
| Lenovo IdeaPad 5 Pro 16IHU6 | |
| MSI Summit E16 Flip A12UDT-031 | |
| HP Omen 16-n0033dx | |
| Acer Nitro 16 AN16-41 | |
| Asus VivoBook 14X K3405 | |
| Lenovo Legion Pro 5 16IRX8 | |
| Dell Inspiron 16 Plus 7620 | |
| Przeciętny Intel Core i7-13700H (0.4308 - 0.607, n=29) | |
| Lenovo Legion S7 16ARHA7 | |
| MSI Stealth 16 Studio A13VG | |
| Dell Inspiron 16 Plus 7630 | |
| Lenovo Legion Slim 5 16APH8 | |
| Alienware m16 R1 AMD | |
| Lenovo Legion Pro 5 16ARX8 | |
| Lenovo Slim Pro 9i 16IRP8 | |
| Asus Vivobook Pro 16X K6604JV-MX016W | |
| HP Omen Transcend 16 | |
| Asus Zephyrus Duo 16 GX650PY-NM006W | |
Cinebench R23: Multi Core | Single Core
Cinebench R20: CPU (Multi Core) | CPU (Single Core)
Cinebench R15: CPU Multi 64Bit | CPU Single 64Bit
Blender: v2.79 BMW27 CPU
7-Zip 18.03: 7z b 4 | 7z b 4 -mmt1
Geekbench 5.5: Multi-Core | Single-Core
HWBOT x265 Benchmark v2.2: 4k Preset
LibreOffice : 20 Documents To PDF
R Benchmark 2.5: Overall mean
* ... im mniej tym lepiej
AIDA64: FP32 Ray-Trace | FPU Julia | CPU SHA3 | CPU Queen | FPU SinJulia | FPU Mandel | CPU AES | CPU ZLib | FP64 Ray-Trace | CPU PhotoWorxx
| Performance rating | |
| Asus Vivobook Pro 16X K6604JV-MX016W | |
| Lenovo Slim Pro 9i 16IRP8 | |
| Przeciętny Intel Core i7-13700H | |
| Dell Inspiron 16 Plus 7630 | |
| MSI Summit E16 Flip A12UDT-031 | |
| HP Envy 16 h0112nr | |
| Dell Inspiron 16 Plus 7620 | |
| AIDA64 / FP32 Ray-Trace | |
| Asus Vivobook Pro 16X K6604JV-MX016W | |
| Lenovo Slim Pro 9i 16IRP8 | |
| Przeciętny Intel Core i7-13700H (4986 - 18908, n=29) | |
| Dell Inspiron 16 Plus 7630 | |
| MSI Summit E16 Flip A12UDT-031 | |
| Dell Inspiron 16 Plus 7620 | |
| HP Envy 16 h0112nr | |
| AIDA64 / FPU Julia | |
| Asus Vivobook Pro 16X K6604JV-MX016W | |
| Lenovo Slim Pro 9i 16IRP8 | |
| Przeciętny Intel Core i7-13700H (25360 - 92359, n=29) | |
| Dell Inspiron 16 Plus 7630 | |
| MSI Summit E16 Flip A12UDT-031 | |
| Dell Inspiron 16 Plus 7620 | |
| HP Envy 16 h0112nr | |
| AIDA64 / CPU SHA3 | |
| Asus Vivobook Pro 16X K6604JV-MX016W | |
| Lenovo Slim Pro 9i 16IRP8 | |
| Przeciętny Intel Core i7-13700H (1339 - 4224, n=29) | |
| Dell Inspiron 16 Plus 7630 | |
| MSI Summit E16 Flip A12UDT-031 | |
| Dell Inspiron 16 Plus 7620 | |
| HP Envy 16 h0112nr | |
| AIDA64 / CPU Queen | |
| Asus Vivobook Pro 16X K6604JV-MX016W | |
| Lenovo Slim Pro 9i 16IRP8 | |
| Dell Inspiron 16 Plus 7630 | |
| HP Envy 16 h0112nr | |
| MSI Summit E16 Flip A12UDT-031 | |
| Przeciętny Intel Core i7-13700H (59324 - 107159, n=29) | |
| Dell Inspiron 16 Plus 7620 | |
| AIDA64 / FPU SinJulia | |
| Asus Vivobook Pro 16X K6604JV-MX016W | |
| Lenovo Slim Pro 9i 16IRP8 | |
| Dell Inspiron 16 Plus 7630 | |
| Przeciętny Intel Core i7-13700H (4800 - 11050, n=29) | |
| MSI Summit E16 Flip A12UDT-031 | |
| Dell Inspiron 16 Plus 7620 | |
| HP Envy 16 h0112nr | |
| AIDA64 / FPU Mandel | |
| Asus Vivobook Pro 16X K6604JV-MX016W | |
| Lenovo Slim Pro 9i 16IRP8 | |
| Przeciętny Intel Core i7-13700H (12321 - 45118, n=29) | |
| Dell Inspiron 16 Plus 7630 | |
| MSI Summit E16 Flip A12UDT-031 | |
| Dell Inspiron 16 Plus 7620 | |
| HP Envy 16 h0112nr | |
| AIDA64 / CPU AES | |
| HP Envy 16 h0112nr | |
| Asus Vivobook Pro 16X K6604JV-MX016W | |
| Lenovo Slim Pro 9i 16IRP8 | |
| Przeciętny Intel Core i7-13700H (28769 - 151254, n=29) | |
| Dell Inspiron 16 Plus 7620 | |
| MSI Summit E16 Flip A12UDT-031 | |
| Dell Inspiron 16 Plus 7630 | |
| AIDA64 / CPU ZLib | |
| Asus Vivobook Pro 16X K6604JV-MX016W | |
| Lenovo Slim Pro 9i 16IRP8 | |
| Dell Inspiron 16 Plus 7620 | |
| Przeciętny Intel Core i7-13700H (389 - 1215, n=29) | |
| MSI Summit E16 Flip A12UDT-031 | |
| Dell Inspiron 16 Plus 7630 | |
| HP Envy 16 h0112nr | |
| AIDA64 / FP64 Ray-Trace | |
| Asus Vivobook Pro 16X K6604JV-MX016W | |
| Lenovo Slim Pro 9i 16IRP8 | |
| Przeciętny Intel Core i7-13700H (2540 - 10135, n=29) | |
| Dell Inspiron 16 Plus 7630 | |
| MSI Summit E16 Flip A12UDT-031 | |
| Dell Inspiron 16 Plus 7620 | |
| HP Envy 16 h0112nr | |
| AIDA64 / CPU PhotoWorxx | |
| Lenovo Slim Pro 9i 16IRP8 | |
| Asus Vivobook Pro 16X K6604JV-MX016W | |
| MSI Summit E16 Flip A12UDT-031 | |
| Przeciętny Intel Core i7-13700H (12872 - 52727, n=29) | |
| Dell Inspiron 16 Plus 7630 | |
| HP Envy 16 h0112nr | |
| Dell Inspiron 16 Plus 7620 | |
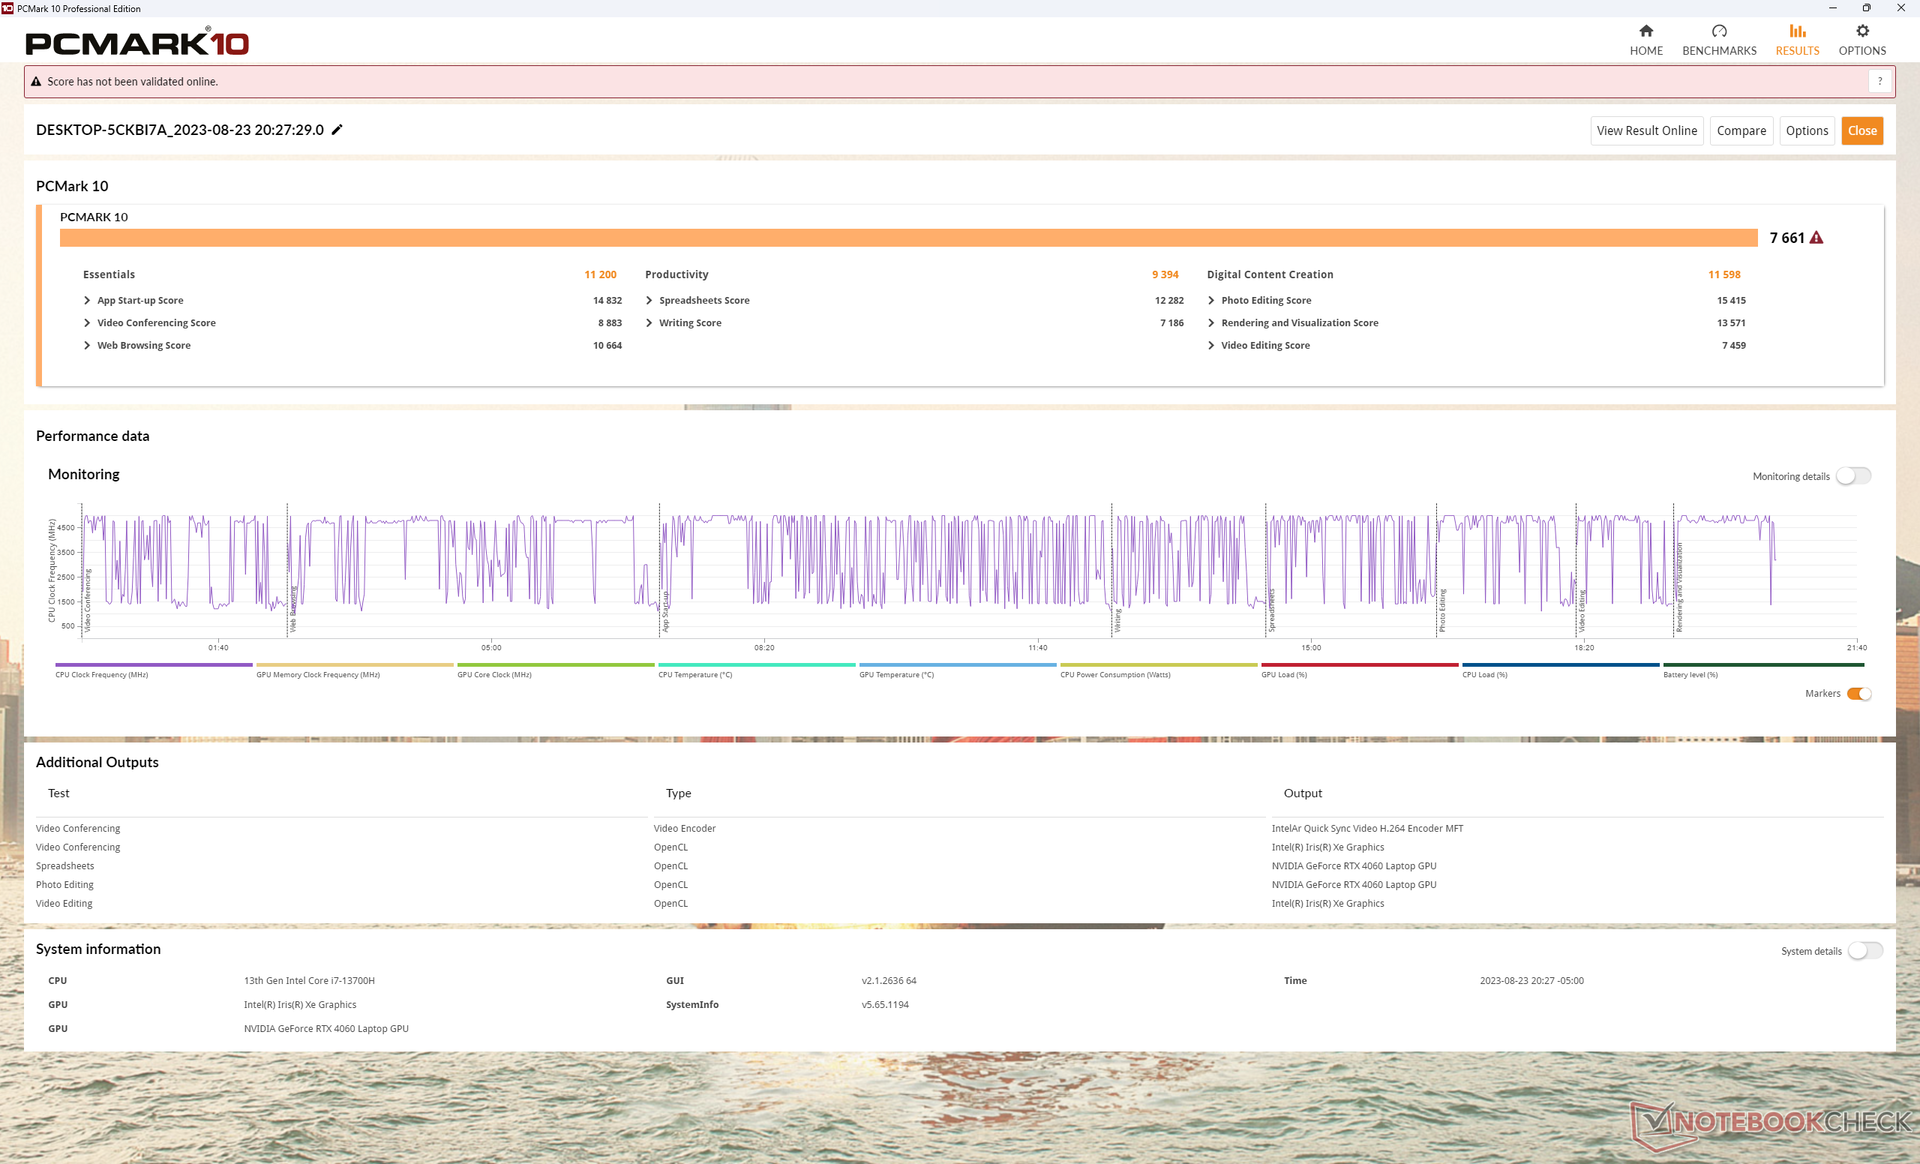
Wydajność systemu
Wyniki PCMark są konsekwentnie wyższe niż w zeszłorocznym Inspironie 16 Plus 7620, szczególnie w podteście Digital Content Creation, gdzie wydajność GPU ma największe znaczenie.
Nie doświadczyliśmy żadnych problemów z wybudzaniem z uśpienia lub BSOD, w przeciwieństwie do niedawnego Alienware m16 R1.
CrossMark: Overall | Productivity | Creativity | Responsiveness
| PCMark 10 / Score | |
| Lenovo Slim Pro 9i 16IRP8 | |
| Dell Inspiron 16 Plus 7630 | |
| HP Envy 16 h0112nr | |
| Przeciętny Intel Core i7-13700H, NVIDIA GeForce RTX 4060 Laptop GPU (7157 - 7661, n=5) | |
| Asus Vivobook Pro 16X K6604JV-MX016W | |
| Dell Inspiron 16 Plus 7620 | |
| MSI Summit E16 Flip A12UDT-031 | |
| PCMark 10 / Essentials | |
| HP Envy 16 h0112nr | |
| Lenovo Slim Pro 9i 16IRP8 | |
| Dell Inspiron 16 Plus 7630 | |
| Przeciętny Intel Core i7-13700H, NVIDIA GeForce RTX 4060 Laptop GPU (10179 - 11200, n=5) | |
| Asus Vivobook Pro 16X K6604JV-MX016W | |
| Dell Inspiron 16 Plus 7620 | |
| MSI Summit E16 Flip A12UDT-031 | |
| PCMark 10 / Productivity | |
| Lenovo Slim Pro 9i 16IRP8 | |
| Przeciętny Intel Core i7-13700H, NVIDIA GeForce RTX 4060 Laptop GPU (8238 - 10249, n=5) | |
| Dell Inspiron 16 Plus 7630 | |
| HP Envy 16 h0112nr | |
| Dell Inspiron 16 Plus 7620 | |
| Asus Vivobook Pro 16X K6604JV-MX016W | |
| MSI Summit E16 Flip A12UDT-031 | |
| PCMark 10 / Digital Content Creation | |
| Dell Inspiron 16 Plus 7630 | |
| Lenovo Slim Pro 9i 16IRP8 | |
| Przeciętny Intel Core i7-13700H, NVIDIA GeForce RTX 4060 Laptop GPU (10308 - 11862, n=5) | |
| HP Envy 16 h0112nr | |
| Dell Inspiron 16 Plus 7620 | |
| Asus Vivobook Pro 16X K6604JV-MX016W | |
| MSI Summit E16 Flip A12UDT-031 | |
| CrossMark / Overall | |
| Asus Vivobook Pro 16X K6604JV-MX016W | |
| Dell Inspiron 16 Plus 7630 | |
| HP Envy 16 h0112nr | |
| Lenovo Slim Pro 9i 16IRP8 | |
| Dell Inspiron 16 Plus 7620 | |
| Przeciętny Intel Core i7-13700H, NVIDIA GeForce RTX 4060 Laptop GPU (1629 - 1849, n=5) | |
| MSI Summit E16 Flip A12UDT-031 | |
| CrossMark / Productivity | |
| Asus Vivobook Pro 16X K6604JV-MX016W | |
| Dell Inspiron 16 Plus 7630 | |
| HP Envy 16 h0112nr | |
| Dell Inspiron 16 Plus 7620 | |
| Lenovo Slim Pro 9i 16IRP8 | |
| Przeciętny Intel Core i7-13700H, NVIDIA GeForce RTX 4060 Laptop GPU (1561 - 1743, n=5) | |
| MSI Summit E16 Flip A12UDT-031 | |
| CrossMark / Creativity | |
| Asus Vivobook Pro 16X K6604JV-MX016W | |
| Lenovo Slim Pro 9i 16IRP8 | |
| Dell Inspiron 16 Plus 7630 | |
| HP Envy 16 h0112nr | |
| Dell Inspiron 16 Plus 7620 | |
| Przeciętny Intel Core i7-13700H, NVIDIA GeForce RTX 4060 Laptop GPU (1691 - 2064, n=5) | |
| MSI Summit E16 Flip A12UDT-031 | |
| CrossMark / Responsiveness | |
| Asus Vivobook Pro 16X K6604JV-MX016W | |
| HP Envy 16 h0112nr | |
| Dell Inspiron 16 Plus 7630 | |
| MSI Summit E16 Flip A12UDT-031 | |
| Dell Inspiron 16 Plus 7620 | |
| Przeciętny Intel Core i7-13700H, NVIDIA GeForce RTX 4060 Laptop GPU (1381 - 1656, n=5) | |
| Lenovo Slim Pro 9i 16IRP8 | |
| PCMark 10 Score | 7661 pkt. | |
Pomoc | ||
| AIDA64 / Memory Copy | |
| Lenovo Slim Pro 9i 16IRP8 | |
| Asus Vivobook Pro 16X K6604JV-MX016W | |
| MSI Summit E16 Flip A12UDT-031 | |
| Przeciętny Intel Core i7-13700H (24334 - 78081, n=29) | |
| Dell Inspiron 16 Plus 7630 | |
| HP Envy 16 h0112nr | |
| Dell Inspiron 16 Plus 7620 | |
| AIDA64 / Memory Read | |
| Asus Vivobook Pro 16X K6604JV-MX016W | |
| Lenovo Slim Pro 9i 16IRP8 | |
| Dell Inspiron 16 Plus 7630 | |
| HP Envy 16 h0112nr | |
| MSI Summit E16 Flip A12UDT-031 | |
| Przeciętny Intel Core i7-13700H (23681 - 79656, n=29) | |
| Dell Inspiron 16 Plus 7620 | |
| AIDA64 / Memory Write | |
| Lenovo Slim Pro 9i 16IRP8 | |
| Asus Vivobook Pro 16X K6604JV-MX016W | |
| Przeciętny Intel Core i7-13700H (22986 - 99898, n=29) | |
| Dell Inspiron 16 Plus 7630 | |
| HP Envy 16 h0112nr | |
| MSI Summit E16 Flip A12UDT-031 | |
| Dell Inspiron 16 Plus 7620 | |
| AIDA64 / Memory Latency | |
| MSI Summit E16 Flip A12UDT-031 | |
| Lenovo Slim Pro 9i 16IRP8 | |
| Dell Inspiron 16 Plus 7620 | |
| Przeciętny Intel Core i7-13700H (82.4 - 136.8, n=29) | |
| Dell Inspiron 16 Plus 7630 | |
| HP Envy 16 h0112nr | |
| Asus Vivobook Pro 16X K6604JV-MX016W | |
* ... im mniej tym lepiej
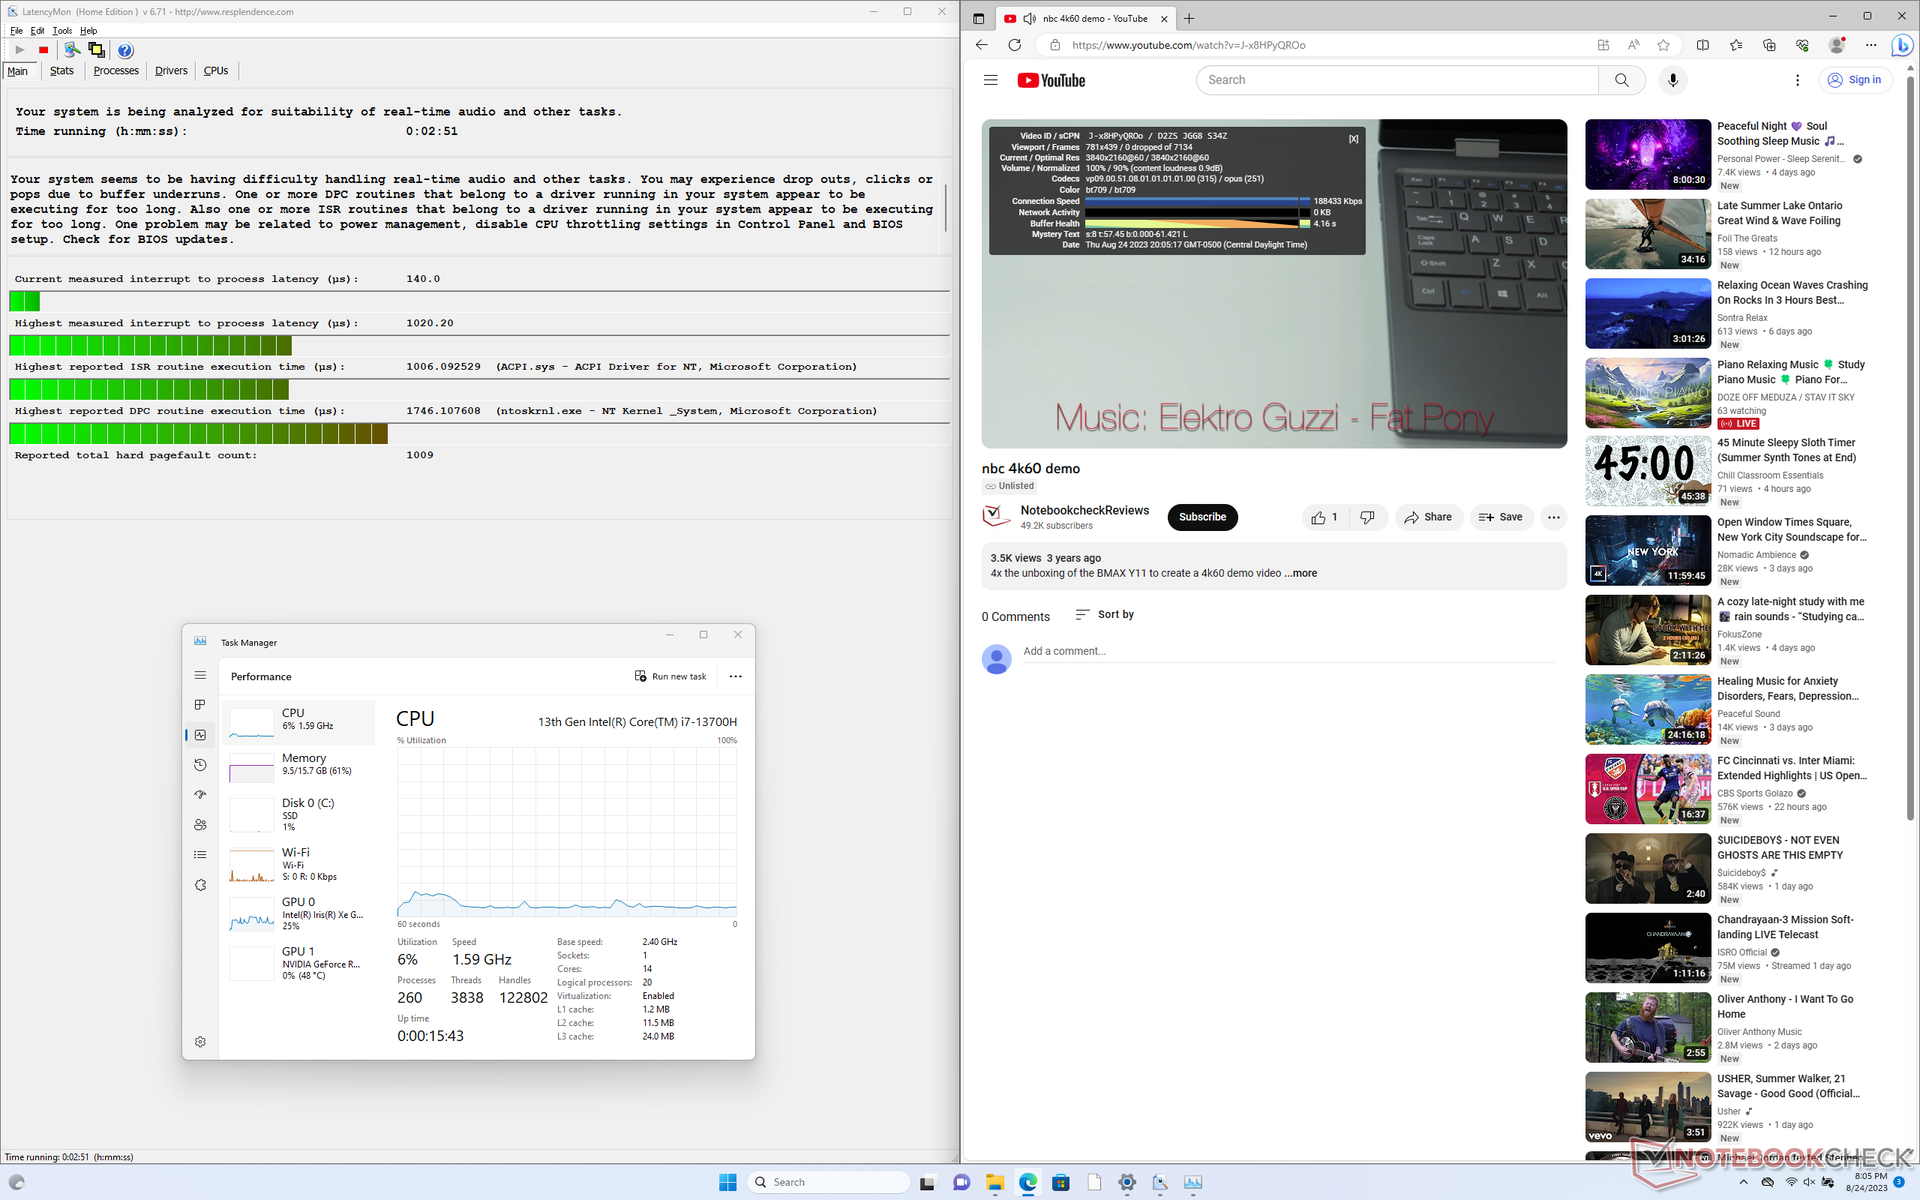
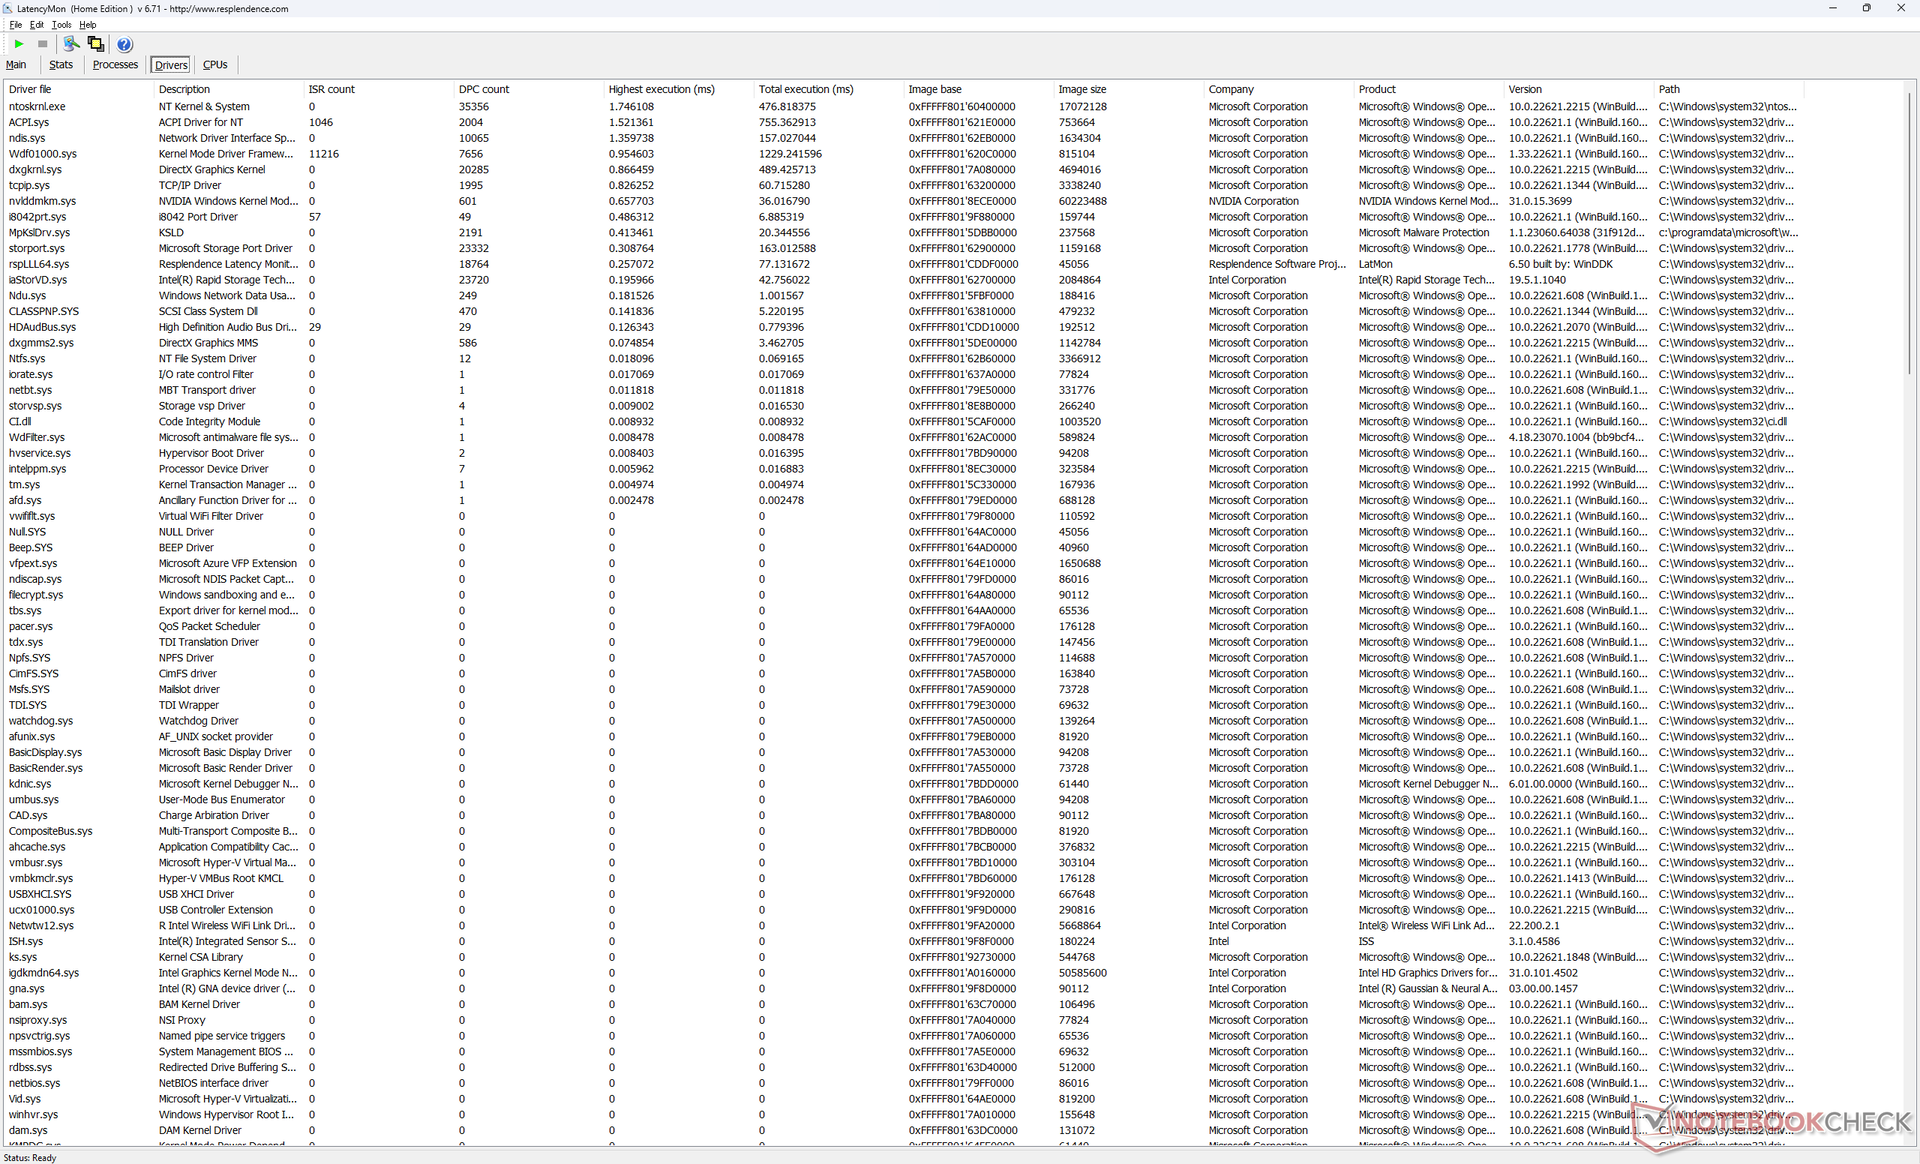
Opóźnienie DPC
LatencyMon pokazuje tylko niewielkie problemy z DPC podczas otwierania wielu kart przeglądarki na naszej stronie głównej. odtwarzanie wideo 4K przy 60 FPS jest poza tym idealne, bez rejestrowanych spadków klatek, w przeciwieństwie do niedawnego Alienware m16 R1, w którym pomijanie klatek było trwałe.
| DPC Latencies / LatencyMon - interrupt to process latency (max), Web, Youtube, Prime95 | |
| Asus Vivobook Pro 16X K6604JV-MX016W | |
| Lenovo Slim Pro 9i 16IRP8 | |
| Dell Inspiron 16 Plus 7630 | |
| Dell Inspiron 16 Plus 7620 | |
| MSI Summit E16 Flip A12UDT-031 | |
| HP Envy 16 h0112nr | |
* ... im mniej tym lepiej
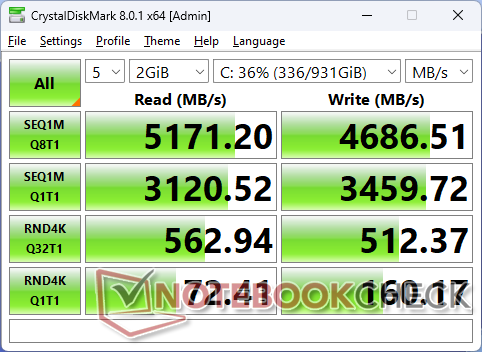
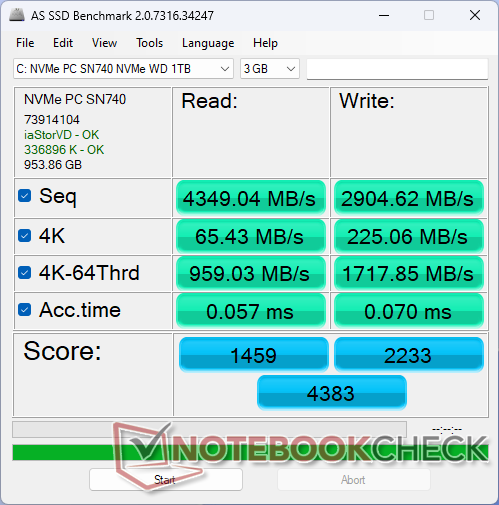
Urządzenia pamięci masowej - obsługa tylko jednego dysku SSD
Nasze urządzenie jest wyposażone w dysk klasy średniej Western Digital SN740 PCIe4 x4 NVMe SSD oferujący prędkość transferu do 5200 MB/s. To maksimum jest jednak możliwe do utrzymania tylko przez około minutę, zanim ostatecznie spadnie do niskiego poziomu 2400 MB/s, jak pokazują poniższe wyniki testu pętli DiskSpd. Ograniczenie to nie stanowi problemu dla wydajności w grach i zdecydowanej większości scenariuszy użytkowania.
Model ten obsługuje tylko jeden wewnętrzny dysk SSD, podczas gdy kilka innych 16-calowych laptopów, takich jak Envy 16 może obsługiwać do dwóch dysków.

| Drive Performance rating - Percent | |
| MSI Summit E16 Flip A12UDT-031 | |
| Lenovo Slim Pro 9i 16IRP8 | |
| HP Envy 16 h0112nr | |
| Dell Inspiron 16 Plus 7630 | |
| Asus Vivobook Pro 16X K6604JV-MX016W | |
| Dell Inspiron 16 Plus 7620 | |
* ... im mniej tym lepiej
Disk Throttling: DiskSpd Read Loop, Queue Depth 8
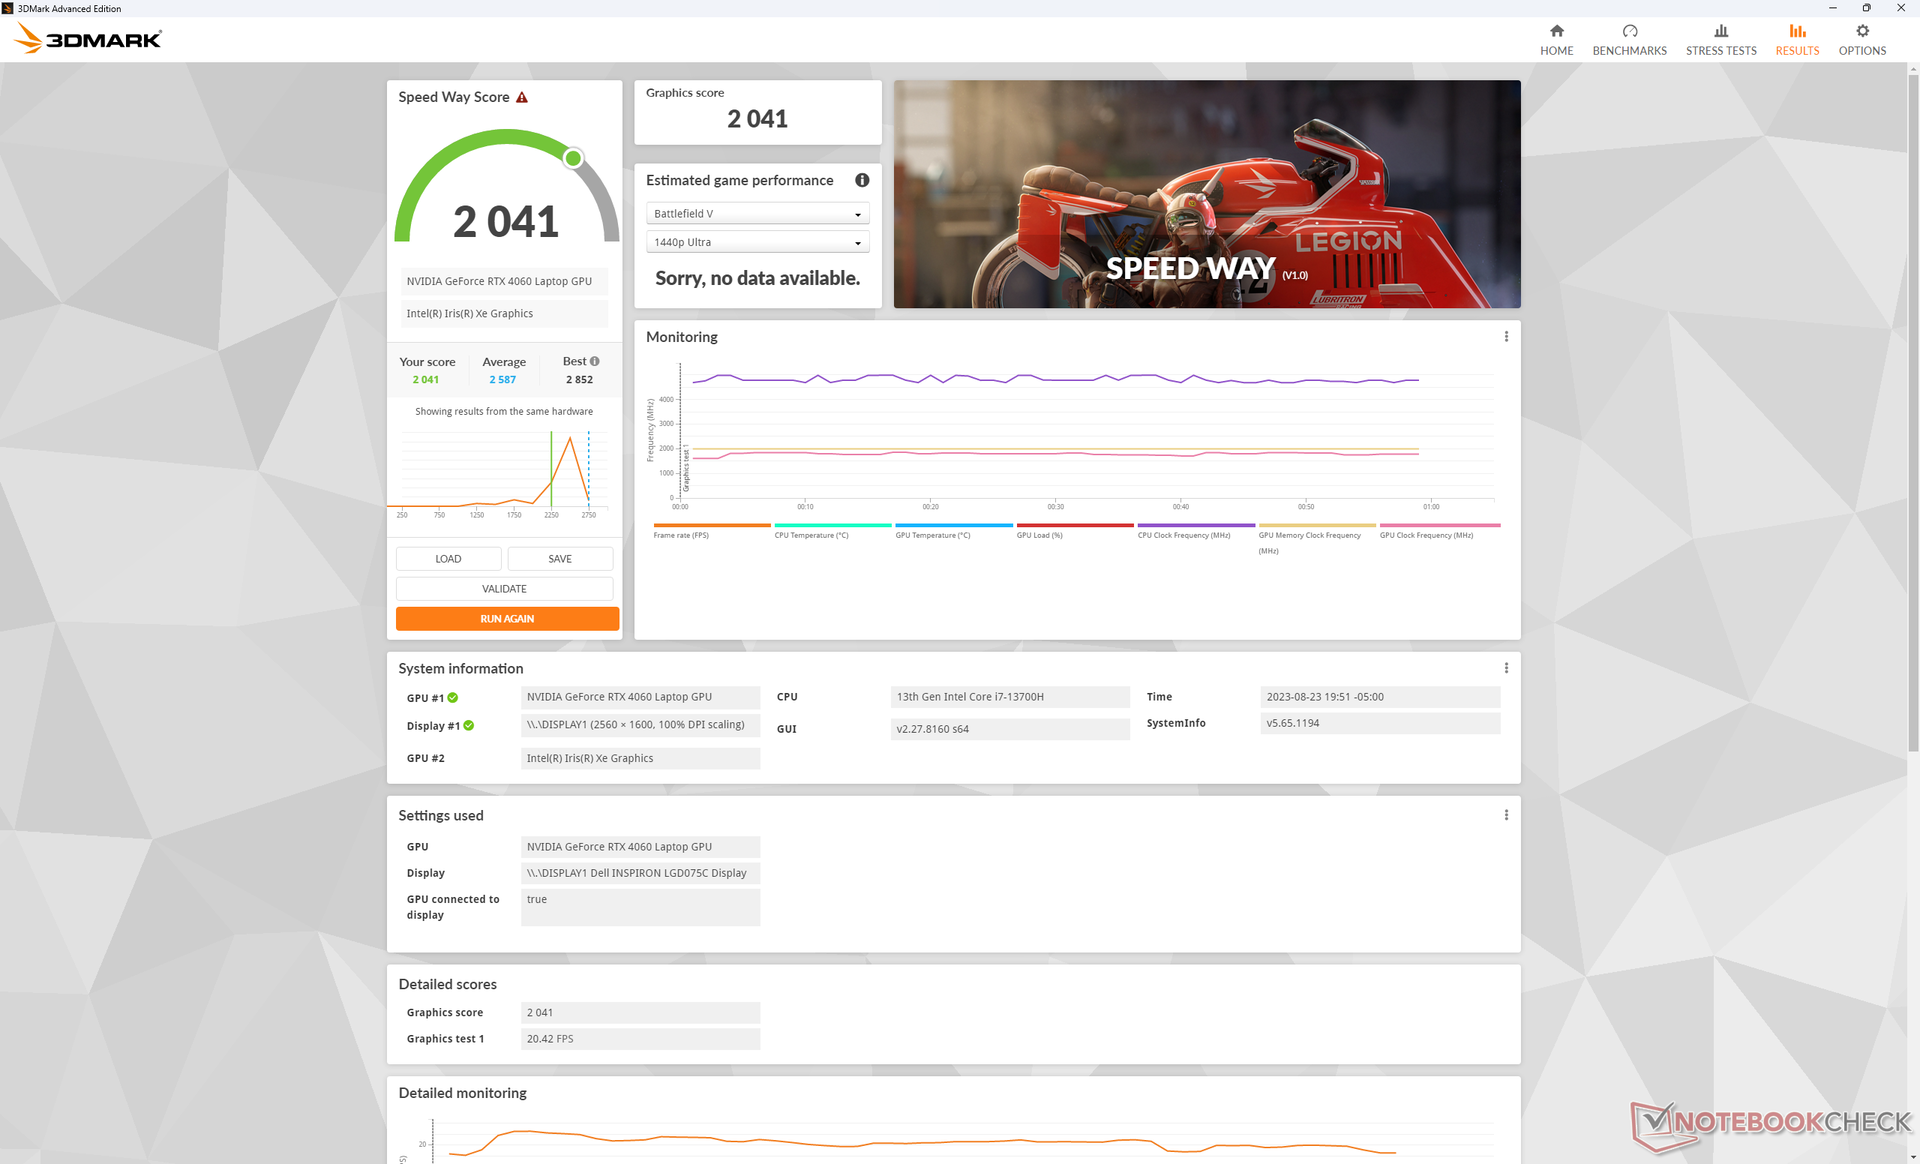
Wydajność GPU
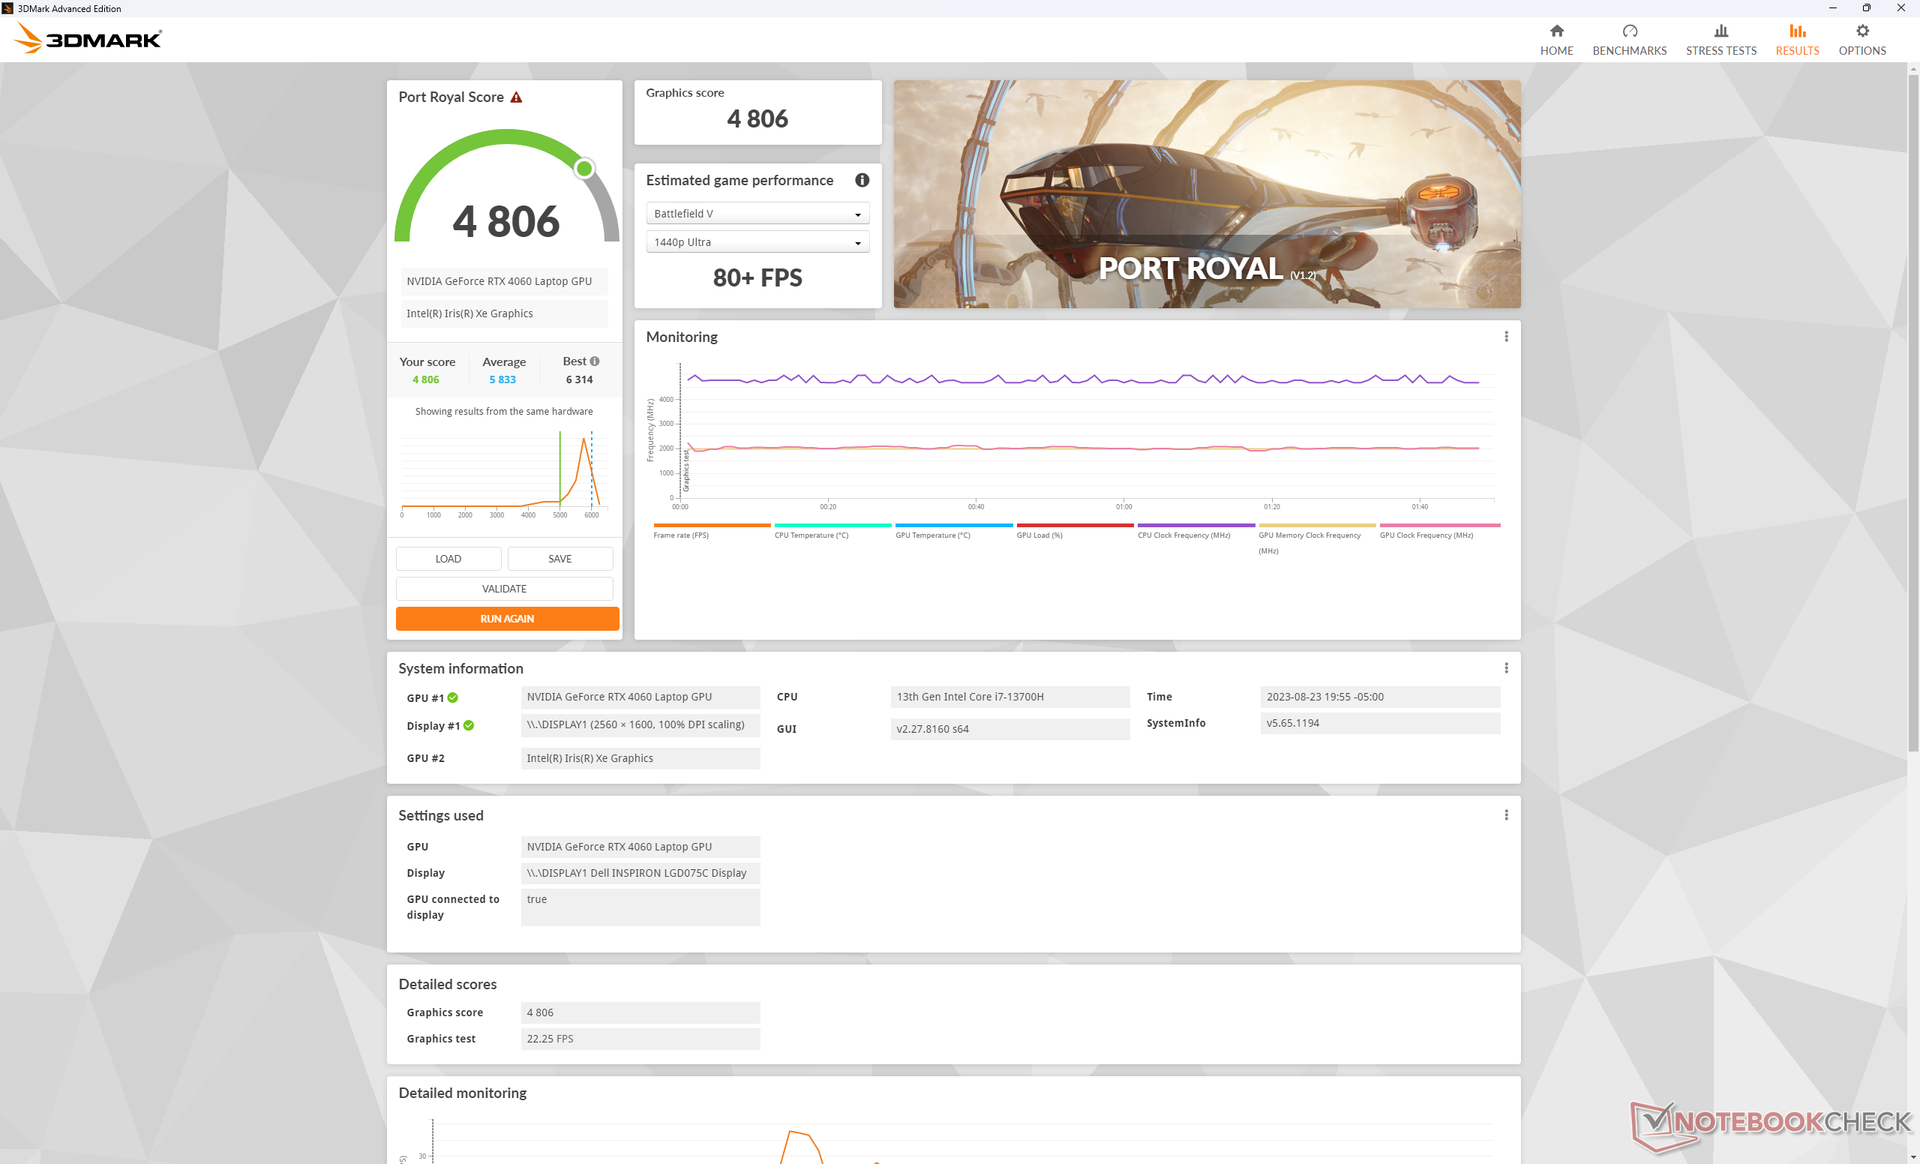
Karta GeForce RTX 4060 w naszym Dellu jest o około 10 do 15 procent wolniejsza niż przeciętny laptop w naszej bazie danych wyposażony w ten sam GPU. Różnica jest prawdopodobnie spowodowana stosunkowo niskim docelowym 60 W TGP Inspirona 16 Plus 7630, ponieważ większość laptopów z RTX 4060 to zwykle dedykowane laptopy do gier zoptymalizowane pod kątem wyższych zakresów mocy GPU wynoszących 90 W lub więcej. Ogólna wydajność jest zatem bardziej porównywalna do GeForce RTX 4050 w Lenovo Slim Pro 9i 16, co jest nieco rozczarowujące. Niemniej jednak, wzrost wydajności z generacji na generację w porównaniu do RTX 3050 Ti w zeszłorocznym Inspironie 16 Plus 7620 jest nadal znaczący i wynosi od 40 do 60 procent.
Użytkownicy mogą rozważyć skonfigurowanie Inspirona 16 Plus 7630 z tańszym RTX 4050, ponieważ opcja RTX 4060 jest słabsza. Wszystkie opcje GPU celują w to samo 60 W TGP.
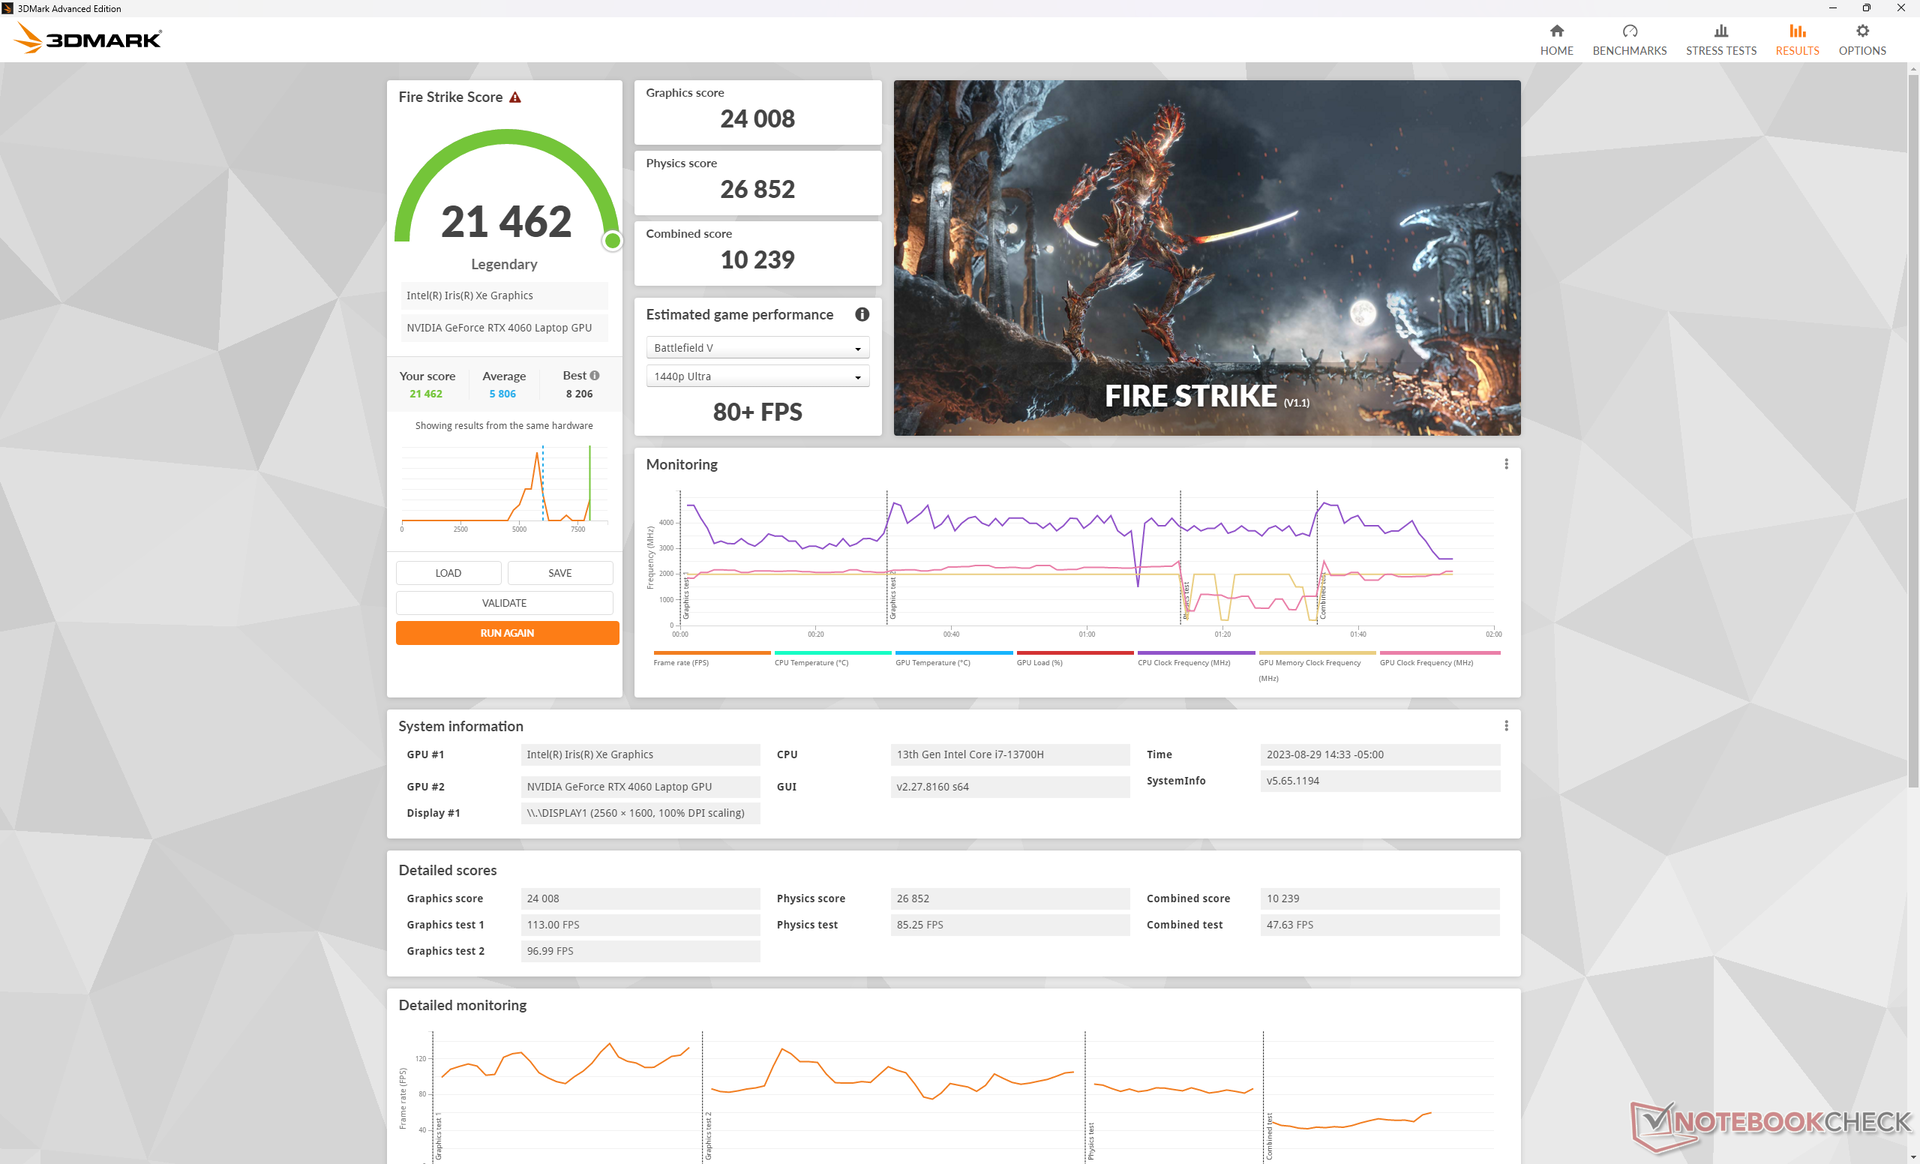
Przełączenie z trybu wydajności na tryb zrównoważony dość mocno wpływa na wydajność procesora, podczas gdy wydajność GPU pozostanie prawie taka sama, jak pokazują nasze wyniki Fire Strike poniżej. Upewnij się, że korzystasz z trybu wydajności, jeśli wykonujesz zadania wymagające dużej mocy procesora.
| Profil zasilania | Wynik grafiki | Wynik fizyki | Łączny wynik |
| Moc baterii | 19574 (-9%) | 10010 (-61%) | 4793 (-46%) |
| Tryb zrównoważony | 23511 (-2%) | 15963 (-41%) | 8110 (-21%) |
| Tryb wydajności | 24008 | 26852 | 10239 |

| 3DMark Performance rating - Percent | |
| Asus Zephyrus Duo 16 GX650PY-NM006W | |
| Alienware m16 R1 AMD | |
| Lenovo Legion Pro 5 16ARX8 | |
| Asus Vivobook Pro 16X K6604JV-MX016W -2! | |
| Przeciętny NVIDIA GeForce RTX 4060 Laptop GPU | |
| Lenovo Legion S7 16ARHA7 -1! | |
| Lenovo Slim Pro 9i 16IRP8 | |
| Dell Inspiron 16 Plus 7630 | |
| HP Omen 16-n0033dx | |
| HP Omen 15-en0375ng -1! | |
| Dell Inspiron 16 Plus 7620 -2! | |
| MSI Summit E16 Flip A12UDT-031 -1! | |
| Lenovo IdeaPad 5 Pro 16IHU6 -2! | |
| 3DMark 11 - 1280x720 Performance GPU | |
| Asus Zephyrus Duo 16 GX650PY-NM006W | |
| Alienware m16 R1 AMD | |
| Lenovo Legion Pro 5 16ARX8 | |
| Lenovo Legion S7 16ARHA7 | |
| Przeciętny NVIDIA GeForce RTX 4060 Laptop GPU (28136 - 38912, n=57) | |
| Asus Vivobook Pro 16X K6604JV-MX016W | |
| HP Omen 16-n0033dx | |
| Lenovo Slim Pro 9i 16IRP8 | |
| Dell Inspiron 16 Plus 7630 | |
| HP Omen 15-en0375ng | |
| Dell Inspiron 16 Plus 7620 | |
| MSI Summit E16 Flip A12UDT-031 | |
| Lenovo IdeaPad 5 Pro 16IHU6 | |
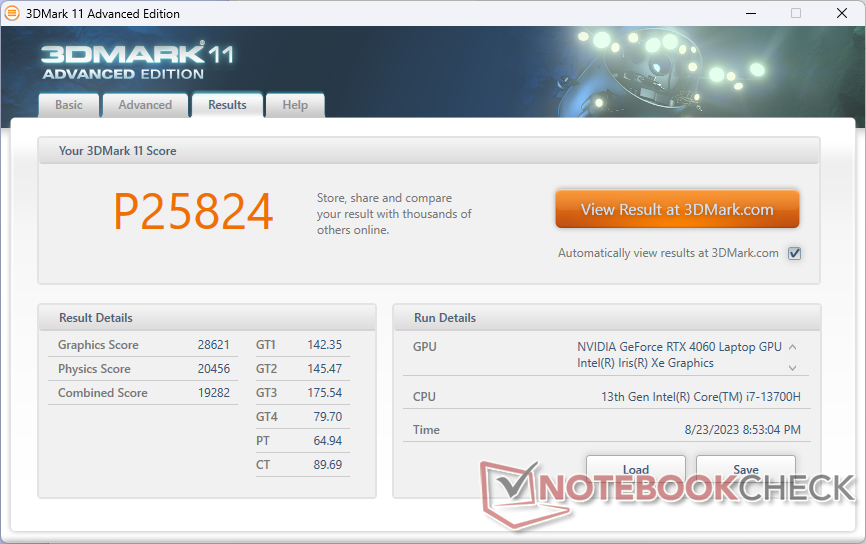
| 3DMark 11 Performance | 25824 pkt. | |
| 3DMark Fire Strike Score | 19289 pkt. | |
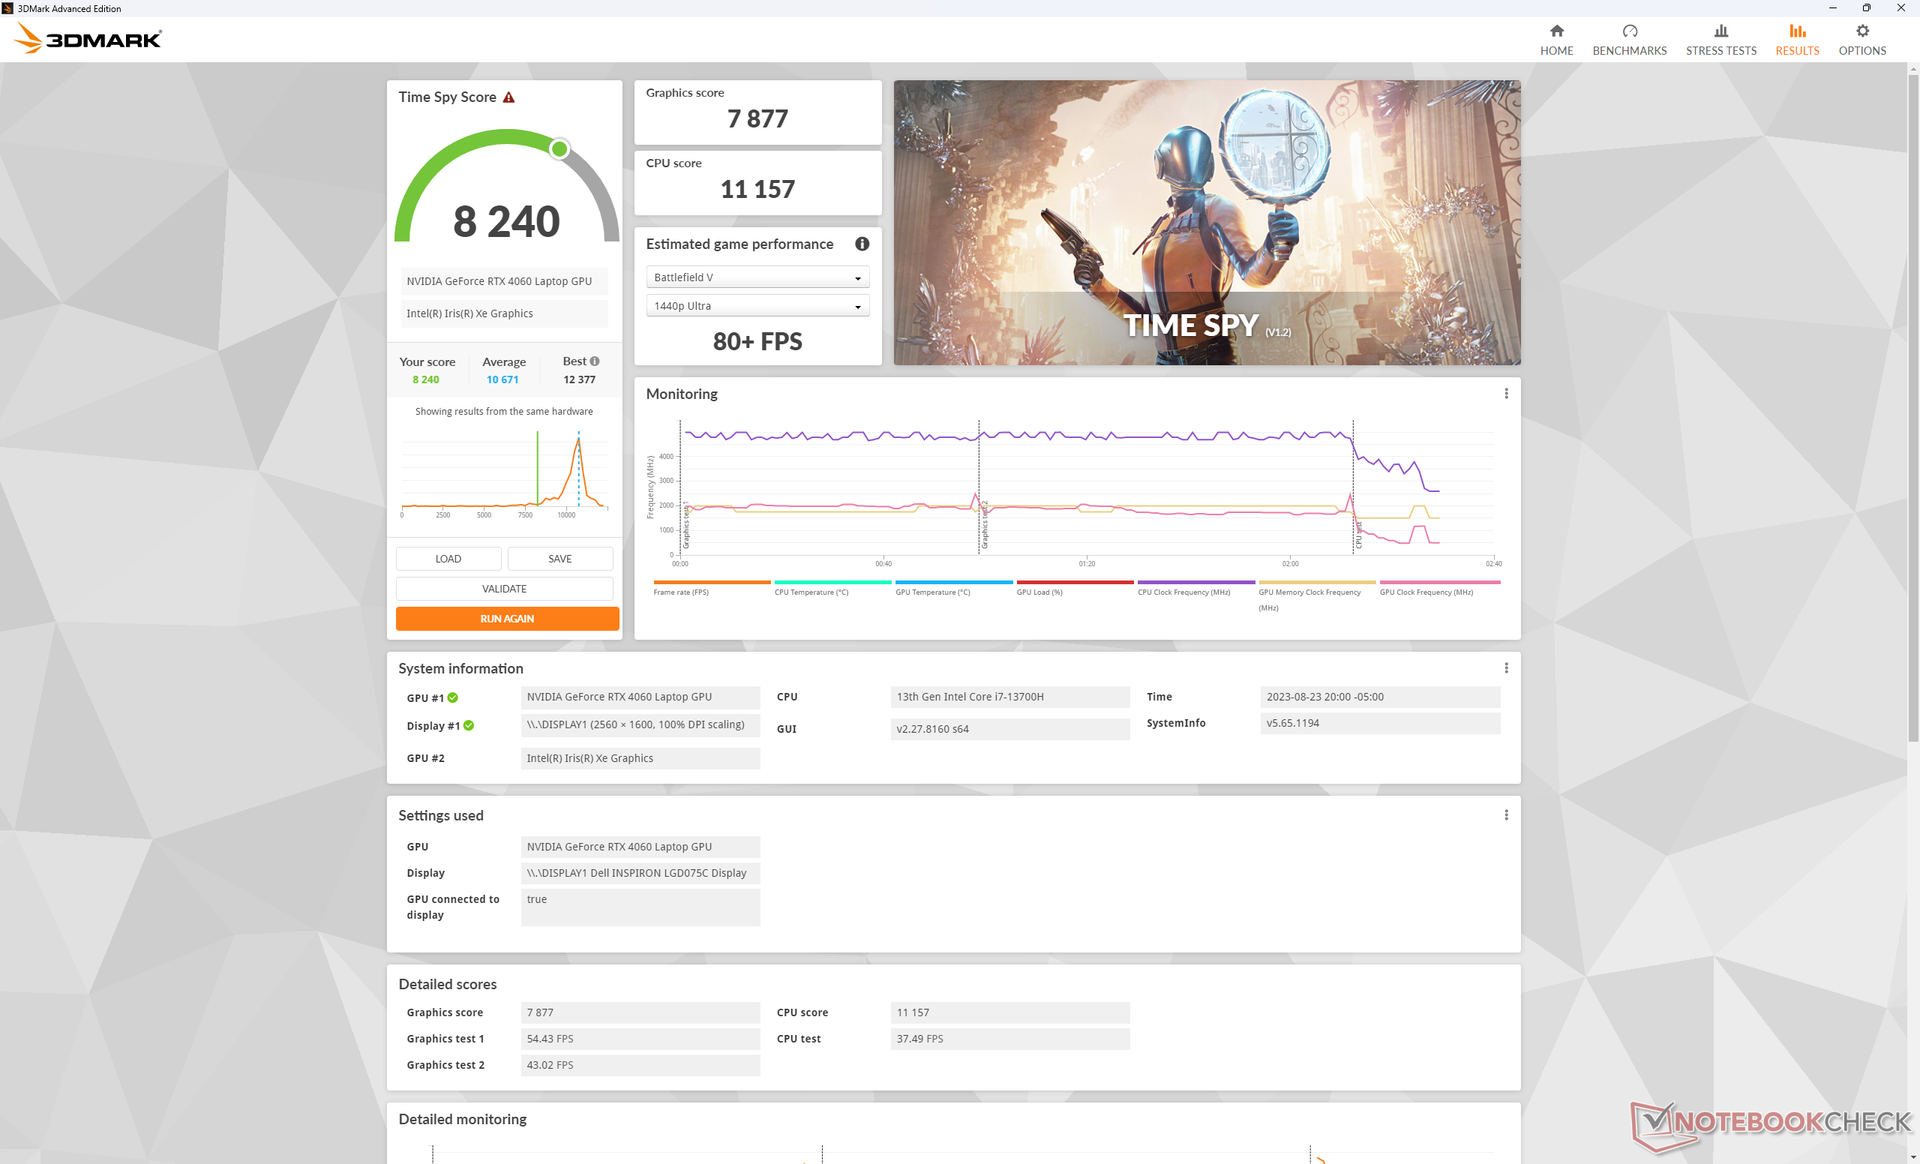
| 3DMark Time Spy Score | 8240 pkt. | |
Pomoc | ||
* ... im mniej tym lepiej
Wydajność w grach
Zgodnie z przewidywaniami wynikającymi z powyższych wyników 3DMark, ogólna wydajność w grach jest nieco poniżej średniej dla laptopa z grafiką RTX 4060. Na przykład gra Tiny Tina's Wonderlands działa przy 48 FPS przy maksymalnych ustawieniach 1440p w porównaniu do 57 FPS na większości innych laptopów z RTX 4060. G-Sync nie jest niestety obsługiwany w serii Inspiron 7630, co wygładziłoby rozrywanie klatek.
| Far Cry 5 | |
| 1280x720 Low Preset AA:T | |
| Alienware m16 R1 AMD | |
| Przeciętny NVIDIA GeForce RTX 4060 Laptop GPU (130 - 199, n=29) | |
| Dell Inspiron 16 Plus 7630 | |
| Lenovo IdeaPad 5 Pro 16IHU6 | |
| 1920x1080 Medium Preset AA:T | |
| Alienware m16 R1 AMD | |
| Przeciętny NVIDIA GeForce RTX 4060 Laptop GPU (110 - 165, n=30) | |
| Dell Inspiron 16 Plus 7630 | |
| Lenovo IdeaPad 5 Pro 16IHU6 | |
| 1920x1080 High Preset AA:T | |
| Alienware m16 R1 AMD | |
| Przeciętny NVIDIA GeForce RTX 4060 Laptop GPU (104 - 158, n=33) | |
| Asus Vivobook Pro 16X K6604JV-MX016W | |
| Dell Inspiron 16 Plus 7630 | |
| Lenovo IdeaPad 5 Pro 16IHU6 | |
| 1920x1080 Ultra Preset AA:T | |
| Alienware m16 R1 AMD | |
| Asus Vivobook Pro 16X K6604JV-MX016W | |
| Przeciętny NVIDIA GeForce RTX 4060 Laptop GPU (95 - 148, n=34) | |
| Dell Inspiron 16 Plus 7630 | |
| Lenovo IdeaPad 5 Pro 16IHU6 | |
| 2560x1440 Ultra Preset AA:T | |
| Alienware m16 R1 AMD | |
| Przeciętny NVIDIA GeForce RTX 4060 Laptop GPU (71 - 111, n=26) | |
| Asus Vivobook Pro 16X K6604JV-MX016W | |
| Dell Inspiron 16 Plus 7630 | |
| Lenovo IdeaPad 5 Pro 16IHU6 | |
Witcher 3 FPS Chart
| low | med. | high | ultra | QHD | |
|---|---|---|---|---|---|
| The Witcher 3 (2015) | 409.3 | 275.3 | 169.5 | 90.9 | 68 |
| Dota 2 Reborn (2015) | 184.7 | 166.6 | 157.9 | 146.1 | |
| Final Fantasy XV Benchmark (2018) | 172.2 | 122.2 | 88.9 | 64.4 | |
| X-Plane 11.11 (2018) | 153.5 | 135.7 | 109.7 | ||
| Far Cry 5 (2018) | 133 | 120 | 115 | 103 | 83 |
| Strange Brigade (2018) | 378 | 234 | 185.9 | 161 | 110.9 |
| Cyberpunk 2077 1.6 (2022) | 108.1 | 84.2 | 72.9 | 65.7 | 40.8 |
| Tiny Tina's Wonderlands (2022) | 169.5 | 141.5 | 92.1 | 71.4 | 48 |
| F1 22 (2022) | 205 | 201 | 148.4 | 53.8 | 34.1 |
| Returnal (2023) | 71 | 68 | 63 | 57 | 39 |
Emisje
Hałas systemowy - ciszej i głośniej niż wcześniej
Wewnętrzne wentylatory mogą być ciche na biegu jałowym na pulpicie, ale częściej niż nie oscylują wokół 26-28 dB(A) podczas uruchamiania typowych obciążeń, takich jak przeglądarki internetowe lub strumienie wideo. Co bardziej imponujące, mogą pozostać względnie ciche przez dłuższy czas, nawet przy wyższych obciążeniach, podczas gdy wentylatory w Inspiron 16 Plus 7620 pulsowałyby szybciej i szybciej. Na przykład podczas uruchamiania 3DMark 06 hałas wentylatora wzrósłby do 35 dB(A) dopiero pod koniec pierwszej 90-sekundowej sceny testu porównawczego.
Hałas wentylatora znacznie wzrasta podczas uruchamiania gier. Podczas gdy Inspiron 16 Plus 7630 jest generalnie cichszy niż zeszłoroczny model podczas pracy z niewymagającymi obciążeniami, podczas grania jest odwrotnie. Hałas wentylatora osiągał prawie 53 dB(A) podczas uruchamiania Witcher 3 w porównaniu do nieco ponad 49 dB(A) w Inspiron 16 Plus 7620. Niemniej jednak niski zakres 50 dB(A) jest porównywalny z konkurentami, takimi jakSlim Pro 9i 16 czy Envy 16.
Co ciekawe, zmiana profilu zasilania między trybami zrównoważonym i wydajnym nie wpływa na pułap hałasu wentylatora podczas grania, ponieważ nadal osiąga on szczyt na poziomie 52,5 dB(A) przy obu ustawieniach.
Hałas
| luz |
| 23.2 / 23.2 / 23.2 dB |
| obciążenie |
| 35.1 / 52.5 dB |
 | ||
30 dB cichy 40 dB(A) słyszalny 50 dB(A) irytujący |
||
min: | ||
| Dell Inspiron 16 Plus 7630 GeForce RTX 4060 Laptop GPU, i7-13700H, WD PC SN740 SDDPTQD-1T00 | Dell Inspiron 16 Plus 7620 GeForce RTX 3050 Ti Laptop GPU, i7-12700H, Kioxia BG5 KBG50ZNS512G | Lenovo Slim Pro 9i 16IRP8 GeForce RTX 4050 Laptop GPU, i9-13905H, Samsung PM9A1 MZVL21T0HCLR | Asus Vivobook Pro 16X K6604JV-MX016W GeForce RTX 4060 Laptop GPU, i9-13980HX, Solidigm P41 Plus SSDPFKNU010TZ | HP Envy 16 h0112nr GeForce RTX 3060 Laptop GPU, i7-12700H, Micron 3400 1TB MTFDKBA1T0TFH | MSI Summit E16 Flip A12UDT-031 GeForce RTX 3050 Ti Laptop GPU, i7-1280P, Samsung PM9A1 MZVL22T0HBLB | |
|---|---|---|---|---|---|---|
| Noise | -11% | 1% | -21% | -6% | -14% | |
| wyłączone / środowisko * (dB) | 23.2 | 23.3 -0% | 22.7 2% | 25.2 -9% | 22.8 2% | 25 -8% |
| Idle Minimum * (dB) | 23.2 | 25.7 -11% | 22.7 2% | 26.6 -15% | 22.9 1% | 25 -8% |
| Idle Average * (dB) | 23.2 | 26.1 -13% | 22.7 2% | 26.6 -15% | 22.9 1% | 25 -8% |
| Idle Maximum * (dB) | 23.2 | 30.6 -32% | 27.5 -19% | 29.2 -26% | 30.5 -31% | 28.9 -25% |
| Load Average * (dB) | 35.1 | 46.2 -32% | 28.9 18% | 53.4 -52% | 41.4 -18% | 49.3 -40% |
| Witcher 3 ultra * (dB) | 52.5 | 49.2 6% | 52.6 -0% | 51.1 3% | ||
| Load Maximum * (dB) | 52.5 | 49.4 6% | 52.5 -0% | 56.9 -8% | 51.4 2% | 48.2 8% |
* ... im mniej tym lepiej
Temperatura
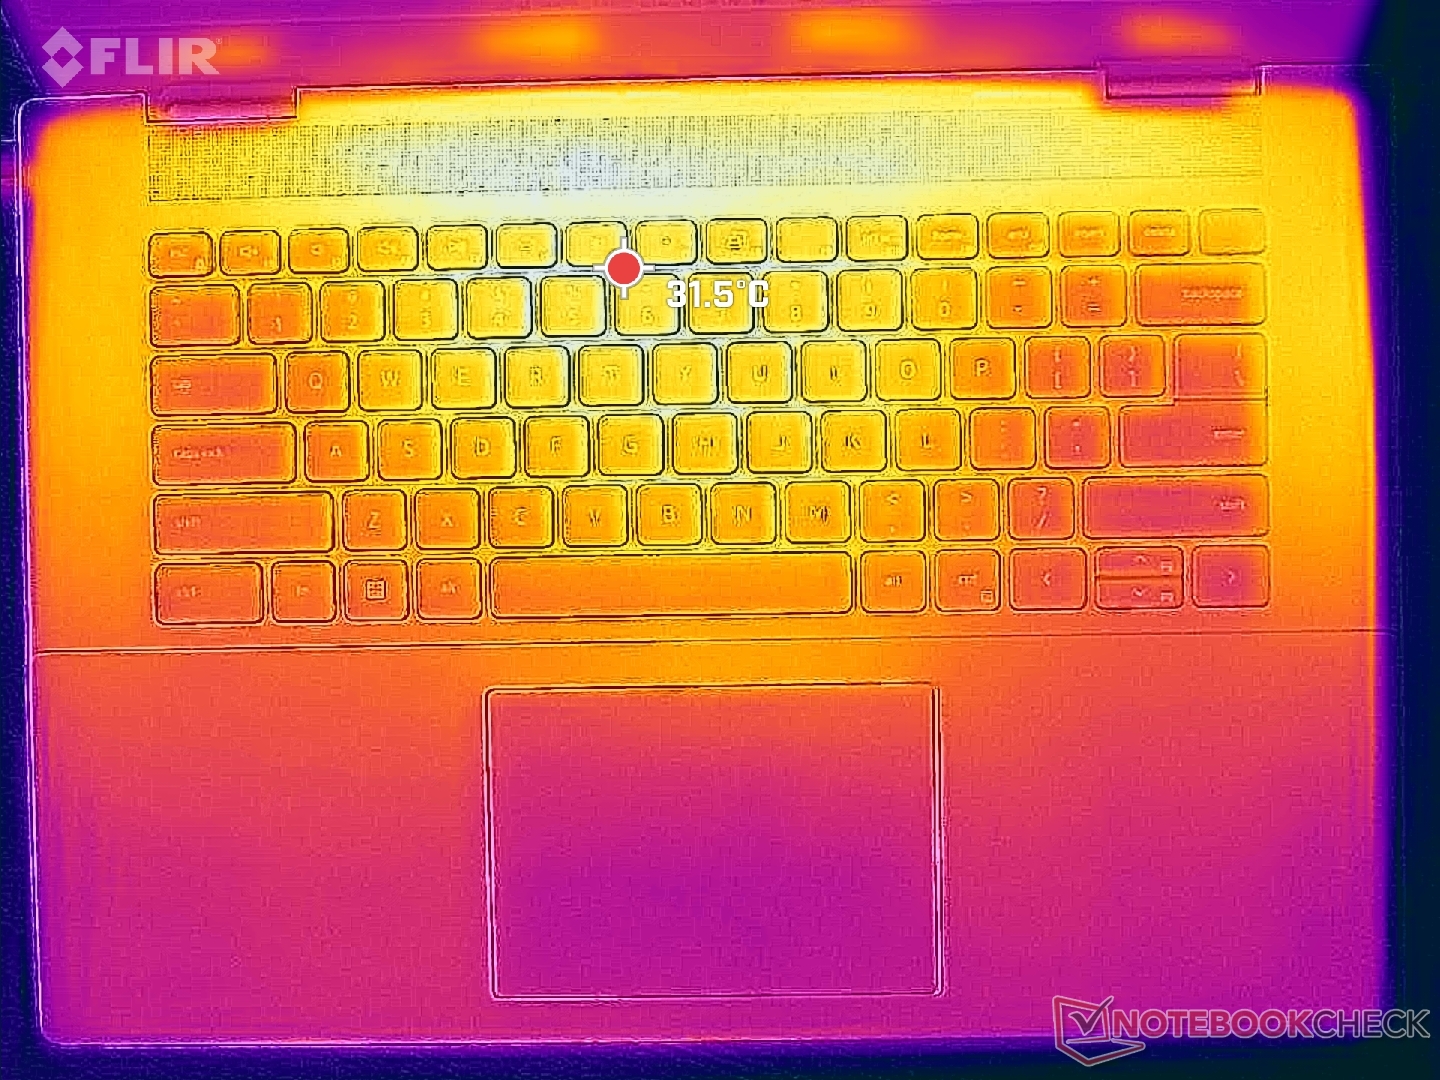
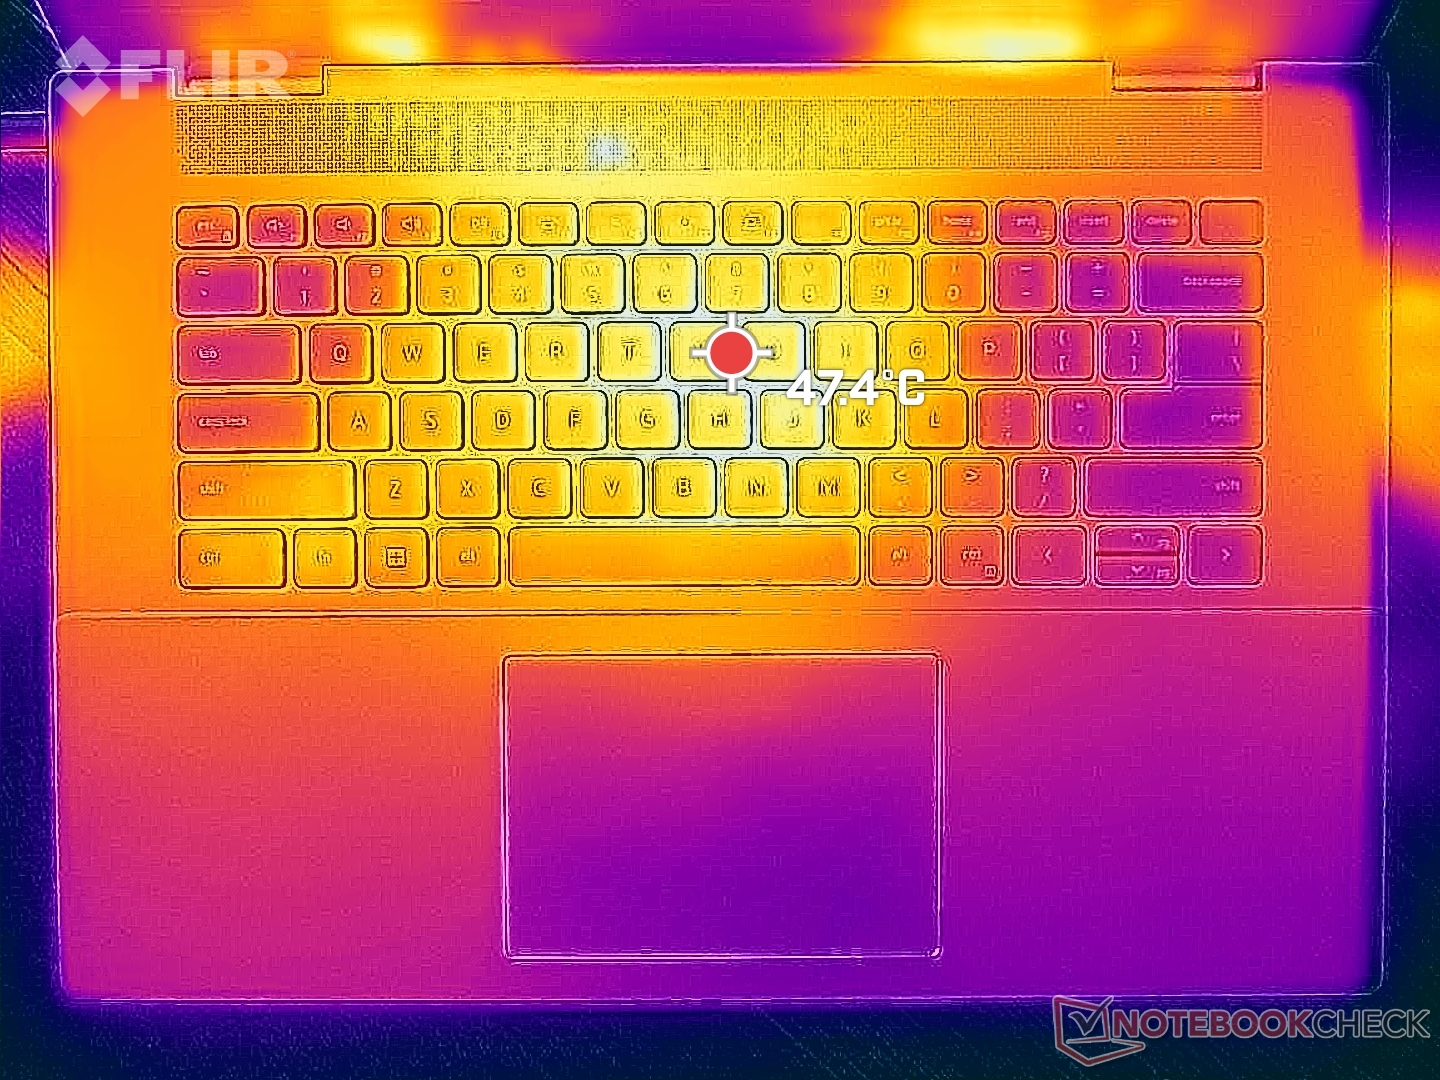
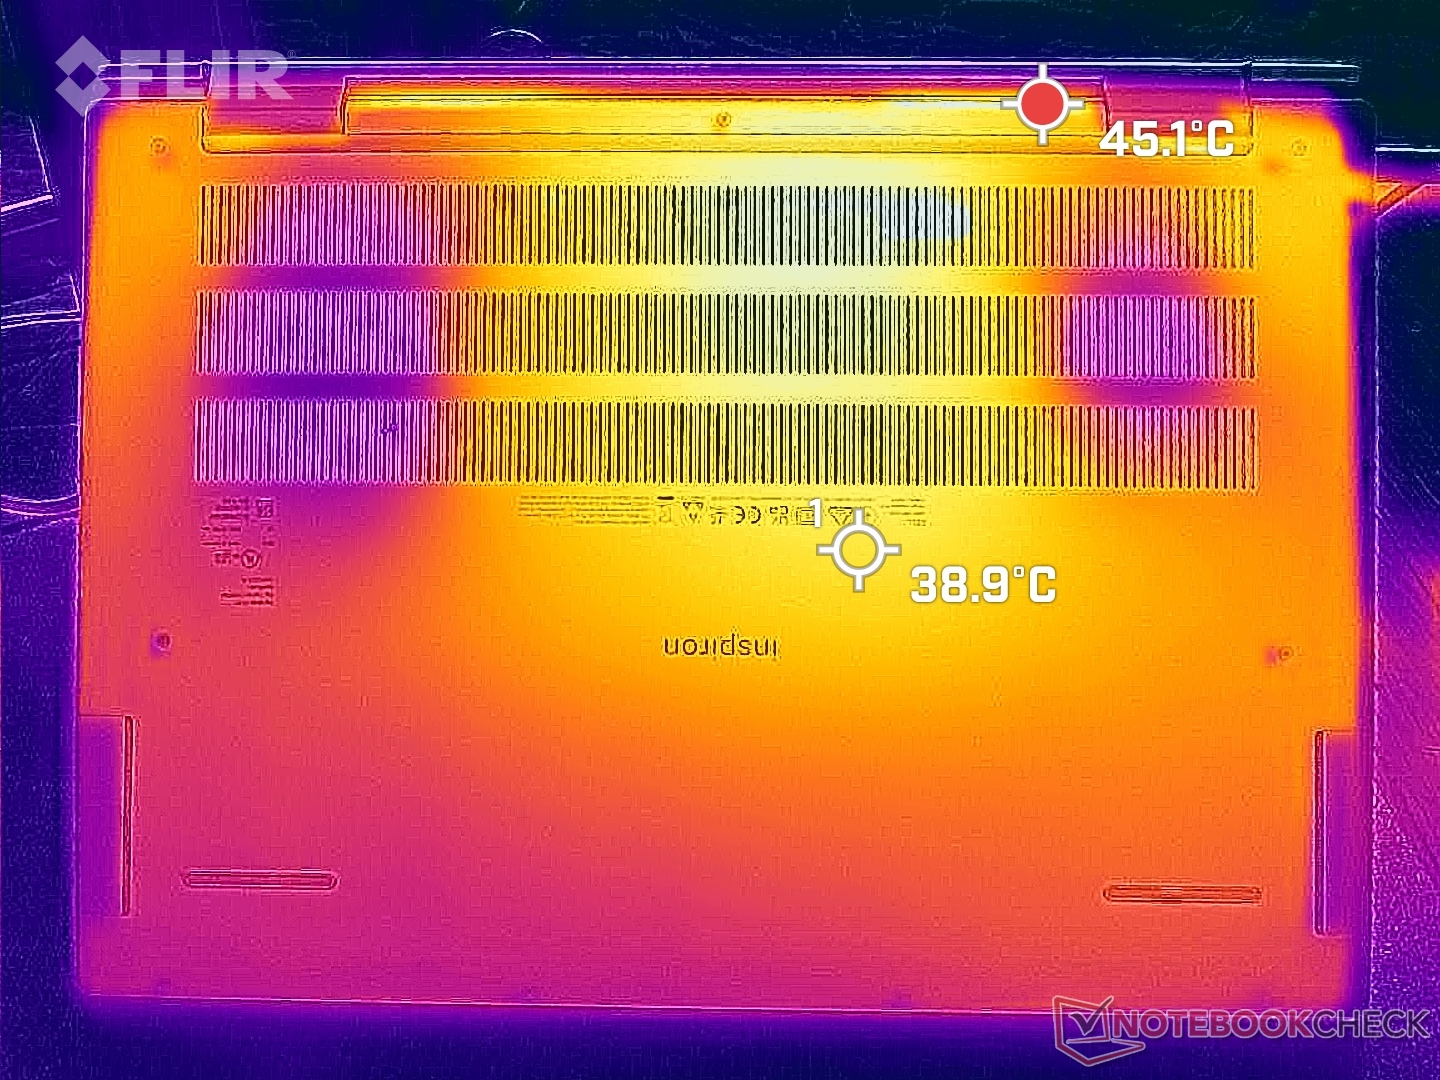
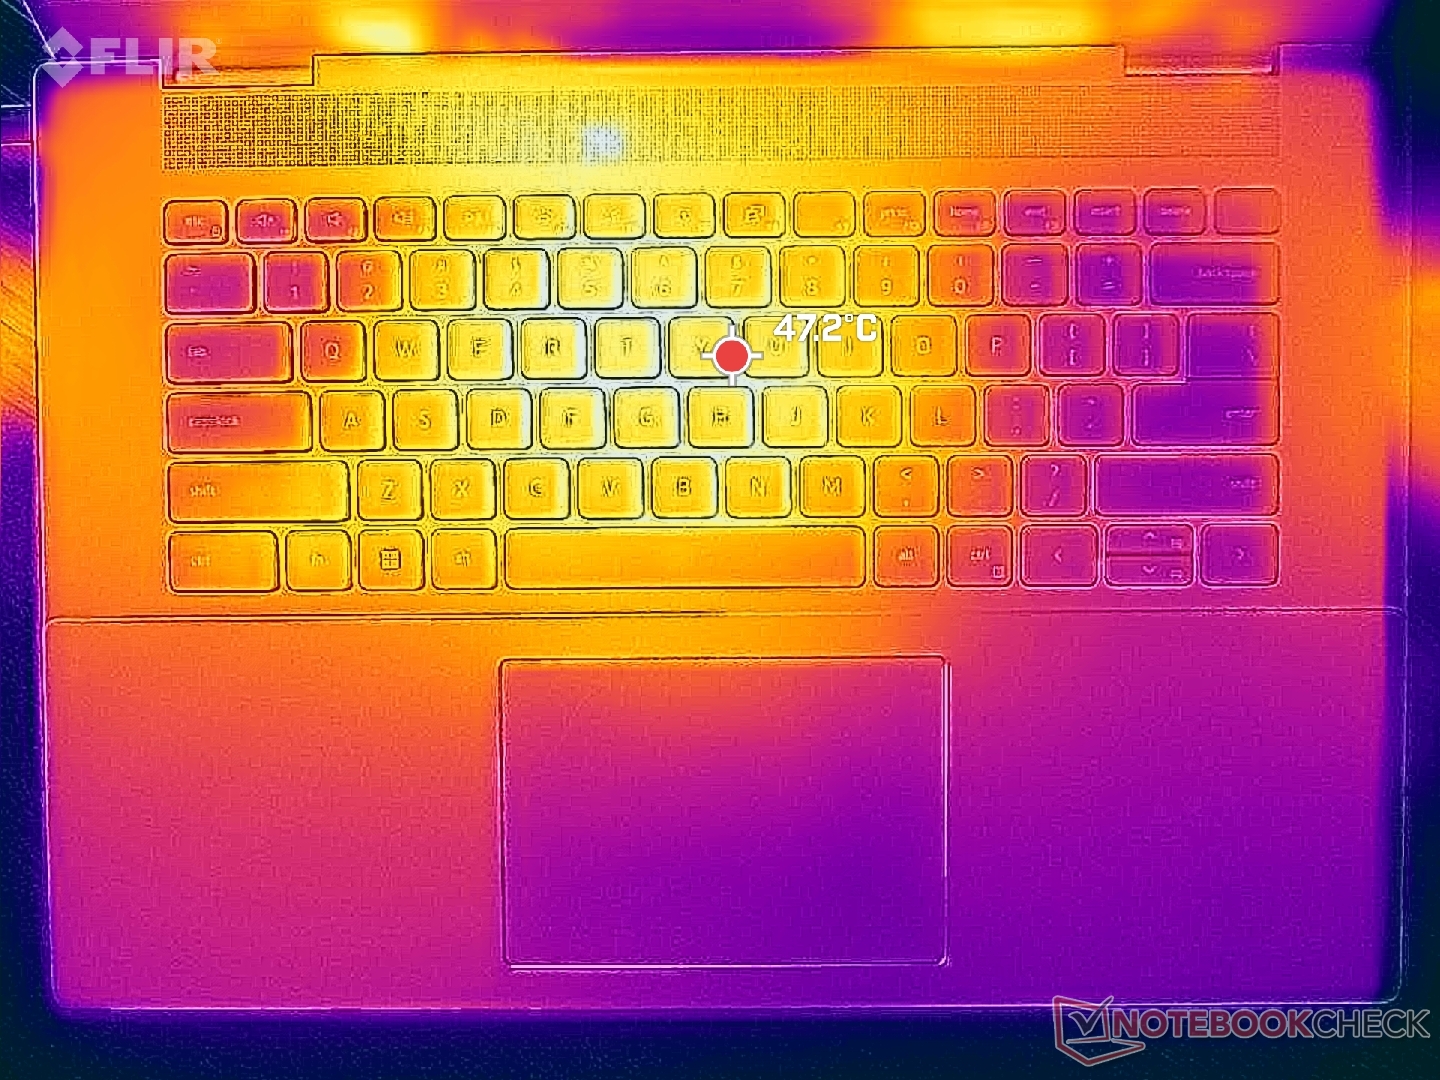
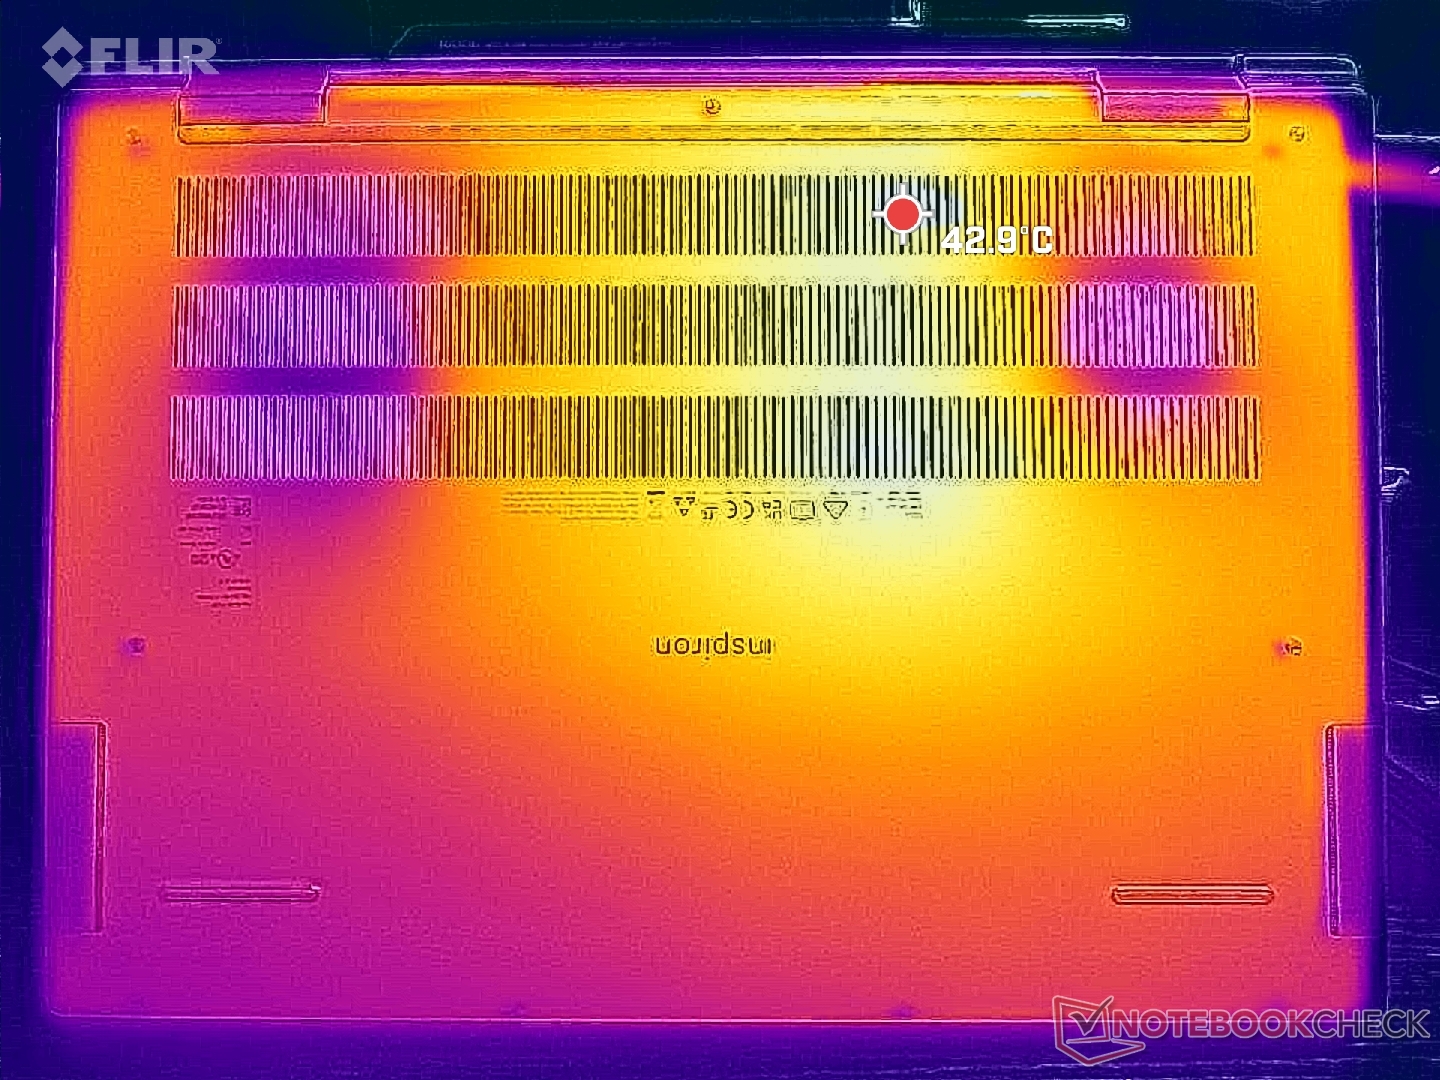
Temperatury powierzchni podczas uruchamiania wymagających obciążeń, takich jak gry, są wyższe niż oczekiwano. Gorące punkty na górze i na dole mogą mieć temperaturę odpowiednio 48 C i 43 C w pobliżu środka klawiatury. Podpórki pod nadgarstki również mogą być bardzo ciepłe, osiągając nawet 37 C w porównaniu do zaledwie 31 C w modeluAsus Vivobook Pro 16X lub HP Envy 16. To z pewnością bardziej ogrzewa dłonie w porównaniu do innych laptopów.
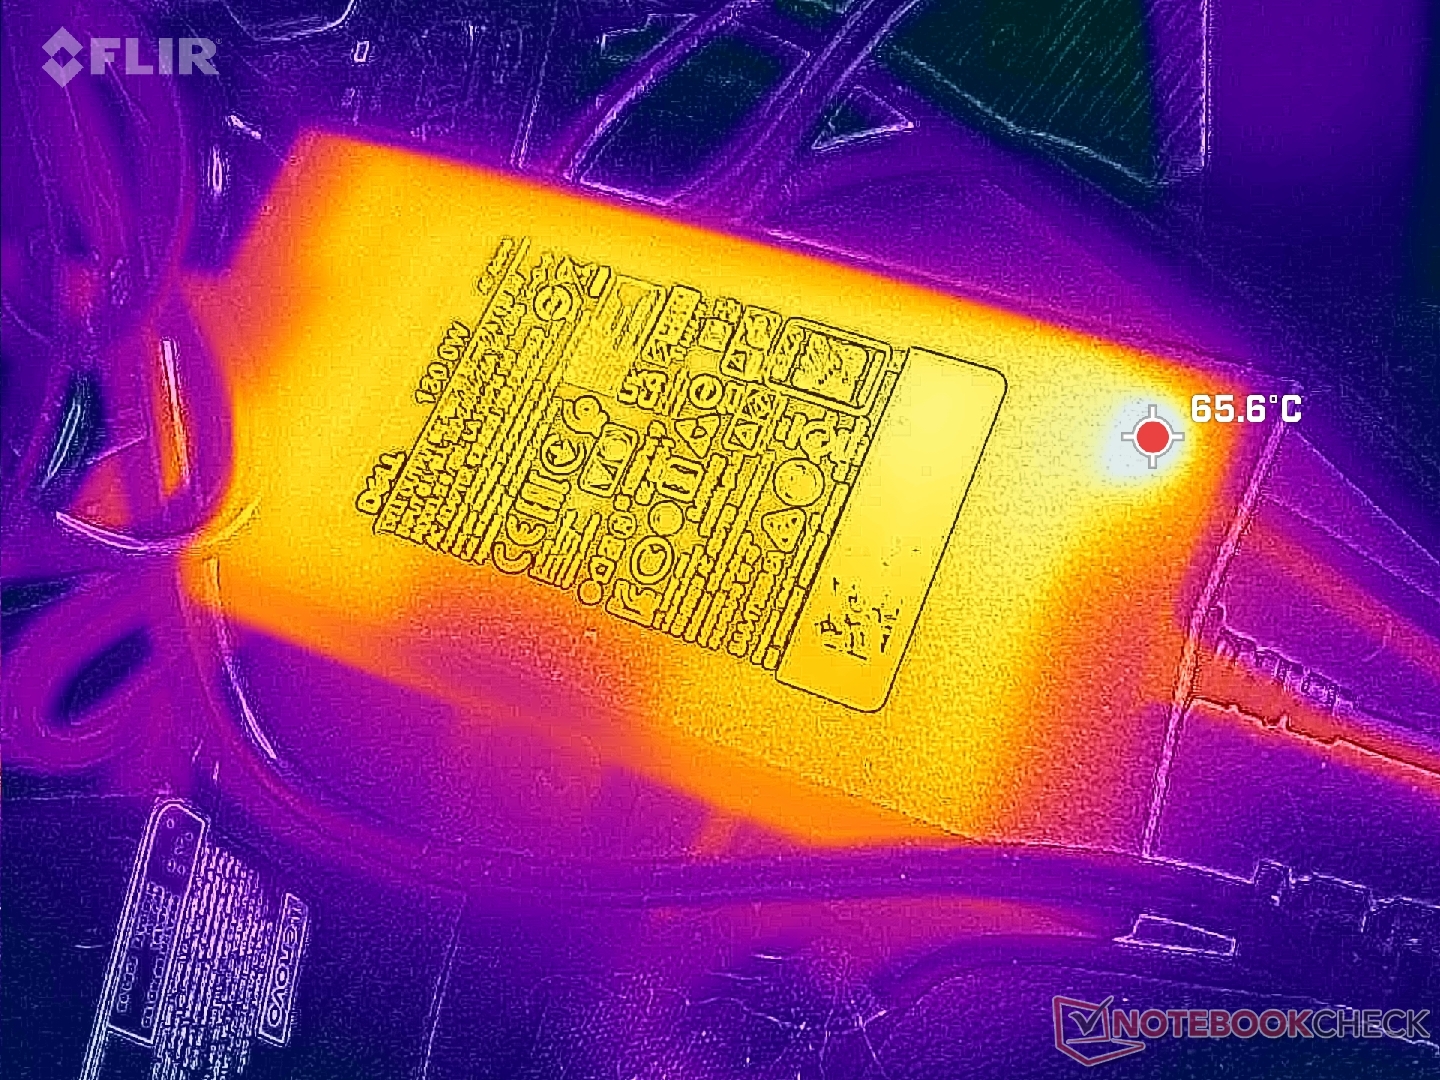
Dodatkowo, zasilacz sieciowy jest zauważalnie cieplejszy niż przeciętnie przy ponad 65 C. Na wszelki wypadek warto zapewnić zasilaczowi wystarczającą przestrzeń do oddychania.
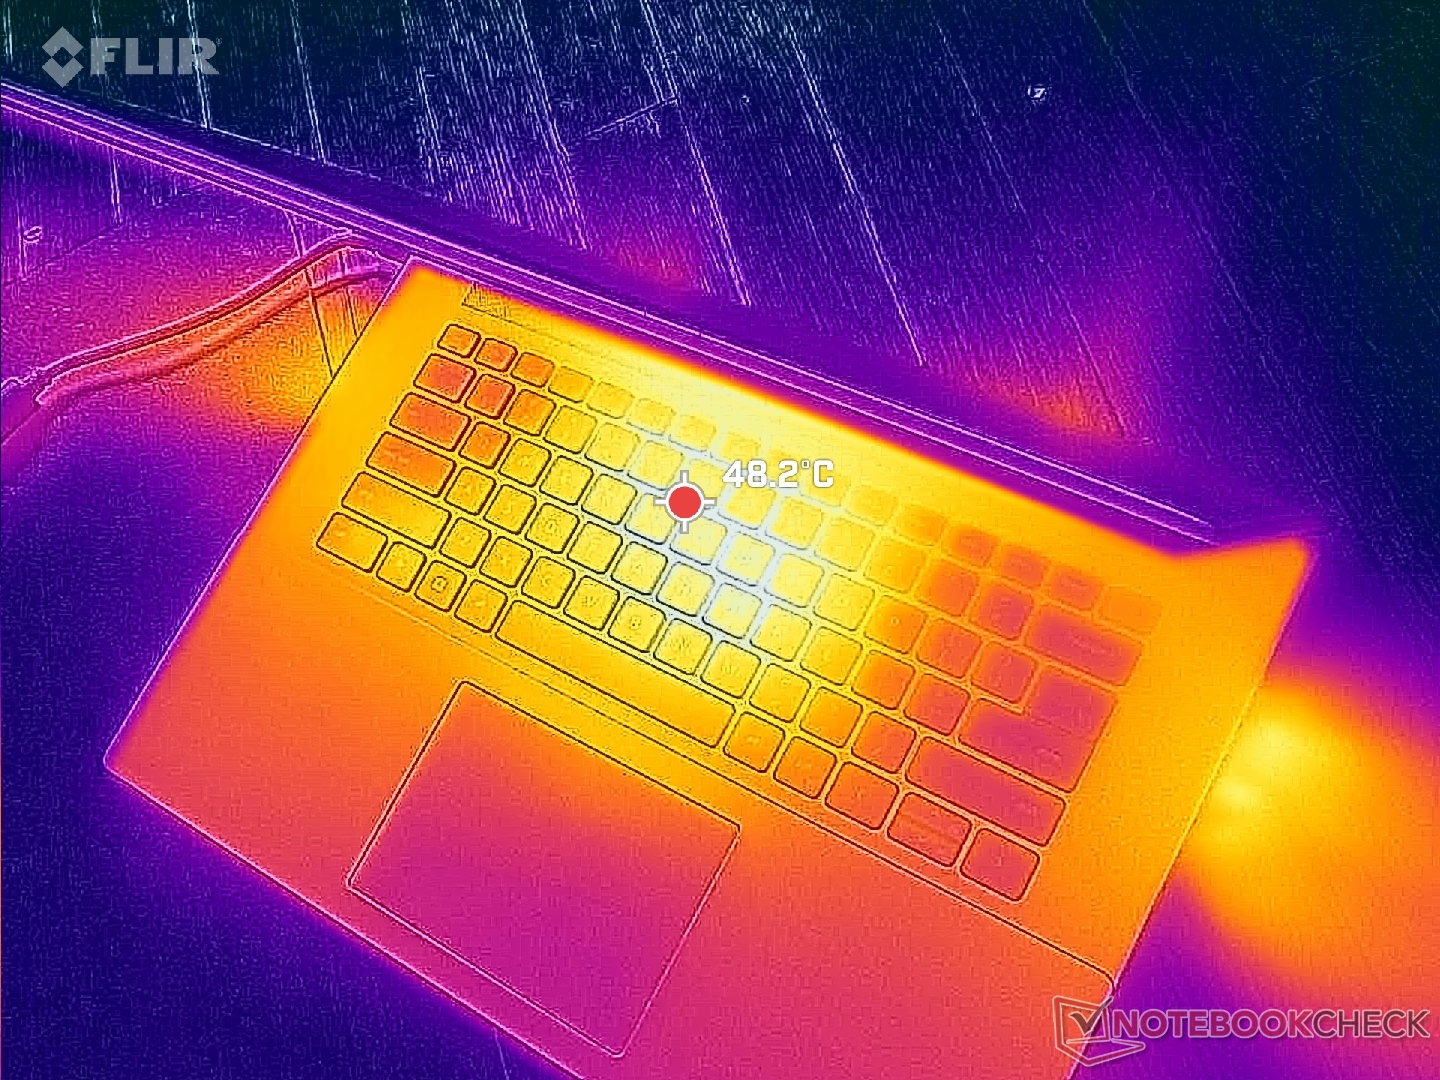
(-) Maksymalna temperatura w górnej części wynosi 47.8 °C / 118 F, w porównaniu do średniej 36.8 °C / 98 F , począwszy od 21 do 71 °C dla klasy Multimedia.
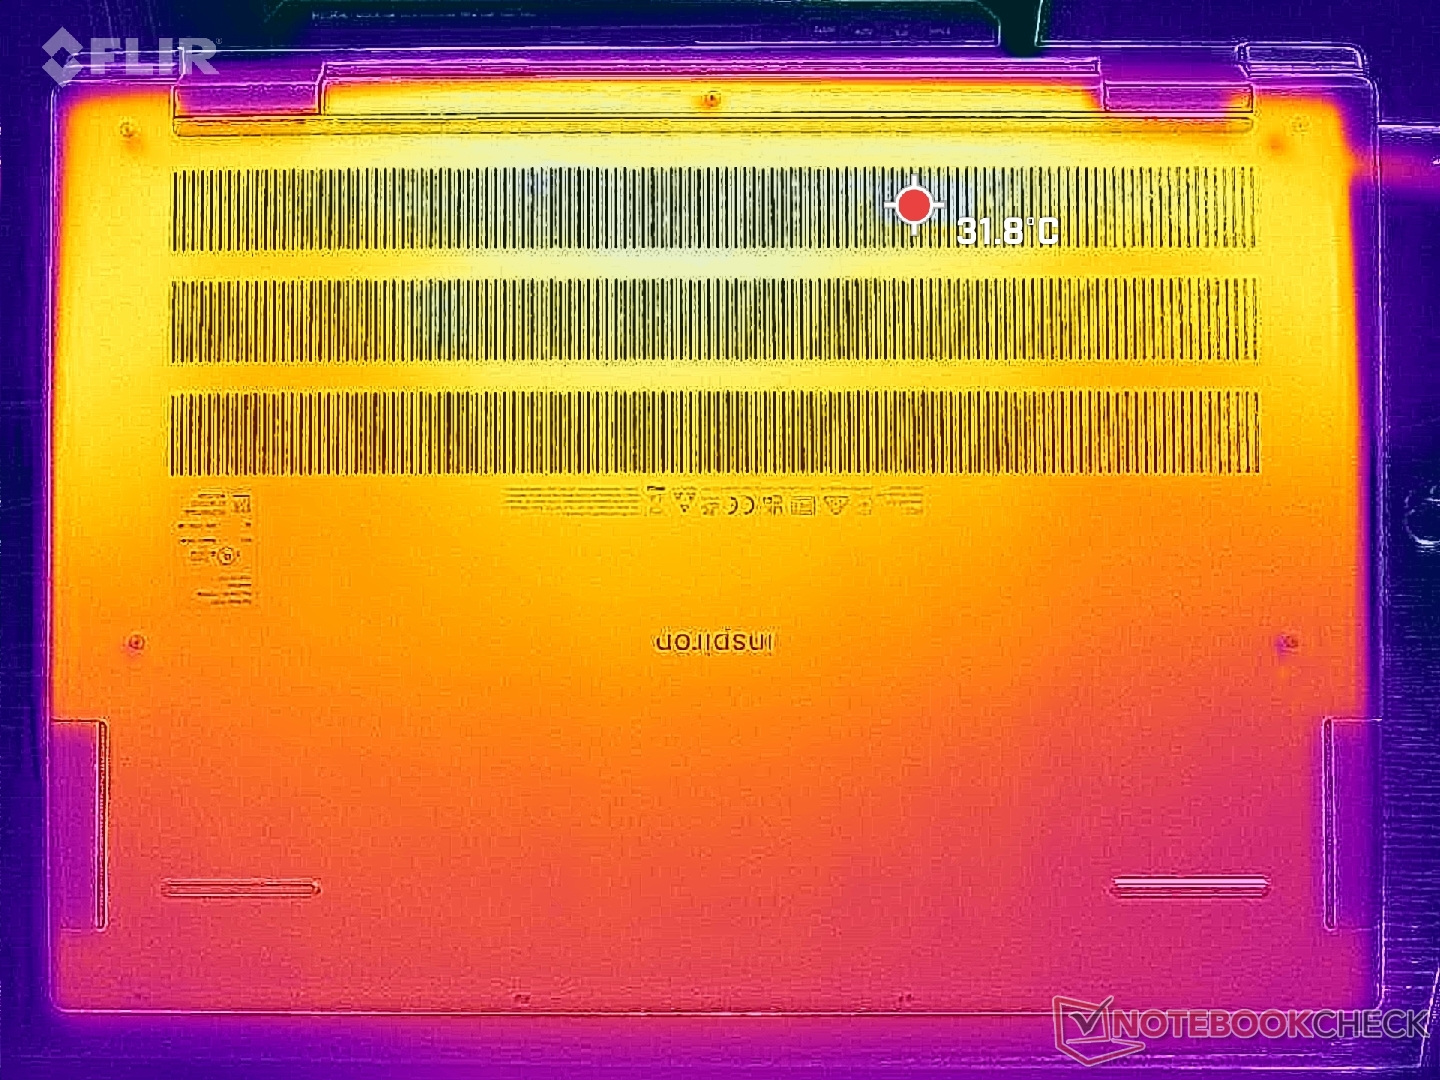
(±) Dno nagrzewa się maksymalnie do 42.2 °C / 108 F, w porównaniu do średniej 39.1 °C / 102 F
(±) W stanie bezczynności średnia temperatura górnej części wynosi 32 °C / 90 F, w porównaniu ze średnią temperaturą urządzenia wynoszącą 31.3 °C / ### class_avg_f### F.
(-) Podczas gry w Wiedźmina 3 średnia temperatura górnej części wynosi 40.6 °C / 105 F, w porównaniu do średniej temperatury urządzenia wynoszącej 31.3 °C / ## #class_avg_f### F.
(±) Podpórki pod nadgarstki i touchpad mogą się bardzo nagrzać w dotyku, maksymalnie do 36.6 °C / 97.9 F.
(-) Średnia temperatura obszaru podparcia dłoni w podobnych urządzeniach wynosiła 28.7 °C / 83.7 F (-7.9 °C / -14.2 F).
| Dell Inspiron 16 Plus 7630 Intel Core i7-13700H, NVIDIA GeForce RTX 4060 Laptop GPU | Dell Inspiron 16 Plus 7620 Intel Core i7-12700H, NVIDIA GeForce RTX 3050 Ti Laptop GPU | Lenovo Slim Pro 9i 16IRP8 Intel Core i9-13905H, NVIDIA GeForce RTX 4050 Laptop GPU | Asus Vivobook Pro 16X K6604JV-MX016W Intel Core i9-13980HX, NVIDIA GeForce RTX 4060 Laptop GPU | HP Envy 16 h0112nr Intel Core i7-12700H, NVIDIA GeForce RTX 3060 Laptop GPU | MSI Summit E16 Flip A12UDT-031 Intel Core i7-1280P, NVIDIA GeForce RTX 3050 Ti Laptop GPU | |
|---|---|---|---|---|---|---|
| Heat | 6% | 10% | -3% | 3% | 2% | |
| Maximum Upper Side * (°C) | 47.8 | 46 4% | 37.8 21% | 39.7 17% | 45.2 5% | 49.2 -3% |
| Maximum Bottom * (°C) | 42.2 | 45.8 -9% | 44.8 -6% | 60 -42% | 44 -4% | 50.2 -19% |
| Idle Upper Side * (°C) | 35.2 | 29.2 17% | 30.6 13% | 30.9 12% | 33.6 5% | 29.4 16% |
| Idle Bottom * (°C) | 35 | 31 11% | 31 11% | 34.7 1% | 32.6 7% | 30 14% |
* ... im mniej tym lepiej
Test warunków skrajnych
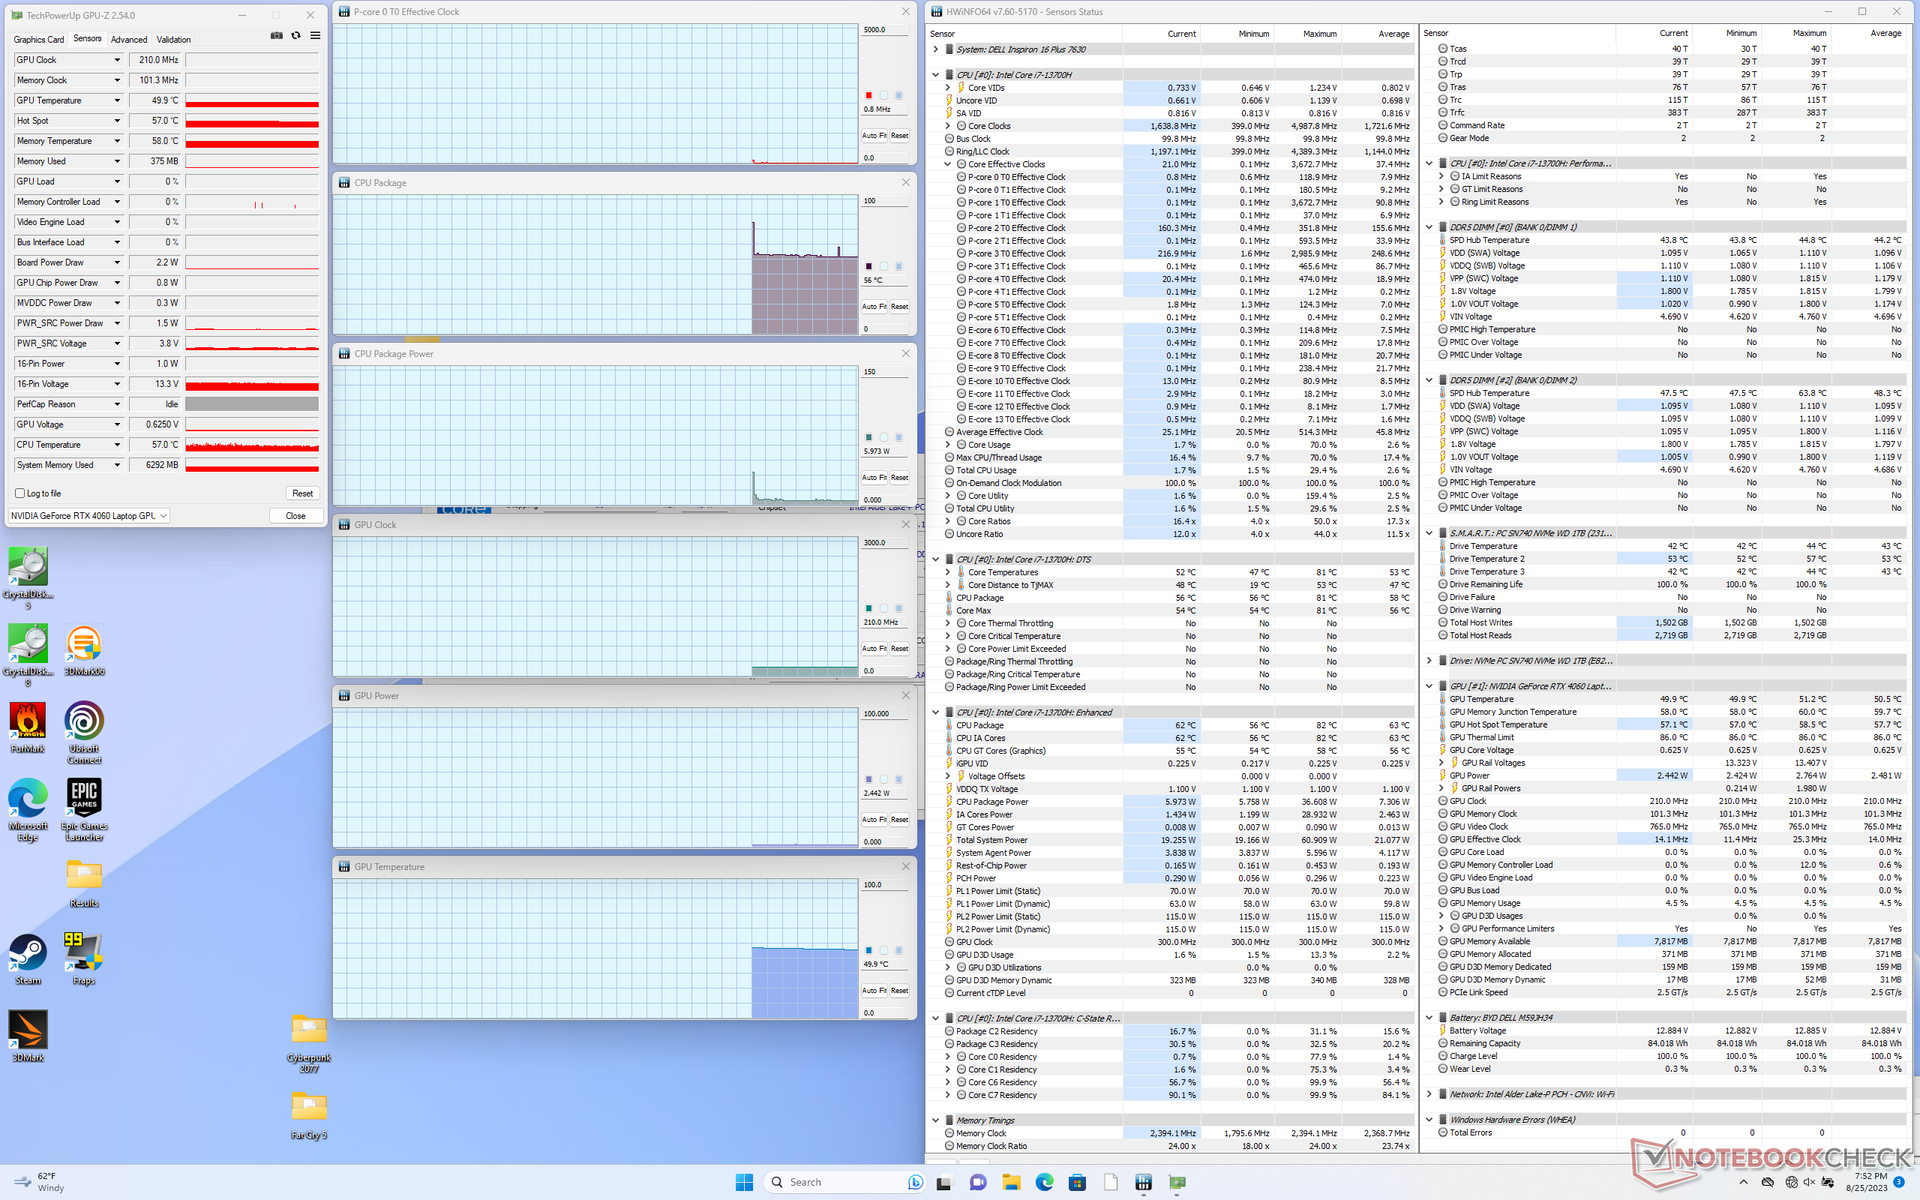
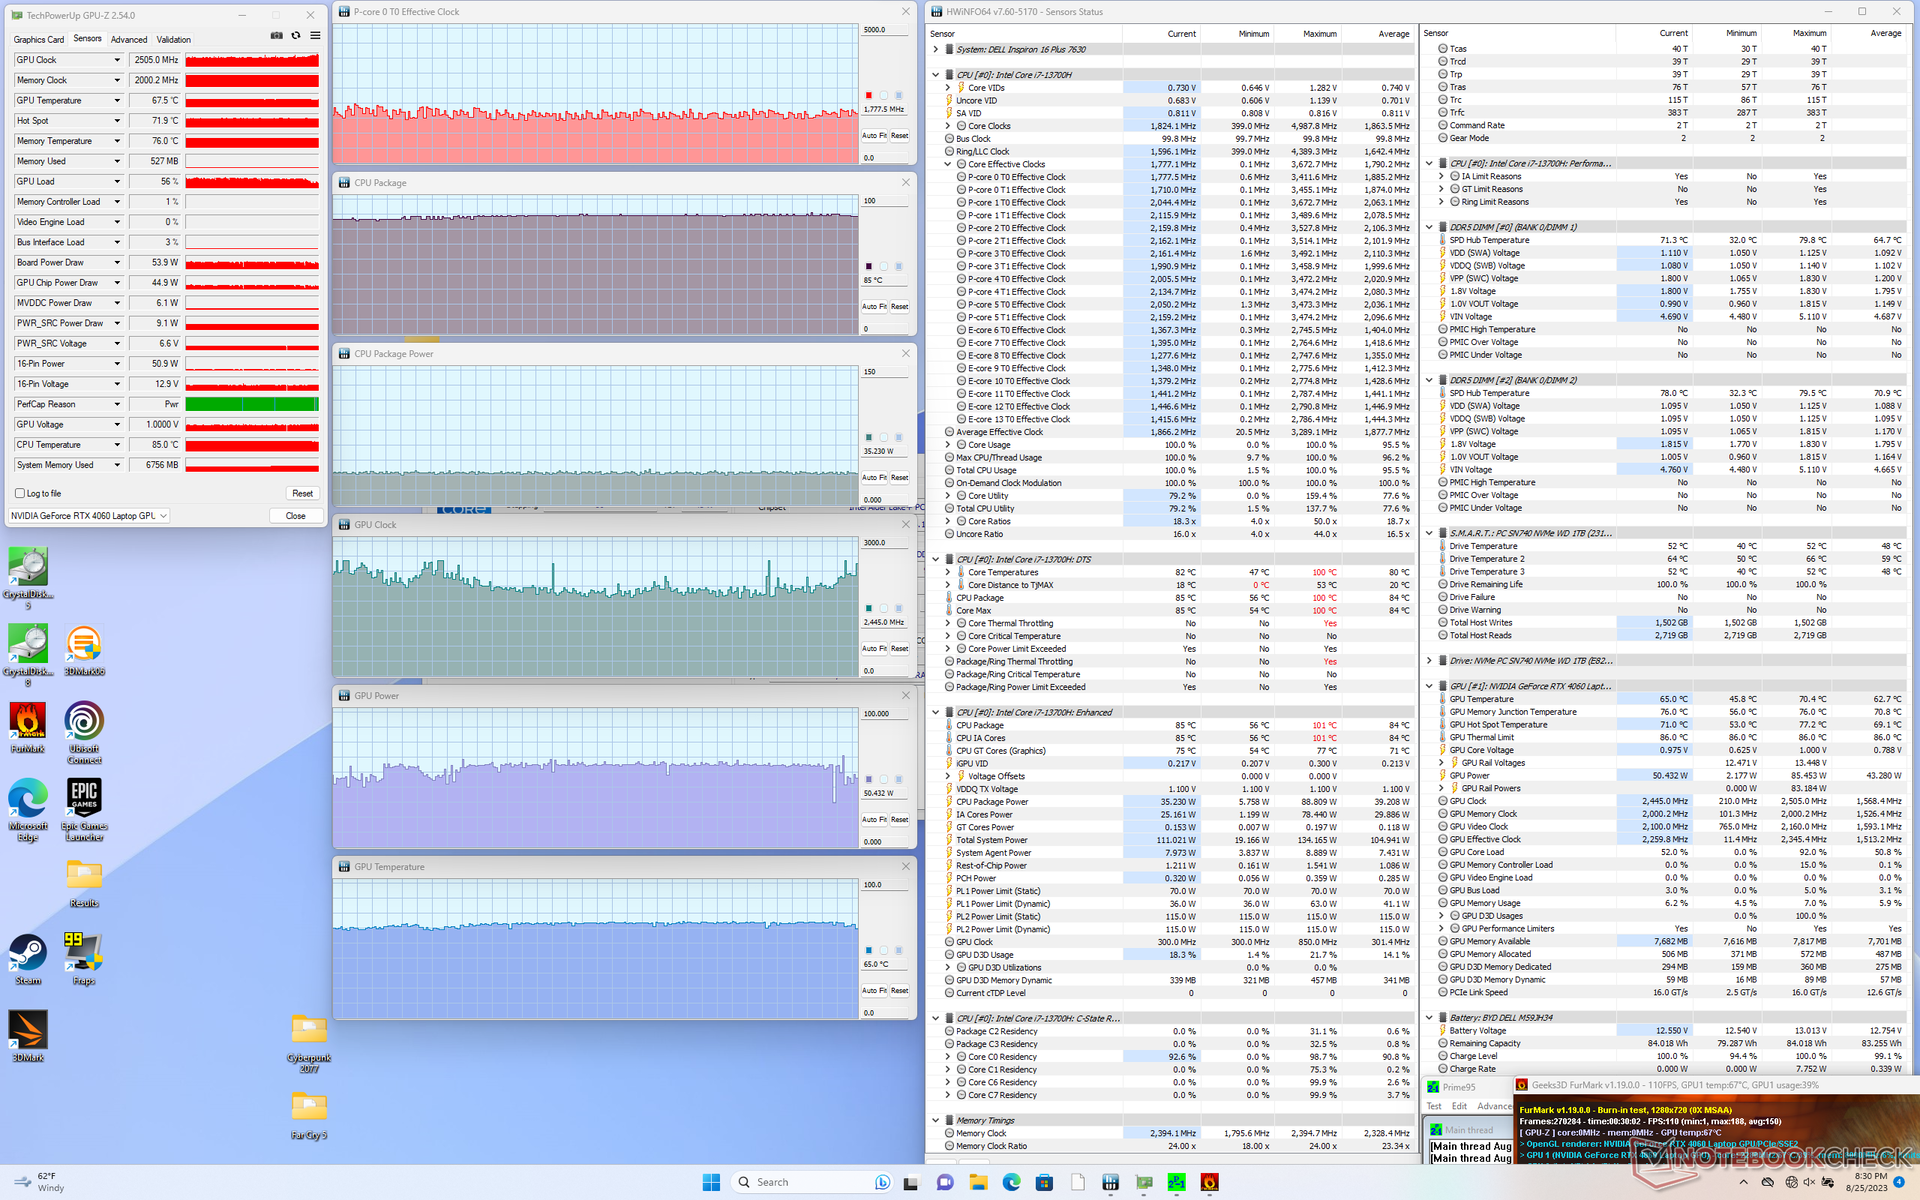
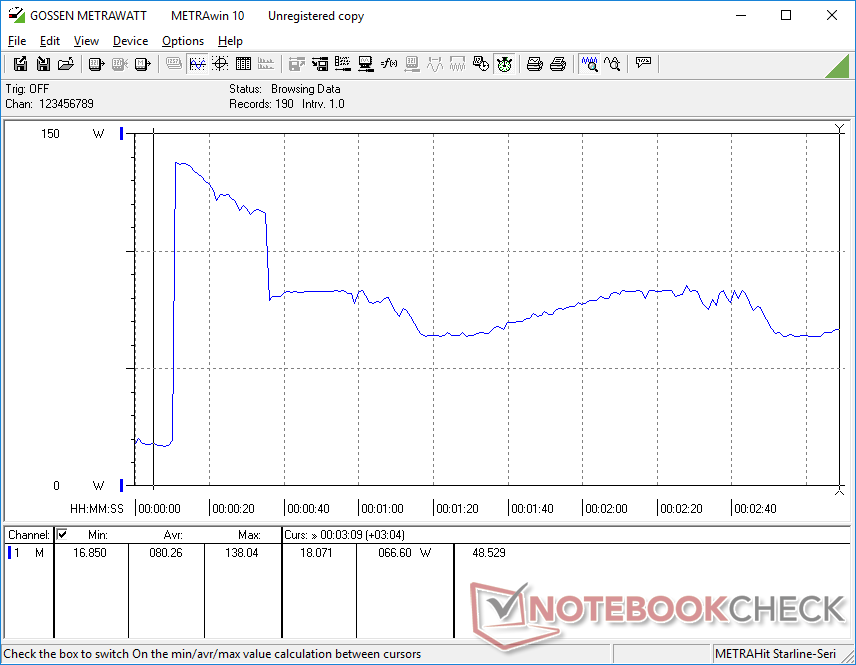
Po uruchomieniu Prime95, procesor zwiększał częstotliwość taktowania do 3,4 GHz, pobierał 89 W mocy i osiągał temperaturę 100 C przez zaledwie kilka sekund, po czym ostatecznie ustabilizował się na poziomie około 2,3 GHz i 50 W, aby utrzymać bardziej rozsądną temperaturę rdzenia na poziomie 84 C. Zeszłoroczny model ustabilizował się na mniej więcej tych samych wartościach podczas wykonywania tego samego testu.
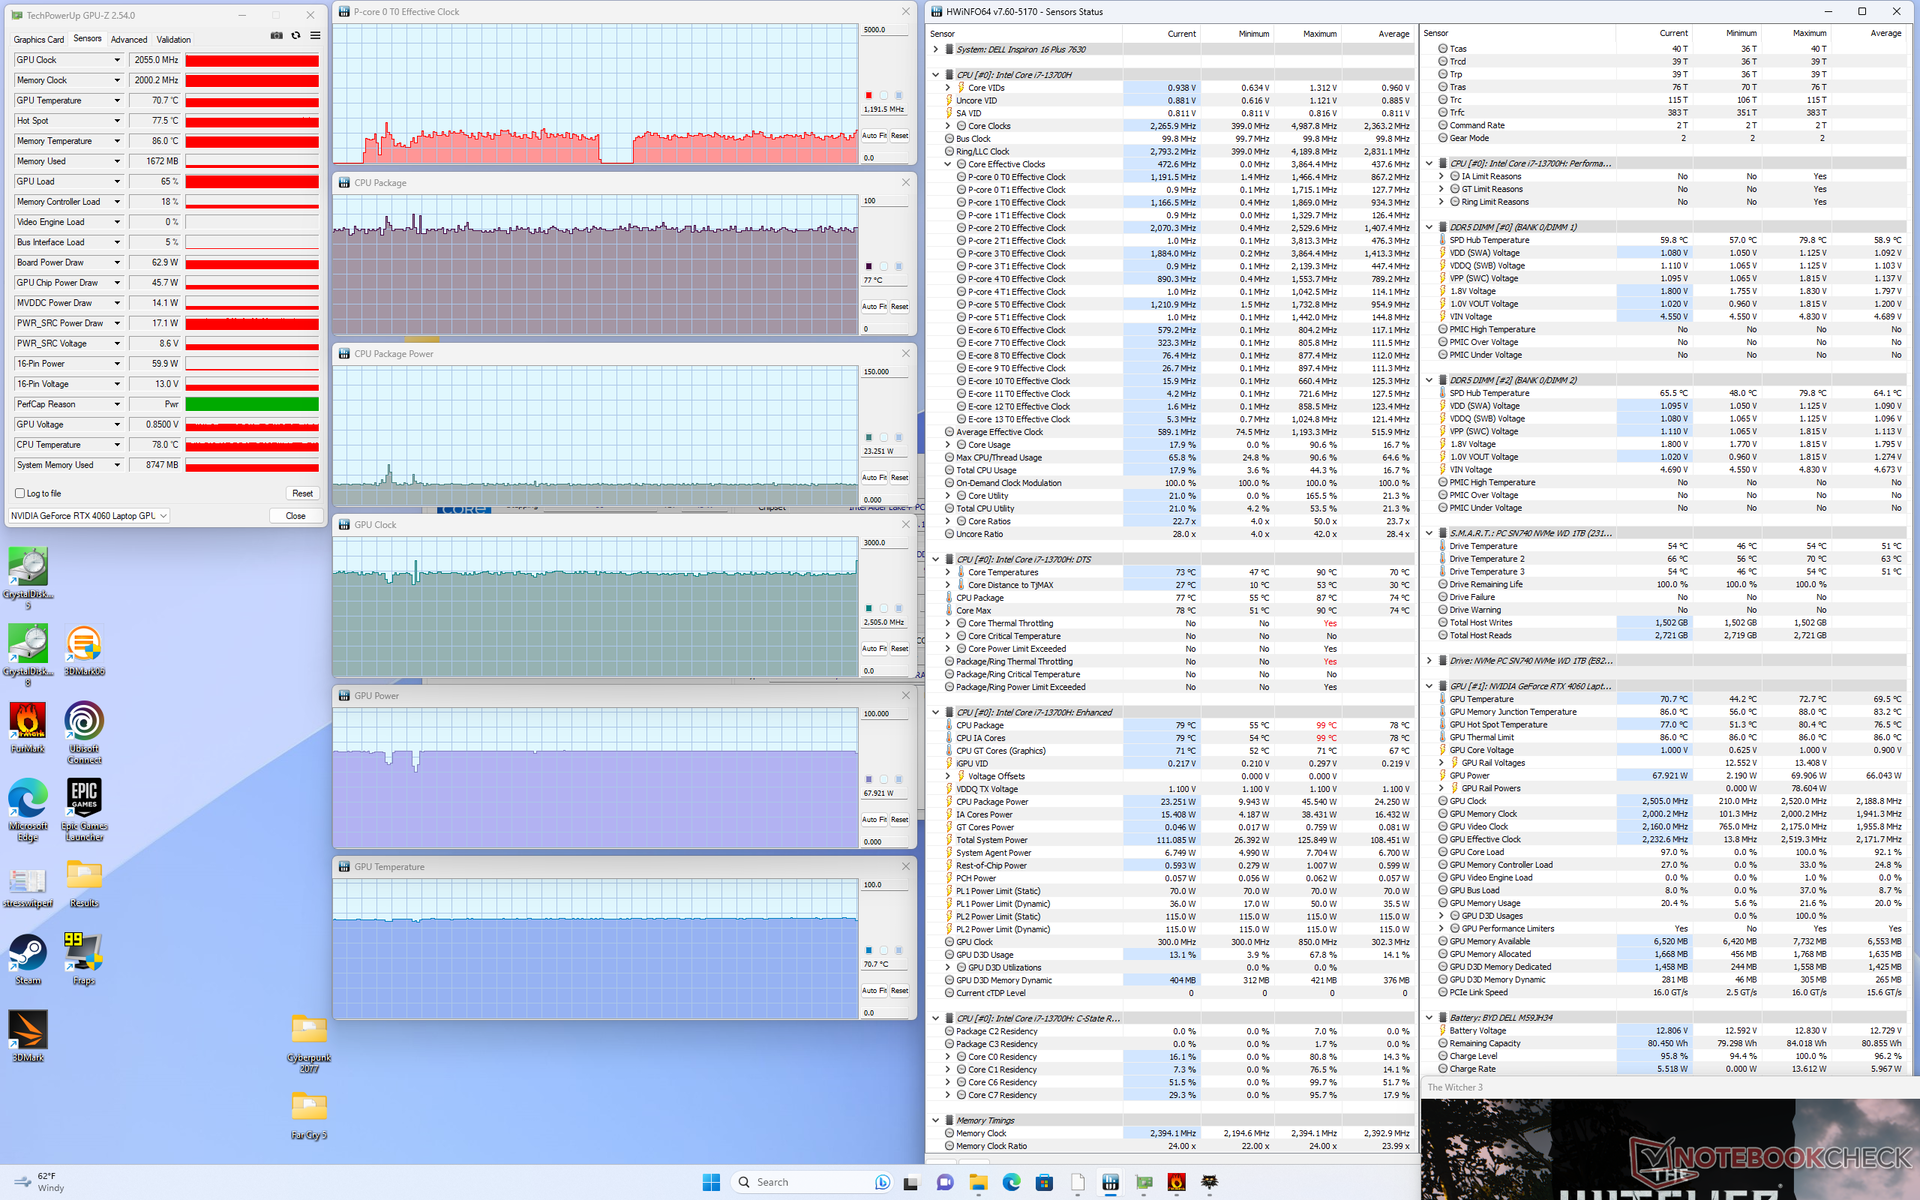
Podczas pracy Witcher 3 w trybie Performance, który reprezentuje typowe obciążenia w grach, procesor graficzny Nvidii ustabilizowałby się na poziomie 2235 MHz, 71 C i 69 W według HWiNFO. Przejście do trybu zrównoważonego nie wpływa znacząco na te wartości, co jest zgodne z naszymi obserwacjami Fire Strike powyżej. Co ciekawe, temperatury rdzenia byłyby znacznie niższe niż te, które odnotowaliśmy na Inspiron 16 Plus 7620 podczas uruchamiania tej samej gry, prawdopodobnie ze względu na głośniejszy hałas wentylatora i ogólne ulepszenia rozwiązania chłodzącego.
Warto zauważyć, że podczas gdy HWiNFO podaje pobór mocy GPU na poziomie 69 W podczas grania, Dell reklamuje moc GPU na poziomie zaledwie 60 W. Panel sterowania Nvidia podaje docelową moc GPU na poziomie 70 W.
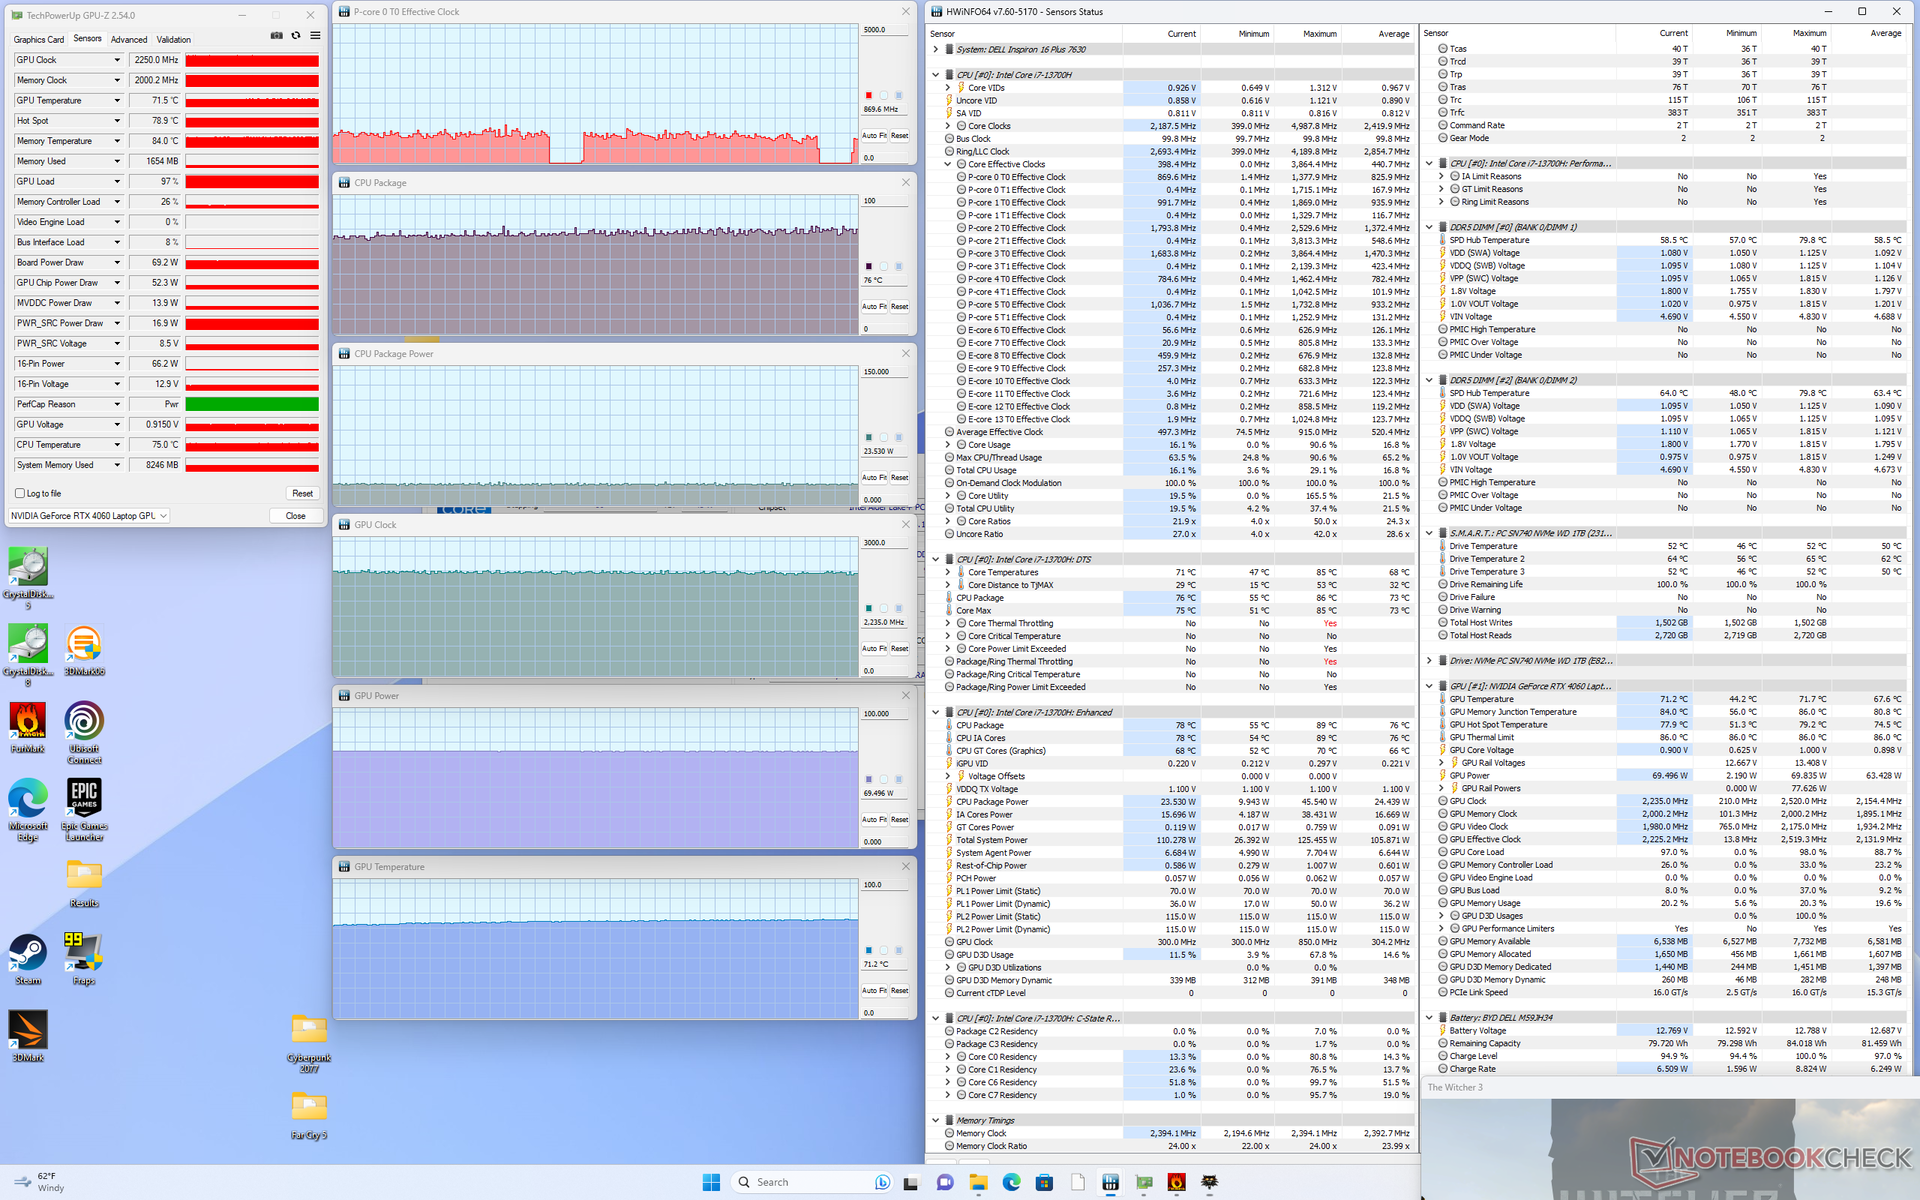
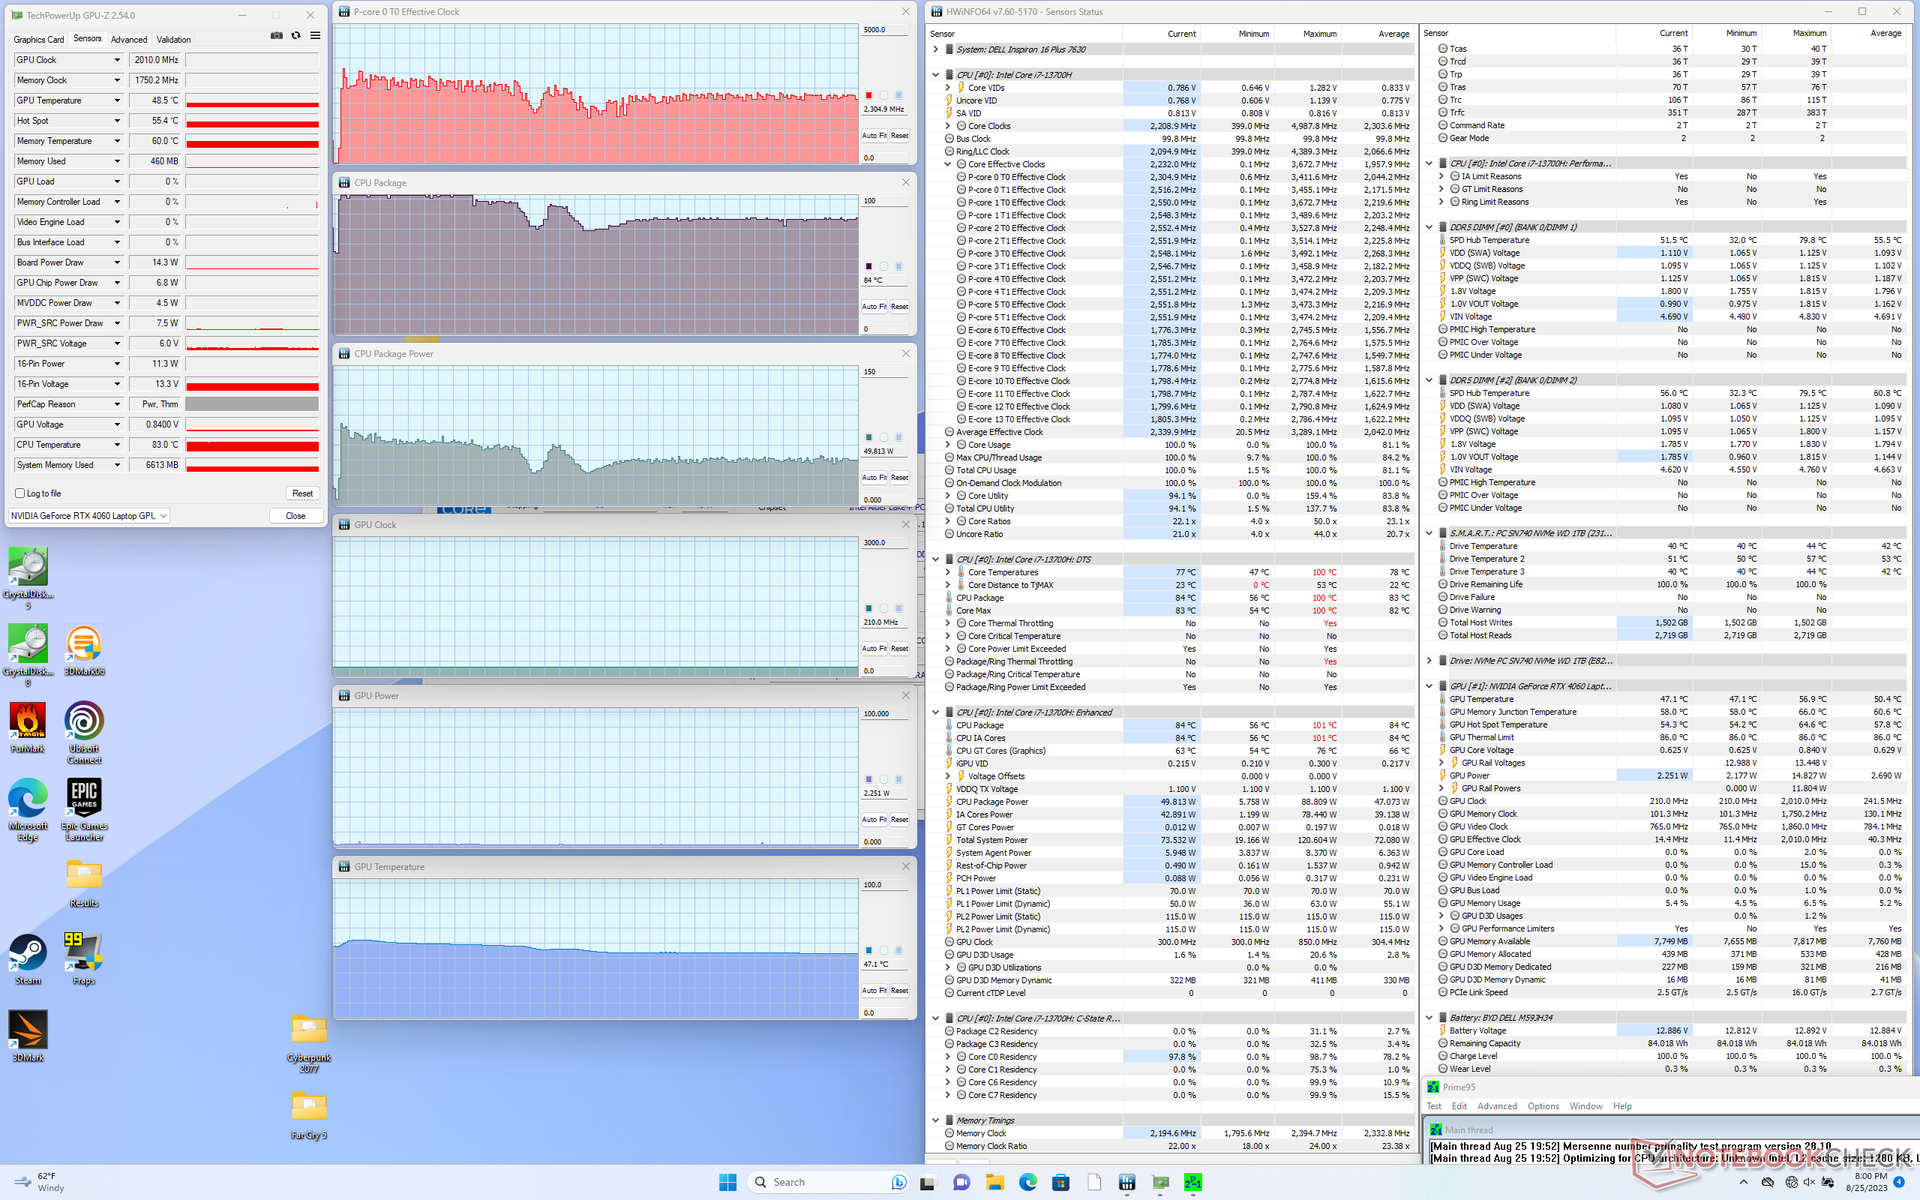
| Taktowanie CPU (GHz) | Taktowanie GPU (MHz) | Średnia temperatura CPU (°C) | Średnia temperatura GPU (°C) | |
| System w stanie spoczynku | -- | -- | 56 | 50 |
| Prime95Stress | 2.3 - 2.4 | -- | 84 | 47 |
| Prime95+ FurMark Stress | ~1.8 | ~2445 | 85 | 65 |
| Witcher 3 Obciążenie (trybzrównoważony) | ~1.1 | 2055 | 77 | 71 |
| Witcher 3 Obciążenie (trybwydajności) | ~1.1 | 2250 | 76 | 71 |
Głośniki
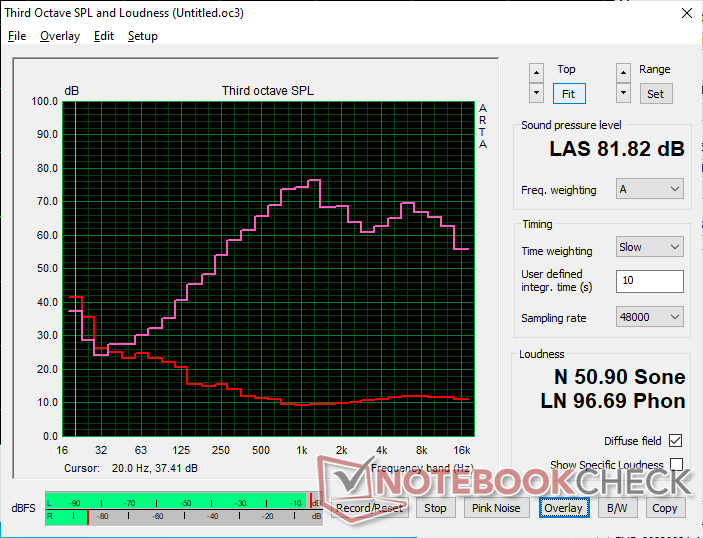
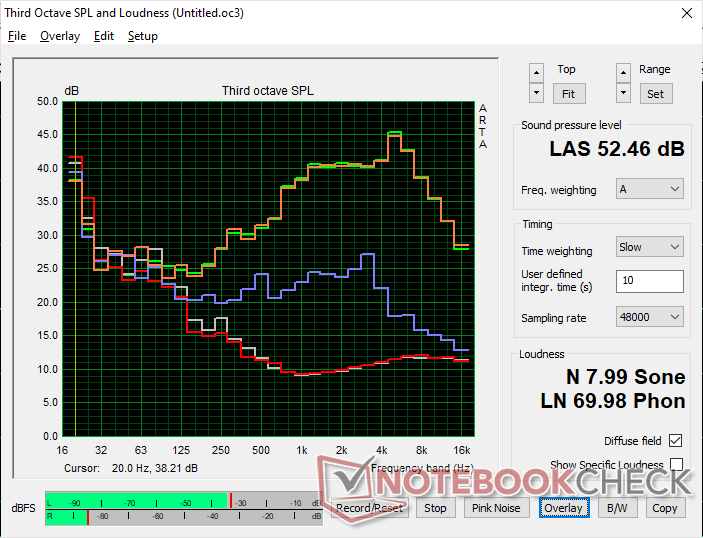
Dell Inspiron 16 Plus 7630 analiza dźwięku
(±) | głośność głośnika jest średnia, ale dobra (81.8 dB)
Bas 100 - 315 Hz
(-) | prawie brak basu - średnio 17% niższa od mediany
(±) | liniowość basu jest średnia (8.4% delta do poprzedniej częstotliwości)
Średnie 400 - 2000 Hz
(±) | wyższe średnie - średnio 6.3% wyższe niż mediana
(+) | średnie są liniowe (6.2% delta do poprzedniej częstotliwości)
Wysokie 2–16 kHz
(+) | zrównoważone maksima - tylko 2.2% od mediany
(+) | wzloty są liniowe (5.6% delta do poprzedniej częstotliwości)
Ogólnie 100 - 16.000 Hz
(±) | liniowość ogólnego dźwięku jest średnia (15.9% różnicy w stosunku do mediany)
W porównaniu do tej samej klasy
» 40% wszystkich testowanych urządzeń w tej klasie było lepszych, 6% podobnych, 54% gorszych
» Najlepszy miał deltę 5%, średnia wynosiła ###średnia###%, najgorsza wynosiła 45%
W porównaniu do wszystkich testowanych urządzeń
» 25% wszystkich testowanych urządzeń było lepszych, 5% podobnych, 70% gorszych
» Najlepszy miał deltę 4%, średnia wynosiła ###średnia###%, najgorsza wynosiła 134%
Apple MacBook Pro 16 2021 M1 Pro analiza dźwięku
(+) | głośniki mogą odtwarzać stosunkowo głośno (84.7 dB)
Bas 100 - 315 Hz
(+) | dobry bas - tylko 3.8% od mediany
(+) | bas jest liniowy (5.2% delta do poprzedniej częstotliwości)
Średnie 400 - 2000 Hz
(+) | zbalansowane środki średnie - tylko 1.3% od mediany
(+) | średnie są liniowe (2.1% delta do poprzedniej częstotliwości)
Wysokie 2–16 kHz
(+) | zrównoważone maksima - tylko 1.9% od mediany
(+) | wzloty są liniowe (2.7% delta do poprzedniej częstotliwości)
Ogólnie 100 - 16.000 Hz
(+) | ogólny dźwięk jest liniowy (4.6% różnicy w stosunku do mediany)
W porównaniu do tej samej klasy
» 0% wszystkich testowanych urządzeń w tej klasie było lepszych, 0% podobnych, 100% gorszych
» Najlepszy miał deltę 5%, średnia wynosiła ###średnia###%, najgorsza wynosiła 45%
W porównaniu do wszystkich testowanych urządzeń
» 0% wszystkich testowanych urządzeń było lepszych, 0% podobnych, 100% gorszych
» Najlepszy miał deltę 4%, średnia wynosiła ###średnia###%, najgorsza wynosiła 134%
Zarządzanie energią
Pobór mocy - wysoka wydajność GPU w przeliczeniu na wat
Zużycie energii jest nieco wyższe niż w zeszłorocznym modelu podczas pracy na biegu jałowym na pulpicie lub podczas uruchamiania gier. 8-procentowy wzrost podczas uruchamiania gier blednie jednak w porównaniu z 40-60-procentowym wzrostem wydajności graficznej w porównaniu z RTX 3050 Ti. Tak więc wydajność w przeliczeniu na wat nadal faworyzuje nasz nowszy model, nawet jeśli zużycie energii może być nieco wyższe.
Laptopy do gier z tym samym CPU i GPU co nasz Dell Inspiron, takie jakAcer Nitro 17są zwykle bardziej energochłonne, ponieważ celują w wyższe poziomy mocy, aby wycisnąć większą wydajność z procesorów. Na przykład podczas grania Acer wymagałby około 30 W więcej.
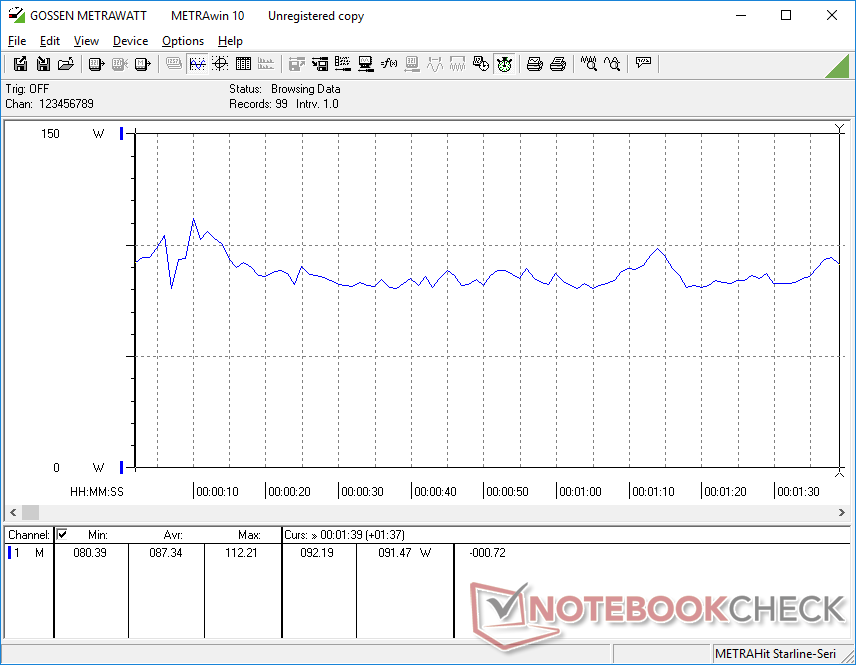
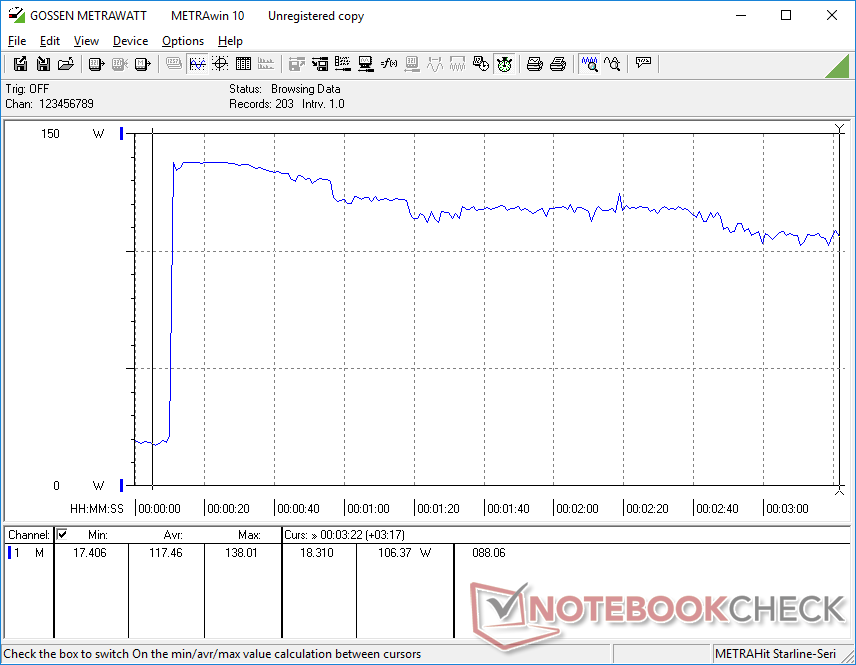
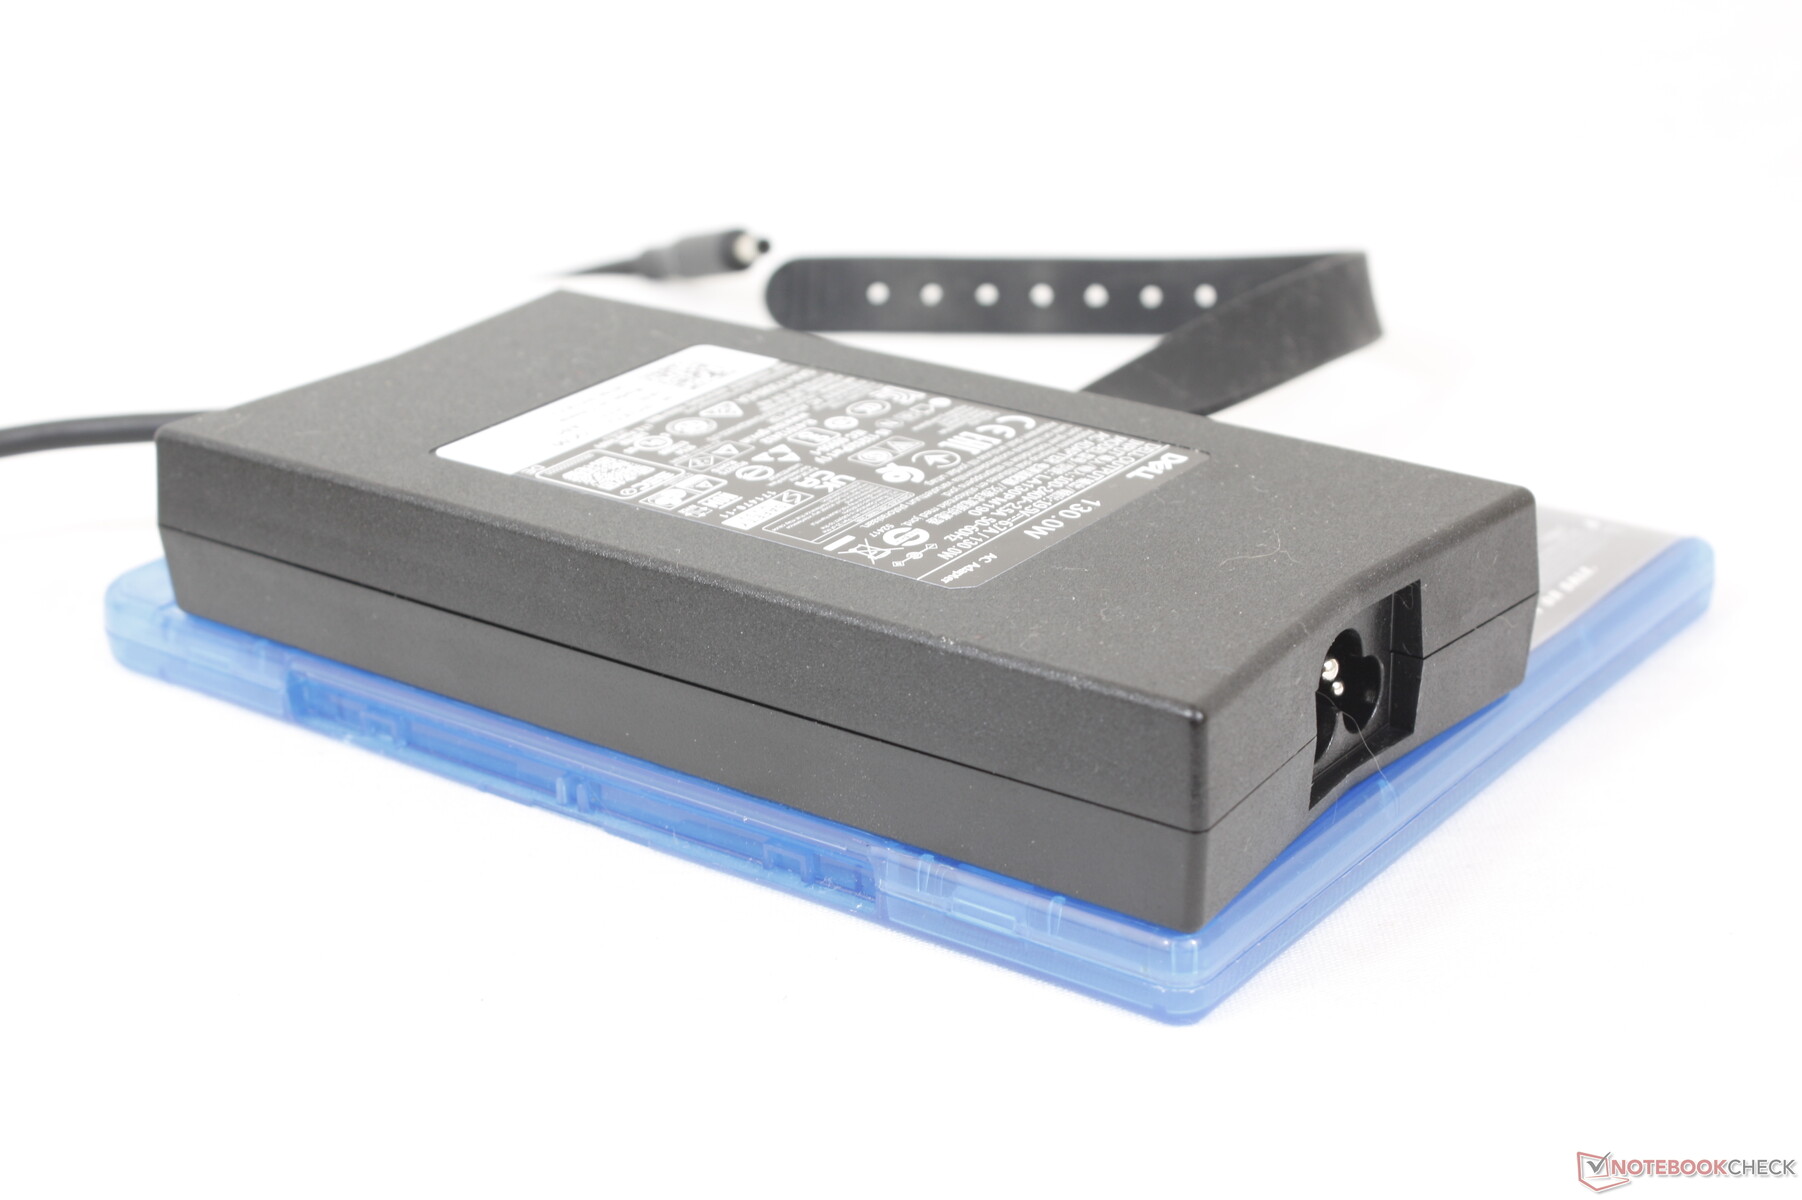
Jesteśmy w stanie zmierzyć tymczasowe maksymalne zużycie energii na poziomie 138 W ze średniej wielkości (~ 15 x 7,4 x 2,5 cm) zasilacza sieciowego o mocy 130 W, gdy procesor i karta graficzna są wykorzystywane w 100 procentach. Należy pamiętać, że konfiguracje bez oddzielnej grafiki są dostarczane z mniejszym zasilaczem sieciowym 90 W.
| wyłączony / stan wstrzymania | |
| luz | |
| obciążenie |
|
Legenda:
min: | |
| Dell Inspiron 16 Plus 7630 i7-13700H, GeForce RTX 4060 Laptop GPU, WD PC SN740 SDDPTQD-1T00, IPS, 2560x1600, 16" | Dell Inspiron 16 Plus 7620 i7-12700H, GeForce RTX 3050 Ti Laptop GPU, Kioxia BG5 KBG50ZNS512G, IPS, 3072x1920, 16" | Lenovo Slim Pro 9i 16IRP8 i9-13905H, GeForce RTX 4050 Laptop GPU, Samsung PM9A1 MZVL21T0HCLR, Mini-LED, 3200x2000, 16" | Asus Vivobook Pro 16X K6604JV-MX016W i9-13980HX, GeForce RTX 4060 Laptop GPU, Solidigm P41 Plus SSDPFKNU010TZ, OLED, 3200x2000, 16" | HP Envy 16 h0112nr i7-12700H, GeForce RTX 3060 Laptop GPU, Micron 3400 1TB MTFDKBA1T0TFH, OLED, 3840x2400, 16" | MSI Summit E16 Flip A12UDT-031 i7-1280P, GeForce RTX 3050 Ti Laptop GPU, Samsung PM9A1 MZVL22T0HBLB, IPS, 2560x1600, 16" | |
|---|---|---|---|---|---|---|
| Power Consumption | 15% | -28% | -23% | -9% | 22% | |
| Idle Minimum * (Watt) | 15.6 | 6.8 56% | 16 -3% | 13.8 12% | 10 36% | 9.8 37% |
| Idle Average * (Watt) | 17.7 | 9.6 46% | 30 -69% | 16 10% | 10.9 38% | 15.3 14% |
| Idle Maximum * (Watt) | 20.6 | 17 17% | 30.4 -48% | 19 8% | 27.8 -35% | 16.3 21% |
| Load Average * (Watt) | 87.4 | 117.5 -34% | 78.9 10% | 147 -68% | 116.4 -33% | 87 -0% |
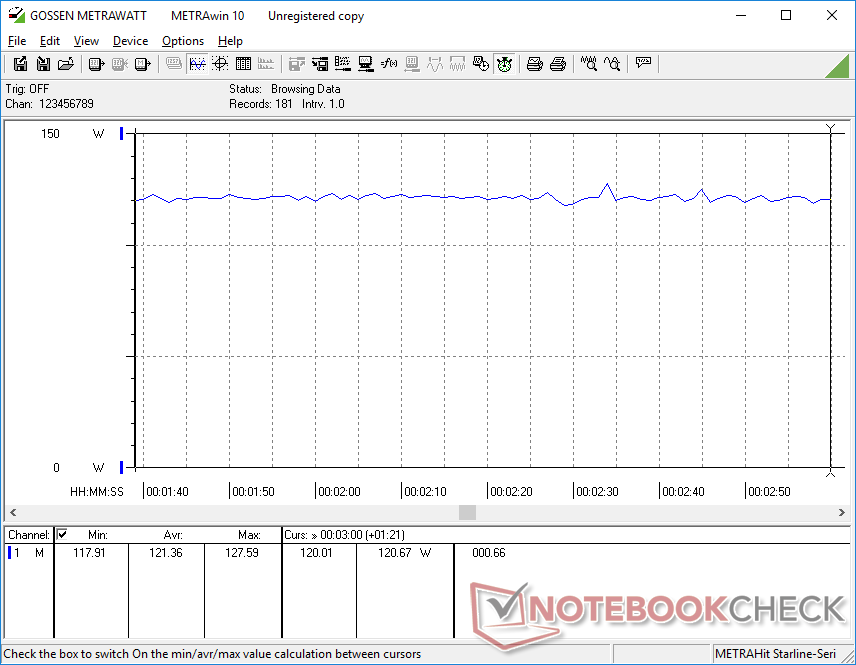
| Witcher 3 ultra * (Watt) | 121.7 | 113.1 7% | 155.3 -28% | 147.8 -21% | 133.7 -10% | 86.1 29% |
| Load Maximum * (Watt) | 138 | 137.4 -0% | 180.4 -31% | 244 -77% | 209.8 -52% | 100 28% |
* ... im mniej tym lepiej
Power Consumption Witcher 3 / Stresstest
Power Consumption external Monitor
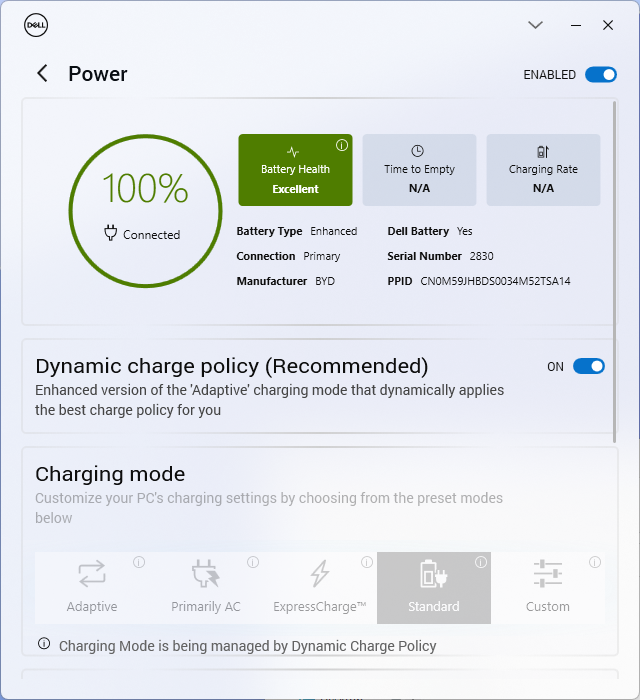
Żywotność baterii
Zarówno pojemność baterii, jak i jej żywotność pozostają takie same jak poprzednio. Jesteśmy w stanie zarejestrować 9,5 godziny rzeczywistego przeglądania sieci WLAN w trybie zrównoważonym, który jest dłuższy niż w konkurencyjnych modelach, takich jakLenovo Slim Pro 9i 16IRP8 lub HP Envy 16 o co najmniej kilka godzin każdy.
Ładowanie od stanu pustego do pełnej pojemności zajmuje około 90 minut przy użyciu dołączonego zasilacza sieciowego. System można również ładować za pomocą adapterów USB-C, takich jak te dostarczane z serią XPS.
| Dell Inspiron 16 Plus 7630 i7-13700H, GeForce RTX 4060 Laptop GPU, 86 Wh | Dell Inspiron 16 Plus 7620 i7-12700H, GeForce RTX 3050 Ti Laptop GPU, 86 Wh | Lenovo Slim Pro 9i 16IRP8 i9-13905H, GeForce RTX 4050 Laptop GPU, 75 Wh | Asus Vivobook Pro 16X K6604JV-MX016W i9-13980HX, GeForce RTX 4060 Laptop GPU, 90 Wh | HP Envy 16 h0112nr i7-12700H, GeForce RTX 3060 Laptop GPU, 83 Wh | MSI Summit E16 Flip A12UDT-031 i7-1280P, GeForce RTX 3050 Ti Laptop GPU, 82 Wh | |
|---|---|---|---|---|---|---|
| Czasy pracy | -2% | -30% | -12% | -0% | -24% | |
| Reader / Idle (h) | 17.6 | 18.6 6% | 17.8 1% | |||
| WiFi v1.3 (h) | 9.4 | 9.6 2% | 6.6 -30% | 6.5 -31% | 7.9 -16% | 7.1 -24% |
| Load (h) | 1.4 | 1.2 -14% | 1.5 7% | 1.6 14% | ||
| H.264 (h) | 5.3 |
Za
Przeciw
Werdykt - aktualizacja dla szybszego GPU
Ulepszenia w stosunku do zeszłorocznego Inspiron 16 Plus 7620 są bardziej znaczące niż początkowo oczekiwano pod wieloma względami. Oprócz ogromnego wzrostu wydajności graficznej po przeskoczeniu z RTX 3050 Ti na RTX 4060, zauważalny jest cichszy i głośniejszy hałas wentylatora między dwoma modelami, a także niższe temperatury rdzenia w nowszym modelu. Opcje wyświetlania są inne, ponieważ obejmują teraz opcjonalną częstotliwość odświeżania 120 Hz, podczas gdy aktualizacje SODIMM oferują teraz dwa gniazda zamiast jednego. Sztywniejsze zawiasy są również mile widzianą zmianą, aby zmniejszyć ryzyko ich zbyt szybkiego zepsucia. Wrażenia użytkownika uległy wystarczającej poprawie, nawet jeśli wydajność procesora jest nieaktualna, a klawiatura pozostaje taka sama jak wcześniej.
Inspiron 16 Plus 7630 to przede wszystkim równowaga. Jego funkcje i wydajność są wystarczające, aby zaspokoić większość celów multimedialnych i gier bez konieczności wydawania ręki i nogi.
Jako uniwersalny laptop multimedialny i do gier, Inspiron 16 Plus 7630 nie ma jednak kilku funkcji, które zwykle posiadają hardkorowe laptopy multimedialne i hardkorowe laptopy do gier. Po stronie multimediów, właściciele Inspiron 16 Plus 7630 będą tęsknić za pełniejszymi kolorami DCi-P3, wyższymi natywnymi rozdzielczościami i szybkim zintegrowanym czytnikiem kart SD. Po stronie gier, system pomija G-Sync i MUX, a jego RTX 4060 jest ogólnie wolniejszy niż przeciętnie. Inspiron 16 Plus 7630 świetnie nadaje się do tworzenia treści i gier, ale użytkownicy, którzy bardziej skłaniają się ku tworzeniu treści, powinni rozważyć HP Envy 16 lub Asus ZenBook Pro Duo podczas gdy ciężcy gracze będą chcieli przyjrzeć się dedykowanym maszynom do gier, takim jak Dell G lub Asus ROG.
Cena i dostępność
Dell dostarcza teraz Inspiron 16 Plus 7630 z Core i7 i RTX 4060 za 1250 USD.
Dell Inspiron 16 Plus 7630
- 30/08/2023 v7 (old)
Allen Ngo
Przezroczystość
Wyboru urządzeń do recenzji dokonuje nasza redakcja. Próbka testowa została udostępniona autorowi jako pożyczka od producenta lub sprzedawcy detalicznego na potrzeby tej recenzji. Pożyczkodawca nie miał wpływu na tę recenzję, producent nie otrzymał też kopii tej recenzji przed publikacją. Nie było obowiązku publikowania tej recenzji. Jako niezależna firma medialna, Notebookcheck nie podlega władzy producentów, sprzedawców detalicznych ani wydawców.
Tak testuje Notebookcheck
Każdego roku Notebookcheck niezależnie sprawdza setki laptopów i smartfonów, stosując standardowe procedury, aby zapewnić porównywalność wszystkich wyników. Od około 20 lat stale rozwijamy nasze metody badawcze, ustanawiając przy tym standardy branżowe. W naszych laboratoriach testowych doświadczeni technicy i redaktorzy korzystają z wysokiej jakości sprzętu pomiarowego. Testy te obejmują wieloetapowy proces walidacji. Nasz kompleksowy system ocen opiera się na setkach uzasadnionych pomiarów i benchmarków, co pozwala zachować obiektywizm.Price comparison

