

Recenzja mini PC ACEMagician ACE-CK10-8259U - cichy komputer biurowy z miejscem na nawet trzy dyski SSD
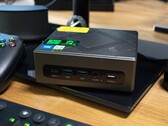
ACEMagician ACE-CK10-8259U to mały komputer biurowy oparty na natywnym 4-rdzeniowym procesorze. Jego procesor należy jednak jeszcze do generacji Coffee Lake, co niekoniecznie byłoby już pierwszym wyborem dla nowych urządzeń. Niemniej jednak producent zapewnił temu modelowi wystarczający potencjał wydajnościowy do codziennych zastosowań. Przełożyliśmy ACEMagician ACE-CK10-8259U przez swoje siły, a niniejsza recenzja pokaże Wam wszystko, co potrafi ten SoC.
Intel Core i5-8259U, Iris Plus Graphics 655, 449 g