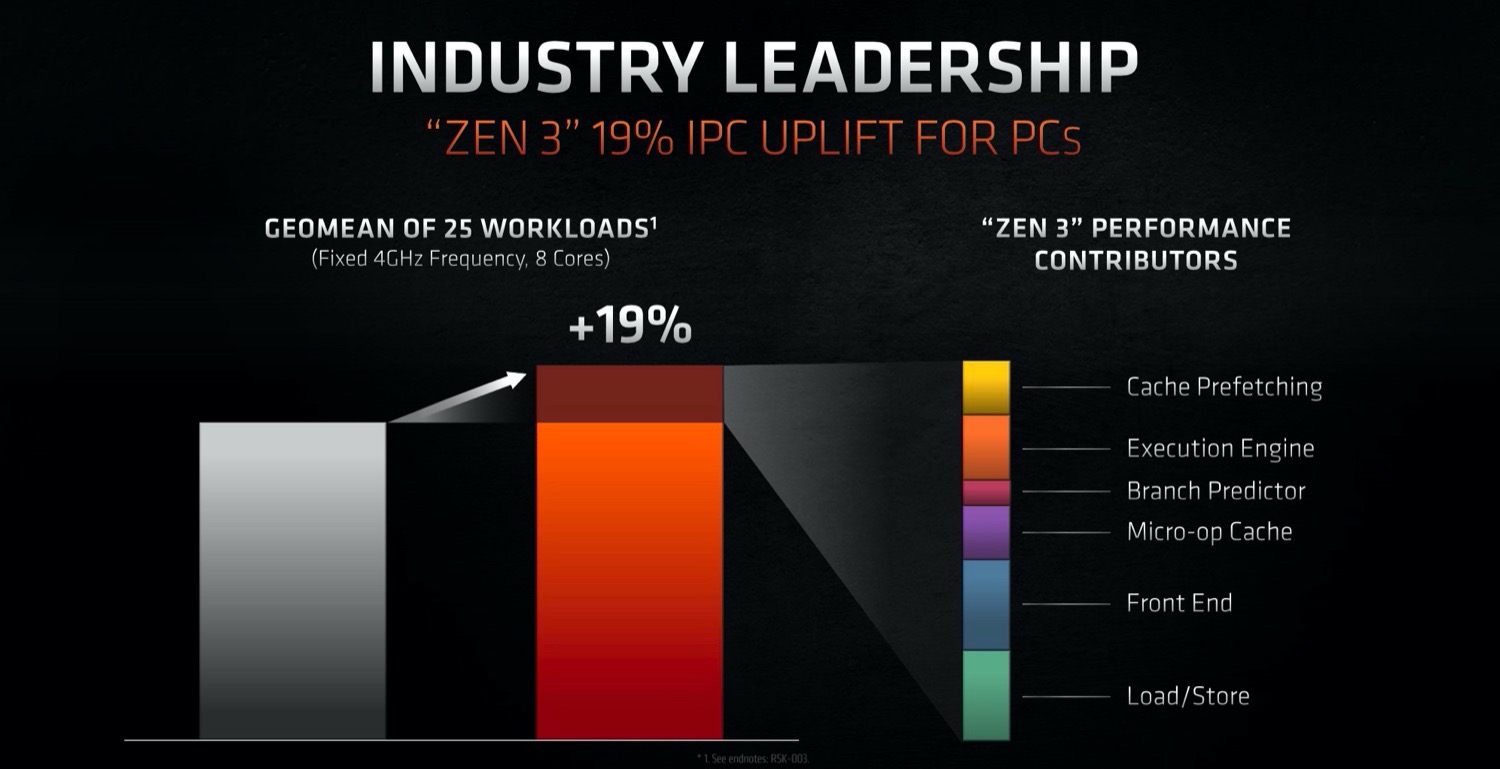
Nowa mikroarchitektura Zen 3 oferuje znacznie wyższe IPC (instrukcje na zegar) w porównaniu do Zen 2. W przypadku procesorów do komputerów stacjonarnych AMD twierdzi, że średnio o 19 procent, a w recenzjach aplikacji wykazano około 12% wzrost przy tej samej prędkości zegara.
Oprócz sześciu rdzeni CPU, APU integruje również zintegrowany procesor graficzny Radeon RX Vega 7 z 7 jednostkami CU działającymi z częstotliwością do 1800 MHz. Dwukanałowy kontroler pamięci obsługuje pamięci RAM DDR4-3200 i energooszczędne LPDDR4-4266. Co więcej, na chipie można znaleźć 16 MB pamięci podręcznej L3.
Dzięki przyzwoitemu rozwiązaniu chłodzącemu i długoterminowemu limitowi mocy procesora wynoszącemu 45 W, Lenovo Lenovo Legion 5 17 jest jednym z najszybszych laptopów z procesorem 5600H, jakie znamy. Może być o około 30% szybszy w obciążeniach związanych z procesorem niż najwolniejszy system z tym samym układem w naszej bazie danych, według stanu na sierpień 2023 r.
Ten układ z serii Ryzen 5 ma domyślny współczynnik TDP (znany również jako długoterminowy limit mocy) wynoszący 45 W, wartość, którą producenci laptopów mogą zmienić na dowolną wartość od 35 W do 54 W, przy czym prędkość zegara i wydajność odpowiednio się zmieniają. Wysokowydajne rozwiązanie chłodzące jest koniecznością w przypadku takiego procesora.
Sześciordzeniowy APU został zbudowany w procesie technologicznym 7 nm TSMC, co zapewnia przyzwoitą, jak na koniec 2022 roku, efektywność energetyczną.
Nazwa robocza Cezanne-H (Zen 3) Seria AMD Cezanne (Zen 3, Ryzen 5000) Rodzina: Cezanne (Zen 3, Ryzen 5000) Cezanne-H (Zen 3) Taktowanie 3300 - 4200 MHz Pamięć 1. poziomu 384 KB Pamięć 2. poziomu 3 MB Pamięć 3. poziomu 16 MB Liczba rdzeni / wątków 6 / 12 TDP (Thermal Design Power) 45 W Technologia wytwarzania 7 nm Gniazdo FP6 Cechy DDR4-3200/LPDDR4-4266 RAM, PCIe 3, MMX, SSE, SSE2, SSE3, SSSE3, SSE4A, SSE4.1, SSE4.2, AVX, AVX2, BMI2, ABM, FMA, ADX, SMEP, SMAP, SMT, CPB, AES-NI, RDRAND, RDSEED, SHA, SME GPU AMD Radeon RX Vega 7 ( - 1800 MHz)64-bity obsługa 64-bitów Architecture x86 Data premiery 07/01/2021 Odnośnik do produktu (zewn.) www.amd.com
Performance Rating - CB R15 + R20 + 7-Zip + X265 + Blender + 3DM11 CPU
...
Intel Core i5-11500B
...
AMD Ryzen 9 9955HX
max:
Cinebench 2024 - Cinebench 2024 CPU Single Core
...
AMD Ryzen 7 4700U
Intel Core i5-10300H
AMD Ryzen 5 4600H
...
Apple M5 Pro 18-Core
Cinebench 2024 - Cinebench 2024 CPU Multi Core
...
Apple M1
Intel Core i5-11500B
...
Apple M5 Pro 18-Core
max:
Cinebench R23 - Cinebench R23 Multi Core
min: 7945 przeciętny: 9466 mediana: 9564 (9%) maks: 10416 Points
...
Intel Core i9-10885H
Intel Core i7-10870H
...
AMD Ryzen 9 9955HX3D
max:
Cinebench R23 - Cinebench R23 Single Core
min: 1316 przeciętny: 1363 mediana: 1367 (56%) maks: 1381 Points
...
Intel Core i3-1115G4
Intel Xeon W-10885M
Intel Core i5-1230U
Intel Core i5-1135G7
Intel Core i5-1145G7
...
Apple M5 10-Core
Cinebench R20 - Cinebench R20 CPU (Single Core)
min: 527 przeciętny: 533 mediana: 533 (58%) maks: 538 Points
...
Intel Core i3-1115G4
Intel Core i5-1135G7
Intel Core i7-1160G7
Intel Core i5-1145G7
Intel Core i7-1165G7
...
max:
Intel Core Ultra 7 270K Plus
Cinebench R20 - Cinebench R20 CPU (Multi Core)
min: 3074 przeciętny: 3678 mediana: 3688.5 (9%) maks: 4059 Points
...
Intel Core i7-10870H
Intel Xeon W-10885M
...
AMD Ryzen 9 9955HX3D
max:
Cinebench R15 - Cinebench R15 CPU Multi 64 Bit
min: 1319 przeciętny: 1562 mediana: 1563 (10%) maks: 1723 Points
...
Intel Xeon W-10885M
Intel Core i7-10875H
...
AMD Ryzen 9 9955HX3D
max:
0 35 70 105 140 175 210 245 280 315 350 385 420 455 490 525 560 595 630 665 700 735 770 805 840 875 910 945 980 1015 1050 1085 1120 1155 1190 1225 1260 1295 1330 1365 1400 1435 1470 1505 1540 1575 1610 1645 1680 Tooltip Beelink SER Pro Ryzen 5 5600H: Ø1310 (1286.46-1319.48)
Asus VivoBook 15 Pro M3500QC-L1062 Performance Mode: Ø1224 (1166.35-1434.93)
Asus VivoBook 15 Pro M3500QC-L1062 Performance Mode: Ø1463 (1457.89-1472.1)
Asus VivoBook 15 Pro M3500QC-L1062 Performance Mode: Ø1495 (1487.93-1521.72)
Asus Vivobook Pro 14 M3401QC-KM007T: Ø1460 (1451.69-1497.57)
MSI Bravo 15 B5DD-010US: Ø1506 (1493.93-1515.9)
HP Victus 15-fb0354ng: Ø1529 (1513.55-1537.28)
Asus VivoBook 15 X M1503QA: Ø1520 (1499.87-1552.92)
Acer Nitro 5 AN515-45-R05E: Ø1515 (1493.48-1573.63)
Minisforum Venus Series UM560 XT: Ø1586 (1574.56-1611.34)
Honor MagicBook 16 2022: Ø1601 (1588.94-1610.89)
HP Victus 16-e0145ng: Ø1610 (1599.49-1621.21)
XMG Prototyp: Ø1605 (1595.79-1622.39)
Gigabyte A5 K1: Ø1670 (1660.65-1681.66)
Lenovo Legion 5 17ACH6H-82JY0003GE: Ø1697 (1651.6-1708.01)
Lenovo Legion 5 15ACH6A-82NW0010GE: Ø1622 (1447.86-1653.64)
Cinebench R15 - Cinebench R15 CPU Single 64 Bit
min: 218 przeciętny: 222.2 mediana: 223 (62%) maks: 225 Points
...
Intel Core Ultra 5 115U
Intel Core i5-11500B
Apple M2
Intel Core i5-1240U
...
max:
Intel Core Ultra 9 285K
Cinebench R11.5 - Cinebench R11.5 CPU Multi 64 Bit
min: 17.51 przeciętny: 18.7 mediana: 18.7 (23%) maks: 19.71 Points
...
AMD Ryzen 7 4800U
AMD Ryzen 9 4900HS
Intel Xeon W-10885M
Intel Core i7-10875H
...
AMD Ryzen 9 9955HX3D
max:
Intel Core Ultra 7 270K Plus
Cinebench R11.5 - Cinebench R11.5 CPU Single 64 Bit
min: 2.62 przeciętny: 2.6 mediana: 2.6 (62%) maks: 2.63 Points
...
Intel Core i7-1185G7
Intel Core i5-11500B
...
max:
Intel Core Ultra 9 285K
Cinebench R10 - Cinebench R10 Rend. Single (32bit)
min: 5719 przeciętny: 5804 mediana: 5817 (35%) maks: 5847 pkt.
AMD Geode LX 800
...
Intel Core i3-1000NG4
AMD Ryzen 9 4900HS
...
max:
Cinebench R10 - Cinebench R10 Rend. Multi (32bit)
min: 32456 przeciętny: 34272 mediana: 34229 (25%) maks: 35806 pkt.
...
AMD Ryzen 7 4800U
Intel Core i7-10850H
...
max:
Cinebench R10 - Cinebench R10 Rend. Multi (64bit)
min: 57574 przeciętny: 60347 mediana: 59479 (37%) maks: 63144 Points
...
Intel Core i7-1265U
Intel Core i5-1245U
AMD Ryzen 7 4800H
AMD Ryzen 9 4900H
...
max:
Intel Core Ultra 7 270K Plus
Cinebench R10 - Cinebench R10 Rend. Single (64bit)
min: 11082 przeciętny: 11111 mediana: 11095 (14%) maks: 11201 Points
...
AMD Ryzen 7 4700U
AMD Ryzen 7 4800H
AMD Ryzen 9 4900H
Intel Core i5-1135G7
Intel Core i5-1145G7
Intel Core i7-1185G7
Intel Core i7-1165G7
...
max:
Intel Core Ultra 7 270K Plus
wPrime 2.10 - wPrime 2.0 1024m *
min: 129.204 przeciętny: 201.1 mediana: 201.1 (2%) maks: 273 s
...
Intel Core i5-10300H
Intel Core i7-1265U
...
wPrime 2.10 - wPrime 2.0 32m *
min: 4.552 przeciętny: 6.6 mediana: 6.6 (1%) maks: 8.6 s
...
Intel Core i5-1135G7
Intel Core i7-10610U
...
Transmeta Crusoe TM-5800
wPrime 1.55 - wPrime 1.55 1024m *
...
AMD Ryzen 5 PRO 4650U
AMD Ryzen 7 PRO 4750U
Intel Core i7-1165G7
...
wPrime 1.55 - wPrime 1.55 32m *
...
AMD Ryzen 5 PRO 4650U
AMD Ryzen 7 PRO 4750U
Intel Core i7-1165G7
...
WinRAR - WinRAR 4.0
...
Intel Core i7-10875H
...
max:
7-Zip 18.03 - 7-Zip 18.03 Multi Thread 4 runs
min: 36315 przeciętny: 43438 mediana: 44558 (26%) maks: 46562 MIPS
...
Intel Core i7-10875H
Intel Xeon W-10885M
Intel Core i7-10870H
...
AMD Ryzen 9 9955HX3D
max:
7-Zip 18.03 - 7-Zip 18.03 Single Thread 4 runs
min: 5213 przeciętny: 5350 mediana: 5358.5 (61%) maks: 5446 MIPS
...
Intel Core i7-10875H
Intel Core i9-10980HK
...
max:
AMD Ryzen 7 9850X3D
X264 HD Benchmark 4.0 - x264 Pass 2
...
Intel Core i9-10980HK
AMD Ryzen 7 4800HS
Intel Xeon W-10885M
...
X264 HD Benchmark 4.0 - x264 Pass 1
...
Intel Core i9-10980HK
Intel Core i7-10875H
...
HWBOT x265 Benchmark v2.2 - HWBOT x265 4k Preset
min: 9.92 przeciętny: 12 mediana: 12.2 (21%) maks: 13.3 fps
...
Intel Core i9-10885H
Intel Core i7-10875H
Intel Xeon W-10885M
AMD Ryzen 7 4800HS
AMD Ryzen 9 4900HS
Intel Core i7-10870H
...
AMD Ryzen 9 9955HX3D
max:
0 5 10 15 20 Tooltip Asus VivoBook 15 X M1503QA: Ø9.93 (0.7-12.8)
Beelink SER Pro Ryzen 5 5600H: Ø10.9 (1.02-18)
HP Victus 15-fb0354ng: Ø11.2 (1-16.7)
Asus Vivobook Pro 14 M3401QC-KM007T: Ø11.3 (0.39-14.1)
Asus VivoBook 15 Pro M3500QC-L1062: Ø12 (1.03-19.1)
Acer Nitro 5 AN515-45-R05E: Ø12 (0.97-18.3)
MSI Bravo 15 B5DD-010US: Ø12.4 (1.29-20.3)
Minisforum Venus Series UM560 XT: Ø12.9 (1.13-21)
Honor MagicBook 16 2022: Ø12.9 (1.03-19.8)
HP Victus 16-e0145ng: Ø13.2 (1.17-21.4)
Lenovo Legion 5 15ACH6A-82NW0010GE: Ø13.2 (1.02-19.4)
XMG Prototyp: Ø13.3 (1.1-20.9)
Lenovo Legion 5 17ACH6H-82JY0003GE: Ø13.6 (1.33-21)
Gigabyte A5 K1: Ø13.7 (1.14-21.5)
TrueCrypt - TrueCrypt Serpent
min: 0.806 przeciętny: 0.8 mediana: 0.8 (24%) maks: 0.857 GB/s
...
Intel Core i7-10750H
Intel Core i7-10850H
AMD Ryzen 5 PRO 4650U
AMD Ryzen 5 4600H
Intel Core i5-11500B
AMD Ryzen 7 PRO 4750U
Intel Core i5-1245U
...
AMD Ryzen 9 9955HX3D
max:
TrueCrypt - TrueCrypt Twofish
min: 1.1 przeciętny: 1.2 mediana: 1.2 (21%) maks: 1.3 GB/s
...
AMD Ryzen 5 PRO 4650U
AMD Ryzen 7 PRO 4750U
...
max:
TrueCrypt - TrueCrypt AES
min: 5.3 przeciętny: 7.4 mediana: 7.4 (19%) maks: 9.4 GB/s
...
AMD Ryzen 7 PRO 4750U
AMD Ryzen 9 4900H
...
max:
Blender - Blender 3.3 Classroom CPU *
min: 556 przeciętny: 598 mediana: 584 (7%) maks: 666 Seconds
AMD Ryzen 9 9955HX3D
...
Apple M2
AMD Ryzen 5 4600H
...
Intel Celeron J4125
Blender - Blender 2.79 BMW27 CPU *
min: 299.7 przeciętny: 325.8 mediana: 324 (2%) maks: 384 Seconds
Intel Core i5-1038NG7
...
Intel Core i9-10885H
Intel Xeon W-10885M
Intel Core i7-10875H
...
R Benchmark 2.5 - R Benchmark 2.5 *
min: 0.526 przeciętny: 0.5 mediana: 0.5 (12%) maks: 0.596 sec
AMD Ryzen 9 9955HX3D
...
Intel Core i5-1240U
...
3DMark 06 - CPU - 3DMark 06 - CPU
min: 11446 przeciętny: 12027 mediana: 11952 (20%) maks: 12757 Points
...
Intel Core i9-10885H
Intel Core i5-1245U
AMD Ryzen 9 4900HS
...
max:
Super Pi mod 1.5 XS 1M - Super Pi mod 1.5 XS 1M *
min: 7.2 przeciętny: 7.9 mediana: 7.9 (2%) maks: 8.672 s
...
Intel Core i7-10610U
Intel Core i9-10980HK
AMD Ryzen 9 9955HX
Intel Core i7-10810U
Intel Core i7-1265U
...
Super Pi mod 1.5 XS 2M - Super Pi mod 1.5 XS 2M *
min: 15.7 przeciętny: 17.2 mediana: 17.2 (1%) maks: 18.772 s
...
AMD Ryzen 9 9955HX
Intel Xeon W-10885M
Intel Core i9-10980HK
Intel Core i7-1160G7
Intel Core i7-10810U
...
Super Pi Mod 1.5 XS 32M - Super Pi mod 1.5 XS 32M *
min: 366 przeciętny: 406.6 mediana: 406.6 (2%) maks: 447.224 s
...
Intel Core i5-1145G7
Intel Core i7-1165G7
Intel Core i5-1135G7
...
3DMark Vantage - 3DM Vant. Perf. CPU no Physx
min: 52691 przeciętny: 54378 mediana: 55183 (41%) maks: 55261 Points
...
Intel Core i5-11500B
AMD Ryzen 7 4800U
Intel Core i7-10875H
Intel Core i9-10980HK
AMD Ryzen 9 4900HS
AMD Ryzen 7 4800H
...
max:
Intel Core Ultra 7 270K Plus
3DMark 11 - 3DM11 Performance Physics
min: 8662 przeciętny: 13031 mediana: 13537 (33%) maks: 15562 Points
...
Intel Core i5-1240U
Intel Core i7-10750H
...
AMD Ryzen 9 9955HX3D
max:
AMD Ryzen 9 9950X3D
3DMark - 3DMark Ice Storm Physics
min: 78452 przeciętny: 81114 mediana: 80711.5 (66%) maks: 84582 Points
...
AMD Ryzen 9 9955HX
...
max:
3DMark - 3DMark Ice Storm Extreme Physics
min: 80031 przeciętny: 81646 mediana: 80543 (65%) maks: 84364 Points
AMD A6-9220e
...
AMD Ryzen 9 9955HX
...
max:
3DMark - 3DMark Ice Storm Unlimited Physics
min: 83587 przeciętny: 84905 mediana: 85177 (68%) maks: 85952 Points
AMD A6-9220e
...
...
max:
Intel Core Ultra 5 250K Plus
3DMark - 3DMark Cloud Gate Physics
min: 9129 przeciętny: 12370 mediana: 12951 (33%) maks: 13650 Points
...
Intel Core i5-1245U
AMD Ryzen 7 PRO 4750U
Intel Core i5-11500B
...
max:
Intel Core Ultra 7 270K Plus
3DMark - 3DMark Fire Strike Standard Physics
min: 1131 przeciętny: 18287 mediana: 20724.5 (37%) maks: 21597 Points
AMD A6-9220e
...
AMD Ryzen 5 4600H
AMD Ryzen 7 4800U
Intel Core i5-1245U
...
max:
Intel Core Ultra 7 270K Plus
3DMark - 3DMark Time Spy CPU
min: 3754 przeciętny: 6442 mediana: 6796 (29%) maks: 7512 Points
...
Intel Core i5-1240U
Intel Core i5-10500H
AMD Ryzen 7 4800U
AMD Ryzen 9 4900H
Intel Core i7-10750H
...
max:
Intel Core Ultra 7 270K Plus
Geekbench 6.7 - Geekbench 6.7.1 Single-Core
min: 1610 przeciętny: 1729 mediana: 1728.5 (40%) maks: 1847 pkt.
...
Intel Core i7-1065G7
Intel Core i9-10980HK
AMD Ryzen 9 4900H
Intel Core i7-10870H
Intel Xeon W-10855M
Intel Core i9-10885H
Intel Core i5-1140G7
Intel Xeon W-10885M
Intel Core i7-10850H
Intel Core i7-10875H
...
Apple M5 Pro 15-Core
Geekbench 6.7 - Geekbench 6.7.1 Multi-Core
min: 5801 przeciętny: 6856 mediana: 6855.5 (23%) maks: 7910 pkt.
...
Intel Core i7-1185G7
AMD Ryzen 5 4600H
Intel Core i7-10750H
Intel Core i7-10850H
Intel Core i9-10885H
Intel Core i5-1230U
...
Apple M5 Max
Geekbench 6.0 - Geekbench 6.0 Single-Core
...
Intel Core i5-10300H
Intel Core i7-1265U
Intel Core Ultra 5 115U
...
AMD Ryzen 9 9955HX
max:
Intel Core Ultra 7 270K Plus
Geekbench 6.0 - Geekbench 6.0 Multi-Core
...
AMD Ryzen 5 4600H
Intel Core Ultra 5 115U
Intel Core i5-11500B
Intel Core i7-1265U
...
AMD Ryzen 9 9955HX3D
max:
Geekbench 5.5 - Geekbench 5.1 - 5.5 64 Bit Single-Core
min: 1365 przeciętny: 1412 mediana: 1422.5 (48%) maks: 1445 pkt.
...
AMD Ryzen 5 7235HS
Intel Core i5-1135G7
Intel Core i5-1145G7
Intel Core i7-1160G7
...
Apple M5 10-Core
Geekbench 5.5 - Geekbench 5.1 - 5.5 64 Bit Multi-Core
min: 4990 przeciętny: 6521 mediana: 6536 (12%) maks: 7253 pkt.
...
Intel Xeon W-10855M
AMD Ryzen 7 4800U
AMD Ryzen 5 4600HS
...
max:
Geekbench 5.0 - Geekbench 5.0 64 Bit Single-Core
min: 1341 przeciętny: 1368 mediana: 1369 (6%) maks: 1393 pkt.
...
Intel Core i5-1130G7
Intel Core i9-10980HK
Intel Core i3-1115G4
Intel Xeon W-10885M
Intel Core i5-1140G7
Intel Core i5-1135G7
Intel Core i5-1145G7
...
AMD Ryzen 9 9955HX3D
max:
AMD Ryzen 7 9850X3D
Geekbench 5.0 - Geekbench 5.0 64 Bit Multi-Core
min: 4955 przeciętny: 6222 mediana: 6483 (20%) maks: 7128 pkt.
...
Intel Core Ultra 5 115U
Intel Core i5-10500H
Intel Core i7-10750H
AMD Ryzen 7 PRO 4750U
...
AMD Ryzen 9 9955HX3D
max:
AMD Ryzen Threadripper PRO 3995WX
Geekbench 4.4 - Geekbench 4.1 - 4.4 64 Bit Single-Core
min: 5812 przeciętny: 5914 mediana: 5813 (53%) maks: 6117 pkt.
...
Intel Core i7-10875H
Intel Core i5-1135G7
Intel Xeon W-10885M
Intel Core i9-10980HK
Intel Core i5-1140G7
...
AMD Ryzen 9 9955HX3D
max:
Samsung Exynos 2600
Geekbench 4.4 - Geekbench 4.1 - 4.4 64 Bit Multi-Core
min: 27071 przeciętny: 27953 mediana: 27790 (26%) maks: 28997 pkt.
...
AMD Ryzen 5 4600H
AMD Ryzen 7 PRO 4750U
Intel Core i5-10500H
AMD Ryzen 7 4800H
AMD Ryzen 7 4800U
AMD Ryzen 9 4900H
Intel Core i5-11500B
Intel Core i9-10885H
...
AMD Ryzen 9 9955HX3D
max:
Intel Core Ultra 7 270K Plus
Mozilla Kraken 1.1 - Kraken 1.1 Total Score *
min: 640 przeciętny: 654 mediana: 652 (1%) maks: 674 ms
Apple M5 Pro 18-Core
...
Intel Core i7-1185G7
Intel Core i5-11500B
Intel Core i7-1165G7
Intel Core i5-1240U
Intel Core i7-1180G7
...
max:
Apple S7
Octane V2 - Octane V2 Total Score
min: 64416 przeciętny: 66303 mediana: 67221 (44%) maks: 67271 Points
unknown
...
Apple M1
Intel Core i7-1165G7
Apple M1 Pro
...
Apple M5 Pro 18-Core
WebXPRT 4 - WebXPRT 4 Score
min: 196.4 przeciętny: 200.7 mediana: 200.2 (50%) maks: 206 Points
...
Intel Core i7-1165G7
Intel Core i5-1230U
...
Apple M5 Pro 18-Core
WebXPRT 3 - WebXPRT 3 Score
min: 245 przeciętny: 263 mediana: 267 (45%) maks: 273 Points
...
Intel Core i5-1240U
Apple M1
Intel Core i7-1265U
...
Apple M5 Pro 18-Core
CrossMark - CrossMark Overall
min: 1157 przeciętny: 1292 mediana: 1311 (46%) maks: 1353 Points
...
Intel Core i5-1230U
Intel Core i5-1130G7
Intel Core i5-1145G7
Apple M1
Intel Core i7-1165G7
...
Apple M5 Max
Power Consumption - Prime95 Power Consumption - external Monitor *
min: 48.8 przeciętny: 72 mediana: 69.1 (12%) maks: 104.2 Watt
...
Intel Core i5-10400H
AMD Ryzen 9 4900H
Intel Core i5-11500B
...
AMD Ryzen 9 9955HX3D
max:
AMD Ryzen Threadripper PRO 3975WX
0 5 10 15 20 25 30 35 40 45 50 55 60 65 70 75 80 85 90 95 100 105 110 115 Tooltip Asus VivoBook 15 X M1503QA: Ø48.8 (48.2-53.5)
Beelink SER Pro Ryzen 5 5600H: Ø53.3 (52.3-54)
Asus VivoBook 15 Pro M3500QC-L1062: Ø62.4 (59.8-74.5)
Minisforum Venus Series UM560 XT: Ø64.9 (63.1-73.4)
Honor MagicBook 16 2022: Ø66.1 (65.7-66.4)
Asus Vivobook Pro 14 M3401QC-KM007T: Ø66.9 (59.4-76.3)
MSI Bravo 15 B5DD-010US: Ø71.3 (69.1-82.2)
HP Victus 16-e0145ng: Ø72.3 (62.1-89.4)
Acer Nitro 5 AN515-45-R05E: Ø74.3 (72-79.9)
Lenovo Legion 5 17ACH6H-82JY0003GE: Ø81.8 (80.3-94.3)
Lenovo Legion 5 15ACH6A-82NW0010GE: Ø97.5 (95.3-120)
Gigabyte A5 K1: Ø104.2 (100-108)
Power Consumption - Cinebench R15 Multi Power Consumption - external Monitor *
min: 48.2 przeciętny: 75.4 mediana: 71.7 (13%) maks: 106.2 Watt
...
Intel Core i5-10400H
...
AMD Ryzen 9 9955HX3D
max:
0 5 10 15 20 25 30 35 40 45 50 55 60 65 70 75 80 85 90 95 100 105 110 115 120 125 Tooltip Beelink SER Pro Ryzen 5 5600H: Ø48.2 (47.8-48.5)
Asus VivoBook 15 Pro M3500QC-L1062: Ø61.2 (53.3-73)
Minisforum Venus Series UM560 XT: Ø65.1 (61.9-70.2)
Honor MagicBook 16 2022: Ø66.1 (65.9-66.2)
Asus VivoBook 15 X M1503QA: Ø68.7 (61-70.2)
Acer Nitro 5 AN515-45-R05E: Ø71.6 (70.1-77)
Asus Vivobook Pro 14 M3401QC-KM007T: Ø71.7 (40.9-80.7)
MSI Bravo 15 B5DD-010US: Ø73.4 (67.5-85.1)
Lenovo Legion 5 17ACH6H-82JY0003GE: Ø86.1 (58.2-91.4)
HP Victus 16-e0145ng: Ø90.8 (85.8-102)
Lenovo Legion 5 15ACH6A-82NW0010GE: Ø96.6 (64.6-101)
Gigabyte A5 K1: Ø106.2 (92.7-126.3)
Power Consumption - Idle Power Consumption - external Monitor *
min: 5.05 przeciętny: 6.2 mediana: 6.2 (4%) maks: 7.26 Watt
CPU TDP 40 W TDP 41 W 100% 102%
...
Intel Core i5-8260U
Apple M1 Pro
...
max:
0 1 2 3 4 5 6 7 8 9 10 Tooltip Asus VivoBook 15 X M1503QA: Ø5.04 (3.76-9.93)
Minisforum Venus Series UM560 XT: Ø7.26 (6.46-10.2)
Power Consumption - Idle Power Consumption 150cd 1min *
min: 5.72 przeciętny: 10.7 mediana: 11.8 (9%) maks: 17.4 Watt
0 5 10 15 20 25 30 35 40 45 50 55 60 65 70 75 Tooltip Asus VivoBook 15 X M1503QA: Ø5.72 (4.08-10.7)
Asus Vivobook Pro 14 M3401QC-KM007T: Ø6.42 (2.03-14.8)
Lenovo Legion 5 15ACH6A-82NW0010GE: Ø11.8 (10.2-77.5)
Gigabyte A5 K1: Ø11.9 (11.3-16.5)
Lenovo Legion 5 17ACH6H-82JY0003GE: Ø17.4 (5.56-31.8)
Power Consumption - Power Efficiency - Cinebench R15 Multi external Monitor
min: 15.8 przeciętny: 21.3 mediana: 20.9 (16%) maks: 27.4 Points per Watt
...
Intel Core i7-1165G7
AMD Ryzen 5 4600H
Intel Celeron J4115
...
Intel Core i5-10200H
- Zakres wyników testów referencyjnych dla tej karty graficznej
- Średnia wartość wyników testów referencyjnych dla tej karty graficzne
* Mniejsze liczby oznaczają wyższą wydajność
log 18. 08:10:54
#0 ran 0s before starting gpusingle class +0s ... 0s
#1 no ids found in url (should be separated by "_") +0s ... 0s
#2 not redirecting to Ajax server +0s ... 0s
#3 did not recreate cache, as it is less than 5 days old! Created at Tue, 16 Jun 2026 19:29:24 +0200 +0.003s ... 0.003s
#4 no comparison url found in template nbc.compare_page_2 needed +0.023s ... 0.026s
#5 no comparison url found in template nbc.compare_page_2 needed +0s ... 0.026s
#6 composed specs +0s ... 0.026s
#7 did output specs +0s ... 0.026s
#8 getting avg benchmarks for device 13003 +0.054s ... 0.081s
#9 got single benchmarks 13003 +0.072s ... 0.153s
#10 got avg benchmarks for devices +0s ... 0.153s
#11 min, max, avg, median took s +3.536s ... 3.689s
#12 no comparison url found in template nbc.compare_page_2 needed +0.653s ... 4.341s
#13 return log +0s ... 4.341s