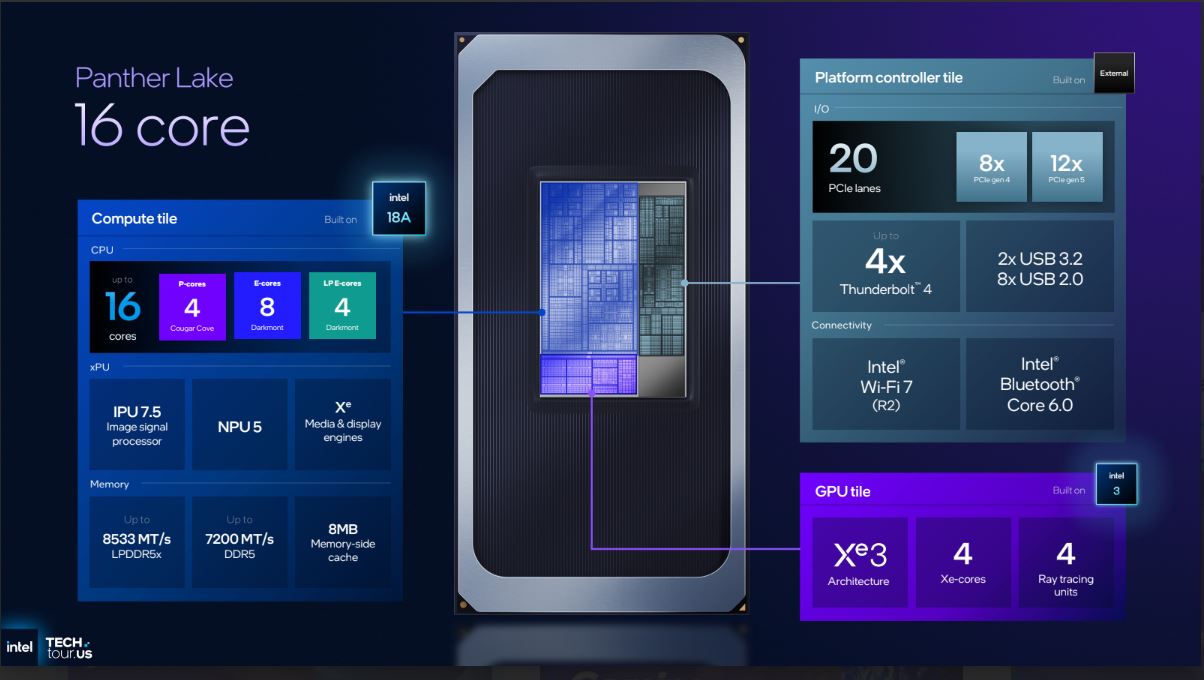
Testy dla Intel Core Ultra 9 386H procesor
Recenzja MSI Stealth 16 AI B3WH: po części gamingowy, po części dla twórców, w pełni profesjonalny
W przeciwieństwie do najnowszych modeli Razer Blade 16 czy Lenovo Yoga Pro 9 16, MSI Stealth 16 z 2026 roku ma wymienną pamięć RAM o pojemności do 128 GB, dzięki czemu jest prawdziwą bestią do wielozadaniowej pracy — od grania i montażu wideo po zadania związane ze sztuczną inteligencją i nie tylko.
Intel Core Ultra 9 386H, NVIDIA GeForce RTX 5070 Ti Laptop, 16", 2 kgJeden z najlepszych smukłych laptopów do gier stał się jeszcze lepszy – recenzja Asus ROG Zephyrus G16 2026
Model Asus ROG Zephyrus G16 z 2026 roku został wreszcie wyposażony w jaśniejszy wyświetlacz OLED o częstotliwości odświeżania 240 Hz, a także w nowy procesor Panther Lake firmy Intel. W rezultacie powstał jeden z najlepszych smukłych laptopów do gier dostępnych na rynku, mimo że jego cena jest wyższa niż kiedykolwiek.
Intel Core Ultra 9 386H, NVIDIA GeForce RTX 5080 Laptop, 16", 1.9 kgRecenzja laptopa Asus ZenBook S14 2026 – jaśniejszy wyświetlacz OLED, ale powolny zintegrowany procesor graficzny Panther Lake
Firma Asus zmodernizowała swój wysokiej klasy model Zenbook S14, wyposażając go w nowy procesor Panther Lake firmy Intel, nieco większą baterię oraz jaśniejszy ekran OLED. Chociaż wydajność procesora wzrosła, wydajność karty graficznej jest niższa niż poprzednio.
Intel Core Ultra 9 386H, Intel Graphics 4 Xe3 PTL, 14", 1.2 kgJeden z najlepszych laptopów multimedialnych zyskał jaśniejszy wyświetlacz OLED – recenzja Asus ROG Zephyrus G14 2026
Firma Asus zdecydowała się na zastosowanie procesorów Intel w nowym modelu ROG Zephyrus G14, a dzięki karcie graficznej RTX 5070 Ti z serii „ GeForce ” urządzenie to nadal pozostaje jednym z najpotężniejszych 14-calowych laptopów dostępnych na rynku. Otrzymują Państwo również zmodernizowany ekran OLED o częstotliwości odświeżania 120 Hz, który obecnie osiąga poziom jasności przekraczający 1 000 nitów.
Intel Core Ultra 9 386H, NVIDIA GeForce RTX 5070 Ti Laptop, 14", 1.6 kgRecenzja laptopa MSI Prestige 13 AI+: Idealny towarzysz w podróży?
Wraz z modelem Prestige 13 AI+, MSI kieruje swoją ofertę do użytkowników mobilnych, którzy często przemieszczają się i cenią sobie kompaktowe, lekkie laptopy. Wyposażone w zupełnie nowy procesor Panther Lake, 13-calowe urządzenie zostało zaprojektowane z myślą o pozyskaniu klientów poszukujących maksymalnej przenośności.
Intel Core Ultra 9 386H, Intel Graphics 4 Xe3 PTL, 13.3", 888 gLenovo Yoga Pro 7 15IPH11: NVIDIA GeForce RTX 5060 Laptop, 15.30", 1.7 kg
Recenzja » Doskonały 15-calowy laptop multimedialny z ekranem OLED o jasności 1100 nitów - recenzja Lenovo Yoga Pro 7i Aura Edition
MSI Cubi NUC AI+ 3MG: Intel Graphics 4 Xe3 Panther Lake iGPU, 0.6 kg
Recenzja » Recenzja MSI Cubi NUC AI+ 3MG: Mini PC z nawet 128 GB pamięci RAM
Razer Blade 16 Core Ultra 9 386H: NVIDIA GeForce RTX 5090 Laptop, 16.00", 2.1 kg
Recenzja » Recenzja Razer Blade 16: Intel Core Ultra zapewnia szybszą liczbę klatek na sekundę
Asus ROG Zephyrus Duo GX651: NVIDIA GeForce RTX 5090 Laptop, 16.00", 2.8 kg
Recenzja » Dwuekranowy gamingowy kabriolet z RTX 5090 - recenzja Asus ROG Zephyrus Duo GX651
Lenovo Pro 9 16IPH11: NVIDIA GeForce RTX 5060 Laptop, 16.00", 1.9 kg
Recenzja » Recenzja Lenovo Pro 9i 16 G11 Aura Edition: Bezpośredni odpowiednik Dell XPS 16
HP HyperX Omen 15-ga0000nr: NVIDIA GeForce RTX 5070 Laptop, 15.30", 2.2 kg
Zewnętrzna recenzja » HP HyperX Omen 15-ga0000nr – Recenzje i specyfikacja
Dell Pro Precision 7 16: NVIDIA RTX PRO 3000 Blackwell Generation Laptop, 16.00", 2.2 kg
Zewnętrzna recenzja » Dell Pro Precision 7 16 – Recenzje i specyfikacja
LG gram Pro 17Z90UR: NVIDIA GeForce RTX 5050 Laptop, 17.00", 1.7 kg
Zewnętrzna recenzja » LG gram Pro 17Z90UR - Recenzje i Specyfikacja
Asus ROG Zephyrus G16 GU606AX: NVIDIA GeForce RTX 5090 Laptop, 16.00", 2 kg
Zewnętrzna recenzja » Asus ROG Zephyrus G16 GU606AX – Recenzje i specyfikacja
Asus ROG Zephyrus G16 GU606AR: NVIDIA GeForce RTX 5070 Ti Laptop, 16.00", 1.9 kg
Zewnętrzna recenzja » Asus ROG Zephyrus G16 GU606AR – recenzje i specyfikacja
Lenovo Pro 9 16IPH11, RTX 5070: NVIDIA GeForce RTX 5070 Laptop, 16.00", 1.9 kg
Zewnętrzna recenzja » Lenovo Pro 9 16IPH11, RTX 5070 - Recenzje i Specyfikacja
Acer Predator Helios Neo 16S AI PHN16S-I51: NVIDIA GeForce RTX 5060 Laptop, 16.00", 2.2 kg
Zewnętrzna recenzja » Acer Predator Helios Neo 16S AI PHN16S-I51 - Recenzje i Specyfikacja
Lenovo Yoga Pro 9i 16 Gen 11: NVIDIA GeForce RTX 5060 Laptop, 16.00", 1.9 kg
Zewnętrzna recenzja » Lenovo Yoga Pro 9 16i Gen 11 - Recenzje i Specyfikacja
MSI Stealth 16 AI+ B3WI: NVIDIA GeForce RTX 5080 Laptop, 16.00", 2 kg
Zewnętrzna recenzja » MSI Stealth 16 AI+ B3WI – recenzje i specyfikacja
MSI Stealth 16 AI+ B3WH: NVIDIA GeForce RTX 5070 Ti Laptop, 16.00", 2 kg
Zewnętrzna recenzja » MSI Stealth 16 AI+ B3WH - Recenzje i Specyfikacja
Acer Predator Helios 16S AI PHN16S-I51-94NV: NVIDIA GeForce RTX 5070 Laptop, 16.00", 2.2 kg
Zewnętrzna recenzja » Acer Predator Helios 16S AI PHN16S-I51-94NV - Recenzje i Specyfikacja
Asus ROG Zephyrus G16 GU606AW: NVIDIA GeForce RTX 5080 Laptop, 16.00", 1.9 kg
Zewnętrzna recenzja » Asus ROG Zephyrus G16 GU606AW – recenzje i specyfikacja
Asus ROG Zephyrus G14 GU405AW: NVIDIA GeForce RTX 5080 Laptop, 14.00", 1.6 kg
Zewnętrzna recenzja » Asus ROG Zephyrus G14 GU405AW
MSI Stealth 16 AI+ B3WF: NVIDIA GeForce RTX 5060 Laptop, 16.00", 2 kg
Zewnętrzna recenzja » MSI Stealth 16 AI+ B3WF
Lenovo Pro 9 16IPH11: NVIDIA GeForce RTX 5060 Laptop, 16.00", 1.9 kg
Zewnętrzna recenzja » Lenovo Pro 9 16IPH11
Lenovo Yoga Pro 7 15IPH11: NVIDIA GeForce RTX 5060 Laptop, 15.30", 1.7 kg
Zewnętrzna recenzja » Lenovo Yoga Pro 7 15IPH11
Razer Blade 16 Core Ultra 9 386H: NVIDIA GeForce RTX 5090 Laptop, 16.00", 2.1 kg
Zewnętrzna recenzja » Razer Blade 16 Core Ultra 9 386H
Asus ROG Zephyrus G14 GU405AR: NVIDIA GeForce RTX 5070 Ti Laptop, 14.00", 1.6 kg
Zewnętrzna recenzja » Asus ROG Zephyrus G14 GU405AR
MSI Prestige 14 Flip AI+ D3MTG: Intel Graphics 4 Xe3 Panther Lake iGPU, 14.00", 1.4 kg
Zewnętrzna recenzja » MSI Prestige 14 Flip AI+ D3MTG
Acer Aspire 14 AI A14-I71M: Intel Graphics 4 Xe3 Panther Lake iGPU, 14.00", 1.4 kg
Zewnętrzna recenzja » Acer Aspire 14 AI A14-I71M
MSI Prestige 13 AI+ A3MG: Intel Graphics 4 Xe3 Panther Lake iGPU, 13.30", 0.9 kg
Zewnętrzna recenzja » MSI Prestige 13 AI+ A3MG
MSI Prestige 16 Flip AI+ C3MTG (2026): Intel Graphics 4 Xe3 Panther Lake iGPU, 16.00", 1.7 kg
Zewnętrzna recenzja » MSI Prestige 16 Flip AI+ C3MTG (2026)
Asus ZenBook S14 UX5406AA: Intel Graphics 4 Xe3 Panther Lake iGPU, 14.00", 1.2 kg
Zewnętrzna recenzja » Asus ZenBook S14 UX5406AA
Asus ROG Zephyrus G14 GU405: NVIDIA GeForce RTX 5060 Laptop, 14.00", 1.5 kg
Zewnętrzna recenzja » Asus ROG Zephyrus G14 GU405
Asus ROG Zephyrus Duo GX651: NVIDIA GeForce RTX 5090 Laptop, 16.00", 2.8 kg
Zewnętrzna recenzja » Asus ROG Zephyrus Duo GX651
Asus ROG Zephyrus G16 GU606: NVIDIA GeForce RTX 5070 Laptop, 16.00"
Zewnętrzna recenzja » Asus ROG Zephyrus G16 GU606
MSI Stealth 16 AI B3WH: NVIDIA GeForce RTX 5070 Ti Laptop, 16.00", 2 kg
» MSI Stealth 16 z 2026 roku traci ważną funkcję obecną w starszej konstrukcji
Asus ROG Zephyrus G16 GU606AW: NVIDIA GeForce RTX 5080 Laptop, 16.00", 1.9 kg
» Werdykt z recenzji modelu Asus ROG Zephyrus G16 2026 – Większa moc, dłuższy czas pracy i wysoka cena
» Karta RTX 5080 w laptopie Asus ROG Zephyrus G16 może pobierać do 160 watów, ale tylko przez krótki czas
Asus ZenBook S14 UX5406AA: Intel Graphics 4 Xe3 Panther Lake iGPU, 14.00", 1.2 kg
» Nowy Asus Zenbook S14 2026 to świetny laptop, ale zasługuje on na procesory Core Ultra X z wbudowanym procesorem graficznym Arc B390.
» Smukły Asus Zenbook S14 ujawnia poważny problem procesorów Intel Panther Lake
Asus ROG Zephyrus G14 GU405AR: NVIDIA GeForce RTX 5070 Ti Laptop, 14.00", 1.6 kg
» Wniosek z recenzji laptopa Asus ROG Zephyrus G14 – wydajny i energooszczędny, wszechstronny model
» Model Asus ROG Zepyhrus G14 z 2026 roku to lepszy, wszechstronny komputer wyposażony w procesor Intel Panther Lake
» Model ROG Zephyrus G14 z 2026 roku stanowi ulepszenie, jednak model z 2025 roku, który jest o 600 dolarów tańszy, nadal pozostaje bardzo dobrym wyborem
» Asus ROG Zephyrus G14 2026 pozostaje najwydajniejszym 14-calowym laptopem do gier dzięki karcie graficznej RTX 5070 Ti
Lenovo Yoga Pro 7 15IPH11: NVIDIA GeForce RTX 5060 Laptop, 15.30", 1.7 kg
» Kiedy Apple MacBook Pro staje się nagle okazyjną alternatywą, laptopy takie jak Lenovo Yoga Pro 7i 15 mają problem
» Lenovo pobiera ponad 2600 USD za Yoga Pro 7i 15, czy to nowa rzeczywistość?
MSI Cubi NUC AI+ 3MG: Intel Graphics 4 Xe3 Panther Lake iGPU, 0.6 kg
» MSI Cubi AI+ 3MG jest o ponad 60 procent szybszy niż wcześniej, ale mógłby być jeszcze lepszy
» Miniaturowy komputer MSI Cubi NUC AI+ 3MG obsługuje ogromne 128 GB wymiennej pamięci RAM
» MSI Cubi NUC AI+ 3MG vs. Cubi NUC AI+ 2MG: Ulepszenia niemal wszędzie
Razer Blade 16 Core Ultra 9 386H: NVIDIA GeForce RTX 5090 Laptop, 16.00", 2.1 kg
» Najnowszy Razer Blade 16 jest dwa razy jaśniejszy niż wcześniej, dzięki znacznie ulepszonej obsłudze HDR
» Żywotność baterii Razer Blade 16 jest o kilka godzin dłuższa z procesorem Intel zamiast AMD
» 2026 Razer Blade 16 wymienia AMD na Intela z doskonałymi wynikami
» Razer Blade 16: Granie w trybie cichym o niskiej wydajności może być naprawdę opłacalne
Lenovo Yoga Pro 7 15IPH11: NVIDIA GeForce RTX 5060 Laptop, 15.30", 1.7 kg
» Lenovo Yoga Pro 7i 15 G11 to jeden z pierwszych laptopów multimedialnych z nową kartą graficzną RTX 5070 12 GB
Asus ROG Zephyrus Duo GX651: NVIDIA GeForce RTX 5090 Laptop, 16.00", 2.8 kg
» Weryfikacja recenzji Asus ROG Zephyrus Duo GX651 - wyjątkowy, ale tak drogi
» Asus ROG Zephyrus Duo 2026 vs 2023 - Poświęcenie wydajności dla lepszej wielozadaniowości
Lenovo Pro 9 16IPH11: NVIDIA GeForce RTX 5060 Laptop, 16.00", 1.9 kg
» Przy prawie 1600 nitach, wyświetlacz Lenovo Pro 9 16 Aura OLED jest jednym z najjaśniejszych, jakie można kupić za pieniądze
» Ziarniste strony produktowe Lenovo o niskiej rozdzielczości sprawiają, że elegancki Pro 9i 16 Aura wygląda okropnie
» Lenovo Pro 9 16 G11 Aura działa znacznie ciszej w trybie zrównoważonym przy niewielkim spadku wydajności grafiki
» Core Ultra 9 386H jest niewiele szybszy od Core Ultra 9 285H w pierwszych testach porównawczych







 - Średnia wartość wyników testów referencyjnych dla tej karty graficzne



 Add as a preferred source on Google


