Recenzja Medion Erazer Scout E20: Niedrogi laptop do gier FHD z RTX 4050
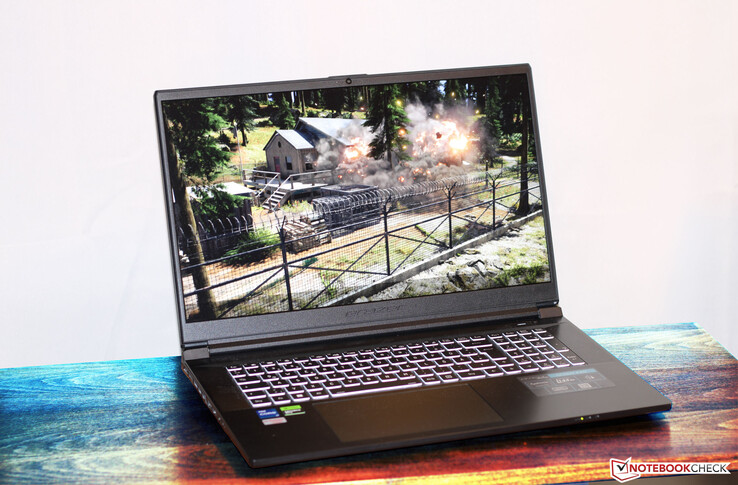
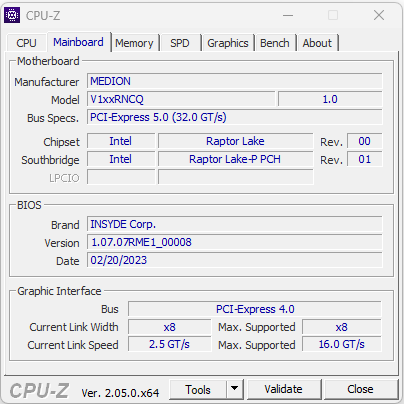
Chociaż Erazer Scout E20 jest przede wszystkim uważany za laptop do gier z segmentu podstawowego, może być również używany w innych obszarach wymagających wysokiej wydajności, takich jak renderowanie lub przetwarzanie wideo. Medion łączy procesor Raptor Lake z kartą graficzną GeForce RTX 4050laptop GPU, żądając za cały pakiet około 1500 euro (~1 658 USD). Komputer bazuje na platformie barebone od Clevo (V170RNCQ). Jego konkurentami są takie urządzenia jak Gigabyte G7 KEiMSI Katana 17 B13VFK, Asus TUF GamingAsus TUF Gaming A16 FA617lenovoLenovo Legion 5 15IAH7H 82RBorazAcer Nitro 5 AN515-46-R1A1.
Potencjalni konkurenci w porównaniu
Ocena | Data | Model | Waga | Wysokość | Rozmiar | Rezolucja | Cena |
|---|---|---|---|---|---|---|---|
| 83 % v7 (old) | 05/2023 | Medion Erazer Scout E20 i7-13700H, GeForce RTX 4050 Laptop GPU | 2.8 kg | 29 mm | 17.30" | 1920x1080 | |
| 83.3 % v7 (old) | 01/2023 | Gigabyte G7 KE i5-12500H, GeForce RTX 3060 Laptop GPU | 2.6 kg | 25 mm | 17.30" | 1920x1080 | |
| 82.1 % v7 (old) | 02/2023 | MSI Katana 17 B13VFK i7-13620H, GeForce RTX 4060 Laptop GPU | 2.8 kg | 25.2 mm | 17.30" | 1920x1080 | |
| 86.2 % v7 (old) | 02/2023 | Asus TUF Gaming A16 FA617 R7 7735HS, Radeon RX 7600S | 2.2 kg | 27 mm | 16.00" | 1920x1200 | |
| 87.5 % v7 (old) | 11/2022 | Lenovo Legion 5 15IAH7H 82RB i7-12700H, GeForce RTX 3060 Laptop GPU | 2.4 kg | 19.99 mm | 15.60" | 1920x1080 | |
| 83.9 % v7 (old) | 11/2022 | Acer Nitro 5 AN515-46-R1A1 R7 6800H, GeForce RTX 3070 Ti Laptop GPU | 2.5 kg | 26.8 mm | 15.60" | 1920x1080 |
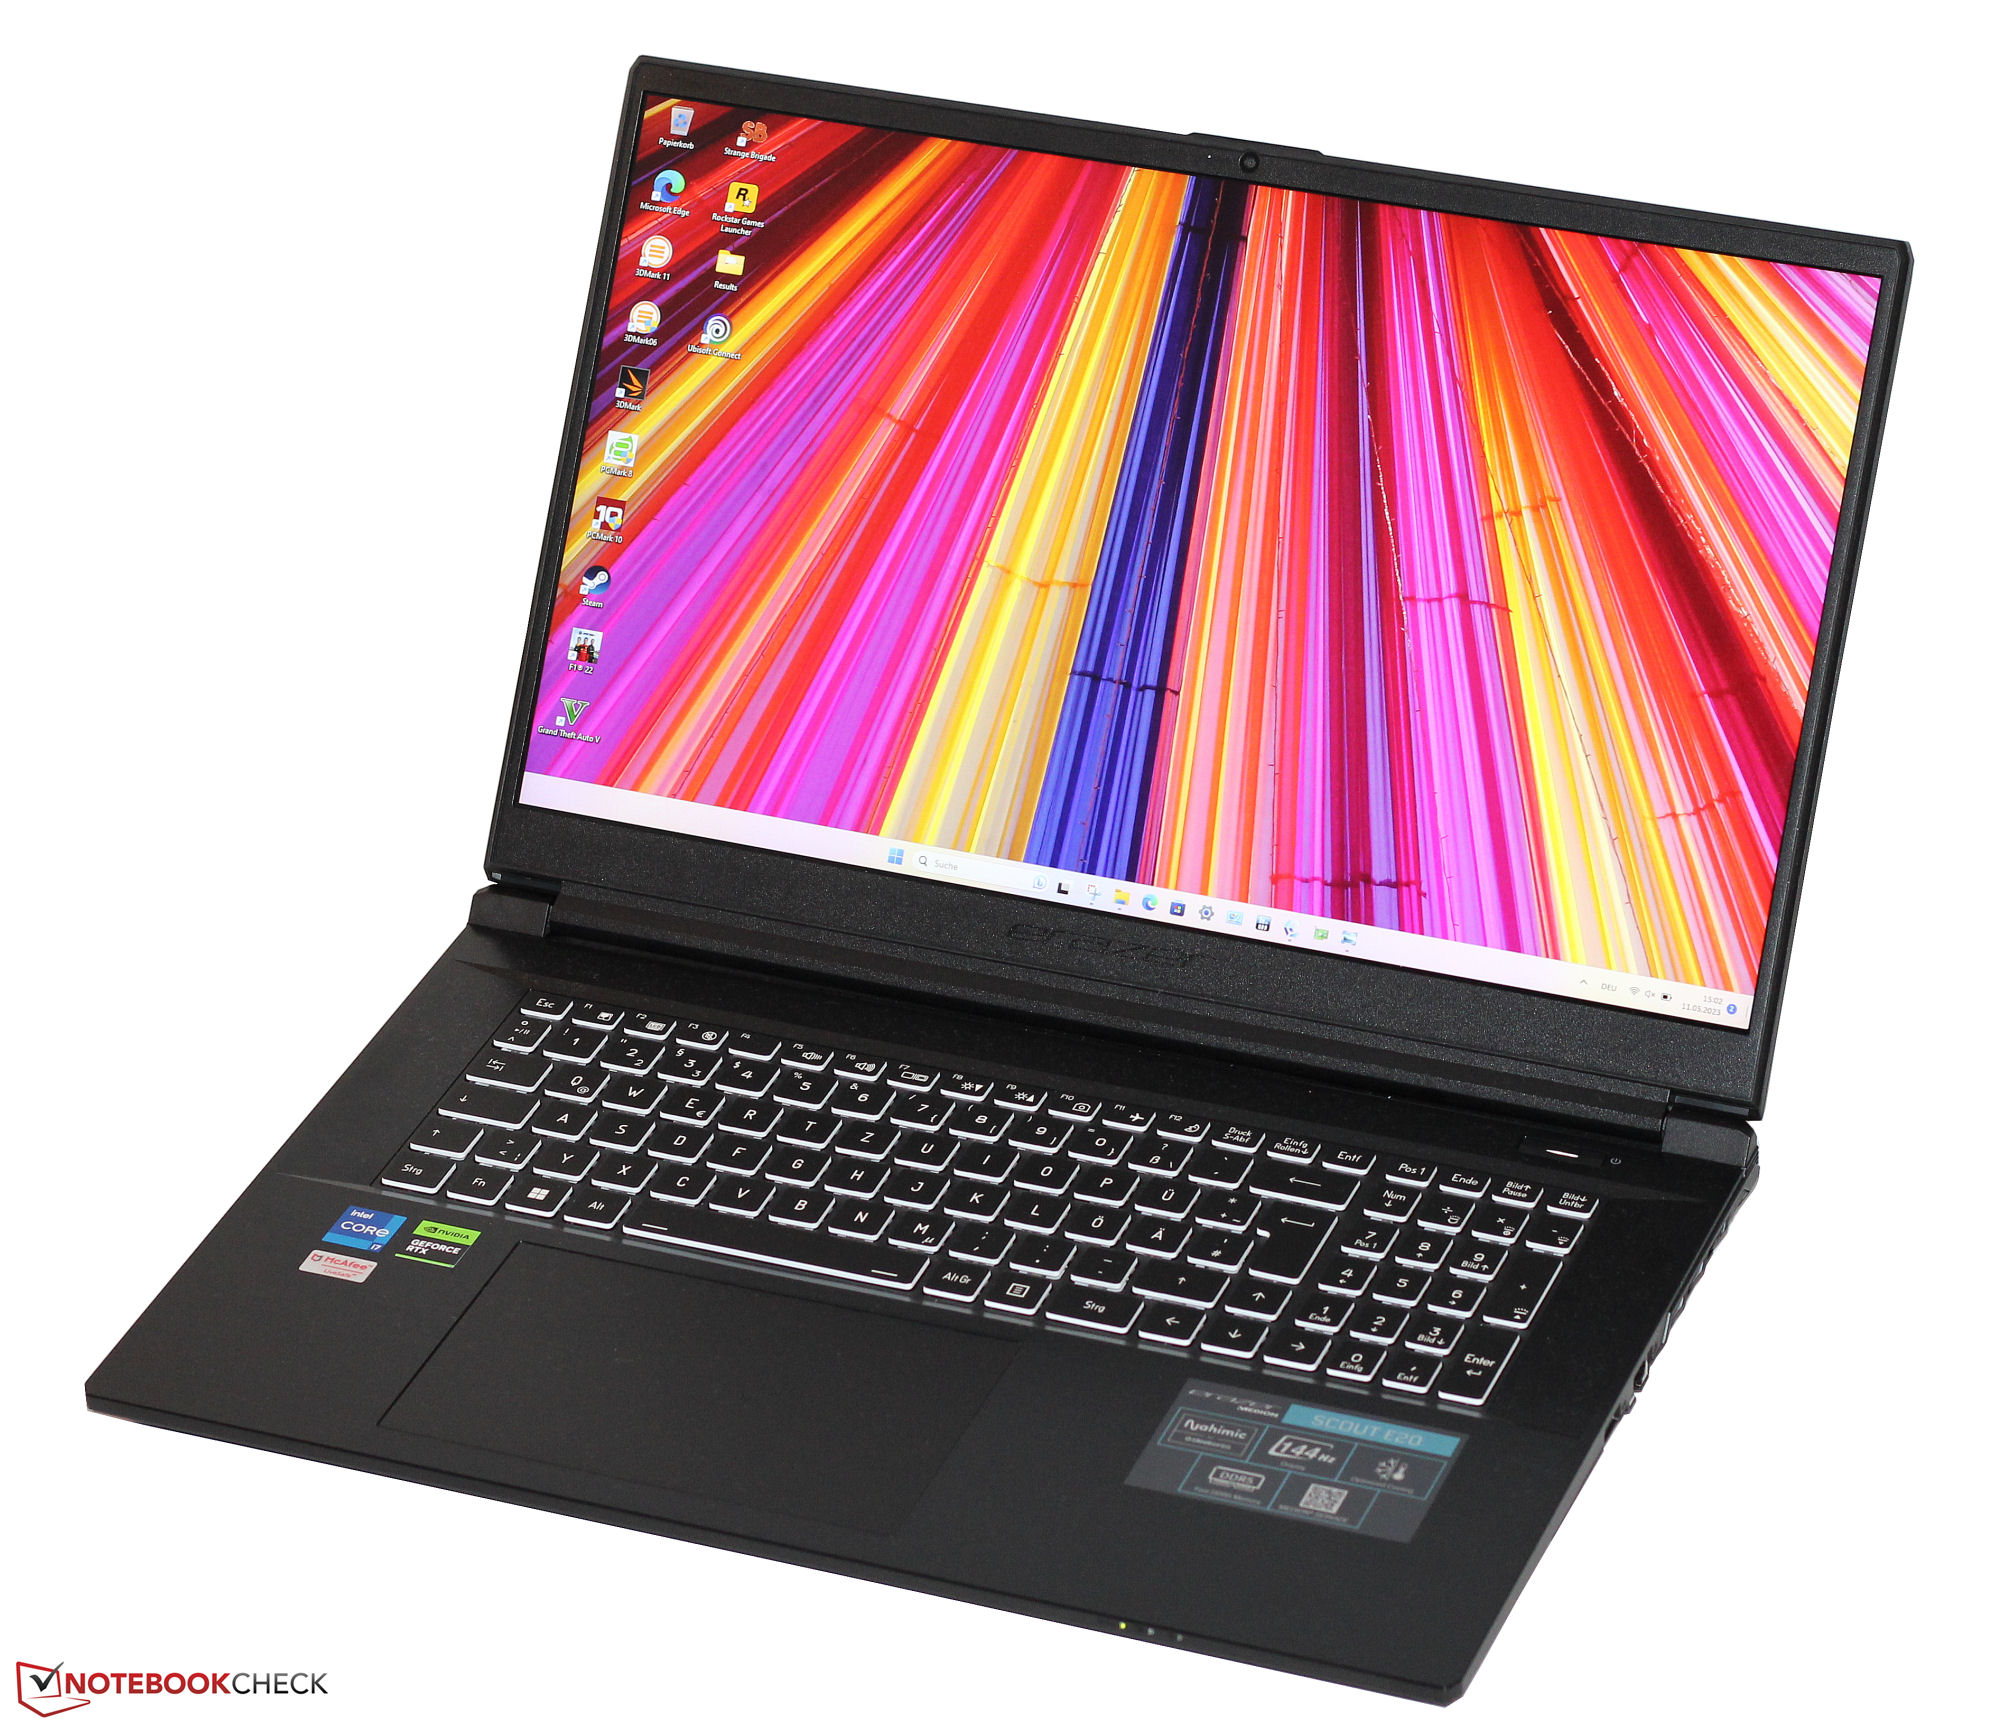
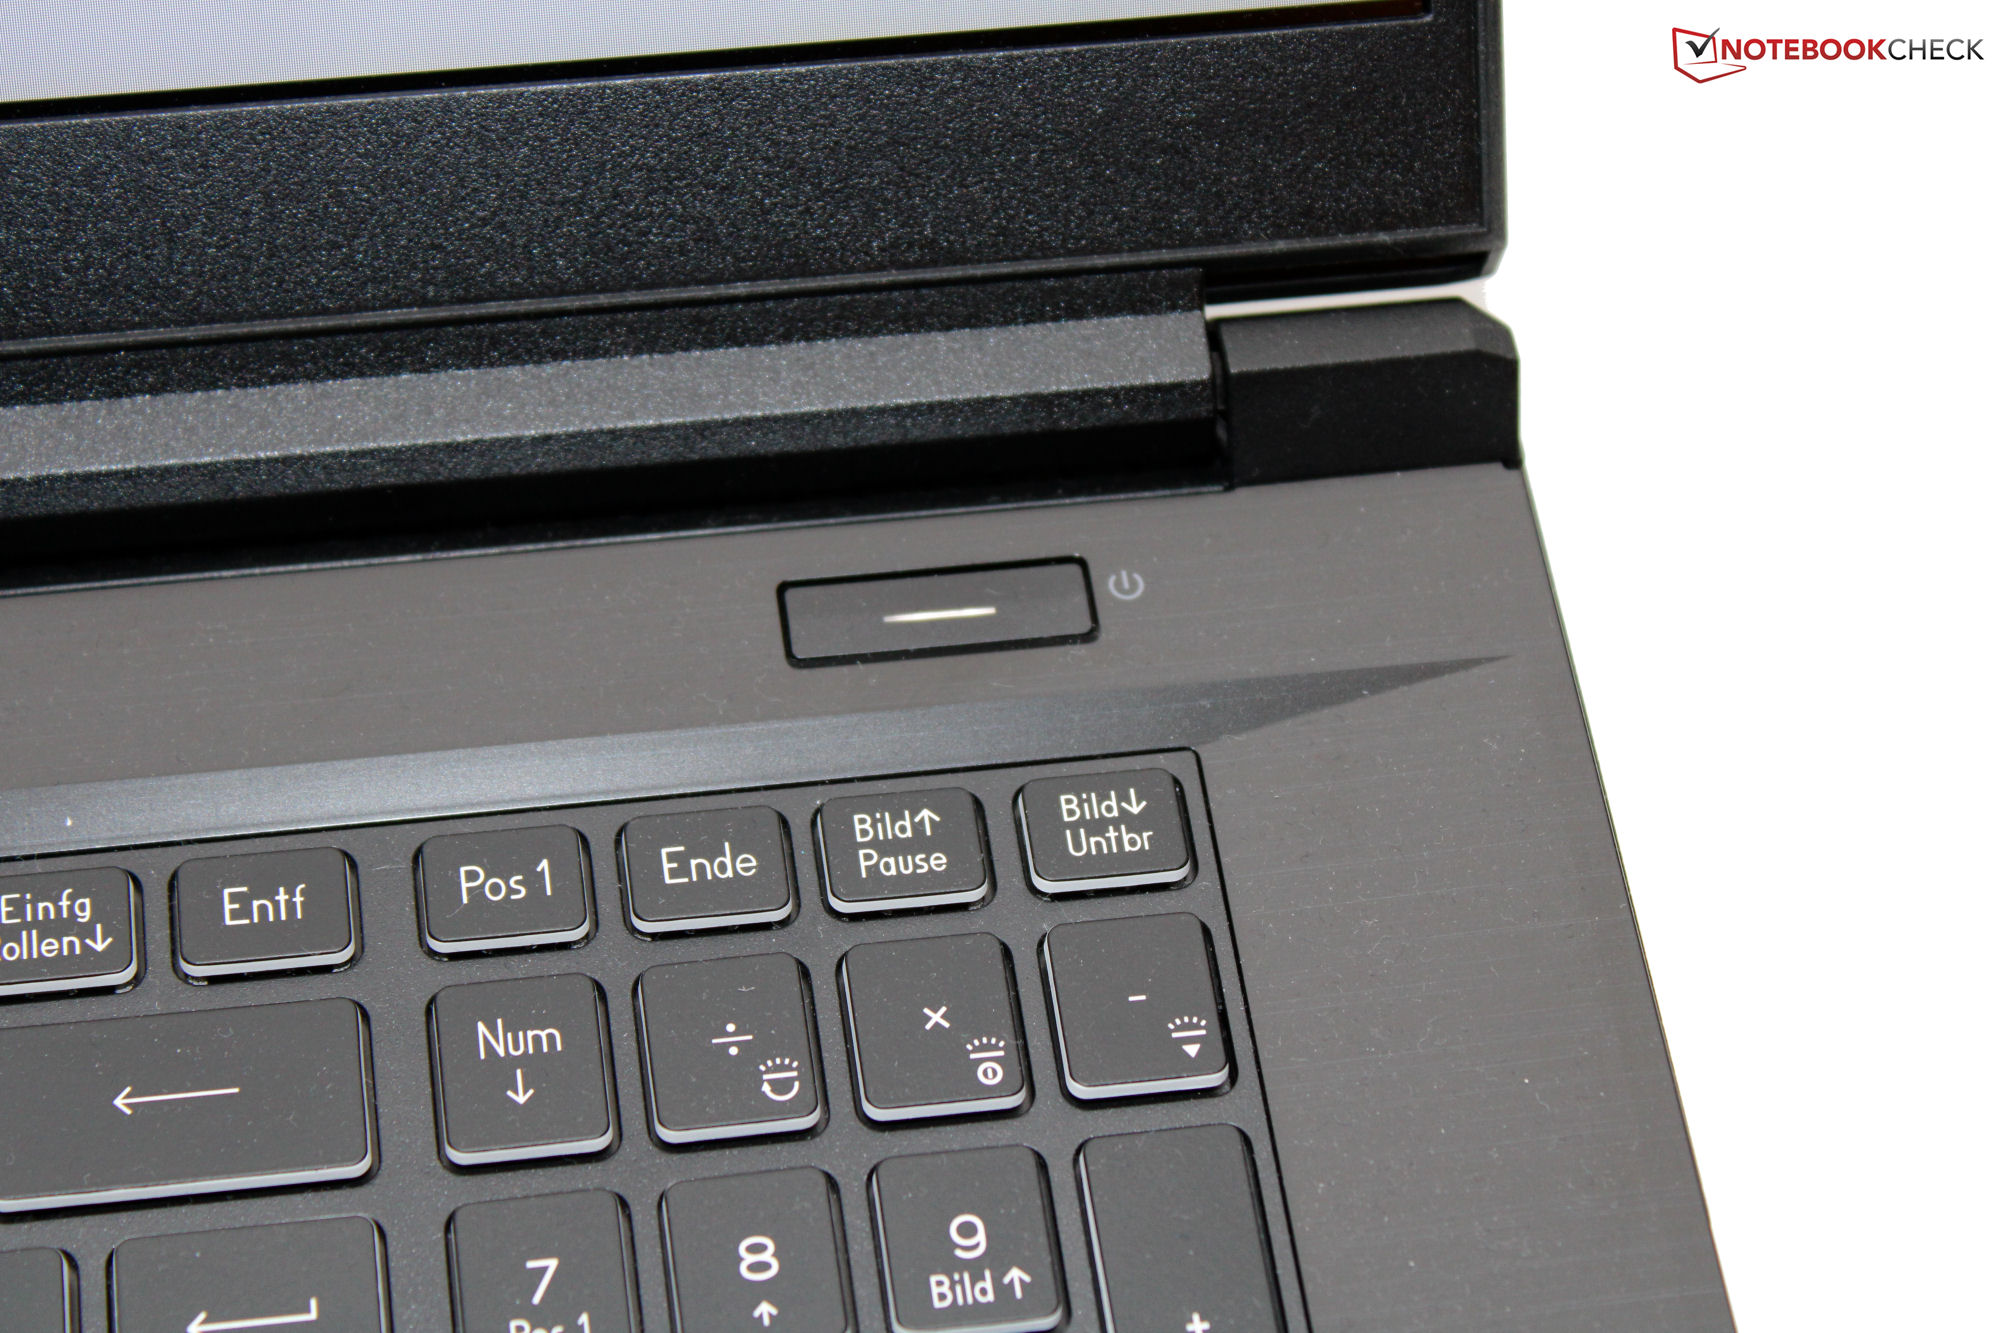
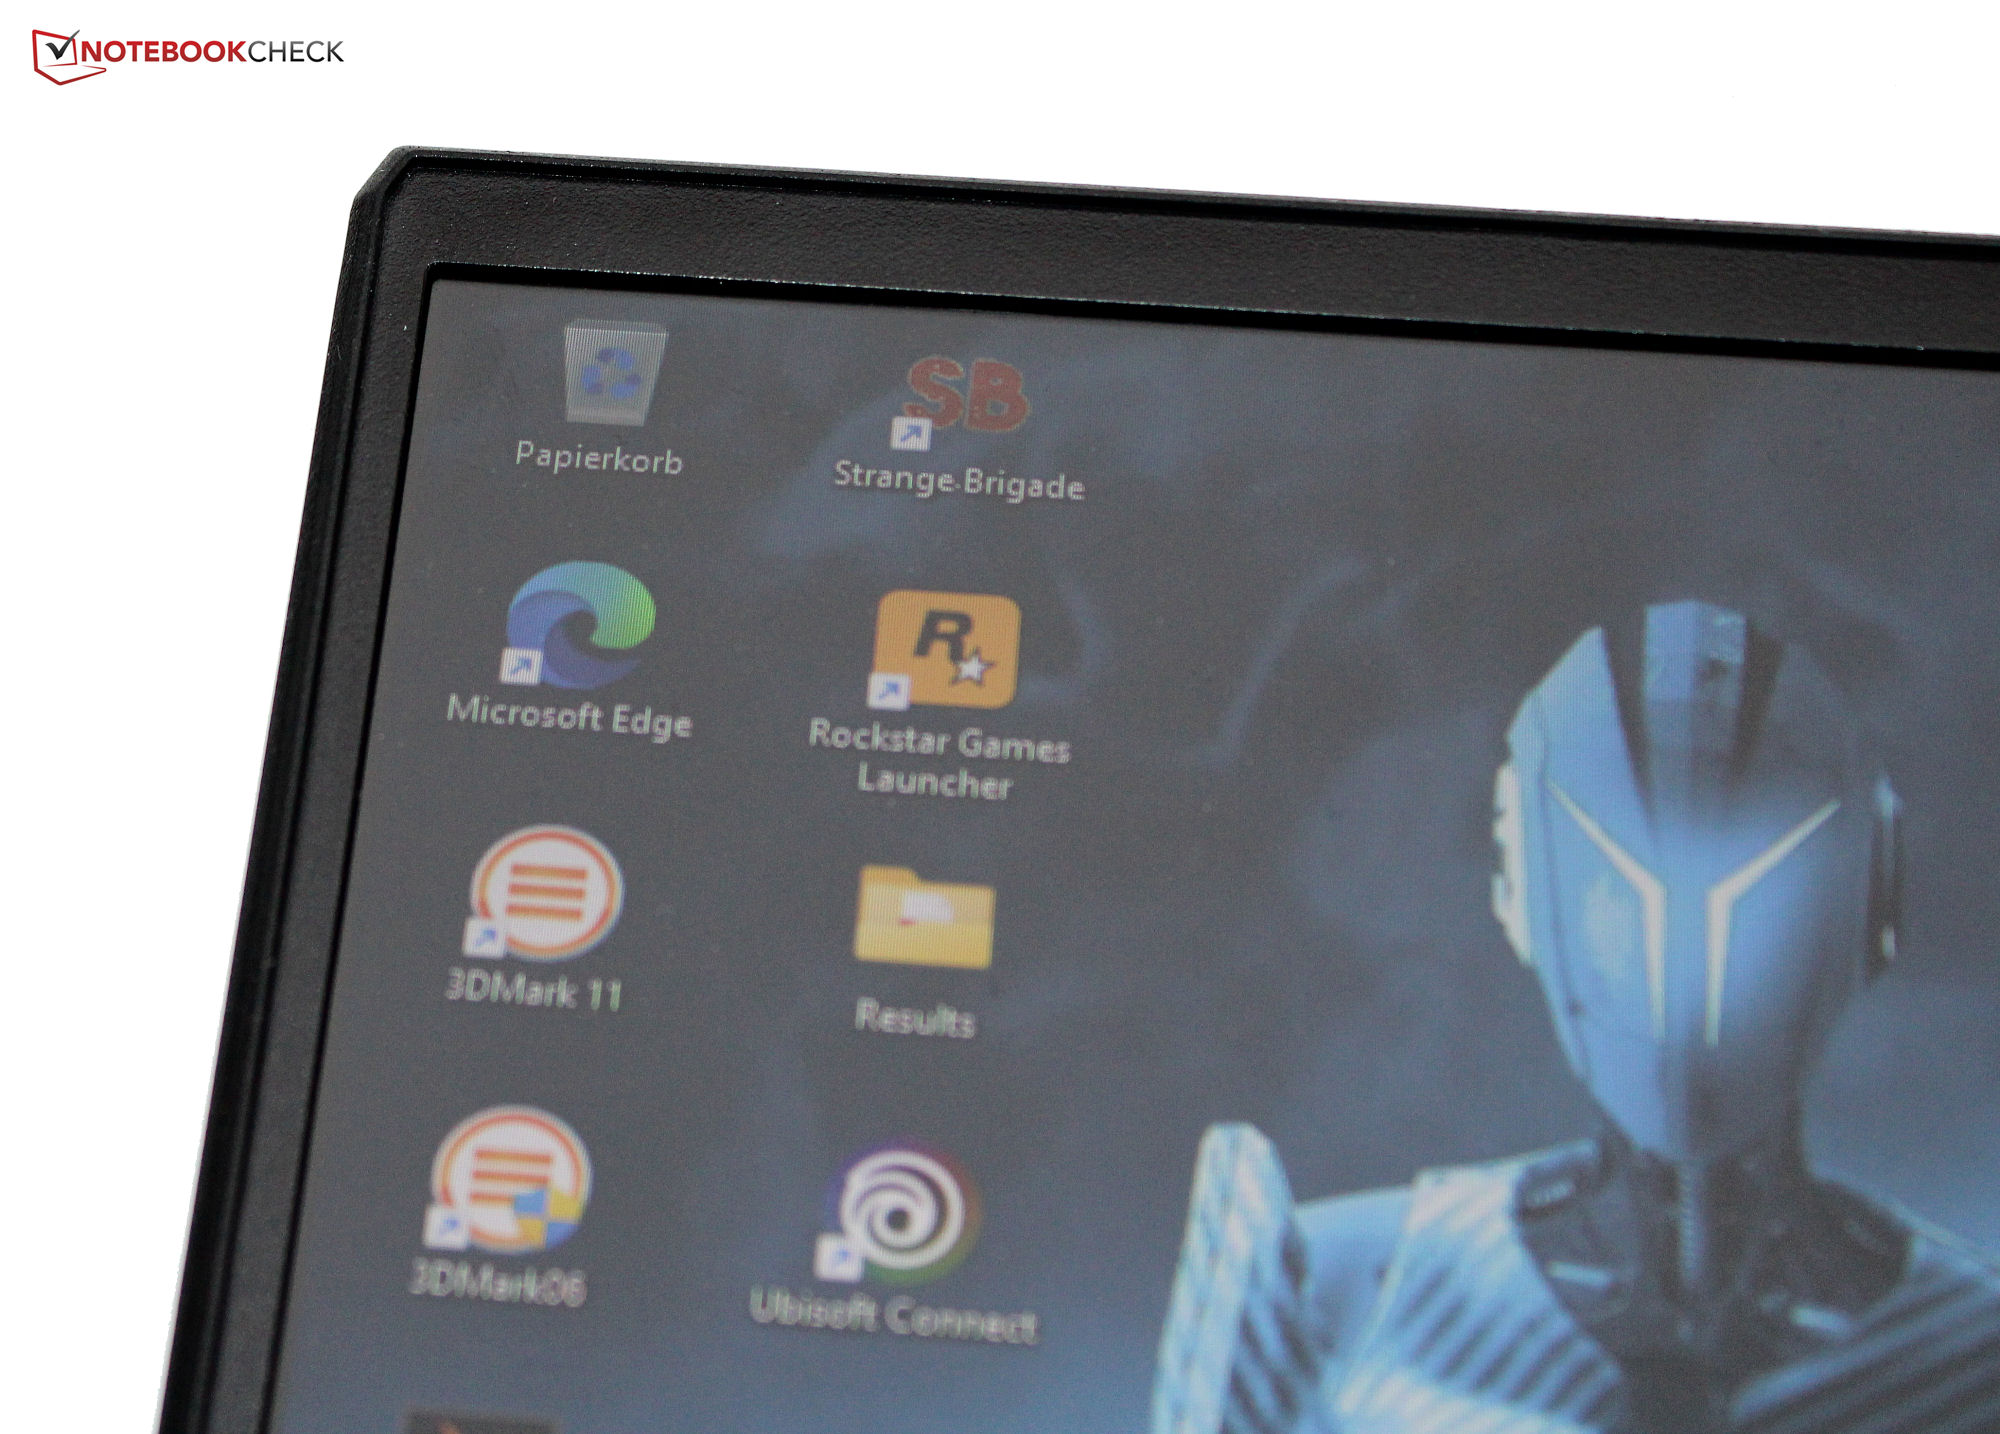
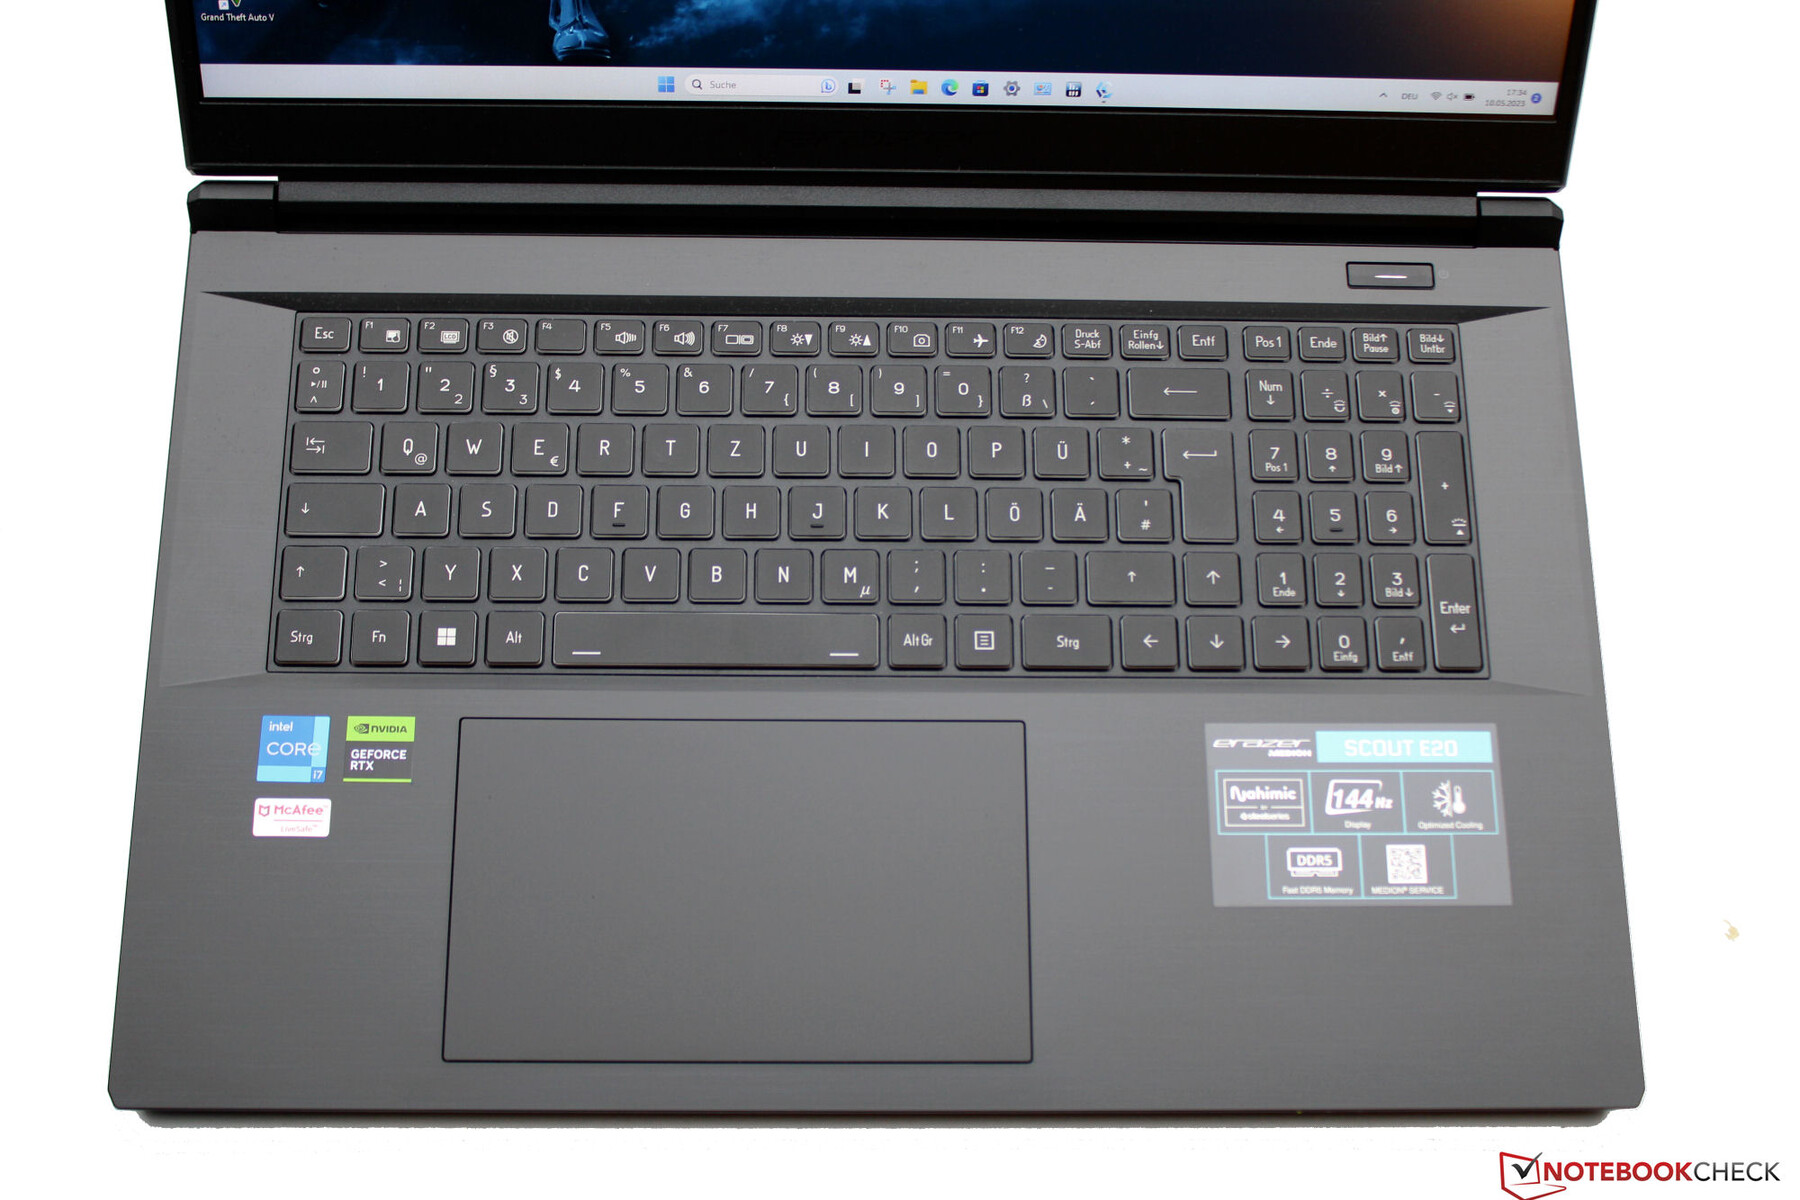
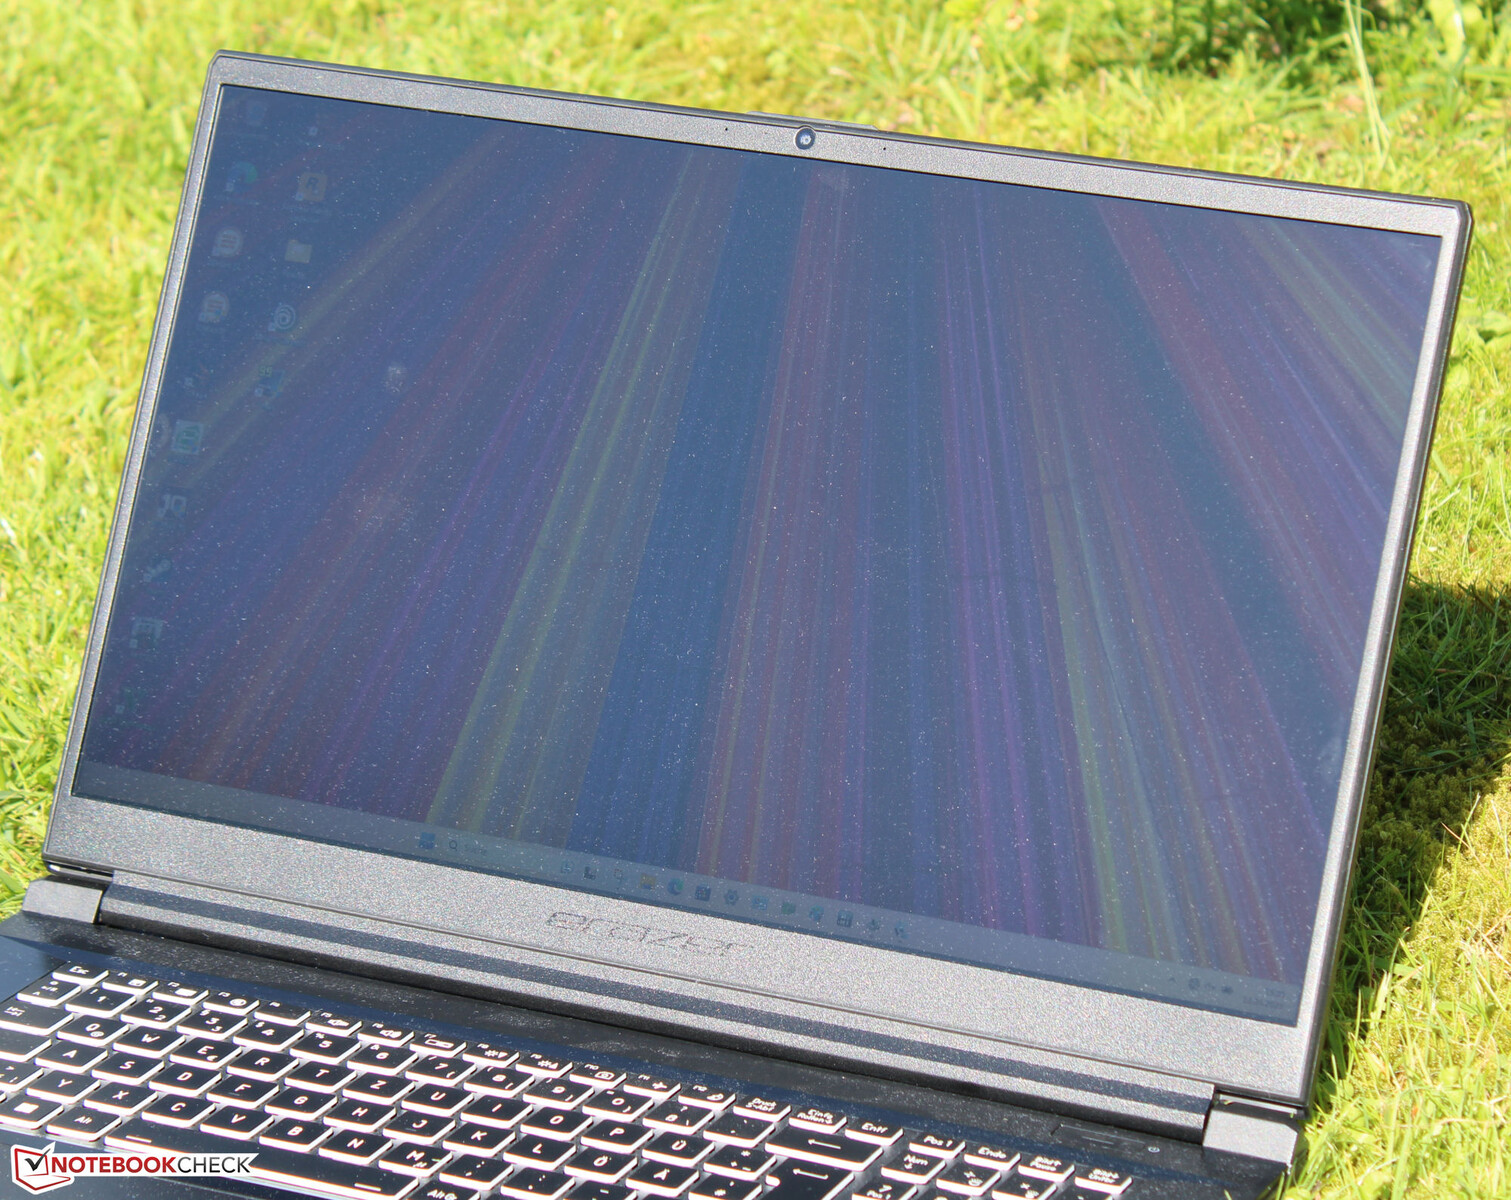
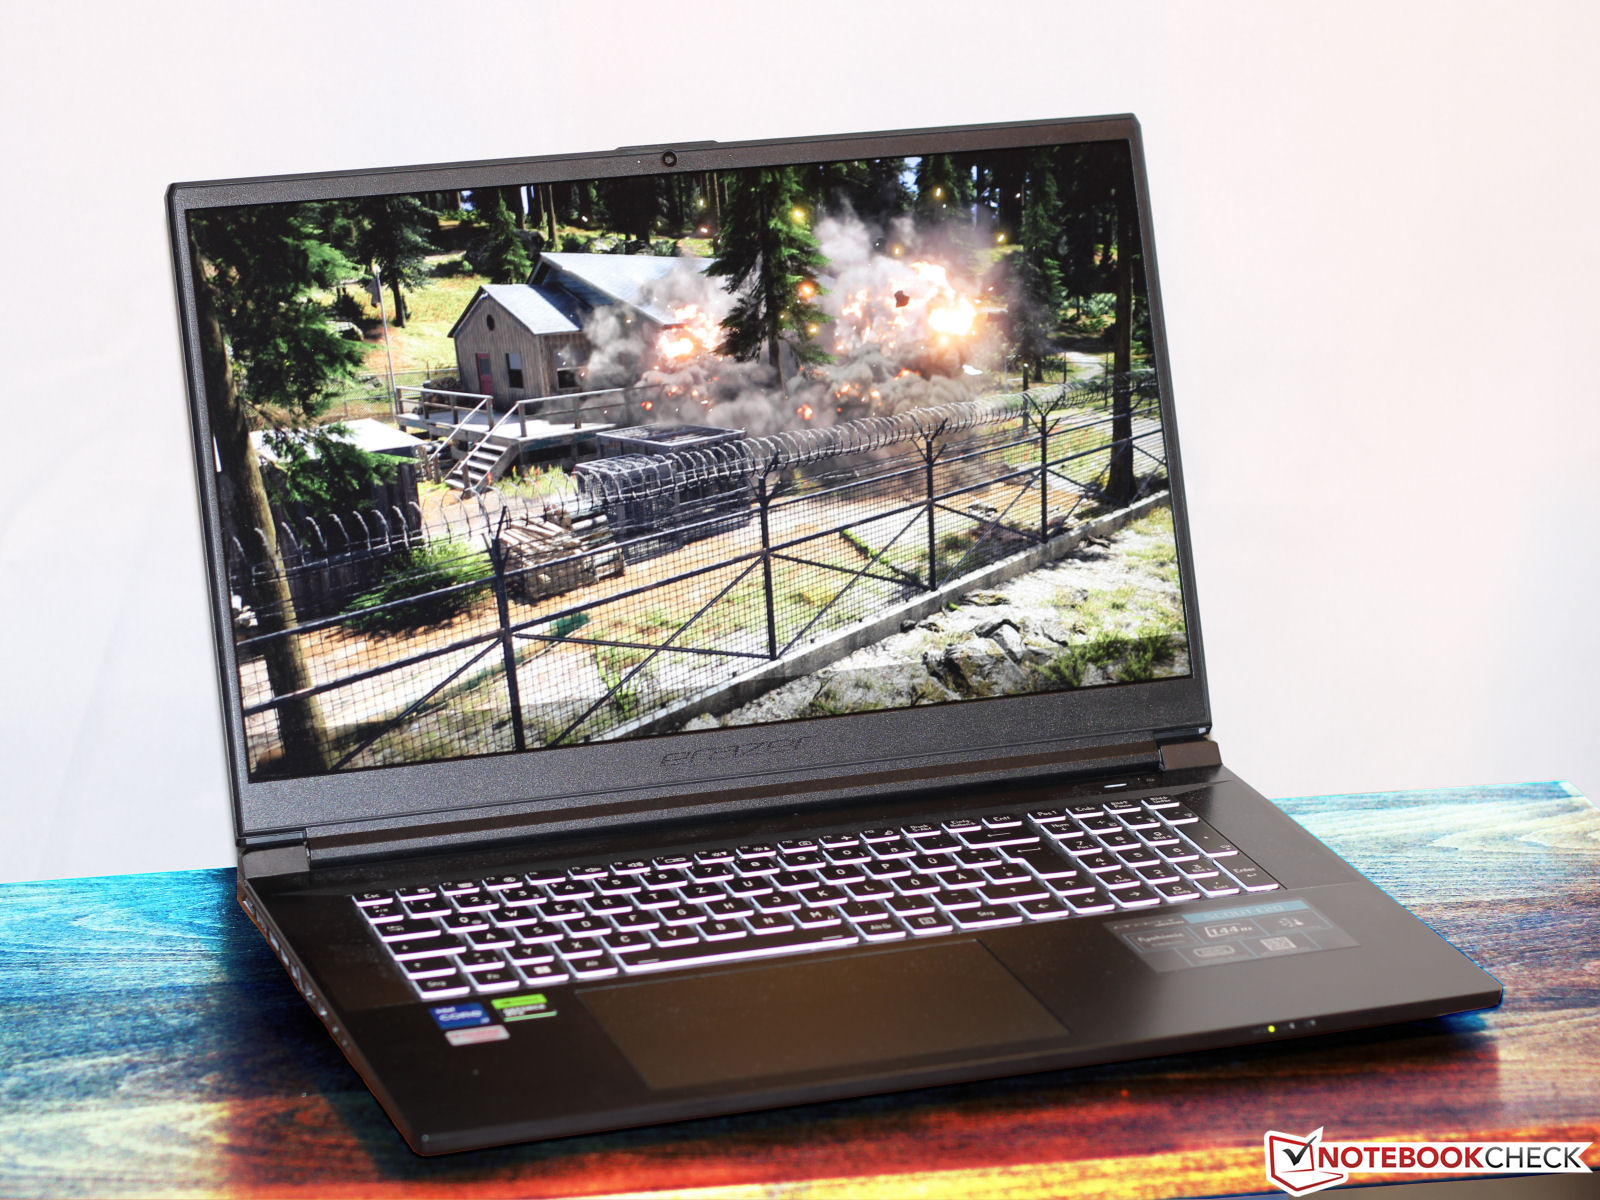
Obudowa - laptop Medion posiada plastikową obudowę
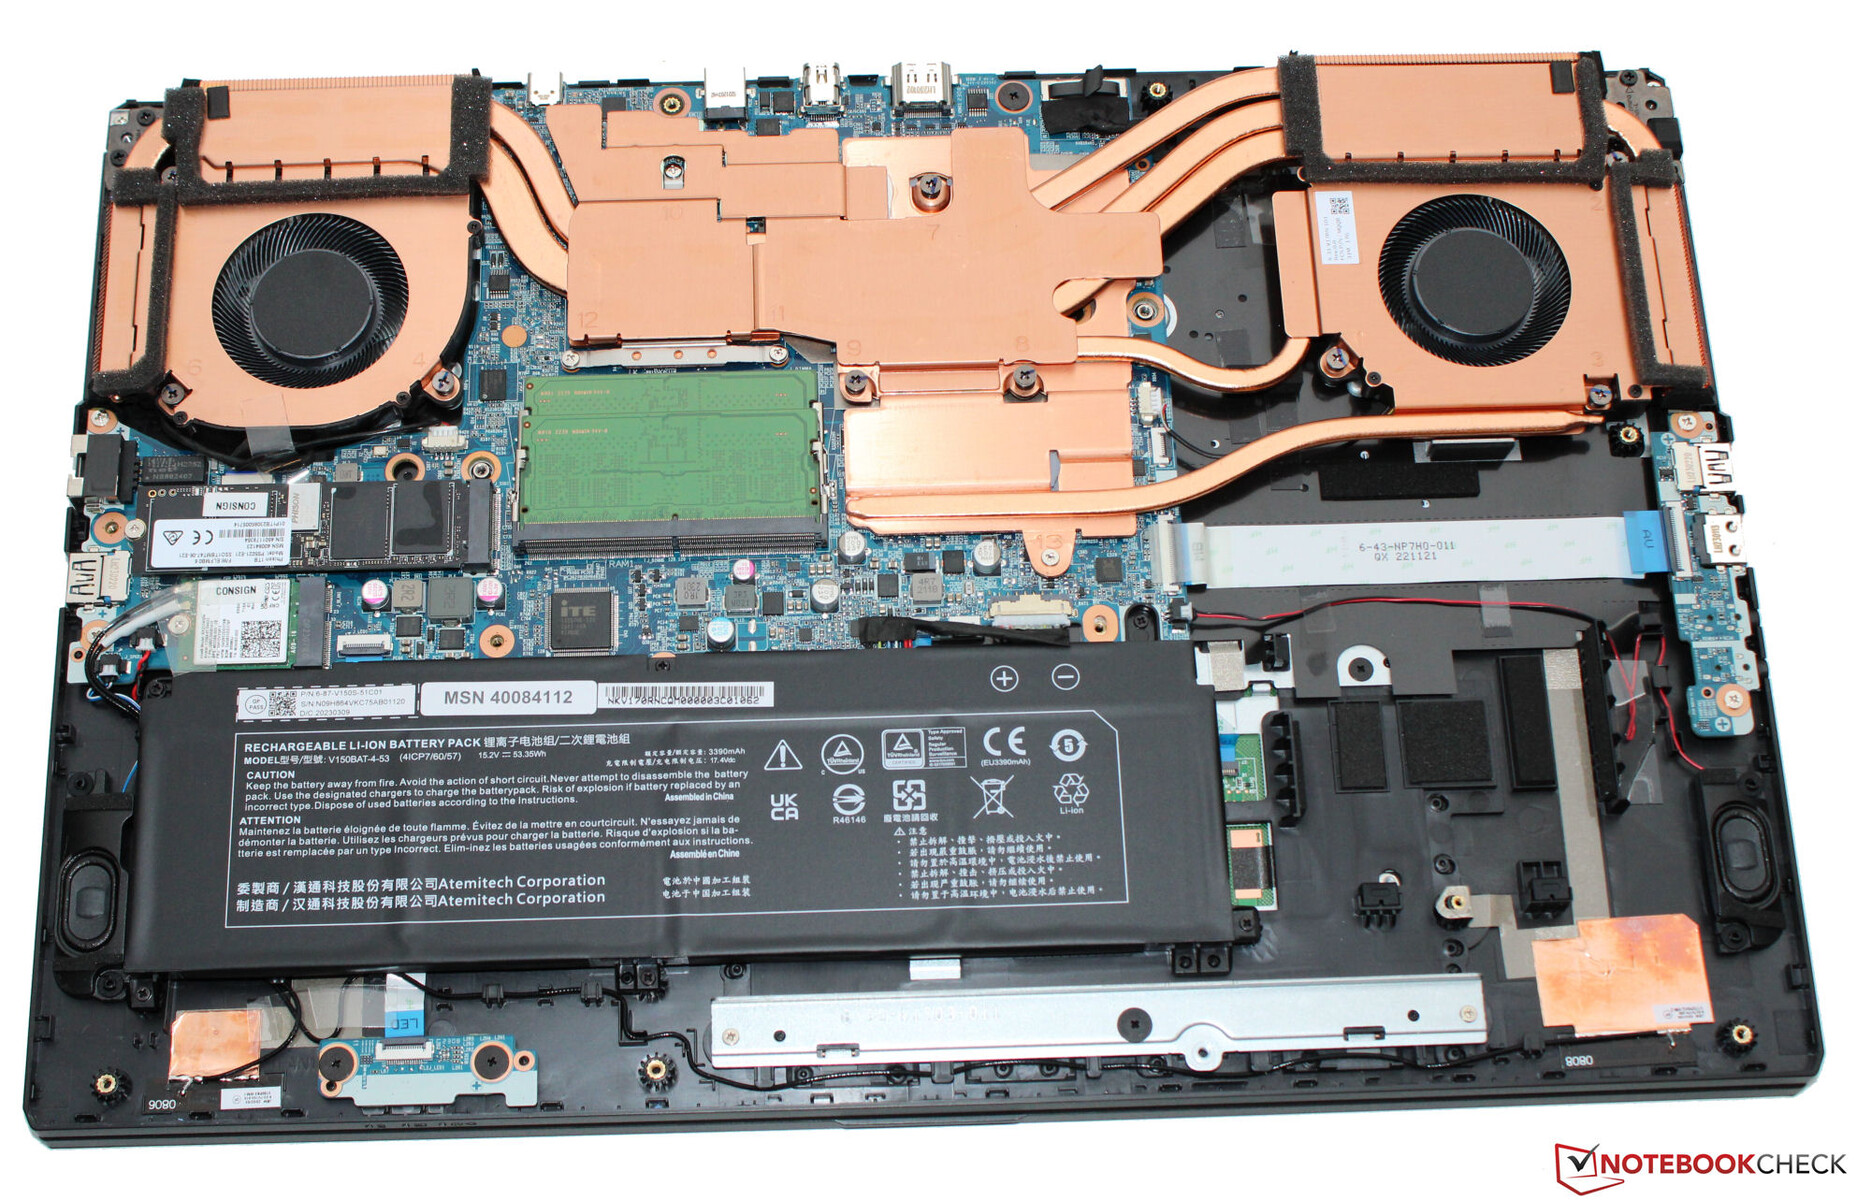
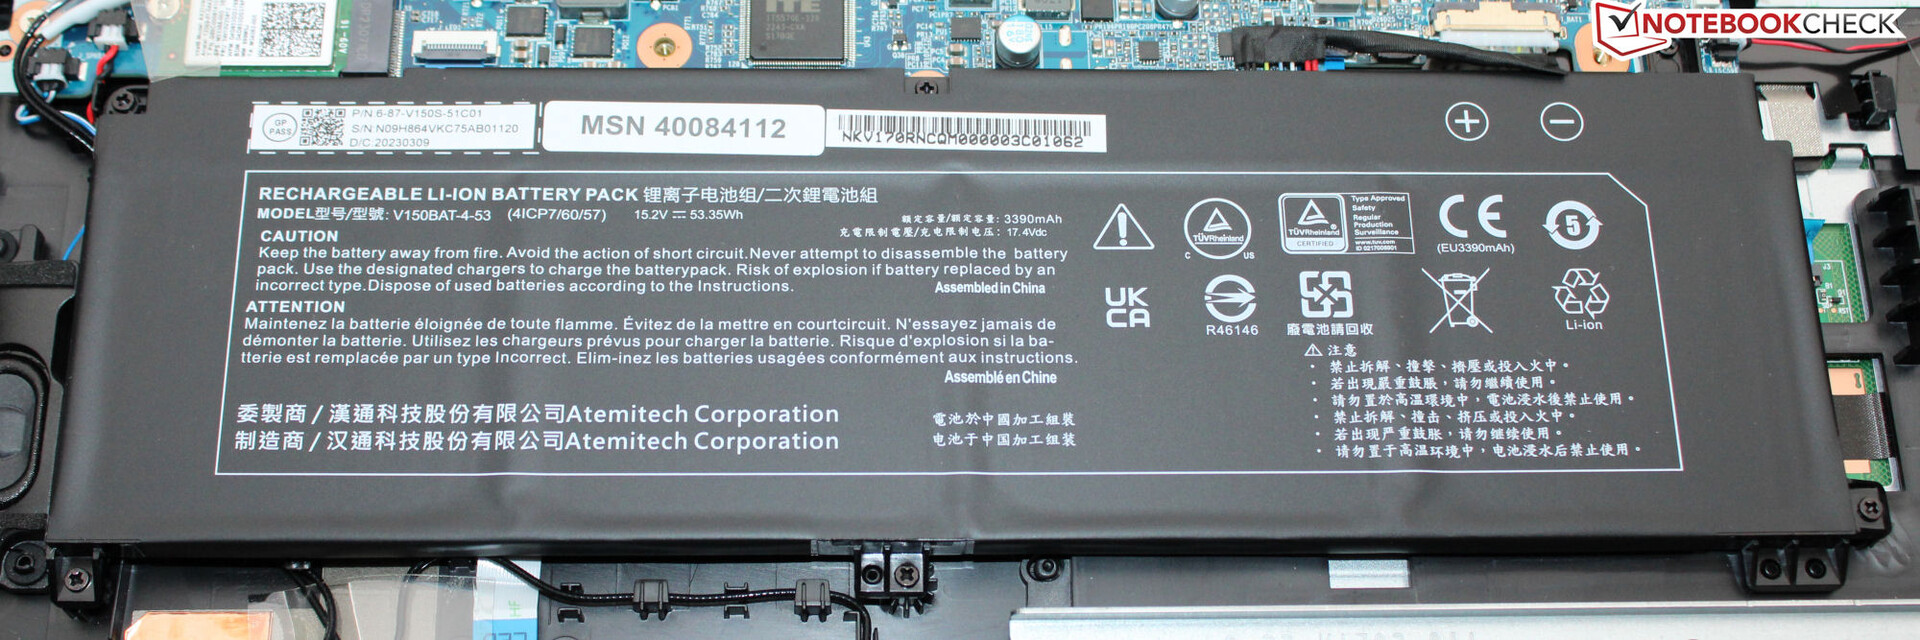
E20 nie oferuje żadnych materiałów obudowy, które zapewniają wysokiej jakości wygląd, ale cała obudowa jest wykonana z czarnego plastiku. Medion stosuje gładkie, matowe powierzchnie. Bezpretensjonalna stylistyka laptopa pozwoliłaby na używanie go również w środowisku biznesowym. Poza podświetleniem klawiatury, laptop nie posiada żadnych kolorowych ozdób w postaci pasków LED. Dostęp do baterii (która jest przykręcana, a nie przyklejana) i reszty wyposażenia jest możliwy po zdjęciu spodu obudowy.
Scout nie wykazuje żadnych wad w wykonaniu. Szczeliny są równe i nie ma żadnych wypukłości materiału. Podstawa może być tylko nieznacznie wypaczona, ale pokrywa bardziej znacząco, chociaż nadal pozostaje to w granicach. Zawiasy mocno trzymają pokrywę, a maksymalny kąt otwarcia wynosi około 135 stopni. Pokrywę można otworzyć jedną ręką.
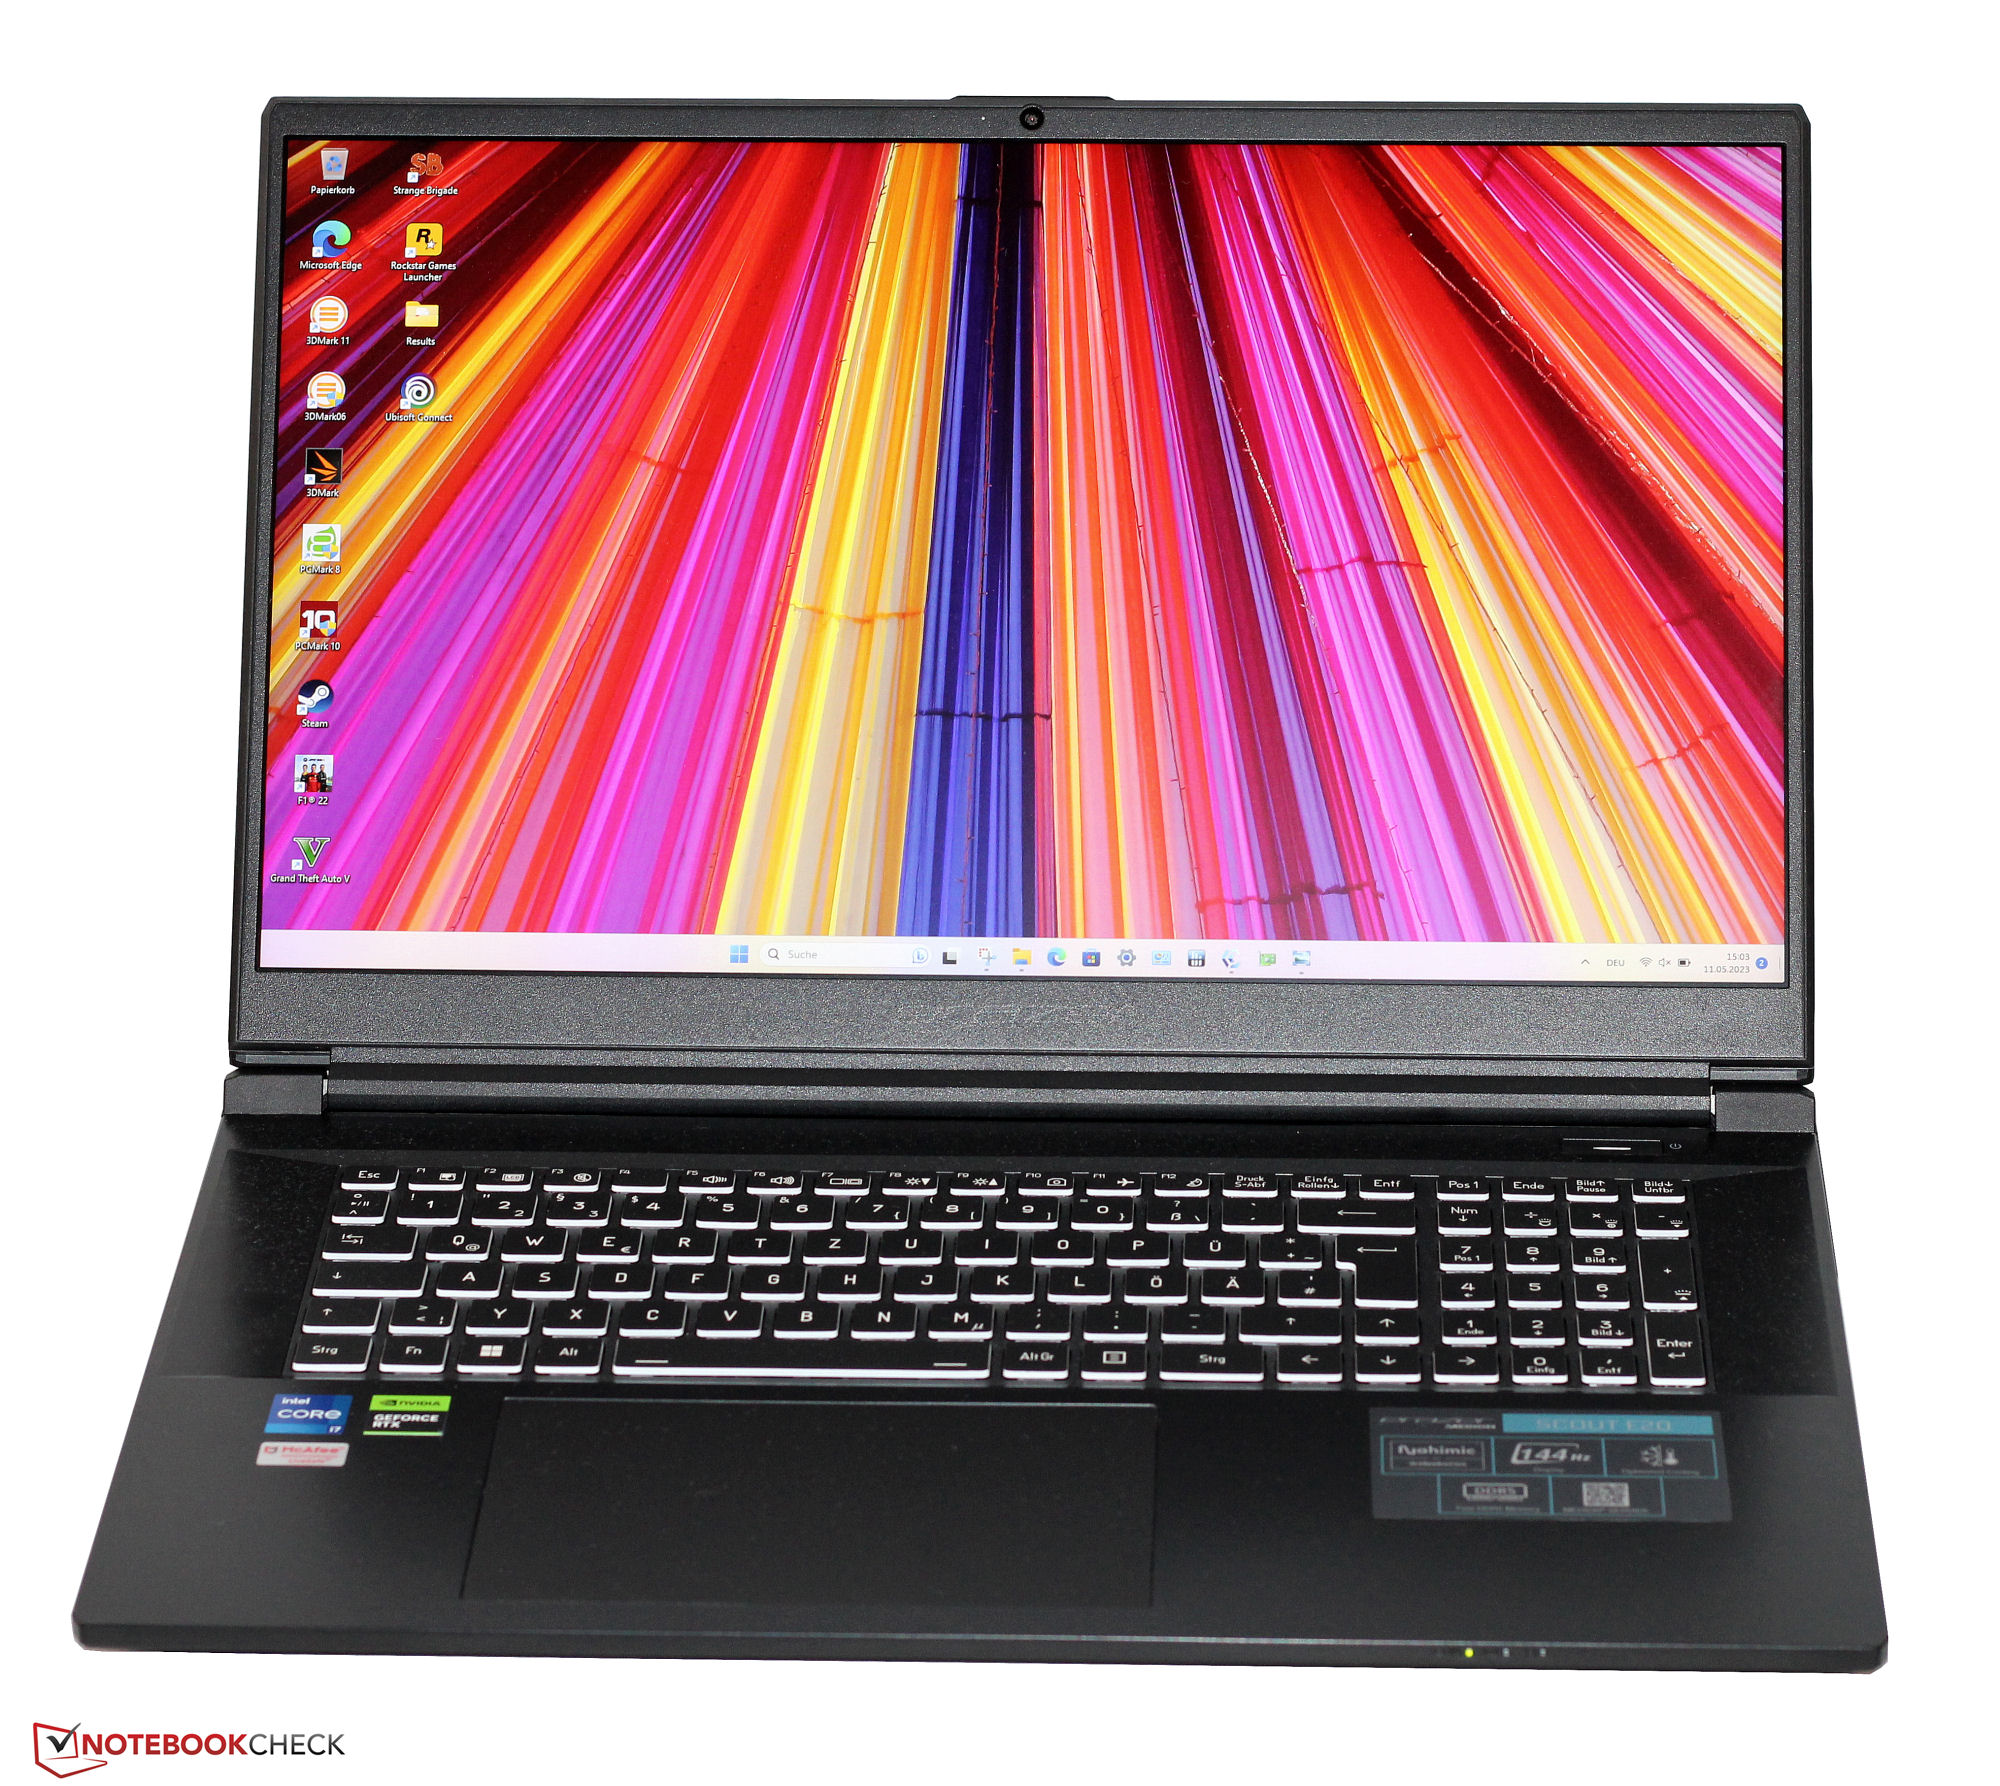
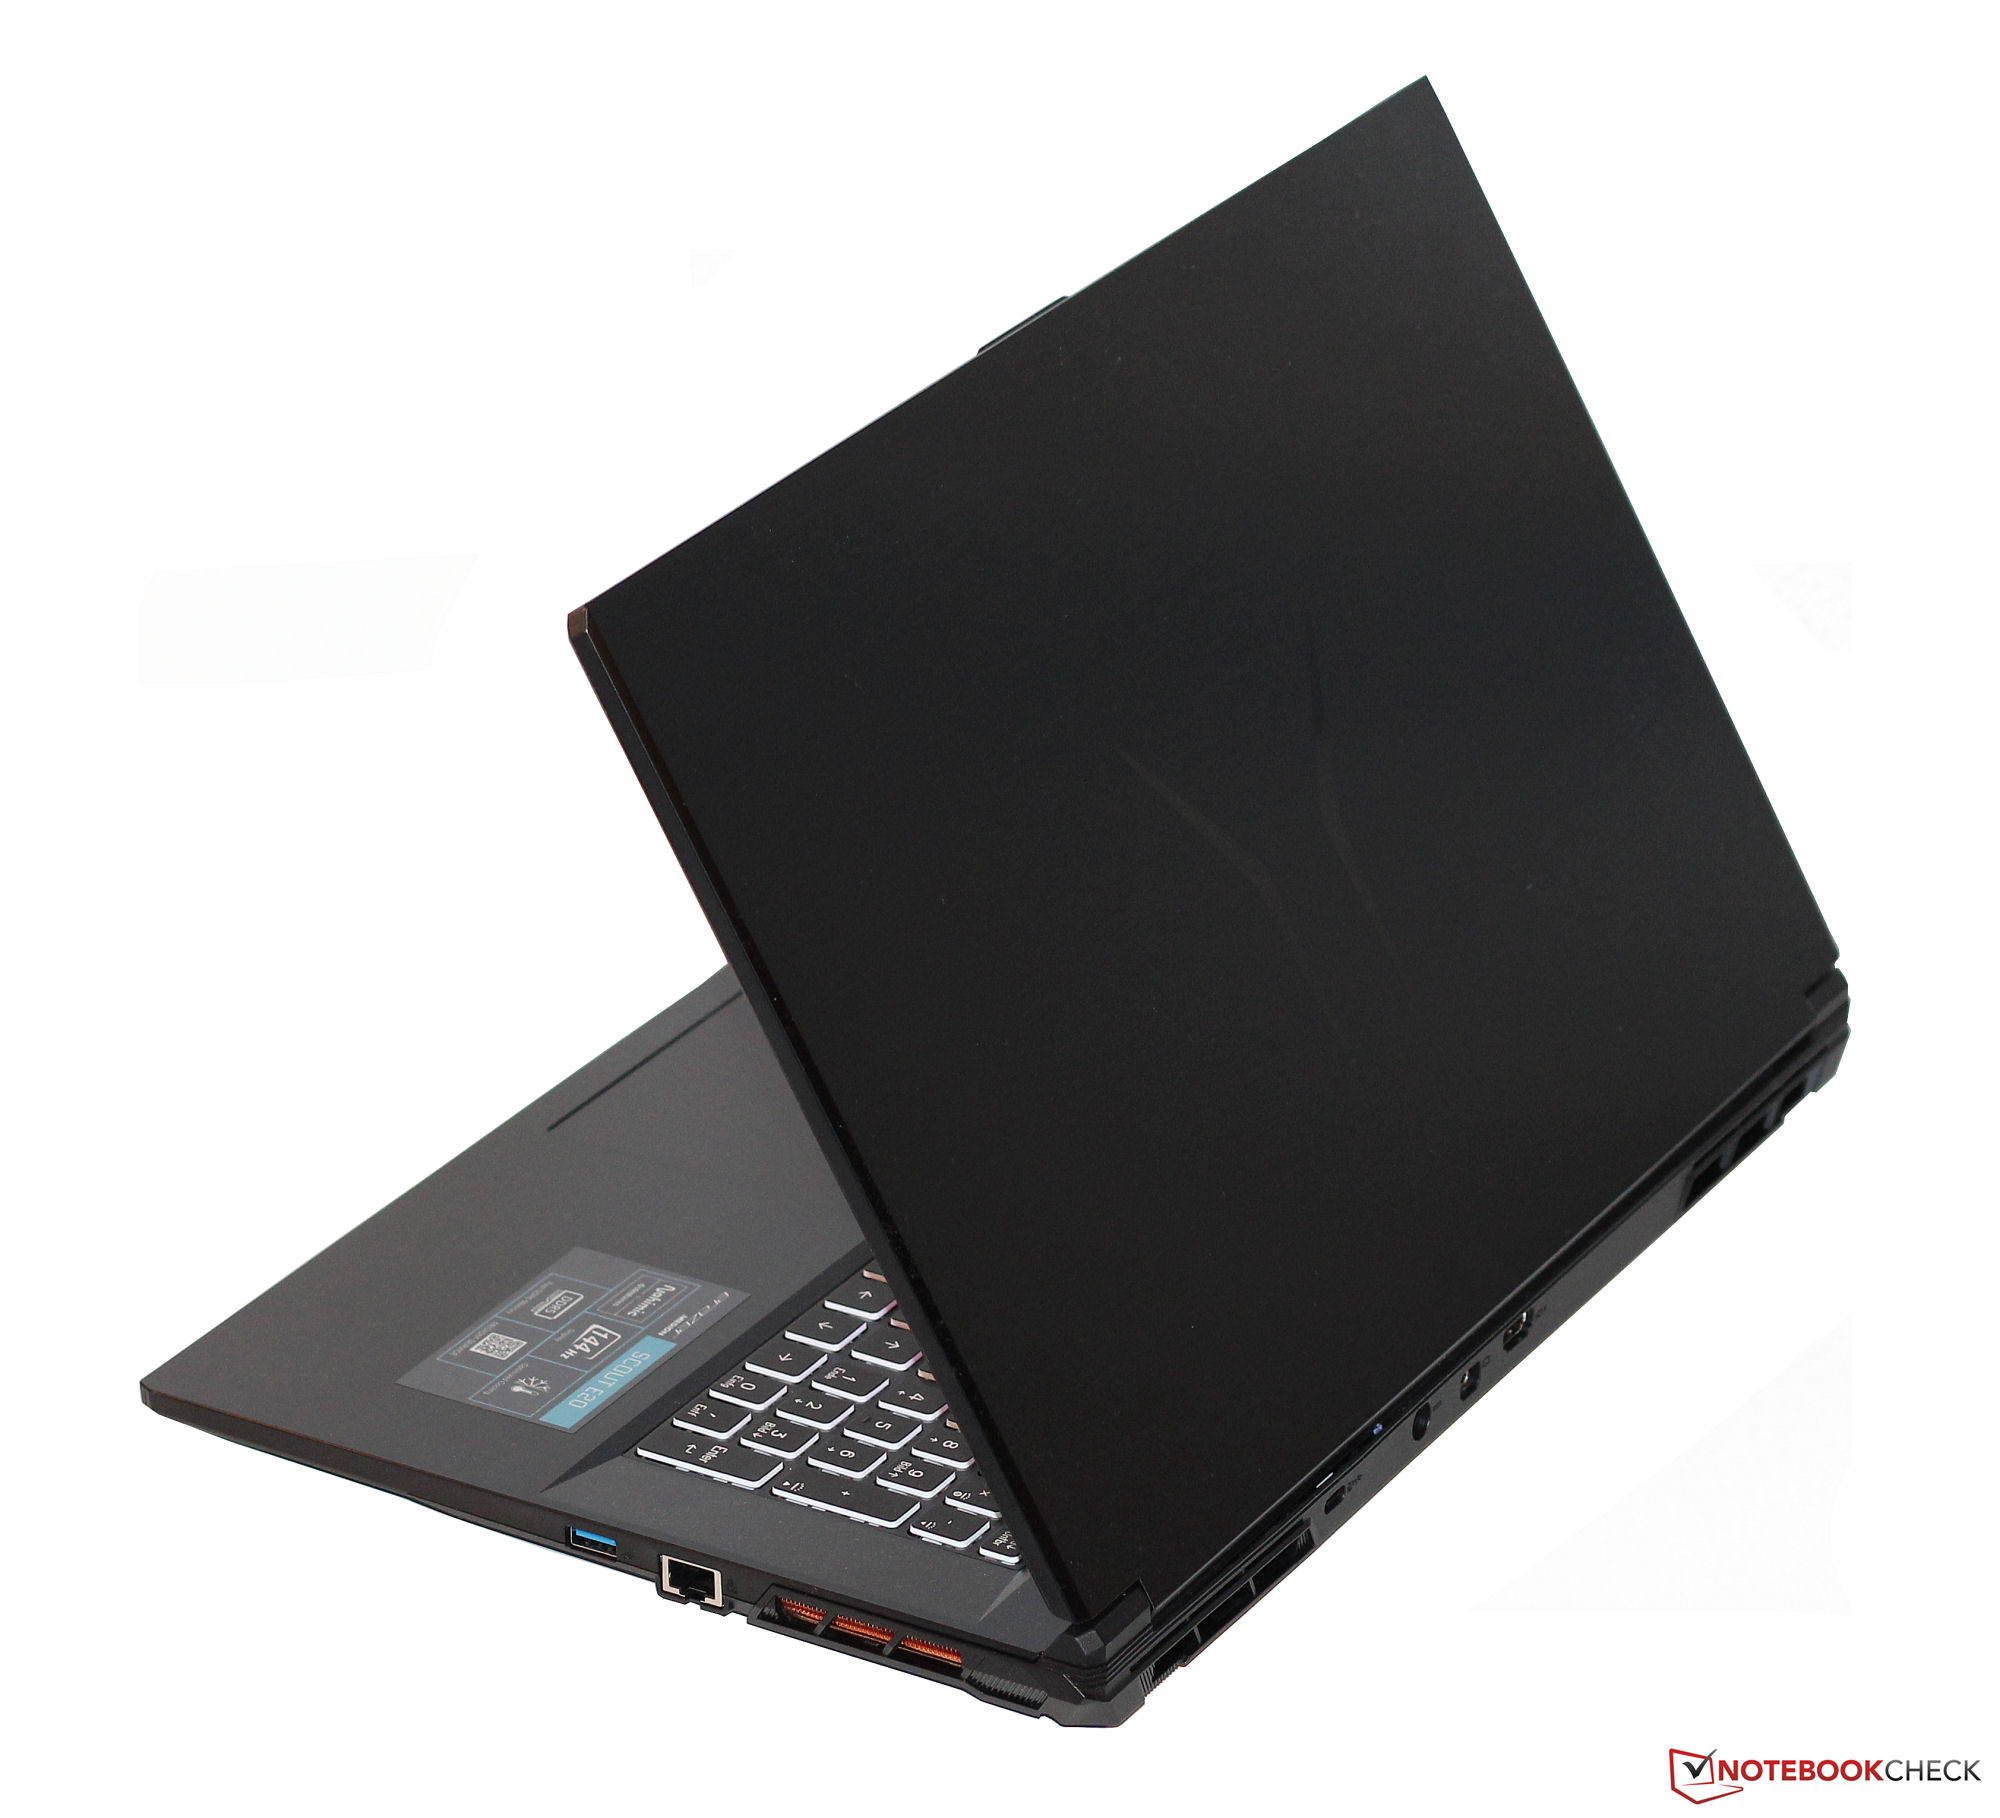
Pod względem rozmiaru, E20 mierzy na poziomie porównywalnych 17,3-calowych laptopów, a to samo dotyczy w pewnym stopniu jego wagi. W naszym polu porównawczym jest to najcięższe urządzenie - wraz z Katana 17- o wadze 2,8 kg (~6,2 lb). G7 KEG7 KEważy dobre 200 gramów (7 uncji) mniej niż obaj konkurenci.
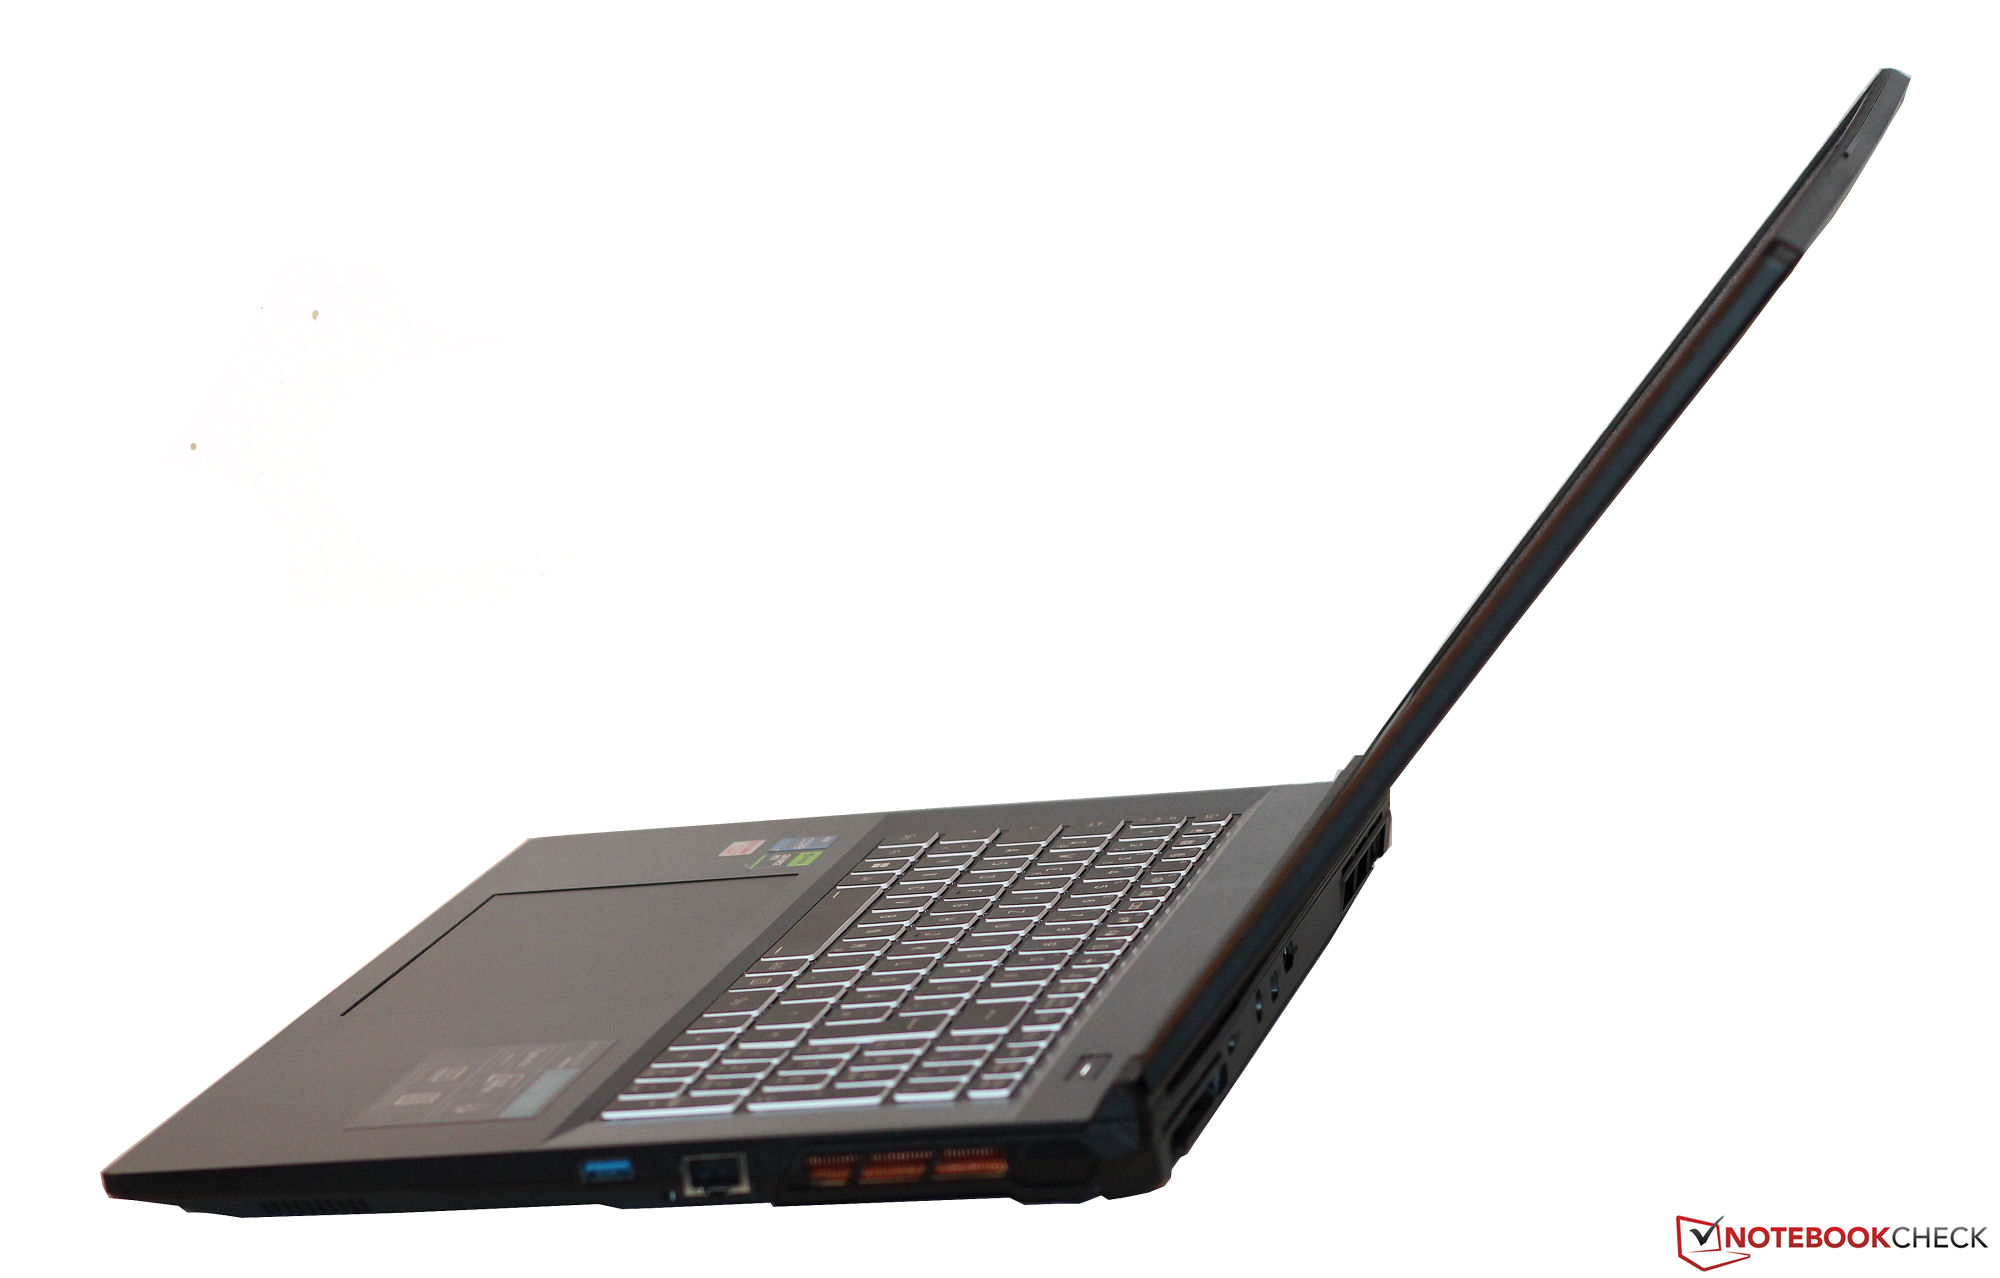
Wyposażenie - brak Thunderbolta dla Erazera
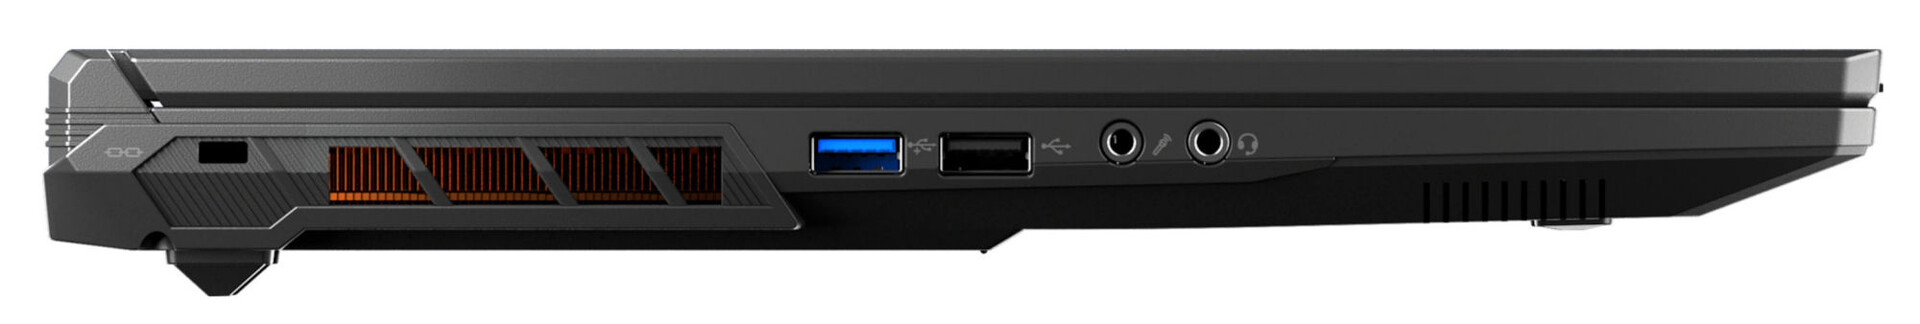
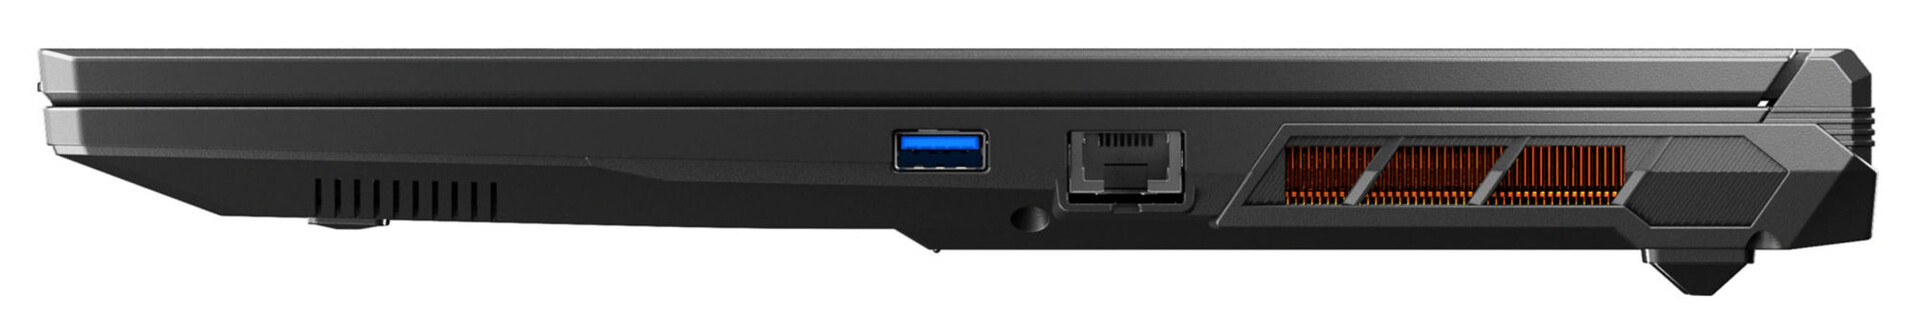
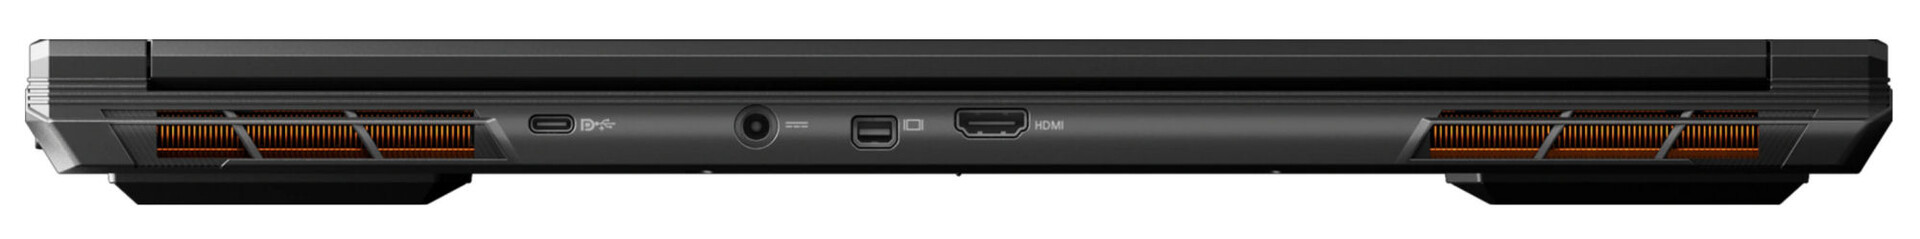
Erazer oferuje trzy porty USB-A (1x USB 2.0, 1x USB 3.2 Gen 1, 1x USB 3.2 Gen 2) i jeden port USB-C (USB 3.2 Gen 2). Ten ostatni może wyprowadzać sygnał DisplayPort, ale nie obsługuje funkcji Power Delivery. Scout E20 zawiera łącznie trzy porty wyjściowe wideo (HDMI 2.1, 2x DP). Wyposażenie uzupełniają dwa porty audio i port Gigabit Ethernet. Nie ma czytnika kart pamięci.
Porty wideo i złącze zasilania znajdują się z tyłu urządzenia, więc odpowiednie kable biegną z tyłu i nie przeszkadzają.
Komunikacja
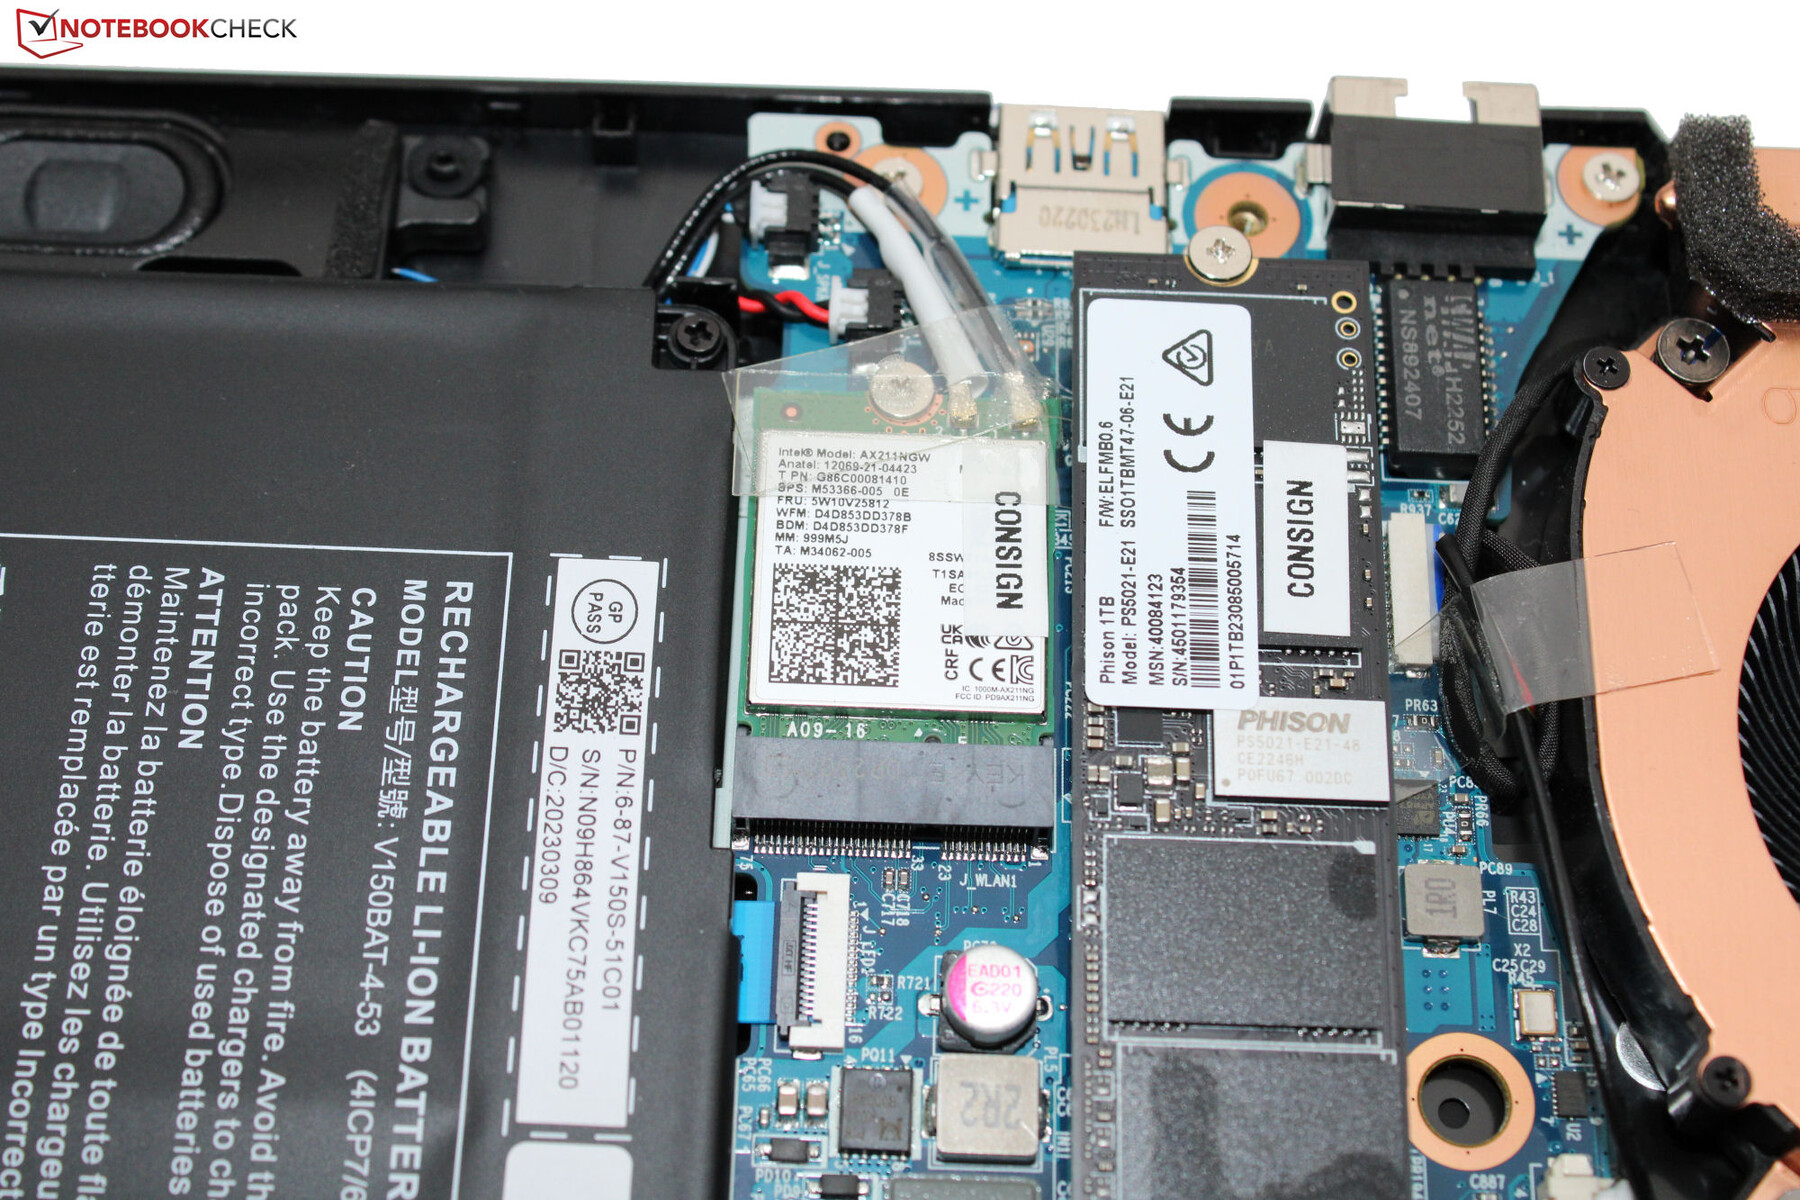
W optymalnych warunkach (bez innych urządzeń WLAN w bliskiej odległości i niewielkiej odległości między laptopem a komputerem serwera) osiągane są doskonałe prędkości transmisji danych WiFi. Laptop Medion wykorzystuje układ Intel AX211 WiFi-6E, a połączenia przewodowe są również obsługiwane przez układ Intel (I219-V; 1 Gbit/s).
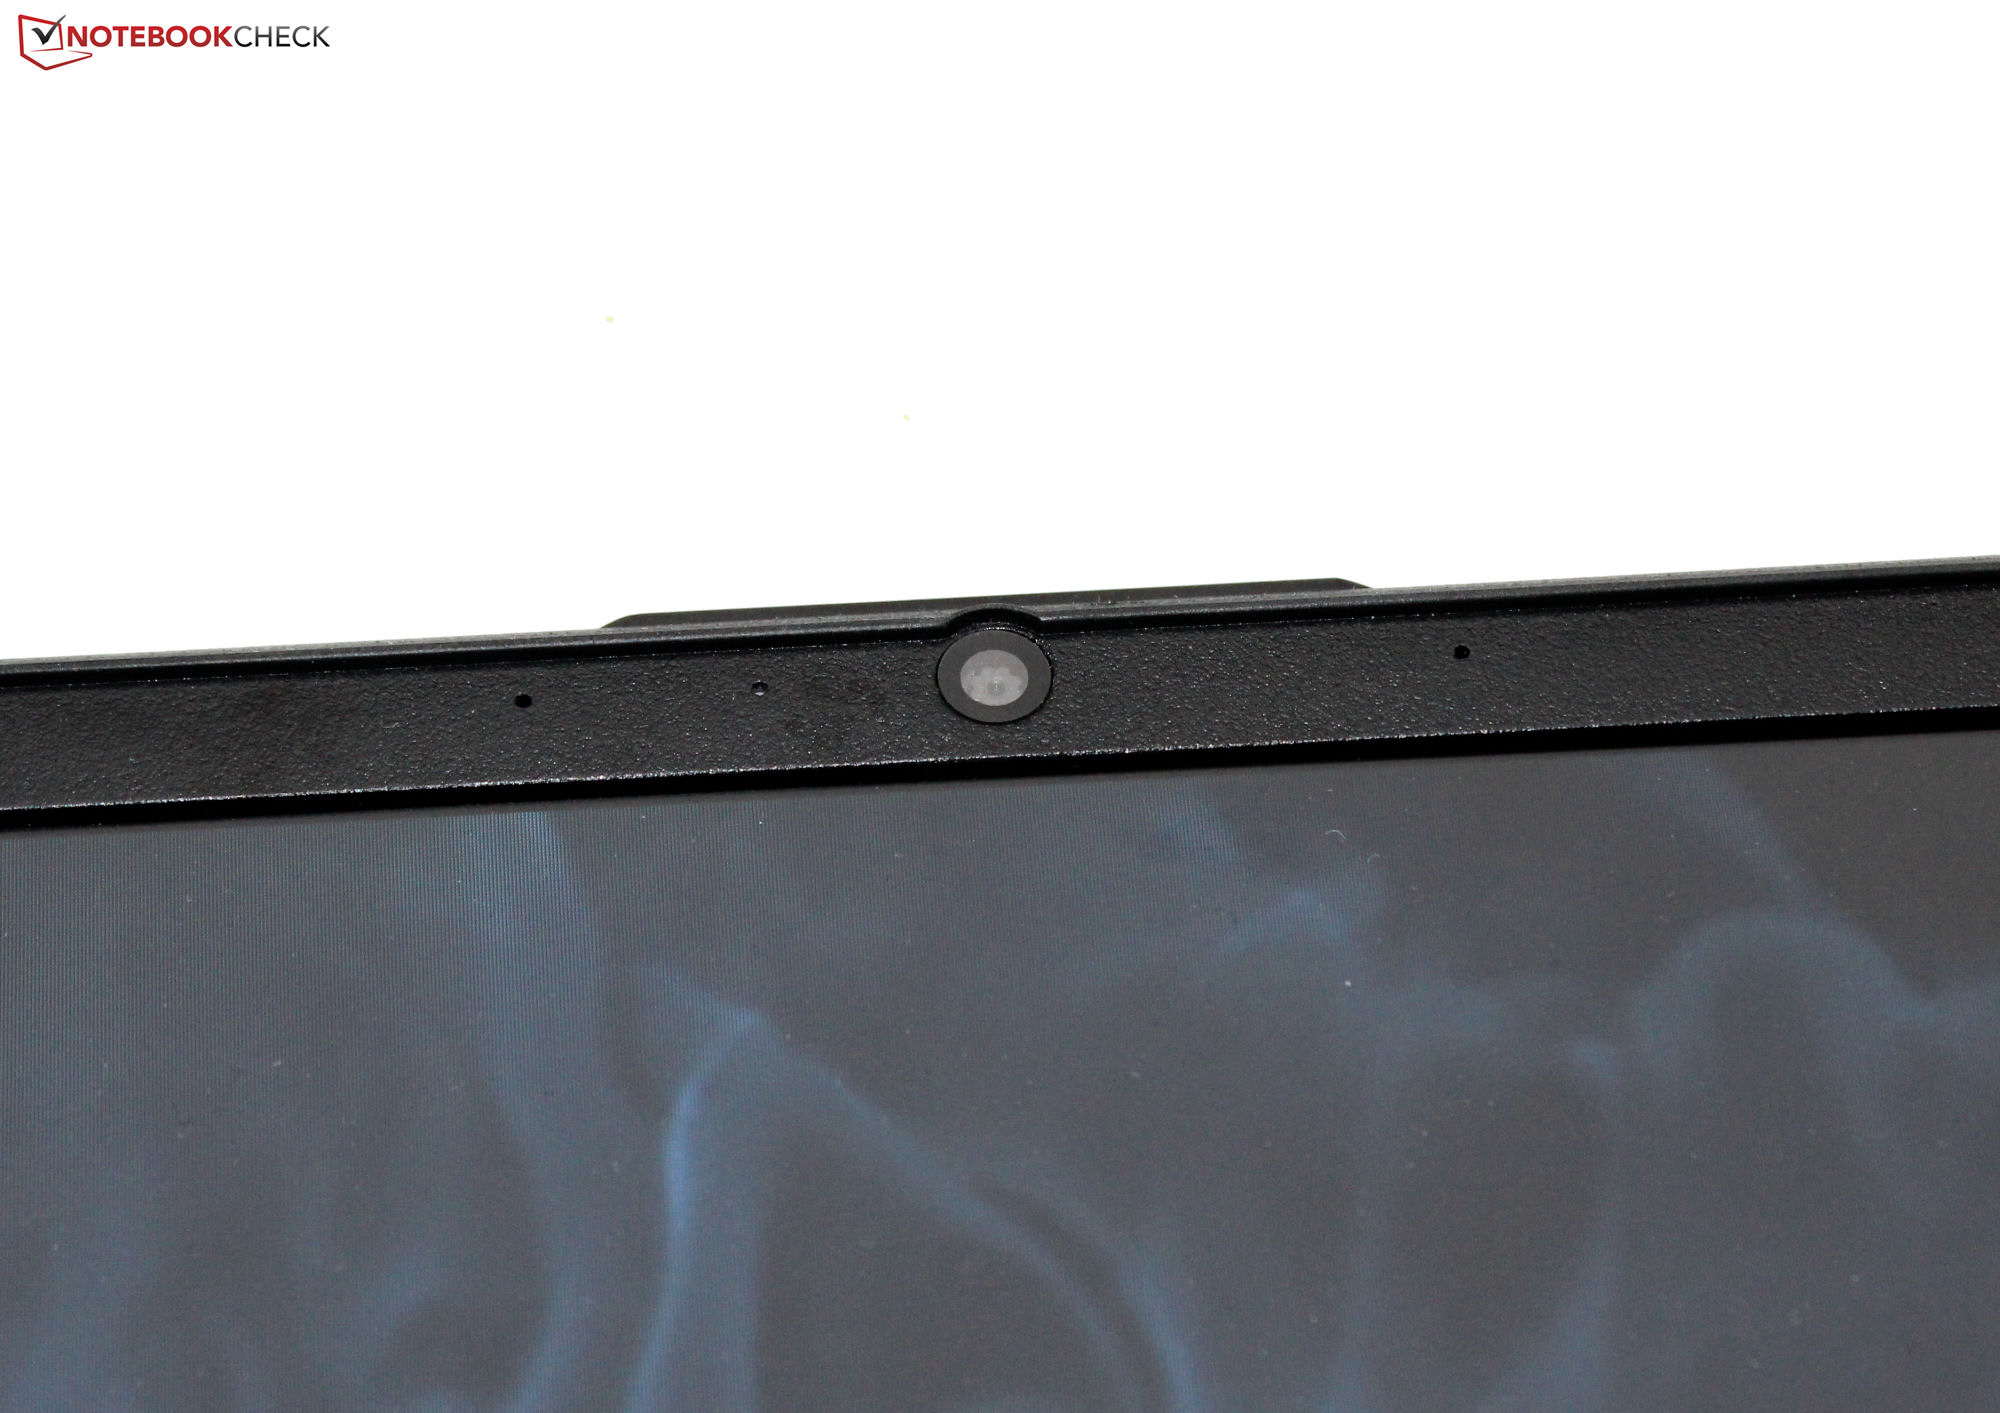
Kamera internetowa
Kamera internetowa 0,9 MP ma maksymalną rozdzielczość 1280 x 720 pikseli i nie oferuje mechanicznej migawki. Jakość, jaką jest w stanie zapewnić, jest standardowa, ale przynajmniej wyniki pokazują tylko stosunkowo niskie odchylenie kolorów.


Akcesoria
Laptop nie zawiera żadnych dodatkowych akcesoriów poza zwykłą dokumentacją, taką jak instrukcja szybkiego startu i informacje gwarancyjne.
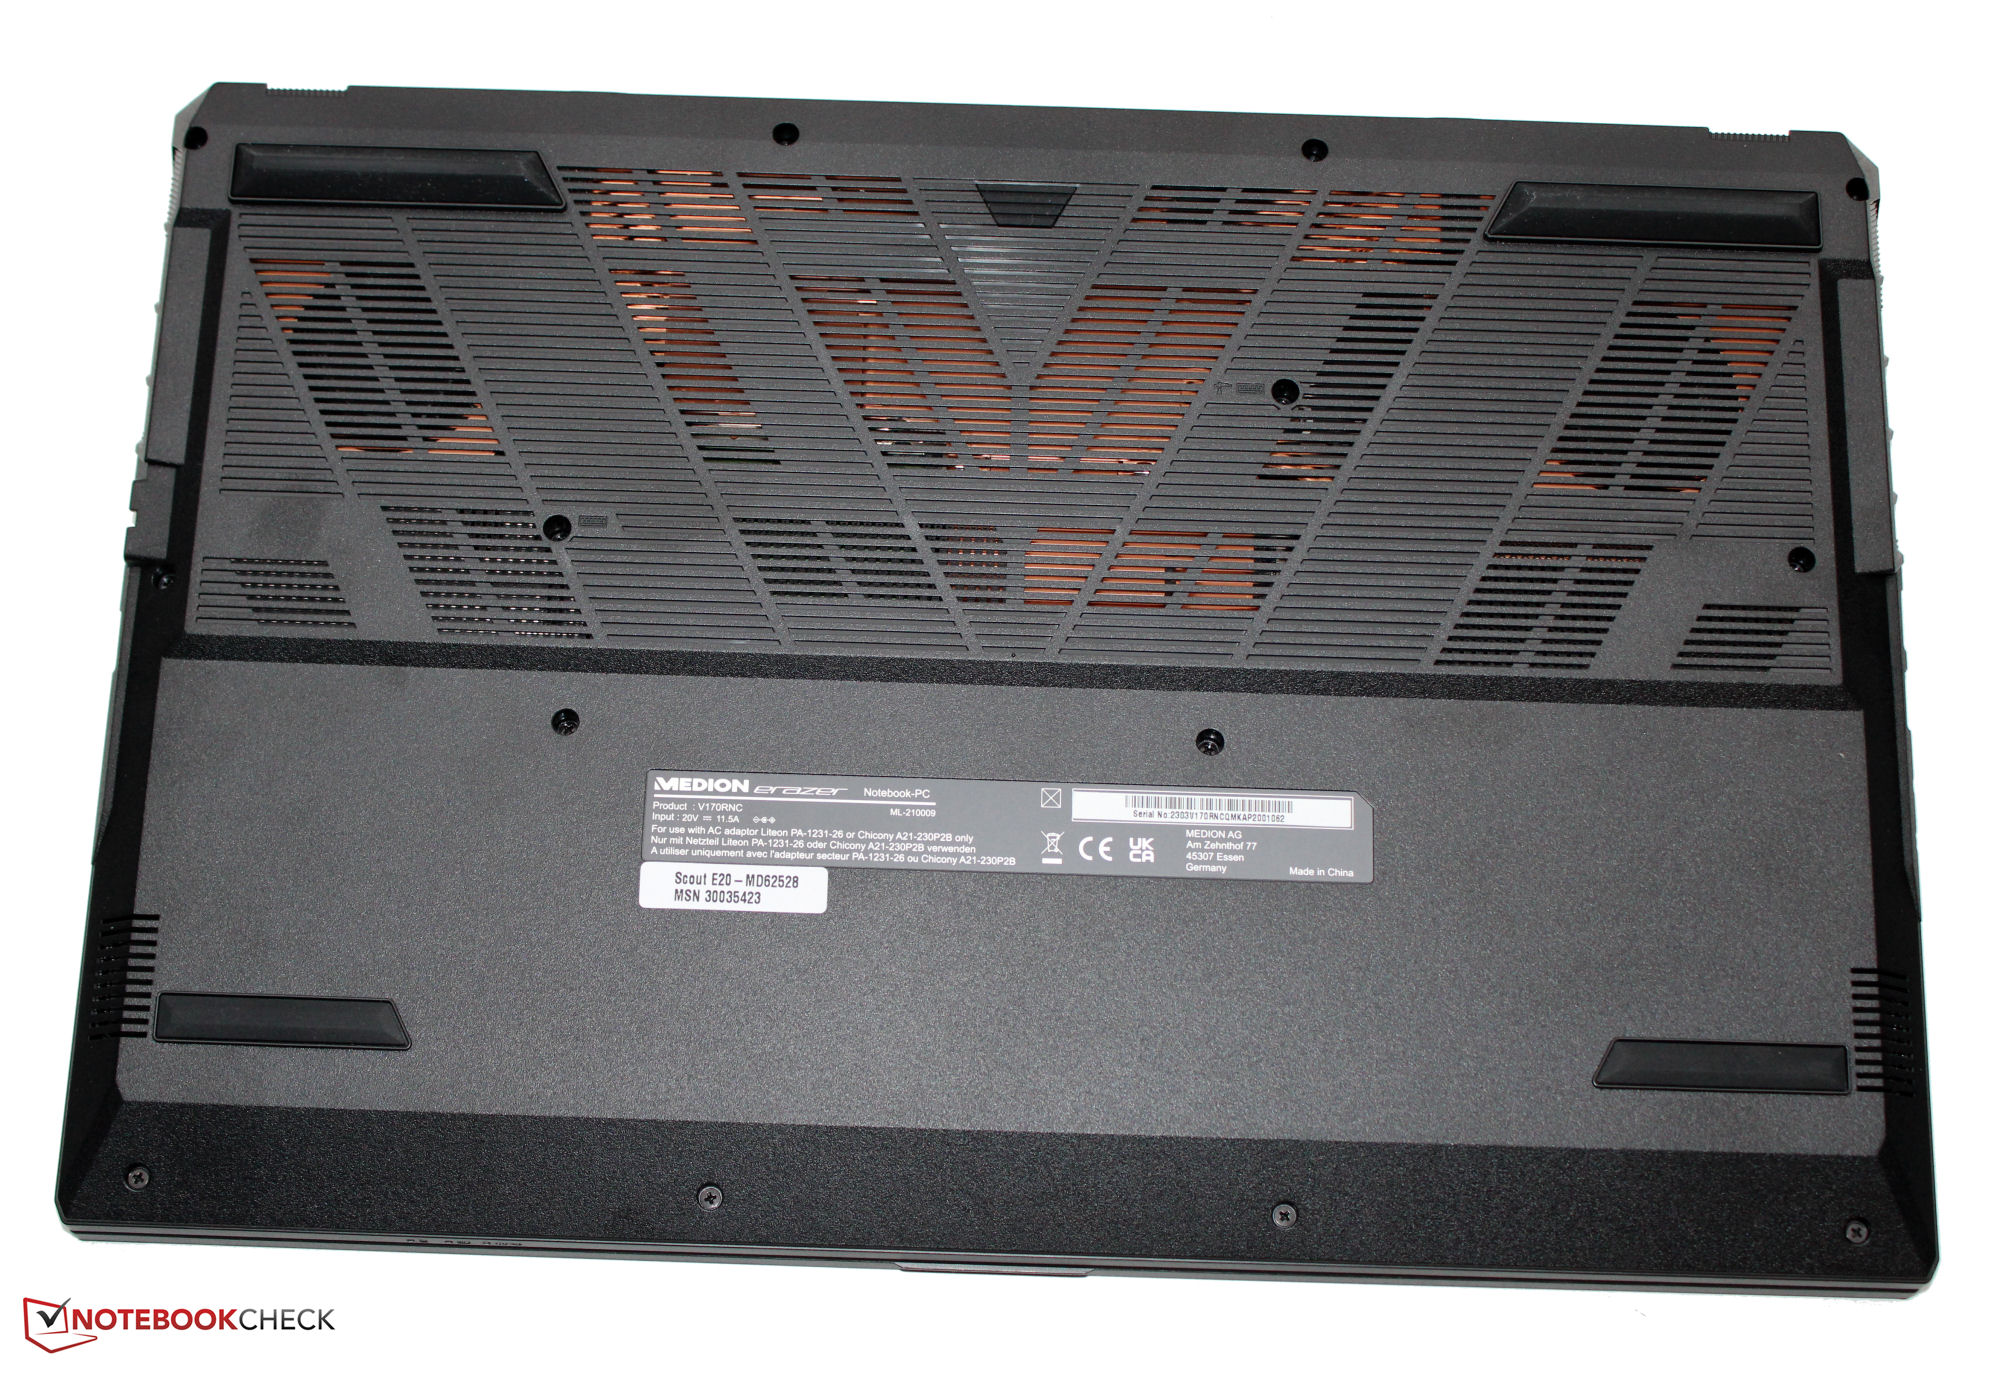
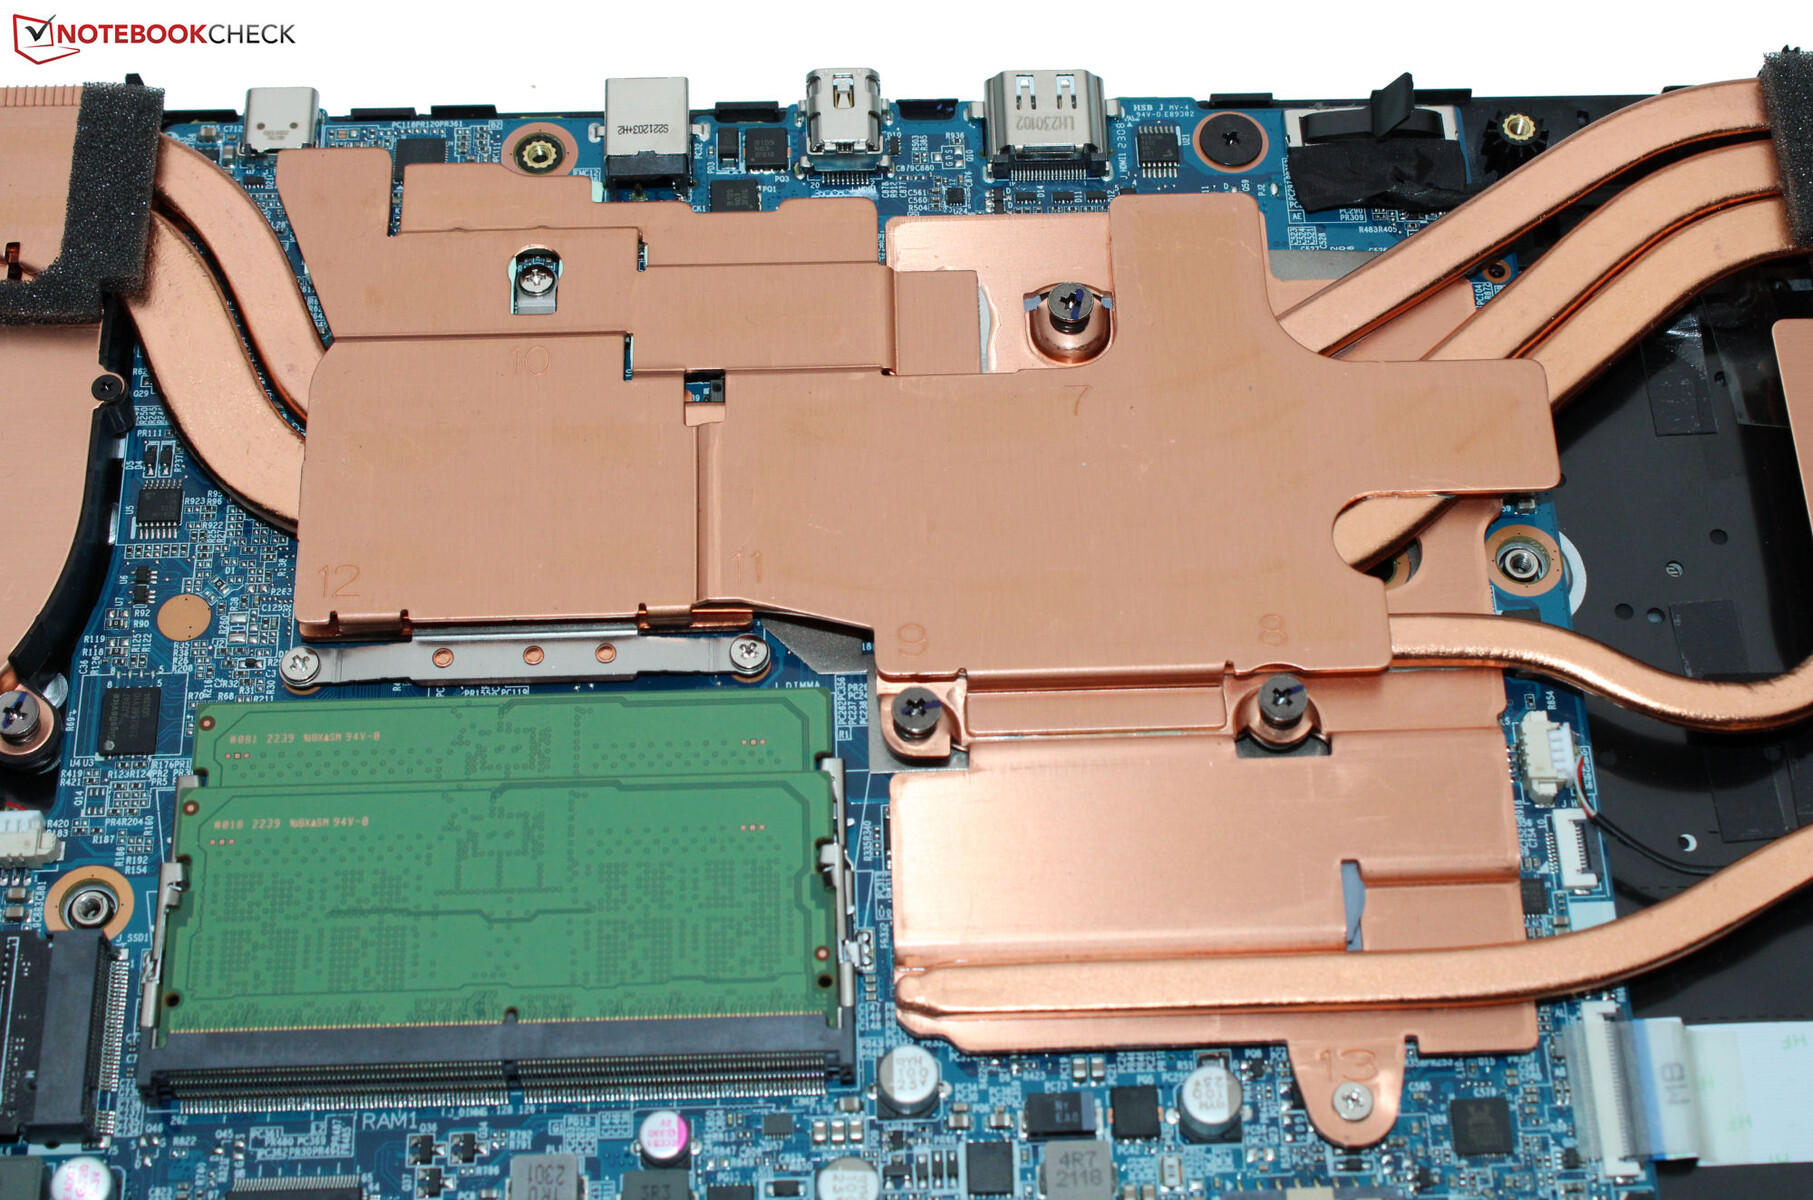
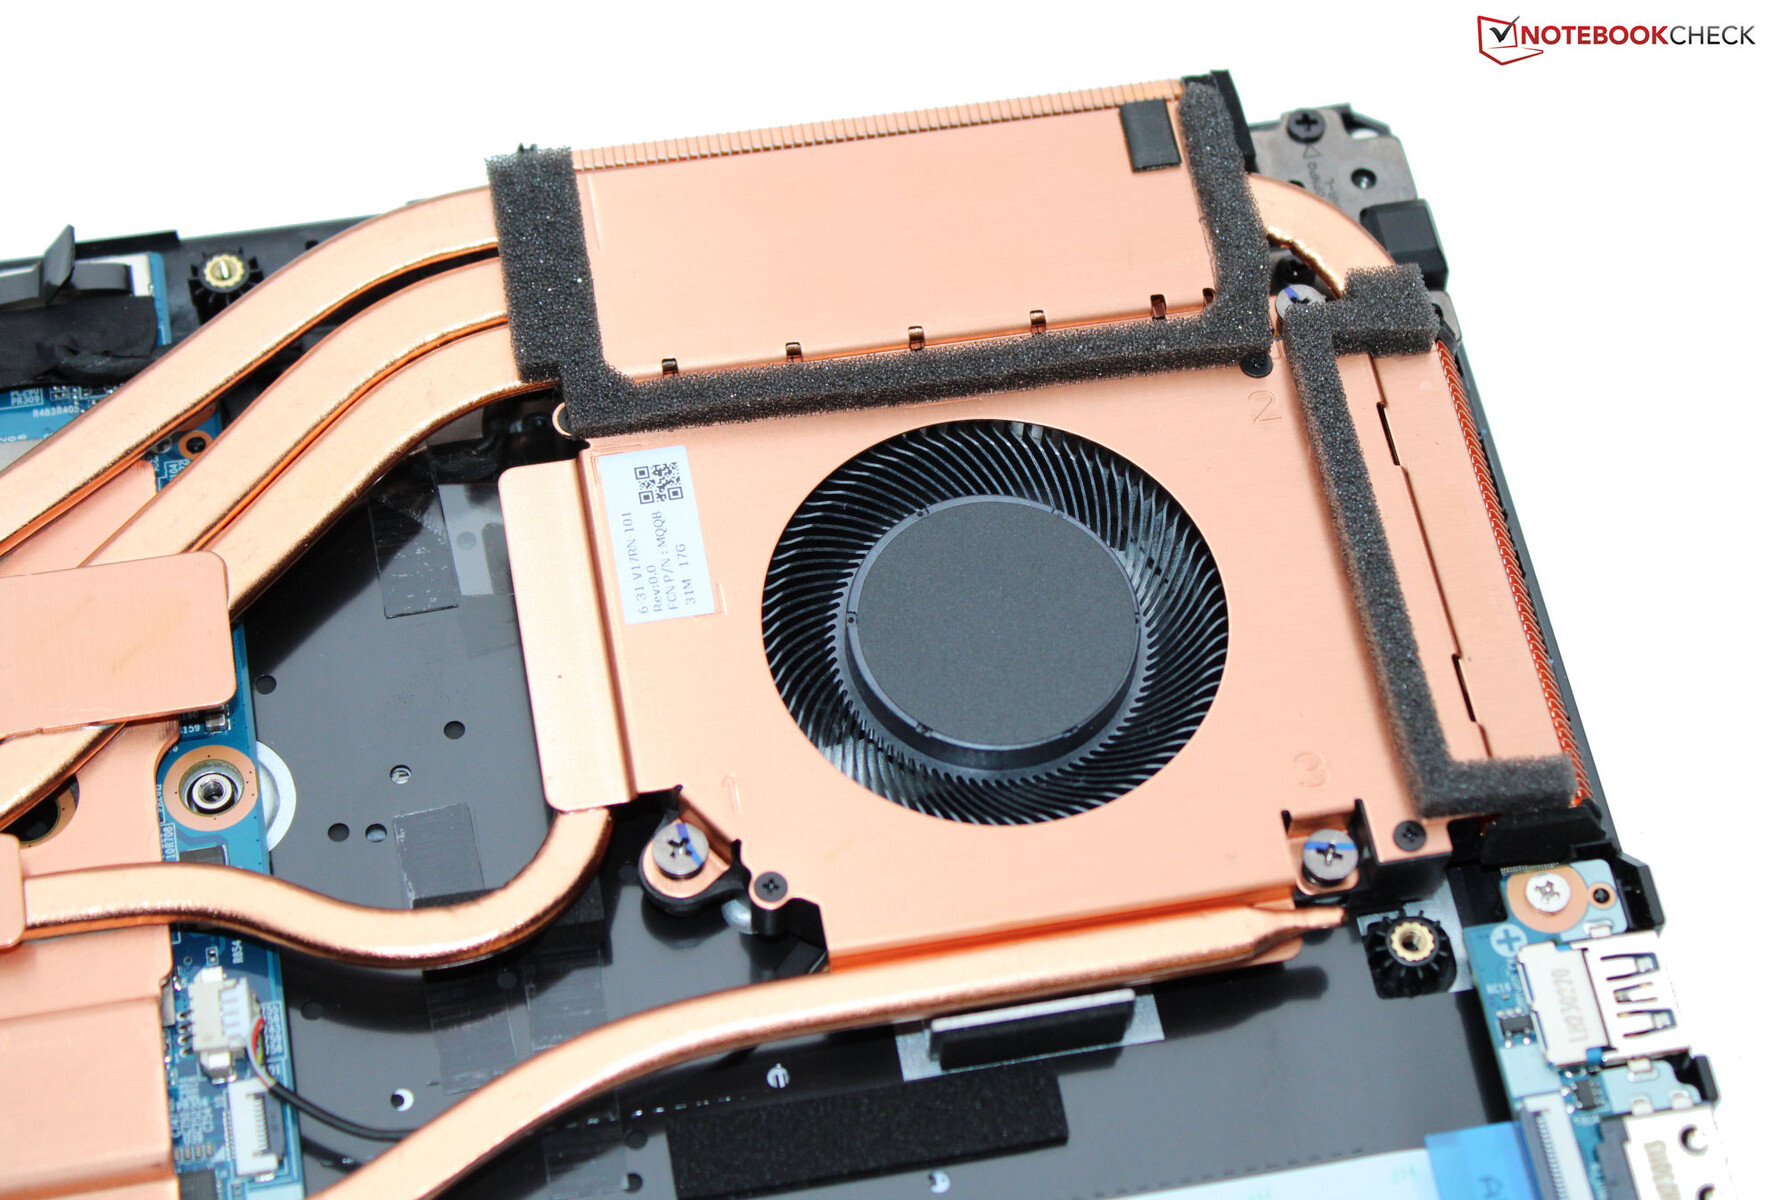
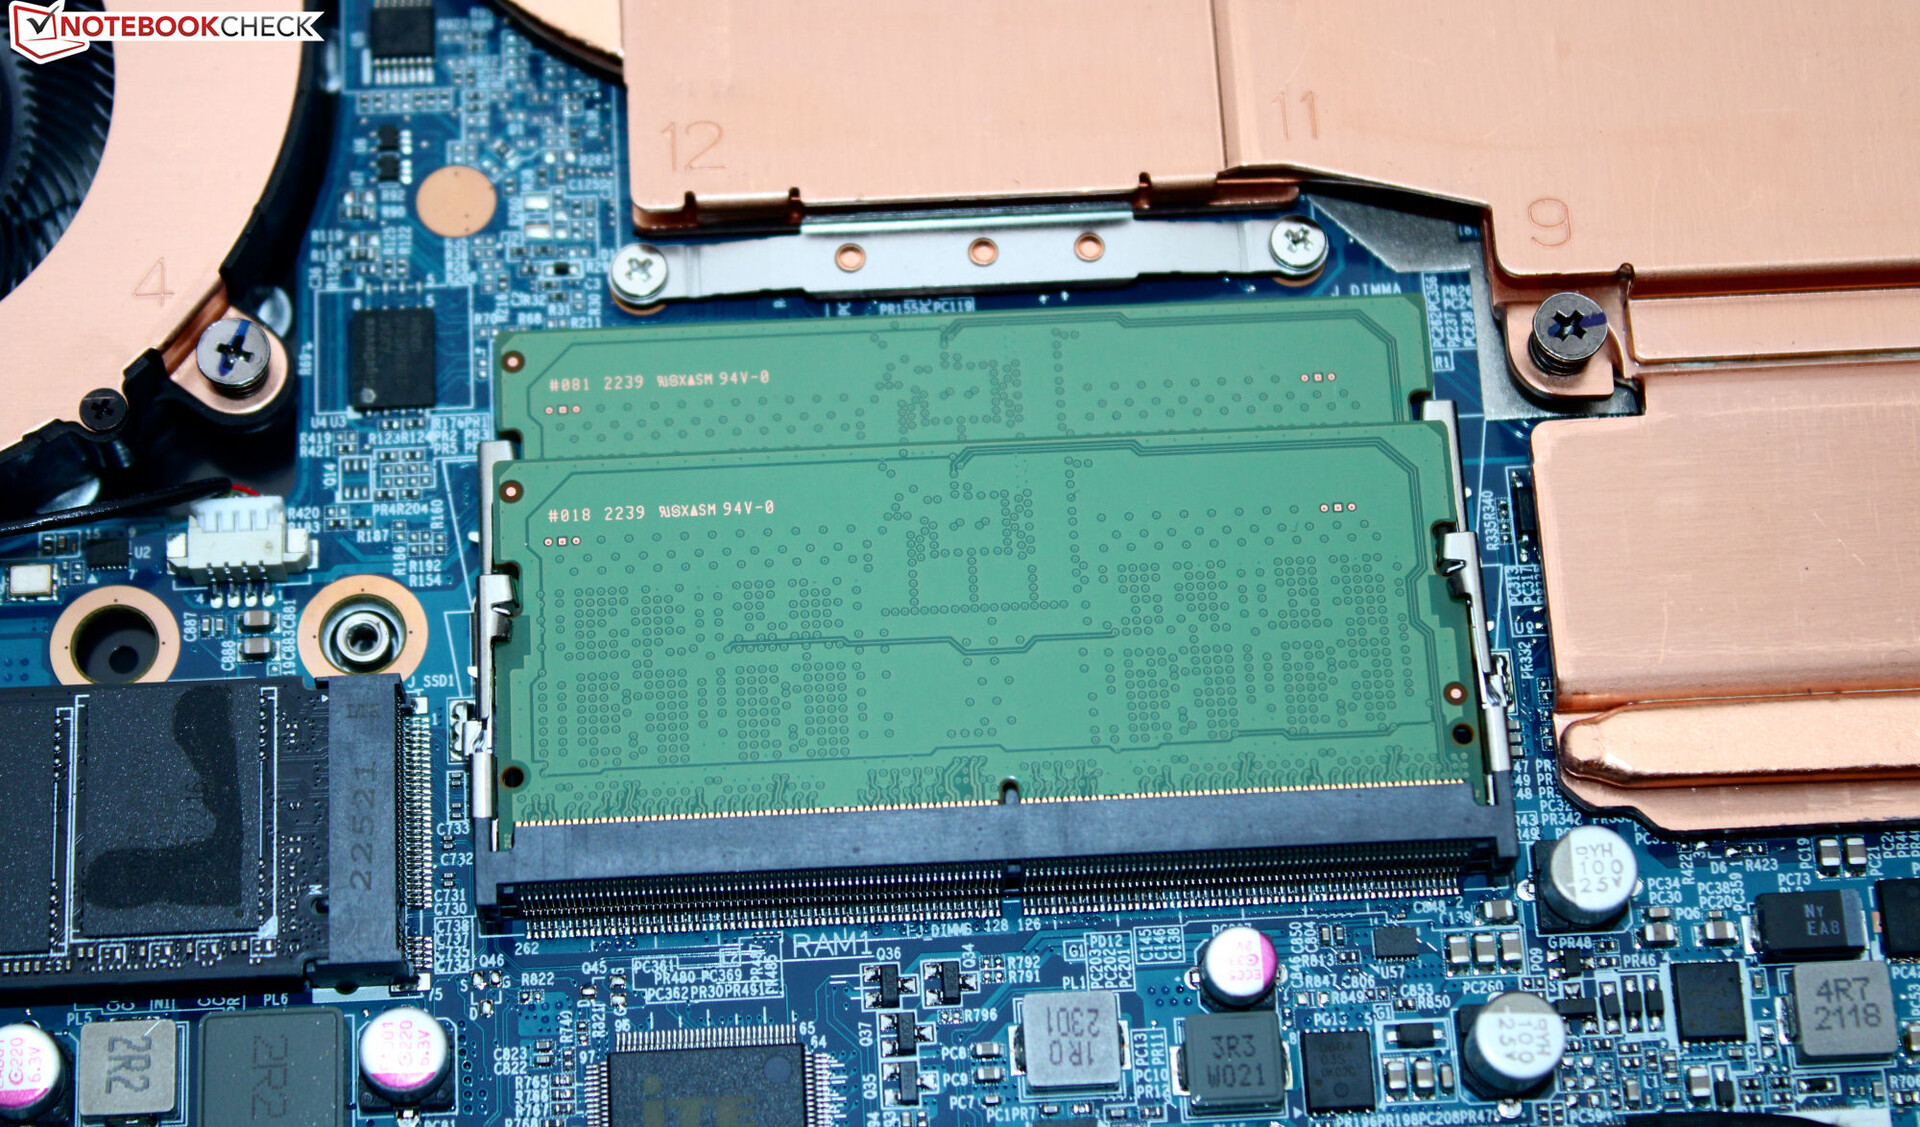
Konserwacja
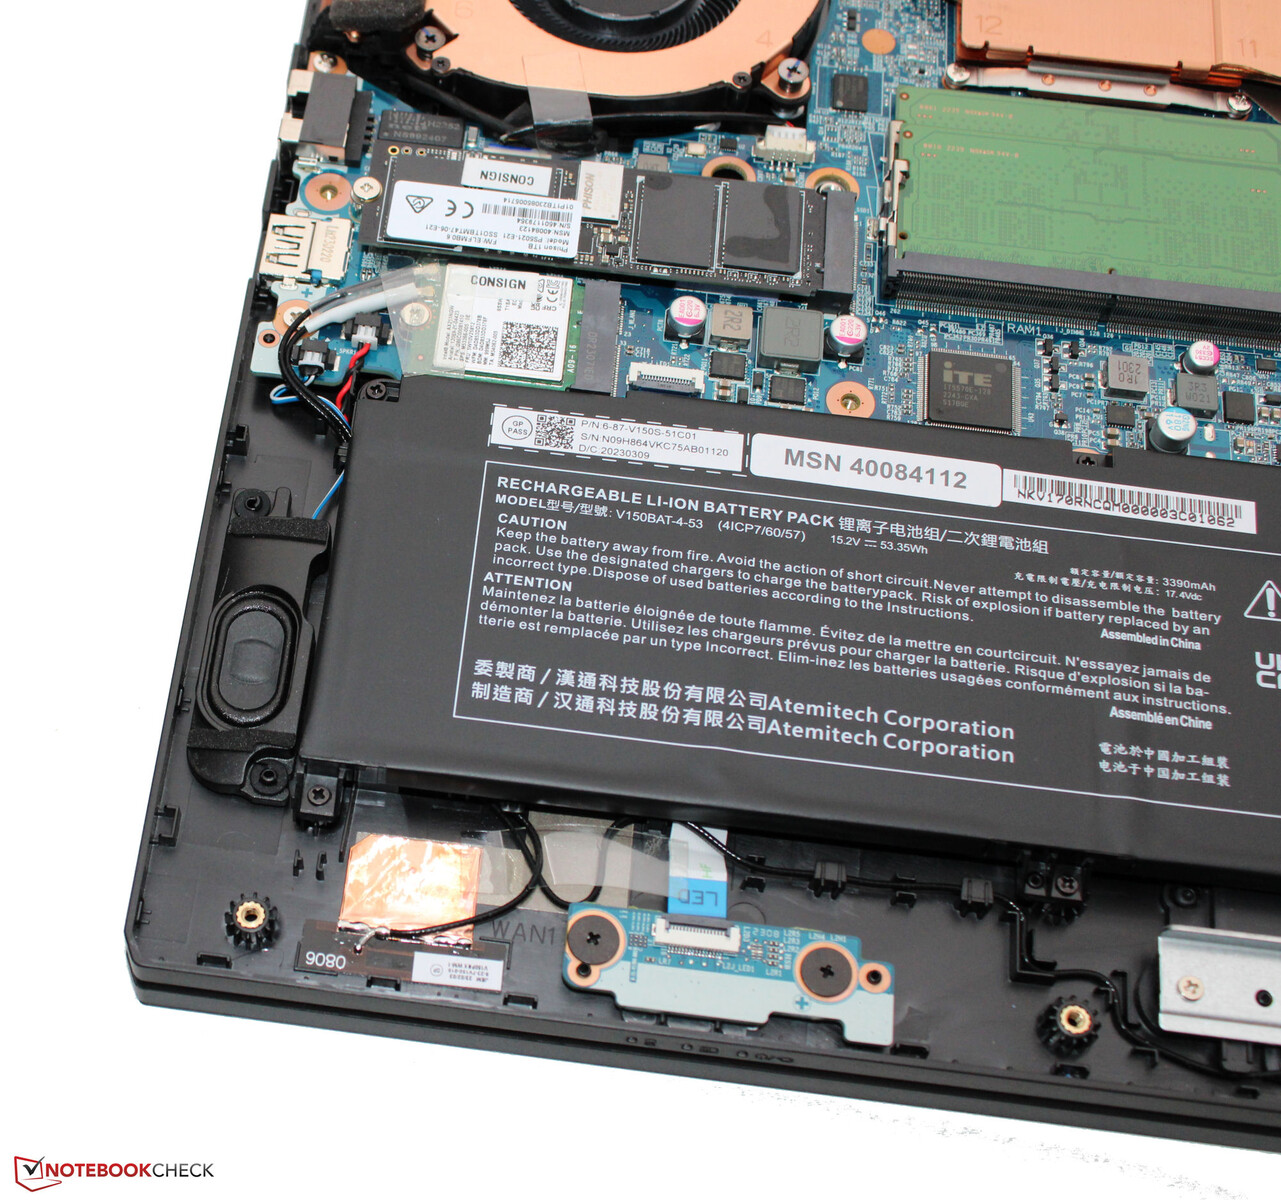
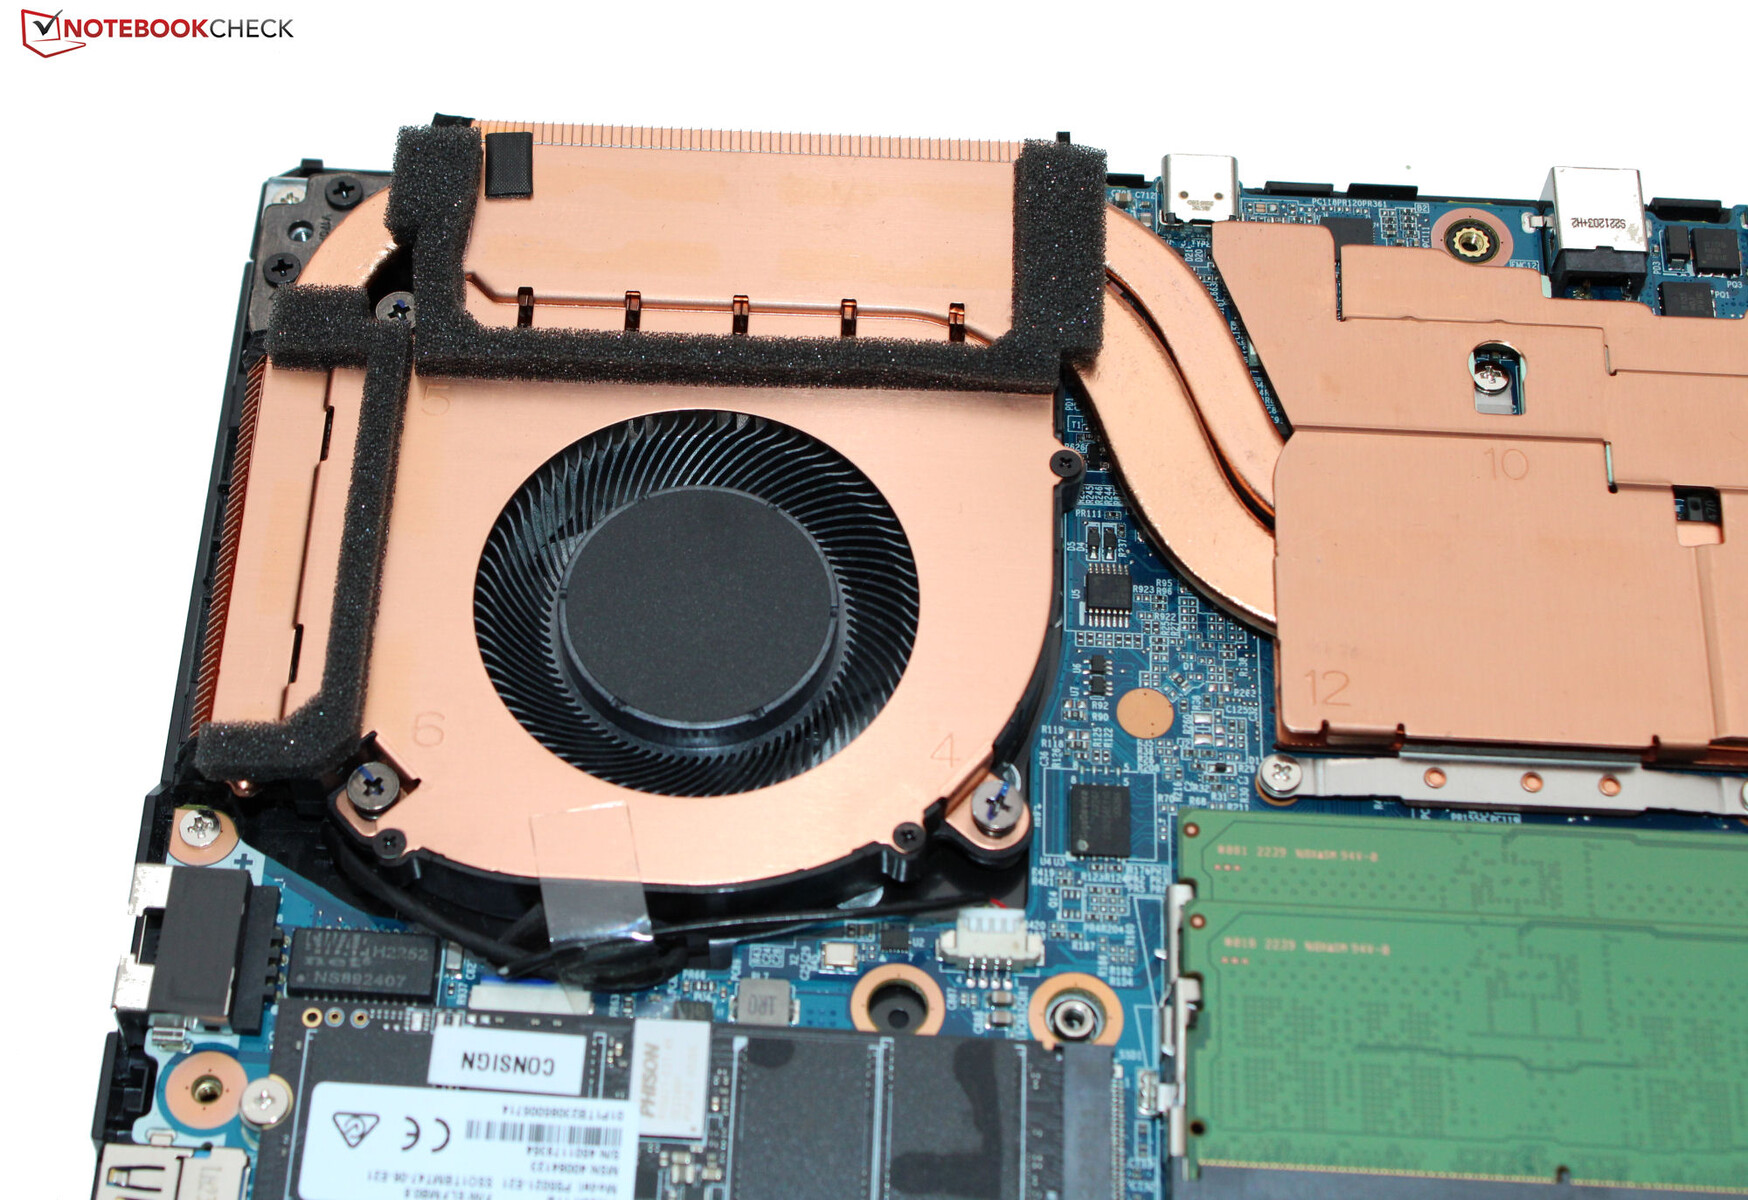
Po odkręceniu licznych śrubek na spodzie obudowy, można zdjąć dolną płytę za pomocą narzędzia do podważania, takiego jak płaska szpatułka. Uzyskamy wtedy dostęp do banków pamięci operacyjnej (oba są zajęte), dysku SSD PCIe 4 M.2-2280, modułu WLAN, wentylatorów i baterii.
Gwarancja
Medion oferuje dwuletnią gwarancję na Erazera. Rozszerzenia gwarancji są dostępne, ale należy je zakupić wraz z laptopem w sklepie internetowym Medion. Nie ma możliwości dokupienia ich później.
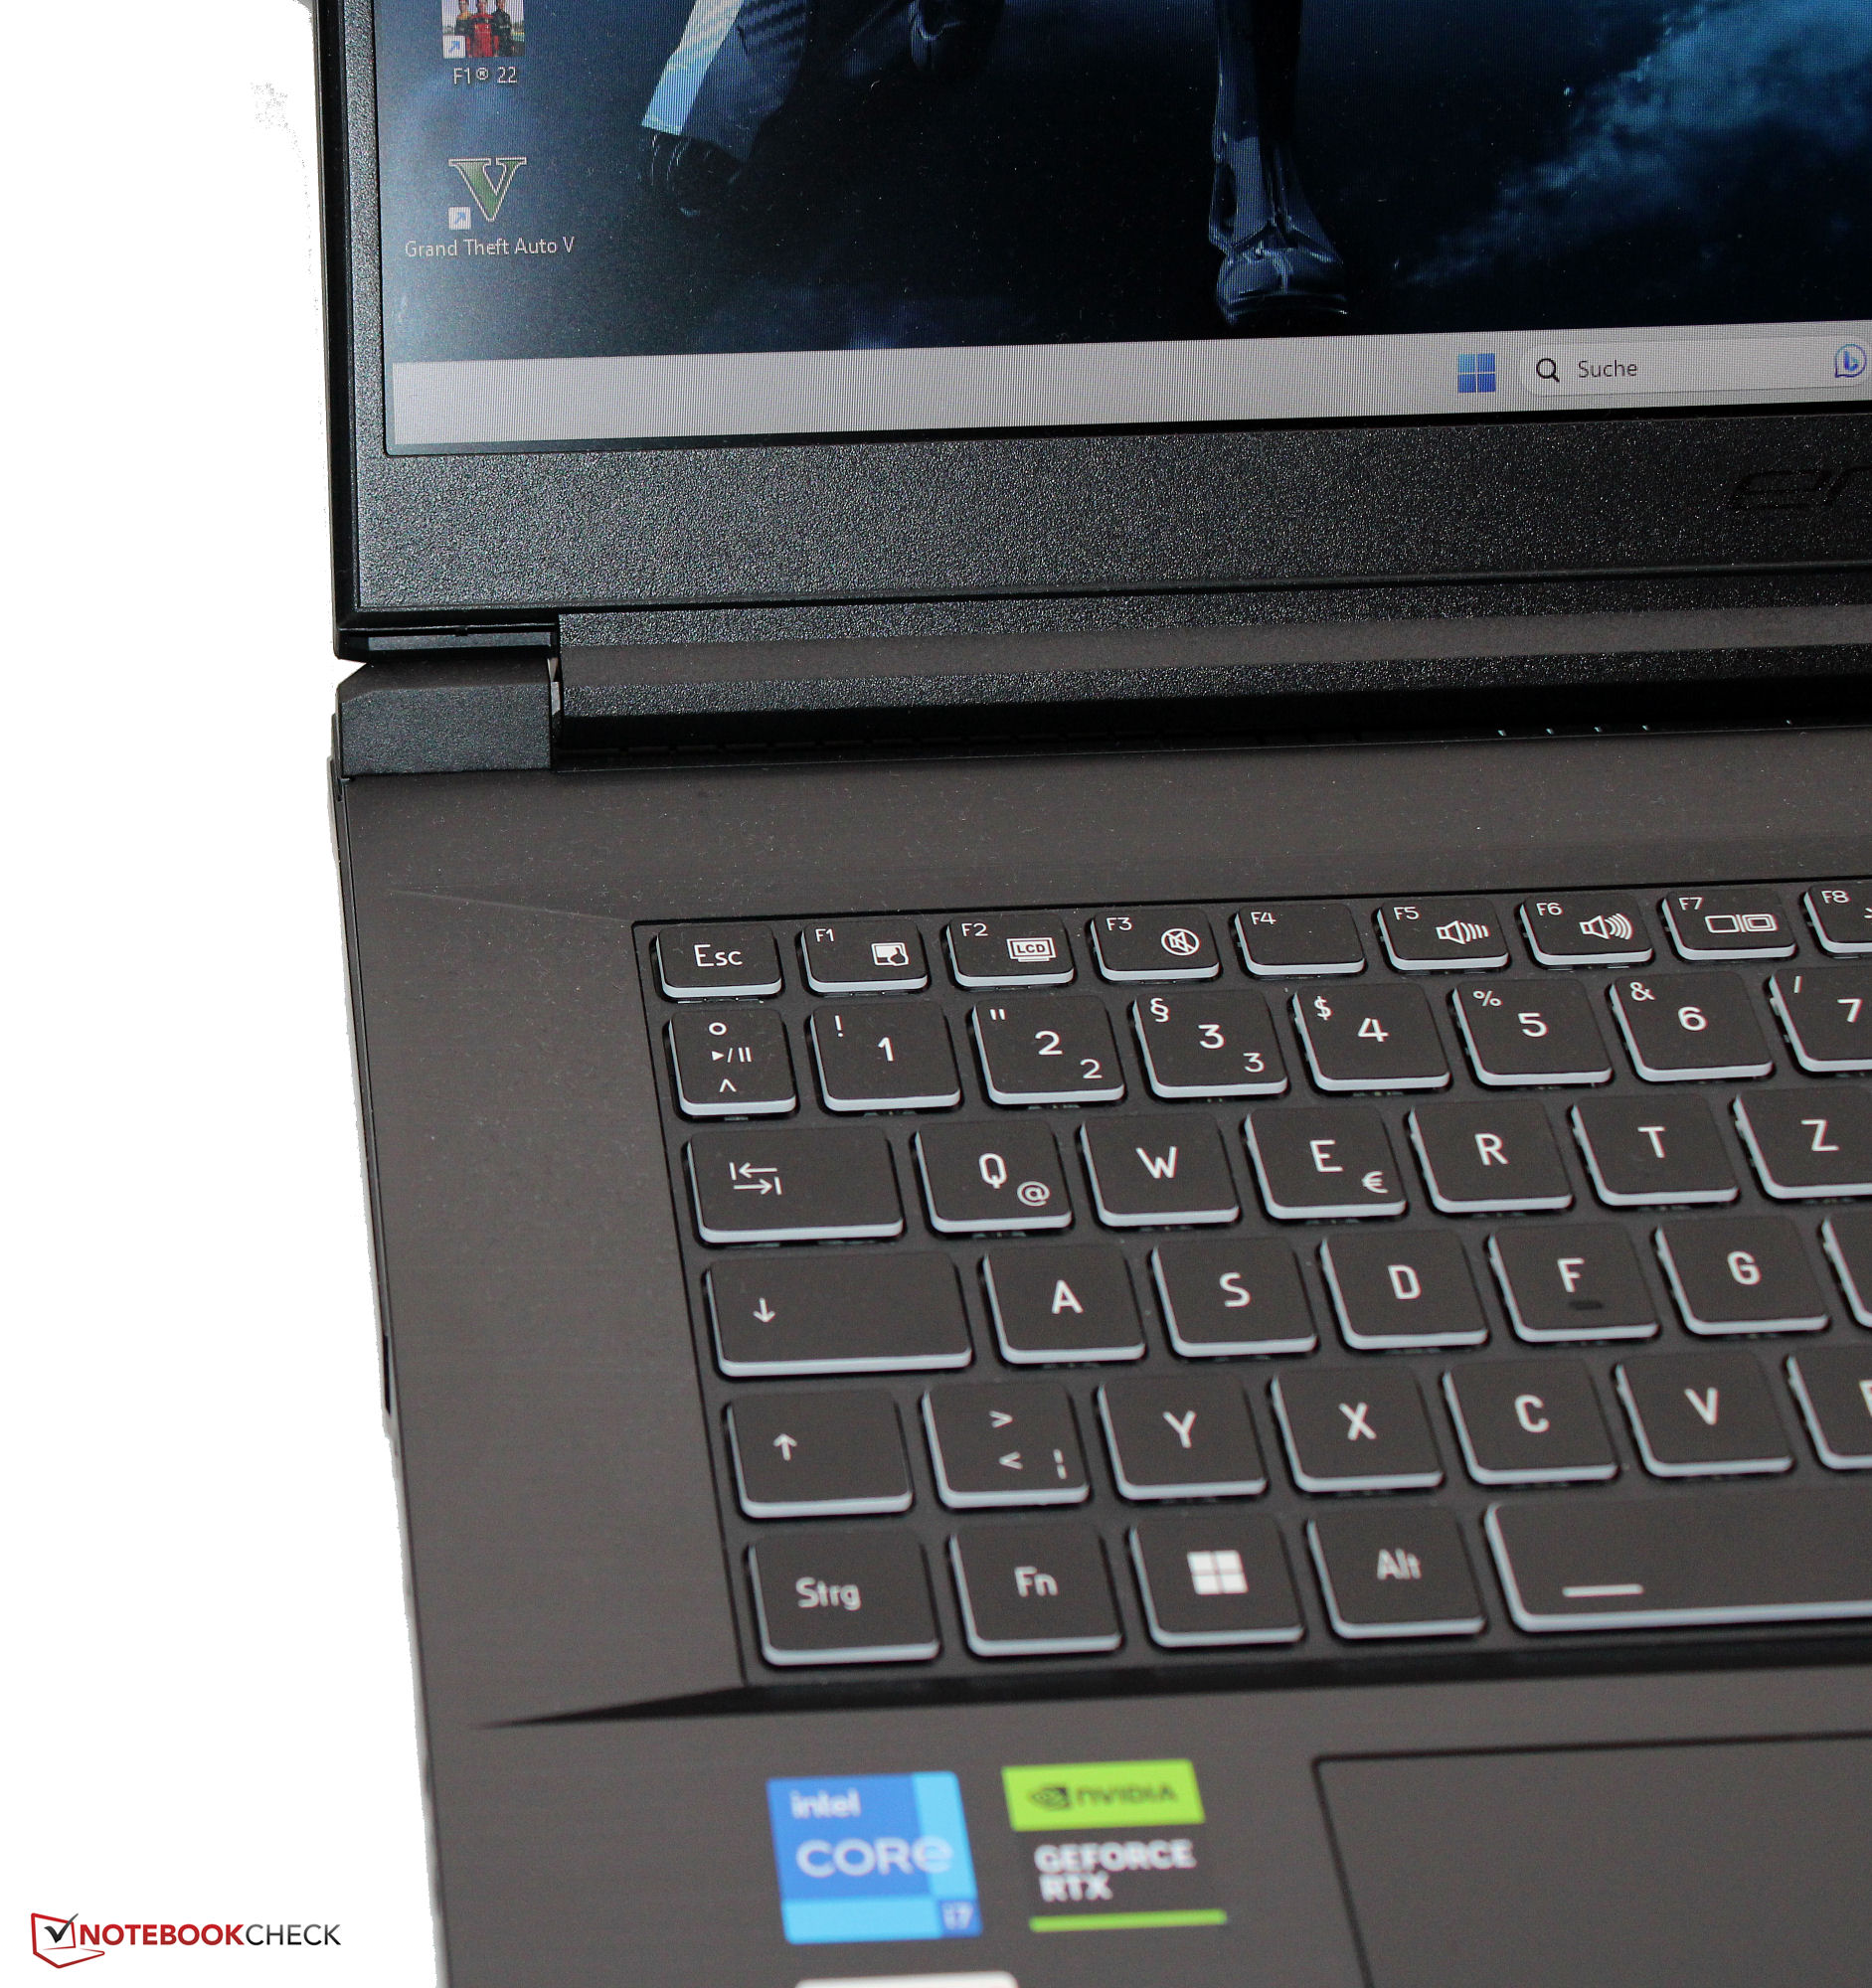
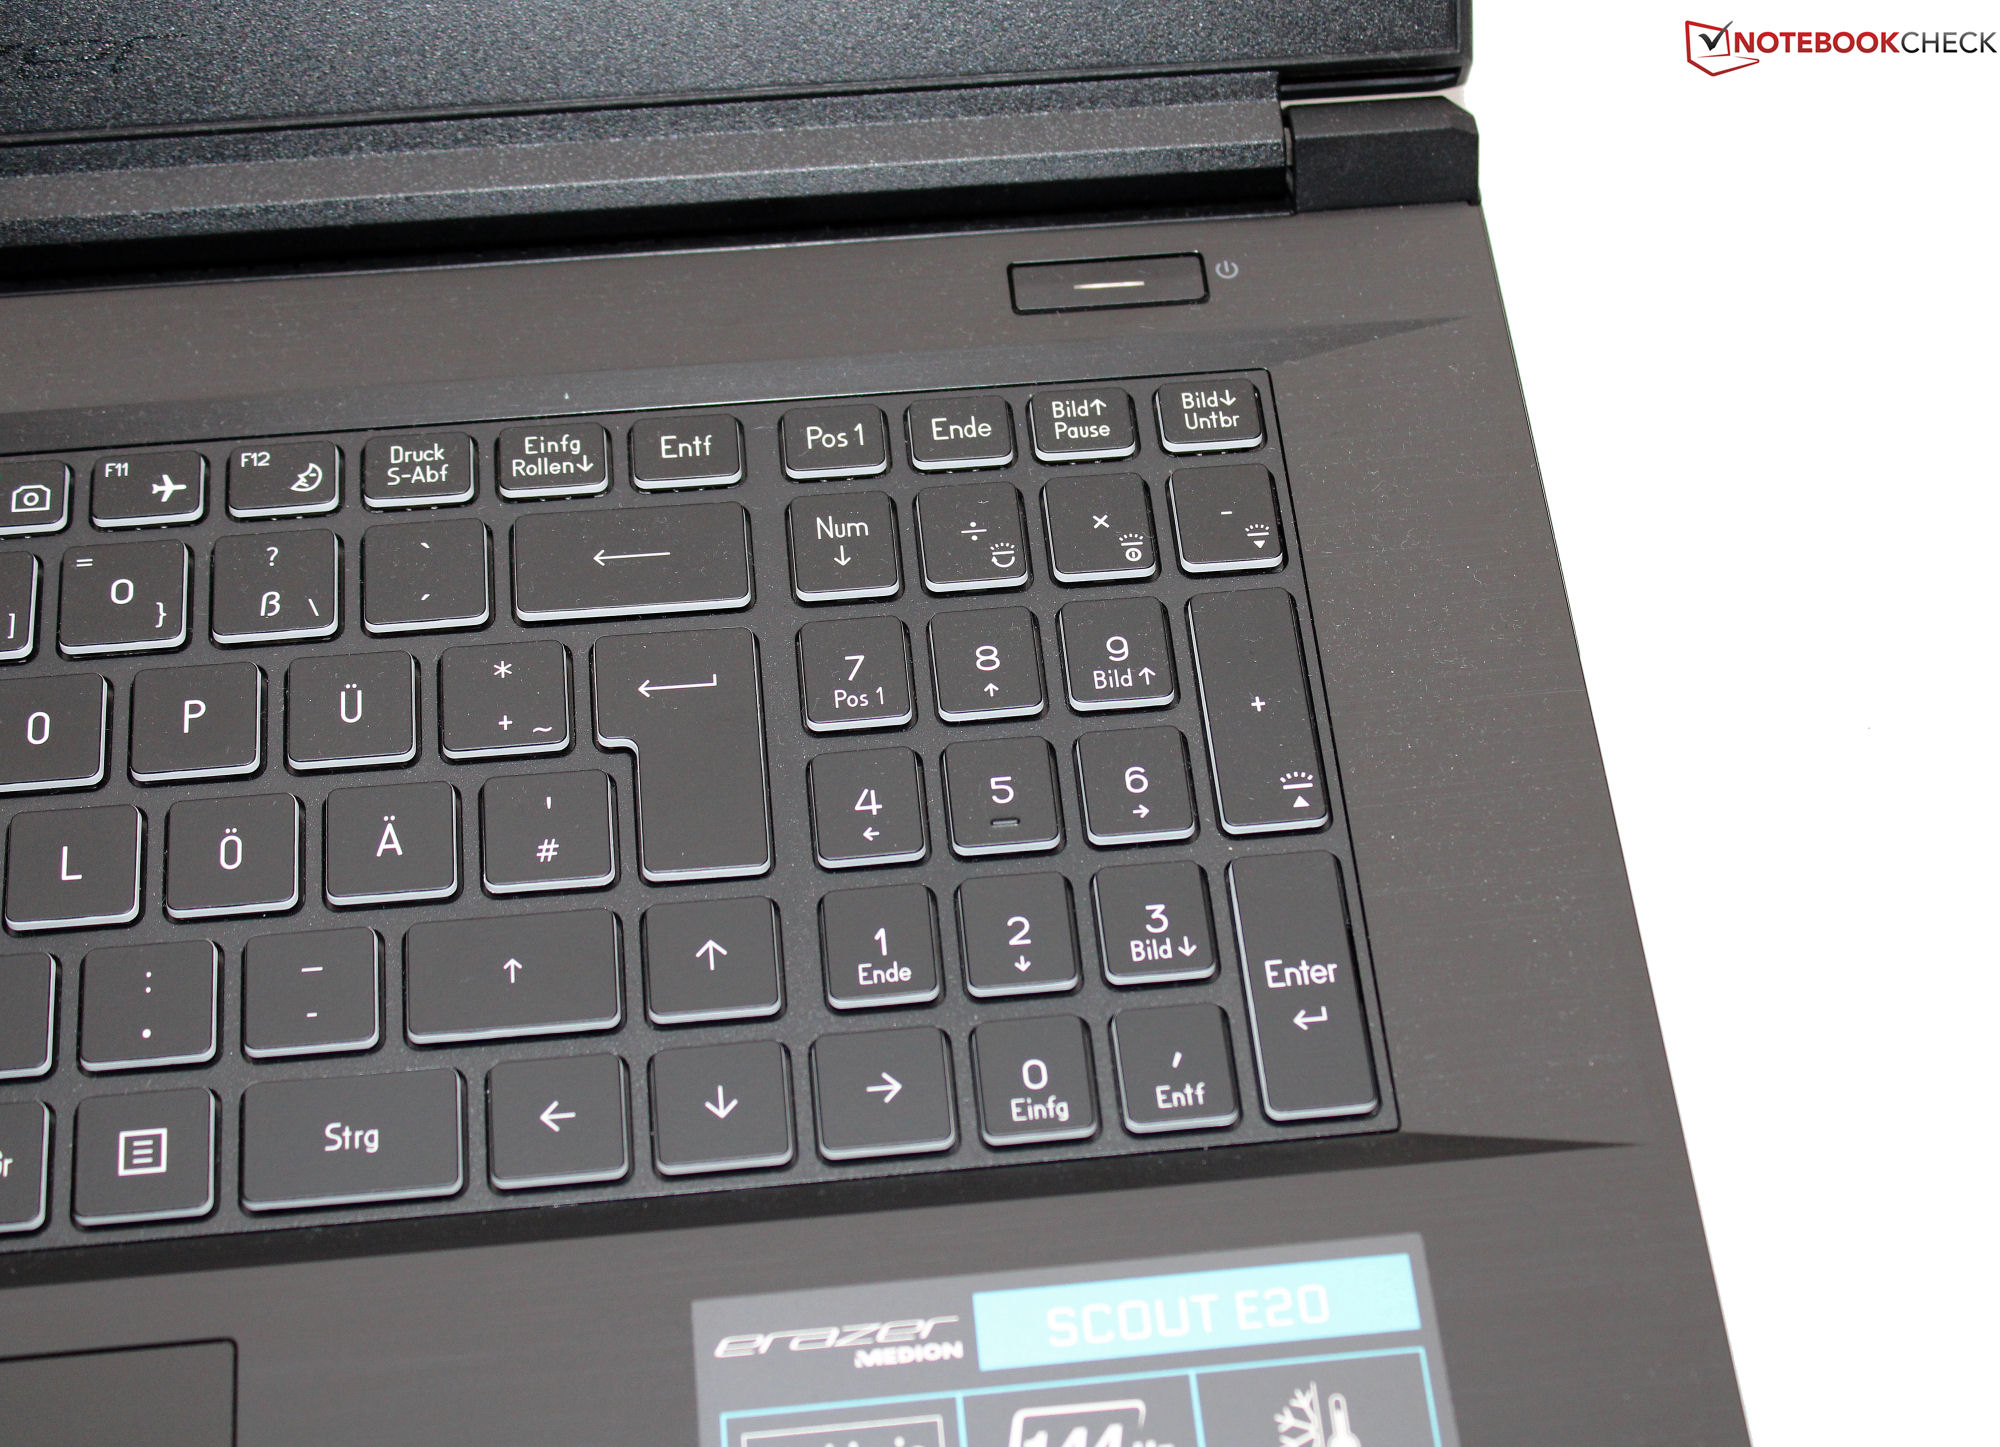
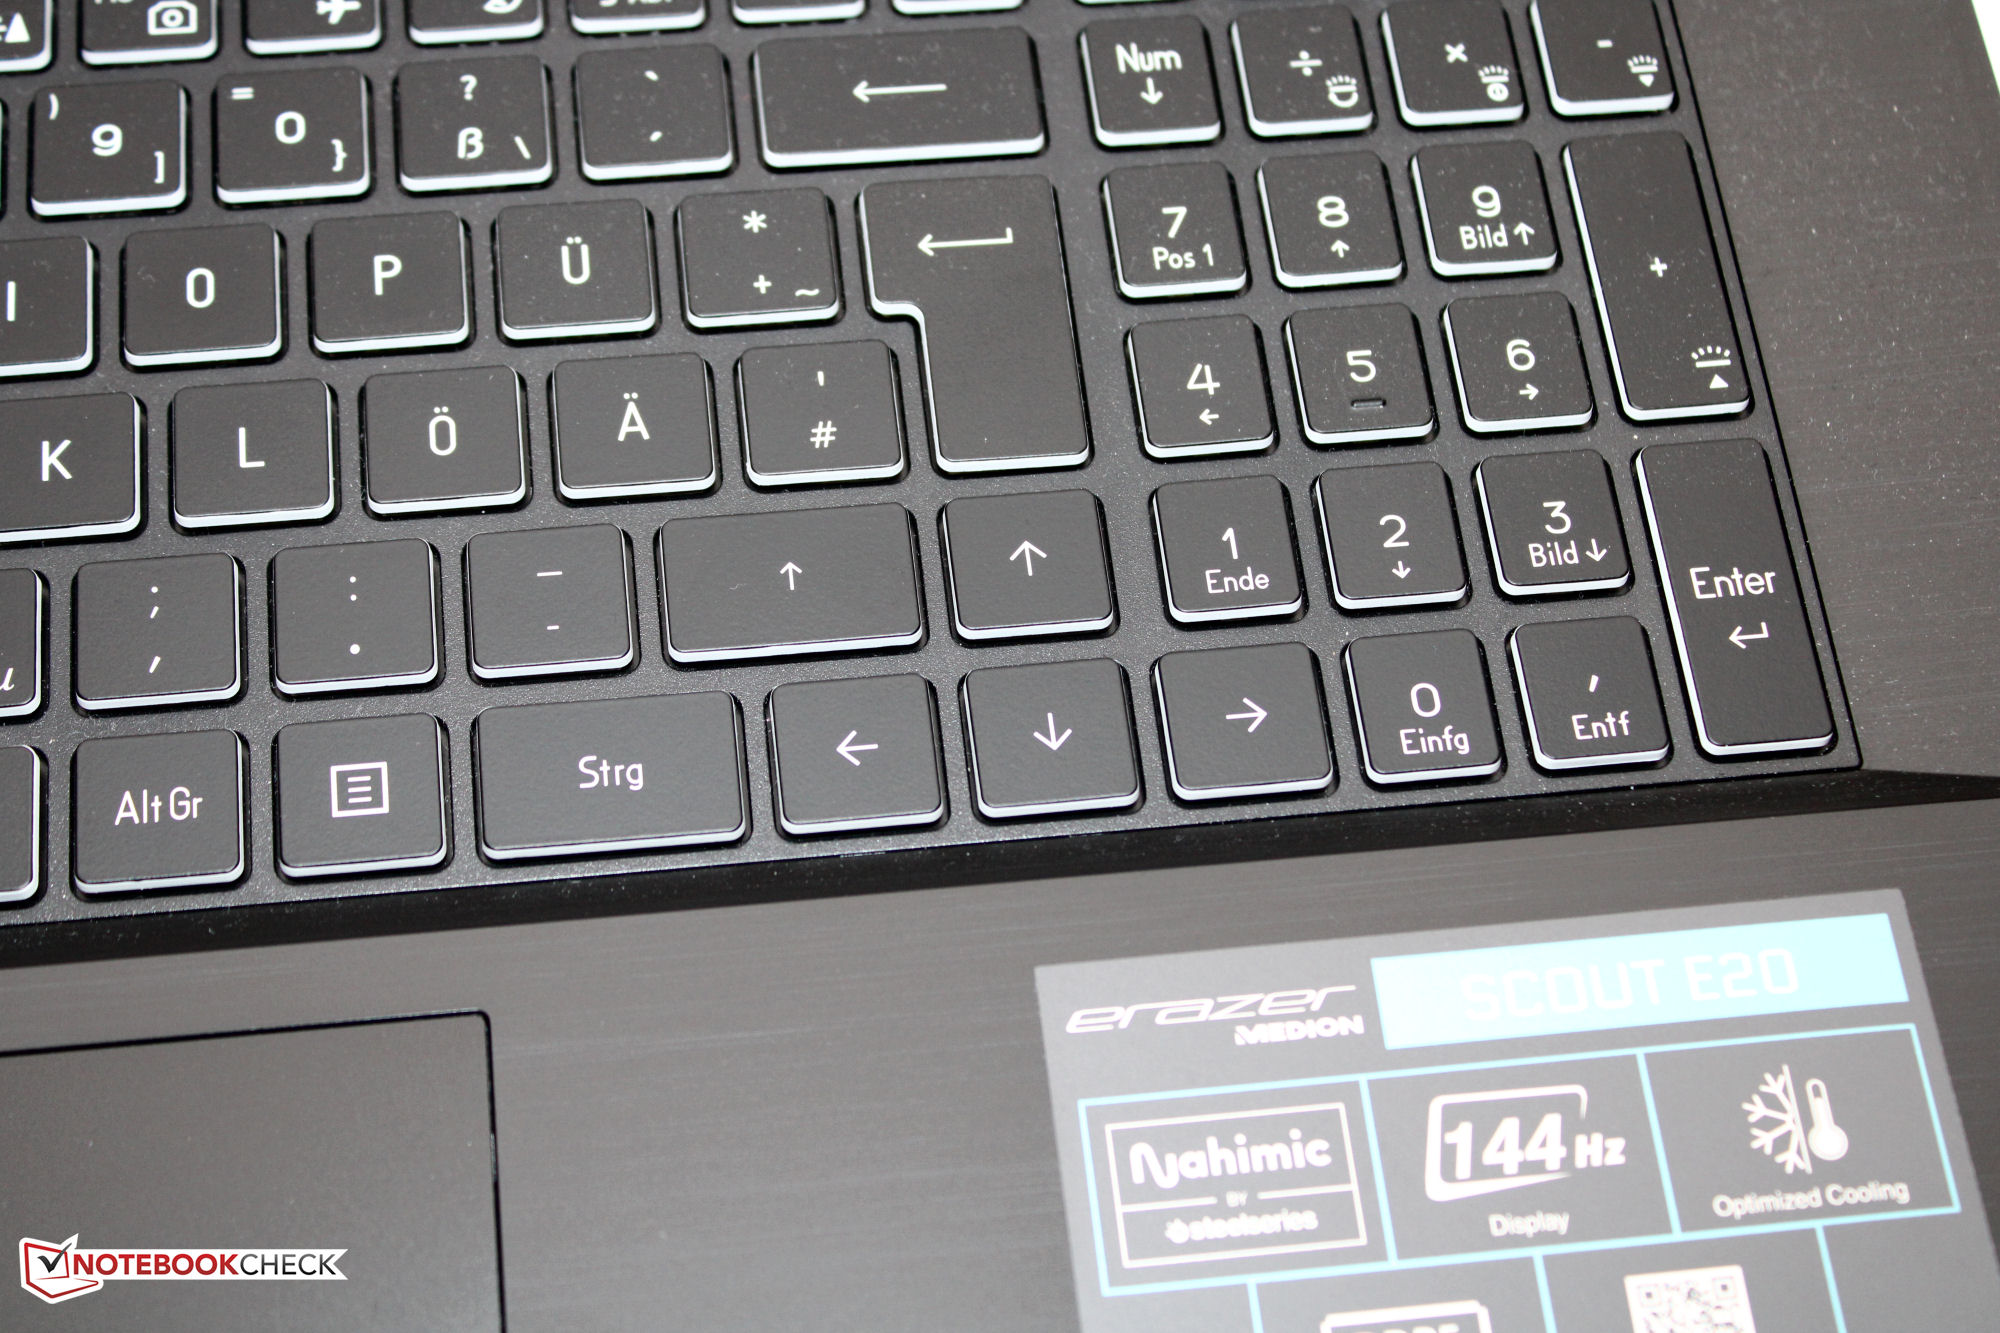
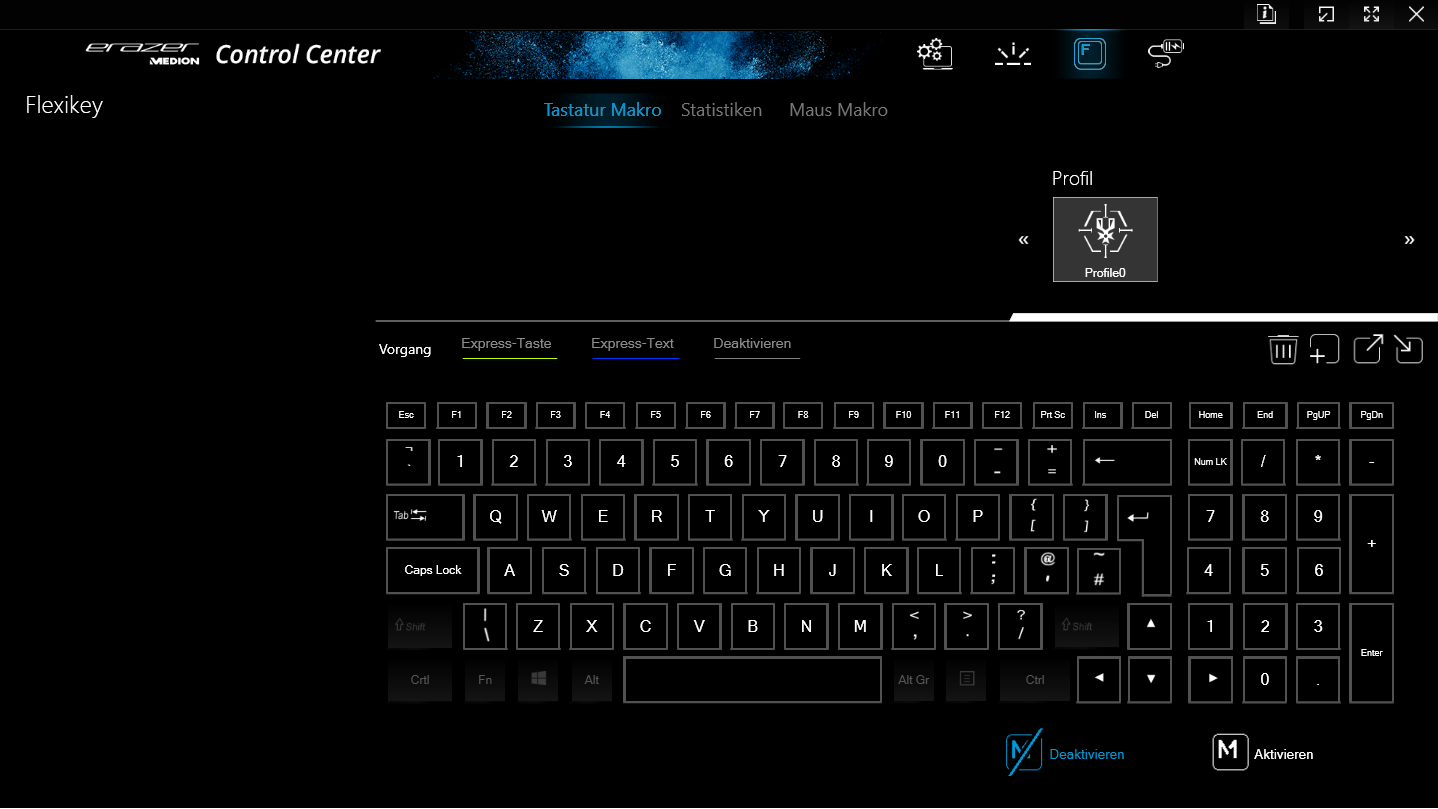
Urządzenia wejściowe - klawiatura E20 z podświetleniem RGB
Klawiatura
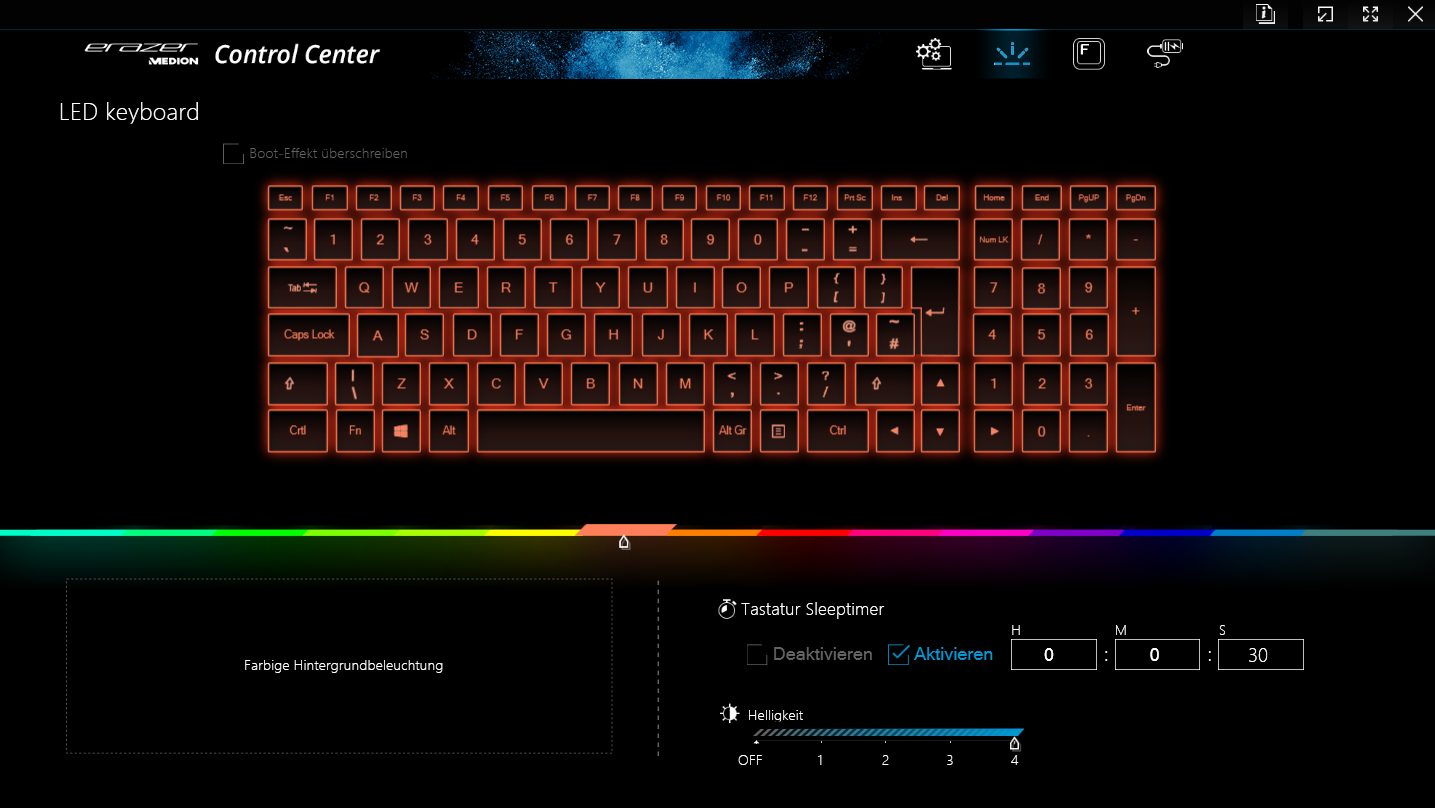
Gładkie, płaskie klawisze klawiatury typu chiclet (zawierającej blok numeryczny) oferują krótki skok i wyraźny punkt nacisku. Opór klawiszy jest w porządku. Podczas pisania klawiatura ma co najwyżej minimalne ugięcie, co nie okazuje się przeszkodą. Podświetlenie klawiatury ma cztery poziomy jasności. Ogólnie rzecz biorąc, Medion dostarczył tutaj klawiaturę, która nadaje się do codziennych zadań.
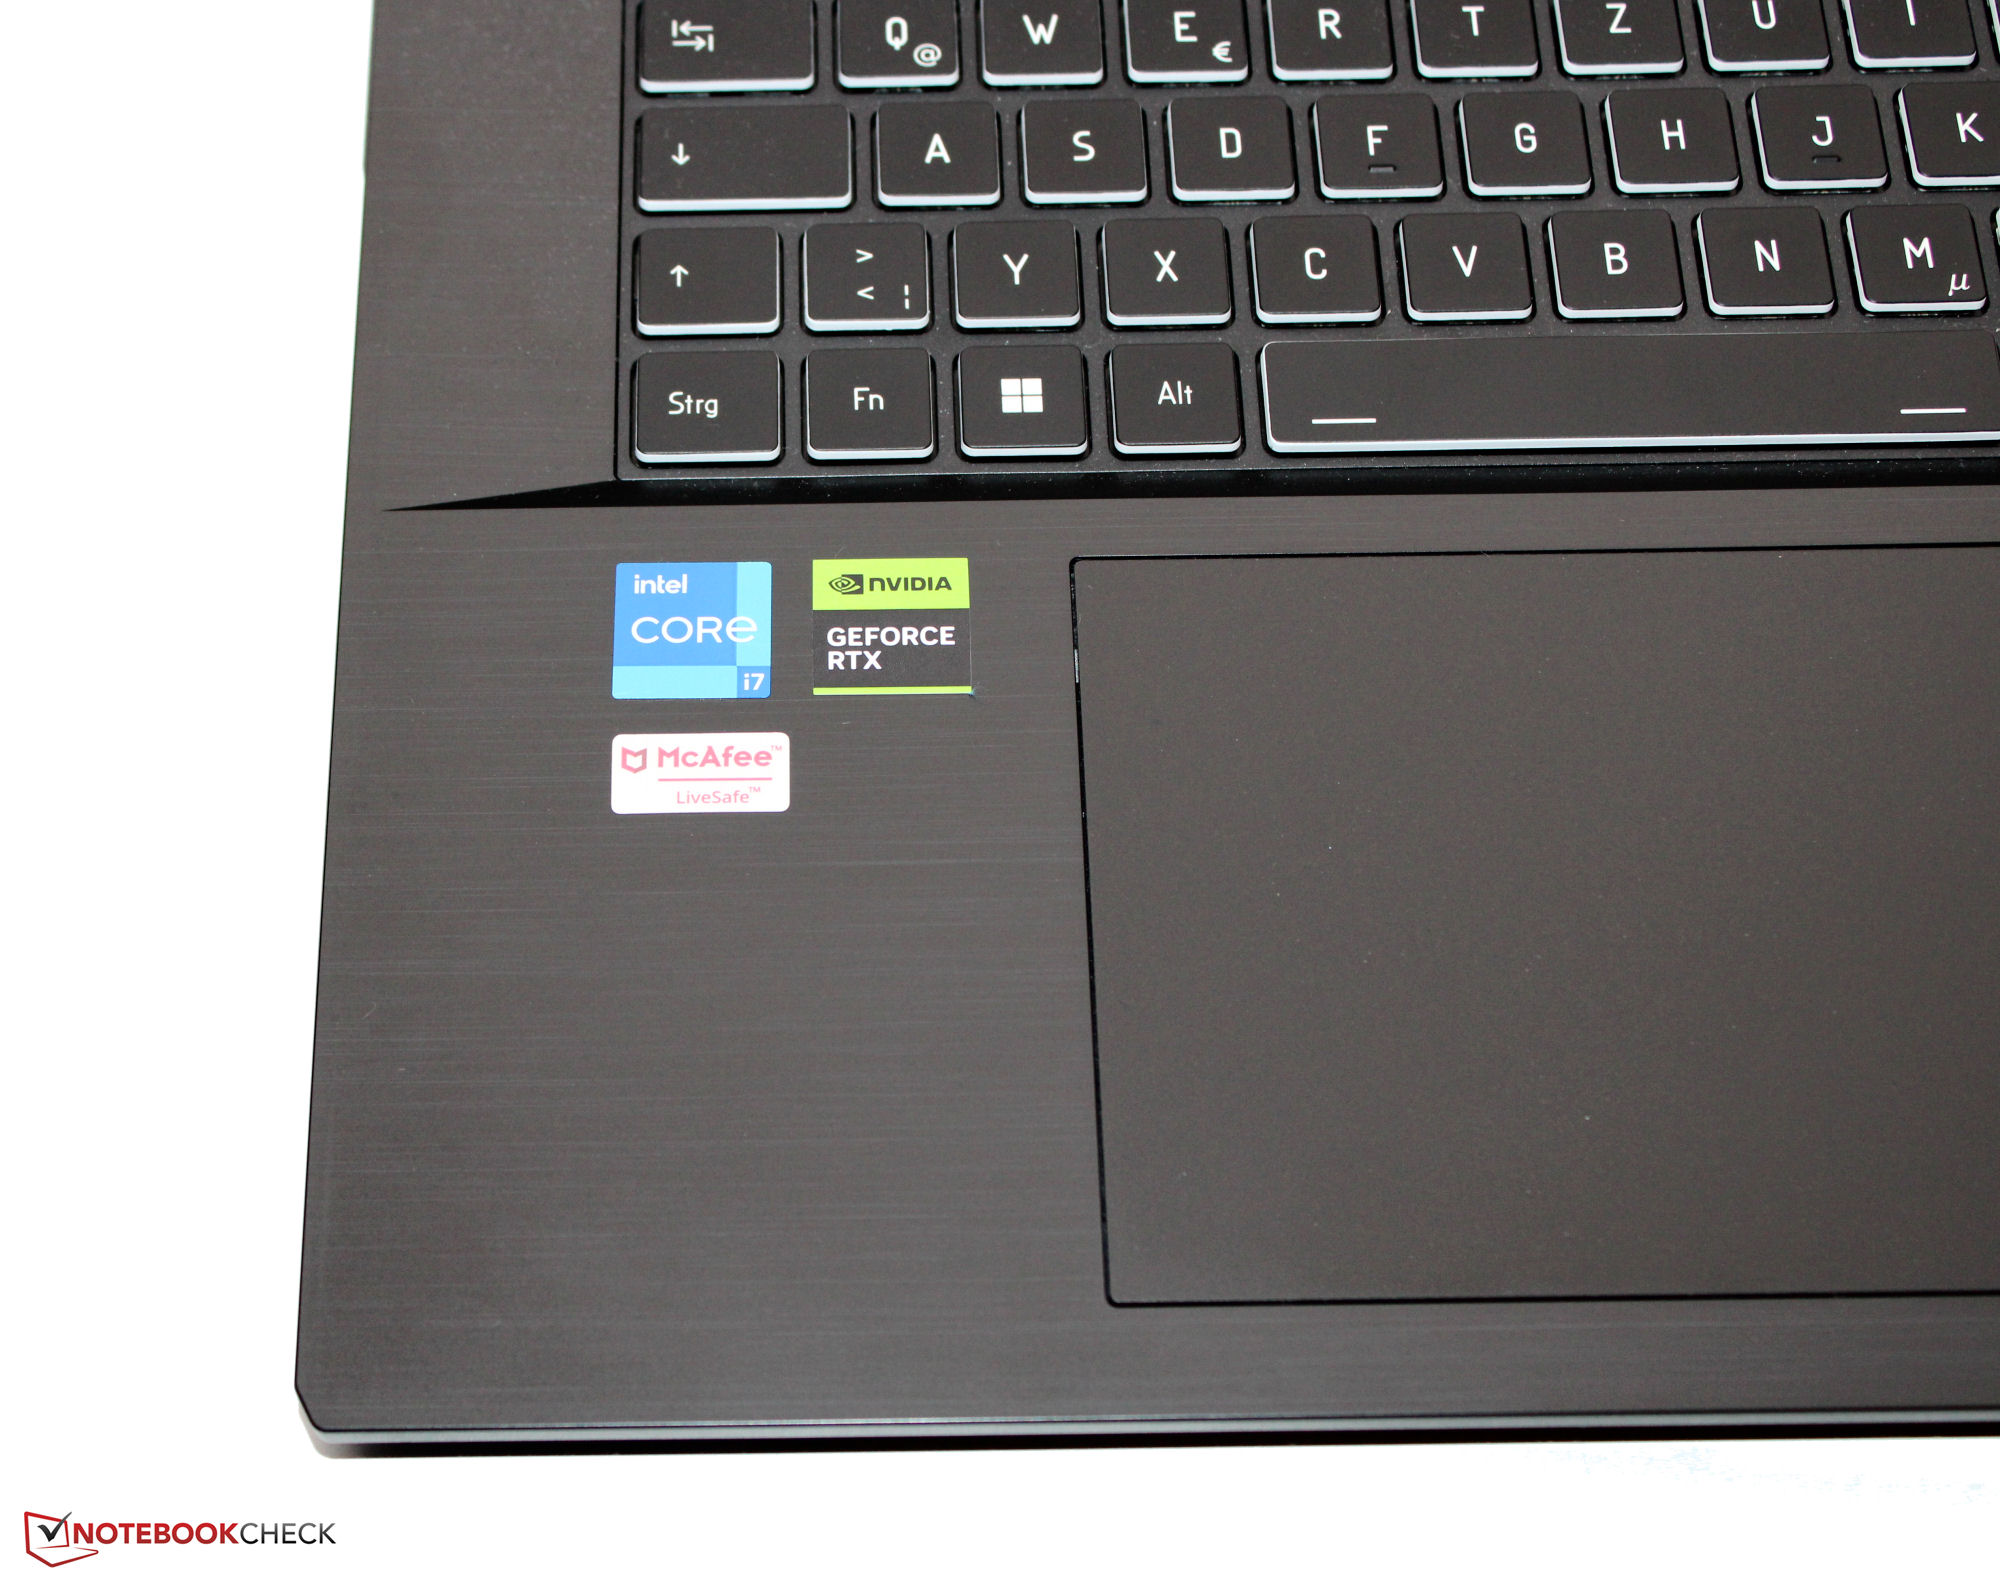
Touchpad
ClickPad o wymiarach 15,1 x 9,2 cm (~6 x 3,6 cala), którego gładka powierzchnia ułatwia przesuwanie palców, służy jako zamiennik myszy. Reaguje również na ruchy w rogach i oferuje krótki skok oraz wyraźny punkt nacisku.
Wyświetlacz - panel FHD z pokryciem sRGB
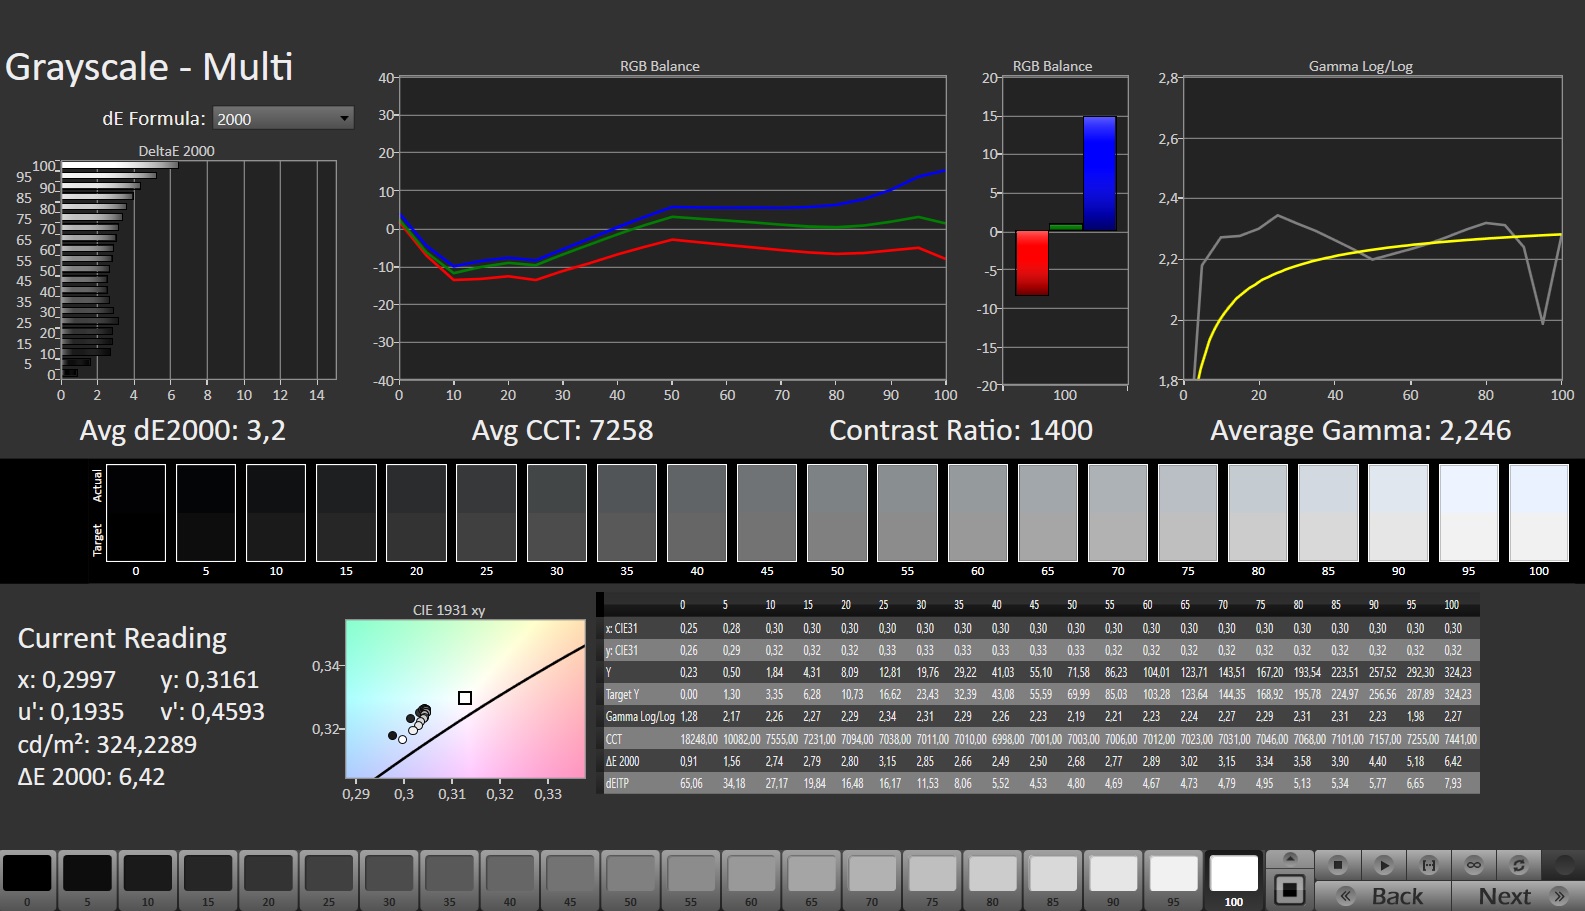
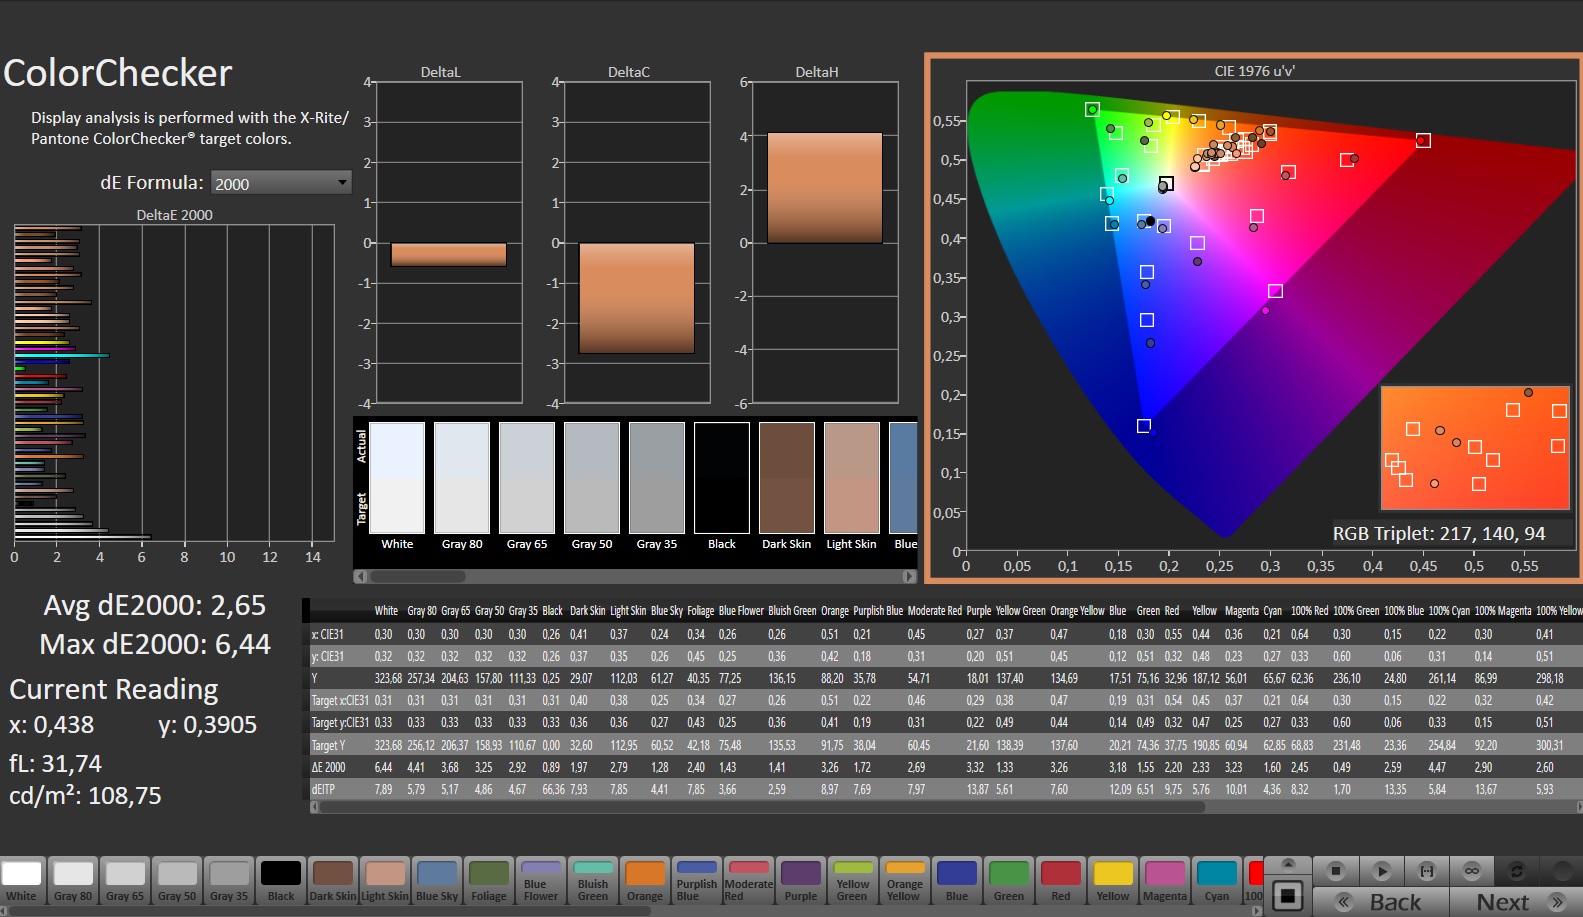
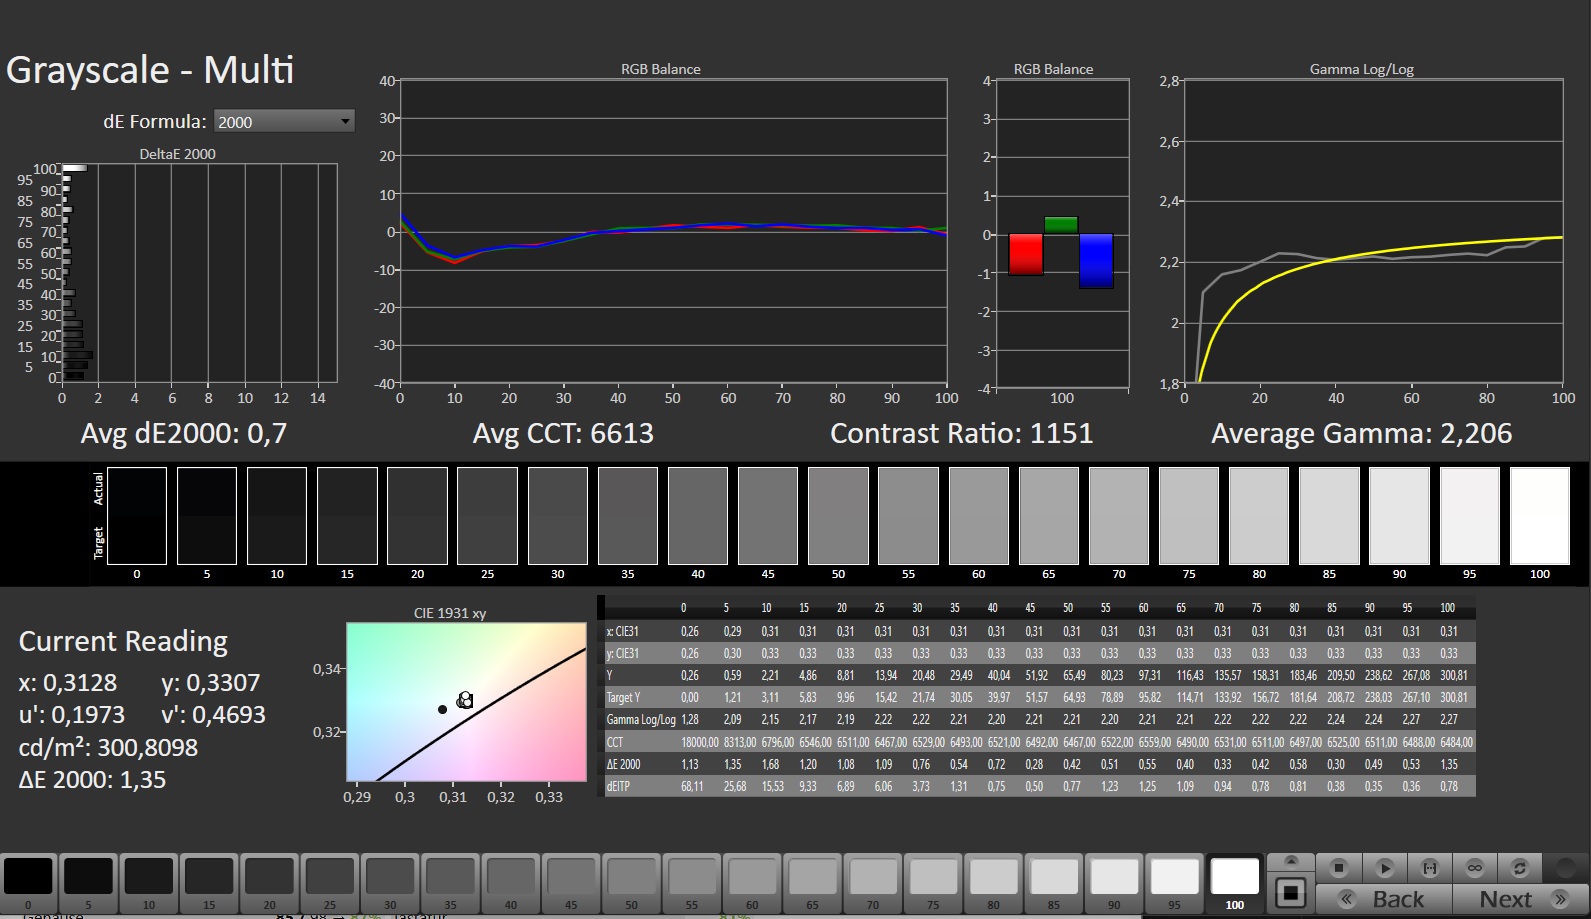
Medion wyposażył E20 w bardzo responsywny panel 144-Hz w formacie 16:9, który nie wykazuje migotania PWM na żadnym poziomie jasności. Jasność i kontrast matowego wyświetlacza o przekątnej 17,3 cala (1,920 x 1,080 pikseli) spełniają docelowe wymagania odpowiednio >300 cd/m² i 1,000:1.
| |||||||||||||||||||||||||
rozświetlenie: 91 %
na akumulatorze: 312 cd/m²
kontrast: 1248:1 (czerń: 0.25 cd/m²)
ΔE ColorChecker Calman: 2.65 | ∀{0.5-29.43 Ø4.71}
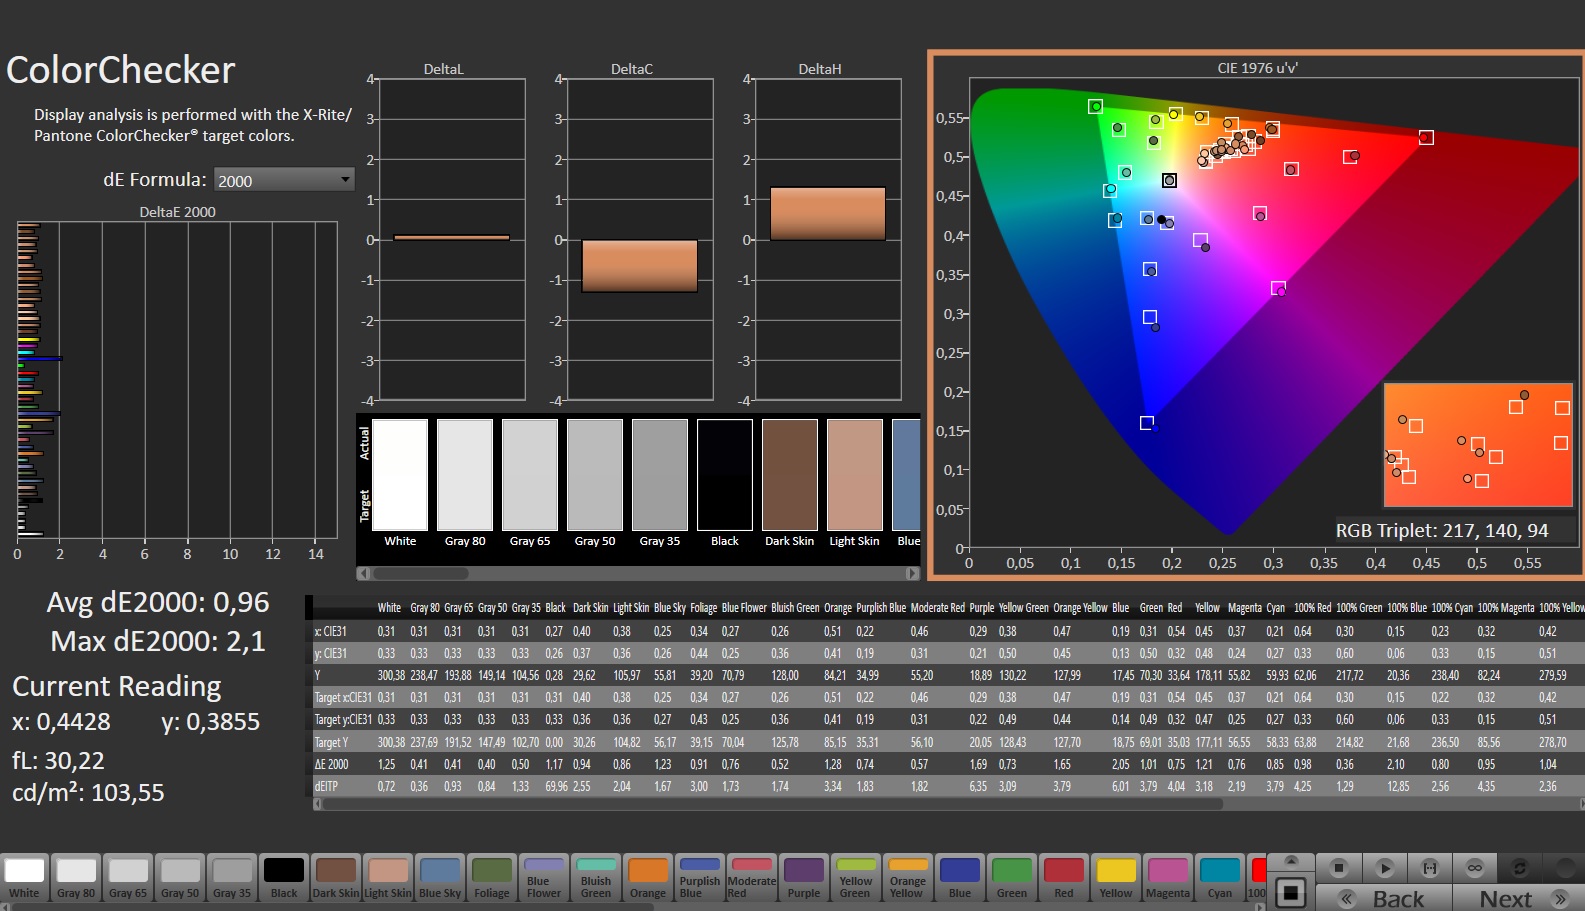
calibrated: 0.96
ΔE Greyscale Calman: 3.2 | ∀{0.09-98 Ø4.96}
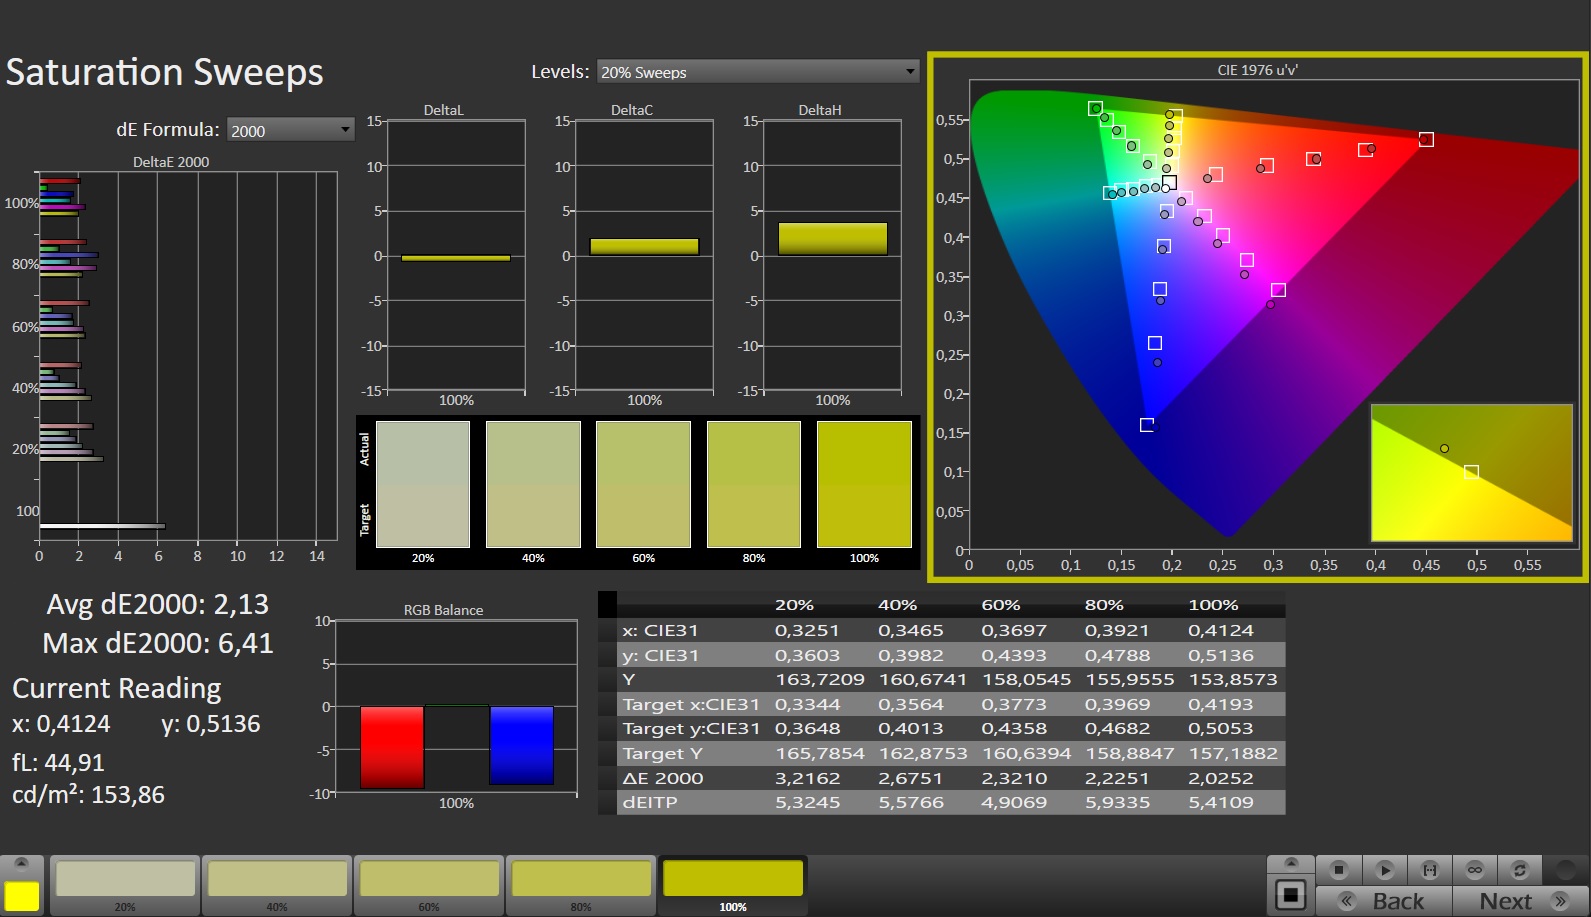
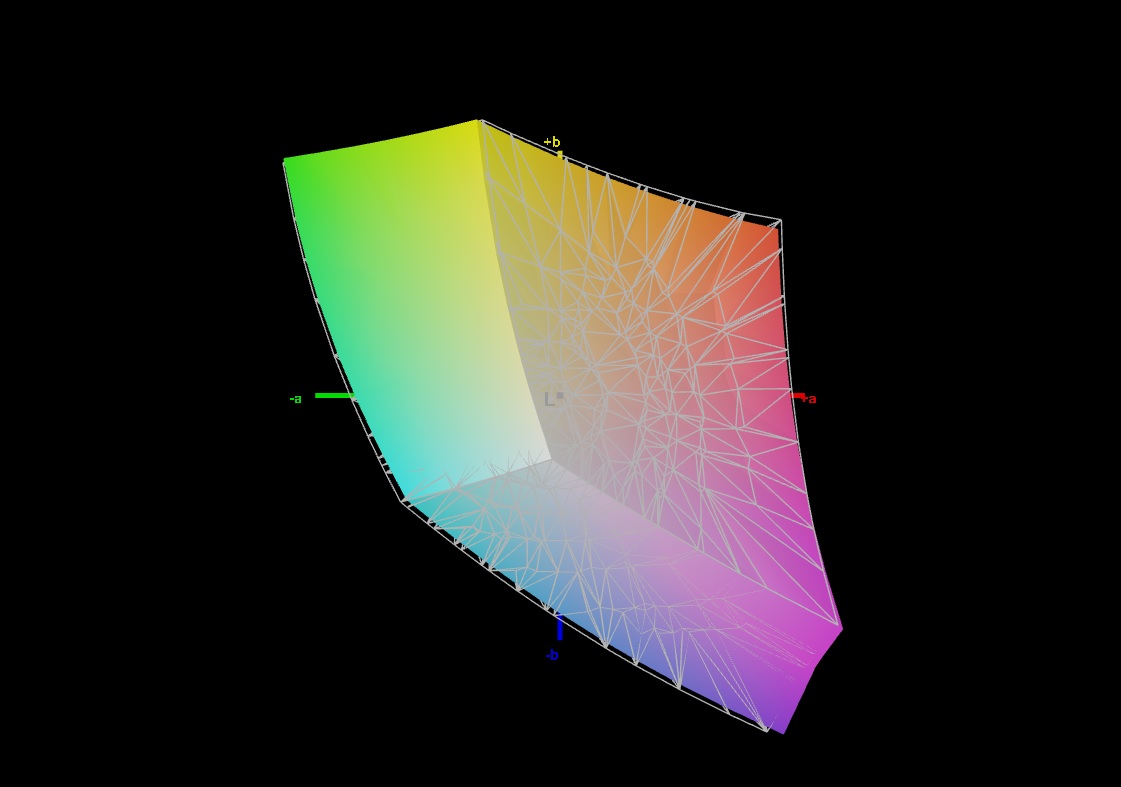
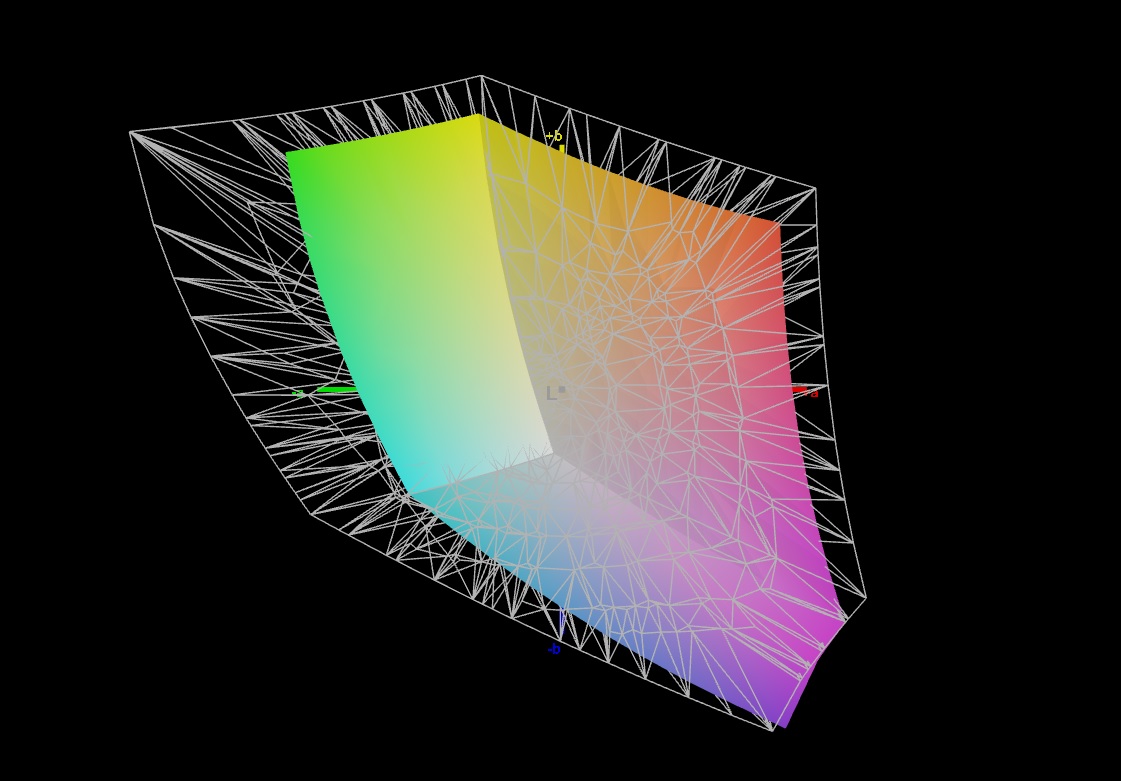
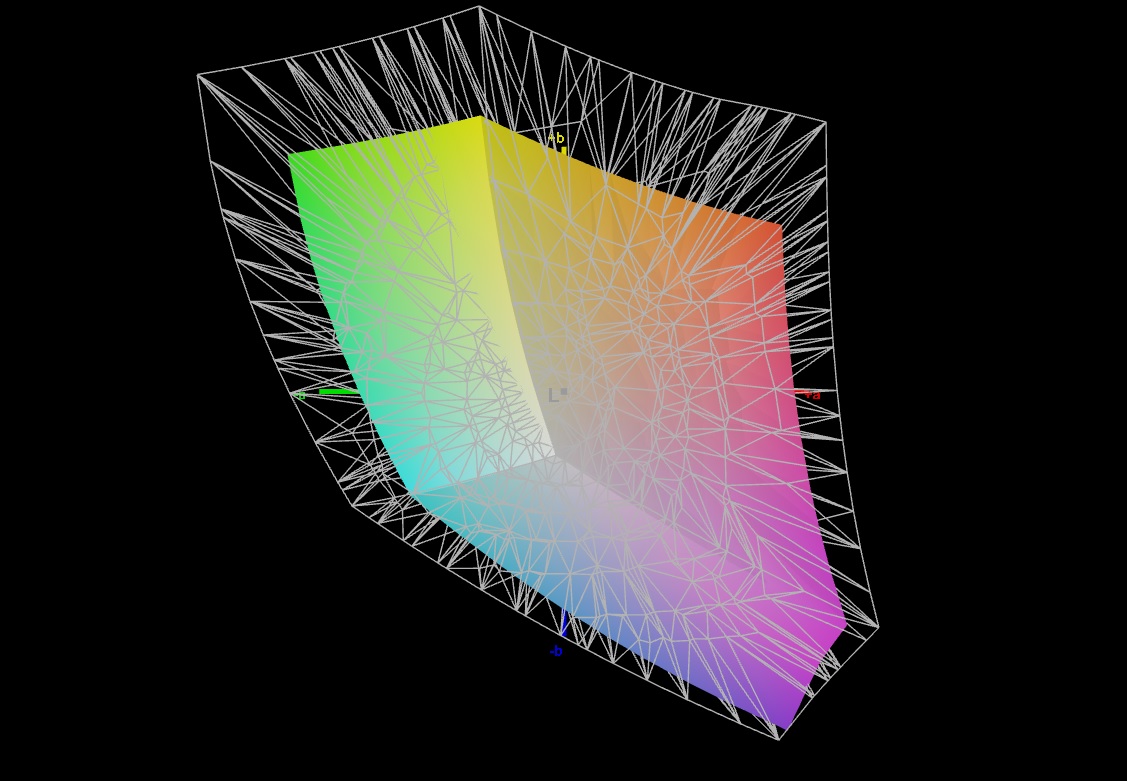
66.5% AdobeRGB 1998 (Argyll 3D)
96.7% sRGB (Argyll 3D)
65.1% Display P3 (Argyll 3D)
Gamma: 2.246
CCT: 7258 K
| Medion Erazer Scout E20 LG Philips LGD0611, IPS, 1920x1080, 17.3" | Gigabyte G7 KE AU Optronics B173HAN05.1, IPS, 1920x1080, 17.3" | MSI Katana 17 B13VFK B173HAN04.9, IPS LED, 1920x1080, 17.3" | Asus TUF Gaming A16 FA617 NE160WUM-NX2 (BOE0B33), IPS-Level, 1920x1200, 16" | Lenovo Legion 5 15IAH7H 82RB CSOT MNF601CA1-3, IPS, 1920x1080, 15.6" | Acer Nitro 5 AN515-46-R1A1 AU Optronics B156HAN12.H, IPS, 1920x1080, 15.6" | |
|---|---|---|---|---|---|---|
| Display | 6% | -37% | 5% | 5% | 4% | |
| Display P3 Coverage (%) | 65.1 | 70.4 8% | 40.8 -37% | 69.4 7% | 69.1 6% | 68.8 6% |
| sRGB Coverage (%) | 96.7 | 99.8 3% | 61 -37% | 97.8 1% | 99.5 3% | 98.1 1% |
| AdobeRGB 1998 Coverage (%) | 66.5 | 71.7 8% | 42.2 -37% | 70.9 7% | 70 5% | 69.7 5% |
| Response Times | 43% | -137% | -6% | -8% | 18% | |
| Response Time Grey 50% / Grey 80% * (ms) | 14.8 ? | 5 ? 66% | 33 ? -123% | 17 ? -15% | 14.8 ? -0% | 13 ? 12% |
| Response Time Black / White * (ms) | 10.4 ? | 8.3 ? 20% | 26 ? -150% | 10.1 ? 3% | 12 ? -15% | 8 ? 23% |
| PWM Frequency (Hz) | ||||||
| Screen | 16% | -69% | 15% | -21% | -8% | |
| Brightness middle (cd/m²) | 312 | 307 -2% | 267 -14% | 308 -1% | 363.5 17% | 327 5% |
| Brightness (cd/m²) | 303 | 301 -1% | 256 -16% | 293 -3% | 350 16% | 320 6% |
| Brightness Distribution (%) | 91 | 93 2% | 93 2% | 90 -1% | 89 -2% | 93 2% |
| Black Level * (cd/m²) | 0.25 | 0.2 20% | 0.21 16% | 0.23 8% | 0.39 -56% | 0.24 4% |
| Contrast (:1) | 1248 | 1535 23% | 1271 2% | 1339 7% | 932 -25% | 1363 9% |
| Colorchecker dE 2000 * | 2.65 | 1.32 50% | 4.7 -77% | 1.47 45% | 3.68 -39% | 3.26 -23% |
| Colorchecker dE 2000 max. * | 6.44 | 4.6 29% | 20.4 -217% | 2.98 54% | 8.92 -39% | 8.73 -36% |
| Colorchecker dE 2000 calibrated * | 0.96 | 1.03 -7% | 4.5 -369% | 1.02 -6% | 0.53 45% | 0.87 9% |
| Greyscale dE 2000 * | 3.2 | 2.1 34% | 1.5 53% | 2.2 31% | 6.5 -103% | 4.87 -52% |
| Gamma | 2.246 98% | 2.247 98% | 2.12 104% | 2.228 99% | 2.2 100% | 2.3 96% |
| CCT | 7258 90% | 6815 95% | 6552 99% | 6228 104% | 5995 108% | 7070 92% |
| Całkowita średnia (program / ustawienia) | 22% /
18% | -81% /
-72% | 5% /
10% | -8% /
-13% | 5% /
-2% |
* ... im mniej tym lepiej
Wyświetlacz wykazuje dobre odwzorowanie kolorów już w stanie dostawy, a przy odchyleniu około 2,65, cel DeltaE < 3 jest spełniony. Dodatkowa kalibracja obniża odchylenie do 0,96 i zapewnia bardziej zrównoważoną skalę szarości.
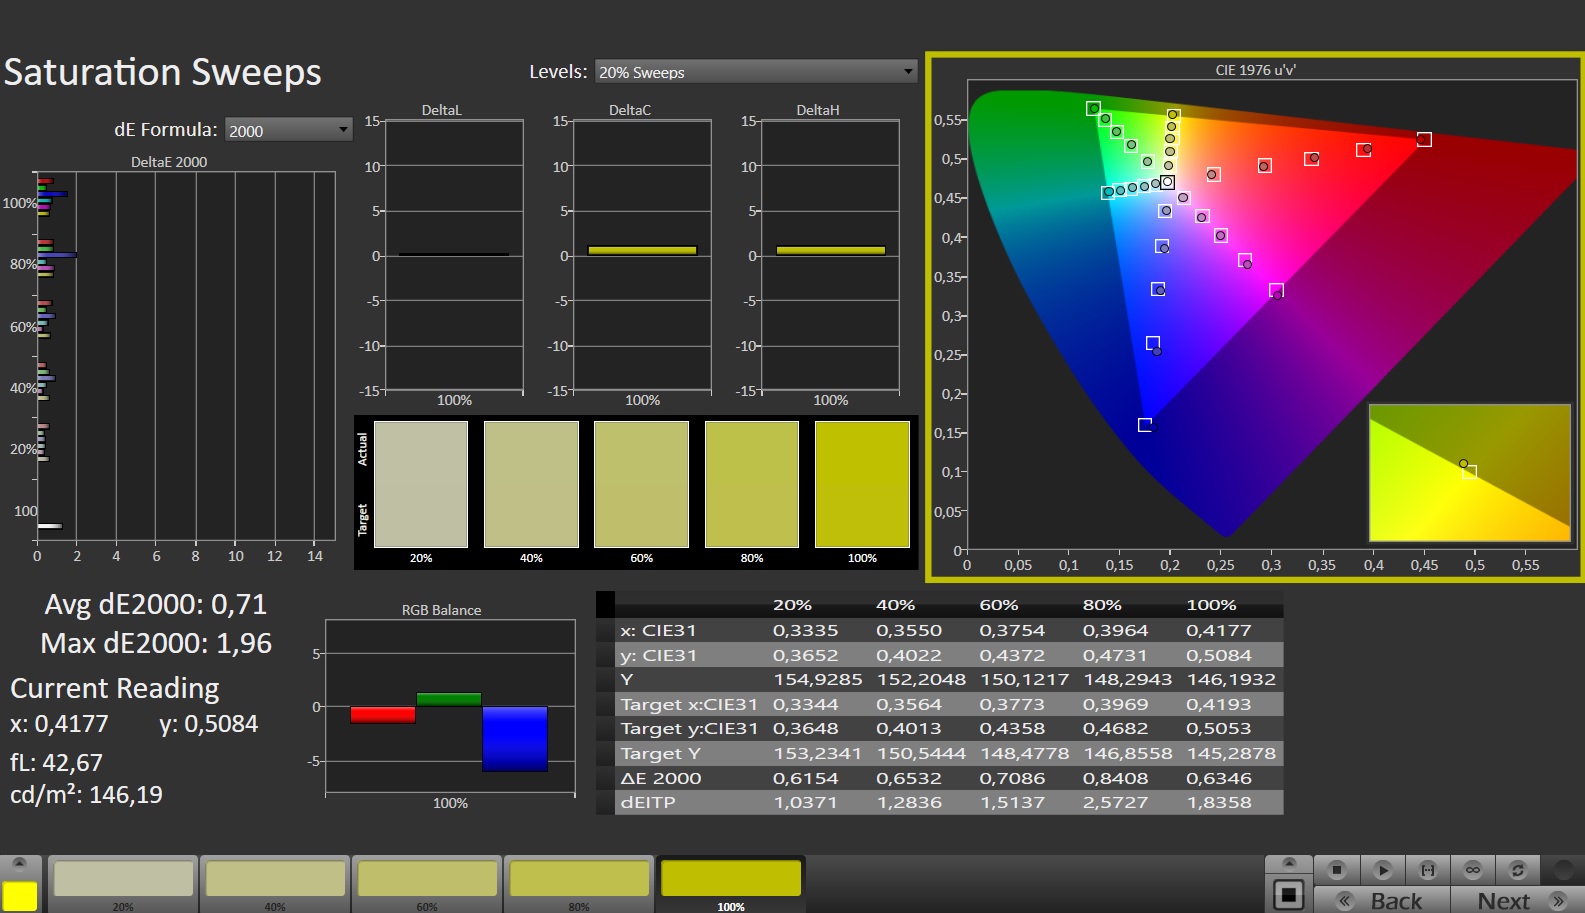
Panel jest w stanie całkowicie pokryć przestrzeń kolorów sRGB, ale nie AdobeRGB i DCI-P3. Wyświetlacze większości konkurentów wykazują podobne cechy.
Wyświetl czasy reakcji
| ↔ Czas reakcji od czerni do bieli | ||
|---|---|---|
| 10.4 ms ... wzrost ↗ i spadek ↘ łącznie | ↗ 5.4 ms wzrost | 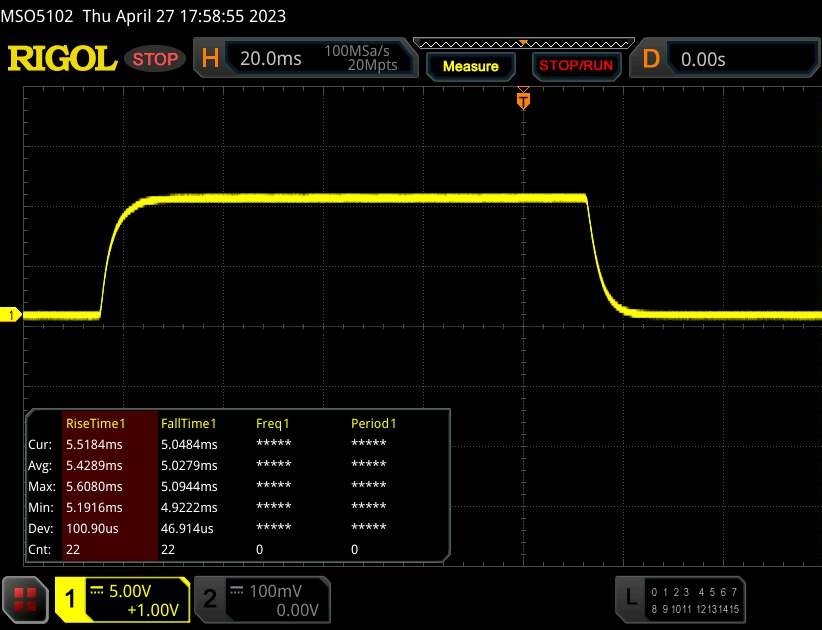 |
| ↘ 5 ms upadek | ||
| W naszych testach ekran wykazuje dobry współczynnik reakcji, ale może być zbyt wolny dla graczy rywalizujących ze sobą. Dla porównania, wszystkie testowane urządzenia wahają się od 0.1 (minimum) do 240 (maksimum) ms. » 28 % wszystkich urządzeń jest lepszych. Oznacza to, że zmierzony czas reakcji jest lepszy od średniej wszystkich testowanych urządzeń (19.8 ms). | ||
| ↔ Czas reakcji 50% szarości do 80% szarości | ||
| 14.8 ms ... wzrost ↗ i spadek ↘ łącznie | ↗ 7.2 ms wzrost | 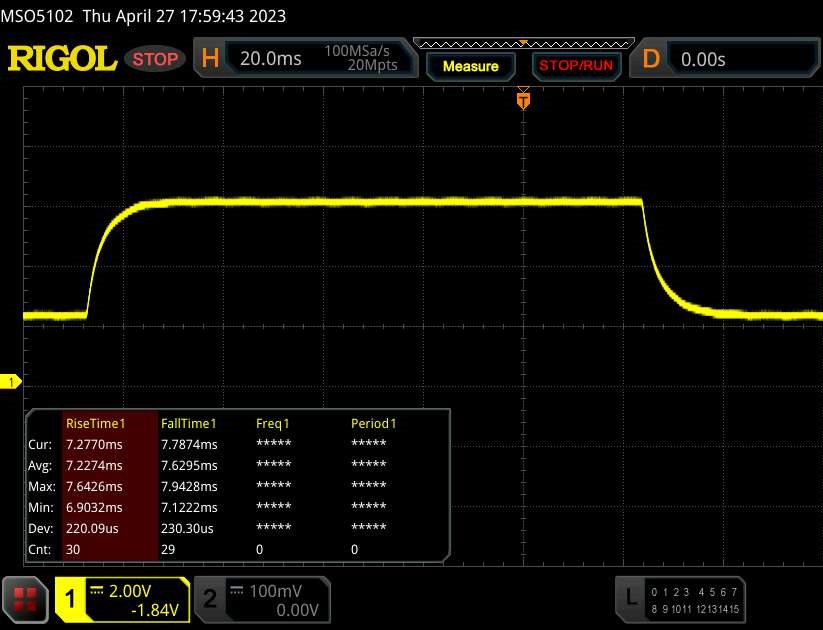 |
| ↘ 7.6 ms upadek | ||
| W naszych testach ekran wykazuje dobry współczynnik reakcji, ale może być zbyt wolny dla graczy rywalizujących ze sobą. Dla porównania, wszystkie testowane urządzenia wahają się od 0.165 (minimum) do 636 (maksimum) ms. » 29 % wszystkich urządzeń jest lepszych. Oznacza to, że zmierzony czas reakcji jest lepszy od średniej wszystkich testowanych urządzeń (31 ms). | ||
Migotanie ekranu / PWM (modulacja szerokości impulsu)
| Migotanie ekranu/nie wykryto PWM | 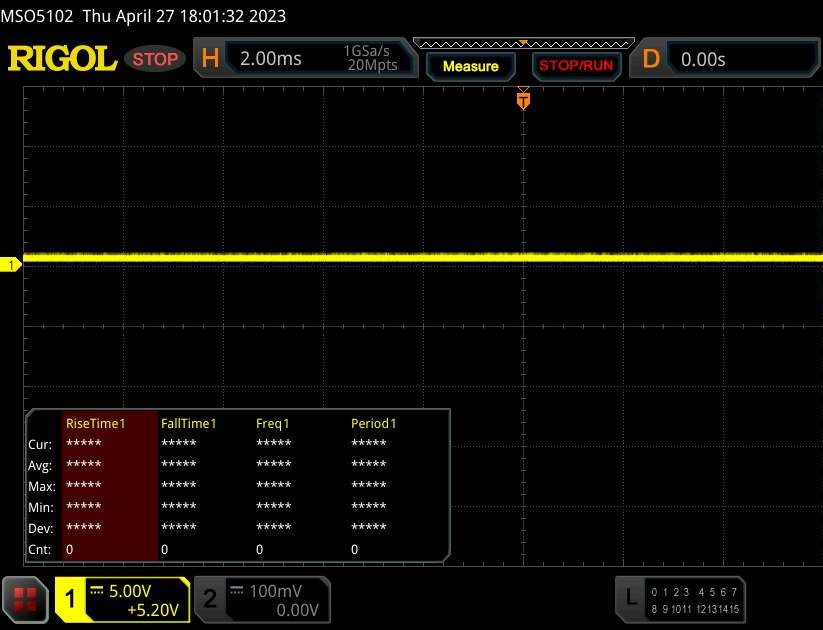 | ||
Dla porównania: 52 % wszystkich testowanych urządzeń nie używa PWM do przyciemniania wyświetlacza. Jeśli wykryto PWM, zmierzono średnio 7754 (minimum: 5 - maksimum: 343500) Hz. | |||
Panel IPS ma stabilne kąty widzenia i może być odczytywany z dowolnej pozycji. Na zewnątrz można odczytać zawartość wyświetlacza, gdy światło słoneczne nie jest zbyt jasne.

Wydajność - Scout wykorzystuje Raptor Lake i Adę Lovelace
Erazer Scout E20 to gamingowy laptop z segmentu podstawowego. Niezbędną wydajność obliczeniową zapewniają układy Raptor Lake i Ada Lovelace. Nasza jednostka testowa jest dostępna za około 1500 euro (~1 658 USD). W momencie przeprowadzania tego testu nie byliśmy w stanie znaleźć żadnych innych konfiguracji sprzętowych.
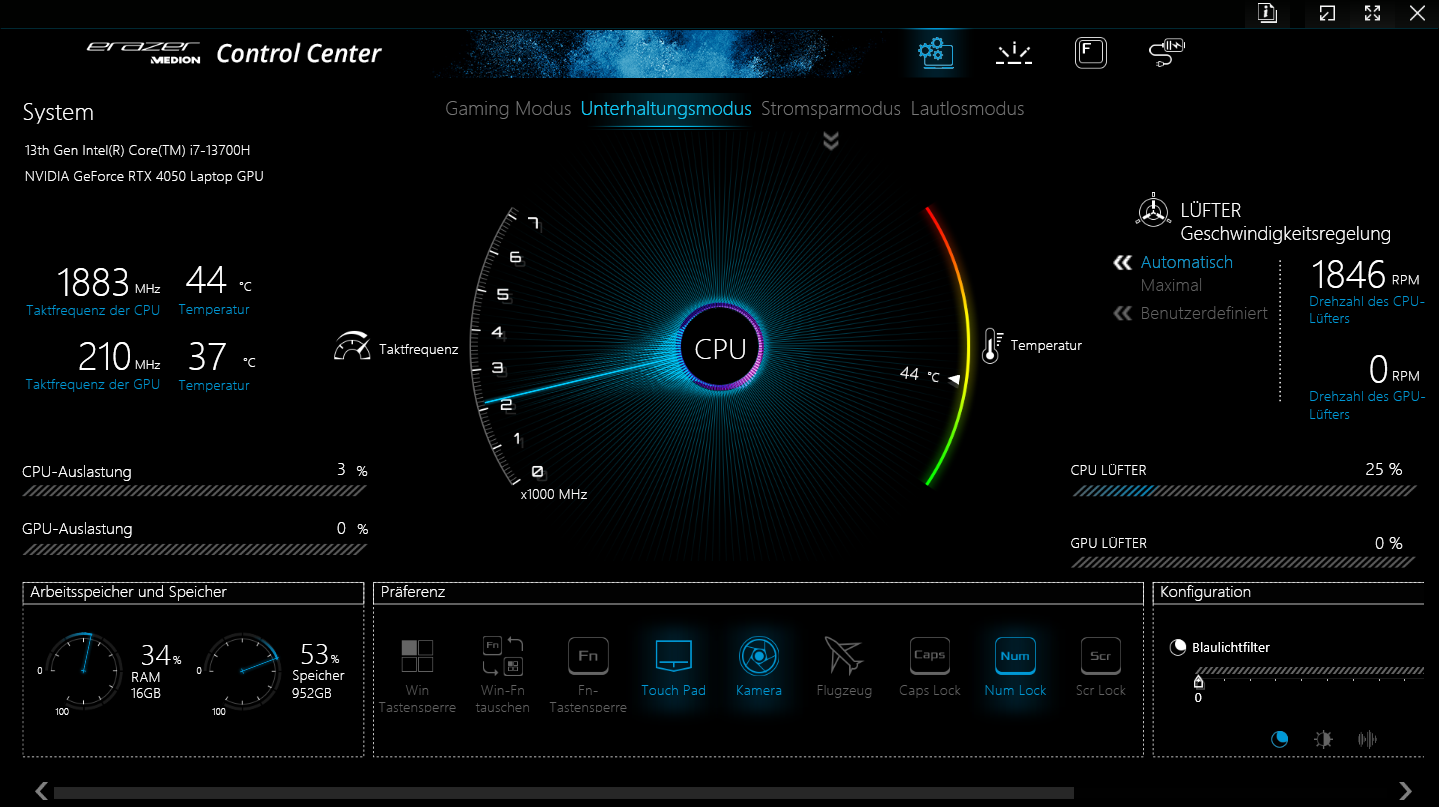
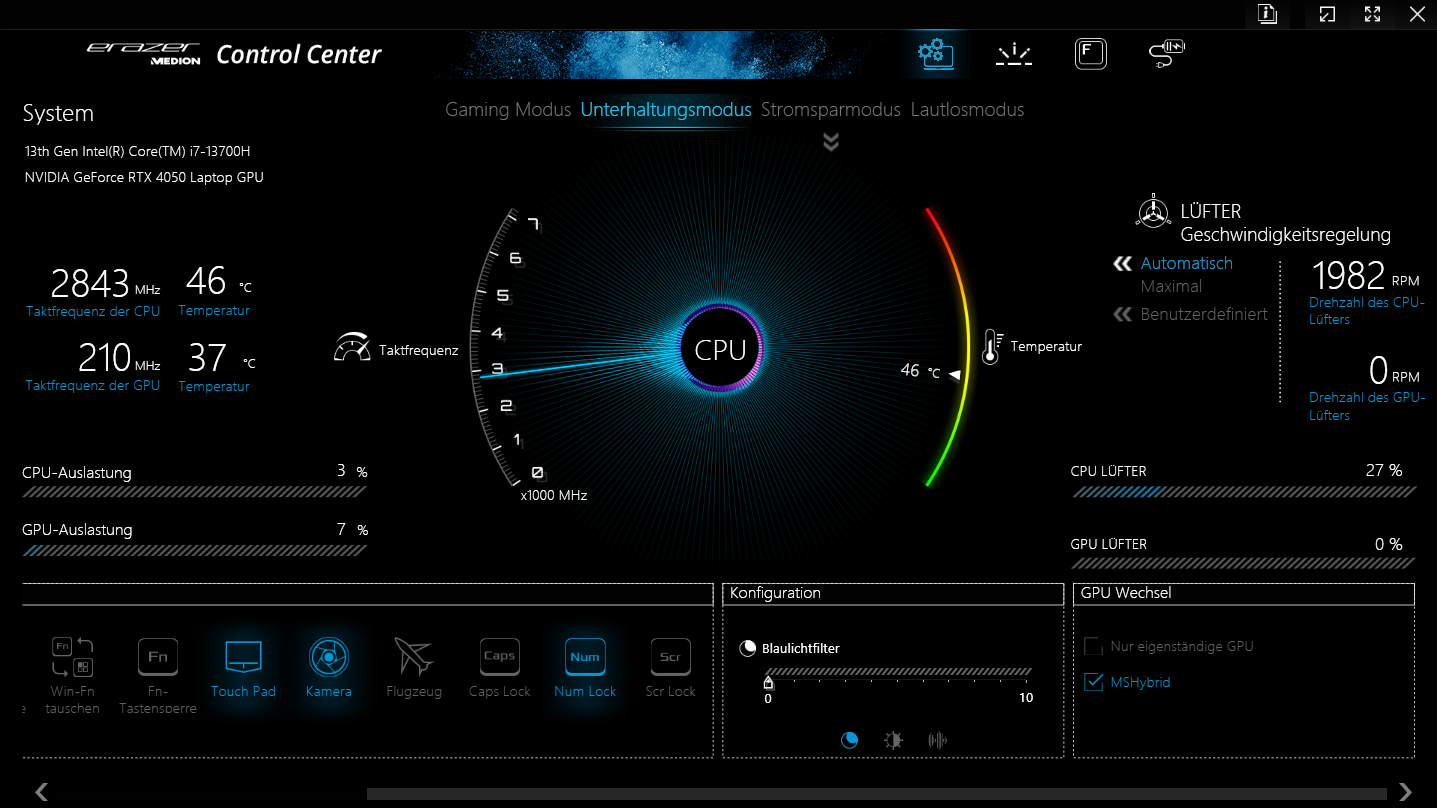
Warunki testu
E20 zawiera cztery tryby wydajności specyficzne dla producenta (patrz tabela). Możesz przełączać się między nimi za pomocą oprogramowania Control Center, które jest centrum sterowania laptopem. Użyliśmy "Trybu rozrywki" do testów porównawczych i "Trybu oszczędzania energii" do testów baterii, przy aktywnym Optimusie. Tryb oszczędzania energii stanowi również szczególny przypadek wśród trybów, ponieważ dezaktywuje rdzeń graficzny GeForce.
| Tryb gry | Tryb rozrywki | Tryb oszczędzania energii | Tryb cichy | |
|---|---|---|---|---|
| Limit mocy 1 (HWInfo) | 110 W | 50 W | 20 W | 15 W |
| Limit mocy 2 (HWInfo) | 115 W | 115 W | 30 W | 30 W |
| Hałas (The Witcher 3 ) | 57 dB(A) | 50 dB(A) | - | 34 dB(A) |
| Wydajność (The Witcher 3 ) | ~83 fps | ~80 fps | - | 30-50 fps |
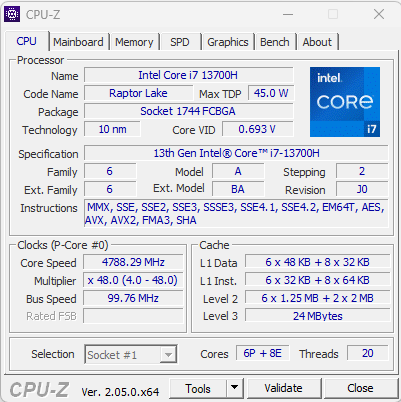
Procesor
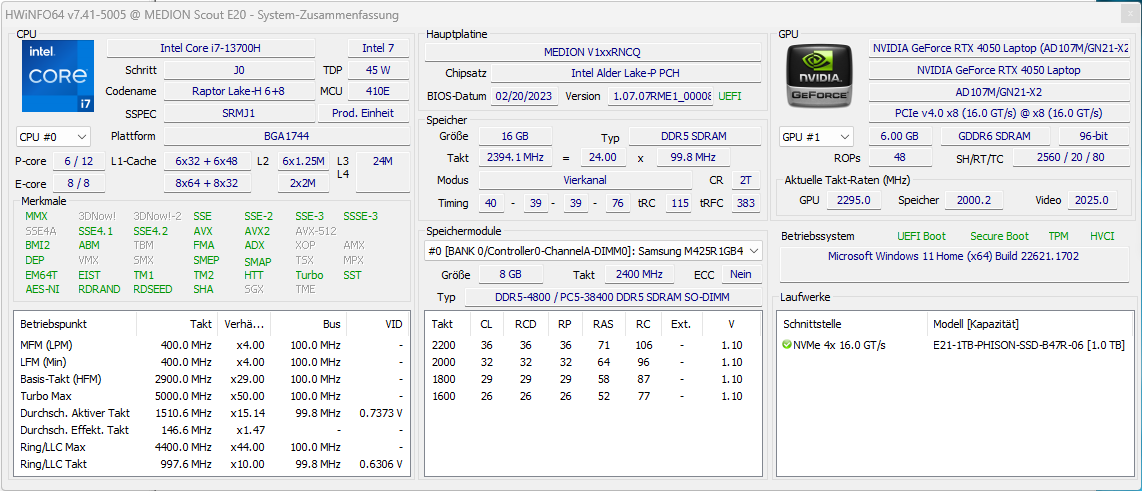
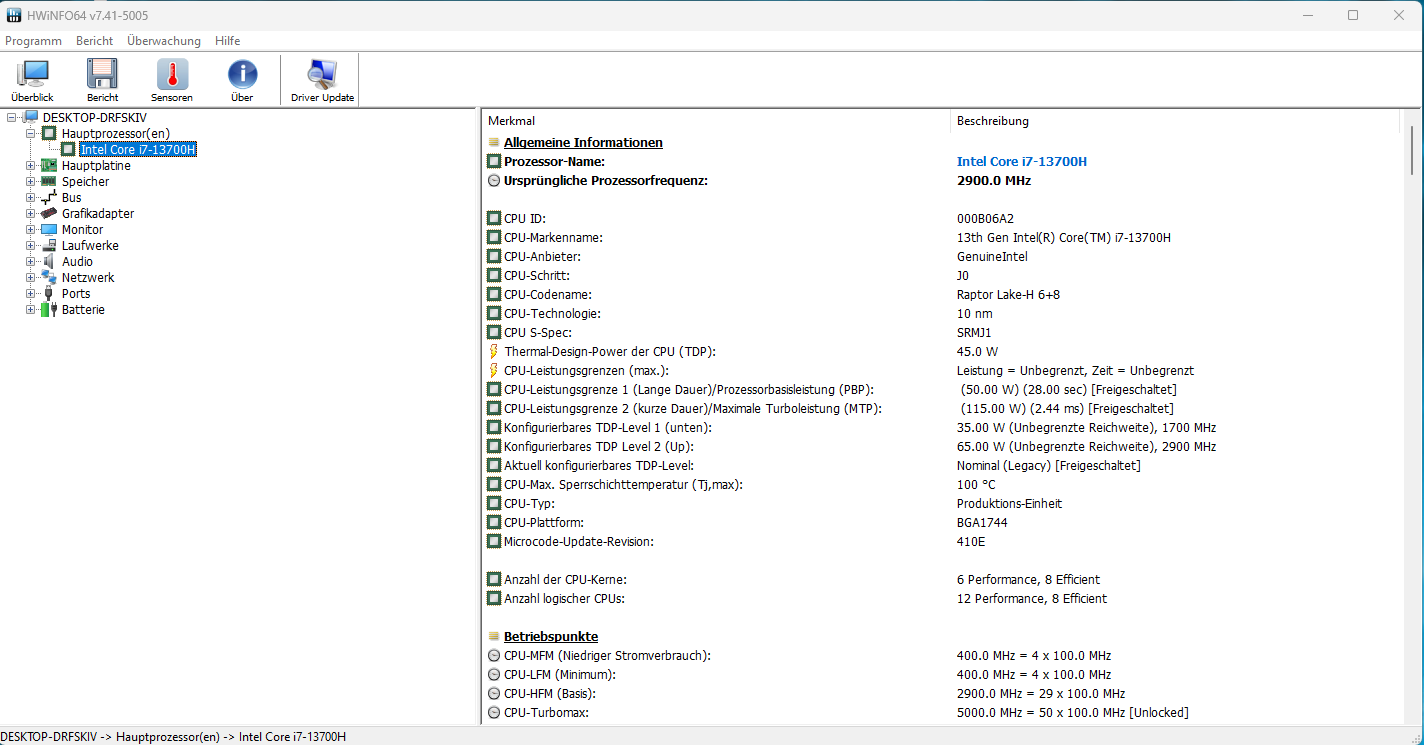
Raptor LakeCore i7-13700Hskłada się z ośmiu rdzeni Efficiency (bez hyperthreadingu, od 1,8 do 3,7 GHz) i sześciu rdzeni Performance (hyperthreading, od 2,4 do 5 GHz), co daje łącznie 20 logicznych rdzeni CPU.
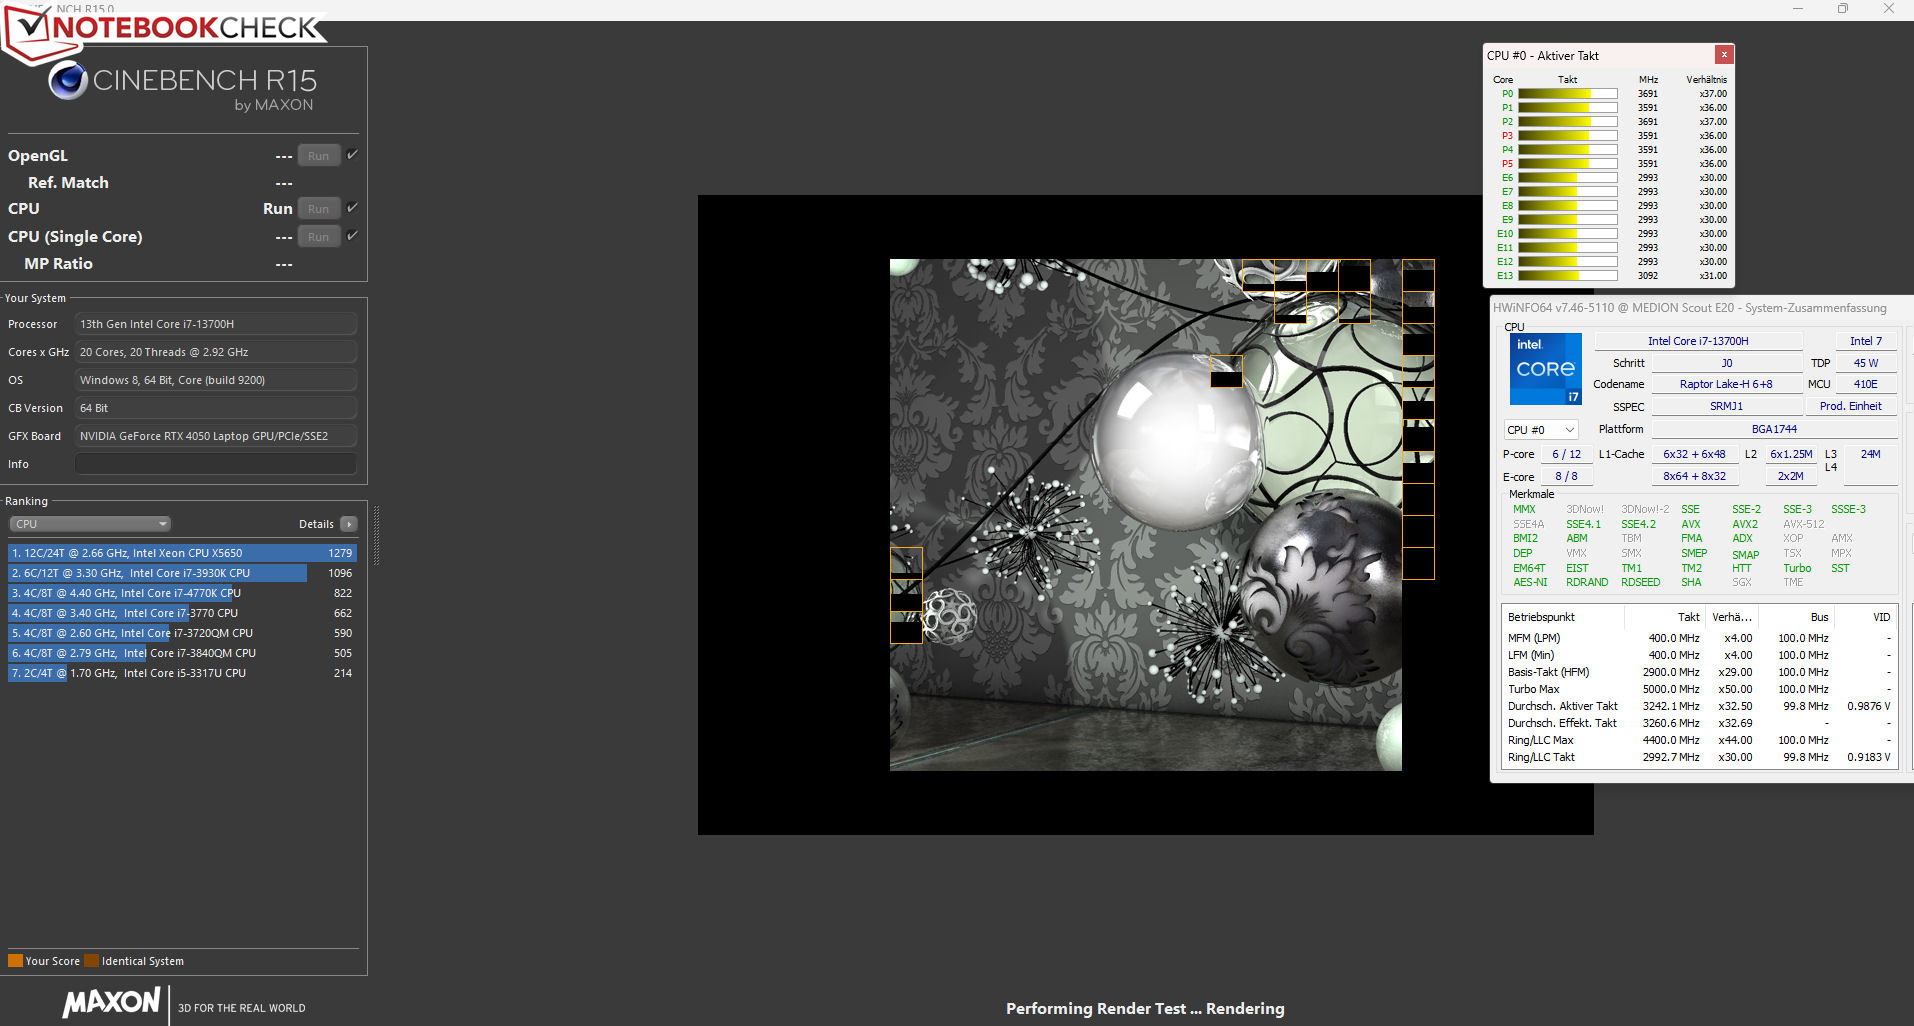
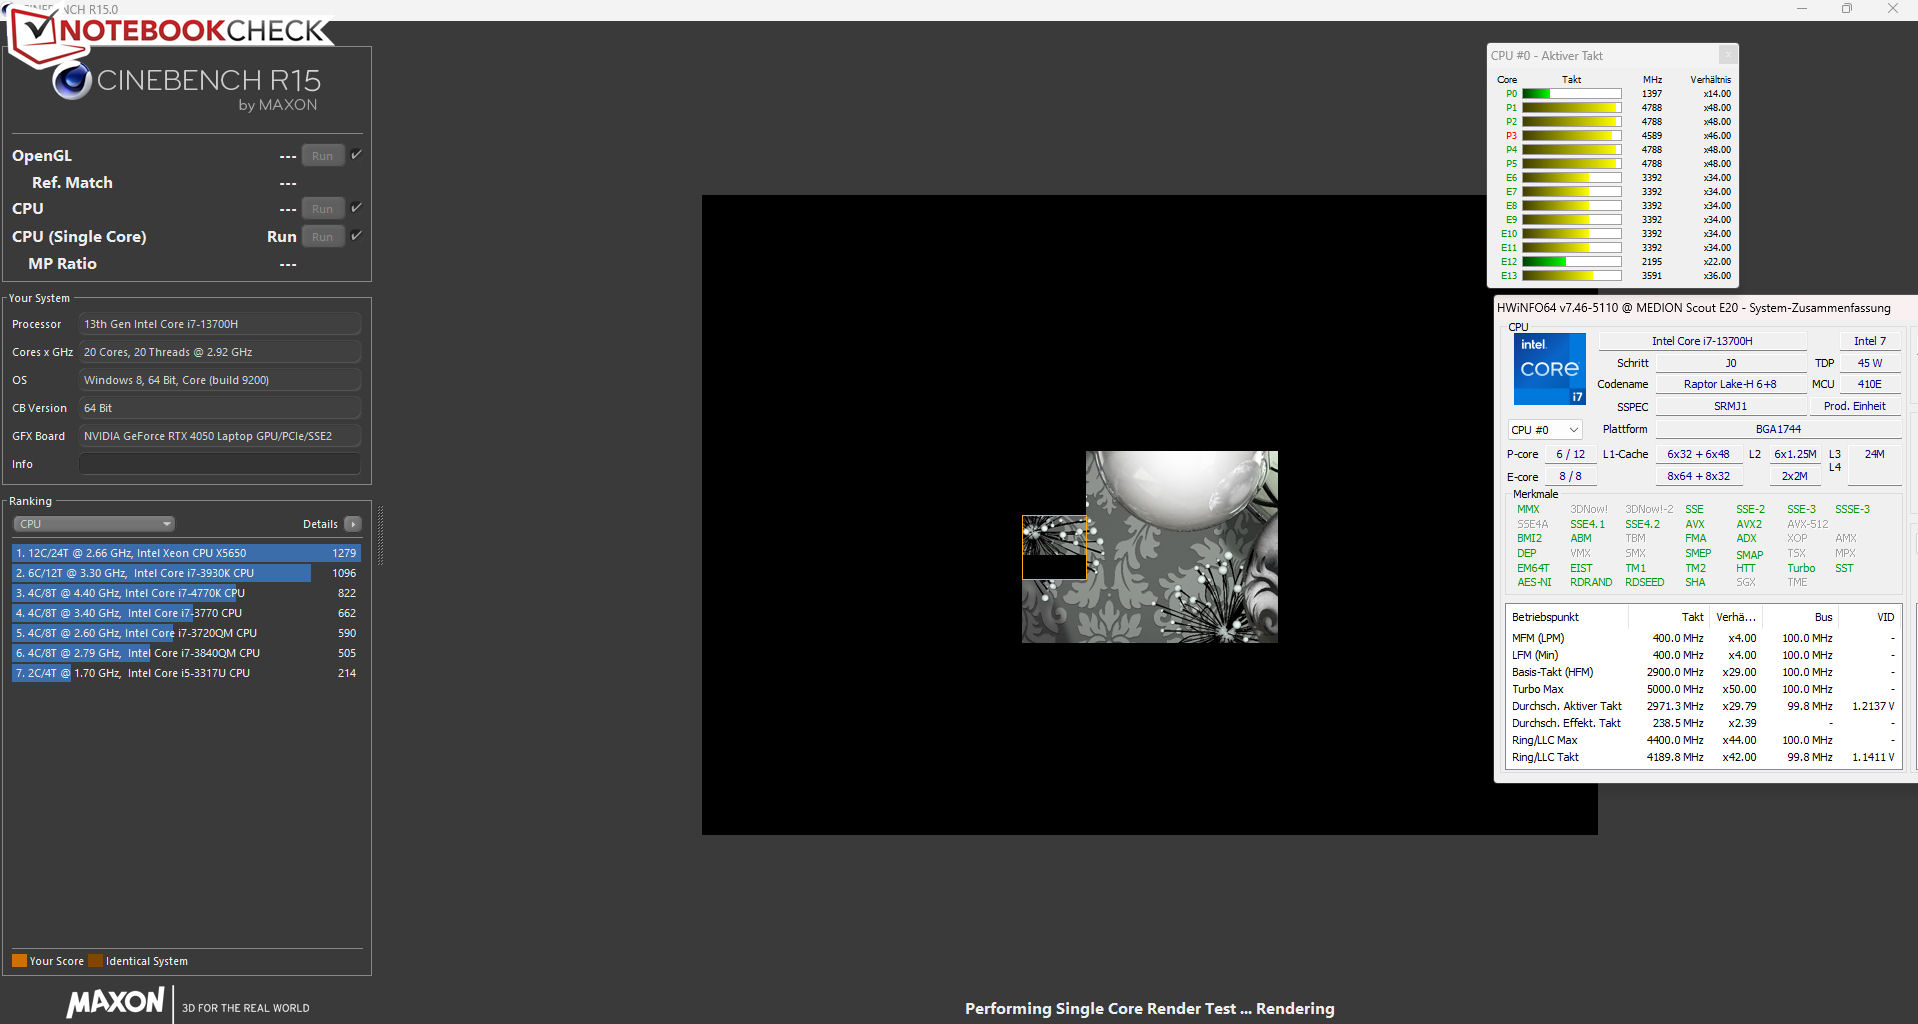
Testy porównawcze zapewniają wyniki powyżej (tryb gier, tryb rozrywki) i poniżej (inne tryby) aktualnej średniej CPU do tej pory. Bardziej istotna wydajność pojedynczego wątku (170 punktów) jest mniejsza podczas pracy na baterii niż wydajność wielowątkowa (1,335 punktów).
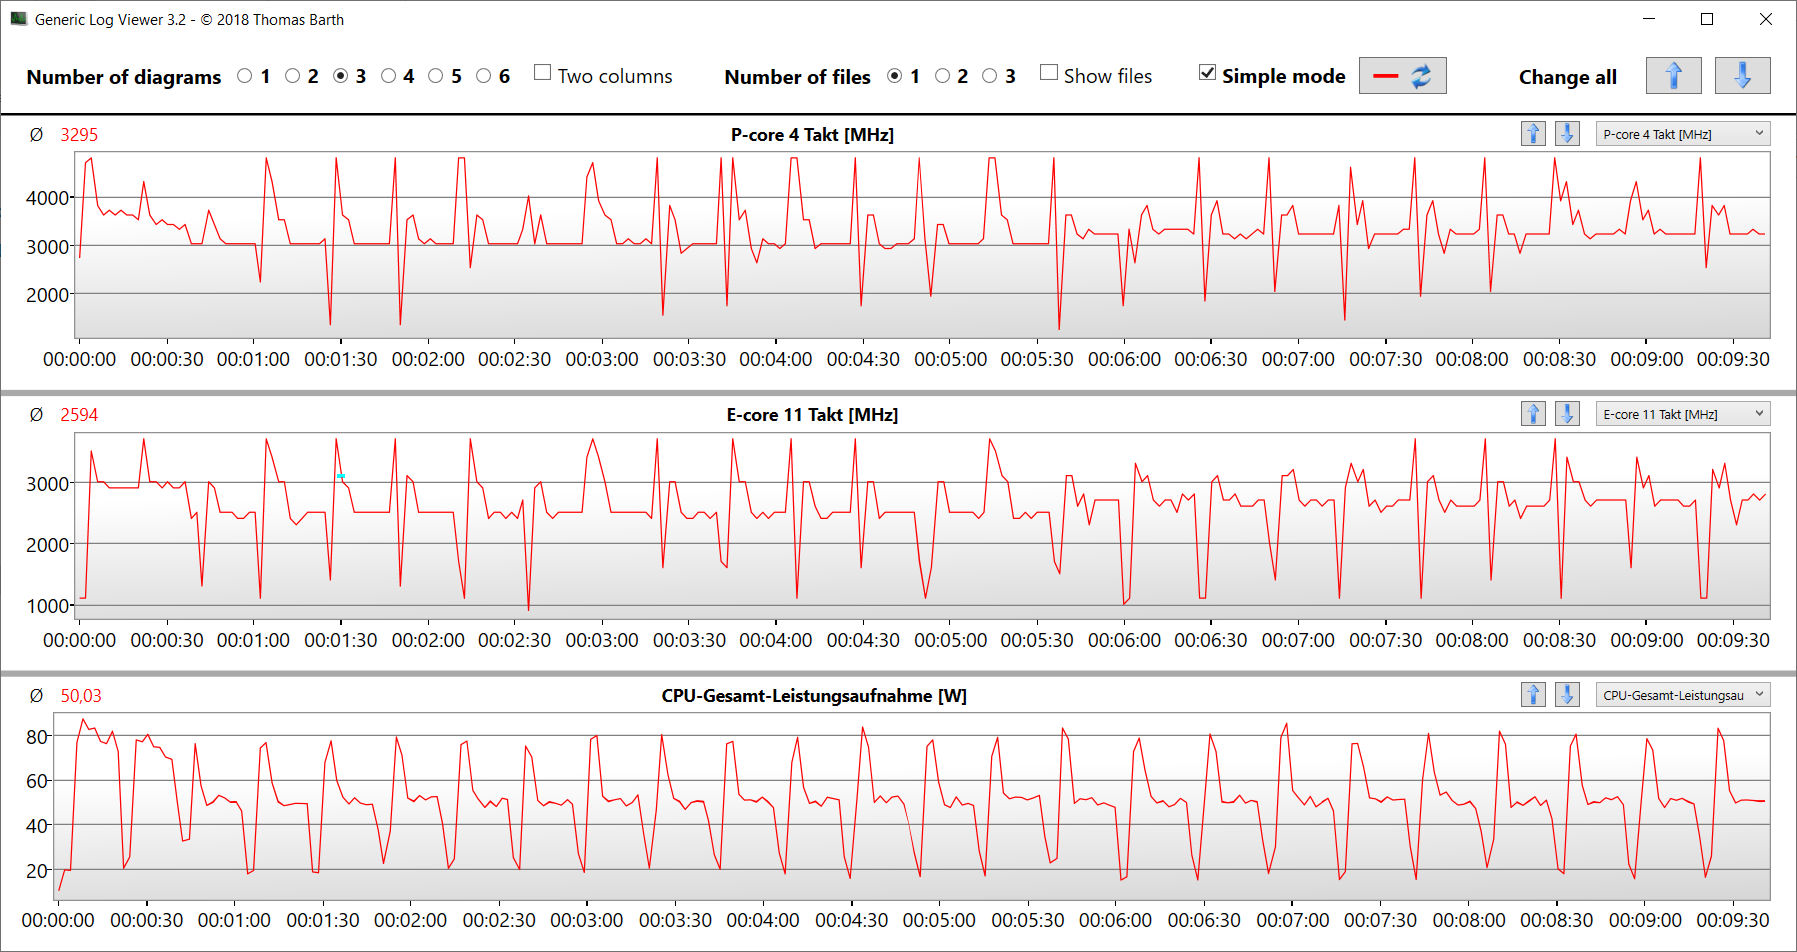
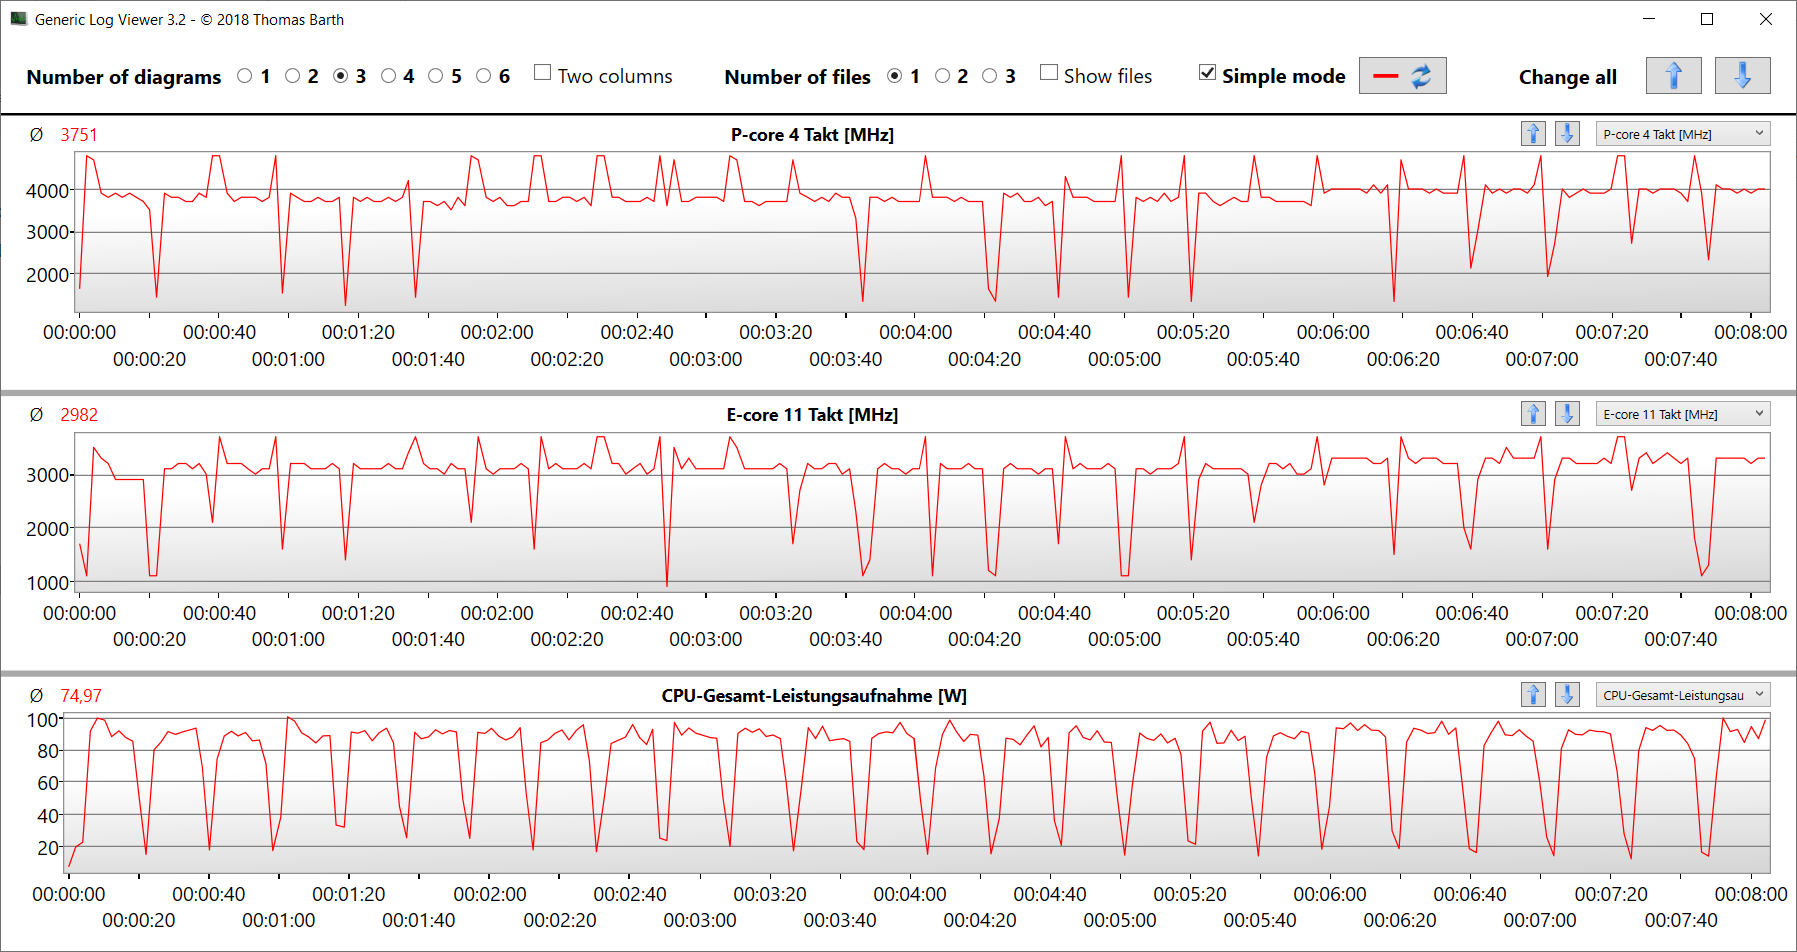
Test pętli CB15 pokazuje, że stałe obciążenie wielowątkowe powoduje spadek prędkości Turbo od pierwszego do trzeciego uruchomienia. Później udaje się utrzymać stały poziom - przynajmniej przez jakiś czas. Tryb Gaming zapewnia wyższą stałą prędkość zegara.
Cinebench R15 Multi Constant Load Test
| CPU Performance rating - Percent | |
| Średnia w klasie Gaming | |
| Lenovo Legion 5 15IAH7H 82RB | |
| Medion Erazer Scout E20 | |
| Medion Erazer Scout E20 | |
| Przeciętny Intel Core i7-13700H | |
| MSI Katana 17 B13VFK | |
| Gigabyte G7 KE | |
| Asus TUF Gaming A16 FA617 | |
| Acer Nitro 5 AN515-46-R1A1 | |
| Medion Erazer Scout E20 | |
| Cinebench R23 | |
| Multi Core | |
| Średnia w klasie Gaming (10488 - 42661, n=107, ostatnie 2 lata) | |
| Lenovo Legion 5 15IAH7H 82RB | |
| Medion Erazer Scout E20 (Gaming Modus) | |
| Medion Erazer Scout E20 | |
| MSI Katana 17 B13VFK | |
| Przeciętny Intel Core i7-13700H (5890 - 20034, n=29) | |
| Gigabyte G7 KE | |
| Asus TUF Gaming A16 FA617 | |
| Acer Nitro 5 AN515-46-R1A1 | |
| Medion Erazer Scout E20 (Lautlosmodus) | |
| Single Core | |
| Średnia w klasie Gaming (1166 - 2415, n=107, ostatnie 2 lata) | |
| Medion Erazer Scout E20 (Gaming Modus) | |
| Medion Erazer Scout E20 | |
| Lenovo Legion 5 15IAH7H 82RB | |
| MSI Katana 17 B13VFK | |
| Przeciętny Intel Core i7-13700H (1323 - 1914, n=29) | |
| Gigabyte G7 KE | |
| Asus TUF Gaming A16 FA617 | |
| Acer Nitro 5 AN515-46-R1A1 | |
| Medion Erazer Scout E20 (Lautlosmodus) | |
| Cinebench R20 | |
| CPU (Multi Core) | |
| Średnia w klasie Gaming (4029 - 16433, n=106, ostatnie 2 lata) | |
| Lenovo Legion 5 15IAH7H 82RB | |
| Medion Erazer Scout E20 (Gaming Modus) | |
| Medion Erazer Scout E20 | |
| MSI Katana 17 B13VFK | |
| Przeciętny Intel Core i7-13700H (2322 - 7674, n=29) | |
| Asus TUF Gaming A16 FA617 | |
| Gigabyte G7 KE | |
| Acer Nitro 5 AN515-46-R1A1 | |
| Medion Erazer Scout E20 (Lautlosmodus) | |
| CPU (Single Core) | |
| Średnia w klasie Gaming (442 - 913, n=106, ostatnie 2 lata) | |
| Medion Erazer Scout E20 | |
| Medion Erazer Scout E20 (Gaming Modus) | |
| Lenovo Legion 5 15IAH7H 82RB | |
| Przeciętny Intel Core i7-13700H (508 - 741, n=29) | |
| MSI Katana 17 B13VFK | |
| Gigabyte G7 KE | |
| Asus TUF Gaming A16 FA617 | |
| Acer Nitro 5 AN515-46-R1A1 | |
| Medion Erazer Scout E20 (Lautlosmodus) | |
| Cinebench R15 | |
| CPU Multi 64Bit | |
| Średnia w klasie Gaming (1578 - 6330, n=105, ostatnie 2 lata) | |
| Lenovo Legion 5 15IAH7H 82RB | |
| Medion Erazer Scout E20 (Gaming Modus) | |
| Medion Erazer Scout E20 | |
| Przeciętny Intel Core i7-13700H (905 - 2982, n=29) | |
| MSI Katana 17 B13VFK | |
| Asus TUF Gaming A16 FA617 | |
| Acer Nitro 5 AN515-46-R1A1 | |
| Gigabyte G7 KE | |
| Medion Erazer Scout E20 (Lautlosmodus) | |
| CPU Single 64Bit | |
| Średnia w klasie Gaming (188.8 - 350, n=106, ostatnie 2 lata) | |
| Medion Erazer Scout E20 | |
| Medion Erazer Scout E20 (Gaming Modus) | |
| Lenovo Legion 5 15IAH7H 82RB | |
| Przeciętny Intel Core i7-13700H (213 - 278, n=29) | |
| MSI Katana 17 B13VFK | |
| Gigabyte G7 KE | |
| Acer Nitro 5 AN515-46-R1A1 | |
| Asus TUF Gaming A16 FA617 | |
| Medion Erazer Scout E20 (Lautlosmodus) | |
| Blender - v2.79 BMW27 CPU | |
| Medion Erazer Scout E20 (Lautlosmodus) | |
| Acer Nitro 5 AN515-46-R1A1 | |
| Przeciętny Intel Core i7-13700H (169 - 555, n=29) | |
| Gigabyte G7 KE | |
| Asus TUF Gaming A16 FA617 | |
| MSI Katana 17 B13VFK | |
| Medion Erazer Scout E20 | |
| Medion Erazer Scout E20 (Gaming Modus) | |
| Lenovo Legion 5 15IAH7H 82RB | |
| Średnia w klasie Gaming (79 - 330, n=104, ostatnie 2 lata) | |
| 7-Zip 18.03 | |
| 7z b 4 | |
| Średnia w klasie Gaming (33491 - 148086, n=105, ostatnie 2 lata) | |
| Lenovo Legion 5 15IAH7H 82RB | |
| Medion Erazer Scout E20 (Gaming Modus) | |
| Medion Erazer Scout E20 | |
| MSI Katana 17 B13VFK | |
| Acer Nitro 5 AN515-46-R1A1 | |
| Asus TUF Gaming A16 FA617 | |
| Przeciętny Intel Core i7-13700H (27322 - 76344, n=29) | |
| Gigabyte G7 KE | |
| Medion Erazer Scout E20 (Lautlosmodus) | |
| 7z b 4 -mmt1 | |
| Średnia w klasie Gaming (4199 - 7436, n=105, ostatnie 2 lata) | |
| Medion Erazer Scout E20 | |
| Medion Erazer Scout E20 (Gaming Modus) | |
| Przeciętny Intel Core i7-13700H (4825 - 6238, n=29) | |
| Lenovo Legion 5 15IAH7H 82RB | |
| Asus TUF Gaming A16 FA617 | |
| MSI Katana 17 B13VFK | |
| Acer Nitro 5 AN515-46-R1A1 | |
| Gigabyte G7 KE | |
| Medion Erazer Scout E20 (Lautlosmodus) | |
| Geekbench 5.5 | |
| Multi-Core | |
| Średnia w klasie Gaming (6460 - 28263, n=105, ostatnie 2 lata) | |
| Lenovo Legion 5 15IAH7H 82RB | |
| Medion Erazer Scout E20 (Gaming Modus) | |
| Medion Erazer Scout E20 | |
| Przeciętny Intel Core i7-13700H (6165 - 14215, n=29) | |
| MSI Katana 17 B13VFK | |
| Gigabyte G7 KE | |
| Asus TUF Gaming A16 FA617 | |
| Acer Nitro 5 AN515-46-R1A1 | |
| Medion Erazer Scout E20 (Lautlosmodus) | |
| Single-Core | |
| Średnia w klasie Gaming (986 - 2474, n=105, ostatnie 2 lata) | |
| Medion Erazer Scout E20 (Gaming Modus) | |
| Medion Erazer Scout E20 | |
| Przeciętny Intel Core i7-13700H (1362 - 1919, n=29) | |
| MSI Katana 17 B13VFK | |
| Lenovo Legion 5 15IAH7H 82RB | |
| Gigabyte G7 KE | |
| Medion Erazer Scout E20 (Lautlosmodus) | |
| Asus TUF Gaming A16 FA617 | |
| Acer Nitro 5 AN515-46-R1A1 | |
| HWBOT x265 Benchmark v2.2 - 4k Preset | |
| Średnia w klasie Gaming (11.5 - 44.4, n=105, ostatnie 2 lata) | |
| Lenovo Legion 5 15IAH7H 82RB | |
| Medion Erazer Scout E20 (Gaming Modus) | |
| Asus TUF Gaming A16 FA617 | |
| MSI Katana 17 B13VFK | |
| Medion Erazer Scout E20 | |
| Acer Nitro 5 AN515-46-R1A1 | |
| Gigabyte G7 KE | |
| Przeciętny Intel Core i7-13700H (6.72 - 21.2, n=29) | |
| Medion Erazer Scout E20 (Lautlosmodus) | |
| LibreOffice - 20 Documents To PDF | |
| Asus TUF Gaming A16 FA617 | |
| MSI Katana 17 B13VFK | |
| Acer Nitro 5 AN515-46-R1A1 | |
| Średnia w klasie Gaming (33.2 - 88.8, n=105, ostatnie 2 lata) | |
| Przeciętny Intel Core i7-13700H (31.3 - 62.4, n=29) | |
| Medion Erazer Scout E20 (Lautlosmodus) | |
| Gigabyte G7 KE | |
| Medion Erazer Scout E20 | |
| Medion Erazer Scout E20 (Gaming Modus) | |
| Lenovo Legion 5 15IAH7H 82RB | |
| R Benchmark 2.5 - Overall mean | |
| Medion Erazer Scout E20 (Lautlosmodus) | |
| Asus TUF Gaming A16 FA617 | |
| Acer Nitro 5 AN515-46-R1A1 | |
| Gigabyte G7 KE | |
| Przeciętny Intel Core i7-13700H (0.4308 - 0.607, n=29) | |
| Lenovo Legion 5 15IAH7H 82RB | |
| Medion Erazer Scout E20 (Gaming Modus) | |
| Medion Erazer Scout E20 | |
| MSI Katana 17 B13VFK | |
| Średnia w klasie Gaming (0.3439 - 0.759, n=106, ostatnie 2 lata) | |
* ... im mniej tym lepiej
AIDA64: FP32 Ray-Trace | FPU Julia | CPU SHA3 | CPU Queen | FPU SinJulia | FPU Mandel | CPU AES | CPU ZLib | FP64 Ray-Trace | CPU PhotoWorxx
| Performance rating | |
| Średnia w klasie Gaming | |
| Lenovo Legion 5 15IAH7H 82RB | |
| Acer Nitro 5 AN515-46-R1A1 | |
| Asus TUF Gaming A16 FA617 | |
| Medion Erazer Scout E20 | |
| Medion Erazer Scout E20 | |
| Przeciętny Intel Core i7-13700H | |
| Gigabyte G7 KE | |
| MSI Katana 17 B13VFK | |
| Medion Erazer Scout E20 | |
| AIDA64 / FP32 Ray-Trace | |
| Średnia w klasie Gaming (10227 - 85542, n=105, ostatnie 2 lata) | |
| Lenovo Legion 5 15IAH7H 82RB (v6.75.6100) | |
| Asus TUF Gaming A16 FA617 (v6.85.6300) | |
| Medion Erazer Scout E20 (v6.75.6100, Gaming Modus) | |
| Acer Nitro 5 AN515-46-R1A1 (v6.75.6100) | |
| Medion Erazer Scout E20 (v6.75.6100) | |
| Przeciętny Intel Core i7-13700H (4986 - 18908, n=29) | |
| MSI Katana 17 B13VFK (v6.85.6300) | |
| Gigabyte G7 KE (v6.75.6100) | |
| Medion Erazer Scout E20 (v6.75.6100, Lautlosmodus) | |
| AIDA64 / FPU Julia | |
| Średnia w klasie Gaming (51376 - 238426, n=105, ostatnie 2 lata) | |
| Asus TUF Gaming A16 FA617 (v6.85.6300) | |
| Acer Nitro 5 AN515-46-R1A1 (v6.75.6100) | |
| Lenovo Legion 5 15IAH7H 82RB (v6.75.6100) | |
| Medion Erazer Scout E20 (v6.75.6100, Gaming Modus) | |
| Medion Erazer Scout E20 | |
| Przeciętny Intel Core i7-13700H (25360 - 92359, n=29) | |
| MSI Katana 17 B13VFK (v6.85.6300) | |
| Gigabyte G7 KE (v6.75.6100) | |
| Medion Erazer Scout E20 (v6.75.6100, Lautlosmodus) | |
| AIDA64 / CPU SHA3 | |
| Średnia w klasie Gaming (2180 - 10115, n=105, ostatnie 2 lata) | |
| Lenovo Legion 5 15IAH7H 82RB (v6.75.6100) | |
| Medion Erazer Scout E20 (v6.75.6100, Gaming Modus) | |
| Asus TUF Gaming A16 FA617 (v6.85.6300) | |
| Acer Nitro 5 AN515-46-R1A1 (v6.75.6100) | |
| Gigabyte G7 KE (v6.75.6100) | |
| Medion Erazer Scout E20 (v6.75.6100) | |
| Przeciętny Intel Core i7-13700H (1339 - 4224, n=29) | |
| MSI Katana 17 B13VFK (v6.85.6300) | |
| Medion Erazer Scout E20 (v6.75.6100, Lautlosmodus) | |
| AIDA64 / CPU Queen | |
| Średnia w klasie Gaming (49785 - 173351, n=90, ostatnie 2 lata) | |
| Medion Erazer Scout E20 (v6.75.6100) | |
| Acer Nitro 5 AN515-46-R1A1 (v6.75.6100) | |
| Medion Erazer Scout E20 (v6.75.6100, Gaming Modus) | |
| Asus TUF Gaming A16 FA617 (v6.85.6300) | |
| Lenovo Legion 5 15IAH7H 82RB (v6.75.6100) | |
| Przeciętny Intel Core i7-13700H (59324 - 107159, n=29) | |
| Gigabyte G7 KE (v6.75.6100) | |
| MSI Katana 17 B13VFK | |
| Medion Erazer Scout E20 (v6.75.6100, Lautlosmodus) | |
| AIDA64 / FPU SinJulia | |
| Średnia w klasie Gaming (4424 - 33636, n=105, ostatnie 2 lata) | |
| Acer Nitro 5 AN515-46-R1A1 (v6.75.6100) | |
| Asus TUF Gaming A16 FA617 (v6.85.6300) | |
| Medion Erazer Scout E20 (v6.75.6100, Gaming Modus) | |
| Lenovo Legion 5 15IAH7H 82RB (v6.75.6100) | |
| Medion Erazer Scout E20 (v6.75.6100) | |
| Przeciętny Intel Core i7-13700H (4800 - 11050, n=29) | |
| MSI Katana 17 B13VFK | |
| Gigabyte G7 KE (v6.75.6100) | |
| Medion Erazer Scout E20 (v6.75.6100, Lautlosmodus) | |
| AIDA64 / FPU Mandel | |
| Średnia w klasie Gaming (25115 - 128721, n=105, ostatnie 2 lata) | |
| Acer Nitro 5 AN515-46-R1A1 (v6.75.6100) | |
| Asus TUF Gaming A16 FA617 (v6.85.6300) | |
| Lenovo Legion 5 15IAH7H 82RB (v6.75.6100) | |
| Medion Erazer Scout E20 (v6.75.6100, Gaming Modus) | |
| Medion Erazer Scout E20 (v6.75.6100) | |
| Przeciętny Intel Core i7-13700H (12321 - 45118, n=29) | |
| MSI Katana 17 B13VFK (v6.85.6300) | |
| Gigabyte G7 KE (v6.75.6100) | |
| Medion Erazer Scout E20 (v6.75.6100, Lautlosmodus) | |
| AIDA64 / CPU AES | |
| Lenovo Legion 5 15IAH7H 82RB (v6.75.6100) | |
| Acer Nitro 5 AN515-46-R1A1 | |
| Gigabyte G7 KE (v6.75.6100) | |
| Średnia w klasie Gaming (39258 - 247074, n=105, ostatnie 2 lata) | |
| Medion Erazer Scout E20 (v6.75.6100, Gaming Modus) | |
| Przeciętny Intel Core i7-13700H (28769 - 151254, n=29) | |
| Medion Erazer Scout E20 (v6.75.6100) | |
| Asus TUF Gaming A16 FA617 (v6.85.6300) | |
| MSI Katana 17 B13VFK (v6.85.6300) | |
| Medion Erazer Scout E20 (v6.75.6100, Lautlosmodus) | |
| AIDA64 / CPU ZLib | |
| Średnia w klasie Gaming (574 - 2531, n=105, ostatnie 2 lata) | |
| Lenovo Legion 5 15IAH7H 82RB (v6.75.6100) | |
| Medion Erazer Scout E20 (v6.75.6100, Gaming Modus) | |
| Medion Erazer Scout E20 (v6.75.6100) | |
| Przeciętny Intel Core i7-13700H (389 - 1215, n=29) | |
| Gigabyte G7 KE (v6.75.6100) | |
| Asus TUF Gaming A16 FA617 (v6.85.6300) | |
| Acer Nitro 5 AN515-46-R1A1 (v6.75.6100) | |
| MSI Katana 17 B13VFK (v6.85.6300) | |
| Medion Erazer Scout E20 (v6.75.6100, Lautlosmodus) | |
| AIDA64 / FP64 Ray-Trace | |
| Średnia w klasie Gaming (5509 - 45446, n=105, ostatnie 2 lata) | |
| Lenovo Legion 5 15IAH7H 82RB (v6.75.6100) | |
| Asus TUF Gaming A16 FA617 (v6.85.6300) | |
| Medion Erazer Scout E20 (v6.75.6100, Gaming Modus) | |
| Acer Nitro 5 AN515-46-R1A1 (v6.75.6100) | |
| Medion Erazer Scout E20 (v6.75.6100) | |
| Przeciętny Intel Core i7-13700H (2540 - 10135, n=29) | |
| MSI Katana 17 B13VFK (v6.85.6300) | |
| Gigabyte G7 KE (v6.75.6100) | |
| Medion Erazer Scout E20 (v6.75.6100, Lautlosmodus) | |
| AIDA64 / CPU PhotoWorxx | |
| Średnia w klasie Gaming (12271 - 89891, n=105, ostatnie 2 lata) | |
| Przeciętny Intel Core i7-13700H (12872 - 52727, n=29) | |
| Medion Erazer Scout E20 (v6.75.6100, Gaming Modus) | |
| Medion Erazer Scout E20 (v6.75.6100) | |
| Lenovo Legion 5 15IAH7H 82RB (v6.75.6100) | |
| MSI Katana 17 B13VFK (v6.85.6300) | |
| Medion Erazer Scout E20 (v6.75.6100, Lautlosmodus) | |
| Gigabyte G7 KE (v6.75.6100) | |
| Acer Nitro 5 AN515-46-R1A1 | |
| Asus TUF Gaming A16 FA617 (v6.85.6300) | |
Wydajność systemu
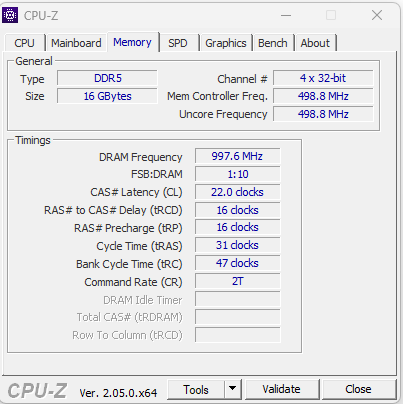
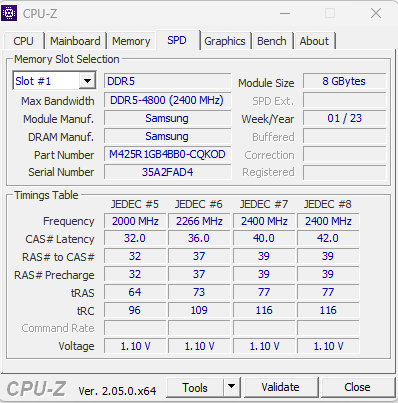
Płynnie działający system oferuje wystarczającą wydajność dla wymagających obszarów zadań, takich jak rendering i gry, co potwierdzają również dobre wyniki PCMark. Prędkości transferu pamięci roboczej mieszczą się w normie dla pamięci DDR5-4800.
CrossMark: Overall | Productivity | Creativity | Responsiveness
| PCMark 10 / Score | |
| Średnia w klasie Gaming (5828 - 12414, n=93, ostatnie 2 lata) | |
| Lenovo Legion 5 15IAH7H 82RB | |
| Medion Erazer Scout E20 | |
| Asus TUF Gaming A16 FA617 | |
| Przeciętny Intel Core i7-13700H, NVIDIA GeForce RTX 4050 Laptop GPU (6822 - 7556, n=7) | |
| MSI Katana 17 B13VFK | |
| Acer Nitro 5 AN515-46-R1A1 | |
| Gigabyte G7 KE | |
| PCMark 10 / Essentials | |
| Lenovo Legion 5 15IAH7H 82RB | |
| Medion Erazer Scout E20 | |
| Przeciętny Intel Core i7-13700H, NVIDIA GeForce RTX 4050 Laptop GPU (10283 - 11549, n=7) | |
| MSI Katana 17 B13VFK | |
| Średnia w klasie Gaming (8810 - 11935, n=97, ostatnie 2 lata) | |
| Asus TUF Gaming A16 FA617 | |
| Acer Nitro 5 AN515-46-R1A1 | |
| Gigabyte G7 KE | |
| PCMark 10 / Productivity | |
| Średnia w klasie Gaming (6845 - 25323, n=95, ostatnie 2 lata) | |
| Lenovo Legion 5 15IAH7H 82RB | |
| Medion Erazer Scout E20 | |
| Asus TUF Gaming A16 FA617 | |
| MSI Katana 17 B13VFK | |
| Przeciętny Intel Core i7-13700H, NVIDIA GeForce RTX 4050 Laptop GPU (8368 - 9836, n=7) | |
| Gigabyte G7 KE | |
| Acer Nitro 5 AN515-46-R1A1 | |
| PCMark 10 / Digital Content Creation | |
| Średnia w klasie Gaming (7602 - 19954, n=95, ostatnie 2 lata) | |
| Lenovo Legion 5 15IAH7H 82RB | |
| Asus TUF Gaming A16 FA617 | |
| Medion Erazer Scout E20 | |
| Przeciętny Intel Core i7-13700H, NVIDIA GeForce RTX 4050 Laptop GPU (9527 - 10643, n=7) | |
| MSI Katana 17 B13VFK | |
| Acer Nitro 5 AN515-46-R1A1 | |
| Gigabyte G7 KE | |
| CrossMark / Overall | |
| Lenovo Legion 5 15IAH7H 82RB | |
| Średnia w klasie Gaming (1366 - 2409, n=94, ostatnie 2 lata) | |
| Medion Erazer Scout E20 | |
| MSI Katana 17 B13VFK | |
| Gigabyte G7 KE | |
| Przeciętny Intel Core i7-13700H, NVIDIA GeForce RTX 4050 Laptop GPU (1205 - 1937, n=9) | |
| Acer Nitro 5 AN515-46-R1A1 | |
| CrossMark / Productivity | |
| Lenovo Legion 5 15IAH7H 82RB | |
| Medion Erazer Scout E20 | |
| Średnia w klasie Gaming (1386 - 2254, n=94, ostatnie 2 lata) | |
| Gigabyte G7 KE | |
| MSI Katana 17 B13VFK | |
| Przeciętny Intel Core i7-13700H, NVIDIA GeForce RTX 4050 Laptop GPU (1158 - 1877, n=9) | |
| Acer Nitro 5 AN515-46-R1A1 | |
| CrossMark / Creativity | |
| Średnia w klasie Gaming (1343 - 2786, n=94, ostatnie 2 lata) | |
| Medion Erazer Scout E20 | |
| Lenovo Legion 5 15IAH7H 82RB | |
| MSI Katana 17 B13VFK | |
| Przeciętny Intel Core i7-13700H, NVIDIA GeForce RTX 4050 Laptop GPU (1293 - 2044, n=9) | |
| Gigabyte G7 KE | |
| Acer Nitro 5 AN515-46-R1A1 | |
| CrossMark / Responsiveness | |
| Lenovo Legion 5 15IAH7H 82RB | |
| Gigabyte G7 KE | |
| Medion Erazer Scout E20 | |
| MSI Katana 17 B13VFK | |
| Średnia w klasie Gaming (1226 - 2334, n=94, ostatnie 2 lata) | |
| Przeciętny Intel Core i7-13700H, NVIDIA GeForce RTX 4050 Laptop GPU (1097 - 1929, n=9) | |
| Acer Nitro 5 AN515-46-R1A1 | |
| PCMark 8 Home Score Accelerated v2 | 5486 pkt. | |
| PCMark 8 Work Score Accelerated v2 | 6205 pkt. | |
| PCMark 10 Score | 7556 pkt. | |
Pomoc | ||
| AIDA64 / Memory Copy | |
| Średnia w klasie Gaming (21750 - 129946, n=105, ostatnie 2 lata) | |
| Przeciętny Intel Core i7-13700H (24334 - 78081, n=29) | |
| Medion Erazer Scout E20 | |
| MSI Katana 17 B13VFK | |
| Lenovo Legion 5 15IAH7H 82RB | |
| Acer Nitro 5 AN515-46-R1A1 | |
| Asus TUF Gaming A16 FA617 | |
| Gigabyte G7 KE | |
| AIDA64 / Memory Read | |
| Średnia w klasie Gaming (22956 - 118858, n=105, ostatnie 2 lata) | |
| Medion Erazer Scout E20 | |
| Przeciętny Intel Core i7-13700H (23681 - 79656, n=29) | |
| MSI Katana 17 B13VFK | |
| Lenovo Legion 5 15IAH7H 82RB | |
| Acer Nitro 5 AN515-46-R1A1 | |
| Asus TUF Gaming A16 FA617 | |
| Gigabyte G7 KE | |
| AIDA64 / Memory Write | |
| Średnia w klasie Gaming (22297 - 135096, n=105, ostatnie 2 lata) | |
| Przeciętny Intel Core i7-13700H (22986 - 99898, n=29) | |
| Medion Erazer Scout E20 | |
| Lenovo Legion 5 15IAH7H 82RB | |
| Acer Nitro 5 AN515-46-R1A1 | |
| Asus TUF Gaming A16 FA617 | |
| MSI Katana 17 B13VFK | |
| Gigabyte G7 KE | |
| AIDA64 / Memory Latency | |
| Średnia w klasie Gaming (75.3 - 259, n=105, ostatnie 2 lata) | |
| MSI Katana 17 B13VFK | |
| Medion Erazer Scout E20 | |
| Lenovo Legion 5 15IAH7H 82RB | |
| Przeciętny Intel Core i7-13700H (82.4 - 136.8, n=29) | |
| Gigabyte G7 KE | |
| Acer Nitro 5 AN515-46-R1A1 | |
| Asus TUF Gaming A16 FA617 | |
* ... im mniej tym lepiej
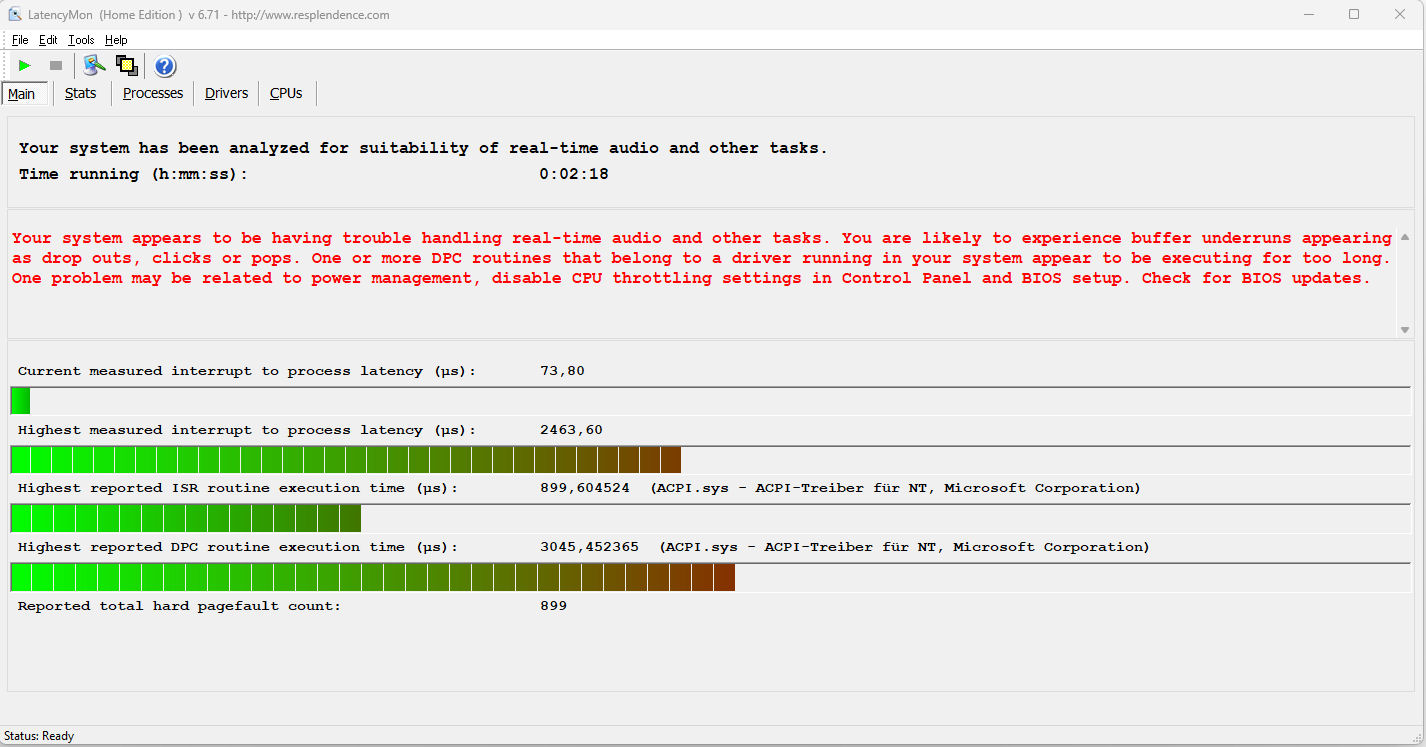
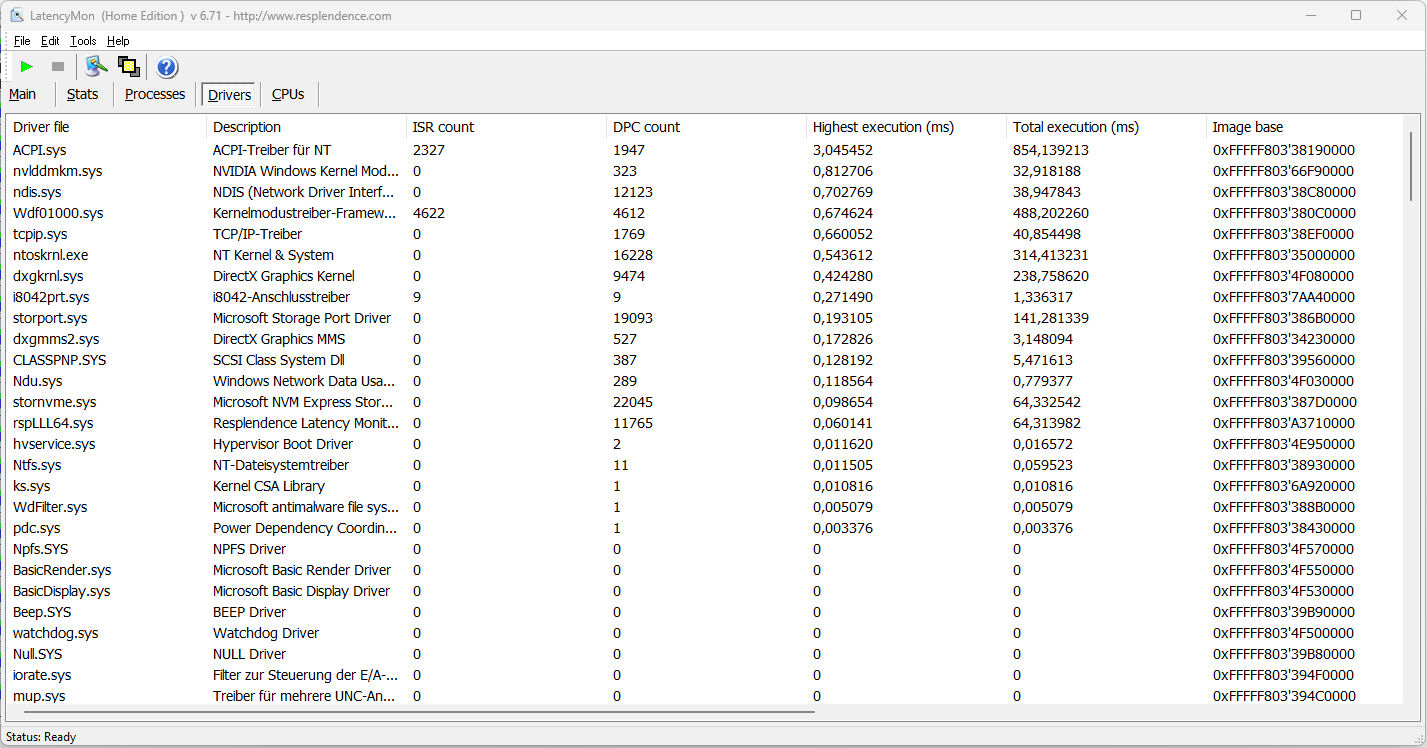
Opóźnienia DPC
Standardowy test Latency Monitor (z przeglądaniem stron internetowych, odtwarzaniem wideo 4k i dużym obciążeniem Prime95) ujawnia pewne wyraźne opóźnienia. System nie wydaje się być przystosowany do przetwarzania wideo i audio w czasie rzeczywistym. Przyszłe aktualizacje oprogramowania mogą przynieść pewne ulepszenia lub nawet pogorszyć sytuację.
| DPC Latencies / LatencyMon - interrupt to process latency (max), Web, Youtube, Prime95 | |
| Acer Nitro 5 AN515-46-R1A1 | |
| Medion Erazer Scout E20 | |
| MSI Katana 17 B13VFK | |
| Gigabyte G7 KE | |
| Lenovo Legion 5 15IAH7H 82RB | |
| Asus TUF Gaming A16 FA617 | |
* ... im mniej tym lepiej
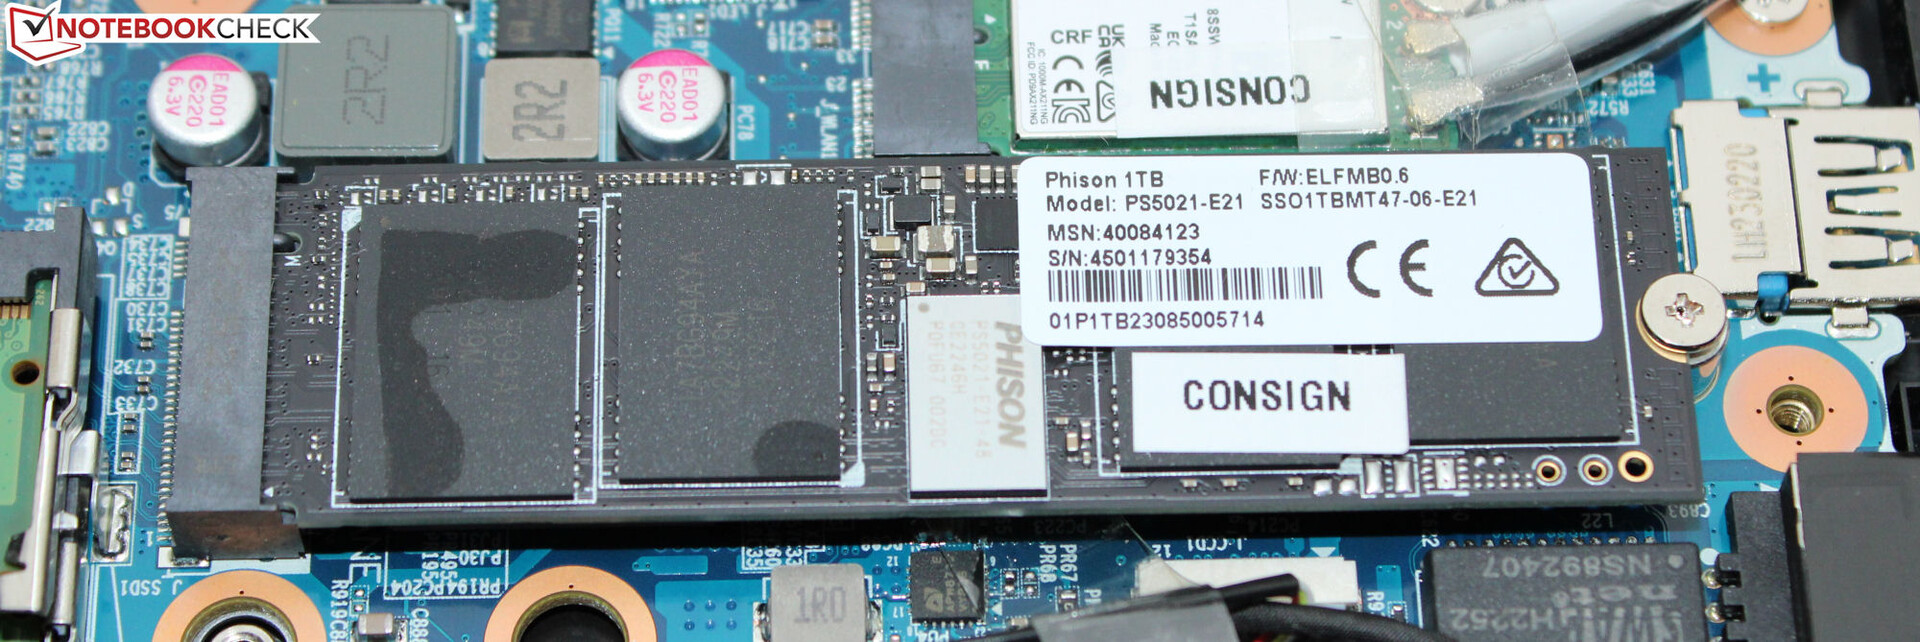
Rozwiązanie pamięci masowej
Jako dysk systemowy służy 1-TB PCIe 4 SSD w formacie M.2-2280 firmy Phison. Chociaż zapewnia bardzo dobre prędkości transferu, nie jest to jeden z najlepszych modeli wśród dysków SSD. Nie ma spadków wydajności spowodowanych dławieniem termicznym.
Według strony internetowej Medion, pamięć masową laptopa można rozszerzyć za pomocą 2,5-calowego nośnika pamięci, ale nasza jednostka testowa nie zawiera ani niezbędnych gniazd SATA, ani ramki do wkładania.

* ... im mniej tym lepiej
Disk Throttling: DiskSpd Read Loop, Queue Depth 8
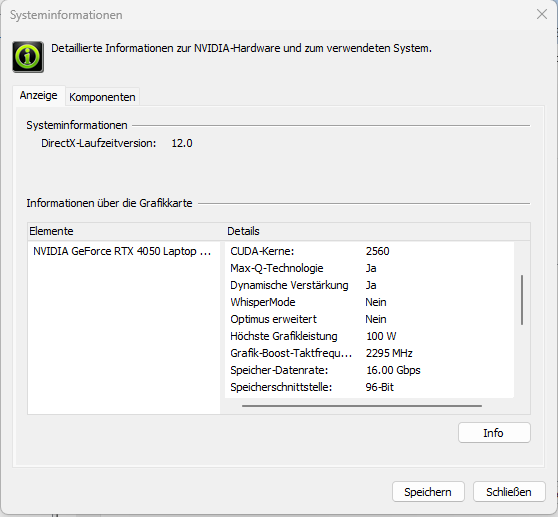
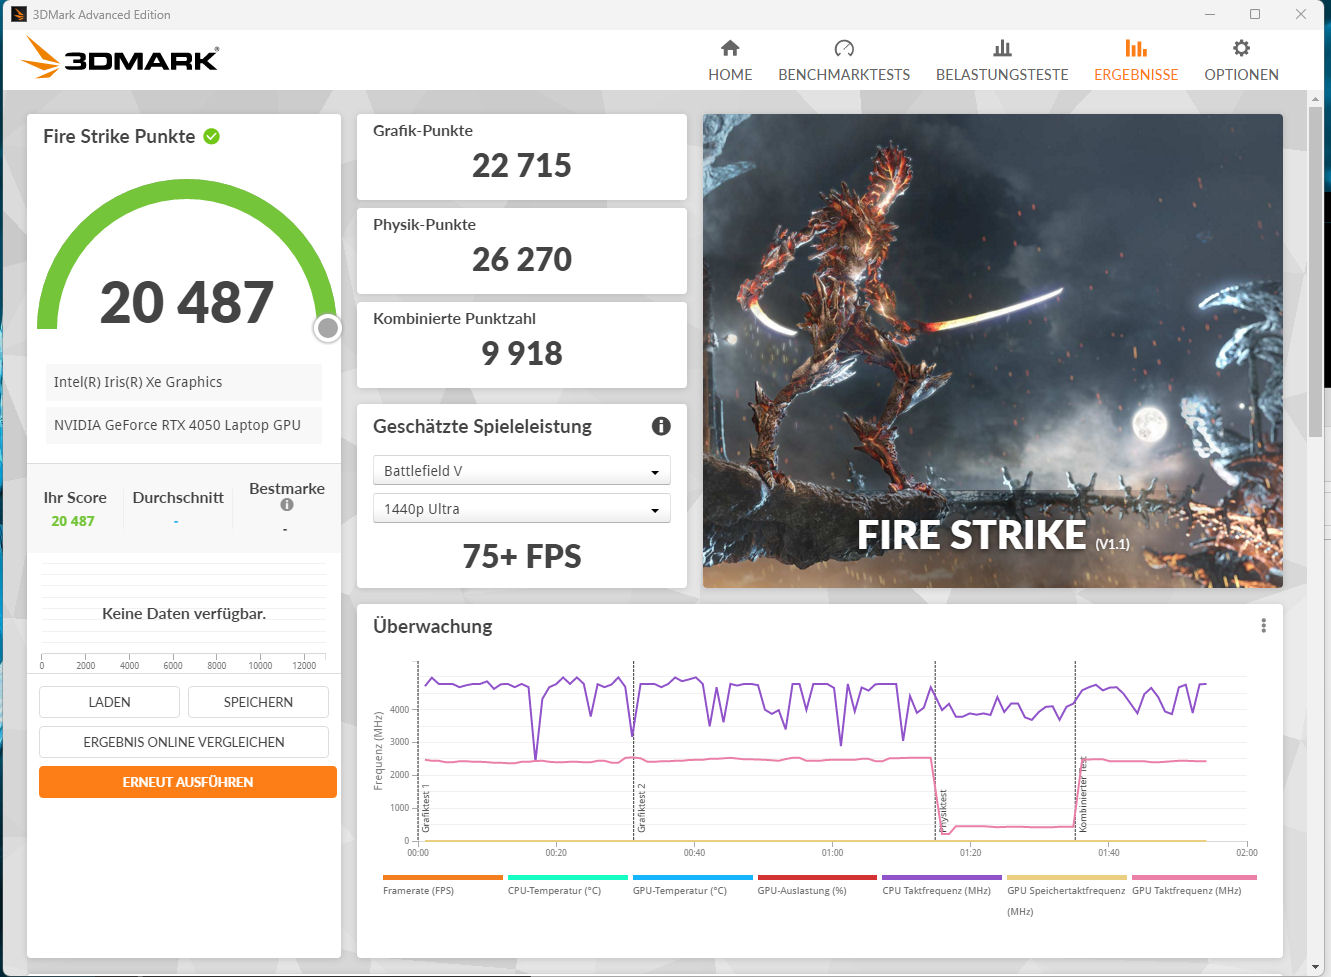
Karta graficzna
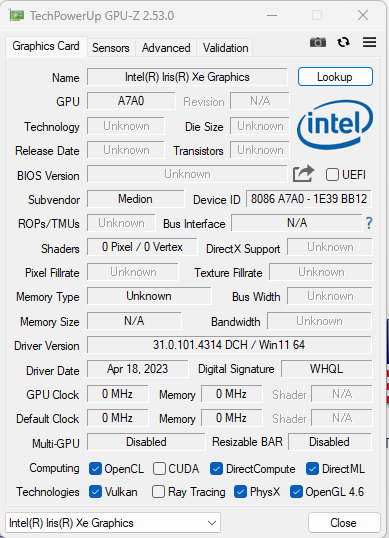
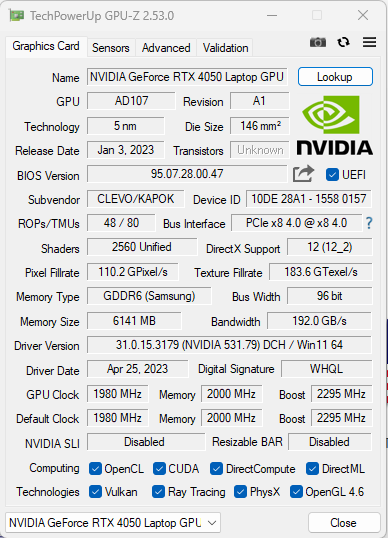
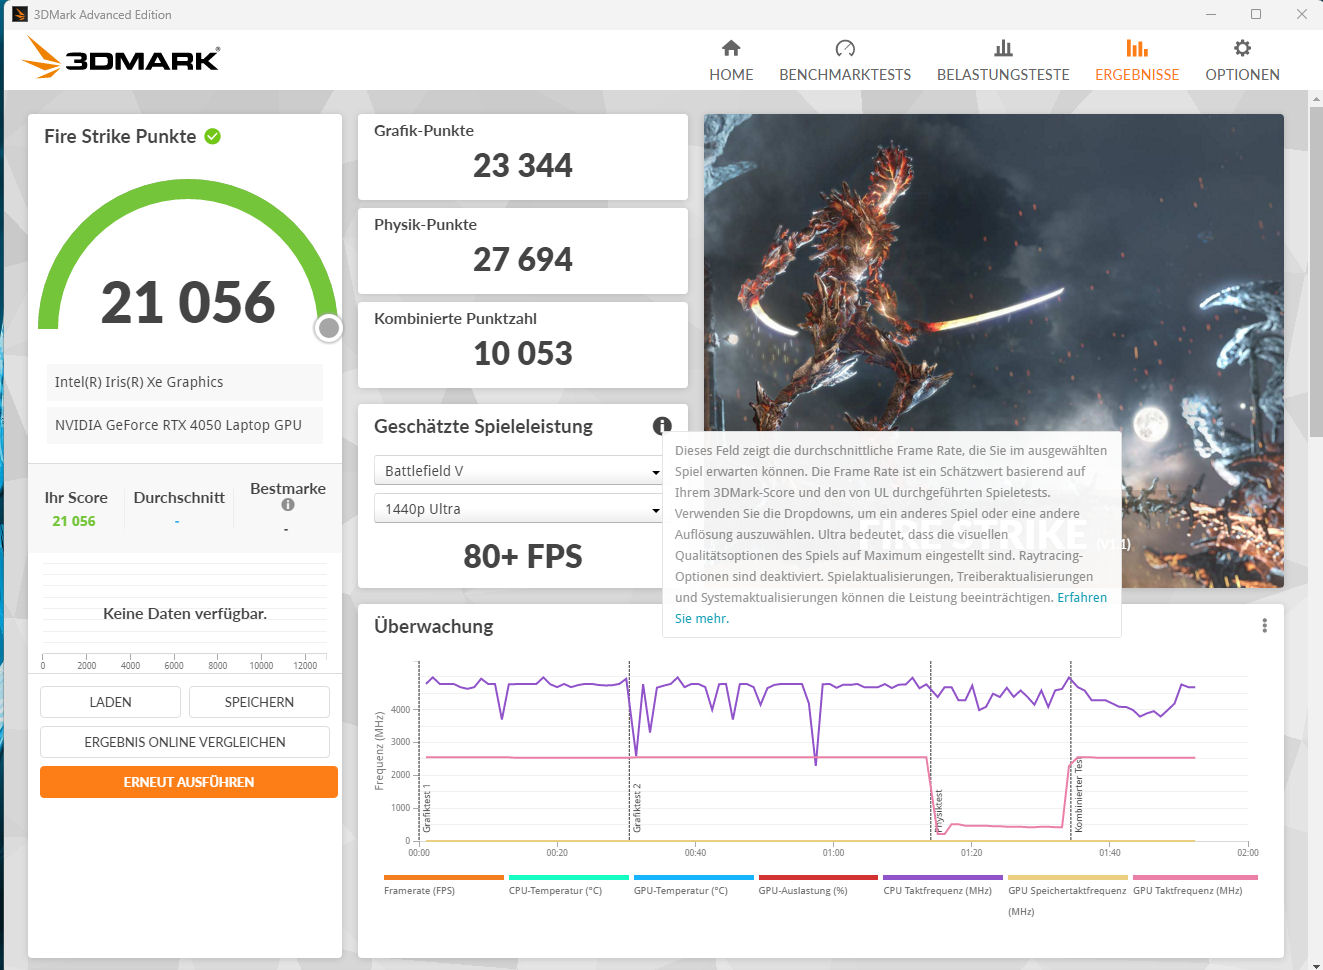
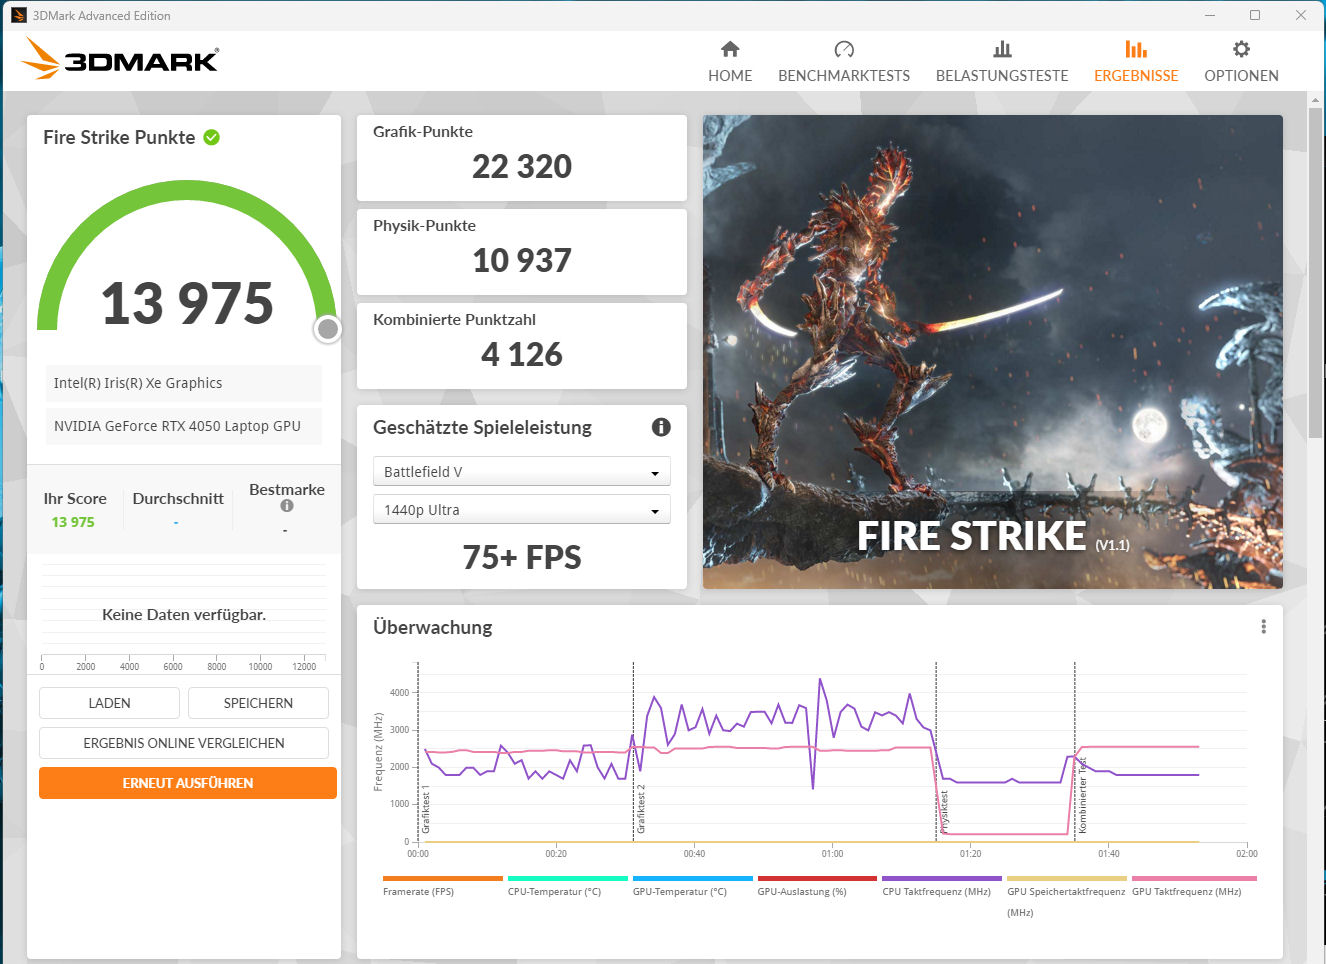
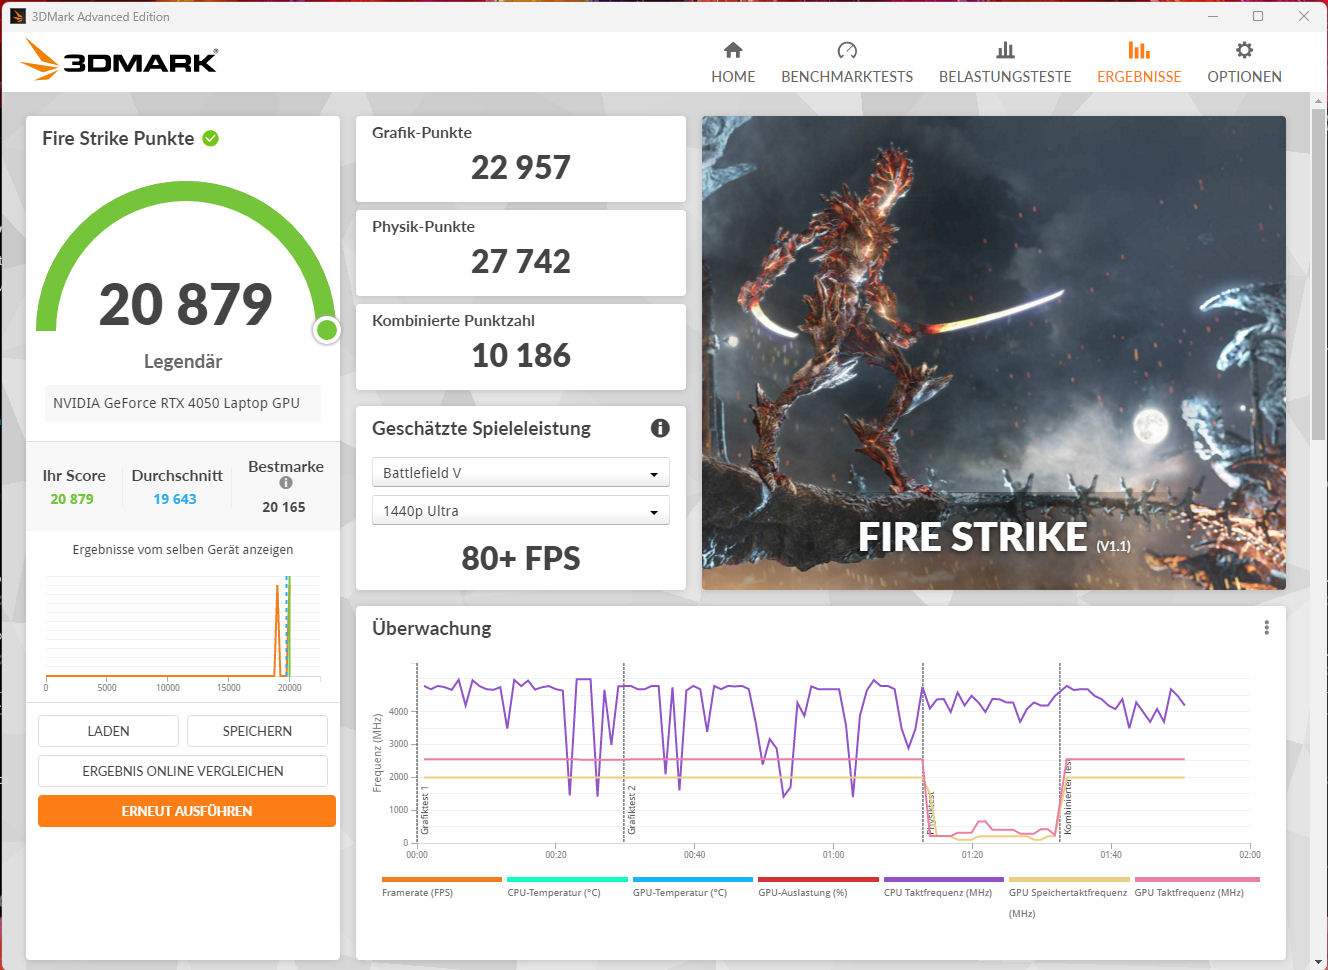
Karta graficznaGeForce RTX 4050laptop GPU oferuje 2560 jednostek cieniujących, 96-bitową magistralę i 6144 MB szybkiej pamięci GDDR6. Medion pozwala mu na maksymalne TGP wynoszące 100 watów. Według naszego testu The Witcher 3, maksymalne TGP nie jest w pełni wykorzystywane.
Wyniki benchmarków mieszczą się powyżej średniej dla RTX 4050. Tryby rozrywki i gier zapewniają niemal taką samą wydajność graficzną. Bezpośrednie wyjście obrazu przez GPU GeForce nie przynosi wzrostu wydajności. Przełączanie między trybem Optimus i dGPU odbywa się w BIOS-ie lub za pośrednictwem Centrum sterowania. Zaawansowany Optimus nie jest obsługiwany.
| 3DMark Performance rating - Percent | |
| Średnia w klasie Gaming | |
| MSI Katana 17 B13VFK | |
| Acer Nitro 5 AN515-46-R1A1 | |
| Asus TUF Gaming A16 FA617 | |
| Medion Erazer Scout E20 | |
| Medion Erazer Scout E20 | |
| Lenovo Legion 5 15IAH7H 82RB -1! | |
| Przeciętny NVIDIA GeForce RTX 4050 Laptop GPU | |
| Medion Erazer Scout E20 | |
| Gigabyte G7 KE | |
| 3DMark 11 - 1280x720 Performance GPU | |
| Średnia w klasie Gaming (21841 - 80022, n=104, ostatnie 2 lata) | |
| Acer Nitro 5 AN515-46-R1A1 | |
| MSI Katana 17 B13VFK | |
| Asus TUF Gaming A16 FA617 | |
| Medion Erazer Scout E20 (Gaming Performance) | |
| Lenovo Legion 5 15IAH7H 82RB | |
| Medion Erazer Scout E20 | |
| Medion Erazer Scout E20 (Lautlosmodus) | |
| Gigabyte G7 KE | |
| Przeciętny NVIDIA GeForce RTX 4050 Laptop GPU (13339 - 32642, n=41) | |
| 3DMark 06 Standard Score | 51372 pkt. | |
| 3DMark 11 Performance | 27315 pkt. | |
| 3DMark Cloud Gate Standard Score | 52998 pkt. | |
| 3DMark Fire Strike Score | 20487 pkt. | |
| 3DMark Time Spy Score | 8594 pkt. | |
Pomoc | ||
| Blender | |
| v3.3 Classroom OPTIX/RTX | |
| Gigabyte G7 KE (3.3.2) | |
| Lenovo Legion 5 15IAH7H 82RB (3.3.0) | |
| Medion Erazer Scout E20 (3.3.3) | |
| Medion Erazer Scout E20 (3.3.3, Lautlosmodus) | |
| Przeciętny NVIDIA GeForce RTX 4050 Laptop GPU (25 - 37, n=40) | |
| Medion Erazer Scout E20 (3.3.3, Gaming Modus) | |
| Acer Nitro 5 AN515-46-R1A1 (3.3.0) | |
| MSI Katana 17 B13VFK (3.3.3) | |
| Średnia w klasie Gaming (9 - 32, n=106, ostatnie 2 lata) | |
| v3.3 Classroom CUDA | |
| Przeciętny NVIDIA GeForce RTX 4050 Laptop GPU (47 - 68, n=39) | |
| Gigabyte G7 KE (3.3.2) | |
| Medion Erazer Scout E20 (3.3.3) | |
| Medion Erazer Scout E20 (3.3.3, Lautlosmodus) | |
| Lenovo Legion 5 15IAH7H 82RB (3.3.0) | |
| Medion Erazer Scout E20 (3.3.3, Gaming Modus) | |
| MSI Katana 17 B13VFK (3.3.3) | |
| Acer Nitro 5 AN515-46-R1A1 (3.3.0) | |
| Średnia w klasie Gaming (15 - 228, n=106, ostatnie 2 lata) | |
| Geekbench 5.5 - OpenCL Score | |
| Średnia w klasie Gaming (80702 - 277970, n=101, ostatnie 2 lata) | |
| Acer Nitro 5 AN515-46-R1A1 | |
| Gigabyte G7 KE | |
| Lenovo Legion 5 15IAH7H 82RB | |
| MSI Katana 17 B13VFK | |
| Medion Erazer Scout E20 (Gaming Modus) | |
| Medion Erazer Scout E20 (Lautlosmodus) | |
| Medion Erazer Scout E20 | |
| Przeciętny NVIDIA GeForce RTX 4050 Laptop GPU (63538 - 90075, n=38) | |
| Asus TUF Gaming A16 FA617 | |
| Geekbench 6.0 - GPU OpenCL 6.0 | |
| Średnia w klasie Gaming (155885 - 241981, n=3, ostatnie 2 lata) | |
| Medion Erazer Scout E20 | |
| Przeciętny NVIDIA GeForce RTX 4050 Laptop GPU (66574 - 84452, n=13) | |
| V-Ray 5 Benchmark | |
| GPU RTX | |
| Średnia w klasie Gaming (1146 - 4363, n=33, ostatnie 2 lata) | |
| Acer Nitro 5 AN515-46-R1A1 (5.0.1) | |
| Medion Erazer Scout E20 (5.0.1, Gaming Modus) | |
| Medion Erazer Scout E20 (5.0.1) | |
| Przeciętny NVIDIA GeForce RTX 4050 Laptop GPU (618 - 1588, n=24) | |
| Medion Erazer Scout E20 (5.0.1, Lautlosmodus) | |
| Gigabyte G7 KE (5.0.1) | |
| GPU CUDA | |
| Średnia w klasie Gaming (887 - 3288, n=33, ostatnie 2 lata) | |
| Acer Nitro 5 AN515-46-R1A1 (5.0.1) | |
| Medion Erazer Scout E20 (5.0.1, Gaming Modus) | |
| Medion Erazer Scout E20 (5.0.1, Lautlosmodus) | |
| Medion Erazer Scout E20 (5.0.1) | |
| Przeciętny NVIDIA GeForce RTX 4050 Laptop GPU (735 - 1202, n=24) | |
| Gigabyte G7 KE (5.0.1) | |
| CPU | |
| Średnia w klasie Gaming (5864 - 30302, n=32, ostatnie 2 lata) | |
| Lenovo Legion 5 15IAH7H 82RB (5.0.1) | |
| Medion Erazer Scout E20 (5.0.1, Gaming Modus) | |
| Przeciętny NVIDIA GeForce RTX 4050 Laptop GPU (3562 - 14401, n=24) | |
| Medion Erazer Scout E20 (5.0.1) | |
| Acer Nitro 5 AN515-46-R1A1 (5.0.1) | |
| Gigabyte G7 KE (5.0.1) | |
| Medion Erazer Scout E20 (5.0.1, Lautlosmodus) | |
| V-Ray Benchmark Next 4.10 | |
| GPU | |
| Średnia w klasie Gaming (427 - 1627, n=99, ostatnie 2 lata) | |
| MSI Katana 17 B13VFK (v4.10.07 ) | |
| Acer Nitro 5 AN515-46-R1A1 (v4.10.07 ) | |
| Medion Erazer Scout E20 (v4.10.07, Gaming Modus) | |
| Medion Erazer Scout E20 (v4.10.07, Lautlosmodus) | |
| Medion Erazer Scout E20 (v4.10.07 ) | |
| Przeciętny NVIDIA GeForce RTX 4050 Laptop GPU (333 - 565, n=35) | |
| Gigabyte G7 KE (v4.10.07 ) | |
| Asus TUF Gaming A16 FA617 (v4.10.07 ) | |
| CPU | |
| Średnia w klasie Gaming (10048 - 45327, n=97, ostatnie 2 lata) | |
| Medion Erazer Scout E20 (v4.10.07, Gaming Modus) | |
| MSI Katana 17 B13VFK (v4.10.07 ) | |
| Medion Erazer Scout E20 (v4.10.07 ) | |
| Przeciętny NVIDIA GeForce RTX 4050 Laptop GPU (5413 - 24181, n=35) | |
| Asus TUF Gaming A16 FA617 (v4.10.07 ) | |
| Gigabyte G7 KE (v4.10.07 ) | |
| Acer Nitro 5 AN515-46-R1A1 (v4.10.07 ) | |
| Medion Erazer Scout E20 (v4.10.07, Lautlosmodus) | |
* ... im mniej tym lepiej
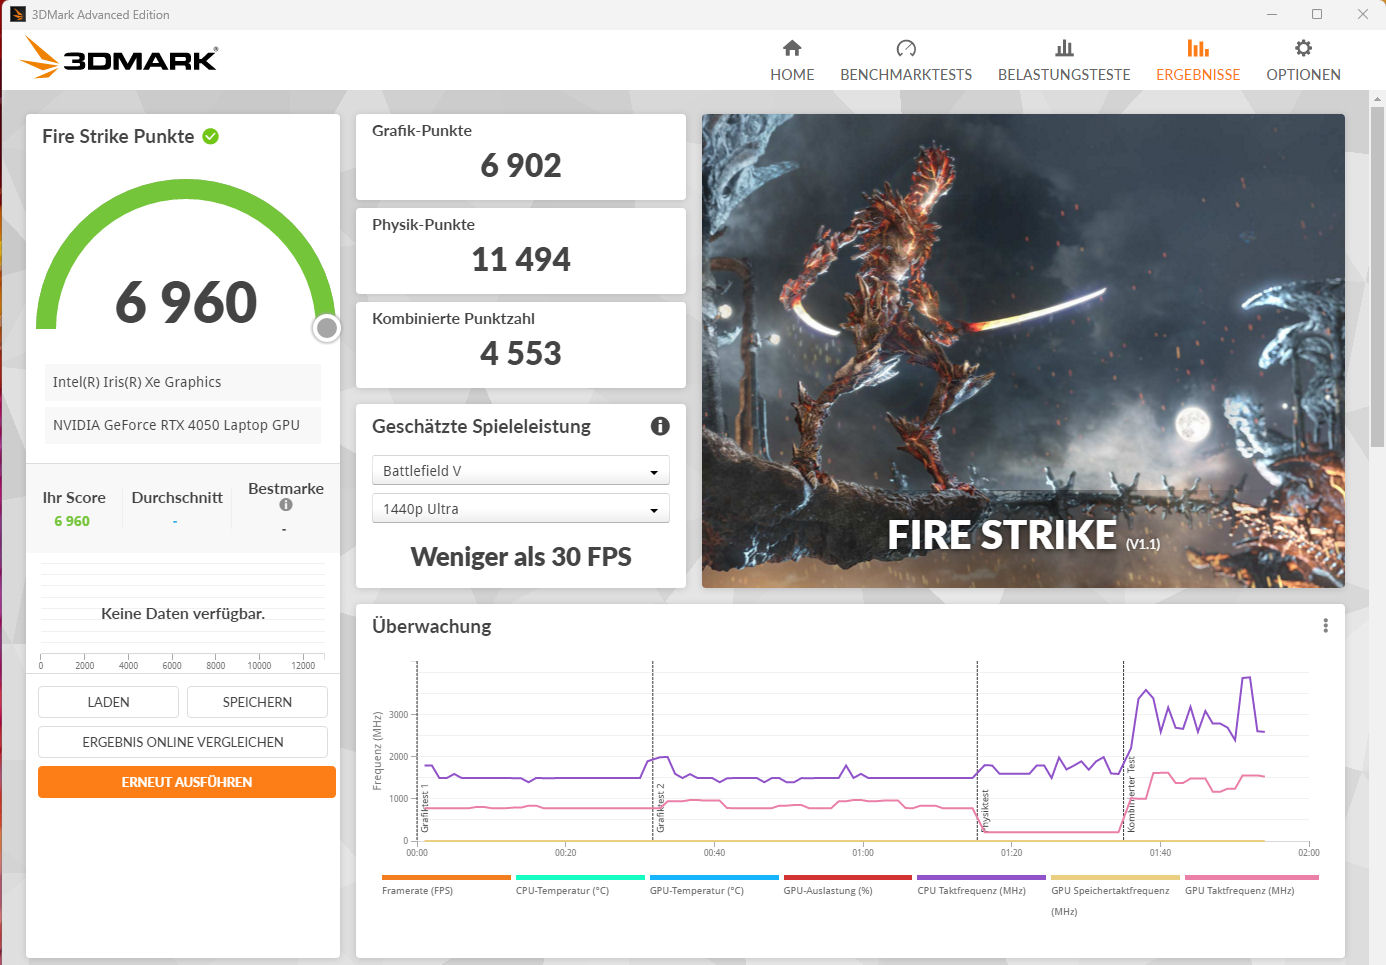
Wydajność w grach
Scout jest skonfigurowany do grania w rozdzielczości FHD przy ustawieniach od wysokich do maksymalnych. "Tryb cichy" umożliwia grę przy niskim poziomie hałasu, ale należy odpowiednio obniżyć rozdzielczość i ustawienia. Laptop osiąga liczbę klatek na sekundę powyżej (tryb Gaming, tryb Entertainment) i poniżej (tryb Silent) średniej, którą ustaliliśmy do tej pory dla RTX 4050. W zależności od gry, bezpośrednie wyjście obrazu przez GPU GeForce może prowadzić do minimalnego wzrostu liczby klatek na sekundę.
| Performance rating - Percent | |
| Średnia w klasie Gaming | |
| MSI Katana 17 B13VFK | |
| Lenovo Legion 5 15IAH7H 82RB | |
| Medion Erazer Scout E20 | |
| Medion Erazer Scout E20 | |
| Acer Nitro 5 AN515-46-R1A1 | |
| Gigabyte G7 KE | |
| Przeciętny NVIDIA GeForce RTX 4050 Laptop GPU | |
| Asus TUF Gaming A16 FA617 | |
| Medion Erazer Scout E20 | |
| The Witcher 3 - 1920x1080 Ultra Graphics & Postprocessing (HBAO+) | |
| Średnia w klasie Gaming (104.7 - 240, n=7, ostatnie 2 lata) | |
| Acer Nitro 5 AN515-46-R1A1 | |
| MSI Katana 17 B13VFK | |
| Asus TUF Gaming A16 FA617 | |
| Lenovo Legion 5 15IAH7H 82RB | |
| Medion Erazer Scout E20 (Gaming Modus) | |
| Medion Erazer Scout E20 | |
| Gigabyte G7 KE | |
| Medion Erazer Scout E20 (Lautlosmodus) | |
| Przeciętny NVIDIA GeForce RTX 4050 Laptop GPU (18.5 - 94.7, n=40) | |
| GTA V - 1920x1080 Highest AA:4xMSAA + FX AF:16x | |
| Średnia w klasie Gaming (48.3 - 186.9, n=94, ostatnie 2 lata) | |
| MSI Katana 17 B13VFK | |
| Lenovo Legion 5 15IAH7H 82RB | |
| Gigabyte G7 KE | |
| Medion Erazer Scout E20 (Gaming Modus) | |
| Medion Erazer Scout E20 | |
| Acer Nitro 5 AN515-46-R1A1 | |
| Asus TUF Gaming A16 FA617 | |
| Przeciętny NVIDIA GeForce RTX 4050 Laptop GPU (14.9 - 101.7, n=35) | |
| Medion Erazer Scout E20 (Lautlosmodus) | |
| Final Fantasy XV Benchmark - 1920x1080 High Quality | |
| Średnia w klasie Gaming (41 - 215, n=95, ostatnie 2 lata) | |
| Acer Nitro 5 AN515-46-R1A1 (1.3) | |
| Lenovo Legion 5 15IAH7H 82RB (1.3) | |
| MSI Katana 17 B13VFK (1.3) | |
| Gigabyte G7 KE (1.3) | |
| Medion Erazer Scout E20 (1.3) | |
| Medion Erazer Scout E20 (1.3, Gaming Modus) | |
| Asus TUF Gaming A16 FA617 (1.3) | |
| Przeciętny NVIDIA GeForce RTX 4050 Laptop GPU (15.5 - 122.3, n=39) | |
| Medion Erazer Scout E20 (1.3, Lautlosmodus) | |
| Strange Brigade - 1920x1080 ultra AA:ultra AF:16 | |
| Średnia w klasie Gaming (76.3 - 458, n=87, ostatnie 2 lata) | |
| MSI Katana 17 B13VFK (1.47.22.14 D3D12) | |
| Acer Nitro 5 AN515-46-R1A1 (1.47.22.14 D3D12) | |
| Lenovo Legion 5 15IAH7H 82RB (1.47.22.14 D3D12) | |
| Asus TUF Gaming A16 FA617 (1.47.22.14 D3D12) | |
| Medion Erazer Scout E20 (1.47.22.14 D3D12, Gaming Modus) | |
| Gigabyte G7 KE (1.47.22.14 D3D12) | |
| Medion Erazer Scout E20 (1.47.22.14 D3D12) | |
| Medion Erazer Scout E20 (1.47.22.14 D3D12, Lautlosmodus) | |
| Przeciętny NVIDIA GeForce RTX 4050 Laptop GPU (21.2 - 156.6, n=38) | |
| Dota 2 Reborn - 1920x1080 ultra (3/3) best looking | |
| MSI Katana 17 B13VFK | |
| Lenovo Legion 5 15IAH7H 82RB | |
| Średnia w klasie Gaming (84.8 - 248, n=107, ostatnie 2 lata) | |
| Medion Erazer Scout E20 (Gaming Modus) | |
| Medion Erazer Scout E20 | |
| Gigabyte G7 KE | |
| Przeciętny NVIDIA GeForce RTX 4050 Laptop GPU (73.5 - 175.6, n=39) | |
| Asus TUF Gaming A16 FA617 | |
| Acer Nitro 5 AN515-46-R1A1 | |
| Medion Erazer Scout E20 (Lautlosmodus) | |
| X-Plane 11.11 - 1920x1080 high (fps_test=3) | |
| MSI Katana 17 B13VFK | |
| Medion Erazer Scout E20 (Gaming Modus) | |
| Lenovo Legion 5 15IAH7H 82RB | |
| Medion Erazer Scout E20 | |
| Średnia w klasie Gaming (55.5 - 143.5, n=109, ostatnie 2 lata) | |
| Przeciętny NVIDIA GeForce RTX 4050 Laptop GPU (55.5 - 117, n=40) | |
| Gigabyte G7 KE | |
| Acer Nitro 5 AN515-46-R1A1 | |
| Medion Erazer Scout E20 (Lautlosmodus) | |
| Asus TUF Gaming A16 FA617 | |
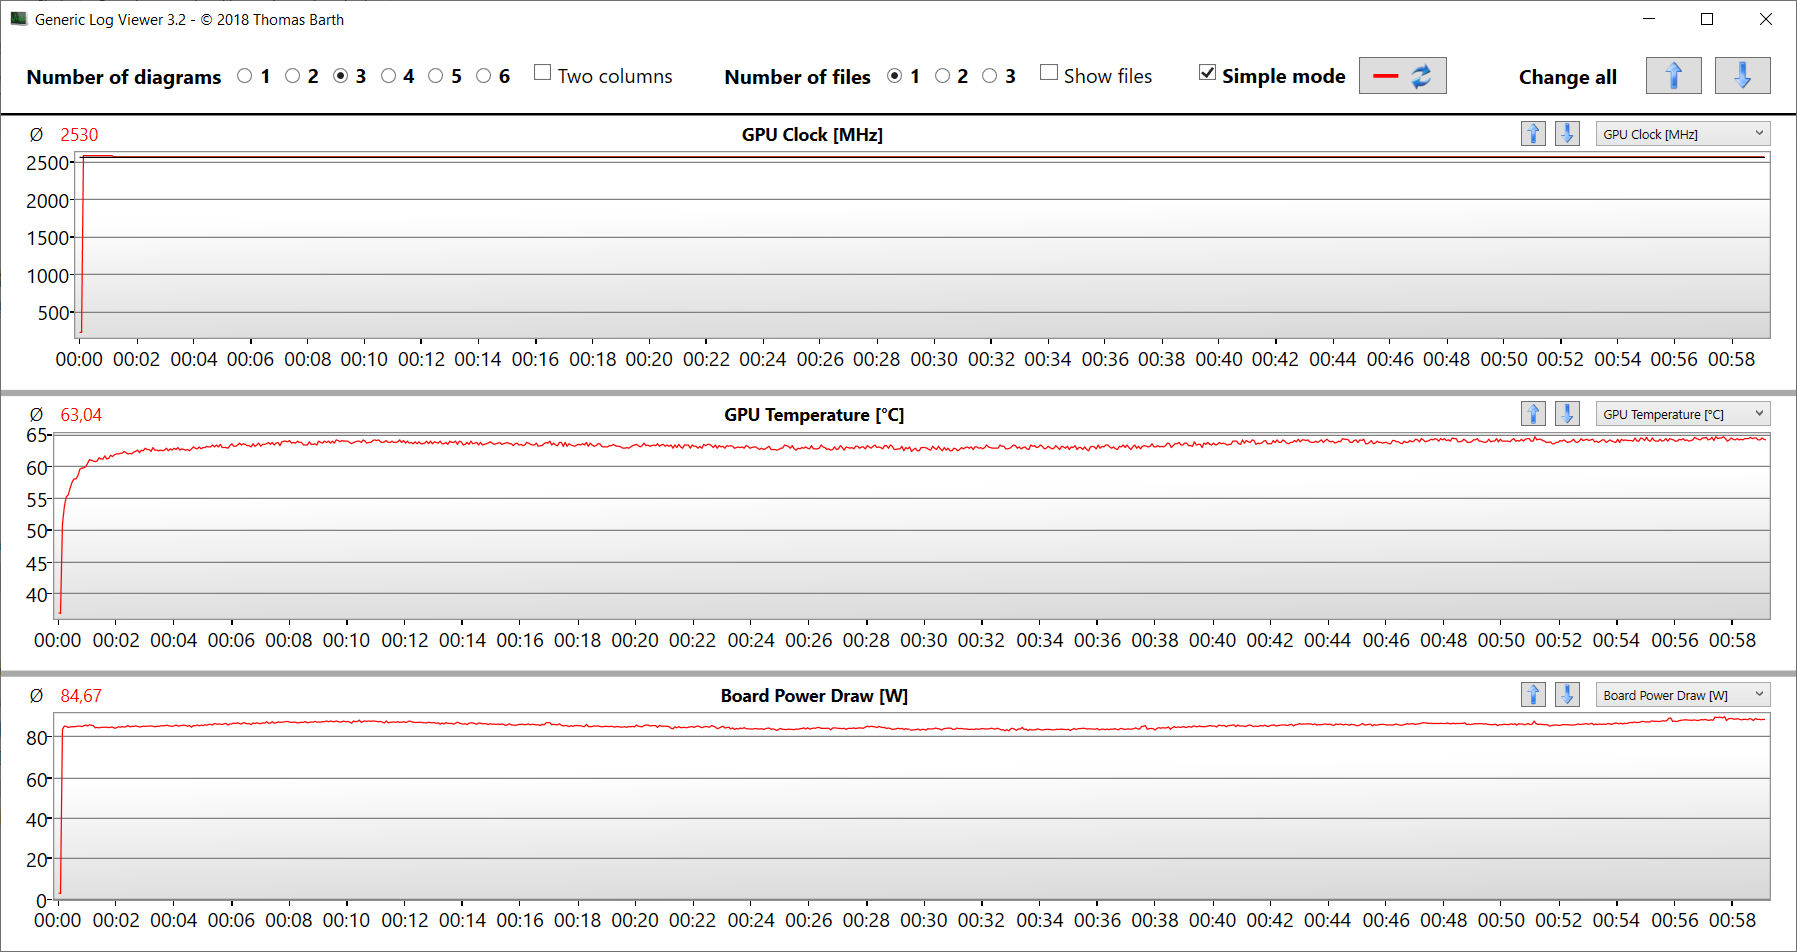
Aby ocenić, czy liczba klatek na sekundę pozostaje w dużym stopniu stała przez dłuższy czas, uruchomiliśmy grę "The Witcher 3" na około 60 minut w rozdzielczości Full-HD i przy maksymalnych ustawieniach jakości. W tym czasie postać w grze nie jest poruszana. Dopiero po włączeniu "trybu cichego" następuje spadek liczby klatek na sekundę.
The Witcher 3 FPS Chart
| low | med. | high | ultra | |
|---|---|---|---|---|
| GTA V (2015) | 184.8 | 180.1 | 172.4 | 94.2 |
| The Witcher 3 (2015) | 382.6 | 265.3 | 150.9 | 83.4 |
| Dota 2 Reborn (2015) | 177.6 | 160.3 | 150.3 | 142.5 |
| Final Fantasy XV Benchmark (2018) | 187.5 | 116.9 | 82.6 | |
| X-Plane 11.11 (2018) | 153.9 | 132.7 | 104.4 | |
| Far Cry 5 (2018) | 172 | 136 | 126 | 119 |
| Strange Brigade (2018) | 447 | 206 | 166.5 | 144 |
| Gears Tactics (2020) | 341.6 | 204.1 | 133.9 | 96.7 |
| Death Stranding (2020) | 174.8 | 140.5 | 132 | 128.8 |
| Assassin´s Creed Valhalla (2020) | 184 | 117 | 92 | 70 |
| Immortals Fenyx Rising (2020) | 171 | 112 | 101 | 93 |
| Mass Effect Legendary Edition (2021) | 150.1 | 135.1 | ||
| Far Cry 6 (2021) | 153.2 | 125.3 | 107.3 | 76.7 |
| Back 4 Blood (2021) | 332 | 221 | 166.1 | 155.3 |
| Guardians of the Galaxy (2021) | 144 | 120 | 119 | 113 |
| Riders Republic (2021) | 164 | 131 | 107 | 96 |
| Halo Infinite (2021) | 122.8 | 104.6 | 85.9 | |
| Rainbow Six Extraction (2022) | 208 | 166 | 159 | 125 |
| GRID Legends (2022) | 206.2 | 171.4 | 140.9 | 109.8 |
| Elex 2 (2022) | 116.3 | 115.7 | 103.4 | 81.4 |
| F1 22 (2022) | 215 | 197.2 | 152.3 | 52.5 |
| Uncharted Legacy of Thieves Collection (2022) | 75.1 | 71.1 | 67.2 | 62.6 |
| Dead Island 2 (2023) | 196 | 171.7 | 133.1 | 120.6 |
| Star Wars Jedi Survivor (2023) | 99.2 | 86.3 | 62.9 | 49.4 |
| Anno 117: Pax Romana (2025) | 83.6 | 64 | 47.8 | 26.2 |
| Forza Horizon 6 (2026) | 147 | 96 | 50 | 18 |
Emisje - Erazer Scout prawie się nie nagrzewa
Poziomy hałasu
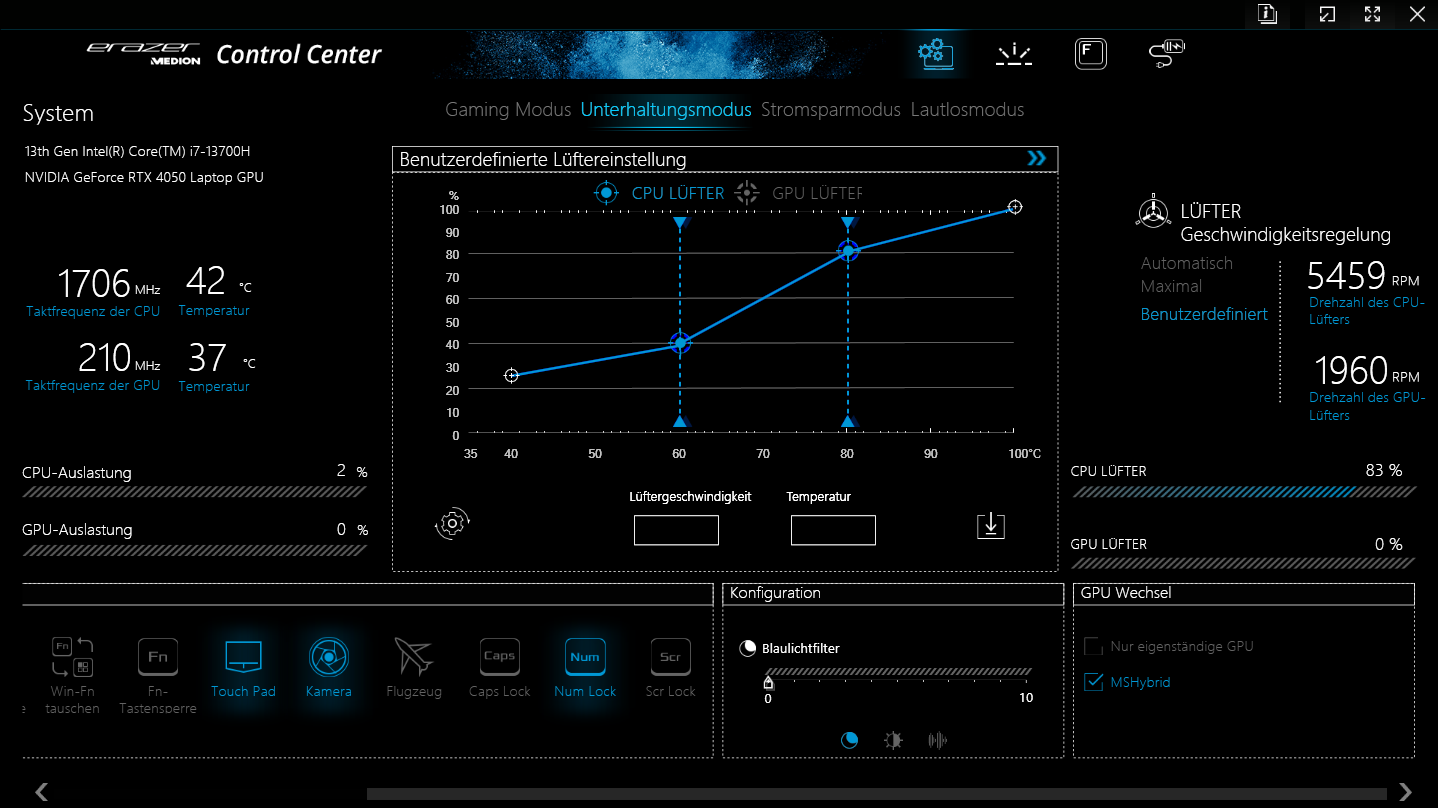
Profile wydajności mają duży wpływ na poziom hałasu generowanego przez laptopa. Podczas grania tryb "Gaming mode" generuje hałas na poziomie około 57 dB(A), a po wybraniu trybu "Entertainment mode" poziom jest zauważalnie niższy i wynosi 50 dB(A). W obu przypadkach wartości te są zbyt wysokie. Procesor i karta graficzna powinny być wystarczająco chłodzone nawet przy wolniej pracujących wentylatorach, a Medion musi jeszcze popracować nad aktualizacją sterowania wentylatorami.
Dwa pozostałe tryby są znacznie bardziej przyjazne dla użytkownika, ponieważ sprawiają, że E20 działa ciszej. Chociaż "tryb cichy" nie spełnia tego, co obiecuje nazwa, nadal umożliwia granie przy niskim poziomie hałasu. Przykładowo, laptop przeszedł nasz test The Witcher 3 przy około 34 dB(A).
Podczas bezczynności lub codziennej pracy (Office, Internet) laptop często działa cicho, a czasem nawet bezgłośnie. Z drugiej strony, wentylatory czasami również niepotrzebnie się rozkręcają (co jest typowym zjawiskiem w przypadku barebone'ów Clevo).
Hałas
| luz |
| 26 / 27 / 32 dB |
| obciążenie |
| 57 / 57 dB |
 | ||
30 dB cichy 40 dB(A) słyszalny 50 dB(A) irytujący |
||
min: | ||
| Medion Erazer Scout E20 i7-13700H, GeForce RTX 4050 Laptop GPU | Gigabyte G7 KE i5-12500H, GeForce RTX 3060 Laptop GPU | MSI Katana 17 B13VFK i7-13620H, GeForce RTX 4060 Laptop GPU | Asus TUF Gaming A16 FA617 R7 7735HS, Radeon RX 7600S | Lenovo Legion 5 15IAH7H 82RB i7-12700H, GeForce RTX 3060 Laptop GPU | Acer Nitro 5 AN515-46-R1A1 R7 6800H, GeForce RTX 3070 Ti Laptop GPU | |
|---|---|---|---|---|---|---|
| Noise | -10% | -1% | 10% | 14% | -3% | |
| wyłączone / środowisko * (dB) | 25 | 27 -8% | 24.5 2% | 24 4% | 23.3 7% | 25 -0% |
| Idle Minimum * (dB) | 26 | 27 -4% | 24.5 6% | 24 8% | 23.5 10% | 25 4% |
| Idle Average * (dB) | 27 | 35 -30% | 24.5 9% | 25 7% | 23.5 13% | 28.6 -6% |
| Idle Maximum * (dB) | 32 | 38 -19% | 40 -25% | 28 12% | 26.8 16% | 44.3 -38% |
| Load Average * (dB) | 57 | 52 9% | 48.3 15% | 42 26% | 29.3 49% | 47.6 16% |
| Witcher 3 ultra * (dB) | 50 | 56 -12% | 56 -12% | 50 -0% | 51.4 -3% | |
| Load Maximum * (dB) | 57 | 59 -4% | 59.1 -4% | 50 12% | 53 7% | 53.6 6% |
* ... im mniej tym lepiej
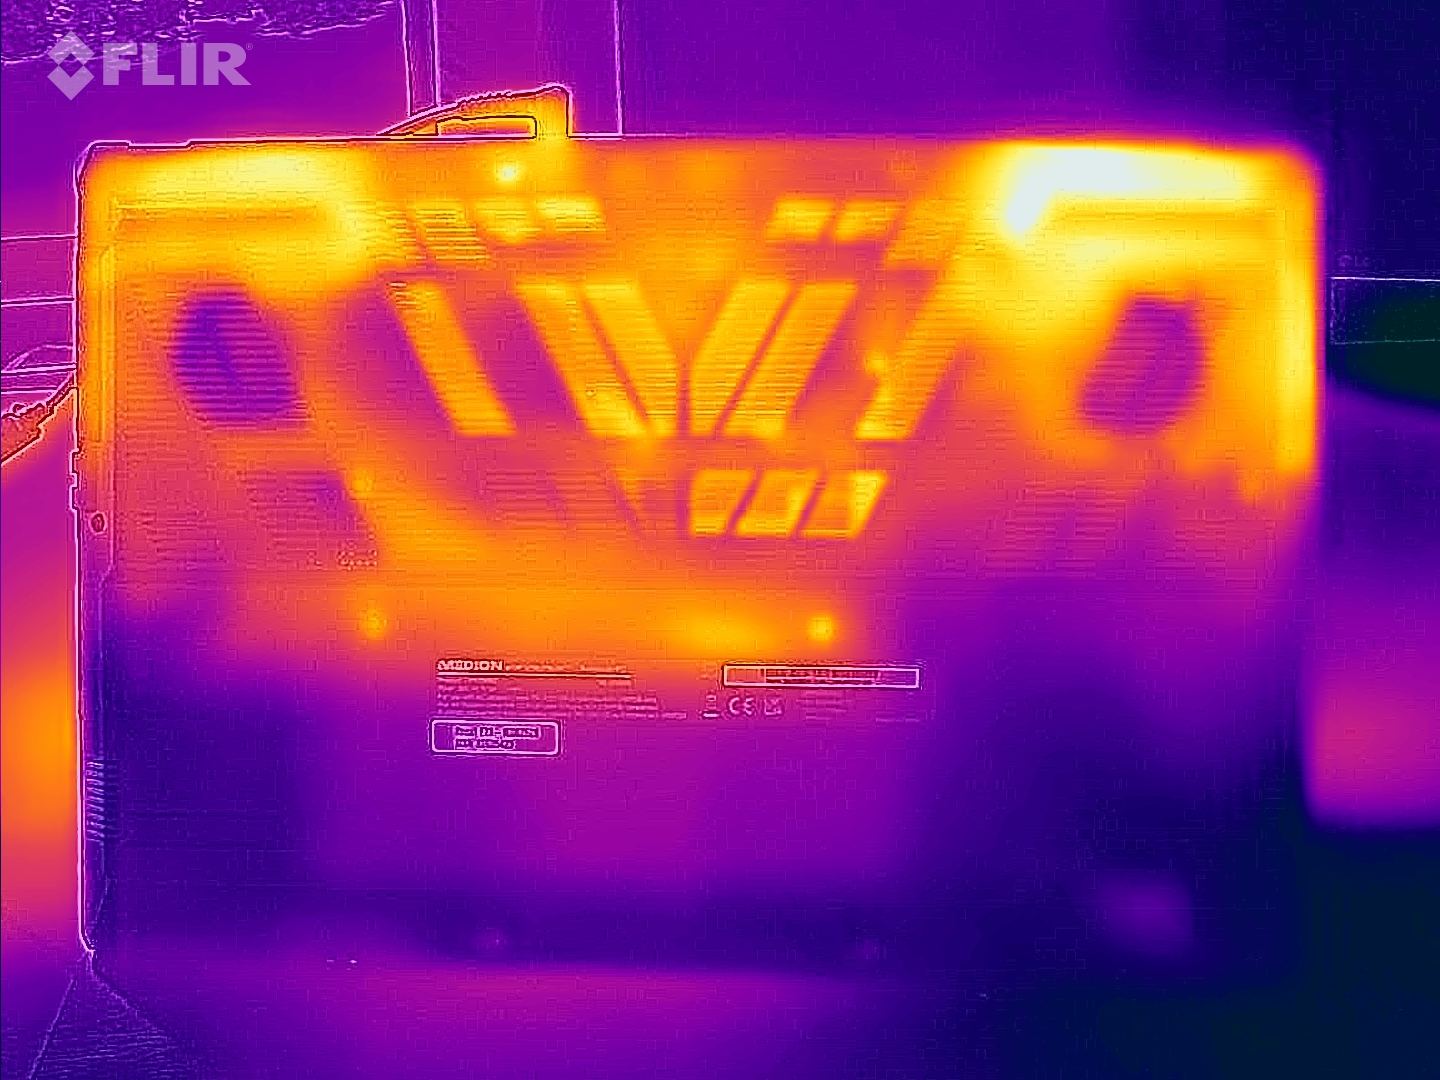
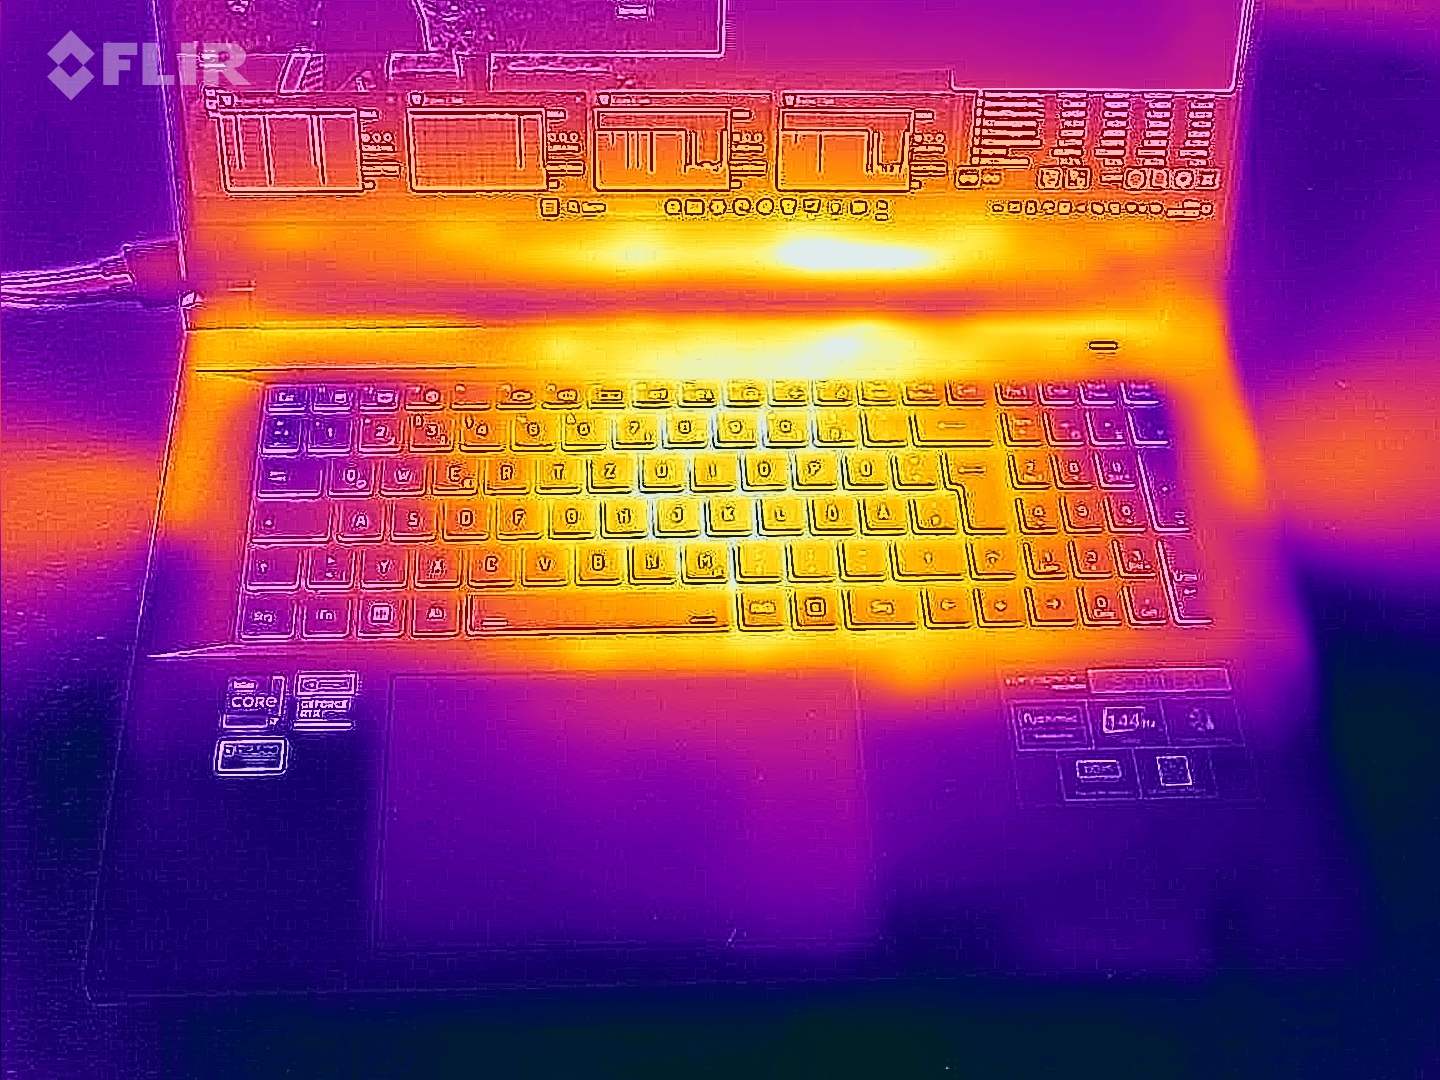
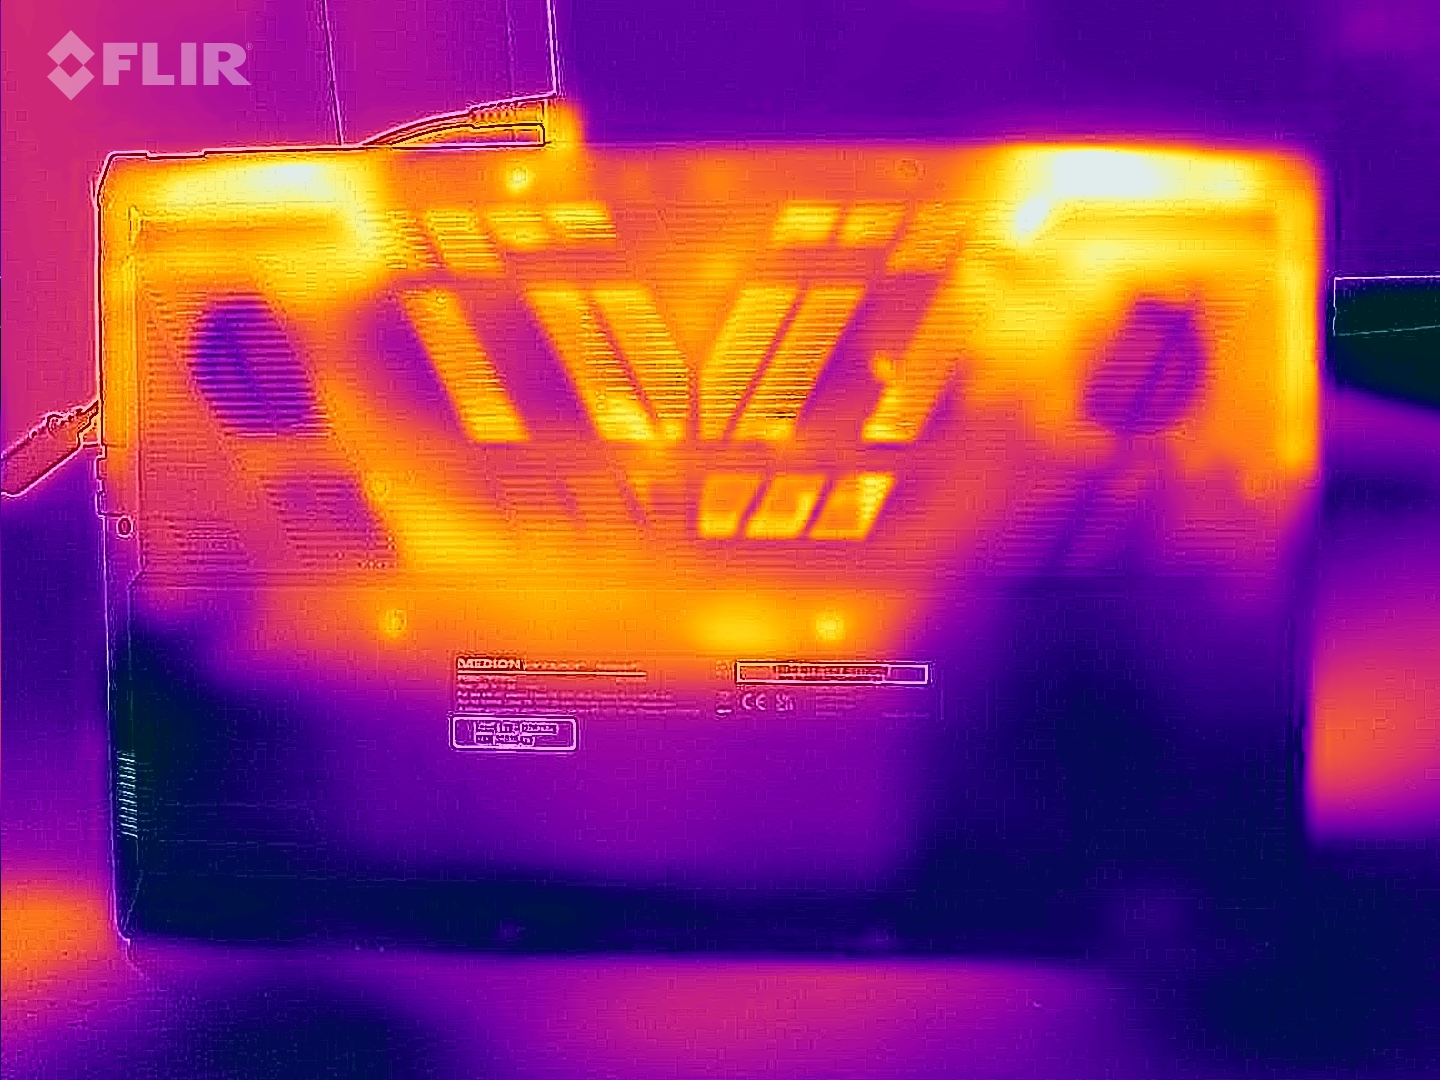
Temperatury
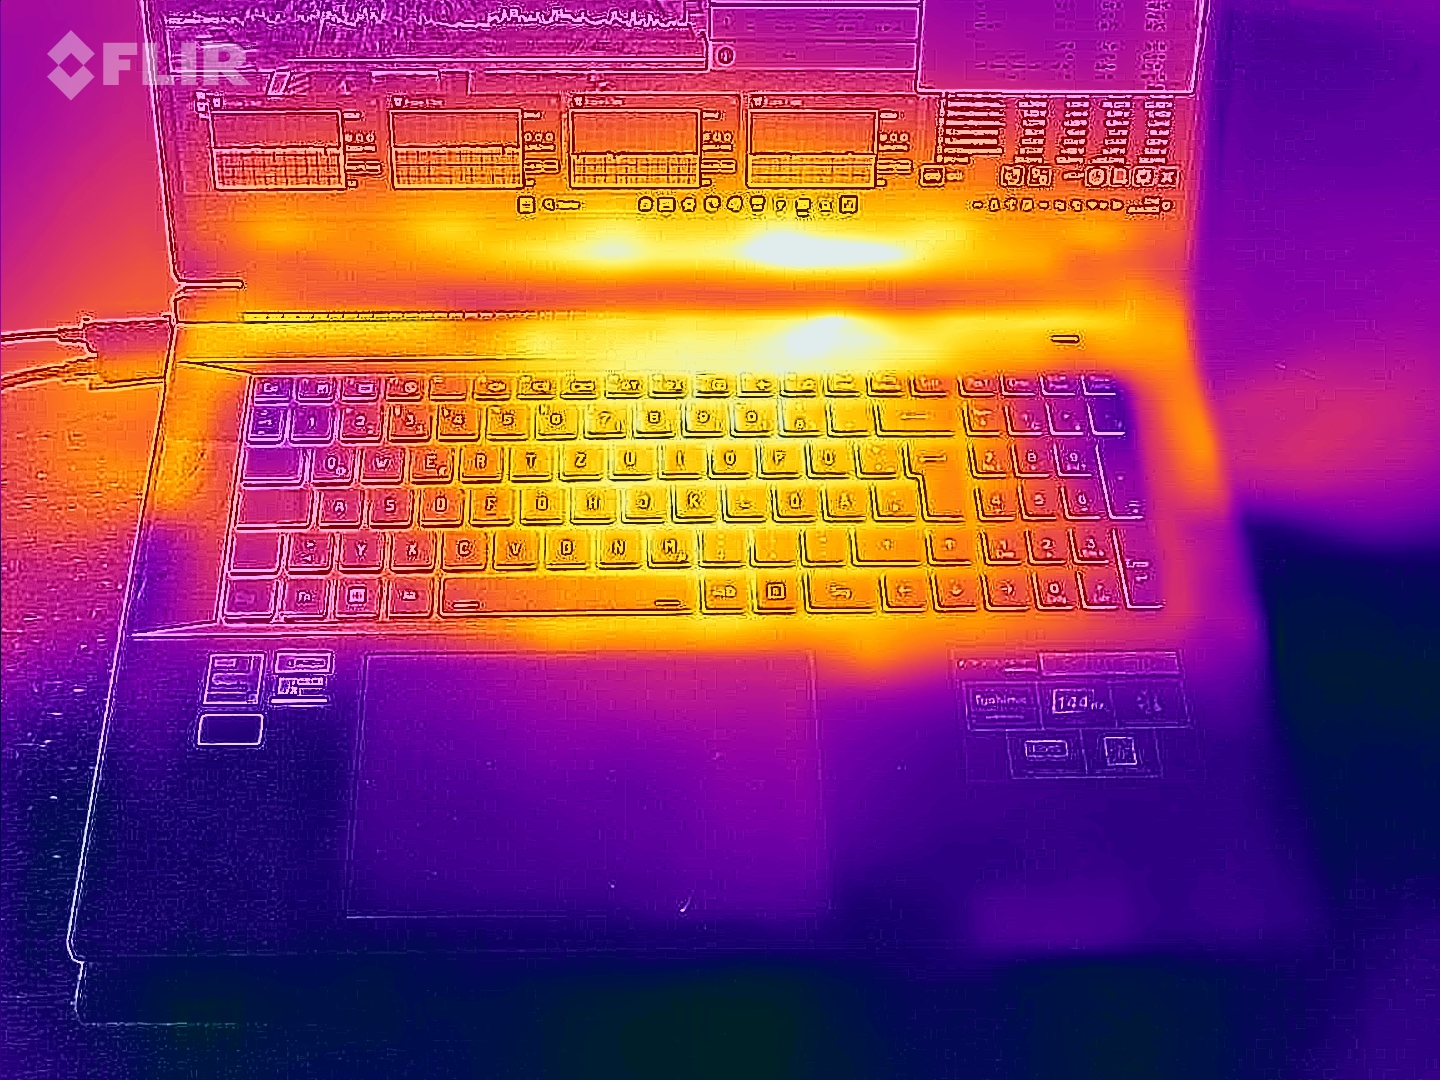
Laptop nagrzewa się co najwyżej umiarkowanie. Najwyższa temperatura została osiągnięta podczas testu obciążeniowego, z 41 °C (106 °F) w jednym punkcie pomiarowym. Podczas codziennej pracy temperatury pozostają w zielonym zakresie.
(±) Maksymalna temperatura w górnej części wynosi 41 °C / 106 F, w porównaniu do średniej 40.4 °C / 105 F , począwszy od 21.2 do 68.8 °C dla klasy Gaming.
(+) Dno nagrzewa się maksymalnie do 39 °C / 102 F, w porównaniu do średniej 43.2 °C / 110 F
(+) W stanie bezczynności średnia temperatura górnej części wynosi 26.8 °C / 80 F, w porównaniu ze średnią temperaturą urządzenia wynoszącą 33.9 °C / ### class_avg_f### F.
(±) Podczas gry w Wiedźmina 3 średnia temperatura górnej części wynosi 34.1 °C / 93 F, w porównaniu do średniej temperatury urządzenia wynoszącej 33.9 °C / ## #class_avg_f### F.
(+) Podpórki pod nadgarstki i touchpad są chłodniejsze niż temperatura skóry i maksymalnie 26 °C / 78.8 F i dlatego są chłodne w dotyku.
(+) Średnia temperatura obszaru podparcia dłoni w podobnych urządzeniach wynosiła 28.8 °C / 83.8 F (+2.8 °C / 5 F).
| Medion Erazer Scout E20 Intel Core i7-13700H, NVIDIA GeForce RTX 4050 Laptop GPU | Gigabyte G7 KE Intel Core i5-12500H, NVIDIA GeForce RTX 3060 Laptop GPU | MSI Katana 17 B13VFK Intel Core i7-13620H, NVIDIA GeForce RTX 4060 Laptop GPU | Asus TUF Gaming A16 FA617 AMD Ryzen 7 7735HS, AMD Radeon RX 7600S | Lenovo Legion 5 15IAH7H 82RB Intel Core i7-12700H, NVIDIA GeForce RTX 3060 Laptop GPU | Acer Nitro 5 AN515-46-R1A1 AMD Ryzen 7 6800H, NVIDIA GeForce RTX 3070 Ti Laptop GPU | |
|---|---|---|---|---|---|---|
| Heat | -16% | -10% | -30% | -1% | -13% | |
| Maximum Upper Side * (°C) | 41 | 52 -27% | 41.6 -1% | 54 -32% | 37.8 8% | 48.1 -17% |
| Maximum Bottom * (°C) | 39 | 54 -38% | 43.1 -11% | 47 -21% | 51 -31% | 49.7 -27% |
| Idle Upper Side * (°C) | 31 | 28 10% | 32 -3% | 40 -29% | 25.8 17% | 30 3% |
| Idle Bottom * (°C) | 29 | 32 -10% | 35.8 -23% | 40 -38% | 28.8 1% | 31.7 -9% |
* ... im mniej tym lepiej
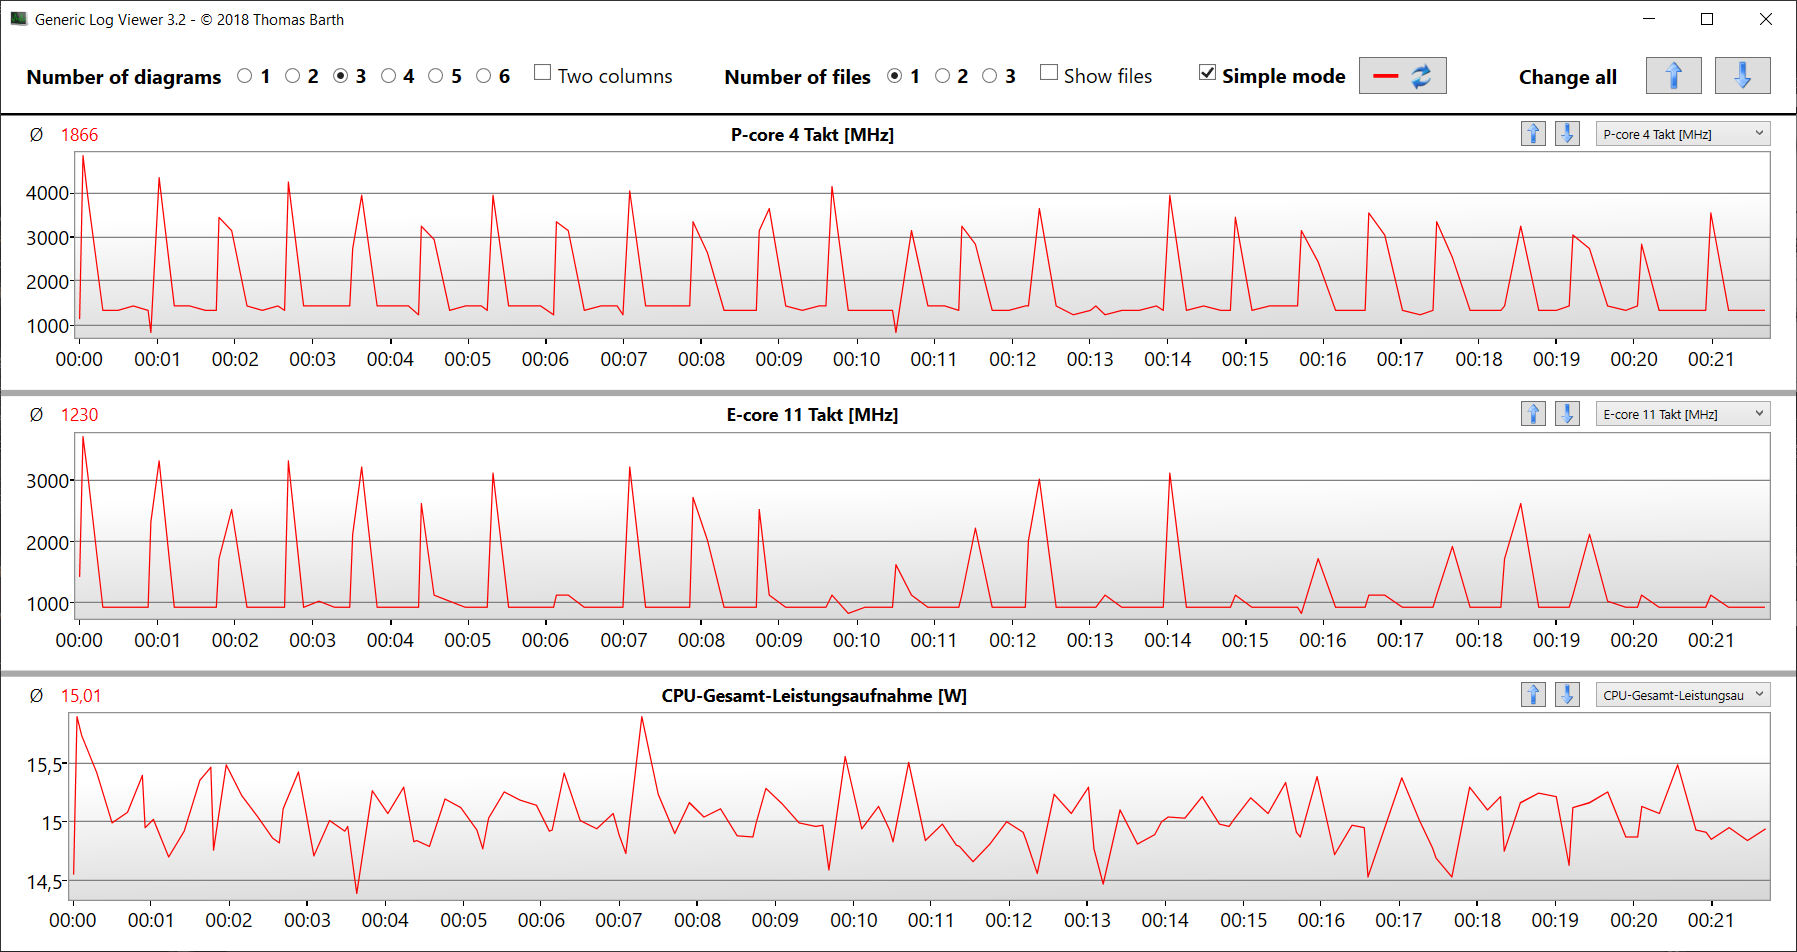
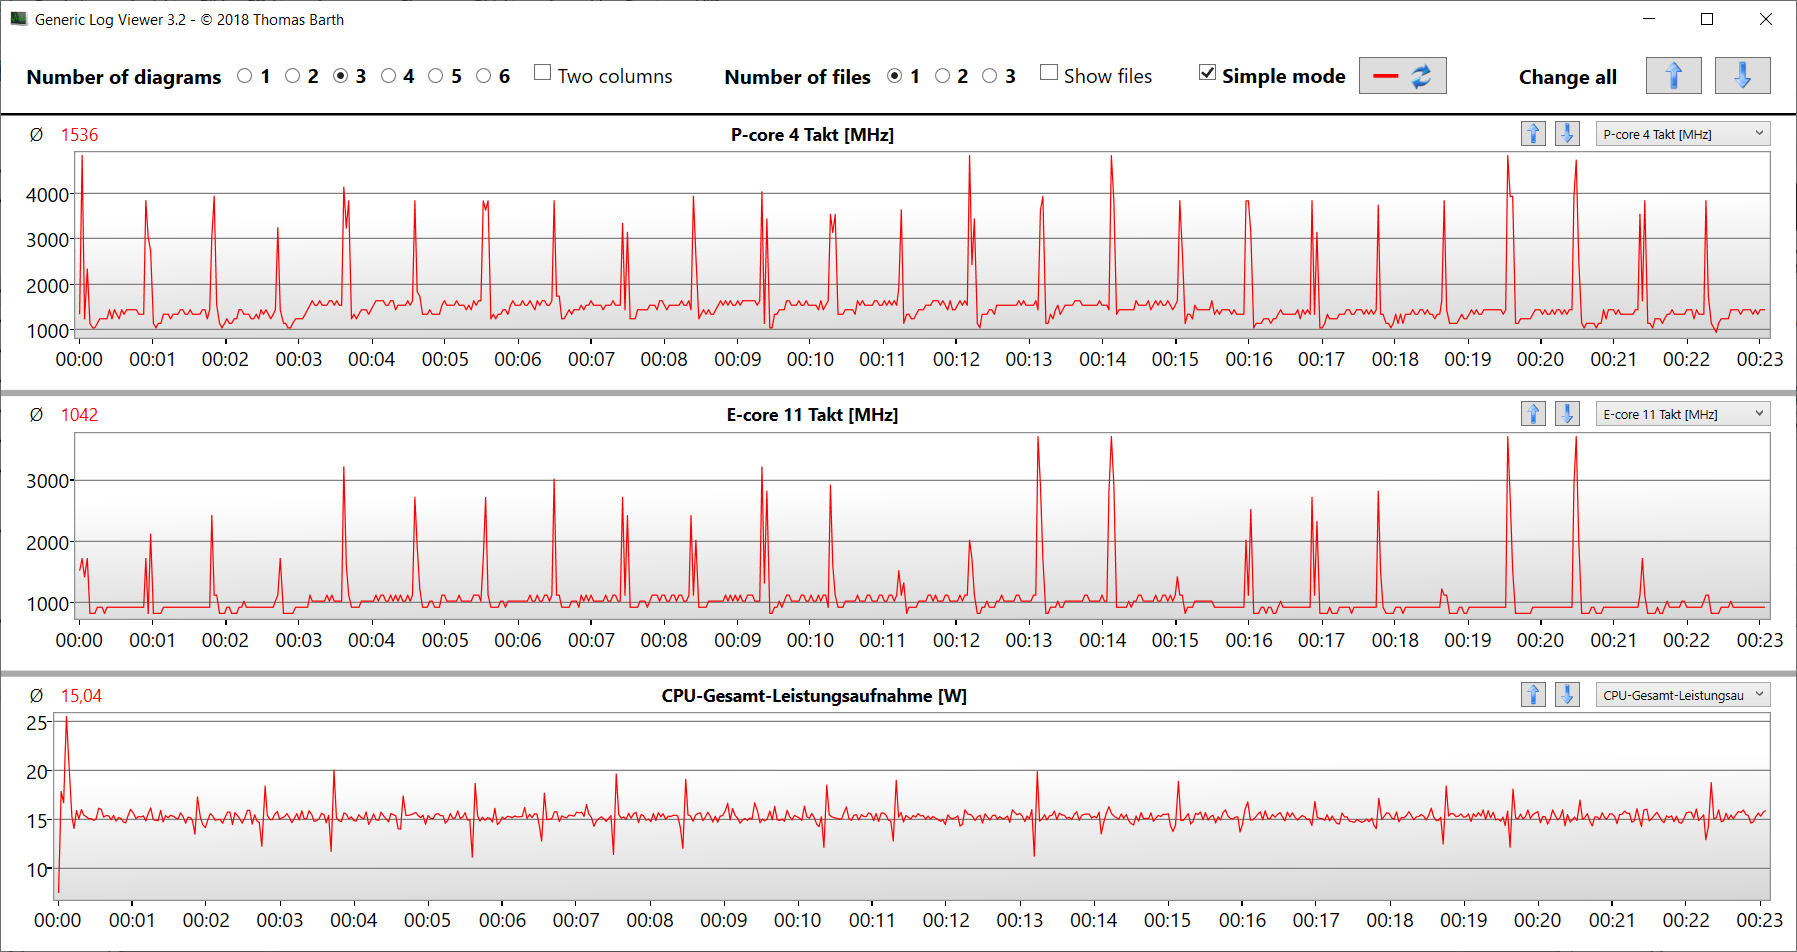
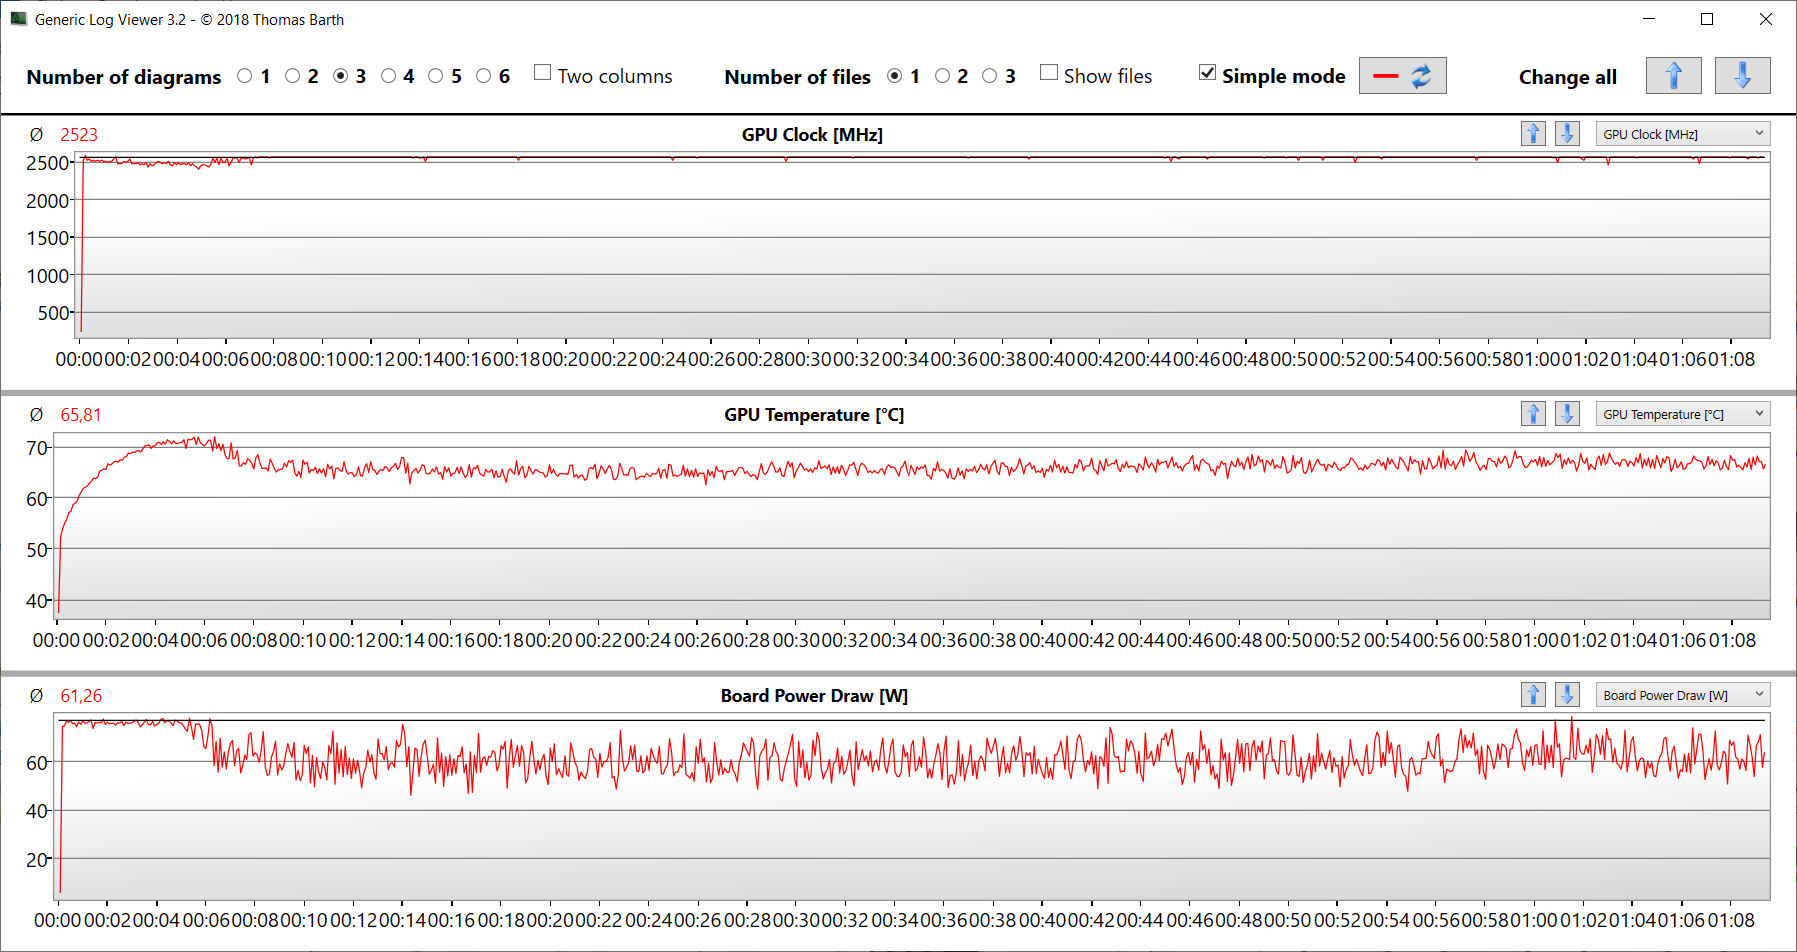
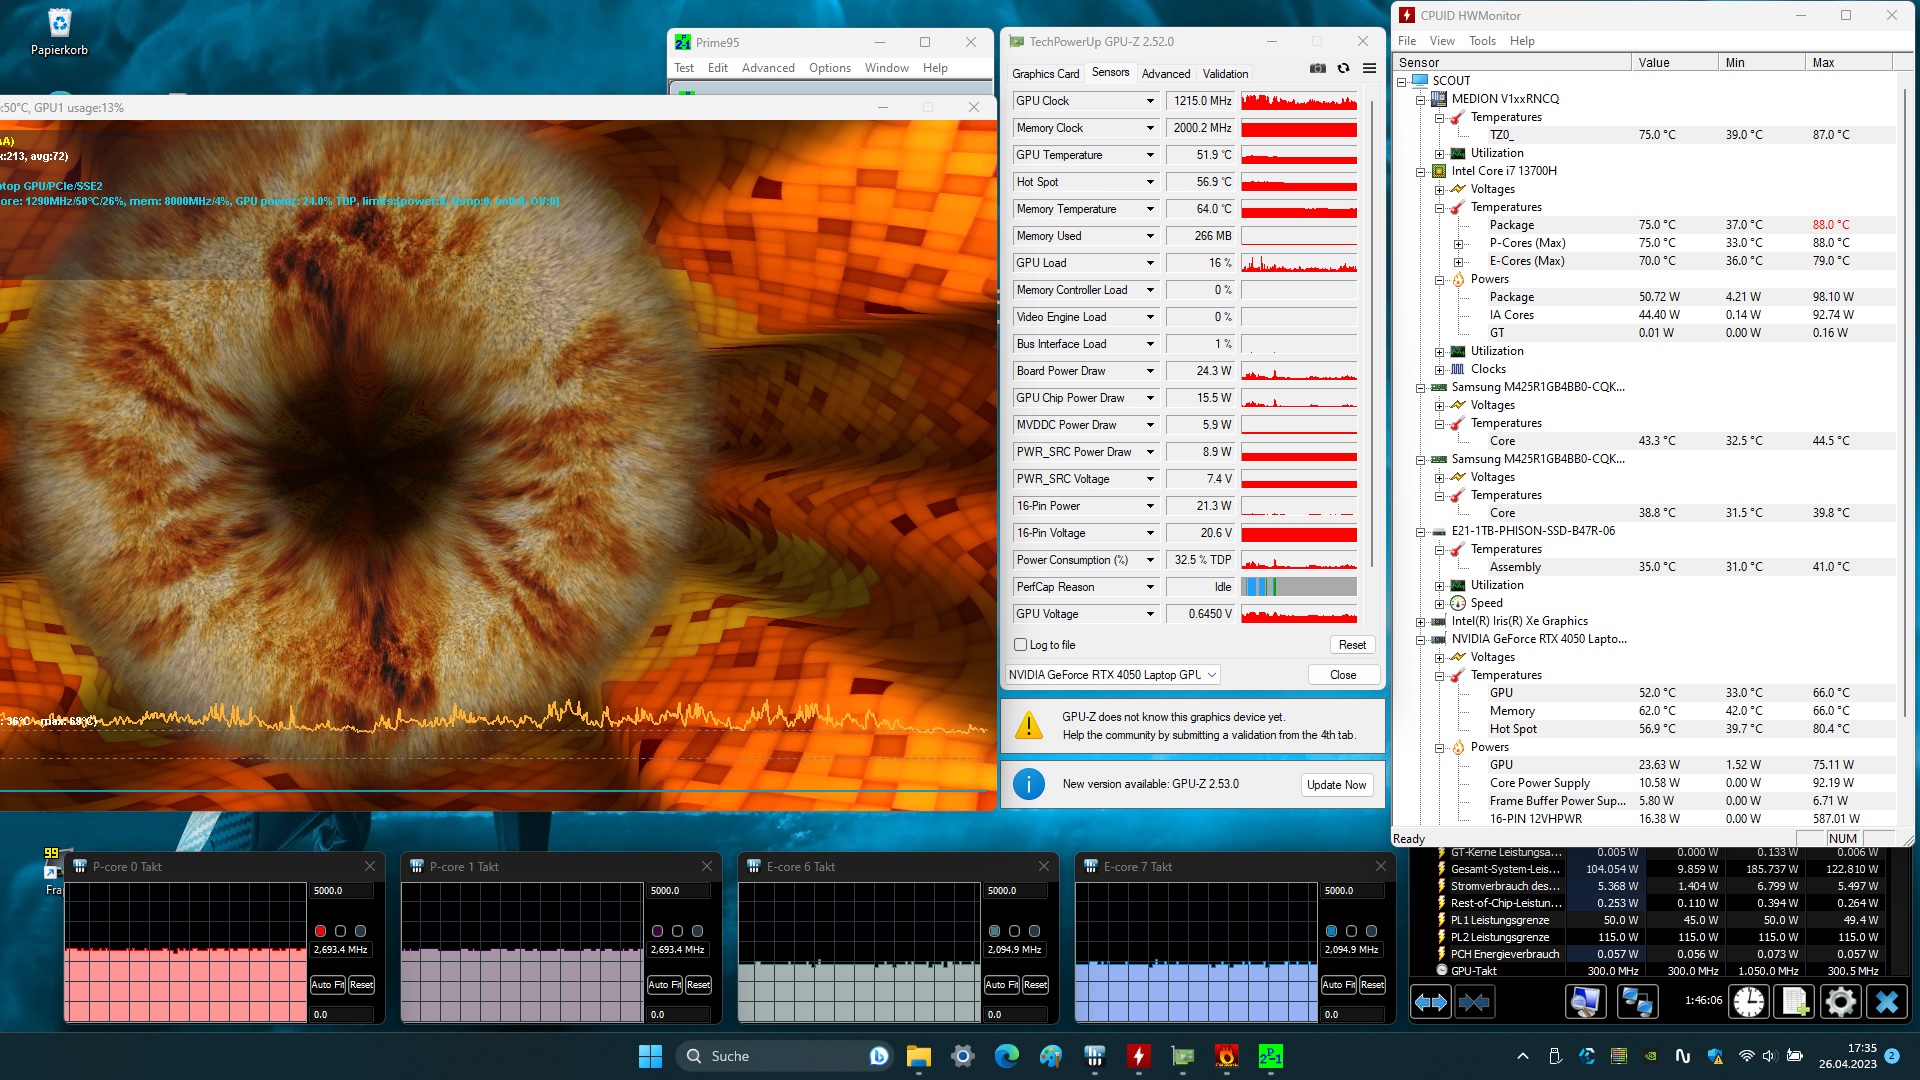
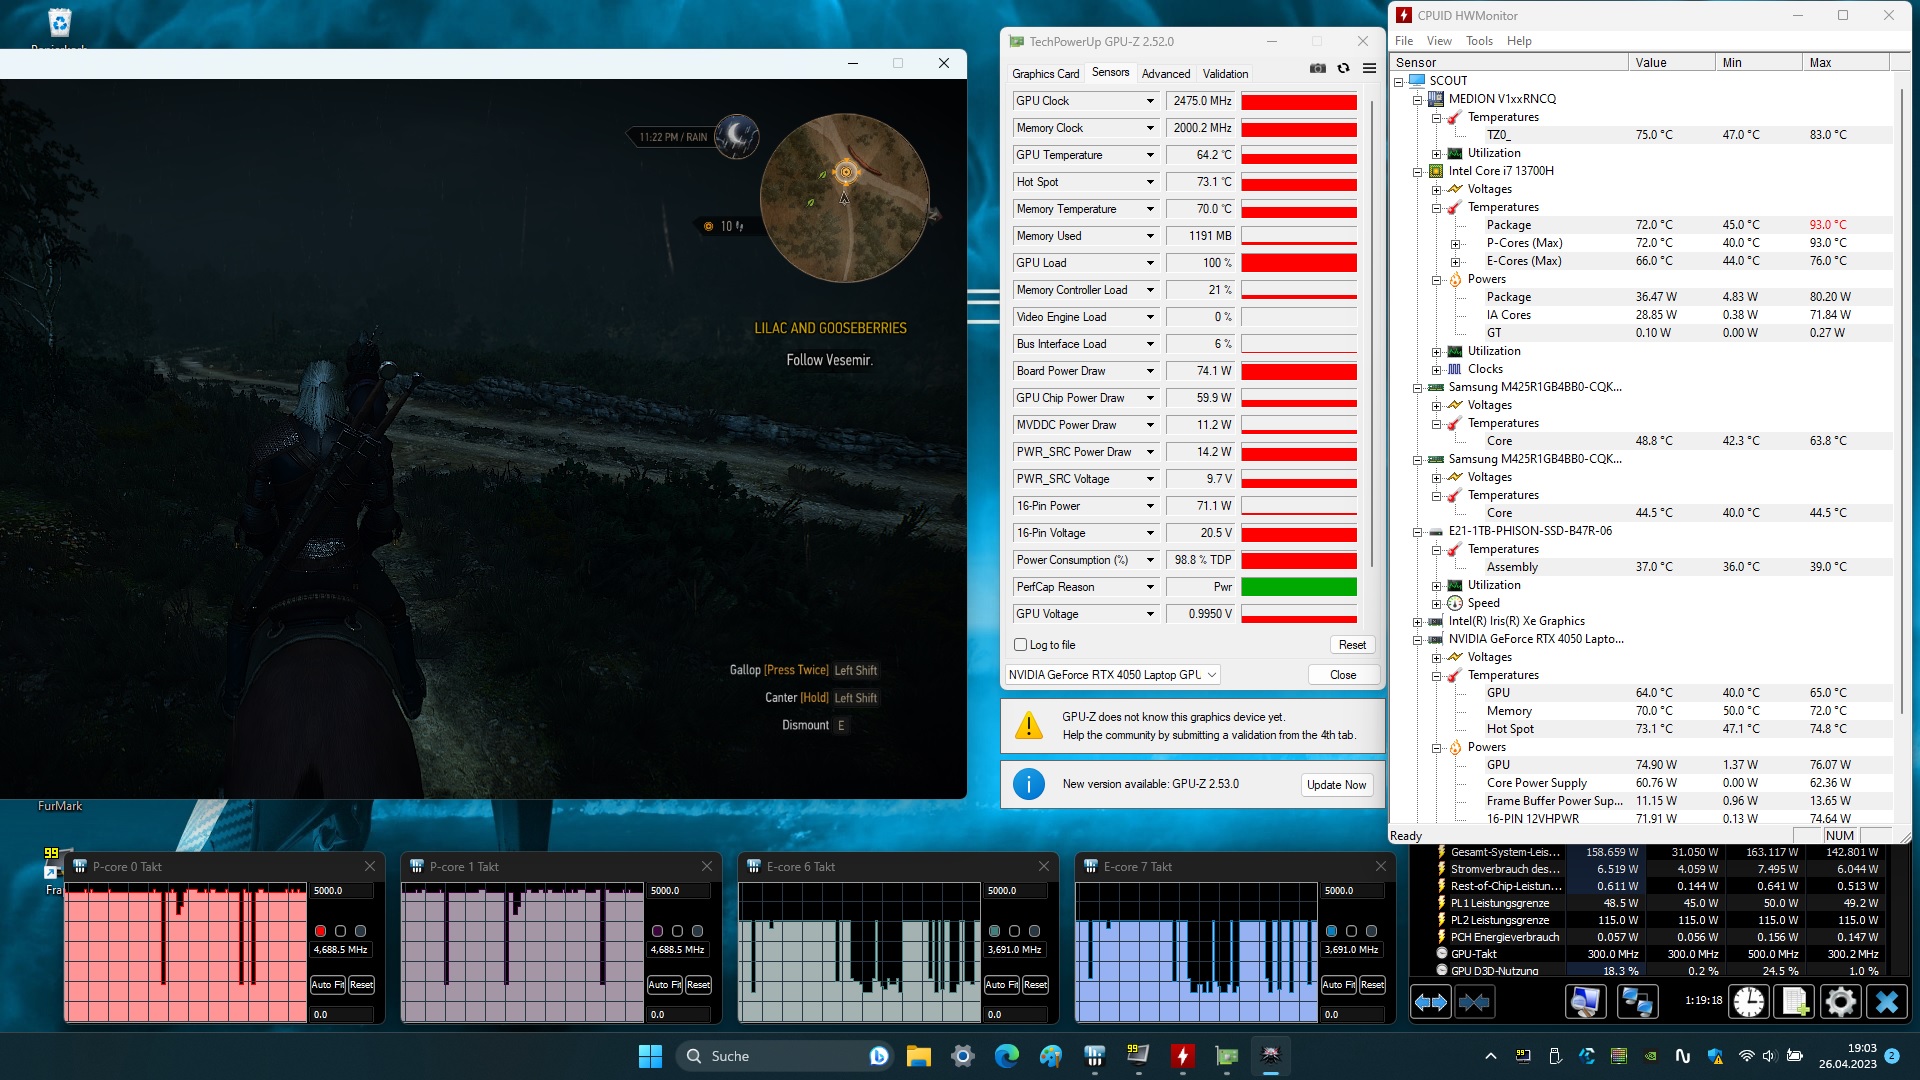
Test warunków skrajnych
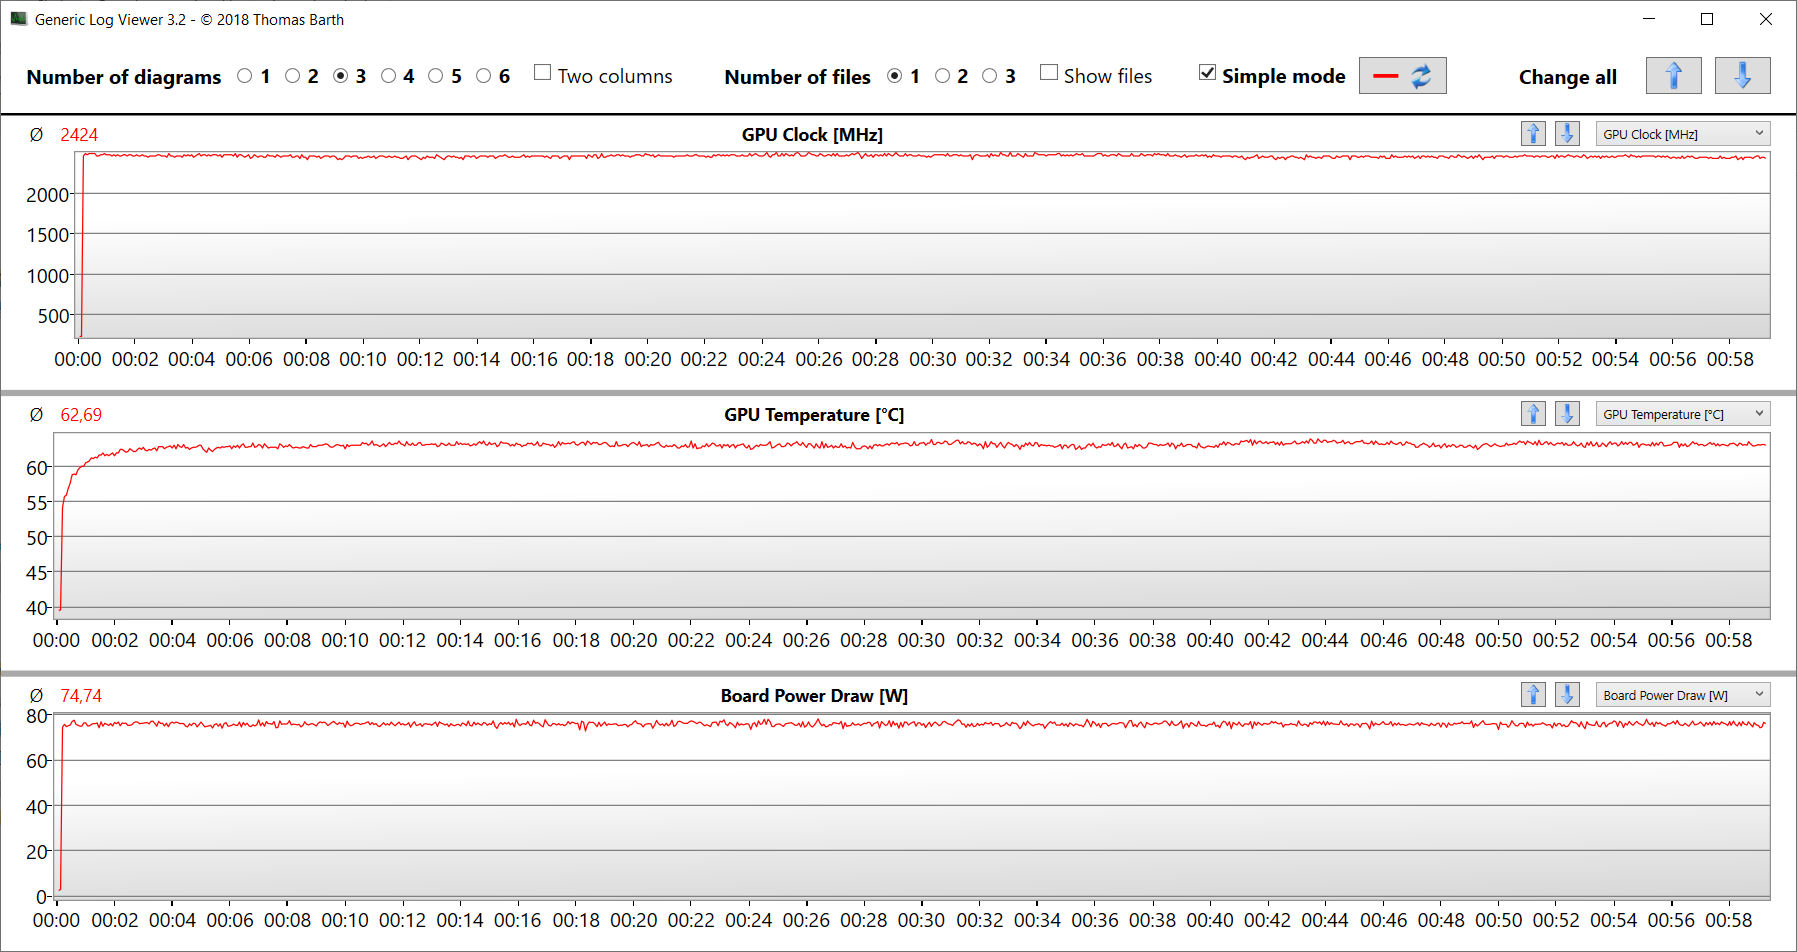
Test warunków skrajnych (z Prime95 i Furmark działającymi bez przerwy) reprezentuje ekstremalny scenariusz, którego używamy do oceny stabilności systemu pod pełnym obciążeniem. Procesor rozpoczyna test ze średnio-wysokimi częstotliwościami taktowania (P: 3,4 do 3,7 GHz, E: 2,8 do 2,9 GHz), a karta graficzna pracuje z częstotliwością 2,3 GHz. Kontynuując test, prędkości taktowania CPU i GPU spadają.
Głośniki
Głośniki stereo wytwarzają skromny dźwięk, który nie oferuje prawie żadnych basów. Aby uzyskać lepsze wrażenia słuchowe, zalecamy korzystanie ze słuchawek lub głośników zewnętrznych.
Medion Erazer Scout E20 analiza dźwięku
(+) | głośniki mogą odtwarzać stosunkowo głośno (84 dB)
Bas 100 - 315 Hz
(-) | prawie brak basu - średnio 33.1% niższa od mediany
(±) | liniowość basu jest średnia (9.9% delta do poprzedniej częstotliwości)
Średnie 400 - 2000 Hz
(±) | wyższe średnie - średnio 6.6% wyższe niż mediana
(±) | liniowość środka jest średnia (8.2% delta do poprzedniej częstotliwości)
Wysokie 2–16 kHz
(+) | zrównoważone maksima - tylko 2.1% od mediany
(±) | liniowość wysokich wartości jest średnia (7.5% delta do poprzedniej częstotliwości)
Ogólnie 100 - 16.000 Hz
(±) | liniowość ogólnego dźwięku jest średnia (22.2% różnicy w stosunku do mediany)
W porównaniu do tej samej klasy
» 79% wszystkich testowanych urządzeń w tej klasie było lepszych, 6% podobnych, 14% gorszych
» Najlepszy miał deltę 6%, średnia wynosiła ###średnia###%, najgorsza wynosiła 132%
W porównaniu do wszystkich testowanych urządzeń
» 65% wszystkich testowanych urządzeń było lepszych, 6% podobnych, 29% gorszych
» Najlepszy miał deltę 4%, średnia wynosiła ###średnia###%, najgorsza wynosiła 134%
MSI Katana 17 B13VFK analiza dźwięku
(±) | głośność głośnika jest średnia, ale dobra (78.5 dB)
Bas 100 - 315 Hz
(-) | prawie brak basu - średnio 17.7% niższa od mediany
(±) | liniowość basu jest średnia (11.7% delta do poprzedniej częstotliwości)
Średnie 400 - 2000 Hz
(±) | wyższe średnie - średnio 6.8% wyższe niż mediana
(+) | średnie są liniowe (6.7% delta do poprzedniej częstotliwości)
Wysokie 2–16 kHz
(+) | zrównoważone maksima - tylko 3.2% od mediany
(±) | liniowość wysokich wartości jest średnia (7.2% delta do poprzedniej częstotliwości)
Ogólnie 100 - 16.000 Hz
(±) | liniowość ogólnego dźwięku jest średnia (19.4% różnicy w stosunku do mediany)
W porównaniu do tej samej klasy
» 67% wszystkich testowanych urządzeń w tej klasie było lepszych, 7% podobnych, 26% gorszych
» Najlepszy miał deltę 6%, średnia wynosiła ###średnia###%, najgorsza wynosiła 132%
W porównaniu do wszystkich testowanych urządzeń
» 48% wszystkich testowanych urządzeń było lepszych, 7% podobnych, 45% gorszych
» Najlepszy miał deltę 4%, średnia wynosiła ###średnia###%, najgorsza wynosiła 134%
Zarządzanie energią - Laptop Medion oferuje tylko skromny czas pracy na baterii
Zużycie energii
Pobór mocy laptopa Medion nie wykazuje żadnych widocznych zachowań, a wartości wahają się na normalnych poziomach dla używanego sprzętu. Laptop przeszedł nasz test Witcher 3 i test warunków skrajnych przy stałym zużyciu energii. Zasilacz o mocy 230 W zapewnia wystarczającą ilość energii przez cały czas.
| wyłączony / stan wstrzymania | |
| luz | |
| obciążenie |
|
Legenda:
min: | |
| Medion Erazer Scout E20 i7-13700H, GeForce RTX 4050 Laptop GPU | Gigabyte G7 KE i5-12500H, GeForce RTX 3060 Laptop GPU | MSI Katana 17 B13VFK i7-13620H, GeForce RTX 4060 Laptop GPU | Asus TUF Gaming A16 FA617 R7 7735HS, Radeon RX 7600S | Lenovo Legion 5 15IAH7H 82RB i7-12700H, GeForce RTX 3060 Laptop GPU | Acer Nitro 5 AN515-46-R1A1 R7 6800H, GeForce RTX 3070 Ti Laptop GPU | Przeciętny NVIDIA GeForce RTX 4050 Laptop GPU | Średnia w klasie Gaming | |
|---|---|---|---|---|---|---|---|---|
| Power Consumption | -51% | -25% | -5% | -104% | -25% | -23% | -58% | |
| Idle Minimum * (Watt) | 5 | 15 -200% | 12.2 -144% | 8 -60% | 19.8 -296% | 7 -40% | 9.95 ? -99% | 13 ? -160% |
| Idle Average * (Watt) | 11 | 17 -55% | 14.9 -35% | 11 -0% | 26.2 -138% | 8.9 19% | 15.8 ? -44% | 19 ? -73% |
| Idle Maximum * (Watt) | 22 | 24 -9% | 15.8 28% | 16 27% | 48.2 -119% | 14.4 35% | 20.1 ? 9% | 24.6 ? -12% |
| Load Average * (Watt) | 96 | 111 -16% | 85.22 11% | 97 -1% | 102.9 -7% | 202 -110% | 88 ? 8% | 110.7 ? -15% |
| Witcher 3 ultra * (Watt) | 145.2 | 174.1 -20% | 151.1 -4% | 161.5 -11% | 186.7 -29% | 203 -40% | ||
| Load Maximum * (Watt) | 201 | 208 -3% | 212.8 -6% | 168 16% | 268 -33% | 230 -14% | 176.3 ? 12% | 259 ? -29% |
* ... im mniej tym lepiej
Power Consumption The Witcher 3 / Stress Test
Power Consumption With External Monitor
Żywotność baterii
W naszym teście WLAN wywołującym strony internetowe za pomocą skryptu i teście wideo odtwarzającym krótki film Big Buck Bunny (kodowanie H.264, FHD) w pętli, 17,3-calowy laptop osiągnął czasy pracy odpowiednio 4:44 h i 4:37 h. Podczas obu testów funkcje oszczędzania energii laptopa są wyłączone, a jasność wyświetlacza jest ustawiona na około 150 cd/m². Ponadto, moduły komunikacyjne są również wyłączone podczas testu wideo.
| Medion Erazer Scout E20 i7-13700H, GeForce RTX 4050 Laptop GPU, 53.35 Wh | Gigabyte G7 KE i5-12500H, GeForce RTX 3060 Laptop GPU, 54 Wh | MSI Katana 17 B13VFK i7-13620H, GeForce RTX 4060 Laptop GPU, 53.5 Wh | Asus TUF Gaming A16 FA617 R7 7735HS, Radeon RX 7600S, 90 Wh | Lenovo Legion 5 15IAH7H 82RB i7-12700H, GeForce RTX 3060 Laptop GPU, 80 Wh | Acer Nitro 5 AN515-46-R1A1 R7 6800H, GeForce RTX 3070 Ti Laptop GPU, 57.5 Wh | Średnia w klasie Gaming | |
|---|---|---|---|---|---|---|---|
| Czasy pracy | -12% | -36% | 119% | 0% | 23% | 39% | |
| Reader / Idle (h) | 6.7 | 7.1 6% | 20.2 201% | 8.1 21% | 10.5 57% | 8.27 ? 23% | |
| H.264 (h) | 4.6 | 2.2 -52% | 5.7 24% | 8.32 ? 81% | |||
| WiFi v1.3 (h) | 4.7 | 5.3 13% | 2.9 -38% | 12.1 157% | 5 6% | 5.8 23% | 7.11 ? 51% |
| Load (h) | 1.5 | 1.3 -13% | 1 -33% | 1.5 0% | 1.1 -27% | 1.3 -13% | 1.502 ? 0% |
Za
Przeciw
Werdykt - Wszechstronny laptop do gier z segmentu podstawowego
Podczas gdy Erazer Scout E20 koncentruje się na grach FHD, laptop osiąga również dobre wyniki w innych obszarach, takich jak renderowanie i przetwarzanie wideo. ProcesorCore i7-13700Hi GeForce RTX 4050są w stanie pracować z wysokimi taktowaniami, a dysk SSD o pojemności 1 TB zapewnia krótkie czasy ładowania i zapewnia niezbędną przestrzeń dyskową.
Dzięki Erazer Scout E20 Medion dostarcza spójny laptop do gier z segmentu podstawowego. Sterowanie wentylatorem nadal mogłoby wymagać pewnej regulacji.
Chociaż laptop nagrzewa się tylko umiarkowanie pod obciążeniem, może wtedy wytwarzać dużo hałasu. Na szczęście istnieje "tryb cichy", który umożliwia grę przy niskim poziomie hałasu - ale nie ciszy.
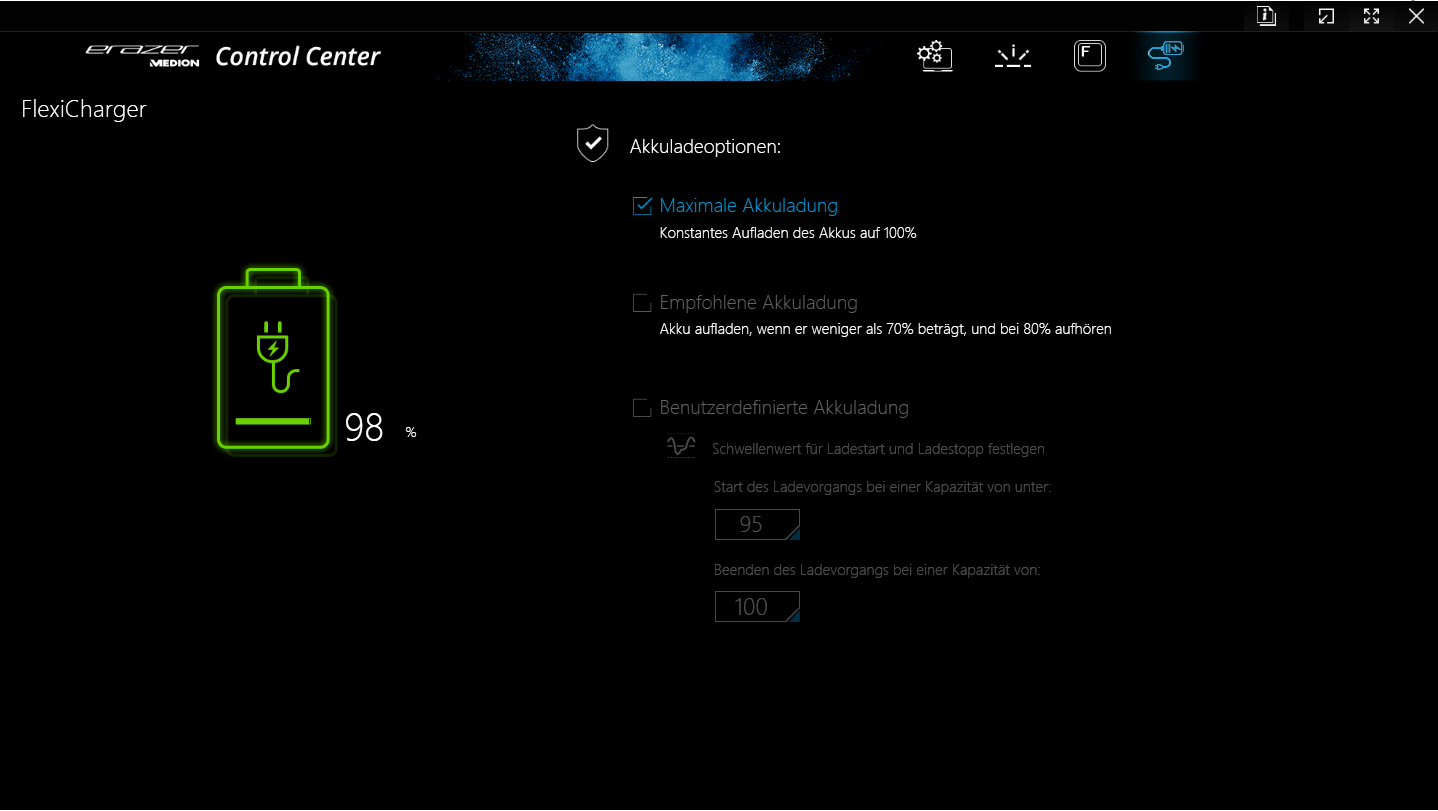
Realny czas pracy na baterii wynoszący zaledwie 4,5 do 5 godzin nie wzbudza entuzjazmu, a stosunkowo niska pojemność baterii wynosząca 53,35 Wh staje się tutaj zauważalna. Ponieważ baterii nie można ładować za pomocą ładowarki USB-C, zawsze trzeba mieć przy sobie zasilacz. Matowy wyświetlacz o przekątnej 17,3 cala (FHD, IPS, 144 Hz, sRGB) pozostawił ogólnie dobre wrażenie.
Alternatywą dla E20 może byćAsus TUF Gaming A16 Advantage Edition. Podczas gdy wydajność oscyluje na podobnym poziomie, może on pochwalić się znacznie dłuższym czasem pracy na baterii i wyświetlaczem w formacie 16:10. Budżetową alternatywą byłbyGigabyte G7 KEktóry ma porównywalną wydajność graficzną, ale cena zakupu jest o około 450 euro (~ 498 USD) niższa. W zestawie nie ma jednak systemu operacyjnego Windows.
Cena i dostępność
W Niemczech Medion Erazer Scout E20 jest dostępny w sklepie internetowym Medionza prawie 1500 euro (~1 658 USD). Jest on oparty na Clevo V170RNCQ, który jest dostępny na stronie Clevo za 1399 euro (~$1,547). Clevo oferuje również różne opcje konfiguracji.
Medion Erazer Scout E20
- 16/05/2023 v7 (old)
Sascha Mölck
Przezroczystość
Wyboru urządzeń do recenzji dokonuje nasza redakcja. Próbka testowa została udostępniona autorowi jako pożyczka od producenta lub sprzedawcy detalicznego na potrzeby tej recenzji. Pożyczkodawca nie miał wpływu na tę recenzję, producent nie otrzymał też kopii tej recenzji przed publikacją. Nie było obowiązku publikowania tej recenzji. Jako niezależna firma medialna, Notebookcheck nie podlega władzy producentów, sprzedawców detalicznych ani wydawców.
Tak testuje Notebookcheck
Każdego roku Notebookcheck niezależnie sprawdza setki laptopów i smartfonów, stosując standardowe procedury, aby zapewnić porównywalność wszystkich wyników. Od około 20 lat stale rozwijamy nasze metody badawcze, ustanawiając przy tym standardy branżowe. W naszych laboratoriach testowych doświadczeni technicy i redaktorzy korzystają z wysokiej jakości sprzętu pomiarowego. Testy te obejmują wieloetapowy proces walidacji. Nasz kompleksowy system ocen opiera się na setkach uzasadnionych pomiarów i benchmarków, co pozwala zachować obiektywizm.Price comparison

