Recenzja HP Pavilion Plus 16: Wysokiej klasy laptop multimedialny, który mógł skorzystać z RTX 4050
 w recenzji")
HP wprowadziło niedawno dwa nowe modele Pavilion Plus jako bardziej przystępną cenowo alternatywę dla serii Envy. Wcześniej recenzowaliśmy Pavilion Plus 14 w obu wersjach Intel Raptor Lake i AMD Zen 4 i AMD Zen 4. Teraz przyjrzymy się większemu Pavilion Plus 16.
Pavilion Plus 16 rezygnuje z panelu OLED "IMAX Enhanced" z Pavilion Plus 14, ale zamiast tego oferuje procesor z serii H i opcjonalną grafikę Nvidii.
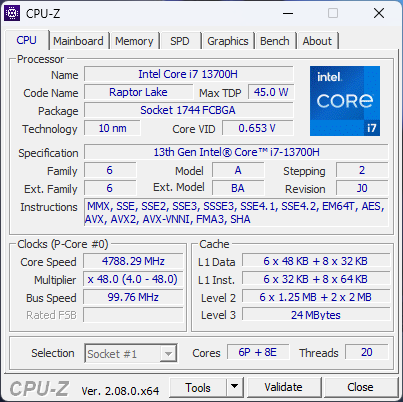
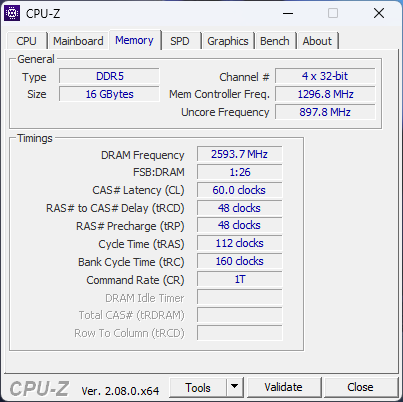
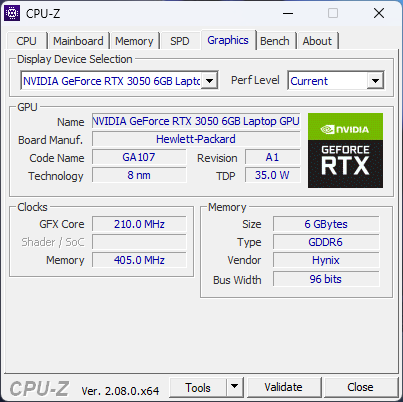
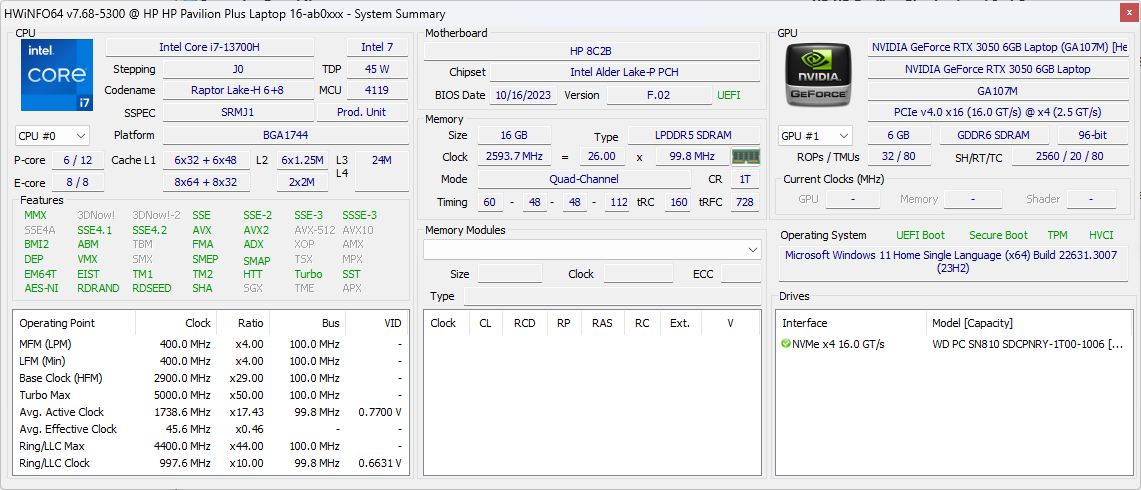
Nasza jednostka Pavilion Plus 16 jest wyposażona w Intel Core i7-13700H wraz z 16 GB pamięci RAM, dyskiem SSD 1 TB i 16-calowym wyświetlaczem IPS 2560 x 1600 120 Hz. Pavilion Plus 16 jest jednym z nielicznych laptopów wyposażonych w technologię Nvidia GeForce RTX 3050 6 GB GPU do laptopów. Ta konfiguracja będzie kosztować 1 24 999 jenów (1350 USD) w oficjalnym sklepie HP India.
Potencjalni konkurenci w porównaniu
Ocena | Data | Model | Waga | Wysokość | Rozmiar | Rezolucja | Cena |
|---|---|---|---|---|---|---|---|
| 88.7 % v7 (old) | 02/2024 | HP Pavilion Plus 16-ab0456tx i7-13700H, GeForce RTX 3050 6GB Laptop GPU | 1.9 kg | 19.9 mm | 16.00" | 2560x1600 | |
| 88.2 % v7 (old) | 01/2024 | Schenker Vision 14 M23 RTX 3050 i7-13700H, GeForce RTX 3050 6GB Laptop GPU | 1.3 kg | 16.6 mm | 14.00" | 2880x1800 | |
| 87.1 % v7 (old) | 08/2023 | Dell Inspiron 16 Plus 7630 i7-13700H, GeForce RTX 4060 Laptop GPU | 2.2 kg | 19.95 mm | 16.00" | 2560x1600 | |
| 85.6 % v7 (old) | 08/2023 | Asus VivoBook 14X K3405 i5-13500H, GeForce RTX 3050 4GB Laptop GPU | 1.4 kg | 18.9 mm | 14.00" | 2880x1800 | |
| 89.2 % v7 (old) | 04/2023 | Lenovo Slim Pro 7 14ARP8 R7 7735HS, GeForce RTX 3050 6GB Laptop GPU | 1.6 kg | 15.6 mm | 14.50" | 2560x1600 | |
| 87.6 % v7 (old) | 11/2023 | Asus VivoBook Pro 16 K6602VU i9-13900H, GeForce RTX 4050 Laptop GPU | 1.9 kg | 19 mm | 16.00" | 3200x2000 | |
| 89.4 % v7 (old) | 04/2023 | Samsung Galaxy Book3 Ultra 16 i7-13700H, GeForce RTX 4050 Laptop GPU | 1.8 kg | 16.5 mm | 16.00" | 2880x1800 |
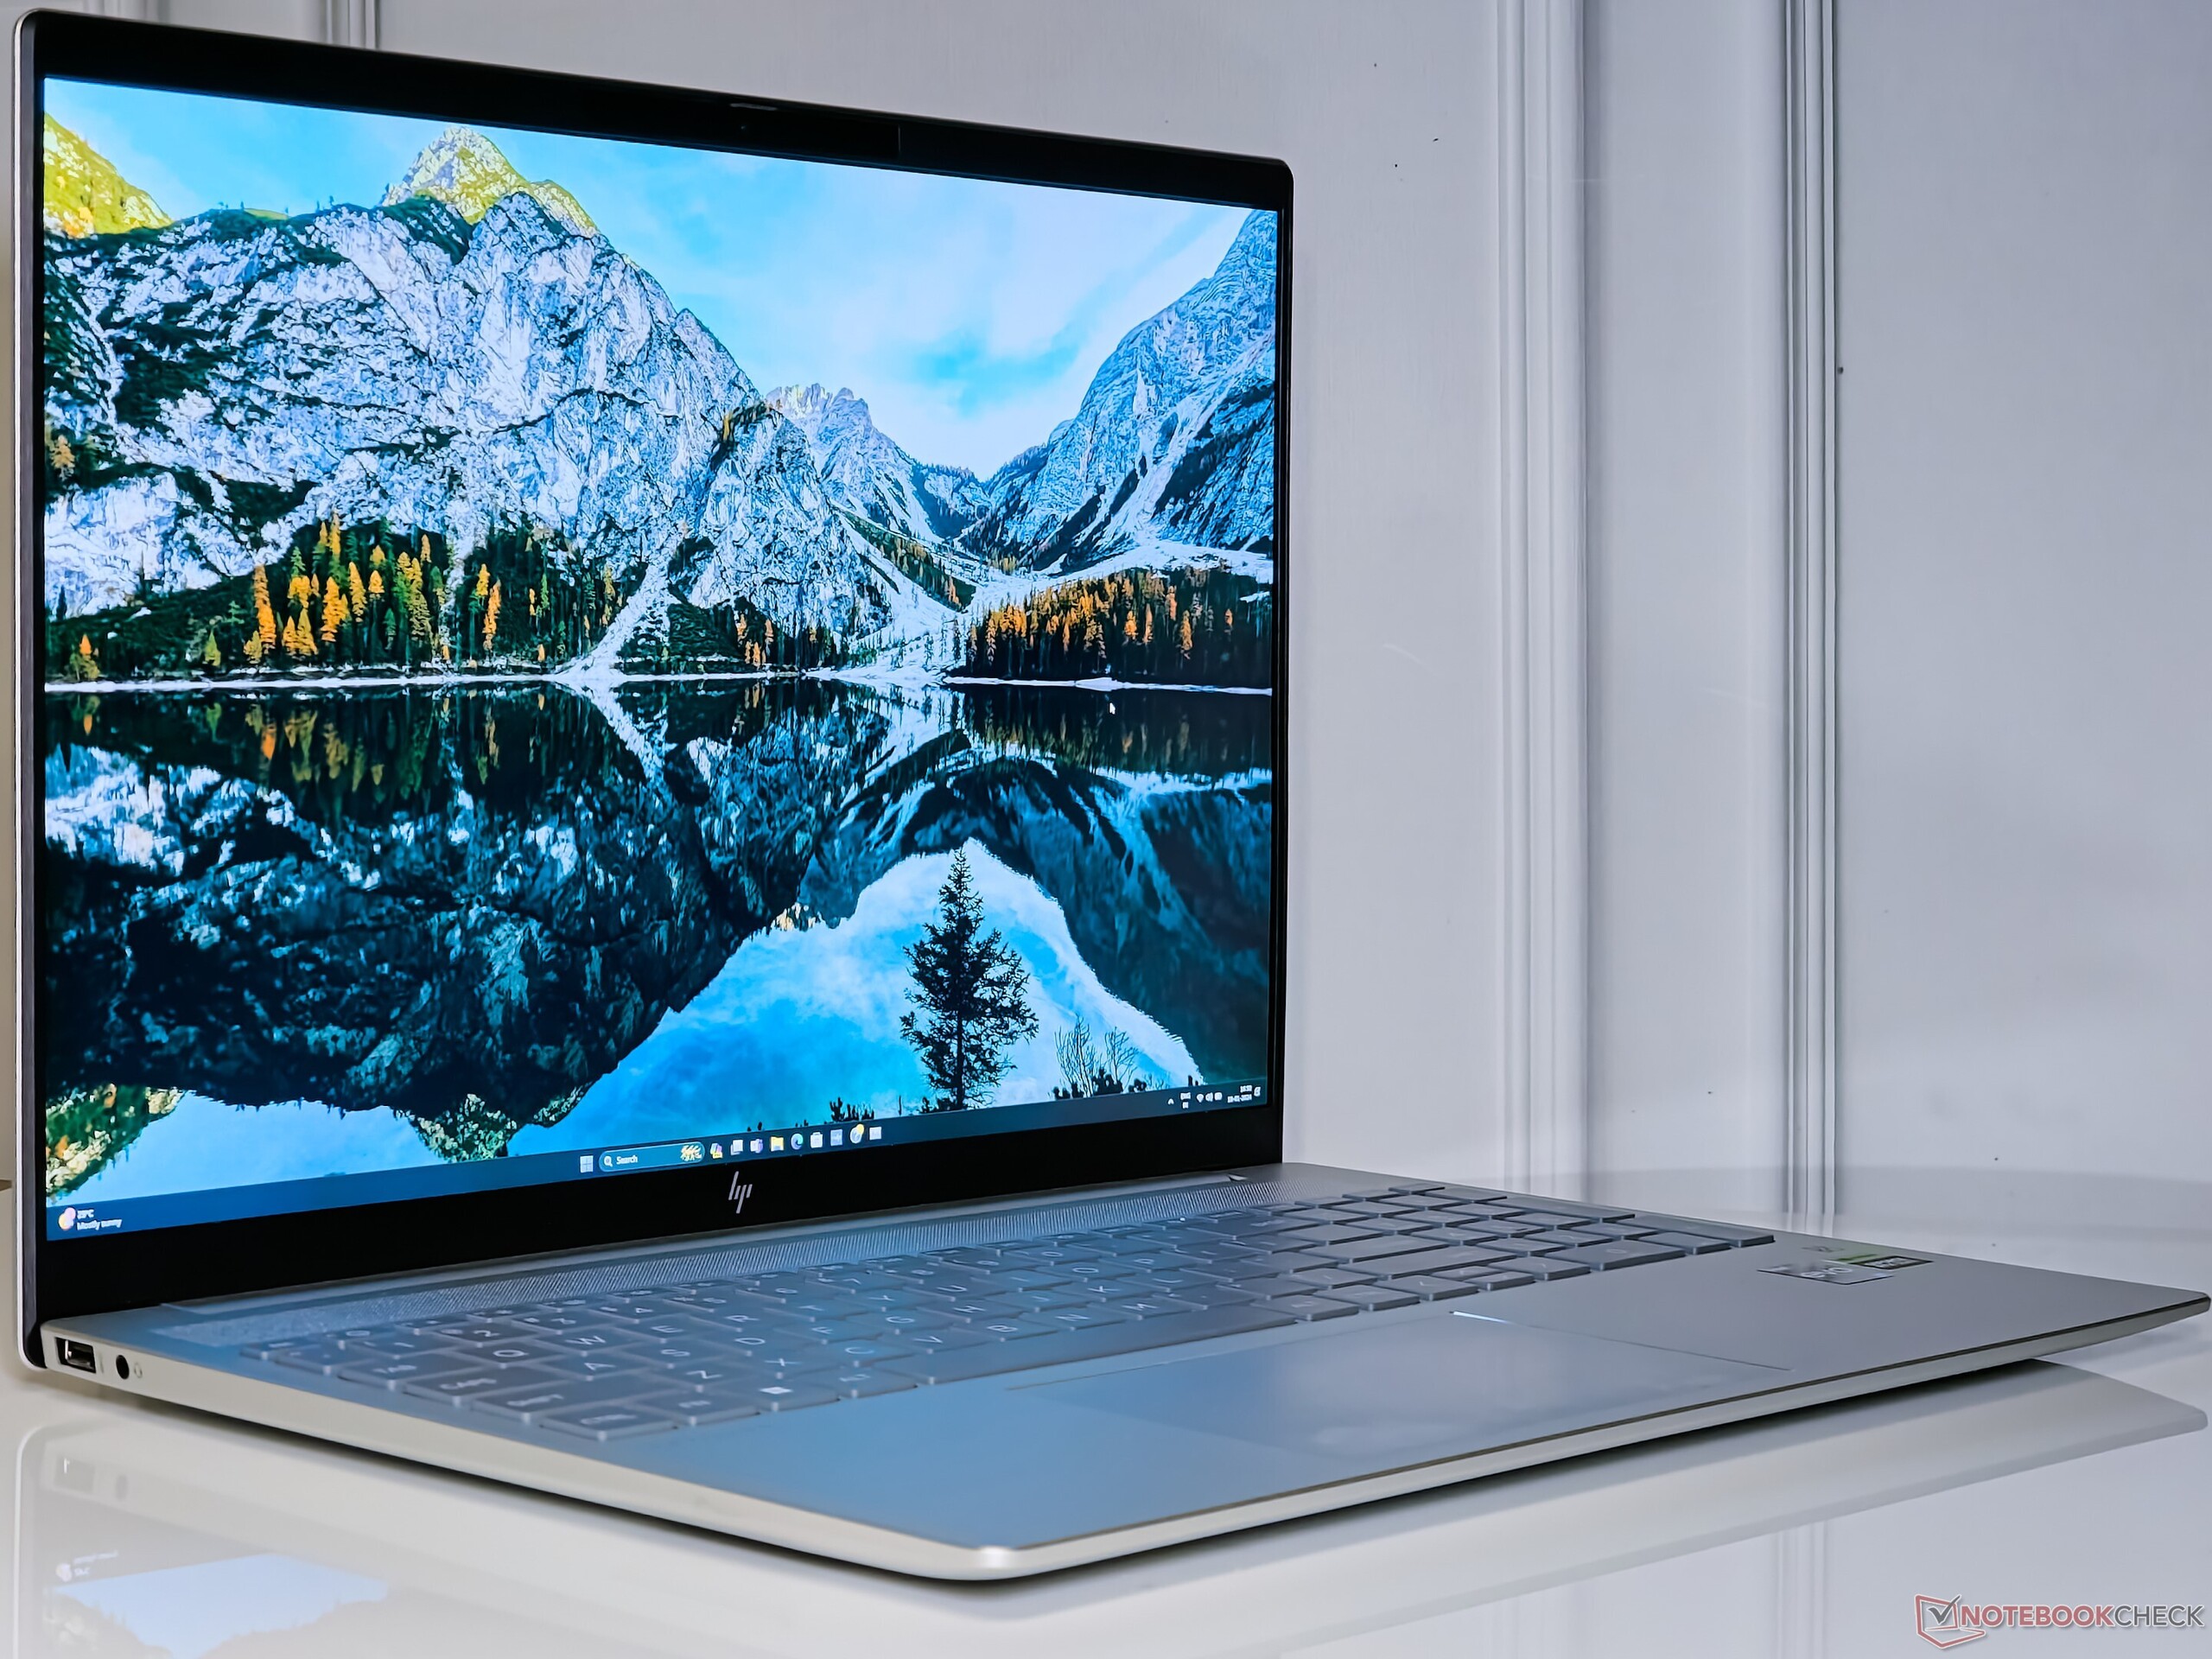
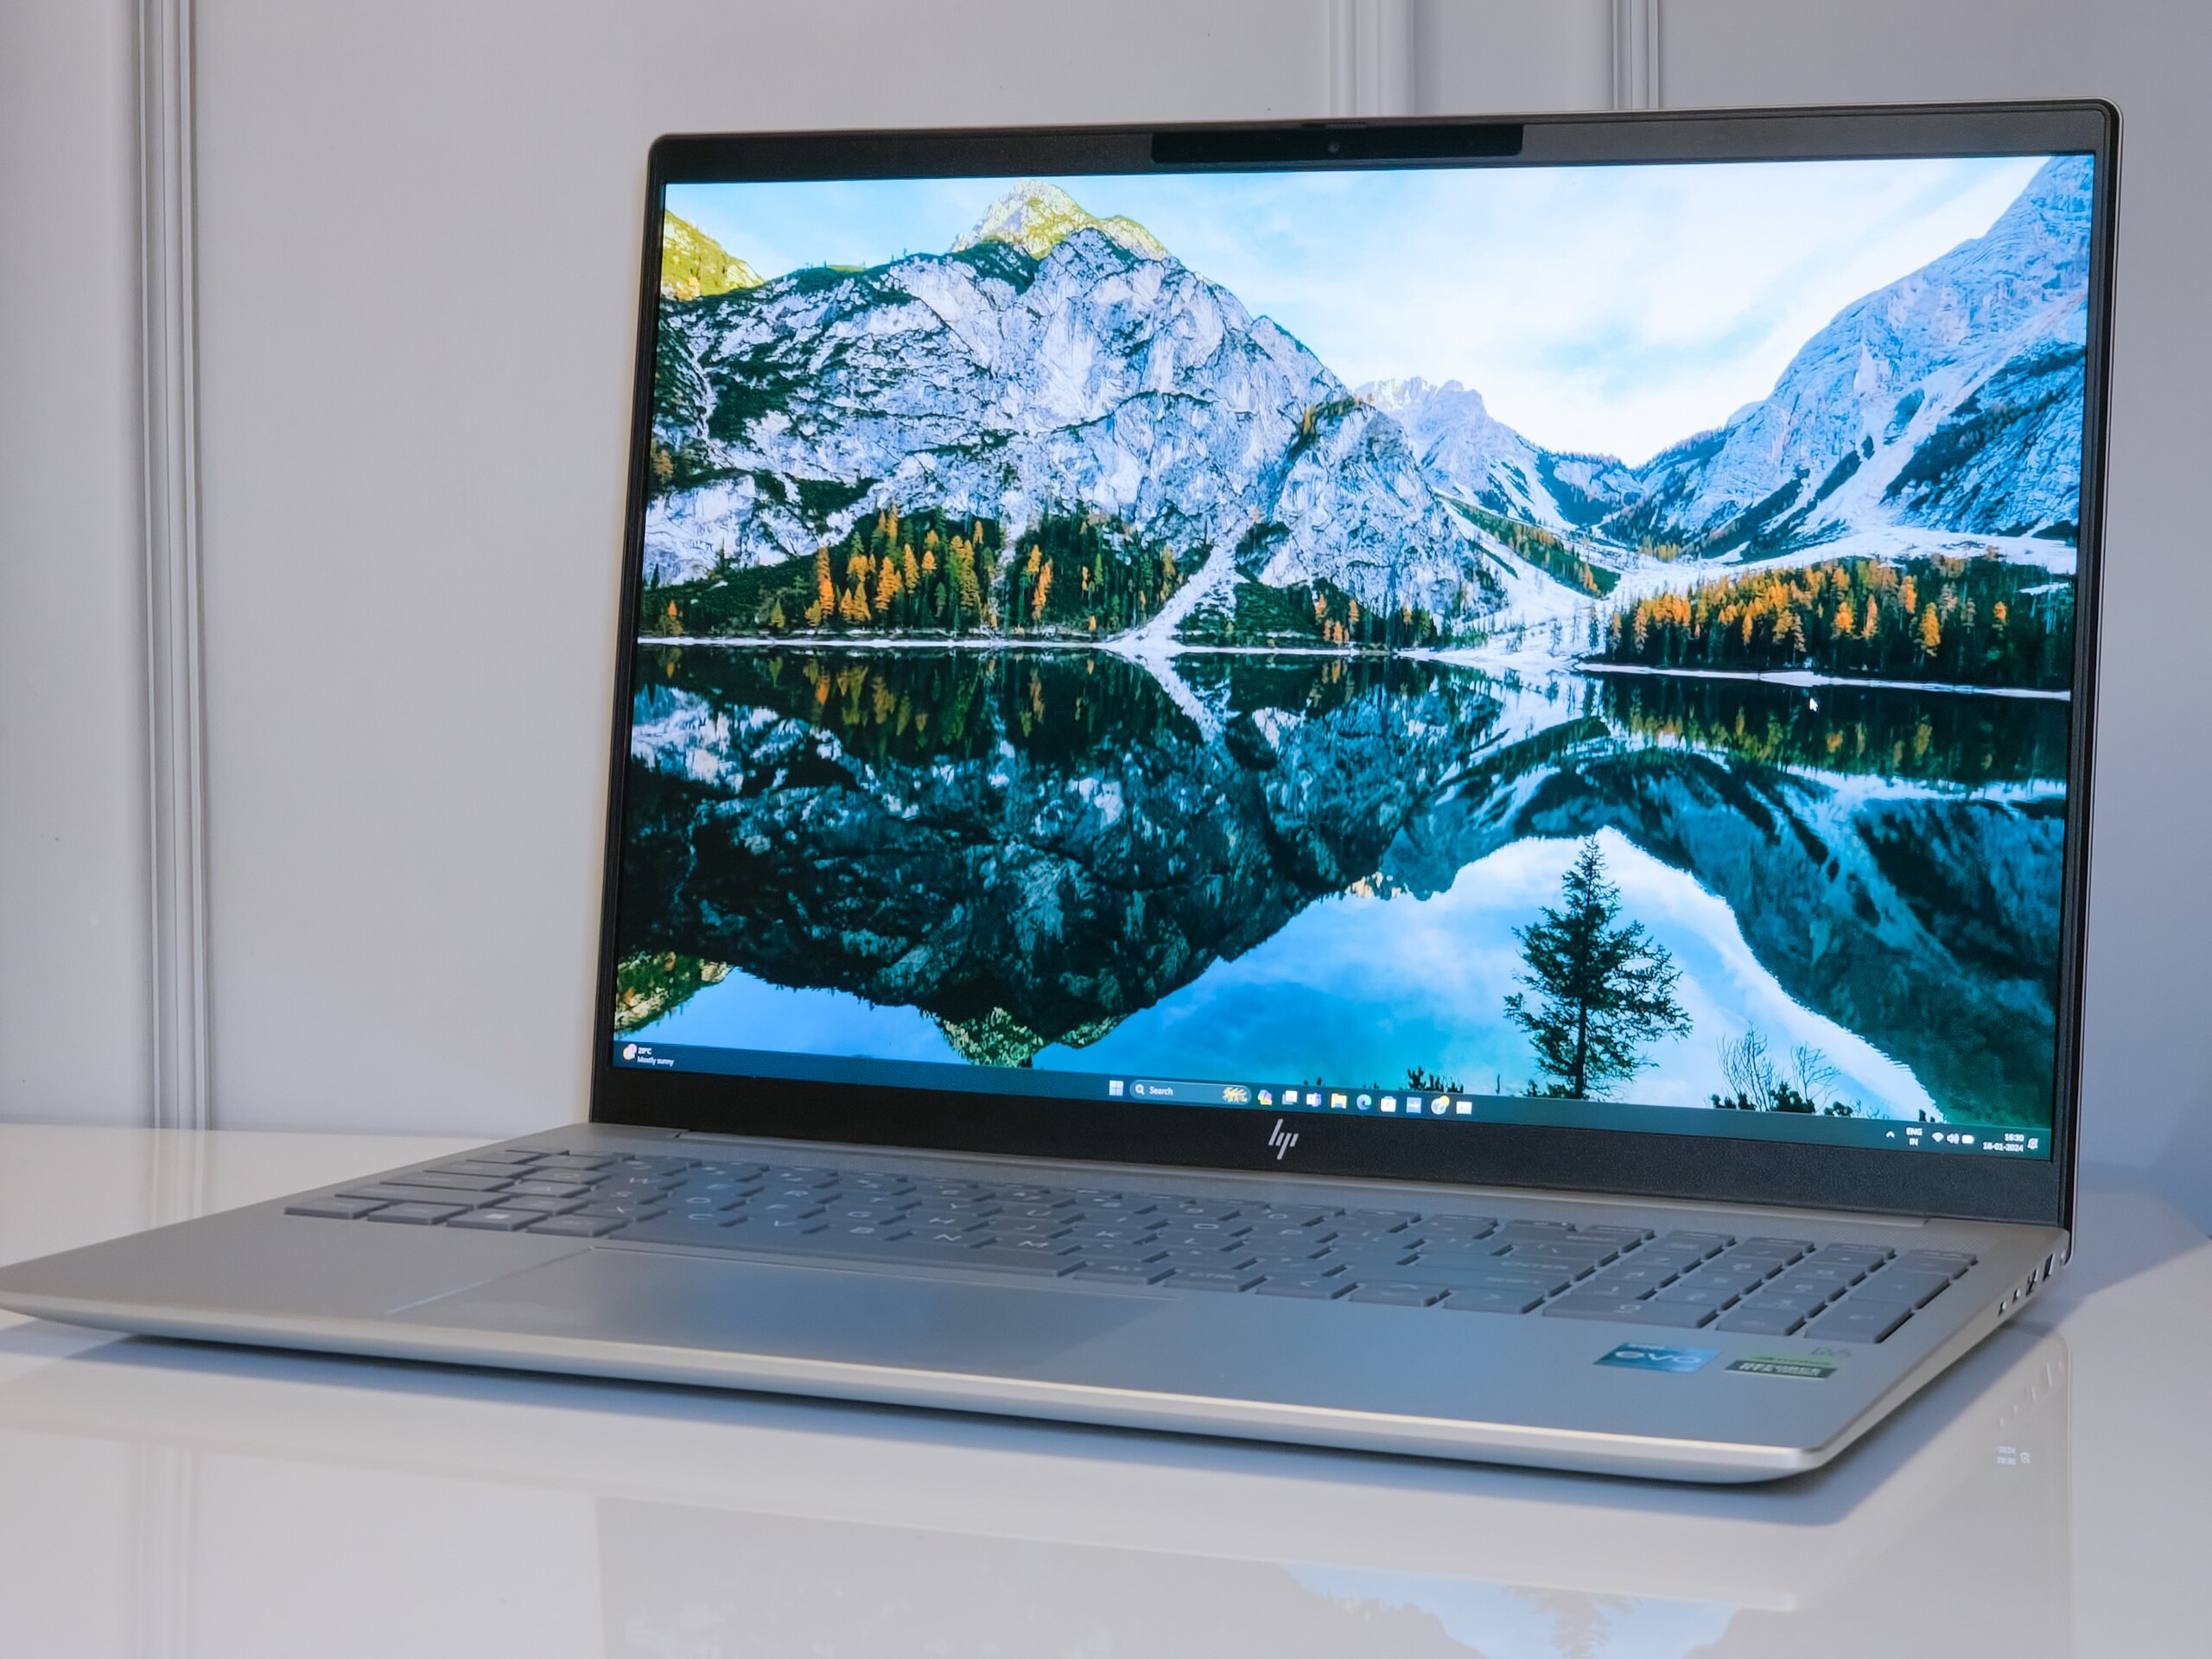
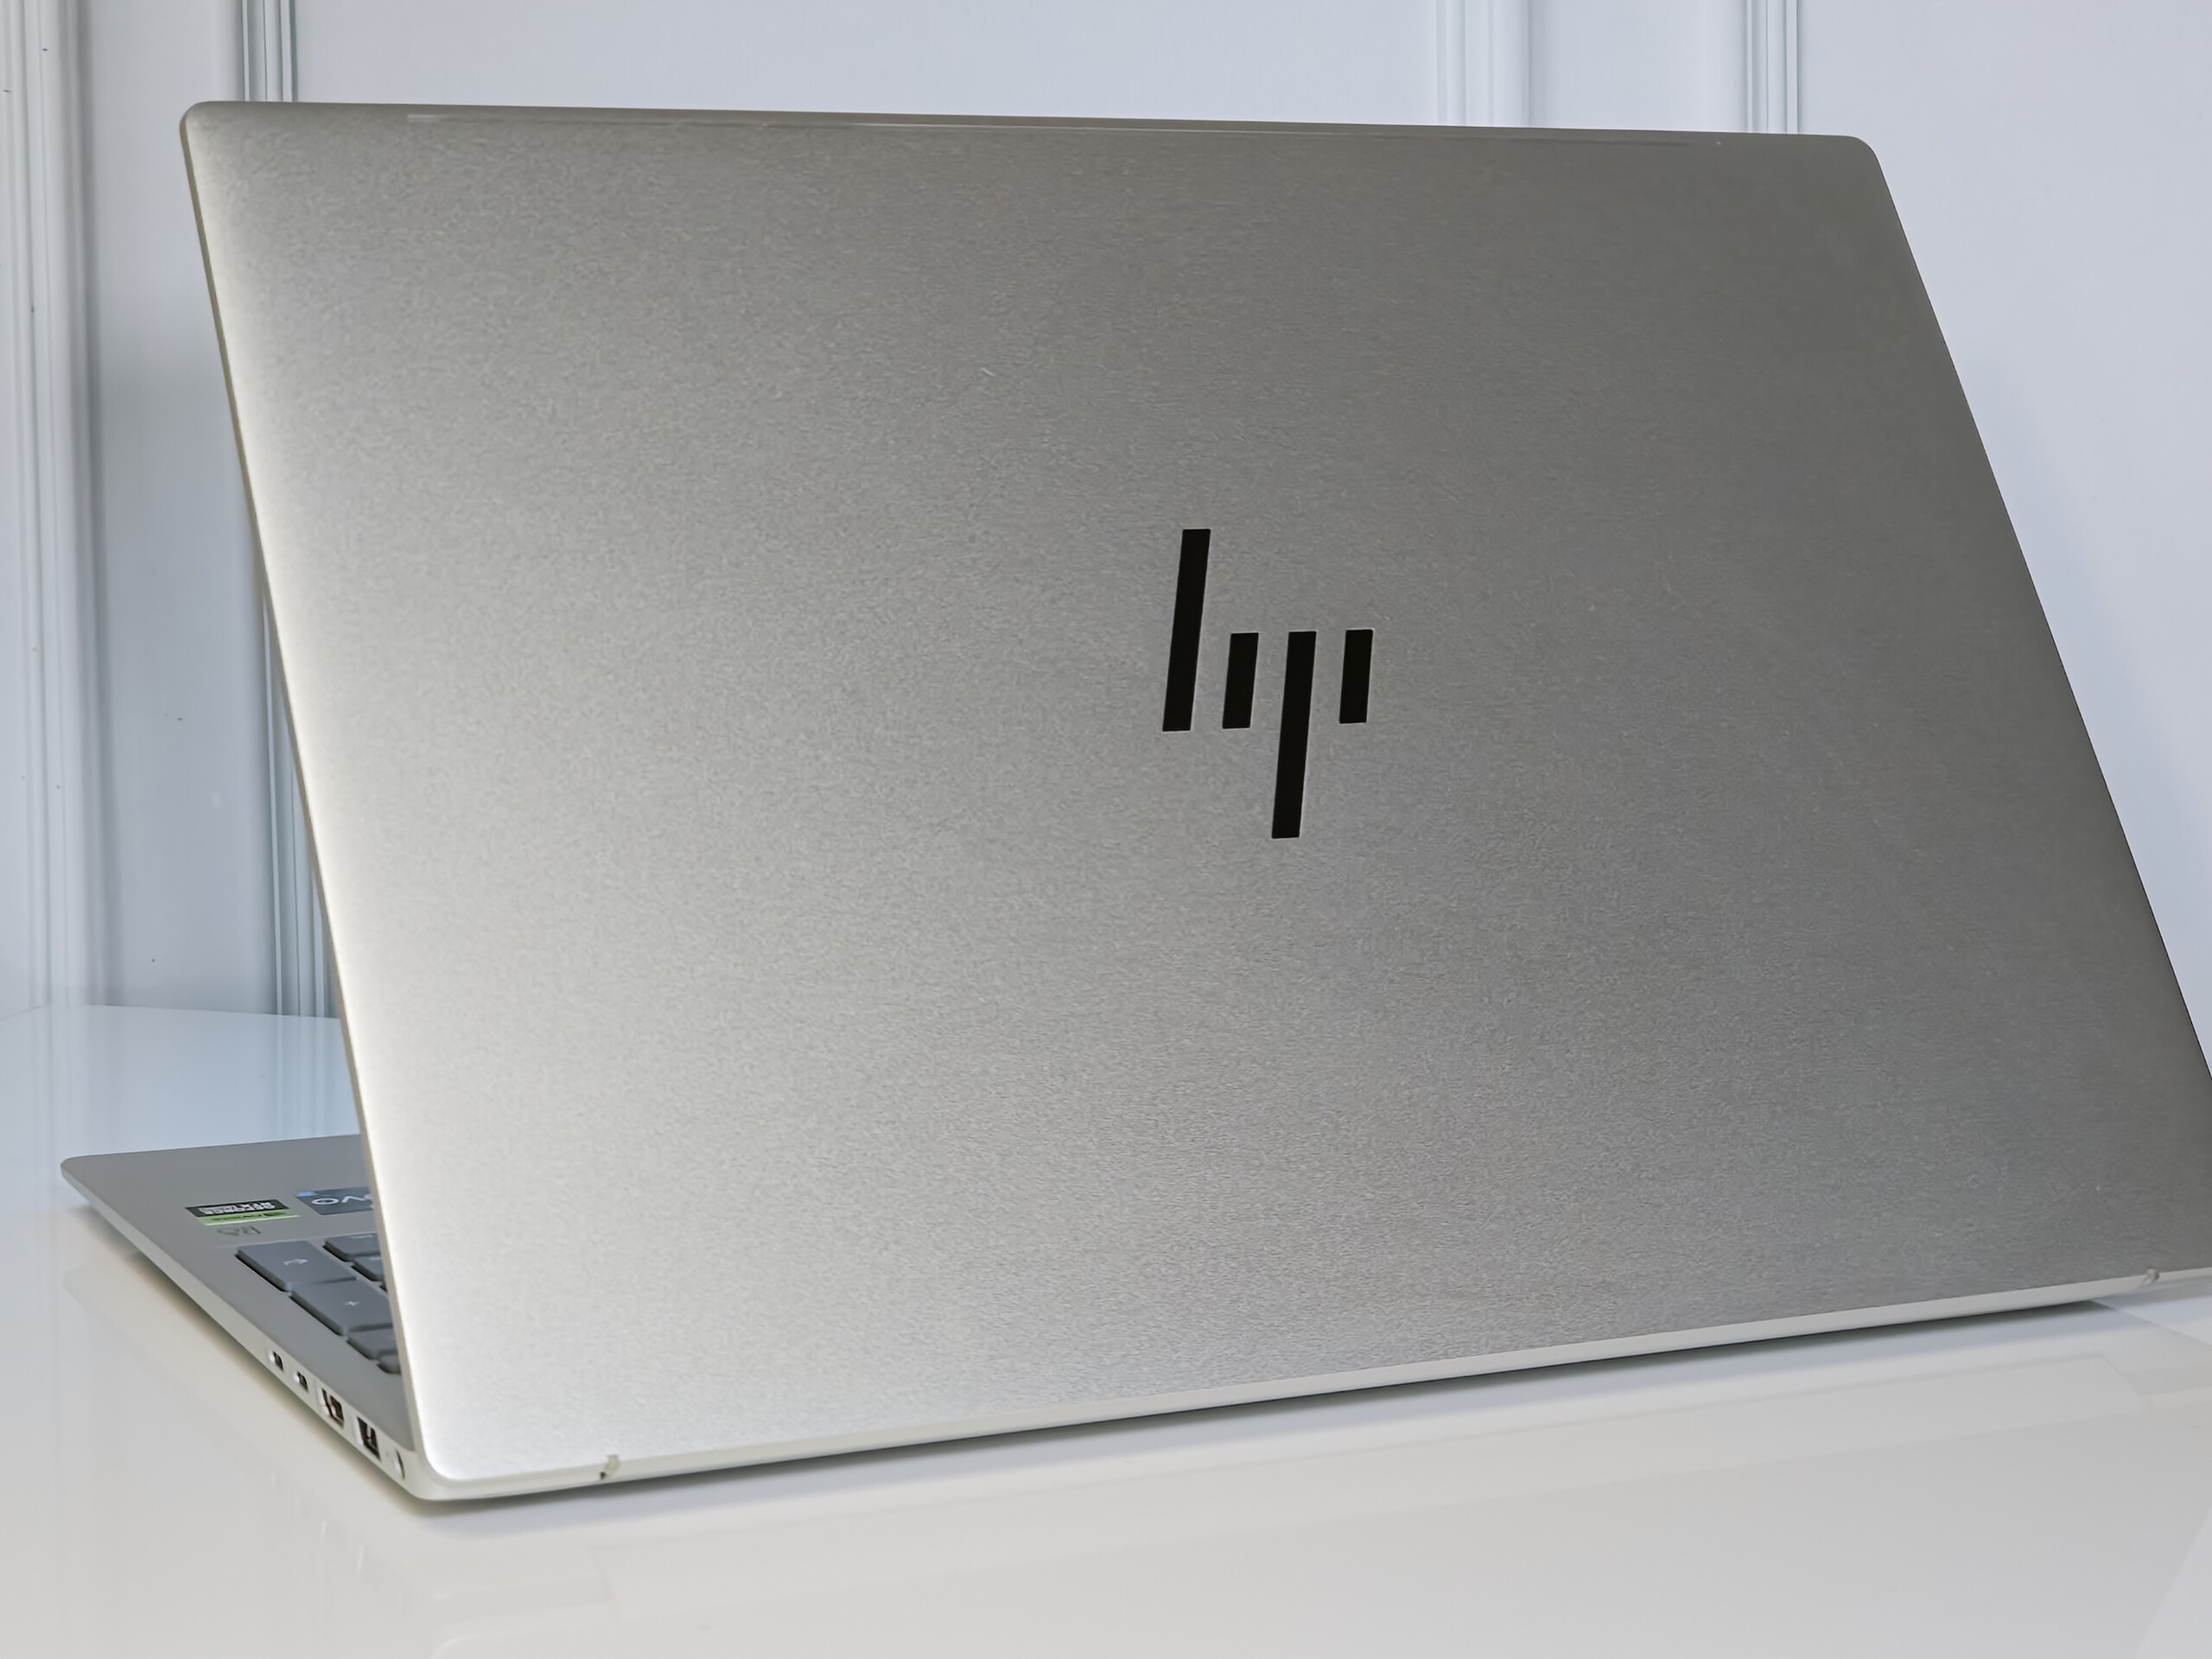
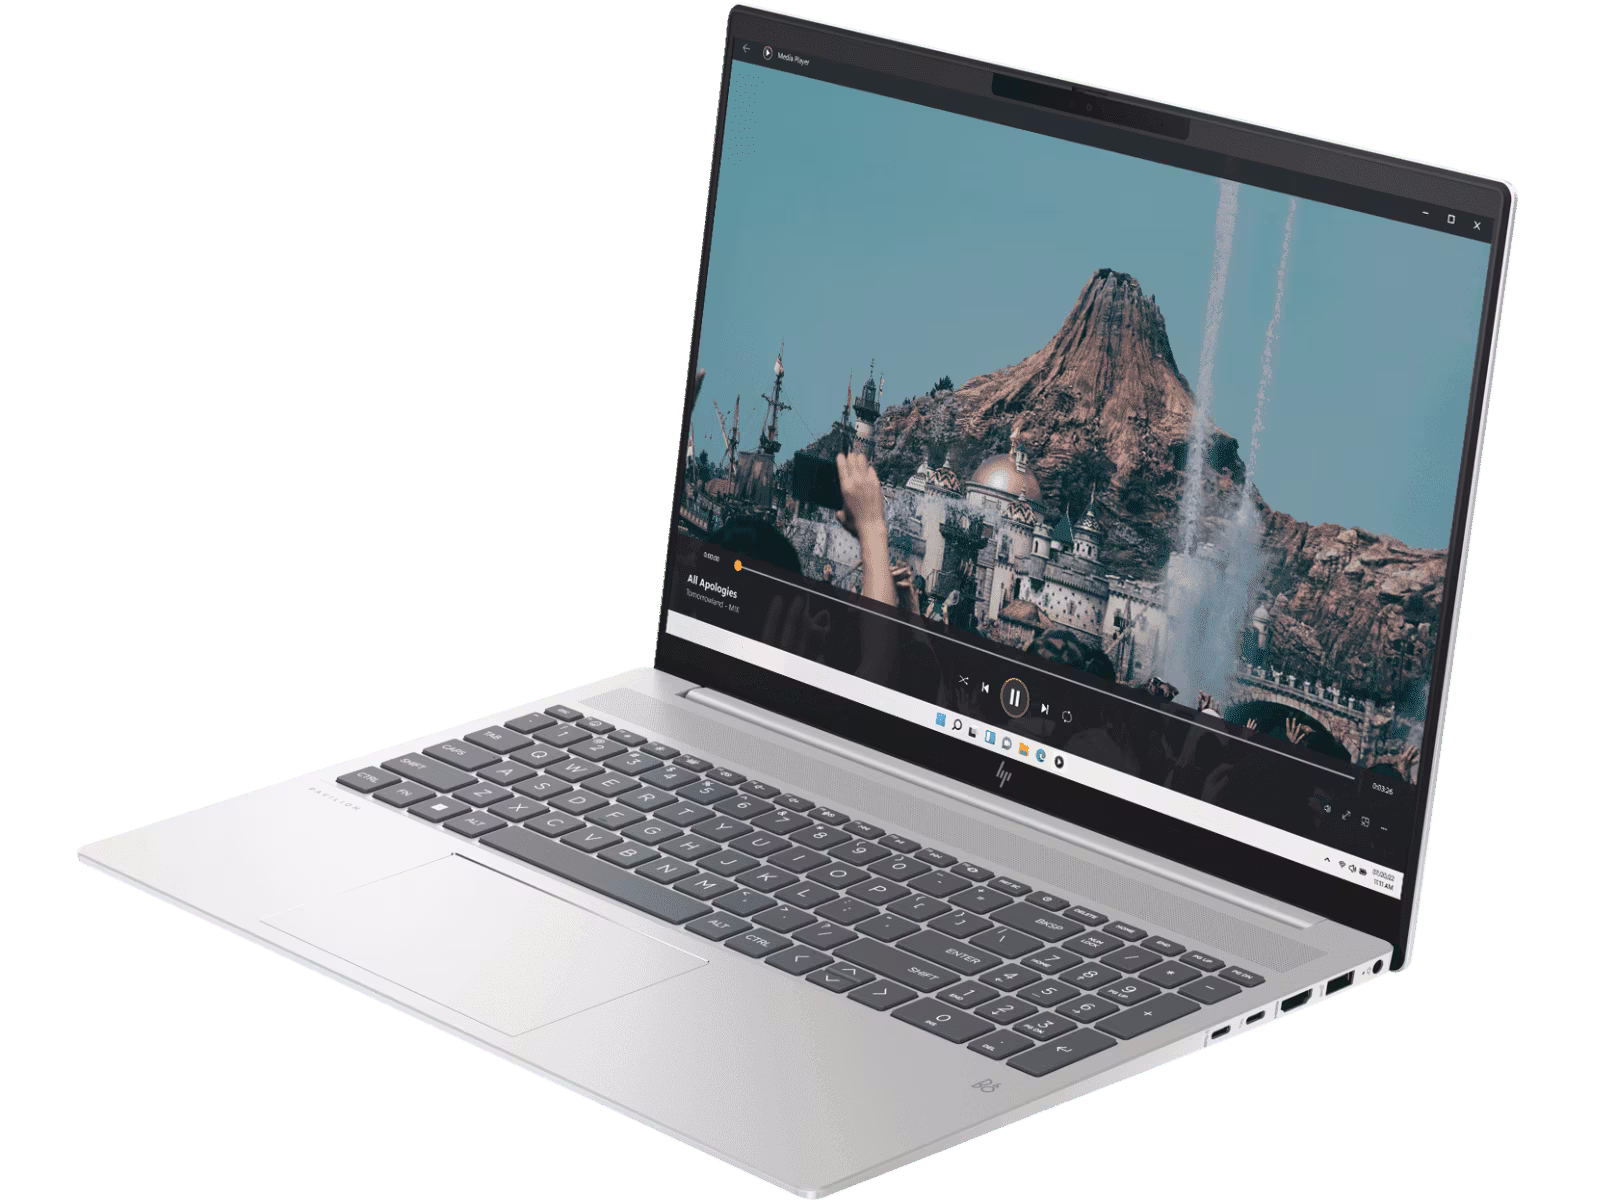
Podwozie: Solidna, całkowicie metalowa konstrukcja
Podobnie jak Pavilion Plus 14, Pavilion Plus 16 ma metaliczną konstrukcję Natural Silver dla pokryw A, C i D, podczas gdy pokrywa jest wykonana z aluminium.
Ogólna jakość wykonania nie pozostawia wiele do życzenia. Nie zauważyliśmy żadnego szczególnego uginania się pokrywy lub klawiatury.
HP reklamuje stosunek ekranu do obudowy na poziomie 89,74%, ale zmierzona wartość wynosi 83%. Przy wadze 1,9 kg, laptop waży podobnie do innych 16-calowych laptopów multimedialnych w modzie.
Łączność: Stała przepustowość WLAN
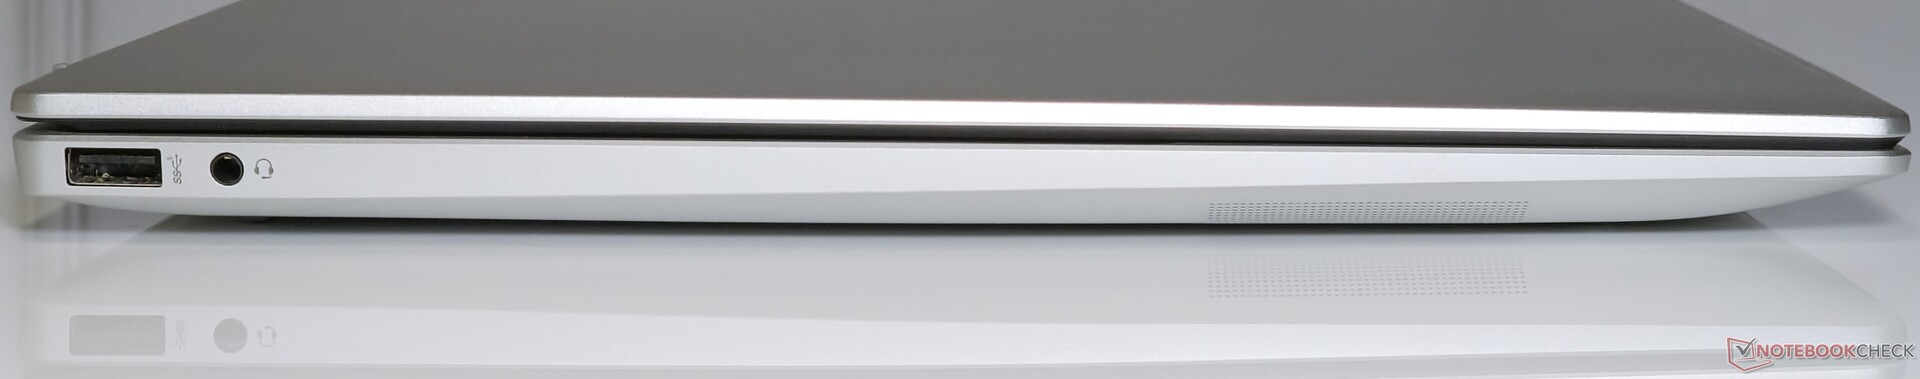
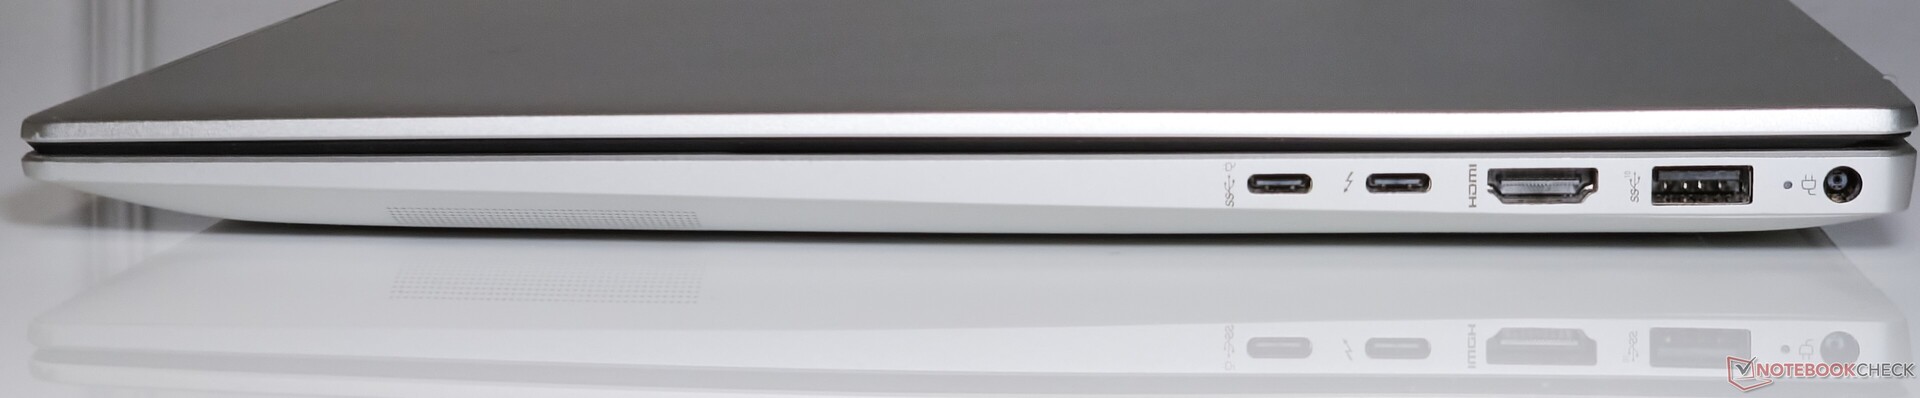
Pavilion Plus 16 oferuje przyzwoity wybór portów, w tym porty USB typu A i USB typu C, w tym Thunderbolt 4.
Rozmieszczenie portów jest w porządku i nie utrudnia podłączania sąsiednich urządzeń peryferyjnych, ale jeden z portów typu C mógłby znajdować się po lewej stronie, aby zapewnić bardziej równomierny rozkład.
Komunikacja
Wydajność iPerf3 Pavilion Plus 16 w paśmie 5 GHz jest odrobinę wolniejsza niż to, co obserwujemy w przypadku Asus VivoBook Pro 16 z tą samą kartą Intel Wi-Fi 6E AX211 WLAN.
Pavilion nadrabia ten brak w stosunku do VivoBook Pro 16 w wydajności odbioru 6 GHz, ale niewiele.
wydajność iPerf3 zarówno w paśmie 5 GHz, jak i 6 GHz jest dość spójna bez żadnych czkawek, w przeciwieństwie do tego, co widzimy w przypadku Lenovo Slim Pro 7 z układem MediaTek Wi-Fi 6E MT7922.
| Networking / iperf3 transmit AXE11000 | |
| Asus VivoBook 14X K3405 | |
| HP Pavilion Plus 16-ab0456tx | |
| Asus VivoBook Pro 16 K6602VU | |
| Samsung Galaxy Book3 Ultra 16 | |
| Średnia w klasie Multimedia (606 - 1978, n=56, ostatnie 2 lata) | |
| Lenovo Slim Pro 7 14ARP8 | |
| Dell Inspiron 16 Plus 7630 | |
| Przeciętny Intel Wi-Fi 6E AX211 (64 - 1921, n=276) | |
| Networking / iperf3 receive AXE11000 | |
| Asus VivoBook 14X K3405 | |
| Asus VivoBook Pro 16 K6602VU | |
| HP Pavilion Plus 16-ab0456tx | |
| Samsung Galaxy Book3 Ultra 16 | |
| Lenovo Slim Pro 7 14ARP8 | |
| Przeciętny Intel Wi-Fi 6E AX211 (582 - 1890, n=276) | |
| Średnia w klasie Multimedia (682 - 1818, n=56, ostatnie 2 lata) | |
| Dell Inspiron 16 Plus 7630 | |
| Networking / iperf3 transmit AXE11000 6GHz | |
| HP Pavilion Plus 16-ab0456tx | |
| Dell Inspiron 16 Plus 7630 | |
| Średnia w klasie Multimedia (869 - 2373, n=23, ostatnie 2 lata) | |
| Asus VivoBook 14X K3405 | |
| Asus VivoBook Pro 16 K6602VU | |
| Przeciętny Intel Wi-Fi 6E AX211 (385 - 1851, n=226) | |
| Networking / iperf3 receive AXE11000 6GHz | |
| HP Pavilion Plus 16-ab0456tx | |
| Średnia w klasie Multimedia (1212 - 2361, n=23, ostatnie 2 lata) | |
| Asus VivoBook Pro 16 K6602VU | |
| Asus VivoBook 14X K3405 | |
| Przeciętny Intel Wi-Fi 6E AX211 (700 - 1857, n=226) | |
| Dell Inspiron 16 Plus 7630 | |
Kamera internetowa
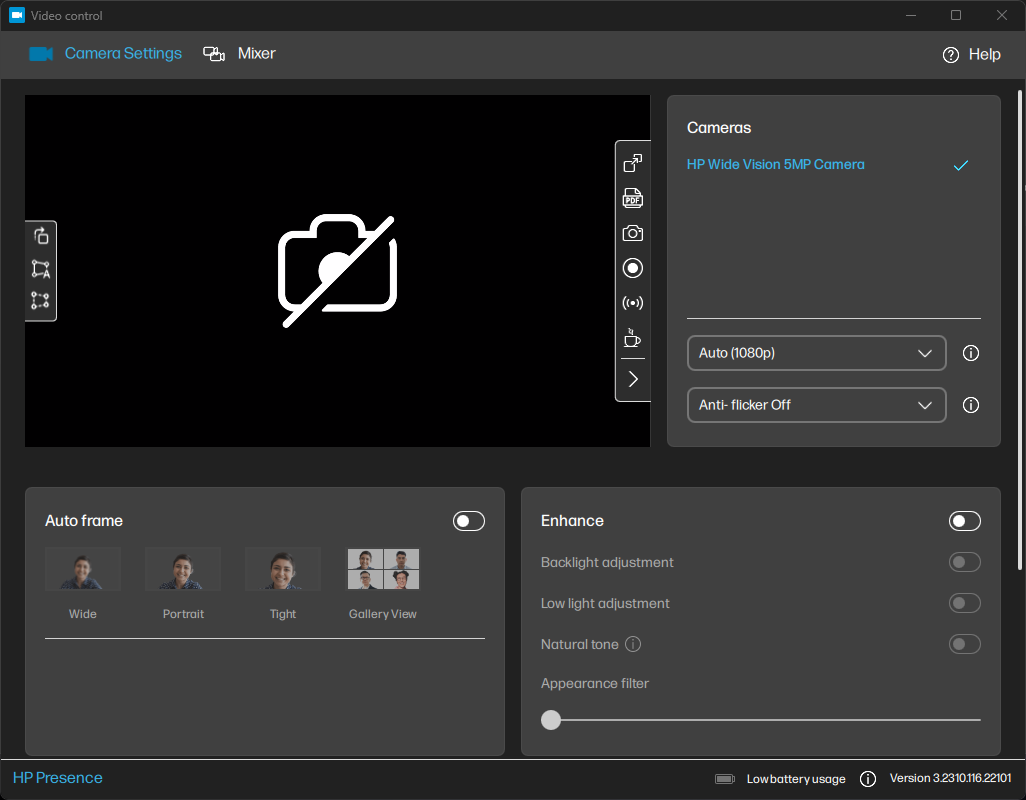
Kamera internetowa 5 MP generuje przyzwoite obrazy, które są całkiem przydatne do wideokonferencji. Szczegóły są dość dobrze zachowane jak na kamerę internetową laptopa, ale kamera może mieć trudności w słabym oświetleniu.
HP zapewnia kilka przydatnych narzędzi, takich jak HP Enhanced Lighting, które rozjaśnia ekran wokół obiektu i aplikację Video Control, która oferuje dodatkowe opcje kadrowania i regulacji obrazu.


Bezpieczeństwo
HP dostarcza kamerę IR kompatybilną z Windows Hello dla Pavilion Plus 16 wraz z migawką prywatności dla kamery internetowej. Kamera na podczerwień działała dość szybko podczas naszego czasu z urządzeniem.
Dodatkowo, moduł TPM 2.0 jest obecny, aby spełnić wymagania bezpieczeństwa systemu Windows 11.
Akcesoria i gwarancja
W pudełku nie ma żadnych dodatkowych akcesoriów oprócz zasilacza 135 W i zwykłej dokumentacji.
HP oferuje roczną gwarancję na Pavilion Plus 16 w Indiach. Kupujący mogą przedłużyć tę gwarancję o kolejne trzy lata, kupując kwalifikujące się pakiety HP Care Pack https://www.hp.com/in-en/shop/carepackfinder.
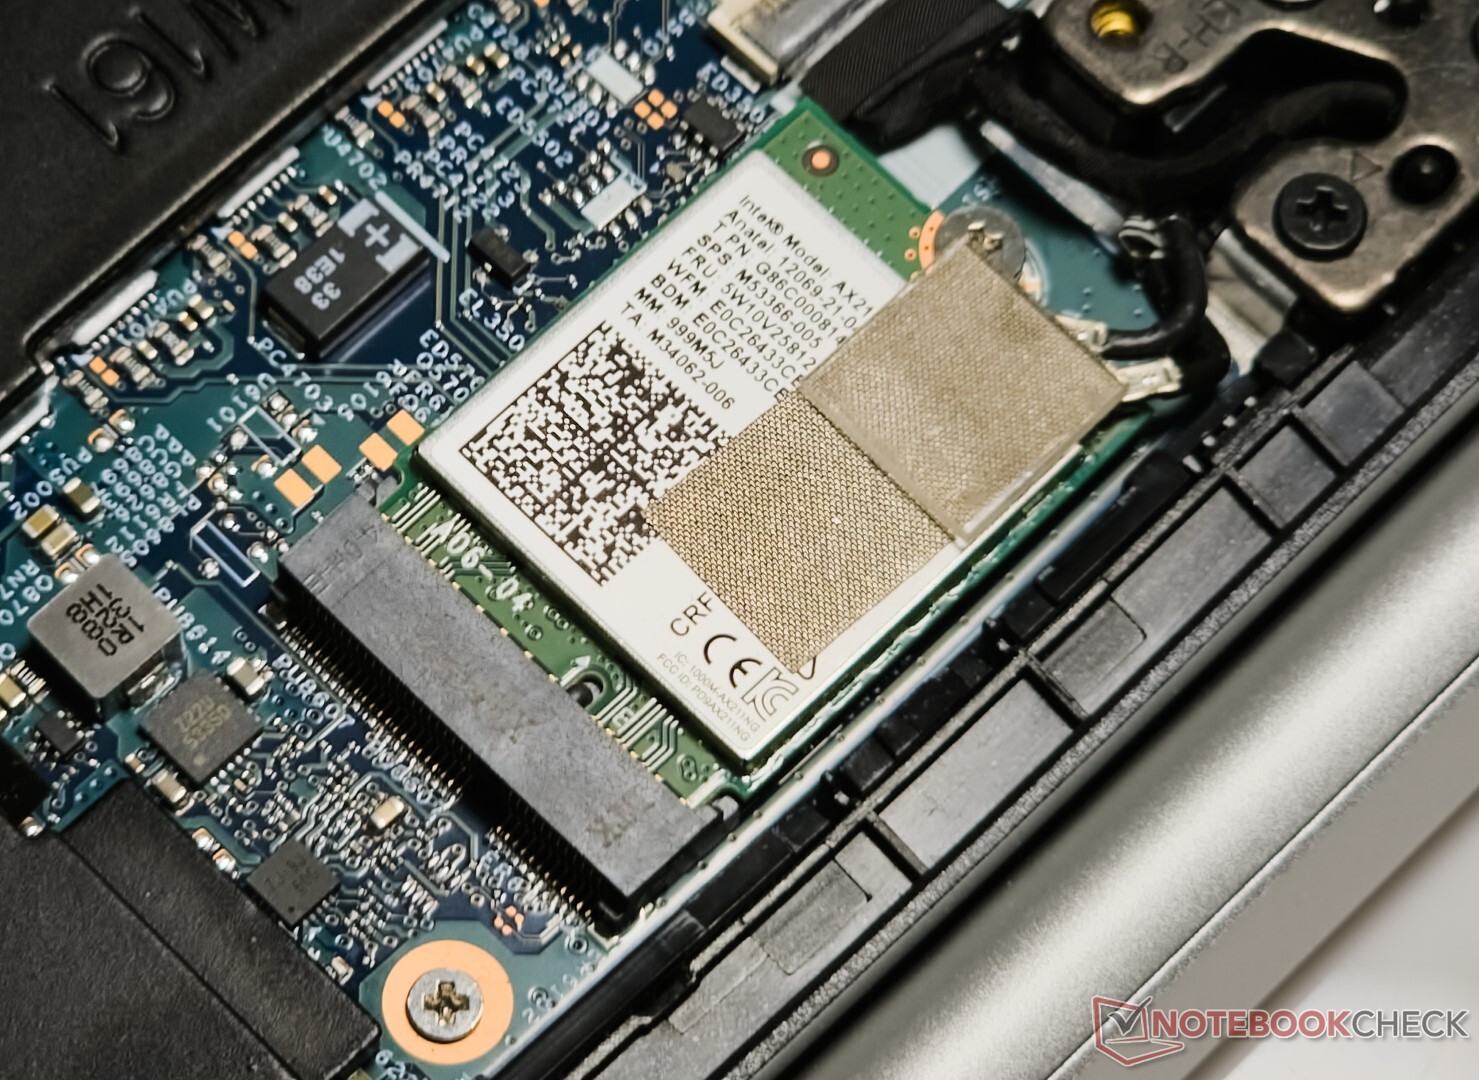
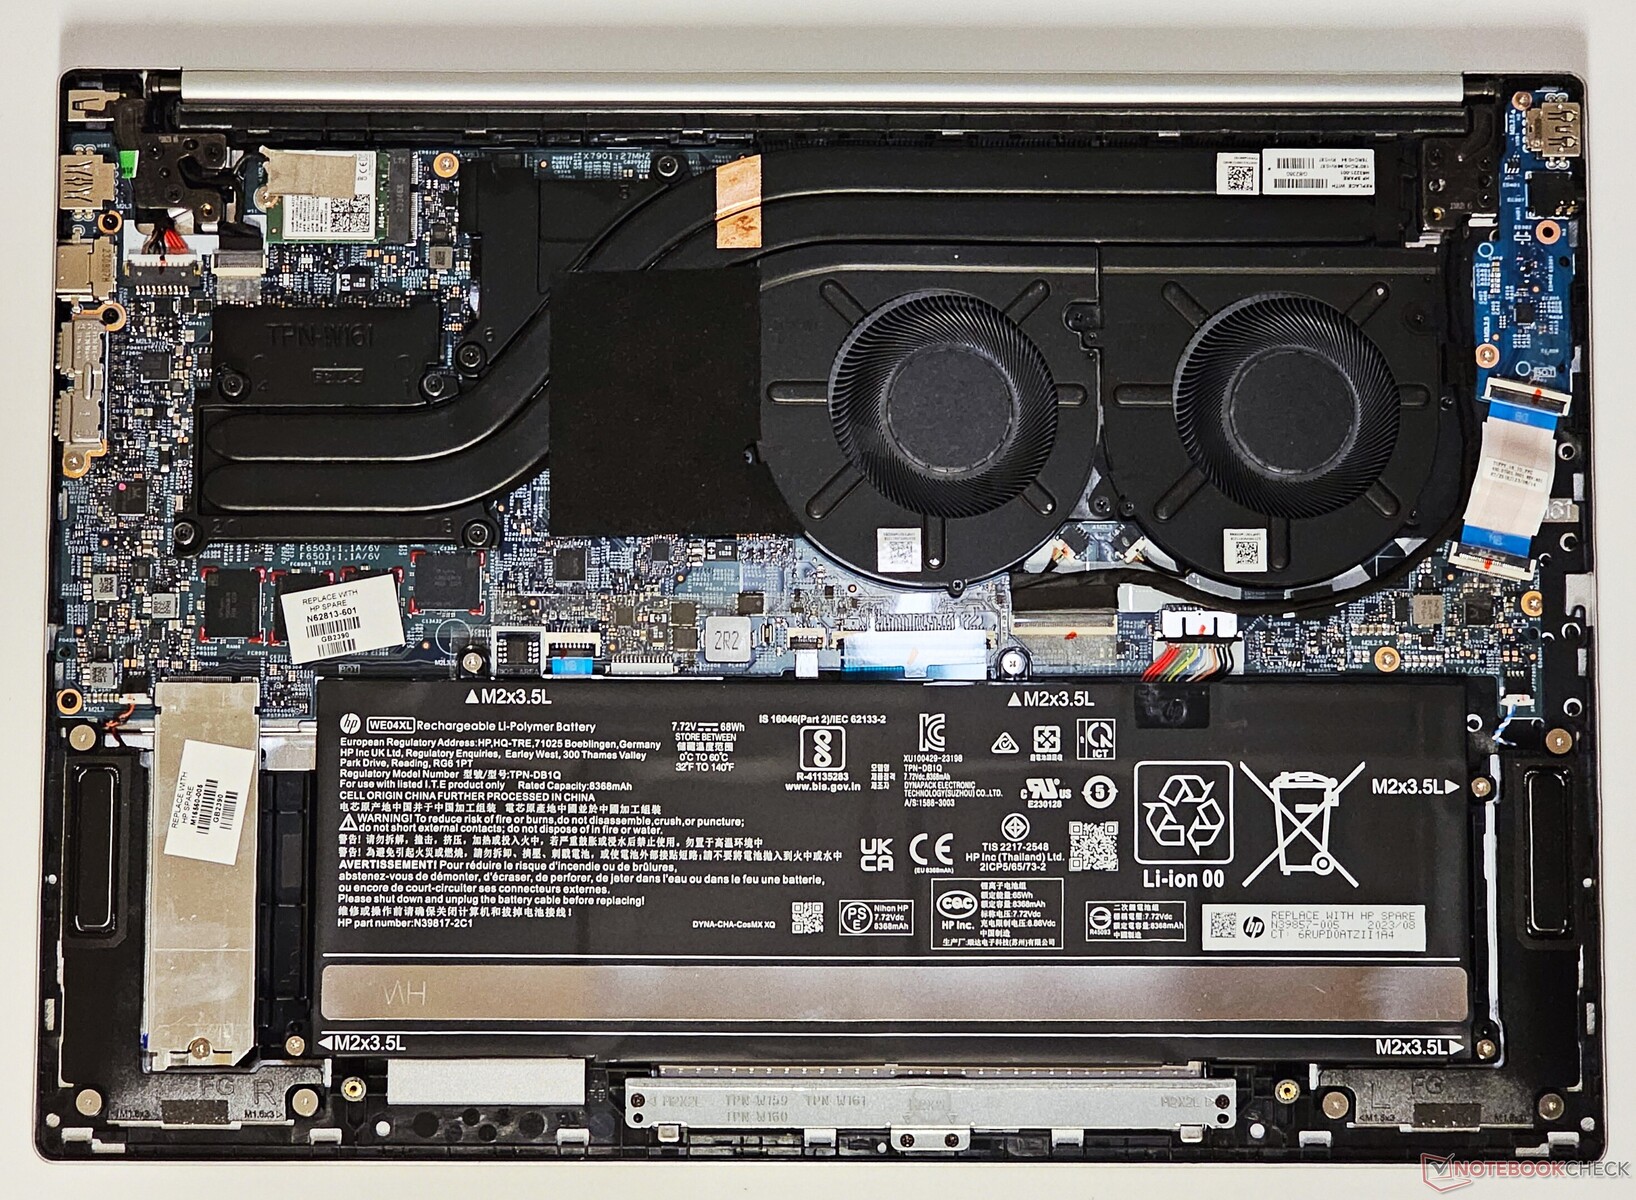
Konserwacja
Dolny panel można podważyć po odkręceniu czterech śrub PH0. Pamięć jest przylutowana, ale w razie potrzeby można wymienić kartę WLAN, dysk SSD NVMe i akumulator.
Urządzenia wejściowe: Pełnowymiarowa klawiatura numeryczna o przyzwoitych właściwościach dotykowych
Klawiatura
Klawiatura Pavilion Plus 16 oferuje przyzwoite wrażenia z pisania. Szare klawisze dobrze kontrastują z obudową w kolorze Natural Silver. Klawiatura numeryczna jest przestronna i przydaje się do obliczania liczb w programie Excel. Brakuje jej jednak wskaźnika Num Lock.
Przycisk zasilania znajduje się tuż obok klawisza Delete, co może zmylić początkujących użytkowników. Górne i dolne klawisze strzałek również wydają się ciasne. Trzystopniowe białe podświetlenie pomaga w czytelności przy słabym oświetleniu.
Panel dotykowy
Panel dotykowy o wymiarach 12,5 cm x 8 cm jest przestronny i zapewnia płynne przesuwanie z dobrym sprzężeniem zwrotnym. Jednak skok nie jest tak głęboki.
Cały touchpad działa jak lewy przycisk myszy. Kliknięcia w środkowej i dolnej części touchpada są bardziej responsywne niż te na górze.
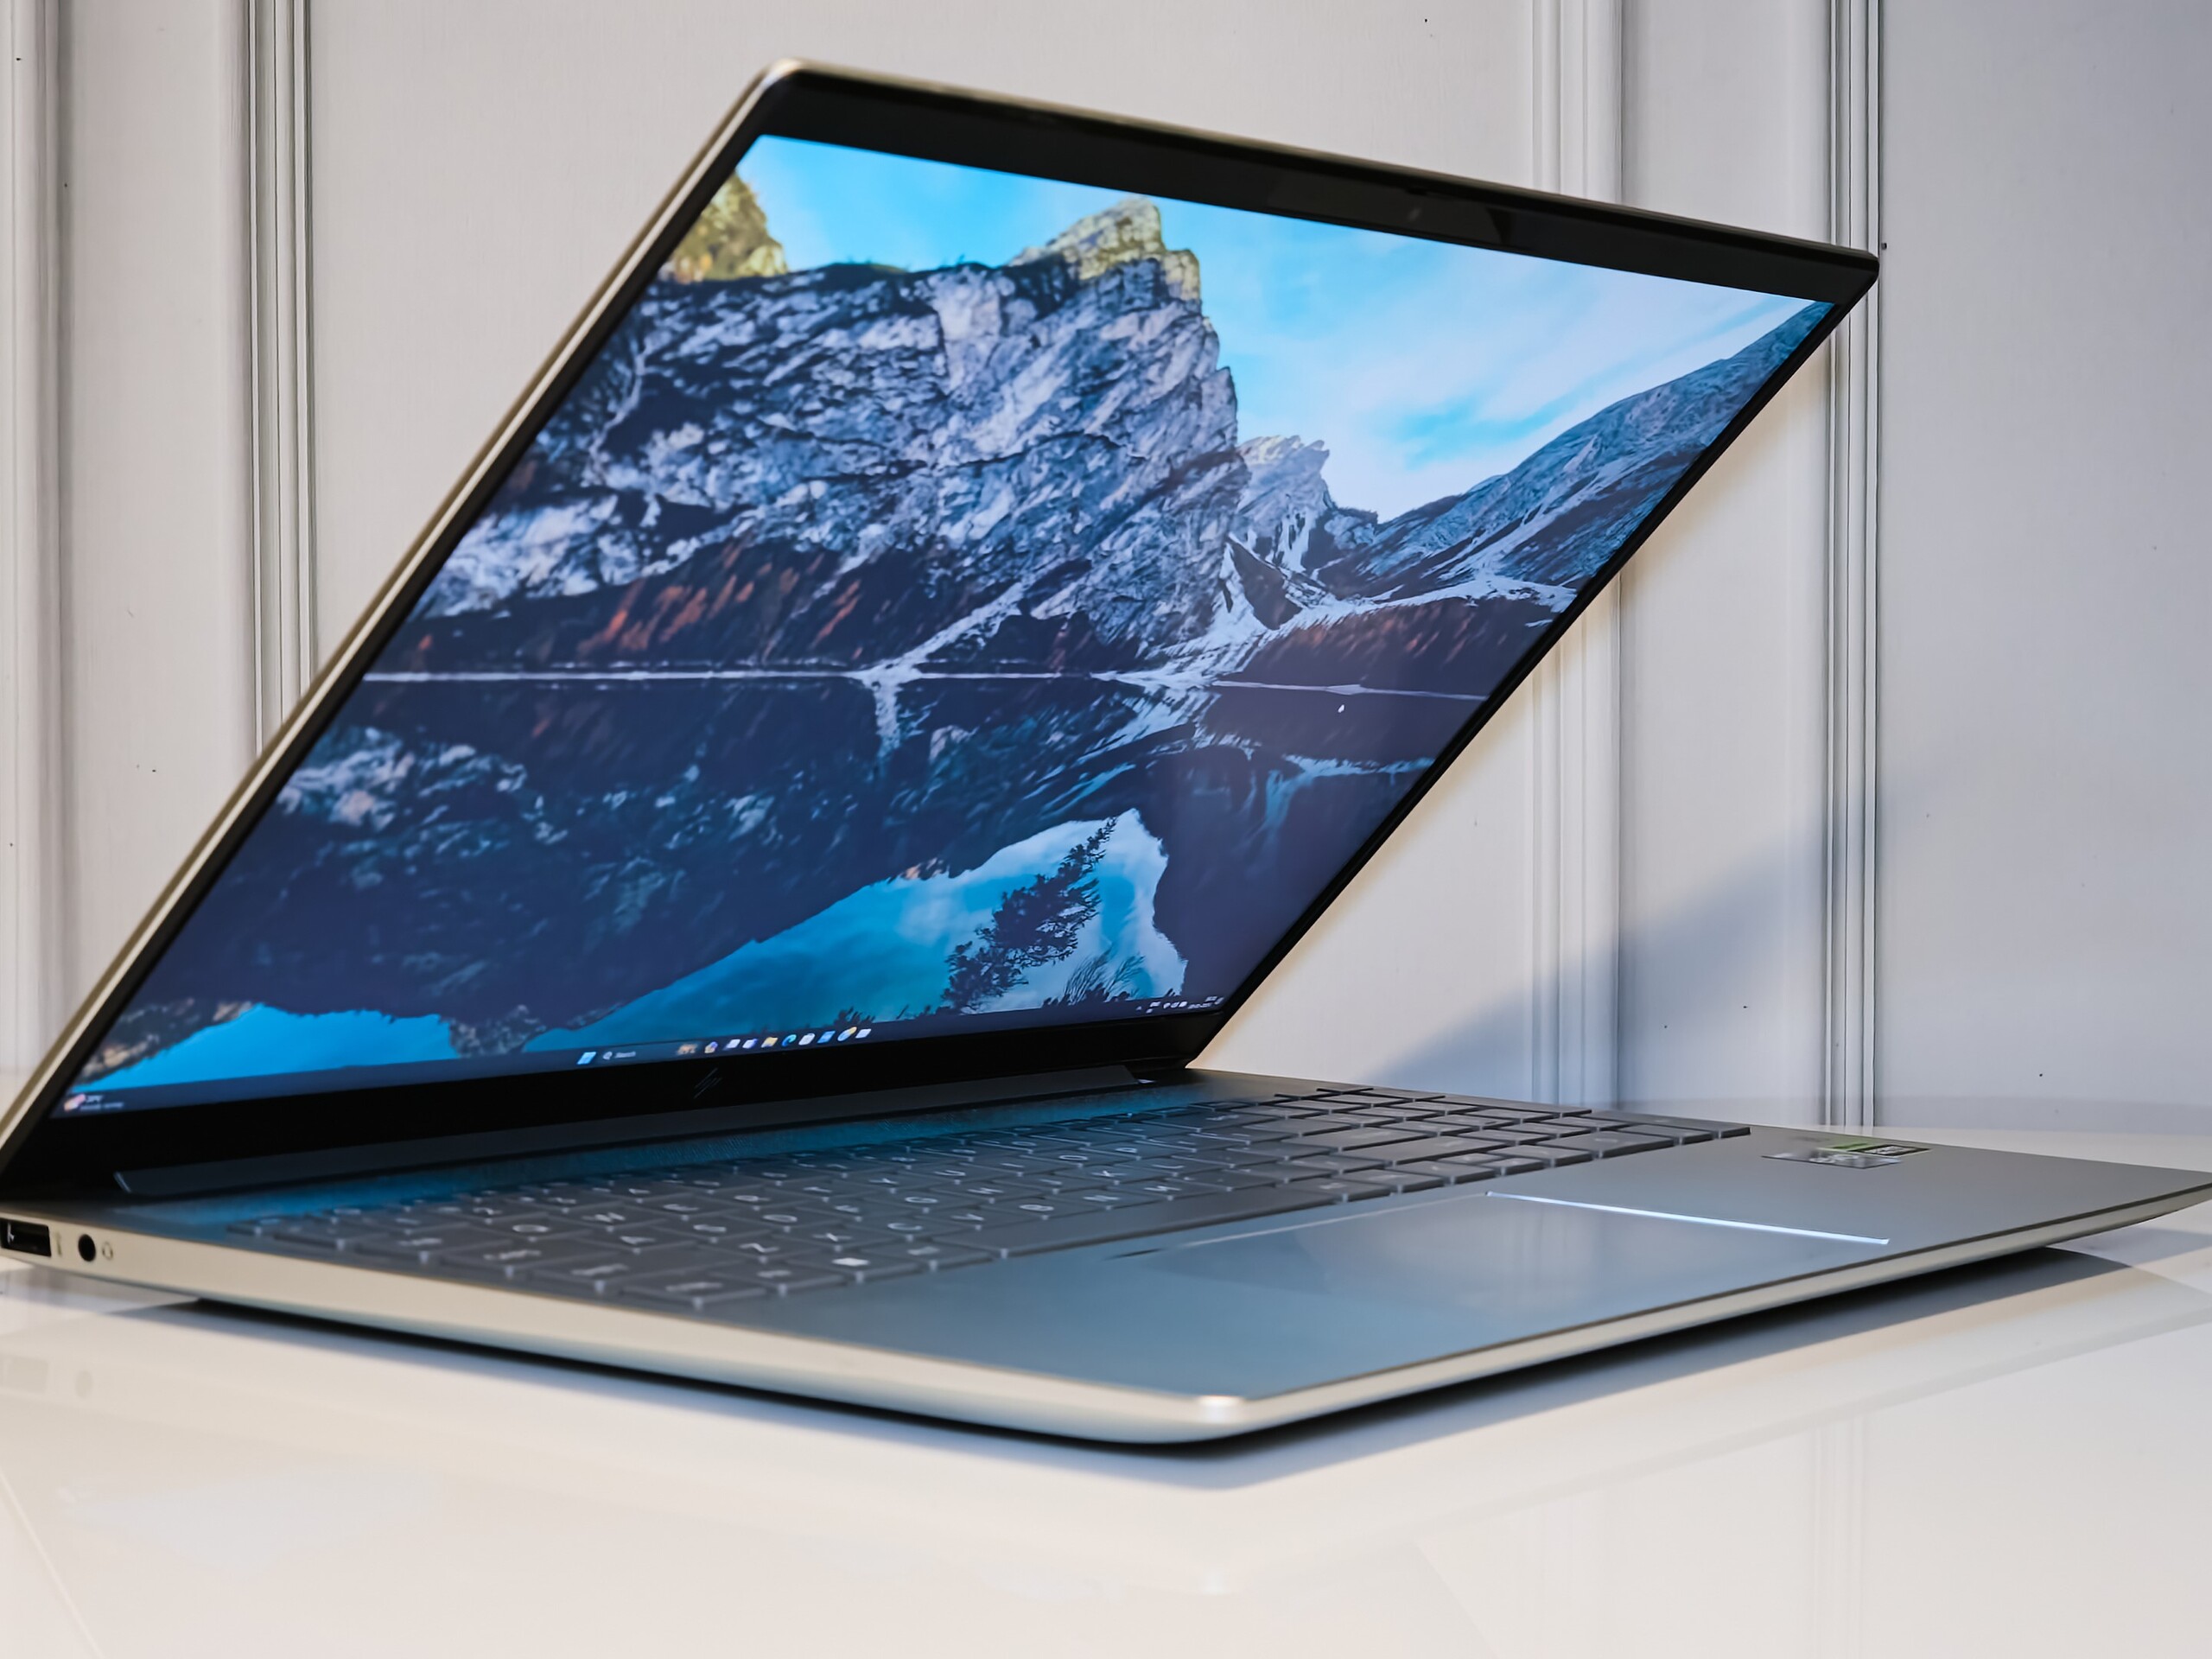
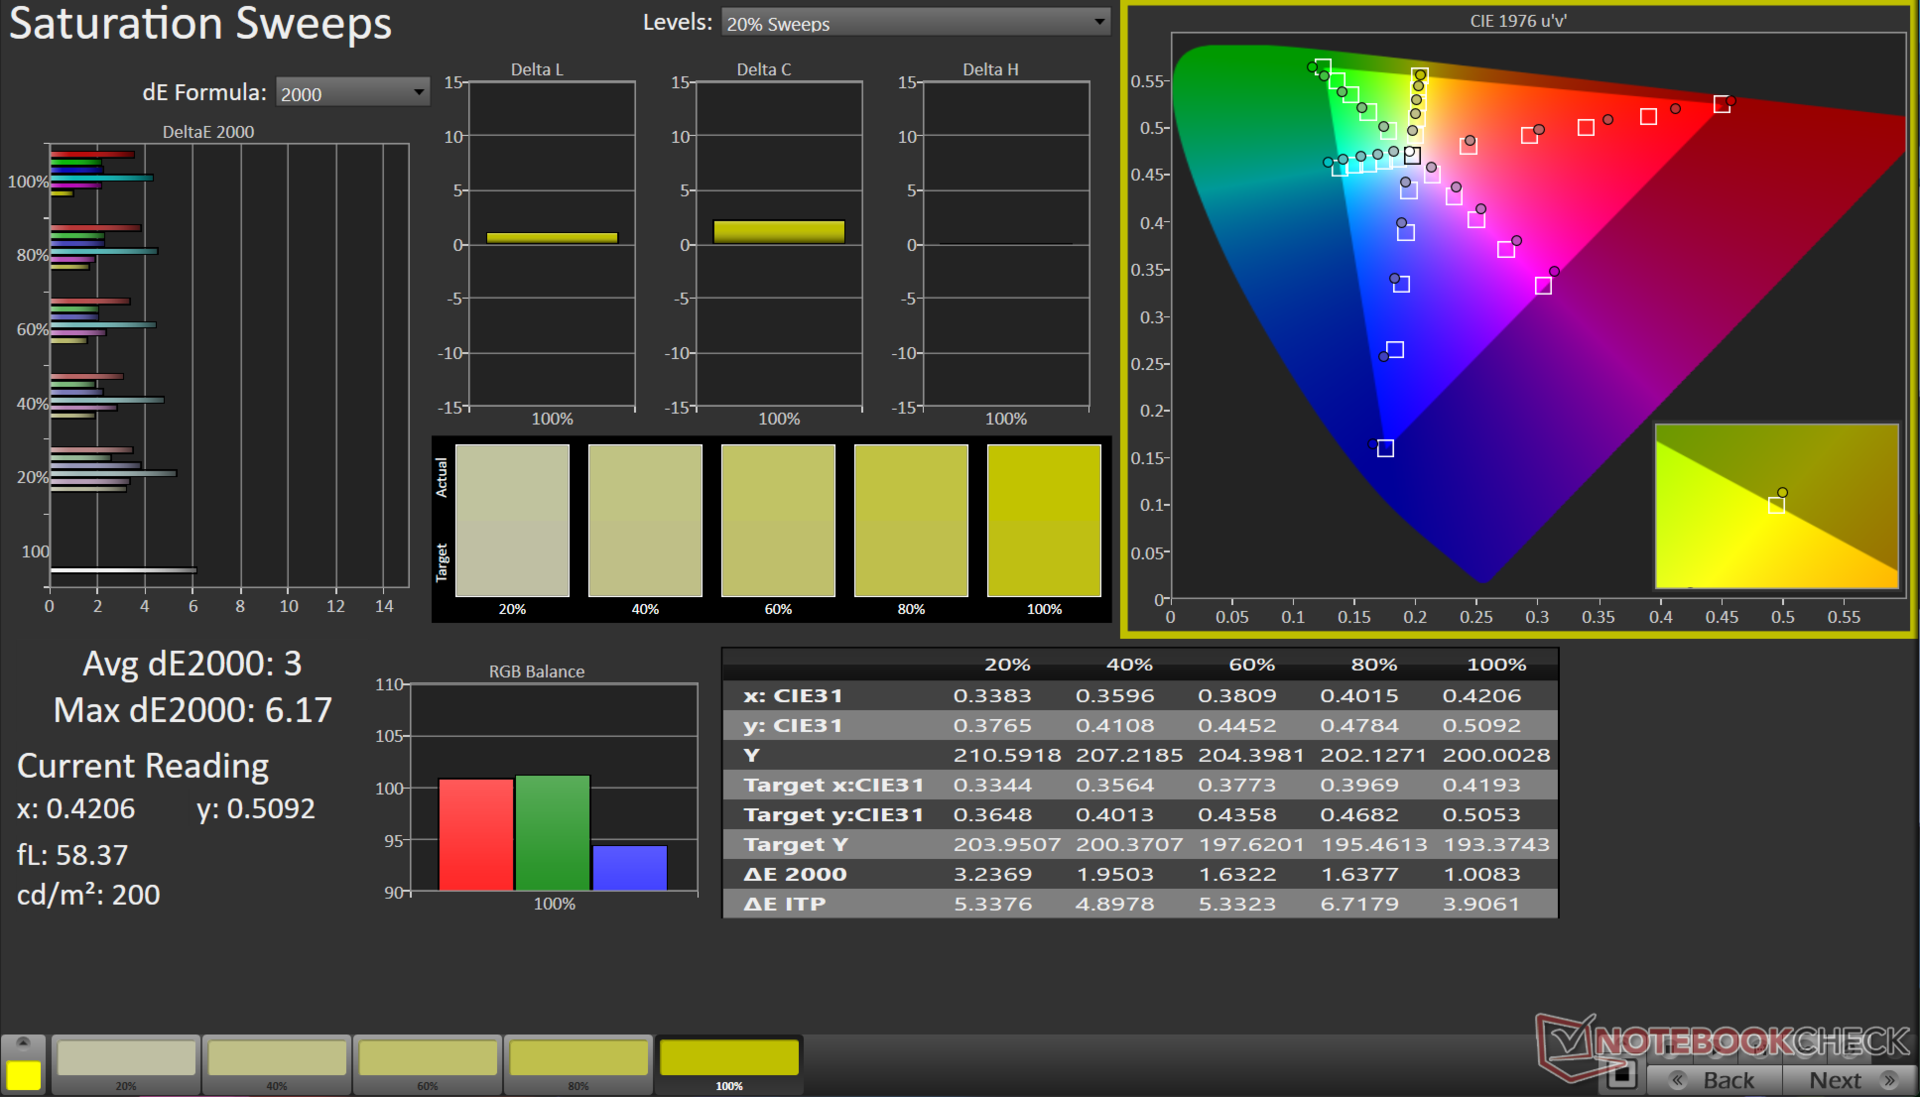
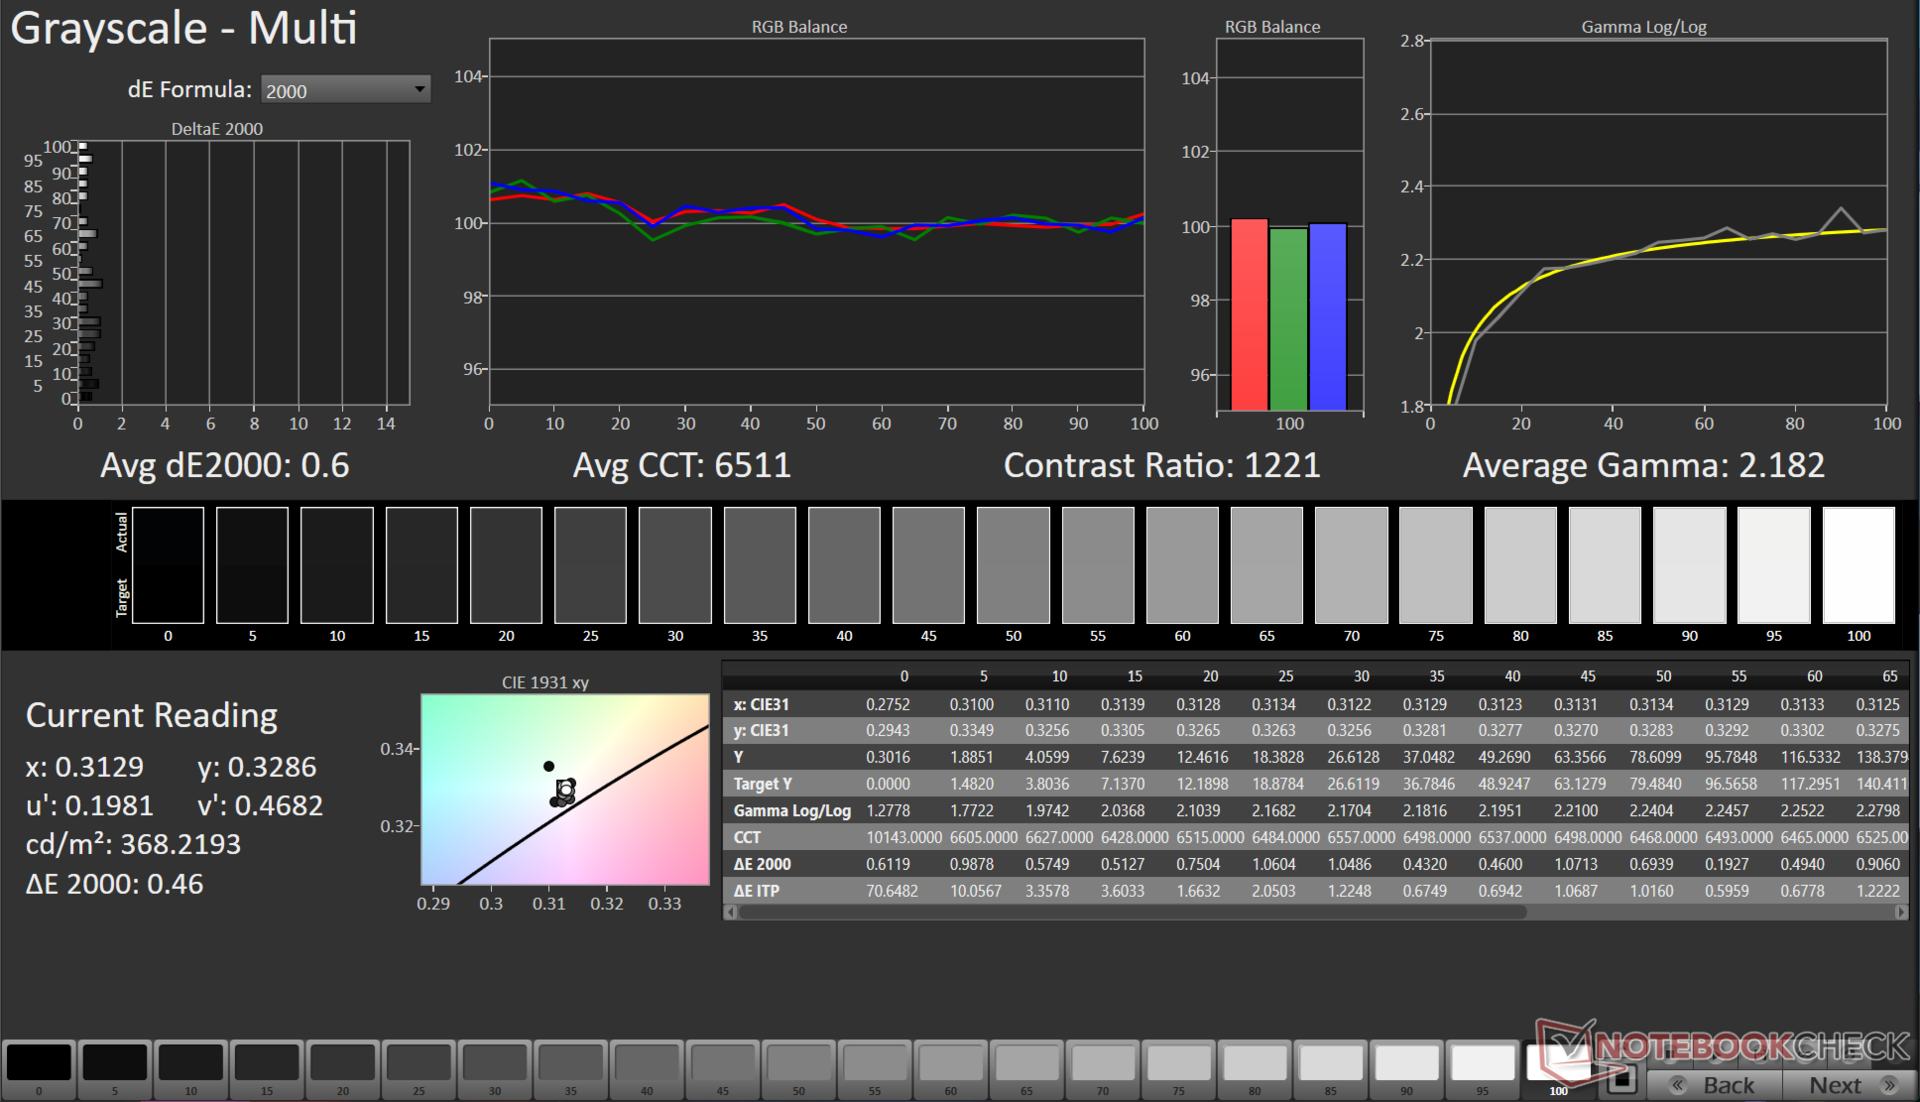
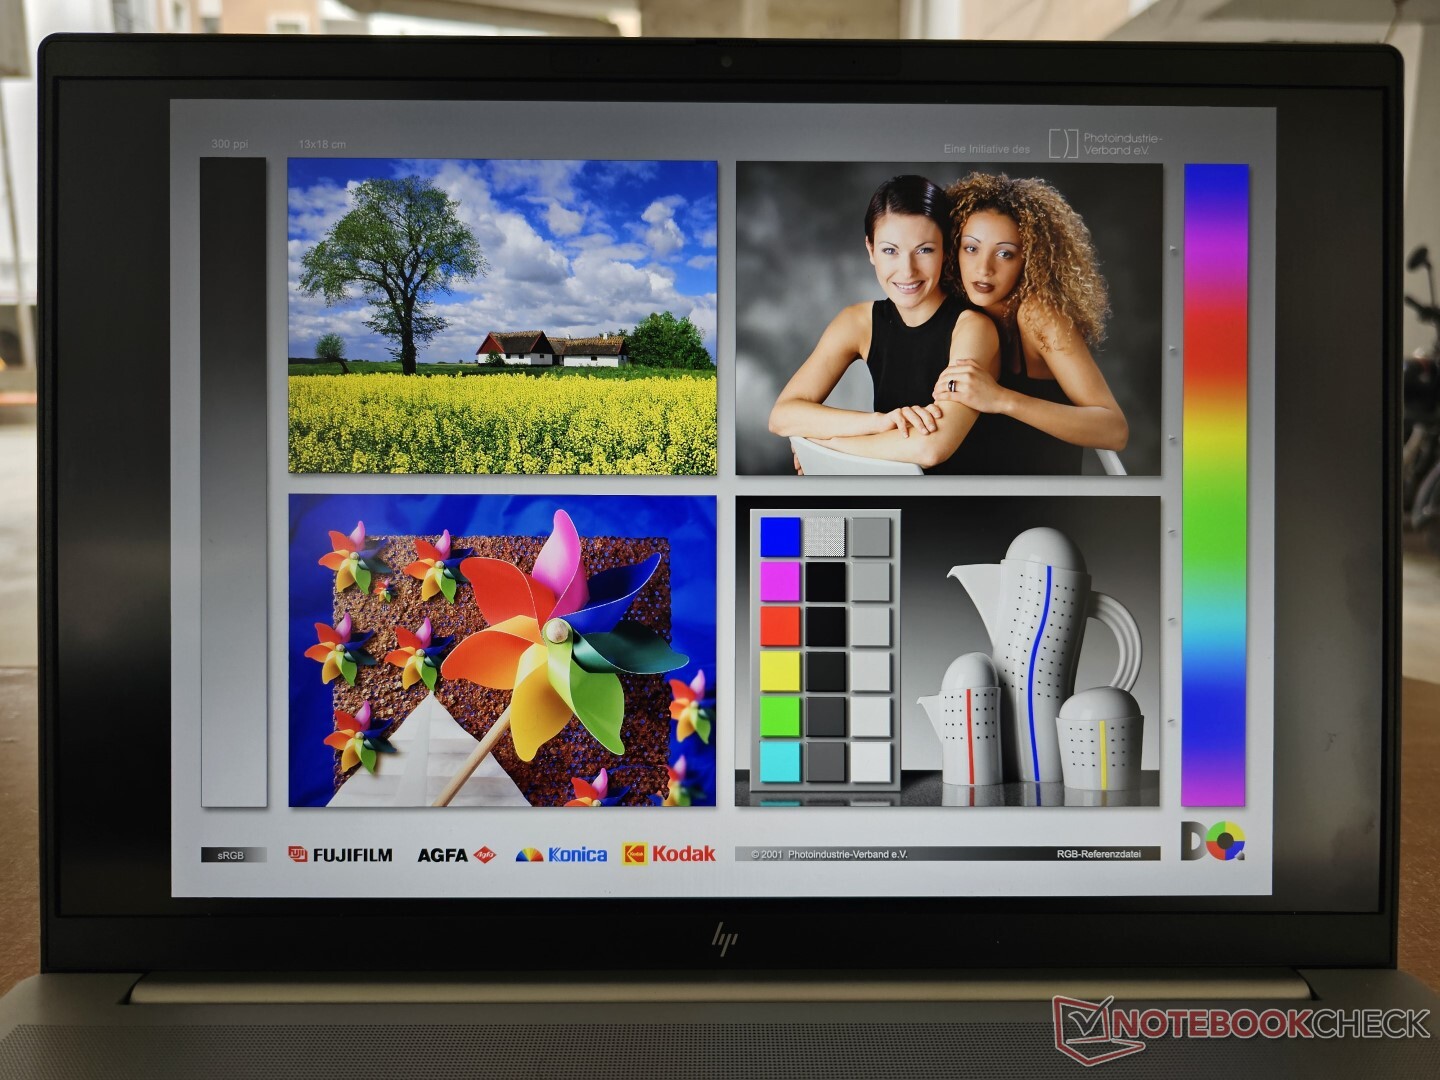
Wyświetlacz: panel WQXGA 120 Hz z przyzwoitym profilem kolorów i bez PWM
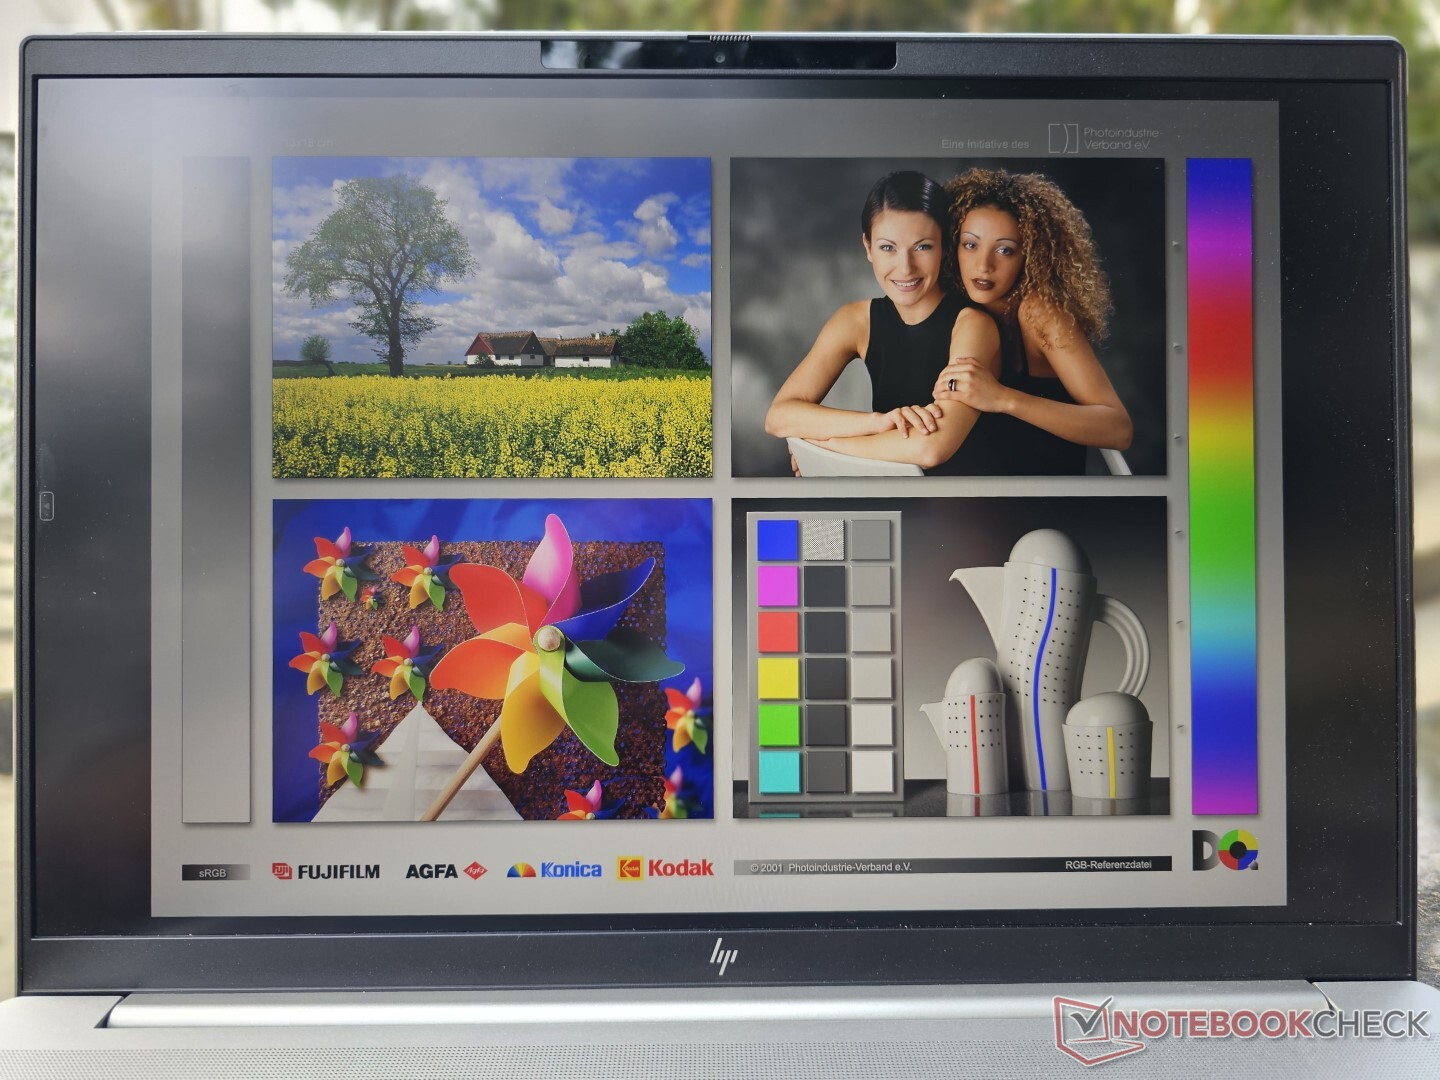
Pavilion Plus 16 jest wyposażony w 16-calowy panel IPS WQXGA o proporcjach 16:10 i rozdzielczości 2560 x 1600, z częstotliwością odświeżania 120 Hz i znamionową jasnością 400 nitów.
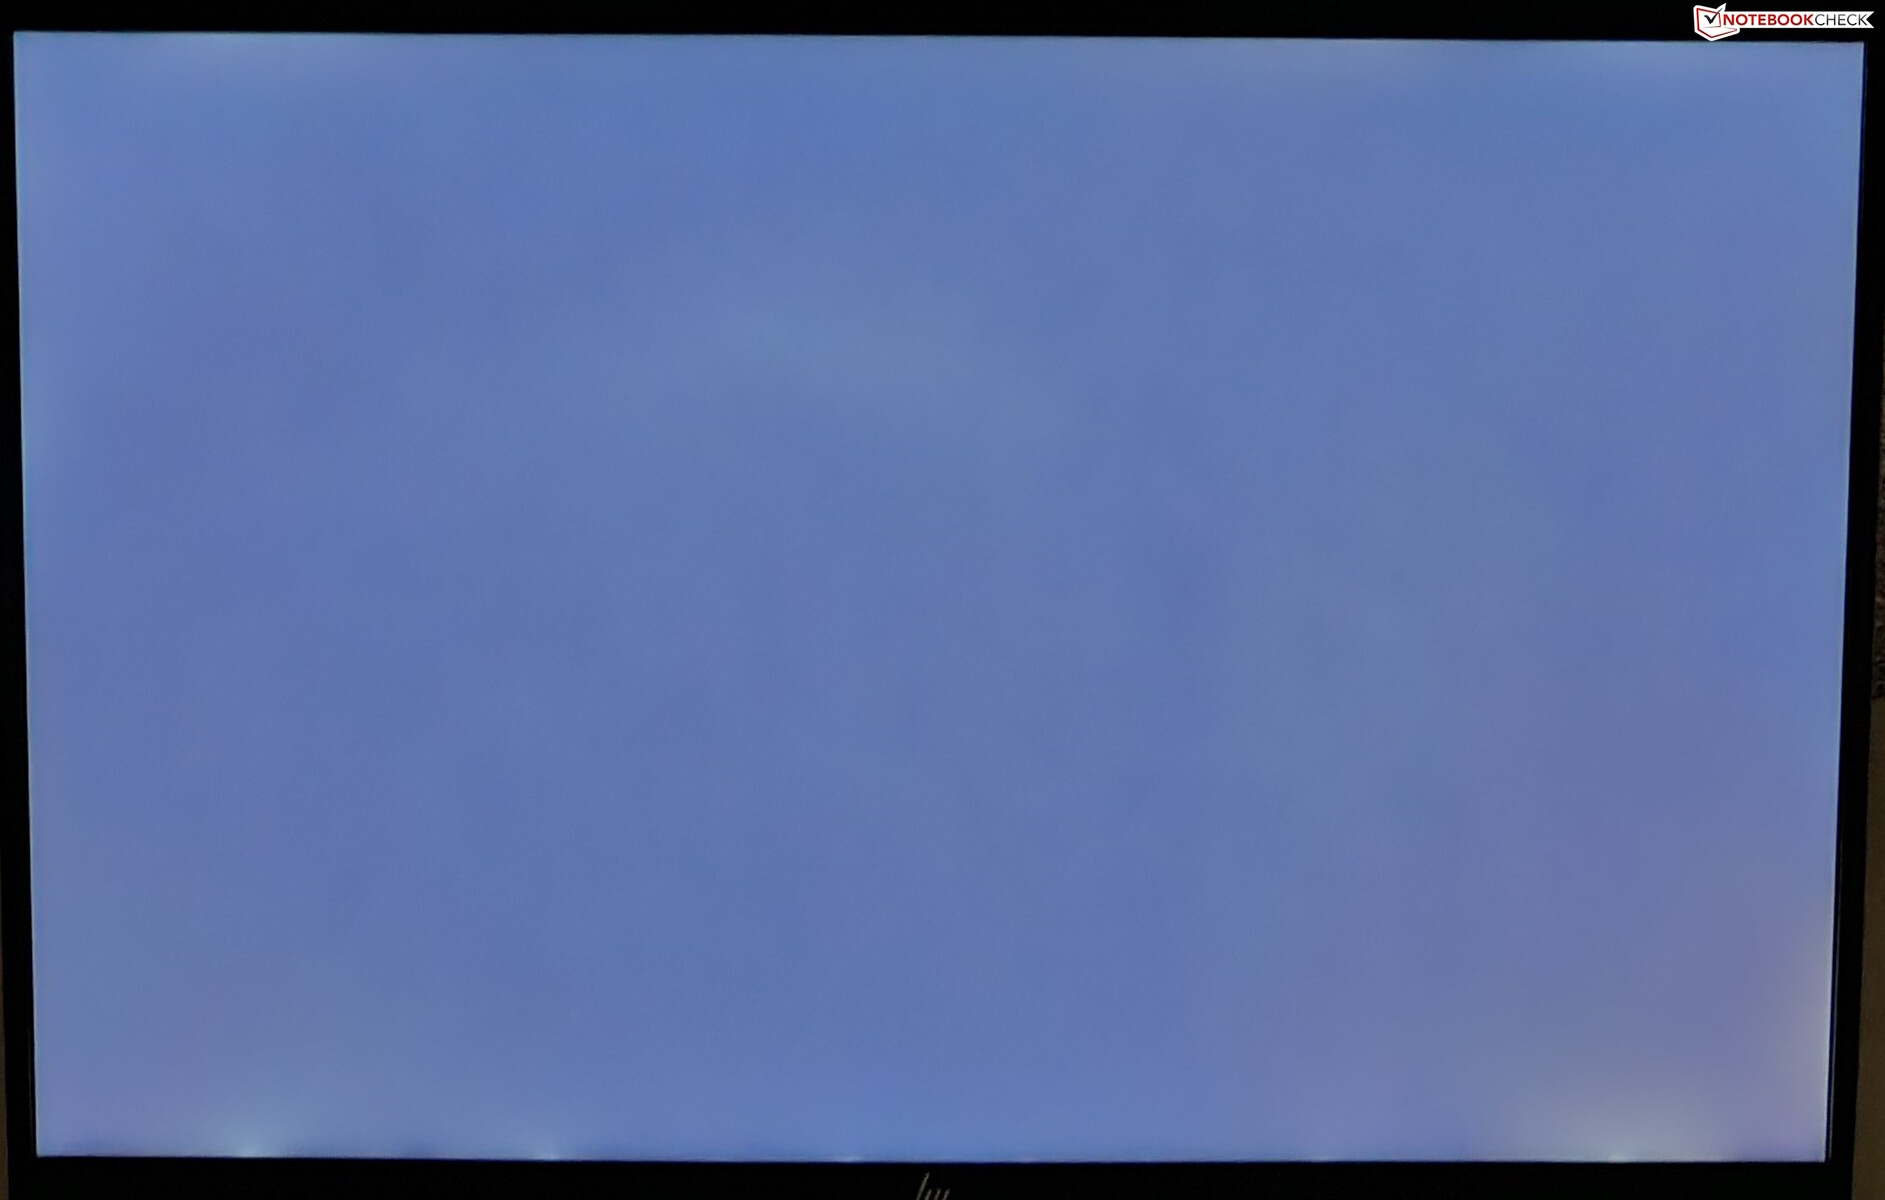
Zmierzyliśmy maksymalną jasność do 415 nitów przy średniej 394 nitów i dobrym rozkładzie 90%. Jako panel IPS, wyświetlacz nie jest odporny na podświetlenie - można to zauważyć w dolnych rogach przy długiej ekspozycji.
Subiektywnie, Pavilion Plus 16 oferuje dobre wrażenia wizualne, które powinny być odpowiednie zarówno do pracy, jak i rozrywki.

| |||||||||||||||||||||||||
rozświetlenie: 90 %
na akumulatorze: 401 cd/m²
kontrast: 1185:1 (czerń: 0.34 cd/m²)
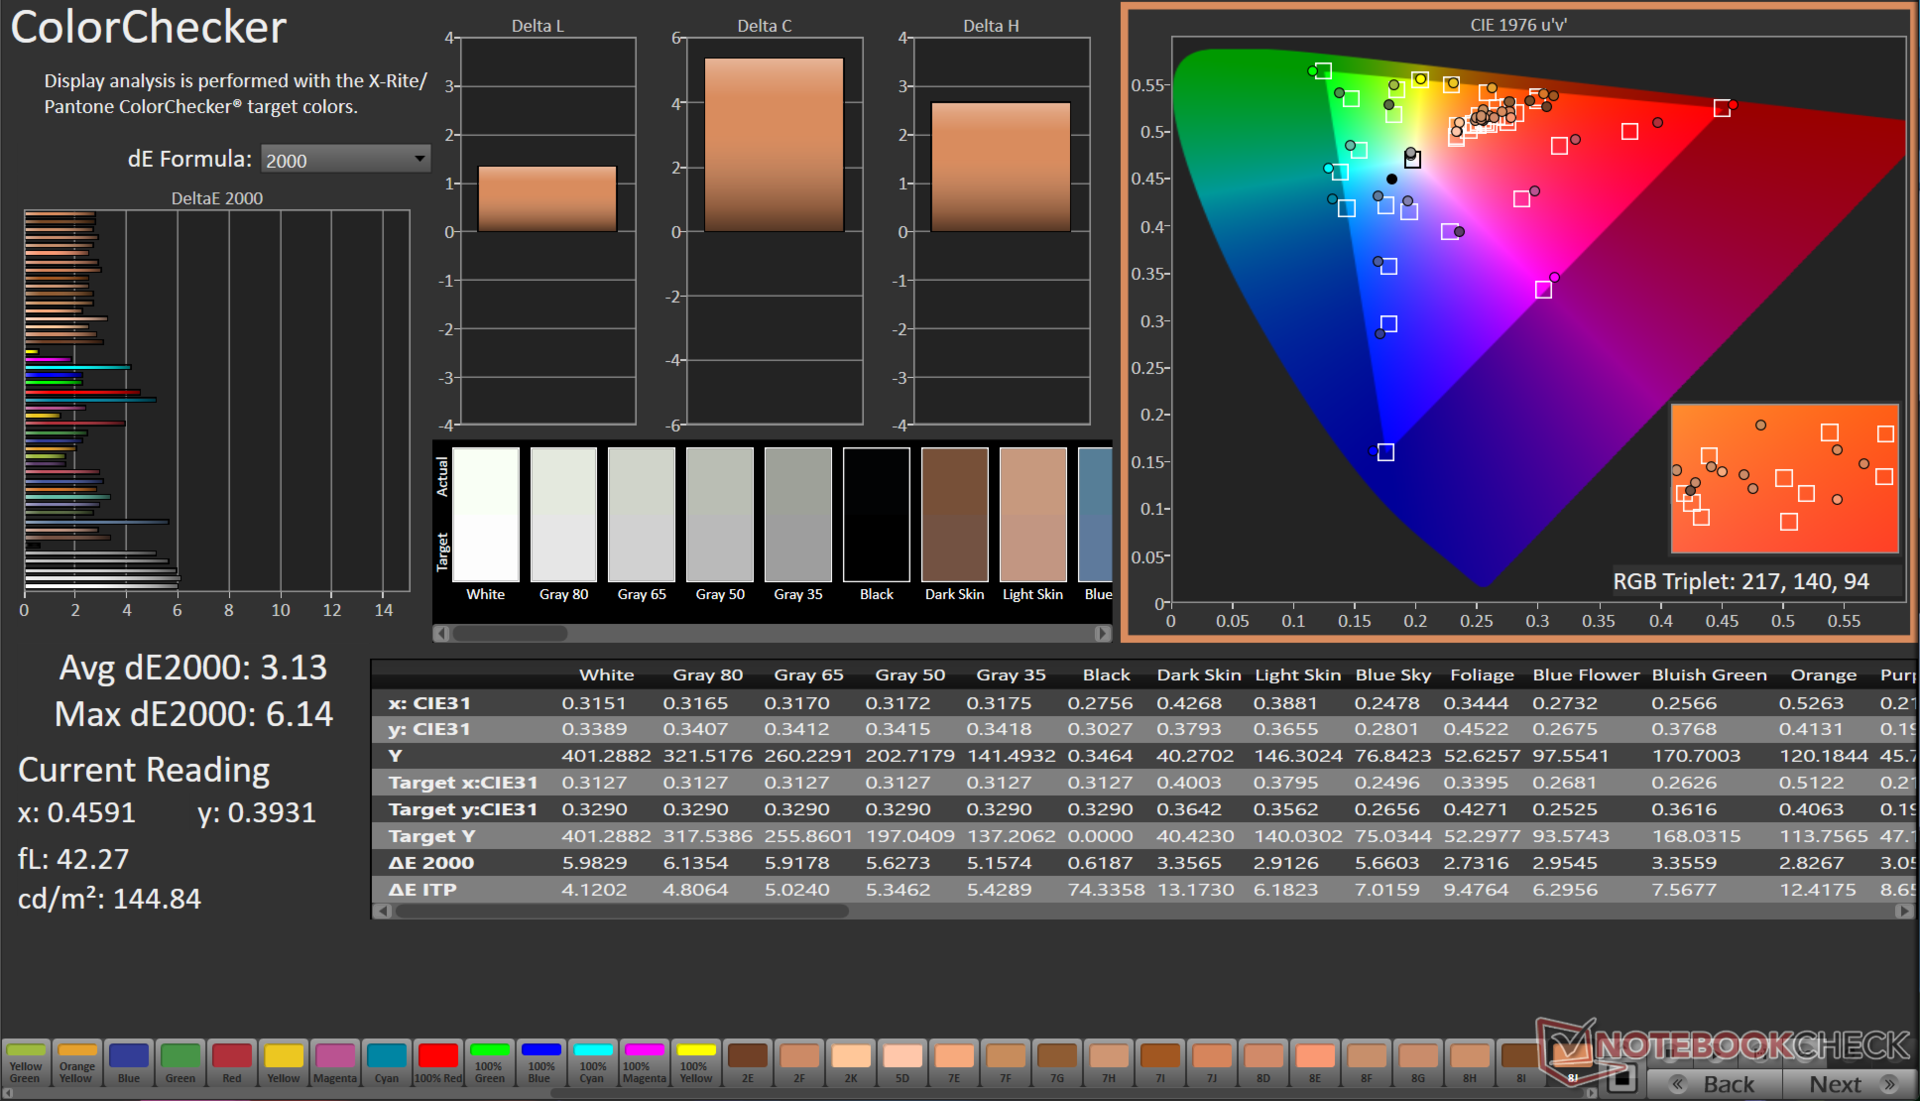
ΔE ColorChecker Calman: 3.13 | ∀{0.5-29.43 Ø4.71}
calibrated: 1.65
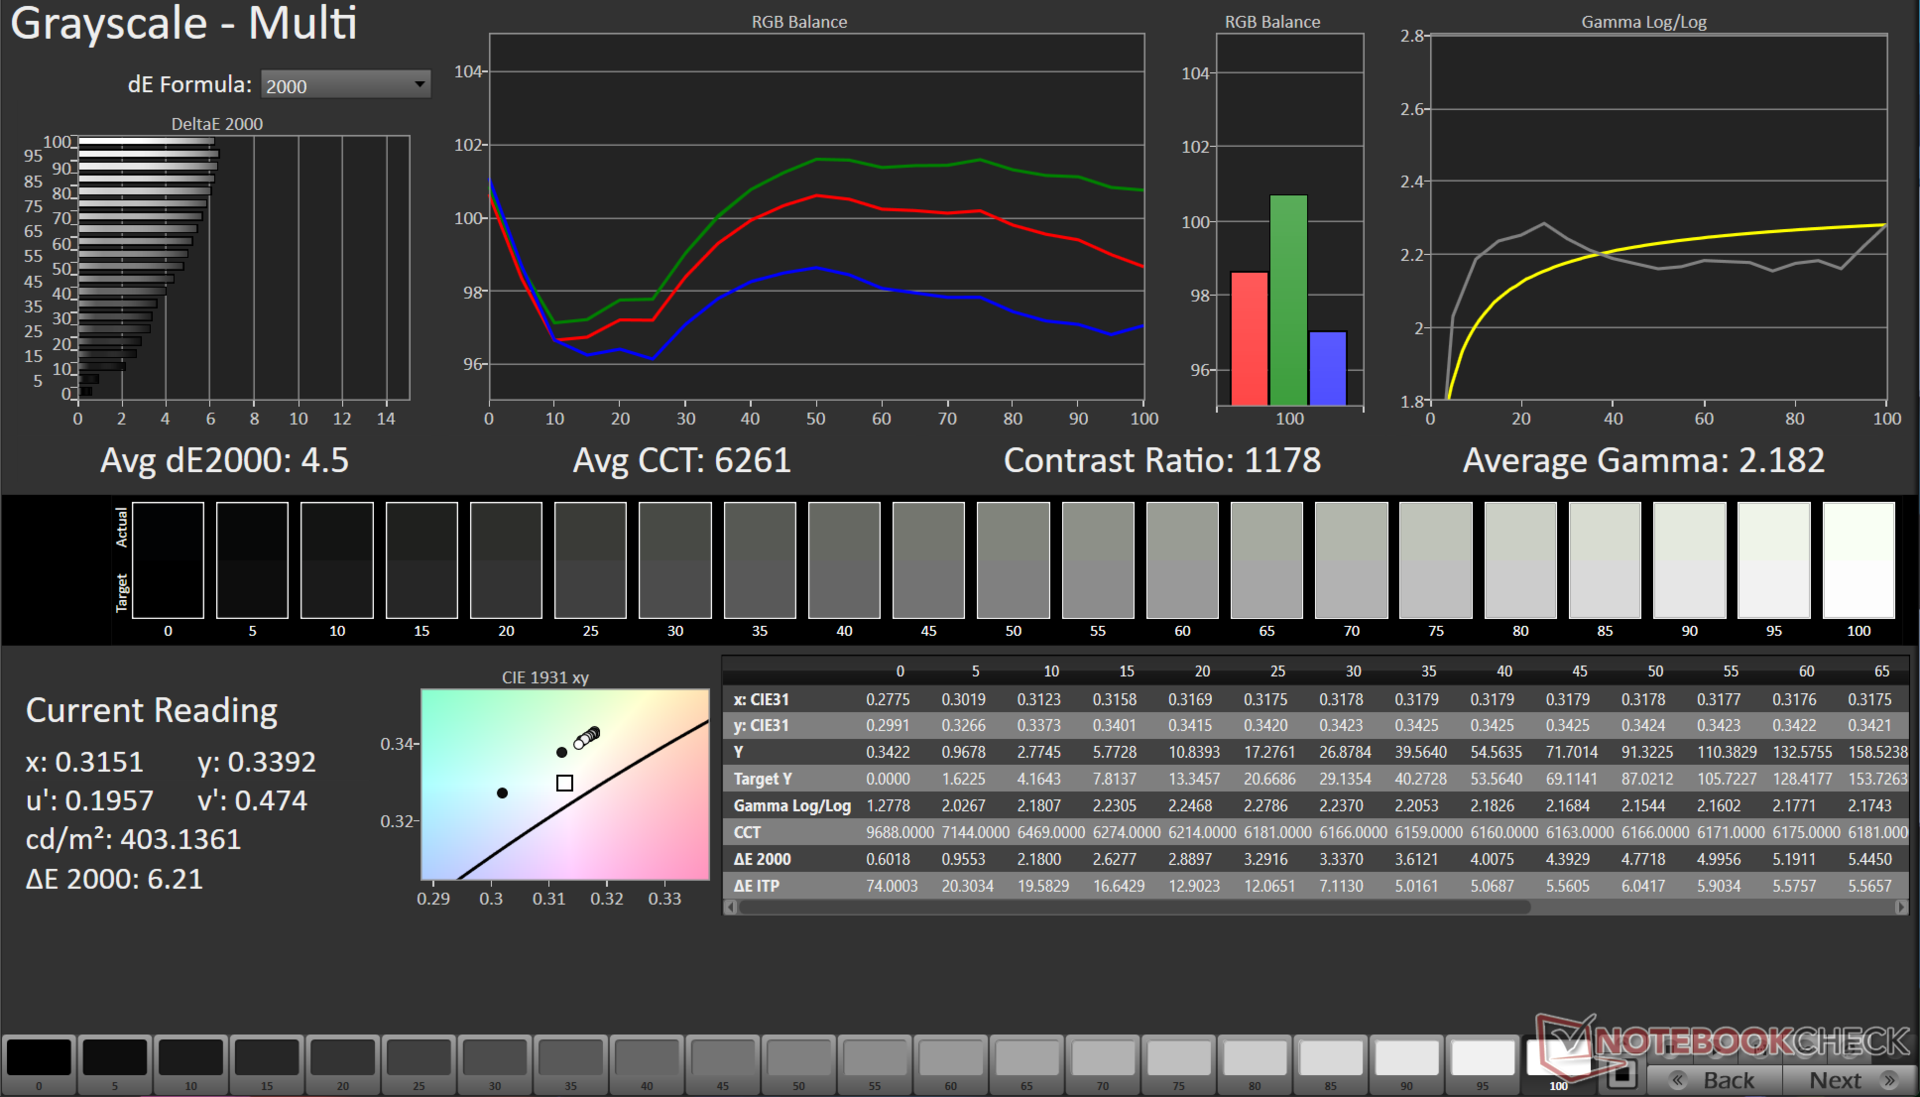
ΔE Greyscale Calman: 4.5 | ∀{0.09-98 Ø4.96}
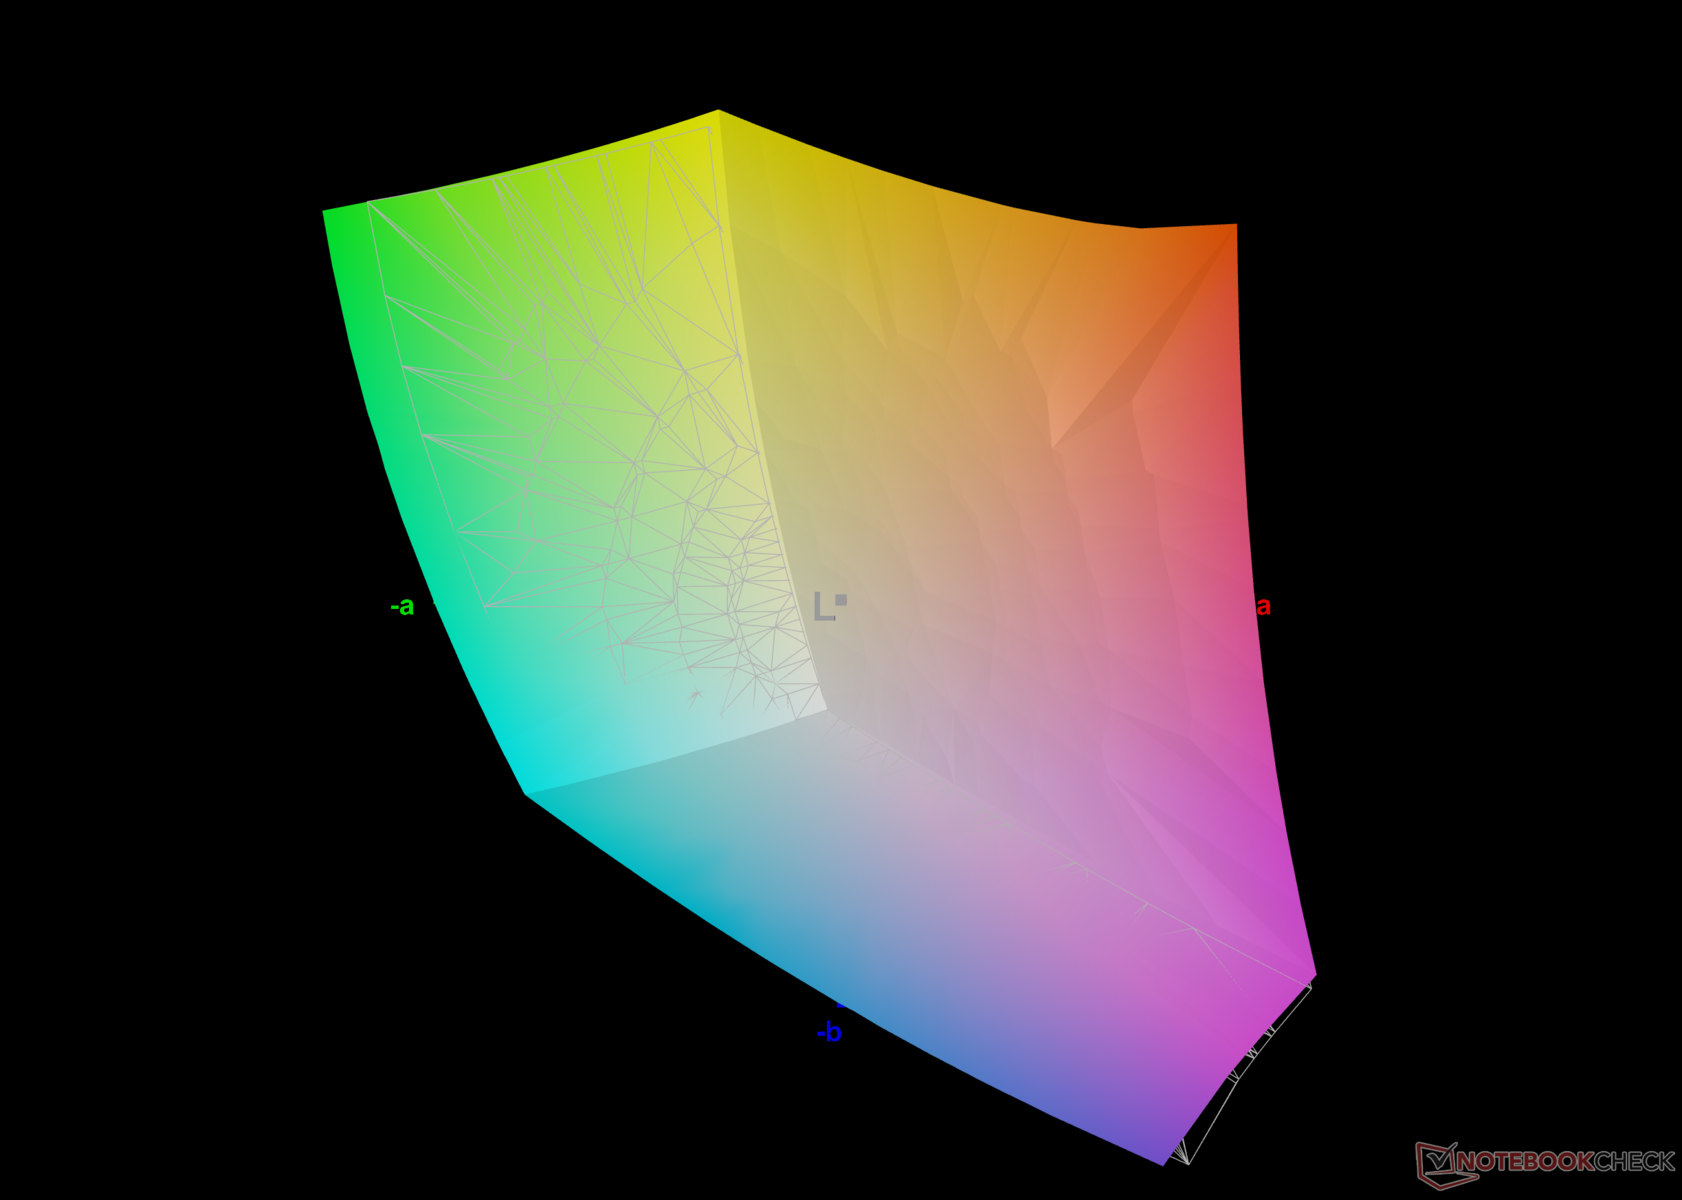
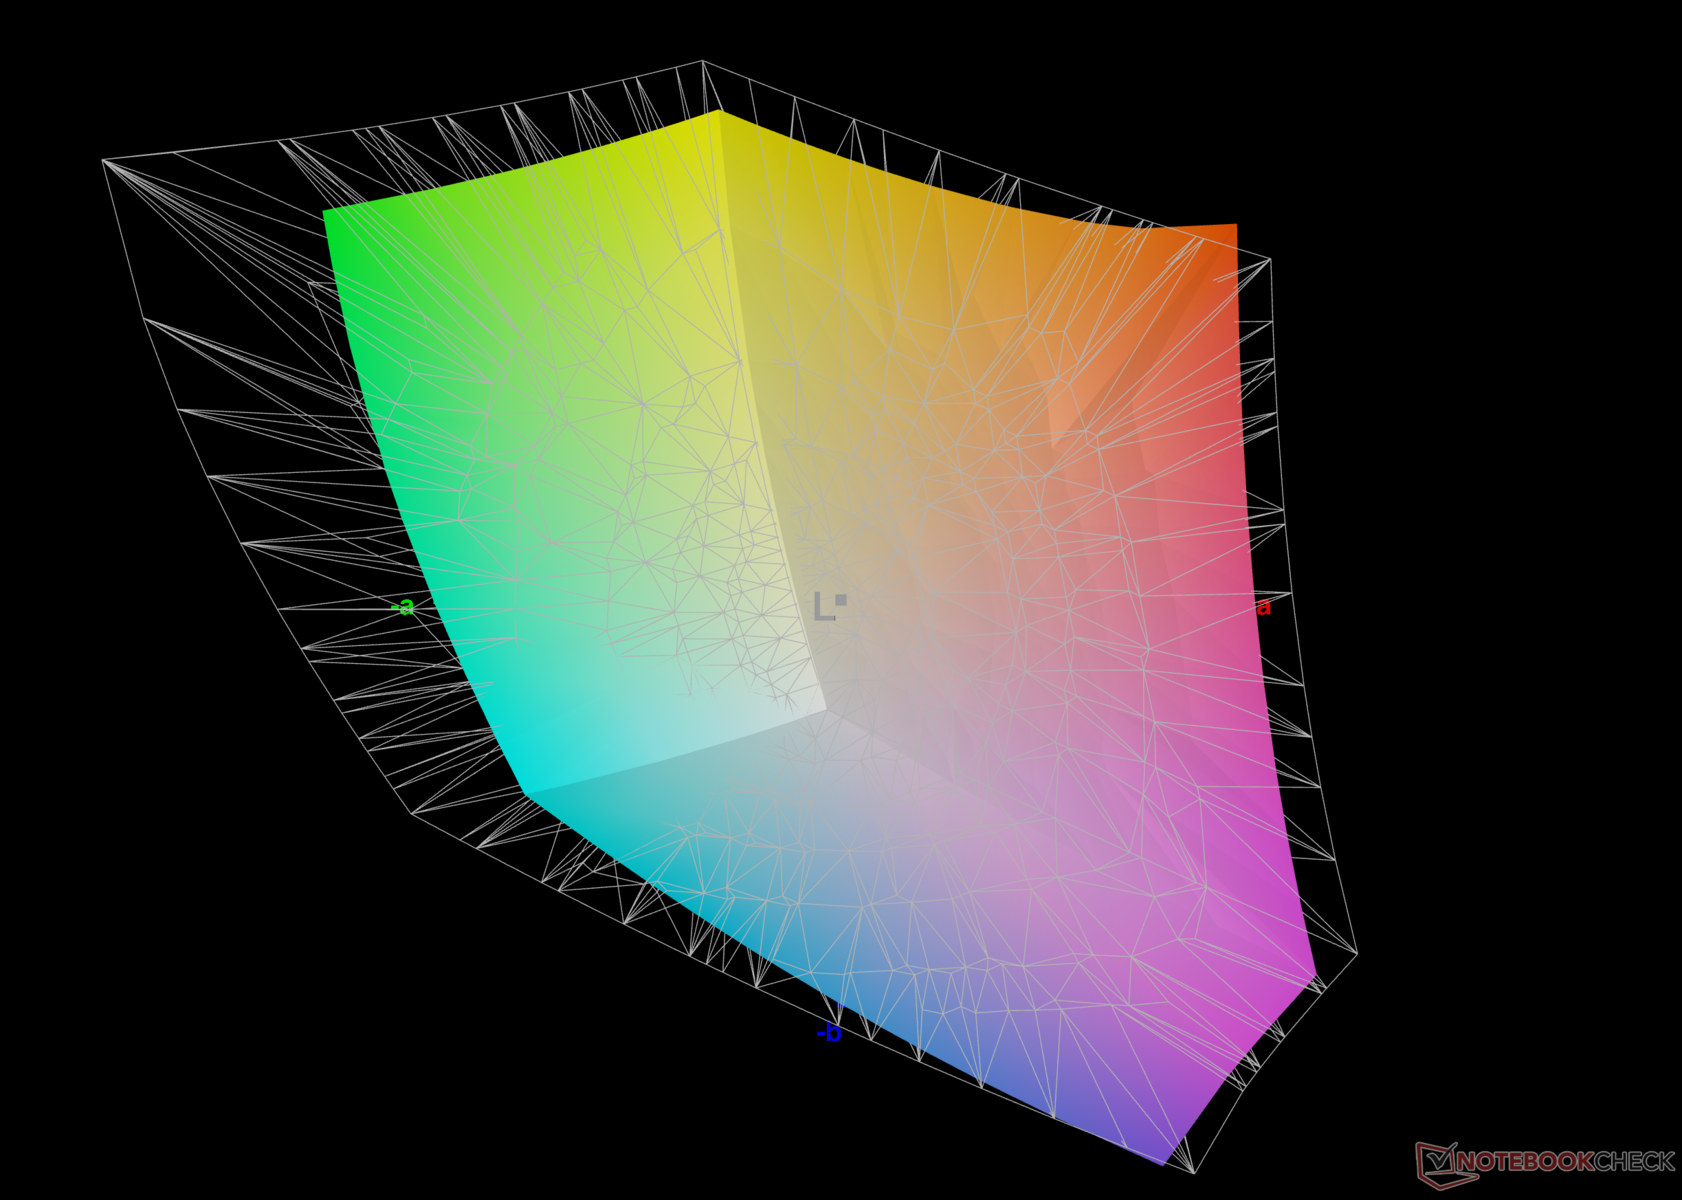
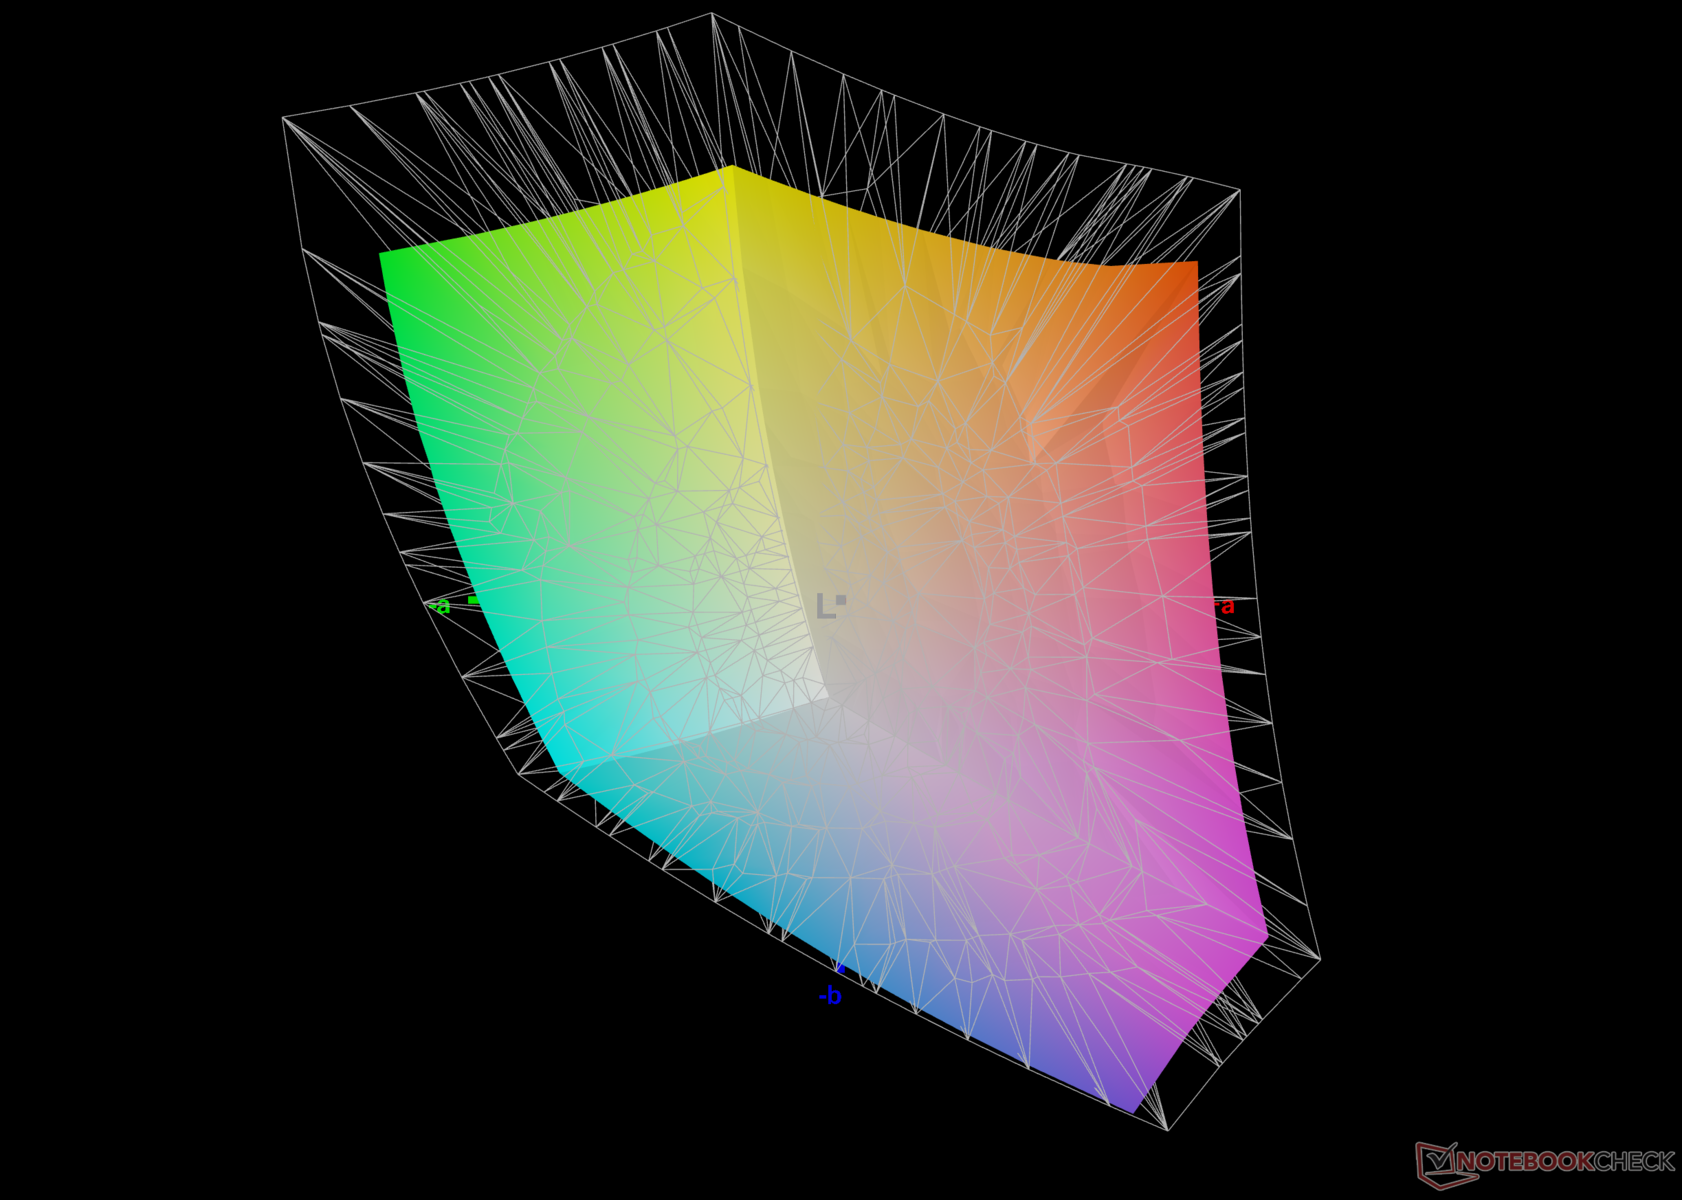
76.5% AdobeRGB 1998 (Argyll 3D)
99% sRGB (Argyll 3D)
74.6% Display P3 (Argyll 3D)
Gamma: 2.18
CCT: 6261 K
| HP Pavilion Plus 16-ab0456tx AU Optronics AUOFDA4, IPS, 2560x1600, 16" | Schenker Vision 14 2023 CSOT T3 MNE007ZA1-3, IPS, 2880x1800, 14" | Dell Inspiron 16 Plus 7630 LG Philips 160WQ2, IPS, 2560x1600, 16" | Asus VivoBook 14X K3405 Samsung ATNA40YK07-1, , 2880x1800, 14" | Lenovo Slim Pro 7 14ARP8 LEN89C1, IPS, 2560x1600, 14.5" | Asus VivoBook Pro 16 K6602VU Samsung ATNA60BX01-1, OLED, 3200x2000, 16" | Samsung Galaxy Book3 Ultra 16 Samsung ATNA60CL03-0, AMOLED, 2880x1800, 16" | |
|---|---|---|---|---|---|---|---|
| Display | 0% | -3% | 20% | -2% | 20% | 20% | |
| Display P3 Coverage (%) | 74.6 | 74.7 0% | 70.1 -6% | 99.9 34% | 72.9 -2% | 98.7 32% | 99.9 34% |
| sRGB Coverage (%) | 99 | 99.6 1% | 99.6 1% | 100 1% | 98.2 -1% | 99.7 1% | 100 1% |
| AdobeRGB 1998 Coverage (%) | 76.5 | 75.8 -1% | 72.3 -5% | 96.5 26% | 74.6 -2% | 96.5 26% | 96.3 26% |
| Response Times | -193% | -274% | -14% | -220% | -3% | 93% | |
| Response Time Grey 50% / Grey 80% * (ms) | 9.06 ? | 32.2 ? -255% | 35 ? -286% | 1.15 ? 87% | 31.8 ? -251% | 0.68 ? 92% | 0.49 ? 95% |
| Response Time Black / White * (ms) | 6.7 ? | 15.4 ? -130% | 24.2 ? -261% | 14.4 ? -115% | 19.3 ? -188% | 13.2 ? -97% | 0.65 ? 90% |
| PWM Frequency (Hz) | 90.02 ? | 240 ? | 240 ? | ||||
| Screen | 21% | 1% | 5% | 3% | -10% | 135% | |
| Brightness middle (cd/m²) | 403 | 402 0% | 299.4 -26% | 369 -8% | 344.7 -14% | 353 -12% | 400 -1% |
| Brightness (cd/m²) | 394 | 371 -6% | 290 -26% | 364 -8% | 334 -15% | 354 -10% | 399 1% |
| Brightness Distribution (%) | 90 | 86 -4% | 92 2% | 85 -6% | 92 2% | 98 9% | 93 3% |
| Black Level * (cd/m²) | 0.34 | 0.27 21% | 0.21 38% | 0.31 9% | 0.03 91% | ||
| Contrast (:1) | 1185 | 1489 26% | 1426 20% | 1112 -6% | 13333 1025% | ||
| Colorchecker dE 2000 * | 3.13 | 1.8 42% | 4.25 -36% | 2.85 9% | 3.01 4% | 4.23 -35% | 2.3 27% |
| Colorchecker dE 2000 max. * | 6.14 | 3.6 41% | 6.71 -9% | 4.22 31% | 6.3 -3% | 7.13 -16% | 4.15 32% |
| Colorchecker dE 2000 calibrated * | 1.65 | 1.5 9% | 0.52 68% | 2.18 -32% | 0.83 50% | 2.42 -47% | 1.66 -1% |
| Greyscale dE 2000 * | 4.5 | 1.8 60% | 5.5 -22% | 2.2 51% | 4.6 -2% | 2.5 44% | 2.7 40% |
| Gamma | 2.18 101% | 2.27 97% | 2.35 94% | 2.15 102% | 2.28 96% | 2.4 92% | 2.266 97% |
| CCT | 6261 104% | 6695 97% | 6368 102% | 6518 100% | 6420 101% | 6642 98% | 7047 92% |
| Całkowita średnia (program / ustawienia) | -57% /
-14% | -92% /
-39% | 4% /
6% | -73% /
-30% | 2% /
-1% | 83% /
105% |
* ... im mniej tym lepiej
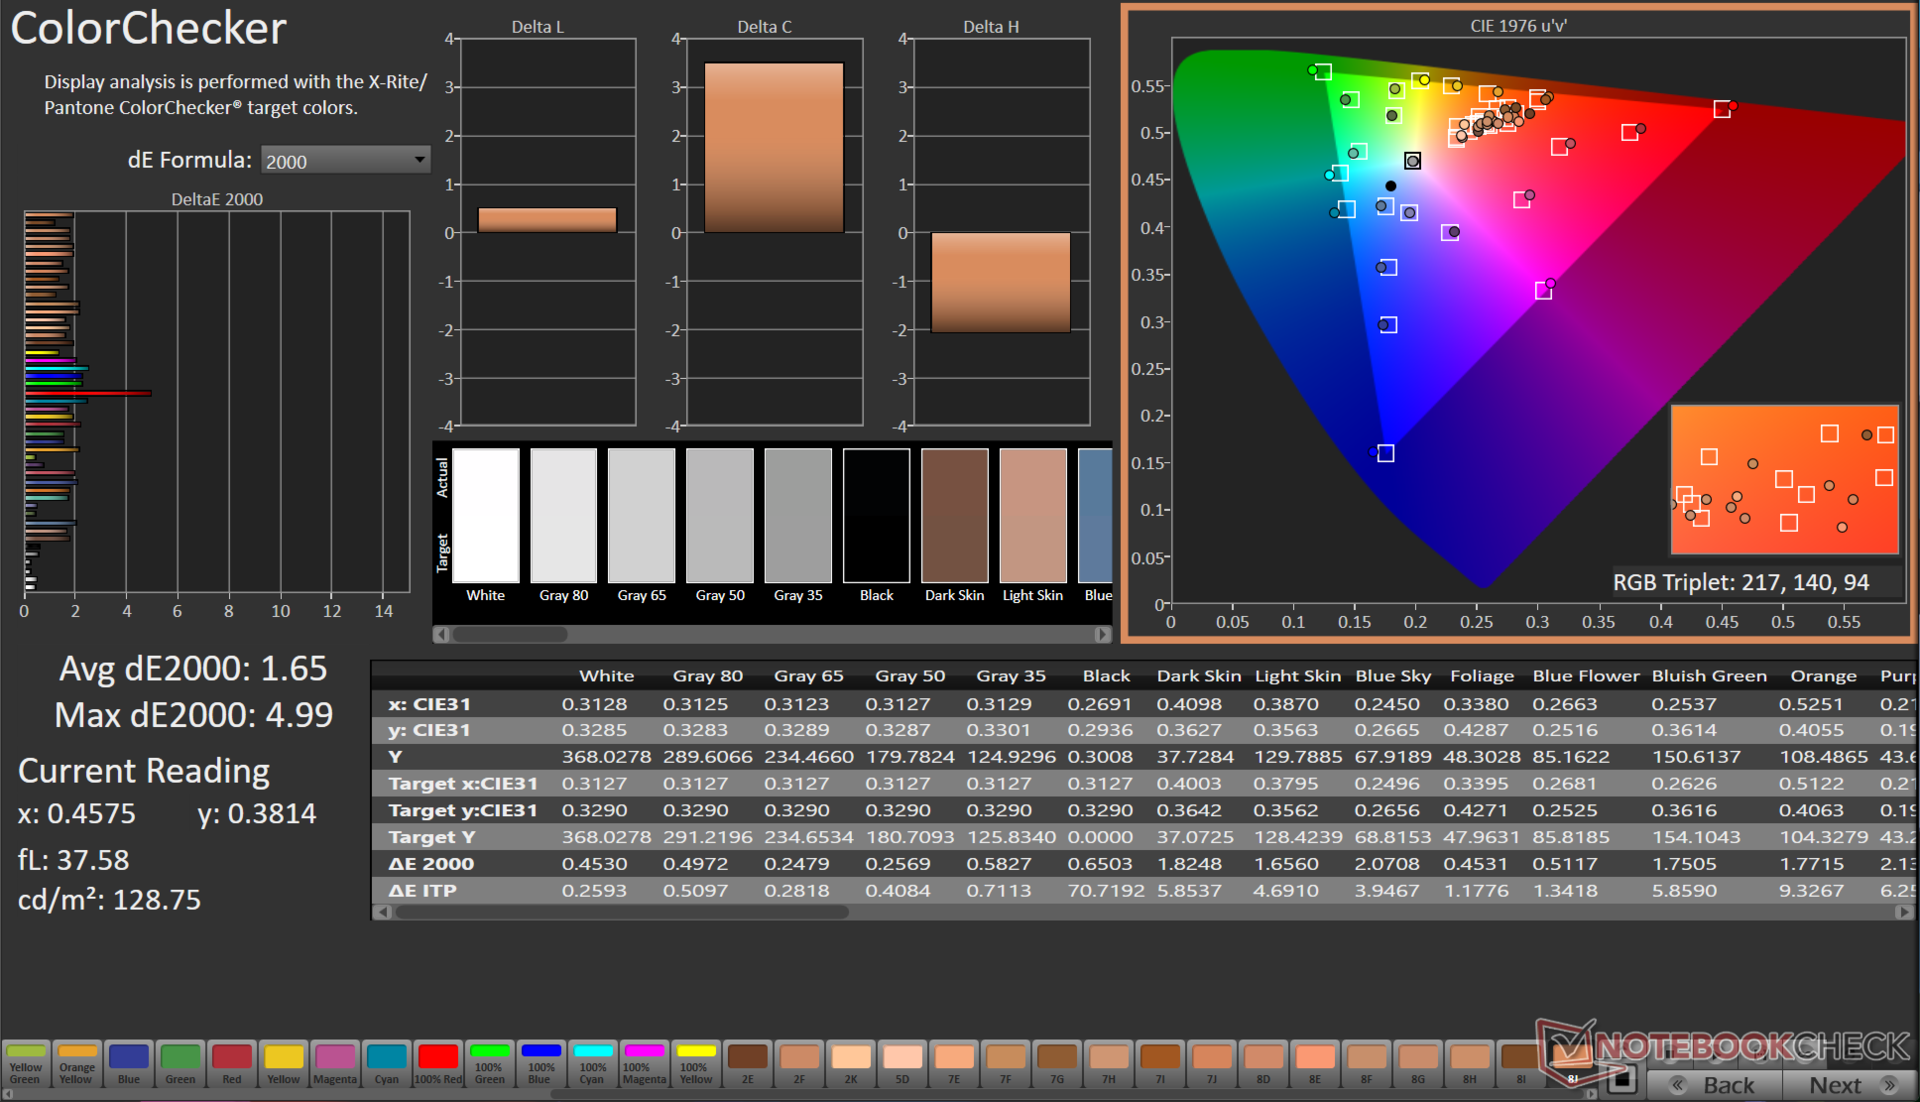
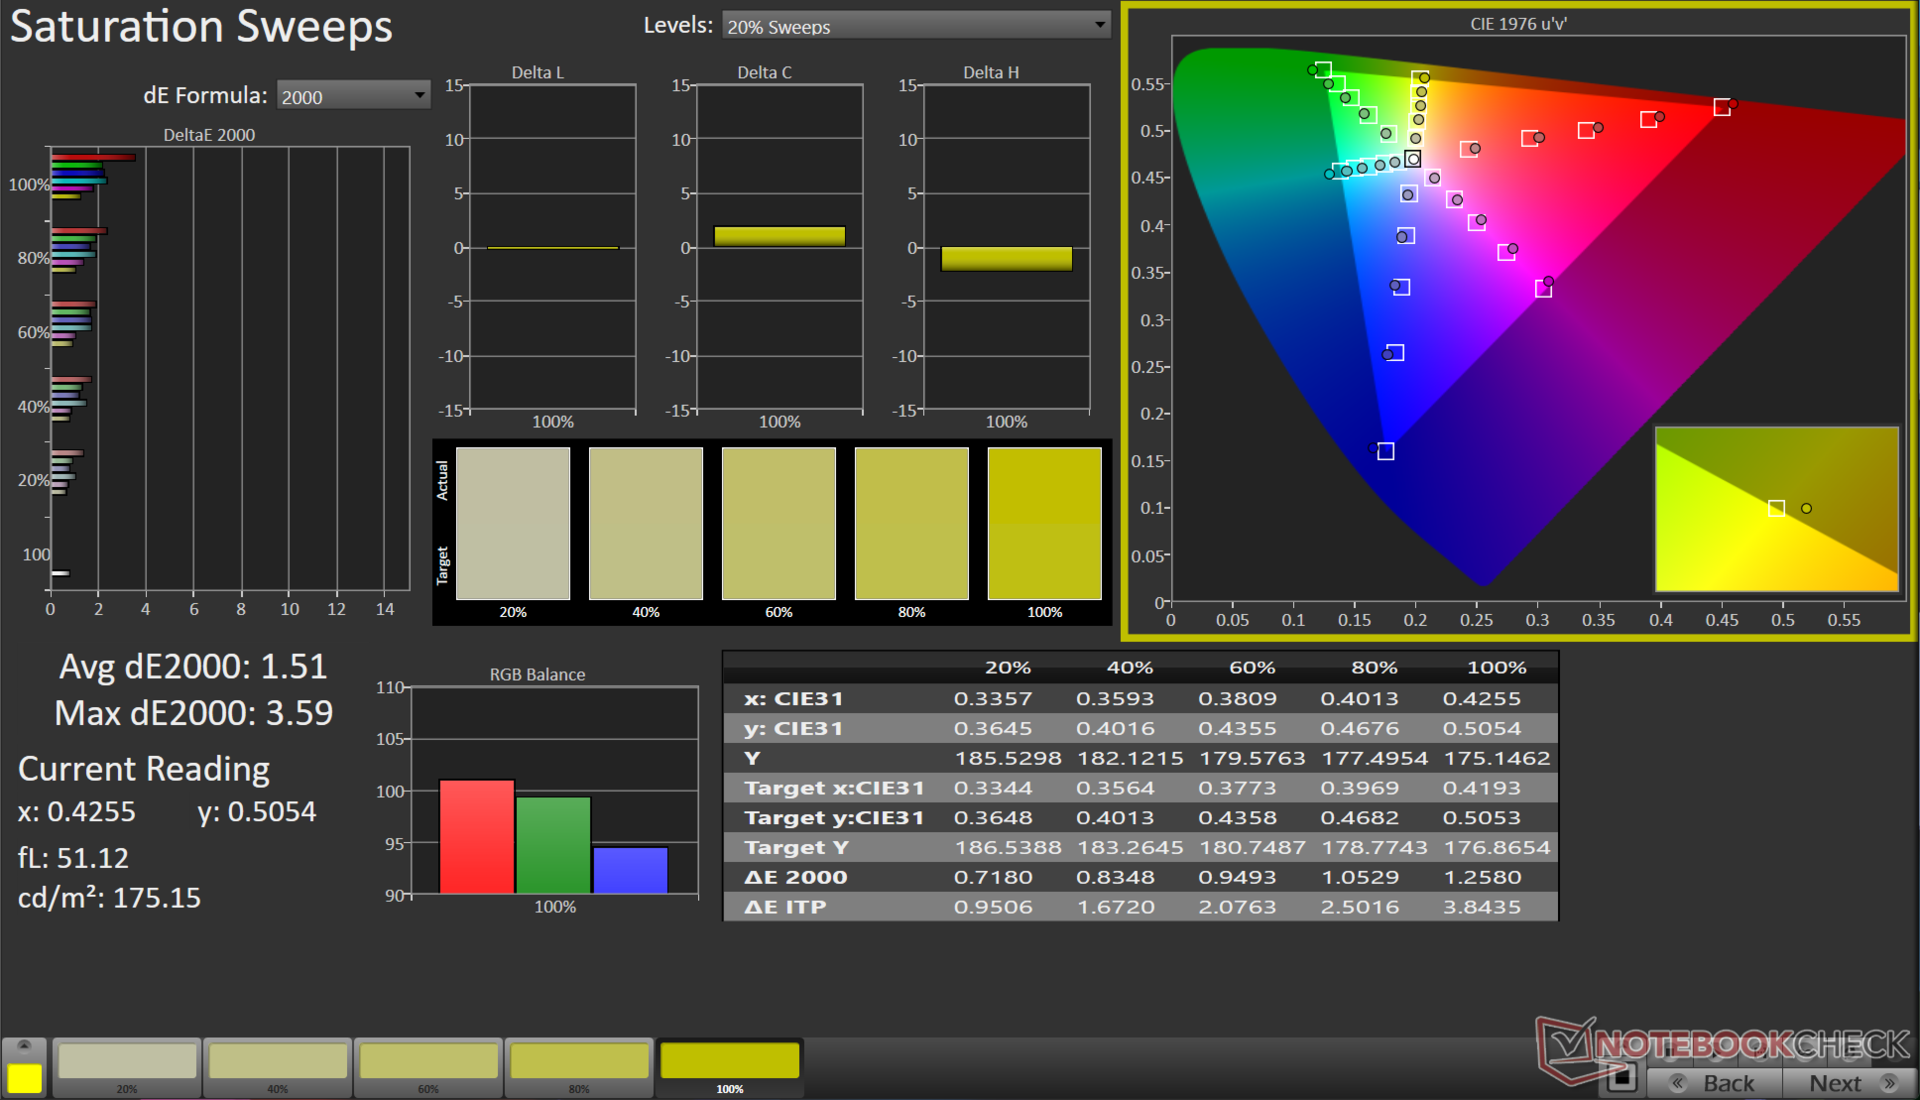
Panel pokrywa 99% przestrzeni barw sRGB, oferując jednocześnie przyzwoitą reprodukcję Adobe RGB i Display P3. Sprawia to, że Pavilion Plus 16 nadaje się do ogólnej konsumpcji multimediów, a także do podstawowych procesów edycji, zwłaszcza treści internetowych.
Korzystając ze spektrofotometru X-Rite i1Basic Pro 3 i oprogramowania Calman Ultimate od Portrait Displays, byliśmy w stanie poprawić średnie wartości skali szarości i ColorChecker Delta E 2000 odpowiednio z 4,5 do 0,6 i 3,13 do 1,65.
Nasz skalibrowany plik można pobrać z linku powyżej.
Wyświetl czasy reakcji
| ↔ Czas reakcji od czerni do bieli | ||
|---|---|---|
| 6.7 ms ... wzrost ↗ i spadek ↘ łącznie | ↗ 3.6 ms wzrost | 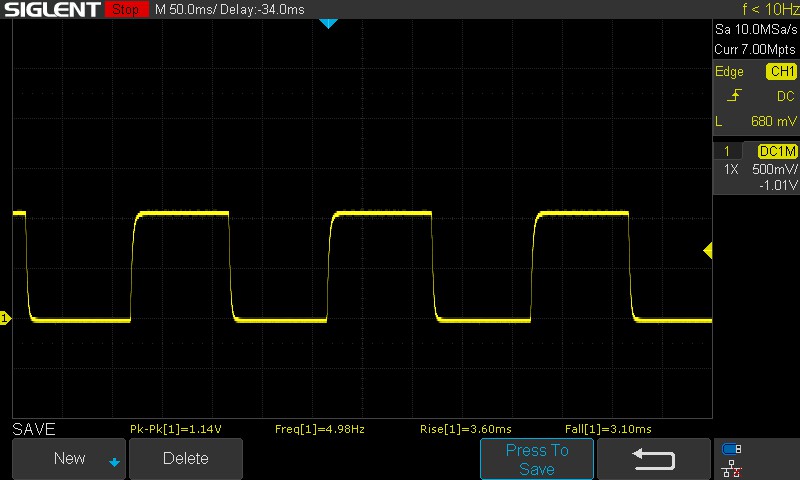 |
| ↘ 3.1 ms upadek | ||
| W naszych testach ekran wykazuje bardzo szybką reakcję i powinien bardzo dobrze nadawać się do szybkich gier. Dla porównania, wszystkie testowane urządzenia wahają się od 0.1 (minimum) do 240 (maksimum) ms. » 21 % wszystkich urządzeń jest lepszych. Oznacza to, że zmierzony czas reakcji jest lepszy od średniej wszystkich testowanych urządzeń (19.8 ms). | ||
| ↔ Czas reakcji 50% szarości do 80% szarości | ||
| 9.06 ms ... wzrost ↗ i spadek ↘ łącznie | ↗ 4.27 ms wzrost | 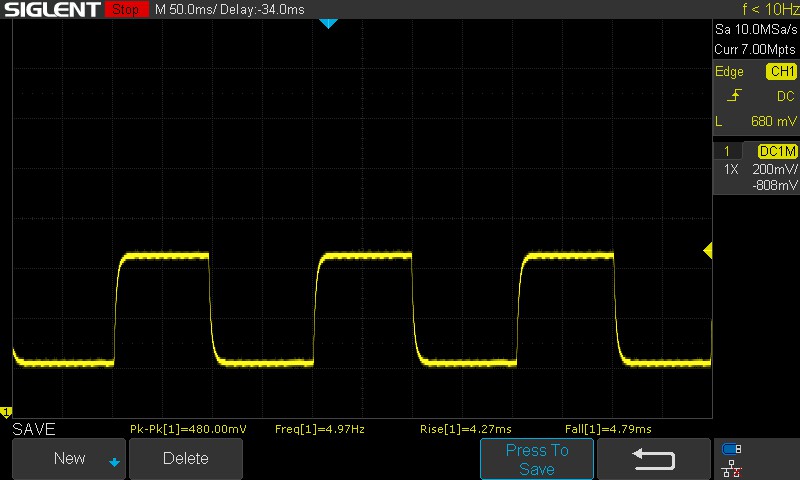 |
| ↘ 4.79 ms upadek | ||
| W naszych testach ekran wykazuje szybki czas reakcji i powinien nadawać się do gier. Dla porównania, wszystkie testowane urządzenia wahają się od 0.165 (minimum) do 636 (maksimum) ms. » 23 % wszystkich urządzeń jest lepszych. Oznacza to, że zmierzony czas reakcji jest lepszy od średniej wszystkich testowanych urządzeń (31 ms). | ||
Migotanie ekranu / PWM (modulacja szerokości impulsu)
| Migotanie ekranu/nie wykryto PWM | ≤ 100 % ustawienia jasności | 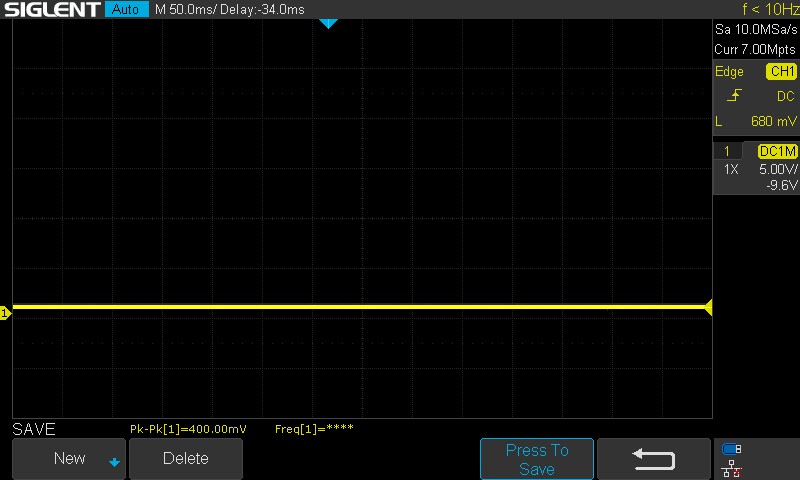 | |
Dla porównania: 52 % wszystkich testowanych urządzeń nie używa PWM do przyciemniania wyświetlacza. Jeśli wykryto PWM, zmierzono średnio 7757 (minimum: 5 - maksimum: 343500) Hz. | |||
Czasy reakcji są przyzwoite, biorąc pod uwagę, że Pavilion Plus 16 nie jest przeznaczony dla graczy. Zaobserwowaliśmy brak PWM na wszystkich testowanych poziomach jasności, co jest dobrą rzeczą.
Aby uzyskać więcej informacji, proszę zapoznać się z naszym artykułem "Dlaczego PWM jest takim bólem głowy". Nasza tabela rankingowa PWM zawiera przegląd zmierzonych PWM w recenzowanych urządzeniach.
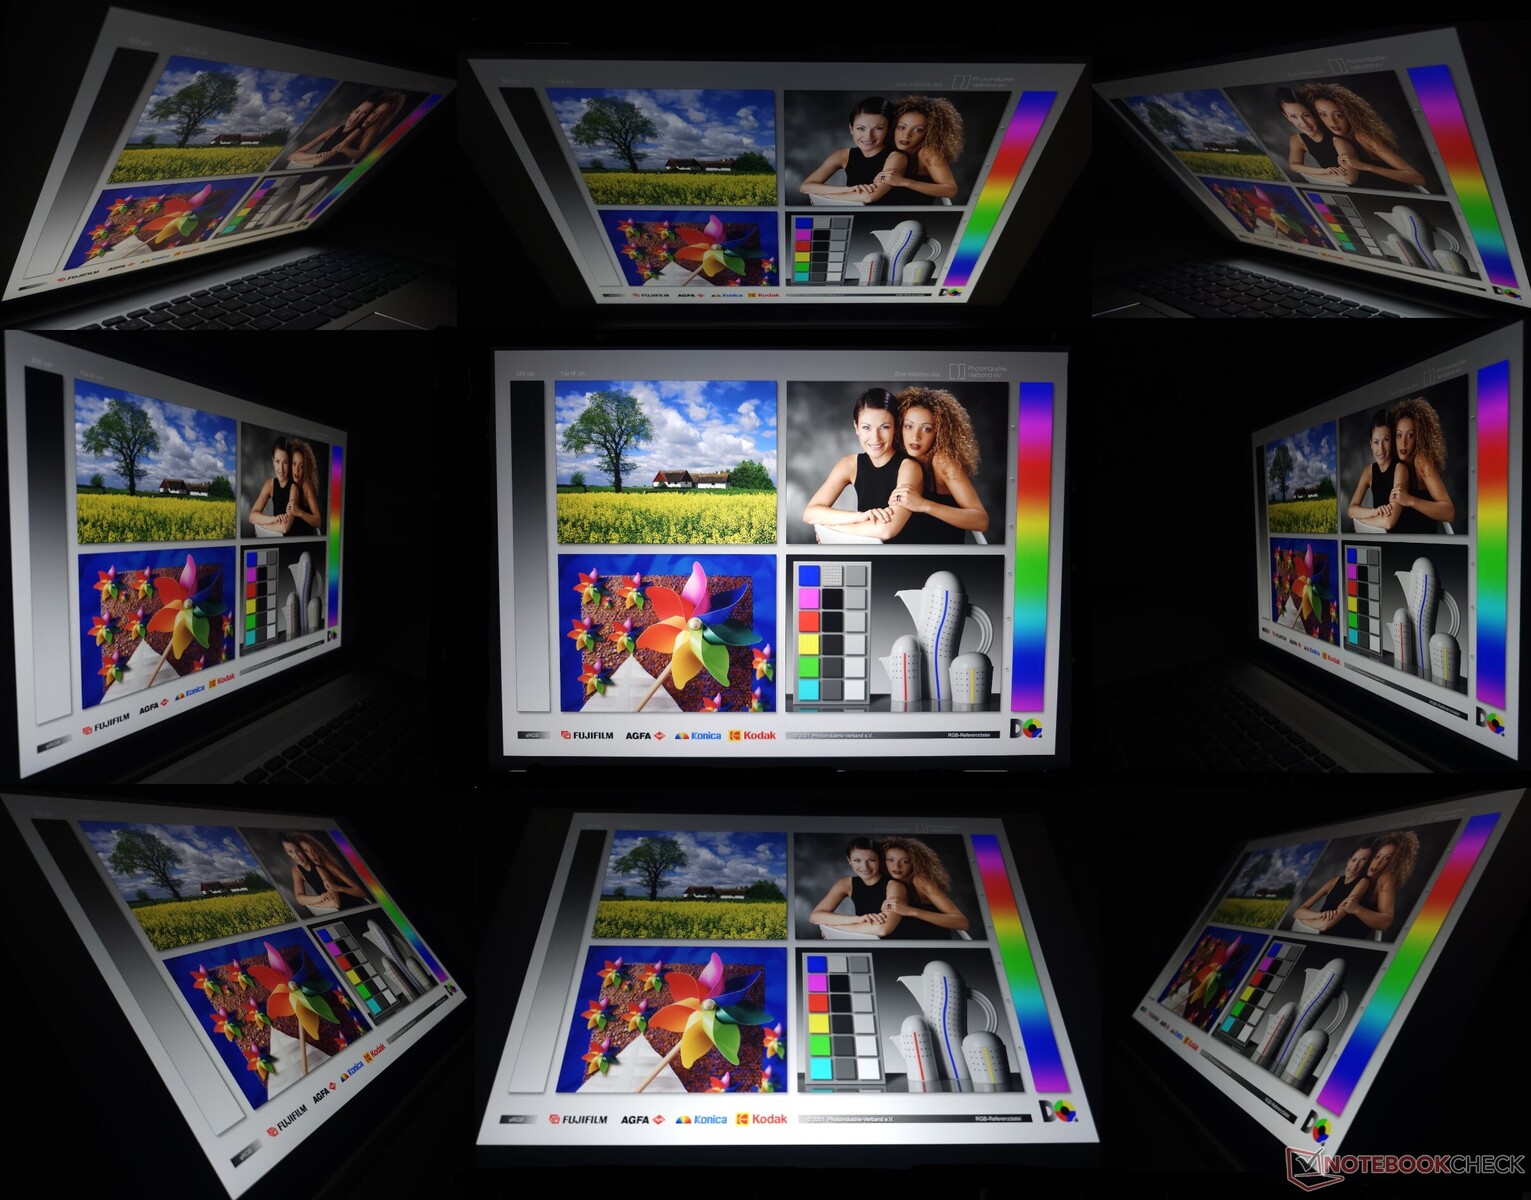
Oglądanie na zewnątrz jest ogólnie w porządku przy maksymalnej jasności, o ile na wyświetlacz nie pada bezpośrednie światło słoneczne. Kąty widzenia są stabilne, ale zaobserwowaliśmy utratę jasności i informacji o kolorach w skrajnych przypadkach.
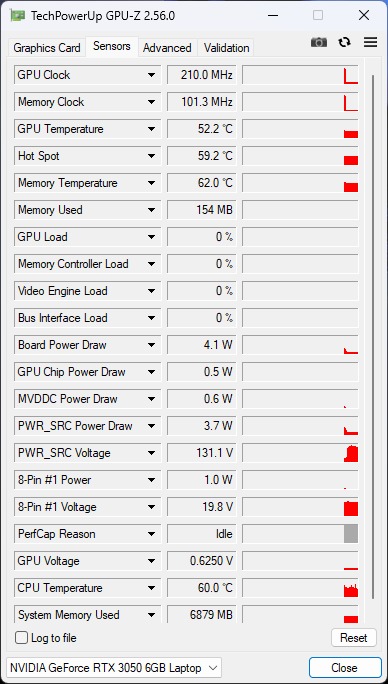
Wydajność: Core i7-13700H ograniczony przez niski PL2
W zależności od regionu, HP oferuje Pavilion Plus 16 in Core i5-13500H i Core i7-13700H wraz z opcjonalną grafiką RTX 3050 6 GB.
Warunki testowania
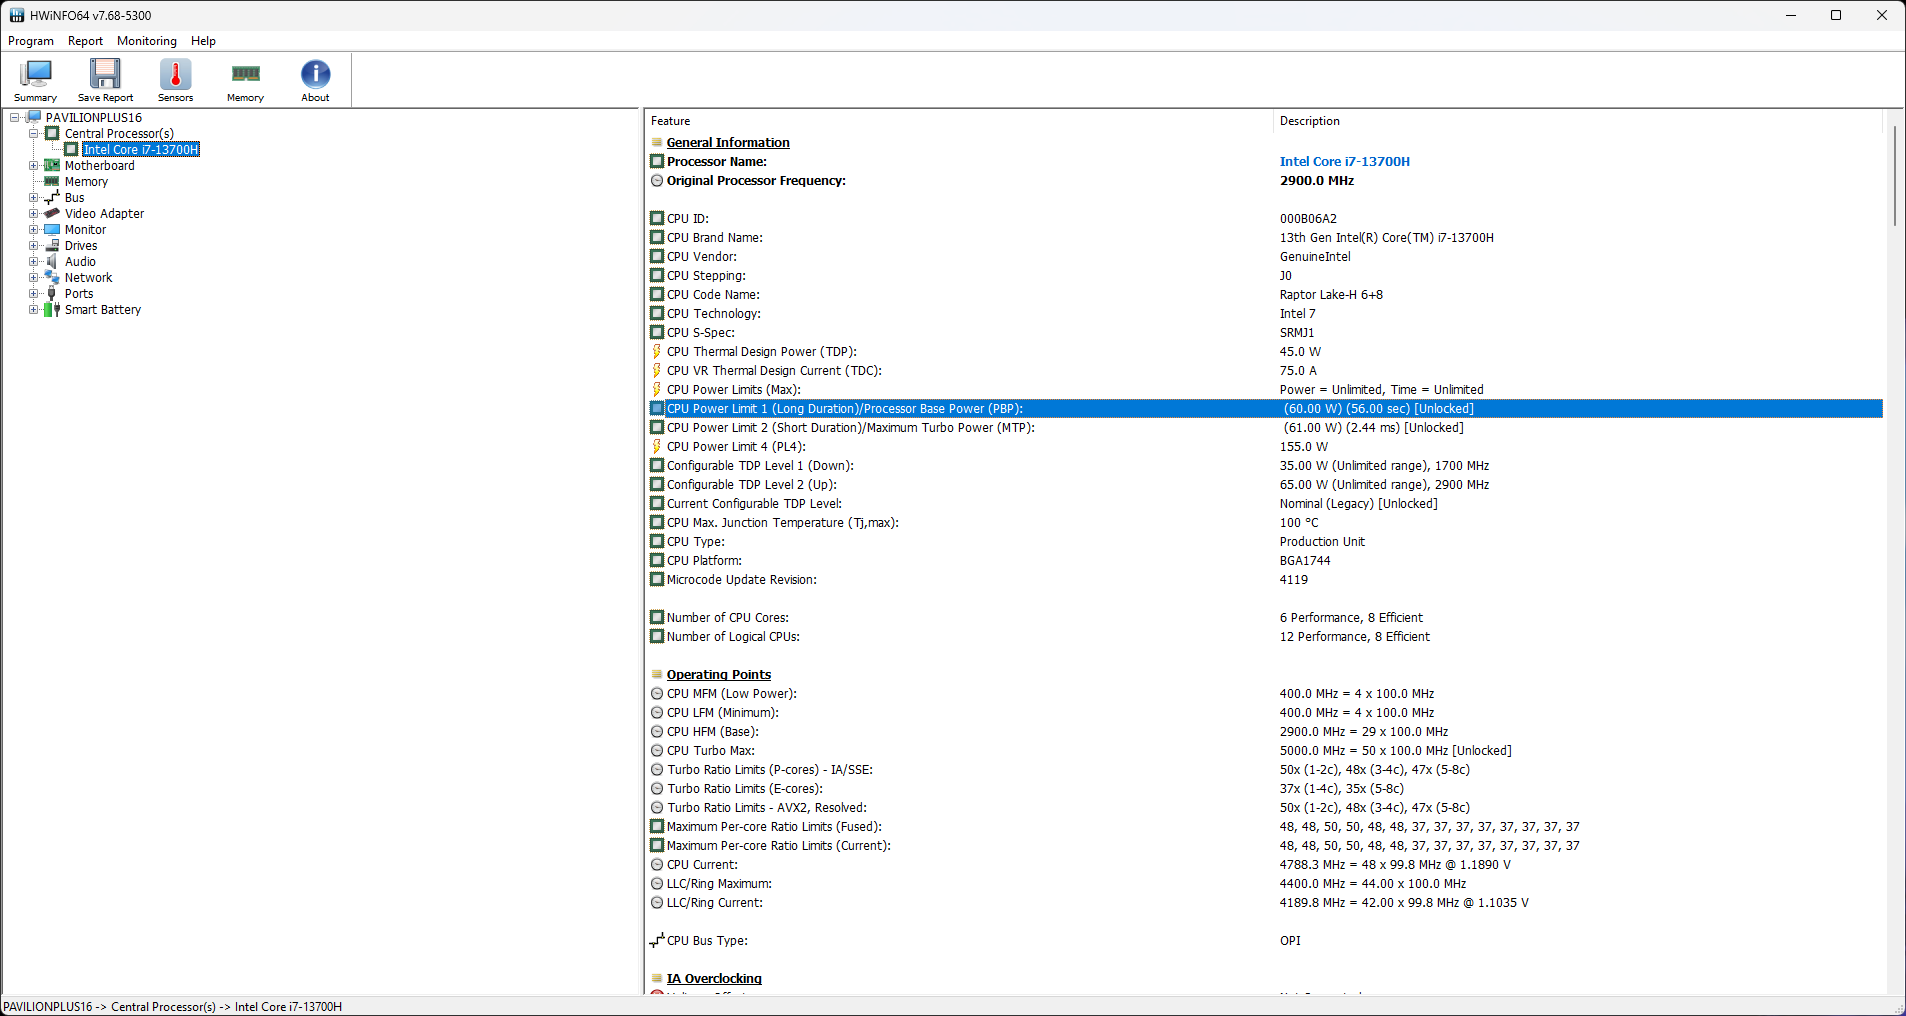
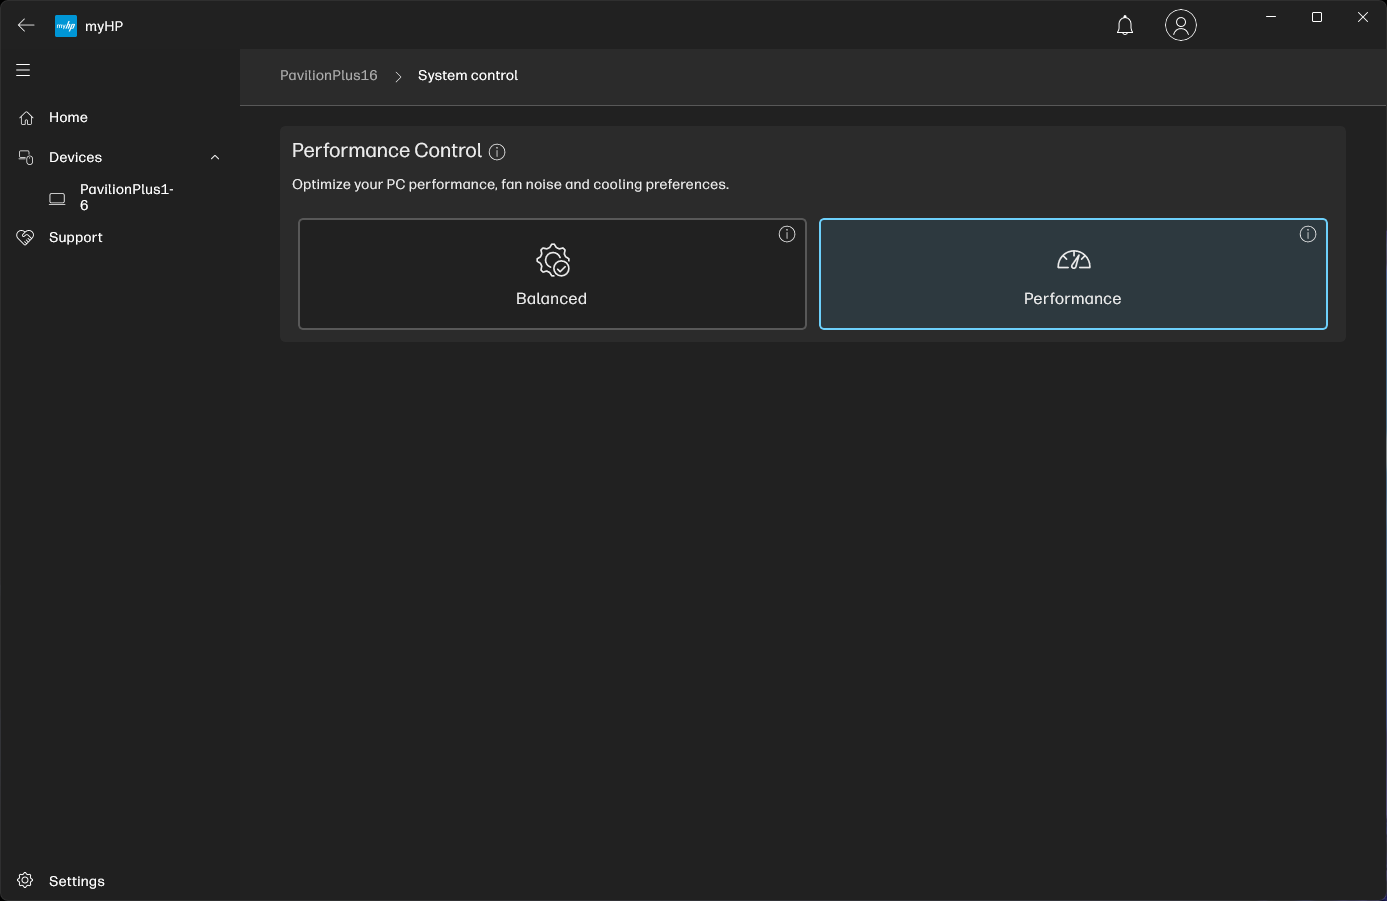
Aplikacja myHP umożliwia użytkownikom wybór jednego z dwóch trybów pracy: Balanced i Performance. Tryb zrównoważony wykorzystuje PL1 o mocy 50 W, która wzrasta do 60 W w trybie wydajności. PL2 w obu tych trybach jest ograniczony do 61 W.
Procesor graficzny RTX 3050 6 GB domyślnie działa w trybie MSHybrid / Optimus bez możliwości przełączania MUX.
We wszystkich testach porównawczych korzystaliśmy z trybu Performance. PL1/PL2 spada do 35 W / 35 W na zasilaniu bateryjnym.
Procesor
Core i7-13700H w Pavilion Plus 16 jest ograniczony przez niską wartość PL2. Staje się to szczególnie widoczne w wielordzeniowych testach porównawczych, w których pozostaje znacznie w tyle za takimi modelami jak Dell Inspiron 16 Plus 7630 który ma 89 W PL2 Core i7-13700H.
To powiedziawszy, chłodzenie Pavilion Plus 16 wydaje się być bardzo skuteczne w zapewnianiu dobrze utrzymanej wydajności podczas naszego wielordzeniowego testu pętli Cinebench R15.
Pavilion Plus 16 znajduje się na szczycie większości wykresów jednordzeniowych procesorów, ale Schenker Vision 14 M23 depcze mu po piętach w tych testach.
Cinebench R15 Multi Loop
Cinebench R23: Multi Core | Single Core
Cinebench R20: CPU (Multi Core) | CPU (Single Core)
Cinebench R15: CPU Multi 64Bit | CPU Single 64Bit
Blender: v2.79 BMW27 CPU
7-Zip 18.03: 7z b 4 | 7z b 4 -mmt1
Geekbench 6.7: Multi-Core | Single-Core
Geekbench 5.5: Multi-Core | Single-Core
HWBOT x265 Benchmark v2.2: 4k Preset
LibreOffice : 20 Documents To PDF
R Benchmark 2.5: Overall mean
| CPU Performance rating | |
| Średnia w klasie Multimedia | |
| Dell Inspiron 16 Plus 7630 | |
| Przeciętny Intel Core i7-13700H | |
| HP Pavilion Plus 16-ab0456tx | |
| Asus VivoBook Pro 16 K6602VU | |
| Samsung Galaxy Book3 Ultra 16 -2! | |
| Schenker Vision 14 M23 RTX 3050 | |
| Asus VivoBook 14X K3405 -2! | |
| Lenovo Slim Pro 7 14ARP8 -2! | |
| Cinebench R23 / Multi Core | |
| Średnia w klasie Multimedia (4861 - 33362, n=76, ostatnie 2 lata) | |
| Dell Inspiron 16 Plus 7630 | |
| Samsung Galaxy Book3 Ultra 16 | |
| Przeciętny Intel Core i7-13700H (5890 - 20034, n=29) | |
| Asus VivoBook Pro 16 K6602VU | |
| Asus VivoBook 14X K3405 | |
| Schenker Vision 14 M23 RTX 3050 | |
| Lenovo Slim Pro 7 14ARP8 | |
| HP Pavilion Plus 16-ab0456tx | |
| Cinebench R23 / Single Core | |
| Średnia w klasie Multimedia (1128 - 2459, n=68, ostatnie 2 lata) | |
| HP Pavilion Plus 16-ab0456tx | |
| Schenker Vision 14 M23 RTX 3050 | |
| Dell Inspiron 16 Plus 7630 | |
| Przeciętny Intel Core i7-13700H (1323 - 1914, n=29) | |
| Asus VivoBook Pro 16 K6602VU | |
| Asus VivoBook 14X K3405 | |
| Samsung Galaxy Book3 Ultra 16 | |
| Lenovo Slim Pro 7 14ARP8 | |
| Cinebench R20 / CPU (Multi Core) | |
| Średnia w klasie Multimedia (1887 - 12912, n=59, ostatnie 2 lata) | |
| Dell Inspiron 16 Plus 7630 | |
| Samsung Galaxy Book3 Ultra 16 | |
| Przeciętny Intel Core i7-13700H (2322 - 7674, n=29) | |
| HP Pavilion Plus 16-ab0456tx | |
| Asus VivoBook Pro 16 K6602VU | |
| Asus VivoBook 14X K3405 | |
| Schenker Vision 14 M23 RTX 3050 | |
| Lenovo Slim Pro 7 14ARP8 | |
| Cinebench R20 / CPU (Single Core) | |
| HP Pavilion Plus 16-ab0456tx | |
| Schenker Vision 14 M23 RTX 3050 | |
| Średnia w klasie Multimedia (425 - 853, n=59, ostatnie 2 lata) | |
| Dell Inspiron 16 Plus 7630 | |
| Przeciętny Intel Core i7-13700H (508 - 741, n=29) | |
| Asus VivoBook Pro 16 K6602VU | |
| Asus VivoBook 14X K3405 | |
| Samsung Galaxy Book3 Ultra 16 | |
| Lenovo Slim Pro 7 14ARP8 | |
| Cinebench R15 / CPU Multi 64Bit | |
| Średnia w klasie Multimedia (856 - 5224, n=63, ostatnie 2 lata) | |
| Samsung Galaxy Book3 Ultra 16 | |
| Asus VivoBook Pro 16 K6602VU | |
| Dell Inspiron 16 Plus 7630 | |
| Przeciętny Intel Core i7-13700H (905 - 2982, n=29) | |
| Asus VivoBook 14X K3405 | |
| HP Pavilion Plus 16-ab0456tx | |
| Lenovo Slim Pro 7 14ARP8 | |
| Schenker Vision 14 M23 RTX 3050 | |
| Cinebench R15 / CPU Single 64Bit | |
| Średnia w klasie Multimedia (184.8 - 326, n=61, ostatnie 2 lata) | |
| HP Pavilion Plus 16-ab0456tx | |
| Schenker Vision 14 M23 RTX 3050 | |
| Dell Inspiron 16 Plus 7630 | |
| Przeciętny Intel Core i7-13700H (213 - 278, n=29) | |
| Asus VivoBook Pro 16 K6602VU | |
| Asus VivoBook 14X K3405 | |
| Samsung Galaxy Book3 Ultra 16 | |
| Lenovo Slim Pro 7 14ARP8 | |
| Blender / v2.79 BMW27 CPU | |
| Schenker Vision 14 M23 RTX 3050 | |
| Średnia w klasie Multimedia (100 - 557, n=60, ostatnie 2 lata) | |
| Lenovo Slim Pro 7 14ARP8 | |
| Asus VivoBook 14X K3405 | |
| Przeciętny Intel Core i7-13700H (169 - 555, n=29) | |
| Samsung Galaxy Book3 Ultra 16 | |
| Dell Inspiron 16 Plus 7630 | |
| HP Pavilion Plus 16-ab0456tx | |
| Asus VivoBook Pro 16 K6602VU | |
| 7-Zip 18.03 / 7z b 4 | |
| Asus VivoBook Pro 16 K6602VU | |
| HP Pavilion Plus 16-ab0456tx | |
| Samsung Galaxy Book3 Ultra 16 | |
| Przeciętny Intel Core i7-13700H (27322 - 76344, n=29) | |
| Dell Inspiron 16 Plus 7630 | |
| Średnia w klasie Multimedia (26062 - 130368, n=57, ostatnie 2 lata) | |
| Lenovo Slim Pro 7 14ARP8 | |
| Schenker Vision 14 M23 RTX 3050 | |
| Asus VivoBook 14X K3405 | |
| 7-Zip 18.03 / 7z b 4 -mmt1 | |
| Schenker Vision 14 M23 RTX 3050 | |
| HP Pavilion Plus 16-ab0456tx | |
| Średnia w klasie Multimedia (3666 - 7545, n=58, ostatnie 2 lata) | |
| Przeciętny Intel Core i7-13700H (4825 - 6238, n=29) | |
| Asus VivoBook Pro 16 K6602VU | |
| Dell Inspiron 16 Plus 7630 | |
| Asus VivoBook 14X K3405 | |
| Samsung Galaxy Book3 Ultra 16 | |
| Lenovo Slim Pro 7 14ARP8 | |
| Geekbench 6.7 / Multi-Core | |
| Średnia w klasie Multimedia (4983 - 29415, n=71, ostatnie 2 lata) | |
| Dell Inspiron 16 Plus 7630 | |
| HP Pavilion Plus 16-ab0456tx | |
| Schenker Vision 14 M23 RTX 3050 | |
| Przeciętny Intel Core i7-13700H (8415 - 13832, n=13) | |
| Asus VivoBook Pro 16 K6602VU | |
| Geekbench 6.7 / Single-Core | |
| Średnia w klasie Multimedia (1534 - 4335, n=70, ostatnie 2 lata) | |
| Schenker Vision 14 M23 RTX 3050 | |
| Dell Inspiron 16 Plus 7630 | |
| HP Pavilion Plus 16-ab0456tx | |
| Przeciętny Intel Core i7-13700H (2316 - 2639, n=13) | |
| Asus VivoBook Pro 16 K6602VU | |
| Geekbench 5.5 / Multi-Core | |
| Średnia w klasie Multimedia (4652 - 20422, n=58, ostatnie 2 lata) | |
| Dell Inspiron 16 Plus 7630 | |
| Przeciętny Intel Core i7-13700H (6165 - 14215, n=29) | |
| Samsung Galaxy Book3 Ultra 16 | |
| HP Pavilion Plus 16-ab0456tx | |
| Schenker Vision 14 M23 RTX 3050 | |
| Asus VivoBook Pro 16 K6602VU | |
| Asus VivoBook 14X K3405 | |
| Lenovo Slim Pro 7 14ARP8 | |
| Geekbench 5.5 / Single-Core | |
| Średnia w klasie Multimedia (805 - 2974, n=58, ostatnie 2 lata) | |
| Dell Inspiron 16 Plus 7630 | |
| Schenker Vision 14 M23 RTX 3050 | |
| HP Pavilion Plus 16-ab0456tx | |
| Przeciętny Intel Core i7-13700H (1362 - 1919, n=29) | |
| Asus VivoBook Pro 16 K6602VU | |
| Samsung Galaxy Book3 Ultra 16 | |
| Asus VivoBook 14X K3405 | |
| Lenovo Slim Pro 7 14ARP8 | |
| HWBOT x265 Benchmark v2.2 / 4k Preset | |
| Średnia w klasie Multimedia (5.26 - 36.1, n=58, ostatnie 2 lata) | |
| Samsung Galaxy Book3 Ultra 16 | |
| Asus VivoBook Pro 16 K6602VU | |
| Przeciętny Intel Core i7-13700H (6.72 - 21.2, n=29) | |
| HP Pavilion Plus 16-ab0456tx | |
| Lenovo Slim Pro 7 14ARP8 | |
| Dell Inspiron 16 Plus 7630 | |
| Asus VivoBook 14X K3405 | |
| Schenker Vision 14 M23 RTX 3050 | |
| LibreOffice / 20 Documents To PDF | |
| HP Pavilion Plus 16-ab0456tx | |
| Lenovo Slim Pro 7 14ARP8 | |
| Schenker Vision 14 M23 RTX 3050 | |
| Asus VivoBook Pro 16 K6602VU | |
| Średnia w klasie Multimedia (23.9 - 146.7, n=59, ostatnie 2 lata) | |
| Samsung Galaxy Book3 Ultra 16 | |
| Przeciętny Intel Core i7-13700H (31.3 - 62.4, n=29) | |
| Asus VivoBook 14X K3405 | |
| Dell Inspiron 16 Plus 7630 | |
| R Benchmark 2.5 / Overall mean | |
| Lenovo Slim Pro 7 14ARP8 | |
| Asus VivoBook 14X K3405 | |
| Samsung Galaxy Book3 Ultra 16 | |
| Asus VivoBook Pro 16 K6602VU | |
| Przeciętny Intel Core i7-13700H (0.4308 - 0.607, n=29) | |
| Średnia w klasie Multimedia (0.3604 - 0.947, n=58, ostatnie 2 lata) | |
| Schenker Vision 14 M23 RTX 3050 | |
| HP Pavilion Plus 16-ab0456tx | |
| Dell Inspiron 16 Plus 7630 | |
* ... im mniej tym lepiej
AIDA64: FP32 Ray-Trace | FPU Julia | CPU SHA3 | CPU Queen | FPU SinJulia | FPU Mandel | CPU AES | CPU ZLib | FP64 Ray-Trace | CPU PhotoWorxx
| Performance rating | |
| Średnia w klasie Multimedia | |
| Asus VivoBook Pro 16 K6602VU | |
| Lenovo Slim Pro 7 14ARP8 | |
| HP Pavilion Plus 16-ab0456tx | |
| Samsung Galaxy Book3 Ultra 16 | |
| Przeciętny Intel Core i7-13700H | |
| Dell Inspiron 16 Plus 7630 | |
| Asus VivoBook 14X K3405 | |
| Schenker Vision 14 M23 RTX 3050 | |
| AIDA64 / FP32 Ray-Trace | |
| Średnia w klasie Multimedia (2214 - 50388, n=55, ostatnie 2 lata) | |
| Lenovo Slim Pro 7 14ARP8 | |
| HP Pavilion Plus 16-ab0456tx | |
| Samsung Galaxy Book3 Ultra 16 | |
| Przeciętny Intel Core i7-13700H (4986 - 18908, n=29) | |
| Dell Inspiron 16 Plus 7630 | |
| Asus VivoBook Pro 16 K6602VU | |
| Asus VivoBook 14X K3405 | |
| Schenker Vision 14 M23 RTX 3050 | |
| AIDA64 / FPU Julia | |
| Lenovo Slim Pro 7 14ARP8 | |
| Średnia w klasie Multimedia (12867 - 201874, n=56, ostatnie 2 lata) | |
| HP Pavilion Plus 16-ab0456tx | |
| Asus VivoBook Pro 16 K6602VU | |
| Przeciętny Intel Core i7-13700H (25360 - 92359, n=29) | |
| Samsung Galaxy Book3 Ultra 16 | |
| Dell Inspiron 16 Plus 7630 | |
| Asus VivoBook 14X K3405 | |
| Schenker Vision 14 M23 RTX 3050 | |
| AIDA64 / CPU SHA3 | |
| Średnia w klasie Multimedia (626 - 8623, n=56, ostatnie 2 lata) | |
| Asus VivoBook 14X K3405 | |
| HP Pavilion Plus 16-ab0456tx | |
| Asus VivoBook Pro 16 K6602VU | |
| Samsung Galaxy Book3 Ultra 16 | |
| Przeciętny Intel Core i7-13700H (1339 - 4224, n=29) | |
| Lenovo Slim Pro 7 14ARP8 | |
| Dell Inspiron 16 Plus 7630 | |
| Schenker Vision 14 M23 RTX 3050 | |
| AIDA64 / CPU Queen | |
| Dell Inspiron 16 Plus 7630 | |
| Samsung Galaxy Book3 Ultra 16 | |
| HP Pavilion Plus 16-ab0456tx | |
| Przeciętny Intel Core i7-13700H (59324 - 107159, n=29) | |
| Asus VivoBook Pro 16 K6602VU | |
| Lenovo Slim Pro 7 14ARP8 | |
| Schenker Vision 14 M23 RTX 3050 | |
| Asus VivoBook 14X K3405 | |
| Średnia w klasie Multimedia (13483 - 181505, n=43, ostatnie 2 lata) | |
| AIDA64 / FPU SinJulia | |
| Lenovo Slim Pro 7 14ARP8 | |
| HP Pavilion Plus 16-ab0456tx | |
| Samsung Galaxy Book3 Ultra 16 | |
| Średnia w klasie Multimedia (886 - 28794, n=56, ostatnie 2 lata) | |
| Dell Inspiron 16 Plus 7630 | |
| Asus VivoBook Pro 16 K6602VU | |
| Przeciętny Intel Core i7-13700H (4800 - 11050, n=29) | |
| Schenker Vision 14 M23 RTX 3050 | |
| Asus VivoBook 14X K3405 | |
| AIDA64 / FPU Mandel | |
| Lenovo Slim Pro 7 14ARP8 | |
| Średnia w klasie Multimedia (6395 - 105740, n=55, ostatnie 2 lata) | |
| HP Pavilion Plus 16-ab0456tx | |
| Samsung Galaxy Book3 Ultra 16 | |
| Przeciętny Intel Core i7-13700H (12321 - 45118, n=29) | |
| Asus VivoBook Pro 16 K6602VU | |
| Dell Inspiron 16 Plus 7630 | |
| Asus VivoBook 14X K3405 | |
| Schenker Vision 14 M23 RTX 3050 | |
| AIDA64 / CPU AES | |
| Asus VivoBook Pro 16 K6602VU | |
| Asus VivoBook 14X K3405 | |
| Przeciętny Intel Core i7-13700H (28769 - 151254, n=29) | |
| HP Pavilion Plus 16-ab0456tx | |
| Samsung Galaxy Book3 Ultra 16 | |
| Średnia w klasie Multimedia (8171 - 126790, n=56, ostatnie 2 lata) | |
| Dell Inspiron 16 Plus 7630 | |
| Schenker Vision 14 M23 RTX 3050 | |
| Lenovo Slim Pro 7 14ARP8 | |
| AIDA64 / CPU ZLib | |
| Samsung Galaxy Book3 Ultra 16 | |
| Średnia w klasie Multimedia (143.8 - 2022, n=56, ostatnie 2 lata) | |
| HP Pavilion Plus 16-ab0456tx | |
| Asus VivoBook Pro 16 K6602VU | |
| Przeciętny Intel Core i7-13700H (389 - 1215, n=29) | |
| Asus VivoBook 14X K3405 | |
| Dell Inspiron 16 Plus 7630 | |
| Schenker Vision 14 M23 RTX 3050 | |
| Lenovo Slim Pro 7 14ARP8 | |
| AIDA64 / FP64 Ray-Trace | |
| Średnia w klasie Multimedia (1014 - 26875, n=56, ostatnie 2 lata) | |
| HP Pavilion Plus 16-ab0456tx | |
| Lenovo Slim Pro 7 14ARP8 | |
| Samsung Galaxy Book3 Ultra 16 | |
| Asus VivoBook Pro 16 K6602VU | |
| Przeciętny Intel Core i7-13700H (2540 - 10135, n=29) | |
| Dell Inspiron 16 Plus 7630 | |
| Asus VivoBook 14X K3405 | |
| Schenker Vision 14 M23 RTX 3050 | |
| AIDA64 / CPU PhotoWorxx | |
| Średnia w klasie Multimedia (8187 - 88154, n=56, ostatnie 2 lata) | |
| Samsung Galaxy Book3 Ultra 16 | |
| Schenker Vision 14 M23 RTX 3050 | |
| HP Pavilion Plus 16-ab0456tx | |
| Przeciętny Intel Core i7-13700H (12872 - 52727, n=29) | |
| Asus VivoBook Pro 16 K6602VU | |
| Dell Inspiron 16 Plus 7630 | |
| Lenovo Slim Pro 7 14ARP8 | |
| Asus VivoBook 14X K3405 | |
Proszę sprawdzić nasz dedykowany Intel Core i7-13700H aby uzyskać więcej porównań wydajności.
Wydajność systemu
Pavilion Plus 16 udaje się w jakiś sposób wyprzedzić VivoBook Pro 16 z Core i9-13900H i RTX 4050 w ogólnych testach CrossMark, ale przegrywa z tym drugim w PCMark 10 o 6%.
Poza tym, system jest całkiem responsywny w codziennych zadaniach związanych z produktywnością i przeglądaniem stron internetowych.
CrossMark: Overall | Productivity | Creativity | Responsiveness
AIDA64: Memory Copy | Memory Read | Memory Write | Memory Latency
WebXPRT 3: Overall
WebXPRT 4: Overall
Mozilla Kraken 1.1: Total
| PCMark 10 / Score | |
| Średnia w klasie Multimedia (4325 - 10386, n=54, ostatnie 2 lata) | |
| Dell Inspiron 16 Plus 7630 | |
| Asus VivoBook Pro 16 K6602VU | |
| Samsung Galaxy Book3 Ultra 16 | |
| Asus VivoBook 14X K3405 | |
| HP Pavilion Plus 16-ab0456tx | |
| Przeciętny Intel Core i7-13700H, NVIDIA GeForce RTX 3050 6GB Laptop GPU (6290 - 6597, n=2) | |
| Lenovo Slim Pro 7 14ARP8 | |
| Schenker Vision 14 M23 RTX 3050 | |
| PCMark 10 / Essentials | |
| Dell Inspiron 16 Plus 7630 | |
| Samsung Galaxy Book3 Ultra 16 | |
| Średnia w klasie Multimedia (8025 - 11664, n=53, ostatnie 2 lata) | |
| Asus VivoBook Pro 16 K6602VU | |
| Asus VivoBook 14X K3405 | |
| HP Pavilion Plus 16-ab0456tx | |
| Przeciętny Intel Core i7-13700H, NVIDIA GeForce RTX 3050 6GB Laptop GPU (9943 - 10112, n=2) | |
| Lenovo Slim Pro 7 14ARP8 | |
| Schenker Vision 14 M23 RTX 3050 | |
| PCMark 10 / Productivity | |
| Średnia w klasie Multimedia (7323 - 18233, n=53, ostatnie 2 lata) | |
| Dell Inspiron 16 Plus 7630 | |
| Asus VivoBook 14X K3405 | |
| Schenker Vision 14 M23 RTX 3050 | |
| Przeciętny Intel Core i7-13700H, NVIDIA GeForce RTX 3050 6GB Laptop GPU (8803 - 8950, n=2) | |
| HP Pavilion Plus 16-ab0456tx | |
| Asus VivoBook Pro 16 K6602VU | |
| Samsung Galaxy Book3 Ultra 16 | |
| Lenovo Slim Pro 7 14ARP8 | |
| PCMark 10 / Digital Content Creation | |
| Dell Inspiron 16 Plus 7630 | |
| Asus VivoBook Pro 16 K6602VU | |
| Średnia w klasie Multimedia (3651 - 16240, n=53, ostatnie 2 lata) | |
| Samsung Galaxy Book3 Ultra 16 | |
| Lenovo Slim Pro 7 14ARP8 | |
| HP Pavilion Plus 16-ab0456tx | |
| Asus VivoBook 14X K3405 | |
| Przeciętny Intel Core i7-13700H, NVIDIA GeForce RTX 3050 6GB Laptop GPU (7590 - 8752, n=2) | |
| Schenker Vision 14 M23 RTX 3050 | |
| CrossMark / Overall | |
| Średnia w klasie Multimedia (866 - 2728, n=62, ostatnie 2 lata) | |
| Dell Inspiron 16 Plus 7630 | |
| HP Pavilion Plus 16-ab0456tx | |
| Asus VivoBook Pro 16 K6602VU | |
| Asus VivoBook 14X K3405 | |
| Przeciętny Intel Core i7-13700H, NVIDIA GeForce RTX 3050 6GB Laptop GPU (1504 - 1752, n=2) | |
| Samsung Galaxy Book3 Ultra 16 | |
| Schenker Vision 14 M23 RTX 3050 | |
| Lenovo Slim Pro 7 14ARP8 | |
| CrossMark / Productivity | |
| Średnia w klasie Multimedia (931 - 2489, n=62, ostatnie 2 lata) | |
| Dell Inspiron 16 Plus 7630 | |
| Asus VivoBook Pro 16 K6602VU | |
| HP Pavilion Plus 16-ab0456tx | |
| Asus VivoBook 14X K3405 | |
| Przeciętny Intel Core i7-13700H, NVIDIA GeForce RTX 3050 6GB Laptop GPU (1417 - 1657, n=2) | |
| Samsung Galaxy Book3 Ultra 16 | |
| Schenker Vision 14 M23 RTX 3050 | |
| Lenovo Slim Pro 7 14ARP8 | |
| CrossMark / Creativity | |
| Średnia w klasie Multimedia (907 - 3465, n=62, ostatnie 2 lata) | |
| Dell Inspiron 16 Plus 7630 | |
| HP Pavilion Plus 16-ab0456tx | |
| Asus VivoBook Pro 16 K6602VU | |
| Przeciętny Intel Core i7-13700H, NVIDIA GeForce RTX 3050 6GB Laptop GPU (1711 - 1970, n=2) | |
| Schenker Vision 14 M23 RTX 3050 | |
| Asus VivoBook 14X K3405 | |
| Samsung Galaxy Book3 Ultra 16 | |
| Lenovo Slim Pro 7 14ARP8 | |
| CrossMark / Responsiveness | |
| Dell Inspiron 16 Plus 7630 | |
| Średnia w klasie Multimedia (605 - 2024, n=62, ostatnie 2 lata) | |
| Asus VivoBook Pro 16 K6602VU | |
| Samsung Galaxy Book3 Ultra 16 | |
| Asus VivoBook 14X K3405 | |
| HP Pavilion Plus 16-ab0456tx | |
| Przeciętny Intel Core i7-13700H, NVIDIA GeForce RTX 3050 6GB Laptop GPU (1220 - 1458, n=2) | |
| Schenker Vision 14 M23 RTX 3050 | |
| Lenovo Slim Pro 7 14ARP8 | |
| AIDA64 / Memory Copy | |
| Średnia w klasie Multimedia (11299 - 132135, n=56, ostatnie 2 lata) | |
| Samsung Galaxy Book3 Ultra 16 | |
| Schenker Vision 14 M23 RTX 3050 | |
| Przeciętny Intel Core i7-13700H, NVIDIA GeForce RTX 3050 6GB Laptop GPU (64356 - 65837, n=2) | |
| HP Pavilion Plus 16-ab0456tx | |
| Dell Inspiron 16 Plus 7630 | |
| Asus VivoBook Pro 16 K6602VU | |
| Lenovo Slim Pro 7 14ARP8 | |
| Asus VivoBook 14X K3405 | |
| AIDA64 / Memory Read | |
| Średnia w klasie Multimedia (11624 - 174586, n=56, ostatnie 2 lata) | |
| Schenker Vision 14 M23 RTX 3050 | |
| Samsung Galaxy Book3 Ultra 16 | |
| Przeciętny Intel Core i7-13700H, NVIDIA GeForce RTX 3050 6GB Laptop GPU (65825 - 70861, n=2) | |
| Dell Inspiron 16 Plus 7630 | |
| Asus VivoBook Pro 16 K6602VU | |
| HP Pavilion Plus 16-ab0456tx | |
| Lenovo Slim Pro 7 14ARP8 | |
| Asus VivoBook 14X K3405 | |
| AIDA64 / Memory Write | |
| Samsung Galaxy Book3 Ultra 16 | |
| Średnia w klasie Multimedia (11755 - 134998, n=56, ostatnie 2 lata) | |
| HP Pavilion Plus 16-ab0456tx | |
| Przeciętny Intel Core i7-13700H, NVIDIA GeForce RTX 3050 6GB Laptop GPU (68174 - 76930, n=2) | |
| Schenker Vision 14 M23 RTX 3050 | |
| Asus VivoBook Pro 16 K6602VU | |
| Dell Inspiron 16 Plus 7630 | |
| Lenovo Slim Pro 7 14ARP8 | |
| Asus VivoBook 14X K3405 | |
| AIDA64 / Memory Latency | |
| Średnia w klasie Multimedia (7 - 535, n=55, ostatnie 2 lata) | |
| Lenovo Slim Pro 7 14ARP8 | |
| Samsung Galaxy Book3 Ultra 16 | |
| Dell Inspiron 16 Plus 7630 | |
| Asus VivoBook Pro 16 K6602VU | |
| HP Pavilion Plus 16-ab0456tx | |
| Asus VivoBook 14X K3405 | |
| Przeciętny Intel Core i7-13700H, NVIDIA GeForce RTX 3050 6GB Laptop GPU (85.7 - 89.7, n=2) | |
| Schenker Vision 14 M23 RTX 3050 | |
| WebXPRT 3 / Overall | |
| Średnia w klasie Multimedia (136.4 - 596, n=65, ostatnie 2 lata) | |
| Dell Inspiron 16 Plus 7630 | |
| Schenker Vision 14 M23 RTX 3050 | |
| Przeciętny Intel Core i7-13700H, NVIDIA GeForce RTX 3050 6GB Laptop GPU (286 - 300, n=2) | |
| HP Pavilion Plus 16-ab0456tx | |
| Asus VivoBook 14X K3405 | |
| Lenovo Slim Pro 7 14ARP8 | |
| Samsung Galaxy Book3 Ultra 16 | |
| WebXPRT 4 / Overall | |
| Schenker Vision 14 M23 RTX 3050 | |
| Przeciętny Intel Core i7-13700H, NVIDIA GeForce RTX 3050 6GB Laptop GPU (273 - 325, n=2) | |
| Średnia w klasie Multimedia (167.3 - 402, n=67, ostatnie 2 lata) | |
| Dell Inspiron 16 Plus 7630 | |
| HP Pavilion Plus 16-ab0456tx | |
| Asus VivoBook 14X K3405 | |
| Asus VivoBook Pro 16 K6602VU | |
| Samsung Galaxy Book3 Ultra 16 | |
| Lenovo Slim Pro 7 14ARP8 | |
| Mozilla Kraken 1.1 / Total | |
| Lenovo Slim Pro 7 14ARP8 | |
| Samsung Galaxy Book3 Ultra 16 | |
| Asus VivoBook 14X K3405 | |
| Asus VivoBook Pro 16 K6602VU | |
| Dell Inspiron 16 Plus 7630 | |
| Schenker Vision 14 M23 RTX 3050 | |
| Przeciętny Intel Core i7-13700H, NVIDIA GeForce RTX 3050 6GB Laptop GPU (490 - 496, n=2) | |
| HP Pavilion Plus 16-ab0456tx | |
| Średnia w klasie Multimedia (228 - 835, n=68, ostatnie 2 lata) | |
* ... im mniej tym lepiej
| PCMark 8 Home Score Accelerated v2 | 5525 pkt. | |
| PCMark 8 Work Score Accelerated v2 | 5653 pkt. | |
| PCMark 10 Score | 6597 pkt. | |
Pomoc | ||
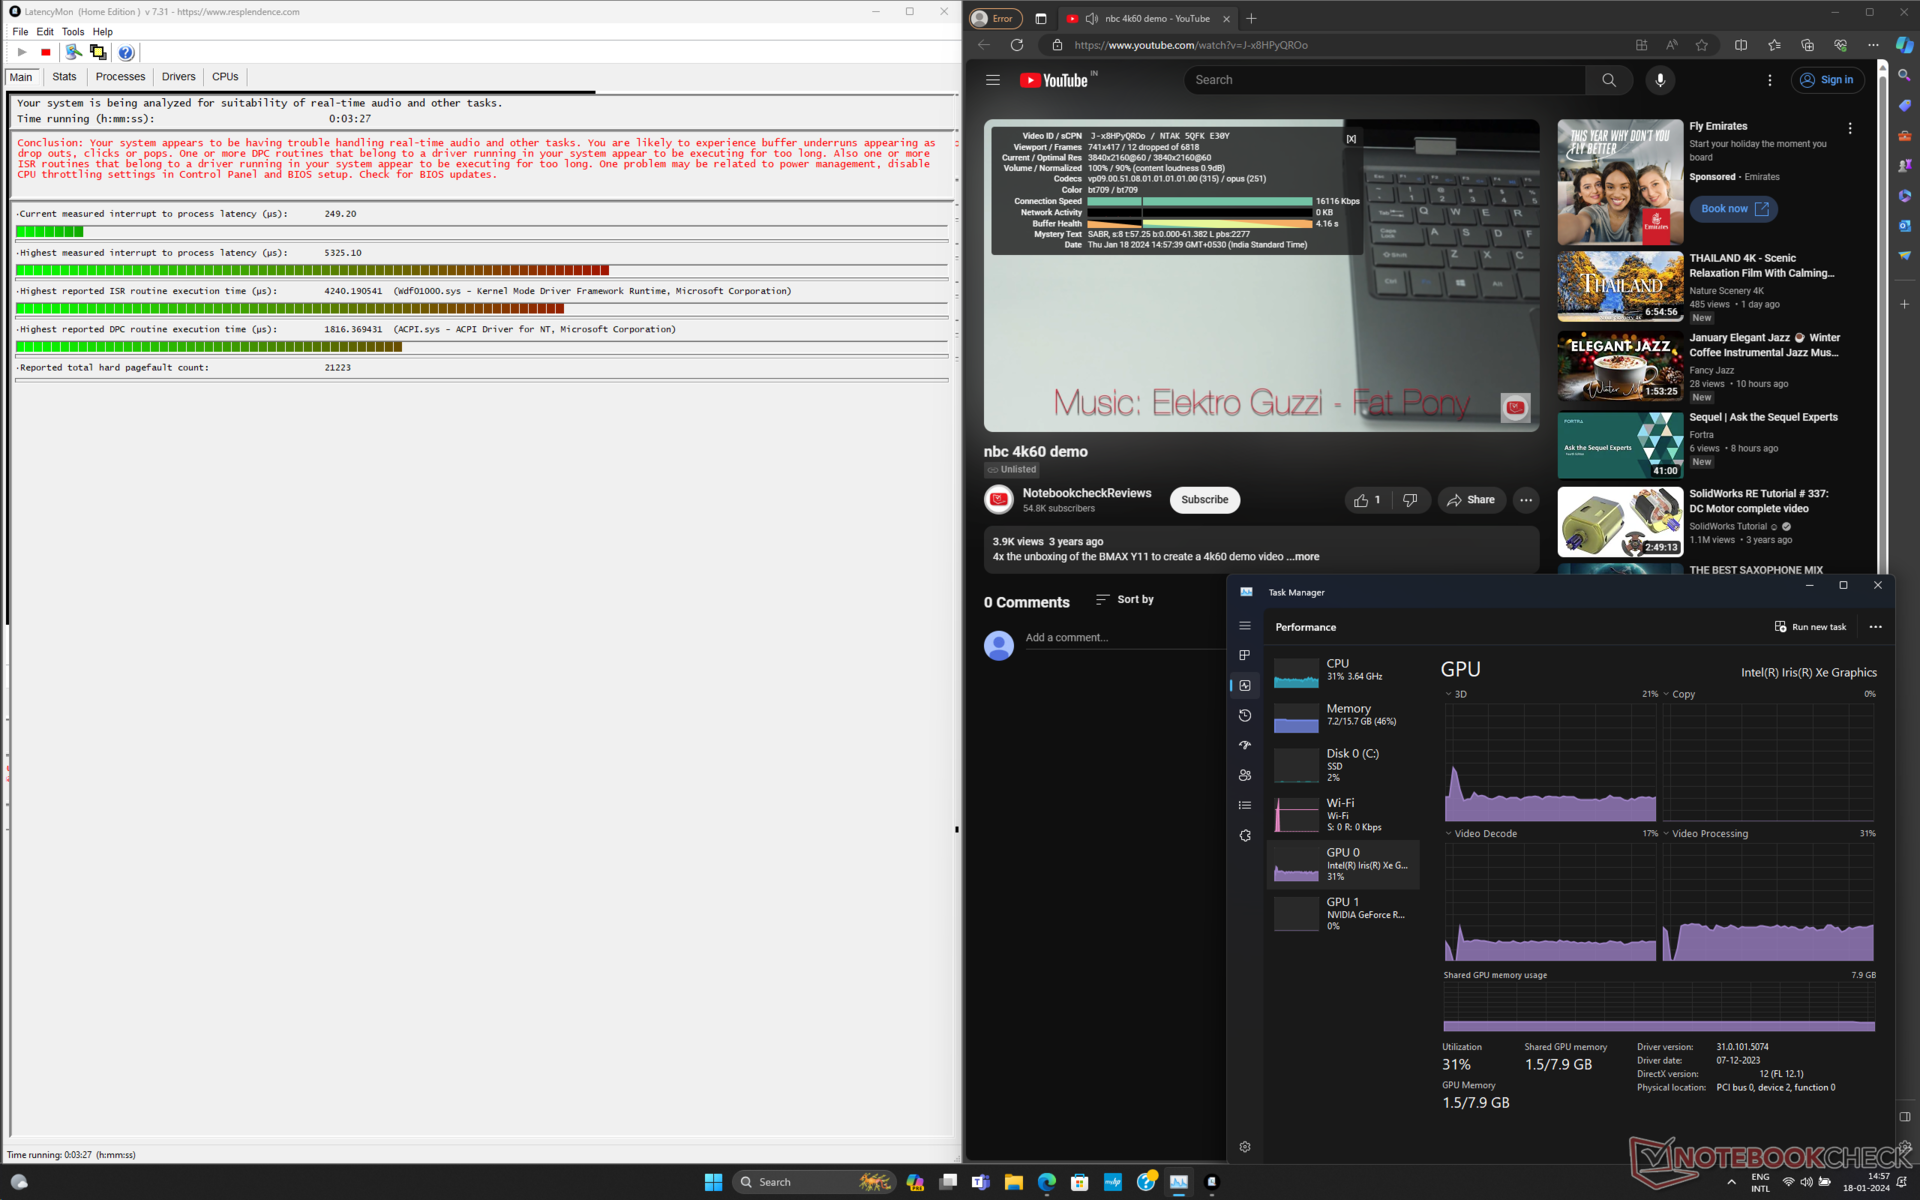
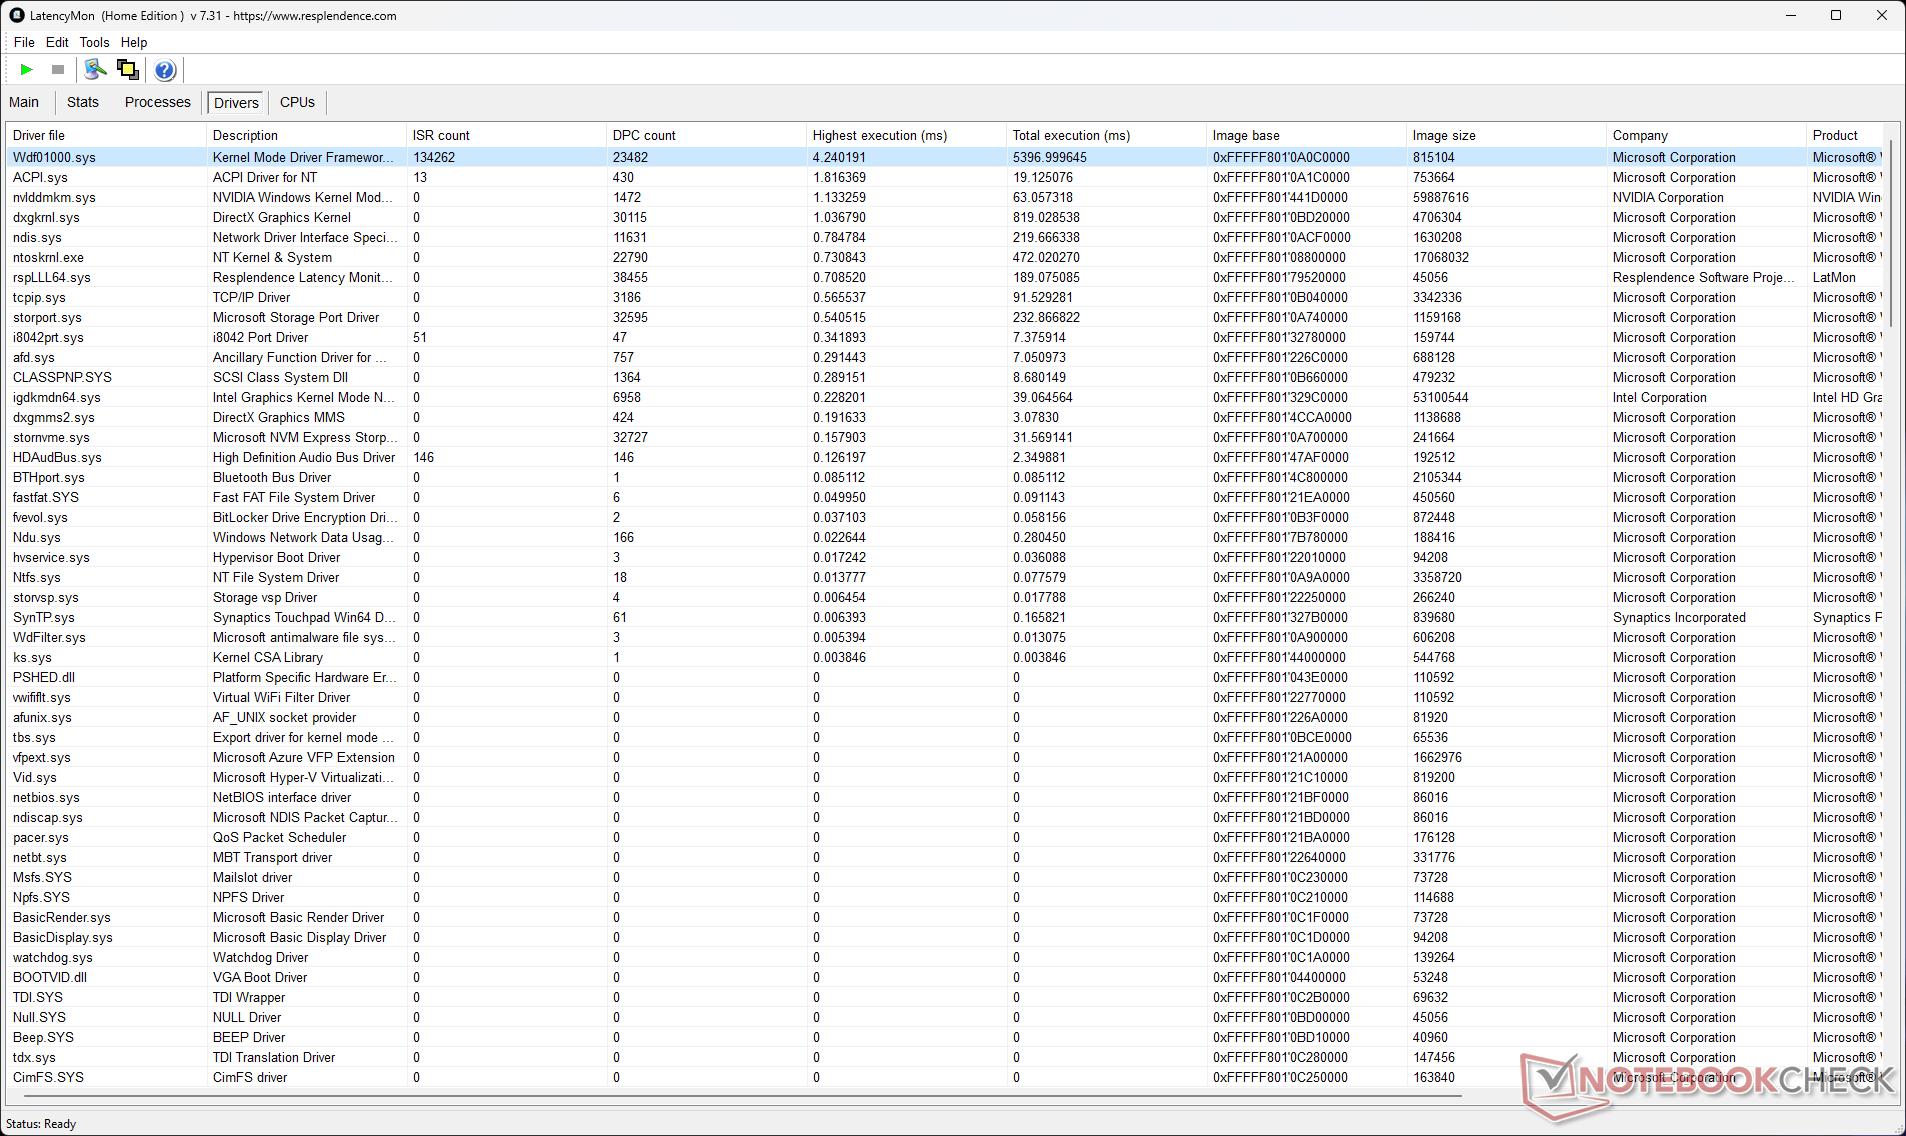
Opóźnienie DPC
Zmierzone przez Pavilion Plus 16 opóźnienie między przerwaniem a procesem wynoszące 5325,1 μs jest wyższe, co może być niepokojące dla osób zajmujących się przepływem pracy audio i wideo w czasie rzeczywistym.
| DPC Latencies / LatencyMon - interrupt to process latency (max), Web, Youtube, Prime95 | |
| HP Pavilion Plus 16-ab0456tx | |
| Samsung Galaxy Book3 Ultra 16 | |
| Asus VivoBook Pro 16 K6602VU | |
| Schenker Vision 14 M23 RTX 3050 | |
| Lenovo Slim Pro 7 14ARP8 | |
| Asus VivoBook 14X K3405 | |
| Dell Inspiron 16 Plus 7630 | |
* ... im mniej tym lepiej
Nasz Ranking opóźnień DPC znajdą Państwo więcej porównań opóźnień w recenzowanych urządzeniach.
Urządzenia pamięci masowej
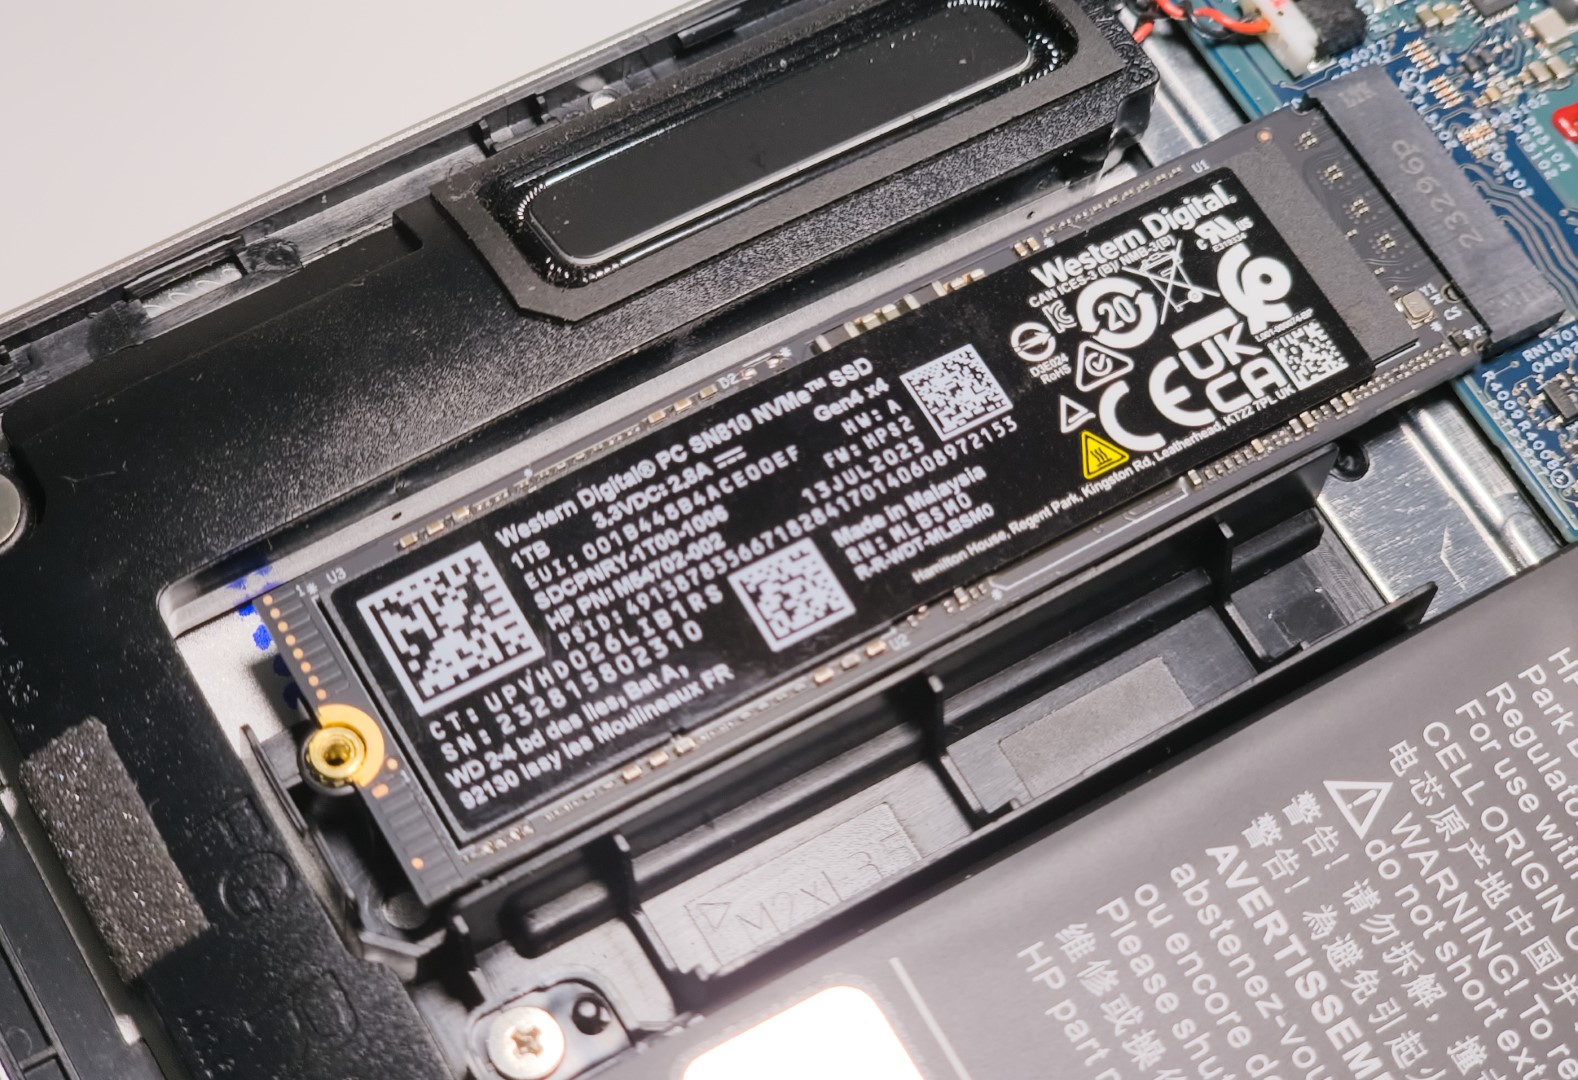
Dysk Western Digital PC SN810 1 TB NVMe został zainstalowany w naszym urządzeniu Pavilion Plus 16. Łączna wydajność dysku jest około 10% wolniejsza niż Samsung 990 Pro w Schenker Vision 14 M23 i około 16% wolniejsza niż Samsung PM9A1 w Samsung Galaxy Book3 Ultra 16.
Niższa wydajność odczytu/zapisu 4K głównie przyczynia się do tego deficytu wydajności.
Niestety, w obudowie można zainstalować tylko jeden dysk SSD. Nie ma również możliwości dodania dysków 2,5-calowych.

* ... im mniej tym lepiej
Dławienie dysku: Pętla odczytu DiskSpd, głębokość kolejki 8
Chociaż HP zapewnia osłonę termiczną dla dysku SSD, najwyraźniej nie jest ona wystarczająca, aby zapobiec dławieniu się dysku po 25. pętli podczas naszego testu pętli odczytu DiskSpd przy głębokości kolejki 8.
Więcej testów porównawczych pamięci masowej można znaleźć na naszej stronie Stronie porównania dysków SSD.
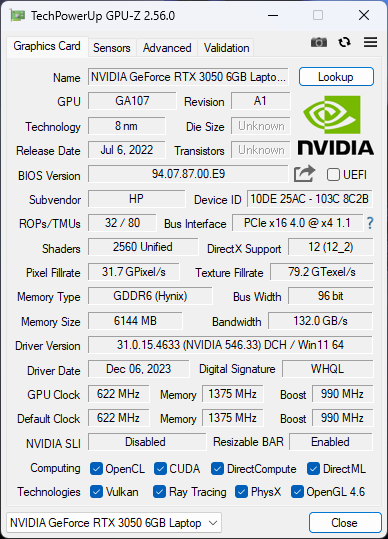
Wydajność GPU
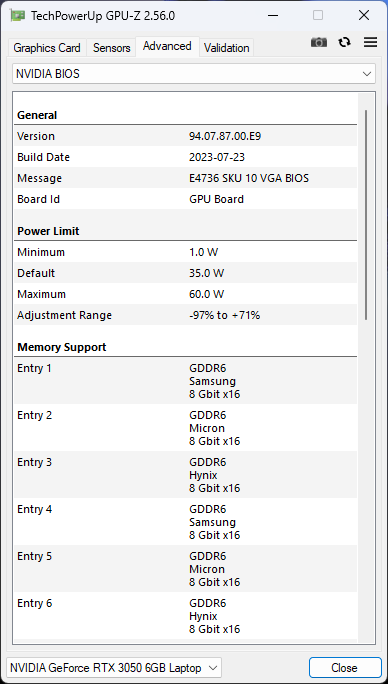
Pavilion Plus 16 to jedyny laptop, który przetestowaliśmy, wyposażony w nowszy procesor graficzny RTX 3050 6 GB, oprócz Lenovo Slim Pro 7 i Schenker Vision 14 M23.
RTX 3050 6 GB w notebooku HP jest oceniany na 60 W TGP, podczas gdy Schenker i Lenovo mają odpowiednio 50 W i 63 W implementacje.
W związku z tym Slim 7 Pro ma niewielką przewagę w skumulowanej wydajności 3DMark nad Pavilion Plus 16, podczas gdy Vision 14 M23 ustępuje HP o 5%.
| 3DMark 11 Performance | 17282 pkt. | |
| 3DMark Ice Storm Standard Score | 82182 pkt. | |
| 3DMark Cloud Gate Standard Score | 43015 pkt. | |
| 3DMark Fire Strike Score | 10890 pkt. | |
| 3DMark Fire Strike Extreme Score | 5641 pkt. | |
Pomoc | ||
| Blender / v3.3 Classroom OPTIX/RTX | |
| Asus VivoBook 14X K3405 | |
| Schenker Vision 14 M23 RTX 3050 | |
| Przeciętny NVIDIA GeForce RTX 3050 4GB Laptop GPU (53 - 99, n=12) | |
| Lenovo Slim Pro 7 14ARP8 | |
| HP Pavilion Plus 16-ab0456tx | |
| Średnia w klasie Multimedia (12 - 105, n=23, ostatnie 2 lata) | |
| Samsung Galaxy Book3 Ultra 16 | |
| Asus VivoBook Pro 16 K6602VU | |
| Dell Inspiron 16 Plus 7630 | |
| Blender / v3.3 Classroom CUDA | |
| Asus VivoBook 14X K3405 | |
| Asus VivoBook 14X K3405 | |
| Przeciętny NVIDIA GeForce RTX 3050 4GB Laptop GPU (97 - 152, n=13) | |
| Schenker Vision 14 M23 RTX 3050 | |
| Lenovo Slim Pro 7 14ARP8 | |
| HP Pavilion Plus 16-ab0456tx | |
| Samsung Galaxy Book3 Ultra 16 | |
| Średnia w klasie Multimedia (20 - 186, n=23, ostatnie 2 lata) | |
| Asus VivoBook Pro 16 K6602VU | |
| Dell Inspiron 16 Plus 7630 | |
| Blender / v3.3 Classroom CPU | |
| Przeciętny NVIDIA GeForce RTX 3050 4GB Laptop GPU (388 - 937, n=11) | |
| Schenker Vision 14 M23 RTX 3050 | |
| Asus VivoBook 14X K3405 | |
| Lenovo Slim Pro 7 14ARP8 | |
| Dell Inspiron 16 Plus 7630 | |
| Średnia w klasie Multimedia (134.5 - 1042, n=63, ostatnie 2 lata) | |
| Samsung Galaxy Book3 Ultra 16 | |
| HP Pavilion Plus 16-ab0456tx | |
| Asus VivoBook Pro 16 K6602VU | |
* ... im mniej tym lepiej
Wydajność w grach
Widzimy około 10% łączną korzyść w grach 1080p z RTX 3050 6 GB w porównaniu do RTX 3050 4 GB średnia.
RTX 3050 w Pavilion Plus 16 wykazuje dobry wzrost skumulowanej wydajności w grach 1080p w porównaniu do Slim Pro 7 i Vision 14 M23, pozostając jednocześnie w tyle za 65 W GPU RTX 4050 w laptopie VivoBook Pro 16 o 25%.
Co ciekawe, Pavilion Plus 16 jest również w stanie wyprzedzić Galaxy Book3 Ultra 16 z RTX 4050 w ogólnej rozgrywce, ale jest to spowodowane słabym występem tego ostatniego w Dota 2 Reborn i X-Plane 11.
RTX 3050 6 GB może płynnie grać w starsze tytuły w rozdzielczości 1080p Ultra, ale nowoczesne gry AAA zmagają się z ustawieniami wyższymi niż 1080p High.
Wykres Witcher 3 FPS
Nie zaobserwowaliśmy zauważalnego throttlingu podczas testu obciążeniowego z The Witcher 3 przy 1080p Ultra, co wskazuje na wydajne chłodzenie.
| low | med. | high | ultra | QHD | |
|---|---|---|---|---|---|
| GTA V (2015) | 177.9 | 172 | 123.3 | 62.7 | 42.7 |
| The Witcher 3 (2015) | 244 | 159.1 | 91.4 | 50.1 | 37 |
| Dota 2 Reborn (2015) | 155.2 | 131 | 124.2 | 116.9 | |
| Final Fantasy XV Benchmark (2018) | 128.2 | 70.9 | 52 | 37.4 | |
| X-Plane 11.11 (2018) | 140.6 | 117 | 97.3 | ||
| Far Cry 5 (2018) | 89 | 82 | 76 | 52 | |
| Strange Brigade (2018) | 256 | 112.8 | 91.9 | 80.5 | 57.1 |
| F1 22 (2022) | 150.2 | 145.3 | 109.5 | 34 | 20.1 |
| F1 23 (2023) | 150.1 | 141.2 | 97.5 | 26 | 14.3 |
| Cyberpunk 2077 (2023) | 67.6 | 52.1 | 43.2 | 36.9 | 21.3 |
| Assassin's Creed Mirage (2023) | 70 | 63 | 55 | 41 | 31 |
| Avatar Frontiers of Pandora (2023) | 39.5 | 36.3 | 31.5 | 23.4 | 15.1 |
Proszę odnieść się do naszego dedykowanego Karta graficzna Nvidia GeForce RTX 3050 6 GB do laptopów aby uzyskać więcej informacji.
Emisje: Tolerowalny hałas wentylatora, ale wysoka temperatura powierzchni pod obciążeniem
Hałas systemowy
Zmierzyliśmy poziom ciśnienia akustycznego (SPL) 42,1 dB(A) w trybie Performance pod maksymalnym obciążeniem. Wygląda na to, że HP ustaliło limity hałasu wentylatora na poziomie poniżej 35 dB(A) w trybie zrównoważonym i 45 dB(A) w trybie wydajności.
Hałas
| luz |
| 22.22 / 22.22 / 22.22 dB |
| obciążenie |
| 42.03 / 42.1 dB |
 | ||
30 dB cichy 40 dB(A) słyszalny 50 dB(A) irytujący |
||
min: | ||
| Tryb wydajności | Bezczynność dB(A) | Średnie obciążenie dB(A) | Maksymalne obciążenie dB(A) | Witcher 3 1080p Ultra dB(A) |
|---|---|---|---|---|
| Zrównoważony | 22.22 | 33.81 | 34.08 | 34.41 / 48 fps |
| Wydajność | 22.22 | 42.03 | 42.1 | 42.1 / 50 fps |
| HP Pavilion Plus 16-ab0456tx i7-13700H, GeForce RTX 3050 6GB Laptop GPU | Schenker Vision 14 M23 RTX 3050 i7-13700H, GeForce RTX 3050 6GB Laptop GPU | Dell Inspiron 16 Plus 7630 i7-13700H, GeForce RTX 4060 Laptop GPU | Asus VivoBook 14X K3405 i5-13500H, GeForce RTX 3050 4GB Laptop GPU | Lenovo Slim Pro 7 14ARP8 R7 7735HS, GeForce RTX 3050 6GB Laptop GPU | Asus VivoBook Pro 16 K6602VU i9-13900H, GeForce RTX 4050 Laptop GPU | Samsung Galaxy Book3 Ultra 16 i7-13700H, GeForce RTX 4050 Laptop GPU | |
|---|---|---|---|---|---|---|---|
| Noise | -10% | -7% | -10% | -4% | -14% | -9% | |
| wyłączone / środowisko * (dB) | 22.22 | 23.5 -6% | 23.2 -4% | 21.46 3% | 22.7 -2% | 20.96 6% | 25 -13% |
| Idle Minimum * (dB) | 22.22 | 23.5 -6% | 23.2 -4% | 22.08 1% | 22.8 -3% | 25.28 -14% | 26 -17% |
| Idle Average * (dB) | 22.22 | 23.5 -6% | 23.2 -4% | 22.08 1% | 22.8 -3% | 25.28 -14% | 27 -22% |
| Idle Maximum * (dB) | 22.22 | 26 -17% | 23.2 -4% | 22.08 1% | 22.8 -3% | 25.28 -14% | 28 -26% |
| Load Average * (dB) | 42.03 | 43.6 -4% | 35.1 16% | 52.98 -26% | 43.8 -4% | 51.88 -23% | 40 5% |
| Witcher 3 ultra * (dB) | 42.1 | 48.7 -16% | 52.5 -25% | 52.7 -25% | 43.8 -4% | 49 -16% | 39 7% |
| Load Maximum * (dB) | 42.1 | 49.1 -17% | 52.5 -25% | 52.67 -25% | 47.1 -12% | 51.8 -23% | 41 3% |
* ... im mniej tym lepiej
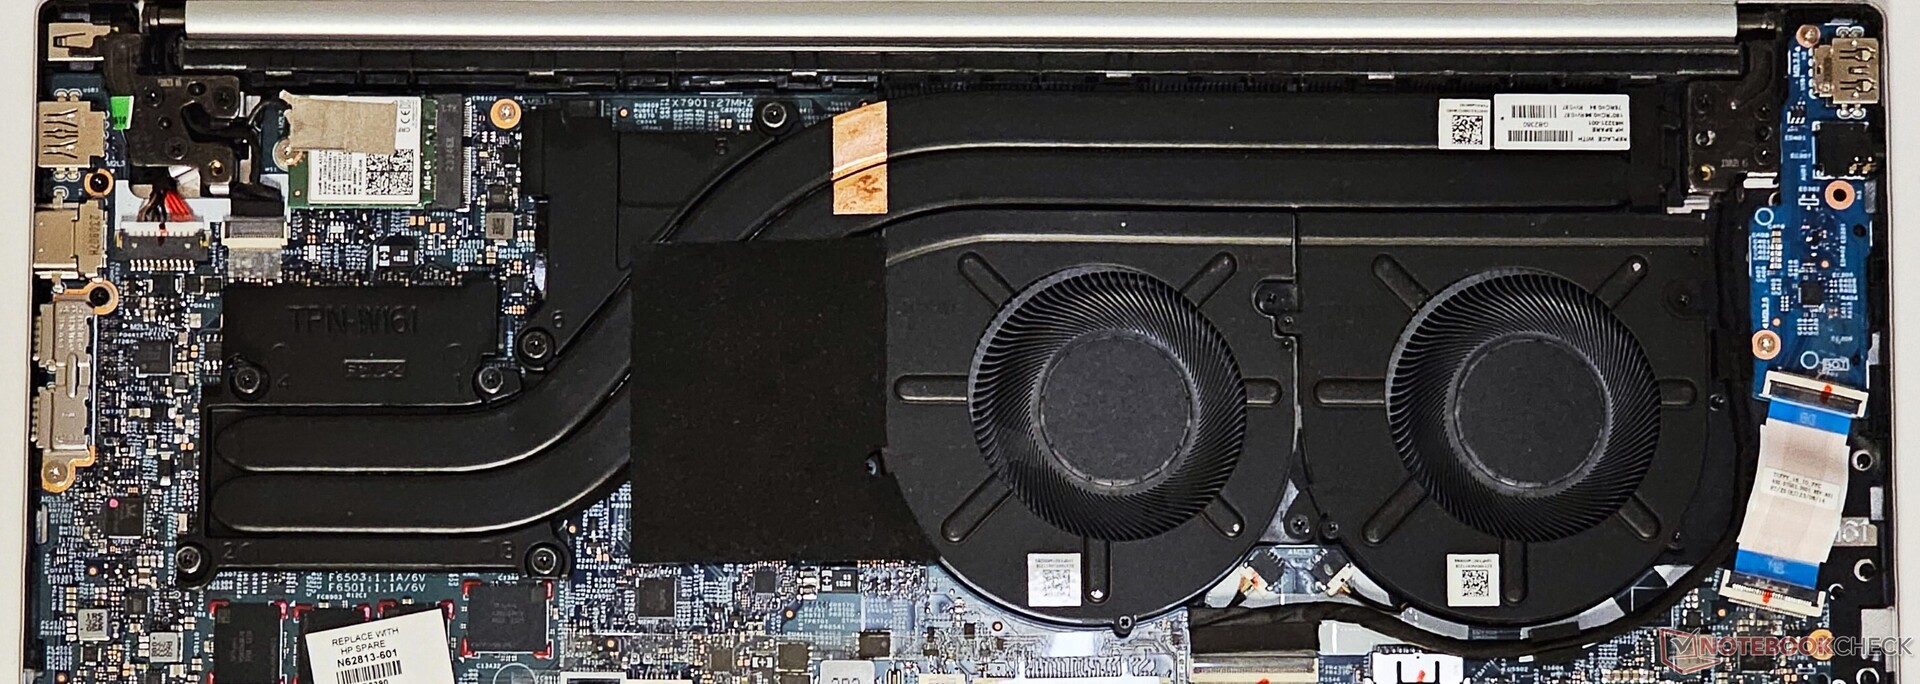
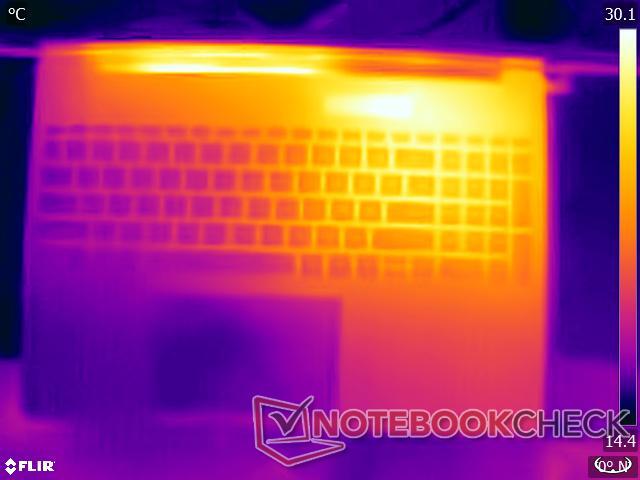
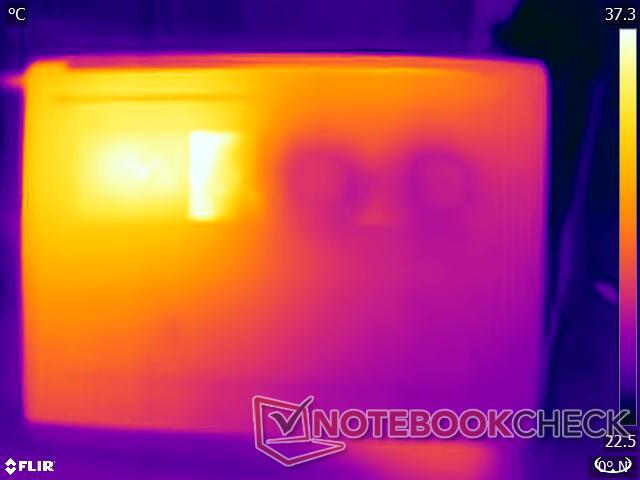
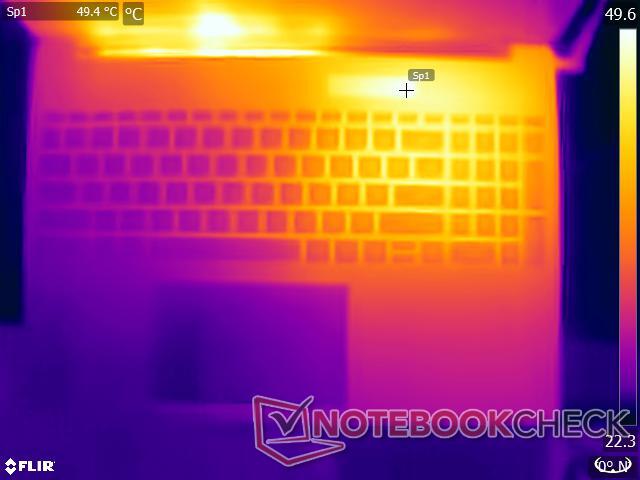
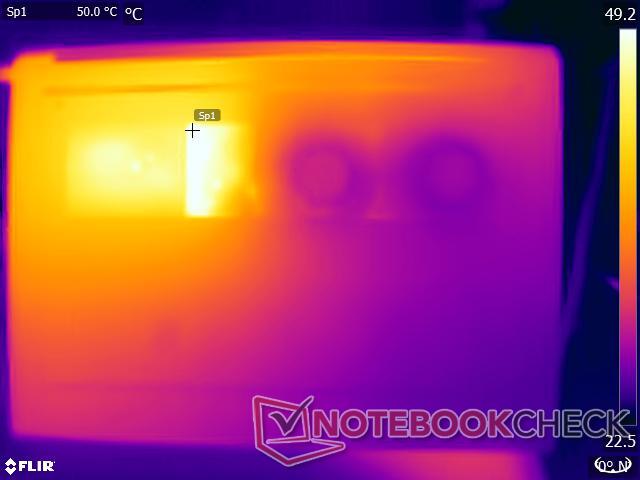
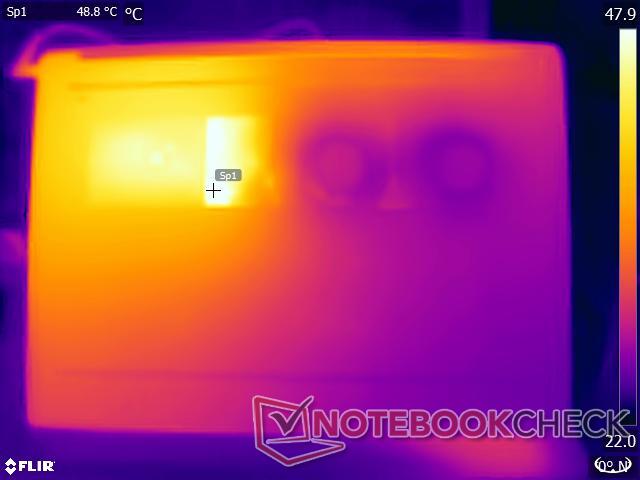
Temperatura
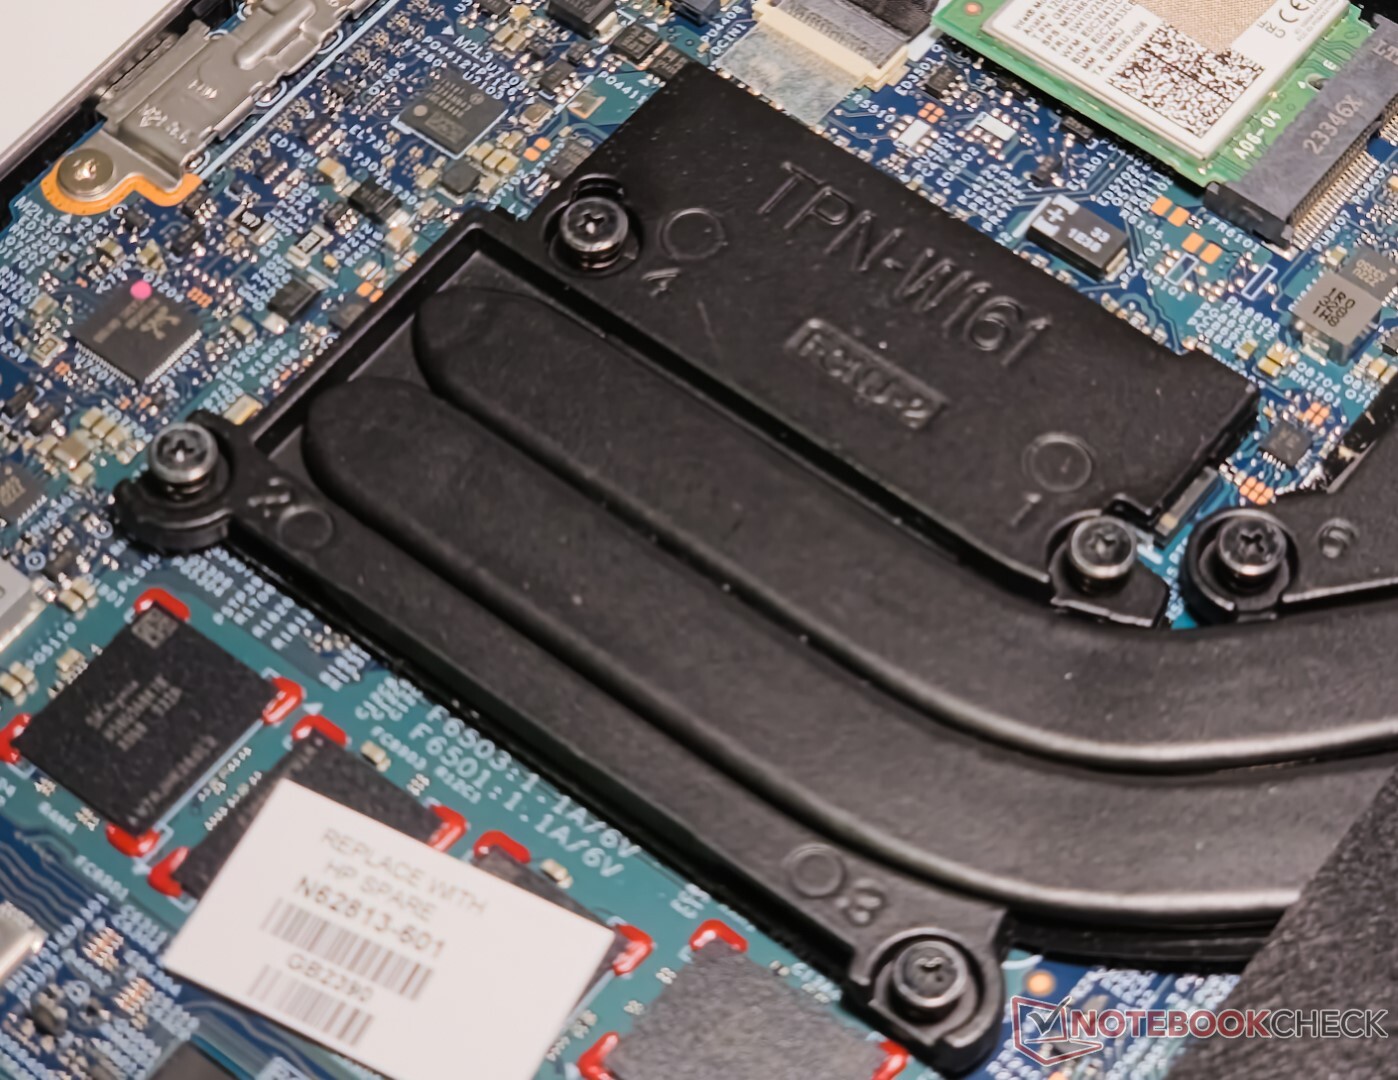
W Pavilion Plus 16 zastosowano system chłodzenia CPU i GPU z dwoma wentylatorami i dwoma ciepłowodami. Podczas naszych testów obciążeniowych, ta konfiguracja została doprowadzona do granic możliwości, a temperatury powierzchni osiągnęły 49,6°C na górze i 45,8°C na dole.
Chociaż urządzenie może być wygodnie używane na kolanach do lekkich zadań, może stać się niewygodne przy dużym obciążeniu.
(-) Maksymalna temperatura w górnej części wynosi 49.6 °C / 121 F, w porównaniu do średniej 36.8 °C / 98 F , począwszy od 21 do 71 °C dla klasy Multimedia.
(-) Dno nagrzewa się maksymalnie do 45.8 °C / 114 F, w porównaniu do średniej 39.1 °C / 102 F
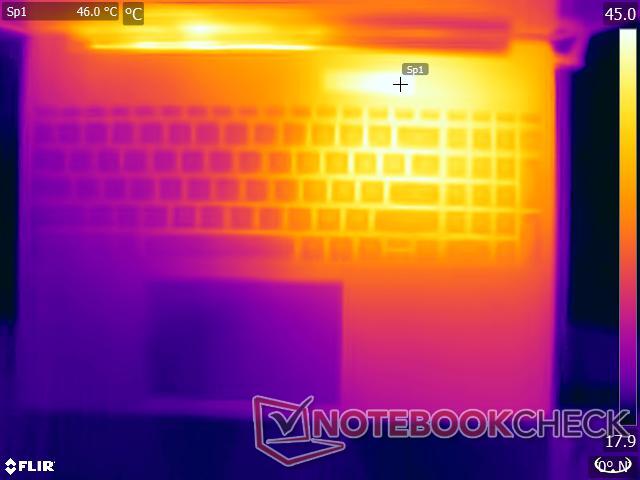
(±) W stanie bezczynności średnia temperatura górnej części wynosi 32.3 °C / 90 F, w porównaniu ze średnią temperaturą urządzenia wynoszącą 31.3 °C / ### class_avg_f### F.
(-) Podczas gry w Wiedźmina 3 średnia temperatura górnej części wynosi 39.7 °C / 103 F, w porównaniu do średniej temperatury urządzenia wynoszącej 31.3 °C / ## #class_avg_f### F.
(+) Podparcia dłoni i touchpad osiągają maksymalną temperaturę skóry (35 °C / 95 F) i dlatego nie są gorące.
(-) Średnia temperatura obszaru podparcia dłoni w podobnych urządzeniach wynosiła 28.7 °C / 83.7 F (-6.3 °C / -11.3 F).
| HP Pavilion Plus 16-ab0456tx Intel Core i7-13700H, NVIDIA GeForce RTX 3050 6GB Laptop GPU | Schenker Vision 14 M23 RTX 3050 Intel Core i7-13700H, NVIDIA GeForce RTX 3050 6GB Laptop GPU | Dell Inspiron 16 Plus 7630 Intel Core i7-13700H, NVIDIA GeForce RTX 4060 Laptop GPU | Asus VivoBook 14X K3405 Intel Core i5-13500H, NVIDIA GeForce RTX 3050 4GB Laptop GPU | Lenovo Slim Pro 7 14ARP8 AMD Ryzen 7 7735HS, NVIDIA GeForce RTX 3050 6GB Laptop GPU | Asus VivoBook Pro 16 K6602VU Intel Core i9-13900H, NVIDIA GeForce RTX 4050 Laptop GPU | Samsung Galaxy Book3 Ultra 16 Intel Core i7-13700H, NVIDIA GeForce RTX 4050 Laptop GPU | |
|---|---|---|---|---|---|---|---|
| Heat | 10% | 6% | -2% | 19% | -1% | 22% | |
| Maximum Upper Side * (°C) | 49.6 | 48.5 2% | 47.8 4% | 49.2 1% | 42.2 15% | 42.6 14% | 41 17% |
| Maximum Bottom * (°C) | 45.8 | 52.8 -15% | 42.2 8% | 54 -18% | 49 -7% | 48.4 -6% | 44 4% |
| Idle Upper Side * (°C) | 39.2 | 27.6 30% | 35.2 10% | 33.6 14% | 24.4 38% | 39.4 -1% | 23 41% |
| Idle Bottom * (°C) | 35.4 | 27 24% | 35 1% | 37.6 -6% | 25.2 29% | 39.8 -12% | 26 27% |
* ... im mniej tym lepiej
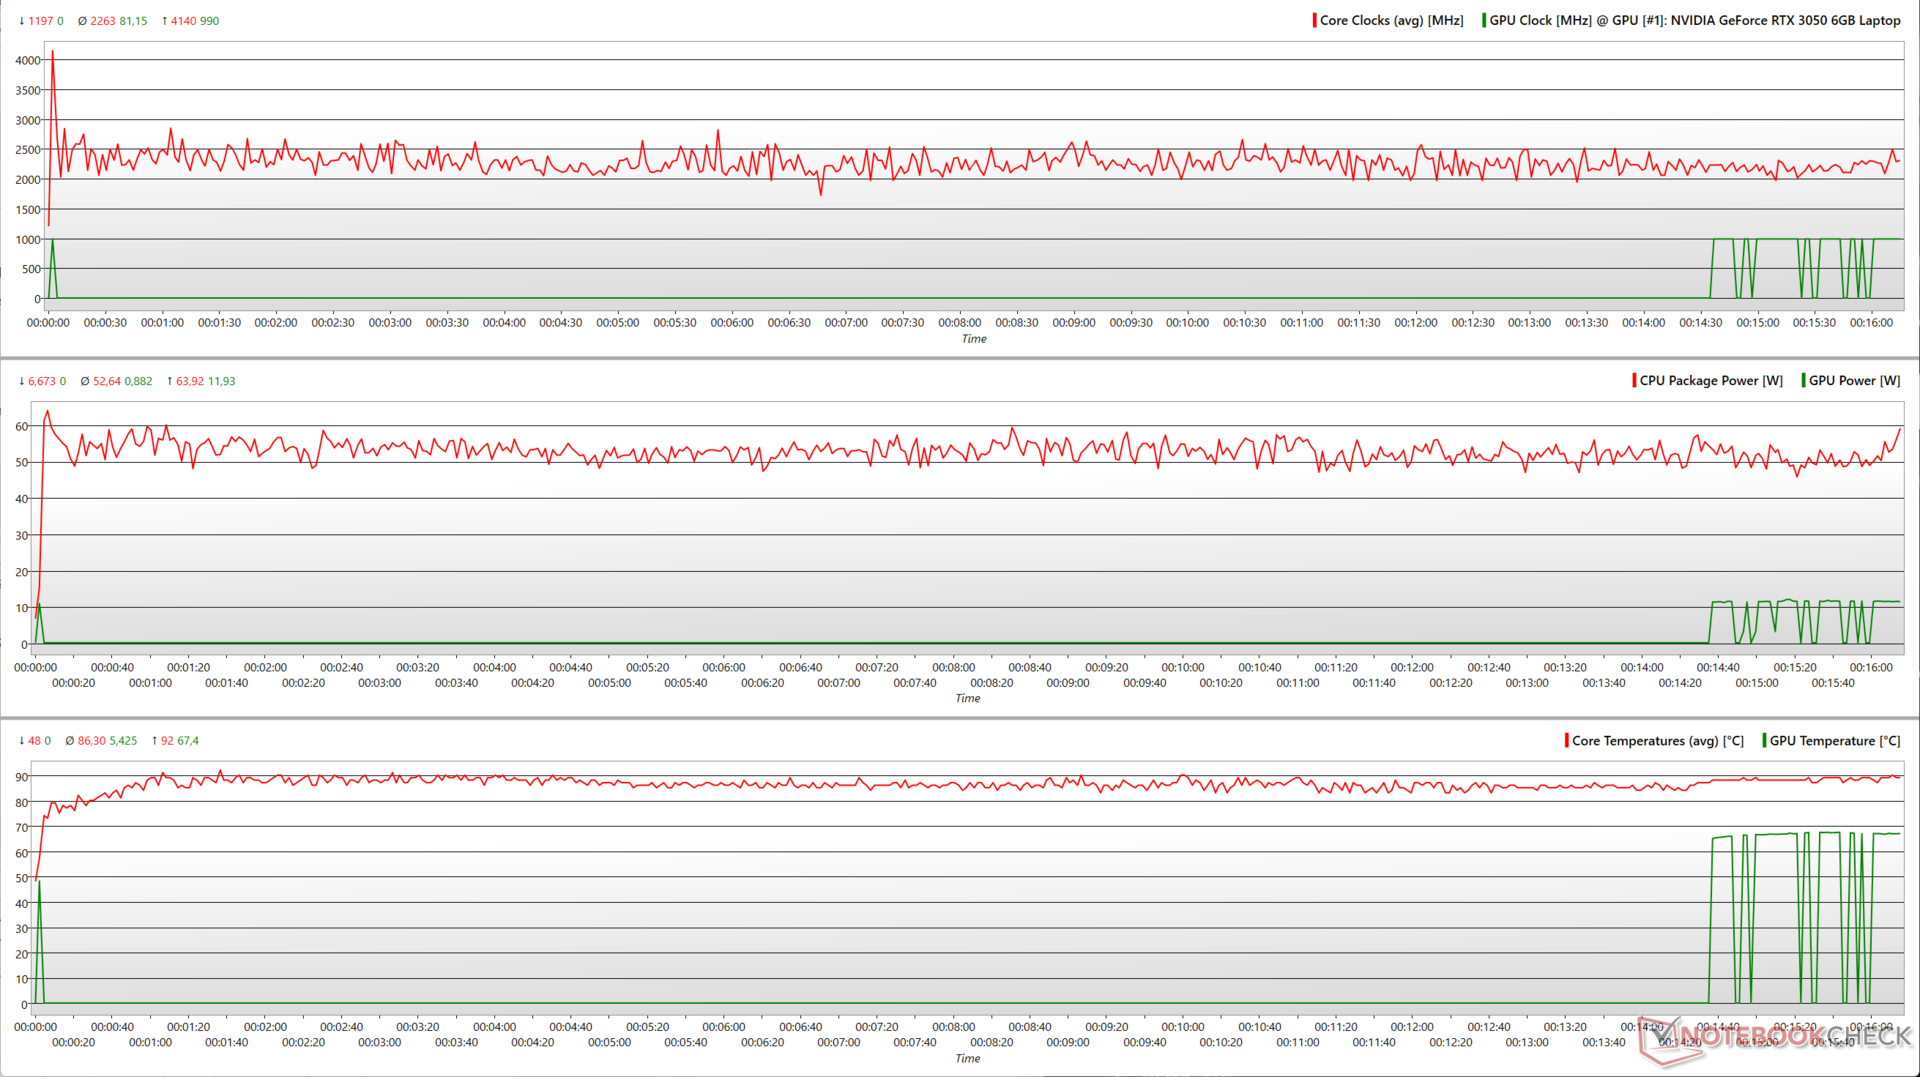
Test warunków skrajnych
Podczas testu Prime95 in-place large FFTs stress, procesor Core i7-13700H w Pavilion Plus 16 taktował ze średnią częstotliwością 2,2 GHz, zużywając przy tym średnio 53 W energii.
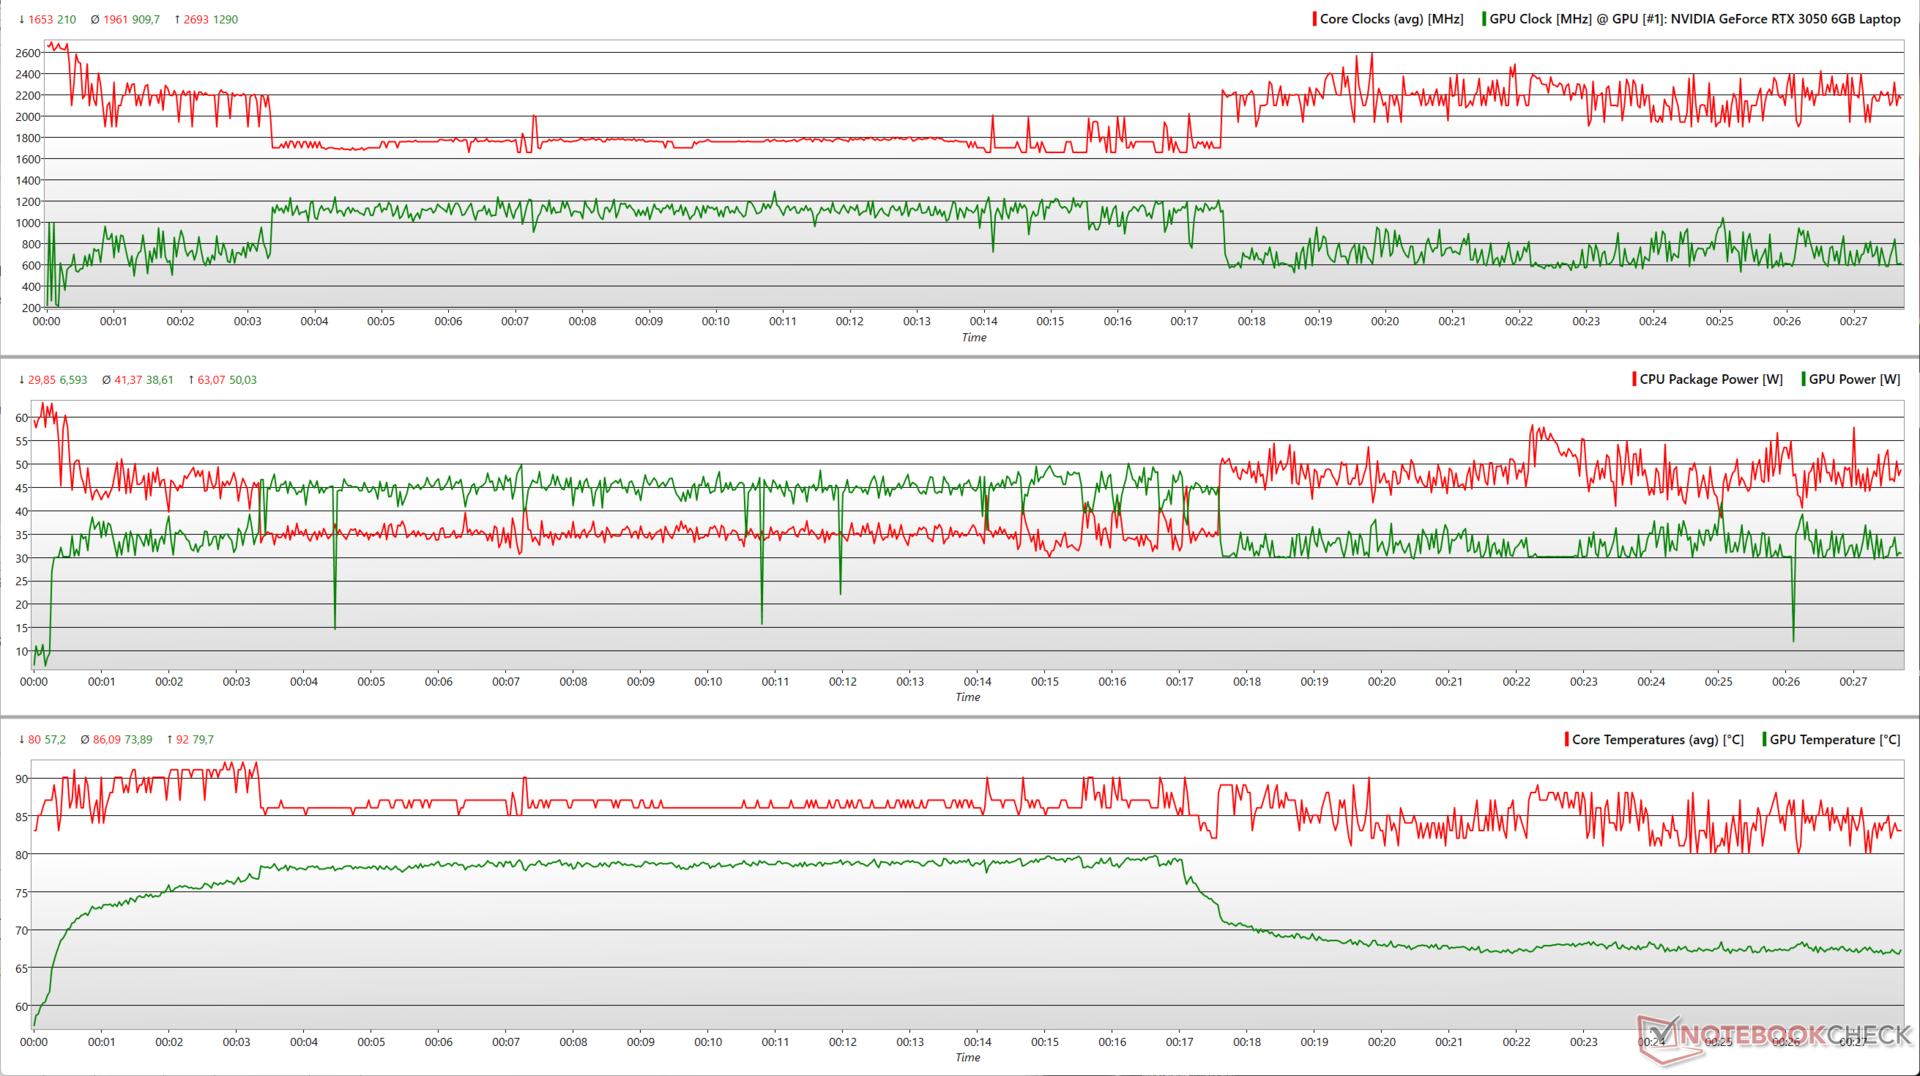
Dodanie FurMark powoduje, że Core i7-13700H i RTX 3050 konkurują o moc, co skutkuje przerywanym wzrostem i spadkiem zegara zarówno dla CPU, jak i GPU.
Średnio, Core i7-13700H może taktować tylko do 1,96 GHz, podczas gdy RTX 3050 osiąga 910 MHz, zużywając odpowiednio 41 W i 39 W.
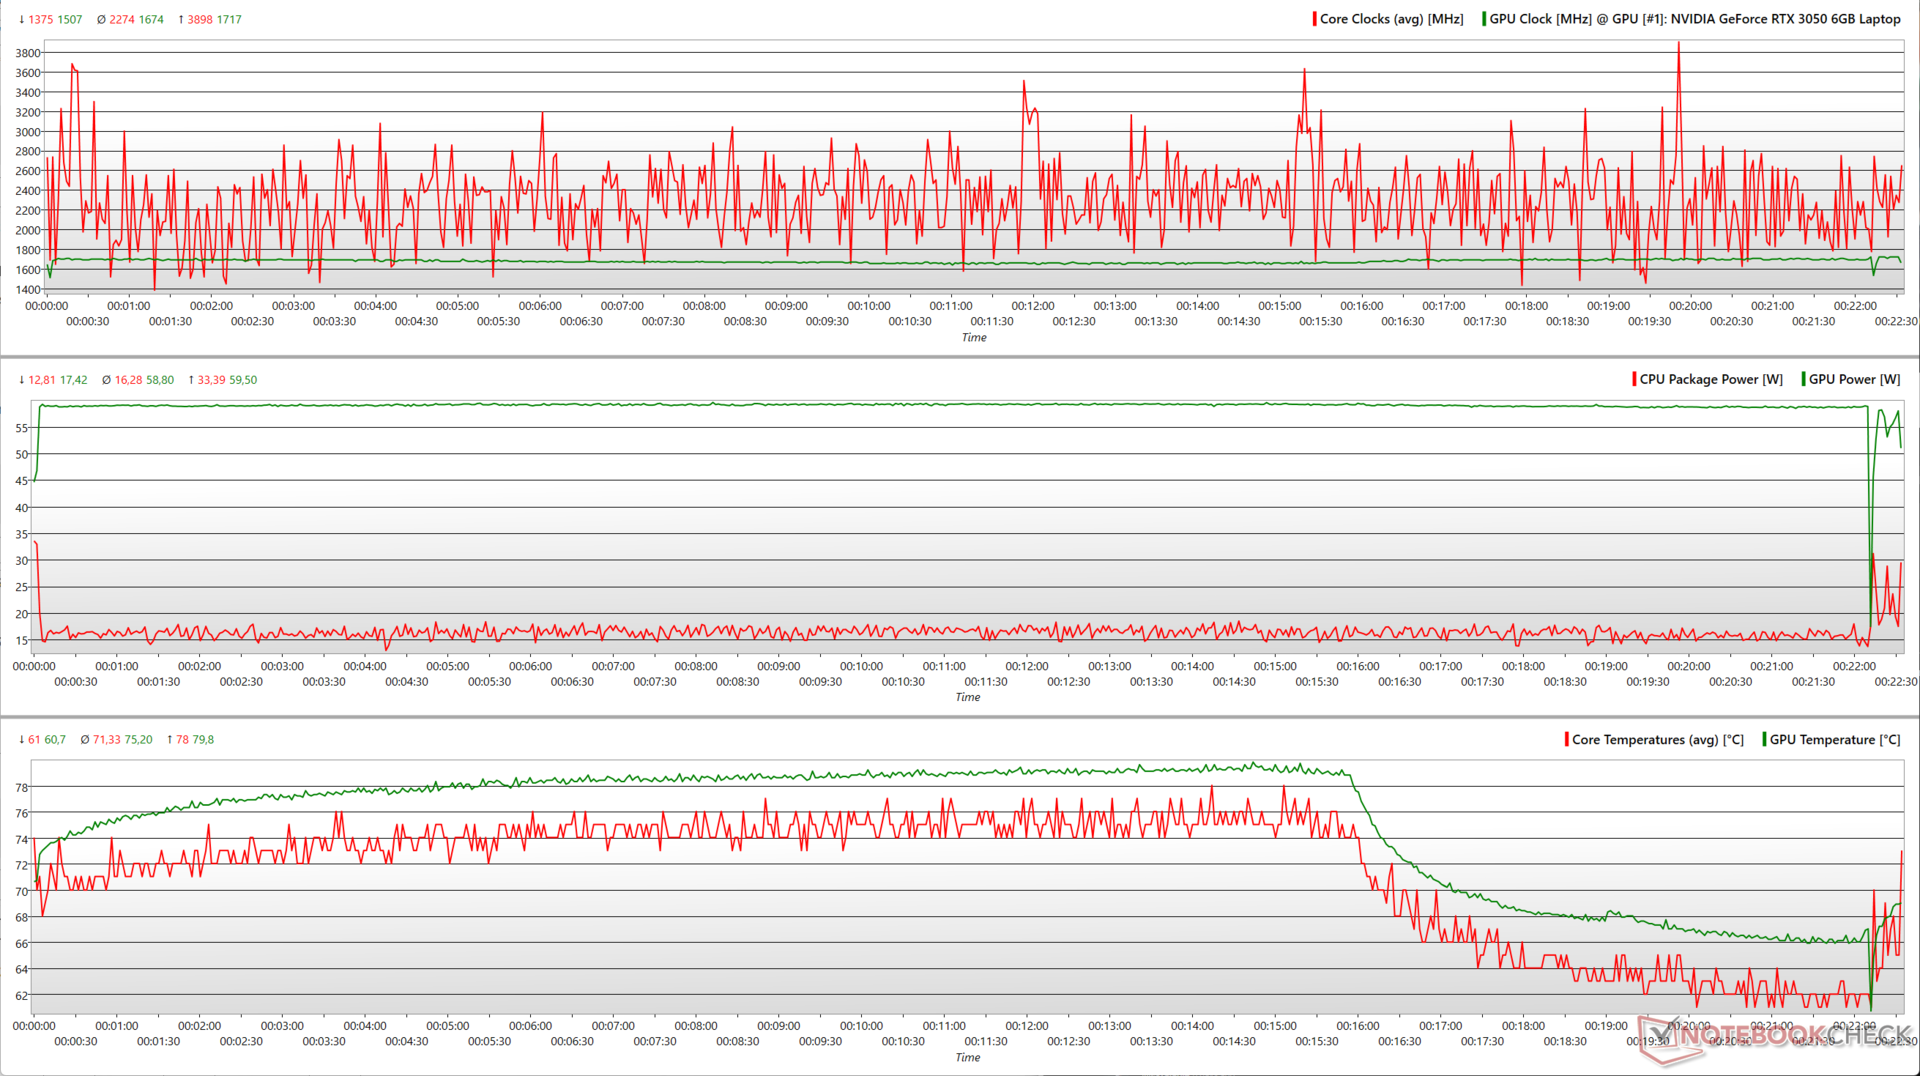
Sprawy stają się o wiele bardziej przewidywalne w przypadku The Witcher 3 w rozdzielczości 1080p Ultra. RTX 3050 jest teraz w stanie niemal konsekwentnie wykorzystywać swoje maksymalne TGP bliskie 60 W.
Co ciekawe, temperatury rdzenia zaczynają spadać po pewnym czasie, nawet gdy zegary CPU/GPU i moc pozostają względnie niezmienione.
| Test obciążeniowy | Taktowanie CPU (GHz) | Taktowanie GPU (MHz) | Średnia temperatura CPU (°C) | Średnia temperatura GPU (°C) |
| Bezczynność systemu | 3,74 | - | 52 | 31,1 |
| Prime95 | 2.1 | - | 86 | 67.4 |
| Prime95+ FurMark | 1.93 | 735 | 86 | 73.5 |
| The Witcher 3 1080p Ultra | 2.2 | 1,717 | 71 | 74.2 |
Głośniki
Pavilion Plus 16 jest wyposażony w parę głośników stereo, które mają dość głośną moc wyjściową 74,2 dB(A), co powinno wystarczyć w większości średniej wielkości pomieszczeń. Bas jest odczuwalny, ale niezbyt wyraźny. Jednak średnie i wysokie tony są stosunkowo dobrze zdefiniowane.
Niemniej jednak użytkownicy mogą uzyskać lepszy dźwięk za pomocą zewnętrznych głośników lub Bluetooth 5.3.
HP Pavilion Plus 16-ab0456tx analiza dźwięku
(±) | głośność głośnika jest średnia, ale dobra (74.2 dB)
Bas 100 - 315 Hz
(±) | zredukowany bas - średnio 14.7% niższy od mediany
(±) | liniowość basu jest średnia (7.8% delta do poprzedniej częstotliwości)
Średnie 400 - 2000 Hz
(+) | zbalansowane środki średnie - tylko 3.4% od mediany
(+) | średnie są liniowe (4.2% delta do poprzedniej częstotliwości)
Wysokie 2–16 kHz
(+) | zrównoważone maksima - tylko 4.6% od mediany
(+) | wzloty są liniowe (4.8% delta do poprzedniej częstotliwości)
Ogólnie 100 - 16.000 Hz
(±) | liniowość ogólnego dźwięku jest średnia (16.7% różnicy w stosunku do mediany)
W porównaniu do tej samej klasy
» 44% wszystkich testowanych urządzeń w tej klasie było lepszych, 8% podobnych, 48% gorszych
» Najlepszy miał deltę 5%, średnia wynosiła ###średnia###%, najgorsza wynosiła 45%
W porównaniu do wszystkich testowanych urządzeń
» 29% wszystkich testowanych urządzeń było lepszych, 7% podobnych, 64% gorszych
» Najlepszy miał deltę 4%, średnia wynosiła ###średnia###%, najgorsza wynosiła 134%
Apple MacBook Pro 16 2021 M1 Pro analiza dźwięku
(+) | głośniki mogą odtwarzać stosunkowo głośno (84.7 dB)
Bas 100 - 315 Hz
(+) | dobry bas - tylko 3.8% od mediany
(+) | bas jest liniowy (5.2% delta do poprzedniej częstotliwości)
Średnie 400 - 2000 Hz
(+) | zbalansowane środki średnie - tylko 1.3% od mediany
(+) | średnie są liniowe (2.1% delta do poprzedniej częstotliwości)
Wysokie 2–16 kHz
(+) | zrównoważone maksima - tylko 1.9% od mediany
(+) | wzloty są liniowe (2.7% delta do poprzedniej częstotliwości)
Ogólnie 100 - 16.000 Hz
(+) | ogólny dźwięk jest liniowy (4.6% różnicy w stosunku do mediany)
W porównaniu do tej samej klasy
» 0% wszystkich testowanych urządzeń w tej klasie było lepszych, 0% podobnych, 100% gorszych
» Najlepszy miał deltę 5%, średnia wynosiła ###średnia###%, najgorsza wynosiła 45%
W porównaniu do wszystkich testowanych urządzeń
» 0% wszystkich testowanych urządzeń było lepszych, 0% podobnych, 100% gorszych
» Najlepszy miał deltę 4%, średnia wynosiła ###średnia###%, najgorsza wynosiła 134%
Zarządzanie energią: Oszczędny pobór mocy i długa żywotność baterii
Zużycie energii
Pavilion Plus 16 zużywa relatywnie mniej energii dla danego sprzętu ogółem. Podczas gdy Schenker Vision 14 M23 i Lenovo Slim Pro 7 są bardziej oszczędne przy średnim obciążeniu i Witcher 3, Pavilion Plus 16 jest bardziej oszczędny przy maksymalnym obciążeniu .
Dostarczony zasilacz o mocy 135 W jest więcej niż wystarczający do zasilania laptopa pod obciążeniem.
| wyłączony / stan wstrzymania | |
| luz | |
| obciążenie |
|
Legenda:
min: | |
| HP Pavilion Plus 16-ab0456tx i7-13700H, GeForce RTX 3050 6GB Laptop GPU, IPS, 2560x1600, 16" | Schenker Vision 14 M23 RTX 3050 i7-13700H, GeForce RTX 3050 6GB Laptop GPU, IPS, 2880x1800, 14" | Dell Inspiron 16 Plus 7630 i7-13700H, GeForce RTX 4060 Laptop GPU, IPS, 2560x1600, 16" | Asus VivoBook 14X K3405 i5-13500H, GeForce RTX 3050 4GB Laptop GPU, , 2880x1800, 14" | Lenovo Slim Pro 7 14ARP8 R7 7735HS, GeForce RTX 3050 6GB Laptop GPU, IPS, 2560x1600, 14.5" | Asus VivoBook Pro 16 K6602VU i9-13900H, GeForce RTX 4050 Laptop GPU, OLED, 3200x2000, 16" | Samsung Galaxy Book3 Ultra 16 i7-13700H, GeForce RTX 4050 Laptop GPU, AMOLED, 2880x1800, 16" | Przeciętny NVIDIA GeForce RTX 3050 6GB Laptop GPU | Średnia w klasie Multimedia | |
|---|---|---|---|---|---|---|---|---|---|
| Power Consumption | -2% | -100% | 6% | -30% | -141% | 20% | -8% | -14% | |
| Idle Minimum * (Watt) | 3.3 | 5.2 -58% | 15.6 -373% | 4.96 -50% | 7.6 -130% | 21.06 -538% | 3 9% | 4.55 ? -38% | 5.72 ? -73% |
| Idle Average * (Watt) | 7.3 | 7.8 -7% | 17.7 -142% | 7.54 -3% | 12.2 -67% | 24.27 -232% | 5 32% | 8.63 ? -18% | 10.2 ? -40% |
| Idle Maximum * (Watt) | 14.24 | 9 37% | 20.6 -45% | 9.31 35% | 12.8 10% | 25.12 -76% | 11 23% | 11.7 ? 18% | 12.4 ? 13% |
| Load Average * (Watt) | 91.7 | 78.6 14% | 87.4 5% | 83.4 9% | 76.5 17% | 52.4 43% | 72 21% | 86.6 ? 6% | 65.5 ? 29% |
| Witcher 3 ultra * (Watt) | 96.2 | 86.8 10% | 121.7 -27% | 73.3 24% | 89.5 7% | 110.2 -15% | 69.7 28% | ||
| Load Maximum * (Watt) | 115.8 | 121.2 -5% | 138 -19% | 91.74 21% | 135.7 -17% | 146 -26% | 108 7% | 127.6 ? -10% | 114 ? 2% |
* ... im mniej tym lepiej
Power Consumption: The Witcher 3 / Stress test
Power Consumption: External monitor
Żywotność baterii
Potężne, ale mało wydajne podzespoły wewnętrzne pomagają w dobrym czasie pracy na baterii. Przy jasności 150 nitów, bateria Pavilion Plus 16 o mocy 68 Whr może osiągnąć prawie 10,5 godziny przeglądania stron internetowych i 12 godzin odtwarzania wideo 1080p, co jest imponującym czasem pracy.
| HP Pavilion Plus 16-ab0456tx i7-13700H, GeForce RTX 3050 6GB Laptop GPU, 68 Wh | Schenker Vision 14 M23 RTX 3050 i7-13700H, GeForce RTX 3050 6GB Laptop GPU, 99 Wh | Dell Inspiron 16 Plus 7630 i7-13700H, GeForce RTX 4060 Laptop GPU, 86 Wh | Asus VivoBook 14X K3405 i5-13500H, GeForce RTX 3050 4GB Laptop GPU, 63 Wh | Lenovo Slim Pro 7 14ARP8 R7 7735HS, GeForce RTX 3050 6GB Laptop GPU, 73 Wh | Asus VivoBook Pro 16 K6602VU i9-13900H, GeForce RTX 4050 Laptop GPU, 96 Wh | Samsung Galaxy Book3 Ultra 16 i7-13700H, GeForce RTX 4050 Laptop GPU, 76 Wh | Średnia w klasie Multimedia | |
|---|---|---|---|---|---|---|---|---|
| Czasy pracy | 16% | -10% | -18% | 1% | -11% | 2% | 27% | |
| H.264 (h) | 12 | 10.4 -13% | 9.8 -18% | 13.4 12% | 16.4 ? 37% | |||
| WiFi v1.3 (h) | 10.4 | 12.1 16% | 9.4 -10% | 8.1 -22% | 10.5 1% | 10.1 -3% | 9.6 -8% | 12.2 ? 17% |
| Reader / Idle (h) | 17.6 | 18.2 | 24.9 ? | |||||
| Load (h) | 1.4 | 1.1 | 1.8 | 1.668 ? | ||||
| Witcher 3 ultra (h) | 1.3 |
Za
Przeciw
Werdykt: Wielki potencjał powstrzymywany przez kompromisy
HP Pavilion Plus 16 spełnia większość wymagań, jakich można oczekiwać od nowoczesnego laptopa multimedialnego do pracy i rozrywki. Laptop Pavilion Plus 16 charakteryzuje się całkowicie metalową konstrukcją, która sprawia wrażenie wysokiej jakości, bez zbędnych wygięć, a także wyborem portów, który obejmuje najważniejsze elementy.
Panel 2560 x 1600 120 Hz nie może pochwalić się HDR ani szerokim pokryciem Adobe RGB i Display P3, jak w przypadku Pavilion Plus 142,8K OLED. Niemniej jednak, zapewnia on odpowiednie podstawy z przyzwoitym czasem reakcji i brakiem migotania PWM.
HP Pavilion Plus 16 to sprawny, wszechstronny laptop multimedialny i produktywny, ale cena wywoławcza mogłaby idealnie pasować do co najmniej RTX 4050 "
Ograniczenia wydajności stają się widoczne, gdy zaczniemy porównywać go z konkurencją. 60 W PL2 okazuje się szczególnie niekorzystne dla Pavilion Plus 16 w trybie wielordzeniowym w porównaniu do Dell Inspiron 16 Plus 7630 a nawet Samsung Galaxy Book3 Ultra 16które posiadają Core i7-13700H o wyższej mocy.
HP mogło z łatwością pozwolić na 80 W PL2 lub więcej w dodatkowym profilu mocy, aby zmaksymalizować potencjał układu. Jednak podsystem chłodzenia już teraz wydaje się nadwyrężony przy obecnej konfiguracji pod obciążeniem.
Nvidia GeForce RTX 3050 6 GB nie dorównuje generacji Ada pod względem wydajności i efektywności energetycznej. Chociaż w grach 1080p widać zauważalny wzrost w stosunku do RTX 3050 4 GB, testy syntetyczne nie wykazują większej zachęty.
Przy cenie wywoławczej 1350 USD na stronie HP, Pavilion Plus 16 jest o 100 USD droższy niż Inspiron 16 Plus 7630, który oferuje 60 W RTX 4060 i wydajniejszy Core i7-13700H. Biorąc to pod uwagę, Pavilion Plus 16 jest tańszy niż Inspiron 16 Plus 7630 na rynku indyjskim.
The Asus VivoBook Pro 16 z wyświetlaczem OLED 3,2K, procesorem Core i9-13900H i nawet RTX 4060 jest doskonałą alternatywą dla początkujących twórców, o ile plastik i dodatkowe 300 USD premii nie powstrzymują Państwa.
Cena i dostępność
Testowany HP Pavilion Plus 16-ab0456tx można nabyć na oficjalnej stronie HP India za 1 24 999 jenów. Laptop można również skonfigurować na stronie HP US za 1 350 USD.
Amazon India oferuje Pavilion Plus 16 bez RTX 3050 dGPU za 1 25 900 jenów.
HP Pavilion Plus 16-ab0456tx
- 07/02/2024 v7 (old)
Vaidyanathan Subramaniam
Przezroczystość
Wyboru urządzeń do recenzji dokonuje nasza redakcja. Próbka testowa została udostępniona autorowi jako pożyczka od producenta lub sprzedawcy detalicznego na potrzeby tej recenzji. Pożyczkodawca nie miał wpływu na tę recenzję, producent nie otrzymał też kopii tej recenzji przed publikacją. Nie było obowiązku publikowania tej recenzji. Jako niezależna firma medialna, Notebookcheck nie podlega władzy producentów, sprzedawców detalicznych ani wydawców.
Tak testuje Notebookcheck
Każdego roku Notebookcheck niezależnie sprawdza setki laptopów i smartfonów, stosując standardowe procedury, aby zapewnić porównywalność wszystkich wyników. Od około 20 lat stale rozwijamy nasze metody badawcze, ustanawiając przy tym standardy branżowe. W naszych laboratoriach testowych doświadczeni technicy i redaktorzy korzystają z wysokiej jakości sprzętu pomiarowego. Testy te obejmują wieloetapowy proces walidacji. Nasz kompleksowy system ocen opiera się na setkach uzasadnionych pomiarów i benchmarków, co pozwala zachować obiektywizm.Price comparison

