Notebookcheck Logo

Intel Processor N200

Intel N200

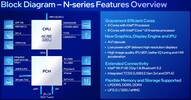
Procesor Intel N200 to podstawowy mobilny CPU dla cienkich i lekkich laptopów z serii Alder Lake-N. Został zapowiedziany na początku 2023 roku i nie oferuje wydajnych rdzeni oraz 4 z 8 wydajnych rdzeni (rdzenie E, architektura Gracemont). Układ nie obsługuje technologii HyperThreading i taktuje z częstotliwością do 3,7 GHz. Wydajność rdzeni E powinna być zbliżona do starych rdzeni Skylake (proszę porównać do Core i7-6700HQ). Wszystkie rdzenie mogą wykorzystywać do 6 MB pamięci podręcznej L3.

Wydajność

Wydajność jest wyraźnie niższa od Core i3-N300 i N305 ze względu na mniejszą liczbę rdzeni. W porównaniu do starszych procesorów, N200 powinien być podobny do Core i5-8250U (4 rdzenie z HyperThreading, 3,4 GHz, 15W), gdy limit mocy nie ogranicza wydajności.

Cechy

Układy Alder Lake-N obsługują tylko pamięć jednokanałową do DDR5-4800, DDR4-3200 lub LPDDR5-4800. Układ obsługuje również funkcję Quick Sync i dekodowanie AV1 (najprawdopodobniej ten sam silnik co w Alder Lake). Co więcej, Wi-Fi 6E i Bluetooth 5.2 są częściowo zintegrowane (ale nie ma Thunderbolt). Zewnętrzne układy można podłączyć przez PCIe Gen3 x9 (przez PCH).

Zintegrowana karta graficzna bazuje na architekturze Xe i oferuje 32 jednostki EU (Execution Units) pracujące z częstotliwością zaledwie 450 - 750 MHz. Ze względu na jednokanałową pamięć, niskie taktowanie i małą liczbę jednostek cieniujących, wydajność iGPU w grach jest bardzo ograniczona.

Pobór mocy

Podstawowy pobór mocy N200 wynosi zaledwie 6 W, dzięki czemu nadaje się on do chłodzenia bez wentylatora. Procesor został zbudowany w jeszcze bardziej ulepszonym procesie technologicznym 10 nm SuperFin firmy Intel (zwanym Intel 7).

Nazwa roboczaAlder Lake-N
SeriaIntel Alder Lake-N

Rodzina: Alder Lake-N Alder Lake-N

Intel Core i3-N3051.8 - 3.8 GHz8 / 8 cores6 MB L3
Intel Core i3-N300 - 3.8 GHz8 / 8 cores6 MB L3
Intel Processor N200 « 1 - 3.7 GHz4 / 4 cores6 MB L3
Intel Processor N97 - 3.6 GHz4 / 4 cores6 MB L3
Intel Processor N95 - 3.4 GHz4 / 4 cores6 MB L3
Intel Processor N1001 - 3.4 GHz4 / 4 cores6 MB L3
Intel Processor N501 - 3.4 GHz2 / 2 cores6 MB L3
Taktowanie1000 - 3700 MHz
Pamięć 3. poziomu6 MB
Liczba rdzeni / wątków4 / 4
4 x 3.7 GHz Intel Crestmont E-Core
TDP (Thermal Design Power)6 W
Technologia wytwarzania10 nm
Maks. temperatura105 °C
GPUIntel UHD Graphics Xe 750 32EUs (Rocket Lake) (450 - 750 MHz)
64-bityobsługa 64-bitów
Architecturex86
Data premiery03/01/2023
Odnośnik do produktu (zewn.)ark.intel.com

Testy

Performance Rating - CB R15 + R20 + 7-Zip + X265 + Blender + 3DM11 CPU
20.7 pt (34%)
2.31 -89%
...
18.2 -12%
AMD 3020e
18.2 -12%
18.4 -11%
AMD Athlon Silver 3050e
18.8 -9%
19 -8%
19.2 -7%
19.5 -6%
Intel Core i5-L16G7
20.4 -1%
20.6 0%
Intel Processor N200
20.7
20.7 0%
20.9 1%
21 1%
21.3 3%
21.5 4%
21.7 5%
AMD Athlon Gold 3150U
21.9 6%
Intel Core i3-10100Y
22.2 7%
AMD Ryzen 3 3250U
22.3 8%
...
47.4 129%
max:
60.1 190%
0%
100%
Cinebench 2024 - Cinebench 2024 CPU Single Core
45 Points (25%)
Cinebench 2024 - Cinebench 2024 CPU Multi Core
91 Points (2%)
Cinebench R23 - Cinebench R23 Multi Core
1406 Points (1%)
202 -86%
...
Intel Celeron J4125
1203 -14%
1225 -13%
1232 -12%
1293 -8%
1341 -5%
1366 -3%
Intel Core i3-10100Y
1375 -2%
1390 -1%
1390 -1%
Intel Processor N200
1406
1417 1%
1496 6%
1529 9%
Qualcomm Snapdragon 7c+ Gen 3
1555 11%
1614 15%
1618 15%
1730 23%
1786 27%
Intel Core i5-L16G7
1810 29%
...
32782 2232%
max:
107681 7559%
0%
100%
Cinebench R23 - Cinebench R23 Single Core
690 Points (29%)
74.4 -89%
...
624 -10%
Intel Core i5-8260U
629 -9%
637 -8%
638 -8%
660 -4%
663 -4%
669 -3%
671 -3%
679 -2%
Intel Processor N200
690
692 0%
Intel Core i5-L16G7
710 3%
721 4%
AMD Ryzen 3 3250U
785 14%
Intel Core i3-10100Y
788 14%
820 19%
AMD Ryzen Embedded V1605B
841 22%
863 25%
874 27%
...
2270 229%
max:
Intel Core Ultra 9 285K
2348 240%
0%
100%
Cinebench R20 - Cinebench R20 CPU (Single Core)
265 Points (29%)
Cinebench R20 - Cinebench R20 CPU (Multi Core)
542 Points (1%)
Cinebench R15 - Cinebench R15 CPU Multi 64 Bit
219 Points (1%)
31 -86%
...
208 -5%
209 -5%
211 -4%
211 -4%
212.5 -3%
213.4 -3%
214 -2%
215 -2%
216.8 -1%
Intel Processor N200
219
Intel Core i3-10100Y
220 0%
Intel Celeron J4125
223.4 2%
223.7 2%
224 2%
225.3 3%
225.5 3%
226 3%
AMD Athlon Silver 3050e
226.5 3%
226.6 3%
...
5600 2457%
max:
15842 7134%
0%
100%
0153045607590105120135150165180195210Tooltip
Cinebench R11.5 - Cinebench R11.5 CPU Multi 64 Bit
2.7 Points (4%)
Cinebench R11.5 - Cinebench R11.5 CPU Single 64 Bit
1.4 Points (32%)
Cinebench R10 - Cinebench R10 Rend. Multi (32bit)
7549 pkt. (5%)
Cinebench R10 - Cinebench R10 Rend. Multi (64bit)
11030 Points (7%)
wPrime 2.10 - wPrime 2.0 32m *
26 s (5%)
7-Zip 18.03 - 7-Zip 18.03 Multi Thread 4 runs
7146 MIPS (4%)
7-Zip 18.03 - 7-Zip 18.03 Single Thread 4 runs
3230 MIPS (38%)
X264 HD Benchmark 4.0 - x264 Pass 2
16.3 fps (5%)
X264 HD Benchmark 4.0 - x264 Pass 1
80 fps (18%)
HWBOT x265 Benchmark v2.2 - HWBOT x265 4k Preset
1.5 fps (3%)
00.20.40.60.811.21.41.61.81.92.12.32.52.72.93.13.33.53.7Tooltip
TrueCrypt - TrueCrypt Serpent
0.3 GB/s (8%)
TrueCrypt - TrueCrypt Twofish
0.6 GB/s (10%)
TrueCrypt - TrueCrypt AES
3.2 GB/s (8%)
Blender - Blender 3.3 Classroom CPU *
4297 Seconds (55%)
Blender - Blender 2.79 BMW27 CPU *
2150 Seconds (15%)
R Benchmark 2.5 - R Benchmark 2.5 *
1.1 sec (25%)
Super Pi mod 1.5 XS 1M - Super Pi mod 1.5 XS 1M *
18.8 s (4%)
3DMark 11 - 3DM11 Performance Physics
2765 Points (7%)
3DMark - 3DMark Ice Storm Physics
27649 Points (22%)
3DMark - 3DMark Ice Storm Extreme Physics
28655 Points (23%)
3DMark - 3DMark Ice Storm Unlimited Physics
34749 Points (29%)
3DMark - 3DMark Cloud Gate Physics
2848 Points (7%)
3DMark - 3DMark Fire Strike Standard Physics
4135 Points (7%)
3DMark - 3DMark Time Spy CPU
1251 Points (5%)
Geekbench 6.3 - Geekbench 6.3 Single-Core
956 pkt. (24%)
Geekbench 6.3 - Geekbench 6.3 Multi-Core
1660 pkt. (6%)
662 -60%
668 -60%
763 -54%
Zhaoxin KaiXian KX-6000G
1012 -39%
1332 -20%
Intel Processor N200
1660
2024 22%
Qualcomm Snapdragon 7c+ Gen 3
2244 35%
2803 69%
2937 77%
2958 78%
Intel Core i3-1005G1
3165 91%
3181 92%
3324 100%
Intel Core i7-10810U
4090 146%
...
25760 1452%
0%
100%
Geekbench 5.5 - Geekbench 5.1 - 5.5 64 Bit Multi-Core
1540 pkt. (3%)
Geekbench 5.0 - Geekbench 5.0 64 Bit Single-Core
891 pkt. (4%)
Geekbench 5.0 - Geekbench 5.0 64 Bit Multi-Core
1518 pkt. (5%)
Geekbench 4.4 - Geekbench 4.1 - 4.4 64 Bit Single-Core
4552 pkt. (45%)
Geekbench 4.4 - Geekbench 4.1 - 4.4 64 Bit Multi-Core
9989 pkt. (10%)
Mozilla Kraken 1.1 - Kraken 1.1 Total Score *
1460 ms (2%)
WebXPRT 3 - WebXPRT 3 Score
171.3 Points (31%)
CrossMark - CrossMark Overall
614 Points (24%)
Power Consumption - Prime95 Power Consumption - external Monitor *
14.1 Watt (2%)
051015202530Tooltip
Power Consumption - Cinebench R15 Multi Power Consumption - external Monitor *
13.6 Watt (2%)
0510152025Tooltip
Power Consumption - Idle Power Consumption - external Monitor *
6.1 Watt (4%)
0123456789Tooltip
Power Consumption - Cinebench R15 Multi Power Efficiency - external Monitor
16.1 Points per Watt (12%)
- Zakres wyników testów referencyjnych dla tej karty graficznej
red legend - Średnia wartość wyników testów referencyjnych dla tej karty graficzne
* Smaller numbers mean a higher performance

v1.28
log 07. 04:17:33

#0 ran 0s before starting gpusingle class +0s ... 0s

#1 no ids found in url (should be separated by "_") +0s ... 0s

#2 not redirecting to Ajax server +0s ... 0s

#3 did not recreate cache, as it is less than 5 days old! Created at Wed, 04 Dec 2024 05:27:59 +0100 +0.001s ... 0.001s

#4 no comparison url found in template nbc.compare_page_2 needed +0.012s ... 0.013s

#5 no comparison url found in template nbc.compare_page_2 needed +0s ... 0.014s

#6 no comparison url found in template nbc.compare_page_2 needed +0s ... 0.014s

#7 no comparison url found in template nbc.compare_page_2 needed +0s ... 0.014s

#8 no comparison url found in template nbc.compare_page_2 needed +0s ... 0.014s

#9 no comparison url found in template nbc.compare_page_2 needed +0s ... 0.015s

#10 composed specs +0.001s ... 0.015s

#11 did output specs +0s ... 0.015s

#12 getting avg benchmarks for device 14930 +0.017s ... 0.033s

#13 got single benchmarks 14930 +0.012s ... 0.045s

#14 got avg benchmarks for devices +0s ... 0.045s

#15 min, max, avg, median took s +1.169s ... 1.214s

#16 no comparison url found in template nbc.compare_page_2 needed +0s ... 1.214s

#17 return log +0s ... 1.214s

Please share our article, every link counts!
Mail Logo

Inne procesory tej serii Alder Lake-N

» Intel Core i3-N305
   8x 1.8 GHz - 3.8 GHz
» Intel Core i3-N300
   8x - 3.8 GHz
» Intel Processor N200
   4x 1 GHz - 3.7 GHz
» Intel Processor N97
   4x - 3.6 GHz
» Intel Processor N95
   4x - 3.4 GHz
» Intel Processor N100
   4x 1 GHz - 3.4 GHz
» Intel Processor N50
   2x 1 GHz - 3.4 GHz

Porównywalne CPU

+ Intel Core i5-7287U
   2x 3.3 GHz - 3.7 GHz
+ Microsoft SQ1
   8x 3 GHz
+ Intel Core i7-7560U
   2x 2.4 GHz - 3.8 GHz
+ Intel Core i3-1110G4
   2x 2.5 GHz - 3.9 GHz
+ Qualcomm Snapdragon 8cx
   8x 2.84 GHz
» Intel Processor N200
   4x 1 GHz - 3.7 GHz
- Intel Core i7-2820QM
   4x 2.3 GHz - 3.4 GHz
- Intel Core i7-3612QM
   4x 2.1 GHz - 3.1 GHz
- Intel Core i7-2720QM
   4x 2.2 GHz - 3.3 GHz
- Intel Core i7-2675QM
   4x 2.2 GHz - 3.1 GHz
- Intel Core i7-2670QM
   4x 2.2 GHz - 3.1 GHz
Klaus Hinum (Update: 2023-11-25)