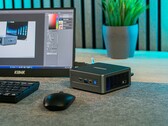


Recenzja BMAX B7 Power: Oszczędny mini PC z procesorem Intel Core i7 za 400 USD
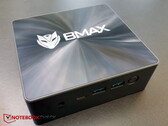
Ponieważ sam Intel nie produkuje już mini PC, inni producenci szybko wypełnili tę lukę. BMAX to chiński producent, który ma do zaoferowania niskie ceny. Jego topowy model, B7 Power, oferuje procesor Intel Core i7-11390H, ciche wentylatory i dobrze nadaje się do pracy biurowej. W tej recenzji przyjrzeliśmy się bliżej, jak dobrze Mini PC sprawdza się w codziennym użytkowaniu i jak wypadł w naszych testach.
Intel Core i7-11390H, Iris Xe G7 96EUs, 363 g