Recenzja Schenker Vision 16 2023: 16-calowy, lekki komputer z wieloma portami

Oprócz Vision 16 Proschenker oferuje również Vision 16. Ten wyjątkowo lekki 16-calowy ultrabook oferuje najnowszy procesor Intel Raptor Lake Core i7-13700H. Dedykowane GPU są zarezerwowane dla modeli Pro. Podczas gdy zeszłoroczny model Vision 16 osiągnął wagę 1,45 kg, nowy model waży 1,5 kg, co nadal czyni go jednym z najlżejszych 16-calowych laptopów na rynku.
Zamiast ekranu 90 Hz z zeszłorocznego modelu, nowy Vision 16 otrzymał panel WQXGA 240 Hz z wariantu Pro. Ciekły metal do odprowadzania ciepła z procesora Core i7-13700H jest nadal wykorzystywany, choć system chłodzenia został przerobiony, aby Vision 16 był mniej hałaśliwy pod obciążeniem.
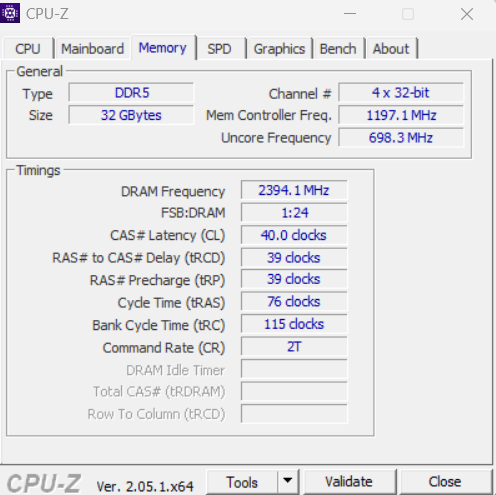
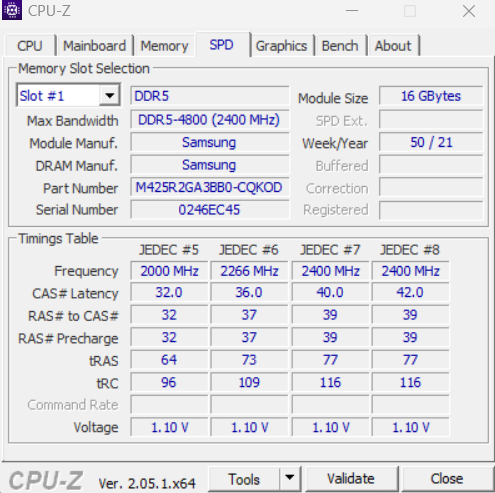
Vision 16 jest dostępny w cenie od 1,539 euro. Podstawowy model posiada 16 GB pamięci DDR5-4800 i 500 GB dysk SSD M.2 firmy Samsung. Nasz recenzowany model wyposażony jest w 32 GB pamięci i 1 TB M.2 Samsung 990 Pro SSD. Recenzowana wersja z systemem Windows jest dostępna za około 1 660 euro.
Potencjalni konkurenci w porównaniu
Ocena | Data | Model | Waga | Wysokość | Rozmiar | Rezolucja | Cena |
|---|---|---|---|---|---|---|---|
| 88.6 % v7 (old) | 08/2023 | Schenker Vision 16 PH6PRX1 i7-13700H, Iris Xe G7 96EUs | 1.5 kg | 17.1 mm | 16.00" | 2560x1600 | |
| 91.8 % v7 (old) | 06/2023 | Apple MacBook Air 15 2023 M2 16 GB M2, M2 10-Core GPU | 1.5 kg | 11.5 mm | 15.30" | 2880x1864 | |
| 86.6 % v7 (old) | 06/2023 | Acer Swift Go SFG16-71 i7-13700H, Iris Xe G7 96EUs | 1.6 kg | 19 mm | 16.00" | 3200x2000 | |
| 85 % v7 (old) | 08/2023 | LG Gram SuperSlim (2023) i7-1360P, Iris Xe G7 96EUs | 990 g | 10.9 mm | 15.60" | 1920x1080 | |
| 84.3 % v7 (old) | 04/2023 | Microsoft Surface Laptop 5 15, i7-1255U i7-1255U, Iris Xe G7 96EUs | 1.6 kg | 14.7 mm | 15.00" | 2496x1664 | |
| 83.2 % v7 (old) | 02/2023 | Asus VivoBook S15 M3502RA-L1029W R7 6800H, Radeon 680M | 1.9 kg | 18.8 mm | 15.60" | 1920x1080 |
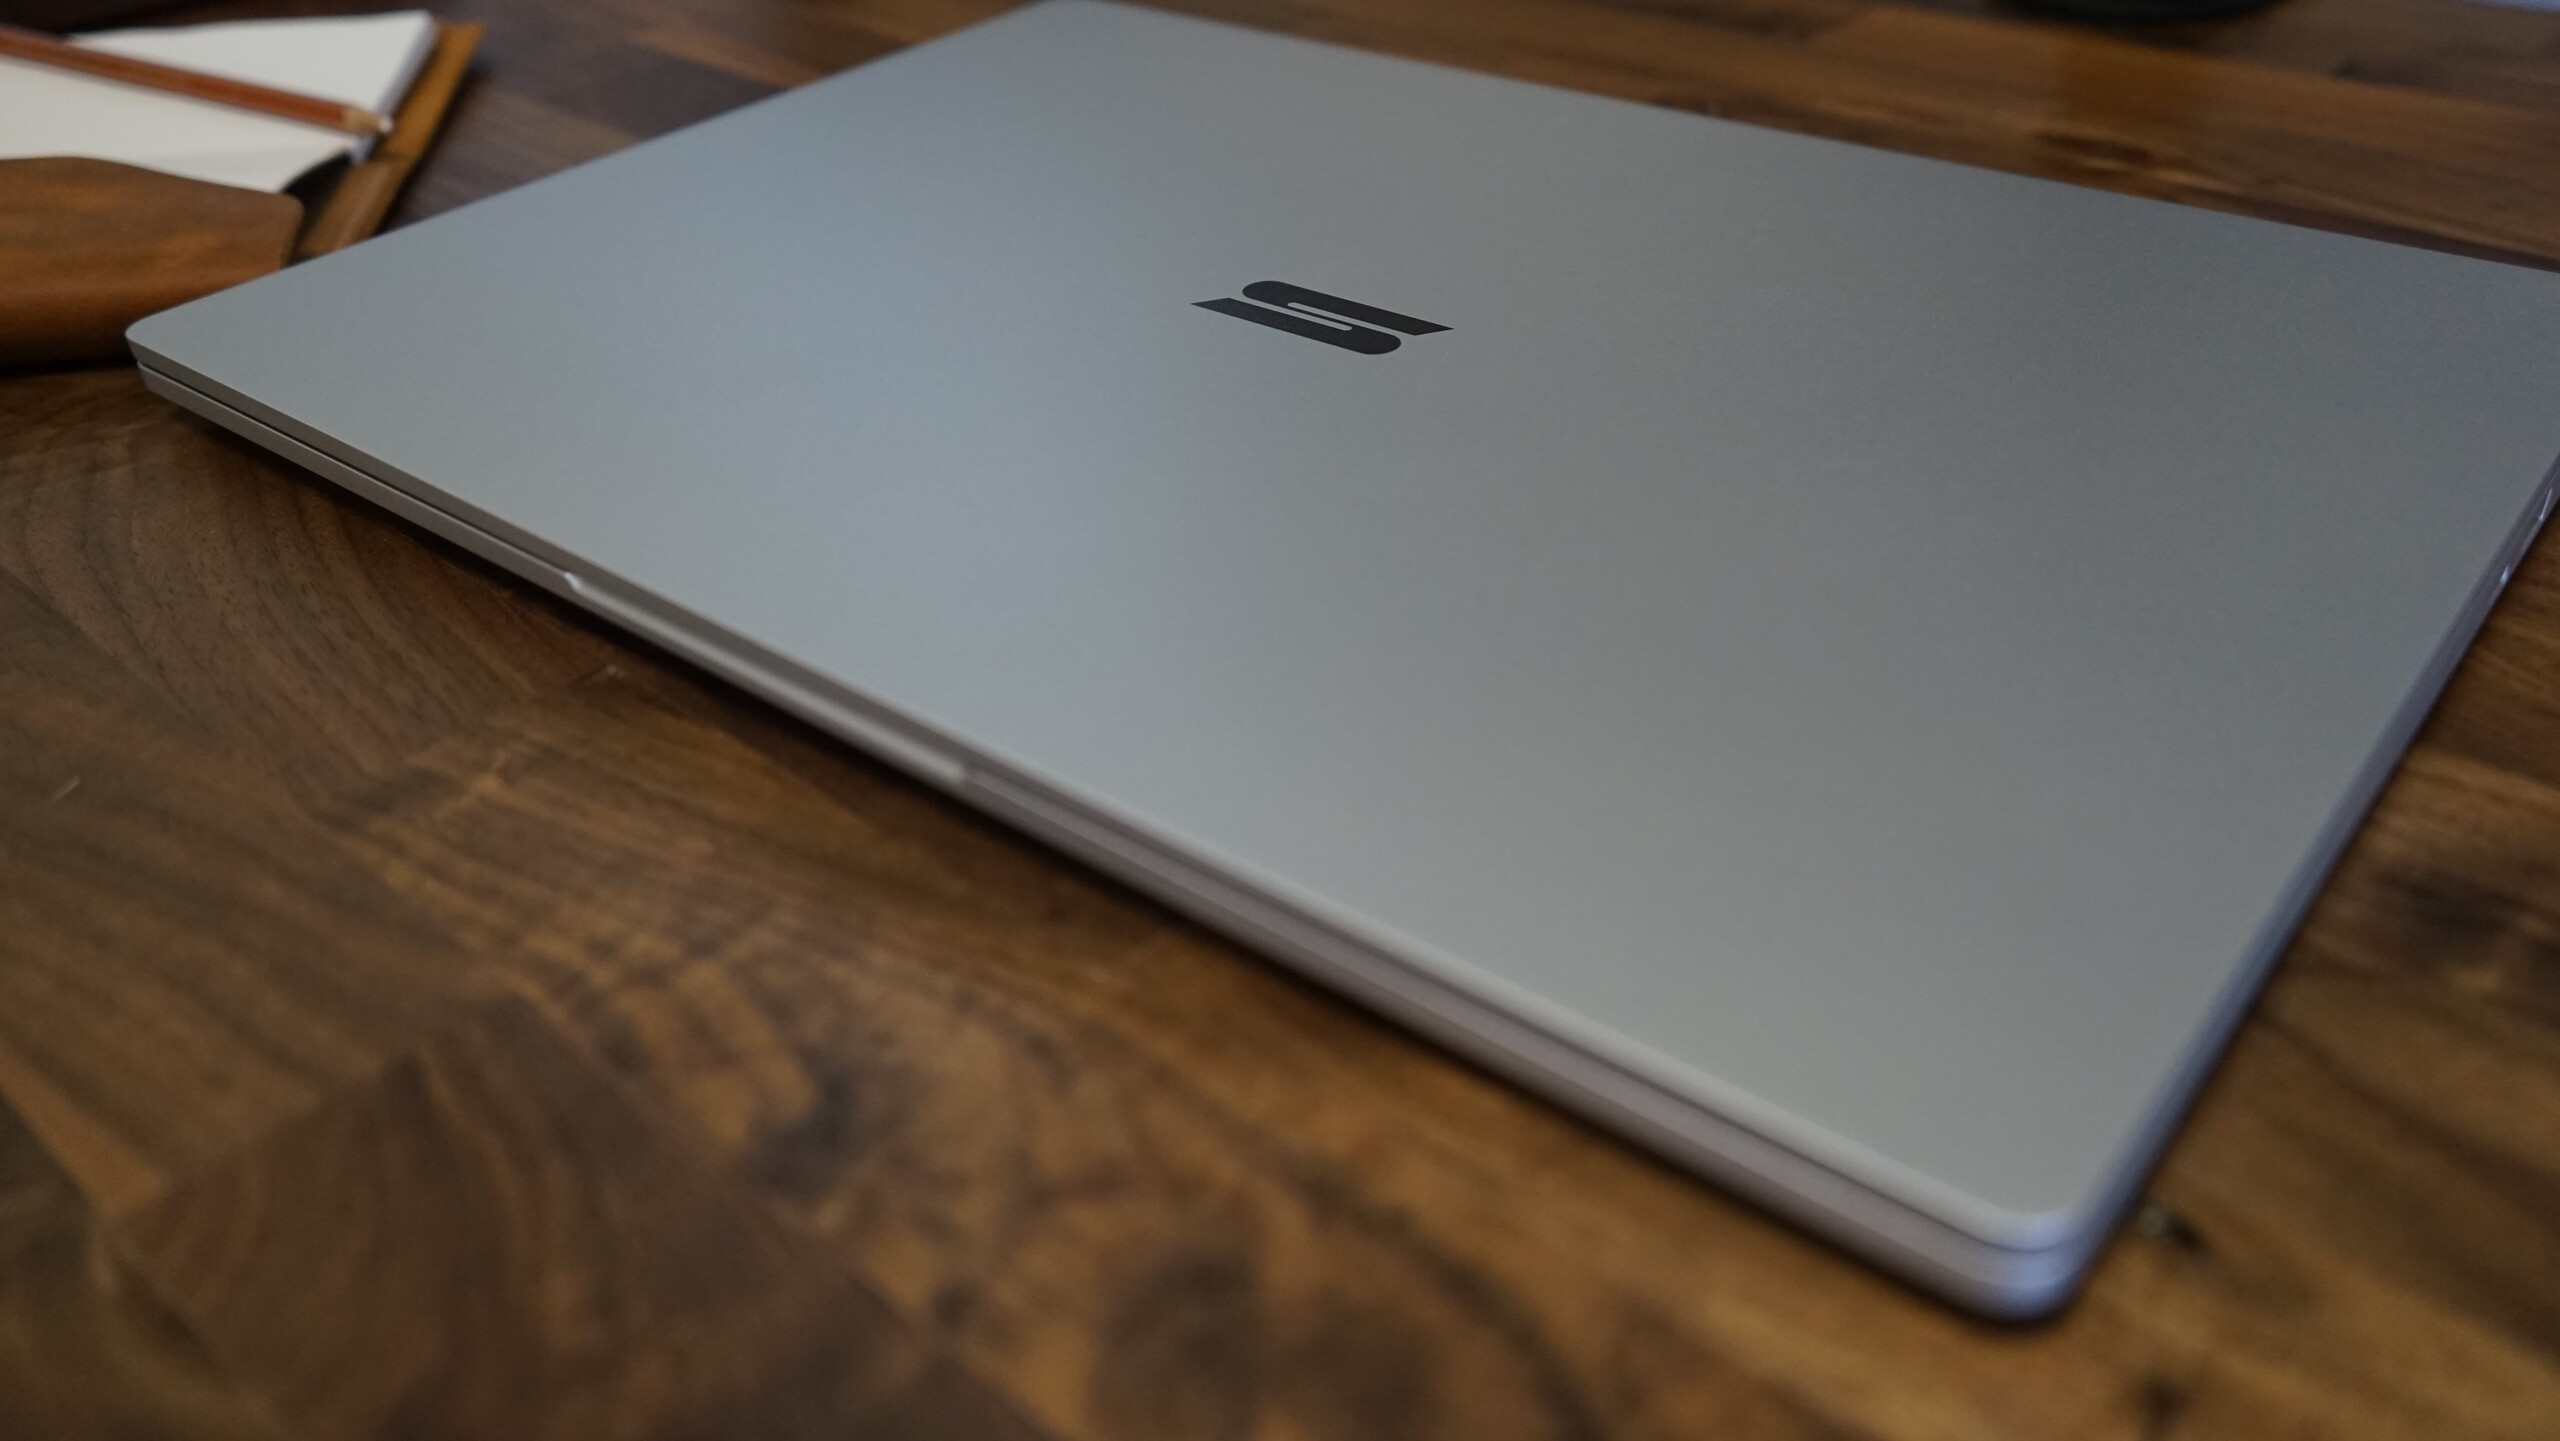
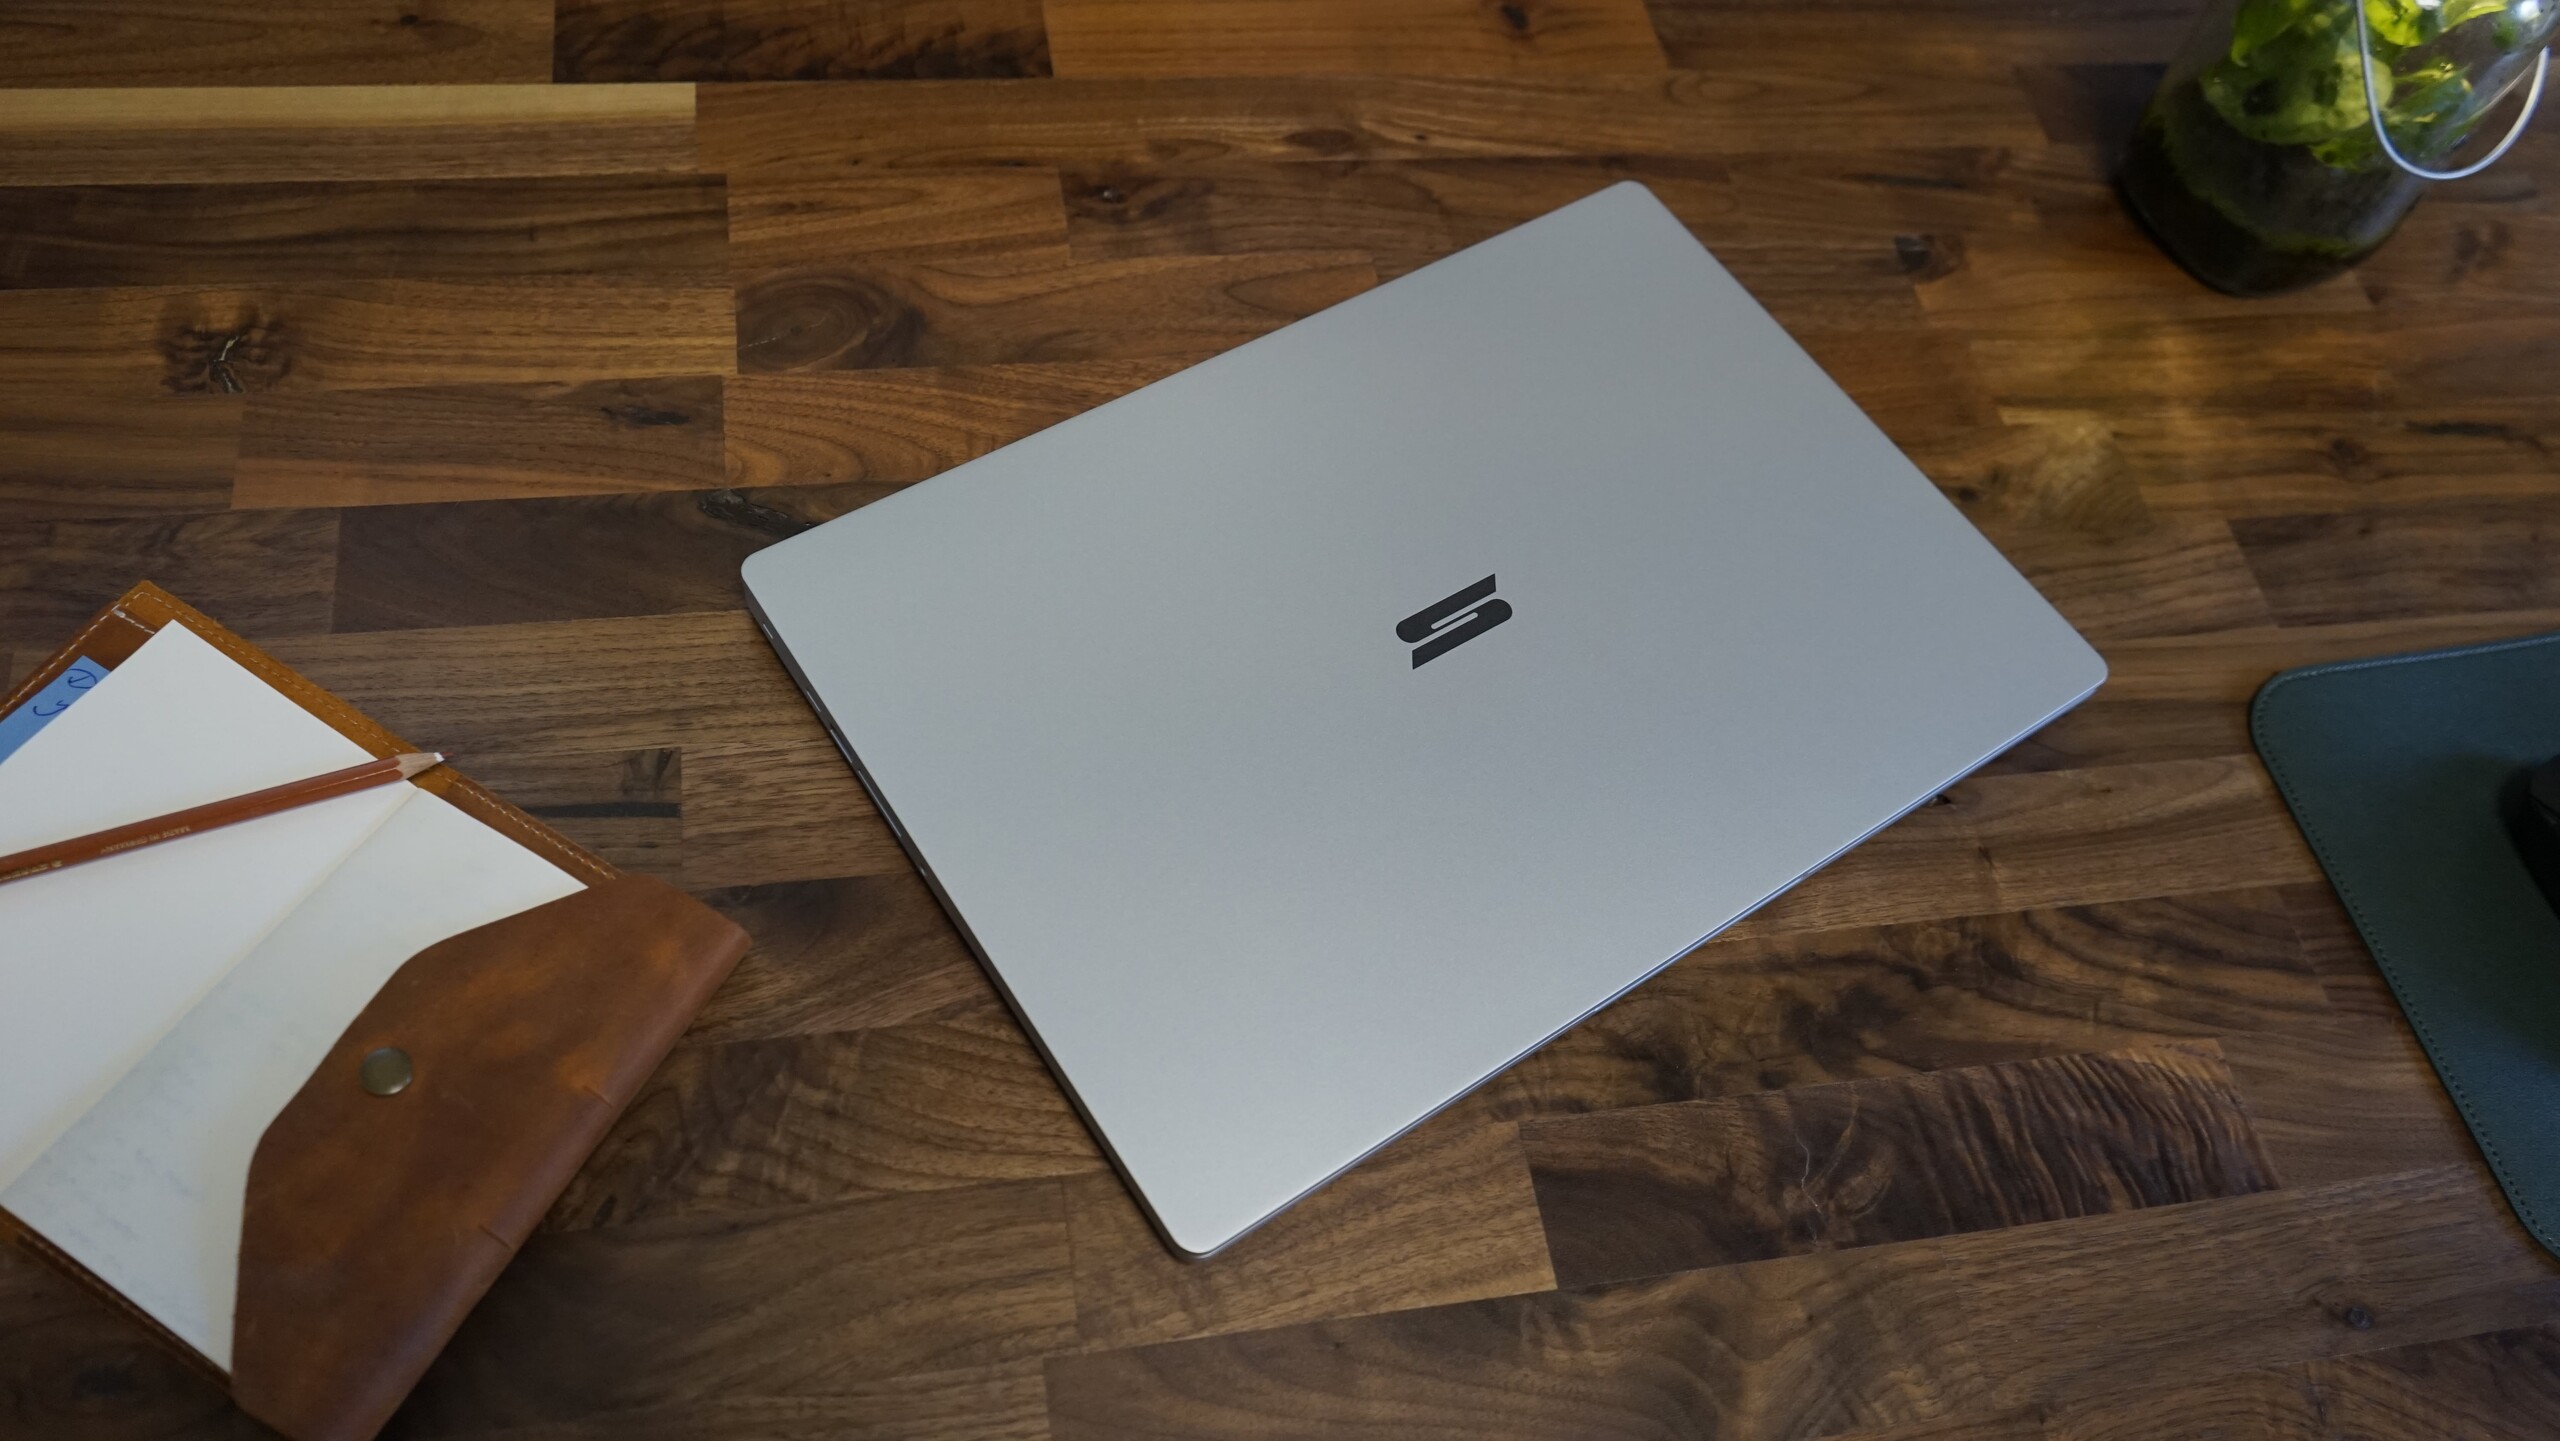
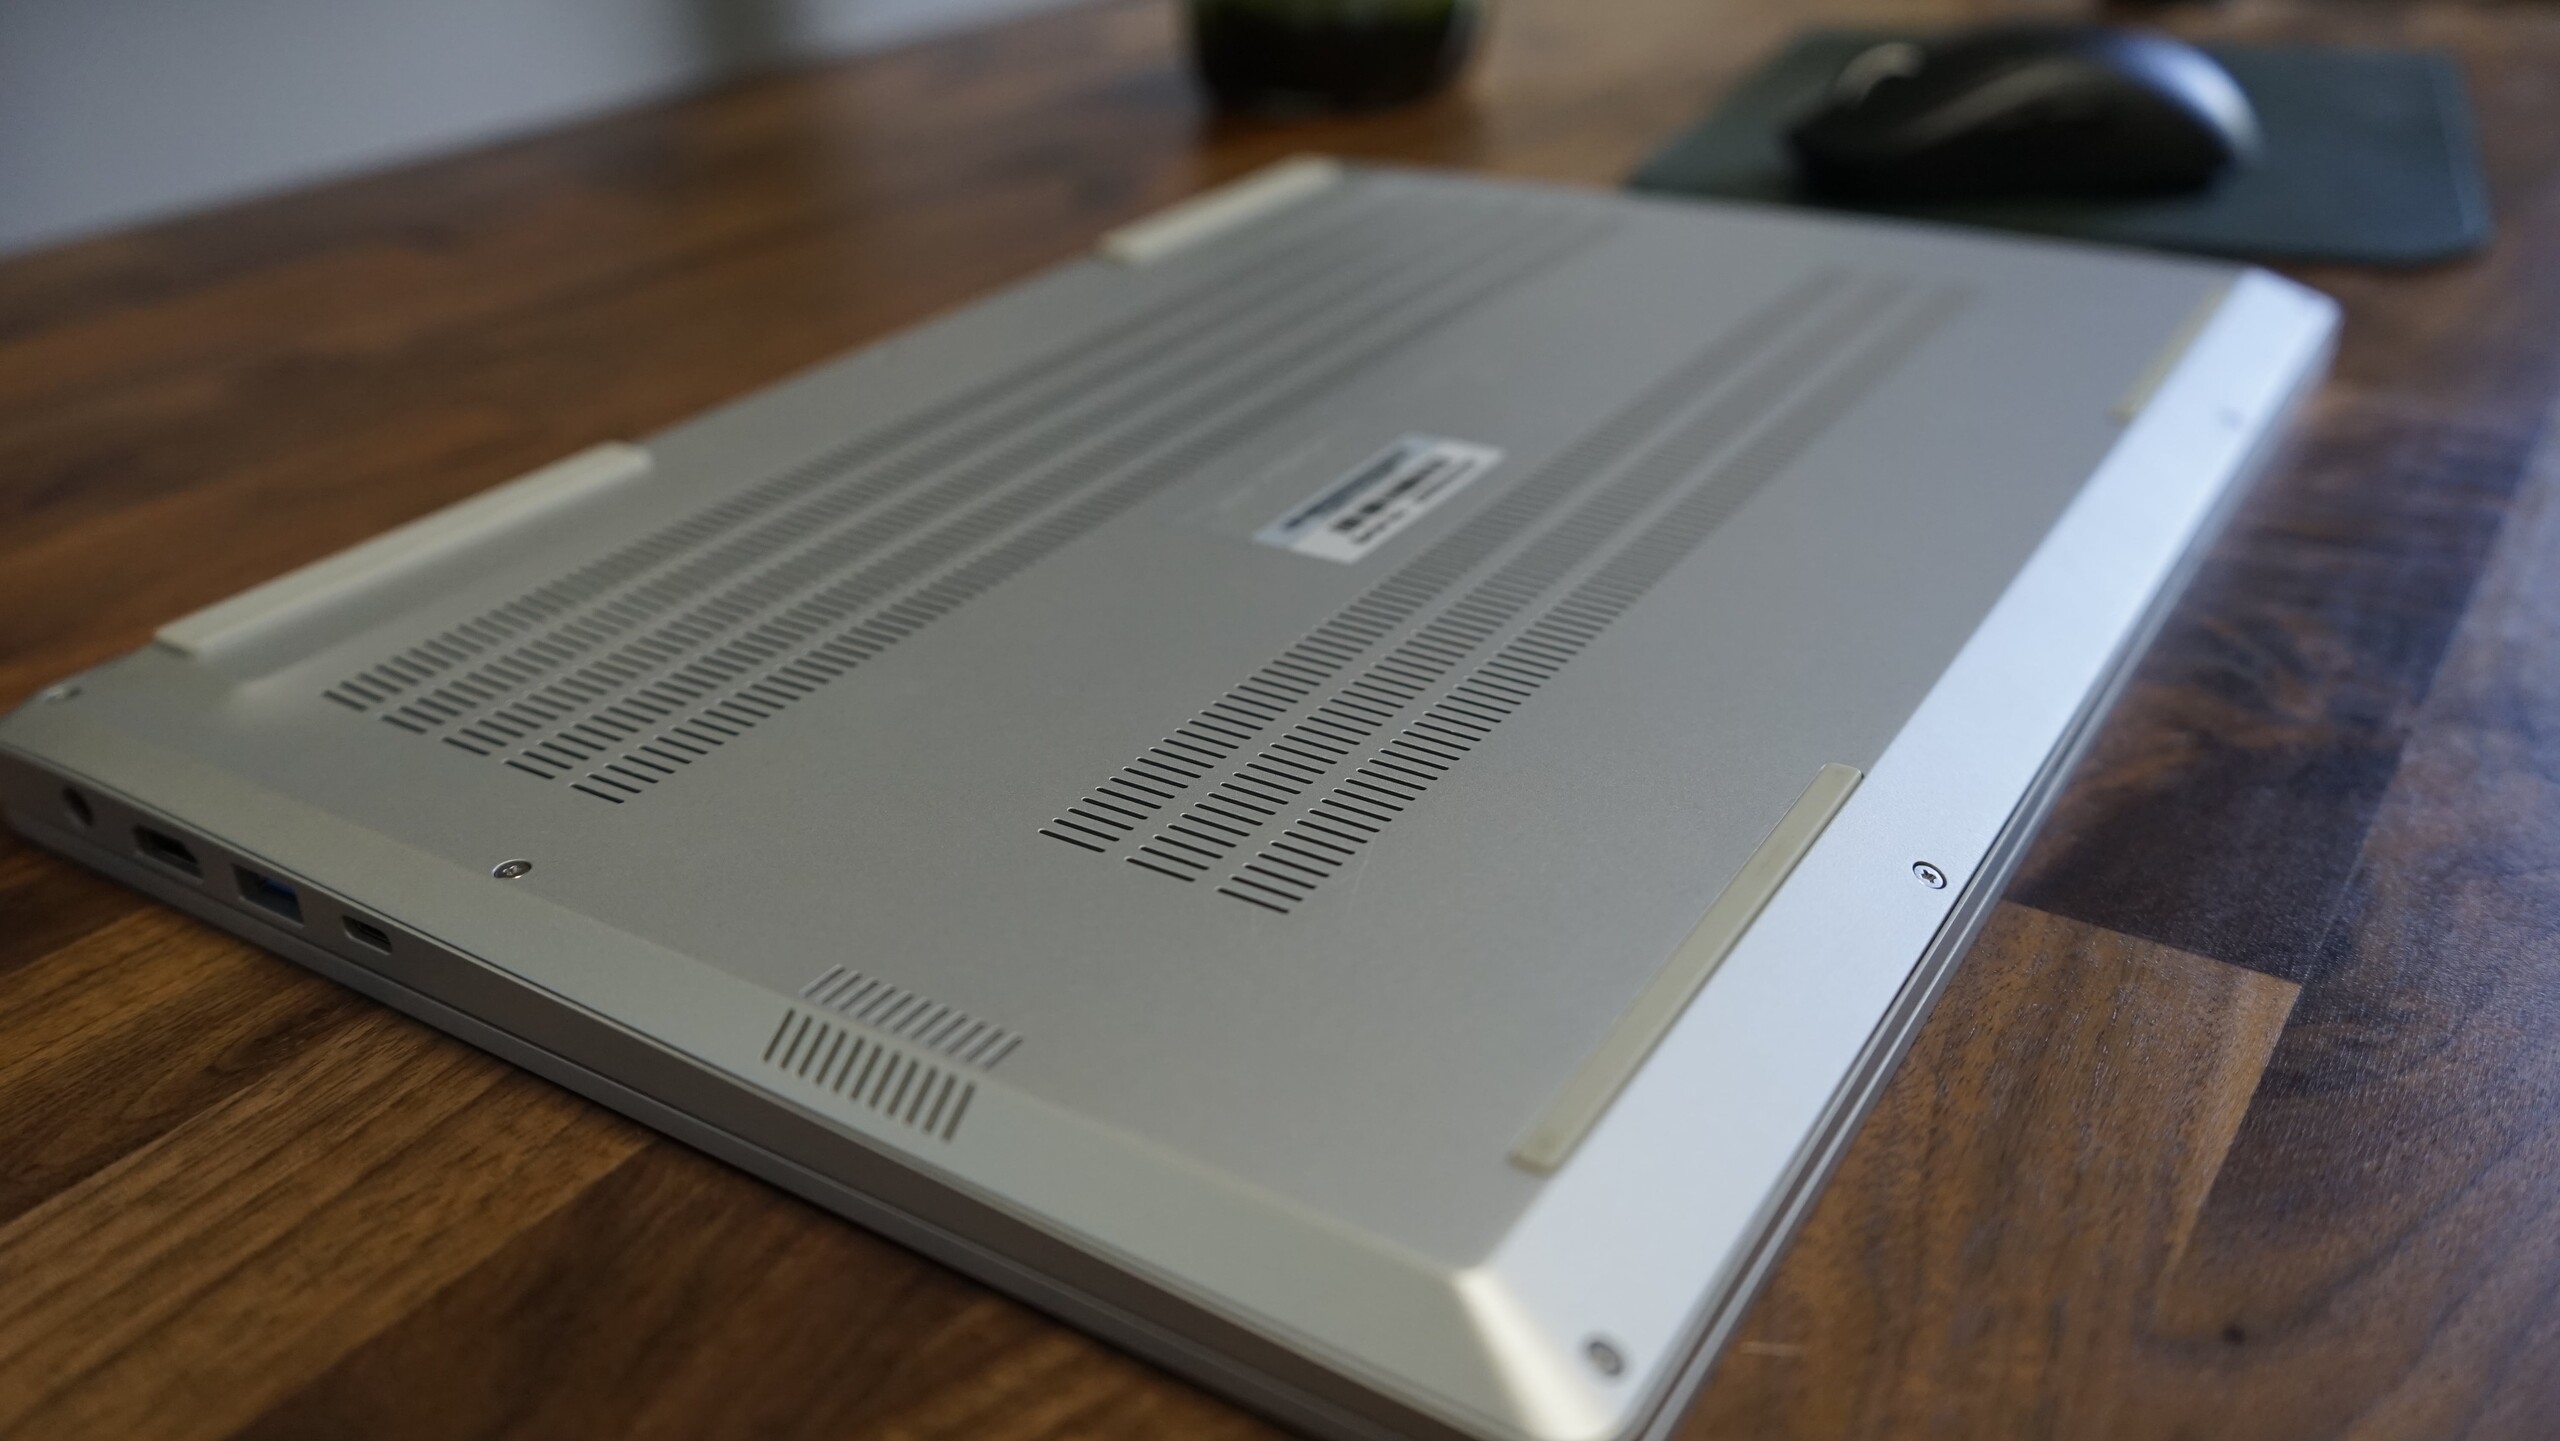
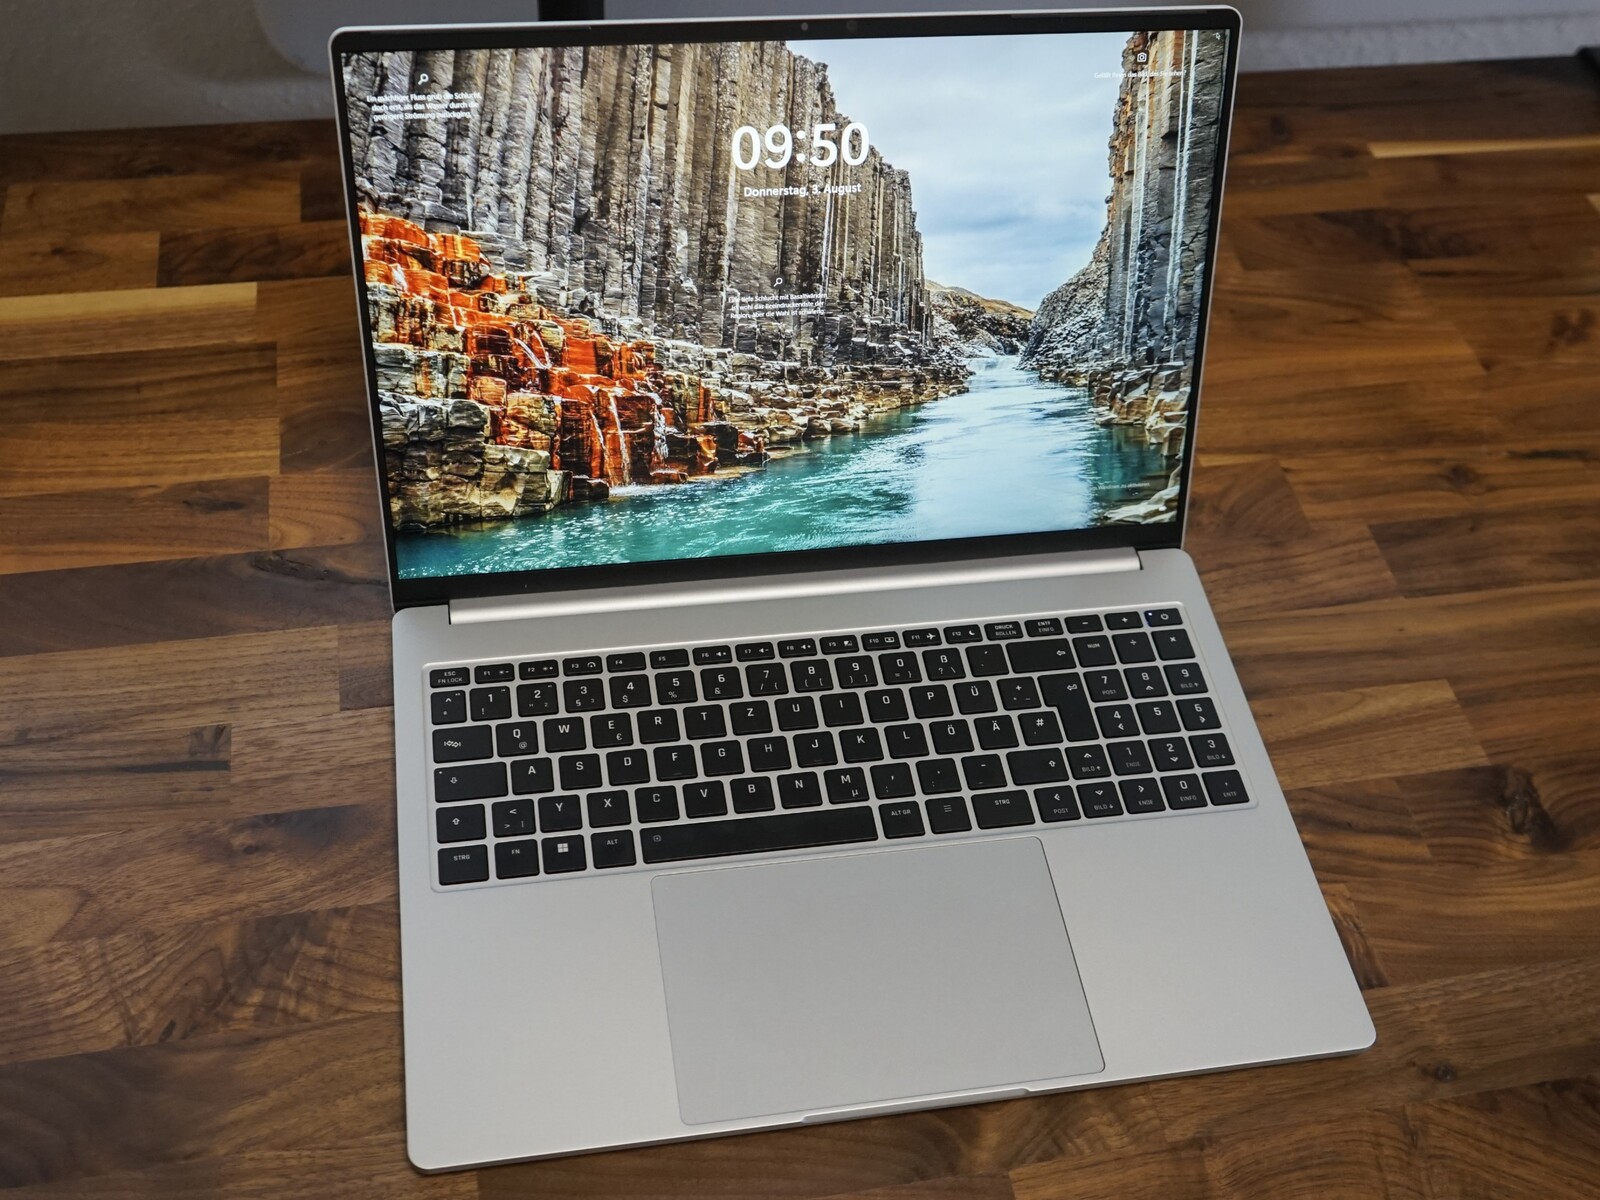
Obudowa - magnezowy laptop o wadze 1,5 kg
Obudowa jest identyczna jak w Vision 16 Pro i praktycznie niezmieniona w stosunku do poprzedniego modelu. Recenzujemy srebrną wersję, podczas gdy Vision 16 Pro był czarny. Srebrna wersja wyróżnia się bardziej i przypomina nam MacBook Pro 16ze względu na zbyt duży touchpad. Magnezowa obudowa (podstawa i pokrywa ekranu) utrzymuje niską wagę na poziomie zaledwie 1,5 kg. Na środku klawiatury jest tylko niewielki luz, poza tym obudowa jest sztywna. Zawiasy nie są zbyt mocne i pozwalają na spore chybotanie się ekranu.
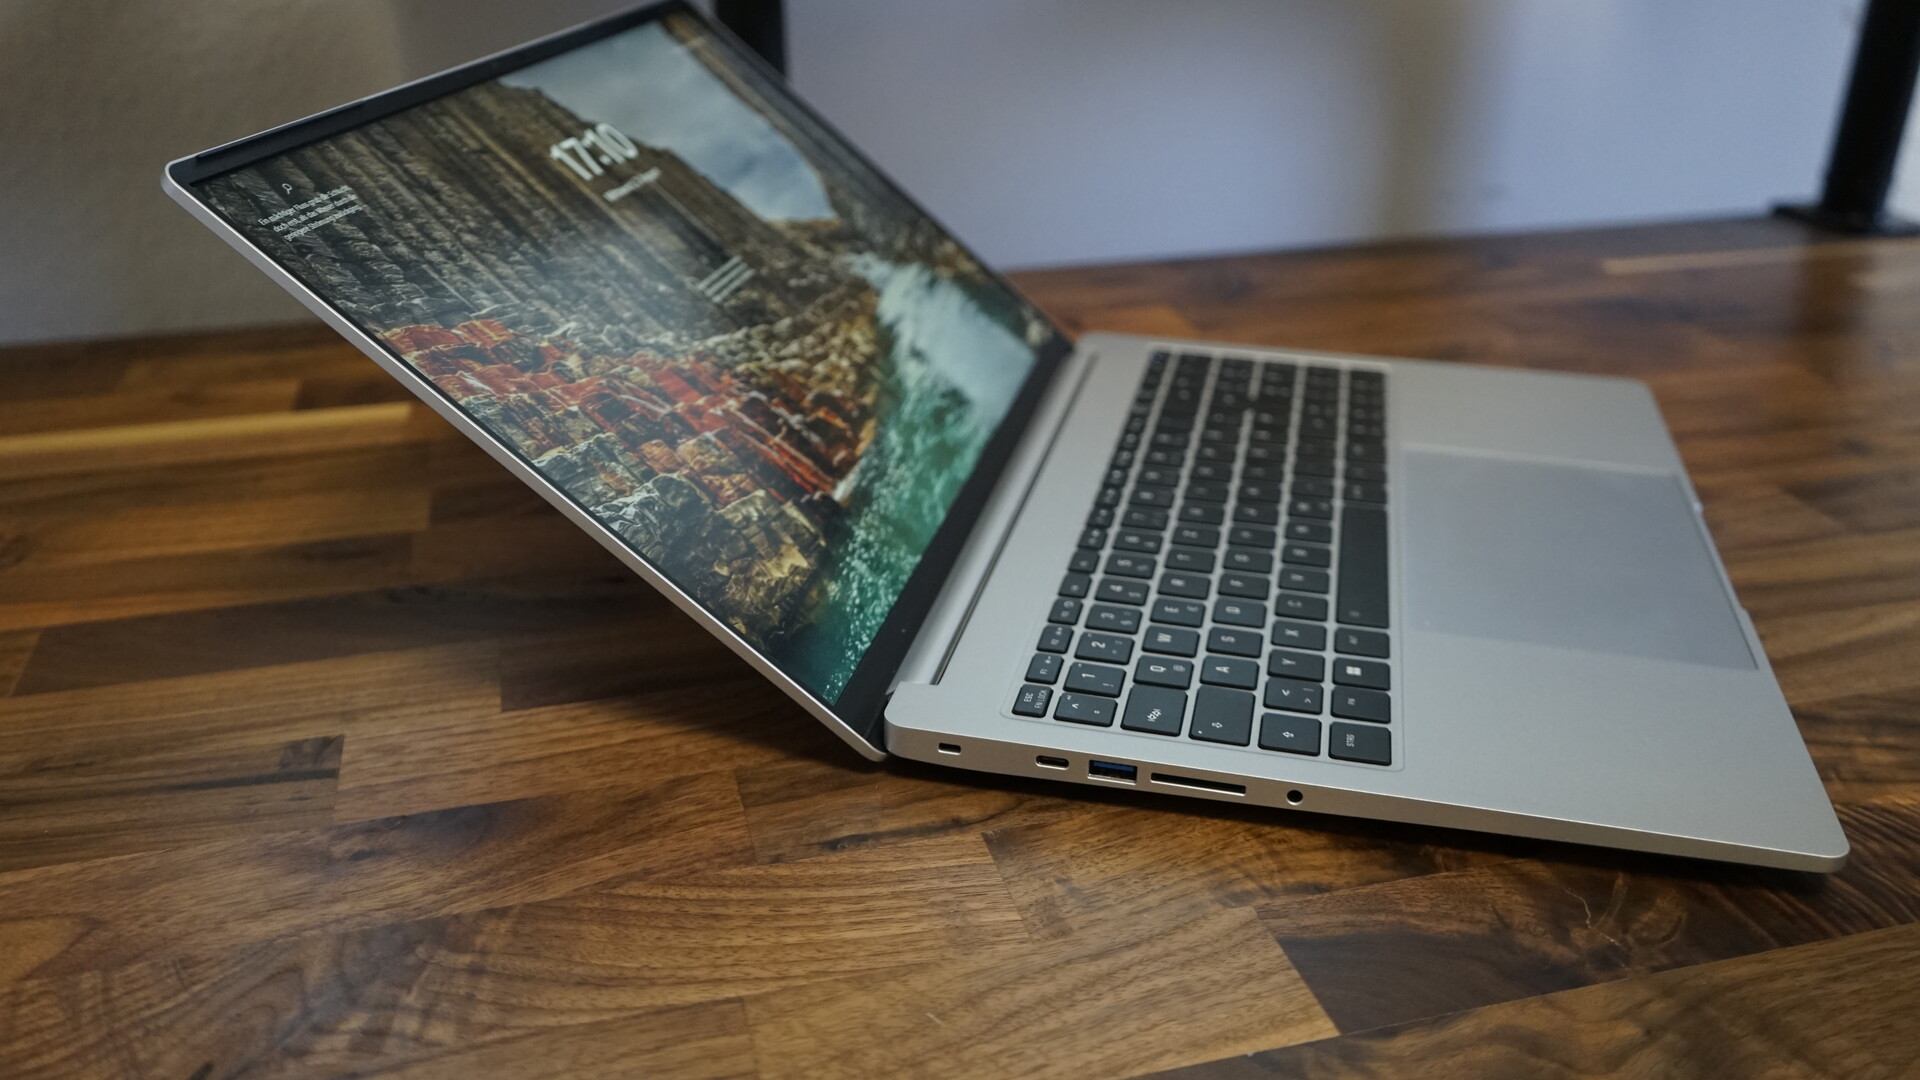
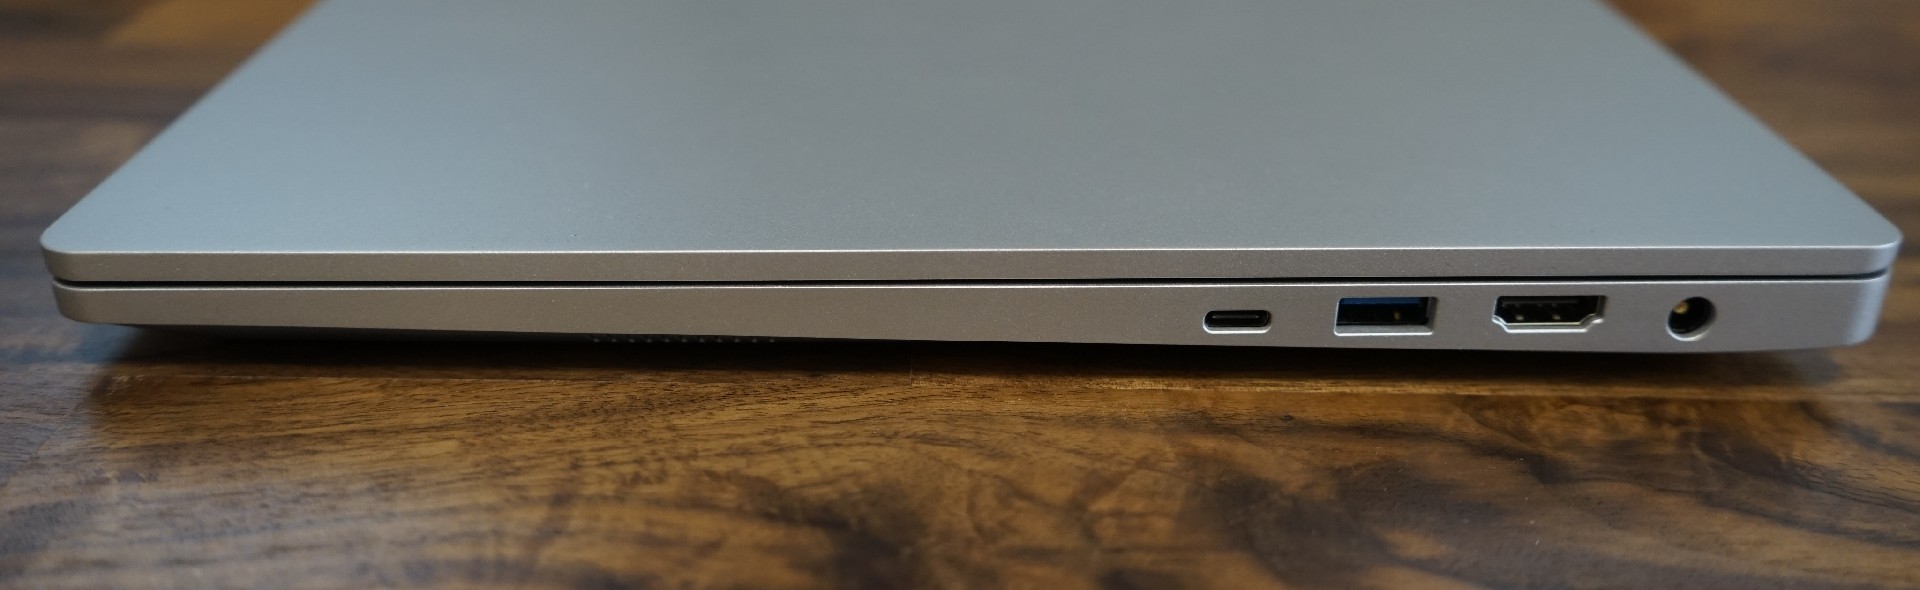
Łączność - Thunderbolt 4, pełnowymiarowy czytnik kart SD i wiele portów USB
Porty są również identyczne jak w Vision 16 Pro. Klucze sprzętowe lub adaptery nie są konieczne w przypadku tego ultrabooka, dzięki dobremu wyborowi portów. W porównaniu z MacBookiem Air, Vision 16 ma w zasadzie wszystkie porty, których większość ludzi będzie potrzebować. Po lewej stronie znajduje się gniazdo audio 3,5 mm i pełnowymiarowe gniazdo kart SD. Dwa porty USB A 3.2 Gen 1 sprawiają, że klucze sprzętowe do myszy lub klawiatury są zbędne. Praktyczny jest również port HDMI, choć jest to tylko HDMI 2.0b, a nie HDMI 2.1. Port Thunderbolt 4 po lewej stronie i port USB C po prawej stronie uzupełniają opcje łączności. Dzięki dedykowanemu portowi ładowania, żaden z pozostałych portów nie jest zajęty podczas ładowania. Jedyną brakującą rzeczą jest gniazdo Ethernet.
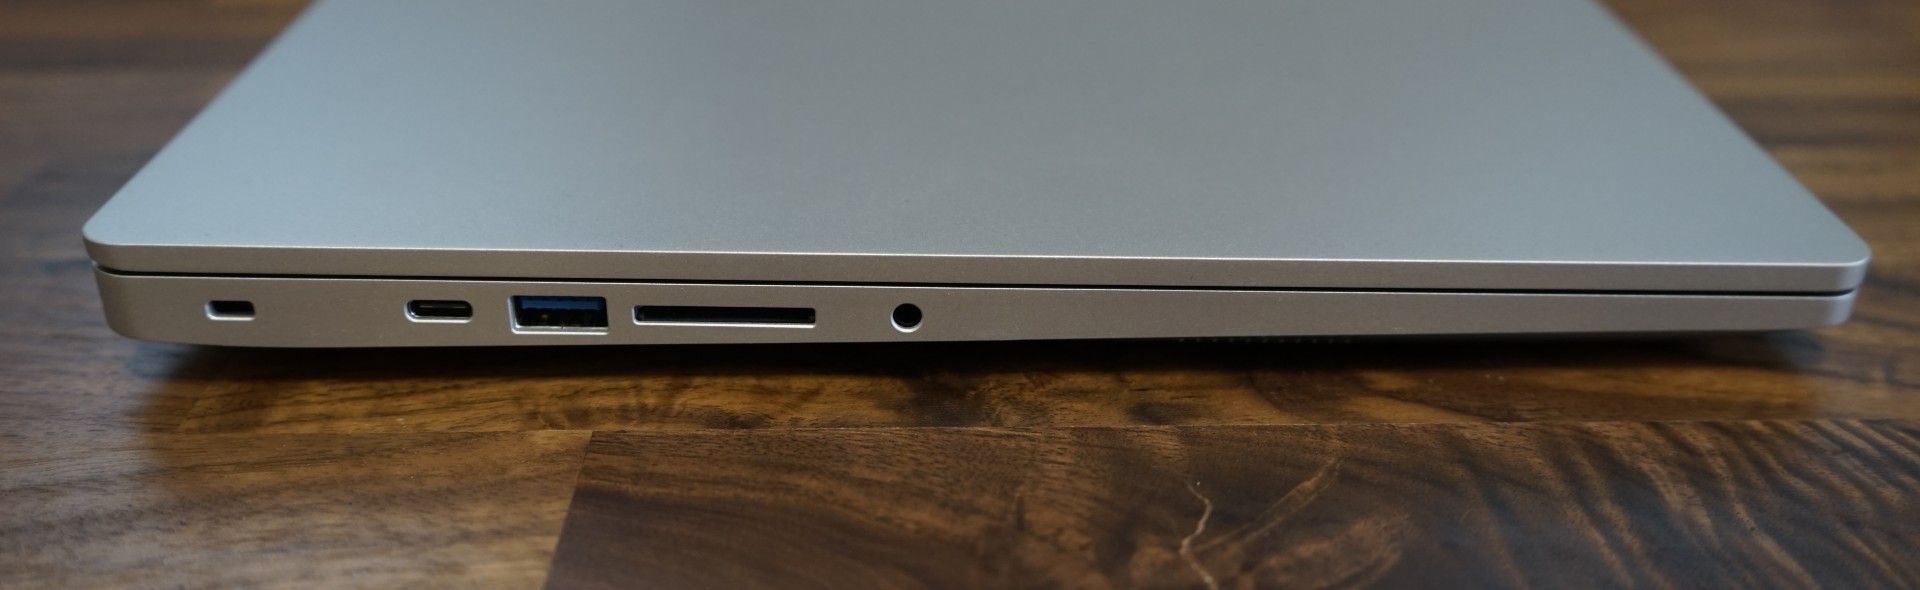
Czytnik kart SD
Schenker Vision 16 posiada czytnik kart SD, ale jest on dość wolny, o czym świadczy prędkość zapisu 22,7 MB/s i odczytu 27,7 MB/s, którą zmierzyliśmy z naszą kartą referencyjną (Angelbird AV Ori V60). Dla intensywnych użytkowników lepszym rozwiązaniem może być zewnętrzny czytnik kart. Do codziennego użytku czytnik kart powinien wystarczyć.
| SD Card Reader | |
| average JPG Copy Test (av. of 3 runs) | |
| MSI Stealth 16 Studio A13VG | |
| Dell XPS 15 9530 RTX 4070 (Toshiba Exceria Pro SDXC 64 GB UHS-II) | |
| Średnia w klasie Office (19.8 - 198.5, n=22, ostatnie 2 lata) | |
| Schenker Vision 16 PH6PRX1 (AV Pro V60) | |
| Acer Swift Go SFG16-71 | |
| maximum AS SSD Seq Read Test (1GB) | |
| Dell XPS 15 9530 RTX 4070 (Toshiba Exceria Pro SDXC 64 GB UHS-II) | |
| MSI Stealth 16 Studio A13VG | |
| Średnia w klasie Office (27.4 - 249, n=21, ostatnie 2 lata) | |
| Schenker Vision 16 PH6PRX1 (AV Pro V60) | |
| Acer Swift Go SFG16-71 | |
Komunikacja
Moduł AX201 WiFi 6 w Vision 16 zapewniał dobre wyniki podczas odbierania danych, ale wykazywał słabości podczas wysyłania danych. Doświadczenie może się jednak różnić, ponieważ ten sam moduł WLAN w niemal identycznym Schenker Vision 16 Pro zapewniał lepsze wyniki.
Kamera internetowa
Kamera internetowa FHD w Schenker Vision 16 może tworzyć akceptowalne obrazy. Jest wystarczająca do wideokonferencji, o ile warunki oświetleniowe nie są złe. 2-megapikselowa kamera internetowa umożliwia logowanie biometryczne przez Windows Hello, dzięki zintegrowanemu czujnikowi podczerwieni.


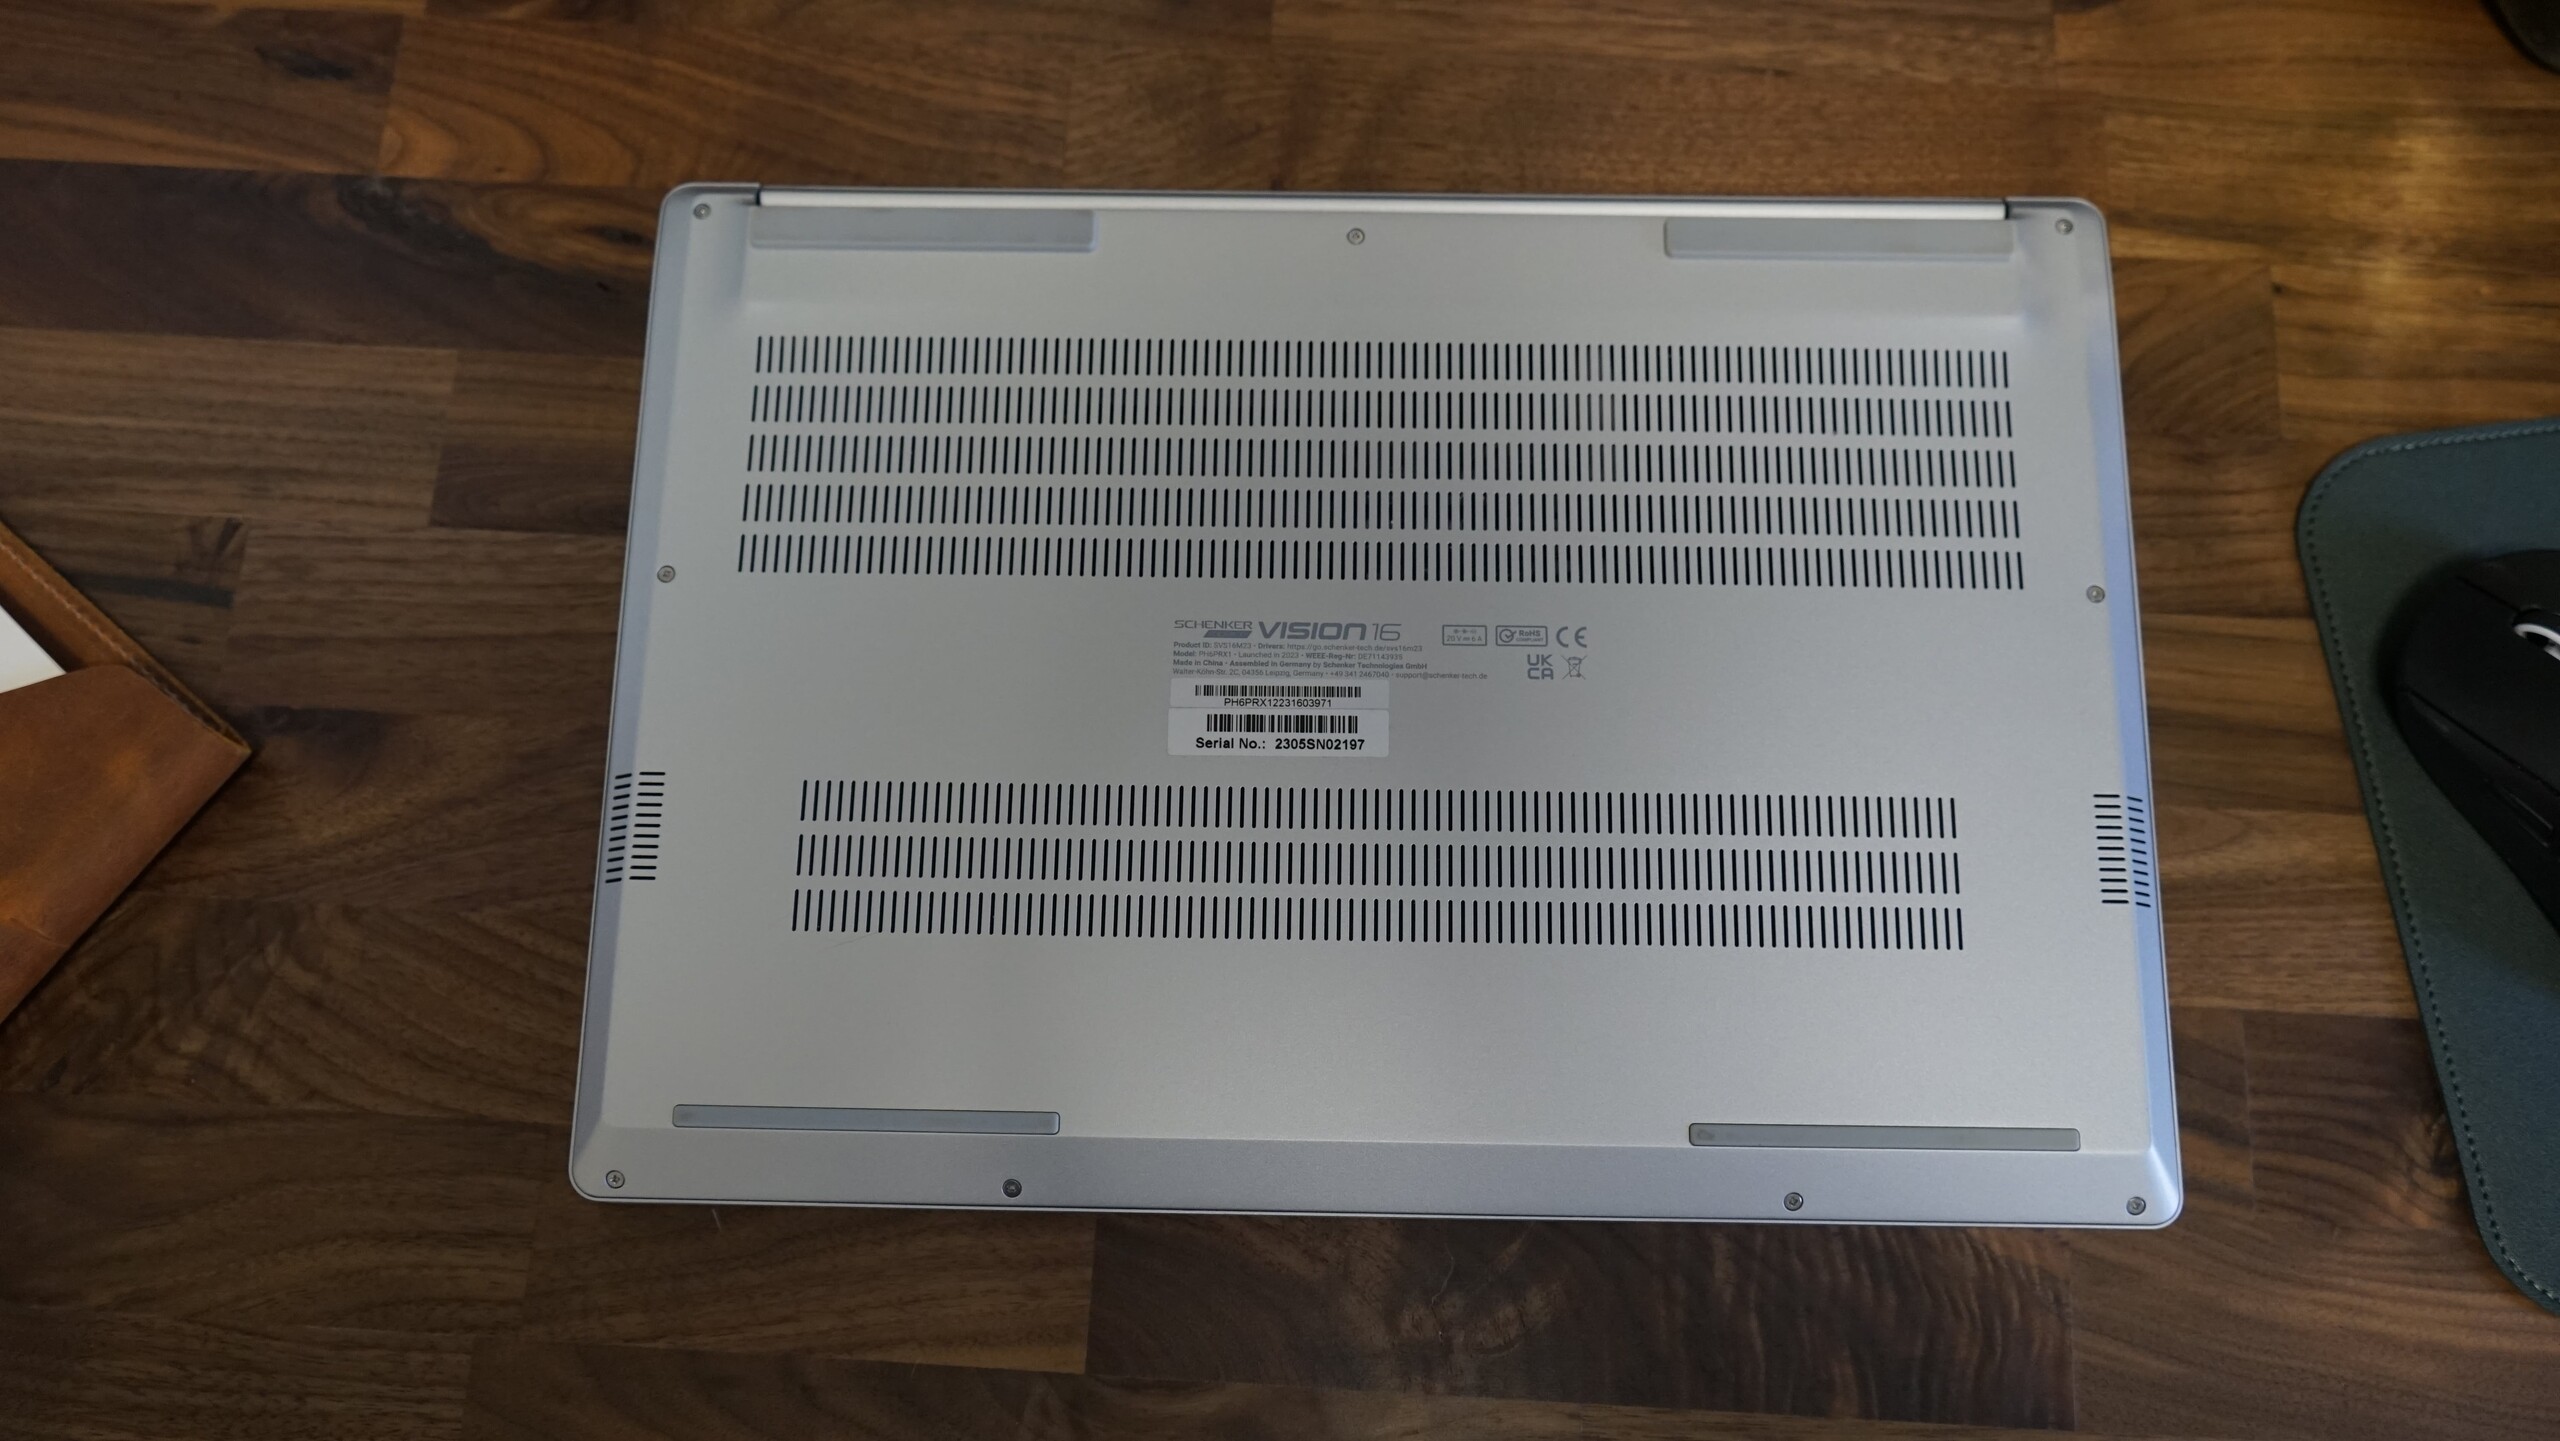
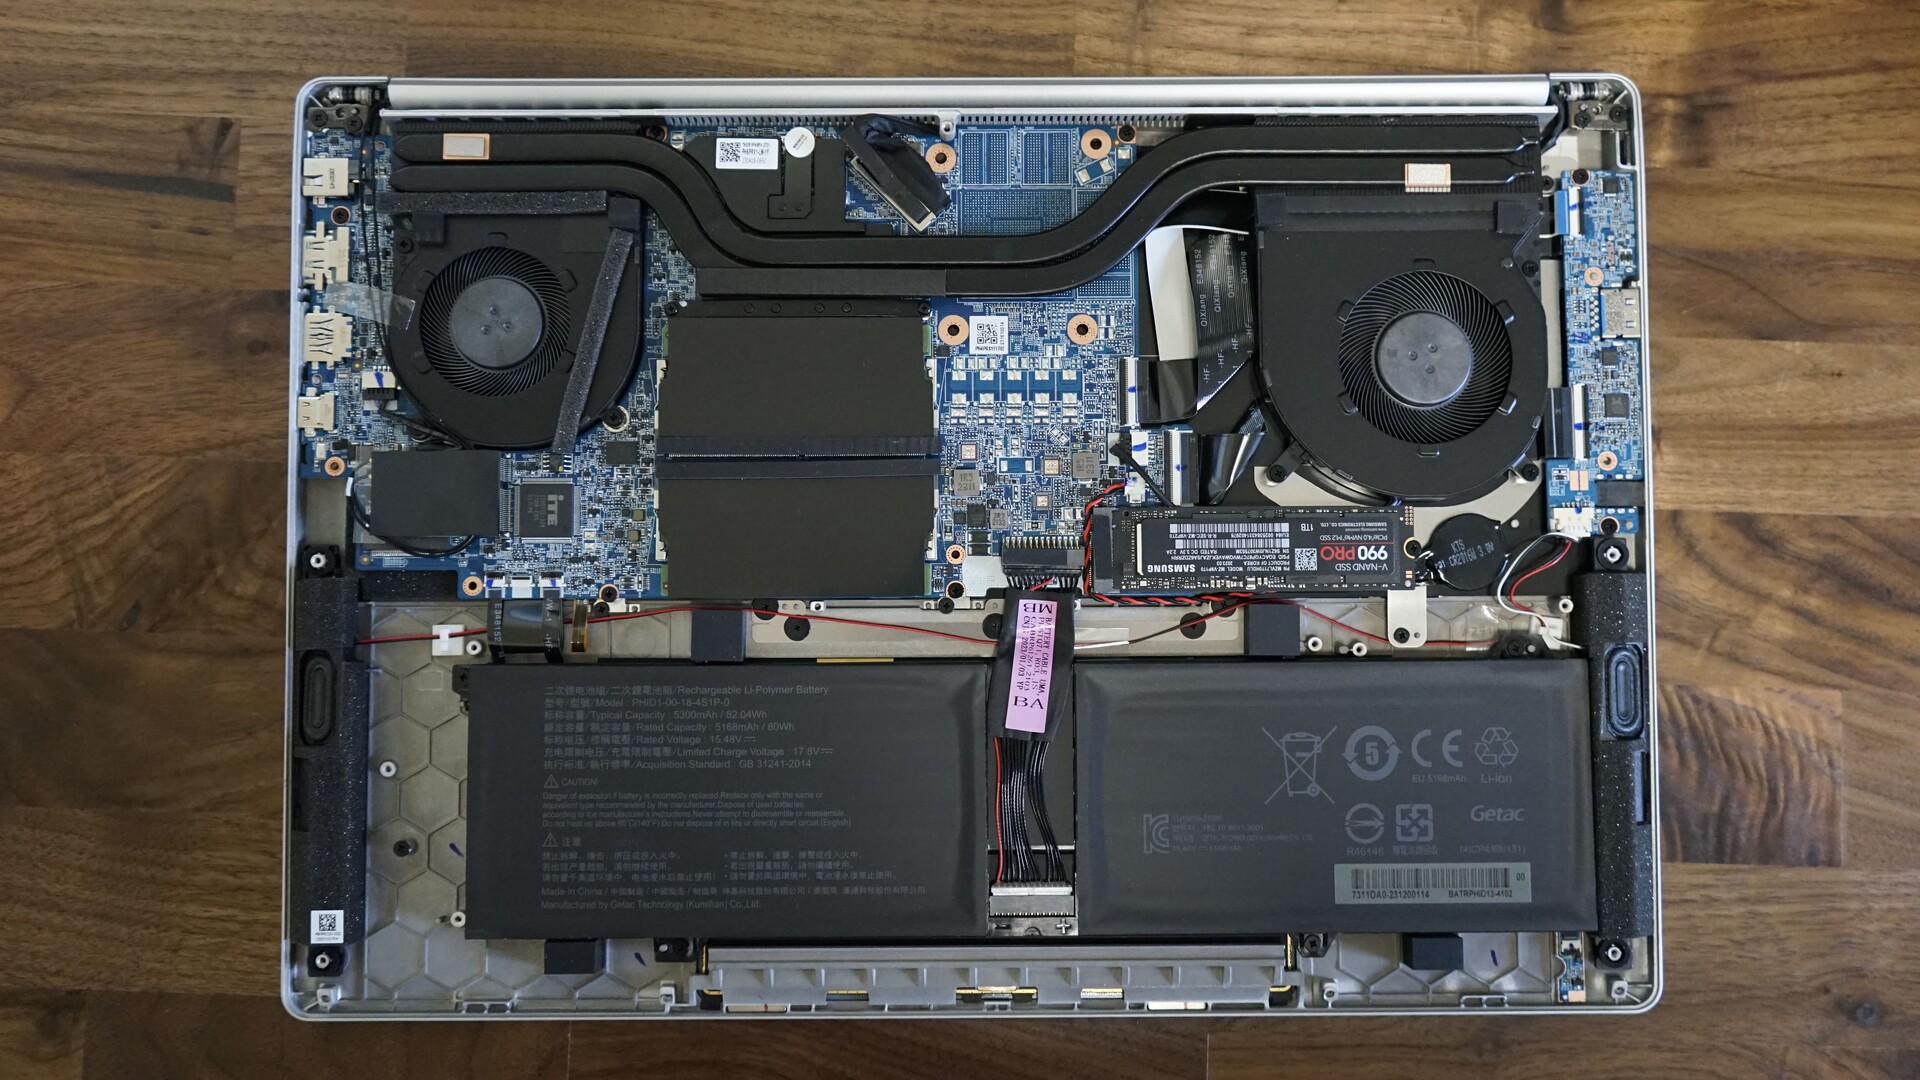
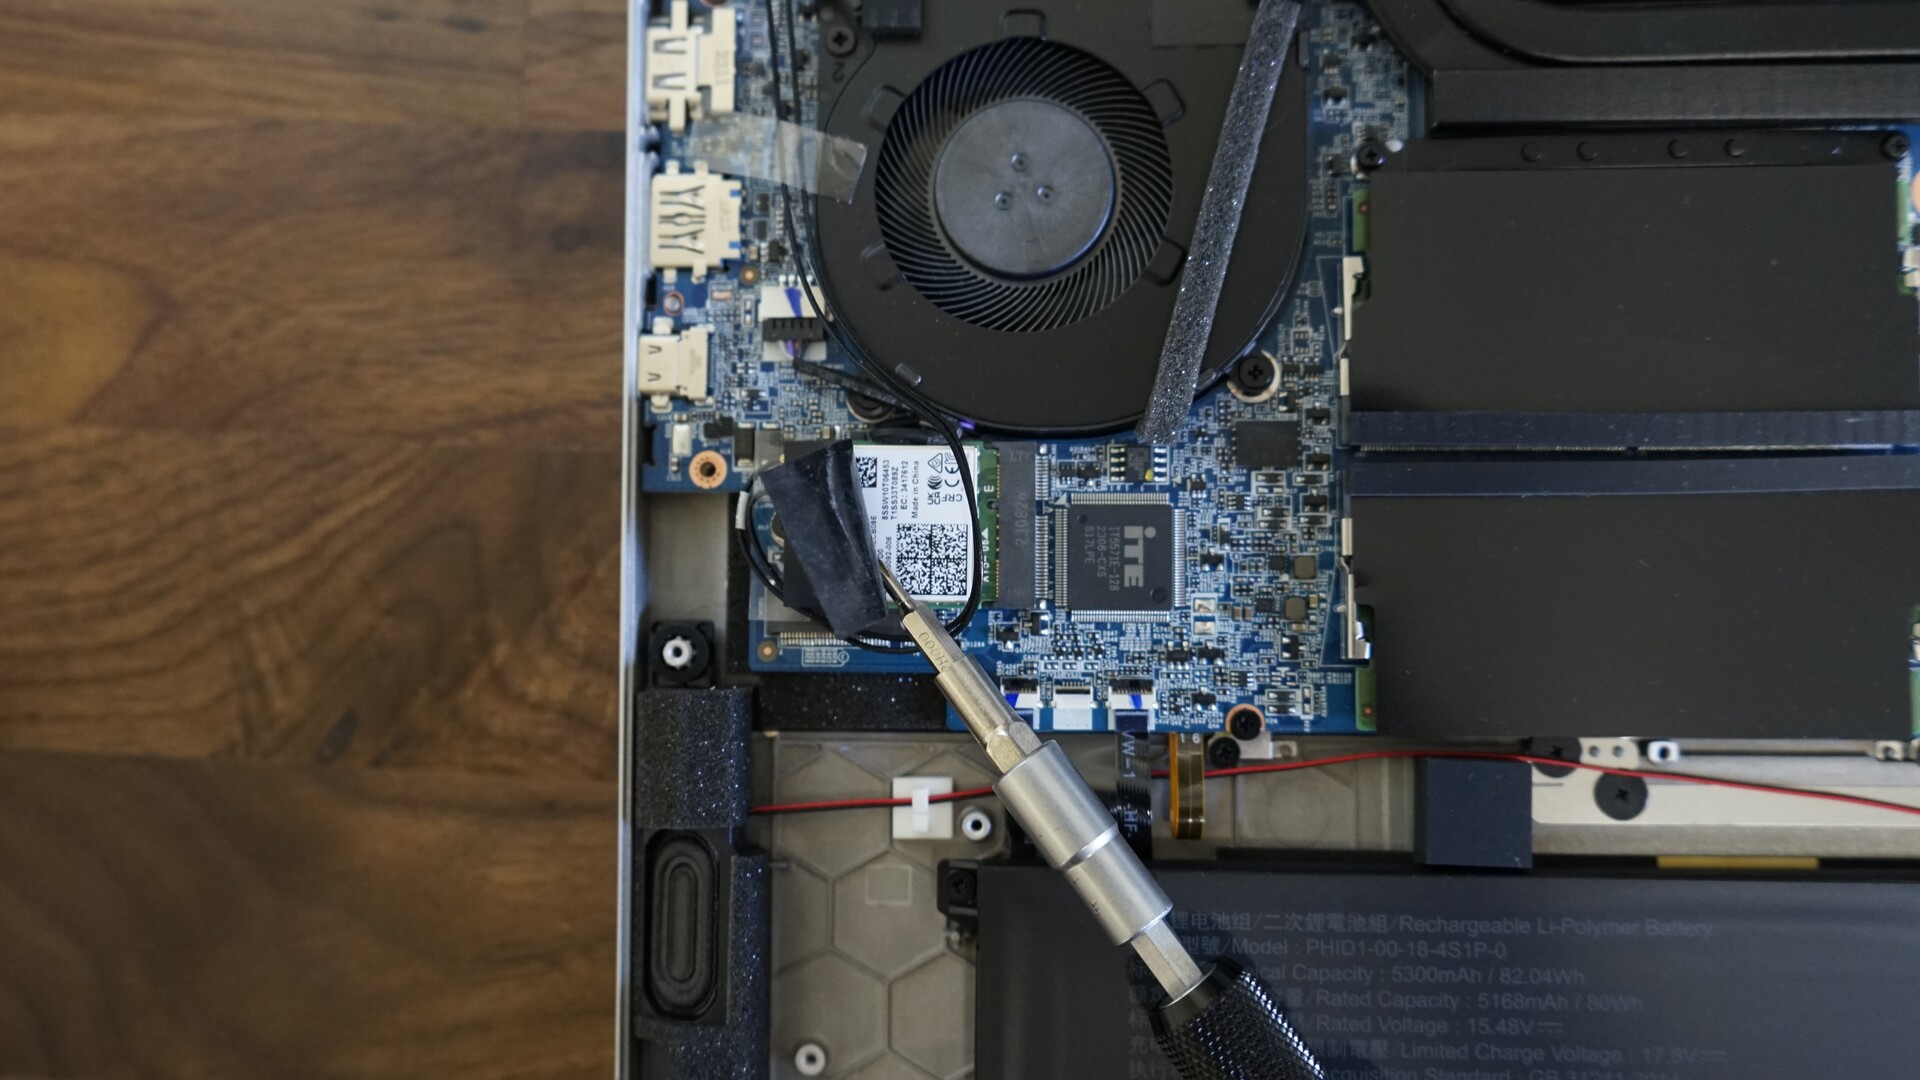
Konserwacja
Dolna pokrywa Schenker Vision 16 jest zabezpieczona łącznie dziewięcioma śrubami. Cztery śruby z przodu i środkowa z tyłu są krótsze niż pozostałe. Przestrzeń wewnętrzna jest bardzo podobna do Vision 16 Pro, z wyjątkiem brakującego GPU, mniejszej ilości rurek cieplnych i mniejszego prawego wentylatora. Ten ostatni aspekt stanie się istotny dla naszych pomiarów wydajności.
Użytkownicy Vision 16 mogą wymienić oba moduły pamięci RAM, moduły WiFi, dysk SSD M.2 i baterię. Jest też wolne drugie gniazdo na dysk SSD M.2.
Gwarancja
Schenker oferuje podstawową 24-miesięczną gwarancję, która obejmuje usługę odbioru i zwrotu, a także szybką naprawę w ciągu pierwszych sześciu miesięcy. Na życzenie można wybrać 36-miesięczną gwarancję i rozszerzyć ją o różne pakiety gwarancyjne, takie jak szybka naprawa przez cały okres gwarancji.
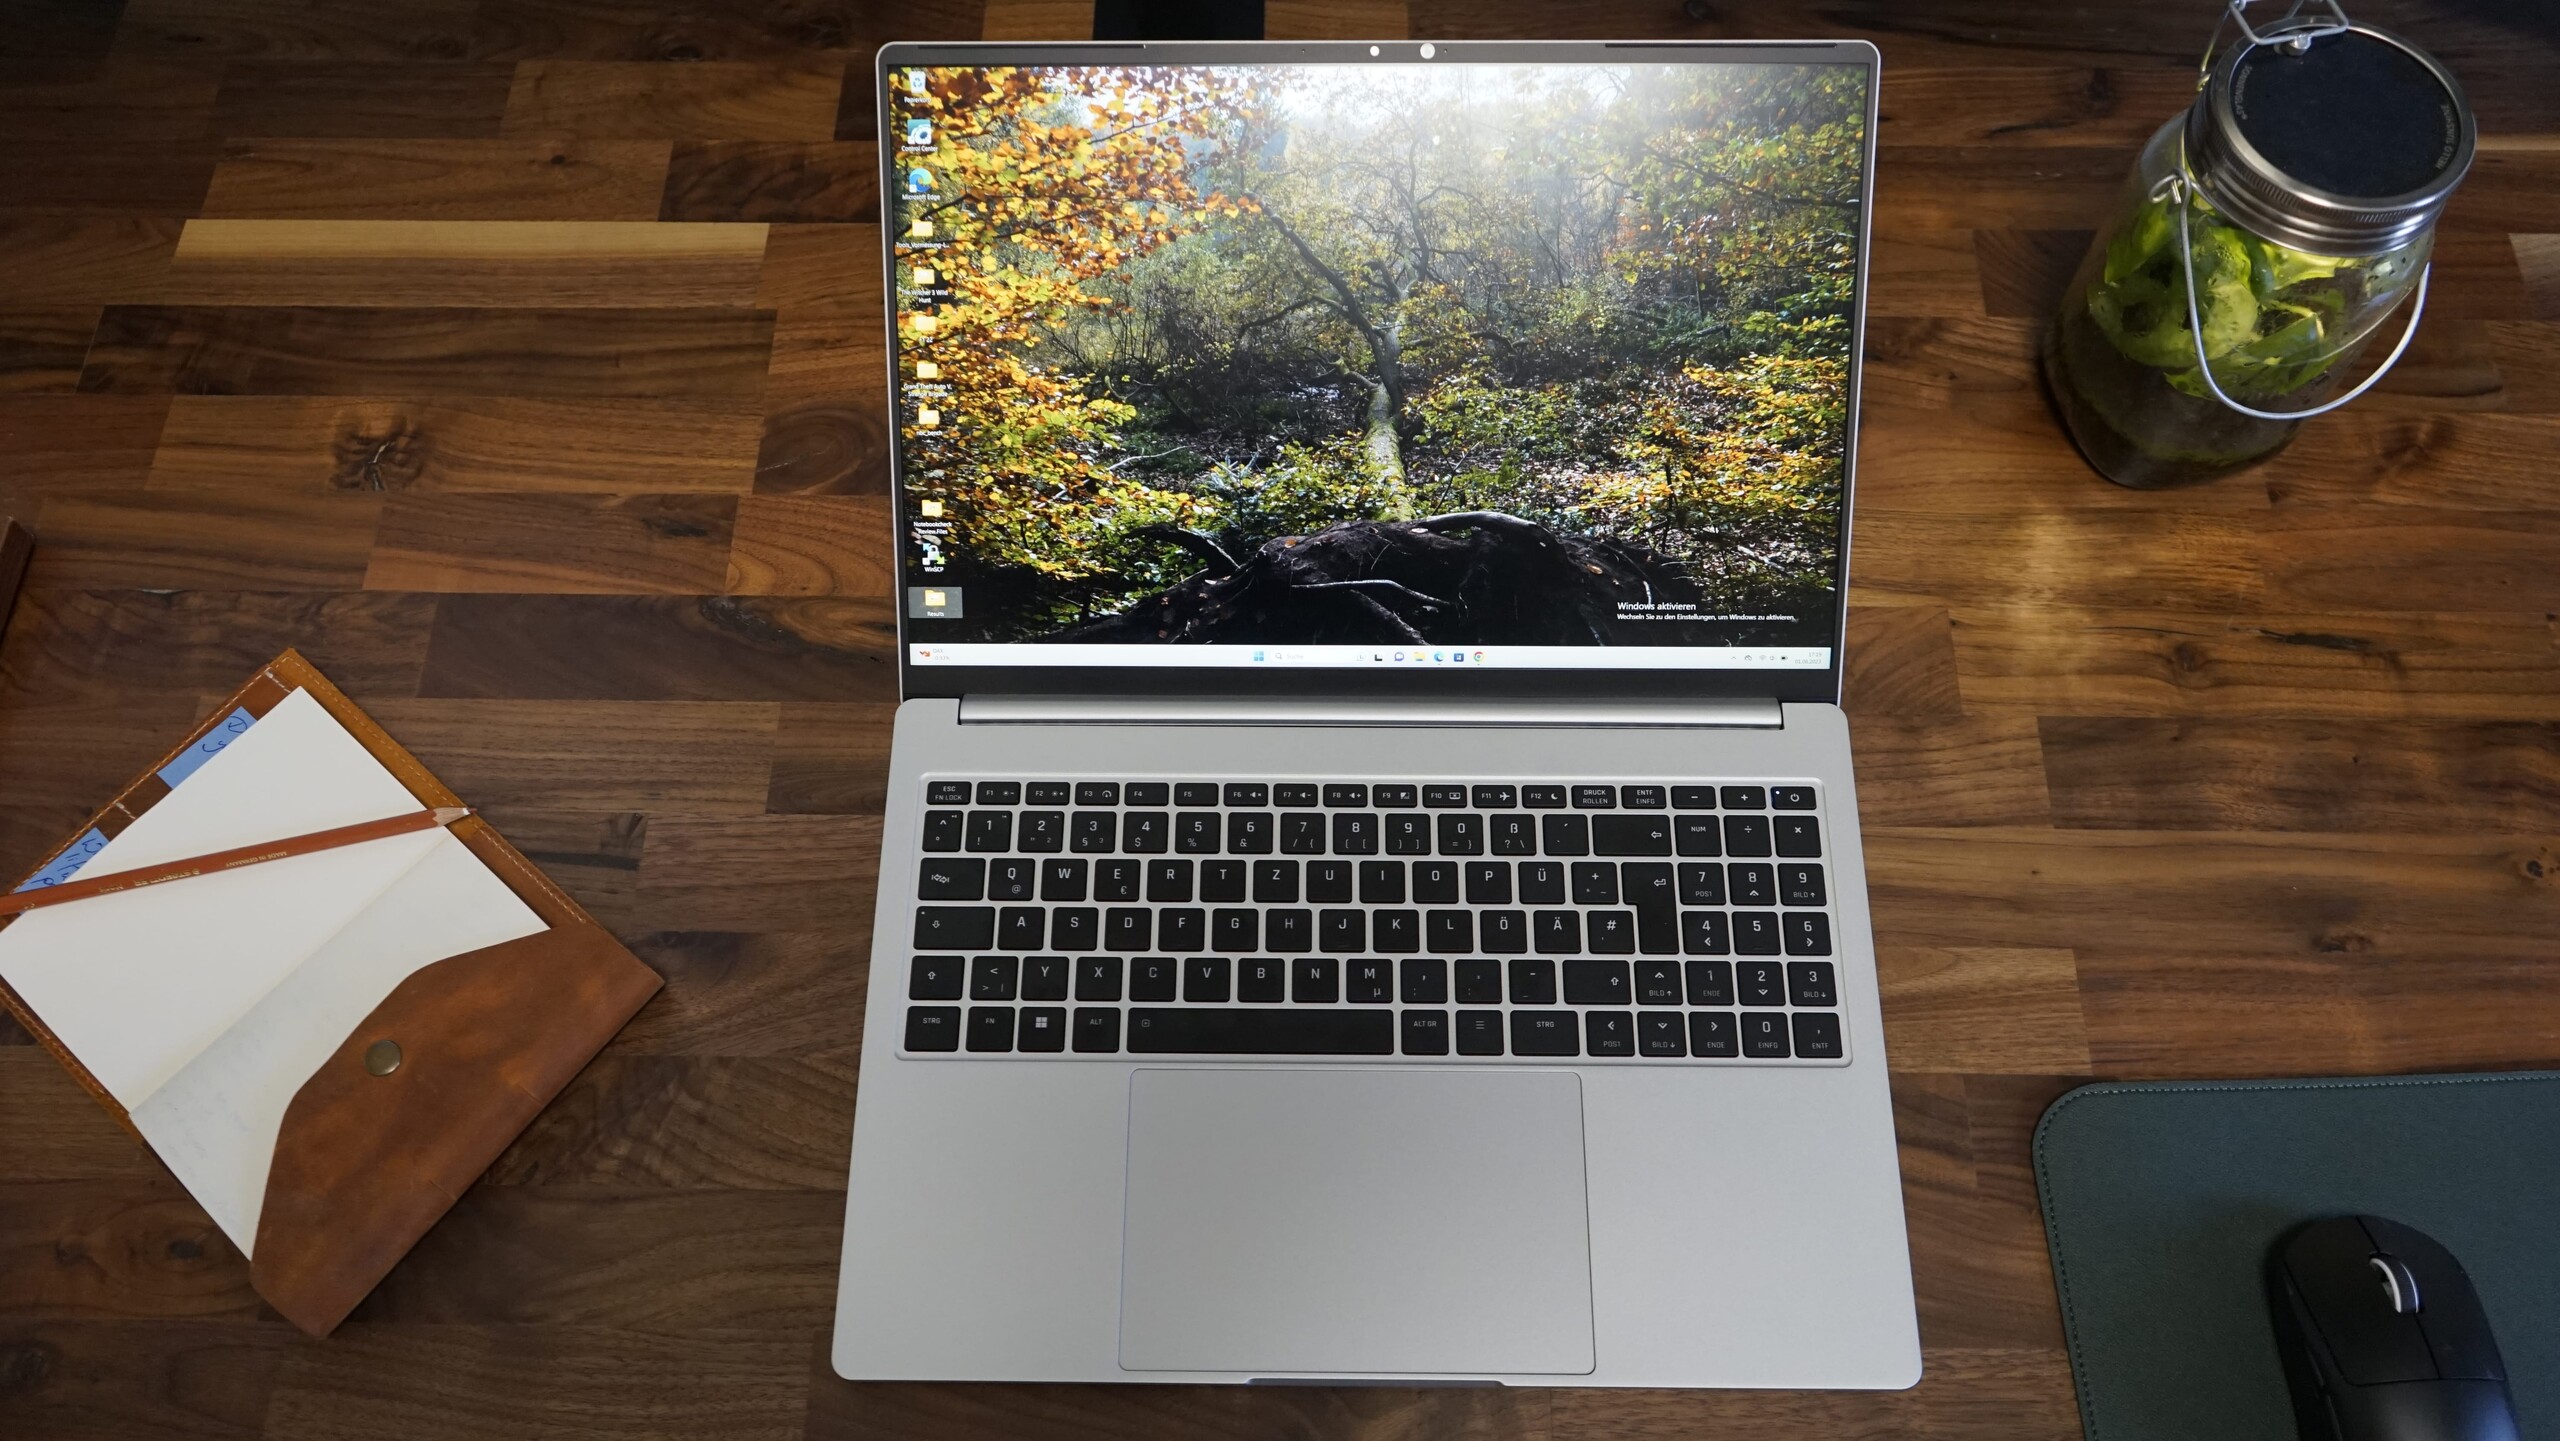
Urządzenia wejściowe - ogromny szklany panel dotykowy, ale układ klawiatury nie jest idealny.
Urządzenia wejściowe Vision 16 są solidne. Touchpad jest bardzo duży i precyzyjny, ale są pewne niedociągnięcia, jeśli chodzi o klawiaturę.
Klawiatura
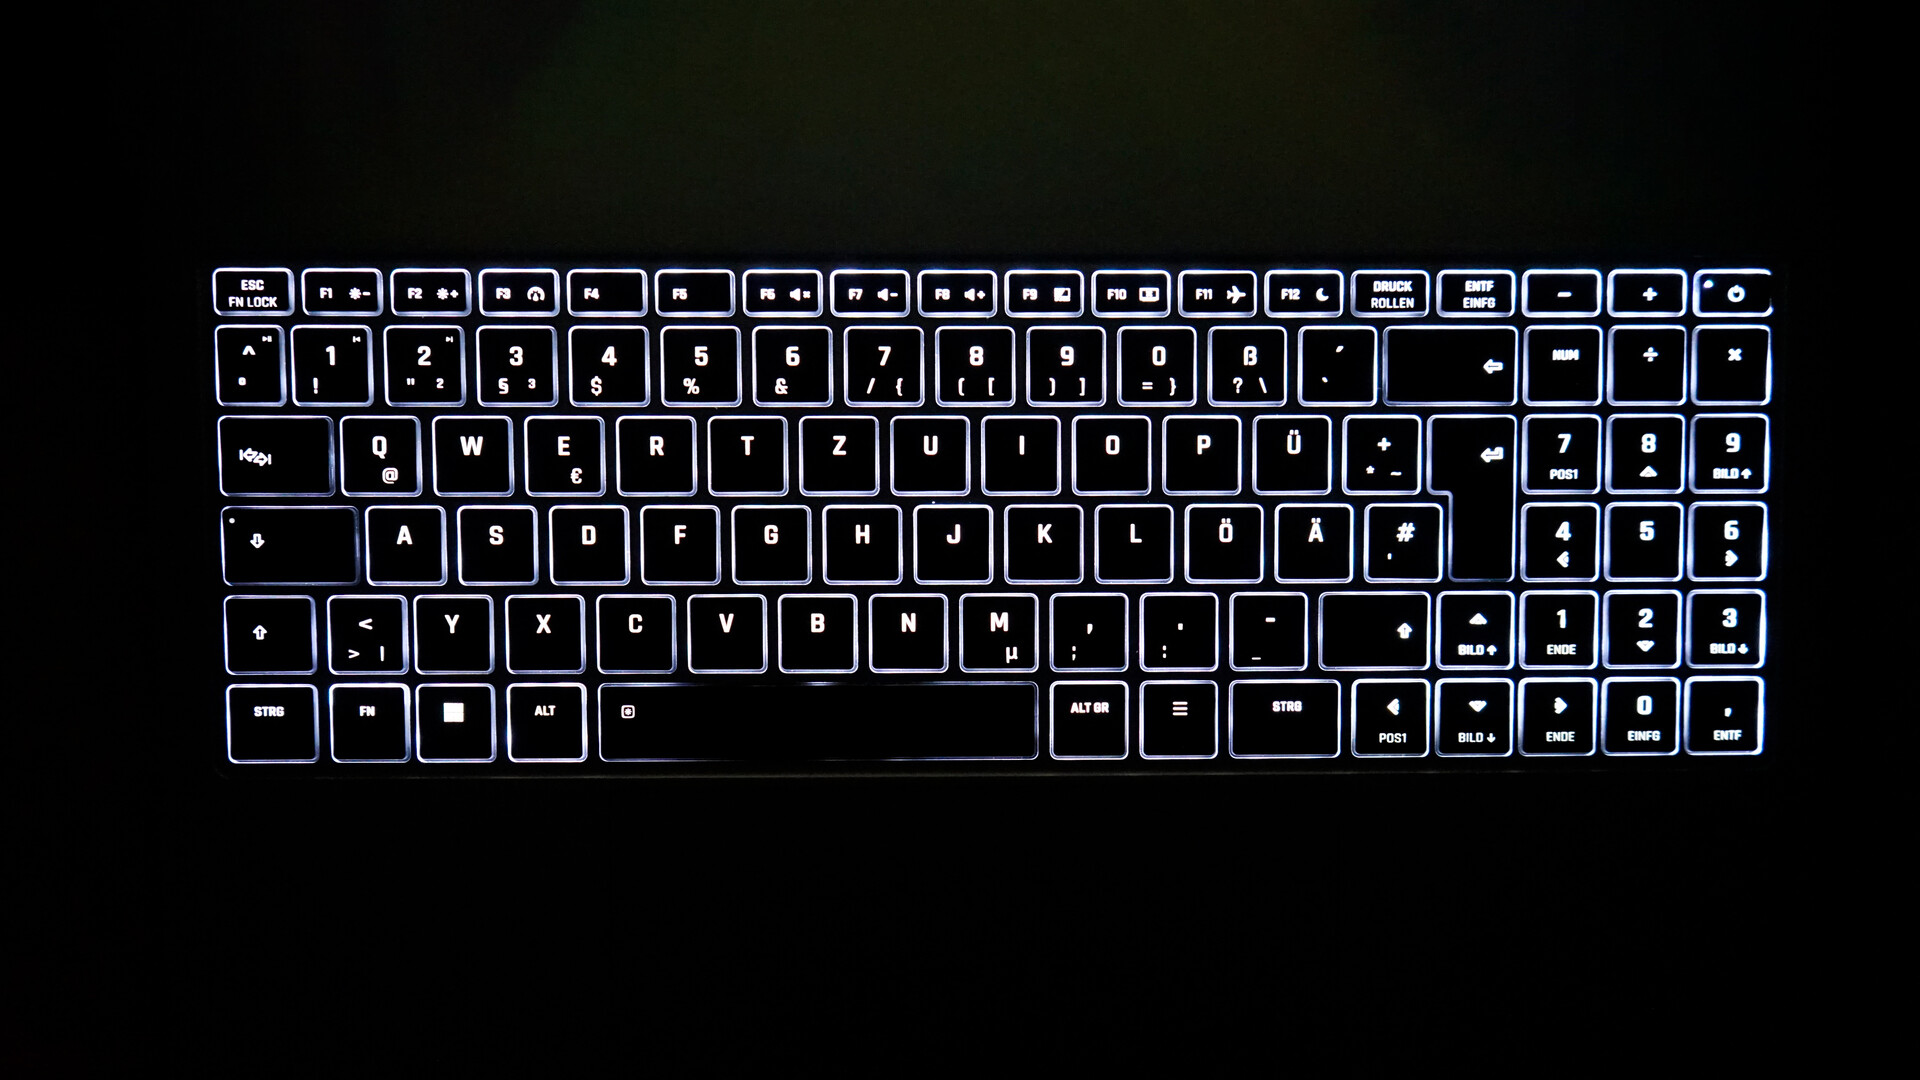
Klawiatura ma dedykowany blok numeryczny z pełnowymiarowymi klawiszami strzałek, skracając prawy klawisz Shift i wypierając dodatkowy klawisz Enter z bloku numerycznego. Blok numeryczny jest raczej skompresowaną wersją i nie nadaje się zbytnio do szybkiego wprowadzania liczb. Nasuwa się pytanie, dlaczego Schenker w ogóle dołączył blok numeryczny, skoro cała klawiatura jest przesunięta w lewo z jego powodu. Ze względu na przesuniętą klawiaturę i krótszy prawy klawisz Shift, pisanie ma negatywny wpływ, a klawiatura wymaga dłuższego czasu, aby się do niej przyzwyczaić.
Jeśli chodzi o same klawisze, oferują one bardzo dobry i precyzyjny komfort pisania z solidnym, niezbyt głośnym odgłosem pisania. Klawiatura jest podświetlana na dwóch poziomach jasności, a wszystkie klawisze są podświetlone równomiernie.

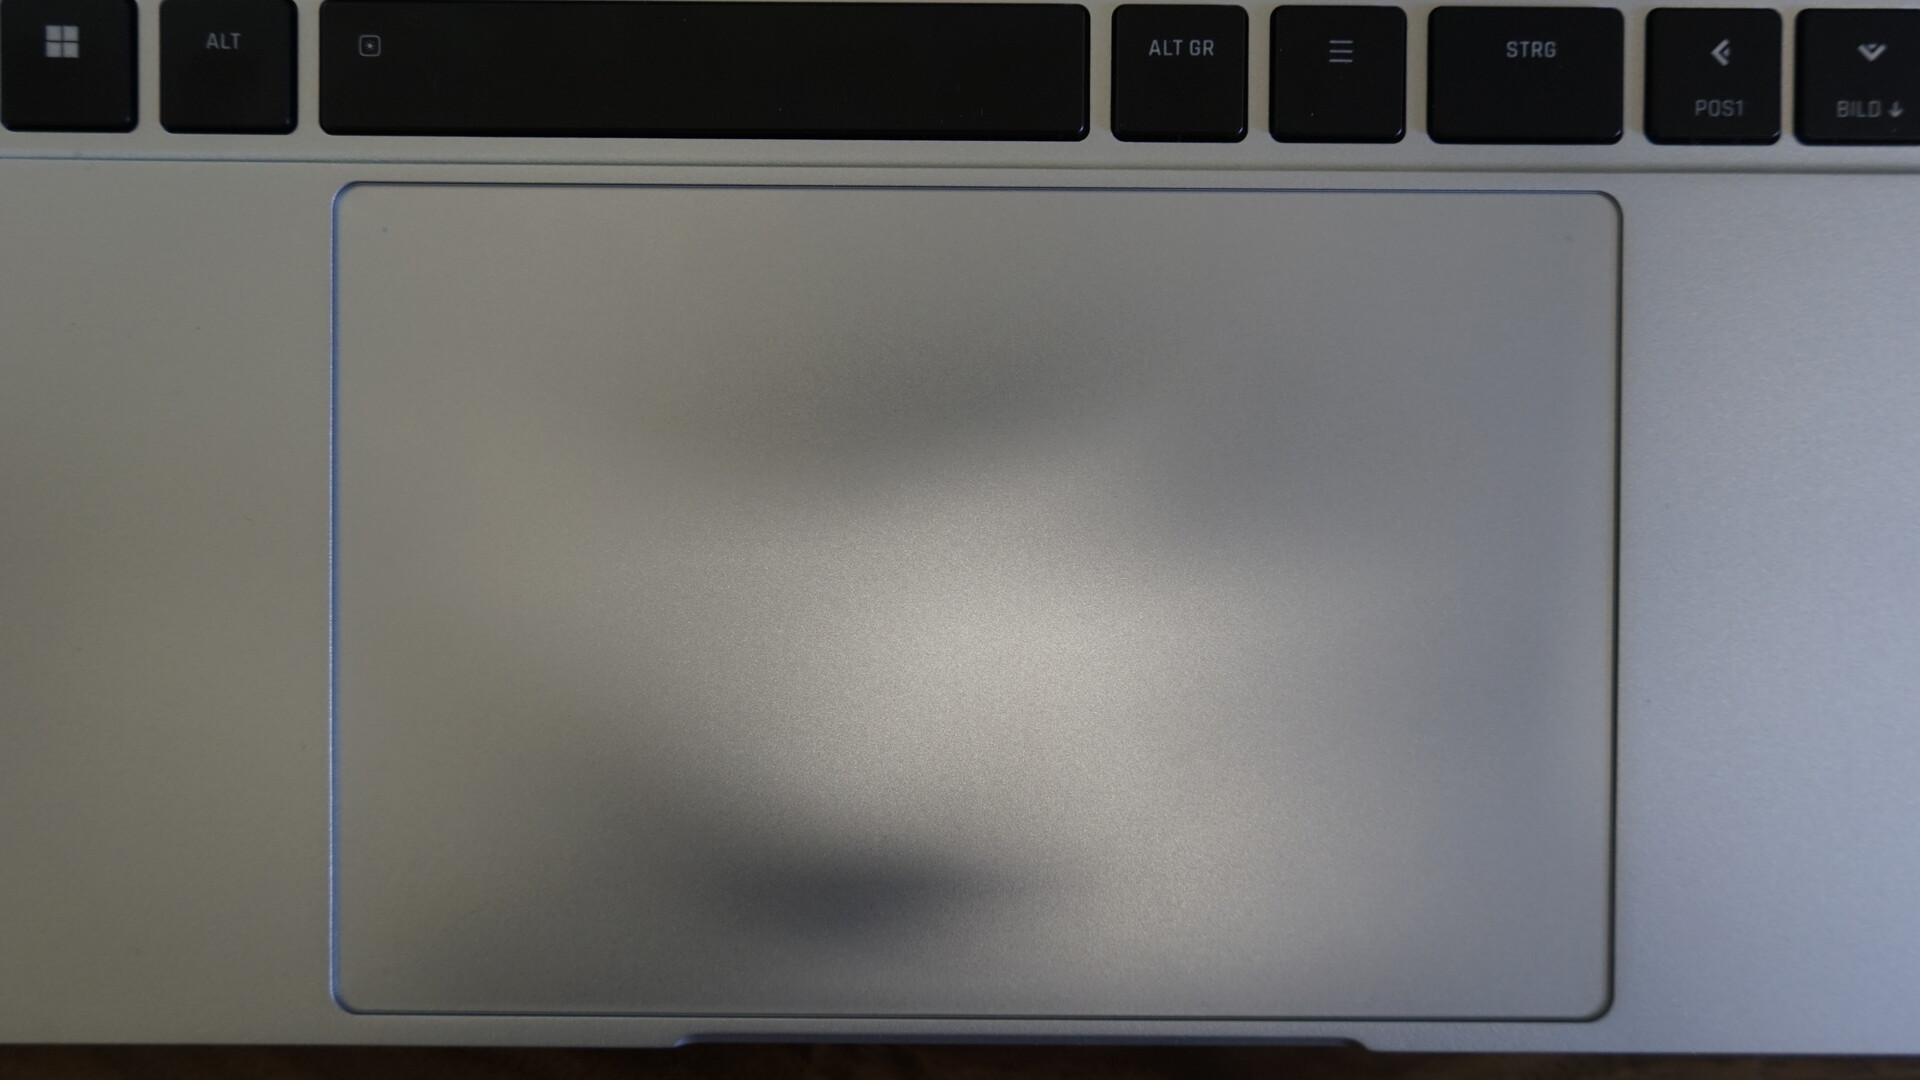
Touchpad
Najważniejszym elementem Vision 16 i wersji Pro jest duży szklany gładzik (15,4 x 10 cm). Korzystanie z gładzika jest łatwe, a dzięki dużej powierzchni gesty i ruch kursora są płynne. Precyzja tego touchpada jest bardzo dobra. Mógłby być jednak nieco mniej hałaśliwy, jeśli chodzi o mechanizm klikania, a trafienie w obszar prawego przycisku myszy może być trudne.
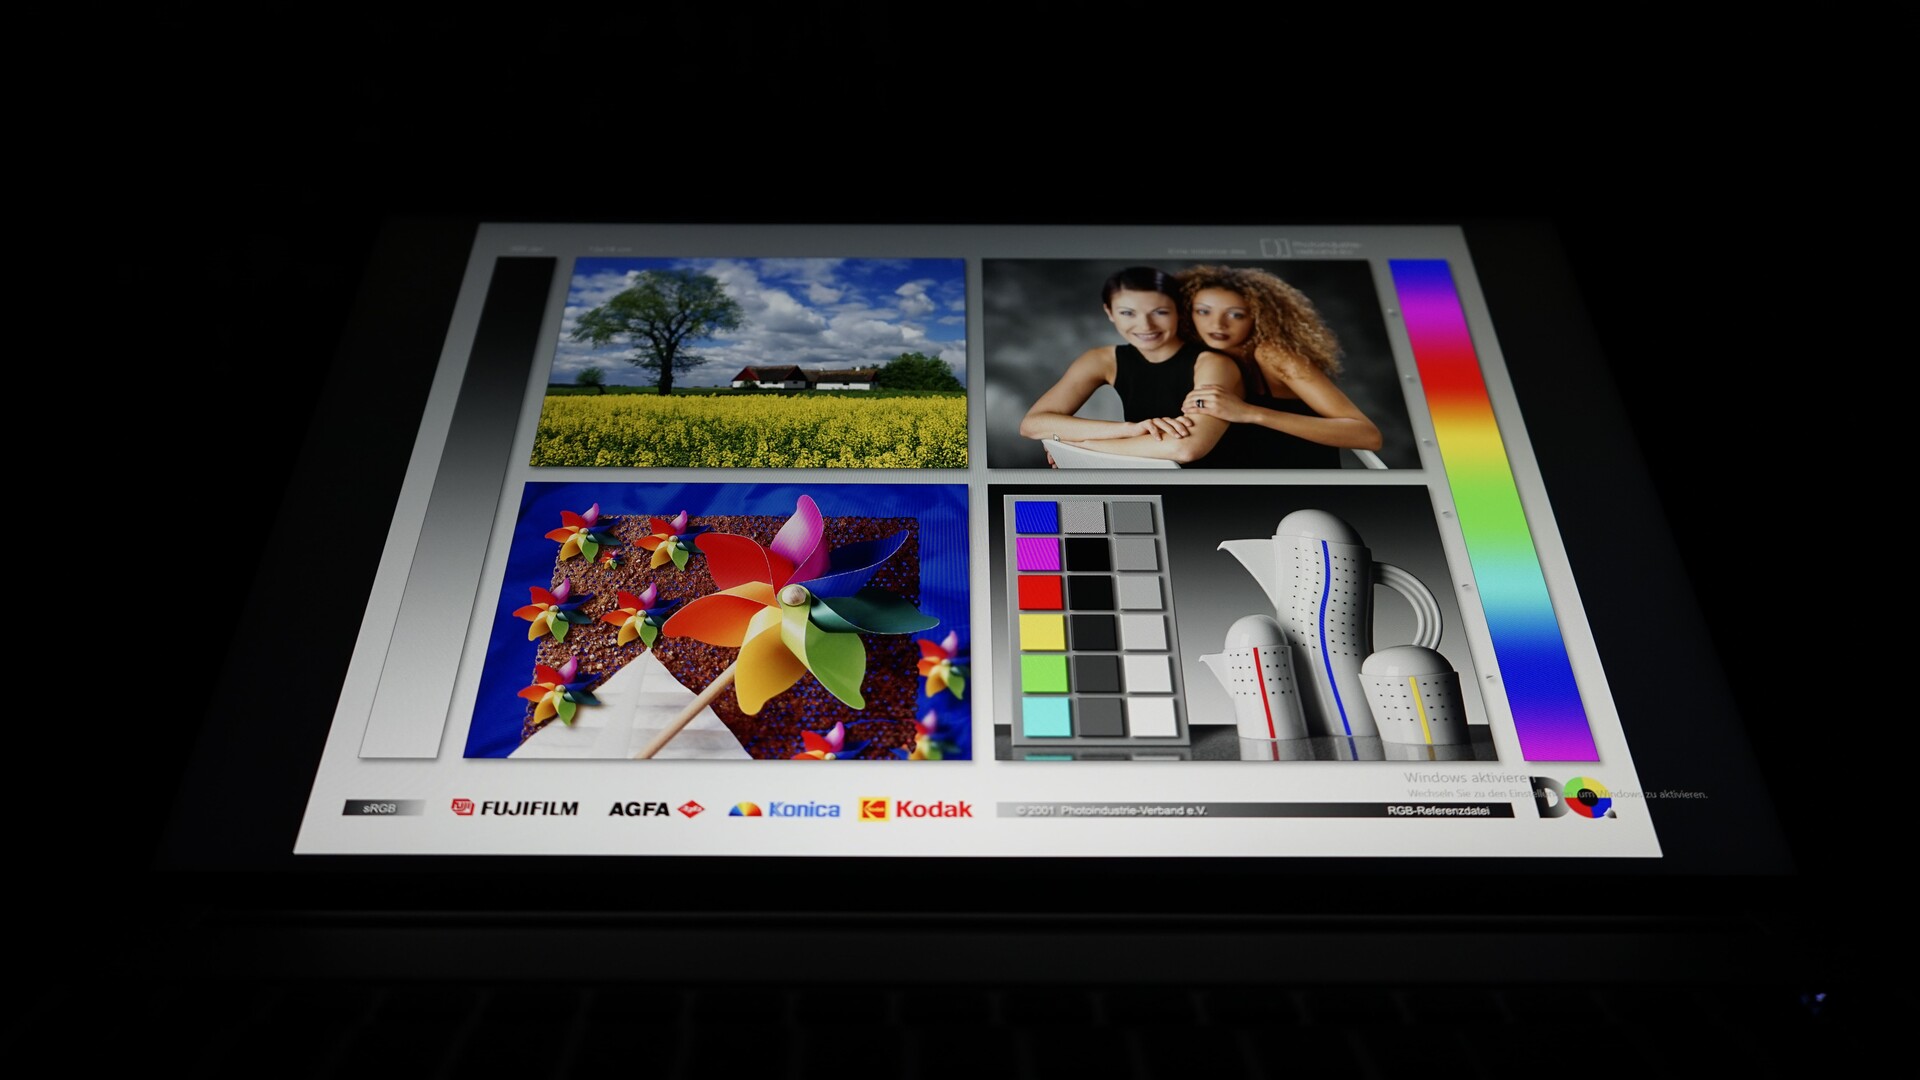
Wyświetlacz - ekran IPS 240 Hz w formacie 16:10
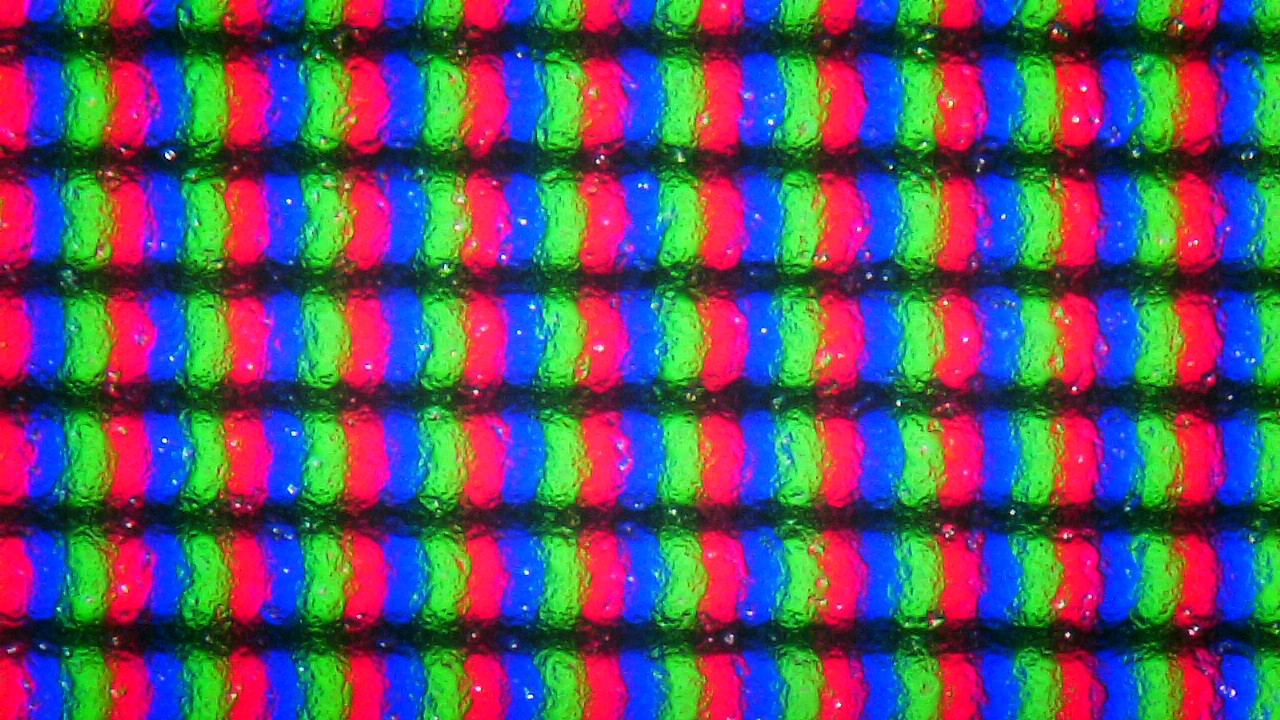

Jedną z najważniejszych cech ultrabooka Vision 16 2023 jest nowy panel WQXGA (2560 x 1600), który w zeszłorocznym modelu był dostępny wyłącznie w wersji Pro. Zamiast 90 Hz, tegoroczny model Vision 16 oferuje częstotliwość odświeżania 240 Hz - nietypową dla laptopów biurowych.
Pomimo faktu, że obie wersje Vision 16 wykorzystują ten sam ekran w tym roku, Vision 16 nieznacznie przewyższył Vision 16 Pro w naszej recenzji. Różnice te przypisujemy normalnym różnicom w jakości między panelami. Jasność ekranu powinna osiągnąć 350 cd/m² według Schenkera, co potwierdzają nasze pomiary.
Wysoka częstotliwość 240 Hz zapewnia płynne wrażenia użytkownika. Prawdziwe zalety tej płynności podczas grania są jednak marnowane na Vision 16, chyba że jest on połączony z zewnętrznym procesorem graficznym Thunderbolt.
| |||||||||||||||||||||||||
rozświetlenie: 93 %
na akumulatorze: 356 cd/m²
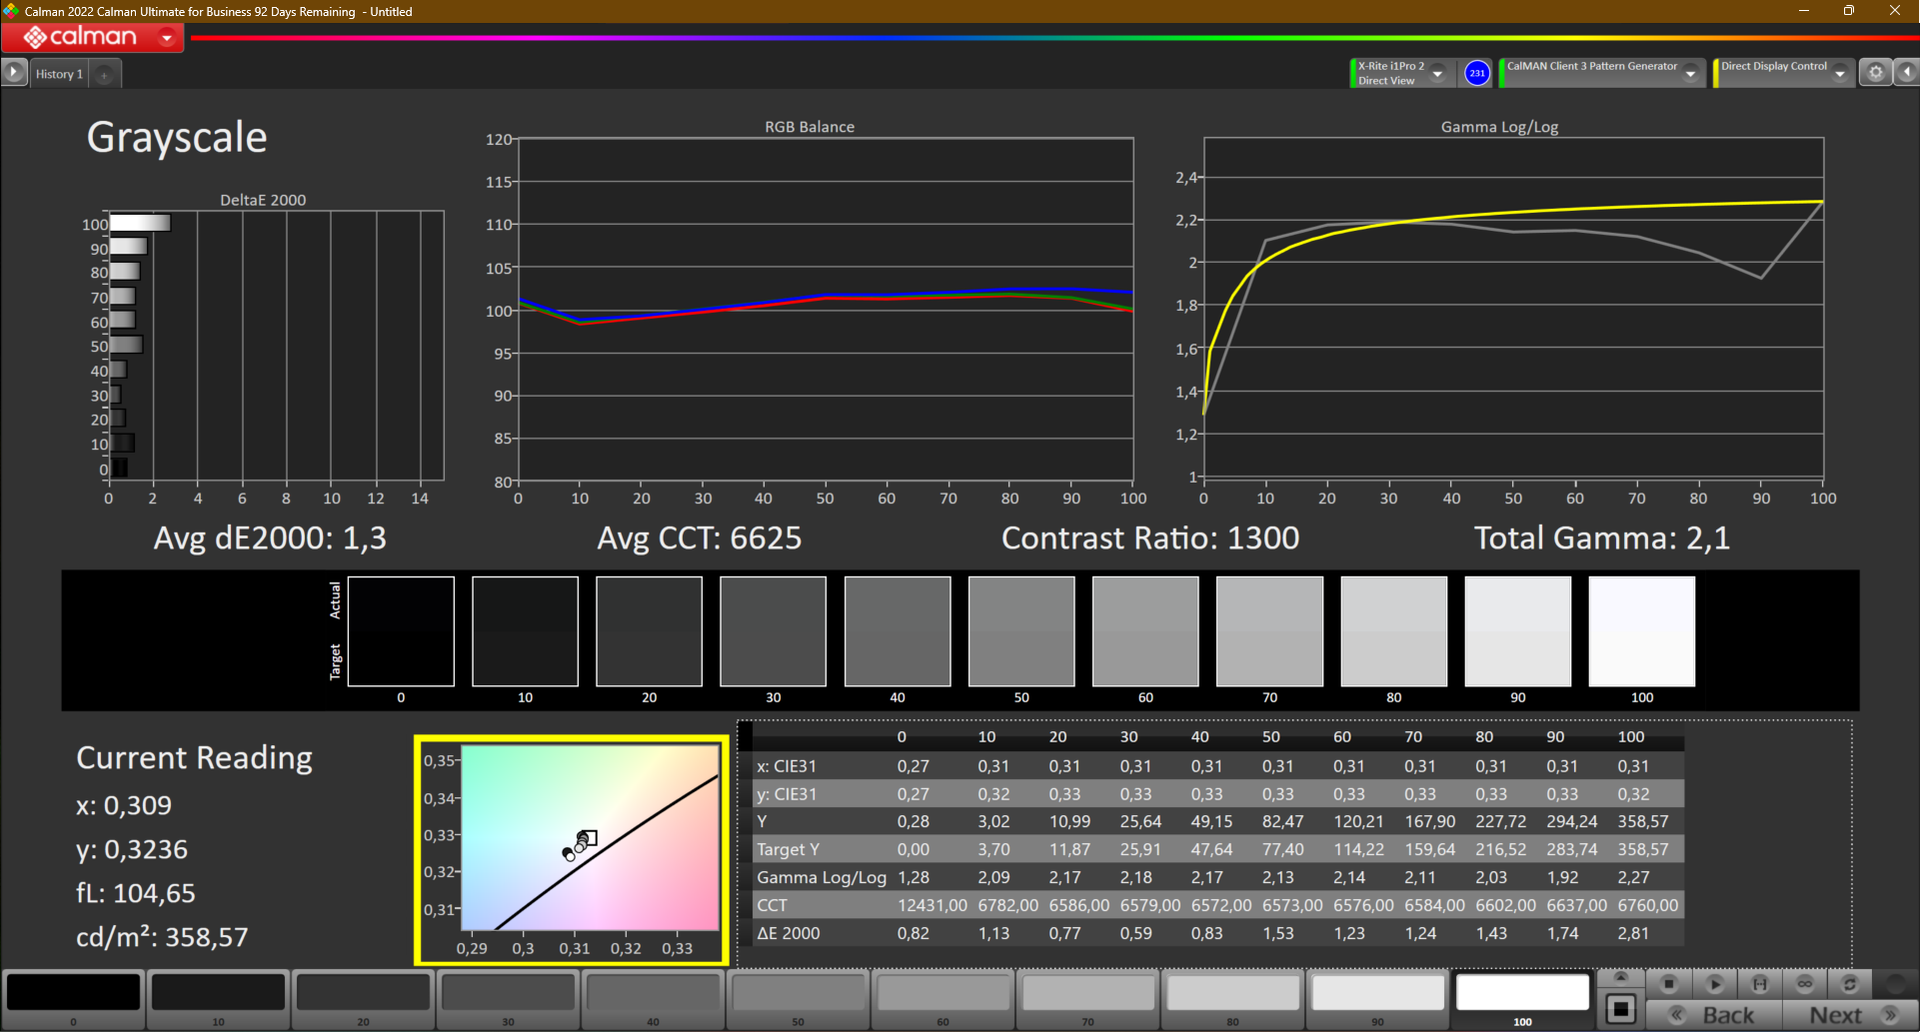
kontrast: 1271:1 (czerń: 0.28 cd/m²)
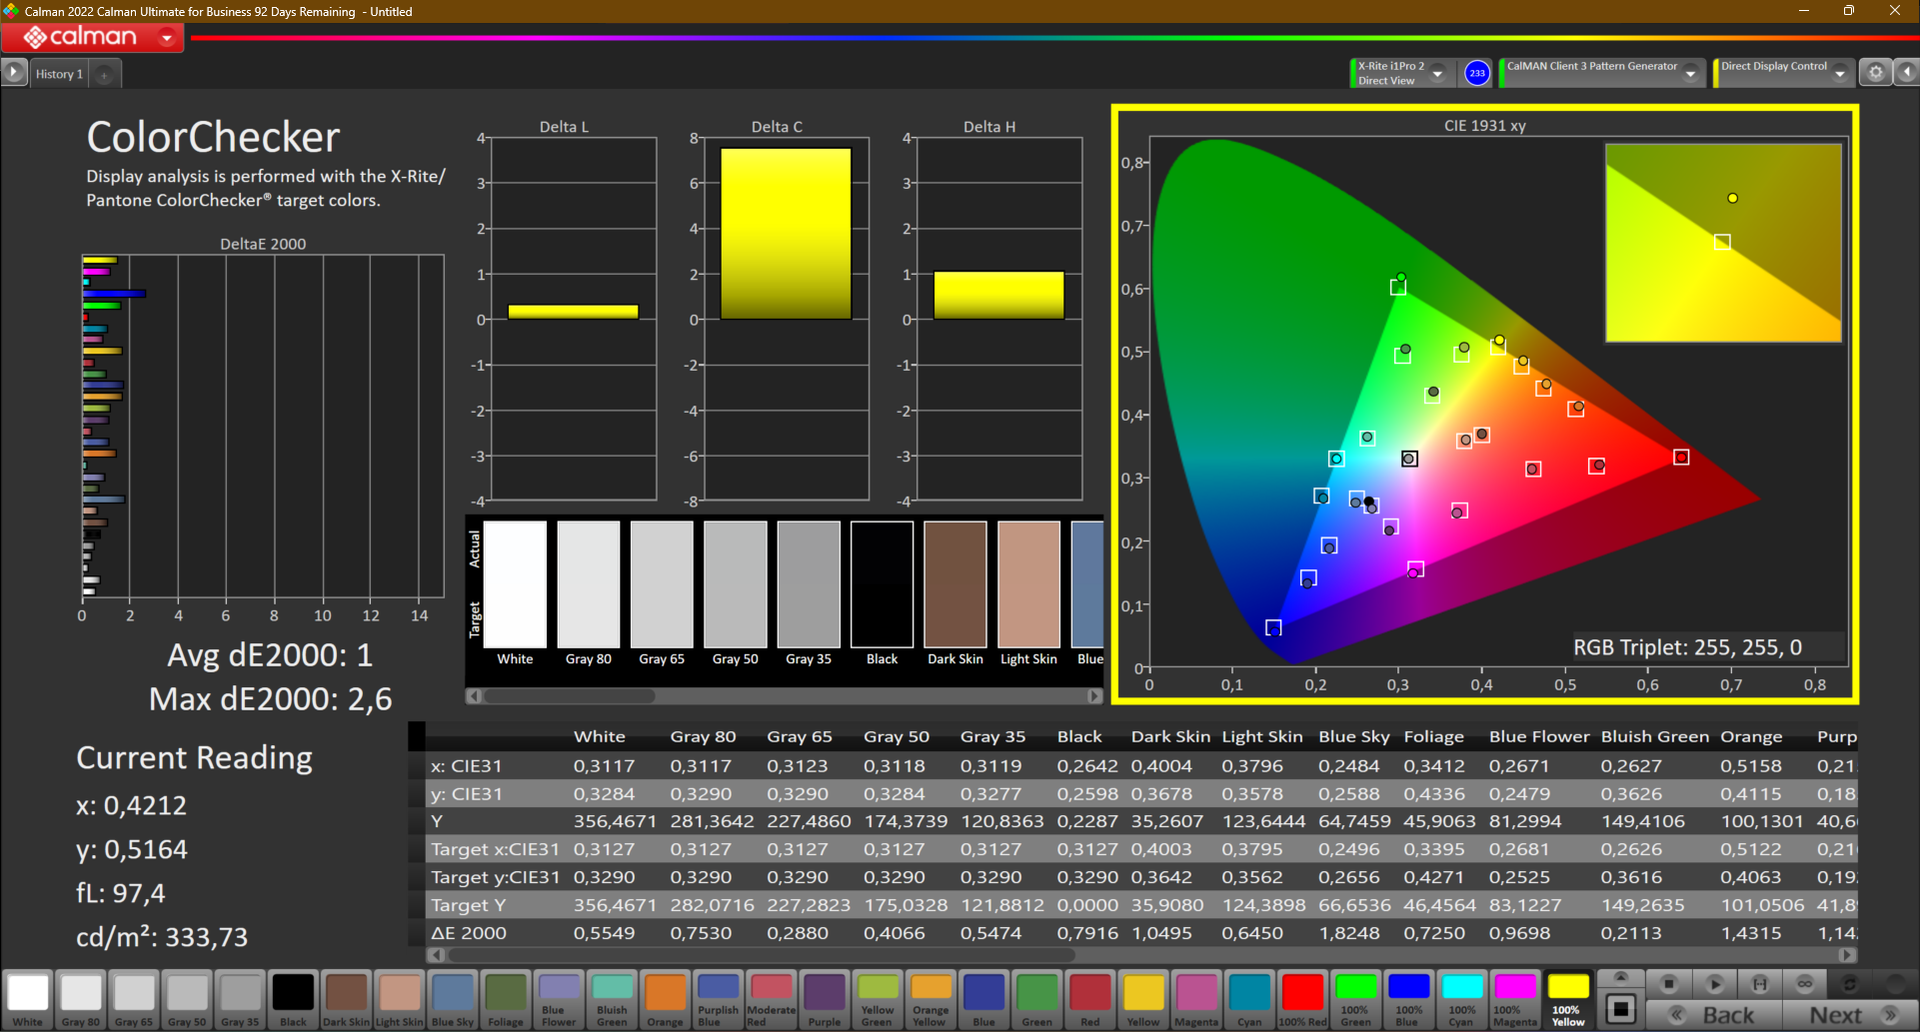
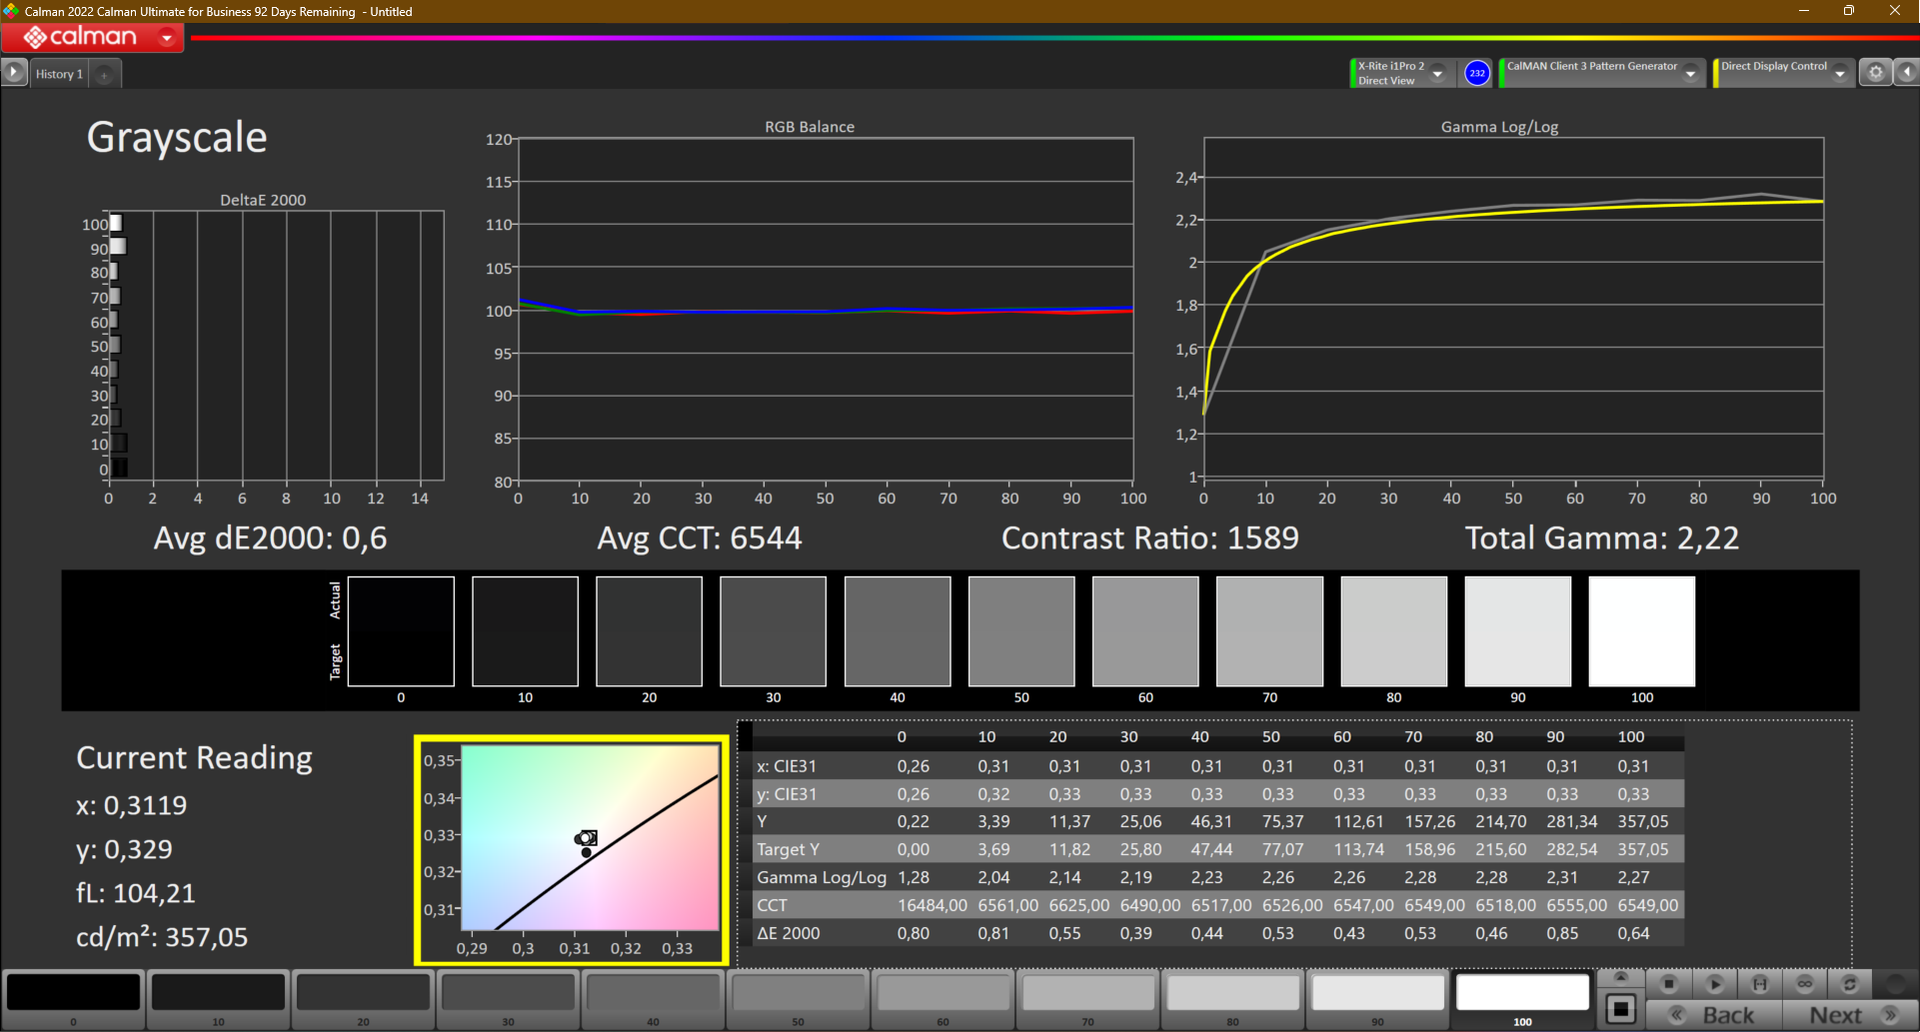
ΔE ColorChecker Calman: 1.7 | ∀{0.5-29.43 Ø4.71}
calibrated: 1
ΔE Greyscale Calman: 1.3 | ∀{0.09-98 Ø4.96}
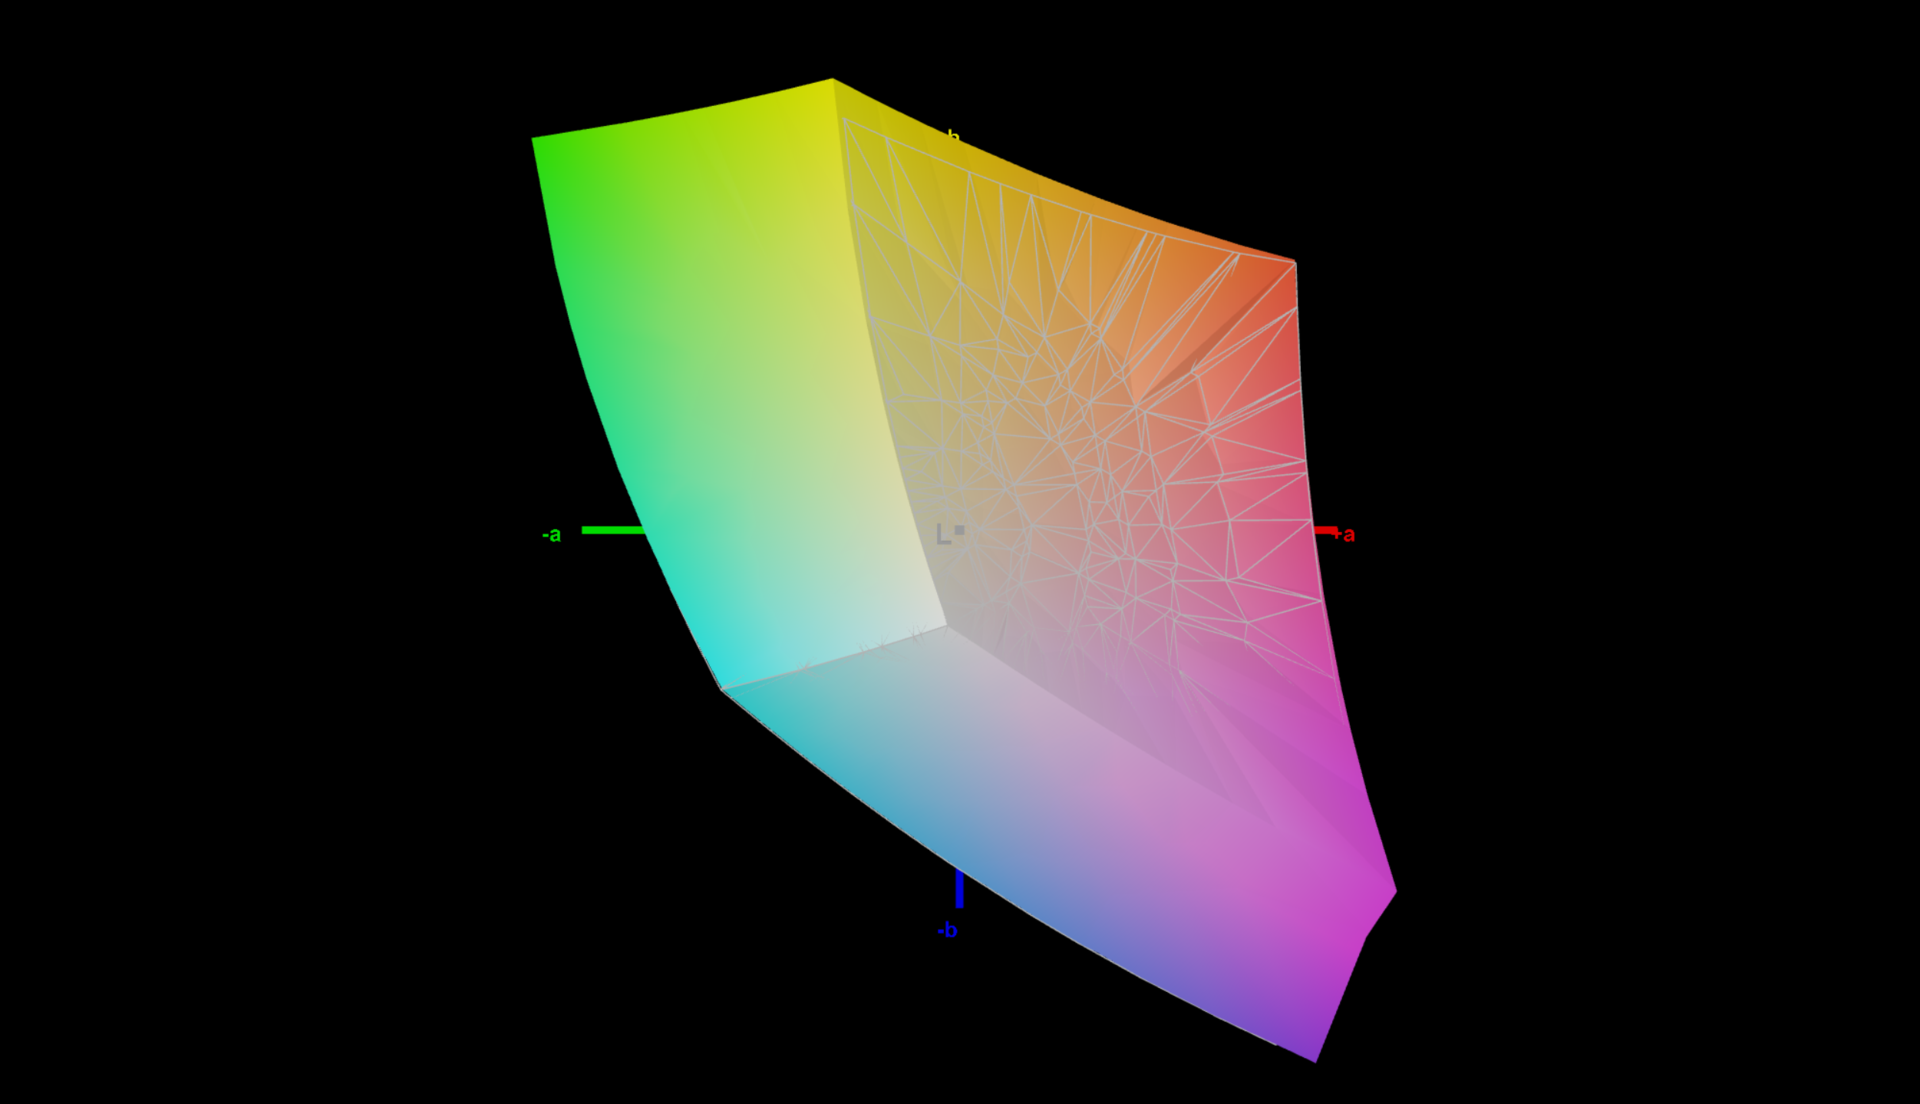
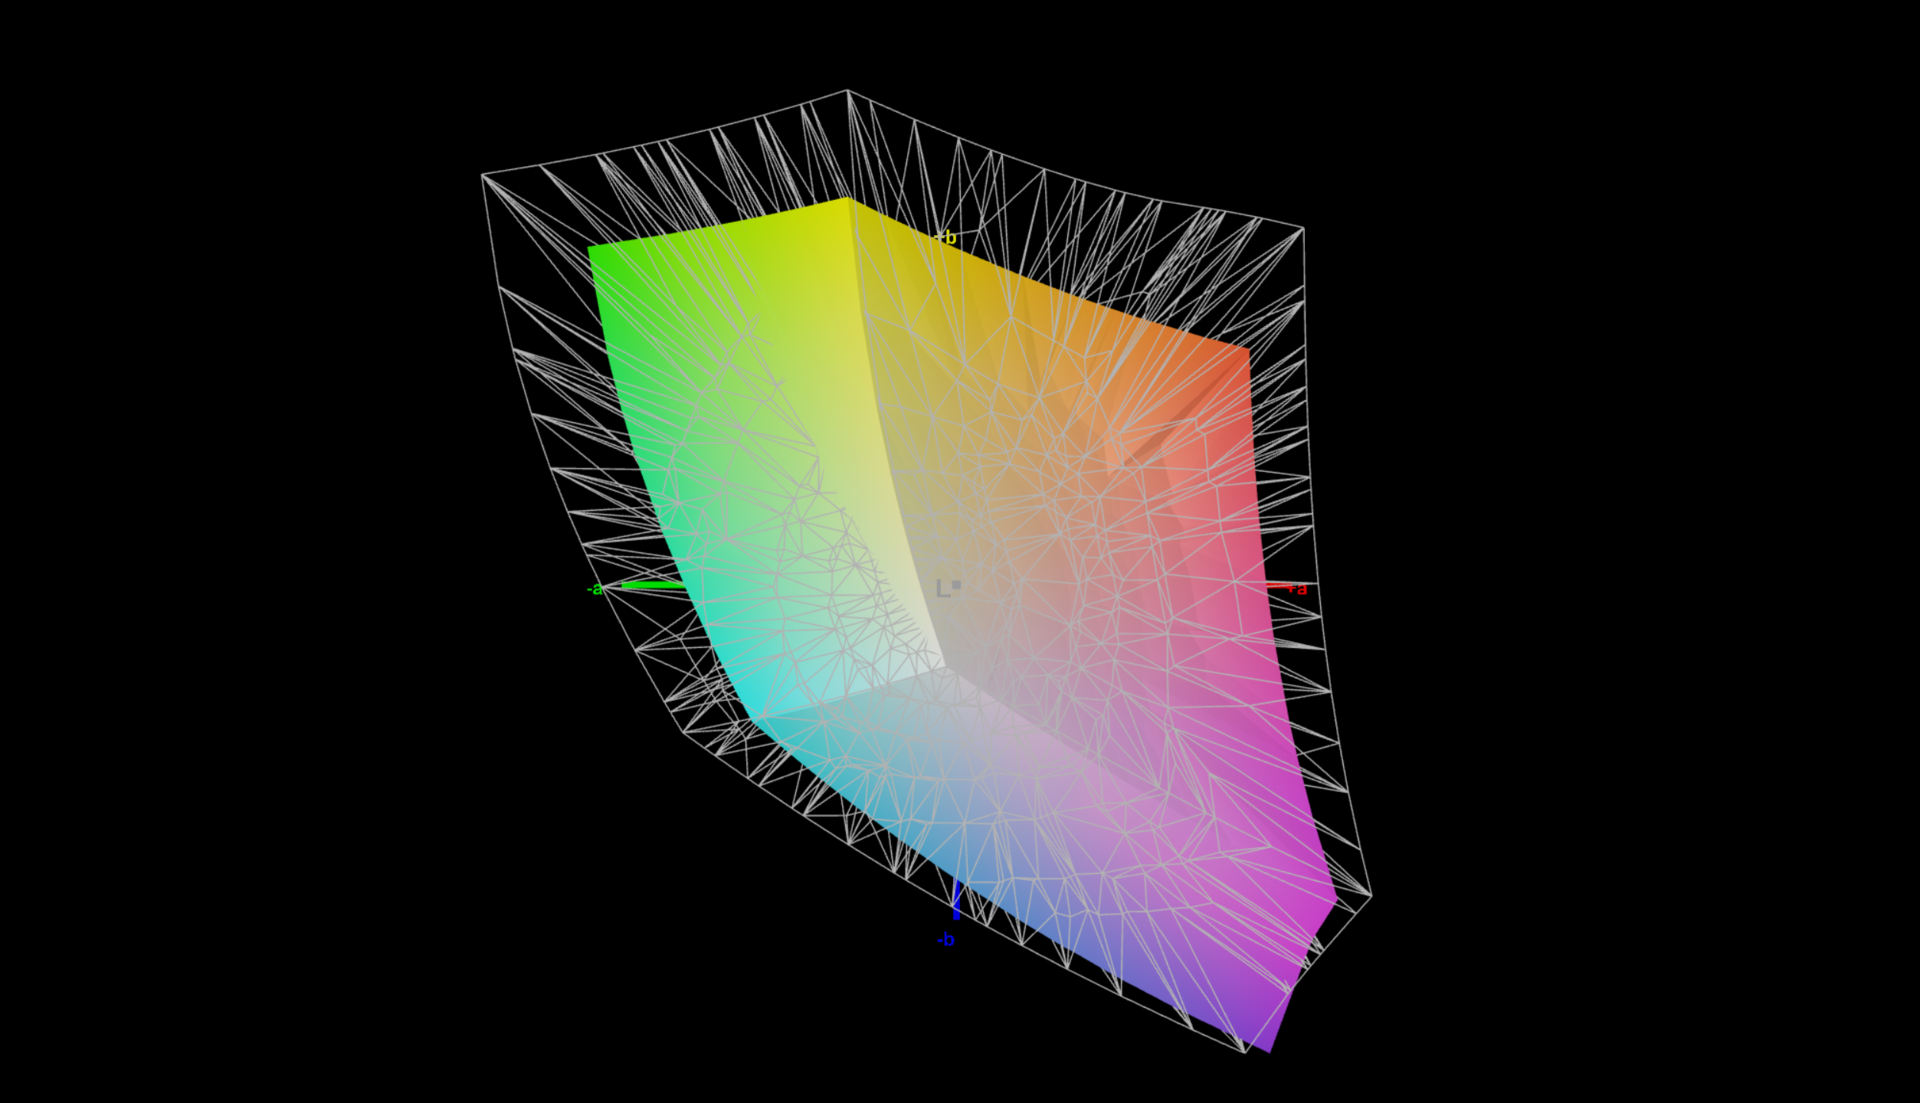
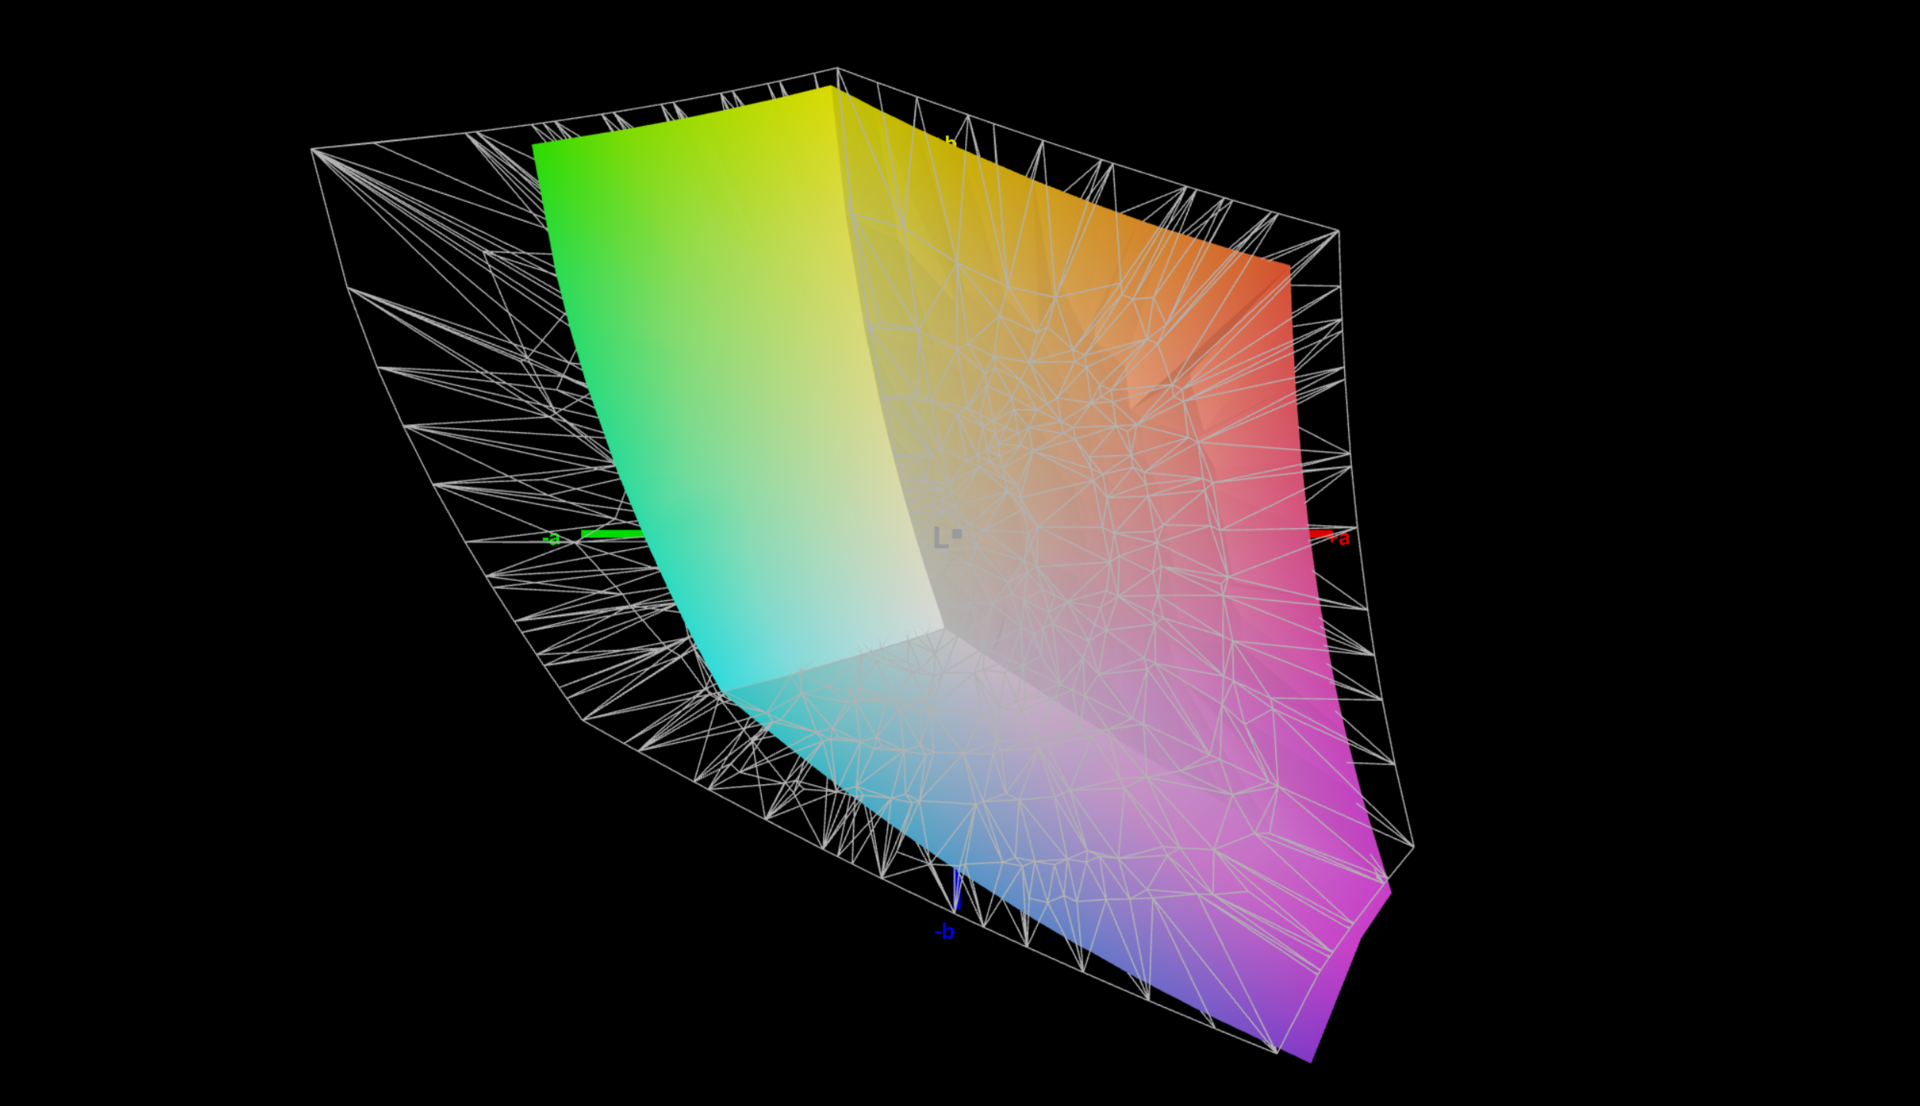
71.2% AdobeRGB 1998 (Argyll 3D)
99.3% sRGB (Argyll 3D)
70% Display P3 (Argyll 3D)
Gamma: 2.1
CCT: 6625 K
| Schenker Vision 16 PH6PRX1 BOE CQ NE160QDM-NZ1 , IPS, 2560x1600, 16" | Apple MacBook Air 15 2023 M2 16 GB IPS, 2880x1864, 15.3" | Acer Swift Go SFG16-71 Samsung SDC418D ATNA60BC03-0, OLED, 3200x2000, 16" | LG Gram SuperSlim (2023) Samsung ATNA56YX08-0, OLED, 1920x1080, 15.6" | Microsoft Surface Laptop 5 15, i7-1255U LQ150P1JX51, IPS, 2496x1664, 15" | Asus VivoBook S15 M3502RA-L1029W Samsung SDC4161, OLED, 1920x1080, 15.6" | |
|---|---|---|---|---|---|---|
| Display | 22% | 28% | 27% | -2% | 27% | |
| Display P3 Coverage (%) | 70 | 98.7 41% | 99.91 43% | 99.8 43% | 68.1 -3% | 99.9 43% |
| sRGB Coverage (%) | 99.3 | 99.9 1% | 100 1% | 100 1% | 97.3 -2% | 100 1% |
| AdobeRGB 1998 Coverage (%) | 71.2 | 87.9 23% | 98.87 39% | 98.09 38% | 70.3 -1% | 98.6 38% |
| Response Times | -149% | 79% | 79% | -318% | 84% | |
| Response Time Grey 50% / Grey 80% * (ms) | 11 ? | 28.8 ? -162% | 2 ? 82% | 2 ? 82% | 52.4 ? -376% | 0.74 93% |
| Response Time Black / White * (ms) | 8 ? | 18.9 ? -136% | 2 ? 75% | 2 ? 75% | 28.7 ? -259% | 2 ? 75% |
| PWM Frequency (Hz) | 227 ? | 22000 ? | 59 ? | |||
| Screen | 9% | -52% | -20% | 18% | -36% | |
| Brightness middle (cd/m²) | 356 | 517 45% | 370 4% | 395 11% | 397 12% | 378 6% |
| Brightness (cd/m²) | 349 | 501 44% | 371 6% | 392 12% | 399 14% | 378 8% |
| Brightness Distribution (%) | 93 | 93 0% | 98 5% | 97 4% | 85 -9% | 98 5% |
| Black Level * (cd/m²) | 0.28 | 0.39 -39% | 0.1 64% | 0.29 -4% | ||
| Contrast (:1) | 1271 | 1326 4% | 3950 211% | 1369 8% | ||
| Colorchecker dE 2000 * | 1.7 | 1.2 29% | 2.77 -63% | 2.2 -29% | 0.8 53% | 2.2 -29% |
| Colorchecker dE 2000 max. * | 3 | 2.5 17% | 4.08 -36% | 4.43 -48% | 1.4 53% | 4.87 -62% |
| Colorchecker dE 2000 calibrated * | 1 | 0.8 20% | 2.83 -183% | 4.65 -365% | 2.68 -168% | |
| Greyscale dE 2000 * | 1.3 | 1.8 -38% | 2.58 -98% | 1.78 -37% | 1.1 15% | 1.43 -10% |
| Gamma | 2.1 105% | 2.24 98% | 2.46 89% | 2.39 92% | 2.18 101% | 2.47 89% |
| CCT | 6625 98% | 6241 104% | 6284 103% | 6705 97% | 6464 101% | |
| Całkowita średnia (program / ustawienia) | -39% /
-11% | 18% /
-10% | 29% /
4% | -101% /
-38% | 25% /
0% |
* ... im mniej tym lepiej
Pomiary wartości czerni wyniosły solidne 0,28 cd/m², co daje współczynnik kontrastu ekranu przekraczający 1200:1. Mimo to wyświetlacz IPS nie może konkurować z głębokimi wartościami czerni paneli OLED.
Wartość deltaE ekranu przed kalibracją wynosiła dobre 1,7 i byliśmy w stanie poprawić ją do 1,0. Dla porównania, wyświetlacz Vision 16 Pro miał deltaE na poziomie 3,4 przed kalibracją. Różnica jest szczególnie zauważalna w przypadku skali szarości. Fabrycznie, wersja Pro miała deltaE w skali szarości na poziomie 4,9, podczas gdy nasza próbka testowa Vision 16 miała znacznie niższy deltaE w skali szarości na poziomie 1,3.
Nie wykryliśmy niebieskiego odcienia, jak w przypadku ekranu Vision 16 Pro. Ze względu na dobrą kalibrację fabryczną, nie korzystaliśmy z profilu kolorów Schenker w centrum sterowania. Różnica w pomiarach między Vision 16 i Vision 16 Pro pokazuje, że jakość ekranu jest szczęśliwa. Jak zawsze, profil kolorów, który stworzyliśmy dla Schenker Vision 16, jest dostępny do pobrania za darmo w szarym polu powyżej.
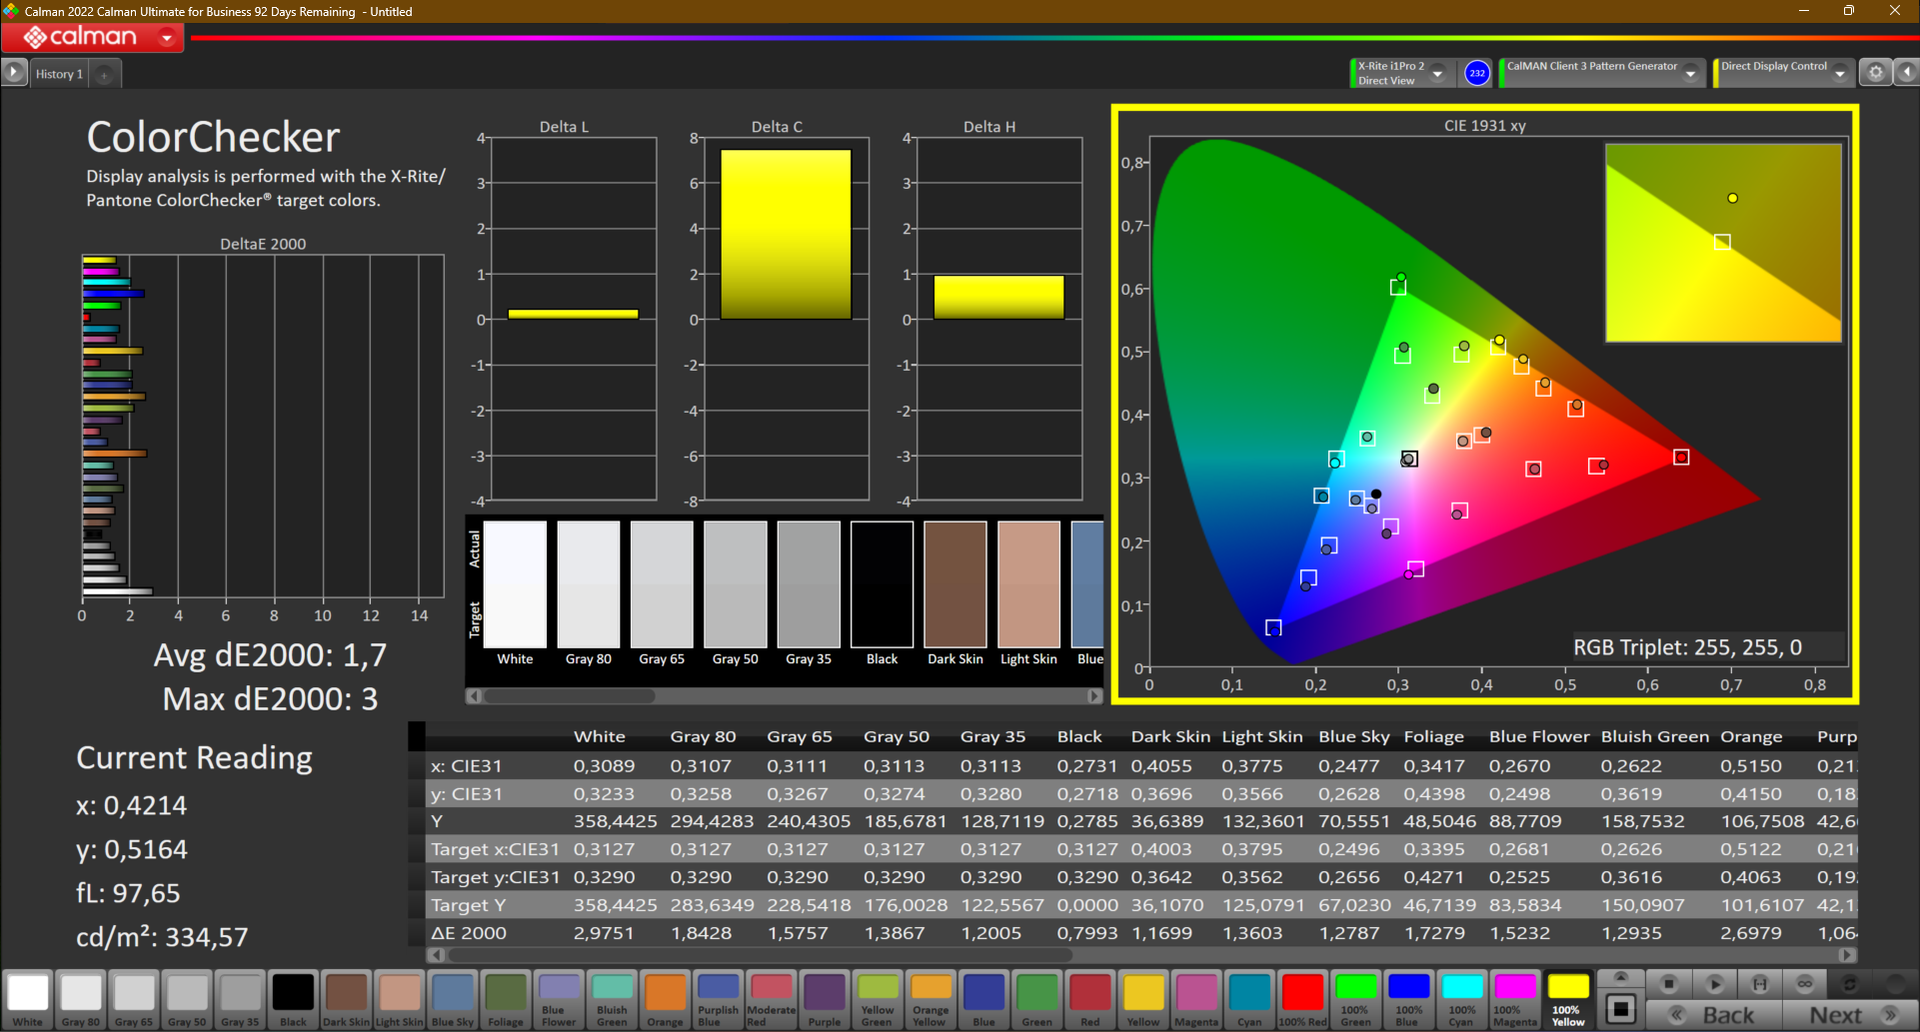

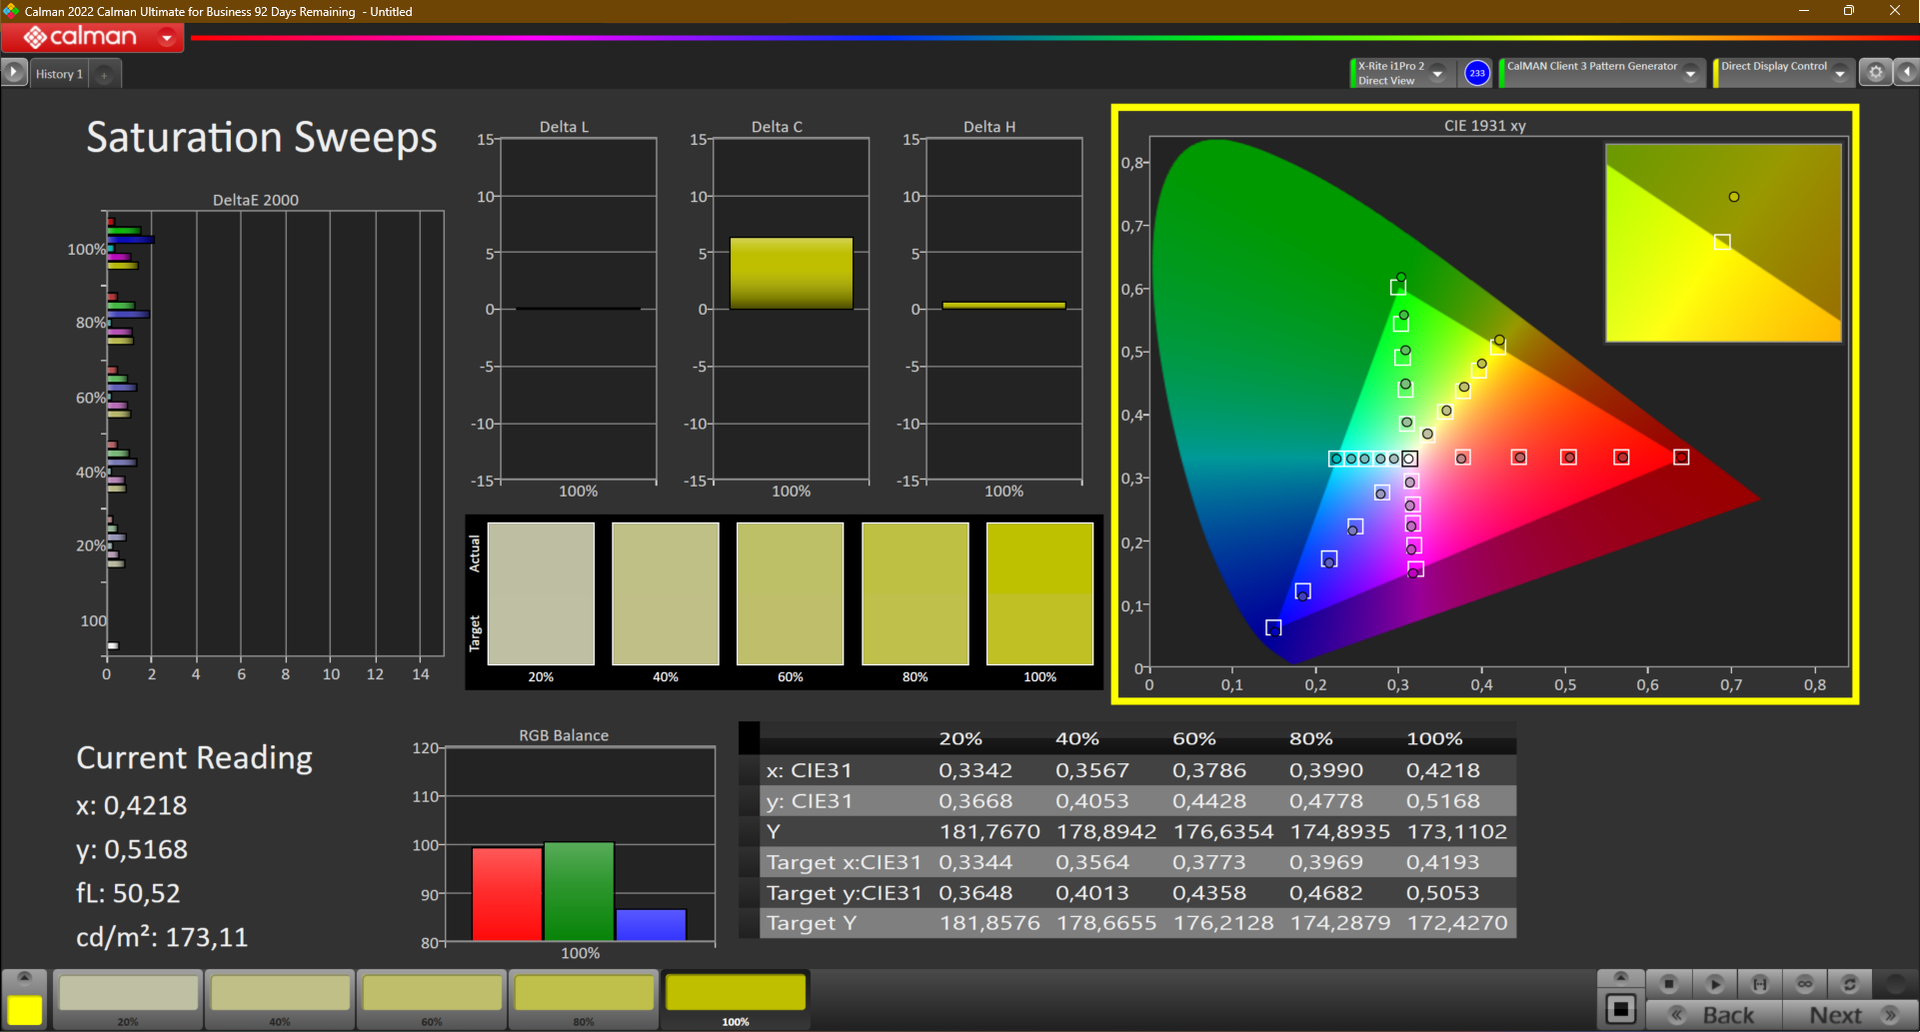
Ponieważ ekran prawie całkowicie pokrywa gamę sRGB, Vision 16 2023 nadaje się do prostej edycji zdjęć. W przypadku profesjonalnych fotografów lub kamerzystów ekran nie jest wystarczająco dobry, ponieważ szersze zakresy AdobeRGB i DCI P3 nie są wystarczająco pokryte.
Wyświetl czasy reakcji
| ↔ Czas reakcji od czerni do bieli | ||
|---|---|---|
| 8 ms ... wzrost ↗ i spadek ↘ łącznie | ↗ 4 ms wzrost | 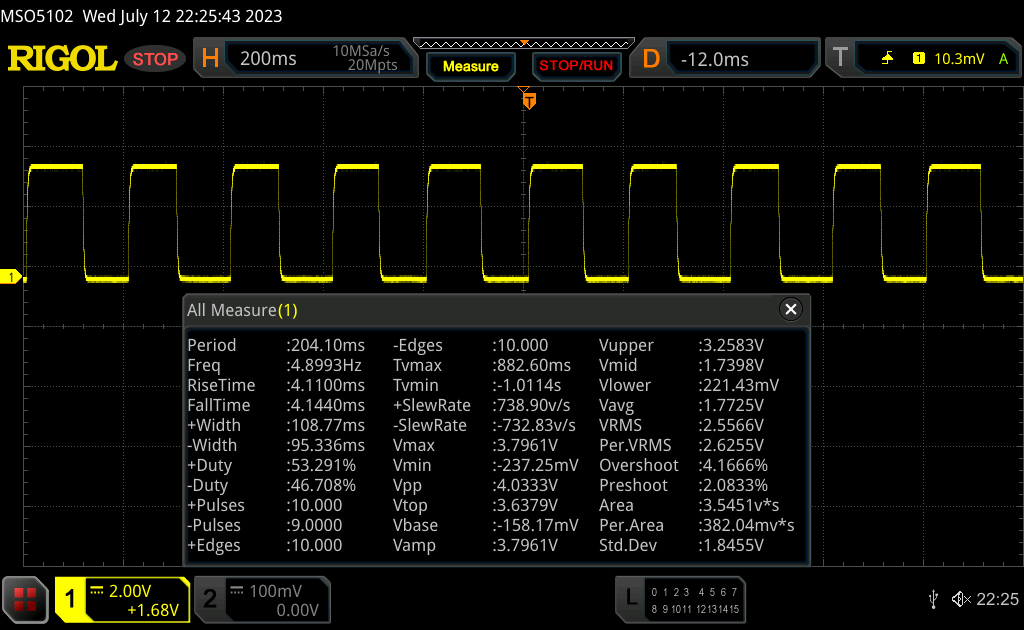 |
| ↘ 4 ms upadek | ||
| W naszych testach ekran wykazuje szybki czas reakcji i powinien nadawać się do gier. Dla porównania, wszystkie testowane urządzenia wahają się od 0.1 (minimum) do 240 (maksimum) ms. » 22 % wszystkich urządzeń jest lepszych. Oznacza to, że zmierzony czas reakcji jest lepszy od średniej wszystkich testowanych urządzeń (19.8 ms). | ||
| ↔ Czas reakcji 50% szarości do 80% szarości | ||
| 11 ms ... wzrost ↗ i spadek ↘ łącznie | ↗ 5 ms wzrost | 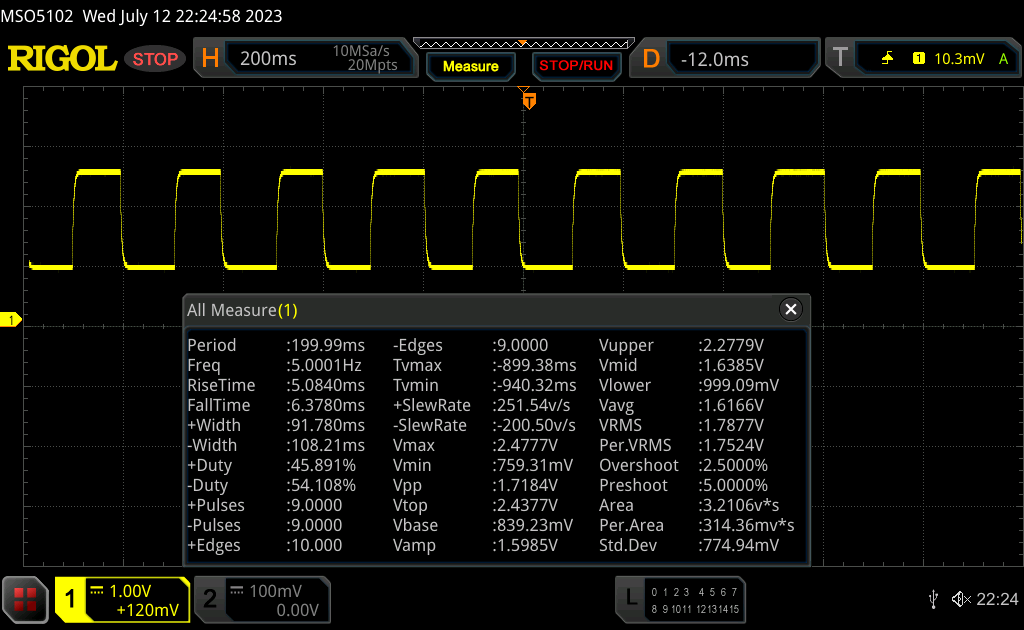 |
| ↘ 6 ms upadek | ||
| W naszych testach ekran wykazuje dobry współczynnik reakcji, ale może być zbyt wolny dla graczy rywalizujących ze sobą. Dla porównania, wszystkie testowane urządzenia wahają się od 0.165 (minimum) do 636 (maksimum) ms. » 25 % wszystkich urządzeń jest lepszych. Oznacza to, że zmierzony czas reakcji jest lepszy od średniej wszystkich testowanych urządzeń (30.9 ms). | ||
Migotanie ekranu / PWM (modulacja szerokości impulsu)
| Migotanie ekranu/nie wykryto PWM | 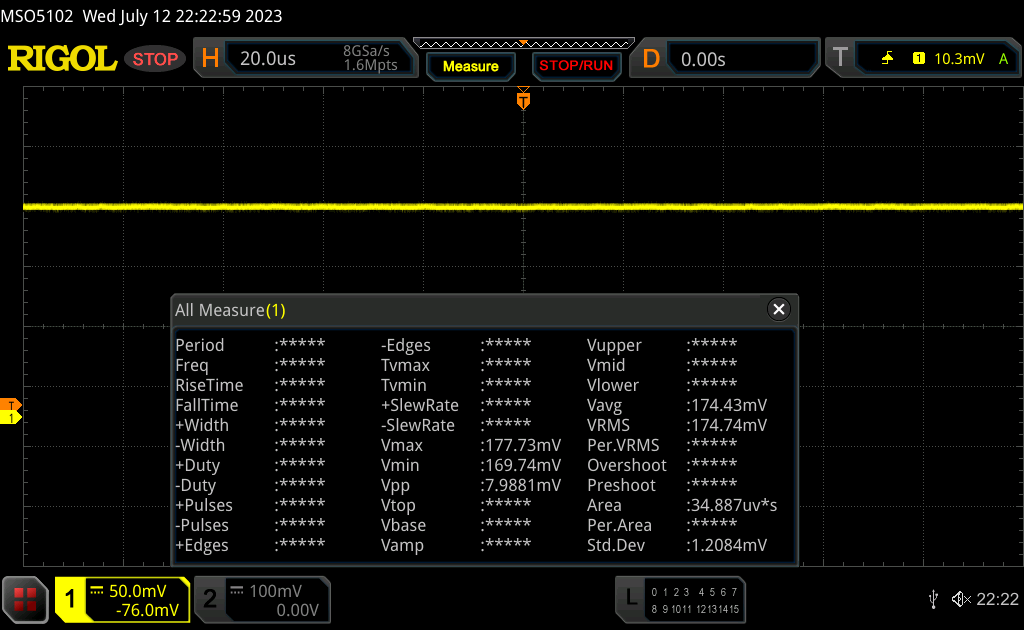 | ||
Dla porównania: 52 % wszystkich testowanych urządzeń nie używa PWM do przyciemniania wyświetlacza. Jeśli wykryto PWM, zmierzono średnio 7741 (minimum: 5 - maksimum: 343500) Hz. | |||
Dzięki matowemu ekranowi Vision 16 nadaje się do użytku na zewnątrz. Należy jednak unikać bezpośredniego światła słonecznego, ponieważ utrudnia ono pracę.
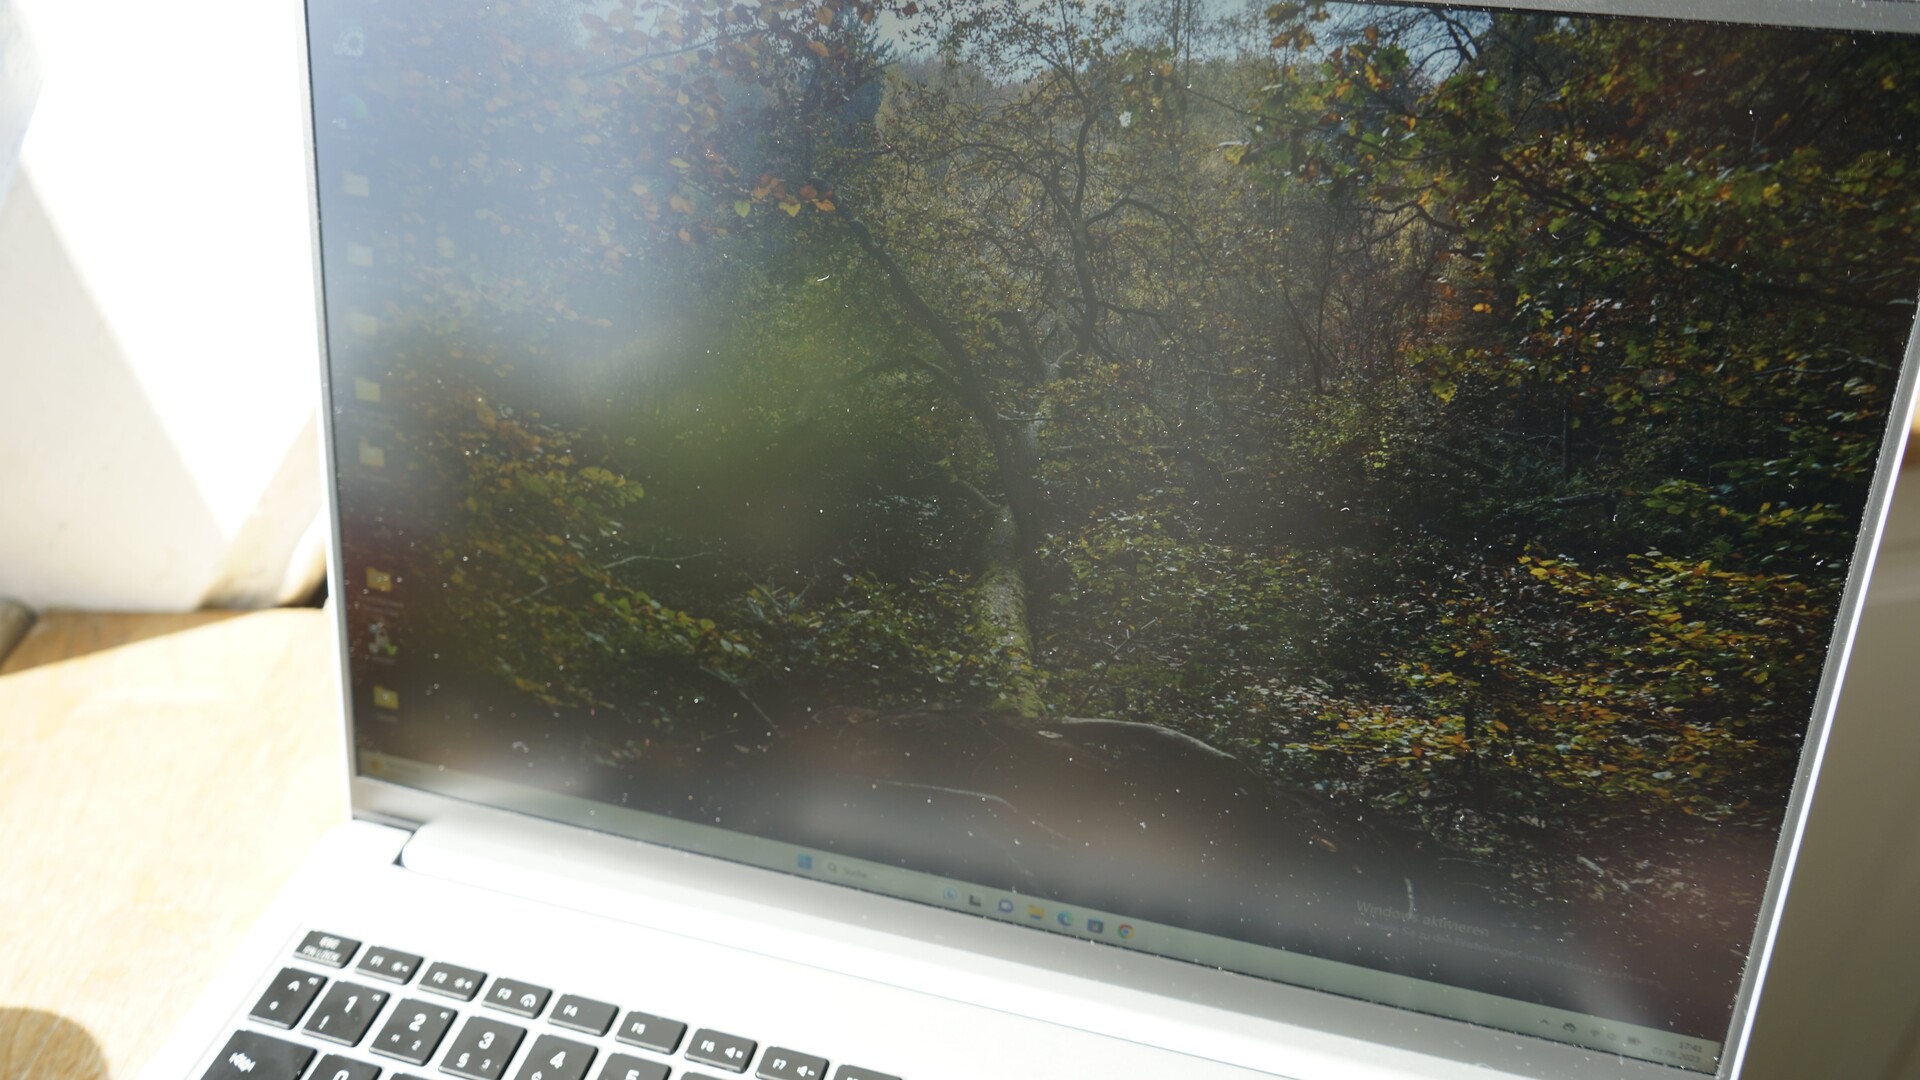
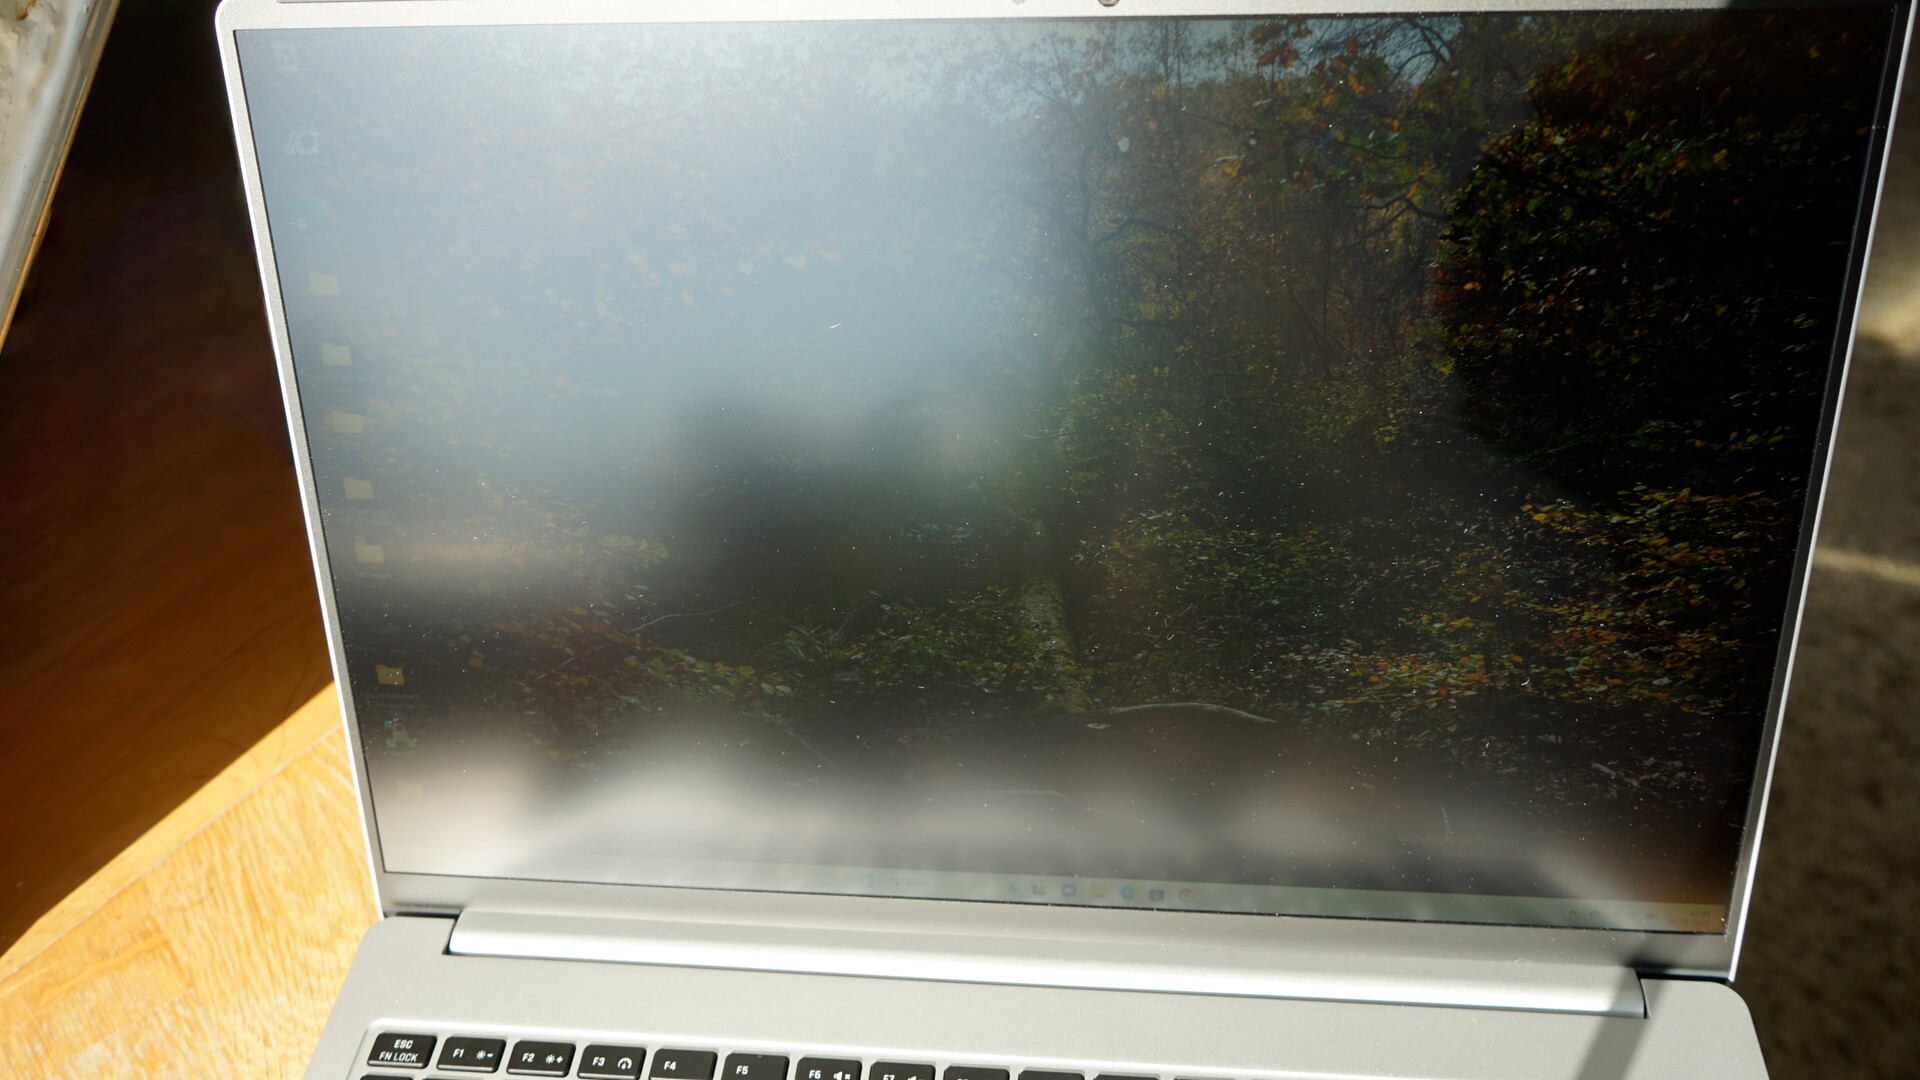
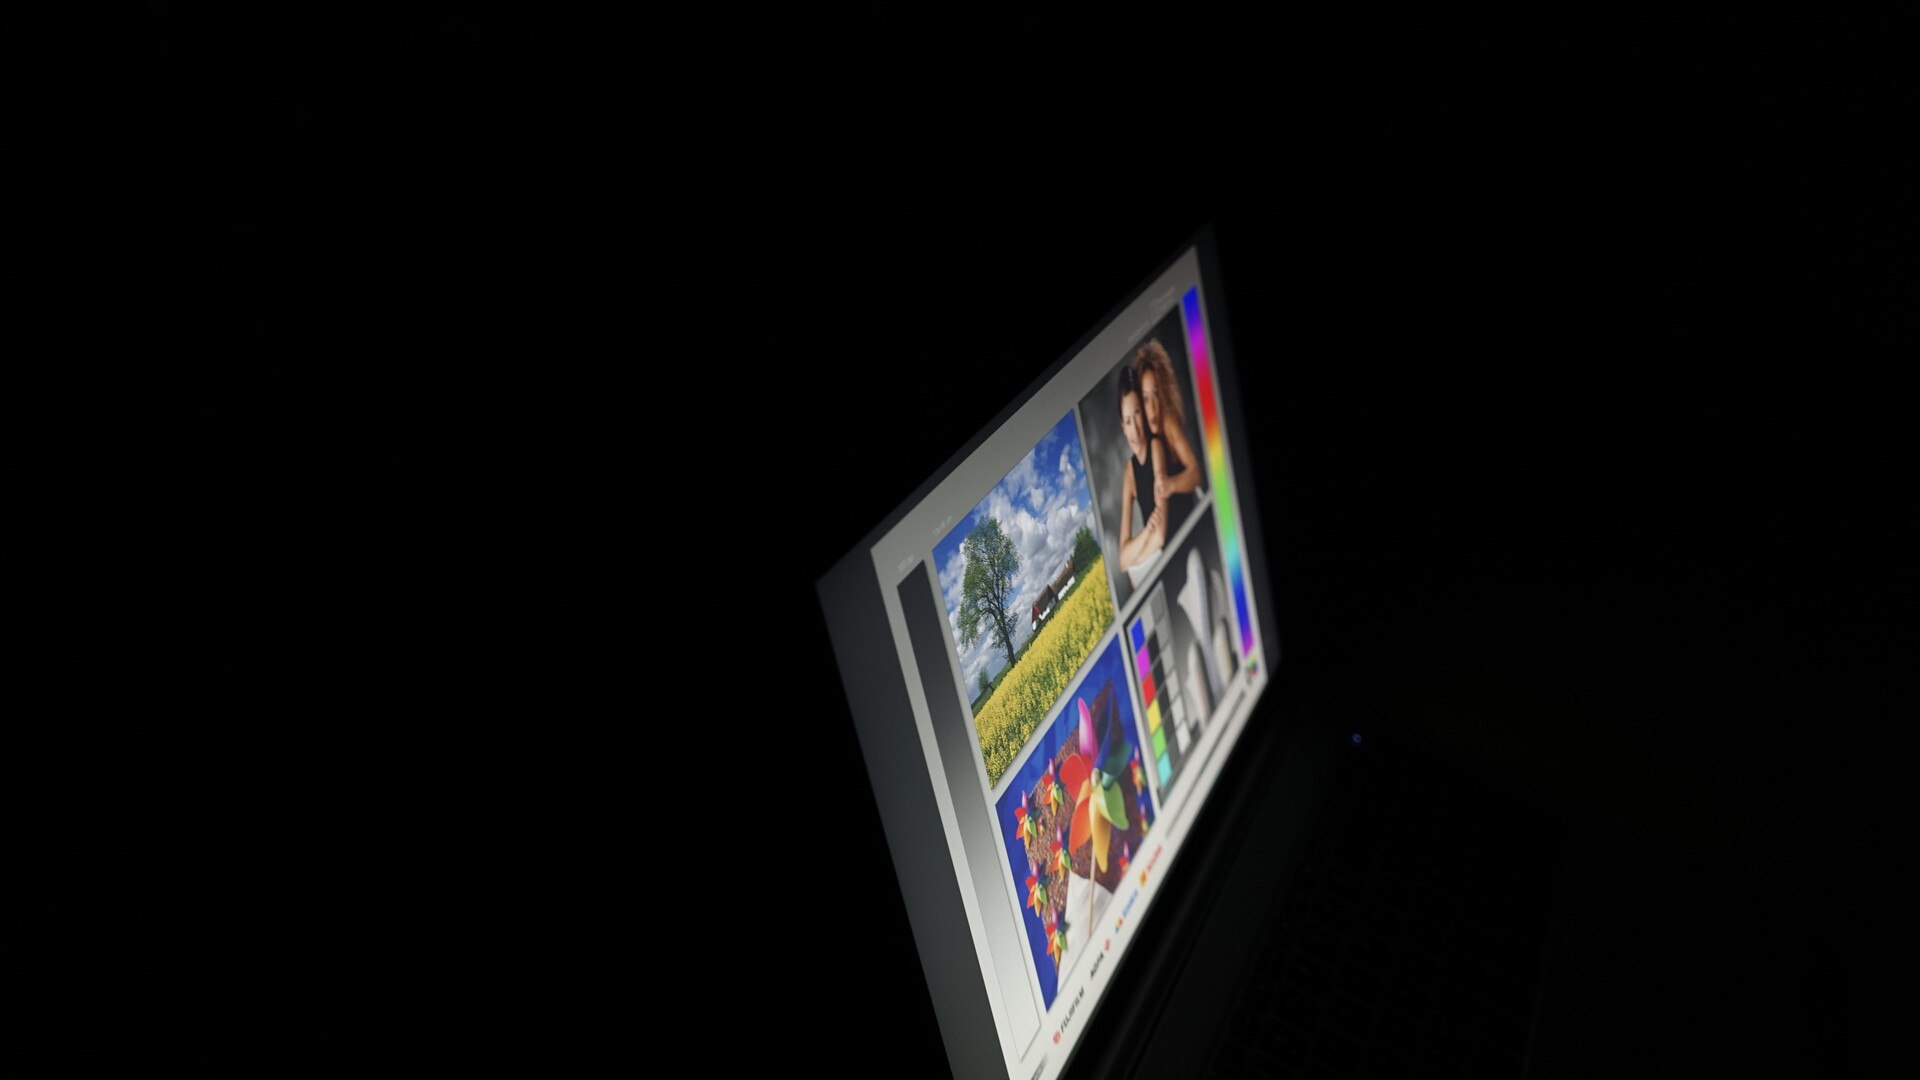
Stabilność kąta widzenia jest dobra, ale nie na poziomie ekranów OLED. Wyświetlacz traci kontrast podczas oglądania pod ekstremalnymi kątami.

Wydajność - Core i7-13700H nie może pracować z pełną wydajnością
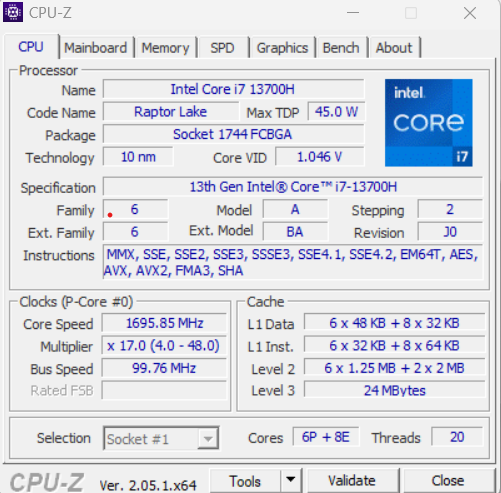
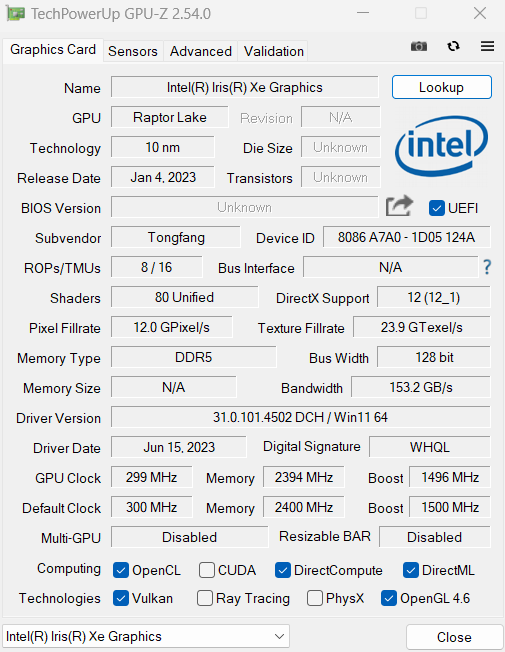
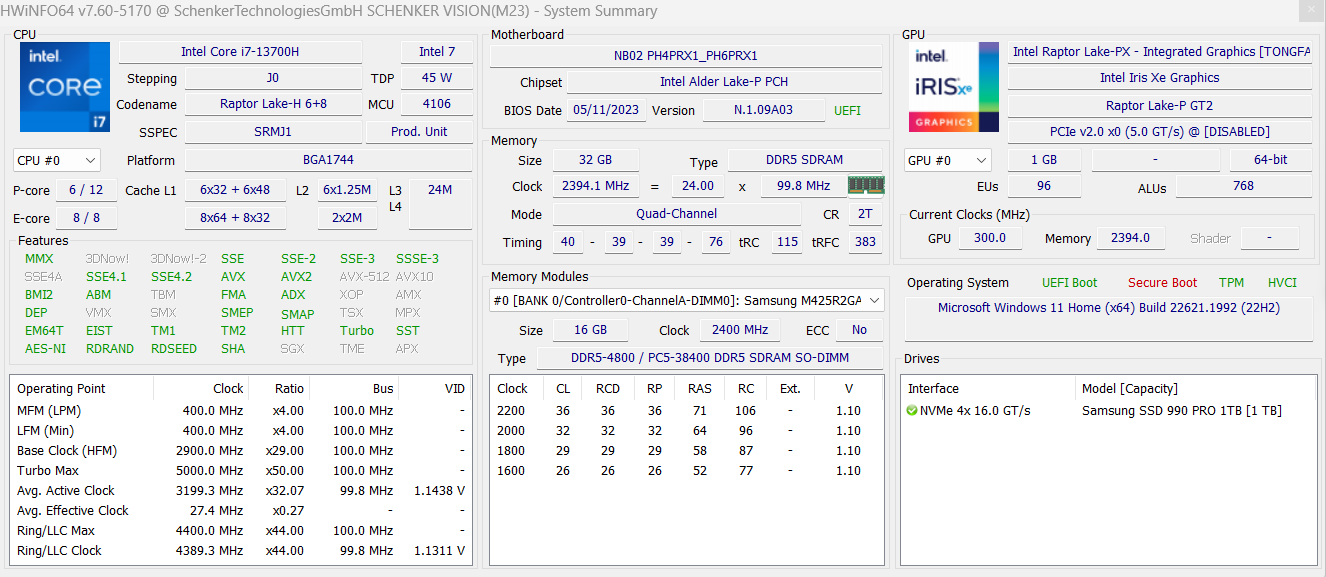
Zamiast zeszłorocznych Intel Core i7-12700H. nowy model Vision 16 oferuje nowszy procesorIntel Core i7-13700H. Podczas gdy poprzednik oferował RTX 3050 Ti, tegoroczny model zawiera tylko zintegrowany GPU procesora Intel. Częścią pakietu jest również 32 GB pamięci RAM DDR5 i 1 TB M.2 NVMe PCIe SSD.
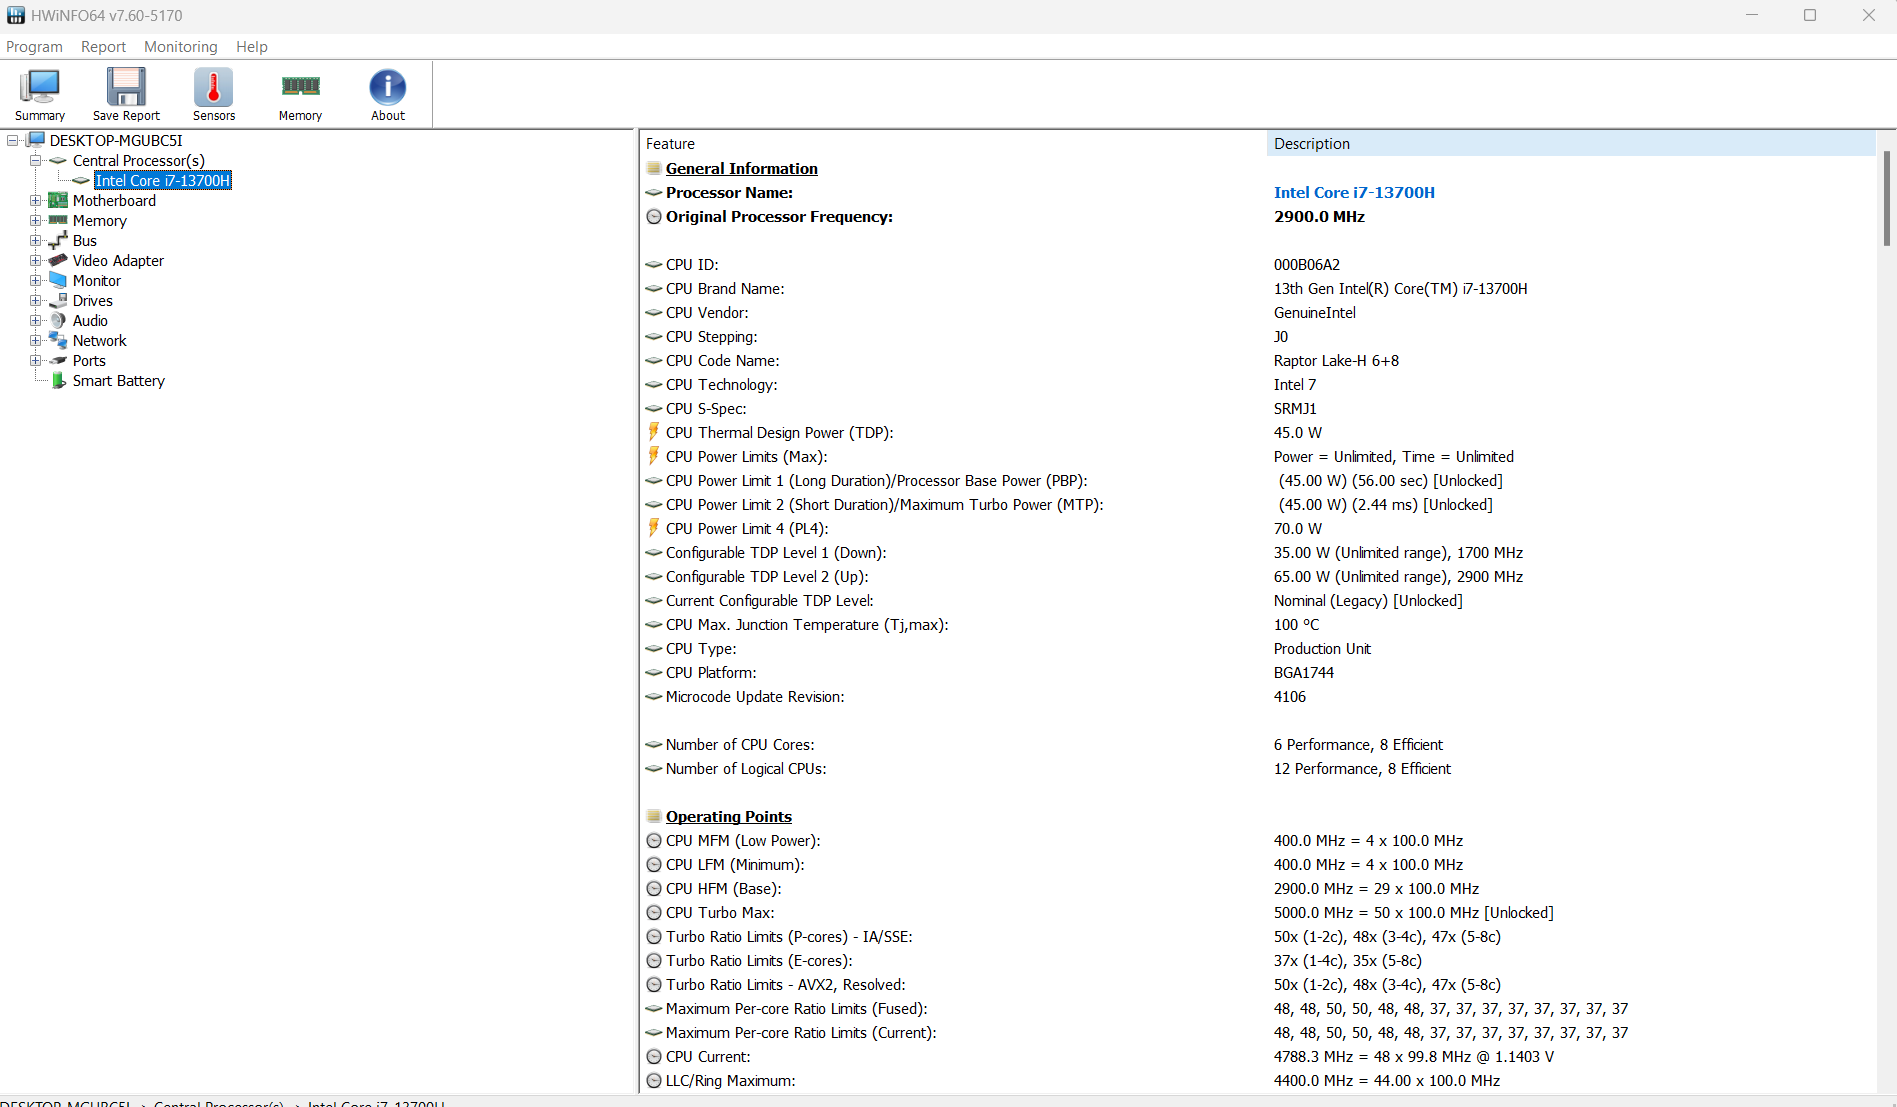
Warunki testowania
Schenker oferuje wiele profili w aplikacji Control center, ale profil ręczny nie jest już dostępny, tak jak to było w przypadku poprzednika. Progi TDP procesora nie są zatem zmieniane przez użytkownika. Wszystkie testy wydajnościowe zostały przeprowadzone w trybie "Entuzjasta", z TDP wynoszącym 45 W. W trybie "Cichy" aplikacji Control Center Schenker, TDP jest ustalone na 15 W. Do testów baterii używamy trybu "Zrównoważony", który również ma limit TDP wynoszący 45 W.
| Enthusiast | Balanced | Quiet | |
|---|---|---|---|
| CPU PL1 (HWInfo) | 45 Watt | 45 Watt | 15 Watt |
| CPU PL2 (HWInfo) | 45 Watt | 45 Watt | 15 Watt |
Procesor
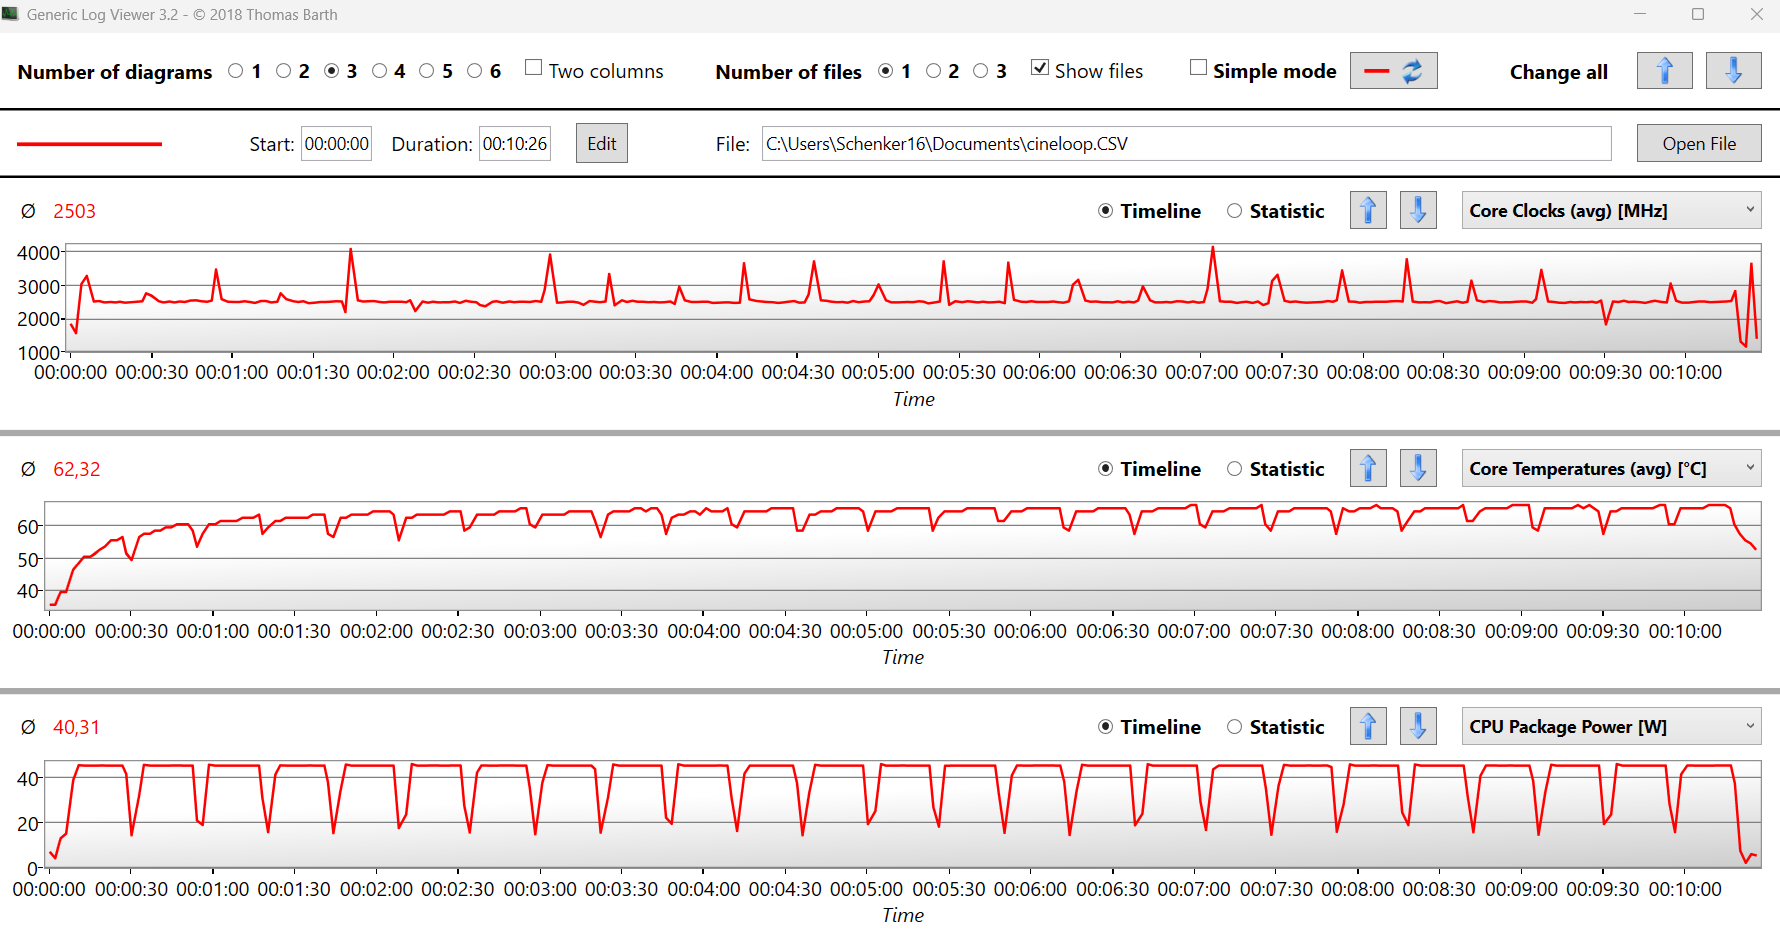
W Vision 16, ten sam Core i7-13700Hz generacji Intel Raptor Lake jest używany tak samo jak w Vision 16 Pro. Ponieważ limit mocy jest raczej ograniczony, temperatury pozostają niskie, ale cierpi na tym wydajność, a procesor jest wolniejszy w porównaniu z Vision 16 Pro. Wydajność wielordzeniowa w pętli Cinebench R15 Vision 16 jest o około 15 procent gorsza niż Vision 16 Pro. Ten niższy wynik przypisujemy gorszemu systemowi chłodzenia Vision 16. Ponieważ zmierzyliśmy raczej niską temperaturę 62 stopni podczas pętli Cinebench, procesor ma miejsce na lepsze wyniki. W trybie bateryjnym, CPU jest ograniczony do 35 W, co obniża wydajność Multi rdzenia o 20 procent.
Cinebench R15 Multi sustained loop
Cinebench R23: Multi Core | Single Core
Cinebench R20: CPU (Multi Core) | CPU (Single Core)
Cinebench R15: CPU Multi 64Bit | CPU Single 64Bit
Blender: v2.79 BMW27 CPU
7-Zip 18.03: 7z b 4 | 7z b 4 -mmt1
Geekbench 5.5: Multi-Core | Single-Core
HWBOT x265 Benchmark v2.2: 4k Preset
LibreOffice : 20 Documents To PDF
R Benchmark 2.5: Overall mean
| CPU Performance rating | |
| Schenker VISION 16 Pro (M23) | |
| Przeciętny Intel Core i7-13700H | |
| Acer Swift Go SFG16-71 | |
| Schenker Vision 16 PH6PRX1 | |
| Asus VivoBook S15 M3502RA-L1029W | |
| Średnia w klasie Office | |
| LG Gram SuperSlim (2023) | |
| Microsoft Surface Laptop 5 15, i7-1255U | |
| Apple MacBook Air 15 2023 M2 16 GB -5! | |
| Cinebench R23 / Multi Core | |
| Przeciętny Intel Core i7-13700H (5890 - 20034, n=29) | |
| Schenker VISION 16 Pro (M23) | |
| Acer Swift Go SFG16-71 | |
| Asus VivoBook S15 M3502RA-L1029W | |
| Schenker Vision 16 PH6PRX1 | |
| Średnia w klasie Office (1673 - 22808, n=76, ostatnie 2 lata) | |
| LG Gram SuperSlim (2023) | |
| Microsoft Surface Laptop 5 15, i7-1255U | |
| Apple MacBook Air 15 2023 M2 16 GB | |
| Cinebench R23 / Single Core | |
| Acer Swift Go SFG16-71 | |
| Schenker VISION 16 Pro (M23) | |
| Schenker Vision 16 PH6PRX1 | |
| Przeciętny Intel Core i7-13700H (1323 - 1914, n=29) | |
| LG Gram SuperSlim (2023) | |
| Średnia w klasie Office (708 - 2130, n=76, ostatnie 2 lata) | |
| Microsoft Surface Laptop 5 15, i7-1255U | |
| Apple MacBook Air 15 2023 M2 16 GB | |
| Asus VivoBook S15 M3502RA-L1029W | |
| Cinebench R20 / CPU (Multi Core) | |
| Przeciętny Intel Core i7-13700H (2322 - 7674, n=29) | |
| Schenker VISION 16 Pro (M23) | |
| Acer Swift Go SFG16-71 | |
| Asus VivoBook S15 M3502RA-L1029W | |
| Schenker Vision 16 PH6PRX1 | |
| Średnia w klasie Office (648 - 8840, n=75, ostatnie 2 lata) | |
| LG Gram SuperSlim (2023) | |
| Microsoft Surface Laptop 5 15, i7-1255U | |
| Apple MacBook Air 15 2023 M2 16 GB | |
| Cinebench R20 / CPU (Single Core) | |
| Schenker VISION 16 Pro (M23) | |
| Acer Swift Go SFG16-71 | |
| Schenker Vision 16 PH6PRX1 | |
| Przeciętny Intel Core i7-13700H (508 - 741, n=29) | |
| LG Gram SuperSlim (2023) | |
| Średnia w klasie Office (345 - 816, n=75, ostatnie 2 lata) | |
| Microsoft Surface Laptop 5 15, i7-1255U | |
| Asus VivoBook S15 M3502RA-L1029W | |
| Apple MacBook Air 15 2023 M2 16 GB | |
| Cinebench R15 / CPU Multi 64Bit | |
| Przeciętny Intel Core i7-13700H (905 - 2982, n=29) | |
| Acer Swift Go SFG16-71 | |
| Schenker VISION 16 Pro (M23) | |
| Asus VivoBook S15 M3502RA-L1029W | |
| Schenker Vision 16 PH6PRX1 | |
| Średnia w klasie Office (250 - 3380, n=77, ostatnie 2 lata) | |
| LG Gram SuperSlim (2023) | |
| Microsoft Surface Laptop 5 15, i7-1255U | |
| Apple MacBook Air 15 2023 M2 16 GB | |
| Cinebench R15 / CPU Single 64Bit | |
| Schenker VISION 16 Pro (M23) | |
| Schenker Vision 16 PH6PRX1 | |
| Przeciętny Intel Core i7-13700H (213 - 278, n=29) | |
| Acer Swift Go SFG16-71 | |
| Średnia w klasie Office (99.5 - 316, n=77, ostatnie 2 lata) | |
| LG Gram SuperSlim (2023) | |
| Asus VivoBook S15 M3502RA-L1029W | |
| Microsoft Surface Laptop 5 15, i7-1255U | |
| Apple MacBook Air 15 2023 M2 16 GB | |
| Blender / v2.79 BMW27 CPU | |
| Apple MacBook Air 15 2023 M2 16 GB | |
| Microsoft Surface Laptop 5 15, i7-1255U | |
| Średnia w klasie Office (158 - 1940, n=76, ostatnie 2 lata) | |
| LG Gram SuperSlim (2023) | |
| Acer Swift Go SFG16-71 | |
| Asus VivoBook S15 M3502RA-L1029W | |
| Schenker Vision 16 PH6PRX1 | |
| Przeciętny Intel Core i7-13700H (169 - 555, n=29) | |
| Schenker VISION 16 Pro (M23) | |
| 7-Zip 18.03 / 7z b 4 | |
| Schenker VISION 16 Pro (M23) | |
| Przeciętny Intel Core i7-13700H (27322 - 76344, n=29) | |
| Asus VivoBook S15 M3502RA-L1029W | |
| Acer Swift Go SFG16-71 | |
| Schenker Vision 16 PH6PRX1 | |
| Średnia w klasie Office (7098 - 76886, n=77, ostatnie 2 lata) | |
| LG Gram SuperSlim (2023) | |
| Microsoft Surface Laptop 5 15, i7-1255U | |
| 7-Zip 18.03 / 7z b 4 -mmt1 | |
| Schenker VISION 16 Pro (M23) | |
| Acer Swift Go SFG16-71 | |
| Schenker Vision 16 PH6PRX1 | |
| Przeciętny Intel Core i7-13700H (4825 - 6238, n=29) | |
| Asus VivoBook S15 M3502RA-L1029W | |
| Średnia w klasie Office (3387 - 6469, n=77, ostatnie 2 lata) | |
| LG Gram SuperSlim (2023) | |
| Microsoft Surface Laptop 5 15, i7-1255U | |
| Geekbench 5.5 / Multi-Core | |
| Acer Swift Go SFG16-71 | |
| Schenker VISION 16 Pro (M23) | |
| Przeciętny Intel Core i7-13700H (6165 - 14215, n=29) | |
| LG Gram SuperSlim (2023) | |
| Średnia w klasie Office (1483 - 16999, n=73, ostatnie 2 lata) | |
| Asus VivoBook S15 M3502RA-L1029W | |
| Schenker Vision 16 PH6PRX1 | |
| Apple MacBook Air 15 2023 M2 16 GB | |
| Microsoft Surface Laptop 5 15, i7-1255U | |
| Geekbench 5.5 / Single-Core | |
| Apple MacBook Air 15 2023 M2 16 GB | |
| Schenker VISION 16 Pro (M23) | |
| Acer Swift Go SFG16-71 | |
| LG Gram SuperSlim (2023) | |
| Schenker Vision 16 PH6PRX1 | |
| Średnia w klasie Office (811 - 2175, n=73, ostatnie 2 lata) | |
| Przeciętny Intel Core i7-13700H (1362 - 1919, n=29) | |
| Microsoft Surface Laptop 5 15, i7-1255U | |
| Asus VivoBook S15 M3502RA-L1029W | |
| HWBOT x265 Benchmark v2.2 / 4k Preset | |
| Schenker VISION 16 Pro (M23) | |
| Przeciętny Intel Core i7-13700H (6.72 - 21.2, n=29) | |
| Acer Swift Go SFG16-71 | |
| Asus VivoBook S15 M3502RA-L1029W | |
| Schenker Vision 16 PH6PRX1 | |
| Średnia w klasie Office (2.21 - 26, n=76, ostatnie 2 lata) | |
| LG Gram SuperSlim (2023) | |
| Microsoft Surface Laptop 5 15, i7-1255U | |
| LibreOffice / 20 Documents To PDF | |
| Średnia w klasie Office (39.9 - 102.3, n=76, ostatnie 2 lata) | |
| Asus VivoBook S15 M3502RA-L1029W | |
| Przeciętny Intel Core i7-13700H (31.3 - 62.4, n=29) | |
| Schenker VISION 16 Pro (M23) | |
| Microsoft Surface Laptop 5 15, i7-1255U | |
| LG Gram SuperSlim (2023) | |
| Acer Swift Go SFG16-71 | |
| Schenker Vision 16 PH6PRX1 | |
| R Benchmark 2.5 / Overall mean | |
| Średnia w klasie Office (0.393 - 0.888, n=76, ostatnie 2 lata) | |
| Microsoft Surface Laptop 5 15, i7-1255U | |
| Asus VivoBook S15 M3502RA-L1029W | |
| LG Gram SuperSlim (2023) | |
| Przeciętny Intel Core i7-13700H (0.4308 - 0.607, n=29) | |
| Schenker Vision 16 PH6PRX1 | |
| Acer Swift Go SFG16-71 | |
| Schenker VISION 16 Pro (M23) | |
* ... im mniej tym lepiej
AIDA64: FP32 Ray-Trace | FPU Julia | CPU SHA3 | CPU Queen | FPU SinJulia | FPU Mandel | CPU AES | CPU ZLib | FP64 Ray-Trace | CPU PhotoWorxx
| Performance rating | |
| Asus VivoBook S15 M3502RA-L1029W | |
| Przeciętny Intel Core i7-13700H | |
| Acer Swift Go SFG16-71 | |
| Średnia w klasie Office | |
| Schenker Vision 16 PH6PRX1 | |
| Microsoft Surface Laptop 5 15, i7-1255U | |
| LG Gram SuperSlim (2023) | |
| AIDA64 / FP32 Ray-Trace | |
| Asus VivoBook S15 M3502RA-L1029W | |
| Średnia w klasie Office (2083 - 31245, n=83, ostatnie 2 lata) | |
| Przeciętny Intel Core i7-13700H (4986 - 18908, n=29) | |
| Acer Swift Go SFG16-71 | |
| Schenker Vision 16 PH6PRX1 | |
| LG Gram SuperSlim (2023) | |
| Microsoft Surface Laptop 5 15, i7-1255U | |
| AIDA64 / FPU Julia | |
| Asus VivoBook S15 M3502RA-L1029W | |
| Przeciętny Intel Core i7-13700H (25360 - 92359, n=29) | |
| Acer Swift Go SFG16-71 | |
| Średnia w klasie Office (8191 - 125394, n=83, ostatnie 2 lata) | |
| Schenker Vision 16 PH6PRX1 | |
| Microsoft Surface Laptop 5 15, i7-1255U | |
| LG Gram SuperSlim (2023) | |
| AIDA64 / CPU SHA3 | |
| Przeciętny Intel Core i7-13700H (1339 - 4224, n=29) | |
| Asus VivoBook S15 M3502RA-L1029W | |
| Acer Swift Go SFG16-71 | |
| Średnia w klasie Office (433 - 5755, n=83, ostatnie 2 lata) | |
| Schenker Vision 16 PH6PRX1 | |
| Microsoft Surface Laptop 5 15, i7-1255U | |
| LG Gram SuperSlim (2023) | |
| AIDA64 / CPU Queen | |
| Asus VivoBook S15 M3502RA-L1029W | |
| Acer Swift Go SFG16-71 | |
| Przeciętny Intel Core i7-13700H (59324 - 107159, n=29) | |
| Schenker Vision 16 PH6PRX1 | |
| LG Gram SuperSlim (2023) | |
| Średnia w klasie Office (22784 - 115197, n=67, ostatnie 2 lata) | |
| Microsoft Surface Laptop 5 15, i7-1255U | |
| AIDA64 / FPU SinJulia | |
| Asus VivoBook S15 M3502RA-L1029W | |
| Przeciętny Intel Core i7-13700H (4800 - 11050, n=29) | |
| Acer Swift Go SFG16-71 | |
| Średnia w klasie Office (1378 - 18321, n=83, ostatnie 2 lata) | |
| Schenker Vision 16 PH6PRX1 | |
| LG Gram SuperSlim (2023) | |
| Microsoft Surface Laptop 5 15, i7-1255U | |
| AIDA64 / FPU Mandel | |
| Asus VivoBook S15 M3502RA-L1029W | |
| Przeciętny Intel Core i7-13700H (12321 - 45118, n=29) | |
| Acer Swift Go SFG16-71 | |
| Średnia w klasie Office (4601 - 66922, n=83, ostatnie 2 lata) | |
| Schenker Vision 16 PH6PRX1 | |
| Microsoft Surface Laptop 5 15, i7-1255U | |
| LG Gram SuperSlim (2023) | |
| AIDA64 / CPU AES | |
| Asus VivoBook S15 M3502RA-L1029W | |
| Przeciętny Intel Core i7-13700H (28769 - 151254, n=29) | |
| Acer Swift Go SFG16-71 | |
| Schenker Vision 16 PH6PRX1 | |
| Średnia w klasie Office (4854 - 155900, n=83, ostatnie 2 lata) | |
| Microsoft Surface Laptop 5 15, i7-1255U | |
| LG Gram SuperSlim (2023) | |
| AIDA64 / CPU ZLib | |
| Przeciętny Intel Core i7-13700H (389 - 1215, n=29) | |
| Acer Swift Go SFG16-71 | |
| Schenker Vision 16 PH6PRX1 | |
| Asus VivoBook S15 M3502RA-L1029W | |
| Średnia w klasie Office (114.6 - 1366, n=83, ostatnie 2 lata) | |
| Microsoft Surface Laptop 5 15, i7-1255U | |
| LG Gram SuperSlim (2023) | |
| AIDA64 / FP64 Ray-Trace | |
| Średnia w klasie Office (1109 - 17834, n=83, ostatnie 2 lata) | |
| Asus VivoBook S15 M3502RA-L1029W | |
| Przeciętny Intel Core i7-13700H (2540 - 10135, n=29) | |
| Acer Swift Go SFG16-71 | |
| Schenker Vision 16 PH6PRX1 | |
| Microsoft Surface Laptop 5 15, i7-1255U | |
| LG Gram SuperSlim (2023) | |
| AIDA64 / CPU PhotoWorxx | |
| Schenker Vision 16 PH6PRX1 | |
| Microsoft Surface Laptop 5 15, i7-1255U | |
| Acer Swift Go SFG16-71 | |
| Przeciętny Intel Core i7-13700H (12872 - 52727, n=29) | |
| LG Gram SuperSlim (2023) | |
| Średnia w klasie Office (11090 - 65229, n=83, ostatnie 2 lata) | |
| Asus VivoBook S15 M3502RA-L1029W | |
Wydajność systemu
Bezpośrednie porównanie zAcer Swift Go SFG16-71ponownie pokazuje, że Core i7-13700H w Vision 16 jest ograniczony przez niskie TDP. Wydajność procesora w syntetycznych benchmarkach jest nieco poniżej średniej, choć subiektywna wydajność ultrabooka jest bardzo dobra. Podczas przeglądania stron internetowych, oglądania filmów 4K na Youtube lub wielozadaniowości z programami Office i przeglądaniem stron internetowych w tym samym czasie, Vision 16 nie wykazywał żadnych oznak spowolnienia.
CrossMark: Overall | Productivity | Creativity | Responsiveness
| PCMark 10 / Score | |
| Asus VivoBook S15 M3502RA-L1029W | |
| Średnia w klasie Office (2601 - 9298, n=69, ostatnie 2 lata) | |
| Acer Swift Go SFG16-71 | |
| Przeciętny Intel Core i7-13700H, Intel Iris Xe Graphics G7 96EUs (5531 - 6247, n=5) | |
| LG Gram SuperSlim (2023) | |
| Schenker Vision 16 PH6PRX1 | |
| Microsoft Surface Laptop 5 15, i7-1255U | |
| PCMark 10 / Essentials | |
| LG Gram SuperSlim (2023) | |
| Acer Swift Go SFG16-71 | |
| Przeciętny Intel Core i7-13700H, Intel Iris Xe Graphics G7 96EUs (9648 - 11401, n=5) | |
| Asus VivoBook S15 M3502RA-L1029W | |
| Microsoft Surface Laptop 5 15, i7-1255U | |
| Średnia w klasie Office (3245 - 11594, n=69, ostatnie 2 lata) | |
| Schenker Vision 16 PH6PRX1 | |
| PCMark 10 / Productivity | |
| Średnia w klasie Office (5336 - 17243, n=69, ostatnie 2 lata) | |
| Asus VivoBook S15 M3502RA-L1029W | |
| Acer Swift Go SFG16-71 | |
| Przeciętny Intel Core i7-13700H, Intel Iris Xe Graphics G7 96EUs (7072 - 7691, n=5) | |
| Microsoft Surface Laptop 5 15, i7-1255U | |
| Schenker Vision 16 PH6PRX1 | |
| LG Gram SuperSlim (2023) | |
| PCMark 10 / Digital Content Creation | |
| Asus VivoBook S15 M3502RA-L1029W | |
| Średnia w klasie Office (2049 - 13541, n=69, ostatnie 2 lata) | |
| Acer Swift Go SFG16-71 | |
| Przeciętny Intel Core i7-13700H, Intel Iris Xe Graphics G7 96EUs (6413 - 7727, n=5) | |
| LG Gram SuperSlim (2023) | |
| Schenker Vision 16 PH6PRX1 | |
| Microsoft Surface Laptop 5 15, i7-1255U | |
| CrossMark / Overall | |
| Acer Swift Go SFG16-71 | |
| Schenker Vision 16 PH6PRX1 | |
| Przeciętny Intel Core i7-13700H, Intel Iris Xe Graphics G7 96EUs (1548 - 1868, n=5) | |
| LG Gram SuperSlim (2023) | |
| Asus VivoBook S15 M3502RA-L1029W | |
| Apple MacBook Air 15 2023 M2 16 GB | |
| Średnia w klasie Office (381 - 2010, n=75, ostatnie 2 lata) | |
| Microsoft Surface Laptop 5 15, i7-1255U | |
| CrossMark / Productivity | |
| Acer Swift Go SFG16-71 | |
| Schenker Vision 16 PH6PRX1 | |
| Przeciętny Intel Core i7-13700H, Intel Iris Xe Graphics G7 96EUs (1500 - 1787, n=5) | |
| LG Gram SuperSlim (2023) | |
| Asus VivoBook S15 M3502RA-L1029W | |
| Microsoft Surface Laptop 5 15, i7-1255U | |
| Średnia w klasie Office (464 - 1880, n=75, ostatnie 2 lata) | |
| Apple MacBook Air 15 2023 M2 16 GB | |
| CrossMark / Creativity | |
| Acer Swift Go SFG16-71 | |
| Apple MacBook Air 15 2023 M2 16 GB | |
| Przeciętny Intel Core i7-13700H, Intel Iris Xe Graphics G7 96EUs (1620 - 2009, n=5) | |
| Asus VivoBook S15 M3502RA-L1029W | |
| LG Gram SuperSlim (2023) | |
| Schenker Vision 16 PH6PRX1 | |
| Średnia w klasie Office (319 - 2361, n=75, ostatnie 2 lata) | |
| Microsoft Surface Laptop 5 15, i7-1255U | |
| CrossMark / Responsiveness | |
| Acer Swift Go SFG16-71 | |
| LG Gram SuperSlim (2023) | |
| Schenker Vision 16 PH6PRX1 | |
| Przeciętny Intel Core i7-13700H, Intel Iris Xe Graphics G7 96EUs (1439 - 1715, n=5) | |
| Asus VivoBook S15 M3502RA-L1029W | |
| Średnia w klasie Office (360 - 1820, n=75, ostatnie 2 lata) | |
| Microsoft Surface Laptop 5 15, i7-1255U | |
| Apple MacBook Air 15 2023 M2 16 GB | |
| PCMark 10 Score | 5531 pkt. | |
Pomoc | ||
| AIDA64 / Memory Copy | |
| Średnia w klasie Office (20075 - 110930, n=80, ostatnie 2 lata) | |
| Schenker Vision 16 PH6PRX1 | |
| Przeciętny Intel Core i7-13700H (24334 - 78081, n=29) | |
| AIDA64 / Memory Read | |
| Schenker Vision 16 PH6PRX1 | |
| Średnia w klasie Office (10084 - 128030, n=81, ostatnie 2 lata) | |
| Przeciętny Intel Core i7-13700H (23681 - 79656, n=29) | |
| AIDA64 / Memory Write | |
| Średnia w klasie Office (20073 - 119858, n=81, ostatnie 2 lata) | |
| Przeciętny Intel Core i7-13700H (22986 - 99898, n=29) | |
| Schenker Vision 16 PH6PRX1 | |
| AIDA64 / Memory Latency | |
| Średnia w klasie Office (7.6 - 162.9, n=76, ostatnie 2 lata) | |
| Przeciętny Intel Core i7-13700H (82.4 - 136.8, n=29) | |
| Schenker Vision 16 PH6PRX1 | |
* ... im mniej tym lepiej
Opóźnienie DPC
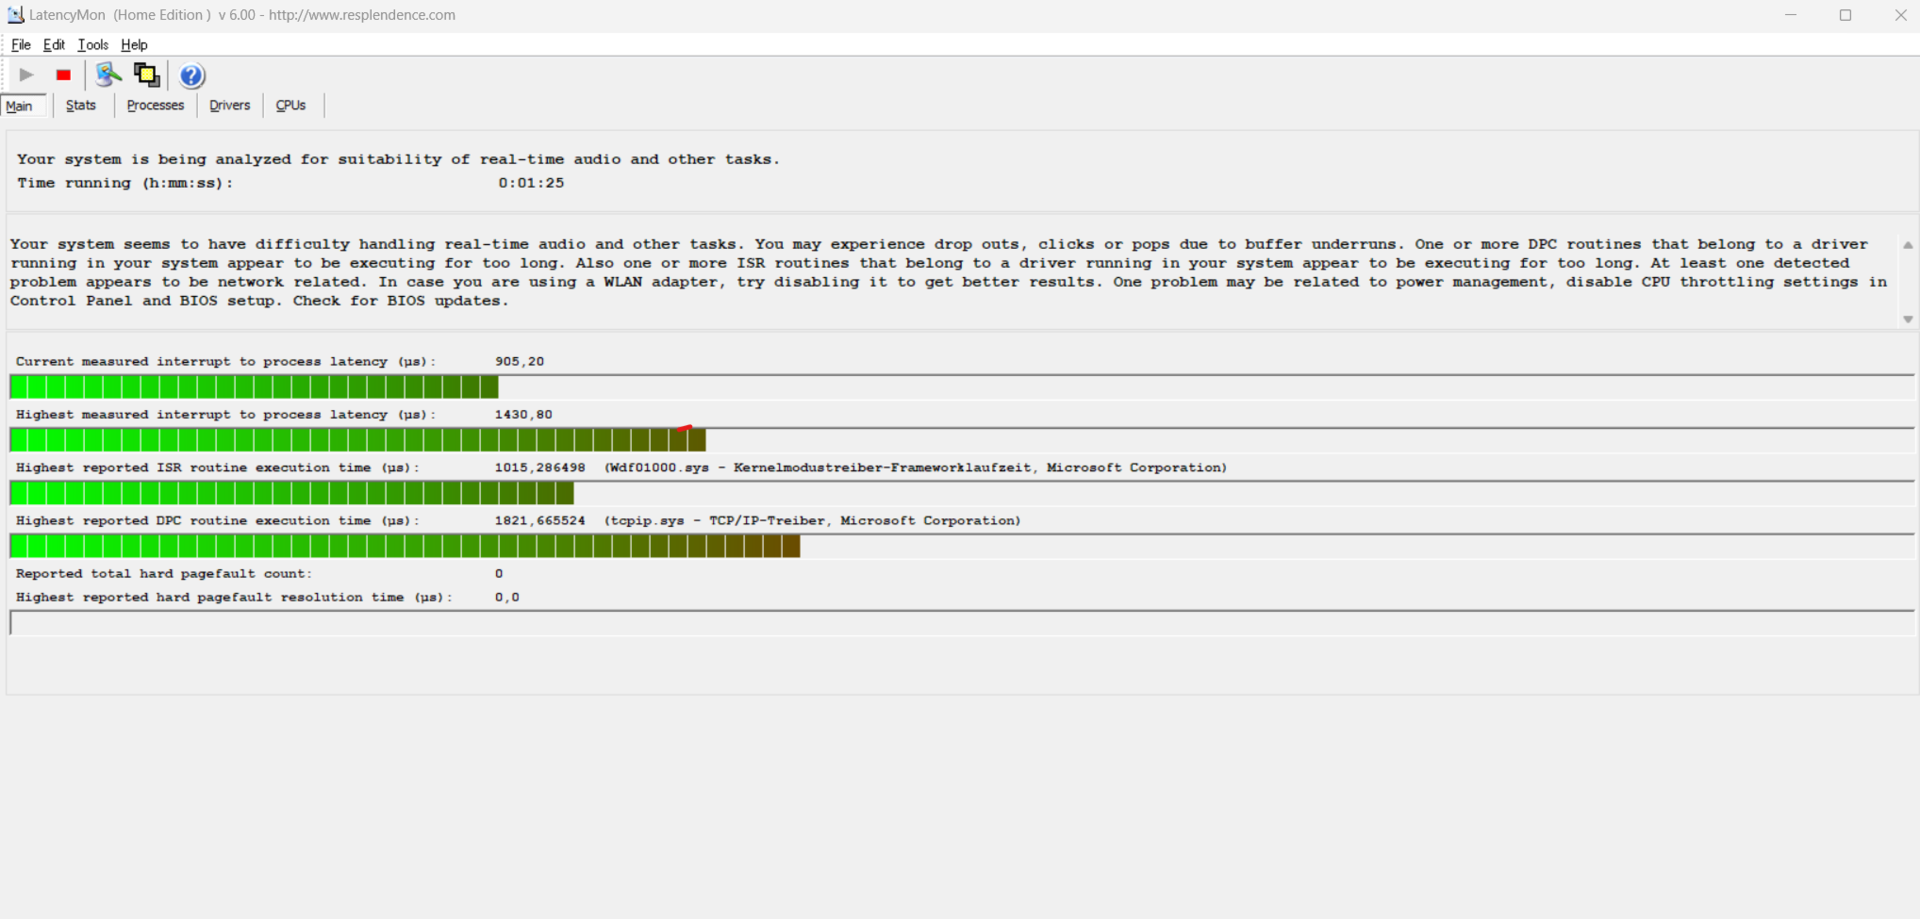
Nasz standardowy test opóźnień (surfowanie po sieci, 4K Youtube, obciążenie CPU) wykazał pewne problemy z opóźnieniami DPC. W testowanym stanie Vision 16 nie nadaje się w pełni do odtwarzania dźwięku w czasie rzeczywistym, ale aktualizacje BIOS-u mogą rozwiązać ten problem.
| DPC Latencies / LatencyMon - interrupt to process latency (max), Web, Youtube, Prime95 | |
| Acer Swift Go SFG16-71 | |
| LG Gram SuperSlim (2023) | |
| Schenker Vision 16 PH6PRX1 | |
| Microsoft Surface Laptop 5 15, i7-1255U | |
| Asus VivoBook S15 M3502RA-L1029W | |
* ... im mniej tym lepiej
Pamięć masowa
W Schenker Vision 16 znajdują się dwa gniazda PCIe 4.0 na dyski SSD. W naszej recenzji znalazł się dysk SSD Samsung 990 Pro M.2 o pojemności 1 TB. Wyniki testów porównawczych z DiskSpd pokazują wyraźne słabości pod względem prędkości odczytu i zapisu dysku SSD. Pomiary AS SSD dają lepszy obraz, z prędkościami bardziej pasującymi do wysokowydajnych dysków SSD. Ten sam dysk SSD Samsung 990 Pro został użyty w próbce testowej Vision 16 Pro i osiągnął tam lepsze wyniki.

* ... im mniej tym lepiej
Sustained load Read: DiskSpd Read Loop, Queue Depth 8
Karta graficzna
Vision 16 z 2022 roku był oferowany z RTX 3050. Tegoroczny model ma tylko zintegrowaną grafikę Intel Iris Xe Graphics G7 z 96 EU. Codzienne zadania nie stanowią problemu, ale nie nadaje się do gier. W syntetycznych benchmarkach iGPU wypada przynajmniej o 11 procent lepiej niż przeciętny Intel Iris Xe Graphics G7.
| 3DMark 11 Performance | 7613 pkt. | |
| 3DMark Cloud Gate Standard Score | 21964 pkt. | |
| 3DMark Fire Strike Score | 5433 pkt. | |
| 3DMark Time Spy Score | 1953 pkt. | |
Pomoc | ||
| Blender - v3.3 Classroom CPU | |
| Przeciętny Intel Iris Xe Graphics G7 96EUs (336 - 1259, n=109) | |
| Średnia w klasie Office (245 - 3219, n=75, ostatnie 2 lata) | |
| Schenker Vision 16 PH6PRX1 | |
* ... im mniej tym lepiej
Wydajność w grach
Iris Xe Graphics G7 to najmocniejszy iGPU od Intela, ale jego wydajność w grach jest raczej niska. Procesory graficzne AMD, takie jakRadeon 680Mlub Radeon 780Msą bardziej wydajne. Tak długo, jak rozdzielczość i ustawienia graficzne są utrzymywane na niskim poziomie, starsze gry są nadal grywalne. Ekran 240 Hz nadal marnuje się bez zewnętrznego GPU, który można podłączyć przez Thunderbolt 4.
| The Witcher 3 - 1920x1080 Ultra Graphics & Postprocessing (HBAO+) | |
| Apple MacBook Air 15 2023 M2 16 GB | |
| Asus VivoBook S15 M3502RA-L1029W | |
| Średnia w klasie Office (14.8 - 28.1, n=3, ostatnie 2 lata) | |
| Schenker Vision 16 PH6PRX1 | |
| Acer Swift Go SFG16-71 | |
| LG Gram SuperSlim (2023) | |
| Microsoft Surface Laptop 5 15, i7-1255U | |
| GTA V - 1920x1080 Highest AA:4xMSAA + FX AF:16x | |
| Asus VivoBook S15 M3502RA-L1029W | |
| Średnia w klasie Office (5.77 - 45.3, n=70, ostatnie 2 lata) | |
| Acer Swift Go SFG16-71 | |
| Schenker Vision 16 PH6PRX1 | |
| Microsoft Surface Laptop 5 15, i7-1255U | |
| Final Fantasy XV Benchmark - 1920x1080 High Quality | |
| Średnia w klasie Office (8.09 - 79.5, n=72, ostatnie 2 lata) | |
| Asus VivoBook S15 M3502RA-L1029W | |
| Schenker Vision 16 PH6PRX1 | |
| Acer Swift Go SFG16-71 | |
| LG Gram SuperSlim (2023) | |
| Microsoft Surface Laptop 5 15, i7-1255U | |
| Strange Brigade - 1920x1080 ultra AA:ultra AF:16 | |
| Asus VivoBook S15 M3502RA-L1029W | |
| Średnia w klasie Office (12.9 - 142.1, n=54, ostatnie 2 lata) | |
| Acer Swift Go SFG16-71 | |
| Schenker Vision 16 PH6PRX1 | |
| Microsoft Surface Laptop 5 15, i7-1255U | |
| LG Gram SuperSlim (2023) | |
Witcher 3 FPS diagramm
| low | med. | high | ultra | QHD | 4K | |
|---|---|---|---|---|---|---|
| GTA V (2015) | 117.4 | 104.3 | 24.8 | 10.4 | 6.7 | |
| The Witcher 3 (2015) | 45 | 35 | 23 | 19 | ||
| Dota 2 Reborn (2015) | 95.5 | 70.8 | 61.3 | 52.4 | ||
| Final Fantasy XV Benchmark (2018) | 44 | 24 | 18 | 12 | 7 | |
| X-Plane 11.11 (2018) | 35 | 33 | 32 | 27 | ||
| Far Cry 5 (2018) | 52 | 28 | 26 | 24 | 17 | |
| Strange Brigade (2018) | 81.7 | 39.7 | 31.7 | 25.1 | ||
| F1 23 (2023) | 39.4 | 35.5 | 24.8 | 18.4 |
Emisje
Hałas
Emisja spalin przez Vision 16 jest akceptowalna. Podczas pracy na biegu jałowym wentylatory prawie zawsze działają i są słyszalne w cichych warunkach. Pod maksymalnym obciążeniem zmierzyliśmy 45 dB(a), co nie będzie osiągane w większości zastosowań. W codziennym użytkowaniu wentylator będzie raczej pracował na poziomie 33,8 dB(a), czyli raczej cicho. W normalnym użytkowaniu biurowym ultrabook prawie nigdy nie pozostaje cichy, szum wentylatora miał jednak niską częstotliwość i nie przeszkadzał. Wrażliwszych użytkowników może on jednak irytować.
Hałas
| luz |
| 25.5 / 28.7 / 29.1 dB |
| obciążenie |
| 33.8 / 44.9 dB |
 | ||
30 dB cichy 40 dB(A) słyszalny 50 dB(A) irytujący |
||
min: | ||
| Schenker Vision 16 PH6PRX1 Iris Xe G7 96EUs, i7-13700H, Samsung 990 Pro 1 TB | Apple MacBook Air 15 2023 M2 16 GB M2 10-Core GPU, M2, Apple SSD AP1024Z | Acer Swift Go SFG16-71 Iris Xe G7 96EUs, i7-13700H, Micron 2400 MTFDKBA1T0QFM | LG Gram SuperSlim (2023) Iris Xe G7 96EUs, i7-1360P, SK hynix PC801 HFS001TEJ9X101N | Microsoft Surface Laptop 5 15, i7-1255U Iris Xe G7 96EUs, i7-1255U, SK Hynix BC711 512GB HFM512GD3GX013N | Asus VivoBook S15 M3502RA-L1029W Radeon 680M, R7 6800H, WD PC SN735 SDBPNHH-512G | |
|---|---|---|---|---|---|---|
| Noise | -4% | 1% | 10% | -17% | ||
| wyłączone / środowisko * (dB) | 25.5 | 25.7 -1% | 25.2 1% | 23.3 9% | 26 -2% | |
| Idle Minimum * (dB) | 25.5 | 26.1 -2% | 25.2 1% | 23.3 9% | 26 -2% | |
| Idle Average * (dB) | 28.7 | 26.1 9% | 25.2 12% | 23.3 19% | 26 9% | |
| Idle Maximum * (dB) | 29.1 | 27.2 7% | 25.2 13% | 23.3 20% | 28.1 3% | |
| Load Average * (dB) | 33.8 | 44.2 -31% | 43.1 -28% | 35 -4% | 56.9 -68% | |
| Witcher 3 ultra * (dB) | 37.6 | 38.1 -1% | ||||
| Load Maximum * (dB) | 44.9 | 47.5 -6% | 43.3 4% | 38.1 15% | 62.6 -39% |
* ... im mniej tym lepiej
Ciepło
Pomimo dość cichych wentylatorów, Vision 16 pozostaje stosunkowo chłodny. Temperatura oparcia dłoni pod obciążeniem osiąga 28,5 stopni Celsjusza / 83 F w gorącym punkcie nad klawiaturą. Pod obciążeniem gorący punkt znajduje się na środku klawiatury, gdzie temperatura osiąga 42 stopnie Celsjusza / 108 F, co jest niekomfortową temperaturą. Jednak ta maksymalna temperatura obciążenia zwykle nie jest osiągana podczas codziennego użytkowania.
Dwa wentylatory pobierają powietrze z dołu i wydmuchują je z tyłu.
(±) Maksymalna temperatura w górnej części wynosi 41.1 °C / 106 F, w porównaniu do średniej 34.3 °C / 94 F , począwszy od 21.2 do 62.5 °C dla klasy Office.
(±) Dno nagrzewa się maksymalnie do 42 °C / 108 F, w porównaniu do średniej 36.8 °C / 98 F
(+) W stanie bezczynności średnia temperatura górnej części wynosi 25.7 °C / 78 F, w porównaniu ze średnią temperaturą urządzenia wynoszącą 29.5 °C / ### class_avg_f### F.
(+) Podczas gry w Wiedźmina 3 średnia temperatura górnej części wynosi 28.8 °C / 84 F, w porównaniu do średniej temperatury urządzenia wynoszącej 29.5 °C / ## #class_avg_f### F.
(+) Podpórki pod nadgarstki i touchpad są chłodniejsze niż temperatura skóry i maksymalnie 28.2 °C / 82.8 F i dlatego są chłodne w dotyku.
(±) Średnia temperatura obszaru podparcia dłoni w podobnych urządzeniach wynosiła 27.6 °C / 81.7 F (-0.6 °C / -1.1 F).
| Schenker Vision 16 PH6PRX1 Intel Core i7-13700H, Intel Iris Xe Graphics G7 96EUs | Apple MacBook Air 15 2023 M2 16 GB Apple M2, Apple M2 10-Core GPU | Acer Swift Go SFG16-71 Intel Core i7-13700H, Intel Iris Xe Graphics G7 96EUs | LG Gram SuperSlim (2023) Intel Core i7-1360P, Intel Iris Xe Graphics G7 96EUs | Microsoft Surface Laptop 5 15, i7-1255U Intel Core i7-1255U, Intel Iris Xe Graphics G7 96EUs | Asus VivoBook S15 M3502RA-L1029W AMD Ryzen 7 6800H, AMD Radeon 680M | |
|---|---|---|---|---|---|---|
| Heat | 1% | -13% | -23% | 3% | -21% | |
| Maximum Upper Side * (°C) | 41.1 | 45.1 -10% | 44.4 -8% | 43.9 -7% | 44.6 -9% | 50.2 -22% |
| Maximum Bottom * (°C) | 42 | 42.5 -1% | 48 -14% | 50.4 -20% | 47.4 -13% | 50.2 -20% |
| Idle Upper Side * (°C) | 28.5 | 25.9 9% | 31.9 -12% | 35.8 -26% | 22.6 21% | 32.1 -13% |
| Idle Bottom * (°C) | 26.8 | 25.8 4% | 31.9 -19% | 37.5 -40% | 23.3 13% | 34.6 -29% |
* ... im mniej tym lepiej
Test warunków skrajnych
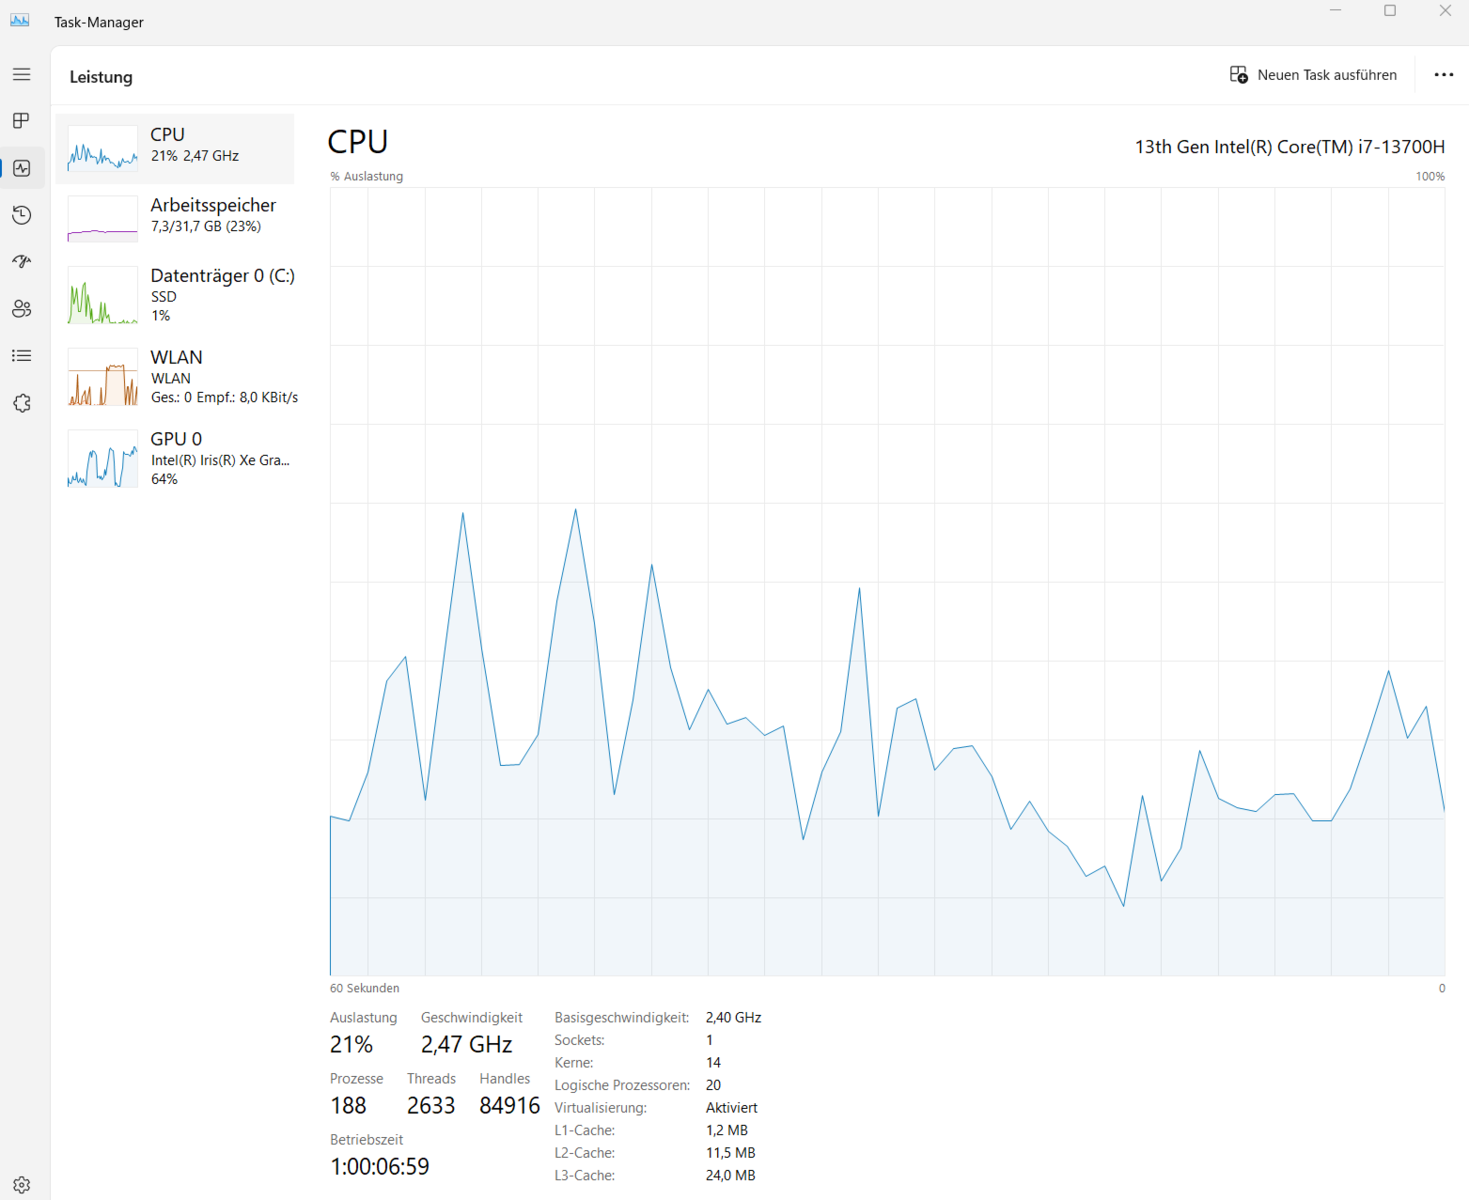
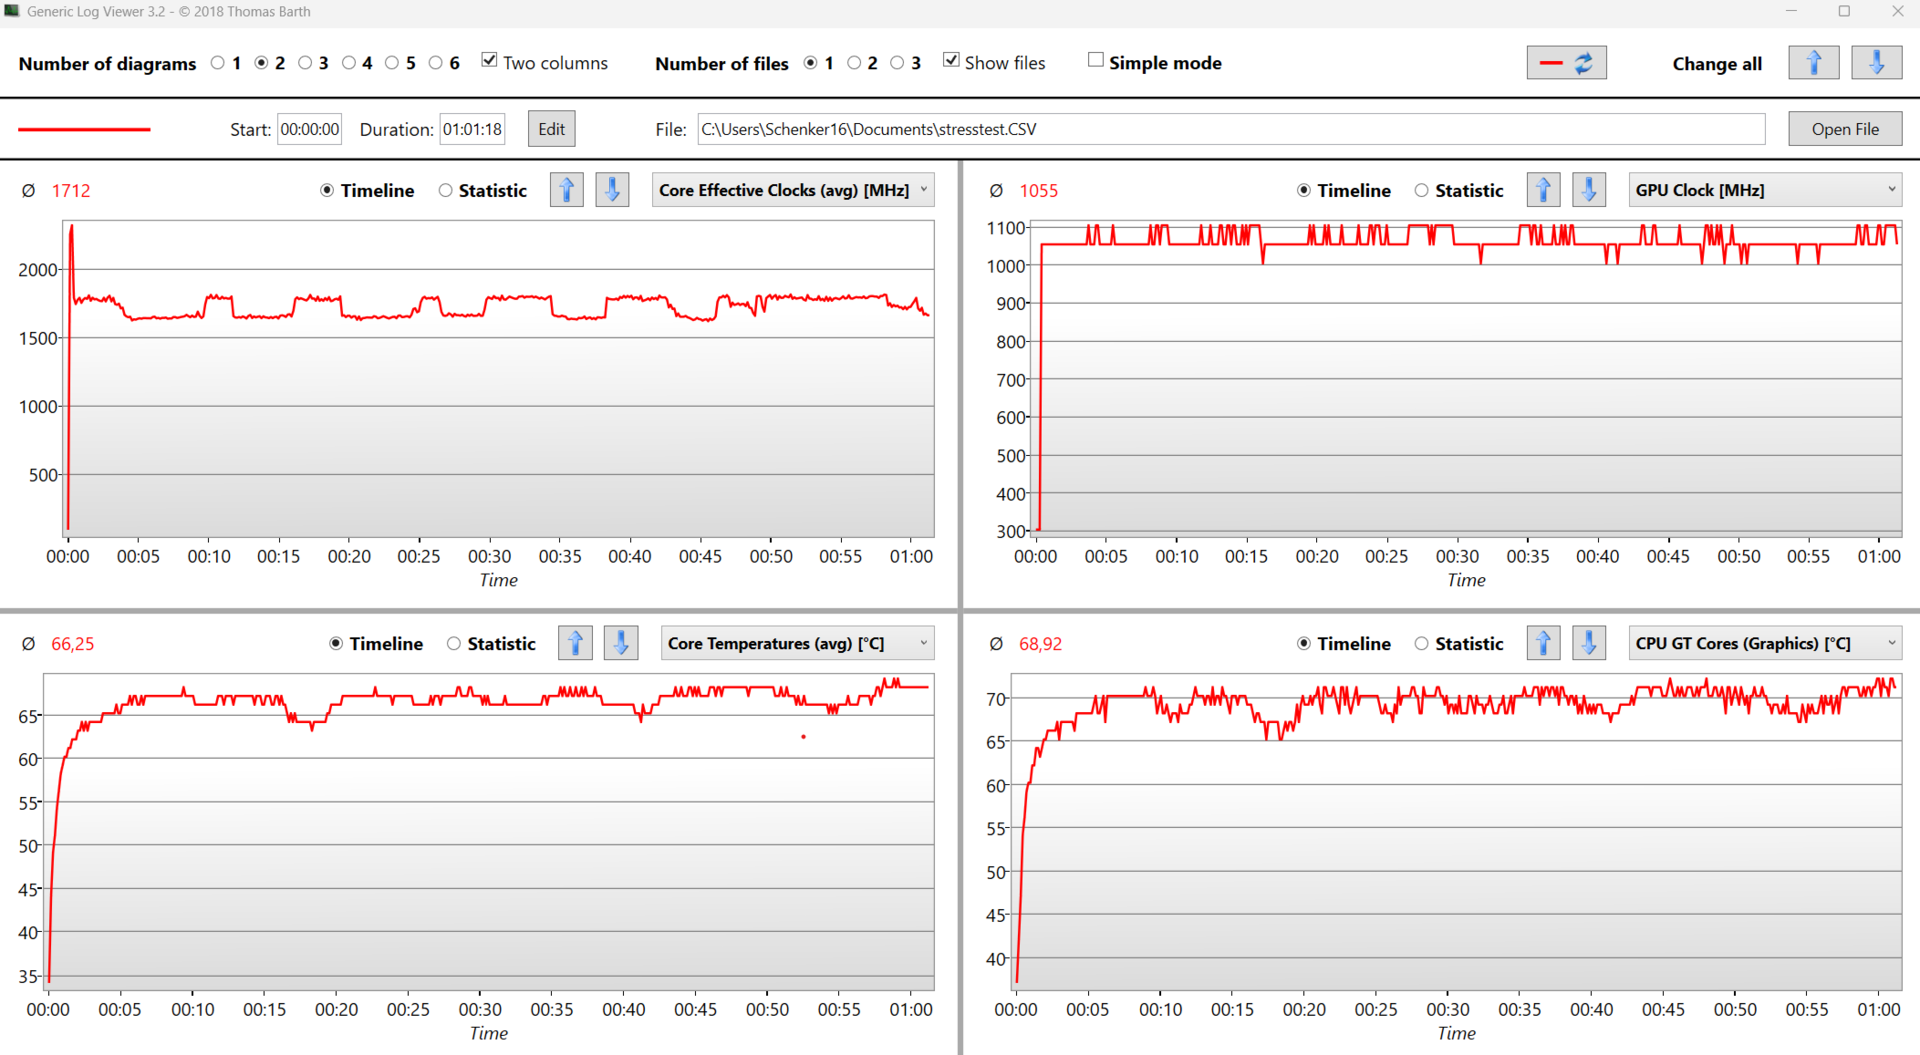
Na początku testu obciążeniowego (Prime95 i Furmark) procesor osiąga 2,5 GHz, ale szybko osiada między 1,6 a 1,7 GHz. Podobnie jak w teście pętli Wiedźmina, wydajność stabilizuje się później podczas testu warunków skrajnych i pozostaje na poziomie 1,7 GHz. Temperatury procesora pozostają niskie ze średnią temperaturą 66 stopni Celsjusza / 150 F, prawdopodobnie ze względu na niskie TDP.
Głośniki
System głośników jest identyczny jak w Vision 16 Pro i niezmieniony w porównaniu do poprzednika. Wysokie tony są precyzyjne, ale brakuje im podstawy.
Schenker Vision 16 PH6PRX1 analiza dźwięku
(±) | głośność głośnika jest średnia, ale dobra (78.4 dB)
Bas 100 - 315 Hz
(-) | prawie brak basu - średnio 15.5% niższa od mediany
(±) | liniowość basu jest średnia (11.9% delta do poprzedniej częstotliwości)
Średnie 400 - 2000 Hz
(+) | zbalansowane środki średnie - tylko 3.6% od mediany
(+) | średnie są liniowe (3.2% delta do poprzedniej częstotliwości)
Wysokie 2–16 kHz
(+) | zrównoważone maksima - tylko 2.9% od mediany
(+) | wzloty są liniowe (3.9% delta do poprzedniej częstotliwości)
Ogólnie 100 - 16.000 Hz
(+) | ogólny dźwięk jest liniowy (14.7% różnicy w stosunku do mediany)
W porównaniu do tej samej klasy
» 13% wszystkich testowanych urządzeń w tej klasie było lepszych, 4% podobnych, 83% gorszych
» Najlepszy miał deltę 7%, średnia wynosiła ###średnia###%, najgorsza wynosiła 53%
W porównaniu do wszystkich testowanych urządzeń
» 19% wszystkich testowanych urządzeń było lepszych, 4% podobnych, 77% gorszych
» Najlepszy miał deltę 4%, średnia wynosiła ###średnia###%, najgorsza wynosiła 134%
Acer Swift Go SFG16-71 analiza dźwięku
(±) | głośność głośnika jest średnia, ale dobra (81.6 dB)
Bas 100 - 315 Hz
(-) | prawie brak basu - średnio 18.1% niższa od mediany
(±) | liniowość basu jest średnia (10% delta do poprzedniej częstotliwości)
Średnie 400 - 2000 Hz
(+) | zbalansowane środki średnie - tylko 1% od mediany
(+) | średnie są liniowe (4.9% delta do poprzedniej częstotliwości)
Wysokie 2–16 kHz
(+) | zrównoważone maksima - tylko 2.4% od mediany
(+) | wzloty są liniowe (6.6% delta do poprzedniej częstotliwości)
Ogólnie 100 - 16.000 Hz
(+) | ogólny dźwięk jest liniowy (13% różnicy w stosunku do mediany)
W porównaniu do tej samej klasy
» 26% wszystkich testowanych urządzeń w tej klasie było lepszych, 5% podobnych, 70% gorszych
» Najlepszy miał deltę 5%, średnia wynosiła ###średnia###%, najgorsza wynosiła 45%
W porównaniu do wszystkich testowanych urządzeń
» 13% wszystkich testowanych urządzeń było lepszych, 2% podobnych, 85% gorszych
» Najlepszy miał deltę 4%, średnia wynosiła ###średnia###%, najgorsza wynosiła 134%
Zarządzanie energią - zbyt duży pobór mocy jak na laptop biurowy
Zużycie energii
Jak na ultrabooka bez dedykowanego GPU, zużycie energii na biegu jałowym jest znacznie wyższe niż w przypadku porównywalnych urządzeń. Wyższe zużycie energii jest prawdopodobnie spowodowane procesorem H od Intela, ponieważ laptopy biurowe zwykle używają procesorów U/P. Procesory AMD mają pod tym względem przewagę. TheAsus VivoBook S15 jest bardziej wydajny dzięki mniej energochłonnemu procesorowi, pomimo wyświetlacza OLED. Pod obciążeniem zużycie energii normalizuje się i czasami jest niższe w porównaniu z innymi laptopami.
| wyłączony / stan wstrzymania | |
| luz | |
| obciążenie |
|
Legenda:
min: | |
| Schenker Vision 16 PH6PRX1 i7-13700H, Iris Xe G7 96EUs, Samsung 990 Pro 1 TB, IPS, 2560x1600, 16" | Apple MacBook Air 15 2023 M2 16 GB M2, M2 10-Core GPU, Apple SSD AP1024Z, IPS, 2880x1864, 15.3" | Acer Swift Go SFG16-71 i7-13700H, Iris Xe G7 96EUs, Micron 2400 MTFDKBA1T0QFM, OLED, 3200x2000, 16" | LG Gram SuperSlim (2023) i7-1360P, Iris Xe G7 96EUs, SK hynix PC801 HFS001TEJ9X101N, OLED, 1920x1080, 15.6" | Microsoft Surface Laptop 5 15, i7-1255U i7-1255U, Iris Xe G7 96EUs, SK Hynix BC711 512GB HFM512GD3GX013N, IPS, 2496x1664, 15" | Asus VivoBook S15 M3502RA-L1029W R7 6800H, Radeon 680M, WD PC SN735 SDBPNHH-512G, OLED, 1920x1080, 15.6" | Przeciętny Intel Iris Xe Graphics G7 96EUs | Średnia w klasie Office | |
|---|---|---|---|---|---|---|---|---|
| Power Consumption | 44% | 11% | 26% | 27% | 8% | 21% | 32% | |
| Idle Minimum * (Watt) | 6.3 | 2.2 65% | 5.8 8% | 4.2 33% | 3.8 40% | 4.4 30% | 5.51 ? 13% | 4.25 ? 33% |
| Idle Average * (Watt) | 14.4 | 10 31% | 6 58% | 8.9 38% | 8.2 43% | 5.1 65% | 8.66 ? 40% | 7.3 ? 49% |
| Idle Maximum * (Watt) | 16.2 | 10.1 38% | 6.9 57% | 10.3 36% | 8.4 48% | 9.3 43% | 10.9 ? 33% | 8.57 ? 47% |
| Load Average * (Watt) | 46.2 | 33.6 27% | 59 -28% | 47 -2% | 50.1 -8% | 67 -45% | 45.6 ? 1% | 43.8 ? 5% |
| Witcher 3 ultra * (Watt) | 49.4 | 27.8 44% | 61.1 -24% | 43.8 11% | 38.8 21% | 66.4 -34% | ||
| Load Maximum * (Watt) | 85.2 | 37.2 56% | 92 -8% | 49 42% | 69.6 18% | 93.5 -10% | 67.8 ? 20% | 64.5 ? 24% |
* ... im mniej tym lepiej
Power consumption Witcher 3 / stress test
Power consumption external monitor
Żywotność baterii
Żywotność baterii Vision 16 nie jest dobra, pomimo baterii 80 Wh. Przy naszym teście WiFi i jasności ekranu 150 cd/m² laptop działa prawie dokładnie osiem godzin. Procesor H jest po prostu zbyt energochłonny jak na laptop biurowy. W porównaniu z Vision 16 pro z RTX 4070, usunięcie dedykowanego GPU nie daje Vision 16 żadnych korzyści, jeśli chodzi o żywotność baterii.
Przy maksymalnej jasności podczas skryptu WiFi, żywotność baterii Vision 16 jest jeszcze bardziej skrócona do sześciu godzin i trzydziestu minut.
| Schenker Vision 16 PH6PRX1 i7-13700H, Iris Xe G7 96EUs, 80 Wh | Apple MacBook Air 15 2023 M2 16 GB M2, M2 10-Core GPU, 66.5 Wh | Acer Swift Go SFG16-71 i7-13700H, Iris Xe G7 96EUs, 65 Wh | LG Gram SuperSlim (2023) i7-1360P, Iris Xe G7 96EUs, 60 Wh | Microsoft Surface Laptop 5 15, i7-1255U i7-1255U, Iris Xe G7 96EUs, 47.4 Wh | Asus VivoBook S15 M3502RA-L1029W R7 6800H, Radeon 680M, 70 Wh | Schenker VISION 16 Pro (M23) i7-13700H, GeForce RTX 4070 Laptop GPU, 80 Wh | Średnia w klasie Office | |
|---|---|---|---|---|---|---|---|---|
| Czasy pracy | 68% | -13% | 40% | -2% | -9% | -26% | 18% | |
| WiFi v1.3 (h) | 8 | 16.6 108% | 7.8 -2% | 12.5 56% | 8.6 8% | 11.5 44% | 7.8 -2% | 13.2 ? 65% |
| Load (h) | 2.6 | 3.3 27% | 2 -23% | 3.2 23% | 2.3 -12% | 1 -62% | 1.3 -50% | 1.808 ? -30% |
| H.264 (h) | 16.8 | 14.7 | 9.7 | 12.8 | 7.8 | 15.4 ? | ||
| Reader / Idle (h) | 27.5 | 22.2 ? |
Za
Przeciw
Werdykt - Vision 16 ma solidny wybór portów, ale ograniczoną wydajność procesora
Tegoroczna wersja Vision 16 zawiera najnowsze procesory Intel Raptor Lake, ulepszony system chłodzenia i szybszy ekran 240 Hz. TDP procesora jest ograniczone do 45 W, utrzymując niskie temperatury. Ogranicza to jednak również wydajność procesora H firmy Intel. Obudowa Vision 16 jest wykonana z magnezu i sprawia wrażenie wysokiej jakości. Pozwala to 16-calowemu laptopowi osiągnąć niską wagę 1,5 kg, co czyni go lekkim w swojej klasie.
W przeciwieństwie do poprzednich modeli, TDP nie jest już regulowane przez użytkownika w Schenker Control Center. Ponieważ procesor osiąga tylko 70 stopni Celsjusza podczas testów obciążeniowych (Prime95 i FurMark), urządzenie mogłoby potencjalnie działać lepiej. Konfigurowalne TDP mogłoby zapewnić lepszą wydajność.
Vision 16 pozostaje raczej chłodny, z wyjątkiem środkowego obszaru klawiatury. Nawet pod obciążeniem hałas wentylatora jest znośny. Jednak wentylatory prawie nigdy nie pozostają naprawdę ciche, zawsze pracują z niskim poziomem hałasu, nawet na biegu jałowym. Biorąc pod uwagę fakt, że niskie TDP tak bardzo ogranicza układ Intel H, procesor z serii P/U mógłby być lepszym wyborem dla Vision 16. Core i7-13700H ma wady, jeśli chodzi o zużycie energii, więc Schenker 16 zużywa jej więcej niż porównywalni konkurenci.
W naszej recenzji znaleźliśmy również problemy z wewnętrznym dyskiem SSD M.2 i czytnikiem kart SD. Oba są upośledzone pod względem prędkości.
Schenker Vision 16 oferuje dobry poziom wydajności, dobry wybór portów i możliwość rozbudowy pomimo lekkiej i cienkiej obudowy.
Nowy matowy wyświetlacz IPS jest znacznie lepszy i dobrze skalibrowany, nawet przed naszą własną kalibracją, i dobrze nadaje się do prostej edycji zdjęć. Jak na laptop biurowy, częstotliwość odświeżania 240 Hz jest nietypowa. Zapewnia płynne wrażenia użytkownika, ale laptop nie jest wystarczająco wydajny do gier, marnując część potencjału panelu. Panel nie pokrywa szerszej gamy kolorów i nie obsługuje HDR, ale nie ma tu PWM.
Alternatywą dla Schenker Vision 16 jest Vision 16 Pro, który pomimo tego samego procesora i opcjonalnego procesora RTX 4070 jest mocniejszą odmianą z szybszym procesorem. Acer Swift Go 16 Recenzja Acer Swift Go 16: Multimedialny laptop z olśniewającym wyświetlaczem OLED wykorzystuje ten sam procesor, ale pozwala na wyższe TDP wynoszące 80 W. Ponadto Acer używa ekranu OLED. Żaden z nich nie oferuje jednak tak niskiej wagi jak Vision 16.
Ceny i dostępność
Nowy Vision 16 2023 jest dostępny w Niemczech w cenie od 1 424 euro od Bestware. Nasza konfiguracja testowa z 32 GB pamięci RAM i dyskiem SSD M.2 Samsung 990 Pro o pojemności 1 TB kosztuje 1661 euro.
Schenker Vision 16 PH6PRX1
- 30/08/2023 v7 (old)
Philip Macdonald
Przezroczystość
Wyboru urządzeń do recenzji dokonuje nasza redakcja. Próbka testowa została udostępniona autorowi jako pożyczka od producenta lub sprzedawcy detalicznego na potrzeby tej recenzji. Pożyczkodawca nie miał wpływu na tę recenzję, producent nie otrzymał też kopii tej recenzji przed publikacją. Nie było obowiązku publikowania tej recenzji. Jako niezależna firma medialna, Notebookcheck nie podlega władzy producentów, sprzedawców detalicznych ani wydawców.
Tak testuje Notebookcheck
Każdego roku Notebookcheck niezależnie sprawdza setki laptopów i smartfonów, stosując standardowe procedury, aby zapewnić porównywalność wszystkich wyników. Od około 20 lat stale rozwijamy nasze metody badawcze, ustanawiając przy tym standardy branżowe. W naszych laboratoriach testowych doświadczeni technicy i redaktorzy korzystają z wysokiej jakości sprzętu pomiarowego. Testy te obejmują wieloetapowy proces walidacji. Nasz kompleksowy system ocen opiera się na setkach uzasadnionych pomiarów i benchmarków, co pozwala zachować obiektywizm.Price comparison

