Recenzja MSI Stealth 14 Studio - drogi laptop do gier, który poszedł na zbyt wiele kompromisów
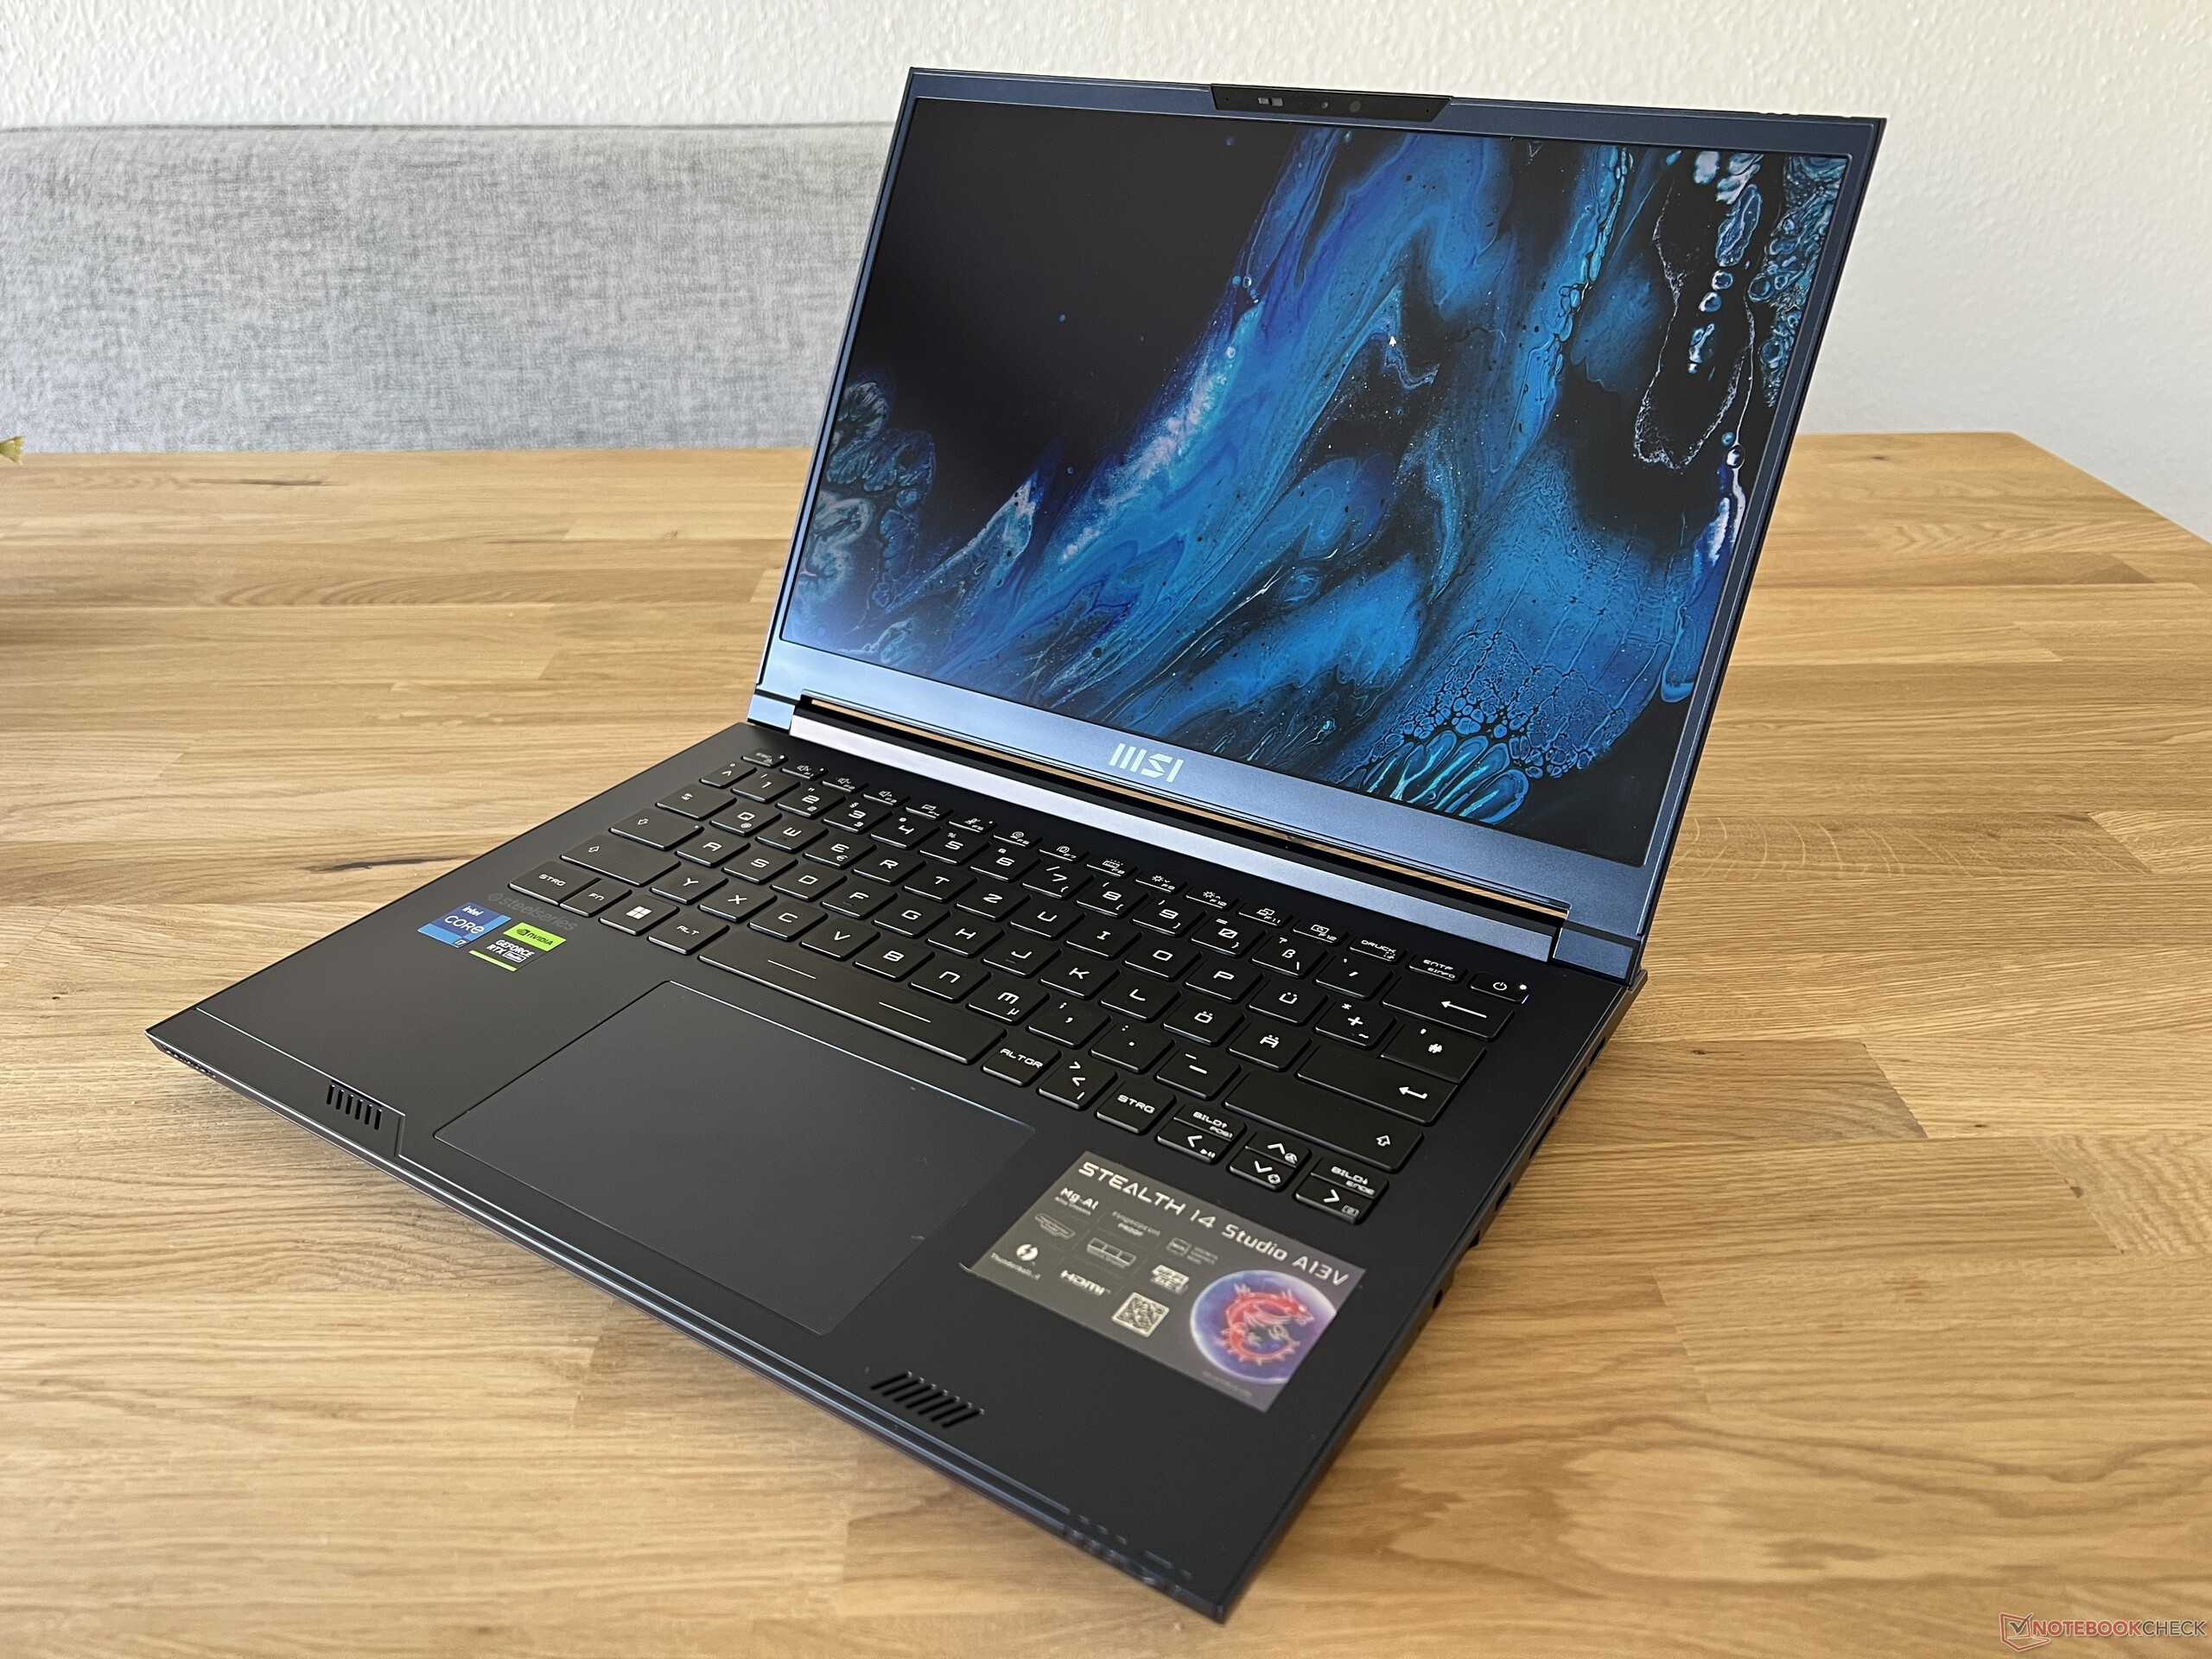
MSI Stealth 14 Studio ma być kompaktowym, ale potężnym 14-calowym laptopem do gier, który ma również przemawiać do twórców treści - lub wszystkich użytkowników, którzy szukają dobrego poziomu wydajności w małej obudowie. Producent postawił na swój sprawdzony przepis, łącząc układy Intel Raptor Lake z serii H45 z nowymi laptopami RTX 4000 od Nvidii. Nasze urządzenie testowe to Stealth 14 Studio A13VE-029, który w cenie 1 699,99 USD oferuje następujące podzespołyCore i7-13700HiGeForce RTX 4050 Laptop16 GB pamięci RAM, a także dysk SSD NVMe o pojemności 1 TB. Posiada matowy panel IPS (2,560 x 1,600 pikseli) z częstotliwością odświeżania 240 Hz. Opcjonalnie, Stealth 14 Studio można nabyć w zestawie zRTX 4070 Laptopi 32 GB pamięci RAM.
Potencjalni konkurenci w porównaniu
Ocena | Data | Model | Waga | Wysokość | Rozmiar | Rezolucja | Cena |
|---|---|---|---|---|---|---|---|
| 85.4 % v7 (old) | 07/2023 | MSI Stealth 14 Studio A13V i7-13700H, GeForce RTX 4050 Laptop GPU | 1.7 kg | 19 mm | 14.00" | 2560x1600 | |
| 89.4 % v7 (old) | 05/2023 | Gigabyte Aero 14 OLED BMF i7-13700H, GeForce RTX 4050 Laptop GPU | 1.4 kg | 17 mm | 14.00" | 2880x1800 | |
| 88.8 % v7 (old) | 10/2022 | Schenker Vision 14 2022 RTX 3050 Ti i7-12700H, GeForce RTX 3050 Ti Laptop GPU | 1.3 kg | 16.6 mm | 14.00" | 2880x1800 | |
| 86.8 % v7 (old) | Asus ROG Flow Z13 GZ301ZE i9-12900H, GeForce RTX 3050 Ti Laptop GPU | 1.2 kg | 12 mm | 13.40" | 1920x1200 | ||
| 86.7 % v7 (old) | Alienware x14 i7 RTX 3060 i7-12700H, GeForce RTX 3060 Laptop GPU | 1.8 kg | 14.5 mm | 14.00" | 1920x1080 | ||
| 89.4 % v7 (old) | Razer Blade 14 Ryzen 9 6900HX R9 6900HX, GeForce RTX 3070 Ti Laptop GPU | 1.8 kg | 16.8 mm | 14.00" | 2560x1440 | ||
| 86 % v7 (old) | 11/2022 | Acer Predator Triton 300 SE i9-12900H, GeForce RTX 3060 Laptop GPU | 1.7 kg | 19.8 mm | 14.00" | 2880x1800 |
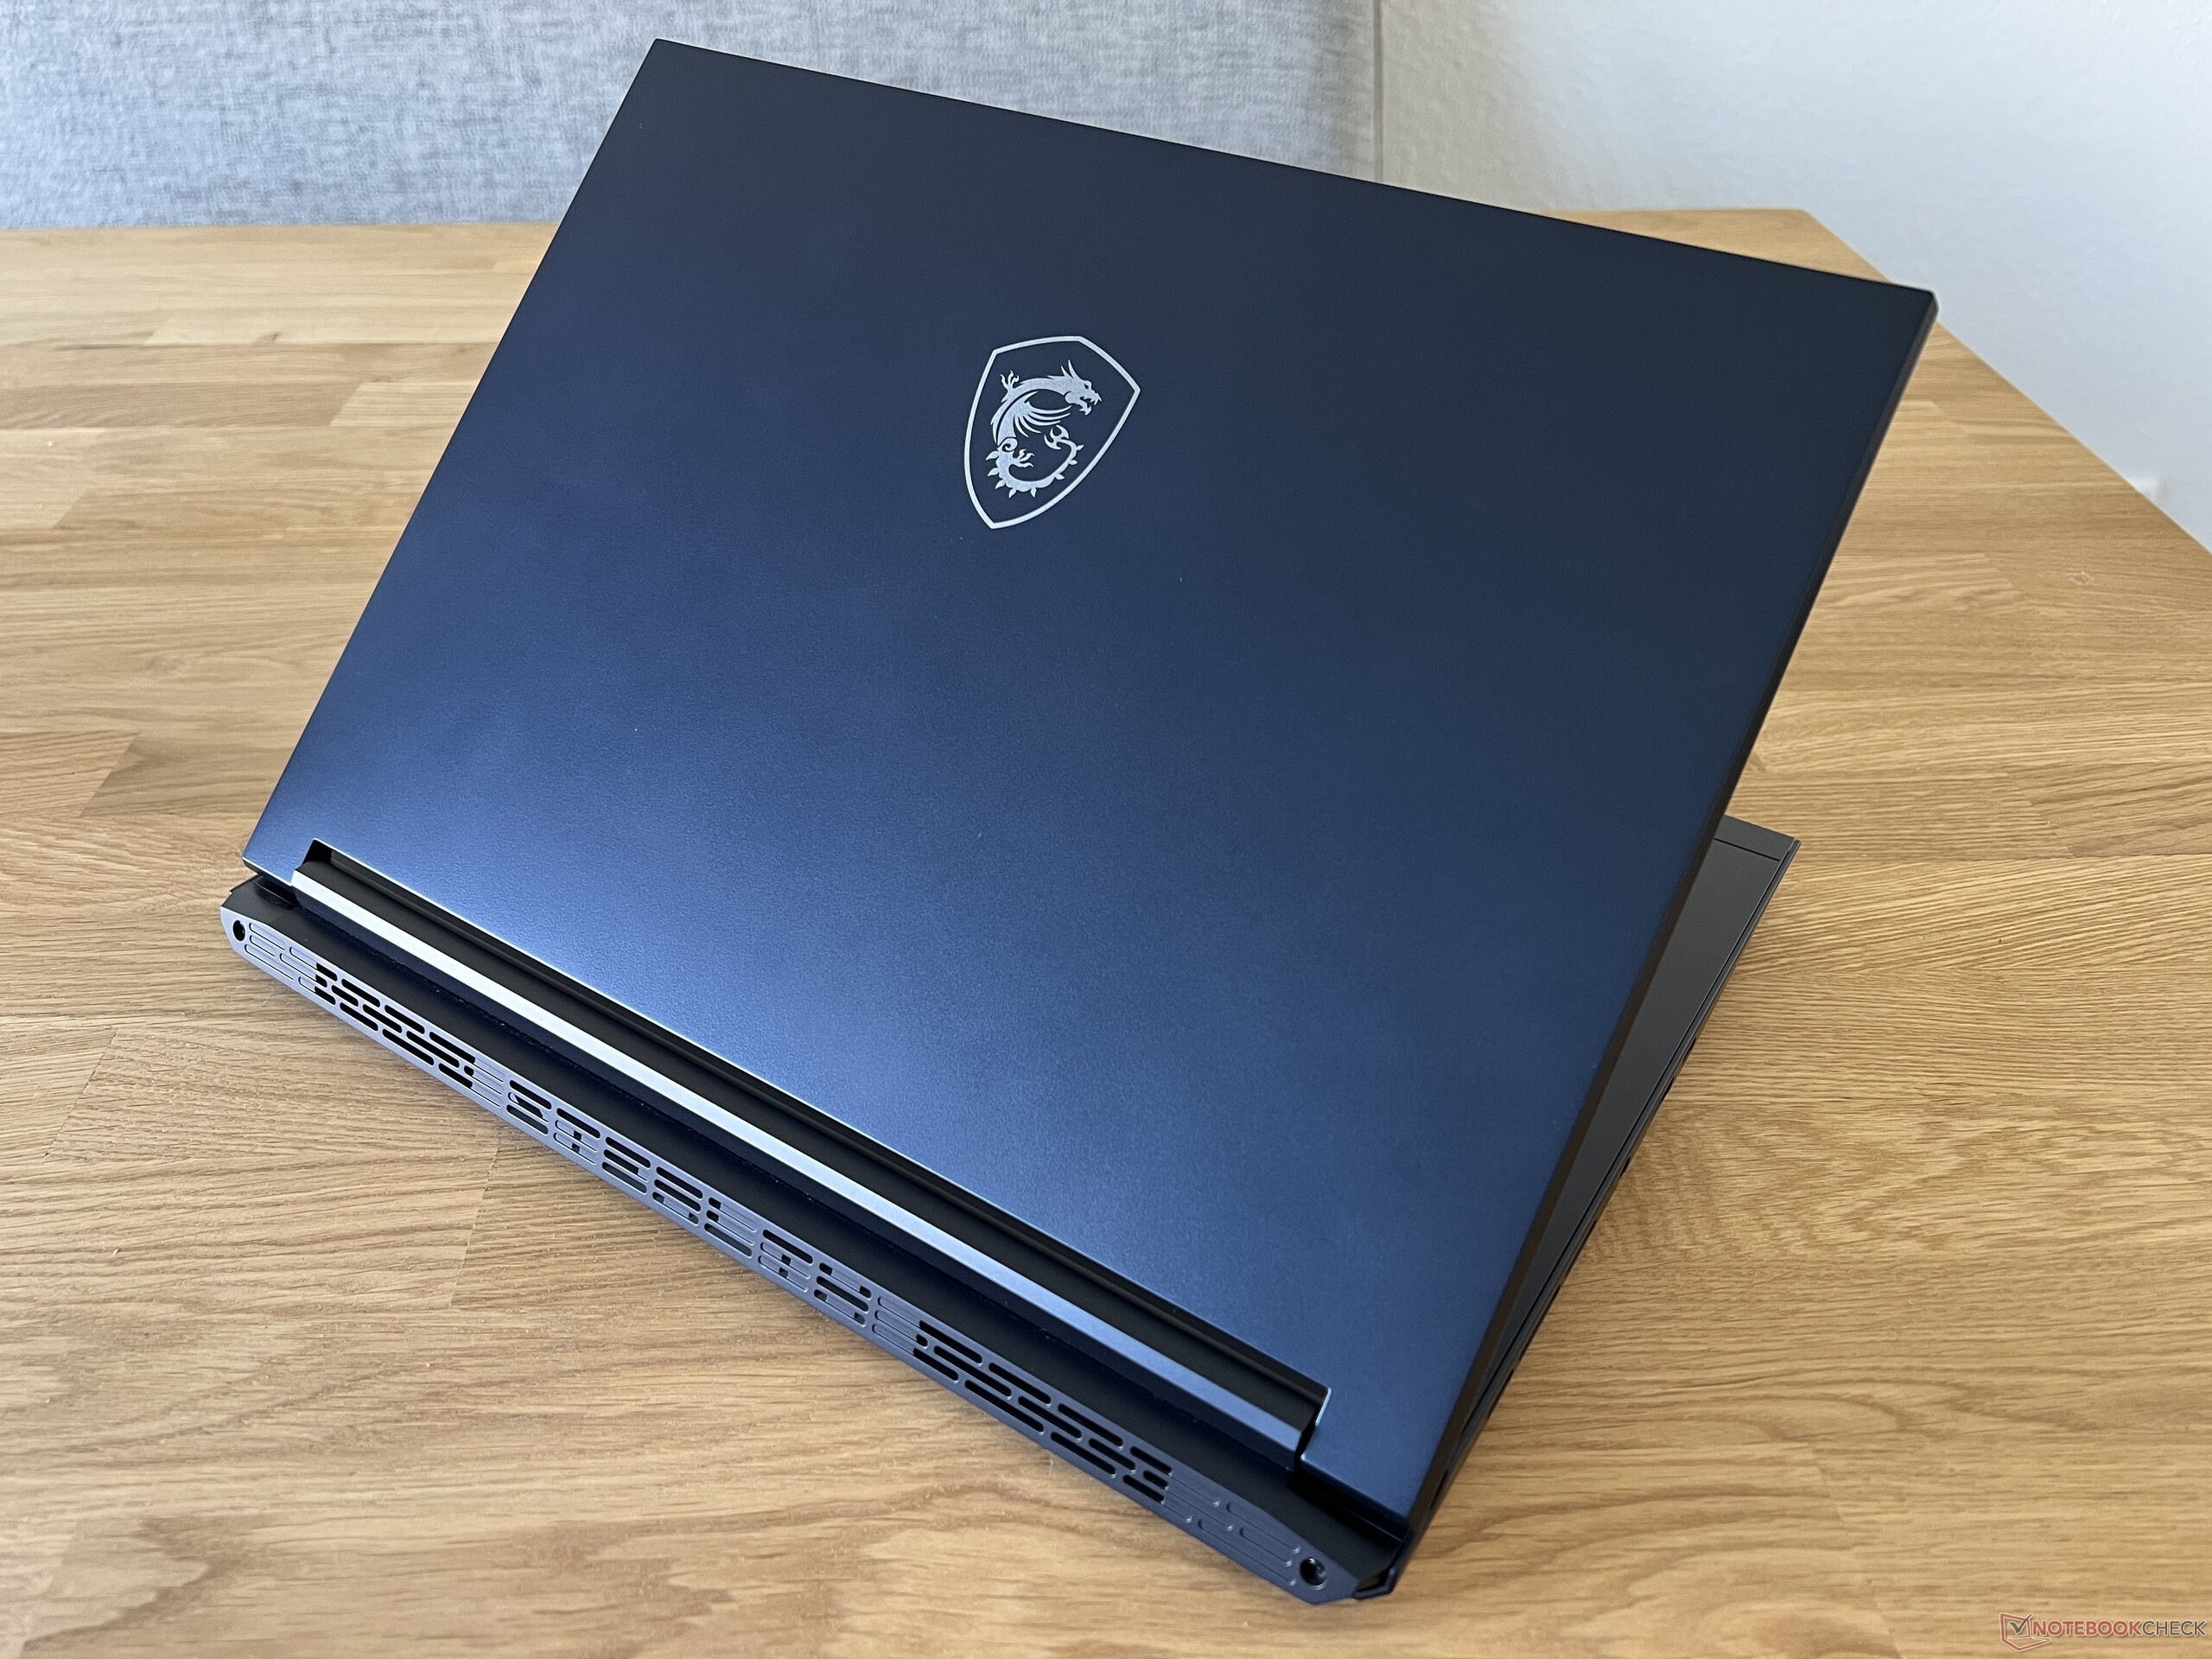
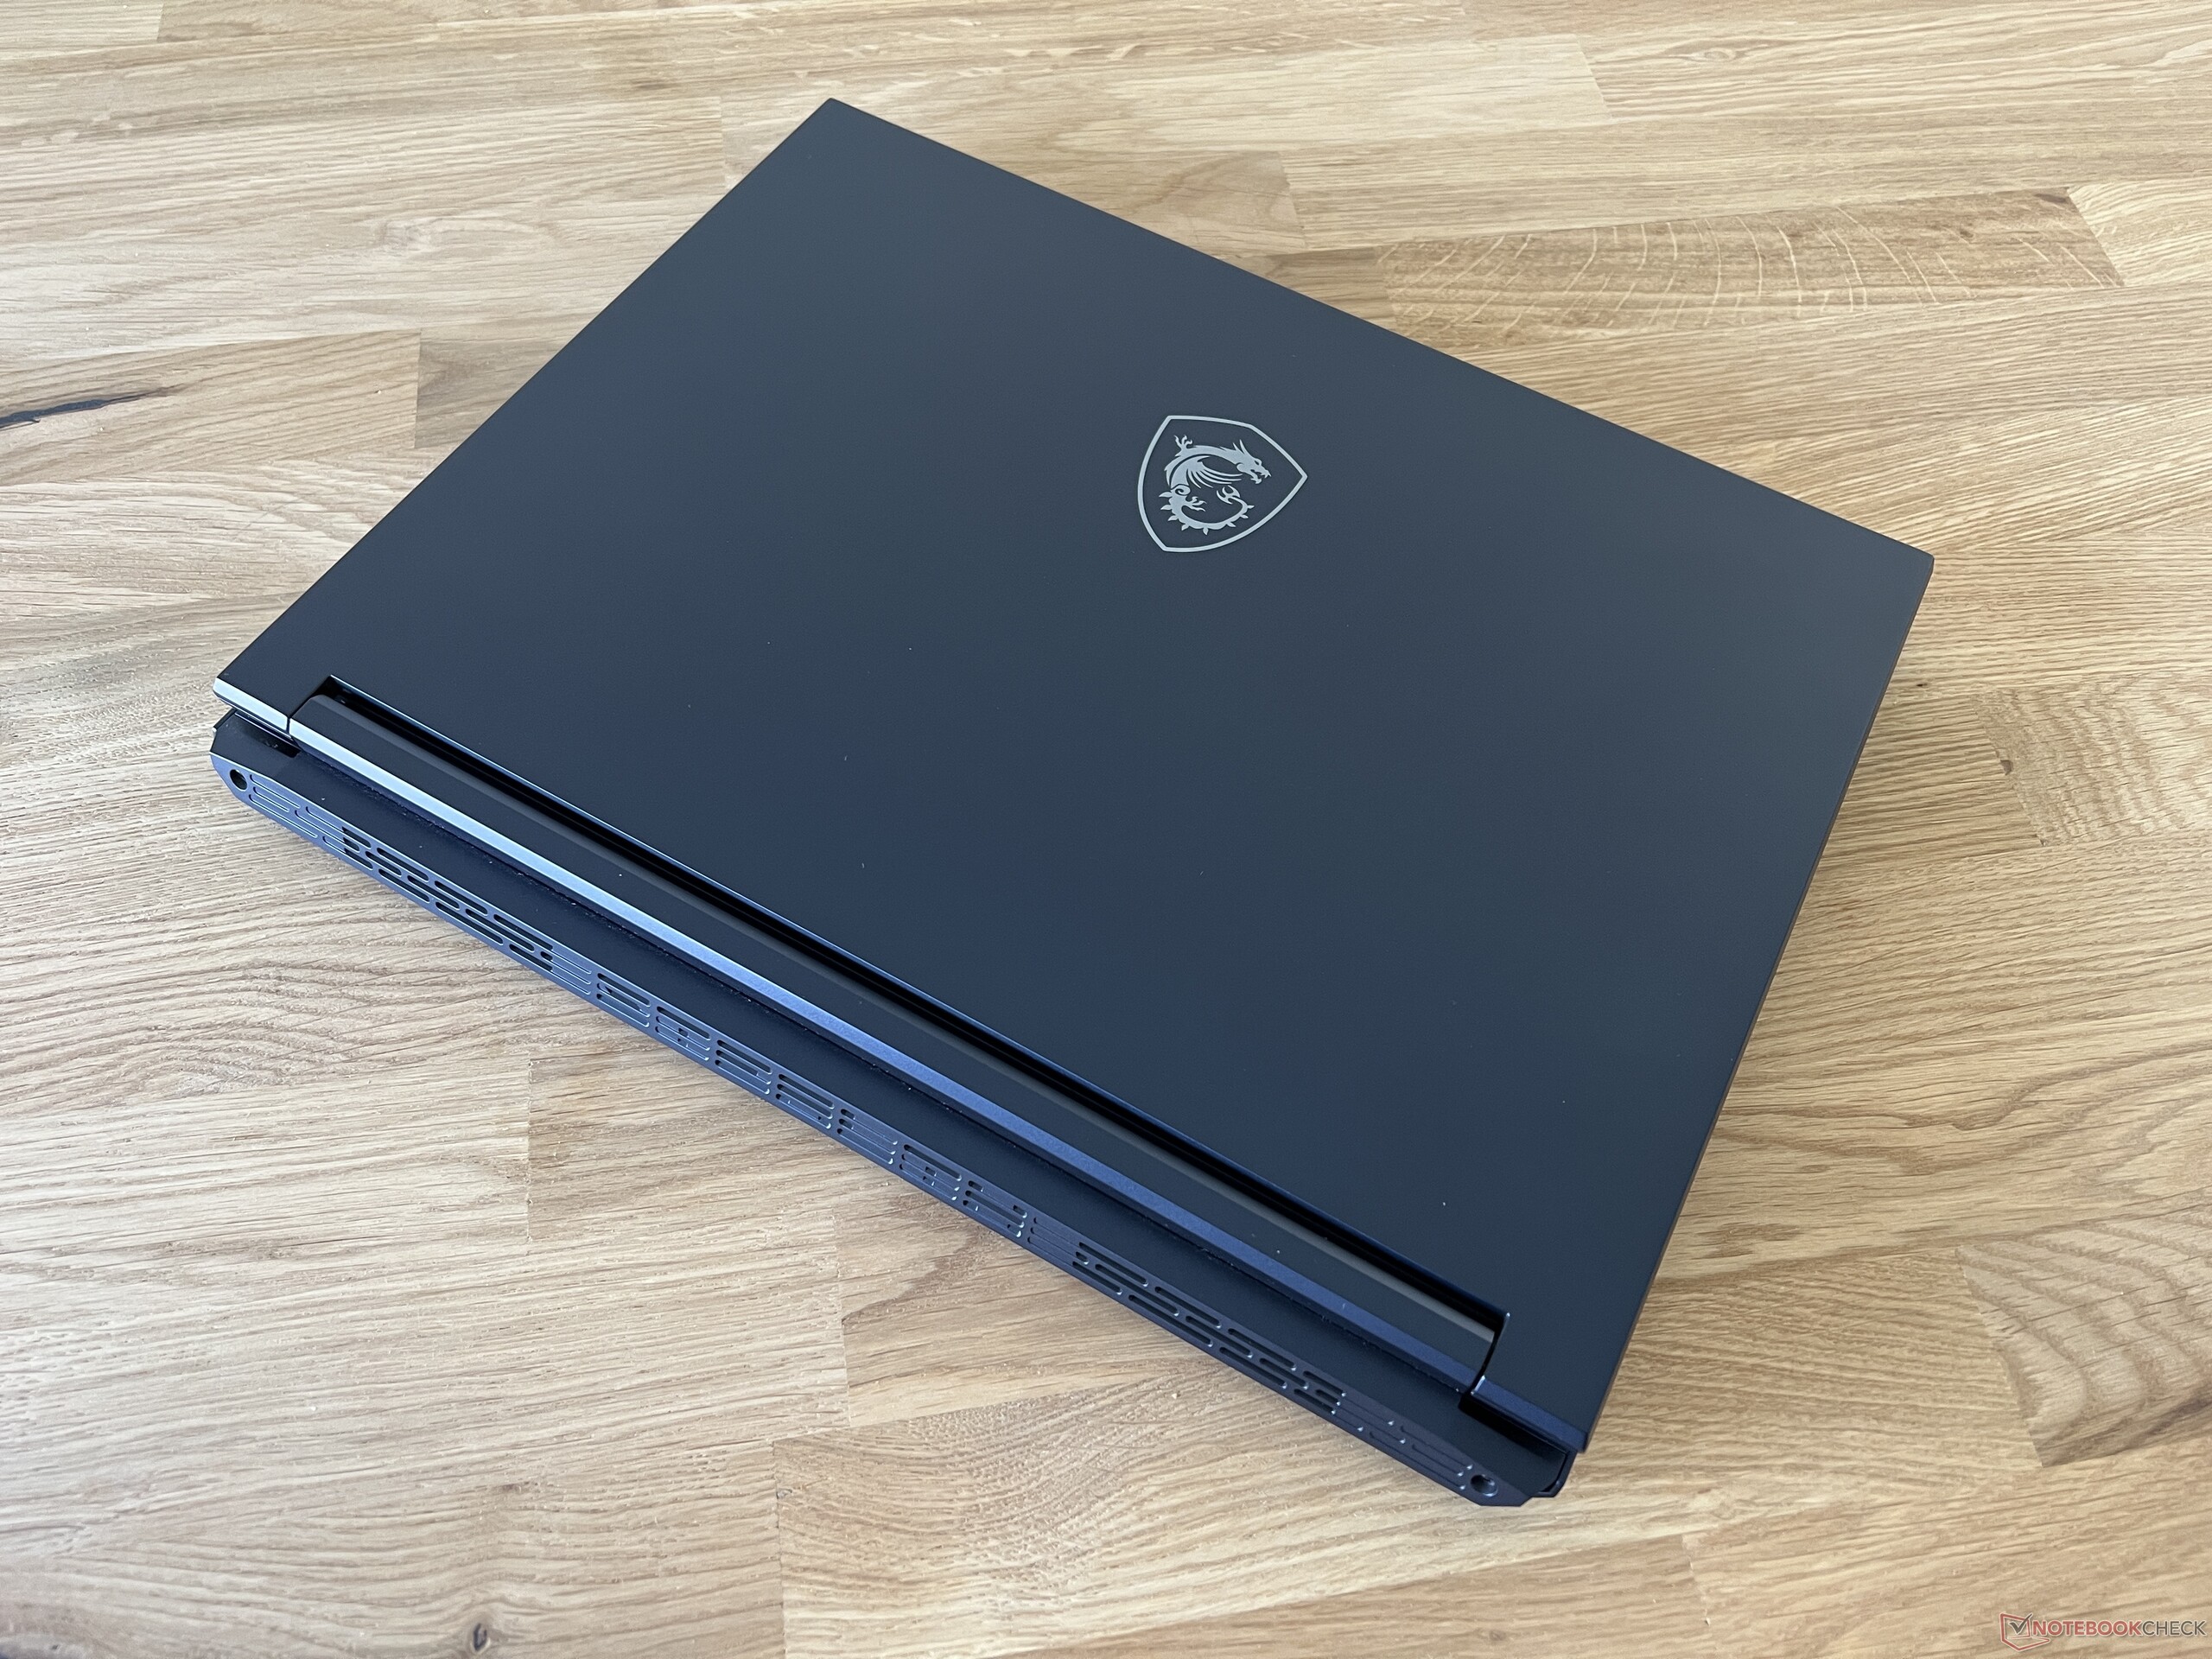
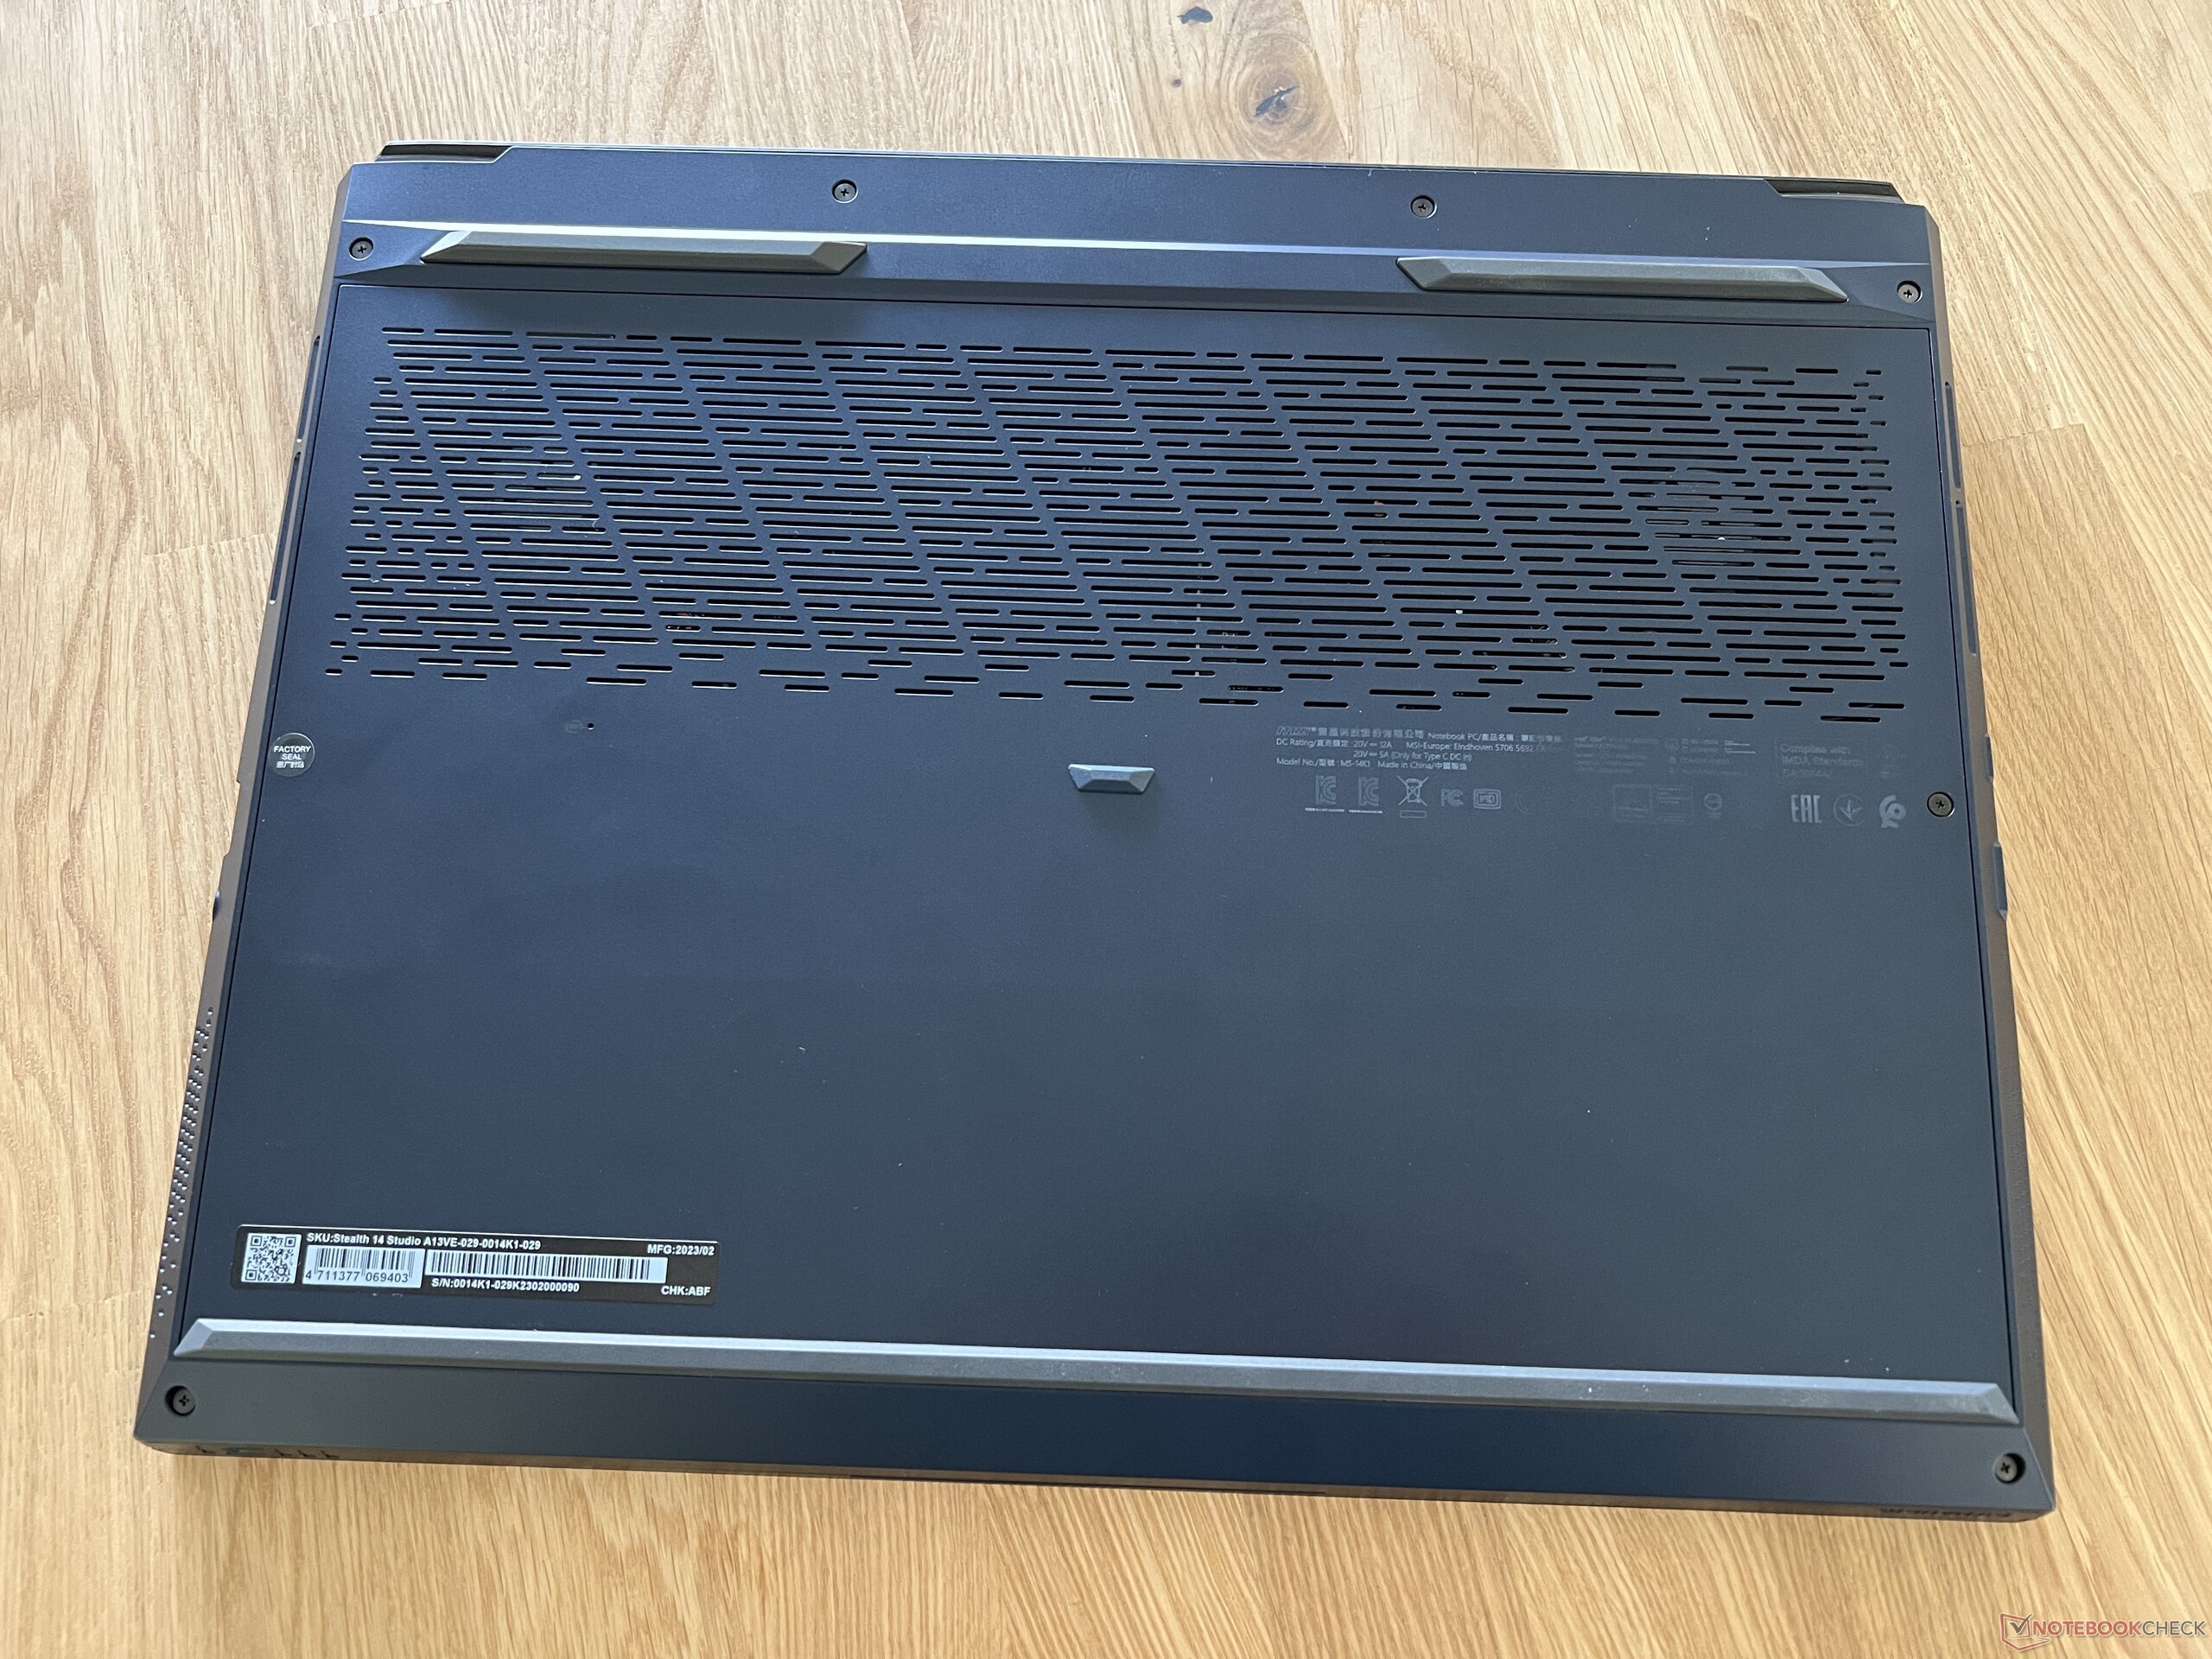
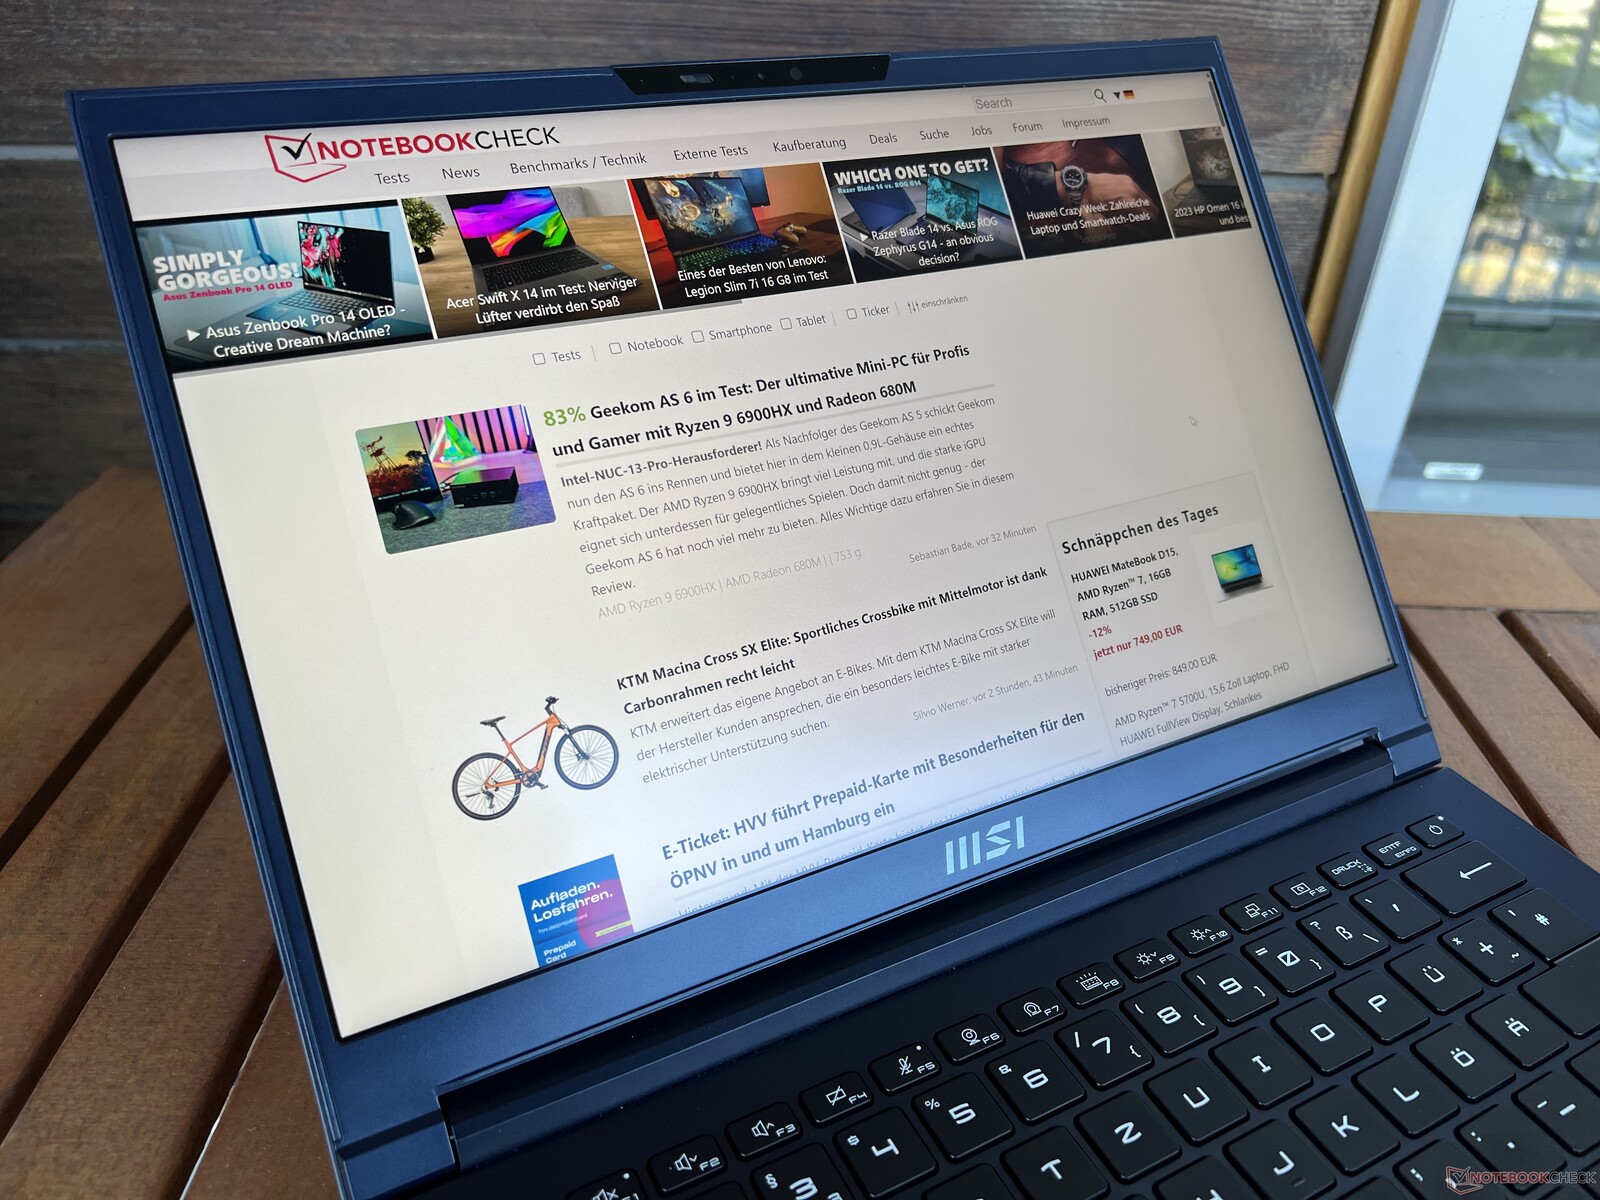
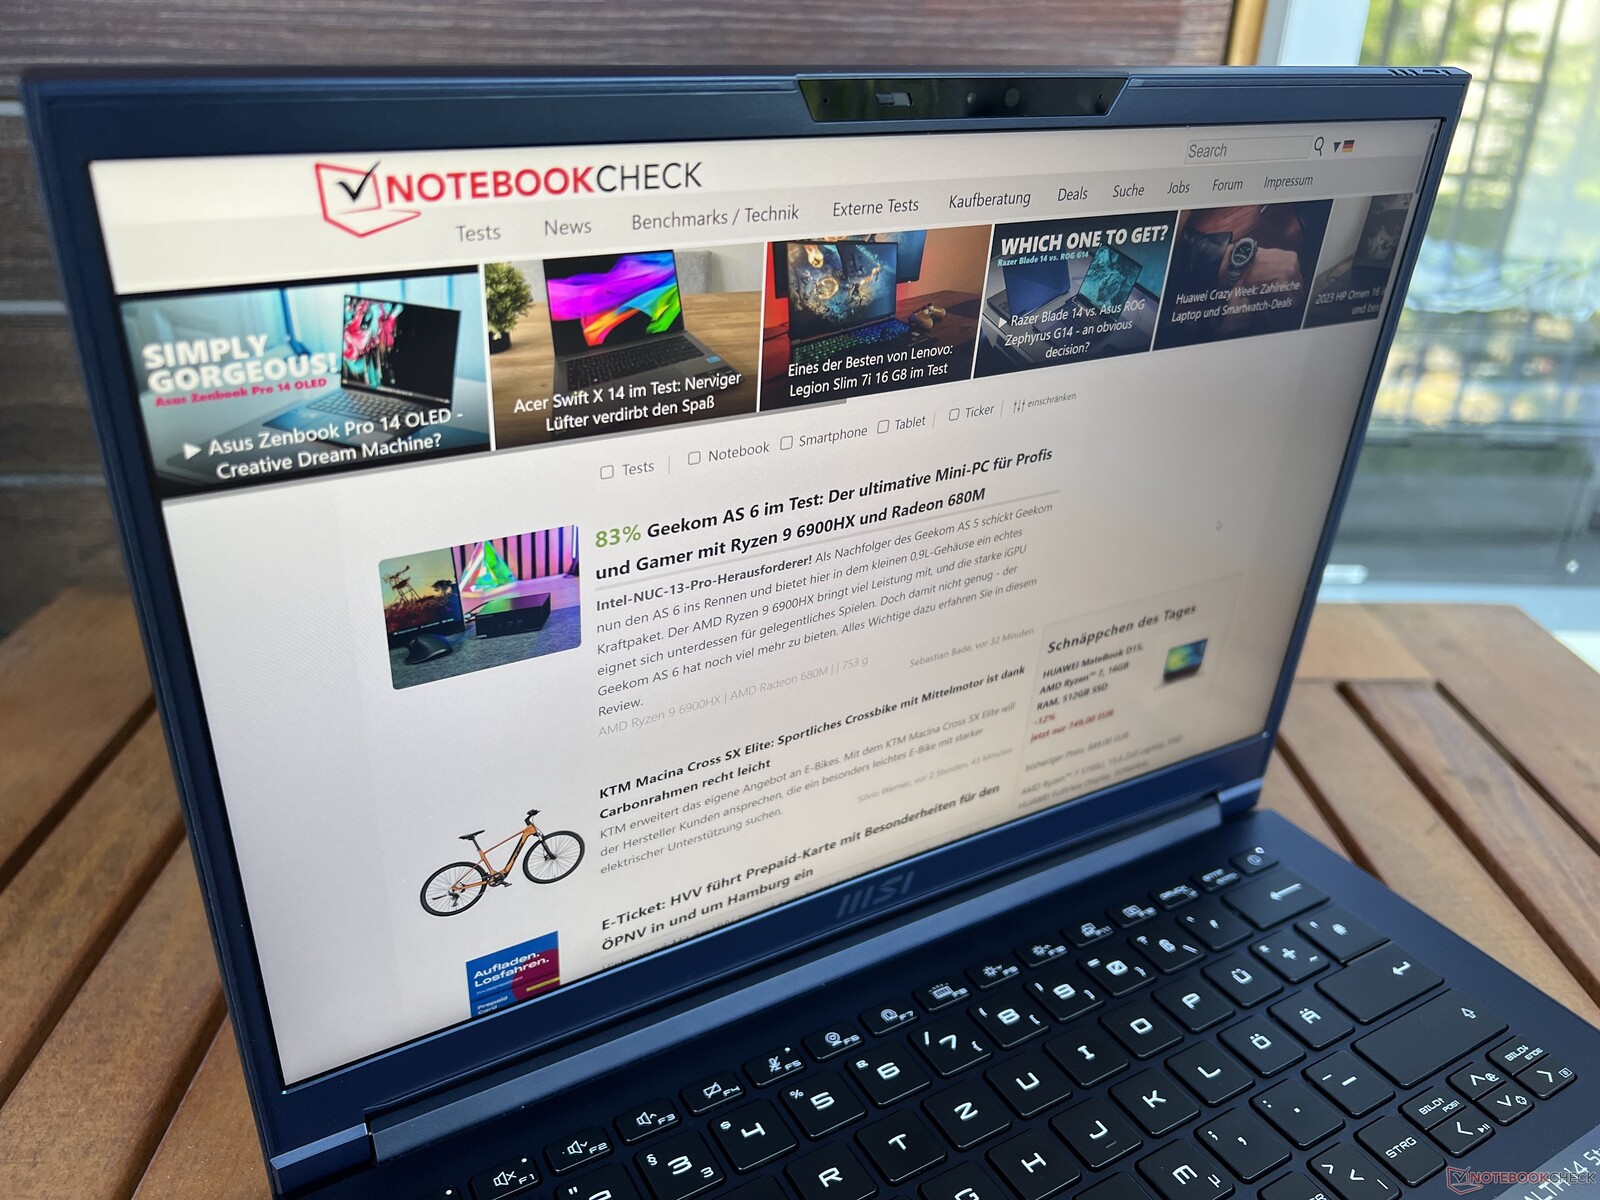
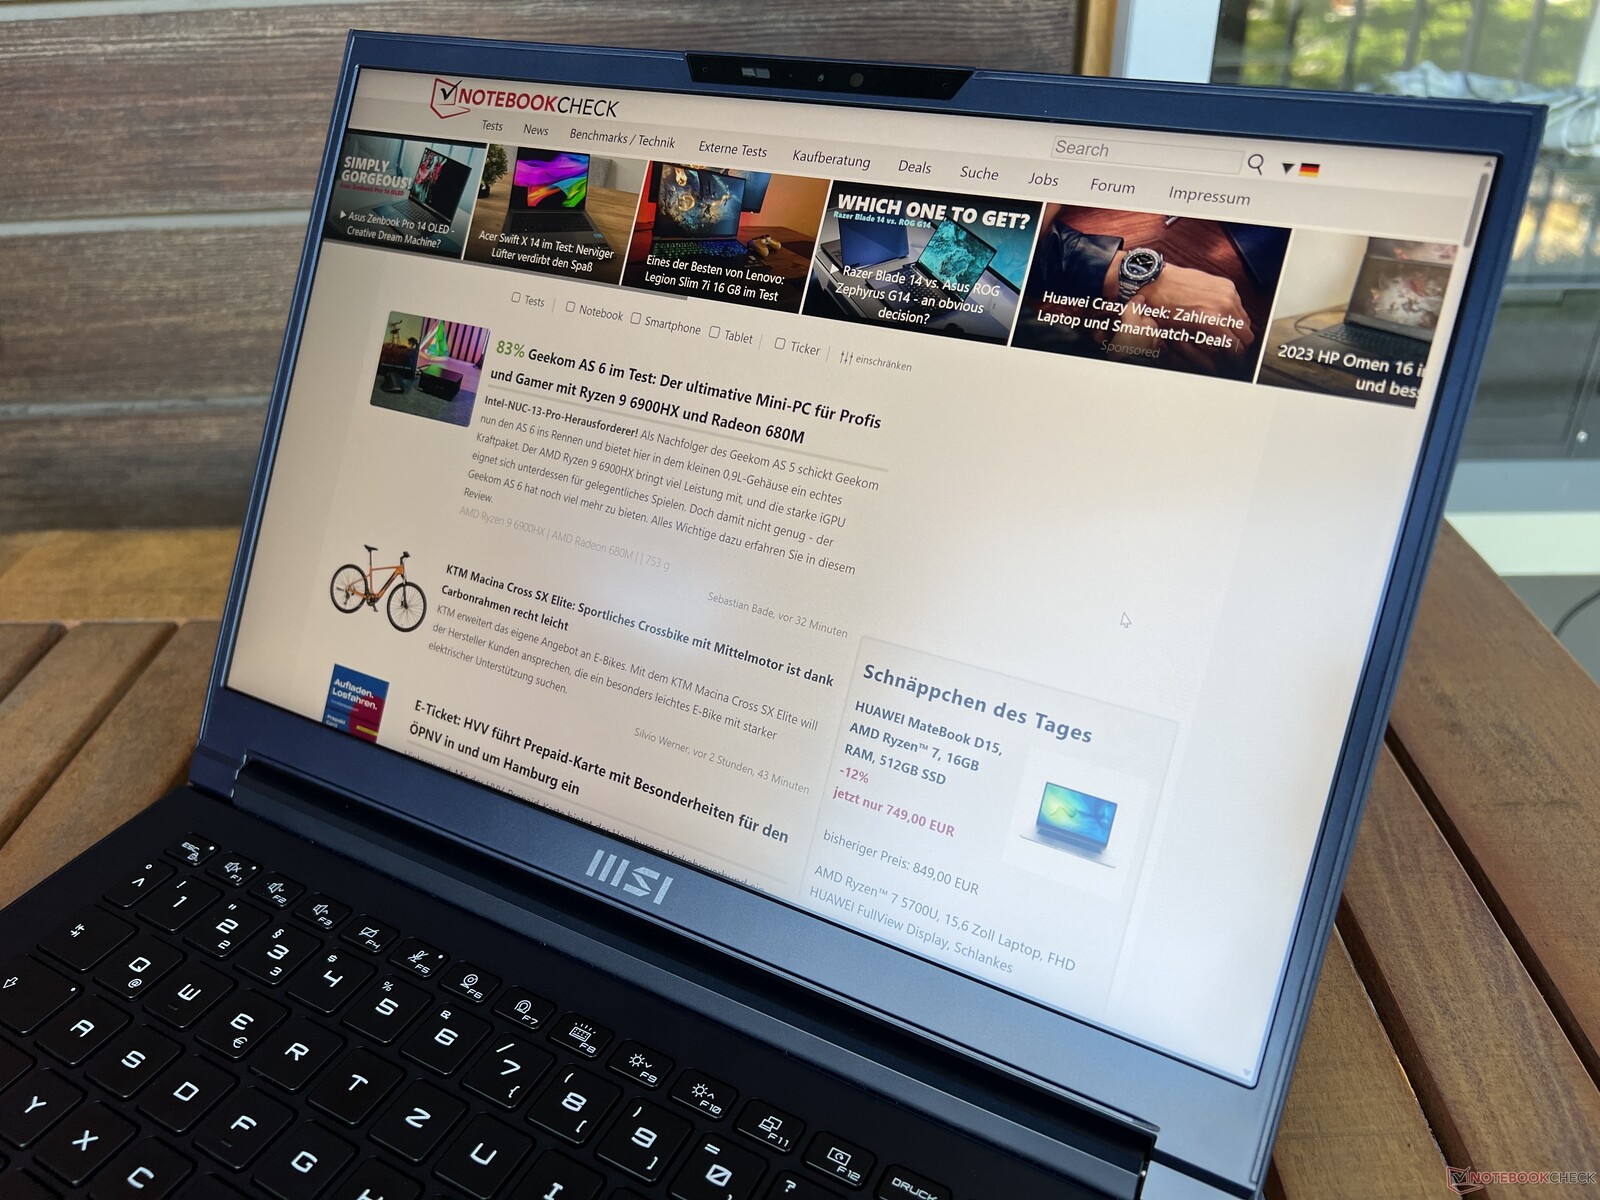
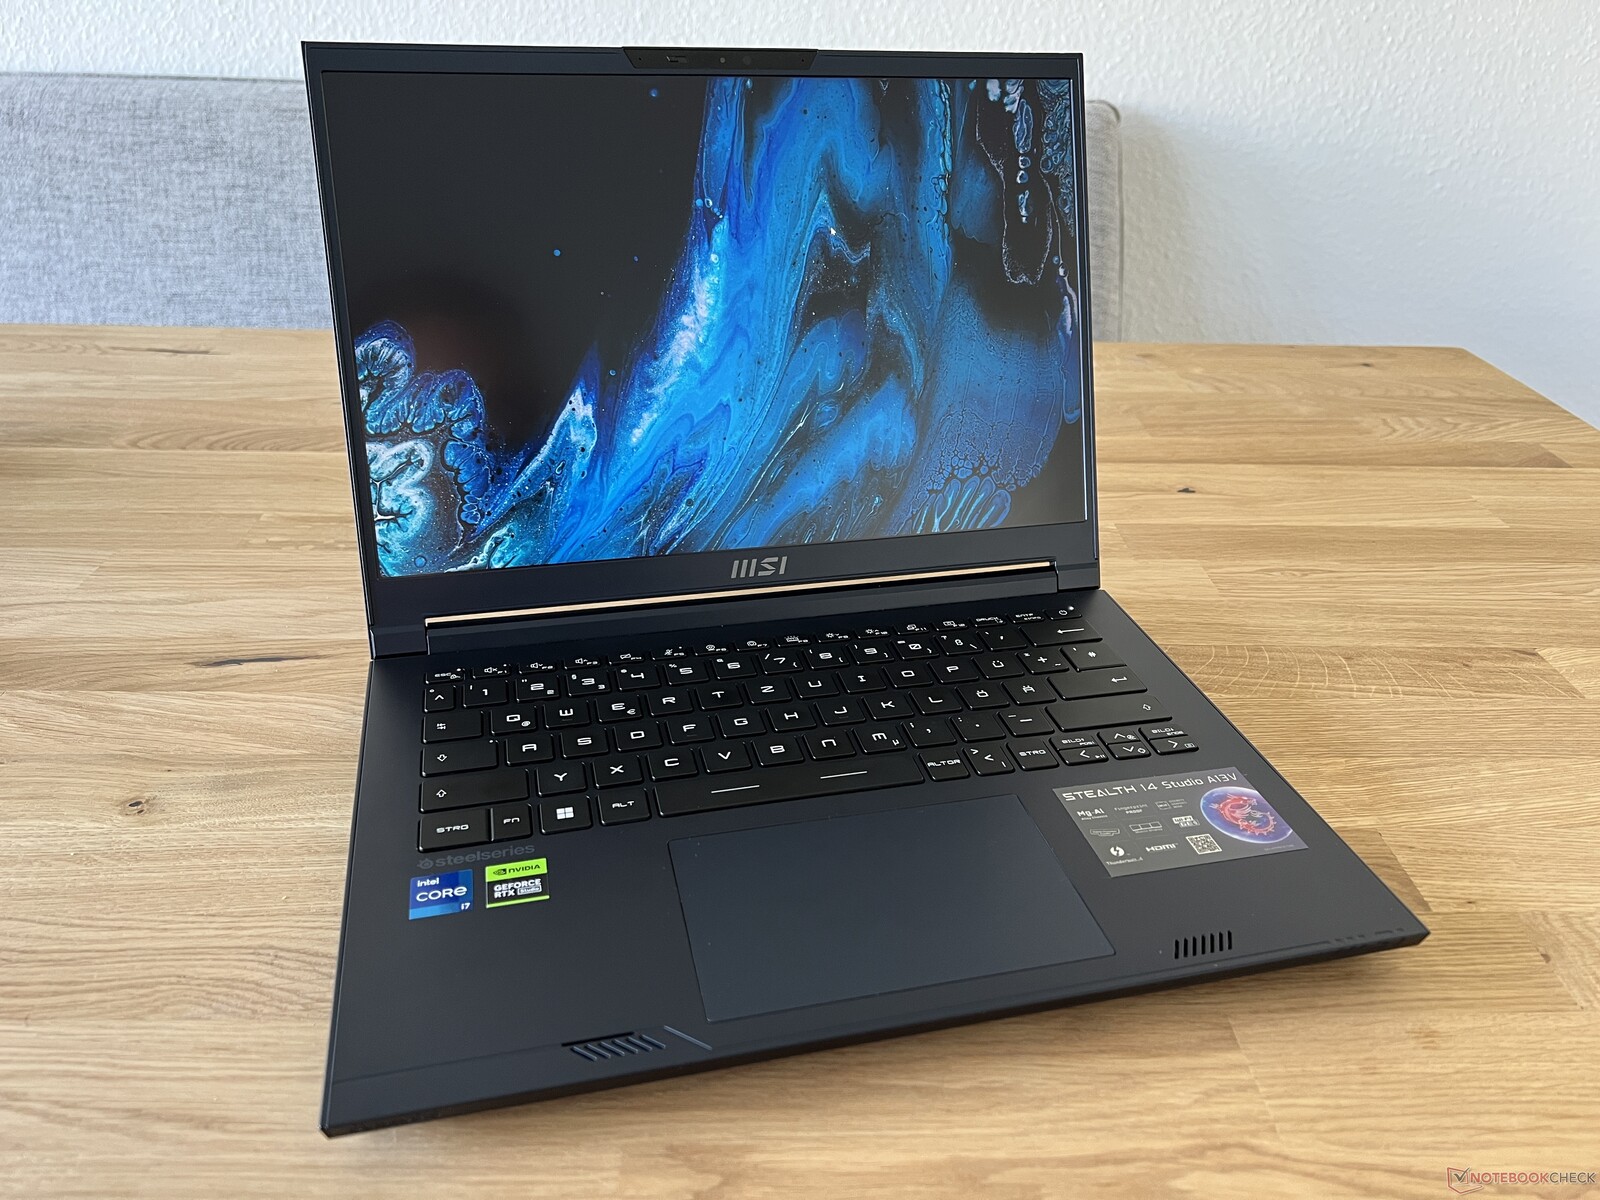
Obudowa - niebieski lub biały metal
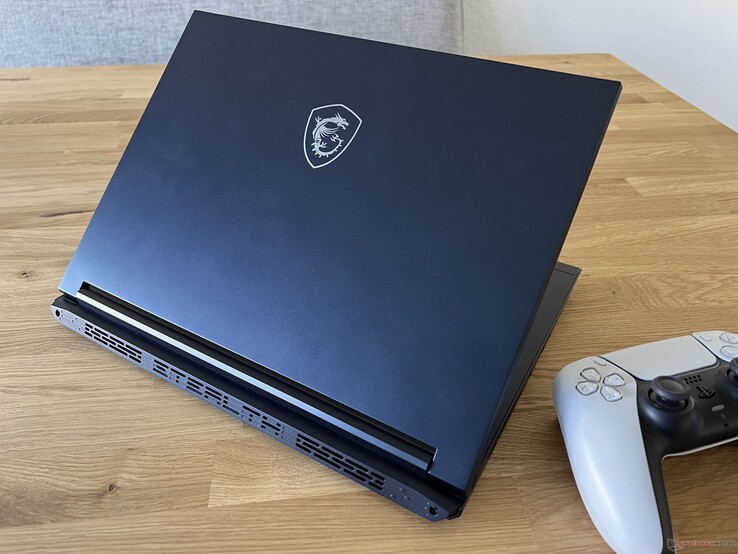
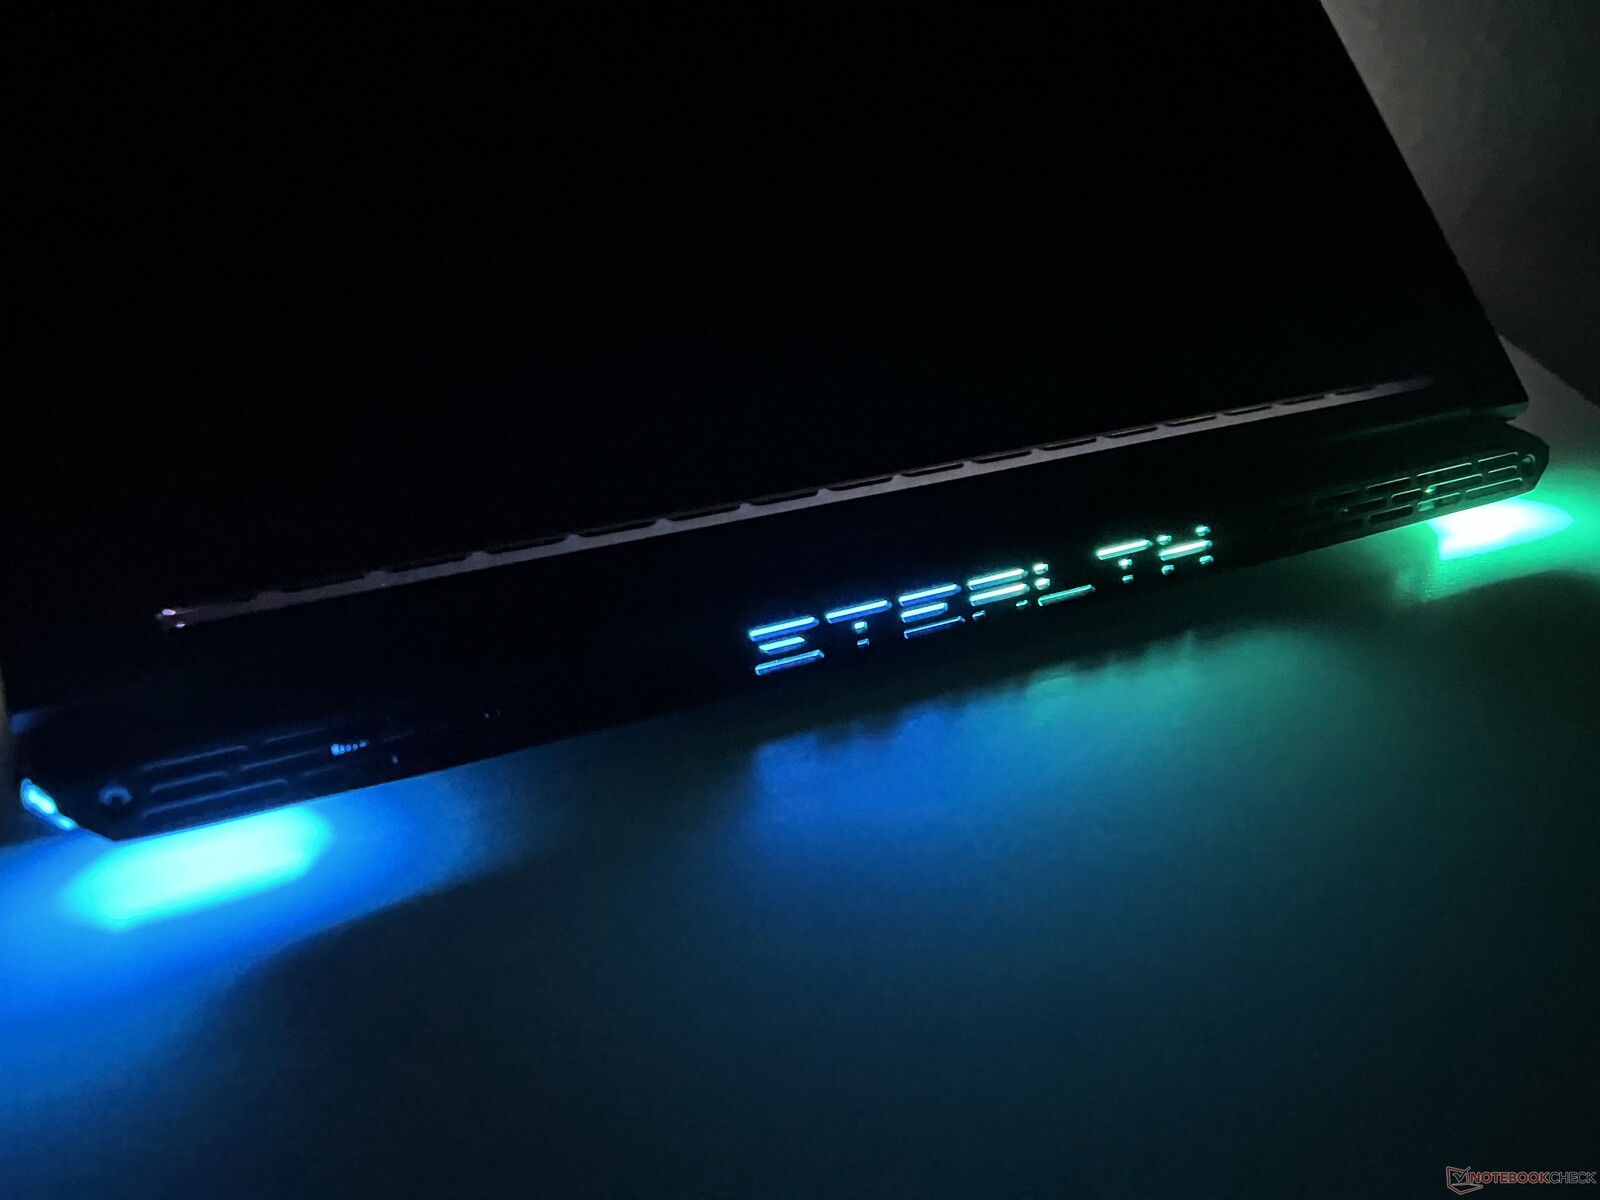
MSI oferuje Stealth 14 Studio w kolorze ciemnoniebieskim lub białym. My testujemy model niebieski, który wygląda dość elegancko, ale ma tendencję do pokazywania sporej ilości śladów odcisków palców. Jak na laptopa gamingowego, konstrukcja jest dość powściągliwa - logo smoka na pokrywie to jedyna rzecz, która zwraca uwagę na serię urządzeń. Z tyłu znalazło się kilka dodatkowych elementów świetlnych (które można aktywować za pośrednictwem MSI Center) - oba narożniki, a także logo Stealth, mogą być podświetlane. Niestety, nie można zmienić koloru ani intensywności podświetlenia.
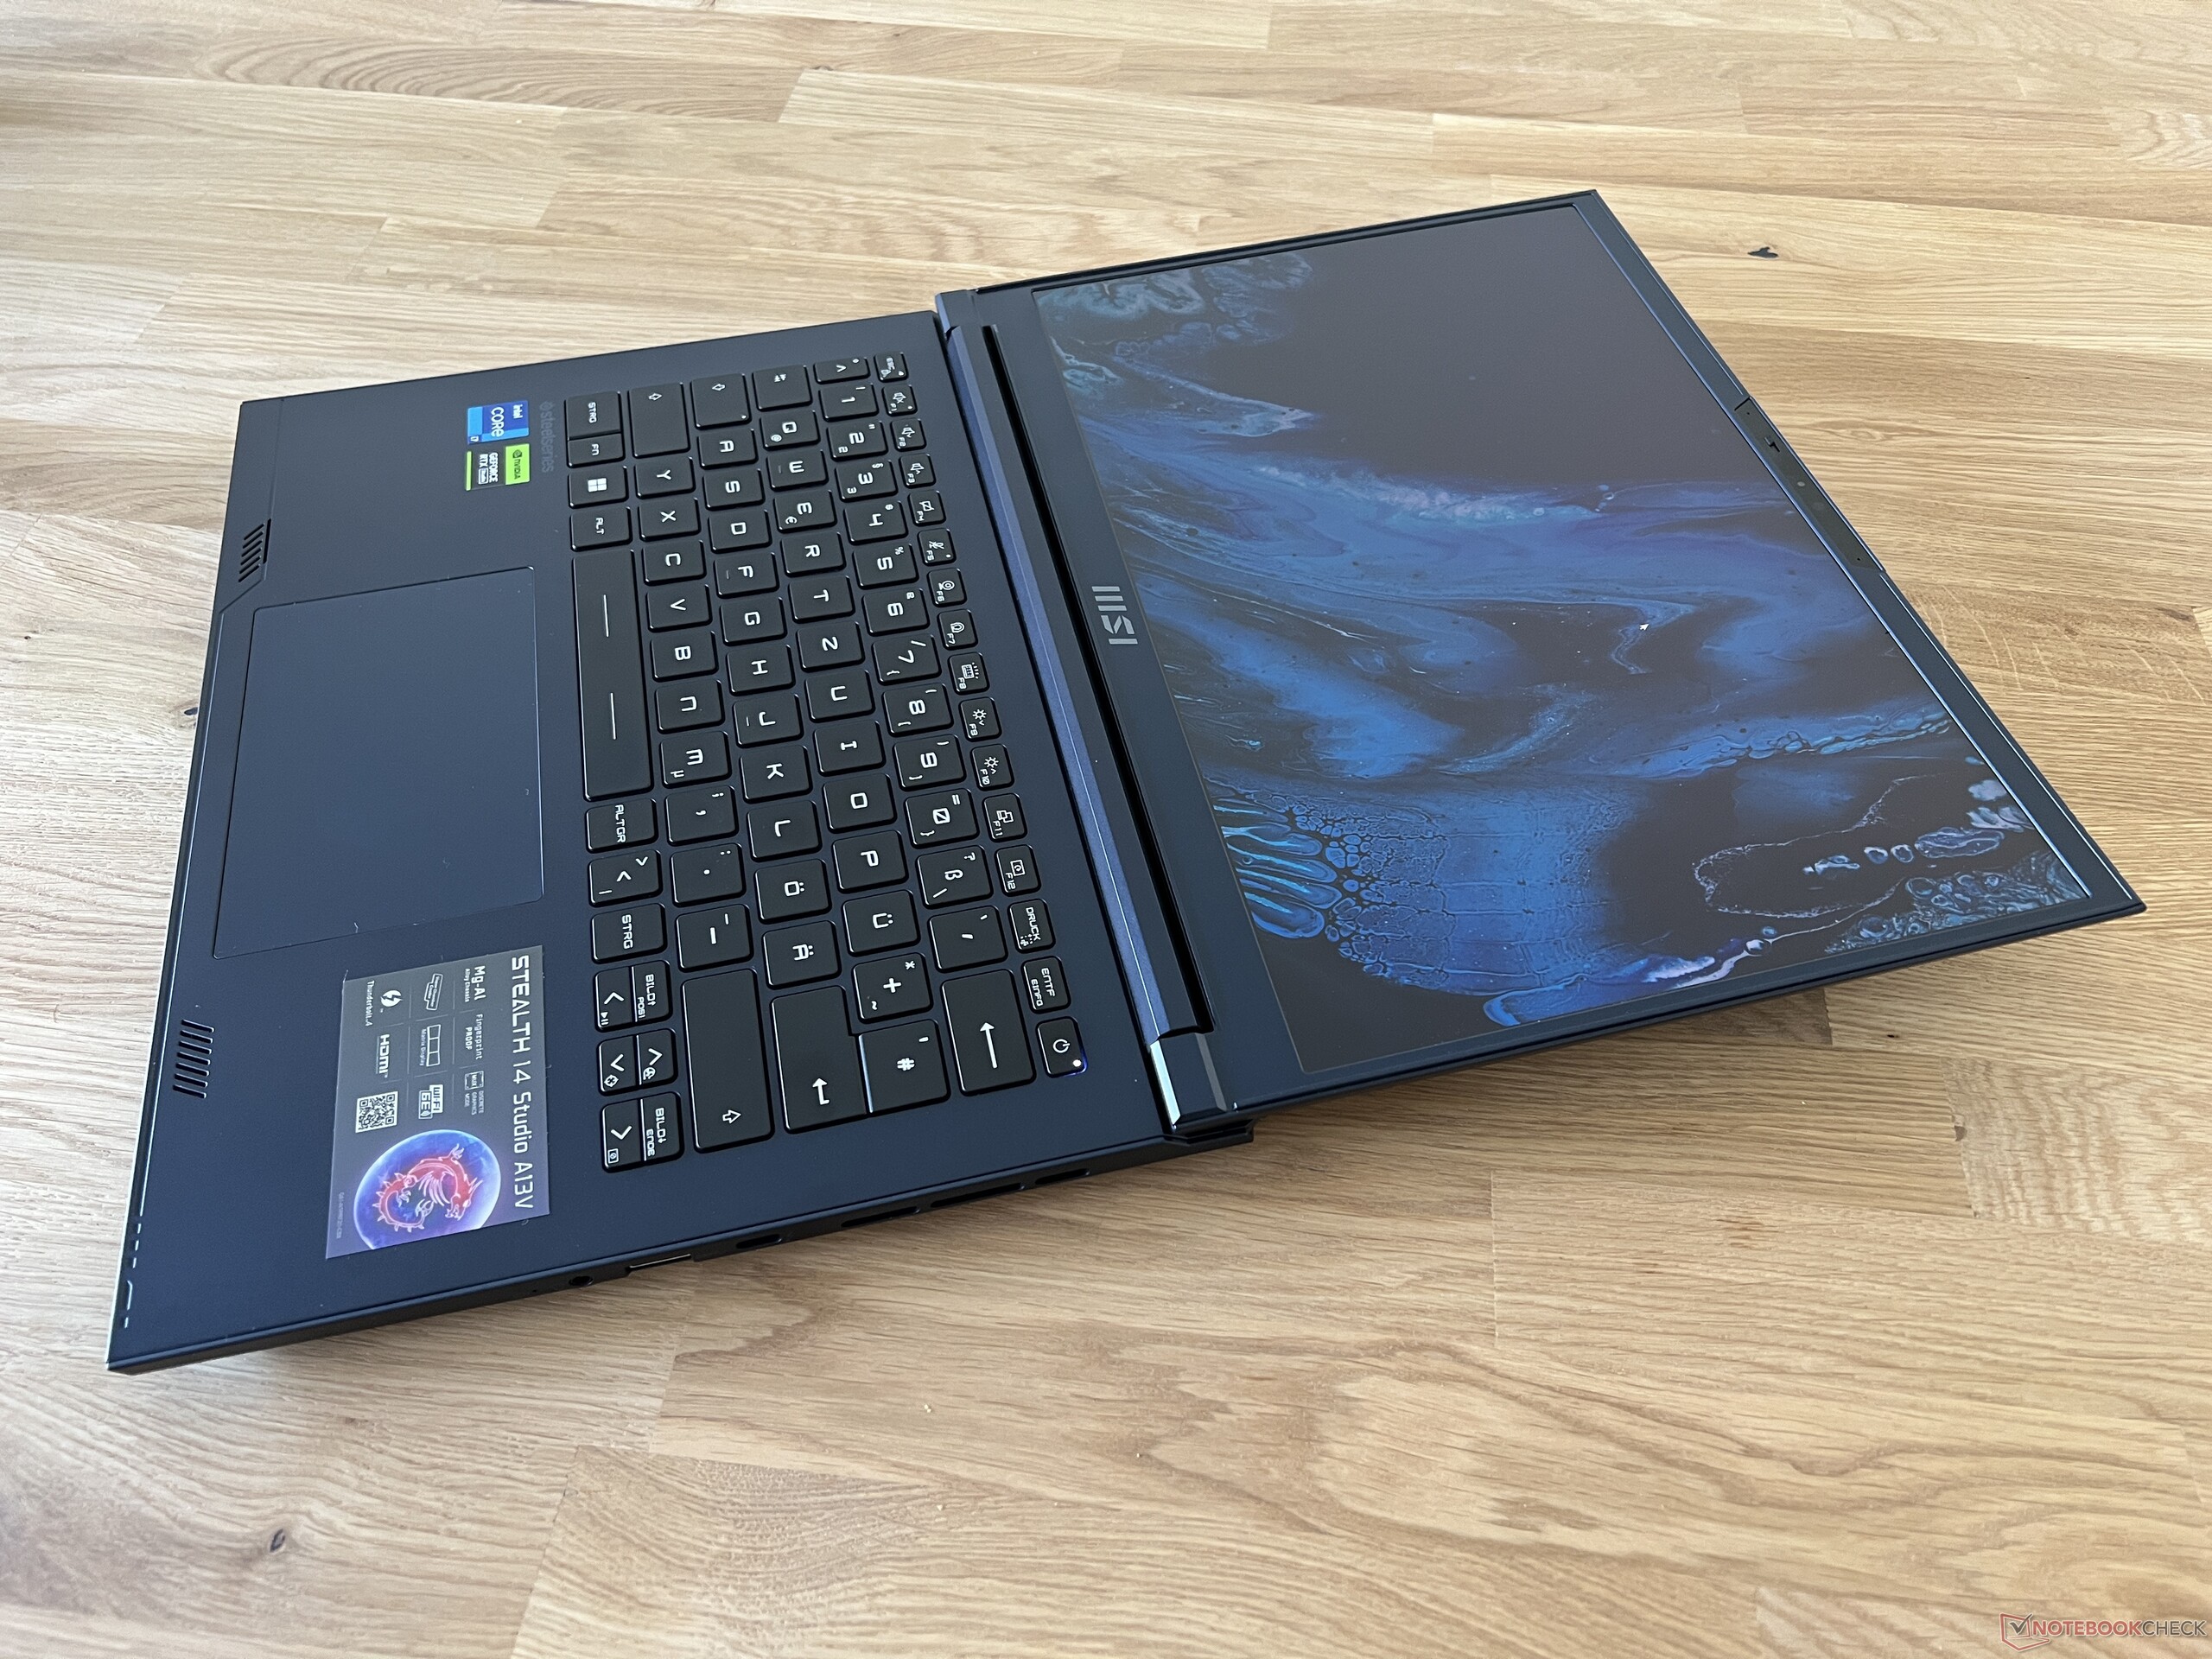
Obudowa wykonana jest ze stopu magnezu i aluminium, a podstawa jest niezwykle stabilna. Nie można jej wygiąć ani skręcić i nie słychać żadnych skrzypnięć. Tego samego niestety nie można powiedzieć o pokrywie urządzenia, która jest znacznie bardziej elastyczna i można ją nawet lekko wygiąć, co prowadzi do słyszalnych skrzypień. W nowoczesnych urządzeniach zwykle zapomina się już o tych kwestiach, więc zdecydowanie trzeba uważać, aby nie podnieść laptopa za ekran, aby nie spowodować trwałych uszkodzeń. Oba zawiasy są dobrze wyregulowane i pozwalają na maksymalny kąt otwarcia 180 stopni. Ramki są dość grube jak na nowoczesne urządzenie - stosunek ekranu do obudowy wynosi tylko 73%.
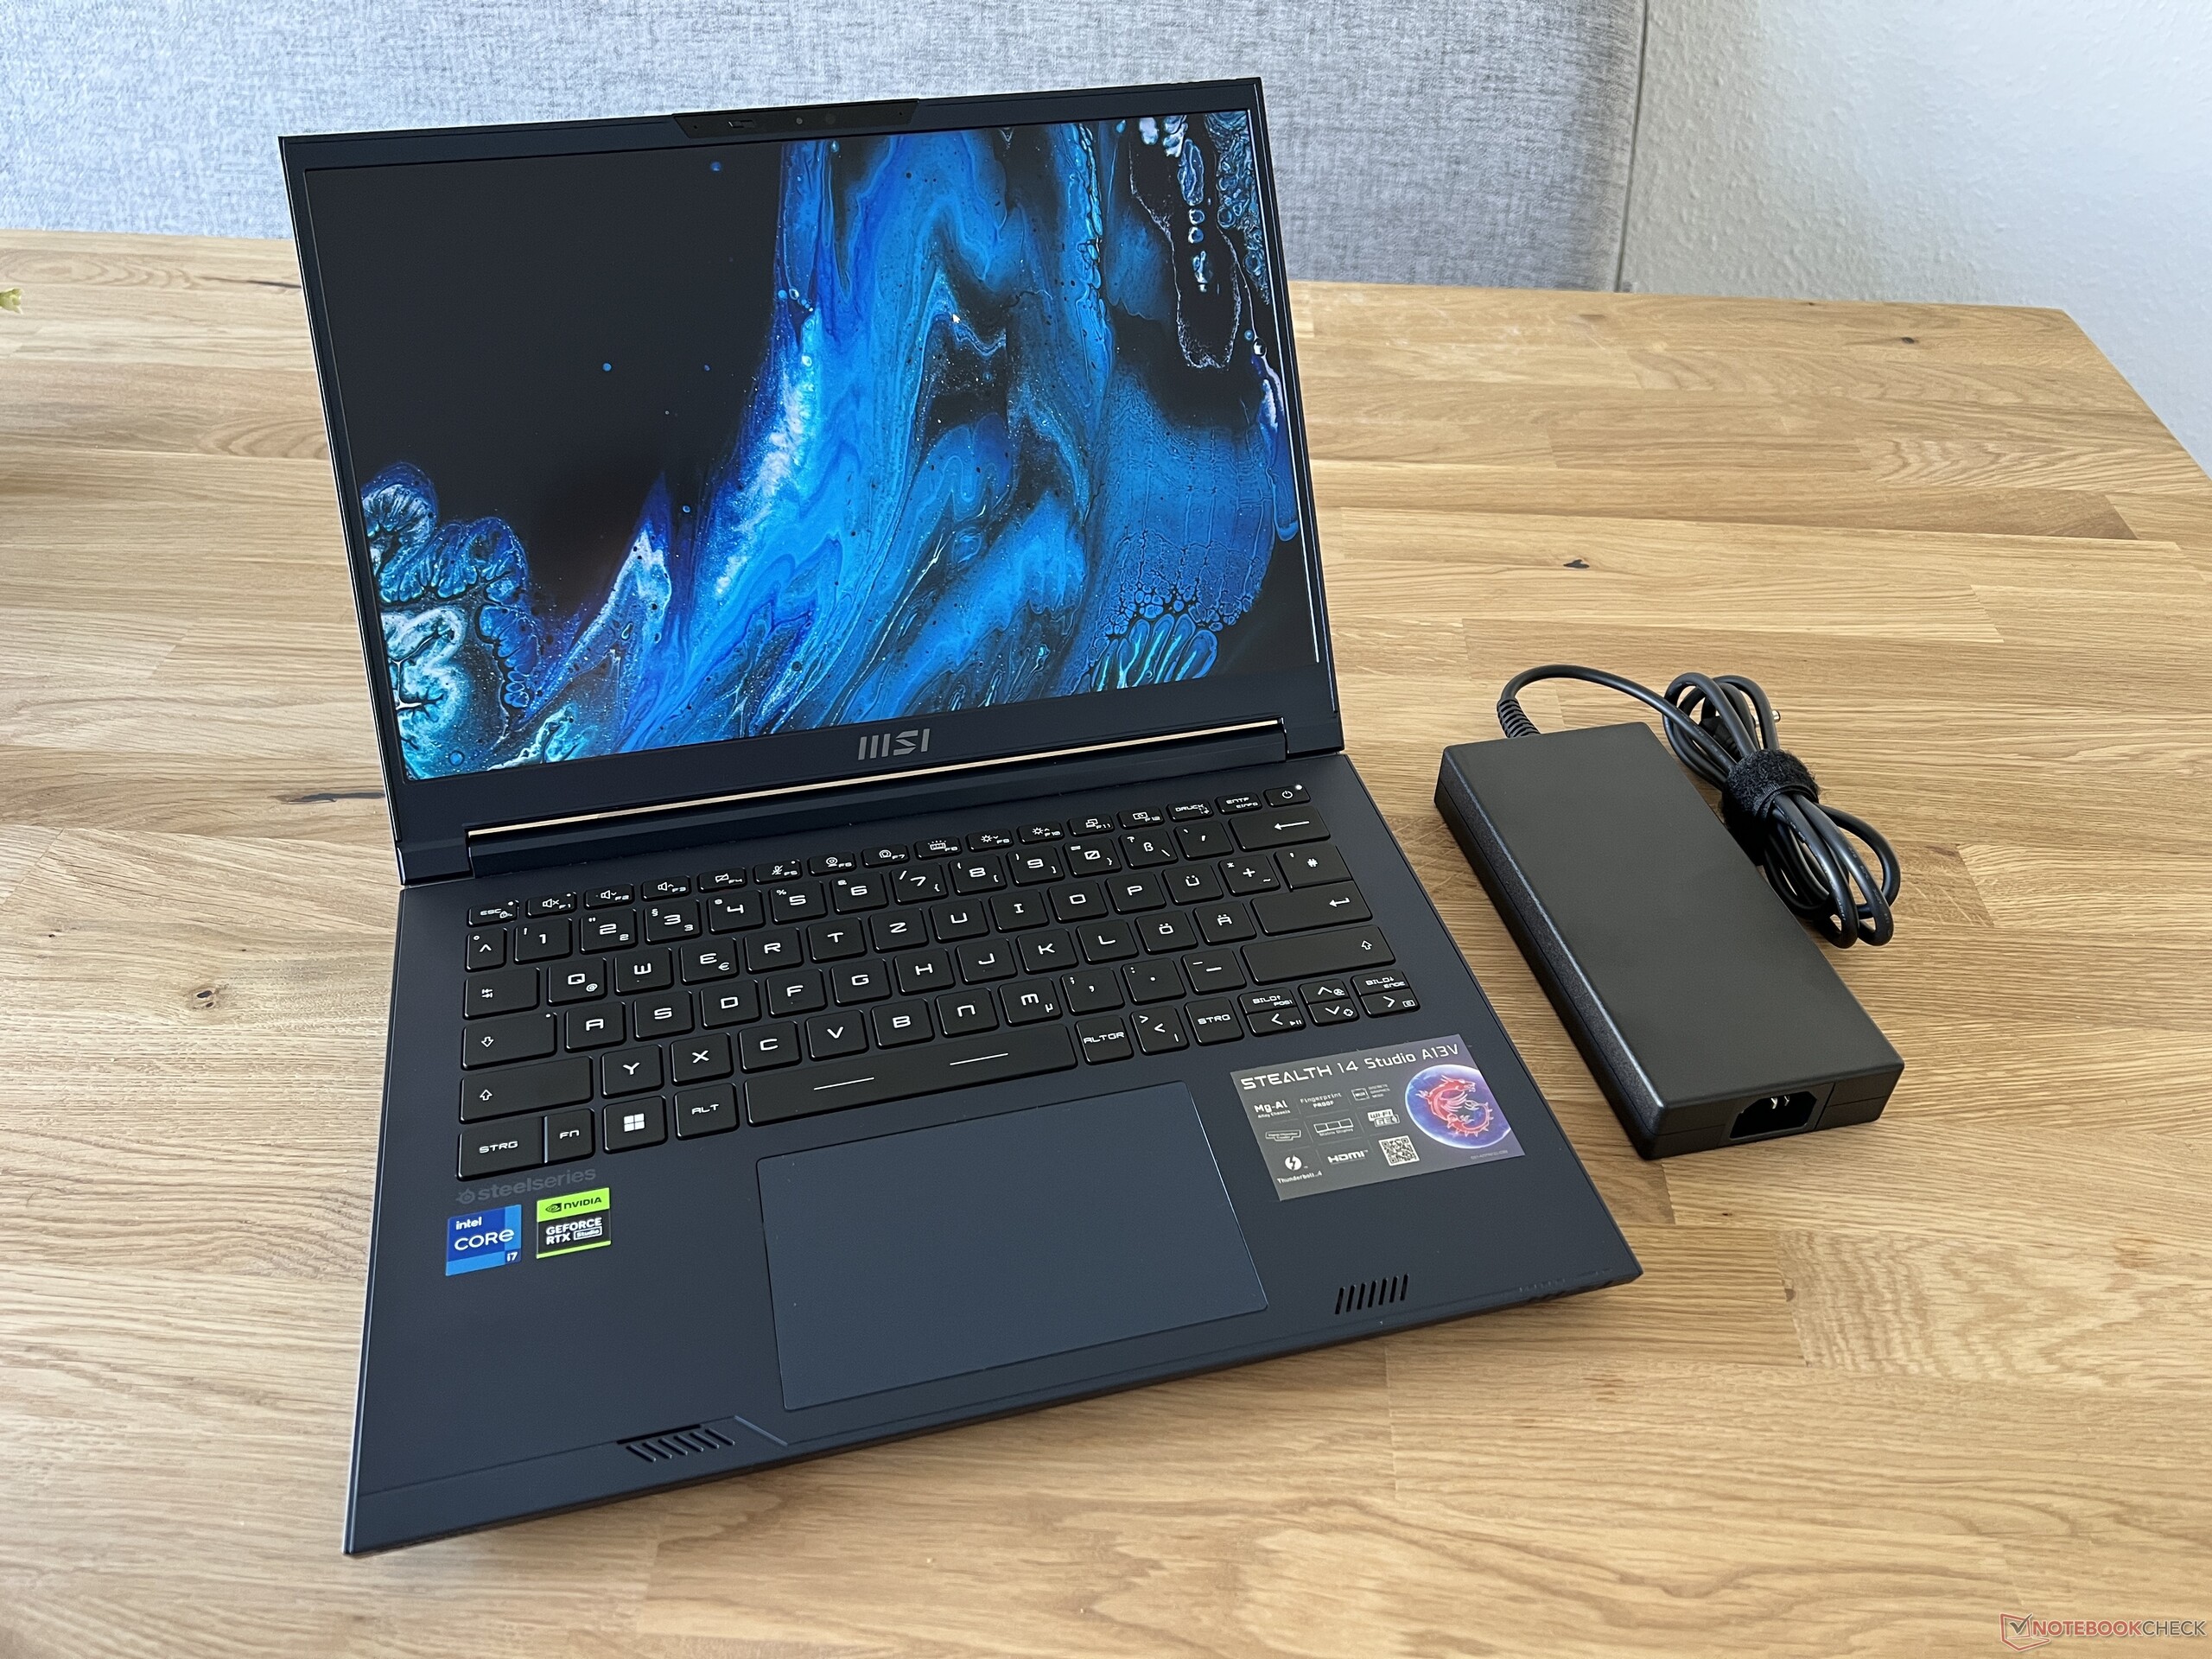
Stealth 14 Studio jest jednym z największych urządzeń w naszej grupie porównawczej - tylkoAlienware x14zajmuje jeszcze więcej miejsca. Jego waga, wynosząca nieco ponad 1,7 kg, jest mniej więcej przeciętna. 240-watowy zasilacz dodaje kolejne 700 gramów do wagi.
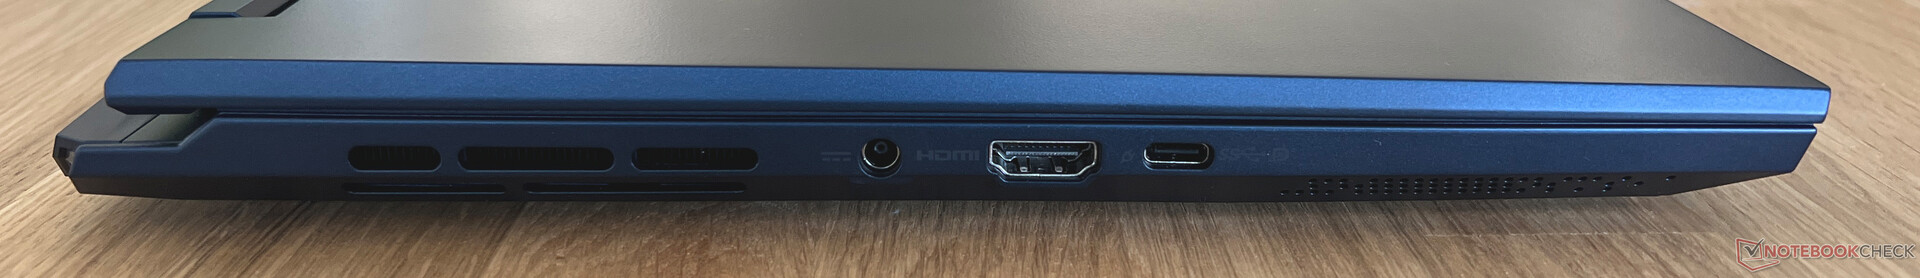
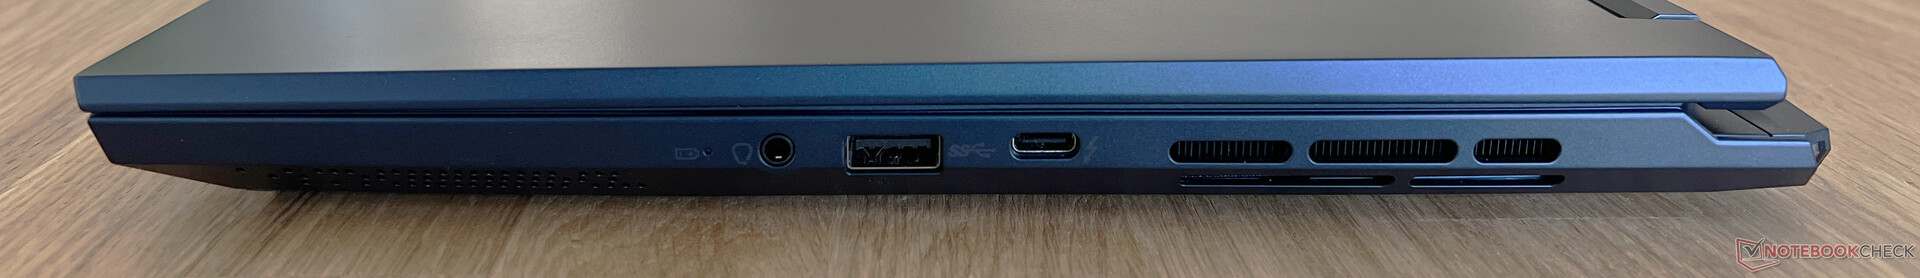
Łączność - Thunderbolt 4, ale brak czytnika kart SD
Porty Stealth 14 Studio znajdują się pośrodku po obu stronach urządzenia, choć jest ich tylko trzy z każdej strony. Będziesz w stanie znaleźć tylko najbardziej potrzebne połączenia, ale porty laptopa są przynajmniej aktualne, ponieważ zawierają Thunderbolt 4 i HDMI 2.1. Czytnik kart SD i port Ethernet nie są niestety dołączone - zamiast tego będziesz musiał polegać na adapterze.
Komunikacja
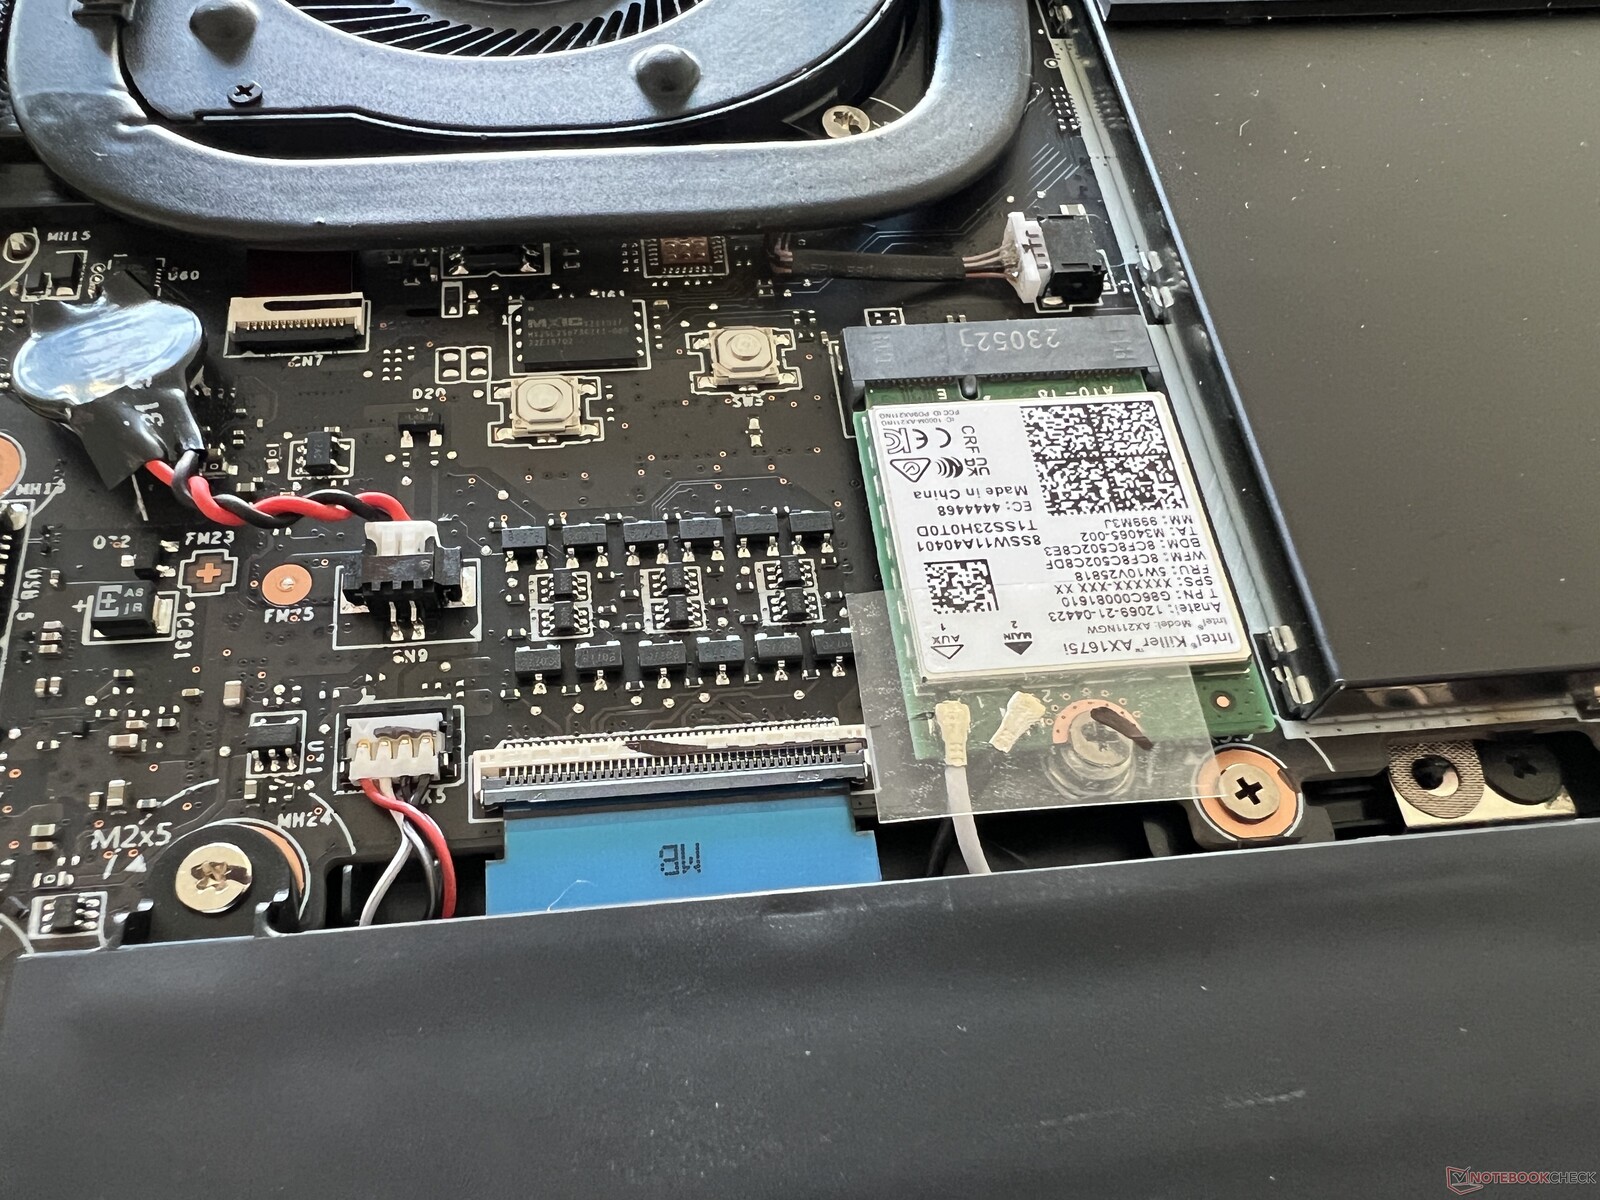
Laptop opiera się na Killer AX1675i jako module WLAN, który obsługuje również nowoczesne połączenia 6 GHz (Wi-Fi 6E). Korzystając z naszego referencyjnego routera od Asusa, zmierzyliśmy dobre (ale nie świetne) wyniki transferu. W codziennym użytkowaniu nie powinno to prowadzić do żadnych problemów, a w naszych testach nigdy nie mieliśmy żadnych problemów ze stabilnością sygnału.
| Networking | |
| MSI Stealth 14 Studio A13V | |
| iperf3 transmit AXE11000 | |
| iperf3 receive AXE11000 | |
| Gigabyte Aero 14 OLED BMF | |
| iperf3 transmit AXE11000 | |
| iperf3 receive AXE11000 | |
| iperf3 transmit AXE11000 6GHz | |
| iperf3 receive AXE11000 6GHz | |
| Schenker Vision 14 2022 RTX 3050 Ti | |
| iperf3 transmit AXE11000 | |
| iperf3 receive AXE11000 | |
| Asus ROG Flow Z13 GZ301ZE | |
| iperf3 transmit AX12 | |
| iperf3 receive AX12 | |
| Alienware x14 i7 RTX 3060 | |
| iperf3 transmit AX12 | |
| iperf3 receive AX12 | |
| Razer Blade 14 Ryzen 9 6900HX | |
| iperf3 transmit AX12 | |
| iperf3 receive AX12 | |
| Acer Predator Triton 300 SE | |
| iperf3 transmit AXE11000 6GHz | |
| iperf3 receive AXE11000 6GHz | |
Kamera internetowa
Nieco zaskakująca jest skromna kamera internetowa Stealth 14 Studio 720p, która ma trudności z zapewnieniem przyzwoitego obrazu nawet w dobrych warunkach oświetleniowych. Dodatkowo zainstalowano moduł podczerwieni - rozpoznawanie twarzy jest obsługiwane przez Windows Hello.


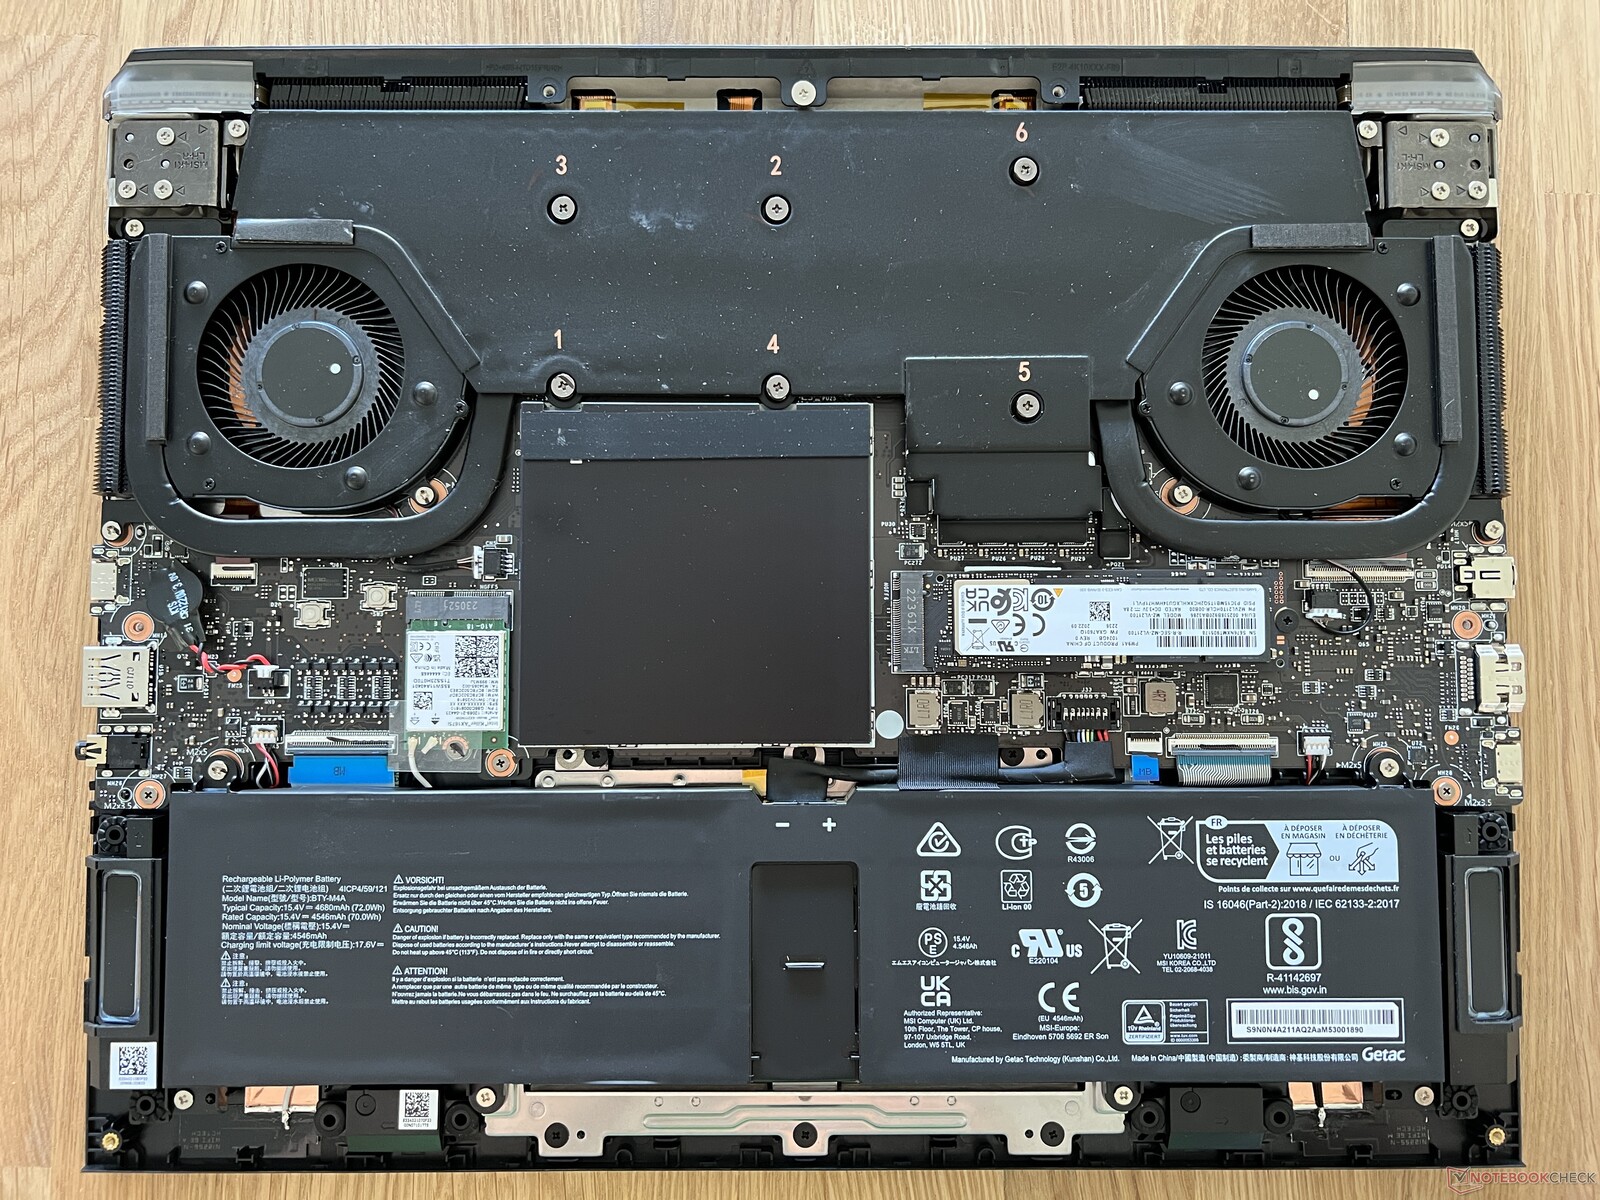
Konserwacja
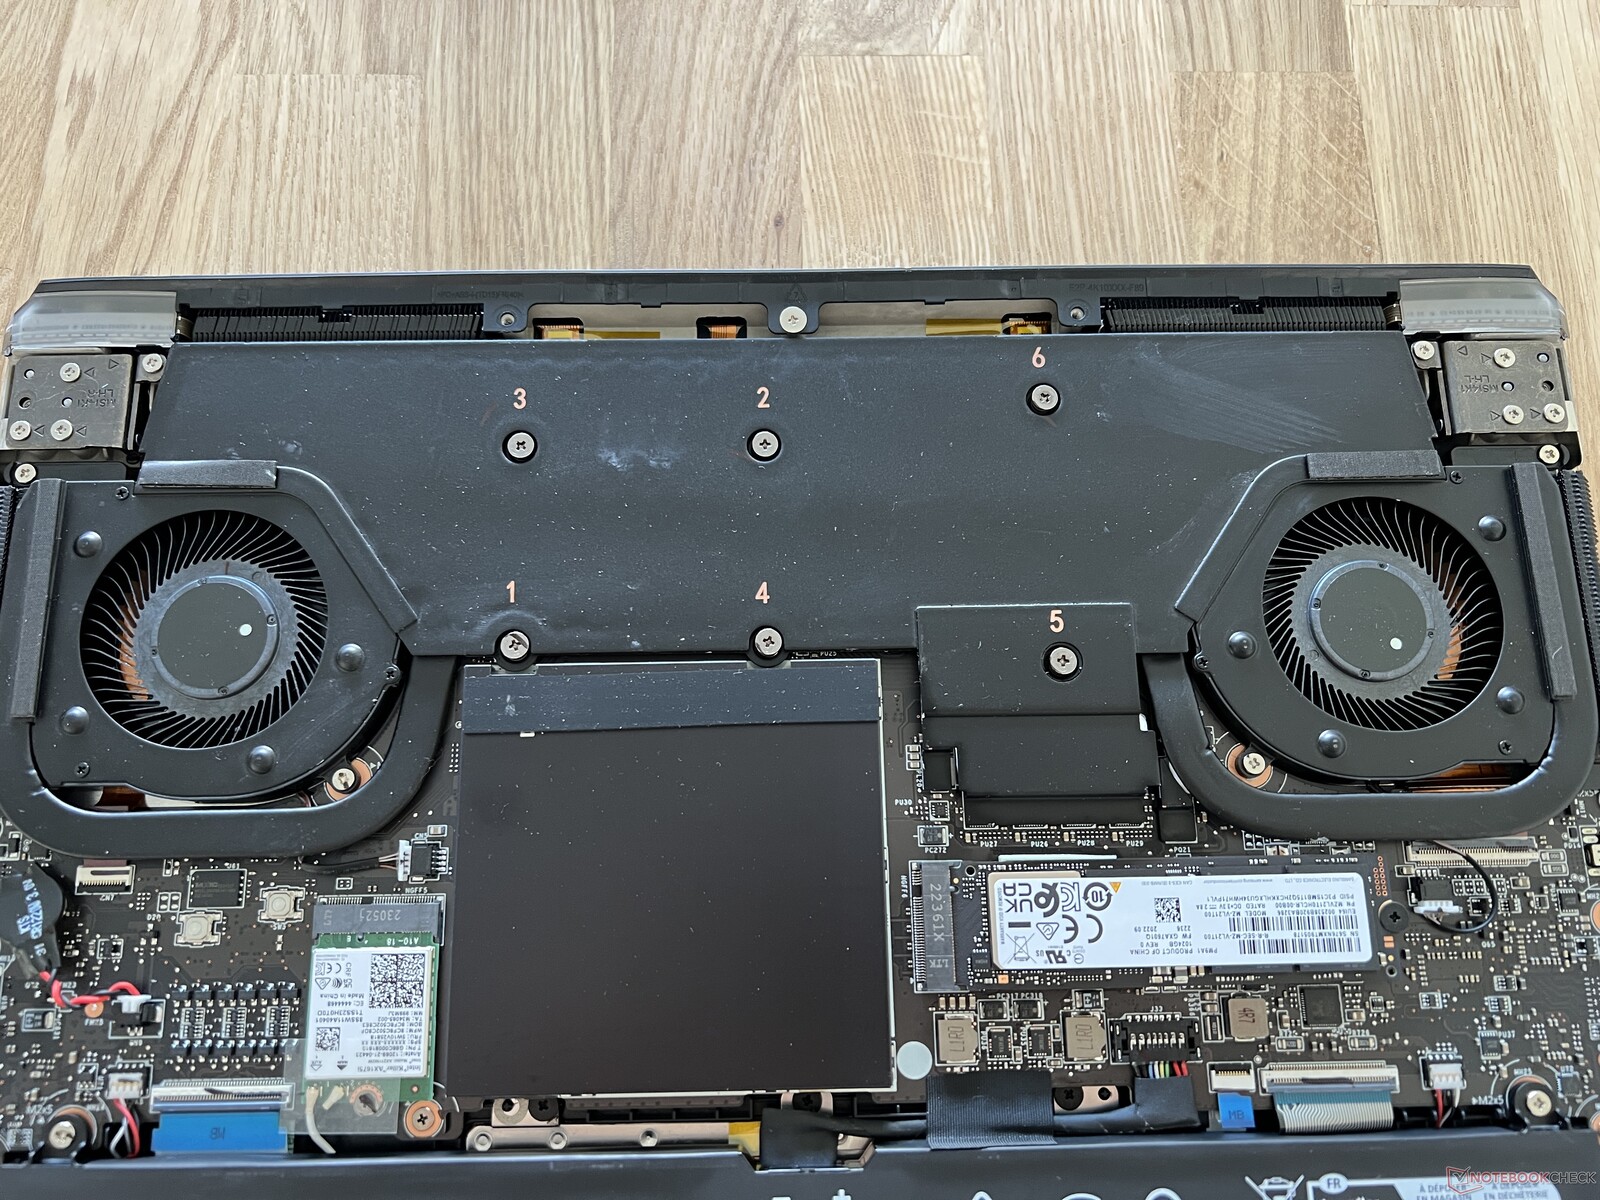
Aby dostać się do podzespołów laptopa, należy rozebrać całą dolną część obudowy. Jedna ze śrub krzyżakowych jest zakryta plombą, przynajmniej w Niemczech (gdzie przeprowadzamy ten test), odpowiednie jej użycie nie powinno wpłynąć na gwarancję. Wewnątrz można wyczyścić wentylatory i wymienić moduł WLAN oraz dysk SSD M.2 2280. Teoretycznie można również wymienić moduł pamięci RAM, jednak dodatkowa pokrywa była przymocowana tak mocno, że nie byliśmy w stanie jej zdjąć (a nie chcieliśmy uszkodzić naszego sampla testowego). Prawdopodobnie istnieje dodatkowa podkładka klejąca, która utrzymuje ją na miejscu, co dodatkowo utrudnia użytkownikowi jej wyjęcie.
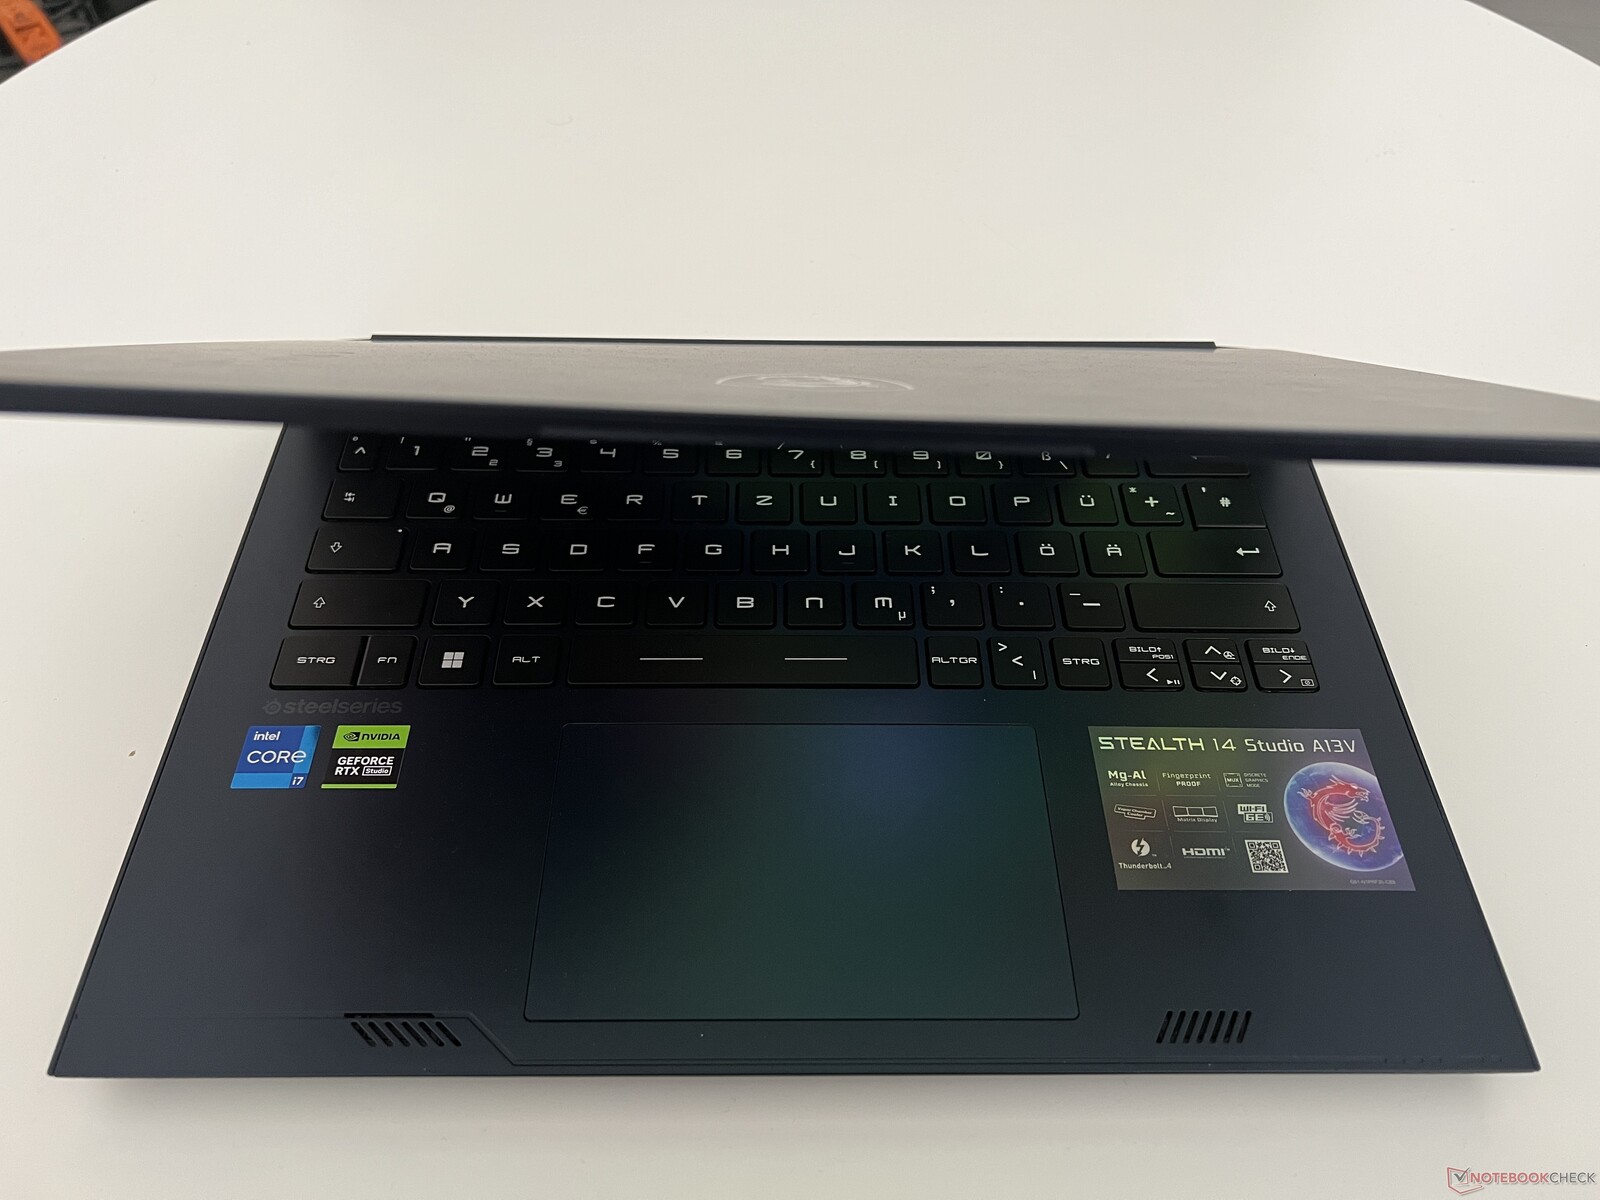
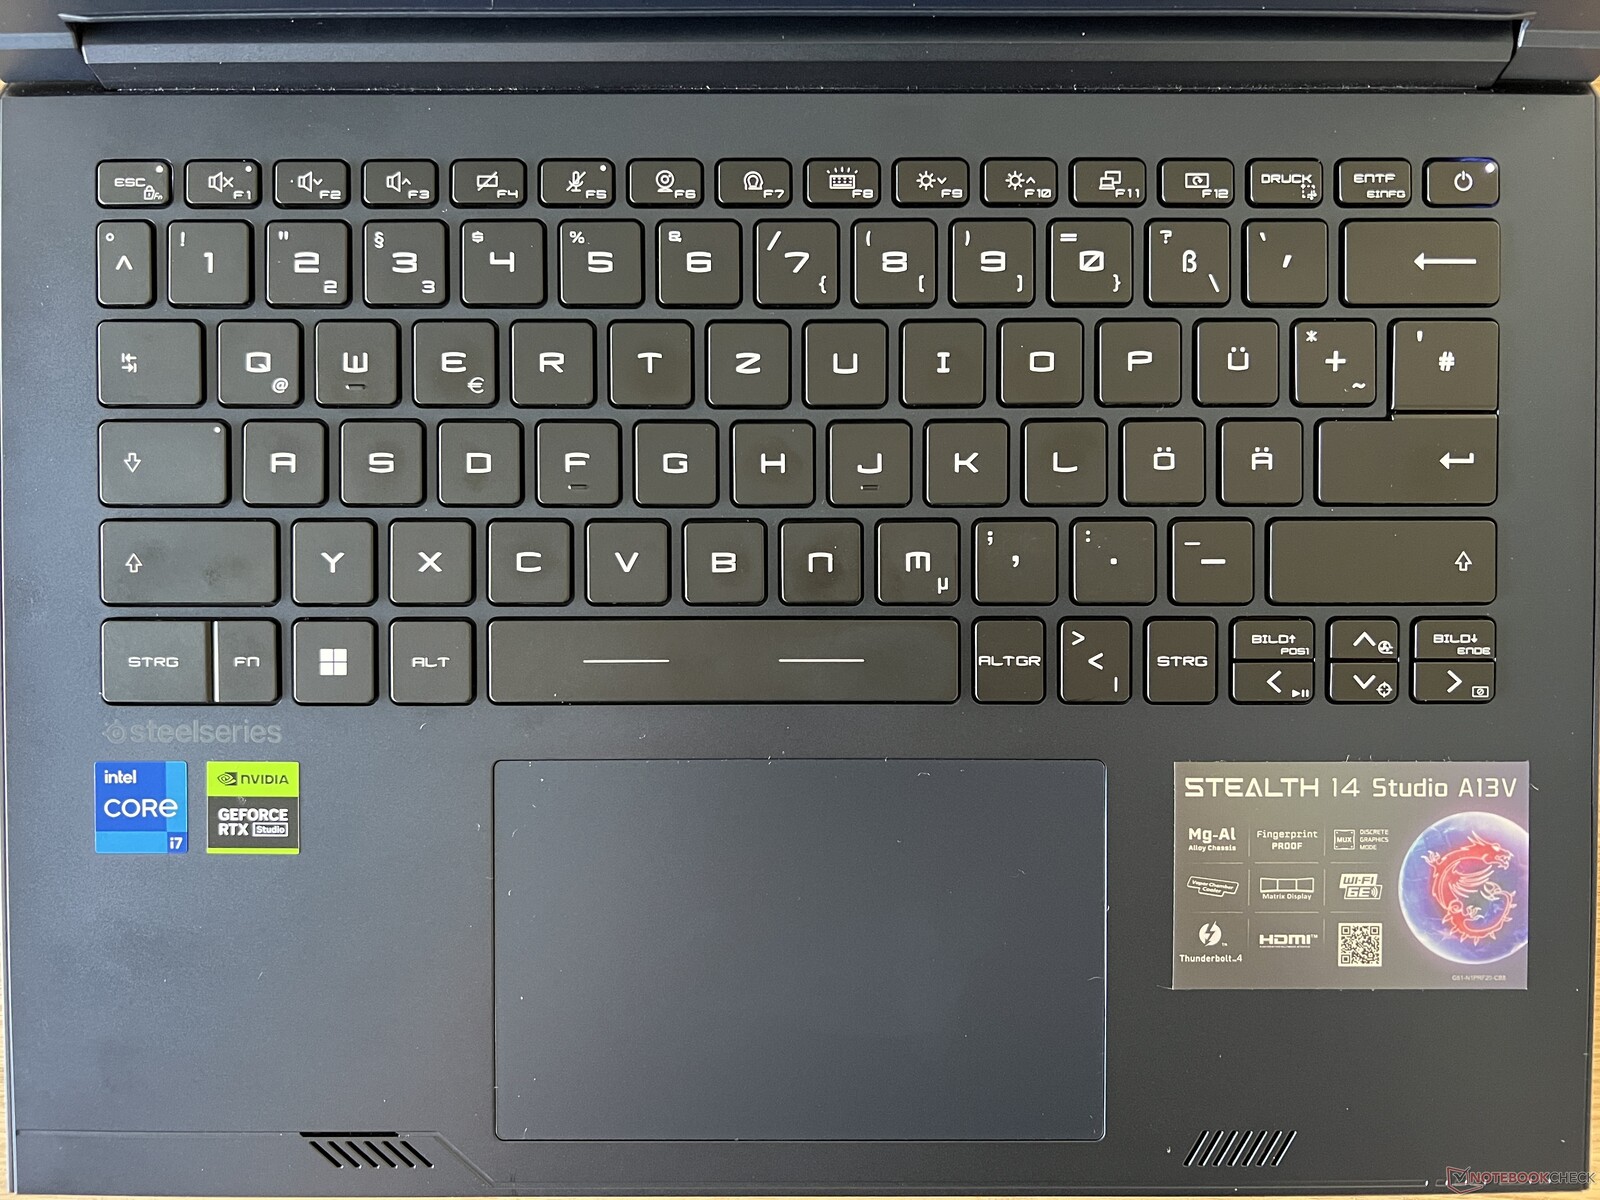
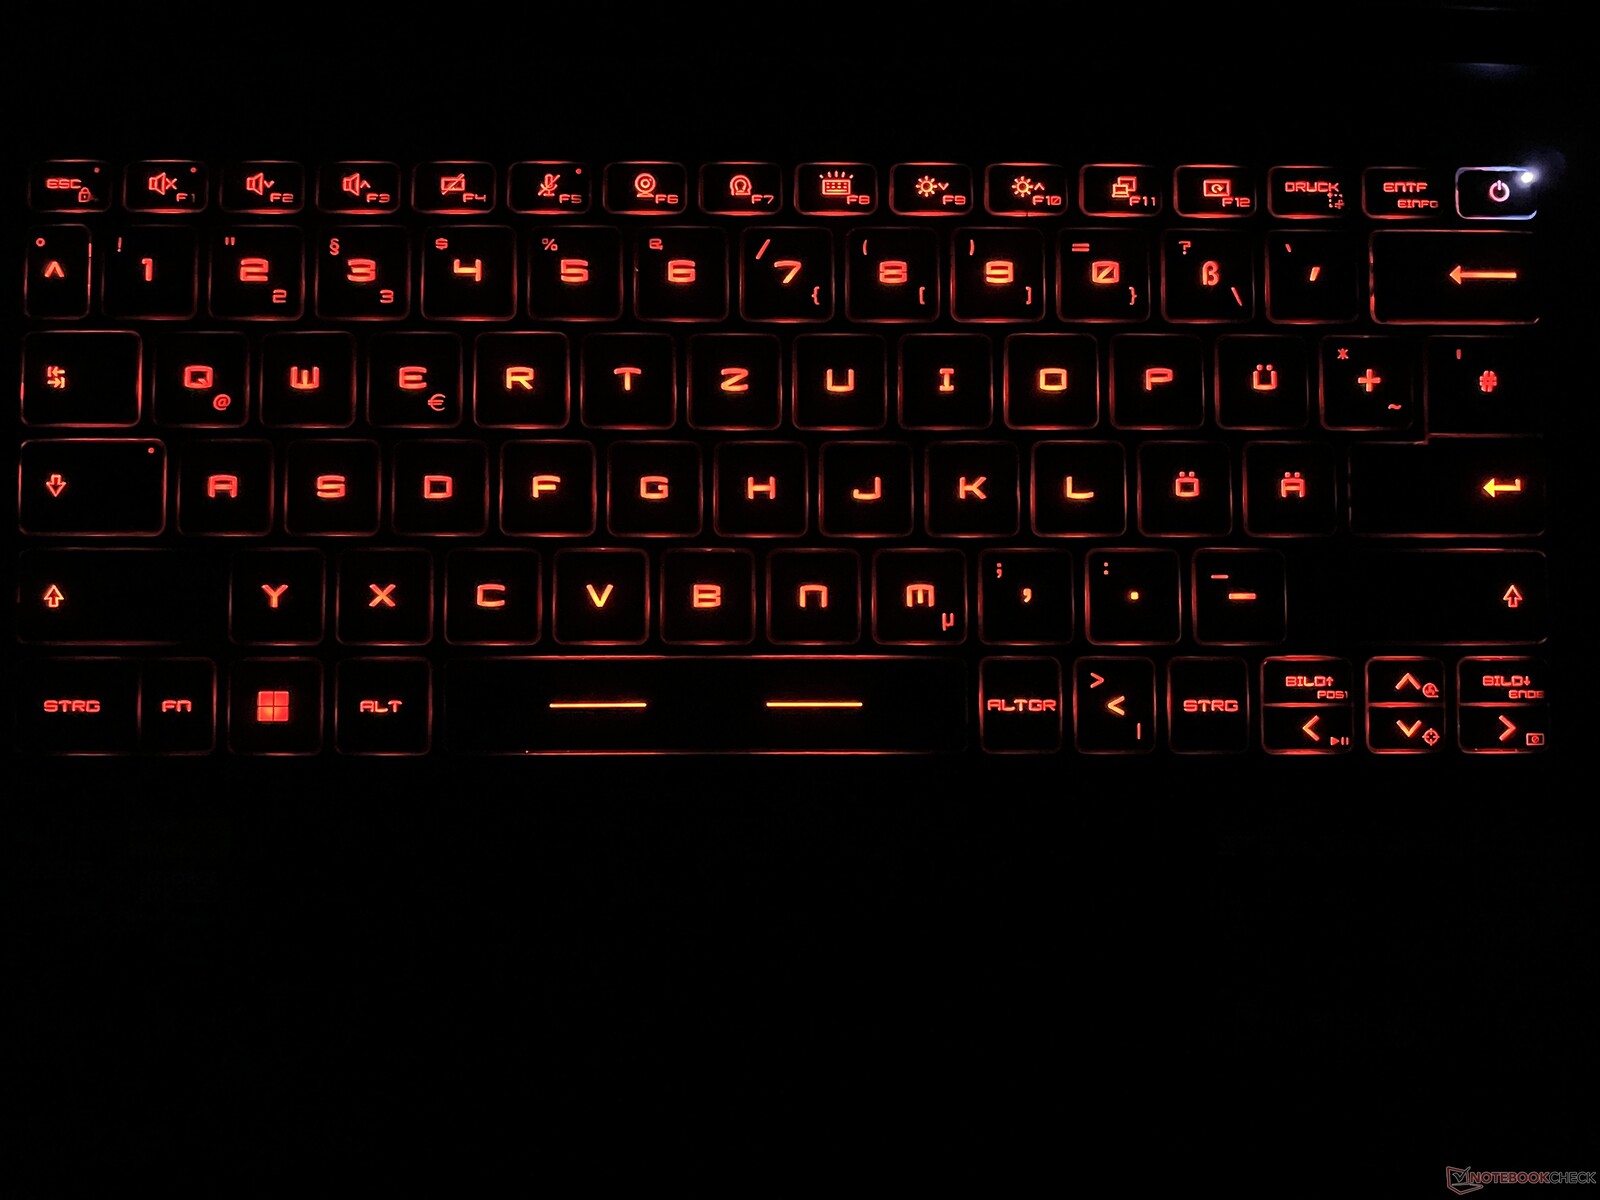
Urządzenia wejściowe - klawiatura z indywidualnie podświetlanymi klawiszami
Klawiaturę można zaliczyć do wad Stealth 14 Studio, ponieważ jej skok klawiszy jest bardzo płytki, a klawisze są dość chwiejne. Mimo to stukanie w klawisze jest dość precyzyjne i nie odnotowaliśmy żadnych fałszywych wejść. Musisz tylko przyzwyczaić się do jego układu, ponieważ ma on jednowierszowy klawisz Enter, a klawisz "|<>" znajduje się w nieco nietypowym miejscu. Cztery klawisze strzałek są również dość małe, ale przynajmniej są wyznaczone klawisze "obraz w górę" i "obraz w dół". Podświetlenie każdego klawisza można regulować za pomocą oprogramowania Steelseries, ale nie jest to zbyt intuicyjne.
Gładki clickpad (12 x 7,5 cm) działa dobrze w codziennym użytkowaniu, ale zalecamy po prostu stukanie go w celu wprowadzania poleceń. Jeśli faktycznie naciśniesz dolną część podkładki, spowoduje to bardzo głośny i tandetnie brzmiący odgłos kliknięcia.
Wyświetlacz - szybki panel 240 Hz
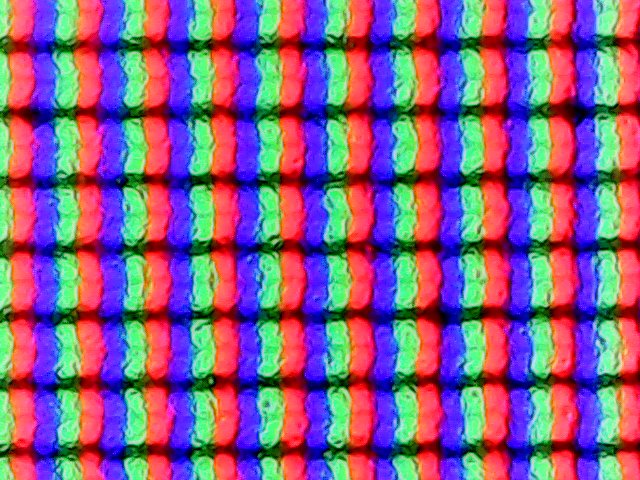
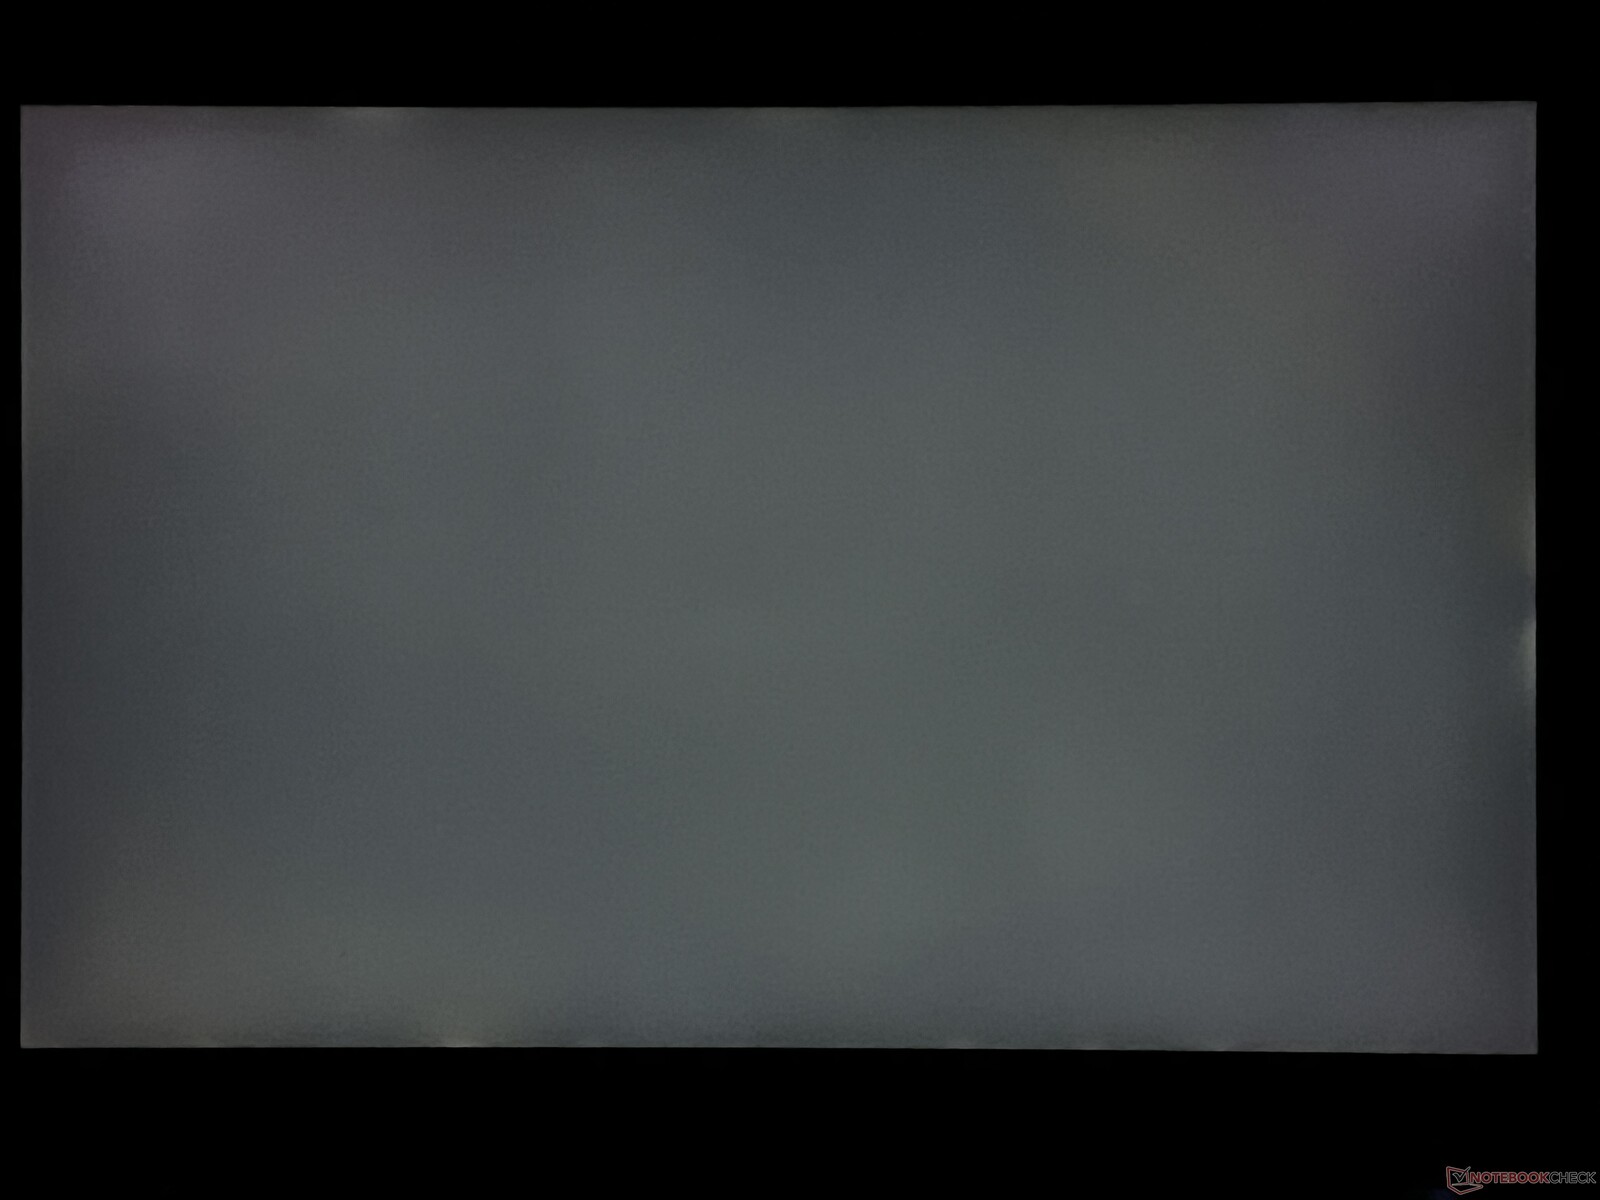
MSI postawiło na 14-calowy panel IPS o rozdzielczości 2560 x 1600 pikseli. Jego główną zaletą jest częstotliwość odświeżania 240 Hz, a także szybki czas reakcji - choć subiektywnie nie byliśmy pod wrażeniem jakości obrazu. Poziomy ostrości są dobre, ale ciemne obszary zawsze wyglądają trochę tak, jakby wisiała nad nimi szara zasłona.
Odpowiada za to wysoka wartość czerni ekranu wynosząca 0,43 cd/m², co - nawet w połączeniu z przyzwoitą jasnością około 400 cd/m² - prowadzi do miernego współczynnika kontrastu poniżej 1000:1. Wyświetlacz nie jest w żadnym wypadku zły, ale zwłaszcza w czasach Mini LED i OLED zainstalowany panel pozostawia wiele do życzenia w subiektywnym odczuciu. Znikanie podświetlenia nie wydaje się być zbyt dużym problemem i nie odnotowaliśmy żadnego migotania PWM.
| |||||||||||||||||||||||||
rozświetlenie: 89 %
na akumulatorze: 422 cd/m²
kontrast: 974:1 (czerń: 0.43 cd/m²)
ΔE ColorChecker Calman: 2.3 | ∀{0.5-29.43 Ø4.73}
calibrated: 0.9
ΔE Greyscale Calman: 3.3 | ∀{0.09-98 Ø4.97}
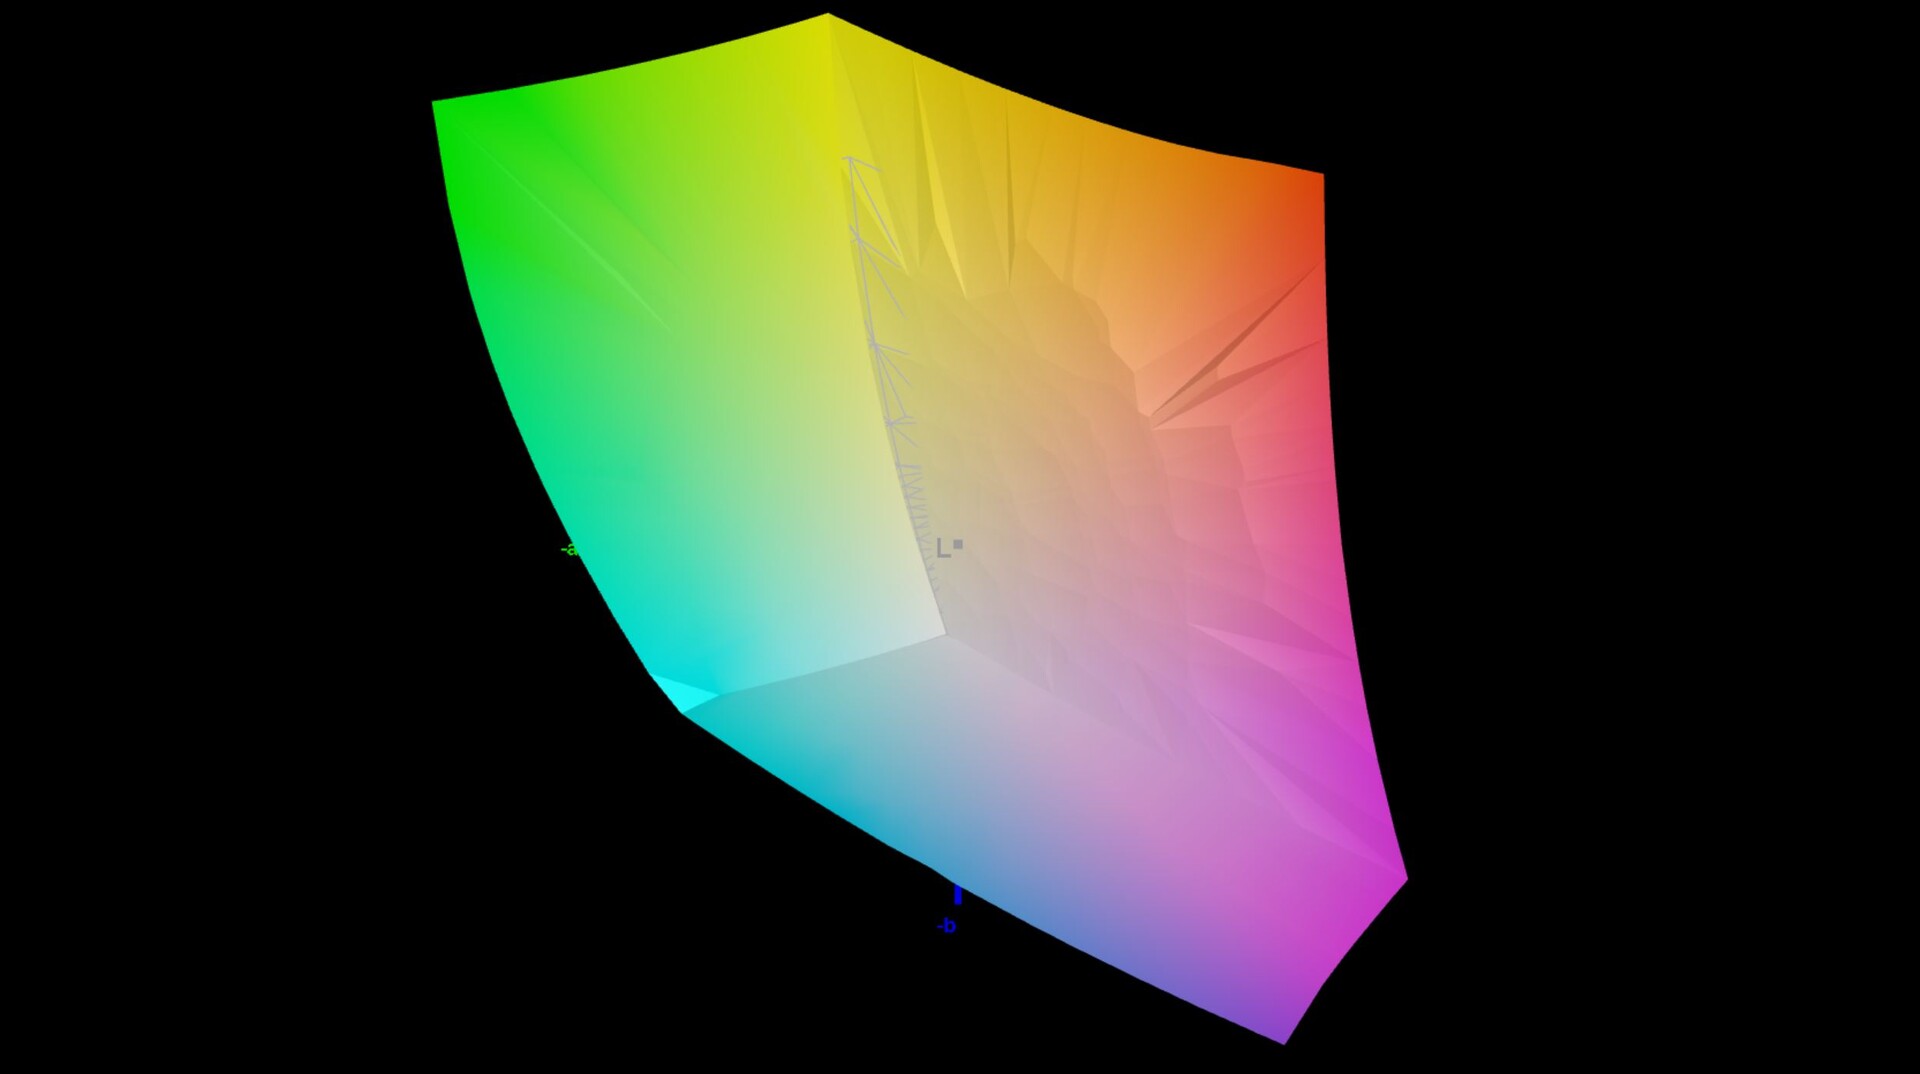
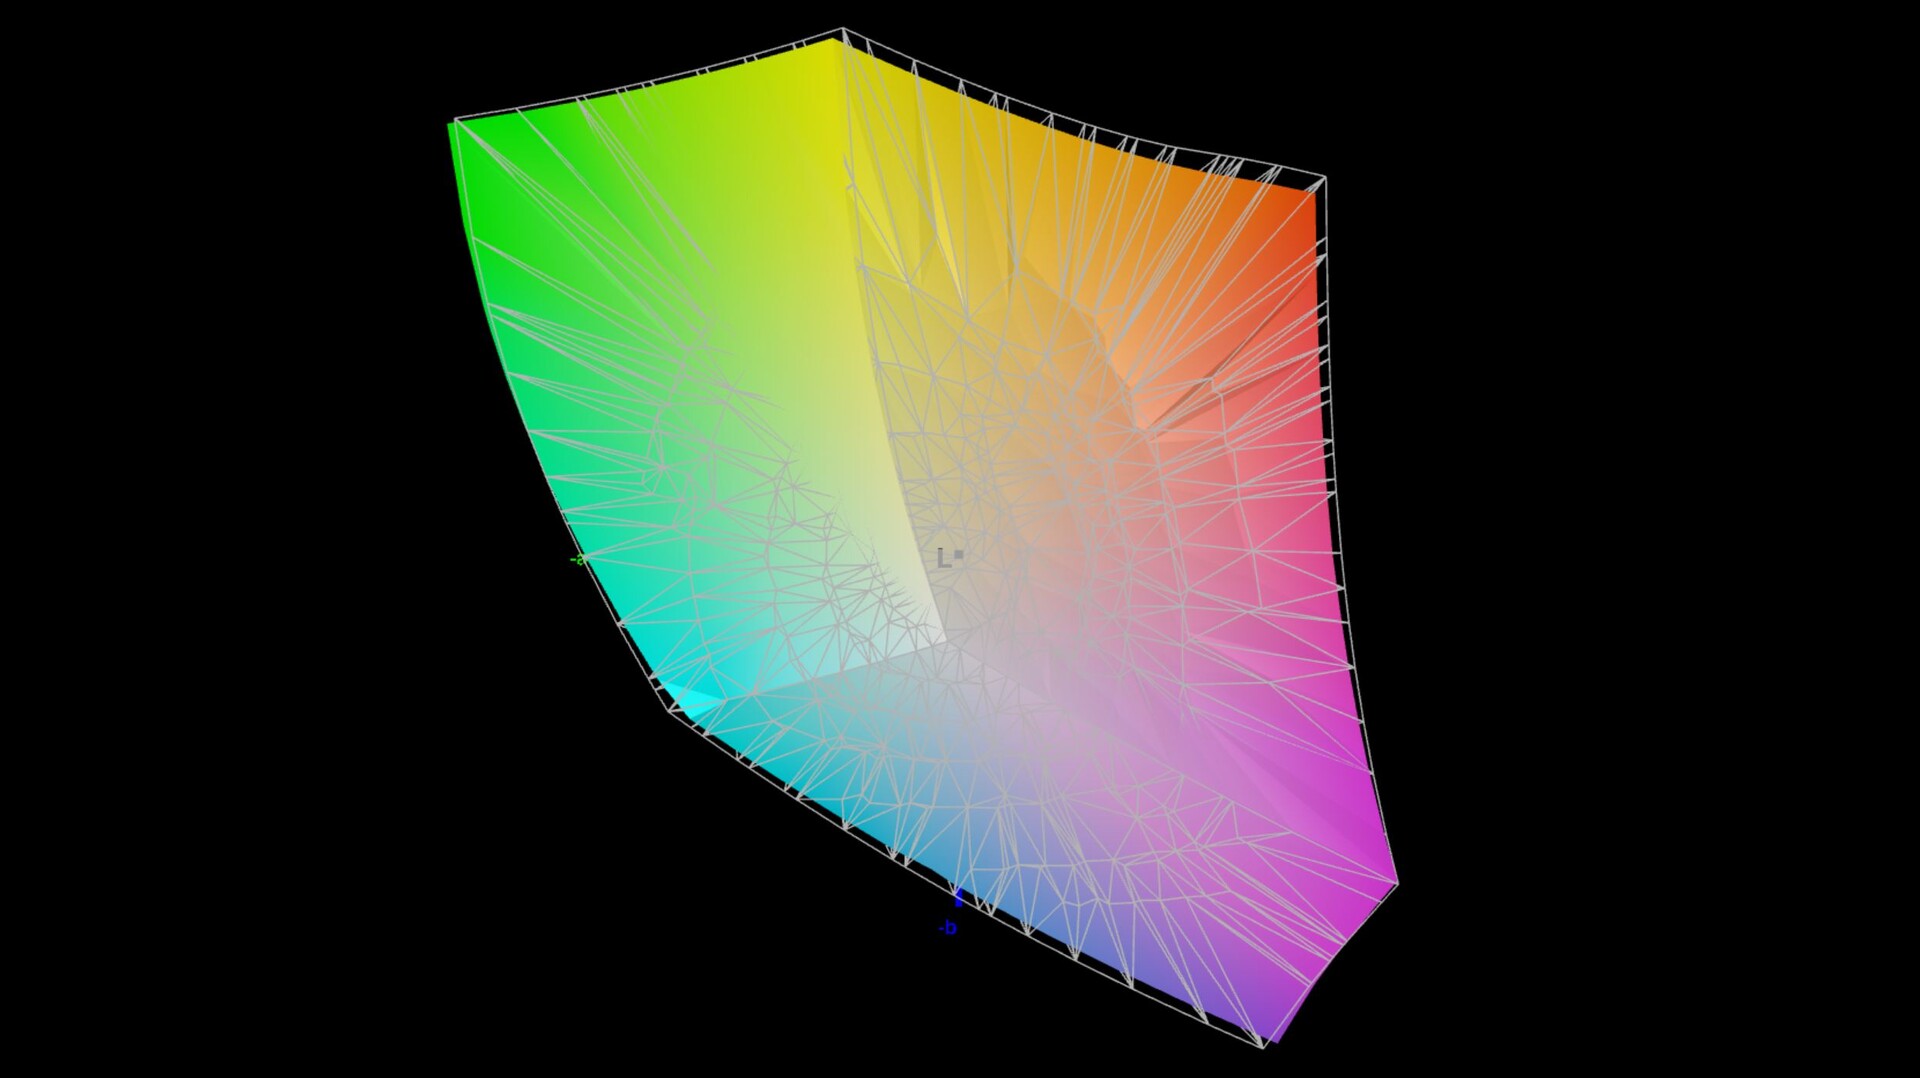
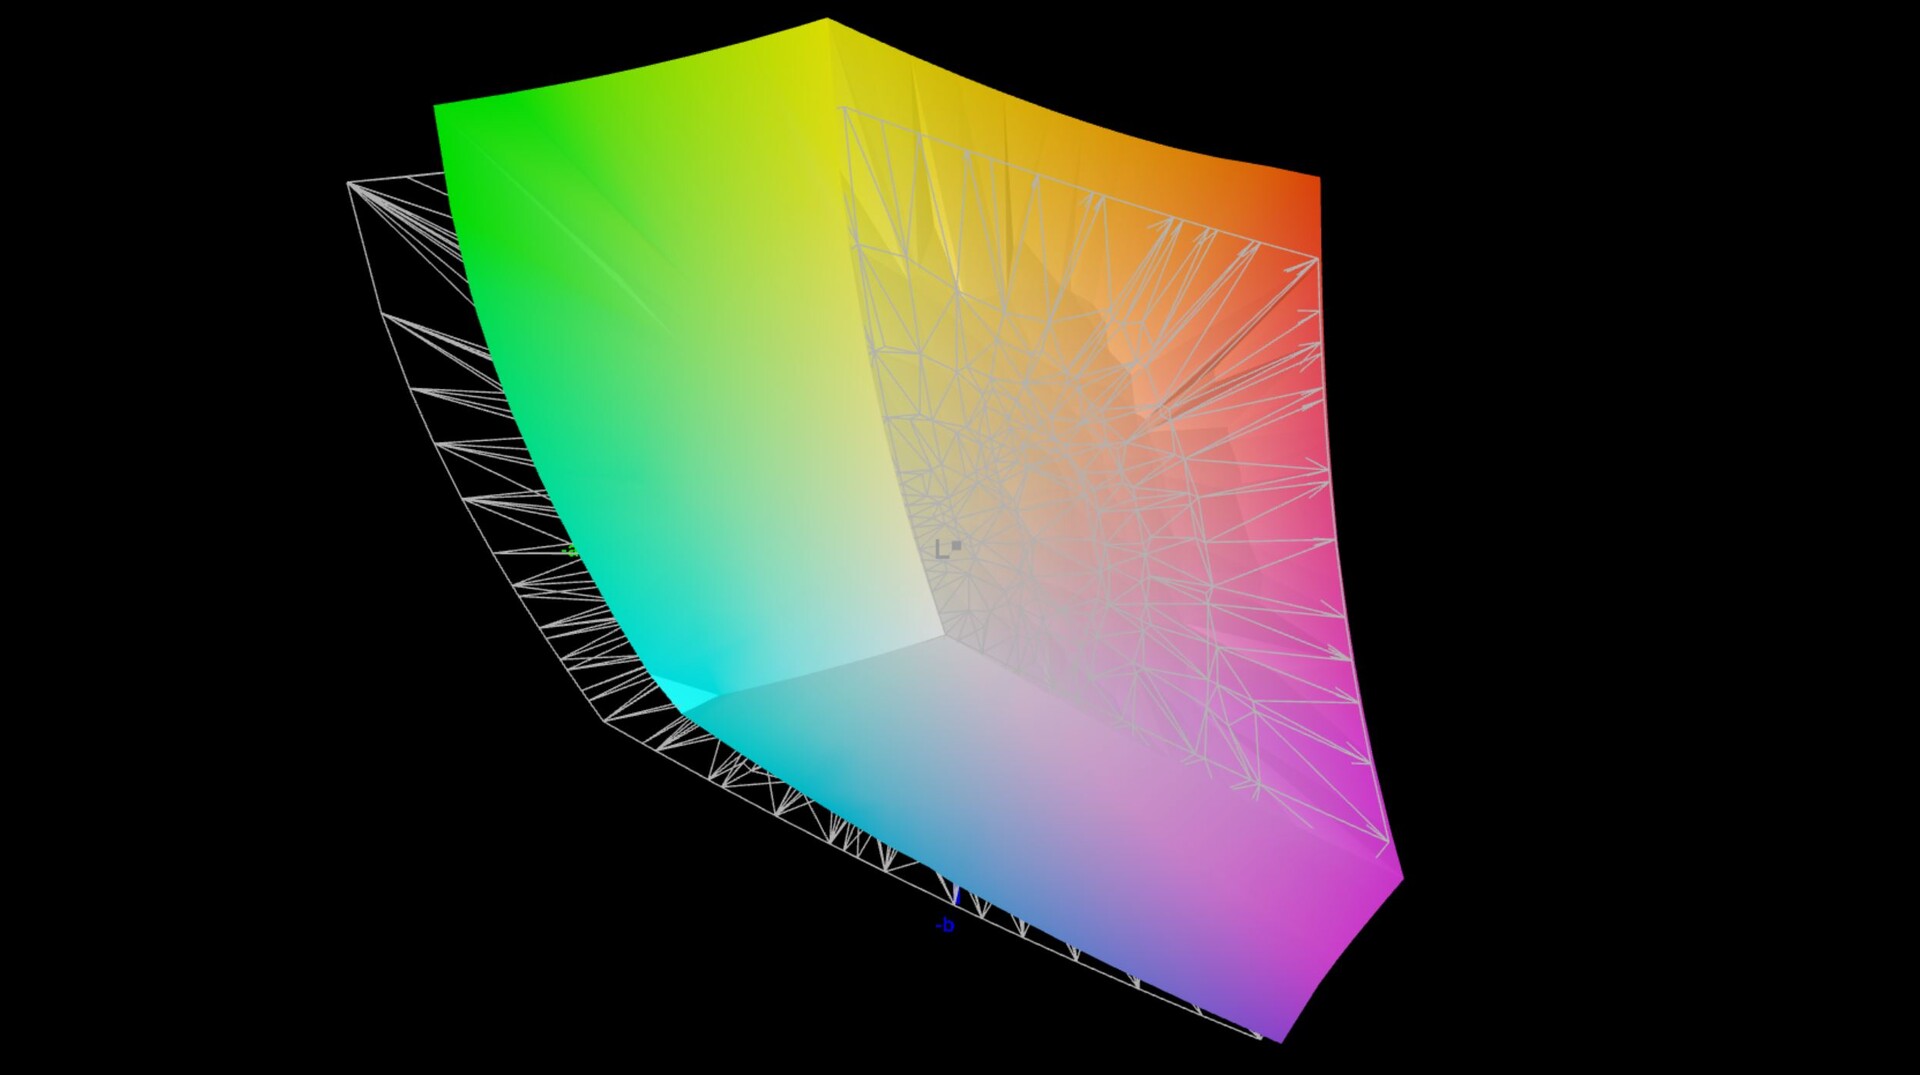
85.3% AdobeRGB 1998 (Argyll 3D)
99.6% sRGB (Argyll 3D)
96.2% Display P3 (Argyll 3D)
Gamma: 2.14
CCT: 6550 K
| MSI Stealth 14 Studio A13V B140QAN06.T, IPS, 2560x1600, 14" | Gigabyte Aero 14 OLED BMF Samsung SDC4192 (ATNA40YK14-0), OLED, 2880x1800, 14" | Schenker Vision 14 2022 RTX 3050 Ti MNE007ZA1-1, IPS, 2880x1800, 14" | Asus ROG Flow Z13 GZ301ZE LQ134N1JW54, IPS, 1920x1200, 13.4" | Alienware x14 i7 RTX 3060 SHP154D, IPS, 1920x1080, 14" | Razer Blade 14 Ryzen 9 6900HX TL140BDXP02-0, IPS, 2560x1440, 14" | Acer Predator Triton 300 SE Samsung ATNA40YK07-0, OLED, 2880x1800, 14" | |
|---|---|---|---|---|---|---|---|
| Display | 3% | -12% | -17% | 2% | 0% | 7% | |
| Display P3 Coverage (%) | 96.2 | 99.8 4% | 74.1 -23% | 67.5 -30% | 99.6 4% | 97.2 1% | 99.9 4% |
| sRGB Coverage (%) | 99.6 | 100 0% | 97.4 -2% | 97.1 -3% | 100 0% | 99.9 0% | 100 0% |
| AdobeRGB 1998 Coverage (%) | 85.3 | 88.7 4% | 75.3 -12% | 69.3 -19% | 87.6 3% | 85.7 0% | 99 16% |
| Response Times | 58% | -312% | -452% | -53% | -184% | 76% | |
| Response Time Grey 50% / Grey 80% * (ms) | 5.5 ? | 2.4 ? 56% | 31.5 ? -473% | 44 ? -700% | 9.6 ? -75% | 16.8 ? -205% | 1.36 ? 75% |
| Response Time Black / White * (ms) | 5.8 ? | 2.4 ? 59% | 14.5 ? -150% | 17.6 ? -203% | 7.6 ? -31% | 15.2 ? -162% | 1.36 ? 77% |
| PWM Frequency (Hz) | 300 | 367.6 ? | |||||
| Screen | 71% | -11% | 18% | 5% | 11% | -13% | |
| Brightness middle (cd/m²) | 419 | 423 1% | 421 0% | 515 23% | 434 4% | 354 -16% | 414.3 -1% |
| Brightness (cd/m²) | 402 | 427 6% | 416 3% | 476 18% | 411 2% | 328 -18% | 416 3% |
| Brightness Distribution (%) | 89 | 98 10% | 89 0% | 87 -2% | 89 0% | 86 -3% | 99 11% |
| Black Level * (cd/m²) | 0.43 | 0.1 77% | 0.28 35% | 0.35 19% | 0.25 42% | 0.37 14% | |
| Contrast (:1) | 974 | 4230 334% | 1504 54% | 1471 51% | 1736 78% | 957 -2% | |
| Colorchecker dE 2000 * | 2.3 | 0.55 76% | 3.2 -39% | 1.6 30% | 3 -30% | 1.66 28% | 4.68 -103% |
| Colorchecker dE 2000 max. * | 5.8 | 1.15 80% | 5.5 5% | 4 31% | 7.1 -22% | 3.83 34% | 7.78 -34% |
| Colorchecker dE 2000 calibrated * | 0.9 | 1.15 -28% | 2 -122% | 1.2 -33% | 0.7 22% | ||
| Greyscale dE 2000 * | 3.3 | 0.69 79% | 4.4 -33% | 2.5 24% | 5.1 -55% | 1.6 52% | 1.8 45% |
| Gamma | 2.14 103% | 2.42 91% | 2.22 99% | 2.2 100% | 2.19 100% | 2.23 99% | 2.22 99% |
| CCT | 6550 99% | 6479 100% | 6384 102% | 6939 94% | 6204 105% | 6542 99% | 6207 105% |
| Całkowita średnia (program / ustawienia) | 44% /
54% | -112% /
-54% | -150% /
-57% | -15% /
-4% | -58% /
-21% | 23% /
8% |
* ... im mniej tym lepiej
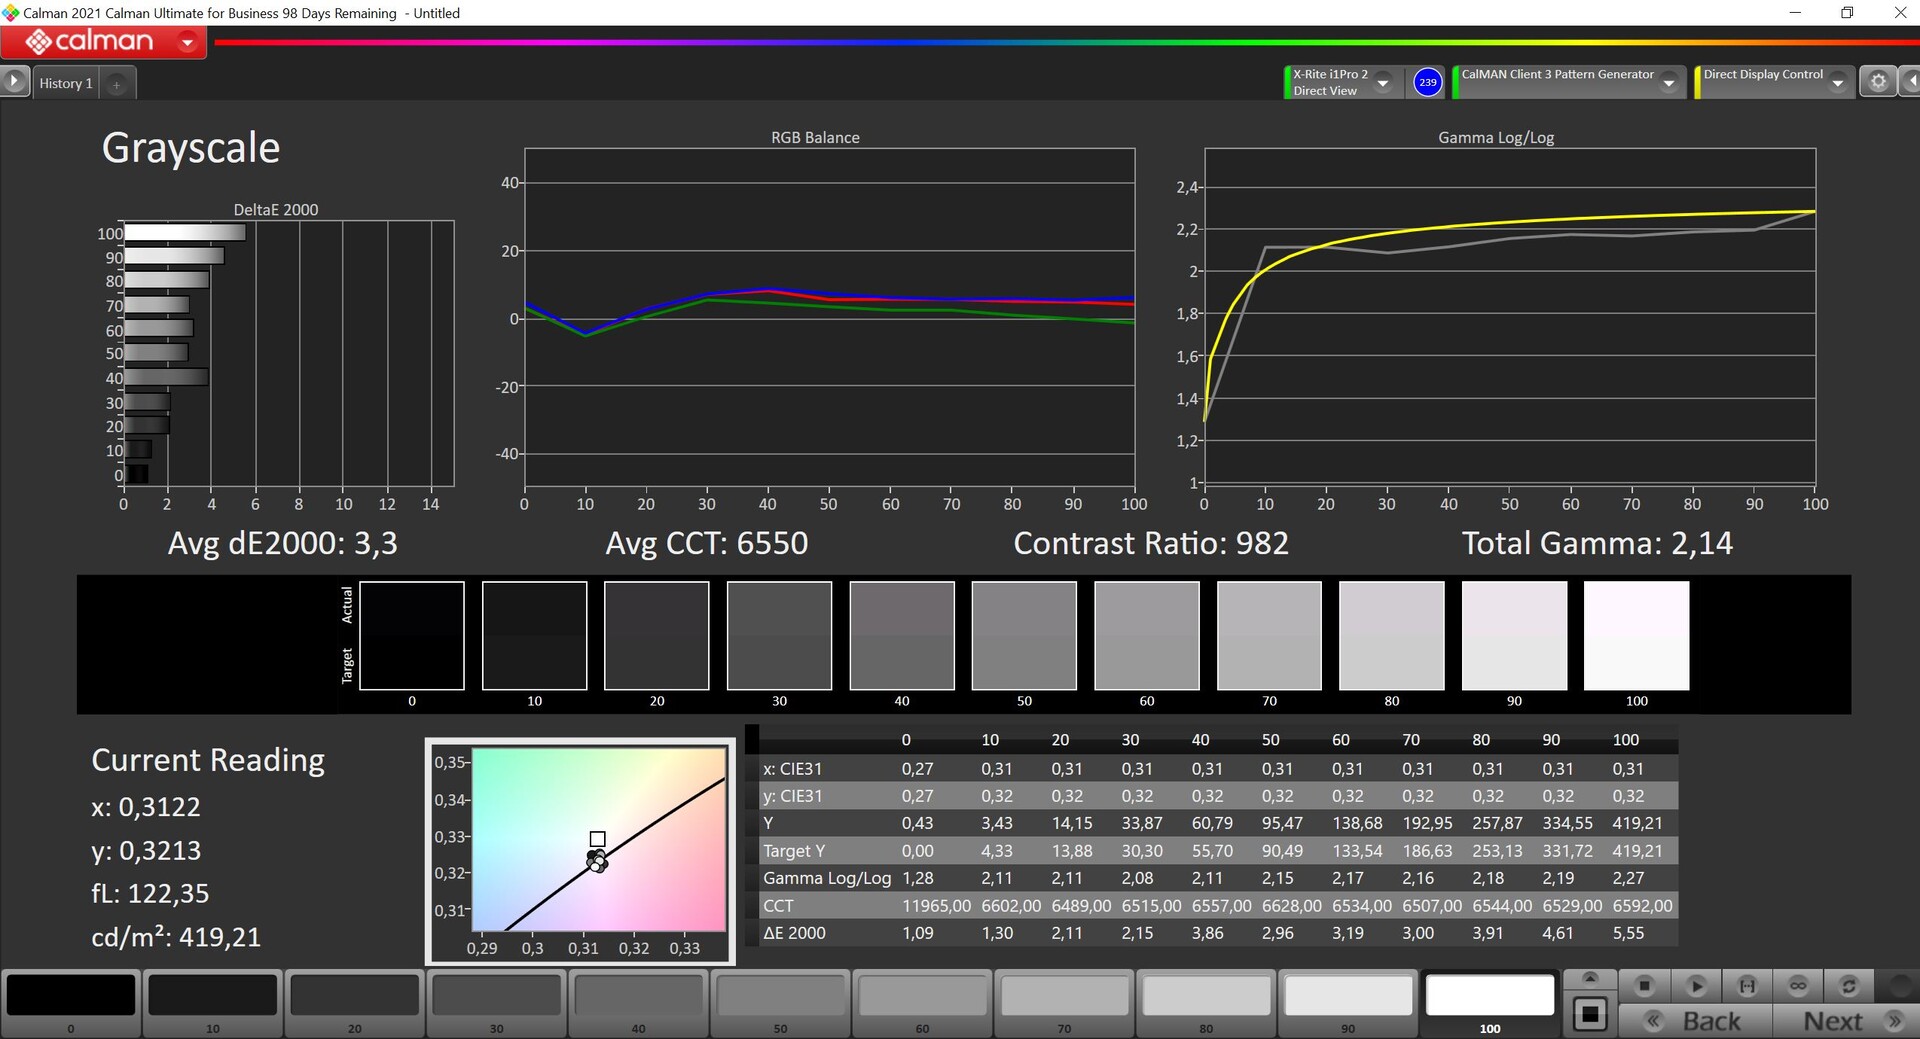
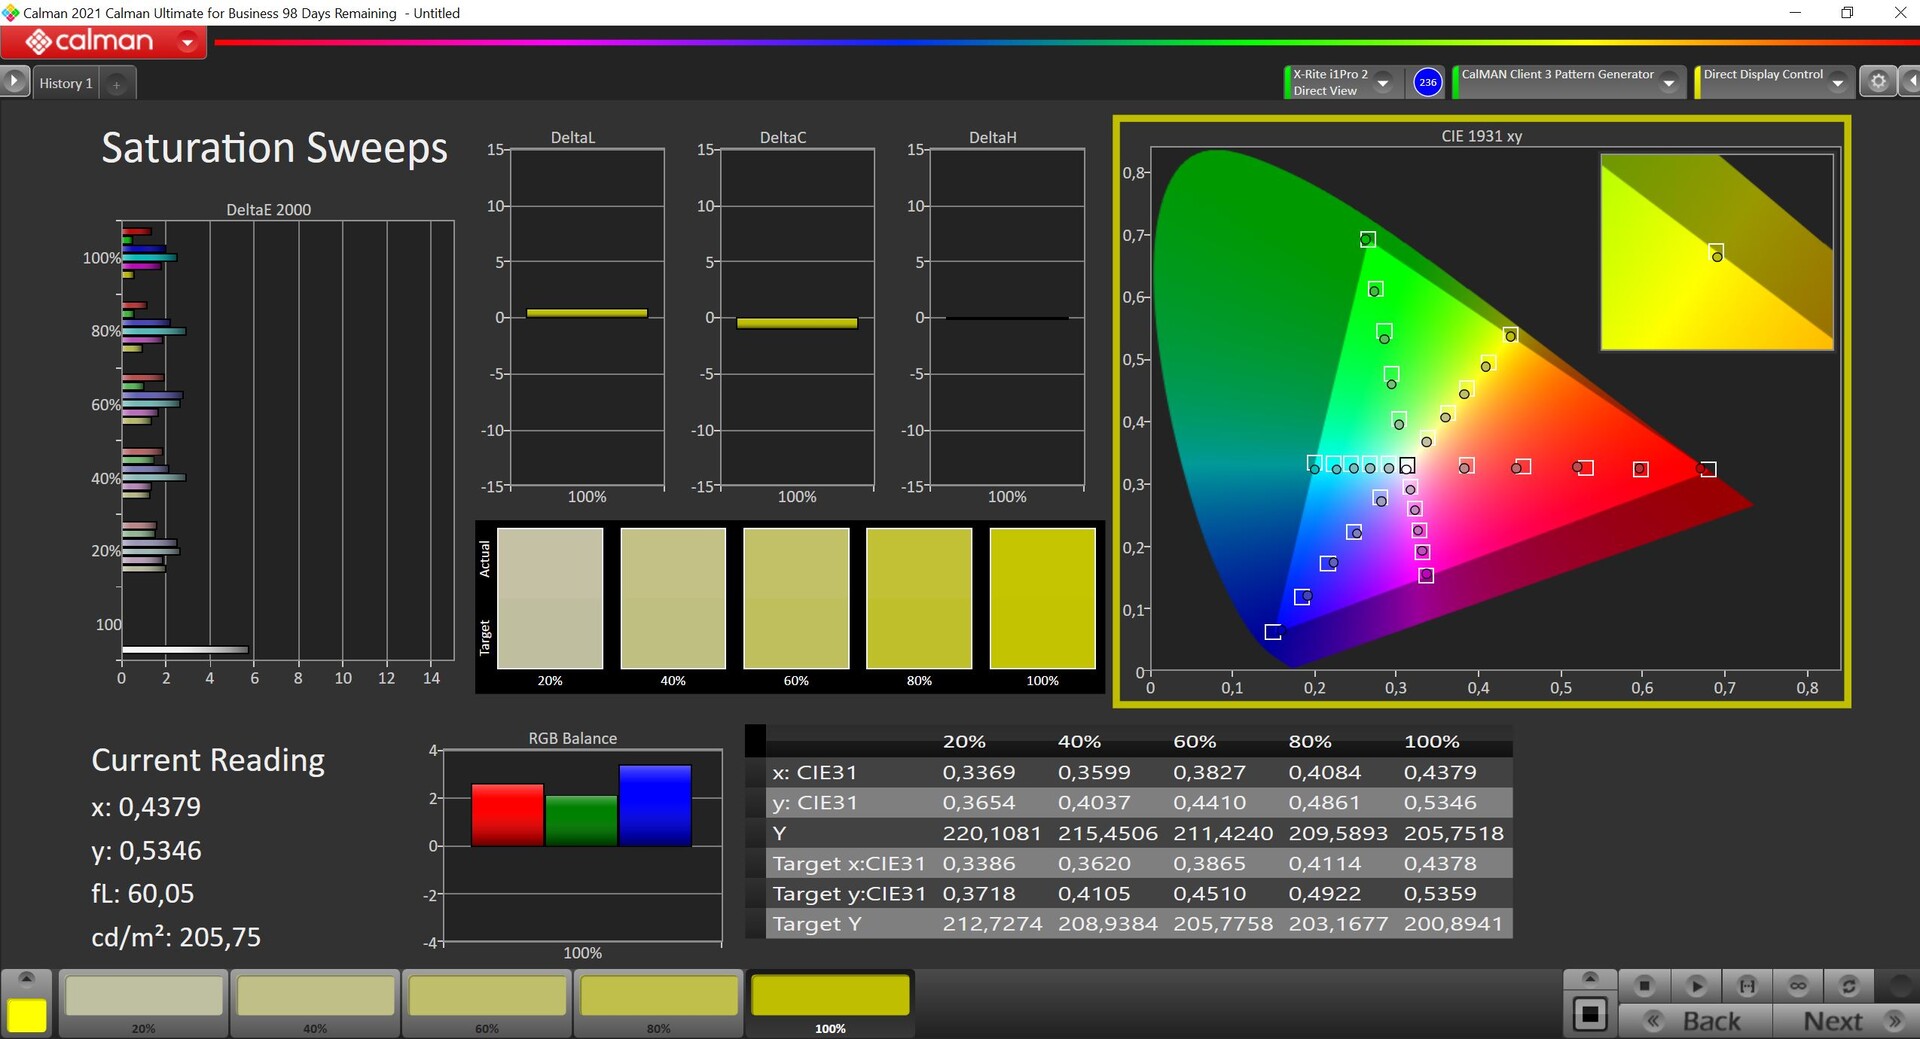
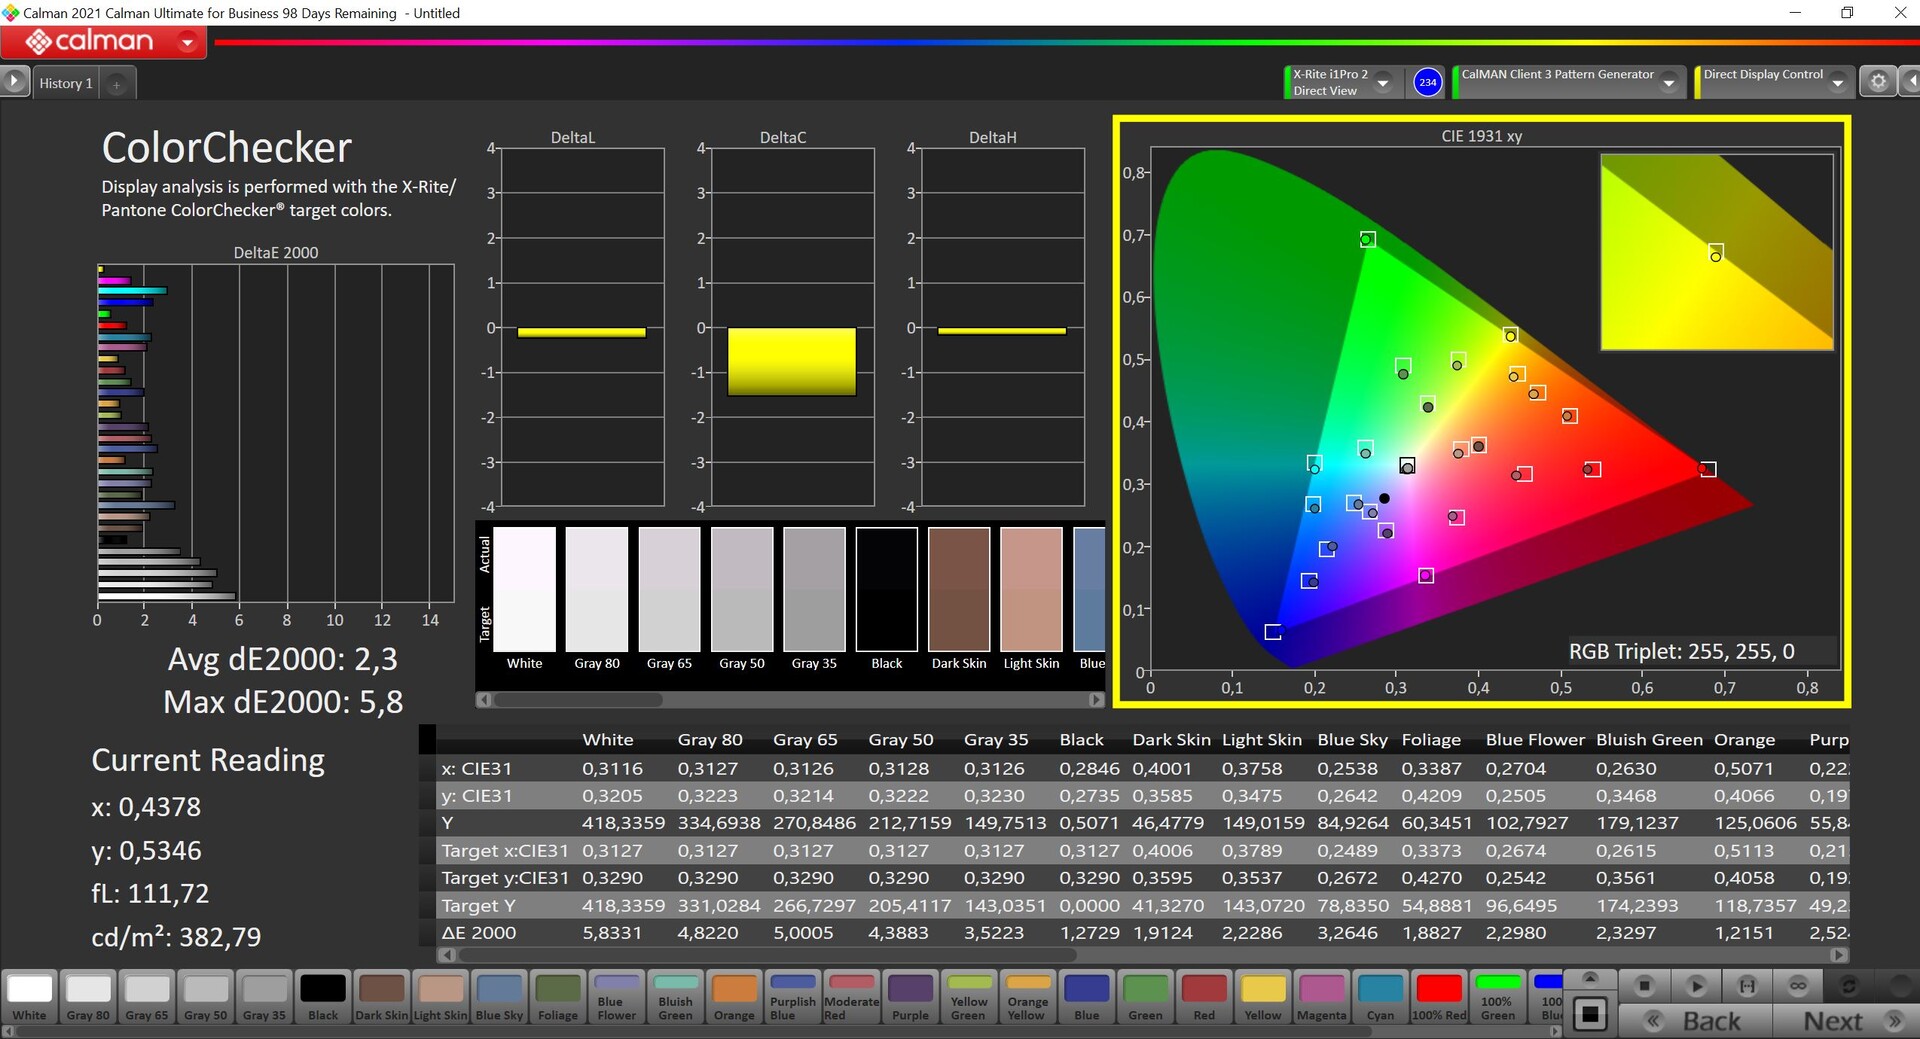
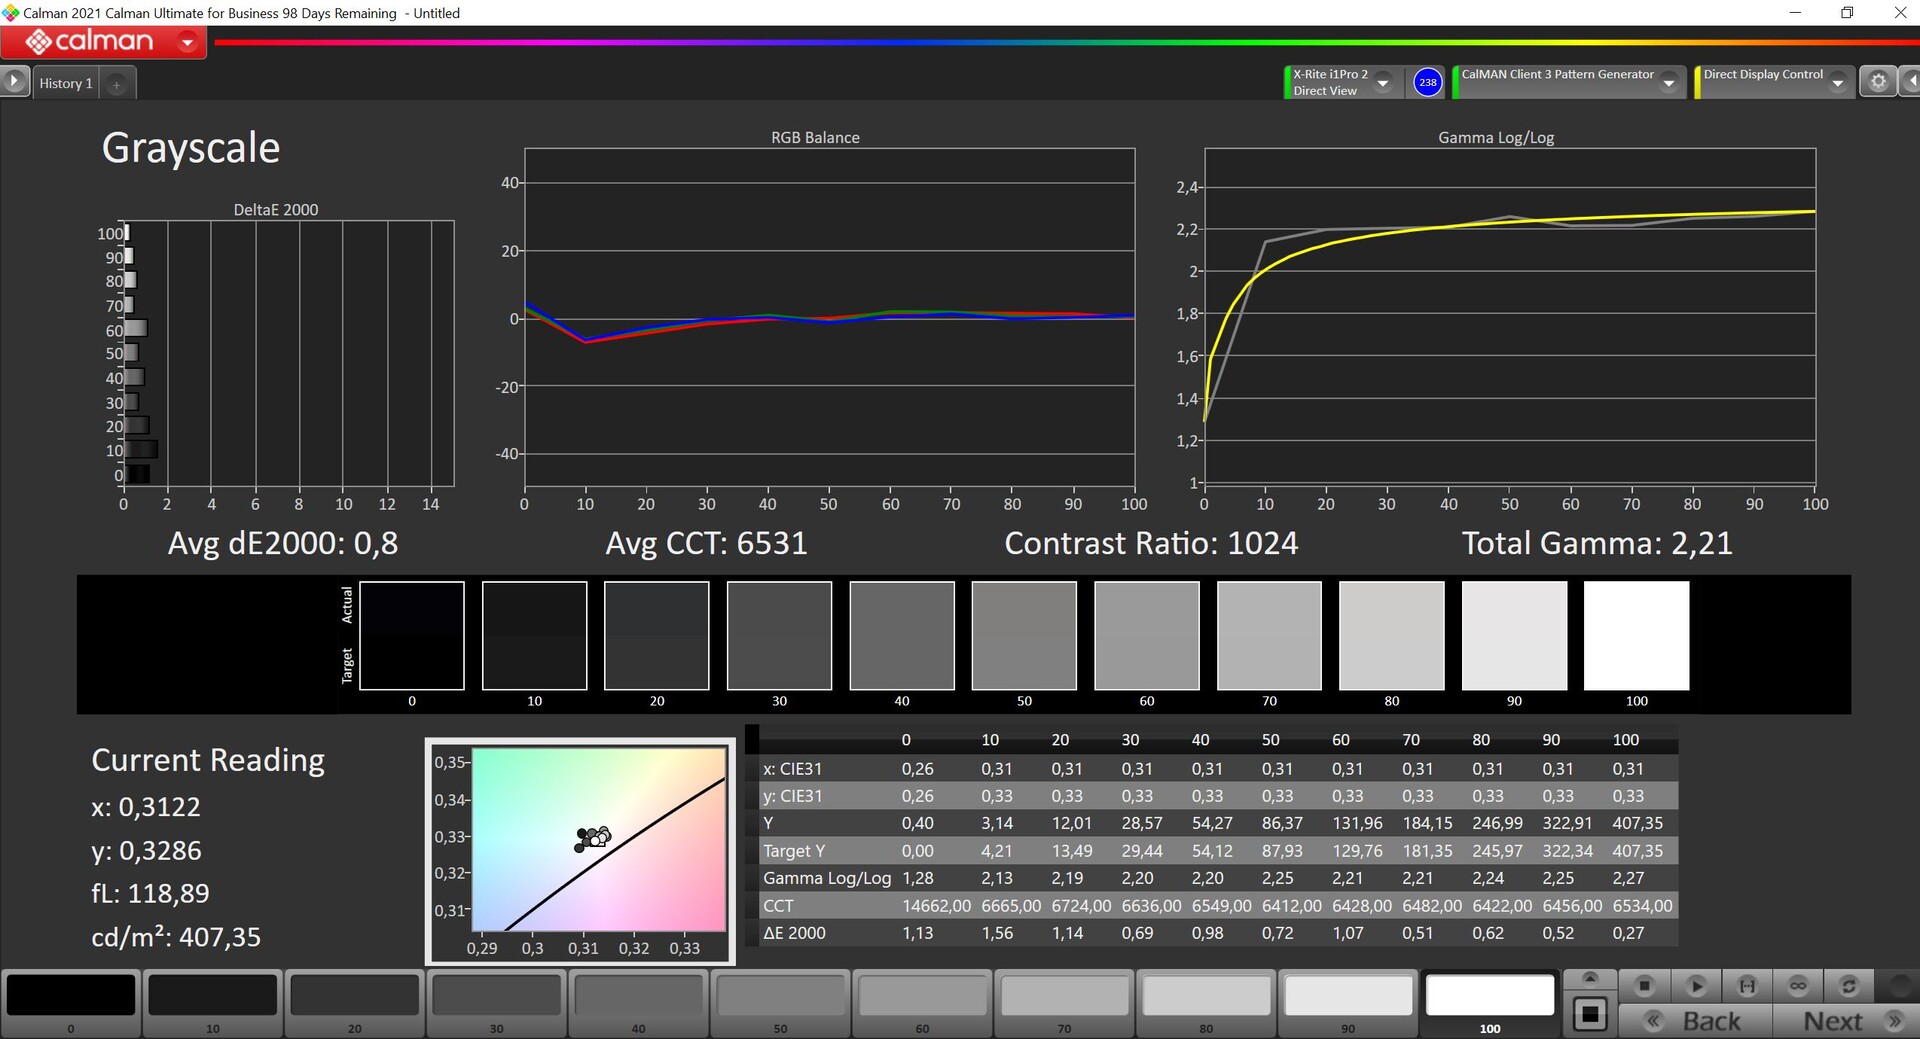
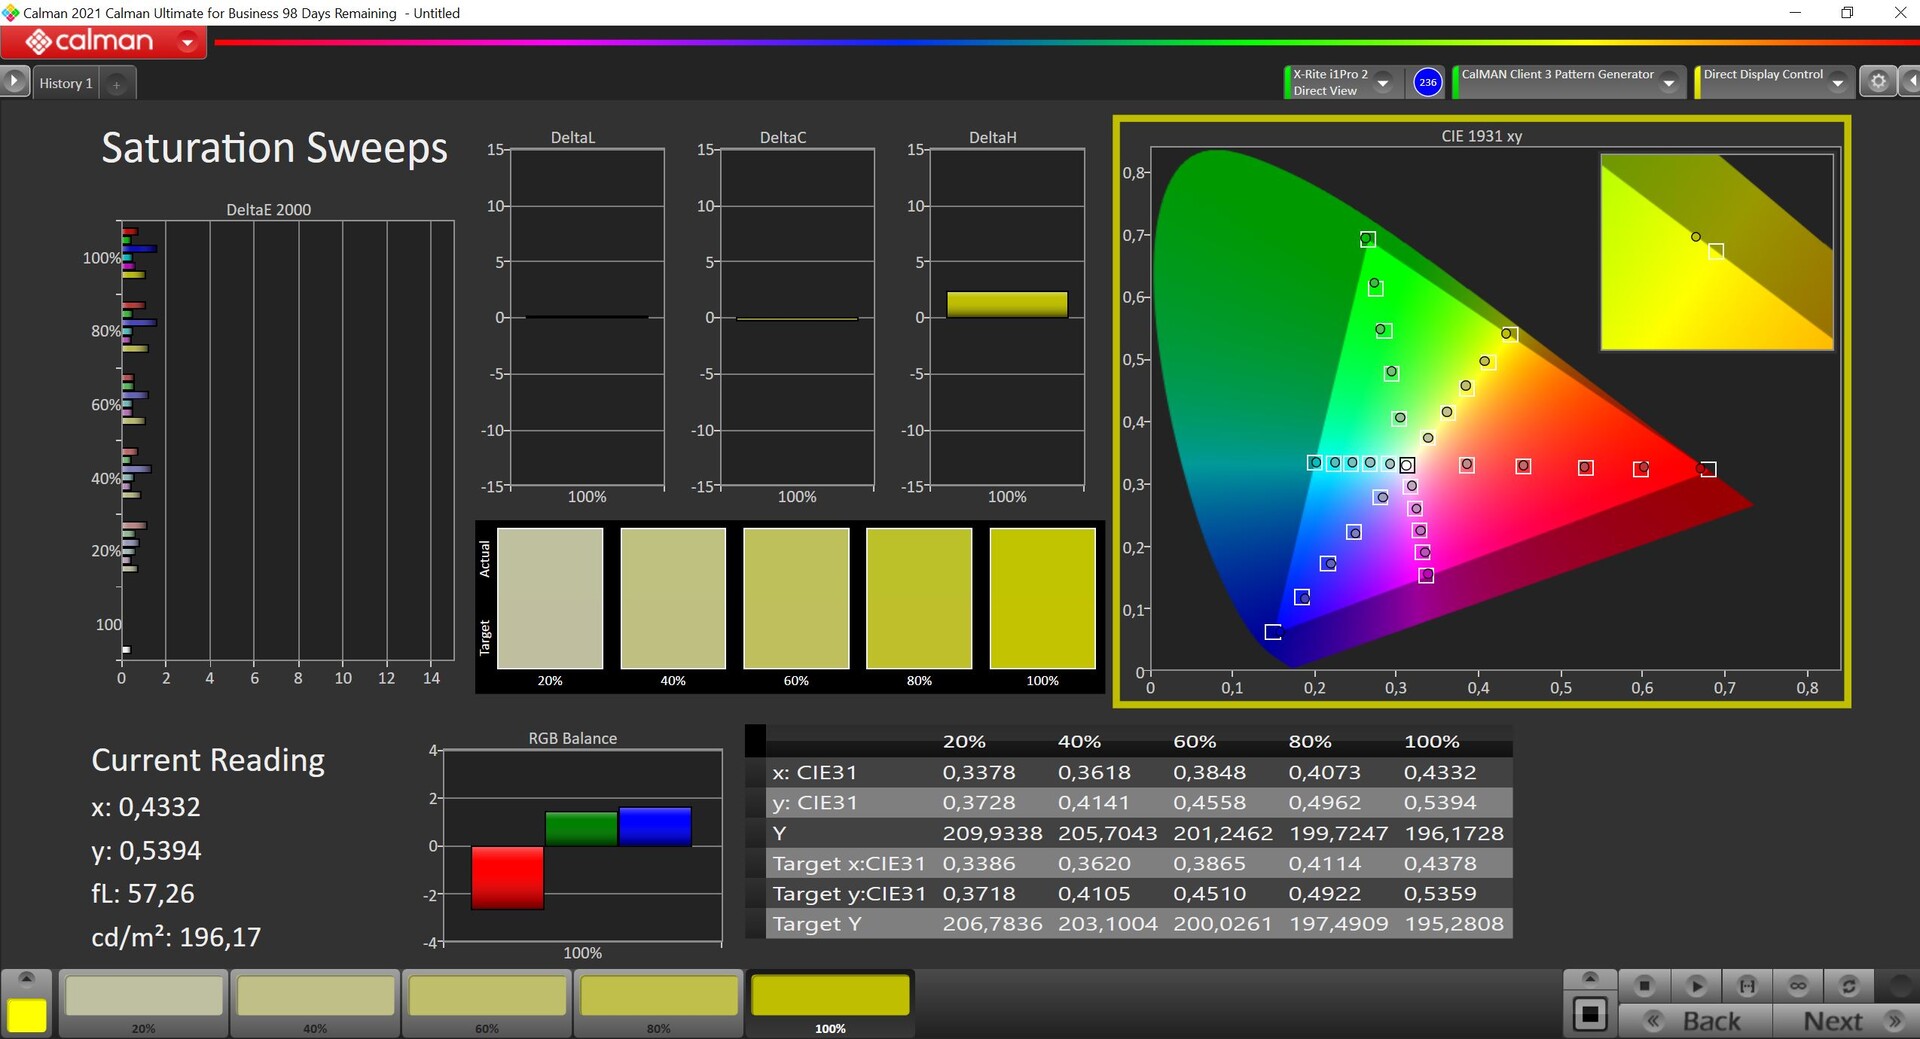
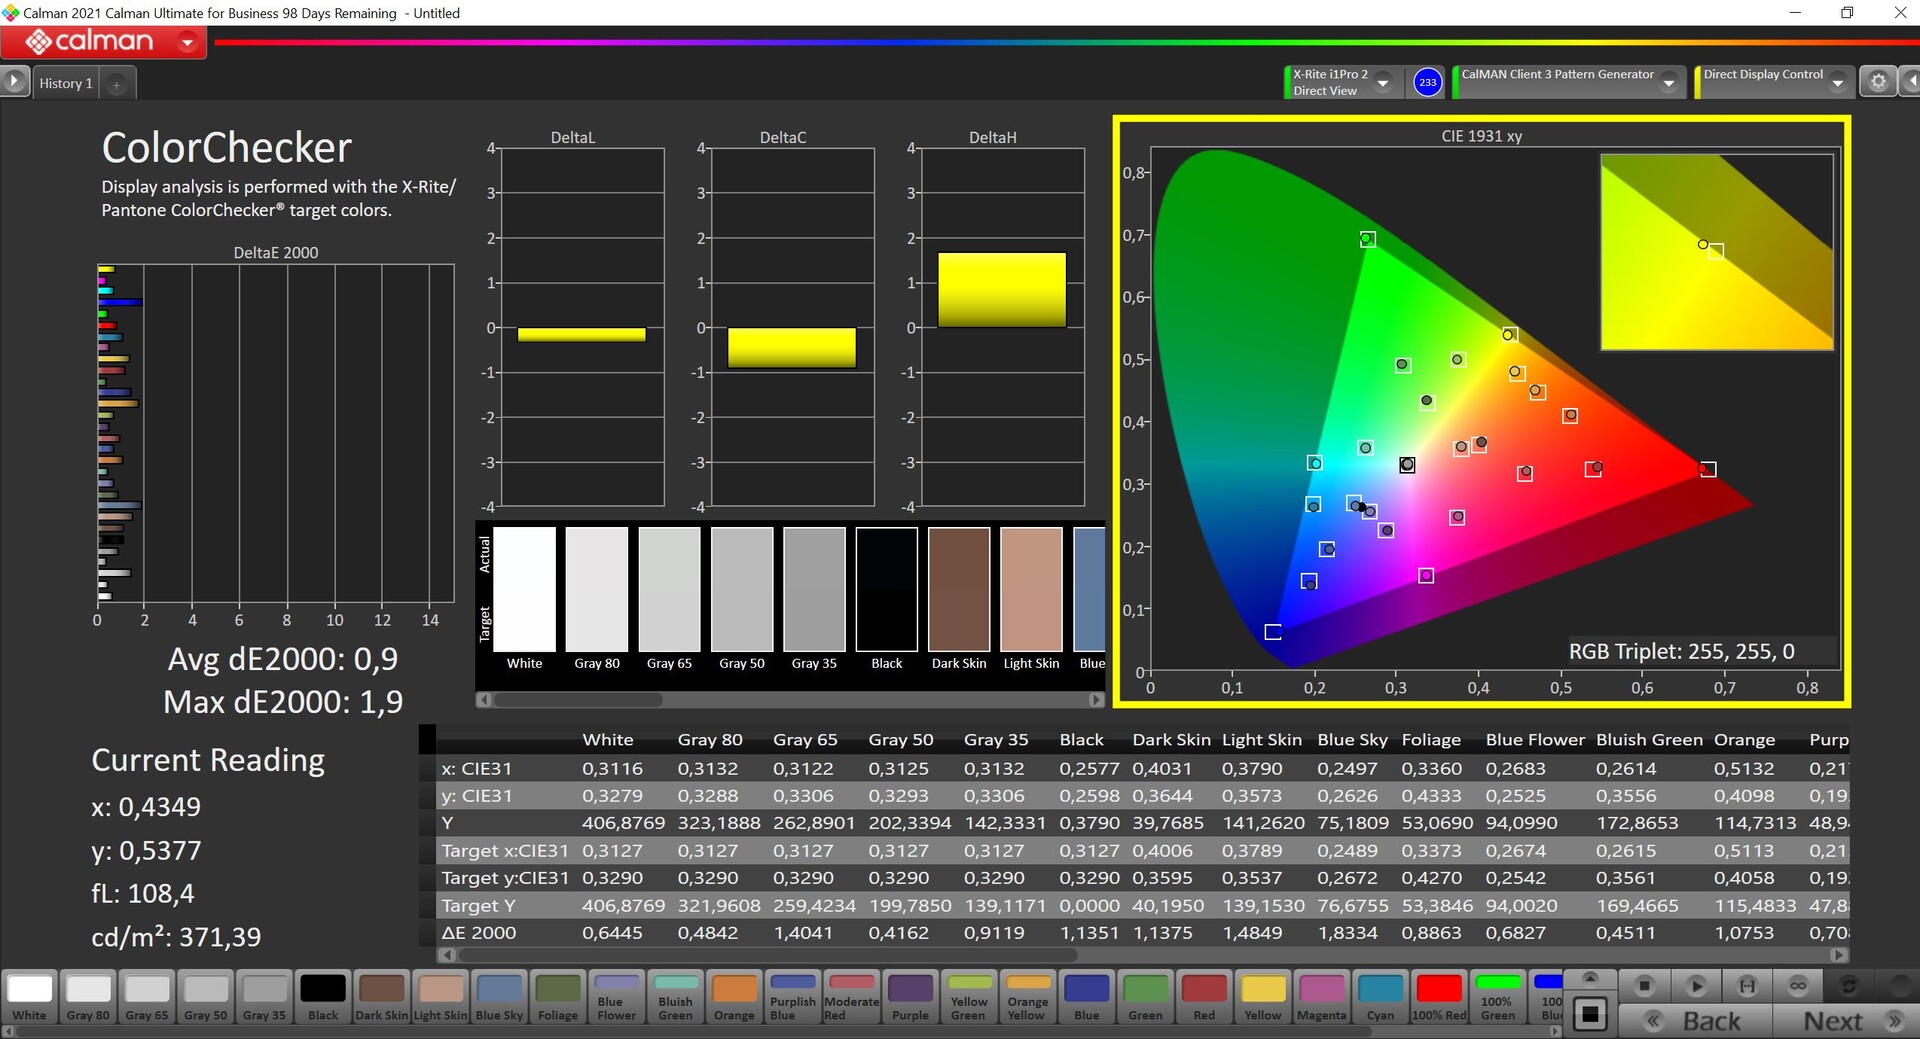
MSI oferuje wiele różnych profili kolorów za pośrednictwem oprogramowania TrueColor, a my wybraliśmy tryb Display P3 do naszych pomiarów przy użyciu profesjonalnego oprogramowania CalMAN (X-Rite i1 Pro2). Jest to tryb aktywowany standardowo. Zmierzone przez nas kolory leżały poniżej ważnego odchylenia DeltaE 2000 wynoszącego 3 w porównaniu do wartości referencyjnej P3, jednak odcienie szarości wydawały się wykazywać lekki fioletowy odcień. Korzystając z naszej własnej kalibracji (możesz pobrać nasz profil za darmo powyżej), z łatwością udało nam się nad tym zapanować. Przestrzeń barw P3 została odwzorowana niemal w pełni.
Wyświetl czasy reakcji
| ↔ Czas reakcji od czerni do bieli | ||
|---|---|---|
| 5.8 ms ... wzrost ↗ i spadek ↘ łącznie | ↗ 2.1 ms wzrost | 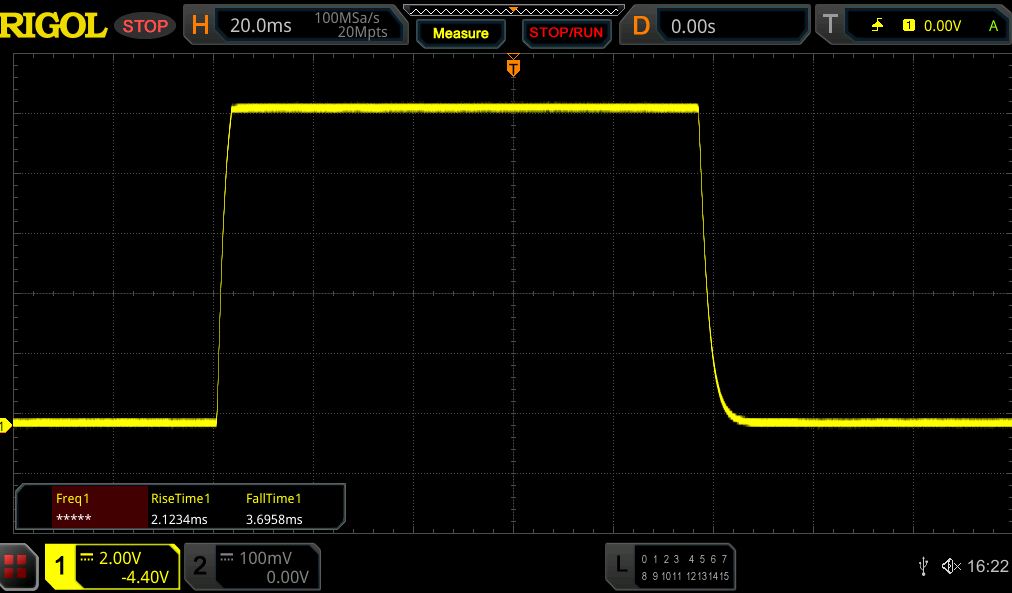 |
| ↘ 3.7 ms upadek | ||
| W naszych testach ekran wykazuje bardzo szybką reakcję i powinien bardzo dobrze nadawać się do szybkich gier. Dla porównania, wszystkie testowane urządzenia wahają się od 0.1 (minimum) do 240 (maksimum) ms. » 18 % wszystkich urządzeń jest lepszych. Oznacza to, że zmierzony czas reakcji jest lepszy od średniej wszystkich testowanych urządzeń (19.9 ms). | ||
| ↔ Czas reakcji 50% szarości do 80% szarości | ||
| 5.5 ms ... wzrost ↗ i spadek ↘ łącznie | ↗ 2.7 ms wzrost | 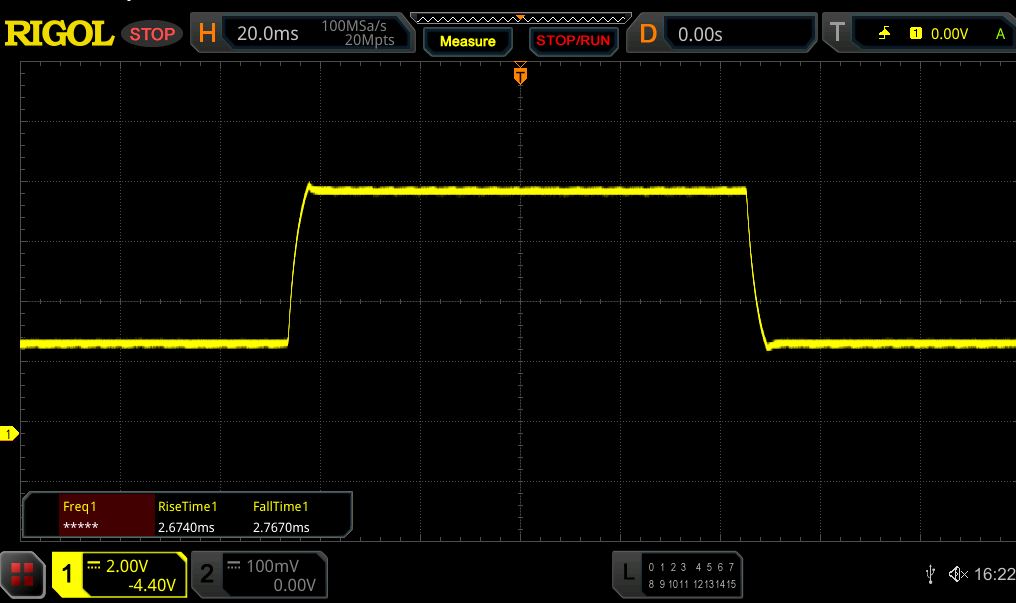 |
| ↘ 2.8 ms upadek | ||
| W naszych testach ekran wykazuje bardzo szybką reakcję i powinien bardzo dobrze nadawać się do szybkich gier. Dla porównania, wszystkie testowane urządzenia wahają się od 0.165 (minimum) do 636 (maksimum) ms. » 18 % wszystkich urządzeń jest lepszych. Oznacza to, że zmierzony czas reakcji jest lepszy od średniej wszystkich testowanych urządzeń (31.1 ms). | ||
Migotanie ekranu / PWM (modulacja szerokości impulsu)
| Migotanie ekranu/nie wykryto PWM |  | ||
Dla porównania: 52 % wszystkich testowanych urządzeń nie używa PWM do przyciemniania wyświetlacza. Jeśli wykryto PWM, zmierzono średnio 7794 (minimum: 5 - maksimum: 343500) Hz. | |||
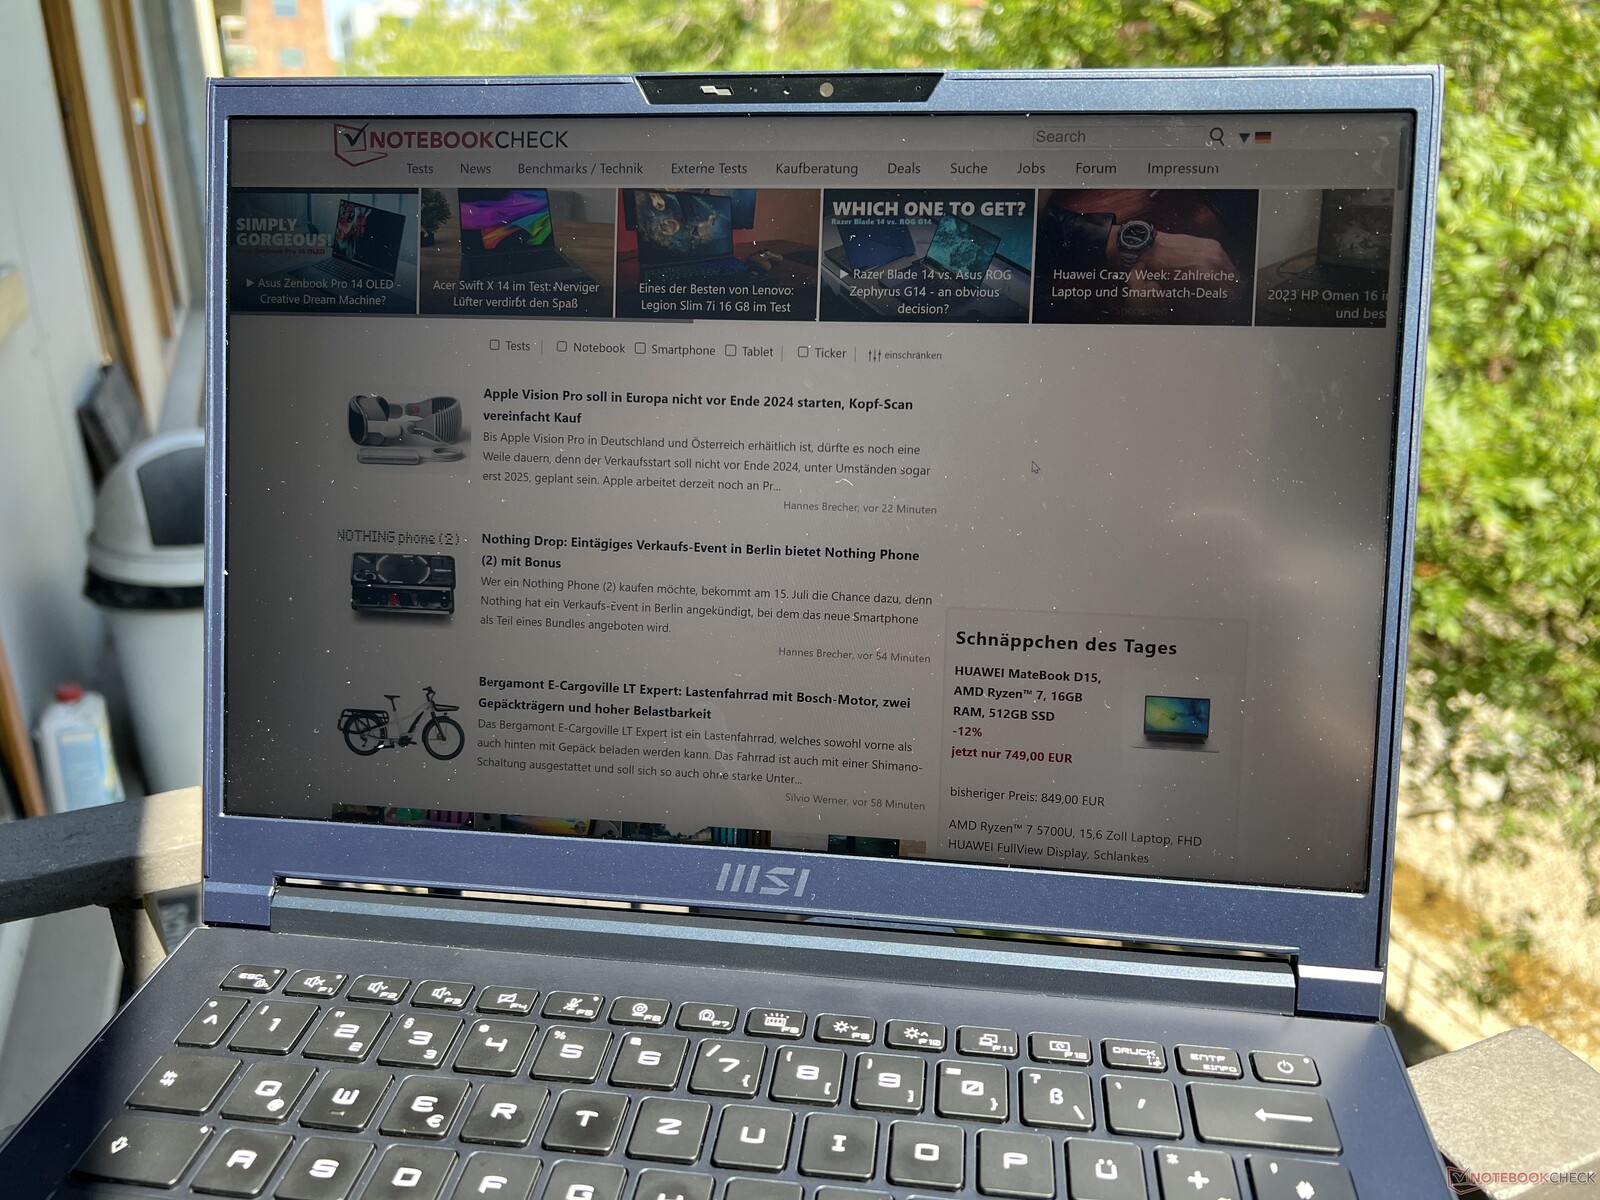
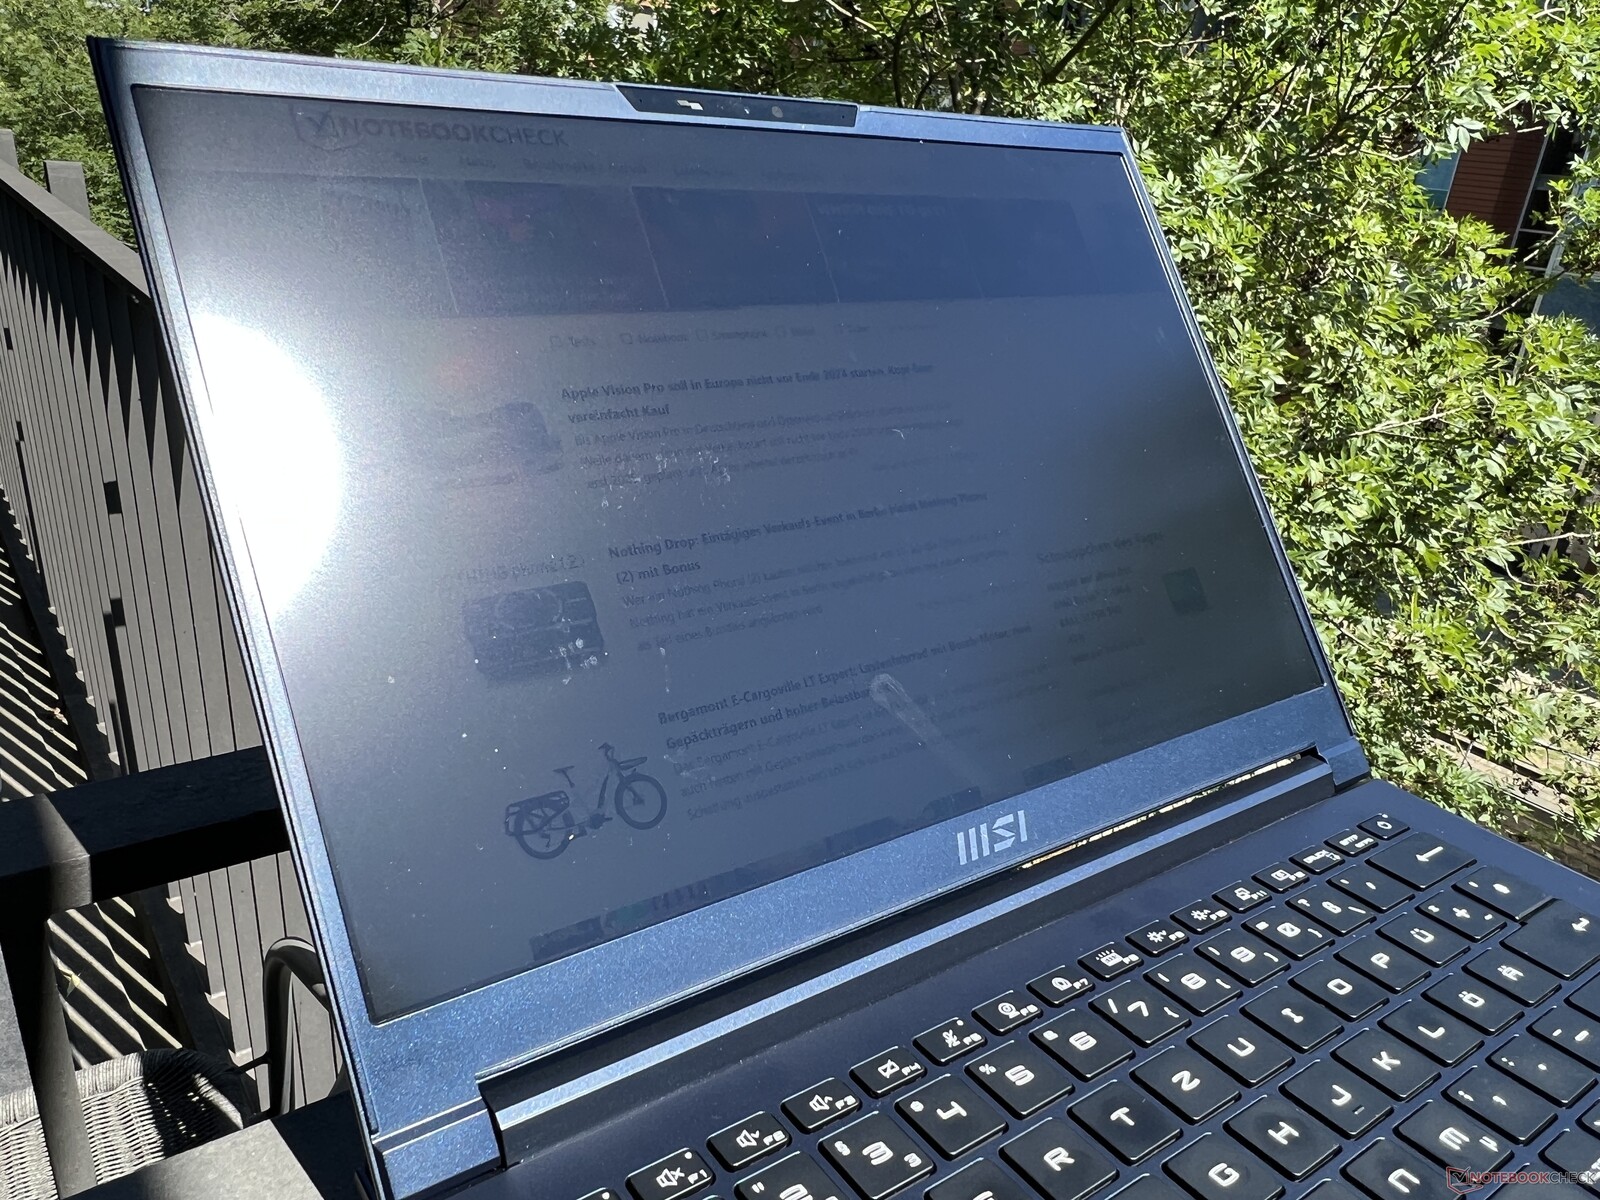
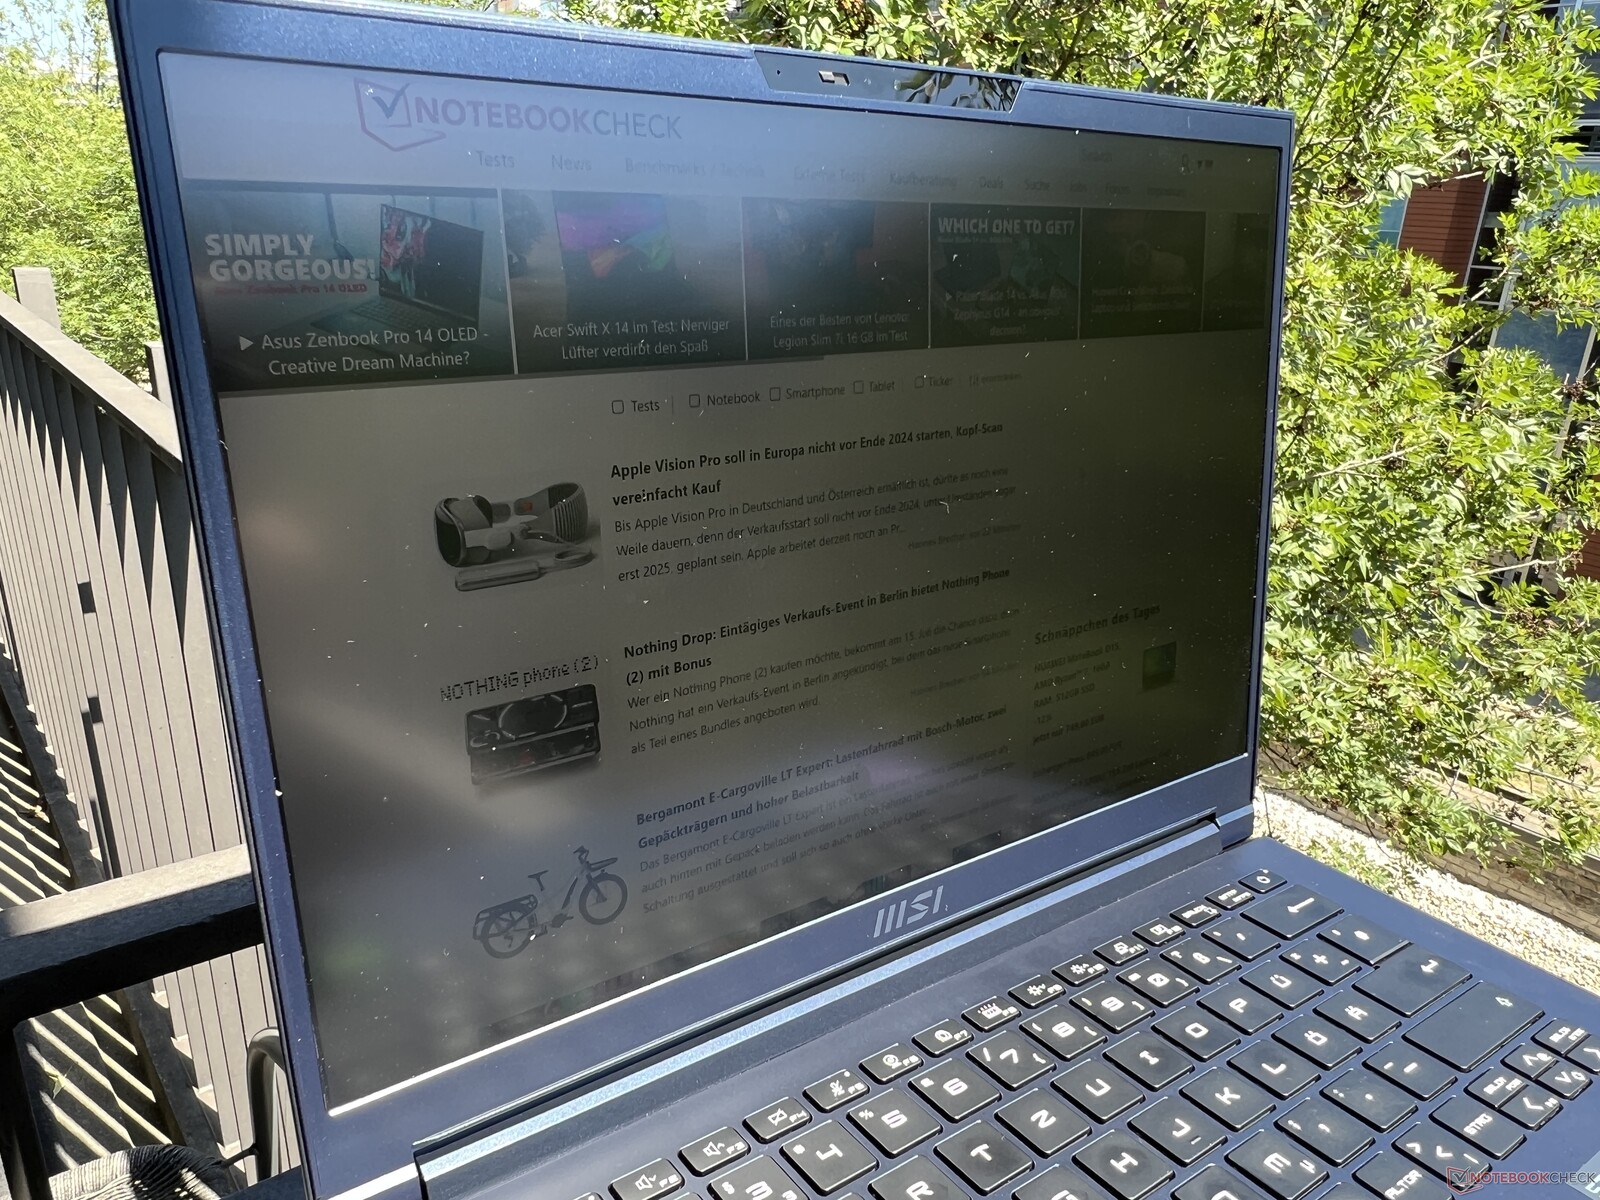
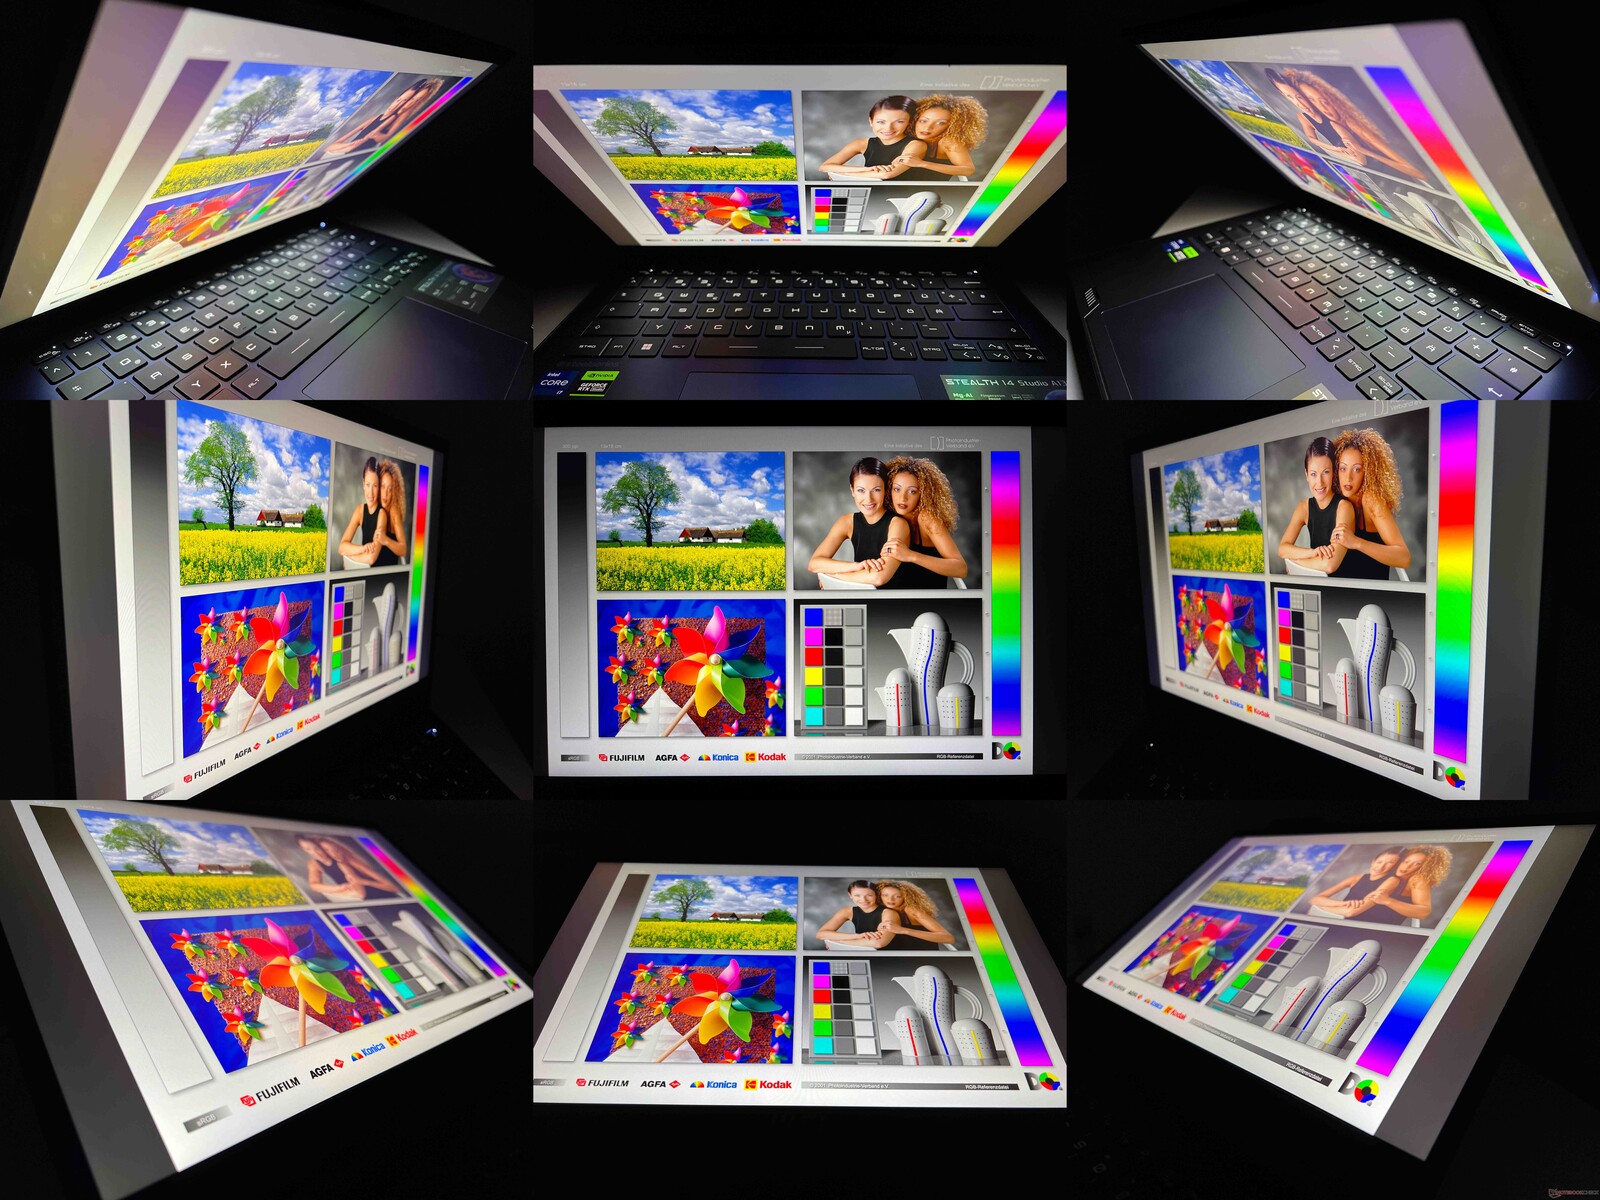
Dopóki nie ustawisz Stealth 14 Studio w bezpośrednim świetle słonecznym, nie powinieneś mieć problemów z czytaniem z matowego wyświetlacza na zewnątrz - nawet w dość jasne dni. Stabilność kąta widzenia jest w porządku, ale mogłaby być lepsza. Szczególnie podczas oglądania z ukosa, obraz szybko staje się zbyt jasny i traci sporo kontrastu.
Wydajność - Raptor Lake i laptop z RTX 4050
Warunki testowania
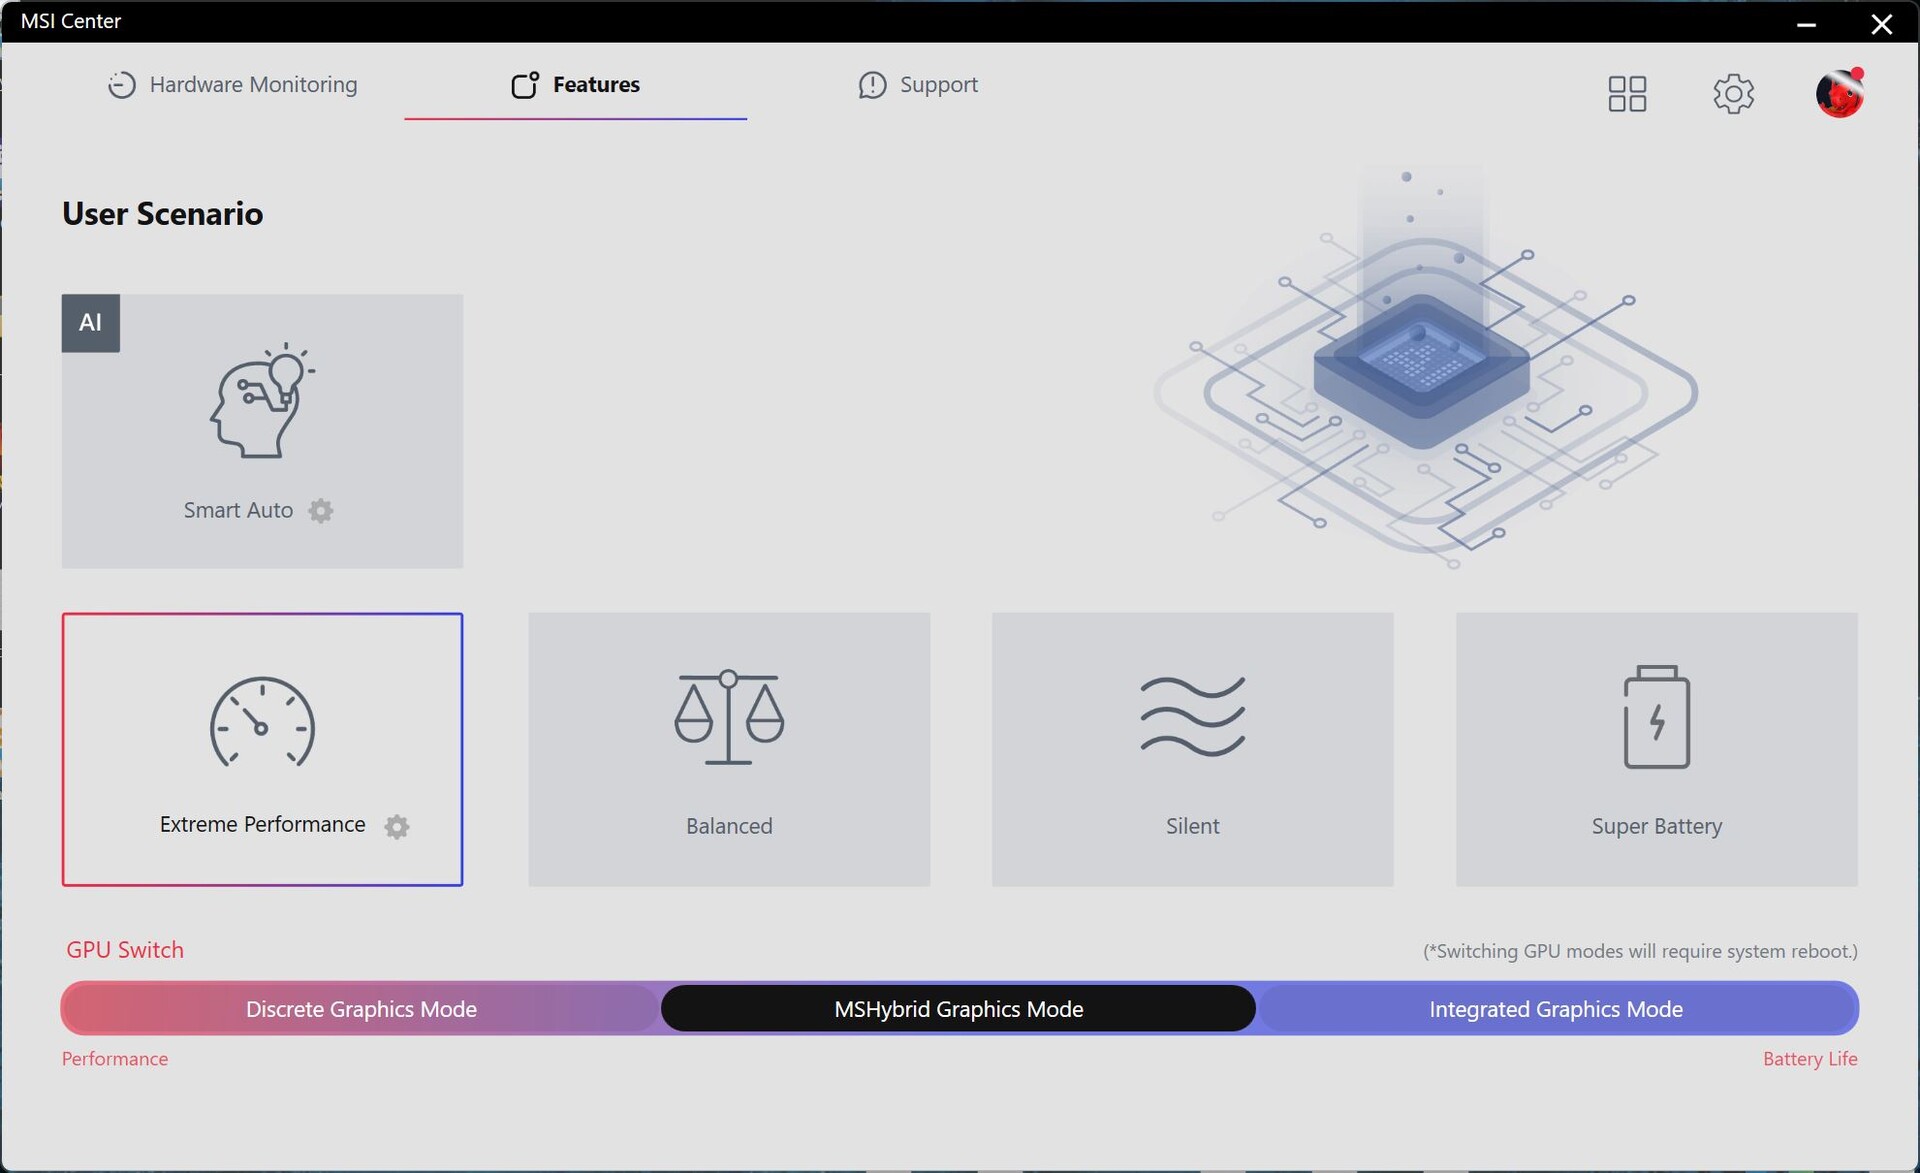
W preinstalowanym MSI Center dostępne są różne profile energetyczne do wyboru. Tryb Smart Auto ma dynamicznie dostosowywać poziomy wydajności zgodnie z wymaganiami laptopa za pomocą kilku różnych parametrów - w naszych testach wyniki nie zawsze wydawały się spójne. W rezultacie zdecydowaliśmy się użyć trybu energetycznego Extreme Performance dla naszych benchmarków i pomiarów, aby zmaksymalizować poziom wydajności - szczególnie w okresach połączonego obciążenia CPU/GPU. Do naszych testów baterii wykorzystaliśmy profil Zrównoważony. Jednocześnie zawsze aktywowany był tryb Hybrid Graphics Mode MSI, który w razie potrzeby przełącza się na dedykowany procesor graficzny Nvidia. Kontrola MUX jest dostępna, ale przełączanie wymaga ponownego uruchomienia. Jeśli chodzi o cenę, chętnie zobaczylibyśmy tutaj technologię Advanced Optimus.
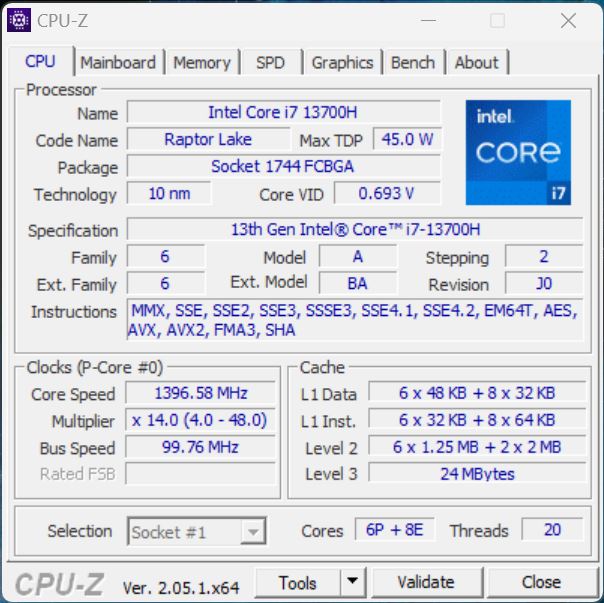
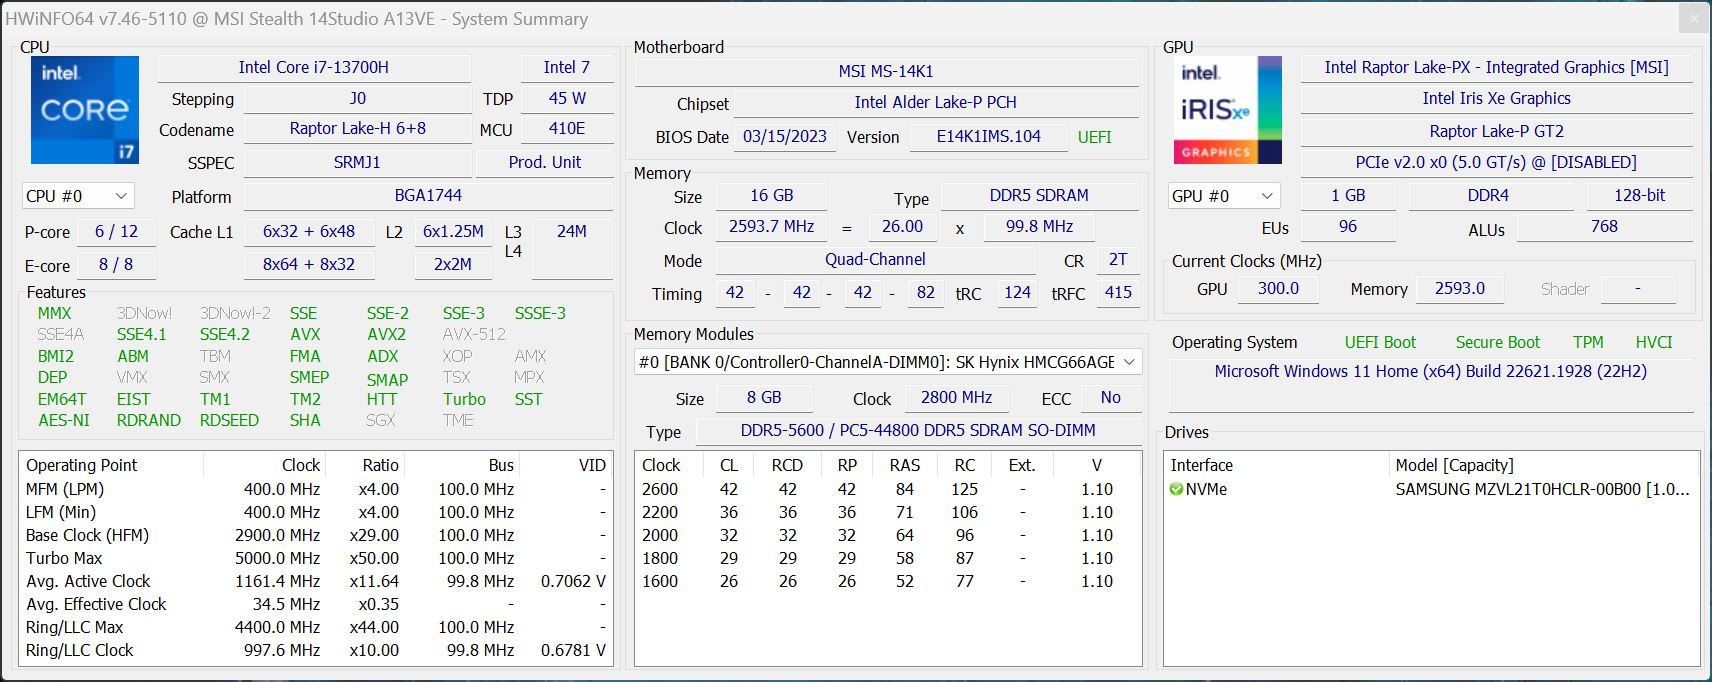
Procesor - Core i7-13700H
Stealth 14 Studio jest wyposażony w najnowszy procesor firmy Intel, tj Core i7-13700H- przeznaczony do laptopów multimedialnych i gamingowych. Ma on 6 szybkich rdzeni wydajnościowych i 8 rdzeni wydajnościowych, co oznacza, że może przetwarzać łącznie 20 wątków jednocześnie. W porównaniu do swojego poprzednika, wykazuje tylko niewielkie ulepszenia, w tym nieco wyższy zegar turbo. Jego wydajność energetyczna jest bardzo dobra, ponieważ procesor zużywa dużo energii. Zmierzyliśmy szczytowe wartości 115 watów, a podczas ciągłego obciążenia laptop nadal zużywa nieco ponad 80 watów - chociaż zmierzyliśmy pewne wahania. W testach jednordzeniowych wydajność laptopa nie do końca spełniła nasze oczekiwania.
Podczas korzystania z baterii jego wydajność wielordzeniowa jest znacznie zmniejszona, ponieważ procesor zużywa maksymalnie 35 watów - co prowadzi do deficytu około 33%. Więcej testów porównawczych procesora można znaleźć tutaj.
Cinebench R15 Multi continuous test
Cinebench R23: Multi Core | Single Core
Cinebench R20: CPU (Multi Core) | CPU (Single Core)
Cinebench R15: CPU Multi 64Bit | CPU Single 64Bit
Blender: v2.79 BMW27 CPU
7-Zip 18.03: 7z b 4 | 7z b 4 -mmt1
Geekbench 5.5: Multi-Core | Single-Core
HWBOT x265 Benchmark v2.2: 4k Preset
LibreOffice : 20 Documents To PDF
R Benchmark 2.5: Overall mean
| CPU Performance rating | |
| Średnia w klasie Gaming | |
| Asus ROG Flow Z13 GZ301ZE | |
| Acer Predator Triton 300 SE | |
| Alienware x14 i7 RTX 3060 | |
| Gigabyte Aero 14 OLED BMF | |
| MSI Stealth 14 Studio A13V | |
| Przeciętny Intel Core i7-13700H | |
| Schenker Vision 14 2022 RTX 3050 Ti | |
| Razer Blade 14 Ryzen 9 6900HX | |
| Cinebench R23 / Multi Core | |
| Średnia w klasie Gaming (10488 - 40970, n=112, ostatnie 2 lata) | |
| MSI Stealth 14 Studio A13V | |
| Acer Predator Triton 300 SE | |
| Alienware x14 i7 RTX 3060 | |
| Asus ROG Flow Z13 GZ301ZE | |
| Przeciętny Intel Core i7-13700H (5890 - 20034, n=29) | |
| Schenker Vision 14 2022 RTX 3050 Ti | |
| Gigabyte Aero 14 OLED BMF | |
| Razer Blade 14 Ryzen 9 6900HX | |
| Cinebench R23 / Single Core | |
| Średnia w klasie Gaming (1166 - 2356, n=112, ostatnie 2 lata) | |
| Asus ROG Flow Z13 GZ301ZE | |
| Acer Predator Triton 300 SE | |
| Gigabyte Aero 14 OLED BMF | |
| Przeciętny Intel Core i7-13700H (1323 - 1914, n=29) | |
| Alienware x14 i7 RTX 3060 | |
| Schenker Vision 14 2022 RTX 3050 Ti | |
| MSI Stealth 14 Studio A13V | |
| Razer Blade 14 Ryzen 9 6900HX | |
| Cinebench R20 / CPU (Multi Core) | |
| Średnia w klasie Gaming (4029 - 16108, n=111, ostatnie 2 lata) | |
| MSI Stealth 14 Studio A13V | |
| Acer Predator Triton 300 SE | |
| Alienware x14 i7 RTX 3060 | |
| Przeciętny Intel Core i7-13700H (2322 - 7674, n=29) | |
| Schenker Vision 14 2022 RTX 3050 Ti | |
| Asus ROG Flow Z13 GZ301ZE | |
| Razer Blade 14 Ryzen 9 6900HX | |
| Gigabyte Aero 14 OLED BMF | |
| Cinebench R20 / CPU (Single Core) | |
| Średnia w klasie Gaming (442 - 895, n=111, ostatnie 2 lata) | |
| Asus ROG Flow Z13 GZ301ZE | |
| Acer Predator Triton 300 SE | |
| Gigabyte Aero 14 OLED BMF | |
| Schenker Vision 14 2022 RTX 3050 Ti | |
| Przeciętny Intel Core i7-13700H (508 - 741, n=29) | |
| Alienware x14 i7 RTX 3060 | |
| MSI Stealth 14 Studio A13V | |
| Razer Blade 14 Ryzen 9 6900HX | |
| Cinebench R15 / CPU Multi 64Bit | |
| Średnia w klasie Gaming (1578 - 6271, n=111, ostatnie 2 lata) | |
| Asus ROG Flow Z13 GZ301ZE | |
| MSI Stealth 14 Studio A13V | |
| Alienware x14 i7 RTX 3060 | |
| Gigabyte Aero 14 OLED BMF | |
| Przeciętny Intel Core i7-13700H (905 - 2982, n=29) | |
| Acer Predator Triton 300 SE | |
| Razer Blade 14 Ryzen 9 6900HX | |
| Schenker Vision 14 2022 RTX 3050 Ti | |
| Cinebench R15 / CPU Single 64Bit | |
| Średnia w klasie Gaming (188.8 - 343, n=111, ostatnie 2 lata) | |
| Asus ROG Flow Z13 GZ301ZE | |
| Acer Predator Triton 300 SE | |
| Gigabyte Aero 14 OLED BMF | |
| Schenker Vision 14 2022 RTX 3050 Ti | |
| Przeciętny Intel Core i7-13700H (213 - 278, n=29) | |
| Alienware x14 i7 RTX 3060 | |
| Razer Blade 14 Ryzen 9 6900HX | |
| MSI Stealth 14 Studio A13V | |
| Blender / v2.79 BMW27 CPU | |
| Schenker Vision 14 2022 RTX 3050 Ti | |
| Gigabyte Aero 14 OLED BMF | |
| Przeciętny Intel Core i7-13700H (169 - 555, n=29) | |
| Alienware x14 i7 RTX 3060 | |
| Razer Blade 14 Ryzen 9 6900HX | |
| Asus ROG Flow Z13 GZ301ZE | |
| Acer Predator Triton 300 SE | |
| MSI Stealth 14 Studio A13V | |
| Średnia w klasie Gaming (80 - 330, n=109, ostatnie 2 lata) | |
| 7-Zip 18.03 / 7z b 4 | |
| Średnia w klasie Gaming (33491 - 148086, n=110, ostatnie 2 lata) | |
| MSI Stealth 14 Studio A13V | |
| Alienware x14 i7 RTX 3060 | |
| Acer Predator Triton 300 SE | |
| Asus ROG Flow Z13 GZ301ZE | |
| Razer Blade 14 Ryzen 9 6900HX | |
| Przeciętny Intel Core i7-13700H (27322 - 76344, n=29) | |
| Gigabyte Aero 14 OLED BMF | |
| Schenker Vision 14 2022 RTX 3050 Ti | |
| 7-Zip 18.03 / 7z b 4 -mmt1 | |
| Średnia w klasie Gaming (4199 - 7436, n=110, ostatnie 2 lata) | |
| Asus ROG Flow Z13 GZ301ZE | |
| Gigabyte Aero 14 OLED BMF | |
| Przeciętny Intel Core i7-13700H (4825 - 6238, n=29) | |
| Razer Blade 14 Ryzen 9 6900HX | |
| Schenker Vision 14 2022 RTX 3050 Ti | |
| Alienware x14 i7 RTX 3060 | |
| Acer Predator Triton 300 SE | |
| MSI Stealth 14 Studio A13V | |
| Geekbench 5.5 / Multi-Core | |
| Średnia w klasie Gaming (6460 - 27010, n=110, ostatnie 2 lata) | |
| Asus ROG Flow Z13 GZ301ZE | |
| Alienware x14 i7 RTX 3060 | |
| MSI Stealth 14 Studio A13V | |
| Acer Predator Triton 300 SE | |
| Przeciętny Intel Core i7-13700H (6165 - 14215, n=29) | |
| Schenker Vision 14 2022 RTX 3050 Ti | |
| Gigabyte Aero 14 OLED BMF | |
| Razer Blade 14 Ryzen 9 6900HX | |
| Geekbench 5.5 / Single-Core | |
| Średnia w klasie Gaming (986 - 2474, n=110, ostatnie 2 lata) | |
| Asus ROG Flow Z13 GZ301ZE | |
| Gigabyte Aero 14 OLED BMF | |
| Acer Predator Triton 300 SE | |
| Alienware x14 i7 RTX 3060 | |
| Przeciętny Intel Core i7-13700H (1362 - 1919, n=29) | |
| Schenker Vision 14 2022 RTX 3050 Ti | |
| MSI Stealth 14 Studio A13V | |
| Razer Blade 14 Ryzen 9 6900HX | |
| HWBOT x265 Benchmark v2.2 / 4k Preset | |
| Średnia w klasie Gaming (11.5 - 44.3, n=110, ostatnie 2 lata) | |
| Acer Predator Triton 300 SE | |
| MSI Stealth 14 Studio A13V | |
| Razer Blade 14 Ryzen 9 6900HX | |
| Alienware x14 i7 RTX 3060 | |
| Asus ROG Flow Z13 GZ301ZE | |
| Przeciętny Intel Core i7-13700H (6.72 - 21.2, n=29) | |
| Gigabyte Aero 14 OLED BMF | |
| Schenker Vision 14 2022 RTX 3050 Ti | |
| LibreOffice / 20 Documents To PDF | |
| MSI Stealth 14 Studio A13V | |
| Razer Blade 14 Ryzen 9 6900HX | |
| Średnia w klasie Gaming (19 - 88.8, n=110, ostatnie 2 lata) | |
| Przeciętny Intel Core i7-13700H (31.3 - 62.4, n=29) | |
| Schenker Vision 14 2022 RTX 3050 Ti | |
| Asus ROG Flow Z13 GZ301ZE | |
| Acer Predator Triton 300 SE | |
| Gigabyte Aero 14 OLED BMF | |
| Alienware x14 i7 RTX 3060 | |
| R Benchmark 2.5 / Overall mean | |
| MSI Stealth 14 Studio A13V | |
| Razer Blade 14 Ryzen 9 6900HX | |
| Przeciętny Intel Core i7-13700H (0.4308 - 0.607, n=29) | |
| Schenker Vision 14 2022 RTX 3050 Ti | |
| Alienware x14 i7 RTX 3060 | |
| Gigabyte Aero 14 OLED BMF | |
| Średnia w klasie Gaming (0.3439 - 0.759, n=111, ostatnie 2 lata) | |
| Acer Predator Triton 300 SE | |
| Asus ROG Flow Z13 GZ301ZE | |
* ... im mniej tym lepiej
AIDA64: FP32 Ray-Trace | FPU Julia | CPU SHA3 | CPU Queen | FPU SinJulia | FPU Mandel | CPU AES | CPU ZLib | FP64 Ray-Trace | CPU PhotoWorxx
| Performance rating | |
| Średnia w klasie Gaming | |
| Razer Blade 14 Ryzen 9 6900HX | |
| Acer Predator Triton 300 SE | |
| MSI Stealth 14 Studio A13V | |
| Gigabyte Aero 14 OLED BMF | |
| Przeciętny Intel Core i7-13700H | |
| Alienware x14 i7 RTX 3060 | |
| Schenker Vision 14 2022 RTX 3050 Ti | |
| Asus ROG Flow Z13 GZ301ZE | |
| AIDA64 / FP32 Ray-Trace | |
| Średnia w klasie Gaming (10227 - 85542, n=109, ostatnie 2 lata) | |
| MSI Stealth 14 Studio A13V | |
| Razer Blade 14 Ryzen 9 6900HX | |
| Acer Predator Triton 300 SE | |
| Przeciętny Intel Core i7-13700H (4986 - 18908, n=29) | |
| Gigabyte Aero 14 OLED BMF | |
| Schenker Vision 14 2022 RTX 3050 Ti | |
| Alienware x14 i7 RTX 3060 | |
| Asus ROG Flow Z13 GZ301ZE | |
| AIDA64 / FPU Julia | |
| Średnia w klasie Gaming (51376 - 238426, n=109, ostatnie 2 lata) | |
| Razer Blade 14 Ryzen 9 6900HX | |
| MSI Stealth 14 Studio A13V | |
| Acer Predator Triton 300 SE | |
| Przeciętny Intel Core i7-13700H (25360 - 92359, n=29) | |
| Gigabyte Aero 14 OLED BMF | |
| Schenker Vision 14 2022 RTX 3050 Ti | |
| Alienware x14 i7 RTX 3060 | |
| Asus ROG Flow Z13 GZ301ZE | |
| AIDA64 / CPU SHA3 | |
| Średnia w klasie Gaming (2180 - 9817, n=109, ostatnie 2 lata) | |
| MSI Stealth 14 Studio A13V | |
| Acer Predator Triton 300 SE | |
| Razer Blade 14 Ryzen 9 6900HX | |
| Przeciętny Intel Core i7-13700H (1339 - 4224, n=29) | |
| Gigabyte Aero 14 OLED BMF | |
| Alienware x14 i7 RTX 3060 | |
| Schenker Vision 14 2022 RTX 3050 Ti | |
| Asus ROG Flow Z13 GZ301ZE | |
| AIDA64 / CPU Queen | |
| Średnia w klasie Gaming (49785 - 173351, n=100, ostatnie 2 lata) | |
| Acer Predator Triton 300 SE | |
| Gigabyte Aero 14 OLED BMF | |
| MSI Stealth 14 Studio A13V | |
| Asus ROG Flow Z13 GZ301ZE | |
| Razer Blade 14 Ryzen 9 6900HX | |
| Alienware x14 i7 RTX 3060 | |
| Przeciętny Intel Core i7-13700H (59324 - 107159, n=29) | |
| Schenker Vision 14 2022 RTX 3050 Ti | |
| AIDA64 / FPU SinJulia | |
| Średnia w klasie Gaming (4424 - 33636, n=109, ostatnie 2 lata) | |
| Razer Blade 14 Ryzen 9 6900HX | |
| MSI Stealth 14 Studio A13V | |
| Acer Predator Triton 300 SE | |
| Alienware x14 i7 RTX 3060 | |
| Asus ROG Flow Z13 GZ301ZE | |
| Przeciętny Intel Core i7-13700H (4800 - 11050, n=29) | |
| Gigabyte Aero 14 OLED BMF | |
| Schenker Vision 14 2022 RTX 3050 Ti | |
| AIDA64 / FPU Mandel | |
| Średnia w klasie Gaming (25115 - 128721, n=109, ostatnie 2 lata) | |
| Razer Blade 14 Ryzen 9 6900HX | |
| MSI Stealth 14 Studio A13V | |
| Acer Predator Triton 300 SE | |
| Przeciętny Intel Core i7-13700H (12321 - 45118, n=29) | |
| Gigabyte Aero 14 OLED BMF | |
| Schenker Vision 14 2022 RTX 3050 Ti | |
| Alienware x14 i7 RTX 3060 | |
| Asus ROG Flow Z13 GZ301ZE | |
| AIDA64 / CPU AES | |
| Razer Blade 14 Ryzen 9 6900HX | |
| Acer Predator Triton 300 SE | |
| Gigabyte Aero 14 OLED BMF | |
| Średnia w klasie Gaming (39258 - 247074, n=109, ostatnie 2 lata) | |
| Alienware x14 i7 RTX 3060 | |
| Asus ROG Flow Z13 GZ301ZE | |
| MSI Stealth 14 Studio A13V | |
| Przeciętny Intel Core i7-13700H (28769 - 151254, n=29) | |
| Schenker Vision 14 2022 RTX 3050 Ti | |
| AIDA64 / CPU ZLib | |
| Średnia w klasie Gaming (574 - 2531, n=109, ostatnie 2 lata) | |
| MSI Stealth 14 Studio A13V | |
| Acer Predator Triton 300 SE | |
| Alienware x14 i7 RTX 3060 | |
| Schenker Vision 14 2022 RTX 3050 Ti | |
| Przeciętny Intel Core i7-13700H (389 - 1215, n=29) | |
| Asus ROG Flow Z13 GZ301ZE | |
| Razer Blade 14 Ryzen 9 6900HX | |
| Gigabyte Aero 14 OLED BMF | |
| AIDA64 / FP64 Ray-Trace | |
| Średnia w klasie Gaming (5509 - 45446, n=109, ostatnie 2 lata) | |
| MSI Stealth 14 Studio A13V | |
| Razer Blade 14 Ryzen 9 6900HX | |
| Acer Predator Triton 300 SE | |
| Przeciętny Intel Core i7-13700H (2540 - 10135, n=29) | |
| Gigabyte Aero 14 OLED BMF | |
| Schenker Vision 14 2022 RTX 3050 Ti | |
| Alienware x14 i7 RTX 3060 | |
| Asus ROG Flow Z13 GZ301ZE | |
| AIDA64 / CPU PhotoWorxx | |
| Gigabyte Aero 14 OLED BMF | |
| Acer Predator Triton 300 SE | |
| Alienware x14 i7 RTX 3060 | |
| Średnia w klasie Gaming (12271 - 89891, n=109, ostatnie 2 lata) | |
| Asus ROG Flow Z13 GZ301ZE | |
| Przeciętny Intel Core i7-13700H (12872 - 52727, n=29) | |
| MSI Stealth 14 Studio A13V | |
| Schenker Vision 14 2022 RTX 3050 Ti | |
| Razer Blade 14 Ryzen 9 6900HX | |
Wydajność systemu
Subiektywnie (i bez zaskoczenia), komponent ten wywarł na nas świetne wrażenie pod względem wydajności - nawet pomimo tego, że nasze urządzenie testowe osiągnęło jedynie przeciętne wyniki w syntetycznych benchmarkach. Podczas testów nie odnotowaliśmy żadnych problemów.
CrossMark: Overall | Productivity | Creativity | Responsiveness
| PCMark 10 / Score | |
| Średnia w klasie Gaming (5828 - 11574, n=95, ostatnie 2 lata) | |
| Acer Predator Triton 300 SE | |
| Razer Blade 14 Ryzen 9 6900HX | |
| Gigabyte Aero 14 OLED BMF | |
| Przeciętny Intel Core i7-13700H, NVIDIA GeForce RTX 4050 Laptop GPU (6822 - 7556, n=7) | |
| Alienware x14 i7 RTX 3060 | |
| MSI Stealth 14 Studio A13V | |
| Schenker Vision 14 2022 RTX 3050 Ti | |
| Asus ROG Flow Z13 GZ301ZE | |
| PCMark 10 / Essentials | |
| Gigabyte Aero 14 OLED BMF | |
| Acer Predator Triton 300 SE | |
| Razer Blade 14 Ryzen 9 6900HX | |
| Przeciętny Intel Core i7-13700H, NVIDIA GeForce RTX 4050 Laptop GPU (10283 - 11549, n=7) | |
| Asus ROG Flow Z13 GZ301ZE | |
| Średnia w klasie Gaming (8810 - 12600, n=99, ostatnie 2 lata) | |
| Schenker Vision 14 2022 RTX 3050 Ti | |
| Alienware x14 i7 RTX 3060 | |
| MSI Stealth 14 Studio A13V | |
| PCMark 10 / Productivity | |
| Średnia w klasie Gaming (6845 - 18766, n=97, ostatnie 2 lata) | |
| Acer Predator Triton 300 SE | |
| Asus ROG Flow Z13 GZ301ZE | |
| Alienware x14 i7 RTX 3060 | |
| Gigabyte Aero 14 OLED BMF | |
| Przeciętny Intel Core i7-13700H, NVIDIA GeForce RTX 4050 Laptop GPU (8368 - 9836, n=7) | |
| Razer Blade 14 Ryzen 9 6900HX | |
| Schenker Vision 14 2022 RTX 3050 Ti | |
| MSI Stealth 14 Studio A13V | |
| PCMark 10 / Digital Content Creation | |
| Średnia w klasie Gaming (7602 - 19657, n=97, ostatnie 2 lata) | |
| Razer Blade 14 Ryzen 9 6900HX | |
| Acer Predator Triton 300 SE | |
| MSI Stealth 14 Studio A13V | |
| Przeciętny Intel Core i7-13700H, NVIDIA GeForce RTX 4050 Laptop GPU (9527 - 10643, n=7) | |
| Alienware x14 i7 RTX 3060 | |
| Gigabyte Aero 14 OLED BMF | |
| Schenker Vision 14 2022 RTX 3050 Ti | |
| Asus ROG Flow Z13 GZ301ZE | |
| CrossMark / Overall | |
| Asus ROG Flow Z13 GZ301ZE | |
| Średnia w klasie Gaming (1366 - 2409, n=97, ostatnie 2 lata) | |
| Acer Predator Triton 300 SE | |
| Alienware x14 i7 RTX 3060 | |
| Gigabyte Aero 14 OLED BMF | |
| MSI Stealth 14 Studio A13V | |
| Przeciętny Intel Core i7-13700H, NVIDIA GeForce RTX 4050 Laptop GPU (1205 - 1937, n=9) | |
| Schenker Vision 14 2022 RTX 3050 Ti | |
| CrossMark / Productivity | |
| Asus ROG Flow Z13 GZ301ZE | |
| Acer Predator Triton 300 SE | |
| Średnia w klasie Gaming (1386 - 2254, n=97, ostatnie 2 lata) | |
| Alienware x14 i7 RTX 3060 | |
| Gigabyte Aero 14 OLED BMF | |
| Przeciętny Intel Core i7-13700H, NVIDIA GeForce RTX 4050 Laptop GPU (1158 - 1877, n=9) | |
| MSI Stealth 14 Studio A13V | |
| Schenker Vision 14 2022 RTX 3050 Ti | |
| CrossMark / Creativity | |
| Średnia w klasie Gaming (1343 - 2729, n=97, ostatnie 2 lata) | |
| Asus ROG Flow Z13 GZ301ZE | |
| Acer Predator Triton 300 SE | |
| Alienware x14 i7 RTX 3060 | |
| Gigabyte Aero 14 OLED BMF | |
| MSI Stealth 14 Studio A13V | |
| Przeciętny Intel Core i7-13700H, NVIDIA GeForce RTX 4050 Laptop GPU (1293 - 2044, n=9) | |
| Schenker Vision 14 2022 RTX 3050 Ti | |
| CrossMark / Responsiveness | |
| Asus ROG Flow Z13 GZ301ZE | |
| Acer Predator Triton 300 SE | |
| Alienware x14 i7 RTX 3060 | |
| Gigabyte Aero 14 OLED BMF | |
| Średnia w klasie Gaming (1226 - 2334, n=97, ostatnie 2 lata) | |
| Przeciętny Intel Core i7-13700H, NVIDIA GeForce RTX 4050 Laptop GPU (1097 - 1929, n=9) | |
| MSI Stealth 14 Studio A13V | |
| Schenker Vision 14 2022 RTX 3050 Ti | |
| PCMark 10 Score | 6924 pkt. | |
Pomoc | ||
| AIDA64 / Memory Copy | |
| Gigabyte Aero 14 OLED BMF | |
| Alienware x14 i7 RTX 3060 | |
| Asus ROG Flow Z13 GZ301ZE | |
| Acer Predator Triton 300 SE | |
| Średnia w klasie Gaming (21750 - 129946, n=109, ostatnie 2 lata) | |
| Przeciętny Intel Core i7-13700H (24334 - 78081, n=29) | |
| MSI Stealth 14 Studio A13V | |
| Razer Blade 14 Ryzen 9 6900HX | |
| Schenker Vision 14 2022 RTX 3050 Ti | |
| AIDA64 / Memory Read | |
| Gigabyte Aero 14 OLED BMF | |
| Alienware x14 i7 RTX 3060 | |
| Acer Predator Triton 300 SE | |
| Średnia w klasie Gaming (22956 - 118858, n=109, ostatnie 2 lata) | |
| Asus ROG Flow Z13 GZ301ZE | |
| MSI Stealth 14 Studio A13V | |
| Przeciętny Intel Core i7-13700H (23681 - 79656, n=29) | |
| Razer Blade 14 Ryzen 9 6900HX | |
| Schenker Vision 14 2022 RTX 3050 Ti | |
| AIDA64 / Memory Write | |
| Gigabyte Aero 14 OLED BMF | |
| Średnia w klasie Gaming (22297 - 135096, n=109, ostatnie 2 lata) | |
| Przeciętny Intel Core i7-13700H (22986 - 99898, n=29) | |
| Alienware x14 i7 RTX 3060 | |
| Acer Predator Triton 300 SE | |
| Asus ROG Flow Z13 GZ301ZE | |
| Razer Blade 14 Ryzen 9 6900HX | |
| MSI Stealth 14 Studio A13V | |
| Schenker Vision 14 2022 RTX 3050 Ti | |
| AIDA64 / Memory Latency | |
| Alienware x14 i7 RTX 3060 | |
| Średnia w klasie Gaming (75.3 - 259, n=109, ostatnie 2 lata) | |
| Asus ROG Flow Z13 GZ301ZE | |
| Acer Predator Triton 300 SE | |
| Przeciętny Intel Core i7-13700H (82.4 - 136.8, n=29) | |
| Gigabyte Aero 14 OLED BMF | |
| Schenker Vision 14 2022 RTX 3050 Ti | |
| MSI Stealth 14 Studio A13V | |
| Razer Blade 14 Ryzen 9 6900HX | |
* ... im mniej tym lepiej
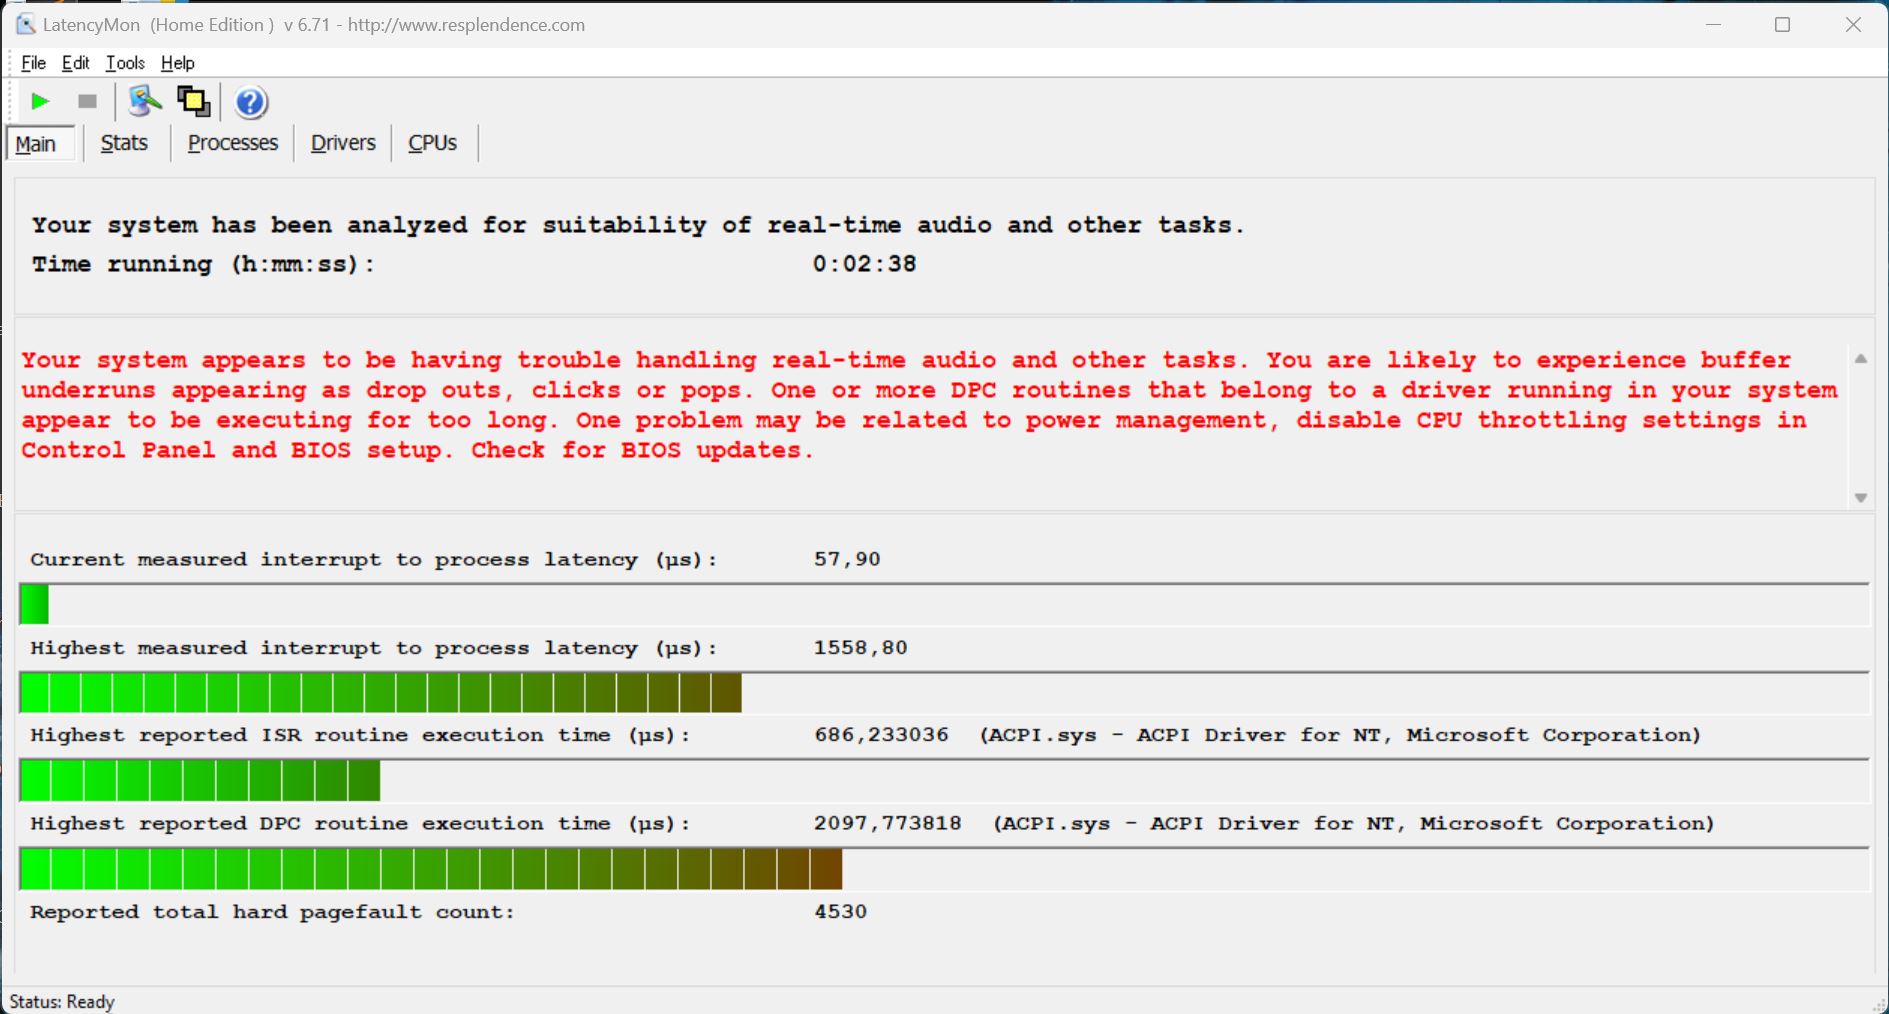
Opóźnienie DPC
Nasze urządzenie testowe tylko częściowo nadaje się do zastosowań audio w czasie rzeczywistym przy użyciu obecnej wersji BIOS-u, ponieważ nasz standardowy test opóźnień (surfowanie po Internecie, odtwarzanie YouTube w 4K, obciążenie procesora) wykazał kilka drobnych problemów.
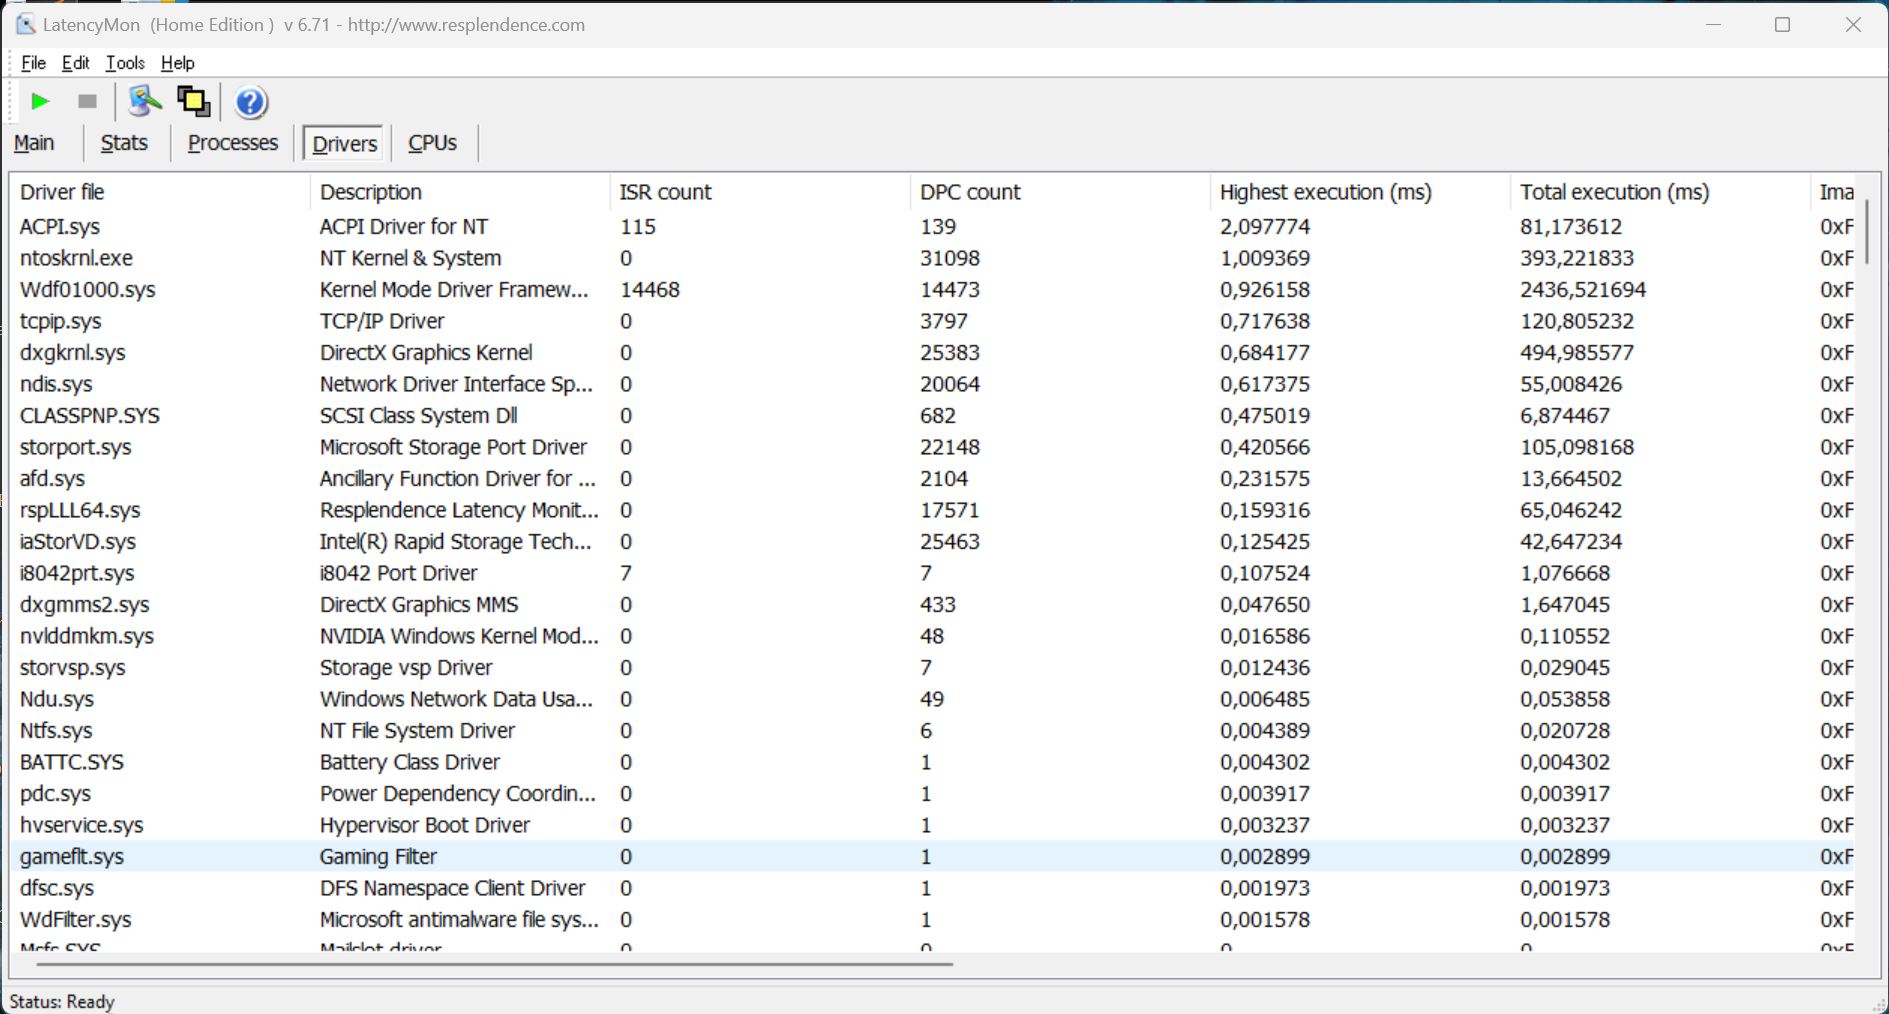
| DPC Latencies / LatencyMon - interrupt to process latency (max), Web, Youtube, Prime95 | |
| Acer Predator Triton 300 SE | |
| Gigabyte Aero 14 OLED BMF | |
| MSI Stealth 14 Studio A13V | |
| Asus ROG Flow Z13 GZ301ZE | |
| Razer Blade 14 Ryzen 9 6900HX | |
| Alienware x14 i7 RTX 3060 | |
| Schenker Vision 14 2022 RTX 3050 Ti | |
* ... im mniej tym lepiej
Urządzenia pamięci masowej
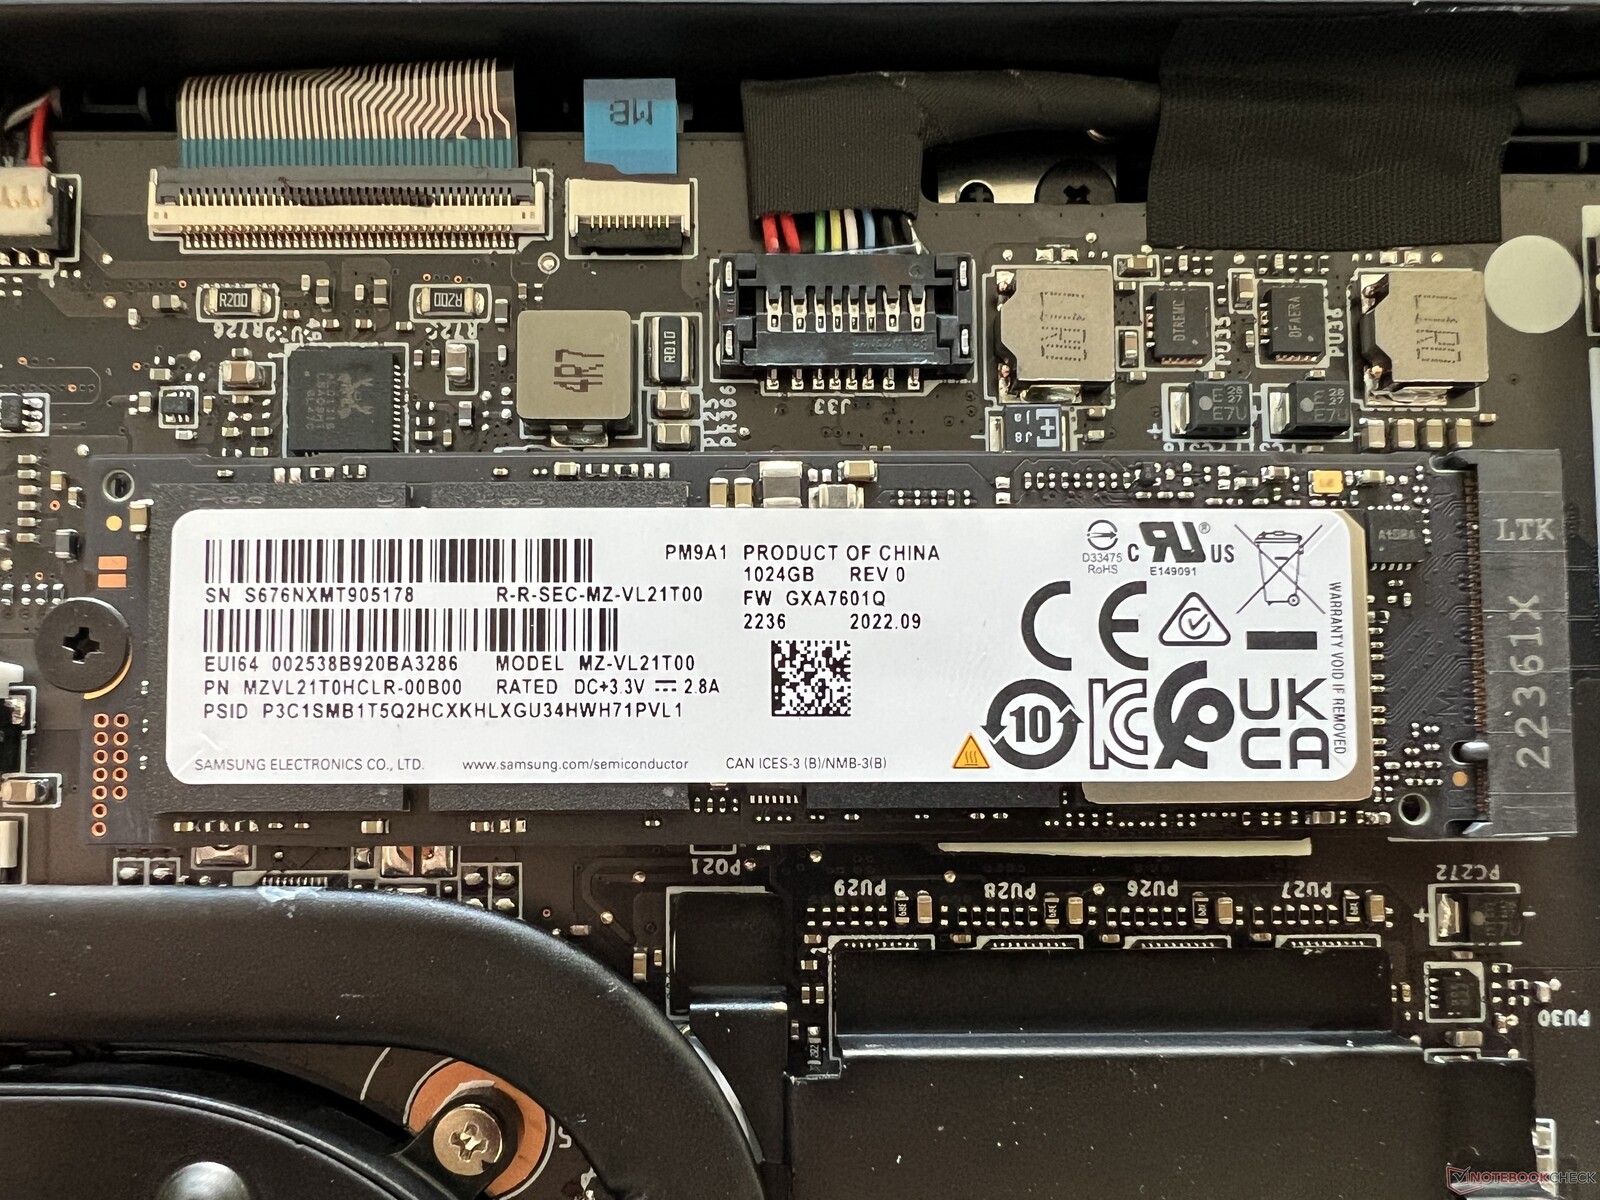
Nasza próbka testowa została wyposażona w wersję Samsung PM9A1 o pojemności 1 TB. Jest to szybki dysk PCIe 4.0, a prędkości transferu w naszych testach porównawczych były całkiem dobre, z wynikami do 7 GB/s - jednak jego wydajność nie pozostała stabilna. Po kilku minutach dysk SSD musiał zmniejszyć swoją wydajność o około 50%, co nie powinno być tak zauważalne w codziennym użytkowaniu. Fakt, że dysk SSD jest umieszczony tuż obok rurki cieplnej, z pewnością nie może być dobry dla jego temperatur. Więcej testów porównawczych dysków SSD można znaleźćtutaj.

| Drive Performance rating - Percent | |
| MSI Stealth 14 Studio A13V | |
| Razer Blade 14 Ryzen 9 6900HX | |
| Schenker Vision 14 2022 RTX 3050 Ti | |
| Gigabyte Aero 14 OLED BMF | |
| Przeciętny Samsung PM9A1 MZVL21T0HCLR | |
| Średnia w klasie Gaming | |
| Acer Predator Triton 300 SE -11! | |
| Asus ROG Flow Z13 GZ301ZE | |
| Alienware x14 i7 RTX 3060 | |
* ... im mniej tym lepiej
Reading continuous performance: DiskSpd Read Loop, Queue Depth 8
Karta graficzna - GeForce RTX 4050 Laptop
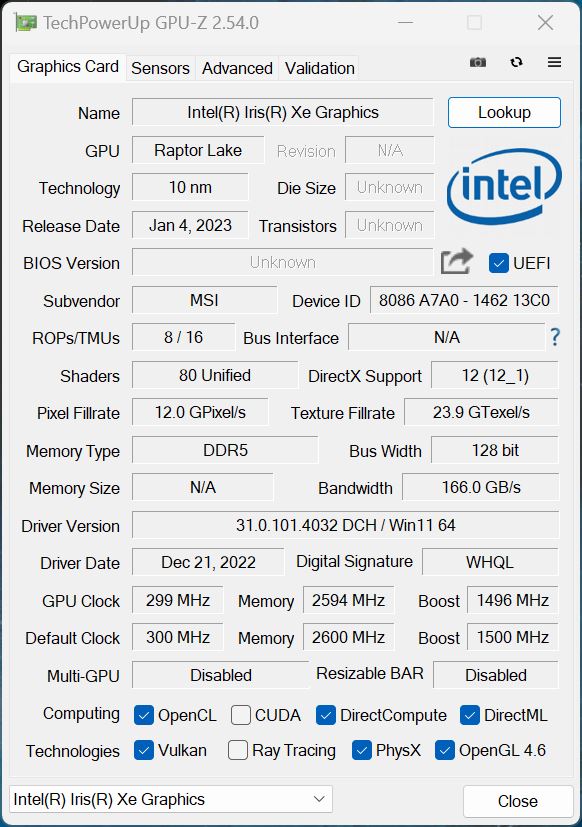
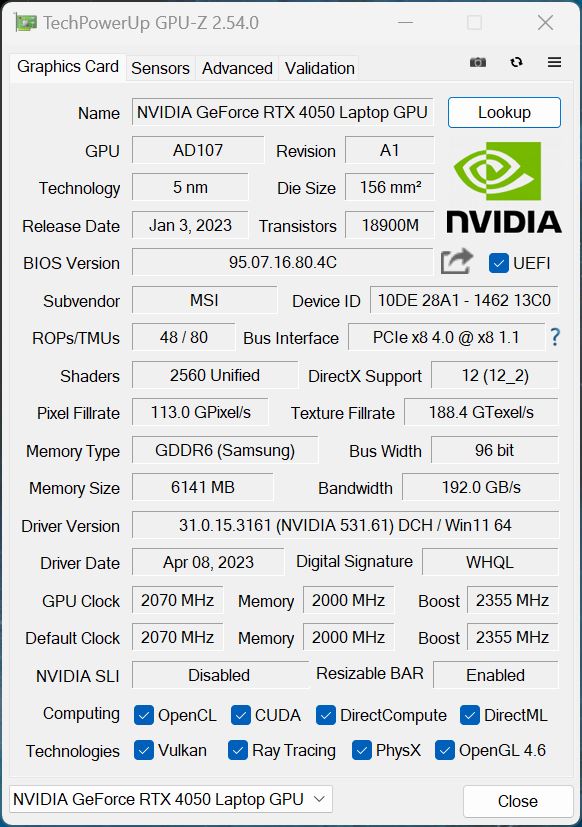
Jak już wspomniano, Stealth 14 Studio może mieć kontrolę MUX, za pomocą której można całkowicie dezaktywować zintegrowany procesor graficzny, jednak wymaga to ponownego uruchomienia, co w pewnym momencie może stać się irytujące podczas codziennego użytkowania. Wolelibyśmy zobaczyć technologię Advanced Optimus firmy Nvidia. W rezultacie polegaliśmy na normalnej metodzie przełączania grafiki przez Optimus. Karta graficznaGeForce RTX 4050 Laptopto nowy procesor graficzny Nvidii ze średniej półki i w przeciwieństwie do wielu innych obecnych laptopów multimedialnych (głównie z TGP między 40 a 50 watów), jeden z najszybszych wariantów jest w użyciu, z TGP 90 watów.
W rezultacie wyniki testów porównawczych laptopa były odpowiednio dobre i mniej więcej na tym samym poziomie coRTX 3060wAcer Predator Triton 300 SE. Uwzględniliśmy również dodatkowe modele zRTX 4060iRTX 4070 Laptopi które mają podobne wartości TGP w naszym porównaniu, dzięki czemu byliśmy w stanie uzyskać lepsze wyobrażenie o tym, jak dobrze mogą działać szybsze modele Stealth 14 Studio. Ogólnie rzecz biorąc, można oczekiwać około 20-35% lepszej wydajności graficznej.
Pod ciągłym obciążeniem wydajność graficzna pozostała stabilna, ale podczas korzystania z baterii GPU zużywał tylko 35 watów, co oznacza, że wydajność GPU spada średnio o około 35%, jeśli nie jesteś podłączony do gniazdka. Więcej testów porównawczych GPU można znaleźć w naszej sekcji technicznej.
| 3DMark 11 - 1280x720 Performance GPU | |
| Średnia w klasie Gaming (21841 - 80022, n=108, ostatnie 2 lata) | |
| Razer Blade 14 RTX 4070 | |
| Asus Zenbook Pro 14 OLED UX6404VI | |
| MSI Katana 17 B13VFK | |
| Razer Blade 14 Ryzen 9 6900HX | |
| MSI Stealth 14 Studio A13V | |
| Przeciętny NVIDIA GeForce RTX 4050 Laptop GPU (13339 - 32642, n=41) | |
| Acer Predator Triton 300 SE | |
| Gigabyte Aero 14 OLED BMF | |
| Schenker Vision 14 2022 RTX 3050 Ti | |
| Asus ROG Flow Z13 GZ301ZE | |
| 3DMark | |
| 1920x1080 Fire Strike Graphics | |
| Średnia w klasie Gaming (12242 - 62849, n=120, ostatnie 2 lata) | |
| Razer Blade 14 RTX 4070 | |
| Asus Zenbook Pro 14 OLED UX6404VI | |
| MSI Katana 17 B13VFK | |
| Razer Blade 14 Ryzen 9 6900HX | |
| MSI Stealth 14 Studio A13V | |
| Przeciętny NVIDIA GeForce RTX 4050 Laptop GPU (13591 - 24007, n=41) | |
| Acer Predator Triton 300 SE | |
| Alienware x14 i7 RTX 3060 | |
| Gigabyte Aero 14 OLED BMF | |
| Schenker Vision 14 2022 RTX 3050 Ti | |
| Asus ROG Flow Z13 GZ301ZE | |
| 2560x1440 Time Spy Graphics | |
| Średnia w klasie Gaming (5012 - 26212, n=119, ostatnie 2 lata) | |
| Razer Blade 14 RTX 4070 | |
| Asus Zenbook Pro 14 OLED UX6404VI | |
| MSI Katana 17 B13VFK | |
| Razer Blade 14 Ryzen 9 6900HX | |
| Acer Predator Triton 300 SE | |
| Przeciętny NVIDIA GeForce RTX 4050 Laptop GPU (5107 - 9040, n=41) | |
| MSI Stealth 14 Studio A13V | |
| Alienware x14 i7 RTX 3060 | |
| Gigabyte Aero 14 OLED BMF | |
| Schenker Vision 14 2022 RTX 3050 Ti | |
| Asus ROG Flow Z13 GZ301ZE | |
| Geekbench 5.5 - OpenCL Score | |
| Średnia w klasie Gaming (80702 - 277970, n=107, ostatnie 2 lata) | |
| Razer Blade 14 RTX 4070 | |
| Asus Zenbook Pro 14 OLED UX6404VI | |
| Razer Blade 14 Ryzen 9 6900HX | |
| MSI Katana 17 B13VFK | |
| Alienware x14 i7 RTX 3060 | |
| Acer Predator Triton 300 SE | |
| MSI Stealth 14 Studio A13V | |
| Przeciętny NVIDIA GeForce RTX 4050 Laptop GPU (63538 - 90075, n=38) | |
| Gigabyte Aero 14 OLED BMF | |
| Schenker Vision 14 2022 RTX 3050 Ti | |
| Asus ROG Flow Z13 GZ301ZE | |
| 3DMark 11 Performance | 26475 pkt. | |
| 3DMark Cloud Gate Standard Score | 48584 pkt. | |
| 3DMark Fire Strike Score | 19121 pkt. | |
| 3DMark Time Spy Score | 7845 pkt. | |
Pomoc | ||
| Blender / v3.3 Classroom OPTIX/RTX | |
| Schenker Vision 14 2022 RTX 3050 Ti | |
| Acer Predator Triton 300 SE | |
| Gigabyte Aero 14 OLED BMF | |
| Przeciętny NVIDIA GeForce RTX 4050 Laptop GPU (25 - 37, n=40) | |
| MSI Stealth 14 Studio A13V | |
| Średnia w klasie Gaming (9 - 32, n=111, ostatnie 2 lata) | |
| Blender / v3.3 Classroom CUDA | |
| Schenker Vision 14 2022 RTX 3050 Ti | |
| Gigabyte Aero 14 OLED BMF | |
| Acer Predator Triton 300 SE | |
| Przeciętny NVIDIA GeForce RTX 4050 Laptop GPU (47 - 68, n=39) | |
| Średnia w klasie Gaming (15 - 228, n=111, ostatnie 2 lata) | |
| Blender / v3.3 Classroom CPU | |
| Schenker Vision 14 2022 RTX 3050 Ti | |
| Gigabyte Aero 14 OLED BMF | |
| Przeciętny NVIDIA GeForce RTX 4050 Laptop GPU (243 - 907, n=40) | |
| Acer Predator Triton 300 SE | |
| MSI Stealth 14 Studio A13V | |
| Średnia w klasie Gaming (122 - 565, n=107, ostatnie 2 lata) | |
* ... im mniej tym lepiej
Wydajność w grach
Rzeczywista wydajność Stealth 14 Studio w grach wyprzedza jego konkurenta, Gigabyte Aero 14, który również jest wyposażony w RTX 4050 Laptop. Z kolei starszyRTX 3060(np.Alienware x14,Acer Triton 300 SE) ma wyraźną przewagę, jeśli chodzi o granie w gry. To samo można oczywiście powiedzieć o szybszych procesorach graficznychRTX 4060 LaptopiRTX 4070 Laptop. Ogólnie rzecz biorąc, można płynnie grać w większość gier w rozdzielczości QHD przy użyciu RTX 4050 Laptop - tylko kilka bardziej złożonych gier może wymagać obniżenia ustawień szczegółów/rozdzielczości lub użycia technologii upsamplingu, takiej jak DLSS (jeśli gra to obsługuje). To samo dotyczy ray tracingu, w przypadku którego laptop RTX 4050 nie byłby wystarczająco wydajny. Ponadto należy zauważyć, że zwłaszcza w wyższych rozdzielczościach, niewielka pamięć graficzna laptopa o pojemności 6 GB nie jest całkowicie przyszłościowa. Podobnie jak w testach czystego GPU, wydajność Stealth 14 Studio w grach również pozostała całkowicie stabilna podczas dłuższych sesji.
| Performance rating - Percent | |
| Średnia w klasie Gaming | |
| Asus Zenbook Pro 14 OLED UX6404VI | |
| MSI Katana 17 B13VFK | |
| Razer Blade 14 RTX 4070 | |
| Acer Predator Triton 300 SE | |
| Razer Blade 14 Ryzen 9 6900HX | |
| Alienware x14 i7 RTX 3060 -1! | |
| MSI Stealth 14 Studio A13V | |
| Gigabyte Aero 14 OLED BMF | |
| Asus ROG Flow Z13 GZ301ZE | |
| Schenker Vision 14 2022 RTX 3050 Ti | |
| The Witcher 3 - 1920x1080 Ultra Graphics & Postprocessing (HBAO+) | |
| Średnia w klasie Gaming (95 - 240, n=8, ostatnie 2 lata) | |
| Razer Blade 14 RTX 4070 | |
| Asus Zenbook Pro 14 OLED UX6404VI | |
| MSI Katana 17 B13VFK | |
| Razer Blade 14 Ryzen 9 6900HX | |
| MSI Stealth 14 Studio A13V | |
| Acer Predator Triton 300 SE | |
| Gigabyte Aero 14 OLED BMF | |
| Gigabyte Aero 14 OLED BMF | |
| Alienware x14 i7 RTX 3060 | |
| Alienware x14 i7 RTX 3060 | |
| Schenker Vision 14 2022 RTX 3050 Ti | |
| Asus ROG Flow Z13 GZ301ZE | |
| GTA V - 1920x1080 Highest AA:4xMSAA + FX AF:16x | |
| Średnia w klasie Gaming (48.3 - 186.9, n=102, ostatnie 2 lata) | |
| Asus Zenbook Pro 14 OLED UX6404VI | |
| MSI Katana 17 B13VFK | |
| Razer Blade 14 RTX 4070 | |
| Acer Predator Triton 300 SE | |
| Razer Blade 14 Ryzen 9 6900HX | |
| Alienware x14 i7 RTX 3060 | |
| Gigabyte Aero 14 OLED BMF | |
| Schenker Vision 14 2022 RTX 3050 Ti | |
| MSI Stealth 14 Studio A13V | |
| Asus ROG Flow Z13 GZ301ZE | |
| Final Fantasy XV Benchmark - 1920x1080 High Quality | |
| Średnia w klasie Gaming (41 - 215, n=103, ostatnie 2 lata) | |
| Razer Blade 14 RTX 4070 | |
| Asus Zenbook Pro 14 OLED UX6404VI | |
| Asus ROG Flow Z13 GZ301ZE | |
| Razer Blade 14 Ryzen 9 6900HX | |
| MSI Katana 17 B13VFK | |
| MSI Stealth 14 Studio A13V | |
| Acer Predator Triton 300 SE | |
| Alienware x14 i7 RTX 3060 | |
| Gigabyte Aero 14 OLED BMF | |
| Schenker Vision 14 2022 RTX 3050 Ti | |
| Strange Brigade - 1920x1080 ultra AA:ultra AF:16 | |
| Średnia w klasie Gaming (76.3 - 456, n=93, ostatnie 2 lata) | |
| Razer Blade 14 RTX 4070 | |
| Asus Zenbook Pro 14 OLED UX6404VI | |
| MSI Katana 17 B13VFK | |
| Razer Blade 14 Ryzen 9 6900HX | |
| Acer Predator Triton 300 SE | |
| Alienware x14 i7 RTX 3060 | |
| MSI Stealth 14 Studio A13V | |
| Gigabyte Aero 14 OLED BMF | |
| Schenker Vision 14 2022 RTX 3050 Ti | |
| Asus ROG Flow Z13 GZ301ZE | |
| Dota 2 Reborn - 1920x1080 ultra (3/3) best looking | |
| Asus Zenbook Pro 14 OLED UX6404VI | |
| MSI Katana 17 B13VFK | |
| Acer Predator Triton 300 SE | |
| Alienware x14 i7 RTX 3060 | |
| Średnia w klasie Gaming (84.8 - 248, n=112, ostatnie 2 lata) | |
| Asus ROG Flow Z13 GZ301ZE | |
| Razer Blade 14 RTX 4070 | |
| MSI Stealth 14 Studio A13V | |
| Gigabyte Aero 14 OLED BMF | |
| Razer Blade 14 Ryzen 9 6900HX | |
| Schenker Vision 14 2022 RTX 3050 Ti | |
| X-Plane 11.11 - 1920x1080 high (fps_test=3) | |
| MSI Katana 17 B13VFK | |
| Asus Zenbook Pro 14 OLED UX6404VI | |
| Acer Predator Triton 300 SE | |
| Średnia w klasie Gaming (52.1 - 143.5, n=115, ostatnie 2 lata) | |
| Gigabyte Aero 14 OLED BMF | |
| Gigabyte Aero 14 OLED BMF | |
| MSI Stealth 14 Studio A13V | |
| Asus ROG Flow Z13 GZ301ZE | |
| Razer Blade 14 RTX 4070 | |
| Schenker Vision 14 2022 RTX 3050 Ti | |
| Razer Blade 14 Ryzen 9 6900HX | |
| The Witcher 3 - 1920x1080 Ultra Graphics & Postprocessing (HBAO+) | |
| Średnia w klasie Gaming (95 - 240, n=8, ostatnie 2 lata) | |
| Razer Blade 14 RTX 4070 | |
| Asus Zenbook Pro 14 OLED UX6404VI | |
| MSI Katana 17 B13VFK | |
| Razer Blade 14 Ryzen 9 6900HX | |
| MSI Stealth 14 Studio A13V | |
| Przeciętny NVIDIA GeForce RTX 4050 Laptop GPU (18.5 - 94.7, n=40) | |
| Acer Predator Triton 300 SE | |
| Gigabyte Aero 14 OLED BMF | |
| Gigabyte Aero 14 OLED BMF | |
| Alienware x14 i7 RTX 3060 | |
| Alienware x14 i7 RTX 3060 (Battery) | |
| Schenker Vision 14 2022 RTX 3050 Ti | |
| Asus ROG Flow Z13 GZ301ZE | |
| F1 2021 - 1920x1080 Ultra High Preset + Raytracing AA:T AF:16x | |
| MSI Katana 17 B13VFK (874931) | |
| Asus Zenbook Pro 14 OLED UX6404VI (874931) | |
| MSI Stealth 14 Studio A13V (874931) | |
| Przeciętny NVIDIA GeForce RTX 4050 Laptop GPU (70.7 - 119.5, n=7) | |
| Alienware x14 i7 RTX 3060 | |
| Schenker Vision 14 2022 RTX 3050 Ti (874931) | |
| Asus ROG Flow Z13 GZ301ZE (843175) | |
| F1 22 - 1920x1080 Ultra High Preset AA:T AF:16x | |
| Razer Blade 14 RTX 4070 (959964) | |
| Średnia w klasie Gaming (40.1 - 121.2, n=5, ostatnie 2 lata) | |
| Asus Zenbook Pro 14 OLED UX6404VI (959964) | |
| MSI Katana 17 B13VFK (946728) | |
| MSI Stealth 14 Studio A13V (959964) | |
| Przeciętny NVIDIA GeForce RTX 4050 Laptop GPU (10.9 - 56.4, n=24) | |
| Gigabyte Aero 14 OLED BMF (959964) | |
| Schenker Vision 14 2022 RTX 3050 Ti (923650) | |
| Cyberpunk 2077 1.6 - 1920x1080 Ultra Preset | |
| Razer Blade 14 RTX 4070 | |
| Razer Blade 14 Ryzen 9 6900HX | |
| Asus Zenbook Pro 14 OLED UX6404VI | |
| MSI Katana 17 B13VFK | |
| Alienware x14 i7 RTX 3060 | |
| Przeciętny NVIDIA GeForce RTX 4050 Laptop GPU (44.4 - 79.4, n=14) | |
| MSI Stealth 14 Studio A13V | |
| Acer Predator Triton 300 SE | |
| Schenker Vision 14 2022 RTX 3050 Ti | |
| Call of Duty Modern Warfare 2 2022 - 1920x1080 Extreme Quality Preset AA:T2X Filmic SM | |
| Razer Blade 14 RTX 4070 | |
| MSI Katana 17 B13VFK | |
| MSI Stealth 14 Studio A13V | |
| Przeciętny NVIDIA GeForce RTX 4050 Laptop GPU (54 - 77, n=3) | |
Witcher 3 FPS diagram
| low | med. | high | ultra | QHD | 4K | |
|---|---|---|---|---|---|---|
| GTA V (2015) | 161.7 | 142.4 | 55.9 | 55.7 | ||
| The Witcher 3 (2015) | 168.5 | 121.7 | 76.7 | |||
| Dota 2 Reborn (2015) | 172.1 | 157.1 | 142.8 | 135.3 | 101.2 | |
| Final Fantasy XV Benchmark (2018) | 180.2 | 116.2 | 82 | 59.7 | ||
| X-Plane 11.11 (2018) | 141.6 | 124.7 | 97.8 | |||
| Strange Brigade (2018) | 277 | 191.9 | 145.3 | 123.1 | 79.8 | |
| Shadow of the Tomb Raider (2018) | 102 | 95 | 86 | 60 | ||
| F1 2021 (2021) | 323 | 245 | 194.5 | 105.4 | 74.3 | |
| Cyberpunk 2077 1.6 (2022) | 72.78 | 60.72 | 57.77 | 37.66 | ||
| F1 22 (2022) | 156.5 | 149.6 | 133.6 | 48.4 | 29.9 | |
| Call of Duty Modern Warfare 2 2022 (2022) | 101 | 75 | 70 | 47 |
Emisje - komora parowa z umiarkowanym wskaźnikiem skuteczności
Emisja hałasu
Układ chłodzenia laptopa składa się z dużej komory parowej, a także dwóch wentylatorów, które stają się szczególnie irytujące podczas codziennego użytkowania. Pod niskim obciążeniem, a czasem nawet w trybie bezczynności, odnotowaliśmy warkot do prawie 34 dB(A), co zdecydowanie słychać. Czasami odnotowywaliśmy nawet krótkie skoki powyżej 40 dB(A), gdy wentylatory się uruchamiały, co jest całkowicie niepotrzebne. Pod obciążeniem tryb Extreme Performance był najgłośniejszy, mierząc 51 dB(A) - chociaż 47 dB(A), które zmierzyliśmy w trybie Balanced, nie jest dużo cichsze. Zdecydowanie zalecamy noszenie słuchawek podczas grania. Nie odnotowaliśmy żadnych innych odgłosów elektronicznych.
| Zastosowanie | Cichy | Zrównoważony | Ekstremalna wydajność |
|---|---|---|---|
| 3DMark 06 | 36,6 dB(A) | 42,2 dB(A) | 42,2 dB(A) |
| Witcher 3 | 42.2 dB(A) | 47,3 dB(A) | 51 dB(A) |
| Test obciążeniowy | 42,2 dB(A) | 47,3 dB(A) | 51 dB(A) |
Hałas
| luz |
| 25.3 / 25 / 33.7 dB |
| obciążenie |
| 42.2 / 51 dB |
 | ||
30 dB cichy 40 dB(A) słyszalny 50 dB(A) irytujący |
||
min: | ||
| MSI Stealth 14 Studio A13V GeForce RTX 4050 Laptop GPU, i7-13700H, Samsung PM9A1 MZVL21T0HCLR | Gigabyte Aero 14 OLED BMF GeForce RTX 4050 Laptop GPU, i7-13700H, Gigabyte AG470S1TB-SI B10 | Schenker Vision 14 2022 RTX 3050 Ti GeForce RTX 3050 Ti Laptop GPU, i7-12700H, Samsung SSD 980 Pro 1TB MZ-V8P1T0BW | Asus ROG Flow Z13 GZ301ZE GeForce RTX 3050 Ti Laptop GPU, i9-12900H, Micron 2450 1TB MTFDKBK1T0TFK | Alienware x14 i7 RTX 3060 GeForce RTX 3060 Laptop GPU, i7-12700H, WDC PC SN810 1TB | Razer Blade 14 Ryzen 9 6900HX GeForce RTX 3070 Ti Laptop GPU, R9 6900HX, Samsung PM9A1 MZVL21T0HCLR | Acer Predator Triton 300 SE GeForce RTX 3060 Laptop GPU, i9-12900H, Micron 3400 1TB MTFDKBA1T0TFH | |
|---|---|---|---|---|---|---|---|
| Noise | 5% | 5% | 11% | 2% | 15% | -2% | |
| wyłączone / środowisko * (dB) | 25.3 | 24 5% | 24.4 4% | 24.5 3% | 24.7 2% | 23.3 8% | 23.8 6% |
| Idle Minimum * (dB) | 25.3 | 24 5% | 24.4 4% | 24.5 3% | 24.7 2% | 23.3 8% | 23.8 6% |
| Idle Average * (dB) | 25 | 24 4% | 24.4 2% | 24.5 2% | 24.7 1% | 23.3 7% | 23.8 5% |
| Idle Maximum * (dB) | 33.7 | 35.71 -6% | 27.8 18% | 24.5 27% | 30.9 8% | 23.3 31% | 30.6 9% |
| Load Average * (dB) | 42.2 | 43.3 -3% | 41 3% | 40 5% | 34.7 18% | 44.2 -5% | |
| Witcher 3 ultra * (dB) | 51 | 40.22 21% | 48.2 5% | 41 20% | 51.5 -1% | 42.1 17% | 60.1 -18% |
| Load Maximum * (dB) | 51 | 51.93 -2% | 48.8 4% | 41 20% | 51.5 -1% | 42.1 17% | 60 -18% |
* ... im mniej tym lepiej
Temperatura
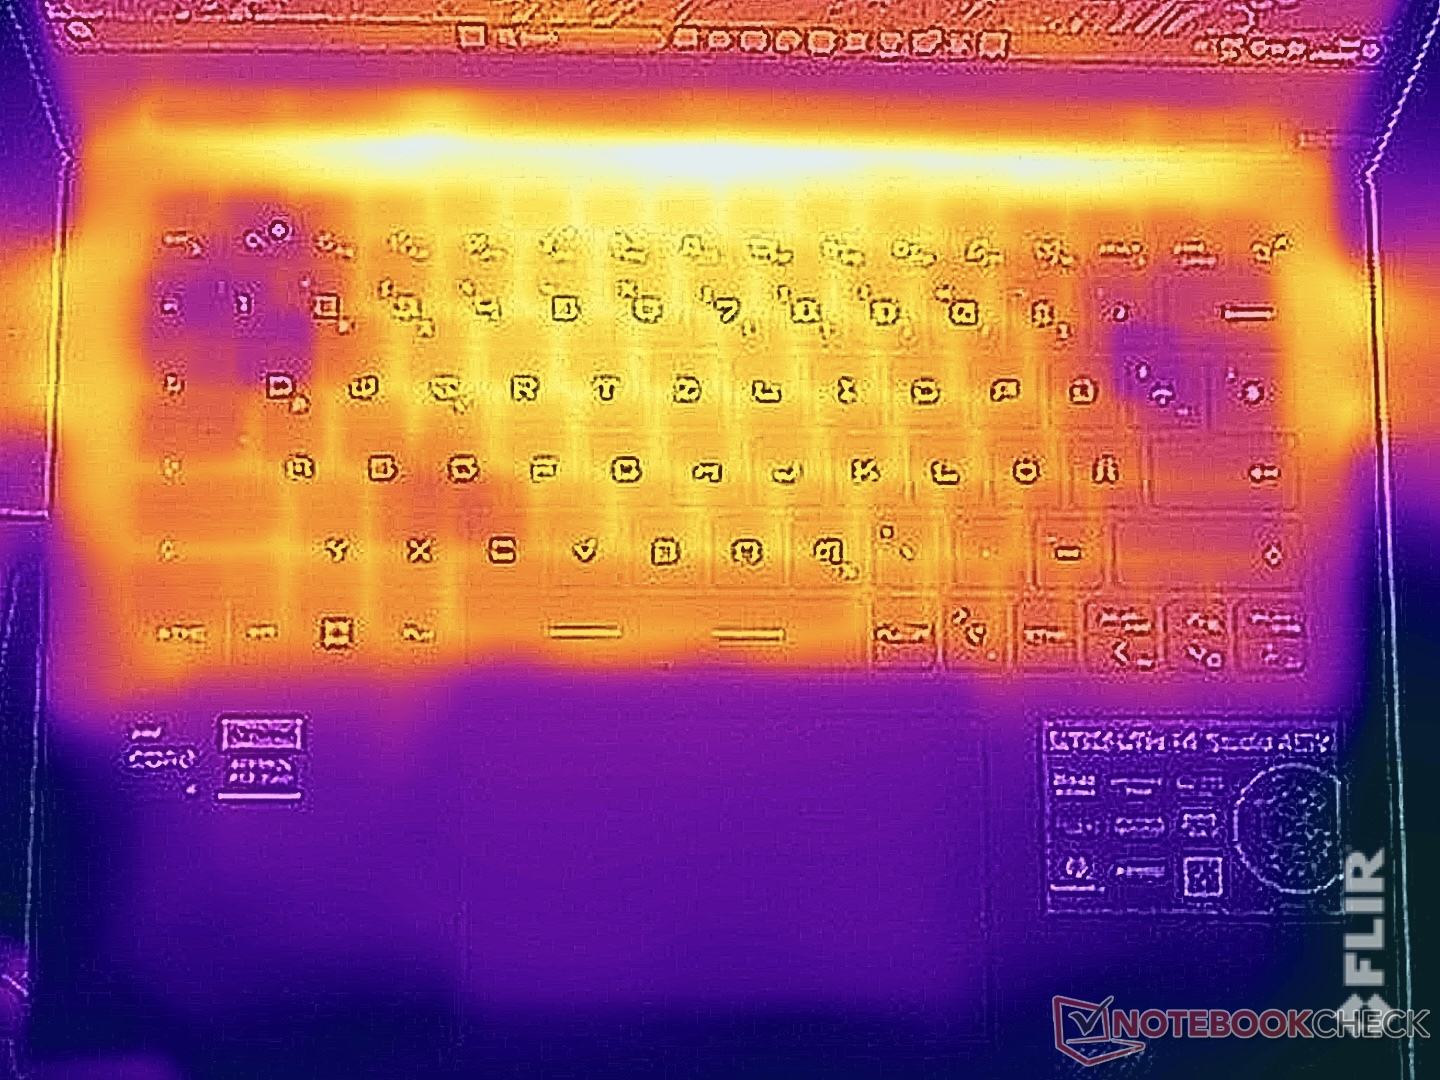
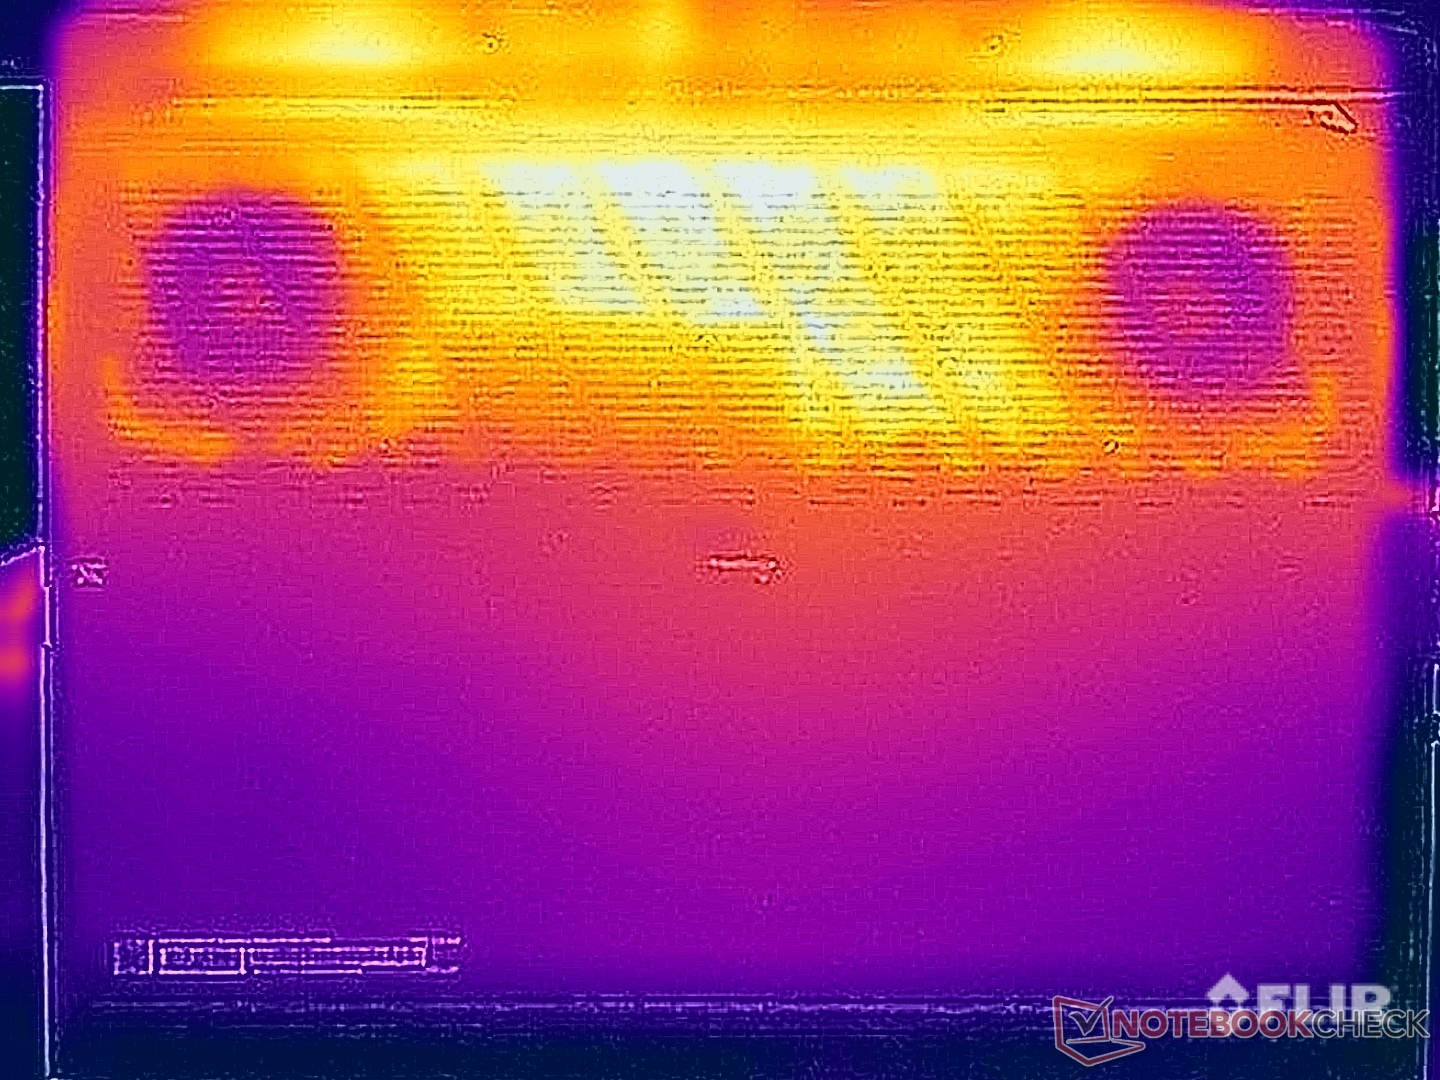
Zauważyliśmy już, że Stealth 14 Studio robi się dość ciepły w czasie bezczynności, zwłaszcza spód urządzenia. Podczas prostych codziennych zadań nadal można wygodnie posadzić laptopa na udach. Gdy tylko urządzenie zostanie poddane większemu obciążeniu lub gdy zaczniesz grać, prawdopodobnie powinieneś tego unikać, ponieważ szybko zacznie to być niewygodne. Zmierzyliśmy ponad 55 °C na spodzie urządzenia. Nawet klawiatura nagrzała się i osiągnęła temperaturę do 45 °C, co zdecydowanie można zauważyć podczas grania w gry, a po dłuższym czasie zaczyna być nieco niewygodne.
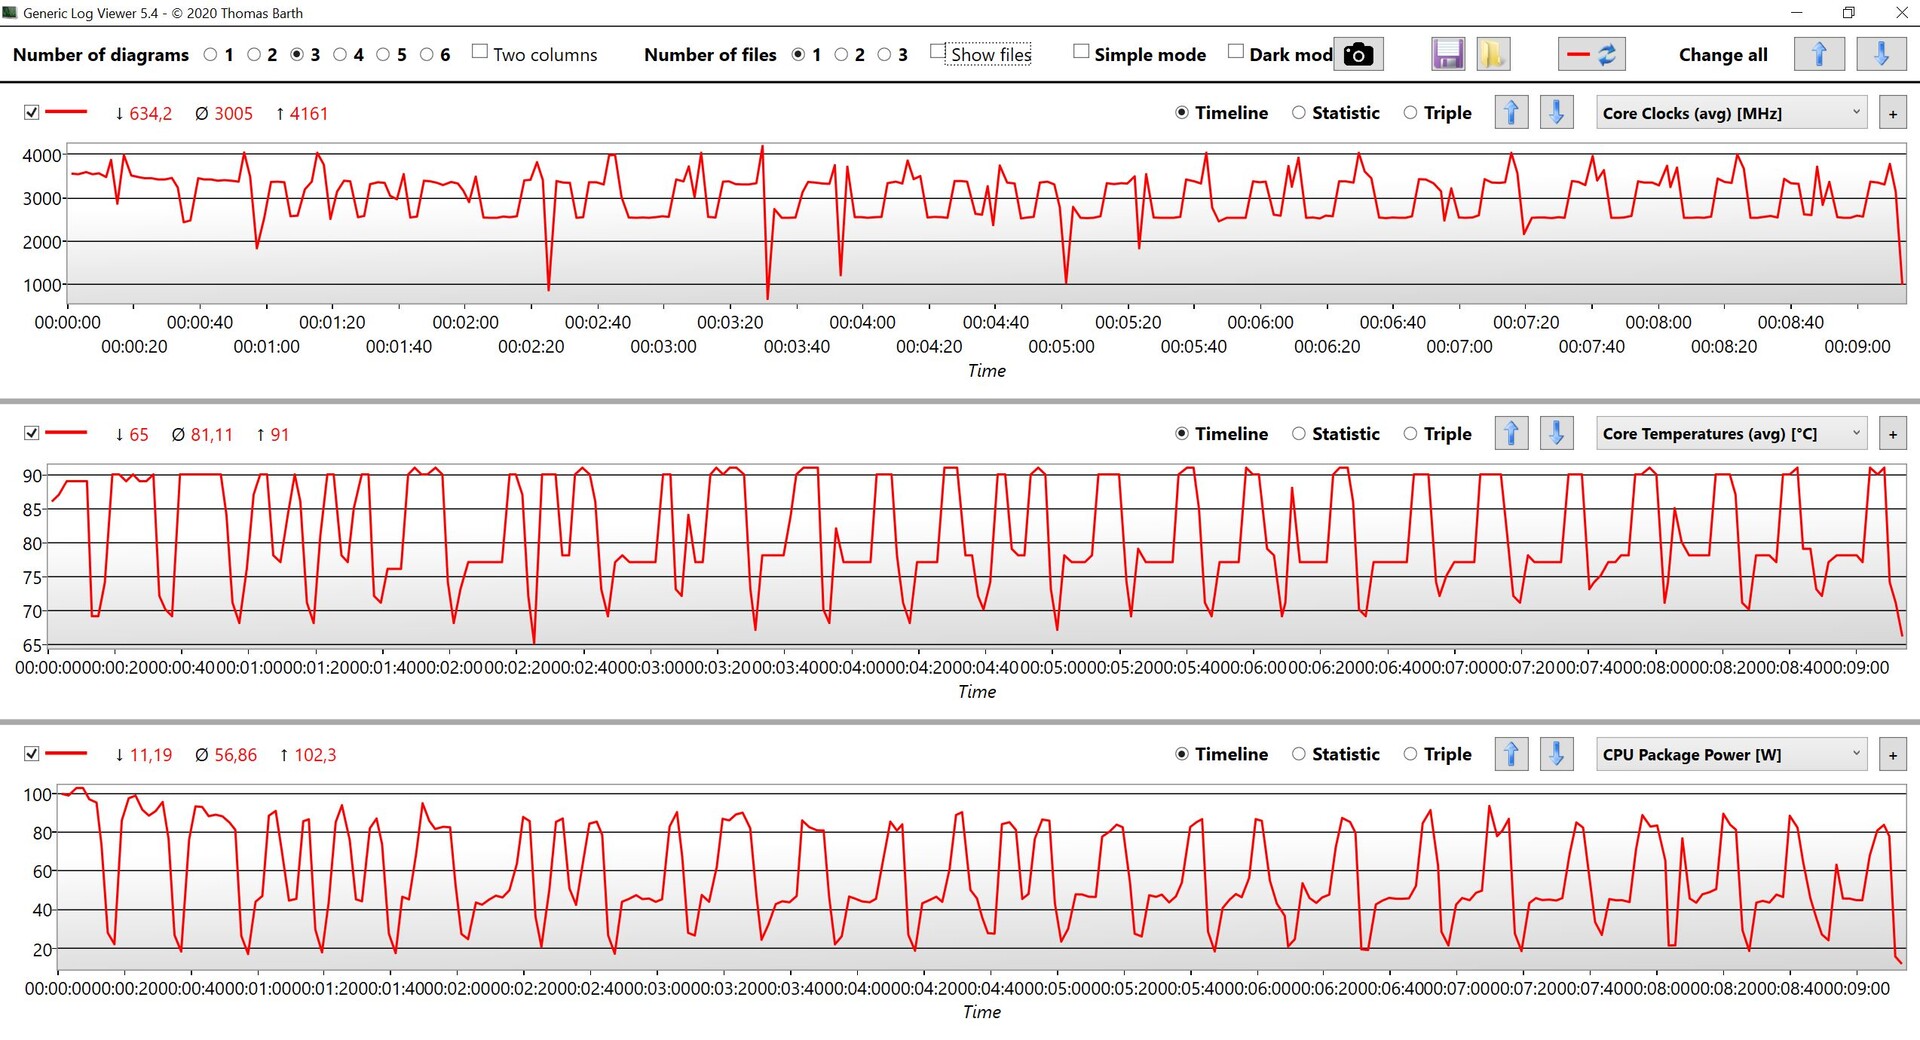
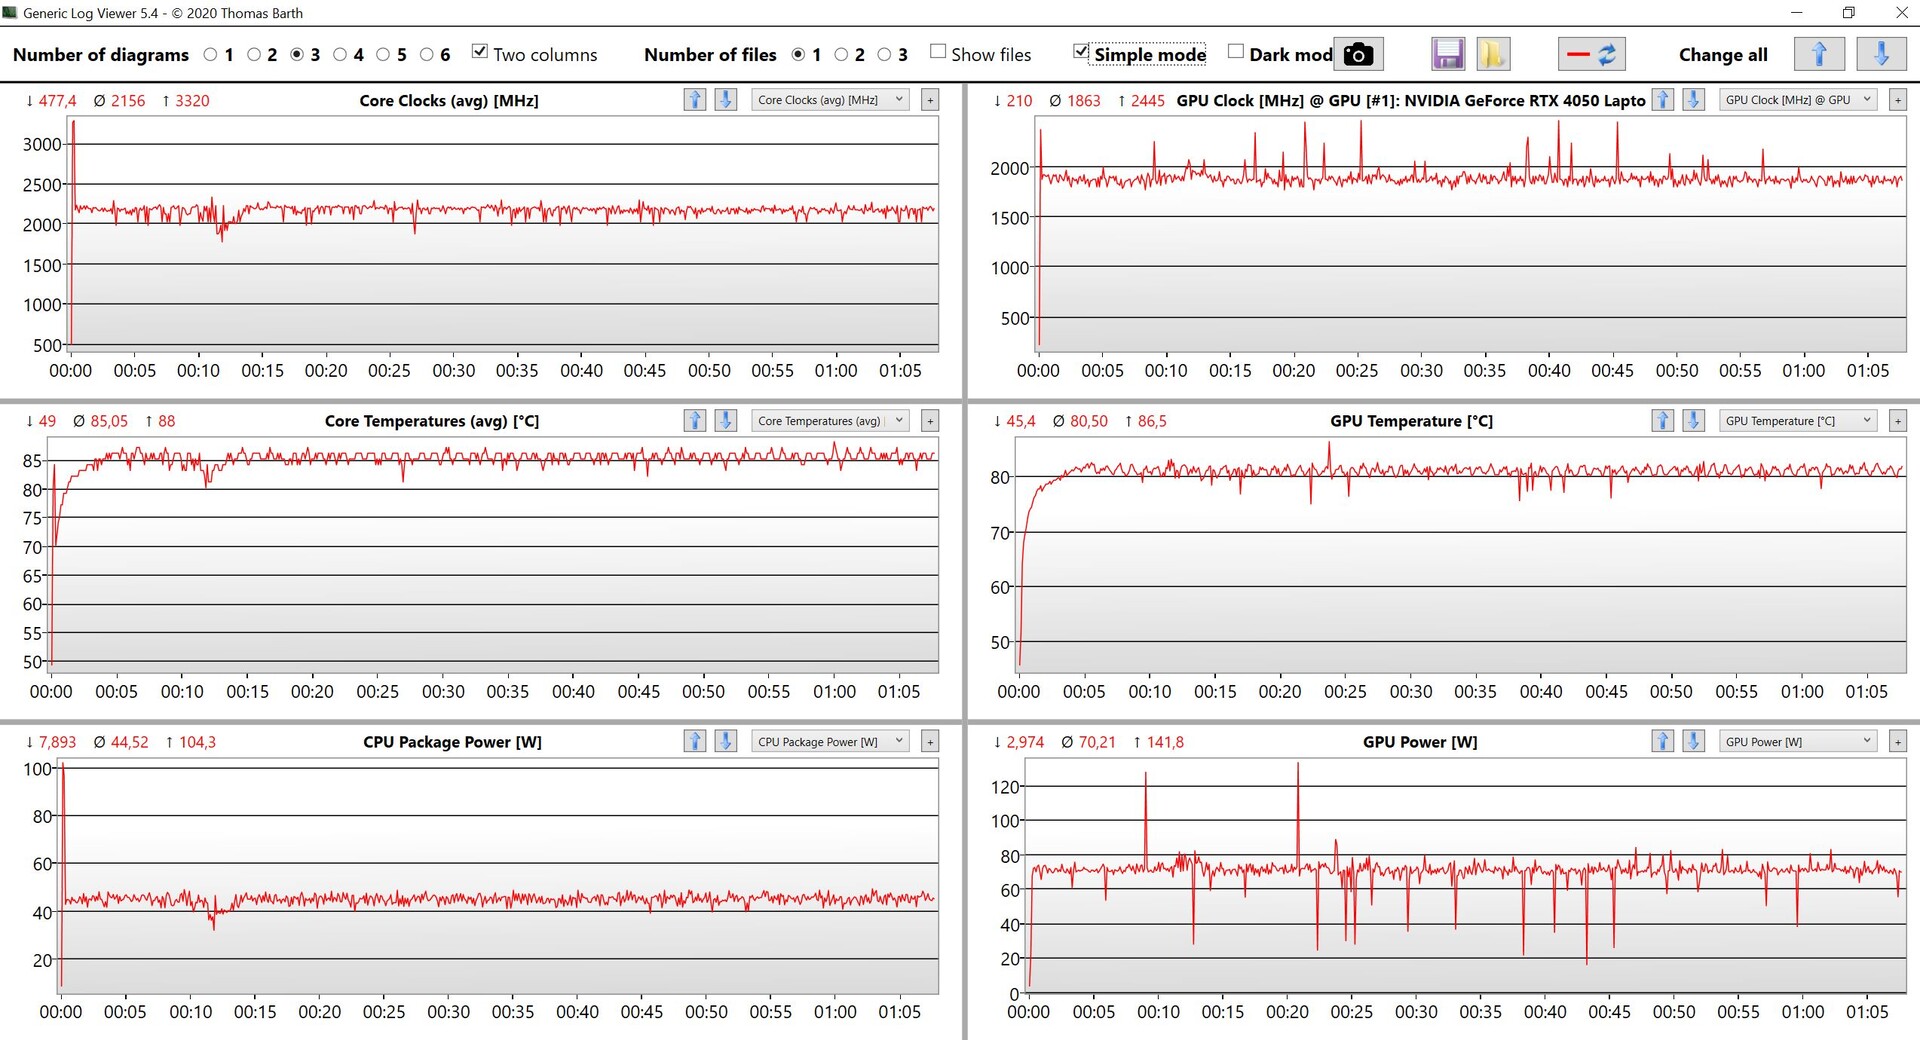
Podczas testu obciążeniowego CPU i GPU szybko wyrównały się na poziomie odpowiednio 45 i 70 watów, co oznacza, że laptop musi chłodzić 115 watów w czasie. Bezpośrednio po teście obciążeniowym nie odnotowaliśmy spadku wydajności.
(-) Maksymalna temperatura w górnej części wynosi 46.9 °C / 116 F, w porównaniu do średniej 40.4 °C / 105 F , począwszy od 21.2 do 68.8 °C dla klasy Gaming.
(-) Dno nagrzewa się maksymalnie do 56.1 °C / 133 F, w porównaniu do średniej 43.2 °C / 110 F
(+) W stanie bezczynności średnia temperatura górnej części wynosi 29.7 °C / 85 F, w porównaniu ze średnią temperaturą urządzenia wynoszącą 33.9 °C / ### class_avg_f### F.
(-) Podczas gry w Wiedźmina 3 średnia temperatura górnej części wynosi 38.3 °C / 101 F, w porównaniu do średniej temperatury urządzenia wynoszącej 33.9 °C / ## #class_avg_f### F.
(+) Podpórki pod nadgarstki i touchpad są chłodniejsze niż temperatura skóry i maksymalnie 27.5 °C / 81.5 F i dlatego są chłodne w dotyku.
(±) Średnia temperatura obszaru podparcia dłoni w podobnych urządzeniach wynosiła 28.8 °C / 83.8 F (+1.3 °C / 2.3 F).
| MSI Stealth 14 Studio A13V Intel Core i7-13700H, NVIDIA GeForce RTX 4050 Laptop GPU | Gigabyte Aero 14 OLED BMF Intel Core i7-13700H, NVIDIA GeForce RTX 4050 Laptop GPU | Schenker Vision 14 2022 RTX 3050 Ti Intel Core i7-12700H, NVIDIA GeForce RTX 3050 Ti Laptop GPU | Asus ROG Flow Z13 GZ301ZE Intel Core i9-12900H, NVIDIA GeForce RTX 3050 Ti Laptop GPU | Alienware x14 i7 RTX 3060 Intel Core i7-12700H, NVIDIA GeForce RTX 3060 Laptop GPU | Razer Blade 14 Ryzen 9 6900HX AMD Ryzen 9 6900HX, NVIDIA GeForce RTX 3070 Ti Laptop GPU | Acer Predator Triton 300 SE Intel Core i9-12900H, NVIDIA GeForce RTX 3060 Laptop GPU | |
|---|---|---|---|---|---|---|---|
| Heat | 17% | 9% | 13% | 16% | 7% | 17% | |
| Maximum Upper Side * (°C) | 46.9 | 42 10% | 48.4 -3% | 45.3 3% | 51.3 -9% | 40.6 13% | 43 8% |
| Maximum Bottom * (°C) | 56.1 | 52 7% | 57.1 -2% | 48.3 14% | 44.4 21% | 42.6 24% | 46.4 17% |
| Idle Upper Side * (°C) | 33.8 | 26 23% | 28.1 17% | 29.2 14% | 27.2 20% | 38 -12% | 28.2 17% |
| Idle Bottom * (°C) | 37.9 | 27 29% | 29 23% | 30 21% | 26.6 30% | 37 2% | 28.4 25% |
* ... im mniej tym lepiej
Głośniki
MSI wyposażyło Stealth 14 Studio w cztery głośniki, w tym oprogramowanie Nahimic Audio. Oprogramowanie to oferuje różne profile, które można dodatkowo dostosować (na przykład z większą ilością basów lub bardziej wyrazistym wokalem) i zdecydowanie zalecamy korzystanie z tego oprogramowania. Ogólnie rzecz biorąc, odnotowaliśmy dobre wyniki i zdecydowanie lepsze niż urządzenia porównawcze - jedynymi urządzeniami, do których laptop MSI nie mógł się zbliżyć, było kilka laptopów multimedialnych z naprawdę dobrymi systemami dźwiękowymi. Niestety, głośniki i tak nie są najlepsze do gier, ponieważ głośne wentylatory laptopa zagłuszają prawie wszystko.
MSI Stealth 14 Studio A13V analiza dźwięku
(±) | głośność głośnika jest średnia, ale dobra (81 dB)
Bas 100 - 315 Hz
(±) | zredukowany bas - średnio 11.2% niższy od mediany
(+) | bas jest liniowy (6.7% delta do poprzedniej częstotliwości)
Średnie 400 - 2000 Hz
(+) | zbalansowane środki średnie - tylko 1.6% od mediany
(+) | średnie są liniowe (2.9% delta do poprzedniej częstotliwości)
Wysokie 2–16 kHz
(±) | wyższe maksima - średnio 5.3% wyższe od mediany
(±) | liniowość wysokich wartości jest średnia (7.5% delta do poprzedniej częstotliwości)
Ogólnie 100 - 16.000 Hz
(+) | ogólny dźwięk jest liniowy (11.9% różnicy w stosunku do mediany)
W porównaniu do tej samej klasy
» 12% wszystkich testowanych urządzeń w tej klasie było lepszych, 4% podobnych, 84% gorszych
» Najlepszy miał deltę 6%, średnia wynosiła ###średnia###%, najgorsza wynosiła 132%
W porównaniu do wszystkich testowanych urządzeń
» 9% wszystkich testowanych urządzeń było lepszych, 2% podobnych, 89% gorszych
» Najlepszy miał deltę 4%, średnia wynosiła ###średnia###%, najgorsza wynosiła 134%
Acer Predator Triton 300 SE analiza dźwięku
(±) | głośność głośnika jest średnia, ale dobra (79.9 dB)
Bas 100 - 315 Hz
(±) | zredukowany bas - średnio 10.3% niższy od mediany
(±) | liniowość basu jest średnia (9.7% delta do poprzedniej częstotliwości)
Średnie 400 - 2000 Hz
(±) | wyższe średnie - średnio 5% wyższe niż mediana
(+) | średnie są liniowe (4% delta do poprzedniej częstotliwości)
Wysokie 2–16 kHz
(±) | wyższe maksima - średnio 5.5% wyższe od mediany
(±) | liniowość wysokich wartości jest średnia (7.6% delta do poprzedniej częstotliwości)
Ogólnie 100 - 16.000 Hz
(±) | liniowość ogólnego dźwięku jest średnia (15.1% różnicy w stosunku do mediany)
W porównaniu do tej samej klasy
» 32% wszystkich testowanych urządzeń w tej klasie było lepszych, 6% podobnych, 62% gorszych
» Najlepszy miał deltę 6%, średnia wynosiła ###średnia###%, najgorsza wynosiła 132%
W porównaniu do wszystkich testowanych urządzeń
» 21% wszystkich testowanych urządzeń było lepszych, 4% podobnych, 75% gorszych
» Najlepszy miał deltę 4%, średnia wynosiła ###średnia###%, najgorsza wynosiła 134%
Zarządzanie energią - mała wytrzymałość
Zużycie energii
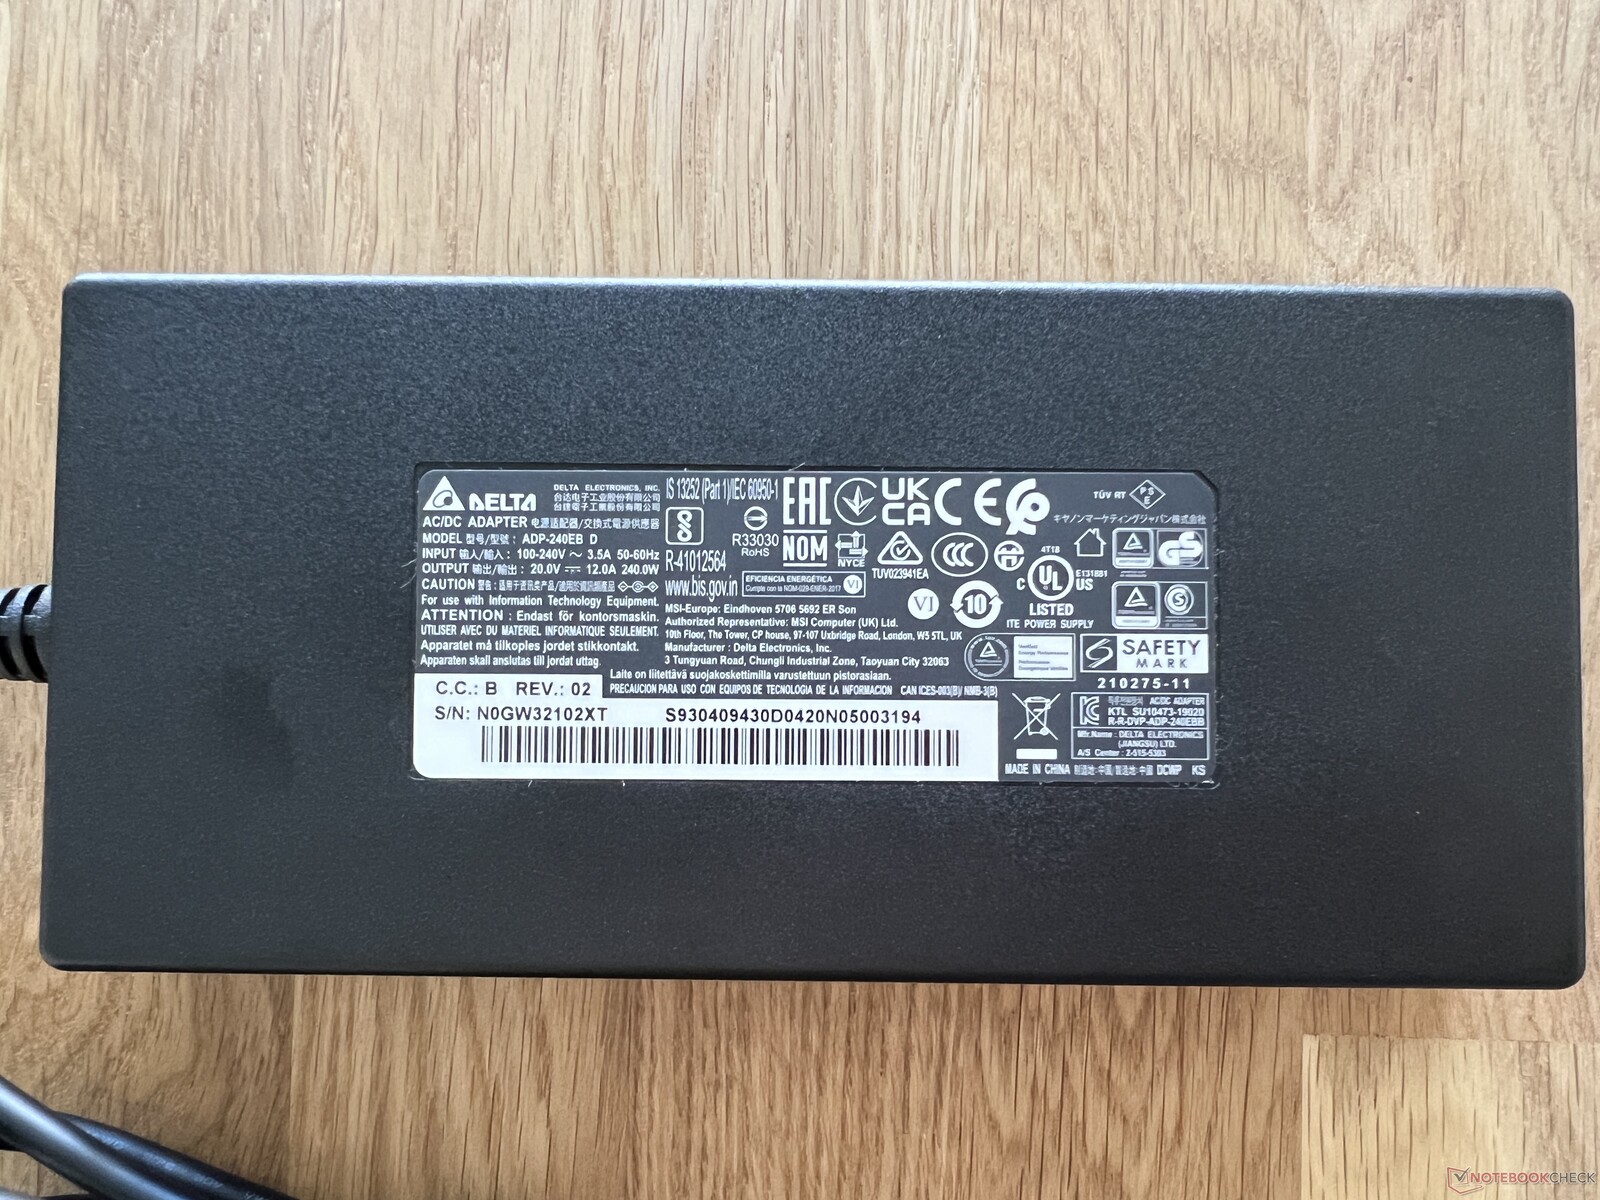
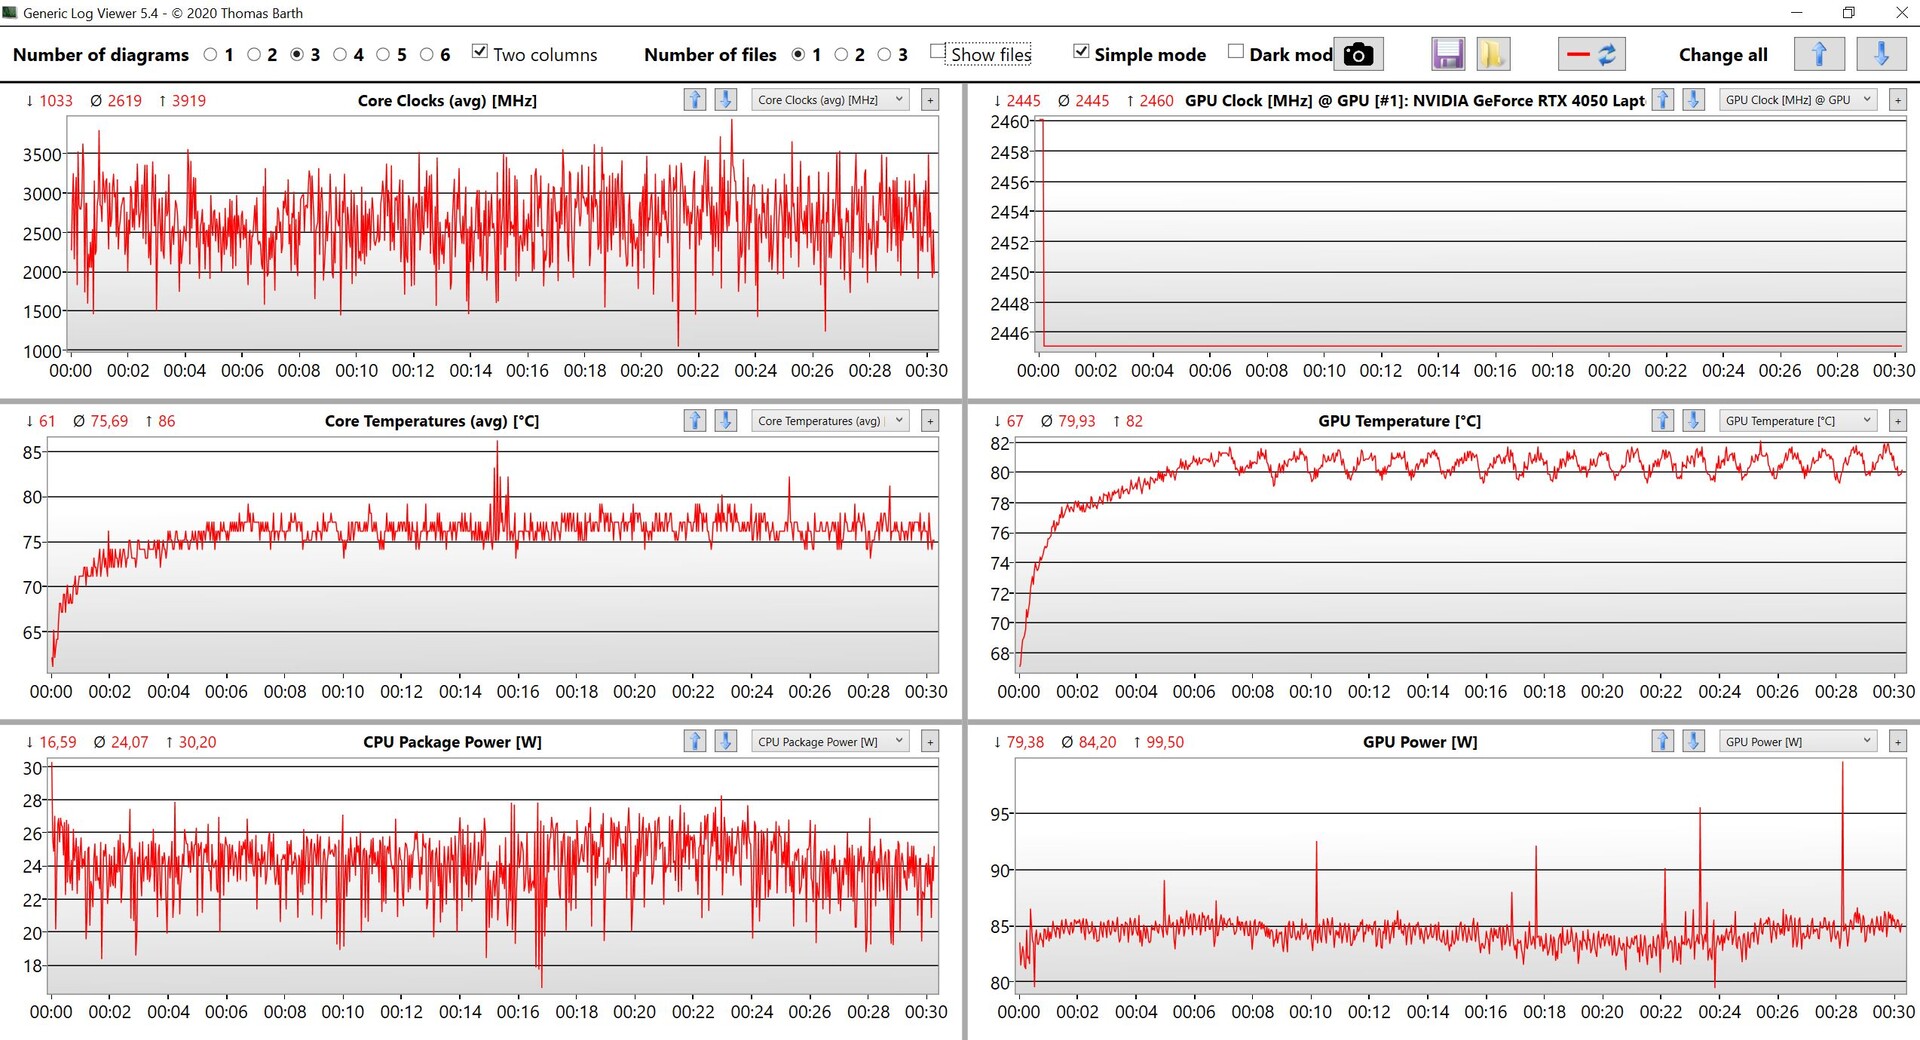
Zwłaszcza w trybie bezczynności byliśmy zaskoczeni tym, ile energii zużywa urządzenie pomimo przełączania grafiki. Zdecydowanie zauważyliśmy dużą przewagę nad konkurencją w tym aspekcie. Przy pełnej jasności zmierzyliśmy około 20 watów w trybie bezczynności, co jest dużo jak na kompaktowe 14-calowe urządzenie o jasności 400 cd/m². Laptop MSI zużywa również dużo energii podczas grania; producent naprawdę mógłby się temu przyjrzeć. Podczas naszego testu obciążeniowego zmierzyliśmy maksymalnie 200 watów - szybko wyrównało się to do około 150 watów. W rezultacie dostarczony 240-watowy zasilacz jest całkowicie wystarczający - może nawet nieco zbyt mocny.
| wyłączony / stan wstrzymania | |
| luz | |
| obciążenie |
|
Legenda:
min: | |
| MSI Stealth 14 Studio A13V i7-13700H, GeForce RTX 4050 Laptop GPU, Samsung PM9A1 MZVL21T0HCLR, IPS, 2560x1600, 14" | Gigabyte Aero 14 OLED BMF i7-13700H, GeForce RTX 4050 Laptop GPU, Gigabyte AG470S1TB-SI B10, OLED, 2880x1800, 14" | Schenker Vision 14 2022 RTX 3050 Ti i7-12700H, GeForce RTX 3050 Ti Laptop GPU, Samsung SSD 980 Pro 1TB MZ-V8P1T0BW, IPS, 2880x1800, 14" | Asus ROG Flow Z13 GZ301ZE i9-12900H, GeForce RTX 3050 Ti Laptop GPU, Micron 2450 1TB MTFDKBK1T0TFK, IPS, 1920x1200, 13.4" | Alienware x14 i7 RTX 3060 i7-12700H, GeForce RTX 3060 Laptop GPU, WDC PC SN810 1TB, IPS, 1920x1080, 14" | Razer Blade 14 Ryzen 9 6900HX R9 6900HX, GeForce RTX 3070 Ti Laptop GPU, Samsung PM9A1 MZVL21T0HCLR, IPS, 2560x1440, 14" | Acer Predator Triton 300 SE i9-12900H, GeForce RTX 3060 Laptop GPU, Micron 3400 1TB MTFDKBA1T0TFH, OLED, 2880x1800, 14" | Przeciętny NVIDIA GeForce RTX 4050 Laptop GPU | Średnia w klasie Gaming | |
|---|---|---|---|---|---|---|---|---|---|
| Power Consumption | 41% | 35% | 34% | 24% | -15% | 9% | 8% | -18% | |
| Idle Minimum * (Watt) | 10.4 | 7.4 29% | 7.5 28% | 8.8 15% | 7.9 24% | 10.2 2% | 7.6 27% | 9.95 ? 4% | 13.2 ? -27% |
| Idle Average * (Watt) | 19.1 | 8.3 57% | 10.4 46% | 12.1 37% | 11.1 42% | 26 -36% | 12.3 36% | 15.8 ? 17% | 18.9 ? 1% |
| Idle Maximum * (Watt) | 19.4 | 8.7 55% | 11.4 41% | 12.7 35% | 11.8 39% | 26.7 -38% | 17.6 9% | 20.1 ? -4% | 24.3 ? -25% |
| Load Average * (Watt) | 95.9 | 76 21% | 83.3 13% | 72.3 25% | 107.4 -12% | 89.3 7% | 111 -16% | 88 ? 8% | 108 ? -13% |
| Witcher 3 ultra * (Watt) | 141.6 | 70 51% | 92.7 35% | 77.3 45% | 111 22% | 158.7 -12% | 117.1 17% | ||
| Load Maximum * (Watt) | 203 | 132 35% | 110.3 46% | 103.1 49% | 140.4 31% | 227.5 -12% | 245.8 -21% | 176.3 ? 13% | 254 ? -25% |
* ... im mniej tym lepiej
Power consumption Witcher 3 / stress test
Power consumption with external monitor
Czas trwania
Pomimo baterii o pojemności 72 Wh, czasy pracy laptopa MSI nie są szczególnie dobre, nawet w trybie 60 Hz. Przy dostosowanej jasności 150 cd/m² (co oznacza około 36% jasności naszej próbki testowej), nasz test WLAN zakończył się po nieco ponad 6 godzinach. Przy 240 Hz test nie trwał nawet 5 godzin. Kiedy powtórzyliśmy test przy pełnej jasności laptopa, trwał on tylko 5 godzin przy 60 Hz i 4 godziny przy 240 Hz. Nawet test wideo przy 150 cd/m² i 60 Hz trwał tylko nieco ponad 6,5 godziny. Jak na kompaktowe 14-calowe urządzenie ze stosunkowo dużą baterią i przełączaniem grafiki, jest to rozczarowujący wynik. Pełne naładowanie urządzenia zajmuje około 2 godzin, a 75% jego pojemności osiągane jest po 45 minutach. Laptop może być również ładowany przez USB-C w podróży.
| MSI Stealth 14 Studio A13V i7-13700H, GeForce RTX 4050 Laptop GPU, 72 Wh | Gigabyte Aero 14 OLED BMF i7-13700H, GeForce RTX 4050 Laptop GPU, 63 Wh | Schenker Vision 14 2022 RTX 3050 Ti i7-12700H, GeForce RTX 3050 Ti Laptop GPU, 99.8 Wh | Asus ROG Flow Z13 GZ301ZE i9-12900H, GeForce RTX 3050 Ti Laptop GPU, 56 Wh | Alienware x14 i7 RTX 3060 i7-12700H, GeForce RTX 3060 Laptop GPU, 80 Wh | Razer Blade 14 Ryzen 9 6900HX R9 6900HX, GeForce RTX 3070 Ti Laptop GPU, 62 Wh | Acer Predator Triton 300 SE i9-12900H, GeForce RTX 3060 Laptop GPU, 76 Wh | Średnia w klasie Gaming | |
|---|---|---|---|---|---|---|---|---|
| Czasy pracy | 23% | 68% | -7% | 17% | 42% | 3% | 20% | |
| H.264 (h) | 6.6 | 11.1 68% | 6 -9% | 9.4 42% | 8.26 ? 25% | |||
| WiFi v1.3 (h) | 6.3 | 7.6 21% | 10.1 60% | 5.6 -11% | 8.9 41% | 9.5 51% | 6.2 -2% | 7.02 ? 11% |
| Load (h) | 1.2 | 1.5 25% | 2.1 75% | 1.2 0% | 0.8 -33% | 1.6 33% | 1.3 8% | 1.47 ? 23% |
| Reader / Idle (h) | 11.3 | 12.2 | 8.1 | 8.71 ? | ||||
| Witcher 3 ultra (h) | 0.8 | 0.8 |
Za
Przeciw
Werdykt - MSI Stealth 14 Studio pozostawia mieszane wrażenia

MSI Stealth 14 Studio ma być potężnym, ale kompaktowym laptopem dla graczy i kreatywnych użytkowników. Podczas naszego testu mieliśmy kilka negatywnych punktów do odnotowania, które okazują się być problemem dla laptopa kosztującego 1,699.99 USD. Po pierwsze, urządzenie jest "tylko" wyposażone w małą kartę graficznąRTX 4050 Laptopbez Advanced Optimus - ta wydajność jest po prostu niewystarczająca w stosunku do ceny. Podczas gdy jego moc wyjściowa jest dobra w teorii, system chłodzenia nie zrobił na nas wrażenia w codziennym użytkowaniu. Głośne wentylatory pod maksymalnym obciążeniem są oczekiwane, ale dezorientuje nas, dlaczego wentylatory zawsze wydają się działać słyszalnie - odnotowaliśmy nawet skoki emisji hałasu przekraczające 40 dB(A) podczas korzystania ze słabszych trybów zasilania. To po prostu przeszkadza podczas korzystania z laptopa. Ogólnie rzecz biorąc, jego zużycie energii jest również bardzo wysokie (pomimo przełączania grafiki), co z kolei przyczynia się również do krótszych czasów pracy.
Obudowa laptopa również pozostawiła na nas dość mieszane wrażenie - w porównaniu do niezwykle stabilnej jednostki bazowej, pokrywę ekranu można dość mocno przekręcić i trzeba naprawdę uważać, aby nie spowodować trwałych uszkodzeń. Mamy również kilka negatywów do odnotowania na temat klawiatury. Podczas gdy indywidualne podświetlenie klawiszy jest przyjemne (nawet jeśli oprogramowanie do sterowania nim nie jest intuicyjne), jego uniesienie klawiszy jest bardzo płytkie i ogólnie ma dość chwiejny charakter.
MSI Stealth 14 Studio chce być idealnym, kompaktowym i wszechstronnym komputerem, który oferuje doskonałą wydajność dla graczy i kreatywnych użytkowników. Niestety - choć jego wydajność w grach jest dobra - laptop ma zbyt wiele wad, takich jak irytujące wentylatory, przeciętna klawiatura i elastyczna pokrywa wyświetlacza. Za 1699,99 dolarów to po prostu za mało.
Wyświetlacz urządzenia jest również mieczem obosiecznym, ponieważ ma pozytywne aspekty, takie jak szybkość reakcji, częstotliwość odświeżania 240 Hz i świetna dokładność kolorów. Z drugiej strony, jego wartość czerni jest dość wysoka. Prowadzi to do tego, że czarne treści są przedstawiane jako bardziej ciemnoszare, a poziomy kontrastu nie zawsze są zbyt dobre. Oczywiście jest to marudzenie na najwyższym poziomie, ale w sumie subiektywnie po prostu nie wygląda tak dobrze jak OLED-y, a nawet bardzo dobre panele IPS/mini LED. Pod koniec dnia laptop MSI ma po prostu zbyt wiele słabości - biorąc pod uwagę jego cenę premium - abyśmy mogli go śmiało polecić.
Cena i dostępność
MSI Stealth 14 Studio można kupić w sklepie Best Buy za 1 699,99 USD.
MSI Stealth 14 Studio A13V
- 12/07/2023 v7 (old)
Andreas Osthoff
Przezroczystość
Wyboru urządzeń do recenzji dokonuje nasza redakcja. Próbka testowa została udostępniona autorowi jako pożyczka od producenta lub sprzedawcy detalicznego na potrzeby tej recenzji. Pożyczkodawca nie miał wpływu na tę recenzję, producent nie otrzymał też kopii tej recenzji przed publikacją. Nie było obowiązku publikowania tej recenzji. Jako niezależna firma medialna, Notebookcheck nie podlega władzy producentów, sprzedawców detalicznych ani wydawców.
Tak testuje Notebookcheck
Każdego roku Notebookcheck niezależnie sprawdza setki laptopów i smartfonów, stosując standardowe procedury, aby zapewnić porównywalność wszystkich wyników. Od około 20 lat stale rozwijamy nasze metody badawcze, ustanawiając przy tym standardy branżowe. W naszych laboratoriach testowych doświadczeni technicy i redaktorzy korzystają z wysokiej jakości sprzętu pomiarowego. Testy te obejmują wieloetapowy proces walidacji. Nasz kompleksowy system ocen opiera się na setkach uzasadnionych pomiarów i benchmarków, co pozwala zachować obiektywizm.Price comparison

