Recenzja smukłego laptopa Asus ROG Flow X16: Wydajna, 16-calowa stacja robocza do gier 2 w 1 z ekranem dotykowym

W zeszłym roku ROG Flow X16był naszym pierwszym laptopem do gier wyposażonym w wyświetlacz mini-LED. W tym momencie laptop wyprzedzał swoje czasy i z tego powodu Asus wydaje się nie mieć powodu, aby poddać ten model całkowitemu przeglądowi. Jednak wersja, którą tutaj recenzujemy, nie posiada wyświetlacza mini-LED. Niemniej jednak wiele funkcji pozostaje takich samych, jak obudowa i porty, a Asus zmienia tylko generację CPU / GPU.
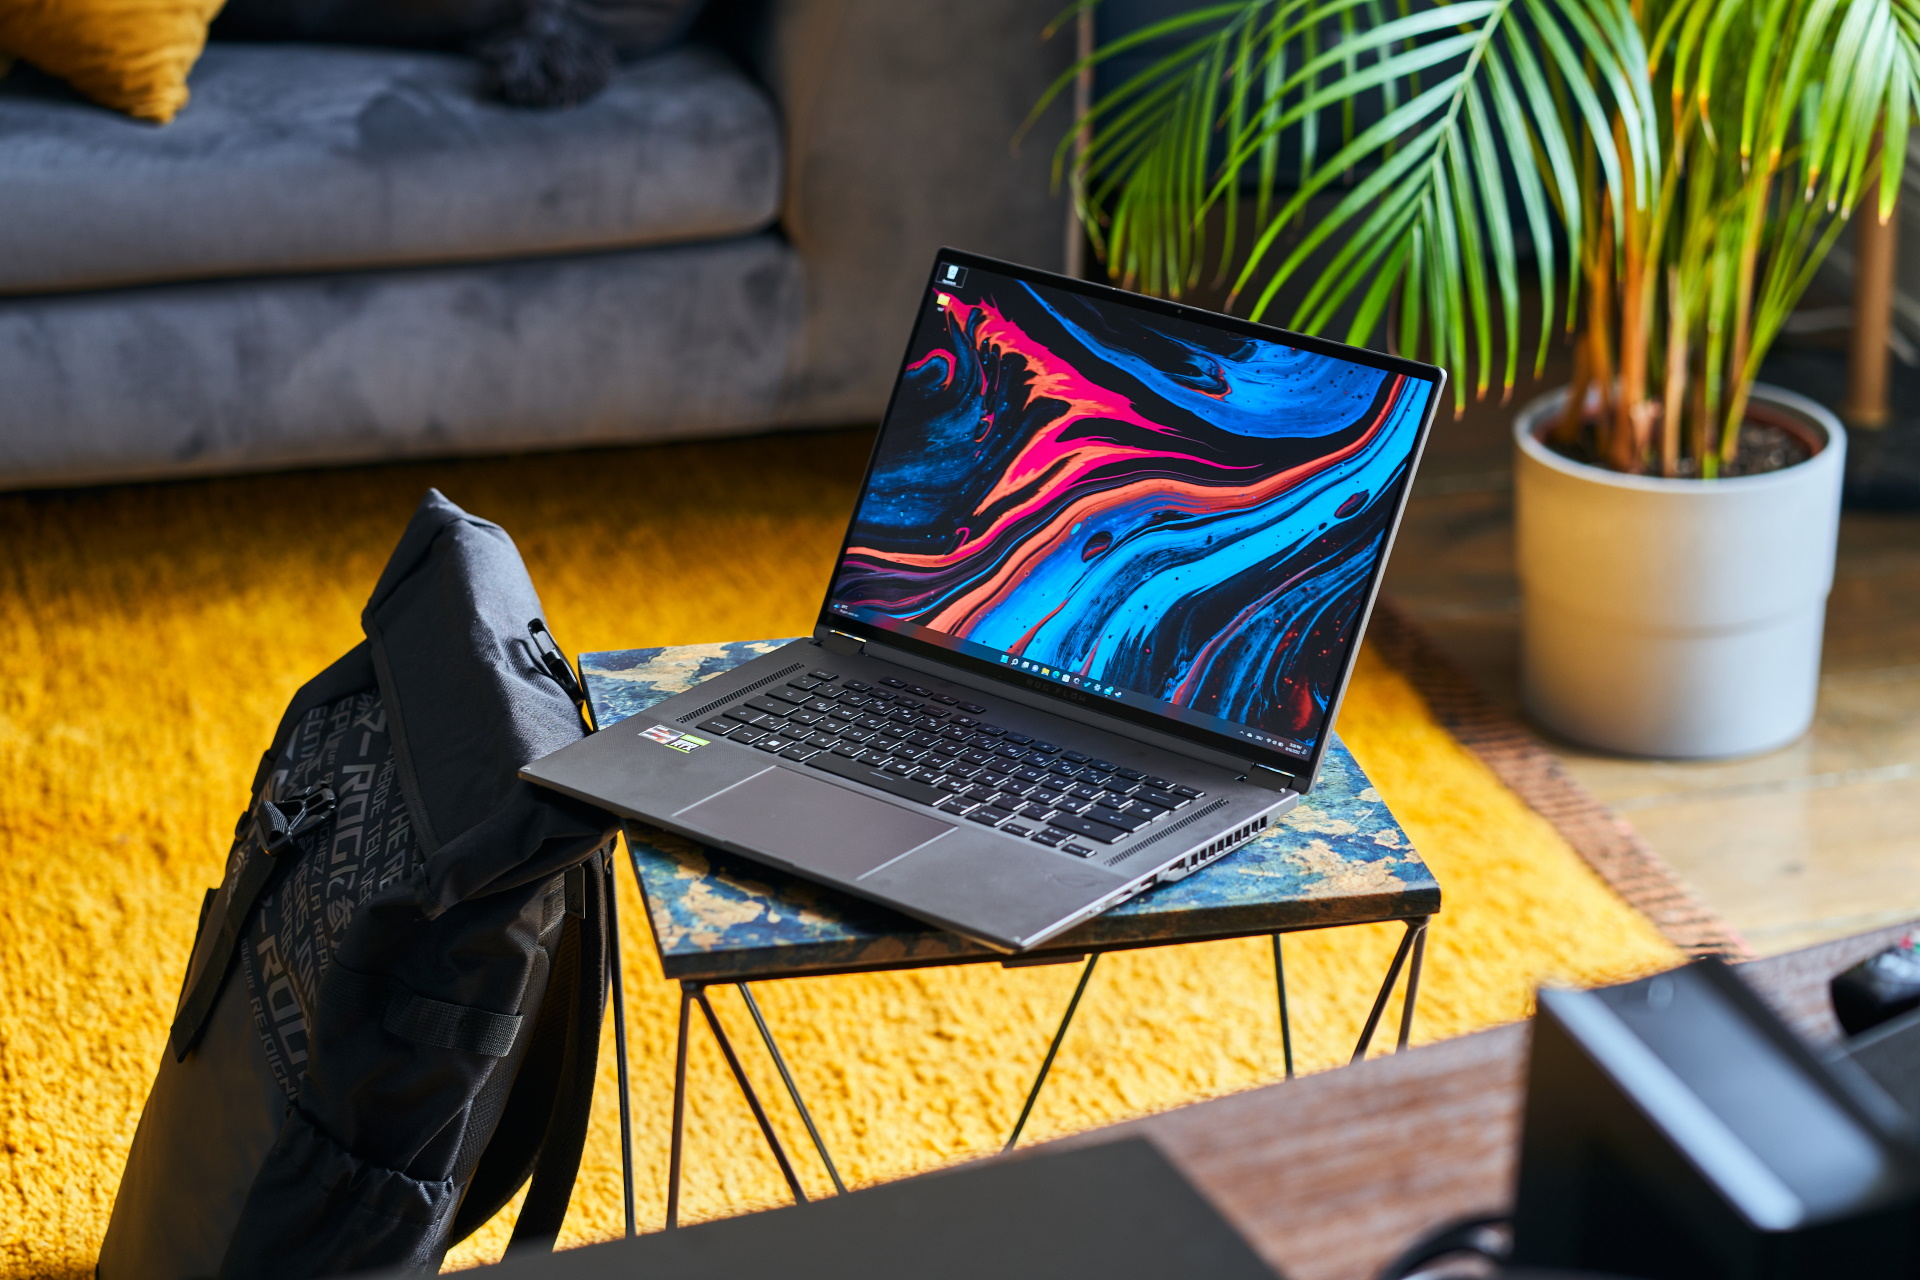
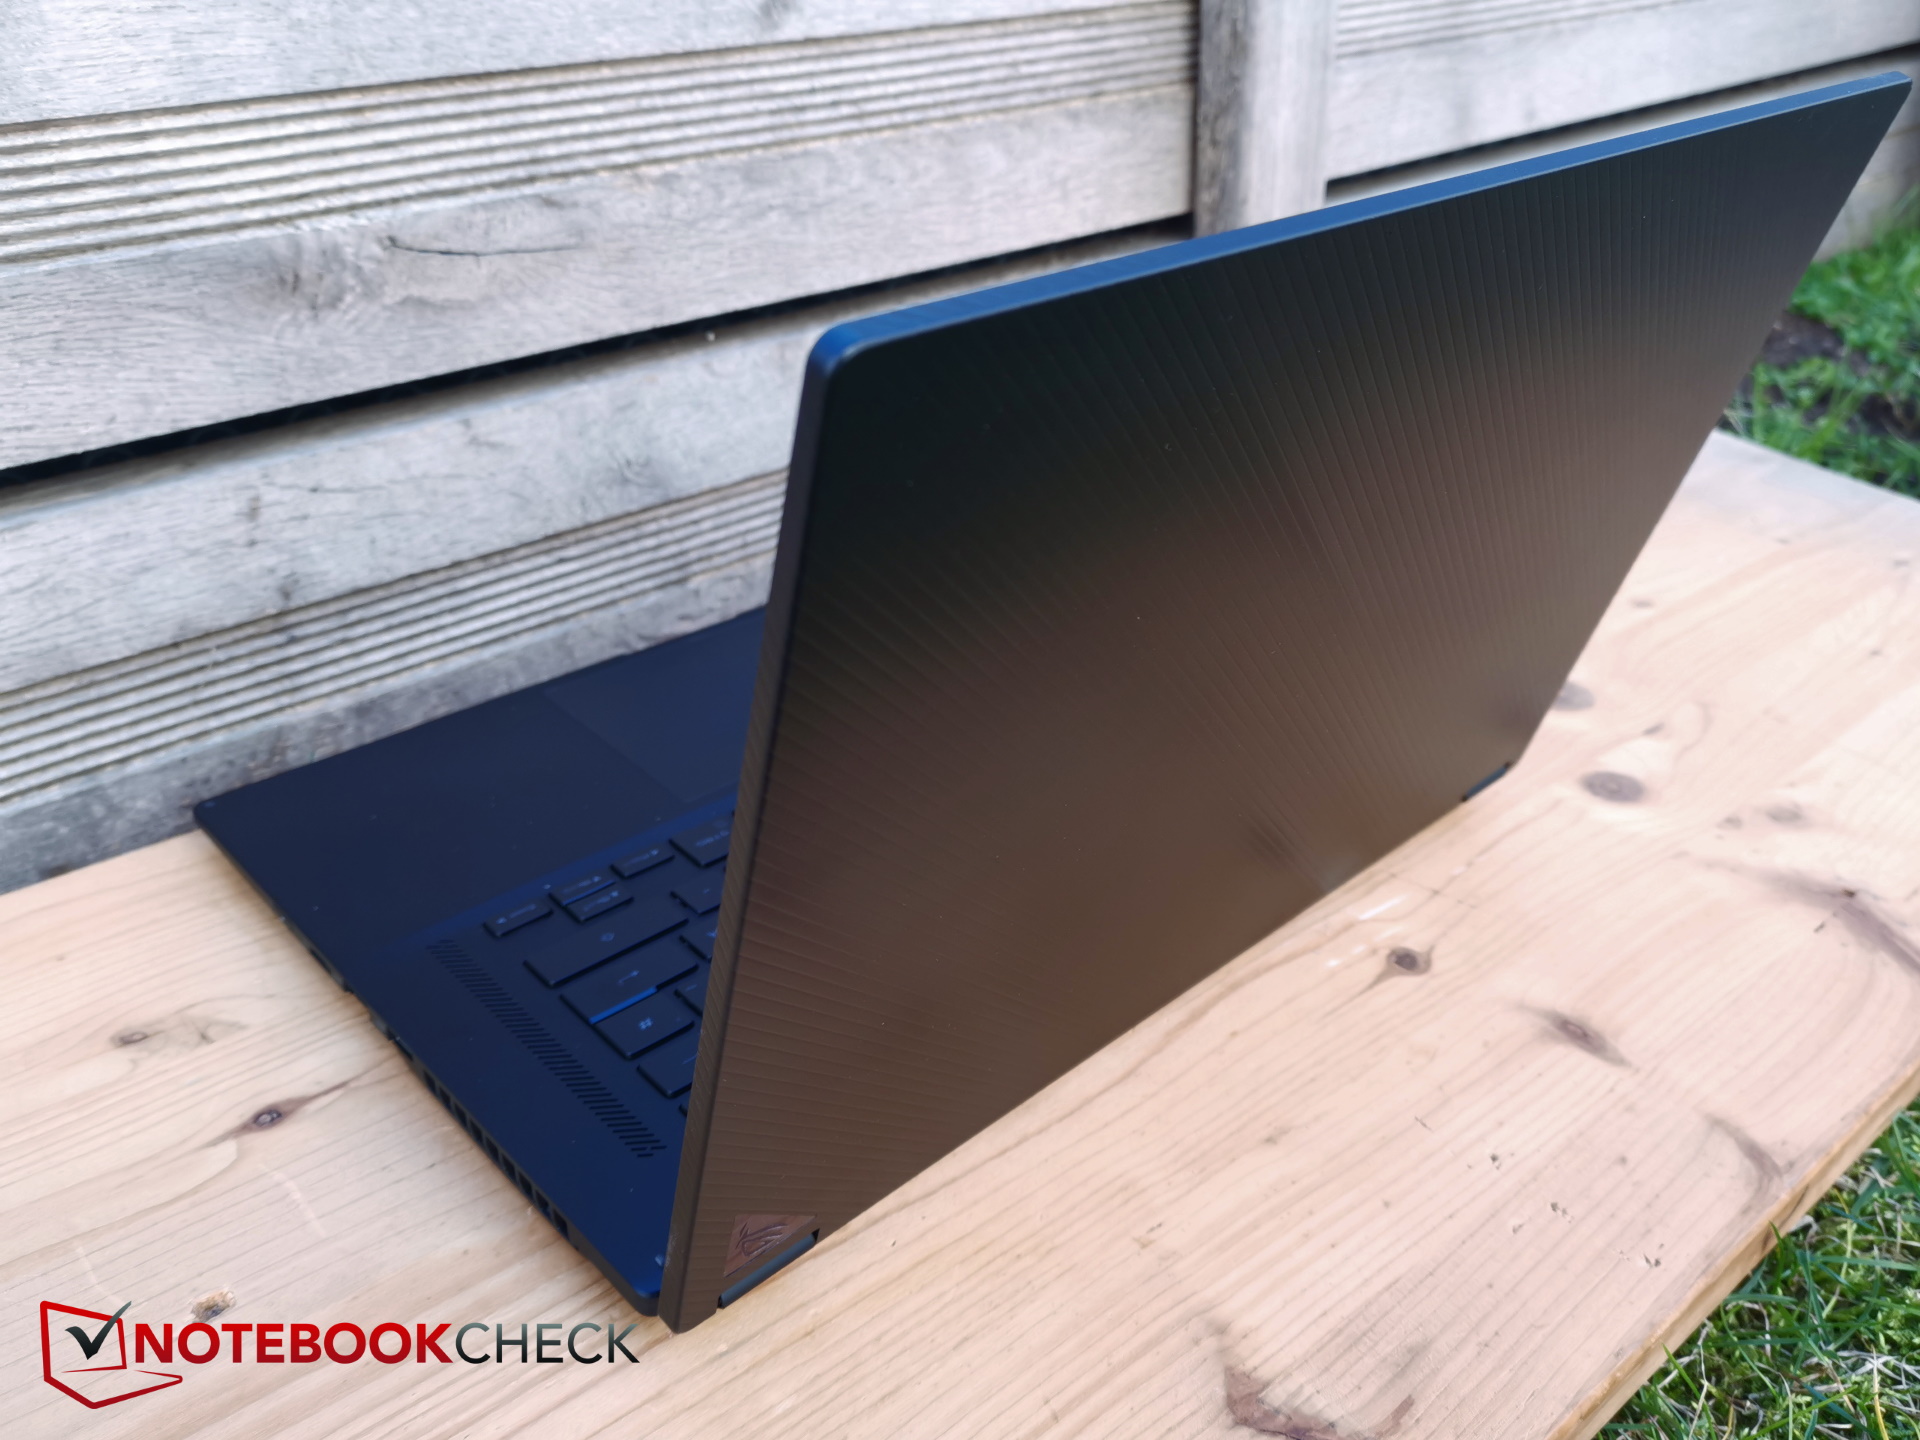
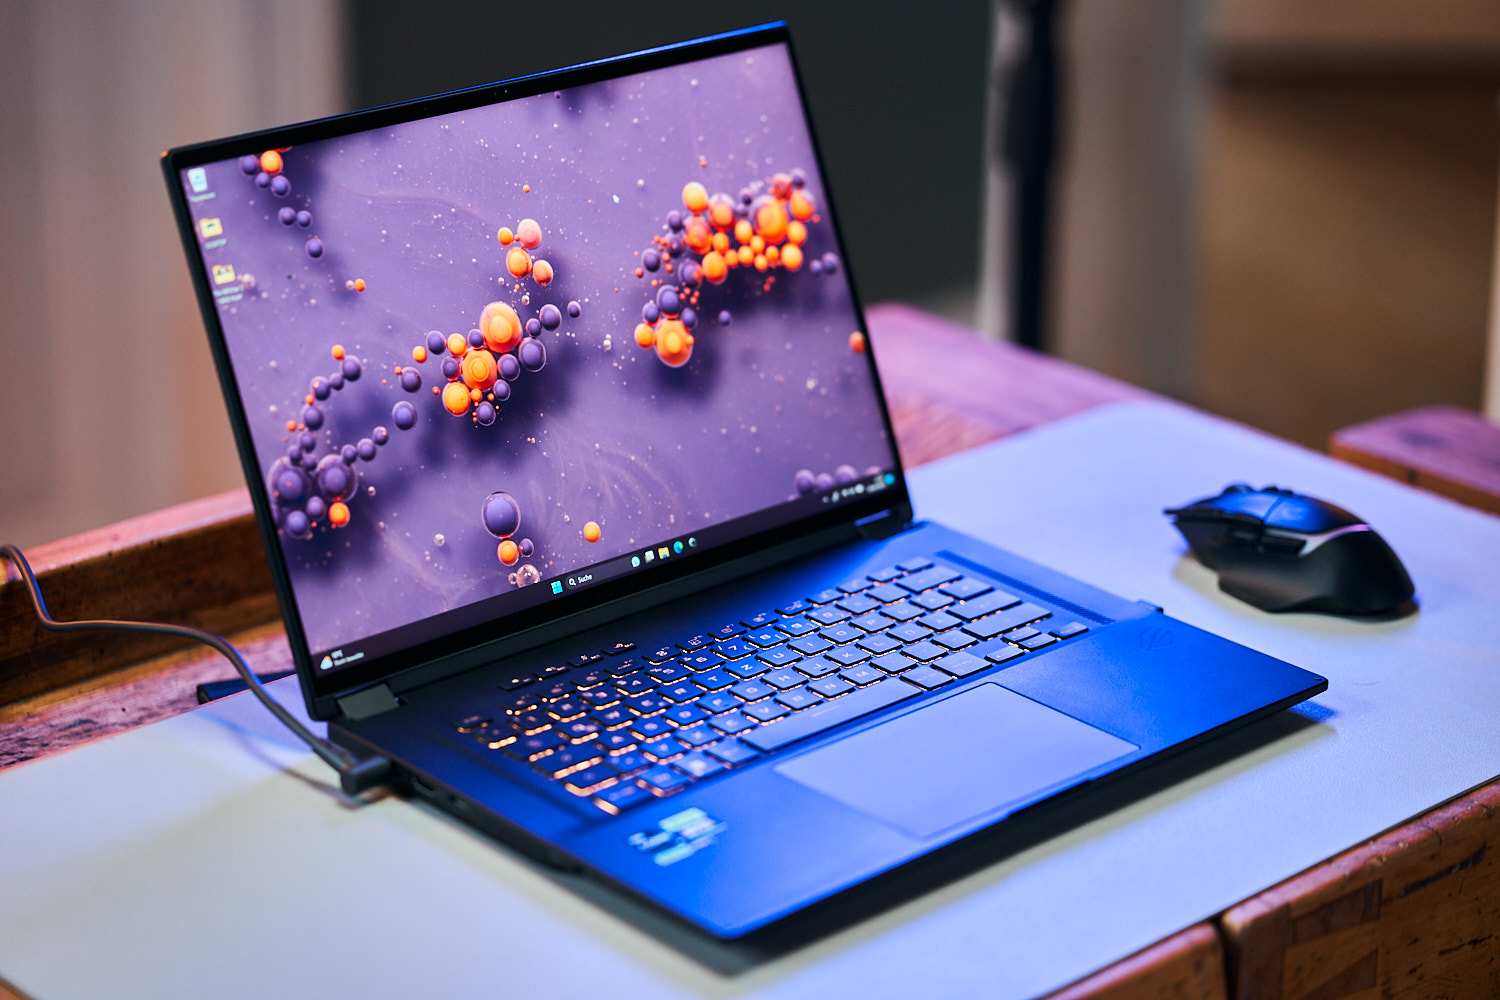
Podobnie, Asus jest obecnie również liderem w realizacji nowych koncepcji, czego dowodem jest nowy Asus ROG Ally jak równieżAsus ROG Flow Z13tablet do gier. X16 nie jest dokładnie codziennym urządzeniem: Mamy tu do czynienia z ultrasmukłym laptopem do gier, który jest jednocześnie urządzeniem 2 w 1. Wyświetlacz można obracać o 360 stopni, dzięki czemu laptop może być używany jako tablet za pośrednictwem ekranu dotykowego. Ponieważ trudno jest znaleźć bezpośrednią konkurencję, dlatego porównujemy go z normalnymi maszynami do gier. Podobnie jak jego poprzednik, używamy równieżSamsung Galaxy Book3 Ultra 16, LenovoLenovo Legion Pro 5, LenovoLenovo Yoga Pro 7 14 G8iMSI Katana 17 B13V dla porównania.
Ponieważ różne funkcje znalezione w zeszłorocznym modelu pozostają takie same, nie zwracamy szczególnej uwagi na obudowę, akcesoria, obsługę i urządzenia wejściowe, ale wolimy skierować Cię w kierunku naszej recenzji zeszłorocznego modelu Asus ROG Flow X16 GV601RWw celu uzyskania dodatkowych informacji.
Potencjalni konkurenci w porównaniu
Ocena | Data | Model | Waga | Wysokość | Rozmiar | Rezolucja | Cena |
|---|---|---|---|---|---|---|---|
| 89.7 % v7 (old) | 06/2023 | Asus ROG Flow X16 GV601V i9-13900H, GeForce RTX 4060 Laptop GPU | 2.1 kg | 19.4 mm | 16.00" | 2560x1600 | |
| 89.5 % v7 (old) | Asus ROG Flow X16 GV601RW-M5082W R9 6900HS, GeForce RTX 3070 Ti Laptop GPU | 2.1 kg | 19.4 mm | 16.10" | 2560x1600 | ||
| 88.8 % v7 (old) | 05/2023 | Samsung Galaxy Book3 Ultra 16, i9-13900H RTX 4070 i9-13900H, GeForce RTX 4070 Laptop GPU | 1.8 kg | 16.8 mm | 16.00" | 2880x1800 | |
| 87.9 % v7 (old) | 05/2023 | Lenovo Legion Pro 5 16IRX8 i7-13700HX, GeForce RTX 4060 Laptop GPU | 2.5 kg | 26.8 mm | 16.00" | 2560x1600 | |
| 90.2 % v7 (old) | 05/2023 | Lenovo Yoga Pro 7 14IRH G8 i7-13700H, GeForce RTX 4050 Laptop GPU | 1.5 kg | 15.6 mm | 14.50" | 3072x1920 | |
| 82.1 % v7 (old) | 02/2023 | MSI Katana 17 B13VFK i7-13620H, GeForce RTX 4060 Laptop GPU | 2.8 kg | 25.2 mm | 17.30" | 1920x1080 |
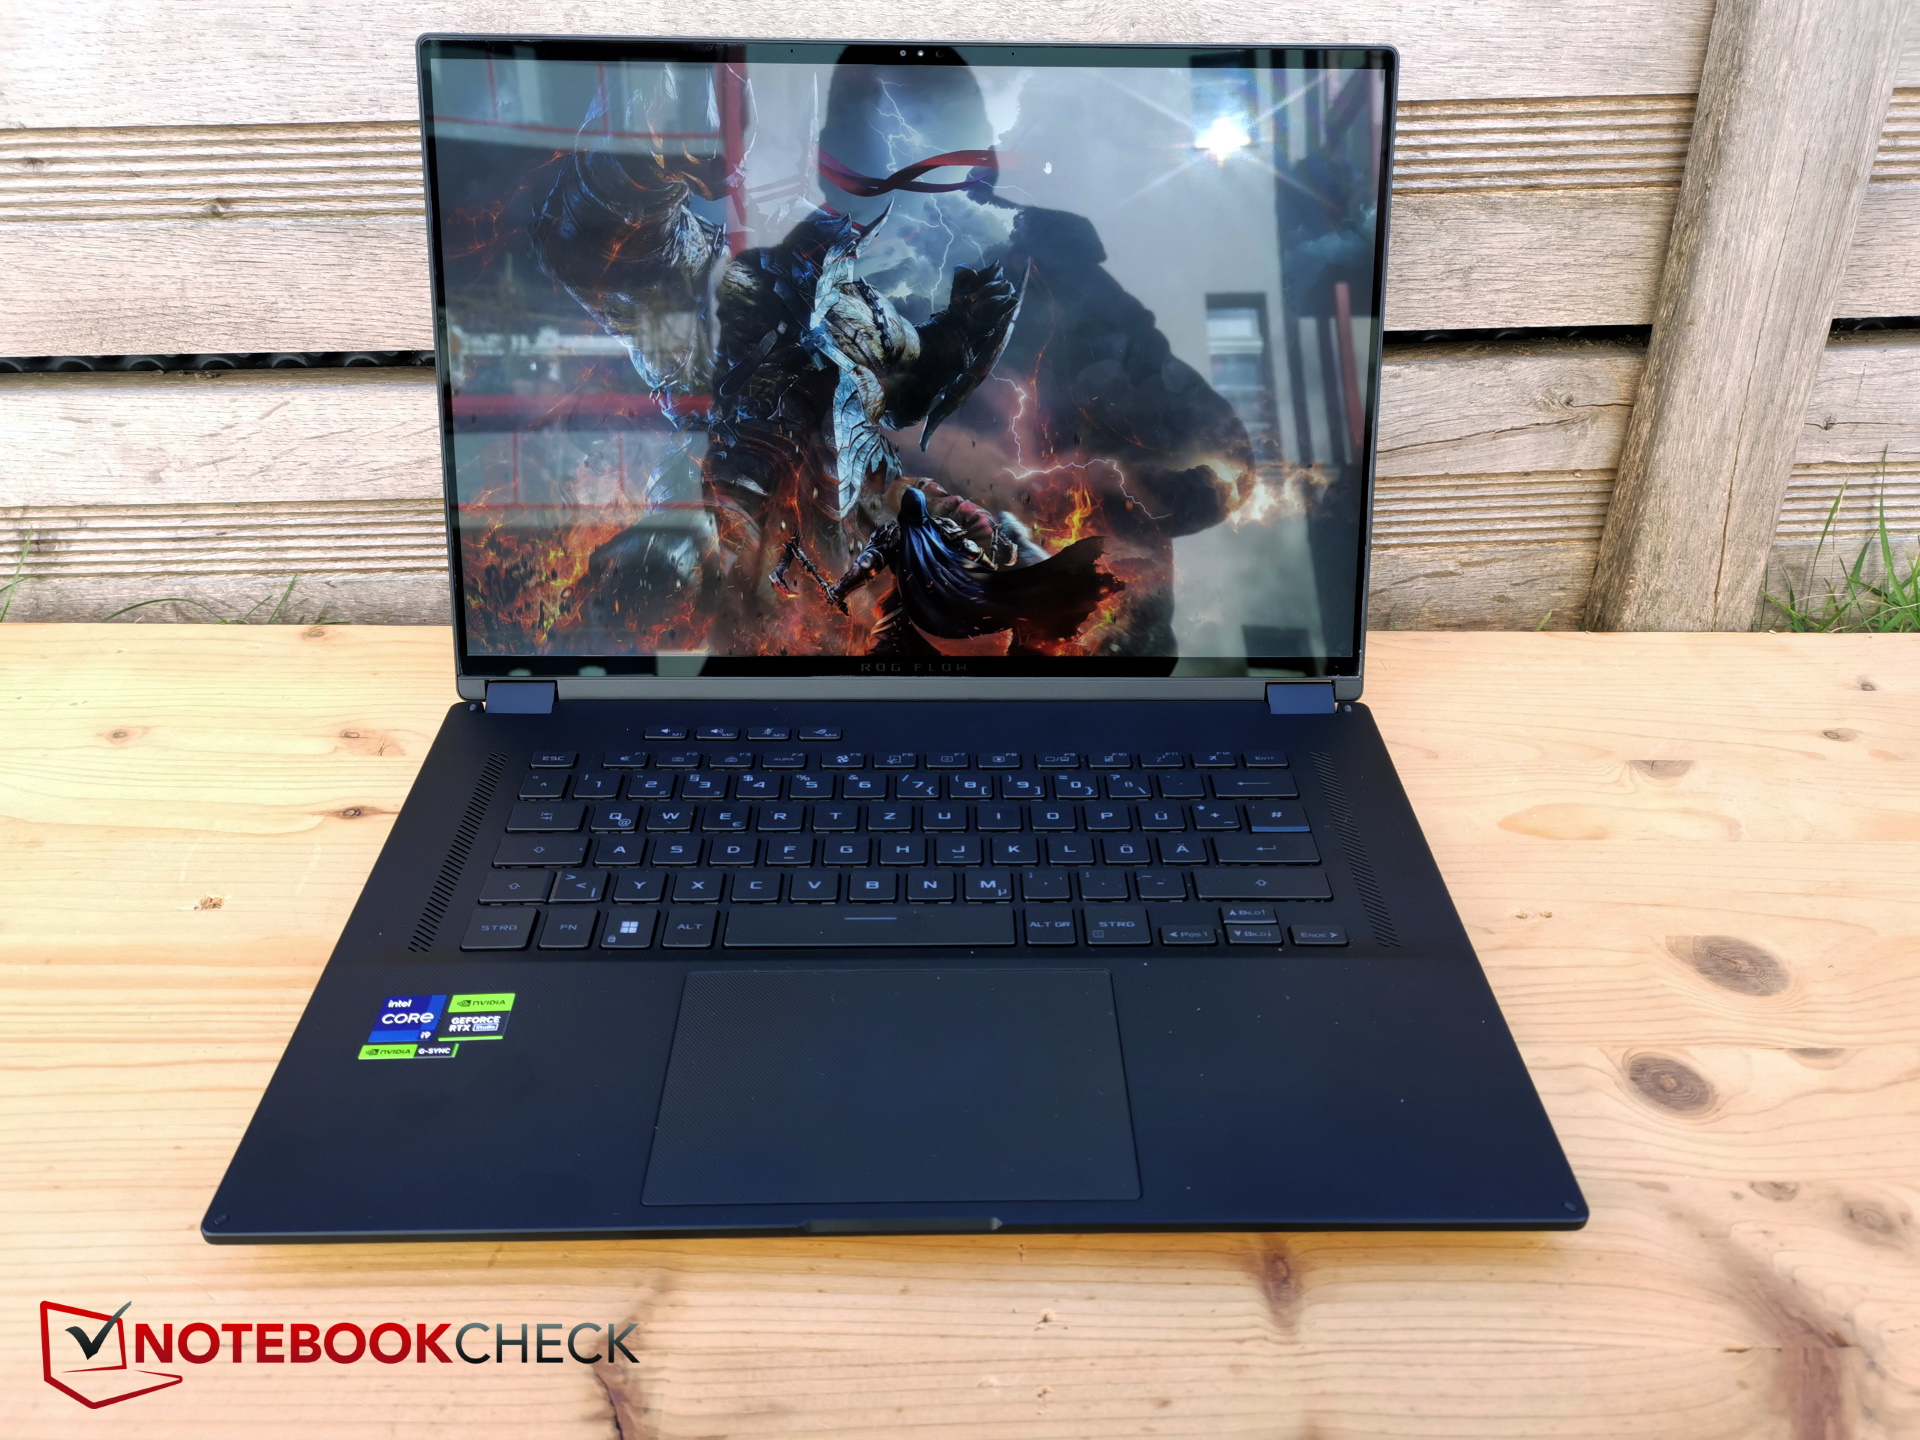
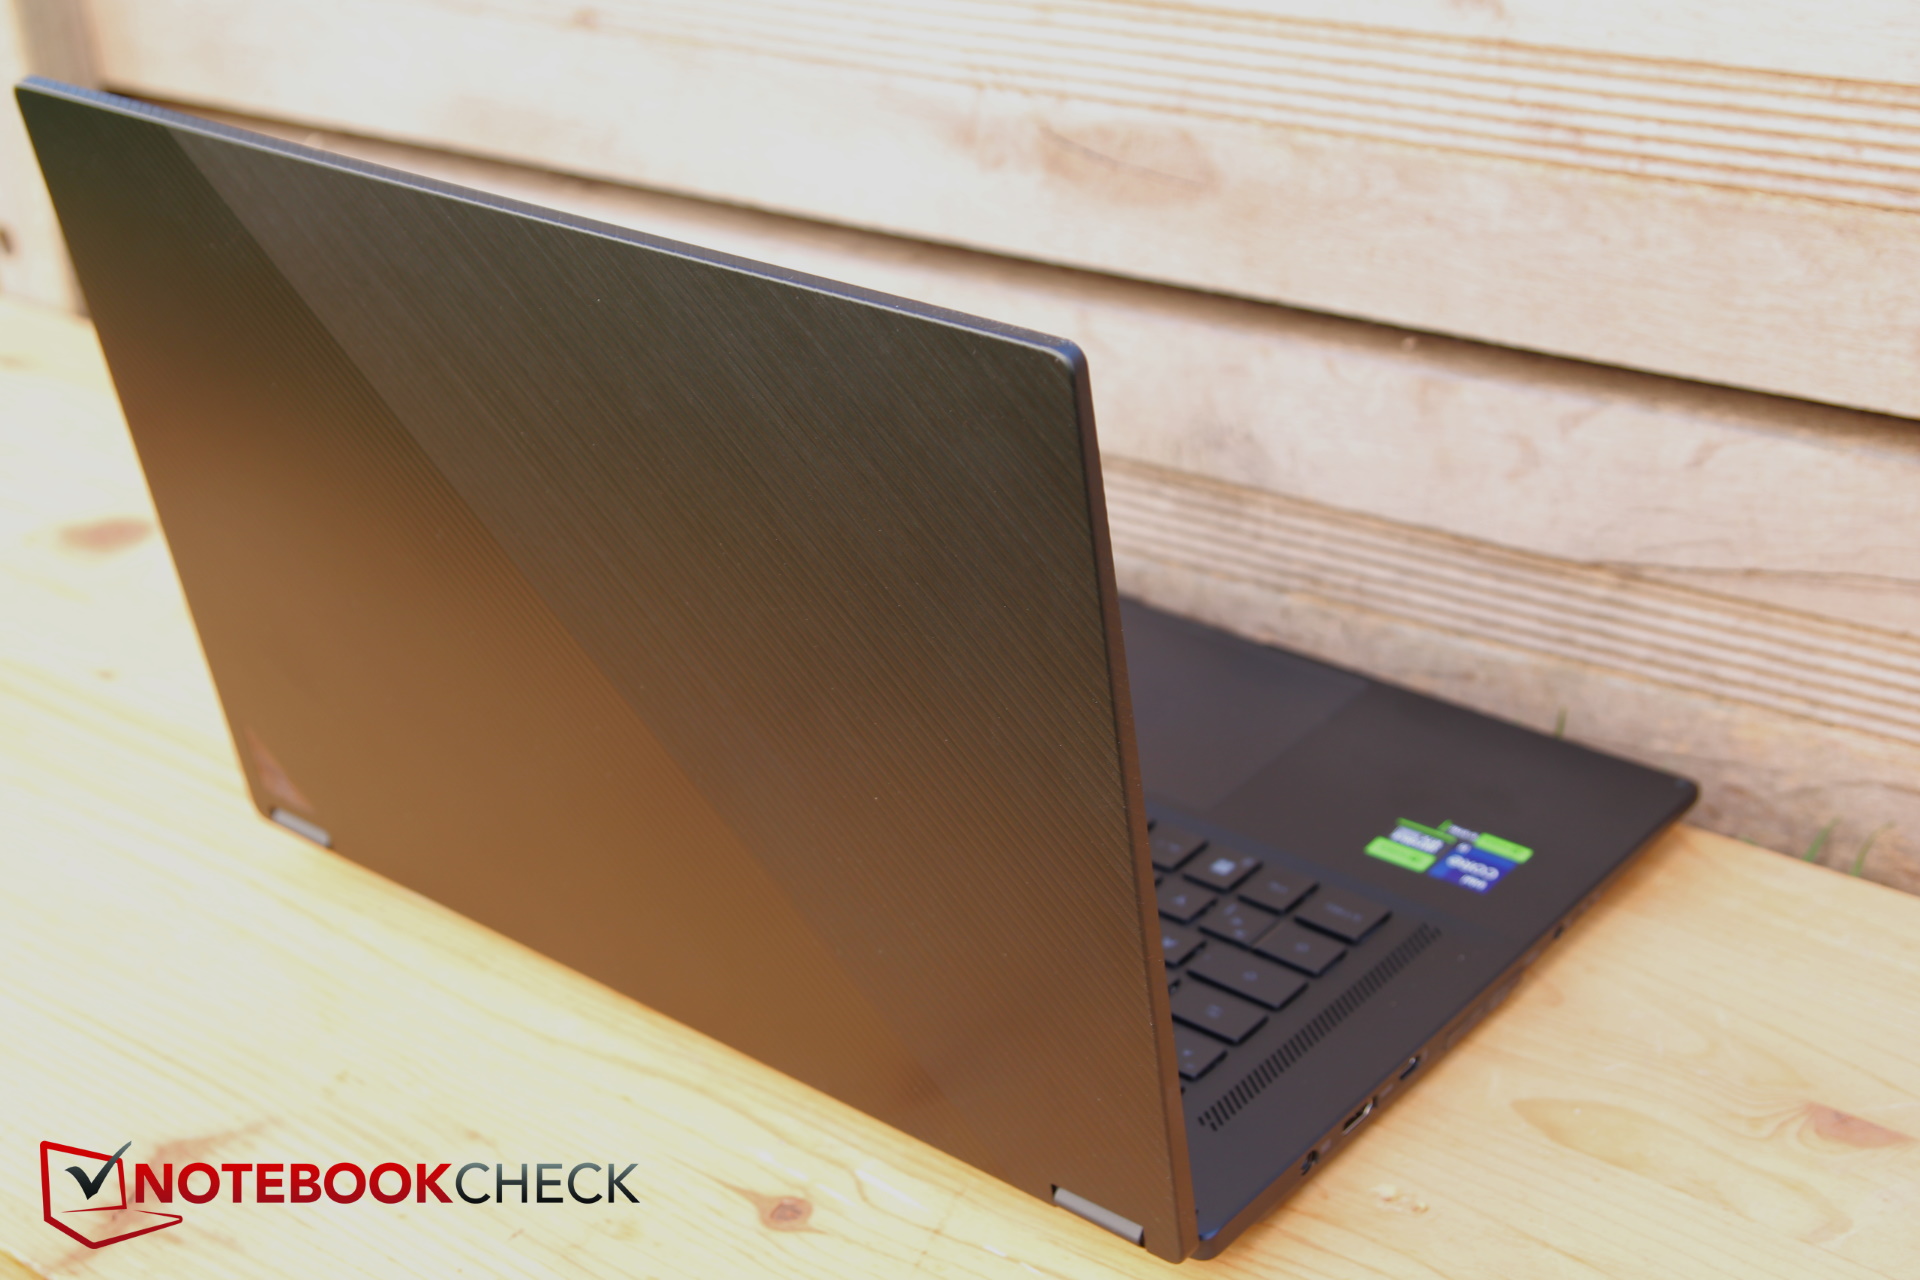
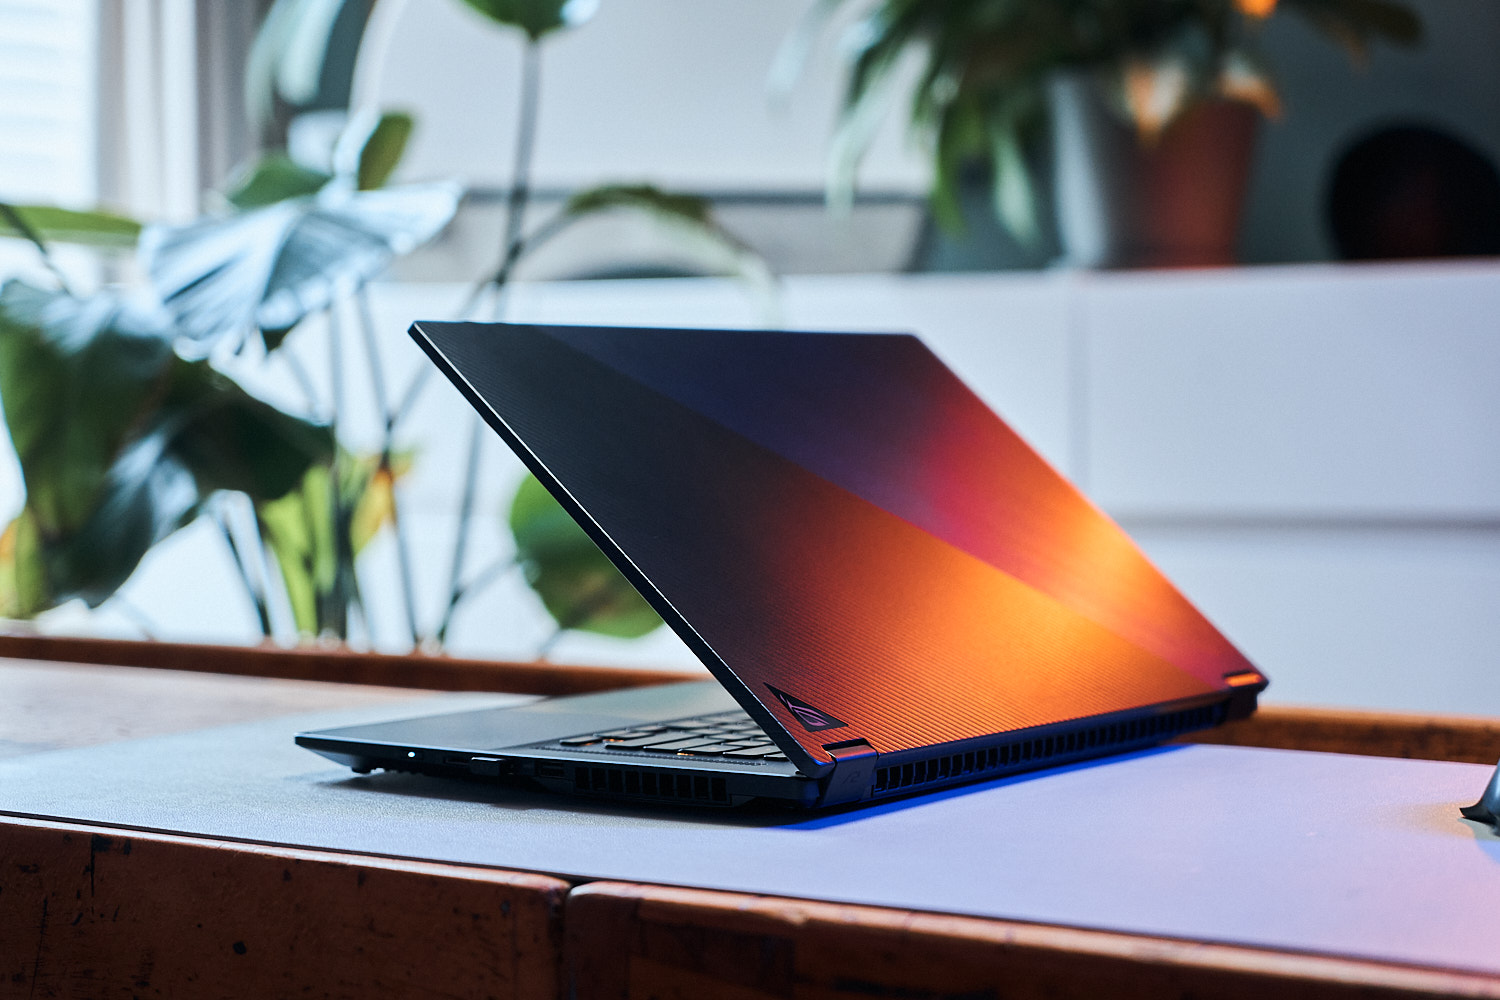
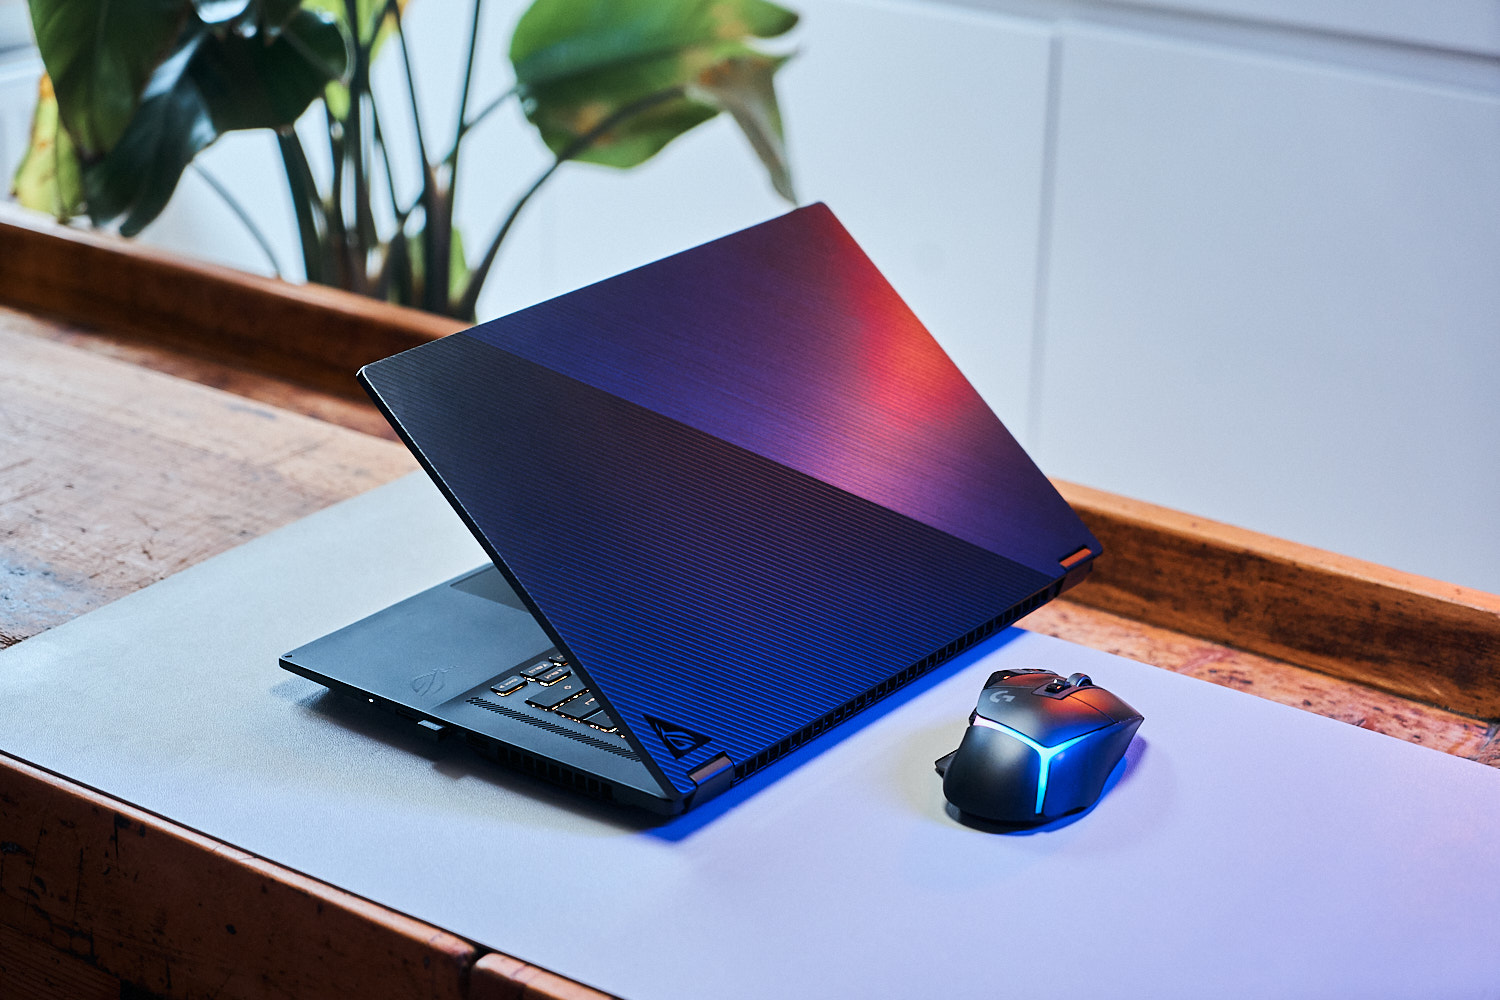
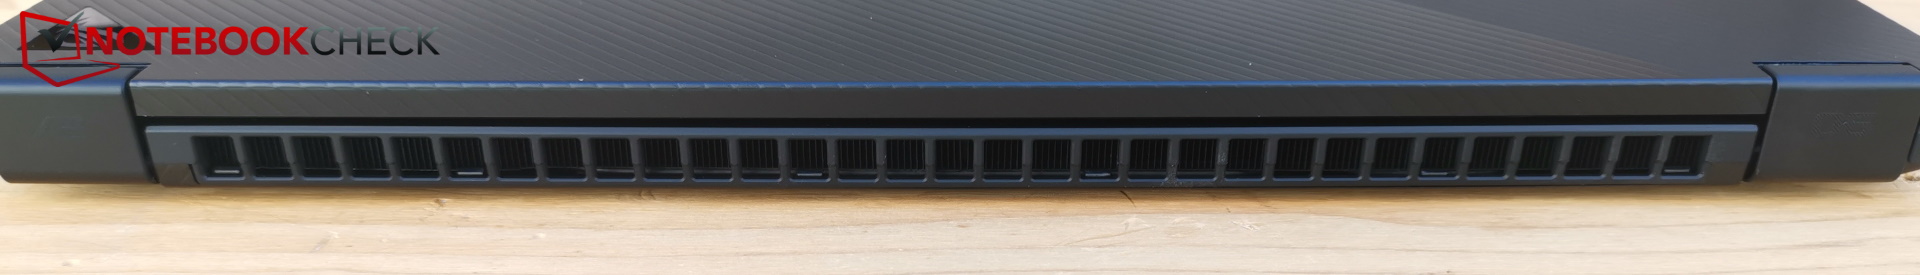
Case - równie smukły i dobry jak w zeszłym roku
Logo na pokrywie obudowy jest nieco inne, ale poza tym wszystko jest w dużej mierze niezmienione.
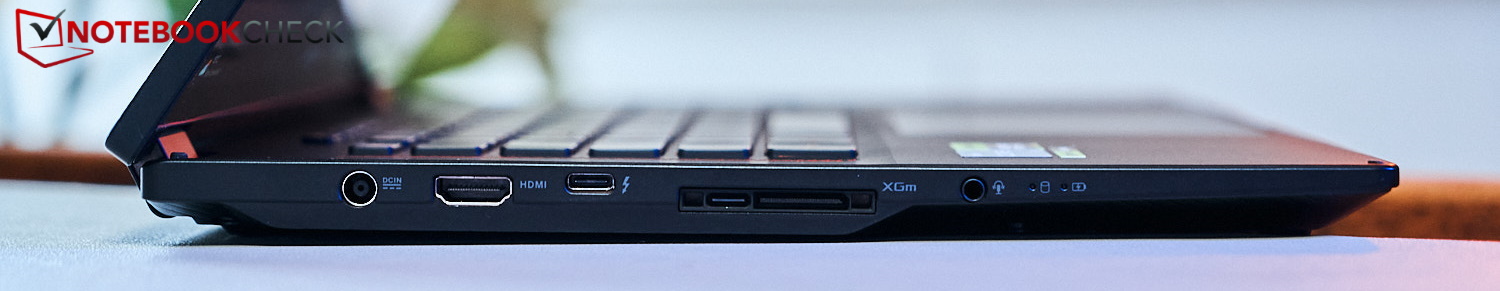
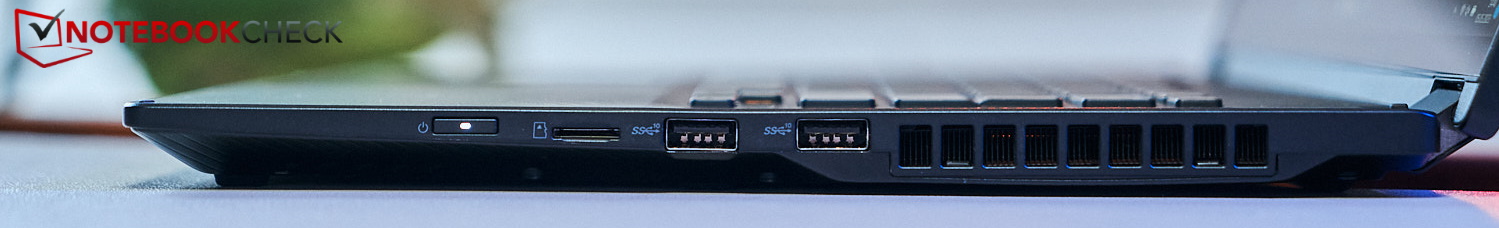
Cechy - Interfejs TB4 i XG Mobile
Czytnik kart SD
| SD Card Reader | |
| average JPG Copy Test (av. of 3 runs) | |
| Asus ROG Flow X16 GV601RW-M5082W (AV Pro SD microSD 128 GB V60) | |
| Średnia w klasie Gaming (20.9 - 210, n=54, ostatnie 2 lata) | |
| Asus ROG Flow X16 GV601V | |
| Samsung Galaxy Book3 Ultra 16, i9-13900H RTX 4070 (AV Pro SD microSD 128 GB V60) | |
| maximum AS SSD Seq Read Test (1GB) | |
| Asus ROG Flow X16 GV601V | |
| Asus ROG Flow X16 GV601RW-M5082W (AV Pro SD microSD 128 GB V60) | |
| Średnia w klasie Gaming (25.5 - 261, n=51, ostatnie 2 lata) | |
| Samsung Galaxy Book3 Ultra 16, i9-13900H RTX 4070 (AV Pro SD microSD 128 GB V60) | |
Komunikacja
Prędkości transferu z Intel AX211 w sieci 6 GHz są bardzo wysokie i stabilne (około 1,6 MBit/s), a w sieci 5 GHz możliwe są niskie prędkości transferu wynoszące tylko około 1 MBit/s.
Kamera internetowa
W tym obszarze Asus ulepszył kamerę 720p znalezioną w zeszłorocznym modelu do kamery Full HD. Obrazy są przyzwoite, ale odchylenie kolorów jest nieco wyższe.


Bezpieczeństwo
TPM jest dostępny dzięki układowi Intela, jednak brakuje czujnika odcisków palców, a nawet blokady Kensington. Kamera jest kompatybilna z Windows Hello.
Akcesoria
Niestety w tym roku rysik nie jest dołączany do zestawu i teoretycznie otrzymujemy laptopa bez żadnych dodatkowych akcesoriów. W zależności od pakietu, w zestawie znajduje się jednak plecak na laptopa marki ROG, zestaw słuchawkowy ROG Fusion II 300, a także mysz ROG Gladius III.
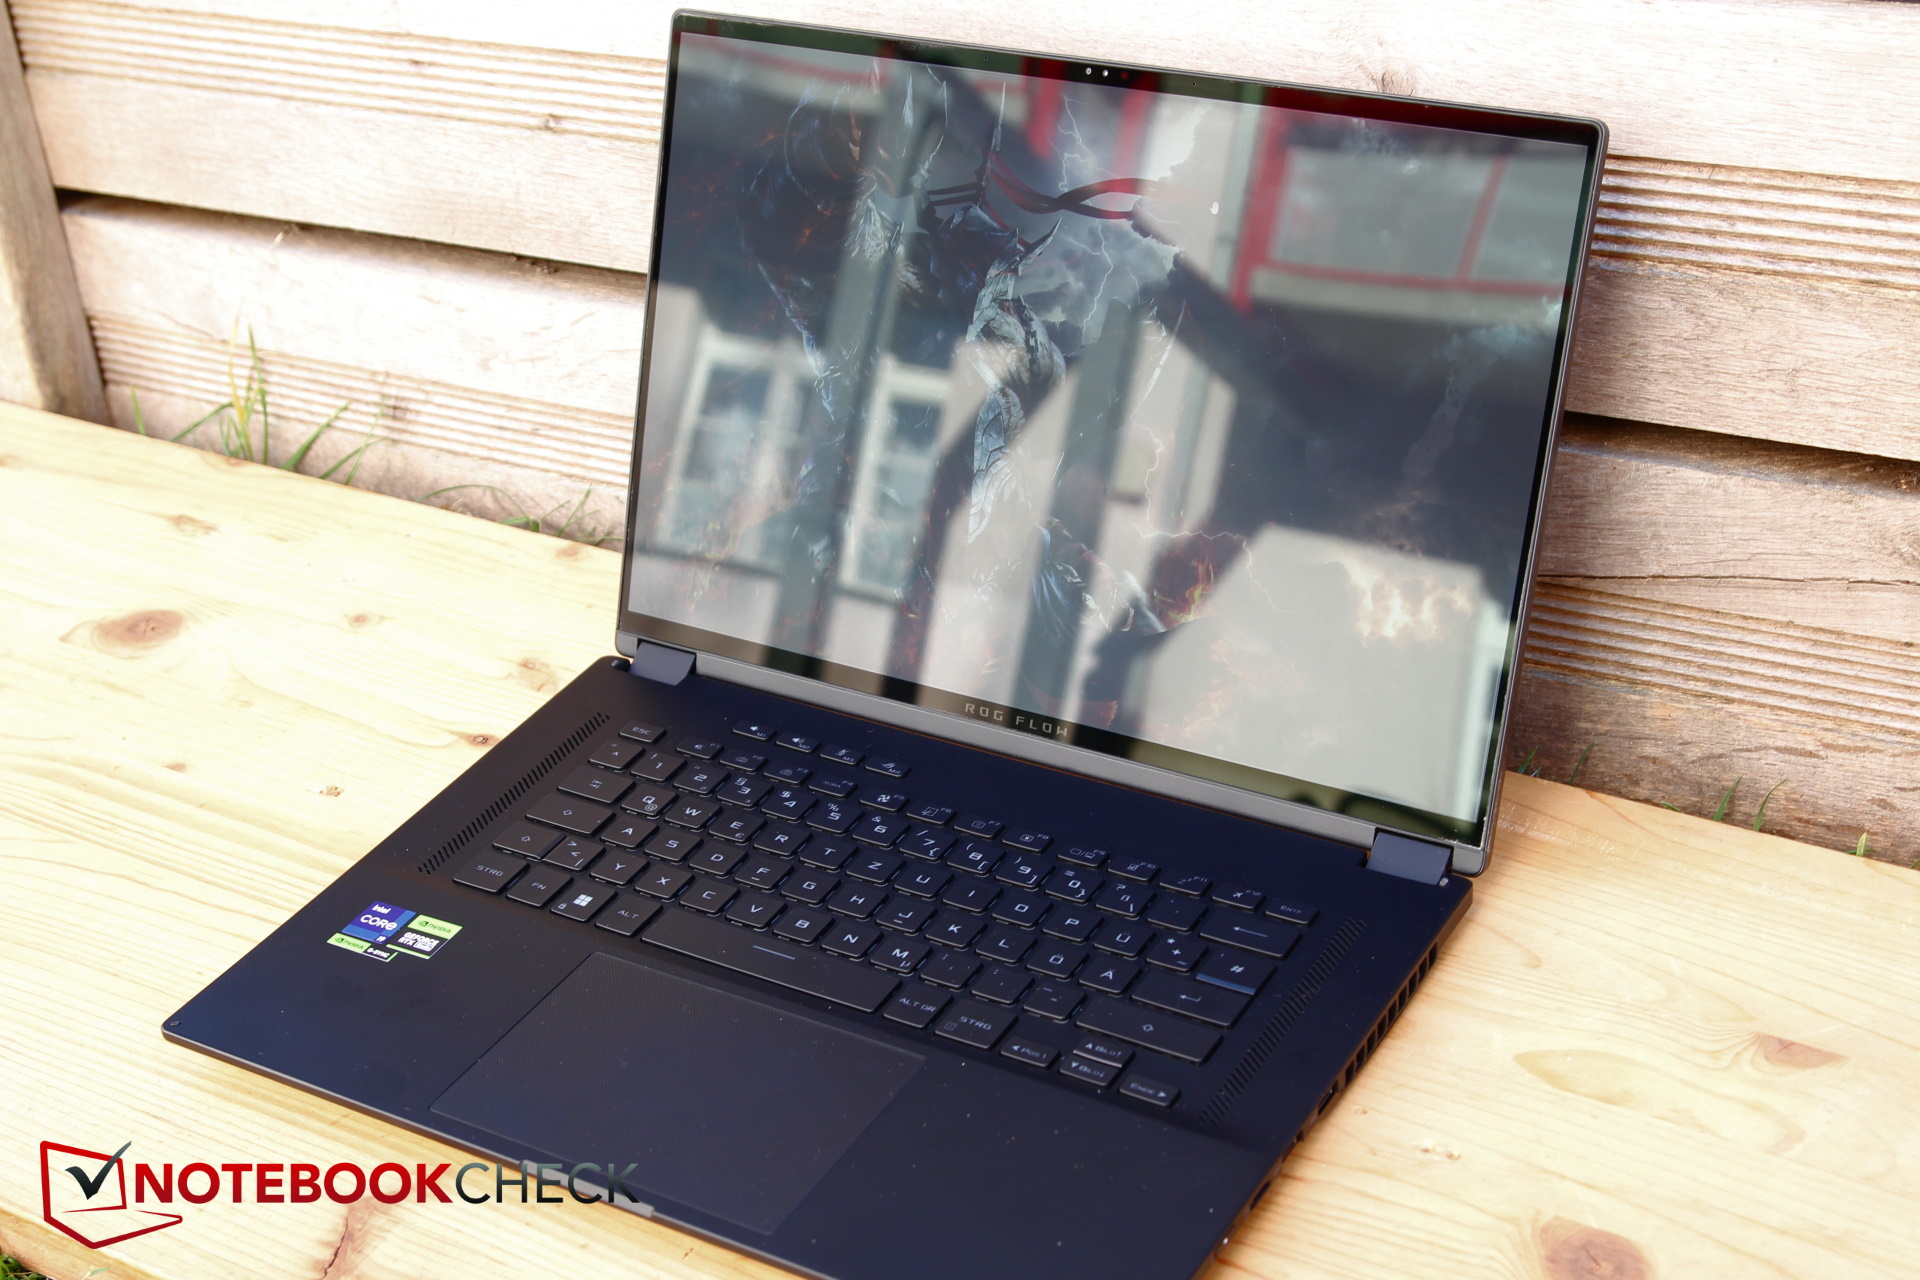
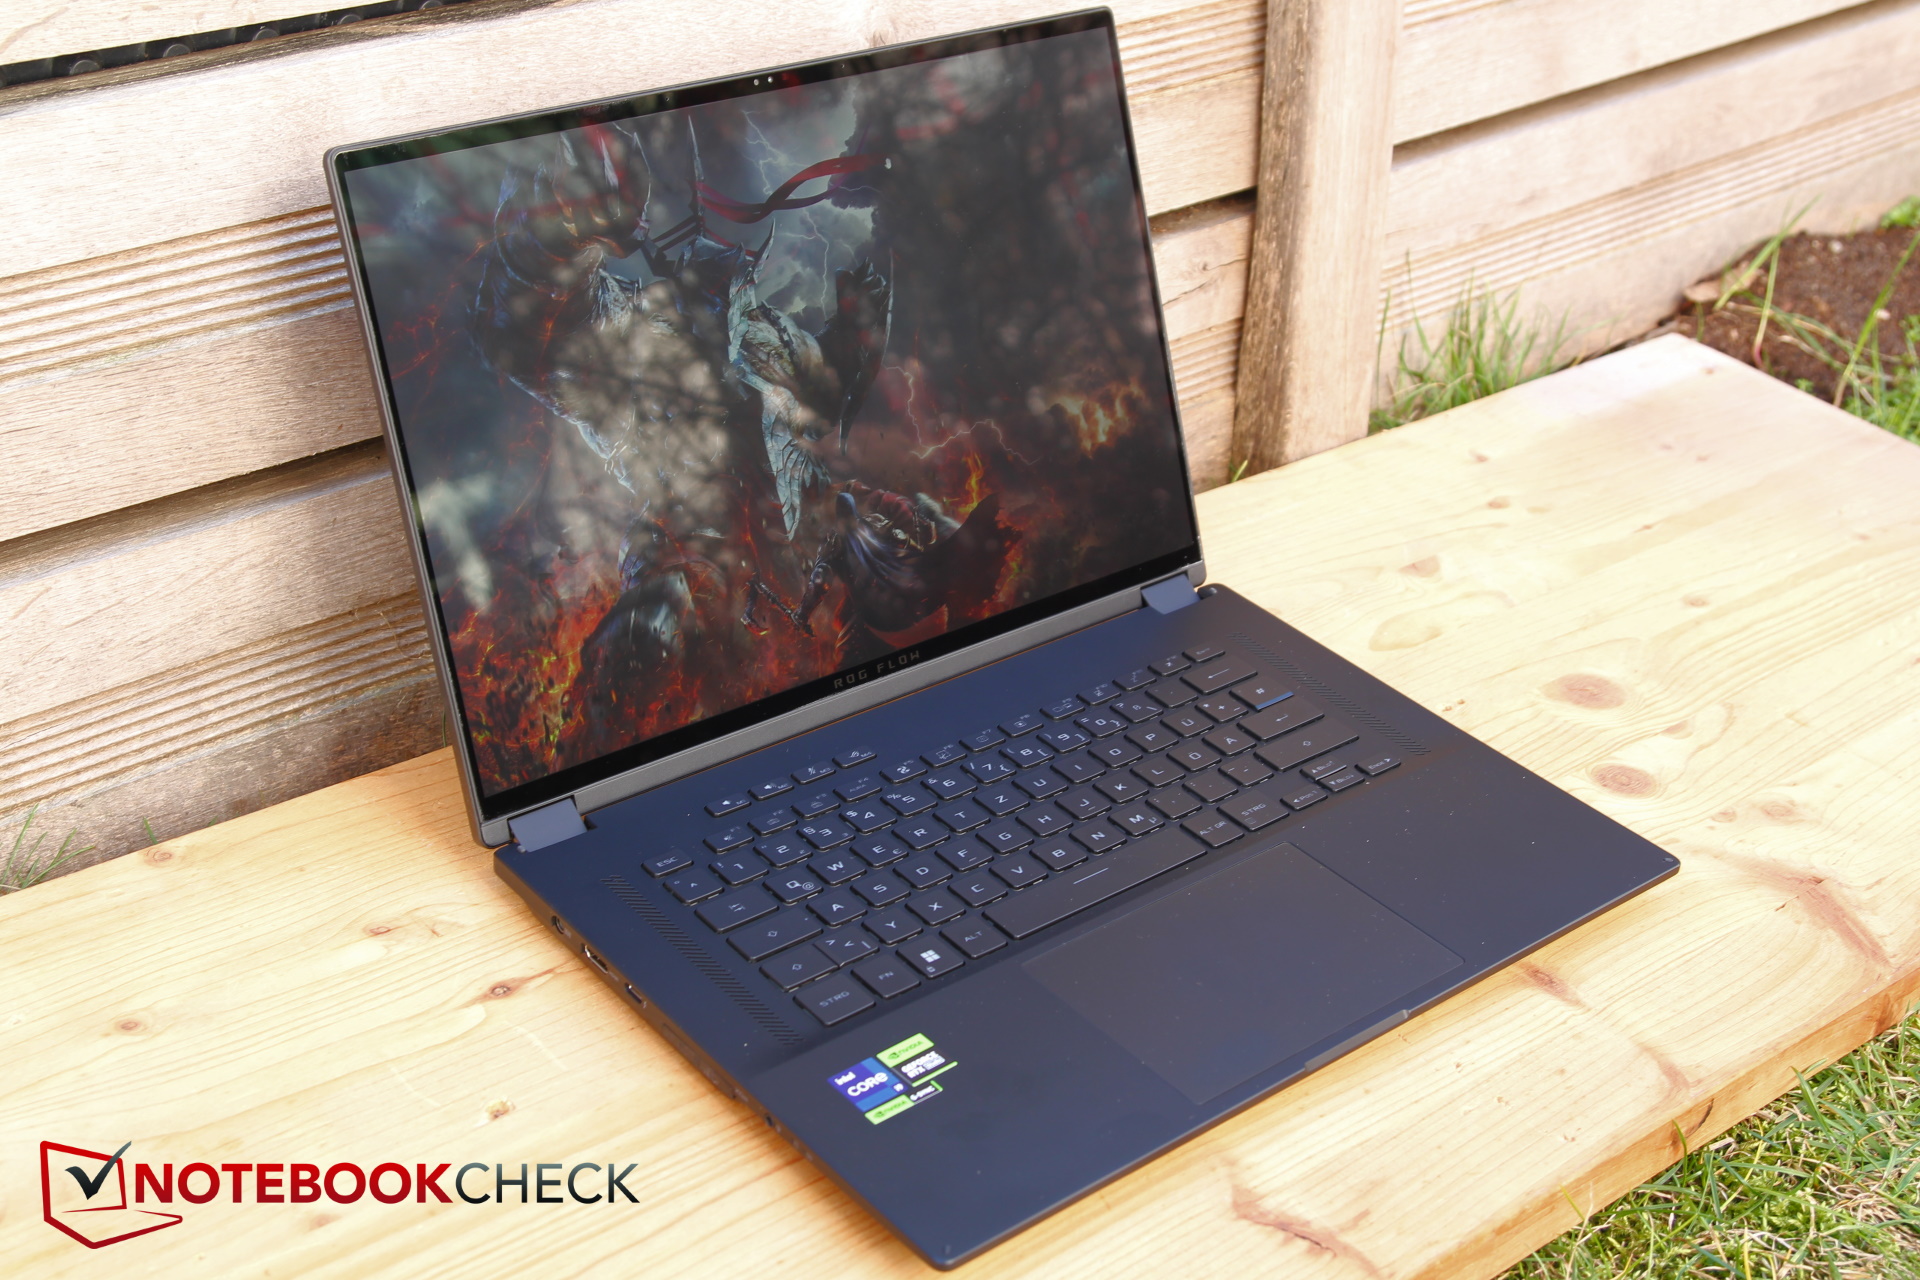
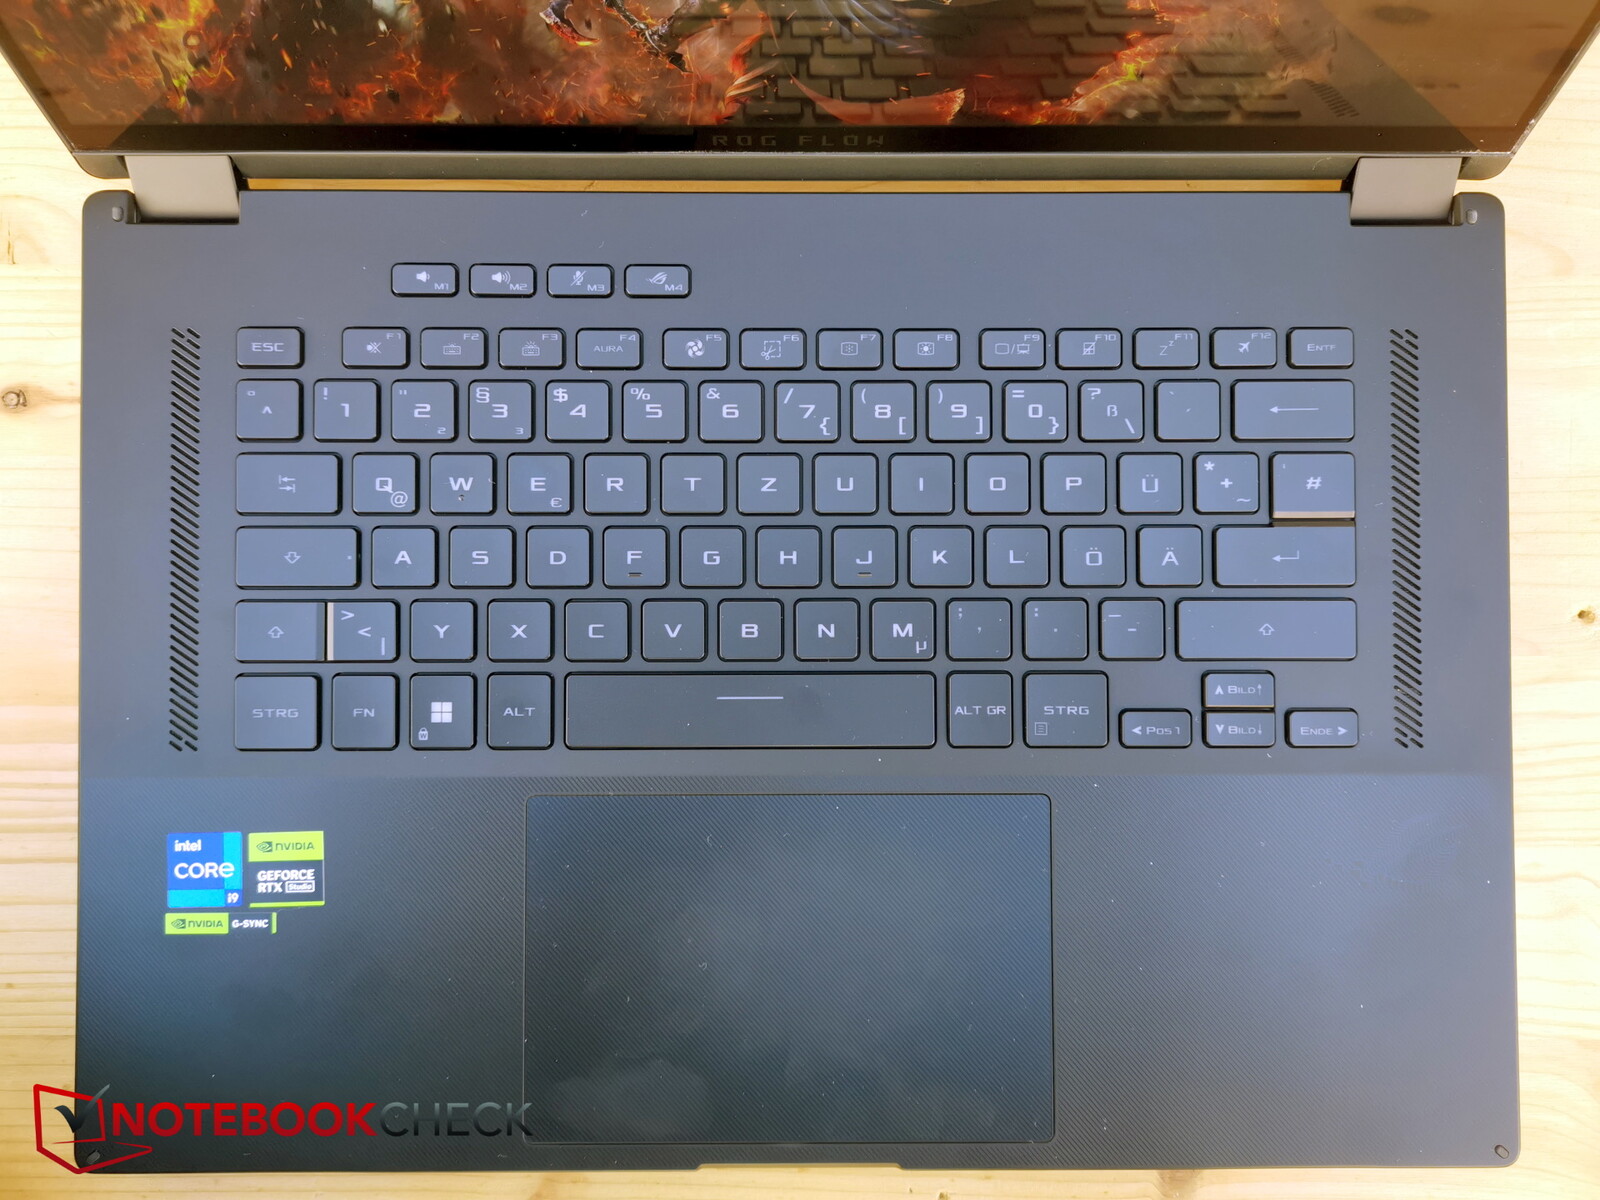
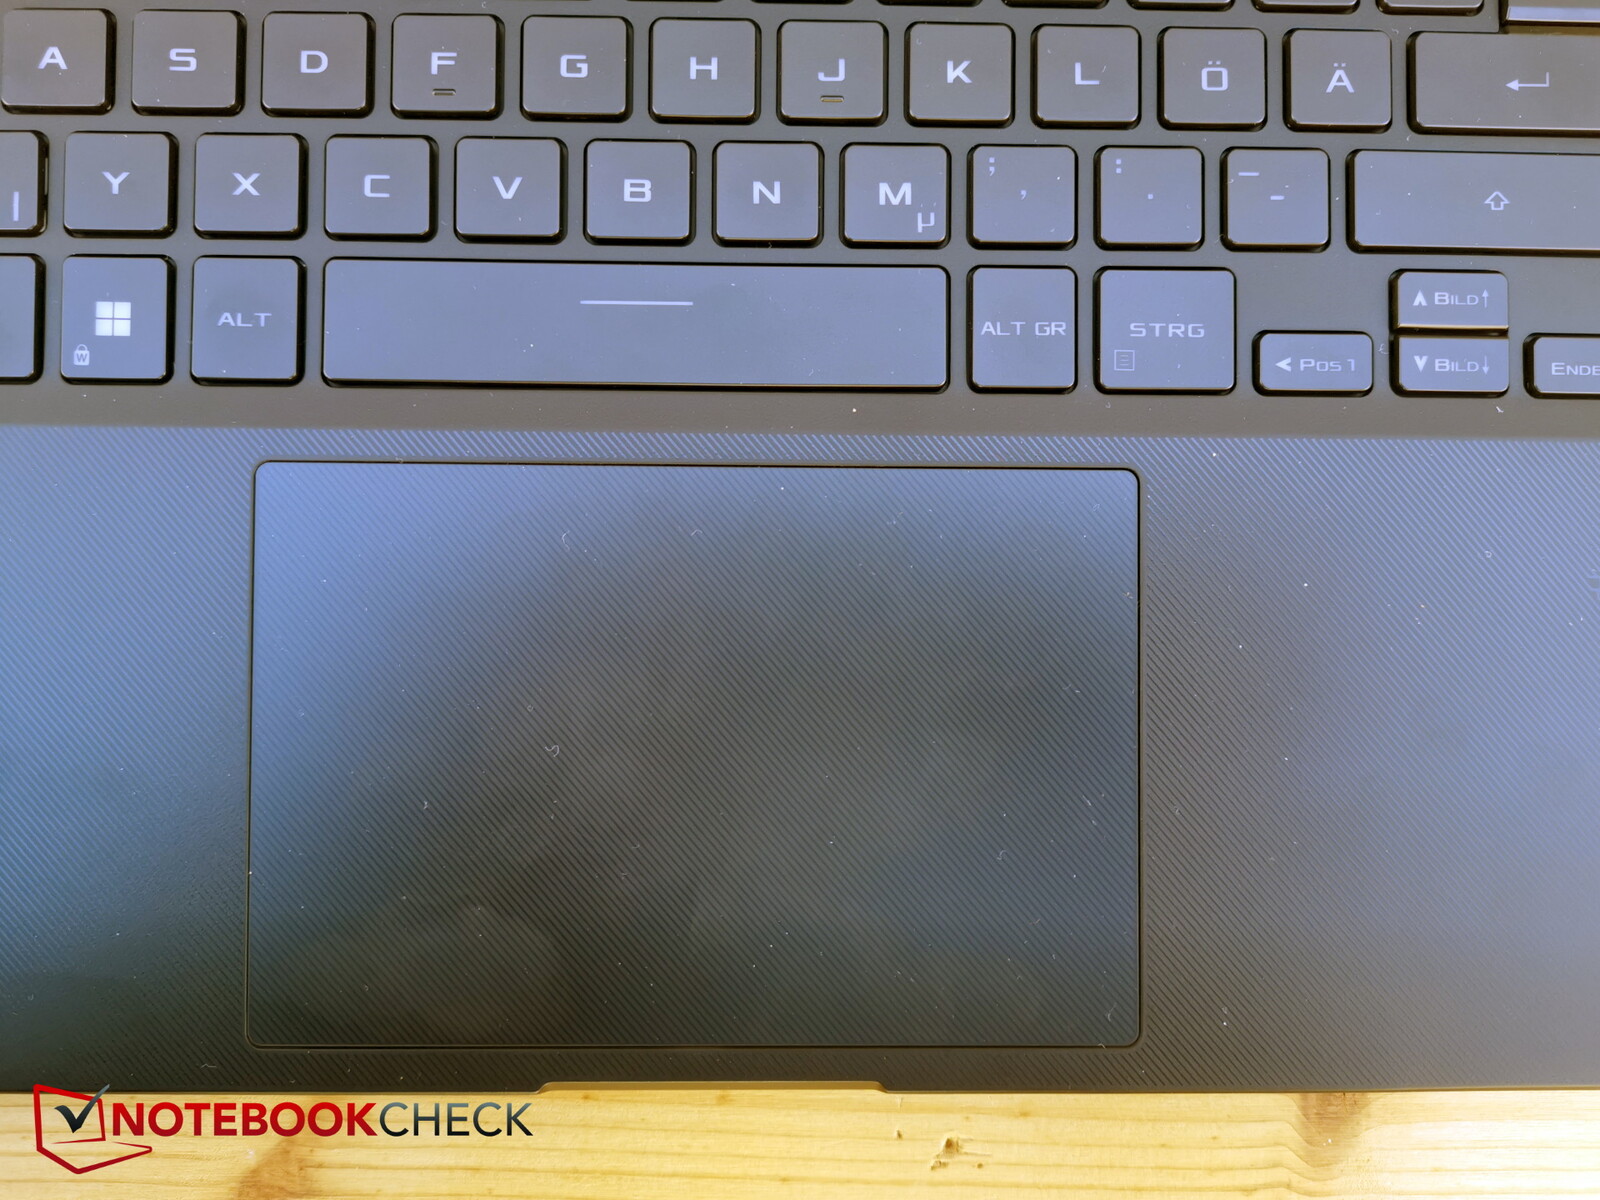
Urządzenia wejściowe - X16 posiada duży touchpad

Wyświetlacz - z mini-LED czy bez?
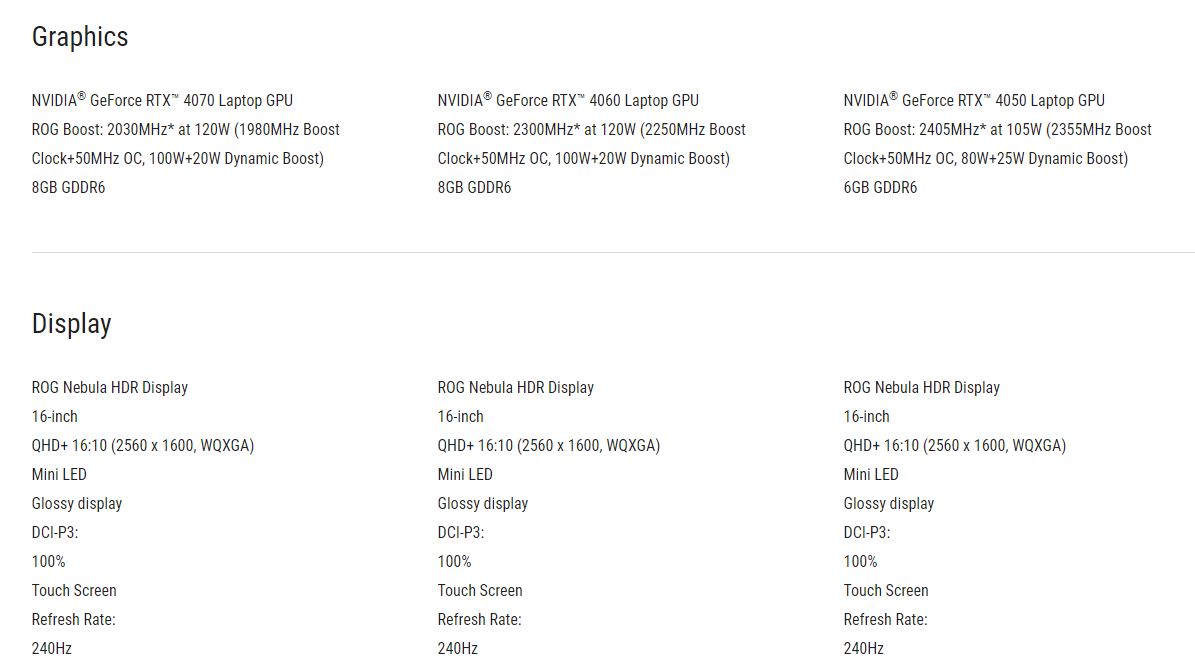
X16 zawiera 16-calowy panel Asus TMX1603 lub TL160ADMP03-0 IPS z funkcją ekranu dotykowego, ale bez mini-LED. Ten sam panel, choć w wariancie bez dotyku, można również znaleźć w Asus ROG Strix G16. Jest to wyświetlacz o formacie 16:10 i rozdzielczości 2560 x 1600 pikseli, który obsługuje wprowadzanie danych za pomocą rysika. Niestety, w przeciwieństwie do zeszłego roku, kiedy rysik był w zestawie, w tym roku trzeba go dokupić osobno.
Ponadto, podobnie jak w zeszłym roku, istnieje również opcja wyboru panelu z podświetleniem mini-LED, który został ponownie ulepszony: Liczba stref przyciemniania została podwojona do 1024, częstotliwość odświeżania wzrosła ze 165 do 240 Hz, a szczytowa jasność nieznacznie wzrosła do 1100 nitów (HDR). Niestety, panel mini-LED (recenzja tutaj) jest dostępny tylko z RTX 4070lub modelach o wyższej specyfikacji i dlatego nie jest obecny w naszym modelu testowym.
Jednak strona internetowa Asusa sprawia wrażenie, że wszystkie modele są wyposażone w wyświetlacz mini-LED - nawet te z RTX 4050 i RTX 4060. Tak więc, zwróć szczególną uwagę przy zakupie!
Ale nawet bez mini-LED, nasz standardowy model zmierzył średnią jasność około 469 nitów z podświetleniem na bardzo dobrym poziomie 91 procent. Poziomy czerni są na akceptowalnym poziomie 0,39, co daje współczynnik kontrastu 1,246:1.
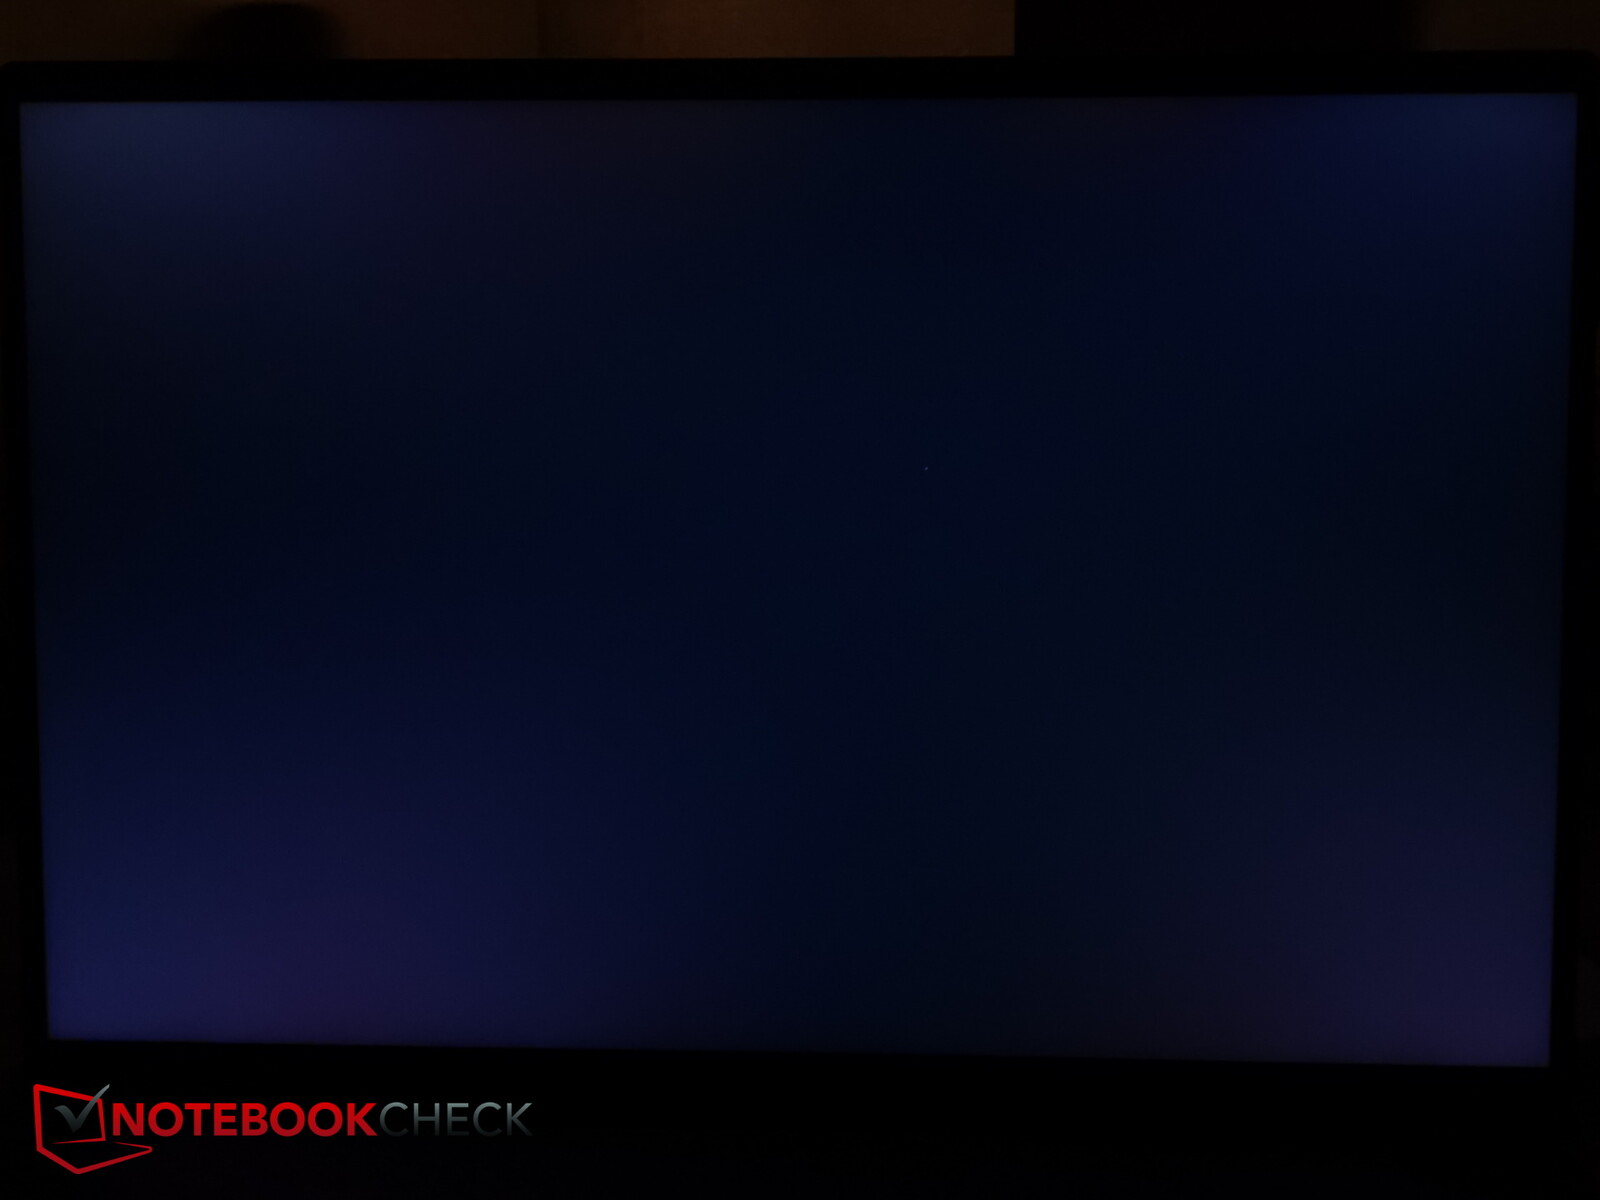
Czasy reakcji są bardzo szybkie, nie ma potrzeby martwić się o PWM, a krwawienie podświetlenia jest bardzo minimalne i widoczne tylko wzdłuż górnej krawędzi.
| |||||||||||||||||||||||||
rozświetlenie: 91 %
na akumulatorze: 487 cd/m²
kontrast: 1246:1 (czerń: 0.39 cd/m²)
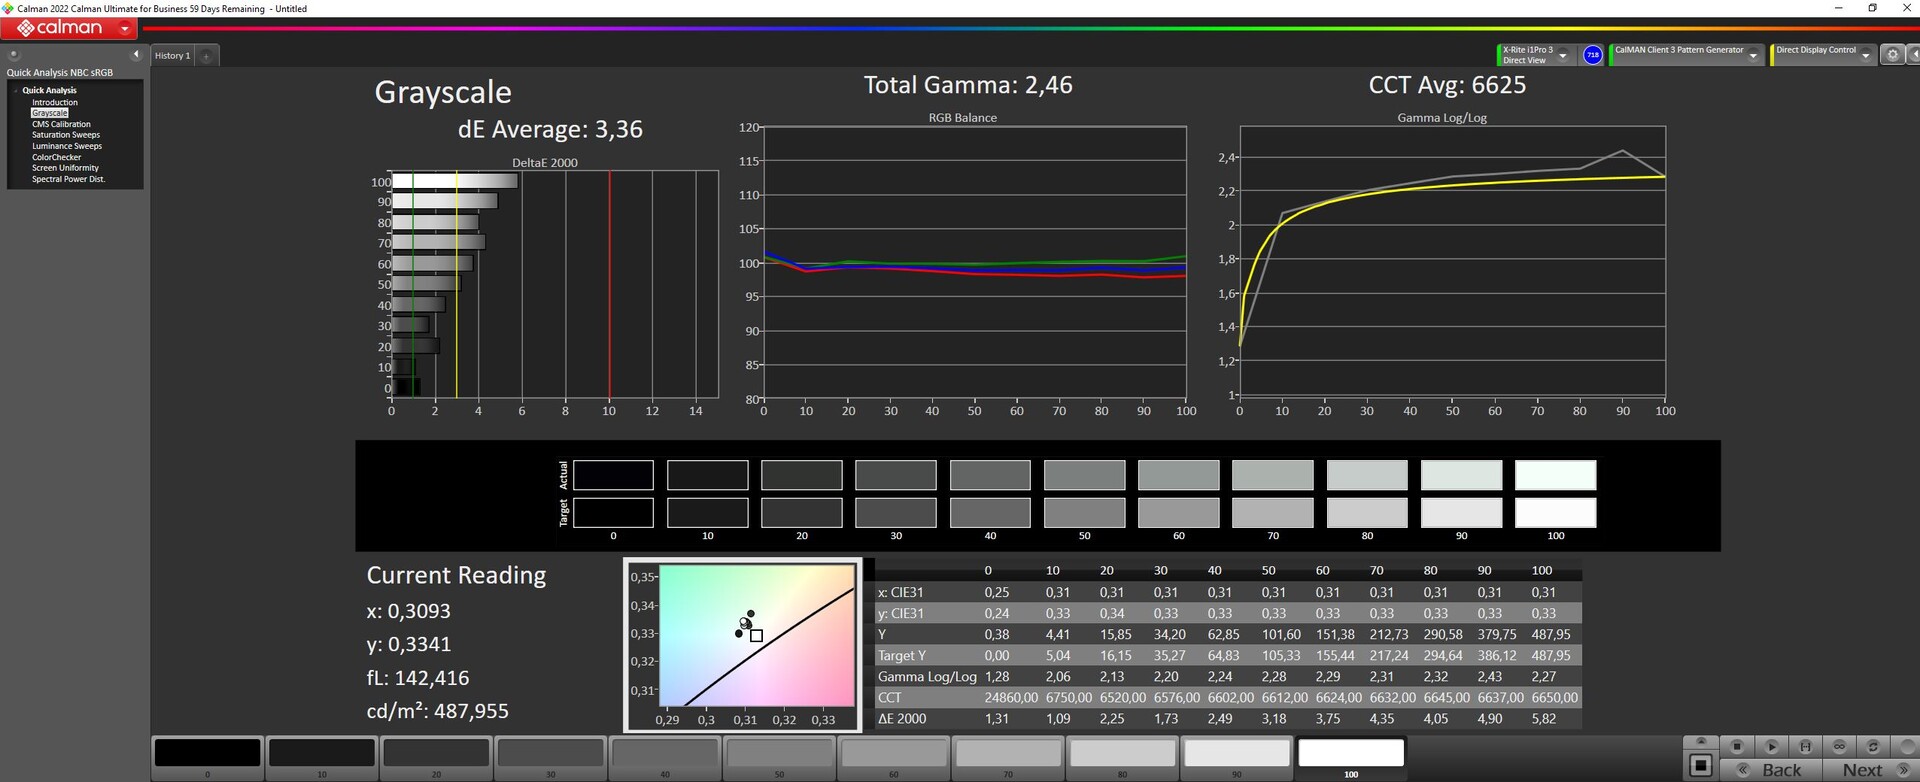
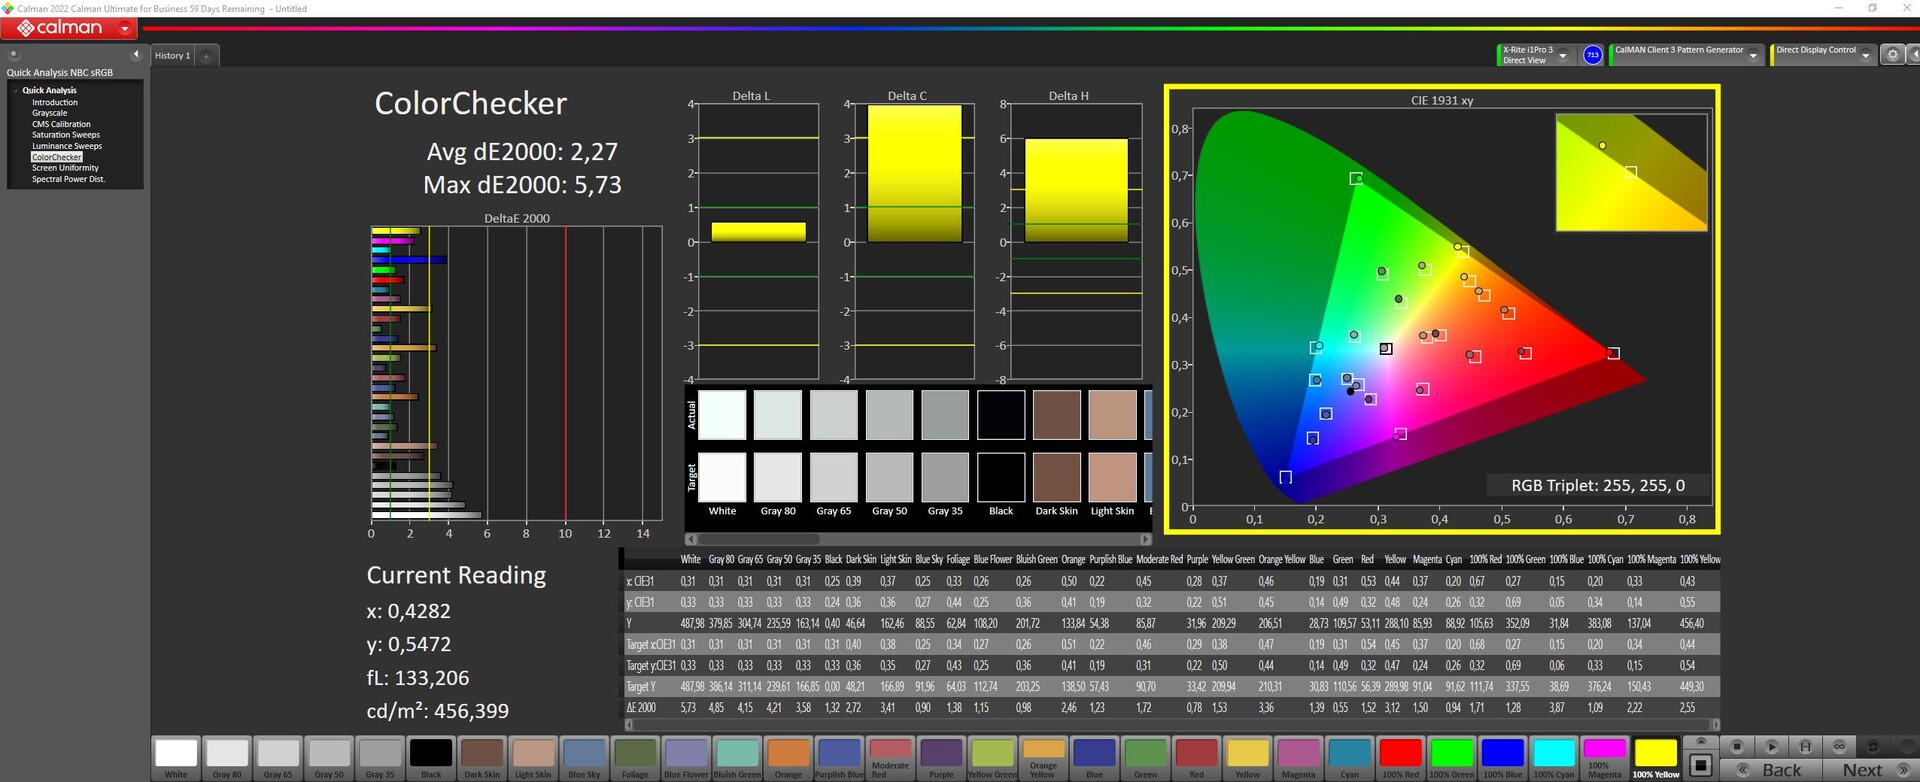
ΔE ColorChecker Calman: 2.27 | ∀{0.5-29.43 Ø4.73}
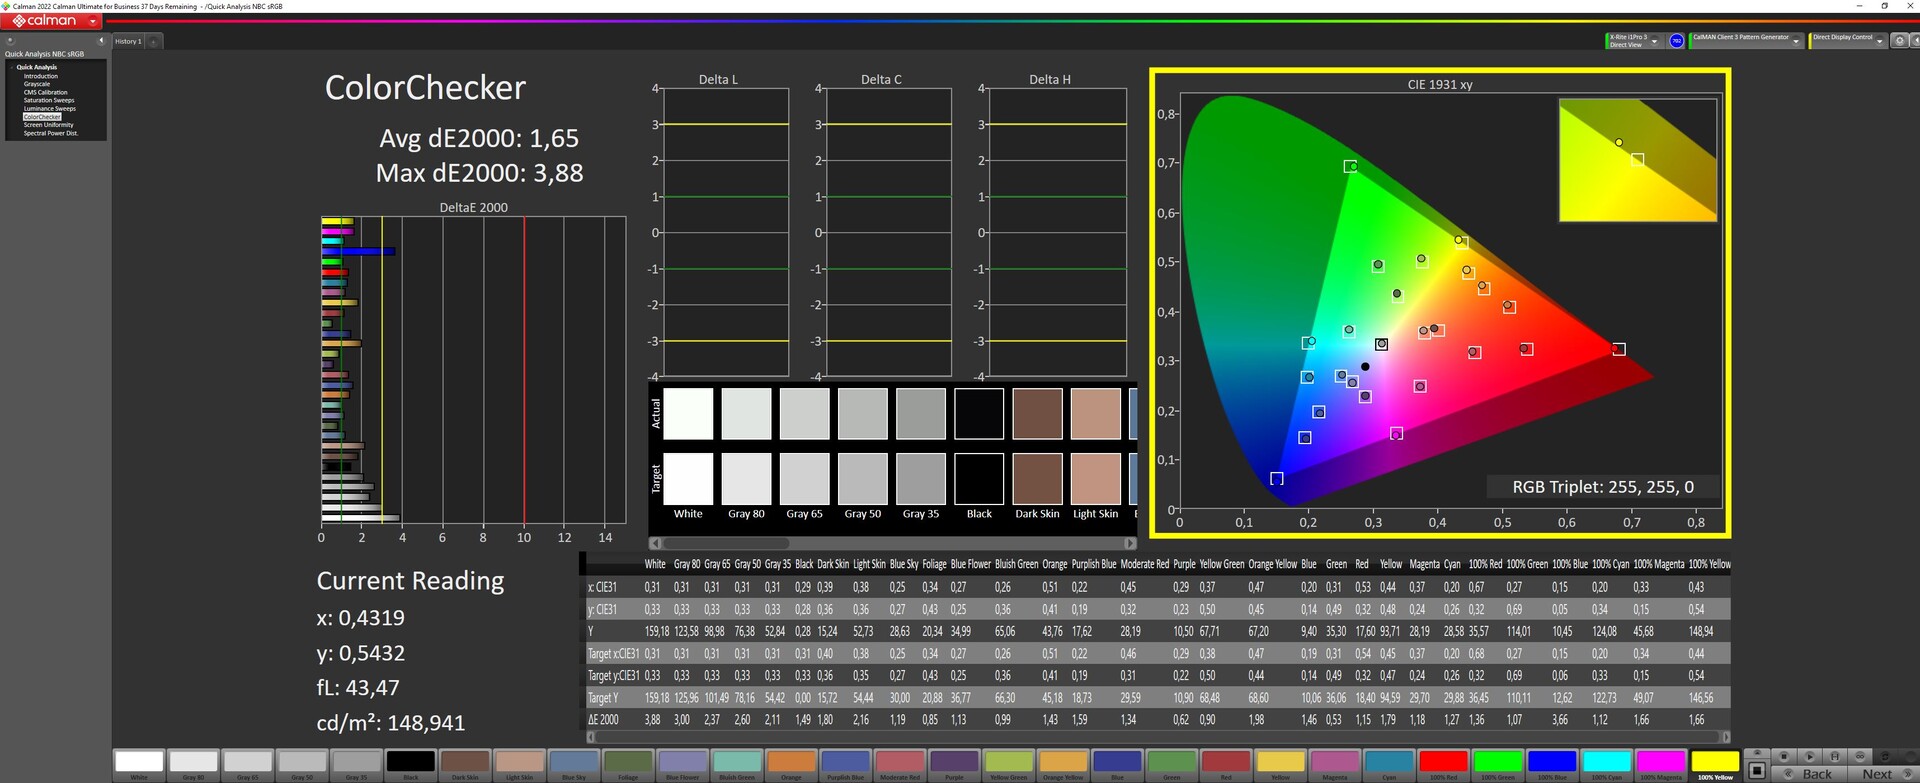
calibrated: 0.6
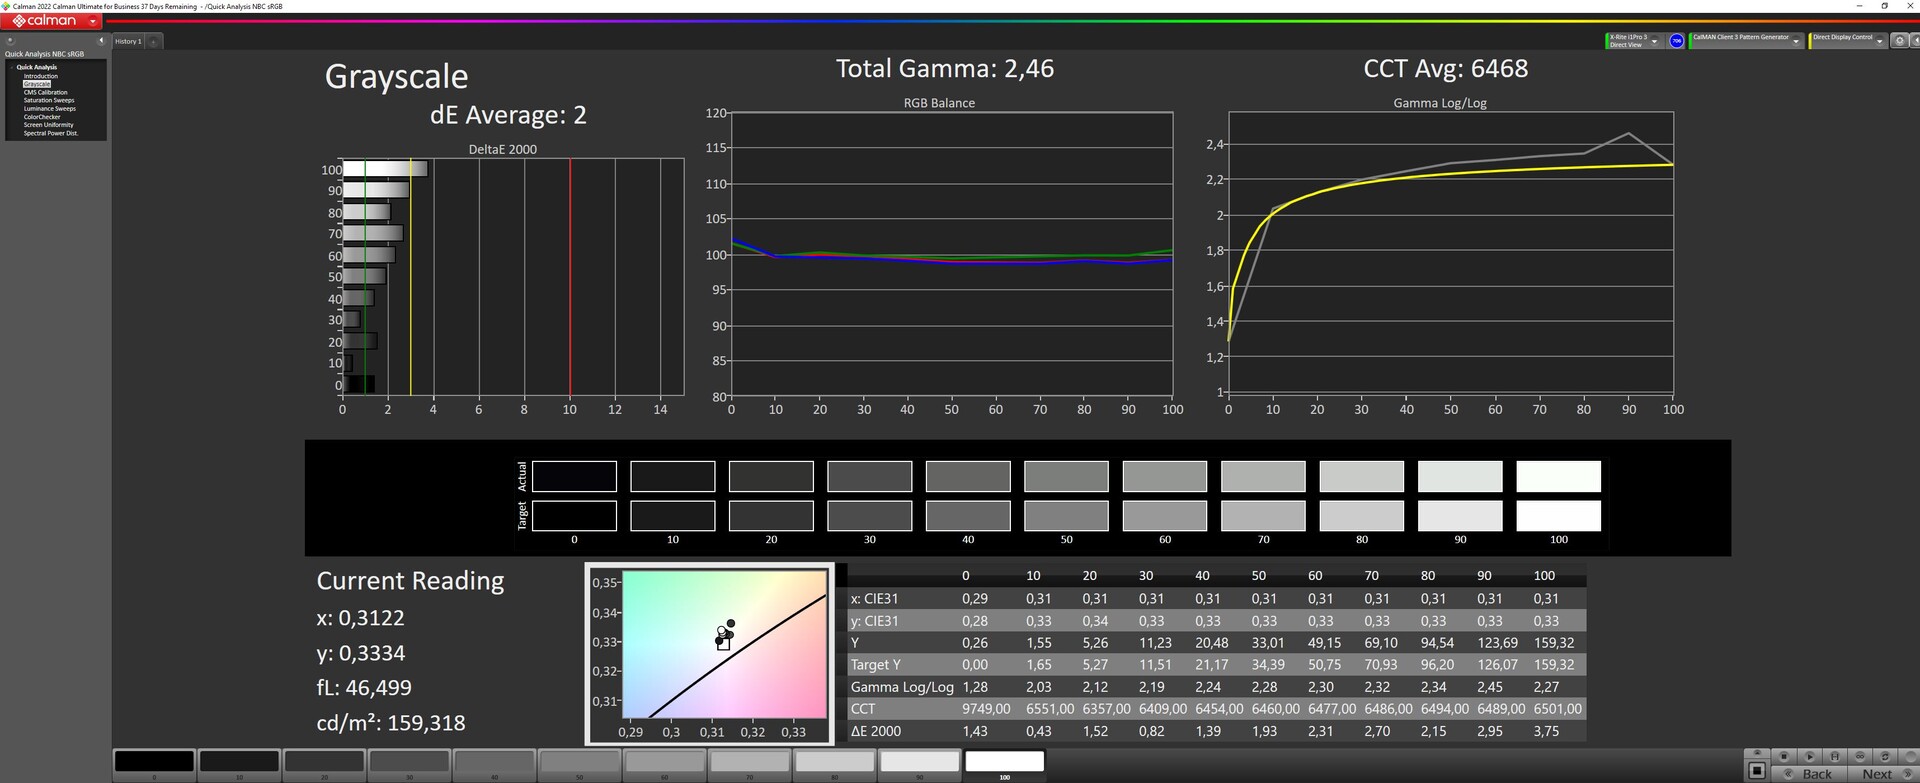
ΔE Greyscale Calman: 3.36 | ∀{0.09-98 Ø4.97}
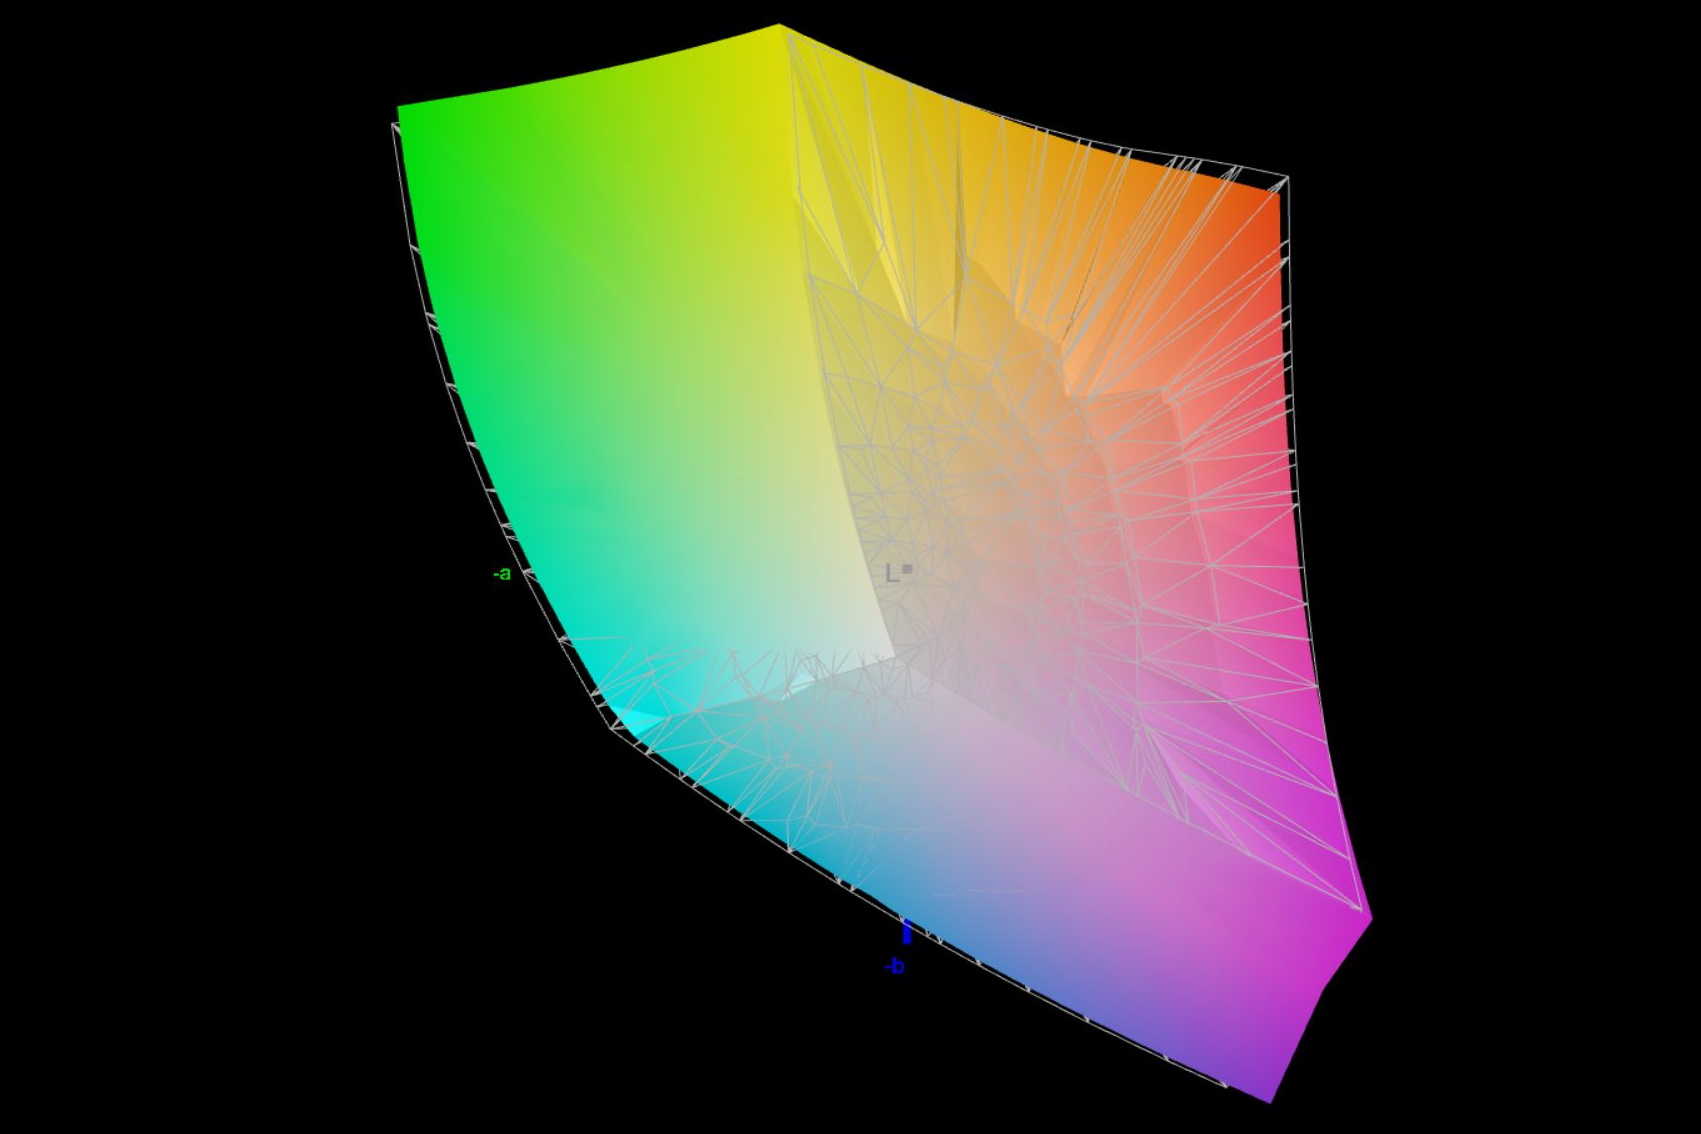
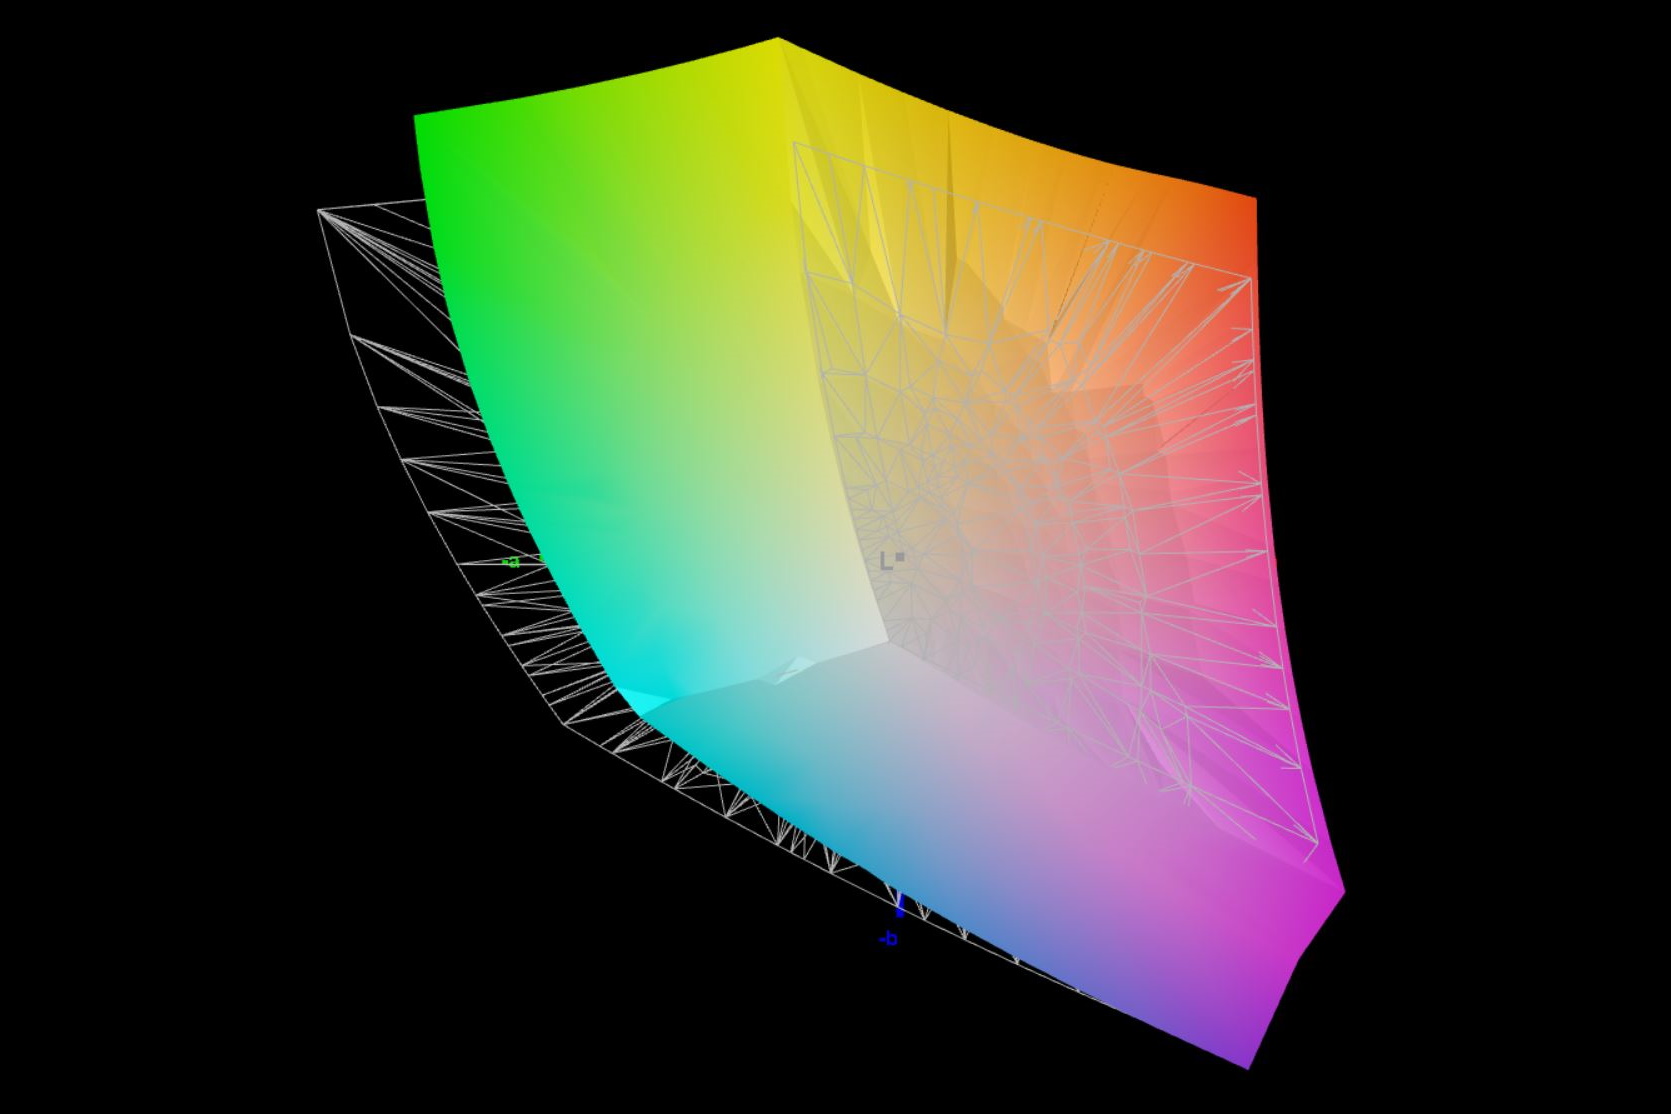
84.63% AdobeRGB 1998 (Argyll 3D)
99.92% sRGB (Argyll 3D)
96.61% Display P3 (Argyll 3D)
Gamma: 2.46
CCT: 6625 K
| Asus ROG Flow X16 GV601V TMX1603 (TL160ADMP03-0), IPS, 2560x1600, 16" | Asus ROG Flow X16 GV601RW-M5082W AUO B160QAN02.S, Mini LED, 2560x1600, 16.1" | Samsung Galaxy Book3 Ultra 16, i9-13900H RTX 4070 Samsung SDC4185 ATNA60CL03-0, OLED / AMOLED, 2880x1800, 16" | Lenovo Legion Pro 5 16IRX8 AU Optronics B160QAN03.1, IPS, 2560x1600, 16" | Lenovo Yoga Pro 7 14IRH G8 LEN145-3K, IPS, 3072x1920, 14.5" | MSI Katana 17 B13VFK B173HAN04.9, IPS LED, 1920x1080, 17.3" | |
|---|---|---|---|---|---|---|
| Display | 3% | 4% | -13% | 2% | -49% | |
| Display P3 Coverage (%) | 96.61 | 99.82 3% | 95.3 -1% | 71.2 -26% | 98.7 2% | 40.8 -58% |
| sRGB Coverage (%) | 99.92 | 99.99 0% | 99.1 -1% | 98.8 -1% | 100 0% | 61 -39% |
| AdobeRGB 1998 Coverage (%) | 84.63 | 90.21 7% | 97.4 15% | 73.3 -13% | 87.6 4% | 42.2 -50% |
| Response Times | -117% | 61% | -160% | -419% | -505% | |
| Response Time Grey 50% / Grey 80% * (ms) | 3.8 ? | 11 ? -189% | 2 ? 47% | 14.5 ? -282% | 31.5 ? -729% | 33 ? -768% |
| Response Time Black / White * (ms) | 7.6 ? | 11 ? -45% | 2 ? 74% | 10.4 ? -37% | 15.8 ? -108% | 26 ? -242% |
| PWM Frequency (Hz) | 7400 ? | 250 ? | ||||
| Screen | 16% | 2% | 8% | 26% | -111% | |
| Brightness middle (cd/m²) | 486 | 498 2% | 403 -17% | 405.7 -17% | 441 -9% | 267 -45% |
| Brightness (cd/m²) | 469 | 502 7% | 408 -13% | 368 -22% | 453 -3% | 256 -45% |
| Brightness Distribution (%) | 91 | 94 3% | 98 8% | 87 -4% | 92 1% | 93 2% |
| Black Level * (cd/m²) | 0.39 | 0.11 72% | 0.38 3% | 0.34 13% | 0.21 46% | |
| Contrast (:1) | 1246 | 4527 263% | 1068 -14% | 1297 4% | 1271 2% | |
| Colorchecker dE 2000 * | 2.27 | 1.87 18% | 2.63 -16% | 1.65 27% | 0.6 74% | 4.7 -107% |
| Colorchecker dE 2000 max. * | 5.73 | 6.15 -7% | 4.07 29% | 4.2 27% | 1.3 77% | 20.4 -256% |
| Colorchecker dE 2000 calibrated * | 0.6 | 1.94 -223% | 0.53 12% | 0.6 -0% | 4.5 -650% | |
| Greyscale dE 2000 * | 3.36 | 3.15 6% | 2.69 20% | 1.2 64% | 0.8 76% | 1.5 55% |
| Gamma | 2.46 89% | 330.95 1% | 2.48 89% | 2.3 96% | 2.2 100% | 2.12 104% |
| CCT | 6625 98% | 7294 89% | 6907 94% | 6453 101% | 6597 99% | 6552 99% |
| Całkowita średnia (program / ustawienia) | -33% /
-6% | 22% /
13% | -55% /
-20% | -130% /
-43% | -222% /
-154% |
* ... im mniej tym lepiej
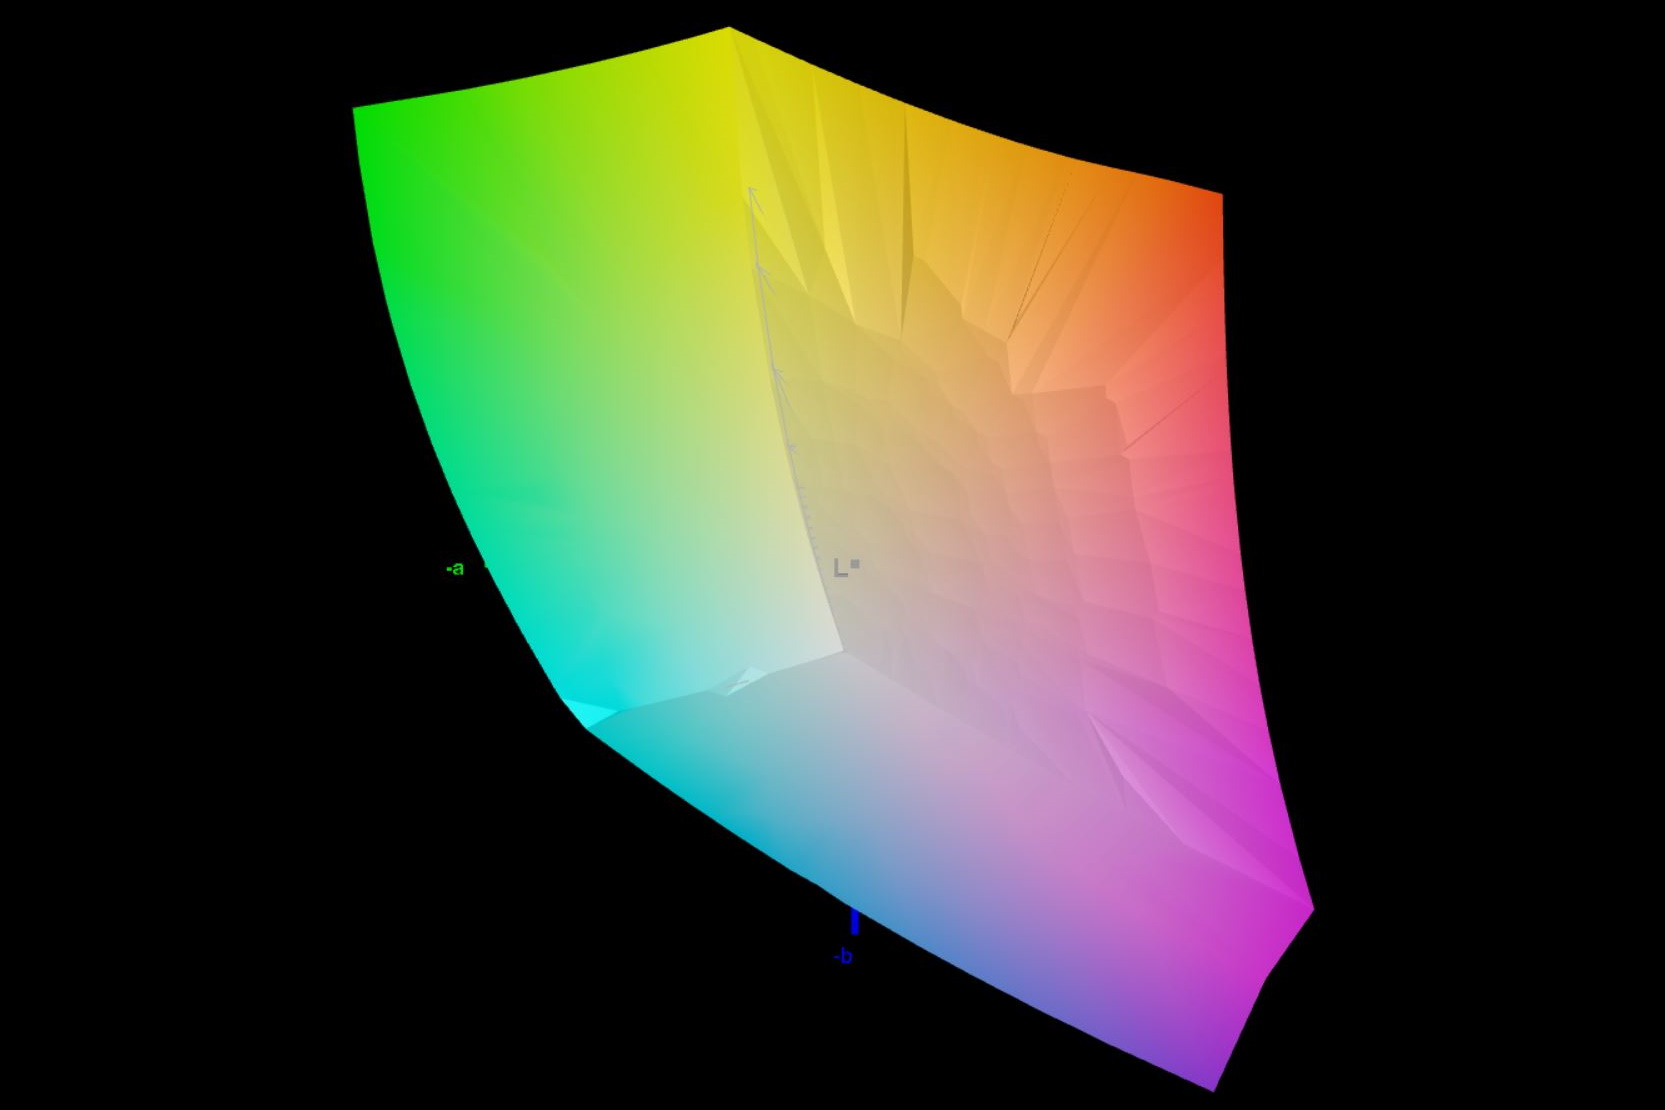
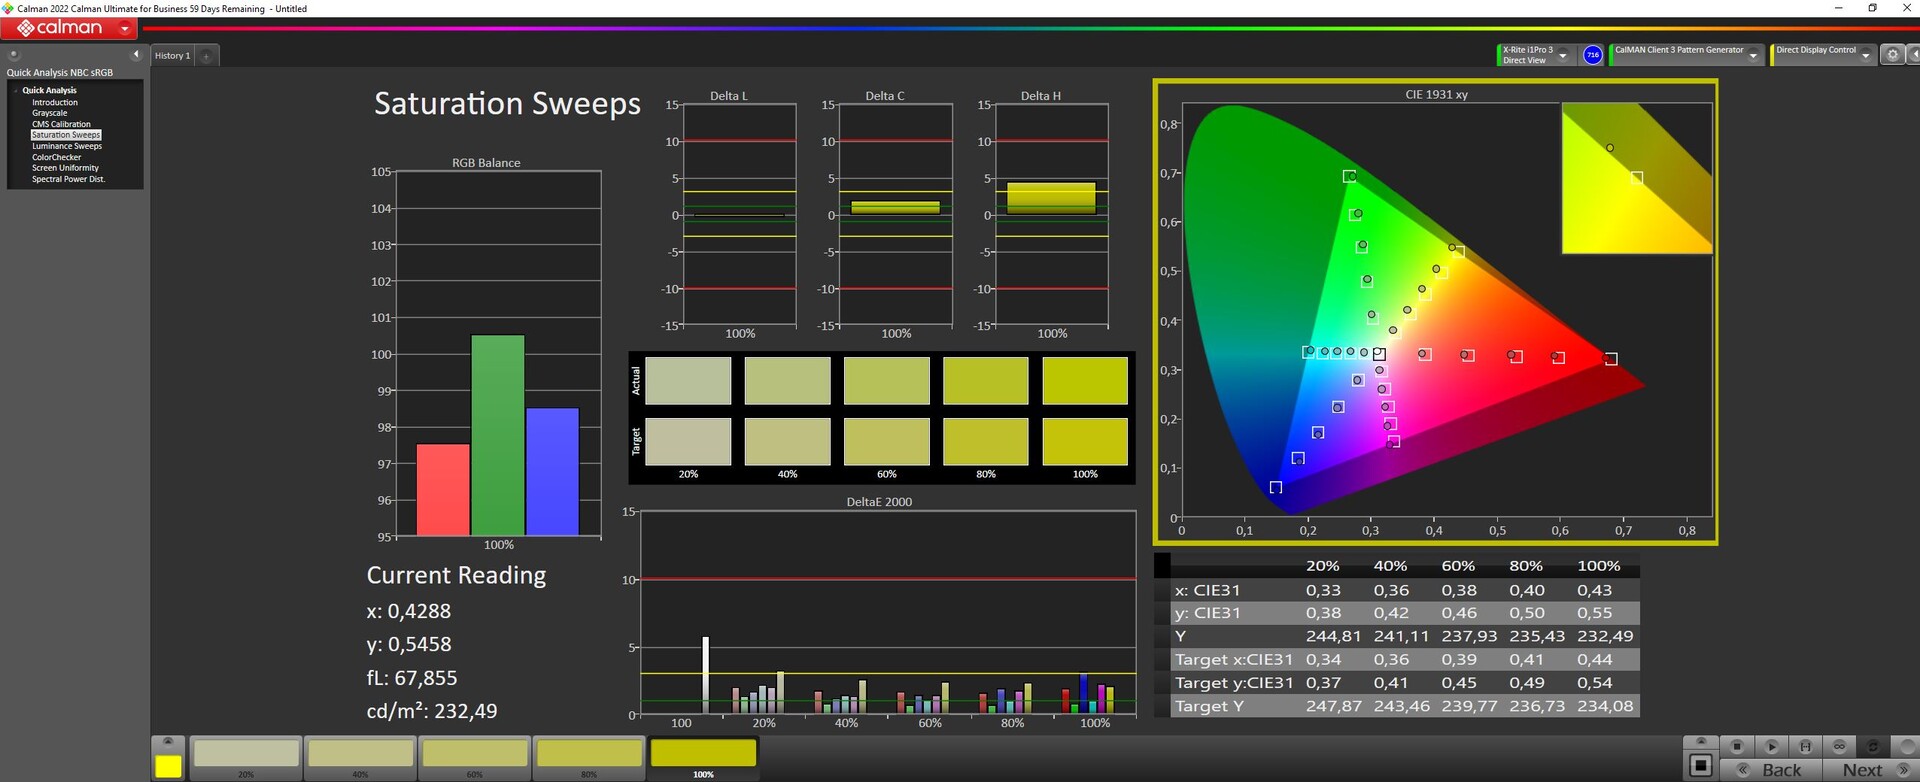
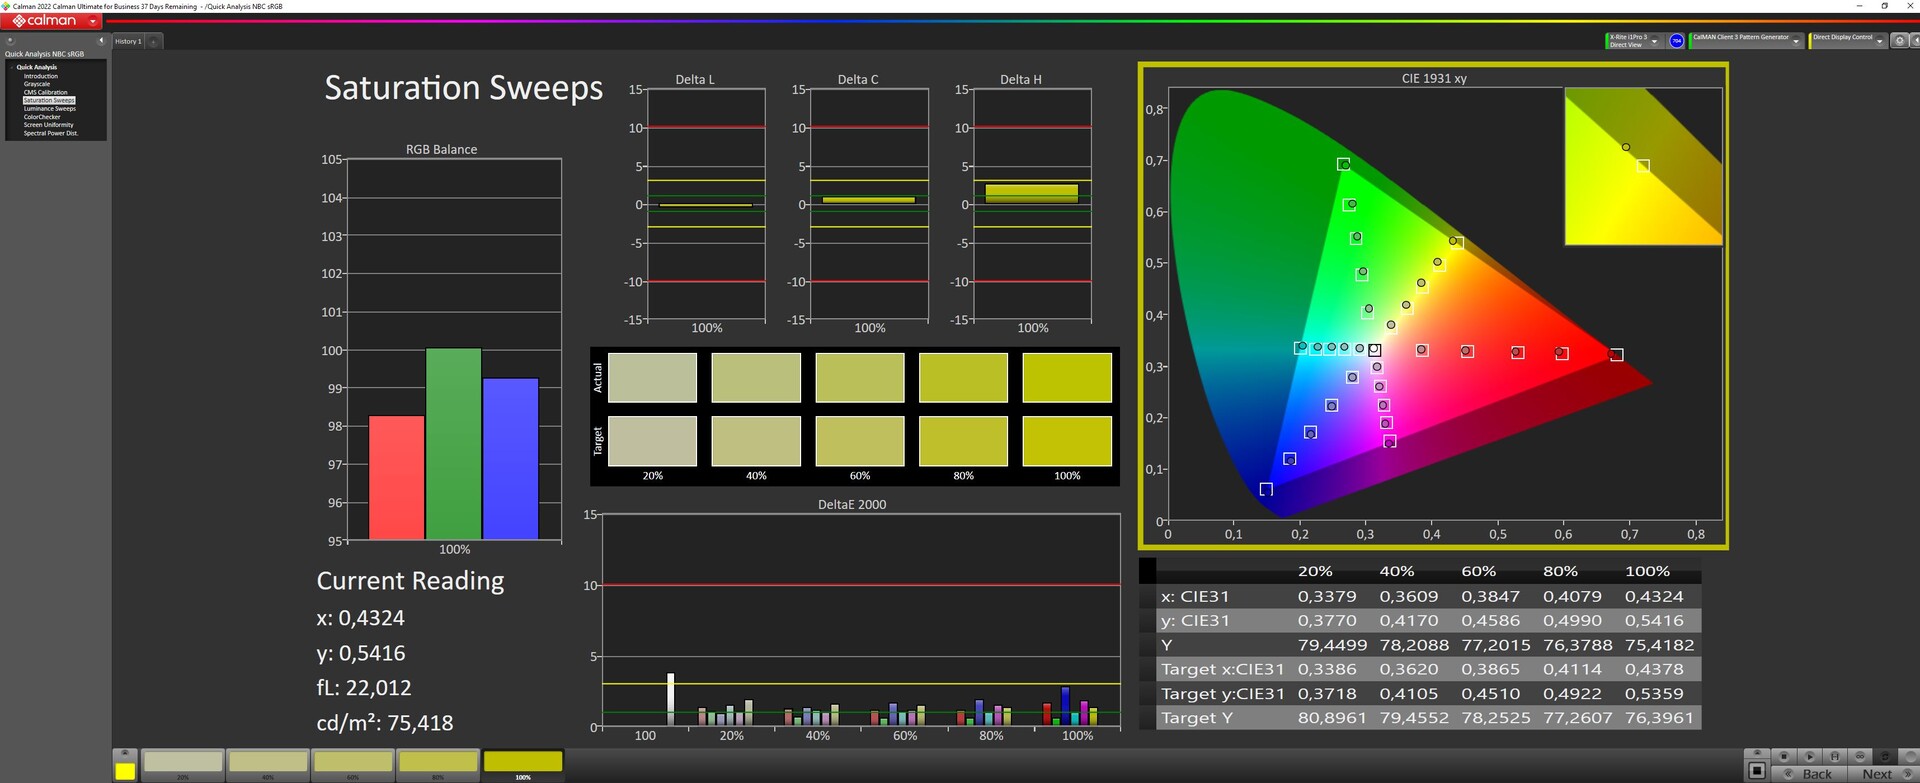
Asus reklamuje urządzenie ze 100-procentowym pokryciem DCI P3, a my zmierzyliśmy około 97 procent. AdobeRGB jest pokryte w około 85 procentach, a sRGB całkowicie.
Aby uzyskać lepszą dokładność kolorów, warto zmniejszyć jasność X16 do około 50 procent. W rezultacie DeltaE w skali szarości poprawia się z 3,36 do zaledwie 2. Ponadto DeltaE ColorCheckera spada dalej. Świeża kalibracja przy użyciu i1Profiler nie ma większego sensu.
Wyświetl czasy reakcji
| ↔ Czas reakcji od czerni do bieli | ||
|---|---|---|
| 7.6 ms ... wzrost ↗ i spadek ↘ łącznie | ↗ 4 ms wzrost | 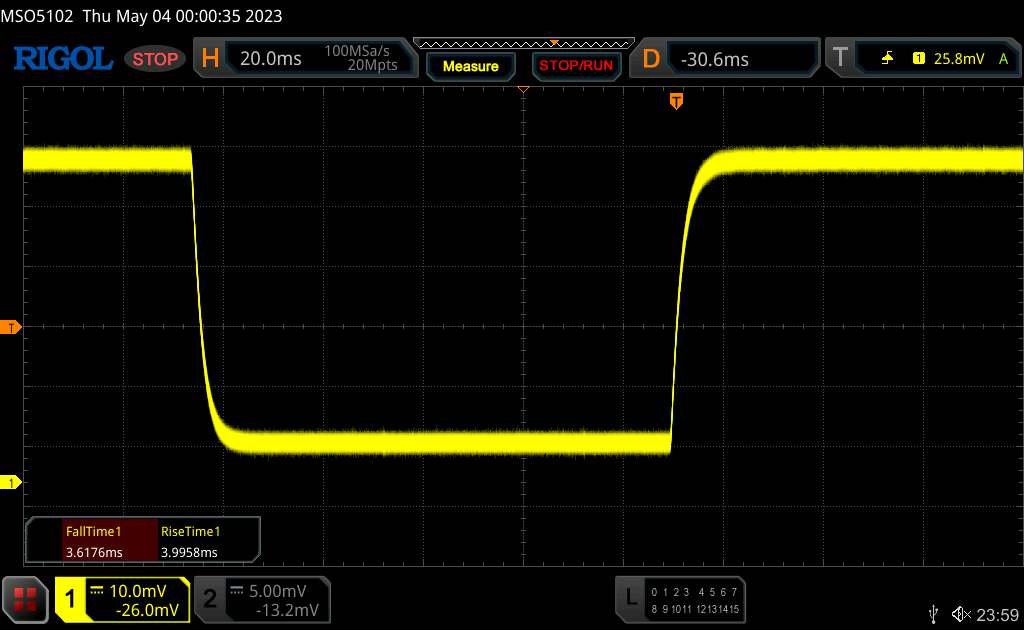 |
| ↘ 3.6 ms upadek | ||
| W naszych testach ekran wykazuje bardzo szybką reakcję i powinien bardzo dobrze nadawać się do szybkich gier. Dla porównania, wszystkie testowane urządzenia wahają się od 0.1 (minimum) do 240 (maksimum) ms. » 22 % wszystkich urządzeń jest lepszych. Oznacza to, że zmierzony czas reakcji jest lepszy od średniej wszystkich testowanych urządzeń (19.9 ms). | ||
| ↔ Czas reakcji 50% szarości do 80% szarości | ||
| 3.8 ms ... wzrost ↗ i spadek ↘ łącznie | ↗ 1.8 ms wzrost | 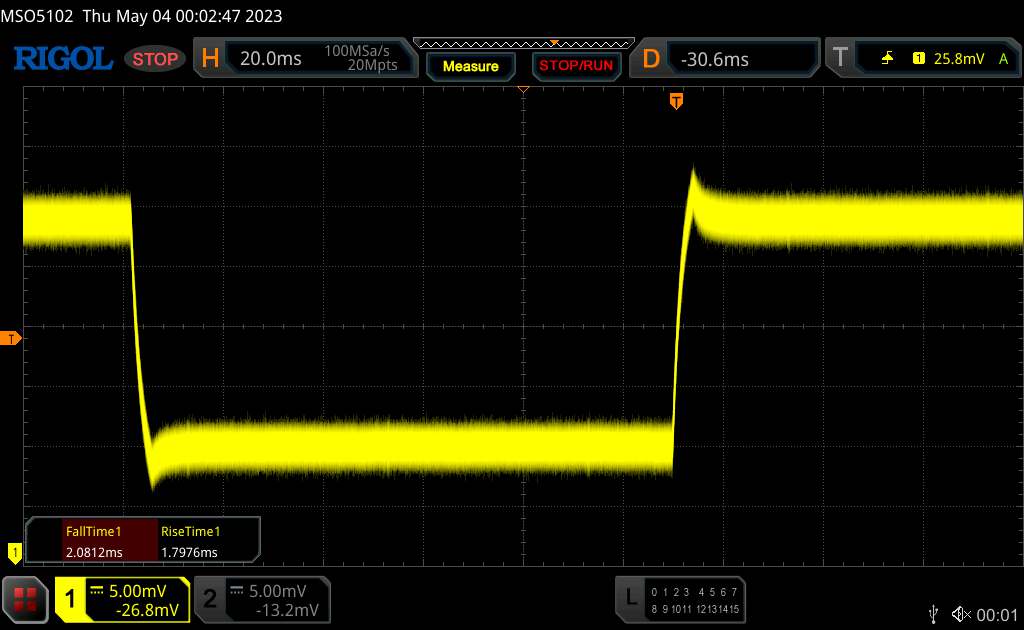 |
| ↘ 2 ms upadek | ||
| W naszych testach ekran wykazuje bardzo szybką reakcję i powinien bardzo dobrze nadawać się do szybkich gier. Dla porównania, wszystkie testowane urządzenia wahają się od 0.165 (minimum) do 636 (maksimum) ms. » 15 % wszystkich urządzeń jest lepszych. Oznacza to, że zmierzony czas reakcji jest lepszy od średniej wszystkich testowanych urządzeń (31.1 ms). | ||
Migotanie ekranu / PWM (modulacja szerokości impulsu)
| Migotanie ekranu/nie wykryto PWM | 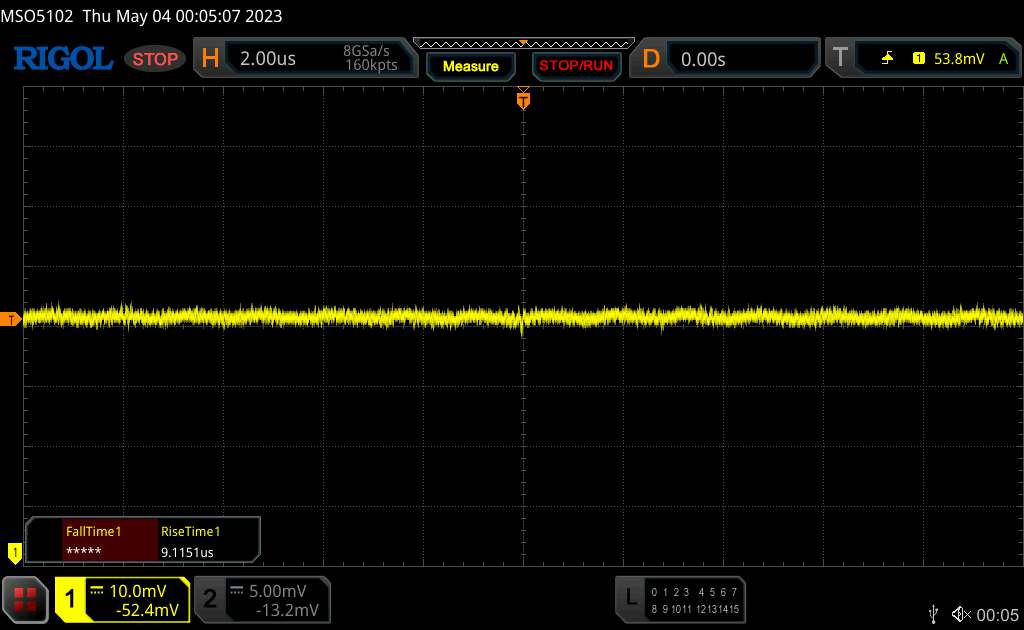 | ||
Dla porównania: 52 % wszystkich testowanych urządzeń nie używa PWM do przyciemniania wyświetlacza. Jeśli wykryto PWM, zmierzono średnio 7791 (minimum: 5 - maksimum: 343500) Hz. | |||
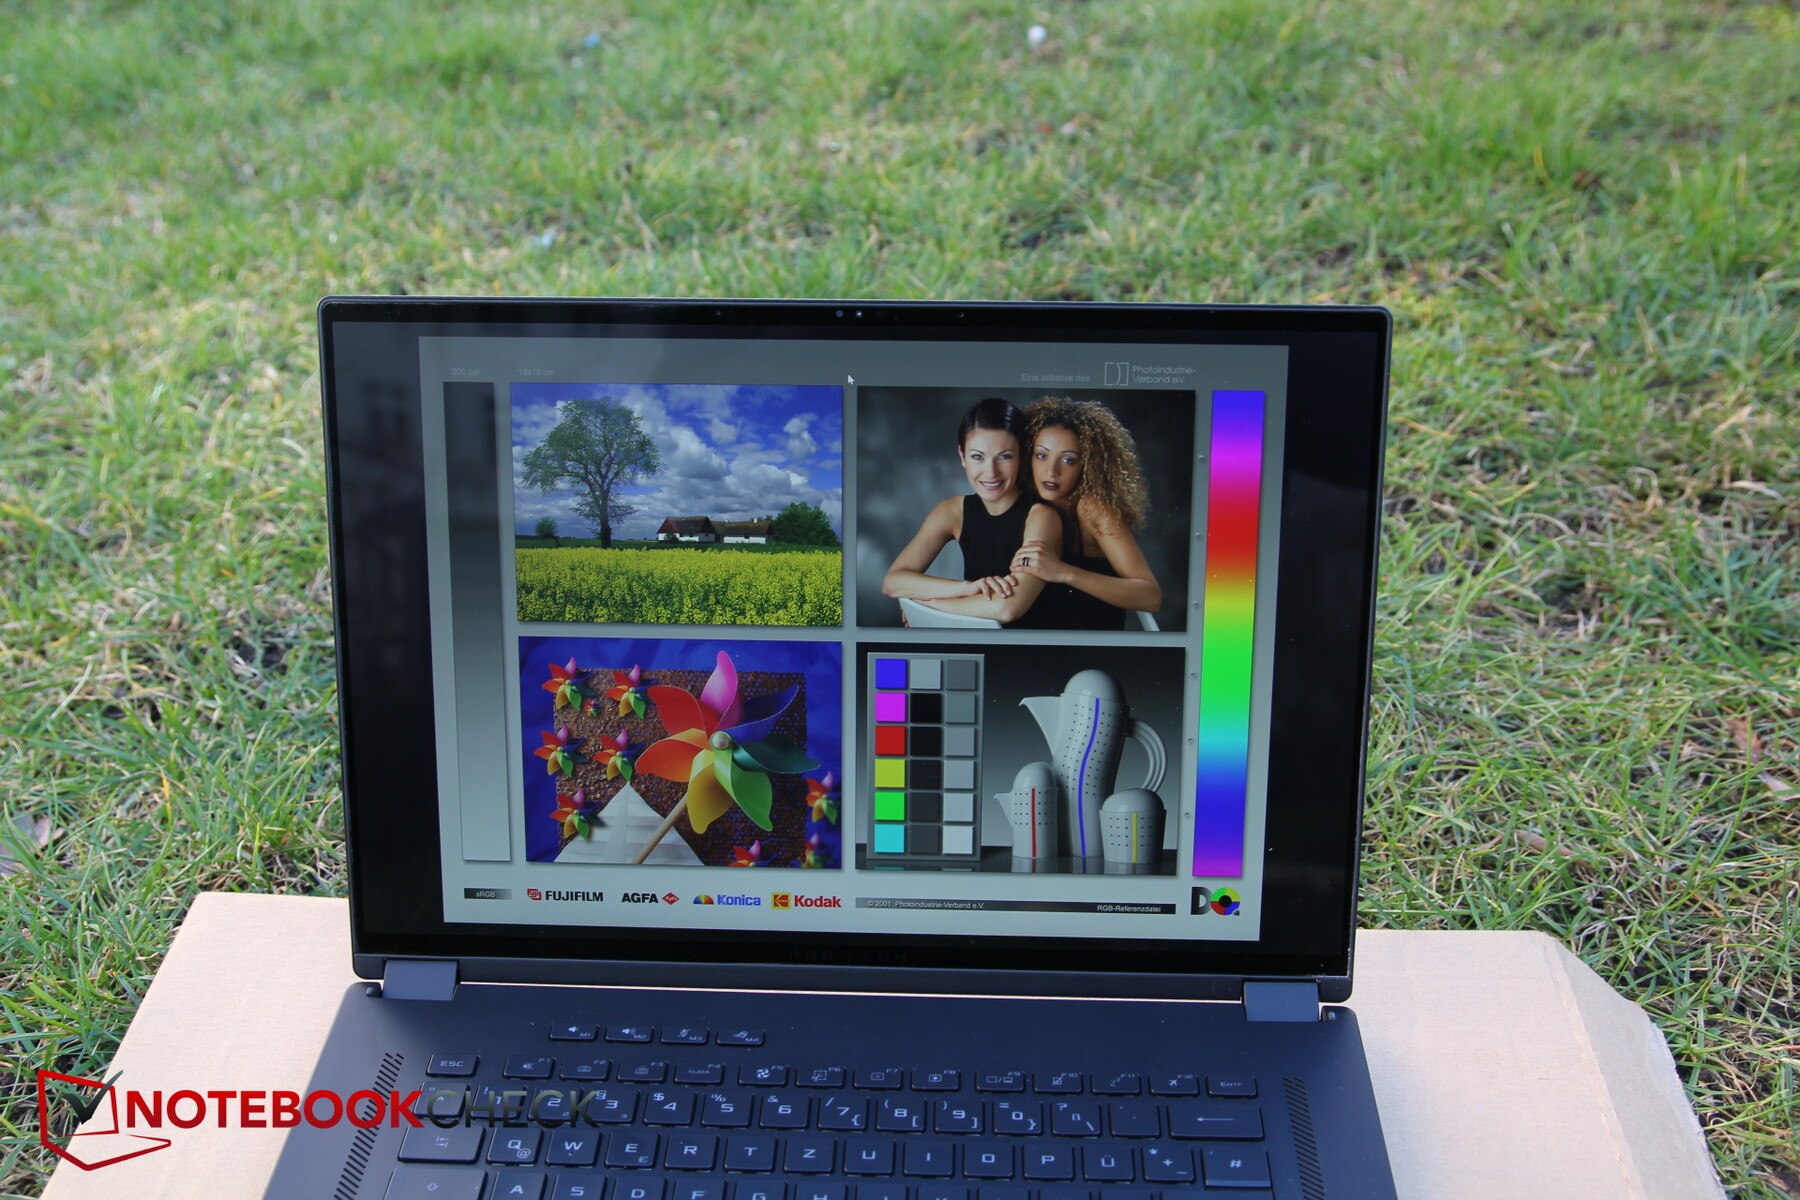
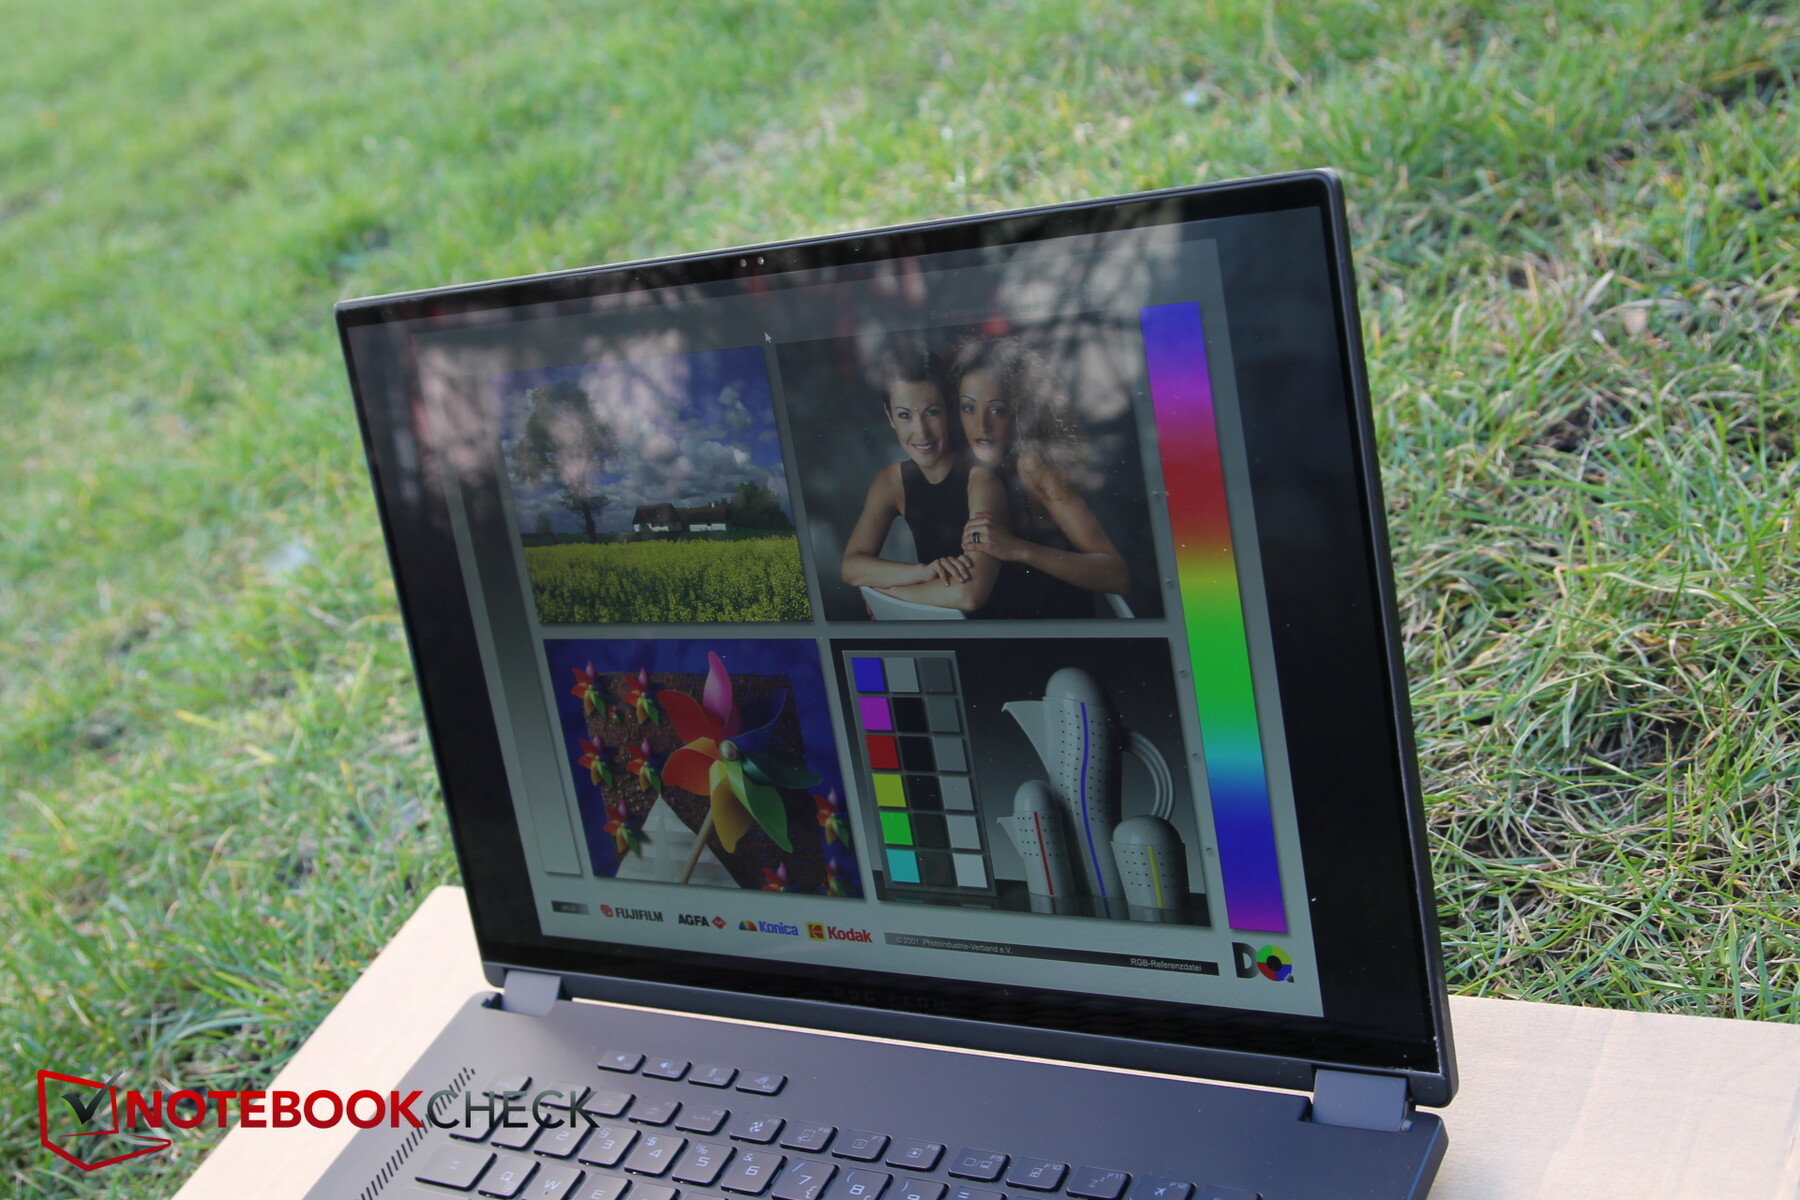
Na zewnątrz bardzo wysoka jasność pomaga zarówno w bezpośrednim świetle słonecznym, jak i w cieniu. Patrząc z szerokiego kąta, błyszczący ekran dotykowy utrudnia oglądanie.

Wydajność - potężny tablet Asus
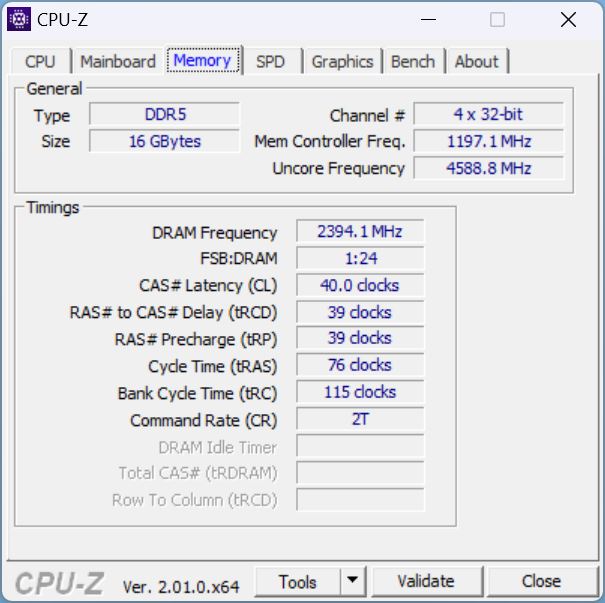
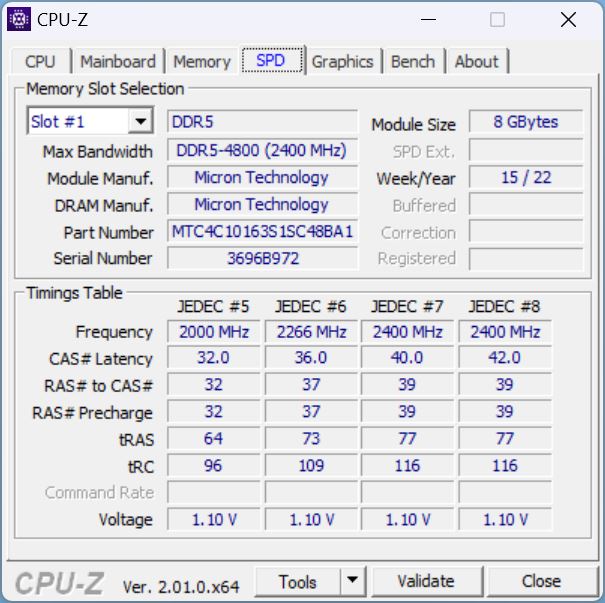
Wszystkie konfiguracje mają wspólny procesor Core i9-13900H. Jest on opcjonalnie połączony zRTX 4050, RTX 4060 lub RTX 4070. Według strony internetowej, jednostki SKU z dwiema słabszymi kartami graficznymi są wyposażone tylko w 8 GB pamięci RAM, a konfiguracja RTX 4070 ma 16 GB. Jednak nasza jednostka testowa jest wyposażona w RTX 4060 i 16 GB pamięci RAM. Wygląda na to, że Asus mógł ulepszyć nasz model testowy. Poza tym urządzenie może być wyposażone w maksymalnie 64 GB pamięci RAM.
Warunki testowe
Laptopy do gier Asus zawsze mają dwie preinstalowane aplikacje od producenta, które przypominają nieco bloatware. MyAsus jest odpowiedzialny za pytania dotyczące wsparcia, podczas gdy Armory Crate działa jako centrum sterowania i, jak to niestety jest obecnie w zwyczaju, gromadzi dane. Aplikacja nie jest jeszcze szczególnie dojrzała, zwłaszcza jeśli chodzi o tłumaczenie. Ciągle pojawiają się w niej brakujące lub ucięte fragmenty. Ponadto aplikacja czasami aktualizuje się dobrowolnie podczas uruchamiania, co oznacza, że użytkownik musi długo czekać, zanim uzyska dostęp do takich rzeczy, jak tryby wydajności - irytujące!
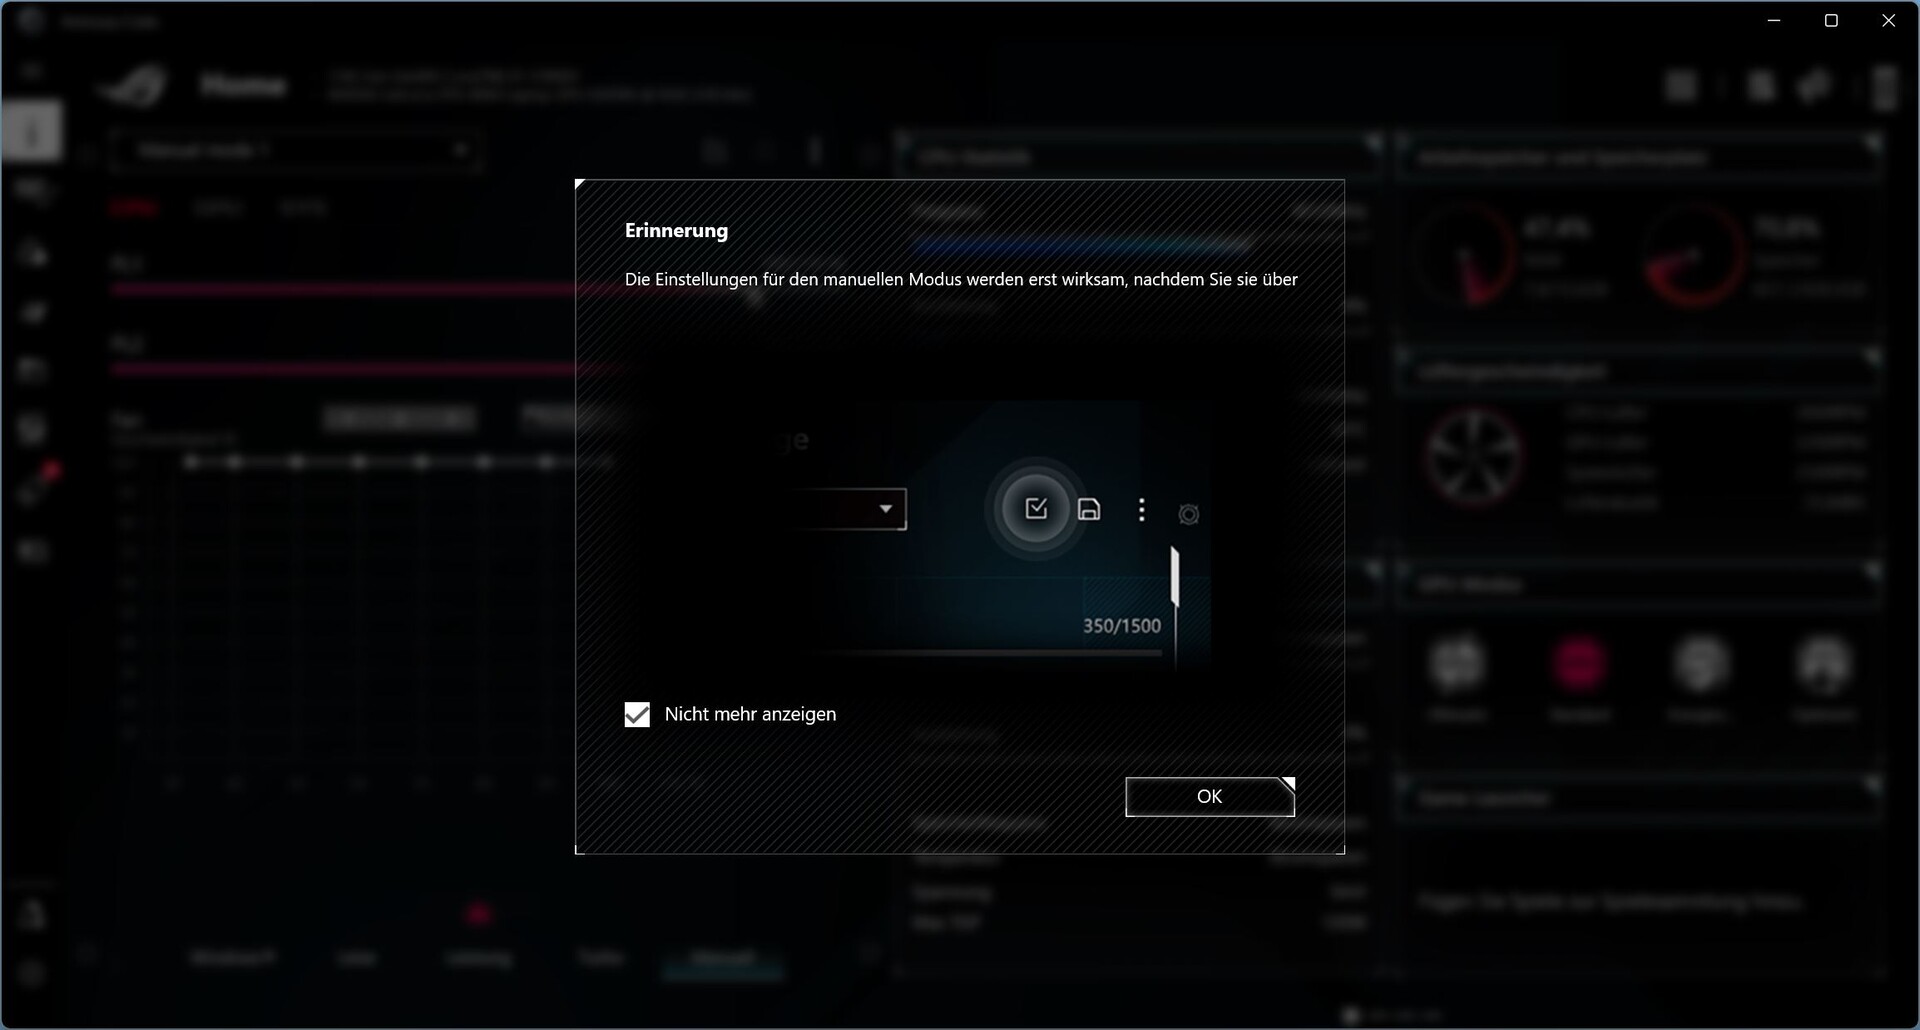
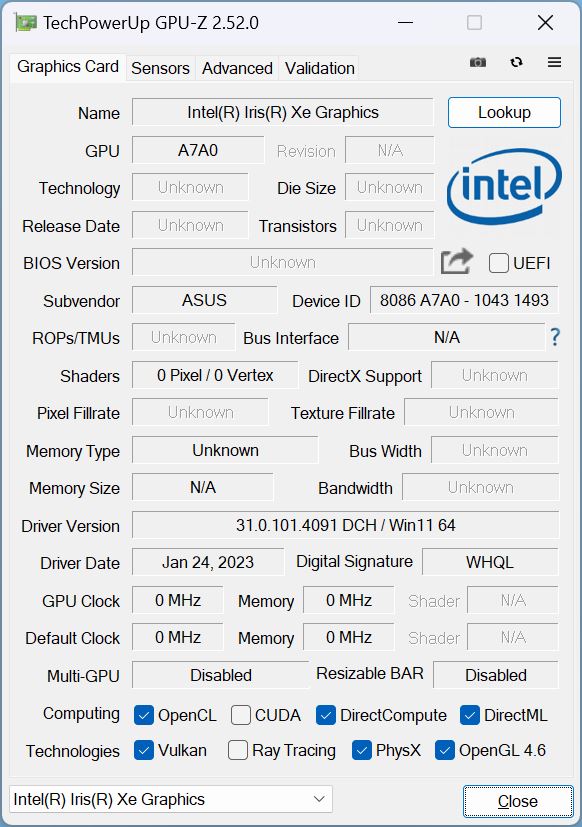
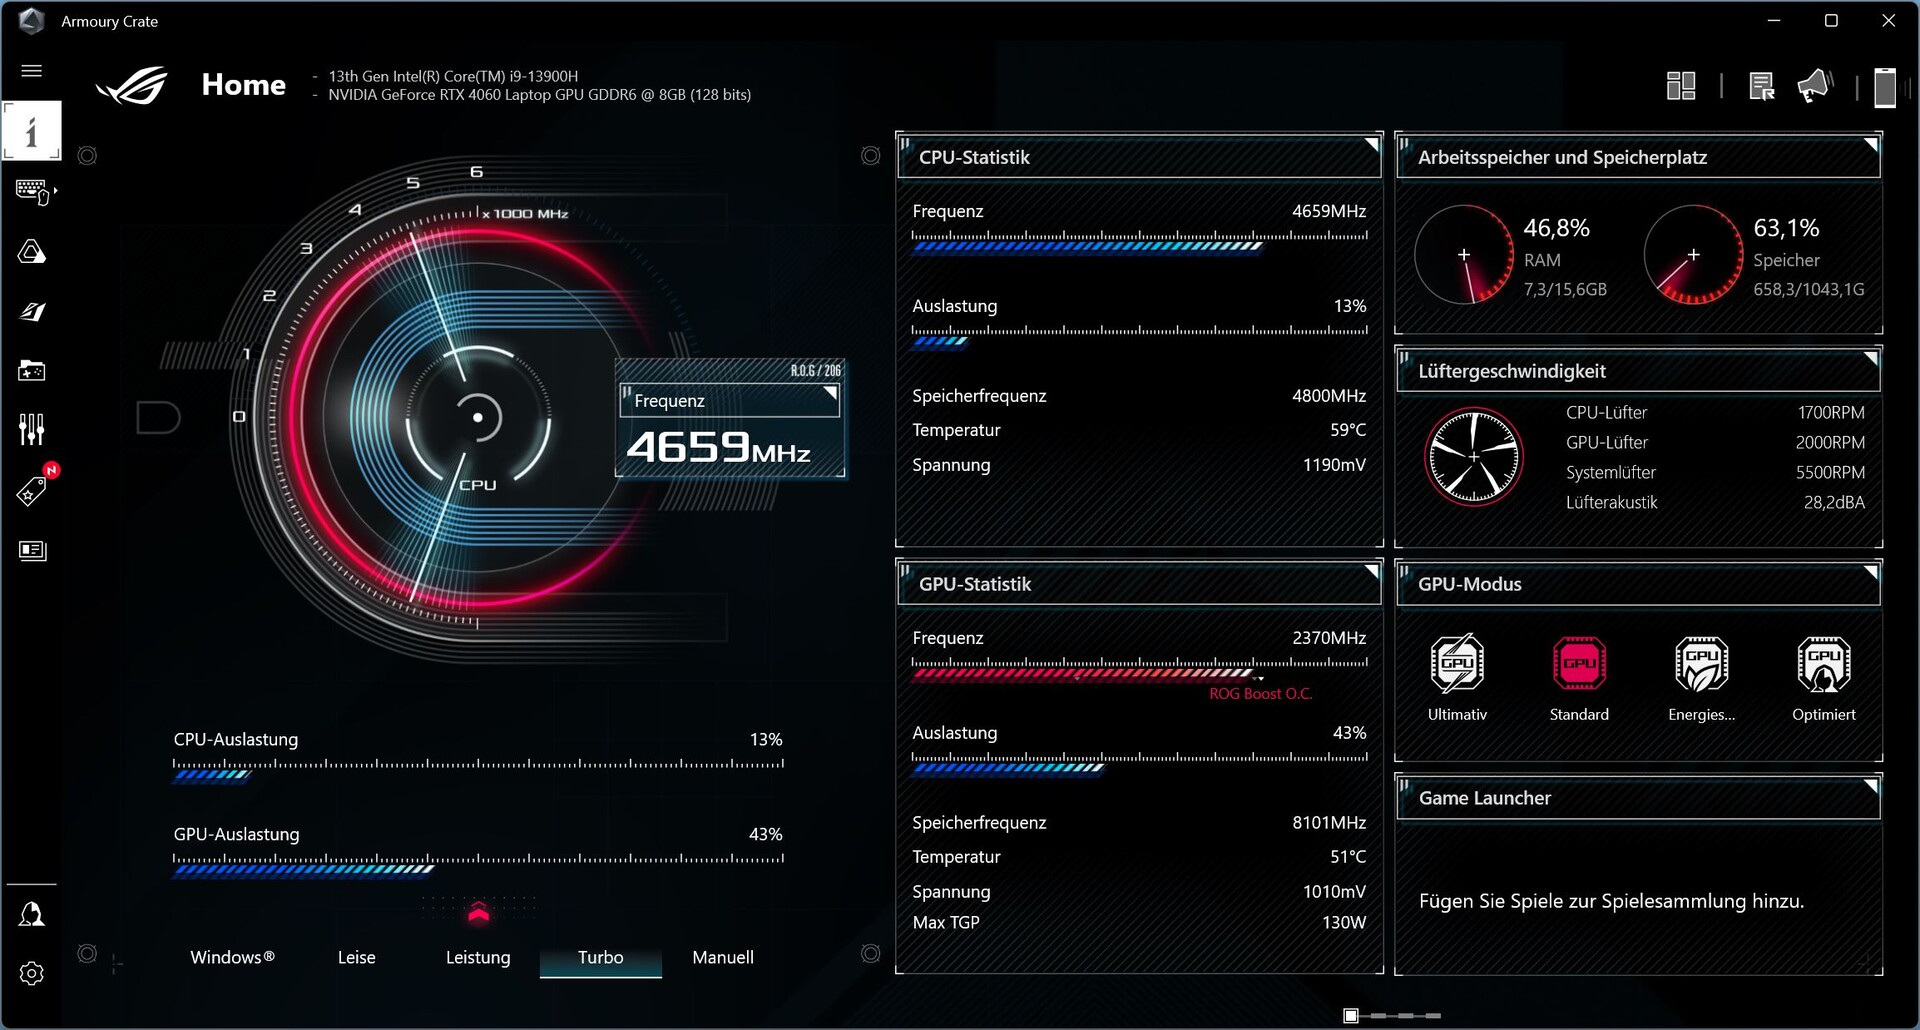
Dostępne są cztery tryby wydajności (Windows, Cichy, Wydajność, Turbo, Ręczny). Aby osiągnąć najlepsze wyniki w testach porównawczych, zdecydowaliśmy się na turbo. Nadal jednak prezentujemy wszystkie wyniki uzyskane przy użyciu innych trybów. Tutaj można również znaleźć przełącznik MUX, innymi słowy, przełączanie między iGPU i dGPU.
Procesor
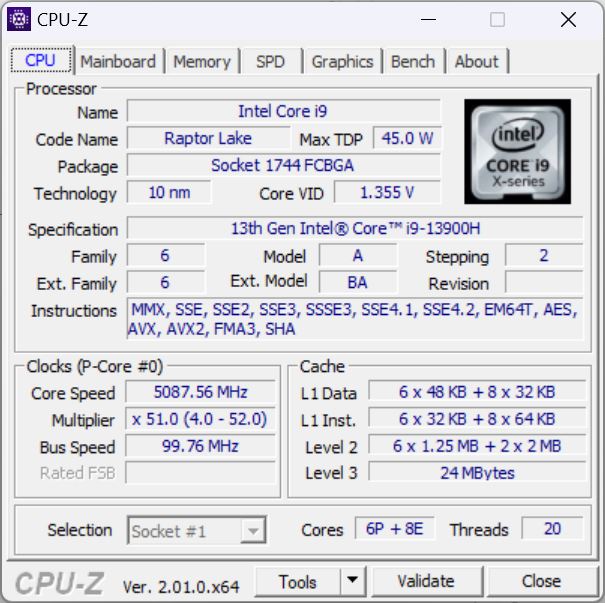
Pomimo smukłej obudowy, X16 mieści w sobie Intel Core i9-13900Hwysokiej klasy procesor Raptor Lake z 6 rdzeniami P i 8 rdzeniami E, które mogą pracować z częstotliwością od 1,9 GHz (bazowa prędkość taktowania rdzenia E) do 5,4 GHz (jednordzeniowy turbo).
Ponieważ nowsza seria H nie posiada prawie żadnych zmian w porównaniu do serii Alder Lake, nic dziwnego, że X16 nie jest w stanie oderwać się od zeszłorocznej konkurencji. Lenovo Legion Pro 7z procesorem HX-CPU, jest tutaj w innej lidze. Imponujące jest jednak to, że wynik jest o całe 10 procent powyżej średniej i9-13900H z naszej bazy danych, pomimo smukłej obudowy.
Po pierwszych dwóch lub trzech uruchomieniach wartość nieco spadła. Poniżej można znaleźć TDP procesora w zależności od wybranego trybu wydajności, choć wartości te są bardziej teoretyczne (HWinfo). W rezultacie procesor prawie nie pobiera więcej niż 100 watów, nawet podczas korzystania z trybu turbo w CinebenchR15, a podczas pracy w trybie cichym TDP spadło poniżej 60 watów.
W trybie bateryjnym tryb cichy jest wybierany automatycznie. Turbo jest zablokowane, ale teoretycznie nadal można włączyć zasilanie.
| Leistungsmodus/TDP der CPU | PL1 | PL2 | Wynik |
|---|---|---|---|
| Turbo | 110 | 135 | 3.100 |
| Leistung | 100 | 120 | 2.882 |
| Leise | 80 | 100 | 2.342 |
| Akku Leistung | 38 | 60 | 2.199 |
| Akku Leise | 30 | 30 | 1.604 |
Cinebench R15 Multi Continuous Test
Cinebench R23: Multi Core | Single Core
Cinebench R20: CPU (Multi Core) | CPU (Single Core)
Cinebench R15: CPU Multi 64Bit | CPU Single 64Bit
Blender: v2.79 BMW27 CPU
7-Zip 18.03: 7z b 4 | 7z b 4 -mmt1
Geekbench 5.5: Multi-Core | Single-Core
HWBOT x265 Benchmark v2.2: 4k Preset
LibreOffice : 20 Documents To PDF
R Benchmark 2.5: Overall mean
| CPU Performance rating | |
| Lenovo Legion Pro 7 16IRX8H | |
| Średnia w klasie Gaming | |
| Asus ROG Flow X16 GV601V | |
| Asus ROG Zephyrus M16 GU604VY-NM042X | |
| Apple MacBook Pro 16 2023 M2 Max -6! | |
| MSI Creator Z16P B12UHST | |
| Przeciętny Intel Core i9-13900H | |
| Lenovo Legion Slim 7-16IAH 82TF004YGE | |
| MSI Katana 17 B13VFK | |
| Razer Blade 15 OLED (Early 2022) | |
| Lenovo Legion S7 16ARHA7 | |
| Asus ROG Flow X16 GV601RW-M5082W | |
| Corsair Voyager a1600 | |
| Cinebench R23 / Multi Core | |
| Lenovo Legion Pro 7 16IRX8H | |
| Średnia w klasie Gaming (10488 - 40970, n=110, ostatnie 2 lata) | |
| Asus ROG Zephyrus M16 GU604VY-NM042X | |
| Asus ROG Flow X16 GV601V | |
| MSI Creator Z16P B12UHST | |
| Lenovo Legion Slim 7-16IAH 82TF004YGE | |
| Przeciętny Intel Core i9-13900H (11997 - 20385, n=28) | |
| Razer Blade 15 OLED (Early 2022) | |
| MSI Katana 17 B13VFK | |
| Apple MacBook Pro 16 2023 M2 Max | |
| Lenovo Legion S7 16ARHA7 | |
| Asus ROG Flow X16 GV601RW-M5082W | |
| Corsair Voyager a1600 | |
| Cinebench R23 / Single Core | |
| Lenovo Legion Pro 7 16IRX8H | |
| Asus ROG Flow X16 GV601V | |
| Średnia w klasie Gaming (1166 - 2356, n=110, ostatnie 2 lata) | |
| Asus ROG Zephyrus M16 GU604VY-NM042X | |
| MSI Creator Z16P B12UHST | |
| Przeciętny Intel Core i9-13900H (1297 - 2054, n=26) | |
| MSI Katana 17 B13VFK | |
| Lenovo Legion Slim 7-16IAH 82TF004YGE | |
| Razer Blade 15 OLED (Early 2022) | |
| Apple MacBook Pro 16 2023 M2 Max | |
| Lenovo Legion S7 16ARHA7 | |
| Corsair Voyager a1600 | |
| Asus ROG Flow X16 GV601RW-M5082W | |
| Cinebench R20 / CPU (Multi Core) | |
| Lenovo Legion Pro 7 16IRX8H | |
| Średnia w klasie Gaming (4029 - 16108, n=109, ostatnie 2 lata) | |
| Asus ROG Flow X16 GV601V | |
| Asus ROG Zephyrus M16 GU604VY-NM042X | |
| MSI Creator Z16P B12UHST | |
| Lenovo Legion Slim 7-16IAH 82TF004YGE | |
| Przeciętny Intel Core i9-13900H (4935 - 7716, n=25) | |
| Razer Blade 15 OLED (Early 2022) | |
| MSI Katana 17 B13VFK | |
| Lenovo Legion S7 16ARHA7 | |
| Asus ROG Flow X16 GV601RW-M5082W | |
| Corsair Voyager a1600 | |
| Apple MacBook Pro 16 2023 M2 Max | |
| Cinebench R20 / CPU (Single Core) | |
| Lenovo Legion Pro 7 16IRX8H | |
| Średnia w klasie Gaming (442 - 895, n=109, ostatnie 2 lata) | |
| Asus ROG Flow X16 GV601V | |
| Asus ROG Zephyrus M16 GU604VY-NM042X | |
| MSI Creator Z16P B12UHST | |
| Przeciętny Intel Core i9-13900H (428 - 792, n=25) | |
| MSI Katana 17 B13VFK | |
| Lenovo Legion Slim 7-16IAH 82TF004YGE | |
| Razer Blade 15 OLED (Early 2022) | |
| Lenovo Legion S7 16ARHA7 | |
| Asus ROG Flow X16 GV601RW-M5082W | |
| Corsair Voyager a1600 | |
| Apple MacBook Pro 16 2023 M2 Max | |
| Cinebench R15 / CPU Multi 64Bit | |
| Lenovo Legion Pro 7 16IRX8H | |
| Średnia w klasie Gaming (1578 - 6271, n=109, ostatnie 2 lata) | |
| Asus ROG Flow X16 GV601V | |
| Asus ROG Zephyrus M16 GU604VY-NM042X | |
| MSI Creator Z16P B12UHST | |
| Lenovo Legion Slim 7-16IAH 82TF004YGE | |
| Przeciętny Intel Core i9-13900H (2061 - 3100, n=26) | |
| Razer Blade 15 OLED (Early 2022) | |
| Lenovo Legion S7 16ARHA7 | |
| MSI Katana 17 B13VFK | |
| Asus ROG Flow X16 GV601RW-M5082W | |
| Corsair Voyager a1600 | |
| Apple MacBook Pro 16 2023 M2 Max | |
| Cinebench R15 / CPU Single 64Bit | |
| Lenovo Legion Pro 7 16IRX8H | |
| Średnia w klasie Gaming (188.8 - 343, n=109, ostatnie 2 lata) | |
| Asus ROG Zephyrus M16 GU604VY-NM042X | |
| Asus ROG Flow X16 GV601V | |
| MSI Creator Z16P B12UHST | |
| Przeciętny Intel Core i9-13900H (211 - 297, n=26) | |
| MSI Katana 17 B13VFK | |
| Lenovo Legion S7 16ARHA7 | |
| Lenovo Legion Slim 7-16IAH 82TF004YGE | |
| Razer Blade 15 OLED (Early 2022) | |
| Corsair Voyager a1600 | |
| Asus ROG Flow X16 GV601RW-M5082W | |
| Apple MacBook Pro 16 2023 M2 Max | |
| Blender / v2.79 BMW27 CPU | |
| Corsair Voyager a1600 | |
| Asus ROG Flow X16 GV601RW-M5082W | |
| Razer Blade 15 OLED (Early 2022) | |
| MSI Katana 17 B13VFK | |
| Lenovo Legion S7 16ARHA7 | |
| Przeciętny Intel Core i9-13900H (166 - 268, n=24) | |
| MSI Creator Z16P B12UHST | |
| Lenovo Legion Slim 7-16IAH 82TF004YGE | |
| Asus ROG Flow X16 GV601V | |
| Asus ROG Zephyrus M16 GU604VY-NM042X | |
| Średnia w klasie Gaming (80 - 330, n=107, ostatnie 2 lata) | |
| Lenovo Legion Pro 7 16IRX8H | |
| 7-Zip 18.03 / 7z b 4 | |
| Lenovo Legion Pro 7 16IRX8H | |
| Średnia w klasie Gaming (33491 - 148086, n=108, ostatnie 2 lata) | |
| Asus ROG Zephyrus M16 GU604VY-NM042X | |
| Asus ROG Flow X16 GV601V | |
| MSI Creator Z16P B12UHST | |
| Przeciętny Intel Core i9-13900H (45045 - 79032, n=25) | |
| Lenovo Legion Slim 7-16IAH 82TF004YGE | |
| Razer Blade 15 OLED (Early 2022) | |
| Lenovo Legion S7 16ARHA7 | |
| MSI Katana 17 B13VFK | |
| Corsair Voyager a1600 | |
| Asus ROG Flow X16 GV601RW-M5082W | |
| 7-Zip 18.03 / 7z b 4 -mmt1 | |
| Lenovo Legion Pro 7 16IRX8H | |
| Średnia w klasie Gaming (4199 - 7436, n=108, ostatnie 2 lata) | |
| Asus ROG Flow X16 GV601V | |
| Asus ROG Zephyrus M16 GU604VY-NM042X | |
| MSI Creator Z16P B12UHST | |
| Lenovo Legion S7 16ARHA7 | |
| Przeciętny Intel Core i9-13900H (3665 - 6600, n=25) | |
| Corsair Voyager a1600 | |
| MSI Katana 17 B13VFK | |
| Asus ROG Flow X16 GV601RW-M5082W | |
| Lenovo Legion Slim 7-16IAH 82TF004YGE | |
| Razer Blade 15 OLED (Early 2022) | |
| Geekbench 5.5 / Multi-Core | |
| Lenovo Legion Pro 7 16IRX8H | |
| Średnia w klasie Gaming (6460 - 27010, n=108, ostatnie 2 lata) | |
| Asus ROG Zephyrus M16 GU604VY-NM042X | |
| Apple MacBook Pro 16 2023 M2 Max | |
| MSI Creator Z16P B12UHST | |
| Asus ROG Flow X16 GV601V | |
| Przeciętny Intel Core i9-13900H (9094 - 15410, n=26) | |
| Lenovo Legion Slim 7-16IAH 82TF004YGE | |
| Razer Blade 15 OLED (Early 2022) | |
| MSI Katana 17 B13VFK | |
| Corsair Voyager a1600 | |
| Lenovo Legion S7 16ARHA7 | |
| Asus ROG Flow X16 GV601RW-M5082W | |
| Geekbench 5.5 / Single-Core | |
| Średnia w klasie Gaming (986 - 2474, n=108, ostatnie 2 lata) | |
| Lenovo Legion Pro 7 16IRX8H | |
| Asus ROG Flow X16 GV601V | |
| Apple MacBook Pro 16 2023 M2 Max | |
| Asus ROG Zephyrus M16 GU604VY-NM042X | |
| Przeciętny Intel Core i9-13900H (1140 - 2043, n=26) | |
| MSI Creator Z16P B12UHST | |
| MSI Katana 17 B13VFK | |
| Lenovo Legion Slim 7-16IAH 82TF004YGE | |
| Razer Blade 15 OLED (Early 2022) | |
| Lenovo Legion S7 16ARHA7 | |
| Asus ROG Flow X16 GV601RW-M5082W | |
| Corsair Voyager a1600 | |
| HWBOT x265 Benchmark v2.2 / 4k Preset | |
| Lenovo Legion Pro 7 16IRX8H | |
| Średnia w klasie Gaming (11.5 - 44.3, n=108, ostatnie 2 lata) | |
| Asus ROG Zephyrus M16 GU604VY-NM042X | |
| Asus ROG Flow X16 GV601V | |
| MSI Creator Z16P B12UHST | |
| Lenovo Legion Slim 7-16IAH 82TF004YGE | |
| Przeciętny Intel Core i9-13900H (14.1 - 22.3, n=25) | |
| Lenovo Legion S7 16ARHA7 | |
| Razer Blade 15 OLED (Early 2022) | |
| MSI Katana 17 B13VFK | |
| Corsair Voyager a1600 | |
| Asus ROG Flow X16 GV601RW-M5082W | |
| LibreOffice / 20 Documents To PDF | |
| Corsair Voyager a1600 | |
| MSI Katana 17 B13VFK | |
| Asus ROG Flow X16 GV601RW-M5082W | |
| Razer Blade 15 OLED (Early 2022) | |
| Asus ROG Zephyrus M16 GU604VY-NM042X | |
| Średnia w klasie Gaming (19 - 88.8, n=108, ostatnie 2 lata) | |
| Lenovo Legion S7 16ARHA7 | |
| Przeciętny Intel Core i9-13900H (34.4 - 82.8, n=25) | |
| Lenovo Legion Pro 7 16IRX8H | |
| Lenovo Legion Slim 7-16IAH 82TF004YGE | |
| MSI Creator Z16P B12UHST | |
| Asus ROG Flow X16 GV601V | |
| R Benchmark 2.5 / Overall mean | |
| Razer Blade 15 OLED (Early 2022) | |
| Asus ROG Flow X16 GV601RW-M5082W | |
| Corsair Voyager a1600 | |
| Lenovo Legion Slim 7-16IAH 82TF004YGE | |
| Lenovo Legion S7 16ARHA7 | |
| Przeciętny Intel Core i9-13900H (0.4052 - 0.723, n=25) | |
| MSI Katana 17 B13VFK | |
| MSI Creator Z16P B12UHST | |
| Średnia w klasie Gaming (0.3439 - 0.759, n=109, ostatnie 2 lata) | |
| Asus ROG Flow X16 GV601V | |
| Asus ROG Zephyrus M16 GU604VY-NM042X | |
| Lenovo Legion Pro 7 16IRX8H | |
* ... im mniej tym lepiej
AIDA64: FP32 Ray-Trace | FPU Julia | CPU SHA3 | CPU Queen | FPU SinJulia | FPU Mandel | CPU AES | CPU ZLib | FP64 Ray-Trace | CPU PhotoWorxx
| Performance rating | |
| Średnia w klasie Gaming | |
| Asus ROG Flow X16 GV601RW-M5082W | |
| Lenovo Legion S7 16ARHA7 | |
| Corsair Voyager a1600 | |
| Asus ROG Flow X16 GV601V | |
| Lenovo Legion Slim 7-16IAH 82TF004YGE | |
| Przeciętny Intel Core i9-13900H | |
| Razer Blade 15 OLED (Early 2022) | |
| MSI Creator Z16P B12UHST | |
| MSI Katana 17 B13VFK | |
| AIDA64 / FP32 Ray-Trace | |
| Średnia w klasie Gaming (10227 - 85542, n=107, ostatnie 2 lata) | |
| Lenovo Legion Slim 7-16IAH 82TF004YGE | |
| Asus ROG Flow X16 GV601RW-M5082W | |
| Lenovo Legion S7 16ARHA7 | |
| Corsair Voyager a1600 | |
| Przeciętny Intel Core i9-13900H (6788 - 19557, n=25) | |
| MSI Katana 17 B13VFK | |
| Razer Blade 15 OLED (Early 2022) | |
| Asus ROG Flow X16 GV601V | |
| MSI Creator Z16P B12UHST | |
| AIDA64 / FPU Julia | |
| Średnia w klasie Gaming (51376 - 238426, n=107, ostatnie 2 lata) | |
| Lenovo Legion S7 16ARHA7 | |
| Asus ROG Flow X16 GV601RW-M5082W | |
| Corsair Voyager a1600 | |
| Asus ROG Flow X16 GV601V | |
| Lenovo Legion Slim 7-16IAH 82TF004YGE | |
| Przeciętny Intel Core i9-13900H (22551 - 95579, n=25) | |
| Razer Blade 15 OLED (Early 2022) | |
| MSI Katana 17 B13VFK | |
| MSI Creator Z16P B12UHST | |
| AIDA64 / CPU SHA3 | |
| Średnia w klasie Gaming (2180 - 9817, n=107, ostatnie 2 lata) | |
| Asus ROG Flow X16 GV601V | |
| Lenovo Legion Slim 7-16IAH 82TF004YGE | |
| Asus ROG Flow X16 GV601RW-M5082W | |
| Lenovo Legion S7 16ARHA7 | |
| Przeciętny Intel Core i9-13900H (2491 - 4270, n=25) | |
| Corsair Voyager a1600 | |
| Razer Blade 15 OLED (Early 2022) | |
| MSI Creator Z16P B12UHST | |
| MSI Katana 17 B13VFK | |
| AIDA64 / CPU Queen | |
| Średnia w klasie Gaming (49785 - 173351, n=98, ostatnie 2 lata) | |
| Asus ROG Flow X16 GV601V | |
| Lenovo Legion S7 16ARHA7 | |
| MSI Creator Z16P B12UHST | |
| Razer Blade 15 OLED (Early 2022) | |
| Corsair Voyager a1600 | |
| Przeciętny Intel Core i9-13900H (65121 - 120936, n=25) | |
| Asus ROG Flow X16 GV601RW-M5082W | |
| Lenovo Legion Slim 7-16IAH 82TF004YGE | |
| MSI Katana 17 B13VFK | |
| AIDA64 / FPU SinJulia | |
| Średnia w klasie Gaming (4424 - 33636, n=107, ostatnie 2 lata) | |
| Corsair Voyager a1600 | |
| Lenovo Legion S7 16ARHA7 | |
| Asus ROG Flow X16 GV601RW-M5082W | |
| Asus ROG Flow X16 GV601V | |
| MSI Creator Z16P B12UHST | |
| Lenovo Legion Slim 7-16IAH 82TF004YGE | |
| Razer Blade 15 OLED (Early 2022) | |
| Przeciętny Intel Core i9-13900H (6108 - 11631, n=25) | |
| MSI Katana 17 B13VFK | |
| AIDA64 / FPU Mandel | |
| Średnia w klasie Gaming (25115 - 128721, n=107, ostatnie 2 lata) | |
| Lenovo Legion S7 16ARHA7 | |
| Asus ROG Flow X16 GV601RW-M5082W | |
| Corsair Voyager a1600 | |
| Asus ROG Flow X16 GV601V | |
| Lenovo Legion Slim 7-16IAH 82TF004YGE | |
| Przeciętny Intel Core i9-13900H (11283 - 48474, n=25) | |
| Razer Blade 15 OLED (Early 2022) | |
| MSI Katana 17 B13VFK | |
| MSI Creator Z16P B12UHST | |
| AIDA64 / CPU AES | |
| Asus ROG Flow X16 GV601RW-M5082W | |
| Lenovo Legion Slim 7-16IAH 82TF004YGE | |
| Lenovo Legion S7 16ARHA7 | |
| Corsair Voyager a1600 | |
| Średnia w klasie Gaming (39258 - 247074, n=107, ostatnie 2 lata) | |
| MSI Creator Z16P B12UHST | |
| Razer Blade 15 OLED (Early 2022) | |
| Przeciętny Intel Core i9-13900H (3691 - 149377, n=25) | |
| Asus ROG Flow X16 GV601V | |
| MSI Katana 17 B13VFK | |
| AIDA64 / CPU ZLib | |
| Średnia w klasie Gaming (574 - 2531, n=107, ostatnie 2 lata) | |
| Asus ROG Flow X16 GV601V | |
| MSI Creator Z16P B12UHST | |
| Razer Blade 15 OLED (Early 2022) | |
| Przeciętny Intel Core i9-13900H (789 - 1254, n=25) | |
| Lenovo Legion Slim 7-16IAH 82TF004YGE | |
| Asus ROG Flow X16 GV601RW-M5082W | |
| Lenovo Legion S7 16ARHA7 | |
| Corsair Voyager a1600 | |
| MSI Katana 17 B13VFK | |
| AIDA64 / FP64 Ray-Trace | |
| Średnia w klasie Gaming (5509 - 45446, n=107, ostatnie 2 lata) | |
| Asus ROG Flow X16 GV601V | |
| Asus ROG Flow X16 GV601RW-M5082W | |
| Lenovo Legion S7 16ARHA7 | |
| Lenovo Legion Slim 7-16IAH 82TF004YGE | |
| Corsair Voyager a1600 | |
| Przeciętny Intel Core i9-13900H (3655 - 10716, n=25) | |
| MSI Katana 17 B13VFK | |
| Razer Blade 15 OLED (Early 2022) | |
| MSI Creator Z16P B12UHST | |
| AIDA64 / CPU PhotoWorxx | |
| Średnia w klasie Gaming (12271 - 89891, n=107, ostatnie 2 lata) | |
| MSI Creator Z16P B12UHST | |
| Przeciętny Intel Core i9-13900H (10871 - 50488, n=25) | |
| Asus ROG Flow X16 GV601V | |
| Lenovo Legion Slim 7-16IAH 82TF004YGE | |
| Razer Blade 15 OLED (Early 2022) | |
| Razer Blade 15 OLED (Early 2022) | |
| MSI Katana 17 B13VFK | |
| Corsair Voyager a1600 | |
| Asus ROG Flow X16 GV601RW-M5082W | |
| Lenovo Legion S7 16ARHA7 | |
Wydajność systemu
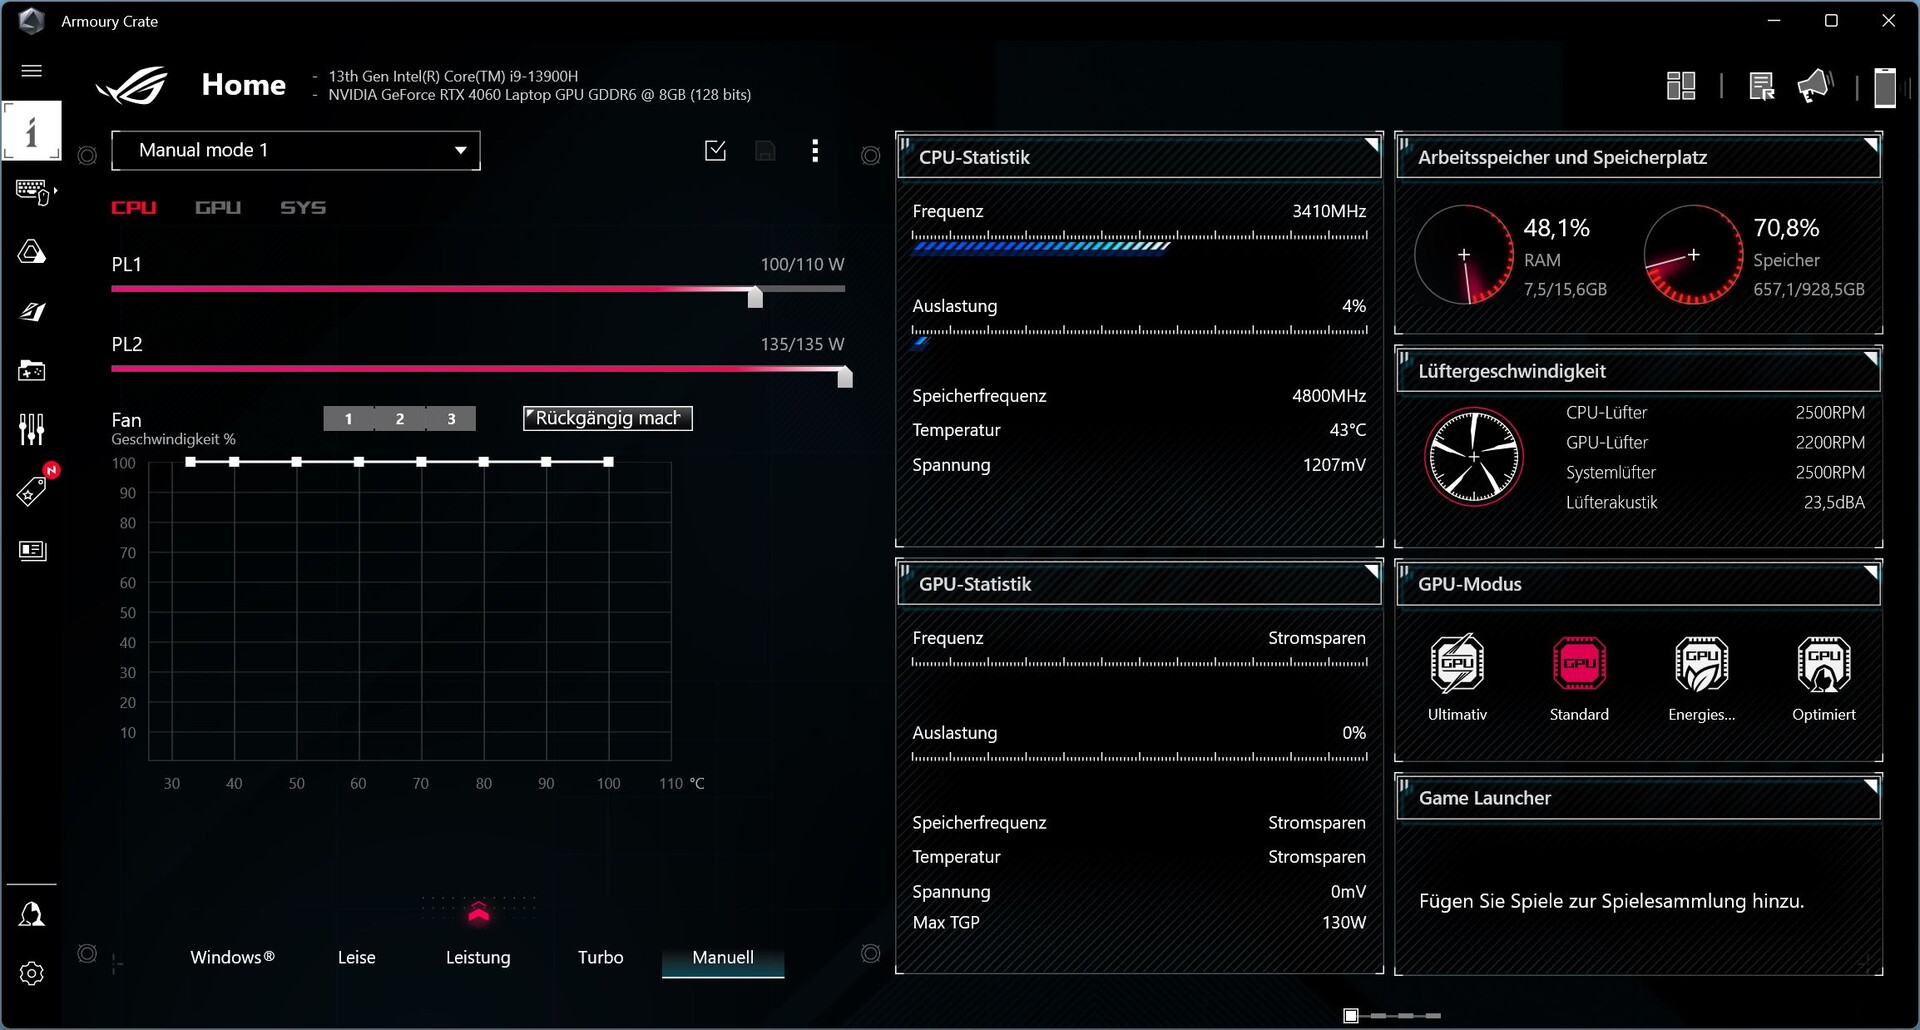
W testach PCMark10, X16 wypadł tak samo, jeśli nie trochę lepiej niż oczekiwaliśmy. W żadnym z naszych podtestów nie wystąpiły wartości odstające lub spadki.
CrossMark: Overall | Productivity | Creativity | Responsiveness
| PCMark 10 / Score | |
| Średnia w klasie Gaming (5828 - 11574, n=94, ostatnie 2 lata) | |
| Asus ROG Zephyrus M16 GU604VY-NM042X | |
| MSI Creator Z16P B12UHST | |
| Asus ROG Flow X16 GV601V | |
| Lenovo Legion Pro 7 16IRX8H | |
| Przeciętny Intel Core i9-13900H, NVIDIA GeForce RTX 4060 Laptop GPU (7578 - 7884, n=3) | |
| Lenovo Legion S7 16ARHA7 | |
| Lenovo Legion Slim 7-16IAH 82TF004YGE | |
| Razer Blade 15 OLED (Early 2022) | |
| Corsair Voyager a1600 | |
| MSI Katana 17 B13VFK | |
| Asus ROG Flow X16 GV601RW-M5082W | |
| PCMark 10 / Essentials | |
| Lenovo Legion Pro 7 16IRX8H | |
| Asus ROG Zephyrus M16 GU604VY-NM042X | |
| Asus ROG Flow X16 GV601V | |
| Przeciętny Intel Core i9-13900H, NVIDIA GeForce RTX 4060 Laptop GPU (11235 - 11539, n=3) | |
| MSI Creator Z16P B12UHST | |
| Lenovo Legion Slim 7-16IAH 82TF004YGE | |
| MSI Katana 17 B13VFK | |
| Lenovo Legion S7 16ARHA7 | |
| Średnia w klasie Gaming (8810 - 12600, n=98, ostatnie 2 lata) | |
| Razer Blade 15 OLED (Early 2022) | |
| Corsair Voyager a1600 | |
| Asus ROG Flow X16 GV601RW-M5082W | |
| PCMark 10 / Productivity | |
| MSI Creator Z16P B12UHST | |
| Asus ROG Zephyrus M16 GU604VY-NM042X | |
| Lenovo Legion Pro 7 16IRX8H | |
| Średnia w klasie Gaming (6845 - 18766, n=96, ostatnie 2 lata) | |
| Asus ROG Flow X16 GV601V | |
| Przeciętny Intel Core i9-13900H, NVIDIA GeForce RTX 4060 Laptop GPU (9888 - 10222, n=3) | |
| Razer Blade 15 OLED (Early 2022) | |
| Lenovo Legion S7 16ARHA7 | |
| Asus ROG Flow X16 GV601RW-M5082W | |
| Lenovo Legion Slim 7-16IAH 82TF004YGE | |
| MSI Katana 17 B13VFK | |
| Corsair Voyager a1600 | |
| PCMark 10 / Digital Content Creation | |
| Średnia w klasie Gaming (7602 - 19657, n=96, ostatnie 2 lata) | |
| Asus ROG Zephyrus M16 GU604VY-NM042X | |
| MSI Creator Z16P B12UHST | |
| Lenovo Legion S7 16ARHA7 | |
| Corsair Voyager a1600 | |
| Asus ROG Flow X16 GV601V | |
| Przeciętny Intel Core i9-13900H, NVIDIA GeForce RTX 4060 Laptop GPU (10418 - 11272, n=3) | |
| Lenovo Legion Slim 7-16IAH 82TF004YGE | |
| Razer Blade 15 OLED (Early 2022) | |
| Lenovo Legion Pro 7 16IRX8H | |
| MSI Katana 17 B13VFK | |
| Asus ROG Flow X16 GV601RW-M5082W | |
| CrossMark / Overall | |
| Średnia w klasie Gaming (1366 - 2409, n=96, ostatnie 2 lata) | |
| Asus ROG Zephyrus M16 GU604VY-NM042X | |
| Asus ROG Flow X16 GV601V | |
| Przeciętny Intel Core i9-13900H, NVIDIA GeForce RTX 4060 Laptop GPU (1874 - 1983, n=3) | |
| Apple MacBook Pro 16 2023 M2 Max | |
| Lenovo Legion Slim 7-16IAH 82TF004YGE | |
| MSI Katana 17 B13VFK | |
| Razer Blade 15 OLED (Early 2022) | |
| Lenovo Legion S7 16ARHA7 | |
| Asus ROG Flow X16 GV601RW-M5082W | |
| Corsair Voyager a1600 | |
| CrossMark / Productivity | |
| Asus ROG Flow X16 GV601V | |
| Średnia w klasie Gaming (1386 - 2254, n=96, ostatnie 2 lata) | |
| Asus ROG Zephyrus M16 GU604VY-NM042X | |
| Przeciętny Intel Core i9-13900H, NVIDIA GeForce RTX 4060 Laptop GPU (1779 - 1889, n=3) | |
| Lenovo Legion Slim 7-16IAH 82TF004YGE | |
| MSI Katana 17 B13VFK | |
| Lenovo Legion S7 16ARHA7 | |
| Razer Blade 15 OLED (Early 2022) | |
| Apple MacBook Pro 16 2023 M2 Max | |
| Asus ROG Flow X16 GV601RW-M5082W | |
| Corsair Voyager a1600 | |
| CrossMark / Creativity | |
| Apple MacBook Pro 16 2023 M2 Max | |
| Asus ROG Zephyrus M16 GU604VY-NM042X | |
| Średnia w klasie Gaming (1343 - 2729, n=96, ostatnie 2 lata) | |
| Asus ROG Flow X16 GV601V | |
| Przeciętny Intel Core i9-13900H, NVIDIA GeForce RTX 4060 Laptop GPU (2104 - 2195, n=3) | |
| MSI Katana 17 B13VFK | |
| Lenovo Legion Slim 7-16IAH 82TF004YGE | |
| Razer Blade 15 OLED (Early 2022) | |
| Lenovo Legion S7 16ARHA7 | |
| Asus ROG Flow X16 GV601RW-M5082W | |
| Corsair Voyager a1600 | |
| CrossMark / Responsiveness | |
| Lenovo Legion Slim 7-16IAH 82TF004YGE | |
| MSI Katana 17 B13VFK | |
| Średnia w klasie Gaming (1226 - 2334, n=96, ostatnie 2 lata) | |
| Asus ROG Flow X16 GV601V | |
| Asus ROG Zephyrus M16 GU604VY-NM042X | |
| Przeciętny Intel Core i9-13900H, NVIDIA GeForce RTX 4060 Laptop GPU (1548 - 1698, n=3) | |
| Razer Blade 15 OLED (Early 2022) | |
| Lenovo Legion S7 16ARHA7 | |
| Asus ROG Flow X16 GV601RW-M5082W | |
| Apple MacBook Pro 16 2023 M2 Max | |
| Corsair Voyager a1600 | |
| PCMark 10 Score | 7884 pkt. | |
Pomoc | ||
| AIDA64 / Memory Copy | |
| Średnia w klasie Gaming (21750 - 129946, n=107, ostatnie 2 lata) | |
| Samsung Galaxy Book3 Ultra 16, i9-13900H RTX 4070 | |
| Lenovo Yoga Pro 7 14IRH G8 | |
| Przeciętny Intel Core i9-13900H (37448 - 74486, n=25) | |
| Asus ROG Flow X16 GV601V | |
| Lenovo Legion Pro 5 16IRX8 | |
| MSI Katana 17 B13VFK | |
| Asus ROG Flow X16 GV601RW-M5082W | |
| AIDA64 / Memory Read | |
| Średnia w klasie Gaming (22956 - 118858, n=107, ostatnie 2 lata) | |
| Samsung Galaxy Book3 Ultra 16, i9-13900H RTX 4070 | |
| Lenovo Yoga Pro 7 14IRH G8 | |
| Asus ROG Flow X16 GV601V | |
| Lenovo Legion Pro 5 16IRX8 | |
| Przeciętny Intel Core i9-13900H (41599 - 75433, n=25) | |
| MSI Katana 17 B13VFK | |
| Asus ROG Flow X16 GV601RW-M5082W | |
| AIDA64 / Memory Write | |
| Samsung Galaxy Book3 Ultra 16, i9-13900H RTX 4070 | |
| Średnia w klasie Gaming (22297 - 135096, n=107, ostatnie 2 lata) | |
| Lenovo Yoga Pro 7 14IRH G8 | |
| Lenovo Legion Pro 5 16IRX8 | |
| Przeciętny Intel Core i9-13900H (36152 - 88505, n=25) | |
| Asus ROG Flow X16 GV601V | |
| Asus ROG Flow X16 GV601RW-M5082W | |
| MSI Katana 17 B13VFK | |
| AIDA64 / Memory Latency | |
| Średnia w klasie Gaming (75.3 - 259, n=107, ostatnie 2 lata) | |
| Lenovo Yoga Pro 7 14IRH G8 | |
| Samsung Galaxy Book3 Ultra 16, i9-13900H RTX 4070 | |
| MSI Katana 17 B13VFK | |
| Asus ROG Flow X16 GV601RW-M5082W | |
| Asus ROG Flow X16 GV601V | |
| Przeciętny Intel Core i9-13900H (75.8 - 102.3, n=25) | |
| Lenovo Legion Pro 5 16IRX8 | |
* ... im mniej tym lepiej
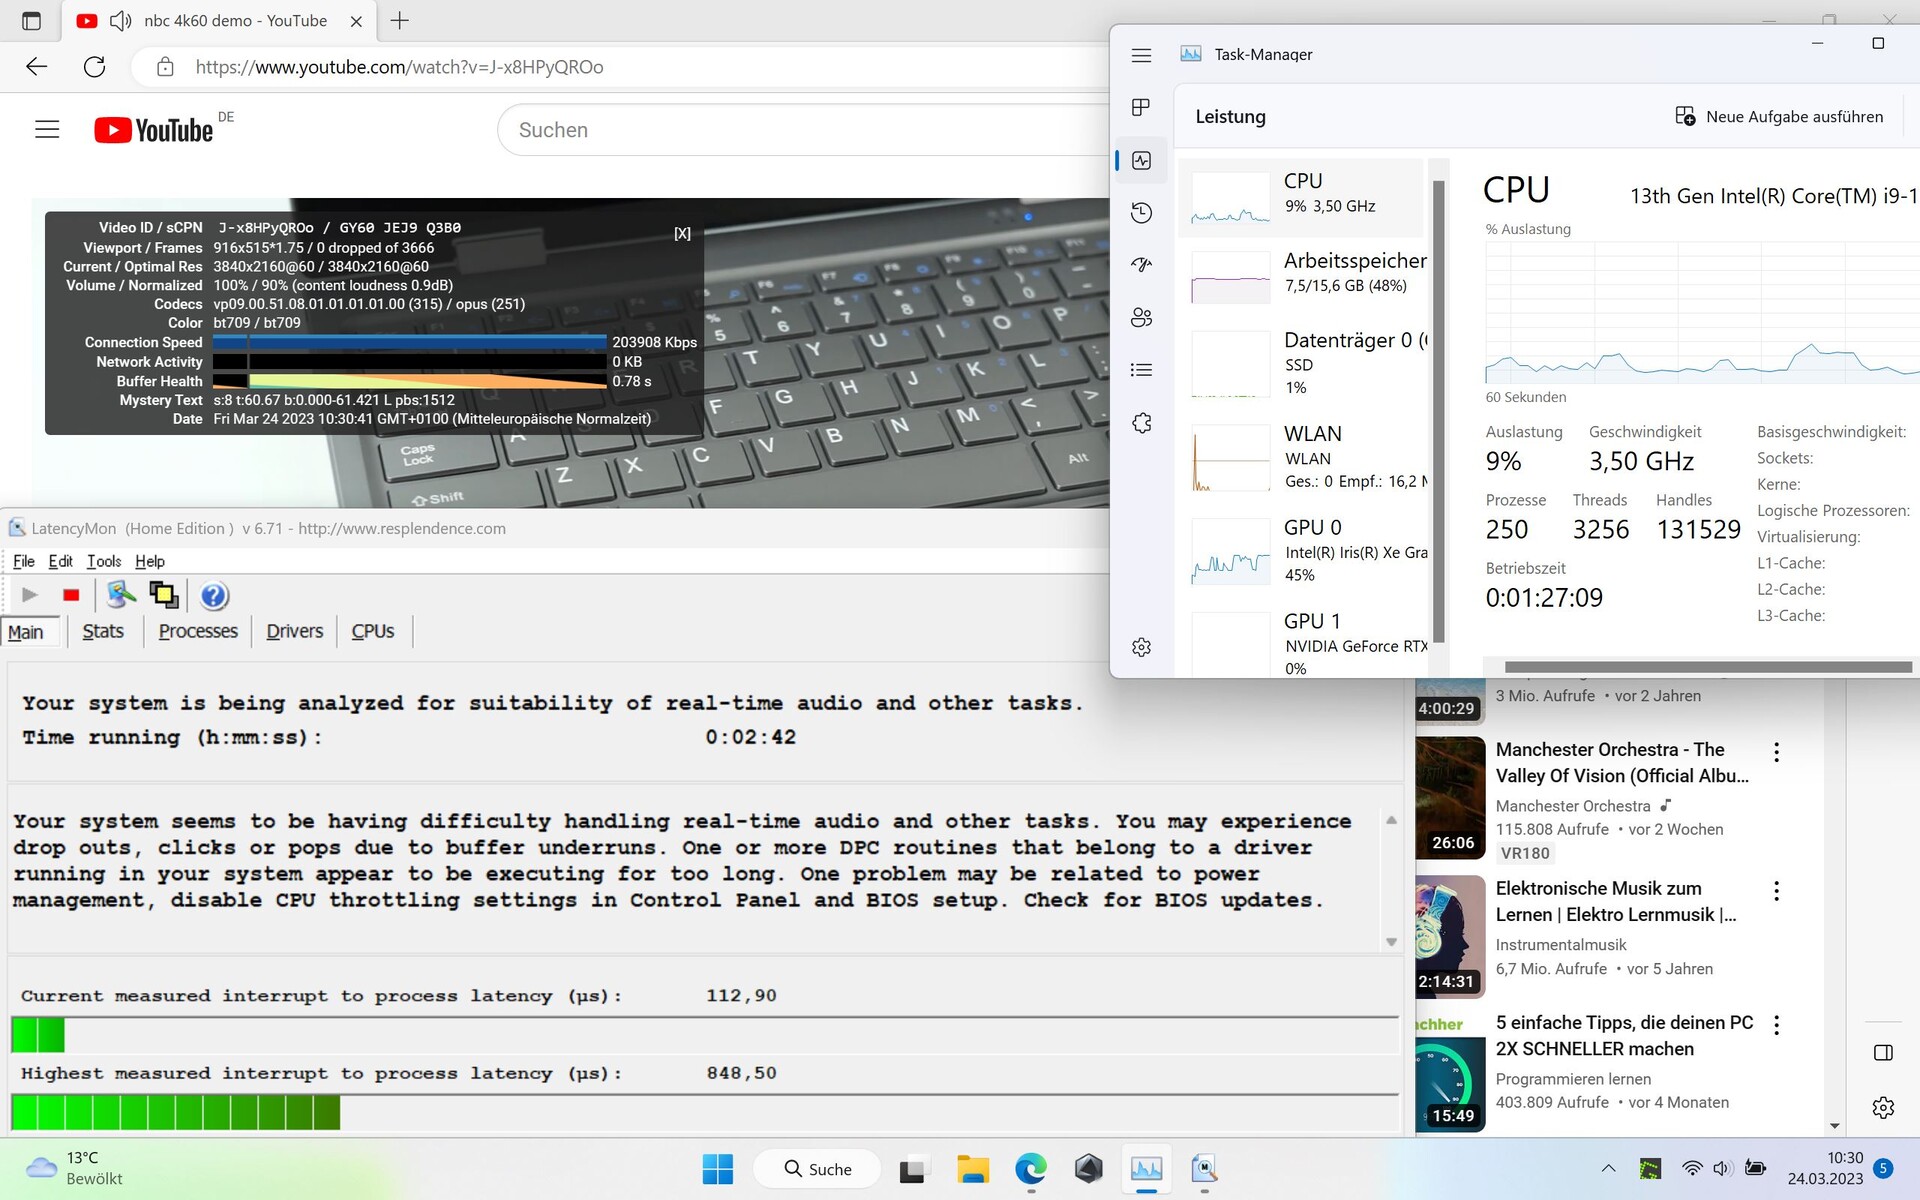
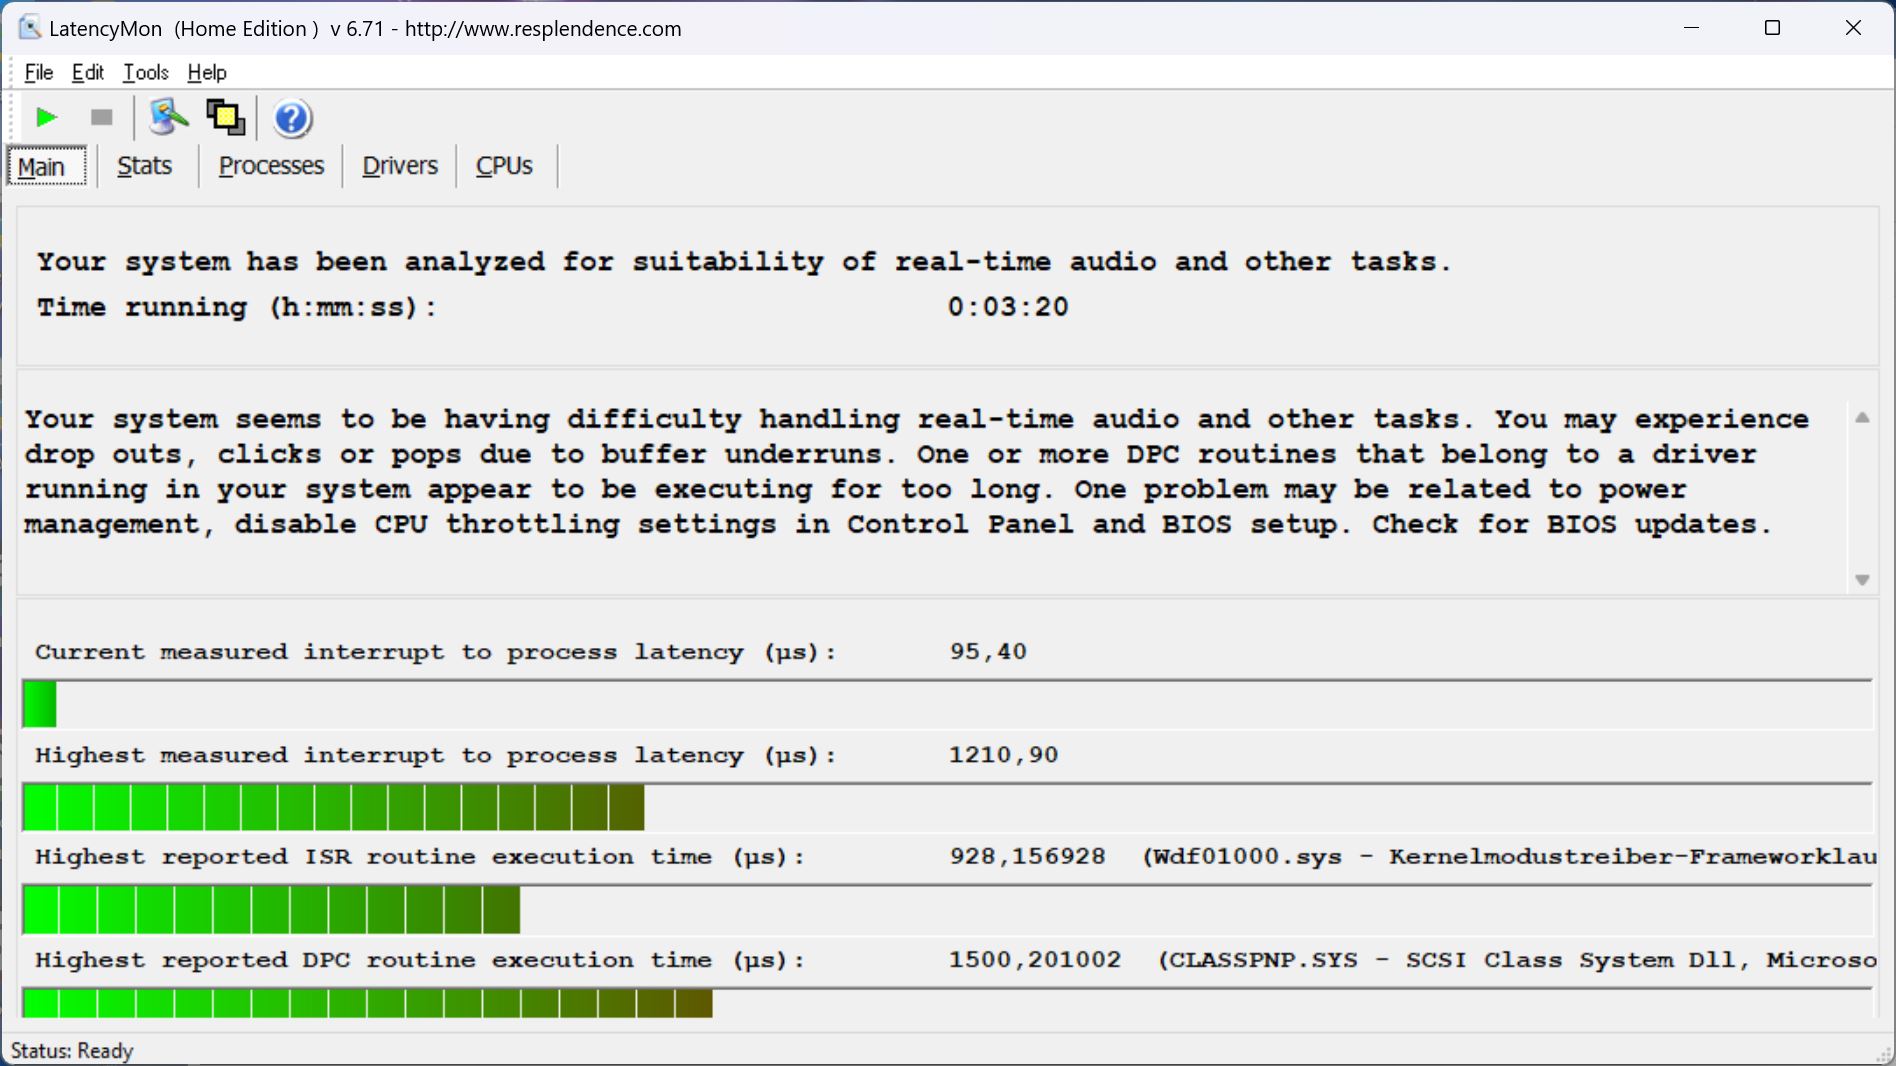
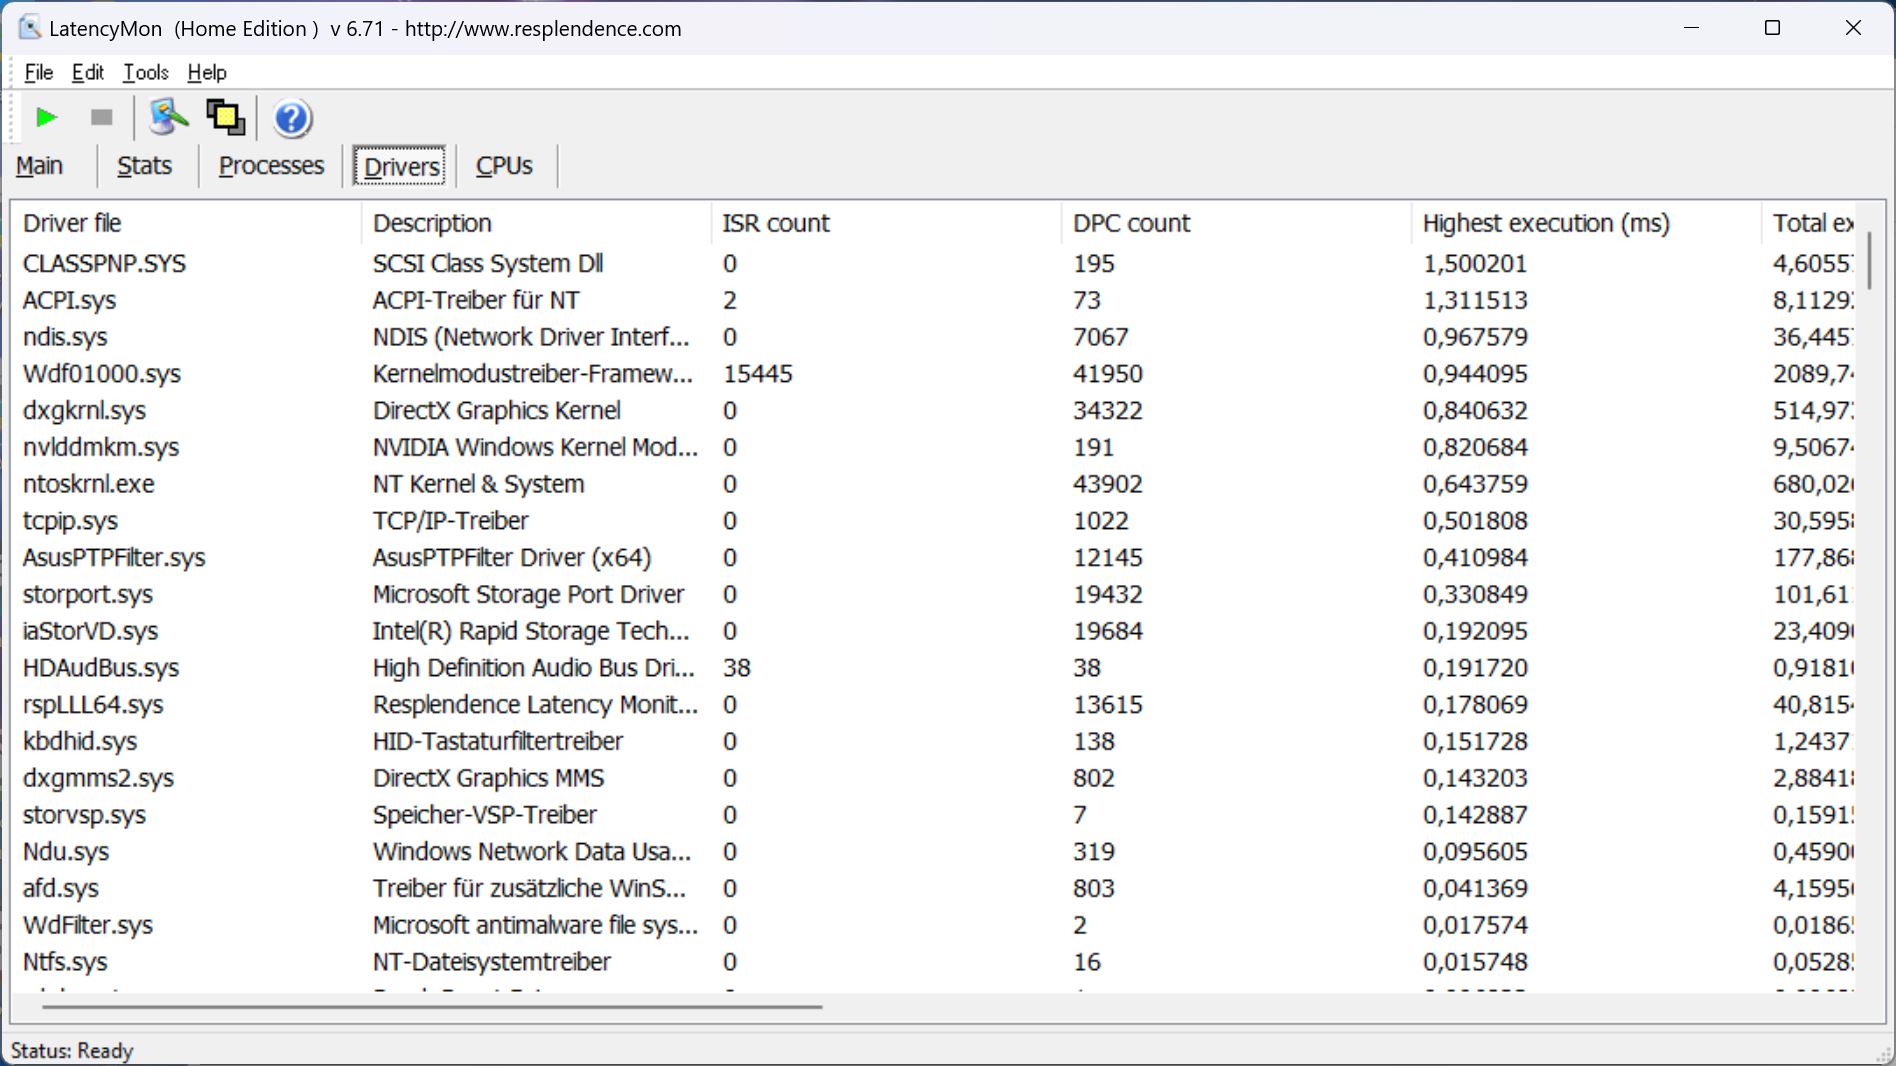
Opóźnienia DPC
Podczas otwierania wielu kart przeglądarki oprogramowanie wyświetlało opóźnienia LatencyMon. Jednak nasze wideo 4K/60fps na YouTube działało płynnie i bez żadnych spadków klatek. Niemniej jednak wyniki mogłyby być nieco niższe, zwłaszcza dla docelowej grupy twórców treści.
| DPC Latencies / LatencyMon - interrupt to process latency (max), Web, Youtube, Prime95 | |
| Samsung Galaxy Book3 Ultra 16, i9-13900H RTX 4070 | |
| MSI Katana 17 B13VFK | |
| Asus ROG Flow X16 GV601V | |
| Asus ROG Flow X16 GV601RW-M5082W | |
| Lenovo Yoga Pro 7 14IRH G8 | |
| Lenovo Legion Pro 5 16IRX8 | |
* ... im mniej tym lepiej
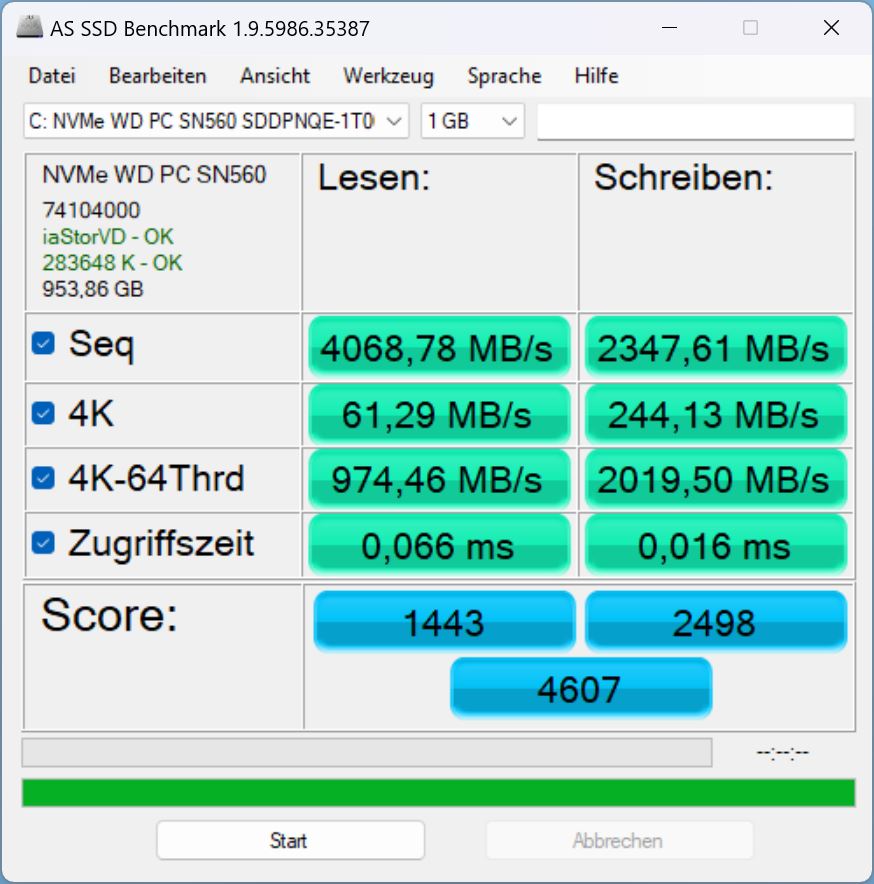
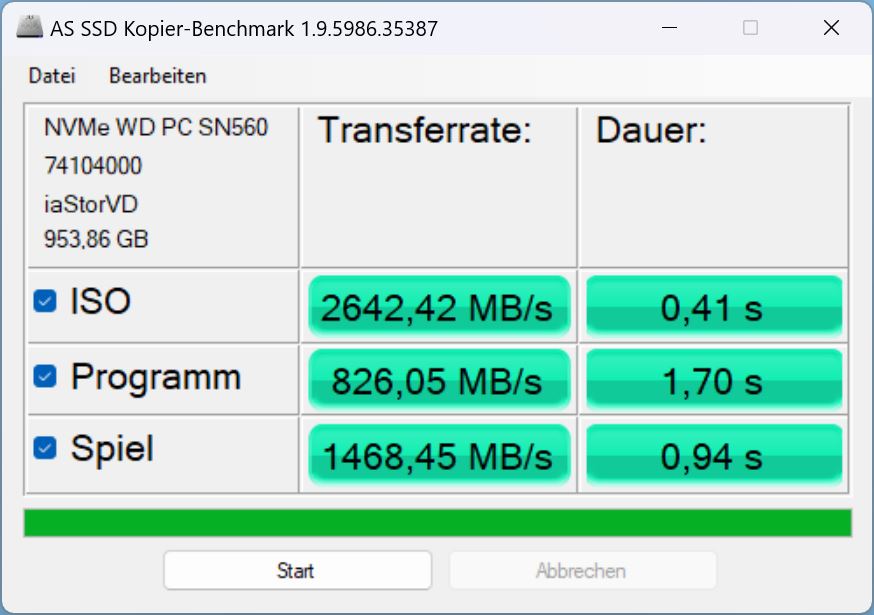
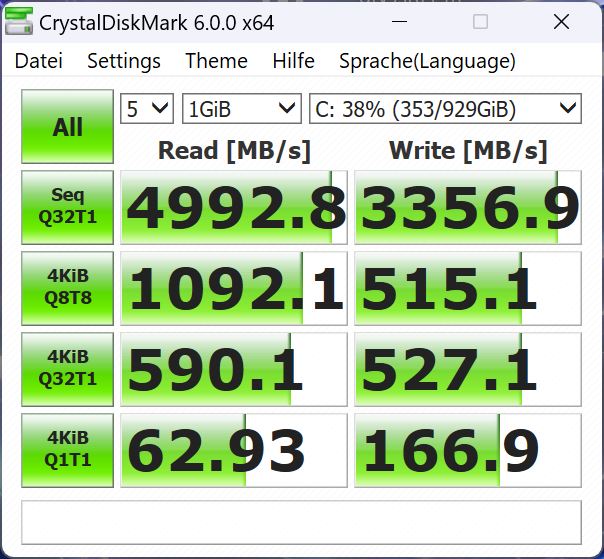
Pamięć masowa
Asus zamontował dysk SSD Western Digital o pojemności 1 TB PCIe-4.0-x4-NVMe. Po raz kolejny dysk znajduje się w dolnej części pleców w naszymLiście najlepszych dysków SSD. Dysk SSD Micron z poprzedniego modelu był znacznie szybszy, średnio o około 42 procent!
Oczywiście do użytku domowego dysk SSD jest wystarczająco szybki, ale dla użytkowników profesjonalnych - kategorii, do której skierowany jest X16 - ten krok wstecz w wydajności jest nieco godny ubolewania.

| Drive Performance rating - Percent | |
| Lenovo Legion Pro 5 16IRX8 | |
| Asus ROG Flow X16 GV601RW-M5082W | |
| Średnia w klasie Gaming | |
| Samsung Galaxy Book3 Ultra 16, i9-13900H RTX 4070 | |
| Lenovo Yoga Pro 7 14IRH G8 | |
| MSI Katana 17 B13VFK | |
| Asus ROG Flow X16 GV601V | |
| Przeciętny WD PC SN560 SDDPNQE-1T00 | |
* ... im mniej tym lepiej
Continuous performance Read: DiskSpd Read Loop, Queue Depth 8
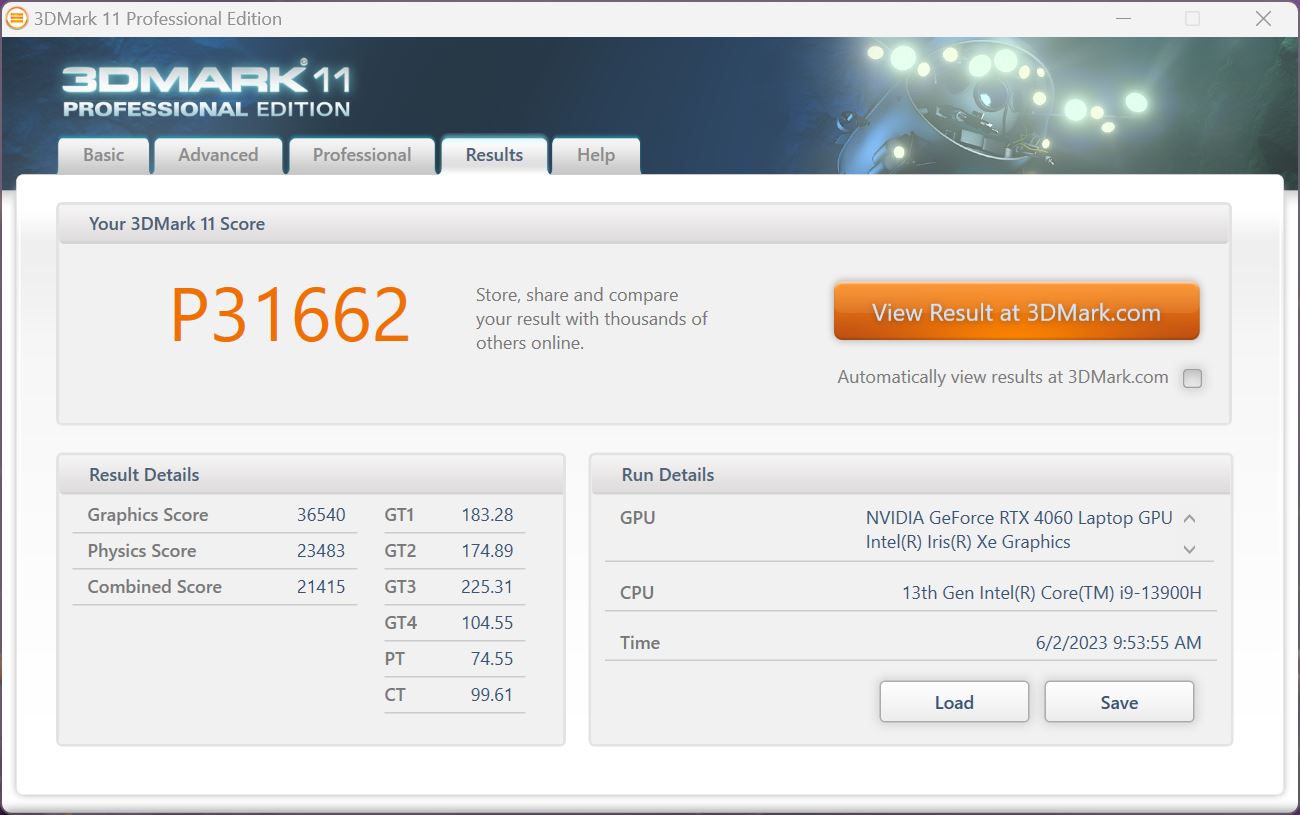
Karta graficzna
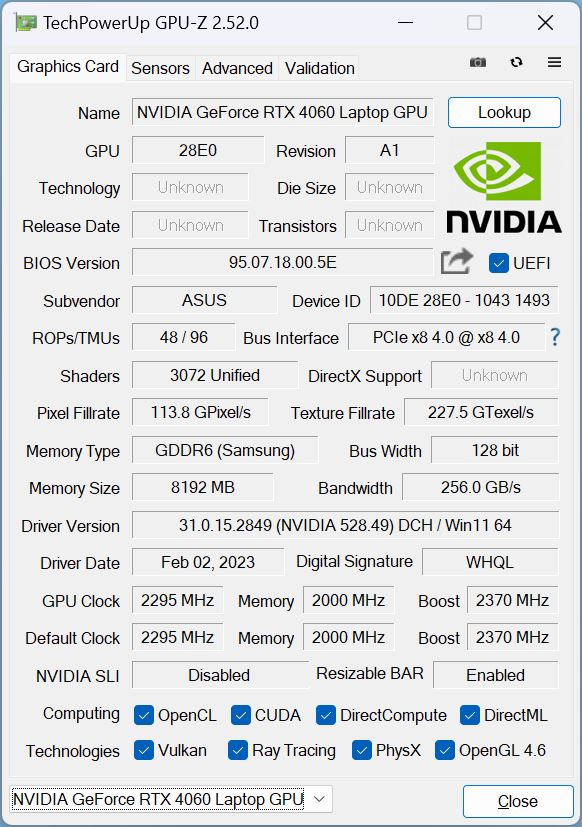
Nasz model testowy jest domem dlaNvidia Geforce RTX 4060. AnRTX 4050lubRTX 4070są również dostępne. Karta może pobierać maksymalnie 120 watów, w tym dynamiczne doładowanie o mocy 20 watów.
W testach porównawczych 3DMark, karta ta wypadła o około 10 procent lepiej (turbo) niż przeciętny laptop z RTX 4060 w naszej bazie danych.
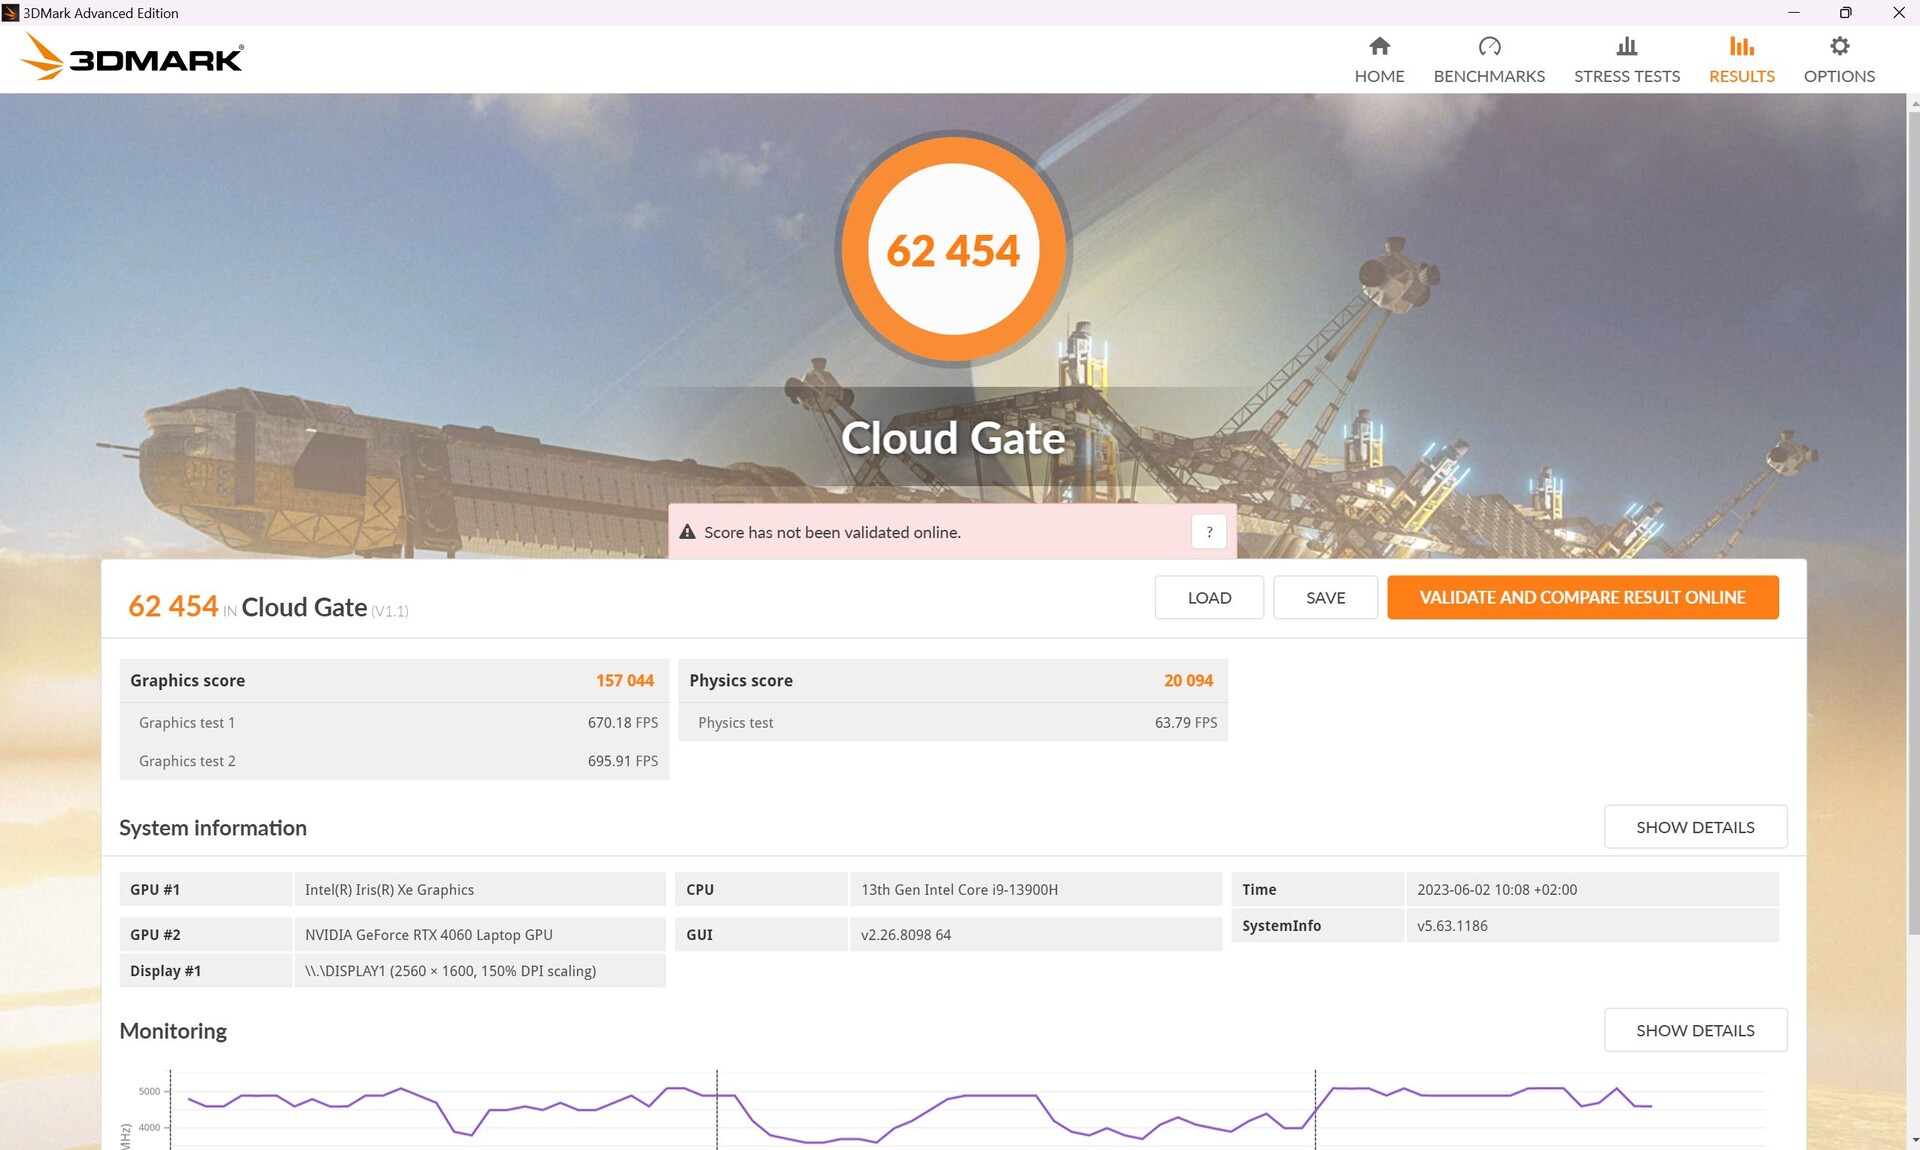
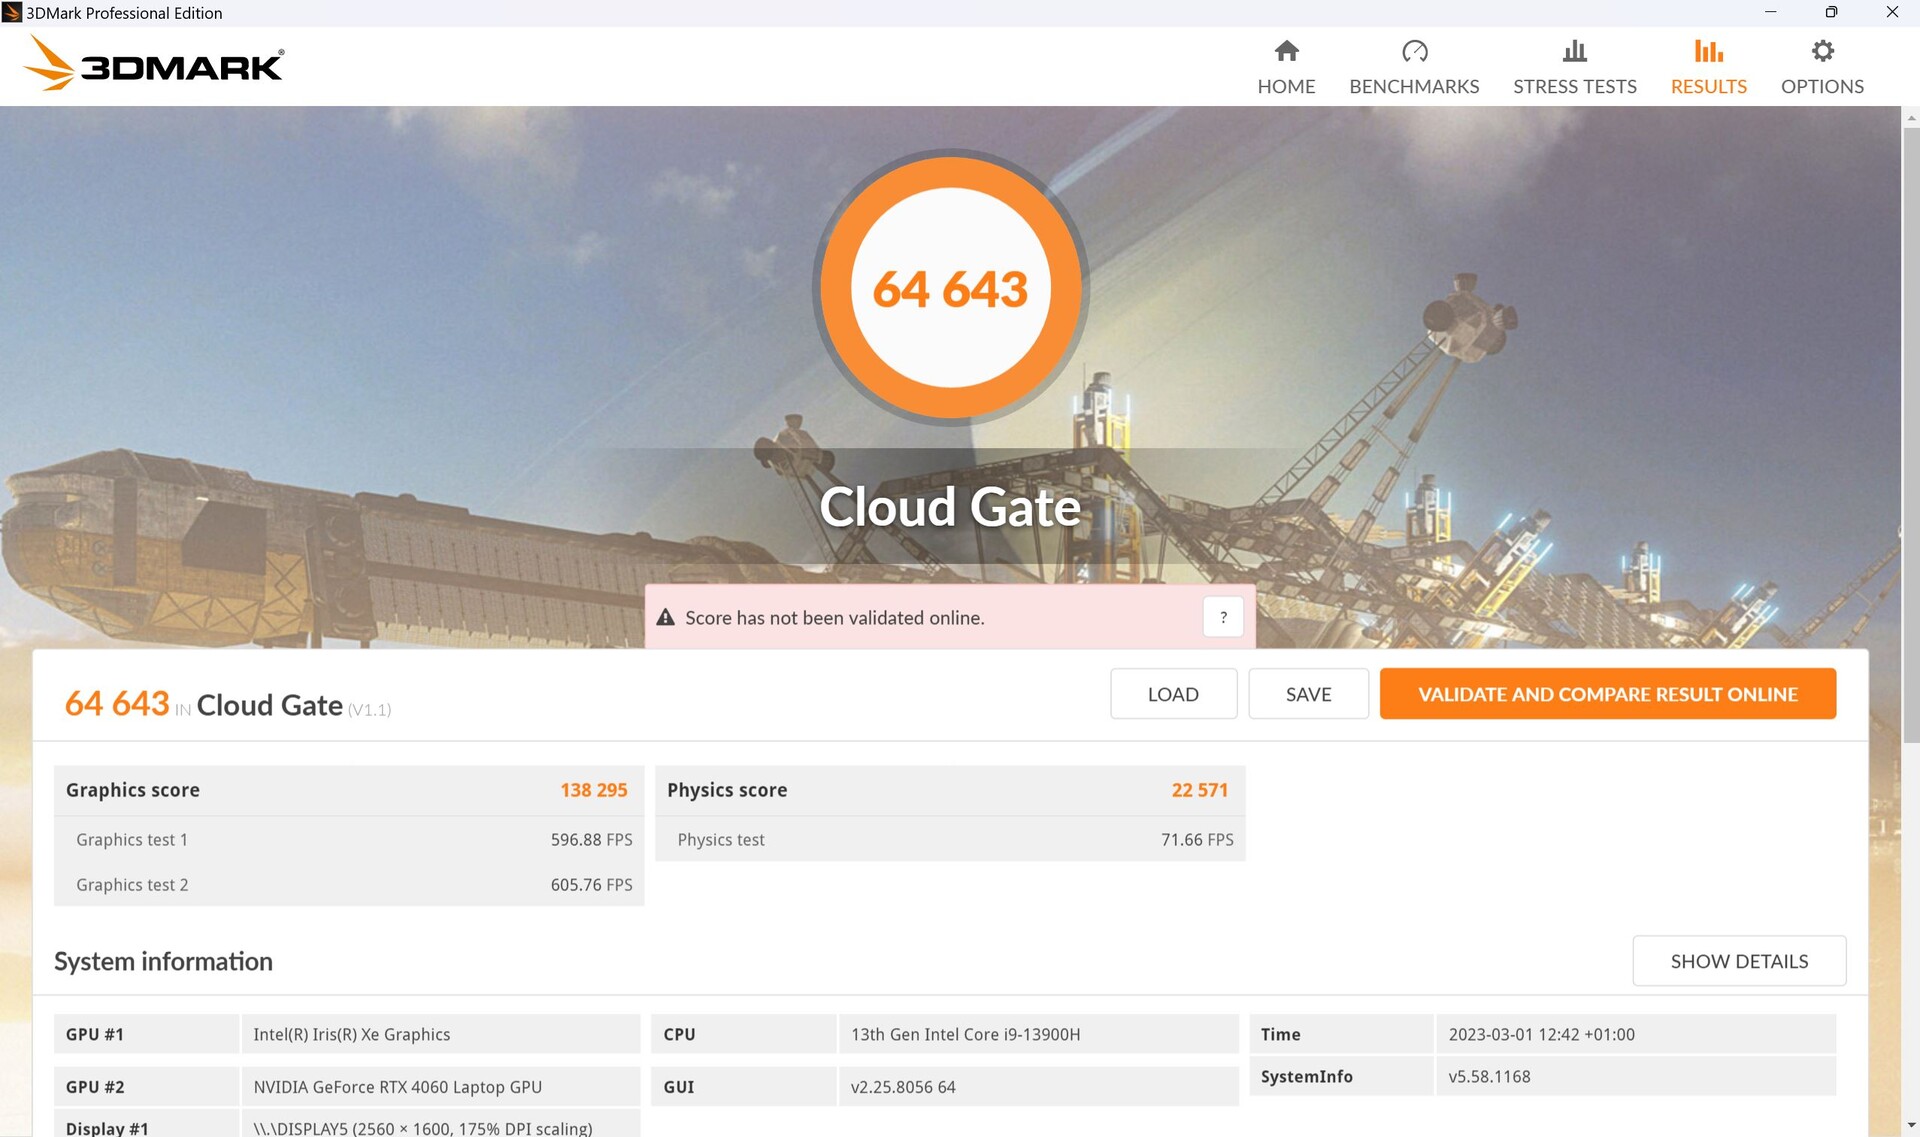
Gdy porównamy wyniki między trybem turbo a trybem wydajności, szczególnie wyraźnie widać, że wydajność grafiki wzrasta, ale wydajność procesora i fizyki mają tendencję do spadku (patrz Cloud Gate lub Fire Strike).
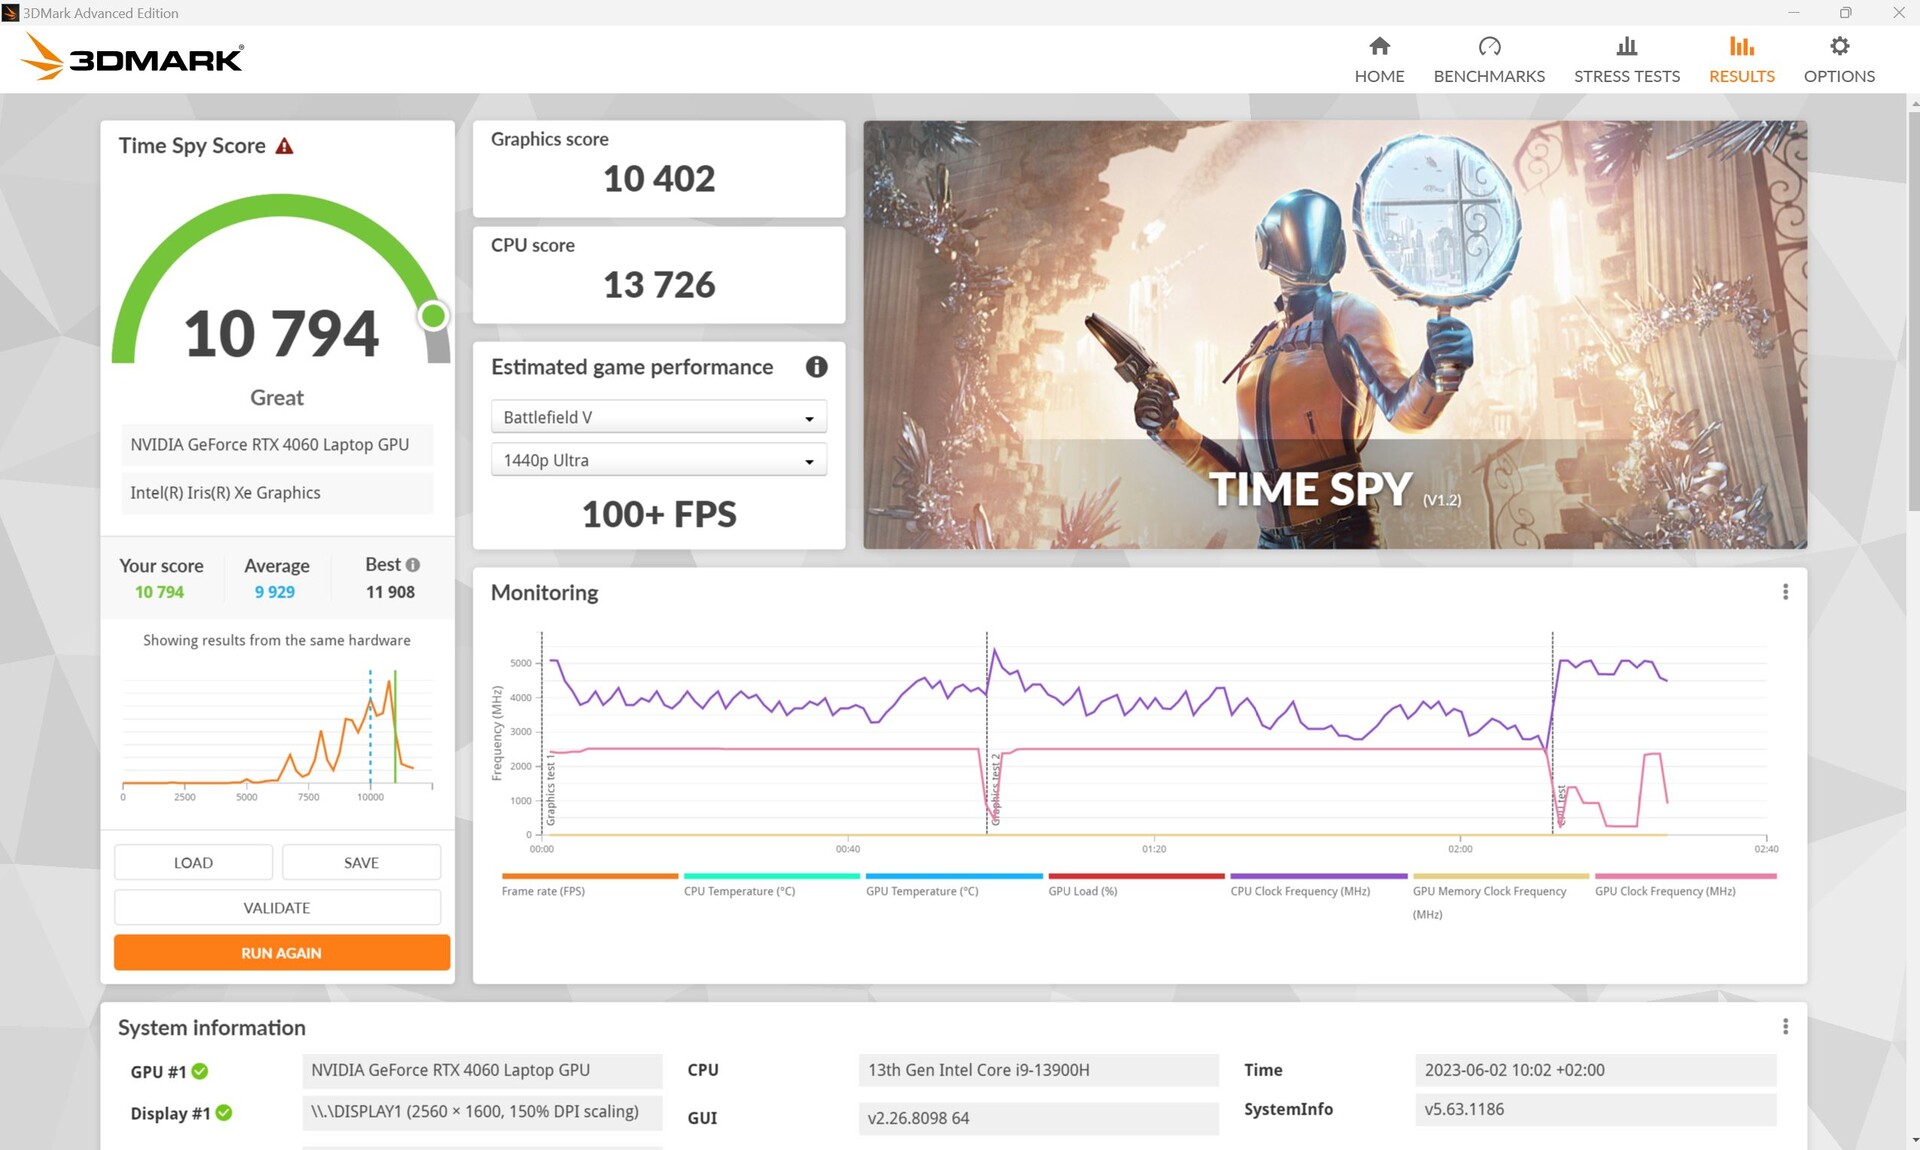
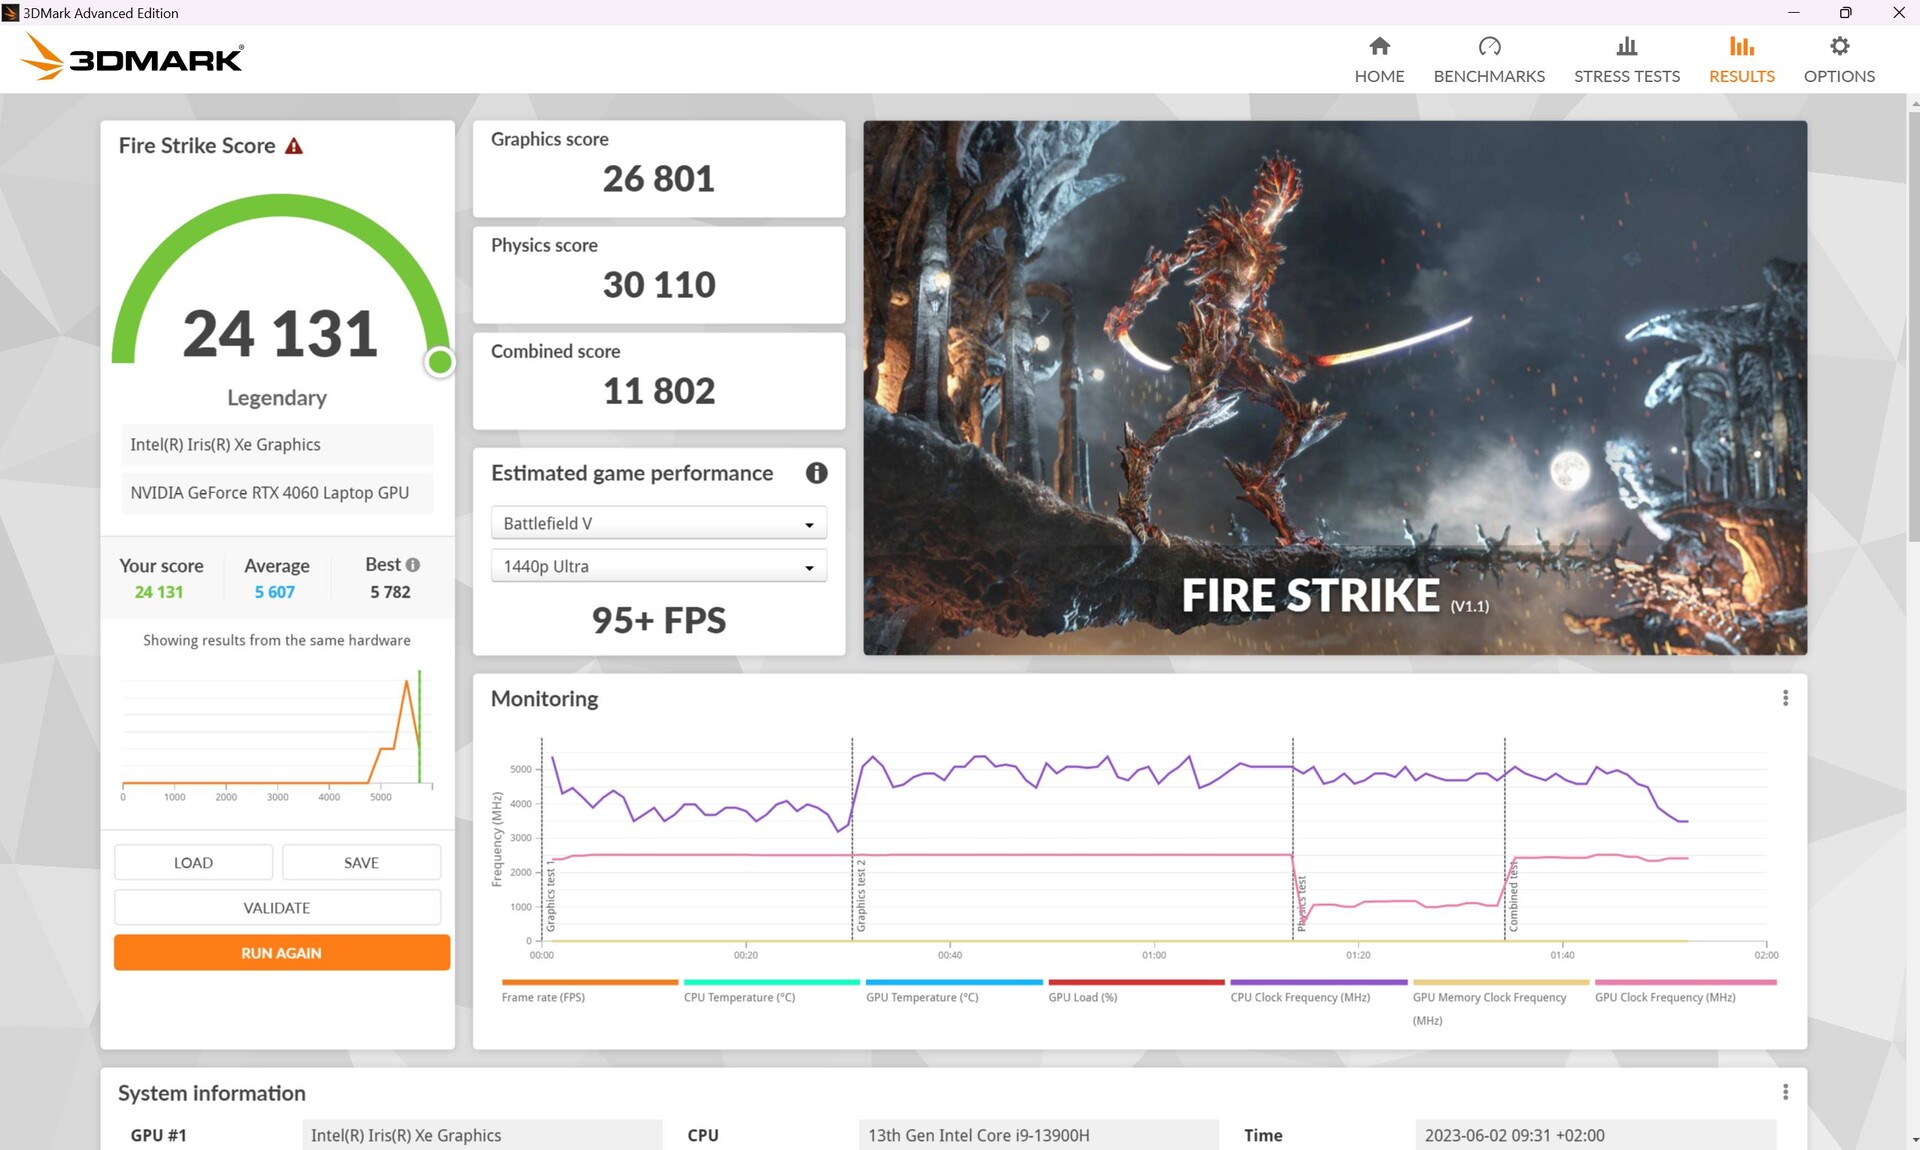
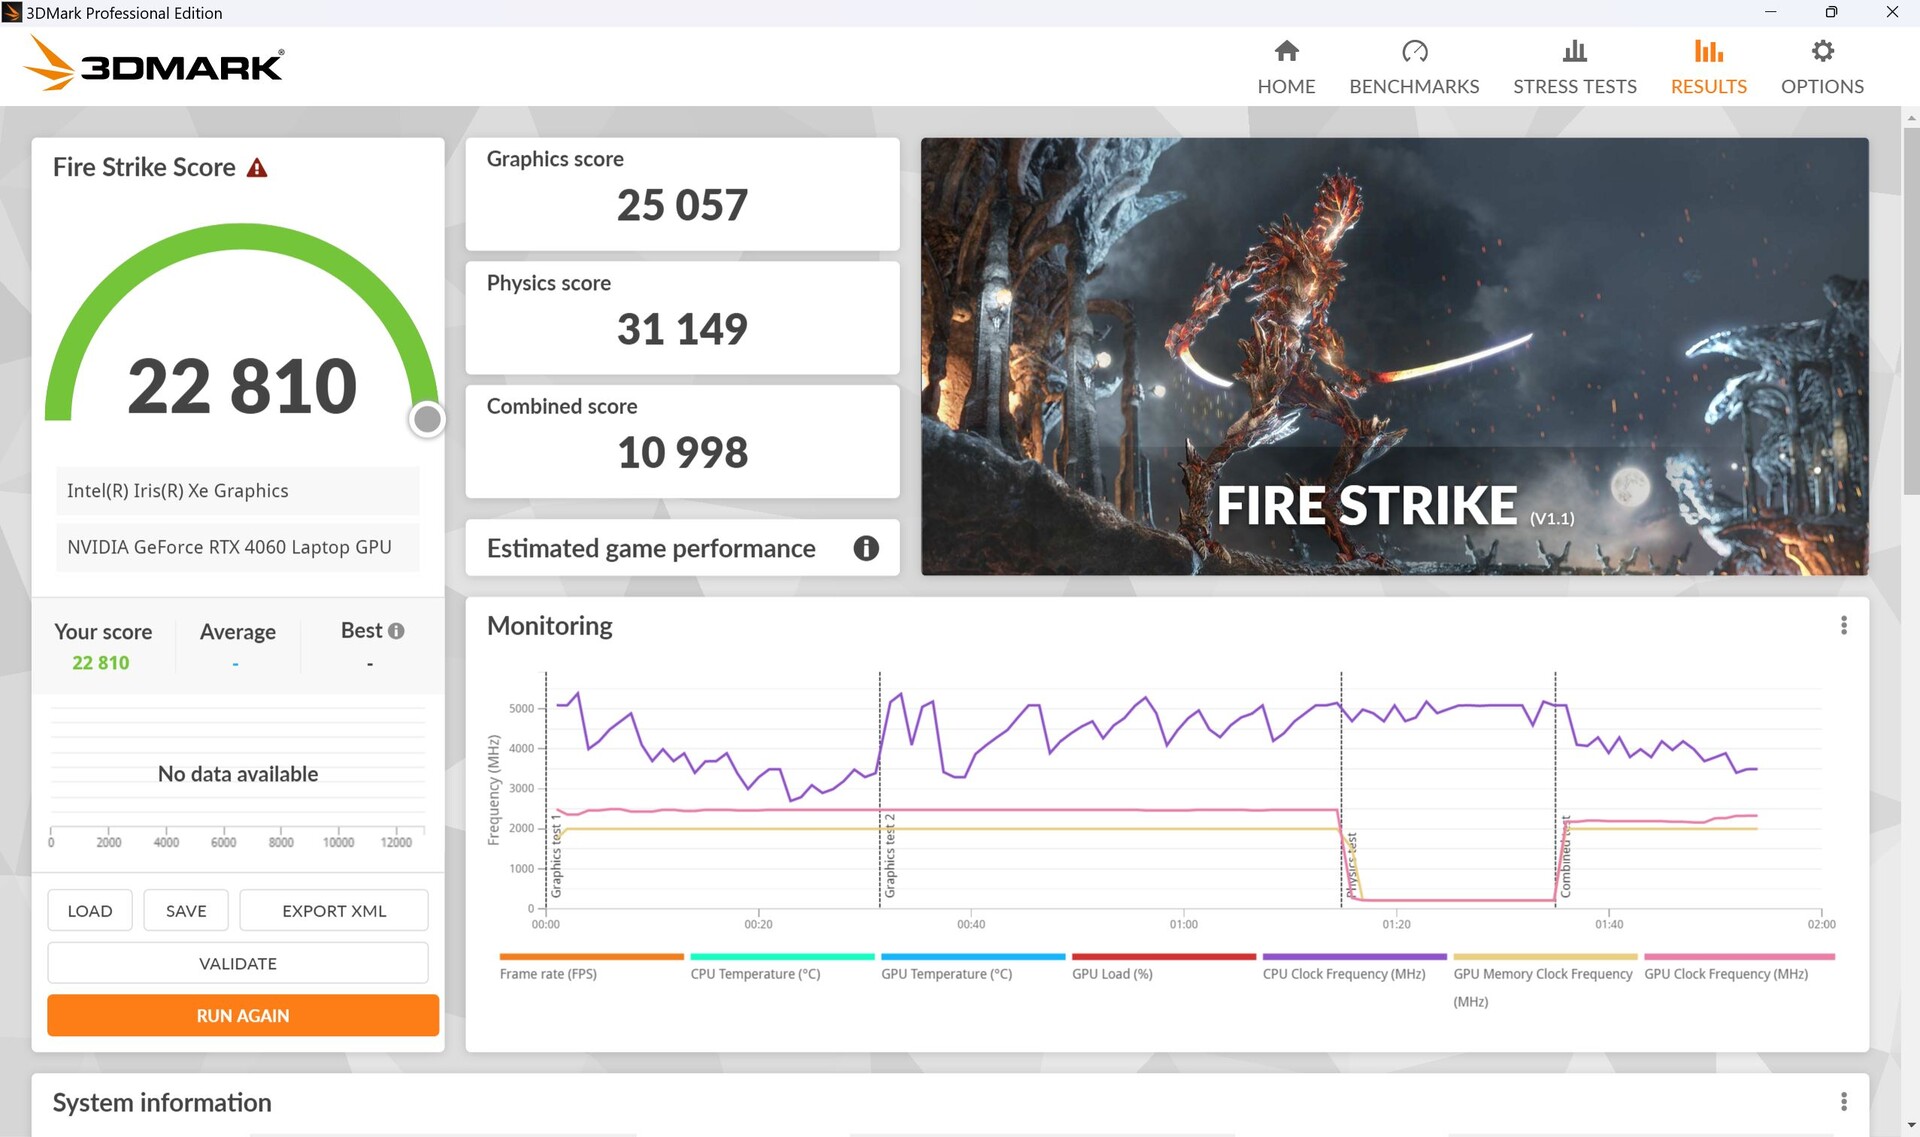
Z dala od ściany wydajność grafiki spada. W trybie wydajności wynik graficzny Fire Strike spadł o około 17 procent, a w trybie cichym o całe 42 procent.


| 3DMark Performance rating - Percent | |
| Średnia w klasie Gaming | |
| MSI Katana 17 B13VFK | |
| Asus ROG Flow X16 GV601V | |
| Lenovo Legion Pro 5 16IRX8 -1! | |
| Przeciętny NVIDIA GeForce RTX 4060 Laptop GPU | |
| Asus ROG Flow X16 GV601RW-M5082W | |
| Samsung Galaxy Book3 Ultra 16, i9-13900H RTX 4070 | |
| Lenovo Yoga Pro 7 14IRH G8 -1! | |
| 3DMark 11 - 1280x720 Performance GPU | |
| Średnia w klasie Gaming (21841 - 80022, n=106, ostatnie 2 lata) | |
| Lenovo Legion Pro 5 16IRX8 | |
| MSI Katana 17 B13VFK | |
| Asus ROG Flow X16 GV601RW-M5082W | |
| Asus ROG Flow X16 GV601V | |
| Przeciętny NVIDIA GeForce RTX 4060 Laptop GPU (28136 - 38912, n=57) | |
| Samsung Galaxy Book3 Ultra 16, i9-13900H RTX 4070 | |
| Lenovo Yoga Pro 7 14IRH G8 | |
| 3DMark | |
| 1280x720 Cloud Gate Standard Graphics | |
| MSI Katana 17 B13VFK | |
| Asus ROG Flow X16 GV601V | |
| Przeciętny NVIDIA GeForce RTX 4060 Laptop GPU (81407 - 180228, n=29) | |
| Średnia w klasie Gaming (86886 - 223650, n=61, ostatnie 2 lata) | |
| Asus ROG Flow X16 GV601RW-M5082W | |
| Samsung Galaxy Book3 Ultra 16, i9-13900H RTX 4070 | |
| 1920x1080 Fire Strike Graphics | |
| Średnia w klasie Gaming (12242 - 62849, n=118, ostatnie 2 lata) | |
| MSI Katana 17 B13VFK | |
| Asus ROG Flow X16 GV601V | |
| Asus ROG Flow X16 GV601RW-M5082W | |
| Lenovo Legion Pro 5 16IRX8 | |
| Przeciętny NVIDIA GeForce RTX 4060 Laptop GPU (20533 - 29656, n=54) | |
| Samsung Galaxy Book3 Ultra 16, i9-13900H RTX 4070 | |
| Lenovo Yoga Pro 7 14IRH G8 | |
| 2560x1440 Time Spy Graphics | |
| Średnia w klasie Gaming (5012 - 26212, n=117, ostatnie 2 lata) | |
| Lenovo Legion Pro 5 16IRX8 | |
| Asus ROG Flow X16 GV601RW-M5082W | |
| Asus ROG Flow X16 GV601V | |
| MSI Katana 17 B13VFK | |
| Przeciętny NVIDIA GeForce RTX 4060 Laptop GPU (7484 - 11451, n=56) | |
| Samsung Galaxy Book3 Ultra 16, i9-13900H RTX 4070 | |
| Lenovo Yoga Pro 7 14IRH G8 | |
| 3DMark 11 Performance | 31662 pkt. | |
| 3DMark Cloud Gate Standard Score | 62454 pkt. | |
| 3DMark Fire Strike Score | 24131 pkt. | |
| 3DMark Time Spy Score | 10794 pkt. | |
Pomoc | ||
* ... im mniej tym lepiej
| Premiere Pro PugetBench - Overall Score 0.9 | |
| MSI Stealth 17 Studio A13VH-014 | |
| Asus ROG Flow X16 GV601V | |
| Asus Zephyrus Duo 16 GX650PY-NM006W | |
| MSI Titan GT77 HX 13VI | |
| Apple MacBook Pro 14 2023 M2 Pro | |
| Asus ROG Zephyrus G14 GA402XY | |
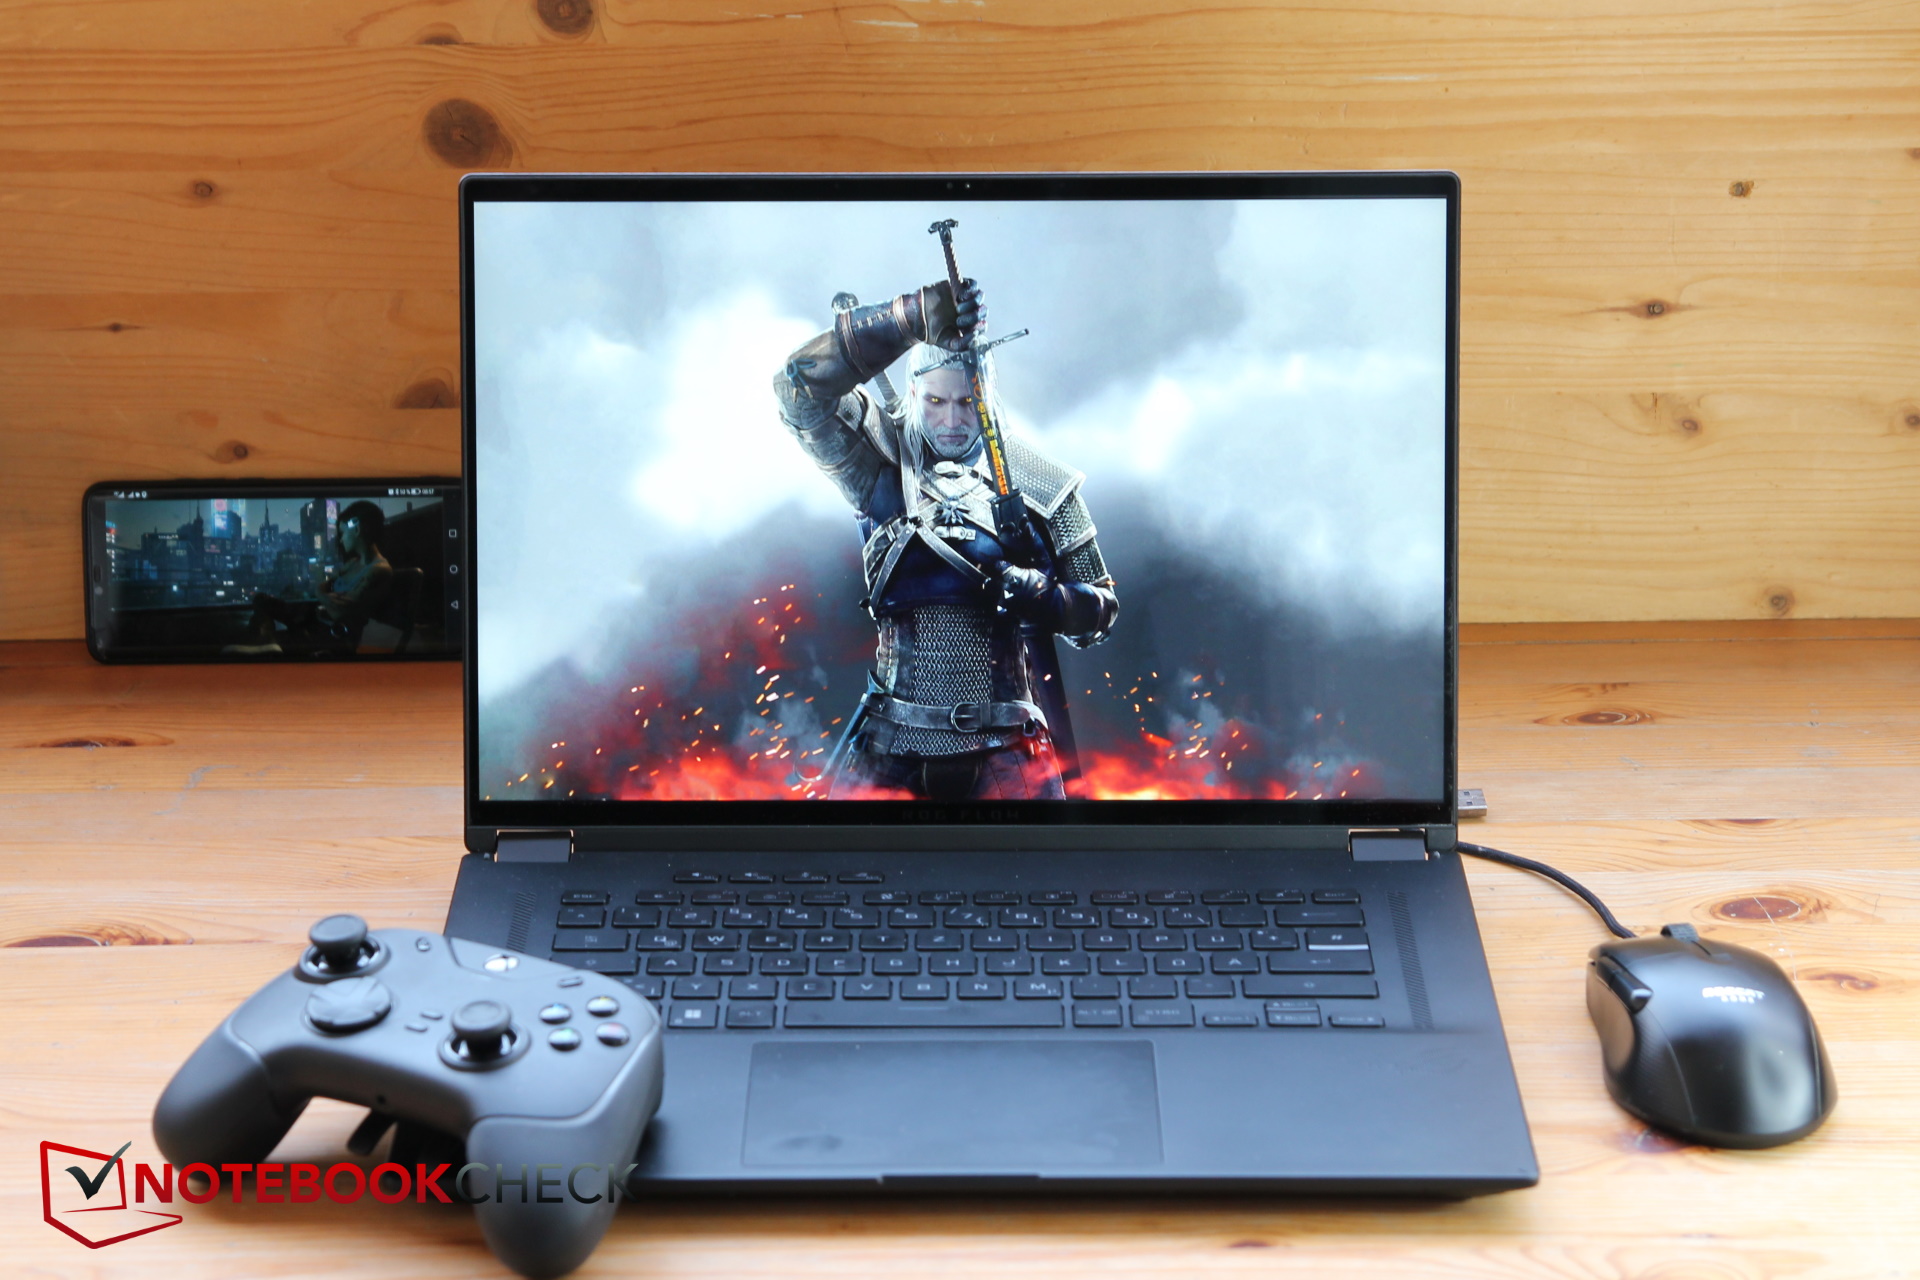
Wydajność w grach
W rozdzielczości Full HD niemal każda testowana gra działała płynnie przy maksymalnych detalach. Dysponujemy nawet wystarczającymi zasobami dla rozdzielczości QHD, przy czym tylko bardzo wymagające tytuły, takie jak The Last of Us, nie mają wystarczającej mocy obliczeniowej.
W naszym porównaniu, Flow X16 jest na tym samym poziomie co Katana 17, której RTX 4060 ma maksymalne TGP wynoszące 105 watów. Z drugiej strony, tylko 5 procent dzieli go od Legion 5, którego RTX 4060 ma TGP 140 watów. To ponownie pokazuje, że GPU ledwo udaje się czerpać korzyści z wyższych TGP, co podkreślił nasz kolega w swojej analizie nowych kart Nvidia Geforce RTX 4000. Poprzednik, z jego RTX 3070 Ti, bije go o całe 21 procent.
| Performance rating - Percent | |
| Średnia w klasie Gaming | |
| Lenovo Legion Pro 5 16IRX8 -1! | |
| MSI Katana 17 B13VFK | |
| Asus ROG Flow X16 GV601V | |
| Asus ROG Flow X16 GV601RW-M5082W | |
| Lenovo Yoga Pro 7 14IRH G8 -1! | |
| Samsung Galaxy Book3 Ultra 16, i9-13900H RTX 4070 | |
| The Witcher 3 - 1920x1080 Ultra Graphics & Postprocessing (HBAO+) | |
| Średnia w klasie Gaming (95 - 240, n=8, ostatnie 2 lata) | |
| Lenovo Legion Pro 5 16IRX8 | |
| Asus ROG Flow X16 GV601V | |
| MSI Katana 17 B13VFK | |
| Asus ROG Flow X16 GV601RW-M5082W | |
| Samsung Galaxy Book3 Ultra 16, i9-13900H RTX 4070 | |
| Lenovo Yoga Pro 7 14IRH G8 | |
| GTA V - 1920x1080 Highest AA:4xMSAA + FX AF:16x | |
| Średnia w klasie Gaming (48.3 - 186.9, n=100, ostatnie 2 lata) | |
| Lenovo Legion Pro 5 16IRX8 | |
| MSI Katana 17 B13VFK | |
| Asus ROG Flow X16 GV601V | |
| Asus ROG Flow X16 GV601RW-M5082W | |
| Lenovo Yoga Pro 7 14IRH G8 | |
| Samsung Galaxy Book3 Ultra 16, i9-13900H RTX 4070 | |
| Final Fantasy XV Benchmark - 1920x1080 High Quality | |
| Średnia w klasie Gaming (41 - 215, n=101, ostatnie 2 lata) | |
| Lenovo Legion Pro 5 16IRX8 | |
| Asus ROG Flow X16 GV601V | |
| MSI Katana 17 B13VFK | |
| Asus ROG Flow X16 GV601RW-M5082W | |
| Samsung Galaxy Book3 Ultra 16, i9-13900H RTX 4070 | |
| Lenovo Yoga Pro 7 14IRH G8 | |
| Strange Brigade - 1920x1080 ultra AA:ultra AF:16 | |
| Średnia w klasie Gaming (76.3 - 456, n=91, ostatnie 2 lata) | |
| Asus ROG Flow X16 GV601V | |
| MSI Katana 17 B13VFK | |
| Asus ROG Flow X16 GV601RW-M5082W | |
| Samsung Galaxy Book3 Ultra 16, i9-13900H RTX 4070 | |
| Dota 2 Reborn - 1920x1080 ultra (3/3) best looking | |
| Lenovo Legion Pro 5 16IRX8 | |
| MSI Katana 17 B13VFK | |
| Średnia w klasie Gaming (84.8 - 248, n=110, ostatnie 2 lata) | |
| Asus ROG Flow X16 GV601V | |
| Lenovo Yoga Pro 7 14IRH G8 | |
| Asus ROG Flow X16 GV601RW-M5082W | |
| Samsung Galaxy Book3 Ultra 16, i9-13900H RTX 4070 | |
| X-Plane 11.11 - 1920x1080 high (fps_test=3) | |
| Lenovo Legion Pro 5 16IRX8 | |
| MSI Katana 17 B13VFK | |
| Asus ROG Flow X16 GV601V | |
| Lenovo Yoga Pro 7 14IRH G8 | |
| Średnia w klasie Gaming (52.1 - 143.5, n=113, ostatnie 2 lata) | |
| Samsung Galaxy Book3 Ultra 16, i9-13900H RTX 4070 | |
| Asus ROG Flow X16 GV601RW-M5082W | |
Liczba klatek na sekundę na stronie Witcher 3 wyświetla zwykłą krzywą dzień/noc, ale poza tym jest bardzo stabilna. Według dziennika GPU-Z, częstotliwość taktowania rdzenia wynosi prawie stałe 2460 MHz, a częstotliwość taktowania pamięci jest również stabilna (2 GHz).
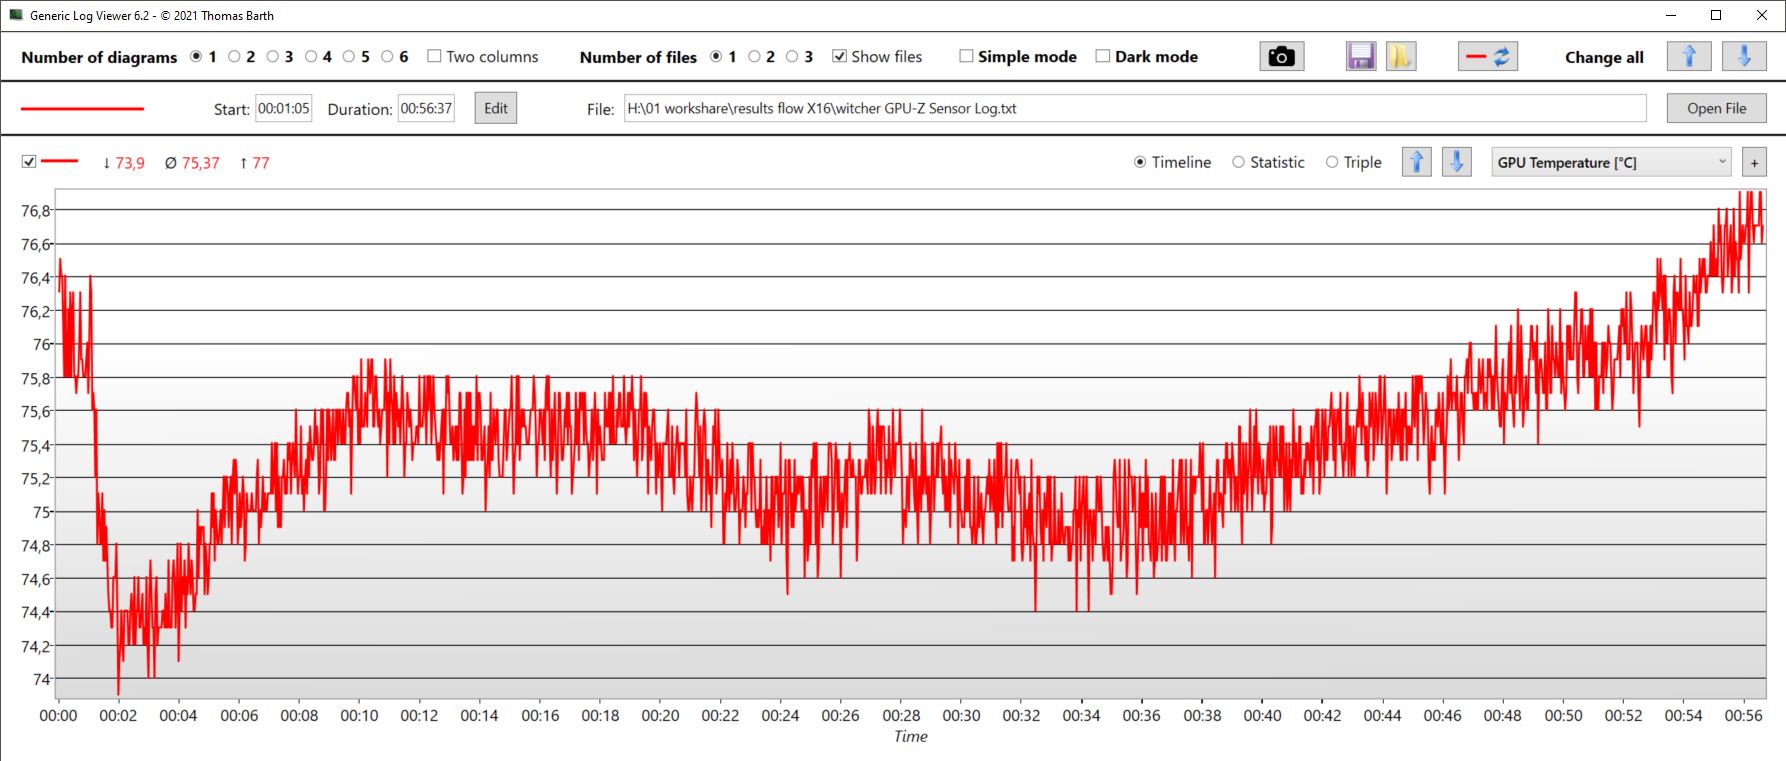
Temperatura GPU wahała się nieco na średnim poziomie około 75 °C, ale stale rosła pod koniec godziny, co oznacza, że prędkość zegara mogła być dławiona podczas dłuższych okresów pracy.
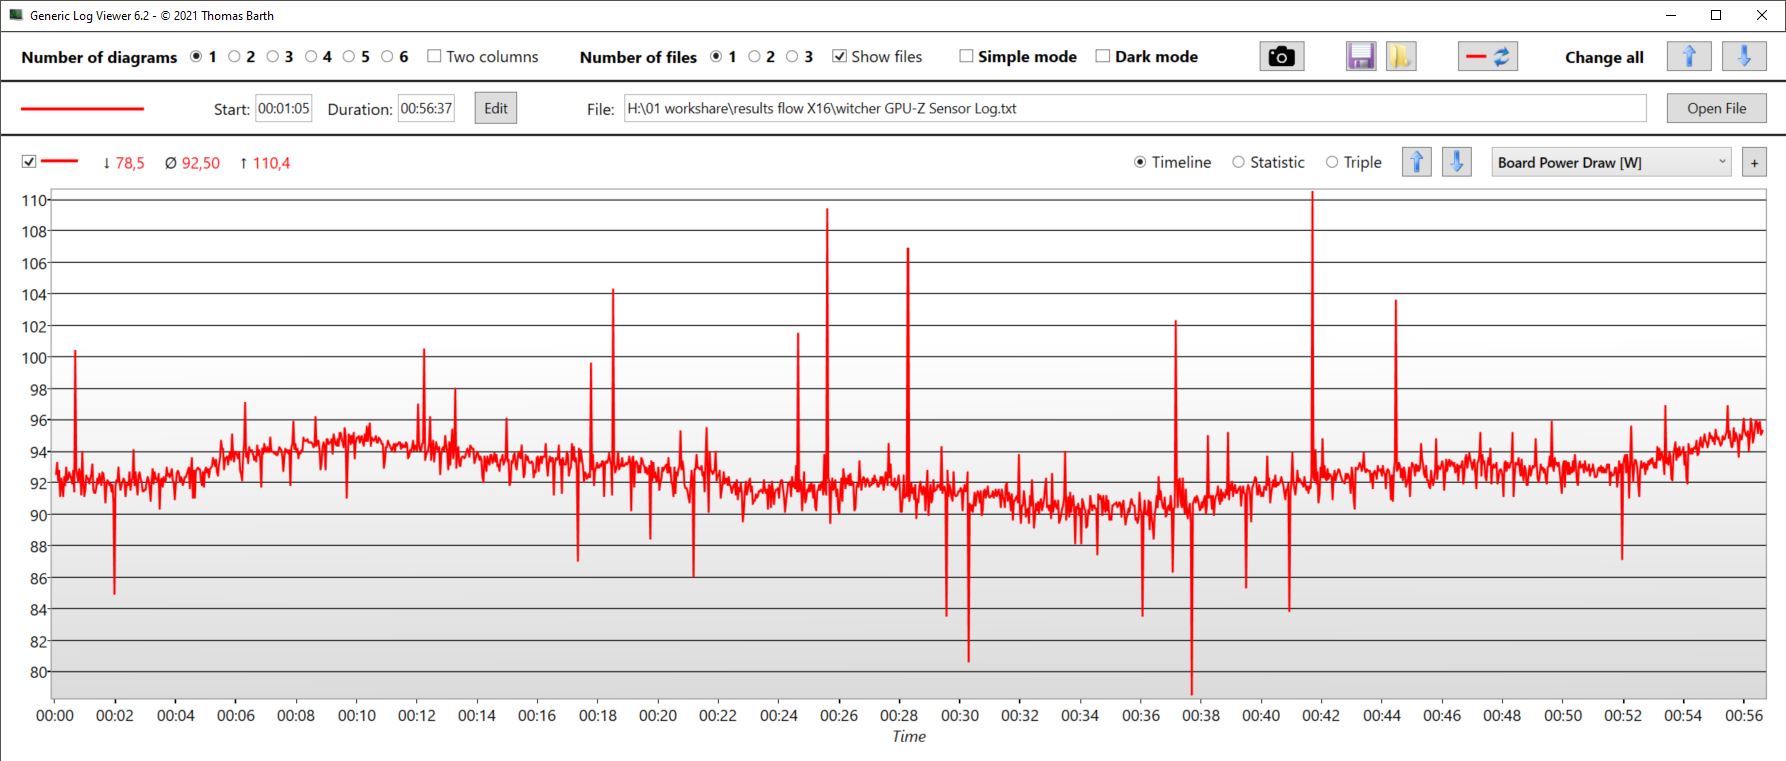
Karta pobierała średnio tylko 92,5 W i widzieliśmy bardzo krótkie skoki do 110 W, ale możliwe 120 W nigdy nie zostało osiągnięte.
Z jegoRTX 4070kartaGalaxy Book3 nie ma szans z naszym X16, który z technicznego punktu widzenia jest nawet w stanie zbliżyć się do Legion 5.
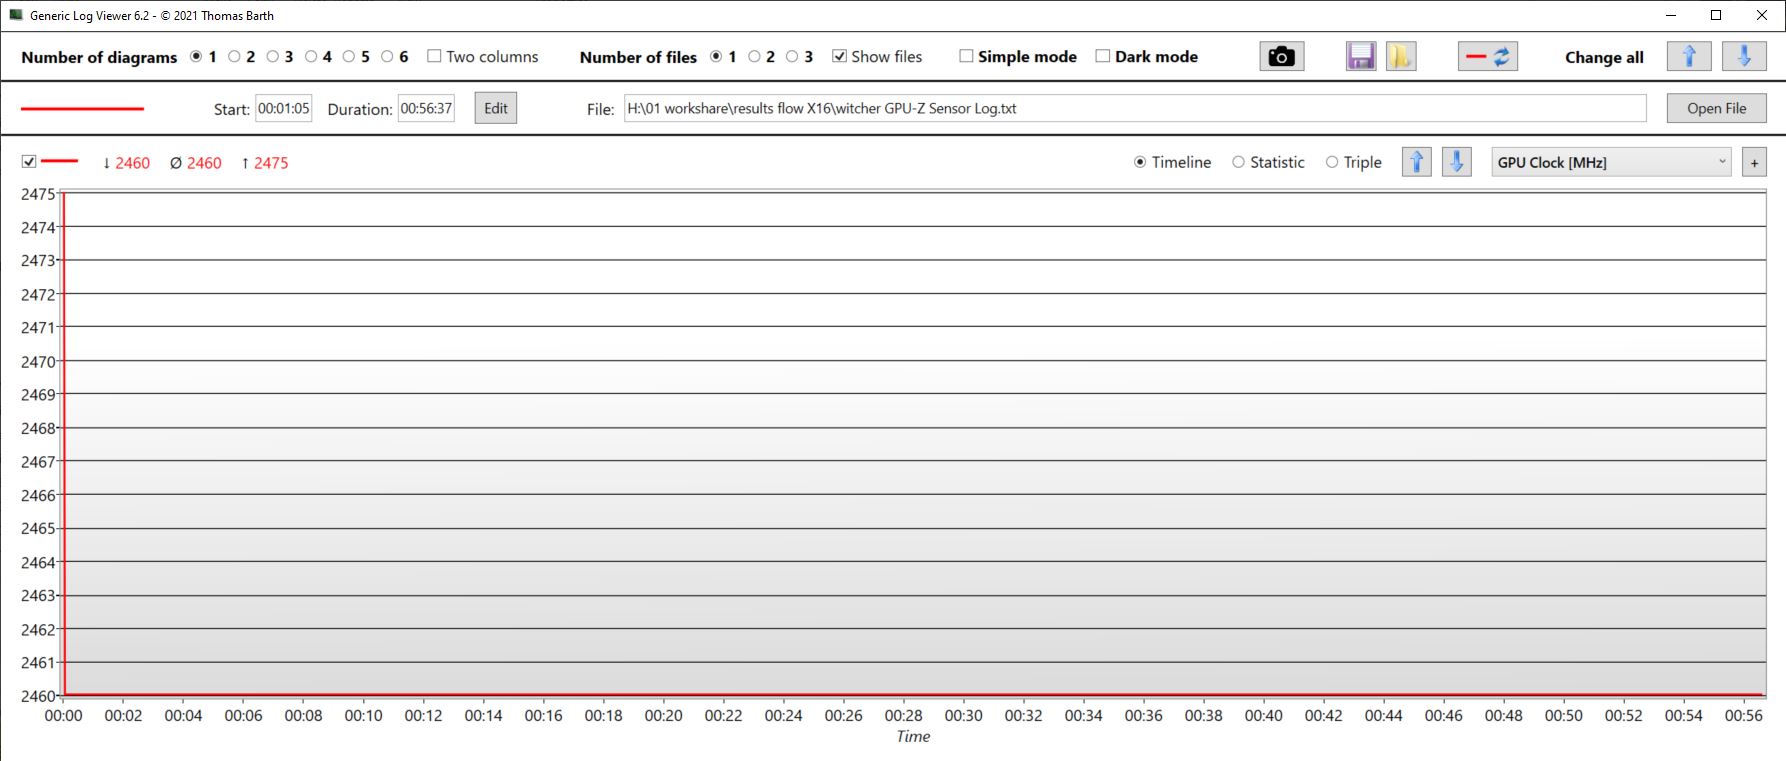
Witcher 3 FPS diagram
| low | med. | high | ultra | QHD | 4K | |
|---|---|---|---|---|---|---|
| GTA V (2015) | 184.4 | 179.8 | 173.9 | 110.3 | 79.4 | |
| The Witcher 3 (2015) | 214.8 | 106.5 | ||||
| Dota 2 Reborn (2015) | 188.3 | 166 | 162.8 | 149.2 | 115.5 | |
| Final Fantasy XV Benchmark (2018) | 100.8 | |||||
| X-Plane 11.11 (2018) | 174 | 145.4 | 116.4 | 105.6 | ||
| Far Cry 5 (2018) | 140 | 130 | 99 | |||
| Strange Brigade (2018) | 419 | 266 | 225 | 192.5 | 129.2 | |
| Shadow of the Tomb Raider (2018) | 150 | 137 | 93 | |||
| Assassin´s Creed Valhalla (2020) | 114 | 98 | 71 | |||
| Far Cry 6 (2021) | 120 | 108 | 79 | |||
| Cyberpunk 2077 1.6 (2022) | 84.25 | 76.64 | 48.71 | |||
| F1 22 (2022) | 257 | 218 | 183.9 | 64.8 | 42.3 | |
| Call of Duty Modern Warfare 2 2022 (2022) | 91 | 86 | 61 | |||
| Hogwarts Legacy (2023) | 106.9 | 91.9 | 42.8 | |||
| The Last of Us (2023) | 71.2 | 53.1 | 32.7 |
Emisje - Cicha praca jest również możliwa dzięki Flow X16
Emisja hałasu
Podczas pracy na biegu jałowym wentylatory w większości pozostawały nieruchome. Pod obciążeniem hałas wyraźnie zależy od wybranego trybu wydajności. Na przykład podczas grania w trybie turbo wentylatory osiągnęły poziom ponad 50 dB, podczas gdy w trybie wydajnościowym działały na znacznie bardziej znośnym poziomie 44 dB. Już sama ta stosunkowo duża różnica powinna sprawić, że niewielki spadek wydajności w trybie wydajności będzie bardziej znośny. W trybie cichym poziom decybeli spadł do około 37 dB.
W trybie turbo wentylatory pracowały przez dłuższy czas po uruchomieniu wymagających zadań, takich jak gry, jeśli nie z pełną prędkością. Jednak nawet pracując na biegu jałowym, X16 pozostawał głośny przez kilka minut, jeśli wcześniej odbyła się sesja gry.
W przypadku twórców treści zalecamy zatem korzystanie z trybu wydajności (lub nawet cichego), ponieważ są one znacznie cichsze przy tolerowanym spadku dostępnej mocy.
Podczas bezczynności, Windows lub procesy Asusa działające w tle zakłócają pracę cichych wentylatorów. Wentylatory te włączają się, zwłaszcza w trybie turbo.
| Modus/Witcher 3 Ultra | FPS | Lautstärke w dB | Durchschnittsverbrauch w W |
|---|---|---|---|
| Turbo | 102 | 50.92 | 142 |
| Leistung | 92 | 44 | |
| Leise | 80 | 37.53 | 106 |
Hałas
| luz |
| 24 / 24 / 24 dB |
| obciążenie |
| 36.71 / 50.92 dB |
 | ||
30 dB cichy 40 dB(A) słyszalny 50 dB(A) irytujący |
||
min: | ||
| Asus ROG Flow X16 GV601V GeForce RTX 4060 Laptop GPU, i9-13900H, WD PC SN560 SDDPNQE-1T00 | Asus ROG Flow X16 GV601RW-M5082W GeForce RTX 3070 Ti Laptop GPU, R9 6900HS, Micron 3400 1TB MTFDKBA1T0TFH | Samsung Galaxy Book3 Ultra 16, i9-13900H RTX 4070 GeForce RTX 4070 Laptop GPU, i9-13900H, Samsung PM9A1 MZVL21T0HCLR | Lenovo Legion Pro 5 16IRX8 GeForce RTX 4060 Laptop GPU, i7-13700HX, SK hynix PC801 HFS512GEJ9X115N | Lenovo Yoga Pro 7 14IRH G8 GeForce RTX 4050 Laptop GPU, i7-13700H, Samsung PM9A1 MZVL21T0HCLR | MSI Katana 17 B13VFK GeForce RTX 4060 Laptop GPU, i7-13620H, Micron 2400 MTFDKBA1T0QFM | |
|---|---|---|---|---|---|---|
| Noise | -13% | -9% | 1% | -6% | -19% | |
| wyłączone / środowisko * (dB) | 24 | 25.5 -6% | 25.2 -5% | 23 4% | 22.9 5% | 24.5 -2% |
| Idle Minimum * (dB) | 24 | 25.5 -6% | 25.2 -5% | 23.1 4% | 22.9 5% | 24.5 -2% |
| Idle Average * (dB) | 24 | 25.5 -6% | 25.2 -5% | 23.1 4% | 22.9 5% | 24.5 -2% |
| Idle Maximum * (dB) | 24 | 27.4 -14% | 31.3 -30% | 26.6 -11% | 36.8 -53% | 40 -67% |
| Load Average * (dB) | 36.71 | 49.9 -36% | 38.8 -6% | 34.7 5% | 43.7 -19% | 48.3 -32% |
| Witcher 3 ultra * (dB) | 50.92 | 47.6 7% | 46.2 9% | 56 -10% | ||
| Load Maximum * (dB) | 50.92 | 55 -8% | 51.2 -1% | 54.8 -8% | 46.2 9% | 59.1 -16% |
* ... im mniej tym lepiej
Temperatura
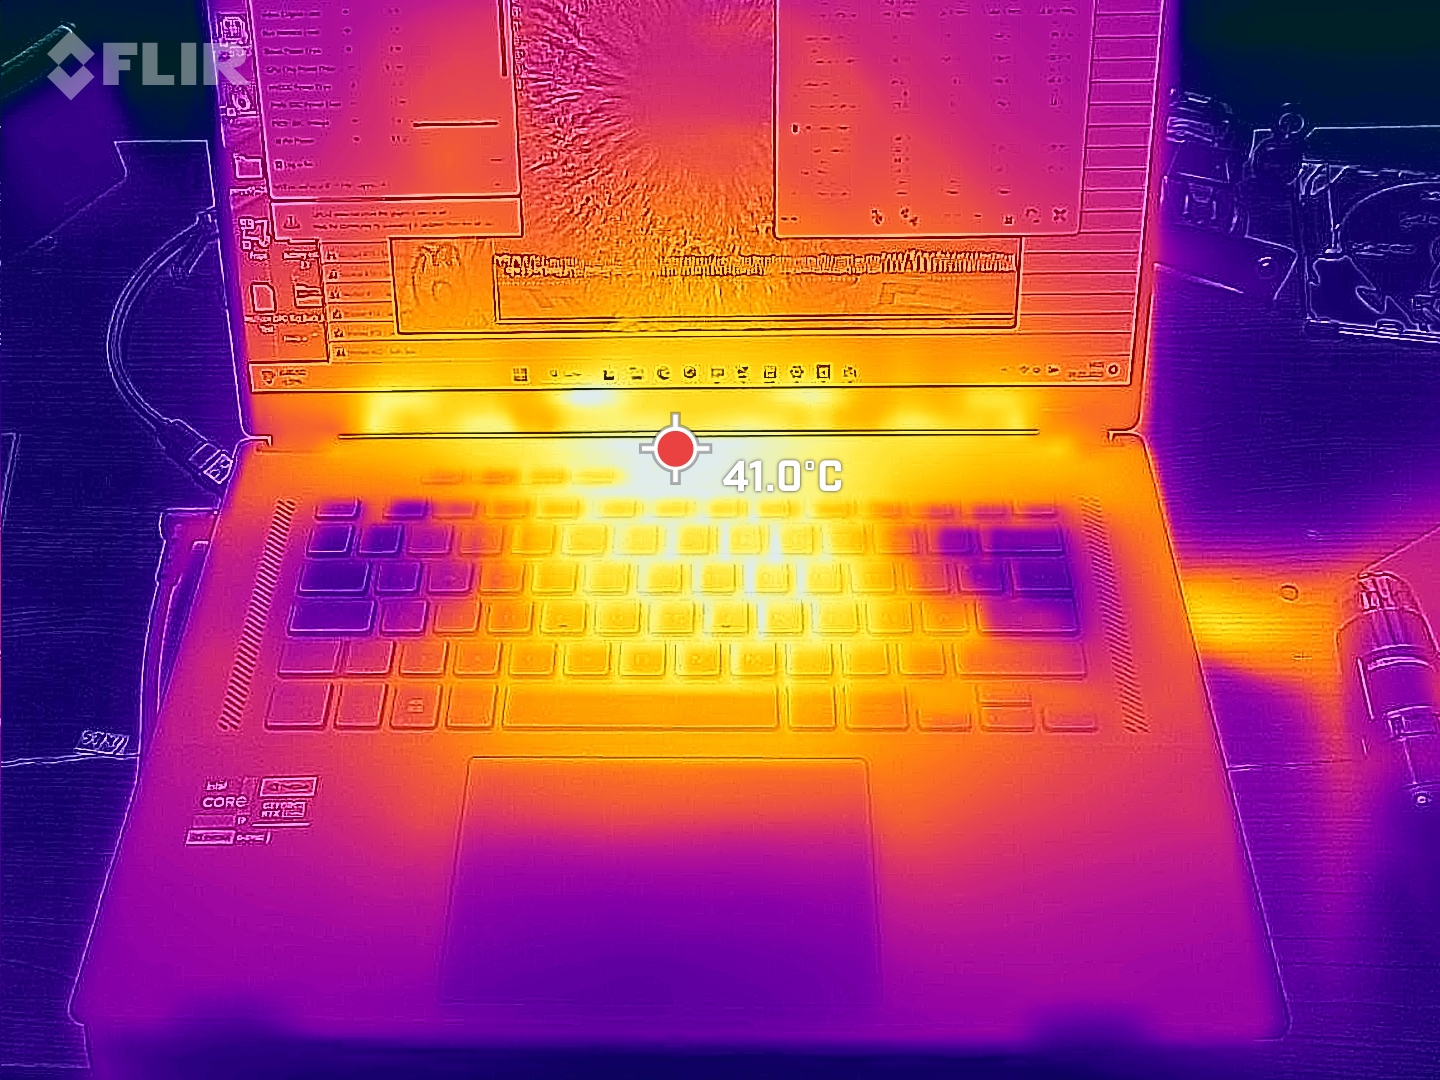
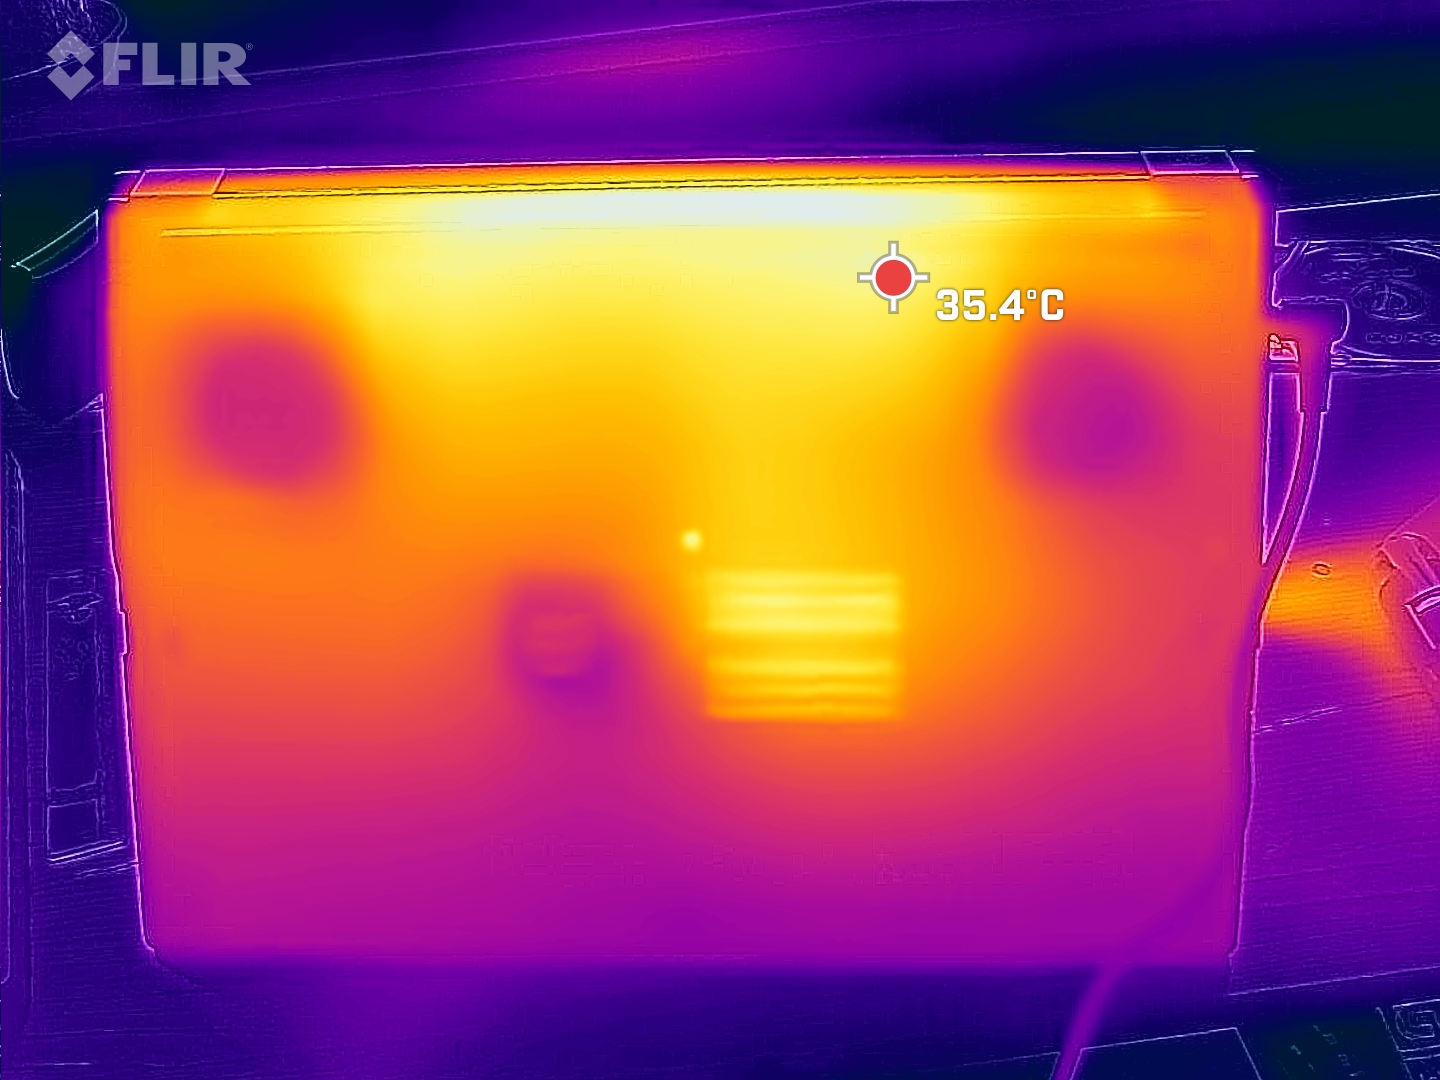
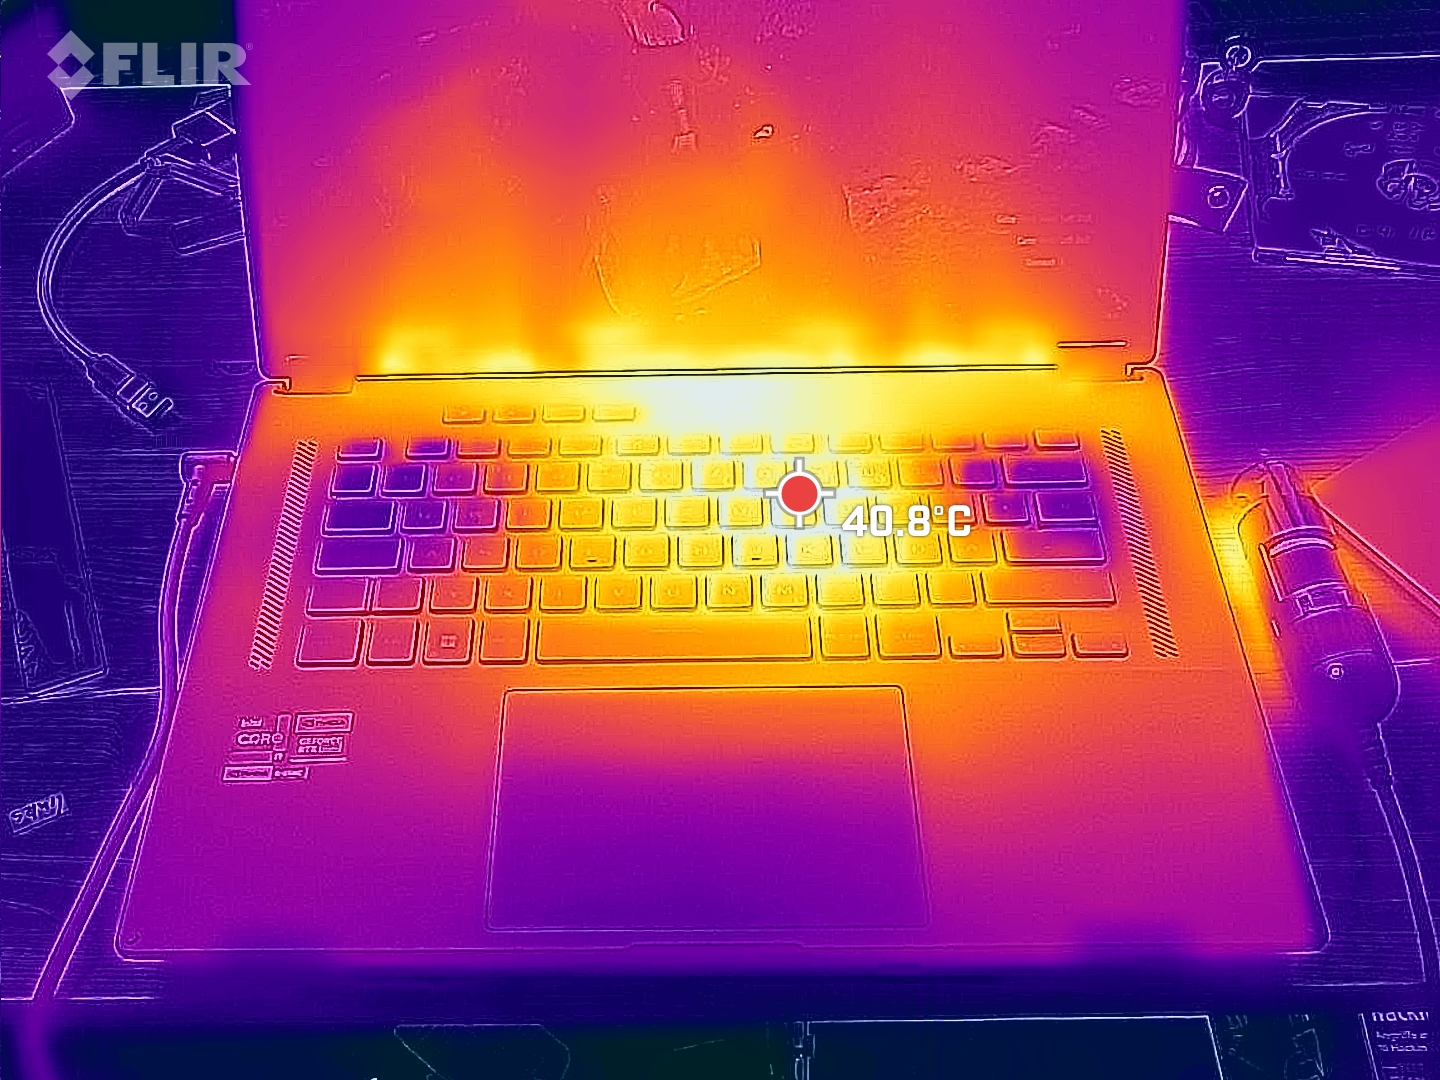
Podczas grania występują gorące punkty o temperaturze około 50°C, które można znaleźć na środku, górnej części urządzenia i z tyłu, przy czym podpórka pod nadgarstki i klawisze WASD pozostają stosunkowo chłodne. Spód laptopa nie nagrzewa się nadmiernie.
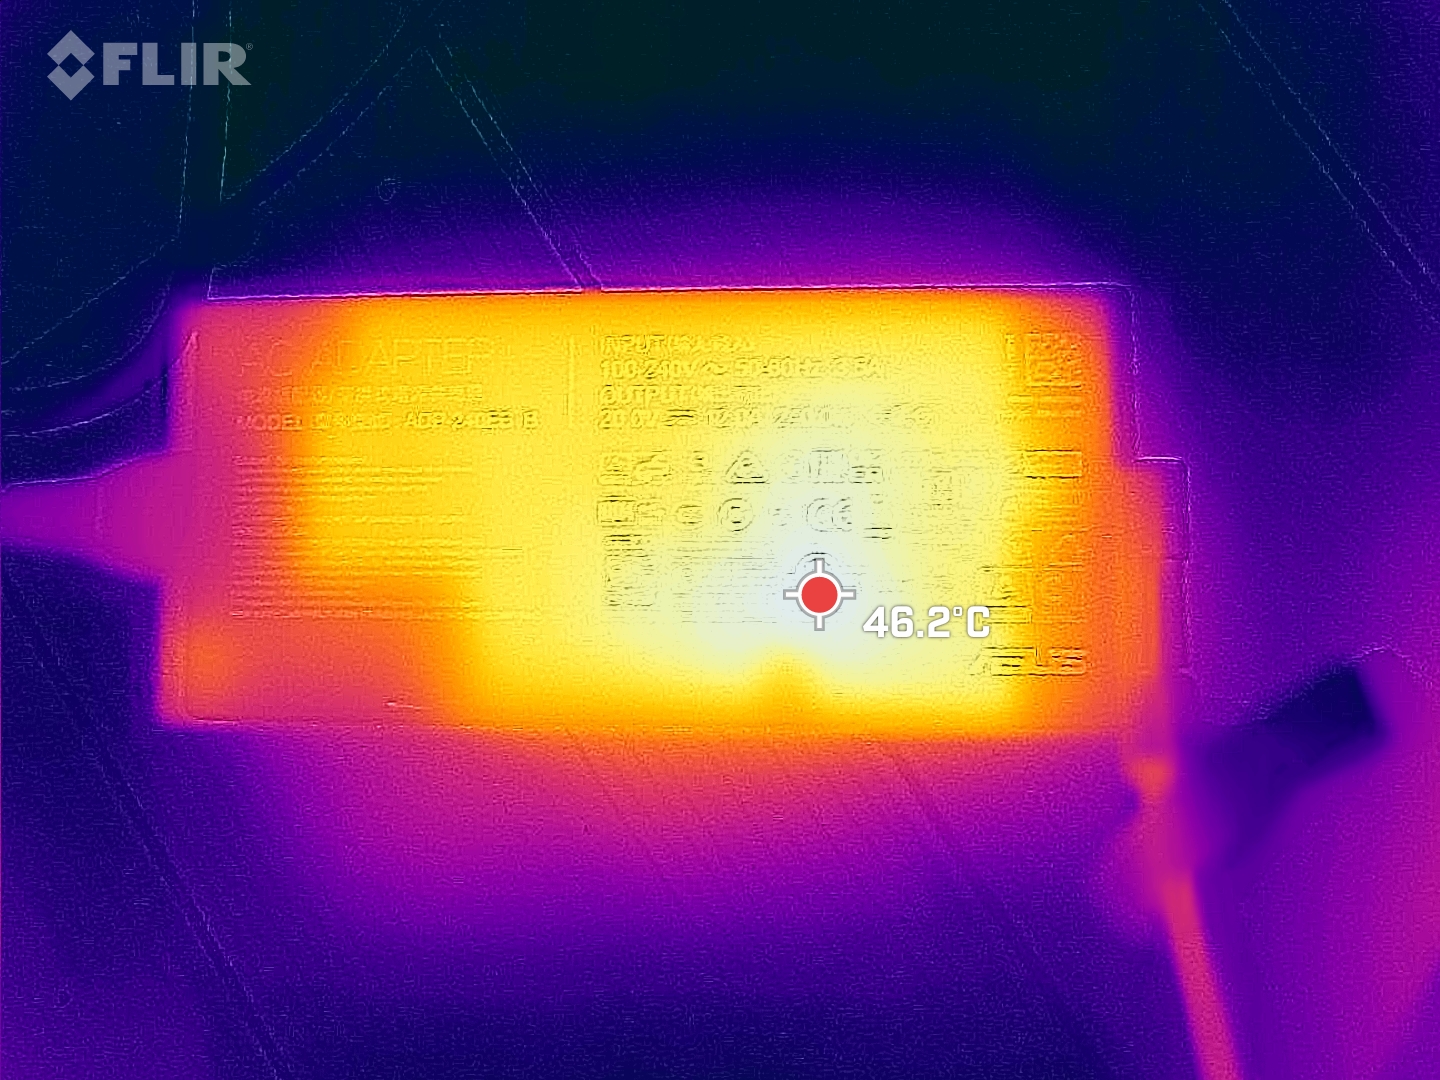
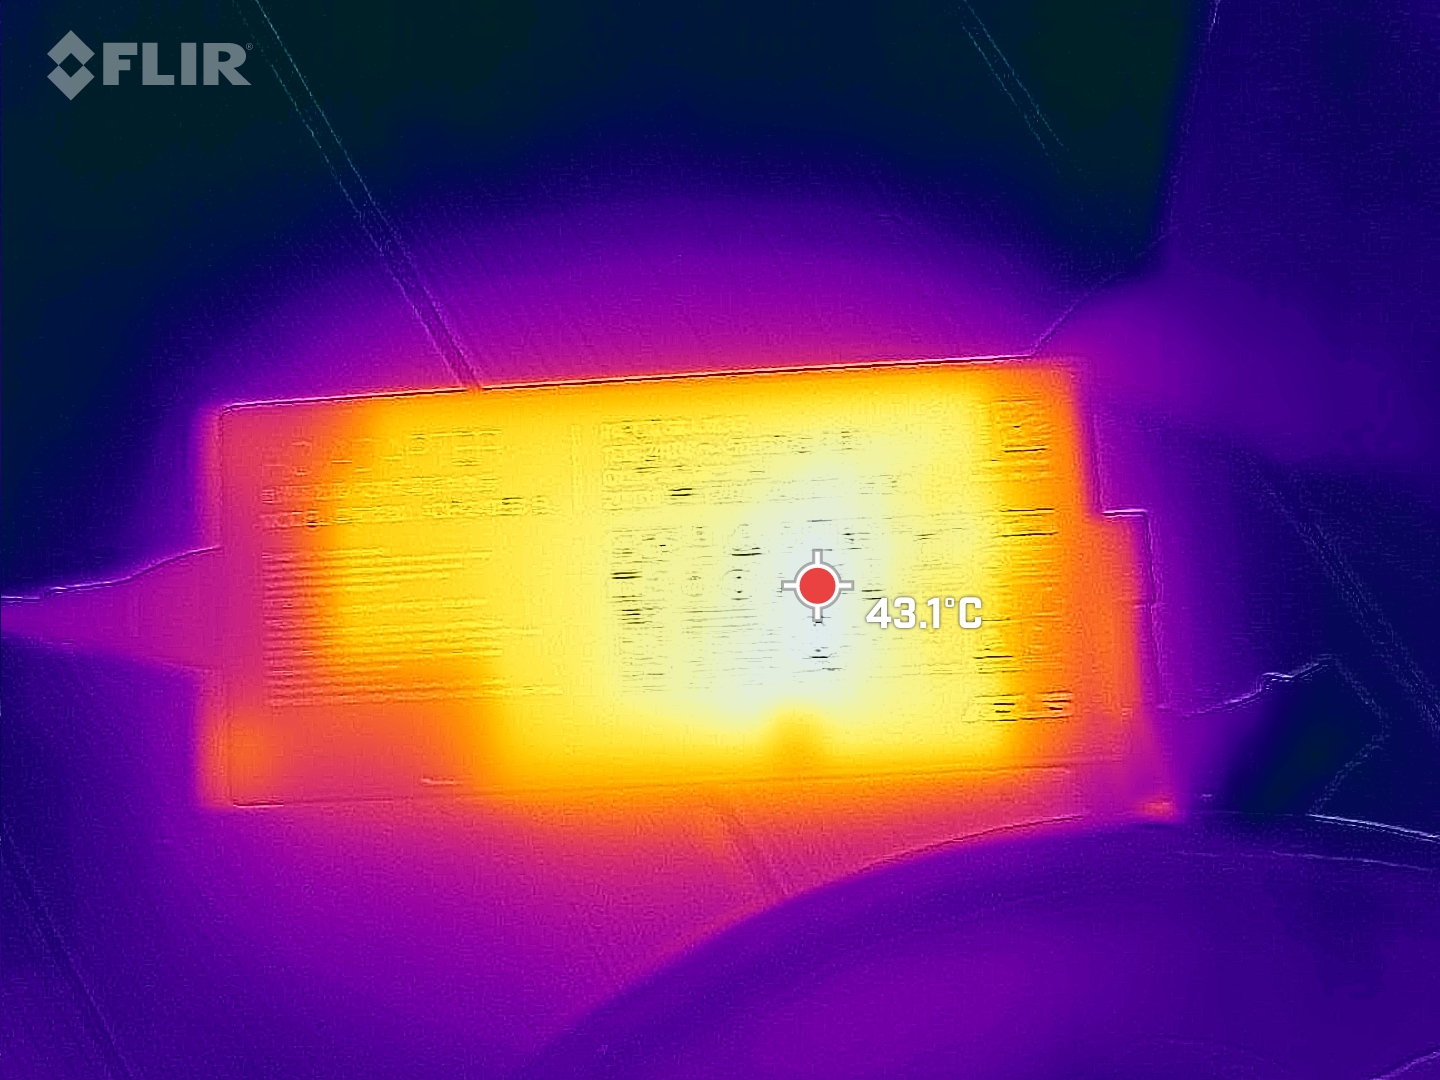
Jednak nawet w trybie bezczynności zasilacz może być bardzo gorący. Wystarczy tylko kilka procesów działających w tle, aby smukły zasilacz rozgrzał się do temperatury 45 °C!
(-) Maksymalna temperatura w górnej części wynosi 46 °C / 115 F, w porównaniu do średniej 40.4 °C / 105 F , począwszy od 21.2 do 68.8 °C dla klasy Gaming.
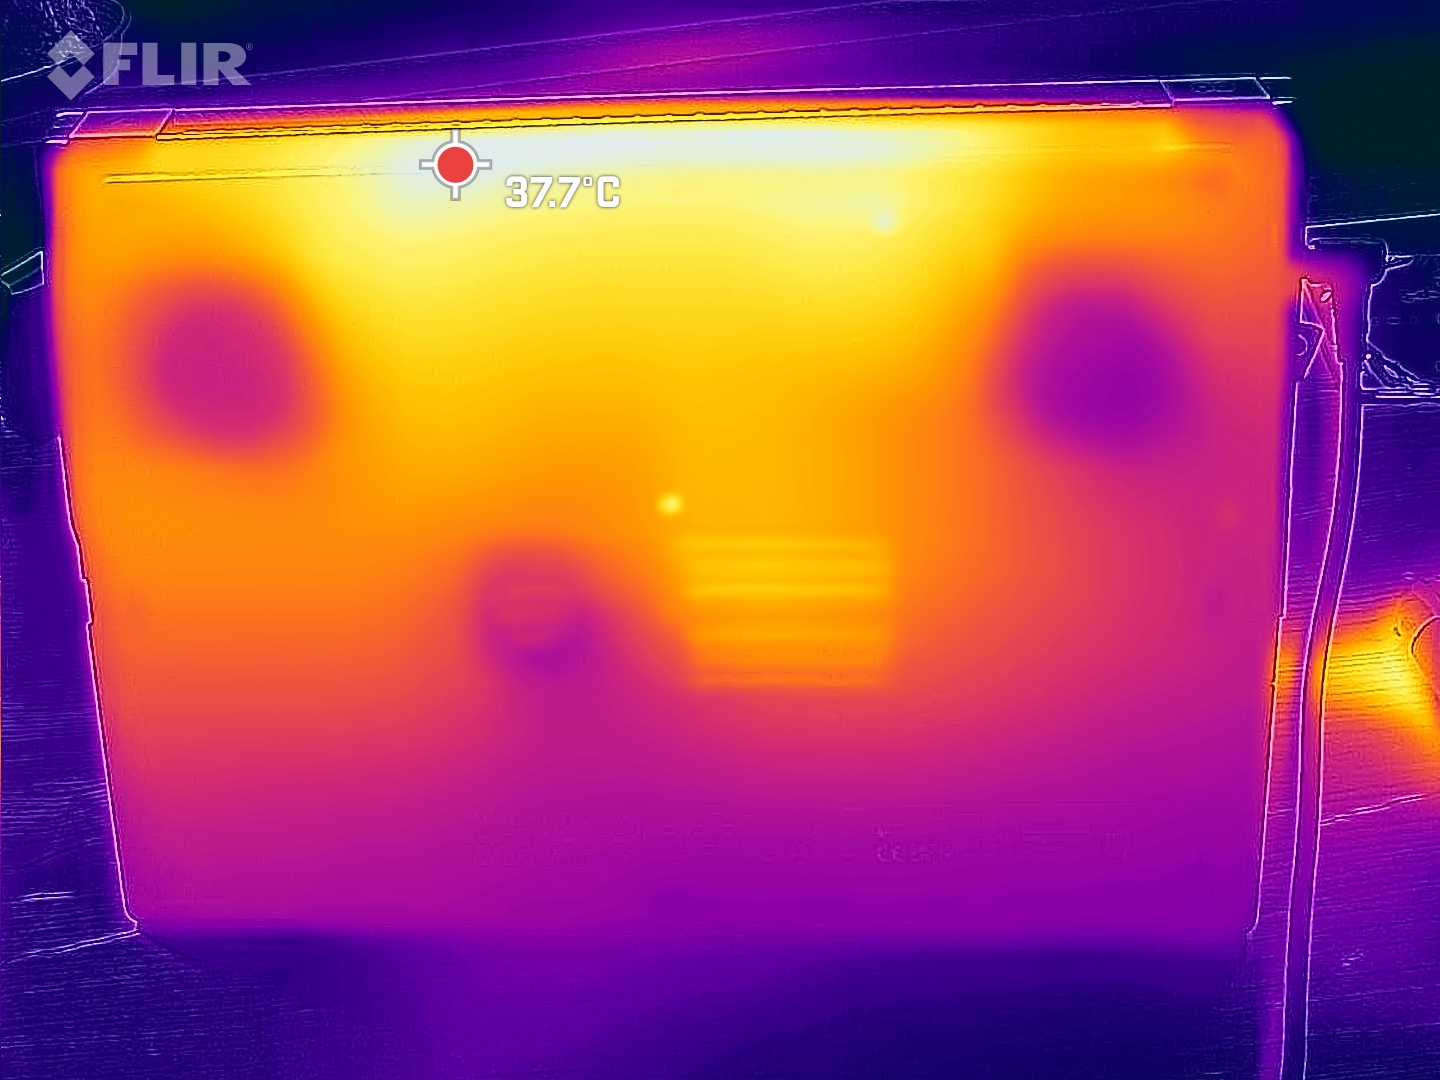
(±) Dno nagrzewa się maksymalnie do 41 °C / 106 F, w porównaniu do średniej 43.2 °C / 110 F
(+) W stanie bezczynności średnia temperatura górnej części wynosi 31.9 °C / 89 F, w porównaniu ze średnią temperaturą urządzenia wynoszącą 33.9 °C / ### class_avg_f### F.
(±) Podczas gry w Wiedźmina 3 średnia temperatura górnej części wynosi 37.4 °C / 99 F, w porównaniu do średniej temperatury urządzenia wynoszącej 33.9 °C / ## #class_avg_f### F.
(+) Podpórki pod nadgarstki i touchpad są chłodniejsze niż temperatura skóry i maksymalnie 31 °C / 87.8 F i dlatego są chłodne w dotyku.
(-) Średnia temperatura obszaru podparcia dłoni w podobnych urządzeniach wynosiła 28.8 °C / 83.8 F (-2.2 °C / -4 F).
| Asus ROG Flow X16 GV601V Intel Core i9-13900H, NVIDIA GeForce RTX 4060 Laptop GPU | Asus ROG Flow X16 GV601RW-M5082W AMD Ryzen 9 6900HS, NVIDIA GeForce RTX 3070 Ti Laptop GPU | Samsung Galaxy Book3 Ultra 16, i9-13900H RTX 4070 Intel Core i9-13900H, NVIDIA GeForce RTX 4070 Laptop GPU | Lenovo Legion Pro 5 16IRX8 Intel Core i7-13700HX, NVIDIA GeForce RTX 4060 Laptop GPU | Lenovo Yoga Pro 7 14IRH G8 Intel Core i7-13700H, NVIDIA GeForce RTX 4050 Laptop GPU | MSI Katana 17 B13VFK Intel Core i7-13620H, NVIDIA GeForce RTX 4060 Laptop GPU | |
|---|---|---|---|---|---|---|
| Heat | -13% | -4% | 0% | 4% | 2% | |
| Maximum Upper Side * (°C) | 46 | 55.1 -20% | 45.9 -0% | 42.8 7% | 41.6 10% | 41.6 10% |
| Maximum Bottom * (°C) | 41 | 50.3 -23% | 50.9 -24% | 50 -22% | 55.7 -36% | 43.1 -5% |
| Idle Upper Side * (°C) | 36 | 35.5 1% | 31.6 12% | 29.6 18% | 25.9 28% | 32 11% |
| Idle Bottom * (°C) | 33 | 36.1 -9% | 34.2 -4% | 34 -3% | 28 15% | 35.8 -8% |
* ... im mniej tym lepiej
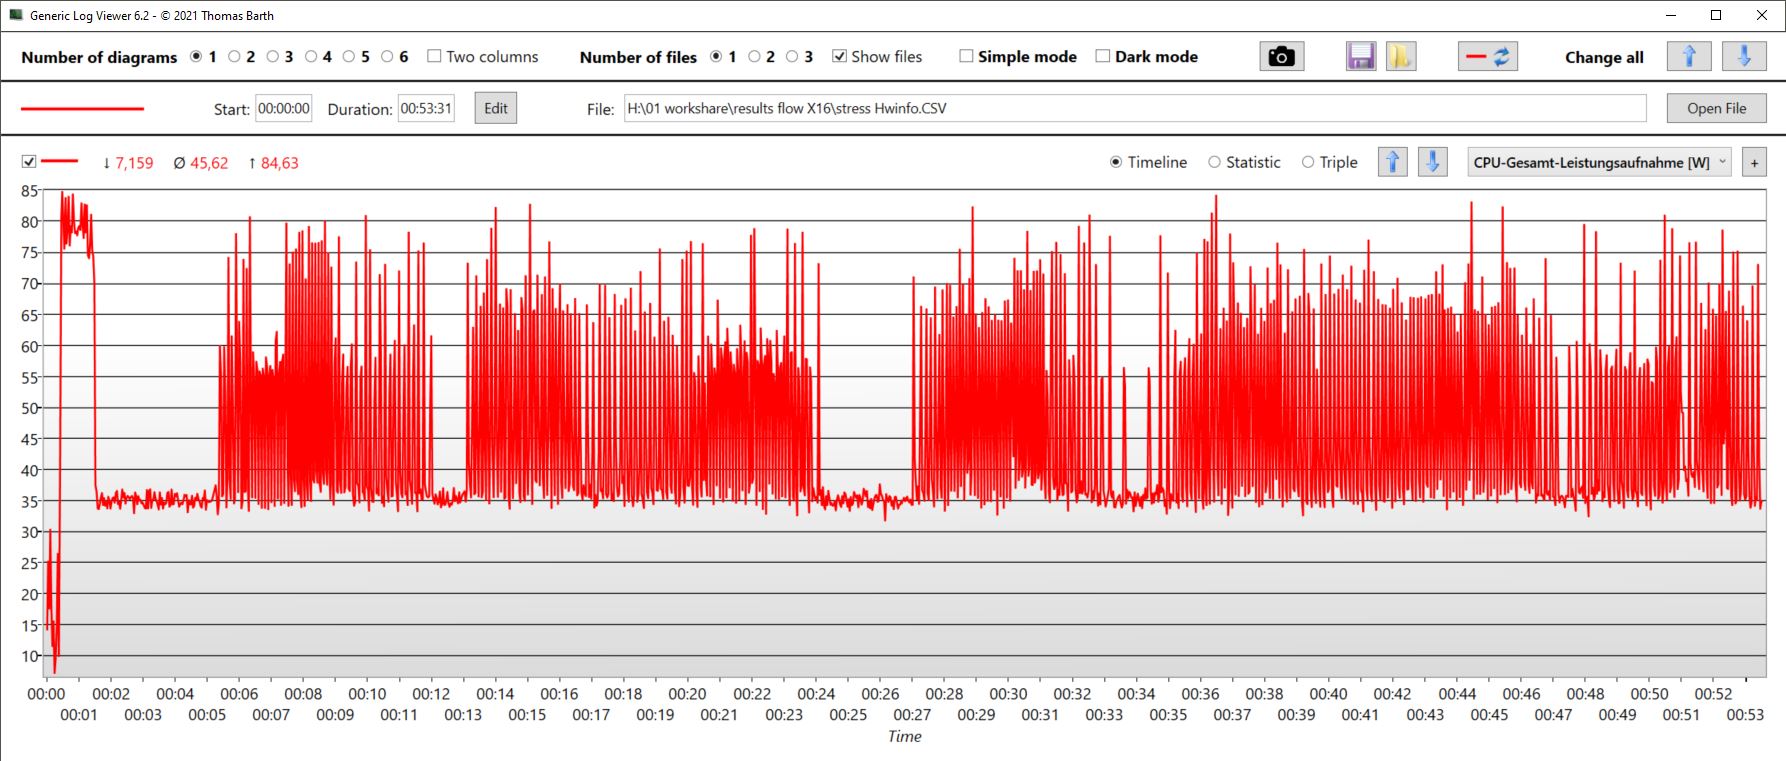
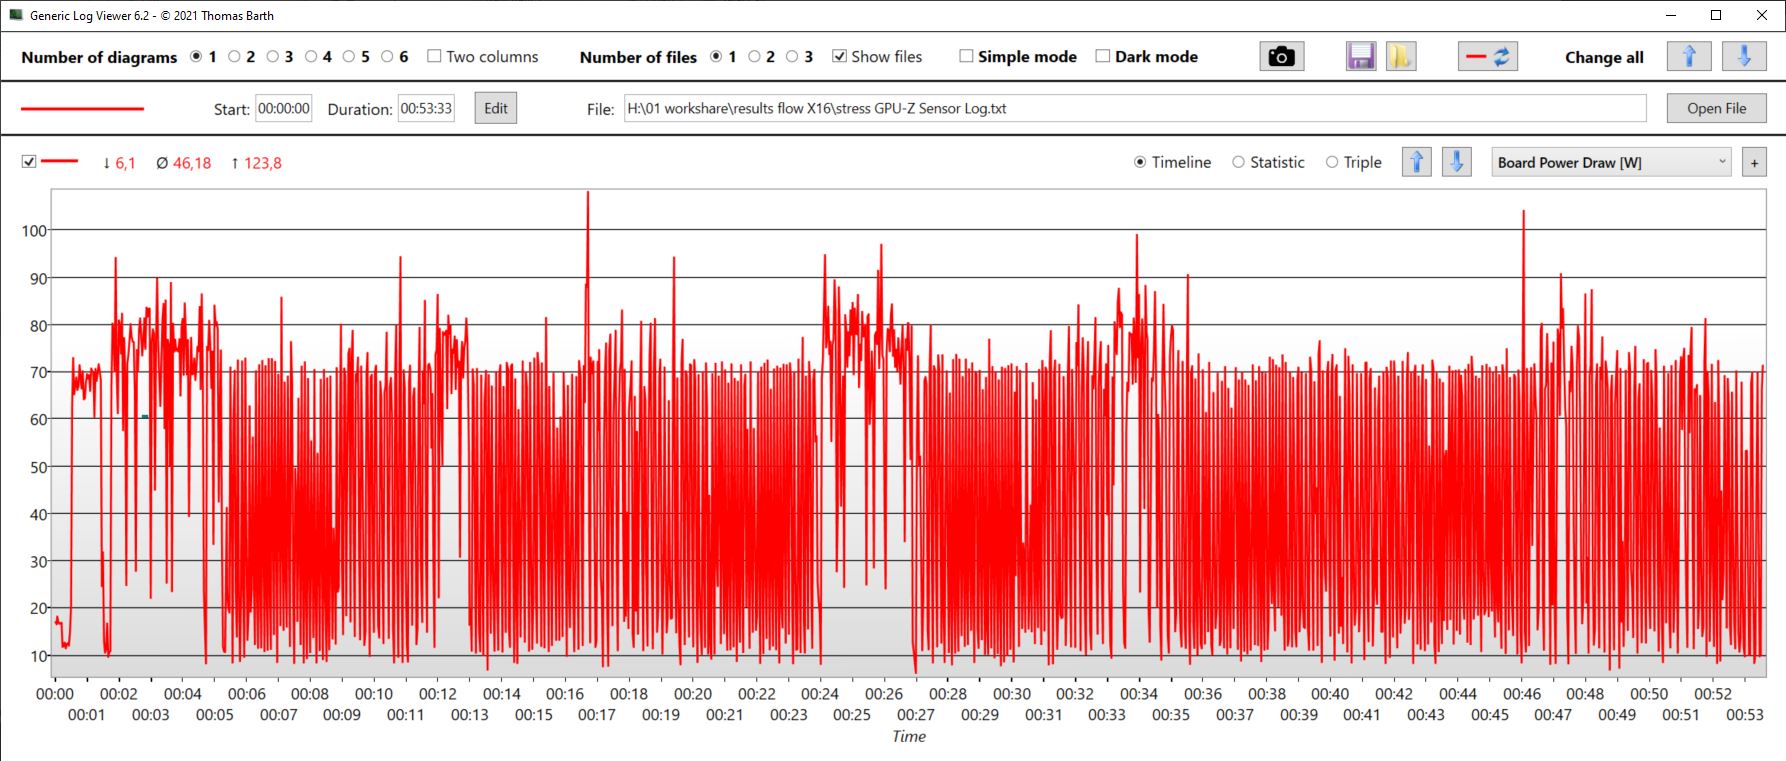
Test warunków skrajnych
Na początku rdzenie zwiększyły taktowanie do prawie 4 GHz, a procesor pobierał 85 watów. Jednak po około minucie temperatura rdzenia osiągnęła 96 °C, a wydajność została znacznie ograniczona. Częstotliwość taktowania rdzenia spadła do 2,4 GHz na kilka minut, a TDP wyniosło tylko 35 watów. Spowodowało to dalszy spadek temperatury. Po kilku minutach prędkość wzrosła i wahała się dość znacznie, osiadając średnio na poziomie około 2,6 GHz. Zmniejszenie TDP do 35 watów na kilka minut było zjawiskiem regularnie występującym, po czym ponownie okresowo się wahało. Ponieważ temperatura spadała podobnie szybko, nie był to jedyny powód takiego zachowania.
W mniejszym stopniu, GPU było podobne. Względnie stabilne fazy były znacznie krótsze, a ogólne wartości ulegały większym wahaniom. Częstotliwość taktowania wielokrotnie oscylowała od 2,4 GHz do 2,4 GHz do zaledwie 500 MHz i niżej, a prędkość zegara pamięci wykazywała podobnie ekstremalne wahania. Średnia temperatura wynosiła 65 °C i wzrosła maksymalnie do 82 °C. Pobór mocy wynosił średnio 46 watów, ale wielokrotnie wzrastał do 90 watów lub ponad 100 watów.
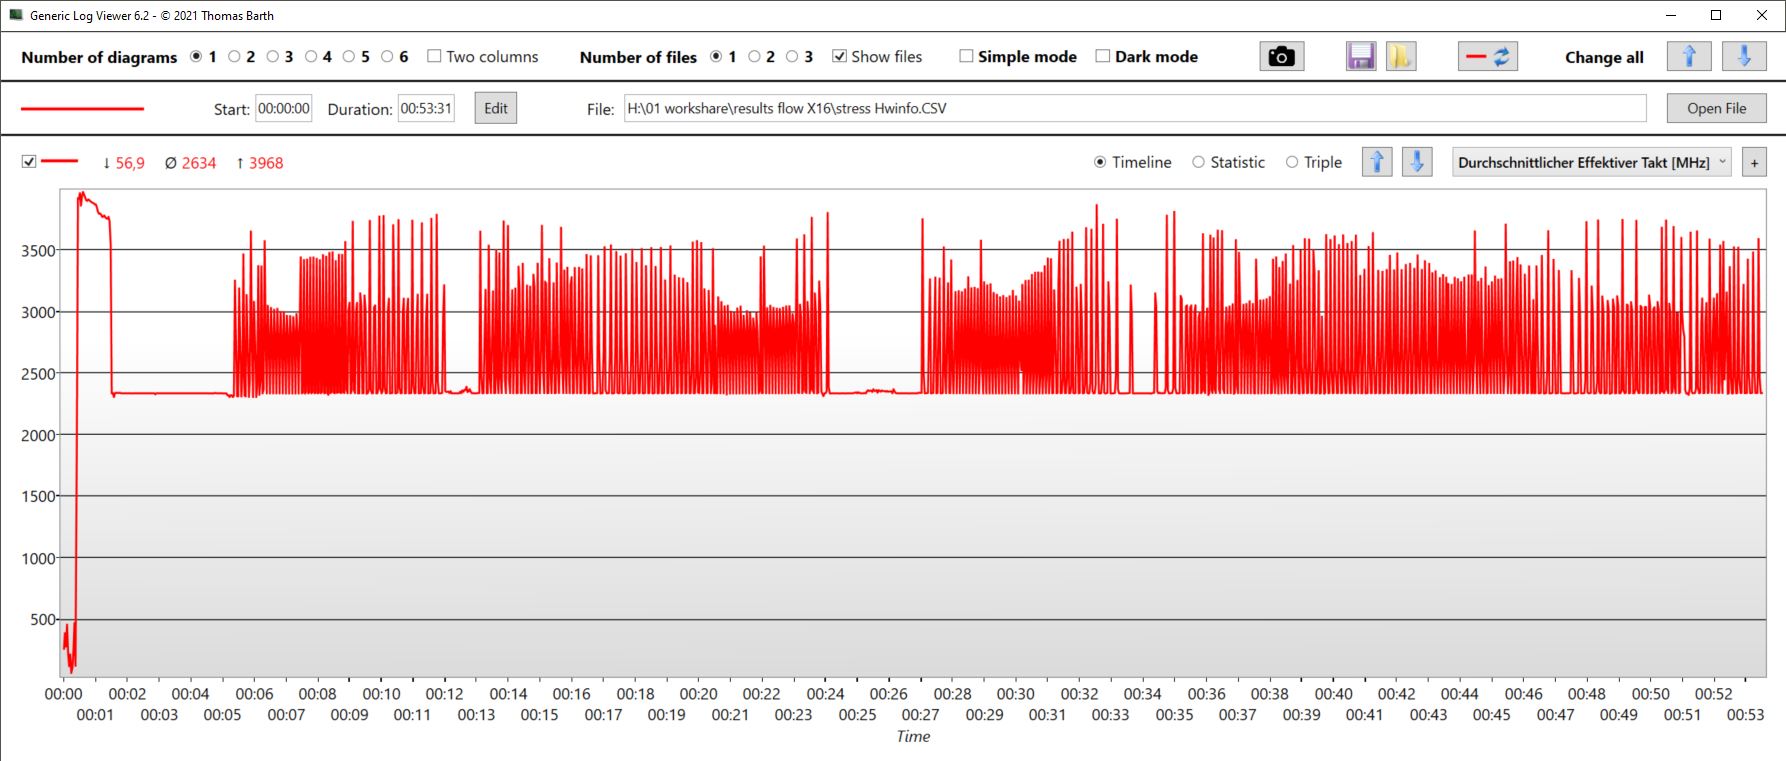
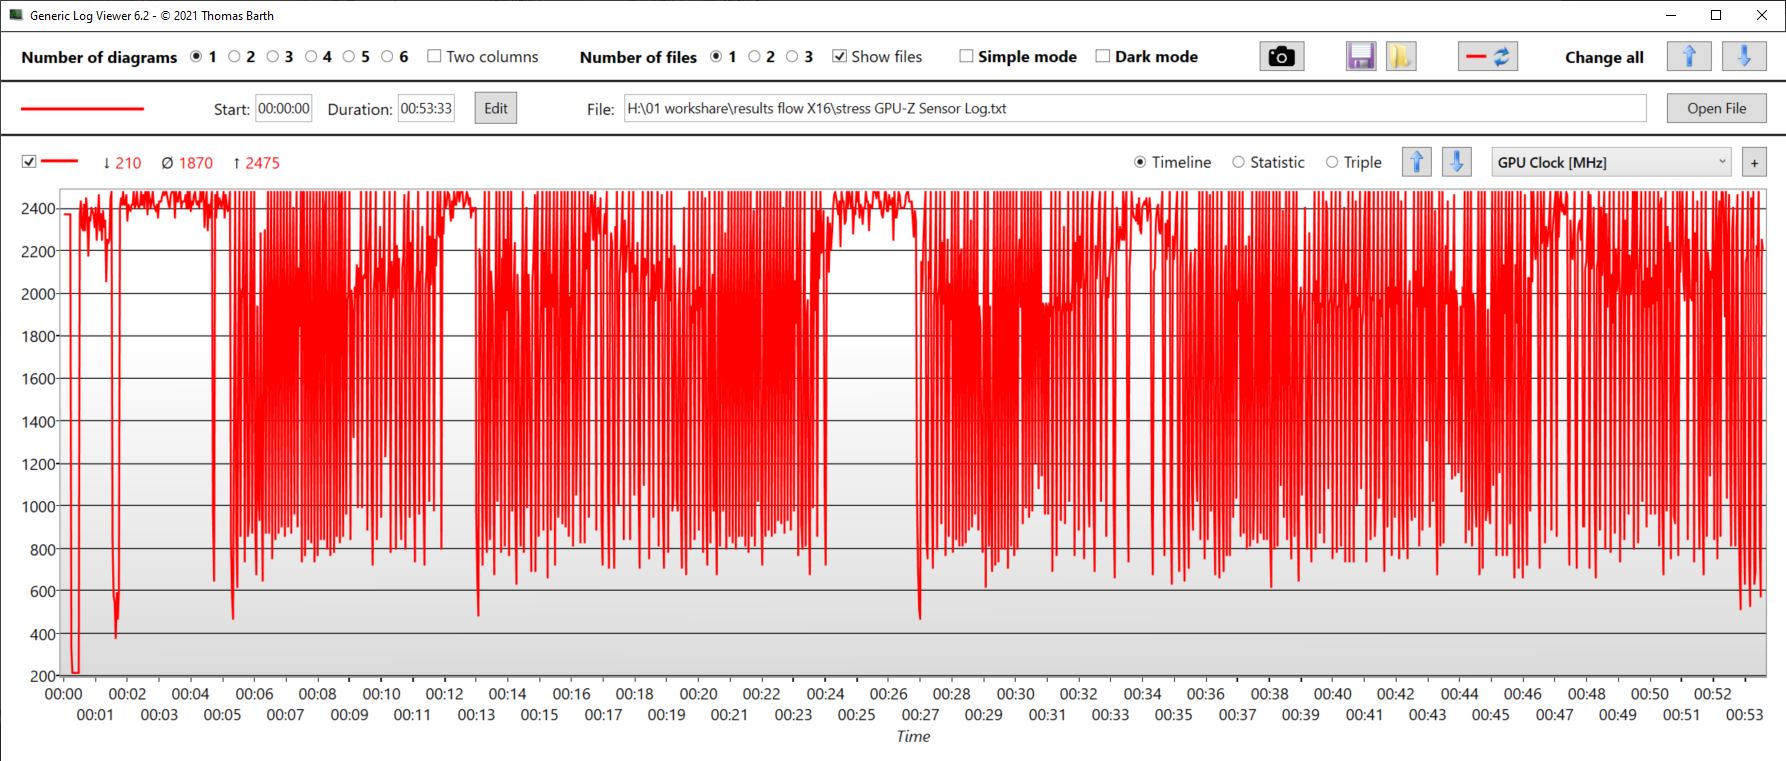
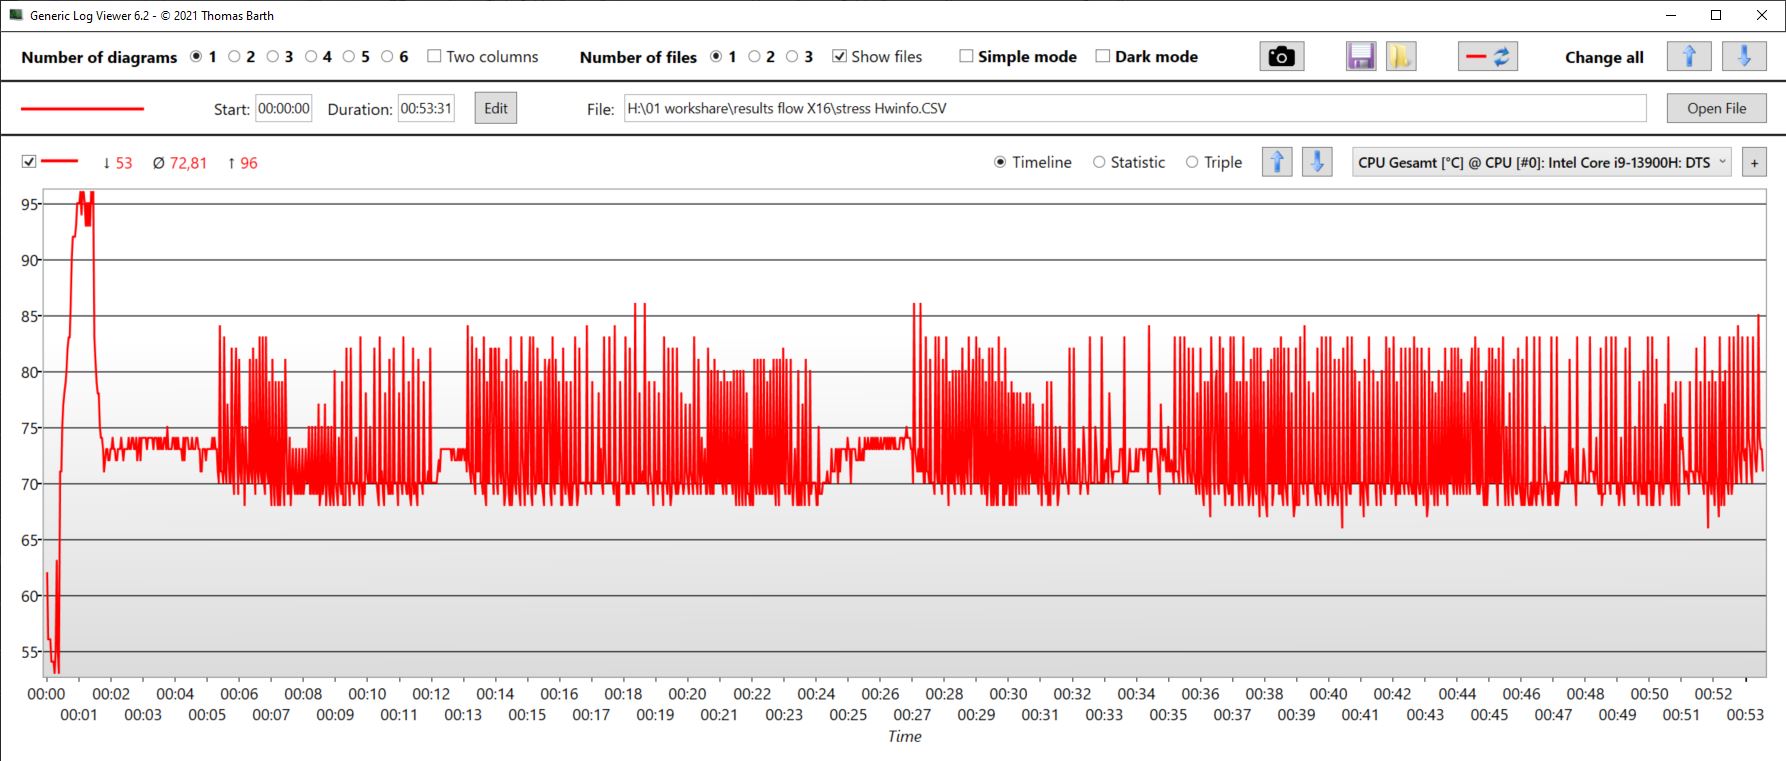
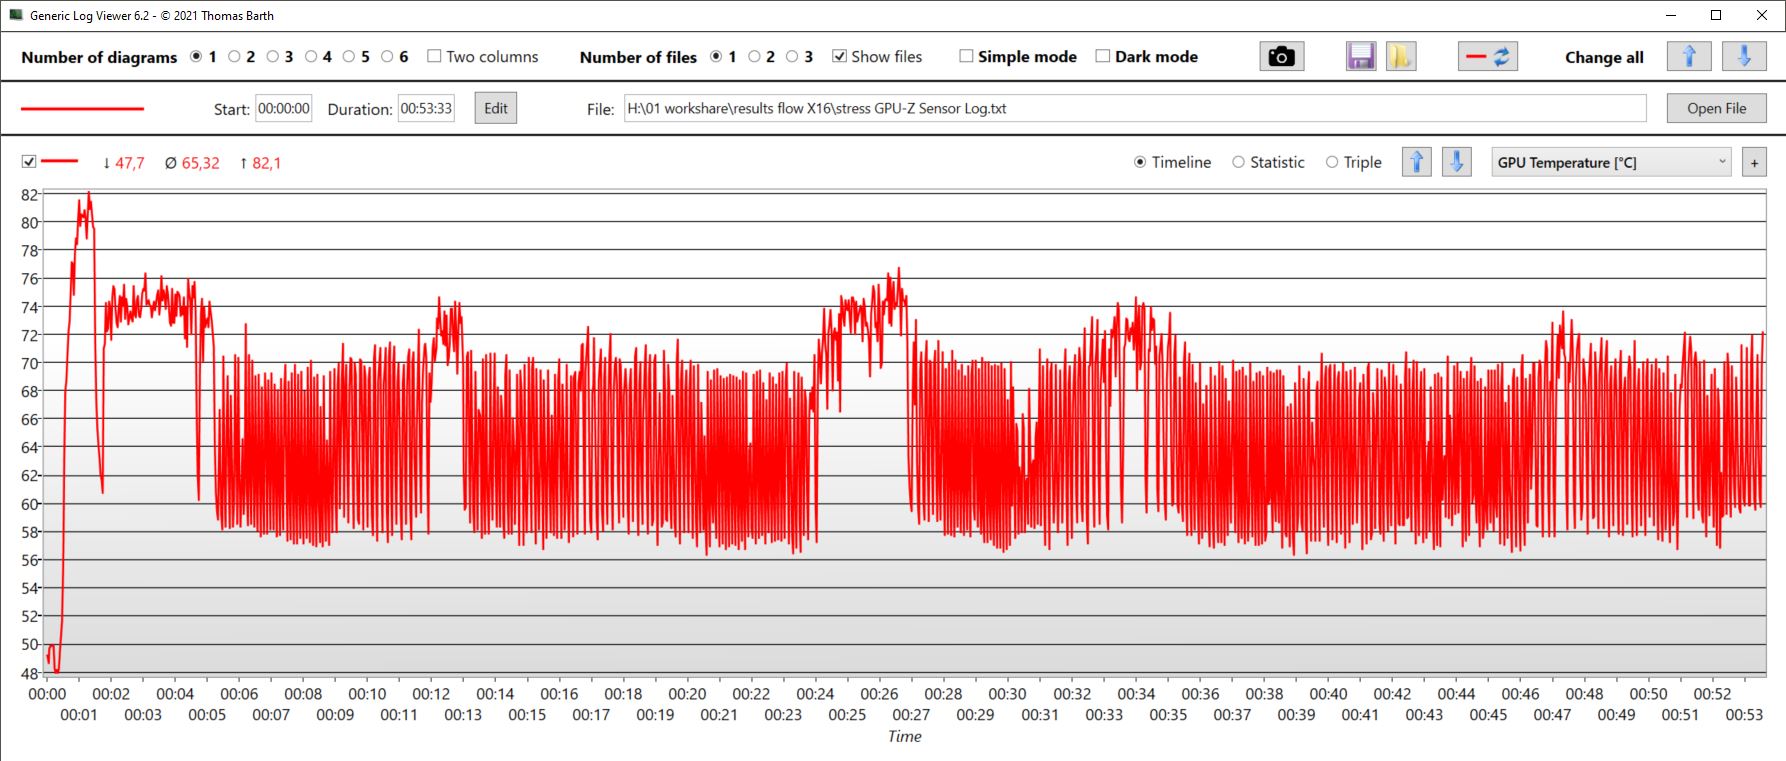
| Taktowanie CPU (GHz) | Taktowanie GPU (MHz) | Średnia temperatura CPU (°C) | Średnia temperatura GPU (°C) | |
| Prime95 + FurMark Stress | 2,6 | 1.870 | 73 | 65 |
| Witcher 3 StressAllerdings könnten die Boxen etwas lauter | 505 | 2.460 | 67,6 | 75 |
Głośniki
Głośniki oferują zrównoważone średnie i wysokie tony, a basy są oczywiście niższe, choć mniej niż w niektórych innych modelach. Głośniki mogłyby jednak brzmieć nieco głośniej.
Gniazdo słuchawkowe 3,5 mm umożliwia podłączenie analogowych urządzeń końcowych.
Asus ROG Flow X16 GV601V analiza dźwięku
(±) | głośność głośnika jest średnia, ale dobra (77.38 dB)
Bas 100 - 315 Hz
(±) | zredukowany bas - średnio 9.6% niższy od mediany
(±) | liniowość basu jest średnia (9.2% delta do poprzedniej częstotliwości)
Średnie 400 - 2000 Hz
(+) | zbalansowane środki średnie - tylko 4.7% od mediany
(±) | liniowość środka jest średnia (7.5% delta do poprzedniej częstotliwości)
Wysokie 2–16 kHz
(+) | zrównoważone maksima - tylko 2.2% od mediany
(+) | wzloty są liniowe (6.1% delta do poprzedniej częstotliwości)
Ogólnie 100 - 16.000 Hz
(+) | ogólny dźwięk jest liniowy (12% różnicy w stosunku do mediany)
W porównaniu do tej samej klasy
» 12% wszystkich testowanych urządzeń w tej klasie było lepszych, 4% podobnych, 84% gorszych
» Najlepszy miał deltę 6%, średnia wynosiła ###średnia###%, najgorsza wynosiła 132%
W porównaniu do wszystkich testowanych urządzeń
» 9% wszystkich testowanych urządzeń było lepszych, 2% podobnych, 88% gorszych
» Najlepszy miał deltę 4%, średnia wynosiła ###średnia###%, najgorsza wynosiła 134%
Lenovo Legion Pro 5 16IRX8 analiza dźwięku
(±) | głośność głośnika jest średnia, ale dobra (72.7 dB)
Bas 100 - 315 Hz
(-) | prawie brak basu - średnio 23.7% niższa od mediany
(±) | liniowość basu jest średnia (10.7% delta do poprzedniej częstotliwości)
Średnie 400 - 2000 Hz
(+) | zbalansowane środki średnie - tylko 3.8% od mediany
(±) | liniowość środka jest średnia (7.1% delta do poprzedniej częstotliwości)
Wysokie 2–16 kHz
(+) | zrównoważone maksima - tylko 3.7% od mediany
(+) | wzloty są liniowe (6.7% delta do poprzedniej częstotliwości)
Ogólnie 100 - 16.000 Hz
(±) | liniowość ogólnego dźwięku jest średnia (21.9% różnicy w stosunku do mediany)
W porównaniu do tej samej klasy
» 79% wszystkich testowanych urządzeń w tej klasie było lepszych, 6% podobnych, 16% gorszych
» Najlepszy miał deltę 6%, średnia wynosiła ###średnia###%, najgorsza wynosiła 132%
W porównaniu do wszystkich testowanych urządzeń
» 63% wszystkich testowanych urządzeń było lepszych, 7% podobnych, 31% gorszych
» Najlepszy miał deltę 4%, średnia wynosiła ###średnia###%, najgorsza wynosiła 134%
Zarządzanie energią - dobre, ale nie świetne
Zarządzanie energią
Podczas bezczynności nasz X16 nie jest tak ekonomiczny jak Galaxy Book3, również ze względu na jasny ekran dotykowy. Mimo to, podczas bezczynności urządzenie jest zupełnie inne w porównaniu do Legion 5. Jednak patrząc na 17-calową Katanę, jasne jest, że Flow X16 mógłby być nieco bardziej energooszczędny w stanie bezczynności.
Podczas grania zużycie energii jest porównywalne doKatana 17z nieco lepszą wydajnością. W tym samym czasieLegion 5pobiera znacznie więcej energii ze ściany. To ostatnie dotyczy również jej poprzednikar, przy czym nowy Asus stał się zauważalnie bardziej wydajny.
| wyłączony / stan wstrzymania | |
| luz | |
| obciążenie |
|
Legenda:
min: | |
| Asus ROG Flow X16 GV601V i9-13900H, GeForce RTX 4060 Laptop GPU, WD PC SN560 SDDPNQE-1T00, IPS, 2560x1600, 16" | Asus ROG Flow X16 GV601RW-M5082W R9 6900HS, GeForce RTX 3070 Ti Laptop GPU, Micron 3400 1TB MTFDKBA1T0TFH, Mini LED, 2560x1600, 16.1" | Samsung Galaxy Book3 Ultra 16, i9-13900H RTX 4070 i9-13900H, GeForce RTX 4070 Laptop GPU, Samsung PM9A1 MZVL21T0HCLR, OLED / AMOLED, 2880x1800, 16" | Lenovo Legion Pro 5 16IRX8 i7-13700HX, GeForce RTX 4060 Laptop GPU, SK hynix PC801 HFS512GEJ9X115N, IPS, 2560x1600, 16" | Lenovo Yoga Pro 7 14IRH G8 i7-13700H, GeForce RTX 4050 Laptop GPU, Samsung PM9A1 MZVL21T0HCLR, IPS, 3072x1920, 14.5" | MSI Katana 17 B13VFK i7-13620H, GeForce RTX 4060 Laptop GPU, Micron 2400 MTFDKBA1T0QFM, IPS LED, 1920x1080, 17.3" | Przeciętny NVIDIA GeForce RTX 4060 Laptop GPU | Średnia w klasie Gaming | |
|---|---|---|---|---|---|---|---|---|
| Power Consumption | -48% | 41% | -63% | 23% | 0% | -5% | -25% | |
| Idle Minimum * (Watt) | 9.6 | 12.2 -27% | 4.3 55% | 24.5 -155% | 7.6 21% | 12.2 -27% | 11.5 ? -20% | 13.2 ? -38% |
| Idle Average * (Watt) | 16 | 25.5 -59% | 4.6 71% | 29.2 -83% | 13.3 17% | 14.9 7% | 16 ? -0% | 18.9 ? -18% |
| Idle Maximum * (Watt) | 16.9 | 29.8 -76% | 11.4 33% | 34.3 -103% | 13.7 19% | 15.8 7% | 20.3 ? -20% | 24.3 ? -44% |
| Load Average * (Watt) | 104 | 183 -76% | 97 7% | 98.7 5% | 88.2 15% | 85.22 18% | 92.9 ? 11% | 108.3 ? -4% |
| Witcher 3 ultra * (Watt) | 142 | 183.6 -29% | 100.9 29% | 178.6 -26% | 94.2 34% | 151.1 -6% | ||
| Load Maximum * (Watt) | 214 | 253 -18% | 107 50% | 249.6 -17% | 143 33% | 212.8 1% | 210 ? 2% | 254 ? -19% |
* ... im mniej tym lepiej
Power consumption Witcher 3 / Stress test
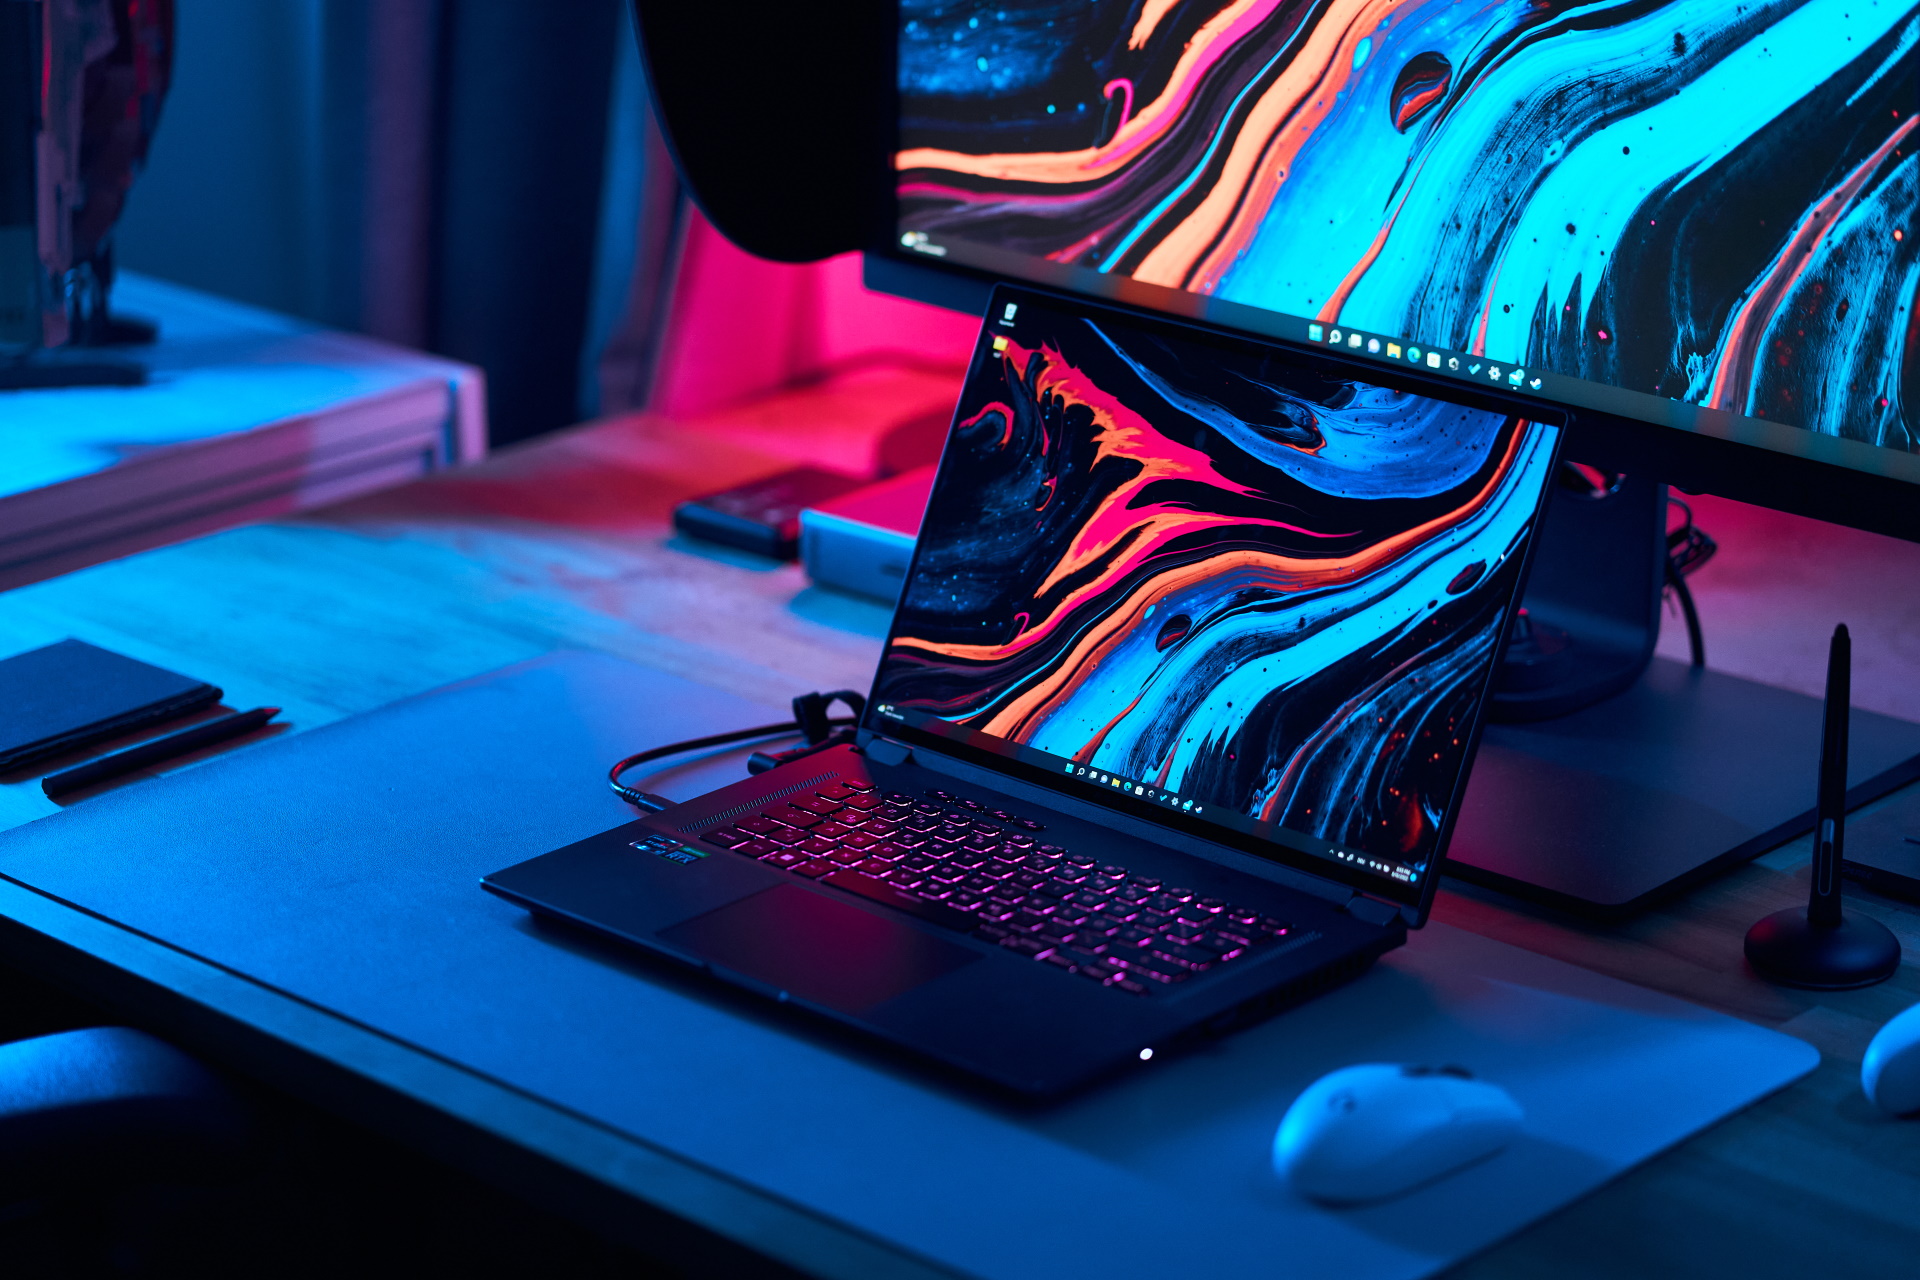
Power consumption with an external monitor
Żywotność baterii
Nasz recenzowany model zachował ten sam rozmiar baterii (90 Wh), co jego poprzednik poprzednik. W ten sposób smukła bateria X16 jest większa niż typ spotykany w normalnych, średniej wielkości maszynach do gier, takich jak Legion 5.
Dlatego też można oczekiwać długiego czasu pracy na baterii. To sprawiło, że nasz test Wi-Fi był tym bardziej zaskakujący. Konkurenci z mniejszymi bateriami, tacy jak Galaxy Book3 (76 Wh) lub Yoga Pro 7 (73 Wh) mają równie dobrą wytrzymałość. Jest to jeden z obszarów, w którym X16 mógłby poprawić zużycie energii w stanie spoczynku.
Niemniej jednak, czas pracy na baterii jest dobry, ale biorąc pod uwagę duży rozmiar baterii, można było oczekiwać lepszych czasów pracy - przynajmniej jeśli chodzi o niewymagające zadania, takie jak przeglądanie Internetu. Ponadto podczas surfowania po Internecie w trybie baterii należy upewnić się, że wybrany jest tryb cichy, a nie wydajność.
| Asus ROG Flow X16 GV601V i9-13900H, GeForce RTX 4060 Laptop GPU, 90 Wh | Asus ROG Flow X16 GV601RW-M5082W R9 6900HS, GeForce RTX 3070 Ti Laptop GPU, 90 Wh | Samsung Galaxy Book3 Ultra 16, i9-13900H RTX 4070 i9-13900H, GeForce RTX 4070 Laptop GPU, 76 Wh | Lenovo Legion Pro 5 16IRX8 i7-13700HX, GeForce RTX 4060 Laptop GPU, 80 Wh | Lenovo Yoga Pro 7 14IRH G8 i7-13700H, GeForce RTX 4050 Laptop GPU, 73 Wh | MSI Katana 17 B13VFK i7-13620H, GeForce RTX 4060 Laptop GPU, 53.5 Wh | Średnia w klasie Gaming | |
|---|---|---|---|---|---|---|---|
| Czasy pracy | -34% | -13% | -55% | 6% | -48% | -7% | |
| H.264 (h) | 8.9 | 9 1% | 12.4 39% | 8.26 ? -7% | |||
| WiFi v1.3 (h) | 7.9 | 5.7 -28% | 8 1% | 3.4 -57% | 9.9 25% | 2.9 -63% | 7.04 ? -11% |
| Load (h) | 1.5 | 0.9 -40% | 0.9 -40% | 0.7 -53% | 0.8 -47% | 1 -33% | 1.47 ? -2% |
| Witcher 3 ultra (h) | 0.9 | ||||||
| Reader / Idle (h) | 6.7 | 8.71 ? |
Za
Przeciw
Werdykt - Wspaniałe, bardzo wszechstronne urządzenie
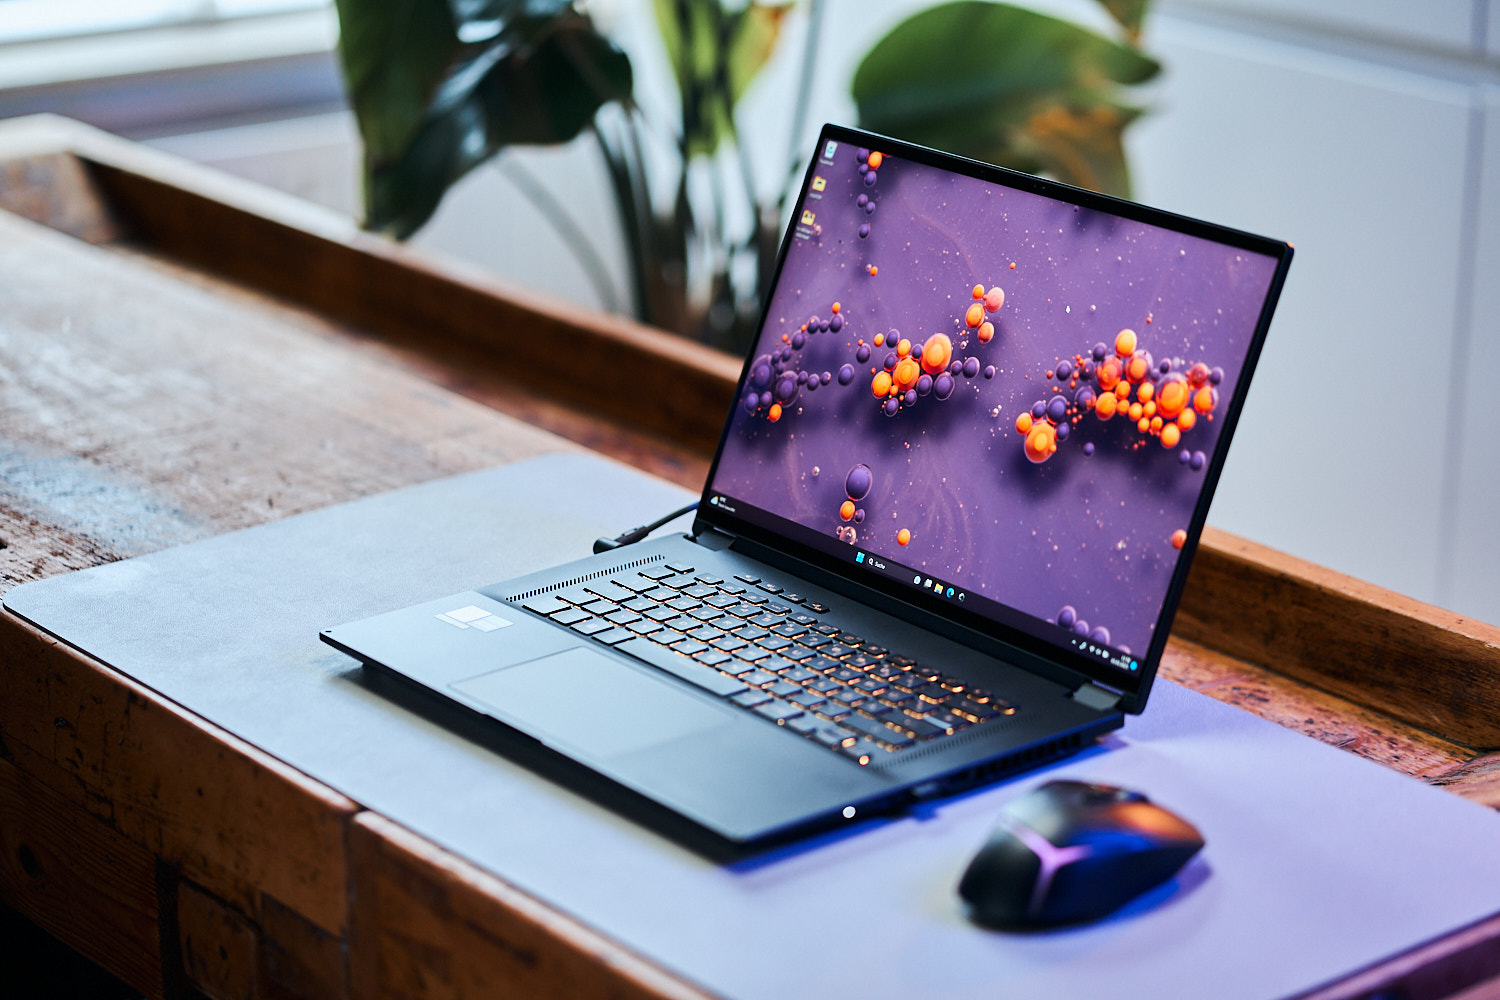
Asus ROG Flow X16 jest przede wszystkim wszechstronny! To cienkie, mobilne urządzenie do pracy, 2 w 1, tablet, potężna stacja robocza, a nawet komputer do gier. Ale coś jeszcze bardziej zaskakującego: Wszystkie te rzeczy robi naprawdę dobrze, nie popełniając przy tym żadnych większych błędów. To nic innego jak leniwy kompromis.
Pomimo kompaktowych wymiarów i funkcjonalności 2 w 1, sprzęt nie jest dławiony i może pochwalić się, przynajmniej w trybie turbo, ponadprzeciętną wydajnością. Chociaż w tym miejscu robi się trochę głośno, nie jest to głośniejsze niż konkurencja skoncentrowana wyłącznie na grach. Jednak nawet po zakończeniu okresu dużego obciążenia wentylatory nadal działają przez dłuższy czas.
Zmieniamy kategorię produktu na "Gaming", ponieważ wynik tutaj jest o około 2,4 punktu procentowego wyższy niż w kategorii "Convertible".
Asus ROG Flow X16 to niezwykle wszechstronna i wydajna gamingowa stacja robocza 2 w 1 z dobrym ekranem dotykowym.
Jak dotąd, alternatywy tego rodzaju są nieliczne. Obecnie sam Asus wydaje się być bardzo chętny do eksperymentowania. Potencjalni nabywcy mogą przyjrzeć się urządzeniu, o którym wspomnieliśmy na początku artykułu, czyli tabletowi do gier Asus ROG Flow Z13. TheSamsung Galaxy Book3 Ultra 16(89%) jest podobnie dobry, ale nieco powolny pomimo mocniejszego GPU. Słabsza specyfikacjaLenovo Yoga Pro 7 14 G8(90%) jest również wart rozważenia.
Cena i dostępność
Obecnie nasza konfiguracja Flow X16 z RTX 4060 jest niedostępna na Amazon lub BestBuy. Jednak w tym drugim sklepie model RTX 4070 można nabyć za 2699,99 USD.
Asus ROG Flow X16 GV601V
- 08/06/2023 v7 (old)
Christian Hintze
Przezroczystość
Wyboru urządzeń do recenzji dokonuje nasza redakcja. Próbka testowa została udostępniona autorowi jako pożyczka od producenta lub sprzedawcy detalicznego na potrzeby tej recenzji. Pożyczkodawca nie miał wpływu na tę recenzję, producent nie otrzymał też kopii tej recenzji przed publikacją. Nie było obowiązku publikowania tej recenzji. Jako niezależna firma medialna, Notebookcheck nie podlega władzy producentów, sprzedawców detalicznych ani wydawców.
Tak testuje Notebookcheck
Każdego roku Notebookcheck niezależnie sprawdza setki laptopów i smartfonów, stosując standardowe procedury, aby zapewnić porównywalność wszystkich wyników. Od około 20 lat stale rozwijamy nasze metody badawcze, ustanawiając przy tym standardy branżowe. W naszych laboratoriach testowych doświadczeni technicy i redaktorzy korzystają z wysokiej jakości sprzętu pomiarowego. Testy te obejmują wieloetapowy proces walidacji. Nasz kompleksowy system ocen opiera się na setkach uzasadnionych pomiarów i benchmarków, co pozwala zachować obiektywizm.Price comparison

