
Recenzja Lenovo Yoga 920-13IKB
Yoga 920-13 znacznie różni się od starszej Yogi 910-13. Nie chodzi tylko o zmieniony procesor, choć czterordzeniowy Kaby Lake Refresh robi dużą różnicę.
Intel Core i7-8550U, UHD Graphics 620, 13.9", 1.4 kg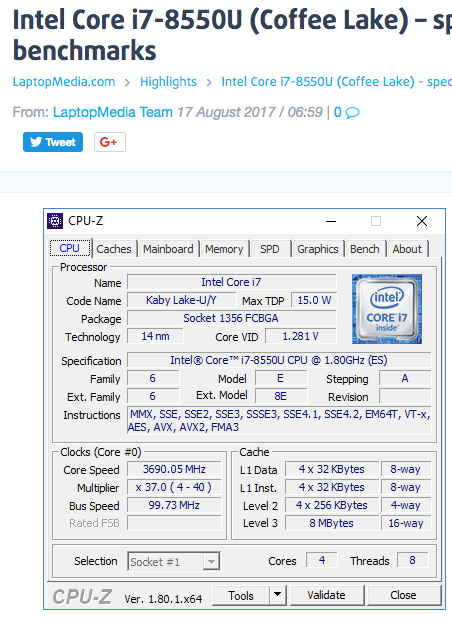
Core i7-8550U to jednostka z serii Kaby Lake Refresh (obok i5-8250U jedna z dwóch najbardziej popularnych). Ten procesor posiada 4 rdzenie i jest 8-wątkowy. Mimo to ma niskie TDP (15 W, tyle co w 2-rdzeniowych Kaby Lake). W testach wielowątkowych jest o około 25% słabszy od i7-7700HQ. Wskutek niskiego TDP nie jest jednak w stanie utrzymywać takiej wydajności przez dłuższy czas. Procesor ten ma teoretycznie sporo wyższe taktowanie maksymalne, niż podobny i5-8250U, i ma 8 a nie 6 MB pamięci L3C. W praktyce jego wydajność wielowątkowa jest niewiele lepsza a wydajność jednowątkowa jest o 15% lepsza od tej reprezentowanej przez i5-8250U.
| Nazwa robocza | Kaby Lake Refresh | ||||||||||||||||||||||||
| Seria | Intel Kaby Lake Refresh | ||||||||||||||||||||||||
Rodzina: Kaby Lake Refresh Kaby Lake Refresh
| |||||||||||||||||||||||||
| Taktowanie | 1800 - 4000 MHz | ||||||||||||||||||||||||
| Pamięć 1. poziomu | 256 KB | ||||||||||||||||||||||||
| Pamięć 2. poziomu | 1 MB | ||||||||||||||||||||||||
| Pamięć 3. poziomu | 8 MB | ||||||||||||||||||||||||
| Liczba rdzeni / wątków | 4 / 8 | ||||||||||||||||||||||||
| TDP (Thermal Design Power) | 15 W | ||||||||||||||||||||||||
| Technologia wytwarzania | 14 nm | ||||||||||||||||||||||||
| Gniazdo | BGA1356 | ||||||||||||||||||||||||
| Cechy | kontroler pamięci Dual-Channel DDR4, HyperThreading, AVX, AVX2, Quick Sync, Virtualization, AES-NI | ||||||||||||||||||||||||
| GPU | Intel UHD Graphics 620 (300 - 1150 MHz) | ||||||||||||||||||||||||
| 64-bity | obsługa 64-bitów | ||||||||||||||||||||||||
| Architecture | x86 | ||||||||||||||||||||||||
| Najniższa cena | $409 U.S. | ||||||||||||||||||||||||
| Data premiery | 21/08/2017 | ||||||||||||||||||||||||
| Model | CPU | GPU | RAM | Wartość |
|---|---|---|---|---|
Kuu LeBook 12.6 Core i7-8550U  | i5-8550U 18 W / 15 W | UHD Graphics 620 1067 / 1150 MHz | 8 GB | 2914 |
| Model | CPU | GPU | RAM | Wartość |
|---|---|---|---|---|
| Kuu LeBook 12.6 Core i7-8550U | i5-8550U 18 W / 15 W | UHD Graphics 620 1067 / 1150 MHz | 8 GB | 1021 |
| Model | CPU | GPU | RAM | Wartość |
|---|---|---|---|---|
| Dynabook Portege A30-E-174 | i5-8550U | UHD Graphics 620 1150 / 1200 MHz | 16 GB | 383 |
| Kuu LeBook 12.6 Core i7-8550U | i5-8550U 18 W / 15 W | UHD Graphics 620 1067 / 1150 MHz | 8 GB | 394 |
| CPU TDP ? | TDP 15 W |
|---|---|
| 97% | 100% |
| Model | CPU | GPU | RAM | Wartość |
|---|---|---|---|---|
| Kuu LeBook 12.6 Core i7-8550U | i5-8550U 18 W / 15 W | UHD Graphics 620 1067 / 1150 MHz | 8 GB | 1118 |
| Dynabook Portege A30-E-174 | i5-8550U | UHD Graphics 620 1150 / 1200 MHz | 16 GB | 1138 |
| CPU TDP ? | TDP 15 W |
|---|---|
| 100% | 98% |
| Model | CPU | GPU | RAM | Wartość |
|---|---|---|---|---|
| Asus ZenBook S UX391U Quiet Mode on | i5-8550U | UHD Graphics 620 1150 / 1066 MHz | 8 GB | 301 |
| Lenovo Yoga 720-13IKB | i5-8550U | UHD Graphics 620 1150 MHz | 8 GB | 407 |
| Toshiba Portege X30T-E-109 | i5-8550U | UHD Graphics 620 | 16 GB | 432 |
| Kuu LeBook 12.6 Core i7-8550U | i5-8550U 18 W / 15 W | UHD Graphics 620 1067 / 1150 MHz | 8 GB | 478 |
| HP Spectre x360 13t-ae000 | i5-8550U | UHD Graphics 620 1150 / 1067 MHz | 16 GB | 489 |
| Dynabook Portege A30-E-174 | i5-8550U | UHD Graphics 620 1150 / 1200 MHz | 16 GB | 494 |
| Acer TravelMate X3410-M-866T | i5-8550U | UHD Graphics 620 400 / 665 MHz 1 GB | 16 GB | 498 |
| Intel Reference i7-8550U 15W | i5-8550U | UHD Graphics 620 | 501 | |
| HP Spectre x360 13-ae048ng | i5-8550U | UHD Graphics 620 400 / 1064 MHz | 16 GB | 501 |
| MSI Prestige PS42 8RB-059 | i5-8550U | GeForce MX150 1468 / 6008 MHz 2 GB | 16 GB | 503 |
| LG Gram 15Z980-B.AA78B | i5-8550U | UHD Graphics 620 | 16 GB | 506 |
| Lenovo ThinkPad X380 Yoga 20LJS02W00 | i5-8550U | UHD Graphics 620 1150 MHz | 16 GB | 509 |
| Acer Switch 7 BE SW713-51GNP | i5-8550U | GeForce MX150 936 / 5010 MHz 2 GB | 16 GB | 512 |
| Acer TravelMate 2410-G2-MG-82E6 | i5-8550U | GeForce MX130 2 GB | 8 GB | 514 |
| Schenker Slim 15 L17 | i5-8550U | UHD Graphics 620 | 16 GB | 515 |
| HP Spectre 13-af033ng | i5-8550U | UHD Graphics 620 400 / 1064 MHz | 8 GB | 515 |
| Lenovo IdeaPad 530s-14IKB | i5-8550U | GeForce MX150 1532 / 6000 MHz 2 GB | 8 GB | 518 |
| HP Spectre x360 15t-bl100 | i5-8550U | GeForce MX150 1468 / 1502 MHz | 16 GB | 519 |
| Razer Blade Stealth QHD i7-8550U | i5-8550U @4 GHz | UHD Graphics 620 300 / 350 MHz 1 GB | 16 GB | @4 GHz 521 |
| Lenovo ThinkPad E580-20KS001RGE | i5-8550U | Radeon RX 550 (Laptop) 902 / 1500 MHz 2 GB | 8 GB | 521 |
| HP Elite x2 1013 G3 LTE i7 | i5-8550U | UHD Graphics 620 | 16 GB | 523 |
| Lenovo Miix 520-12IKB 20M3000LGE Cool Mode On | i5-8550U | UHD Graphics 620 1150 MHz | 16 GB | 525 |
| i5-8550U | 526 | |||
| HP Pavilion 14-ce0002ng | i5-8550U | GeForce MX150 2 GB | 8 GB | 527 |
| Acer Nitro 5 Spin NP515-51-86CX | i5-8550U | GeForce GTX 1050 Mobile 1354 / 1752 MHz 4 GB | 8 GB | 529 |
| Samsung Notebook 9 NP930QAA | i5-8550U | UHD Graphics 620 | 8 GB | 530 |
| HP ZBook 14u G5-2ZB99EA | i5-8550U | Radeon Pro WX 3100 1046 / 6000 MHz 2 GB | 8 GB | 531 |
| HP Envy 13-ah0003ng | i5-8550U | GeForce MX150 1038 / 1253 MHz 2 GB | 16 GB | 531 |
| Lenovo Miix 520-12IKB 20M3000LGE Cool Mode Off | i5-8550U | UHD Graphics 620 1150 MHz | 16 GB | 532 |
| Huawei MateBook X Pro, i7 | i5-8550U | GeForce MX150 | 8 GB | 537 |
| Getac S410 | i5-8550U | UHD Graphics 620 300 / 1200 MHz | 32 GB | 539 |
| Acer TravelMate X3410-M-50DD | i5-8550U | GeForce MX130 1189 / 1253 MHz 2 GB | 16 GB | 540 |
| Lenovo IdeaPad Flex-1570 81CA000RUS | i5-8550U | GeForce MX130 1108 / 5010 MHz 2 GB | 16 GB | 541 |
| HP Spectre x360 15-ch011nr | i5-8550U | GeForce MX150 1469 / 1502 MHz 2 GB | 16 GB | 542 |
| Acer Swift 3 Pre-Sample Intel | i5-8550U | UHD Graphics 620 | 546 | |
| Tuxedo Book BU1307 | i5-8550U | UHD Graphics 620 | 0 GB | 548 |
| Acer Swift 3 SF314-52G-89SL | i5-8550U | GeForce MX150 1797 / 1502 MHz 2 GB | 8 GB | 550 |
| Lenovo IdeaPad 330-17IKB 81DM | i5-8550U | GeForce MX150 1468 / 6008 MHz 2 GB | 16 GB | 551 |
| HP ZBook 15u G5 2ZC05EA | i5-8550U | Radeon Pro WX 3100 1046 / 1500 MHz 2 GB | 8 GB | 552 |
| Tuxedo InfinityBook Pro 13 2017 | i5-8550U | UHD Graphics 620 | 32 GB | 553 |
| HP EliteBook 840 G5-3JX61EA | i5-8550U | UHD Graphics 620 1150 MHz | 32 GB | 554 |
| Xiaomi Mi Notebook Pro i7 | i5-8550U | GeForce MX150 1341 / 1253 MHz 2 GB | 16 GB | 558 |
| Acer Spin 5 SP515-51GN-80A3 | i5-8550U | GeForce GTX 1050 Mobile 1493 / 7000 MHz 4 GB | 8 GB | 558 |
| Samsung Notebook 9 NP900X5T-X01US | i5-8550U | GeForce MX150 1468 / 6008 MHz 2 GB | 16 GB | 564 |
| Dell Inspiron 15 7570 | i5-8550U | GeForce 940MX 1242 / 4000 MHz 4 GB | 8 GB | 565 |
| HP EliteBook 830 G5-3JX74EA | i5-8550U | UHD Graphics 620 | 32 GB | 566 |
| Schenker Slim 14 M18 | i5-8550U | UHD Graphics 620 | 16 GB | 566 |
| Lenovo Yoga 920-13IKB-80Y7 | i5-8550U | UHD Graphics 620 400 MHz | 7.9 GB | 576 |
| Acer Aspire 5 A517-51G-80L | i5-8550U | GeForce MX150 1532 / 6000 MHz 2 GB | 8 GB | 585 |
| Dell Latitude 15 3590-K8JP | i5-8550U | Radeon 530 1024 / 1125 MHz 2 GB | 8 GB | 588 |
| Asus ZenBook S UX391U Quiet Mode off | i5-8550U | UHD Graphics 620 1150 / 1066 MHz | 8 GB | 602 |
| Dell XPS 13 i7-8550U | i5-8550U | UHD Graphics 620 400 / 930 MHz | 8 GB | 603 |
| Asus ZenBook 13 UX331UN | i5-8550U | GeForce MX150 1700 / 1252 MHz 2 GB | 16 GB | 623 |
| Asus Zenbook UX430UN | i5-8550U | GeForce MX150 1468 / 6008 MHz 2 GB | 16 GB | 624 |
| Medion Akoya S6625 | i5-8550U | GeForce 940MX 1189 / 1253 MHz 2 GB | 8 GB | 627 |
| Asus ZenBook 13 UX331UN | i5-8550U | GeForce MX150 1607 / 1253 MHz 2 GB | 8 GB | 630 |
| Lenovo Yoga 730-13IKB | i5-8550U | UHD Graphics 620 | 16 GB | 630 |
| Dell XPS 13 9370 i7 UHD | i5-8550U | UHD Graphics 620 | 16 GB | 639 |
| Asus VivoBook Pro 17 N705UD-EH76 | i5-8550U | GeForce GTX 1050 Mobile 1354 / 1493 MHz 4 GB | 16 GB | 642 |
| Lenovo ThinkPad X1 Carbon 2018-20KGS03900 | i5-8550U | UHD Graphics 620 1100 MHz | 16 GB | 648 |
| Lenovo Yoga C930-13IKB 81C4 | i5-8550U | UHD Graphics 620 400 MHz | 12 GB | 651 |
| Dell Inspiron 17-7773-0043 | i5-8550U | GeForce MX150 1532 / 6000 MHz 2 GB | 16 GB | 652 |
| Asus VivoBook S410UQ-NH74 | i5-8550U | GeForce 940MX 1242 / 4000 MHz 2 GB | 8 GB | 652 |
| Lenovo ThinkPad X1 Carbon 2018-20KGS5DU00 | i5-8550U | UHD Graphics 620 1100 MHz | 16 GB | 653 |
| Asus VivoBook 15 F510UF-ES71 | i5-8550U | GeForce MX130 1108 / 5010 MHz 2 GB | 8 GB | 655 |
| Lenovo ThinkPad T480-20L6S01V00 | i5-8550U | GeForce MX150 1469 / 1502 MHz 2 GB | 8 GB | 657 |
| Lenovo ThinkPad T580-20LAS01H00 | i5-8550U | GeForce MX150 1532 / 1502 MHz 2 GB | 8 GB | 660 |
| Lenovo ThinkPad X1 Tablet G3 LTE i7 | i5-8550U | UHD Graphics 620 | 16 GB | 681 |
| Lenovo ThinkPad X1 Yoga 2018-20LES01W00 | i5-8550U | UHD Graphics 620 1150 MHz | 16 GB | 699 |
| Zotac ZBOX-CI660 Nano | i5-8550U | UHD Graphics 620 300 / 1067 MHz | 16 GB | 702 |
| Asus VivoBook S13 S330UA-EY034T | i5-8550U | UHD Graphics 620 | 8 GB | 703 |
| Lenovo ThinkPad X1 Carbon 2018-20KGS03900 undervolted | i5-8550U | UHD Graphics 620 1100 MHz | 16 GB | 708 |
| Asus VivoBook 15 X570UD | i5-8550U | GeForce GTX 1050 Mobile 1354 / 7008 MHz 2 GB | 32 GB | 708 |
| Lenovo ThinkPad P52s-20LB000HGE | i5-8550U | Quadro P500 1519 / 1253 MHz 2 GB | 8 GB | 719 |
| Lenovo ThinkPad T480s-20L8S02E00 | i5-8550U | GeForce MX150 1038 / 1252.5 MHz 2 GB | 16 GB | 723 |
| Lenovo Yoga 730-15IKB | i5-8550U | GeForce GTX 1050 Mobile 1493 / 1752 MHz 4 GB | 16 GB | 723 |
| Asus VivoBook S15 S530UN-BQ097T | i5-8550U | GeForce MX150 1532 / 1469 MHz 2 GB | 16 GB | 729 |
| Asus ZenBook Flip 15 UX561UD | i5-8550U | GeForce GTX 1050 Mobile 1493 / 7000 MHz 2 GB | 16 GB | 761 |
| CPU TDP ? | TDP 15 W |
|---|---|
| 100% | 83% |
| Model | CPU | GPU | RAM | Wartość |
|---|---|---|---|---|
| Asus ZenBook S UX391U Quiet Mode on | i5-8550U | UHD Graphics 620 1150 / 1066 MHz | 8 GB | 108 |
| Lenovo Yoga 720-13IKB | i5-8550U | UHD Graphics 620 1150 MHz | 8 GB | 109 |
| Lenovo IdeaPad Flex-1570 81CA000RUS | i5-8550U | GeForce MX130 1108 / 5010 MHz 2 GB | 16 GB | 114 |
| Kuu LeBook 12.6 Core i7-8550U | i5-8550U 18 W / 15 W | UHD Graphics 620 1067 / 1150 MHz | 8 GB | 140 |
| Huawei MateBook X Pro, i7 | i5-8550U | GeForce MX150 | 8 GB | 141 |
| Toshiba Portege X30T-E-109 | i5-8550U | UHD Graphics 620 | 16 GB | 141 |
| Tuxedo Book BU1307 | i5-8550U | UHD Graphics 620 | 0 GB | 142 |
| HP Spectre x360 13-ae048ng | i5-8550U | UHD Graphics 620 400 / 1064 MHz | 16 GB | 144 |
| HP Spectre 13-af033ng | i5-8550U | UHD Graphics 620 400 / 1064 MHz | 8 GB | 145 |
| Schenker Slim 14 M18 | i5-8550U | UHD Graphics 620 | 16 GB | 146 |
| Lenovo ThinkPad X1 Tablet G3 LTE i7 | i5-8550U | UHD Graphics 620 | 16 GB | 148 |
| HP Spectre x360 15-ch011nr | i5-8550U | GeForce MX150 1469 / 1502 MHz 2 GB | 16 GB | 149 |
| Asus ZenBook 13 UX331UN | i5-8550U | GeForce MX150 1607 / 1253 MHz 2 GB | 8 GB | 150 |
| Acer TravelMate 2410-G2-MG-82E6 | i5-8550U | GeForce MX130 2 GB | 8 GB | 150 |
| HP Spectre x360 13t-ae000 | i5-8550U | UHD Graphics 620 1150 / 1067 MHz | 16 GB | 152 |
| Tuxedo InfinityBook Pro 13 2017 | i5-8550U | UHD Graphics 620 | 32 GB | 154 |
| HP Spectre x360 15t-bl100 | i5-8550U | GeForce MX150 1468 / 1502 MHz | 16 GB | 154 |
| Samsung Notebook 9 NP930QAA | i5-8550U | UHD Graphics 620 | 8 GB | 154 |
| Lenovo ThinkPad X380 Yoga 20LJS02W00 | i5-8550U | UHD Graphics 620 1150 MHz | 16 GB | 155 |
| Samsung Notebook 9 NP900X5T-X01US | i5-8550U | GeForce MX150 1468 / 6008 MHz 2 GB | 16 GB | 155 |
| Lenovo ThinkPad E580-20KS001RGE | i5-8550U | Radeon RX 550 (Laptop) 902 / 1500 MHz 2 GB | 8 GB | 156 |
| Zotac ZBOX-CI660 Nano | i5-8550U | UHD Graphics 620 300 / 1067 MHz | 16 GB | 156 |
| Acer TravelMate X3410-M-866T | i5-8550U | UHD Graphics 620 400 / 665 MHz 1 GB | 16 GB | 156 |
| Dynabook Portege A30-E-174 | i5-8550U | UHD Graphics 620 1150 / 1200 MHz | 16 GB | 156 |
| Dell Inspiron 17-7773-0043 | i5-8550U | GeForce MX150 1532 / 6000 MHz 2 GB | 16 GB | 158 |
| LG Gram 15Z980-B.AA78B | i5-8550U | UHD Graphics 620 | 16 GB | 158 |
| HP Envy 13-ah0003ng | i5-8550U | GeForce MX150 1038 / 1253 MHz 2 GB | 16 GB | 160 |
| Lenovo ThinkPad T480-20L6S01V00 | i5-8550U | GeForce MX150 1469 / 1502 MHz 2 GB | 8 GB | 161 |
| Acer Nitro 5 Spin NP515-51-86CX | i5-8550U | GeForce GTX 1050 Mobile 1354 / 1752 MHz 4 GB | 8 GB | 161 |
| Lenovo IdeaPad 530s-14IKB | i5-8550U | GeForce MX150 1532 / 6000 MHz 2 GB | 8 GB | 161 |
| Dell Latitude 15 3590-K8JP | i5-8550U | Radeon 530 1024 / 1125 MHz 2 GB | 8 GB | 161 |
| Asus ZenBook 13 UX331UN | i5-8550U | GeForce MX150 1700 / 1252 MHz 2 GB | 16 GB | 162 |
| Asus VivoBook S410UQ-NH74 | i5-8550U | GeForce 940MX 1242 / 4000 MHz 2 GB | 8 GB | 162 |
| MSI Prestige PS42 8RB-059 | i5-8550U | GeForce MX150 1468 / 6008 MHz 2 GB | 16 GB | 162 |
| HP Elite x2 1013 G3 LTE i7 | i5-8550U | UHD Graphics 620 | 16 GB | 162 |
| Lenovo ThinkPad T580-20LAS01H00 | i5-8550U | GeForce MX150 1532 / 1502 MHz 2 GB | 8 GB | 163 |
| Lenovo Yoga 730-13IKB | i5-8550U | UHD Graphics 620 | 16 GB | 163 |
| Getac S410 | i5-8550U | UHD Graphics 620 300 / 1200 MHz | 32 GB | 163 |
| i5-8550U | 164 | |||
| Razer Blade Stealth QHD i7-8550U | i5-8550U @4 GHz | UHD Graphics 620 300 / 350 MHz 1 GB | 16 GB | @4 GHz 164 |
| Lenovo Miix 520-12IKB 20M3000LGE | i5-8550U | UHD Graphics 620 1150 MHz | 16 GB | 164 |
| Asus Zenbook UX430UN | i5-8550U | GeForce MX150 1468 / 6008 MHz 2 GB | 16 GB | 165 |
| Dell XPS 13 9370 i7 UHD | i5-8550U | UHD Graphics 620 | 16 GB | 165 |
| Asus ZenBook S UX391U Quiet Mode off | i5-8550U | UHD Graphics 620 1150 / 1066 MHz | 8 GB | 165 |
| HP Pavilion 14-ce0002ng | i5-8550U | GeForce MX150 2 GB | 8 GB | 166 |
| Acer Switch 7 BE SW713-51GNP | i5-8550U | GeForce MX150 936 / 5010 MHz 2 GB | 16 GB | 166 |
| Lenovo IdeaPad 330-17IKB 81DM | i5-8550U | GeForce MX150 1468 / 6008 MHz 2 GB | 16 GB | 166 |
| Acer Swift 3 SF314-52G-89SL | i5-8550U | GeForce MX150 1797 / 1502 MHz 2 GB | 8 GB | 167 |
| Dell XPS 13 i7-8550U | i5-8550U | UHD Graphics 620 400 / 930 MHz | 8 GB | 167 |
| Intel Reference i7-8550U 15W | i5-8550U | UHD Graphics 620 | 167 | |
| HP EliteBook 840 G5-3JX61EA | i5-8550U | UHD Graphics 620 1150 MHz | 32 GB | 167 |
| Acer TravelMate X3410-M-50DD | i5-8550U | GeForce MX130 1189 / 1253 MHz 2 GB | 16 GB | 167 |
| Lenovo ThinkPad X1 Carbon 2018-20KGS5DU00 | i5-8550U | UHD Graphics 620 1100 MHz | 16 GB | 167 |
| Schenker Slim 15 L17 | i5-8550U | UHD Graphics 620 | 16 GB | 168 |
| Lenovo ThinkPad X1 Carbon 2018-20KGS03900 | i5-8550U | UHD Graphics 620 1100 MHz | 16 GB | 168 |
| Lenovo ThinkPad X1 Yoga 2018-20LES01W00 | i5-8550U | UHD Graphics 620 1150 MHz | 16 GB | 168 |
| Asus VivoBook 15 F510UF-ES71 | i5-8550U | GeForce MX130 1108 / 5010 MHz 2 GB | 8 GB | 168 |
| Lenovo Yoga 730-15IKB | i5-8550U | GeForce GTX 1050 Mobile 1493 / 1752 MHz 4 GB | 16 GB | 168 |
| Lenovo Yoga C930-13IKB 81C4 | i5-8550U | UHD Graphics 620 400 MHz | 12 GB | 168 |
| Acer Swift 3 Pre-Sample Intel | i5-8550U | UHD Graphics 620 | 169 | |
| HP EliteBook 830 G5-3JX74EA | i5-8550U | UHD Graphics 620 | 32 GB | 169 |
| HP ZBook 14u G5-2ZB99EA | i5-8550U | Radeon Pro WX 3100 1046 / 6000 MHz 2 GB | 8 GB | 169 |
| Dell Inspiron 15 7570 | i5-8550U | GeForce 940MX 1242 / 4000 MHz 4 GB | 8 GB | 170 |
| Xiaomi Mi Notebook Pro i7 | i5-8550U | GeForce MX150 1341 / 1253 MHz 2 GB | 16 GB | 170 |
| Lenovo Yoga 920-13IKB-80Y7 | i5-8550U | UHD Graphics 620 400 MHz | 7.9 GB | 170 |
| Acer Spin 5 SP515-51GN-80A3 | i5-8550U | GeForce GTX 1050 Mobile 1493 / 7000 MHz 4 GB | 8 GB | 170 |
| Lenovo ThinkPad T480s-20L8S02E00 | i5-8550U | GeForce MX150 1038 / 1252.5 MHz 2 GB | 16 GB | 170 |
| Medion Akoya S6625 | i5-8550U | GeForce 940MX 1189 / 1253 MHz 2 GB | 8 GB | 170 |
| Acer Aspire 5 A517-51G-80L | i5-8550U | GeForce MX150 1532 / 6000 MHz 2 GB | 8 GB | 171 |
| Lenovo ThinkPad P52s-20LB000HGE | i5-8550U | Quadro P500 1519 / 1253 MHz 2 GB | 8 GB | 171 |
| Asus ZenBook Flip 15 UX561UD | i5-8550U | GeForce GTX 1050 Mobile 1493 / 7000 MHz 2 GB | 16 GB | 171 |
| Asus VivoBook S13 S330UA-EY034T | i5-8550U | UHD Graphics 620 | 8 GB | 171 |
| Asus VivoBook Pro 17 N705UD-EH76 | i5-8550U | GeForce GTX 1050 Mobile 1354 / 1493 MHz 4 GB | 16 GB | 172 |
| HP ZBook 15u G5 2ZC05EA | i5-8550U | Radeon Pro WX 3100 1046 / 1500 MHz 2 GB | 8 GB | 172 |
| Asus VivoBook 15 X570UD | i5-8550U | GeForce GTX 1050 Mobile 1354 / 7008 MHz 2 GB | 32 GB | 172 |
| Asus VivoBook S15 S530UN-BQ097T | i5-8550U | GeForce MX150 1532 / 1469 MHz 2 GB | 16 GB | 172 |
| CPU TDP ? | TDP 15 W |
|---|---|
| 100% | 88% |
| Model | CPU | GPU | RAM | Wartość |
|---|---|---|---|---|
| Lenovo ThinkPad X380 Yoga 20LJS02W00 | i5-8550U | UHD Graphics 620 1150 MHz | 16 GB | 4.38 |
| Dell Inspiron 17-7773-0043 | i5-8550U | GeForce MX150 1532 / 6000 MHz 2 GB | 16 GB | 4.96 |
| HP Elite x2 1013 G3 LTE i7 | i5-8550U | UHD Graphics 620 | 16 GB | 5.3 |
| HP Spectre x360 13t-ae000 | i5-8550U | UHD Graphics 620 1150 / 1067 MHz | 16 GB | 5.35 |
| Schenker Slim 15 L17 | i5-8550U | UHD Graphics 620 | 16 GB | 5.66 |
| Acer Nitro 5 Spin NP515-51-86CX | i5-8550U | GeForce GTX 1050 Mobile 1354 / 1752 MHz 4 GB | 8 GB | 5.72 |
| Lenovo IdeaPad 530s-14IKB | i5-8550U | GeForce MX150 1532 / 6000 MHz 2 GB | 8 GB | 5.72 |
| HP Spectre x360 15t-bl100 | i5-8550U | GeForce MX150 1468 / 1502 MHz | 16 GB | 5.76 |
| i5-8550U | 5.83 | |||
| HP ZBook 15u G5 2ZC05EA | i5-8550U | Radeon Pro WX 3100 1046 / 1500 MHz 2 GB | 8 GB | 5.86 |
| Xiaomi Mi Notebook Pro i7 | i5-8550U | GeForce MX150 1341 / 1253 MHz 2 GB | 16 GB | 5.87 |
| HP ZBook 14u G5-2ZB99EA | i5-8550U | Radeon Pro WX 3100 1046 / 6000 MHz 2 GB | 8 GB | 5.9 |
| Lenovo Yoga 920-13IKB-80Y7 | i5-8550U | UHD Graphics 620 400 MHz | 7.9 GB | 5.94 |
| Samsung Notebook 9 NP900X5T-X01US | i5-8550U | GeForce MX150 1468 / 6008 MHz 2 GB | 16 GB | 6.03 |
| Tuxedo InfinityBook Pro 13 2017 | i5-8550U | UHD Graphics 620 | 32 GB | 6.06 |
| Asus VivoBook 15 F510UF-ES71 | i5-8550U | GeForce MX130 1108 / 5010 MHz 2 GB | 8 GB | 6.11 |
| Lenovo ThinkPad X1 Tablet G3 LTE i7 | i5-8550U | UHD Graphics 620 | 16 GB | 6.2 |
| Acer Spin 5 SP515-51GN-80A3 | i5-8550U | GeForce GTX 1050 Mobile 1493 / 7000 MHz 4 GB | 8 GB | 6.26 |
| Razer Blade Stealth QHD i7-8550U | i5-8550U @4 GHz | UHD Graphics 620 300 / 350 MHz 1 GB | 16 GB | @4 GHz 6.28 |
| Asus ZenBook 13 UX331UN | i5-8550U | GeForce MX150 1607 / 1253 MHz 2 GB | 8 GB | 6.29 |
| Dell XPS 13 9370 i7 UHD | i5-8550U | UHD Graphics 620 | 16 GB | 6.35 |
| Acer Aspire 5 A517-51G-80L | i5-8550U | GeForce MX150 1532 / 6000 MHz 2 GB | 8 GB | 6.44 |
| Dell XPS 13 i7-8550U | i5-8550U | UHD Graphics 620 400 / 930 MHz | 8 GB | 6.47 |
| Asus VivoBook S410UQ-NH74 | i5-8550U | GeForce 940MX 1242 / 4000 MHz 2 GB | 8 GB | 6.57 |
| Asus Zenbook UX430UN | i5-8550U | GeForce MX150 1468 / 6008 MHz 2 GB | 16 GB | 6.58 |
| Lenovo ThinkPad T480-20L6S01V00 | i5-8550U | GeForce MX150 1469 / 1502 MHz 2 GB | 8 GB | 6.92 |
| Dell Inspiron 15 7570 | i5-8550U | GeForce 940MX 1242 / 4000 MHz 4 GB | 8 GB | 7.01 |
| HP Envy 13-ah0003ng | i5-8550U | GeForce MX150 1038 / 1253 MHz 2 GB | 16 GB | 7.17 |
| Asus VivoBook Pro 17 N705UD-EH76 | i5-8550U | GeForce GTX 1050 Mobile 1354 / 1493 MHz 4 GB | 16 GB | 7.58 |
| Lenovo ThinkPad T480s-20L8S02E00 | i5-8550U | GeForce MX150 1038 / 1252.5 MHz 2 GB | 16 GB | 7.84 |
| Lenovo Yoga 730-15IKB | i5-8550U | GeForce GTX 1050 Mobile 1493 / 1752 MHz 4 GB | 16 GB | 7.94 |
| Asus ZenBook Flip 15 UX561UD | i5-8550U | GeForce GTX 1050 Mobile 1493 / 7000 MHz 2 GB | 16 GB | 8.56 |
| Model | CPU | GPU | RAM | Wartość |
|---|---|---|---|---|
| Lenovo ThinkPad T480-20L6S01V00 | i5-8550U | GeForce MX150 1469 / 1502 MHz 2 GB | 8 GB | 1.43 |
| Lenovo ThinkPad X380 Yoga 20LJS02W00 | i5-8550U | UHD Graphics 620 1150 MHz | 16 GB | 1.51 |
| Dell Inspiron 17-7773-0043 | i5-8550U | GeForce MX150 1532 / 6000 MHz 2 GB | 16 GB | 1.57 |
| Dell XPS 13 i7-8550U | i5-8550U | UHD Graphics 620 400 / 930 MHz | 8 GB | 1.62 |
| Asus Zenbook UX430UN | i5-8550U | GeForce MX150 1468 / 6008 MHz 2 GB | 16 GB | 1.7 |
| Asus ZenBook 13 UX331UN | i5-8550U | GeForce MX150 1607 / 1253 MHz 2 GB | 8 GB | 1.72 |
| HP Spectre x360 13t-ae000 | i5-8550U | UHD Graphics 620 1150 / 1067 MHz | 16 GB | 1.76 |
| HP Spectre x360 15t-bl100 | i5-8550U | GeForce MX150 1468 / 1502 MHz | 16 GB | 1.77 |
| Tuxedo InfinityBook Pro 13 2017 | i5-8550U | UHD Graphics 620 | 32 GB | 1.78 |
| i5-8550U | 1.81 | |||
| HP Elite x2 1013 G3 LTE i7 | i5-8550U | UHD Graphics 620 | 16 GB | 1.83 |
| Acer Nitro 5 Spin NP515-51-86CX | i5-8550U | GeForce GTX 1050 Mobile 1354 / 1752 MHz 4 GB | 8 GB | 1.85 |
| Lenovo IdeaPad 530s-14IKB | i5-8550U | GeForce MX150 1532 / 6000 MHz 2 GB | 8 GB | 1.85 |
| Asus VivoBook Pro 17 N705UD-EH76 | i5-8550U | GeForce GTX 1050 Mobile 1354 / 1493 MHz 4 GB | 16 GB | 1.87 |
| Razer Blade Stealth QHD i7-8550U | i5-8550U @4 GHz | UHD Graphics 620 300 / 350 MHz 1 GB | 16 GB | @4 GHz 1.88 |
| Asus VivoBook S410UQ-NH74 | i5-8550U | GeForce 940MX 1242 / 4000 MHz 2 GB | 8 GB | 1.89 |
| Lenovo ThinkPad X1 Tablet G3 LTE i7 | i5-8550U | UHD Graphics 620 | 16 GB | 1.89 |
| Dell XPS 13 9370 i7 UHD | i5-8550U | UHD Graphics 620 | 16 GB | 1.9 |
| Lenovo Yoga 920-13IKB-80Y7 | i5-8550U | UHD Graphics 620 400 MHz | 7.9 GB | 1.91 |
| Schenker Slim 15 L17 | i5-8550U | UHD Graphics 620 | 16 GB | 1.91 |
| HP ZBook 14u G5-2ZB99EA | i5-8550U | Radeon Pro WX 3100 1046 / 6000 MHz 2 GB | 8 GB | 1.92 |
| HP Envy 13-ah0003ng | i5-8550U | GeForce MX150 1038 / 1253 MHz 2 GB | 16 GB | 1.92 |
| Dell Inspiron 15 7570 | i5-8550U | GeForce 940MX 1242 / 4000 MHz 4 GB | 8 GB | 1.93 |
| Xiaomi Mi Notebook Pro i7 | i5-8550U | GeForce MX150 1341 / 1253 MHz 2 GB | 16 GB | 1.93 |
| HP ZBook 15u G5 2ZC05EA | i5-8550U | Radeon Pro WX 3100 1046 / 1500 MHz 2 GB | 8 GB | 1.93 |
| Acer Spin 5 SP515-51GN-80A3 | i5-8550U | GeForce GTX 1050 Mobile 1493 / 7000 MHz 4 GB | 8 GB | 1.94 |
| Lenovo ThinkPad T480s-20L8S02E00 | i5-8550U | GeForce MX150 1038 / 1252.5 MHz 2 GB | 16 GB | 1.94 |
| Asus VivoBook 15 F510UF-ES71 | i5-8550U | GeForce MX130 1108 / 5010 MHz 2 GB | 8 GB | 1.94 |
| Lenovo Yoga 730-15IKB | i5-8550U | GeForce GTX 1050 Mobile 1493 / 1752 MHz 4 GB | 16 GB | 1.94 |
| Acer Aspire 5 A517-51G-80L | i5-8550U | GeForce MX150 1532 / 6000 MHz 2 GB | 8 GB | 1.95 |
| Samsung Notebook 9 NP900X5T-X01US | i5-8550U | GeForce MX150 1468 / 6008 MHz 2 GB | 16 GB | 1.95 |
| Asus ZenBook Flip 15 UX561UD | i5-8550U | GeForce GTX 1050 Mobile 1493 / 7000 MHz 2 GB | 16 GB | 1.95 |
| Model | CPU | GPU | RAM | Wartość |
|---|---|---|---|---|
| Lenovo Yoga 720-13IKB | i5-8550U | UHD Graphics 620 1150 MHz | 8 GB | 4202 |
| Dell Inspiron 17-7773-0043 | i5-8550U | GeForce MX150 1532 / 6000 MHz 2 GB | 16 GB | 5339 |
| Dell XPS 13 i7-8550U | i5-8550U | UHD Graphics 620 400 / 930 MHz | 8 GB | 5552 |
| Lenovo Miix 520-12IKB 20M3000LGE | i5-8550U | UHD Graphics 620 1150 MHz | 16 GB | 5781 |
| Lenovo ThinkPad X380 Yoga 20LJS02W00 | i5-8550U | UHD Graphics 620 1150 MHz | 16 GB | 6098 |
| Tuxedo InfinityBook Pro 13 2017 | i5-8550U | UHD Graphics 620 | 32 GB | 6153 |
| Razer Blade Stealth QHD i7-8550U | i5-8550U @4 GHz | UHD Graphics 620 300 / 350 MHz 1 GB | 16 GB | @4 GHz 6183 |
| Dynabook Portege A30-E-174 | i5-8550U | UHD Graphics 620 1150 / 1200 MHz | 16 GB | 6212 |
| Lenovo IdeaPad 530s-14IKB | i5-8550U | GeForce MX150 1532 / 6000 MHz 2 GB | 8 GB | 6219 |
| HP Envy 13-ah0003ng | i5-8550U | GeForce MX150 1038 / 1253 MHz 2 GB | 16 GB | 6221 |
| Dell XPS 13 9370 i7 UHD | i5-8550U | UHD Graphics 620 | 16 GB | 6345 |
| Schenker Slim 15 L17 | i5-8550U | UHD Graphics 620 | 16 GB | 6374 |
| HP EliteBook 840 G5-3JX61EA | i5-8550U | UHD Graphics 620 1150 MHz | 32 GB | 6391 |
| Acer Swift 3 SF314-52G-89SL | i5-8550U | GeForce MX150 1797 / 1502 MHz 2 GB | 8 GB | 6400 |
| Asus VivoBook S410UQ-NH74 | i5-8550U | GeForce 940MX 1242 / 4000 MHz 2 GB | 8 GB | 6416 |
| Asus ZenBook 13 UX331UN | i5-8550U | GeForce MX150 1607 / 1253 MHz 2 GB | 8 GB | 6418 |
| HP ZBook 14u G5-2ZB99EA | i5-8550U | Radeon Pro WX 3100 1046 / 6000 MHz 2 GB | 8 GB | 6428 |
| Xiaomi Mi Notebook Pro i7 | i5-8550U | GeForce MX150 1341 / 1253 MHz 2 GB | 16 GB | 6435 |
| Lenovo ThinkPad T480s-20L8S02E00 | i5-8550U | GeForce MX150 1038 / 1252.5 MHz 2 GB | 16 GB | 6437 |
| HP ZBook 15u G5 2ZC05EA | i5-8550U | Radeon Pro WX 3100 1046 / 1500 MHz 2 GB | 8 GB | 6445 |
| Lenovo Yoga 920-13IKB-80Y7 | i5-8550U | UHD Graphics 620 400 MHz | 7.9 GB | 6452 |
| Lenovo Yoga 730-15IKB | i5-8550U | GeForce GTX 1050 Mobile 1493 / 1752 MHz 4 GB | 16 GB | 6454 |
| Asus Zenbook UX430UN | i5-8550U | GeForce MX150 1468 / 6008 MHz 2 GB | 16 GB | 6478 |
| Samsung Notebook 9 NP900X5T-X01US | i5-8550U | GeForce MX150 1468 / 6008 MHz 2 GB | 16 GB | 6478 |
| Acer Spin 5 SP515-51GN-80A3 | i5-8550U | GeForce GTX 1050 Mobile 1493 / 7000 MHz 4 GB | 8 GB | 6494 |
| HP Spectre x360 15t-bl100 | i5-8550U | GeForce MX150 1468 / 1502 MHz | 16 GB | 6501 |
| Asus ZenBook Flip 15 UX561UD | i5-8550U | GeForce GTX 1050 Mobile 1493 / 7000 MHz 2 GB | 16 GB | 6506 |
| Medion Akoya S6625 | i5-8550U | GeForce 940MX 1189 / 1253 MHz 2 GB | 8 GB | 6509 |
| Acer Aspire 5 A517-51G-80L | i5-8550U | GeForce MX150 1532 / 6000 MHz 2 GB | 8 GB | 6518 |
| HP Spectre x360 13-ae048ng | i5-8550U | UHD Graphics 620 400 / 1064 MHz | 16 GB | 7508 |
| Acer Nitro 5 Spin NP515-51-86CX | i5-8550U | GeForce GTX 1050 Mobile 1354 / 1752 MHz 4 GB | 8 GB | 8211 |
| Model | CPU | GPU | RAM | Wartość |
|---|---|---|---|---|
| Lenovo Yoga 720-13IKB | i5-8550U | UHD Graphics 620 1150 MHz | 8 GB | 11694 |
| Dell Inspiron 17-7773-0043 | i5-8550U | GeForce MX150 1532 / 6000 MHz 2 GB | 16 GB | 14212 |
| Dynabook Portege A30-E-174 | i5-8550U | UHD Graphics 620 1150 / 1200 MHz | 16 GB | 15324 |
| HP Envy 13-ah0003ng | i5-8550U | GeForce MX150 1038 / 1253 MHz 2 GB | 16 GB | 15505 |
| Lenovo Yoga 920-13IKB-80Y7 | i5-8550U | UHD Graphics 620 400 MHz | 7.9 GB | 15599 |
| Lenovo ThinkPad X380 Yoga 20LJS02W00 | i5-8550U | UHD Graphics 620 1150 MHz | 16 GB | 15705 |
| Schenker Slim 15 L17 | i5-8550U | UHD Graphics 620 | 16 GB | 16160 |
| HP Spectre x360 15t-bl100 | i5-8550U | GeForce MX150 1468 / 1502 MHz | 16 GB | 16329 |
| Razer Blade Stealth QHD i7-8550U | i5-8550U @4 GHz | UHD Graphics 620 300 / 350 MHz 1 GB | 16 GB | @4 GHz 16554 |
| Xiaomi Mi Notebook Pro i7 | i5-8550U | GeForce MX150 1341 / 1253 MHz 2 GB | 16 GB | 16569 |
| Lenovo Miix 520-12IKB 20M3000LGE | i5-8550U | UHD Graphics 620 1150 MHz | 16 GB | 16646 |
| Lenovo IdeaPad 530s-14IKB | i5-8550U | GeForce MX150 1532 / 6000 MHz 2 GB | 8 GB | 16794 |
| Acer Swift 3 SF314-52G-89SL | i5-8550U | GeForce MX150 1797 / 1502 MHz 2 GB | 8 GB | 16804 |
| Dell XPS 13 i7-8550U | i5-8550U | UHD Graphics 620 400 / 930 MHz | 8 GB | 16869 |
| Samsung Notebook 9 NP900X5T-X01US | i5-8550U | GeForce MX150 1468 / 6008 MHz 2 GB | 16 GB | 17215 |
| HP EliteBook 840 G5-3JX61EA | i5-8550U | UHD Graphics 620 1150 MHz | 32 GB | 17281 |
| Tuxedo InfinityBook Pro 13 2017 | i5-8550U | UHD Graphics 620 | 32 GB | 17362 |
| HP ZBook 14u G5-2ZB99EA | i5-8550U | Radeon Pro WX 3100 1046 / 6000 MHz 2 GB | 8 GB | 17449 |
| HP ZBook 15u G5 2ZC05EA | i5-8550U | Radeon Pro WX 3100 1046 / 1500 MHz 2 GB | 8 GB | 17505 |
| HP Spectre x360 13-ae048ng | i5-8550U | UHD Graphics 620 400 / 1064 MHz | 16 GB | 17960 |
| Acer Spin 5 SP515-51GN-80A3 | i5-8550U | GeForce GTX 1050 Mobile 1493 / 7000 MHz 4 GB | 8 GB | 18269 |
| Acer Aspire 5 A517-51G-80L | i5-8550U | GeForce MX150 1532 / 6000 MHz 2 GB | 8 GB | 18890 |
| Asus Zenbook UX430UN | i5-8550U | GeForce MX150 1468 / 6008 MHz 2 GB | 16 GB | 19550 |
| Asus VivoBook S410UQ-NH74 | i5-8550U | GeForce 940MX 1242 / 4000 MHz 2 GB | 8 GB | 19731 |
| Medion Akoya S6625 | i5-8550U | GeForce 940MX 1189 / 1253 MHz 2 GB | 8 GB | 19753 |
| Asus ZenBook 13 UX331UN | i5-8550U | GeForce MX150 1607 / 1253 MHz 2 GB | 8 GB | 19873 |
| Dell XPS 13 9370 i7 UHD | i5-8550U | UHD Graphics 620 | 16 GB | 20666 |
| Acer Nitro 5 Spin NP515-51-86CX | i5-8550U | GeForce GTX 1050 Mobile 1354 / 1752 MHz 4 GB | 8 GB | 21019 |
| Lenovo ThinkPad T480s-20L8S02E00 | i5-8550U | GeForce MX150 1038 / 1252.5 MHz 2 GB | 16 GB | 22188 |
| Lenovo Yoga 730-15IKB | i5-8550U | GeForce GTX 1050 Mobile 1493 / 1752 MHz 4 GB | 16 GB | 22910 |
| Asus ZenBook Flip 15 UX561UD | i5-8550U | GeForce GTX 1050 Mobile 1493 / 7000 MHz 2 GB | 16 GB | 24180 |
| Model | CPU | GPU | RAM | Wartość |
|---|---|---|---|---|
| Lenovo ThinkPad T480-20L6S01V00 | i5-8550U | GeForce MX150 1469 / 1502 MHz 2 GB | 8 GB | 12279 |
| Dell Inspiron 17-7773-0043 | i5-8550U | GeForce MX150 1532 / 6000 MHz 2 GB | 16 GB | 18697 |
| Schenker Slim 15 L17 | i5-8550U | UHD Graphics 620 | 16 GB | 20666 |
| Lenovo IdeaPad 530s-14IKB | i5-8550U | GeForce MX150 1532 / 6000 MHz 2 GB | 8 GB | 21836 |
| HP ZBook 15u G5 2ZC05EA | i5-8550U | Radeon Pro WX 3100 1046 / 1500 MHz 2 GB | 8 GB | 22346 |
| Tuxedo InfinityBook Pro 13 2017 | i5-8550U | UHD Graphics 620 | 32 GB | 22468 |
| HP ZBook 14u G5-2ZB99EA | i5-8550U | Radeon Pro WX 3100 1046 / 6000 MHz 2 GB | 8 GB | 22966 |
| Acer Spin 5 SP515-51GN-80A3 | i5-8550U | GeForce GTX 1050 Mobile 1493 / 7000 MHz 4 GB | 8 GB | 23730 |
| Acer Aspire 5 A517-51G-80L | i5-8550U | GeForce MX150 1532 / 6000 MHz 2 GB | 8 GB | 25544 |
| Dell Inspiron 15 7570 | i5-8550U | GeForce 940MX 1242 / 4000 MHz 4 GB | 8 GB | 25854 |
| Lenovo ThinkPad T480s-20L8S02E00 | i5-8550U | GeForce MX150 1038 / 1252.5 MHz 2 GB | 16 GB | 29780 |
| Asus ZenBook Flip 15 UX561UD | i5-8550U | GeForce GTX 1050 Mobile 1493 / 7000 MHz 2 GB | 16 GB | 31667 |
| Model | CPU | GPU | RAM | Wartość |
|---|---|---|---|---|
| Lenovo ThinkPad T480-20L6S01V00 | i5-8550U | GeForce MX150 1469 / 1502 MHz 2 GB | 8 GB | 6737 |
| Dell Inspiron 17-7773-0043 | i5-8550U | GeForce MX150 1532 / 6000 MHz 2 GB | 16 GB | 6879 |
| Tuxedo InfinityBook Pro 13 2017 | i5-8550U | UHD Graphics 620 | 32 GB | 7952 |
| Lenovo IdeaPad 530s-14IKB | i5-8550U | GeForce MX150 1532 / 6000 MHz 2 GB | 8 GB | 8125 |
| Schenker Slim 15 L17 | i5-8550U | UHD Graphics 620 | 16 GB | 8271 |
| Acer Spin 5 SP515-51GN-80A3 | i5-8550U | GeForce GTX 1050 Mobile 1493 / 7000 MHz 4 GB | 8 GB | 8359 |
| Dell Inspiron 15 7570 | i5-8550U | GeForce 940MX 1242 / 4000 MHz 4 GB | 8 GB | 8382 |
| HP ZBook 14u G5-2ZB99EA | i5-8550U | Radeon Pro WX 3100 1046 / 6000 MHz 2 GB | 8 GB | 8383 |
| Asus ZenBook Flip 15 UX561UD | i5-8550U | GeForce GTX 1050 Mobile 1493 / 7000 MHz 2 GB | 16 GB | 8397 |
| Acer Aspire 5 A517-51G-80L | i5-8550U | GeForce MX150 1532 / 6000 MHz 2 GB | 8 GB | 8426 |
| HP ZBook 15u G5 2ZC05EA | i5-8550U | Radeon Pro WX 3100 1046 / 1500 MHz 2 GB | 8 GB | 8430 |
| Lenovo ThinkPad T480s-20L8S02E00 | i5-8550U | GeForce MX150 1038 / 1252.5 MHz 2 GB | 16 GB | 8436 |
| Model | CPU | GPU | RAM | Wartość |
|---|---|---|---|---|
| Asus VivoBook Pro 17 N705UD-EH76 | i5-8550U | GeForce GTX 1050 Mobile 1354 / 1493 MHz 4 GB | 16 GB | 257.5 |
| Asus Zenbook UX430UN | i5-8550U | GeForce MX150 1468 / 6008 MHz 2 GB | 16 GB | 269.1 |
| Samsung Notebook 9 NP900X5T-X01US | i5-8550U | GeForce MX150 1468 / 6008 MHz 2 GB | 16 GB | 292.5 |
| Razer Blade Stealth QHD i7-8550U | i5-8550U @4 GHz | UHD Graphics 620 300 / 350 MHz 1 GB | 16 GB | @4 GHz 338.4 |
| Asus VivoBook S410UQ-NH74 | i5-8550U | GeForce 940MX 1242 / 4000 MHz 2 GB | 8 GB | 358.1 |
| Tuxedo InfinityBook Pro 13 2017 | i5-8550U | UHD Graphics 620 | 32 GB | 361 |
| Dell XPS 13 9370 i7 UHD | i5-8550U | UHD Graphics 620 | 16 GB | 372.4 |
| Lenovo Yoga 920-13IKB-80Y7 | i5-8550U | UHD Graphics 620 400 MHz | 7.9 GB | 378 |
| Acer Aspire 5 A517-51G-80L | i5-8550U | GeForce MX150 1532 / 6000 MHz 2 GB | 8 GB | 394 |
| HP Spectre x360 15t-bl100 | i5-8550U | GeForce MX150 1468 / 1502 MHz | 16 GB | 402.6 |
| HP Spectre x360 13t-ae000 | i5-8550U | UHD Graphics 620 1150 / 1067 MHz | 16 GB | 435 |
| Model | CPU | GPU | RAM | Wartość |
|---|---|---|---|---|
| Asus VivoBook Pro 17 N705UD-EH76 | i5-8550U | GeForce GTX 1050 Mobile 1354 / 1493 MHz 4 GB | 16 GB | 7.047 |
| Razer Blade Stealth QHD i7-8550U | i5-8550U @4 GHz | UHD Graphics 620 300 / 350 MHz 1 GB | 16 GB | @4 GHz 7.4 |
| Asus Zenbook UX430UN | i5-8550U | GeForce MX150 1468 / 6008 MHz 2 GB | 16 GB | 7.831 |
| Samsung Notebook 9 NP900X5T-X01US | i5-8550U | GeForce MX150 1468 / 6008 MHz 2 GB | 16 GB | 8.136 |
| Lenovo Yoga 920-13IKB-80Y7 | i5-8550U | UHD Graphics 620 400 MHz | 7.9 GB | 9.52 |
| Asus VivoBook S410UQ-NH74 | i5-8550U | GeForce 940MX 1242 / 4000 MHz 2 GB | 8 GB | 9.82 |
| Acer Aspire 5 A517-51G-80L | i5-8550U | GeForce MX150 1532 / 6000 MHz 2 GB | 8 GB | 9.971 |
| HP Spectre x360 15t-bl100 | i5-8550U | GeForce MX150 1468 / 1502 MHz | 16 GB | 10.59 |
| HP Spectre x360 13t-ae000 | i5-8550U | UHD Graphics 620 1150 / 1067 MHz | 16 GB | 10.6 |
| Tuxedo InfinityBook Pro 13 2017 | i5-8550U | UHD Graphics 620 | 32 GB | 11.7 |
| Dell XPS 13 9370 i7 UHD | i5-8550U | UHD Graphics 620 | 16 GB | 12.7 |
| Model | CPU | GPU | RAM | Wartość |
|---|---|---|---|---|
| Acer Aspire 5 A517-51G-80L | i5-8550U | GeForce MX150 1532 / 6000 MHz 2 GB | 8 GB | 847 |
| Model | CPU | GPU | RAM | Wartość |
|---|---|---|---|---|
| Acer Aspire 5 A517-51G-80L | i5-8550U | GeForce MX150 1532 / 6000 MHz 2 GB | 8 GB | 26.3 |
| Model | CPU | GPU | RAM | Wartość |
|---|---|---|---|---|
| Lenovo Yoga 920-13IKB-80Y7 | i5-8550U | UHD Graphics 620 400 MHz | 7.9 GB | 3847 |
| HP Spectre x360 13t-ae000 | i5-8550U | UHD Graphics 620 1150 / 1067 MHz | 16 GB | 3970 |
| Acer Aspire 5 A517-51G-80L | i5-8550U | GeForce MX150 1532 / 6000 MHz 2 GB | 8 GB | 4121 |
| Asus VivoBook S410UQ-NH74 | i5-8550U | GeForce 940MX 1242 / 4000 MHz 2 GB | 8 GB | 4374 |
| Tuxedo InfinityBook Pro 13 2017 | i5-8550U | UHD Graphics 620 | 32 GB | 4835 |
| HP Spectre x360 15t-bl100 | i5-8550U | GeForce MX150 1468 / 1502 MHz | 16 GB | 4976 |
| Asus VivoBook Pro 17 N705UD-EH76 | i5-8550U | GeForce GTX 1050 Mobile 1354 / 1493 MHz 4 GB | 16 GB | 5287 |
| Model | CPU | GPU | RAM | Wartość |
|---|---|---|---|---|
| Kuu LeBook 12.6 Core i7-8550U | i5-8550U 18 W / 15 W | UHD Graphics 620 1067 / 1150 MHz | 8 GB | 15613 |
| Model | CPU | GPU | RAM | Wartość |
|---|---|---|---|---|
| Kuu LeBook 12.6 Core i7-8550U | i5-8550U 18 W / 15 W | UHD Graphics 620 1067 / 1150 MHz | 8 GB | 4337 |
| Model | CPU | GPU | RAM | Wartość |
|---|---|---|---|---|
| HP Spectre x360 13t-ae000 | i5-8550U | UHD Graphics 620 1150 / 1067 MHz | 16 GB | 32 |
| Acer Aspire 5 A517-51G-80L | i5-8550U | GeForce MX150 1532 / 6000 MHz 2 GB | 8 GB | 33.1 |
| Xiaomi Mi Notebook Pro i7 | i5-8550U | GeForce MX150 1341 / 1253 MHz 2 GB | 16 GB | 33.1 |
| HP Spectre x360 15t-bl100 | i5-8550U | GeForce MX150 1468 / 1502 MHz | 16 GB | 33.19 |
| Asus VivoBook S410UQ-NH74 | i5-8550U | GeForce 940MX 1242 / 4000 MHz 2 GB | 8 GB | 39.3 |
| Asus VivoBook Pro 17 N705UD-EH76 | i5-8550U | GeForce GTX 1050 Mobile 1354 / 1493 MHz 4 GB | 16 GB | 41 |
| Model | CPU | GPU | RAM | Wartość |
|---|---|---|---|---|
| Acer Aspire 5 A517-51G-80L | i5-8550U | GeForce MX150 1532 / 6000 MHz 2 GB | 8 GB | 143.6 |
| Xiaomi Mi Notebook Pro i7 | i5-8550U | GeForce MX150 1341 / 1253 MHz 2 GB | 16 GB | 145 |
| HP Spectre x360 13t-ae000 | i5-8550U | UHD Graphics 620 1150 / 1067 MHz | 16 GB | 147 |
| HP Spectre x360 15t-bl100 | i5-8550U | GeForce MX150 1468 / 1502 MHz | 16 GB | 148.8 |
| Asus VivoBook S410UQ-NH74 | i5-8550U | GeForce 940MX 1242 / 4000 MHz 2 GB | 8 GB | 161 |
| Asus VivoBook Pro 17 N705UD-EH76 | i5-8550U | GeForce GTX 1050 Mobile 1354 / 1493 MHz 4 GB | 16 GB | 178 |
| Model | CPU | GPU | RAM | Wartość |
|---|---|---|---|---|
| Kuu LeBook 12.6 Core i7-8550U | i5-8550U 18 W / 15 W | UHD Graphics 620 1067 / 1150 MHz | 8 GB | 3.77 |
| LG Gram 15Z980-B.AA78B | i5-8550U | UHD Graphics 620 | 16 GB | 3.88 |
| Xiaomi Mi Notebook Pro i7 | i5-8550U | GeForce MX150 1341 / 1253 MHz 2 GB | 16 GB | 4.43 |
| CPU TDP ? | TDP 15 W |
|---|---|
| 100% | 91% |
| Model | CPU | GPU | RAM | Wartość |
|---|---|---|---|---|
| Tuxedo InfinityBook Pro 13 2017 | i5-8550U | UHD Graphics 620 | 32 GB | 0.357 |
| Asus Zenbook UX430UN | i5-8550U | GeForce MX150 1468 / 6008 MHz 2 GB | 16 GB | 0.405 |
| HP Spectre x360 13t-ae000 | i5-8550U | UHD Graphics 620 1150 / 1067 MHz | 16 GB | 0.42 |
| Samsung Notebook 9 NP900X5T-X01US | i5-8550U | GeForce MX150 1468 / 6008 MHz 2 GB | 16 GB | 0.441 |
| Acer Aspire 5 A517-51G-80L | i5-8550U | GeForce MX150 1532 / 6000 MHz 2 GB | 8 GB | 0.46 |
| Asus VivoBook Pro 17 N705UD-EH76 | i5-8550U | GeForce GTX 1050 Mobile 1354 / 1493 MHz 4 GB | 16 GB | 0.469 |
| Model | CPU | GPU | RAM | Wartość |
|---|---|---|---|---|
| Tuxedo InfinityBook Pro 13 2017 | i5-8550U | UHD Graphics 620 | 32 GB | 0.583 |
| Asus Zenbook UX430UN | i5-8550U | GeForce MX150 1468 / 6008 MHz 2 GB | 16 GB | 0.673 |
| HP Spectre x360 13t-ae000 | i5-8550U | UHD Graphics 620 1150 / 1067 MHz | 16 GB | 0.68 |
| Samsung Notebook 9 NP900X5T-X01US | i5-8550U | GeForce MX150 1468 / 6008 MHz 2 GB | 16 GB | 0.778 |
| Acer Aspire 5 A517-51G-80L | i5-8550U | GeForce MX150 1532 / 6000 MHz 2 GB | 8 GB | 0.785 |
| Asus VivoBook Pro 17 N705UD-EH76 | i5-8550U | GeForce GTX 1050 Mobile 1354 / 1493 MHz 4 GB | 16 GB | 0.793 |
| Model | CPU | GPU | RAM | Wartość |
|---|---|---|---|---|
| Tuxedo InfinityBook Pro 13 2017 | i5-8550U | UHD Graphics 620 | 32 GB | 3.3 |
| Asus Zenbook UX430UN | i5-8550U | GeForce MX150 1468 / 6008 MHz 2 GB | 16 GB | 3.9 |
| HP Spectre x360 13t-ae000 | i5-8550U | UHD Graphics 620 1150 / 1067 MHz | 16 GB | 4.1 |
| Acer Aspire 5 A517-51G-80L | i5-8550U | GeForce MX150 1532 / 6000 MHz 2 GB | 8 GB | 4.5 |
| Asus VivoBook Pro 17 N705UD-EH76 | i5-8550U | GeForce GTX 1050 Mobile 1354 / 1493 MHz 4 GB | 16 GB | 4.5 |
| Samsung Notebook 9 NP900X5T-X01US | i5-8550U | GeForce MX150 1468 / 6008 MHz 2 GB | 16 GB | 4.6 |
| Model | CPU | GPU | RAM | Wartość |
|---|---|---|---|---|
| Xiaomi Mi Notebook Pro i7 | i5-8550U | GeForce MX150 1341 / 1253 MHz 2 GB | 16 GB | 841 |
| Razer Blade Stealth QHD i7-8550U | i5-8550U @4 GHz | UHD Graphics 620 300 / 350 MHz 1 GB | 16 GB | @4 GHz 841 |
| Kuu LeBook 12.6 Core i7-8550U | i5-8550U 18 W / 15 W | UHD Graphics 620 1067 / 1150 MHz | 8 GB | 913 |
| LG Gram 15Z980-B.AA78B | i5-8550U | UHD Graphics 620 | 16 GB | 937 |
| CPU TDP ? | TDP 15 W |
|---|---|
| 100% | 100% |
| Model | CPU | GPU | RAM | Wartość |
|---|---|---|---|---|
| Kuu LeBook 12.6 Core i7-8550U | i5-8550U 18 W / 15 W | UHD Graphics 620 1067 / 1150 MHz | 8 GB | 0.716 |
| Model | CPU | GPU | RAM | Wartość |
|---|---|---|---|---|
| Lenovo ThinkPad X380 Yoga 20LJS02W00 | i5-8550U | UHD Graphics 620 1150 MHz | 16 GB | 4534 |
| HP Spectre 13-af033ng | i5-8550U | UHD Graphics 620 400 / 1064 MHz | 8 GB | 5352 |
| Asus ZenBook 13 UX331UN | i5-8550U | GeForce MX150 1607 / 1253 MHz 2 GB | 8 GB | 5403 |
| Asus VivoBook Pro 17 N705UD-EH76 | i5-8550U | GeForce GTX 1050 Mobile 1354 / 1493 MHz 4 GB | 16 GB | 5554 |
| HP Spectre x360 13-ae048ng | i5-8550U | UHD Graphics 620 400 / 1064 MHz | 16 GB | 5559 |
| HP Envy 13-ah0003ng | i5-8550U | GeForce MX150 1038 / 1253 MHz 2 GB | 16 GB | 5665 |
| Acer TravelMate 2410-G2-MG-82E6 | i5-8550U | GeForce MX130 2 GB | 8 GB | 5755 |
| HP Spectre x360 13t-ae000 | i5-8550U | UHD Graphics 620 1150 / 1067 MHz | 16 GB | 5845 |
| Acer Nitro 5 Spin NP515-51-86CX | i5-8550U | GeForce GTX 1050 Mobile 1354 / 1752 MHz 4 GB | 8 GB | 6003 |
| Asus VivoBook 15 F510UF-ES71 | i5-8550U | GeForce MX130 1108 / 5010 MHz 2 GB | 8 GB | 6092 |
| Lenovo Yoga 730-15IKB | i5-8550U | GeForce GTX 1050 Mobile 1493 / 1752 MHz 4 GB | 16 GB | 6101 |
| LG Gram 15Z980-B.AA78B | i5-8550U | UHD Graphics 620 | 16 GB | 6271 |
| Tuxedo InfinityBook Pro 13 2017 | i5-8550U | UHD Graphics 620 | 32 GB | 6392 |
| Acer Aspire 5 A517-51G-80L | i5-8550U | GeForce MX150 1532 / 6000 MHz 2 GB | 8 GB | 6949 |
| Lenovo ThinkPad T480s-20L8S02E00 | i5-8550U | GeForce MX150 1038 / 1252.5 MHz 2 GB | 16 GB | 7795 |
| Model | CPU | GPU | RAM | Wartość |
|---|---|---|---|---|
| HP Spectre x360 13t-ae000 | i5-8550U | UHD Graphics 620 1150 / 1067 MHz | 16 GB | 9 |
| Asus VivoBook Pro 17 N705UD-EH76 | i5-8550U | GeForce GTX 1050 Mobile 1354 / 1493 MHz 4 GB | 16 GB | 9 |
| Asus Zenbook UX430UN | i5-8550U | GeForce MX150 1468 / 6008 MHz 2 GB | 16 GB | 9.239 |
| Samsung Notebook 9 NP900X5T-X01US | i5-8550U | GeForce MX150 1468 / 6008 MHz 2 GB | 16 GB | 9.25 |
| Lenovo Yoga 920-13IKB-80Y7 | i5-8550U | UHD Graphics 620 400 MHz | 7.9 GB | 9.27 |
| HP Spectre x360 15t-bl100 | i5-8550U | GeForce MX150 1468 / 1502 MHz | 16 GB | 9.28 |
| Acer TravelMate X3410-M-866T | i5-8550U | UHD Graphics 620 400 / 665 MHz 1 GB | 16 GB | 9.341 |
| Acer Aspire 5 A517-51G-80L | i5-8550U | GeForce MX150 1532 / 6000 MHz 2 GB | 8 GB | 9.704 |
| Tuxedo InfinityBook Pro 13 2017 | i5-8550U | UHD Graphics 620 | 32 GB | 10 |
| Asus VivoBook S410UQ-NH74 | i5-8550U | GeForce 940MX 1242 / 4000 MHz 2 GB | 8 GB | 14.37 |
| Dell XPS 13 9370 i7 UHD | i5-8550U | UHD Graphics 620 | 16 GB | 17.45 |
| Model | CPU | GPU | RAM | Wartość |
|---|---|---|---|---|
| Asus VivoBook Pro 17 N705UD-EH76 | i5-8550U | GeForce GTX 1050 Mobile 1354 / 1493 MHz 4 GB | 16 GB | 20 |
| Samsung Notebook 9 NP900X5T-X01US | i5-8550U | GeForce MX150 1468 / 6008 MHz 2 GB | 16 GB | 20.78 |
| HP Spectre x360 15t-bl100 | i5-8550U | GeForce MX150 1468 / 1502 MHz | 16 GB | 20.83 |
| Lenovo Yoga 920-13IKB-80Y7 | i5-8550U | UHD Graphics 620 400 MHz | 7.9 GB | 20.85 |
| HP Spectre x360 13t-ae000 | i5-8550U | UHD Graphics 620 1150 / 1067 MHz | 16 GB | 21 |
| Acer Aspire 5 A517-51G-80L | i5-8550U | GeForce MX150 1532 / 6000 MHz 2 GB | 8 GB | 21.16 |
| Acer TravelMate X3410-M-866T | i5-8550U | UHD Graphics 620 400 / 665 MHz 1 GB | 16 GB | 21.18 |
| Asus Zenbook UX430UN | i5-8550U | GeForce MX150 1468 / 6008 MHz 2 GB | 16 GB | 21.24 |
| Tuxedo InfinityBook Pro 13 2017 | i5-8550U | UHD Graphics 620 | 32 GB | 22 |
| Dell XPS 13 9370 i7 UHD | i5-8550U | UHD Graphics 620 | 16 GB | 31 |
| Asus VivoBook S410UQ-NH74 | i5-8550U | GeForce 940MX 1242 / 4000 MHz 2 GB | 8 GB | 32.72 |
| Model | CPU | GPU | RAM | Wartość |
|---|---|---|---|---|
| HP Spectre x360 15t-bl100 | i5-8550U | GeForce MX150 1468 / 1502 MHz | 16 GB | 510 |
| Asus VivoBook Pro 17 N705UD-EH76 | i5-8550U | GeForce GTX 1050 Mobile 1354 / 1493 MHz 4 GB | 16 GB | 512 |
| Samsung Notebook 9 NP900X5T-X01US | i5-8550U | GeForce MX150 1468 / 6008 MHz 2 GB | 16 GB | 514 |
| Tuxedo InfinityBook Pro 13 2017 | i5-8550U | UHD Graphics 620 | 32 GB | 524 |
| Asus Zenbook UX430UN | i5-8550U | GeForce MX150 1468 / 6008 MHz 2 GB | 16 GB | 530 |
| Lenovo Yoga 920-13IKB-80Y7 | i5-8550U | UHD Graphics 620 400 MHz | 7.9 GB | 536 |
| Acer Aspire 5 A517-51G-80L | i5-8550U | GeForce MX150 1532 / 6000 MHz 2 GB | 8 GB | 551 |
| Acer TravelMate X3410-M-866T | i5-8550U | UHD Graphics 620 400 / 665 MHz 1 GB | 16 GB | 577 |
| HP Spectre x360 13t-ae000 | i5-8550U | UHD Graphics 620 1150 / 1067 MHz | 16 GB | 601 |
| Asus VivoBook S410UQ-NH74 | i5-8550U | GeForce 940MX 1242 / 4000 MHz 2 GB | 8 GB | 734 |
| Dell XPS 13 9370 i7 UHD | i5-8550U | UHD Graphics 620 | 16 GB | 740 |
| Model | CPU | GPU | RAM | Wartość |
|---|---|---|---|---|
| HP ZBook 15u G5 2ZC05EA | i5-8550U | Radeon Pro WX 3100 1046 / 1500 MHz 2 GB | 8 GB | 21623 |
| Model | CPU | GPU | RAM | Wartość |
|---|---|---|---|---|
| Lenovo ThinkPad T480-20L6S01V00 | i5-8550U | GeForce MX150 1469 / 1502 MHz 2 GB | 8 GB | 3961 |
| HP Pavilion 14-ce0002ng | i5-8550U | GeForce MX150 2 GB | 8 GB | 4110 |
| Asus ZenBook S UX391U | i5-8550U | UHD Graphics 620 1150 / 1066 MHz | 8 GB | 4702 |
| Lenovo ThinkPad E580-20KS001RGE | i5-8550U | Radeon RX 550 (Laptop) 902 / 1500 MHz 2 GB | 8 GB | 4895 |
| Acer TravelMate X3410-M-866T | i5-8550U | UHD Graphics 620 400 / 665 MHz 1 GB | 16 GB | 4923 |
| Lenovo Yoga 720-13IKB | i5-8550U | UHD Graphics 620 1150 MHz | 8 GB | 5126 |
| Toshiba Portege X30T-E-109 | i5-8550U | UHD Graphics 620 | 16 GB | 5153 |
| Lenovo Yoga 730-15IKB | i5-8550U | GeForce GTX 1050 Mobile 1493 / 1752 MHz 4 GB | 16 GB | 5166 |
| Acer TravelMate X3410-M-50DD | i5-8550U | GeForce MX130 1189 / 1253 MHz 2 GB | 16 GB | 5190 |
| Lenovo IdeaPad Flex-1570 81CA000RUS | i5-8550U | GeForce MX130 1108 / 5010 MHz 2 GB | 16 GB | 5212 |
| Kuu LeBook 12.6 Core i7-8550U | i5-8550U 18 W / 15 W | UHD Graphics 620 1067 / 1150 MHz | 8 GB | 5384 |
| Tuxedo InfinityBook Pro 13 2017 | i5-8550U | UHD Graphics 620 | 32 GB | 5505 |
| HP Spectre x360 13-ae048ng | i5-8550U | UHD Graphics 620 400 / 1064 MHz | 16 GB | 5587 |
| Lenovo ThinkPad X380 Yoga 20LJS02W00 | i5-8550U | UHD Graphics 620 1150 MHz | 16 GB | 5656 |
| Asus VivoBook S15 S530UN-BQ097T | i5-8550U | GeForce MX150 1532 / 1469 MHz 2 GB | 16 GB | 5670 |
| Acer Spin 5 SP515-51GN-80A3 | i5-8550U | GeForce GTX 1050 Mobile 1493 / 7000 MHz 4 GB | 8 GB | 5736 |
| Lenovo Yoga 730-13IKB | i5-8550U | UHD Graphics 620 | 16 GB | 5849 |
| Samsung Notebook 9 NP930QAA | i5-8550U | UHD Graphics 620 | 8 GB | 5897 |
| Lenovo Miix 520-12IKB 20M3000LGE Cool Mode On | i5-8550U | UHD Graphics 620 1150 MHz | 16 GB | 5912 |
| Acer Nitro 5 Spin NP515-51-86CX | i5-8550U | GeForce GTX 1050 Mobile 1354 / 1752 MHz 4 GB | 8 GB | 5981 |
| Tuxedo Book BU1307 | i5-8550U | UHD Graphics 620 | 0 GB | 6027 |
| Dynabook Portege A30-E-174 | i5-8550U | UHD Graphics 620 1150 / 1200 MHz | 16 GB | 6059 |
| HP Spectre x360 13t-ae000 | i5-8550U | UHD Graphics 620 1150 / 1067 MHz | 16 GB | 6084 |
| HP Spectre 13-af033ng | i5-8550U | UHD Graphics 620 400 / 1064 MHz | 8 GB | 6144 |
| Lenovo IdeaPad 330-17IKB 81DM | i5-8550U | GeForce MX150 1468 / 6008 MHz 2 GB | 16 GB | 6202 |
| Lenovo Miix 520-12IKB 20M3000LGE Cool Mode Off | i5-8550U | UHD Graphics 620 1150 MHz | 16 GB | 6206 |
| Dell Inspiron 15 7570 | i5-8550U | GeForce 940MX 1242 / 4000 MHz 4 GB | 8 GB | 6223 |
| Asus ZenBook 13 UX331UN | i5-8550U | GeForce MX150 1700 / 1252 MHz 2 GB | 16 GB | 6235 |
| Lenovo IdeaPad 530s-14IKB | i5-8550U | GeForce MX150 1532 / 6000 MHz 2 GB | 8 GB | 6305 |
| Dell XPS 13 9370 i7 UHD | i5-8550U | UHD Graphics 620 | 16 GB | 6359 |
| Schenker Slim 15 L17 | i5-8550U | UHD Graphics 620 | 16 GB | 6403 |
| Asus VivoBook S410UQ-NH74 | i5-8550U | GeForce 940MX 1242 / 4000 MHz 2 GB | 8 GB | 6581 |
| HP EliteBook 830 G5-3JX74EA | i5-8550U | UHD Graphics 620 | 32 GB | 6619 |
| Getac S410 | i5-8550U | UHD Graphics 620 300 / 1200 MHz | 32 GB | 6635 |
| Dell Latitude 15 3590-K8JP | i5-8550U | Radeon 530 1024 / 1125 MHz 2 GB | 8 GB | 6663 |
| Acer Swift 3 SF314-52G-89SL | i5-8550U | GeForce MX150 1797 / 1502 MHz 2 GB | 8 GB | 6672 |
| Razer Blade Stealth QHD i7-8550U | i5-8550U @4 GHz | UHD Graphics 620 300 / 350 MHz 1 GB | 16 GB | @4 GHz 6763 |
| HP ZBook 15u G5 2ZC05EA | i5-8550U | Radeon Pro WX 3100 1046 / 1500 MHz 2 GB | 8 GB | 6764 |
| Lenovo Yoga 920-13IKB-80Y7 | i5-8550U | UHD Graphics 620 400 MHz | 7.9 GB | 6783 |
| MSI Prestige PS42 8RB-059 | i5-8550U | GeForce MX150 1468 / 6008 MHz 2 GB | 16 GB | 6789 |
| Lenovo ThinkPad X1 Yoga 2018-20LES01W00 | i5-8550U | UHD Graphics 620 1150 MHz | 16 GB | 6810 |
| HP ZBook 14u G5-2ZB99EA | i5-8550U | Radeon Pro WX 3100 1046 / 6000 MHz 2 GB | 8 GB | 6866 |
| Medion Akoya S6625 | i5-8550U | GeForce 940MX 1189 / 1253 MHz 2 GB | 8 GB | 7000 |
| HP EliteBook 840 G5-3JX61EA | i5-8550U | UHD Graphics 620 1150 MHz | 32 GB | 7033 |
| Schenker Slim 14 M18 | i5-8550U | UHD Graphics 620 | 16 GB | 7042 |
| Zotac ZBOX-CI660 Nano | i5-8550U | UHD Graphics 620 300 / 1067 MHz | 16 GB | 7082 |
| Asus VivoBook Pro 17 N705UD-EH76 | i5-8550U | GeForce GTX 1050 Mobile 1354 / 1493 MHz 4 GB | 16 GB | 7108 |
| Asus VivoBook 15 F510UF-ES71 | i5-8550U | GeForce MX130 1108 / 5010 MHz 2 GB | 8 GB | 7150 |
| Acer Aspire 5 A517-51G-80L | i5-8550U | GeForce MX150 1532 / 6000 MHz 2 GB | 8 GB | 7325 |
| Dell XPS 13 i7-8550U | i5-8550U | UHD Graphics 620 400 / 930 MHz | 8 GB | 7334 |
| Acer Switch 7 BE SW713-51GNP | i5-8550U | GeForce MX150 936 / 5010 MHz 2 GB | 16 GB | 7335 |
| Asus ZenBook 13 UX331UN | i5-8550U | GeForce MX150 1607 / 1253 MHz 2 GB | 8 GB | 7587 |
| Acer TravelMate 2410-G2-MG-82E6 | i5-8550U | GeForce MX130 2 GB | 8 GB | 7610 |
| Asus ZenBook Flip 15 UX561UD | i5-8550U | GeForce GTX 1050 Mobile 1493 / 7000 MHz 2 GB | 16 GB | 7789 |
| HP Spectre x360 15t-bl100 | i5-8550U | GeForce MX150 1468 / 1502 MHz | 16 GB | 7886 |
| Lenovo Yoga C930-13IKB 81C4 | i5-8550U | UHD Graphics 620 400 MHz | 12 GB | 7890 |
| Huawei MateBook X Pro, i7 | i5-8550U | GeForce MX150 | 8 GB | 7954 |
| Lenovo ThinkPad X1 Carbon 2018-20KGS03900 | i5-8550U | UHD Graphics 620 1100 MHz | 16 GB | 7978 |
| Lenovo ThinkPad T580-20LAS01H00 | i5-8550U | GeForce MX150 1532 / 1502 MHz 2 GB | 8 GB | 8029 |
| HP Spectre x360 15-ch011nr | i5-8550U | GeForce MX150 1469 / 1502 MHz 2 GB | 16 GB | 8038 |
| Samsung Notebook 9 NP900X5T-X01US | i5-8550U | GeForce MX150 1468 / 6008 MHz 2 GB | 16 GB | 8093 |
| Asus VivoBook 15 X570UD | i5-8550U | GeForce GTX 1050 Mobile 1354 / 7008 MHz 2 GB | 32 GB | 8112 |
| Xiaomi Mi Notebook Pro i7 | i5-8550U | GeForce MX150 1341 / 1253 MHz 2 GB | 16 GB | 8184 |
| Dell Inspiron 17-7773-0043 | i5-8550U | GeForce MX150 1532 / 6000 MHz 2 GB | 16 GB | 8208 |
| Lenovo ThinkPad P52s-20LB000HGE | i5-8550U | Quadro P500 1519 / 1253 MHz 2 GB | 8 GB | 8222 |
| Asus VivoBook S13 S330UA-EY034T | i5-8550U | UHD Graphics 620 | 8 GB | 8347 |
| Asus Zenbook UX430UN | i5-8550U | GeForce MX150 1468 / 6008 MHz 2 GB | 16 GB | 8551 |
| HP Envy 13-ah0003ng | i5-8550U | GeForce MX150 1038 / 1253 MHz 2 GB | 16 GB | 8914 |
| Lenovo ThinkPad T480s-20L8S02E00 | i5-8550U | GeForce MX150 1038 / 1252.5 MHz 2 GB | 16 GB | 9527 |
| CPU TDP ? | TDP 15 W |
|---|---|
| 100% | 81% |
| Model | CPU | GPU | RAM | Wartość |
|---|---|---|---|---|
| Asus ZenBook Flip 15 UX561UD | i5-8550U | GeForce GTX 1050 Mobile 1493 / 7000 MHz 2 GB | 16 GB | 16314 |
| Lenovo Yoga 730-15IKB | i5-8550U | GeForce GTX 1050 Mobile 1493 / 1752 MHz 4 GB | 16 GB | 30414 |
| Asus ZenBook S UX391U | i5-8550U | UHD Graphics 620 1150 / 1066 MHz | 8 GB | 31951 |
| Lenovo IdeaPad 530s-14IKB | i5-8550U | GeForce MX150 1532 / 6000 MHz 2 GB | 8 GB | 36581 |
| Asus Zenbook UX430UN | i5-8550U | GeForce MX150 1468 / 6008 MHz 2 GB | 16 GB | 37193 |
| Acer Aspire 5 A517-51G-80L | i5-8550U | GeForce MX150 1532 / 6000 MHz 2 GB | 8 GB | 37275 |
| Lenovo ThinkPad T480s-20L8S02E00 | i5-8550U | GeForce MX150 1038 / 1252.5 MHz 2 GB | 16 GB | 41226 |
| Acer Spin 5 SP515-51GN-80A3 | i5-8550U | GeForce GTX 1050 Mobile 1493 / 7000 MHz 4 GB | 8 GB | 42926 |
| Asus VivoBook S410UQ-NH74 | i5-8550U | GeForce 940MX 1242 / 4000 MHz 2 GB | 8 GB | 43244 |
| Schenker Slim 15 L17 | i5-8550U | UHD Graphics 620 | 16 GB | 43987 |
| Medion Akoya S6625 | i5-8550U | GeForce 940MX 1189 / 1253 MHz 2 GB | 8 GB | 45377 |
| HP ZBook 15u G5 2ZC05EA | i5-8550U | Radeon Pro WX 3100 1046 / 1500 MHz 2 GB | 8 GB | 45845 |
| Dell XPS 13 i7-8550U | i5-8550U | UHD Graphics 620 400 / 930 MHz | 8 GB | 47858 |
| Lenovo Yoga 920-13IKB-80Y7 | i5-8550U | UHD Graphics 620 400 MHz | 7.9 GB | 48547 |
| Dell XPS 13 9370 i7 UHD | i5-8550U | UHD Graphics 620 | 16 GB | 49193 |
| Samsung Notebook 9 NP900X5T-X01US | i5-8550U | GeForce MX150 1468 / 6008 MHz 2 GB | 16 GB | 49748 |
| Asus VivoBook 15 F510UF-ES71 | i5-8550U | GeForce MX130 1108 / 5010 MHz 2 GB | 8 GB | 50160 |
| HP ZBook 14u G5-2ZB99EA | i5-8550U | Radeon Pro WX 3100 1046 / 6000 MHz 2 GB | 8 GB | 50915 |
| HP Envy 13-ah0003ng | i5-8550U | GeForce MX150 1038 / 1253 MHz 2 GB | 16 GB | 52085 |
| Dell Inspiron 17-7773-0043 | i5-8550U | GeForce MX150 1532 / 6000 MHz 2 GB | 16 GB | 55226 |
| Model | CPU | GPU | RAM | Wartość |
|---|---|---|---|---|
| Asus ZenBook Flip 15 UX561UD | i5-8550U | GeForce GTX 1050 Mobile 1493 / 7000 MHz 2 GB | 16 GB | 16312 |
| Samsung Notebook 9 NP900X5T-X01US | i5-8550U | GeForce MX150 1468 / 6008 MHz 2 GB | 16 GB | 21610 |
| Lenovo Yoga 730-15IKB | i5-8550U | GeForce GTX 1050 Mobile 1493 / 1752 MHz 4 GB | 16 GB | 30339 |
| HP Spectre x360 15t-bl100 | i5-8550U | GeForce MX150 1468 / 1502 MHz | 16 GB | 31062 |
| Asus ZenBook S UX391U | i5-8550U | UHD Graphics 620 1150 / 1066 MHz | 8 GB | 31848 |
| Medion Akoya S6625 | i5-8550U | GeForce 940MX 1189 / 1253 MHz 2 GB | 8 GB | 32417 |
| Acer Aspire 5 A517-51G-80L | i5-8550U | GeForce MX150 1532 / 6000 MHz 2 GB | 8 GB | 35410 |
| Lenovo IdeaPad 530s-14IKB | i5-8550U | GeForce MX150 1532 / 6000 MHz 2 GB | 8 GB | 36558 |
| Acer Spin 5 SP515-51GN-80A3 | i5-8550U | GeForce GTX 1050 Mobile 1493 / 7000 MHz 4 GB | 8 GB | 36876 |
| Dell Inspiron 17-7773-0043 | i5-8550U | GeForce MX150 1532 / 6000 MHz 2 GB | 16 GB | 37271 |
| Asus Zenbook UX430UN | i5-8550U | GeForce MX150 1468 / 6008 MHz 2 GB | 16 GB | 37526 |
| Schenker Slim 15 L17 | i5-8550U | UHD Graphics 620 | 16 GB | 44444 |
| Lenovo Yoga 920-13IKB-80Y7 | i5-8550U | UHD Graphics 620 400 MHz | 7.9 GB | 47389 |
| Dell XPS 13 i7-8550U | i5-8550U | UHD Graphics 620 400 / 930 MHz | 8 GB | 48258 |
| Dell XPS 13 9370 i7 UHD | i5-8550U | UHD Graphics 620 | 16 GB | 49183 |
| HP ZBook 14u G5-2ZB99EA | i5-8550U | Radeon Pro WX 3100 1046 / 6000 MHz 2 GB | 8 GB | 49667 |
| HP Envy 13-ah0003ng | i5-8550U | GeForce MX150 1038 / 1253 MHz 2 GB | 16 GB | 51937 |
| Model | CPU | GPU | RAM | Wartość |
|---|---|---|---|---|
| Lenovo Yoga 720-13IKB | i5-8550U | UHD Graphics 620 1150 MHz | 8 GB | 27917 |
| Lenovo ThinkPad X380 Yoga 20LJS02W00 | i5-8550U | UHD Graphics 620 1150 MHz | 16 GB | 36346 |
| LG Gram 15Z980-B.AA78B | i5-8550U | UHD Graphics 620 | 16 GB | 41407 |
| Lenovo IdeaPad 530s-14IKB | i5-8550U | GeForce MX150 1532 / 6000 MHz 2 GB | 8 GB | 45461 |
| HP EliteBook x360 1030 G3-4QZ12ES | i5-8550U | UHD Graphics 620 | 16 GB | 46110 |
| HP Spectre x360 13t-ae000 | i5-8550U | UHD Graphics 620 1150 / 1067 MHz | 16 GB | 46160 |
| Schenker Slim 15 L17 | i5-8550U | UHD Graphics 620 | 16 GB | 46424 |
| Acer Nitro 5 Spin NP515-51-86CX | i5-8550U | GeForce GTX 1050 Mobile 1354 / 1752 MHz 4 GB | 8 GB | 47408 |
| Dynabook Portege A30-E-174 | i5-8550U | UHD Graphics 620 1150 / 1200 MHz | 16 GB | 48739 |
| Lenovo Miix 520-12IKB 20M3000LGE | i5-8550U | UHD Graphics 620 1150 MHz | 16 GB | 49204 |
| HP EliteBook 840 G5-3JX61EA | i5-8550U | UHD Graphics 620 1150 MHz | 32 GB | 49548 |
| Dell XPS 13 9370 i7 UHD | i5-8550U | UHD Graphics 620 | 16 GB | 51019 |
| HP ZBook 14u G5-2ZB99EA | i5-8550U | Radeon Pro WX 3100 1046 / 6000 MHz 2 GB | 8 GB | 51327 |
| Asus ZenBook 13 UX331UN | i5-8550U | GeForce MX150 1607 / 1253 MHz 2 GB | 8 GB | 52842 |
| HP Envy 13-ah0003ng | i5-8550U | GeForce MX150 1038 / 1253 MHz 2 GB | 16 GB | 53339 |
| Asus VivoBook S410UQ-NH74 | i5-8550U | GeForce 940MX 1242 / 4000 MHz 2 GB | 8 GB | 53389 |
| Medion Akoya S6625 | i5-8550U | GeForce 940MX 1189 / 1253 MHz 2 GB | 8 GB | 53999 |
| Acer Spin 5 SP515-51GN-80A3 | i5-8550U | GeForce GTX 1050 Mobile 1493 / 7000 MHz 4 GB | 8 GB | 54345 |
| Dell XPS 13 i7-8550U | i5-8550U | UHD Graphics 620 400 / 930 MHz | 8 GB | 54554 |
| Samsung Notebook 9 NP900X5T-X01US | i5-8550U | GeForce MX150 1468 / 6008 MHz 2 GB | 16 GB | 54747 |
| Asus ZenBook Flip 15 UX561UD | i5-8550U | GeForce GTX 1050 Mobile 1493 / 7000 MHz 2 GB | 16 GB | 54853 |
| Dell Inspiron 17-7773-0043 | i5-8550U | GeForce MX150 1532 / 6000 MHz 2 GB | 16 GB | 55679 |
| Asus VivoBook Pro 17 N705UD-EH76 | i5-8550U | GeForce GTX 1050 Mobile 1354 / 1493 MHz 4 GB | 16 GB | 55733 |
| Acer Aspire 5 A517-51G-80L | i5-8550U | GeForce MX150 1532 / 6000 MHz 2 GB | 8 GB | 55917 |
| Lenovo Yoga 730-15IKB | i5-8550U | GeForce GTX 1050 Mobile 1493 / 1752 MHz 4 GB | 16 GB | 56249 |
| Asus Zenbook UX430UN | i5-8550U | GeForce MX150 1468 / 6008 MHz 2 GB | 16 GB | 56324 |
| Xiaomi Mi Notebook Pro i7 | i5-8550U | GeForce MX150 1341 / 1253 MHz 2 GB | 16 GB | 58213 |
| Model | CPU | GPU | RAM | Wartość |
|---|---|---|---|---|
| Lenovo ThinkPad T480-20L6S01V00 | i5-8550U | GeForce MX150 1469 / 1502 MHz 2 GB | 8 GB | 3437 |
| Acer TravelMate X3410-M-50DD | i5-8550U | GeForce MX130 1189 / 1253 MHz 2 GB | 16 GB | 3638 |
| Asus ZenBook 13 UX331UN | i5-8550U | GeForce MX150 1700 / 1252 MHz 2 GB | 16 GB | 3733 |
| Lenovo ThinkPad X380 Yoga 20LJS02W00 | i5-8550U | UHD Graphics 620 1150 MHz | 16 GB | 3753 |
| Lenovo Yoga 720-13IKB | i5-8550U | UHD Graphics 620 1150 MHz | 8 GB | 3968 |
| Lenovo IdeaPad Flex-1570 81CA000RUS | i5-8550U | GeForce MX130 1108 / 5010 MHz 2 GB | 16 GB | 4015 |
| Asus ZenBook S UX391U | i5-8550U | UHD Graphics 620 1150 / 1066 MHz | 8 GB | 4090 |
| Acer Spin 5 SP515-51GN-80A3 | i5-8550U | GeForce GTX 1050 Mobile 1493 / 7000 MHz 4 GB | 8 GB | 4769 |
| HP Spectre x360 13-ae048ng | i5-8550U | UHD Graphics 620 400 / 1064 MHz | 16 GB | 4881 |
| Acer Nitro 5 Spin NP515-51-86CX | i5-8550U | GeForce GTX 1050 Mobile 1354 / 1752 MHz 4 GB | 8 GB | 4933 |
| HP EliteBook x360 1030 G3-4QZ12ES | i5-8550U | UHD Graphics 620 | 16 GB | 4956 |
| Lenovo Yoga 730-13IKB | i5-8550U | UHD Graphics 620 | 16 GB | 5015 |
| Samsung Notebook 9 NP930QAA | i5-8550U | UHD Graphics 620 | 8 GB | 5020 |
| HP Elite x2 1013 G3 LTE i7 | i5-8550U | UHD Graphics 620 | 16 GB | 5054 |
| Acer TravelMate X3410-M-866T | i5-8550U | UHD Graphics 620 400 / 665 MHz 1 GB | 16 GB | 5110 |
| Asus VivoBook Pro 17 N705UD-EH76 | i5-8550U | GeForce GTX 1050 Mobile 1354 / 1493 MHz 4 GB | 16 GB | 5120 |
| HP Spectre x360 13t-ae000 | i5-8550U | UHD Graphics 620 1150 / 1067 MHz | 16 GB | 5153 |
| Lenovo IdeaPad 530s-14IKB | i5-8550U | GeForce MX150 1532 / 6000 MHz 2 GB | 8 GB | 5162 |
| HP ZBook 15u G5 2ZC05EA | i5-8550U | Radeon Pro WX 3100 1046 / 1500 MHz 2 GB | 8 GB | 5192 |
| HP EliteBook 830 G5-3JX74EA | i5-8550U | UHD Graphics 620 | 32 GB | 5227 |
| Dynabook Portege A30-E-174 | i5-8550U | UHD Graphics 620 1150 / 1200 MHz | 16 GB | 5238 |
| Lenovo Miix 520-12IKB 20M3000LGE Cool Mode On | i5-8550U | UHD Graphics 620 1150 MHz | 16 GB | 5270 |
| Lenovo Miix 520-12IKB 20M3000LGE Cool Mode Off | i5-8550U | UHD Graphics 620 1150 MHz | 16 GB | 5338 |
| HP ZBook 14u G5-2ZB99EA | i5-8550U | Radeon Pro WX 3100 1046 / 6000 MHz 2 GB | 8 GB | 5359 |
| HP Spectre 13-af033ng | i5-8550U | UHD Graphics 620 400 / 1064 MHz | 8 GB | 5396 |
| LG Gram 15Z980-B.AA78B | i5-8550U | UHD Graphics 620 | 16 GB | 5499 |
| HP Spectre x360 15-ch011nr | i5-8550U | GeForce MX150 1469 / 1502 MHz 2 GB | 16 GB | 5507 |
| Lenovo IdeaPad 330-17IKB 81DM | i5-8550U | GeForce MX150 1468 / 6008 MHz 2 GB | 16 GB | 5536 |
| Lenovo ThinkPad T580-20LAS01H00 | i5-8550U | GeForce MX150 1532 / 1502 MHz 2 GB | 8 GB | 5551 |
| Schenker Slim 15 L17 | i5-8550U | UHD Graphics 620 | 16 GB | 5565 |
| HP EliteBook 840 G5-3JX61EA | i5-8550U | UHD Graphics 620 1150 MHz | 32 GB | 5597 |
| Lenovo ThinkPad T480s-20L8S02E00 | i5-8550U | GeForce MX150 1038 / 1252.5 MHz 2 GB | 16 GB | 5675 |
| Asus VivoBook S410UQ-NH74 | i5-8550U | GeForce 940MX 1242 / 4000 MHz 2 GB | 8 GB | 5715 |
| Lenovo ThinkPad E580-20KS001RGE | i5-8550U | Radeon RX 550 (Laptop) 902 / 1500 MHz 2 GB | 8 GB | 5725 |
| MSI Prestige PS42 8RB-059 | i5-8550U | GeForce MX150 1468 / 6008 MHz 2 GB | 16 GB | 5753 |
| Razer Blade Stealth QHD i7-8550U | i5-8550U @4 GHz | UHD Graphics 620 300 / 350 MHz 1 GB | 16 GB | @4 GHz 5775 |
| Acer Switch 7 BE SW713-51GNP | i5-8550U | GeForce MX150 936 / 5010 MHz 2 GB | 16 GB | 5861 |
| HP Pavilion 14-ce0002ng | i5-8550U | GeForce MX150 2 GB | 8 GB | 5883 |
| Lenovo ThinkPad X1 Tablet G3 LTE i7 | i5-8550U | UHD Graphics 620 | 16 GB | 5903 |
| Kuu LeBook 12.6 Core i7-8550U | i5-8550U 18 W / 15 W | UHD Graphics 620 1067 / 1150 MHz | 8 GB | 5957 |
| Huawei MateBook X Pro, i7 | i5-8550U | GeForce MX150 | 8 GB | 5979 |
| Lenovo Yoga 920-13IKB-80Y7 | i5-8550U | UHD Graphics 620 400 MHz | 7.9 GB | 6003 |
| Asus VivoBook S13 S330UA-EY034T | i5-8550U | UHD Graphics 620 | 8 GB | 6046 |
| Samsung Notebook 9 NP900X5T-X01US | i5-8550U | GeForce MX150 1468 / 6008 MHz 2 GB | 16 GB | 6072 |
| Dell XPS 13 i7-8550U | i5-8550U | UHD Graphics 620 400 / 930 MHz | 8 GB | 6100 |
| Asus Zenbook UX430UN | i5-8550U | GeForce MX150 1468 / 6008 MHz 2 GB | 16 GB | 6116 |
| Xiaomi Mi Notebook Pro i7 | i5-8550U | GeForce MX150 1341 / 1253 MHz 2 GB | 16 GB | 6175 |
| HP Spectre x360 15t-bl100 | i5-8550U | GeForce MX150 1468 / 1502 MHz | 16 GB | 6316 |
| Asus ZenBook 13 UX331UN | i5-8550U | GeForce MX150 1607 / 1253 MHz 2 GB | 8 GB | 6501 |
| Medion Akoya S6625 | i5-8550U | GeForce 940MX 1189 / 1253 MHz 2 GB | 8 GB | 6517 |
| Acer TravelMate 2410-G2-MG-82E6 | i5-8550U | GeForce MX130 2 GB | 8 GB | 6608 |
| Acer Aspire 5 A517-51G-80L | i5-8550U | GeForce MX150 1532 / 6000 MHz 2 GB | 8 GB | 6666 |
| Dell Latitude 15 3590-K8JP | i5-8550U | Radeon 530 1024 / 1125 MHz 2 GB | 8 GB | 6800 |
| Asus VivoBook 15 F510UF-ES71 | i5-8550U | GeForce MX130 1108 / 5010 MHz 2 GB | 8 GB | 6857 |
| Lenovo ThinkPad X1 Yoga 2018-20LES01W00 | i5-8550U | UHD Graphics 620 1150 MHz | 16 GB | 6926 |
| Dell XPS 13 9370 i7 UHD | i5-8550U | UHD Graphics 620 | 16 GB | 6973 |
| Lenovo Yoga C930-13IKB 81C4 | i5-8550U | UHD Graphics 620 400 MHz | 12 GB | 7038 |
| Asus VivoBook S15 S530UN-BQ097T | i5-8550U | GeForce MX150 1532 / 1469 MHz 2 GB | 16 GB | 7075 |
| Lenovo Yoga 730-15IKB | i5-8550U | GeForce GTX 1050 Mobile 1493 / 1752 MHz 4 GB | 16 GB | 7099 |
| Lenovo ThinkPad X1 Carbon 2018-20KGS03900 | i5-8550U | UHD Graphics 620 1100 MHz | 16 GB | 7162 |
| HP Envy 13-ah0003ng | i5-8550U | GeForce MX150 1038 / 1253 MHz 2 GB | 16 GB | 7243 |
| Lenovo ThinkPad X1 Carbon 2018-20KGS5DU00 | i5-8550U | UHD Graphics 620 1100 MHz | 16 GB | 7357 |
| Asus ZenBook Flip 15 UX561UD | i5-8550U | GeForce GTX 1050 Mobile 1493 / 7000 MHz 2 GB | 16 GB | 7703 |
| Dell Inspiron 15 7570 | i5-8550U | GeForce 940MX 1242 / 4000 MHz 4 GB | 8 GB | 7708 |
| Dell Inspiron 17-7773-0043 | i5-8550U | GeForce MX150 1532 / 6000 MHz 2 GB | 16 GB | 7725 |
| CPU TDP ? | TDP 15 W |
|---|---|
| 96% | 100% |
| Model | CPU | GPU | RAM | Wartość |
|---|---|---|---|---|
| Lenovo Miix 520-12IKB 20M3000LGE | i5-8550U | UHD Graphics 620 1150 MHz | 16 GB | 3961 |
| Lenovo ThinkPad E580-20KS001RGE | i5-8550U | Radeon RX 550 (Laptop) 902 / 1500 MHz 2 GB | 8 GB | 4775 |
| Asus ZenBook 13 UX331UN | i5-8550U | GeForce MX150 1700 / 1252 MHz 2 GB | 16 GB | 5244 |
| Lenovo ThinkPad X380 Yoga 20LJS02W00 | i5-8550U | UHD Graphics 620 1150 MHz | 16 GB | 5275 |
| Acer TravelMate X3410-M-50DD | i5-8550U | GeForce MX130 1189 / 1253 MHz 2 GB | 16 GB | 5294 |
| Lenovo IdeaPad Flex-1570 81CA000RUS | i5-8550U | GeForce MX130 1108 / 5010 MHz 2 GB | 16 GB | 5476 |
| Acer Spin 5 SP515-51GN-80A3 | i5-8550U | GeForce GTX 1050 Mobile 1493 / 7000 MHz 4 GB | 8 GB | 5524 |
| Lenovo Yoga 720-13IKB | i5-8550U | UHD Graphics 620 1150 MHz | 8 GB | 5590 |
| Asus ZenBook S UX391U | i5-8550U | UHD Graphics 620 1150 / 1066 MHz | 8 GB | 5774 |
| Acer Nitro 5 Spin NP515-51-86CX | i5-8550U | GeForce GTX 1050 Mobile 1354 / 1752 MHz 4 GB | 8 GB | 6008 |
| Kuu LeBook 12.6 Core i7-8550U | i5-8550U 18 W / 15 W | UHD Graphics 620 1067 / 1150 MHz | 8 GB | 6526 |
| HP Spectre x360 13t-ae000 | i5-8550U | UHD Graphics 620 1150 / 1067 MHz | 16 GB | 6984 |
| HP Spectre x360 13-ae048ng | i5-8550U | UHD Graphics 620 400 / 1064 MHz | 16 GB | 7023 |
| Asus VivoBook S410UQ-NH74 | i5-8550U | GeForce 940MX 1242 / 4000 MHz 2 GB | 8 GB | 7068 |
| Lenovo IdeaPad 330-17IKB 81DM | i5-8550U | GeForce MX150 1468 / 6008 MHz 2 GB | 16 GB | 7103 |
| Dynabook Portege A30-E-174 | i5-8550U | UHD Graphics 620 1150 / 1200 MHz | 16 GB | 7260 |
| Acer TravelMate X3410-M-866T | i5-8550U | UHD Graphics 620 400 / 665 MHz 1 GB | 16 GB | 7273 |
| Lenovo Yoga 730-13IKB | i5-8550U | UHD Graphics 620 | 16 GB | 7388 |
| LG Gram 15Z980-B.AA78B | i5-8550U | UHD Graphics 620 | 16 GB | 7465 |
| Schenker Slim 15 L17 | i5-8550U | UHD Graphics 620 | 16 GB | 7701 |
| HP Spectre 13-af033ng | i5-8550U | UHD Graphics 620 400 / 1064 MHz | 8 GB | 7716 |
| HP EliteBook 830 G5-3JX74EA | i5-8550U | UHD Graphics 620 | 32 GB | 7790 |
| Asus ZenBook Flip 15 UX561UD | i5-8550U | GeForce GTX 1050 Mobile 1493 / 7000 MHz 2 GB | 16 GB | 7875 |
| Lenovo IdeaPad 530s-14IKB | i5-8550U | GeForce MX150 1532 / 6000 MHz 2 GB | 8 GB | 7943 |
| Asus VivoBook S15 S530UN-BQ097T | i5-8550U | GeForce MX150 1532 / 1469 MHz 2 GB | 16 GB | 8007 |
| Lenovo ThinkPad X1 Yoga 2018-20LES01W00 | i5-8550U | UHD Graphics 620 1150 MHz | 16 GB | 8103 |
| Acer Switch 7 BE SW713-51GNP | i5-8550U | GeForce MX150 936 / 5010 MHz 2 GB | 16 GB | 8138 |
| Lenovo ThinkPad T480-20L6S01V00 | i5-8550U | GeForce MX150 1469 / 1502 MHz 2 GB | 8 GB | 8212 |
| HP EliteBook 840 G5-3JX61EA | i5-8550U | UHD Graphics 620 1150 MHz | 32 GB | 8267 |
| Lenovo Yoga 920-13IKB-80Y7 | i5-8550U | UHD Graphics 620 400 MHz | 7.9 GB | 8306 |
| HP ZBook 15u G5 2ZC05EA | i5-8550U | Radeon Pro WX 3100 1046 / 1500 MHz 2 GB | 8 GB | 8512 |
| Dell XPS 13 i7-8550U | i5-8550U | UHD Graphics 620 400 / 930 MHz | 8 GB | 8820 |
| HP Pavilion 14-ce0002ng | i5-8550U | GeForce MX150 2 GB | 8 GB | 8872 |
| HP Spectre x360 15t-bl100 | i5-8550U | GeForce MX150 1468 / 1502 MHz | 16 GB | 8949 |
| Asus VivoBook Pro 17 N705UD-EH76 | i5-8550U | GeForce GTX 1050 Mobile 1354 / 1493 MHz 4 GB | 16 GB | 9100 |
| Acer Aspire 5 A517-51G-80L | i5-8550U | GeForce MX150 1532 / 6000 MHz 2 GB | 8 GB | 9116 |
| HP Spectre x360 15-ch011nr | i5-8550U | GeForce MX150 1469 / 1502 MHz 2 GB | 16 GB | 9124 |
| Medion Akoya S6625 | i5-8550U | GeForce 940MX 1189 / 1253 MHz 2 GB | 8 GB | 9130 |
| HP ZBook 14u G5-2ZB99EA | i5-8550U | Radeon Pro WX 3100 1046 / 6000 MHz 2 GB | 8 GB | 9152 |
| Lenovo ThinkPad T580-20LAS01H00 | i5-8550U | GeForce MX150 1532 / 1502 MHz 2 GB | 8 GB | 9241 |
| Asus VivoBook 15 F510UF-ES71 | i5-8550U | GeForce MX130 1108 / 5010 MHz 2 GB | 8 GB | 9249 |
| Asus ZenBook 13 UX331UN | i5-8550U | GeForce MX150 1607 / 1253 MHz 2 GB | 8 GB | 9341 |
| Acer TravelMate 2410-G2-MG-82E6 | i5-8550U | GeForce MX130 2 GB | 8 GB | 9540 |
| Lenovo Yoga 730-15IKB | i5-8550U | GeForce GTX 1050 Mobile 1493 / 1752 MHz 4 GB | 16 GB | 9705 |
| Huawei MateBook X Pro, i7 | i5-8550U | GeForce MX150 | 8 GB | 9744 |
| MSI Prestige PS42 8RB-059 | i5-8550U | GeForce MX150 1468 / 6008 MHz 2 GB | 16 GB | 9746 |
| Samsung Notebook 9 NP900X5T-X01US | i5-8550U | GeForce MX150 1468 / 6008 MHz 2 GB | 16 GB | 9760 |
| Dell XPS 13 9370 i7 UHD | i5-8550U | UHD Graphics 620 | 16 GB | 9805 |
| Xiaomi Mi Notebook Pro i7 | i5-8550U | GeForce MX150 1341 / 1253 MHz 2 GB | 16 GB | 9842 |
| Dell Latitude 15 3590-K8JP | i5-8550U | Radeon 530 1024 / 1125 MHz 2 GB | 8 GB | 9993 |
| Asus Zenbook UX430UN | i5-8550U | GeForce MX150 1468 / 6008 MHz 2 GB | 16 GB | 10093 |
| Lenovo ThinkPad X1 Carbon 2018-20KGS03900 | i5-8550U | UHD Graphics 620 1100 MHz | 16 GB | 10106 |
| Asus VivoBook S13 S330UA-EY034T | i5-8550U | UHD Graphics 620 | 8 GB | 10125 |
| Lenovo ThinkPad X1 Carbon 2018-20KGS5DU00 | i5-8550U | UHD Graphics 620 1100 MHz | 16 GB | 10126 |
| Dell Inspiron 17-7773-0043 | i5-8550U | GeForce MX150 1532 / 6000 MHz 2 GB | 16 GB | 10280 |
| Lenovo ThinkPad T480s-20L8S02E00 | i5-8550U | GeForce MX150 1038 / 1252.5 MHz 2 GB | 16 GB | 10321 |
| HP Envy 13-ah0003ng | i5-8550U | GeForce MX150 1038 / 1253 MHz 2 GB | 16 GB | 10671 |
| Lenovo ThinkPad P52s-20LB000HGE | i5-8550U | Quadro P500 1519 / 1253 MHz 2 GB | 8 GB | 10825 |
| Dell Inspiron 15 7570 | i5-8550U | GeForce 940MX 1242 / 4000 MHz 4 GB | 8 GB | 11110 |
| CPU TDP ? | TDP 15 W |
|---|---|
| 100% | 79% |
| Model | CPU | GPU | RAM | Wartość |
|---|---|---|---|---|
| Kuu LeBook 12.6 Core i7-8550U | i5-8550U 18 W / 15 W | UHD Graphics 620 1067 / 1150 MHz | 8 GB | 2463 |
| Medion Akoya S6625 | i5-8550U | GeForce 940MX 1189 / 1253 MHz 2 GB | 8 GB | 2500 |
| Dynabook Portege A30-E-174 | i5-8550U | UHD Graphics 620 1150 / 1200 MHz | 16 GB | 2585 |
| Schenker Slim 15 L17 | i5-8550U | UHD Graphics 620 | 16 GB | 2609 |
| LG Gram 15Z980-B.AA78B | i5-8550U | UHD Graphics 620 | 16 GB | 2645 |
| Lenovo IdeaPad 530s-14IKB | i5-8550U | GeForce MX150 1532 / 6000 MHz 2 GB | 8 GB | 2703 |
| Razer Blade Stealth QHD i7-8550U | i5-8550U @4 GHz | UHD Graphics 620 300 / 350 MHz 1 GB | 16 GB | @4 GHz 2846 |
| HP ZBook 14u G5-2ZB99EA | i5-8550U | Radeon Pro WX 3100 1046 / 6000 MHz 2 GB | 8 GB | 2875 |
| HP Envy 13-ah0003ng | i5-8550U | GeForce MX150 1038 / 1253 MHz 2 GB | 16 GB | 2912 |
| Asus ZenBook 13 UX331UN | i5-8550U | GeForce MX150 1607 / 1253 MHz 2 GB | 8 GB | 2923 |
| Acer Spin 5 SP515-51GN-80A3 | i5-8550U | GeForce GTX 1050 Mobile 1493 / 7000 MHz 4 GB | 8 GB | 2973 |
| Asus VivoBook S15 S530UN-BQ097T | i5-8550U | GeForce MX150 1532 / 1469 MHz 2 GB | 16 GB | 3237 |
| Lenovo ThinkPad X1 Carbon 2018-20KGS5DU00 | i5-8550U | UHD Graphics 620 1100 MHz | 16 GB | 3387 |
| Lenovo Yoga 730-15IKB | i5-8550U | GeForce GTX 1050 Mobile 1493 / 1752 MHz 4 GB | 16 GB | 3865 |
| CPU TDP ? | TDP 15 W |
|---|---|
| 100% | 84% |
| Model | CPU | GPU | RAM | Wartość |
|---|---|---|---|---|
| Dynabook Portege A30-E-174 | i5-8550U | UHD Graphics 620 1150 / 1200 MHz | 16 GB | 1081 |
| Model | CPU | GPU | RAM | Wartość |
|---|---|---|---|---|
| Dynabook Portege A30-E-174 | i5-8550U | UHD Graphics 620 1150 / 1200 MHz | 16 GB | 3141 |
| Model | CPU | GPU | RAM | Wartość |
|---|---|---|---|---|
| Medion Akoya S6625 | i5-8550U | GeForce 940MX 1189 / 1253 MHz 2 GB | 8 GB | 4555 |
| Asus ZenBook 13 UX331UN | i5-8550U | GeForce MX150 1607 / 1253 MHz 2 GB | 8 GB | 4700 |
| Xiaomi Mi Notebook Pro i7 | i5-8550U | GeForce MX150 1341 / 1253 MHz 2 GB | 16 GB | 4797 |
| Acer Swift 3 SF314-52G-89SL | i5-8550U | GeForce MX150 1797 / 1502 MHz 2 GB | 8 GB | 4813 |
| HP Envy 13-ah0003ng | i5-8550U | GeForce MX150 1038 / 1253 MHz 2 GB | 16 GB | 4842 |
| Lenovo Yoga 730-15IKB | i5-8550U | GeForce GTX 1050 Mobile 1493 / 1752 MHz 4 GB | 16 GB | 4900 |
| Lenovo Yoga 720-13IKB | i5-8550U | UHD Graphics 620 1150 MHz | 8 GB | 4942 |
| Lenovo ThinkPad X380 Yoga 20LJS02W00 | i5-8550U | UHD Graphics 620 1150 MHz | 16 GB | 4944 |
| Dynabook Portege A30-E-174 | i5-8550U | UHD Graphics 620 1150 / 1200 MHz | 16 GB | 4975 |
| Lenovo Miix 520-12IKB 20M3000LGE | i5-8550U | UHD Graphics 620 1150 MHz | 16 GB | 4977 |
| HP EliteBook 840 G5-3JX61EA | i5-8550U | UHD Graphics 620 1150 MHz | 32 GB | 4997 |
| Model | CPU | GPU | RAM | Wartość |
|---|---|---|---|---|
| Lenovo Yoga 720-13IKB | i5-8550U | UHD Graphics 620 1150 MHz | 8 GB | 10869 |
| Lenovo ThinkPad X380 Yoga 20LJS02W00 | i5-8550U | UHD Graphics 620 1150 MHz | 16 GB | 11870 |
| Lenovo Miix 520-12IKB 20M3000LGE | i5-8550U | UHD Graphics 620 1150 MHz | 16 GB | 13622 |
| Asus ZenBook 13 UX331UN | i5-8550U | GeForce MX150 1607 / 1253 MHz 2 GB | 8 GB | 13897 |
| Medion Akoya S6625 | i5-8550U | GeForce 940MX 1189 / 1253 MHz 2 GB | 8 GB | 13992 |
| Acer Swift 3 SF314-52G-89SL | i5-8550U | GeForce MX150 1797 / 1502 MHz 2 GB | 8 GB | 15117 |
| Dynabook Portege A30-E-174 | i5-8550U | UHD Graphics 620 1150 / 1200 MHz | 16 GB | 15155 |
| HP Envy 13-ah0003ng | i5-8550U | GeForce MX150 1038 / 1253 MHz 2 GB | 16 GB | 15166 |
| Lenovo Yoga 730-15IKB | i5-8550U | GeForce GTX 1050 Mobile 1493 / 1752 MHz 4 GB | 16 GB | 15196 |
| Xiaomi Mi Notebook Pro i7 | i5-8550U | GeForce MX150 1341 / 1253 MHz 2 GB | 16 GB | 15538 |
| HP EliteBook 840 G5-3JX61EA | i5-8550U | UHD Graphics 620 1150 MHz | 32 GB | 16294 |
| Model | CPU | GPU | RAM | Wartość |
|---|---|---|---|---|
| Medion Akoya S6625 | i5-8550U | GeForce 940MX 1189 / 1253 MHz 2 GB | 8 GB | 4439 |
| Lenovo Yoga 720-13IKB | i5-8550U | UHD Graphics 620 1150 MHz | 8 GB | 4523 |
| Asus ZenBook 13 UX331UN | i5-8550U | GeForce MX150 1607 / 1253 MHz 2 GB | 8 GB | 4569 |
| HP Envy 13-ah0003ng | i5-8550U | GeForce MX150 1038 / 1253 MHz 2 GB | 16 GB | 4684 |
| Acer Swift 3 SF314-52G-89SL | i5-8550U | GeForce MX150 1797 / 1502 MHz 2 GB | 8 GB | 4699 |
| Lenovo Yoga 730-15IKB | i5-8550U | GeForce GTX 1050 Mobile 1493 / 1752 MHz 4 GB | 16 GB | 4792 |
| HP EliteBook 840 G5-3JX61EA | i5-8550U | UHD Graphics 620 1150 MHz | 32 GB | 4801 |
| Lenovo ThinkPad X380 Yoga 20LJS02W00 | i5-8550U | UHD Graphics 620 1150 MHz | 16 GB | 4805 |
| Lenovo Miix 520-12IKB 20M3000LGE | i5-8550U | UHD Graphics 620 1150 MHz | 16 GB | 4858 |
| Model | CPU | GPU | RAM | Wartość |
|---|---|---|---|---|
| Lenovo Yoga 720-13IKB | i5-8550U | UHD Graphics 620 1150 MHz | 8 GB | 10747 |
| Lenovo ThinkPad X380 Yoga 20LJS02W00 | i5-8550U | UHD Graphics 620 1150 MHz | 16 GB | 11350 |
| Lenovo Miix 520-12IKB 20M3000LGE | i5-8550U | UHD Graphics 620 1150 MHz | 16 GB | 13014 |
| Medion Akoya S6625 | i5-8550U | GeForce 940MX 1189 / 1253 MHz 2 GB | 8 GB | 13077 |
| Asus ZenBook 13 UX331UN | i5-8550U | GeForce MX150 1607 / 1253 MHz 2 GB | 8 GB | 13251 |
| Acer Swift 3 SF314-52G-89SL | i5-8550U | GeForce MX150 1797 / 1502 MHz 2 GB | 8 GB | 14257 |
| HP Envy 13-ah0003ng | i5-8550U | GeForce MX150 1038 / 1253 MHz 2 GB | 16 GB | 14332 |
| Lenovo Yoga 730-15IKB | i5-8550U | GeForce GTX 1050 Mobile 1493 / 1752 MHz 4 GB | 16 GB | 14519 |
| HP EliteBook 840 G5-3JX61EA | i5-8550U | UHD Graphics 620 1150 MHz | 32 GB | 15294 |
| Model | CPU | GPU | RAM | Wartość |
|---|---|---|---|---|
| Lenovo Yoga 720-13IKB | i5-8550U | UHD Graphics 620 1150 MHz | 8 GB | 8918 |
| Lenovo ThinkPad X380 Yoga 20LJS02W00 | i5-8550U | UHD Graphics 620 1150 MHz | 16 GB | 10917 |
| Tuxedo InfinityBook Pro 13 2017 | i5-8550U | UHD Graphics 620 | 32 GB | 11452 |
| Medion Akoya S6625 | i5-8550U | GeForce 940MX 1189 / 1253 MHz 2 GB | 8 GB | 11701 |
| HP Envy 13-ah0003ng | i5-8550U | GeForce MX150 1038 / 1253 MHz 2 GB | 16 GB | 11795 |
| Dynabook Portege A30-E-174 | i5-8550U | UHD Graphics 620 1150 / 1200 MHz | 16 GB | 12132 |
| Lenovo Miix 520-12IKB 20M3000LGE | i5-8550U | UHD Graphics 620 1150 MHz | 16 GB | 12523 |
| Asus ZenBook 13 UX331UN | i5-8550U | GeForce MX150 1607 / 1253 MHz 2 GB | 8 GB | 13194 |
| Acer Swift 3 SF314-52G-89SL | i5-8550U | GeForce MX150 1797 / 1502 MHz 2 GB | 8 GB | 13525 |
| Acer Aspire 5 A517-51G-80L | i5-8550U | GeForce MX150 1532 / 6000 MHz 2 GB | 8 GB | 13547 |
| HP EliteBook 840 G5-3JX61EA | i5-8550U | UHD Graphics 620 1150 MHz | 32 GB | 13931 |
| Lenovo Yoga 730-15IKB | i5-8550U | GeForce GTX 1050 Mobile 1493 / 1752 MHz 4 GB | 16 GB | 14144 |
| Model | CPU | GPU | RAM | Wartość |
|---|---|---|---|---|
| Lenovo Yoga 720-13IKB | i5-8550U | UHD Graphics 620 1150 MHz | 8 GB | 2471 |
| Medion Akoya S6625 | i5-8550U | GeForce 940MX 1189 / 1253 MHz 2 GB | 8 GB | 3497 |
| HP Envy 13-ah0003ng | i5-8550U | GeForce MX150 1038 / 1253 MHz 2 GB | 16 GB | 3520 |
| Acer Aspire 5 A517-51G-80L | i5-8550U | GeForce MX150 1532 / 6000 MHz 2 GB | 8 GB | 3622 |
| Lenovo ThinkPad X380 Yoga 20LJS02W00 | i5-8550U | UHD Graphics 620 1150 MHz | 16 GB | 3759 |
| Dynabook Portege A30-E-174 | i5-8550U | UHD Graphics 620 1150 / 1200 MHz | 16 GB | 3761 |
| Acer Swift 3 SF314-52G-89SL | i5-8550U | GeForce MX150 1797 / 1502 MHz 2 GB | 8 GB | 3779 |
| Asus ZenBook 13 UX331UN | i5-8550U | GeForce MX150 1607 / 1253 MHz 2 GB | 8 GB | 3871 |
| Lenovo Miix 520-12IKB 20M3000LGE | i5-8550U | UHD Graphics 620 1150 MHz | 16 GB | 3875 |
| Lenovo Yoga 730-15IKB | i5-8550U | GeForce GTX 1050 Mobile 1493 / 1752 MHz 4 GB | 16 GB | 3933 |
| Tuxedo InfinityBook Pro 13 2017 | i5-8550U | UHD Graphics 620 | 32 GB | 3943 |
| HP EliteBook 840 G5-3JX61EA | i5-8550U | UHD Graphics 620 1150 MHz | 32 GB | 4020 |
| Model | CPU | GPU | RAM | Wartość |
|---|---|---|---|---|
| Tuxedo InfinityBook Pro 13 2017 | i5-8550U | UHD Graphics 620 | 32 GB | 11637 |
| Acer Aspire 5 A517-51G-80L | i5-8550U | GeForce MX150 1532 / 6000 MHz 2 GB | 8 GB | 14030 |
| Model | CPU | GPU | RAM | Wartość |
|---|---|---|---|---|
| Acer Aspire 5 A517-51G-80L | i5-8550U | GeForce MX150 1532 / 6000 MHz 2 GB | 8 GB | 3784 |
| Tuxedo InfinityBook Pro 13 2017 | i5-8550U | UHD Graphics 620 | 32 GB | 4113 |
| Model | CPU | GPU | RAM | Wartość |
|---|---|---|---|---|
| Acer Spin 5 SP515-51GN-80A3 Edge 41.16299.15.0 | i5-8550U | GeForce GTX 1050 Mobile 1493 / 7000 MHz 4 GB | 8 GB | 877 |
| Asus VivoBook 15 F510UF-ES71 Edge 41.16299.15.0 | i5-8550U | GeForce MX130 1108 / 5010 MHz 2 GB | 8 GB | 884 |
| Xiaomi Mi Notebook Pro i7 Edge 41 | i5-8550U | GeForce MX150 1341 / 1253 MHz 2 GB | 16 GB | 894 |
| Asus ZenBook 13 UX331UN Edge 41 | i5-8550U | GeForce MX150 1607 / 1253 MHz 2 GB | 8 GB | 911 |
| Tuxedo InfinityBook Pro 13 2017 EDGE: 40.15063.674.0 | i5-8550U | UHD Graphics 620 | 32 GB | 917 |
| Kuu LeBook 12.6 Core i7-8550U Chrome 82 | i5-8550U 18 W / 15 W | UHD Graphics 620 1067 / 1150 MHz | 8 GB | 918 |
| Asus ZenBook 13 UX331UN Edge | i5-8550U | GeForce MX150 1700 / 1252 MHz 2 GB | 16 GB | 925 |
| HP ZBook 14u G5-2ZB99EA EDGE: 41.16299.15.0 | i5-8550U | Radeon Pro WX 3100 1046 / 6000 MHz 2 GB | 8 GB | 930 |
| HP Spectre 13-af033ng | i5-8550U | UHD Graphics 620 400 / 1064 MHz | 8 GB | 937 |
| Acer Aspire 5 A517-51G-80L EDGE: 40.15063.674.0 | i5-8550U | GeForce MX150 1532 / 6000 MHz 2 GB | 8 GB | 944 |
| Lenovo ThinkPad E580-20KS001RGE Edge | i5-8550U | Radeon RX 550 (Laptop) 902 / 1500 MHz 2 GB | 8 GB | 946 |
| HP Spectre x360 13-ae048ng | i5-8550U | UHD Graphics 620 400 / 1064 MHz | 16 GB | 947 |
| Huawei MateBook X Pro, i7 | i5-8550U | GeForce MX150 | 8 GB | 949 |
| HP Spectre x360 15-ch011nr Edge 41.16299.15.0 | i5-8550U | GeForce MX150 1469 / 1502 MHz 2 GB | 16 GB | 963 |
| Schenker Slim 15 L17 Edge: 41.16299.15.0 | i5-8550U | UHD Graphics 620 | 16 GB | 972 |
| Asus VivoBook Pro 17 N705UD-EH76 Microsoft Edge 41.16299.248.0 | i5-8550U | GeForce GTX 1050 Mobile 1354 / 1493 MHz 4 GB | 16 GB | 1041 |
| Asus VivoBook S410UQ-NH74 41.16299.248.0 | i5-8550U | GeForce 940MX 1242 / 4000 MHz 2 GB | 8 GB | 1053 |
| Asus ZenBook Flip 15 UX561UD | i5-8550U | GeForce GTX 1050 Mobile 1493 / 7000 MHz 2 GB | 16 GB | 1058 |
| Lenovo ThinkPad T480s-20L8S02E00 Edge | i5-8550U | GeForce MX150 1038 / 1252.5 MHz 2 GB | 16 GB | 1073 |
| Dell Inspiron 17-7773-0043 EDGE: 41.16299.15.0 | i5-8550U | GeForce MX150 1532 / 6000 MHz 2 GB | 16 GB | 1083 |
| Dell XPS 13 9370 i7 UHD 41.16299.248.0 | i5-8550U | UHD Graphics 620 | 16 GB | 1086 |
| Lenovo ThinkPad X380 Yoga 20LJS02W00 Edge 41 | i5-8550U | UHD Graphics 620 1150 MHz | 16 GB | 1100 |
| HP ZBook 15u G5 2ZC05EA Edge | i5-8550U | Radeon Pro WX 3100 1046 / 1500 MHz 2 GB | 8 GB | 1107 |
| HP Spectre x360 13t-ae000 | i5-8550U | UHD Graphics 620 1150 / 1067 MHz | 16 GB | 1114 |
| HP EliteBook 830 G5-3JX74EA Edge | i5-8550U | UHD Graphics 620 | 32 GB | 1114 |
| Lenovo Yoga 730-15IKB Edge 42 | i5-8550U | GeForce GTX 1050 Mobile 1493 / 1752 MHz 4 GB | 16 GB | 1121 |
| HP Envy 13-ah0003ng Edge 42 | i5-8550U | GeForce MX150 1038 / 1253 MHz 2 GB | 16 GB | 1121 |
| Lenovo ThinkPad T580-20LAS01H00 Edge | i5-8550U | GeForce MX150 1532 / 1502 MHz 2 GB | 8 GB | 1126 |
| Acer Nitro 5 Spin NP515-51-86CX Edge 41 | i5-8550U | GeForce GTX 1050 Mobile 1354 / 1752 MHz 4 GB | 8 GB | 1133 |
| Dynabook Portege A30-E-174 Edge 44 | i5-8550U | UHD Graphics 620 1150 / 1200 MHz | 16 GB | 1133 |
| Lenovo IdeaPad 530s-14IKB Edge 42.17134.1.0 | i5-8550U | GeForce MX150 1532 / 6000 MHz 2 GB | 8 GB | 1134 |
| Dell Latitude 15 3590-K8JP Edge 42.17134.1.0 | i5-8550U | Radeon 530 1024 / 1125 MHz 2 GB | 8 GB | 1134 |
| Acer TravelMate X3410-M-50DD Edge | i5-8550U | GeForce MX130 1189 / 1253 MHz 2 GB | 16 GB | 1134 |
| Acer TravelMate X3410-M-866T Microsoft Edge 44.17763.1.0 | i5-8550U | UHD Graphics 620 400 / 665 MHz 1 GB | 16 GB | 1137 |
| HP Pavilion 14-ce0002ng | i5-8550U | GeForce MX150 2 GB | 8 GB | 1139 |
| Asus VivoBook S15 S530UN-BQ097T Edge | i5-8550U | GeForce MX150 1532 / 1469 MHz 2 GB | 16 GB | 1141 |
| Lenovo ThinkPad X1 Carbon 2018-20KGS5DU00 42.17134.1.0 | i5-8550U | UHD Graphics 620 1100 MHz | 16 GB | 1143 |
| Lenovo ThinkPad P52s-20LB000HGE Edge 41.16299.402.0 | i5-8550U | Quadro P500 1519 / 1253 MHz 2 GB | 8 GB | 1144 |
| Medion Akoya S6625 Edge 42 | i5-8550U | GeForce 940MX 1189 / 1253 MHz 2 GB | 8 GB | 1159 |
| Lenovo Yoga 730-13IKB Edge | i5-8550U | UHD Graphics 620 | 16 GB | 1160 |
| Asus ZenBook S UX391U Edge 42.17134.1.0 | i5-8550U | UHD Graphics 620 1150 / 1066 MHz | 8 GB | 1186 |
| Samsung Notebook 9 NP930QAA 42.17134.1.0 | i5-8550U | UHD Graphics 620 | 8 GB | 1198 |
| Acer TravelMate 2410-G2-MG-82E6 | i5-8550U | GeForce MX130 2 GB | 8 GB | 1201 |
| MSI Prestige PS42 8RB-059 Edge 41.16299.371.0 | i5-8550U | GeForce MX150 1468 / 6008 MHz 2 GB | 16 GB | 1406 |
| Lenovo IdeaPad Flex-1570 81CA000RUS Edge 42.17134.1.0 | i5-8550U | GeForce MX130 1108 / 5010 MHz 2 GB | 16 GB | 2114 |
| CPU TDP ? | TDP 15 W |
|---|---|
| 100% | 100% |
| Model | CPU | GPU | RAM | Wartość |
|---|---|---|---|---|
| HP Spectre x360 15t-bl100 40.15063.674.0 | i5-8550U | GeForce MX150 1468 / 1502 MHz | 16 GB | 63.2 |
| Lenovo Yoga 920-13IKB-80Y7 40.15063.674.0 | i5-8550U | UHD Graphics 620 400 MHz | 7.9 GB | 64.2 |
| Xiaomi Mi Notebook Pro i7 Edge 41 | i5-8550U | GeForce MX150 1341 / 1253 MHz 2 GB | 16 GB | 68.7 |
| Asus VivoBook Pro 17 N705UD-EH76 Microsoft Edge 41.16299.248.0 | i5-8550U | GeForce GTX 1050 Mobile 1354 / 1493 MHz 4 GB | 16 GB | 69 |
| Samsung Notebook 9 NP900X5T-X01US Edge 41.16299.248.0 | i5-8550U | GeForce MX150 1468 / 6008 MHz 2 GB | 16 GB | 69 |
| HP Spectre x360 15-ch011nr Edge 41.16299.15.0 | i5-8550U | GeForce MX150 1469 / 1502 MHz 2 GB | 16 GB | 71.3 |
| Asus VivoBook S410UQ-NH74 41.16299.248.0 | i5-8550U | GeForce 940MX 1242 / 4000 MHz 2 GB | 8 GB | 71.6 |
| Dell XPS 13 9370 i7 UHD 41.16299.248.0 | i5-8550U | UHD Graphics 620 | 16 GB | 85.8 |
| Acer TravelMate X3410-M-866T Microsoft Edge 44.17763.1.0 | i5-8550U | UHD Graphics 620 400 / 665 MHz 1 GB | 16 GB | 91.8 |
| HP Spectre x360 13t-ae000 | i5-8550U | UHD Graphics 620 1150 / 1067 MHz | 16 GB | 106.1 |
| Asus Zenbook UX430UN Edge 40.15063.674.0 | i5-8550U | GeForce MX150 1468 / 6008 MHz 2 GB | 16 GB | 122.7 |
| Model | CPU | GPU | RAM | Wartość |
|---|---|---|---|---|
| Lenovo IdeaPad Flex-1570 81CA000RUS Edge 42.17134.1.0 | i5-8550U | GeForce MX130 1108 / 5010 MHz 2 GB | 16 GB | 17296 |
| MSI Prestige PS42 8RB-059 Edge 41.16299.371.0 | i5-8550U | GeForce MX150 1468 / 6008 MHz 2 GB | 16 GB | 20864 |
| Acer TravelMate X3410-M-866T Microsoft Edge 44.17763.1.0 | i5-8550U | UHD Graphics 620 400 / 665 MHz 1 GB | 16 GB | 21346 |
| Acer TravelMate X3410-M-50DD Edge | i5-8550U | GeForce MX130 1189 / 1253 MHz 2 GB | 16 GB | 26033 |
| HP ZBook 15u G5 2ZC05EA Edge | i5-8550U | Radeon Pro WX 3100 1046 / 1500 MHz 2 GB | 8 GB | 30229 |
| Asus VivoBook 15 F510UF-ES71 Edge 41.16299.15.0 | i5-8550U | GeForce MX130 1108 / 5010 MHz 2 GB | 8 GB | 30300 |
| Dynabook Portege A30-E-174 Edge 44 | i5-8550U | UHD Graphics 620 1150 / 1200 MHz | 16 GB | 31588 |
| HP Spectre x360 13t-ae000 | i5-8550U | UHD Graphics 620 1150 / 1067 MHz | 16 GB | 31699 |
| Dell Latitude 15 3590-K8JP Edge 42.17134.1.0 | i5-8550U | Radeon 530 1024 / 1125 MHz 2 GB | 8 GB | 31705 |
| Samsung Notebook 9 NP930QAA 42.17134.1.0 | i5-8550U | UHD Graphics 620 | 8 GB | 31774 |
| HP EliteBook 830 G5-3JX74EA Edge | i5-8550U | UHD Graphics 620 | 32 GB | 32001 |
| Asus ZenBook S UX391U Edge 42.17134.1.0 | i5-8550U | UHD Graphics 620 1150 / 1066 MHz | 8 GB | 32200 |
| Lenovo IdeaPad 530s-14IKB Edge 42.17134.1.0 | i5-8550U | GeForce MX150 1532 / 6000 MHz 2 GB | 8 GB | 32233 |
| HP Spectre x360 15-ch011nr Edge 41.16299.15.0 | i5-8550U | GeForce MX150 1469 / 1502 MHz 2 GB | 16 GB | 32402 |
| Lenovo ThinkPad T580-20LAS01H00 Edge | i5-8550U | GeForce MX150 1532 / 1502 MHz 2 GB | 8 GB | 32403 |
| Lenovo ThinkPad X380 Yoga 20LJS02W00 Edge 41 | i5-8550U | UHD Graphics 620 1150 MHz | 16 GB | 32651 |
| Lenovo Yoga 730-13IKB Edge | i5-8550U | UHD Graphics 620 | 16 GB | 32888 |
| Lenovo ThinkPad X1 Carbon 2018-20KGS5DU00 42.17134.1.0 | i5-8550U | UHD Graphics 620 1100 MHz | 16 GB | 32984 |
| Medion Akoya S6625 Edge 42 | i5-8550U | GeForce 940MX 1189 / 1253 MHz 2 GB | 8 GB | 33221 |
| HP Envy 13-ah0003ng Edge 42 | i5-8550U | GeForce MX150 1038 / 1253 MHz 2 GB | 16 GB | 33496 |
| Asus VivoBook S15 S530UN-BQ097T Edge | i5-8550U | GeForce MX150 1532 / 1469 MHz 2 GB | 16 GB | 33896 |
| Lenovo Yoga 730-15IKB Edge 42 | i5-8550U | GeForce GTX 1050 Mobile 1493 / 1752 MHz 4 GB | 16 GB | 34087 |
| Lenovo ThinkPad P52s-20LB000HGE Edge 41.16299.402.0 | i5-8550U | Quadro P500 1519 / 1253 MHz 2 GB | 8 GB | 34200 |
| Asus VivoBook S410UQ-NH74 41.16299.248.0 | i5-8550U | GeForce 940MX 1242 / 4000 MHz 2 GB | 8 GB | 34961 |
| Dell Inspiron 17-7773-0043 EDGE: 41.16299.15.0 | i5-8550U | GeForce MX150 1532 / 6000 MHz 2 GB | 16 GB | 35100 |
| Lenovo ThinkPad T480s-20L8S02E00 Edge | i5-8550U | GeForce MX150 1038 / 1252.5 MHz 2 GB | 16 GB | 35599 |
| Samsung Notebook 9 NP900X5T-X01US Edge 41.16299.248.0 | i5-8550U | GeForce MX150 1468 / 6008 MHz 2 GB | 16 GB | 35816 |
| HP ZBook 14u G5-2ZB99EA EDGE: 41.16299.15.0 | i5-8550U | Radeon Pro WX 3100 1046 / 6000 MHz 2 GB | 8 GB | 35855 |
| Asus ZenBook Flip 15 UX561UD | i5-8550U | GeForce GTX 1050 Mobile 1493 / 7000 MHz 2 GB | 16 GB | 36079 |
| Lenovo ThinkPad E580-20KS001RGE Edge | i5-8550U | Radeon RX 550 (Laptop) 902 / 1500 MHz 2 GB | 8 GB | 36084 |
| Asus VivoBook Pro 17 N705UD-EH76 Microsoft Edge 41.16299.248.0 | i5-8550U | GeForce GTX 1050 Mobile 1354 / 1493 MHz 4 GB | 16 GB | 36509 |
| Schenker Slim 15 L17 Edge: 41.16299.15.0 | i5-8550U | UHD Graphics 620 | 16 GB | 36689 |
| Asus ZenBook 13 UX331UN Edge | i5-8550U | GeForce MX150 1700 / 1252 MHz 2 GB | 16 GB | 37517 |
| Huawei MateBook X Pro, i7 | i5-8550U | GeForce MX150 | 8 GB | 38376 |
| Asus ZenBook 13 UX331UN Edge 41 | i5-8550U | GeForce MX150 1607 / 1253 MHz 2 GB | 8 GB | 38710 |
| Xiaomi Mi Notebook Pro i7 Edge 41 | i5-8550U | GeForce MX150 1341 / 1253 MHz 2 GB | 16 GB | 40265 |
| Tuxedo InfinityBook Pro 13 2017 EDGE: 40.15063.674.0 | i5-8550U | UHD Graphics 620 | 32 GB | 41665 |
| Acer Aspire 5 A517-51G-80L EDGE: 40.15063.674.0 | i5-8550U | GeForce MX150 1532 / 6000 MHz 2 GB | 8 GB | 41706 |
| Acer Spin 5 SP515-51GN-80A3 Edge 41.16299.15.0 | i5-8550U | GeForce GTX 1050 Mobile 1493 / 7000 MHz 4 GB | 8 GB | 42043 |
| Model | CPU | GPU | RAM | Wartość |
|---|---|---|---|---|
| Kuu LeBook 12.6 Core i7-8550U Chrome 82 | i5-8550U 18 W / 15 W | UHD Graphics 620 1067 / 1150 MHz | 8 GB | 182 |
| Model | CPU | GPU | RAM | Wartość |
|---|---|---|---|---|
| Kuu LeBook 12.6 Core i7-8550U | i5-8550U 18 W / 15 W | UHD Graphics 620 1067 / 1150 MHz | 8 GB | 25.3 |
| Razer Blade Stealth QHD i7-8550U | i5-8550U @4 GHz | UHD Graphics 620 300 / 350 MHz 1 GB | 16 GB | @4 GHz 31.6 |
| Xiaomi Mi Notebook Pro i7 | i5-8550U | GeForce MX150 1341 / 1253 MHz 2 GB | 16 GB | 33.7 |
| Lenovo ThinkPad T580-20LAS01H00 | i5-8550U | GeForce MX150 1532 / 1502 MHz 2 GB | 8 GB | 61.4 |
| CPU TDP ? | TDP 15 W |
|---|---|
| 100% | 103% |
| Model | CPU | GPU | RAM | Wartość |
|---|---|---|---|---|
| Kuu LeBook 12.6 Core i7-8550U | i5-8550U 18 W / 15 W | UHD Graphics 620 1067 / 1150 MHz | 8 GB | 28.2 |
| LG Gram 15Z980-B.AA78B | i5-8550U | UHD Graphics 620 | 16 GB | 28.9 |
| Razer Blade Stealth QHD i7-8550U | i5-8550U @4 GHz | UHD Graphics 620 300 / 350 MHz 1 GB | 16 GB | @4 GHz 30.1 |
| Xiaomi Mi Notebook Pro i7 | i5-8550U | GeForce MX150 1341 / 1253 MHz 2 GB | 16 GB | 31.9 |
| Lenovo ThinkPad T580-20LAS01H00 | i5-8550U | GeForce MX150 1532 / 1502 MHz 2 GB | 8 GB | 63.2 |
| CPU TDP ? | TDP 15 W |
|---|---|
| 100% | 102% |
| Model | CPU | GPU | RAM | Wartość |
|---|---|---|---|---|
| Lenovo ThinkPad T580-20LAS01H00 | i5-8550U | GeForce MX150 1532 / 1502 MHz 2 GB | 8 GB | 10.4 |
| Kuu LeBook 12.6 Core i7-8550U | i5-8550U 18 W / 15 W | UHD Graphics 620 1067 / 1150 MHz | 8 GB | 17 |
| Razer Blade Stealth QHD i7-8550U | i5-8550U @4 GHz | UHD Graphics 620 300 / 350 MHz 1 GB | 16 GB | @4 GHz 17.3 |
| Xiaomi Mi Notebook Pro i7 | i5-8550U | GeForce MX150 1341 / 1253 MHz 2 GB | 16 GB | 17.5 |
| LG Gram 15Z980-B.AA78B | i5-8550U | UHD Graphics 620 | 16 GB | 17.5 |
| CPU TDP ? | TDP 15 W |
|---|---|
| 92% | 100% |
#0 ran 0s before starting gpusingle class +0s ... 0s
#1 no ids found in url (should be separated by "_") +0s ... 0s
#2 not redirecting to Ajax server +0s ... 0s
#3 did not recreate cache, as it is less than 5 days old! Created at Sat, 04 Jul 2026 05:30:22 +0200 +0.006s ... 0.006s
#4 no comparison url found in template nbc.compare_page_2 needed +0.005s ... 0.011s
#5 no comparison url found in template nbc.compare_page_2 needed +0s ... 0.011s
#6 no comparison url found in template nbc.compare_page_2 needed +0s ... 0.012s
#7 no comparison url found in template nbc.compare_page_2 needed +0s ... 0.012s
#8 no comparison url found in template nbc.compare_page_2 needed +0s ... 0.012s
#9 composed specs +0s ... 0.013s
#10 did output specs +0s ... 0.013s
#11 getting avg benchmarks for device 9208 +0.043s ... 0.056s
#12 got single benchmarks 9208 +0.237s ... 0.293s
#13 got avg benchmarks for devices +0s ... 0.293s
#14 min, max, avg, median took s +3.19s ... 3.483s
#15 no comparison url found in template nbc.compare_page_2 needed +0.527s ... 4.01s
#16 return log +0s ... 4.01s
Dell Inspiron 15 7570: NVIDIA GeForce 940MX, 15.60", 2 kg
Recenzja » Recenzja Dell Inspiron 7570
Lenovo Yoga 730-13IKB: Intel UHD Graphics 620, 13.30", 1.2 kg
» YouTuber instaluje mechaniczną klawiaturę w swoim 13-calowym laptopie Lenovo po tym, jak oryginalna dwukrotnie uległa awarii
Error file "" empty