Recenzja laptopa Asus ROG Zephyrus M16 (2023): RTX 4090 z super jasnym wyświetlaczem Mini-LED

Jako jeden z ostatnich przykładów "starej" generacji CPU/GPU, recenzowaliśmy niedawno m.in ROG Zephyrus M16który został wyposażony wCore i9-12900HorazRTX 3070 Ti. Teraz jednak nastąpiła zmiana warty w postaci M16, tym razem zCore i9-13900HiRTX 4090 zapakowanego wewnątrz obudowy "AniMe Matrix". Ta ostatnia zmieniła się nieco, bo matryca stała się nieco drobniejsza. Przyjrzeliśmy się szczegółowo tym zmianom i zbadaliśmy, czy M16 może dogadać się z RTX 4090.
Nie trzeba dodawać, że porównujemy nowe urządzenie z poprzednikiem, a także z innymi high-endowymi maszynami do gier. Ponieważ RTX 4090 znajduje się zwykle w większych laptopach, przyglądamy się także 18-calowemuAsus ROG Strix Scar 18 lub 17-calowemuMSI Titan GT77. Bierzemy też pod uwagę zarówno m.in Lenovo Legion Pro 7 16IRX oraz Razer Blade 16 za konkurentów.
Potencjalni konkurenci w porównaniu
Ocena | Data | Model | Waga | Wysokość | Rozmiar | Rezolucja | Cena |
|---|---|---|---|---|---|---|---|
| 89.4 % v7 (old) | 03/2023 | Asus ROG Zephyrus M16 GU604VY-NM042X i9-13900H, GeForce RTX 4090 Laptop GPU | 2.3 kg | 22.9 mm | 16.00" | 2560x1600 | |
| 87.8 % v7 (old) | 02/2023 | Asus ROG Zephyrus M16 GU603Z i9-12900H, GeForce RTX 3070 Ti Laptop GPU | 2.1 kg | 19.9 mm | 16.00" | 2560x1600 | |
| 86.6 % v7 (old) | 02/2023 | Asus ROG Strix Scar 18 2023 G834JY-N6005W i9-13980HX, GeForce RTX 4090 Laptop GPU | 3.1 kg | 30.8 mm | 18.00" | 2560x1600 | |
| 89 % v7 (old) | 02/2023 | MSI Titan GT77 HX 13VI i9-13950HX, GeForce RTX 4090 Laptop GPU | 3.5 kg | 23 mm | 17.30" | 3840x2160 | |
| 89.4 % v7 (old) | 02/2023 | Lenovo Legion Pro 7 16IRX8H i9-13900HX, GeForce RTX 4080 Laptop GPU | 2.7 kg | 26 mm | 16.00" | 2560x1600 | |
| 91.2 % v7 (old) | 02/2023 | Razer Blade 16 Early 2023 i9-13950HX, GeForce RTX 4080 Laptop GPU | 2.4 kg | 21.99 mm | 16.00" | 2560x1600 |
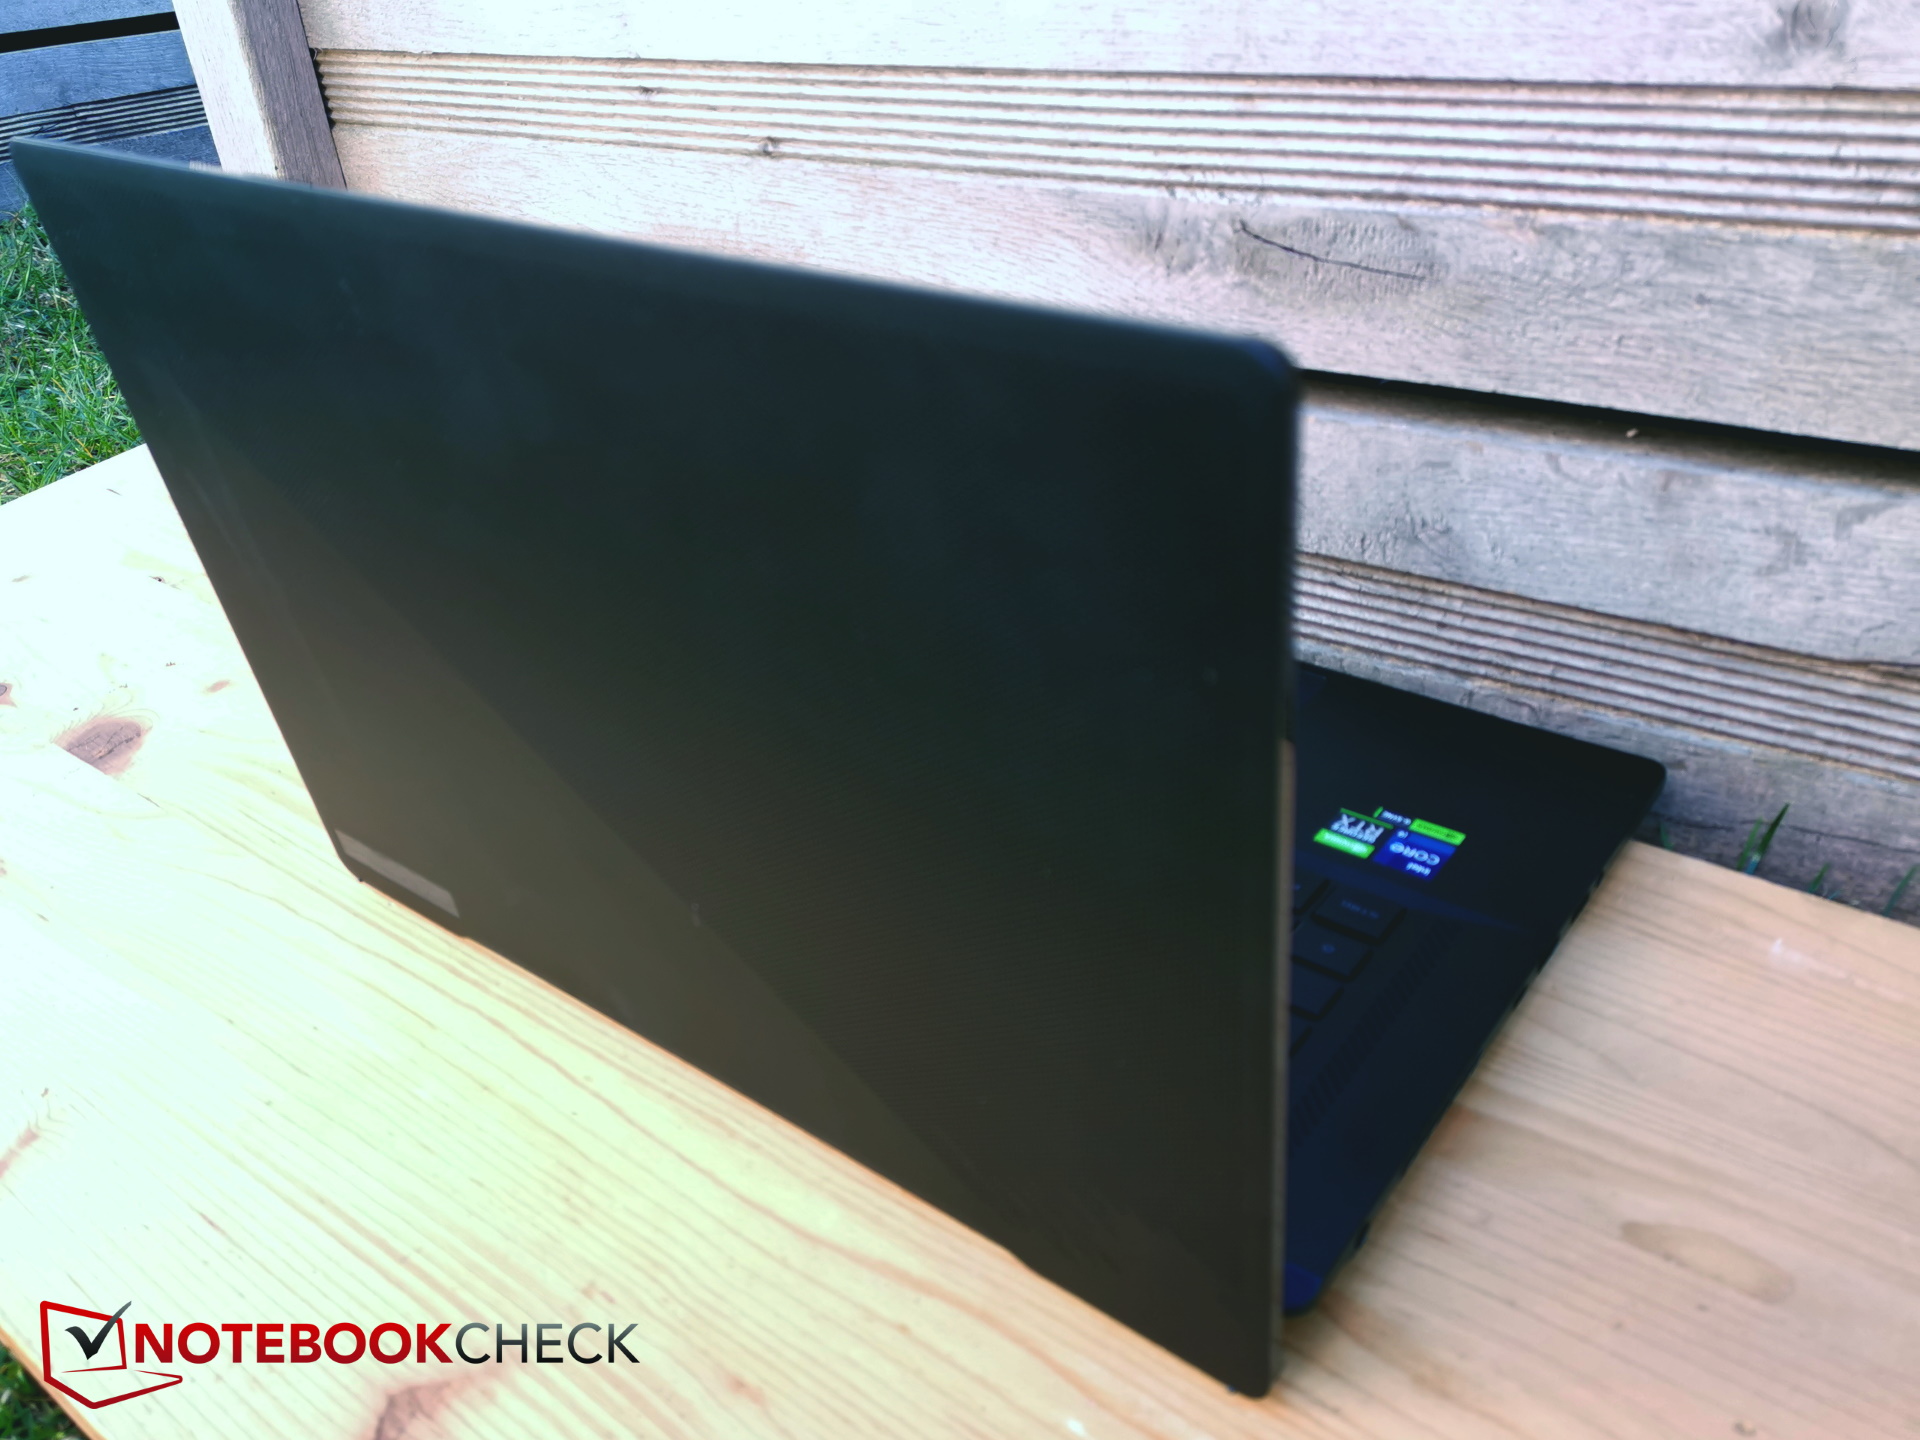
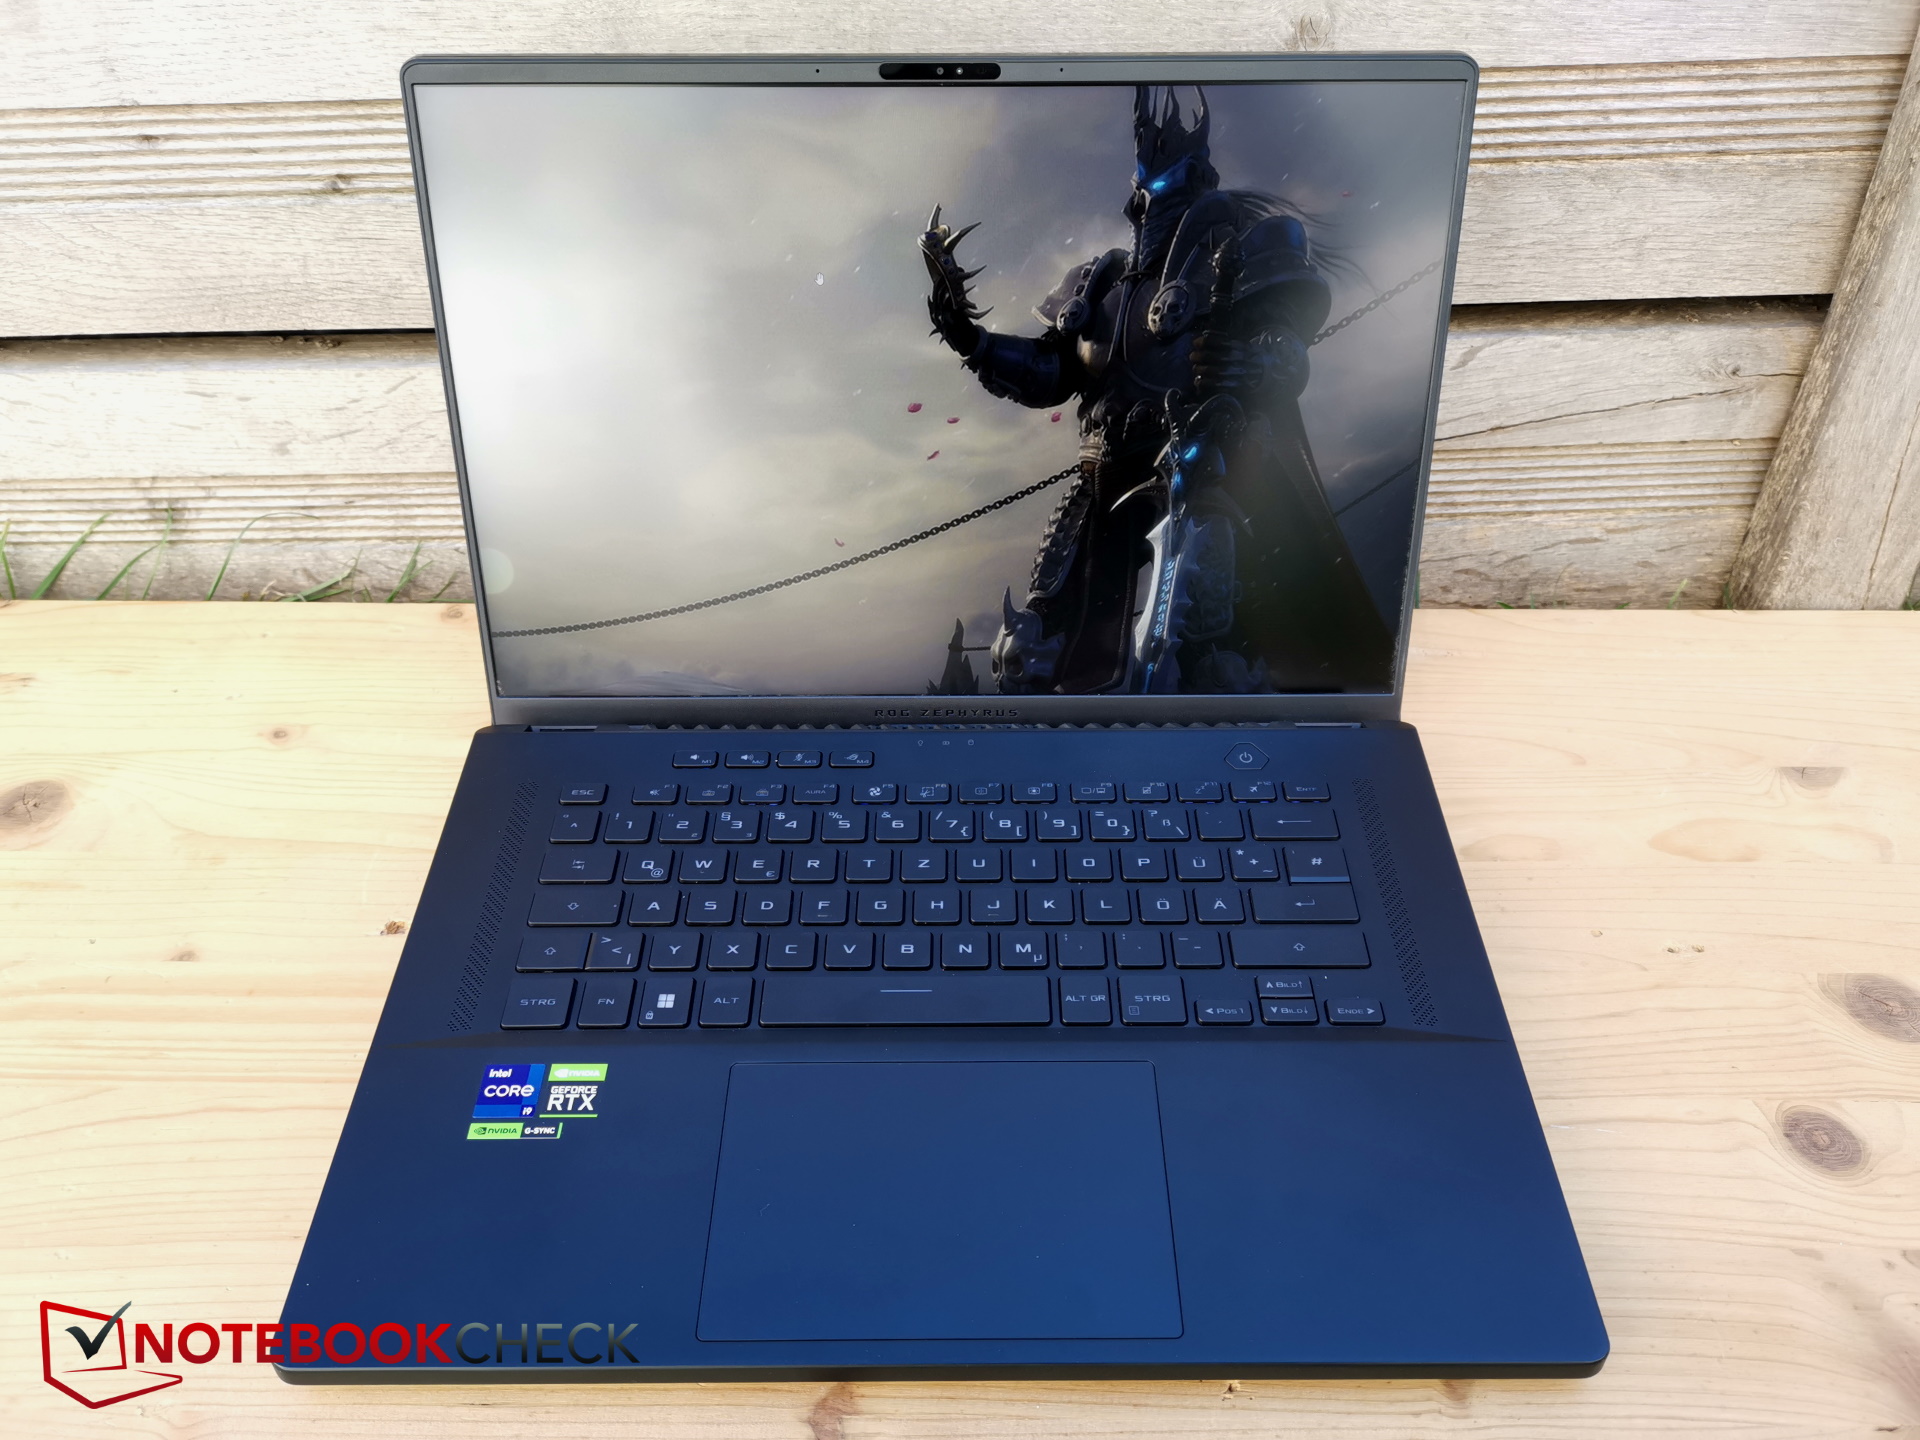
Case - AniMe Matrix head-turner
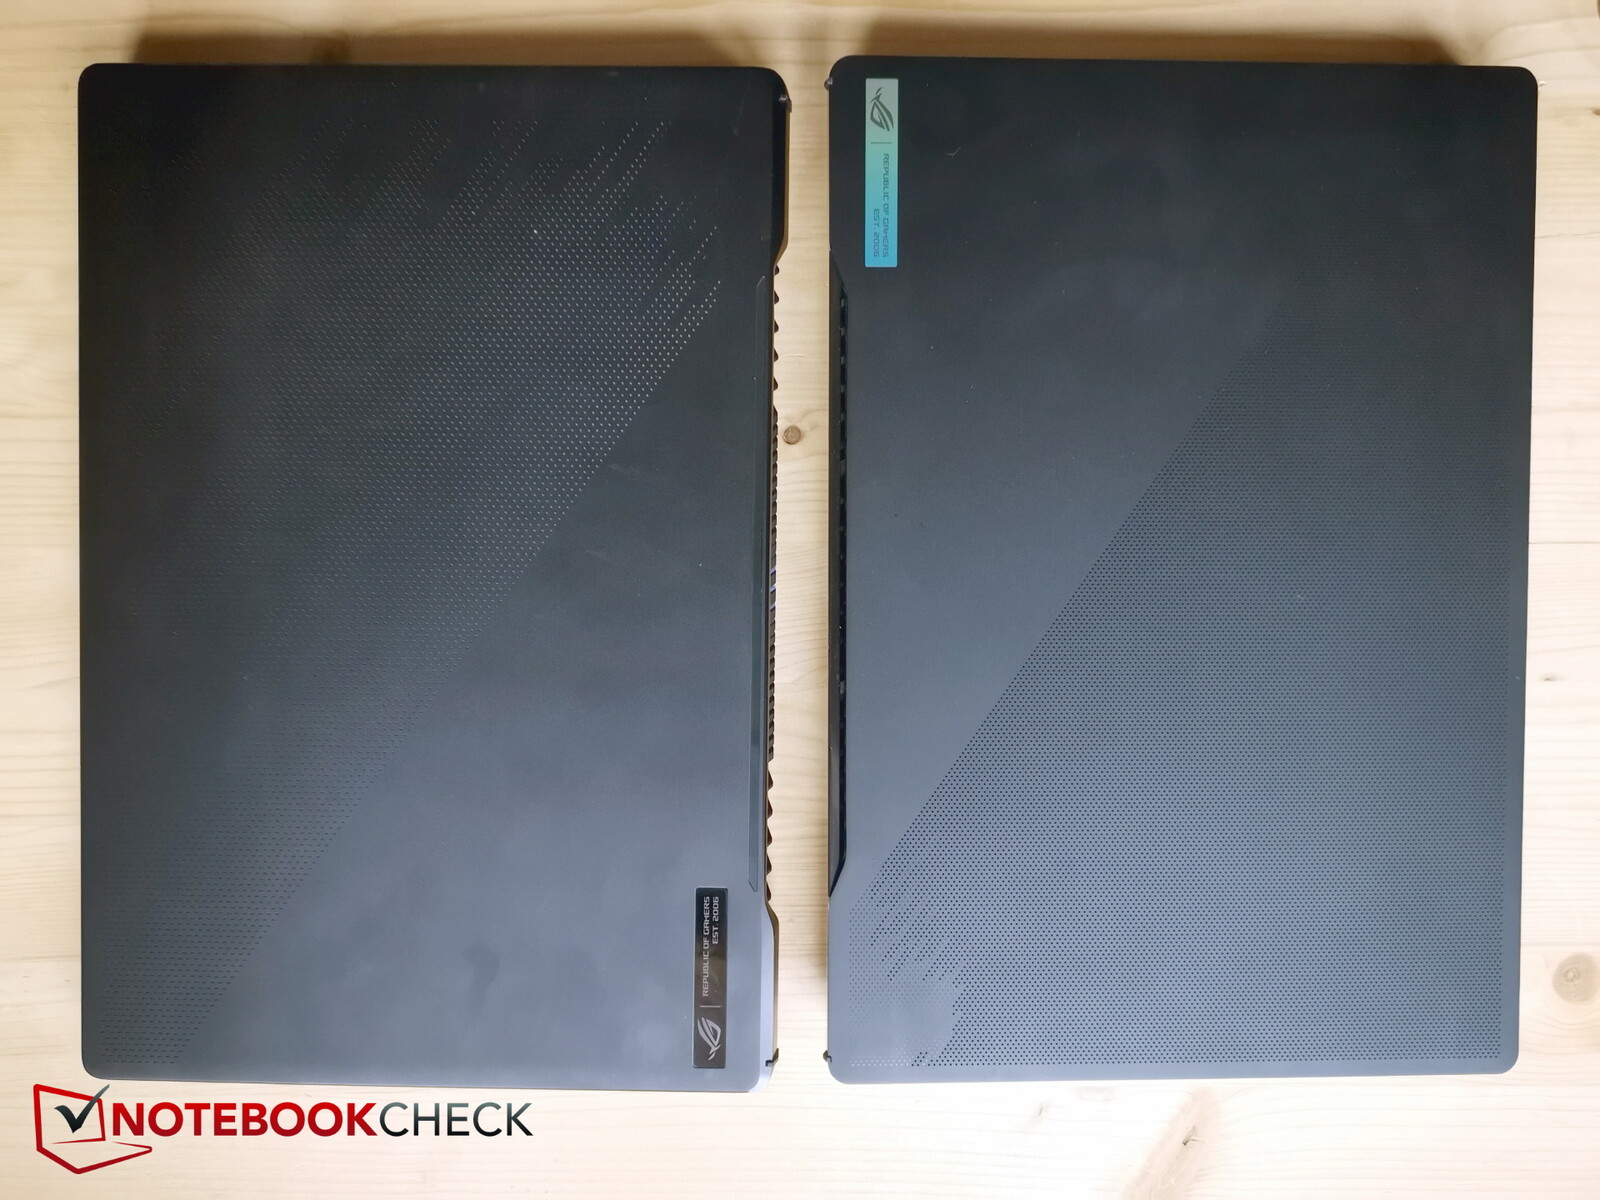
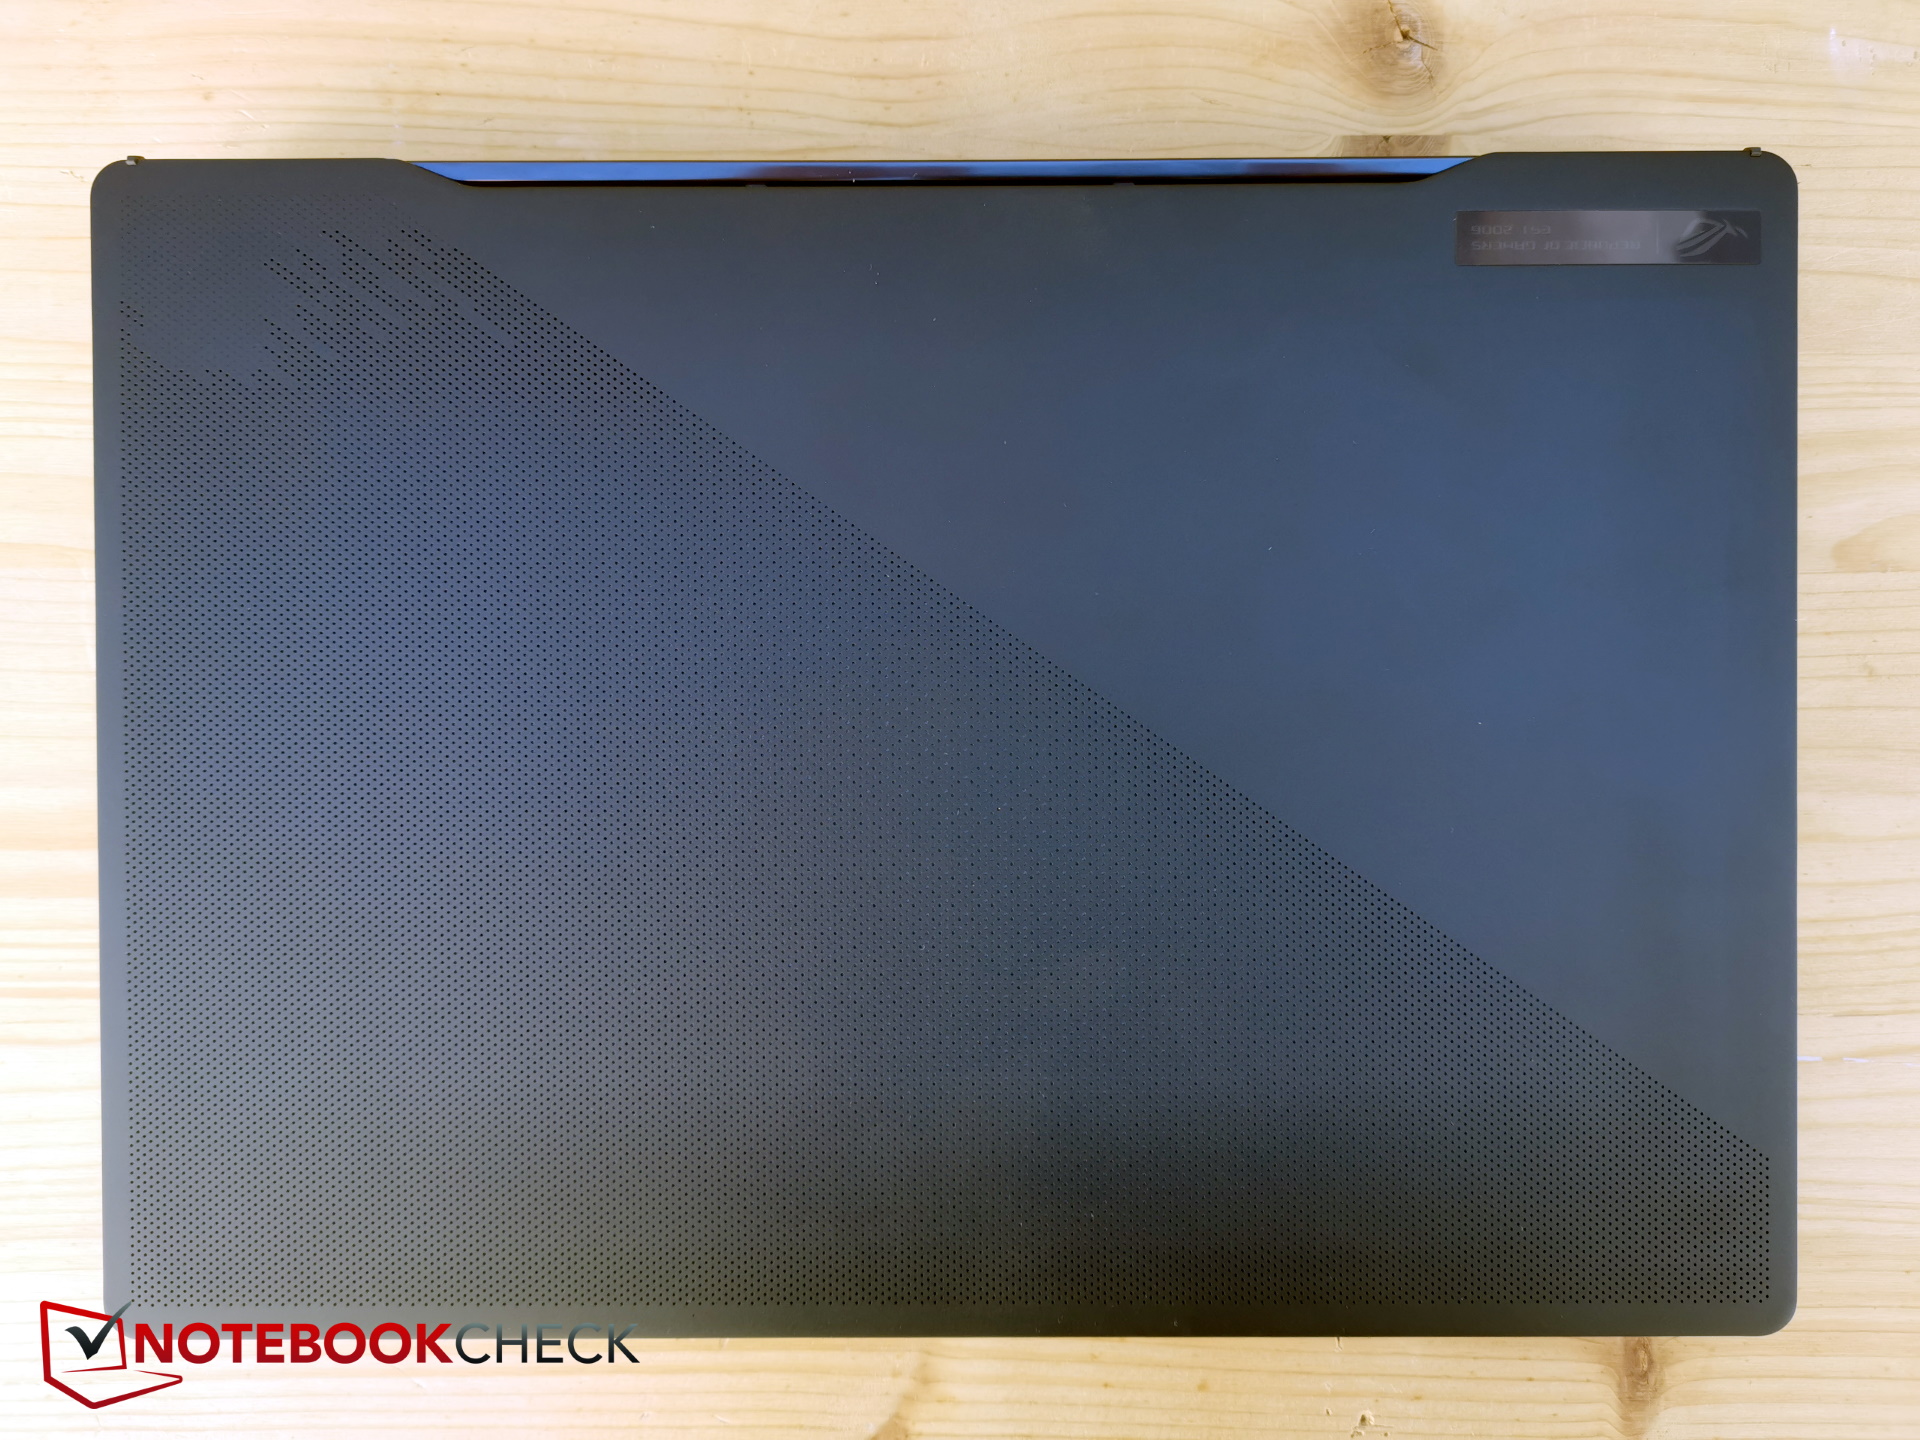
Gigabyte w tym roku zmienił obudowę, ale na pierwszy rzut oka trudno dostrzec jakieś oczywiste różnice. Obudowa nadal wykonana jest z czarnego plastiku, który teraz jest nieco grubszy.
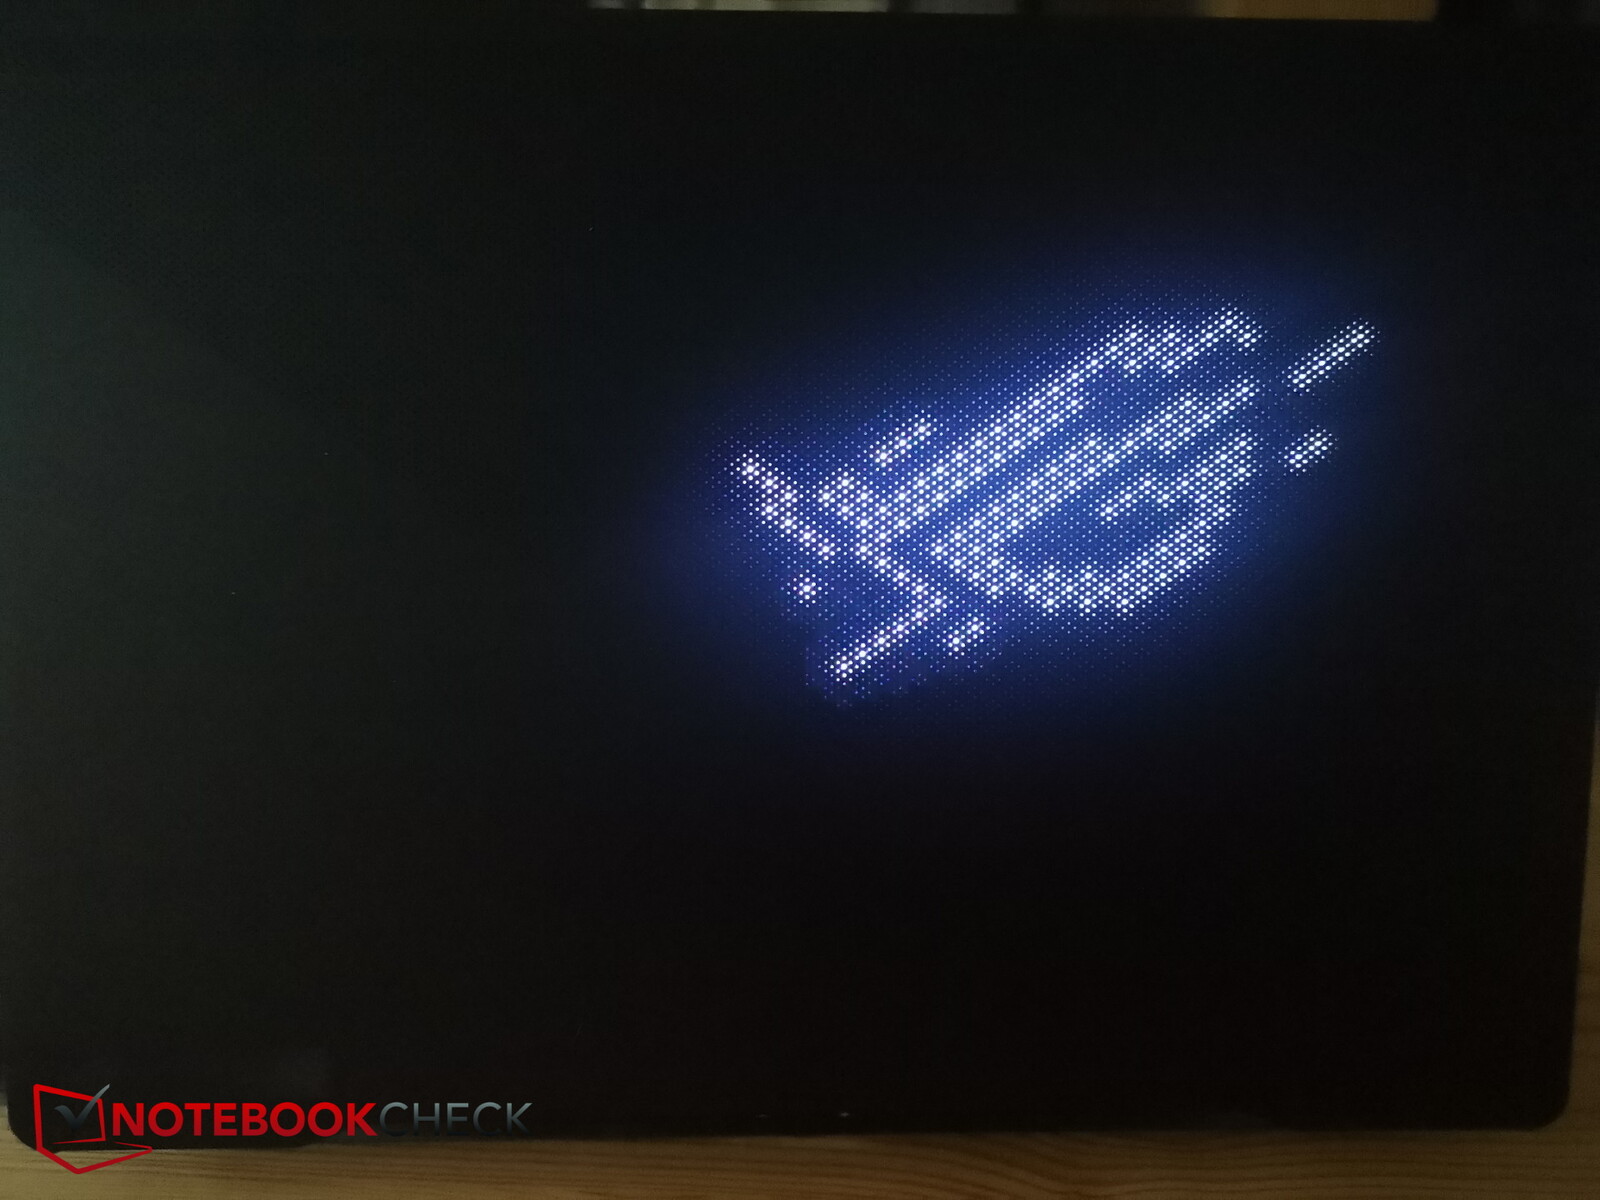
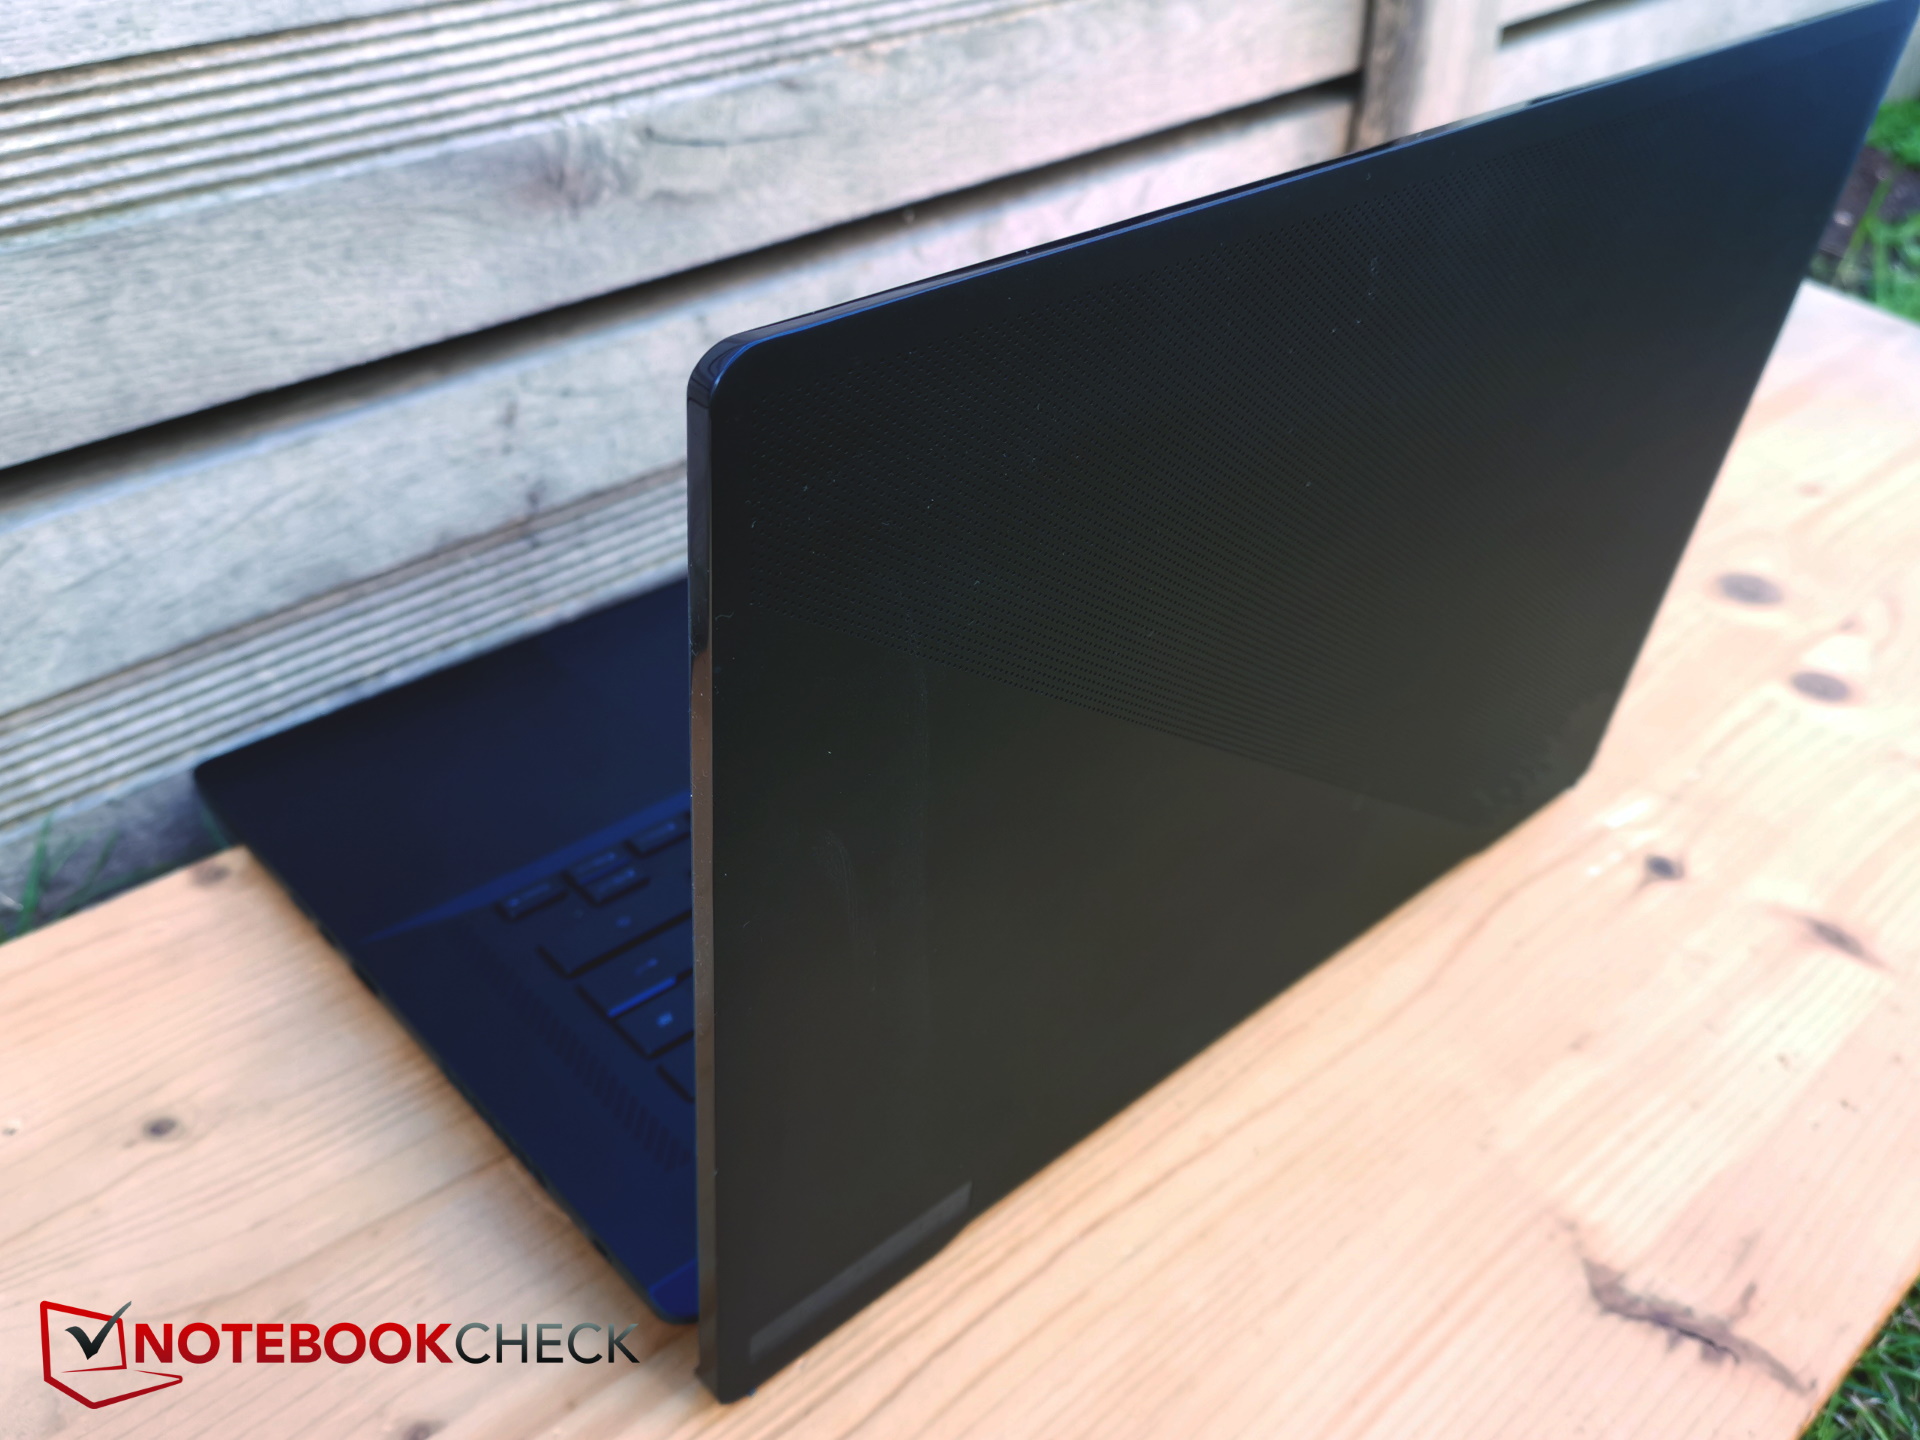
Tak zwana matryca AniMe na górnej powierzchni jest drobniejsza i bardziej szczegółowa niż dotychczas i może wyświetlać proste, ruchome loga lub tekst z dodatkowymi efektami. Z jednej strony to fajne rozwiązanie, ale nie dość, że prawdopodobnie zwiększy zużycie energii przez urządzenie, to jeszcze jest w dużej mierze niewidoczne dla użytkownika, gdy laptop jest otwarty. Z tego powodu efekt jest bardziej nastawiony na zrobienie wrażenia na gapiach.
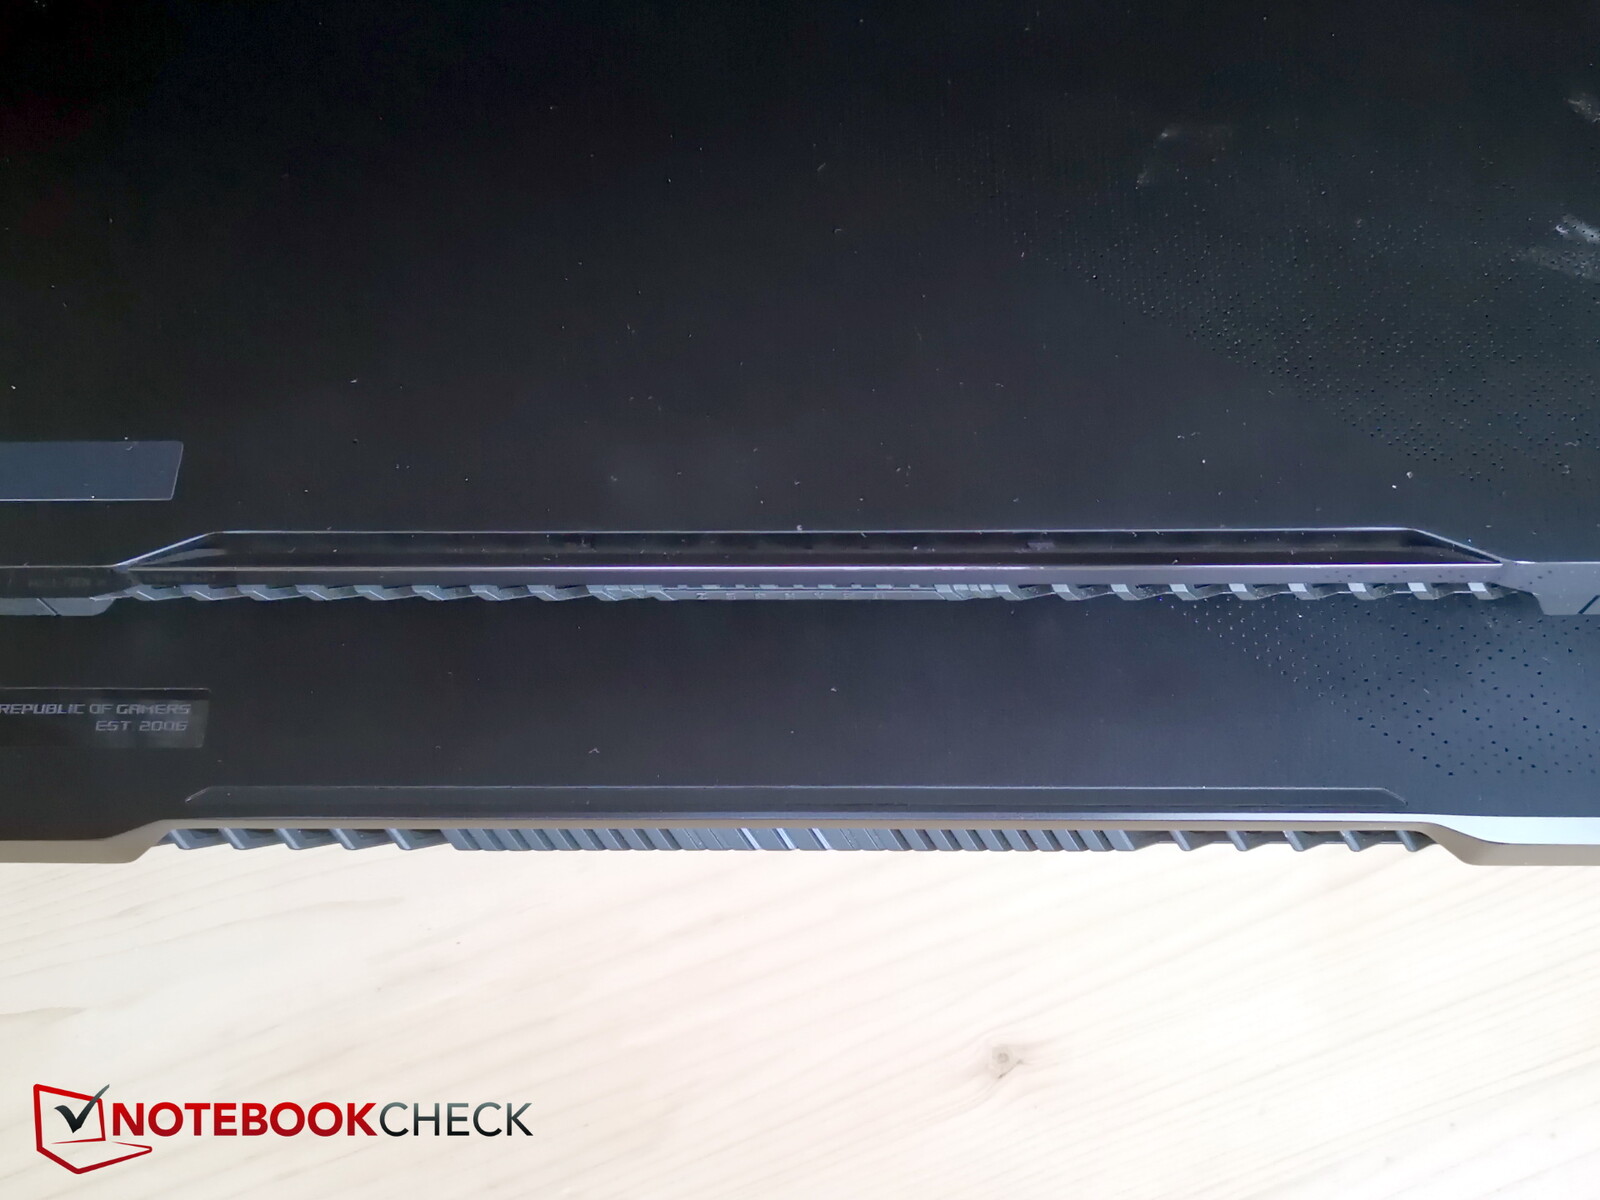
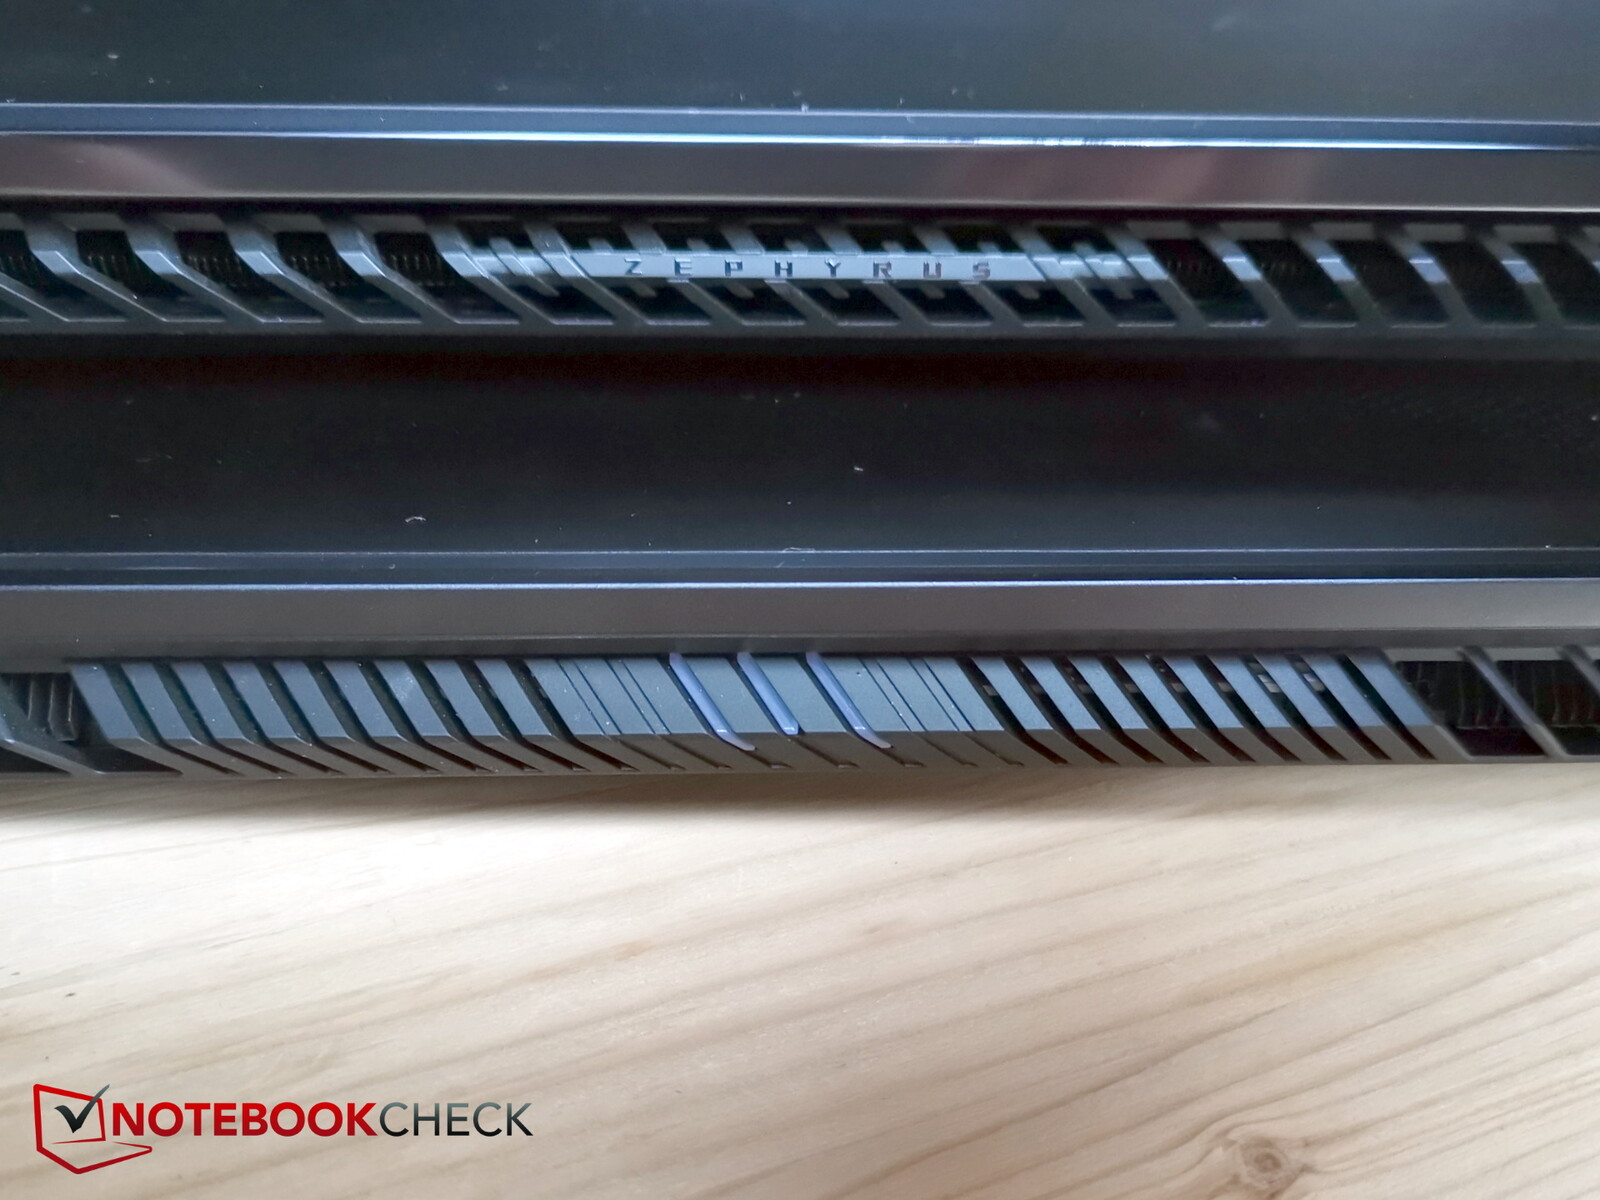
Nie zachwyciła nas pusta, czarna plastikowa listwa w górnej części tylnej części pokrywy. Wygląda on nieco tandetnie, nie jest zbyt stabilny i zaczął już wykazywać oznaki zużycia. W sumie prawie wszystkie kratki wentylacyjne na bokach zostały nieco zmienione, podobnie jak lokalizacja portów.
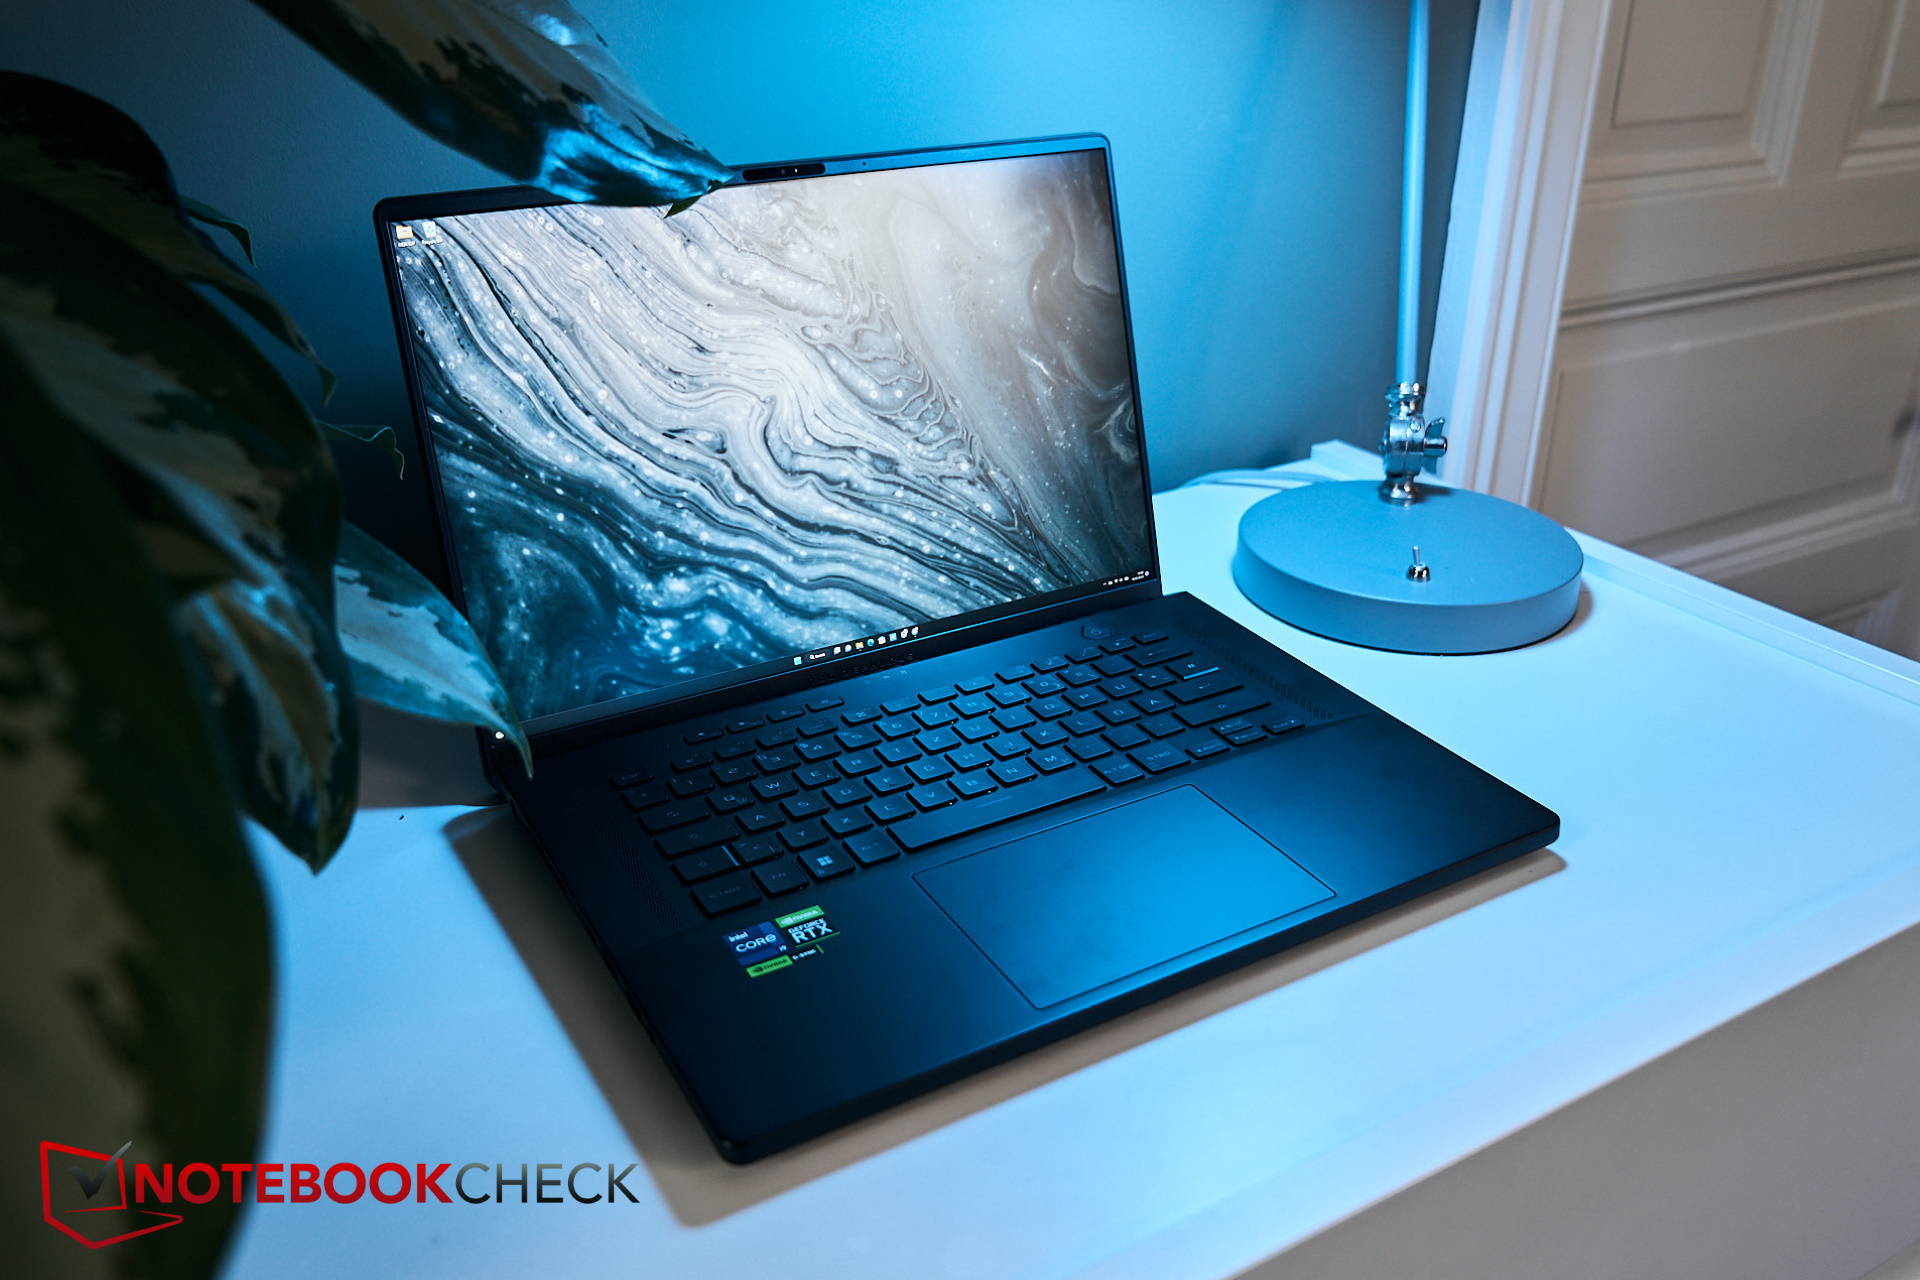
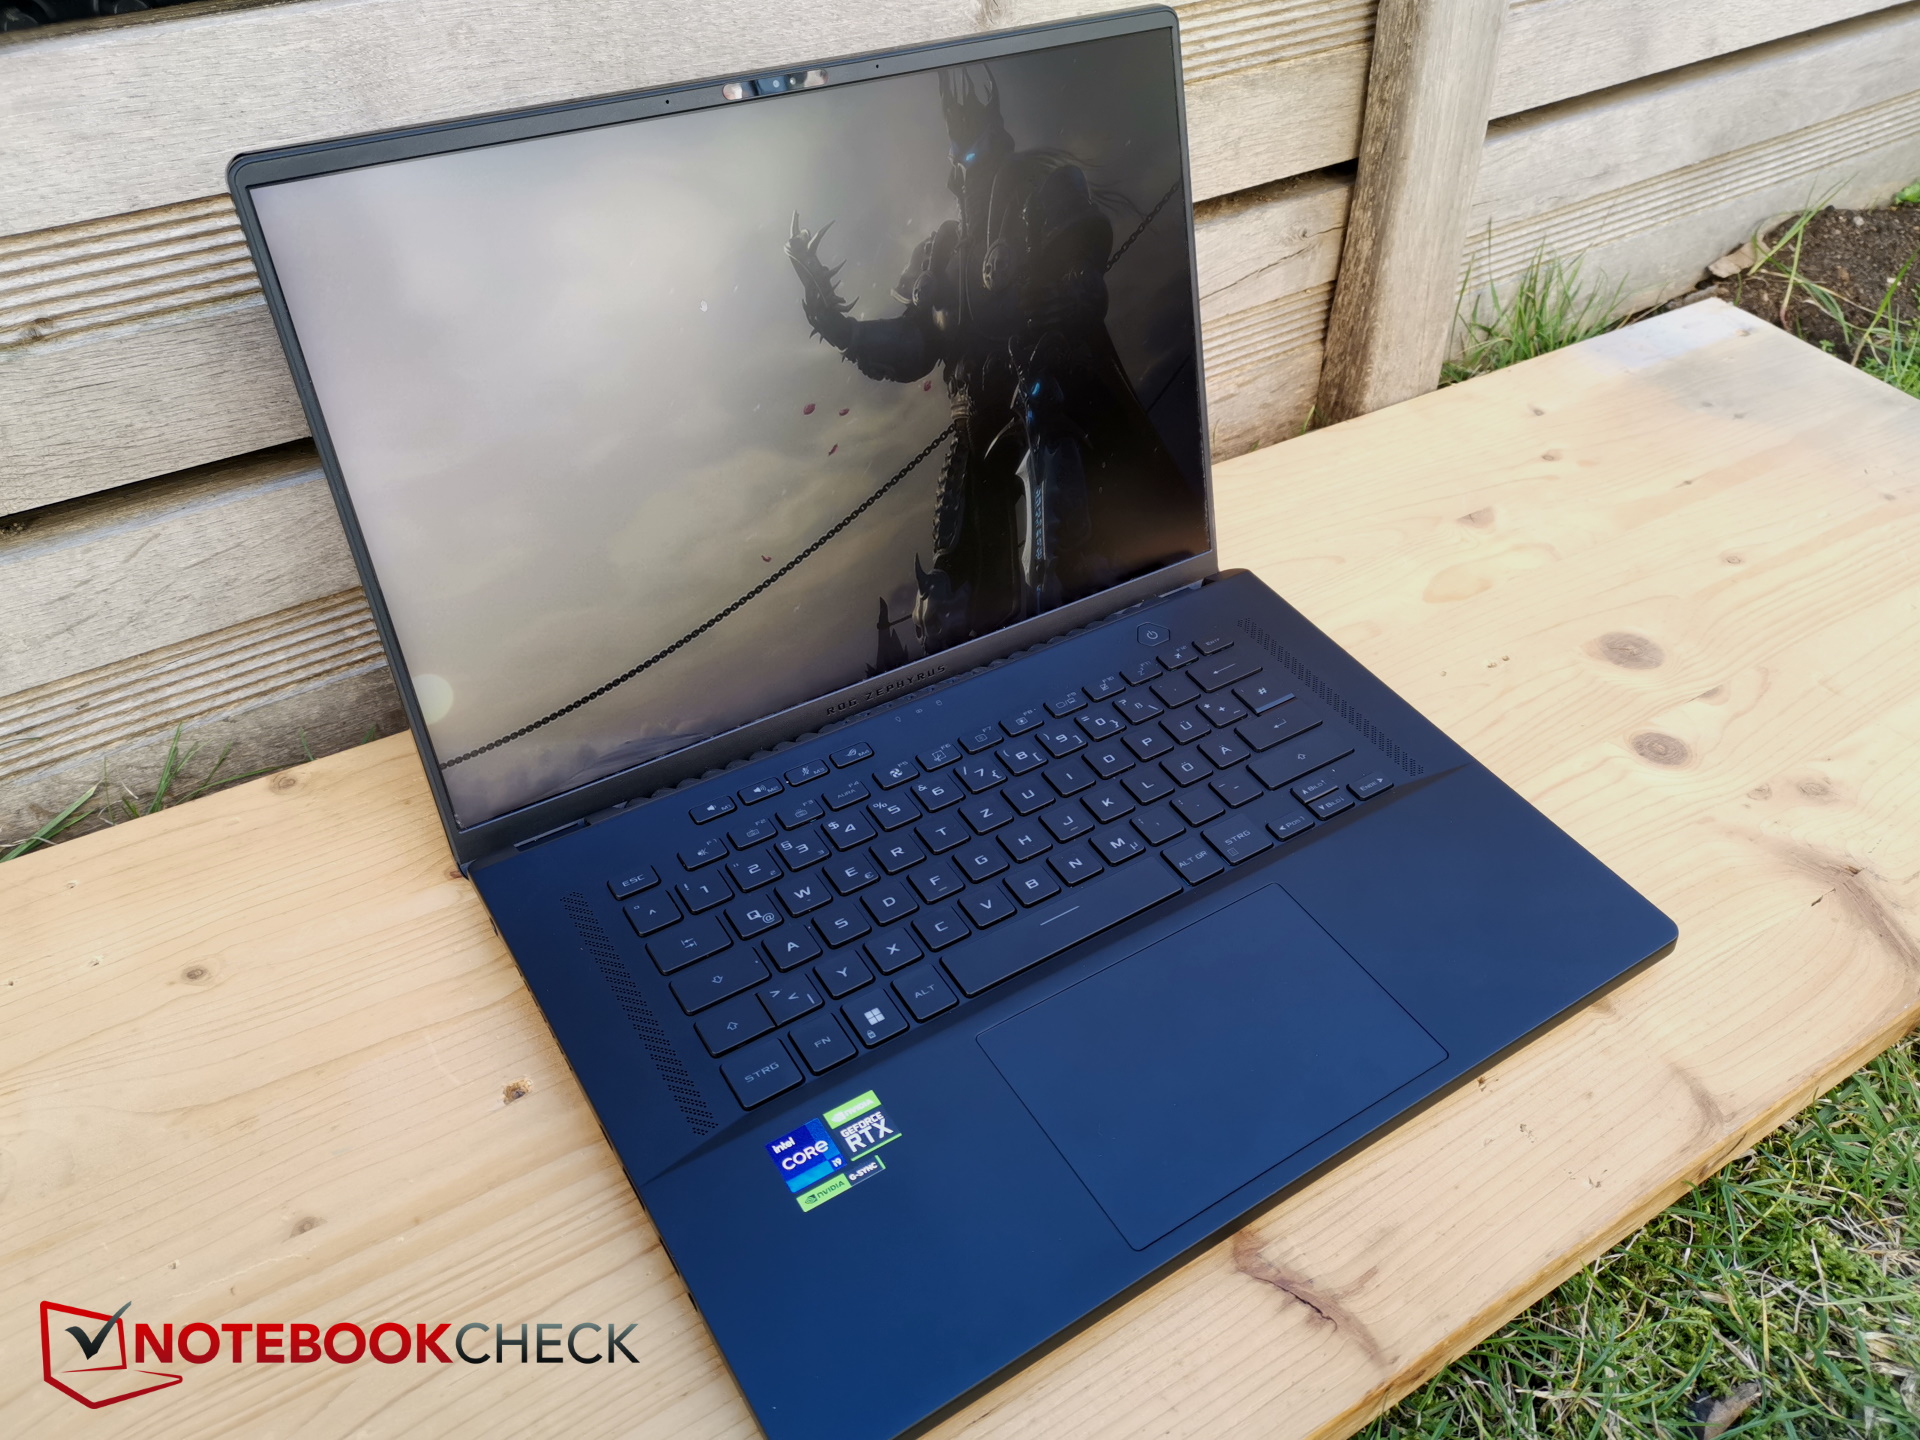
Podstawa wydaje się solidna, ale przy próbie skręcenia obudowy dość głośno skrzypi i trzeszczy. Podobnie jest z pokrywą wyświetlacza, którą można dość łatwo wygiąć. Zawiasy trzymają wyświetlacz dość pewnie i zapewniają możliwość otwarcia pokrywy pod kątem do 180 stopni. Po otwarciu laptopa użytkownikowi ukazują się dwie rzeczy - klawiatura unosi się lekko, a ramki wyświetlacza są dość wąskie.


Co niezwykłe, w porównaniu z poprzednikiem zwiększyła się powierzchnia podstawy urządzenia poprzednika. Wbrew trendowi tworzenia urządzeń mniejszych, cieńszych i lżejszych, nowy M16 jest nieco większy, a także o 3 mm grubszy od modelu last gen's.
Na stronieRazer Blade 16 jest tylko o 1 mm cieńszy, aLenovo Legion Pro 7jest minimalnie grubszy, co oznacza, że nowy M16 plasuje się gdzieś pośrodku, także jeśli chodzi o wagę.
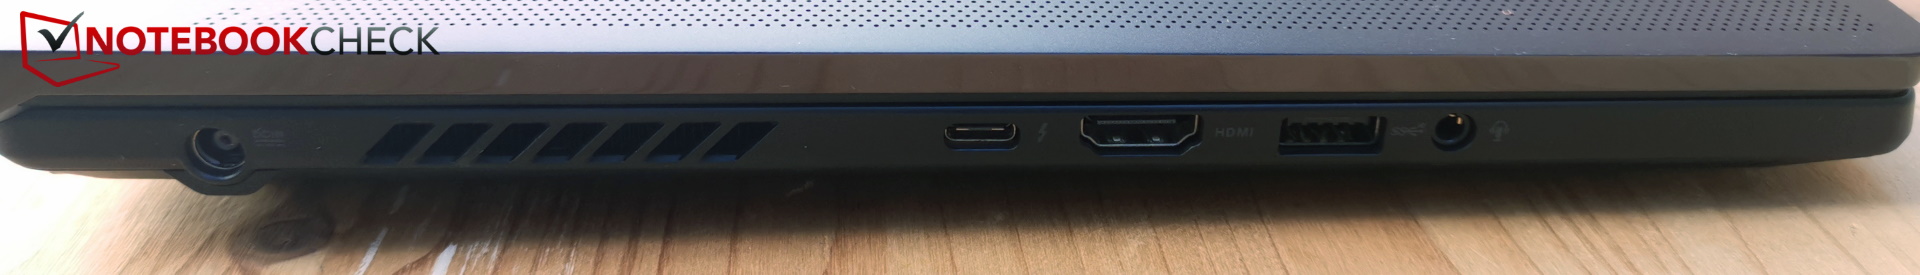
Cechy - Maszyna do gier bez portu LAN
W tej kwestii również nie wszystko zmieniło się na lepsze: Port LAN został po prostu pominięty, co oznacza, że szybkie połączenie z internetem jest możliwe tylko dzięki adapterowi dla tych graczy, którzy szukają najkrótszych opóźnień i najszybszego połączenia.
Jeden z portów USB-C zawędrował z lewej na prawą stronę. Dzięki temu więcej miejsca jest dostępne po lewej stronie urządzenia. Z tyłu nadal można znaleźć jedynie kratki wentylatorów, co skutkuje brakiem miejsca na bardziej wybrzuszone złącza, takie jak HDMI czy brakujący port LAN.
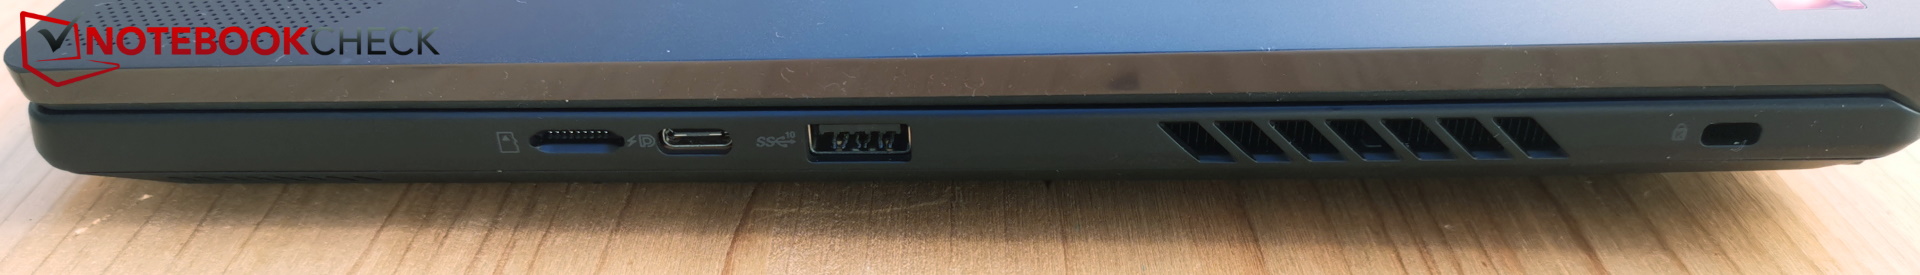
Czytnik kart SD
Przynajmniej laptop posiada wbudowany czytnik kart SD i choć jest on niestety przeznaczony tylko dla kart microSD, to i tak jest bardzo szybki. Udało nam się skopiować obraz o wielkości 1 GB na pulpit w czasie poniżej 6 sekund przy użyciu naszej karty referencyjnej AV PRO microSD 128 GB V60.
| SD Card Reader | |
| average JPG Copy Test (av. of 3 runs) | |
| Asus ROG Zephyrus M16 GU604VY-NM042X | |
| Asus ROG Zephyrus M16 GU603Z | |
| Średnia w klasie Gaming (20.9 - 210, n=55, ostatnie 2 lata) | |
| Razer Blade 16 Early 2023 (AV PRO microSD 128 GB V60) | |
| MSI Titan GT77 HX 13VI (Angelibird AV Pro V60) | |
| maximum AS SSD Seq Read Test (1GB) | |
| Asus ROG Zephyrus M16 GU603Z | |
| Razer Blade 16 Early 2023 (AV PRO microSD 128 GB V60) | |
| Asus ROG Zephyrus M16 GU604VY-NM042X | |
| Średnia w klasie Gaming (25.5 - 261, n=52, ostatnie 2 lata) | |
| MSI Titan GT77 HX 13VI (Angelibird AV Pro V60) | |
Komunikacja
Niestety producent zrezygnował z portu LAN i nie dołączył adaptera.
O połączenia bezprzewodowe dba moduł Intel AX210 WiFi 6E. Ten nadaje na częstotliwościach 2,4 GHz, 5 GHz i 6 GHz.
Prędkości transferu są szybkie i stałe.
Kamera internetowa
W tej dziedzinie producent w końcu uaktualnił się do kamery FullHD i model ten posiada nawet czujnik IR do logowania się do systemu Windows za pomocą Windows Hello. Zdjęcia mają jednak oczywisty żółty odcień, a odchylenie kolorów jest stosunkowo wysokie.


Bezpieczeństwo
Na pokładzie jest zarówno TPM, jak i złącze Kensington, ale brakuje czujnika linii papilarnych, podobnie jak niestety fizycznej migawki kamerki internetowej.
Akcesoria
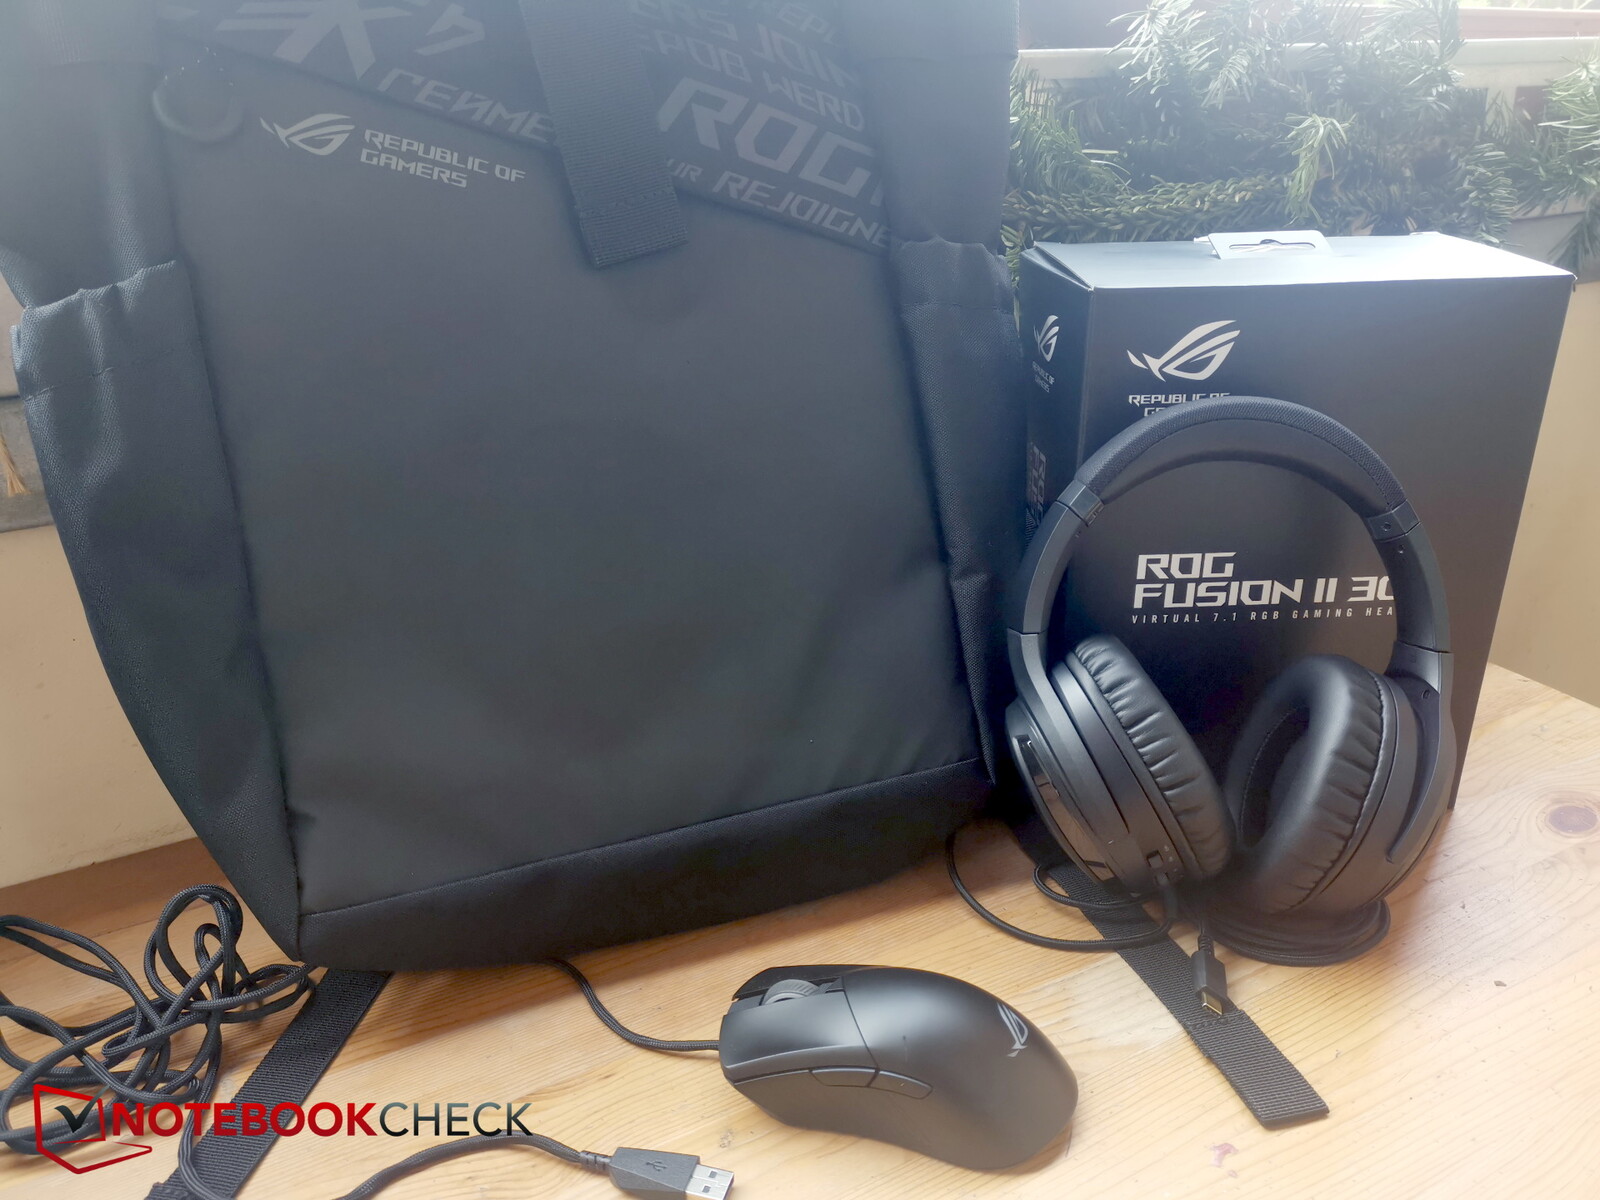
Nasz model recenzencki przyszedł w ogromnym opakowaniu, które bardziej przypominało nam elektrownię. Dla kontrastu, w zestawie znalazło się całkiem sporo akcesoriów. Na przykład torba z przegrodą na laptopa, mysz (ROG Gladius III), a także słuchawki (ROG Fusion II 300), wszystkie ozdobione brandingiem ROG.
Według Asusa, akcesoria te są dołączane do naszego modelu konfiguracyjnego, ale M16 można też kupić jako samodzielne urządzenie.
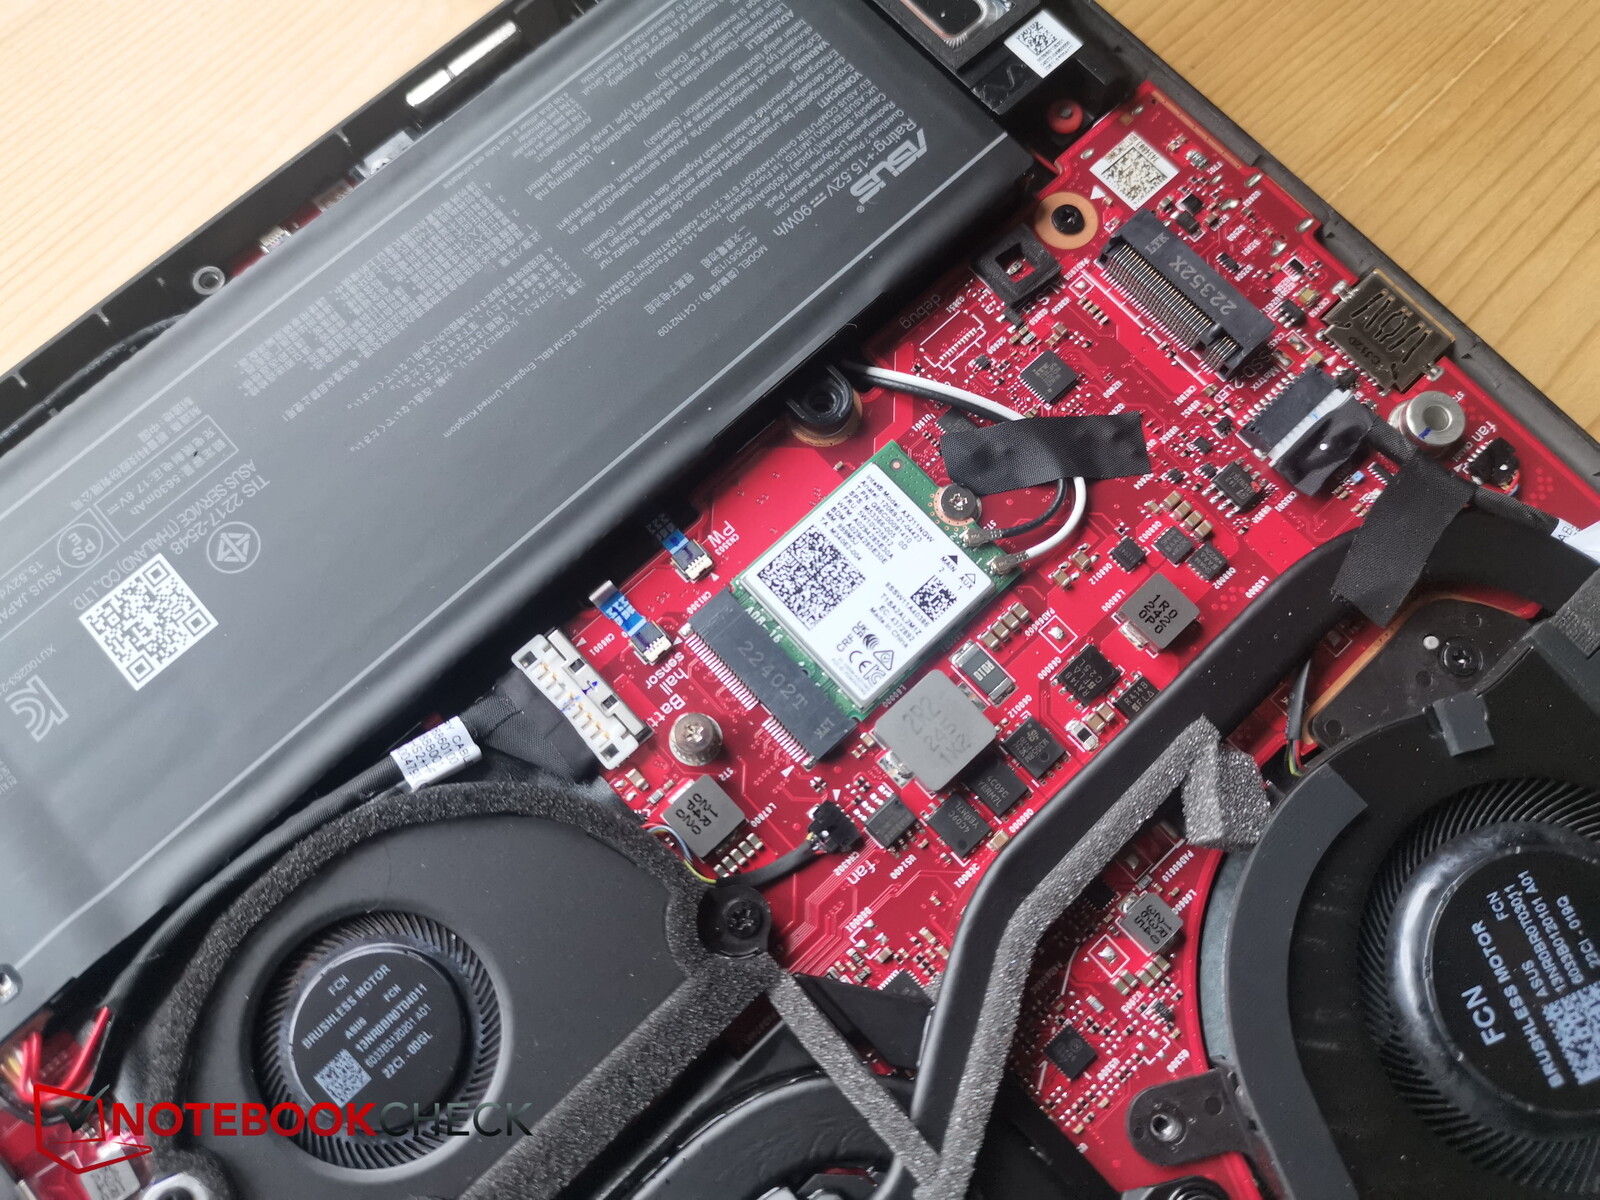
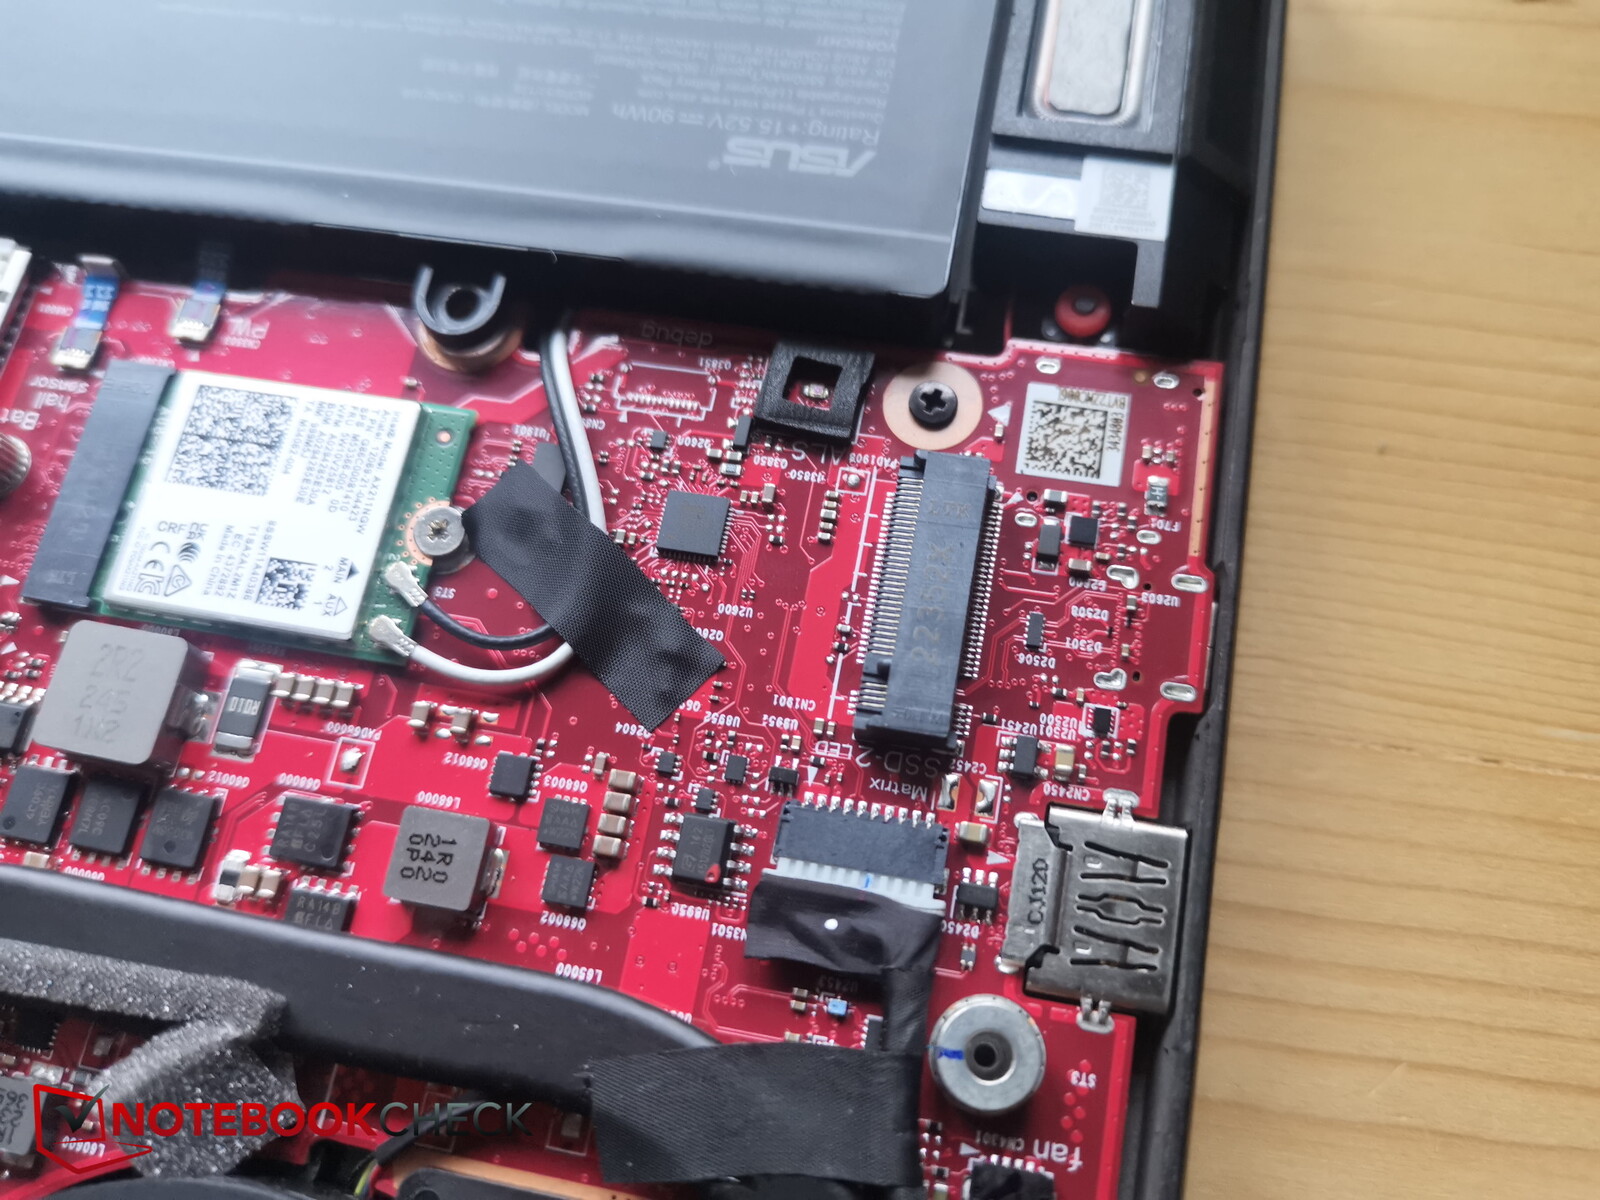
Konserwacja
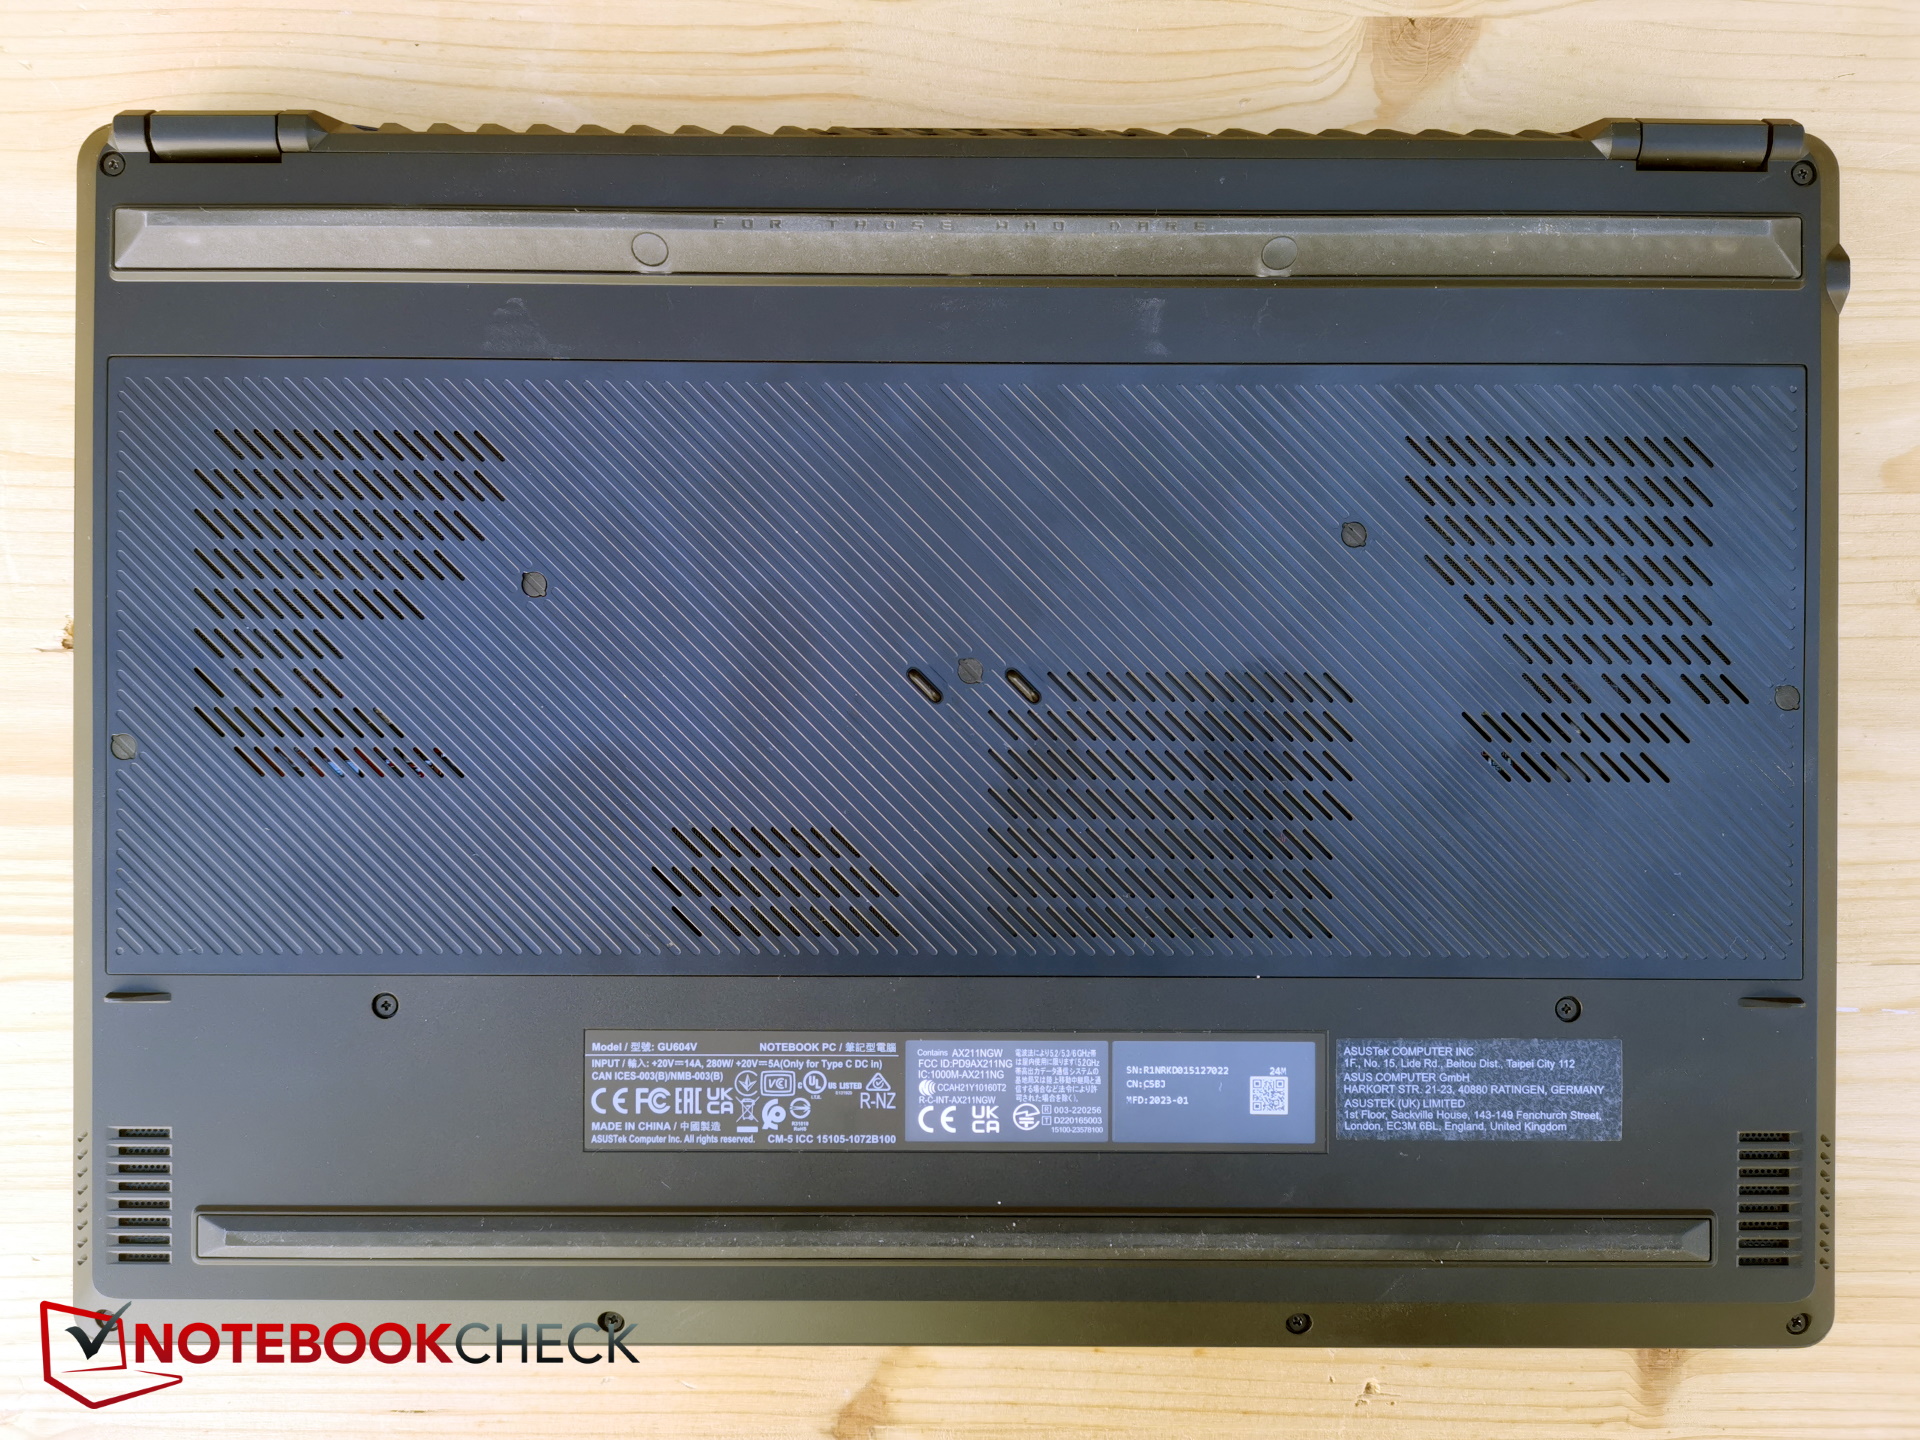
Na podstawie urządzenia na odkręcenie czeka 15 śrubek z łbem krzyżowym. Niestety, siedem (!) z nich znajduje się pod przyklejonymi gumowymi stoperami, których usunięcie jest kłopotliwe, denerwujące i sprawia wrażenie niepotrzebnej niefrasobliwości użytkownika.
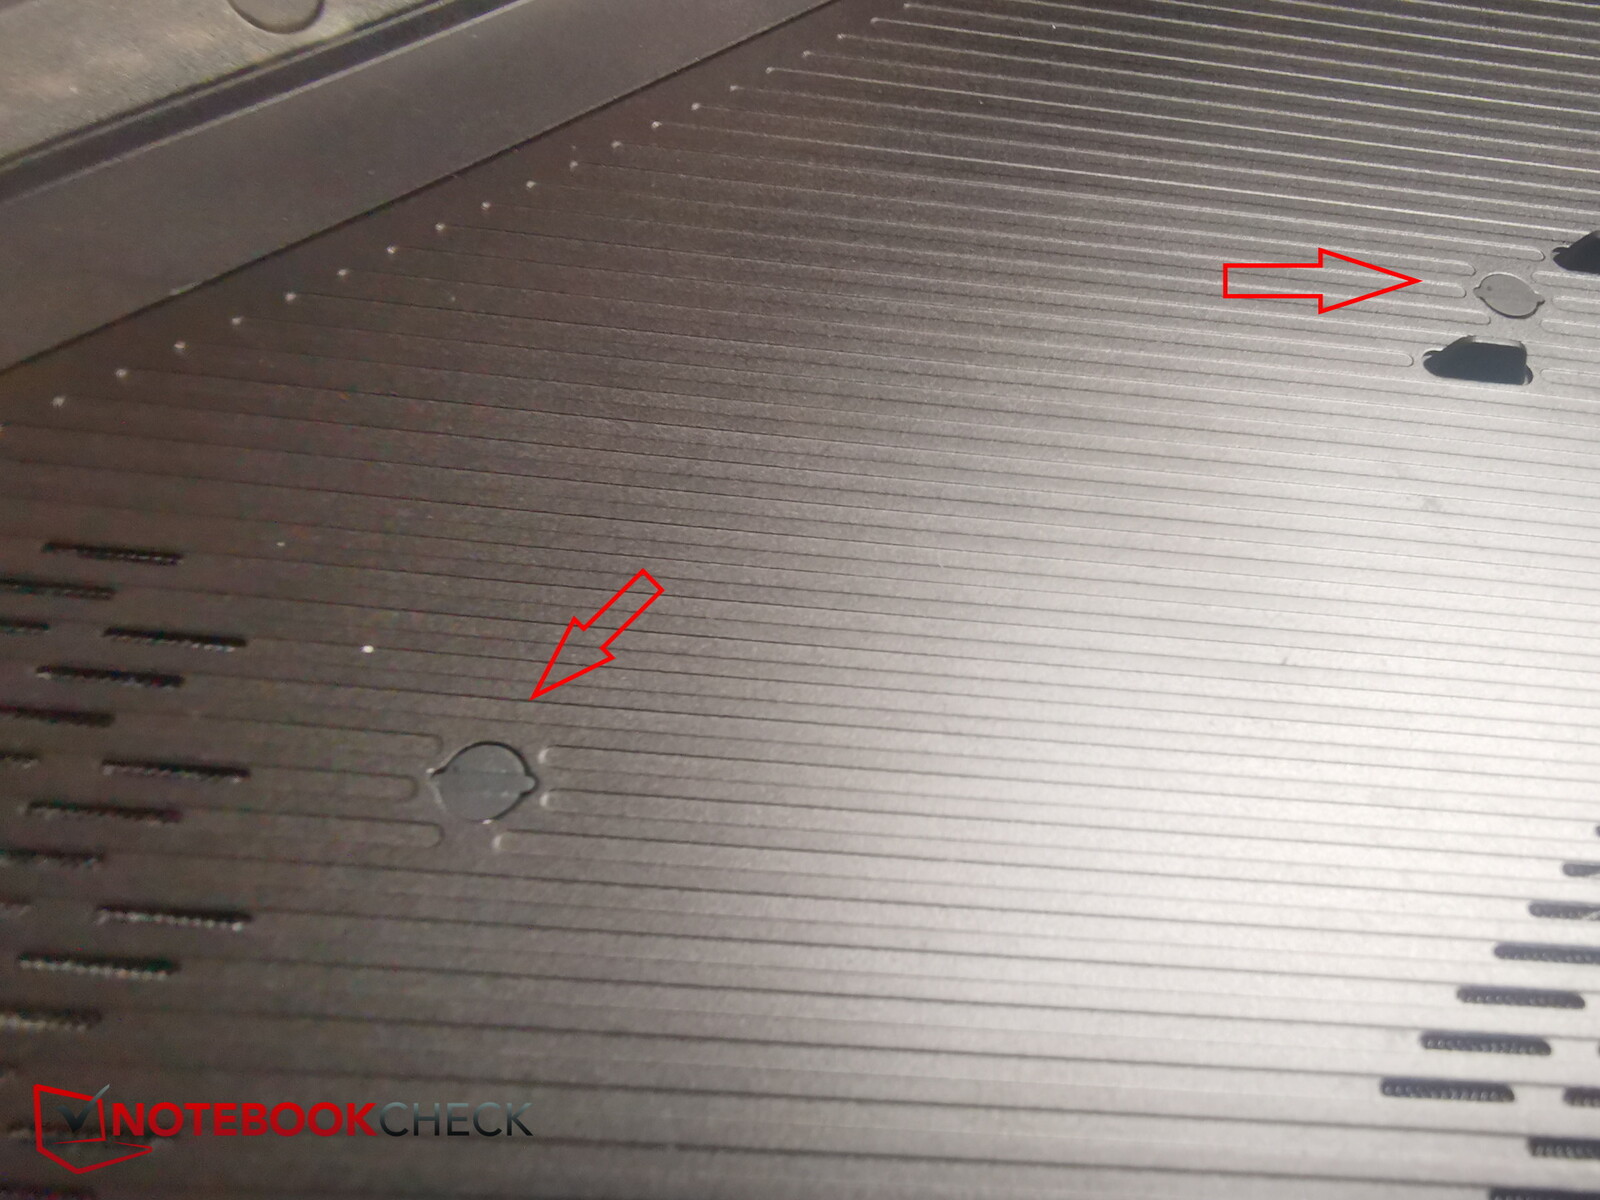
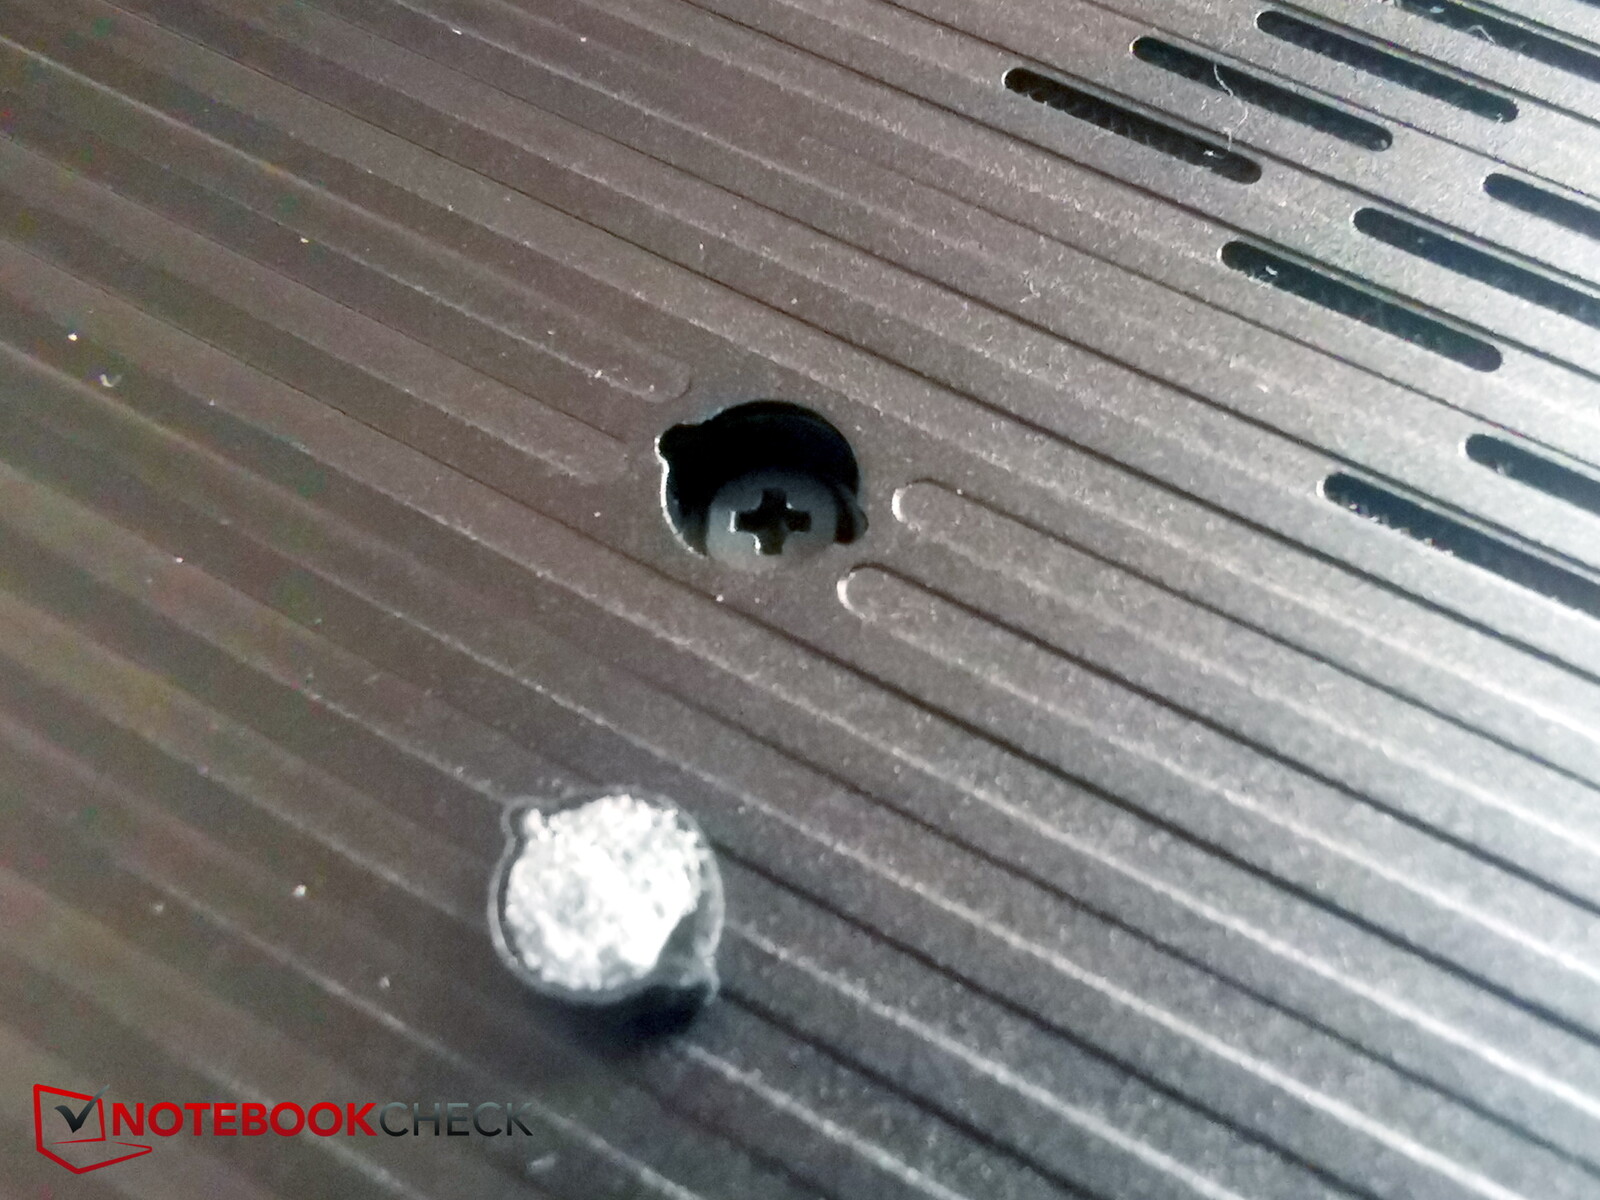
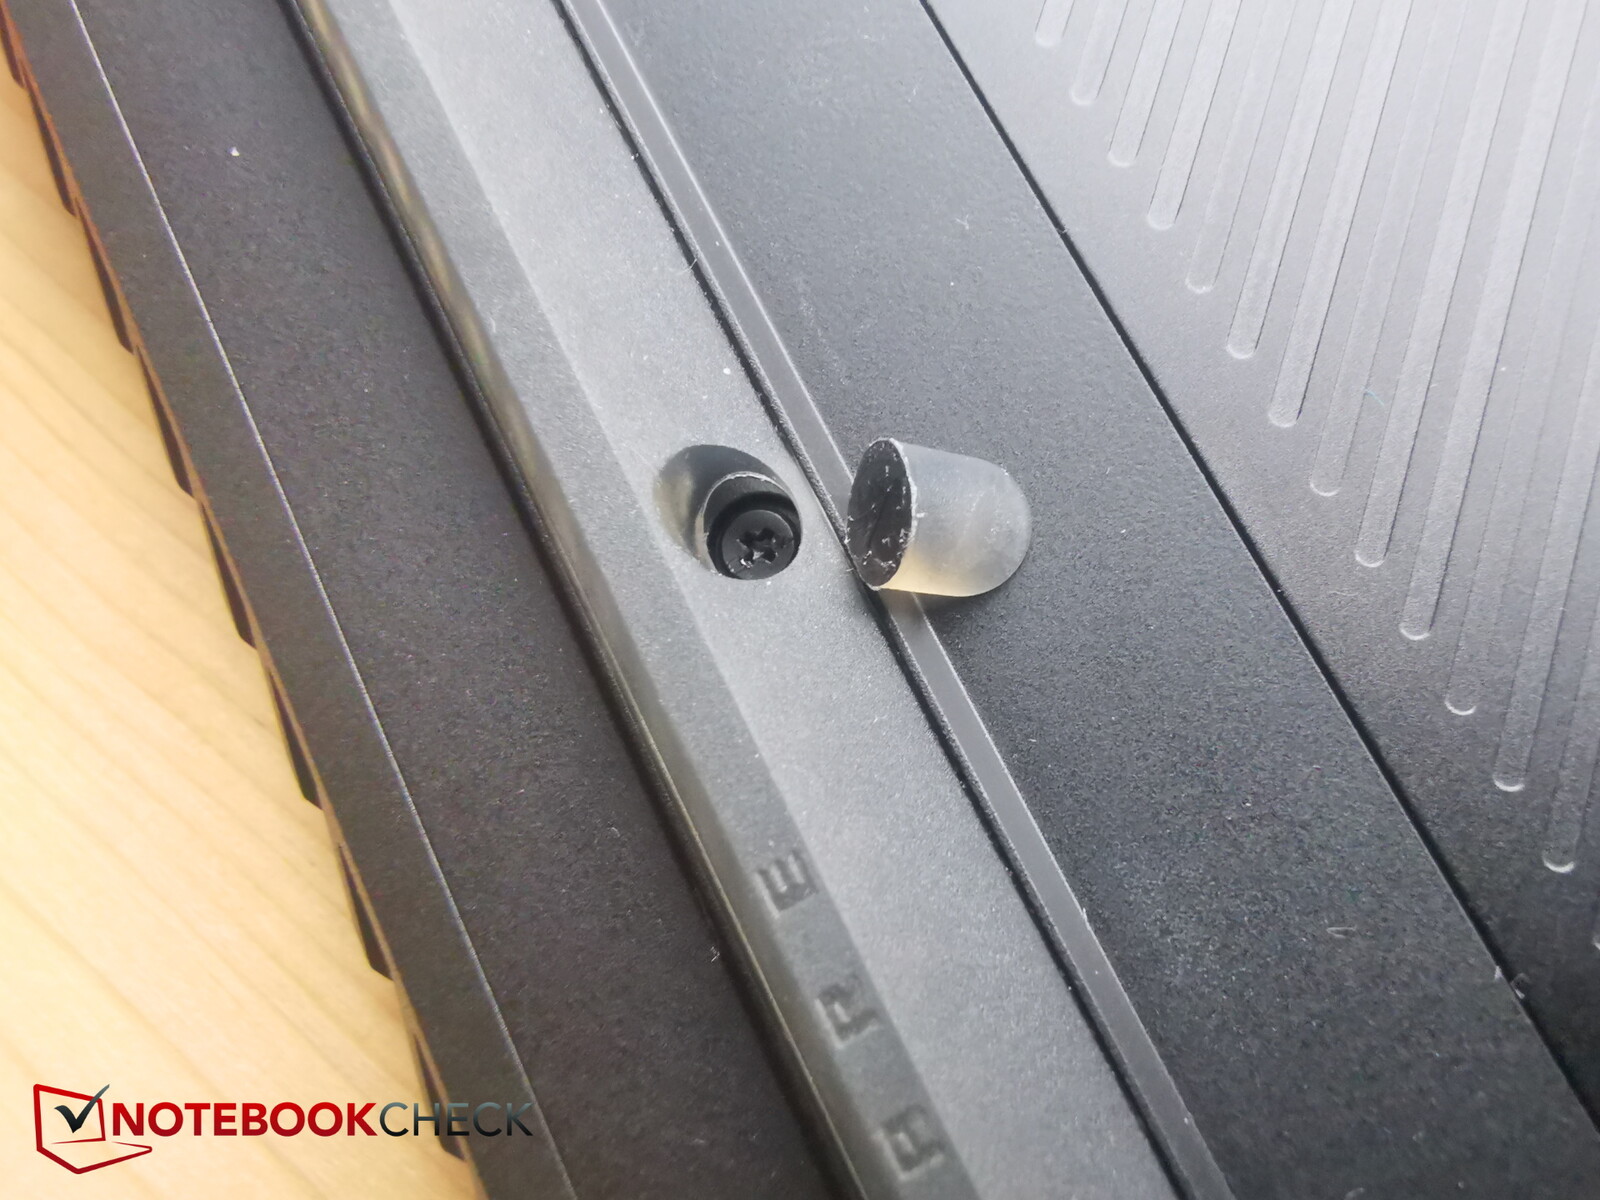
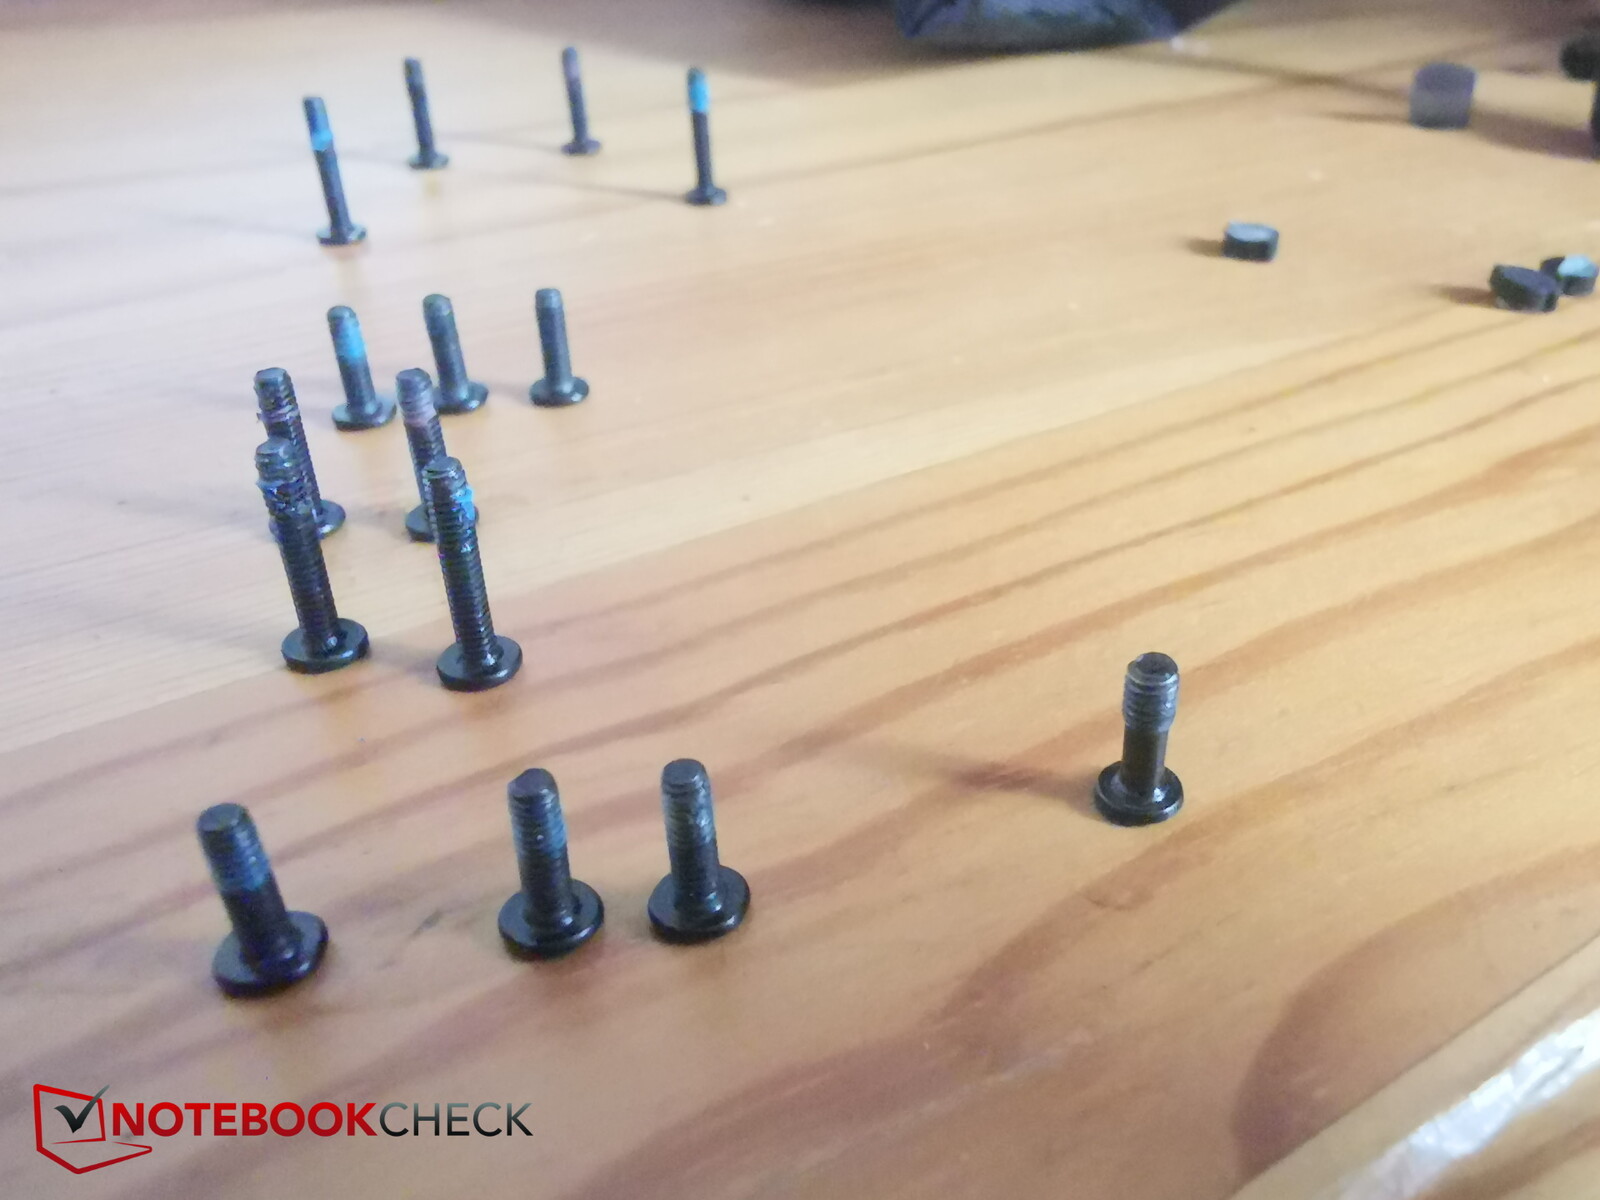
W sumie odkryliśmy 4 różne długości/rodzaje śrub! Dlatego warto zwrócić uwagę na to, które z nich należą gdzie. Wraz z 7 ukrytymi śrubkami i SO-DIMM RAM, M16 można uznać za trudny do modernizacji lub naprawy.
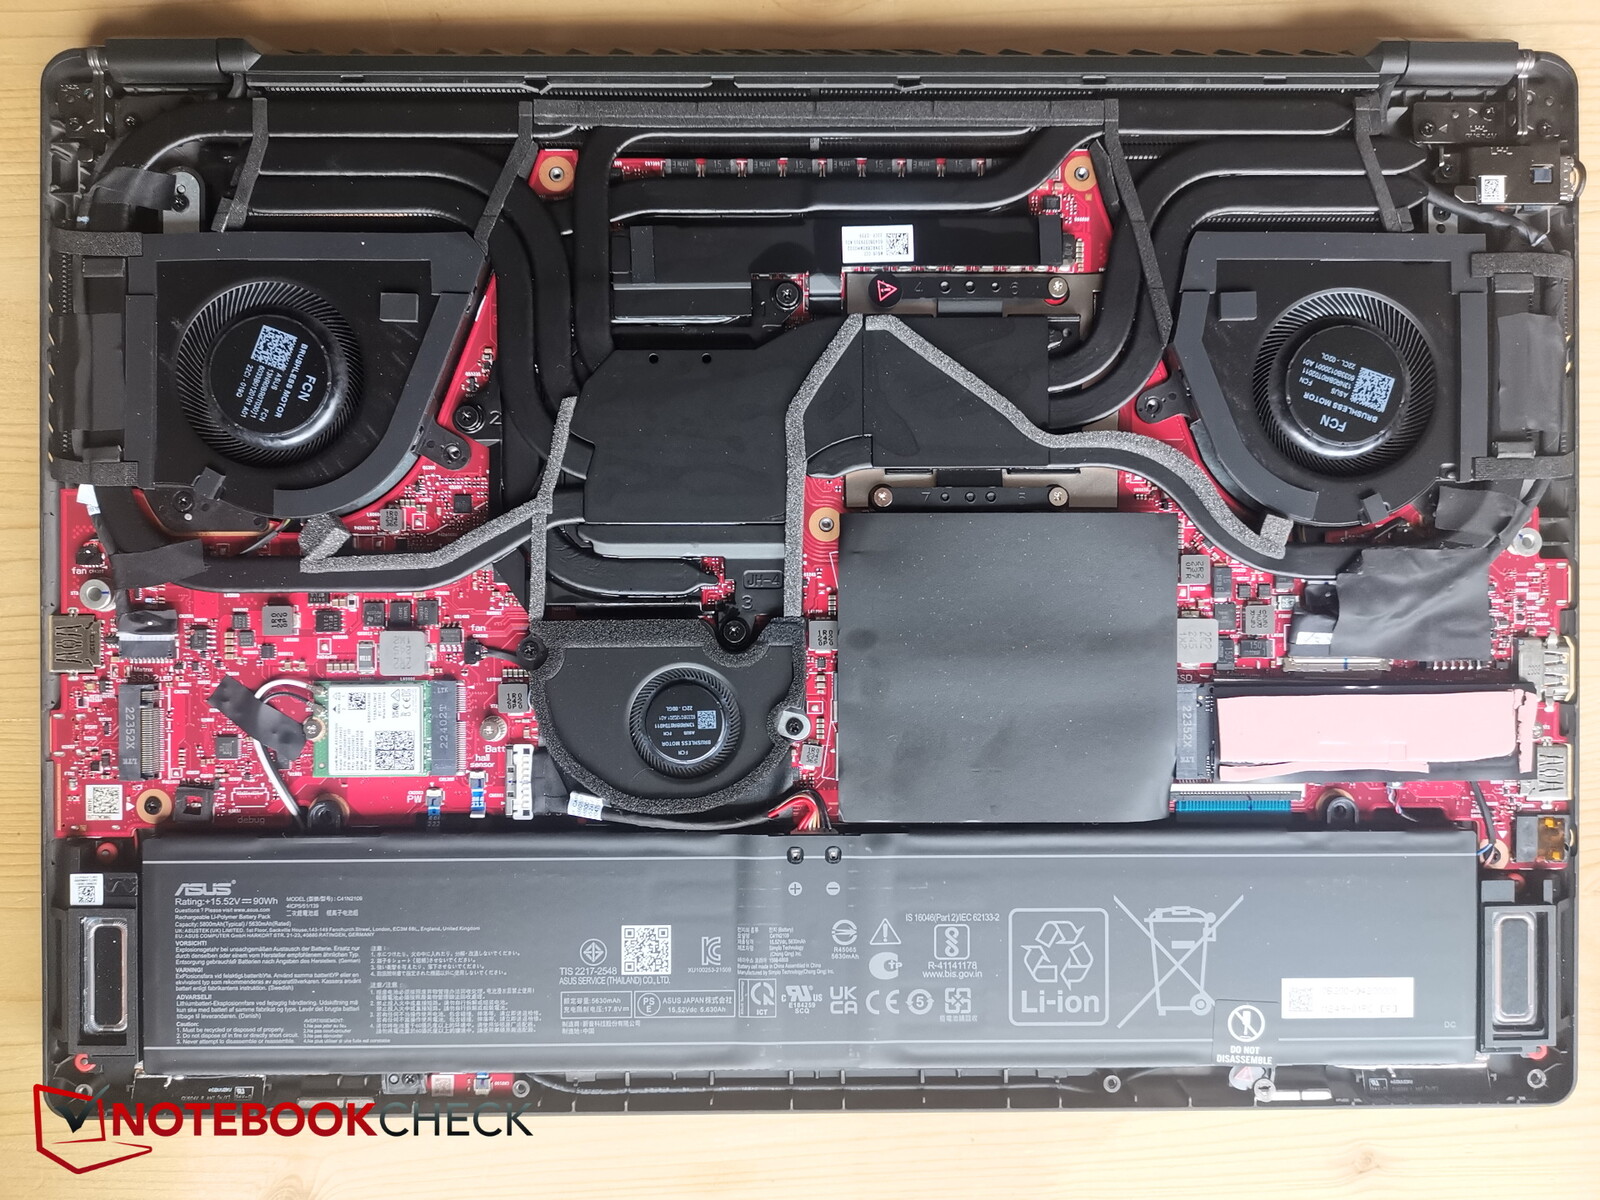
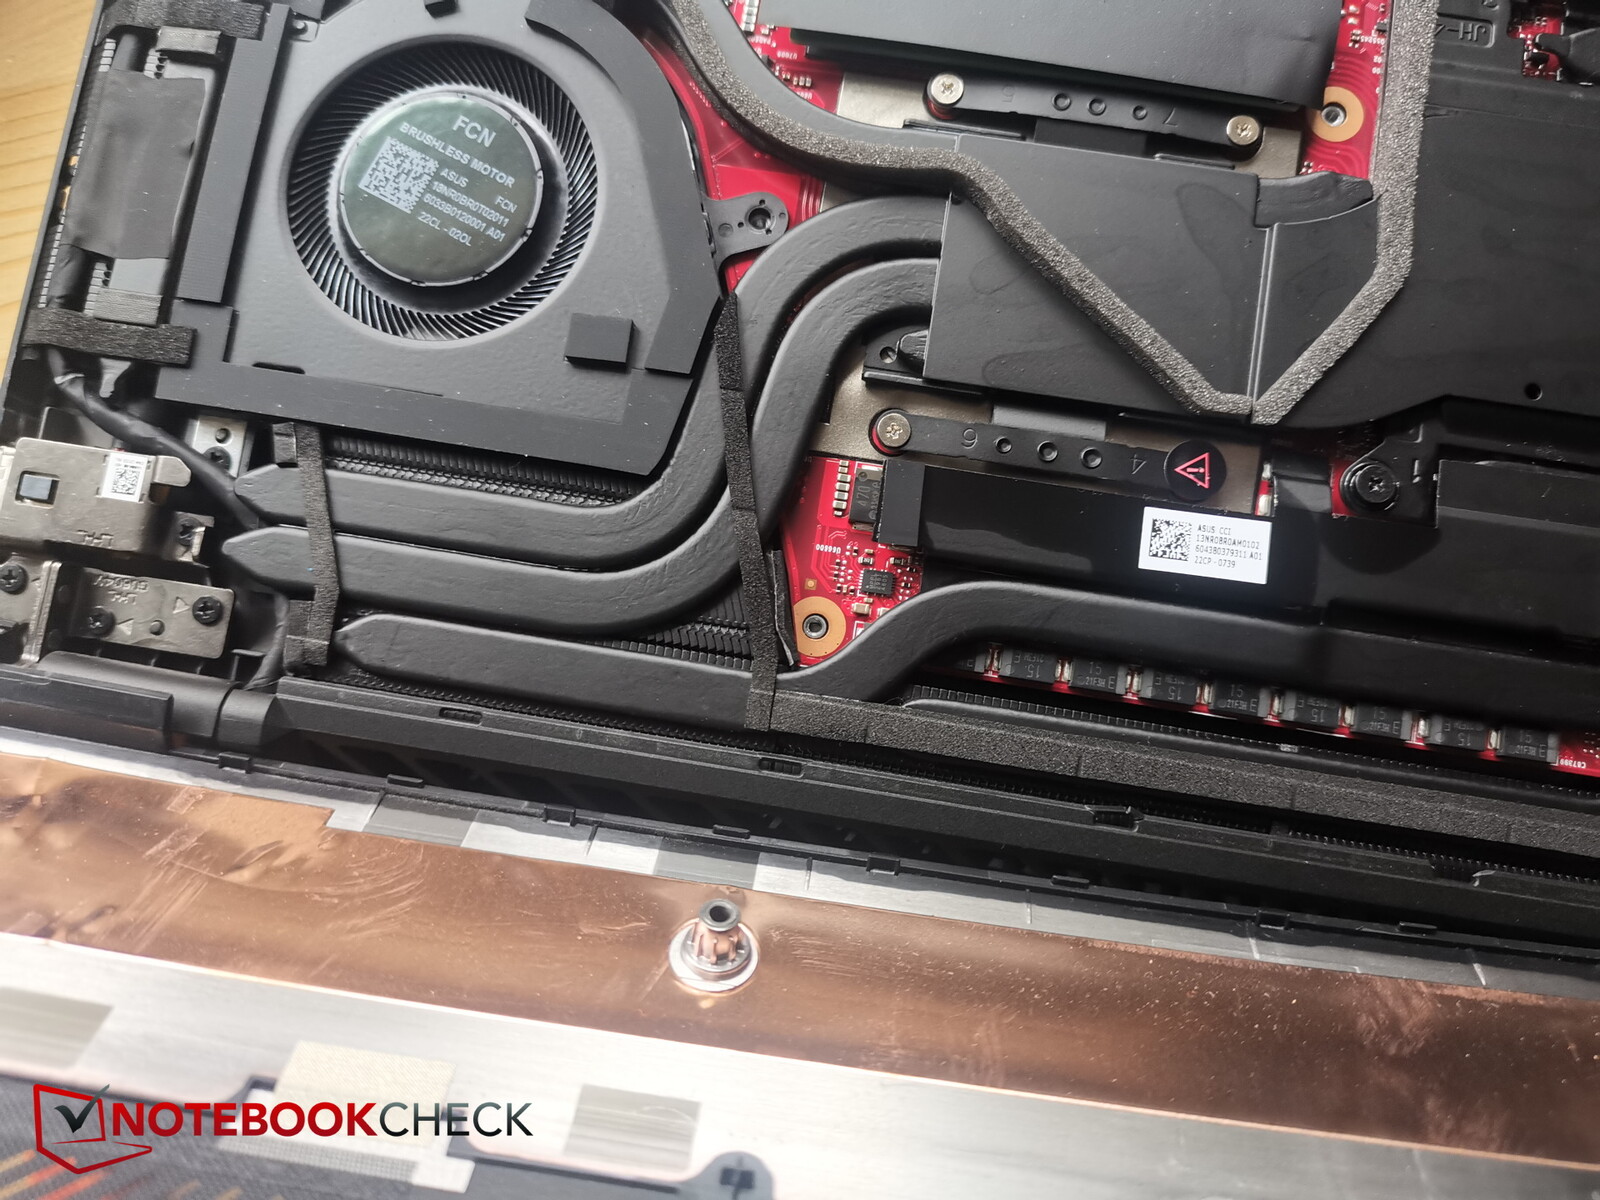
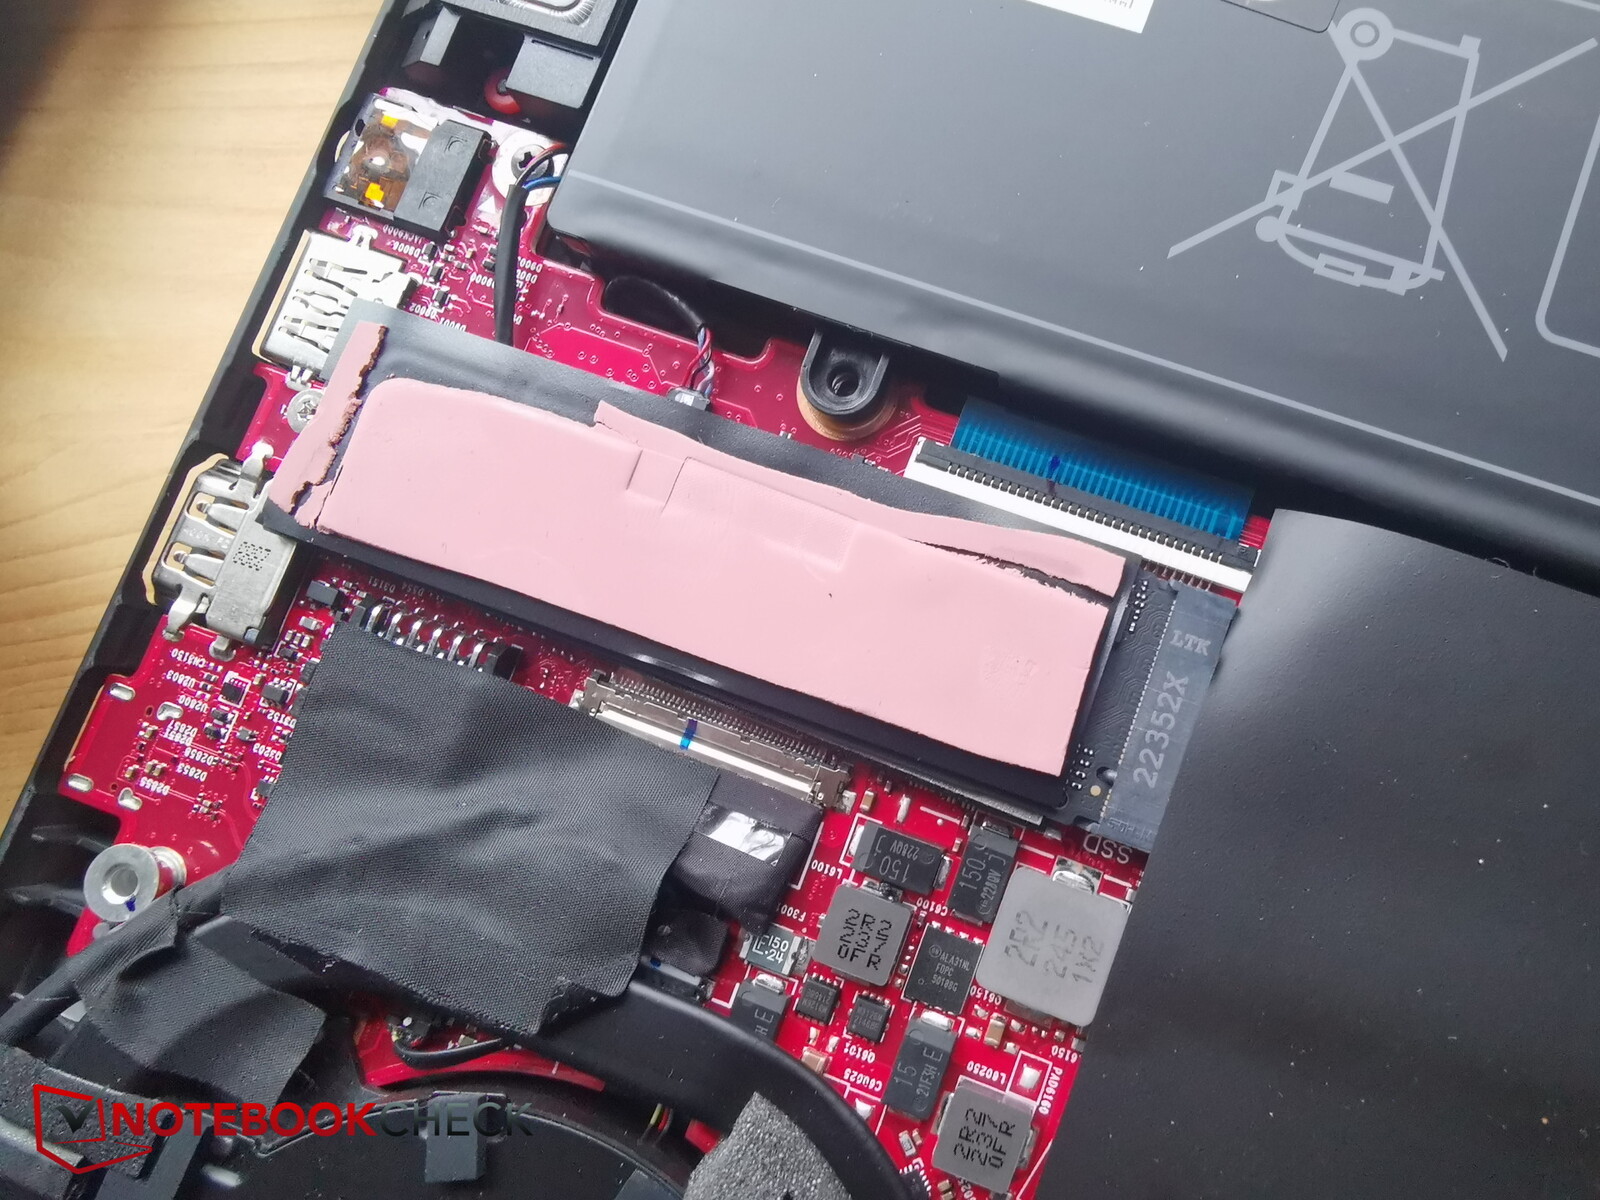
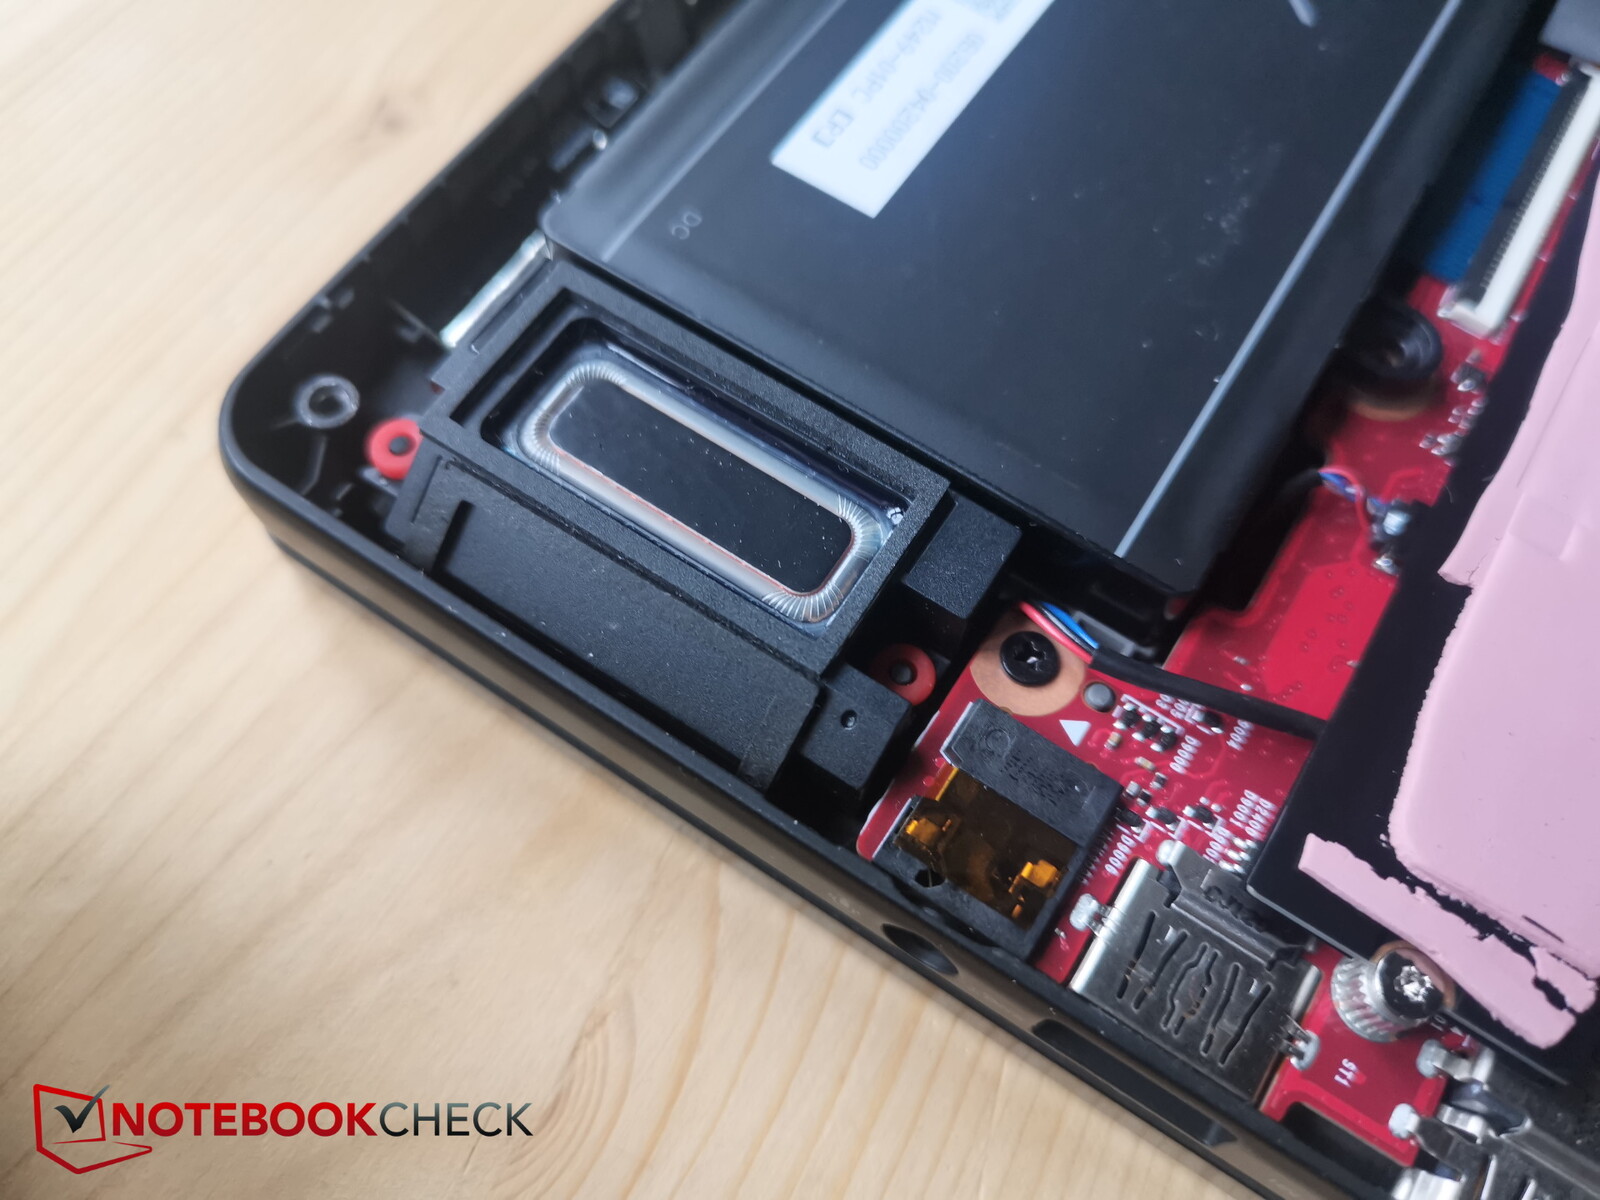
Przynajmniej płyta bazowa może być łatwo otwarta. Wewnątrz można uzyskać dostęp do trzech wentylatorów, baterii, dysku SSD, drugiego gniazda M.2 SSD, wymiennego modułu WiFi. a także gniazda SO-DIMM RAM.
System chłodzenia składa się z 2 normalnej wielkości wentylatorów i dodatkowego małego wentylatora, który przypuszczalnie siedzi na górze jednostki graficznej. Dysk SSD posiada podkładkę chłodzącą, która w naszym modelu recenzenckim wygląda na dość postrzępioną.
Gwarancja
Laptopy Gigabyte objęte są 24-miesięczną gwarancją.
Urządzenia wejściowe - Nieco płytkie klawisze i duży touchpad
Klawiatura
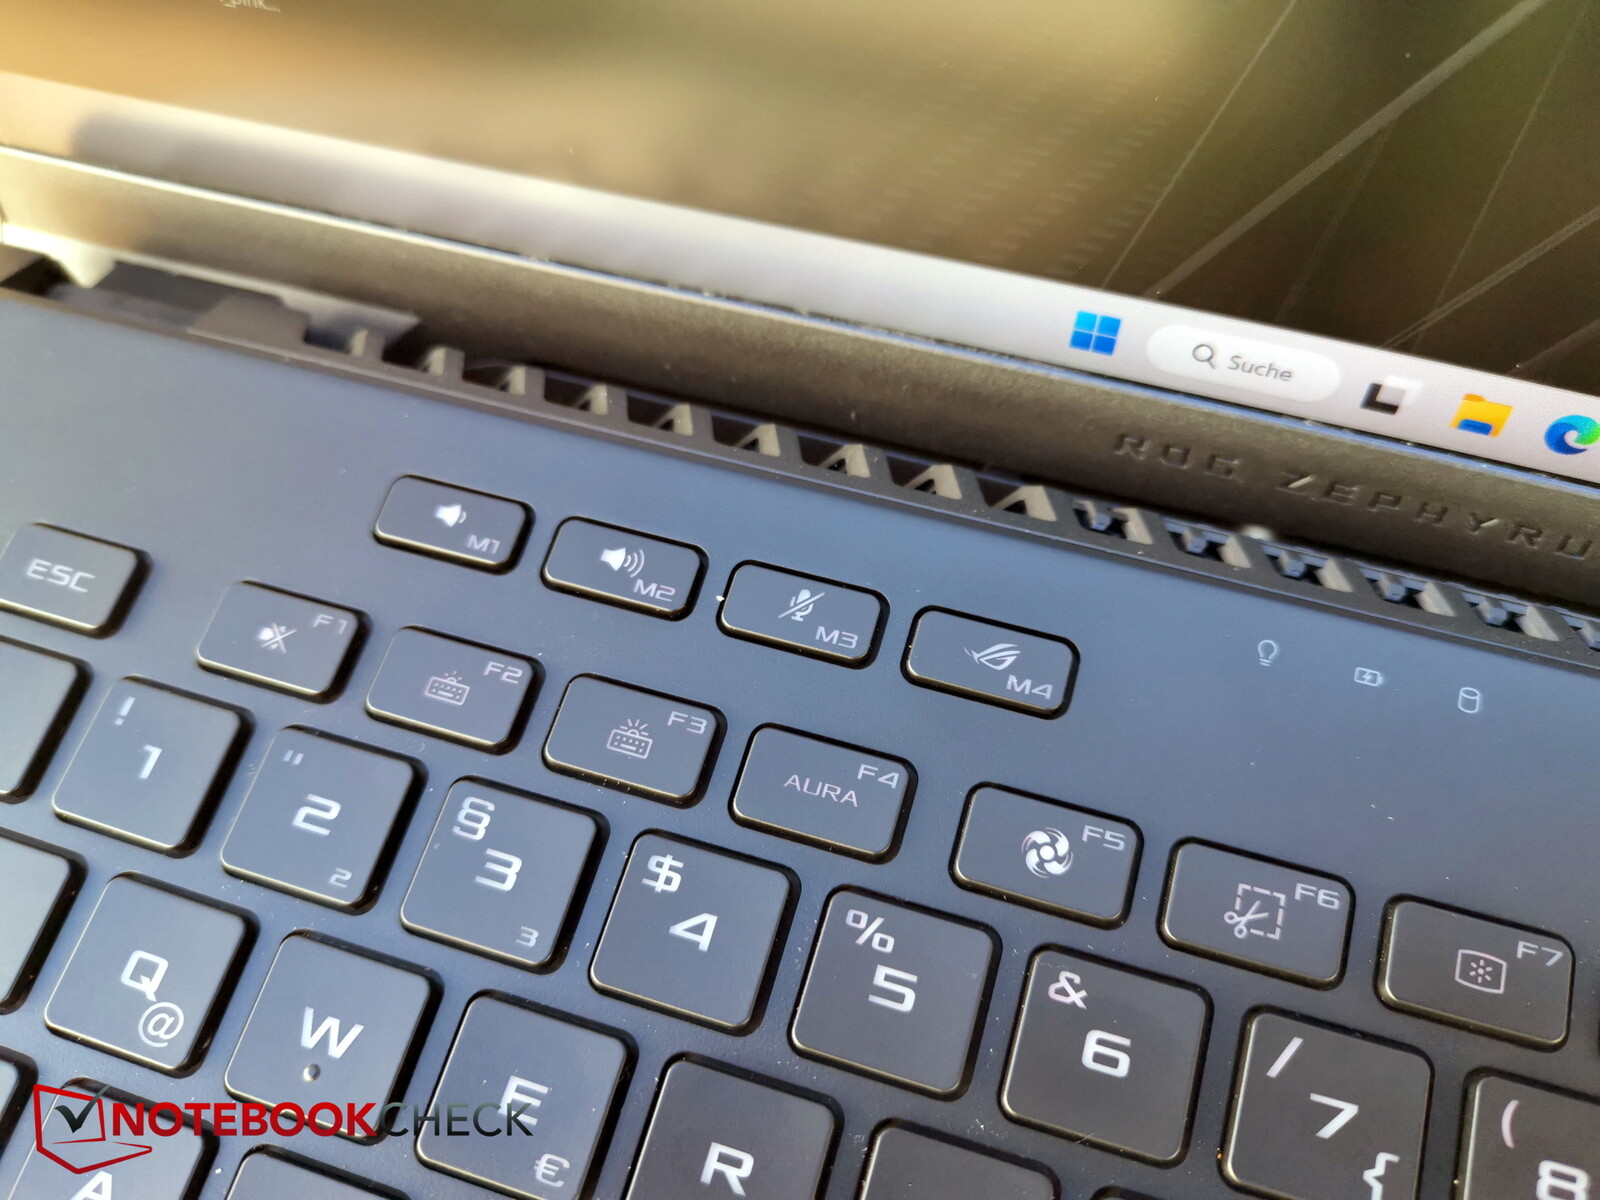
Układ wydaje się bardzo przestronny. Na górze po lewej stronie Asus umieścił cztery dodatkowe klawisze specjalne do regulacji głośności, mikrofonu i centrum sterowania Asusa. Można je również skonfigurować ręcznie.
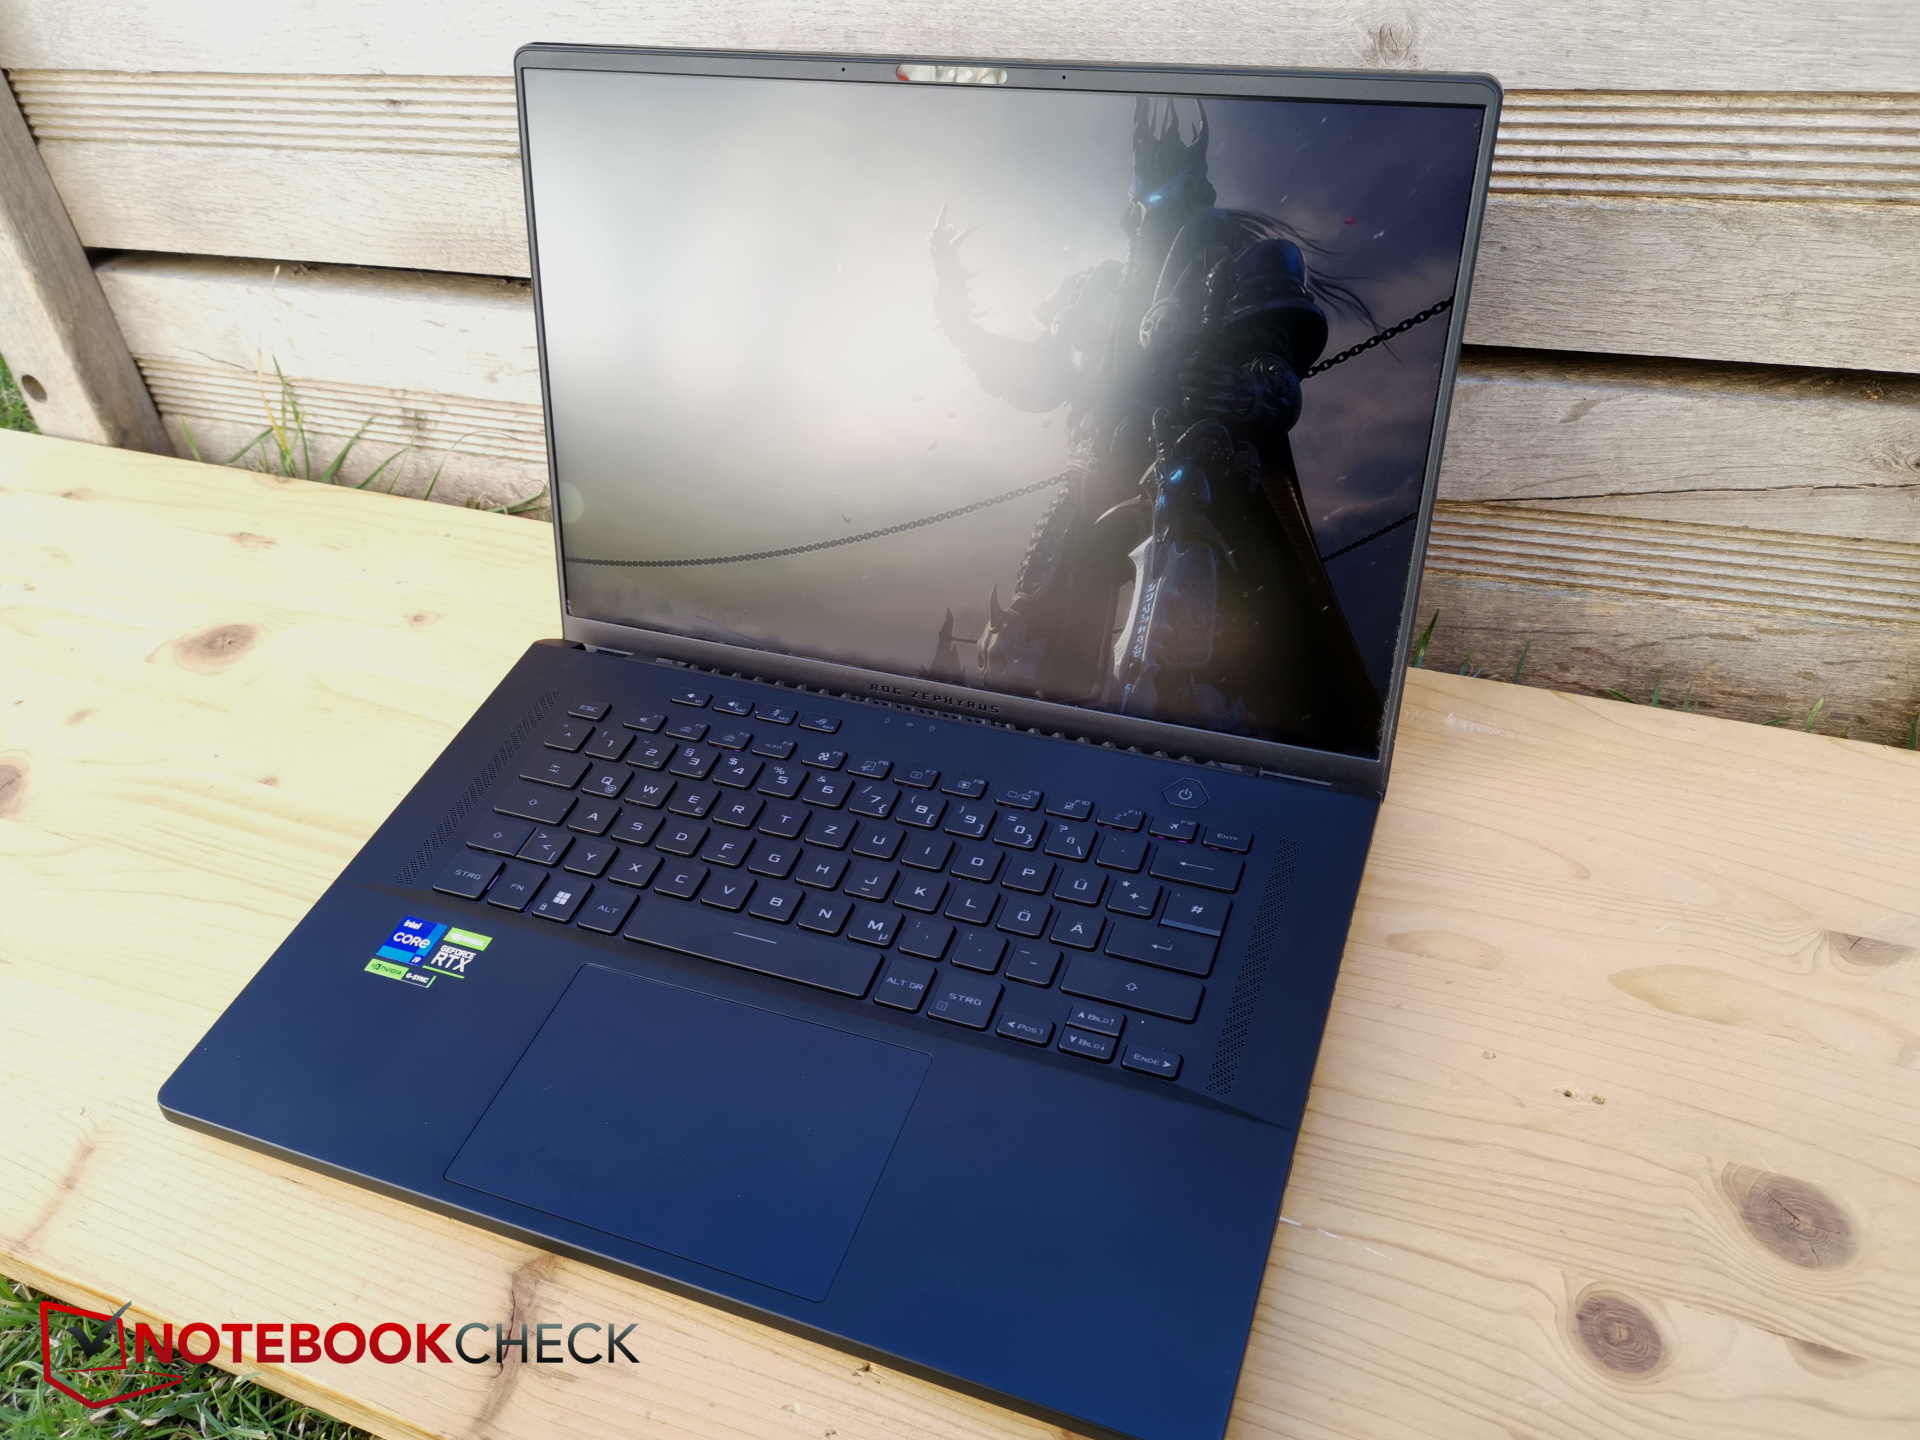
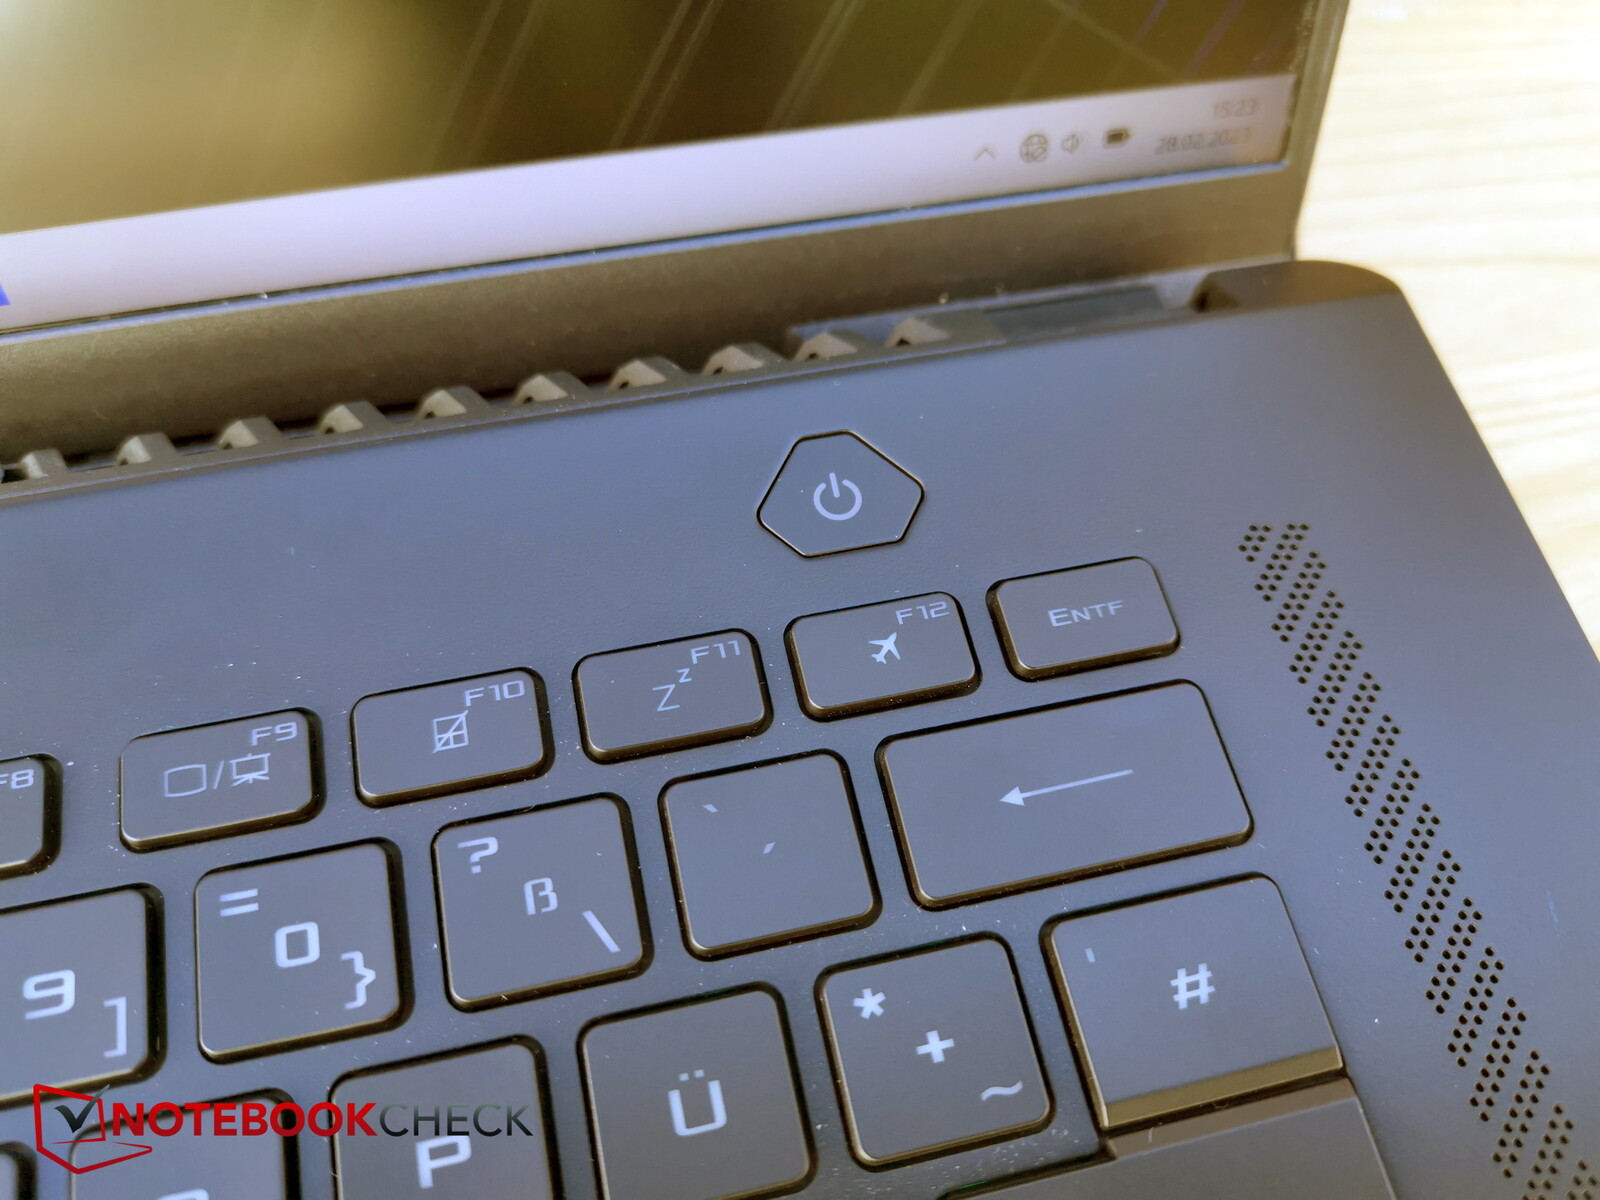
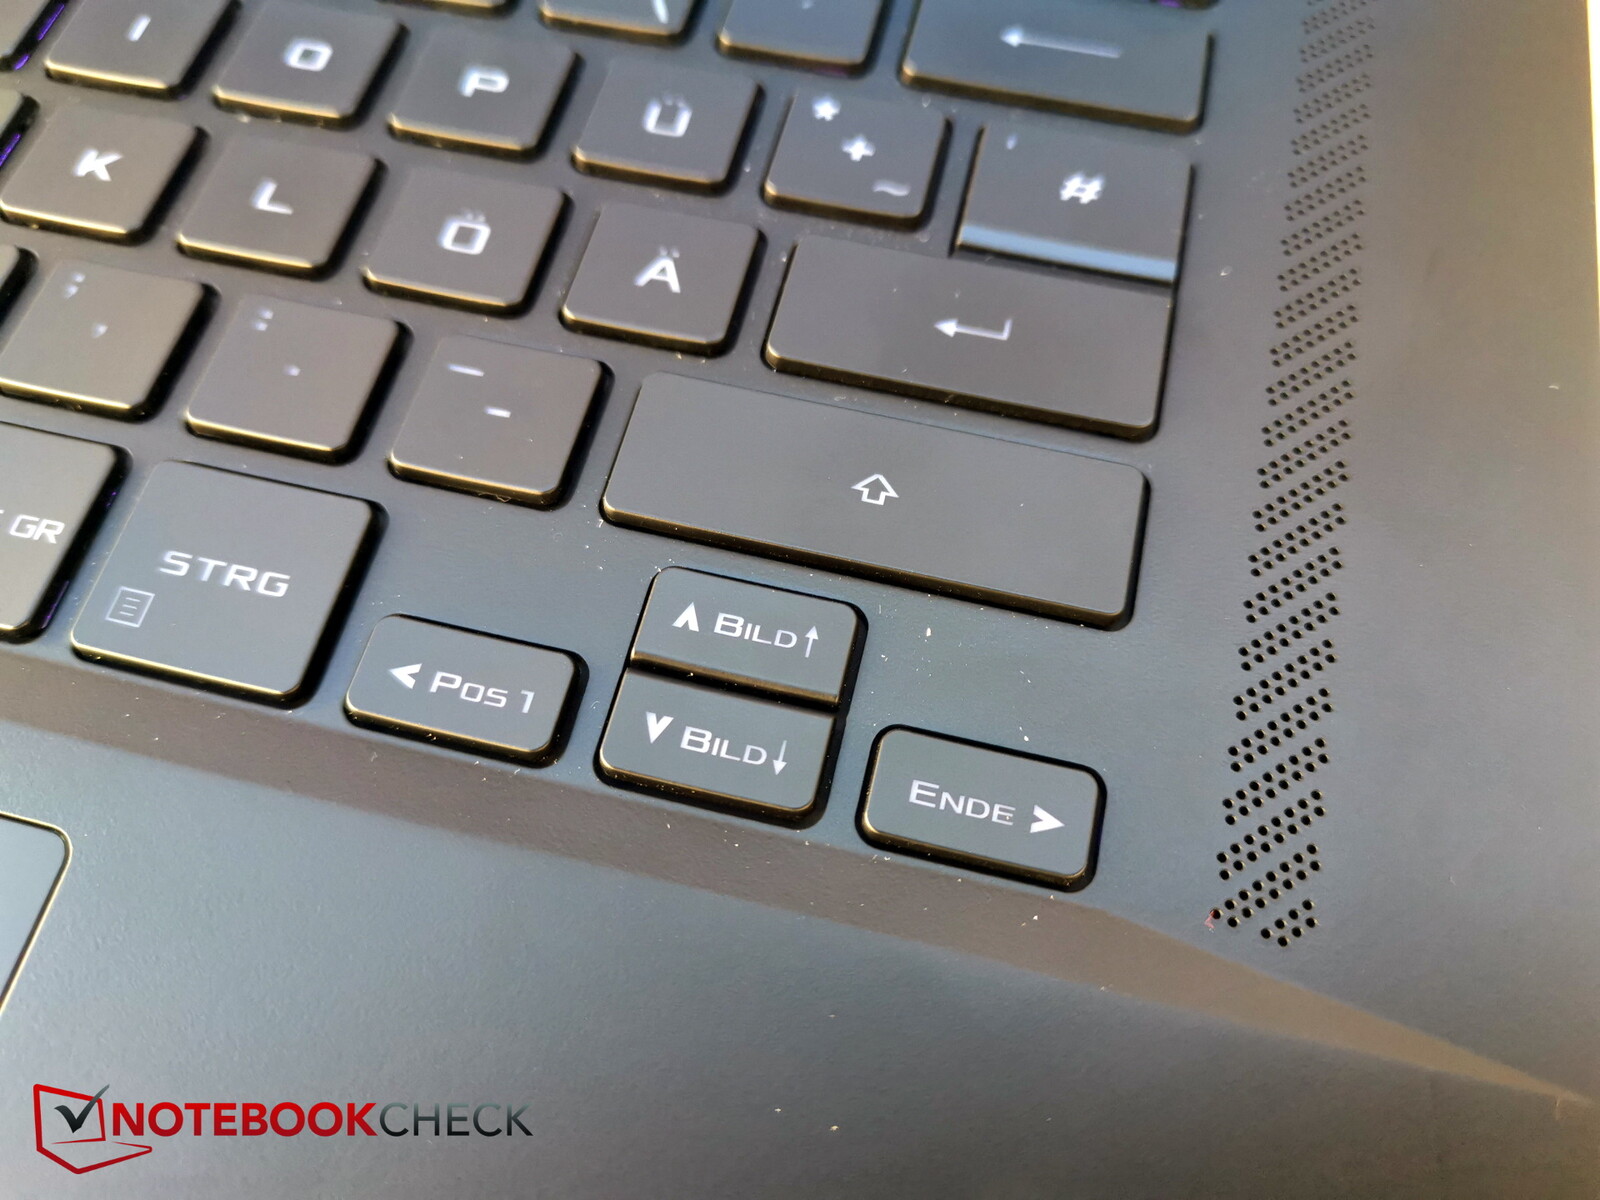
Niestety klawisze strzałek są bardzo wąskie, a przycisk zasilania, typowy dla tego typu klawiatury, jest osobnym klawiszem. Mimo że jest to urządzenie 16-calowe, nie ma klawiatury numerycznej.
Klawisze mają bardzo krótki skok, a sprzężenie zwrotne jest nieco płytkie, ale mimo to wystarczająco precyzyjne. Ogólnie rzecz biorąc, choć wrażenia z pisania są całkiem dobre, wolelibyśmy nieco bardziej wyraziste klawisze. Odgłosy pisania są umiarkowane.
3-stopniowe podświetlenie świeci w różnych kolorach RGB, ale tylko jednostrefowo.
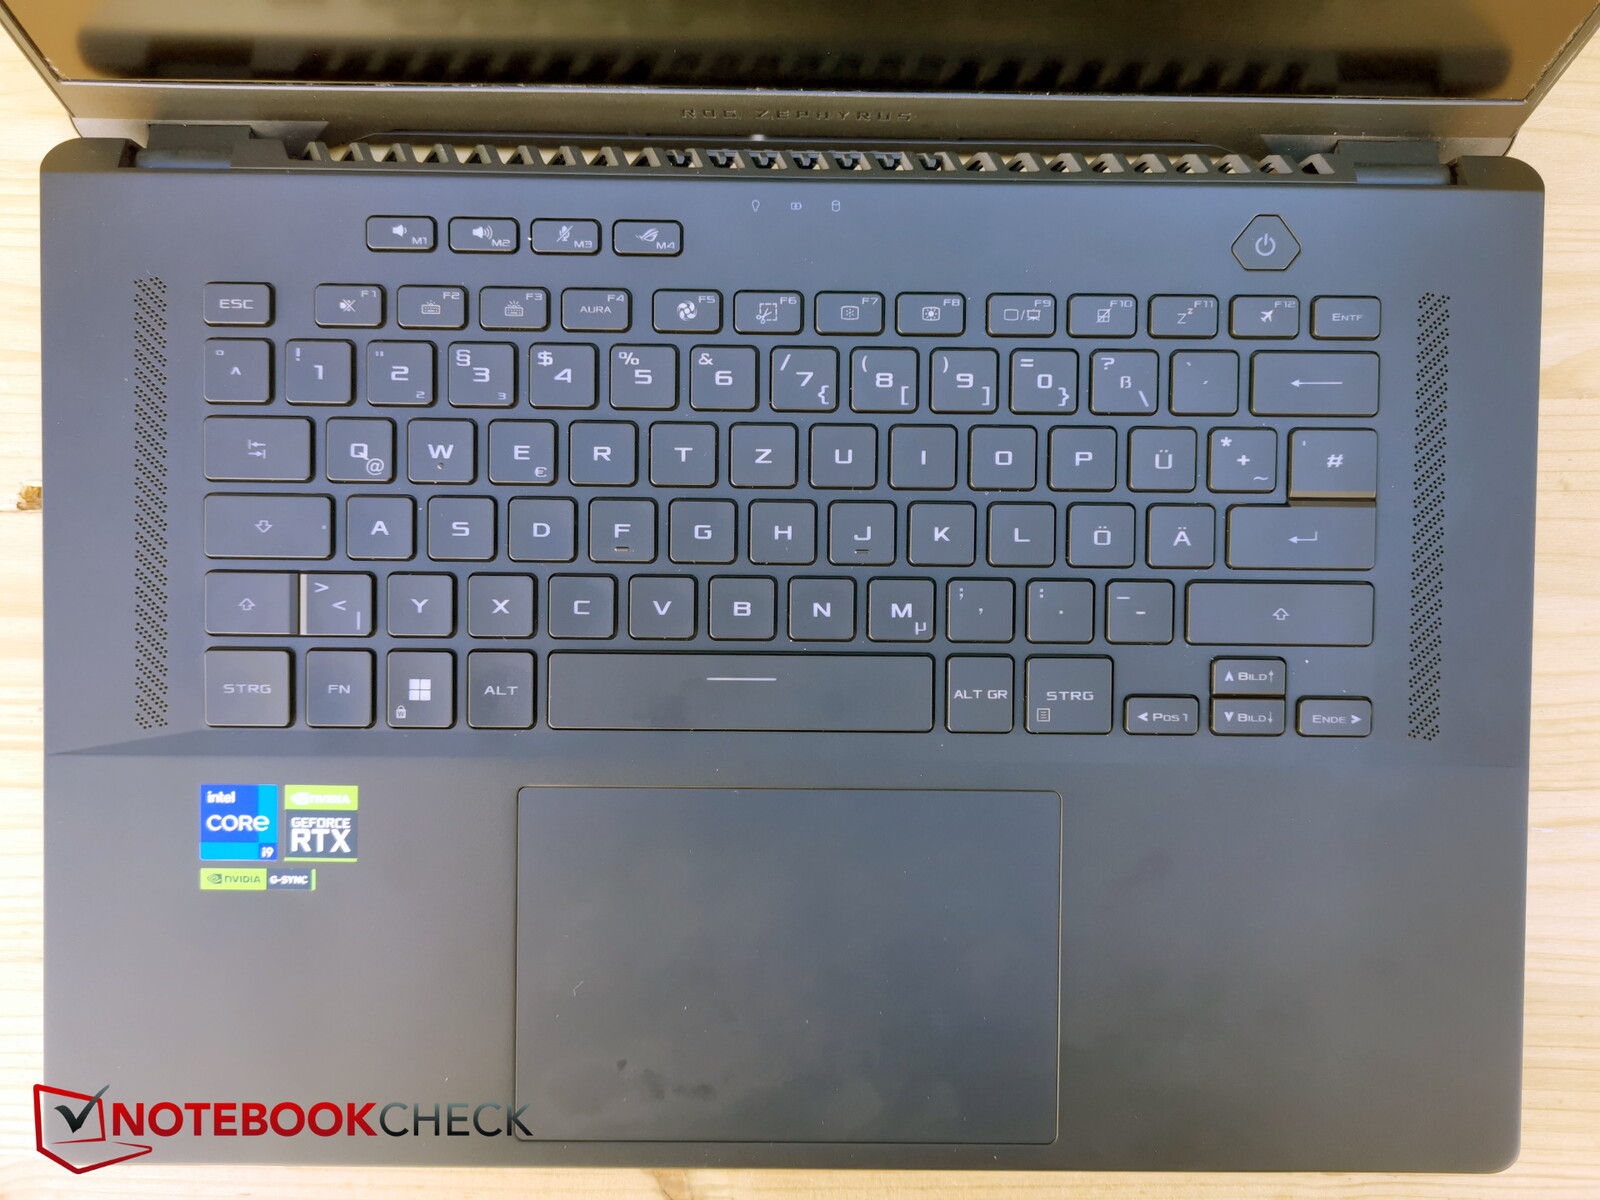
Touchpad
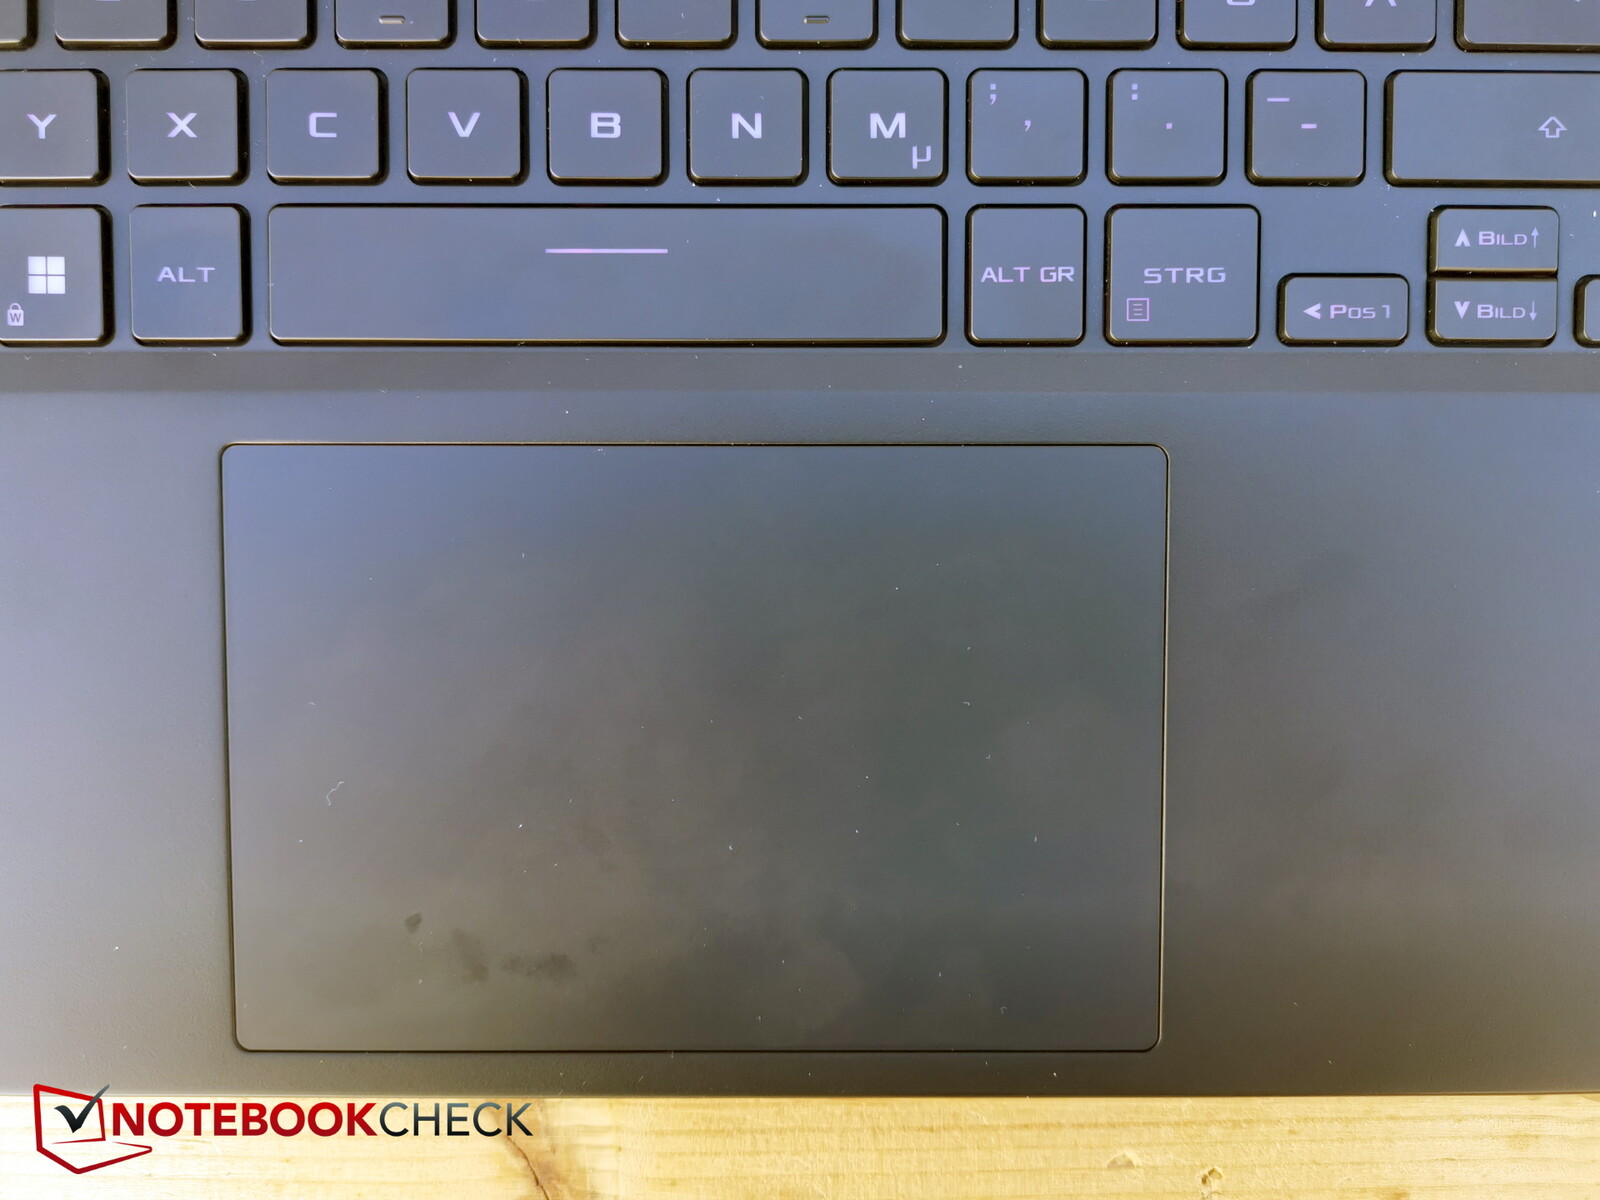
Duży touchpad (ok. 13 x 8,5 cm) jest nieco przesunięty w prawo i oferuje płynne machanie nawet przy wykonywaniu dłuższych ruchów.
Zintegrowane klawisze mają krótki, ale dobry punkt nacisku z wyraźną informacją zwrotną. Odgłosy klikania można określić jako ciche do umiarkowanych.
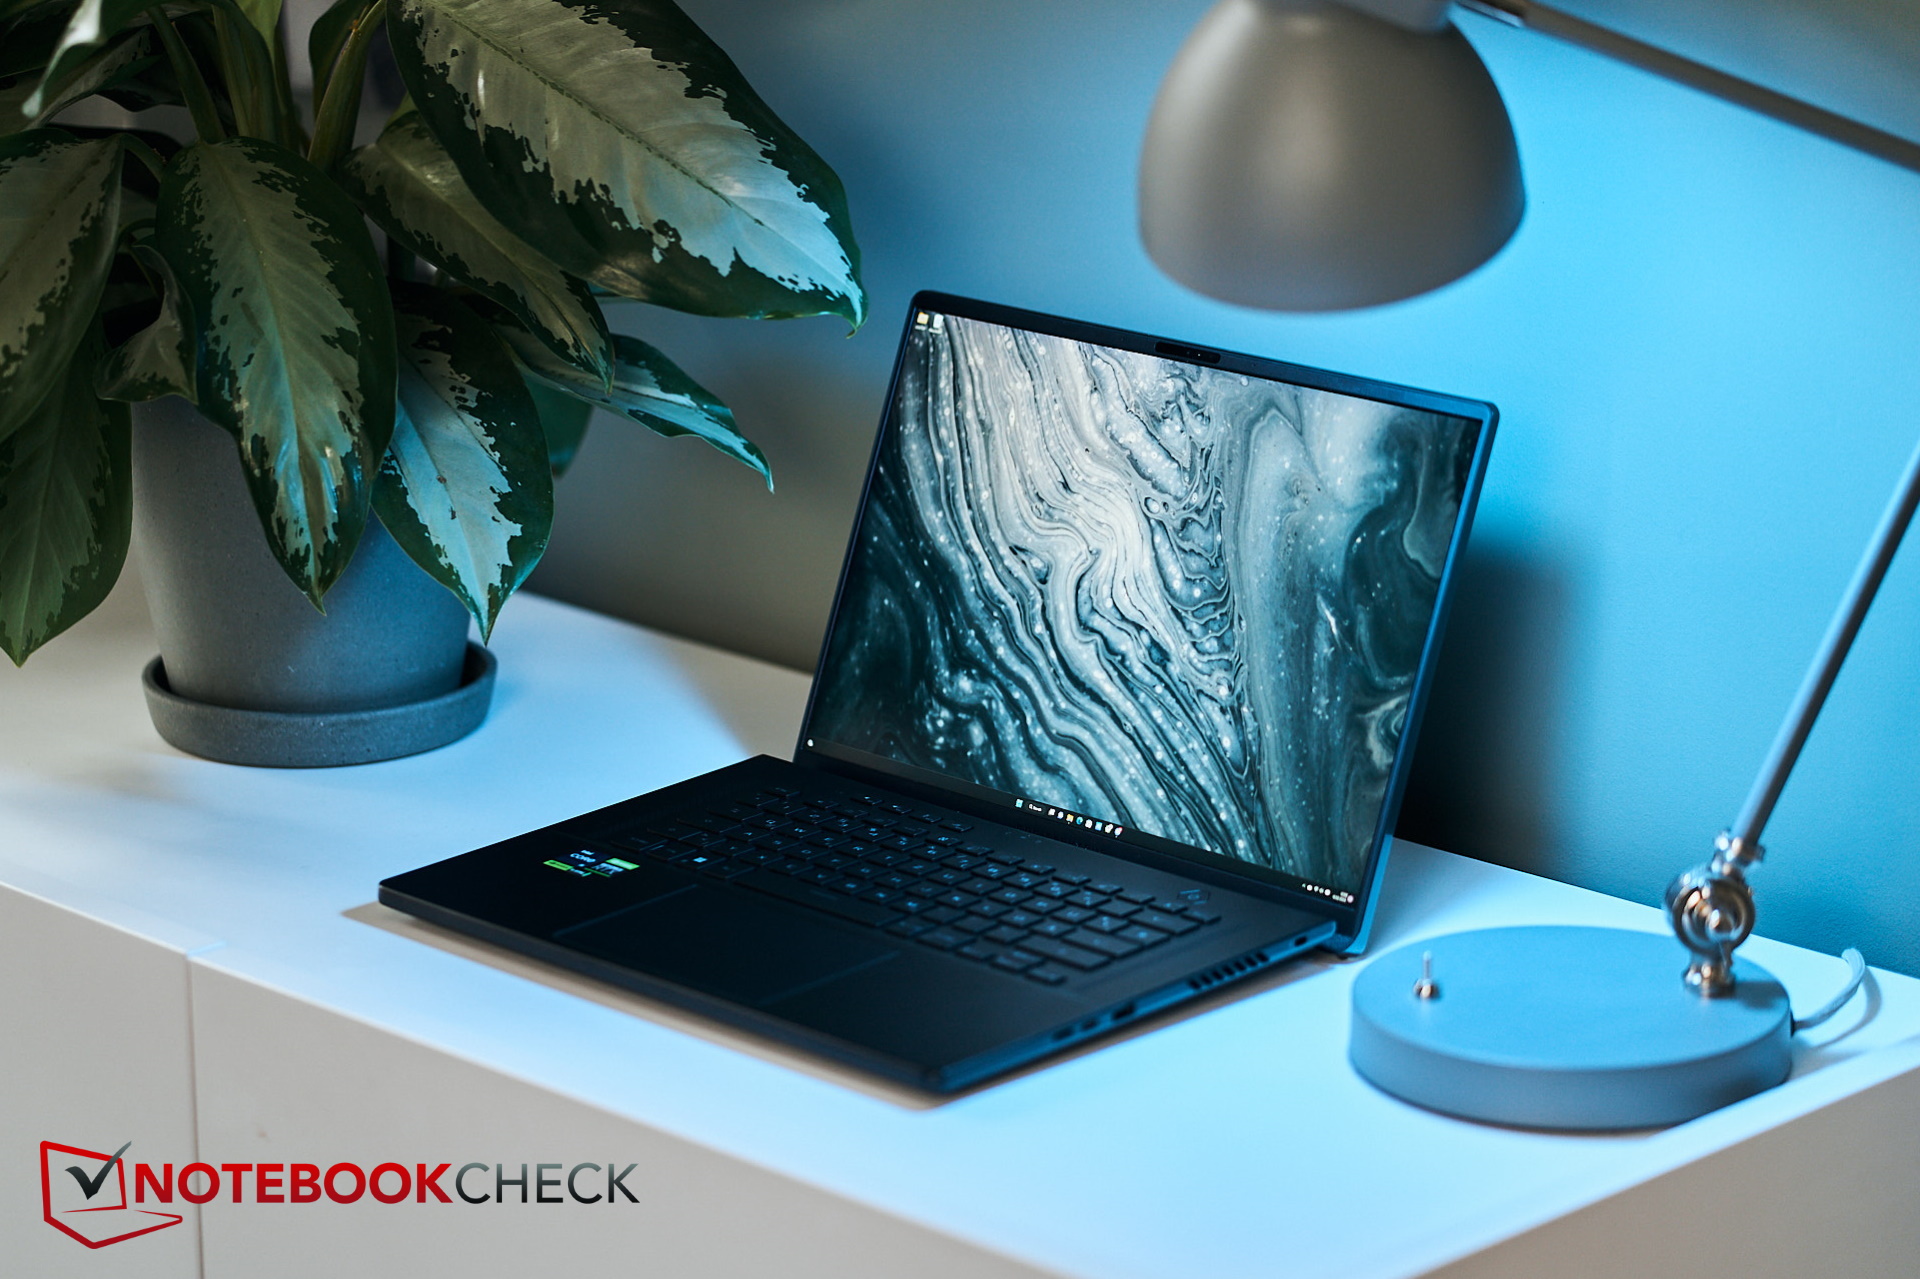
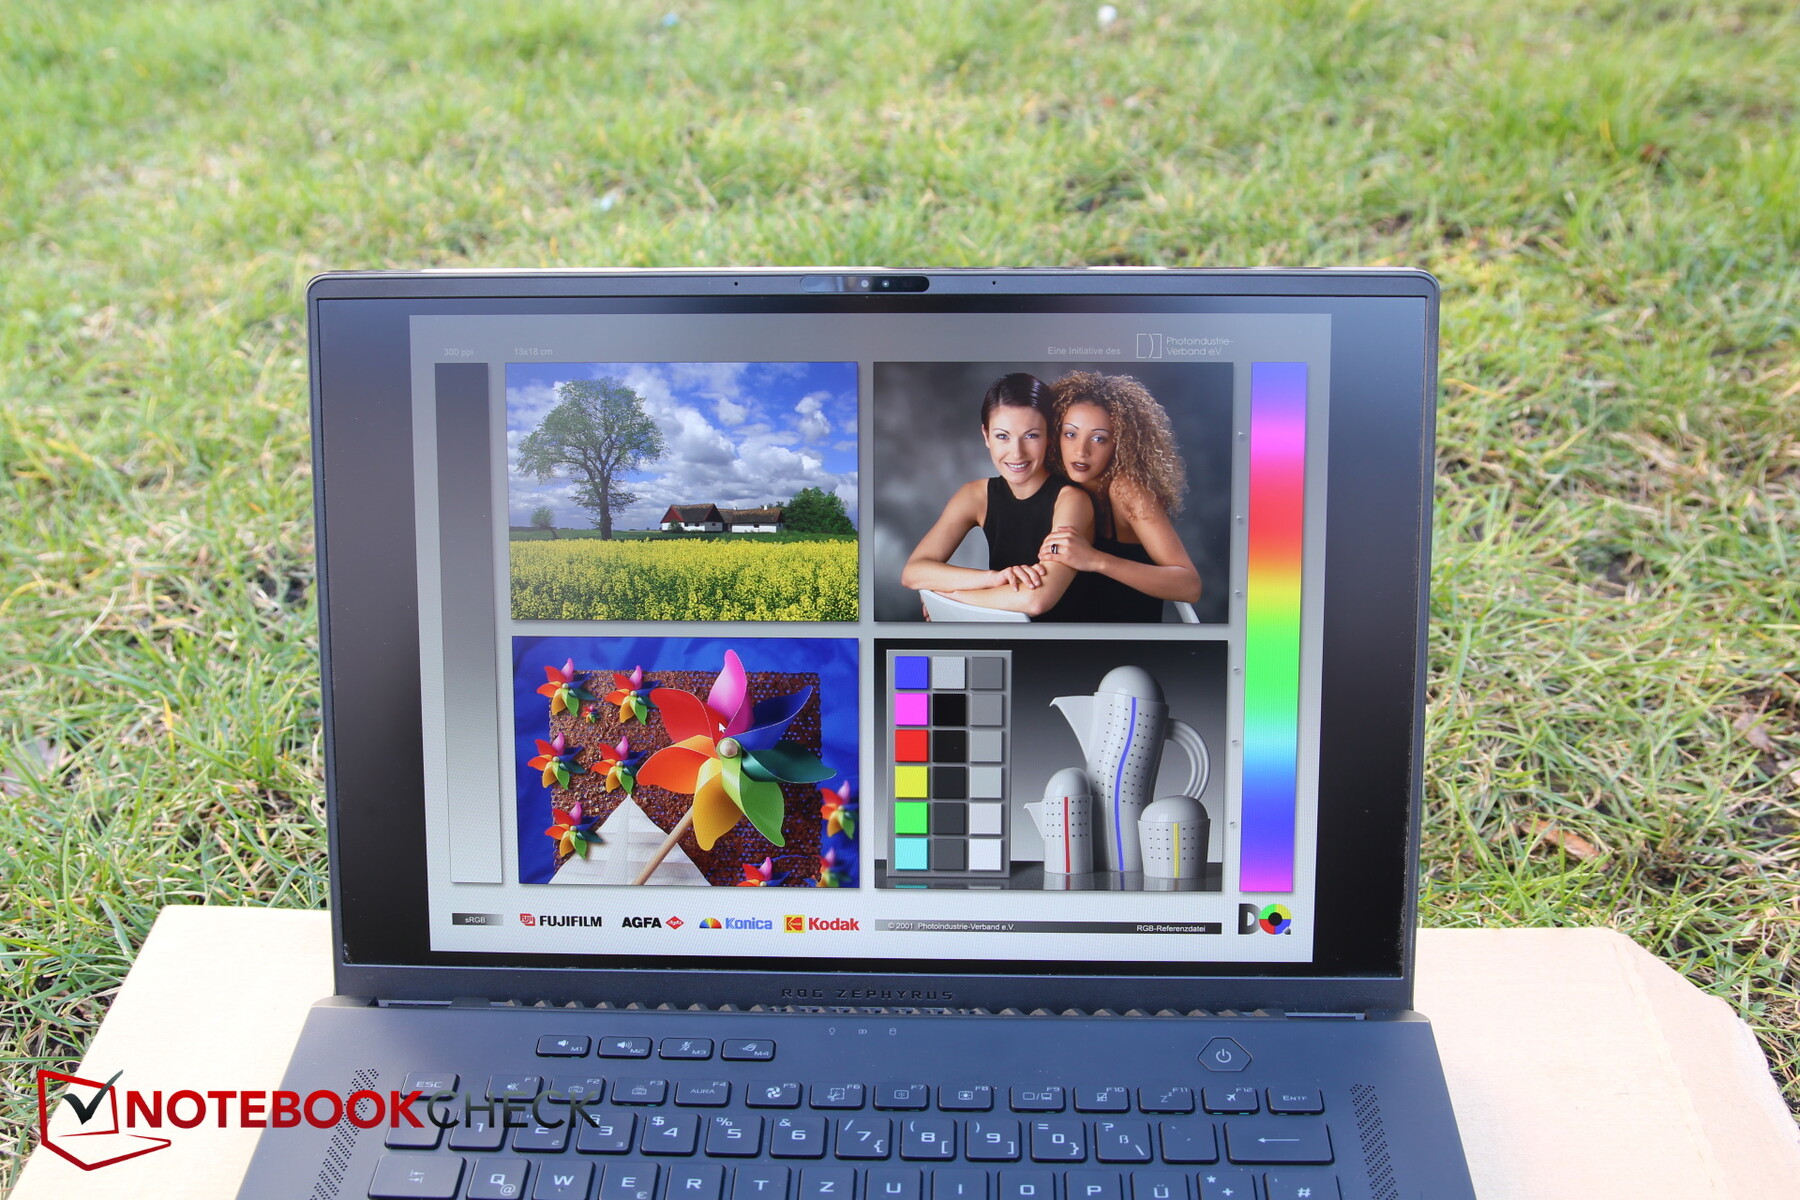
Wyświetlacz - Bardzo jasny Mini-LED z HDR
Po raz kolejny producent zdecydował się na matowy, 16:10, wyświetlacz IPS o rozdzielczości 2 560 x 1 600 pikseli. Nie jest to jednak ten sam panel, gdyż nosi nowy numer wersji i jest teraz podświetlany w technologii Mini-LED. Asus nie ujawnił liczby stref przyciemniania zastosowanych w panelu.
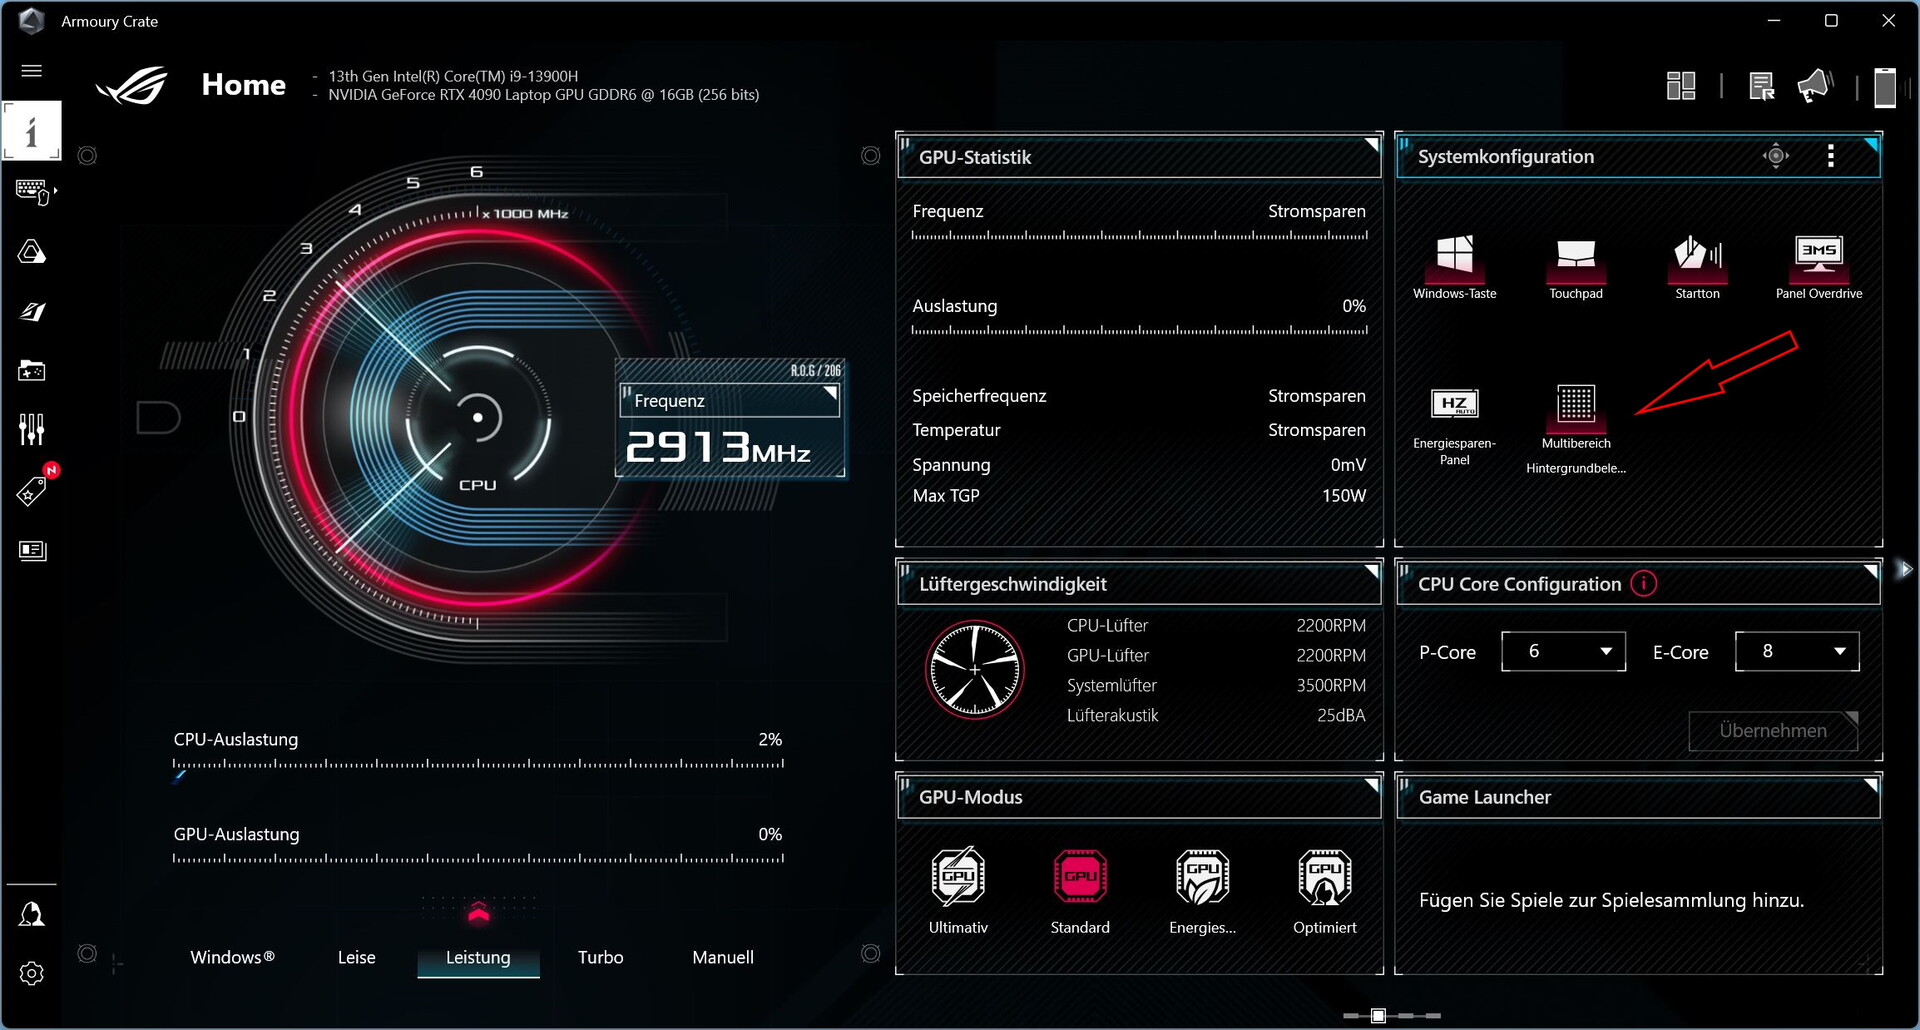
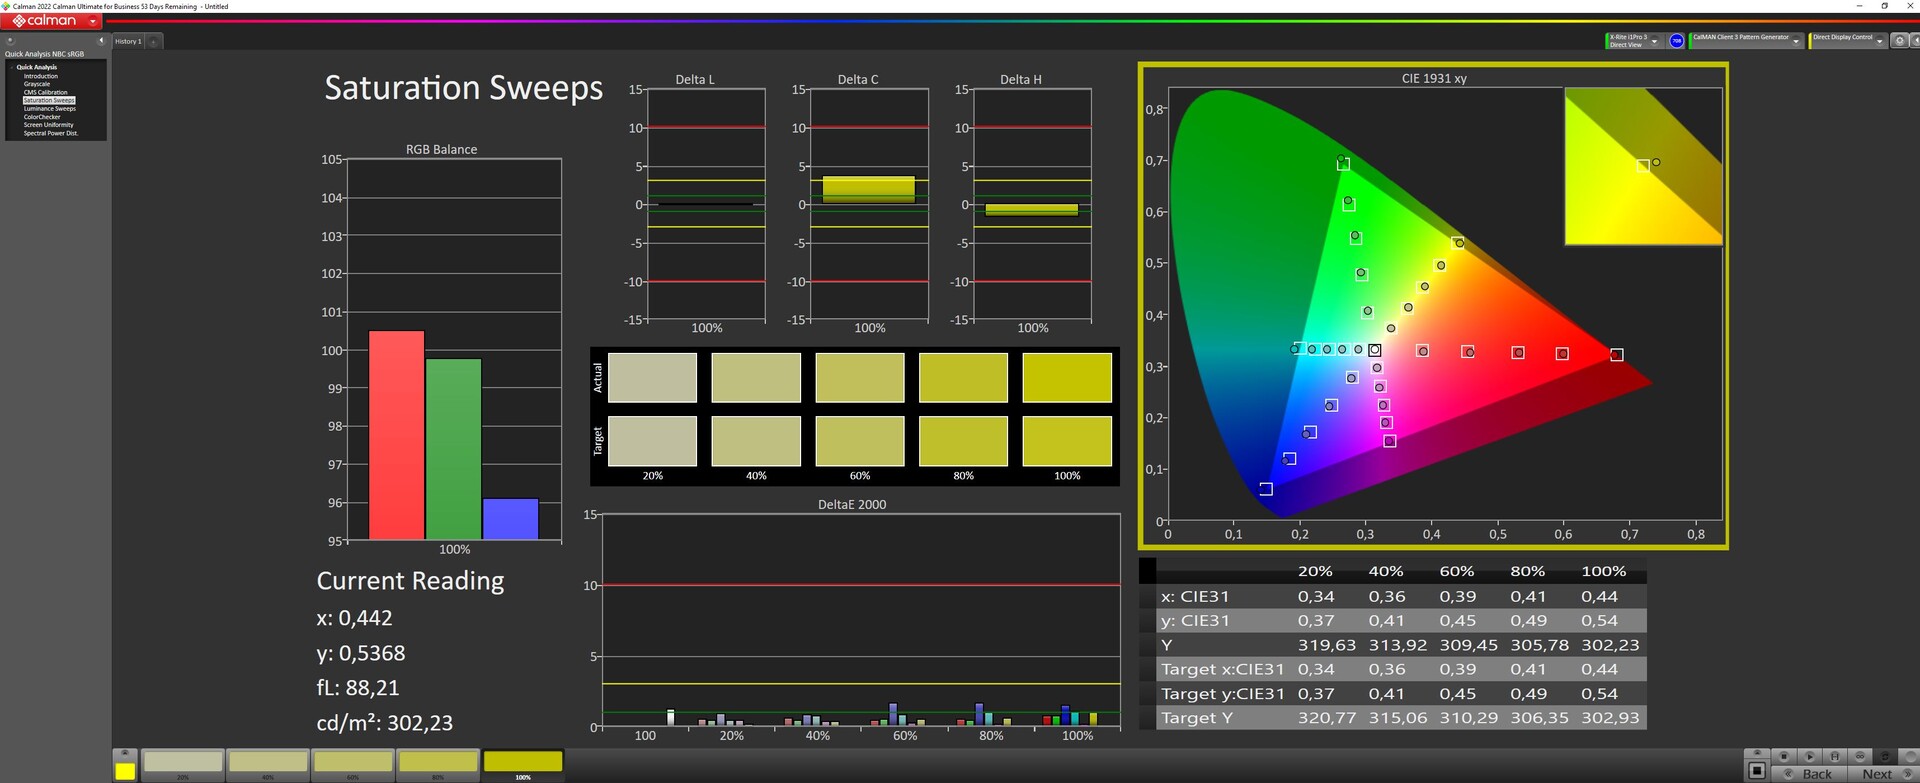
Mając do czynienia z Mini-LED-ami trzeba wziąć pod uwagę kilka rzeczy: Maksymalną jasność można uzyskać tylko wtedy, gdy podświetlenie jest ustawione na wielostrefowe za pomocą autorskiego centrum sterowania Asusa, oprogramowania Armory Crate. W trybie HDR jest to ustawiane automatycznie i jeśli HDR jest wyłączone (tryb SDR jest skalibrowany i ma mniejsze odchylenia kolorów), panel automatycznie podświetla poszczególne obszary. Korzystając z tego ustawienia, jasność jest niższa o około 100 nitów.
W dalszej części artykułu podkreślamy wartości trybu SDR z włączoną wielostrefowością. Ten tryb nie jest jednak idealny do obróbki zdjęć.
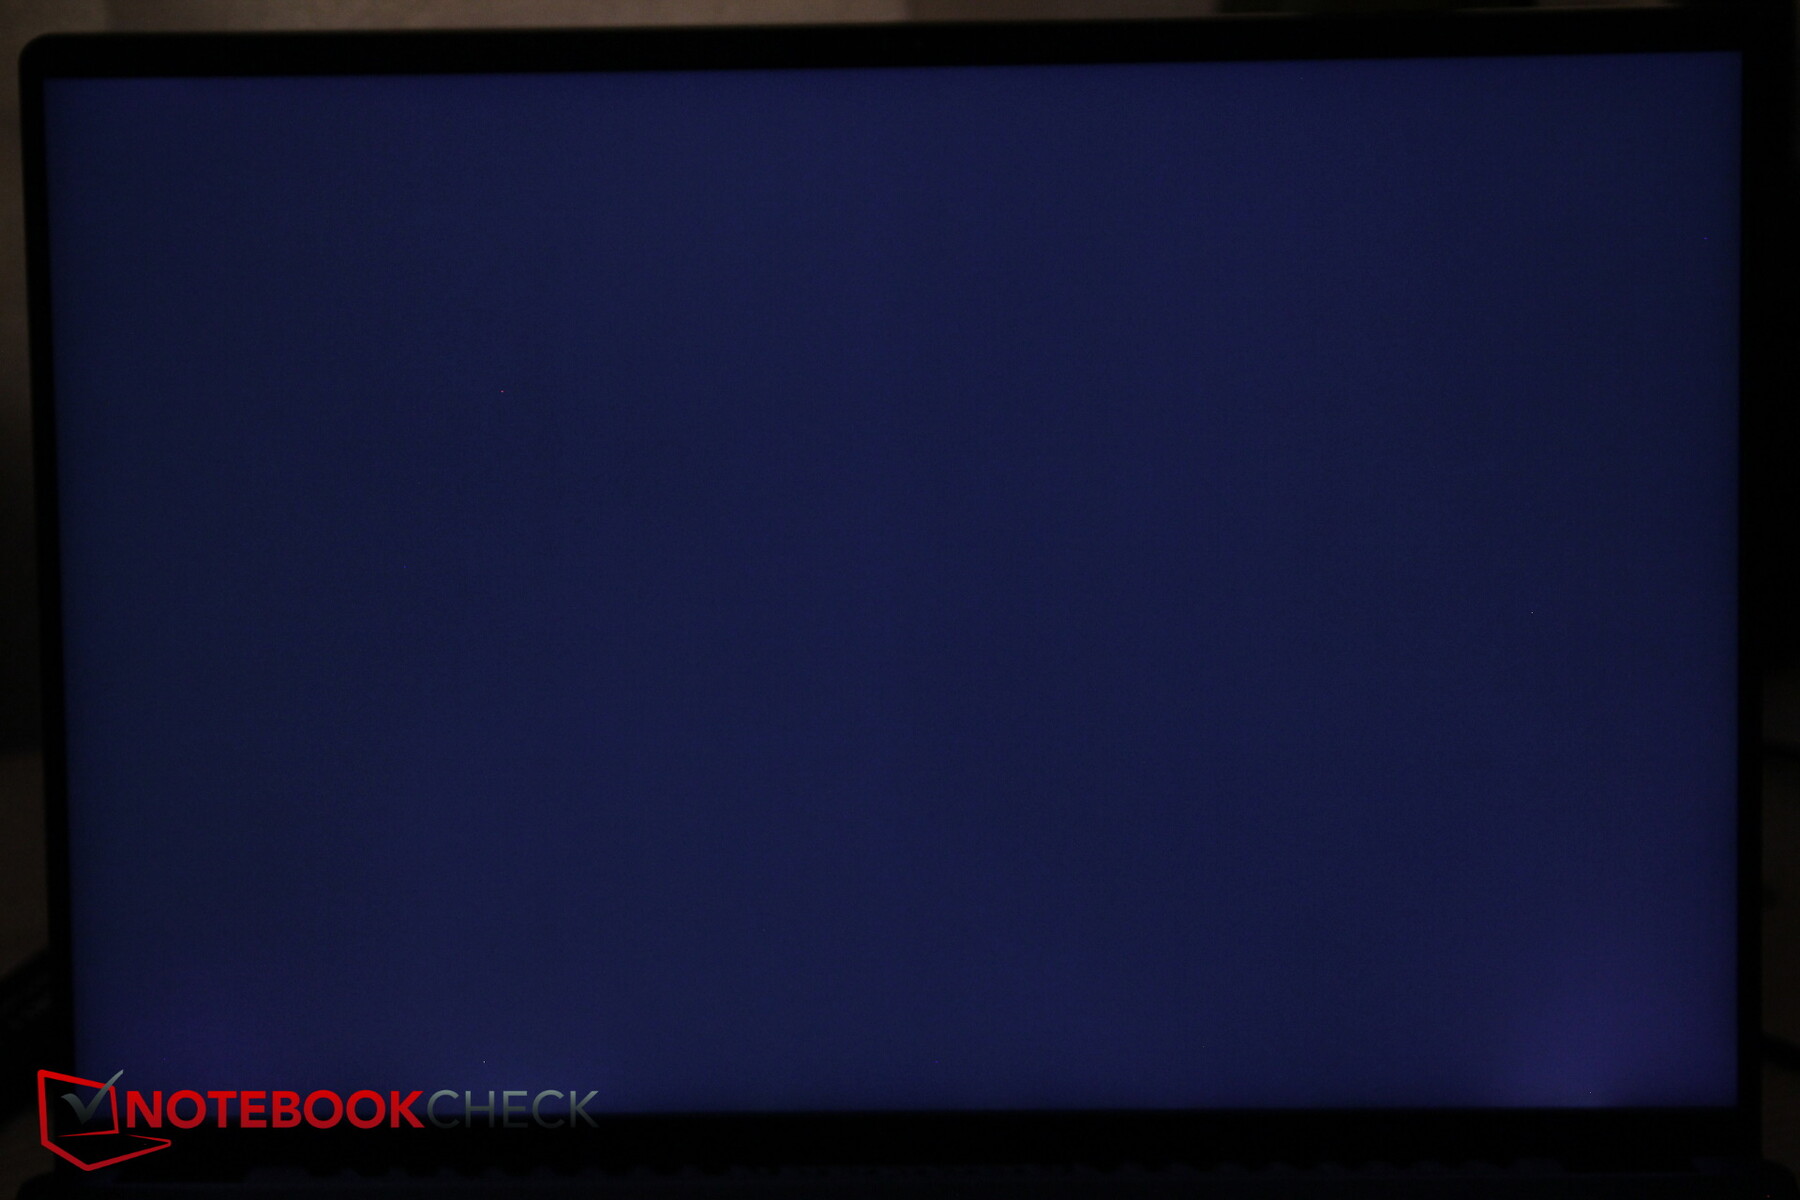
Zaskakujące są również poziomy czerni. Przy zastosowaniu podświetlenia jednostrefowego jest to tylko 0,55, ale kontrast jest słaby. Dopiero przy zastosowaniu ustawienia wielostrefowego spada to do znakomitego poziomu 0,03. Jest to jeden z powodów, dla których nasze pomiary przeprowadziliśmy z włączoną wielostrefowością.
Zmierzyliśmy jasność na poziomie około 627 nitów (wielostrefowa, w innym przypadku około 519 nitów). Przy 92 procentach podświetlenie jest bardzo dobre, a jasność spada w kierunku prawej strony wyświetlacza. W porównaniu do poprzednika, częstotliwość odświeżania panelu wzrosła z 165 do 240 Hz.
| |||||||||||||||||||||||||
rozświetlenie: 92 %
na akumulatorze: 634 cd/m²
kontrast: 21133:1 (czerń: 0.03 cd/m²)
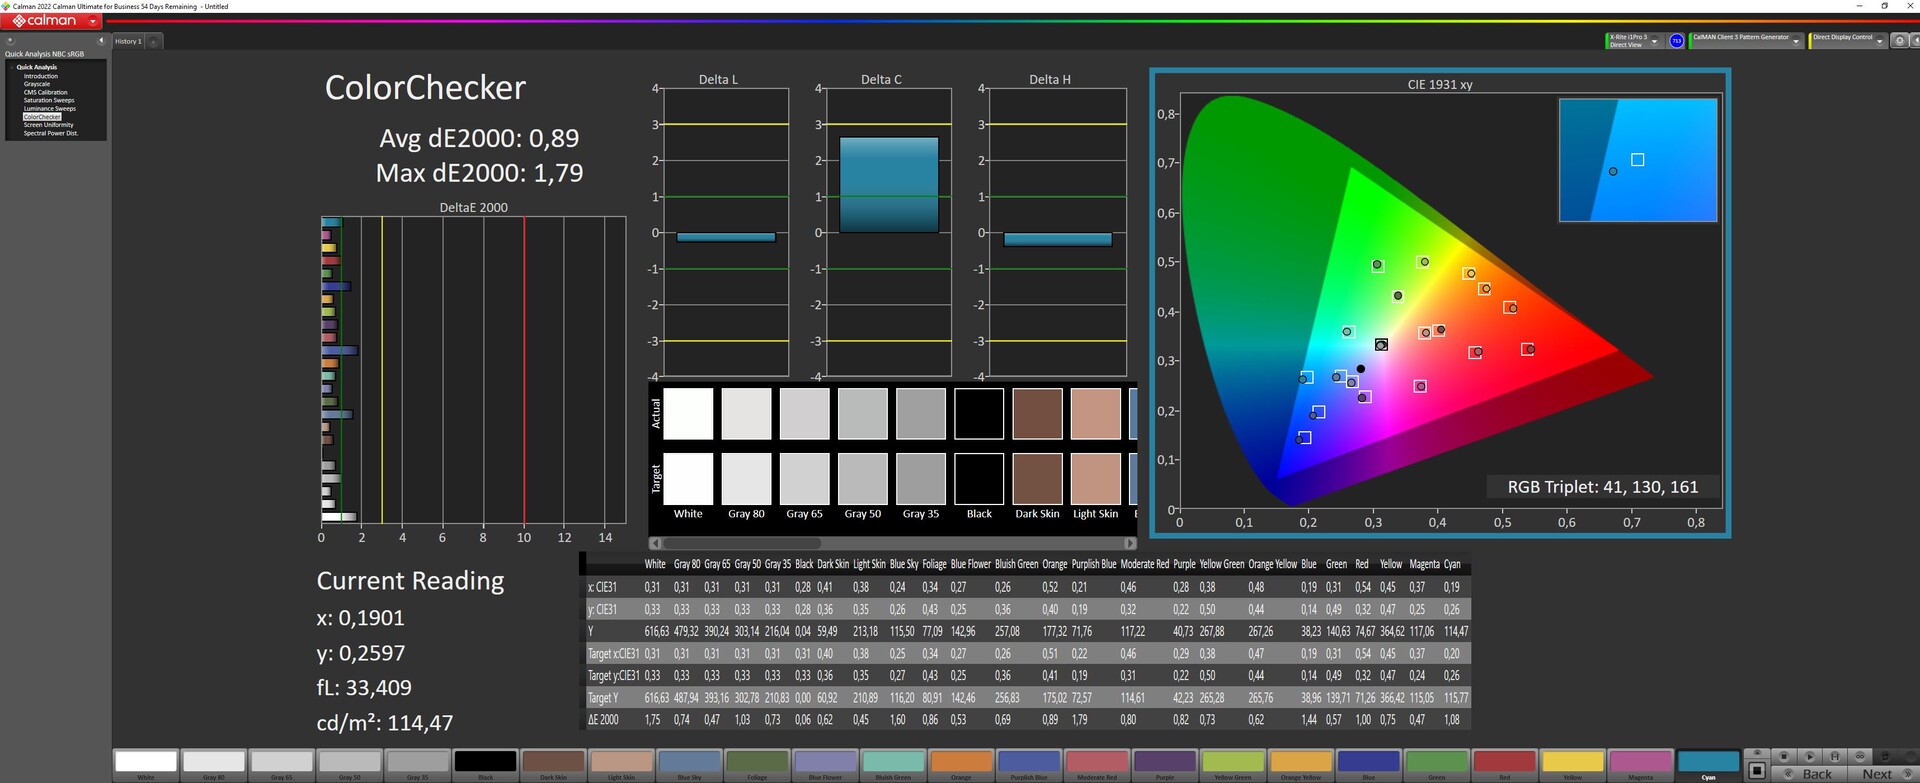
ΔE ColorChecker Calman: 0.89 | ∀{0.5-29.43 Ø4.73}
calibrated: 0.91
ΔE Greyscale Calman: 1.13 | ∀{0.09-98 Ø4.97}
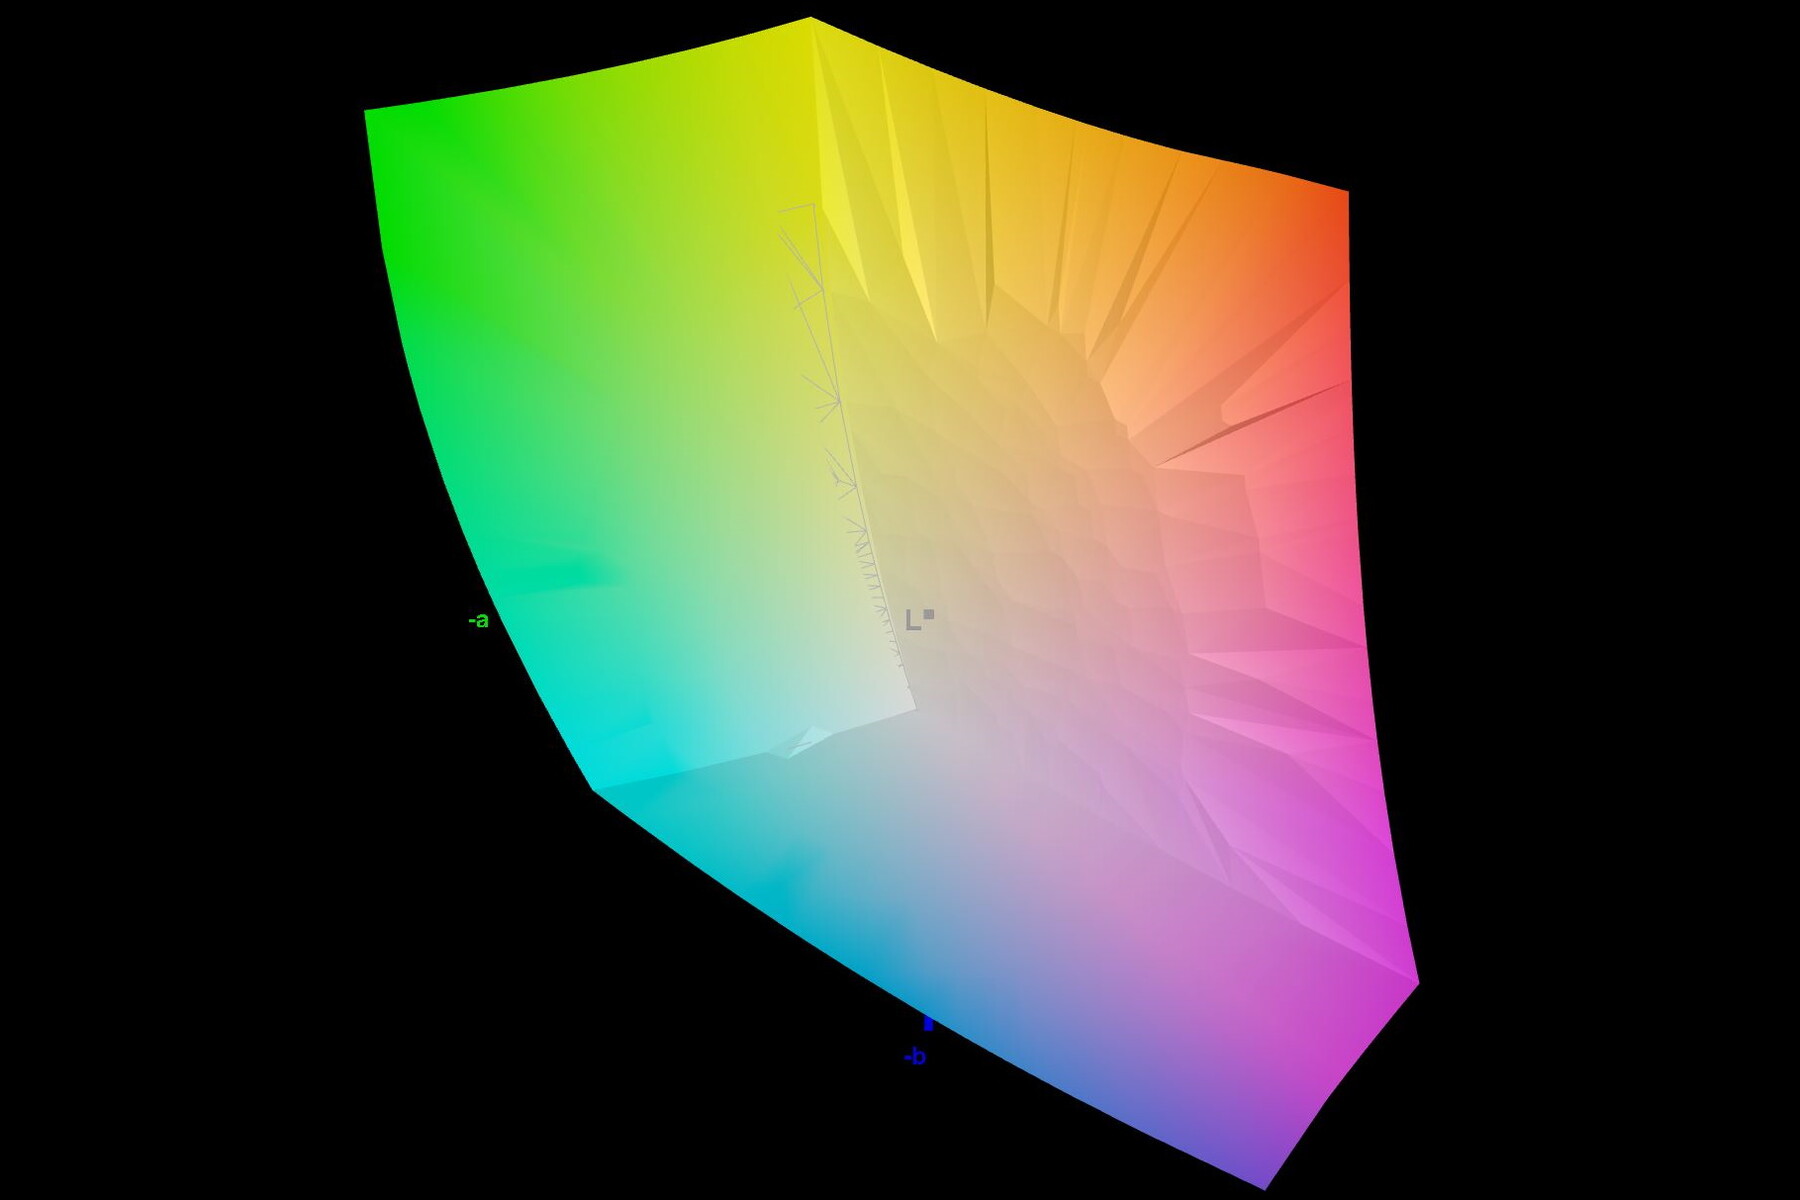
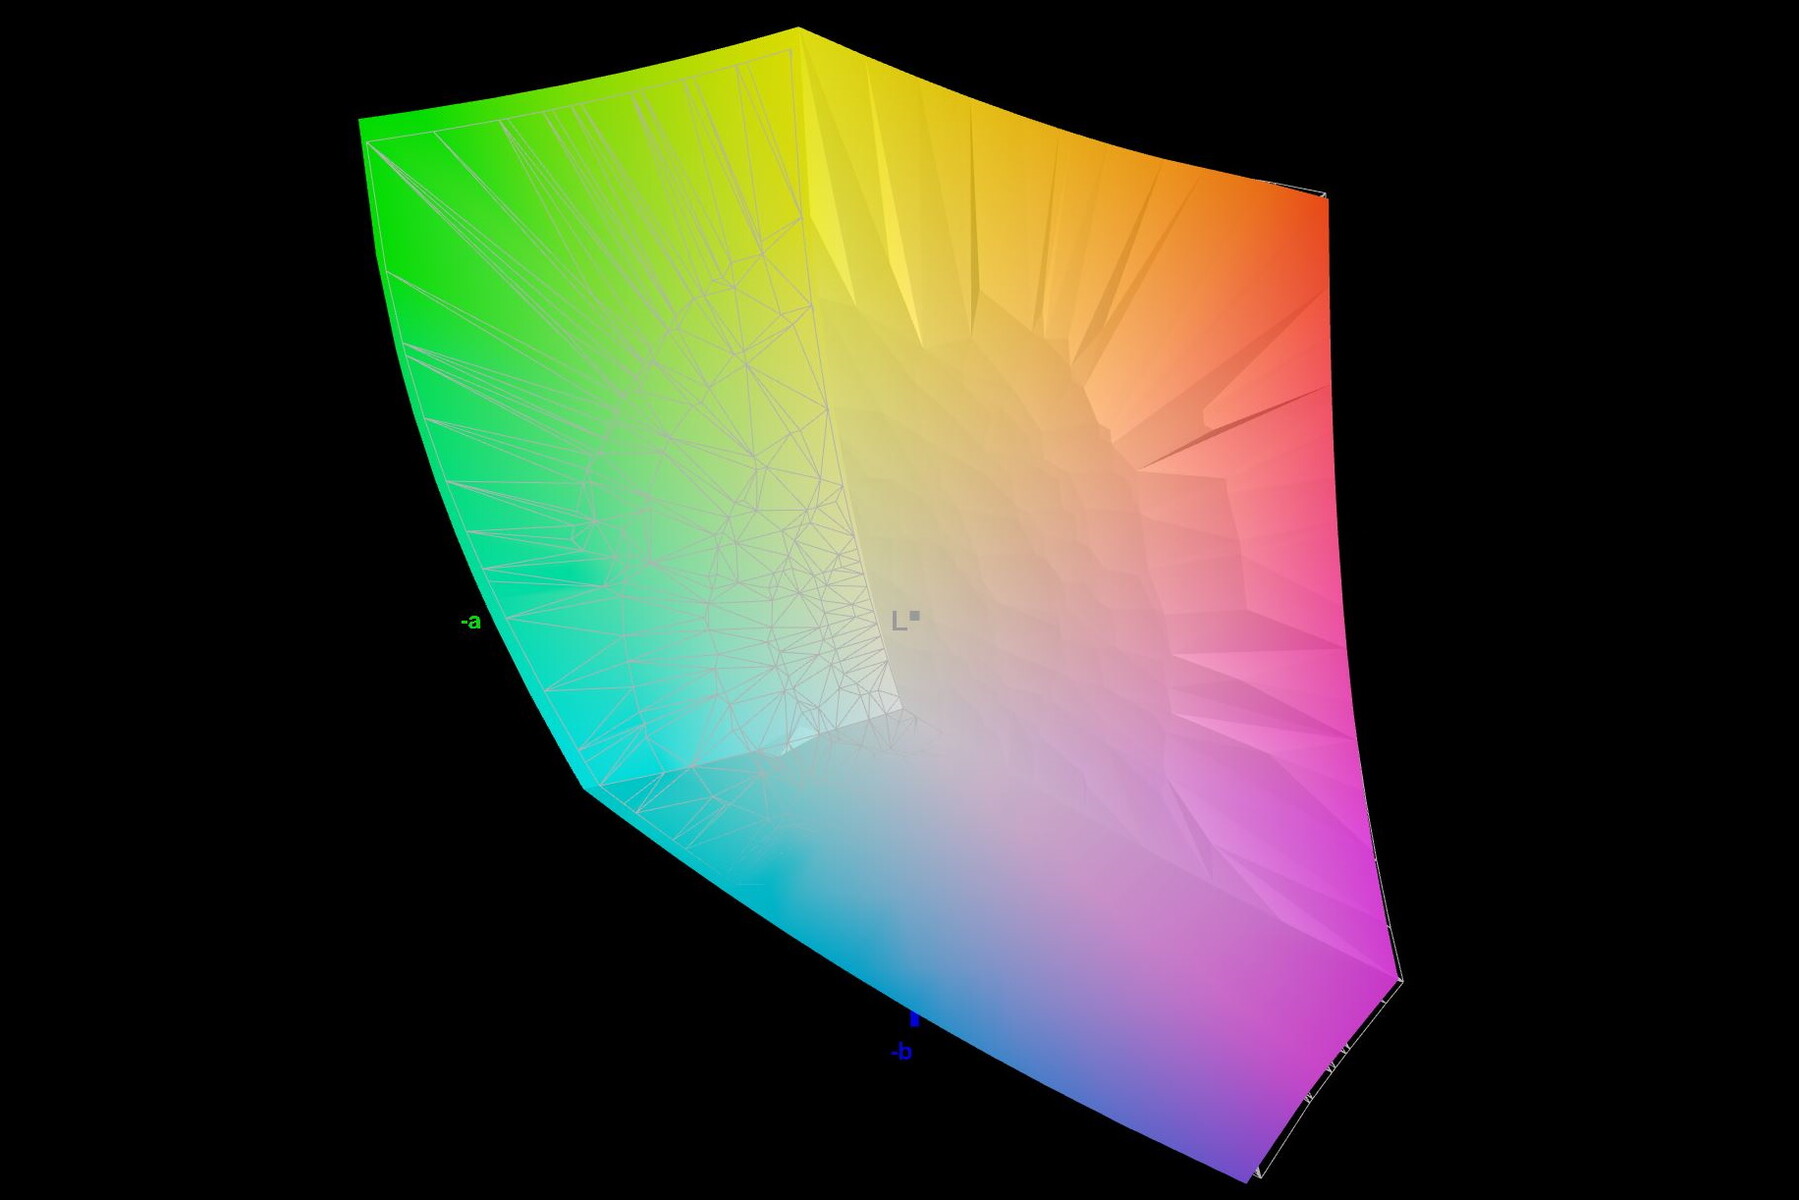
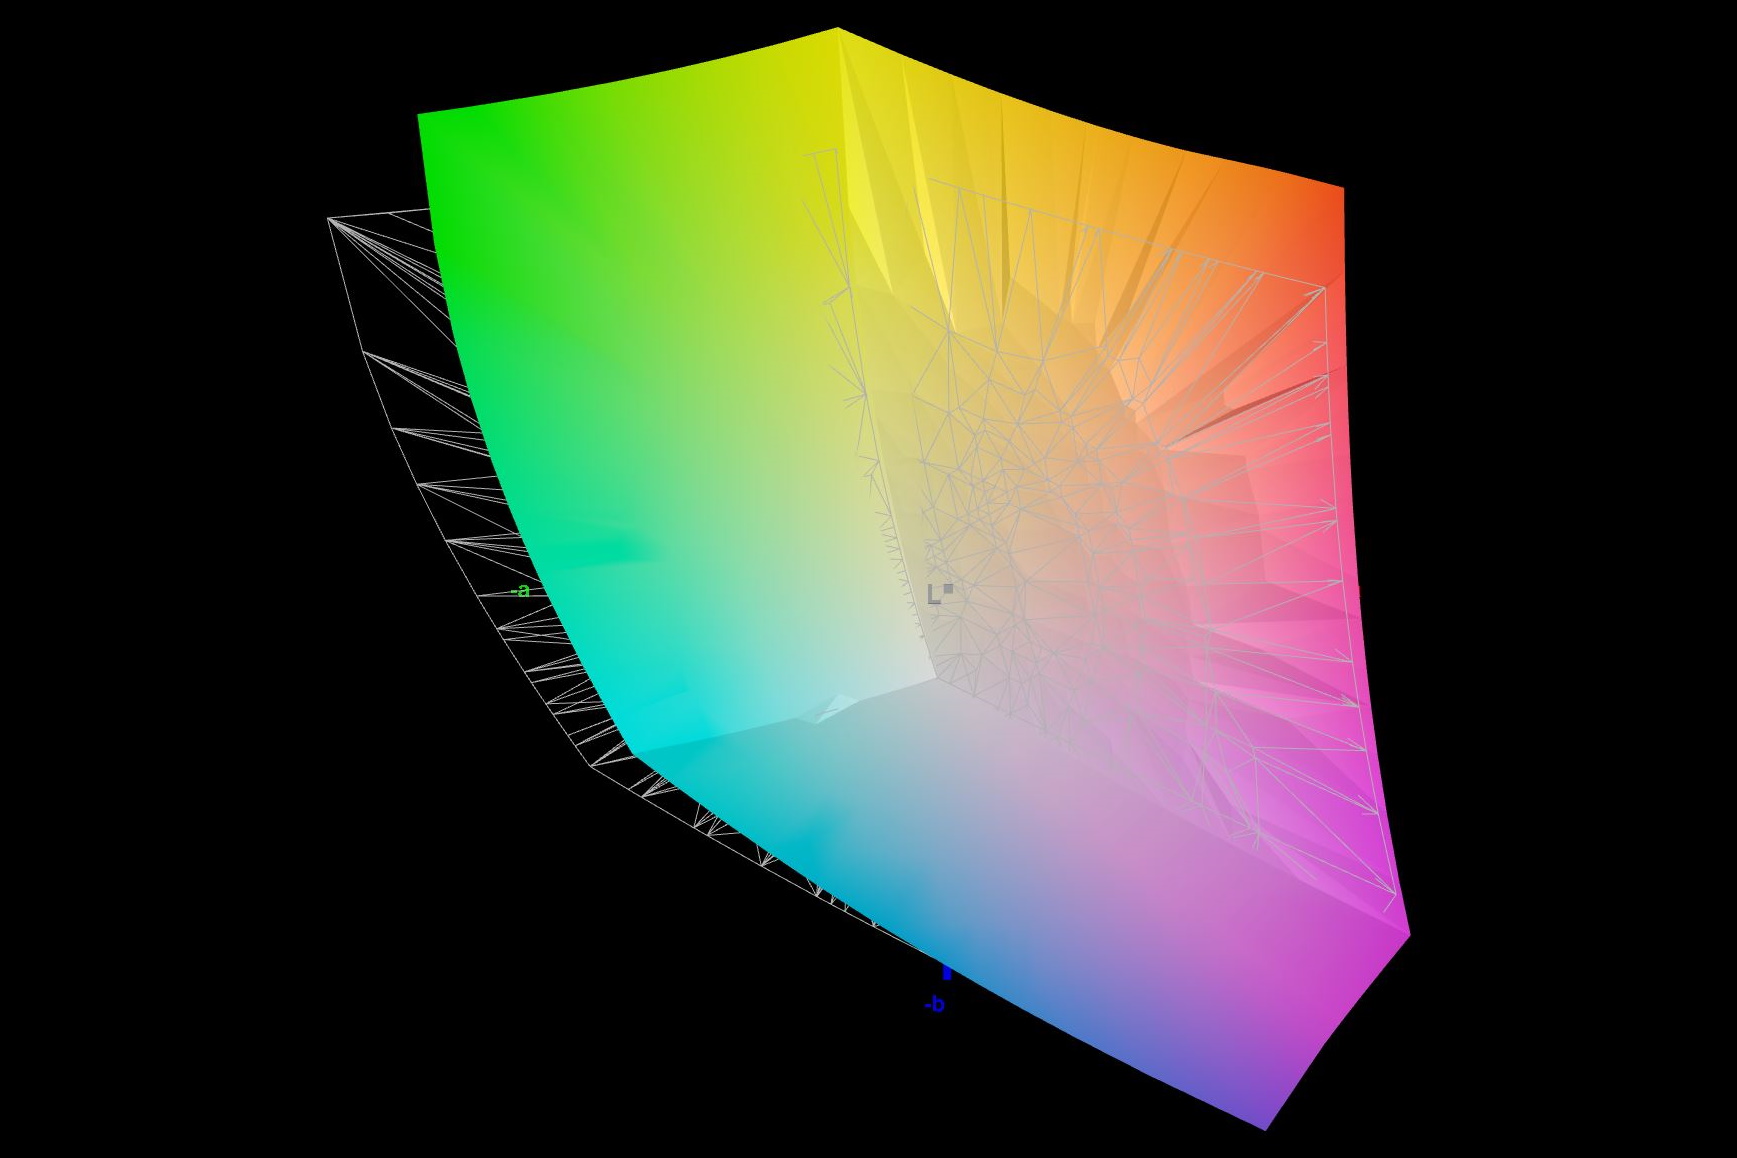
90.01% AdobeRGB 1998 (Argyll 3D)
99.9% sRGB (Argyll 3D)
99.33% Display P3 (Argyll 3D)
Gamma: 2.47
CCT: 6497 K
| Asus ROG Zephyrus M16 GU604VY-NM042X BOE0B74 (NE160QDM-NM4, IPS, 2560x1600, 16" | Asus ROG Zephyrus M16 GU603Z BOE0A0B (BOE CQ NE160QDM-NY3), IPS, 2560x1600, 16" | Asus ROG Strix Scar 18 2023 G834JY-N6005W NE180QDM-NZ2, IPS, 2560x1600, 18" | MSI Titan GT77 HX 13VI B173ZAN06.C, Mini-LED, 3840x2160, 17.3" | Lenovo Legion Pro 7 16IRX8H MNG007DA2-3 (CSO1628), IPS, 2560x1600, 16" | Razer Blade 16 Early 2023 CSOT T3 MNG007DA4-1, IPS, 2560x1600, 16" | |
|---|---|---|---|---|---|---|
| Display | -5% | -3% | -0% | -17% | -0% | |
| Display P3 Coverage (%) | 99.33 | 92.8 -7% | 97.2 -2% | 94.9 -4% | 69.1 -30% | 98.5 -1% |
| sRGB Coverage (%) | 99.9 | 98.5 -1% | 99.9 0% | 99.9 0% | 99.7 0% | 100 0% |
| AdobeRGB 1998 Coverage (%) | 90.01 | 83.1 -8% | 84.9 -6% | 92.4 3% | 71.2 -21% | 89.7 0% |
| Response Times | 76% | 80% | 17% | 78% | 73% | |
| Response Time Grey 50% / Grey 80% * (ms) | 50.8 ? | 7.6 ? 85% | 5.41 ? 89% | 38.4 ? 24% | 12.3 ? 76% | 6.6 ? 87% |
| Response Time Black / White * (ms) | 29.6 ? | 10 ? 66% | 8.62 ? 71% | 26.6 ? 10% | 5.9 ? 80% | 12 ? 59% |
| PWM Frequency (Hz) | 12000 | 2380 ? | ||||
| Screen | -181% | -399% | 3033% | -150% | -212% | |
| Brightness middle (cd/m²) | 634 | 497 -22% | 490 -23% | 606 -4% | 511 -19% | 456.8 -28% |
| Brightness (cd/m²) | 627 | 481 -23% | 468 -25% | 602 -4% | 469 -25% | 437 -30% |
| Brightness Distribution (%) | 92 | 82 -11% | 86 -7% | 93 1% | 86 -7% | 83 -10% |
| Black Level * (cd/m²) | 0.03 | 0.21 -600% | 0.54 -1700% | 0.0001 100% | 0.4 -1233% | 0.35 -1067% |
| Contrast (:1) | 21133 | 2367 -89% | 907 -96% | 6060000 28576% | 1278 -94% | 1305 -94% |
| Colorchecker dE 2000 * | 0.89 | 3.53 -297% | 4.97 -458% | 4.8 -439% | 0.95 -7% | 3.7 -316% |
| Colorchecker dE 2000 max. * | 1.79 | 6.15 -244% | 11.02 -516% | 8.2 -358% | 2.07 -16% | 6.42 -259% |
| Colorchecker dE 2000 calibrated * | 0.91 | 3.53 -288% | 2.97 -226% | 1.8 -98% | 0.91 -0% | 0.66 27% |
| Greyscale dE 2000 * | 1.13 | 1.74 -54% | 7.2 -537% | 6.5 -475% | 0.6 47% | 2.6 -130% |
| Gamma | 2.47 89% | 2.2 100% | 2.161 102% | 2.63 84% | 2.176 101% | 2.3 96% |
| CCT | 6497 100% | 6418 101% | 6515 100% | 6596 99% | 6545 99% | 6108 106% |
| Całkowita średnia (program / ustawienia) | -37% /
-107% | -107% /
-245% | 1017% /
1952% | -30% /
-89% | -46% /
-126% |
* ... im mniej tym lepiej
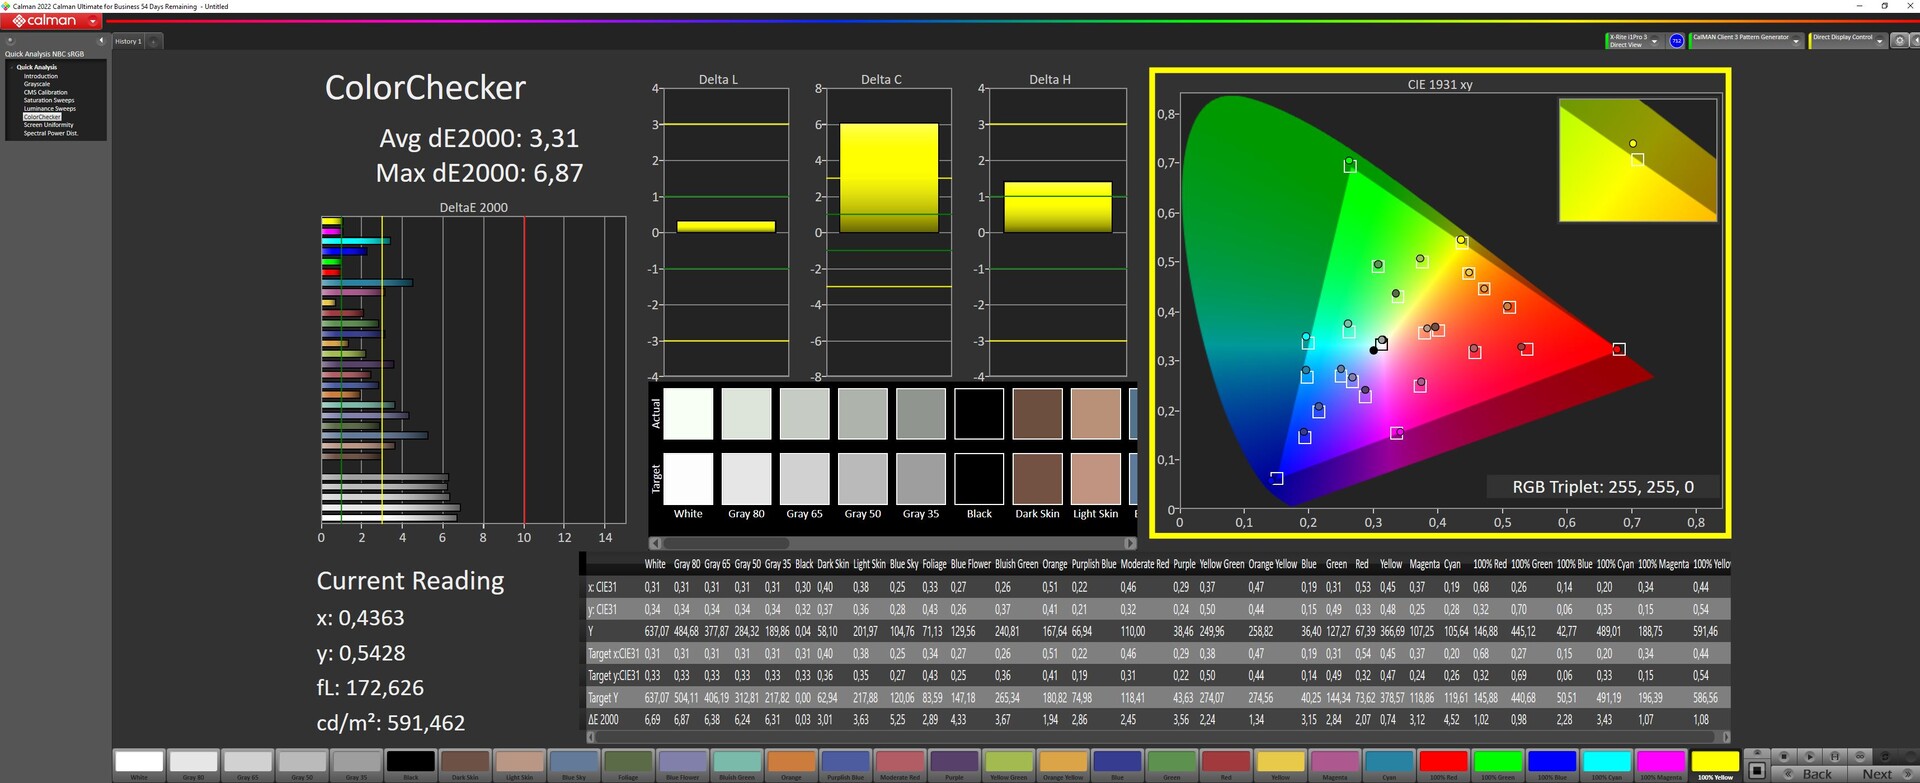
Asus reklamuje urządzenie jako posiadające 100 procent DCI P3 i to nasza analiza była w stanie potwierdzić. AdobeRGB jest odwzorowane w 90 procentach.
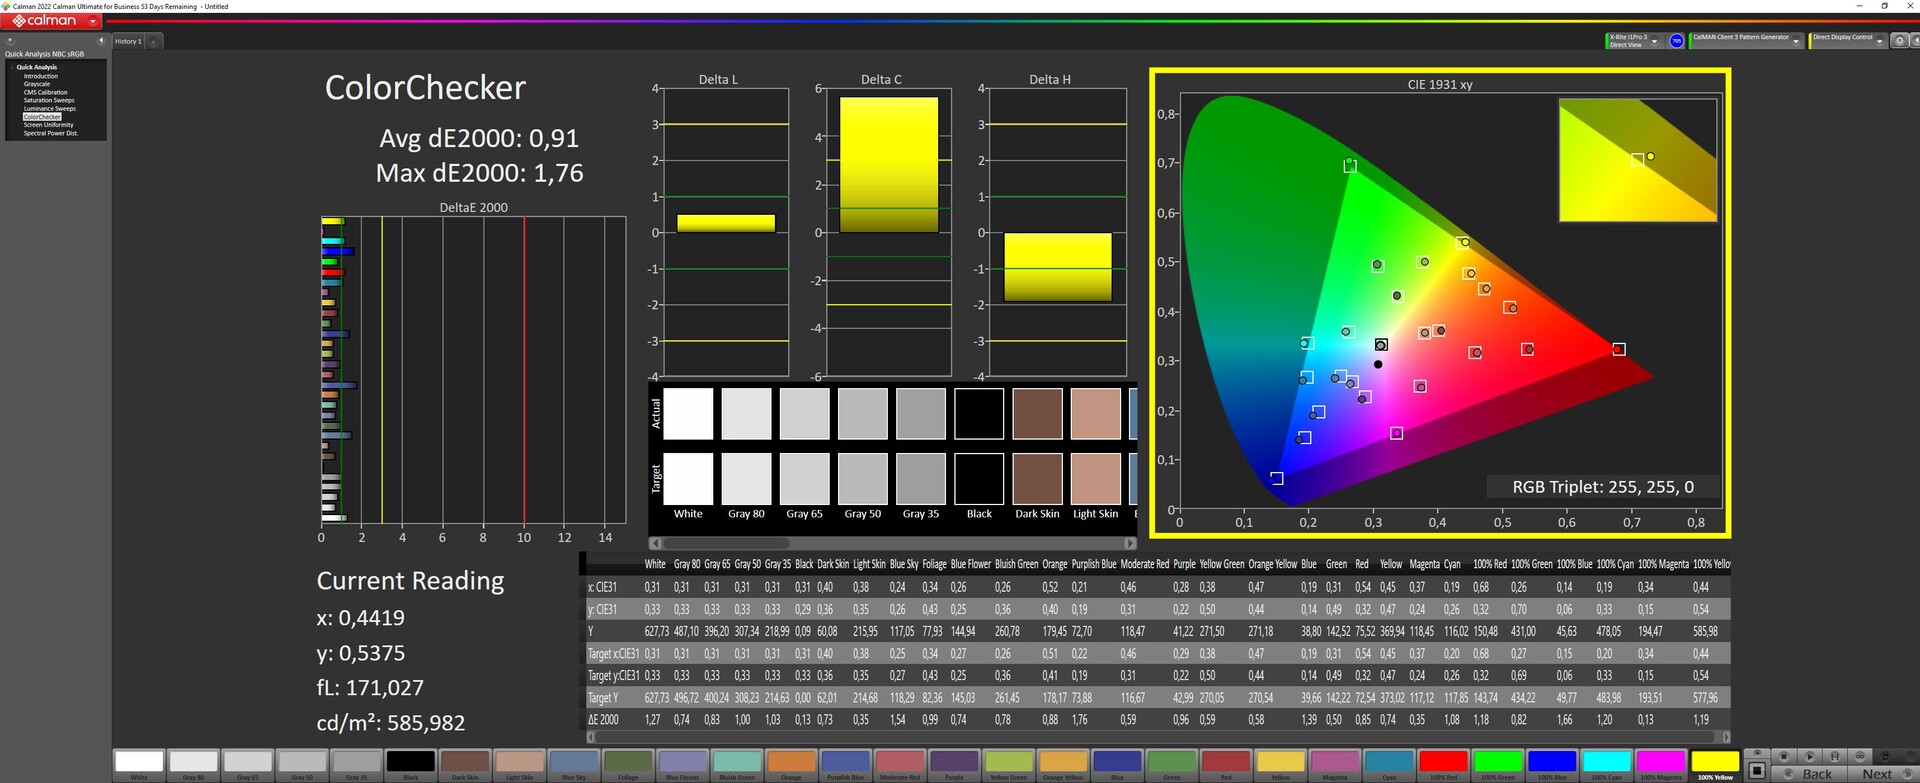
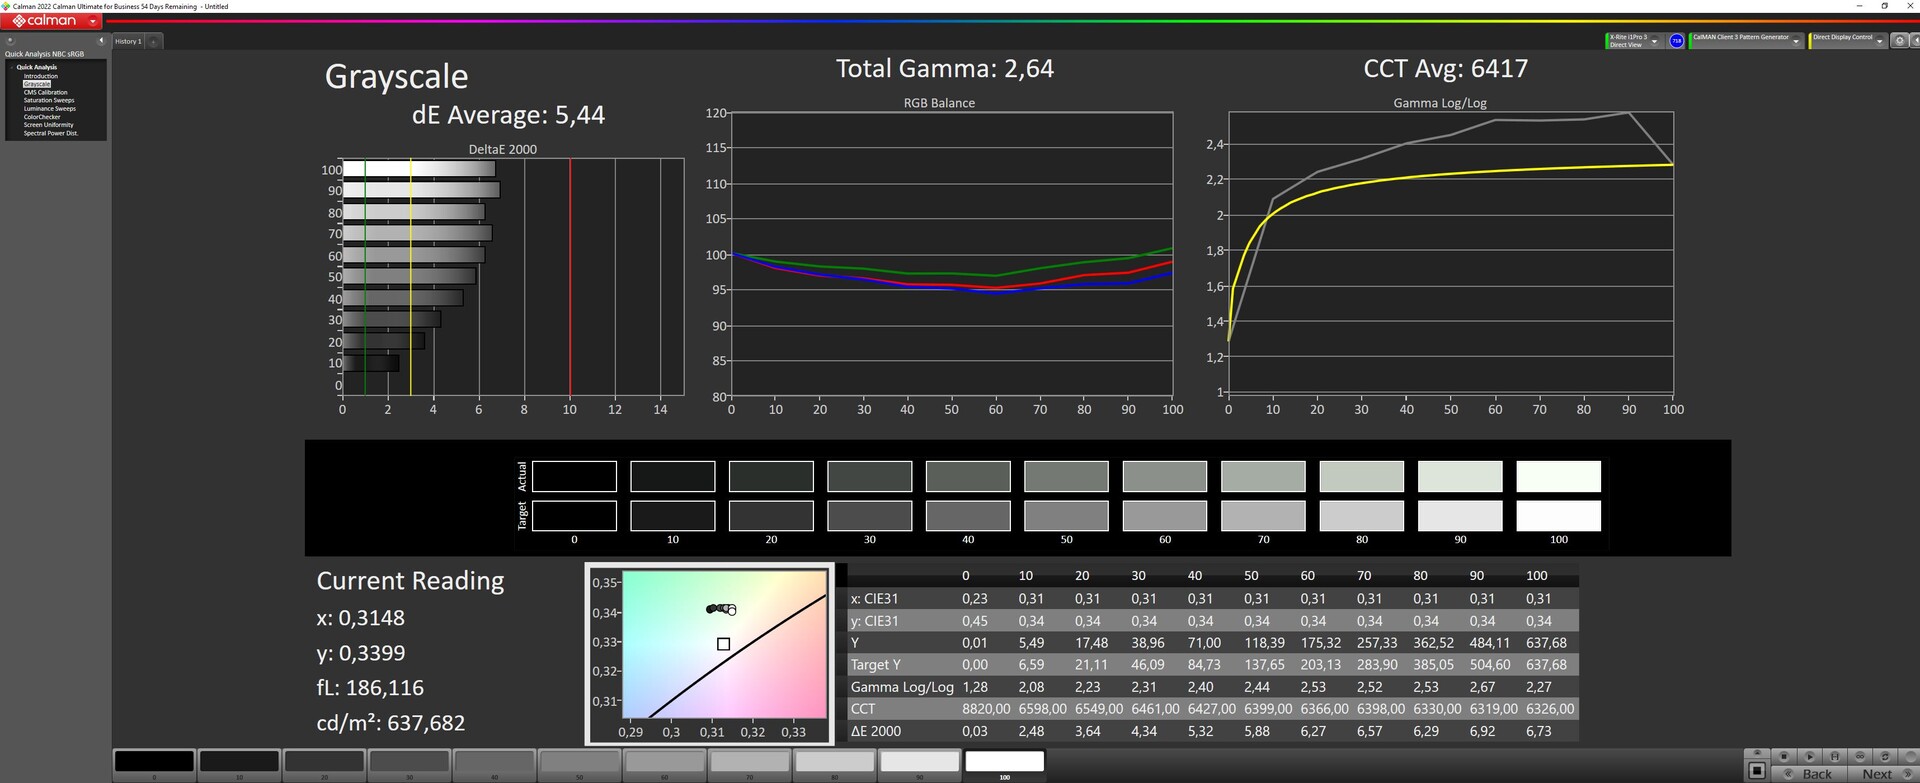
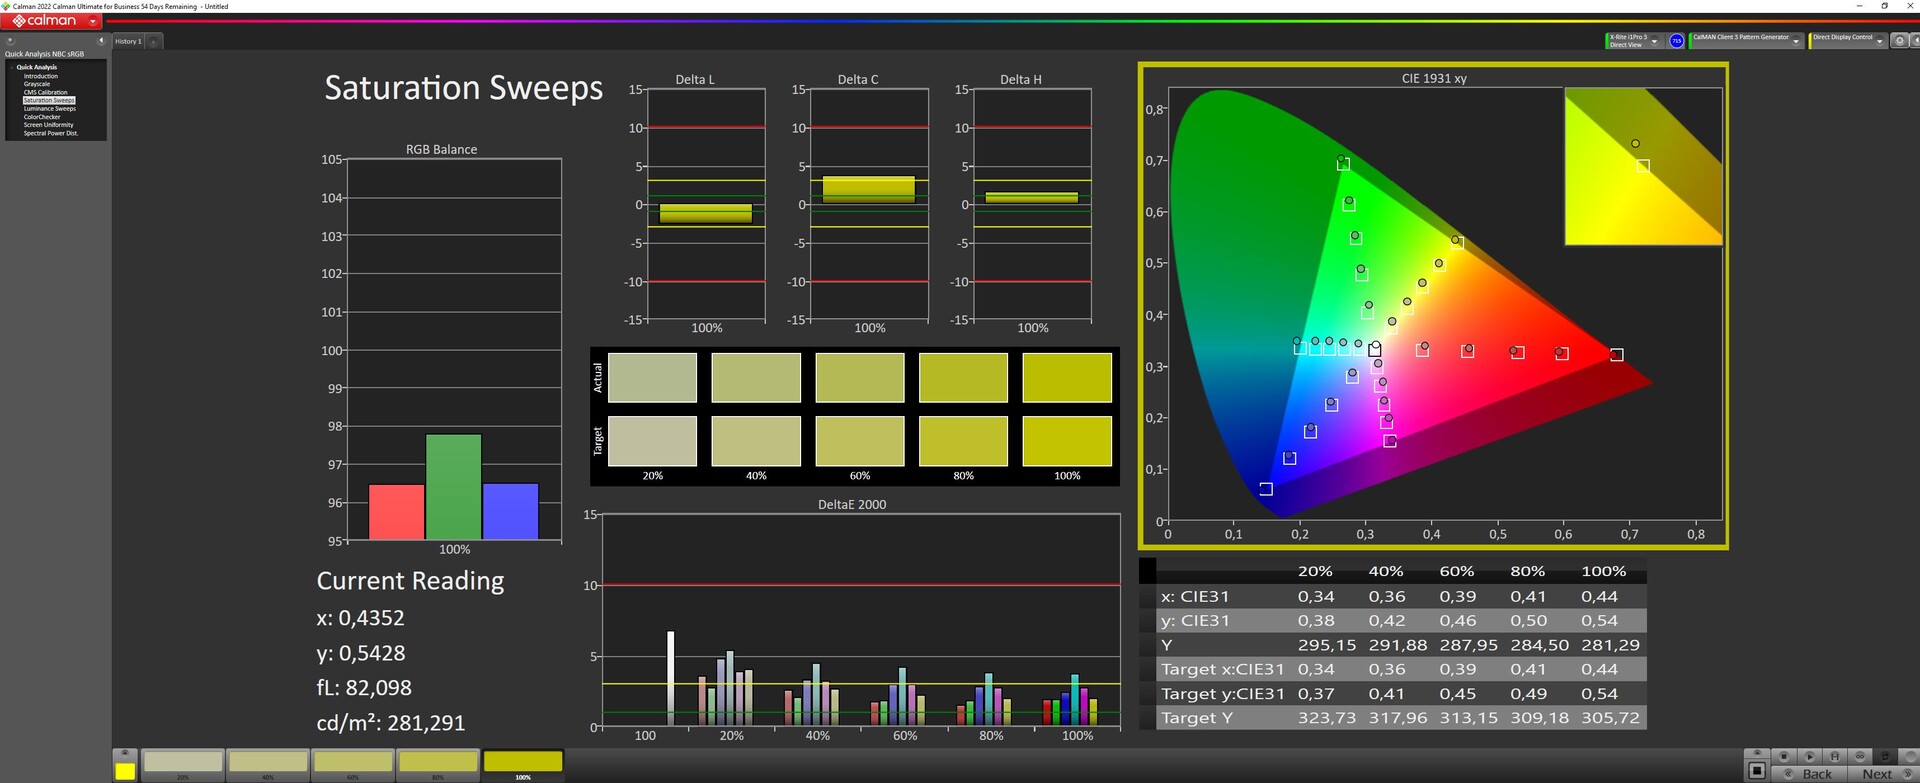
Po wyjęciu z pudełka panel jest bardzo dobrze skalibrowany (SDR), a wartości DeltaE grayscale i ColorChecker wynoszą zaledwie 1,13 i 0,89. Świeża kalibracja nie jest w stanie poprawić sytuacji. DeltaE w skali szarości nieco spadła, a odchylenie ColorCheckera nieznacznie wzrosło.
Jednak w trybie HDR kalibracja znika (patrz ostatni rząd naszych zrzutów ekranu poniżej).


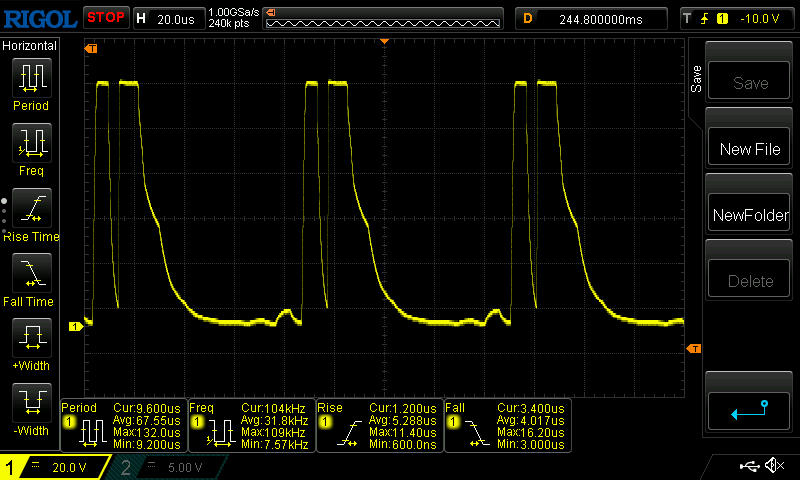
Określenie czasów reakcji nie jest łatwe w przypadku naszego modelu recenzenckiego, ponieważ częstotliwość PWM wynosząca co najmniej 12 kHz (patrz poniżej) nakłada się na krzywe czasu reakcji. Asus określa go na 3 ms, ale nie ujawnia, jakiej techniki pomiarowej użył. Przy pełnej jasności zmierzyliśmy, że wynosi on raczej od 30 do 50 ms, co z jednej strony jest wartością wysoką, ale z drugiej strony może mieć na nią wpływ nakładająca się częstotliwość PWM.
Wyświetl czasy reakcji
| ↔ Czas reakcji od czerni do bieli | ||
|---|---|---|
| 29.6 ms ... wzrost ↗ i spadek ↘ łącznie | ↗ 25 ms wzrost | 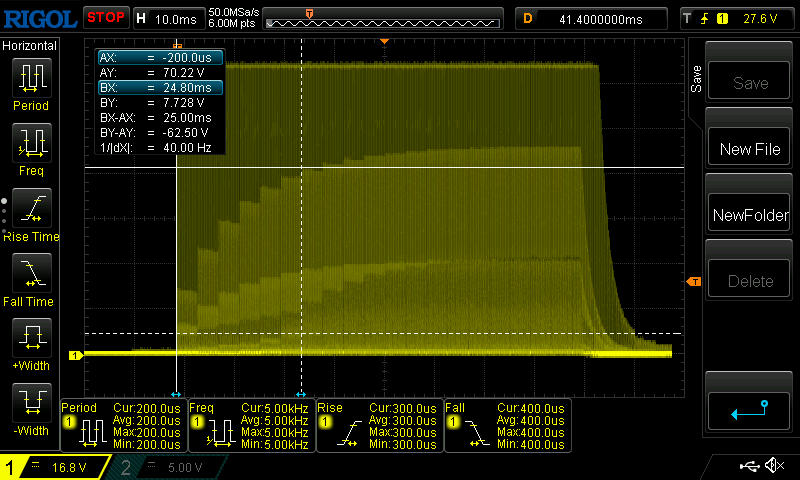 |
| ↘ 4.6 ms upadek | ||
| W naszych testach ekran wykazuje stosunkowo powolne tempo reakcji i może być zbyt wolny dla graczy. Dla porównania, wszystkie testowane urządzenia wahają się od 0.1 (minimum) do 240 (maksimum) ms. » 79 % wszystkich urządzeń jest lepszych. Oznacza to, że zmierzony czas reakcji jest gorszy od średniej wszystkich testowanych urządzeń (19.9 ms). | ||
| ↔ Czas reakcji 50% szarości do 80% szarości | ||
| 50.8 ms ... wzrost ↗ i spadek ↘ łącznie | ↗ 27.6 ms wzrost | 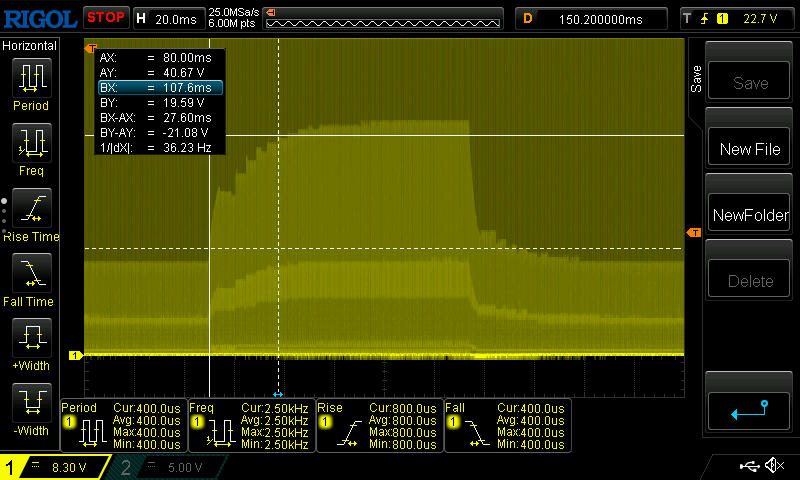 |
| ↘ 23.2 ms upadek | ||
| W naszych testach ekran wykazuje powolne tempo reakcji, co będzie niezadowalające dla graczy. Dla porównania, wszystkie testowane urządzenia wahają się od 0.165 (minimum) do 636 (maksimum) ms. » 87 % wszystkich urządzeń jest lepszych. Oznacza to, że zmierzony czas reakcji jest gorszy od średniej wszystkich testowanych urządzeń (31.1 ms). | ||
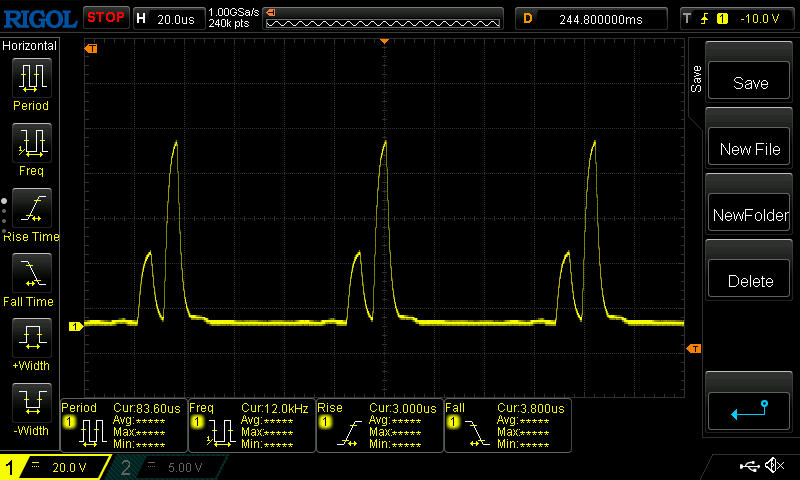
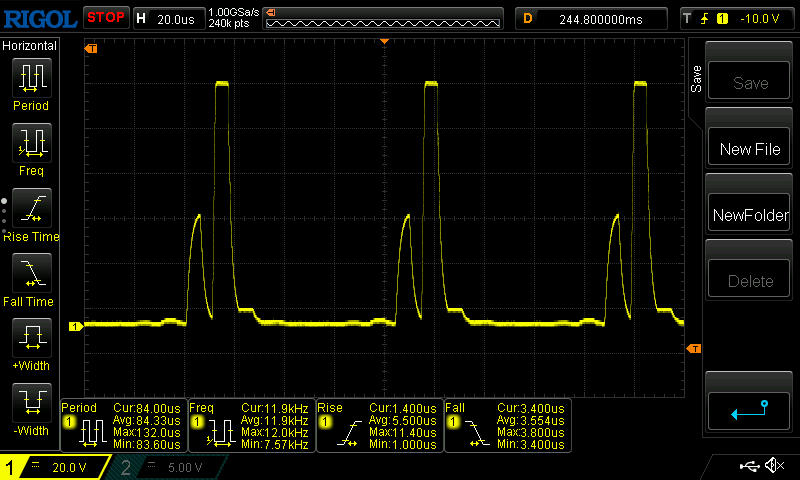
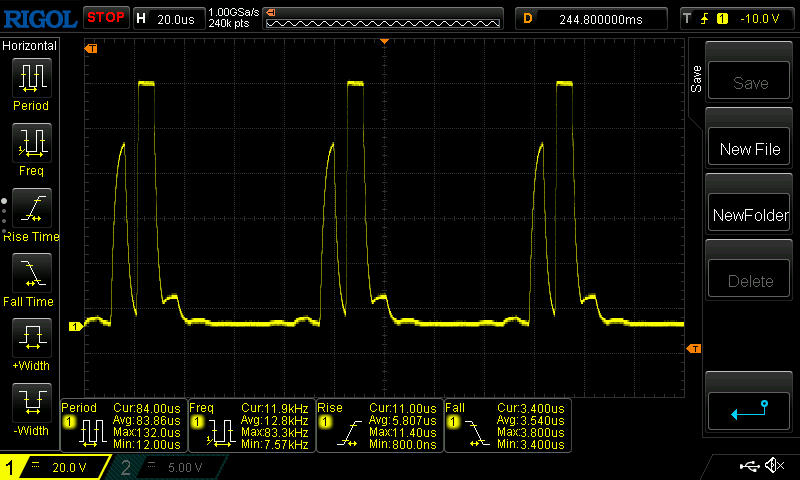
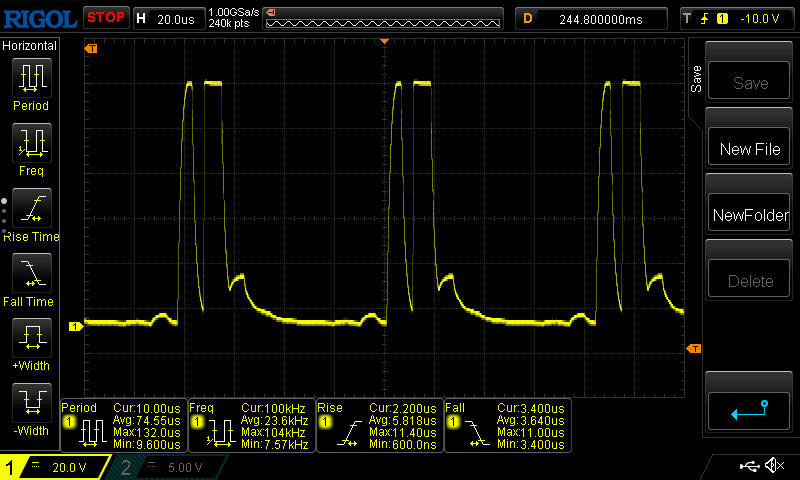
Migotanie ekranu / PWM (modulacja szerokości impulsu)
| Wykryto migotanie ekranu/wykryto PWM | 12000 Hz | 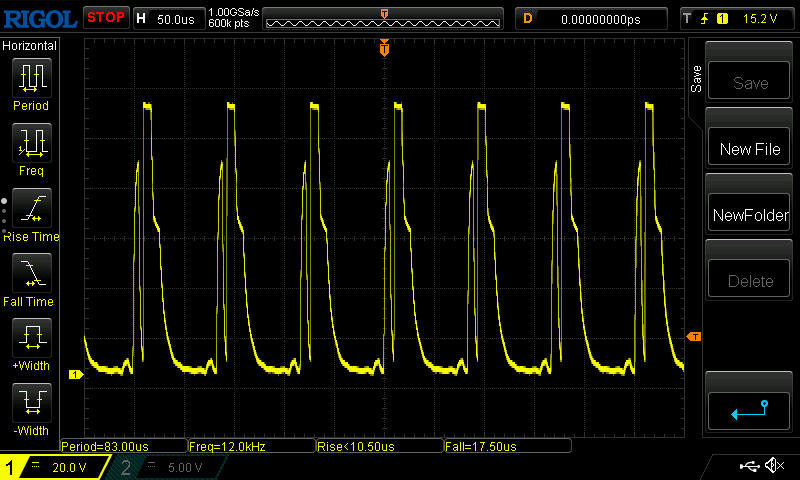 | |
Podświetlenie wyświetlacza miga z częstotliwością 12000 Hz (najgorszy przypadek, np. przy użyciu PWM) . Częstotliwość 12000 Hz jest dość wysoka, więc większość użytkowników wrażliwych na PWM nie powinna zauważyć żadnego migotania. Dla porównania: 52 % wszystkich testowanych urządzeń nie używa PWM do przyciemniania wyświetlacza. Jeśli wykryto PWM, zmierzono średnio 7801 (minimum: 5 - maksimum: 343500) Hz. | |||
PWM służy do regulacji jasności. Przy jasności od 100 do 83 procent częstotliwość siadała na poziomie 12 kHz, co nie powinno być nawet zauważalne dla osób normalnie wrażliwych na PWM. Poniżej tej wartości częstotliwość nadal rosła i wynosiła od 69 do 100 kHz.
Na zewnątrz matowa powierzchnia zapewnia stosunkowo wysoki poziom jasności, a także bardzo dobrą czytelność, przynajmniej w cieniu. Należy zachować ostrożność przy oglądaniu wyświetlacza z góry, gdyż obrazy bardzo szybko ulegają wypłukaniu.


Osiągi - Turbo brakuje iskry
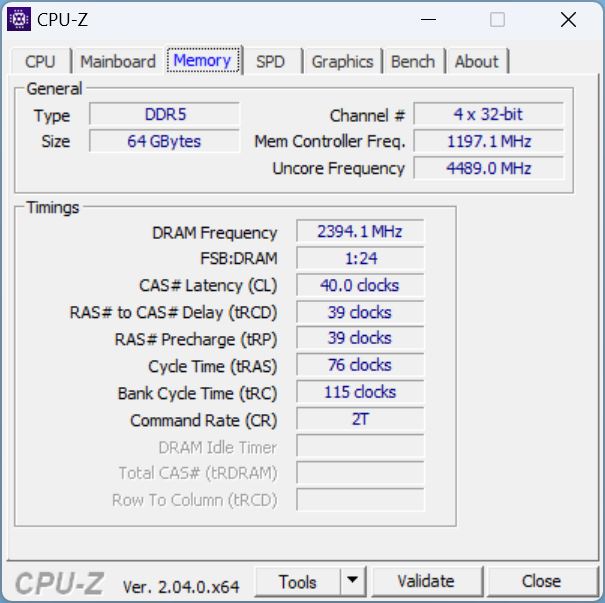
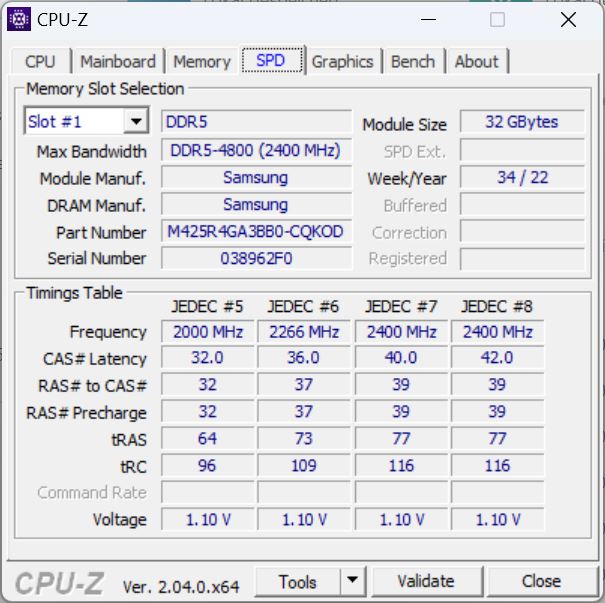
Na papierze nowy M16 powinien być ciężarem wydajnościowym w 16-calowym korpusie: Raptor Lake Core i9-13900H, Nvidia Geforce RTX 4090i 64 GB pamięci RAM rzucają rękawicę wszystkim niedoszłym pretendentom do tronu wydajności.
Warunki badania
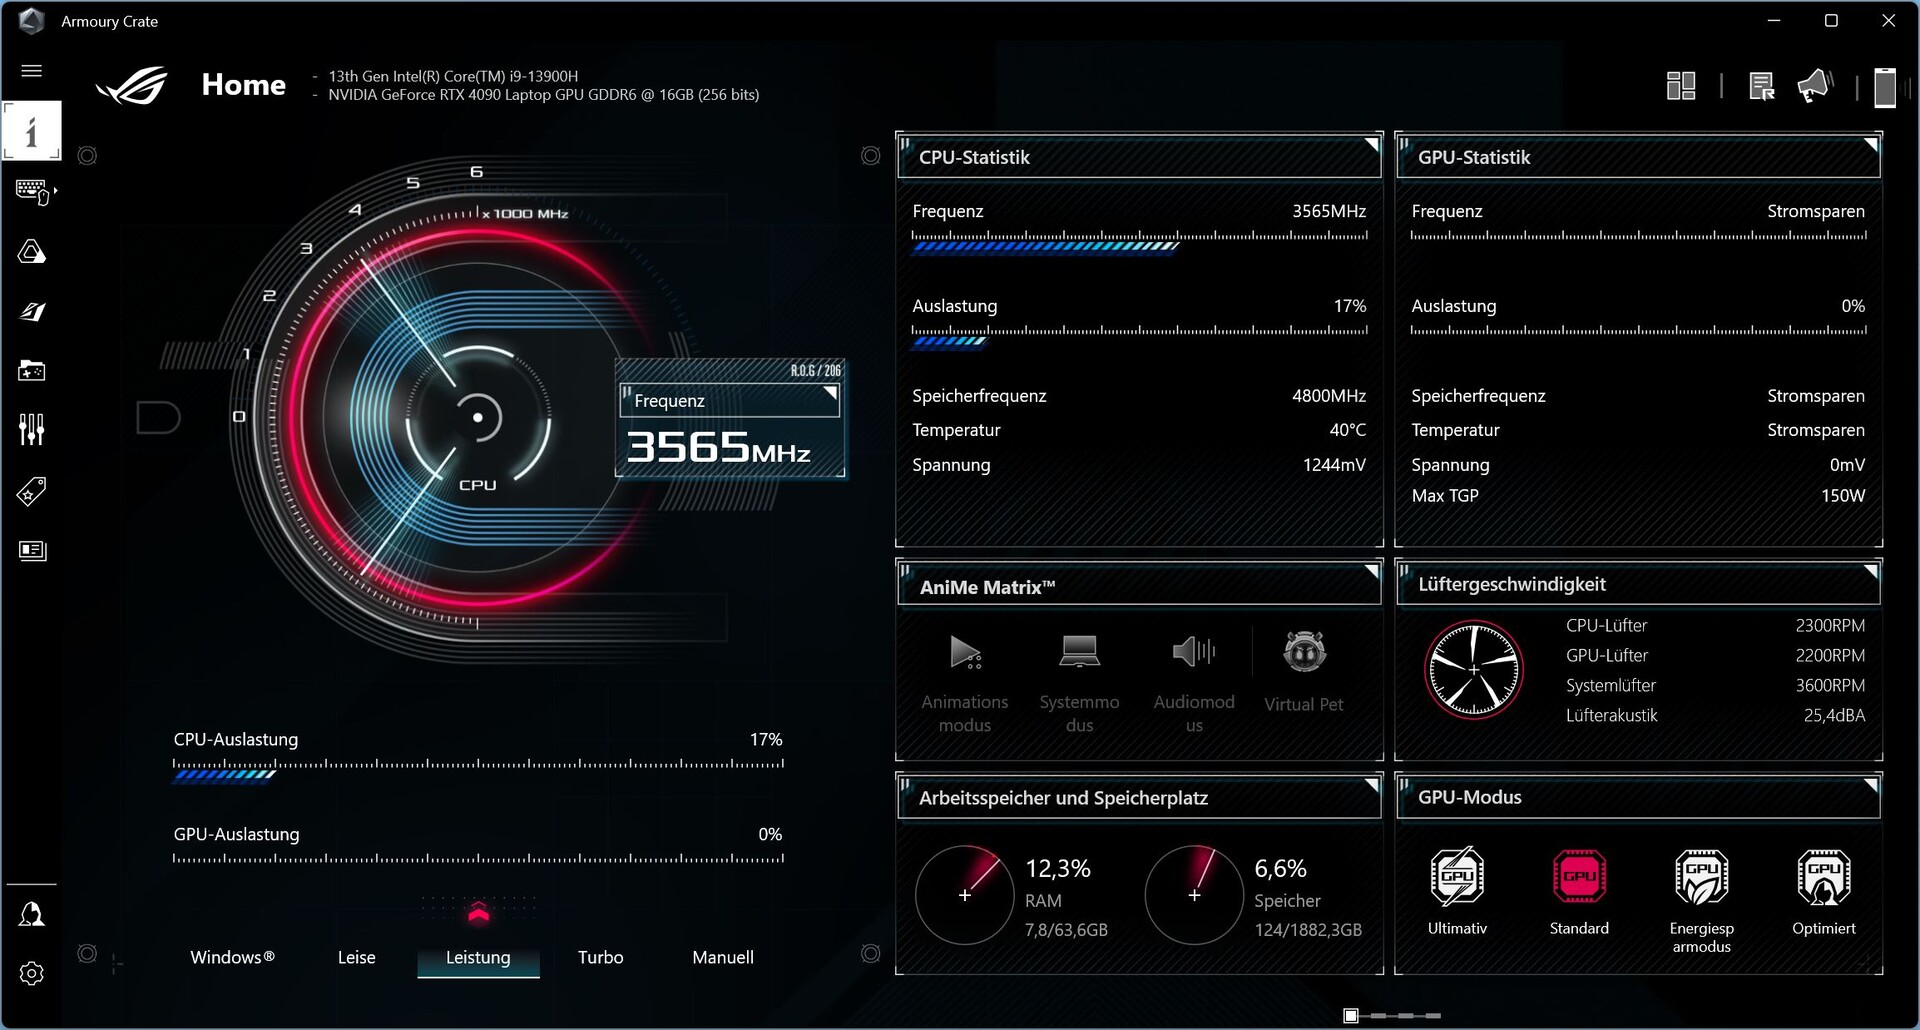
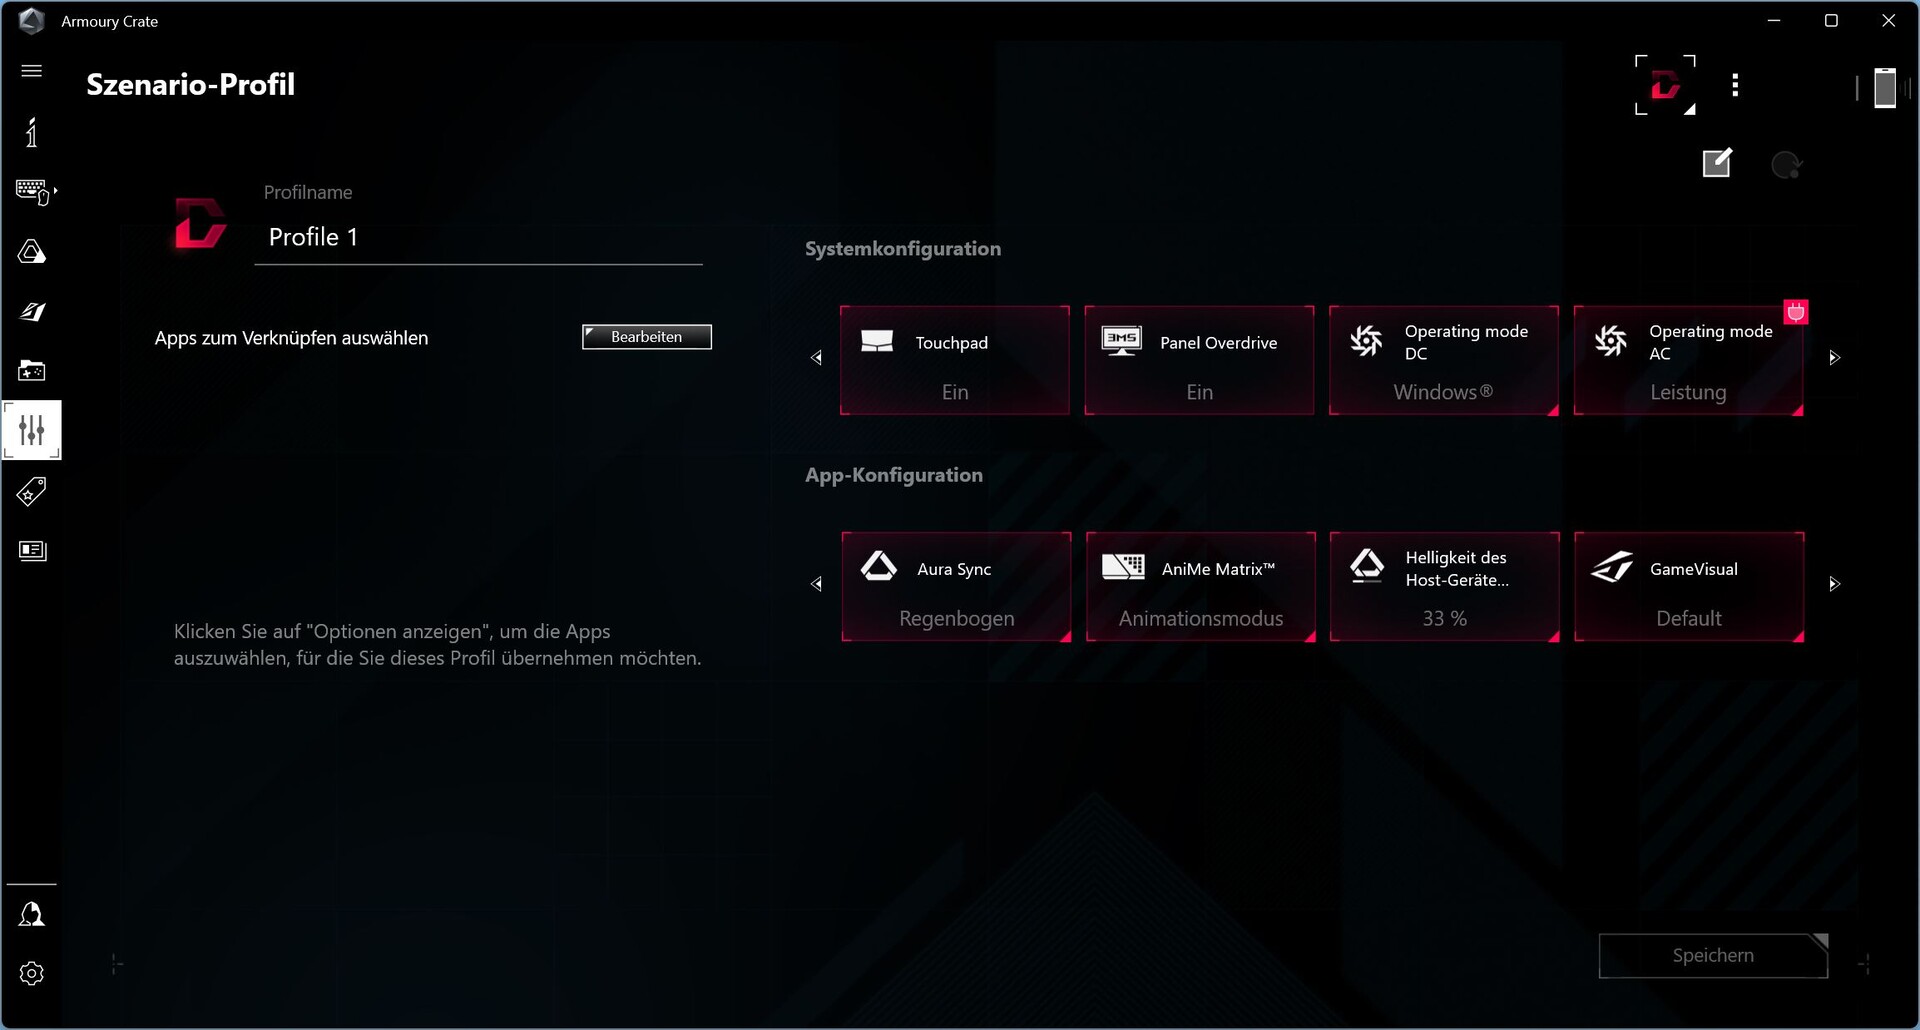
Centrum kontroli Asusa dla graczy to oprogramowanie, Amoury Crate. Oprócz różnych trybów wydajności, to właśnie tutaj dokonywane są wszystkie ważne ustawienia, a także można dostosować takie rzeczy jak AniMe Matrix czy krzywe wentylatorów.
Do naszych benchmarków wybraliśmy w aplikacji tryb Turbo, aby osiągnąć jak najlepsze wyniki. Jego poprzednik był testowany w trybie Performance ze względu na wysoką emisję hałasu przez poprzednią generację i jest to coś bardziej zbliżonego do trybu Balanced.
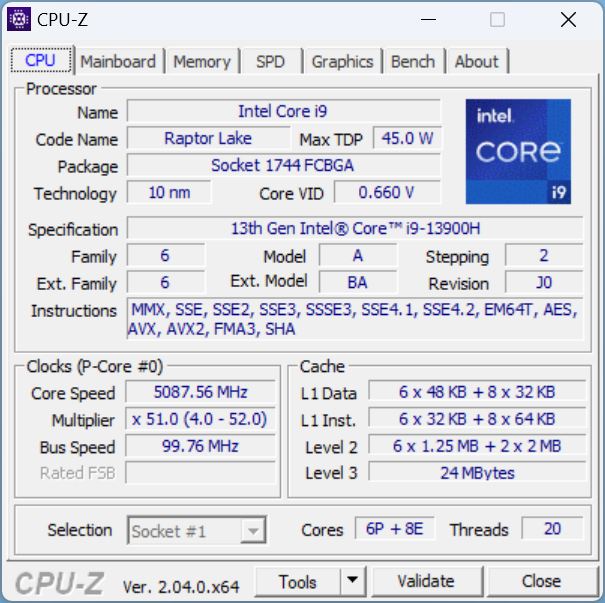
Procesor
Do tej pory.Core i9-13900Hto jedyna opcja CPU i jeden z najmocniejszych procesorów z nowej serii Raptor Lake Intela. Oferuje on 6 rdzeni P i 8 rdzeni E, z których pierwszy taktowany jest z częstotliwością do 5,4 GHz w trybie turbo. Bazowe taktowanie rdzenia E wynosi 1,9 GHz.

W naszej pętli Cinebench, M16 wyprzedził całą konkurencję skonfigurowaną z procesorami ostatniej generacji. Różnica jest jednak stosunkowo niewielka, nawet w porównaniu z wyraźnie mniej wydajnym i7-12700H znajdującym się wHP Omen 16. Przewaga nad poprzednikiem jest podobnie niewielka, a wynik w trybie Performance może być niemal identyczny.
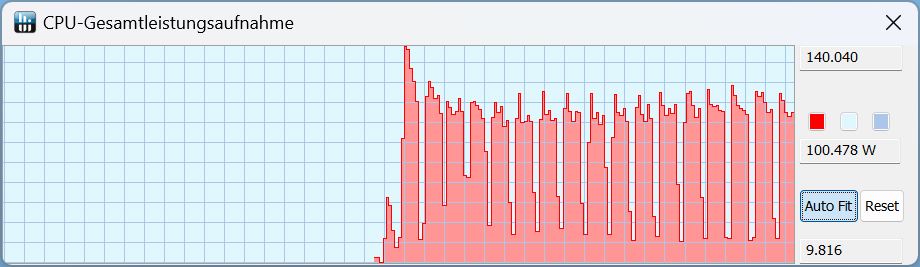
Jeśli chodzi o TDP, to w pierwszym uruchomieniu trybu Turbo osiągnięto 140 W, a pozostałe uruchomienia oscylowały wokół 100 W.
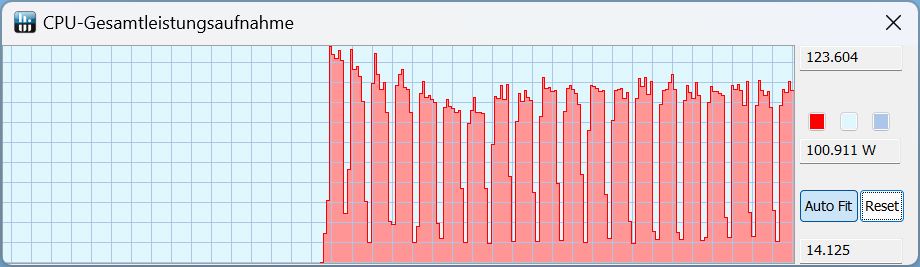
W trybie Performance, początkowy szczyt 140 W spadł do około 120 W, ale również tutaj TDP zwykle oscyluje wokół 100 W.
W trybie cichym szczyt zniknął, a TDP wahało się między 60 a maksymalnie 100 W.
W trybie akumulatorowym wydajność w tym samym trybie(Quiet) jest jeszcze niższa - na krótko dostępne jest maksymalnie 34 W, a w dłuższych okresach stałego obciążenia osiąga się tylko nieco ponad 20 W.
Cinebench R15 Multi Continuous
Cinebench R23: Multi Core | Single Core
Cinebench R20: CPU (Multi Core) | CPU (Single Core)
Cinebench R15: CPU Multi 64Bit | CPU Single 64Bit
Blender: v2.79 BMW27 CPU
7-Zip 18.03: 7z b 4 | 7z b 4 -mmt1
Geekbench 5.5: Multi-Core | Single-Core
HWBOT x265 Benchmark v2.2: 4k Preset
LibreOffice : 20 Documents To PDF
R Benchmark 2.5: Overall mean
| CPU Performance rating | |
| Schenker XMG Neo 16 Raptor Lake | |
| Średnia w klasie Gaming | |
| Asus ROG Zephyrus M16 GU604VY-NM042X | |
| MSI Creator Z16P B12UHST | |
| Lenovo Legion 5 Pro 16 G7 i7 RTX 3070Ti | |
| Asus ROG Zephyrus M16 GU603Z | |
| Acer Predator Triton 300 SE | |
| Przeciętny Intel Core i9-13900H | |
| HP Omen 17-ck1075ng | |
| Razer Blade 15 RZ09-0421NGG3-R3G1 | |
| Cinebench R23 / Multi Core | |
| Schenker XMG Neo 16 Raptor Lake | |
| Schenker XMG Neo 16 Raptor Lake | |
| Schenker XMG Neo 16 Raptor Lake | |
| Średnia w klasie Gaming (10488 - 40970, n=113, ostatnie 2 lata) | |
| Asus ROG Zephyrus M16 GU604VY-NM042X | |
| Lenovo Legion 5 Pro 16 G7 i7 RTX 3070Ti | |
| MSI Creator Z16P B12UHST | |
| Przeciętny Intel Core i9-13900H (11997 - 20385, n=28) | |
| Razer Blade 15 RZ09-0421NGG3-R3G1 | |
| Acer Predator Triton 300 SE | |
| Asus ROG Zephyrus M16 GU603Z | |
| HP Omen 17-ck1075ng | |
| Cinebench R23 / Single Core | |
| Schenker XMG Neo 16 Raptor Lake | |
| Średnia w klasie Gaming (1166 - 2356, n=113, ostatnie 2 lata) | |
| Asus ROG Zephyrus M16 GU604VY-NM042X | |
| MSI Creator Z16P B12UHST | |
| Acer Predator Triton 300 SE | |
| Przeciętny Intel Core i9-13900H (1297 - 2054, n=26) | |
| Asus ROG Zephyrus M16 GU603Z | |
| Lenovo Legion 5 Pro 16 G7 i7 RTX 3070Ti | |
| HP Omen 17-ck1075ng | |
| Razer Blade 15 RZ09-0421NGG3-R3G1 | |
| Cinebench R20 / CPU (Multi Core) | |
| Schenker XMG Neo 16 Raptor Lake | |
| Średnia w klasie Gaming (4029 - 16108, n=112, ostatnie 2 lata) | |
| Asus ROG Zephyrus M16 GU604VY-NM042X | |
| Lenovo Legion 5 Pro 16 G7 i7 RTX 3070Ti | |
| MSI Creator Z16P B12UHST | |
| Przeciętny Intel Core i9-13900H (4935 - 7716, n=25) | |
| Razer Blade 15 RZ09-0421NGG3-R3G1 | |
| Acer Predator Triton 300 SE | |
| Asus ROG Zephyrus M16 GU603Z | |
| HP Omen 17-ck1075ng | |
| Cinebench R20 / CPU (Single Core) | |
| Średnia w klasie Gaming (442 - 895, n=112, ostatnie 2 lata) | |
| Schenker XMG Neo 16 Raptor Lake | |
| Asus ROG Zephyrus M16 GU604VY-NM042X | |
| MSI Creator Z16P B12UHST | |
| Acer Predator Triton 300 SE | |
| Przeciętny Intel Core i9-13900H (428 - 792, n=25) | |
| Asus ROG Zephyrus M16 GU603Z | |
| Lenovo Legion 5 Pro 16 G7 i7 RTX 3070Ti | |
| HP Omen 17-ck1075ng | |
| Razer Blade 15 RZ09-0421NGG3-R3G1 | |
| Cinebench R15 / CPU Multi 64Bit | |
| Schenker XMG Neo 16 Raptor Lake | |
| Schenker XMG Neo 16 Raptor Lake | |
| Średnia w klasie Gaming (1578 - 6271, n=113, ostatnie 2 lata) | |
| Asus ROG Zephyrus M16 GU604VY-NM042X | |
| Lenovo Legion 5 Pro 16 G7 i7 RTX 3070Ti | |
| MSI Creator Z16P B12UHST | |
| Przeciętny Intel Core i9-13900H (2061 - 3100, n=26) | |
| Razer Blade 15 RZ09-0421NGG3-R3G1 | |
| Asus ROG Zephyrus M16 GU603Z | |
| HP Omen 17-ck1075ng | |
| HP Omen 17-ck1075ng | |
| Acer Predator Triton 300 SE | |
| Cinebench R15 / CPU Single 64Bit | |
| Schenker XMG Neo 16 Raptor Lake | |
| Schenker XMG Neo 16 Raptor Lake | |
| Średnia w klasie Gaming (188.8 - 343, n=112, ostatnie 2 lata) | |
| Asus ROG Zephyrus M16 GU604VY-NM042X | |
| MSI Creator Z16P B12UHST | |
| Acer Predator Triton 300 SE | |
| Przeciętny Intel Core i9-13900H (211 - 297, n=26) | |
| Lenovo Legion 5 Pro 16 G7 i7 RTX 3070Ti | |
| Asus ROG Zephyrus M16 GU603Z | |
| HP Omen 17-ck1075ng | |
| HP Omen 17-ck1075ng | |
| Razer Blade 15 RZ09-0421NGG3-R3G1 | |
| Blender / v2.79 BMW27 CPU | |
| HP Omen 17-ck1075ng | |
| Razer Blade 15 RZ09-0421NGG3-R3G1 | |
| Przeciętny Intel Core i9-13900H (166 - 268, n=24) | |
| Acer Predator Triton 300 SE | |
| Asus ROG Zephyrus M16 GU603Z | |
| MSI Creator Z16P B12UHST | |
| Lenovo Legion 5 Pro 16 G7 i7 RTX 3070Ti | |
| Asus ROG Zephyrus M16 GU604VY-NM042X | |
| Średnia w klasie Gaming (80 - 330, n=110, ostatnie 2 lata) | |
| Schenker XMG Neo 16 Raptor Lake | |
| 7-Zip 18.03 / 7z b 4 | |
| Schenker XMG Neo 16 Raptor Lake | |
| Średnia w klasie Gaming (33491 - 148086, n=111, ostatnie 2 lata) | |
| Asus ROG Zephyrus M16 GU604VY-NM042X | |
| MSI Creator Z16P B12UHST | |
| Lenovo Legion 5 Pro 16 G7 i7 RTX 3070Ti | |
| Przeciętny Intel Core i9-13900H (45045 - 79032, n=25) | |
| Asus ROG Zephyrus M16 GU603Z | |
| Acer Predator Triton 300 SE | |
| Razer Blade 15 RZ09-0421NGG3-R3G1 | |
| HP Omen 17-ck1075ng | |
| 7-Zip 18.03 / 7z b 4 -mmt1 | |
| Schenker XMG Neo 16 Raptor Lake | |
| Średnia w klasie Gaming (4199 - 7436, n=111, ostatnie 2 lata) | |
| Asus ROG Zephyrus M16 GU604VY-NM042X | |
| Asus ROG Zephyrus M16 GU603Z | |
| MSI Creator Z16P B12UHST | |
| Przeciętny Intel Core i9-13900H (3665 - 6600, n=25) | |
| Lenovo Legion 5 Pro 16 G7 i7 RTX 3070Ti | |
| HP Omen 17-ck1075ng | |
| Acer Predator Triton 300 SE | |
| Razer Blade 15 RZ09-0421NGG3-R3G1 | |
| Geekbench 5.5 / Multi-Core | |
| Schenker XMG Neo 16 Raptor Lake | |
| Średnia w klasie Gaming (6460 - 27010, n=111, ostatnie 2 lata) | |
| Asus ROG Zephyrus M16 GU604VY-NM042X | |
| MSI Creator Z16P B12UHST | |
| Lenovo Legion 5 Pro 16 G7 i7 RTX 3070Ti | |
| Acer Predator Triton 300 SE | |
| Asus ROG Zephyrus M16 GU603Z | |
| Przeciętny Intel Core i9-13900H (9094 - 15410, n=26) | |
| Razer Blade 15 RZ09-0421NGG3-R3G1 | |
| HP Omen 17-ck1075ng | |
| Geekbench 5.5 / Single-Core | |
| Średnia w klasie Gaming (986 - 2474, n=111, ostatnie 2 lata) | |
| Schenker XMG Neo 16 Raptor Lake | |
| Asus ROG Zephyrus M16 GU604VY-NM042X | |
| Przeciętny Intel Core i9-13900H (1140 - 2043, n=26) | |
| MSI Creator Z16P B12UHST | |
| Acer Predator Triton 300 SE | |
| Asus ROG Zephyrus M16 GU603Z | |
| HP Omen 17-ck1075ng | |
| Lenovo Legion 5 Pro 16 G7 i7 RTX 3070Ti | |
| Razer Blade 15 RZ09-0421NGG3-R3G1 | |
| HWBOT x265 Benchmark v2.2 / 4k Preset | |
| Schenker XMG Neo 16 Raptor Lake | |
| Średnia w klasie Gaming (11.5 - 44.3, n=111, ostatnie 2 lata) | |
| Asus ROG Zephyrus M16 GU604VY-NM042X | |
| Lenovo Legion 5 Pro 16 G7 i7 RTX 3070Ti | |
| MSI Creator Z16P B12UHST | |
| Asus ROG Zephyrus M16 GU603Z | |
| Acer Predator Triton 300 SE | |
| Przeciętny Intel Core i9-13900H (14.1 - 22.3, n=25) | |
| Razer Blade 15 RZ09-0421NGG3-R3G1 | |
| HP Omen 17-ck1075ng | |
| LibreOffice / 20 Documents To PDF | |
| Razer Blade 15 RZ09-0421NGG3-R3G1 | |
| Asus ROG Zephyrus M16 GU604VY-NM042X | |
| Średnia w klasie Gaming (19 - 88.8, n=111, ostatnie 2 lata) | |
| Przeciętny Intel Core i9-13900H (34.4 - 82.8, n=25) | |
| Schenker XMG Neo 16 Raptor Lake | |
| HP Omen 17-ck1075ng | |
| Asus ROG Zephyrus M16 GU603Z | |
| Lenovo Legion 5 Pro 16 G7 i7 RTX 3070Ti | |
| Acer Predator Triton 300 SE | |
| MSI Creator Z16P B12UHST | |
| R Benchmark 2.5 / Overall mean | |
| Razer Blade 15 RZ09-0421NGG3-R3G1 | |
| HP Omen 17-ck1075ng | |
| Lenovo Legion 5 Pro 16 G7 i7 RTX 3070Ti | |
| Przeciętny Intel Core i9-13900H (0.4052 - 0.723, n=25) | |
| Asus ROG Zephyrus M16 GU603Z | |
| MSI Creator Z16P B12UHST | |
| Średnia w klasie Gaming (0.3439 - 0.759, n=112, ostatnie 2 lata) | |
| Acer Predator Triton 300 SE | |
| Asus ROG Zephyrus M16 GU604VY-NM042X | |
| Schenker XMG Neo 16 Raptor Lake | |
* ... im mniej tym lepiej
AIDA64: FP32 Ray-Trace | FPU Julia | CPU SHA3 | CPU Queen | FPU SinJulia | FPU Mandel | CPU AES | CPU ZLib | FP64 Ray-Trace | CPU PhotoWorxx
| Performance rating | |
| MSI Titan GT77 HX 13VI | |
| Asus ROG Strix Scar 18 2023 G834JY-N6005W | |
| Lenovo Legion Pro 7 16IRX8H | |
| Średnia w klasie Gaming | |
| Razer Blade 16 Early 2023 | |
| Asus ROG Zephyrus M16 GU604VY-NM042X | |
| Asus ROG Zephyrus M16 GU603Z | |
| Przeciętny Intel Core i9-13900H | |
| AIDA64 / FP32 Ray-Trace | |
| Średnia w klasie Gaming (10227 - 85542, n=110, ostatnie 2 lata) | |
| MSI Titan GT77 HX 13VI | |
| Asus ROG Strix Scar 18 2023 G834JY-N6005W | |
| Lenovo Legion Pro 7 16IRX8H | |
| Razer Blade 16 Early 2023 | |
| Razer Blade 16 Early 2023 | |
| Razer Blade 16 Early 2023 | |
| Asus ROG Zephyrus M16 GU604VY-NM042X | |
| Asus ROG Zephyrus M16 GU603Z | |
| Przeciętny Intel Core i9-13900H (6788 - 19557, n=25) | |
| AIDA64 / FPU Julia | |
| MSI Titan GT77 HX 13VI | |
| Asus ROG Strix Scar 18 2023 G834JY-N6005W | |
| Średnia w klasie Gaming (51376 - 238426, n=110, ostatnie 2 lata) | |
| Lenovo Legion Pro 7 16IRX8H | |
| Razer Blade 16 Early 2023 | |
| Razer Blade 16 Early 2023 | |
| Razer Blade 16 Early 2023 | |
| Asus ROG Zephyrus M16 GU604VY-NM042X | |
| Przeciętny Intel Core i9-13900H (22551 - 95579, n=25) | |
| Asus ROG Zephyrus M16 GU603Z | |
| AIDA64 / CPU SHA3 | |
| MSI Titan GT77 HX 13VI | |
| Asus ROG Strix Scar 18 2023 G834JY-N6005W | |
| Lenovo Legion Pro 7 16IRX8H | |
| Razer Blade 16 Early 2023 | |
| Razer Blade 16 Early 2023 | |
| Razer Blade 16 Early 2023 | |
| Średnia w klasie Gaming (2180 - 9817, n=110, ostatnie 2 lata) | |
| Asus ROG Zephyrus M16 GU604VY-NM042X | |
| Przeciętny Intel Core i9-13900H (2491 - 4270, n=25) | |
| Asus ROG Zephyrus M16 GU603Z | |
| AIDA64 / CPU Queen | |
| Asus ROG Strix Scar 18 2023 G834JY-N6005W | |
| MSI Titan GT77 HX 13VI | |
| Razer Blade 16 Early 2023 | |
| Razer Blade 16 Early 2023 | |
| Lenovo Legion Pro 7 16IRX8H | |
| Asus ROG Zephyrus M16 GU604VY-NM042X | |
| Średnia w klasie Gaming (49785 - 173351, n=101, ostatnie 2 lata) | |
| Asus ROG Zephyrus M16 GU603Z | |
| Przeciętny Intel Core i9-13900H (65121 - 120936, n=25) | |
| AIDA64 / FPU SinJulia | |
| Asus ROG Strix Scar 18 2023 G834JY-N6005W | |
| MSI Titan GT77 HX 13VI | |
| Razer Blade 16 Early 2023 | |
| Razer Blade 16 Early 2023 | |
| Razer Blade 16 Early 2023 | |
| Lenovo Legion Pro 7 16IRX8H | |
| Średnia w klasie Gaming (4424 - 33636, n=110, ostatnie 2 lata) | |
| Asus ROG Zephyrus M16 GU604VY-NM042X | |
| Przeciętny Intel Core i9-13900H (6108 - 11631, n=25) | |
| Asus ROG Zephyrus M16 GU603Z | |
| AIDA64 / FPU Mandel | |
| MSI Titan GT77 HX 13VI | |
| Asus ROG Strix Scar 18 2023 G834JY-N6005W | |
| Średnia w klasie Gaming (25115 - 128721, n=110, ostatnie 2 lata) | |
| Lenovo Legion Pro 7 16IRX8H | |
| Razer Blade 16 Early 2023 | |
| Razer Blade 16 Early 2023 | |
| Razer Blade 16 Early 2023 | |
| Asus ROG Zephyrus M16 GU604VY-NM042X | |
| Przeciętny Intel Core i9-13900H (11283 - 48474, n=25) | |
| Asus ROG Zephyrus M16 GU603Z | |
| AIDA64 / CPU AES | |
| Razer Blade 16 Early 2023 | |
| Razer Blade 16 Early 2023 | |
| Razer Blade 16 Early 2023 | |
| MSI Titan GT77 HX 13VI | |
| Asus ROG Strix Scar 18 2023 G834JY-N6005W | |
| Asus ROG Zephyrus M16 GU603Z | |
| Lenovo Legion Pro 7 16IRX8H | |
| Średnia w klasie Gaming (39258 - 247074, n=110, ostatnie 2 lata) | |
| Przeciętny Intel Core i9-13900H (3691 - 149377, n=25) | |
| Asus ROG Zephyrus M16 GU604VY-NM042X | |
| AIDA64 / CPU ZLib | |
| MSI Titan GT77 HX 13VI | |
| Asus ROG Strix Scar 18 2023 G834JY-N6005W | |
| Lenovo Legion Pro 7 16IRX8H | |
| Razer Blade 16 Early 2023 | |
| Razer Blade 16 Early 2023 | |
| Razer Blade 16 Early 2023 | |
| Średnia w klasie Gaming (574 - 2531, n=110, ostatnie 2 lata) | |
| Asus ROG Zephyrus M16 GU604VY-NM042X | |
| Przeciętny Intel Core i9-13900H (789 - 1254, n=25) | |
| Asus ROG Zephyrus M16 GU603Z | |
| AIDA64 / FP64 Ray-Trace | |
| Średnia w klasie Gaming (5509 - 45446, n=110, ostatnie 2 lata) | |
| MSI Titan GT77 HX 13VI | |
| Asus ROG Strix Scar 18 2023 G834JY-N6005W | |
| Lenovo Legion Pro 7 16IRX8H | |
| Razer Blade 16 Early 2023 | |
| Razer Blade 16 Early 2023 | |
| Razer Blade 16 Early 2023 | |
| Asus ROG Zephyrus M16 GU604VY-NM042X | |
| Asus ROG Zephyrus M16 GU603Z | |
| Przeciętny Intel Core i9-13900H (3655 - 10716, n=25) | |
| AIDA64 / CPU PhotoWorxx | |
| Razer Blade 16 Early 2023 | |
| Razer Blade 16 Early 2023 | |
| Razer Blade 16 Early 2023 | |
| Lenovo Legion Pro 7 16IRX8H | |
| Asus ROG Zephyrus M16 GU604VY-NM042X | |
| Średnia w klasie Gaming (12271 - 89891, n=110, ostatnie 2 lata) | |
| Asus ROG Strix Scar 18 2023 G834JY-N6005W | |
| Asus ROG Zephyrus M16 GU603Z | |
| MSI Titan GT77 HX 13VI | |
| Przeciętny Intel Core i9-13900H (10871 - 50488, n=25) | |
Wydajność systemu
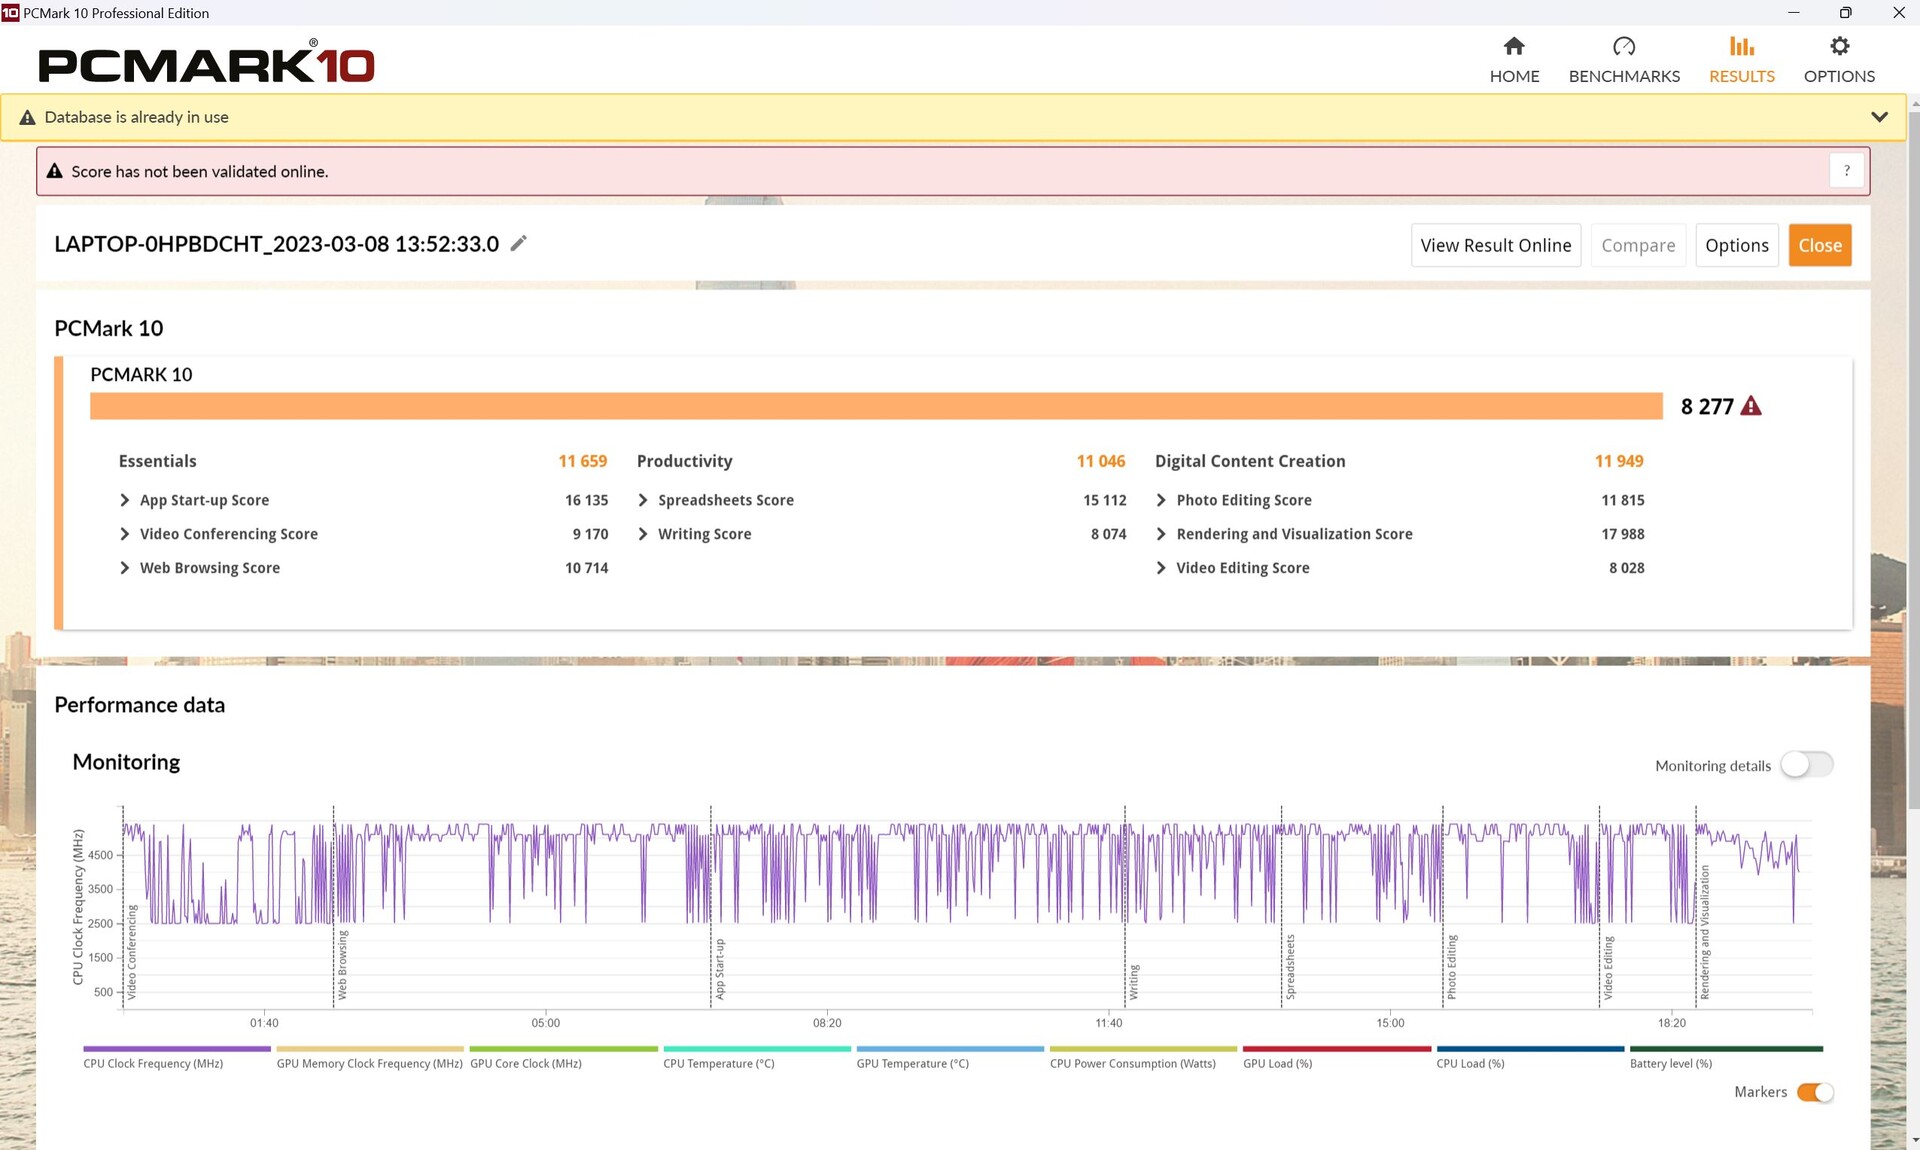
Nasz M16 nie wykazał większych słabości w PCMarku10, ale nie można mu też do końca zarzucić przewagi nad konkurencją last-gen. Na stronieLegion 7 jest właściwie o kilka punktów procentowych szybszy. W teście tworzenia treści cyfrowych wyniki są nieco rozczarowujące, zwłaszcza w obszarach edycji i renderowania.
CrossMark: Overall | Productivity | Creativity | Responsiveness
| PCMark 10 / Score | |
| Lenovo Legion 7 16IAX7-82TD004SGE | |
| Średnia w klasie Gaming (5828 - 11574, n=96, ostatnie 2 lata) | |
| Asus ROG Zephyrus M16 GU604VY-NM042X | |
| Alienware x17 R2 P48E | |
| Przeciętny Intel Core i9-13900H, NVIDIA GeForce RTX 4090 Laptop GPU (7985 - 8277, n=2) | |
| MSI Creator Z16P B12UHST | |
| Acer Predator Triton 500 SE PT516-52s-70KX | |
| Alienware x15 R2 P111F | |
| Asus ROG Zephyrus Duo 16 GX650RX | |
| PCMark 10 / Essentials | |
| Asus ROG Zephyrus M16 GU604VY-NM042X | |
| Przeciętny Intel Core i9-13900H, NVIDIA GeForce RTX 4090 Laptop GPU (11500 - 11659, n=2) | |
| Alienware x17 R2 P48E | |
| Lenovo Legion 7 16IAX7-82TD004SGE | |
| Alienware x15 R2 P111F | |
| MSI Creator Z16P B12UHST | |
| Acer Predator Triton 500 SE PT516-52s-70KX | |
| Średnia w klasie Gaming (8810 - 12600, n=100, ostatnie 2 lata) | |
| Asus ROG Zephyrus Duo 16 GX650RX | |
| PCMark 10 / Productivity | |
| MSI Creator Z16P B12UHST | |
| Asus ROG Zephyrus M16 GU604VY-NM042X | |
| Lenovo Legion 7 16IAX7-82TD004SGE | |
| Przeciętny Intel Core i9-13900H, NVIDIA GeForce RTX 4090 Laptop GPU (10526 - 11046, n=2) | |
| Średnia w klasie Gaming (6845 - 18766, n=98, ostatnie 2 lata) | |
| Alienware x15 R2 P111F | |
| Alienware x17 R2 P48E | |
| Acer Predator Triton 500 SE PT516-52s-70KX | |
| Asus ROG Zephyrus Duo 16 GX650RX | |
| PCMark 10 / Digital Content Creation | |
| Lenovo Legion 7 16IAX7-82TD004SGE | |
| Średnia w klasie Gaming (7602 - 19657, n=98, ostatnie 2 lata) | |
| Alienware x17 R2 P48E | |
| Asus ROG Zephyrus M16 GU604VY-NM042X | |
| Przeciętny Intel Core i9-13900H, NVIDIA GeForce RTX 4090 Laptop GPU (11412 - 11949, n=2) | |
| MSI Creator Z16P B12UHST | |
| Acer Predator Triton 500 SE PT516-52s-70KX | |
| Alienware x15 R2 P111F | |
| Asus ROG Zephyrus Duo 16 GX650RX | |
| CrossMark / Overall | |
| Lenovo Legion 7 16IAX7-82TD004SGE | |
| Schenker XMG Neo 16 Raptor Lake | |
| Średnia w klasie Gaming (1366 - 2409, n=98, ostatnie 2 lata) | |
| Asus ROG Zephyrus M16 GU604VY-NM042X | |
| Przeciętny Intel Core i9-13900H, NVIDIA GeForce RTX 4090 Laptop GPU (n=1) | |
| Alienware x15 R2 P111F | |
| Alienware x17 R2 P48E | |
| Acer Predator Triton 500 SE PT516-52s-70KX | |
| Asus ROG Zephyrus Duo 16 GX650RX | |
| Razer Blade 15 RZ09-0421NGG3-R3G1 | |
| CrossMark / Productivity | |
| Lenovo Legion 7 16IAX7-82TD004SGE | |
| Alienware x15 R2 P111F | |
| Średnia w klasie Gaming (1386 - 2254, n=98, ostatnie 2 lata) | |
| Asus ROG Zephyrus M16 GU604VY-NM042X | |
| Przeciętny Intel Core i9-13900H, NVIDIA GeForce RTX 4090 Laptop GPU (n=1) | |
| Schenker XMG Neo 16 Raptor Lake | |
| Alienware x17 R2 P48E | |
| Acer Predator Triton 500 SE PT516-52s-70KX | |
| Asus ROG Zephyrus Duo 16 GX650RX | |
| Razer Blade 15 RZ09-0421NGG3-R3G1 | |
| CrossMark / Creativity | |
| Schenker XMG Neo 16 Raptor Lake | |
| Lenovo Legion 7 16IAX7-82TD004SGE | |
| Asus ROG Zephyrus M16 GU604VY-NM042X | |
| Przeciętny Intel Core i9-13900H, NVIDIA GeForce RTX 4090 Laptop GPU (n=1) | |
| Średnia w klasie Gaming (1343 - 2729, n=98, ostatnie 2 lata) | |
| Alienware x15 R2 P111F | |
| Alienware x17 R2 P48E | |
| Acer Predator Triton 500 SE PT516-52s-70KX | |
| Razer Blade 15 RZ09-0421NGG3-R3G1 | |
| Asus ROG Zephyrus Duo 16 GX650RX | |
| CrossMark / Responsiveness | |
| Lenovo Legion 7 16IAX7-82TD004SGE | |
| Acer Predator Triton 500 SE PT516-52s-70KX | |
| Alienware x15 R2 P111F | |
| Asus ROG Zephyrus Duo 16 GX650RX | |
| Średnia w klasie Gaming (1226 - 2334, n=98, ostatnie 2 lata) | |
| Alienware x17 R2 P48E | |
| Asus ROG Zephyrus M16 GU604VY-NM042X | |
| Przeciętny Intel Core i9-13900H, NVIDIA GeForce RTX 4090 Laptop GPU (n=1) | |
| Schenker XMG Neo 16 Raptor Lake | |
| Razer Blade 15 RZ09-0421NGG3-R3G1 | |
| PCMark 10 Score | 8277 pkt. | |
Pomoc | ||
| AIDA64 / Memory Copy | |
| Razer Blade 16 Early 2023 | |
| Razer Blade 16 Early 2023 | |
| Razer Blade 16 Early 2023 | |
| Lenovo Legion Pro 7 16IRX8H | |
| Średnia w klasie Gaming (21750 - 129946, n=110, ostatnie 2 lata) | |
| Asus ROG Zephyrus M16 GU604VY-NM042X | |
| Asus ROG Strix Scar 18 2023 G834JY-N6005W | |
| MSI Titan GT77 HX 13VI | |
| Asus ROG Zephyrus M16 GU603Z | |
| Przeciętny Intel Core i9-13900H (37448 - 74486, n=25) | |
| AIDA64 / Memory Read | |
| Razer Blade 16 Early 2023 | |
| Razer Blade 16 Early 2023 | |
| Razer Blade 16 Early 2023 | |
| Lenovo Legion Pro 7 16IRX8H | |
| Asus ROG Strix Scar 18 2023 G834JY-N6005W | |
| Średnia w klasie Gaming (22956 - 118858, n=110, ostatnie 2 lata) | |
| Asus ROG Zephyrus M16 GU604VY-NM042X | |
| Asus ROG Zephyrus M16 GU603Z | |
| MSI Titan GT77 HX 13VI | |
| Przeciętny Intel Core i9-13900H (41599 - 75433, n=25) | |
| AIDA64 / Memory Write | |
| Razer Blade 16 Early 2023 | |
| Razer Blade 16 Early 2023 | |
| Razer Blade 16 Early 2023 | |
| Średnia w klasie Gaming (22297 - 135096, n=110, ostatnie 2 lata) | |
| Asus ROG Zephyrus M16 GU604VY-NM042X | |
| Lenovo Legion Pro 7 16IRX8H | |
| Asus ROG Strix Scar 18 2023 G834JY-N6005W | |
| Asus ROG Zephyrus M16 GU603Z | |
| Przeciętny Intel Core i9-13900H (36152 - 88505, n=25) | |
| MSI Titan GT77 HX 13VI | |
| AIDA64 / Memory Latency | |
| Średnia w klasie Gaming (75.3 - 259, n=110, ostatnie 2 lata) | |
| Razer Blade 16 Early 2023 | |
| Razer Blade 16 Early 2023 | |
| Razer Blade 16 Early 2023 | |
| MSI Titan GT77 HX 13VI | |
| Asus ROG Strix Scar 18 2023 G834JY-N6005W | |
| Przeciętny Intel Core i9-13900H (75.8 - 102.3, n=25) | |
| Asus ROG Zephyrus M16 GU603Z | |
| Asus ROG Zephyrus M16 GU604VY-NM042X | |
| Lenovo Legion Pro 7 16IRX8H | |
* ... im mniej tym lepiej
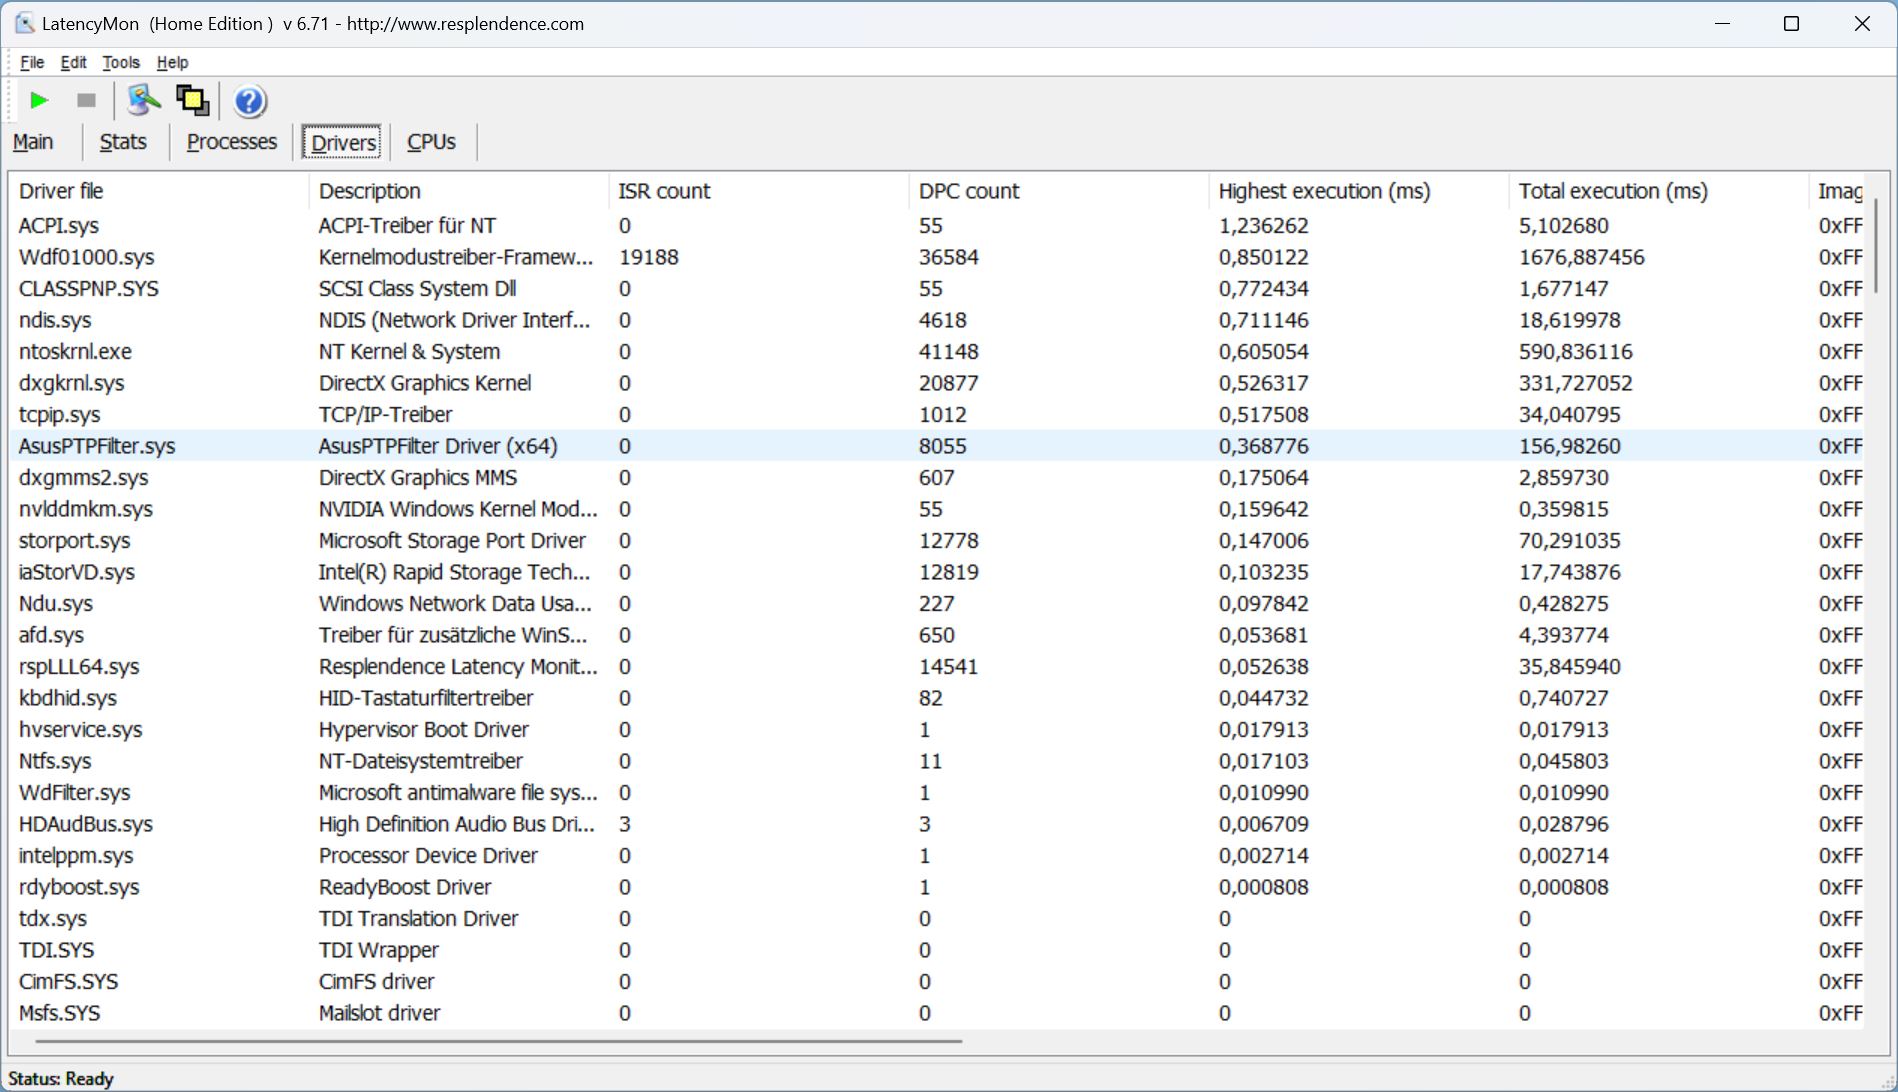
Opóźnienia DPC
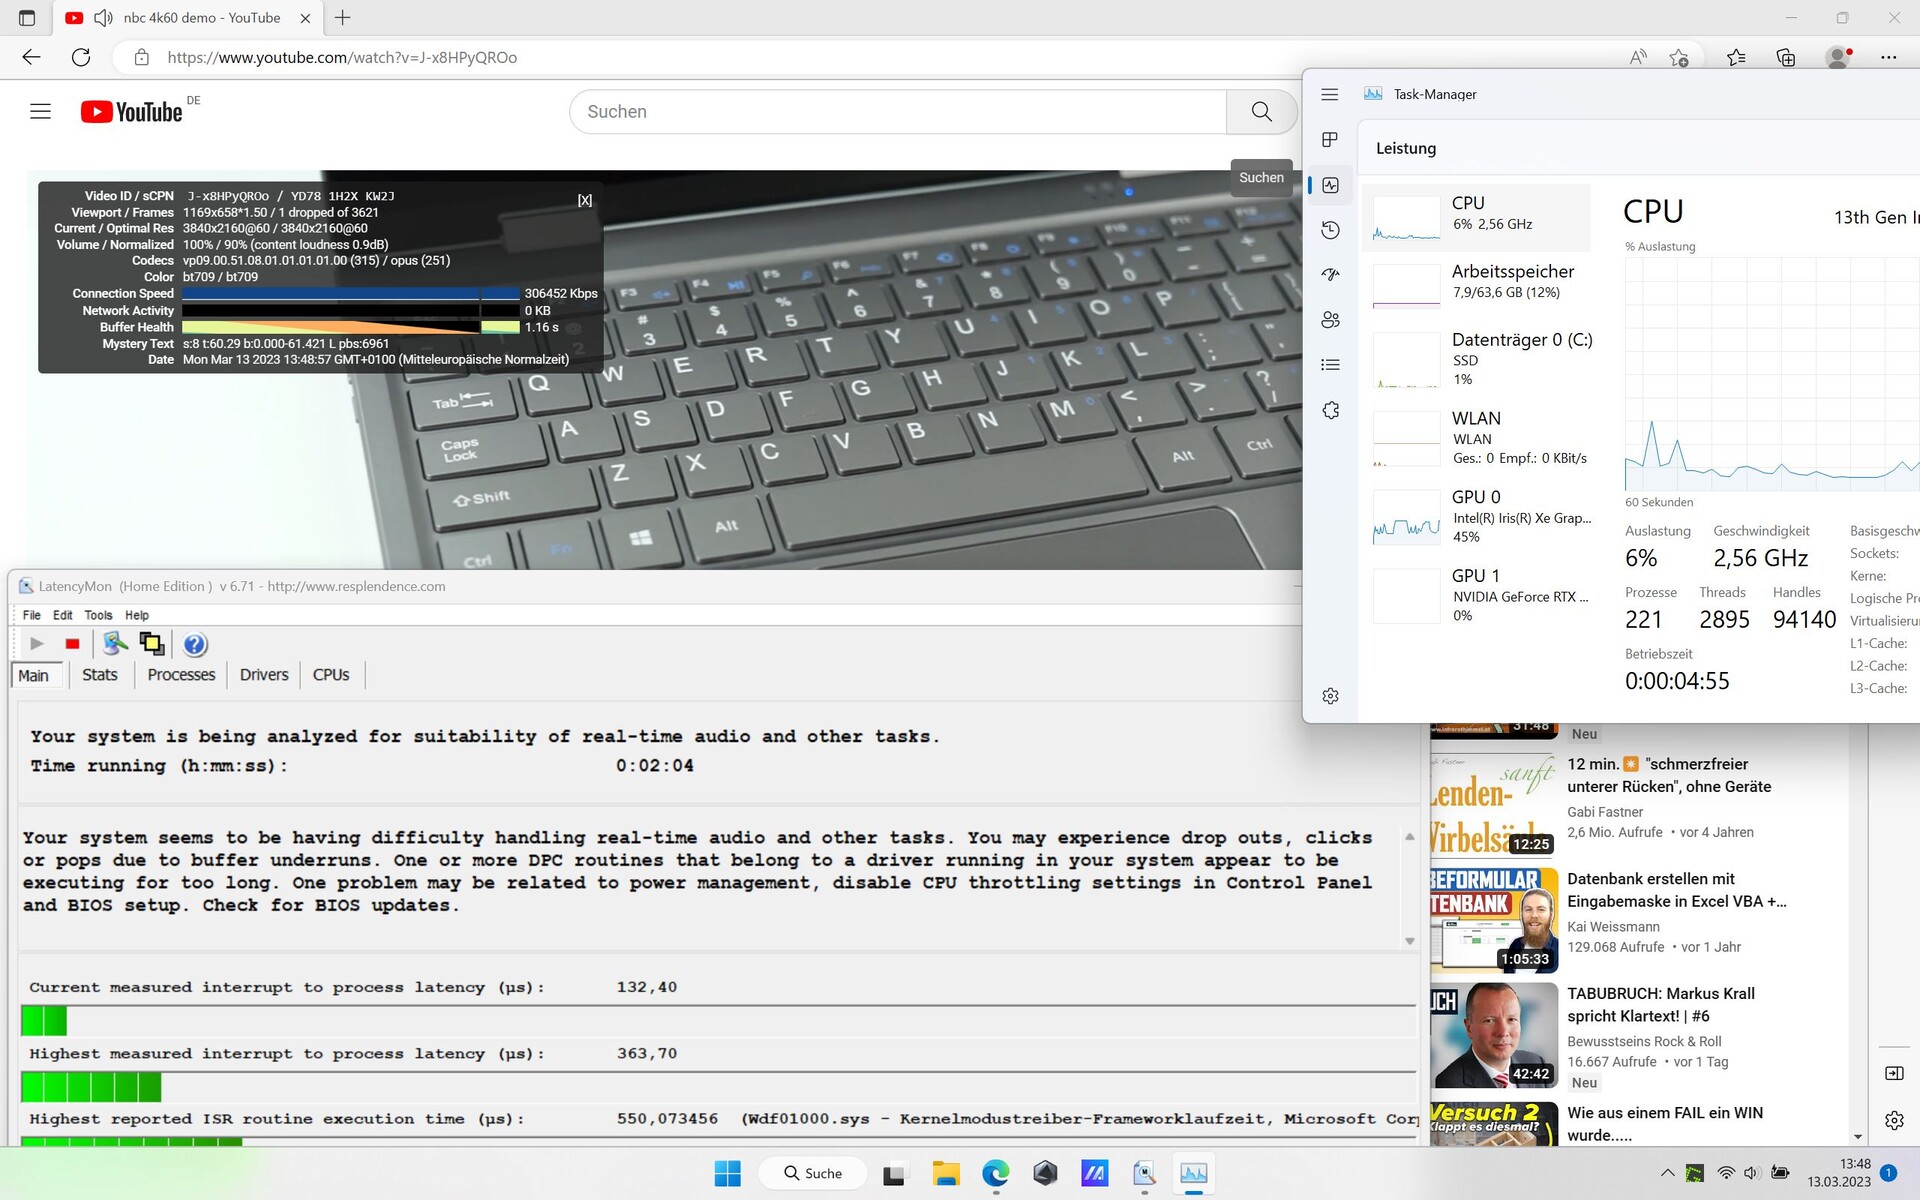
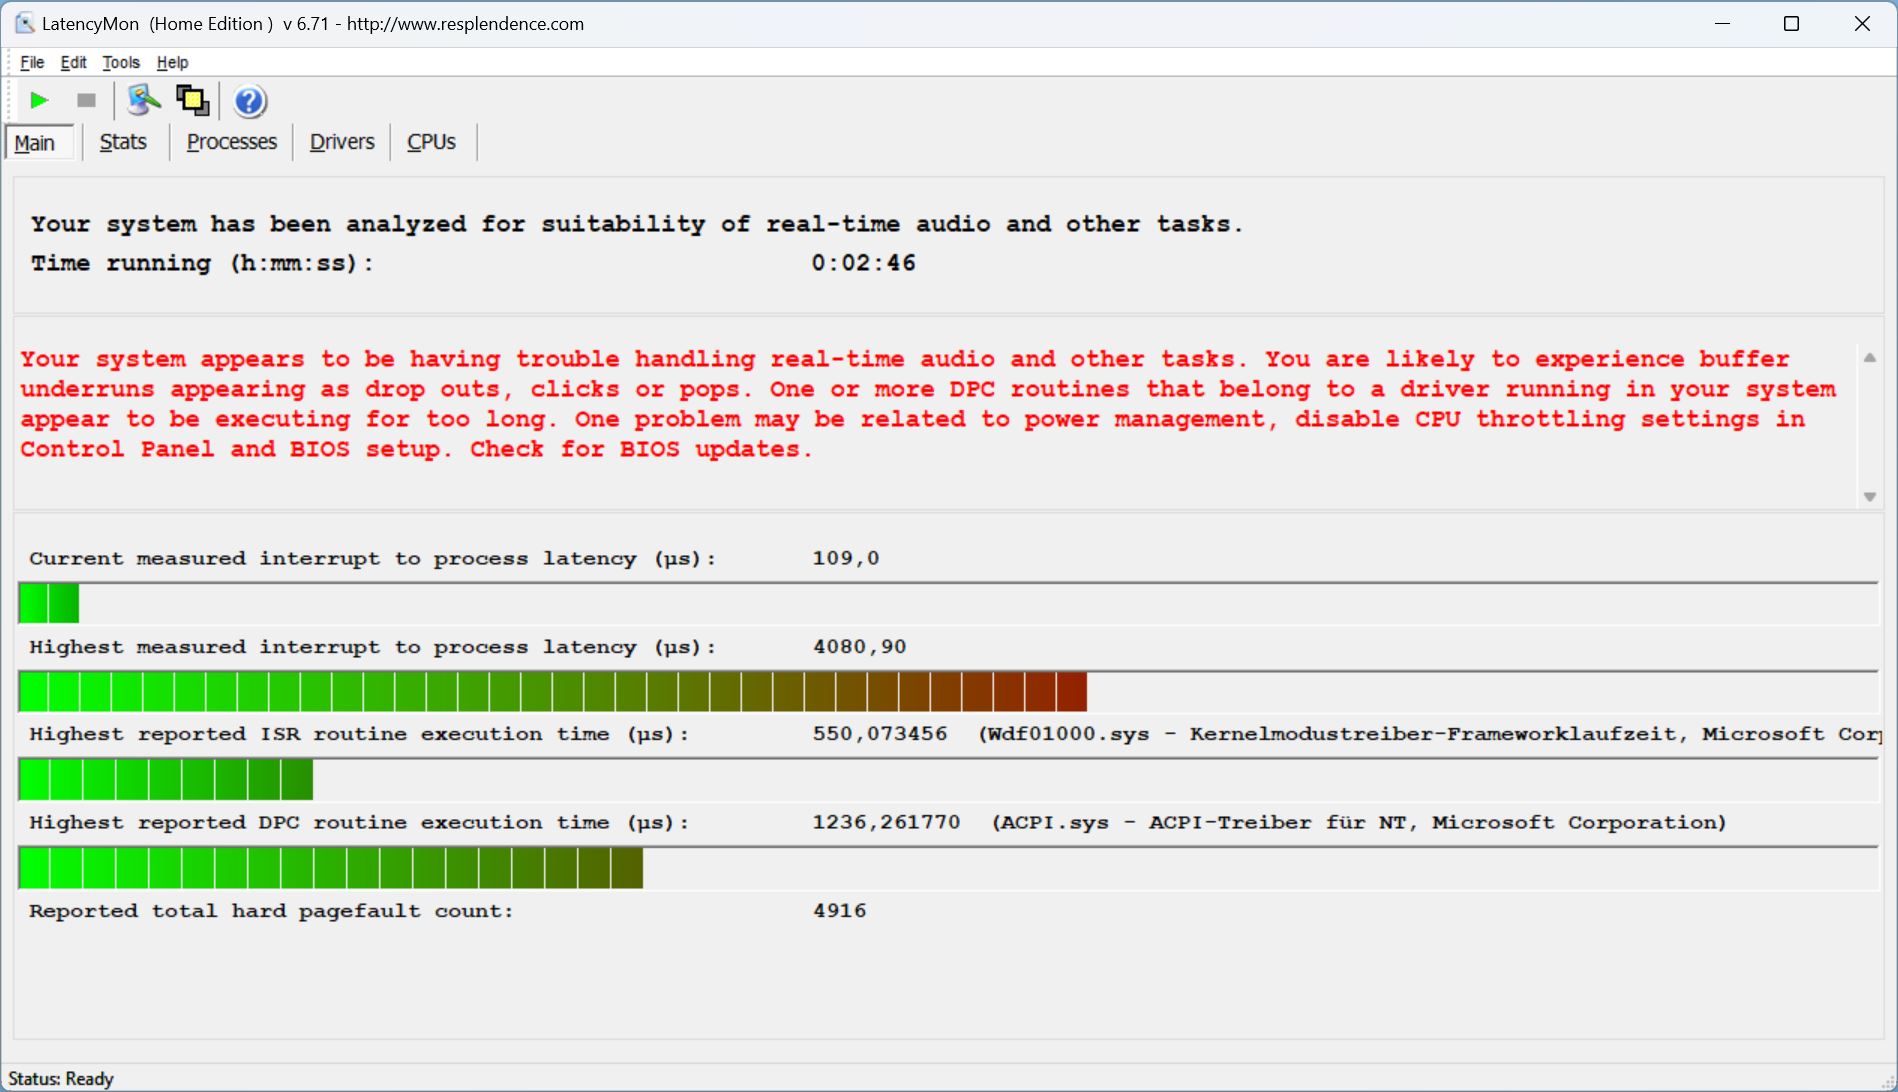
M16 nie poci się, gdy trzeba otworzyć wiele kart przeglądarki. Wszystko wyglądało dobrze, dopóki nie pojawiły się duże opóźnienia podczas odtwarzania naszych filmów 4k/60 fps z YouTube, a następnie w Prime95. To, co do tej pory było dobrą wartością, wzrosło kilkukrotnie.
W ten sposób M16 ma znacznie wyższe latencje niż konkurencja z ostatniej generacji. Sterowniki nowej generacji nie wydają się być wystarczająco dojrzałe, a dowodem na to są podobnie wysokie wartości latencji widoczne w przypadkuMSI Titan.
| DPC Latencies / LatencyMon - interrupt to process latency (max), Web, Youtube, Prime95 | |
| MSI Titan GT77 HX 13VI | |
| Asus ROG Zephyrus M16 GU604VY-NM042X | |
| Razer Blade 16 Early 2023 | |
| Asus ROG Strix Scar 18 2023 G834JY-N6005W | |
| Asus ROG Zephyrus M16 GU603Z | |
| Lenovo Legion Pro 7 16IRX8H | |
* ... im mniej tym lepiej
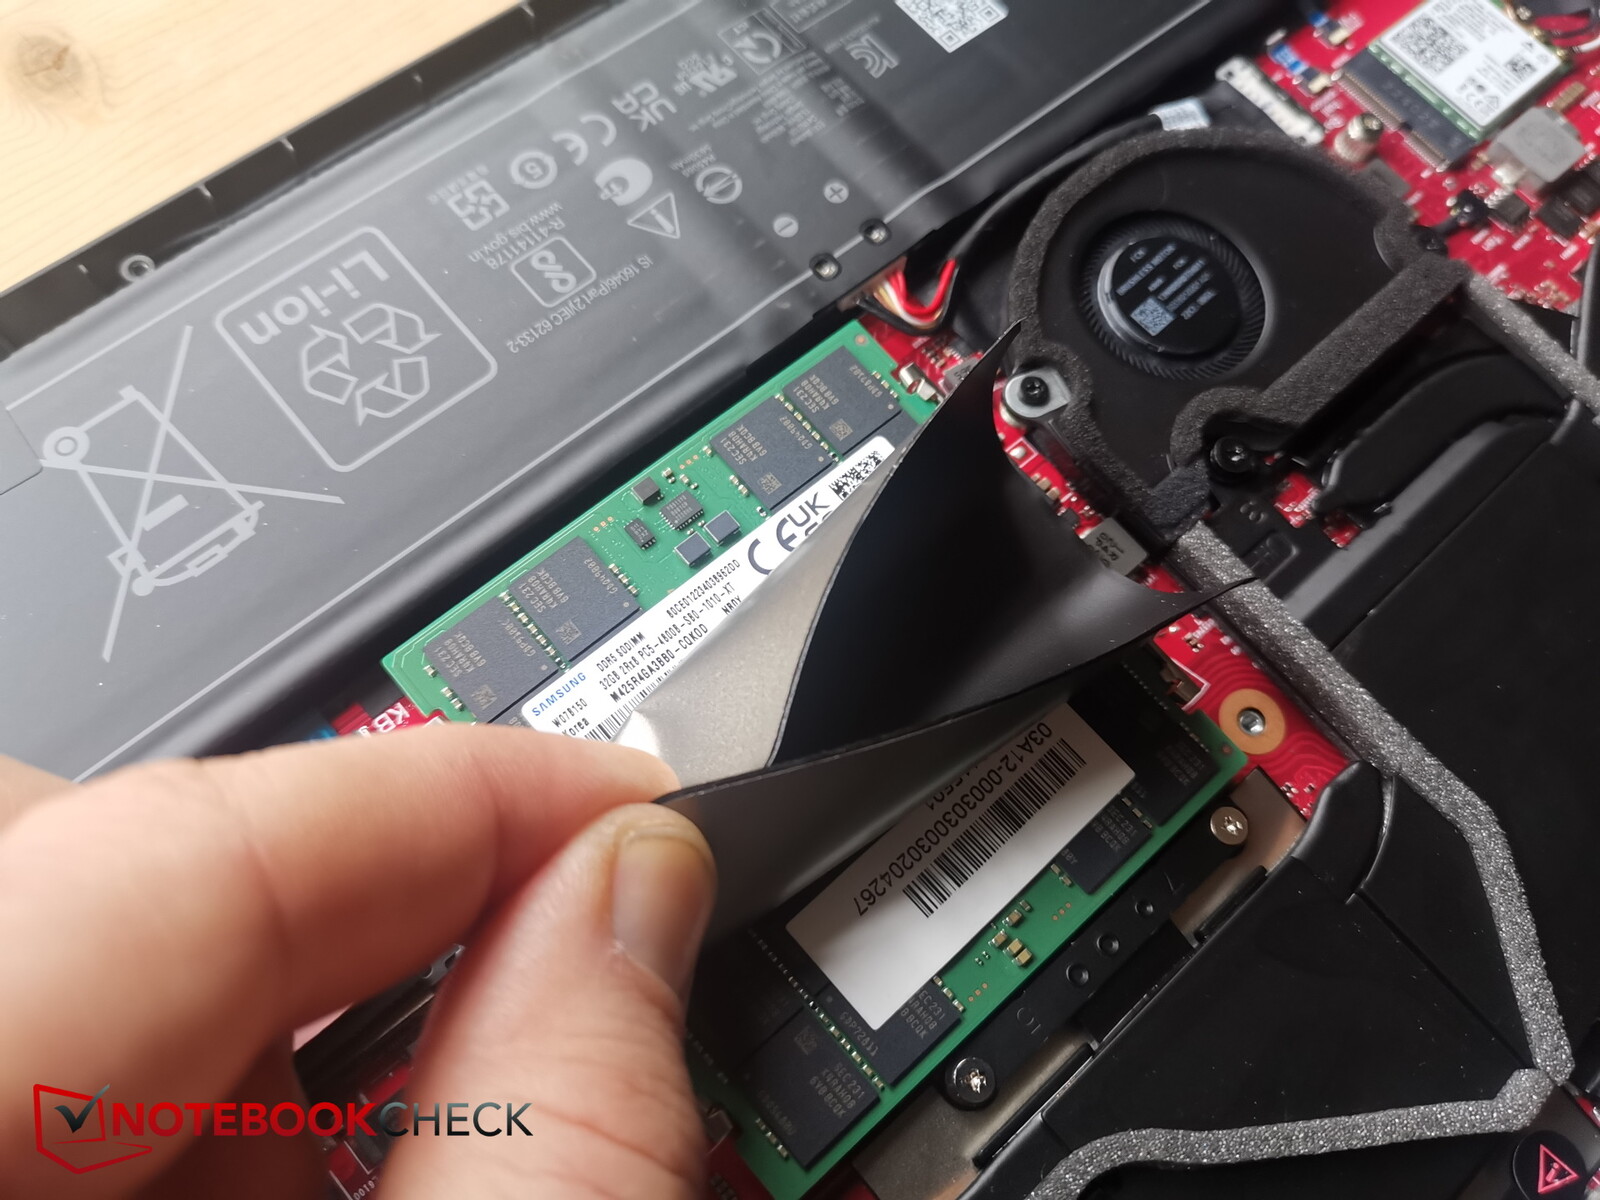
Pamięć masowa
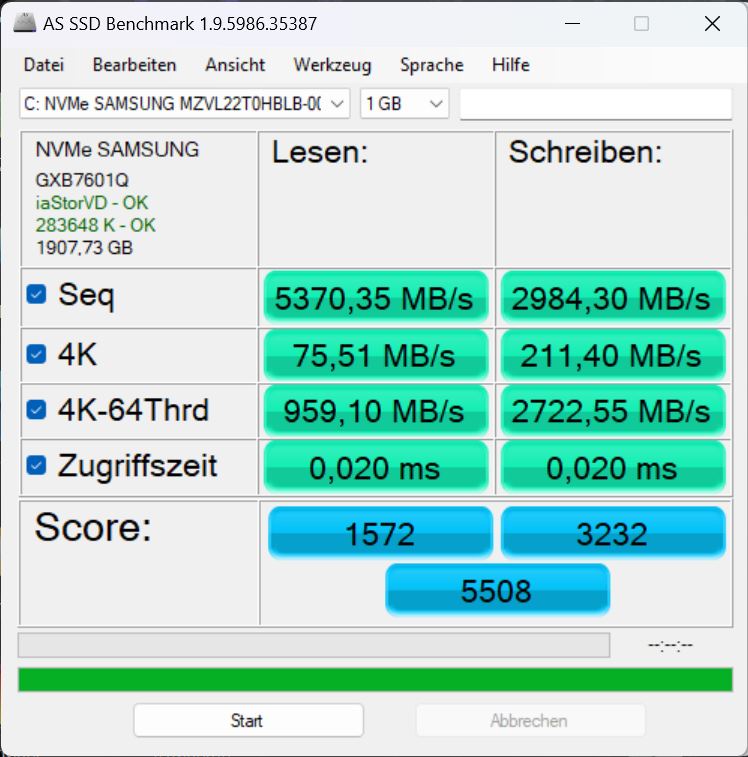
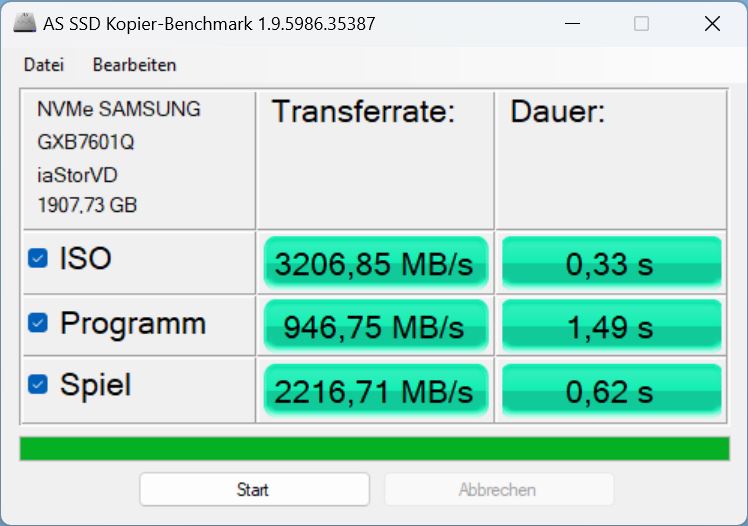
Nasza konfiguracja posiada dysk NVMe SSD Samsung PM9A1 z czterema pasami PCIe 4 i pojemnością 2 TB i siedzi na 11 miejscu w naszym zestawieniu liście najlepszych dysków SSD.
Wydajność dysku SSD M16 jest o około 20 procent niższa od tego, czego można się spodziewać w przypadku tego typu dysku SSD. Jednak w realnym użytkowaniu będzie to w dużej mierze niezauważalne, a po pozytywnej stronie wydajność jest stabilna przez dłuższy czas.


* ... im mniej tym lepiej
Continuous performance Read: DiskSpd Read Loop, Queue Depth 8
Karta graficzna
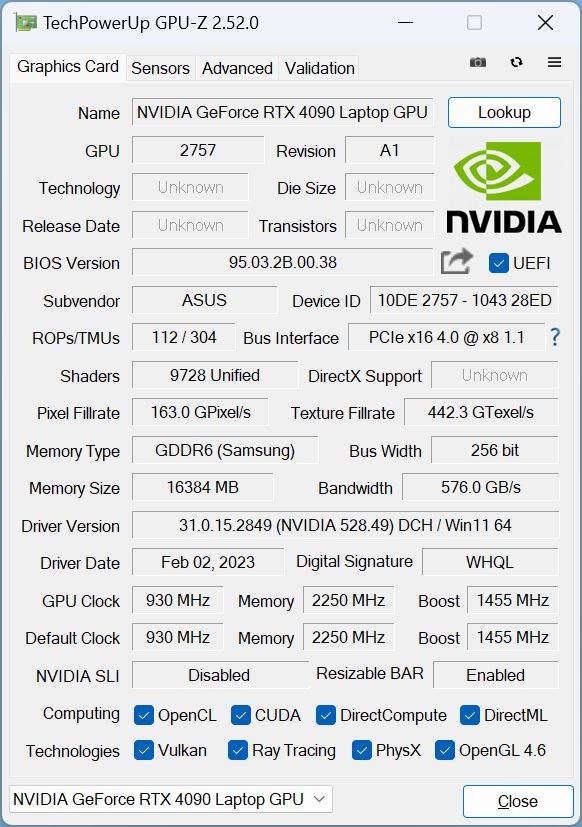
W przypadku nowego M16 masz do wyboru m.in RTX 4070, RTX 4080oraz RTX 4090. W naszej konfiguracji topowy model to najszybsze obecnie dostępne GPU do laptopów, którego pobór mocy waha się od 80 do 150 W plus 15 W dynamic boost. M16 może pobierać maksymalnie 150 W, co obejmuje 25-watowe dynamiczne podbicie.
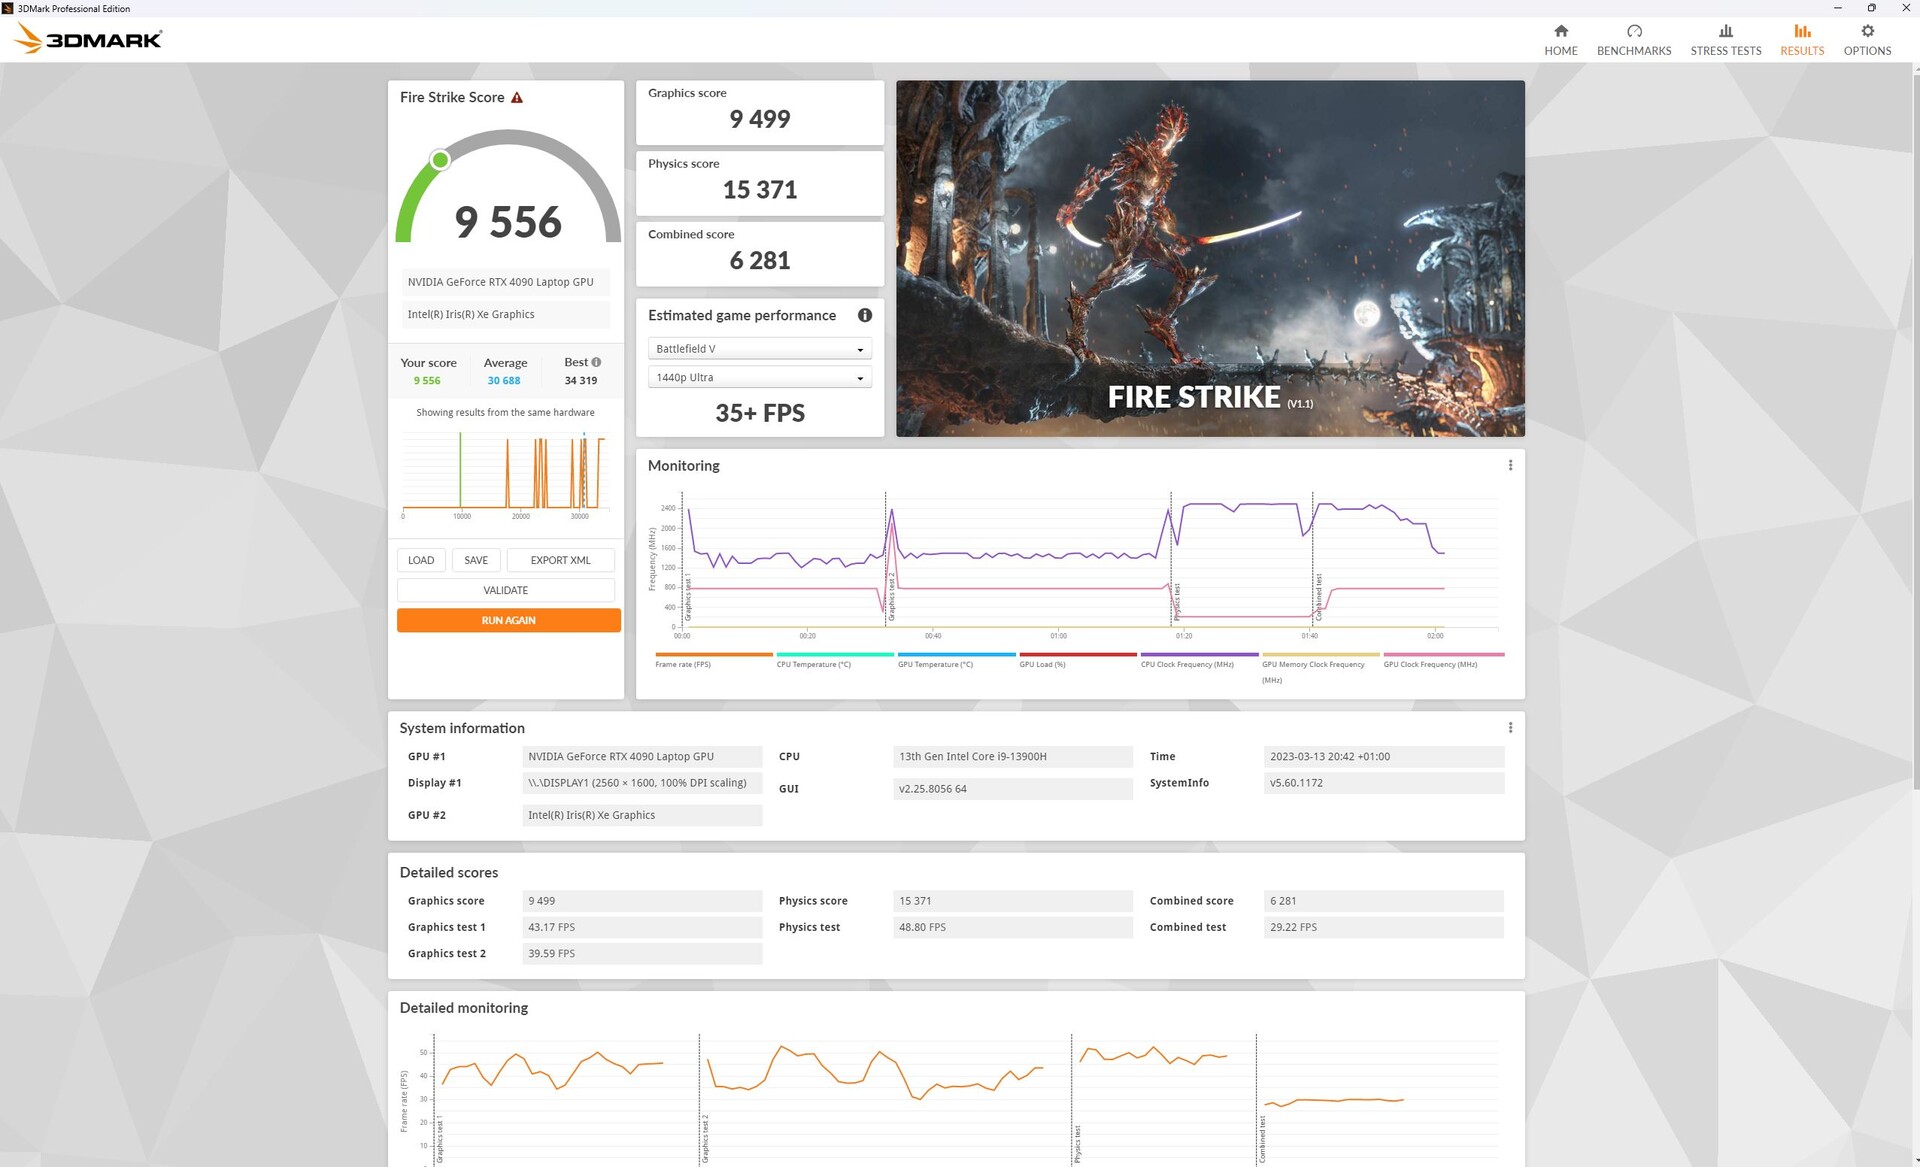
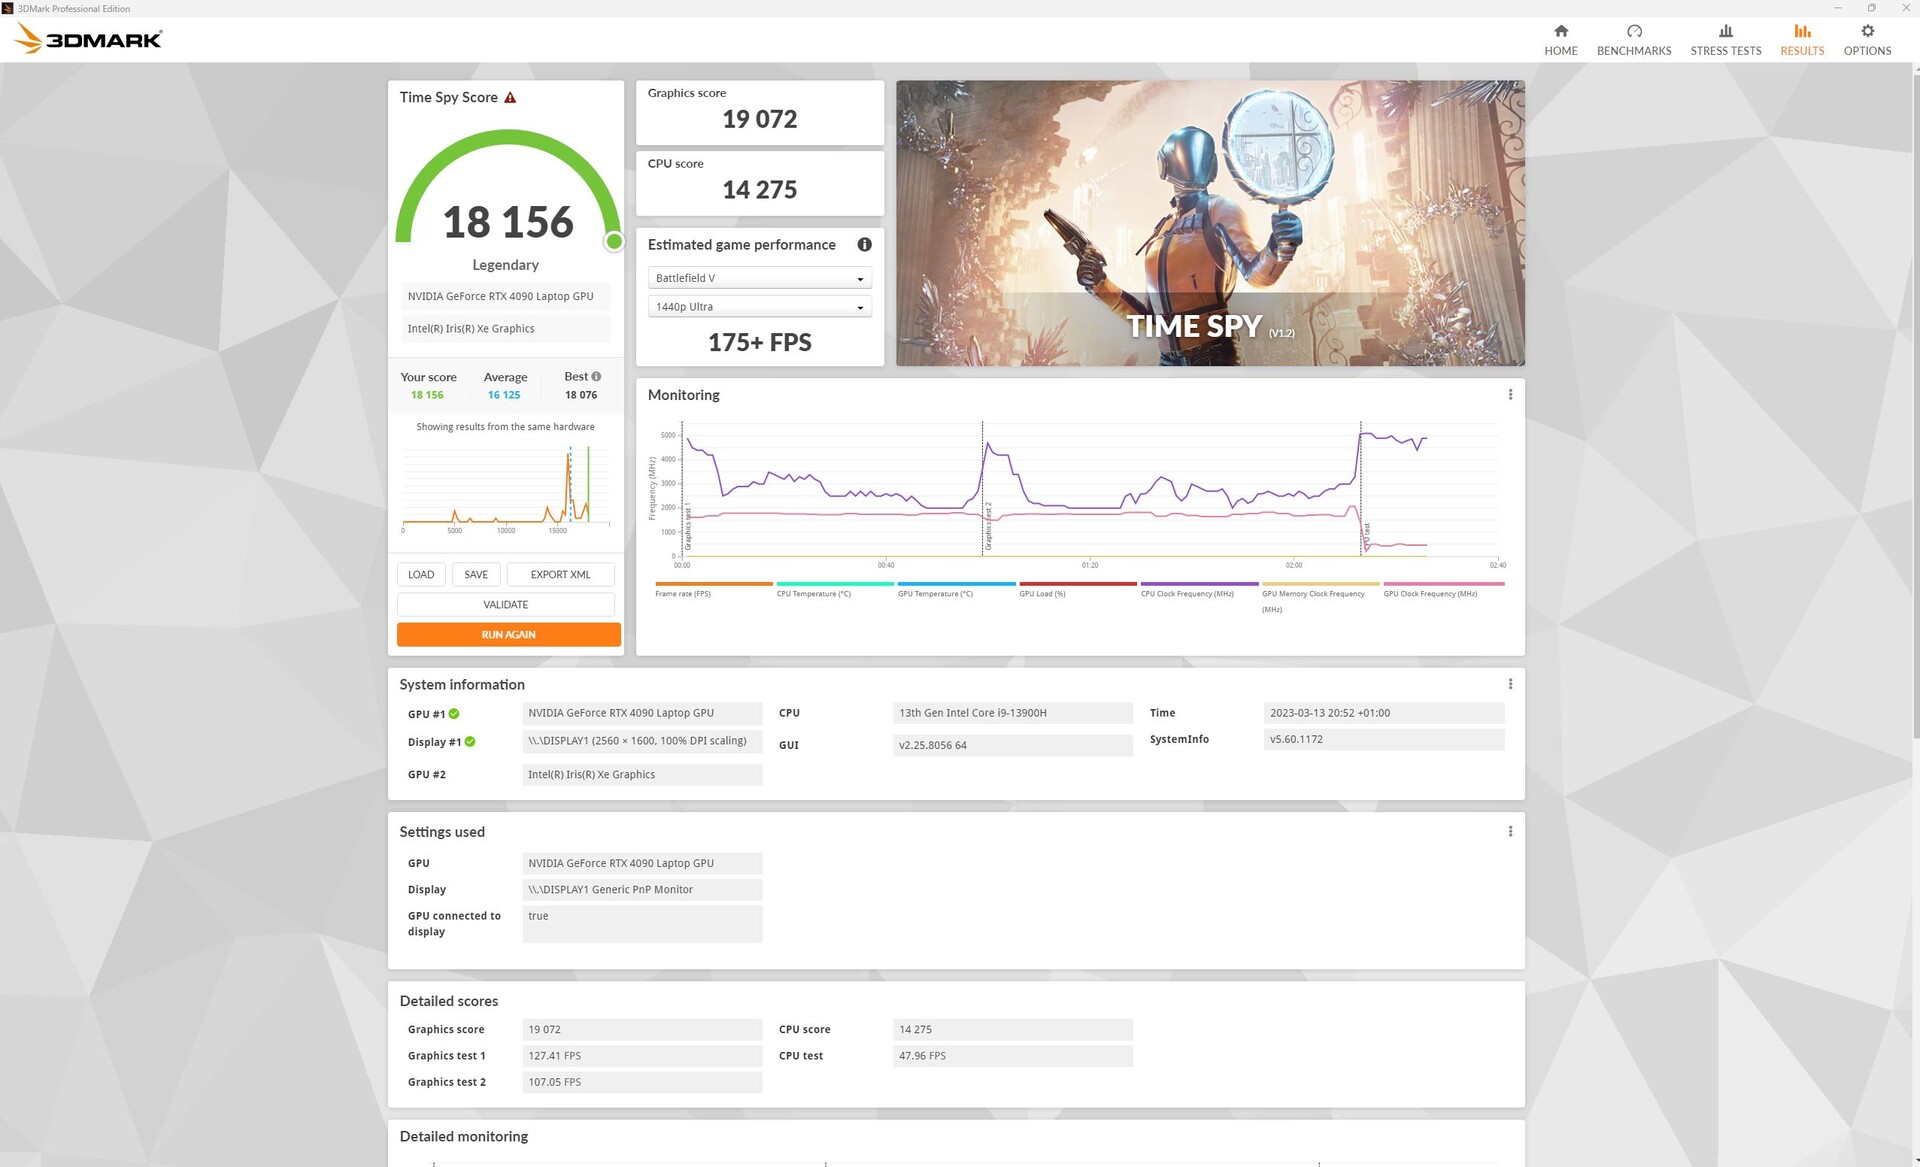
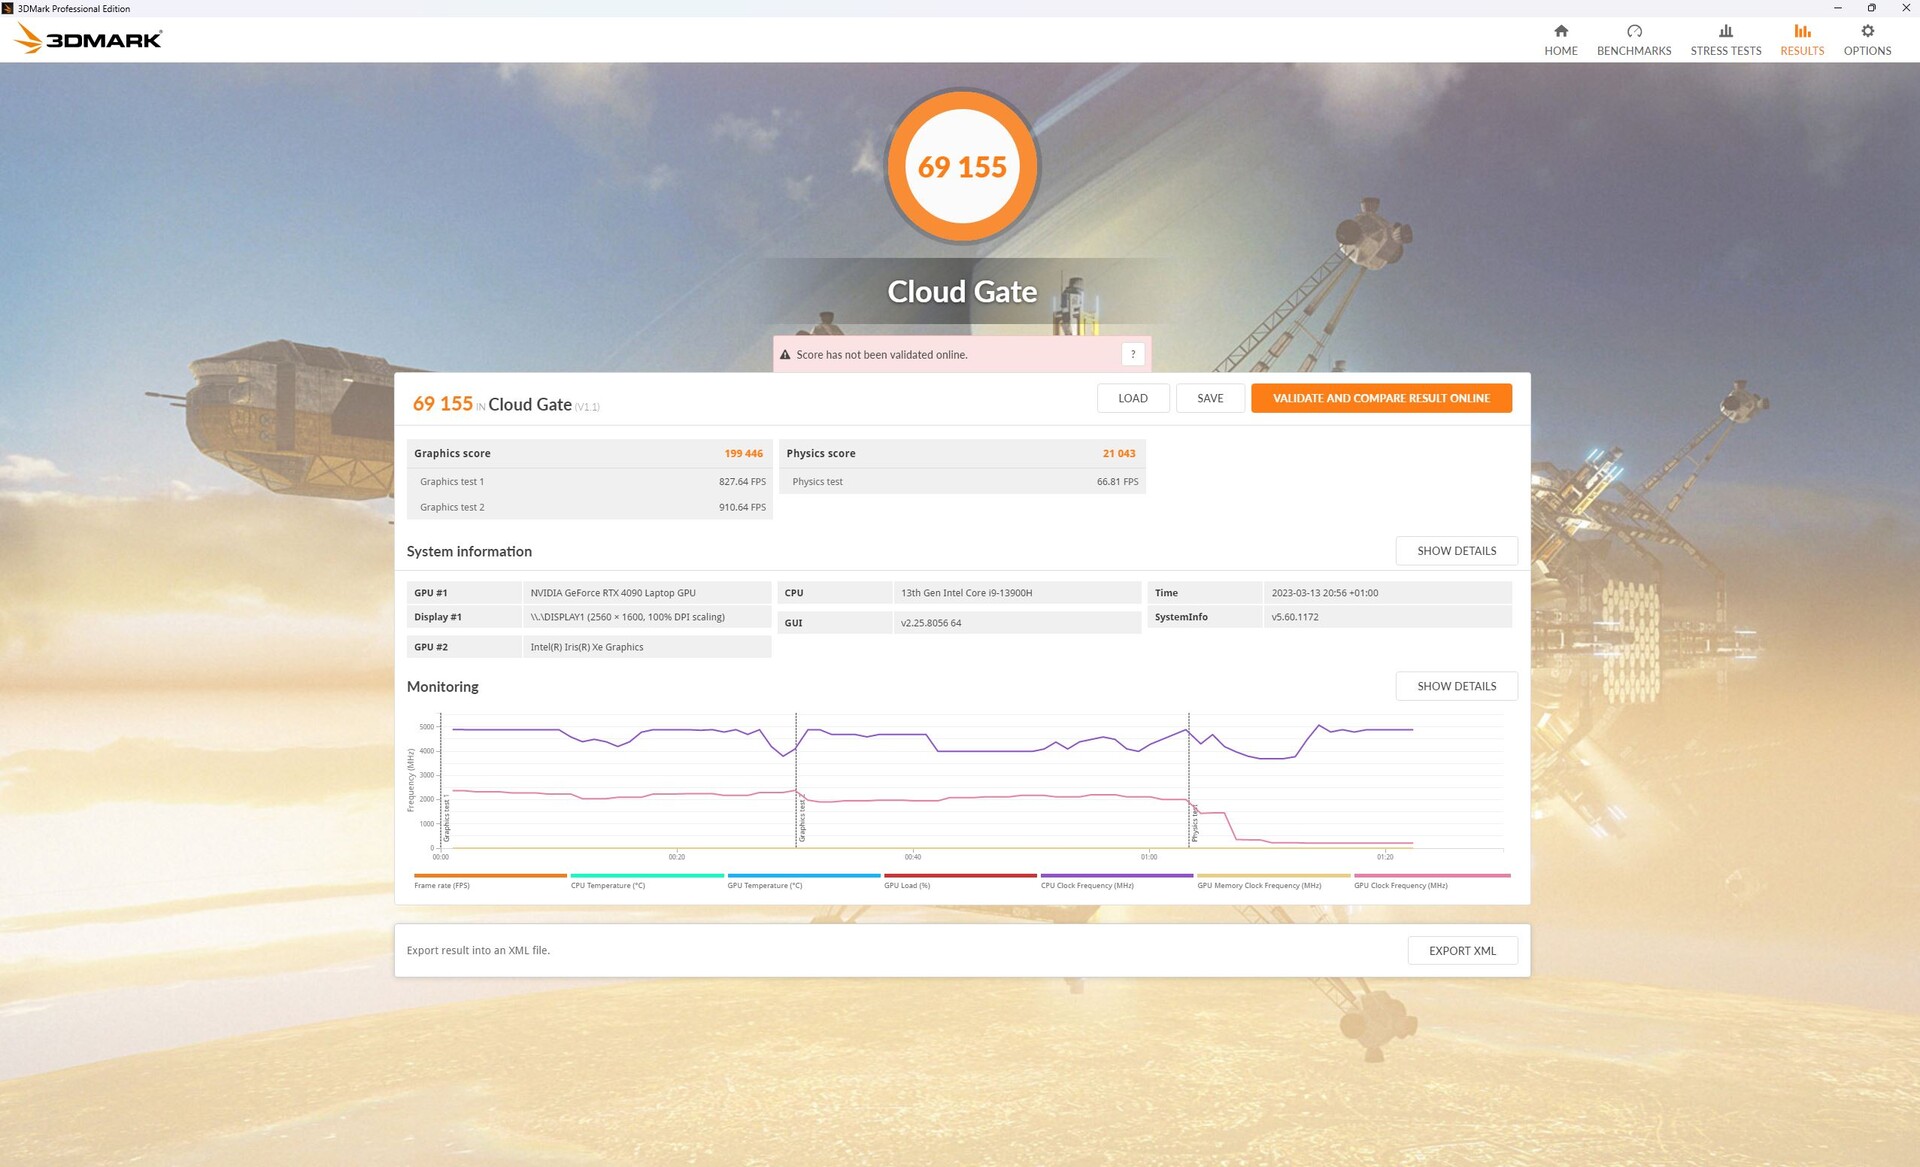
W benchmarkach 3DMark występowały sporadyczne problemy z przełączaniem urządzenia wyświetlającego na dGPU za pośrednictwem Optimusa lub MSHybrid/Standard, co czasami powodowało, że testy były inicjowane przez iGPU. Również w tym obszarze wydaje się, że sterowniki nie są w pełni dojrzałe. W razie wątpliwości należy aktywować dGPU ręcznie (MUX).
Do tej pory testowaliśmy jedynie RTX 4090 sparowany z procesorem HX (patrz konkurencja). Nie jest w pewnym stopniu zaskakujące, że GPU w M16 jest we wszystkich testach wolniejsze o około 10 procent od średniej dla tej karty według naszej (wciąż) ograniczonej bazy danych. Na stronieRazer Blade 16sparowany z marginalnie wolniejszym RTX 4080, pozostaje w tyle o zaledwie 4 procent.
W trybie bateryjnym wydajność 3D gwałtownie spadła, a w Fire Strike z początkowych 44 000 punktów pozostało tylko 9 000, co stanowi spadek o prawie 80 procent!

| 3DMark Performance rating - Percent | |
| Schenker XMG Neo 16 Raptor Lake | |
| Przeciętny NVIDIA GeForce RTX 4090 Laptop GPU | |
| Asus ROG Zephyrus M16 GU604VY-NM042X | |
| Razer Blade 16 Early 2023 | |
| Średnia w klasie Gaming | |
| Lenovo Legion 7 16IAX7-82TD004SGE -1! | |
| Asus ROG Strix Scar 17 SE G733CX-LL014W | |
| MSI Raider GE66 12UHS | |
| Alienware x15 R2 P111F | |
| Acer Predator Triton 500 SE PT516-52s-70KX -1! | |
| Razer Blade 15 RZ09-0421NGG3-R3G1 -1! | |
| Asus ROG Zephyrus M16 GU603Z -1! | |
| 3DMark 11 - 1280x720 Performance GPU | |
| Schenker XMG Neo 16 Raptor Lake | |
| Przeciętny NVIDIA GeForce RTX 4090 Laptop GPU (54073 - 73027, n=42) | |
| Asus ROG Zephyrus M16 GU604VY-NM042X | |
| Razer Blade 16 Early 2023 | |
| Średnia w klasie Gaming (21841 - 80022, n=109, ostatnie 2 lata) | |
| Asus ROG Strix Scar 17 SE G733CX-LL014W | |
| Lenovo Legion 7 16IAX7-82TD004SGE | |
| MSI Raider GE66 12UHS | |
| Alienware x15 R2 P111F | |
| Acer Predator Triton 500 SE PT516-52s-70KX | |
| Asus ROG Zephyrus M16 GU603Z | |
| 3DMark 11 Performance | 41060 pkt. | |
| 3DMark Fire Strike Score | 33550 pkt. | |
| 3DMark Time Spy Score | 15939 pkt. | |
Pomoc | ||
* ... im mniej tym lepiej
Wydajność w grach
Również podczas gry zauważysz, że M16 jestRTX 4090 nie jest sparowany z procesorem HX. Laptopy z procesorem HX iRTX 4080takie jak Blade 16 lubLegion 7są zazwyczaj szybsze, zwłaszcza przy ustawieniu niskich rozdzielczości. Na stronieMSI Titanz RTX 4090 cieszy się największą przewagą wydajności nad M16.
Poza tym, M16 wciąż ma mnóstwo mocy do dyspozycji w 4K, z wystarczającą ilością w zbiorniku dla ray tracingu, zwłaszcza w połączeniu z technologią DLSS 3, AI upscaling. Dodatkowe benchmarki i informacje dotyczące nowych kart RTX 40, w naszym artykule analitycznym.
| The Witcher 3 - 1920x1080 Ultra Graphics & Postprocessing (HBAO+) | |
| MSI Titan GT77 HX 13VI | |
| Asus ROG Zephyrus M16 GU604VY-NM042X | |
| Lenovo Legion Pro 7 16IRX8H | |
| Razer Blade 16 Early 2023 | |
| Średnia w klasie Gaming (95 - 240, n=8, ostatnie 2 lata) | |
| Asus ROG Zephyrus M16 GU603Z | |
| Far Cry 6 | |
| 2560x1440 Ultra Graphics Quality + HD Textures AA:T | |
| MSI Titan GT77 HX 13VI | |
| Schenker XMG Neo 16 Raptor Lake | |
| Przeciętny NVIDIA GeForce RTX 4090 Laptop GPU (85 - 146, n=12) | |
| Razer Blade 16 Early 2023 | |
| Asus ROG Zephyrus M16 GU604VY-NM042X | |
| Średnia w klasie Gaming (74.5 - 116.7, n=2, ostatnie 2 lata) | |
| 1920x1080 Ultra Graphics Quality + HD Textures + DXR AA:T | |
| Razer Blade 16 Early 2023 | |
| MSI Titan GT77 HX 13VI | |
| Schenker XMG Neo 16 Raptor Lake | |
| Średnia w klasie Gaming (n=1ostatnie 2 lata) | |
| Asus ROG Zephyrus M16 GU604VY-NM042X | |
| Przeciętny NVIDIA GeForce RTX 4090 Laptop GPU (81 - 116, n=5) | |
| Tiny Tina's Wonderlands - 2560x1440 Badass Preset (DX12) | |
| Schenker XMG Neo 16 Raptor Lake | |
| MSI Titan GT77 HX 13VI | |
| Przeciętny NVIDIA GeForce RTX 4090 Laptop GPU (103.4 - 137.8, n=14) | |
| Asus ROG Zephyrus M16 GU604VY-NM042X | |
| Średnia w klasie Gaming (58.9 - 111.2, n=3, ostatnie 2 lata) | |
| Spider-Man Miles Morales - 2560x1440 Very High Preset AA:T | |
| Schenker XMG Neo 16 Raptor Lake | |
| MSI Titan GT77 HX 13VI | |
| Przeciętny NVIDIA GeForce RTX 4090 Laptop GPU (93.3 - 119.8, n=7) | |
| Asus ROG Strix Scar 18 2023 G834JY-N6005W | |
| Lenovo Legion Pro 7 16IRX8H | |
| Asus ROG Zephyrus M16 GU604VY-NM042X | |
Po godzinie w naszym teście obciążeniowym Witcher 3 naprawdę widać, że wydajność jest na tym samym poziomie coRTX 4080sparowany z procesorem HX. Niemniej jednak, wydajność jest równie wysoka, co stała.
Nasze dane z dziennika GPU-Z wykonują dobrą robotę, podkreślając różnicę między trybamiTurbo i Performance: Inna jest częstotliwość taktowania (1,9 vs 1,5 GHz), temperatura (70 vs 66 °C), pobór mocy (140 vs 93 waty), a nawet taktowanie pamięci (2 275 vs 2 250 MHz). Liczba klatek na sekundę spadła z około 175 do około 145 kl/s.
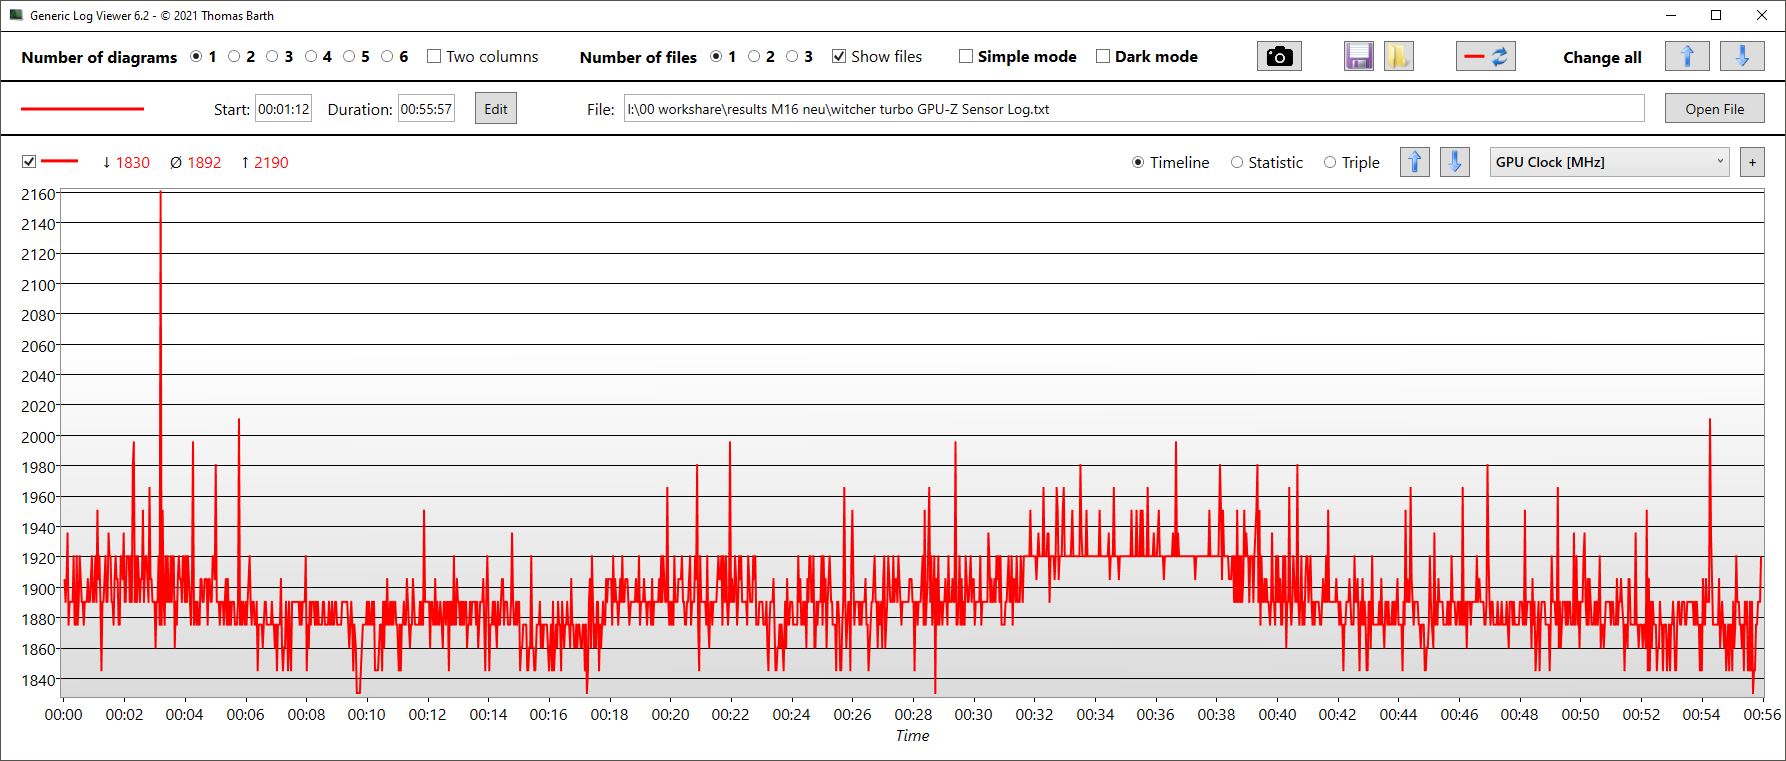
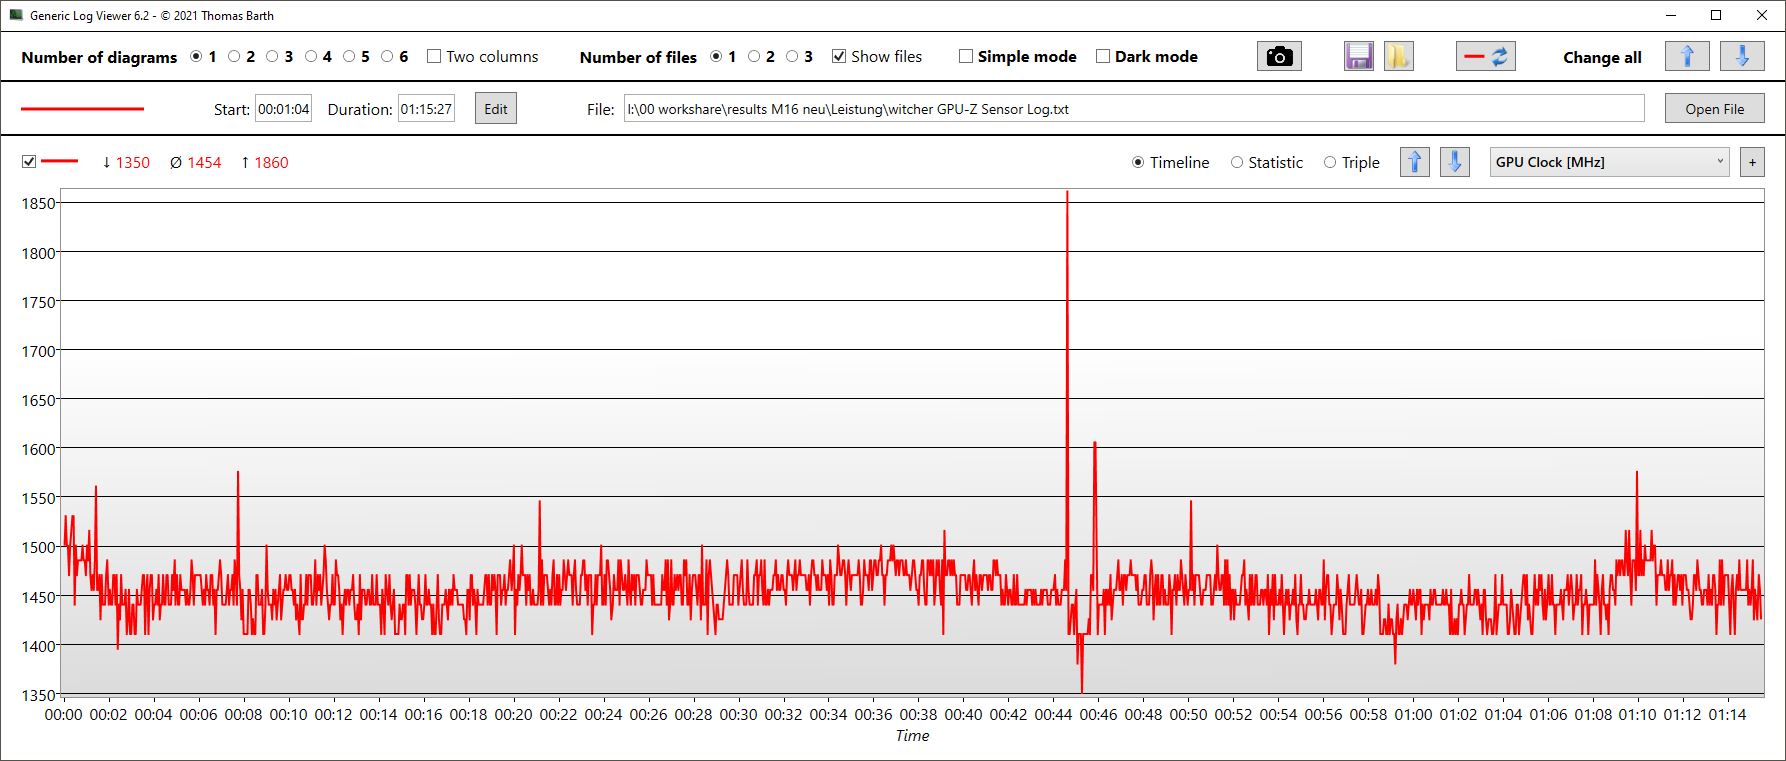
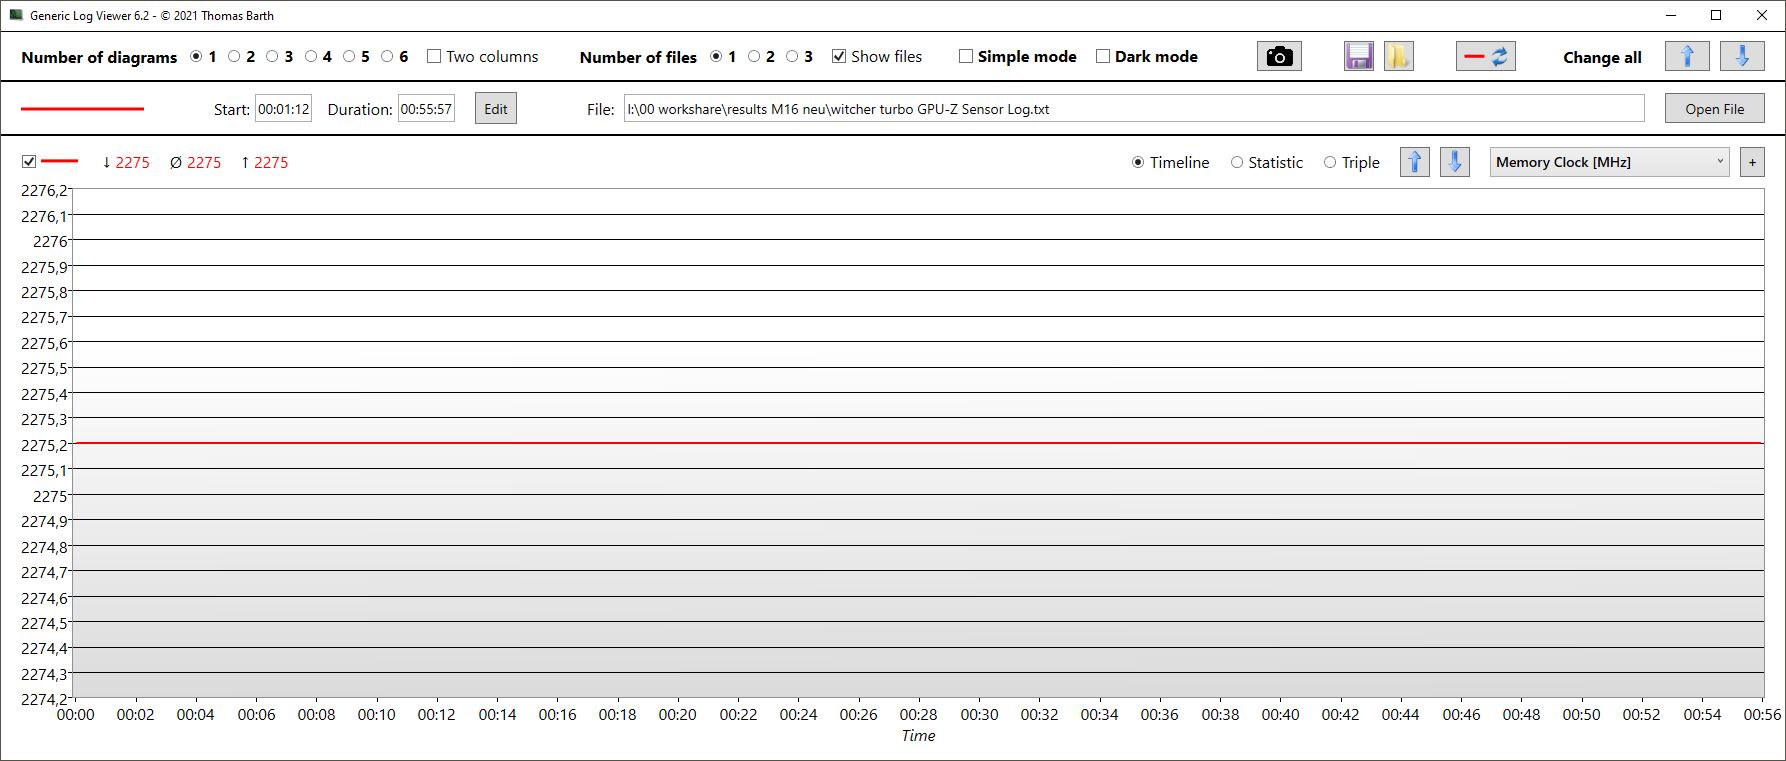
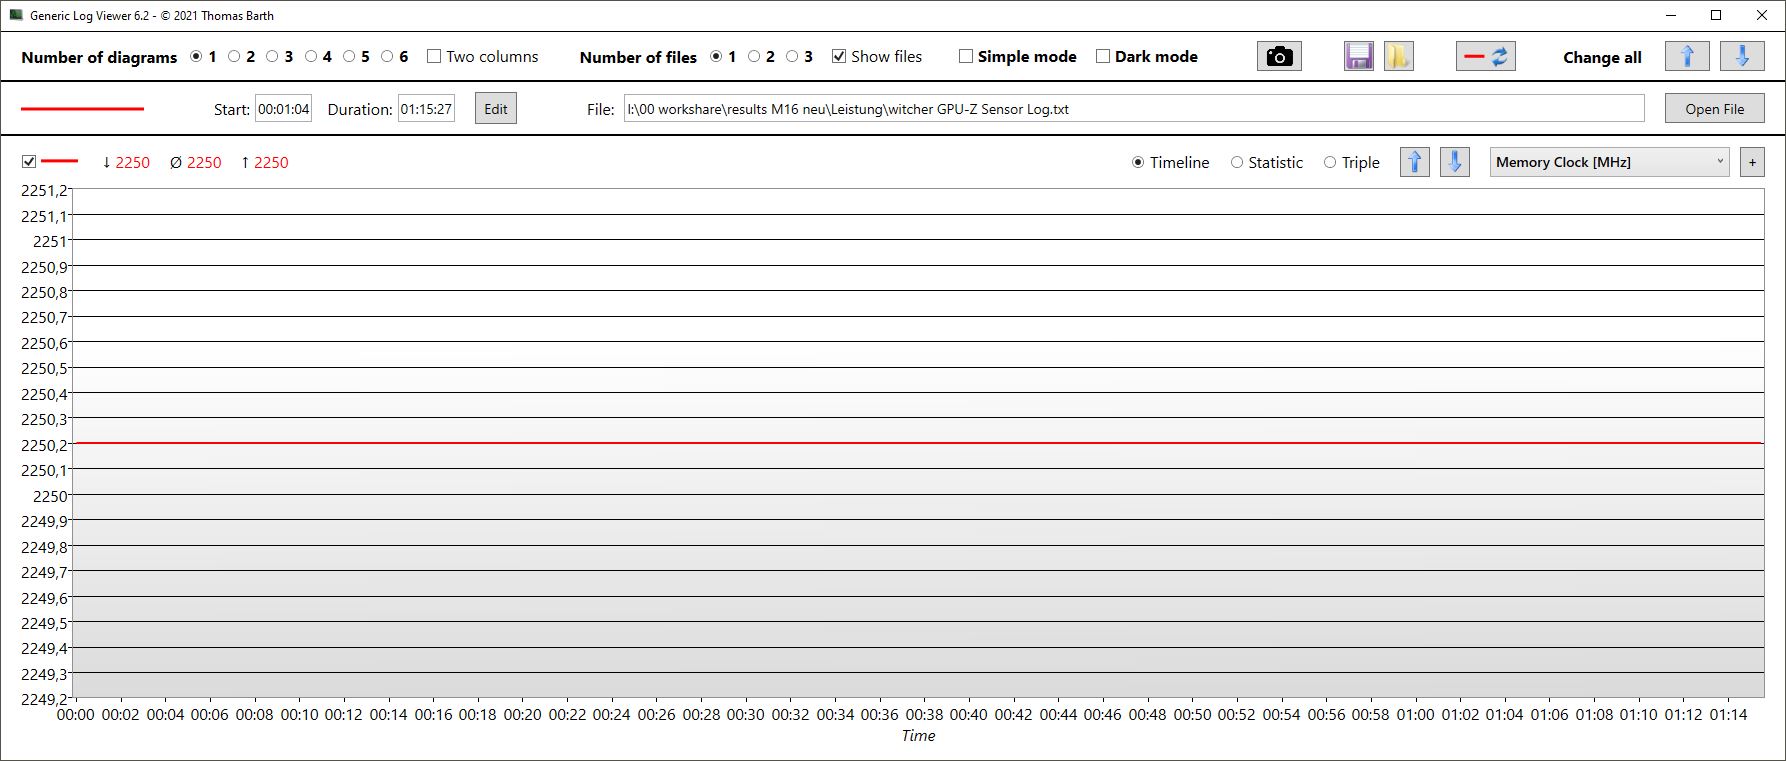
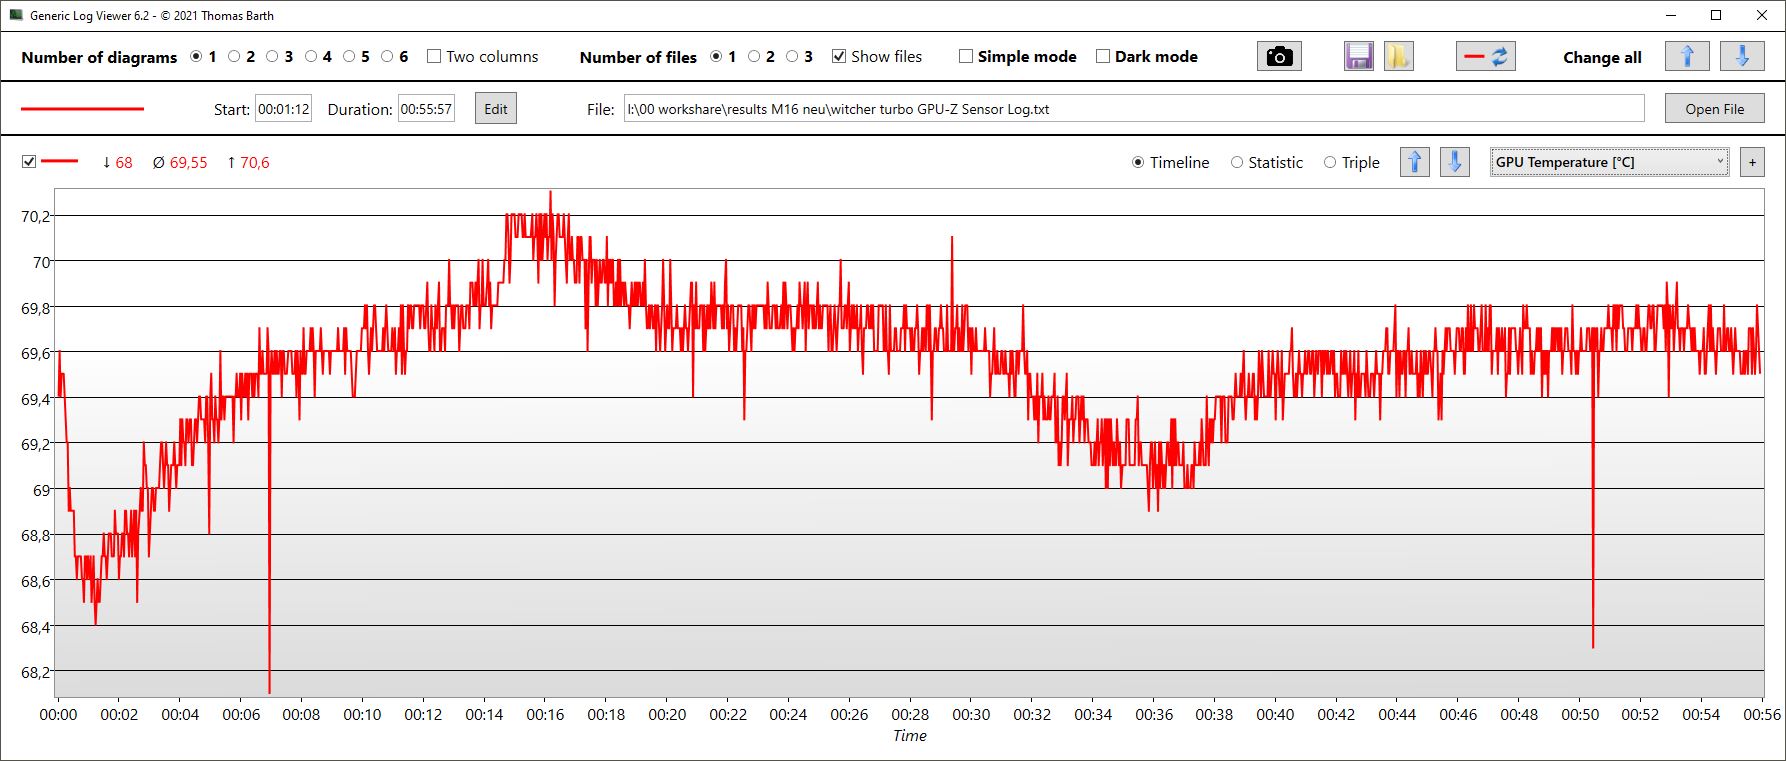
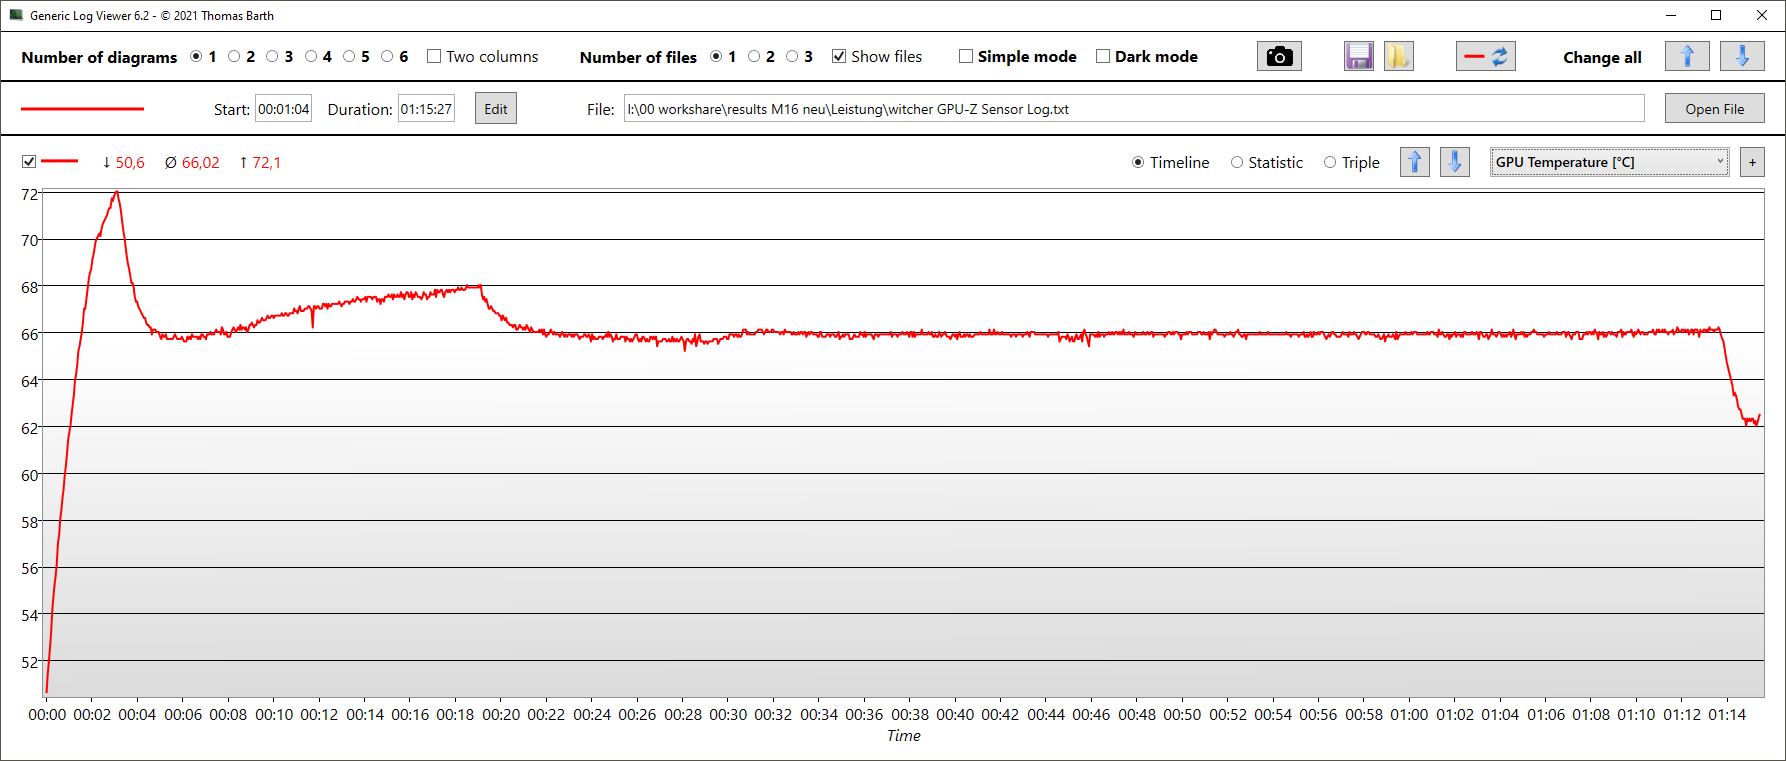
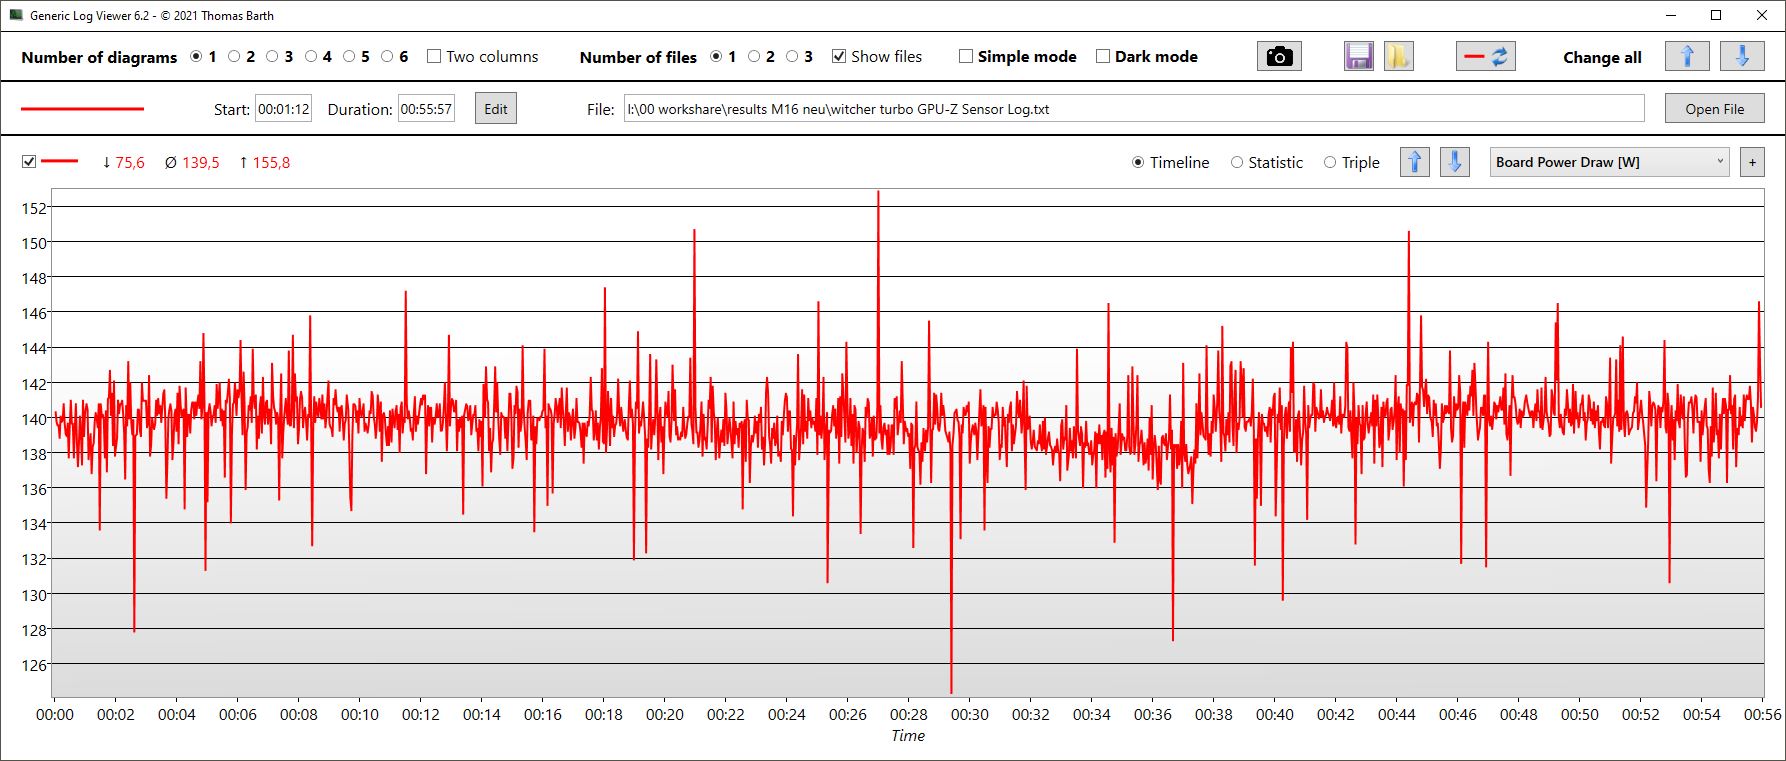
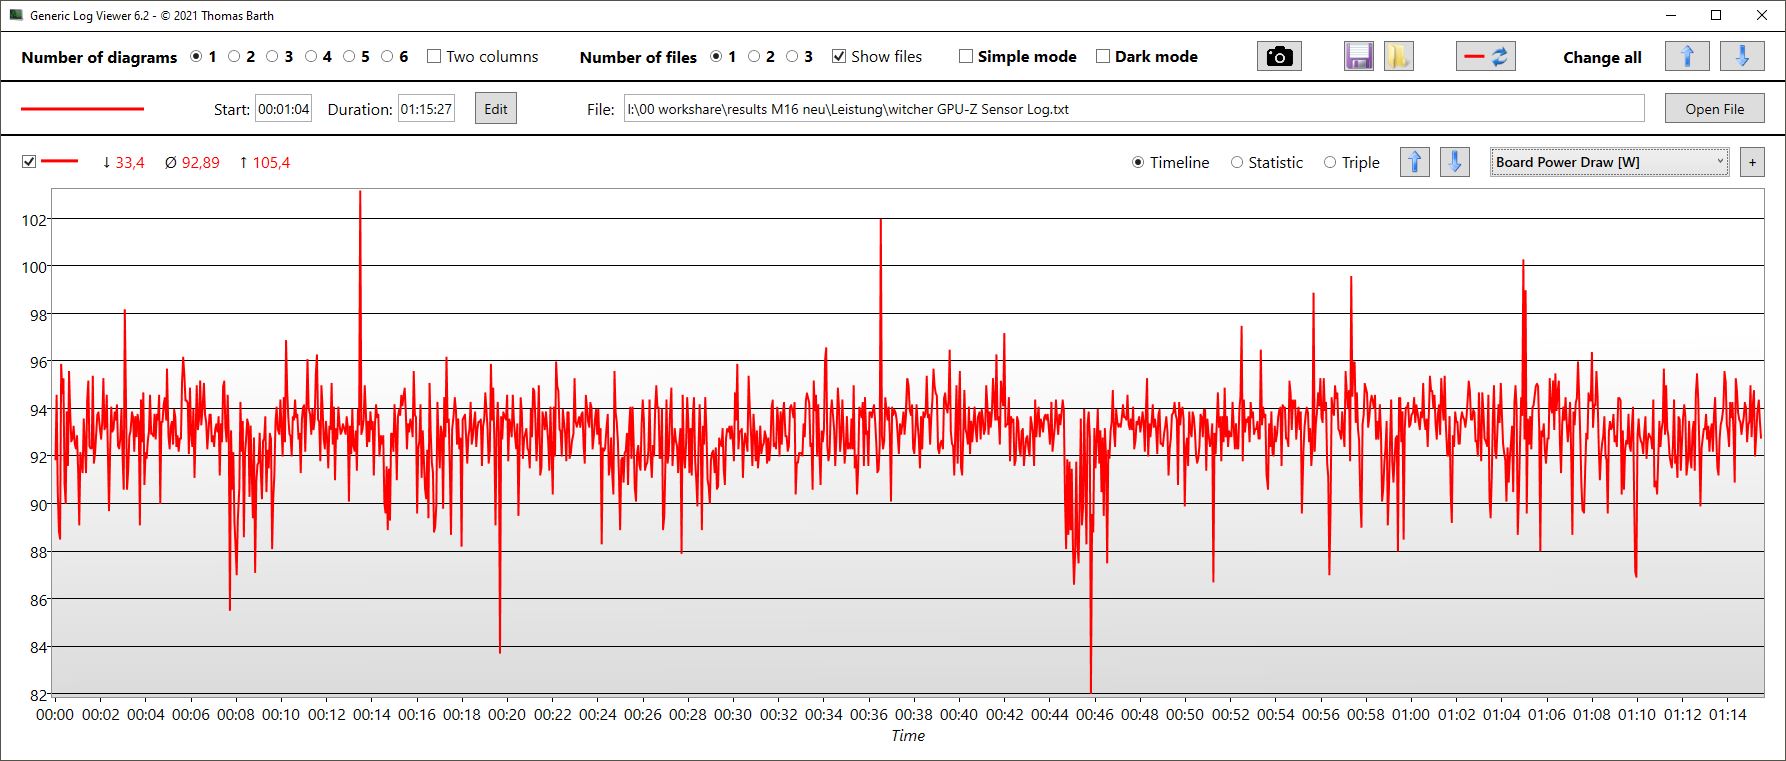
Witcher 3 FPS diagram
| low | med. | high | ultra | QHD | 4K DLSS | 4K | |
|---|---|---|---|---|---|---|---|
| GTA V (2015) | 186 | 183.1 | 179.8 | 127.7 | 123 | ||
| The Witcher 3 (2015) | 444 | 371 | 305 | 178 | |||
| Dota 2 Reborn (2015) | 192.9 | 177.3 | 169.9 | 160.7 | 161.9 | ||
| Final Fantasy XV Benchmark (2018) | 199.1 | 184.5 | 158.6 | 129.5 | |||
| X-Plane 11.11 (2018) | 177.2 | 154.7 | 116.4 | 121.8 | |||
| Far Cry 5 (2018) | 195 | 168 | 156 | 133 | 145 | ||
| Strange Brigade (2018) | 445 | 357 | 343 | 315 | 255 | ||
| Shadow of the Tomb Raider (2018) | 172 | 150 | 90 | ||||
| Watch Dogs Legion (2020) | 102 | 91 | 58 | ||||
| Assassin´s Creed Valhalla (2020) | 126 | 111 | 69 | ||||
| Far Cry 6 (2021) | 111 | 108 | 73 | ||||
| Dying Light 2 (2022) | 145.2 | 103.4 | 53.6 | ||||
| Cyberpunk 2077 1.6 (2022) | 104.49 | 75.69 | 41.9 | ||||
| Tiny Tina's Wonderlands (2022) | 144.06 | 109.64 | 62.33 | ||||
| A Plague Tale Requiem (2022) | 59.4 | ||||||
| Call of Duty Modern Warfare 2 2022 (2022) | 148 | 111 | 98 | 69 | |||
| Spider-Man Miles Morales (2022) | 98.1 | 93.3 | 65.7 | ||||
| The Callisto Protocol (2022) | 113.23 | 90.48 | 53.5 |
Emisja - Nie ma wątpliwości, turbiny są głośne
Emisja hałasu
W trybie cichym wentylatory są przeważnie nieaktywne w czasie bezczynności i pozostają takie również przy lekkich obciążeniach, takich jak pisanie czy przeglądanie internetu. Nawet w trybiePerformance, który zdaniem producenta jest zbliżony do trybu zrównoważonego, wentylatory często pracują, w stanie bezczynności.
Do naszych benchmarków używamy trybu Turbo. Wentylatory są znośne tylko w bezczynności, nigdy nie są ciche i ryczą do maksimum dopiero przy dużym obciążeniu. Wówczas utrzymują się na stałym poziomie 57 dB, co czyni go jednym z najgłośniejszych laptopów w swojej klasie. Tylko MSI Titan GT77 jest głośniejszy pod maksymalnym obciążeniem, ale jest minimalnie cichszy podczas grania. Warto zaznaczyć, że wiele laptopów posiada tryb turbo, w którym wentylatory pracują na maksimum w bezczynności, dlatego często powstrzymujemy się od tego trybu testowego. Tryb turbo w M16 jest nieco inny, ale w grach słuchawki są nadal koniecznością.
W trybie wydajności poziom hałasu jest znośny i porównywalny z konkurencją. W Witcher 3, zmierzyliśmy tylko 49 dB zamiast 57. W zamian za to wydajność w grach spadła o około 15 do 18 procent.
Hałas
| luz |
| 24 / 29.96 / 34.27 dB |
| obciążenie |
| 35.89 / 57.54 dB |
 | ||
30 dB cichy 40 dB(A) słyszalny 50 dB(A) irytujący |
||
min: | ||
| Asus ROG Zephyrus M16 GU604VY-NM042X GeForce RTX 4090 Laptop GPU, i9-13900H, Samsung PM9A1 MZVL22T0HBLB | Asus ROG Zephyrus M16 GU603Z GeForce RTX 3070 Ti Laptop GPU, i9-12900H, Micron 3400 1TB MTFDKBA1T0TFH | Asus ROG Strix Scar 18 2023 G834JY-N6005W GeForce RTX 4090 Laptop GPU, i9-13980HX, 2x Samsung PM9A1 MZVL21T0HCLR (RAID 0) | MSI Titan GT77 HX 13VI GeForce RTX 4090 Laptop GPU, i9-13950HX, Samsung PM9A1 MZVL22T0HBLB | Lenovo Legion Pro 7 16IRX8H GeForce RTX 4080 Laptop GPU, i9-13900HX, Samsung PM9A1 MZVL21T0HCLR | Razer Blade 16 Early 2023 GeForce RTX 4080 Laptop GPU, i9-13950HX, SSSTC CA6-8D1024 | |
|---|---|---|---|---|---|---|
| Noise | -2% | -0% | -7% | -3% | 11% | |
| wyłączone / środowisko * (dB) | 24 | 23 4% | 23.9 -0% | 24.6 -3% | 24 -0% | 23 4% |
| Idle Minimum * (dB) | 24 | 23 4% | 23.9 -0% | 29.2 -22% | 26 -8% | 23 4% |
| Idle Average * (dB) | 29.96 | 24 20% | 32.6 -9% | 29.2 3% | 28 7% | 23 23% |
| Idle Maximum * (dB) | 34.27 | 47 -37% | 32.6 5% | 29.2 15% | 34 1% | 23.6 31% |
| Load Average * (dB) | 35.89 | 47.91 -33% | 35.9 -0% | 50.7 -41% | 47 -31% | 39 -9% |
| Witcher 3 ultra * (dB) | 57.5 | 48.91 15% | 53.3 7% | 55 4% | 51.6 10% | |
| Load Maximum * (dB) | 57.54 | 50.25 13% | 55.8 3% | 61 -6% | 56 3% | 51.3 11% |
* ... im mniej tym lepiej
Temperatura
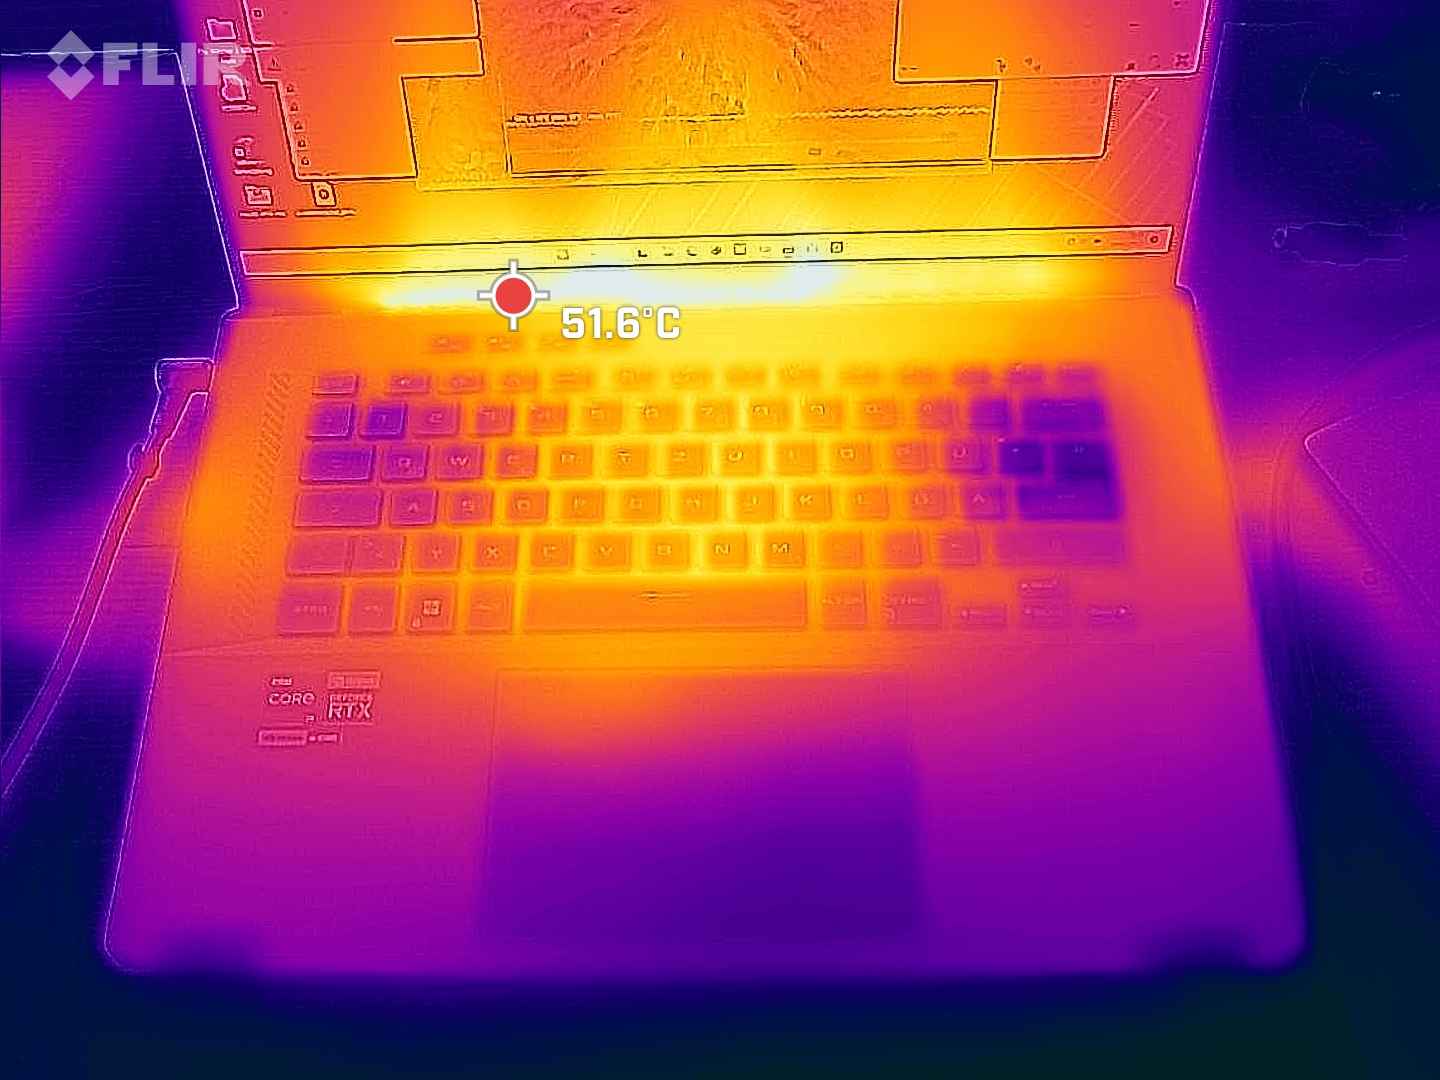
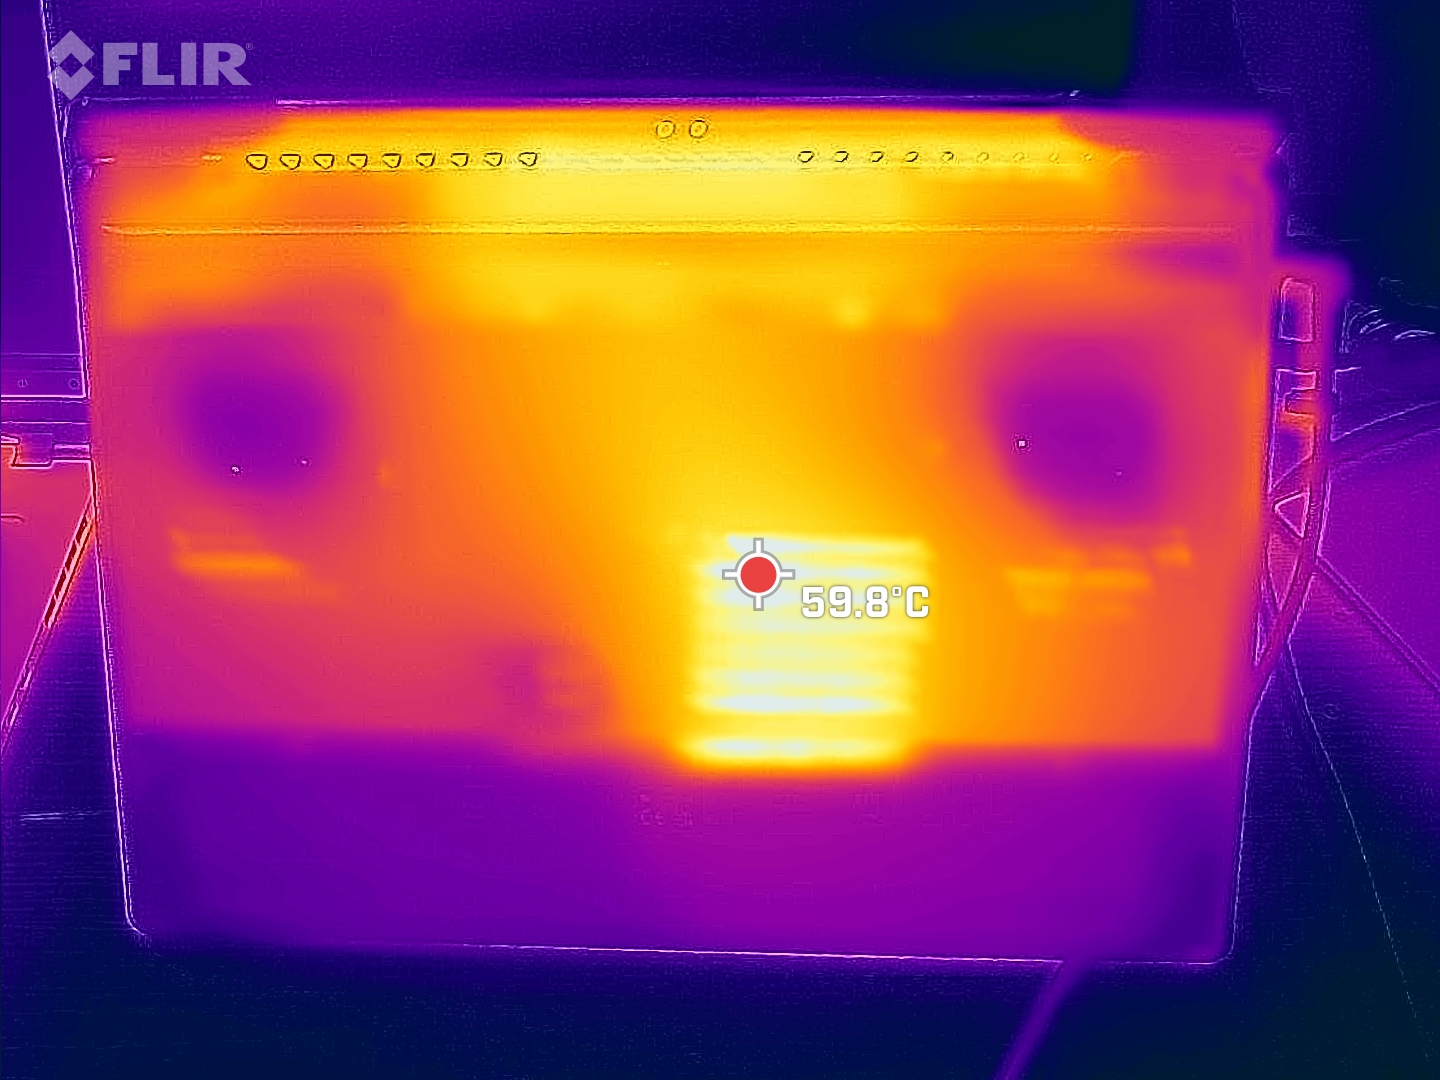
M16 robi się trochę ciepły, szczególnie na spodzie urządzenia. Zmierzone punkty gorąca miały niewiele ponad 60°C w maksymalnym obciążeniu i można je znaleźć na środku i z tyłu. Podczas grania same punkty gorące osiągały temperatury tylko około 50 °C.
Podpórka pod dłonie pozostała natomiast w większości chłodna, co dotyczy także częściowo klawiszy WASD.
(-) Maksymalna temperatura w górnej części wynosi 50 °C / 122 F, w porównaniu do średniej 40.4 °C / 105 F , począwszy od 21.2 do 68.8 °C dla klasy Gaming.
(-) Dno nagrzewa się maksymalnie do 58 °C / 136 F, w porównaniu do średniej 43.2 °C / 110 F
(+) W stanie bezczynności średnia temperatura górnej części wynosi 24 °C / 75 F, w porównaniu ze średnią temperaturą urządzenia wynoszącą 33.9 °C / ### class_avg_f### F.
(-) Podczas gry w Wiedźmina 3 średnia temperatura górnej części wynosi 38.1 °C / 101 F, w porównaniu do średniej temperatury urządzenia wynoszącej 33.9 °C / ## #class_avg_f### F.
(±) Podpórki pod nadgarstki i touchpad mogą się bardzo nagrzać w dotyku, maksymalnie do 37 °C / 98.6 F.
(-) Średnia temperatura obszaru podparcia dłoni w podobnych urządzeniach wynosiła 28.8 °C / 83.8 F (-8.2 °C / -14.8 F).
| Asus ROG Zephyrus M16 GU604VY-NM042X Intel Core i9-13900H, NVIDIA GeForce RTX 4090 Laptop GPU | Asus ROG Zephyrus M16 GU603Z Intel Core i9-12900H, NVIDIA GeForce RTX 3070 Ti Laptop GPU | Asus ROG Strix Scar 18 2023 G834JY-N6005W Intel Core i9-13980HX, NVIDIA GeForce RTX 4090 Laptop GPU | MSI Titan GT77 HX 13VI Intel Core i9-13950HX, NVIDIA GeForce RTX 4090 Laptop GPU | Lenovo Legion Pro 7 16IRX8H Intel Core i9-13900HX, NVIDIA GeForce RTX 4080 Laptop GPU | Razer Blade 16 Early 2023 Intel Core i9-13950HX, NVIDIA GeForce RTX 4080 Laptop GPU | |
|---|---|---|---|---|---|---|
| Heat | -6% | -3% | 10% | -13% | 5% | |
| Maximum Upper Side * (°C) | 50 | 52 -4% | 54 -8% | 40.6 19% | 48 4% | 40 20% |
| Maximum Bottom * (°C) | 58 | 51 12% | 46 21% | 41.1 29% | 49 16% | 37.6 35% |
| Idle Upper Side * (°C) | 26 | 29 -12% | 30 -15% | 26.2 -1% | 40 -54% | 32.4 -25% |
| Idle Bottom * (°C) | 28 | 33 -18% | 31 -11% | 30.3 -8% | 33 -18% | 31.4 -12% |
* ... im mniej tym lepiej
Test na stres
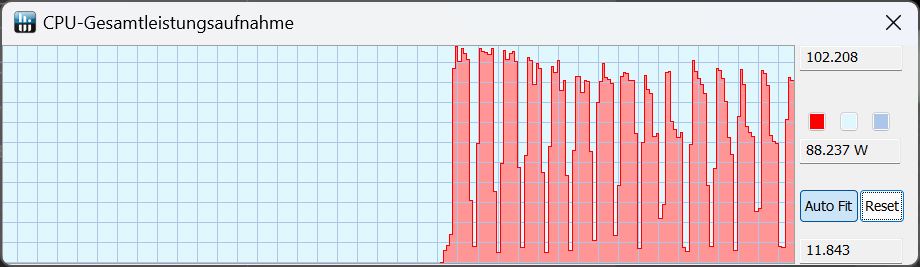
W teście obciążeniowym taktowanie CPU wahało się między 2,2 a 4 GHz, przy czym przez dłuższy czas taktowanie oscylowało wokół górnej granicy. Równolegle do tego zmienia się pobór mocy procesora, który średnio wynosi 77 W. Może on jednak wzrosnąć do 120 W i ponownie spaść. Może jednak wzrosnąć do 120 watów i spaść do 40 watów. W zależności od pozostałych wartości temperatury wahają się w podobny sposób, przy czym procesor rozgrzewa się do 98°C, a jego średnia wartość wynosi 88°C.
W trybiePerformance różnica w stosunku do CPU nie jest właściwie tak duża i temperatury, pobór mocy i taktowanie zegara nie różnią się szczególnie od siebie, ale nadal wahają się w dużym tempie.
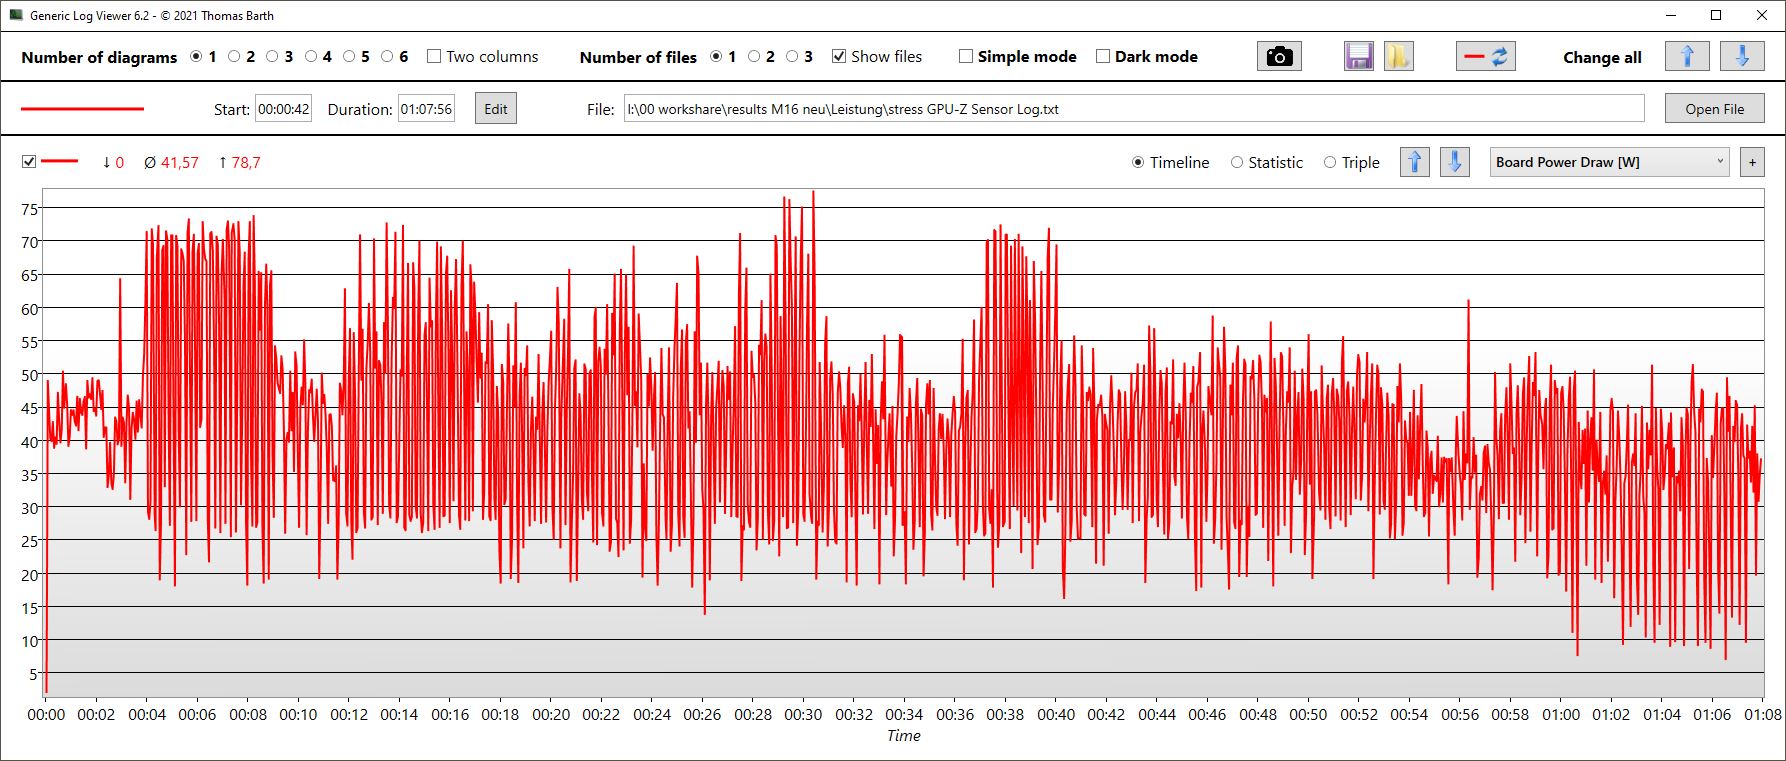
Wartości GPU (nawet taktowanie pamięci) wahają się bardzo mocno. Częstotliwość taktowania rdzenia siedzi średnio w okolicach 1,3 GHz, pobór mocy wynosi średnio 58 W, a temperatury oscylują wokół 64°C.
W trybiePerformance wartości te są tylko minimalnie niższe. Prędkość zegara spada o około 200 MHz, temperatura jest podobnie wysoka, a pobór mocy wynosi około 42 W.
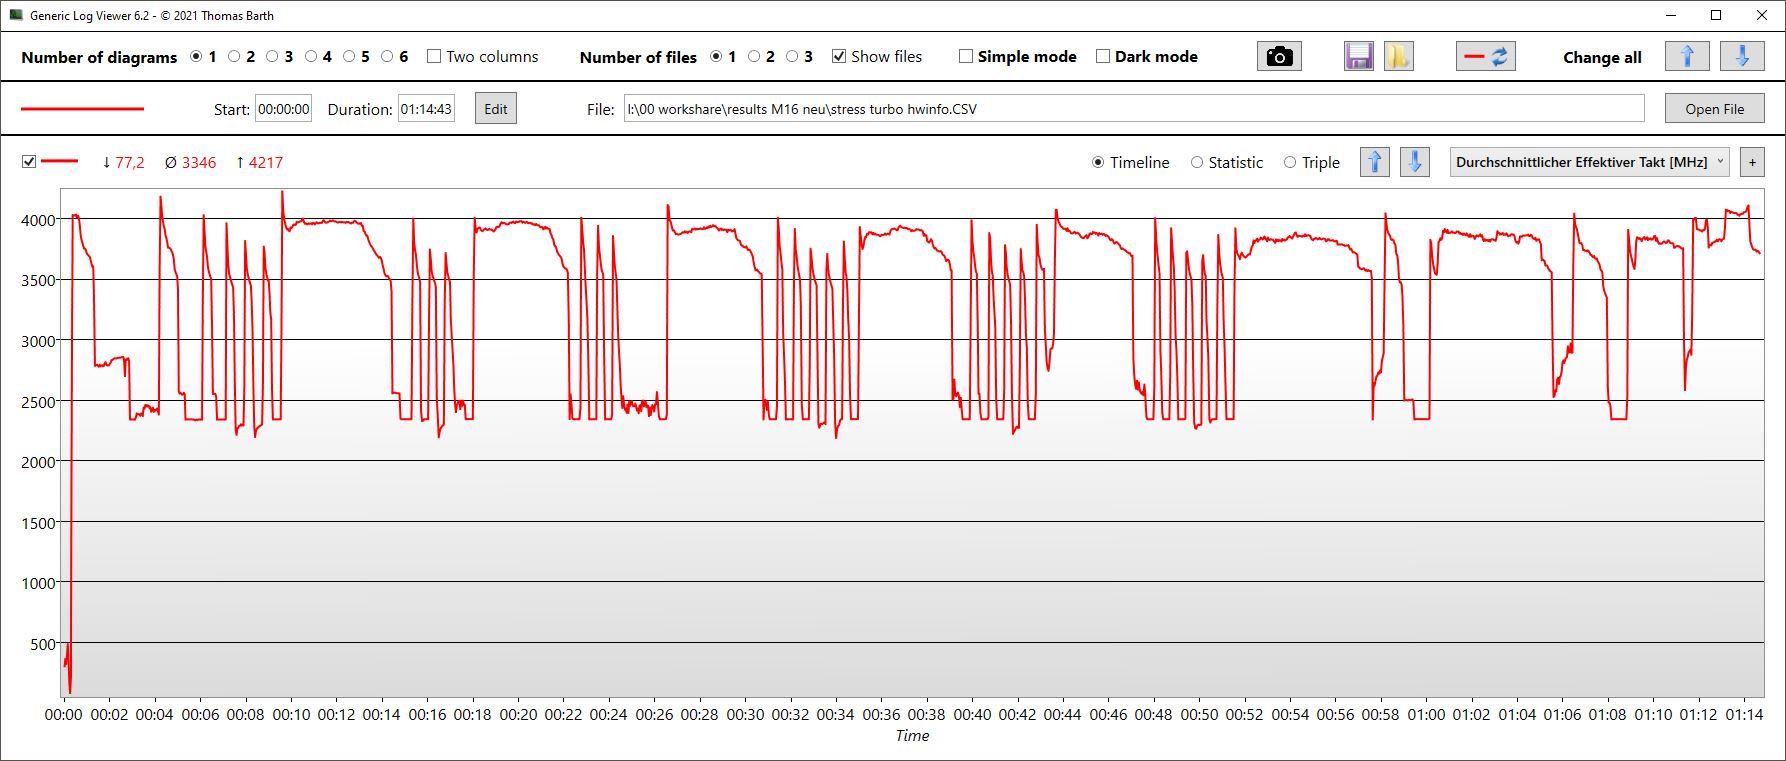
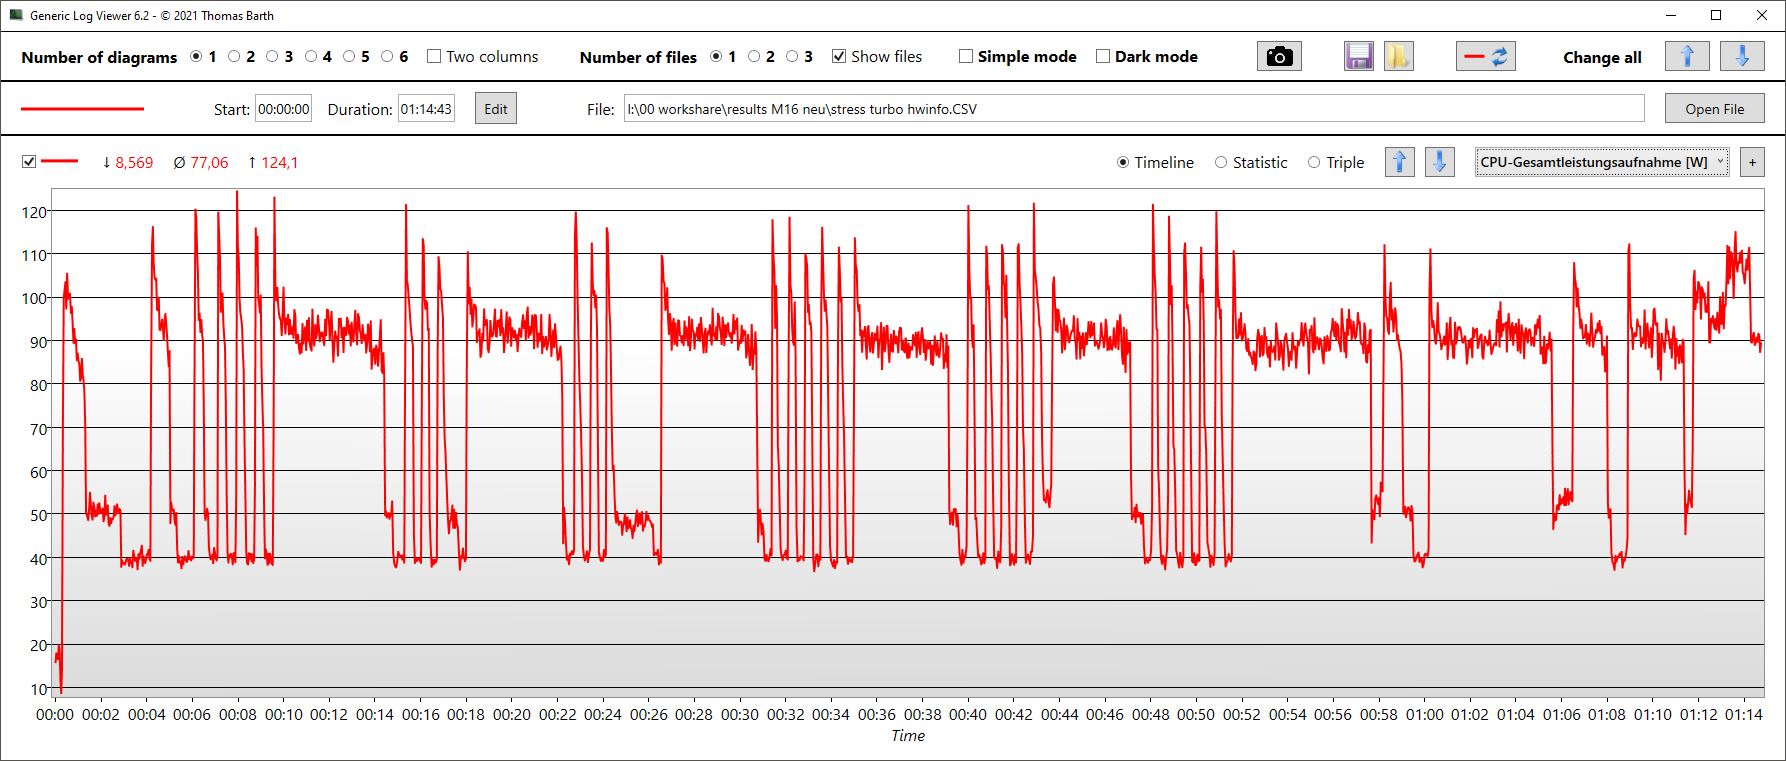
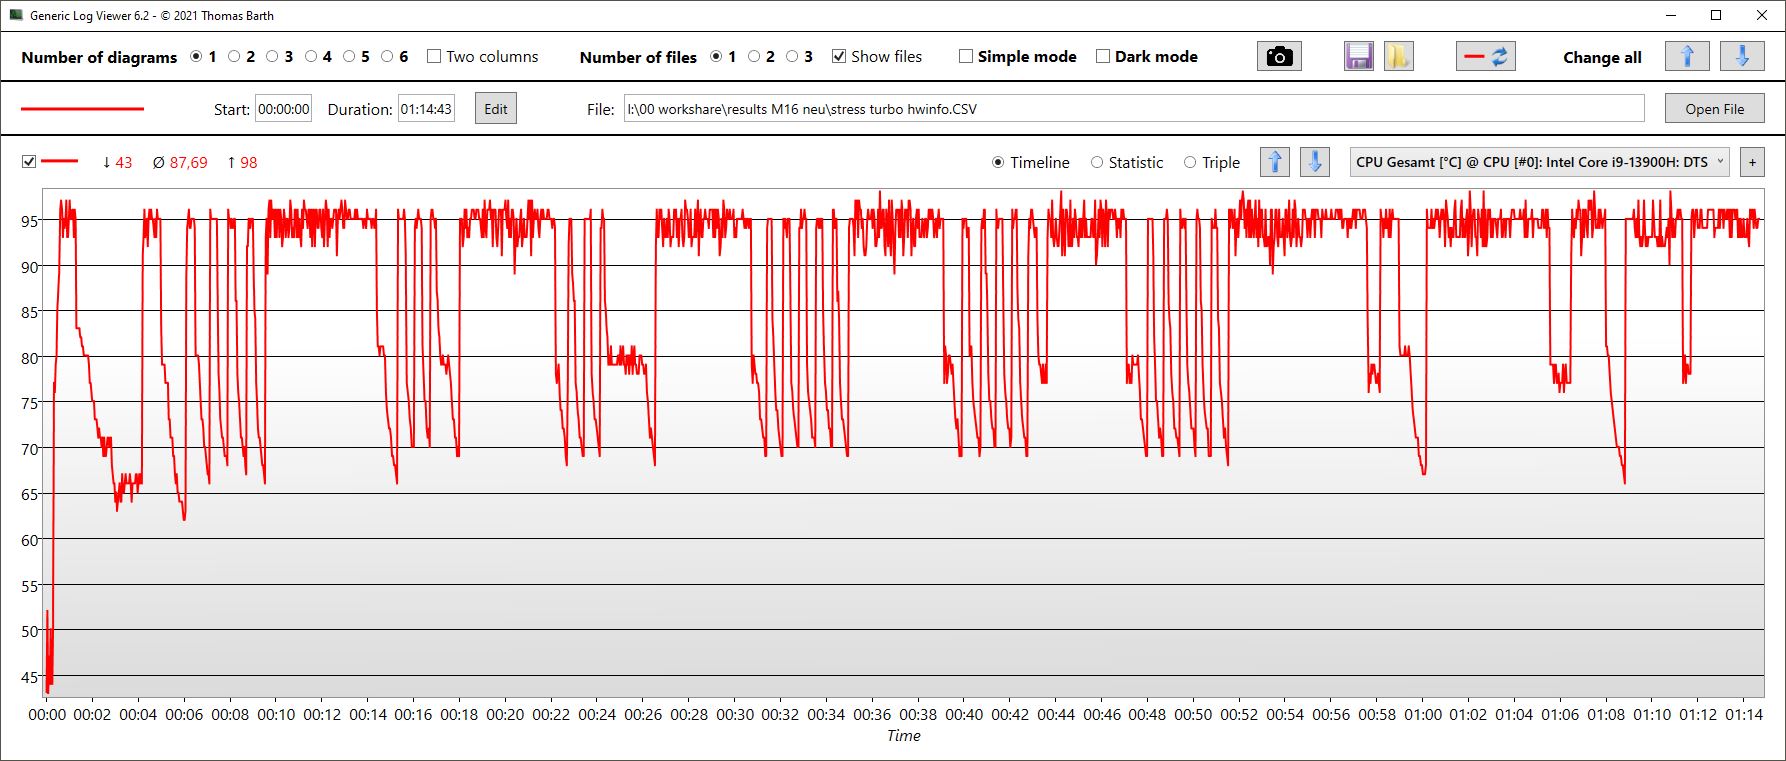
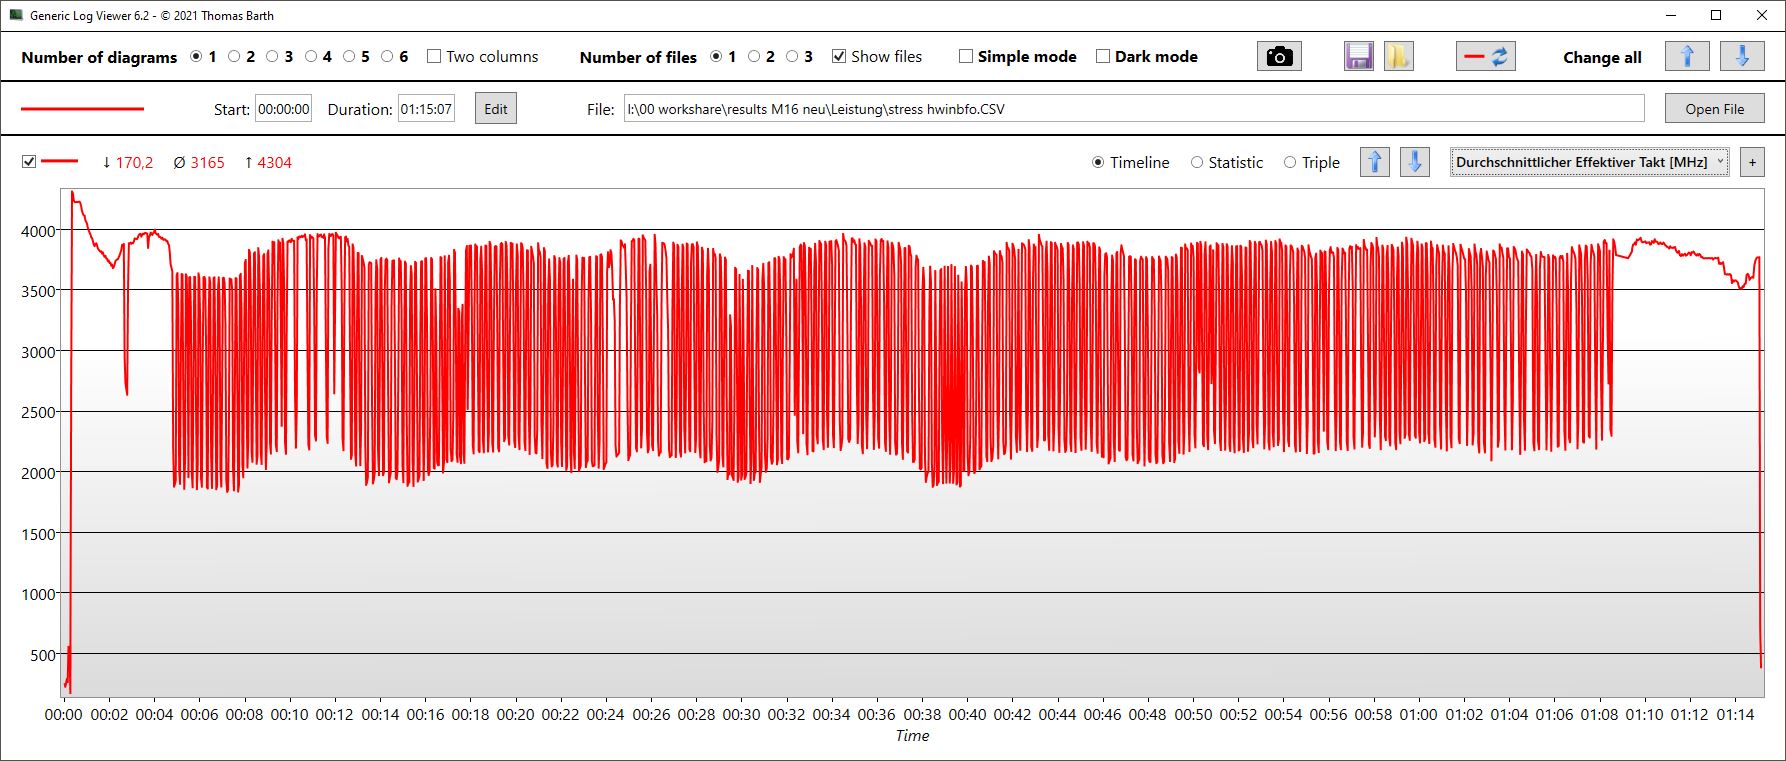
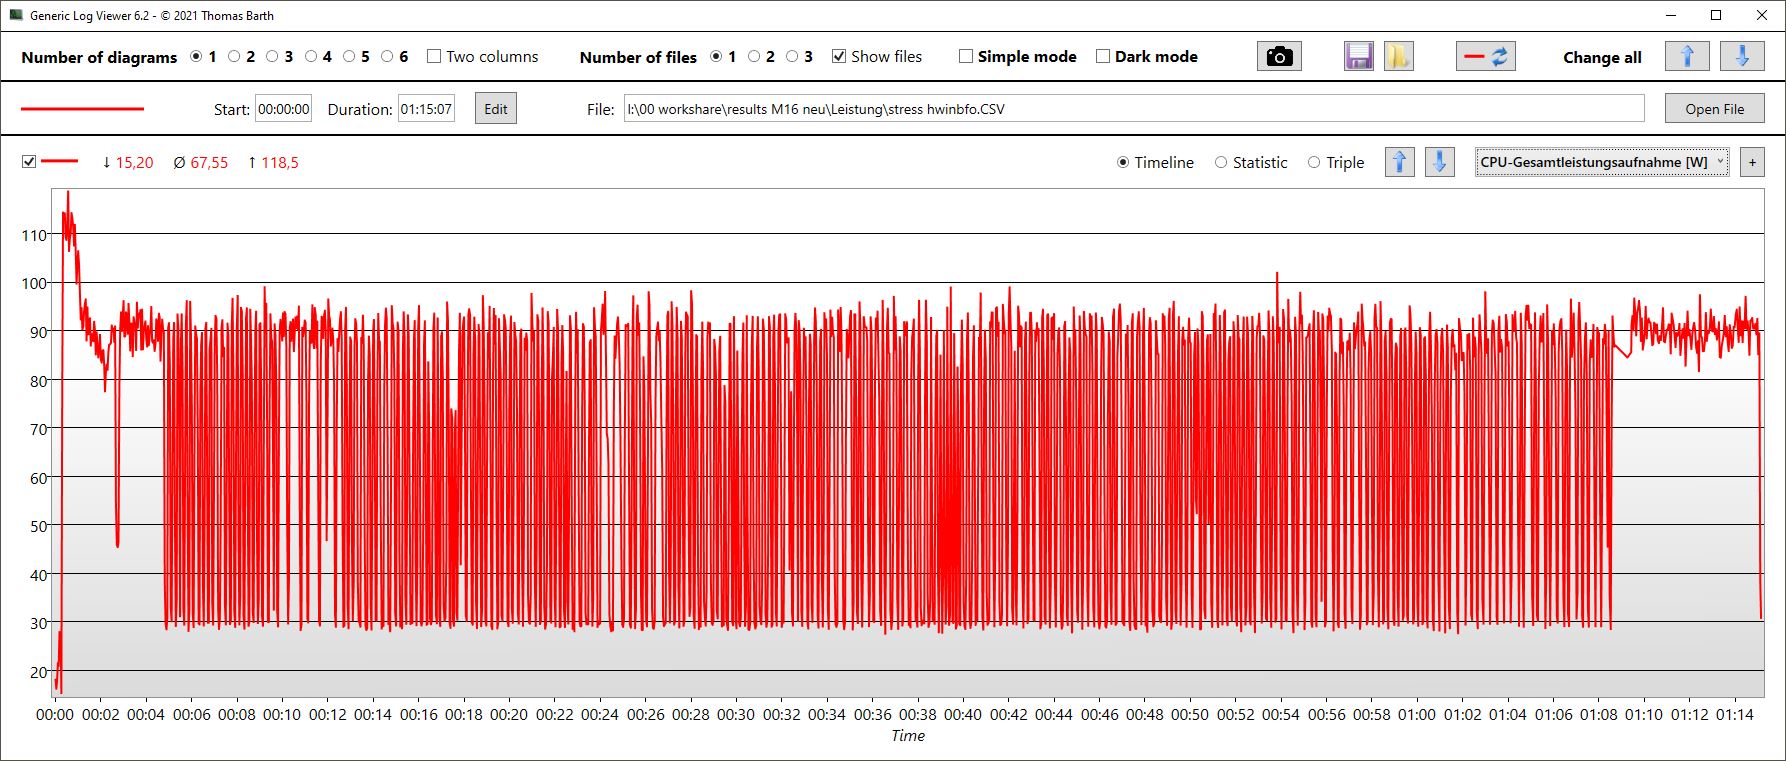
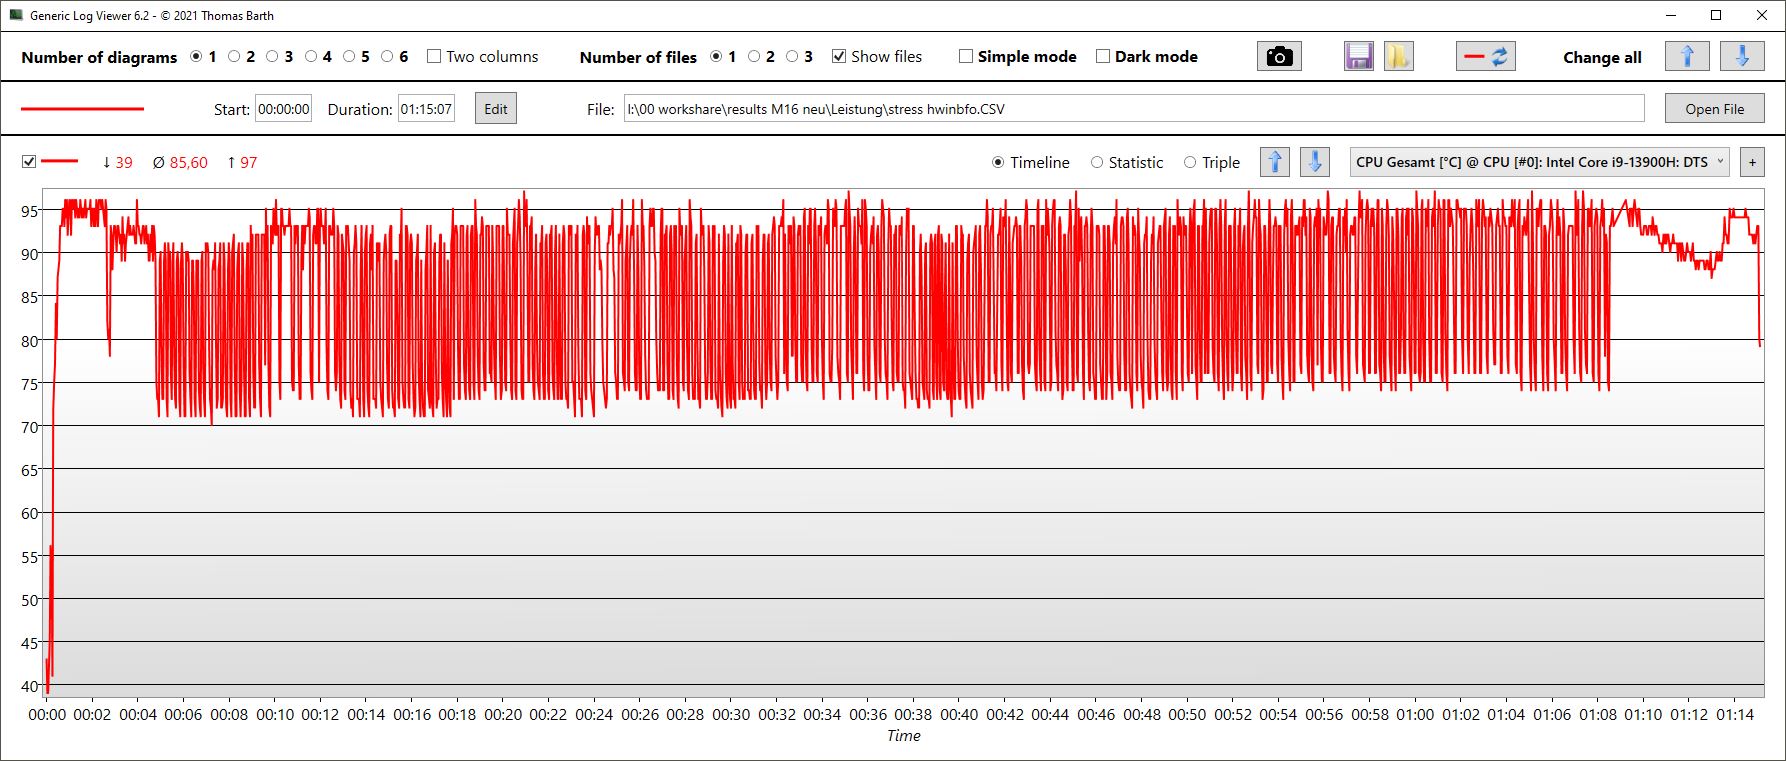
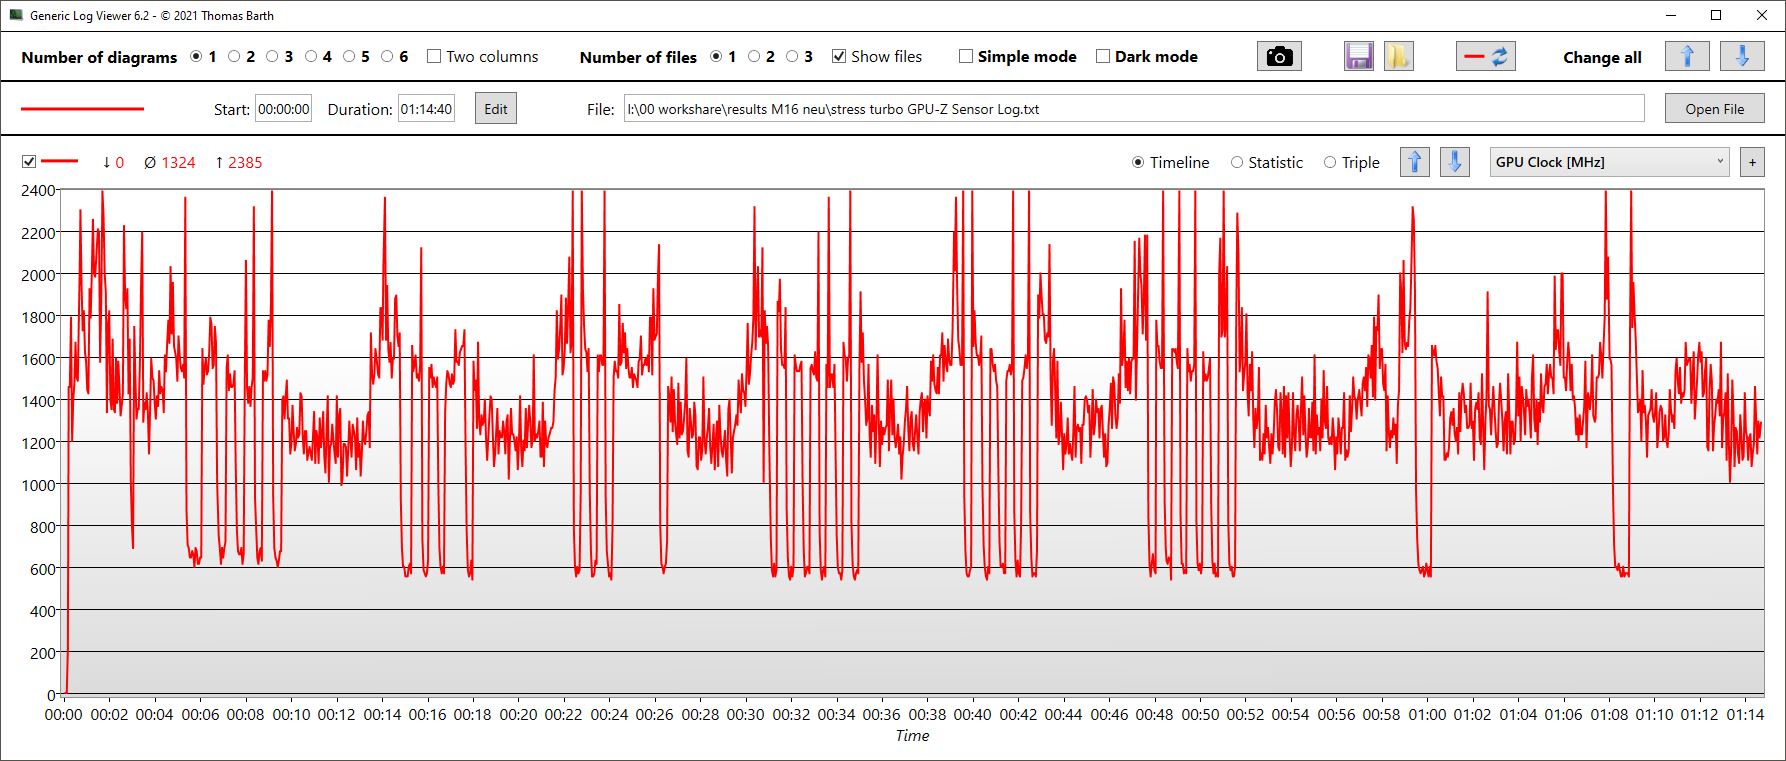
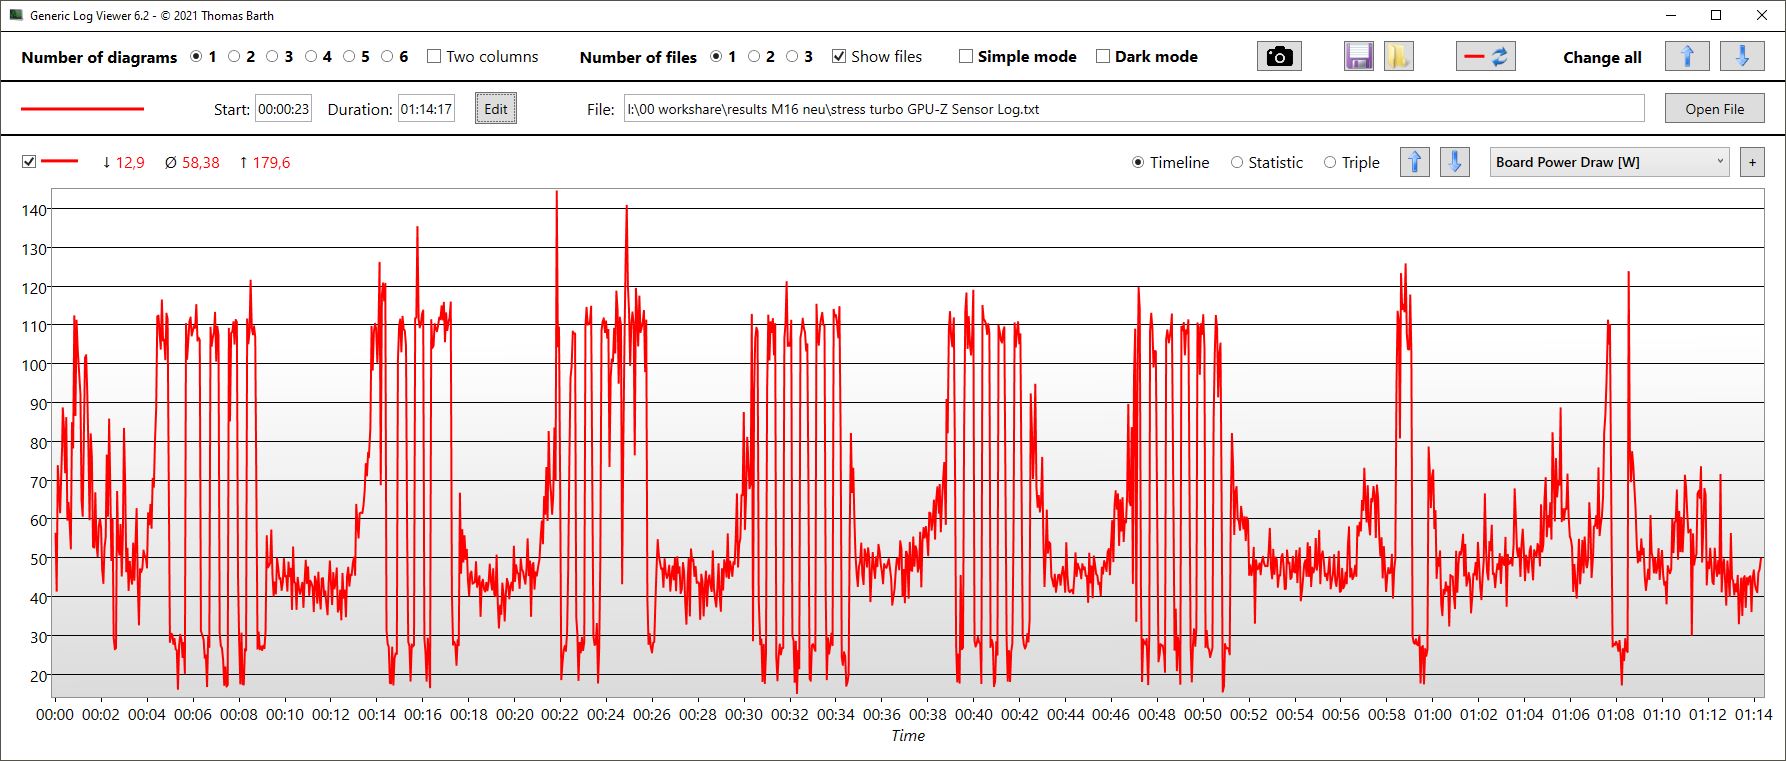
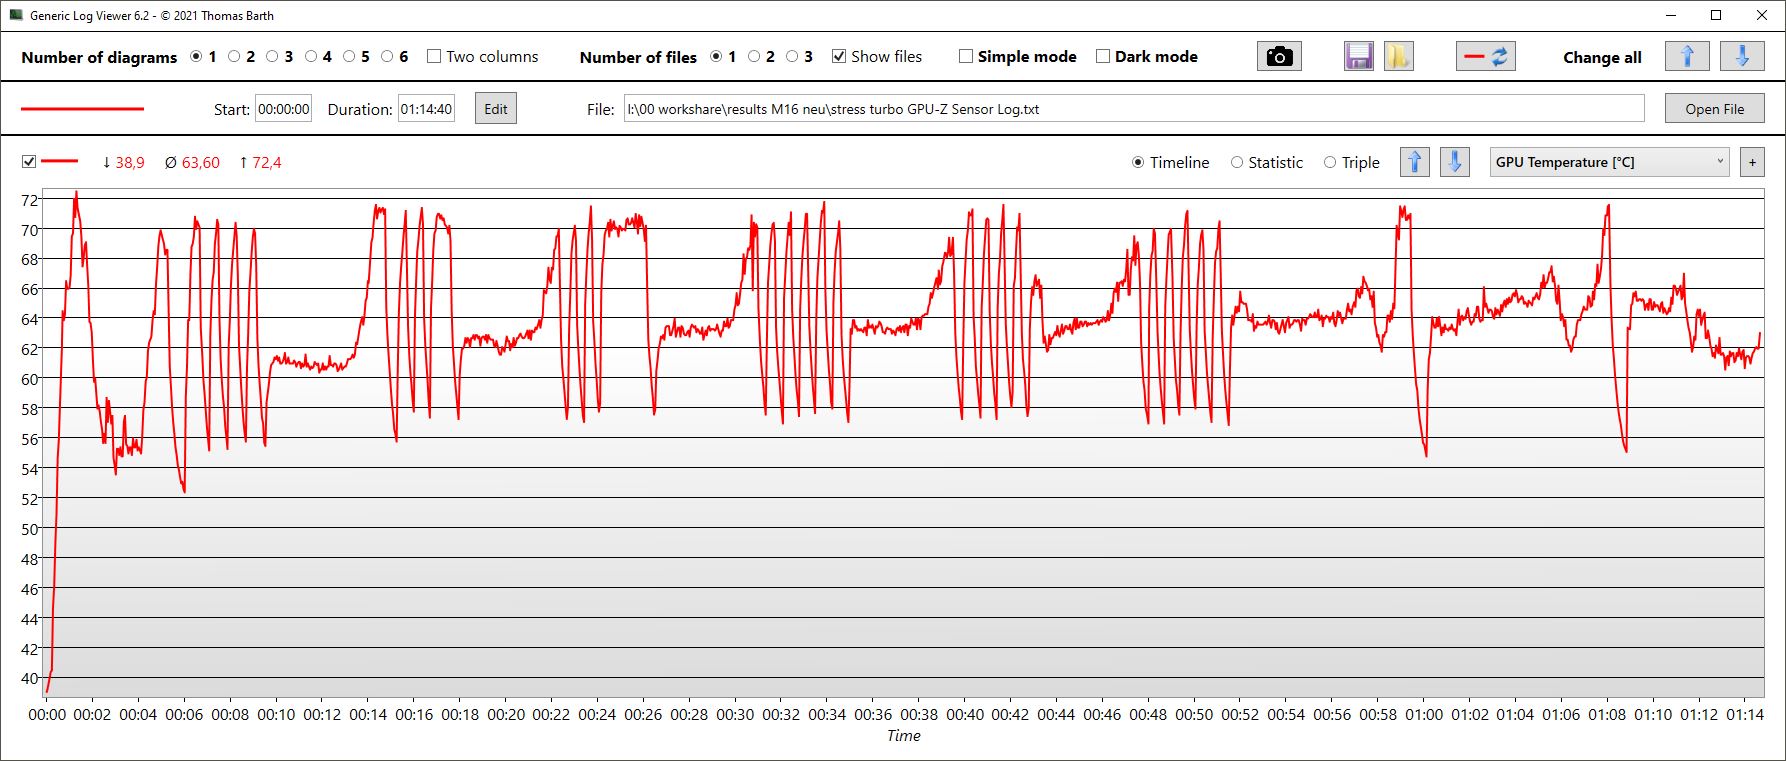
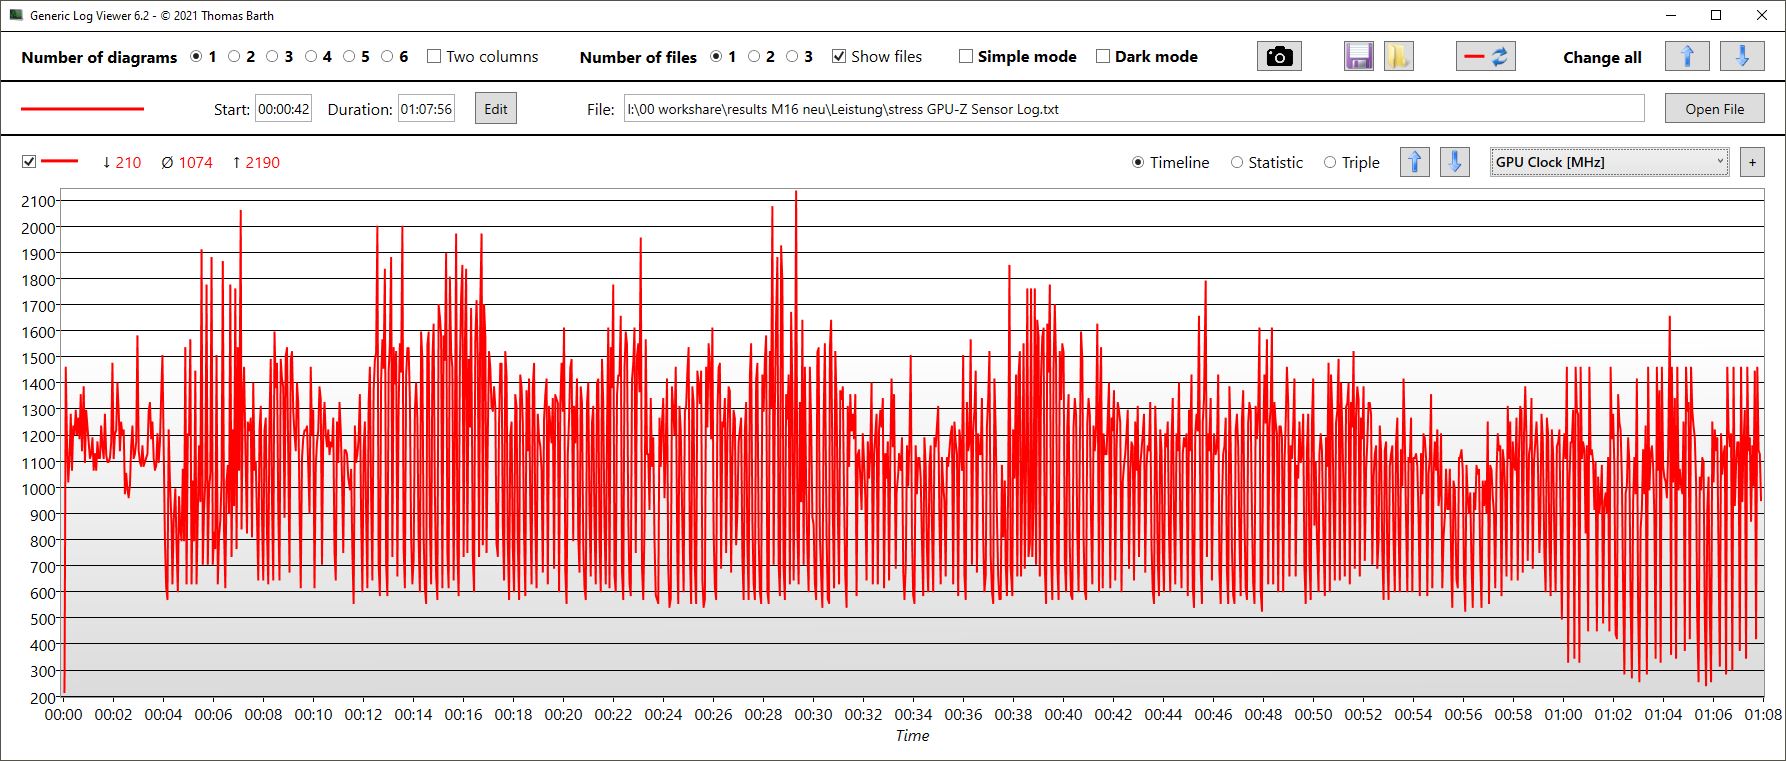
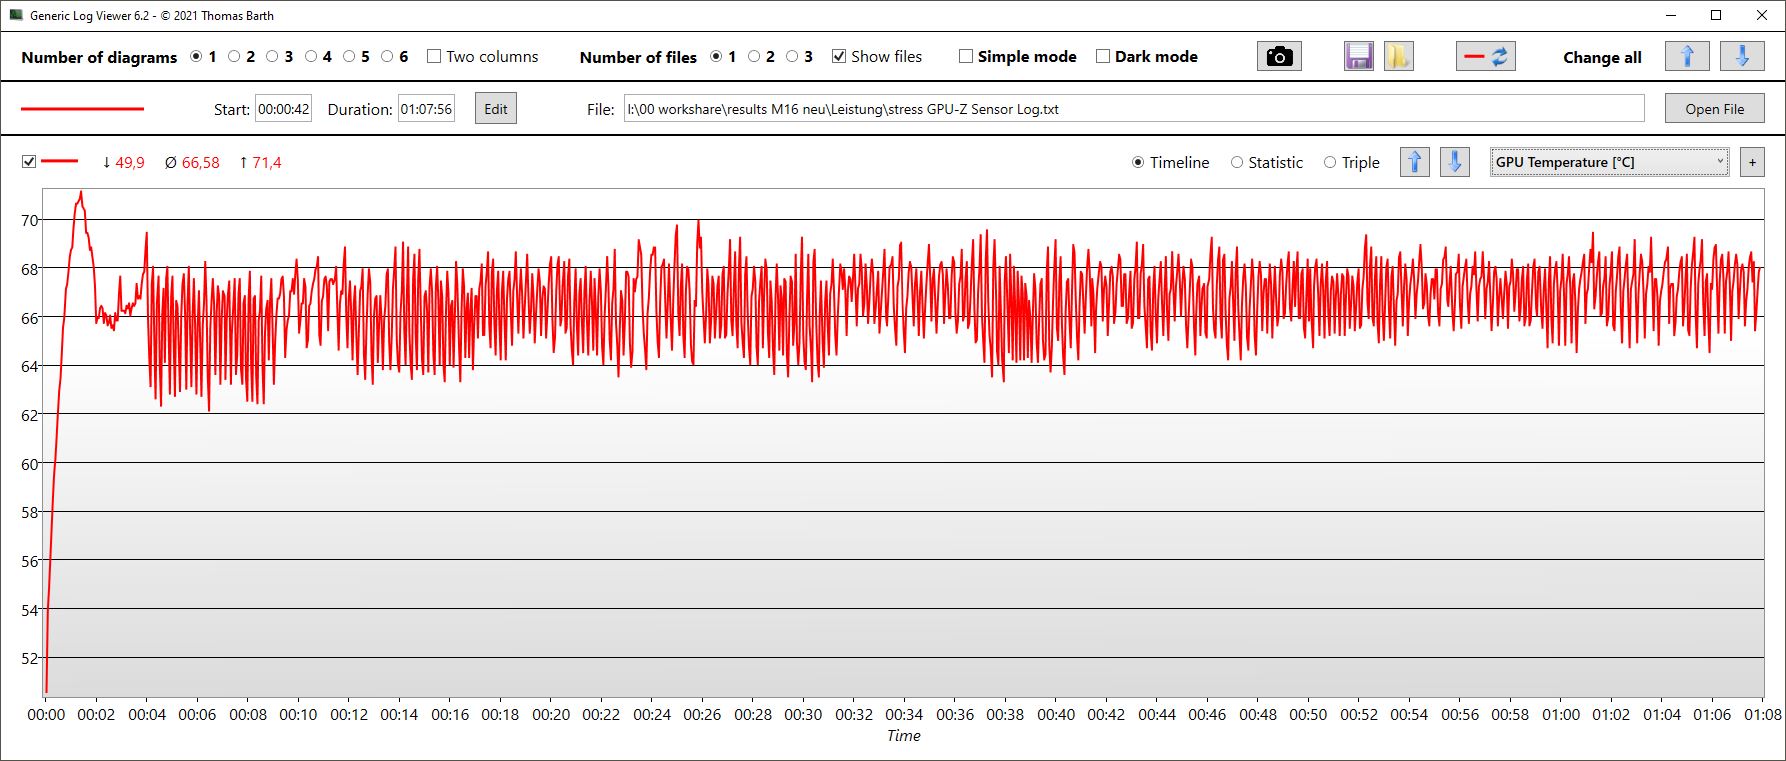
| ZegarCPU (GHz) | Zegar GPU (MHz) | Średnia temperatura CPU (°C) | Średnia temperatura GPU (°C) | |
| Prime95 + FurMark Stress | 3,3 | 1,324 | 88 | 64 |
| Witcher 3 Stres | 668 | 1,830 | 69 | 70 |
Mówcy
W porównaniu do wielu innych producentów, Asus wyposażył laptop w cztery głośniki zamiast dwóch. Daje to pozytywny efekt, gdyż potrafią one uzyskać stosunkowo dużą głośność, oferują zrównoważone średnie i wysokie tony, a nawet bas jest nieco bardziej dziarski niż ma to niestety i zazwyczaj miejsce u konkurencji.
Dodatkową przyjemność z dźwięku można mieć podłączając zewnętrzne urządzenie analogowe poprzez gniazdo audio 3,5 mm.
Asus ROG Zephyrus M16 GU604VY-NM042X analiza dźwięku
(+) | głośniki mogą odtwarzać stosunkowo głośno (84.45 dB)
Bas 100 - 315 Hz
(±) | zredukowany bas - średnio 11.5% niższy od mediany
(±) | liniowość basu jest średnia (10.1% delta do poprzedniej częstotliwości)
Średnie 400 - 2000 Hz
(+) | zbalansowane środki średnie - tylko 4.1% od mediany
(+) | średnie są liniowe (4.9% delta do poprzedniej częstotliwości)
Wysokie 2–16 kHz
(+) | zrównoważone maksima - tylko 1.9% od mediany
(+) | wzloty są liniowe (4.9% delta do poprzedniej częstotliwości)
Ogólnie 100 - 16.000 Hz
(+) | ogólny dźwięk jest liniowy (11.1% różnicy w stosunku do mediany)
W porównaniu do tej samej klasy
» 8% wszystkich testowanych urządzeń w tej klasie było lepszych, 3% podobnych, 89% gorszych
» Najlepszy miał deltę 6%, średnia wynosiła ###średnia###%, najgorsza wynosiła 132%
W porównaniu do wszystkich testowanych urządzeń
» 7% wszystkich testowanych urządzeń było lepszych, 2% podobnych, 92% gorszych
» Najlepszy miał deltę 4%, średnia wynosiła ###średnia###%, najgorsza wynosiła 134%
Razer Blade 16 Early 2023 analiza dźwięku
(+) | głośniki mogą odtwarzać stosunkowo głośno (88.2 dB)
Bas 100 - 315 Hz
(-) | prawie brak basu - średnio 16.4% niższa od mediany
(±) | liniowość basu jest średnia (10.8% delta do poprzedniej częstotliwości)
Średnie 400 - 2000 Hz
(+) | zbalansowane środki średnie - tylko 2.5% od mediany
(+) | średnie są liniowe (2.4% delta do poprzedniej częstotliwości)
Wysokie 2–16 kHz
(+) | zrównoważone maksima - tylko 4.9% od mediany
(±) | liniowość wysokich wartości jest średnia (7.9% delta do poprzedniej częstotliwości)
Ogólnie 100 - 16.000 Hz
(+) | ogólny dźwięk jest liniowy (12.6% różnicy w stosunku do mediany)
W porównaniu do tej samej klasy
» 16% wszystkich testowanych urządzeń w tej klasie było lepszych, 3% podobnych, 81% gorszych
» Najlepszy miał deltę 6%, średnia wynosiła ###średnia###%, najgorsza wynosiła 132%
W porównaniu do wszystkich testowanych urządzeń
» 11% wszystkich testowanych urządzeń było lepszych, 2% podobnych, 86% gorszych
» Najlepszy miał deltę 4%, średnia wynosiła ###średnia###%, najgorsza wynosiła 134%
Zarządzanie energią - wydajna gra, wysokie zużycie energii w stanie spoczynku
Pobór mocy
Ustawiony na minimalną jasność, tryb cichy i lot, pobór mocy w trybie bezczynności na poziomie około 20 W jest nieco wysoki. Podczas gry i pod dużym obciążeniem procesory Intel HX wydawałyby się pobierać znacznie więcej energii niż niektórzy konkurenci o podobnych możliwościach HX (nawet ci z RTX 4080) zużywający więcej mocy.
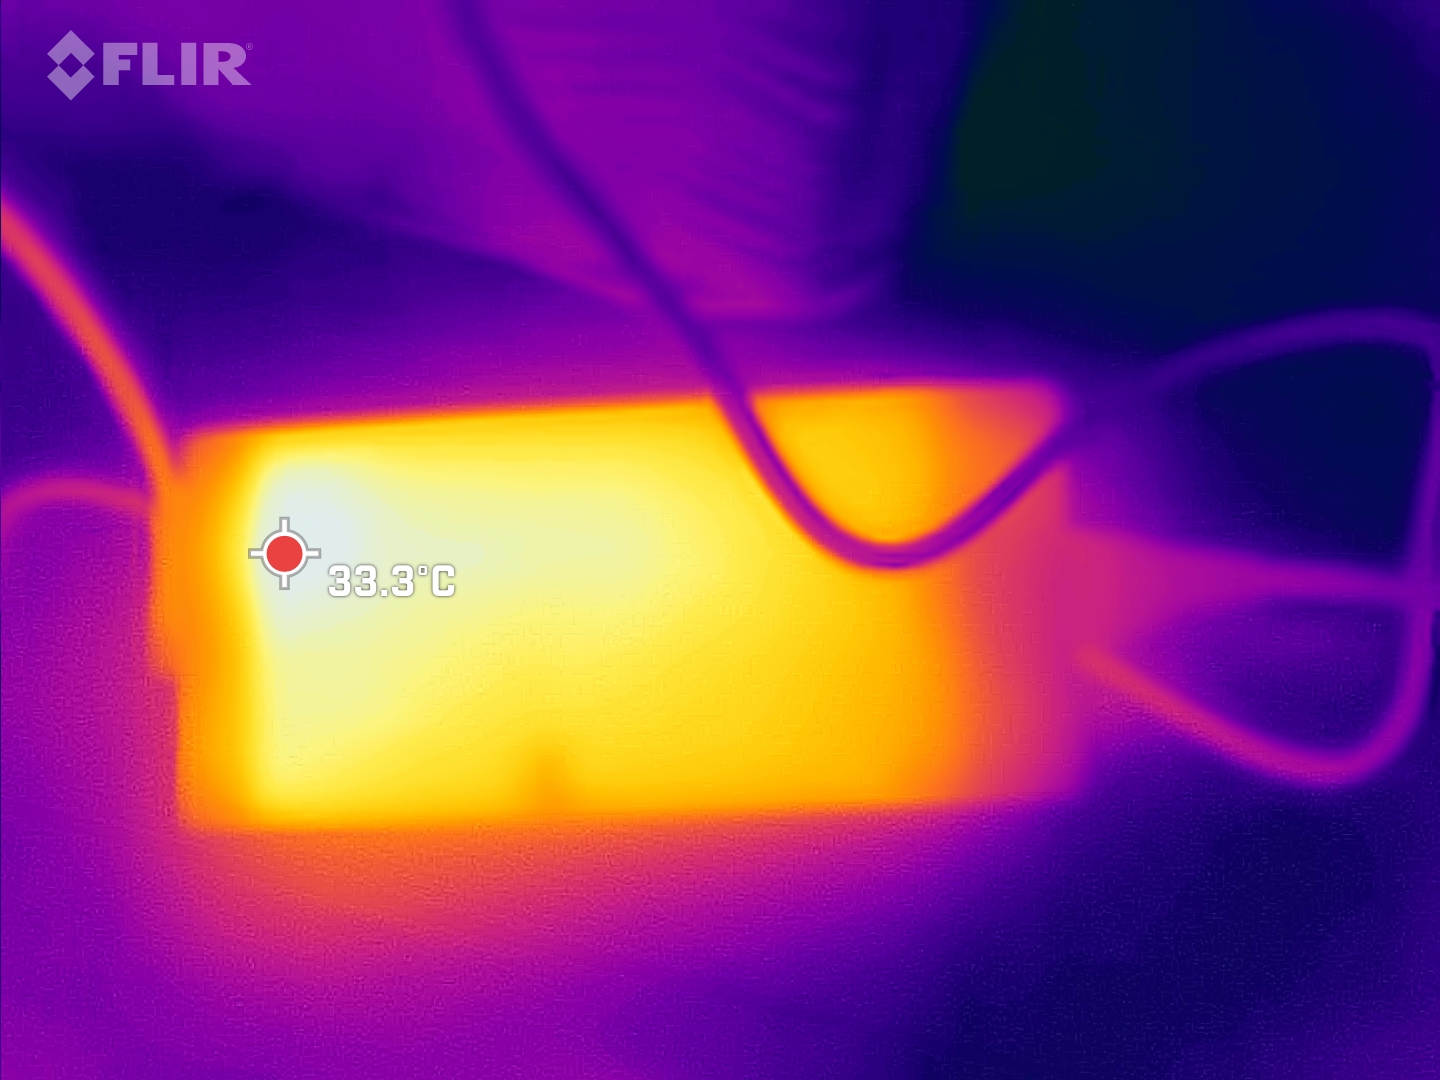
Przez krótki czas zmierzyliśmy szczyty obciążenia wynoszące maksymalnie 267 W na dużym, ale płaskim zasilaczu (około 18 x 8,3 x 2,5 cm). Jest on zaprojektowany na 280 W, a więc oferuje spore rezerwy.
| wyłączony / stan wstrzymania | |
| luz | |
| obciążenie |
|
Legenda:
min: | |
| Asus ROG Zephyrus M16 GU604VY-NM042X i9-13900H, GeForce RTX 4090 Laptop GPU, Samsung PM9A1 MZVL22T0HBLB, IPS, 2560x1600, 16" | Asus ROG Zephyrus M16 GU603Z i9-12900H, GeForce RTX 3070 Ti Laptop GPU, Micron 3400 1TB MTFDKBA1T0TFH, IPS, 2560x1600, 16" | Asus ROG Strix Scar 18 2023 G834JY-N6005W i9-13980HX, GeForce RTX 4090 Laptop GPU, 2x Samsung PM9A1 MZVL21T0HCLR (RAID 0), IPS, 2560x1600, 18" | MSI Titan GT77 HX 13VI i9-13950HX, GeForce RTX 4090 Laptop GPU, Samsung PM9A1 MZVL22T0HBLB, Mini-LED, 3840x2160, 17.3" | Lenovo Legion Pro 7 16IRX8H i9-13900HX, GeForce RTX 4080 Laptop GPU, Samsung PM9A1 MZVL21T0HCLR, IPS, 2560x1600, 16" | Razer Blade 16 Early 2023 i9-13950HX, GeForce RTX 4080 Laptop GPU, SSSTC CA6-8D1024, IPS, 2560x1600, 16" | Przeciętny NVIDIA GeForce RTX 4090 Laptop GPU | Średnia w klasie Gaming | |
|---|---|---|---|---|---|---|---|---|
| Power Consumption | 24% | -26% | -10% | -14% | -17% | -11% | 12% | |
| Idle Minimum * (Watt) | 20 | 10.8 46% | 17.3 13% | 14 30% | 18 10% | 15.2 24% | 16.2 ? 19% | 13.3 ? 33% |
| Idle Average * (Watt) | 24 | 17 29% | 27 -13% | 21.6 10% | 24 -0% | 22.8 5% | 23.1 ? 4% | 19 ? 21% |
| Idle Maximum * (Watt) | 25 | 17.8 29% | 46 -84% | 24.8 1% | 32 -28% | 49.8 -99% | 34.2 ? -37% | 24.5 ? 2% |
| Load Average * (Watt) | 107 | 116 -8% | 133 -24% | 122.5 -14% | 130 -21% | 121.2 -13% | 130.5 ? -22% | 108.1 ? -1% |
| Witcher 3 ultra * (Watt) | 208 | 144 31% | 265 -27% | 260 -25% | 242 -16% | |||
| Load Maximum * (Watt) | 267 | 220 18% | 329 -23% | 418 -57% | 320 -20% | 273.7 -3% | 324 ? -21% | 254 ? 5% |
* ... im mniej tym lepiej
Power consumption Witcher 3 / Stress test
Power consumption with an external monitor
Żywotność baterii
Zephyrus M16 posiada akumulator o pojemności 90 W, co oznacza, że laptop Asusa może osiągnąć około 4,5 godziny korzystania z WiFi przy zmniejszonej jasności.
Przy pełnej jasności możliwe są 3 godziny przeglądania internetu (wielostrefowy Mini-LED). Przy zmniejszonej jasności może to wzrosnąć do prawie 4,5 godziny.
W sumie czasy pracy na akumulatorze nie są szczególnie dobre i wynika to z wysokiego zużycia energii w stanie bezczynności.
| Asus ROG Zephyrus M16 GU604VY-NM042X i9-13900H, GeForce RTX 4090 Laptop GPU, 90 Wh | Asus ROG Zephyrus M16 GU603Z i9-12900H, GeForce RTX 3070 Ti Laptop GPU, 90 Wh | Asus ROG Strix Scar 18 2023 G834JY-N6005W i9-13980HX, GeForce RTX 4090 Laptop GPU, 90 Wh | MSI Titan GT77 HX 13VI i9-13950HX, GeForce RTX 4090 Laptop GPU, 99.9 Wh | Lenovo Legion Pro 7 16IRX8H i9-13900HX, GeForce RTX 4080 Laptop GPU, 99.9 Wh | Razer Blade 16 Early 2023 i9-13950HX, GeForce RTX 4080 Laptop GPU, 95.2 Wh | Średnia w klasie Gaming | |
|---|---|---|---|---|---|---|---|
| Czasy pracy | 24% | 14% | -1% | -5% | -5% | 29% | |
| H.264 (h) | 4.8 | 7.3 52% | 7 46% | 6 25% | 8.26 ? 72% | ||
| WiFi v1.3 (h) | 4.3 | 7.4 72% | 7.1 65% | 5.3 23% | 5.1 19% | 6.1 42% | 7.01 ? 63% |
| Load (h) | 2.9 | 1.4 -52% | 0.9 -69% | 1.4 -52% | 2.1 -28% | 1.4 -52% | 1.47 ? -49% |
| Witcher 3 ultra (h) | 0.9 | ||||||
| Reader / Idle (h) | 6.4 | 8.9 | 8.71 ? |
Za
Przeciw
Werdykt - Nie jest (jeszcze) tak zoptymalizowany jak jego poprzednik

Jeśli chodzi o najnowsze generacje laptopów, producenci lubią podsyłać nam systemy z wyższej półki. I tak, np.RTX 4090i Intel Gen13 robią wrażenie nie tylko na papierze. W porównaniu z poprzednim genem, wydajność i efektywność znacznie się poprawiły. Co więcej, wspaniały, Mini-LED Nebula wyświetlacz jest pretendentem do głównej atrakcji i prawie udaje mu się umieścić CPU i GPU w cieniu.
Już jego poprzednika uznaliśmy za dobrze zaokrągloną i zoptymalizowaną maszynę do gier. Generalnie, choć nie jednoznacznie, dotyczy to także nowego Asusa M16. Podobnie jak w większości obecnych, nowych laptopów, mamy do czynienia z podwójnym skokiem generacyjnym w zakresie CPU i GPU. Zmiana ta nie zawsze przebiega jednak gładko. Wiele laptopów z RTX 40 cierpi obecnie na wysokie latencje z powodu jeszcze nie sfinalizowanych optymalizacji sterowników. Ponadto zużycie energii w stanie spoczynku przez M16 jest nieco zbyt wysokie. Prowadzi to do nieoptymalnego czasu pracy na baterii, ale jest to coś, co można poprawić z pomocą aktualizacji oprogramowania. Trochę irytuje też fakt, że Asus niepotrzebnie utrudnił konserwację z powodu wielu ukrytych śrubek i pamięci RAM SO-DIMM. Również pominięcie portu LAN jest trudne do zrozumienia dla graczy, a topowy RTX 4090 z procesorem H działa "tylko" tak szybko jak np.RTX 4080sparowany z procesorem HX.
Asus ROG Zephyrus M16 w połączeniu z RTX 4090 to potężny zestaw do gier, wyposażony w fantastyczny wyświetlacz Mini-LED i moc do wykorzystania - nawet w 4K. Jednak cena jest wysoka i jest kilka małych błędów, które wymagają wyprasowania.
Dla wielu, bardzo wysoka cena będzie pochodzić jako prawdziwy minus, ale, jak zawsze, będziemy obszernie recenzować możliwe (tańsze) alternatywy, jak i kiedy przybywają.
Cena i dostępność
Obecnie można jedynie złożyć zamówienie wstępne na nowe M16. Maszyna ma się jednak pojawić jeszcze w tym miesiącu (marzec 2023).
Asus ROG Zephyrus M16 GU604VY-NM042X
- 15/03/2023 v7 (old)
Christian Hintze
Przezroczystość
Wyboru urządzeń do recenzji dokonuje nasza redakcja. Próbka testowa została udostępniona autorowi jako pożyczka od producenta lub sprzedawcy detalicznego na potrzeby tej recenzji. Pożyczkodawca nie miał wpływu na tę recenzję, producent nie otrzymał też kopii tej recenzji przed publikacją. Nie było obowiązku publikowania tej recenzji. Jako niezależna firma medialna, Notebookcheck nie podlega władzy producentów, sprzedawców detalicznych ani wydawców.
Tak testuje Notebookcheck
Każdego roku Notebookcheck niezależnie sprawdza setki laptopów i smartfonów, stosując standardowe procedury, aby zapewnić porównywalność wszystkich wyników. Od około 20 lat stale rozwijamy nasze metody badawcze, ustanawiając przy tym standardy branżowe. W naszych laboratoriach testowych doświadczeni technicy i redaktorzy korzystają z wysokiej jakości sprzętu pomiarowego. Testy te obejmują wieloetapowy proces walidacji. Nasz kompleksowy system ocen opiera się na setkach uzasadnionych pomiarów i benchmarków, co pozwala zachować obiektywizm.Price comparison

