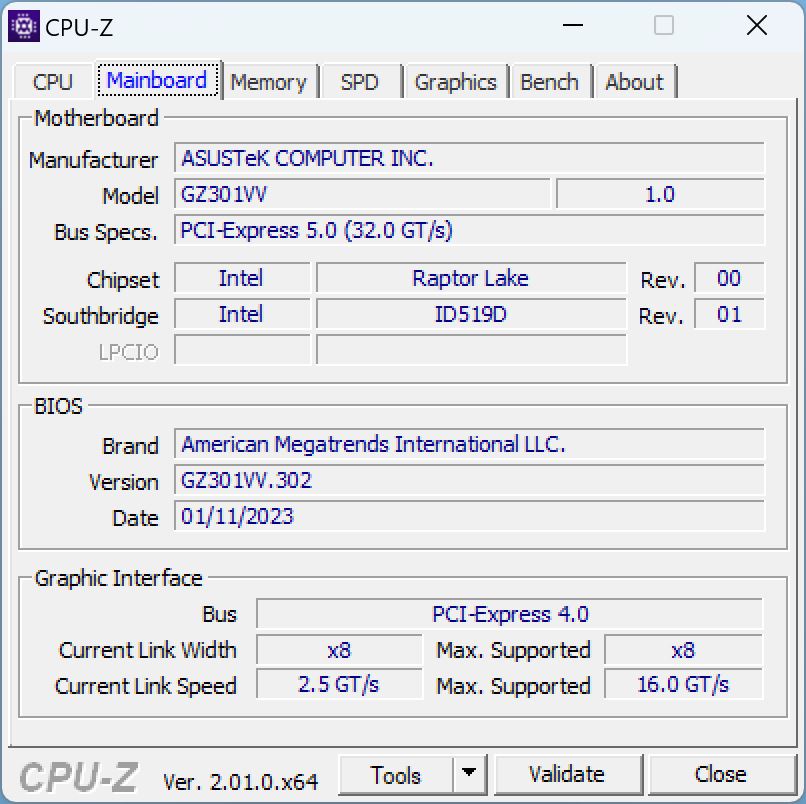
Asus ROG Flow Z13 w recenzji: Szaleństwo - RTX 4060 w imponującym tablecie do gier

Steam Deck, Asus ROG Ally i inni sprawiają, że koncepcja małego komputera do gier staje się obecnie poważna. Nowe generacje CPU i GPU stają się coraz bardziej wydajne, a producenci starają się obecnie zająć nowe nisze, instalując potężne komponenty w coraz mniejszych, a tym samym bardziej mobilnych obudowach.
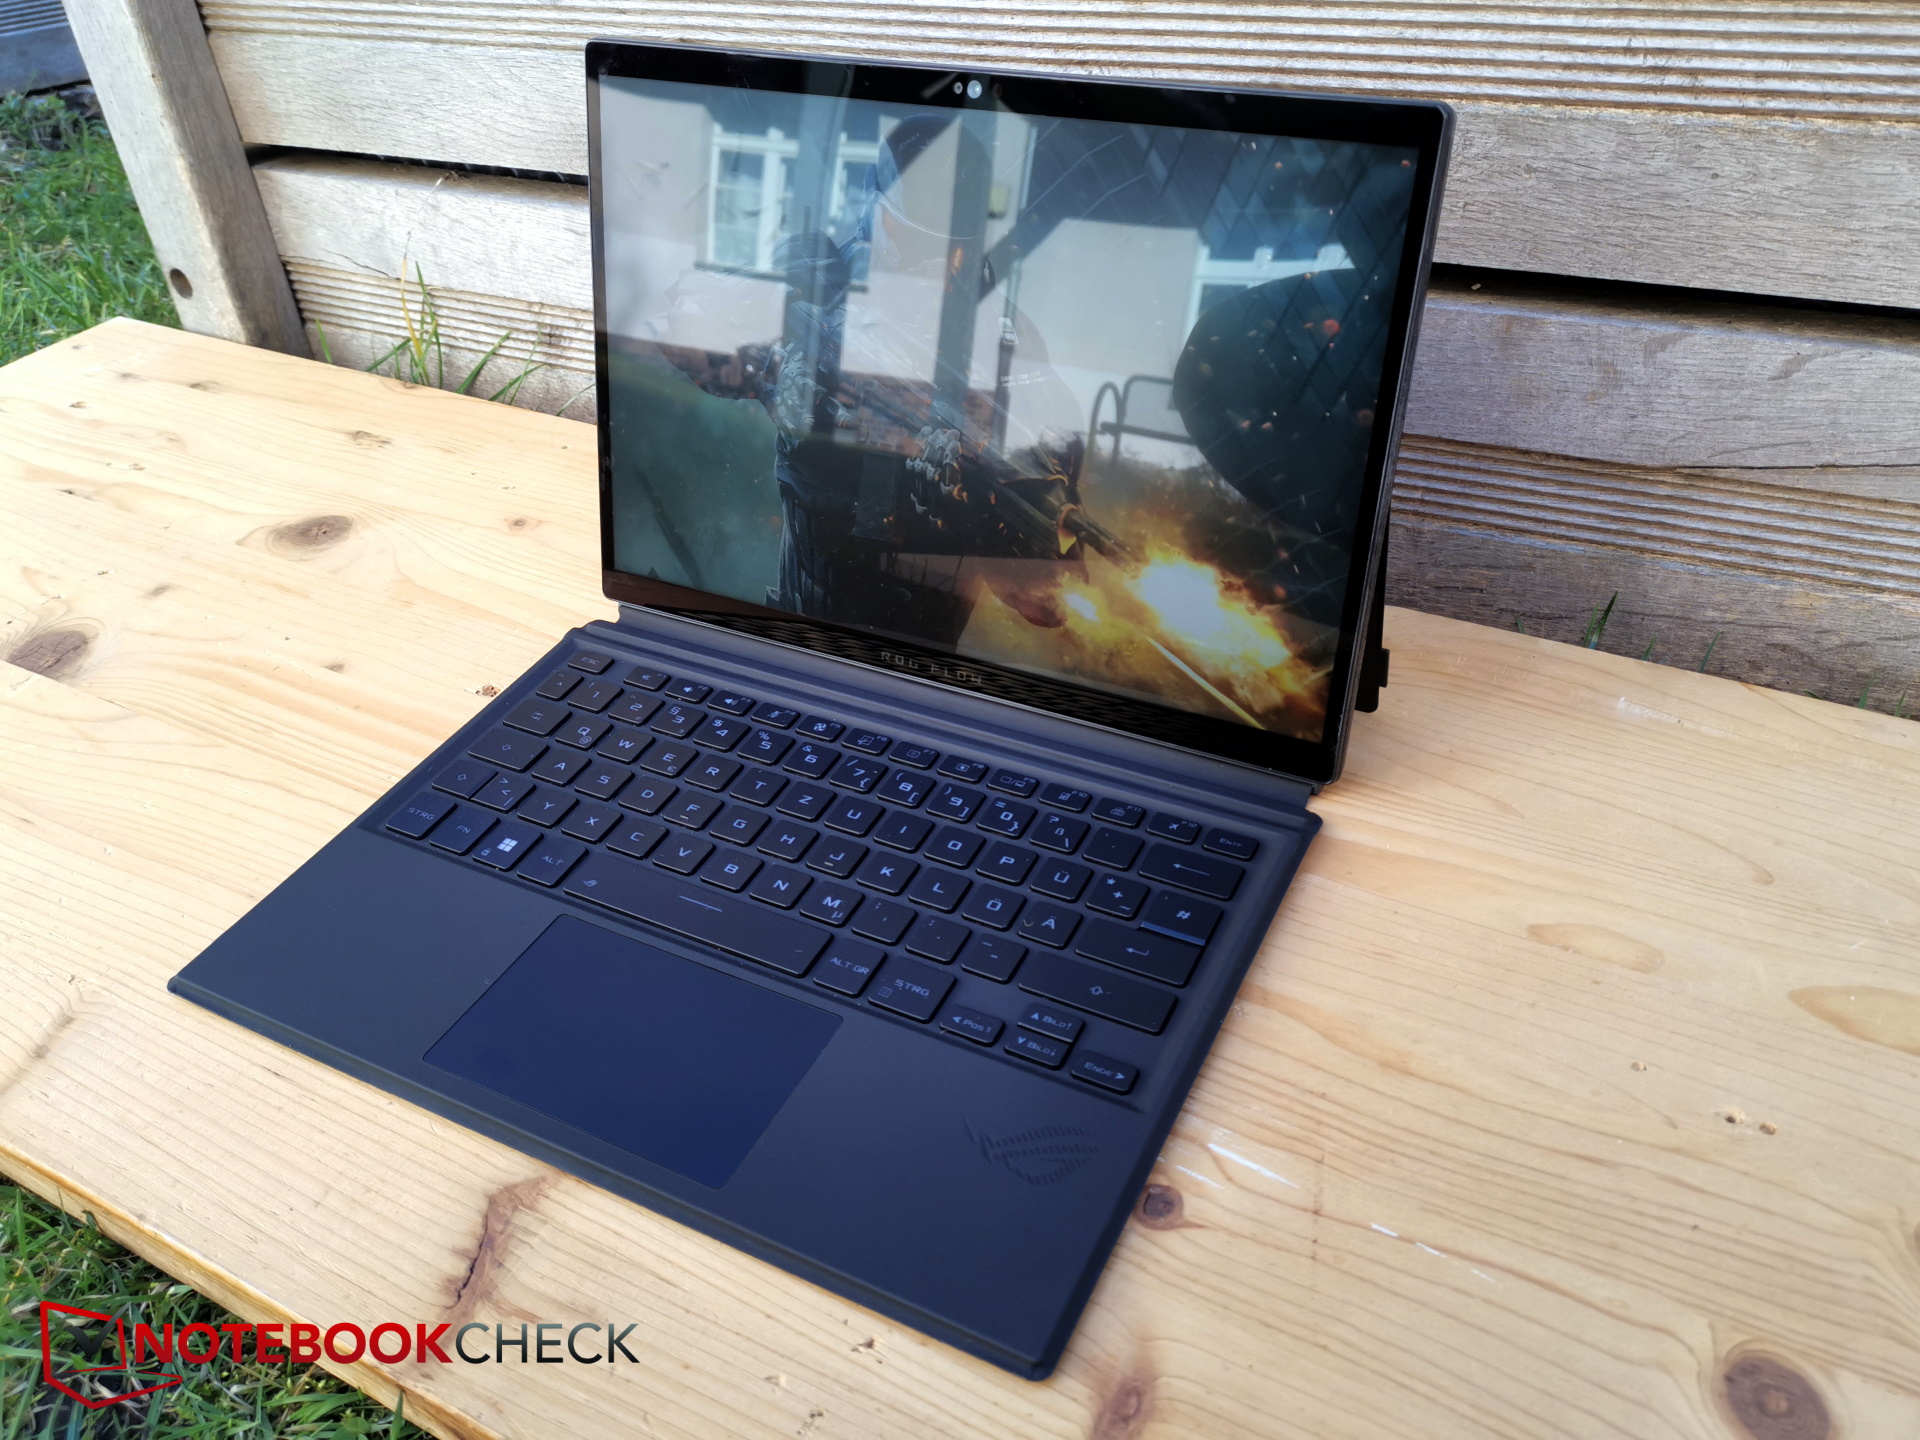
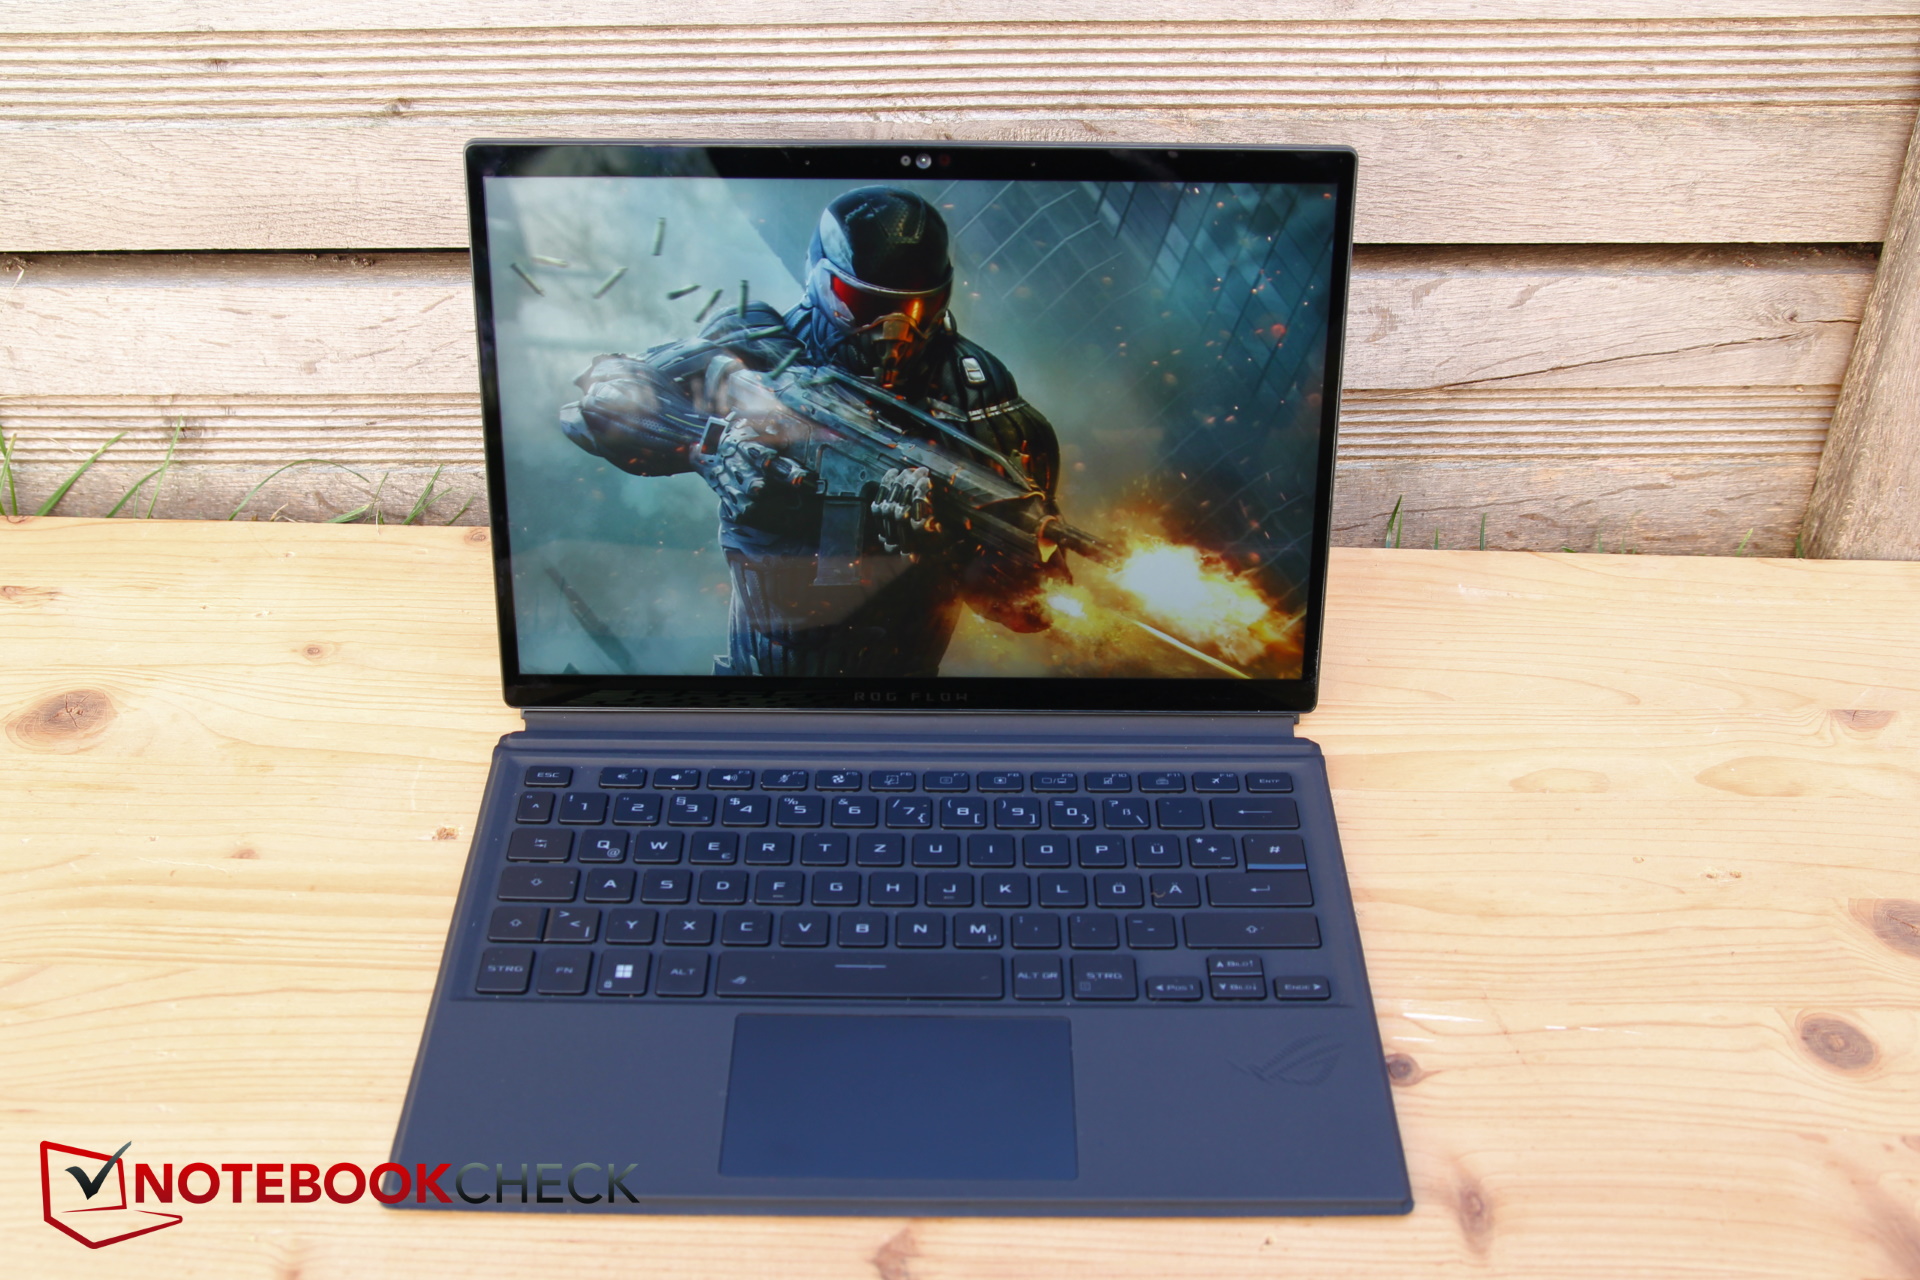
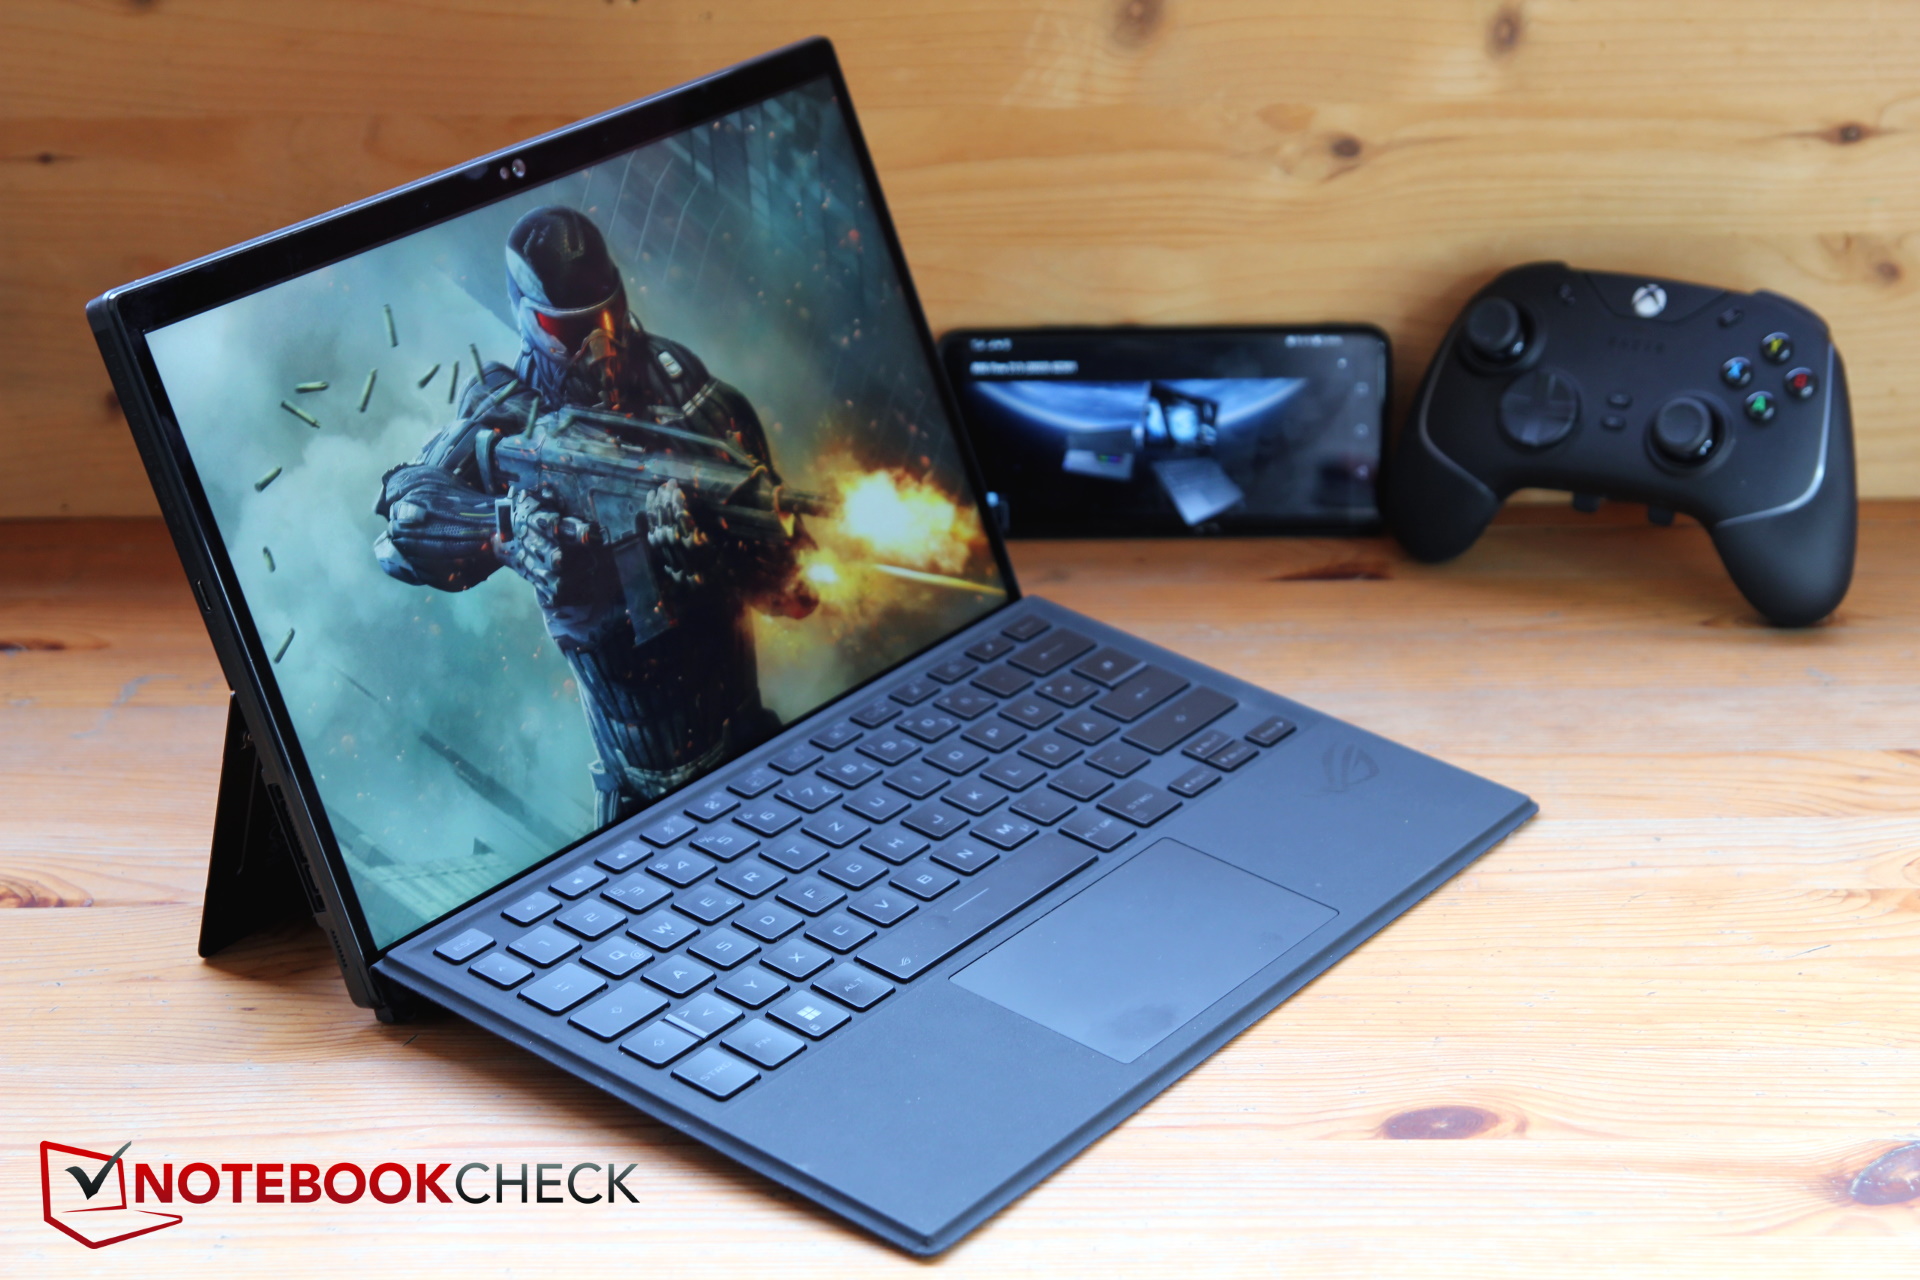
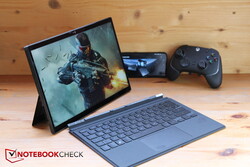
Asus ROG Flow Z13 to 13-calowy tablet z ekranem dotykowym o wysokiej rozdzielczości i obudową z klawiaturą mocowaną na magnes. Co szczególne, zamiast hartowanych i oszczędnych komponentów biurowych, w niezbyt cienkim tablecie wykorzystano prawdziwy sprzęt gamingowy z najwyższej półki. Kompaktowe, wydajne urządzenie powinno spodobać się także twórcom treści.
Niedawno recenzowaliśmy także specjalną edycję Z13. Ta ma inną obudowę i kartę RTX 4070, podczas gdy poprzednik miał tylko kartę RTX 3050 Ti. Oczywiście zamieszczamy oba modele dla porównania.
Pole konkurentów do porównania jest tutaj cienkie, więc musimy uciec się do prawdziwych laptopów gamingowych w górnej części poprzednika i edycji specjalnej. Do porównania wydajności RTX 4060'używamy nowego MSI Katana 17 jak również MSI Cyborg 15, inaczej porównujemy go z zeszłorocznym 14-calowym Acer Predator Triton 300 SE (RTX 3060).
Potencjalni konkurenci w porównaniu
Ocena | Data | Model | Waga | Wysokość | Rozmiar | Rezolucja | Cena |
|---|---|---|---|---|---|---|---|
| 89.1 % v7 (old) | 04/2023 | Asus ROG Flow Z13 GZ301V i9-13900H, GeForce RTX 4060 Laptop GPU | 1.6 kg | 14.2 mm | 13.40" | 2560x1600 | |
| 89.4 % v7 (old) | 04/2023 | Asus ROG Flow Z13 ACRNM i9-13900H, GeForce RTX 4070 Laptop GPU | 1.7 kg | 20 mm | 13.40" | 2560x1600 | |
| 86.8 % v7 (old) | Asus ROG Flow Z13 GZ301ZE i9-12900H, GeForce RTX 3050 Ti Laptop GPU | 1.2 kg | 12 mm | 13.40" | 1920x1200 | ||
| 82.1 % v7 (old) | 02/2023 | MSI Katana 17 B13VFK i7-13620H, GeForce RTX 4060 Laptop GPU | 2.8 kg | 25.2 mm | 17.30" | 1920x1080 | |
| 86 % v7 (old) | 11/2022 | Acer Predator Triton 300 SE i9-12900H, GeForce RTX 3060 Laptop GPU | 1.7 kg | 19.8 mm | 14.00" | 2880x1800 | |
| 82.4 % v7 (old) | 04/2023 | MSI Cyborg 15 A12VF i7-12650H, GeForce RTX 4060 Laptop GPU | 2 kg | 22.9 mm | 15.60" | 1920x1080 |
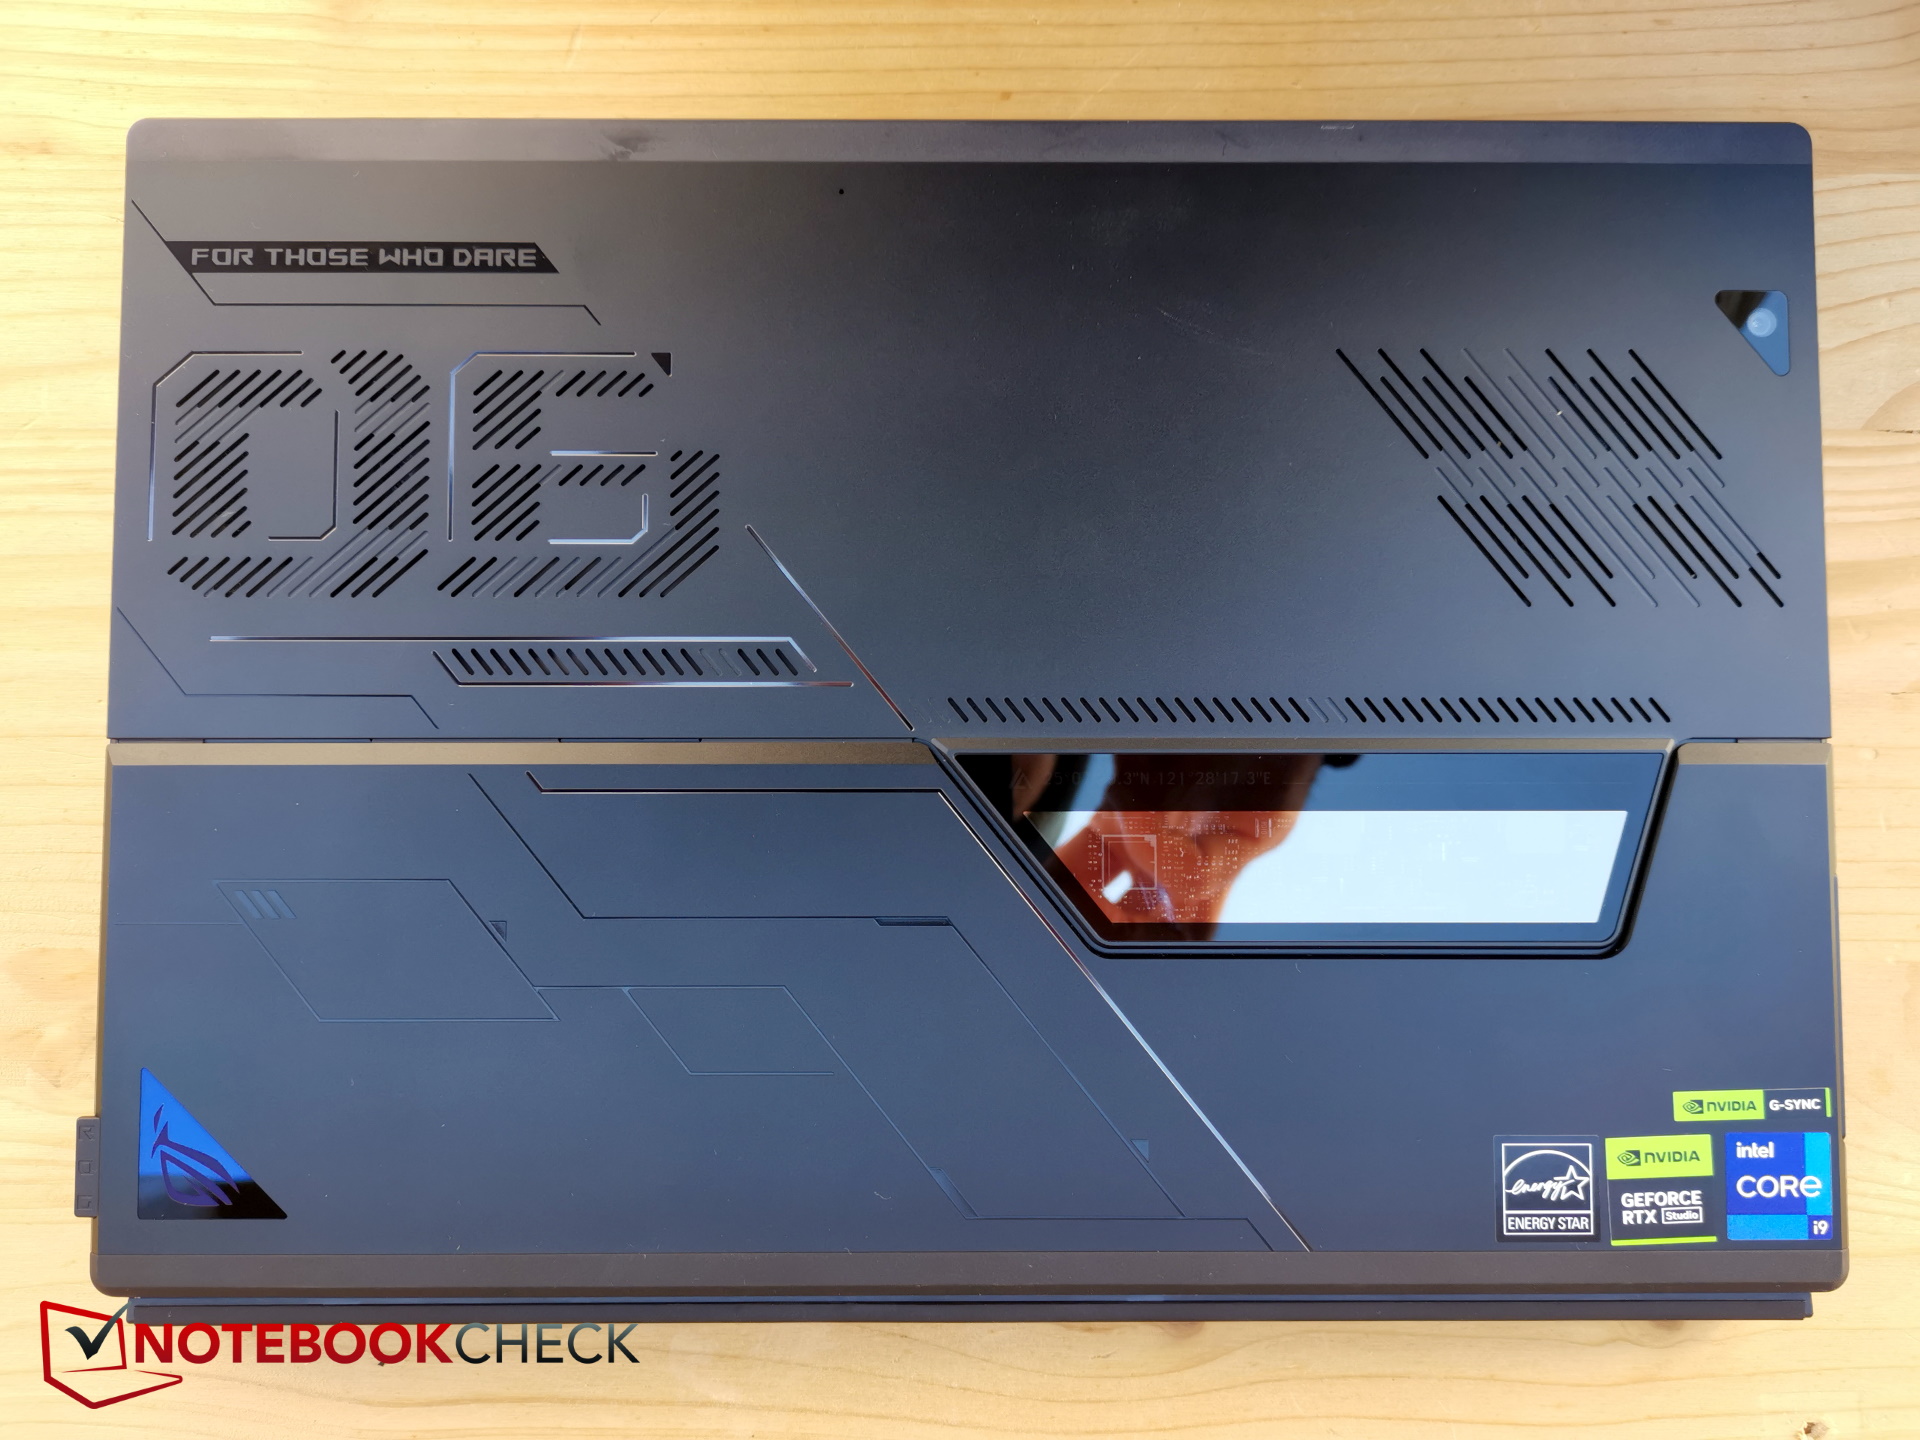
Etui - Nieco grubszy tablet
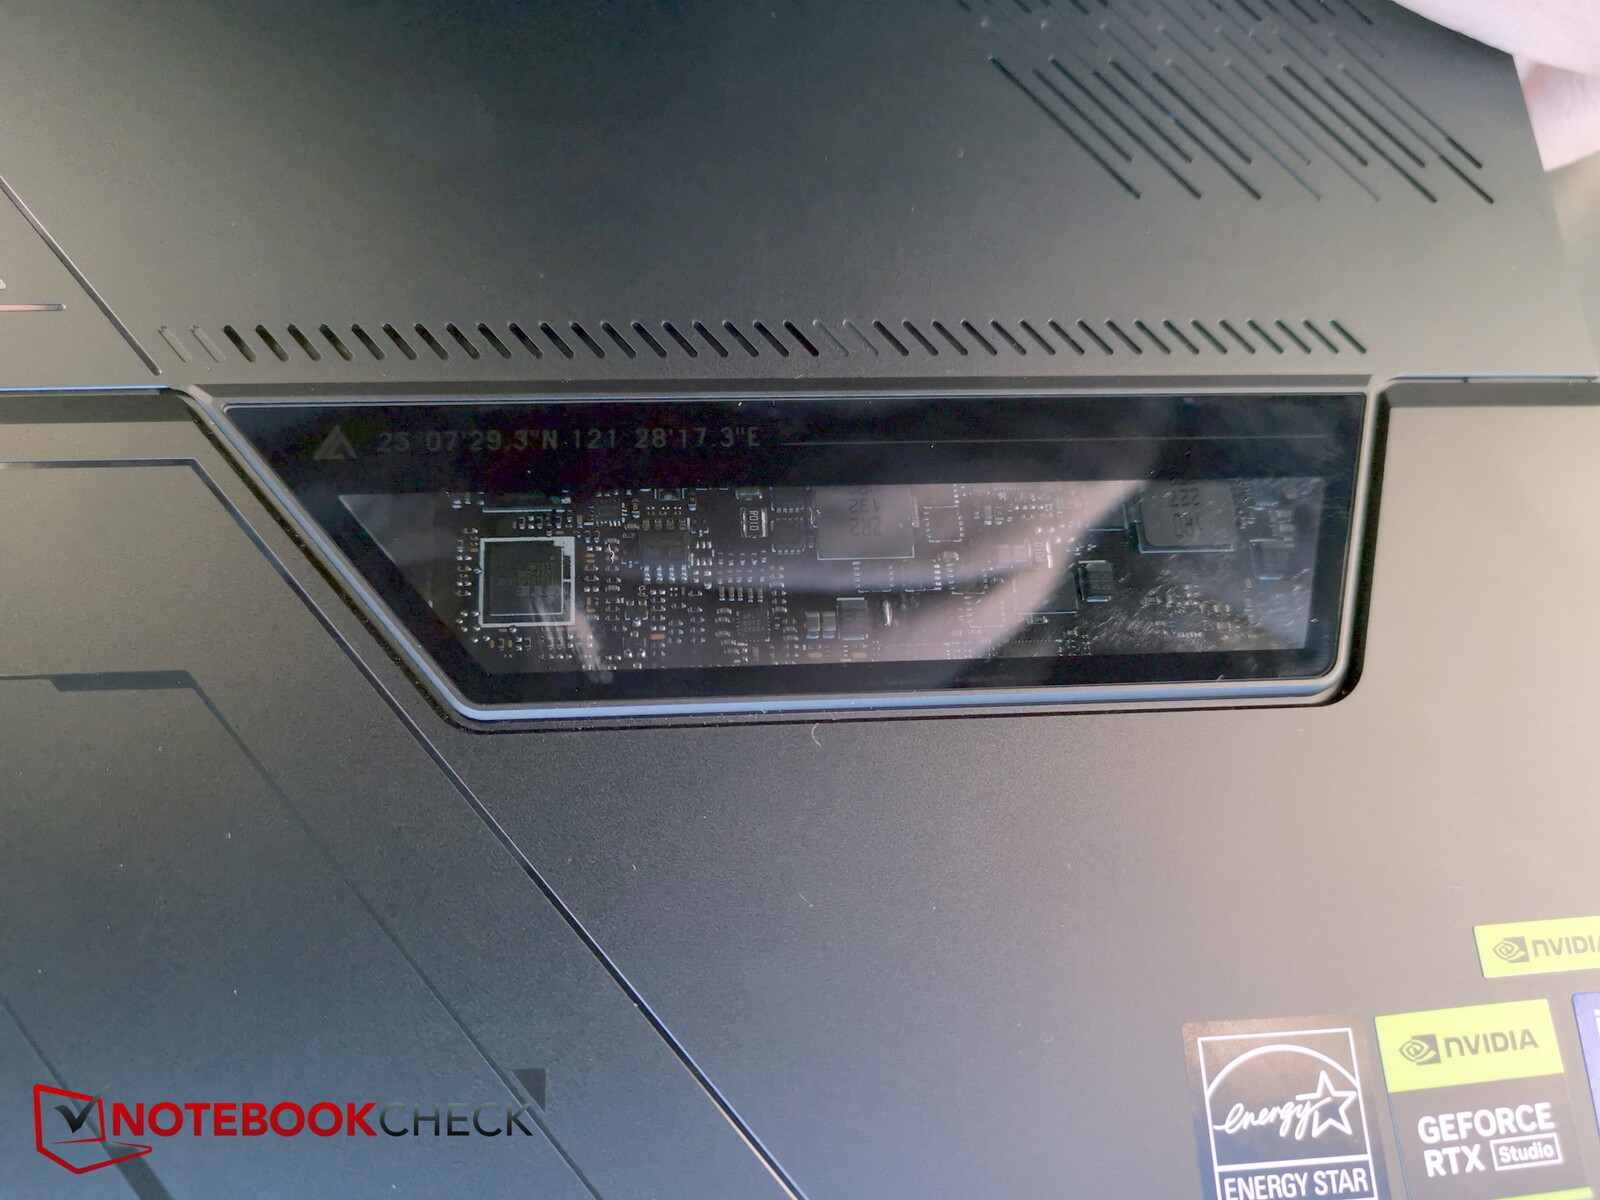
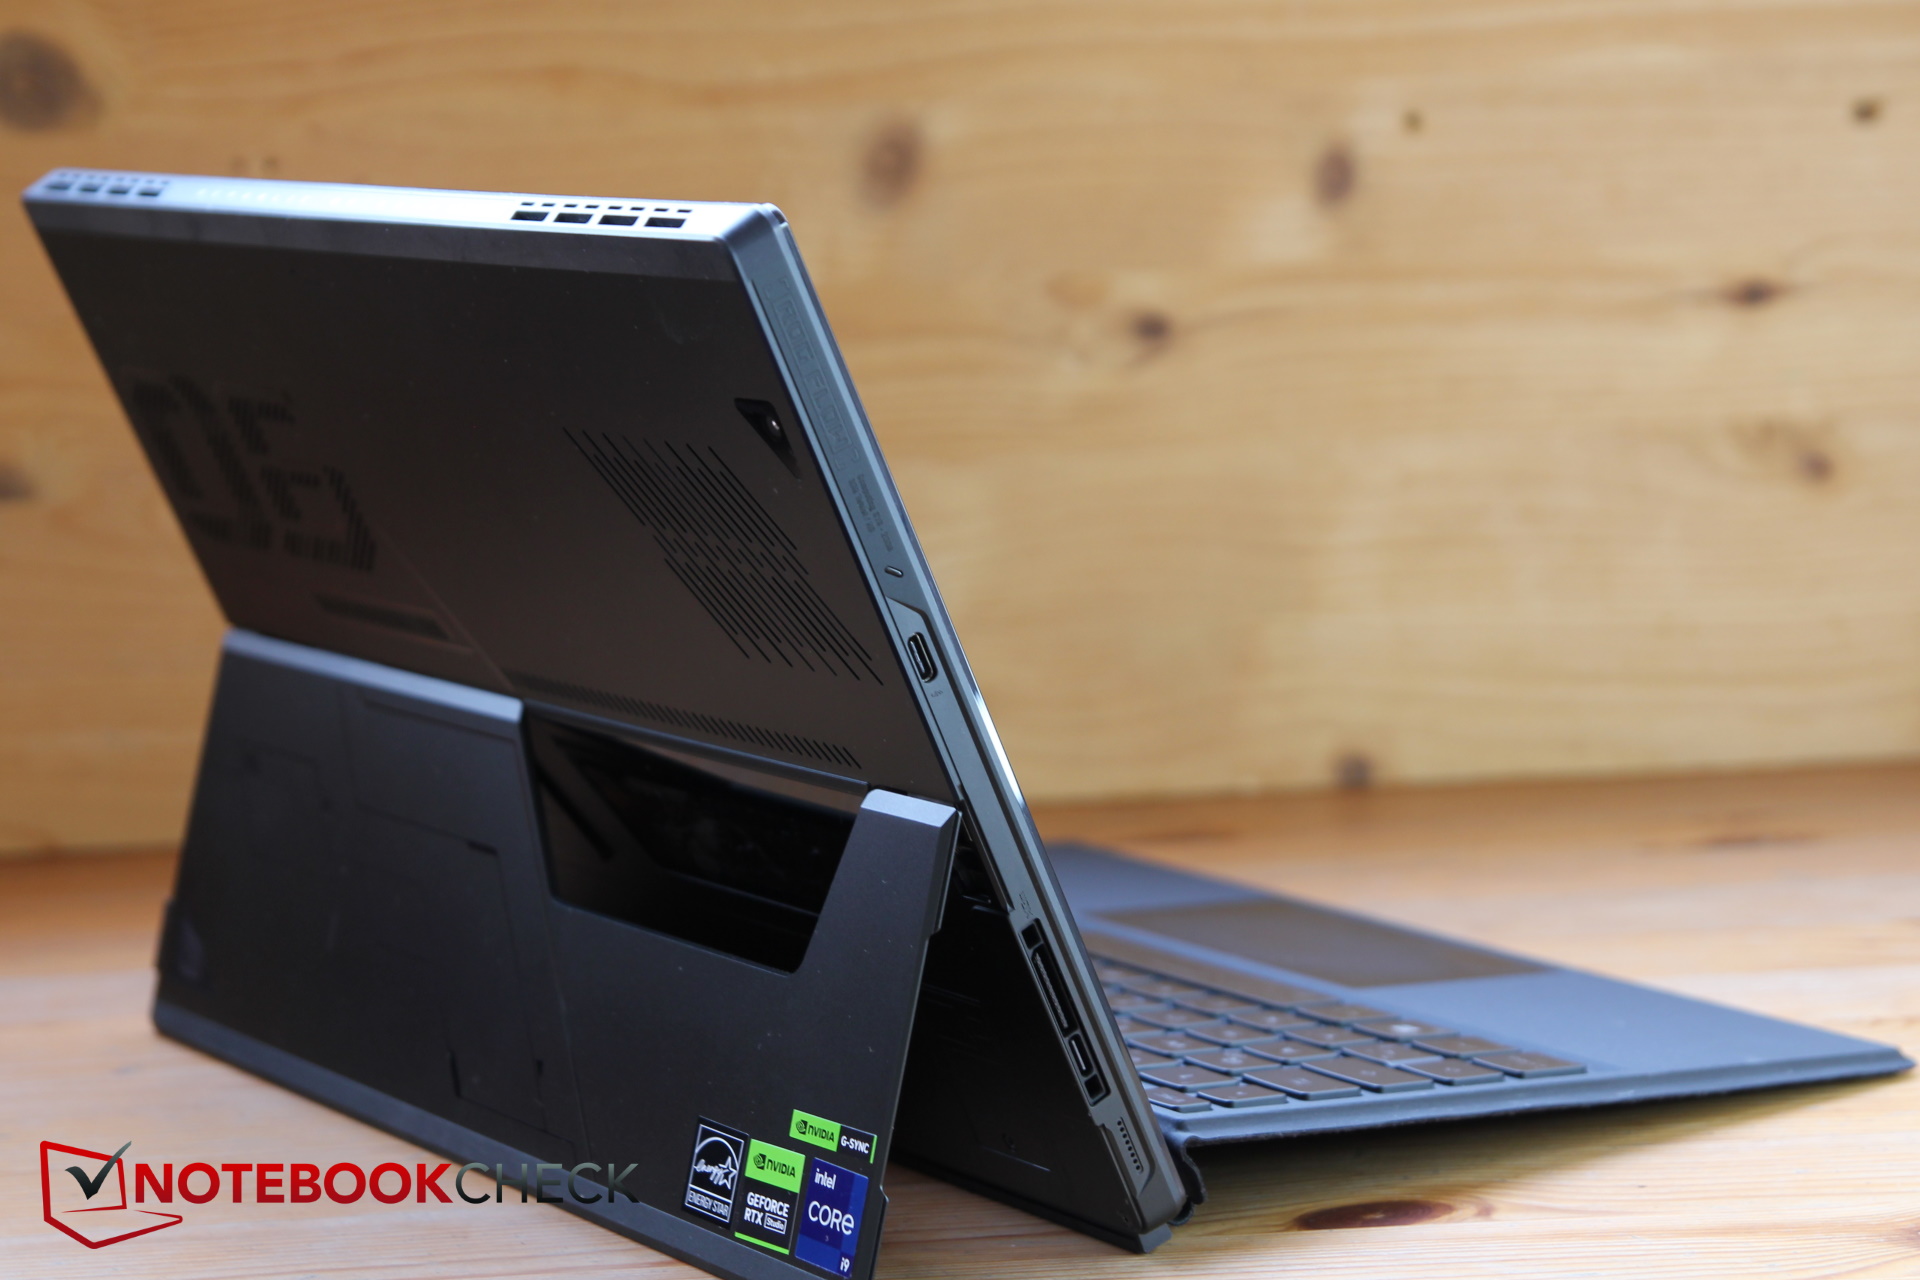
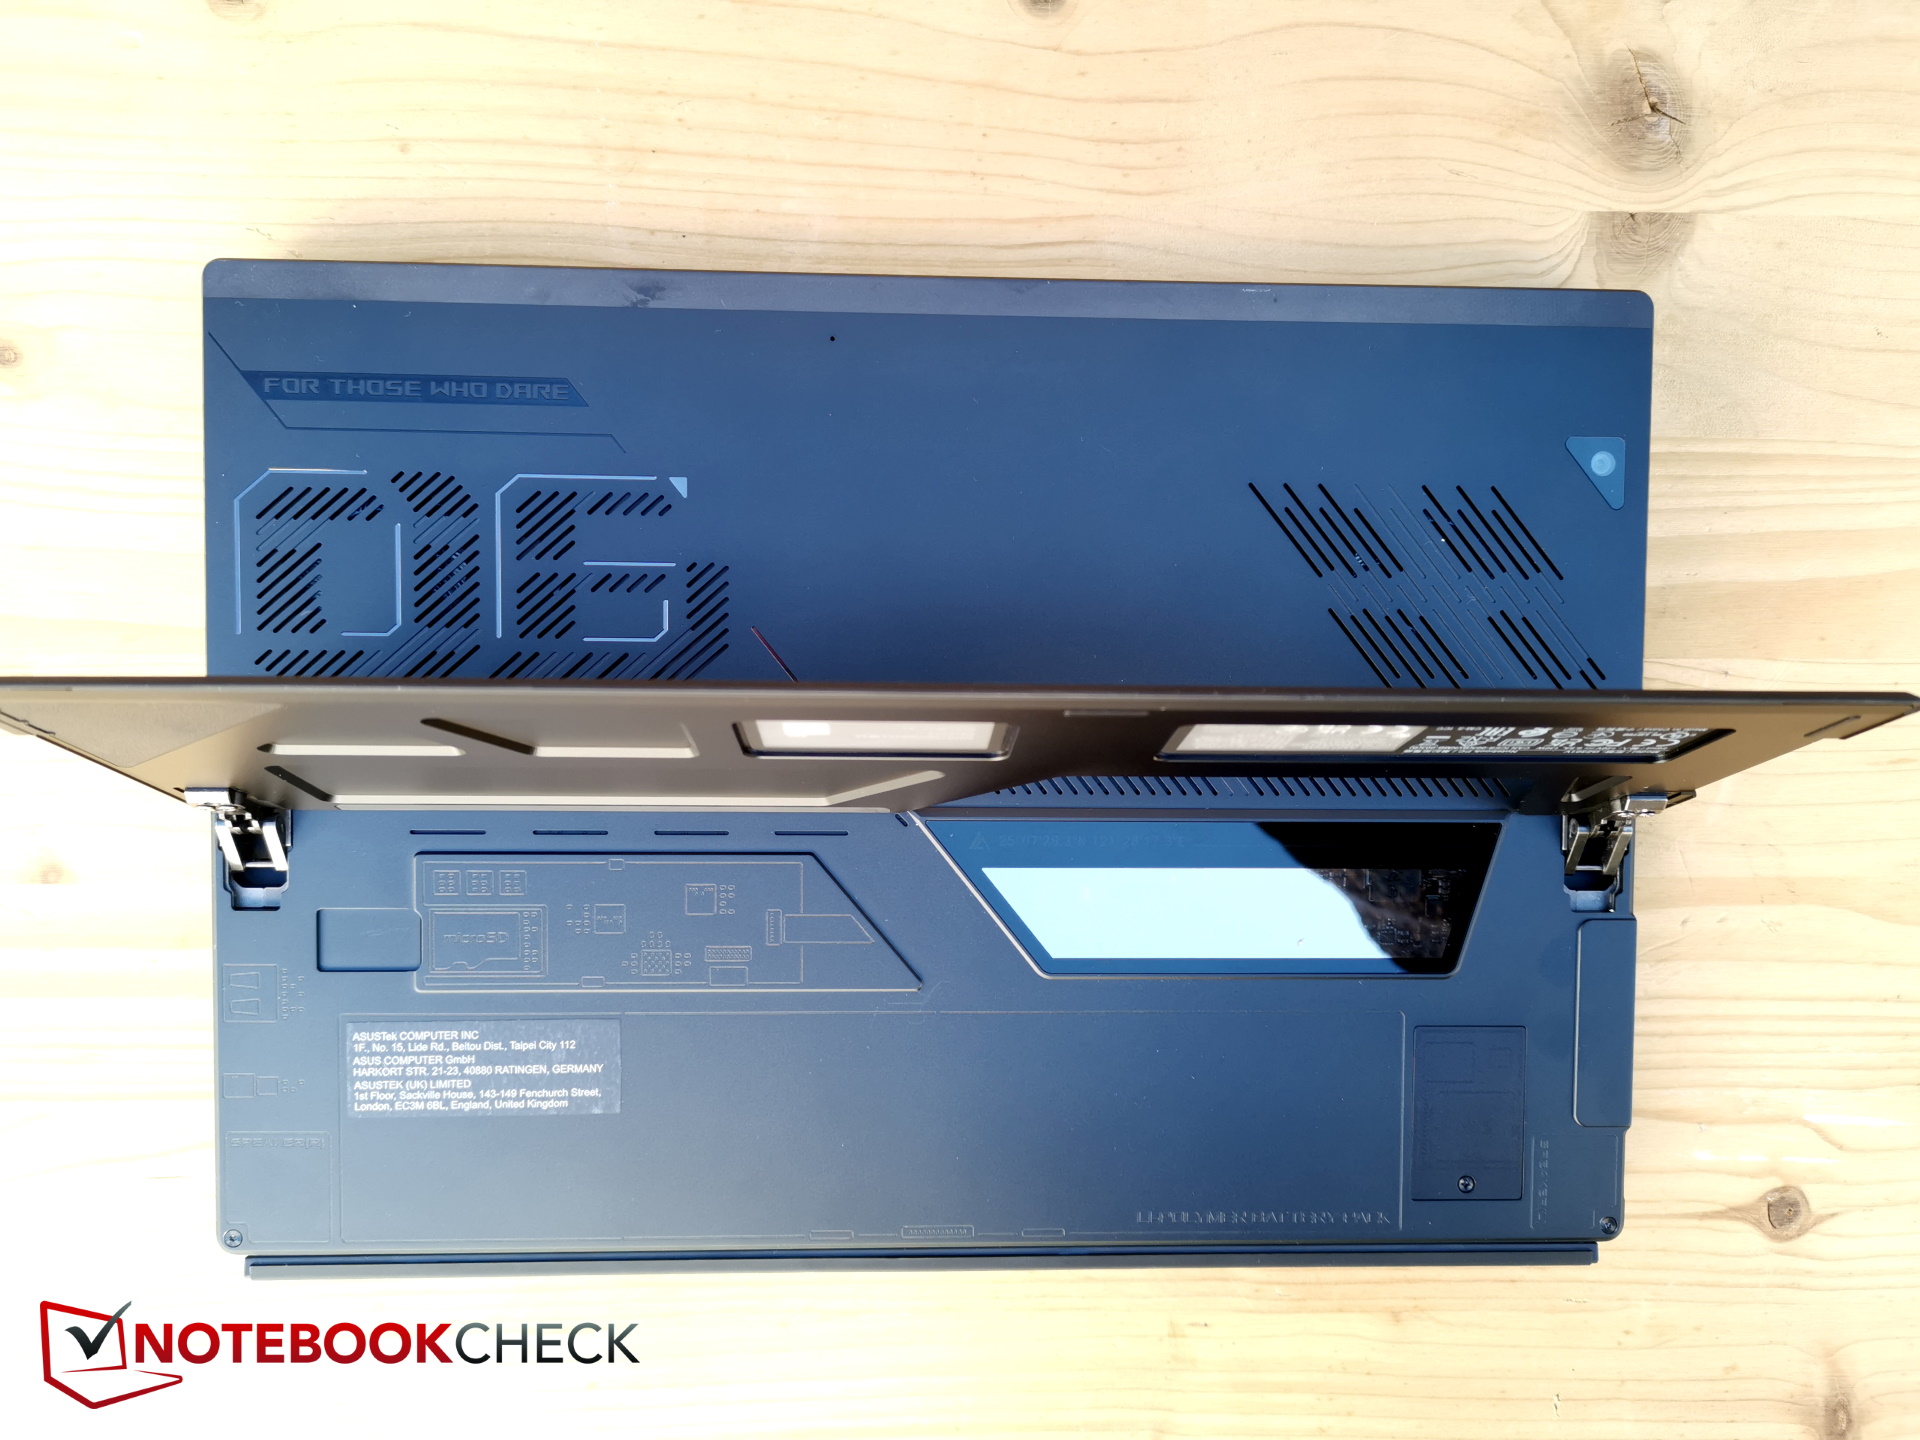
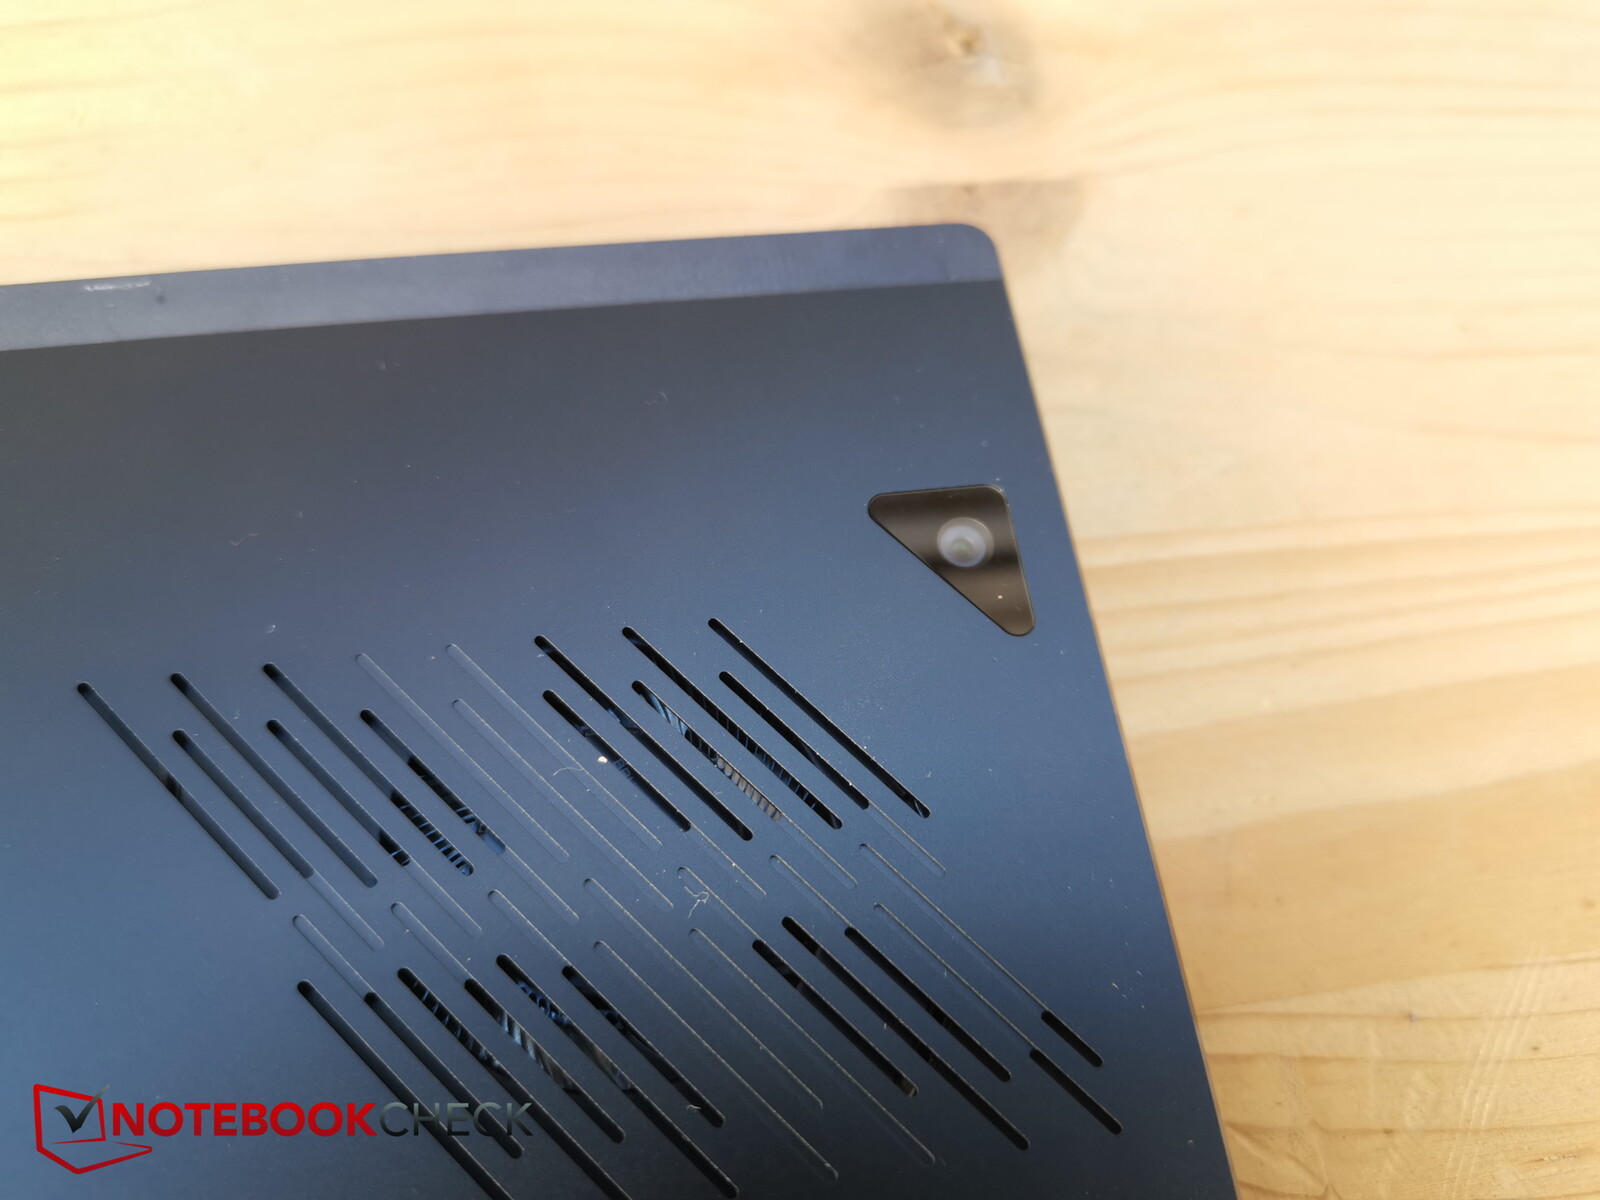
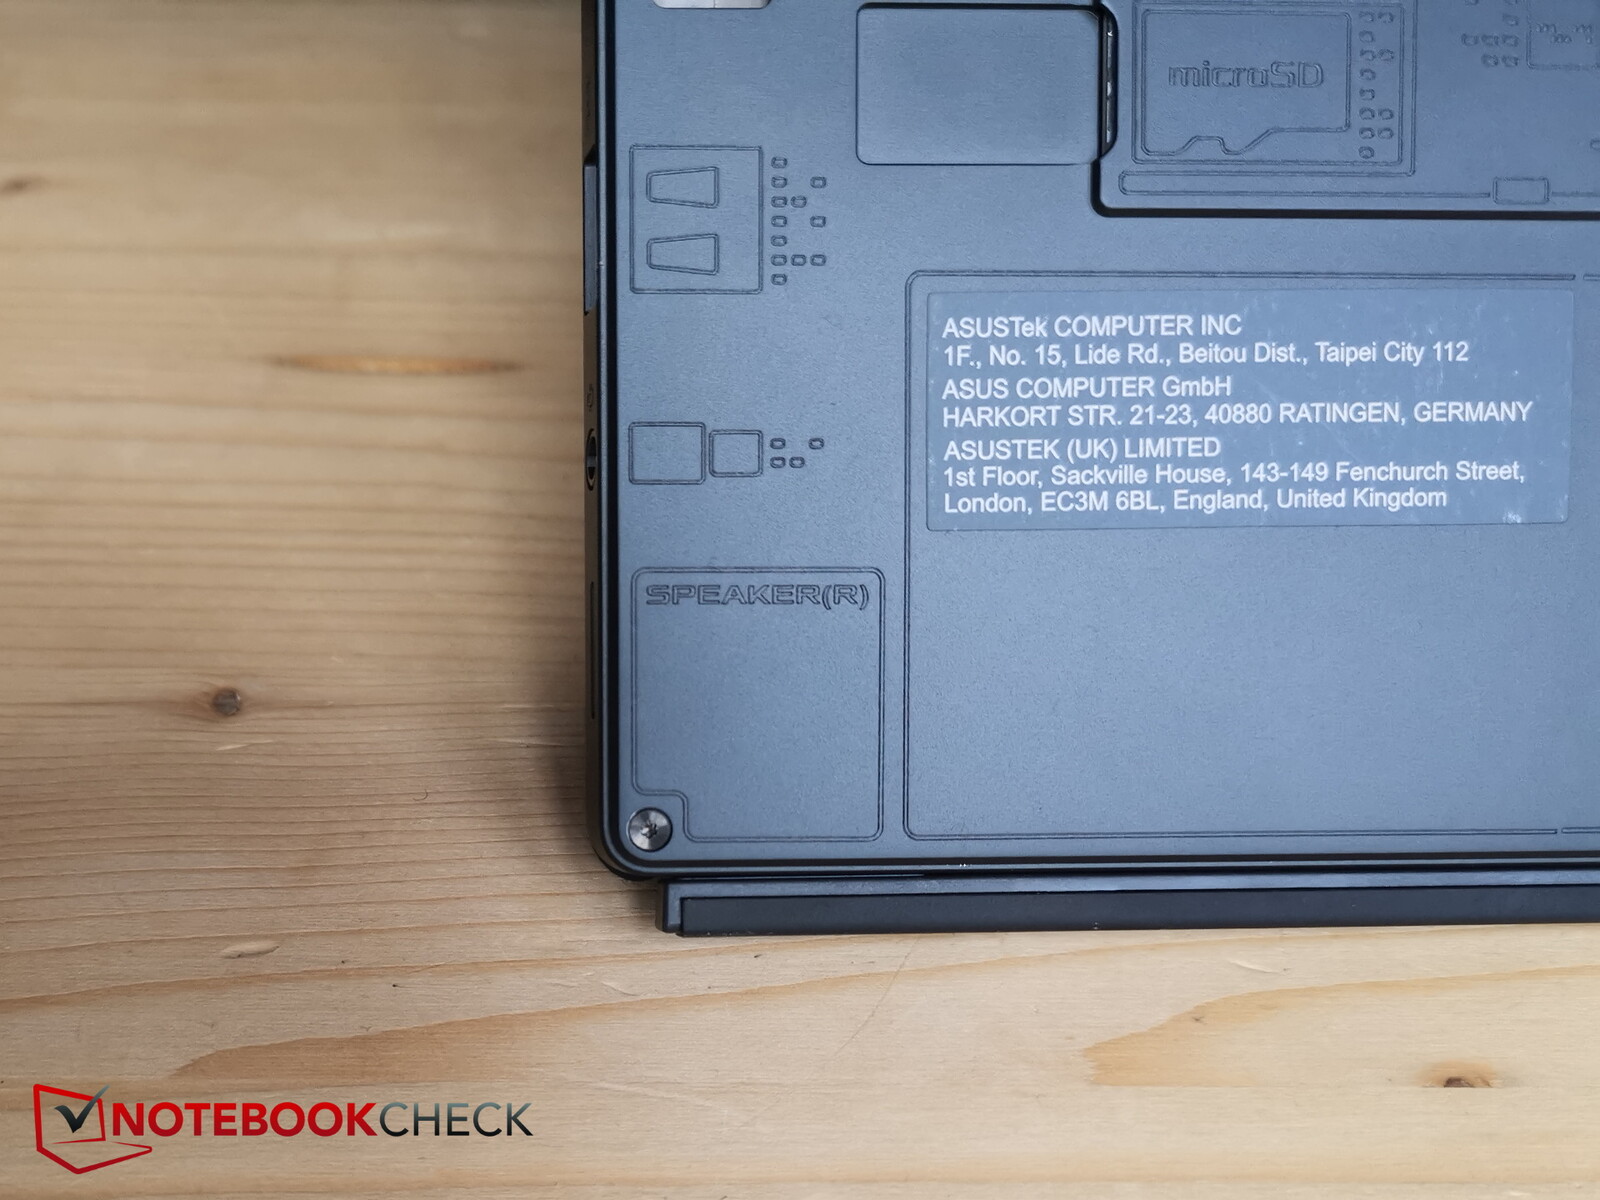
Nawet bez paska na ramię czy niemalże usztywnionej konstrukcji edycji specjalnej, Z13 przyciąga wzrok: tył jest w większości aluminiowy, dolna połowa rozkłada się jako podstawka, a w środku znajduje się ciekawe, wąskie "okienko" z widokiem na wewnętrzne wyposażenie gamingowego tabletu.
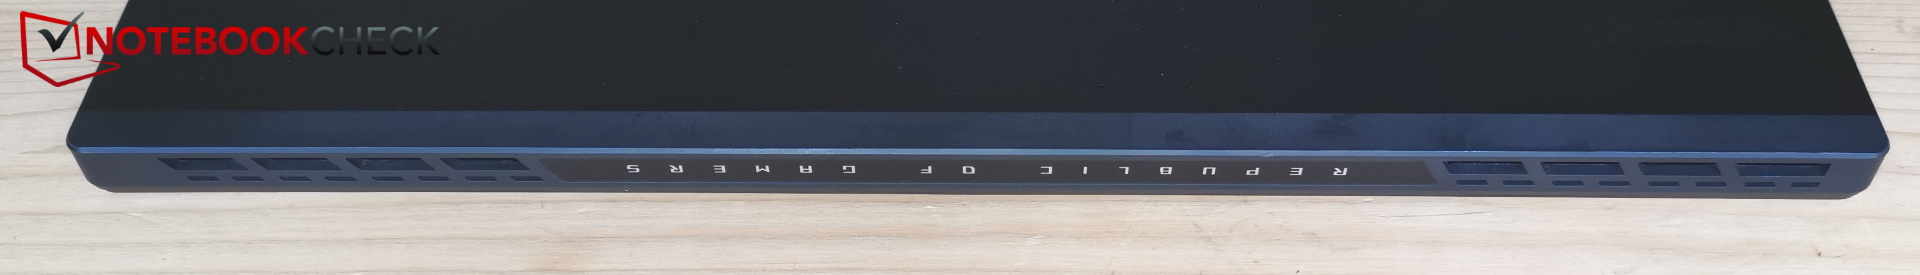
Otwory wylotowe znajdują się u góry na dwóch rogach oraz na plecach. Główna kamera z tyłu wtapia się niemal niepozornie w ogólnie stylowy design na górze po prawej stronie.
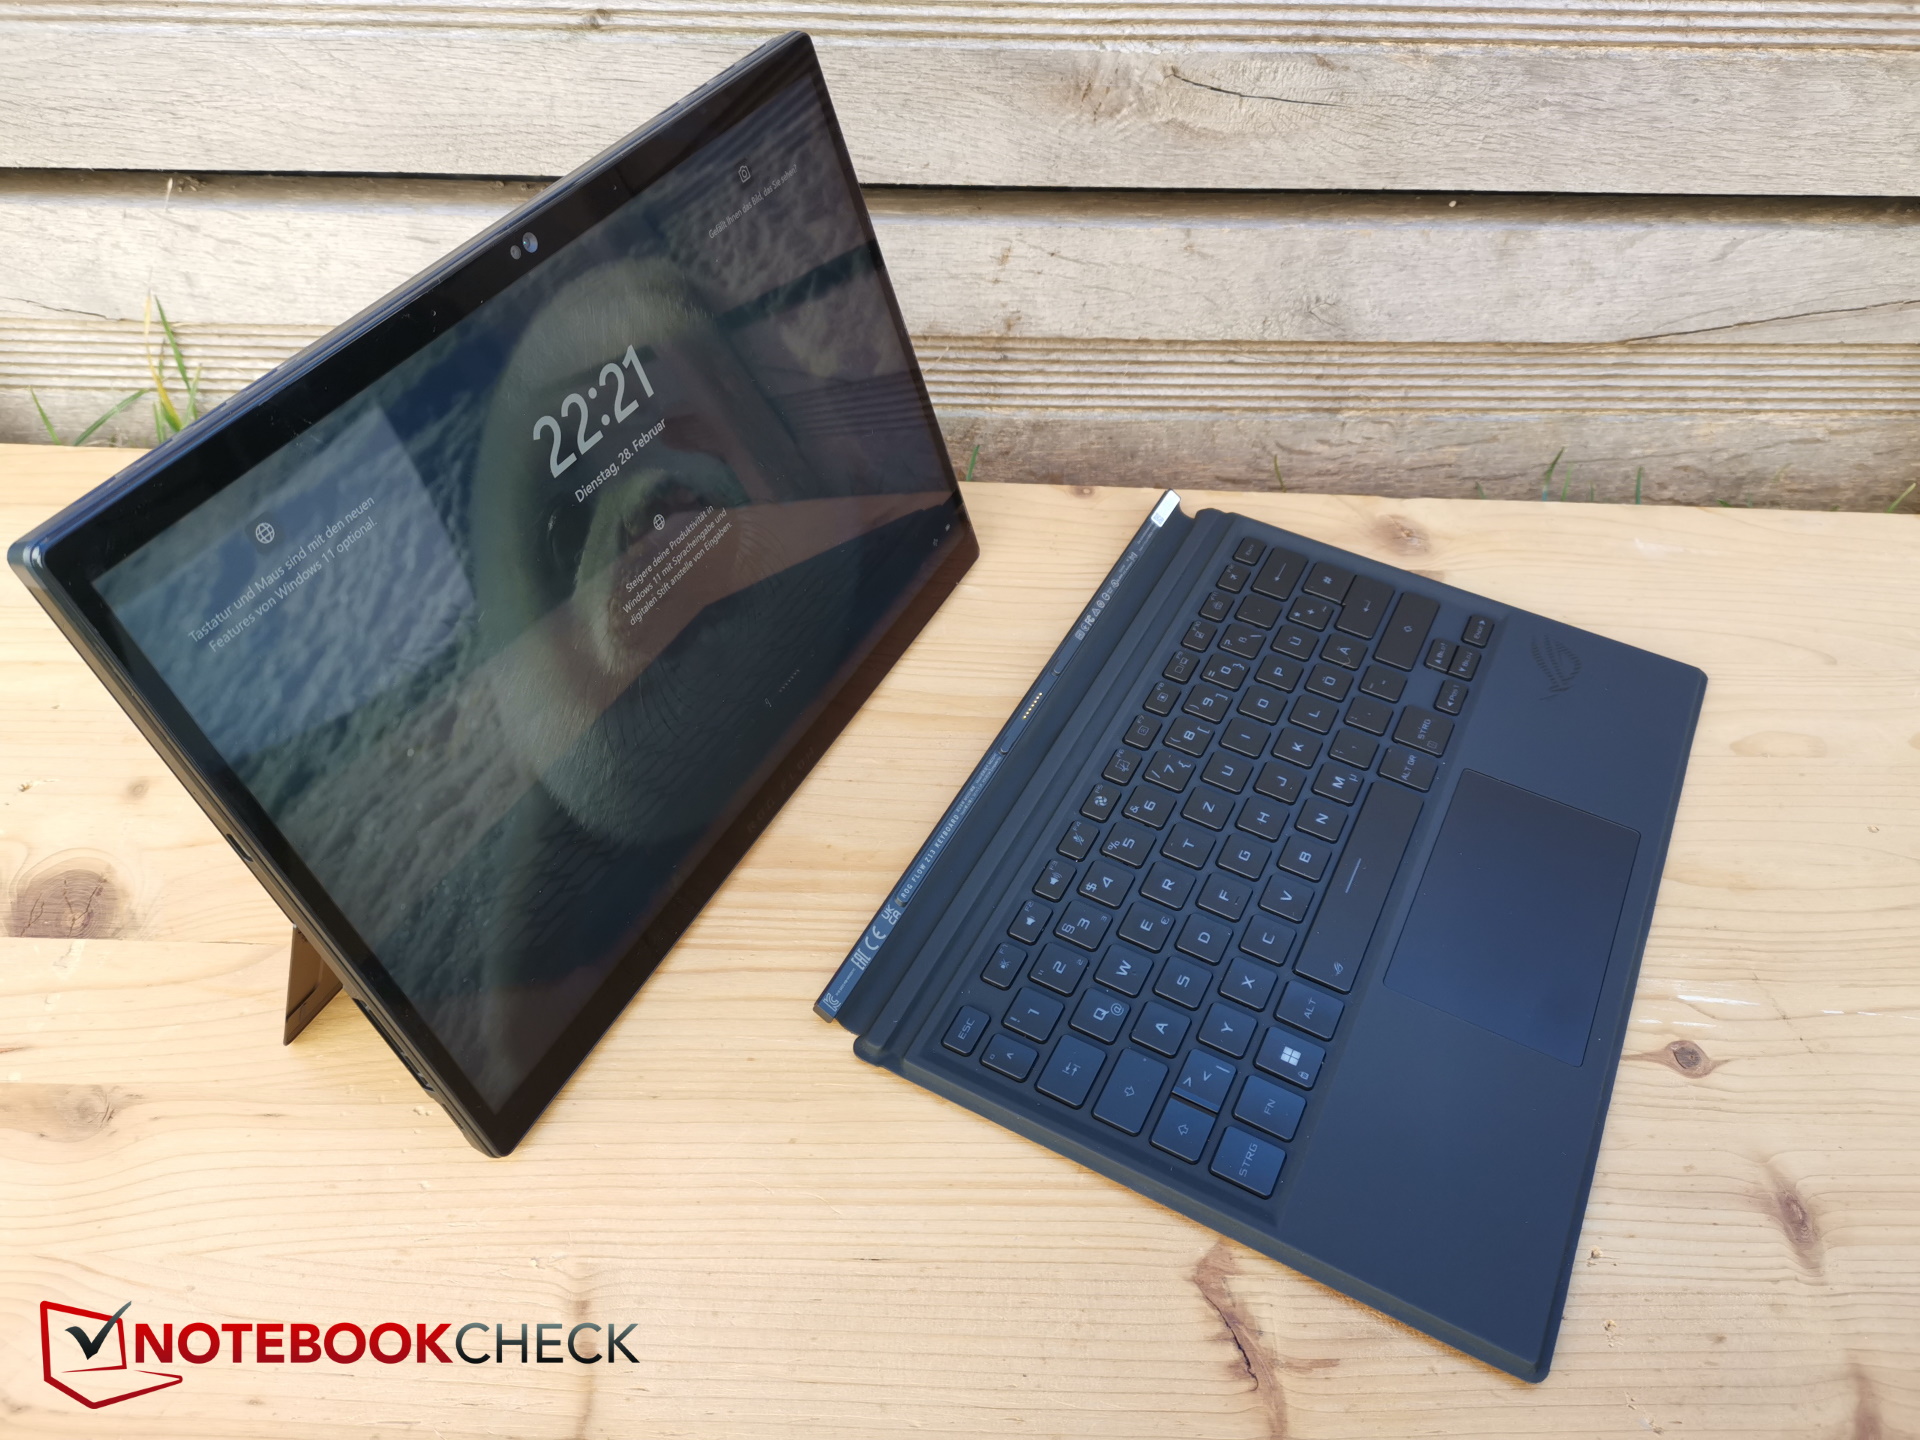
Sam tablet dzięki aluminiowej obudowie i ogólnej grubości jest bardzo stabilny i nie da się go wykręcić. Zawiasy podstawki są również bardzo stabilne i utrzymują tablet w dobrej pozycji podczas stania.
Pokrywa z klawiaturą jest dokowana magnetycznie. Oczywiście cienka stacja dokująca jest trochę mniej odporna na skręcanie, ale spełnia swoją rolę.
Jak na 13-calowy tablet, Z13 jest stosunkowo gruby i ciężki. Trudno się temu dziwić, biorąc pod uwagę potężny sprzęt, a urządzenie jest wciąż imponująco małe w porównaniu z dużo większymi laptopami do gier. Całkowita waga obejmuje klawiaturę, natomiast sam tablet waży około 360 g mniej.
Zarejestrowane wymiary przedstawiają jednak tablet bez stacji dokującej z klawiaturą. Z klawiaturą szerokość wzrasta do 21,1 cm, a grubość do około 1,8 cm, czyli nadal poniżej wymiarów bardziej wybrzuszonej edycji specjalnej. Poprzednik był nieco cieńszy i miał 12 mm.
Oczywiście, inne tablety też są cieńsze, jak np. Apple iPad Pro 12.9, a mianowicie mniej niż o połowę. W zamian jest szerszy, ale też nie tak długi.
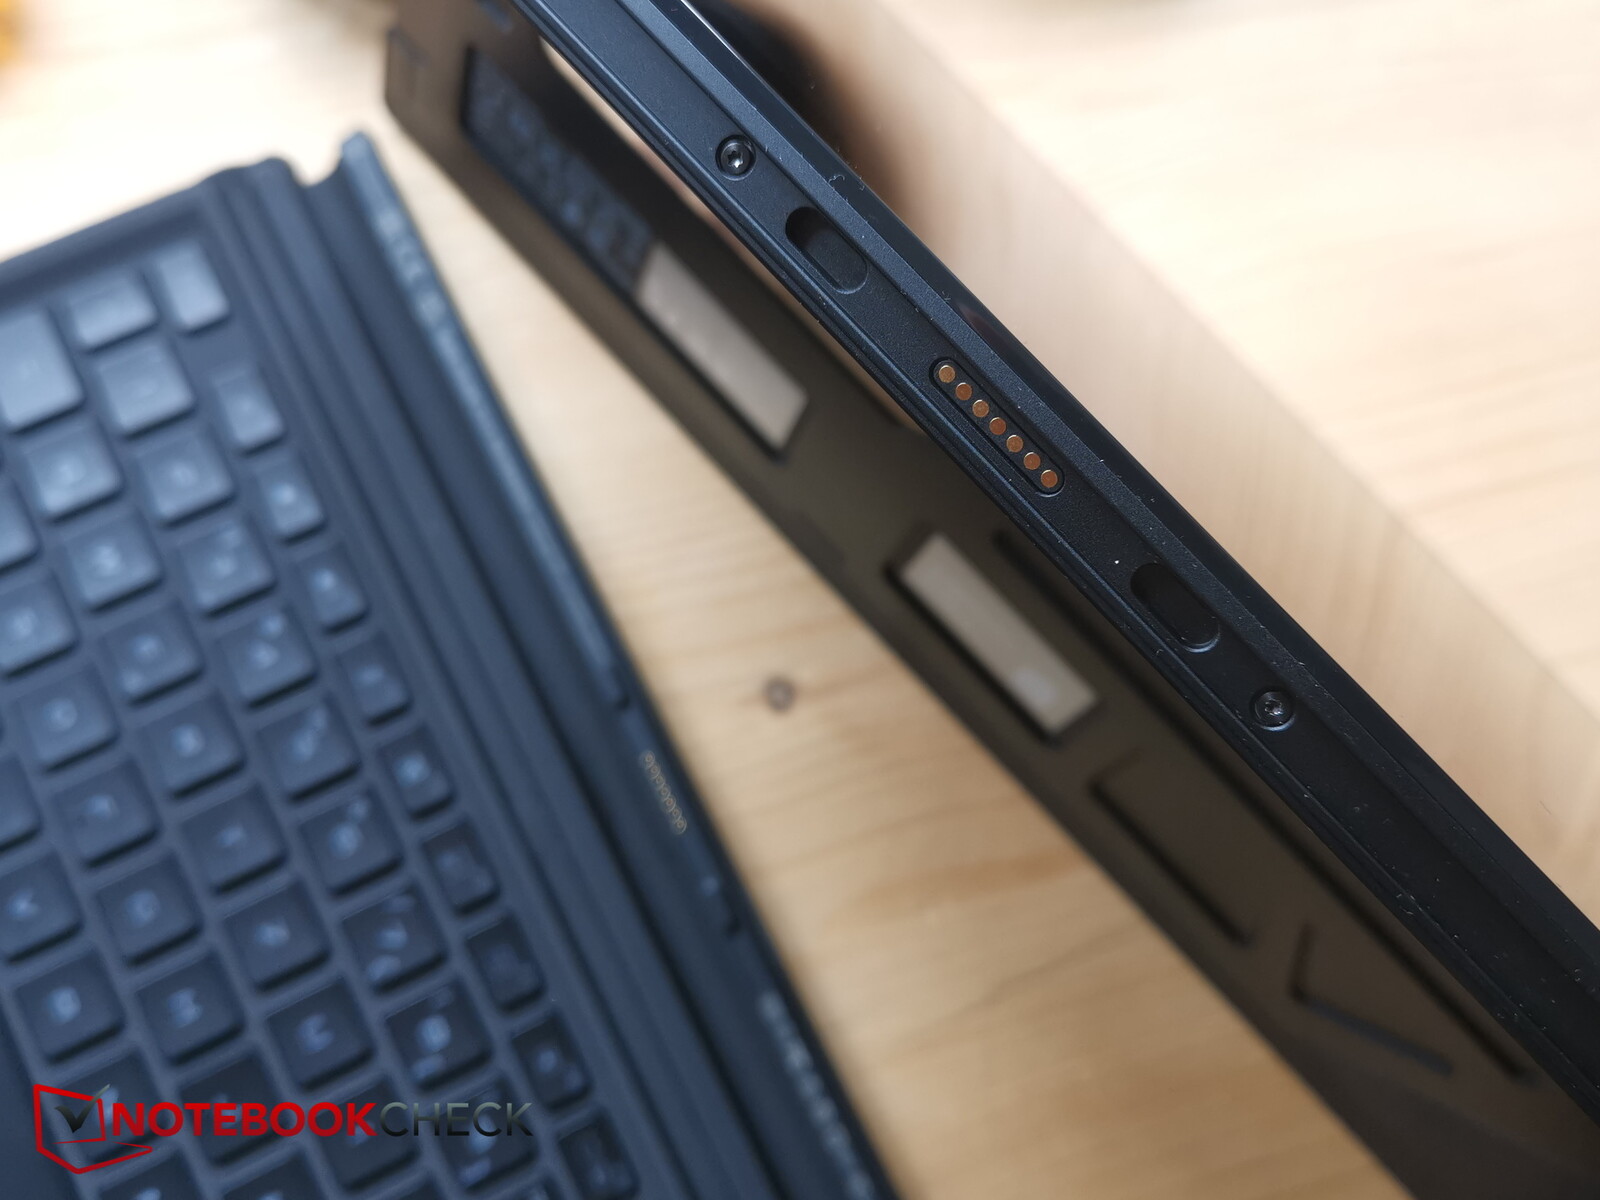
Wyposażenie - dopasowane do RTX 4090!
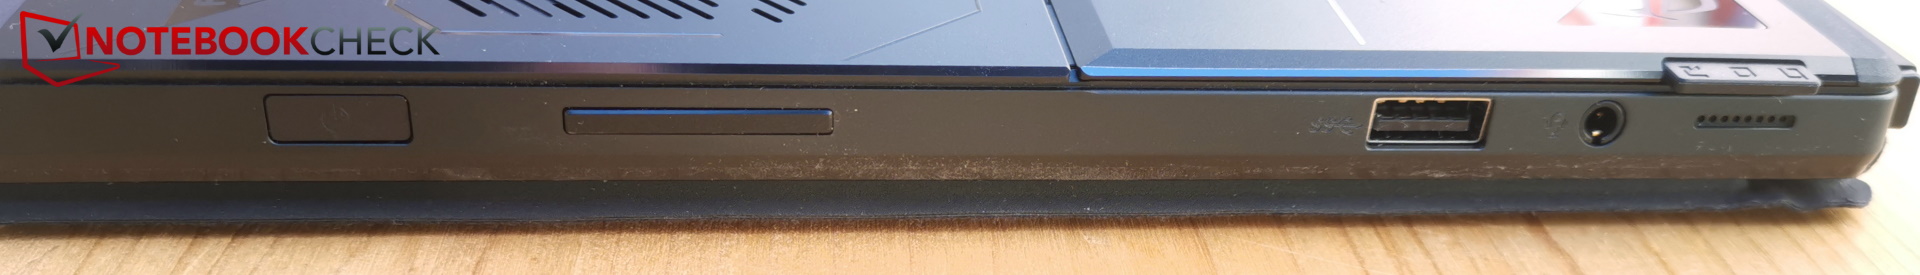
Na pierwszy rzut oka widać tylko jeden port USB-C z Thunderbolt po lewej stronie oraz jeden port USB-A i gniazdo słuchawkowe po prawej stronie. Gumowy pasek zasłania inne porty, a mianowicie port dokujący o nazwie ROG XG Mobile Interface oraz drugi port USB-C. XG Mobile to stacja dokująca z dodatkowymi portami, w której mieści się zewnętrzny RTX 4090. Za 1 999,99 USD, ROG XG Mobile kosztuje co najmniej tyle, co nasz Z13.
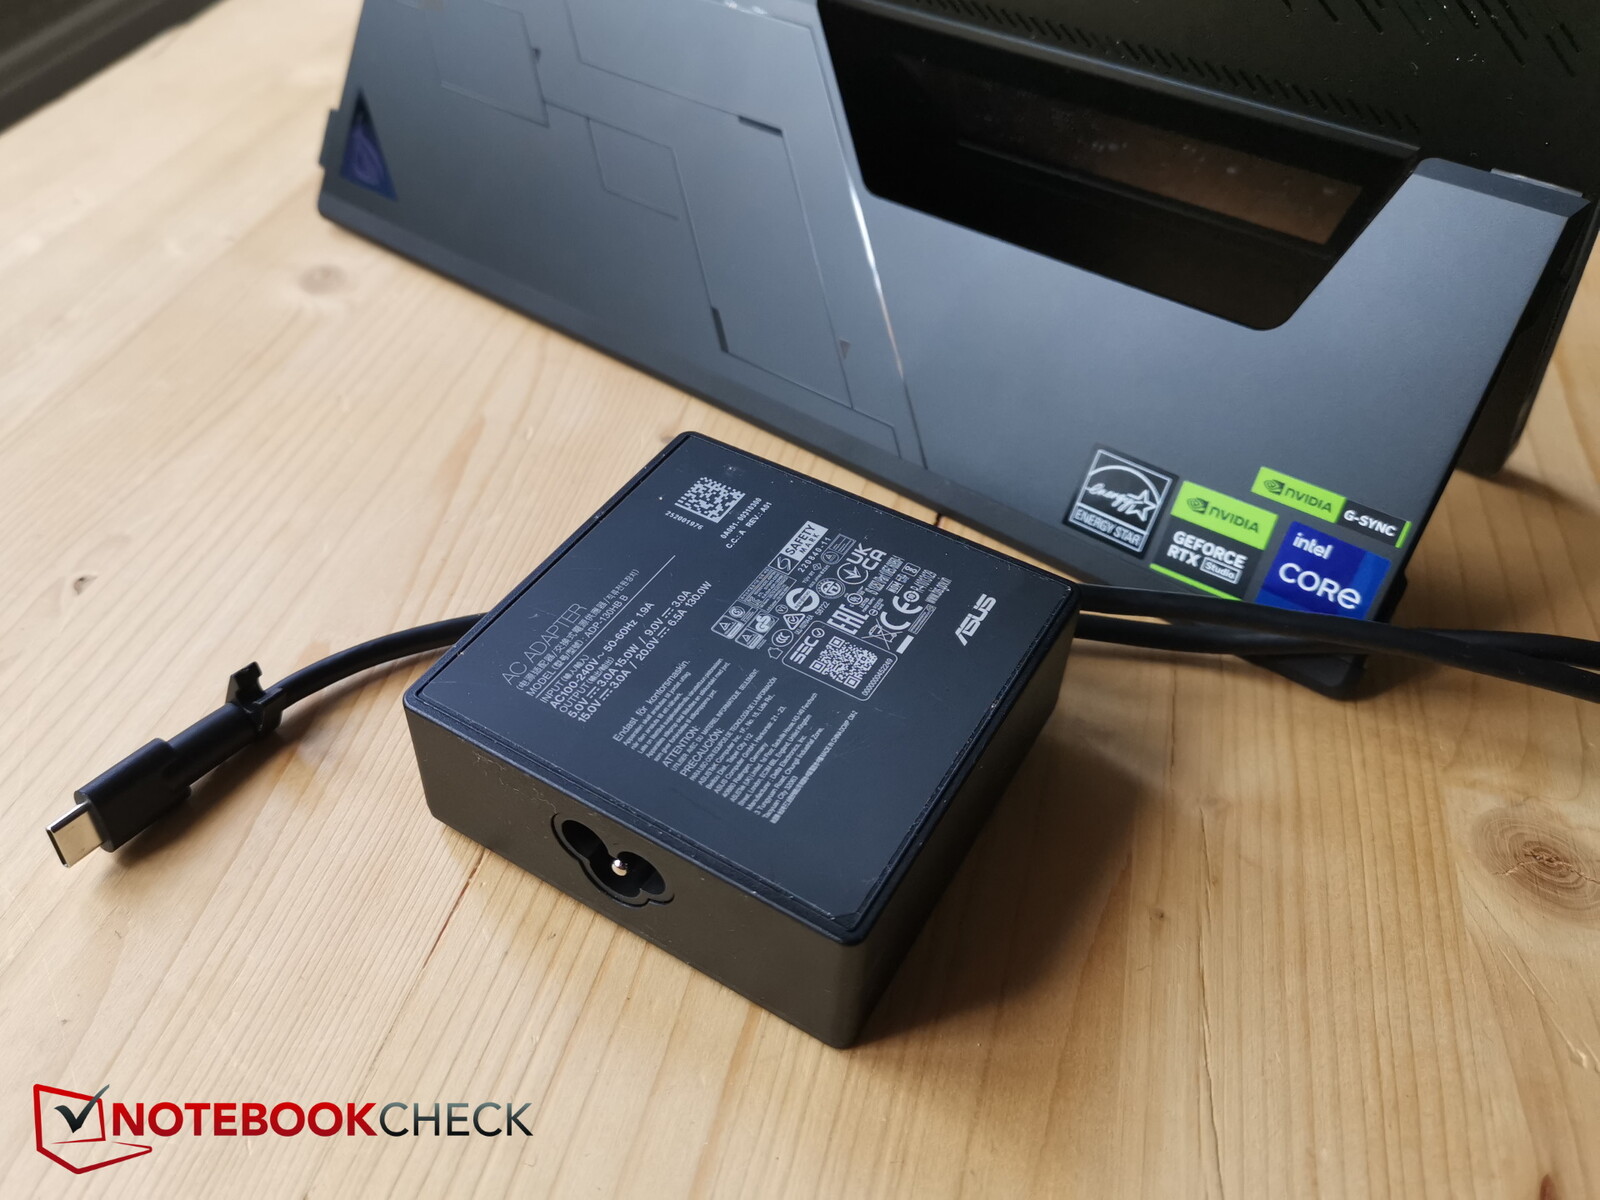
Oba porty USB-C obsługują DisplayPort i Power Delivery, więc tablet może być również ładowany przez te porty. Dołączony, mniejszy 130-W zasilacz również jest typu USB-C.
Oczywiście w tablecie trzeba się obejść bez dedykowanych portów takich jak LAN, HDMI i tym podobnych. W razie potrzeby może pomóc hub UDB, to samo dotyczy podłączenia gamepadów. Przynajmniej jest czytnik microSD.
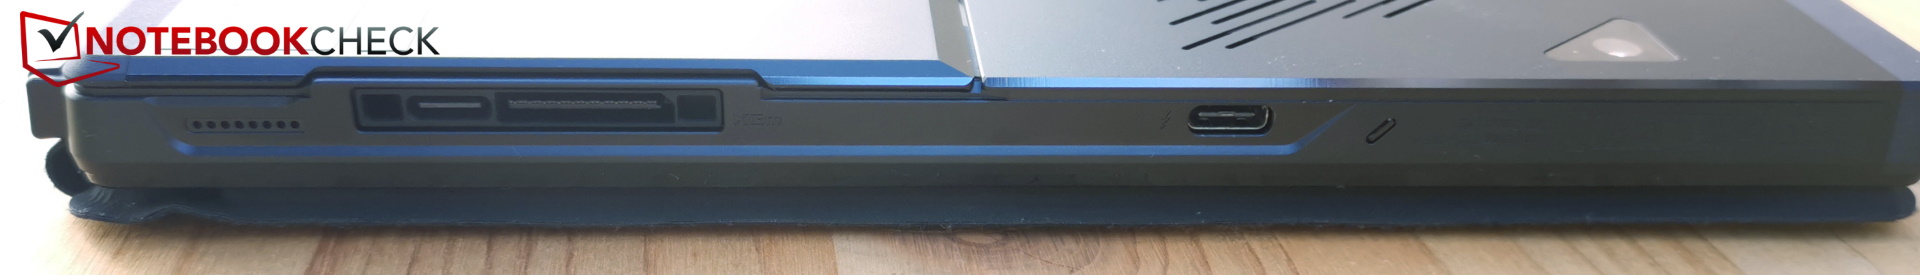
Czytnik kart SD
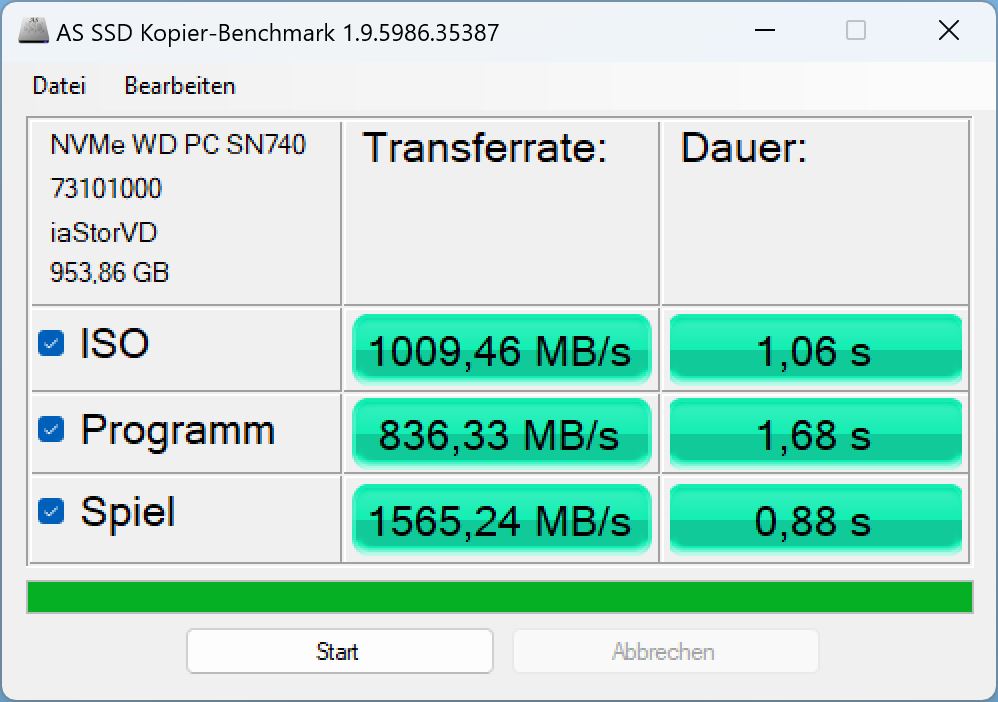
Czytnik microSD znajduje się pod podstawką, więc nie można go dosięgnąć w trybie tabletu; trzeba najpierw rozłożyć podstawkę. Czytnik potrzebował nieco ponad pięć sekund, by skopiować na pulpit 1 GB zdjęć z naszej karty referencyjnej AV PRO microSD 128 GB V60. Szybkość działania czytnika kart jest bardzo wysoka na polu porównawczym, zwłaszcza szybkość odczytu w benchmarku AS-SSD.
| SD Card Reader | |
| average JPG Copy Test (av. of 3 runs) | |
| Asus ROG Flow Z13 GZ301V | |
| Asus ROG Flow Z13 ACRNM (Angelbird AV Pro V60) | |
| Średnia w klasie Gaming (20.9 - 210, n=54, ostatnie 2 lata) | |
| Asus ROG Flow Z13 GZ301ZE (Angelbird AV Pro V60) | |
| maximum AS SSD Seq Read Test (1GB) | |
| Asus ROG Flow Z13 GZ301ZE (Angelbird AV Pro V60) | |
| Asus ROG Flow Z13 ACRNM (Angelbird AV Pro V60) | |
| Asus ROG Flow Z13 GZ301V | |
| Średnia w klasie Gaming (25.5 - 261, n=51, ostatnie 2 lata) | |
Komunikacja
Intel wyposaża AX211 w moduł Wi-Fi Wifi6E, co oznacza, że komunikuje się on również w paśmie 6 GHz i jest dość szybki oraz bardzo stabilny.
Kamera internetowa
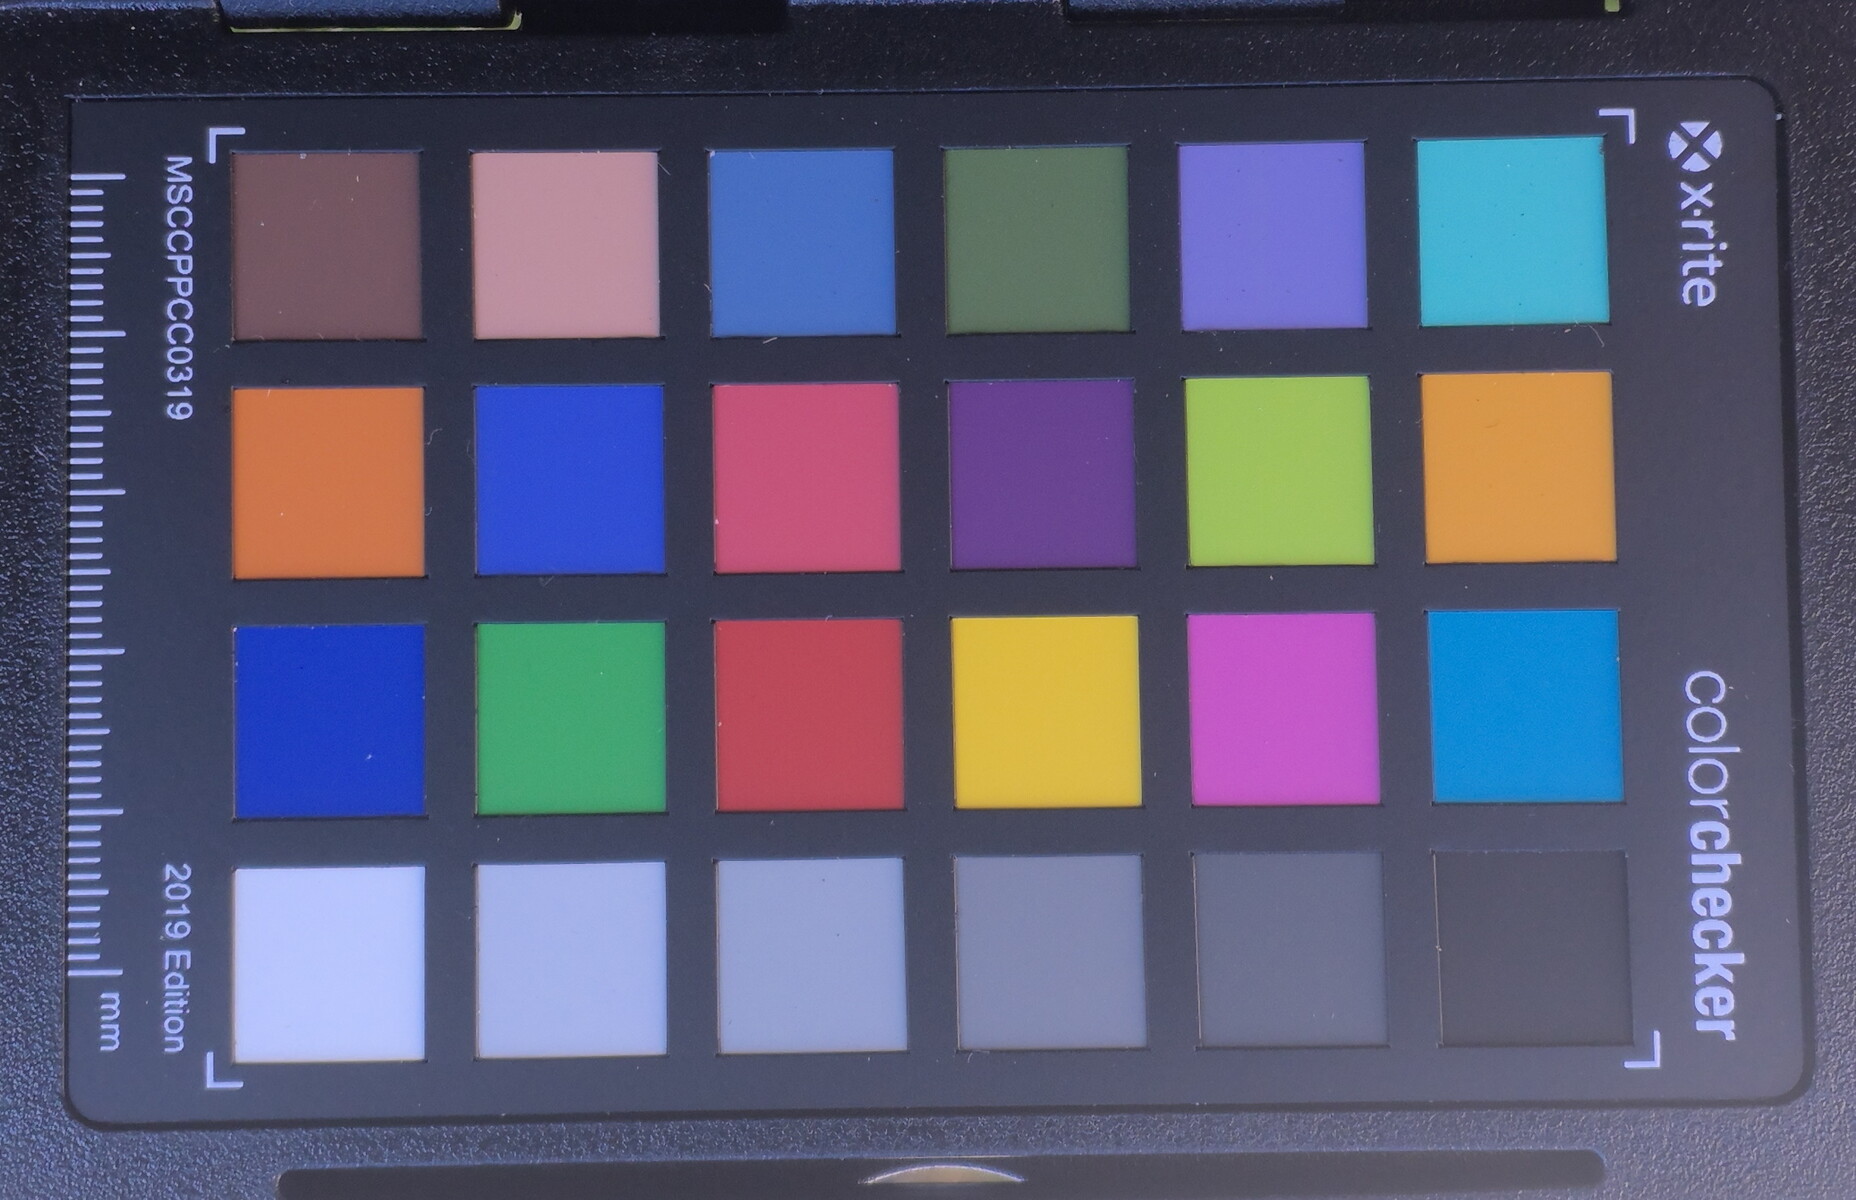
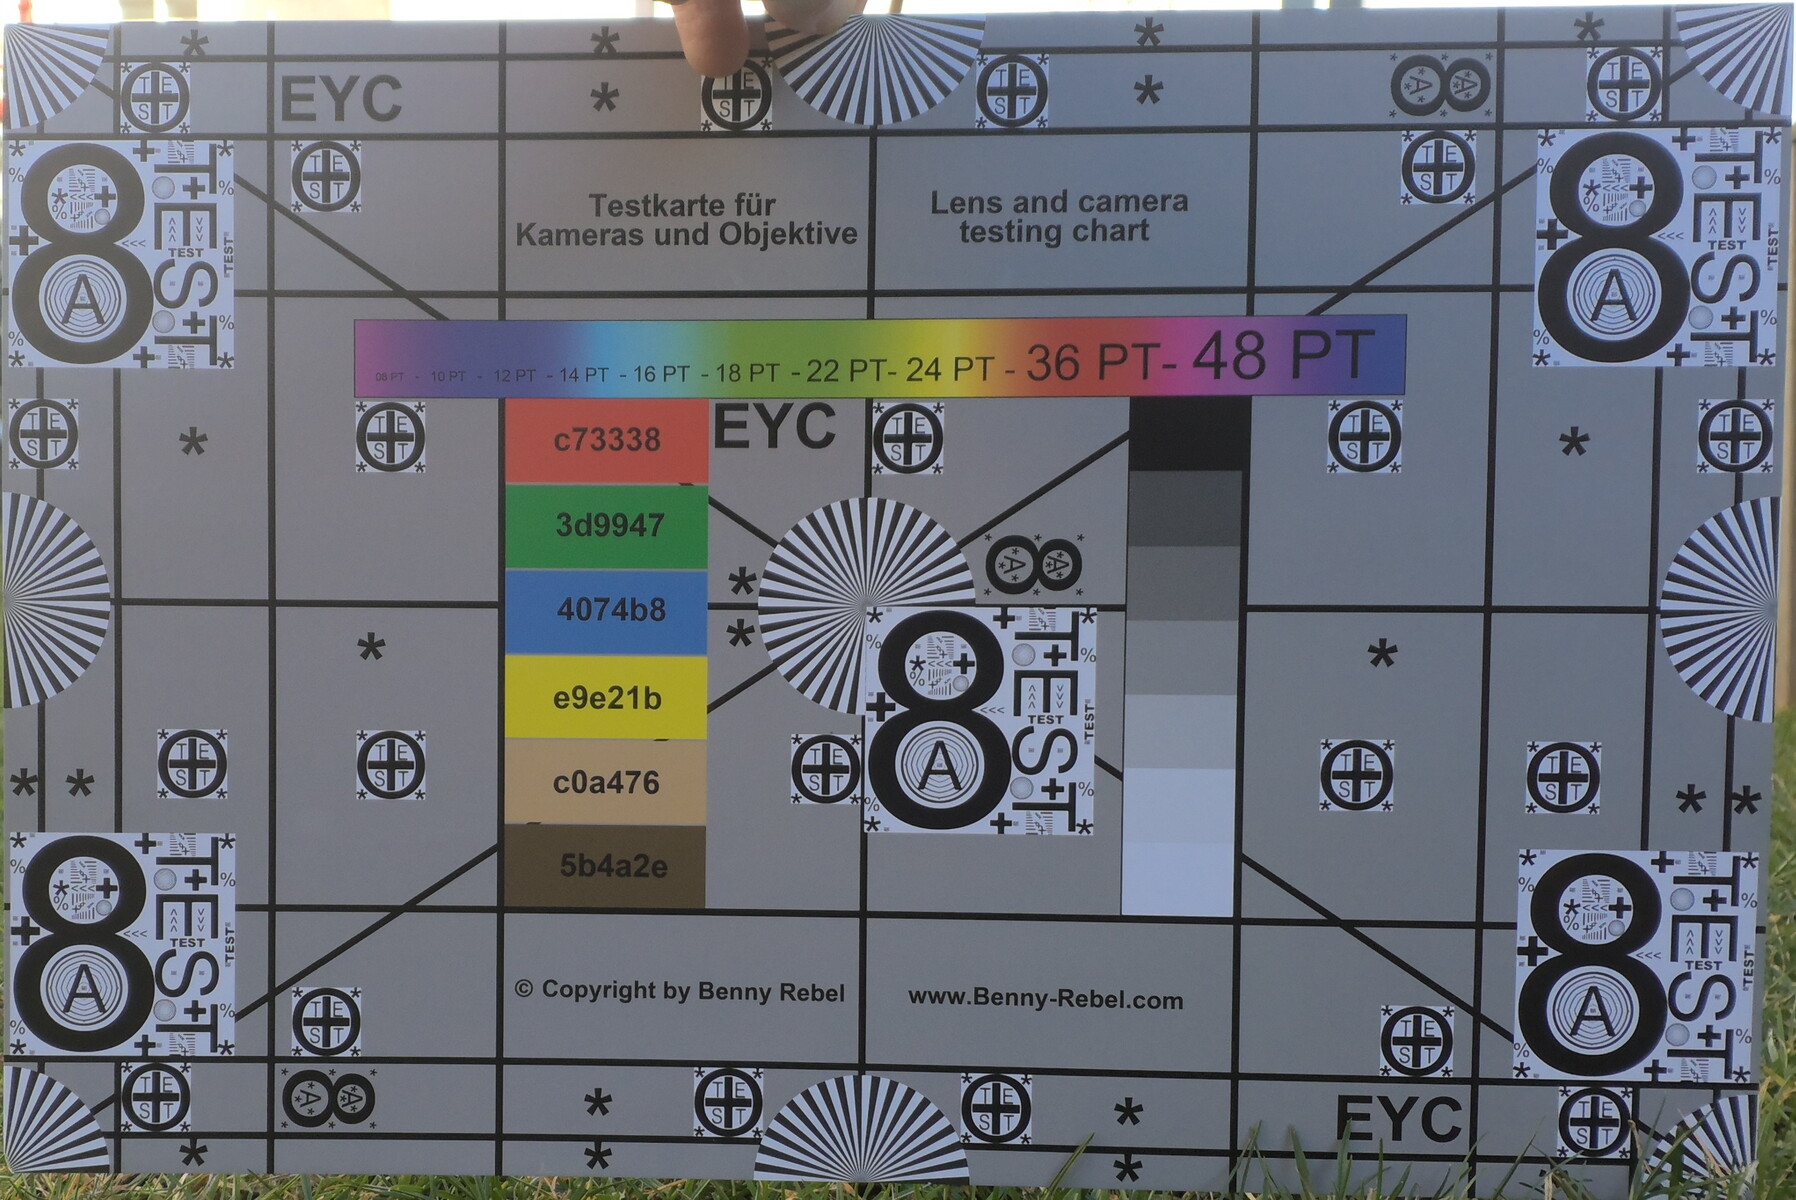
Z przodu umieszczono 5 MP kamerkę IR, która służy do robienia selfie, logowania się poprzez Windows Hello oraz prowadzenia wideorozmów. Jak zwykle w przypadku tabletów, z tyłu znajduje się także główna kamerka, której rozdzielczość wynosi 13 MP.
Filmy i zdjęcia nadal rejestrowane są "tylko" w rozdzielczości 2 MP lub Full HD, ale jakość kamerki jest znacznie lepsza niż w większości modeli laptopów, szczególnie w nieoptymalnych warunkach oświetleniowych. Co prawda występują pewne zakłócenia obrazu, a czerwień ma zbyt duże odchylenia barwne, ale i tak kolory i kontrasty robią wrażenie.
Kamera jest taka sama jak w edycji specjalnej. Nasza wideorecenzja https://www.youtube.com/watch?v=ORXFWsPgZmY&feature=youtu.bezawiera ujęcia testowe obu aparatów i mikrofonów.


Bezpieczeństwo
TPM 2.0 jest na pokładzie, ale brakuje innych funkcji, takich jak Kensington czy czujnik linii papilarnych. Oprócz TPM, Asus zawiera również zabezpieczenia "BIOS Administrator Password" i "User Password Protection", co nam się podoba.
Akcesoria
W zestawie z Z13 znajduje się pokrowiec na klawiaturę i zasilacz 130 W USB-C, ale nie ma innych akcesoriów.
Oczywiście dodatkowym akcesorium jest XG Mobile Interface. To hub i eGPU (RTX 4090) w jednym, ale kosztuje dodatkowo 1 999,99 USD.
Konserwacja
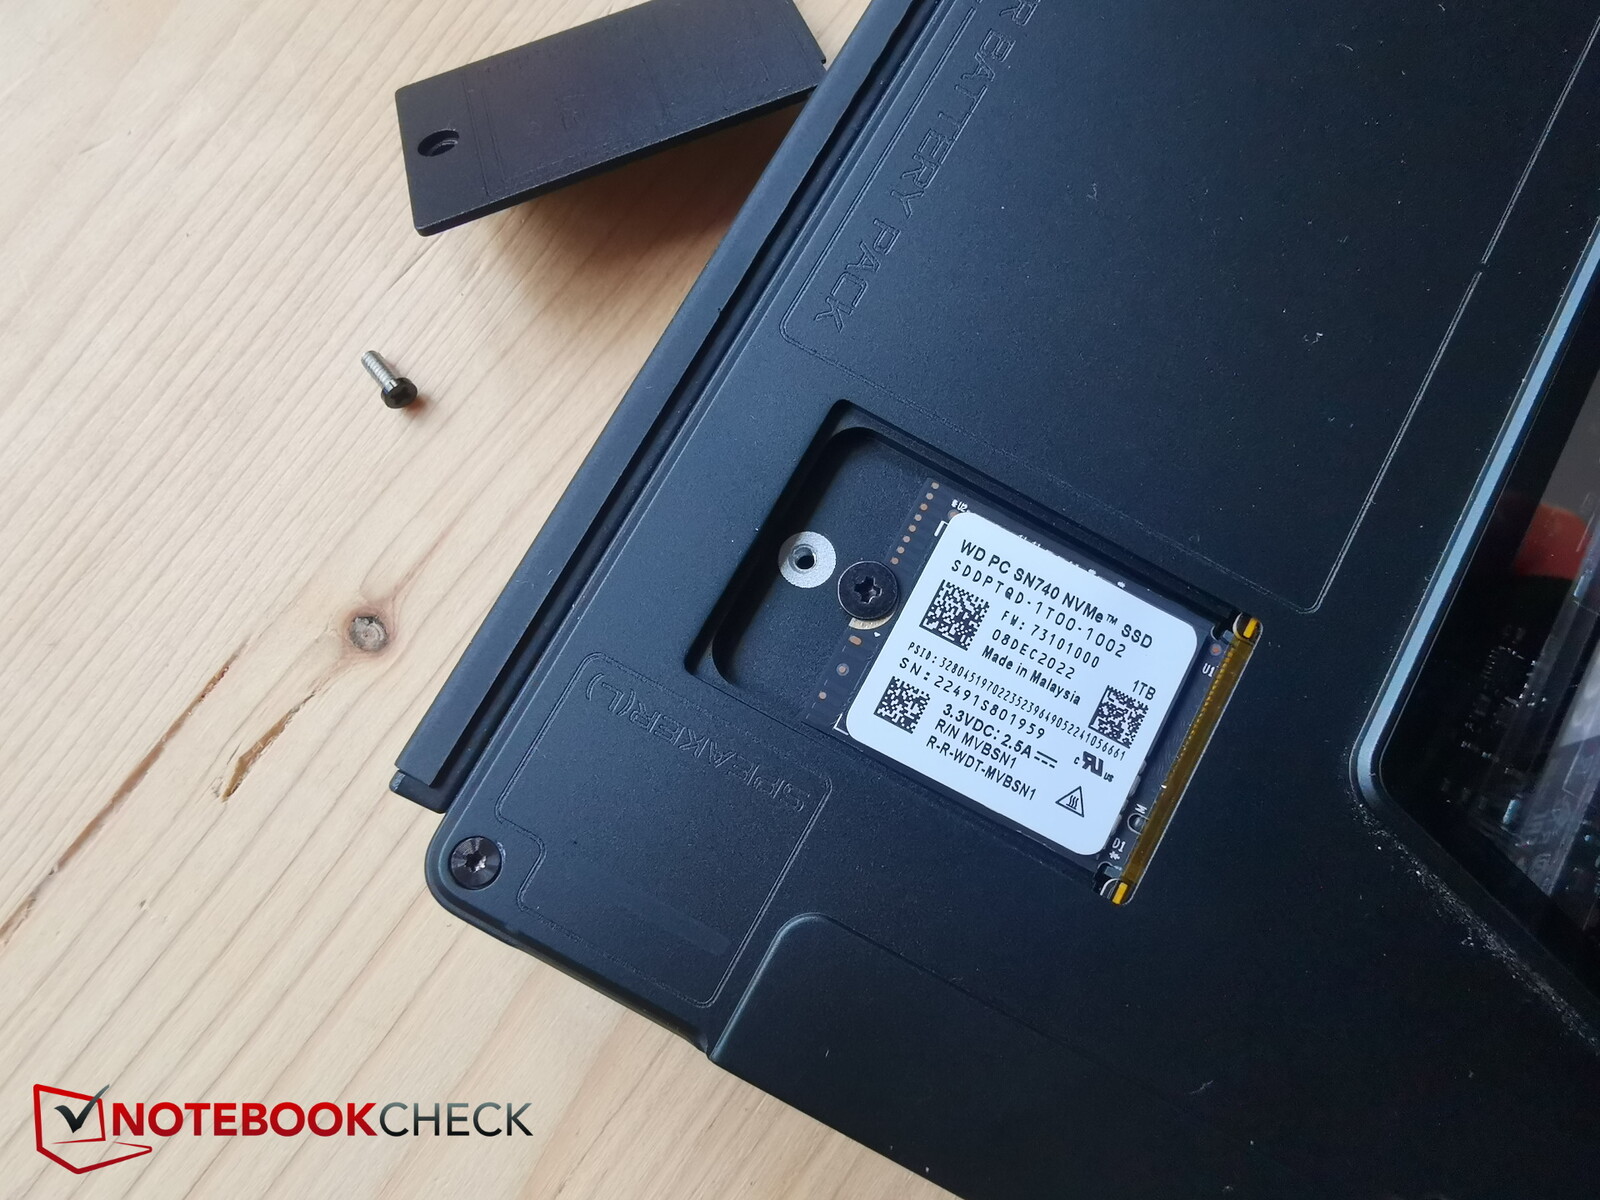
Jasne, granie na tablecie jest niesamowite, ale gdy przychodzi do konserwacji, napotykamy jedną z wad tabletu w porównaniu z "normalnymi" laptopami do gier: Z13 nie może być łatwo otwarty przez użytkownika. Pod zawiasem znajduje się przynajmniej mała klapa konserwacyjna, przez którą można dostać się do dysku SSD w formacie M.2 2230 i wymienić go. Nie można w Z13 odkurzyć wentylatorów, wymienić modułu Wifi czy pamięci RAM.
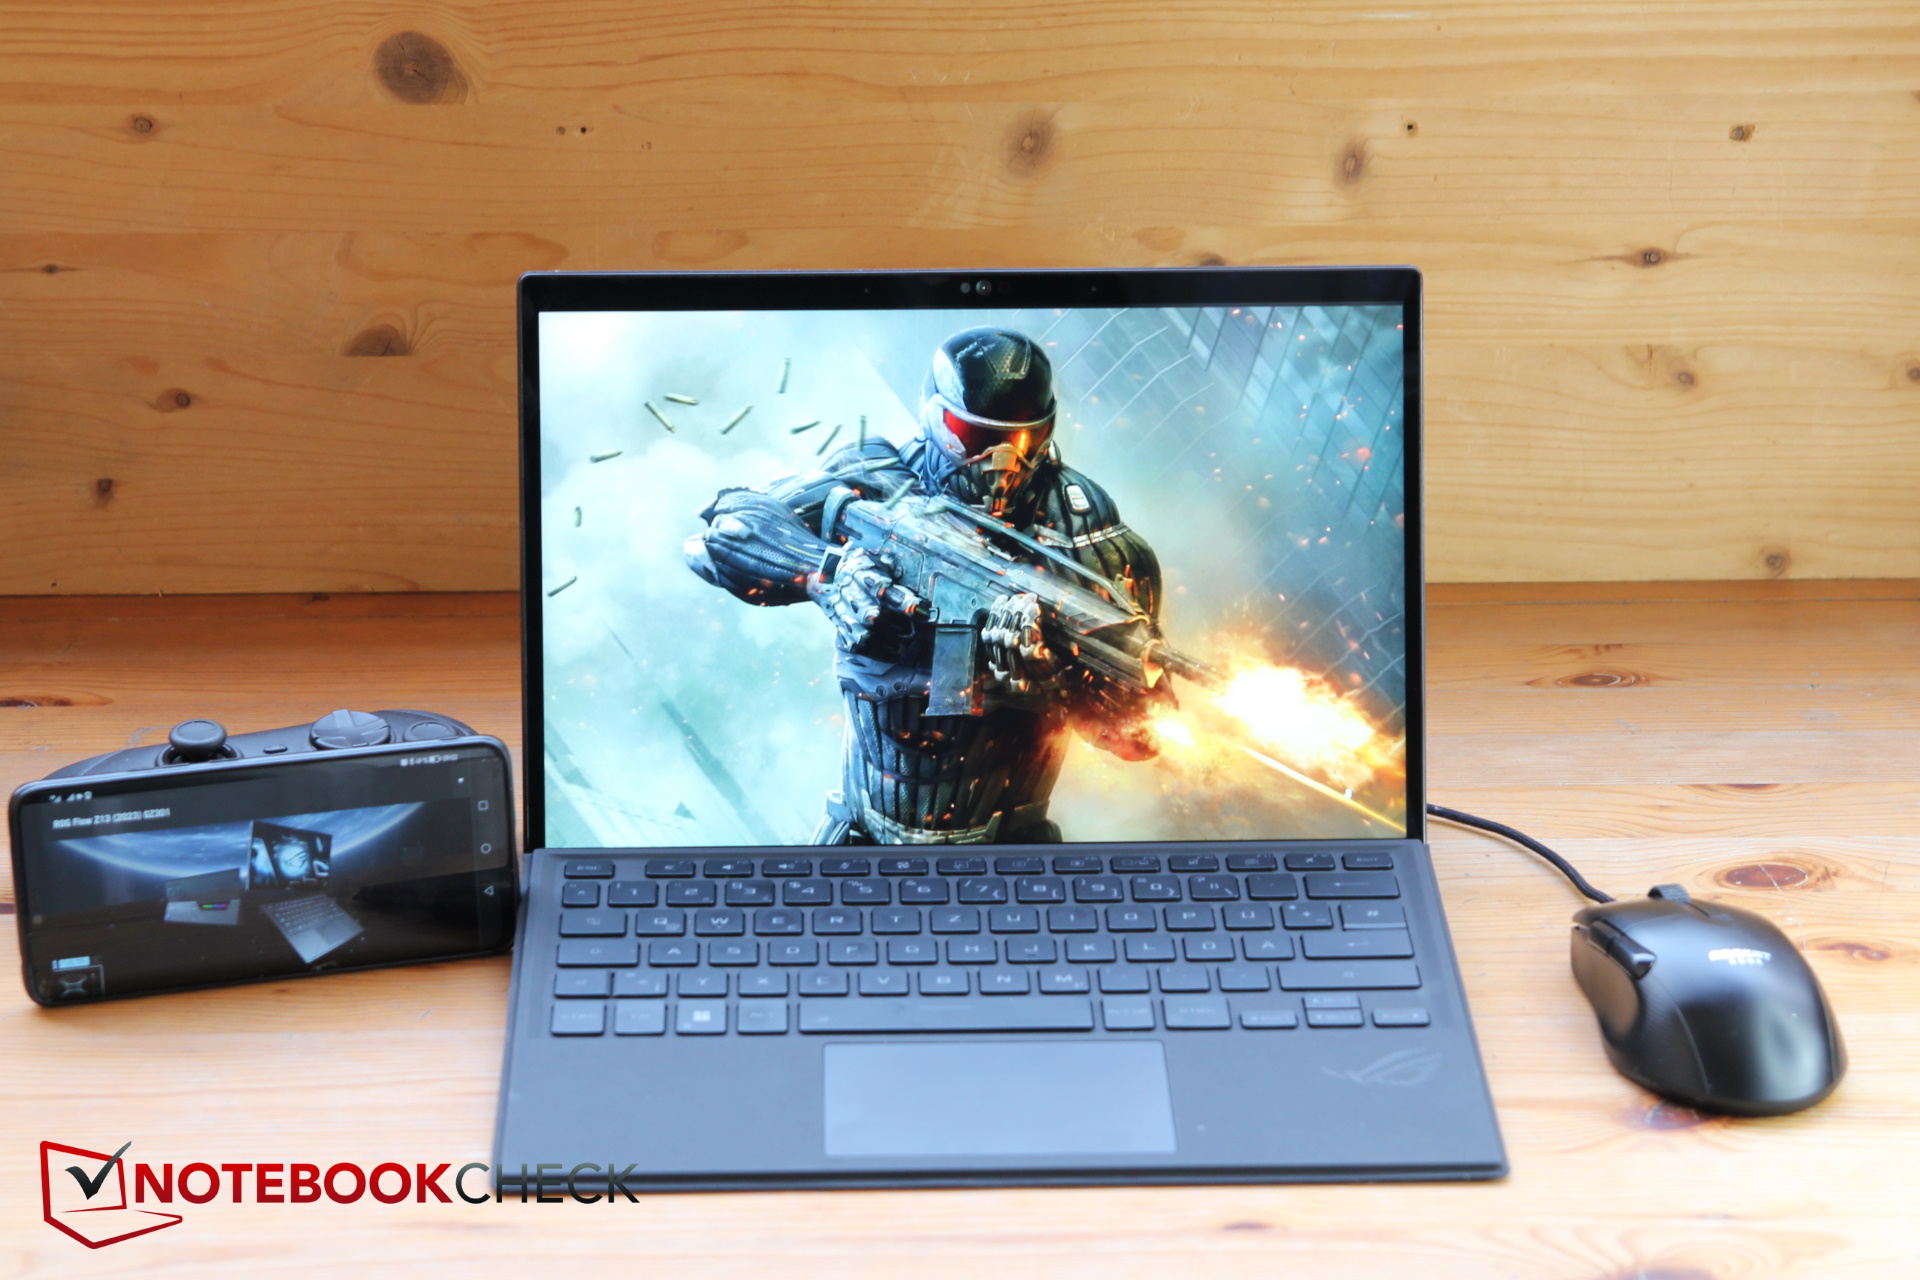
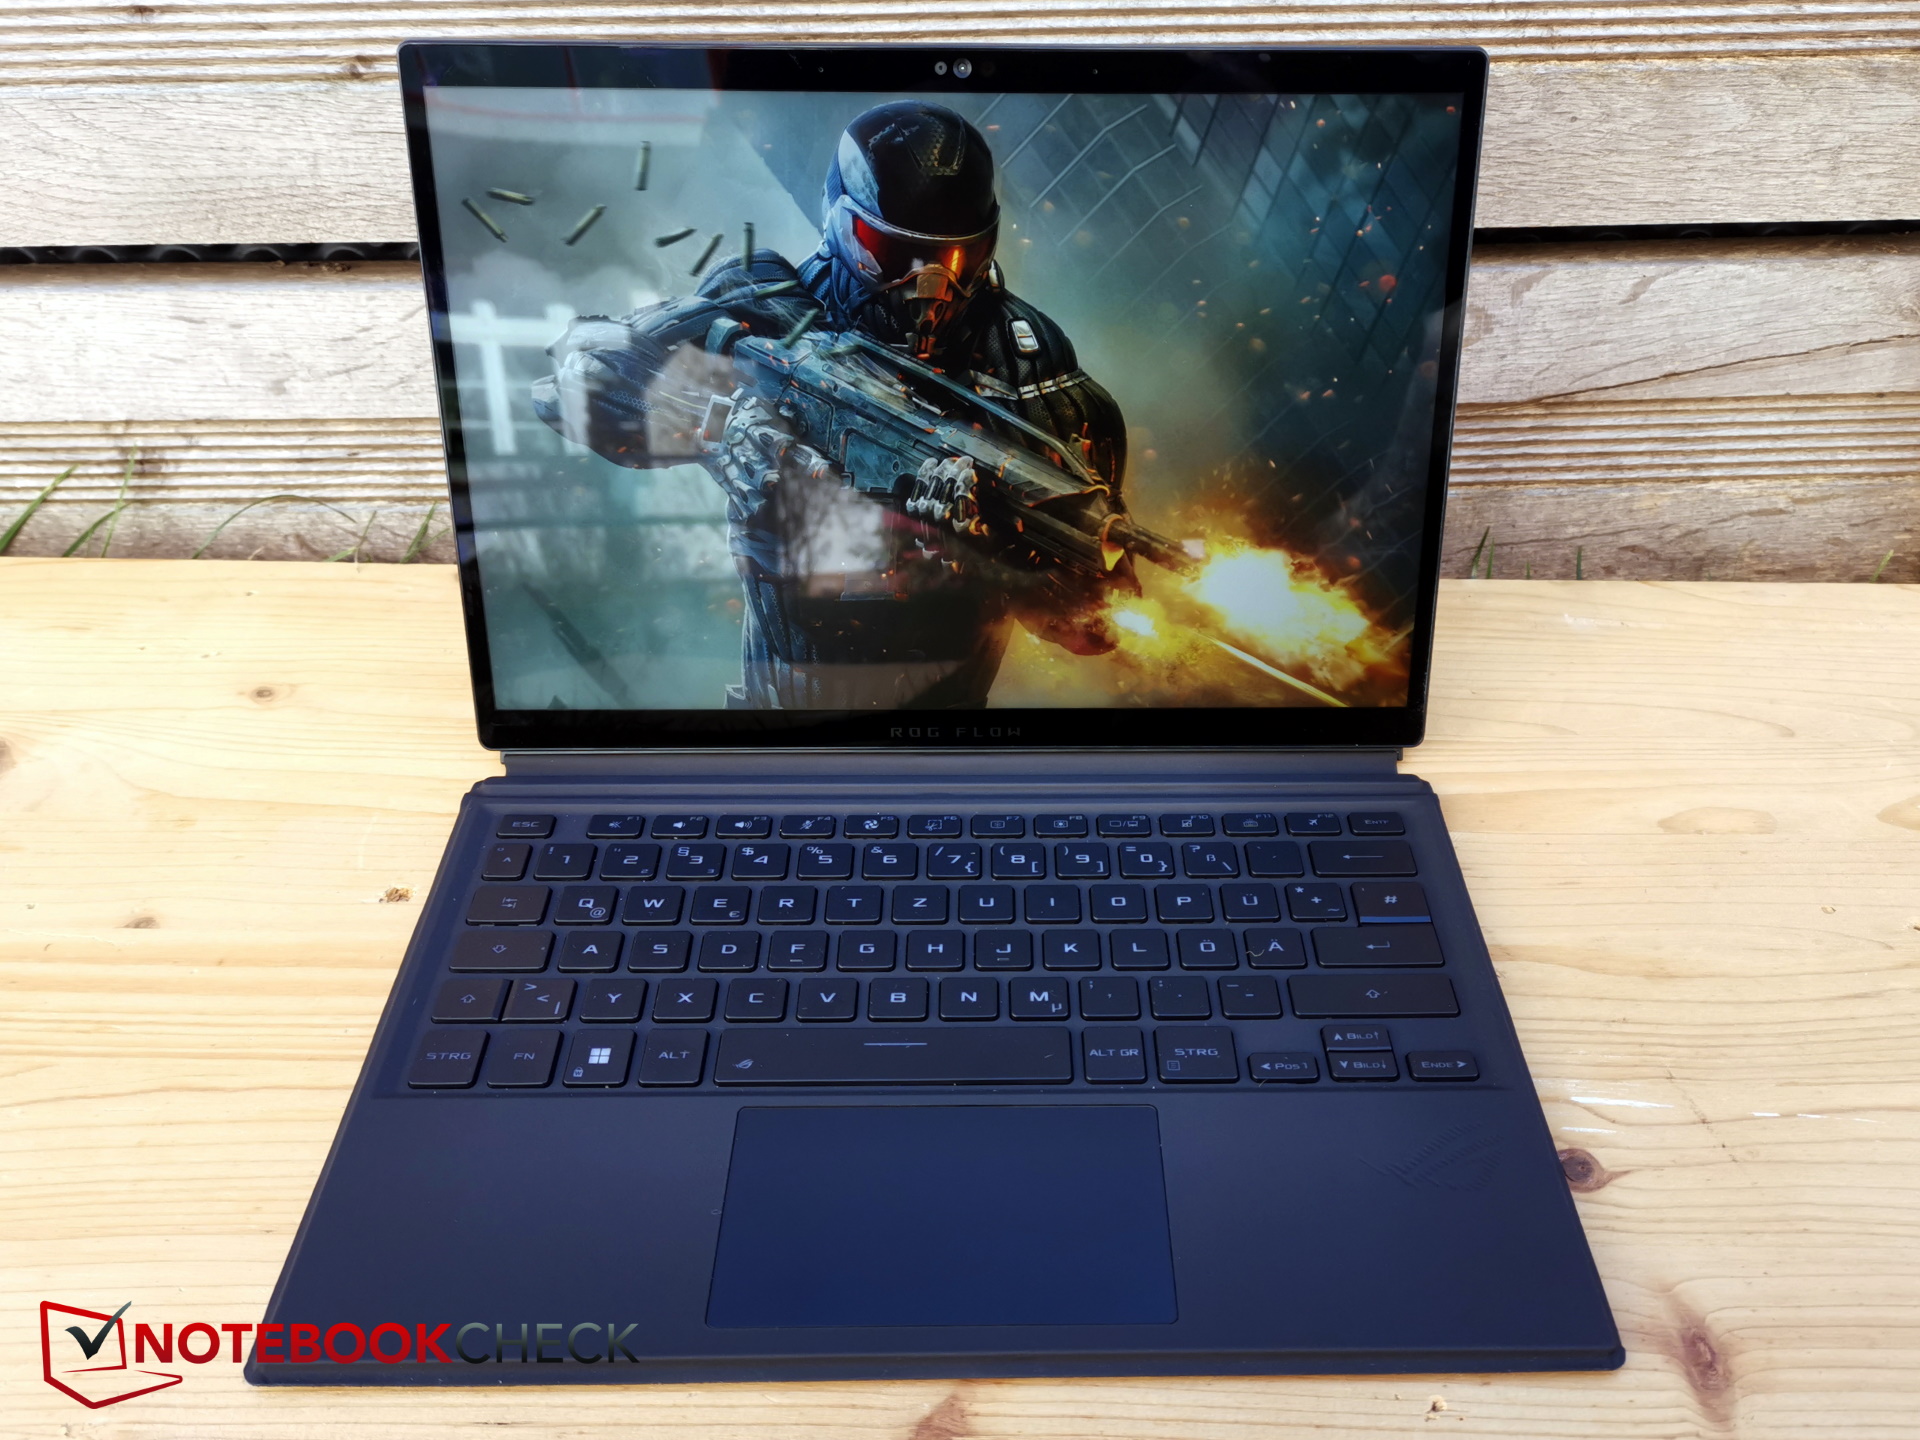
Urządzenia wejściowe - Z13 z pokrywą klawiatury lub ekranem dotykowym
Tablet posiada pojemnościowy ekran dotykowy, który działa znakomicie i obsługuje również wprowadzanie danych za pomocą pióra. Jednak powiązany rysik nie jest dołączony do zestawu i kosztuje dodatkowo 79,99 USD.
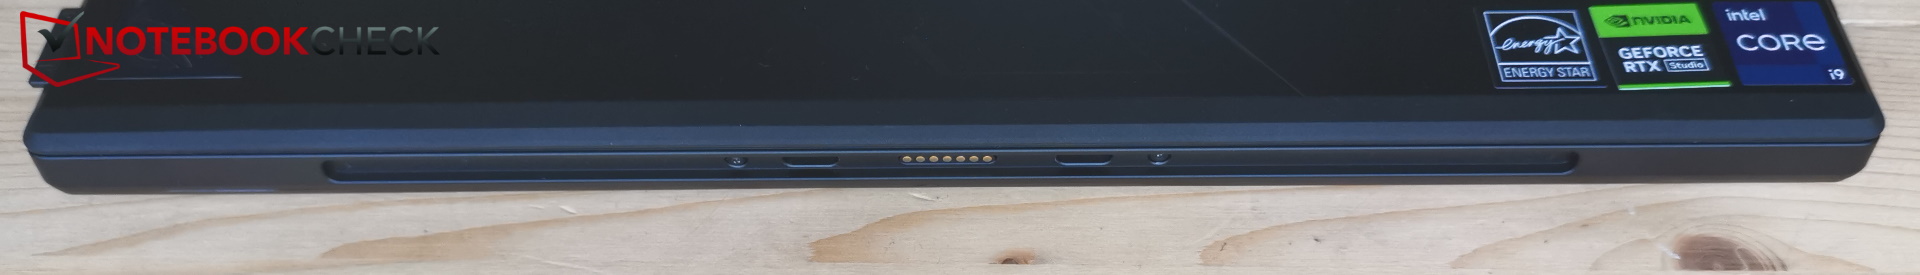
Pokrywa klawiatury jest przymocowana do dolnej krawędzi Z13 za pomocą magnetycznych pinów i przez to otrzymuje również zasilanie dla podświetlenia.

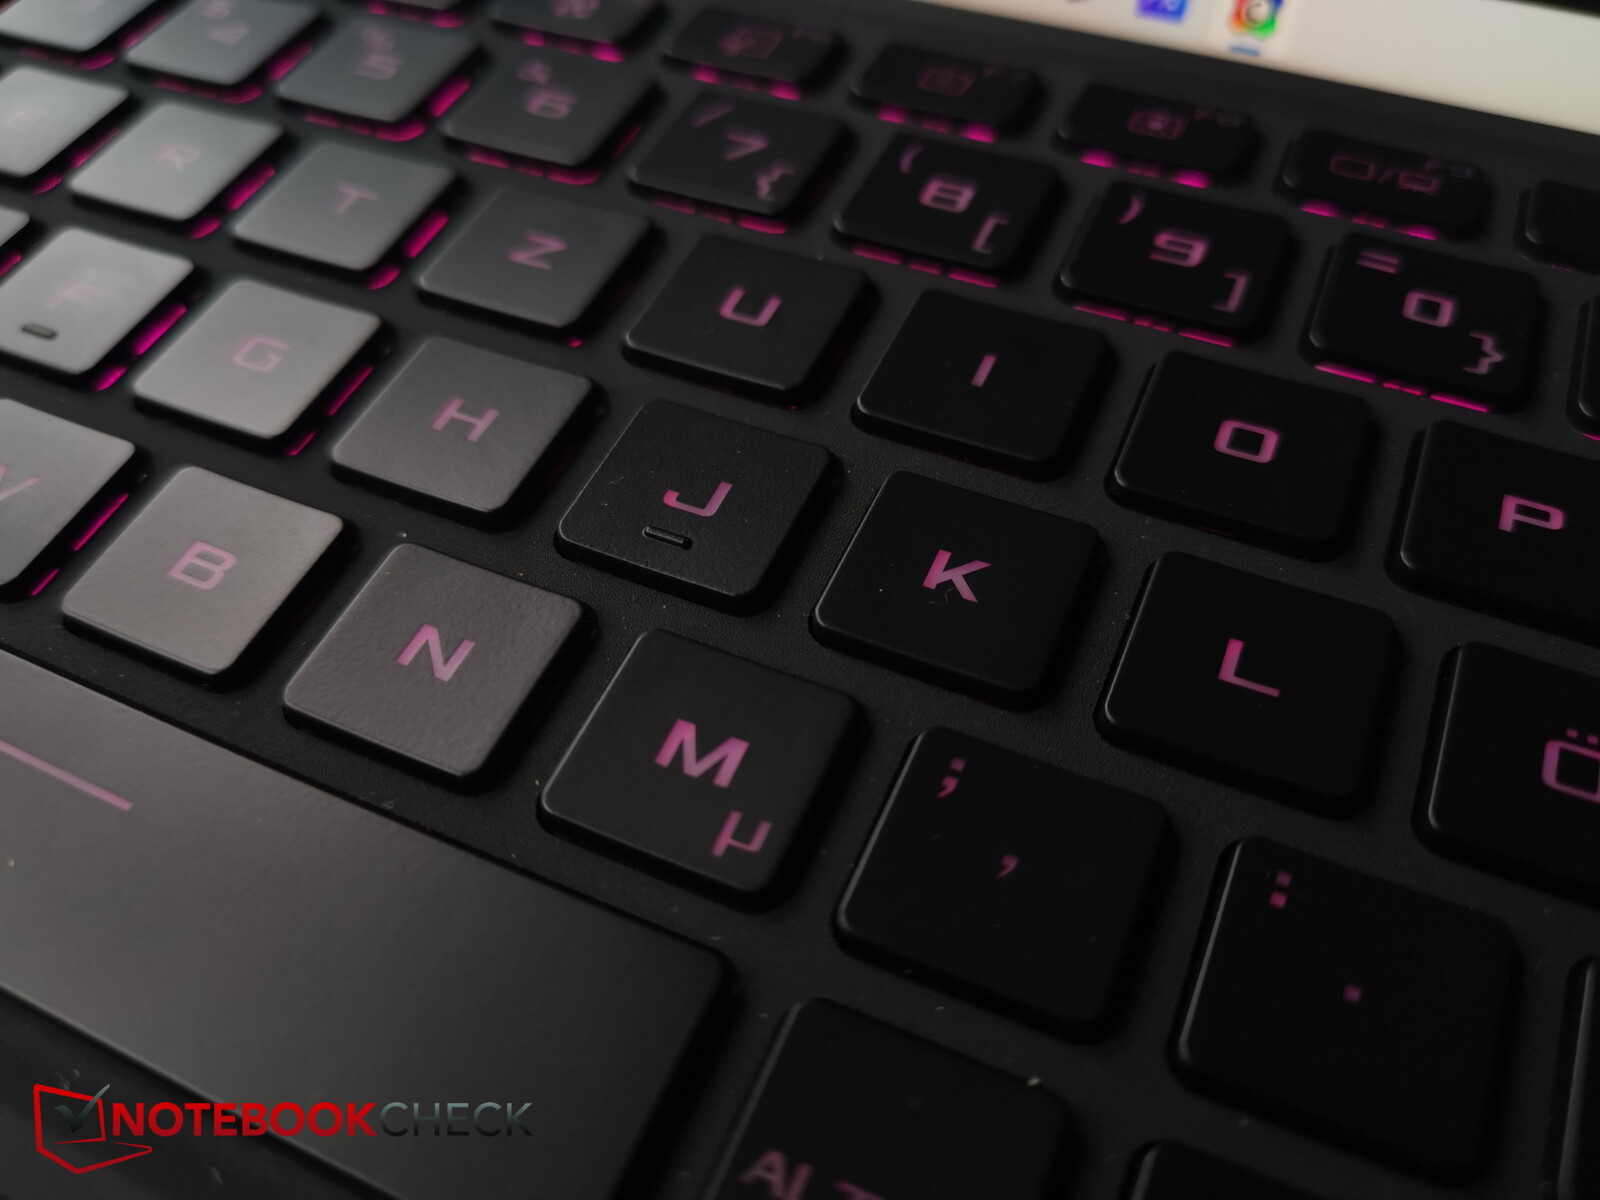
Klawiatura świeci w różnych kolorach i w trzech poziomach jasności. Może ona leżeć płasko na biurku lub być lekko pochylona, co zmienia też nieco odgłosy pisania. Jest to jednak na ogół wciąż umiarkowany hałas.
Klawiatura z okładką jest naturalnie nieco mniej stabilna niż klawiatura stała. Deska do pisania ugina się trochę podczas pisania, szczególnie przy odchyleniu, ale pozostaje w granicach tolerancji. Przynajmniej skok klawiszy wynoszący 1,7 mm jest dość głęboki jak na ten typ. Sprzężenie zwrotne jest również zauważalne, dzięki czemu pisanie jest szybkie mimo dość niewielkiego rozmiaru klawiszy.
Napisy są dobrze widoczne w przyzwoitym świetle, ale mogłyby być nieco jaśniejsze, by zwiększyć kontrast między ciemnymi klawiszami a niezbyt jasnymi napisami. Podświetlenie pomaga w ciemności.
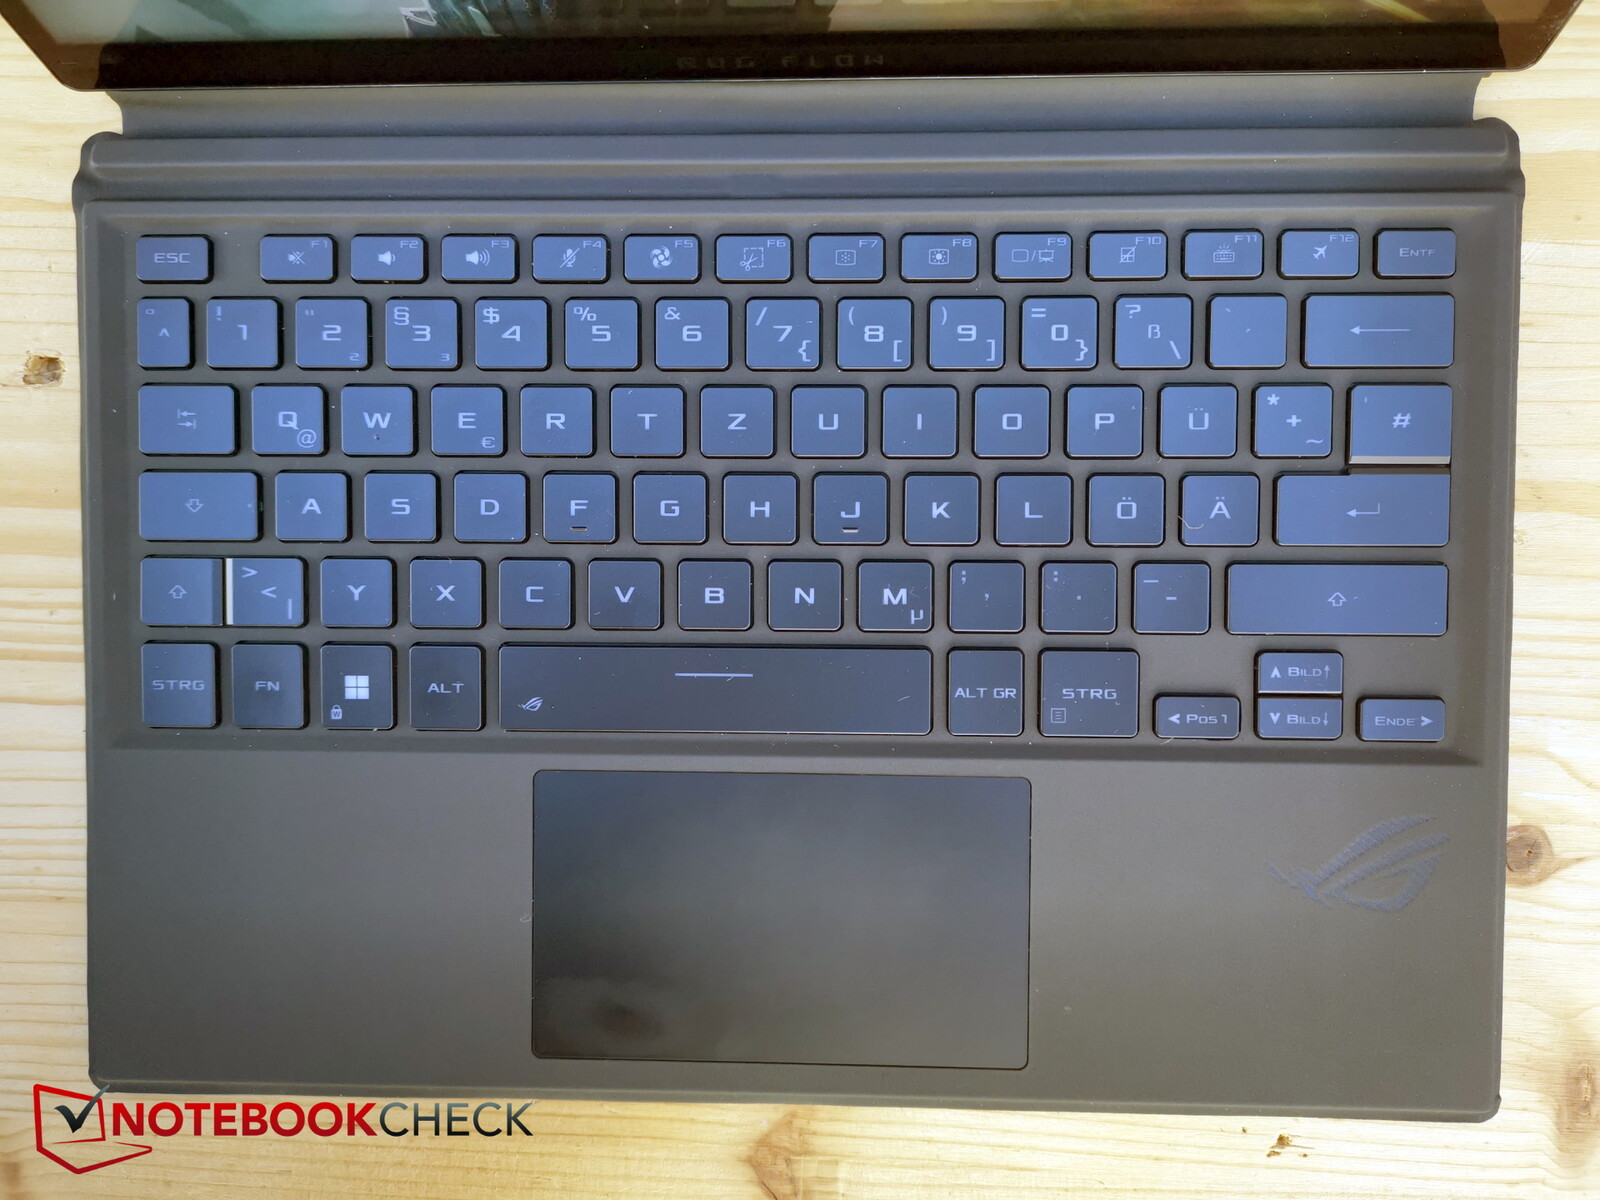
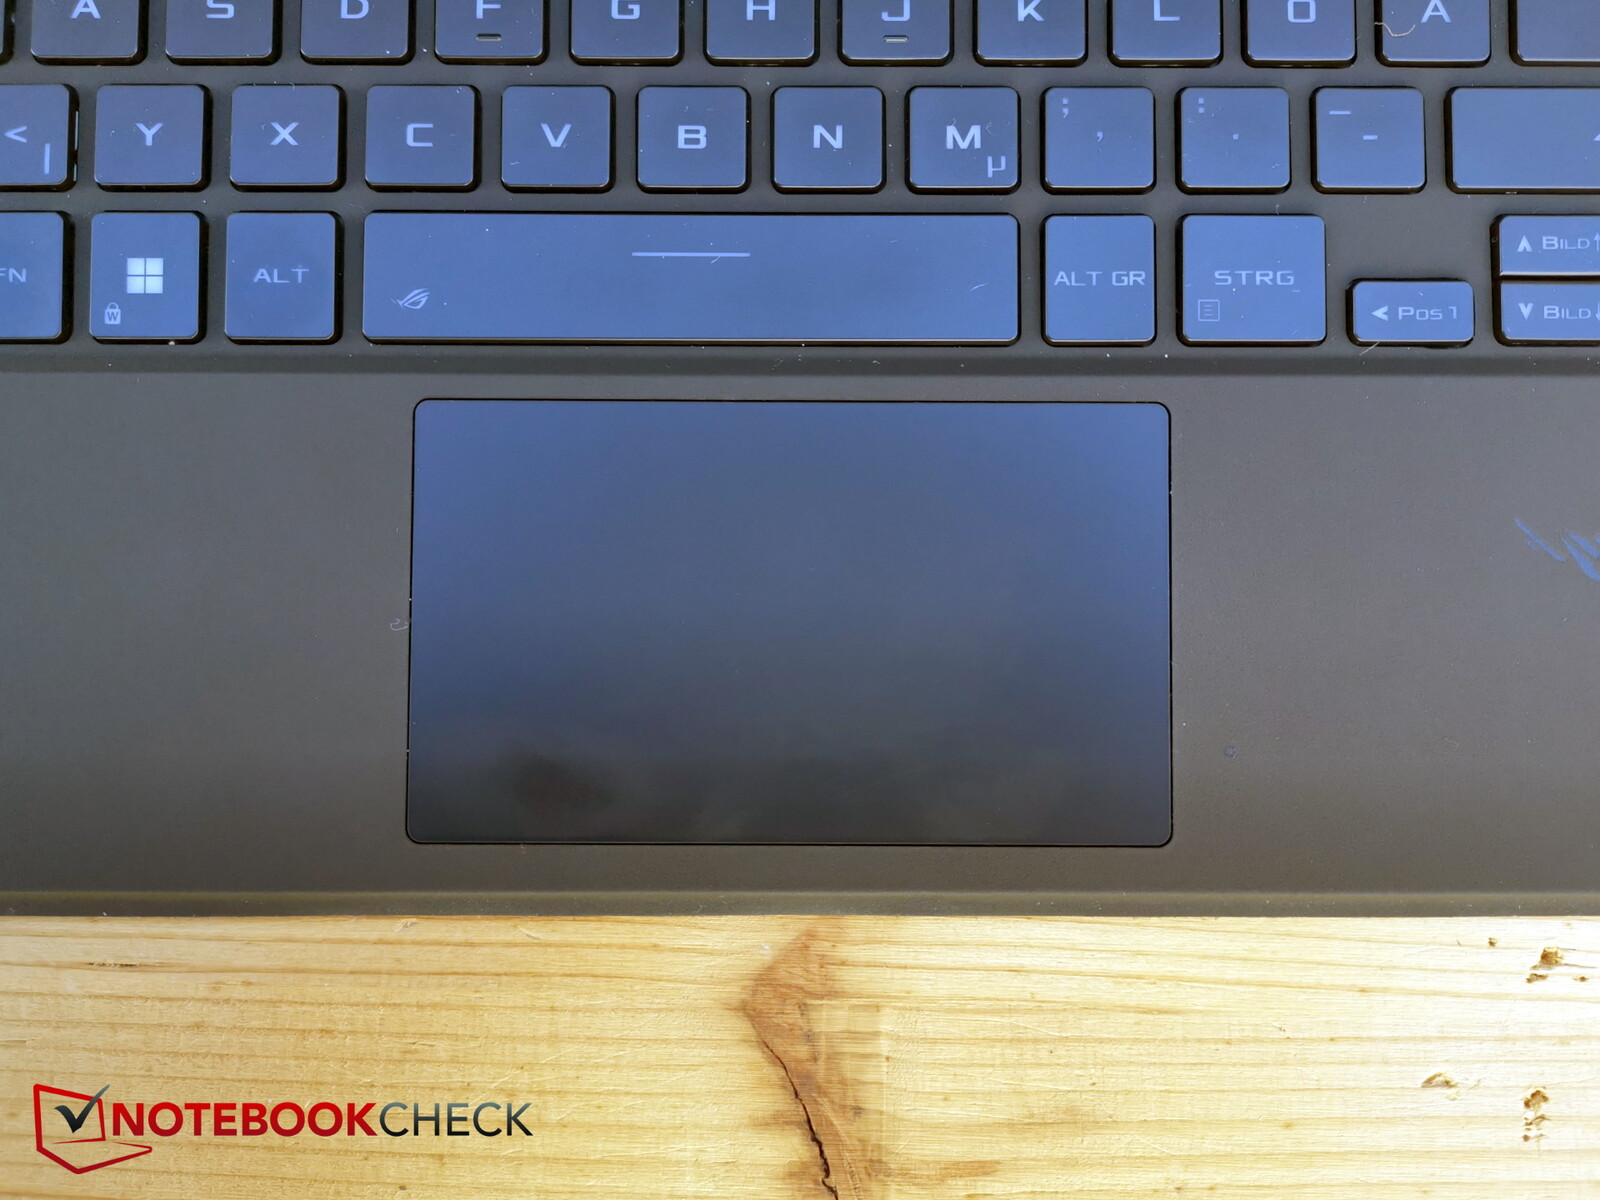
Touchpad jest oczywiście stosunkowo niewielki (ok. 10,5 x 6,1 cm), ale oferuje dobre właściwości ślizgowe i prawie nie chwieje się nawet przy bardzo wolnych ruchach.
Zintegrowane klawisze mają bardzo krótki skok, ale wyczuwalny feedback. Prawy przycisk jest nieco głośniejszy i sprawia wrażenie, że ma głębszy skok.
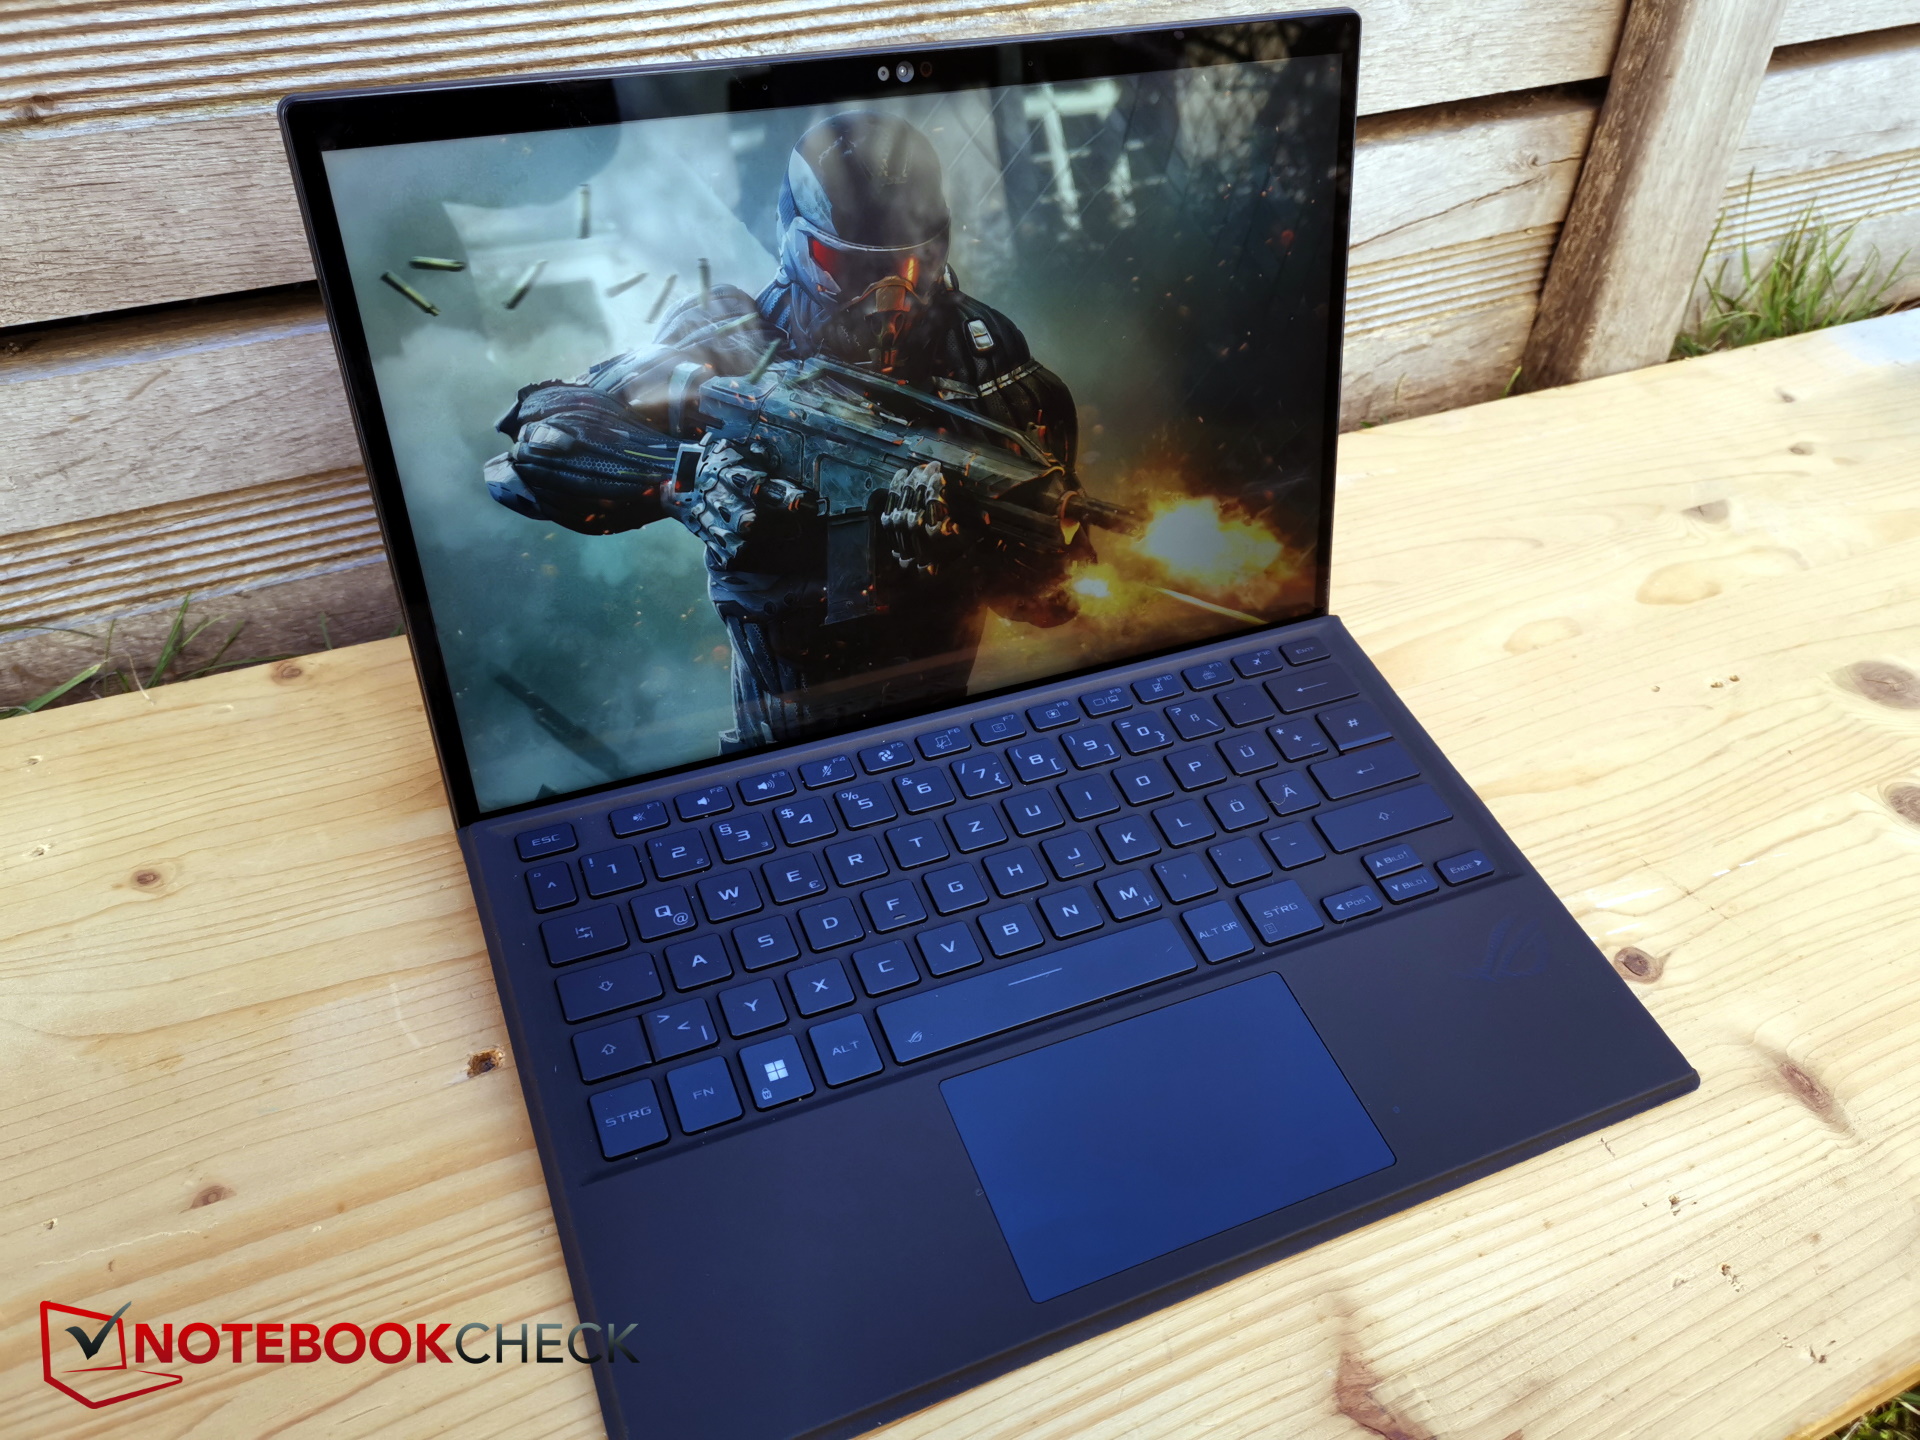
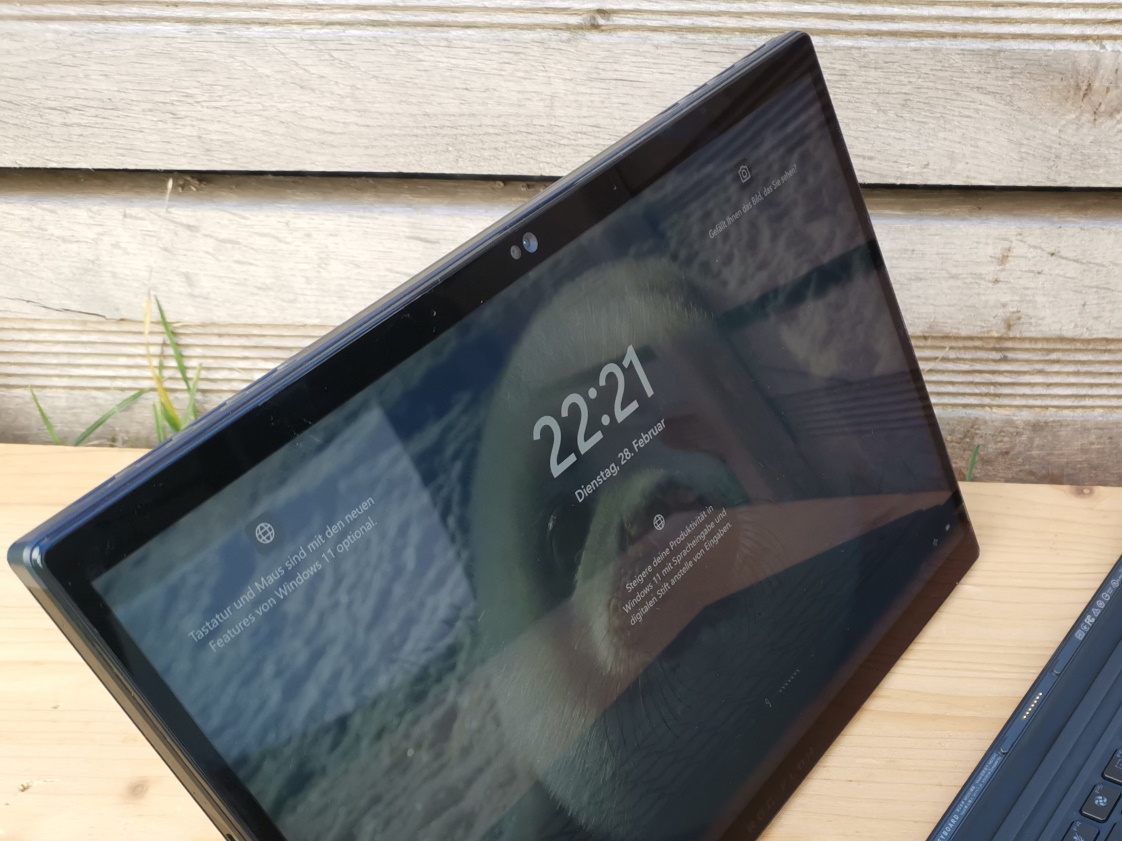
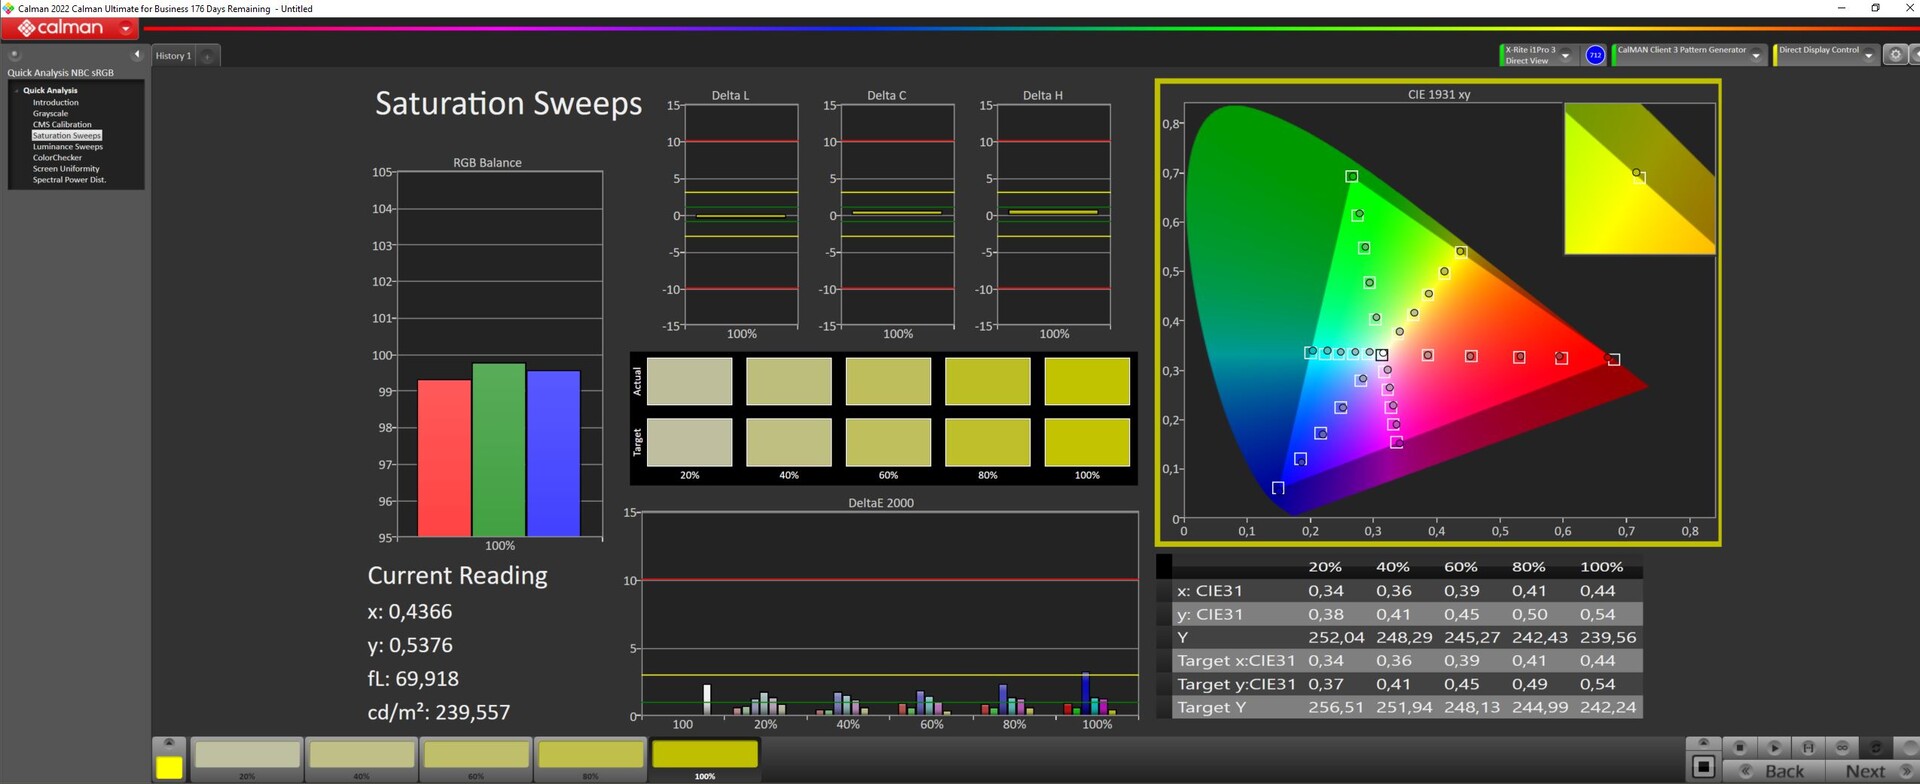
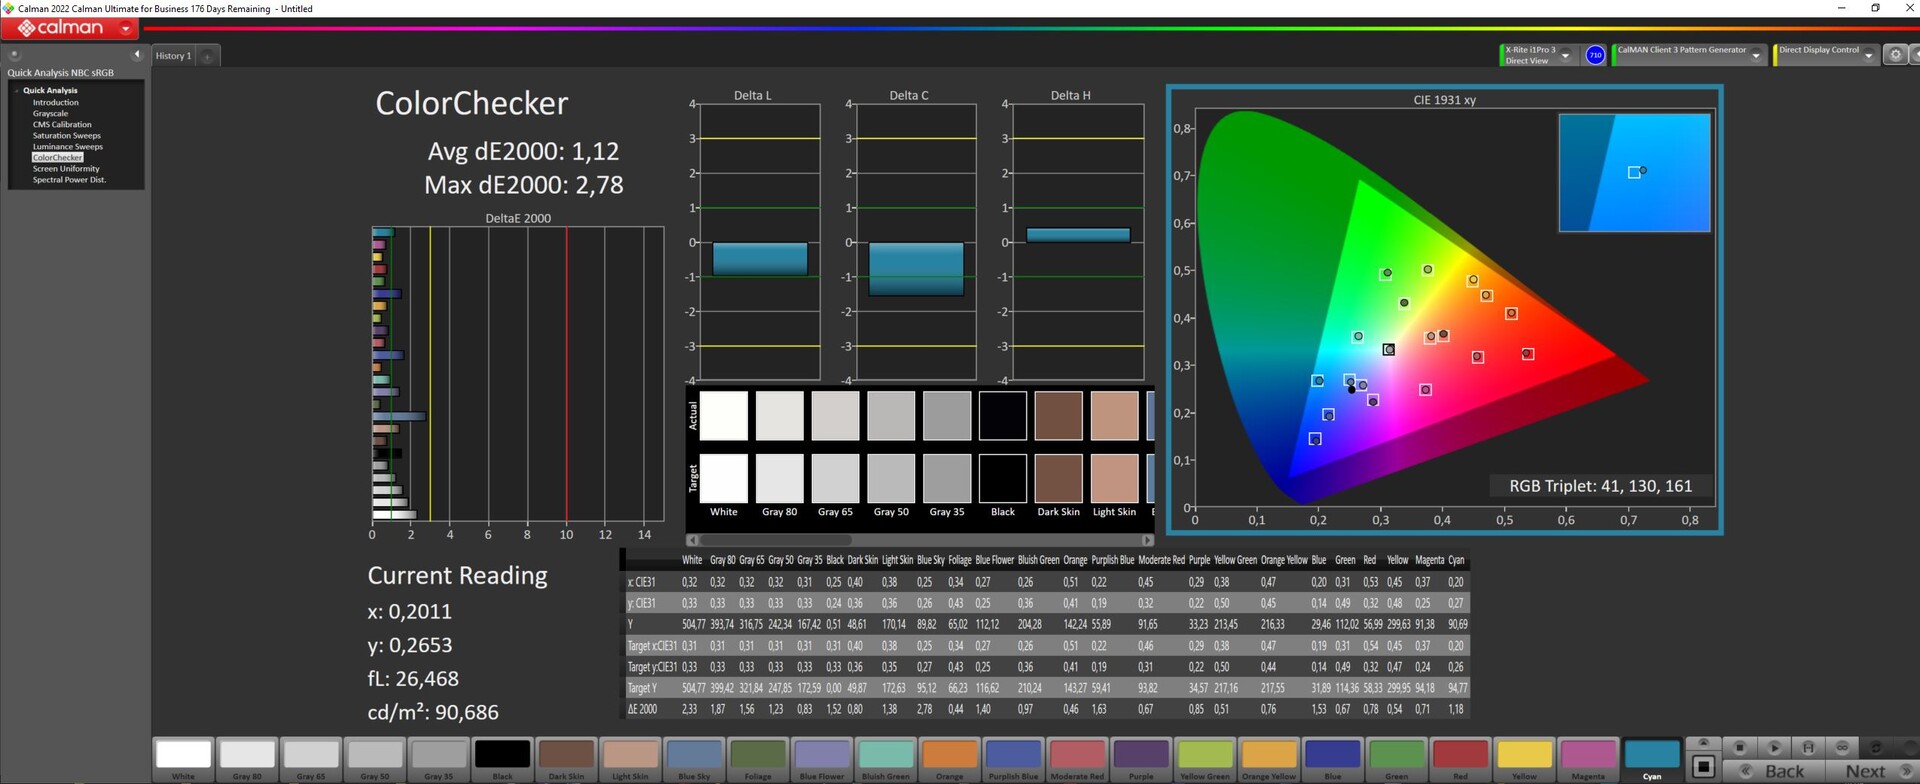
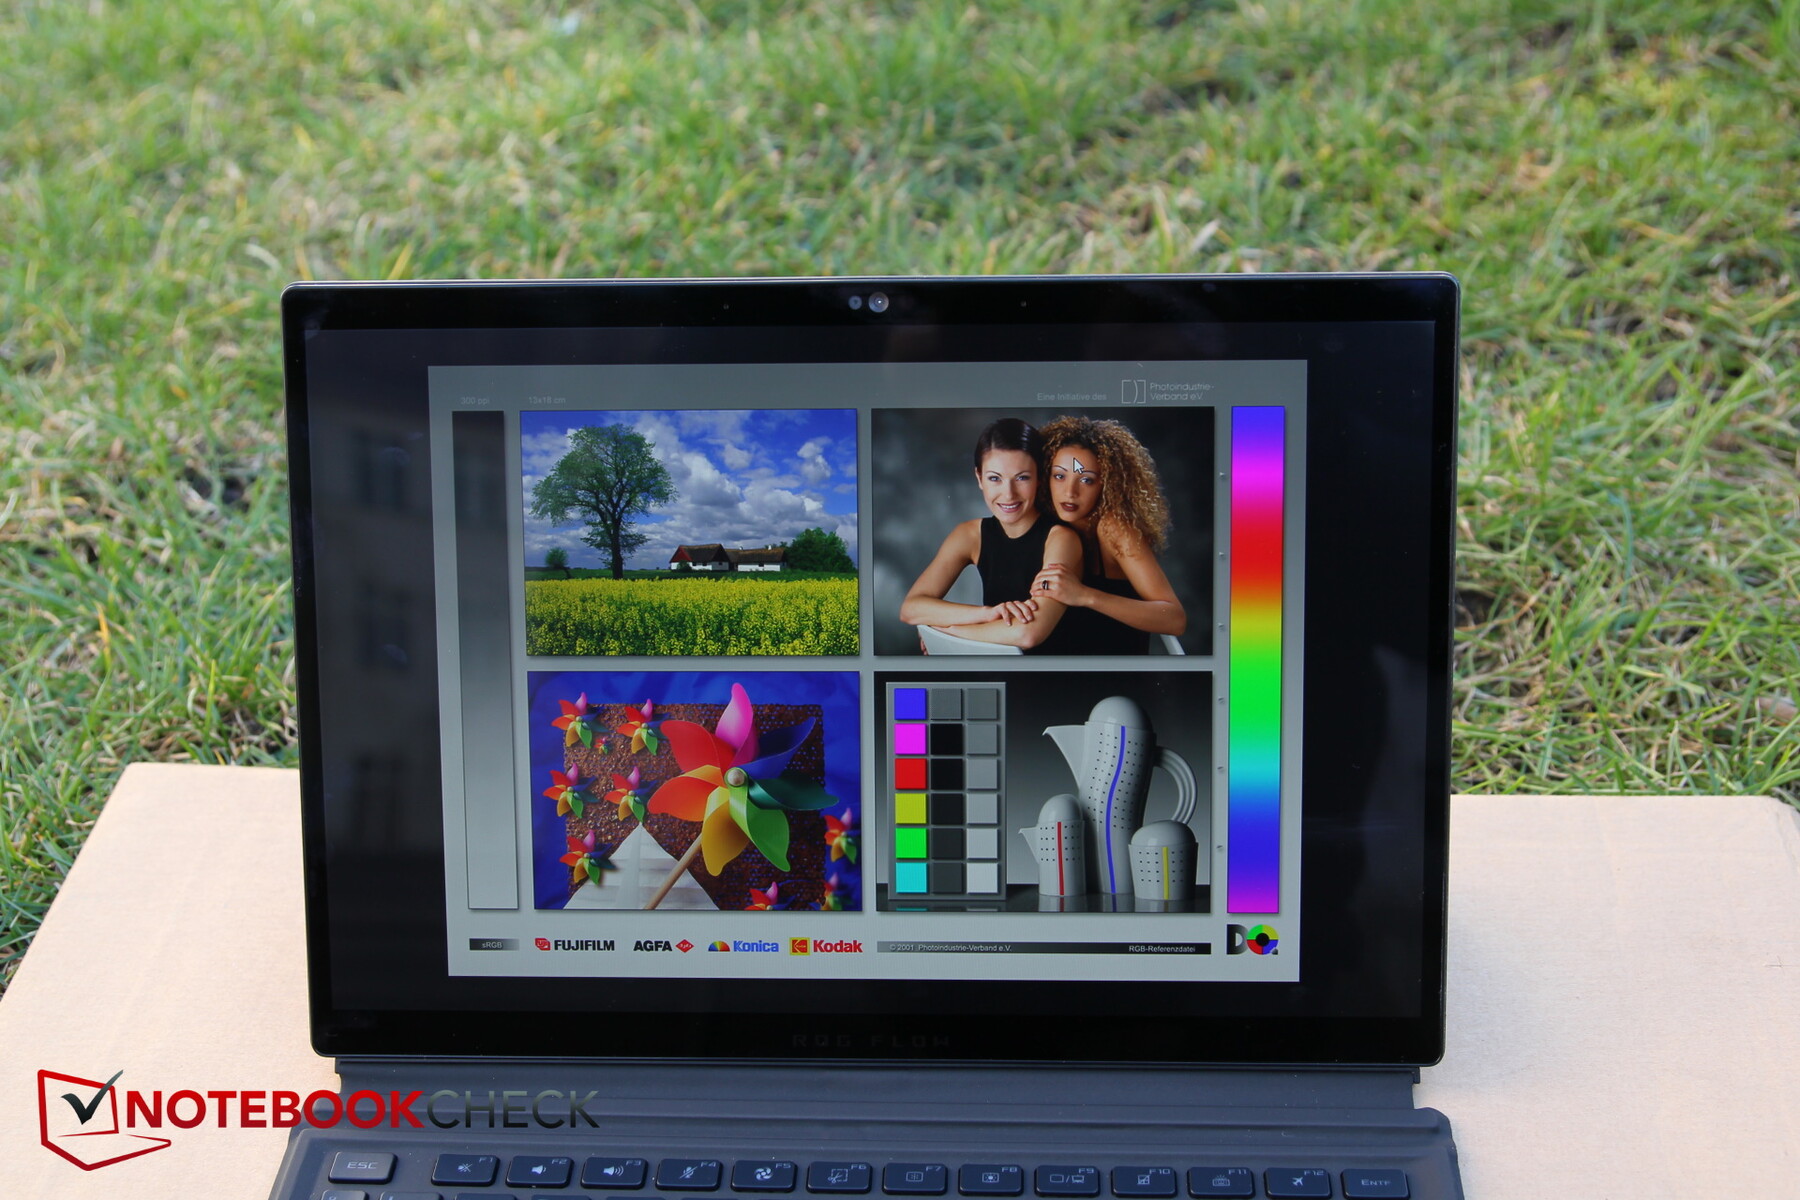
Wyświetlacz - ROG Nebula QHD+ i 500 nitów
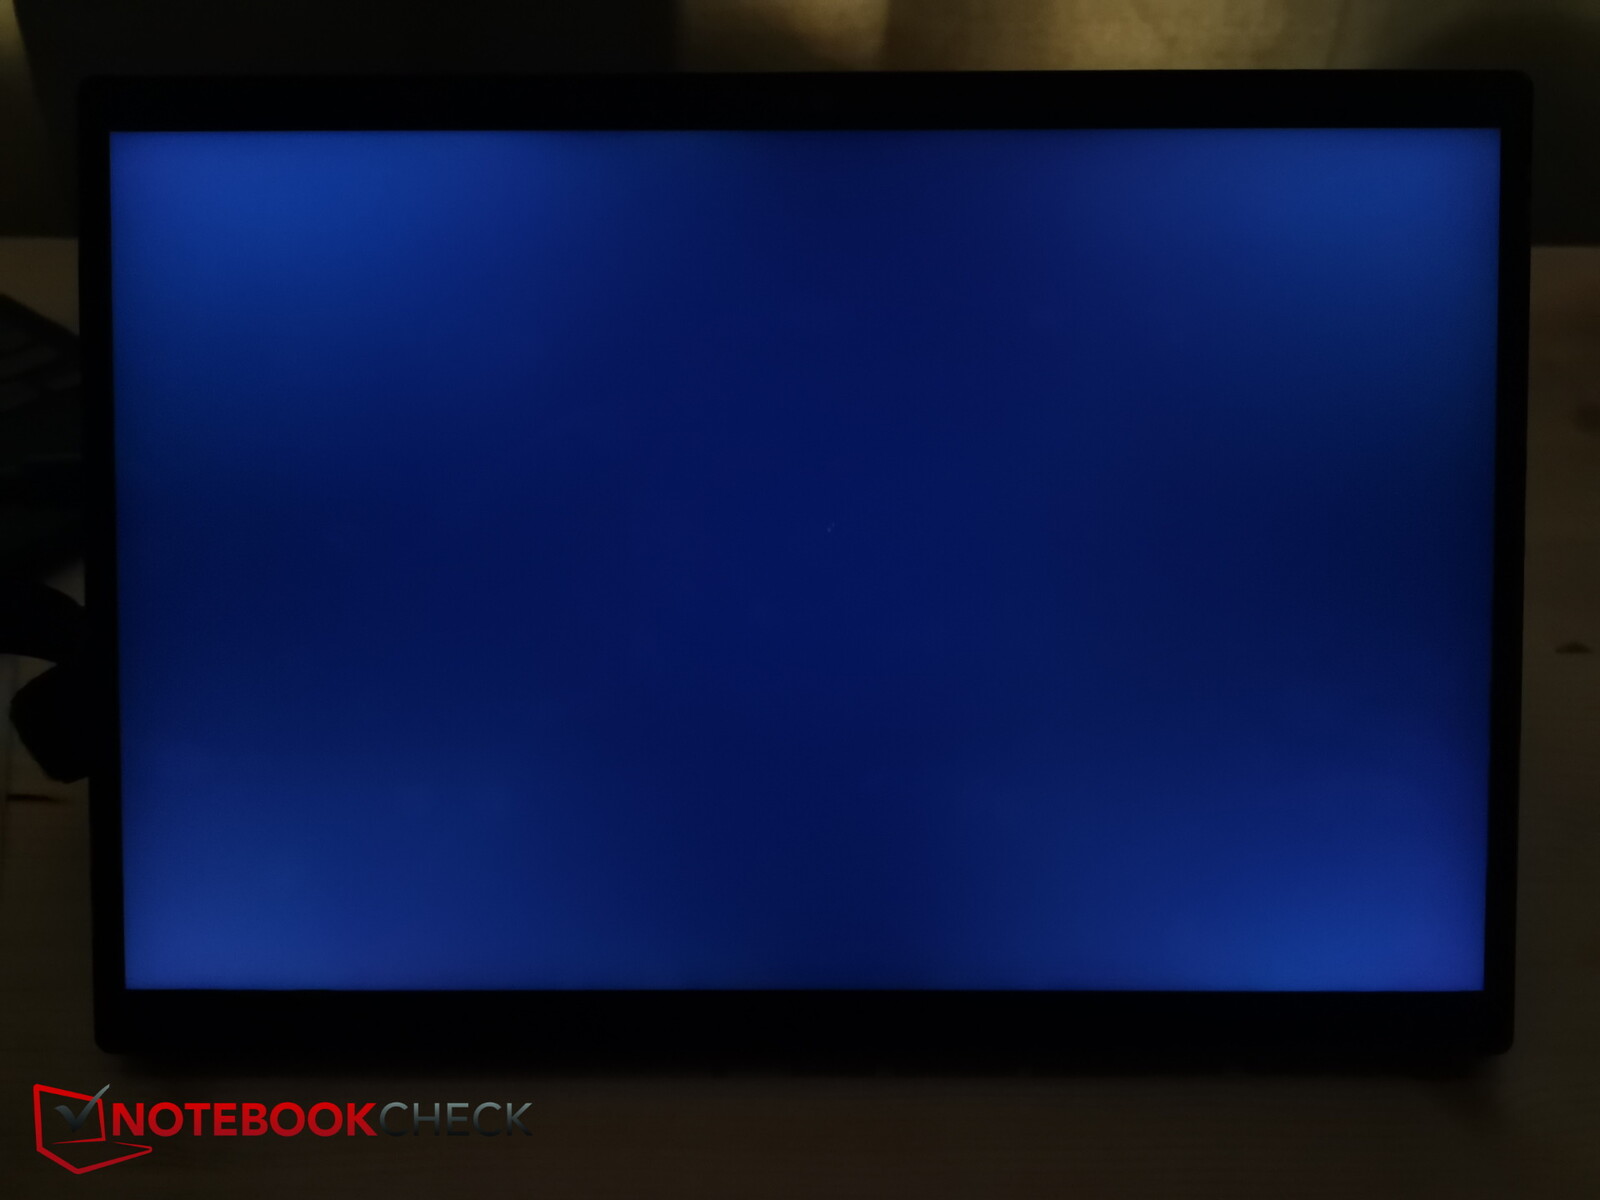
Asus zmienił panel - zamiast Sharpa nowy model pochodzi od firmy Tianma Micro Electronics, która ma swoje siedziby w Chinach i Japonii. 13,4-calowy wyświetlacz ma rozdzielczość 2 560 x 1 600 w formacie 16:10 i oferuje częstotliwość odświeżania 165 Hz.
Jasność jest bardzo dobra i wynosi nieco ponad 500 nitów w trybie SDR, natomiast podświetlenie (88%) spada nieco zwłaszcza w kierunku prawej dolnej krawędzi. Wartość czerni nie jest niemal porównywalna z OLED-em, ale kontrast jest nadal w porządku.
Czasy reakcji są szybkie zarówno dla czerni do bieli, jak i szarości do szarości. Screen bleeding nie jest widoczny na naszym Z13. Ogólnie rzecz biorąc, mamy tutaj jasny i wysokiej rozdzielczości wyświetlacz dotykowy.
| |||||||||||||||||||||||||
rozświetlenie: 88 %
na akumulatorze: 538 cd/m²
kontrast: 1193:1 (czerń: 0.45 cd/m²)
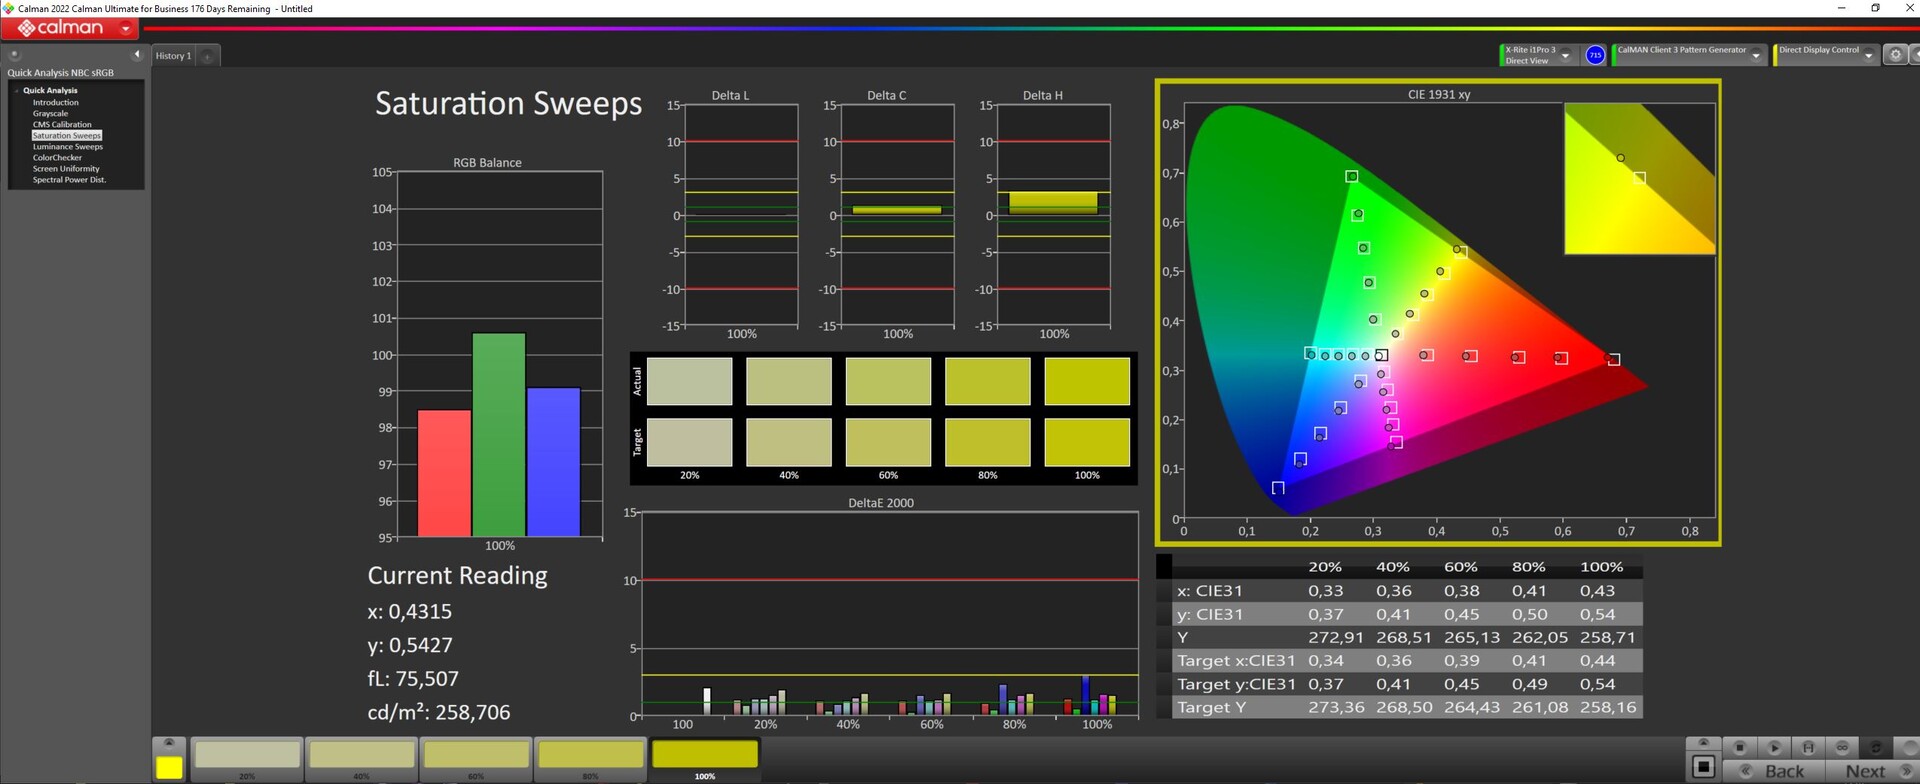
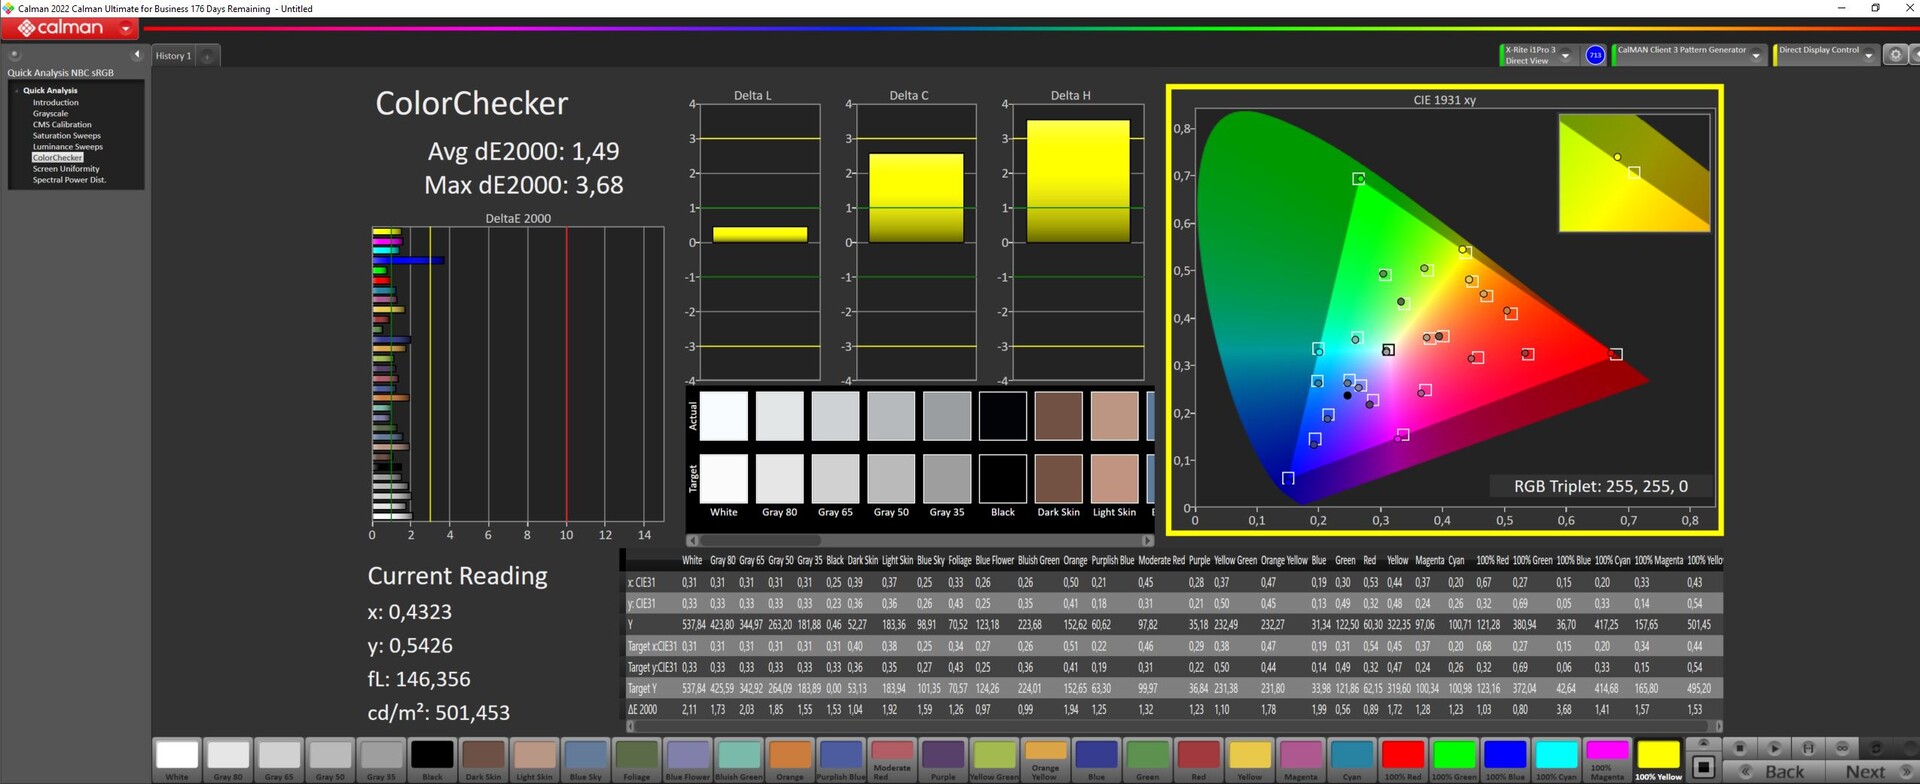
ΔE ColorChecker Calman: 1.49 | ∀{0.5-29.43 Ø4.72}
calibrated: 1.12
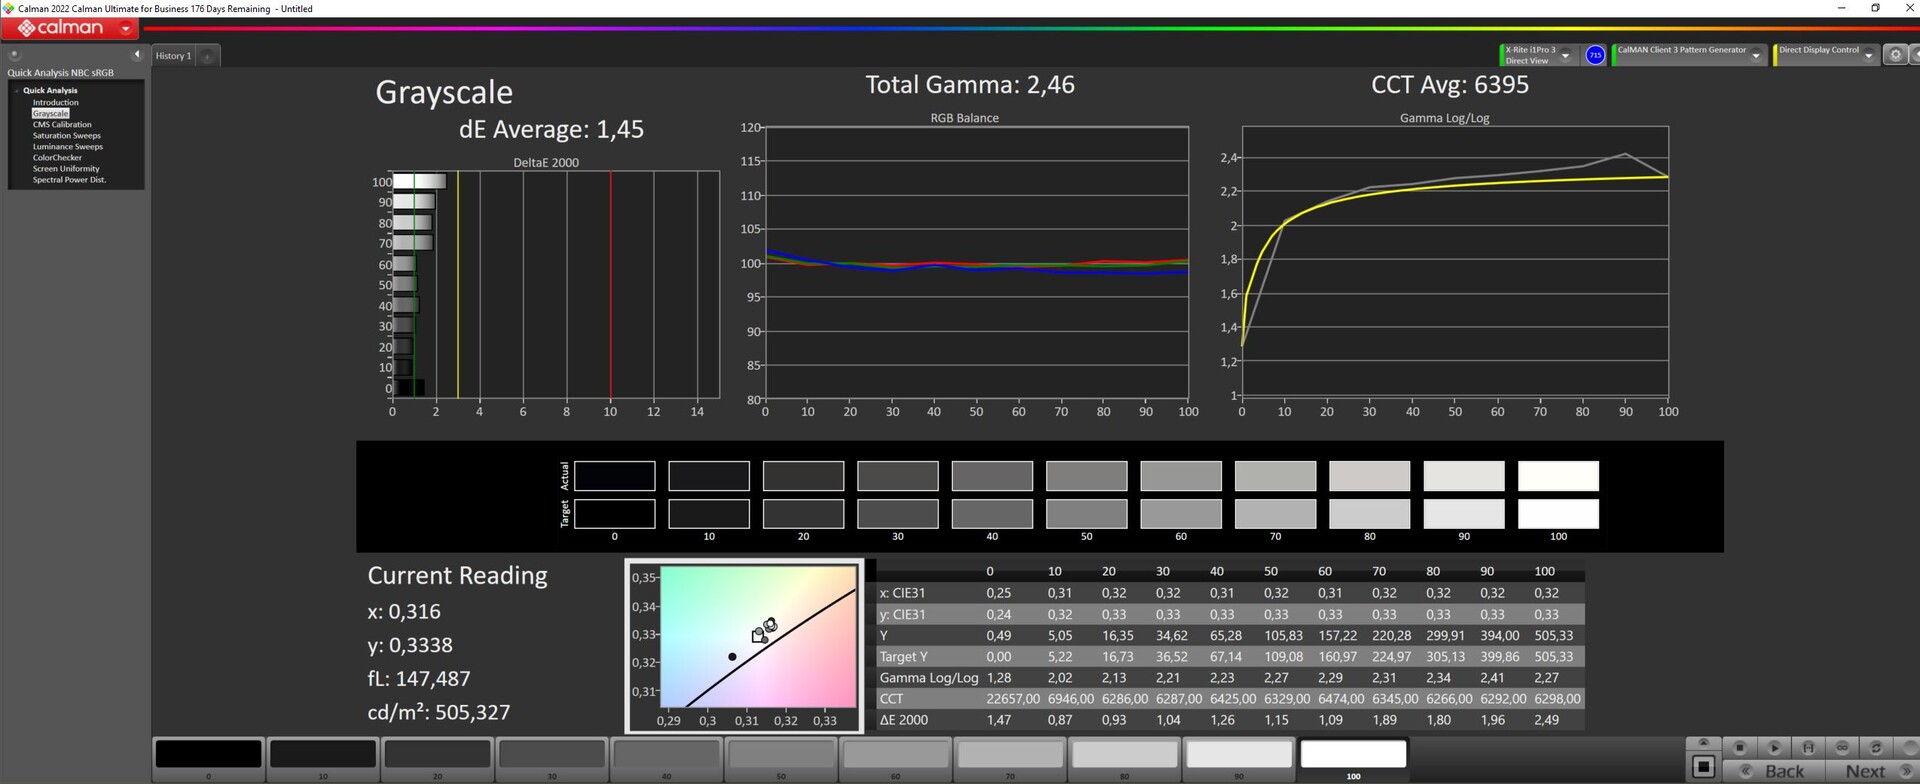
ΔE Greyscale Calman: 1.66 | ∀{0.09-98 Ø4.97}
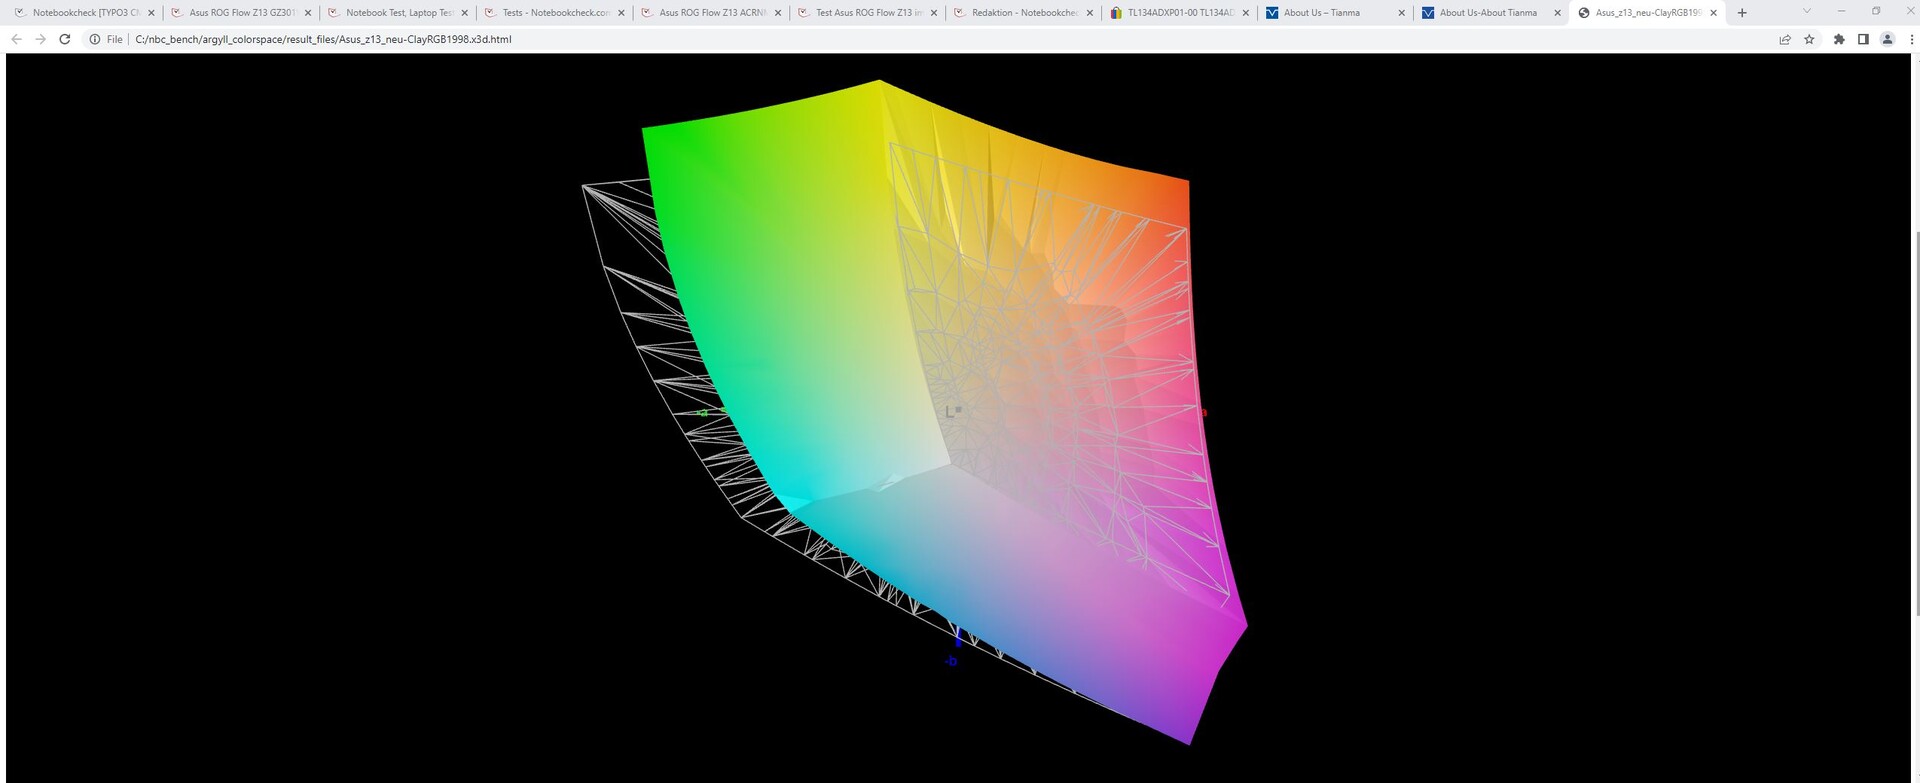
85.3% AdobeRGB 1998 (Argyll 3D)
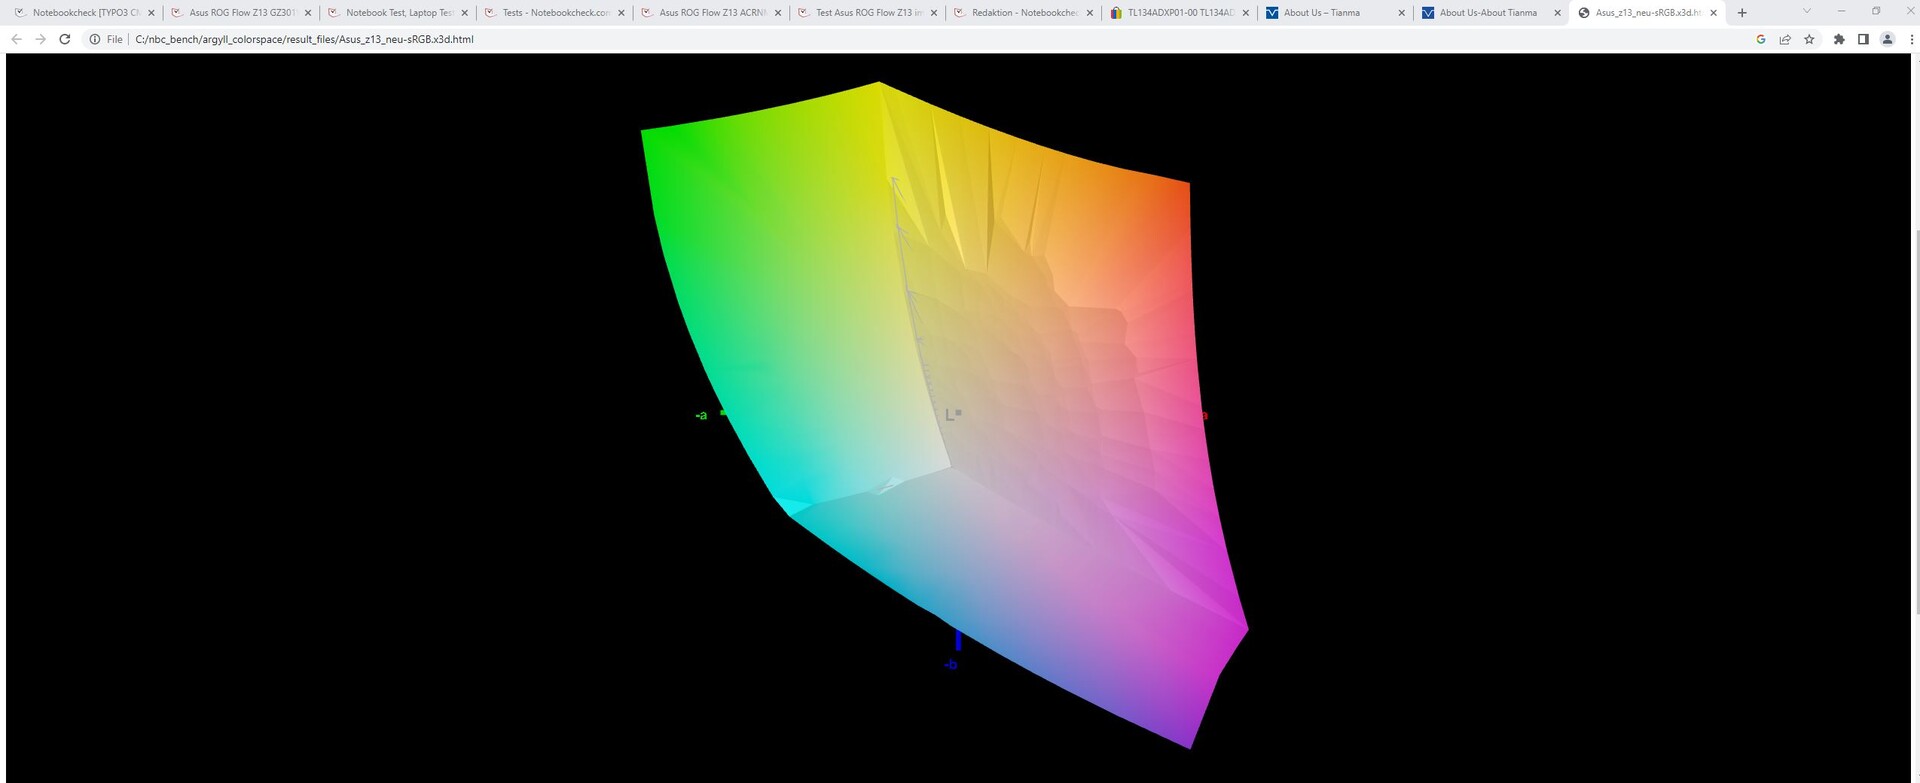
99.9% sRGB (Argyll 3D)
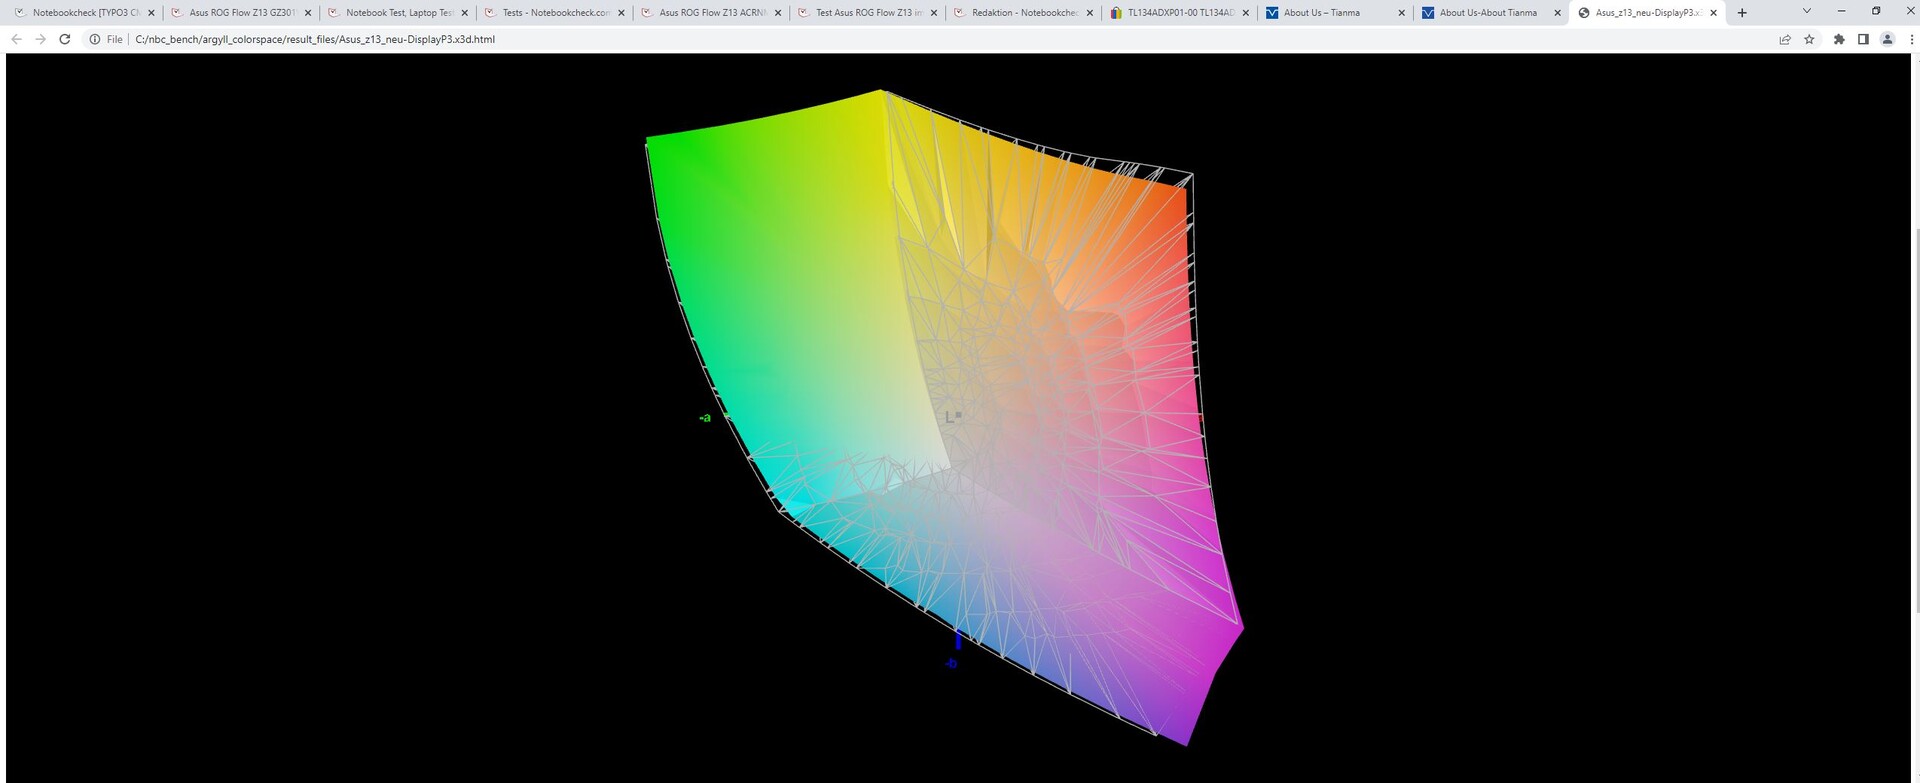
97% Display P3 (Argyll 3D)
Gamma: 2.43
CCT: 6772 K
| Asus ROG Flow Z13 GZ301V TL134ADXP01-0, IPS, 2560x1600, 13.4" | Asus ROG Flow Z13 ACRNM TL134ADXP01-0, IPS, 2560x1600, 13.4" | Asus ROG Flow Z13 GZ301ZE LQ134N1JW54, IPS, 1920x1200, 13.4" | MSI Katana 17 B13VFK B173HAN04.9, IPS LED, 1920x1080, 17.3" | Acer Predator Triton 300 SE Samsung ATNA40YK07-0, OLED, 2880x1800, 14" | MSI Cyborg 15 A12VF AU Optronics B156HAN15.1, IPS, 1920x1080, 15.6" | |
|---|---|---|---|---|---|---|
| Display | 0% | -17% | -49% | 6% | -47% | |
| Display P3 Coverage (%) | 97 | 96.94 0% | 67.5 -30% | 40.8 -58% | 99.9 3% | 42.3 -56% |
| sRGB Coverage (%) | 99.9 | 99.92 0% | 97.1 -3% | 61 -39% | 100 0% | 62.6 -37% |
| AdobeRGB 1998 Coverage (%) | 85.3 | 85.17 0% | 69.3 -19% | 42.2 -51% | 99 16% | 43.7 -49% |
| Response Times | 61% | -374% | -354% | 79% | -177% | |
| Response Time Grey 50% / Grey 80% * (ms) | 6.5 ? | 2.1 ? 68% | 44 ? -577% | 33 ? -408% | 1.36 ? 79% | 22 ? -238% |
| Response Time Black / White * (ms) | 6.5 ? | 3 ? 54% | 17.6 ? -171% | 26 ? -300% | 1.36 ? 79% | 14 ? -115% |
| PWM Frequency (Hz) | 367.6 ? | |||||
| Screen | -15% | -5% | -111% | -60% | -66% | |
| Brightness middle (cd/m²) | 537 | 464 -14% | 515 -4% | 267 -50% | 414.3 -23% | 247 -54% |
| Brightness (cd/m²) | 511 | 455 -11% | 476 -7% | 256 -50% | 416 -19% | 234 -54% |
| Brightness Distribution (%) | 88 | 89 1% | 87 -1% | 93 6% | 99 13% | 89 1% |
| Black Level * (cd/m²) | 0.45 | 0.4 11% | 0.35 22% | 0.21 53% | 0.25 44% | |
| Contrast (:1) | 1193 | 1160 -3% | 1471 23% | 1271 7% | 988 -17% | |
| Colorchecker dE 2000 * | 1.49 | 2 -34% | 1.6 -7% | 4.7 -215% | 4.68 -214% | 3.78 -154% |
| Colorchecker dE 2000 max. * | 3.68 | 4.2 -14% | 4 -9% | 20.4 -454% | 7.78 -111% | 6.42 -74% |
| Colorchecker dE 2000 calibrated * | 1.12 | 1.2 -7% | 1.2 -7% | 4.5 -302% | 3.94 -252% | |
| Greyscale dE 2000 * | 1.66 | 2.7 -63% | 2.5 -51% | 1.5 10% | 1.8 -8% | 2.16 -30% |
| Gamma | 2.43 91% | 2.24 98% | 2.2 100% | 2.12 104% | 2.22 99% | 2.33 94% |
| CCT | 6772 96% | 6832 95% | 6939 94% | 6552 99% | 6207 105% | 6906 94% |
| Całkowita średnia (program / ustawienia) | 15% /
-1% | -132% /
-60% | -171% /
-132% | 8% /
-17% | -97% /
-78% |
* ... im mniej tym lepiej
Asus podaje 100-procentowe pokrycie DCI-P3; zmierzyliśmy 97%. AdobeRGB ma 85% pokrycia, natomiast sRGB jest oczywiście całkowicie pokryte.
Wyświetlacz jest już bardzo dobrze skalibrowany ex works i ma wartości DeltaE, czyli odchylenia mniejsze niż 2 zarówno dla skali szarości jak i ColorChecker. Ręczna kalibracja przy użyciu programu Portrait Display's Calman Color Calibration jeszcze bardziej zmniejsza odchylenia. Nasz profil icc można pobrać powyżej.
W połączeniu z dobrym pokryciem przestrzeni barwnej mamy wyświetlacz, który dobrze nadaje się do edycji zdjęć i filmów.

Wyświetl czasy reakcji
| ↔ Czas reakcji od czerni do bieli | ||
|---|---|---|
| 6.5 ms ... wzrost ↗ i spadek ↘ łącznie | ↗ 3.1 ms wzrost | 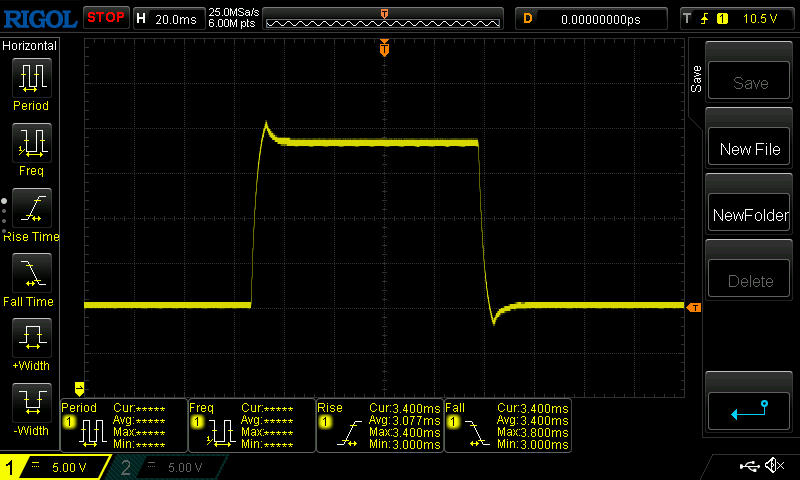 |
| ↘ 3.4 ms upadek | ||
| W naszych testach ekran wykazuje bardzo szybką reakcję i powinien bardzo dobrze nadawać się do szybkich gier. Dla porównania, wszystkie testowane urządzenia wahają się od 0.1 (minimum) do 240 (maksimum) ms. » 21 % wszystkich urządzeń jest lepszych. Oznacza to, że zmierzony czas reakcji jest lepszy od średniej wszystkich testowanych urządzeń (19.8 ms). | ||
| ↔ Czas reakcji 50% szarości do 80% szarości | ||
| 6.5 ms ... wzrost ↗ i spadek ↘ łącznie | ↗ 3.1 ms wzrost | 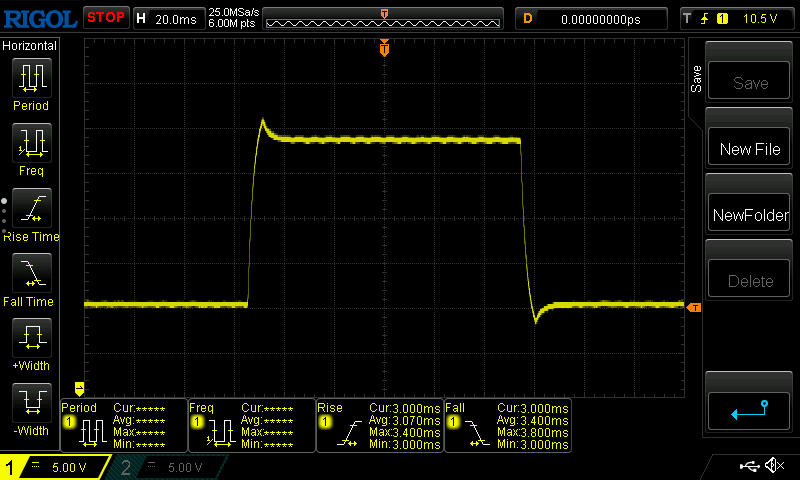 |
| ↘ 3.4 ms upadek | ||
| W naszych testach ekran wykazuje bardzo szybką reakcję i powinien bardzo dobrze nadawać się do szybkich gier. Dla porównania, wszystkie testowane urządzenia wahają się od 0.165 (minimum) do 636 (maksimum) ms. » 19 % wszystkich urządzeń jest lepszych. Oznacza to, że zmierzony czas reakcji jest lepszy od średniej wszystkich testowanych urządzeń (31 ms). | ||
Migotanie ekranu / PWM (modulacja szerokości impulsu)
| Migotanie ekranu/nie wykryto PWM | 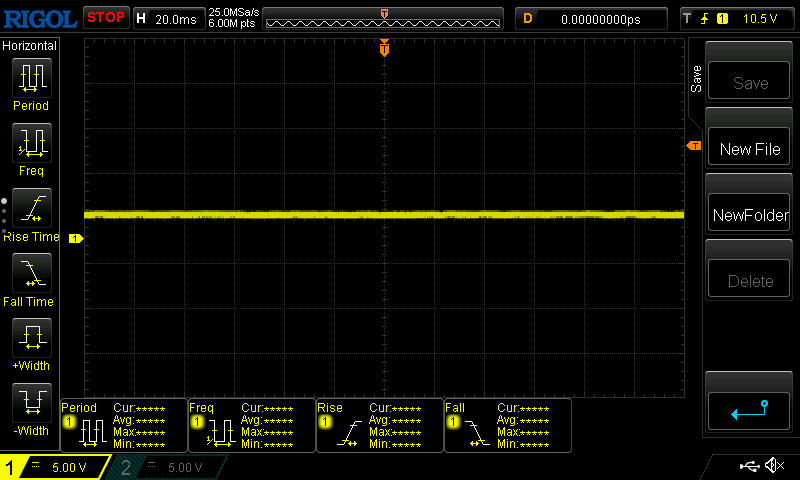 | ||
Dla porównania: 52 % wszystkich testowanych urządzeń nie używa PWM do przyciemniania wyświetlacza. Jeśli wykryto PWM, zmierzono średnio 7778 (minimum: 5 - maksimum: 343500) Hz. | |||
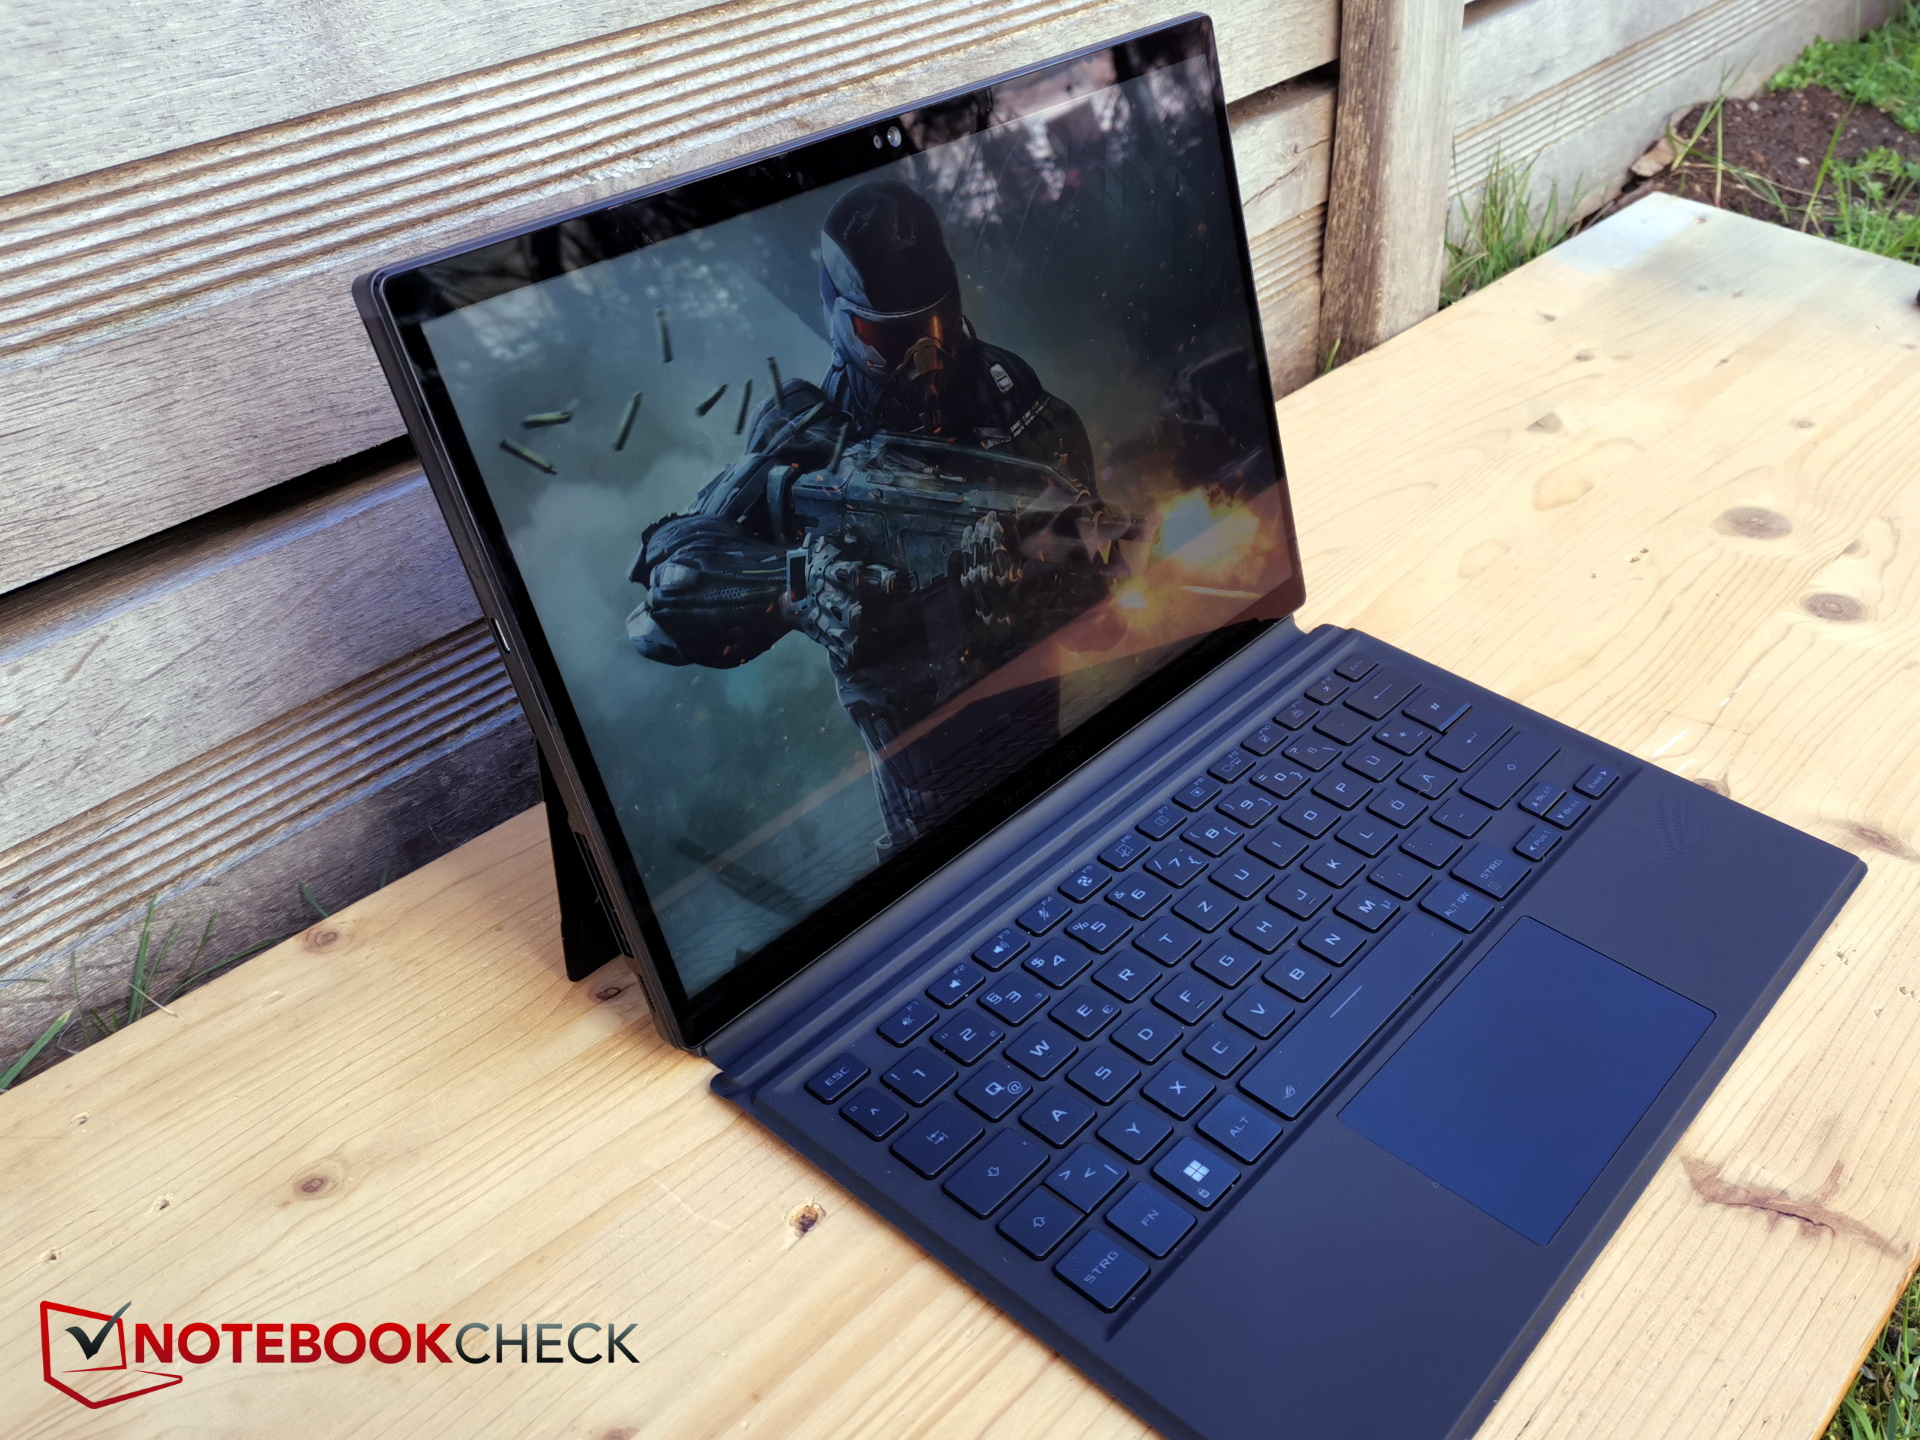
Na zewnątrz Z13 dobrze odnajduje się w zacienionych miejscach bez bezpośredniego światła, co jest głównie zasługą dobrej jasności. Odblaskowa powierzchnia szybko okazuje się jednak przeciwskuteczna w bezpośrednim świetle.
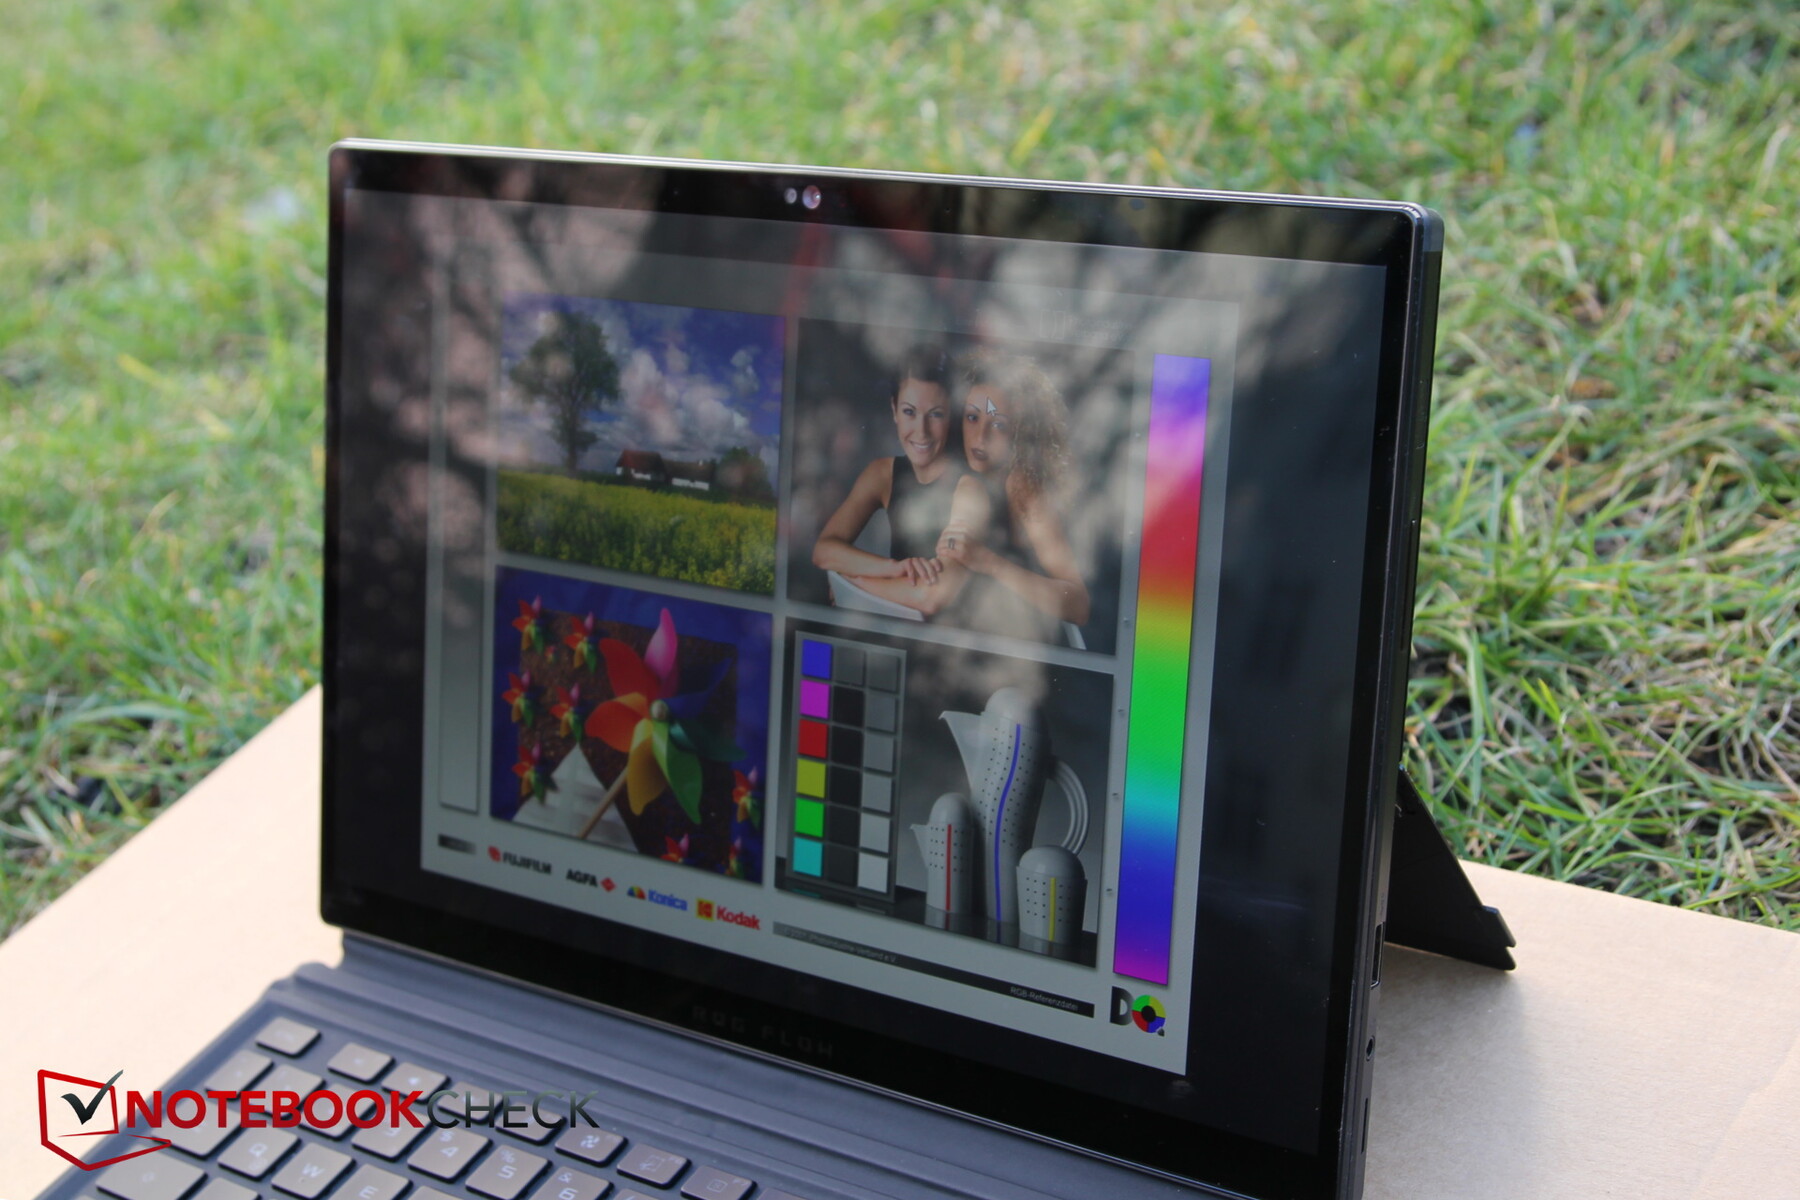
Patrząc na ekran z boków, okazuje się, że jest on bardzo stabilny pod względem kątów widzenia.

Wydajność - Tablet? Nie, laptop do gier!
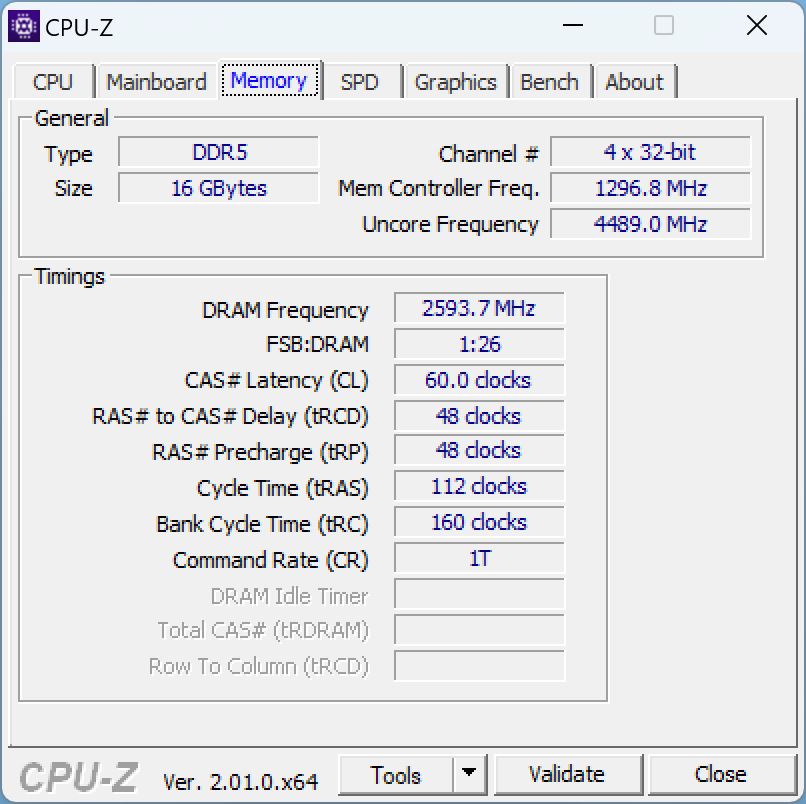
Nie jest to typowy tablet, a raczej prawdziwy gamingowy laptop, gdyż połączenie m.in.Core i9-13900H i RTX 4060a także 16 GB RAM mówią same za siebie. Alternatywnie, Z13 dostępny jest także z RTX 4050, a edycja specjalna, która różni się w wielu obszarach, ma nawet RTX 4070.
Więc powinieneś być w stanie grać we wszystkie obecne gry na tym tablecie. W tym samym czasie potężny tablet Asusa powinien być również ekscytujący dla twórców treści.
Warunki badania
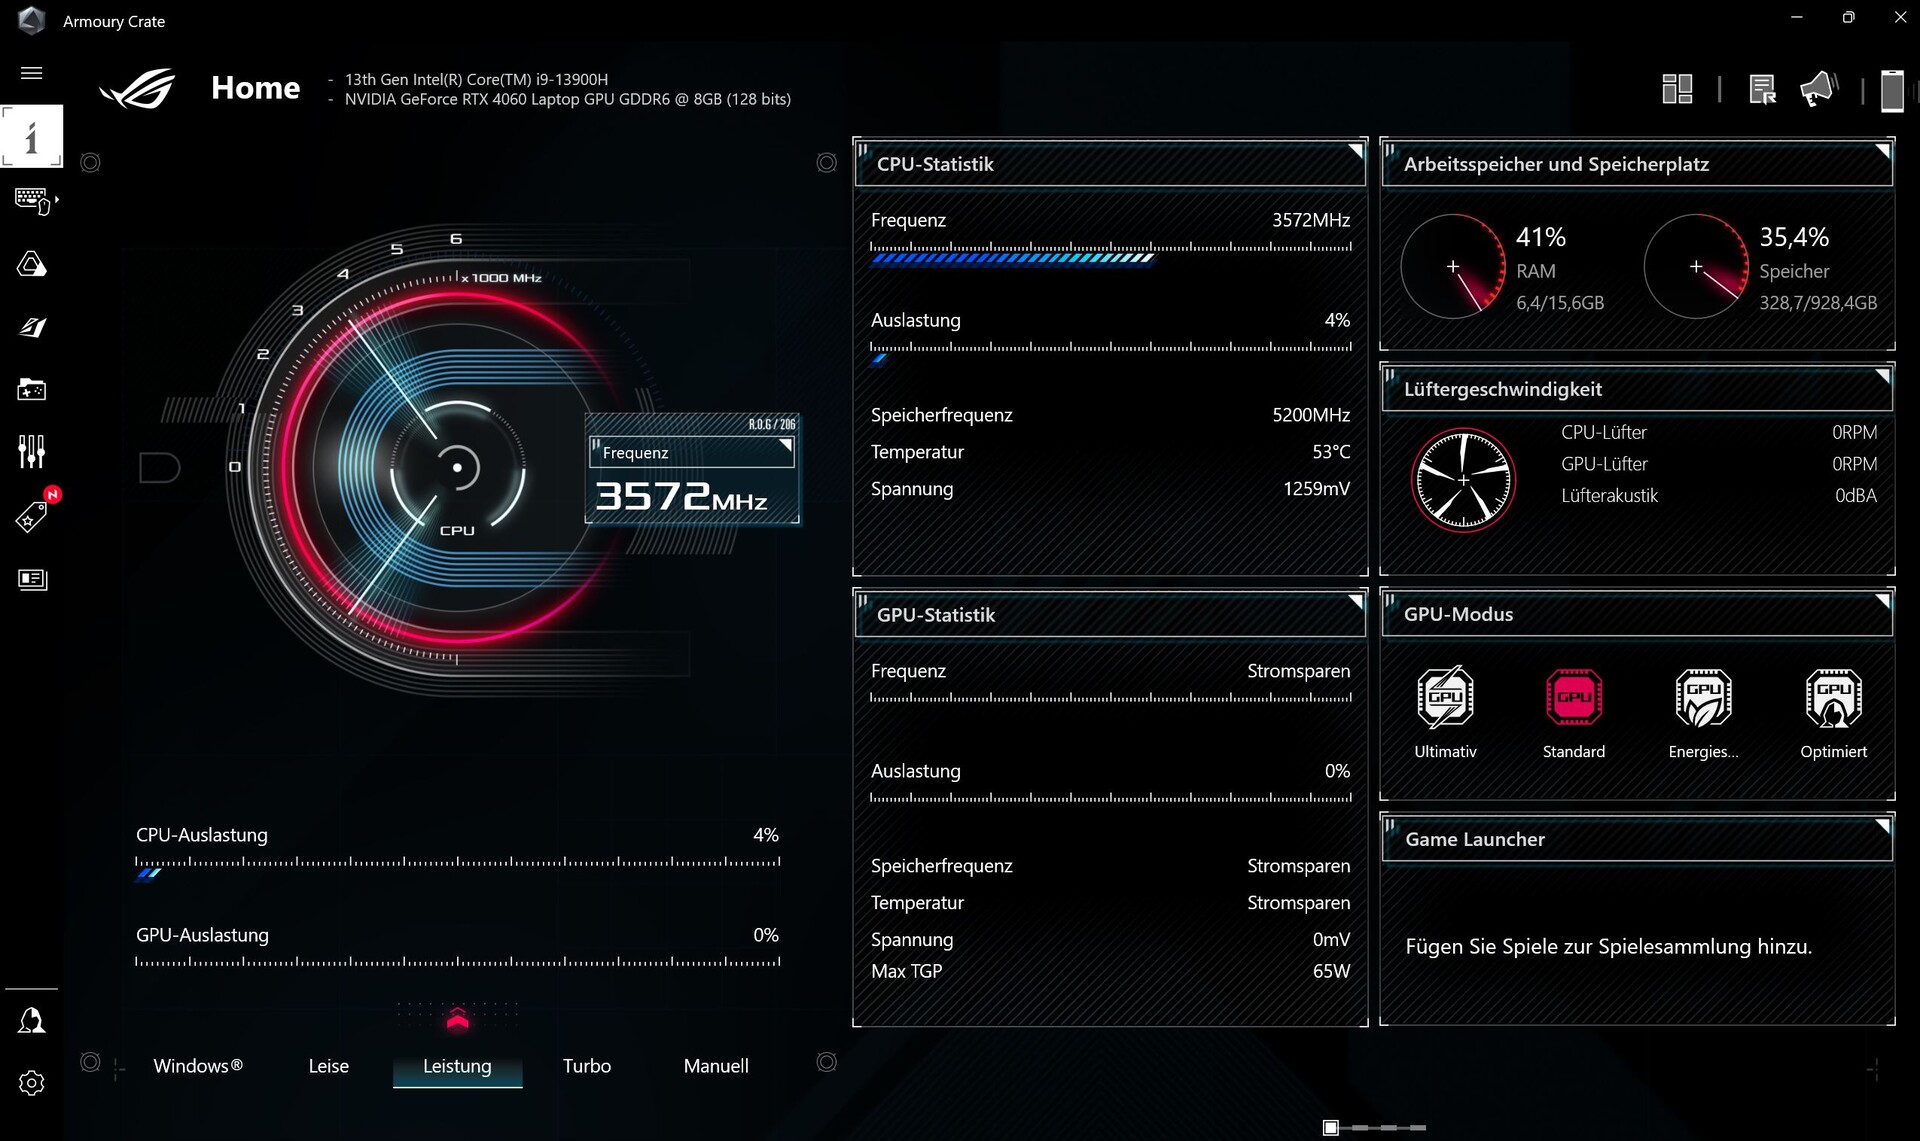
Urządzenia gamingowe Asusa zawsze mają preinstalowane co najmniej dwie aplikacje. Aktualizacje i informacje serwisowe dostępne są za pośrednictwem MyAsus, natomiast ustawienia wydajności wprowadzane są w aplikacji Armoury Crate. Ta ostatnia naśladuje Centrum Sterowania.
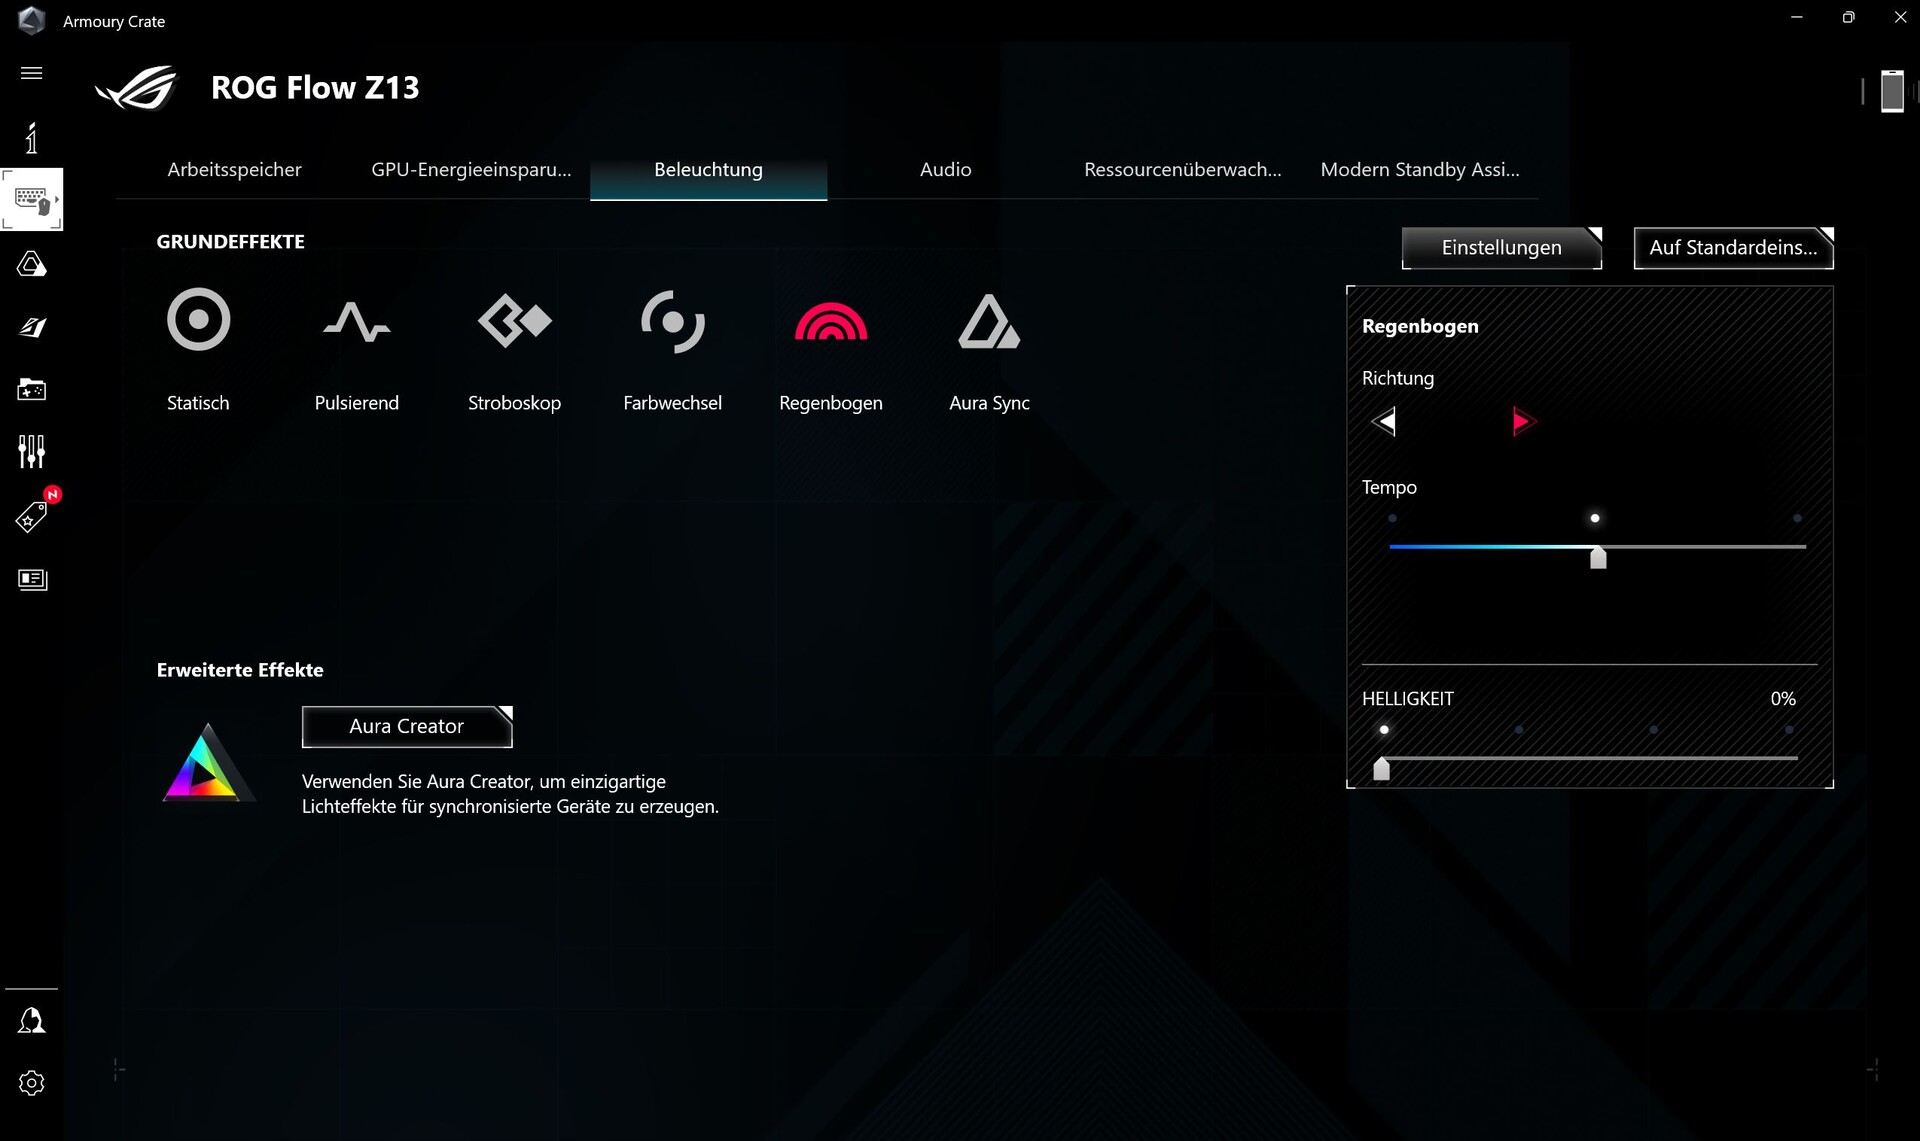
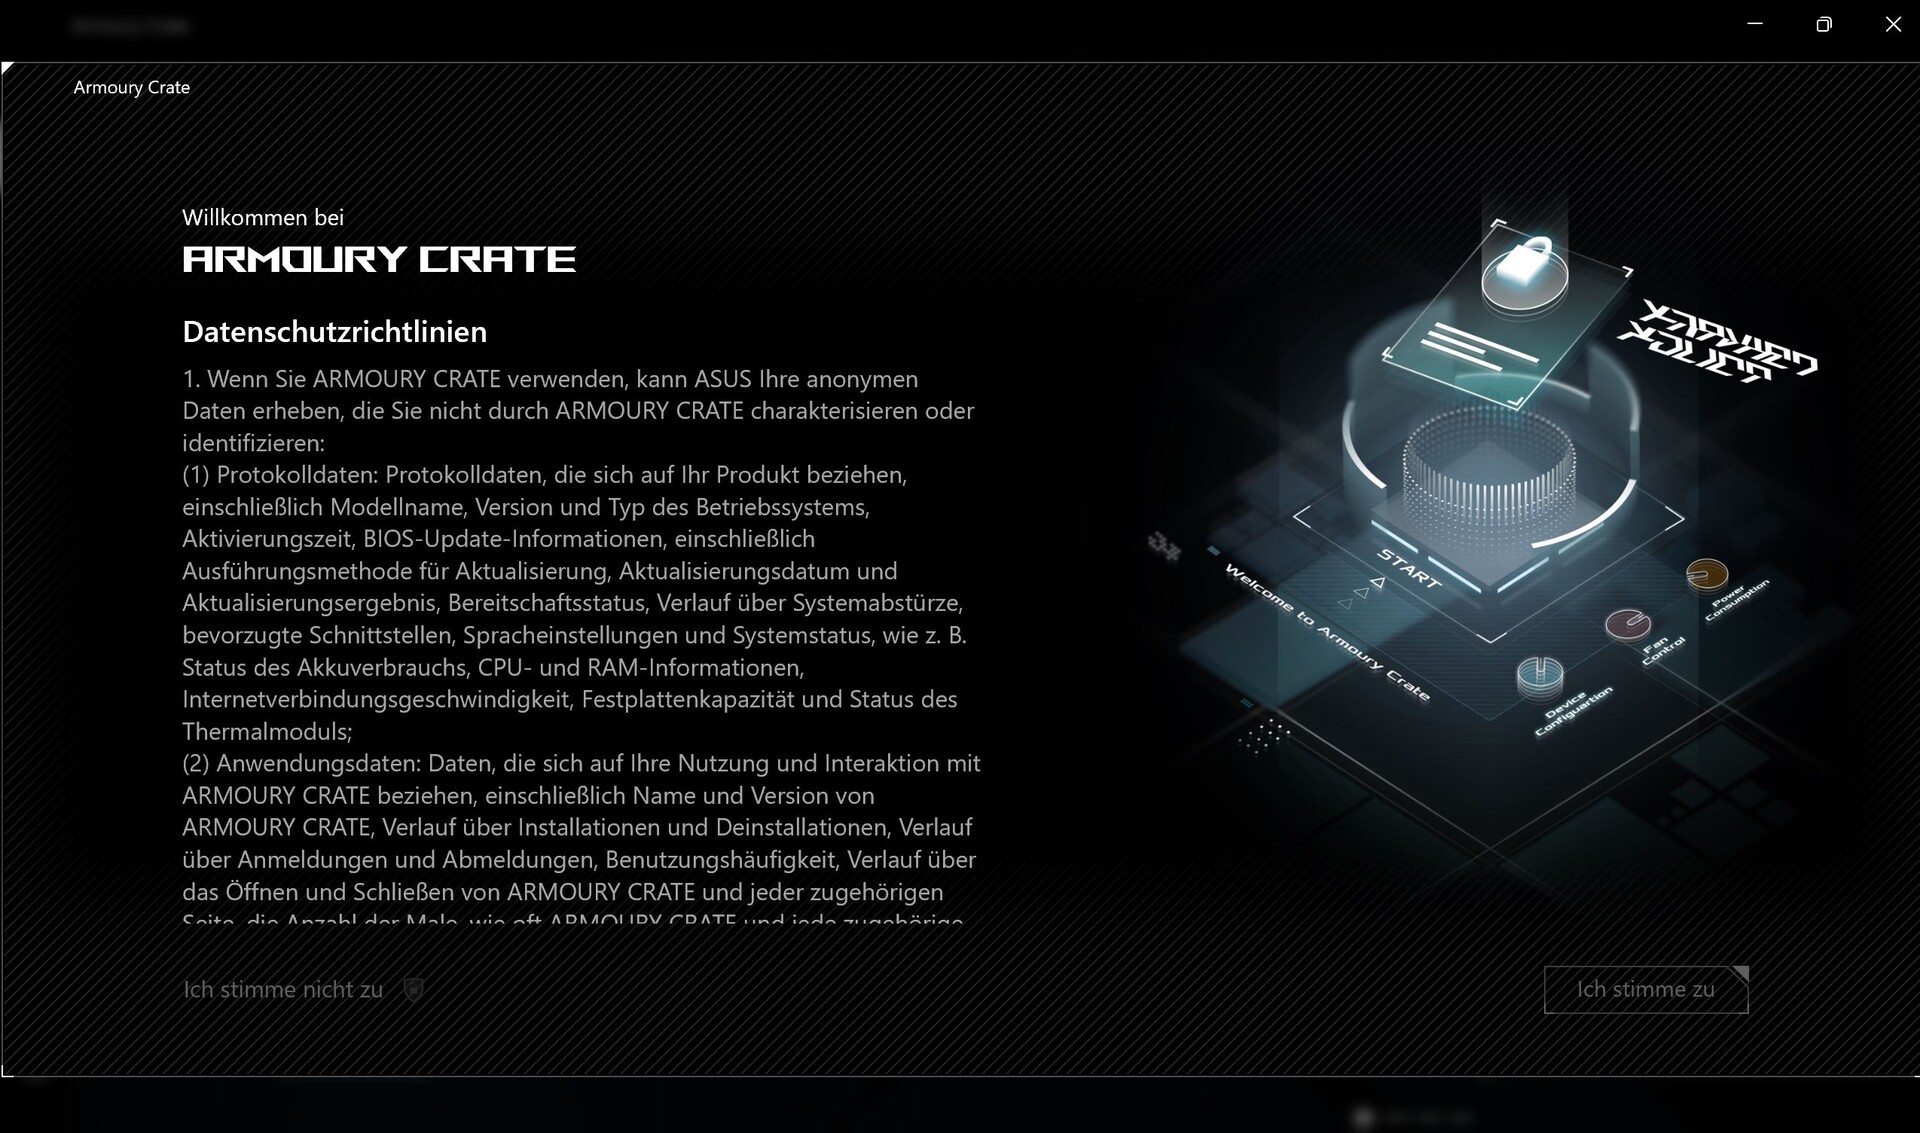
Użytkownicy powinni zapoznać się z oprogramowaniem: oprócz czterech trybów wydajności Quiet, Performance, Turbo i Manual, istnieje możliwość przełączenia grafiki, dostosowania oświetlenia, skonfigurowania dźwięku i wiele więcej. Jeśli chcesz to zrobić, musisz wcześniej wyrazić zgodę na zbieranie (zanonimizowanych) danych przez Asusa. Aplikacja wyszukuje również aktualizacje przez agonalnie długi czas, a wyszukiwanie jest czasami uruchamiane niezamierzenie. Przynajmniej aplikację można łatwo zamknąć i uruchomić ponownie.
Ze względu na tabletowy charakter, wszystkie benchmarki przeprowadziliśmy w trybie Performance , ale prezentujemy też wartości dla trybów Turbo i Quiet .


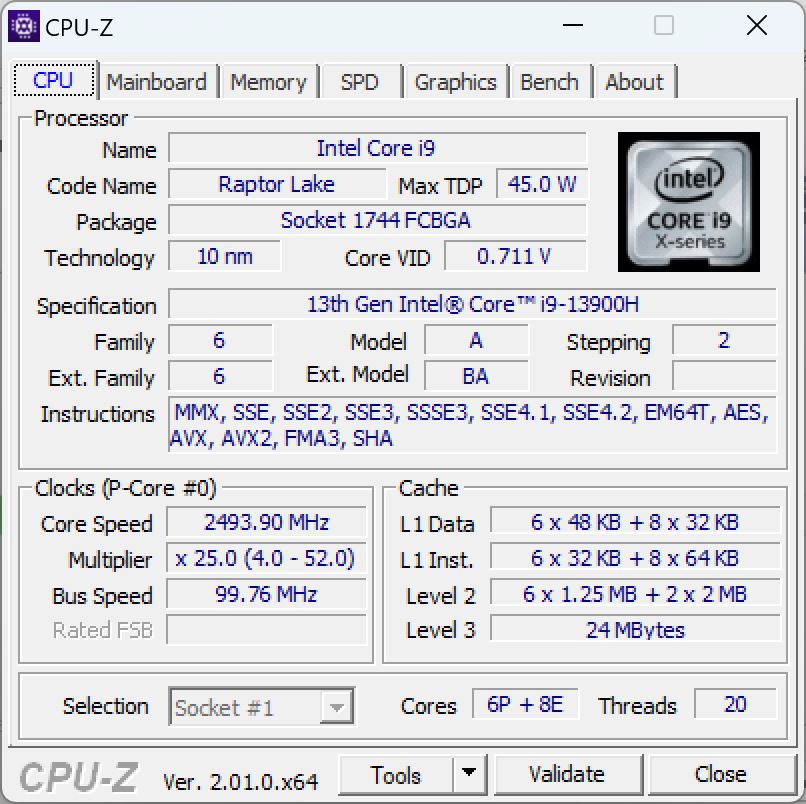
Procesor
Intel Core i9-13900H zazwyczaj nie ma miejsca w tablecie, gdyż częściej pojawia się w laptopach do gier. Wysokiej klasy procesor Gen13 z serii Alder-Lage posiada wszystkie 6 rdzeni P i 8 E, które taktowane są w zakresie od 1,9 (bazowe taktowanie rdzenia E) do 5,4 GHz (pojedyncze turbo).
W zależności od trybu wydajnościowego wartości PL1 i PL2 są różne:
| Tryby działania | PL1 | PL2 | CB R23 Multi |
|---|---|---|---|
| Quiet | 20 | 36 | 8.686 |
| Performance | 55 | 95 | 15.788 |
| Turbo | 65 | 95 | 16.811 |
| Bateria | 55 | 55 | 14,283 |
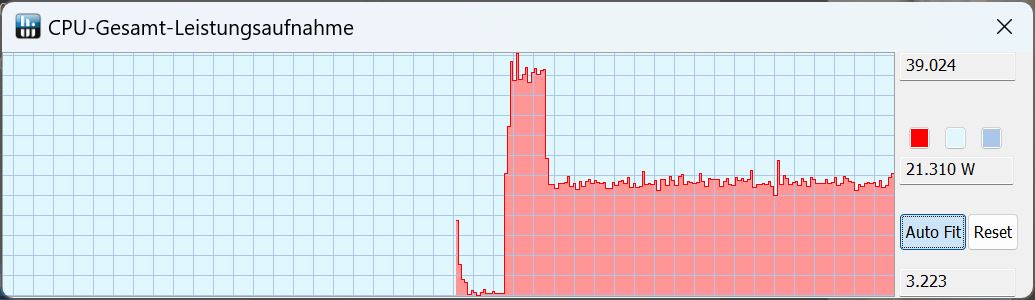
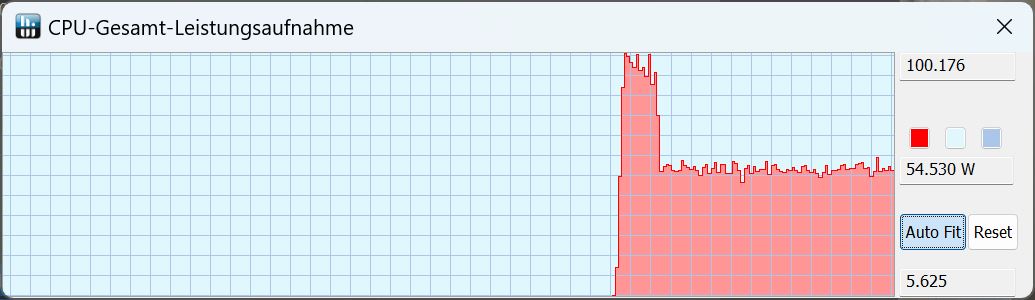
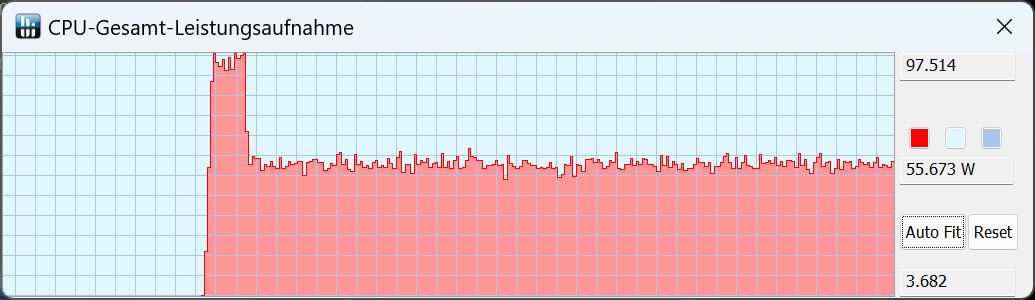
W pętli Cinebench, Z13 początkowo osiąga TDP na poziomie 100 W, ale szybko spada to do około 55 W, zanim pozostanie stabilne. Równolegle wynik jest nieco wyższy w pierwszych dwóch przebiegach CB15, po czym nieco spada i stabilizuje się, podczas gdy inne laptopy do gier z tym samym procesorem są bardziej spójne, a więc z czasem również szybciej obliczają. Z drugiej strony, różnica pomiędzy tabletem a laptopem do gier jest nadzwyczajnie mała, jeśli chodzi o wydajność procesora.
Wydajność jest najwyższa we wszystkich testach, a ocena wydajności jest dokładnie taka sama jak w przypadku modelui9-13900Hprawie nie widać, że jest to tablet.
Z dala od gniazdka elektrycznego wydajność procesora spada z 2908 do 1875 punktów w Cinebench R15, co stanowi różnicę około 35%.
Cinebench R15 Multi Sustained Load
Cinebench R23: Multi Core | Single Core
Cinebench R20: CPU (Multi Core) | CPU (Single Core)
Cinebench R15: CPU Multi 64Bit | CPU Single 64Bit
Blender: v2.79 BMW27 CPU
7-Zip 18.03: 7z b 4 | 7z b 4 -mmt1
Geekbench 5.5: Multi-Core | Single-Core
HWBOT x265 Benchmark v2.2: 4k Preset
LibreOffice : 20 Documents To PDF
R Benchmark 2.5: Overall mean
| CPU Performance rating | |
| Średnia w klasie Gaming | |
| Asus ROG Flow Z13 GZ301V | |
| Asus ROG Flow Z13 ACRNM | |
| Przeciętny Intel Core i9-13900H | |
| Asus ROG Flow Z13 GZ301ZE | |
| Acer Predator Triton 300 SE | |
| MSI Katana 17 B13VFK | |
| MSI Cyborg 15 A12VF | |
| Cinebench R23 / Multi Core | |
| Średnia w klasie Gaming (10488 - 40970, n=112, ostatnie 2 lata) | |
| Asus ROG Flow Z13 ACRNM | |
| Asus ROG Flow Z13 GZ301V | |
| Przeciętny Intel Core i9-13900H (11997 - 20385, n=28) | |
| Acer Predator Triton 300 SE | |
| MSI Katana 17 B13VFK | |
| Asus ROG Flow Z13 GZ301ZE | |
| MSI Cyborg 15 A12VF | |
| Cinebench R23 / Single Core | |
| Asus ROG Flow Z13 GZ301V | |
| Asus ROG Flow Z13 ACRNM | |
| Średnia w klasie Gaming (1166 - 2356, n=112, ostatnie 2 lata) | |
| Asus ROG Flow Z13 GZ301ZE | |
| Acer Predator Triton 300 SE | |
| Przeciętny Intel Core i9-13900H (1297 - 2054, n=26) | |
| MSI Katana 17 B13VFK | |
| MSI Cyborg 15 A12VF | |
| Cinebench R20 / CPU (Multi Core) | |
| Średnia w klasie Gaming (4029 - 16108, n=111, ostatnie 2 lata) | |
| Asus ROG Flow Z13 ACRNM | |
| Asus ROG Flow Z13 GZ301V | |
| Przeciętny Intel Core i9-13900H (4935 - 7716, n=25) | |
| Acer Predator Triton 300 SE | |
| MSI Katana 17 B13VFK | |
| MSI Cyborg 15 A12VF | |
| Asus ROG Flow Z13 GZ301ZE | |
| Cinebench R20 / CPU (Single Core) | |
| Asus ROG Flow Z13 GZ301V | |
| Asus ROG Flow Z13 ACRNM | |
| Średnia w klasie Gaming (442 - 895, n=111, ostatnie 2 lata) | |
| Asus ROG Flow Z13 GZ301ZE | |
| Acer Predator Triton 300 SE | |
| Przeciętny Intel Core i9-13900H (428 - 792, n=25) | |
| MSI Katana 17 B13VFK | |
| MSI Cyborg 15 A12VF | |
| Cinebench R15 / CPU Multi 64Bit | |
| Średnia w klasie Gaming (1578 - 6271, n=111, ostatnie 2 lata) | |
| Asus ROG Flow Z13 GZ301V | |
| Asus ROG Flow Z13 ACRNM | |
| Asus ROG Flow Z13 GZ301ZE | |
| Przeciętny Intel Core i9-13900H (2061 - 3100, n=26) | |
| Acer Predator Triton 300 SE | |
| MSI Katana 17 B13VFK | |
| MSI Cyborg 15 A12VF | |
| Cinebench R15 / CPU Single 64Bit | |
| Średnia w klasie Gaming (188.8 - 343, n=111, ostatnie 2 lata) | |
| Asus ROG Flow Z13 GZ301V | |
| Asus ROG Flow Z13 ACRNM | |
| Asus ROG Flow Z13 GZ301ZE | |
| Acer Predator Triton 300 SE | |
| Przeciętny Intel Core i9-13900H (211 - 297, n=26) | |
| MSI Katana 17 B13VFK | |
| MSI Cyborg 15 A12VF | |
| Blender / v2.79 BMW27 CPU | |
| MSI Cyborg 15 A12VF | |
| Asus ROG Flow Z13 GZ301ZE | |
| MSI Katana 17 B13VFK | |
| Przeciętny Intel Core i9-13900H (166 - 268, n=24) | |
| Acer Predator Triton 300 SE | |
| Asus ROG Flow Z13 GZ301V | |
| Asus ROG Flow Z13 ACRNM | |
| Średnia w klasie Gaming (80 - 330, n=109, ostatnie 2 lata) | |
| 7-Zip 18.03 / 7z b 4 | |
| Średnia w klasie Gaming (33491 - 148086, n=110, ostatnie 2 lata) | |
| Asus ROG Flow Z13 GZ301V | |
| Asus ROG Flow Z13 ACRNM | |
| Przeciętny Intel Core i9-13900H (45045 - 79032, n=25) | |
| Acer Predator Triton 300 SE | |
| Asus ROG Flow Z13 GZ301ZE | |
| MSI Katana 17 B13VFK | |
| MSI Cyborg 15 A12VF | |
| 7-Zip 18.03 / 7z b 4 -mmt1 | |
| Asus ROG Flow Z13 GZ301V | |
| Średnia w klasie Gaming (4199 - 7436, n=110, ostatnie 2 lata) | |
| Asus ROG Flow Z13 ACRNM | |
| Asus ROG Flow Z13 GZ301ZE | |
| Przeciętny Intel Core i9-13900H (3665 - 6600, n=25) | |
| MSI Cyborg 15 A12VF | |
| MSI Katana 17 B13VFK | |
| Acer Predator Triton 300 SE | |
| Geekbench 5.5 / Multi-Core | |
| Średnia w klasie Gaming (6460 - 27010, n=110, ostatnie 2 lata) | |
| Asus ROG Flow Z13 GZ301V | |
| Asus ROG Flow Z13 ACRNM | |
| Asus ROG Flow Z13 GZ301ZE | |
| Acer Predator Triton 300 SE | |
| Przeciętny Intel Core i9-13900H (9094 - 15410, n=26) | |
| MSI Katana 17 B13VFK | |
| MSI Cyborg 15 A12VF | |
| Geekbench 5.5 / Single-Core | |
| Średnia w klasie Gaming (986 - 2474, n=110, ostatnie 2 lata) | |
| Asus ROG Flow Z13 GZ301V | |
| Asus ROG Flow Z13 ACRNM | |
| Przeciętny Intel Core i9-13900H (1140 - 2043, n=26) | |
| Asus ROG Flow Z13 GZ301ZE | |
| Acer Predator Triton 300 SE | |
| MSI Katana 17 B13VFK | |
| MSI Cyborg 15 A12VF | |
| HWBOT x265 Benchmark v2.2 / 4k Preset | |
| Średnia w klasie Gaming (11.5 - 44.3, n=110, ostatnie 2 lata) | |
| Asus ROG Flow Z13 ACRNM | |
| Asus ROG Flow Z13 GZ301V | |
| Acer Predator Triton 300 SE | |
| Przeciętny Intel Core i9-13900H (14.1 - 22.3, n=25) | |
| Asus ROG Flow Z13 GZ301ZE | |
| MSI Katana 17 B13VFK | |
| MSI Cyborg 15 A12VF | |
| MSI Cyborg 15 A12VF | |
| LibreOffice / 20 Documents To PDF | |
| Asus ROG Flow Z13 ACRNM | |
| MSI Katana 17 B13VFK | |
| Średnia w klasie Gaming (19 - 88.8, n=110, ostatnie 2 lata) | |
| Przeciętny Intel Core i9-13900H (34.4 - 82.8, n=25) | |
| Asus ROG Flow Z13 GZ301ZE | |
| Acer Predator Triton 300 SE | |
| Asus ROG Flow Z13 GZ301V | |
| MSI Cyborg 15 A12VF | |
| R Benchmark 2.5 / Overall mean | |
| MSI Cyborg 15 A12VF | |
| Przeciętny Intel Core i9-13900H (0.4052 - 0.723, n=25) | |
| MSI Katana 17 B13VFK | |
| Średnia w klasie Gaming (0.3439 - 0.759, n=111, ostatnie 2 lata) | |
| Acer Predator Triton 300 SE | |
| Asus ROG Flow Z13 GZ301ZE | |
| Asus ROG Flow Z13 ACRNM | |
| Asus ROG Flow Z13 GZ301V | |
* ... im mniej tym lepiej
AIDA64: FP32 Ray-Trace | FPU Julia | CPU SHA3 | CPU Queen | FPU SinJulia | FPU Mandel | CPU AES | CPU ZLib | FP64 Ray-Trace | CPU PhotoWorxx
| Performance rating | |
| Średnia w klasie Gaming | |
| Acer Predator Triton 300 SE | |
| Asus ROG Flow Z13 ACRNM | |
| Asus ROG Flow Z13 GZ301V | |
| Przeciętny Intel Core i9-13900H | |
| MSI Cyborg 15 A12VF | |
| MSI Katana 17 B13VFK | |
| Asus ROG Flow Z13 GZ301ZE | |
| AIDA64 / FP32 Ray-Trace | |
| Średnia w klasie Gaming (10227 - 85542, n=109, ostatnie 2 lata) | |
| Asus ROG Flow Z13 ACRNM | |
| Asus ROG Flow Z13 GZ301V | |
| Acer Predator Triton 300 SE | |
| Przeciętny Intel Core i9-13900H (6788 - 19557, n=25) | |
| MSI Katana 17 B13VFK | |
| MSI Cyborg 15 A12VF | |
| Asus ROG Flow Z13 GZ301ZE | |
| AIDA64 / FPU Julia | |
| Średnia w klasie Gaming (51376 - 238426, n=109, ostatnie 2 lata) | |
| Asus ROG Flow Z13 ACRNM | |
| Asus ROG Flow Z13 GZ301V | |
| Przeciętny Intel Core i9-13900H (22551 - 95579, n=25) | |
| Acer Predator Triton 300 SE | |
| MSI Cyborg 15 A12VF | |
| MSI Katana 17 B13VFK | |
| Asus ROG Flow Z13 GZ301ZE | |
| AIDA64 / CPU SHA3 | |
| Średnia w klasie Gaming (2180 - 9817, n=109, ostatnie 2 lata) | |
| Asus ROG Flow Z13 ACRNM | |
| Acer Predator Triton 300 SE | |
| Przeciętny Intel Core i9-13900H (2491 - 4270, n=25) | |
| Asus ROG Flow Z13 GZ301V | |
| MSI Cyborg 15 A12VF | |
| MSI Katana 17 B13VFK | |
| Asus ROG Flow Z13 GZ301ZE | |
| AIDA64 / CPU Queen | |
| Średnia w klasie Gaming (49785 - 173351, n=98, ostatnie 2 lata) | |
| Asus ROG Flow Z13 GZ301V | |
| Asus ROG Flow Z13 ACRNM | |
| Acer Predator Triton 300 SE | |
| Przeciętny Intel Core i9-13900H (65121 - 120936, n=25) | |
| Asus ROG Flow Z13 GZ301ZE | |
| MSI Cyborg 15 A12VF | |
| MSI Katana 17 B13VFK | |
| AIDA64 / FPU SinJulia | |
| Średnia w klasie Gaming (4424 - 33636, n=109, ostatnie 2 lata) | |
| Asus ROG Flow Z13 ACRNM | |
| Asus ROG Flow Z13 GZ301V | |
| Acer Predator Triton 300 SE | |
| Przeciętny Intel Core i9-13900H (6108 - 11631, n=25) | |
| Asus ROG Flow Z13 GZ301ZE | |
| MSI Cyborg 15 A12VF | |
| MSI Katana 17 B13VFK | |
| AIDA64 / FPU Mandel | |
| Średnia w klasie Gaming (25115 - 128721, n=109, ostatnie 2 lata) | |
| Asus ROG Flow Z13 ACRNM | |
| Asus ROG Flow Z13 GZ301V | |
| Przeciętny Intel Core i9-13900H (11283 - 48474, n=25) | |
| Acer Predator Triton 300 SE | |
| MSI Katana 17 B13VFK | |
| MSI Cyborg 15 A12VF | |
| Asus ROG Flow Z13 GZ301ZE | |
| AIDA64 / CPU AES | |
| Acer Predator Triton 300 SE | |
| Średnia w klasie Gaming (39258 - 247074, n=109, ostatnie 2 lata) | |
| Przeciętny Intel Core i9-13900H (3691 - 149377, n=25) | |
| Asus ROG Flow Z13 GZ301ZE | |
| Asus ROG Flow Z13 ACRNM | |
| Asus ROG Flow Z13 GZ301V | |
| MSI Cyborg 15 A12VF | |
| MSI Katana 17 B13VFK | |
| AIDA64 / CPU ZLib | |
| Średnia w klasie Gaming (574 - 2531, n=109, ostatnie 2 lata) | |
| Asus ROG Flow Z13 ACRNM | |
| Asus ROG Flow Z13 GZ301V | |
| Przeciętny Intel Core i9-13900H (789 - 1254, n=25) | |
| Acer Predator Triton 300 SE | |
| Asus ROG Flow Z13 GZ301ZE | |
| MSI Cyborg 15 A12VF | |
| MSI Katana 17 B13VFK | |
| AIDA64 / FP64 Ray-Trace | |
| Średnia w klasie Gaming (5509 - 45446, n=109, ostatnie 2 lata) | |
| Asus ROG Flow Z13 ACRNM | |
| Asus ROG Flow Z13 GZ301V | |
| Przeciętny Intel Core i9-13900H (3655 - 10716, n=25) | |
| Acer Predator Triton 300 SE | |
| MSI Katana 17 B13VFK | |
| MSI Cyborg 15 A12VF | |
| Asus ROG Flow Z13 GZ301ZE | |
| AIDA64 / CPU PhotoWorxx | |
| Acer Predator Triton 300 SE | |
| Asus ROG Flow Z13 ACRNM | |
| Asus ROG Flow Z13 GZ301ZE | |
| Średnia w klasie Gaming (12271 - 89891, n=109, ostatnie 2 lata) | |
| Asus ROG Flow Z13 GZ301V | |
| Przeciętny Intel Core i9-13900H (10871 - 50488, n=25) | |
| MSI Cyborg 15 A12VF | |
| MSI Katana 17 B13VFK | |
Wydajność systemu
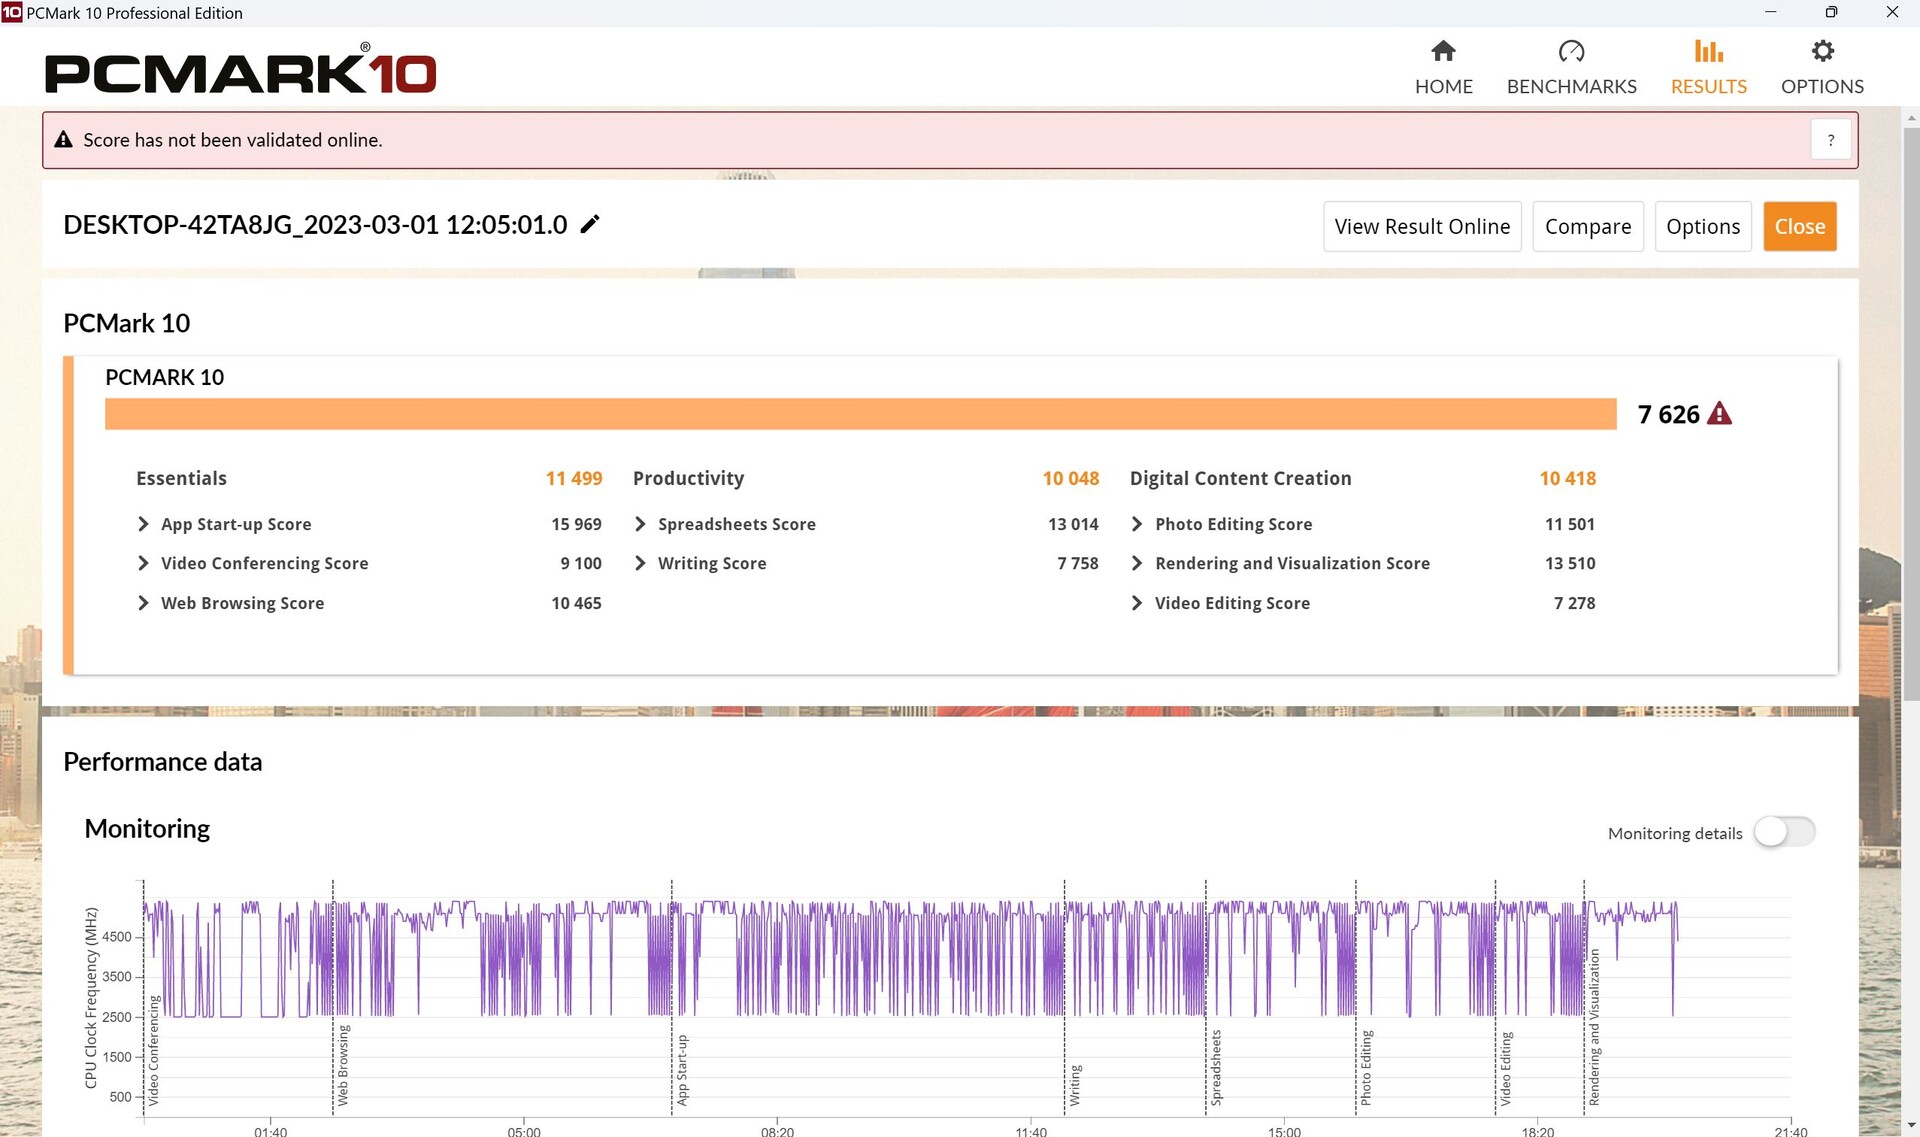
Z13 dobrze radzi sobie w programie PCMark 10. Zostawia swojegopoprzednikaw tyle o około 17% Gigabyte Aero 16z tym samym procesorem ma tylko 6-procentową przewagę, co jest imponujące jak na tablet!
W codziennym użytkowaniu wszystko jest też cudownie płynne.
CrossMark: Overall | Productivity | Creativity | Responsiveness
| PCMark 10 / Score | |
| Średnia w klasie Gaming (5828 - 11574, n=96, ostatnie 2 lata) | |
| Asus ROG Flow Z13 ACRNM | |
| Przeciętny Intel Core i9-13900H, NVIDIA GeForce RTX 4060 Laptop GPU (7578 - 7884, n=3) | |
| Asus ROG Flow Z13 GZ301V | |
| Acer Predator Triton 300 SE | |
| MSI Katana 17 B13VFK | |
| MSI Cyborg 15 A12VF | |
| Asus ROG Flow Z13 GZ301ZE | |
| PCMark 10 / Essentials | |
| Asus ROG Flow Z13 GZ301V | |
| Przeciętny Intel Core i9-13900H, NVIDIA GeForce RTX 4060 Laptop GPU (11235 - 11539, n=3) | |
| Acer Predator Triton 300 SE | |
| Asus ROG Flow Z13 ACRNM | |
| MSI Katana 17 B13VFK | |
| Asus ROG Flow Z13 GZ301ZE | |
| MSI Cyborg 15 A12VF | |
| Średnia w klasie Gaming (8810 - 12600, n=100, ostatnie 2 lata) | |
| PCMark 10 / Productivity | |
| Średnia w klasie Gaming (6845 - 21327, n=98, ostatnie 2 lata) | |
| Acer Predator Triton 300 SE | |
| Przeciętny Intel Core i9-13900H, NVIDIA GeForce RTX 4060 Laptop GPU (9888 - 10222, n=3) | |
| Asus ROG Flow Z13 GZ301V | |
| MSI Cyborg 15 A12VF | |
| Asus ROG Flow Z13 ACRNM | |
| Asus ROG Flow Z13 GZ301ZE | |
| MSI Katana 17 B13VFK | |
| PCMark 10 / Digital Content Creation | |
| Średnia w klasie Gaming (7602 - 19657, n=98, ostatnie 2 lata) | |
| Asus ROG Flow Z13 ACRNM | |
| Przeciętny Intel Core i9-13900H, NVIDIA GeForce RTX 4060 Laptop GPU (10418 - 11272, n=3) | |
| Acer Predator Triton 300 SE | |
| Asus ROG Flow Z13 GZ301V | |
| MSI Katana 17 B13VFK | |
| MSI Cyborg 15 A12VF | |
| Asus ROG Flow Z13 GZ301ZE | |
| CrossMark / Overall | |
| Asus ROG Flow Z13 GZ301ZE | |
| Asus ROG Flow Z13 GZ301V | |
| Średnia w klasie Gaming (1366 - 2409, n=97, ostatnie 2 lata) | |
| Acer Predator Triton 300 SE | |
| Przeciętny Intel Core i9-13900H, NVIDIA GeForce RTX 4060 Laptop GPU (1874 - 1983, n=3) | |
| Asus ROG Flow Z13 ACRNM | |
| MSI Katana 17 B13VFK | |
| MSI Cyborg 15 A12VF | |
| CrossMark / Productivity | |
| Asus ROG Flow Z13 GZ301ZE | |
| Asus ROG Flow Z13 GZ301V | |
| Acer Predator Triton 300 SE | |
| Średnia w klasie Gaming (1386 - 2254, n=97, ostatnie 2 lata) | |
| Przeciętny Intel Core i9-13900H, NVIDIA GeForce RTX 4060 Laptop GPU (1779 - 1889, n=3) | |
| Asus ROG Flow Z13 ACRNM | |
| MSI Katana 17 B13VFK | |
| MSI Cyborg 15 A12VF | |
| CrossMark / Creativity | |
| Średnia w klasie Gaming (1343 - 2729, n=97, ostatnie 2 lata) | |
| Asus ROG Flow Z13 GZ301V | |
| Asus ROG Flow Z13 ACRNM | |
| Asus ROG Flow Z13 GZ301ZE | |
| Przeciętny Intel Core i9-13900H, NVIDIA GeForce RTX 4060 Laptop GPU (2104 - 2195, n=3) | |
| Acer Predator Triton 300 SE | |
| MSI Katana 17 B13VFK | |
| MSI Cyborg 15 A12VF | |
| CrossMark / Responsiveness | |
| Asus ROG Flow Z13 GZ301ZE | |
| Acer Predator Triton 300 SE | |
| MSI Katana 17 B13VFK | |
| Średnia w klasie Gaming (1226 - 2334, n=97, ostatnie 2 lata) | |
| Asus ROG Flow Z13 GZ301V | |
| Asus ROG Flow Z13 ACRNM | |
| MSI Cyborg 15 A12VF | |
| Przeciętny Intel Core i9-13900H, NVIDIA GeForce RTX 4060 Laptop GPU (1548 - 1698, n=3) | |
| PCMark 10 Score | 7626 pkt. | |
Pomoc | ||
| AIDA64 / Memory Copy | |
| Asus ROG Flow Z13 GZ301ZE | |
| Acer Predator Triton 300 SE | |
| Średnia w klasie Gaming (21750 - 129946, n=109, ostatnie 2 lata) | |
| Asus ROG Flow Z13 GZ301V | |
| Asus ROG Flow Z13 ACRNM | |
| Przeciętny Intel Core i9-13900H (37448 - 74486, n=25) | |
| MSI Cyborg 15 A12VF | |
| MSI Katana 17 B13VFK | |
| AIDA64 / Memory Read | |
| Acer Predator Triton 300 SE | |
| Średnia w klasie Gaming (22956 - 118858, n=109, ostatnie 2 lata) | |
| Asus ROG Flow Z13 GZ301ZE | |
| MSI Cyborg 15 A12VF | |
| Asus ROG Flow Z13 ACRNM | |
| Asus ROG Flow Z13 GZ301V | |
| Przeciętny Intel Core i9-13900H (41599 - 75433, n=25) | |
| MSI Katana 17 B13VFK | |
| AIDA64 / Memory Write | |
| Średnia w klasie Gaming (22297 - 135096, n=109, ostatnie 2 lata) | |
| Asus ROG Flow Z13 GZ301V | |
| Asus ROG Flow Z13 ACRNM | |
| Przeciętny Intel Core i9-13900H (36152 - 88505, n=25) | |
| Acer Predator Triton 300 SE | |
| Asus ROG Flow Z13 GZ301ZE | |
| MSI Cyborg 15 A12VF | |
| MSI Katana 17 B13VFK | |
| AIDA64 / Memory Latency | |
| Średnia w klasie Gaming (75.3 - 259, n=109, ostatnie 2 lata) | |
| Asus ROG Flow Z13 GZ301ZE | |
| Acer Predator Triton 300 SE | |
| MSI Katana 17 B13VFK | |
| MSI Cyborg 15 A12VF | |
| Asus ROG Flow Z13 ACRNM | |
| Przeciętny Intel Core i9-13900H (75.8 - 102.3, n=25) | |
| Asus ROG Flow Z13 GZ301V | |
* ... im mniej tym lepiej
Opóźnienie DPC
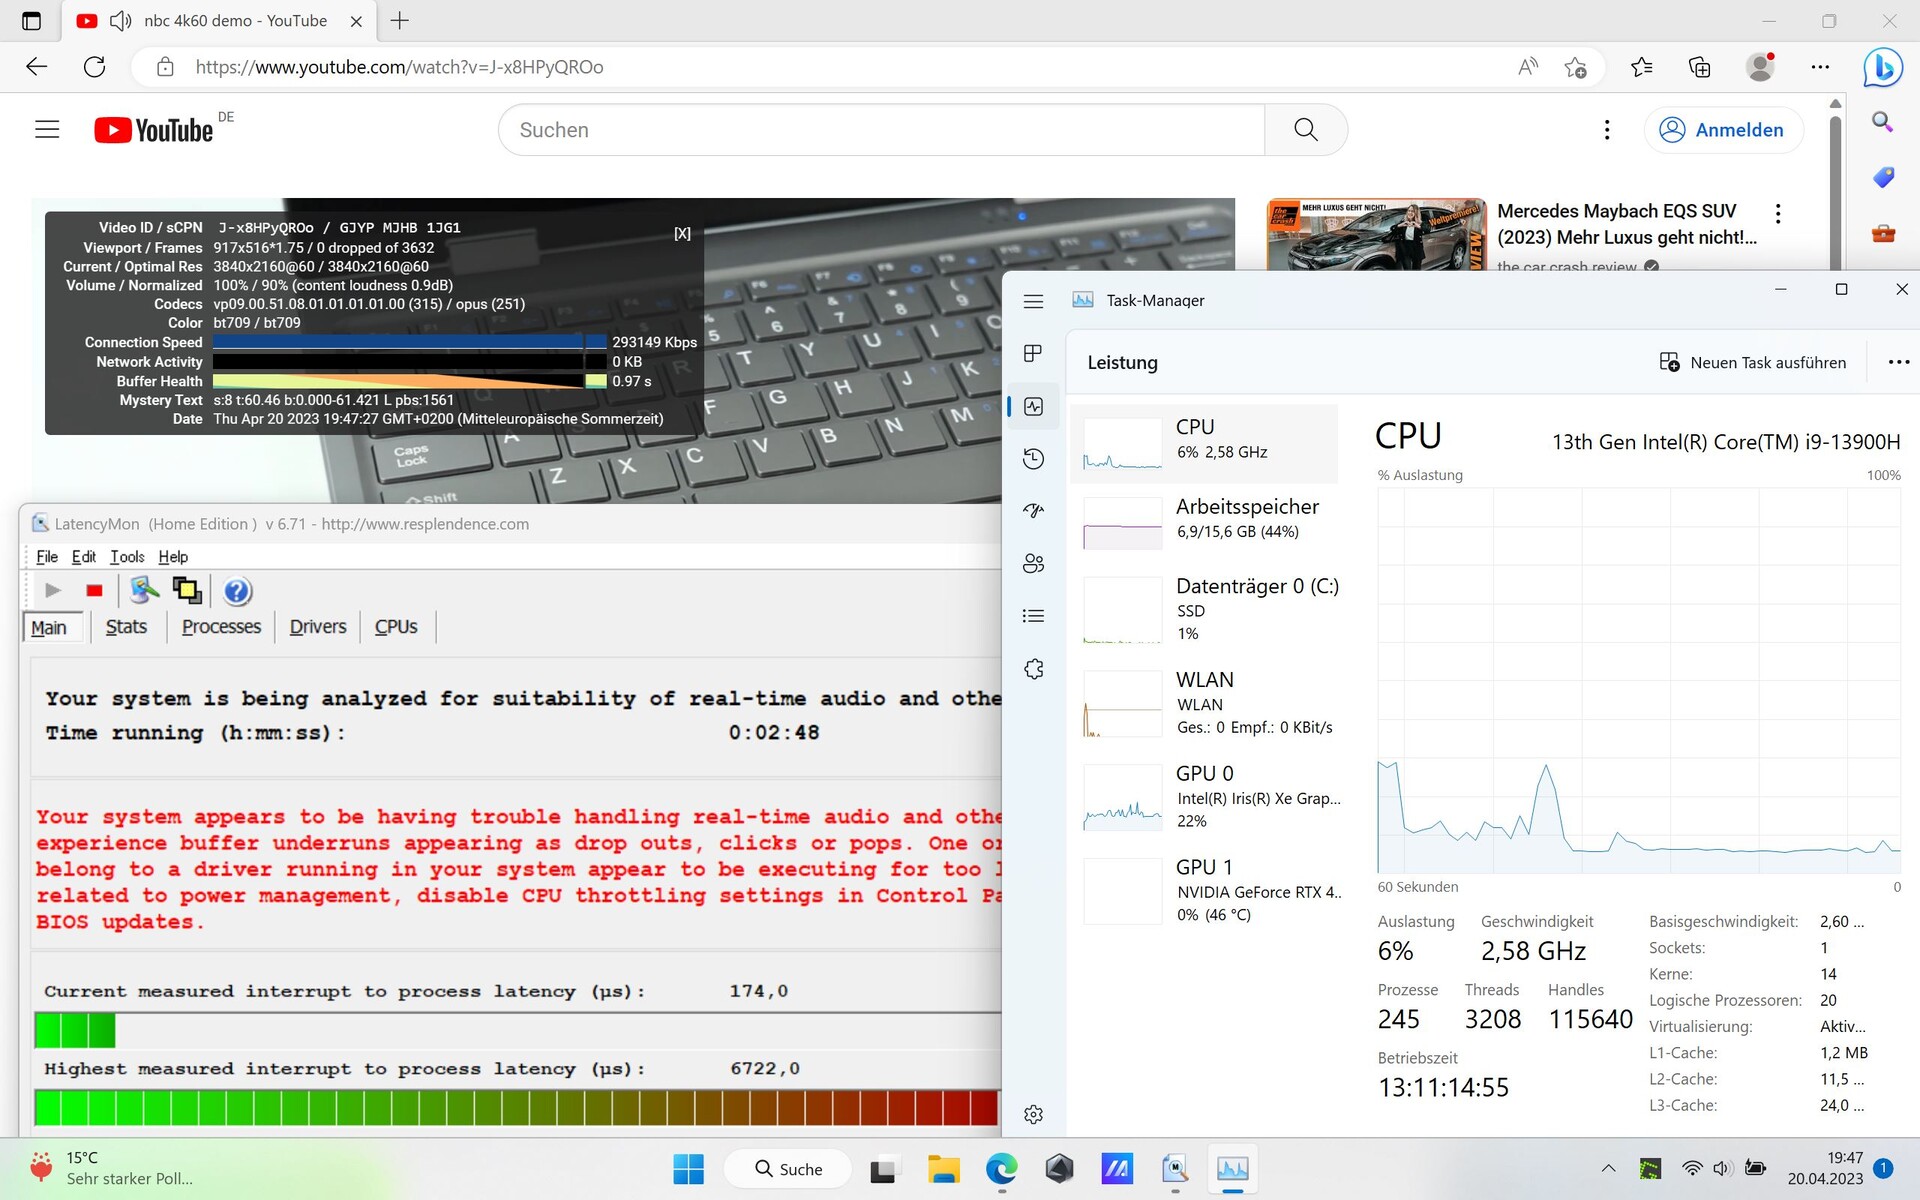
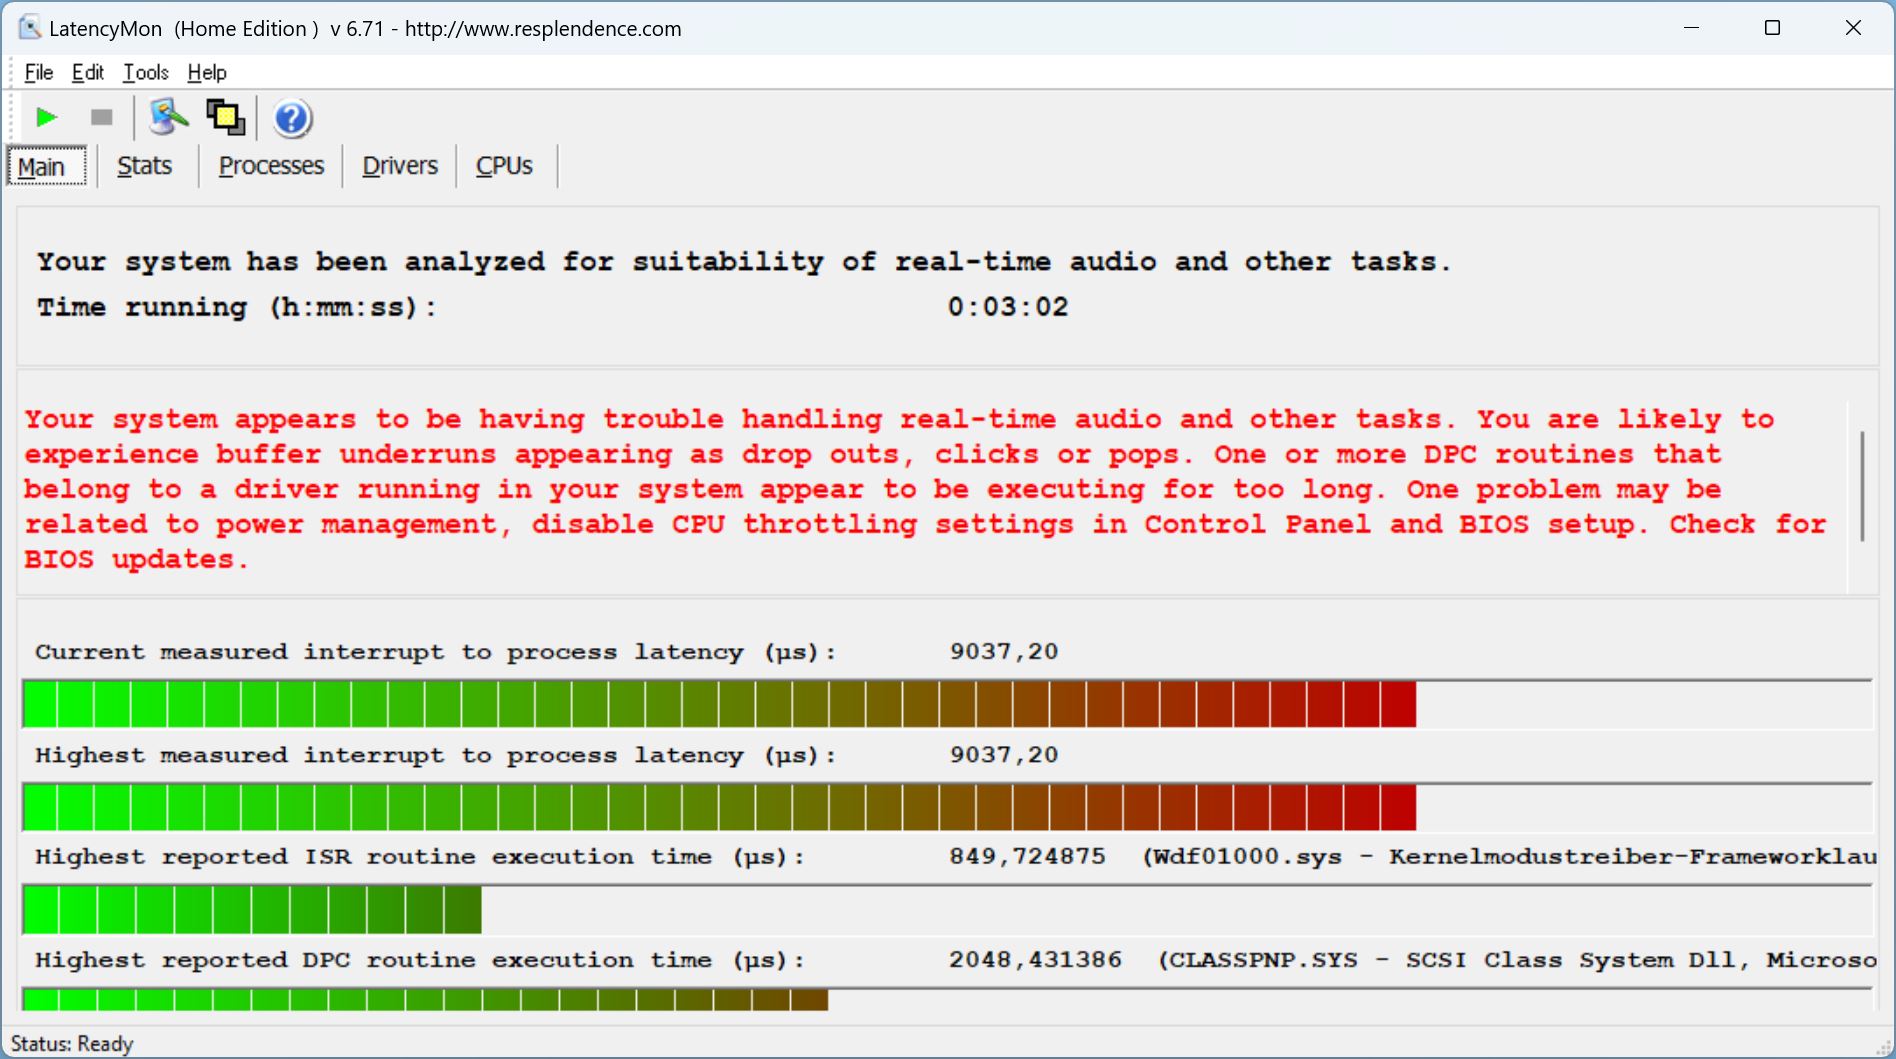
Po otwarciu przeglądarki internetowej pojawiają się pierwsze opóźnienia, które nasilają się po otwarciu wielu kart. Odtwarzanie naszego filmu na YouTube w 4K/60 klatkach na sekundę również zwiększa opóźnienia, mimo że nie spadają żadne klatki. W końcu mamy do czynienia z bardzo wysoką wartością, a problem wysokich opóźnień w obecnych sterownikach Nvidii powinien zostać w dużej mierze wyeliminowany. W trakcie naszej recenzji ukazał się Geforce 531.68, ale aktualizacja nie zmieniła nic w kwestii wysokich latencji. W Z13 jest więc zdecydowanie miejsce na poprawę pod tym względem, zwłaszcza jeśli Asus chce się przypodobać profesjonalistom.
Inny test ujawnił opóźnienie przekraczające 5,5 tys. us podczas otwierania pliku tekstowego i kopiowania adresu URL do schowka.

| DPC Latencies / LatencyMon - interrupt to process latency (max), Web, Youtube, Prime95 | |
| Asus ROG Flow Z13 GZ301V | |
| Acer Predator Triton 300 SE | |
| MSI Katana 17 B13VFK | |
| Asus ROG Flow Z13 ACRNM | |
| Asus ROG Flow Z13 GZ301ZE | |
| MSI Cyborg 15 A12VF | |
* ... im mniej tym lepiej
Urządzenia do przechowywania danych
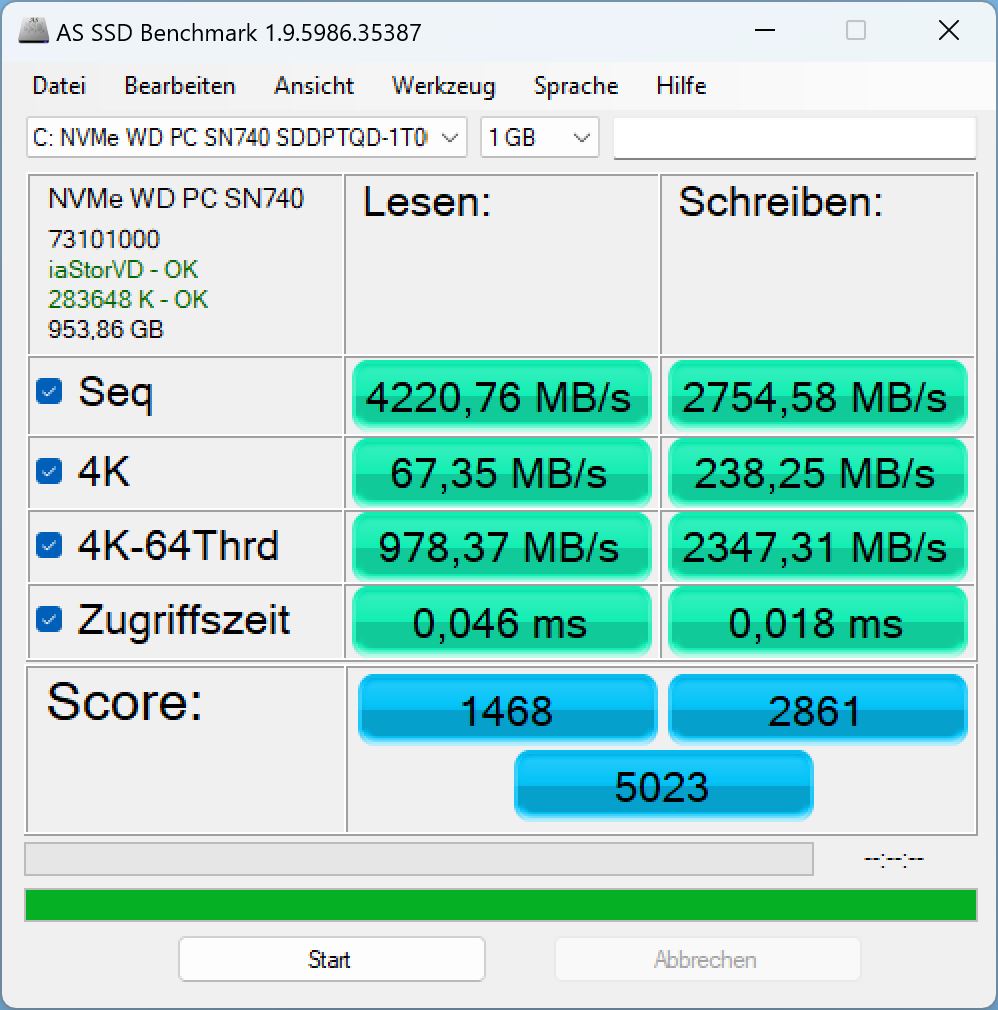
Ze względu na ograniczoną ilość miejsca Asus instaluje dysk SSD NVMe o pojemności 1 TB w małym formacie M.2 2230. Zamienniki dla niego są zwykle nieco droższe od powszechnie stosowanych dysków SSD M.2 2280. Western Digital SN740 zajmuje 110 miejsce wnaszej najlepszej liście, więc nie jest to najszybszy model, ale obsługuje PCIe 4.0 i również osiąga docelową prędkość. Przede wszystkim konsekwentnie osiąga tę prędkość, przynajmniej w trybie Performance .


| Drive Performance rating - Percent | |
| Średnia w klasie Gaming | |
| Acer Predator Triton 300 SE -11! | |
| Asus ROG Flow Z13 GZ301ZE | |
| MSI Katana 17 B13VFK | |
| MSI Cyborg 15 A12VF | |
| Asus ROG Flow Z13 GZ301V | |
| Przeciętny WD PC SN740 SDDPTQD-1T00 | |
| Asus ROG Flow Z13 ACRNM | |
* ... im mniej tym lepiej
Sustained Read Performance: DiskSpd Read Loop, Queue Depth 8
Karta graficzna
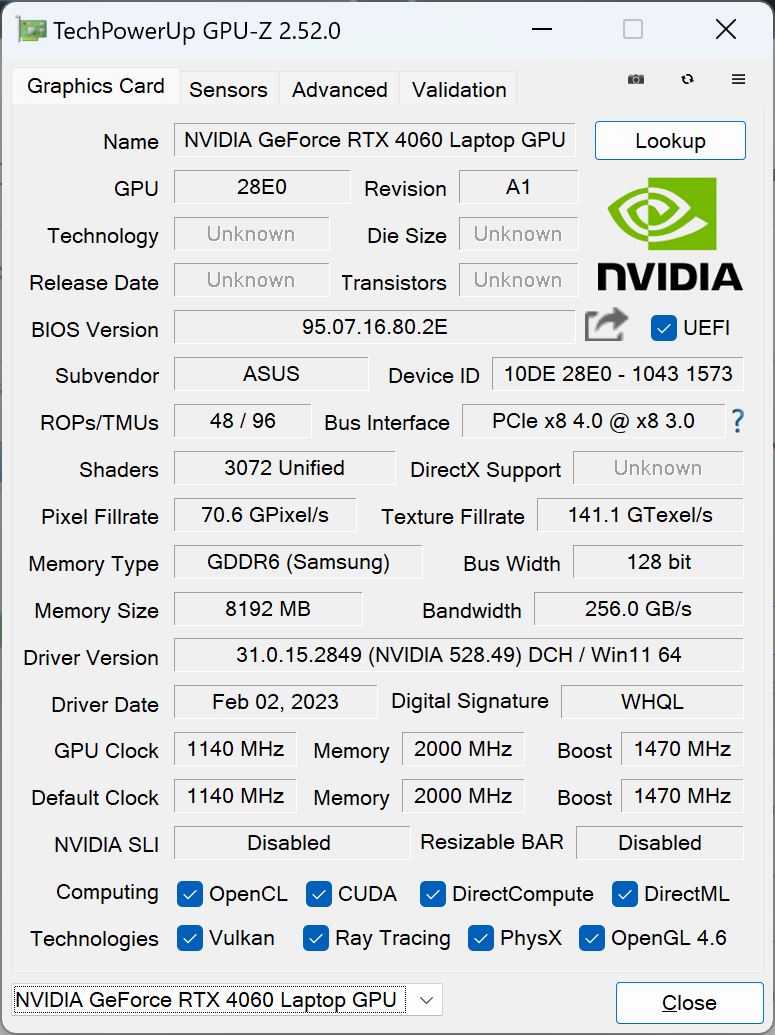
W tablecie znajduje się układ Nvidia Geforce RTX 4060 - pytanie tylko, gdzie w smukłej obudowie. Oczywiście trzeba pogodzić się z kilkoma cięciami w wydajności 3D w przypadku formy tabletu, więc pobór mocy ograniczono do maksymalnie 65 W (50 + 15 W Dynamic Boost).
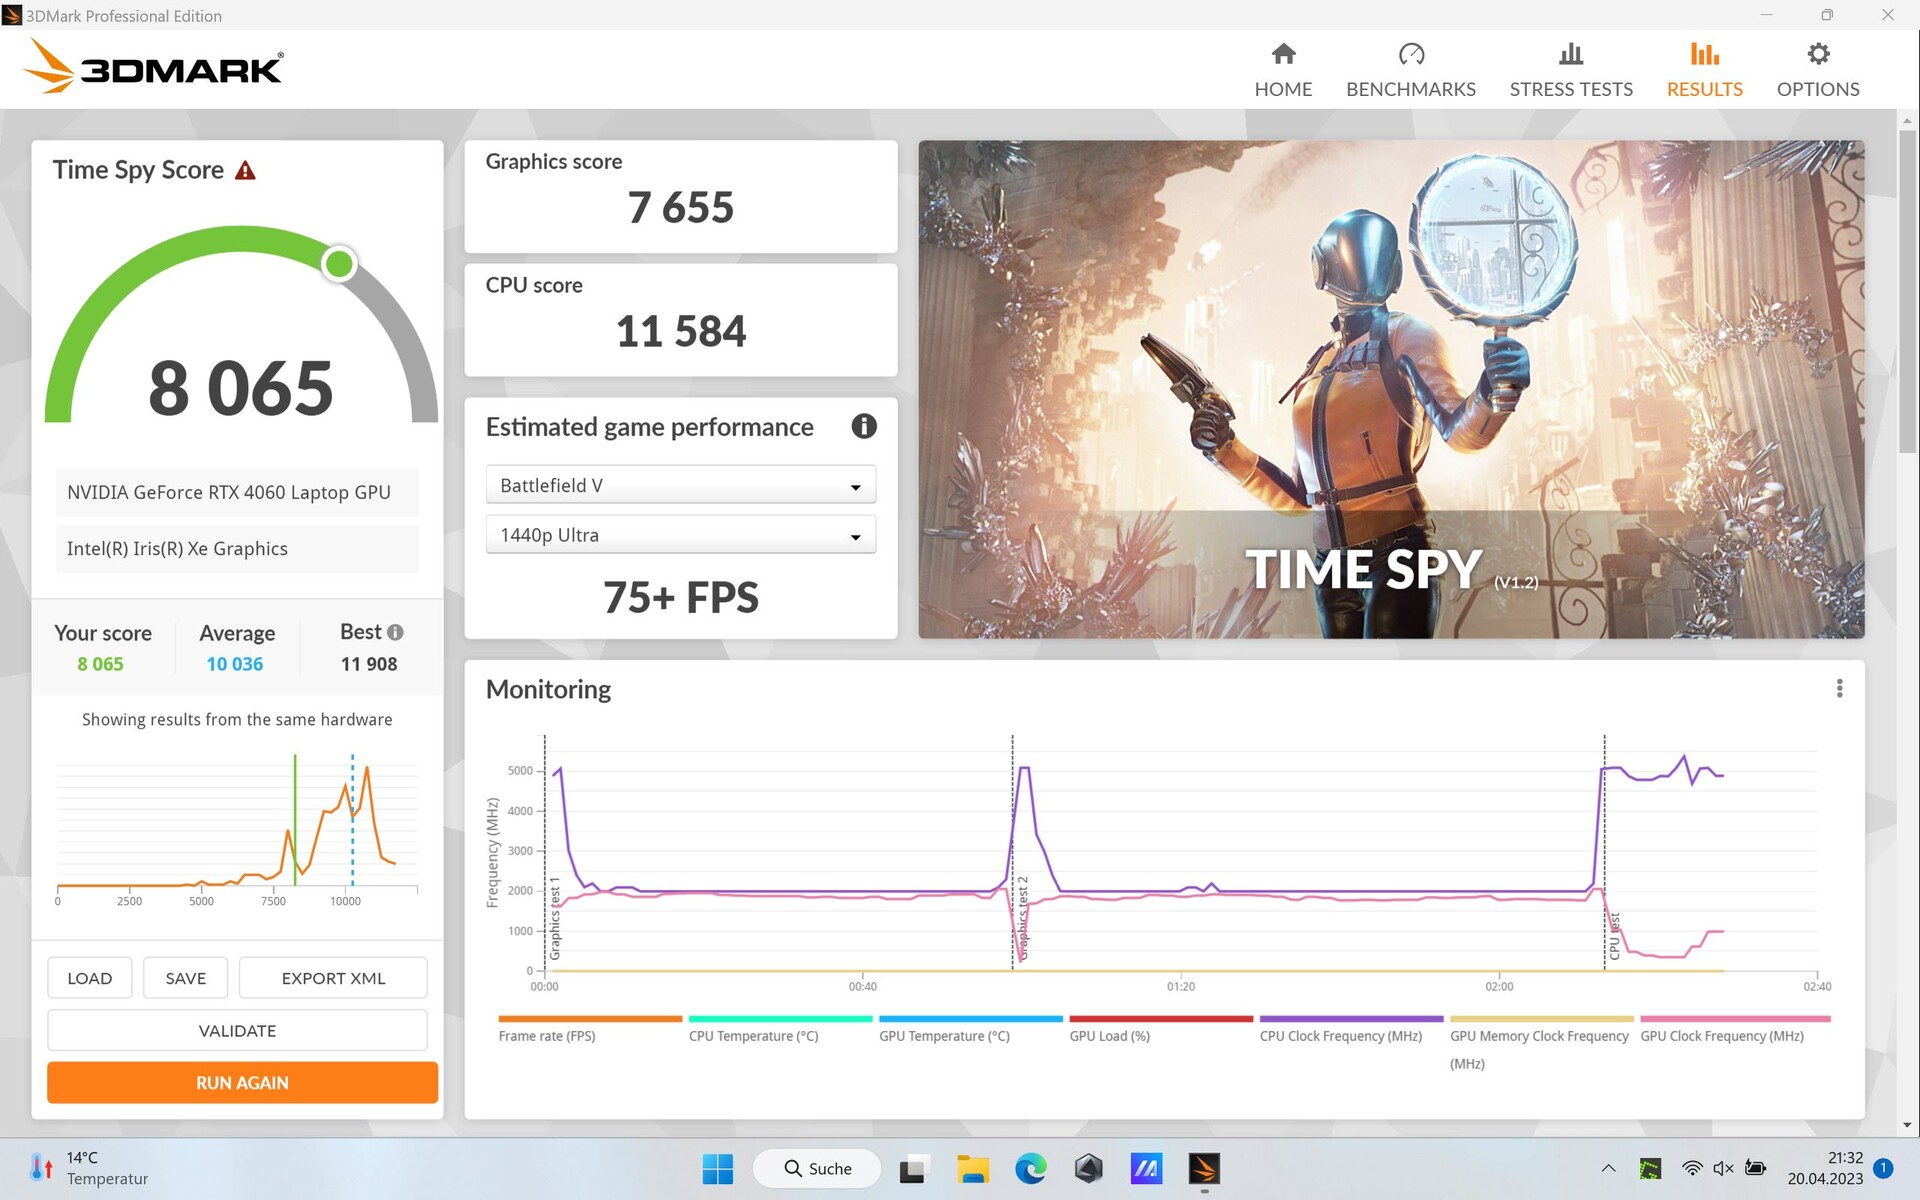
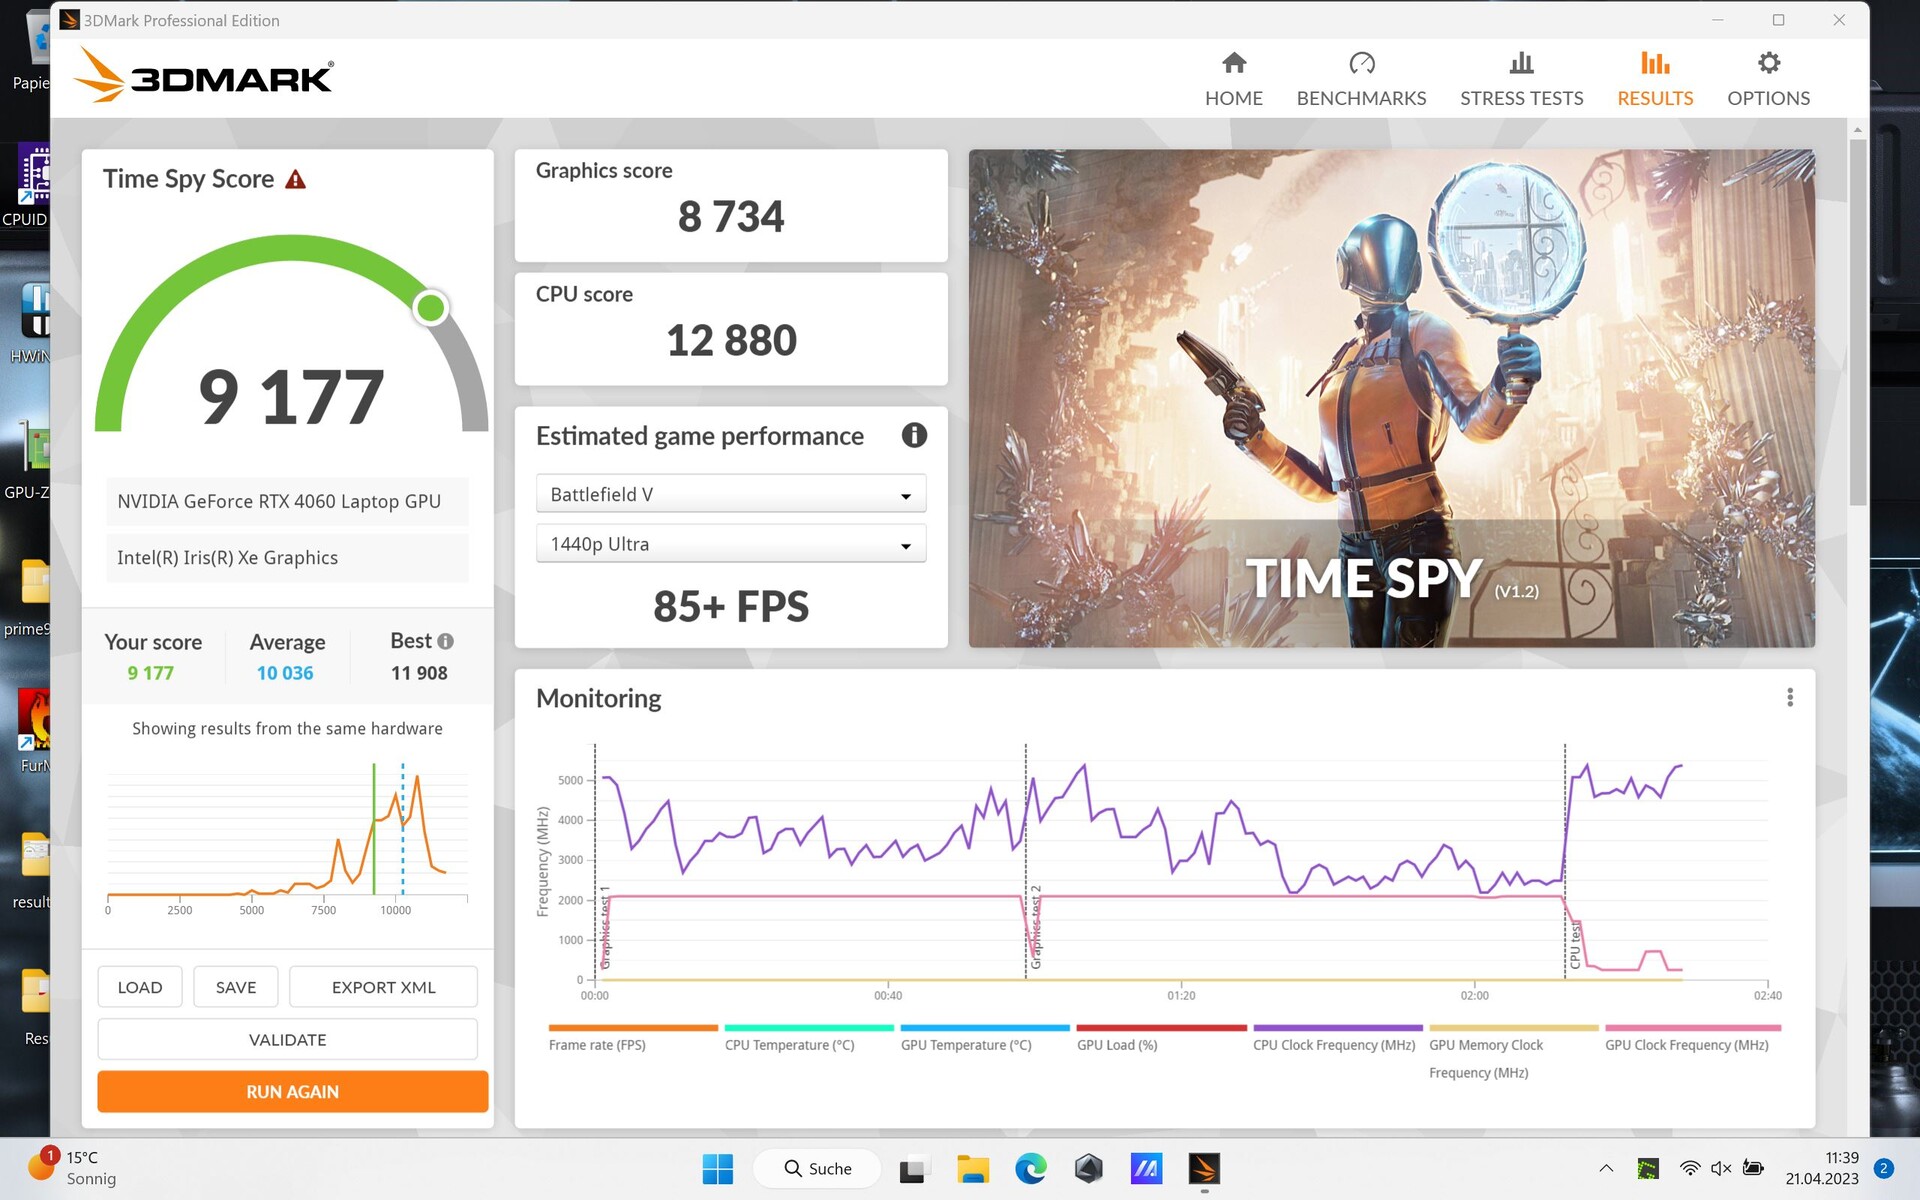
W 3DMarku przełączanie na dGPU przez Optimusa czasem nie działa. Jeżeli przełączy się na dGPU przez MUX, po ponownym uruchomieniu wyniki są znacznie bliższe konkurencji.
Pod względem wyników RTX 4060 w Z13 wypada o około 17-18% słabiej od przeciętnego laptopa do gier z tym samym GPU.
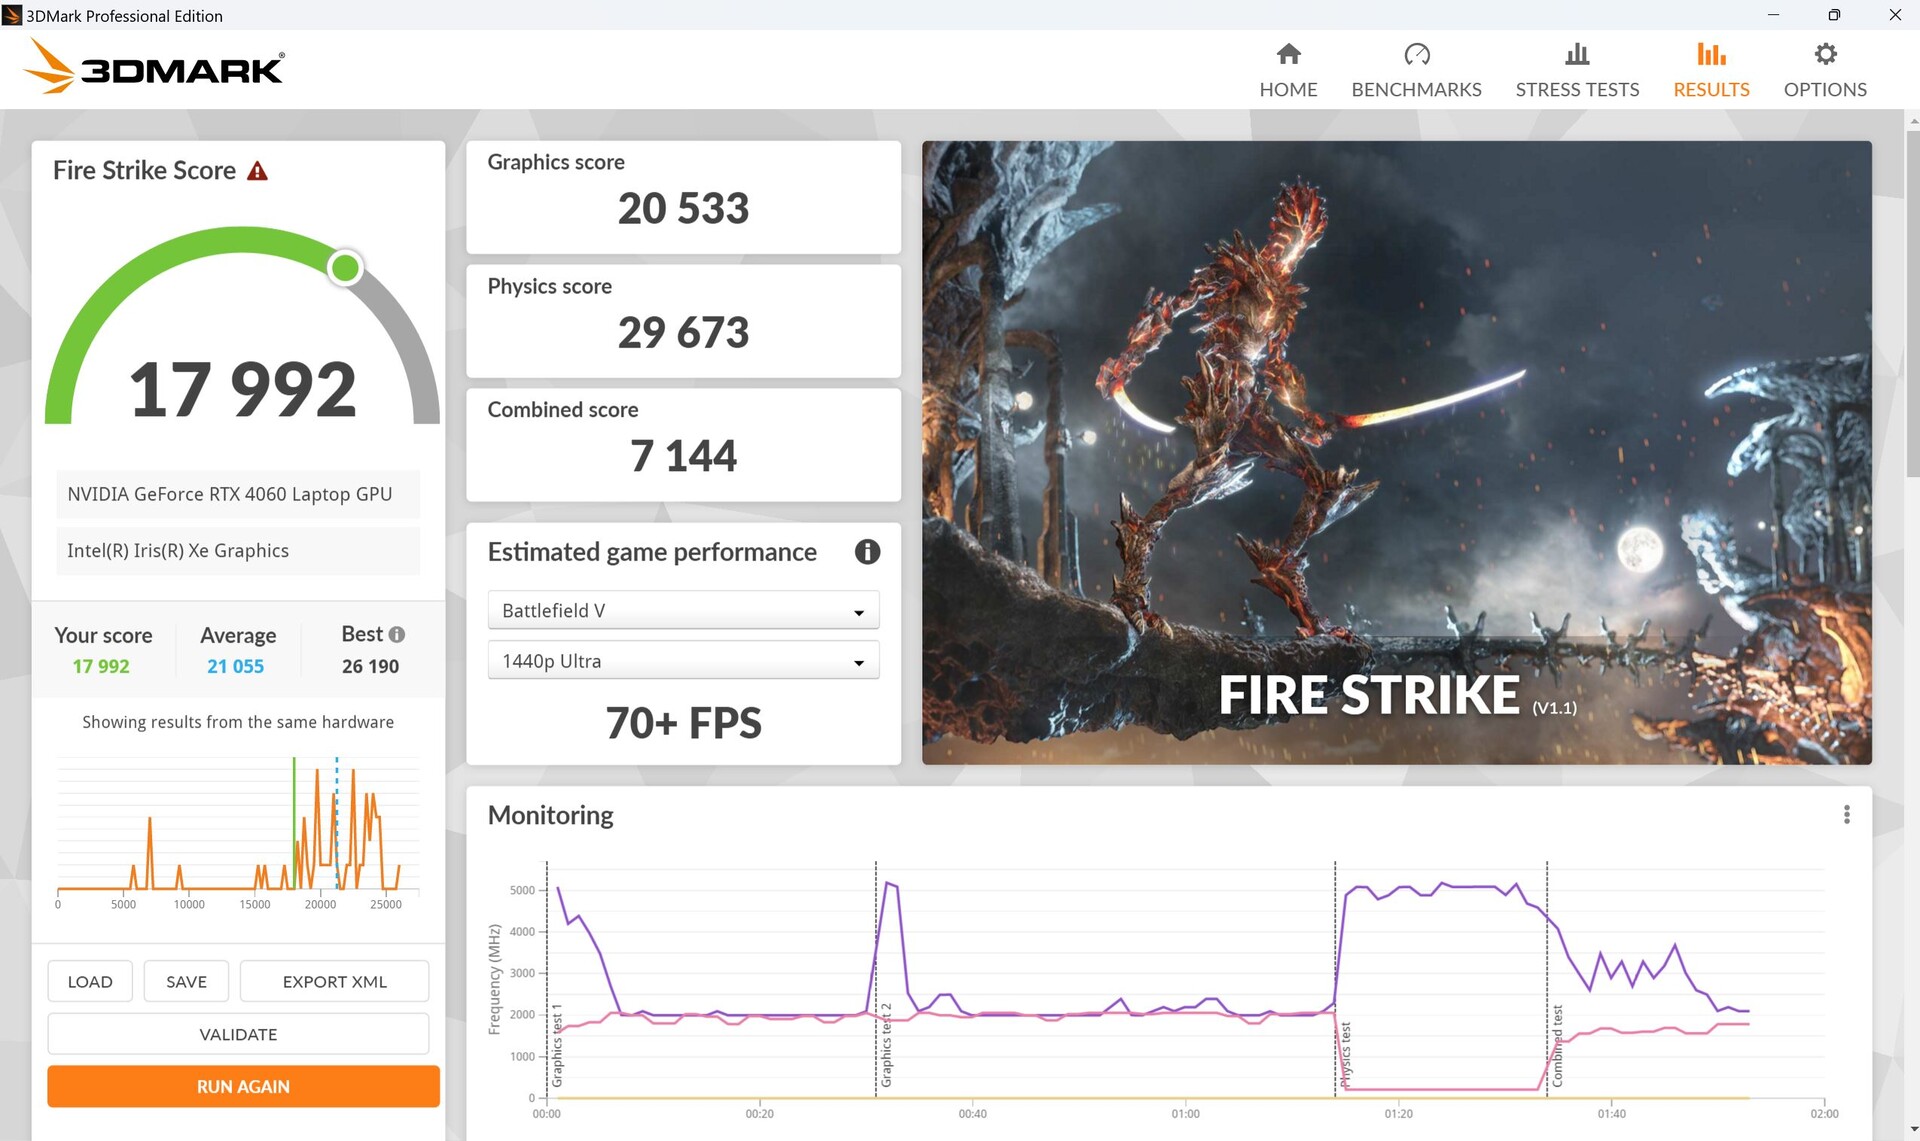
W przeciwieństwie do testu CPU, wyniki w benchmarkach syntetycznych wyraźnie korzystają z trybu Turbo . Tutaj przewaga laptopów dla graczy w rankingu wydajności zawęża się do zaledwie czterech procent! Edycja specjalna ze swoim RTX 4070 (również w trybie Turbo ) jest szybsza tylko o siedem procent.
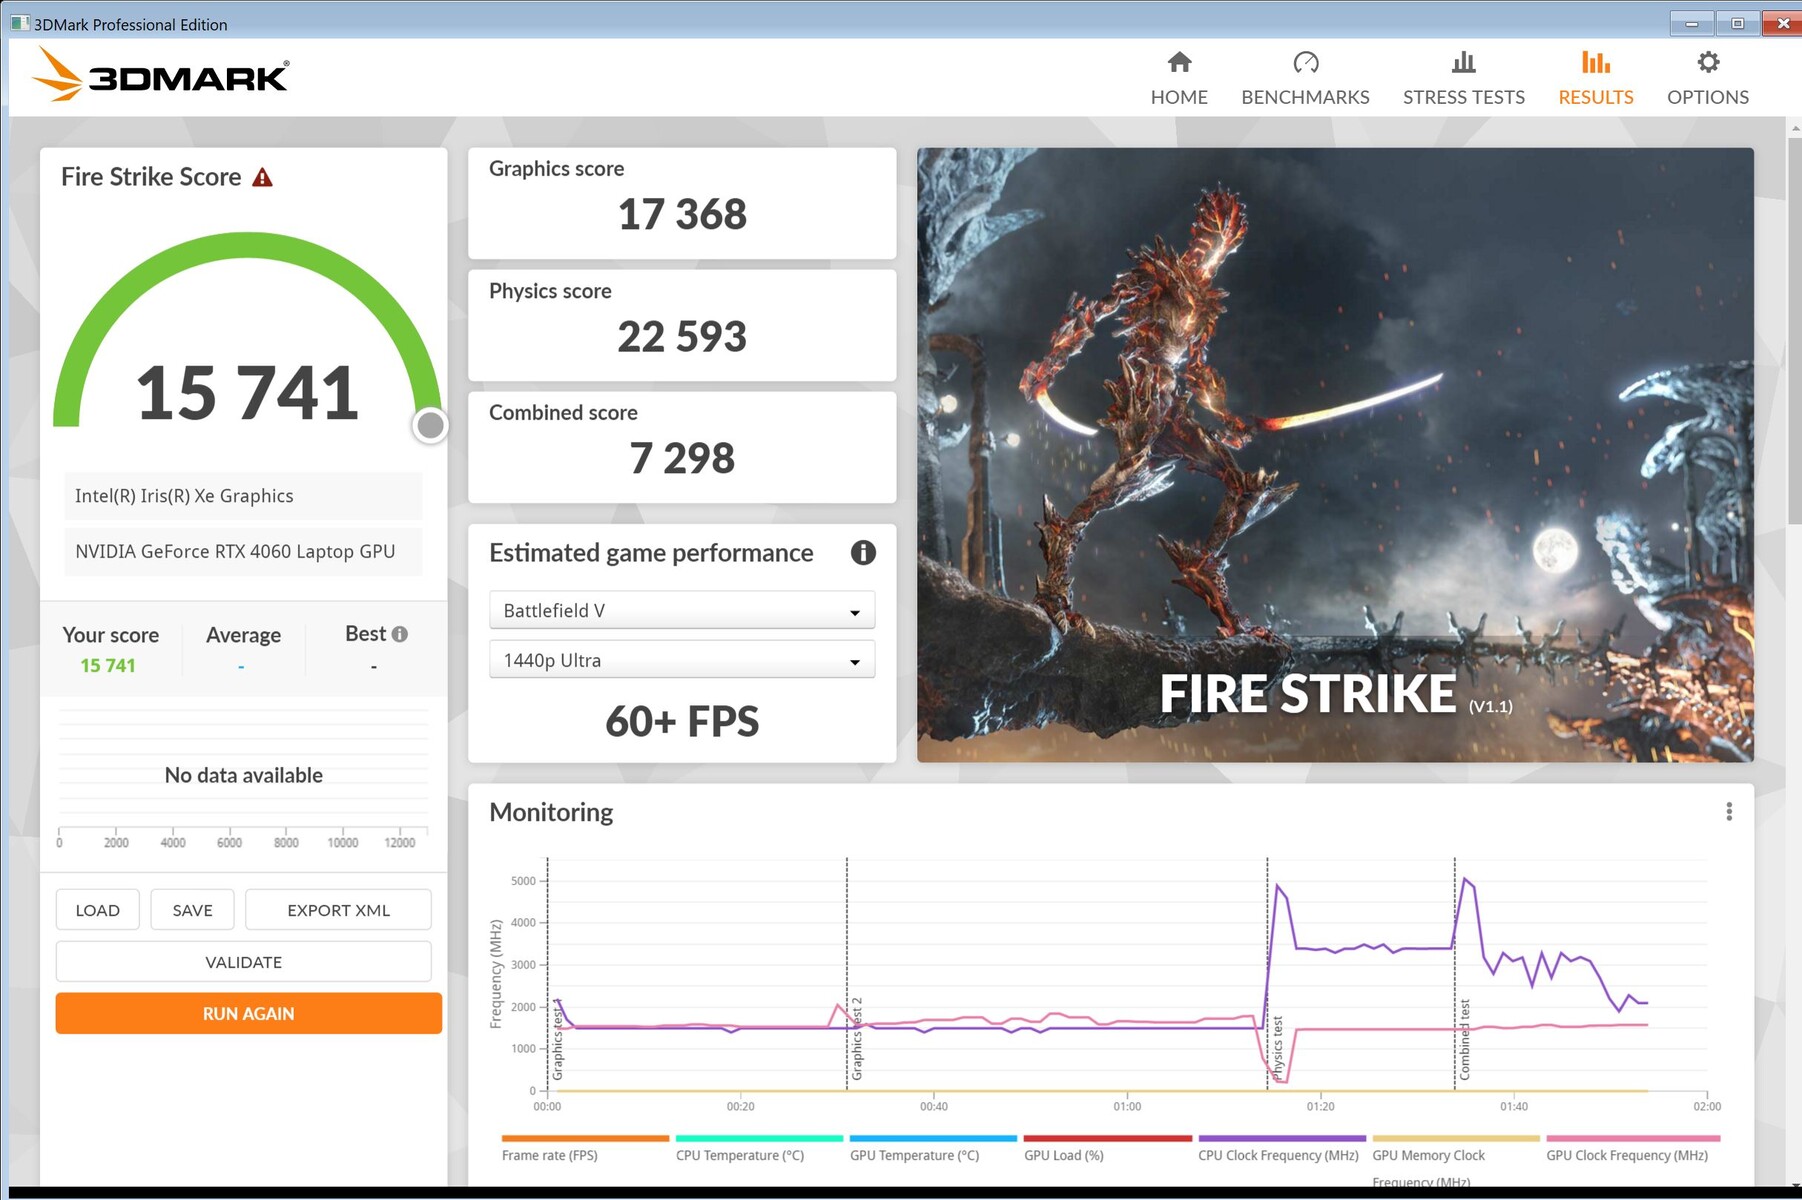
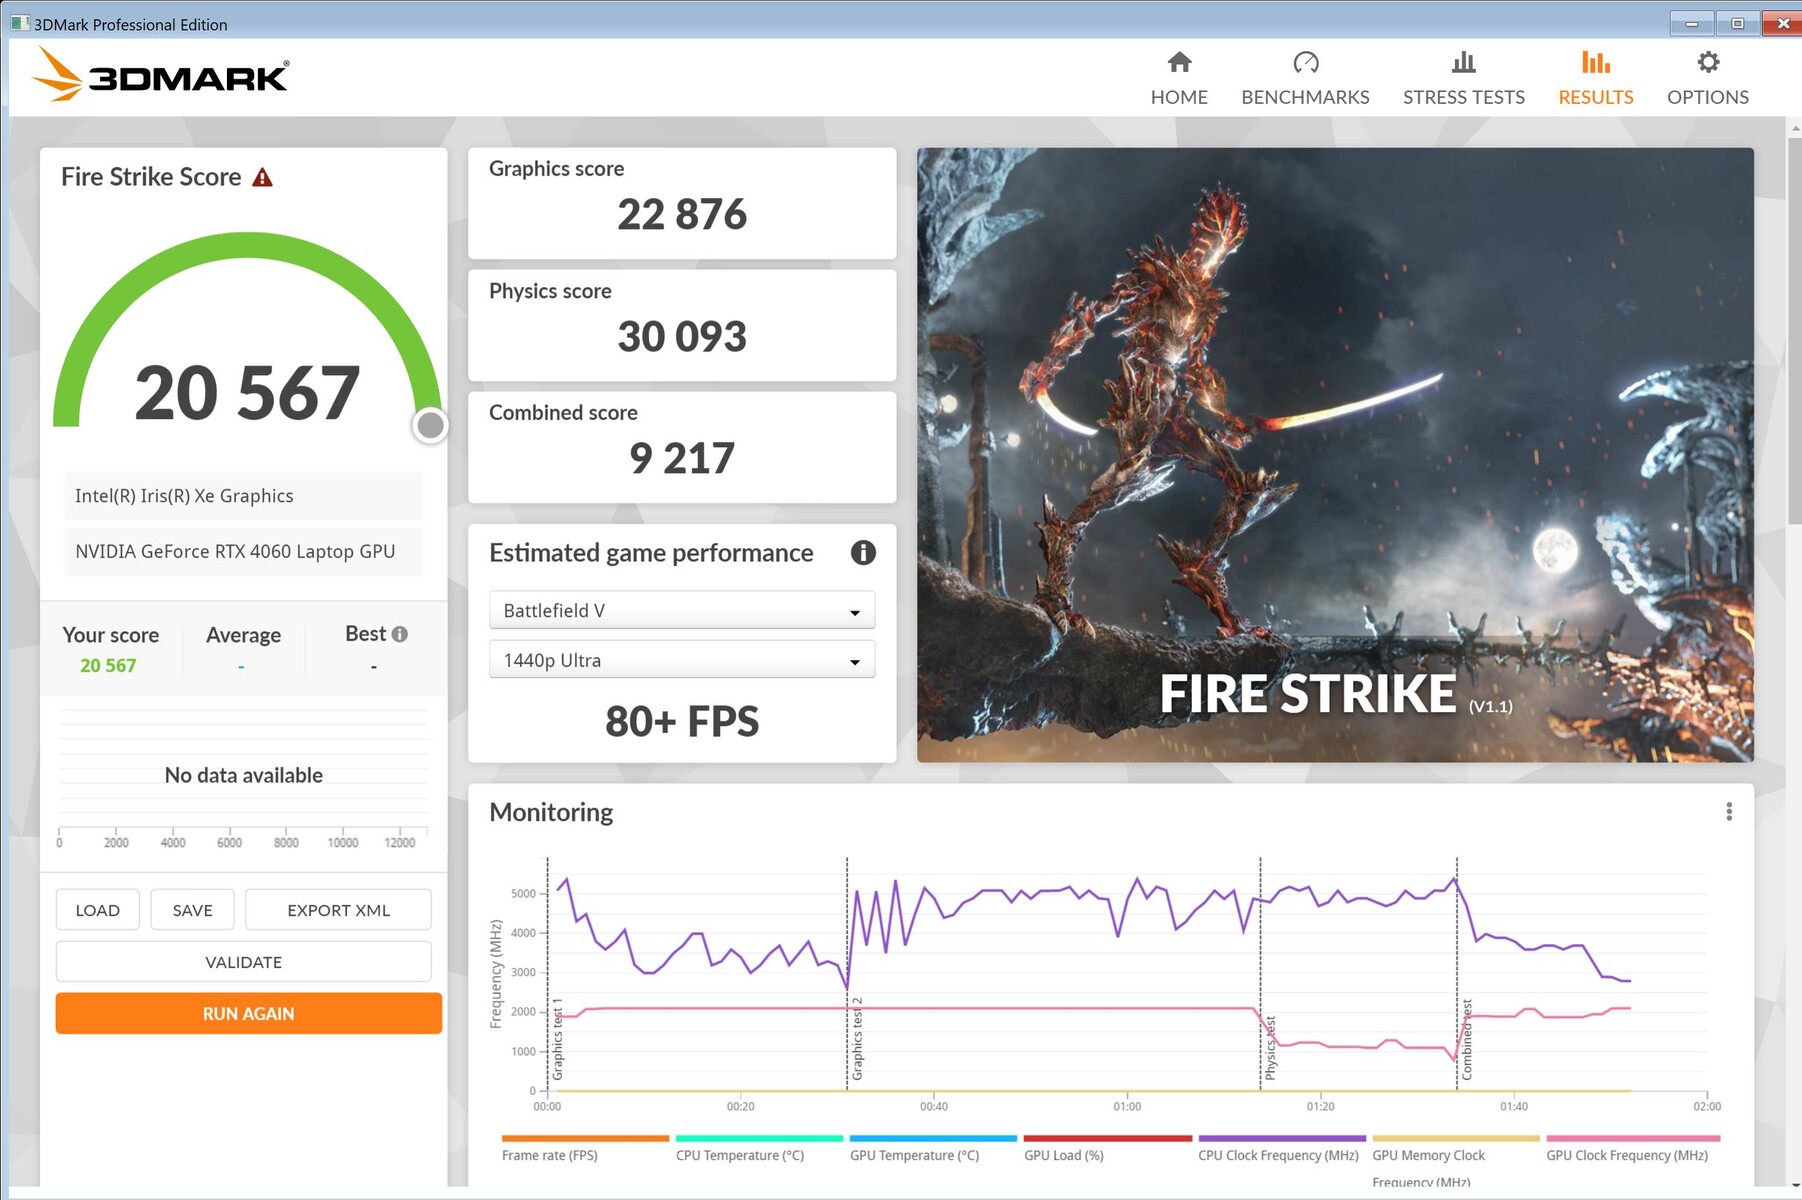
Po odłączeniu tabletu od sieci wydajność 3D spada, ale znacznie mniej niż się spodziewaliśmy, bo kolejne uruchomienie Fire Strike zaowocowało jeszcze 17 368 punktami 3D zamiast 20 553 punktów na sieci. Tak więc nadal można grać z Z13 w podróży bez gniazdka, ale pytanie brzmi jak długo. Więcej na ten temat poniżej.
| 3DMark Performance rating - Percent | |
| Średnia w klasie Gaming | |
| MSI Katana 17 B13VFK | |
| Przeciętny NVIDIA GeForce RTX 4060 Laptop GPU | |
| ROG Flow Z13 Turbo | |
| Asus ROG Flow Z13 ACRNM -1! | |
| MSI Cyborg 15 A12VF | |
| ROG Flow Z13 Leistung | |
| Asus ROG Flow Z13 GZ301ZE -1! | |
| 3DMark 11 - 1280x720 Performance GPU | |
| Średnia w klasie Gaming (21841 - 80022, n=108, ostatnie 2 lata) | |
| MSI Katana 17 B13VFK | |
| Przeciętny NVIDIA GeForce RTX 4060 Laptop GPU (28136 - 38912, n=57) | |
| Asus ROG Flow Z13 ACRNM | |
| ROG Flow Z13 Turbo | |
| ROG Flow Z13 Leistung | |
| MSI Cyborg 15 A12VF | |
| Asus ROG Flow Z13 GZ301ZE | |
| 3DMark | |
| 1280x720 Cloud Gate Standard Graphics | |
| MSI Katana 17 B13VFK | |
| Przeciętny NVIDIA GeForce RTX 4060 Laptop GPU (81407 - 180228, n=29) | |
| Średnia w klasie Gaming (86886 - 223650, n=63, ostatnie 2 lata) | |
| MSI Cyborg 15 A12VF | |
| ROG Flow Z13 Turbo | |
| ROG Flow Z13 Leistung | |
| 1920x1080 Fire Strike Graphics | |
| Średnia w klasie Gaming (12242 - 62849, n=120, ostatnie 2 lata) | |
| MSI Katana 17 B13VFK | |
| Przeciętny NVIDIA GeForce RTX 4060 Laptop GPU (20533 - 29656, n=54) | |
| Asus ROG Flow Z13 ACRNM | |
| ROG Flow Z13 Turbo | |
| MSI Cyborg 15 A12VF | |
| ROG Flow Z13 Leistung | |
| Asus ROG Flow Z13 GZ301ZE | |
| 2560x1440 Time Spy Graphics | |
| Średnia w klasie Gaming (5012 - 26212, n=119, ostatnie 2 lata) | |
| MSI Katana 17 B13VFK | |
| Przeciętny NVIDIA GeForce RTX 4060 Laptop GPU (7484 - 11451, n=56) | |
| Asus ROG Flow Z13 ACRNM | |
| ROG Flow Z13 Turbo | |
| ROG Flow Z13 Leistung | |
| MSI Cyborg 15 A12VF | |
| Asus ROG Flow Z13 GZ301ZE | |
| 3DMark 11 Performance | 26702 pkt. | |
| 3DMark Cloud Gate Standard Score | 55913 pkt. | |
| 3DMark Fire Strike Score | 17992 pkt. | |
| 3DMark Time Spy Score | 8065 pkt. | |
Pomoc | ||
* ... im mniej tym lepiej
Wydajność w grach
Gaming na tablecie w świetle benchmarków jest w przypadku Z13 jak najbardziej możliwy. Jednakże, że.RTX 4060może zużywać tylko maksymalnie 55 W szybko staje się jasne. Większe urządzenia dla graczy, jak np Katana 17 z tym samym GPU mają wyższe TGP i dzięki temu osiągają lepsze wyniki; na przykład wspomniana Katana jest o całe 28% szybsza w Witcher 3 Ultra. Na MSI Cyborgosiąga podobne wskaźniki, ale jego RTX 4060 może zużywać tylko 45 W.
Far Cry 5 jest nadal bardzo grywalny w 71 fps w rozdzielczości 16:9 2 560 x 1 440 w trybie Performance , a tryb Turbo wyciska z niego jeszcze kilka fps.
Dying Light 2 działa w 52 fps w FHD i wysokich ustawieniach, a więc jest o 12% gorszy od laptopów z tym samym GPU. W trybie Turbo jest to 56,7 kl/s, niemal na równi z przeciętnym RTX 4060. 35 kl/s to wynik w 2560x1440. Ray tracing można też włączyć, ale tylko razem z Frame Generation (wsparcie dla AI), co daje około 36 kl/s.
Niemal każda gra może być więc odtwarzana w wysokich rozdzielczościach w FullHD, czasem nawet w QHD. Imponujące jak na tablet.
| Tryby wydajności | Witcher 3 FHD Ultra | Dying Light 2 FHD High |
|---|---|---|
| Cichy | 67 fps | 41 fps |
| Performance | 77 fps | 52 fps |
| Turbo | 83 fps | 56,7 fps |
| Performance rating - Percent | |
| Średnia w klasie Gaming | |
| MSI Katana 17 B13VFK | |
| Asus ROG Flow Z13 ACRNM | |
| MSI Cyborg 15 A12VF | |
| ROG Flow Z13 Leistung | |
| Asus ROG Flow Z13 GZ301ZE | |
| The Witcher 3 - 1920x1080 Ultra Graphics & Postprocessing (HBAO+) | |
| Średnia w klasie Gaming (95 - 240, n=8, ostatnie 2 lata) | |
| MSI Katana 17 B13VFK | |
| Asus ROG Flow Z13 ACRNM | |
| MSI Cyborg 15 A12VF | |
| ROG Flow Z13 Leistung | |
| Asus ROG Flow Z13 GZ301ZE | |
| GTA V - 1920x1080 Highest AA:4xMSAA + FX AF:16x | |
| Średnia w klasie Gaming (48.3 - 186.9, n=101, ostatnie 2 lata) | |
| MSI Katana 17 B13VFK | |
| Asus ROG Flow Z13 ACRNM | |
| MSI Cyborg 15 A12VF | |
| ROG Flow Z13 Leistung | |
| Asus ROG Flow Z13 GZ301ZE | |
| Final Fantasy XV Benchmark - 1920x1080 High Quality | |
| Średnia w klasie Gaming (41 - 215, n=102, ostatnie 2 lata) | |
| Asus ROG Flow Z13 GZ301ZE | |
| MSI Katana 17 B13VFK | |
| Asus ROG Flow Z13 ACRNM | |
| MSI Cyborg 15 A12VF | |
| ROG Flow Z13 Leistung | |
| Strange Brigade - 1920x1080 ultra AA:ultra AF:16 | |
| Średnia w klasie Gaming (76.3 - 456, n=92, ostatnie 2 lata) | |
| MSI Katana 17 B13VFK | |
| Asus ROG Flow Z13 ACRNM | |
| MSI Cyborg 15 A12VF | |
| ROG Flow Z13 Leistung | |
| Asus ROG Flow Z13 GZ301ZE | |
| Dota 2 Reborn - 1920x1080 ultra (3/3) best looking | |
| MSI Katana 17 B13VFK | |
| Średnia w klasie Gaming (84.8 - 248, n=112, ostatnie 2 lata) | |
| ROG Flow Z13 Leistung | |
| Asus ROG Flow Z13 GZ301ZE | |
| MSI Cyborg 15 A12VF | |
| Asus ROG Flow Z13 ACRNM | |
| X-Plane 11.11 - 1920x1080 high (fps_test=3) | |
| MSI Katana 17 B13VFK | |
| Asus ROG Flow Z13 ACRNM | |
| ROG Flow Z13 Leistung | |
| Średnia w klasie Gaming (52.1 - 143.5, n=115, ostatnie 2 lata) | |
| MSI Cyborg 15 A12VF | |
| Asus ROG Flow Z13 GZ301ZE | |
| The Witcher 3 | |
| 1920x1080 High Graphics & Postprocessing (Nvidia HairWorks Off) | |
| Średnia w klasie Gaming (181 - 341, n=3, ostatnie 2 lata) | |
| MSI Katana 17 B13VFK | |
| Przeciętny NVIDIA GeForce RTX 4060 Laptop GPU (110 - 229, n=36) | |
| Acer Predator Triton 300 SE | |
| Asus ROG Flow Z13 GZ301V | |
| MSI Cyborg 15 A12VF | |
| Asus ROG Flow Z13 GZ301ZE | |
| 1920x1080 Ultra Graphics & Postprocessing (HBAO+) | |
| Średnia w klasie Gaming (95 - 240, n=8, ostatnie 2 lata) | |
| MSI Katana 17 B13VFK | |
| Przeciętny NVIDIA GeForce RTX 4060 Laptop GPU (77 - 159.7, n=42) | |
| Asus ROG Flow Z13 ACRNM | |
| MSI Cyborg 15 A12VF | |
| Asus ROG Flow Z13 GZ301V | |
| Acer Predator Triton 300 SE | |
| Asus ROG Flow Z13 GZ301ZE | |
| Far Cry 5 | |
| 1920x1080 Ultra Preset AA:T | |
| MSI Katana 17 B13VFK | |
| Przeciętny NVIDIA GeForce RTX 4060 Laptop GPU (95 - 148, n=34) | |
| Średnia w klasie Gaming (70 - 151, n=10, ostatnie 2 lata) | |
| MSI Cyborg 15 A12VF | |
| Asus ROG Flow Z13 GZ301V | |
| Asus ROG Flow Z13 GZ301ZE | |
| 2560x1440 Ultra Preset AA:T | |
| Średnia w klasie Gaming (90 - 149, n=8, ostatnie 2 lata) | |
| MSI Katana 17 B13VFK | |
| Przeciętny NVIDIA GeForce RTX 4060 Laptop GPU (71 - 111, n=26) | |
| Asus ROG Flow Z13 GZ301V | |
| Dying Light 2 | |
| 1920x1080 High Quality | |
| MSI Katana 17 B13VFK | |
| Przeciętny NVIDIA GeForce RTX 4060 Laptop GPU (52 - 64.7, n=2) | |
| Asus ROG Flow Z13 GZ301V | |
| 2560x1440 High Quality | |
| MSI Katana 17 B13VFK | |
| Przeciętny NVIDIA GeForce RTX 4060 Laptop GPU (35.6 - 43.8, n=2) | |
| Asus ROG Flow Z13 GZ301V | |
| 1920x1080 High Quality Raytracing | |
| MSI Katana 17 B13VFK | |
| Przeciętny NVIDIA GeForce RTX 4060 Laptop GPU (23.5 - 30.8, n=2) | |
| Asus ROG Flow Z13 GZ301V | |
Odświeżanie Witcher 3 jest bardzo stabilne i wykazuje typowy charakter falowy (zmiana dzień/noc). Ciekawą obserwacją jest to, że w trybie Turbo nasza Z13 wydaje się być równie szybka jak np.edycja specjalna z jego RTX 4070.
Przyglądając się danym z dziennika, można stwierdzić, że w trybie Performance nie wyczerpano maksymalnych 65 W. Tutaj GPU pobiera z zasilacza maksymalnie 55 W a średnio nieco poniżej 50 W. GPU nagrzewa się do około 64°C a jego średnie taktowanie wynosi 1,9 GHz. Taktowanie pamięci oscyluje między 1400 a 1750 MHz.
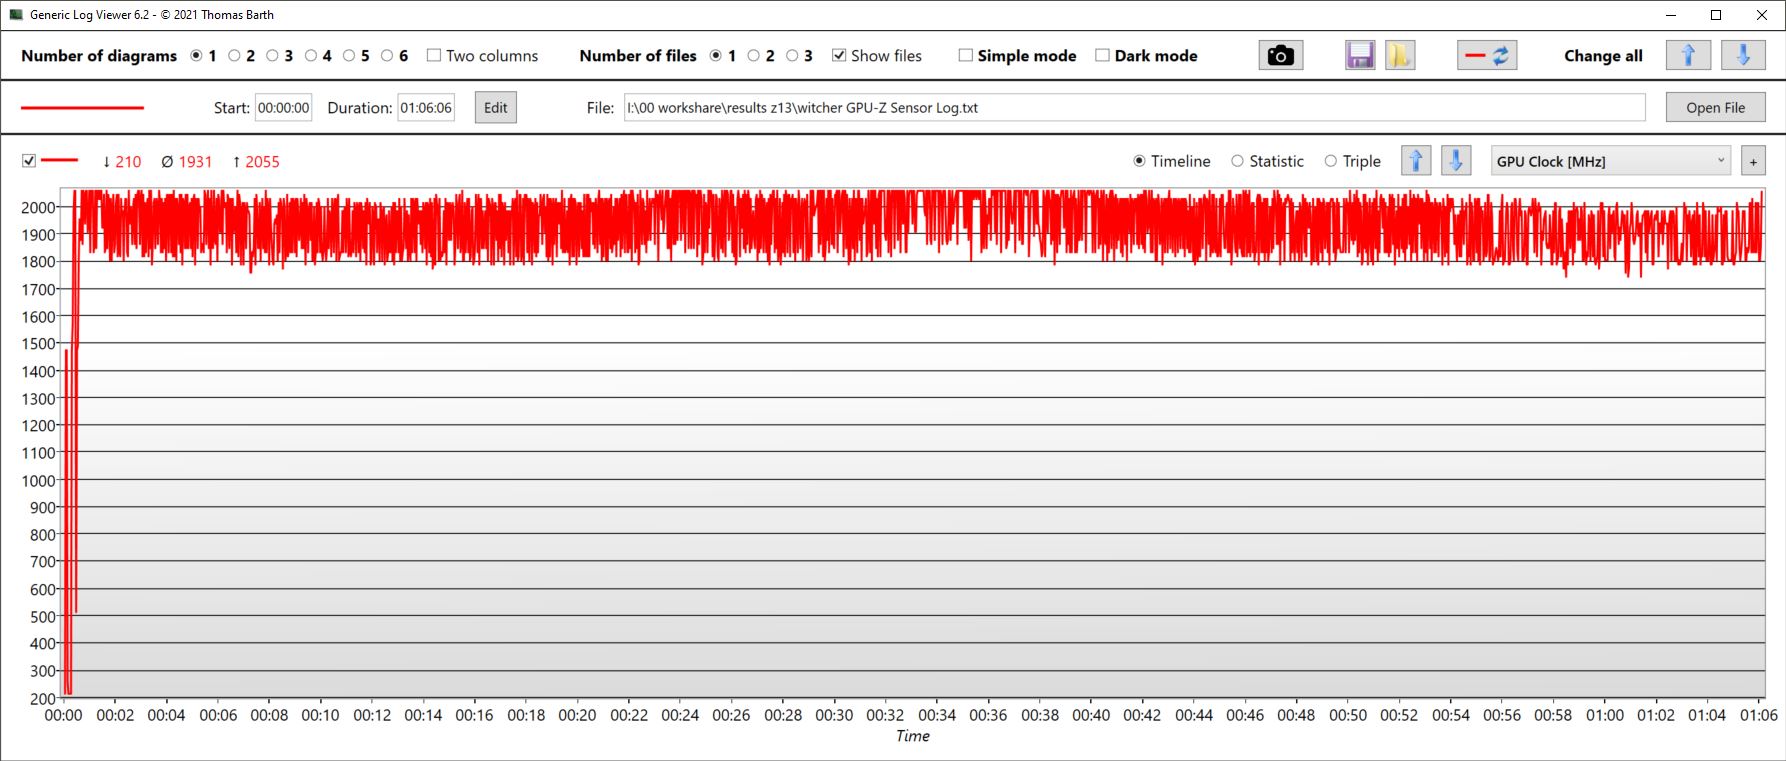
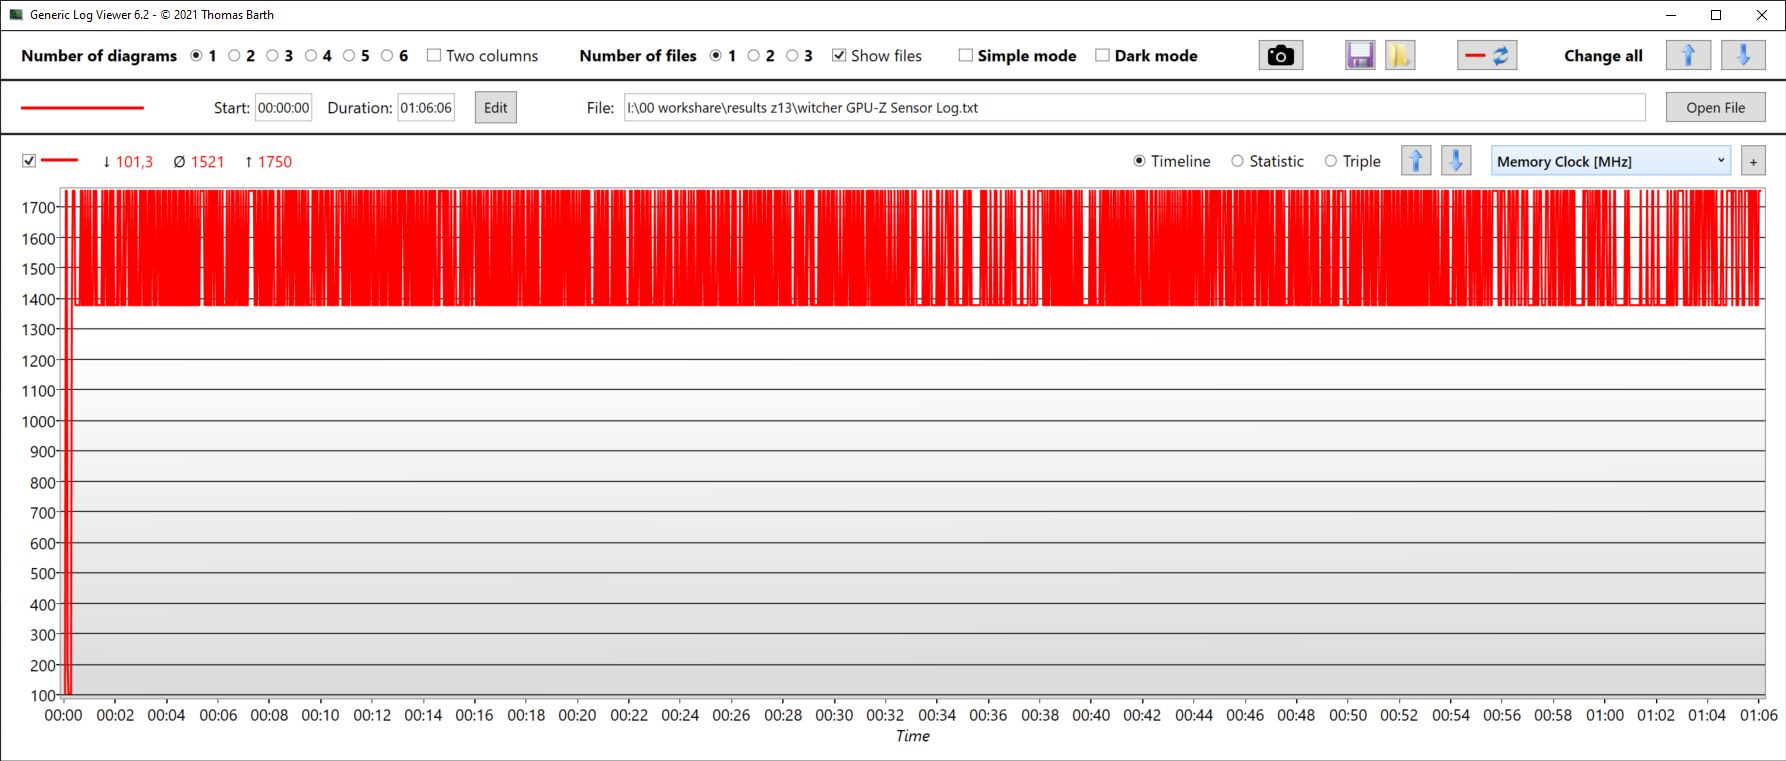
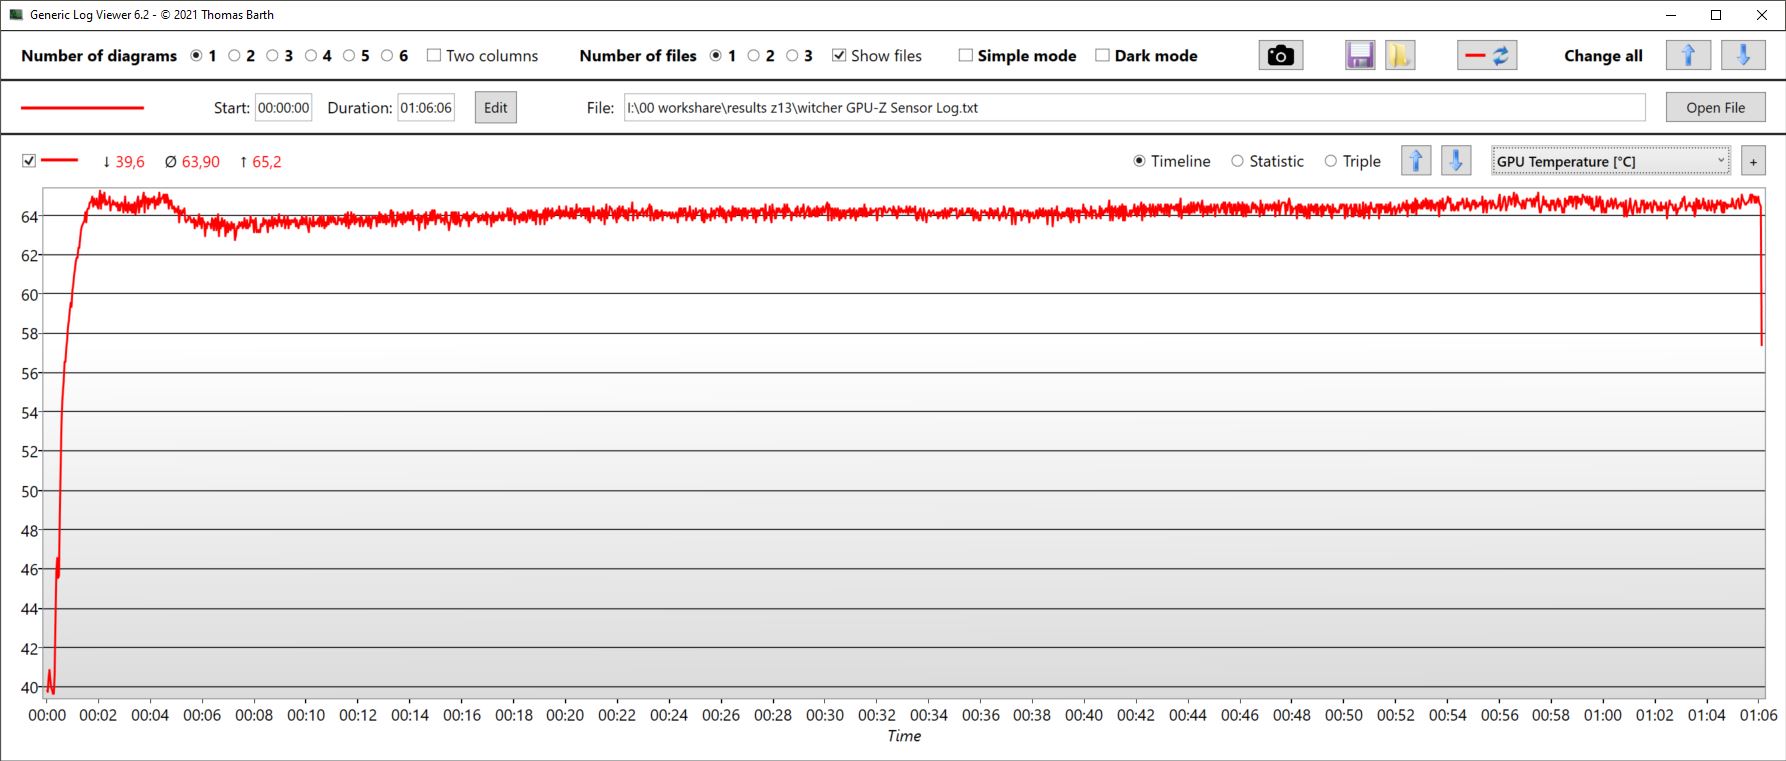
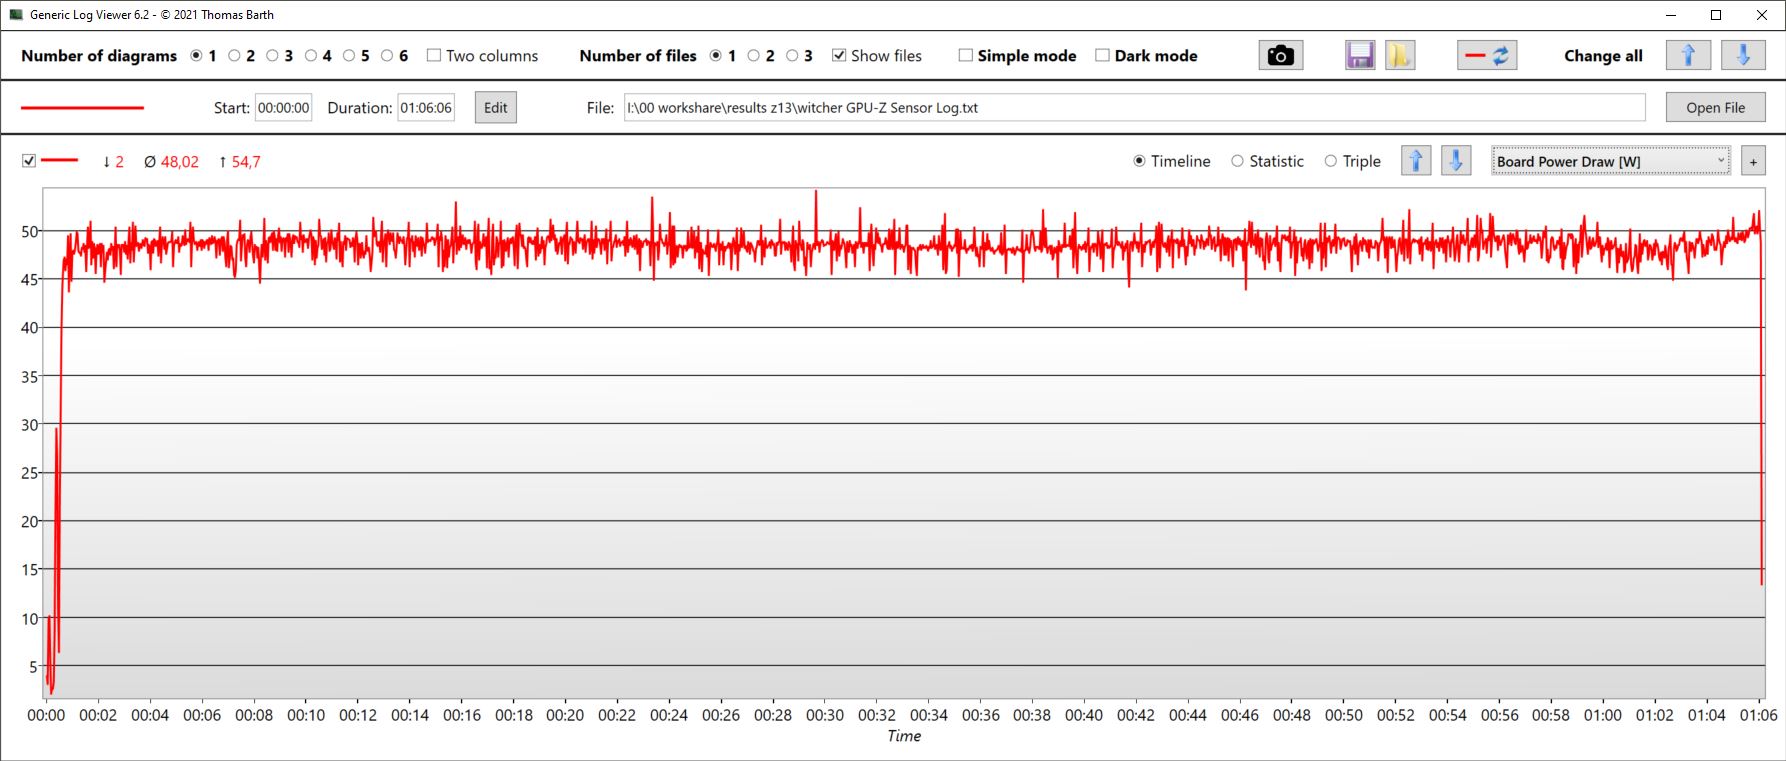
Witcher 3 FPS chart
| low | med. | high | ultra | QHD | 4K | |
|---|---|---|---|---|---|---|
| GTA V (2015) | 183.4 | 173.1 | 144 | 76.9 | ||
| The Witcher 3 (2015) | 325 | 228 | 143 | 77 | ||
| Dota 2 Reborn (2015) | 173.3 | 156 | 148.8 | 139.3 | ||
| Final Fantasy XV Benchmark (2018) | 100.8 | 75.1 | 56 | 32.2 | ||
| X-Plane 11.11 (2018) | 154.8 | 129.1 | 103.6 | |||
| Far Cry 5 (2018) | 154 | 110 | 104 | 95 | 71 | |
| Strange Brigade (2018) | 385 | 196.2 | 156.1 | 135.3 | ||
| Dying Light 2 (2022) | 80 | 64 | 52 | 35.6 |
Emisje - cichsze niż niektóre laptopy do gier
Hałas
Pomimo niewielkiej obudowy Z13 nie jest przesadnie głośny w porównaniu z innymi graczami. W trybie Performance zmierzyliśmy podczas gry około 41 dB. W trybie Turbo głośność wzrasta jednak do około 47 dB. Jest to oczywiście głośne jak na tablet, ale inne notebooki do gier bez problemu przekraczają 50 dB.
Nawiasem mówiąc, w trybie Quiet wewnętrzne wentylatory kręcą się z głośnością około 36 dB. W porównaniu z trybem Turbo tracimy około 19% wydajności, ale otrzymujemy o 23% cichsze urządzenie.
| Tryby wydajności | Poziom hałasu wentylatora | Częstotliwość odświeżania |
|---|---|---|
| Quiet | 36 dB | 67 fps |
| Performance | 41 dB | 77 fps |
| Turbo | 47 dB | 83 fps |
Hałas
| luz |
| 24 / 24 / 24 dB |
| obciążenie |
| 38.61 / 43.59 dB |
 | ||
30 dB cichy 40 dB(A) słyszalny 50 dB(A) irytujący |
||
min: | ||
| Asus ROG Flow Z13 GZ301V GeForce RTX 4060 Laptop GPU, i9-13900H, WD PC SN740 SDDPTQD-1T00 | Asus ROG Flow Z13 ACRNM GeForce RTX 4070 Laptop GPU, i9-13900H, WD PC SN740 SDDPTQD-1T00 | Asus ROG Flow Z13 GZ301ZE GeForce RTX 3050 Ti Laptop GPU, i9-12900H, Micron 2450 1TB MTFDKBK1T0TFK | MSI Katana 17 B13VFK GeForce RTX 4060 Laptop GPU, i7-13620H, Micron 2400 MTFDKBA1T0QFM | Acer Predator Triton 300 SE GeForce RTX 3060 Laptop GPU, i9-12900H, Micron 3400 1TB MTFDKBA1T0TFH | MSI Cyborg 15 A12VF GeForce RTX 4060 Laptop GPU, i7-12650H, Samsung PM9B1 1024GB MZVL41T0HBLB | |
|---|---|---|---|---|---|---|
| Noise | -11% | -1% | -24% | -18% | -36% | |
| wyłączone / środowisko * (dB) | 24 | 24 -0% | 24.5 -2% | 24.5 -2% | 23.8 1% | 27 -13% |
| Idle Minimum * (dB) | 24 | 24 -0% | 24.5 -2% | 24.5 -2% | 23.8 1% | 27 -13% |
| Idle Average * (dB) | 24 | 24 -0% | 24.5 -2% | 24.5 -2% | 23.8 1% | 37.5 -56% |
| Idle Maximum * (dB) | 24 | 36.5 -52% | 24.5 -2% | 40 -67% | 30.6 -28% | 38 -58% |
| Load Average * (dB) | 38.61 | 41.3 -7% | 41 -6% | 48.3 -25% | 44.2 -14% | 56.3 -46% |
| Witcher 3 ultra * (dB) | 41.24 | 44.7 -8% | 41 1% | 56 -36% | 60.1 -46% | |
| Load Maximum * (dB) | 43.59 | 46.9 -8% | 41 6% | 59.1 -36% | 60 -38% | 56.3 -29% |
* ... im mniej tym lepiej
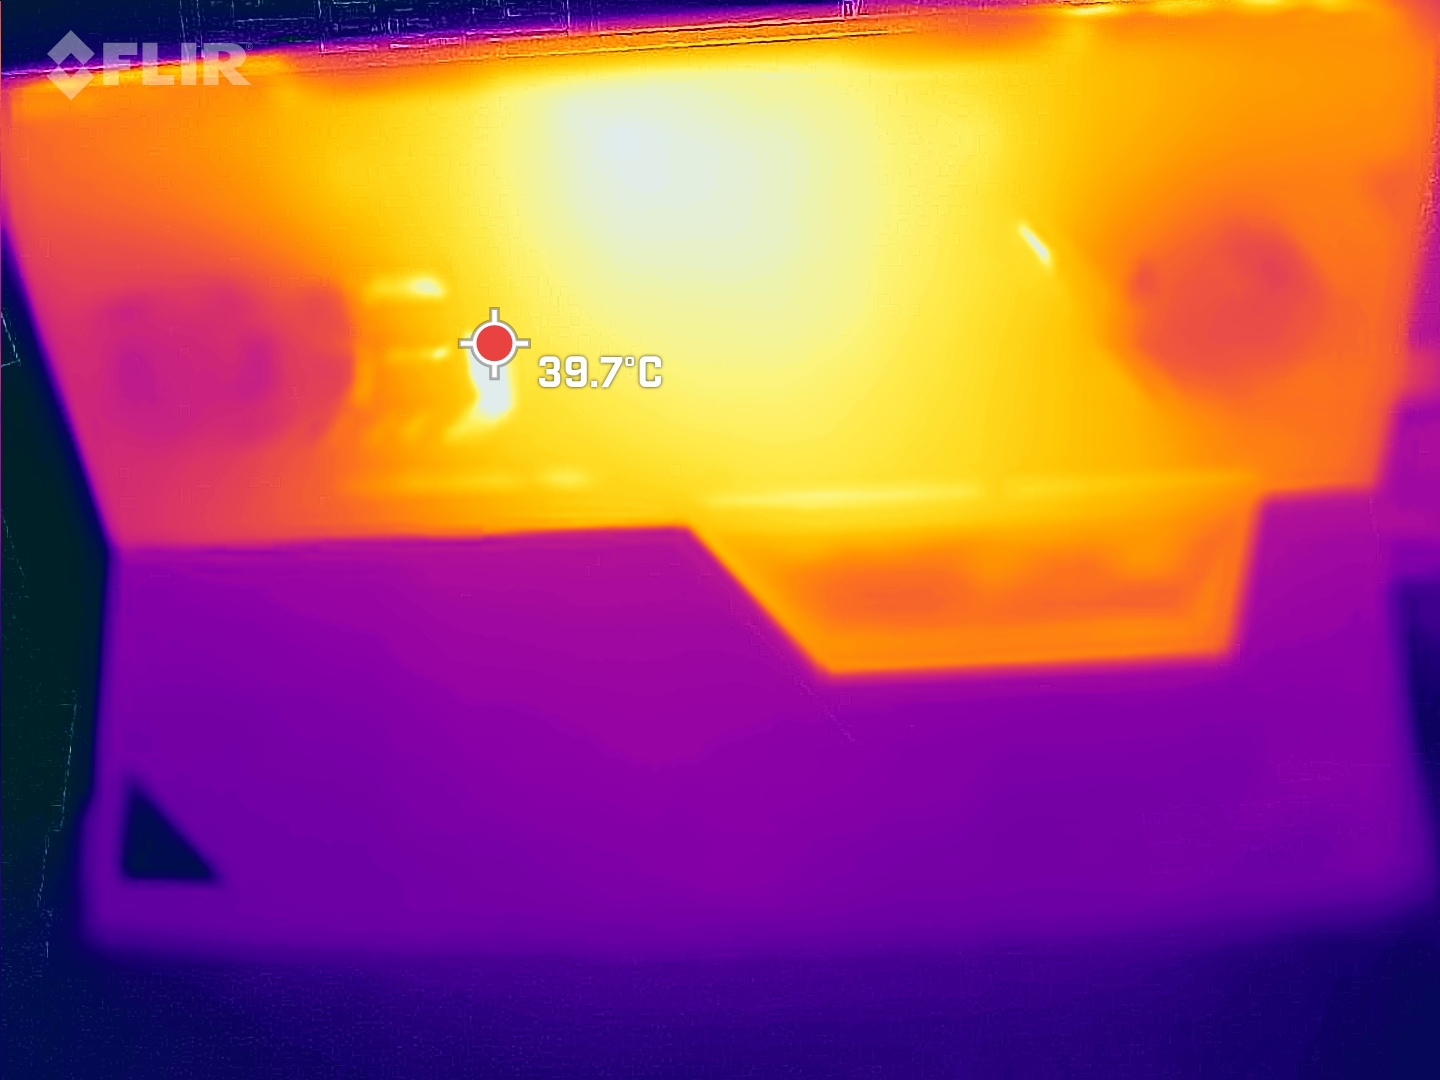
Temperatura
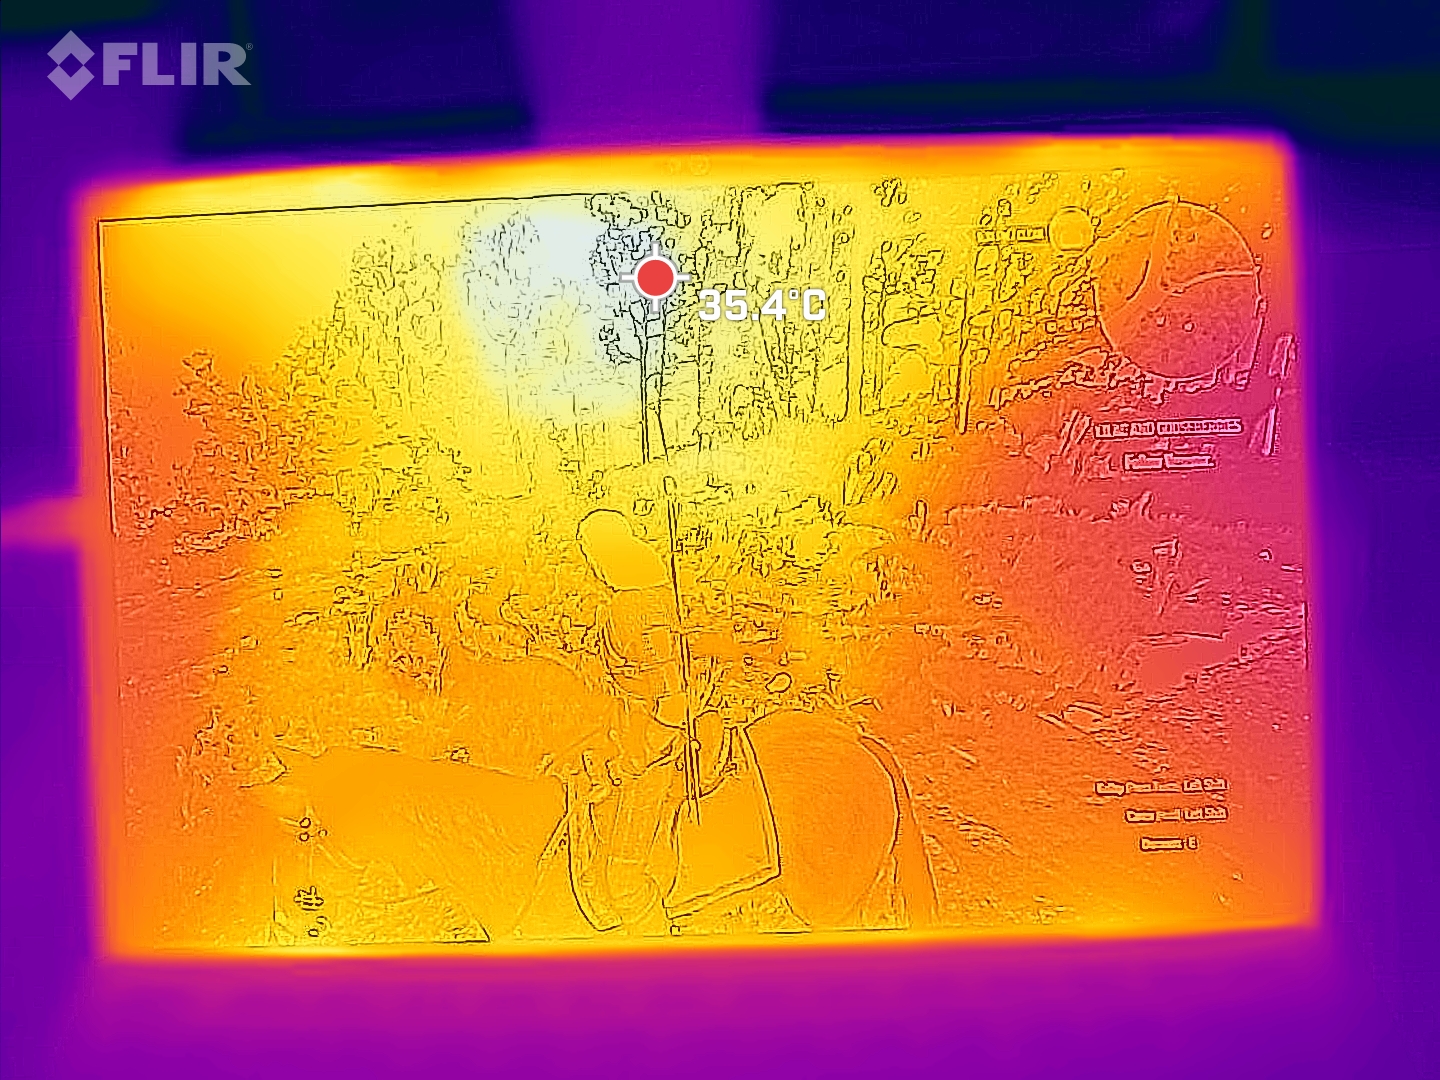
Szczególnie w grach Z13 nagrzewa się umiarkowanie, przynajmniej w trybie Performance . Podczas Witcher 3 Ultra zmierzyliśmy na plecach gorące punkty o temperaturze 42°C. W teście stresowym temperatury powierzchni wzrosły do 47°C. Ponieważ klawiatura jest tylko zadokowana, oparcie dłoni i klawisze WASD pozostają zawsze chłodne.
(±) Maksymalna temperatura w górnej części wynosi 42 °C / 108 F, w porównaniu do średniej 40.4 °C / 105 F , począwszy od 21.2 do 68.8 °C dla klasy Gaming.
(-) Dno nagrzewa się maksymalnie do 47 °C / 117 F, w porównaniu do średniej 43.2 °C / 110 F
(+) W stanie bezczynności średnia temperatura górnej części wynosi 25.8 °C / 78 F, w porównaniu ze średnią temperaturą urządzenia wynoszącą 33.9 °C / ### class_avg_f### F.
(±) Podczas gry w Wiedźmina 3 średnia temperatura górnej części wynosi 35.3 °C / 96 F, w porównaniu do średniej temperatury urządzenia wynoszącej 33.9 °C / ## #class_avg_f### F.
(±) Podpórki pod nadgarstki i touchpad mogą się bardzo nagrzać w dotyku, maksymalnie do 38 °C / 100.4 F.
(-) Średnia temperatura obszaru podparcia dłoni w podobnych urządzeniach wynosiła 28.8 °C / 83.8 F (-9.2 °C / -16.6 F).
| Asus ROG Flow Z13 GZ301V Intel Core i9-13900H, NVIDIA GeForce RTX 4060 Laptop GPU | Asus ROG Flow Z13 ACRNM Intel Core i9-13900H, NVIDIA GeForce RTX 4070 Laptop GPU | Asus ROG Flow Z13 GZ301ZE Intel Core i9-12900H, NVIDIA GeForce RTX 3050 Ti Laptop GPU | MSI Katana 17 B13VFK Intel Core i7-13620H, NVIDIA GeForce RTX 4060 Laptop GPU | Acer Predator Triton 300 SE Intel Core i9-12900H, NVIDIA GeForce RTX 3060 Laptop GPU | MSI Cyborg 15 A12VF Intel Core i7-12650H, NVIDIA GeForce RTX 4060 Laptop GPU | |
|---|---|---|---|---|---|---|
| Heat | 6% | -5% | -7% | 0% | 3% | |
| Maximum Upper Side * (°C) | 42 | 42.5 -1% | 45.3 -8% | 41.6 1% | 43 -2% | 47.5 -13% |
| Maximum Bottom * (°C) | 47 | 42.6 9% | 48.3 -3% | 43.1 8% | 46.4 1% | 35.5 24% |
| Idle Upper Side * (°C) | 27 | 26.2 3% | 29.2 -8% | 32 -19% | 28.2 -4% | 27.7 -3% |
| Idle Bottom * (°C) | 30 | 26 13% | 30 -0% | 35.8 -19% | 28.4 5% | 29.5 2% |
* ... im mniej tym lepiej
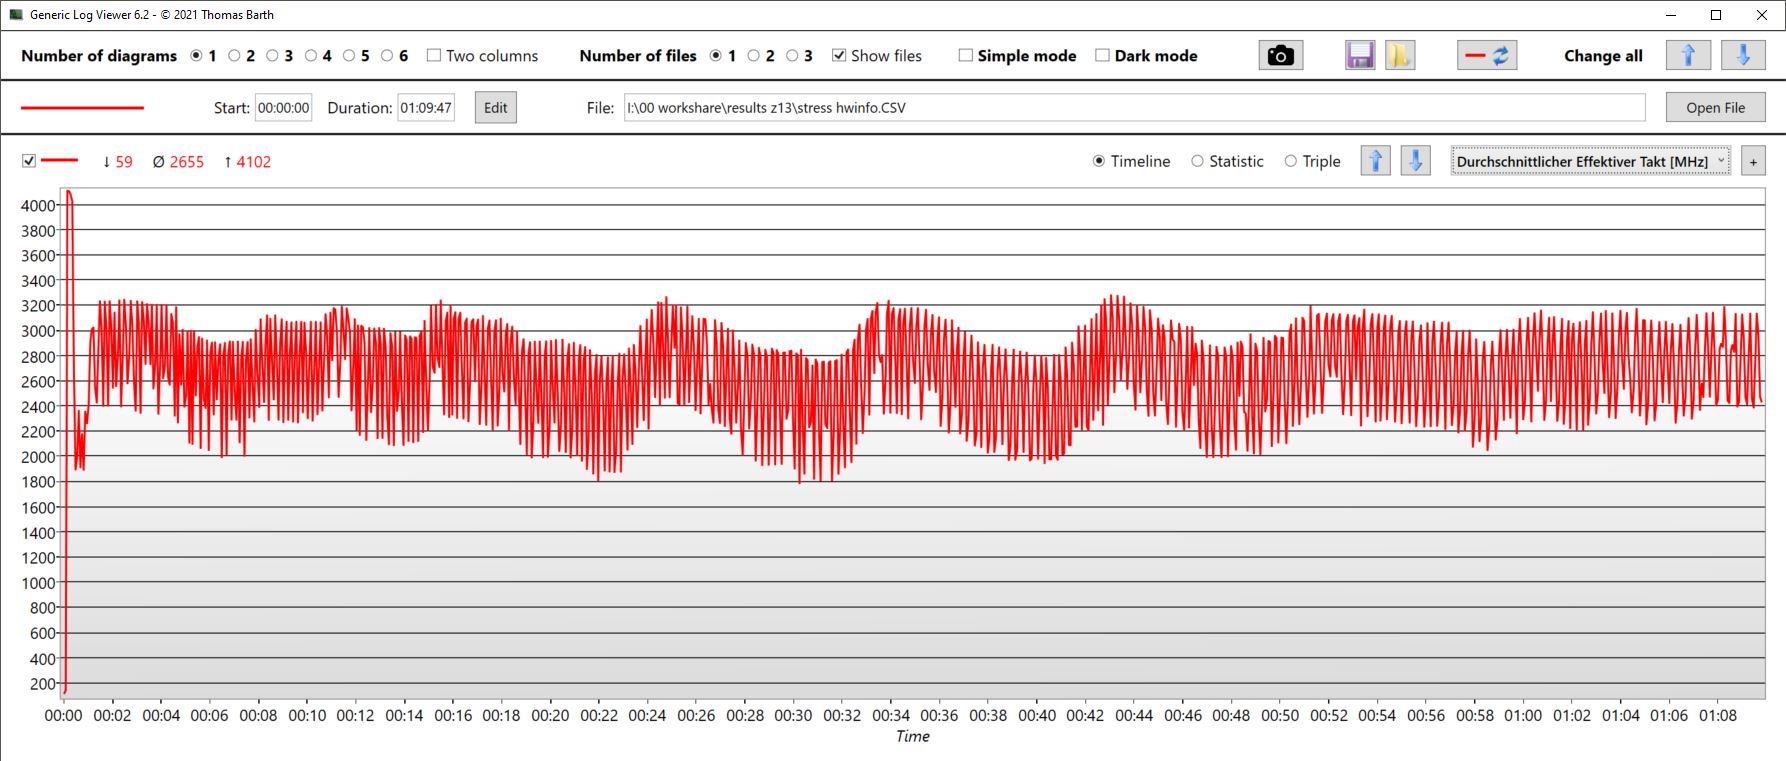
Stress Test
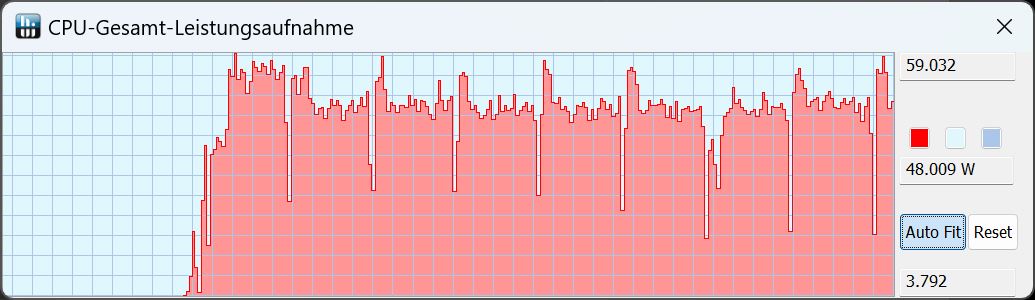
Rdzenie CPU rozpoczynają nasz test obciążeniowy na krótko od 4,1 GHz i pobierają 95 W. Temperatura rdzenia wzrasta do 86°C już po kilku sekundach, po czym następuje dławienie. Ostatecznie częstotliwość taktowania wyrównuje się między 2 a 3,2 GHz przy poborze mocy około 43 W, a temperatury stabilizują się na poziomie około 75°C.
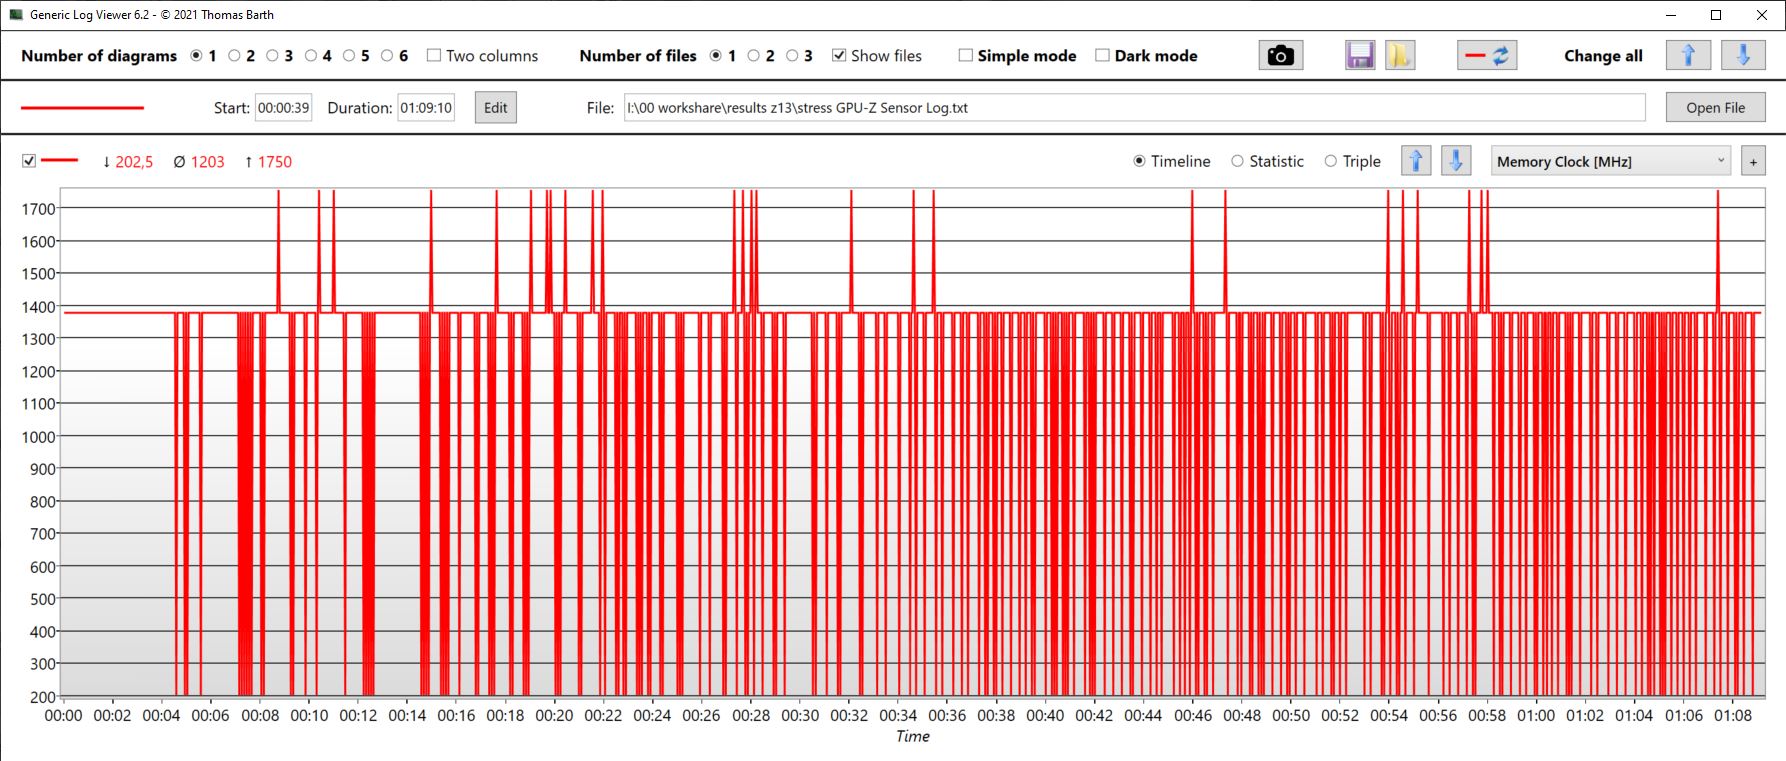
Jednocześnie taktowanie GPU w ciągu całego testu mocno się waha między 750 a 2055 MHz. Taktowanie pamięci również jest bardzo niespójne i stara się utrzymywać na poziomie 1,2 GHz, ale regularnie spada do 200 MHz. Karta grafiki nagrzewa się do około 64°C, ale nigdy nie jest gorętsza od 70°C. Pobór mocy również się waha, ale wynosi średnio tylko 23 W. Zmierzono szczyty obciążenia na poziomie 50,5 W.
Jeżeli więc zarówno CPU jak i GPU są mocno obciążone, wydajność ulega dużym wahaniom, a w szczególności traci na tym wydajność 3D. TDP na poziomie zaledwie 23 W i spadek częstotliwości taktowania pamięci do zaledwie 200 MHz wyraźnie to odzwierciedlają.
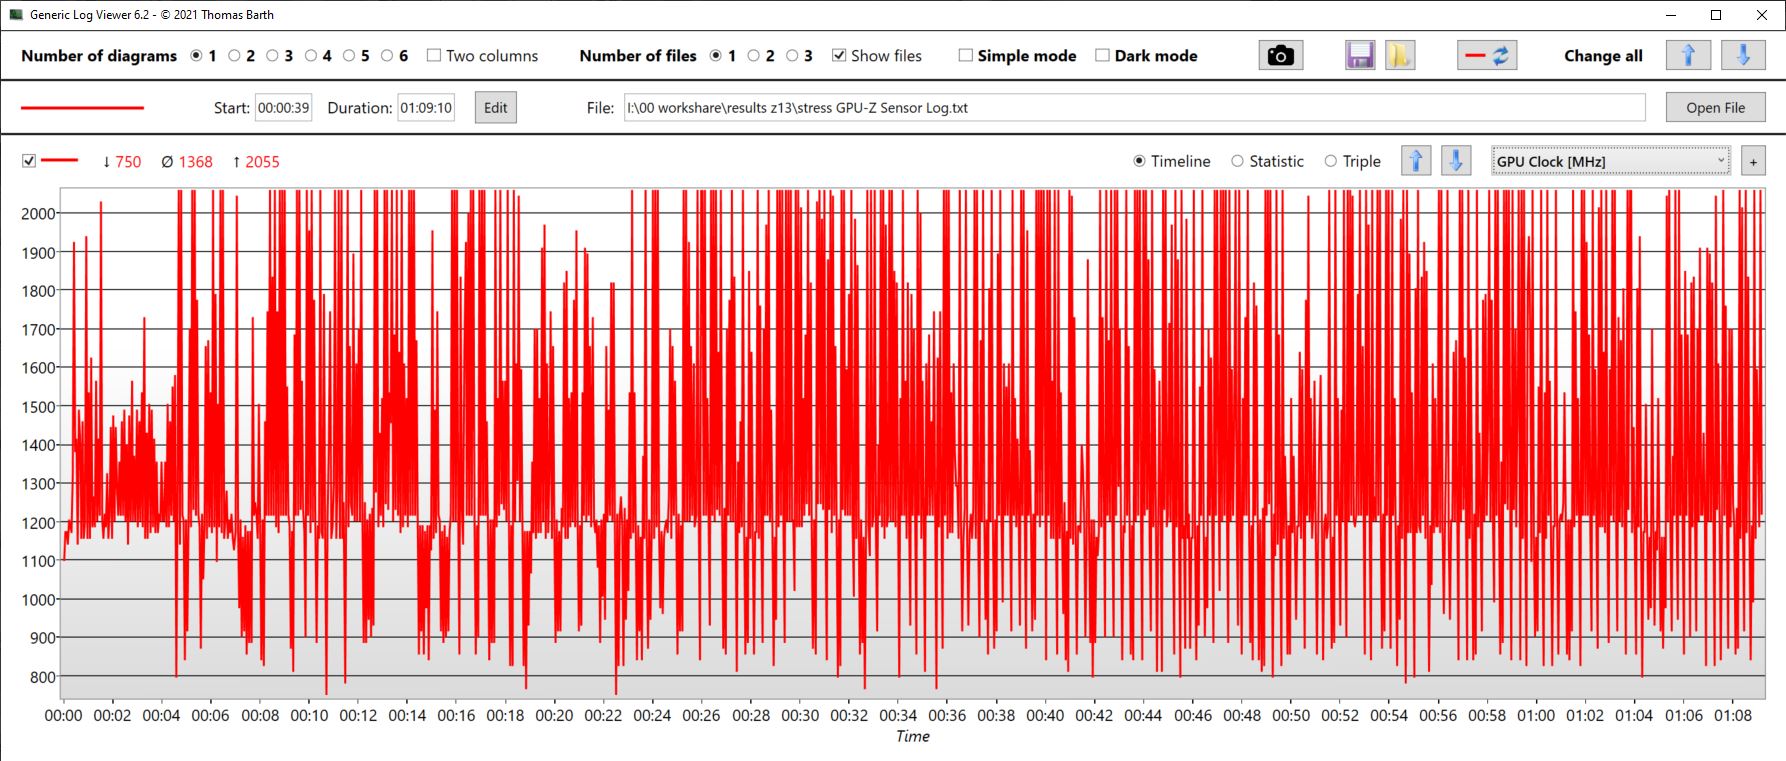

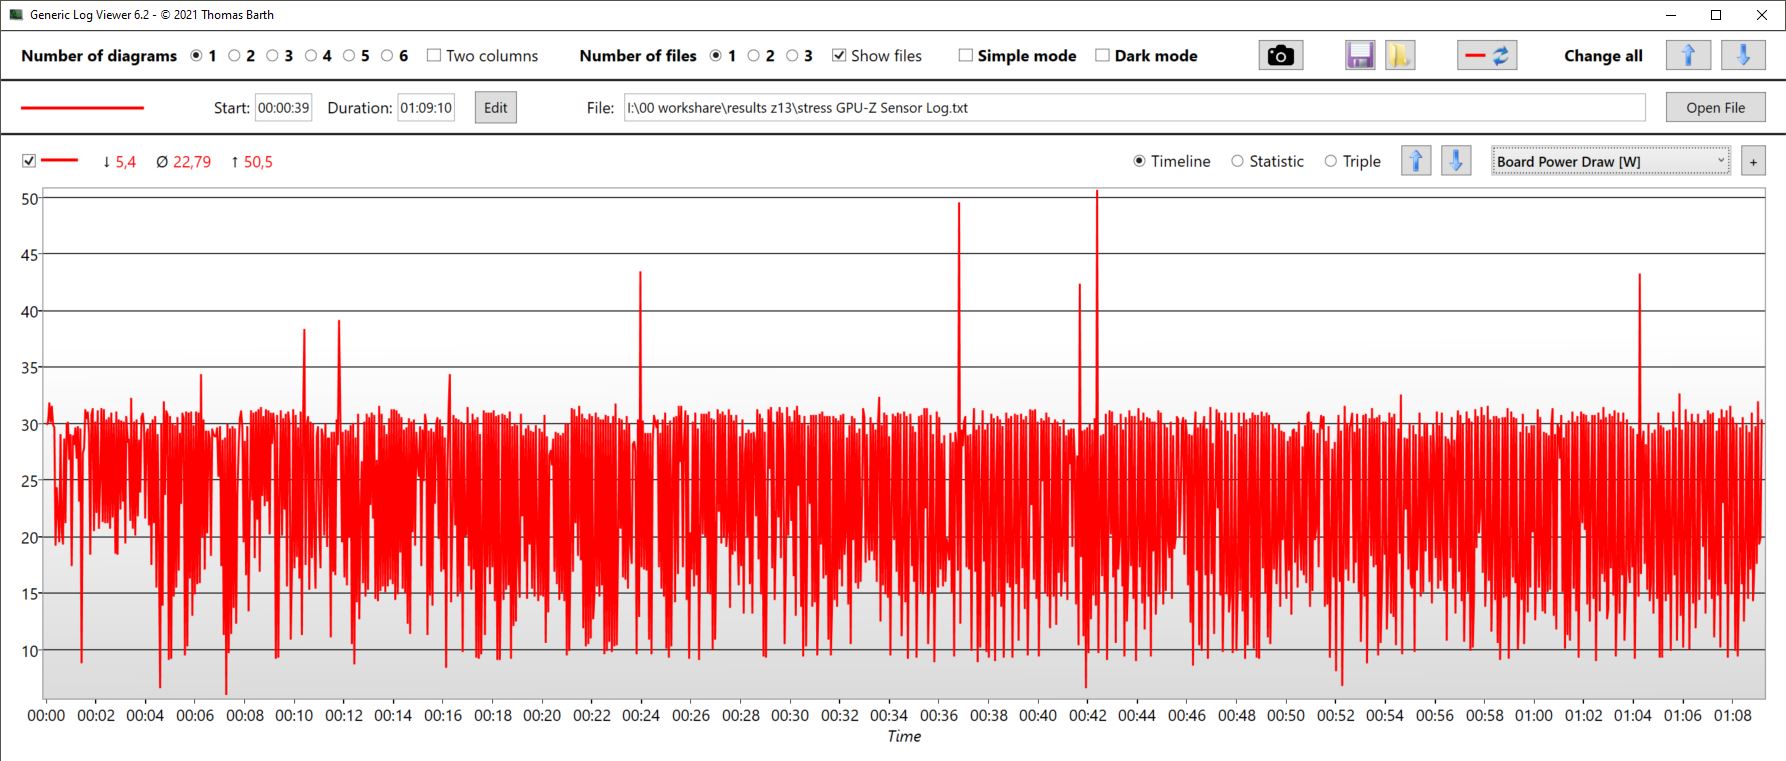
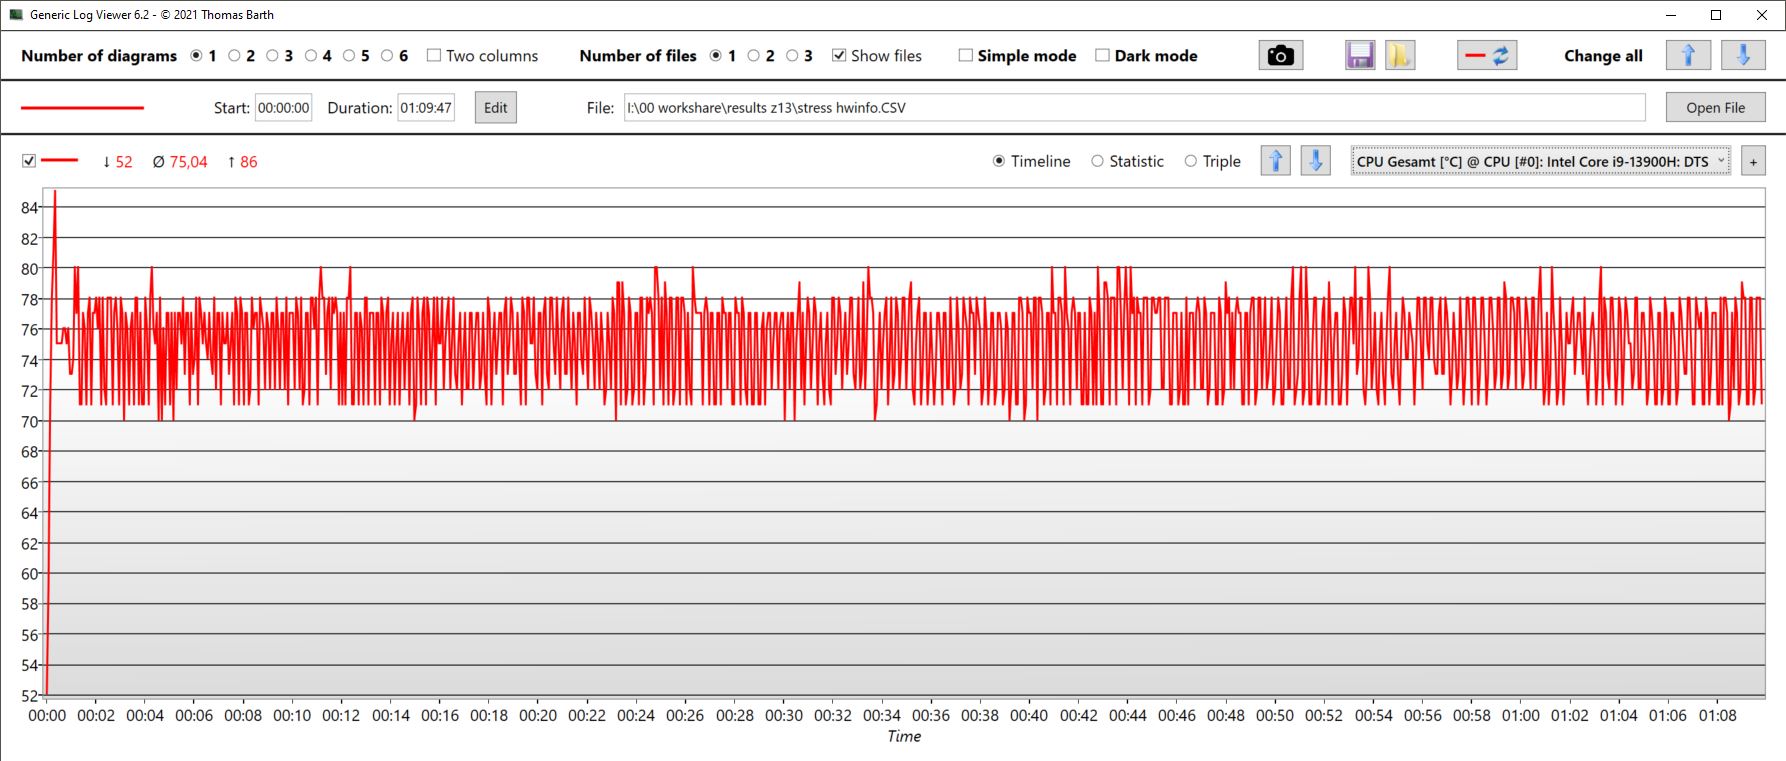
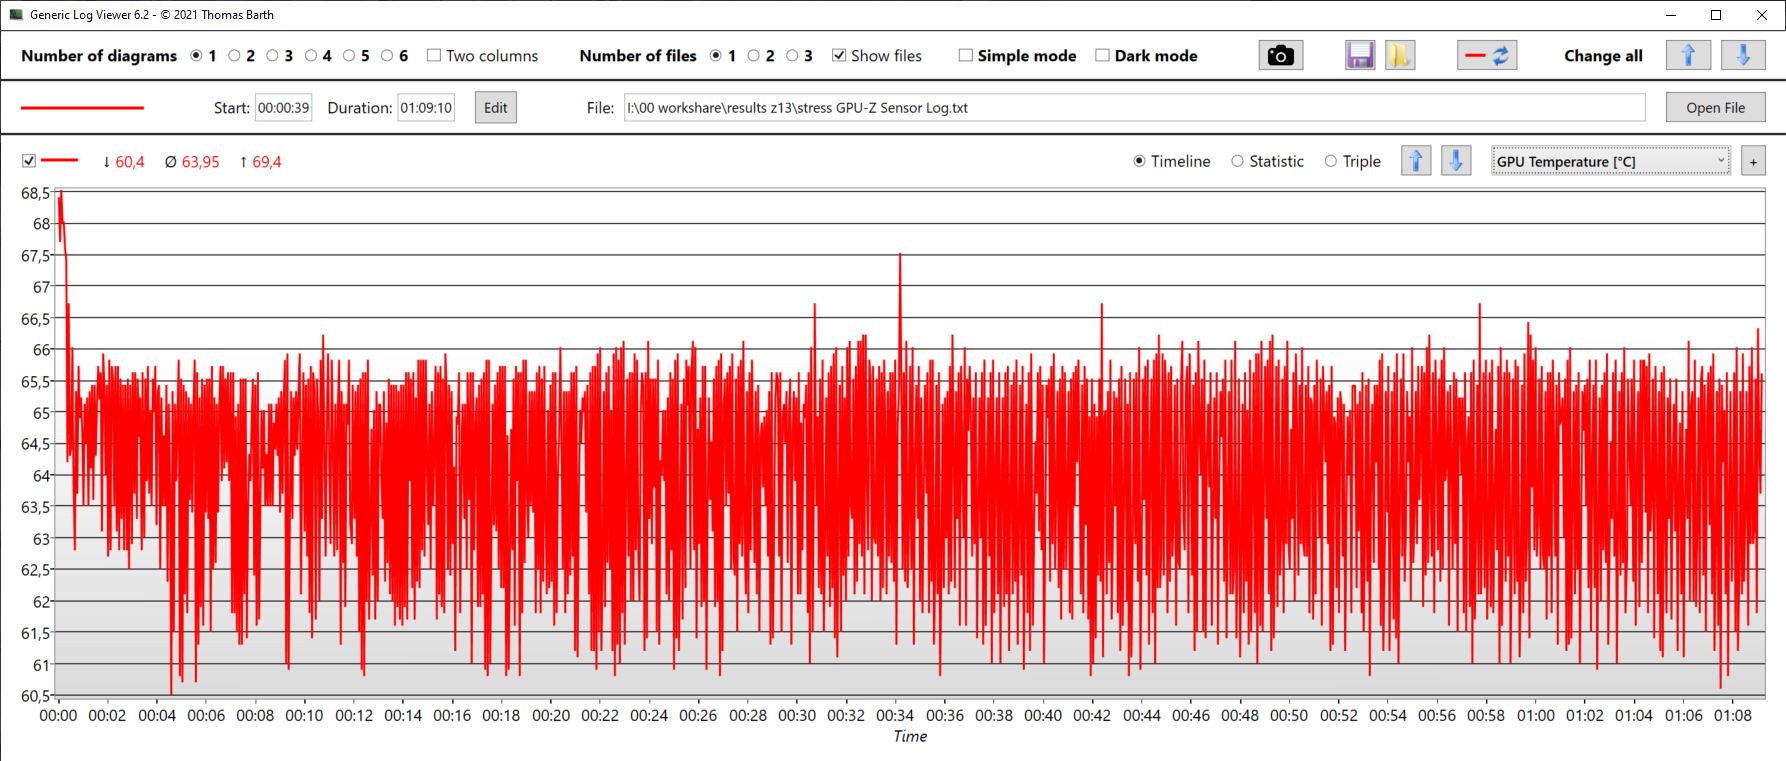
| ZegarCPU (GHz) | Zegar GPU (MHz) | średnia temperatura CPU (°C) | średnia temperatura GPU (°C) | |
| Prime95 + FurMark stress | 2,65 | 1,368 | 75 | 64 |
| Witcher 3 stres | 382 | 1,931 | 66 | 64 |
Mówcy
Asus w dwóch dolnych rogach tabletu instaluje głośniki stereo, które kierują dźwięk na zewnątrz. Ponieważ dźwięk nie jest kierowany do przodu, a raczej na boki, głośniki nie są szczególnie głośne.
Wyważone średnie i wysokie tony są dobre, brak basów mniej. Urządzenia audio można podłączyć przez port słuchawkowy.
Asus ROG Flow Z13 GZ301V analiza dźwięku
(±) | głośność głośnika jest średnia, ale dobra (78.64 dB)
Bas 100 - 315 Hz
(-) | prawie brak basu - średnio 17.5% niższa od mediany
(±) | liniowość basu jest średnia (7.5% delta do poprzedniej częstotliwości)
Średnie 400 - 2000 Hz
(+) | zbalansowane środki średnie - tylko 2.9% od mediany
(+) | średnie są liniowe (5.8% delta do poprzedniej częstotliwości)
Wysokie 2–16 kHz
(+) | zrównoważone maksima - tylko 1.8% od mediany
(+) | wzloty są liniowe (4.8% delta do poprzedniej częstotliwości)
Ogólnie 100 - 16.000 Hz
(±) | liniowość ogólnego dźwięku jest średnia (15% różnicy w stosunku do mediany)
W porównaniu do tej samej klasy
» 31% wszystkich testowanych urządzeń w tej klasie było lepszych, 6% podobnych, 62% gorszych
» Najlepszy miał deltę 6%, średnia wynosiła ###średnia###%, najgorsza wynosiła 132%
W porównaniu do wszystkich testowanych urządzeń
» 20% wszystkich testowanych urządzeń było lepszych, 4% podobnych, 75% gorszych
» Najlepszy miał deltę 4%, średnia wynosiła ###średnia###%, najgorsza wynosiła 134%
MSI Cyborg 15 A12VF analiza dźwięku
(±) | głośność głośnika jest średnia, ale dobra (77.79 dB)
Bas 100 - 315 Hz
(-) | prawie brak basu - średnio 19.8% niższa od mediany
(±) | liniowość basu jest średnia (12.2% delta do poprzedniej częstotliwości)
Średnie 400 - 2000 Hz
(+) | zbalansowane środki średnie - tylko 1.8% od mediany
(+) | średnie są liniowe (5% delta do poprzedniej częstotliwości)
Wysokie 2–16 kHz
(+) | zrównoważone maksima - tylko 4.2% od mediany
(+) | wzloty są liniowe (3.9% delta do poprzedniej częstotliwości)
Ogólnie 100 - 16.000 Hz
(+) | ogólny dźwięk jest liniowy (14.2% różnicy w stosunku do mediany)
W porównaniu do tej samej klasy
» 25% wszystkich testowanych urządzeń w tej klasie było lepszych, 7% podobnych, 68% gorszych
» Najlepszy miał deltę 6%, średnia wynosiła ###średnia###%, najgorsza wynosiła 132%
W porównaniu do wszystkich testowanych urządzeń
» 17% wszystkich testowanych urządzeń było lepszych, 4% podobnych, 79% gorszych
» Najlepszy miał deltę 4%, średnia wynosiła ###średnia###%, najgorsza wynosiła 134%
Zarządzanie energią - nie jest szczególnie oszczędne
Pobór mocy
Tablet do gier oczywiście nie jest tak ekonomiczny w porównaniu do innych tabletów. Niemniej jednak porównanie z laptopami gamingowymi jest zaskakujące. Na przykład MSI Cyborg zużywa ogólnie mniej mimo znacznie większego ekranu i podobnej wydajności. Podczas gdy w grach wskaźniki zużycia są niemal takie same, Z13 nie wypada szczególnie dobrze w zużyciu energii w stanie spoczynku. Cyborg jest tutaj znacznie bardziej oszczędny. Znacznie niższy pobór w spoczynku z zewnętrznym monitorem sugeruje, że jasny i wysokiej rozdzielczości wyświetlacz Nebula pobiera sporo energii.
Różnice w zużyciu energii w Witcher 3 Ultra (w zależności od trybu wydajności) są wymienione w tabeli poniżej
.
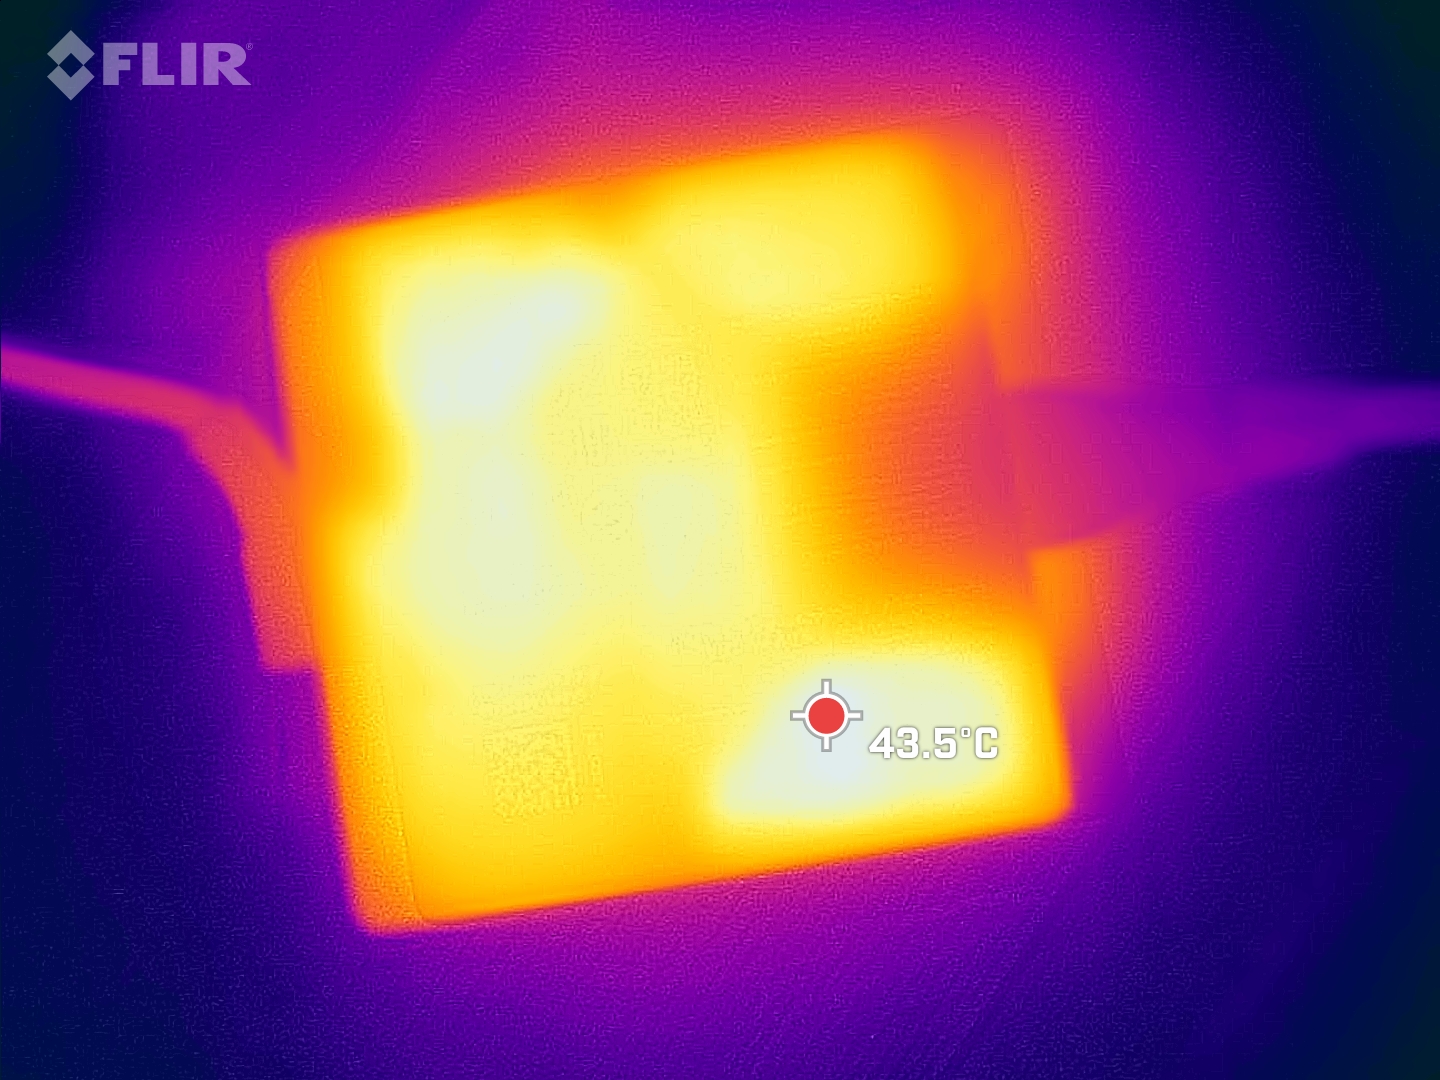
Zmierzyliśmy krótkotrwałe szczyty o maksymalnej wartości 135 W. To prawdopodobnie wyczerpie przyjemnie mały 130 W zasilacz USB-C, ale w teście obciążeniowym zmierzyliśmy średnie zużycie 102 W, więc nie powinno być tu problemów.
| Tryby wydajności/wartości pomiarowe | Poziom hałasu wentylatora | Częstotliwość odświeżania | Zużycie |
|---|---|---|---|
| Quiet | 36 dB | 67 fps | 76 W |
| Performance | 41 dB | 77 fps | 88 W |
| Turbo | 47 dB | 83 fps | 105 W |
| wyłączony / stan wstrzymania | |
| luz | |
| obciążenie |
|
Legenda:
min: | |
| Asus ROG Flow Z13 GZ301V i9-13900H, GeForce RTX 4060 Laptop GPU, WD PC SN740 SDDPTQD-1T00, IPS, 2560x1600, 13.4" | Asus ROG Flow Z13 ACRNM i9-13900H, GeForce RTX 4070 Laptop GPU, WD PC SN740 SDDPTQD-1T00, IPS, 2560x1600, 13.4" | Asus ROG Flow Z13 GZ301ZE i9-12900H, GeForce RTX 3050 Ti Laptop GPU, Micron 2450 1TB MTFDKBK1T0TFK, IPS, 1920x1200, 13.4" | MSI Katana 17 B13VFK i7-13620H, GeForce RTX 4060 Laptop GPU, Micron 2400 MTFDKBA1T0QFM, IPS LED, 1920x1080, 17.3" | Acer Predator Triton 300 SE i9-12900H, GeForce RTX 3060 Laptop GPU, Micron 3400 1TB MTFDKBA1T0TFH, OLED, 2880x1800, 14" | MSI Cyborg 15 A12VF i7-12650H, GeForce RTX 4060 Laptop GPU, Samsung PM9B1 1024GB MZVL41T0HBLB, IPS, 1920x1080, 15.6" | Przeciętny NVIDIA GeForce RTX 4060 Laptop GPU | Średnia w klasie Gaming | |
|---|---|---|---|---|---|---|---|---|
| Power Consumption | -4% | 10% | -34% | -26% | 16% | -35% | -58% | |
| Idle Minimum * (Watt) | 8.5 | 8.9 -5% | 8.8 -4% | 12.2 -44% | 7.6 11% | 6 29% | 11.5 ? -35% | 13.1 ? -54% |
| Idle Average * (Watt) | 12.4 | 12.6 -2% | 12.1 2% | 14.9 -20% | 12.3 1% | 8.8 29% | 16 ? -29% | 18.7 ? -51% |
| Idle Maximum * (Watt) | 13.3 | 13 2% | 12.7 5% | 15.8 -19% | 17.6 -32% | 11.9 11% | 20.3 ? -53% | 24.4 ? -83% |
| Load Average * (Watt) | 93 | 92.5 1% | 72.3 22% | 85.22 8% | 111 -19% | 89 4% | 92.9 ? -0% | 108.1 ? -16% |
| Witcher 3 ultra * (Watt) | 87.8 | 104.4 -19% | 77.3 12% | 151.1 -72% | 117.1 -33% | 90.3 -3% | ||
| Load Maximum * (Watt) | 135 | 133.6 1% | 103.1 24% | 212.8 -58% | 245.8 -82% | 99 27% | 210 ? -56% | 254 ? -88% |
* ... im mniej tym lepiej
Power consumption Witcher 3 / Stress test
Power consumption with an external monitor
Czas pracy na baterii
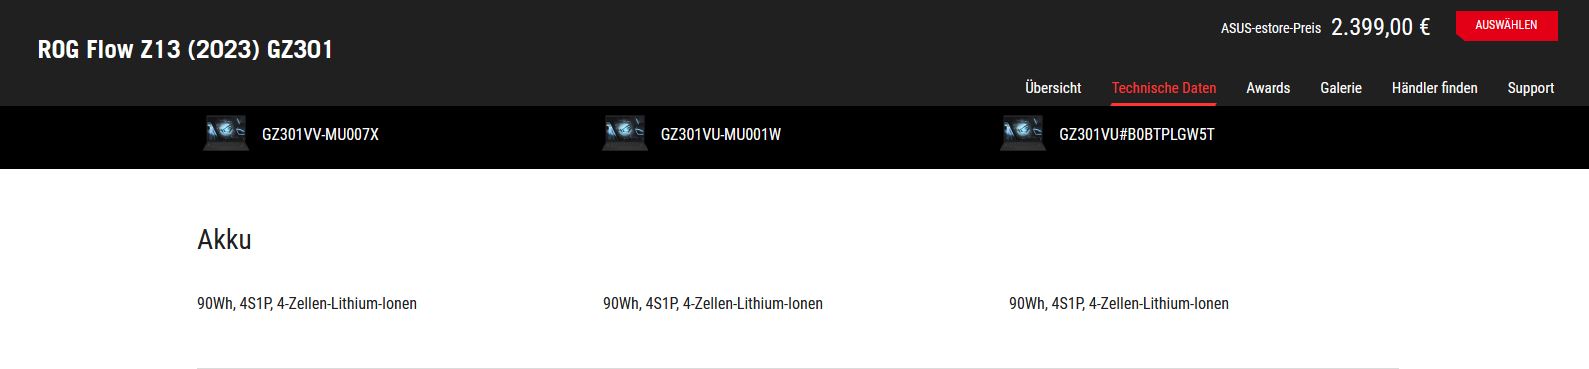
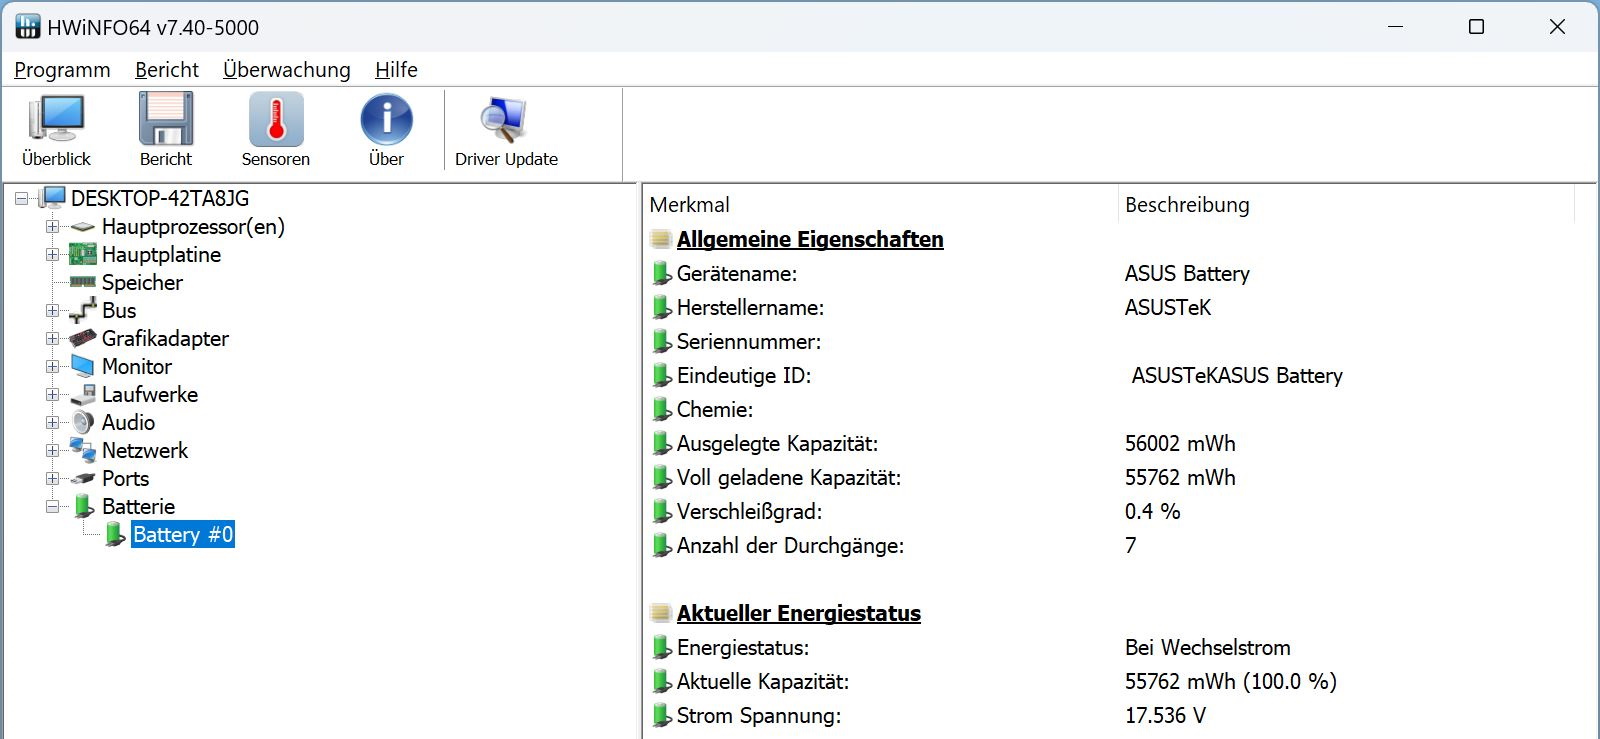
Asus w specyfikacji na stronie internetowej Z13 określa baterię jako 90 Wh, co jest błędem! Podobnie jak poprzednik i edycja specjalna, nowy Z13 ma zainstalowany akumulator o pojemności 56 Wh, a bateria o pojemności 90 Wh raczej nie zmieściłaby się w tablecie. Z kolei w sklepie internetowym bateria jest prawidłowo określona jako 56 Wh.
To wystarczy na nieco mniej niż 5 godzin przeglądania stron internetowych przy obniżonej jasności lub wieczór filmowy trwający 5 godzin i 44 minuty, również przy 150 nitach.
Wcześniej chwaliliśmy stosunkowo niski spadek wydajności podczas grania. Stosunkowo wysoka wydajność zmniejsza jednak czas pracy, tak że w Witcher 3 Ultra można grać tylko przez 50 minut.
MSI Cyborgo podobnej wydajności i podobnej wielkości akumulatora wytrzymuje znacznie dłużej we wszystkich testach bateryjnych, natomiast Katana 17wypada gorzej w podobnych warunkach.
| Asus ROG Flow Z13 GZ301V i9-13900H, GeForce RTX 4060 Laptop GPU, 56 Wh | Asus ROG Flow Z13 ACRNM i9-13900H, GeForce RTX 4070 Laptop GPU, 56 Wh | Asus ROG Flow Z13 GZ301ZE i9-12900H, GeForce RTX 3050 Ti Laptop GPU, 56 Wh | MSI Katana 17 B13VFK i7-13620H, GeForce RTX 4060 Laptop GPU, 53.5 Wh | Acer Predator Triton 300 SE i9-12900H, GeForce RTX 3060 Laptop GPU, 76 Wh | MSI Cyborg 15 A12VF i7-12650H, GeForce RTX 4060 Laptop GPU, 53.5 Wh | Średnia w klasie Gaming | |
|---|---|---|---|---|---|---|---|
| Czasy pracy | 11% | 15% | -21% | 27% | 83% | 55% | |
| H.264 (h) | 4.7 | 5.2 11% | 6 28% | 8 70% | 8.26 ? 76% | ||
| WiFi v1.3 (h) | 5 | 6.6 32% | 5.6 12% | 2.9 -42% | 6.2 24% | 7.5 50% | 7.04 ? 41% |
| Witcher 3 ultra (h) | 0.8 | 0.8 0% | |||||
| Load (h) | 1 | 0.9 -10% | 1.2 20% | 1 0% | 1.3 30% | 2.3 130% | 1.47 ? 47% |
| Reader / Idle (h) | 8.1 | 13.6 | 8.71 ? |
Za
Przeciw
Werdykt - gry AAA na tablecie są możliwe
Szczerze mówiąc, spodziewaliśmy się, że wady małej obudowy będą znacznie bardziej odczuwalne w przypadku mocnego sprzętu. Asus ROG Flow Z13 udowadnia jednak, że gry AAA mogą teraz działać także na tablecie. W aktualne gry w Full HD można grać bez wahania.
Oczywiście wydajność jest nieco niższa od dużych laptopów gamingowych z wyższym TGP, ale kompromisy są raczej niewielkie. Jednocześnie krytyczne dla gier parametry, takie jak hałas wentylatora czy temperatury, są bardzo umiarkowane, czasem wręcz powściągliwe.
Jeśli Asusowi uda się zapanować nad dość wysokimi opóźnieniami dpc, twórcy będą zadowoleni także z wydajnego tabletu z wyświetlaczem Nebula o wysokiej rozdzielczości i stosunkowo dobrymi aparatami.
Trzeba się "tylko" obejść bez kilku opcji konserwacji, przyzwoitej klawiatury i szerokiej gamy portów.
Asus ROG FLow Z13 dzięki RTX 4060 może płynnie grać w aktualne gry w Full HD, a nawet w natywnej rozdzielczości QHD+.
Alternatywne tablety gamingowe na tym poziomie są na razie rzadkością, więc Z13 zajmuje obecnie niszę. Musiałbyś spojrzeć na jeden z równie rzadkich 13- lub nawet 14-calowych laptopów do gier jako alternatywy.
Cena i dostępność
W sklepie internetowym Asusa w USA tylko wariant RTX 4050 w modelu Z13 wydaje się być dostępny w cenie - 1 749,99 dol, ale obecnie nie ma go w magazynie. Zainteresowani nabywcy w innych lokalizacjach powinni sprawdzić bezpośrednio w sklepie internetowym Asusa (w stosownych przypadkach), aby zobaczyć, jakie konfiguracje są dostępne.
Asus ROG Flow Z13 GZ301V
- 26/04/2023 v7 (old)
Christian Hintze
Przezroczystość
Wyboru urządzeń do recenzji dokonuje nasza redakcja. Próbka testowa została udostępniona autorowi jako pożyczka od producenta lub sprzedawcy detalicznego na potrzeby tej recenzji. Pożyczkodawca nie miał wpływu na tę recenzję, producent nie otrzymał też kopii tej recenzji przed publikacją. Nie było obowiązku publikowania tej recenzji. Jako niezależna firma medialna, Notebookcheck nie podlega władzy producentów, sprzedawców detalicznych ani wydawców.
Tak testuje Notebookcheck
Każdego roku Notebookcheck niezależnie sprawdza setki laptopów i smartfonów, stosując standardowe procedury, aby zapewnić porównywalność wszystkich wyników. Od około 20 lat stale rozwijamy nasze metody badawcze, ustanawiając przy tym standardy branżowe. W naszych laboratoriach testowych doświadczeni technicy i redaktorzy korzystają z wysokiej jakości sprzętu pomiarowego. Testy te obejmują wieloetapowy proces walidacji. Nasz kompleksowy system ocen opiera się na setkach uzasadnionych pomiarów i benchmarków, co pozwala zachować obiektywizm.Price comparison

