Recenzja Dell Precision 5680: Ada Lovelace dominuje na stacjach roboczych

Precision 5680 to pierwszy 16-calowy model z serii Precision 5000, który uzupełnia istniejącą 14-calową serię 5000 Precision 5470i 15-calowy Precision 5560i 17-calowy Precision 5750. Jest to wysokiej klasy mobilna stacja robocza, która jest cieńsza i lżejsza niż Precision model 7000 aczkolwiek z mniejszą liczbą zintegrowanych funkcji pomocniczych.
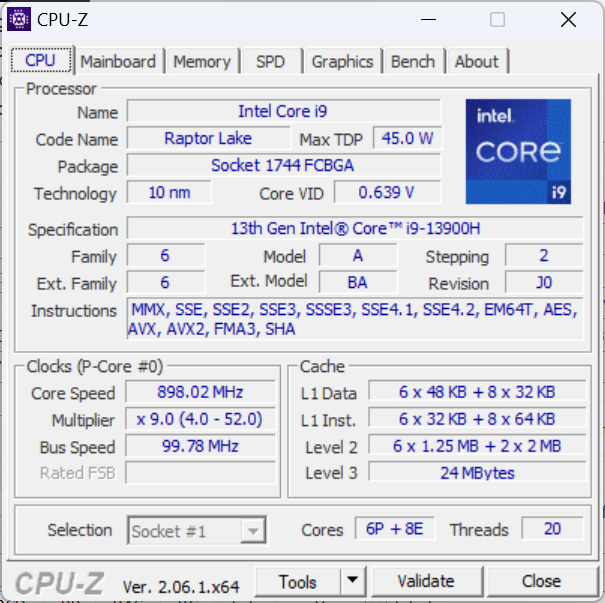
Nasza jednostka testowa to konfiguracja z wyższej półki z procesorem Core i9-13900H 13. generacji Raptor Lake-H, kartą graficzną Nvidia RTX 5000 o mocy 75 W i ekranem dotykowym OLED 2400p za około 6500 USD. Mniejsze jednostki SKU są dostępne z procesorem Core i5-13600H, bez oddzielnego GPU i wyświetlaczem IPS 1200p za niższą cenę początkową wynoszącą około 2490 USD.
Jest to również jedna z pierwszych stacji roboczych wyposażonych w mobilny procesor graficzny RTX 5000 Ada Lovelace, którego nie należy mylić z opartym na architekturze Turing układem Quadro RTX 5000 lub opartym na architekturze Ampere RTX A5000.
Konkurenci w tej dziedzinie obejmują inne 16-calowe stacje robocze, takie jakHP ZBook Fury 16 G9,Lenovo ThinkPad P16 G1,MSI CreatorPro Z16Plub Asus ProArt StudioBook z serii 16.
Więcej recenzji Dell:
Potencjalni konkurenci w porównaniu
Ocena | Data | Model | Waga | Wysokość | Rozmiar | Rezolucja | Cena |
|---|---|---|---|---|---|---|---|
| 89 % v7 (old) | 08/2023 | Dell Precision 5000 5680 i9-13900H, RTX 5000 Ada Generation Laptop | 2.3 kg | 22.17 mm | 16.00" | 3840x2400 | |
| 89.1 % v7 (old) | 12/2022 | Dell Precision 7000 7670 Performance i9-12950HX, RTX A5500 Laptop GPU | 2.8 kg | 25.95 mm | 16.00" | 3840x2400 | |
| 91 % v7 (old) | 06/2023 | HP ZBook Fury 16 G9 i9-12950HX, RTX A5500 Laptop GPU | 2.6 kg | 28.5 mm | 16.00" | 3840x2400 | |
| 91 % v7 (old) | 02/2023 | Lenovo ThinkPad P16 G1 RTX A5500 i9-12950HX, RTX A5500 Laptop GPU | 3 kg | 30.23 mm | 16.00" | 3840x2400 | |
| 84.3 % v7 (old) | 11/2022 | MSI CreatorPro Z16P B12UKST i7-12700H, RTX A3000 Laptop GPU | 2.4 kg | 19 mm | 16.00" | 2560x1600 | |
| 89.6 % v7 (old) | 01/2023 | Asus ExpertBook B6 Flip B6602FC2 i9-12950HX, RTX A2000 Laptop GPU | 2.8 kg | 27.2 mm | 16.00" | 2560x1600 |
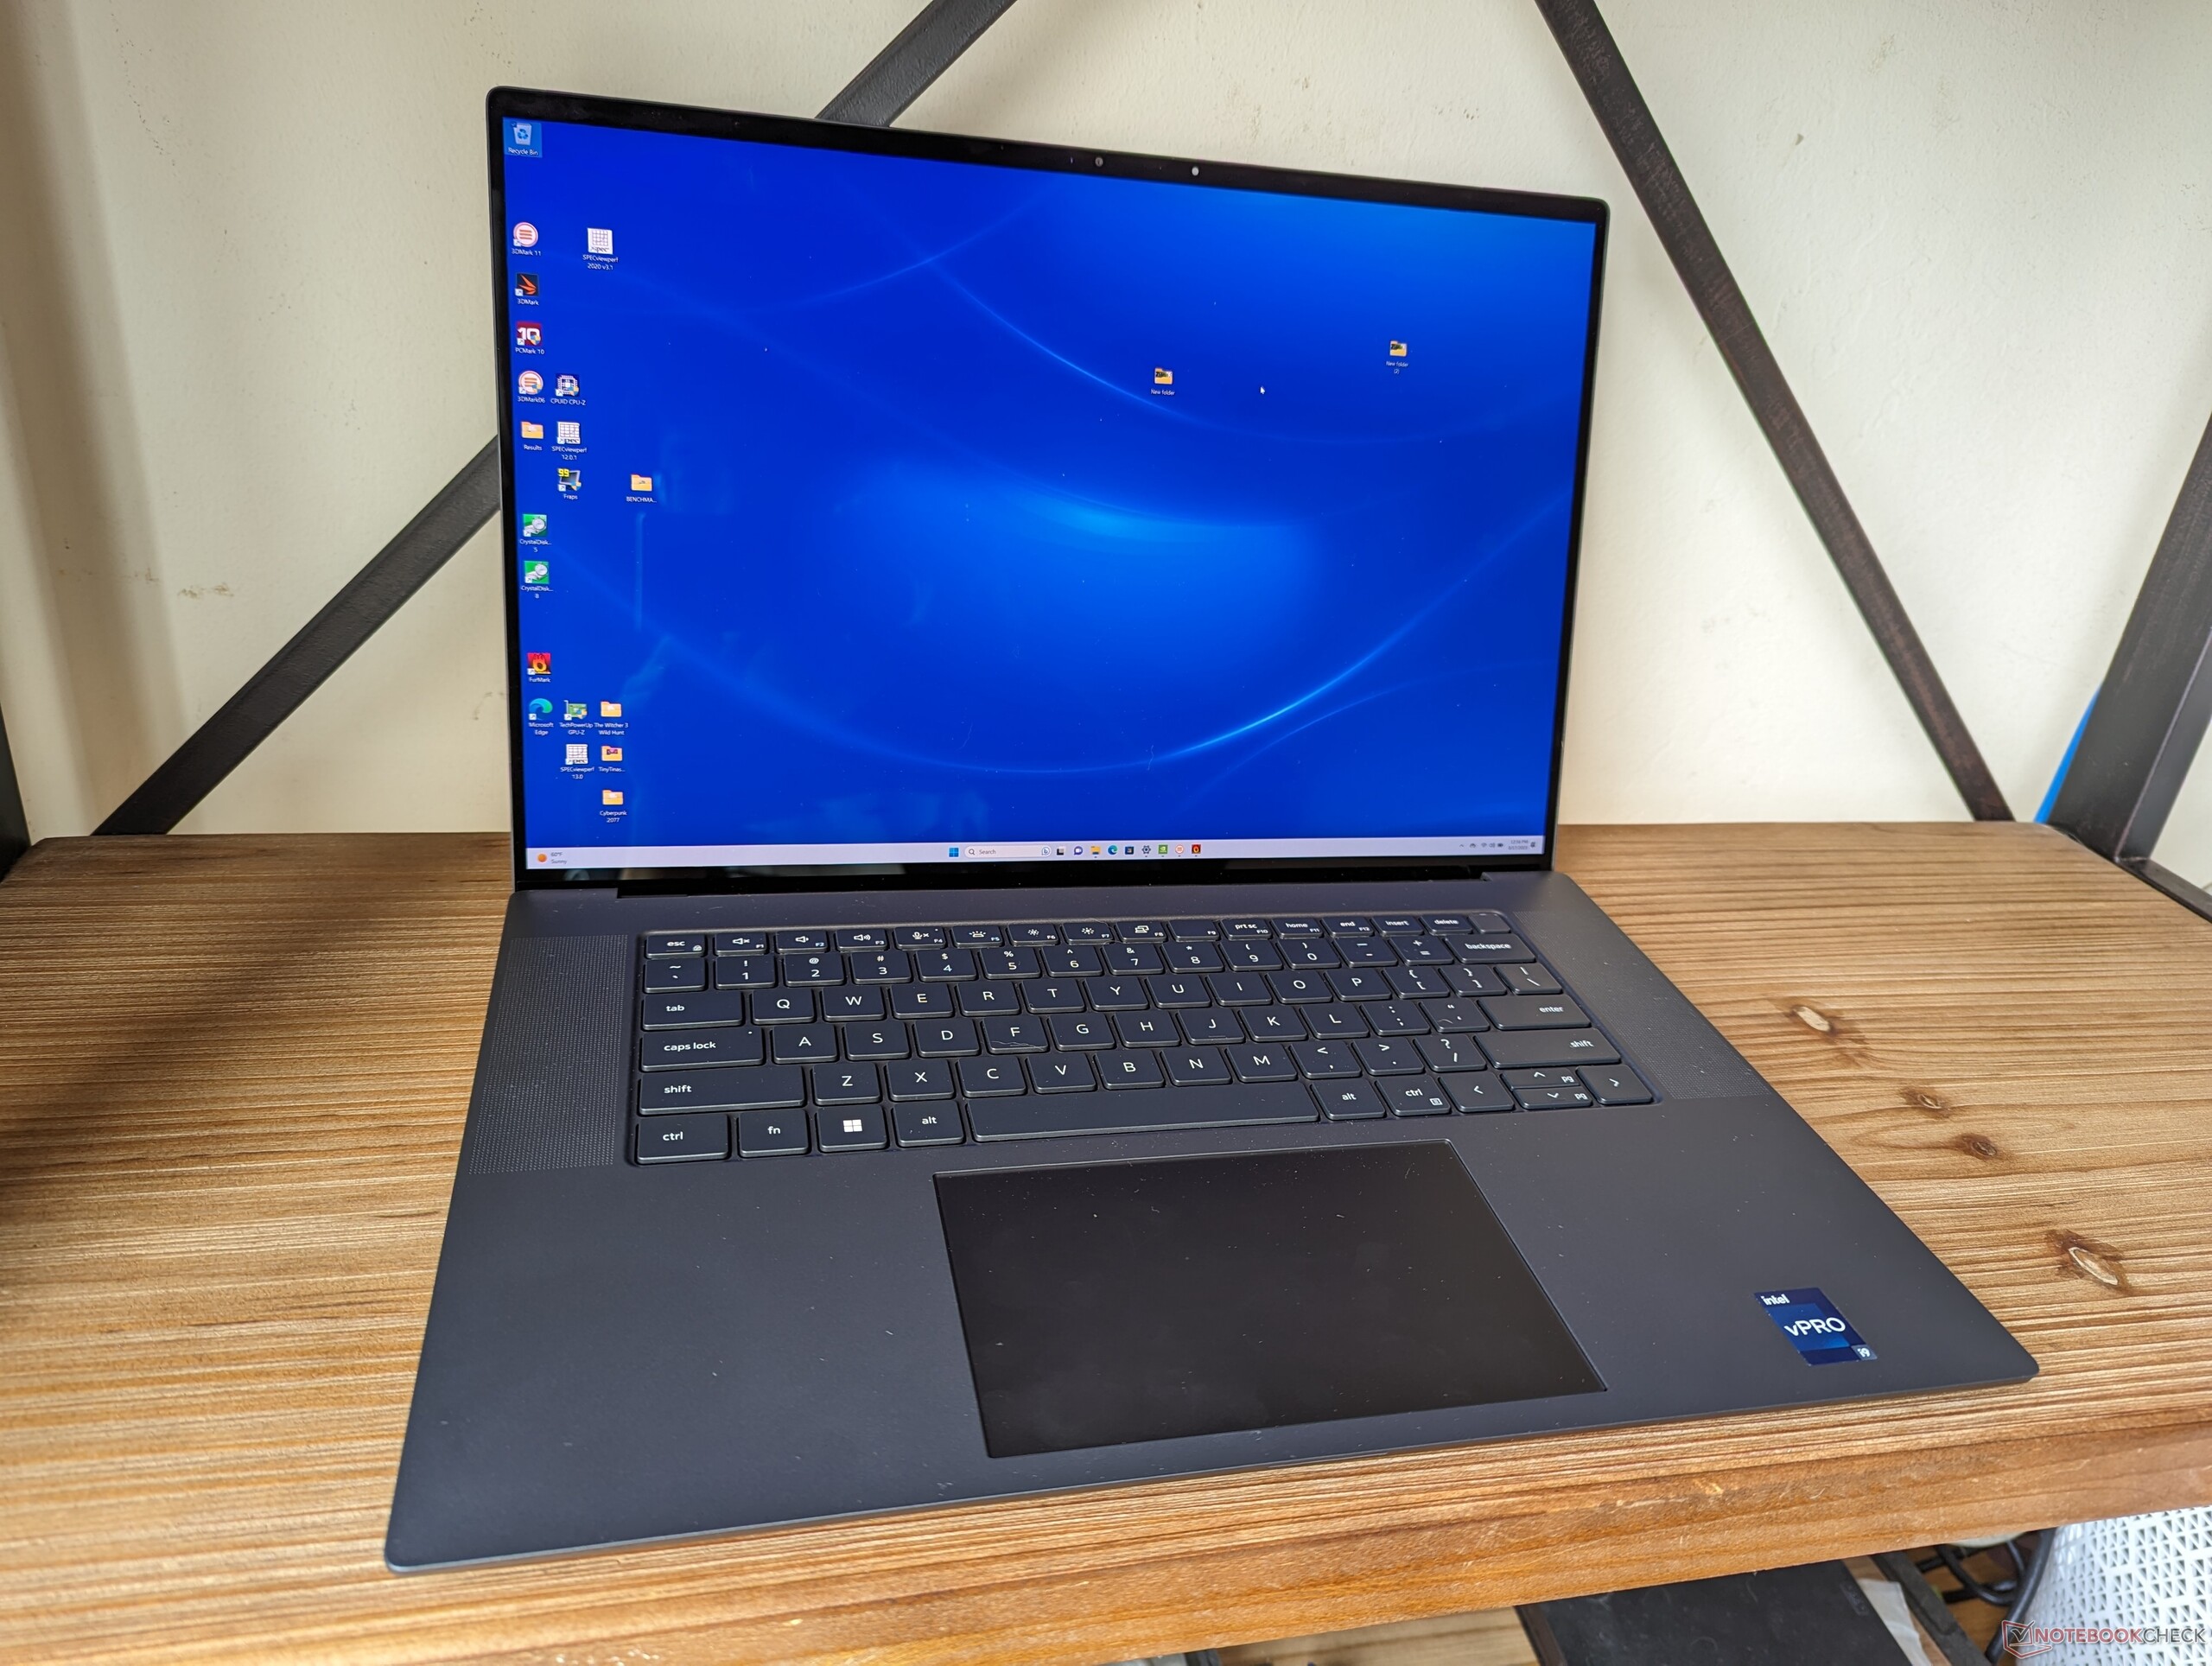
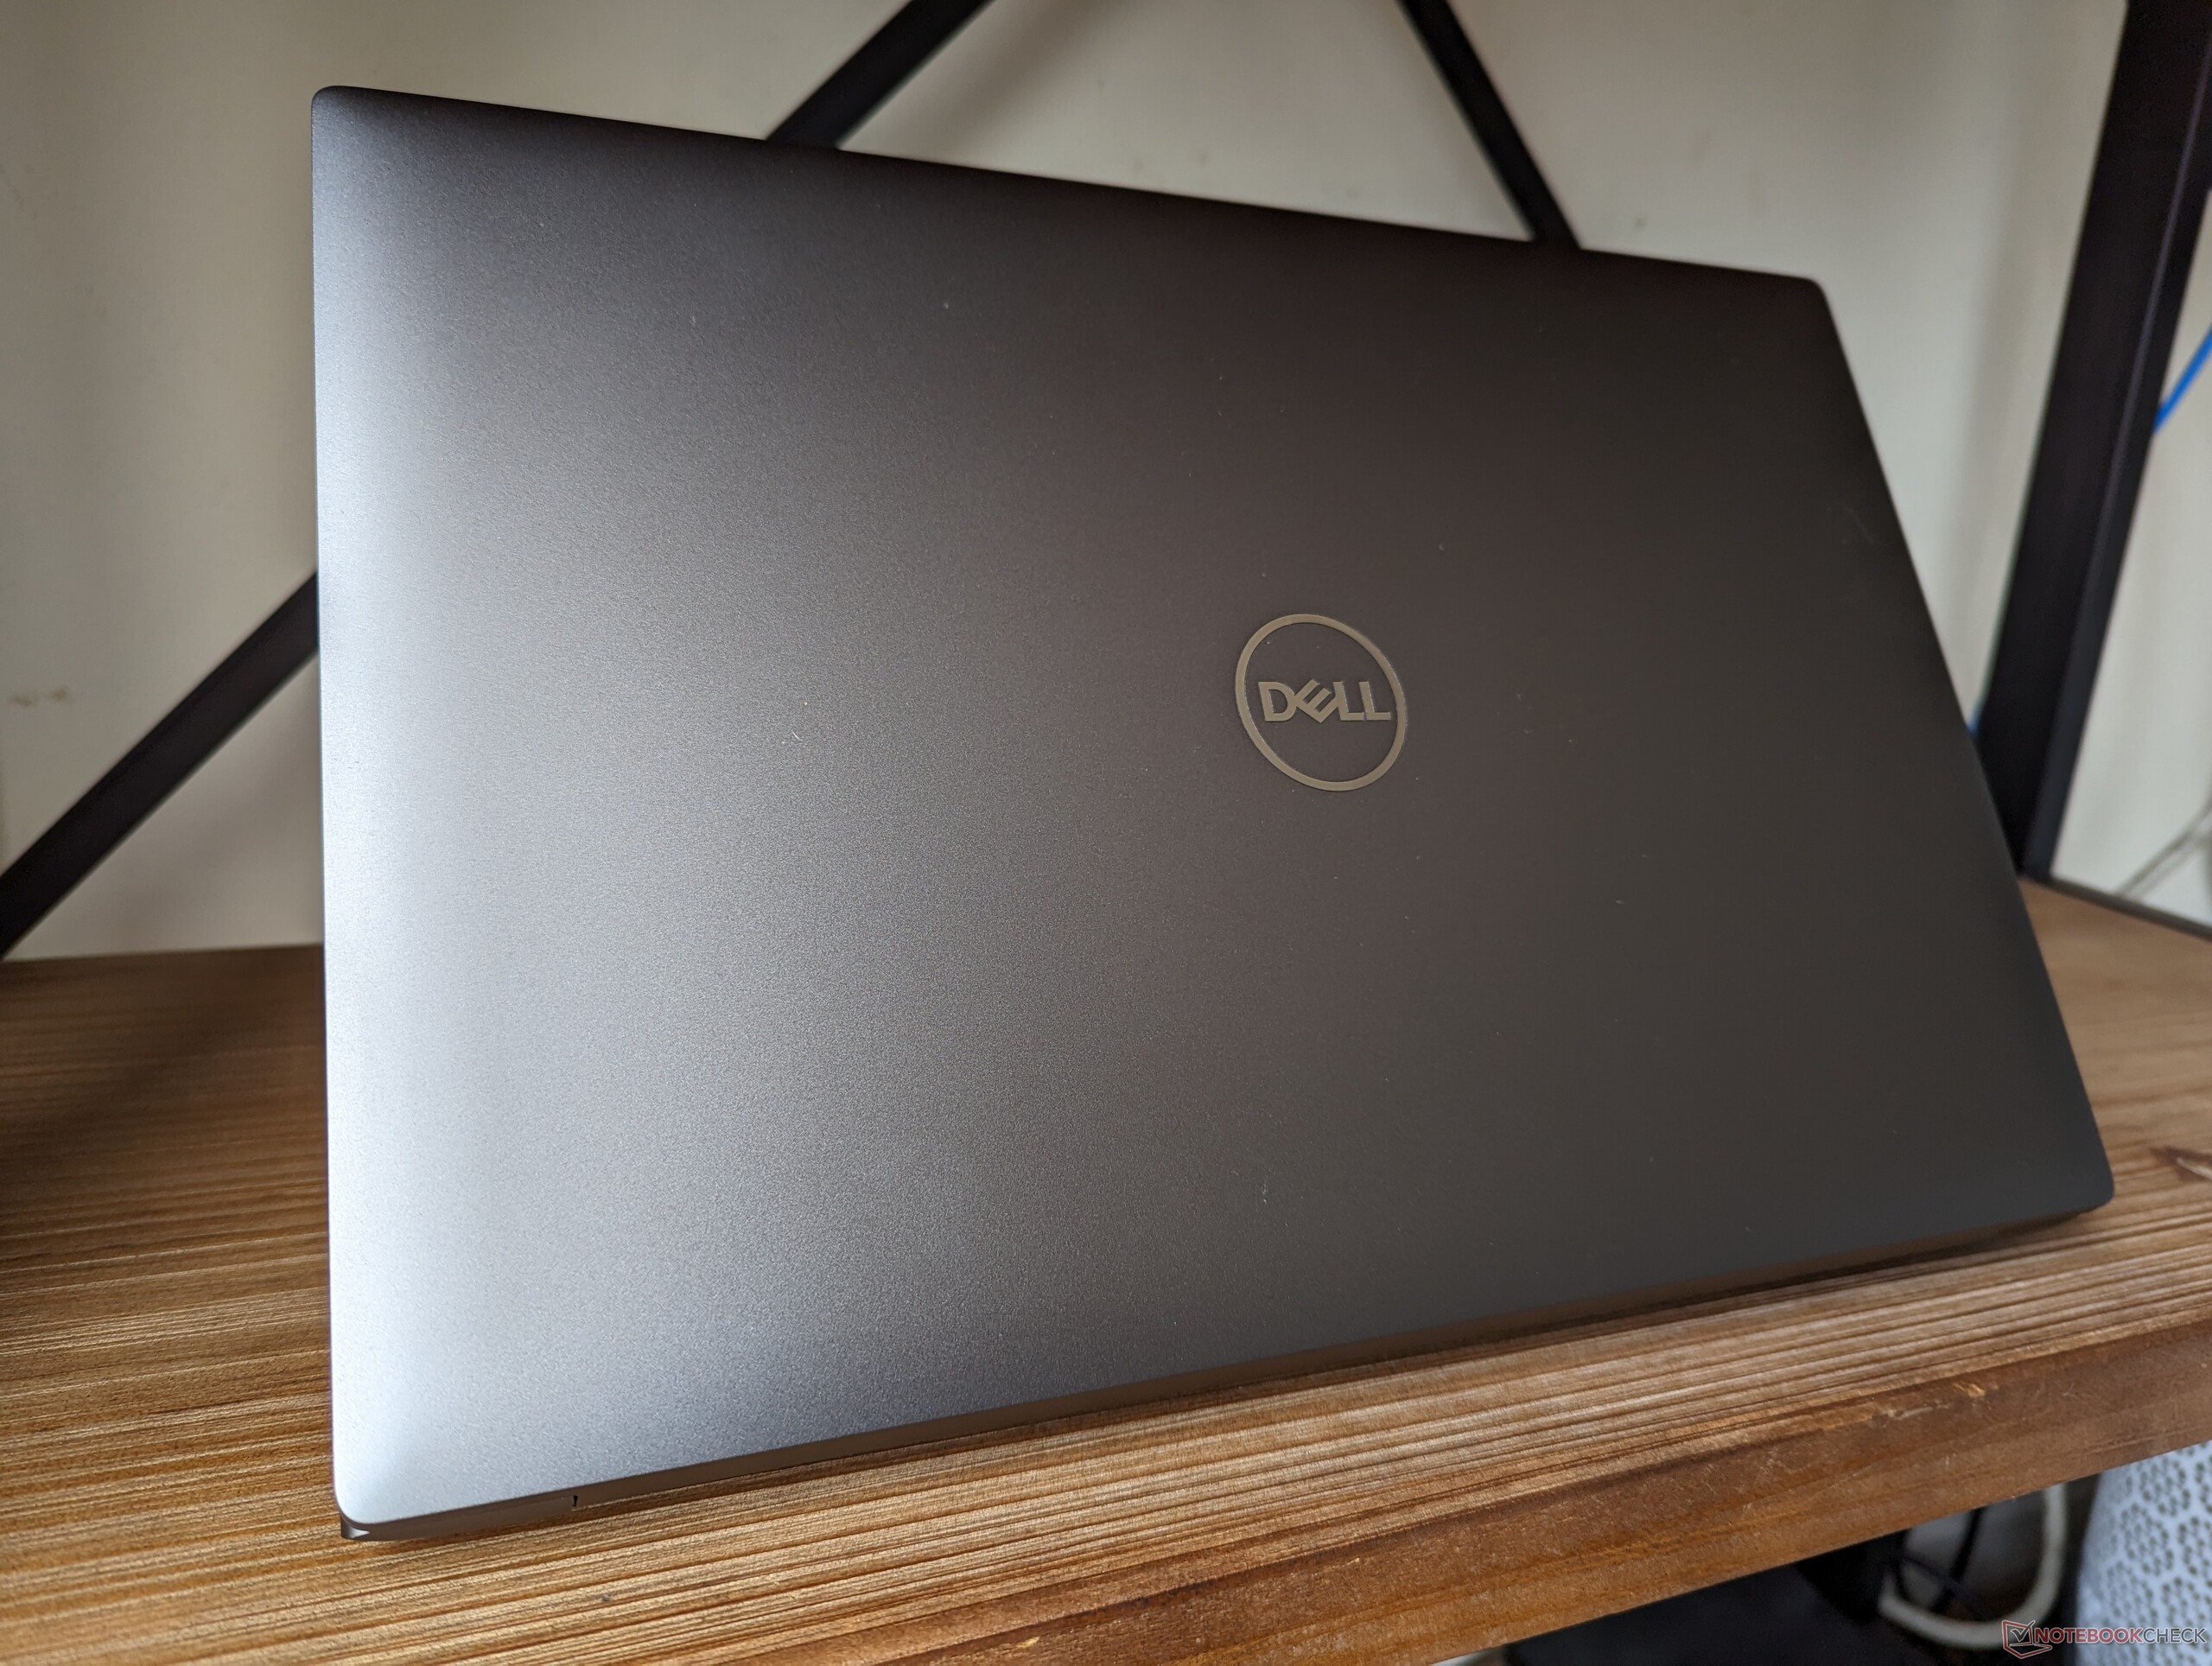
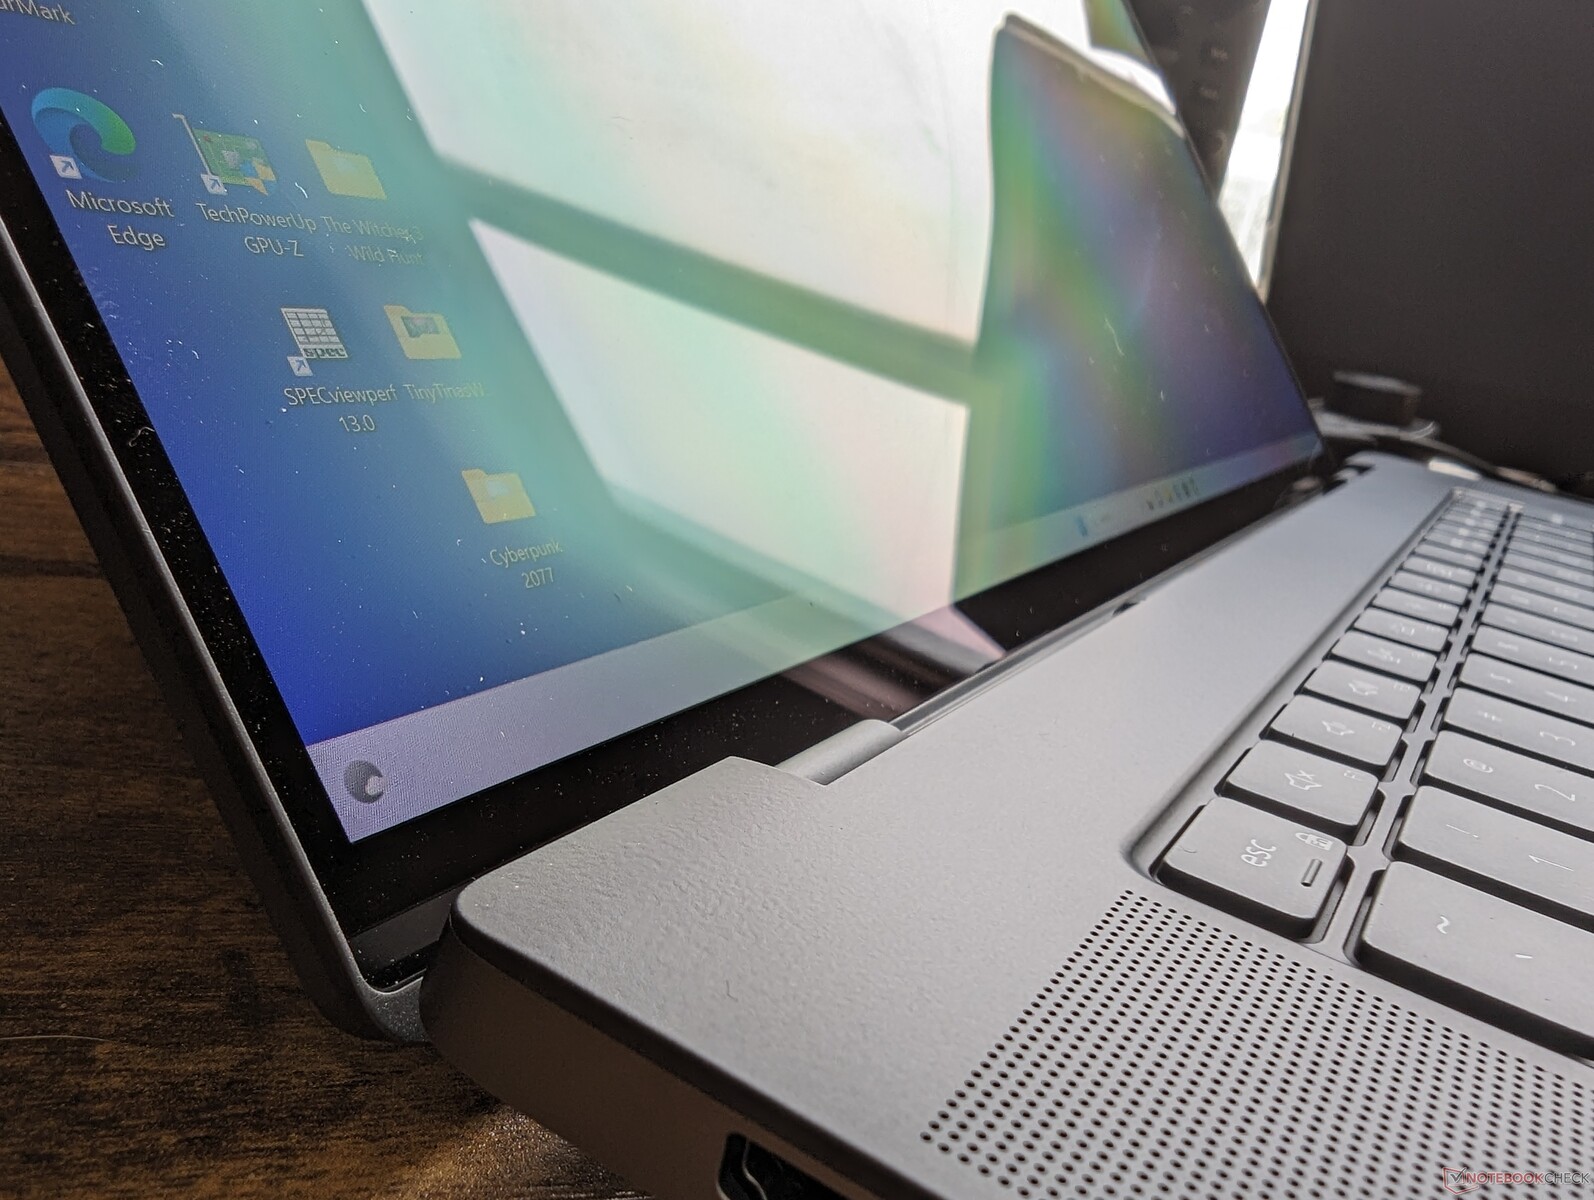
Obudowa - XPS Roots
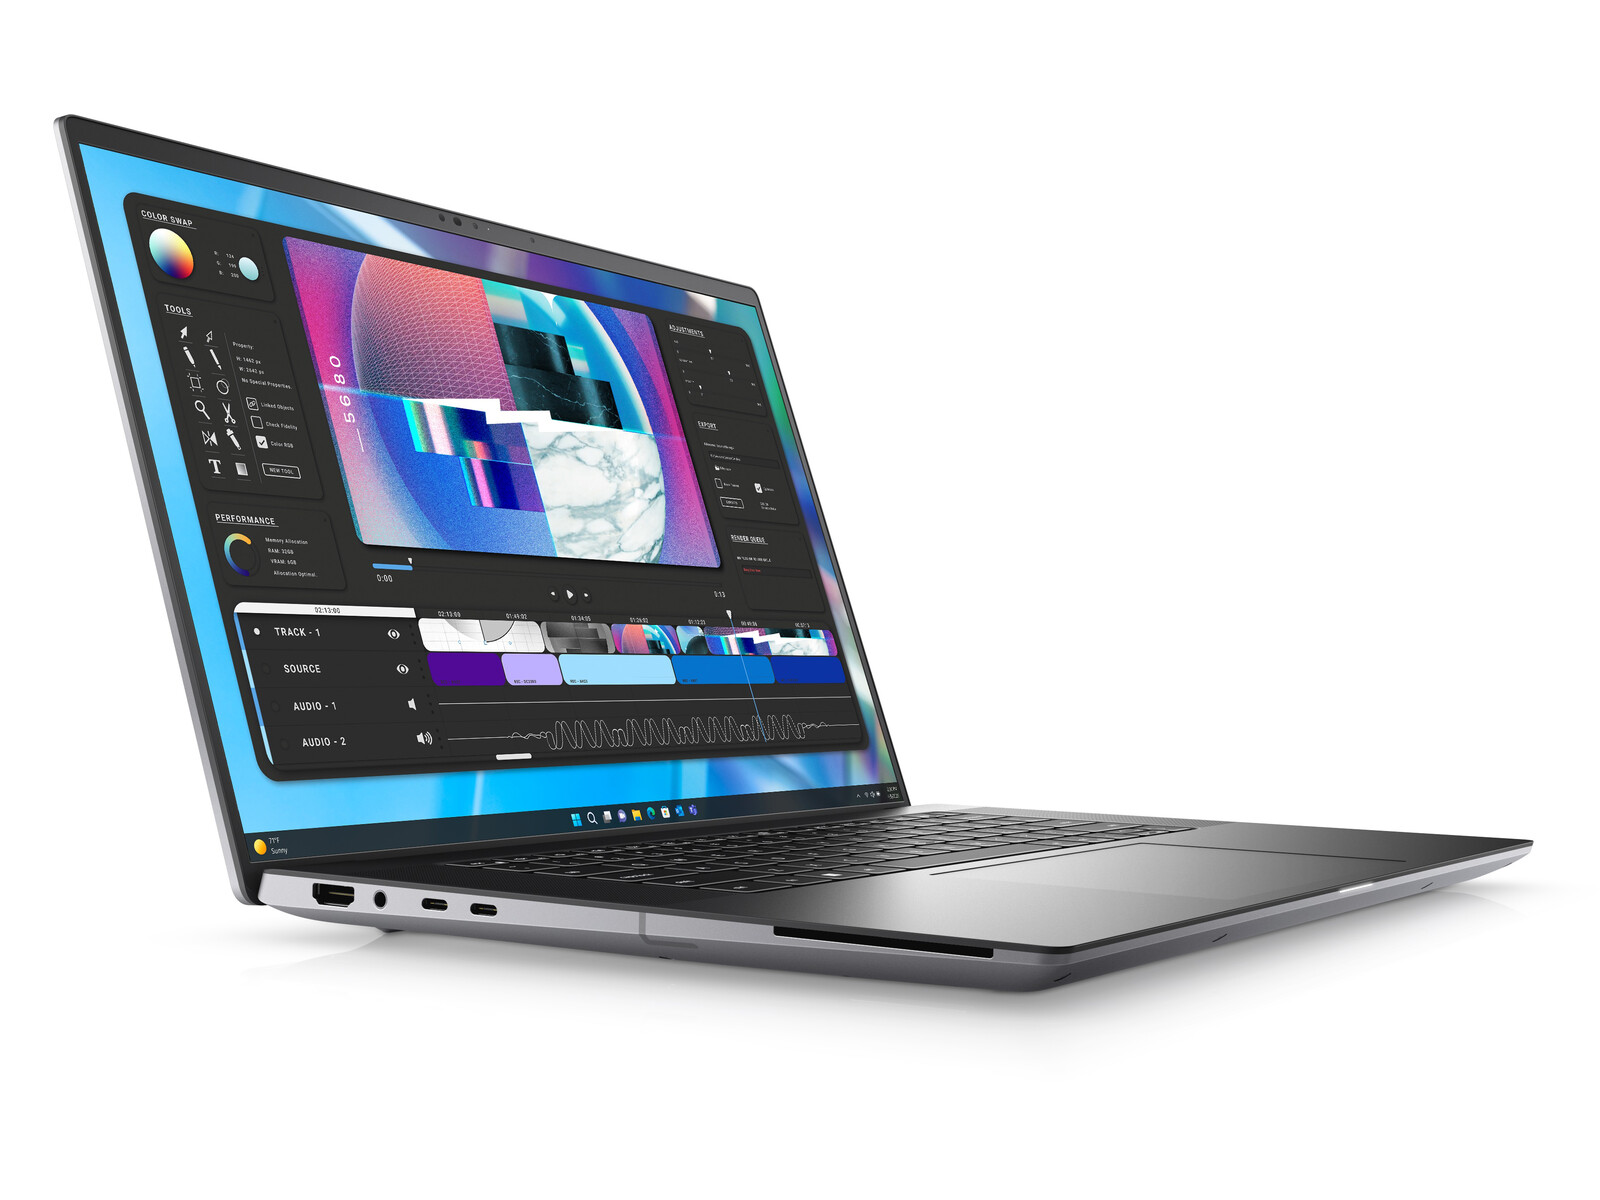
Inspiracja dla projektu Precision 5680 jest oczywista, ponieważ jest to zasadniczo 16-calowa wersja 15-calowego XPS 15 i 17-calowego XPS 17. Jeśli miałeś już wcześniej do czynienia z modelem XPS, to Precision 5680 powinien być od razu znajomy. Wydaje się, że poprzedza on hipotetyczny "XPS 16" i nie bylibyśmy zaskoczeni, gdybyśmy zobaczyli taki model w najbliższej przyszłości z obudową opartą na Precision 5680.
Jakość wykonania wypada korzystnie w porównaniu z alternatywami, takimi jak ZBook Fury 16 G9 lubCreatorPro Z16P które również składają się głównie ze stopów metali, co zapewnia mocne pierwsze wrażenia.
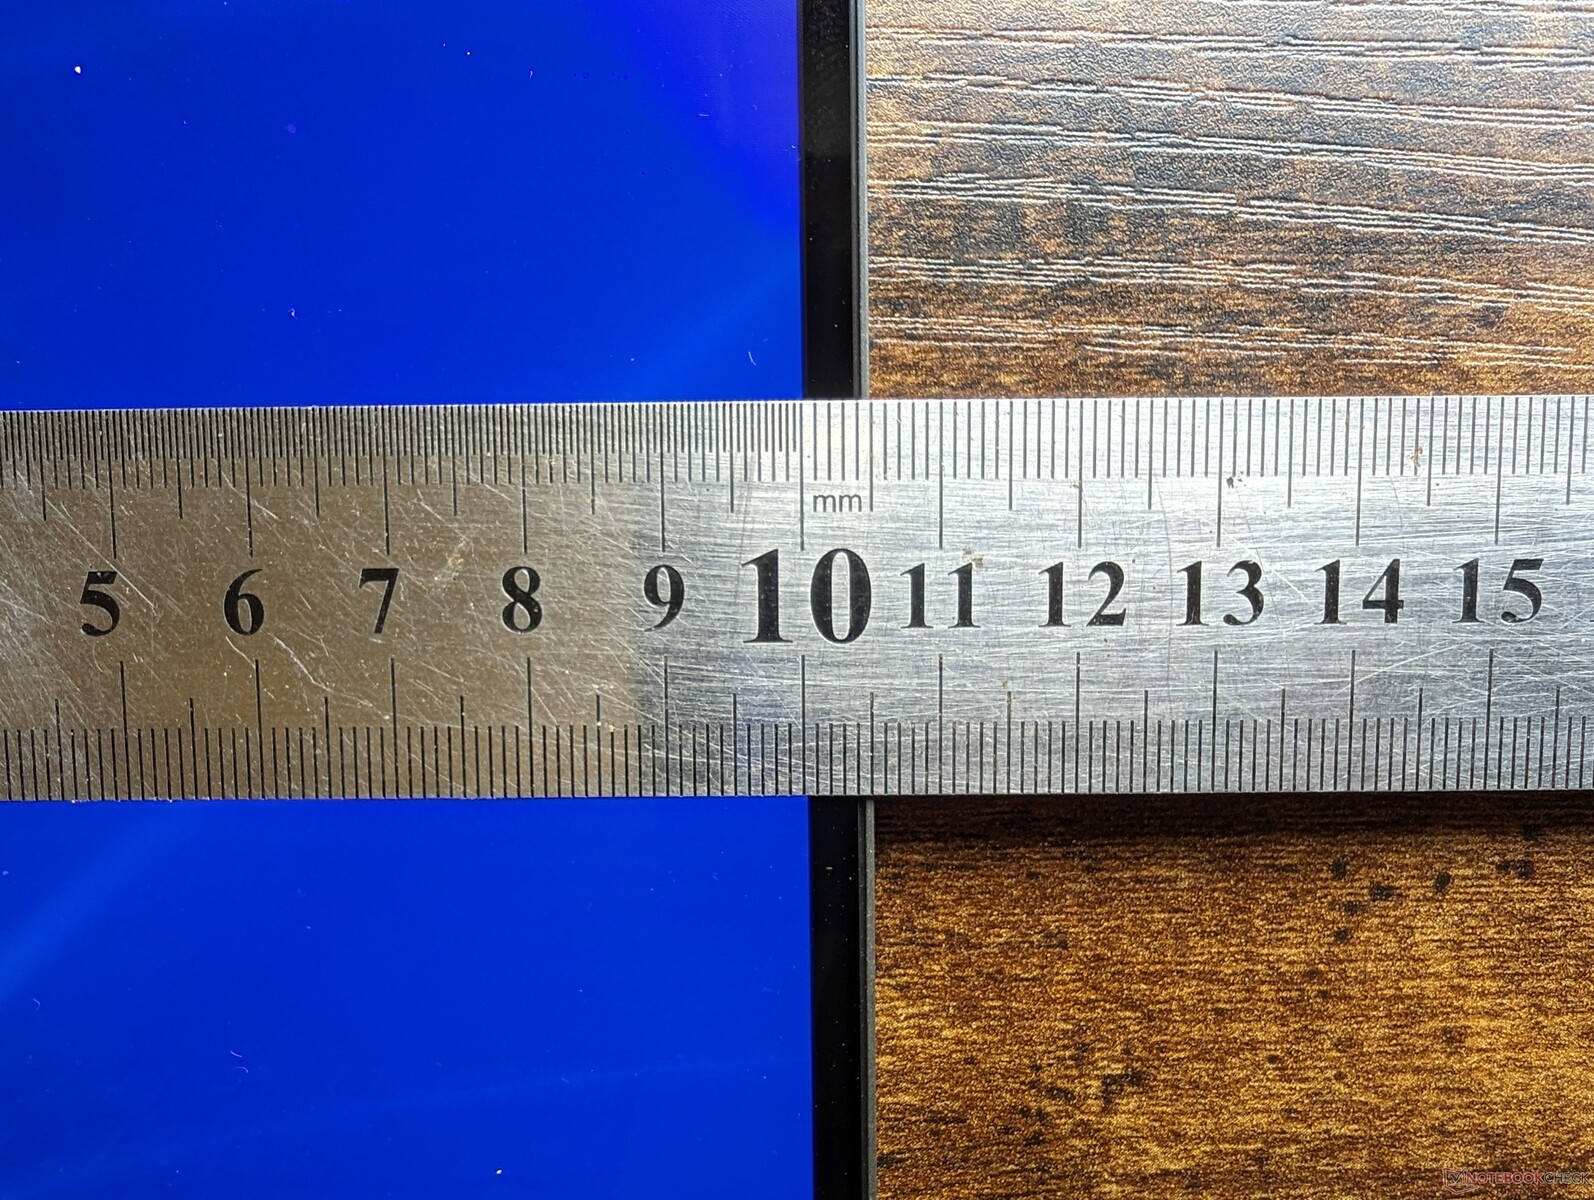
Przy wadze zaledwie 2,3 kg, Precision 5680 jest jedną z najlżejszych 16-calowych stacji roboczych dostępnych na rynku. CreatorPro Z16P iHP ZBook Fury 16 G9na przykład, są odpowiednio o około 100 g i 300 g cięższe, a jednocześnie mają większą powierzchnię niż nasz Dell. Precision 5680 jest zaskakująco przenośny, biorąc pod uwagę jego wydajność.
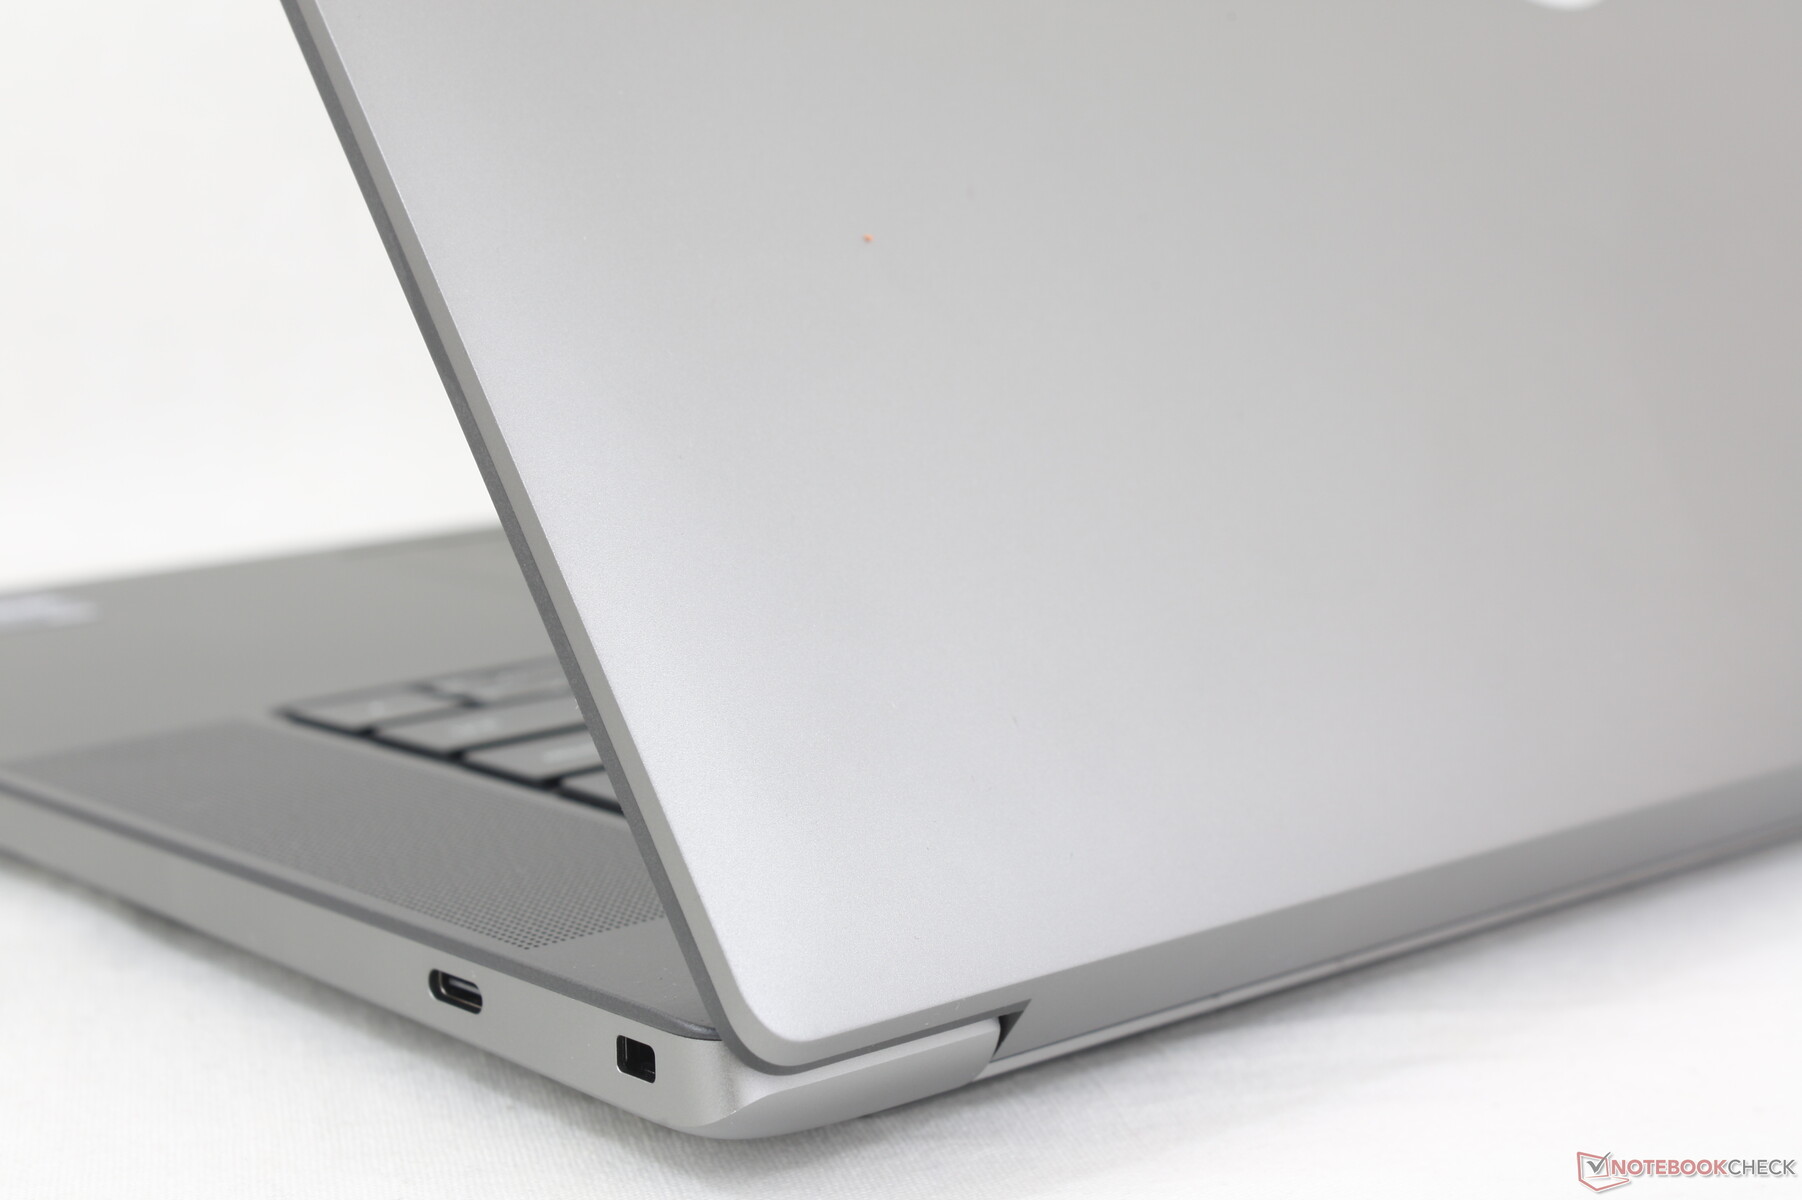
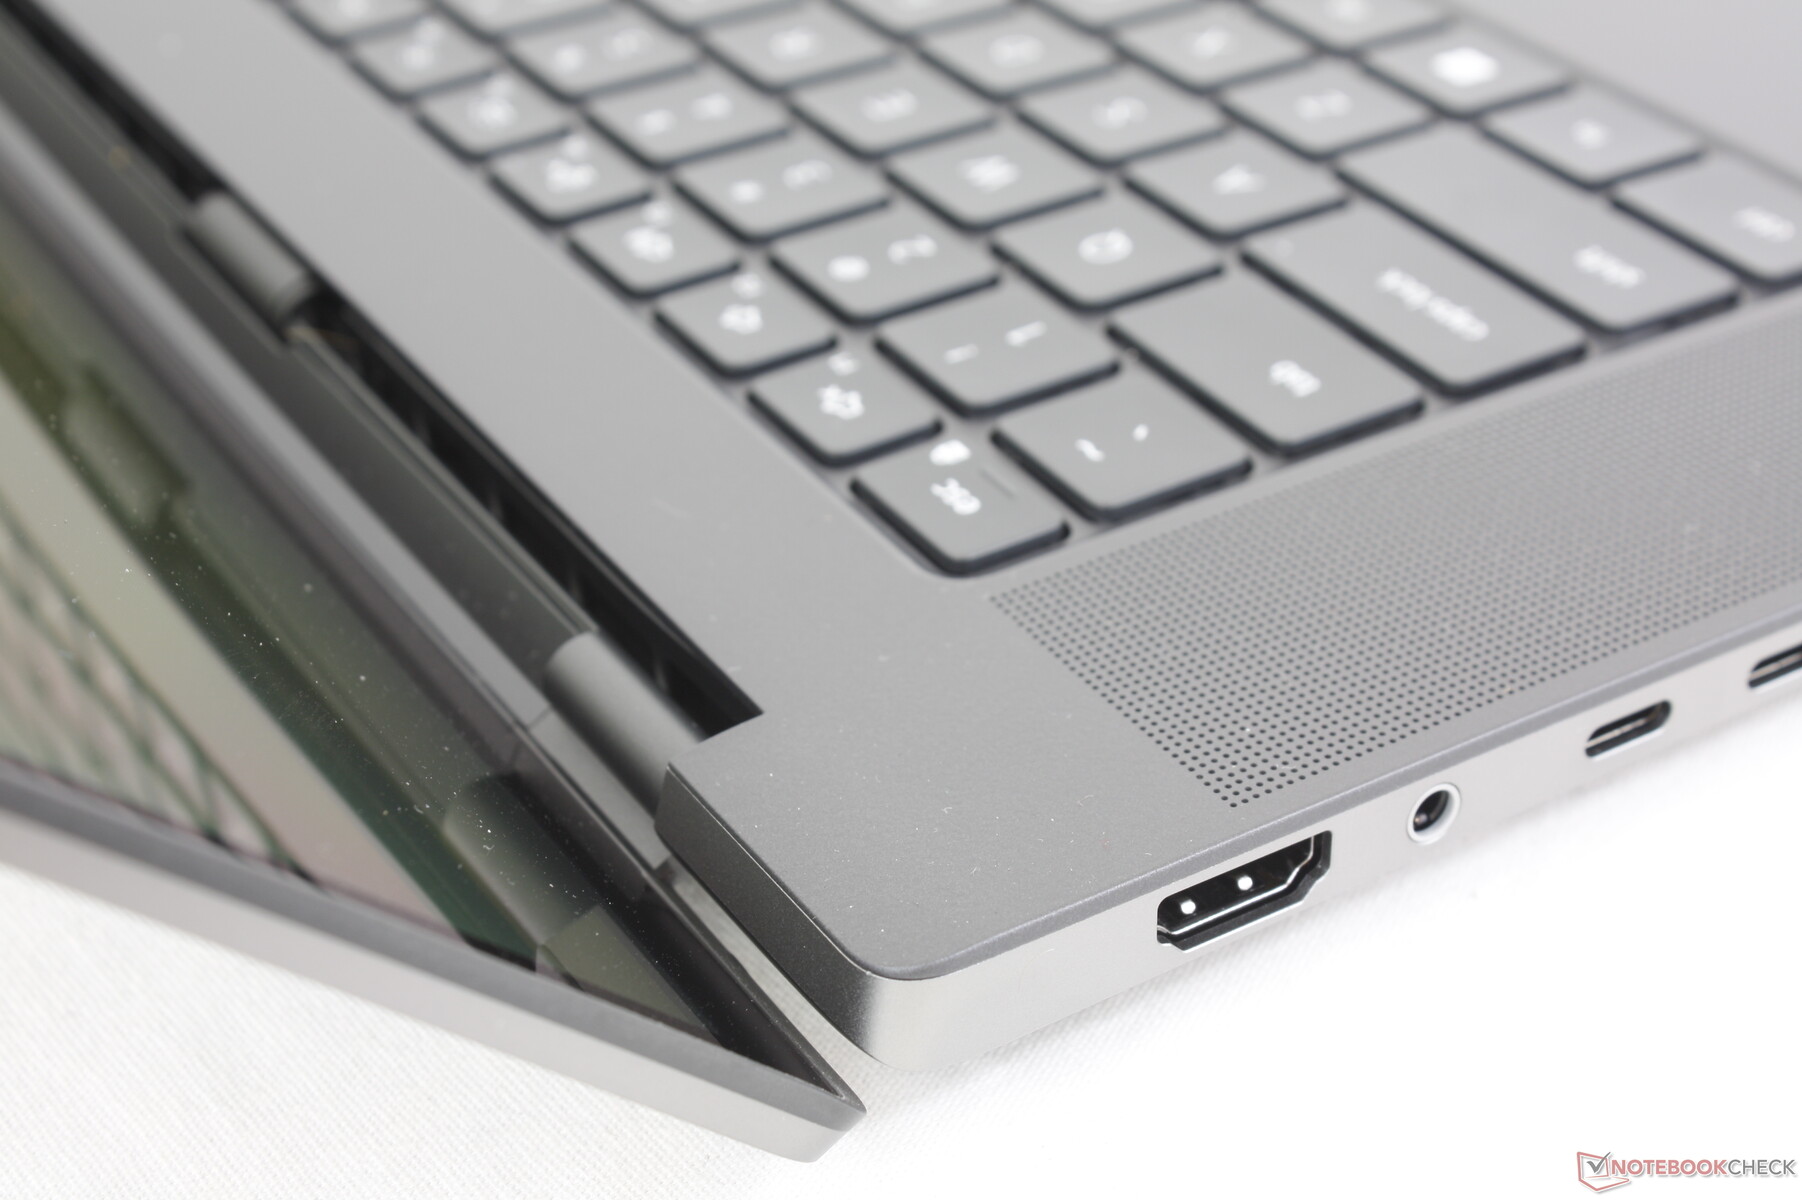
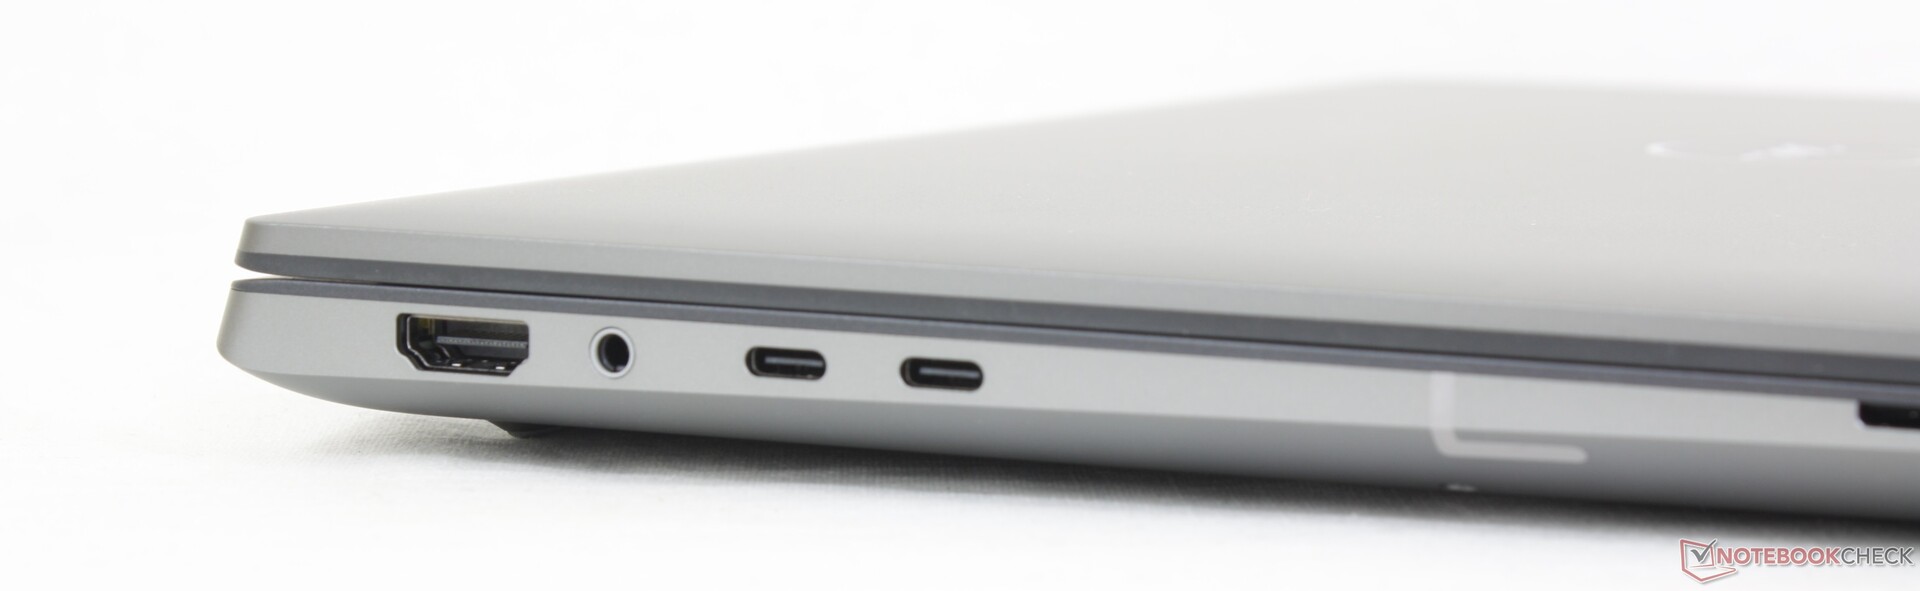
Łączność - niewiele jak na stację roboczą
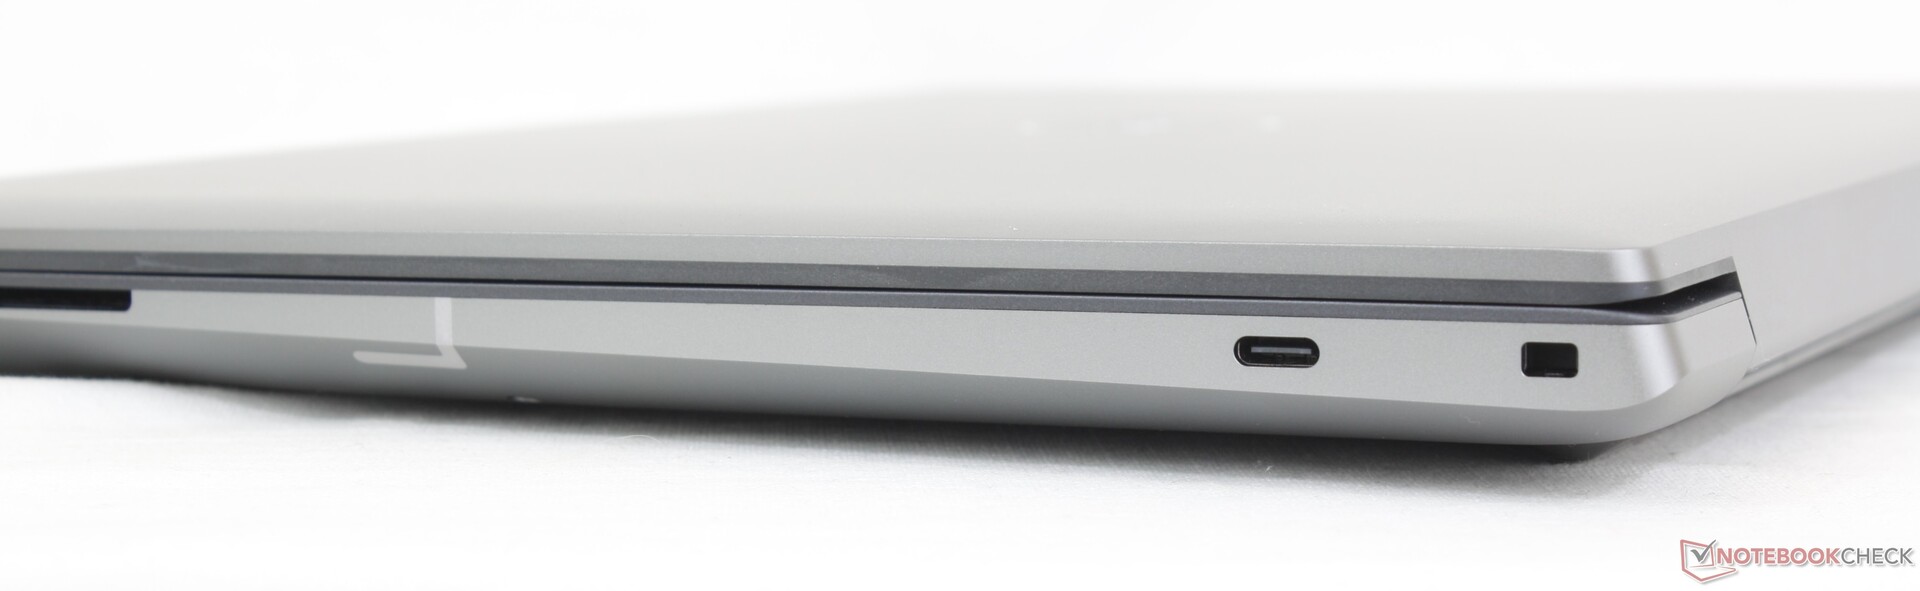
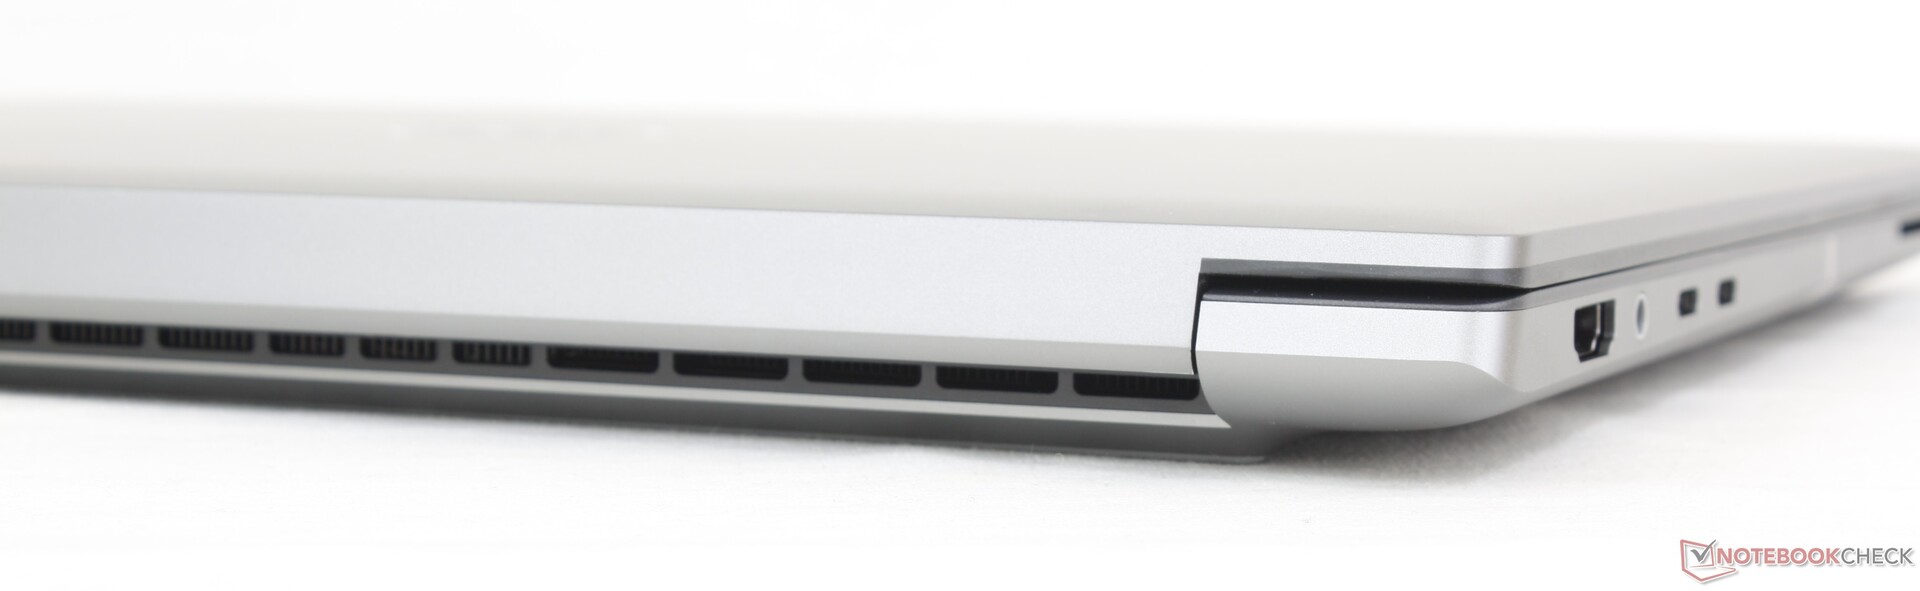
Opcje portów są przyszłościowe, na dobre i na złe. Jest lepiej w tym sensie, że każdy port jest bardzo wszechstronny, jeśli chodzi o adaptery i urządzenia peryferyjne, ale jest też gorzej w tym sensie, że nie ma podstawowych portów, takich jak pełnowymiarowe USB lub RJ-45. Alternatywy takie jak ThinkPad P1 G4 lub ExpertBook B6 Flip oferują szerszą gamę portów niż nasz Dell. W rezultacie należy być przygotowanym na korzystanie z adapterów lub stacji dokujących podczas korzystania z Precision 5680.
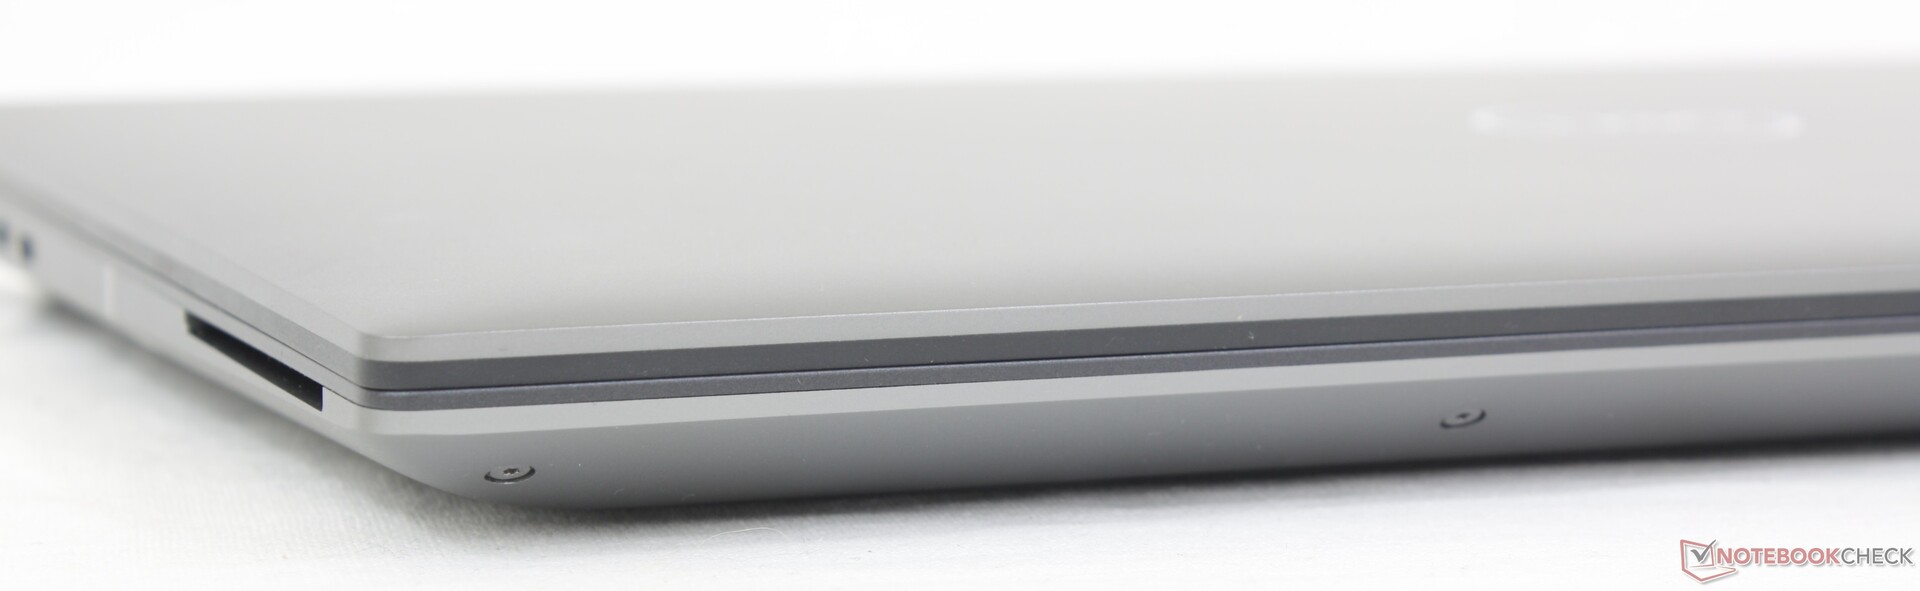
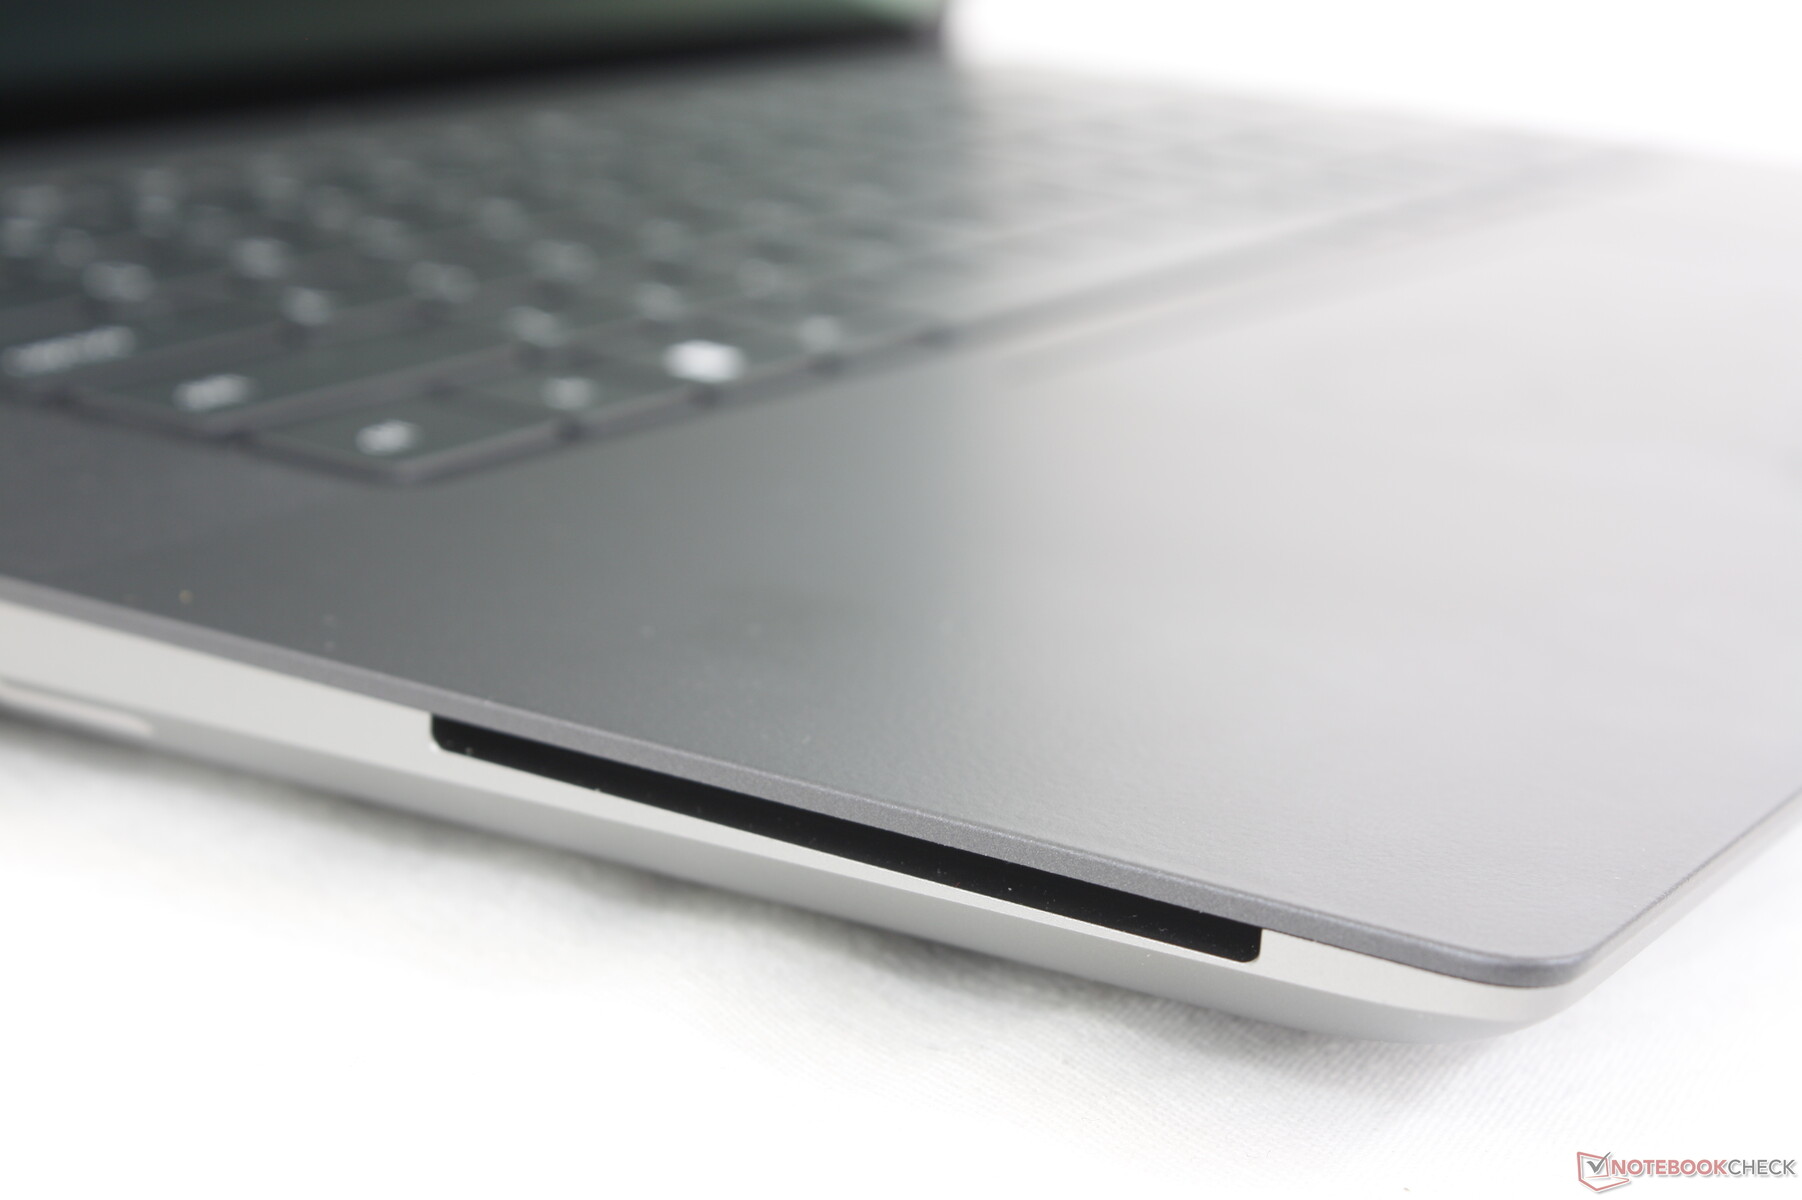
Czytnik kart SD
Modele XPS i Precision mają jedne z najszybszych zintegrowanych czytników kart SD i nadal dotyczy to naszego Precision 5680. Szybkość odczytu jest ponad 2 razy większa niż w przypadku ZBook Fury 16 G9 lub ThinkPad P16 G1, więc przesłanie 1 GB danych z naszej karty testowej UHS-II na komputer stacjonarny zajęłoby zaledwie 5 do 6 sekund.
| SD Card Reader | |
| average JPG Copy Test (av. of 3 runs) | |
| Dell Precision 5000 5680 (Toshiba Exceria Pro SDXC 64 GB UHS-II) | |
| Dell Precision 7000 7670 Performance (Toshiba Exceria Pro SDXC 64 GB UHS-II) | |
| MSI CreatorPro Z16P B12UKST (AV Pro V60) | |
| HP ZBook Fury 16 G9 (PNY EliteX-PRO60) | |
| Lenovo ThinkPad P16 G1 RTX A5500 (Toshiba Exceria Pro SDXC 64 GB UHS-II) | |
| maximum AS SSD Seq Read Test (1GB) | |
| Dell Precision 7000 7670 Performance (Toshiba Exceria Pro SDXC 64 GB UHS-II) | |
| Dell Precision 5000 5680 (Toshiba Exceria Pro SDXC 64 GB UHS-II) | |
| HP ZBook Fury 16 G9 (PNY EliteX-PRO60) | |
| MSI CreatorPro Z16P B12UKST (AV Pro V60) | |
| Lenovo ThinkPad P16 G1 RTX A5500 (Toshiba Exceria Pro SDXC 64 GB UHS-II) | |
Komunikacja
Intel AX211 jest standardowo wyposażony w Wi-Fi 6E i Bluetooth 5.3. Prędkości transferu byłyby stabilne po sparowaniu z naszą siecią Asus AXE11000 6 GHz.
Opcje WAN nie są niestety obsługiwane, w przeciwieństwie do konkurencyjnego ZBook Fury 16 G9.
Kamera internetowa
Dell zwiększył kamerę internetową z 1 MP w Precision 5550 do 2 MP w naszym Precision 5680. Mimo to, irytująco nadal nie ma zintegrowanej przesłony prywatności.


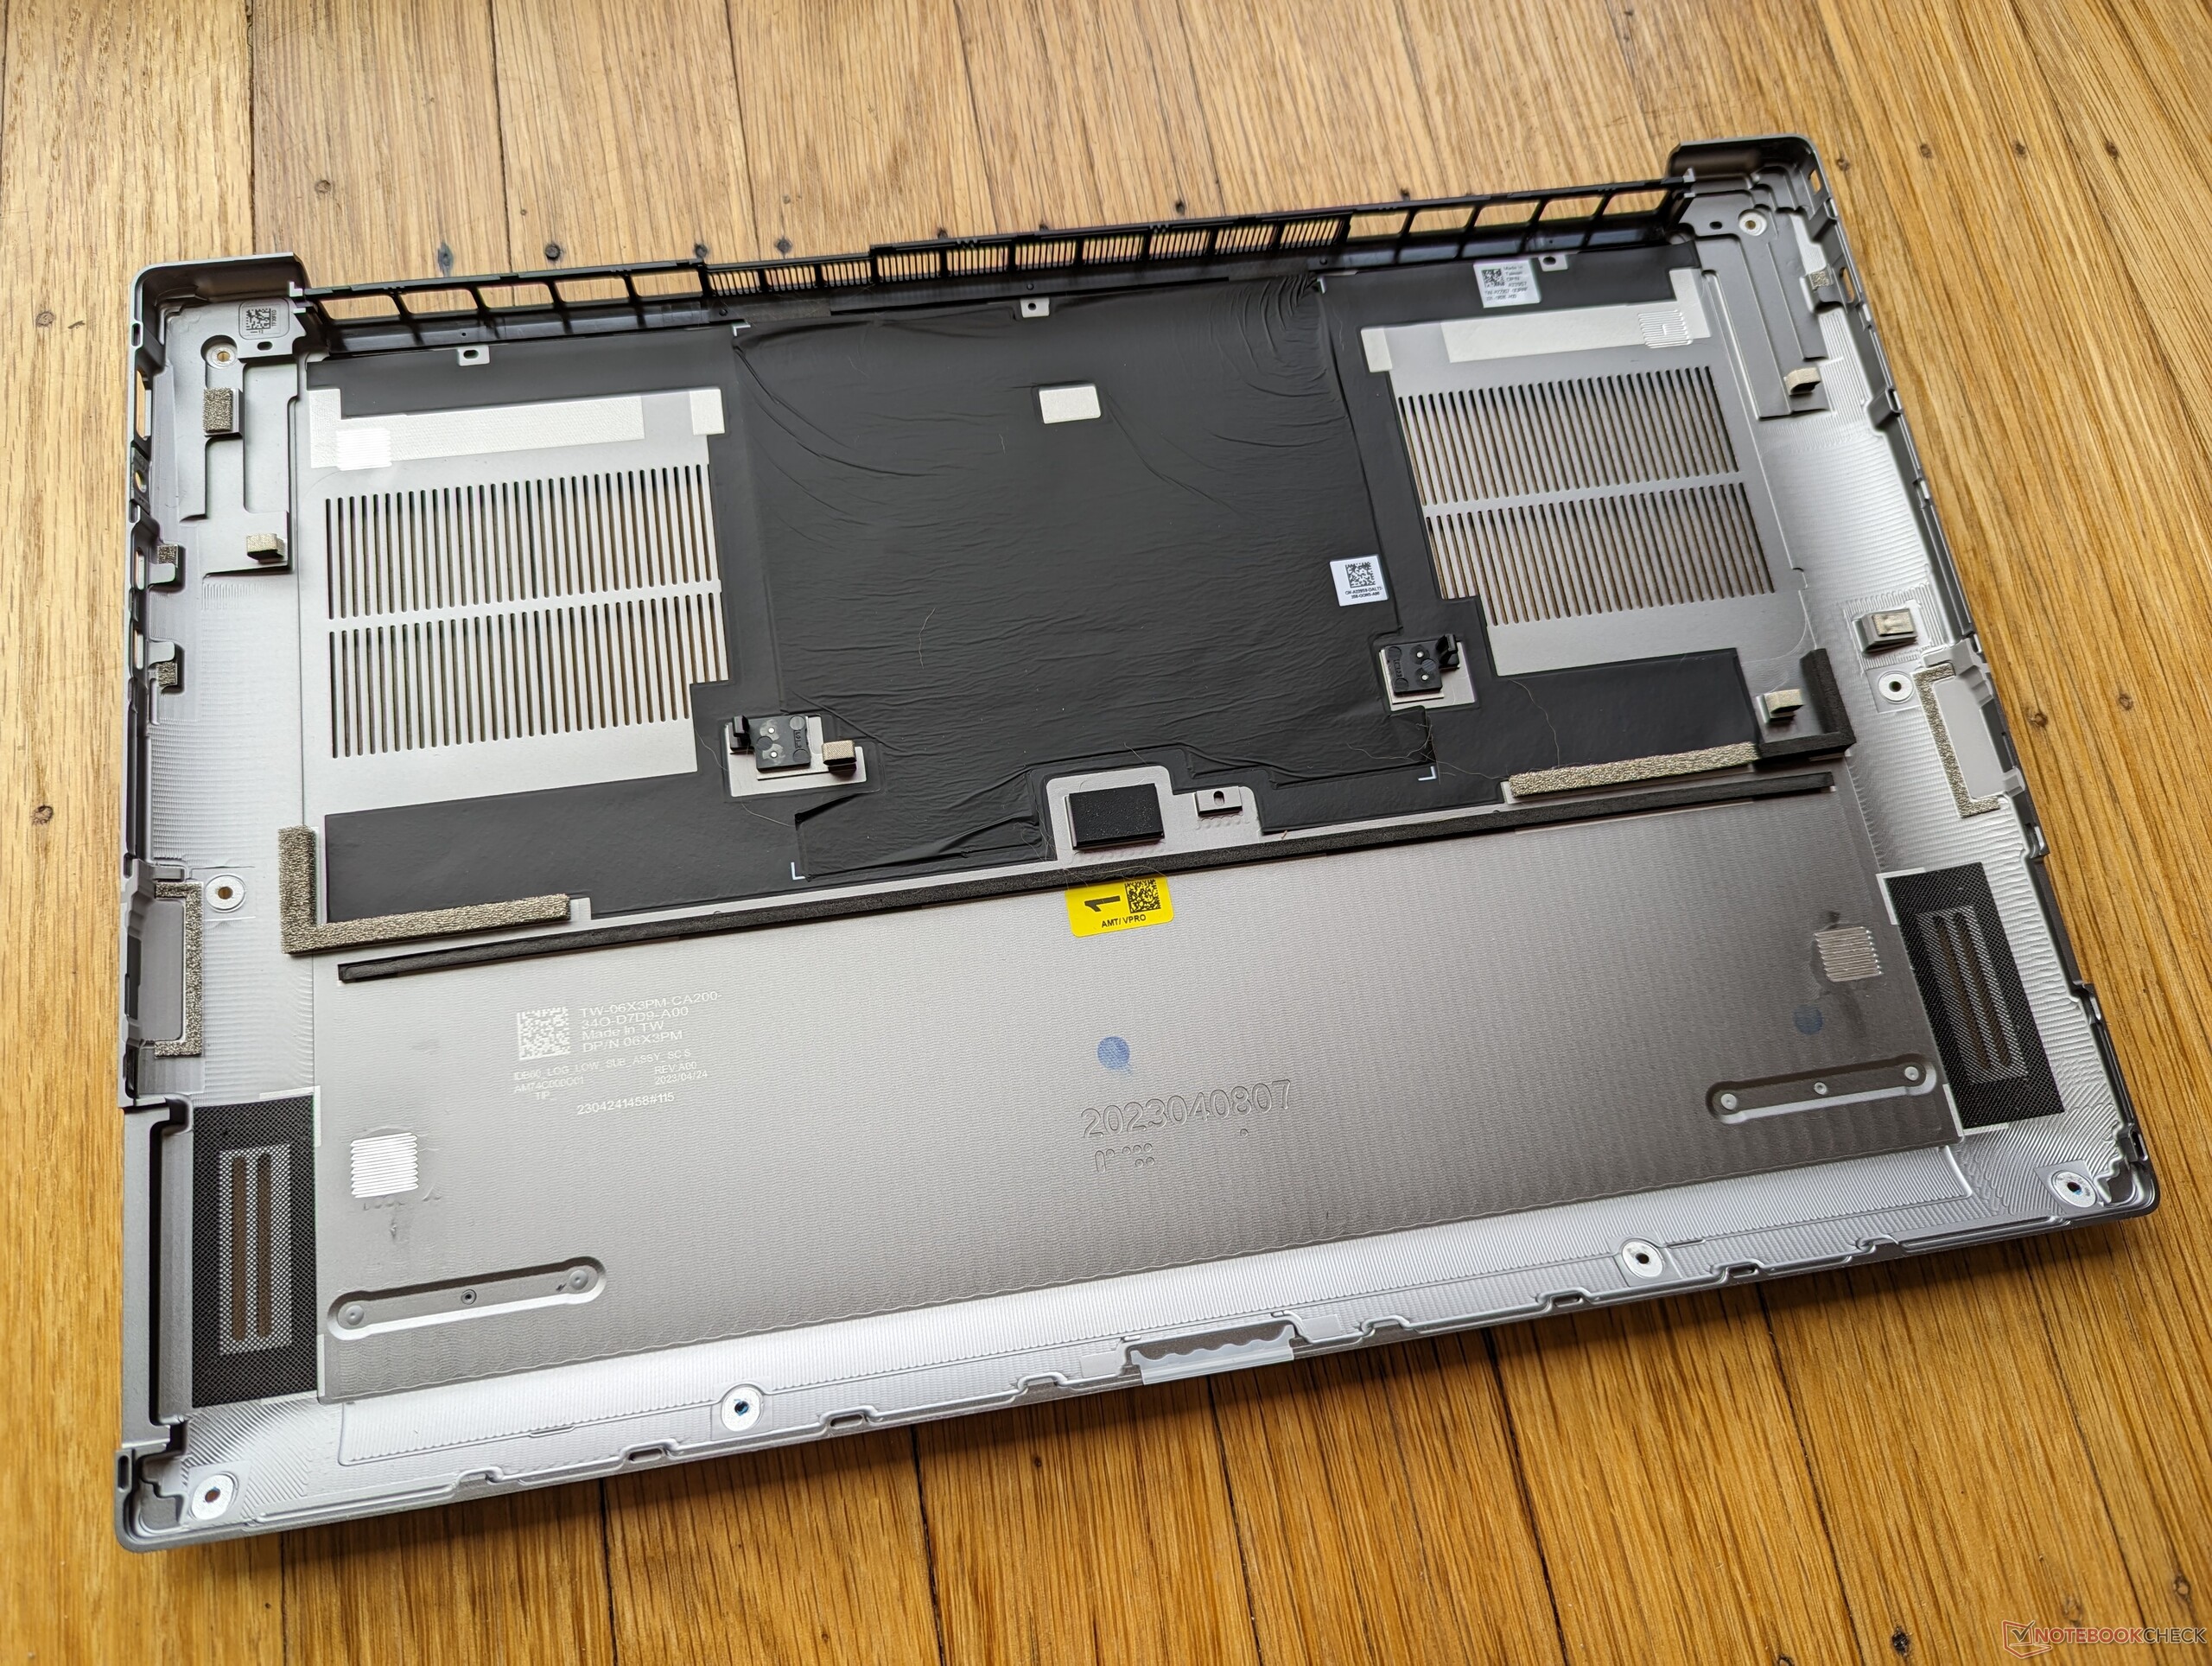
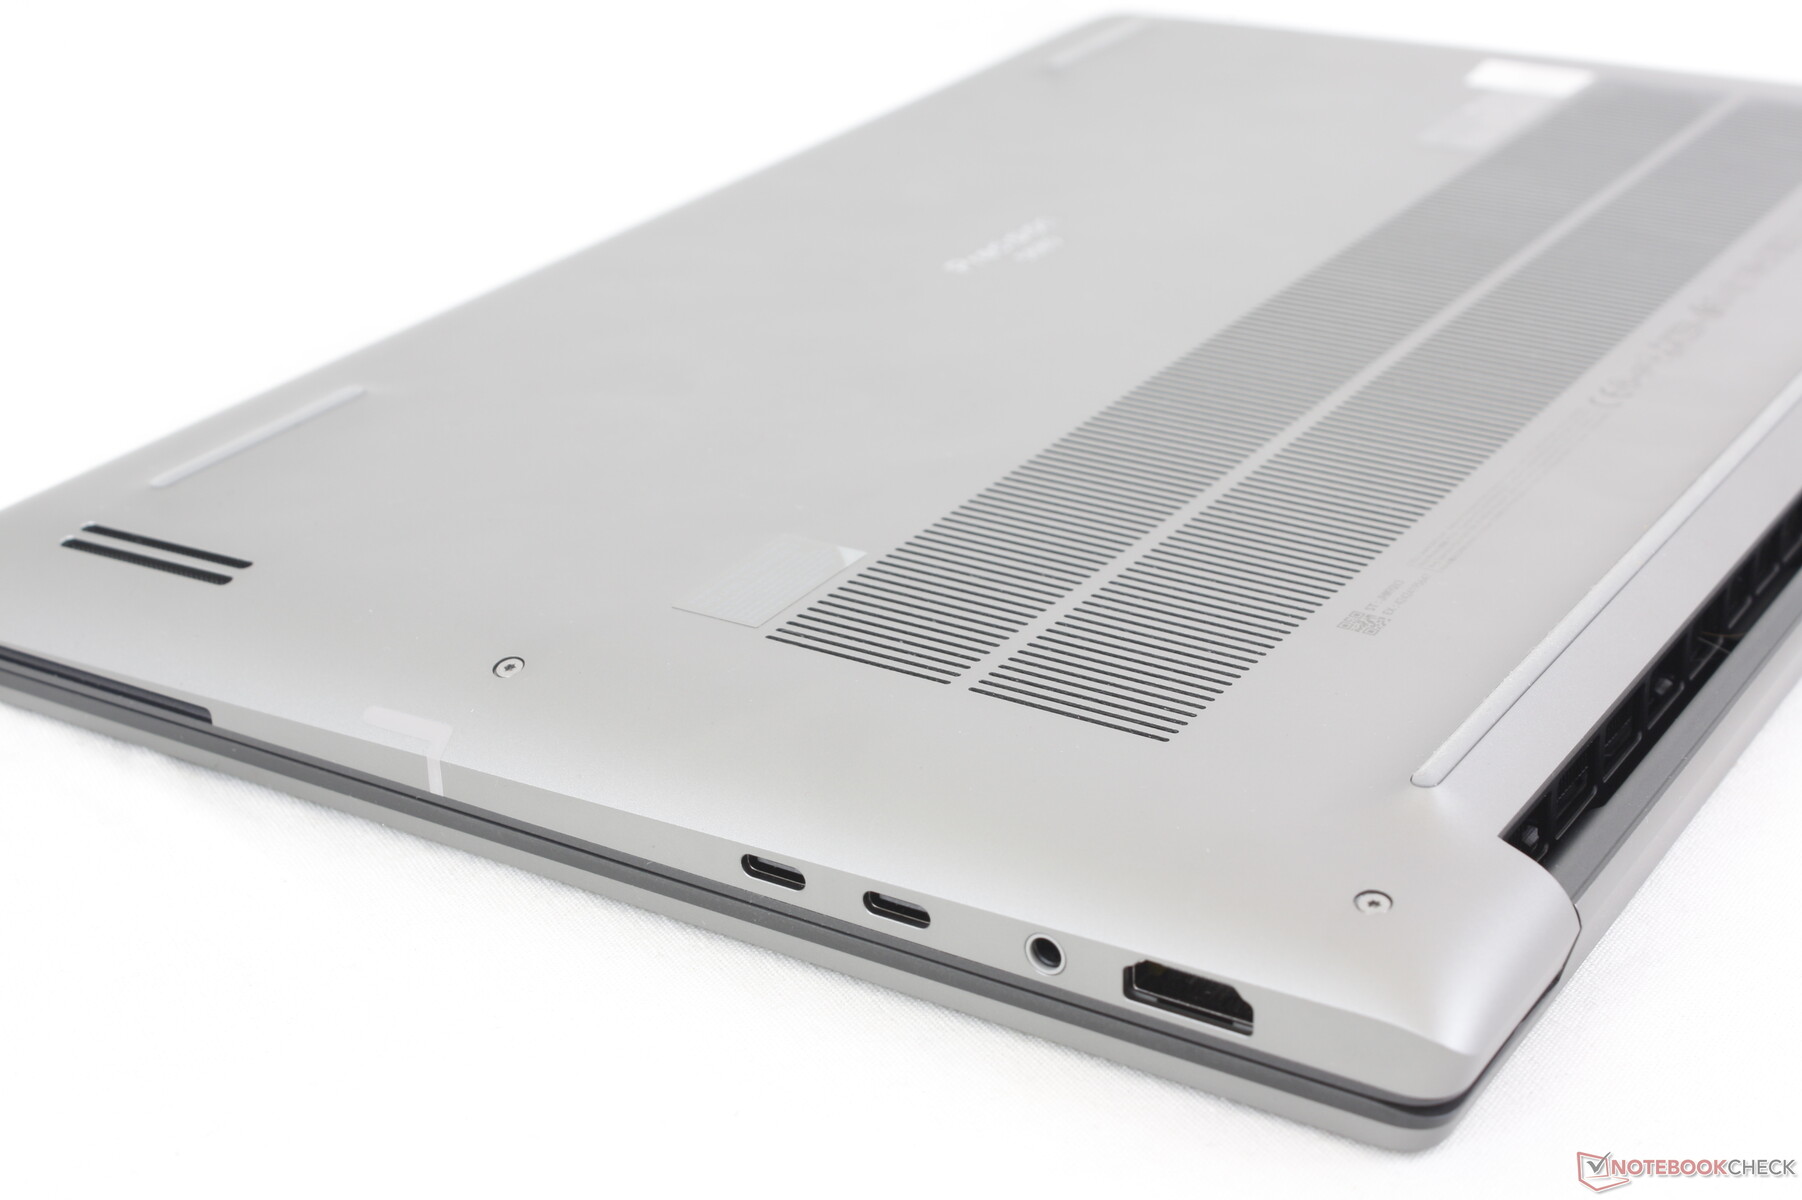
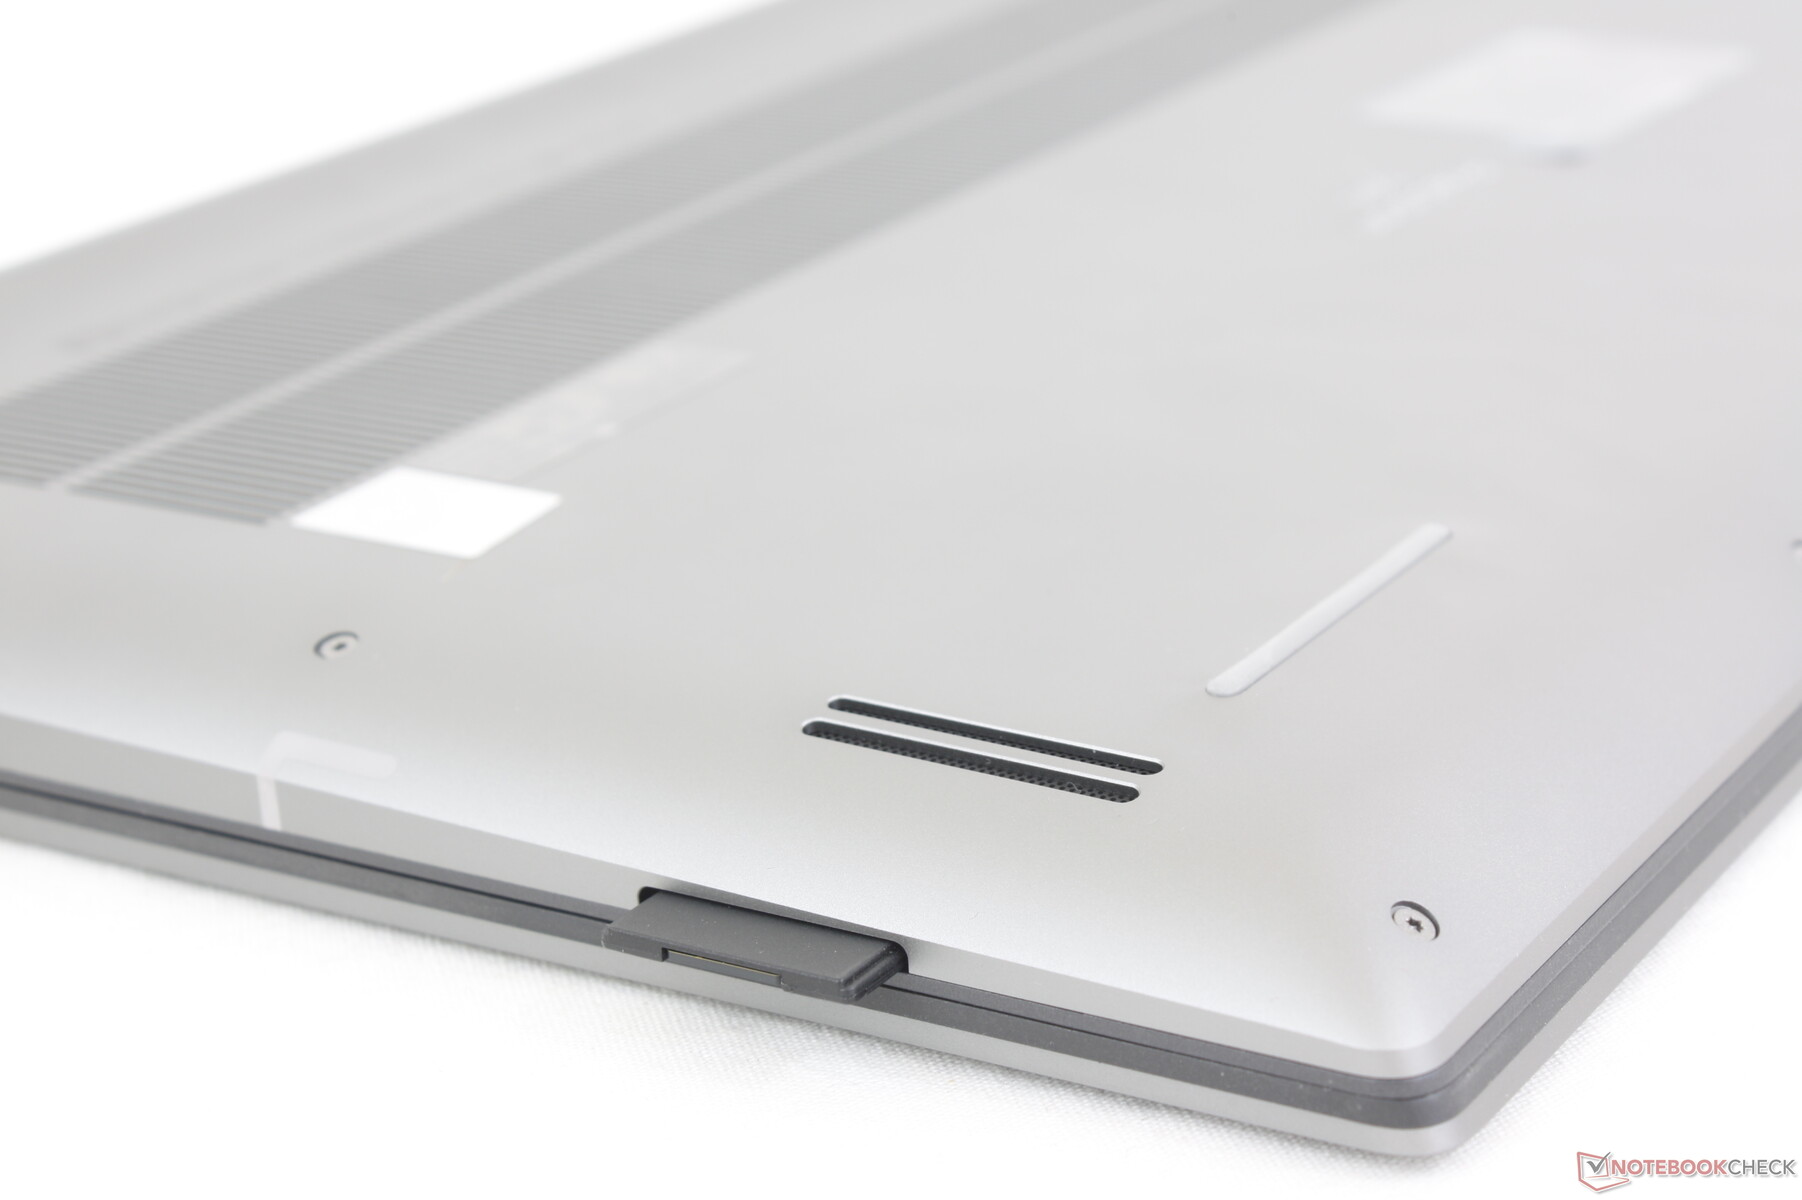
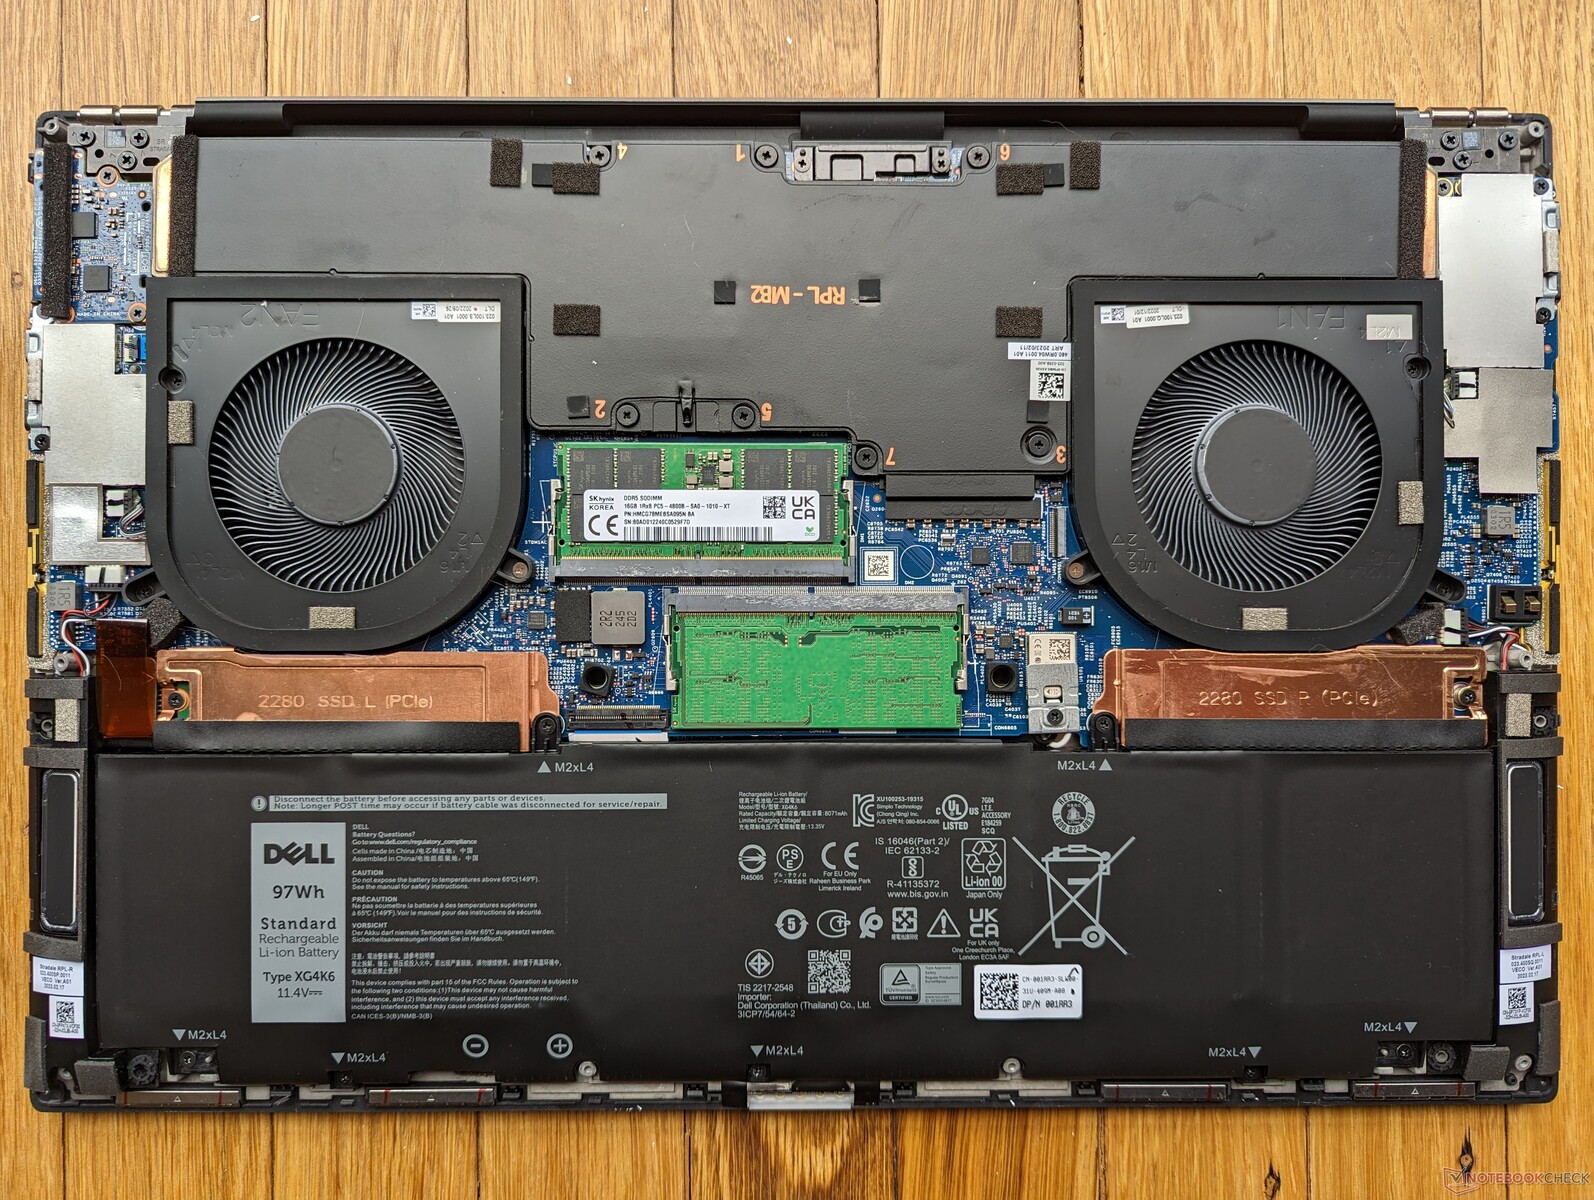
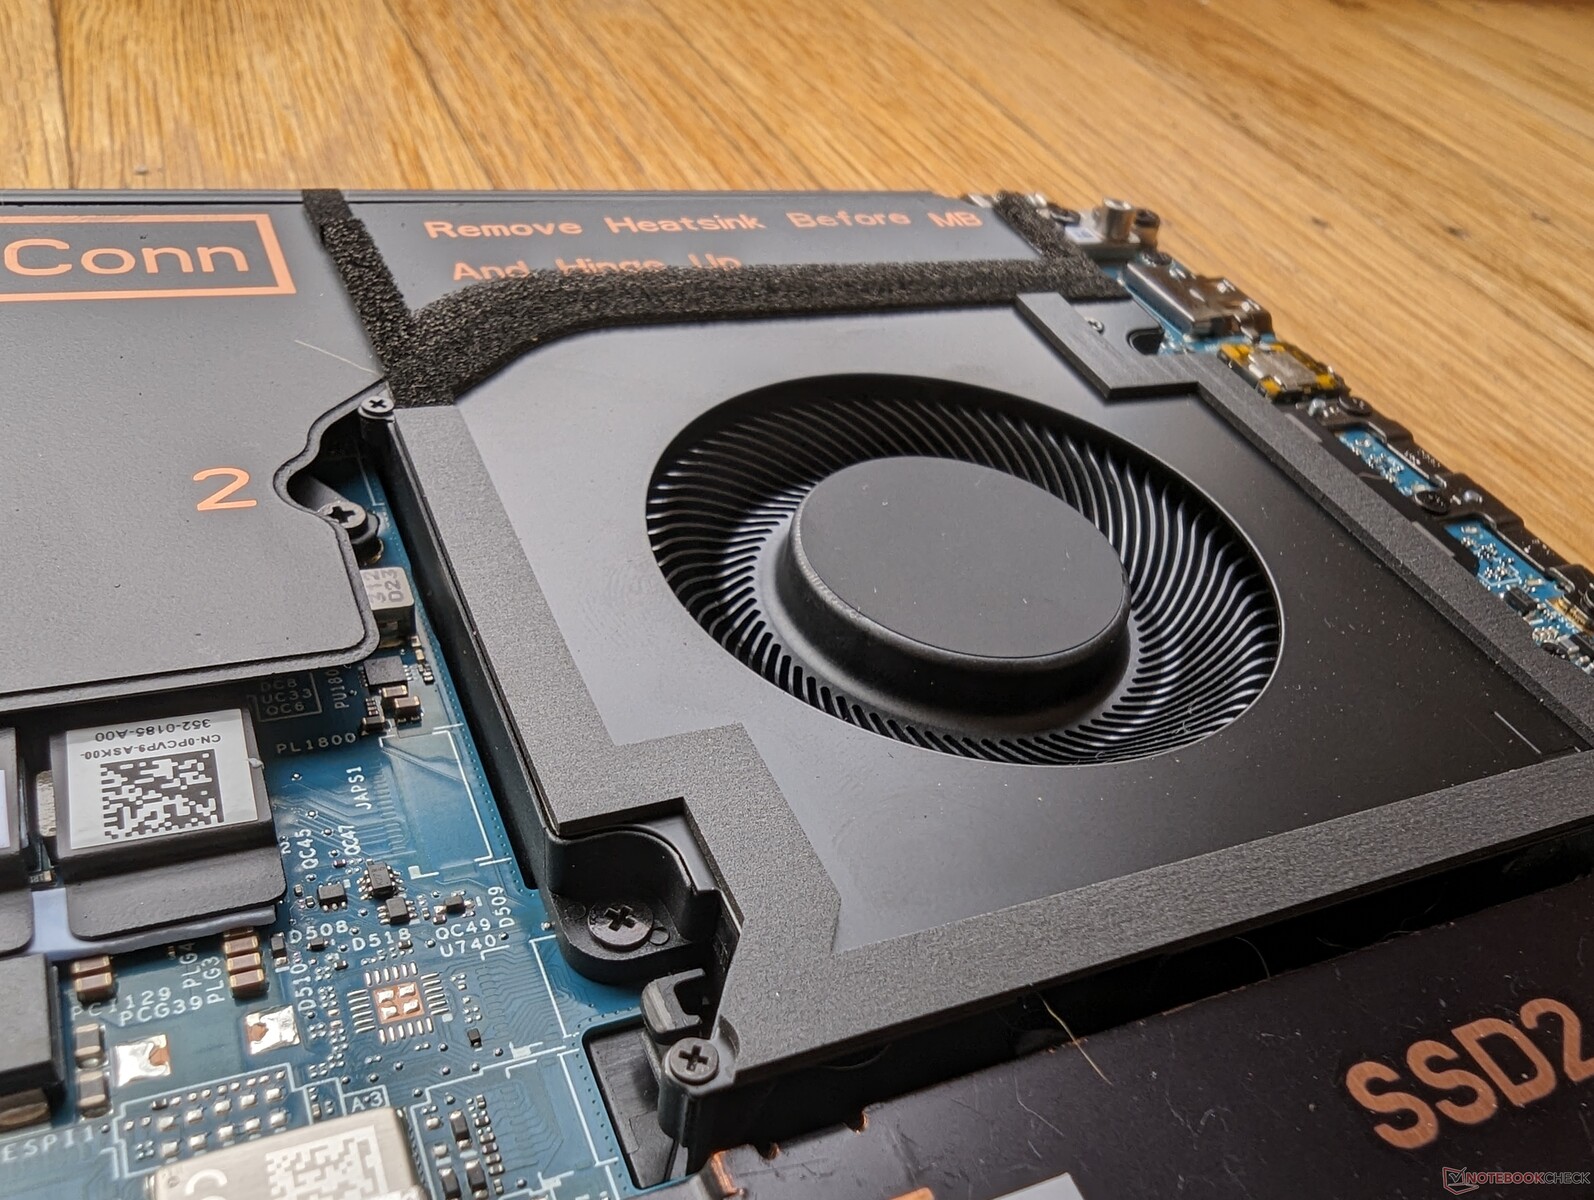
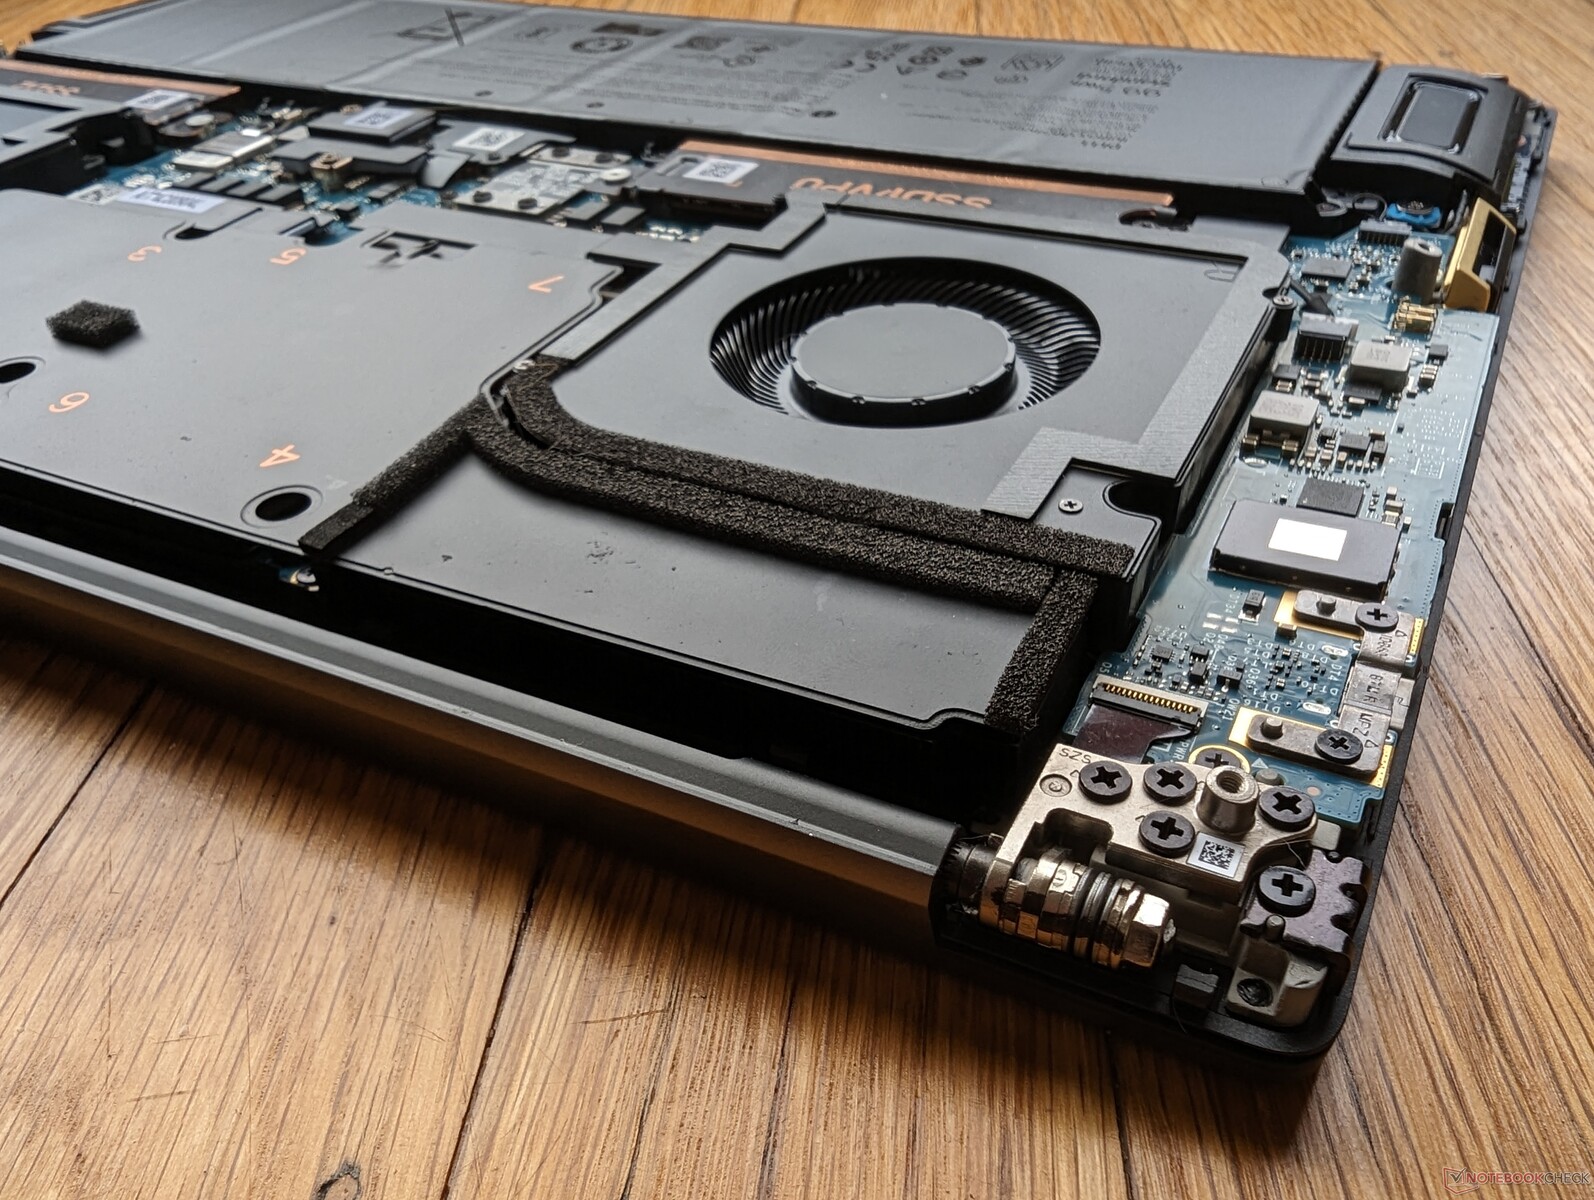
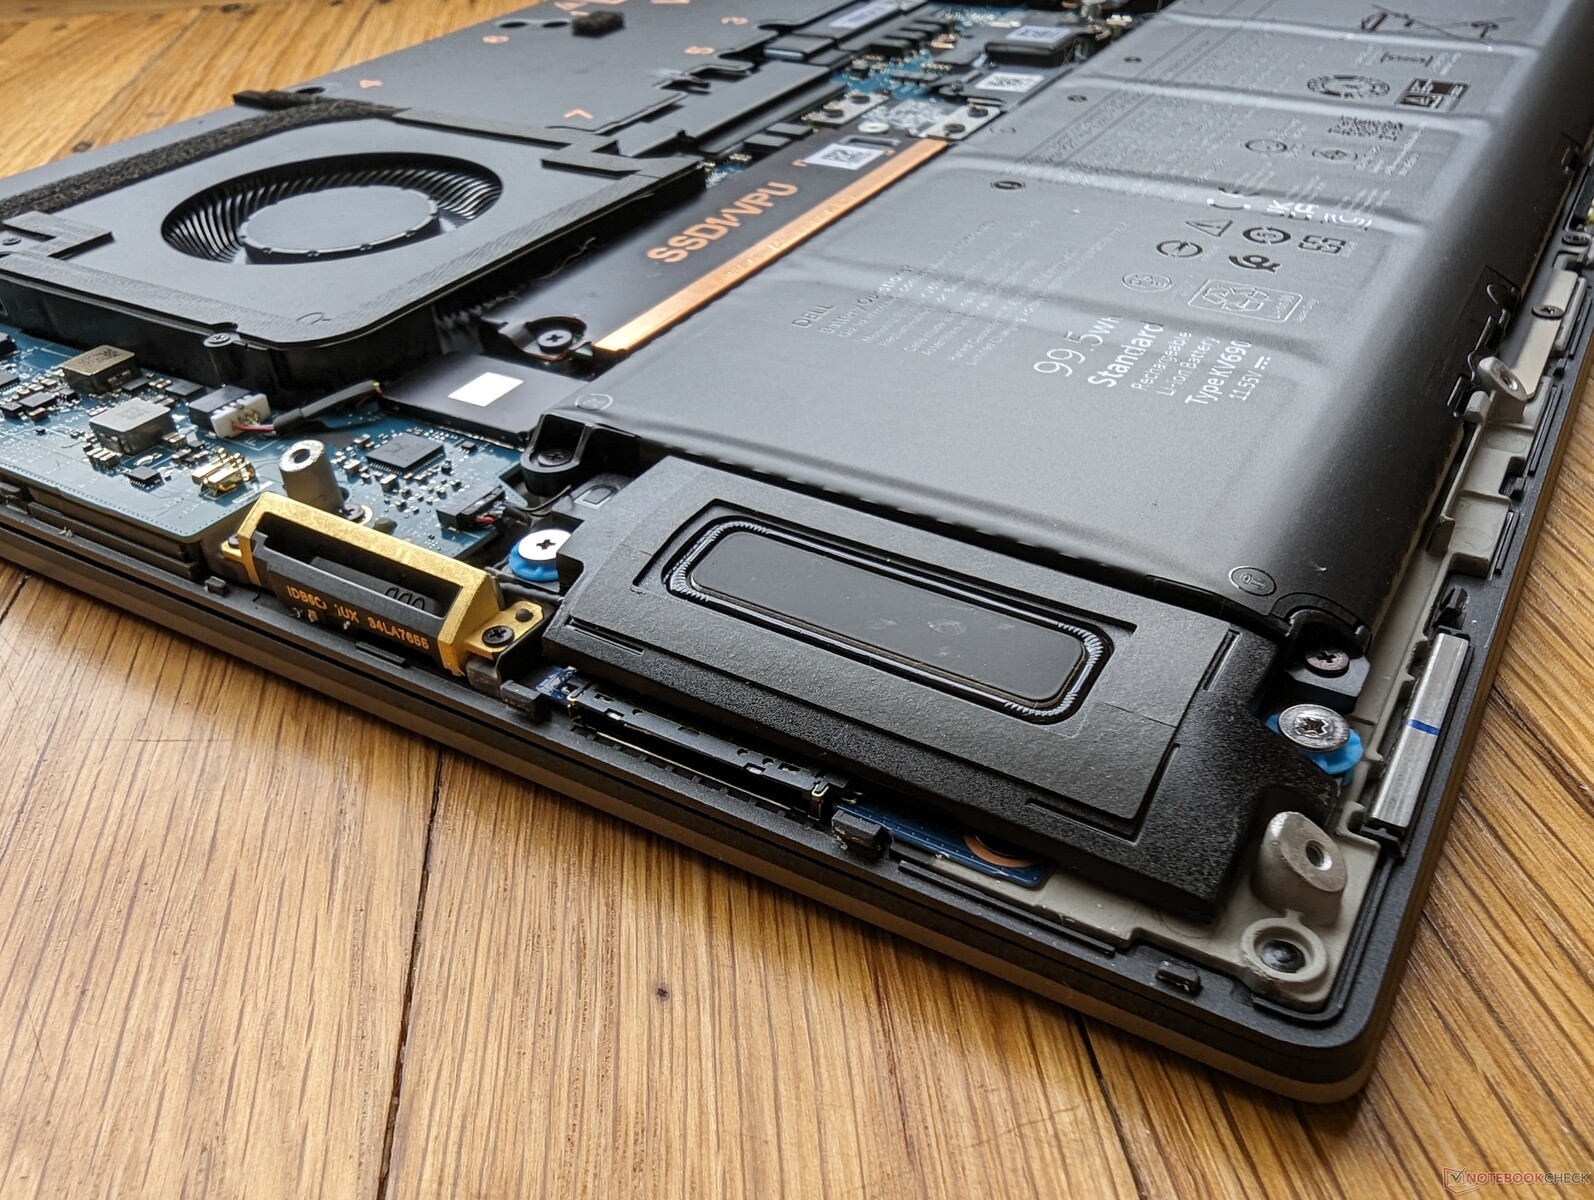
Konserwacja
Dolny panel jest nieco trudniejszy do usunięcia niż oczekiwano, ponieważ krawędzie metalowej płyty są zarówno ostre, jak i mocno zatrzaśnięte, podobnie jak w XPS 15 lub XPS 17. Podczas serwisowania systemu zaleca się użycie śruby Torx i płaskiej krawędzi.
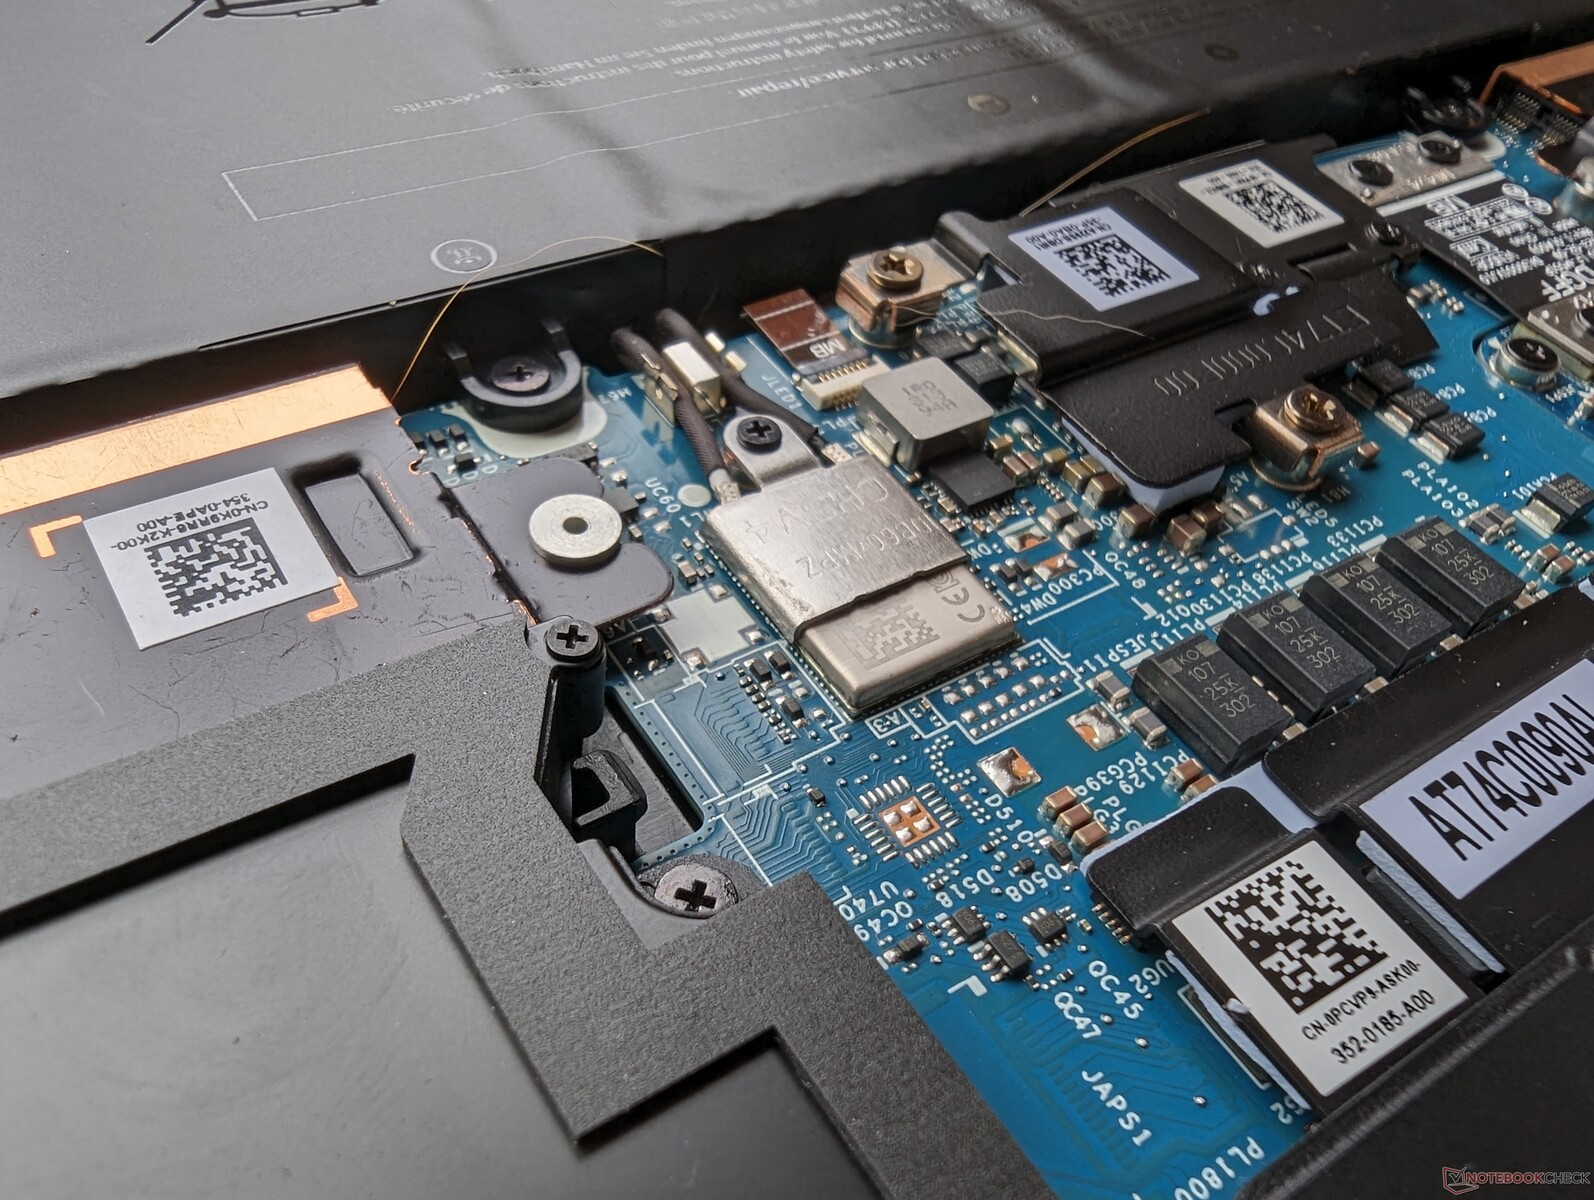
Zarówno moduły WLAN, jak i RAM są lutowane, w przeciwieństwie do większości innych stacji roboczych o tym rozmiarze ekranu. Zarówno wysoce zintegrowane moduły, jak i ograniczone opcje portów są prawdopodobnie wadami eleganckiego wyglądu i stosunkowo niskiej wagi.
Akcesoria i gwarancja
Pudełko detaliczne zawiera małą przejściówkę z USB-C na USB-A, aby zrekompensować fakt, że w systemie nie ma pełnowymiarowych portów USB.
Podstawowa trzyletnia ograniczona gwarancja producenta z naprawą na miejscu ma zastosowanie w przypadku zakupu w USA.
Urządzenia wejściowe - nieco inne niż w XPS
Klawiatura
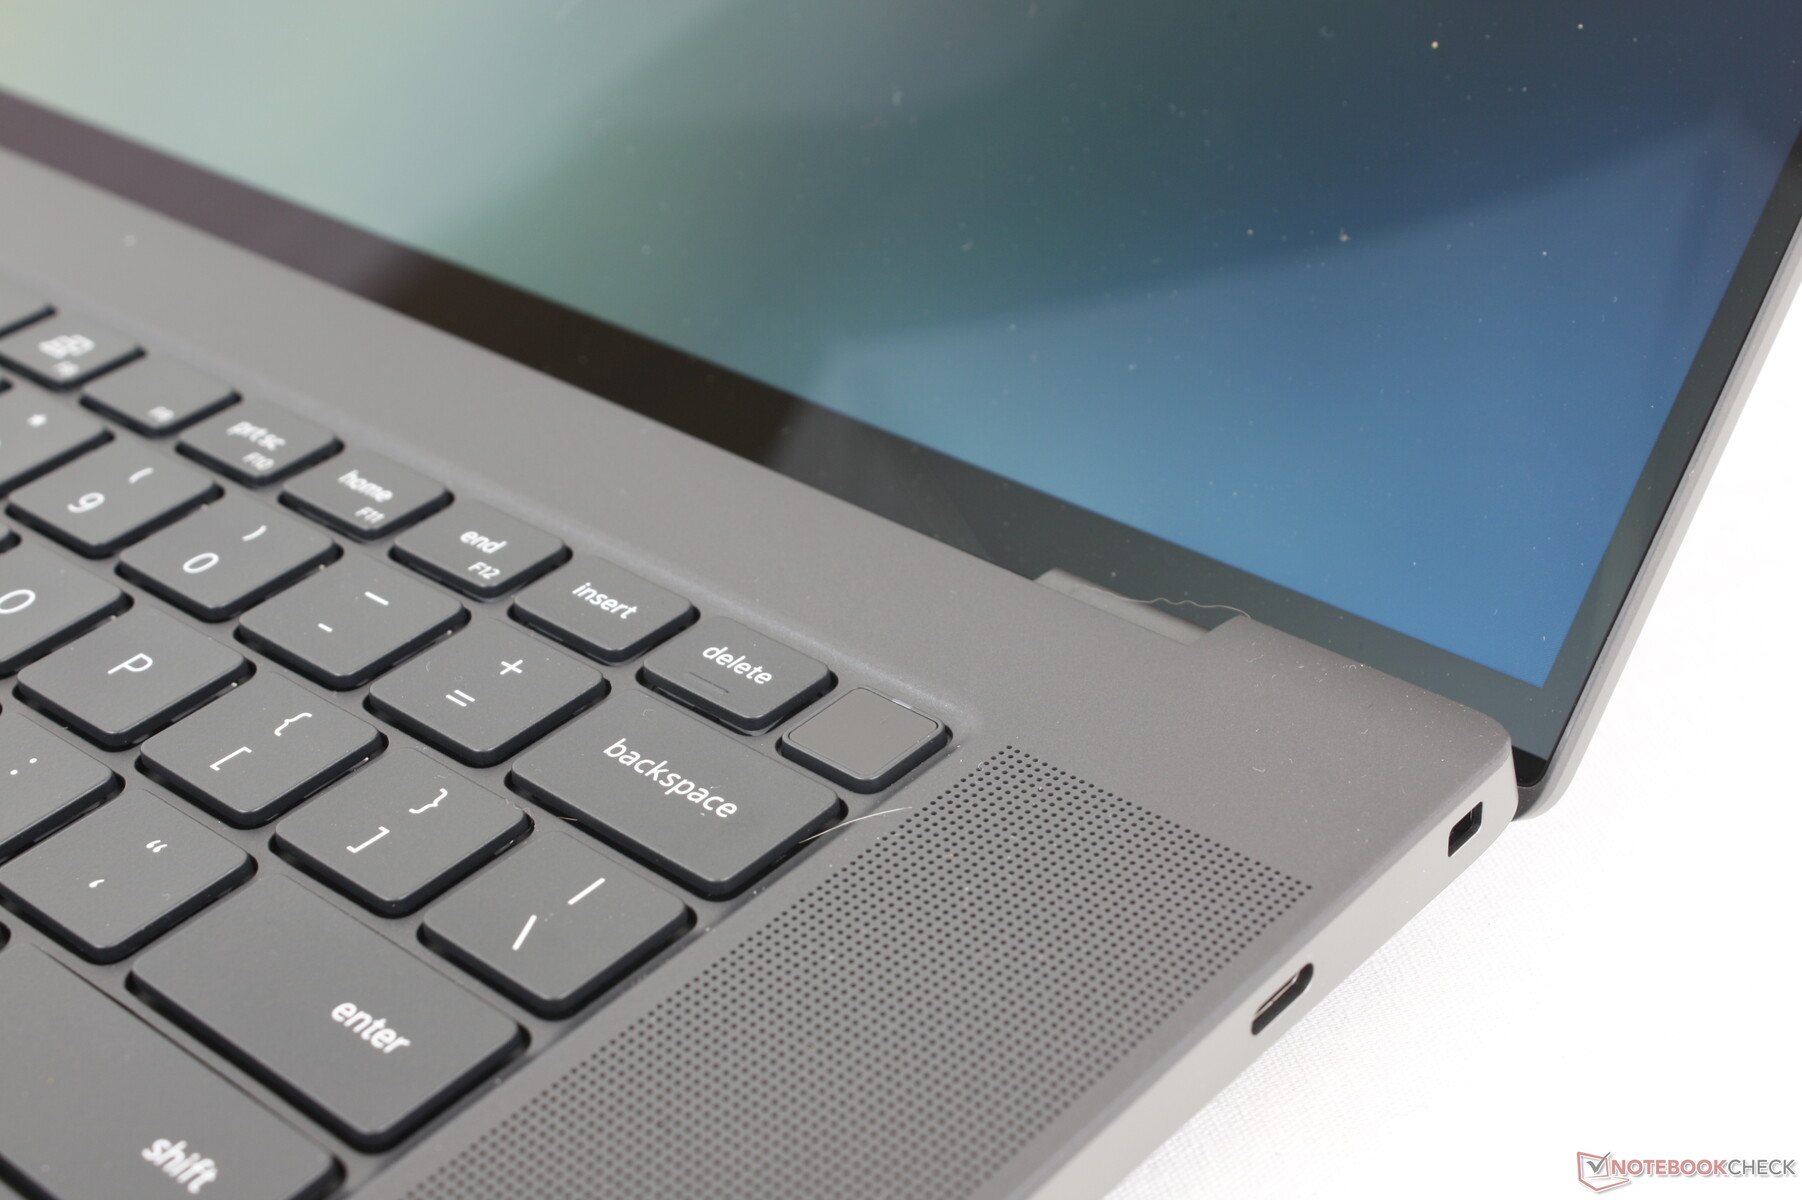
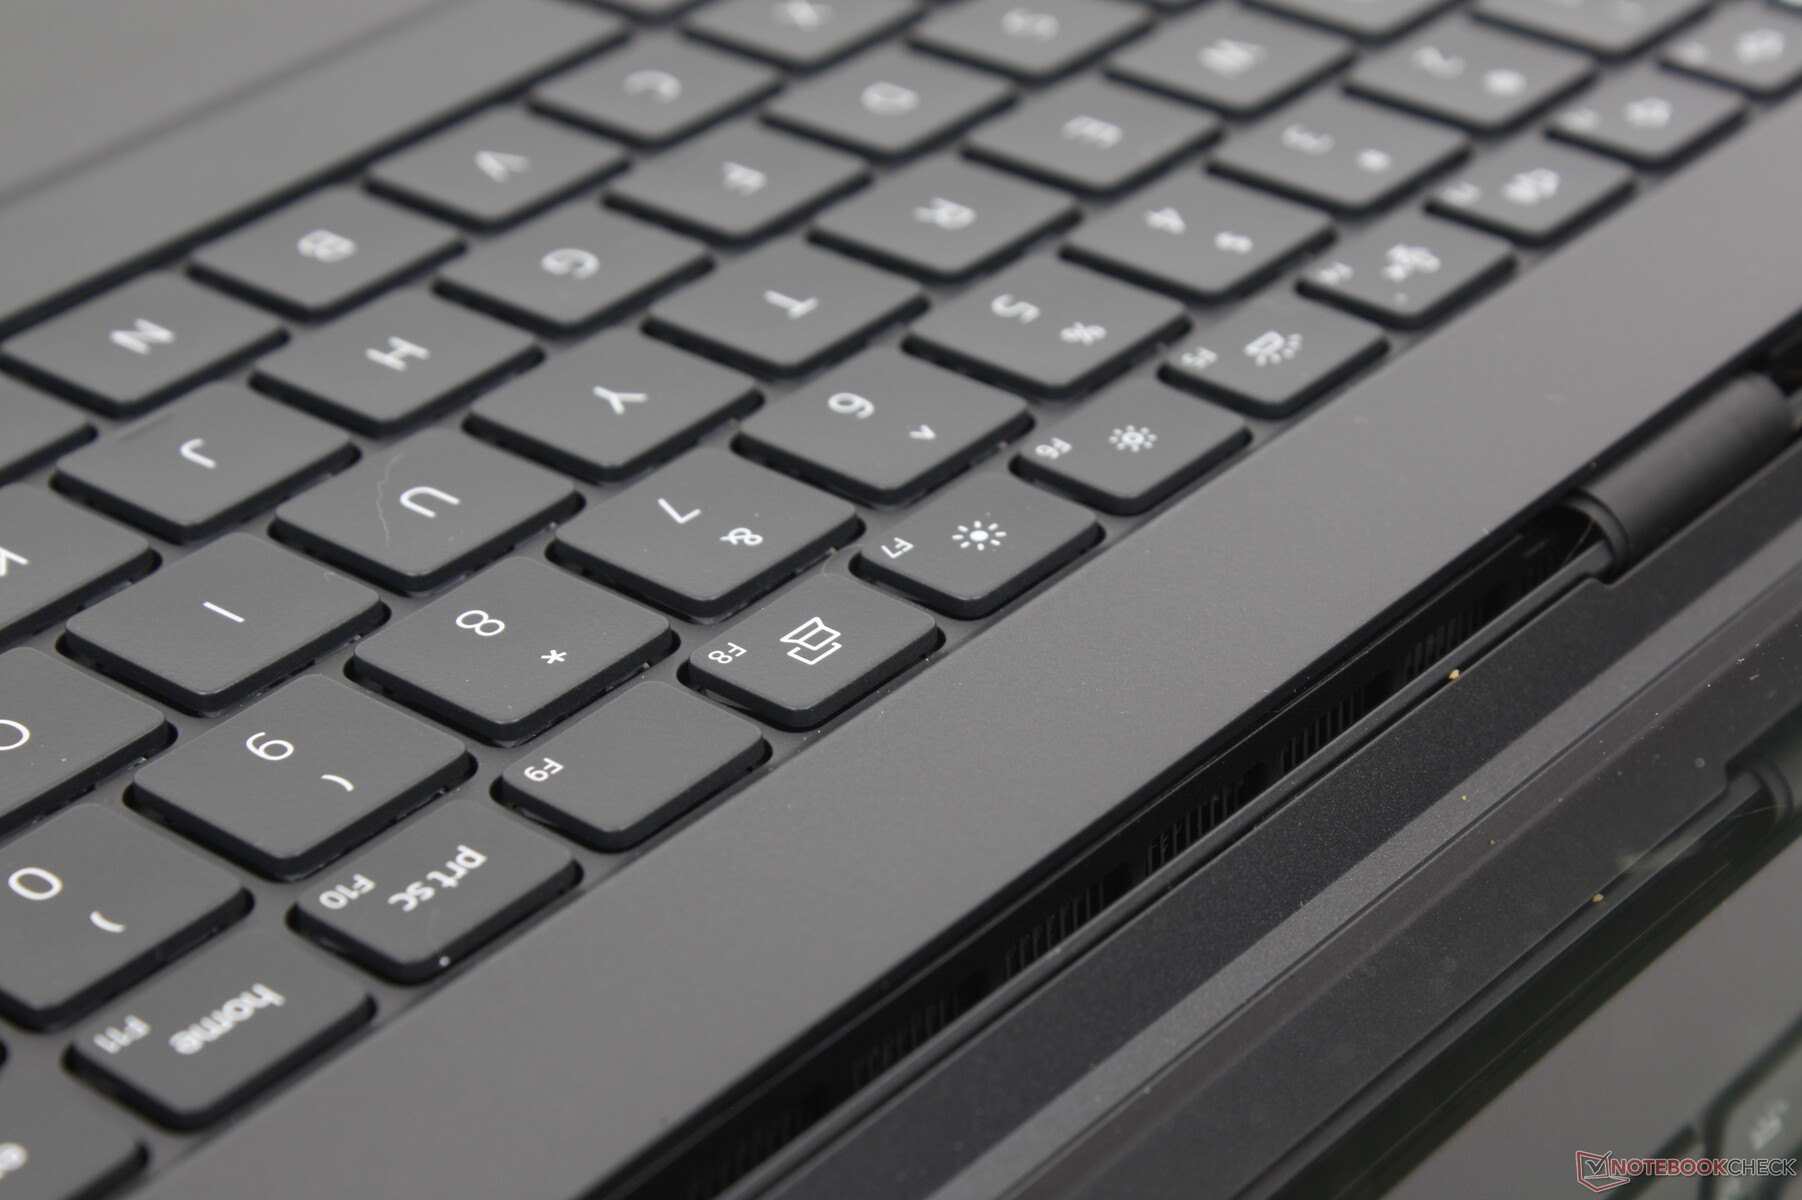
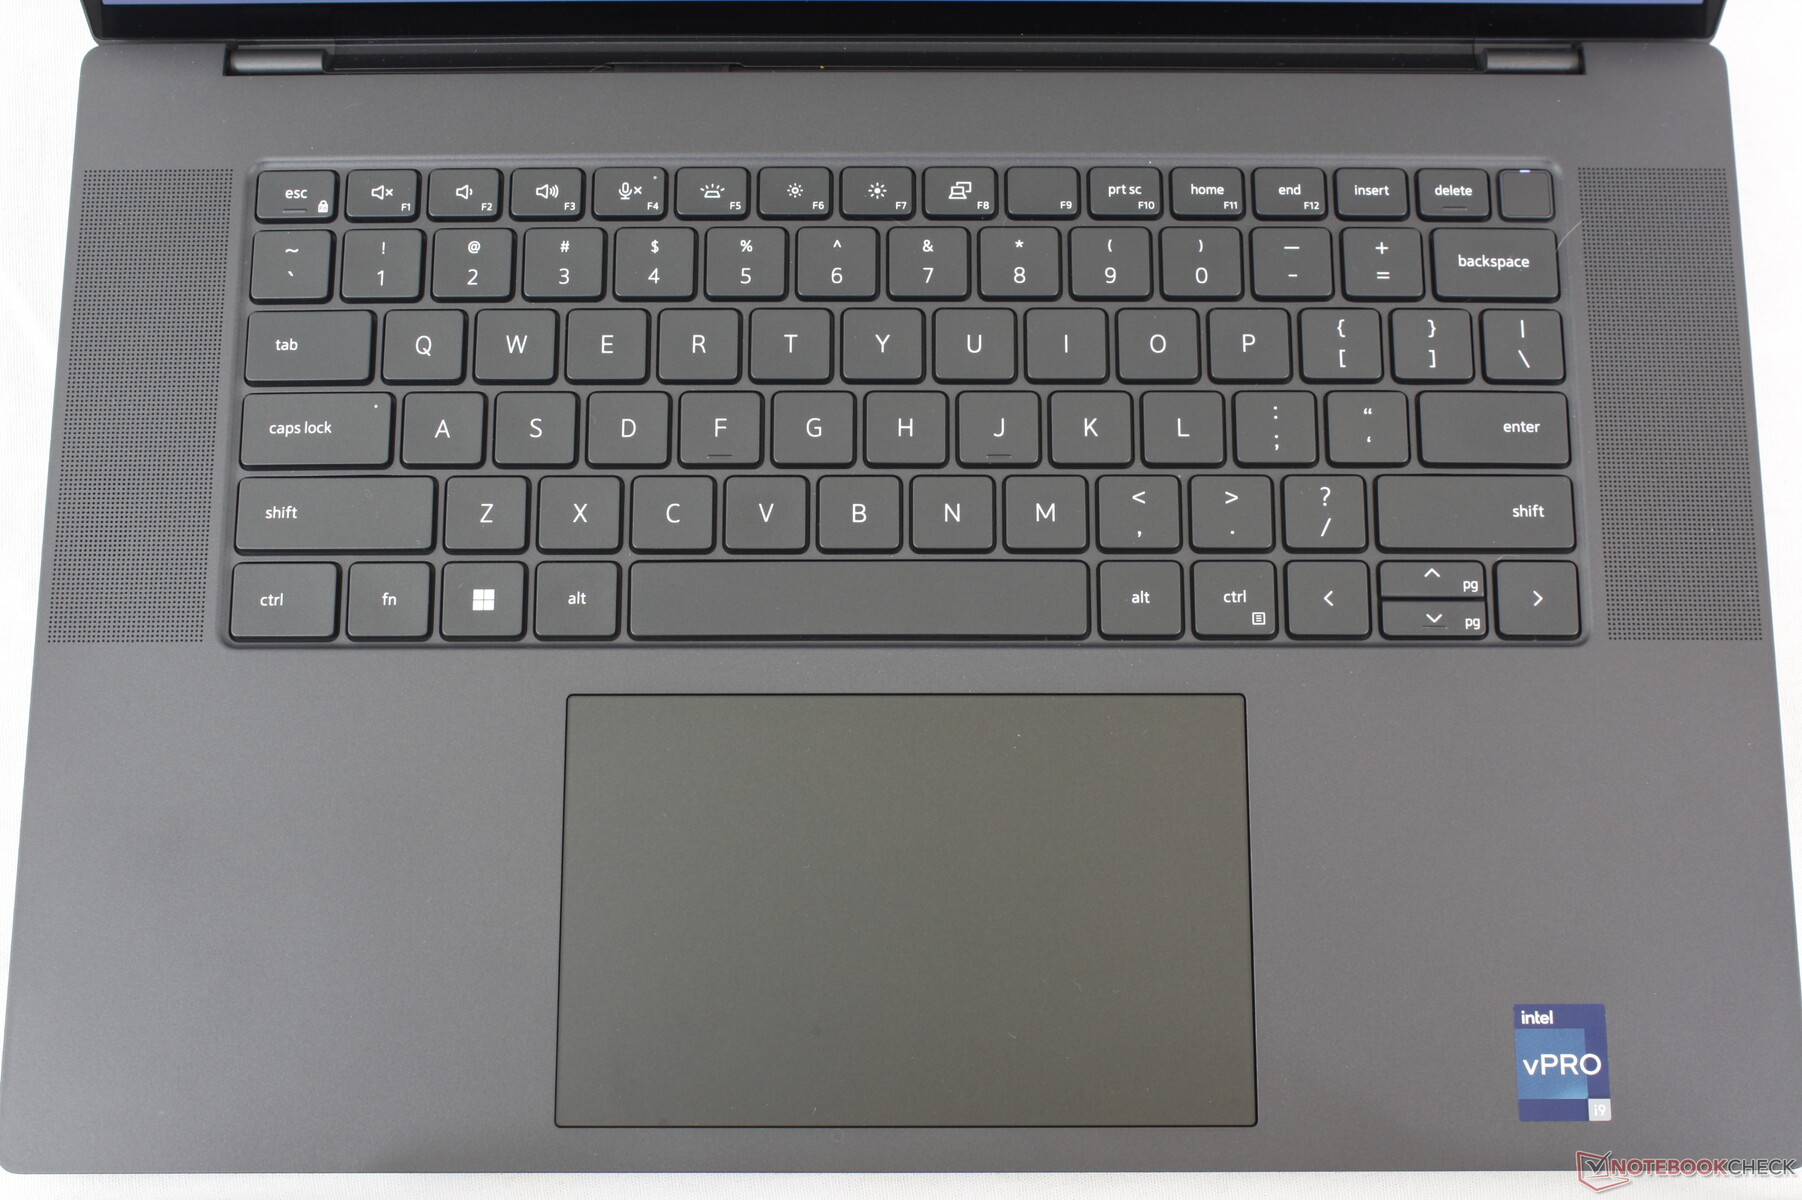
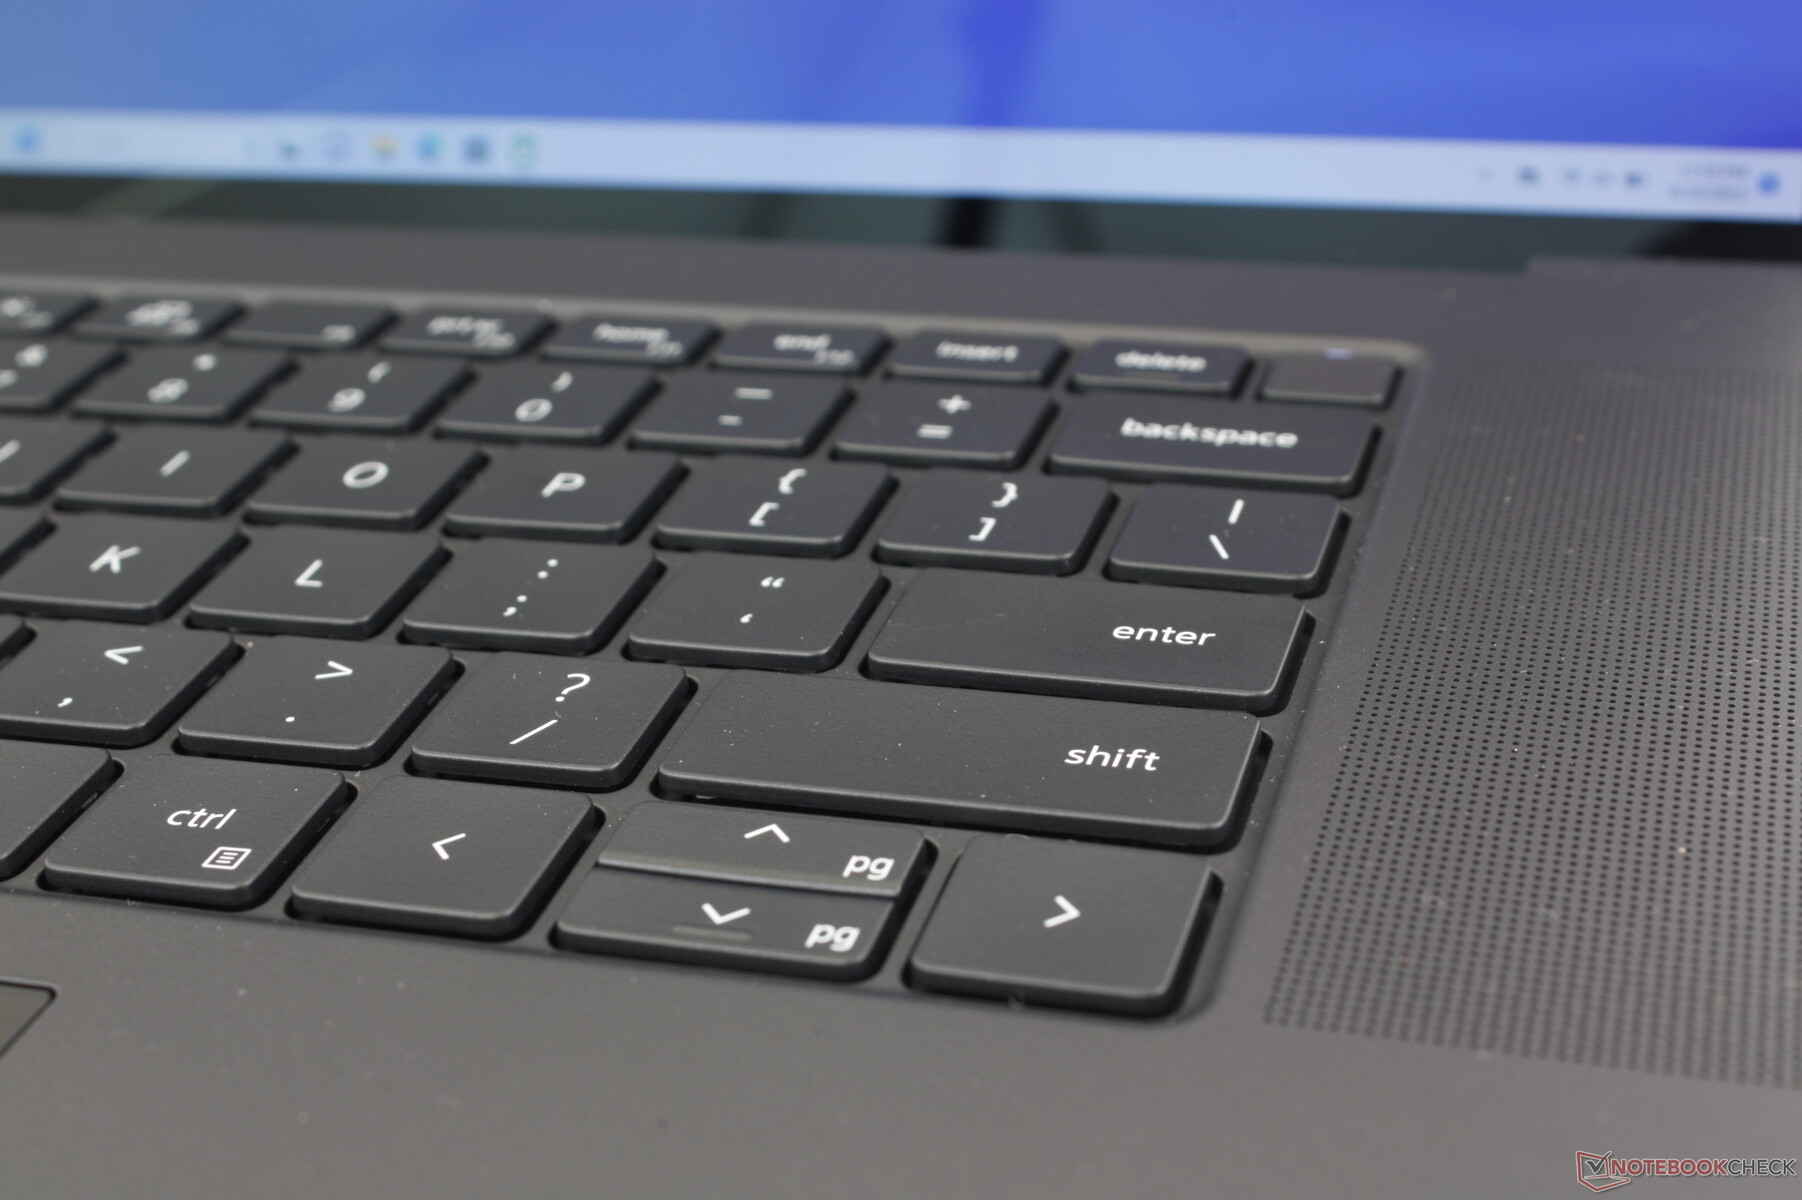
Na pierwszy rzut oka klawiatura może wydawać się identyczna jak w XPS 15 lub Precision 5550, ale jest kilka ważnych zmian. Po pierwsze, górny rząd klawiszy funkcyjnych jest teraz większy, ponieważ niektórzy właściciele XPS 15 narzekali, że są one zbyt wąskie. Po drugie, kilka klawiszy wzdłuż krawędzi jest teraz nieco krótszych, w tym klawisze Backspace, Enter, Shift, Tab, Ctrl i Shift. Poza tym wrażenia z pisania pozostają takie same, zapewniając znajomy charakter XPS.
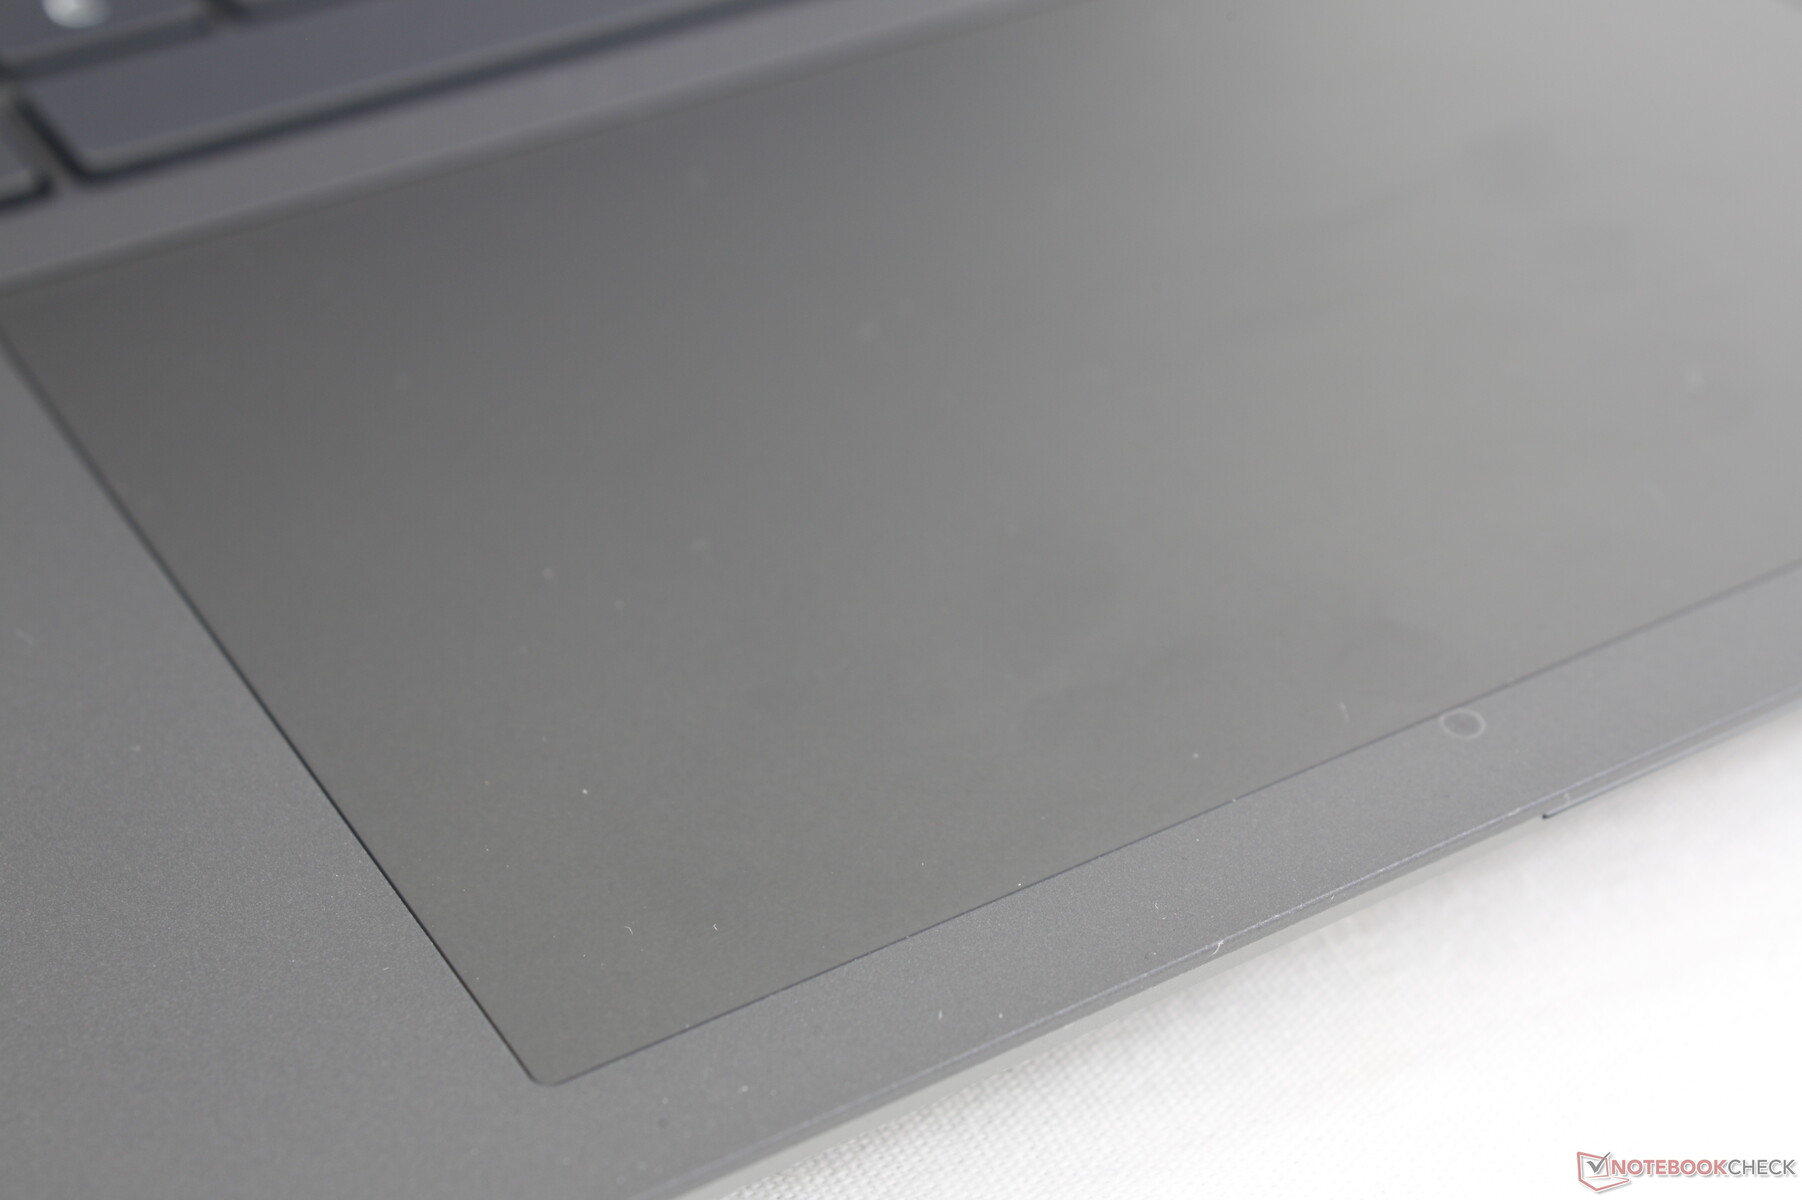
Touchpad
Clickpad jest w rzeczywistości mniejszy niż clickpad w 15-calowym Precision 5550 (13,7 x 8,5 cm vs. 15,1 x 9 cm) pomimo większego rozmiaru ekranu. Mimo to nadal wydaje się przestronny z płynnymi i niezawodnymi właściwościami ślizgowymi, podobnie jak w XPS 15.
Niestety, sprzężenie zwrotne podczas klikania na haptycznym klawiaturze jest prawie nieistniejące. W rzeczywistości nie ma prawie żadnego ruchu ani słyszalnego sprzężenia zwrotnego. Mysz jest wysoce zalecana do dokładniejszego przeciągania i upuszczania.

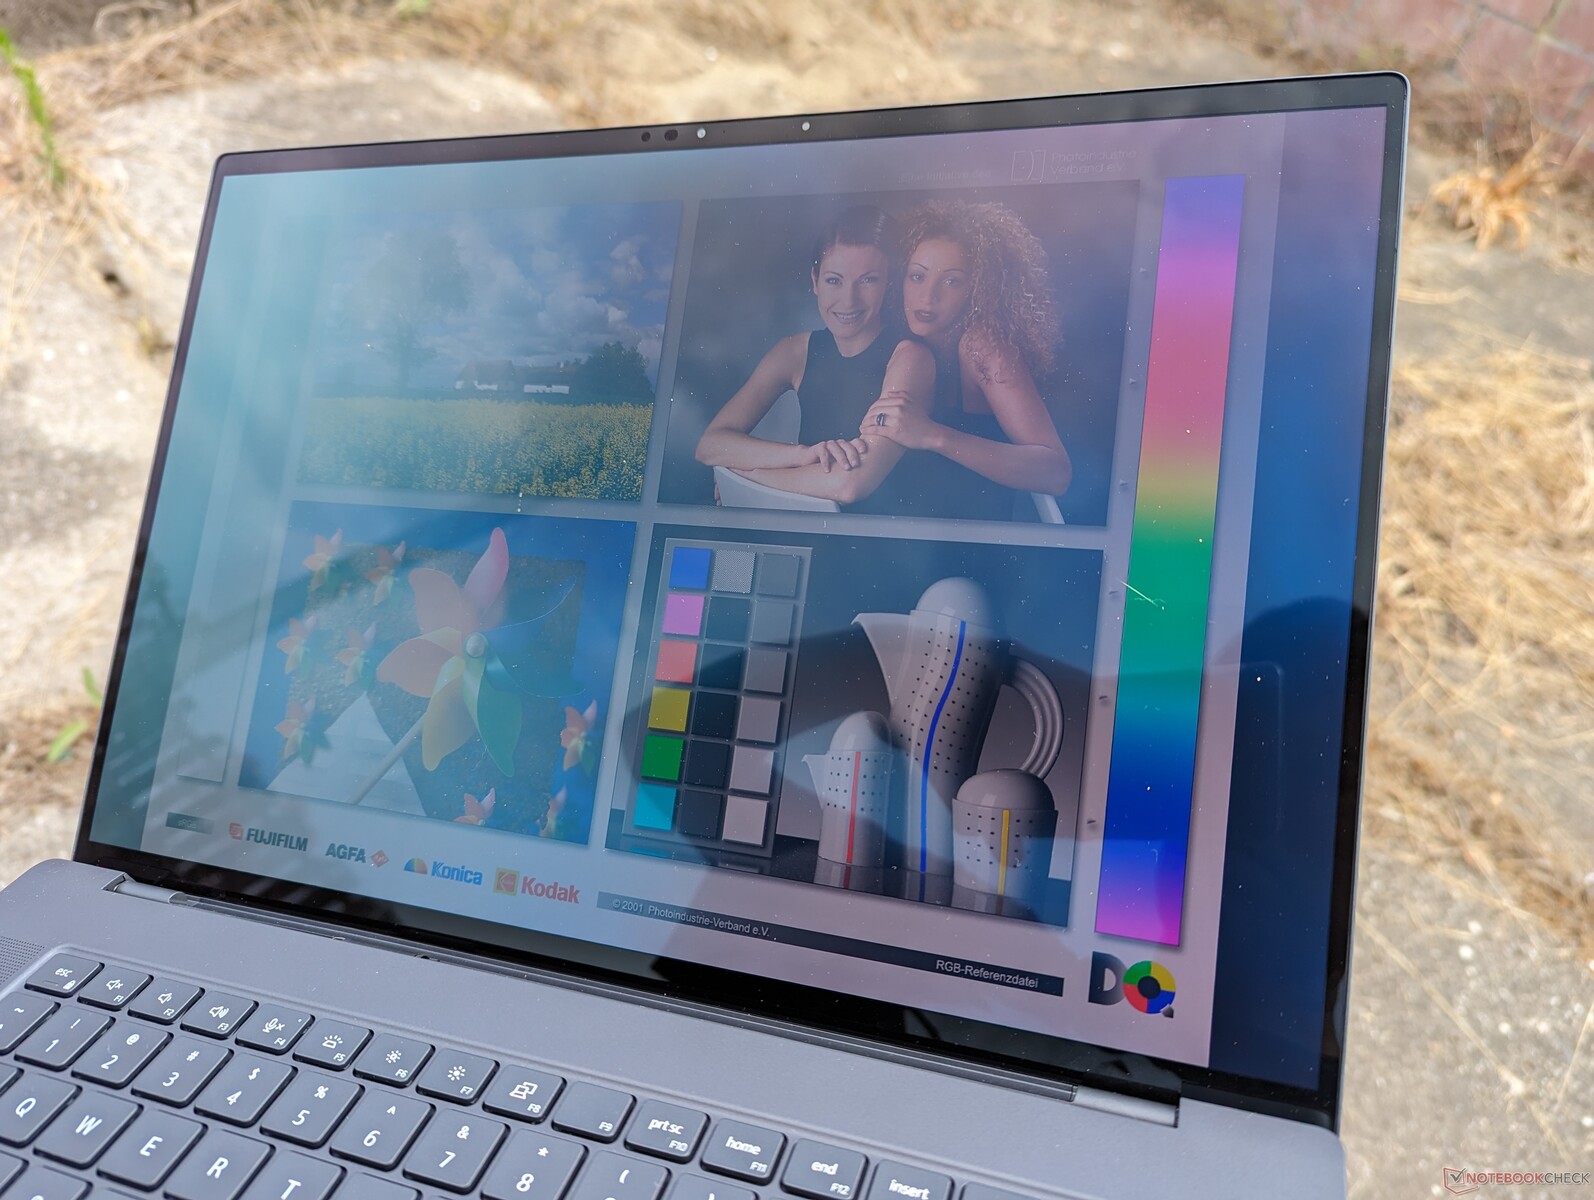
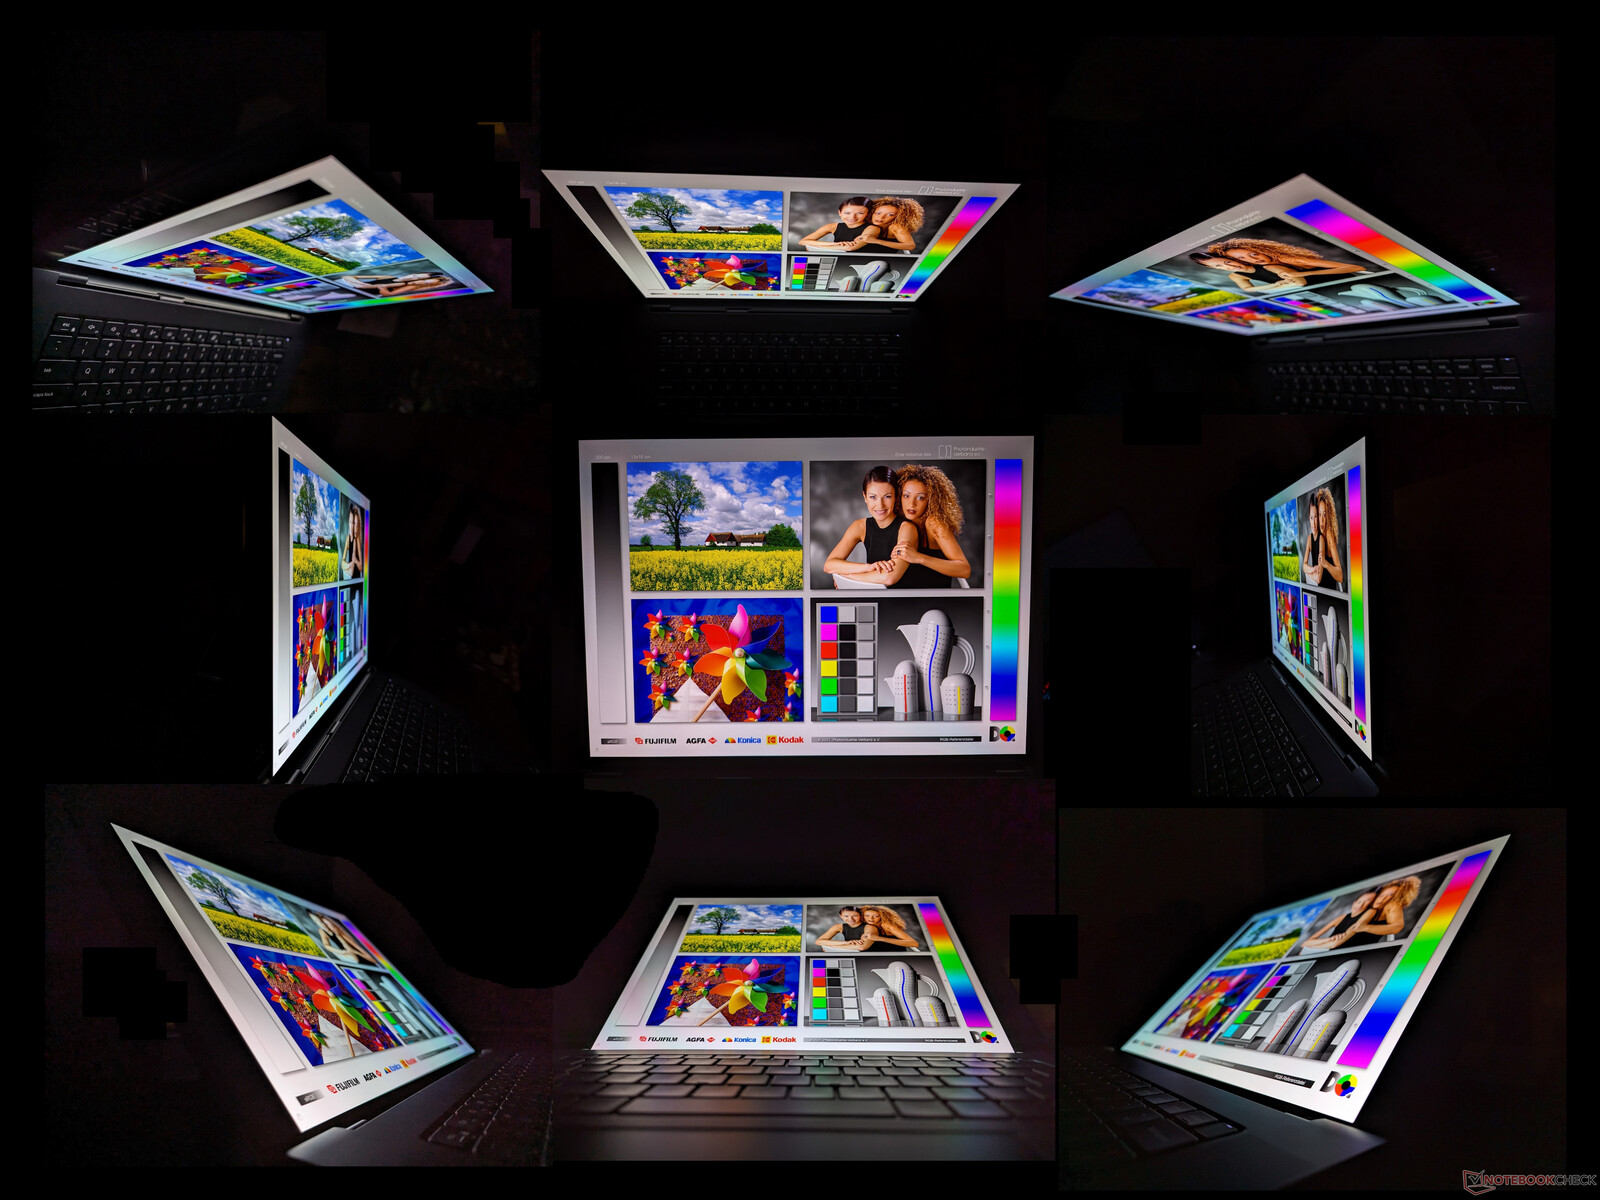
Wyświetlacz
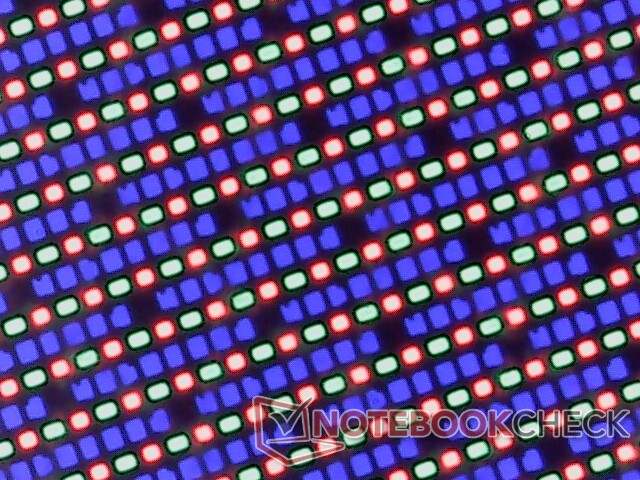
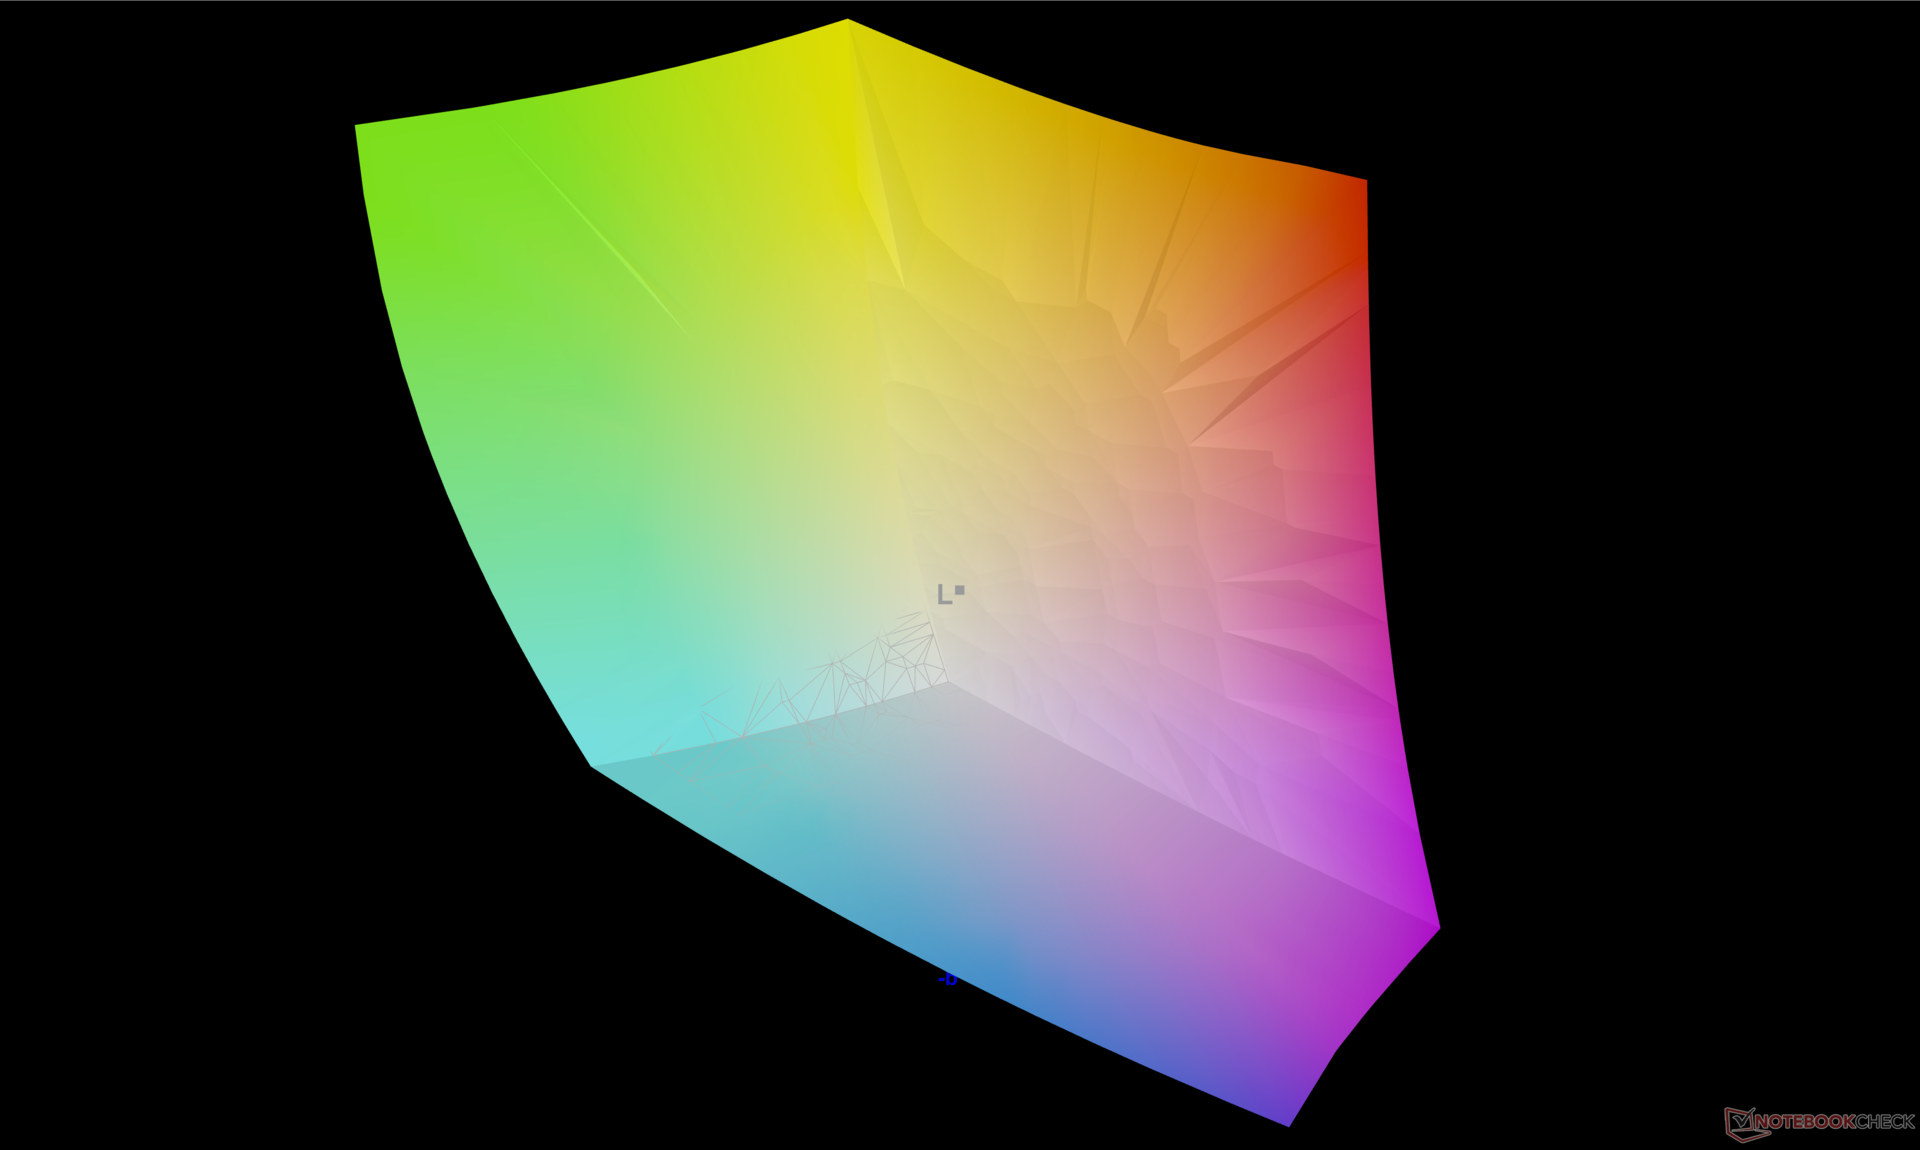
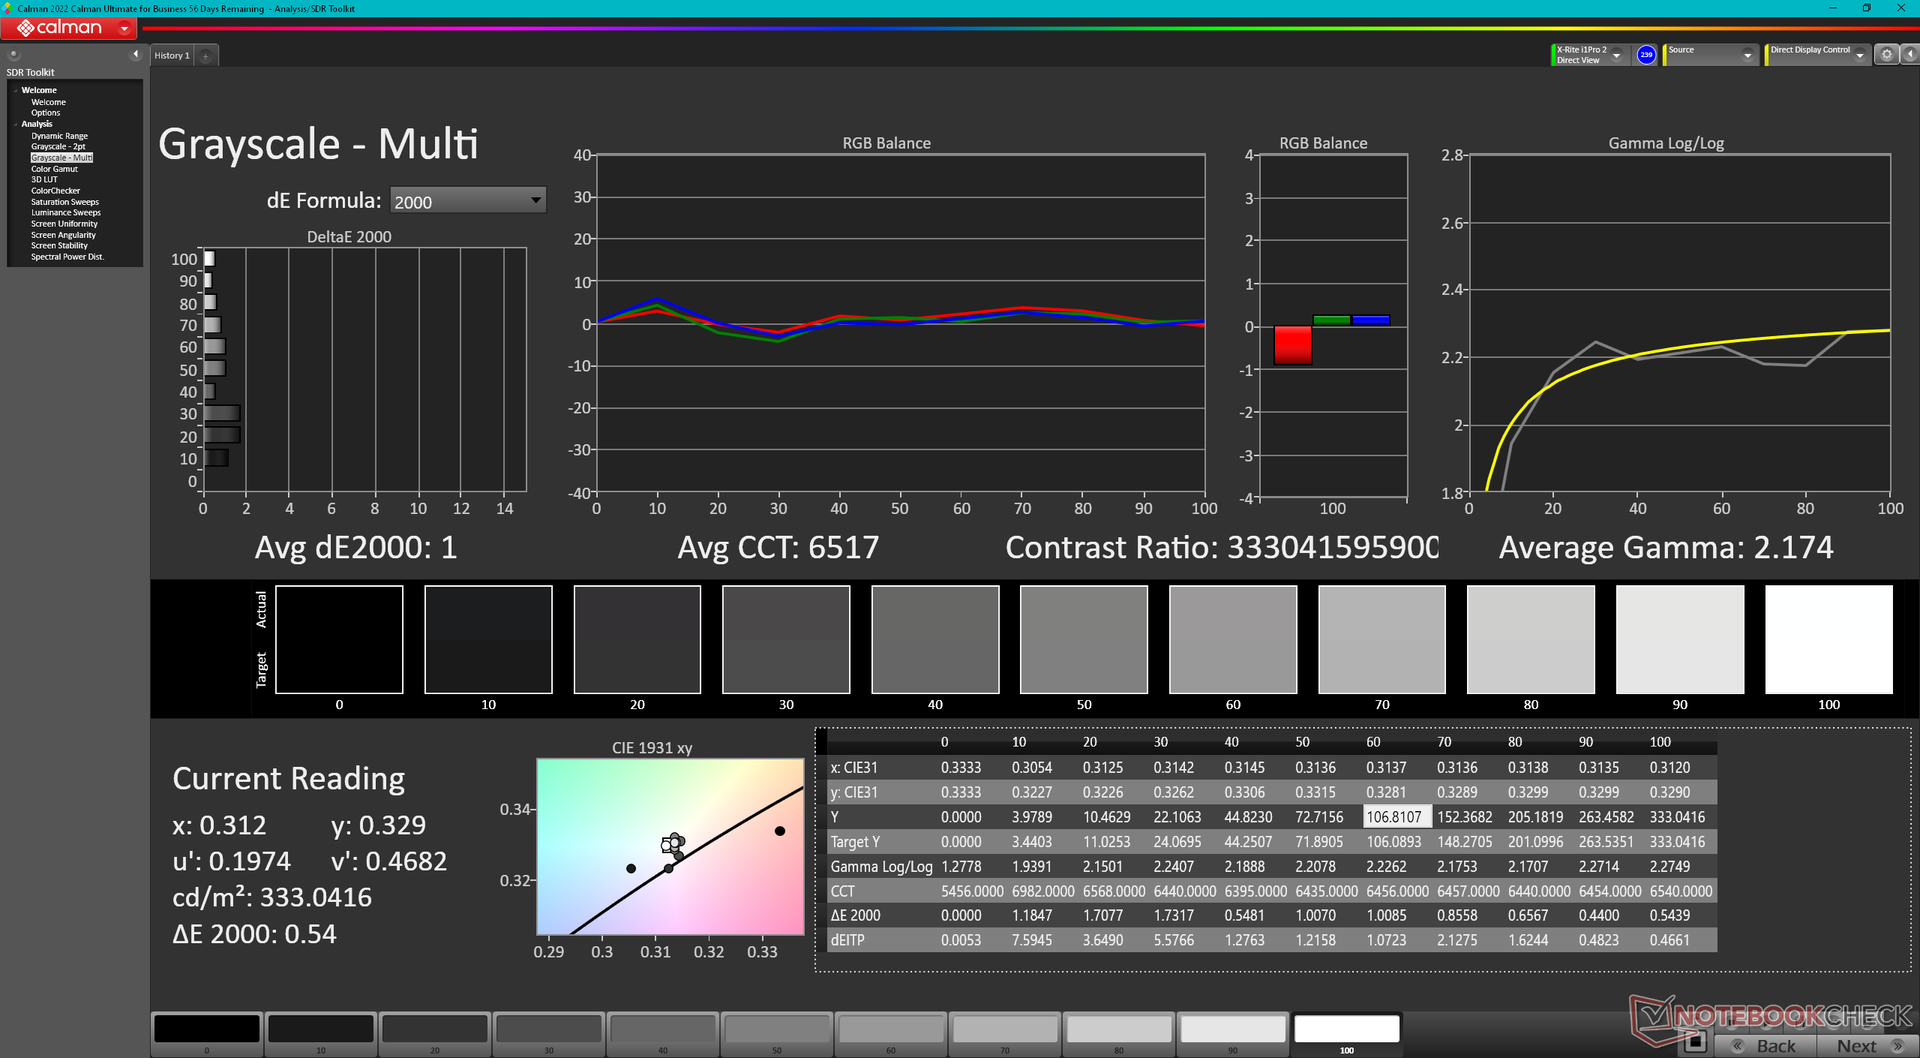
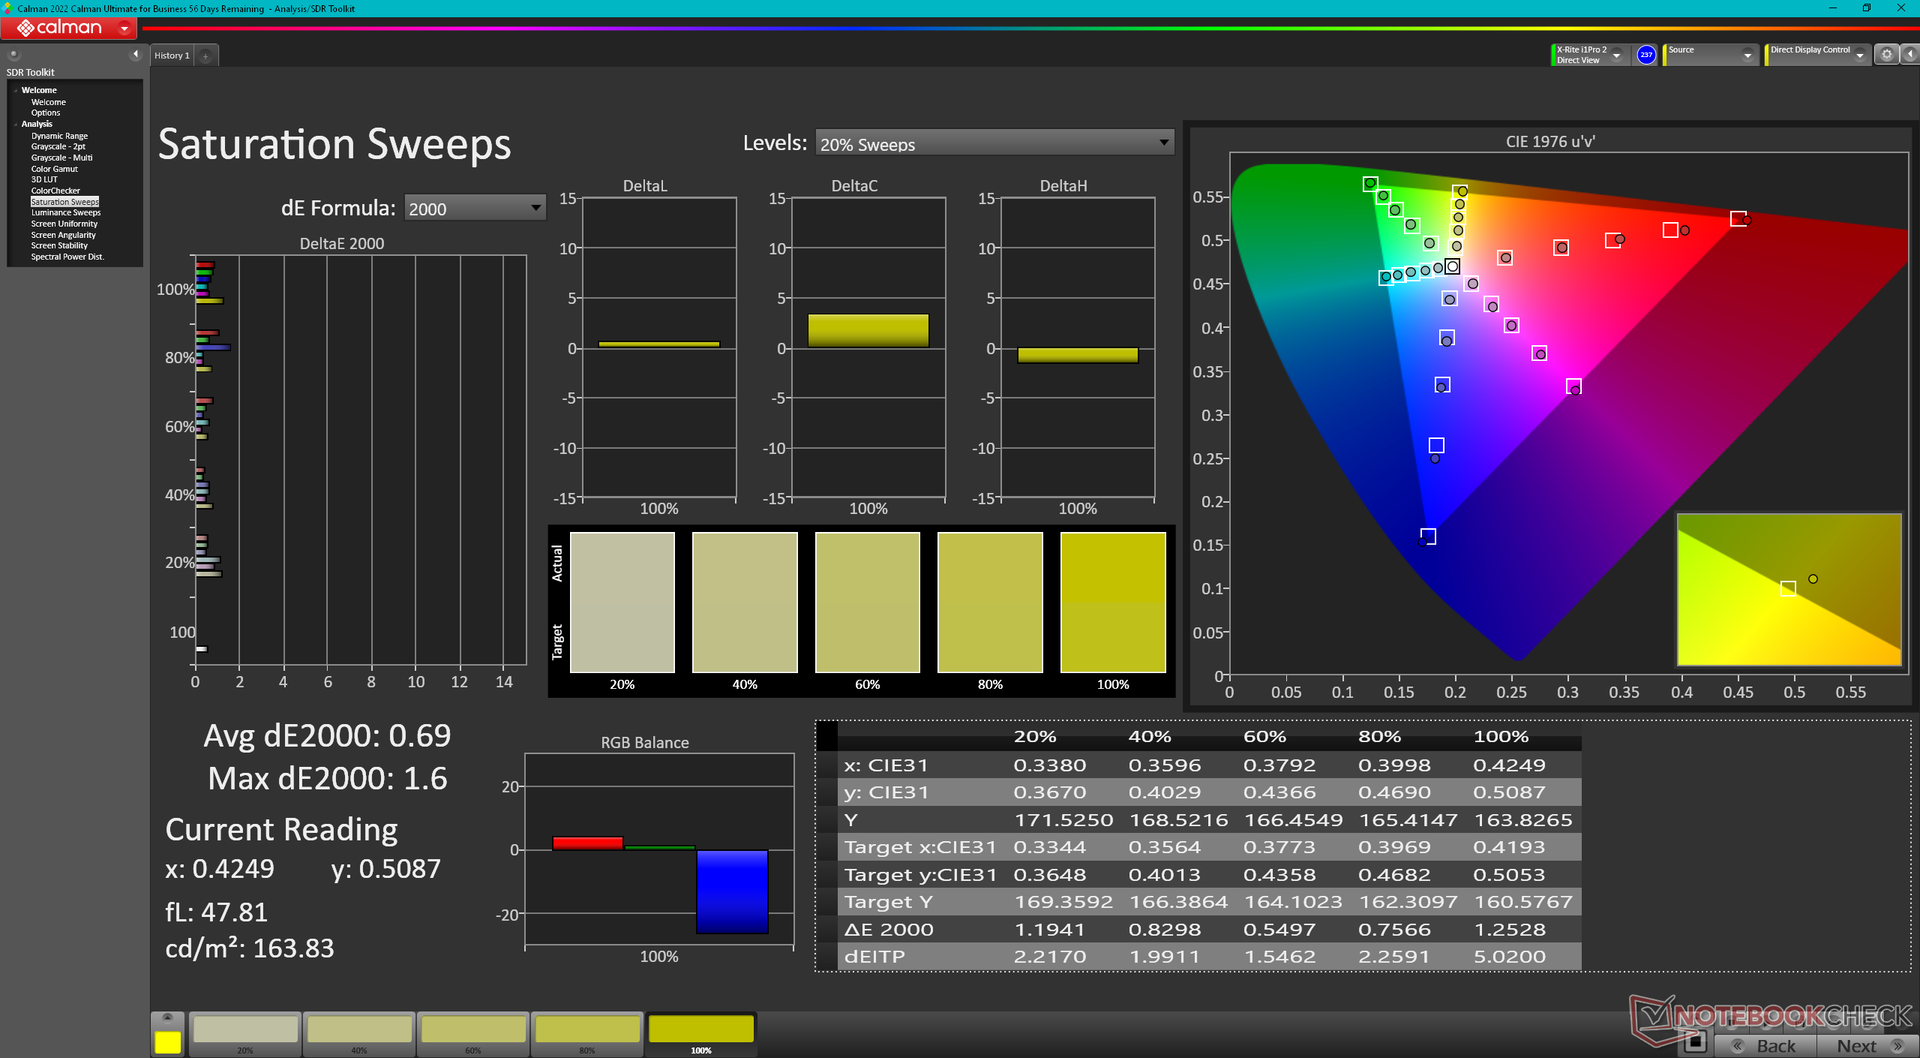
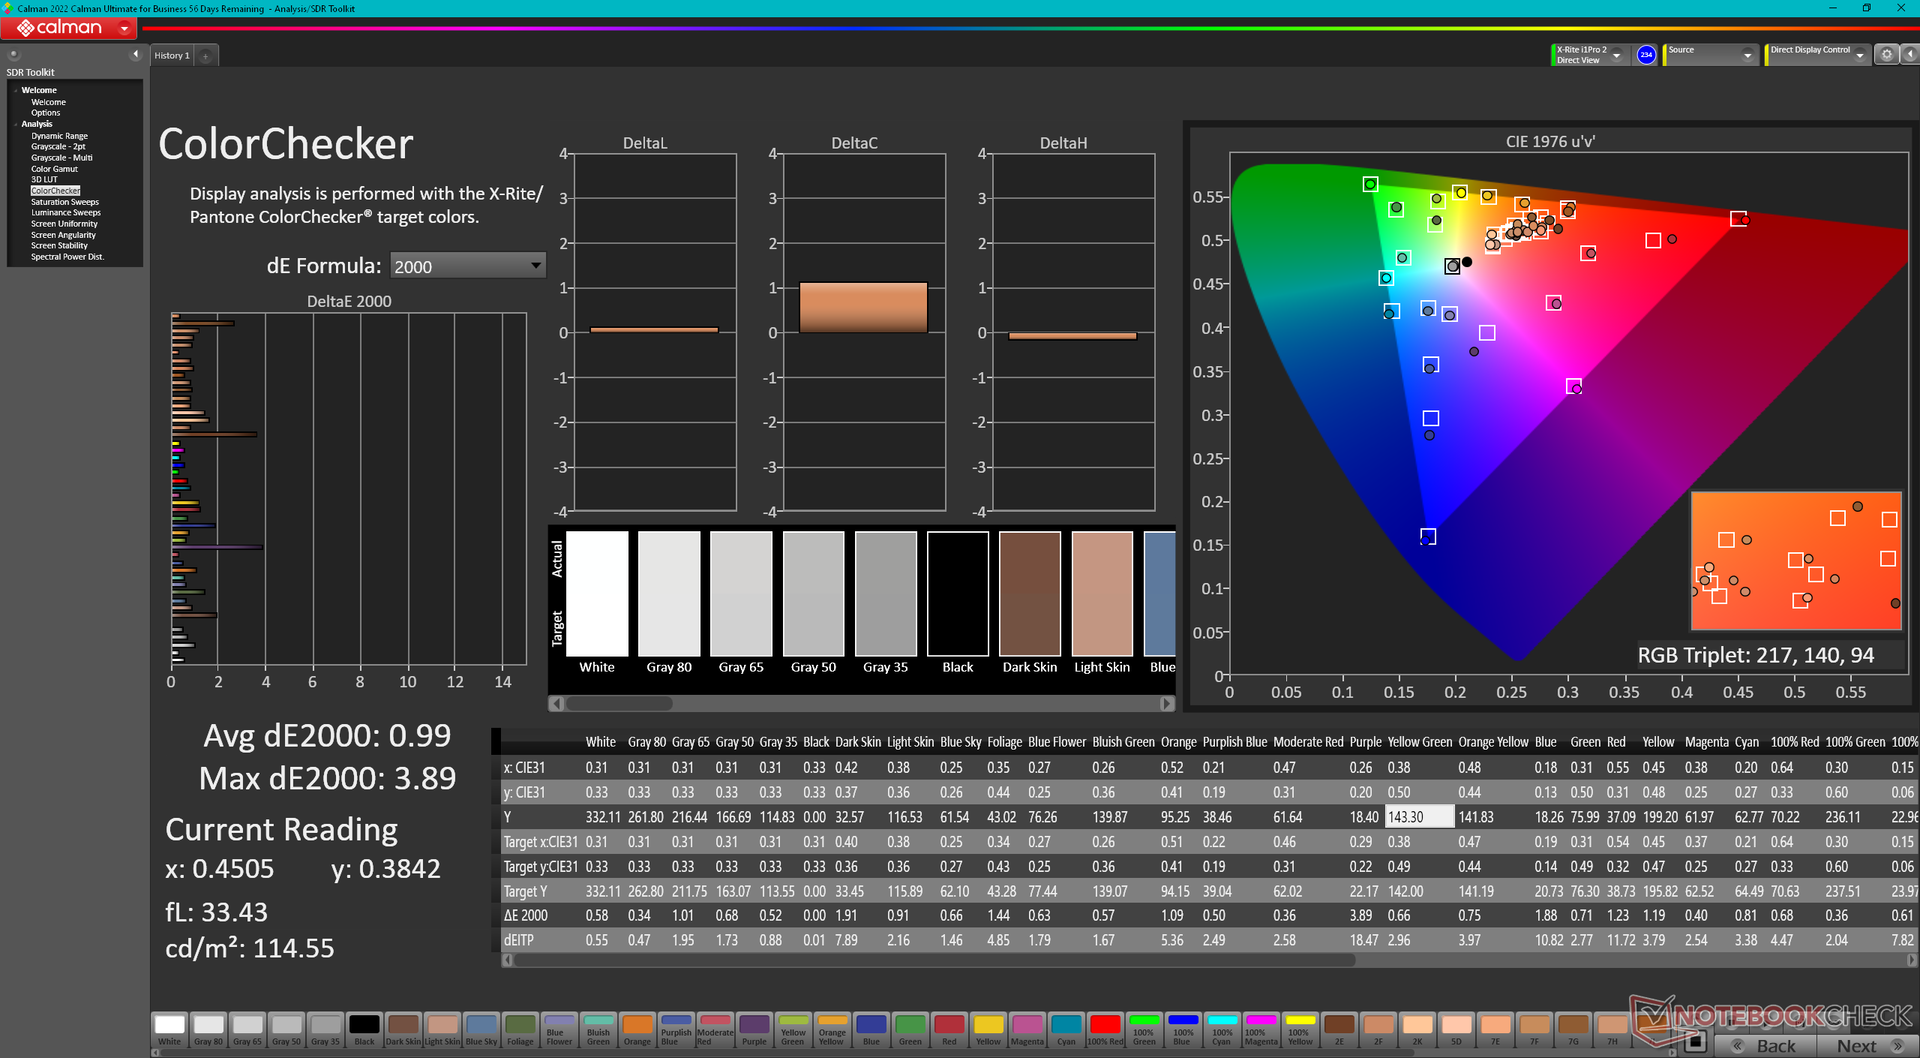
Dell wykorzystuje ten sam panel Samsung 160YV03 OLED zarówno w 16-calowym Precision 5680, jak i 16-calowym 7670 Precision 7670. Tak więc oba modele oferują takie same wrażenia wizualne, aż do podobnych czasów reakcji, pełnych kolorów DCI-P3, a nawet poziomów jasności, jak pokazano w poniższej tabeli porównawczej. Miejmy nadzieję, że w niedalekiej przyszłości zobaczymy opcje o wyższej częstotliwości odświeżania.
| |||||||||||||||||||||||||
rozświetlenie: 98 %
na akumulatorze: 345.7 cd/m²
kontrast: ∞:1 (czerń: 0 cd/m²)
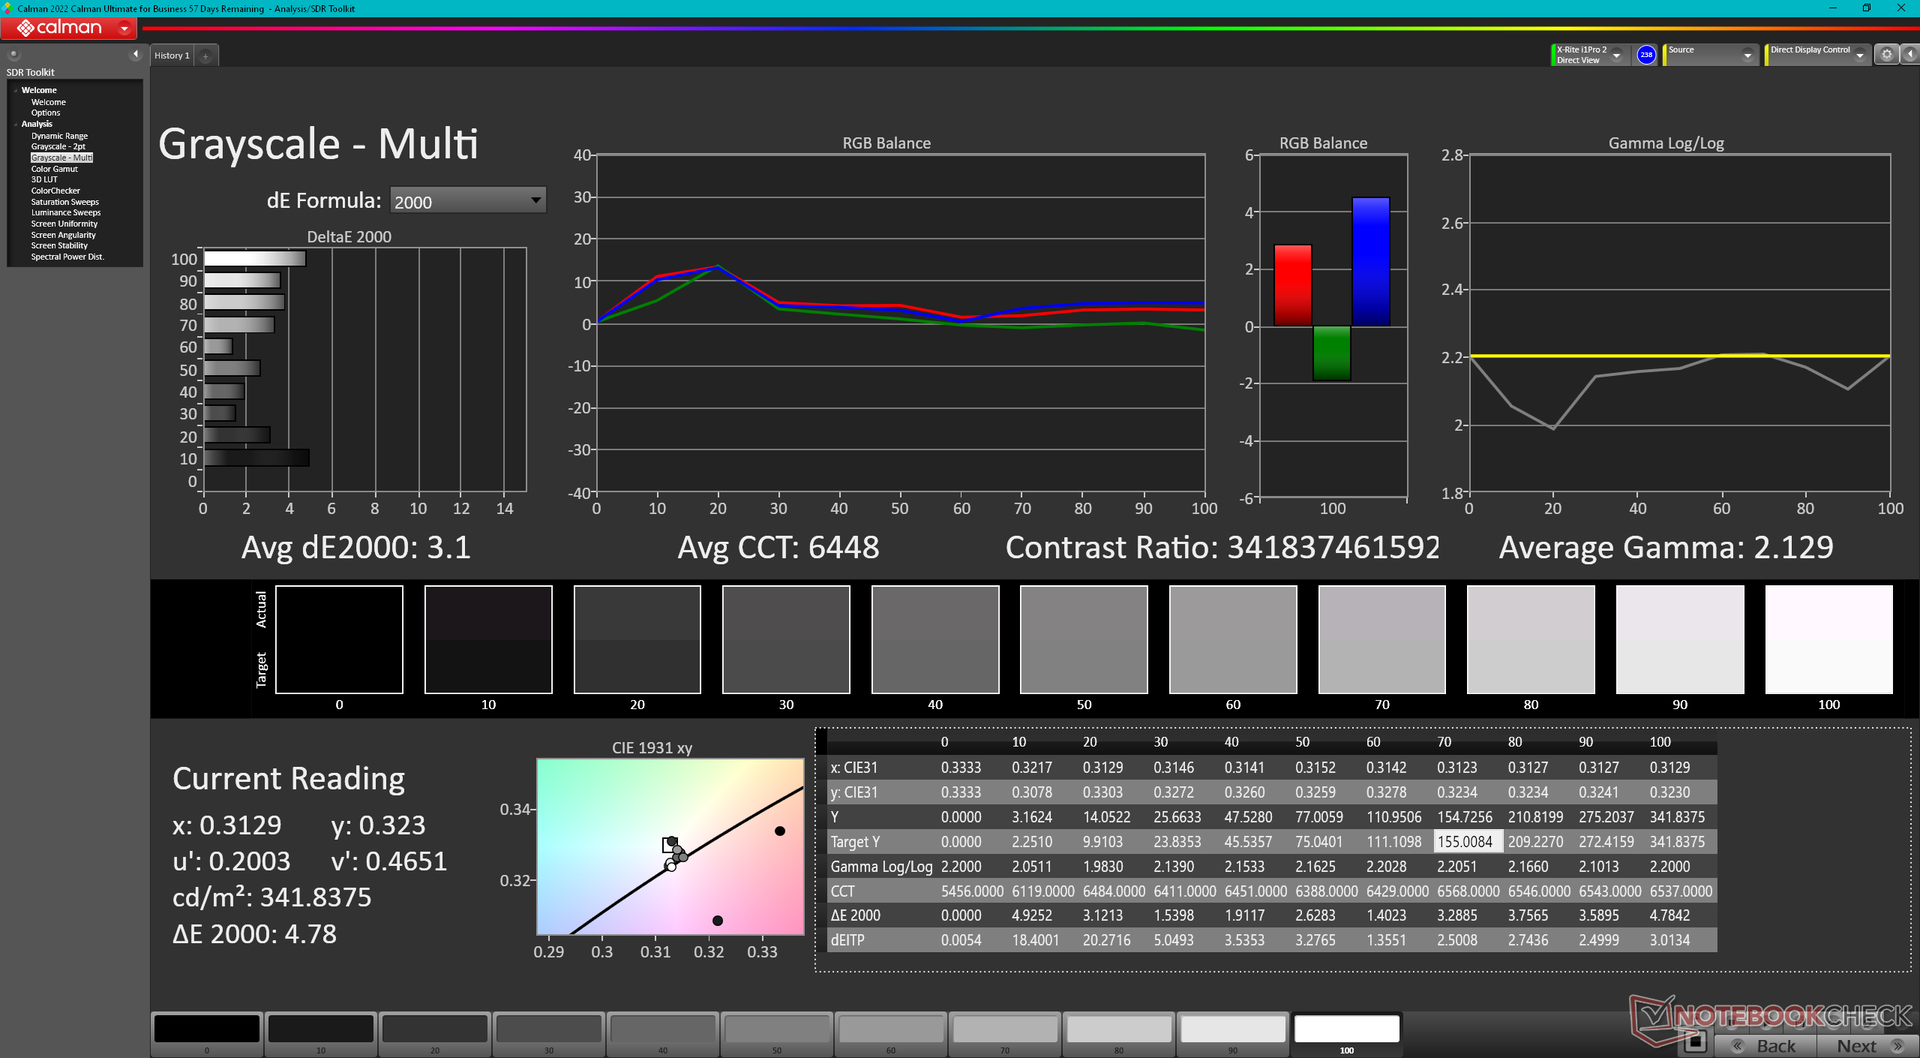
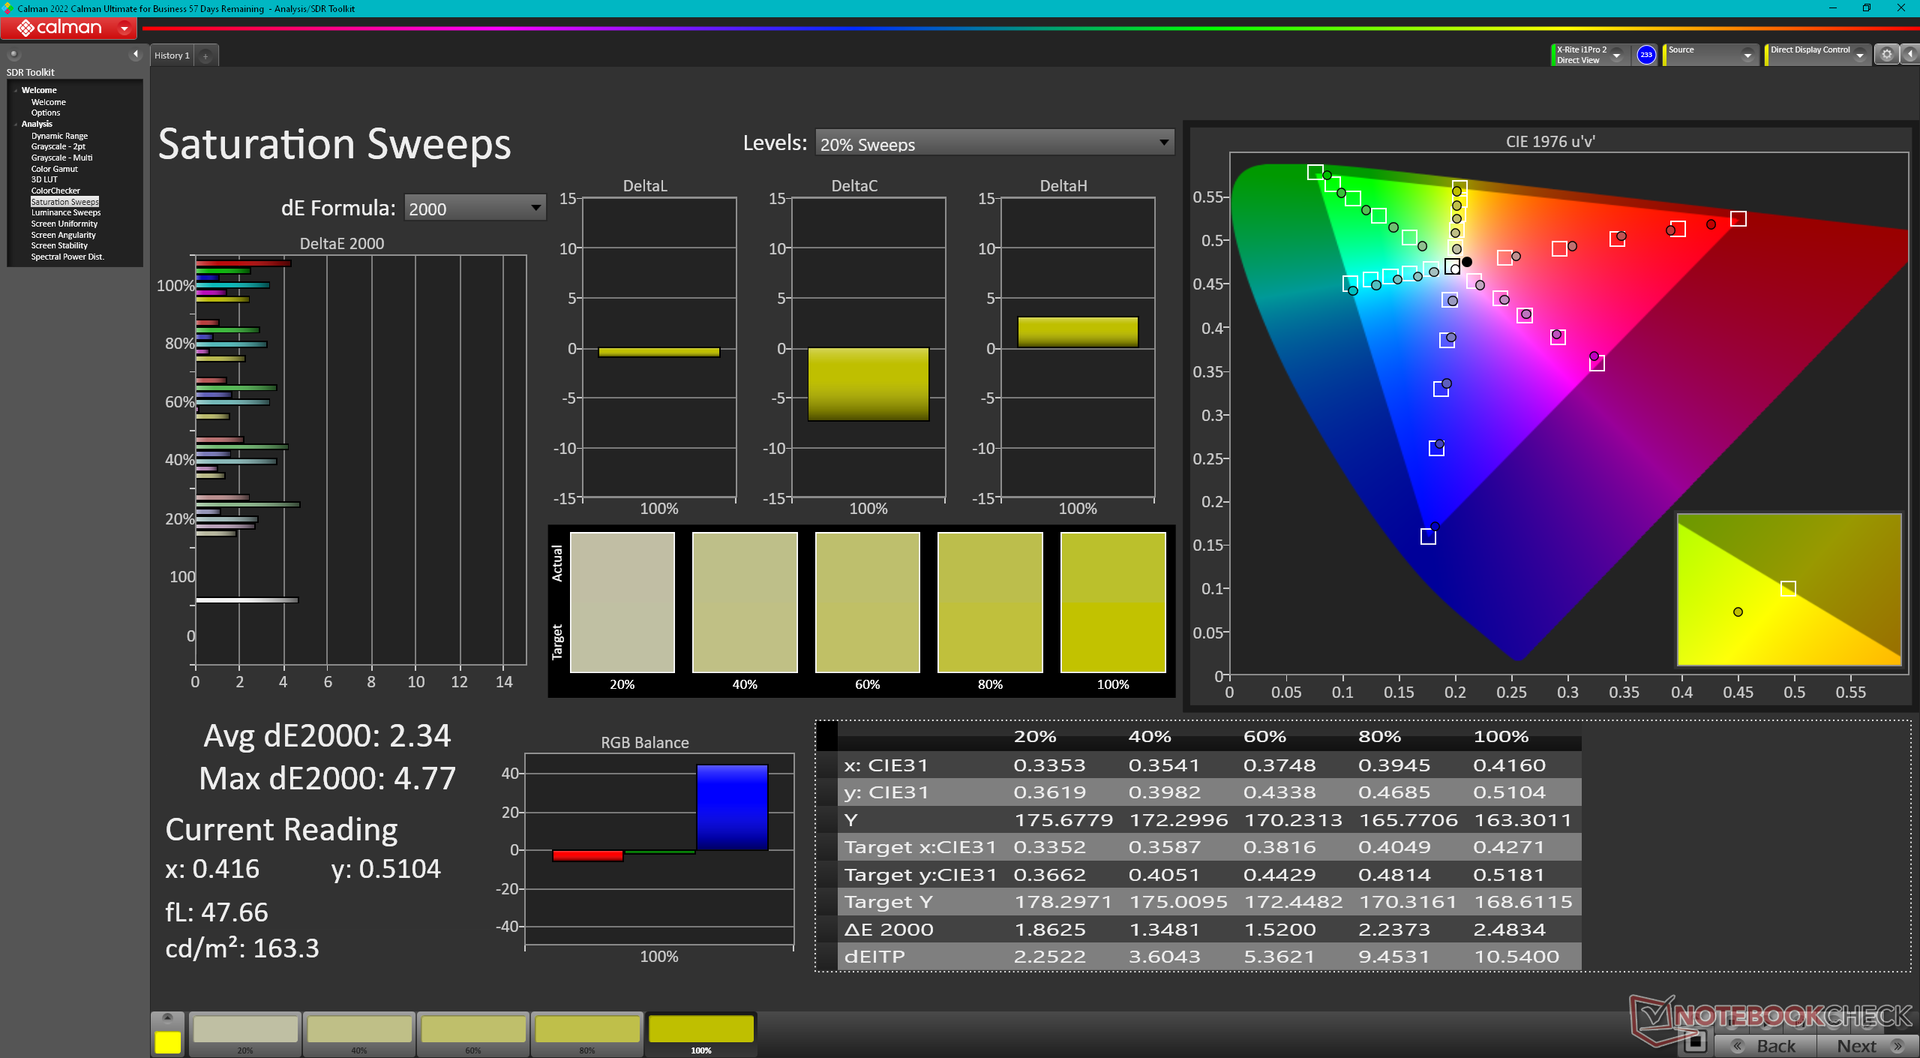
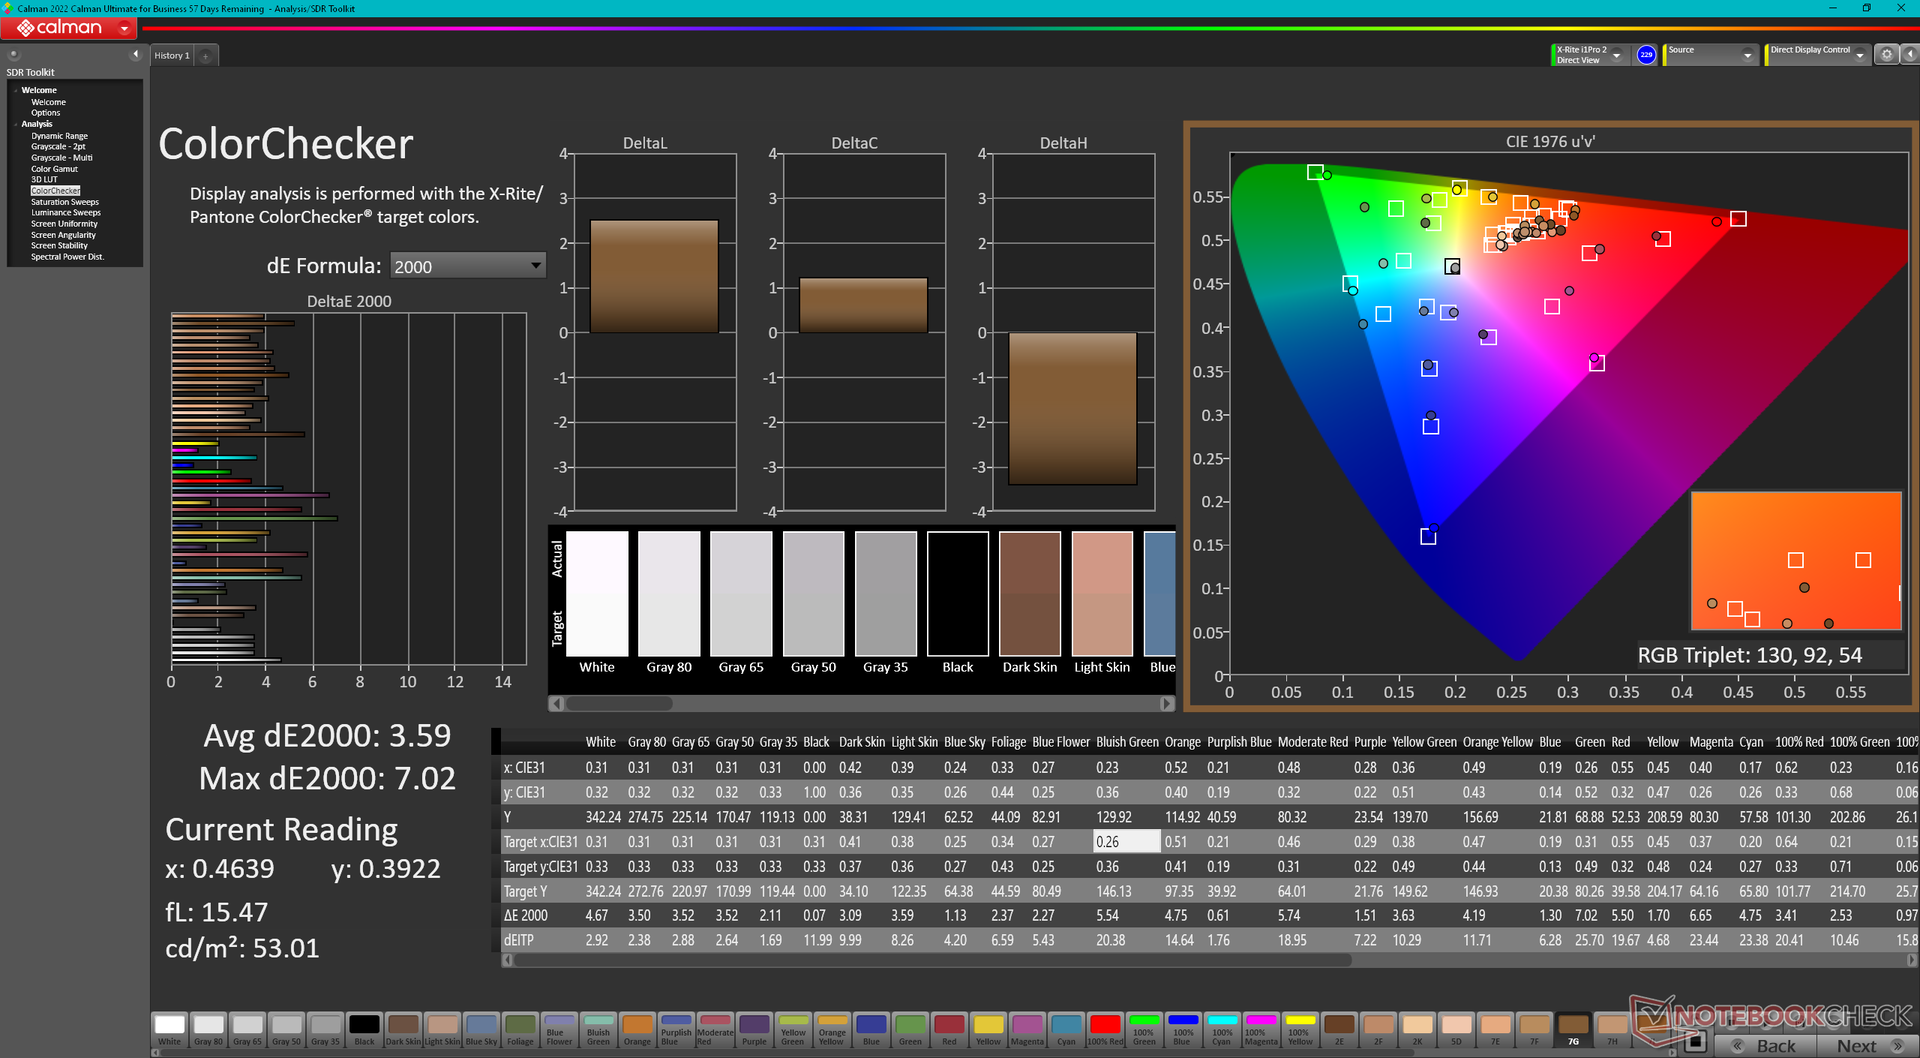
ΔE ColorChecker Calman: 3.59 | ∀{0.5-29.43 Ø4.72}
calibrated: 0.99
ΔE Greyscale Calman: 3.1 | ∀{0.09-98 Ø4.97}
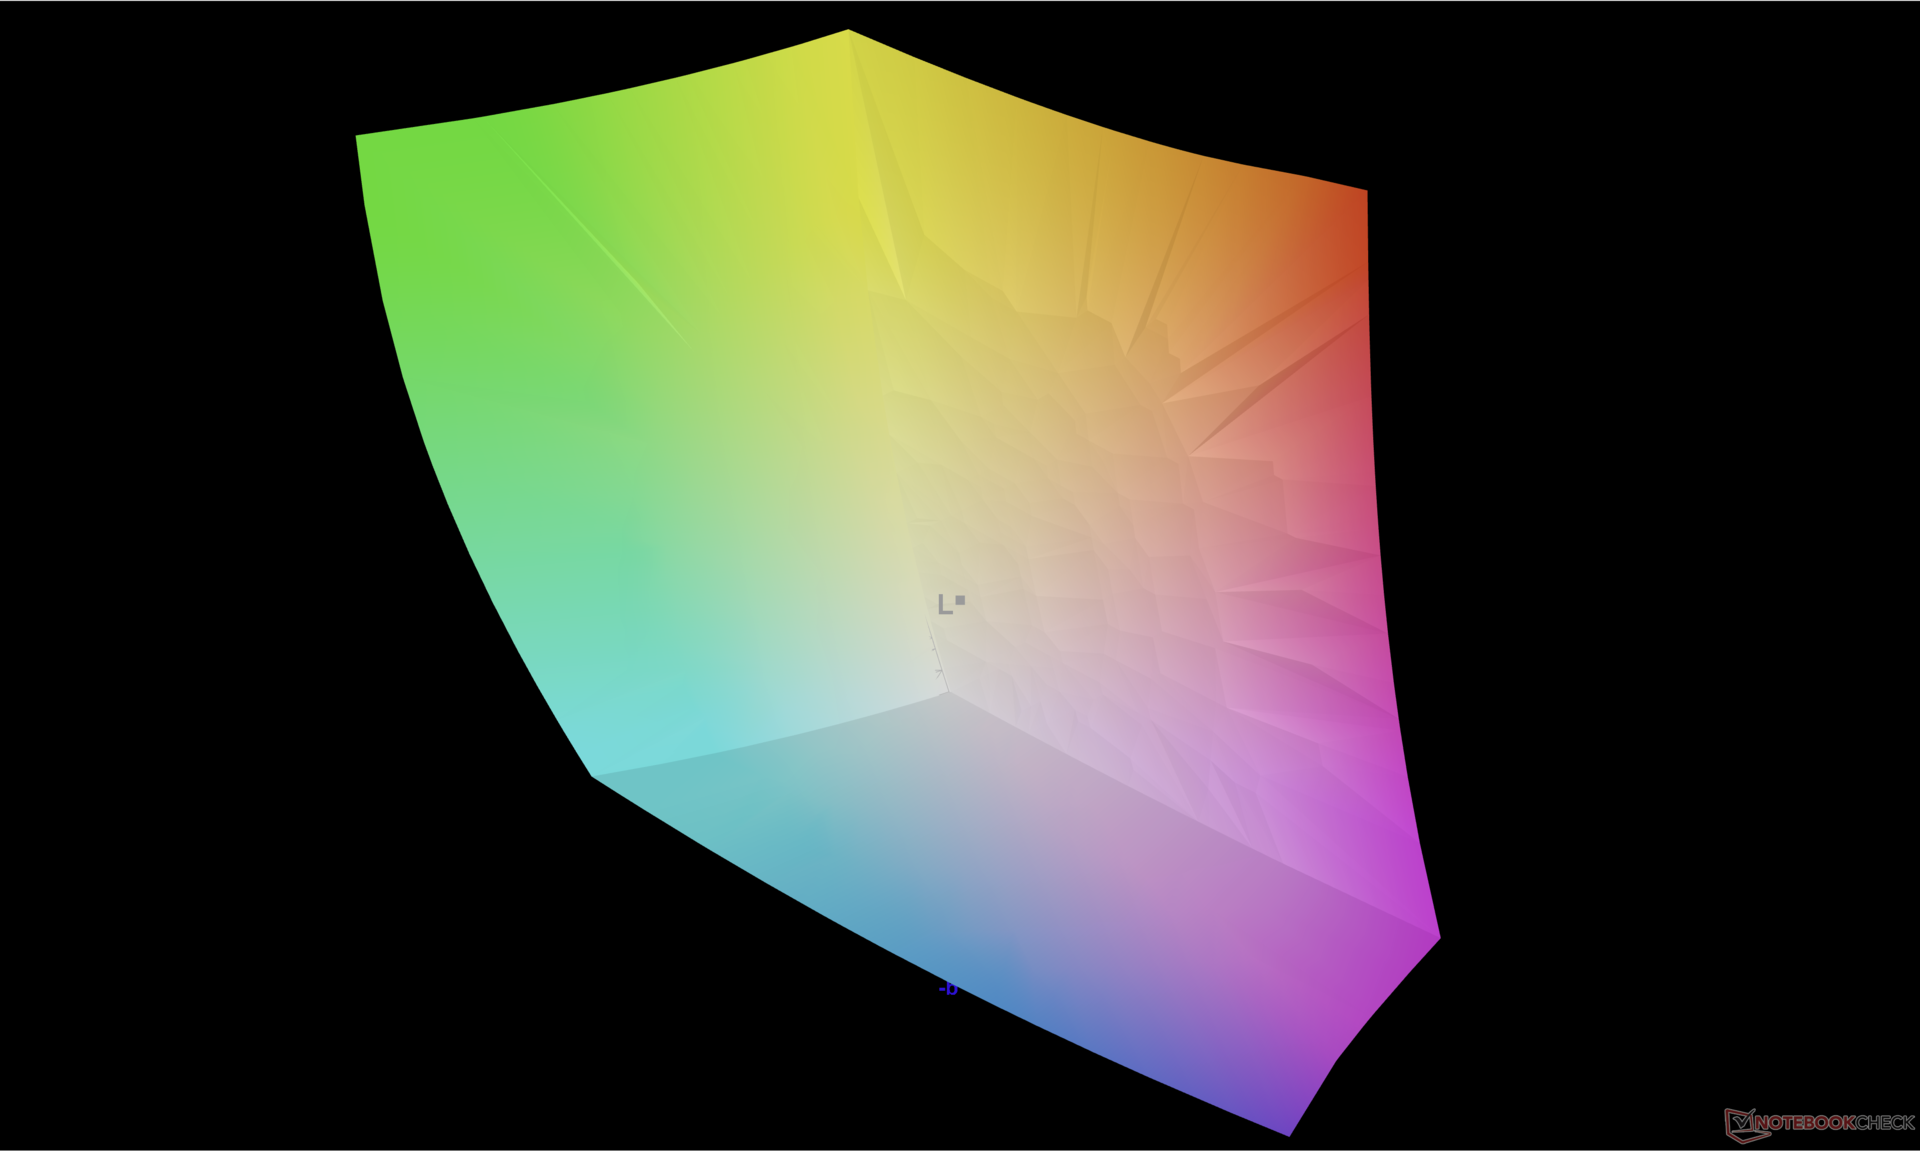
97.5% AdobeRGB 1998 (Argyll 3D)
100% sRGB (Argyll 3D)
99.9% Display P3 (Argyll 3D)
Gamma: 2.13
CCT: 6448 K
| Dell Precision 5000 5680 Samsung 160YV03, OLED, 3840x2400, 16" | Dell Precision 7000 7670 Performance Samsung 160YV03, OLED, 3840x2400, 16" | HP ZBook Fury 16 G9 BOE0A52, IPS, 3840x2400, 16" | Lenovo ThinkPad P16 G1 RTX A5500 LP160UQ1-SPB1, IPS, 3840x2400, 16" | MSI CreatorPro Z16P B12UKST B160QAN02.N, IPS, 2560x1600, 16" | Asus ExpertBook B6 Flip B6602FC2 AU Optronics Model: AUOE495, IPS, 2560x1600, 16" | |
|---|---|---|---|---|---|---|
| Display | 0% | -5% | -7% | -4% | -5% | |
| Display P3 Coverage (%) | 99.9 | 99.9 0% | 97.4 -3% | 82.9 -17% | 97.6 -2% | 97.9 -2% |
| sRGB Coverage (%) | 100 | 100 0% | 99.9 0% | 98.9 -1% | 99.9 0% | 99.89 0% |
| AdobeRGB 1998 Coverage (%) | 97.5 | 98.1 1% | 86.3 -11% | 95.9 -2% | 87.4 -10% | 85.52 -12% |
| Response Times | -9% | -551% | -2297% | -490% | -1452% | |
| Response Time Grey 50% / Grey 80% * (ms) | 1.68 ? | 1.84 ? -10% | 13.7 ? -715% | 45.6 ? -2614% | 12.8 ? -662% | 36 ? -2043% |
| Response Time Black / White * (ms) | 1.77 ? | 1.92 ? -8% | 8.6 ? -386% | 36.8 ? -1979% | 7.4 ? -318% | 17 ? -860% |
| PWM Frequency (Hz) | 60 ? | 59.52 ? | ||||
| Screen | -5% | -33% | 33% | 30% | -6% | |
| Brightness middle (cd/m²) | 345.7 | 325.2 -6% | 530.5 53% | 601.9 74% | 407 18% | 440 27% |
| Brightness (cd/m²) | 349 | 328 -6% | 476 36% | 569 63% | 388 11% | 418 20% |
| Brightness Distribution (%) | 98 | 97 -1% | 83 -15% | 77 -21% | 88 -10% | 82 -16% |
| Black Level * (cd/m²) | 0.57 | 0.47 | 0.36 | 0.3 | ||
| Colorchecker dE 2000 * | 3.59 | 4.59 -28% | 2.26 37% | 2.45 32% | 1.3 64% | 2.81 22% |
| Colorchecker dE 2000 max. * | 7.02 | 7.65 -9% | 4.46 36% | 2.5 64% | 4.62 34% | |
| Colorchecker dE 2000 calibrated * | 0.99 | 4.73 -378% | 0.7 29% | 2.99 -202% | ||
| Greyscale dE 2000 * | 3.1 | 2.5 19% | 1 68% | 2.6 16% | 2.1 32% | 0.91 71% |
| Gamma | 2.13 103% | 2.1 105% | 2.28 96% | 2.3 96% | 2.26 97% | 2.2 100% |
| CCT | 6448 101% | 6541 99% | 6543 99% | 6805 96% | 6437 101% | 6600 98% |
| Contrast (:1) | 931 | 1281 | 1131 | 1467 | ||
| Całkowita średnia (program / ustawienia) | -5% /
-4% | -196% /
-119% | -757% /
-401% | -155% /
-65% | -488% /
-247% |
* ... im mniej tym lepiej
Wyświetlacz jest przyzwoicie skalibrowany po wyjęciu z pudełka ze średnimi wartościami deltaE między 3 a 4. Nasz skalibrowany profil ICM jest dostępny do pobrania powyżej za darmo.
Wyświetl czasy reakcji
| ↔ Czas reakcji od czerni do bieli | ||
|---|---|---|
| 1.77 ms ... wzrost ↗ i spadek ↘ łącznie | ↗ 0.8 ms wzrost | 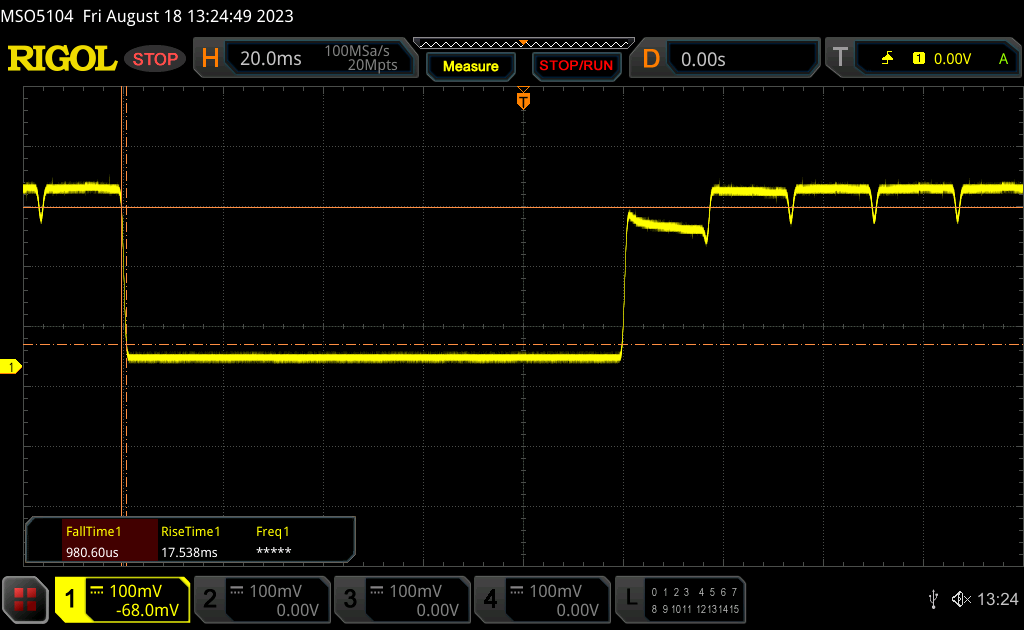 |
| ↘ 0.97 ms upadek | ||
| W naszych testach ekran wykazuje bardzo szybką reakcję i powinien bardzo dobrze nadawać się do szybkich gier. Dla porównania, wszystkie testowane urządzenia wahają się od 0.1 (minimum) do 240 (maksimum) ms. » 10 % wszystkich urządzeń jest lepszych. Oznacza to, że zmierzony czas reakcji jest lepszy od średniej wszystkich testowanych urządzeń (19.8 ms). | ||
| ↔ Czas reakcji 50% szarości do 80% szarości | ||
| 1.68 ms ... wzrost ↗ i spadek ↘ łącznie | ↗ 0.97 ms wzrost | 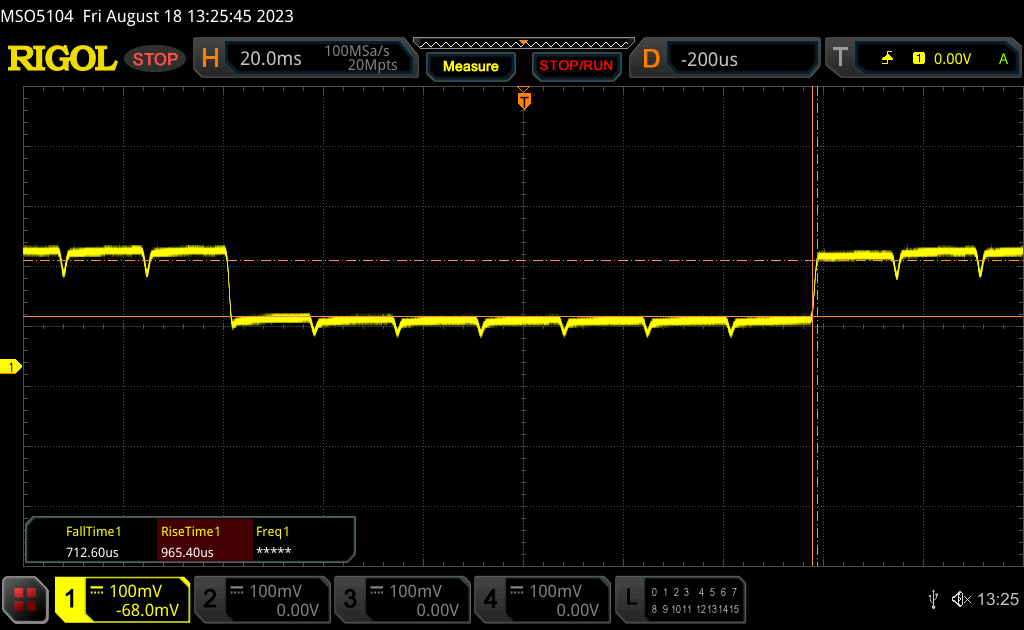 |
| ↘ 0.71 ms upadek | ||
| W naszych testach ekran wykazuje bardzo szybką reakcję i powinien bardzo dobrze nadawać się do szybkich gier. Dla porównania, wszystkie testowane urządzenia wahają się od 0.165 (minimum) do 636 (maksimum) ms. » 8 % wszystkich urządzeń jest lepszych. Oznacza to, że zmierzony czas reakcji jest lepszy od średniej wszystkich testowanych urządzeń (31 ms). | ||
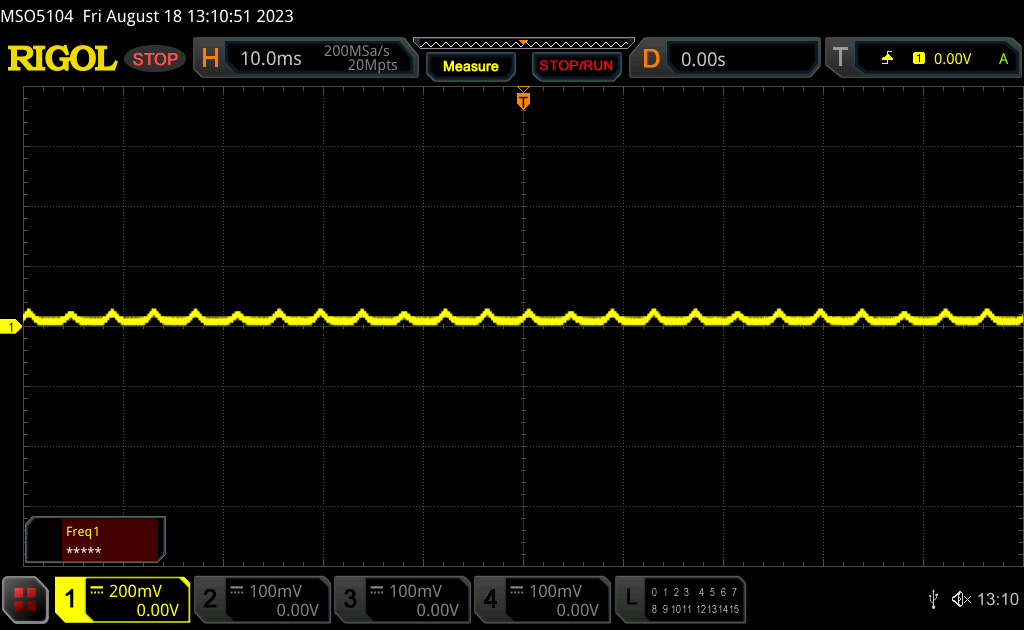
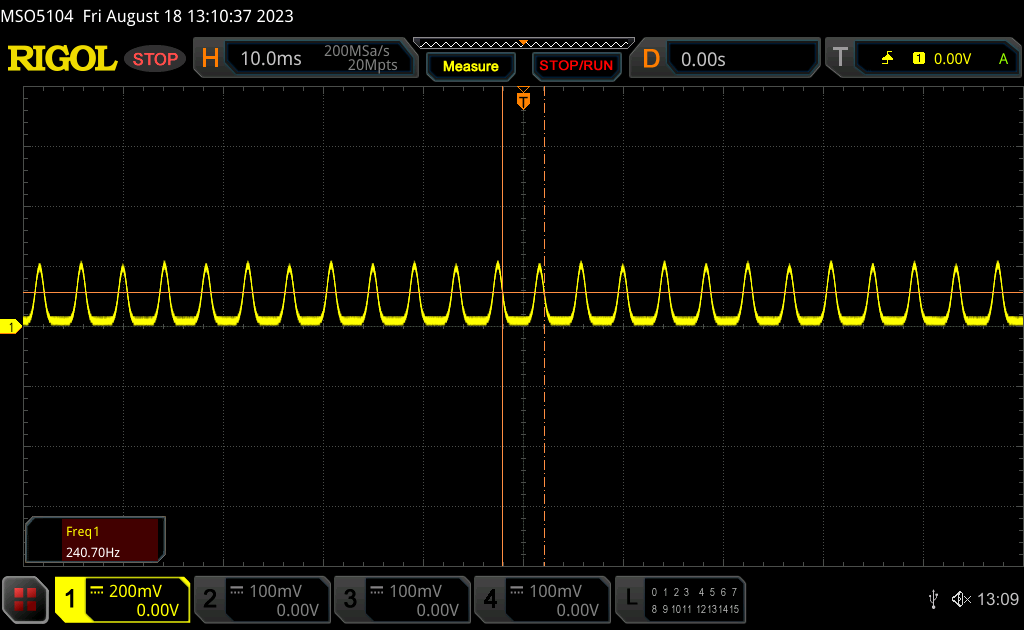
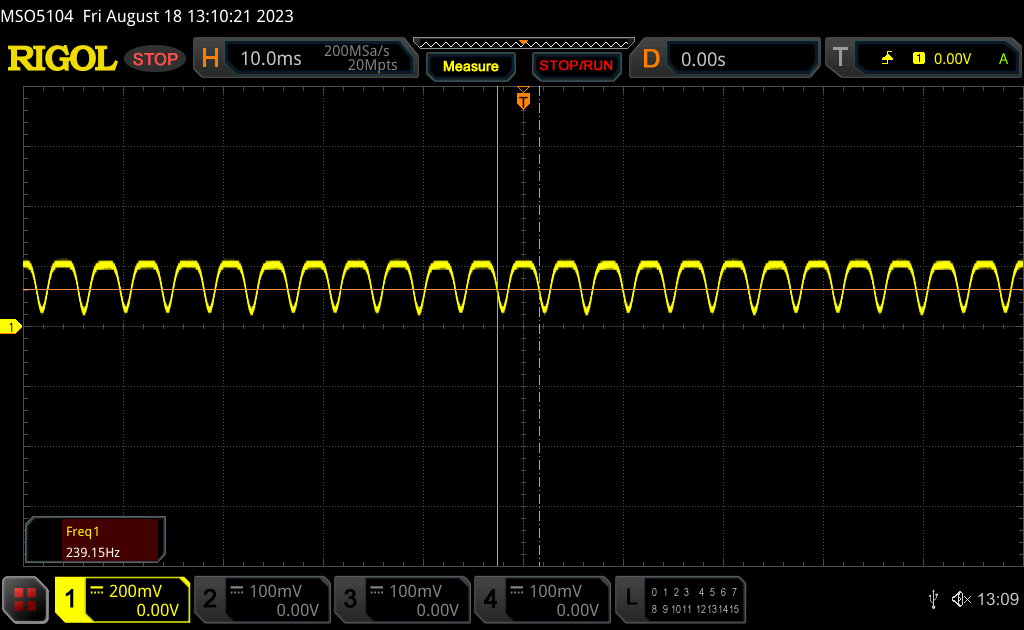
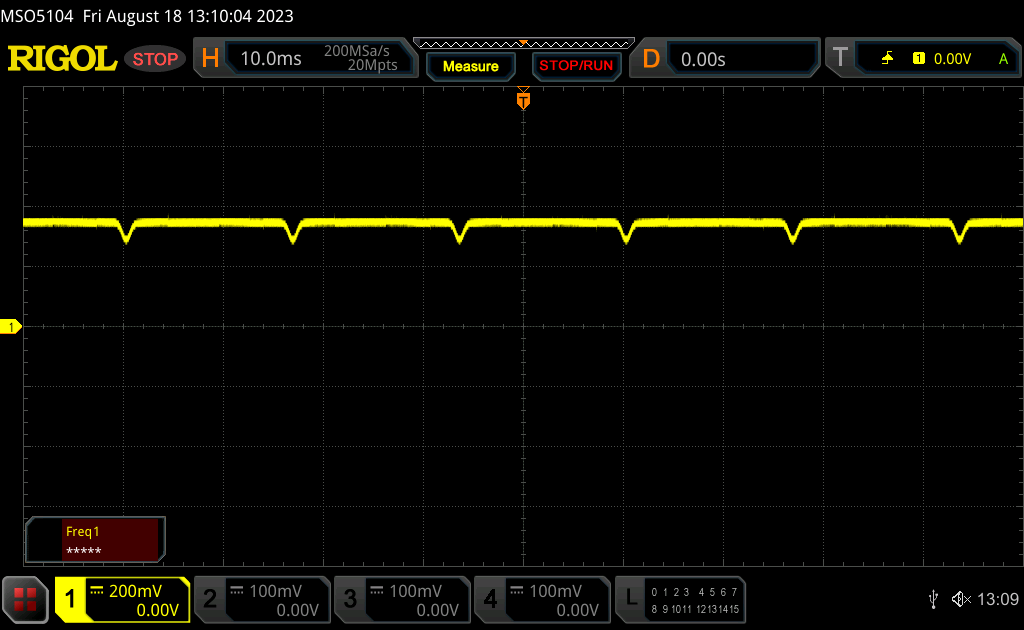
Migotanie ekranu / PWM (modulacja szerokości impulsu)
| Wykryto migotanie ekranu/wykryto PWM | 60 Hz | ≤ 100 % ustawienia jasności | 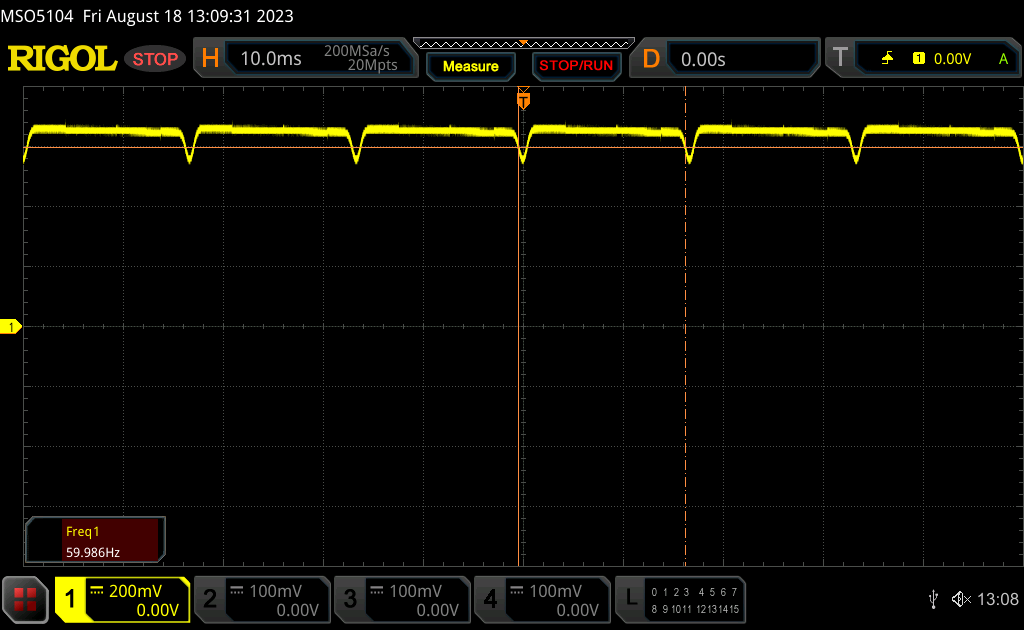 |
Podświetlenie wyświetlacza miga z częstotliwością 60 Hz (najgorszy przypadek, np. przy użyciu PWM) Wykryto migotanie przy ustawieniu jasności 100 % i poniżej. Powyżej tego ustawienia jasności nie powinno być żadnego migotania ani PWM. Częstotliwość 60 Hz jest bardzo niska, więc migotanie może powodować zmęczenie oczu i bóle głowy po dłuższym użytkowaniu. Dla porównania: 52 % wszystkich testowanych urządzeń nie używa PWM do przyciemniania wyświetlacza. Jeśli wykryto PWM, zmierzono średnio 7763 (minimum: 5 - maksimum: 343500) Hz. | |||
Migotanie jest obecne na wszystkich poziomach jasności, podobnie jak w smartfonach i innych laptopach wyposażonych w panele OLED. Częstotliwość byłaby stabilna na poziomie 239 Hz od 0 do 54 procent jasności i 60 Hz od 55 do 100 procent jasności.
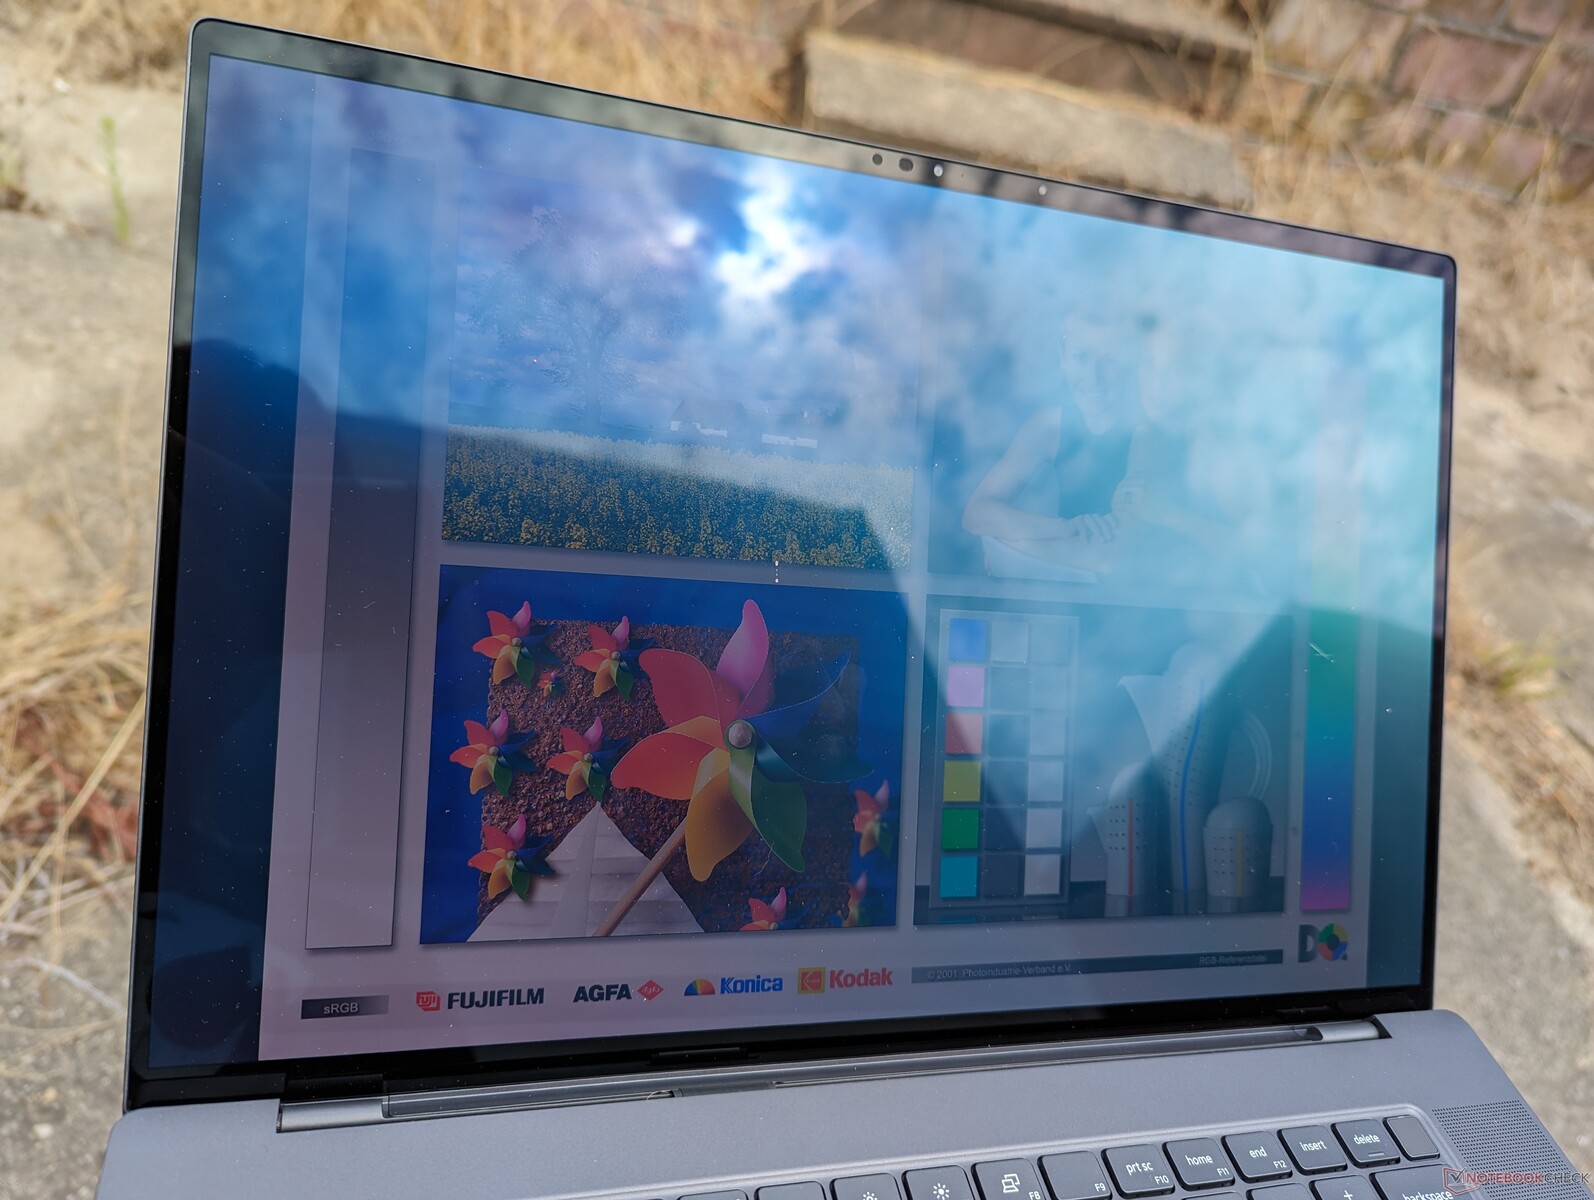
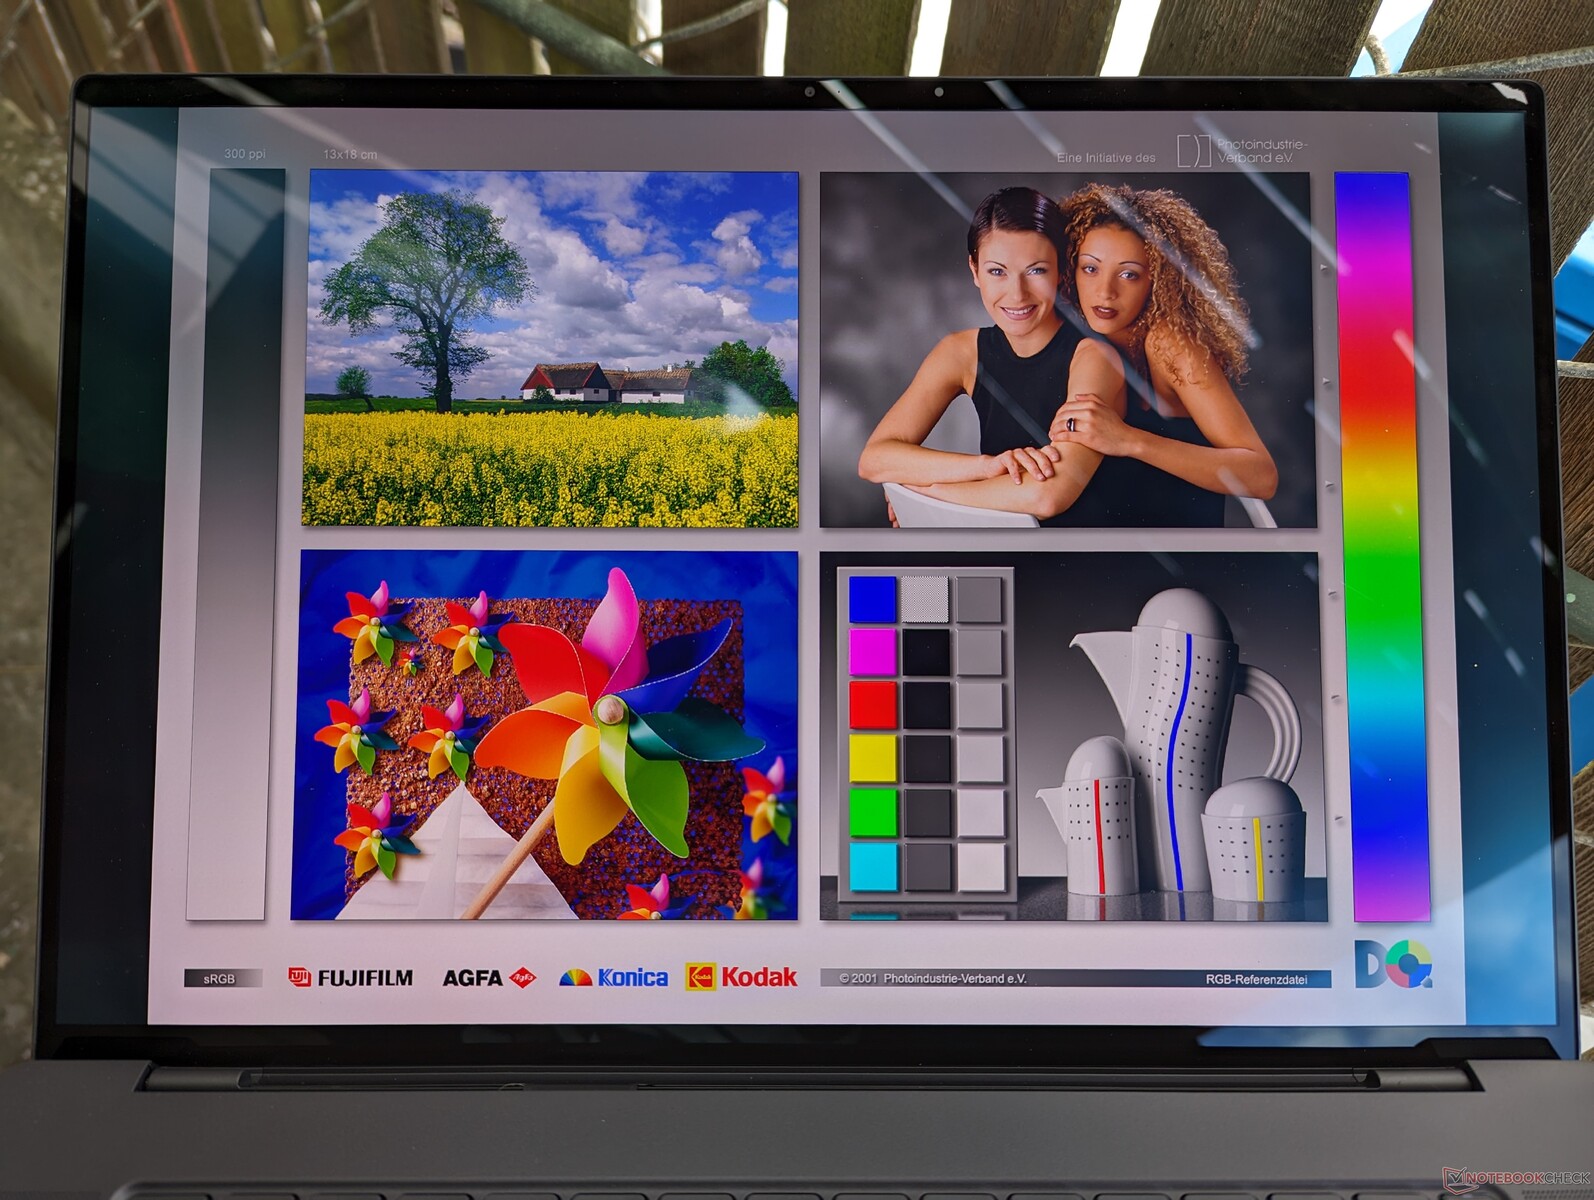
Widoczność na zewnątrz jest co najwyżej przeciętna, ponieważ błyszczący ekran dotykowy OLED o jasności 350 nitów nie jest tak jasny, jak wyświetlacze IPS w ZBook Fury 16 G9 lub ThinkPad P16 G1 które mogą osiągnąć od 500 do 600 nitów.
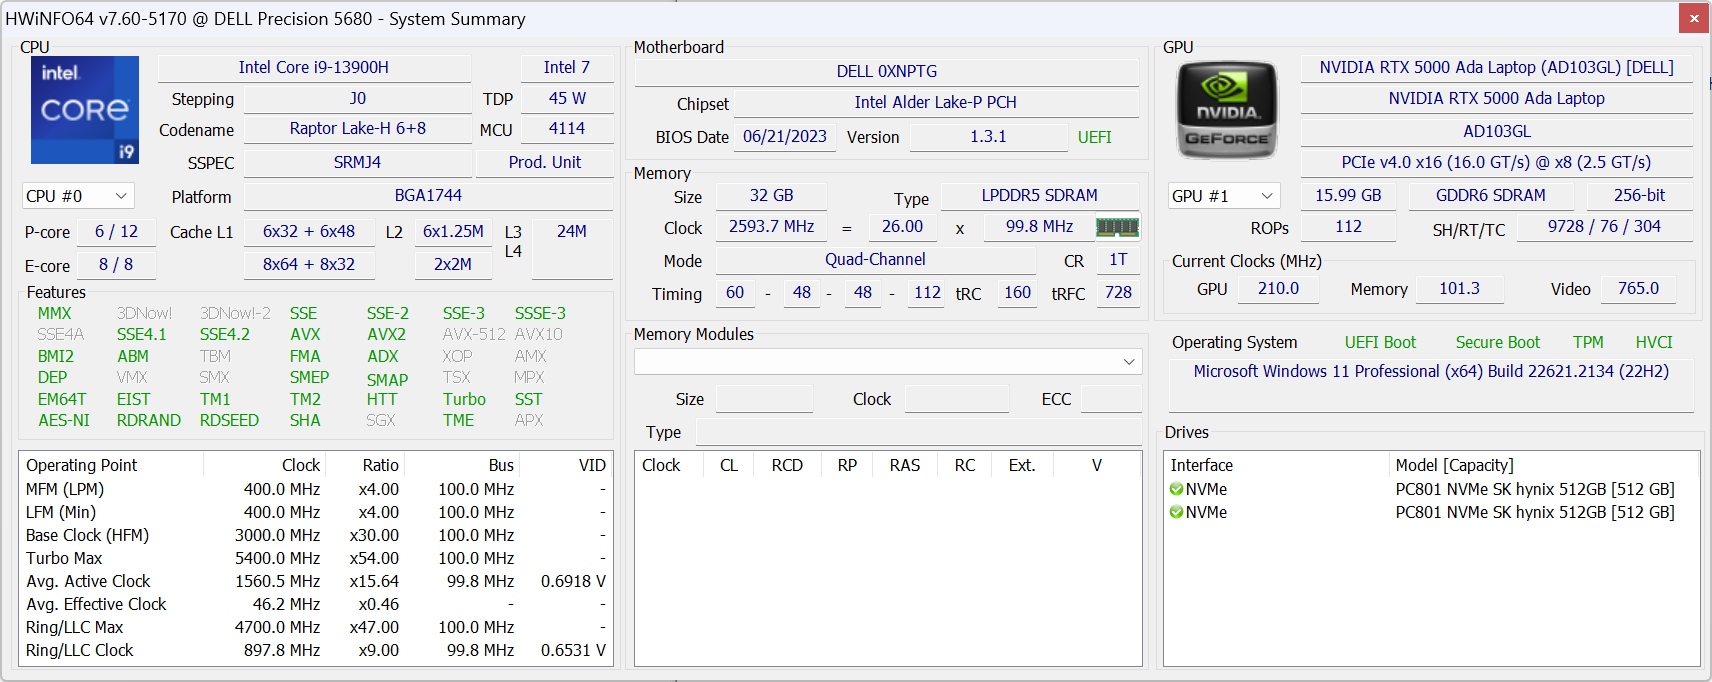
Wydajność - Intel 13. generacji Raptor Lake-H
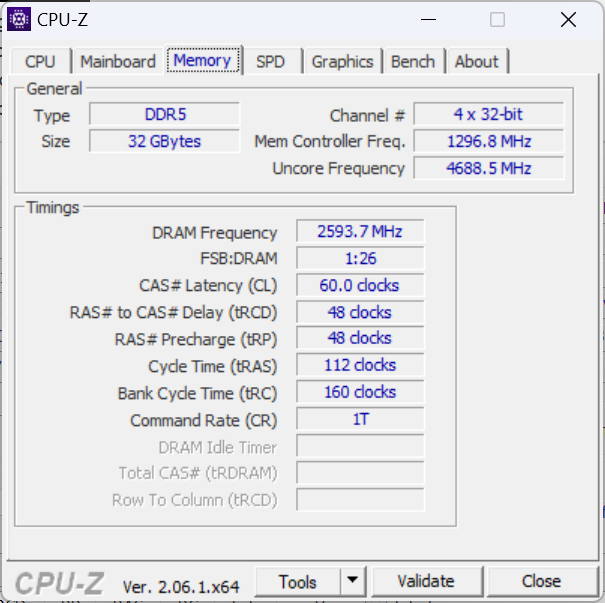
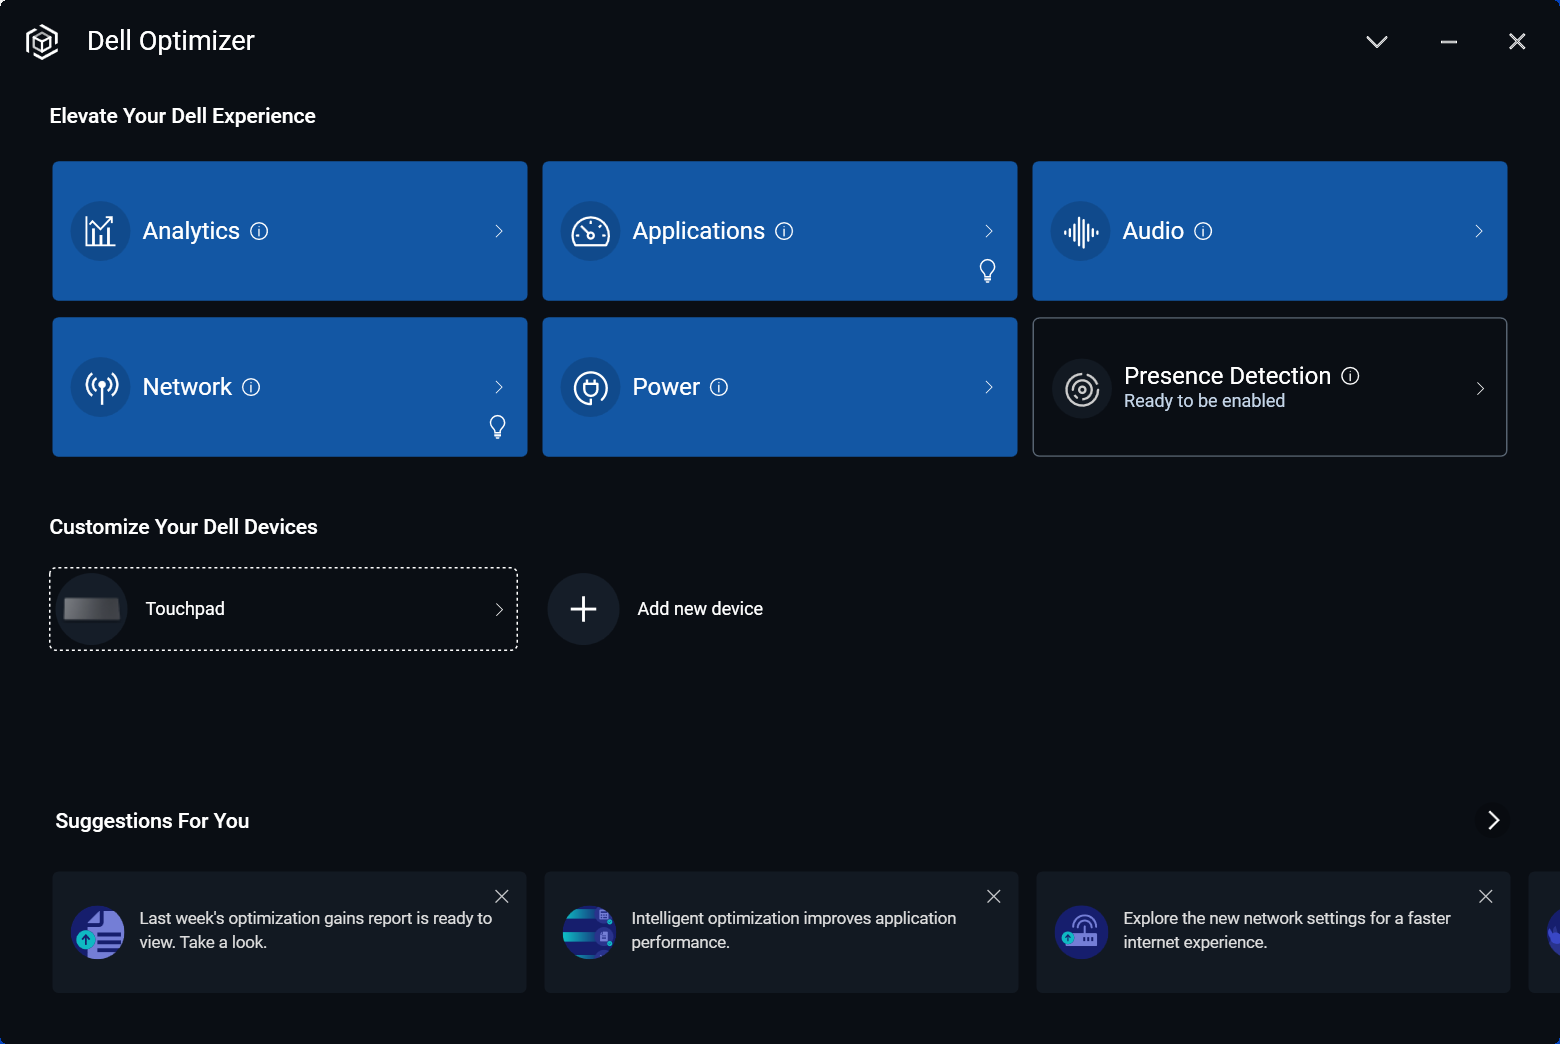
Warunki testowania
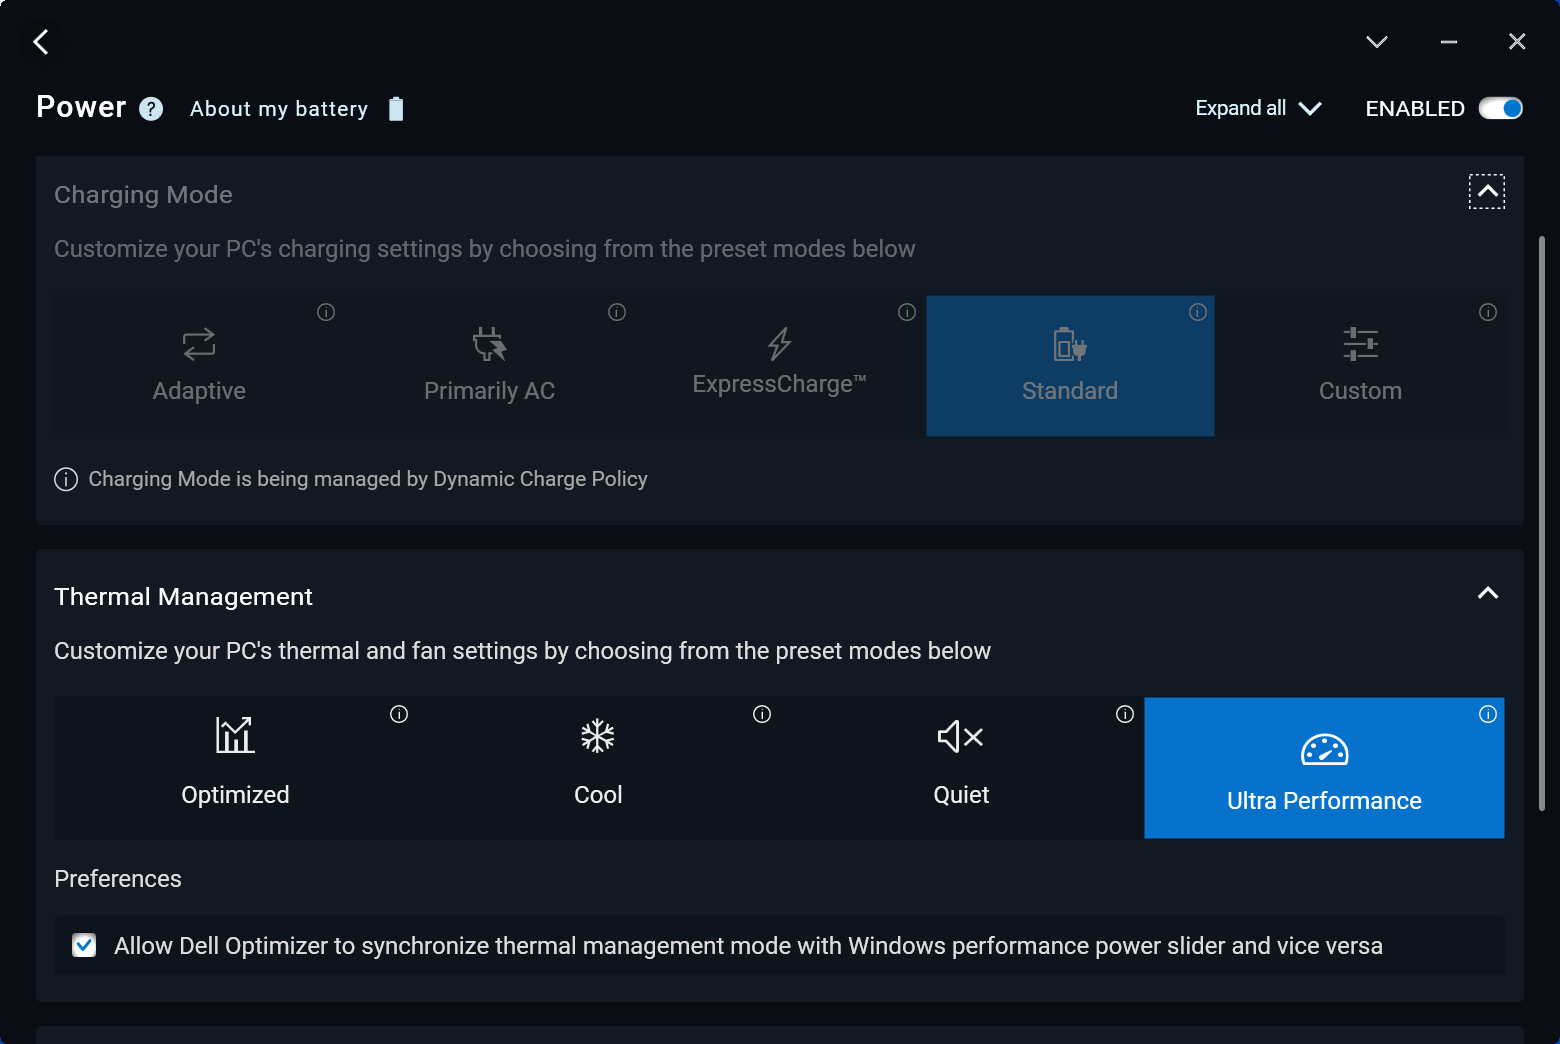
Przed uruchomieniem poniższych testów porównawczych ustawiliśmy naszą jednostkę na tryb Ultra Performance za pomocą oprogramowania Dell Optimizer. Profile zasilania Optimizer można wygodnie zsynchronizować z profilami zasilania systemu Windows, w przeciwieństwie do wyspecjalizowanych profili zasilania większości innych producentów.
Advanced Optimus lub Optimus 2.0 nie są obsługiwane. Nowością w przypadku procesorów graficznych Ada Lovelace dla stacji roboczych jest tryb ECC VRAM, który można włączać i wyłączać za pośrednictwem Panelu sterowania Nvidia. Podczas przełączania tej funkcji wymagane jest ponowne uruchomienie komputera.
Procesor
Procesor 13. generacji Core i9-13900H jest rozczarowujący w tym sensie, że nie jest zauważalnym skokiem naprzód w stosunku do zeszłorocznej 12. generacji Core i9-12900H. Wydajność, na przykład, byłaby zasadniczo identyczna zAsus ProArt StudioBook 16 działającego na starszym Core i9-12900H, z wyjątkiem niewielkiego 5 do 10 procentowego wzrostu w operacjach jednowątkowych. Szkoda, że Precision 5680 nie oferuje procesora Core i9-13900HX który zapewniłby znacznie bardziej znaczący wzrost wydajności w porównaniu do dowolnego mobilnego procesora Alder Lake-H.
Należy również pamiętać, że w serii Precision 5680 nie ma również opcji procesorów klasy Xeon lub W, co oznacza brak obsługi pamięci RAM ECC.
Obniżenie wersji do Core i7-13700H z naszego i9-13900H prawdopodobnie zmniejszy wydajność wielowątkową o około 20 procent w oparciu o nasz czas pracy zSchenker Vision 16 Pro.
Cinebench R15 Multi Loop
Cinebench R23: Multi Core | Single Core
Cinebench R20: CPU (Multi Core) | CPU (Single Core)
Cinebench R15: CPU Multi 64Bit | CPU Single 64Bit
Blender: v2.79 BMW27 CPU
7-Zip 18.03: 7z b 4 | 7z b 4 -mmt1
Geekbench 5.5: Multi-Core | Single-Core
HWBOT x265 Benchmark v2.2: 4k Preset
LibreOffice : 20 Documents To PDF
R Benchmark 2.5: Overall mean
| CPU Performance rating | |
| Lenovo Legion Pro 7 16IRX8H | |
| Lenovo ThinkPad P16 G1 RTX A5500 | |
| Asus ExpertBook B6 Flip B6602FC2 | |
| Asus ProArt StudioBook 16 H7600ZW | |
| Dell Precision 5000 5680 | |
| Lenovo ThinkPad P16 G1 21D6001DMB | |
| Przeciętny Intel Core i9-13900H | |
| Dell Precision 7000 7670 Performance | |
| MSI CreatorPro Z16P B12UKST | |
| Schenker VISION 16 Pro (M23) | |
| HP ZBook Studio 15 G8 | |
| Lenovo ThinkPad P1 G4-20Y4Z9DVUS | |
| Asus ProArt StudioBook 16 W7600H5A-2BL2 | |
| Lenovo ThinkPad P15v G3 21EM001AGE | |
| HP ZBook Studio G7 | |
| Cinebench R23 / Multi Core | |
| Lenovo Legion Pro 7 16IRX8H | |
| Lenovo ThinkPad P16 G1 RTX A5500 | |
| Asus ExpertBook B6 Flip B6602FC2 | |
| Asus ProArt StudioBook 16 H7600ZW | |
| Dell Precision 5000 5680 | |
| Lenovo ThinkPad P16 G1 21D6001DMB | |
| MSI CreatorPro Z16P B12UKST | |
| Przeciętny Intel Core i9-13900H (11997 - 20385, n=28) | |
| Dell Precision 7000 7670 Performance | |
| Schenker VISION 16 Pro (M23) | |
| Lenovo ThinkPad P15v G3 21EM001AGE | |
| Lenovo ThinkPad P1 G4-20Y4Z9DVUS | |
| HP ZBook Studio 15 G8 | |
| Asus ProArt StudioBook 16 W7600H5A-2BL2 | |
| HP ZBook Studio G7 | |
| Cinebench R23 / Single Core | |
| Lenovo Legion Pro 7 16IRX8H | |
| Dell Precision 5000 5680 | |
| Przeciętny Intel Core i9-13900H (1297 - 2054, n=26) | |
| Asus ExpertBook B6 Flip B6602FC2 | |
| Schenker VISION 16 Pro (M23) | |
| Lenovo ThinkPad P16 G1 RTX A5500 | |
| Asus ProArt StudioBook 16 H7600ZW | |
| Lenovo ThinkPad P16 G1 21D6001DMB | |
| MSI CreatorPro Z16P B12UKST | |
| HP ZBook Studio 15 G8 | |
| Lenovo ThinkPad P1 G4-20Y4Z9DVUS | |
| Asus ProArt StudioBook 16 W7600H5A-2BL2 | |
| Lenovo ThinkPad P15v G3 21EM001AGE | |
| Dell Precision 7000 7670 Performance | |
| HP ZBook Studio G7 | |
| Cinebench R20 / CPU (Multi Core) | |
| Lenovo Legion Pro 7 16IRX8H | |
| Asus ExpertBook B6 Flip B6602FC2 | |
| Lenovo ThinkPad P16 G1 RTX A5500 | |
| Asus ProArt StudioBook 16 H7600ZW | |
| Dell Precision 5000 5680 | |
| Lenovo ThinkPad P16 G1 21D6001DMB | |
| MSI CreatorPro Z16P B12UKST | |
| Dell Precision 7000 7670 Performance | |
| Przeciętny Intel Core i9-13900H (4935 - 7716, n=25) | |
| Schenker VISION 16 Pro (M23) | |
| Lenovo ThinkPad P15v G3 21EM001AGE | |
| Lenovo ThinkPad P15v G3 21EM001AGE | |
| Lenovo ThinkPad P1 G4-20Y4Z9DVUS | |
| HP ZBook Studio 15 G8 | |
| Asus ProArt StudioBook 16 W7600H5A-2BL2 | |
| HP ZBook Studio G7 | |
| Cinebench R20 / CPU (Single Core) | |
| Lenovo Legion Pro 7 16IRX8H | |
| Dell Precision 5000 5680 | |
| Asus ProArt StudioBook 16 H7600ZW | |
| Schenker VISION 16 Pro (M23) | |
| Asus ExpertBook B6 Flip B6602FC2 | |
| Lenovo ThinkPad P16 G1 RTX A5500 | |
| Przeciętny Intel Core i9-13900H (428 - 792, n=25) | |
| Lenovo ThinkPad P16 G1 21D6001DMB | |
| Dell Precision 7000 7670 Performance | |
| MSI CreatorPro Z16P B12UKST | |
| HP ZBook Studio 15 G8 | |
| Lenovo ThinkPad P1 G4-20Y4Z9DVUS | |
| Lenovo ThinkPad P15v G3 21EM001AGE | |
| Lenovo ThinkPad P15v G3 21EM001AGE | |
| Asus ProArt StudioBook 16 W7600H5A-2BL2 | |
| HP ZBook Studio G7 | |
| Cinebench R15 / CPU Multi 64Bit | |
| Lenovo Legion Pro 7 16IRX8H | |
| Asus ExpertBook B6 Flip B6602FC2 | |
| Lenovo ThinkPad P16 G1 RTX A5500 | |
| Lenovo ThinkPad P16 G1 21D6001DMB | |
| Asus ProArt StudioBook 16 H7600ZW | |
| Dell Precision 7000 7670 Performance | |
| Przeciętny Intel Core i9-13900H (2061 - 3100, n=26) | |
| Dell Precision 5000 5680 | |
| Schenker VISION 16 Pro (M23) | |
| MSI CreatorPro Z16P B12UKST | |
| Lenovo ThinkPad P1 G4-20Y4Z9DVUS | |
| Lenovo ThinkPad P15v G3 21EM001AGE | |
| Asus ProArt StudioBook 16 W7600H5A-2BL2 | |
| HP ZBook Studio 15 G8 | |
| HP ZBook Studio G7 | |
| Cinebench R15 / CPU Single 64Bit | |
| Lenovo Legion Pro 7 16IRX8H | |
| Dell Precision 5000 5680 | |
| Asus ProArt StudioBook 16 H7600ZW | |
| Schenker VISION 16 Pro (M23) | |
| Asus ExpertBook B6 Flip B6602FC2 | |
| Lenovo ThinkPad P16 G1 RTX A5500 | |
| Przeciętny Intel Core i9-13900H (211 - 297, n=26) | |
| Lenovo ThinkPad P16 G1 21D6001DMB | |
| Dell Precision 7000 7670 Performance | |
| MSI CreatorPro Z16P B12UKST | |
| HP ZBook Studio 15 G8 | |
| Lenovo ThinkPad P1 G4-20Y4Z9DVUS | |
| Asus ProArt StudioBook 16 W7600H5A-2BL2 | |
| HP ZBook Studio G7 | |
| Lenovo ThinkPad P15v G3 21EM001AGE | |
| Blender / v2.79 BMW27 CPU | |
| HP ZBook Studio G7 | |
| Asus ProArt StudioBook 16 W7600H5A-2BL2 | |
| HP ZBook Studio 15 G8 | |
| Lenovo ThinkPad P1 G4-20Y4Z9DVUS | |
| Lenovo ThinkPad P15v G3 21EM001AGE | |
| Schenker VISION 16 Pro (M23) | |
| Przeciętny Intel Core i9-13900H (166 - 268, n=24) | |
| MSI CreatorPro Z16P B12UKST | |
| Dell Precision 5000 5680 | |
| Dell Precision 7000 7670 Performance | |
| Asus ExpertBook B6 Flip B6602FC2 | |
| Lenovo ThinkPad P16 G1 21D6001DMB | |
| Asus ProArt StudioBook 16 H7600ZW | |
| Lenovo ThinkPad P16 G1 RTX A5500 | |
| Lenovo Legion Pro 7 16IRX8H | |
| 7-Zip 18.03 / 7z b 4 | |
| Lenovo Legion Pro 7 16IRX8H | |
| Lenovo ThinkPad P16 G1 RTX A5500 | |
| Asus ProArt StudioBook 16 H7600ZW | |
| Asus ExpertBook B6 Flip B6602FC2 | |
| Dell Precision 5000 5680 | |
| Lenovo ThinkPad P16 G1 21D6001DMB | |
| MSI CreatorPro Z16P B12UKST | |
| Przeciętny Intel Core i9-13900H (45045 - 79032, n=25) | |
| Dell Precision 7000 7670 Performance | |
| Schenker VISION 16 Pro (M23) | |
| Lenovo ThinkPad P15v G3 21EM001AGE | |
| Lenovo ThinkPad P1 G4-20Y4Z9DVUS | |
| HP ZBook Studio 15 G8 | |
| Asus ProArt StudioBook 16 W7600H5A-2BL2 | |
| HP ZBook Studio G7 | |
| 7-Zip 18.03 / 7z b 4 -mmt1 | |
| Lenovo Legion Pro 7 16IRX8H | |
| Asus ProArt StudioBook 16 H7600ZW | |
| Schenker VISION 16 Pro (M23) | |
| Asus ExpertBook B6 Flip B6602FC2 | |
| Dell Precision 5000 5680 | |
| Lenovo ThinkPad P16 G1 RTX A5500 | |
| Przeciętny Intel Core i9-13900H (3665 - 6600, n=25) | |
| Dell Precision 7000 7670 Performance | |
| Lenovo ThinkPad P16 G1 21D6001DMB | |
| HP ZBook Studio 15 G8 | |
| MSI CreatorPro Z16P B12UKST | |
| HP ZBook Studio G7 | |
| Lenovo ThinkPad P1 G4-20Y4Z9DVUS | |
| Lenovo ThinkPad P15v G3 21EM001AGE | |
| Asus ProArt StudioBook 16 W7600H5A-2BL2 | |
| Geekbench 5.5 / Multi-Core | |
| Lenovo Legion Pro 7 16IRX8H | |
| Asus ExpertBook B6 Flip B6602FC2 | |
| Lenovo ThinkPad P16 G1 RTX A5500 | |
| Dell Precision 5000 5680 | |
| Asus ProArt StudioBook 16 H7600ZW | |
| Dell Precision 7000 7670 Performance | |
| Lenovo ThinkPad P16 G1 21D6001DMB | |
| Przeciętny Intel Core i9-13900H (9094 - 15410, n=26) | |
| MSI CreatorPro Z16P B12UKST | |
| Schenker VISION 16 Pro (M23) | |
| Asus ProArt StudioBook 16 W7600H5A-2BL2 | |
| Lenovo ThinkPad P1 G4-20Y4Z9DVUS | |
| Lenovo ThinkPad P15v G3 21EM001AGE | |
| HP ZBook Studio G7 | |
| HP ZBook Studio 15 G8 | |
| Geekbench 5.5 / Single-Core | |
| Dell Precision 5000 5680 | |
| Lenovo Legion Pro 7 16IRX8H | |
| Lenovo ThinkPad P16 G1 RTX A5500 | |
| Dell Precision 7000 7670 Performance | |
| Przeciętny Intel Core i9-13900H (1140 - 2043, n=26) | |
| Asus ExpertBook B6 Flip B6602FC2 | |
| Schenker VISION 16 Pro (M23) | |
| Asus ProArt StudioBook 16 H7600ZW | |
| MSI CreatorPro Z16P B12UKST | |
| Lenovo ThinkPad P16 G1 21D6001DMB | |
| HP ZBook Studio 15 G8 | |
| Lenovo ThinkPad P1 G4-20Y4Z9DVUS | |
| Asus ProArt StudioBook 16 W7600H5A-2BL2 | |
| Lenovo ThinkPad P15v G3 21EM001AGE | |
| HP ZBook Studio G7 | |
| HWBOT x265 Benchmark v2.2 / 4k Preset | |
| Lenovo Legion Pro 7 16IRX8H | |
| Lenovo ThinkPad P16 G1 RTX A5500 | |
| Asus ProArt StudioBook 16 H7600ZW | |
| Asus ExpertBook B6 Flip B6602FC2 | |
| Dell Precision 5000 5680 | |
| MSI CreatorPro Z16P B12UKST | |
| Dell Precision 7000 7670 Performance | |
| Przeciętny Intel Core i9-13900H (14.1 - 22.3, n=25) | |
| Lenovo ThinkPad P16 G1 21D6001DMB | |
| Schenker VISION 16 Pro (M23) | |
| HP ZBook Studio 15 G8 | |
| Lenovo ThinkPad P1 G4-20Y4Z9DVUS | |
| Asus ProArt StudioBook 16 W7600H5A-2BL2 | |
| Lenovo ThinkPad P15v G3 21EM001AGE | |
| HP ZBook Studio G7 | |
| LibreOffice / 20 Documents To PDF | |
| Lenovo ThinkPad P15v G3 21EM001AGE | |
| HP ZBook Studio G7 | |
| Lenovo ThinkPad P1 G4-20Y4Z9DVUS | |
| HP ZBook Studio 15 G8 | |
| Schenker VISION 16 Pro (M23) | |
| Przeciętny Intel Core i9-13900H (34.4 - 82.8, n=25) | |
| Lenovo ThinkPad P16 G1 21D6001DMB | |
| Lenovo Legion Pro 7 16IRX8H | |
| Dell Precision 7000 7670 Performance | |
| Asus ProArt StudioBook 16 H7600ZW | |
| Asus ExpertBook B6 Flip B6602FC2 | |
| Dell Precision 5000 5680 | |
| Lenovo ThinkPad P16 G1 RTX A5500 | |
| MSI CreatorPro Z16P B12UKST | |
| Asus ProArt StudioBook 16 W7600H5A-2BL2 | |
| R Benchmark 2.5 / Overall mean | |
| Asus ProArt StudioBook 16 W7600H5A-2BL2 | |
| HP ZBook Studio G7 | |
| Lenovo ThinkPad P1 G4-20Y4Z9DVUS | |
| HP ZBook Studio 15 G8 | |
| Lenovo ThinkPad P15v G3 21EM001AGE | |
| MSI CreatorPro Z16P B12UKST | |
| Asus ExpertBook B6 Flip B6602FC2 | |
| Lenovo ThinkPad P16 G1 21D6001DMB | |
| Przeciętny Intel Core i9-13900H (0.4052 - 0.723, n=25) | |
| Dell Precision 7000 7670 Performance | |
| Lenovo ThinkPad P16 G1 RTX A5500 | |
| Asus ProArt StudioBook 16 H7600ZW | |
| Schenker VISION 16 Pro (M23) | |
| Dell Precision 5000 5680 | |
| Lenovo Legion Pro 7 16IRX8H | |
Cinebench R23: Multi Core | Single Core
Cinebench R20: CPU (Multi Core) | CPU (Single Core)
Cinebench R15: CPU Multi 64Bit | CPU Single 64Bit
Blender: v2.79 BMW27 CPU
7-Zip 18.03: 7z b 4 | 7z b 4 -mmt1
Geekbench 5.5: Multi-Core | Single-Core
HWBOT x265 Benchmark v2.2: 4k Preset
LibreOffice : 20 Documents To PDF
R Benchmark 2.5: Overall mean
* ... im mniej tym lepiej
AIDA64: FP32 Ray-Trace | FPU Julia | CPU SHA3 | CPU Queen | FPU SinJulia | FPU Mandel | CPU AES | CPU ZLib | FP64 Ray-Trace | CPU PhotoWorxx
| Performance rating | |
| Lenovo ThinkPad P16 G1 RTX A5500 | |
| HP ZBook Fury 16 G9 | |
| Dell Precision 5000 5680 | |
| MSI CreatorPro Z16P B12UKST | |
| Asus ExpertBook B6 Flip B6602FC2 | |
| Przeciętny Intel Core i9-13900H | |
| Dell Precision 7000 7670 Performance | |
| AIDA64 / FP32 Ray-Trace | |
| Lenovo ThinkPad P16 G1 RTX A5500 | |
| HP ZBook Fury 16 G9 | |
| Asus ExpertBook B6 Flip B6602FC2 | |
| Dell Precision 5000 5680 | |
| Dell Precision 7000 7670 Performance | |
| Przeciętny Intel Core i9-13900H (6788 - 19557, n=25) | |
| MSI CreatorPro Z16P B12UKST | |
| AIDA64 / FPU Julia | |
| HP ZBook Fury 16 G9 | |
| Lenovo ThinkPad P16 G1 RTX A5500 | |
| Asus ExpertBook B6 Flip B6602FC2 | |
| Dell Precision 5000 5680 | |
| Dell Precision 7000 7670 Performance | |
| Przeciętny Intel Core i9-13900H (22551 - 95579, n=25) | |
| MSI CreatorPro Z16P B12UKST | |
| AIDA64 / CPU SHA3 | |
| Lenovo ThinkPad P16 G1 RTX A5500 | |
| HP ZBook Fury 16 G9 | |
| MSI CreatorPro Z16P B12UKST | |
| Przeciętny Intel Core i9-13900H (2491 - 4270, n=25) | |
| Dell Precision 5000 5680 | |
| Asus ExpertBook B6 Flip B6602FC2 | |
| Dell Precision 7000 7670 Performance | |
| AIDA64 / CPU Queen | |
| Dell Precision 5000 5680 | |
| Przeciętny Intel Core i9-13900H (65121 - 120936, n=25) | |
| Lenovo ThinkPad P16 G1 RTX A5500 | |
| Dell Precision 7000 7670 Performance | |
| Asus ExpertBook B6 Flip B6602FC2 | |
| HP ZBook Fury 16 G9 | |
| MSI CreatorPro Z16P B12UKST | |
| AIDA64 / FPU SinJulia | |
| Lenovo ThinkPad P16 G1 RTX A5500 | |
| HP ZBook Fury 16 G9 | |
| Asus ExpertBook B6 Flip B6602FC2 | |
| Dell Precision 7000 7670 Performance | |
| Dell Precision 5000 5680 | |
| Przeciętny Intel Core i9-13900H (6108 - 11631, n=25) | |
| MSI CreatorPro Z16P B12UKST | |
| AIDA64 / FPU Mandel | |
| HP ZBook Fury 16 G9 | |
| Lenovo ThinkPad P16 G1 RTX A5500 | |
| Asus ExpertBook B6 Flip B6602FC2 | |
| Dell Precision 5000 5680 | |
| Przeciętny Intel Core i9-13900H (11283 - 48474, n=25) | |
| Dell Precision 7000 7670 Performance | |
| MSI CreatorPro Z16P B12UKST | |
| AIDA64 / CPU AES | |
| MSI CreatorPro Z16P B12UKST | |
| HP ZBook Fury 16 G9 | |
| Lenovo ThinkPad P16 G1 RTX A5500 | |
| Przeciętny Intel Core i9-13900H (3691 - 149377, n=25) | |
| Asus ExpertBook B6 Flip B6602FC2 | |
| Dell Precision 7000 7670 Performance | |
| Dell Precision 5000 5680 | |
| AIDA64 / CPU ZLib | |
| Lenovo ThinkPad P16 G1 RTX A5500 | |
| HP ZBook Fury 16 G9 | |
| Przeciętny Intel Core i9-13900H (789 - 1254, n=25) | |
| Asus ExpertBook B6 Flip B6602FC2 | |
| MSI CreatorPro Z16P B12UKST | |
| Dell Precision 5000 5680 | |
| Dell Precision 7000 7670 Performance | |
| AIDA64 / FP64 Ray-Trace | |
| Lenovo ThinkPad P16 G1 RTX A5500 | |
| HP ZBook Fury 16 G9 | |
| Asus ExpertBook B6 Flip B6602FC2 | |
| Dell Precision 5000 5680 | |
| Dell Precision 7000 7670 Performance | |
| Przeciętny Intel Core i9-13900H (3655 - 10716, n=25) | |
| MSI CreatorPro Z16P B12UKST | |
| AIDA64 / CPU PhotoWorxx | |
| Dell Precision 5000 5680 | |
| MSI CreatorPro Z16P B12UKST | |
| Dell Precision 7000 7670 Performance | |
| Lenovo ThinkPad P16 G1 RTX A5500 | |
| Przeciętny Intel Core i9-13900H (10871 - 50488, n=25) | |
| HP ZBook Fury 16 G9 | |
| Asus ExpertBook B6 Flip B6602FC2 | |
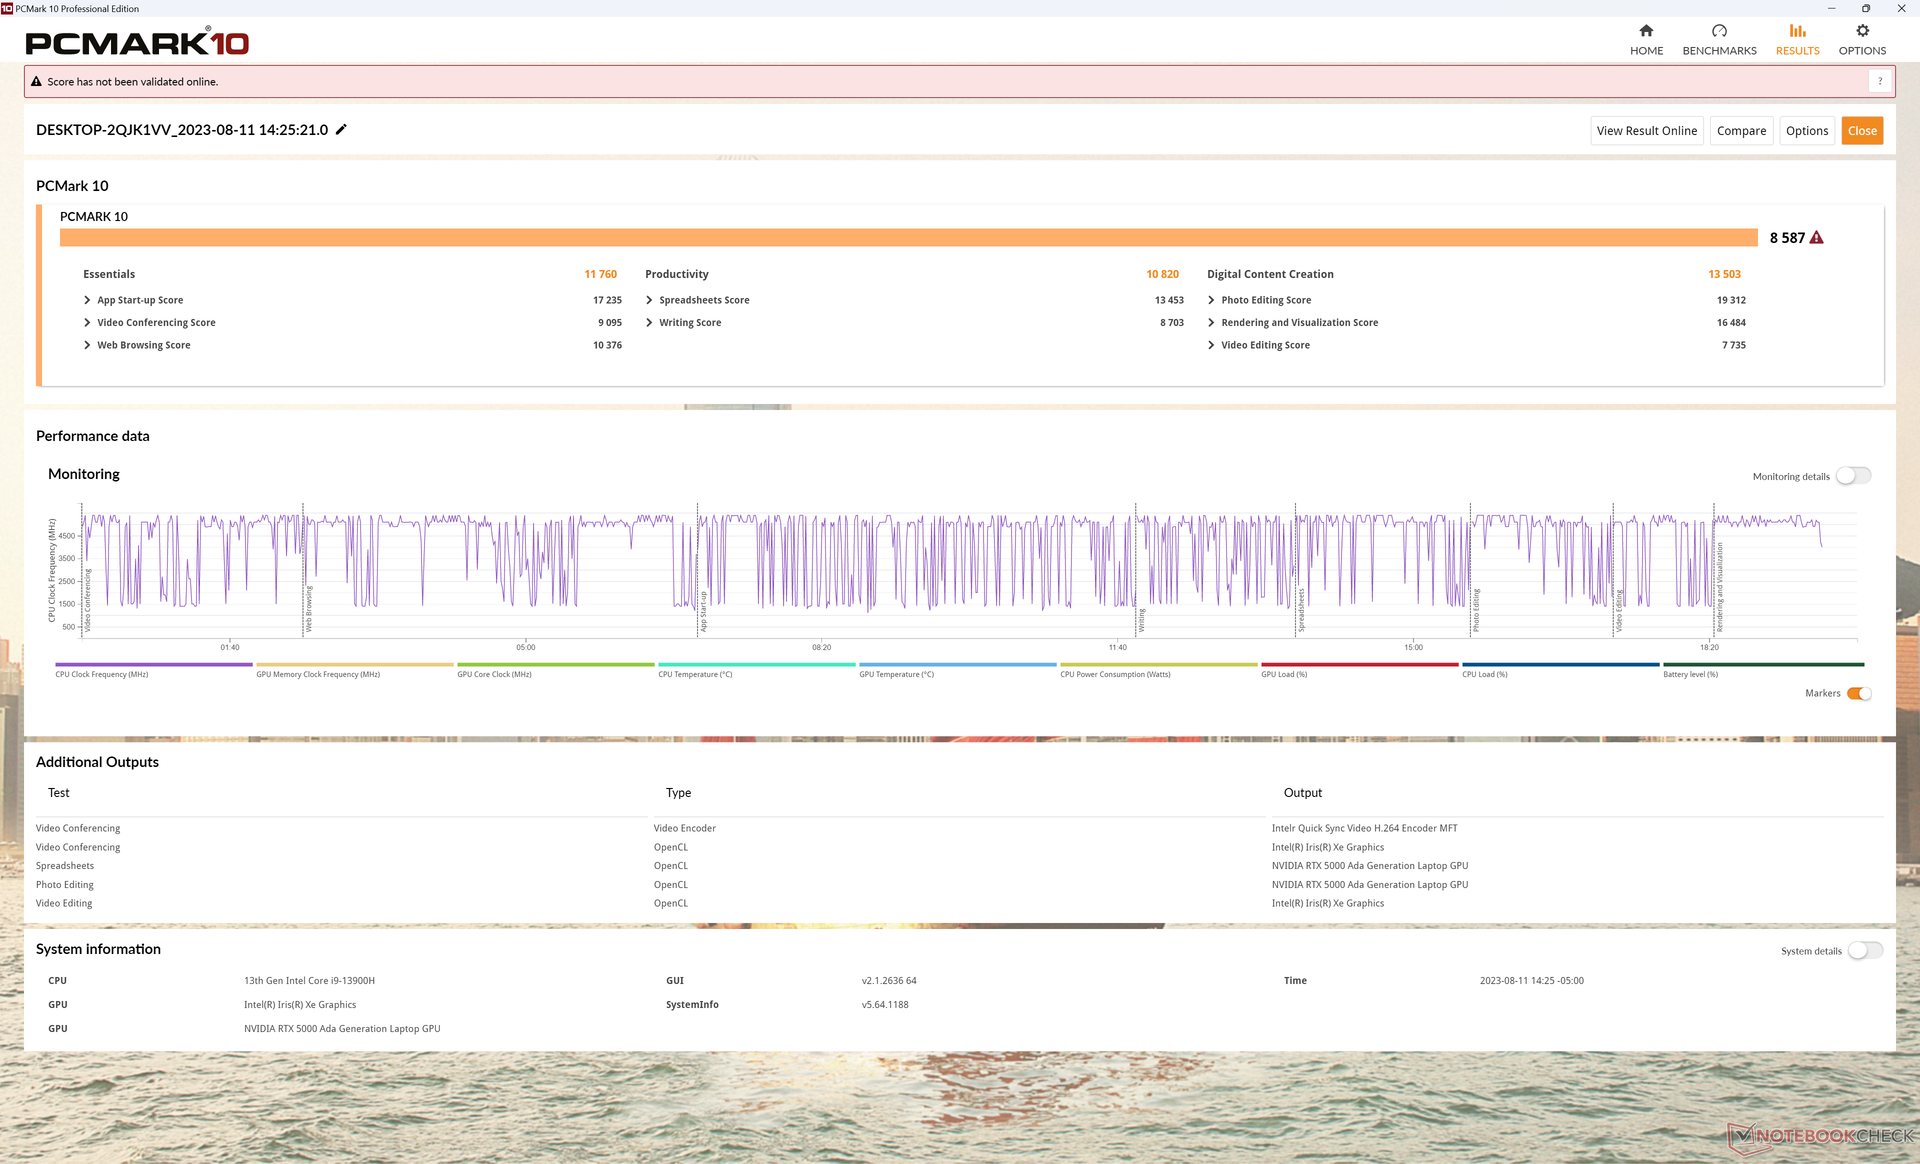
Wydajność systemu
Wyniki PCMark są wyższe niż w przypadku większości innych stacji roboczych o stosunkowo szeroki margines, w tym nawet niektórych mocnych produktów, takich jak HP ZBook Fury 16 G9 lubPrecision 7670 Performance. Można to przypisać naszej konfiguracji RAID 0 SSD i GPU RTX 5000, podczas gdy większość innych stacji roboczych działa na pojedynczych dyskach SSD i GPU starszej generacji.
CrossMark: Overall | Productivity | Creativity | Responsiveness
| PCMark 10 / Score | |
| Dell Precision 5000 5680 | |
| Przeciętny Intel Core i9-13900H, NVIDIA RTX 5000 Ada Generation Laptop (n=1) | |
| Asus ExpertBook B6 Flip B6602FC2 | |
| Lenovo ThinkPad P16 G1 RTX A5500 | |
| MSI CreatorPro Z16P B12UKST | |
| HP ZBook Fury 16 G9 | |
| Dell Precision 7000 7670 Performance | |
| PCMark 10 / Essentials | |
| Dell Precision 5000 5680 | |
| Przeciętny Intel Core i9-13900H, NVIDIA RTX 5000 Ada Generation Laptop (n=1) | |
| Dell Precision 7000 7670 Performance | |
| HP ZBook Fury 16 G9 | |
| Lenovo ThinkPad P16 G1 RTX A5500 | |
| Asus ExpertBook B6 Flip B6602FC2 | |
| MSI CreatorPro Z16P B12UKST | |
| PCMark 10 / Productivity | |
| Dell Precision 5000 5680 | |
| Przeciętny Intel Core i9-13900H, NVIDIA RTX 5000 Ada Generation Laptop (n=1) | |
| Asus ExpertBook B6 Flip B6602FC2 | |
| Lenovo ThinkPad P16 G1 RTX A5500 | |
| MSI CreatorPro Z16P B12UKST | |
| HP ZBook Fury 16 G9 | |
| Dell Precision 7000 7670 Performance | |
| PCMark 10 / Digital Content Creation | |
| Dell Precision 5000 5680 | |
| Przeciętny Intel Core i9-13900H, NVIDIA RTX 5000 Ada Generation Laptop (n=1) | |
| Lenovo ThinkPad P16 G1 RTX A5500 | |
| MSI CreatorPro Z16P B12UKST | |
| Dell Precision 7000 7670 Performance | |
| HP ZBook Fury 16 G9 | |
| Asus ExpertBook B6 Flip B6602FC2 | |
| CrossMark / Overall | |
| Asus ExpertBook B6 Flip B6602FC2 | |
| MSI CreatorPro Z16P B12UKST | |
| Dell Precision 5000 5680 | |
| Przeciętny Intel Core i9-13900H, NVIDIA RTX 5000 Ada Generation Laptop (n=1) | |
| HP ZBook Fury 16 G9 | |
| Lenovo ThinkPad P16 G1 RTX A5500 | |
| Dell Precision 7000 7670 Performance | |
| CrossMark / Productivity | |
| Asus ExpertBook B6 Flip B6602FC2 | |
| MSI CreatorPro Z16P B12UKST | |
| Dell Precision 5000 5680 | |
| Przeciętny Intel Core i9-13900H, NVIDIA RTX 5000 Ada Generation Laptop (n=1) | |
| HP ZBook Fury 16 G9 | |
| Lenovo ThinkPad P16 G1 RTX A5500 | |
| Dell Precision 7000 7670 Performance | |
| CrossMark / Creativity | |
| Lenovo ThinkPad P16 G1 RTX A5500 | |
| Dell Precision 5000 5680 | |
| Przeciętny Intel Core i9-13900H, NVIDIA RTX 5000 Ada Generation Laptop (n=1) | |
| Asus ExpertBook B6 Flip B6602FC2 | |
| HP ZBook Fury 16 G9 | |
| MSI CreatorPro Z16P B12UKST | |
| Dell Precision 7000 7670 Performance | |
| CrossMark / Responsiveness | |
| MSI CreatorPro Z16P B12UKST | |
| Asus ExpertBook B6 Flip B6602FC2 | |
| HP ZBook Fury 16 G9 | |
| Dell Precision 5000 5680 | |
| Przeciętny Intel Core i9-13900H, NVIDIA RTX 5000 Ada Generation Laptop (n=1) | |
| Dell Precision 7000 7670 Performance | |
| Lenovo ThinkPad P16 G1 RTX A5500 | |
| PCMark 10 Score | 8587 pkt. | |
Pomoc | ||
| AIDA64 / Memory Copy | |
| Dell Precision 5000 5680 | |
| Dell Precision 7000 7670 Performance | |
| Lenovo ThinkPad P16 G1 RTX A5500 | |
| MSI CreatorPro Z16P B12UKST | |
| Przeciętny Intel Core i9-13900H (37448 - 74486, n=25) | |
| HP ZBook Fury 16 G9 | |
| Asus ExpertBook B6 Flip B6602FC2 | |
| AIDA64 / Memory Read | |
| Dell Precision 7000 7670 Performance | |
| Dell Precision 5000 5680 | |
| MSI CreatorPro Z16P B12UKST | |
| Lenovo ThinkPad P16 G1 RTX A5500 | |
| Przeciętny Intel Core i9-13900H (41599 - 75433, n=25) | |
| Asus ExpertBook B6 Flip B6602FC2 | |
| HP ZBook Fury 16 G9 | |
| AIDA64 / Memory Write | |
| Dell Precision 5000 5680 | |
| MSI CreatorPro Z16P B12UKST | |
| Dell Precision 7000 7670 Performance | |
| Przeciętny Intel Core i9-13900H (36152 - 88505, n=25) | |
| Lenovo ThinkPad P16 G1 RTX A5500 | |
| Asus ExpertBook B6 Flip B6602FC2 | |
| HP ZBook Fury 16 G9 | |
| AIDA64 / Memory Latency | |
| MSI CreatorPro Z16P B12UKST | |
| Asus ExpertBook B6 Flip B6602FC2 | |
| Dell Precision 5000 5680 | |
| HP ZBook Fury 16 G9 | |
| Lenovo ThinkPad P16 G1 RTX A5500 | |
| Przeciętny Intel Core i9-13900H (75.8 - 102.3, n=25) | |
| Dell Precision 7000 7670 Performance | |
* ... im mniej tym lepiej
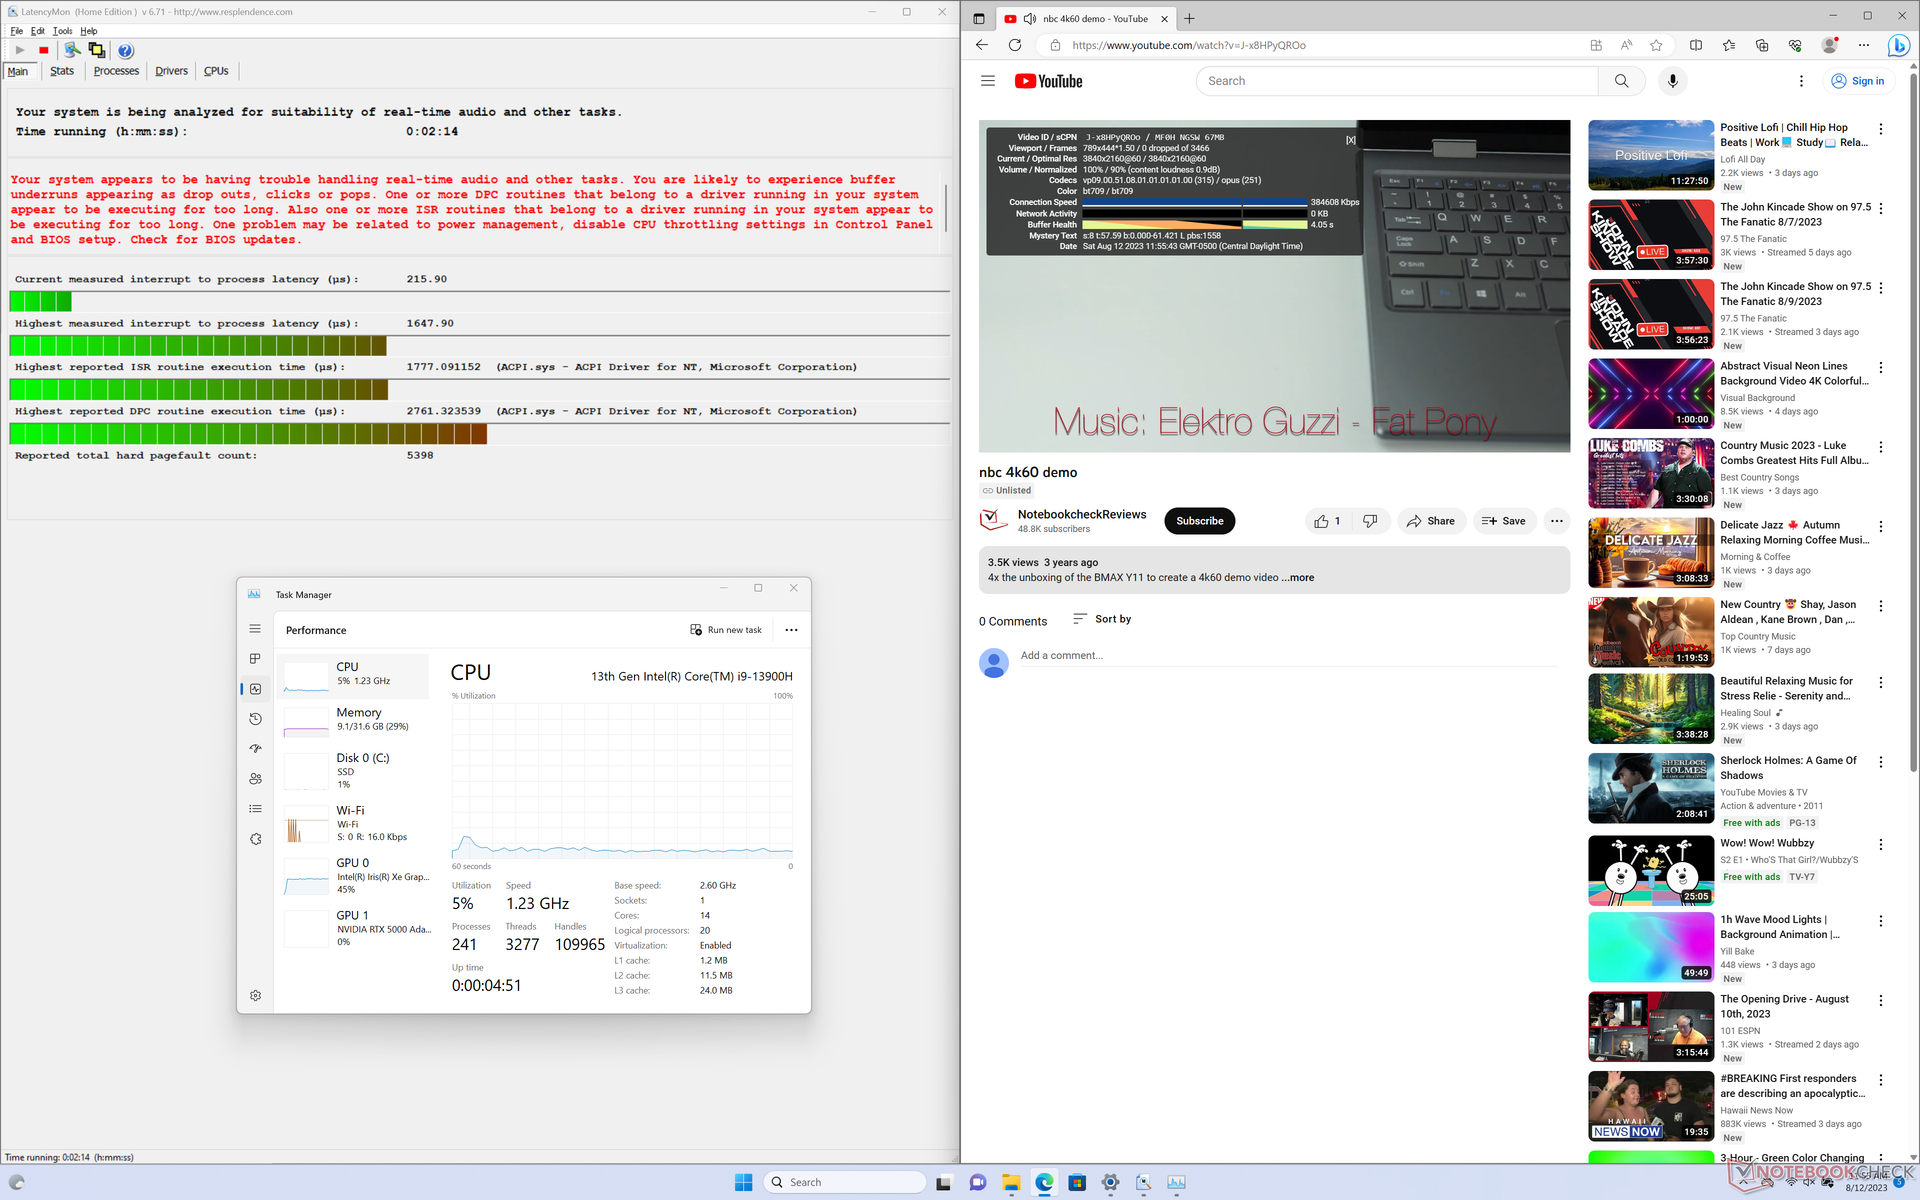
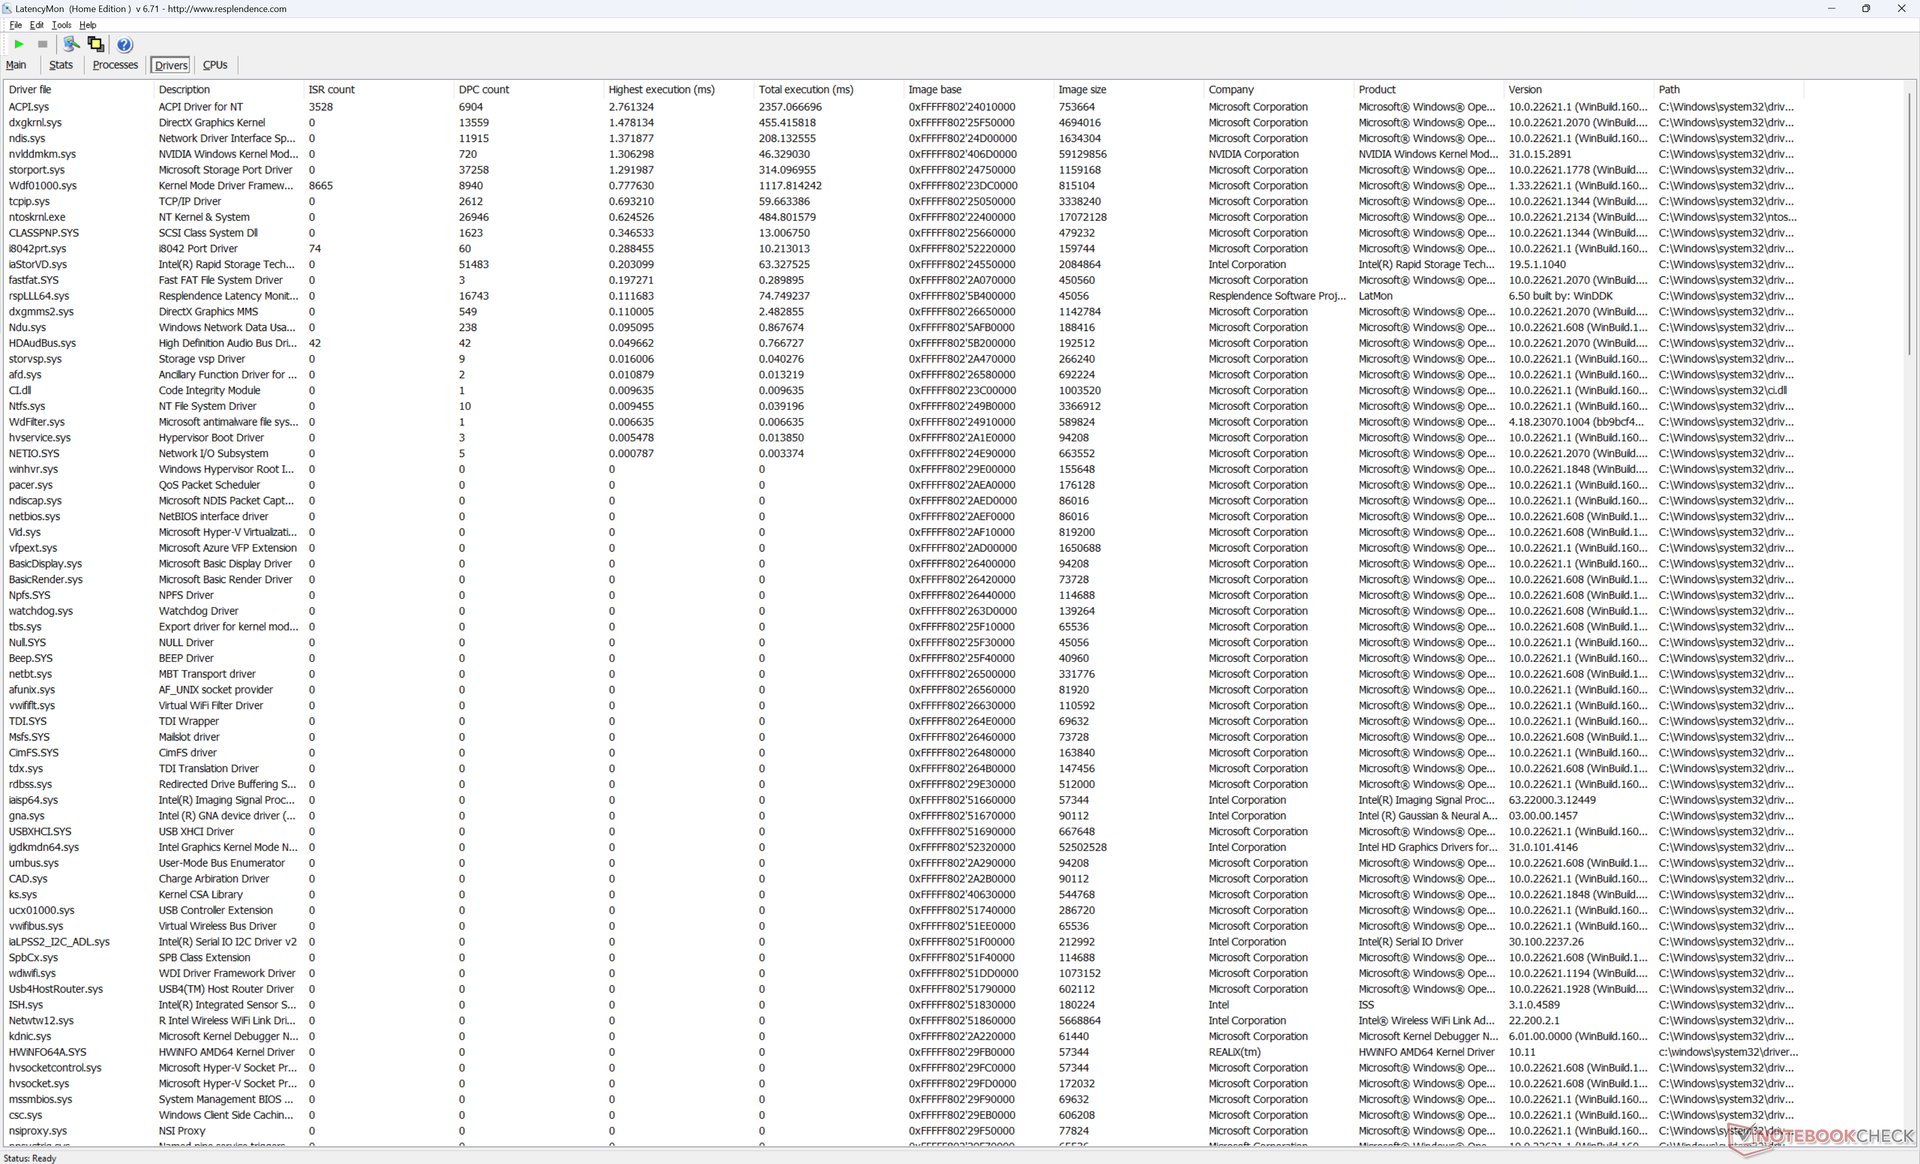
Opóźnienie DPC
LatencyMon ujawnia niewielkie problemy z DPC podczas otwierania wielu kart przeglądarki na naszej stronie głównej, podobne do tego, co zaobserwowaliśmy na Precision 7670. odtwarzanie wideo 4K przy 60 FPS jest poza tym idealne i nie odnotowano żadnych spadków klatek.
| DPC Latencies / LatencyMon - interrupt to process latency (max), Web, Youtube, Prime95 | |
| HP ZBook Fury 16 G9 | |
| Asus ExpertBook B6 Flip B6602FC2 | |
| Dell Precision 7000 7670 Performance | |
| Dell Precision 5000 5680 | |
| Lenovo ThinkPad P16 G1 RTX A5500 | |
| MSI CreatorPro Z16P B12UKST | |
* ... im mniej tym lepiej
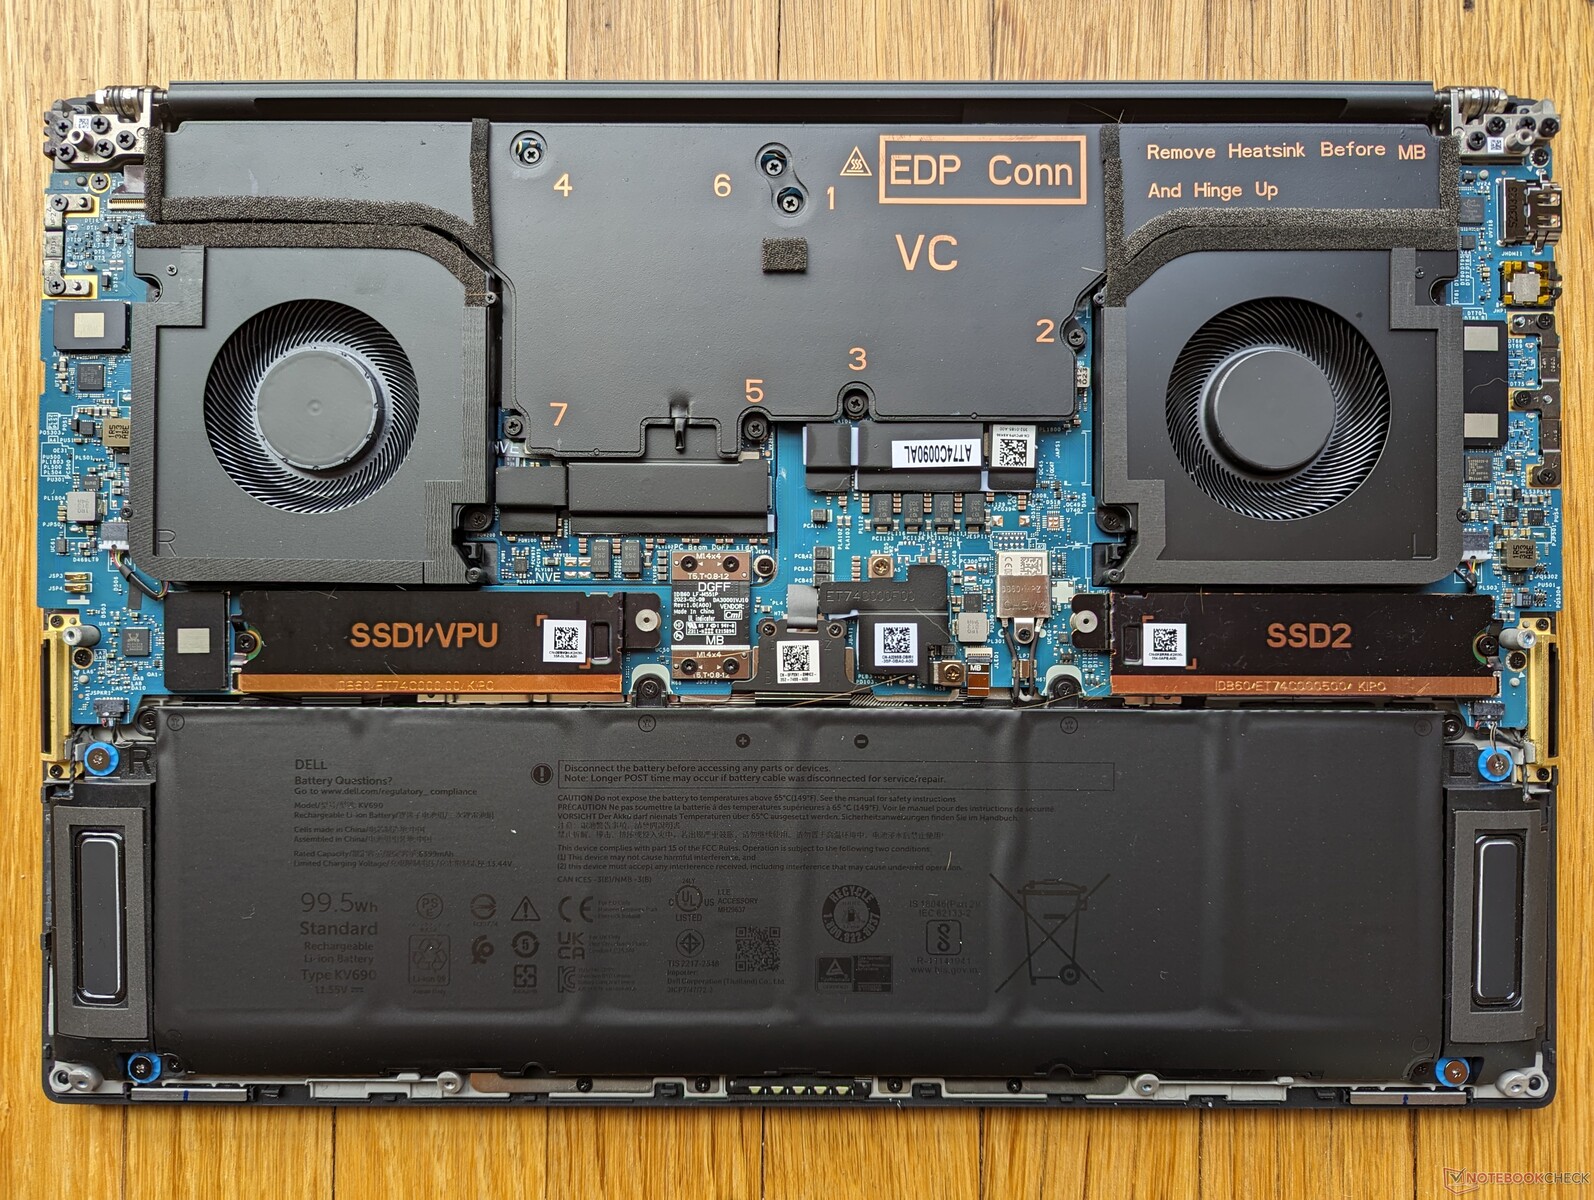
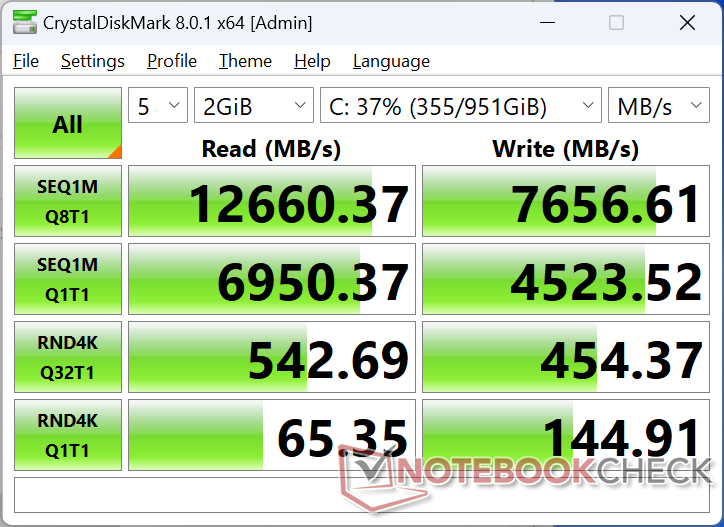
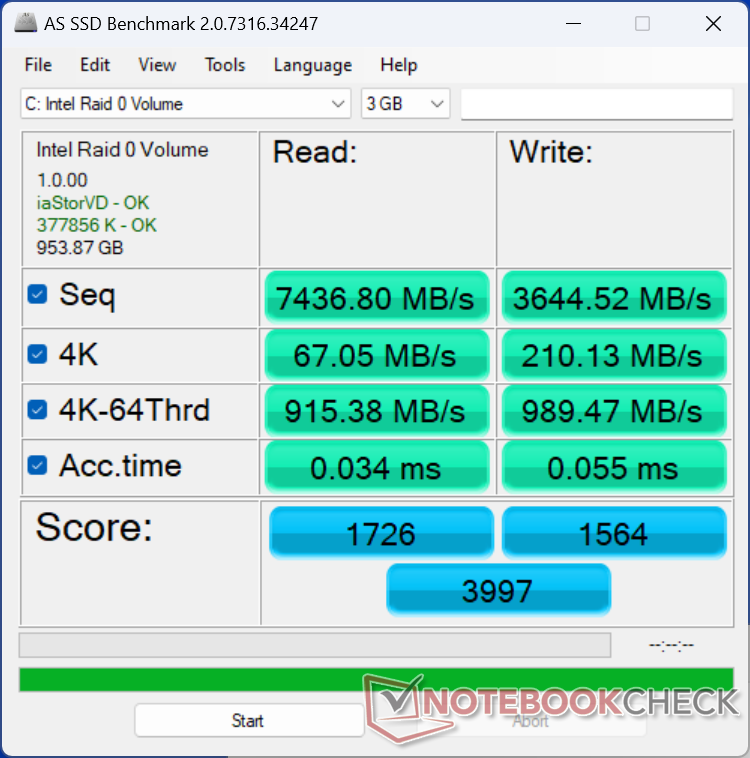
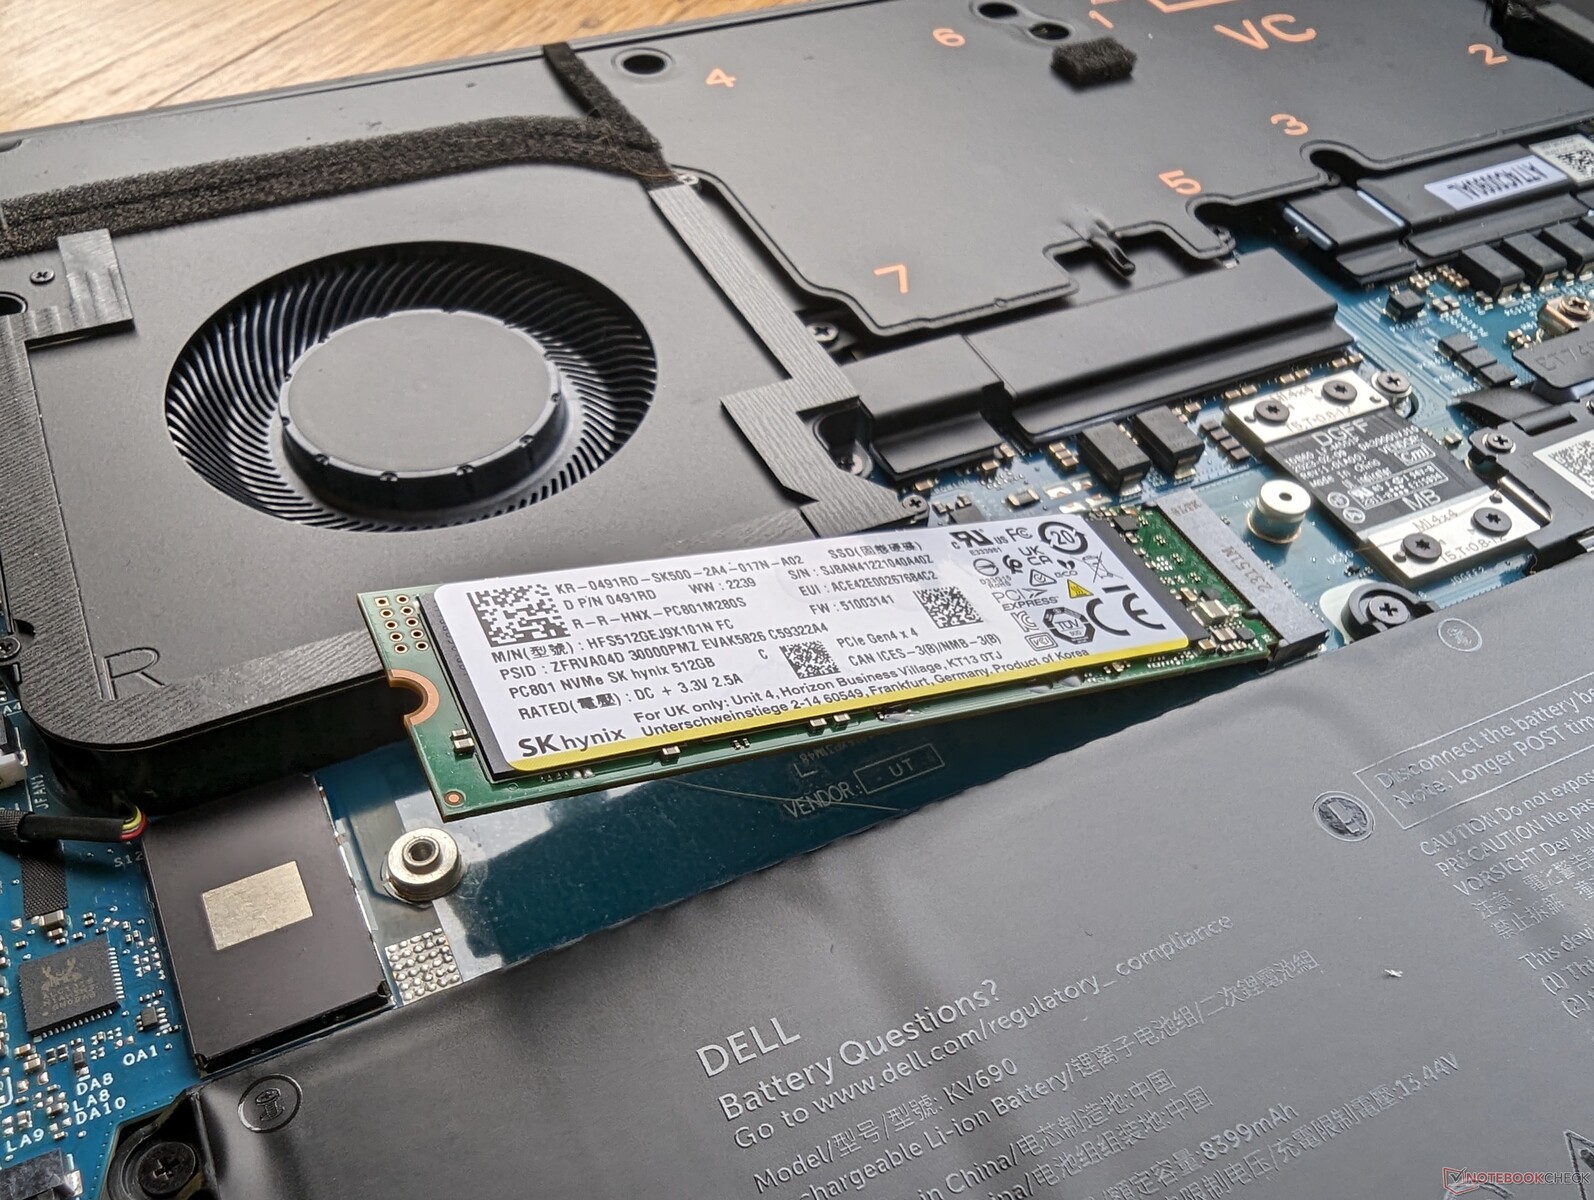
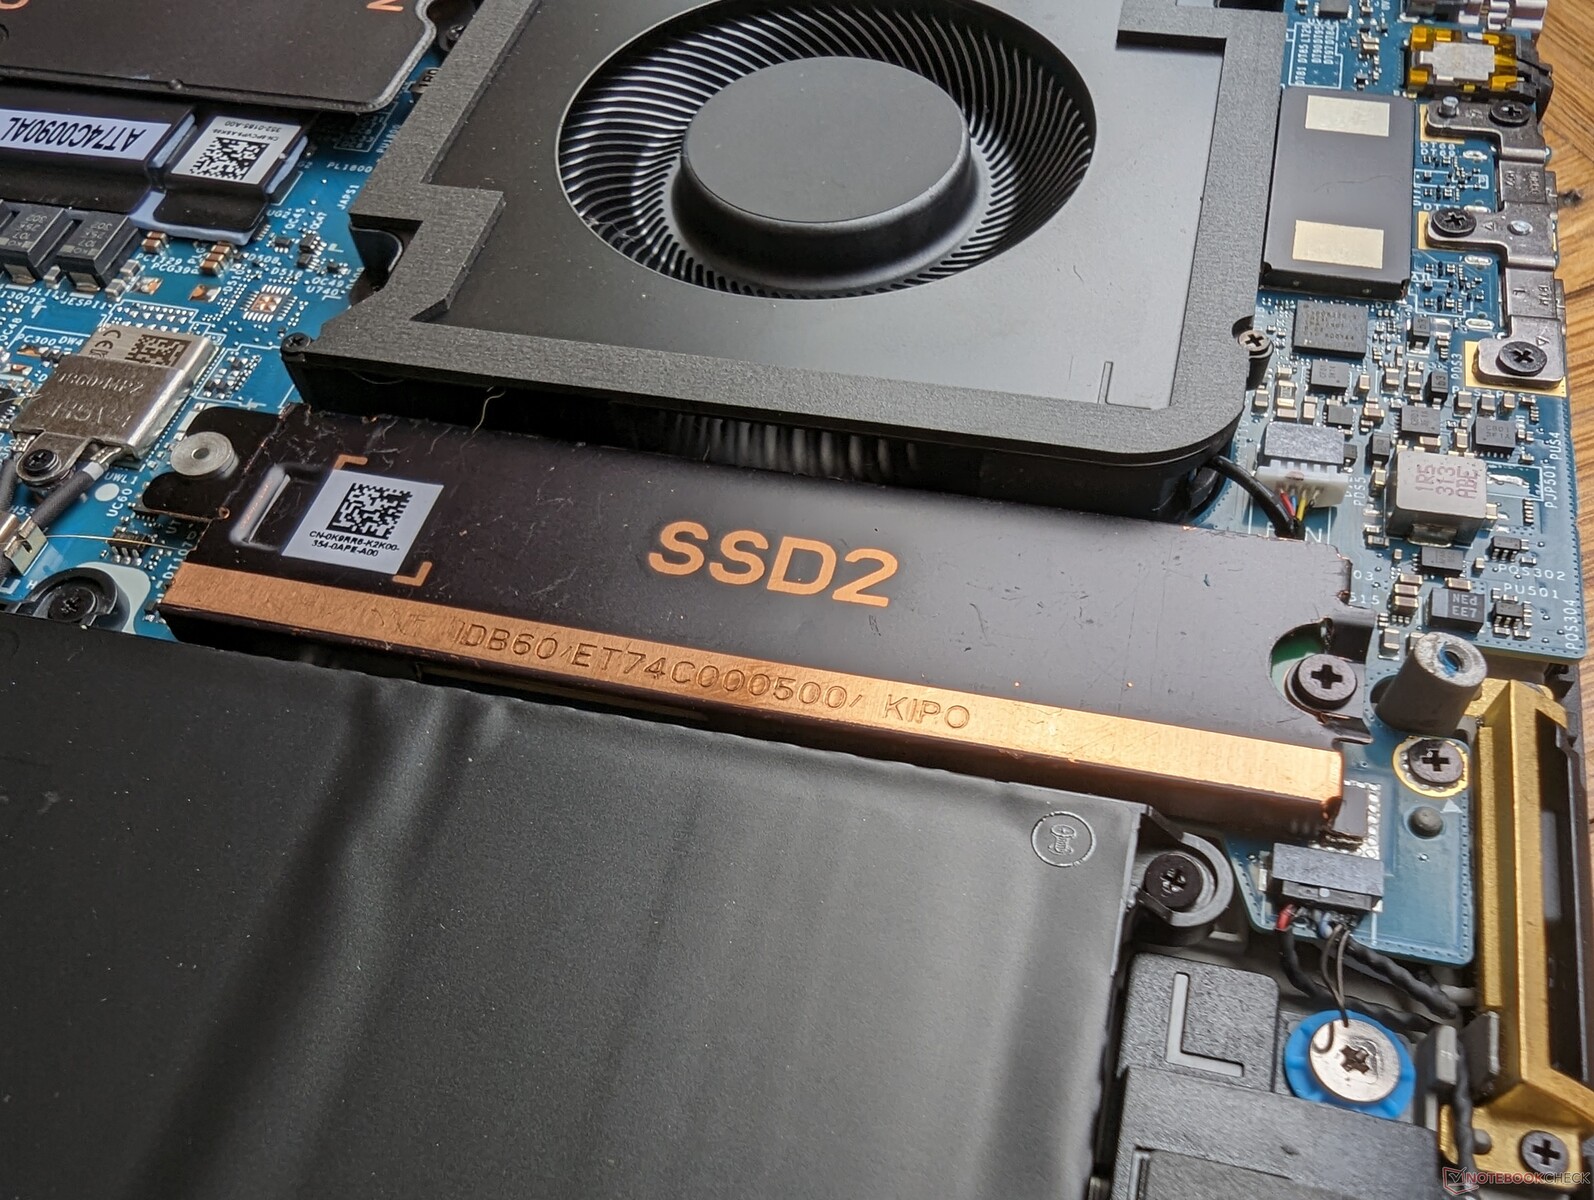
Urządzenia pamięci masowej - do dwóch dysków SSD PCIe4 x4 NVMe
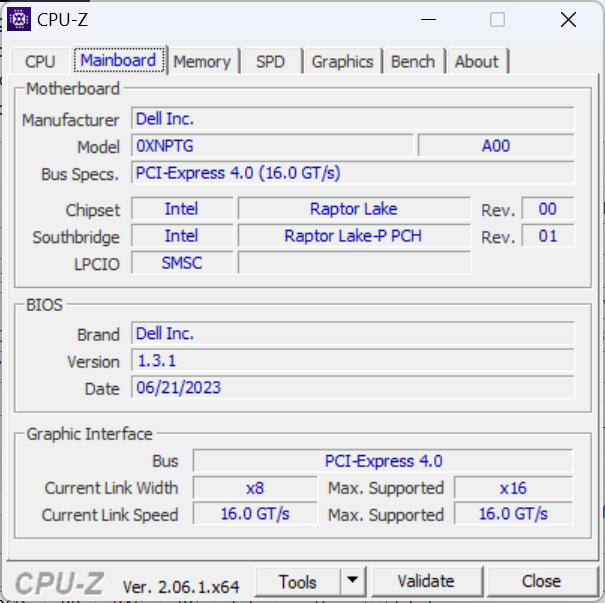
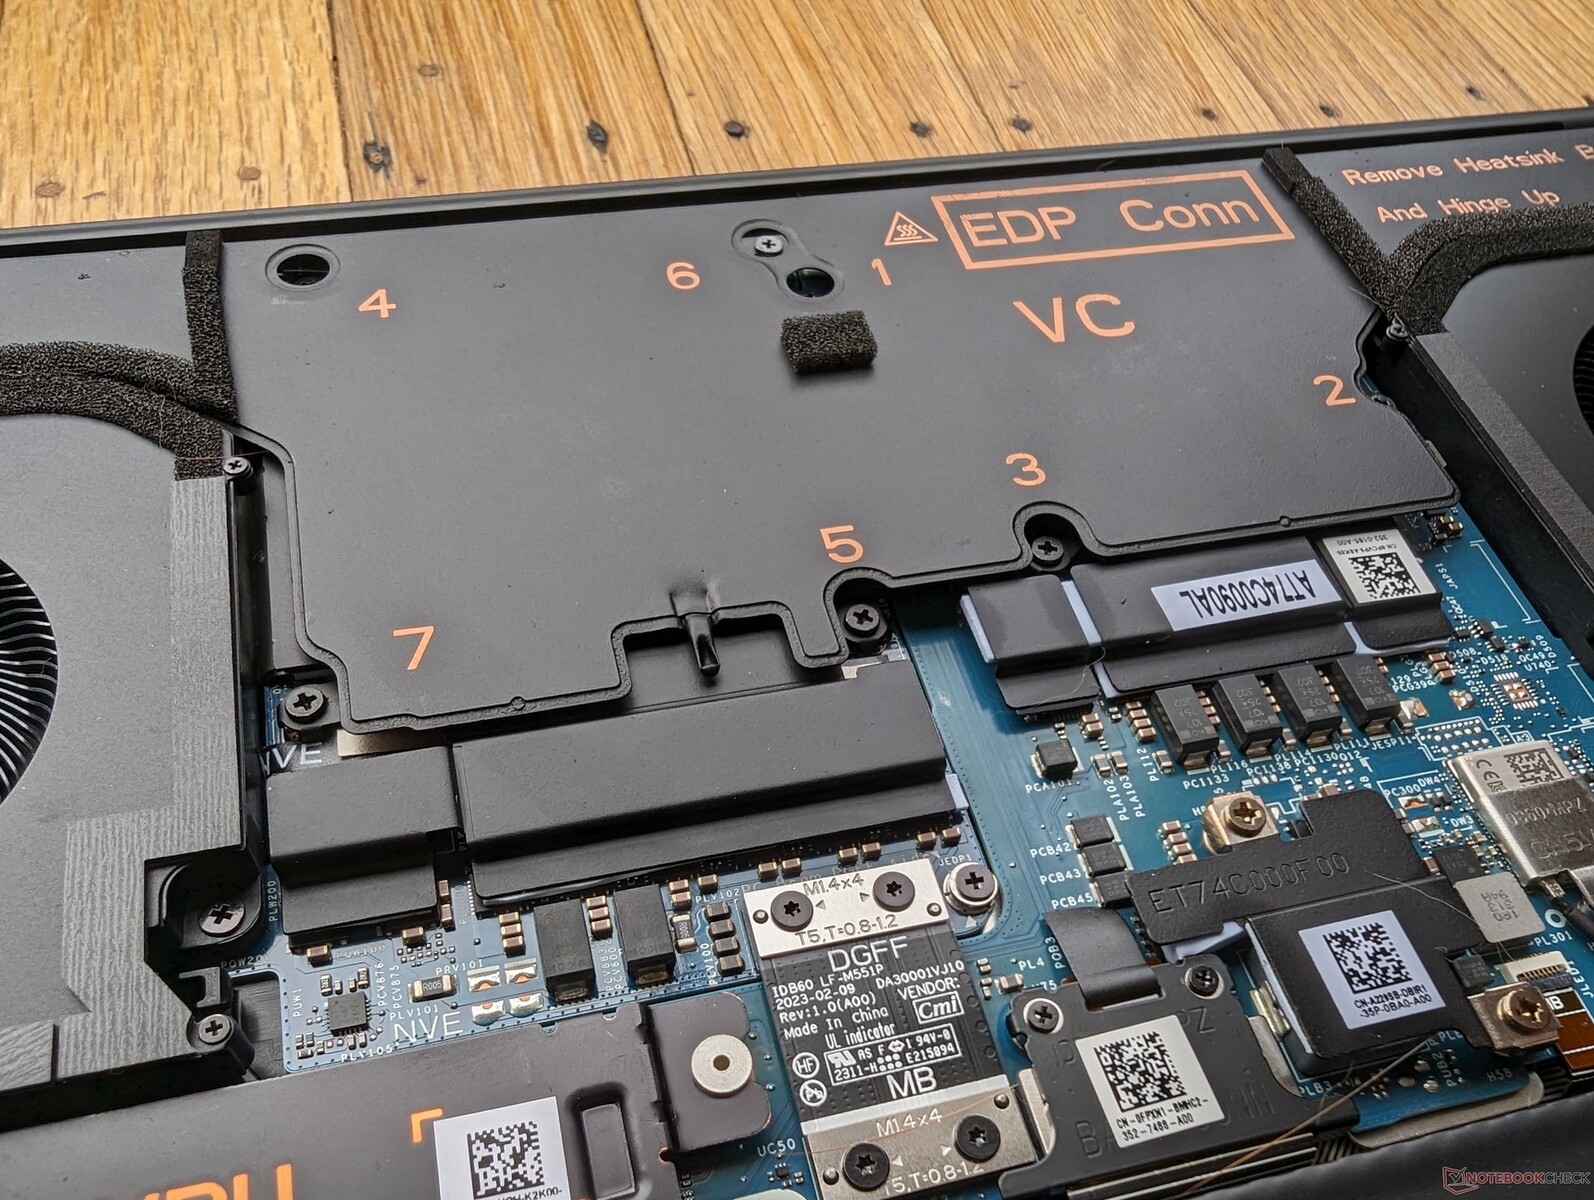
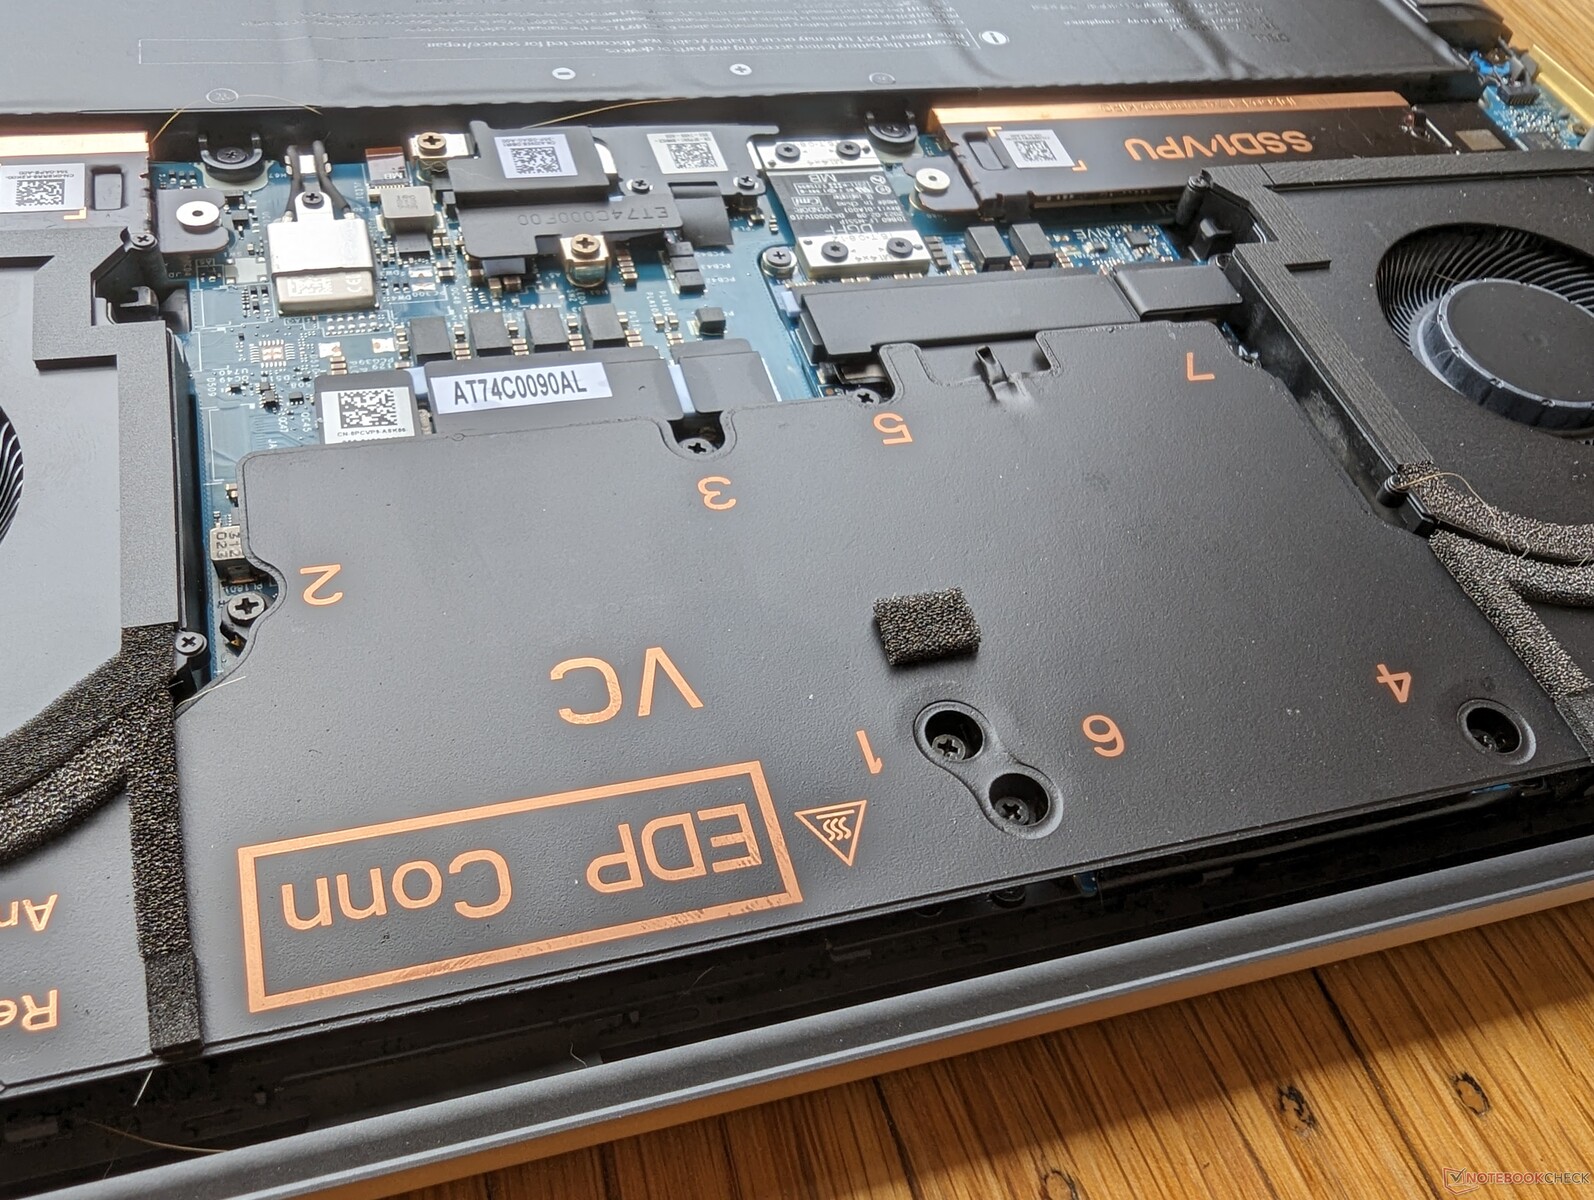
Nasza jednostka testowa jest dostarczana z tym samym SK hynix PC801 PCIe4 x4 NVMe SSD w konfiguracji RAID 0, które można znaleźć w serii Precision 7670. Podczas gdy obsługa PCIe5, jak w niektórych laptopach do gier byłoby miło zobaczyć, nie jest to obecnie ważna funkcja, biorąc pod uwagę, jak rzadkie są dyski SSD PCIe5. Dell oferuje opcje samoszyfrujących dysków SSD dla dodatkowego bezpieczeństwa.
Każde gniazdo M.2 SSD jest wyposażone w miedziany rozpraszacz ciepła, jak pokazano poniżej, aby pomóc w chłodzeniu. Każdy dysk w naszej jednostce nie miał problemów z utrzymaniem wysokich prędkości transferu na poziomie ~5400 MB/s przez długi czas, nie wykazując żadnych poważnych problemów z dławieniem.

* ... im mniej tym lepiej
Disk Throttling: DiskSpd Read Loop, Queue Depth 8
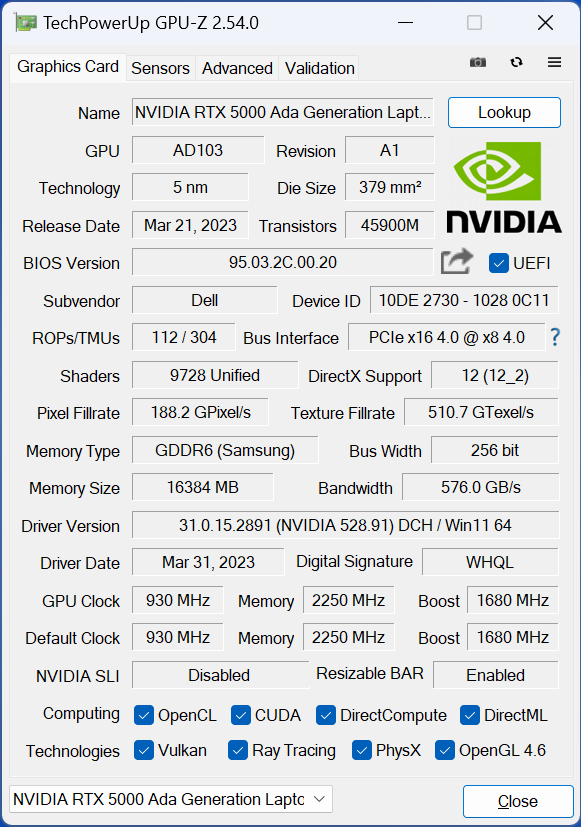
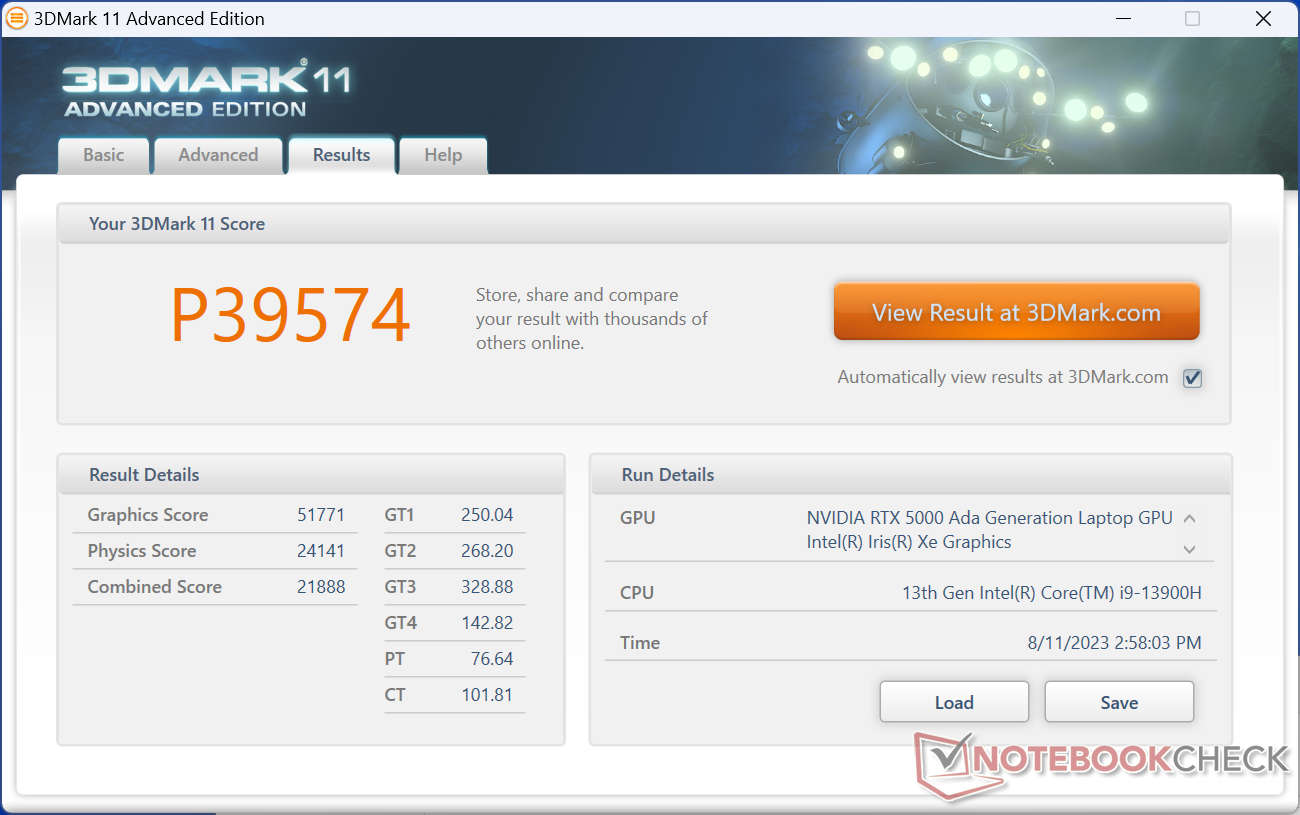
Wydajność GPU - 70 W Nvidia Ada Lovelace
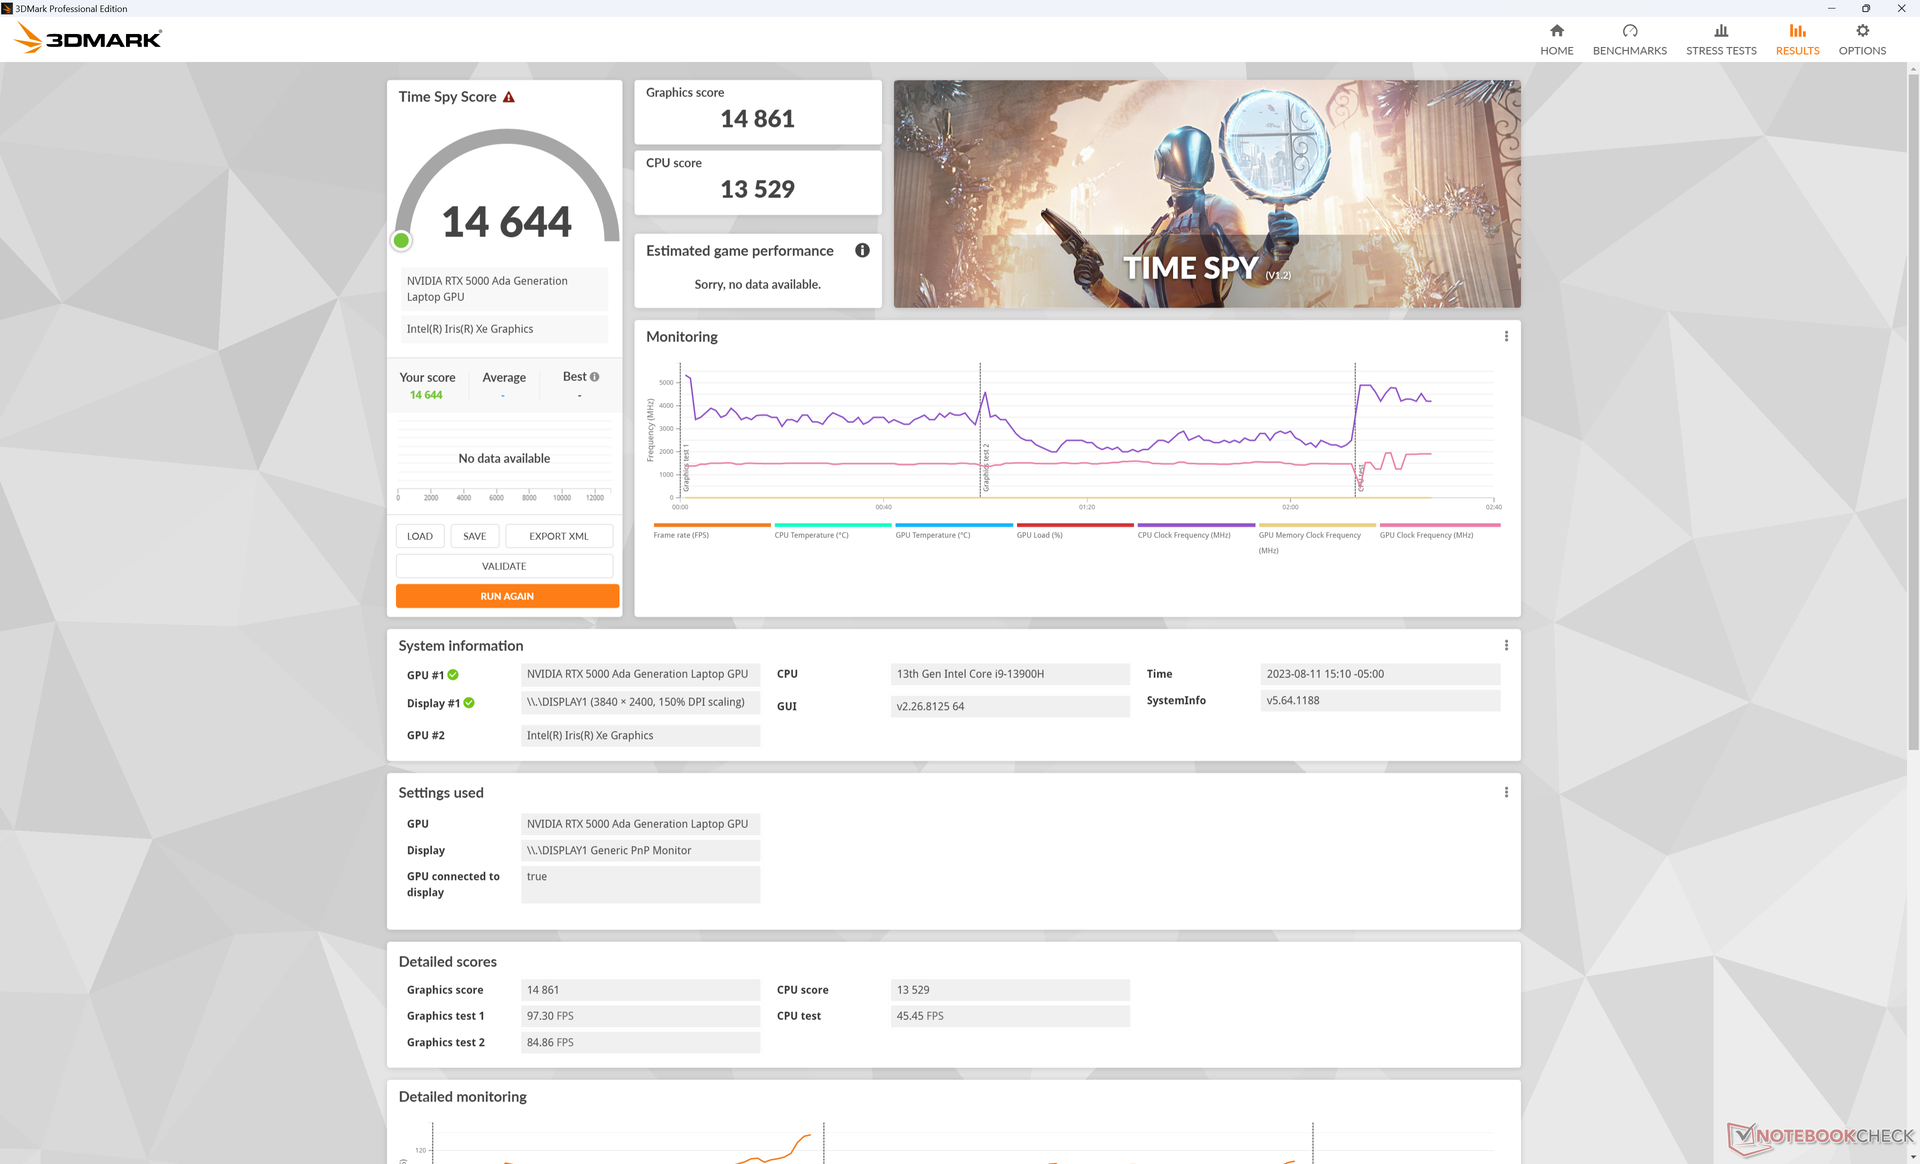
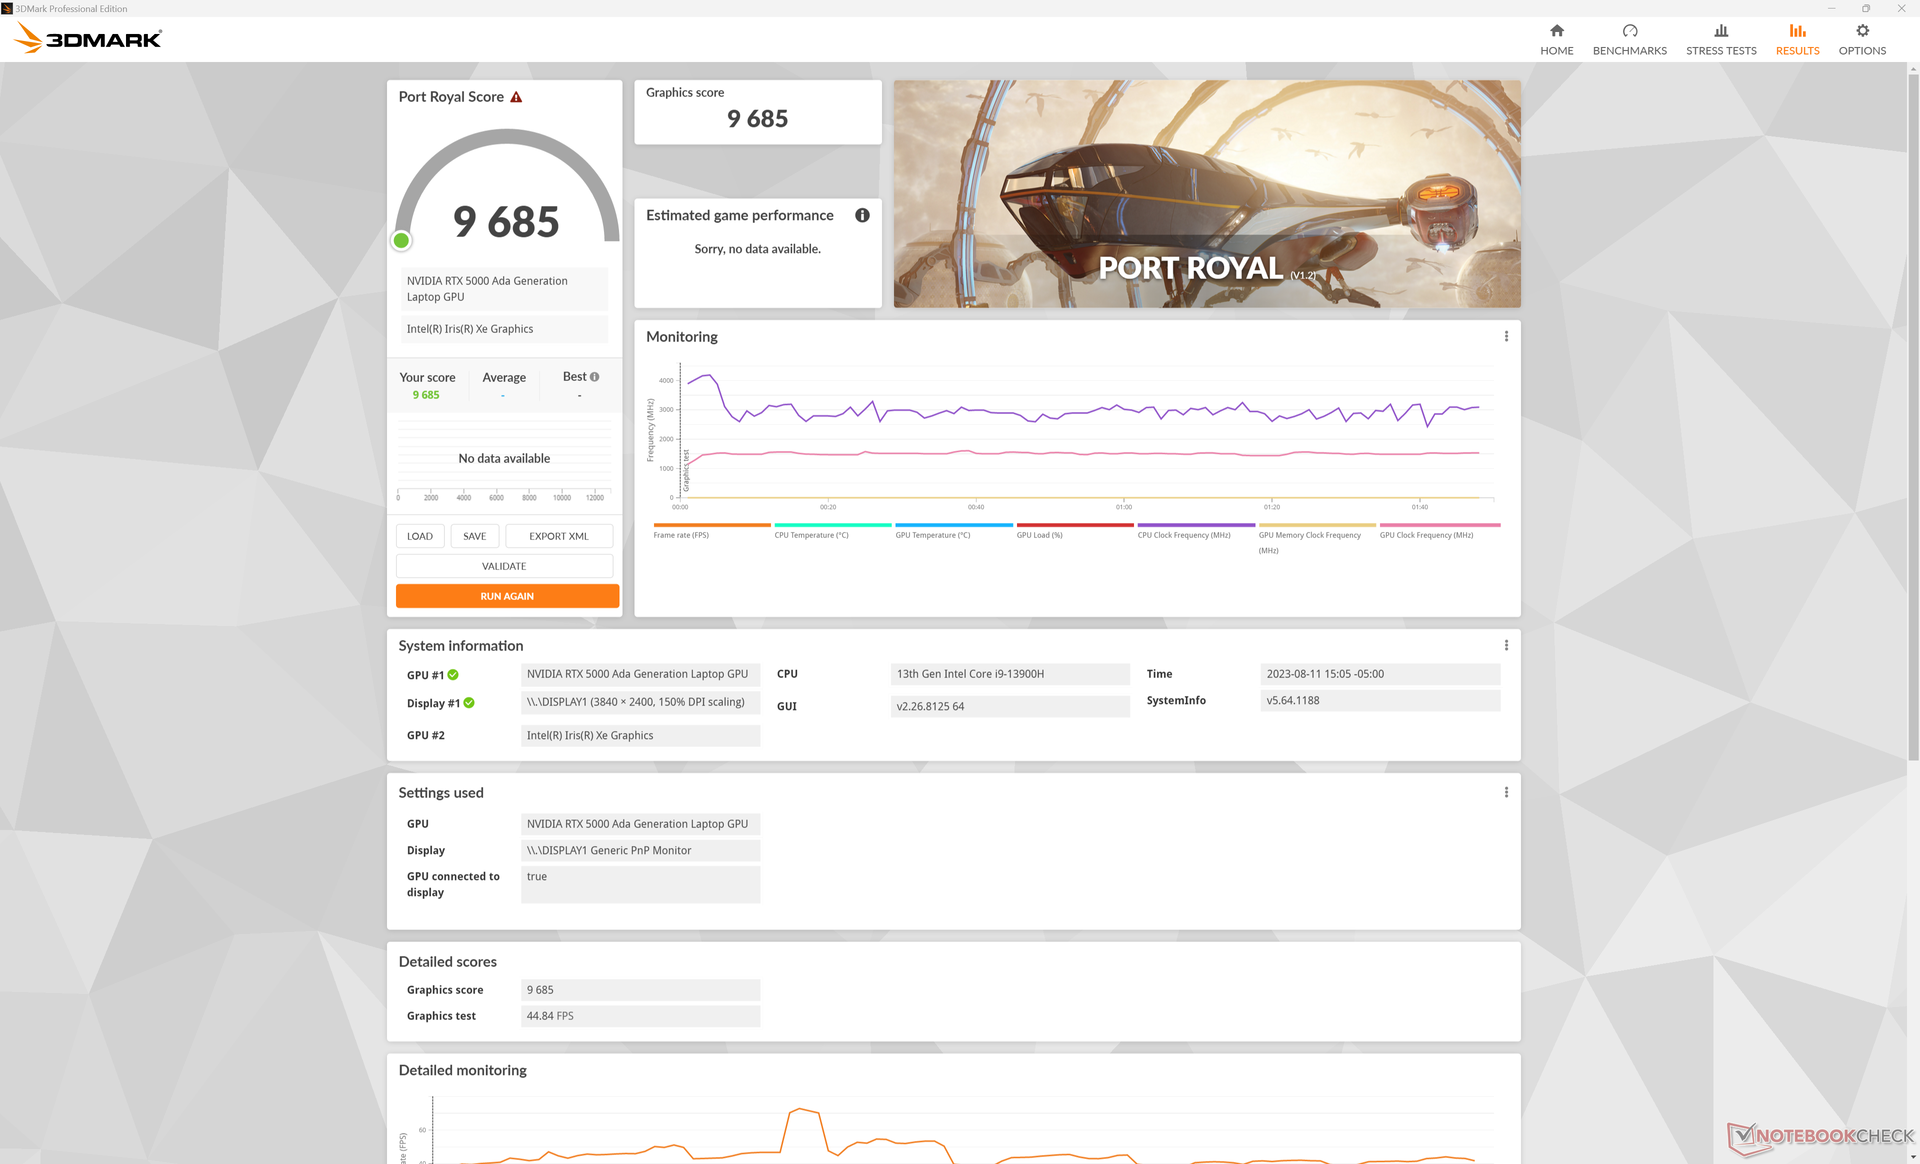
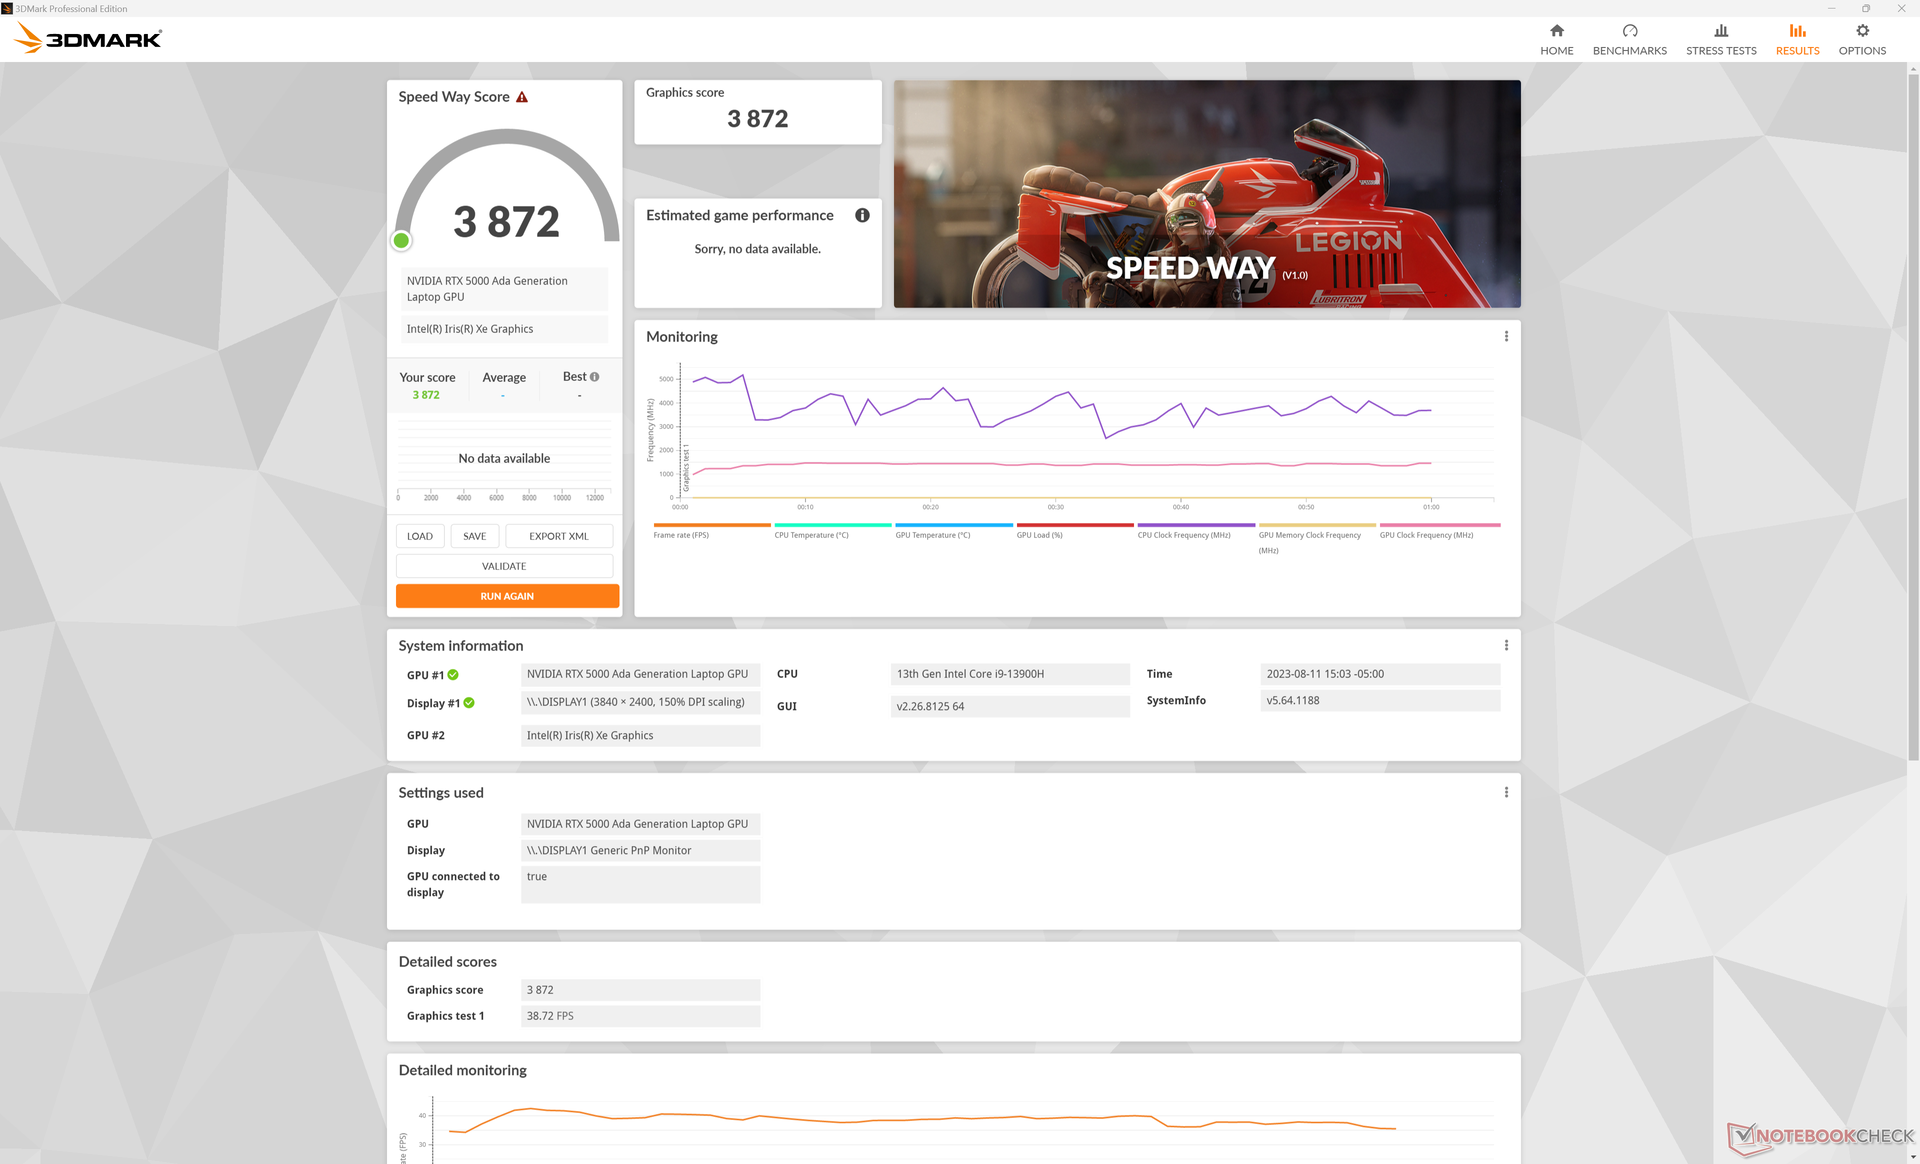
Nowy RTX 5000 oferuje znaczącą przewagę wydajności w porównaniu do zeszłorocznego modelu RTX A5000 i A5500 zwłaszcza w aplikacjach DX12 i akceleracji Blender CUDA. Time Spy na przykład, na naszej stronie Precision uzyskałby wynik o 30 do 40 procent wyższy niż na karcieMSI WE76 lub Lenovo ThinkPad P16 G1, z których każdy działa na starszych procesorach graficznych Ampere. Korzyści te dotyczą również większości podtestów Specviewperf.
Włączenie trybu ECC VRAM nie wydaje się wpływać na częstotliwość taktowania pamięci, ale maksymalna dostępna pamięć VRAM zmniejszyłaby się z 16384 MB do 15360 MB według GPU-Z.
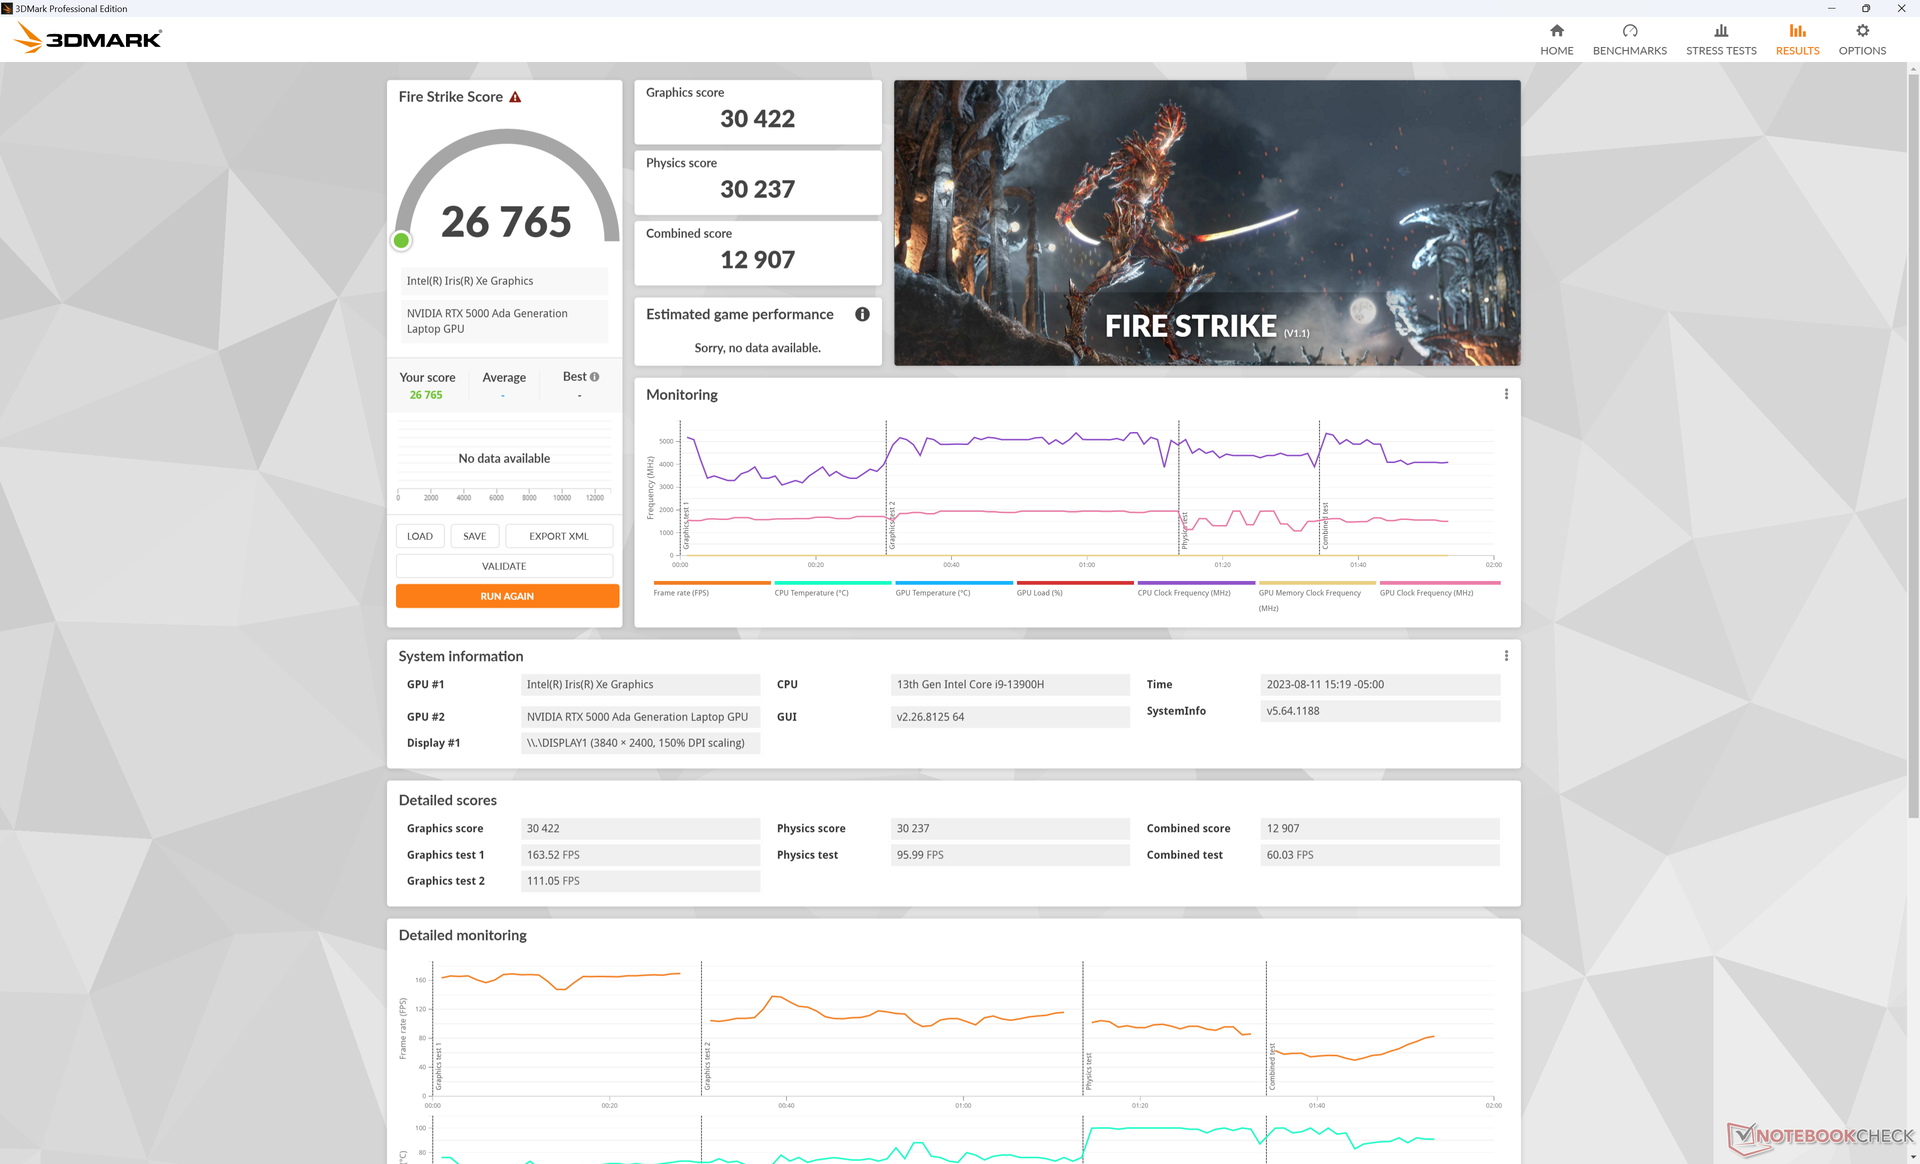
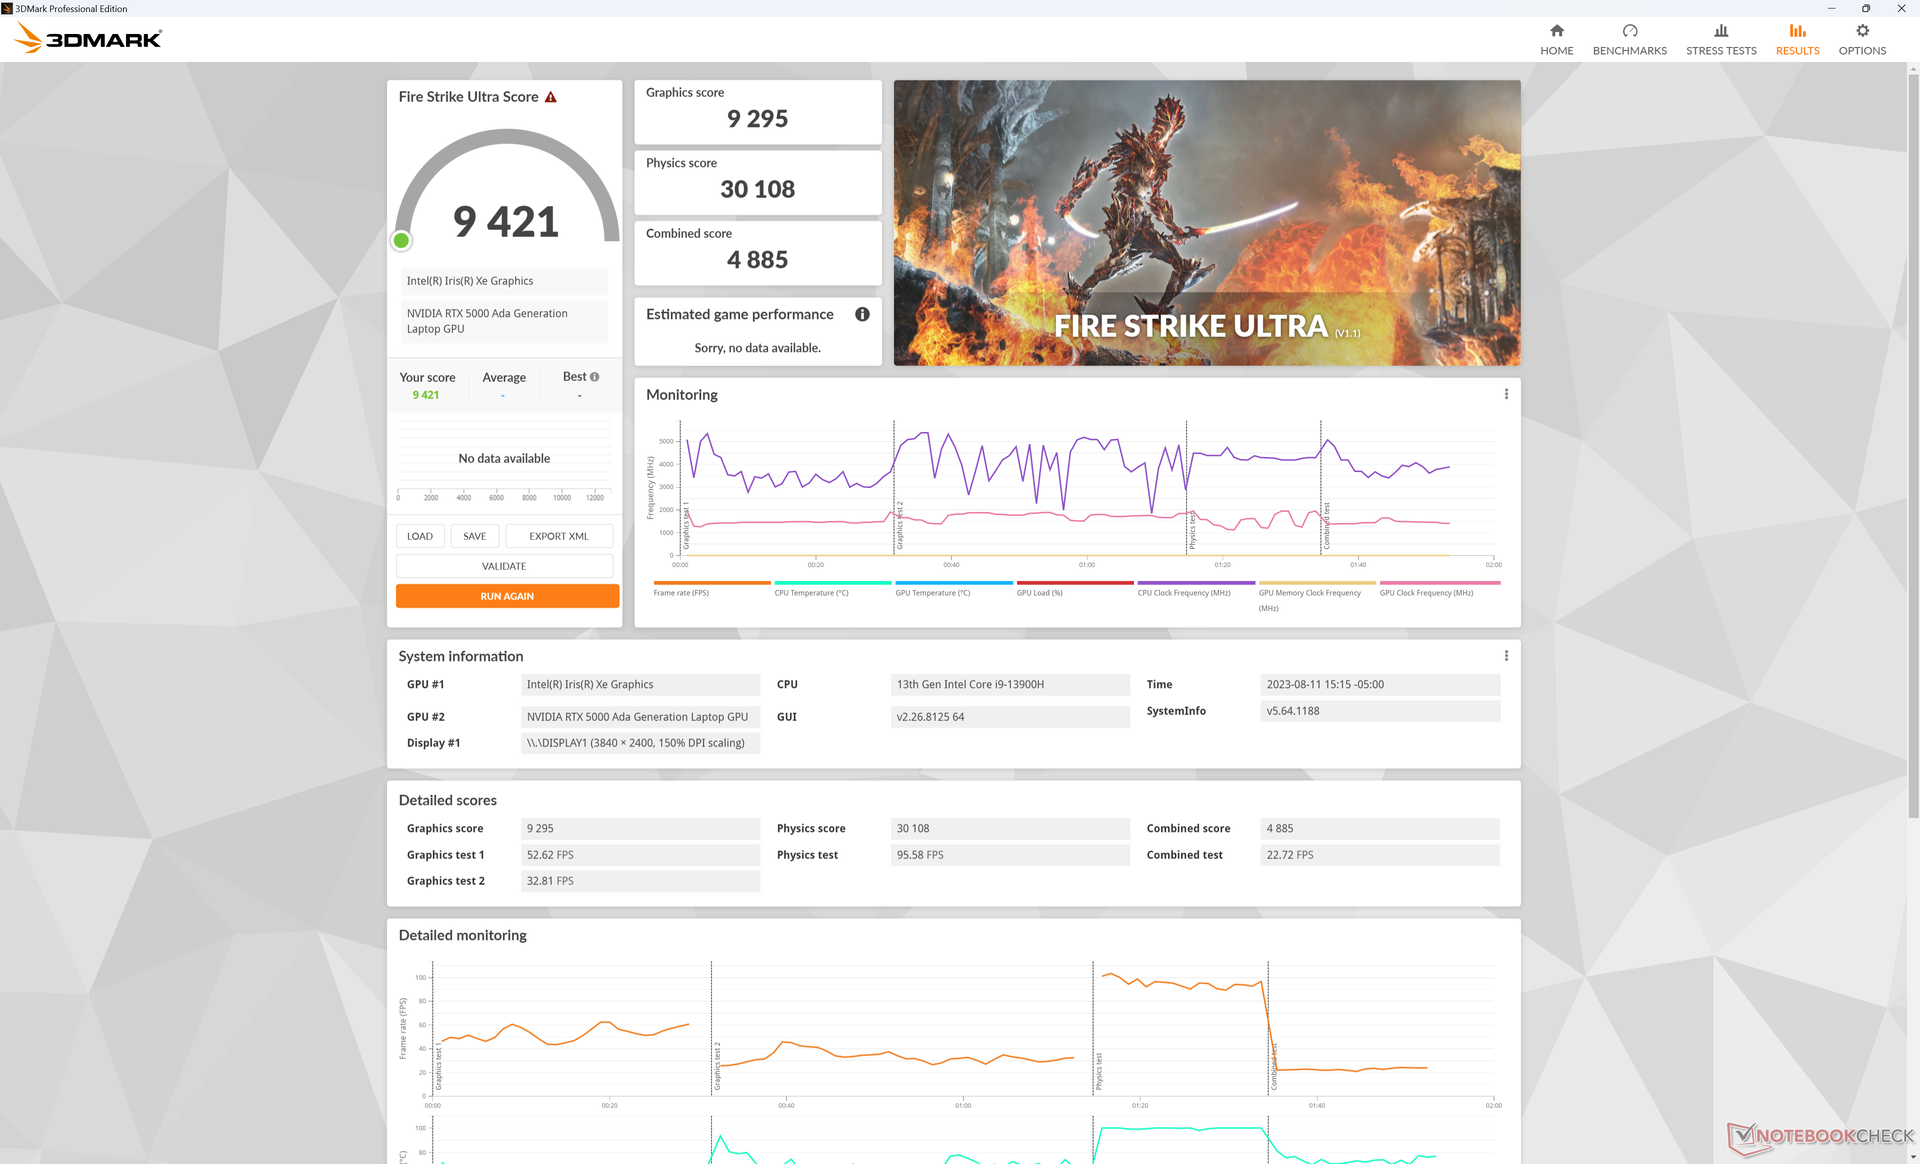
Należy zauważyć, że nie ma większego wpływu na wydajność GPU po przejściu z trybu wydajności do trybu zrównoważonego, jak pokazują poniższe wyniki Fire Strike. Zamiast tego, wydajność procesora byłaby zauważalnie niższa.
| Profil mocy | Wynik fizyki | Wynik grafiki | Łączny wynik |
| Moc baterii | 20938 (-31%) | 27514 (-10%) | 8910 (-31%) |
| Tryb zrównoważony | 24828 (-18%) | 30588 (-0%) | 11365 (-12%) |
| Tryb wydajności | 30237 | 30422 | 12907 |
| 3DMark 11 - 1280x720 Performance GPU | |
| Lenovo Legion Pro 7 RTX4090 | |
| Alienware x16 R1 | |
| Przeciętny NVIDIA RTX 5000 Ada Generation Laptop (49833 - 54334, n=3) | |
| Dell Precision 5000 5680 | |
| MSI WE76 11UM-456 | |
| Lenovo ThinkPad P16 G1 RTX A5500 | |
| Dell Precision 7000 7670 Performance | |
| HP ZBook Studio 15 G8 | |
| HP ZBook Fury 15 G7 | |
| MSI CreatorPro Z16P B12UKST | |
| Asus ExpertBook B6 Flip B6602FC2 | |
| HP ZBook Studio G7 | |
| Lenovo ThinkPad P16 G1 21D6001DMB | |
| Lenovo ThinkPad P15v G3 21EM001AGE | |
| Lenovo ThinkPad P1 G4-20Y4Z9DVUS | |
| 3DMark 11 Performance | 39574 pkt. | |
| 3DMark Fire Strike Score | 26765 pkt. | |
| 3DMark Time Spy Score | 14644 pkt. | |
Pomoc | ||
* ... im mniej tym lepiej
Wydajność w grach
Choć nie jest to laptop do gier, Precision 5680 nadal jest w pełni zdolny do grania w najnowsze wymagające tytuły bez żadnych problemów z kompatybilnością podczas testów. Ogólna wydajność w grach plasuje się pomiędzy mobilnymi GeForce RTX 4060 i mobilnym RTX 4070 jakie można znaleźć w dedykowanych laptopach do gier, takich jak HP Omen Transcend 16.
Witcher 3 FPS Chart
| low | med. | high | ultra | QHD | 4K | |
|---|---|---|---|---|---|---|
| GTA V (2015) | 185.4 | 179.7 | 175.3 | 117.1 | 106.6 | 108 |
| The Witcher 3 (2015) | 412.7 | 329.6 | 256 | 137 | 97 | |
| Dota 2 Reborn (2015) | 178 | 161.7 | 154 | 144 | 142.5 | |
| Final Fantasy XV Benchmark (2018) | 196.3 | 165.6 | 127.4 | 100.8 | 60.4 | |
| X-Plane 11.11 (2018) | 155.3 | 133 | 102.4 | 86.2 | ||
| Far Cry 5 (2018) | 145 | 132 | 129 | 132 | 114 | 70 |
| Cyberpunk 2077 1.6 (2022) | 124.9 | 122.7 | 107.7 | 100 | 66.2 | 32.2 |
| Tiny Tina's Wonderlands (2022) | 220 | 202.3 | 152.6 | 125 | 90.1 | 50.9 |
| F1 22 (2022) | 232 | 218 | 202 | 84.5 | 56.1 | 28.8 |
| Returnal (2023) | 98 | 94 | 90 | 81 | 60 | 34 |
Emisje - cisza przez większość czasu
Hałas systemowy
Poziomy hałasu są najbardziej zbliżone doPrecision 5550 mimo że nasz Precision 5680 posiada znacznie szybszy procesor graficzny. Wentylatory mają tendencję do wahania się w zakresie od średnich do wysokich 20 dB(A) podczas uruchamiania niewymagających obciążeń, takich jak przeglądarki internetowe, podczas gdy bardziej wymagające obciążenia wywoływałyby stały hałas na poziomie 51 dB(A).
Co ciekawe, maksymalny poziom hałasu wentylatora w trybie zrównoważonym jest taki sam jak w trybie wydajności.
Hałas
| luz |
| 23 / 23 / 23 dB |
| obciążenie |
| 37.2 / 51 dB |
 | ||
30 dB cichy 40 dB(A) słyszalny 50 dB(A) irytujący |
||
min: | ||
| Dell Precision 5000 5680 RTX 5000 Ada Generation Laptop, i9-13900H, 2x SK hynix PC801 HFS512GEJ9X101N RAID 0 | Dell Precision 7000 7670 Performance RTX A5500 Laptop GPU, i9-12950HX | HP ZBook Fury 16 G9 RTX A5500 Laptop GPU, i9-12950HX, Micron 3400 1TB MTFDKBA1T0TFH | Lenovo ThinkPad P16 G1 RTX A5500 RTX A5500 Laptop GPU, i9-12950HX, WDC PC SN810 2TB | MSI CreatorPro Z16P B12UKST RTX A3000 Laptop GPU, i7-12700H, Samsung PM9A1 MZVL21T0HCLR | Asus ExpertBook B6 Flip B6602FC2 RTX A2000 Laptop GPU, i9-12950HX, Samsung PM9A1 MZVL21T0HCLR | |
|---|---|---|---|---|---|---|
| Noise | -11% | -2% | 3% | -8% | -30% | |
| wyłączone / środowisko * (dB) | 22.8 | 23.9 -5% | 22.6 1% | 23.1 -1% | 24.1 -6% | 26 -14% |
| Idle Minimum * (dB) | 23 | 24 -4% | 22.7 1% | 23.1 -0% | 27.1 -18% | 32.4 -41% |
| Idle Average * (dB) | 23 | 24 -4% | 22.7 1% | 23.1 -0% | 27.1 -18% | 32.4 -41% |
| Idle Maximum * (dB) | 23 | 38 -65% | 28.8 -25% | 23.1 -0% | 27.1 -18% | 32.4 -41% |
| Load Average * (dB) | 37.2 | 46.3 -24% | 36.2 3% | 28.9 22% | 42.9 -15% | 51.9 -40% |
| Witcher 3 ultra * (dB) | 51 | 41.9 18% | 49.5 3% | 51.6 -1% | 44 14% | |
| Load Maximum * (dB) | 51 | 47.9 6% | 49.3 3% | 51.4 -1% | 47 8% | 52.1 -2% |
* ... im mniej tym lepiej
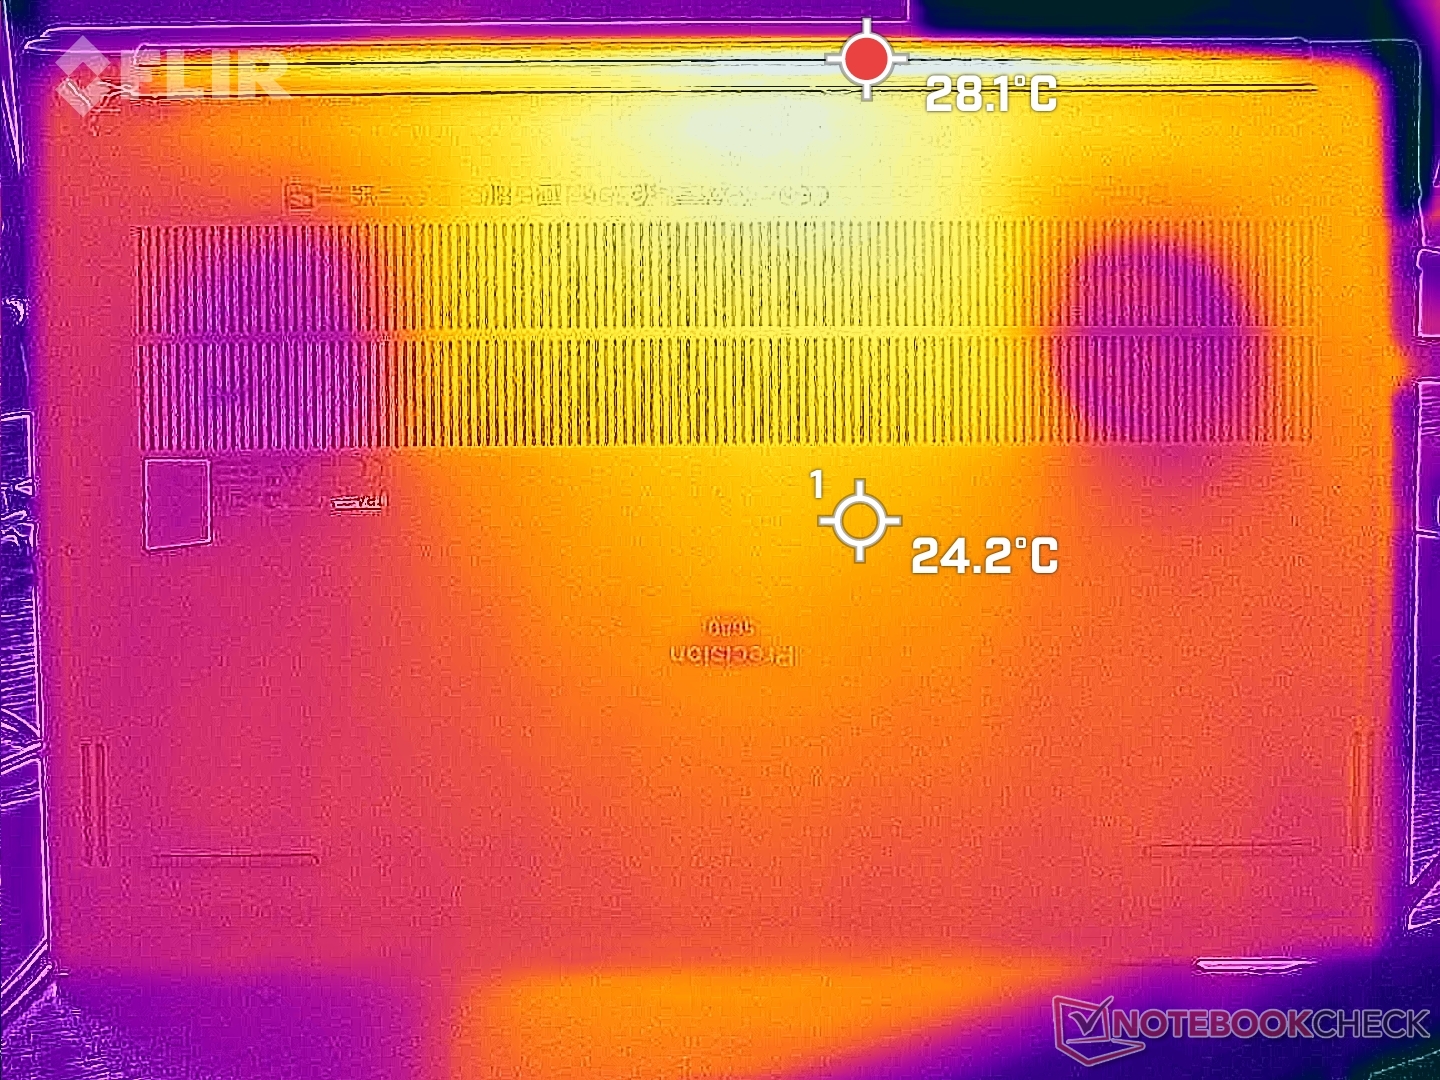
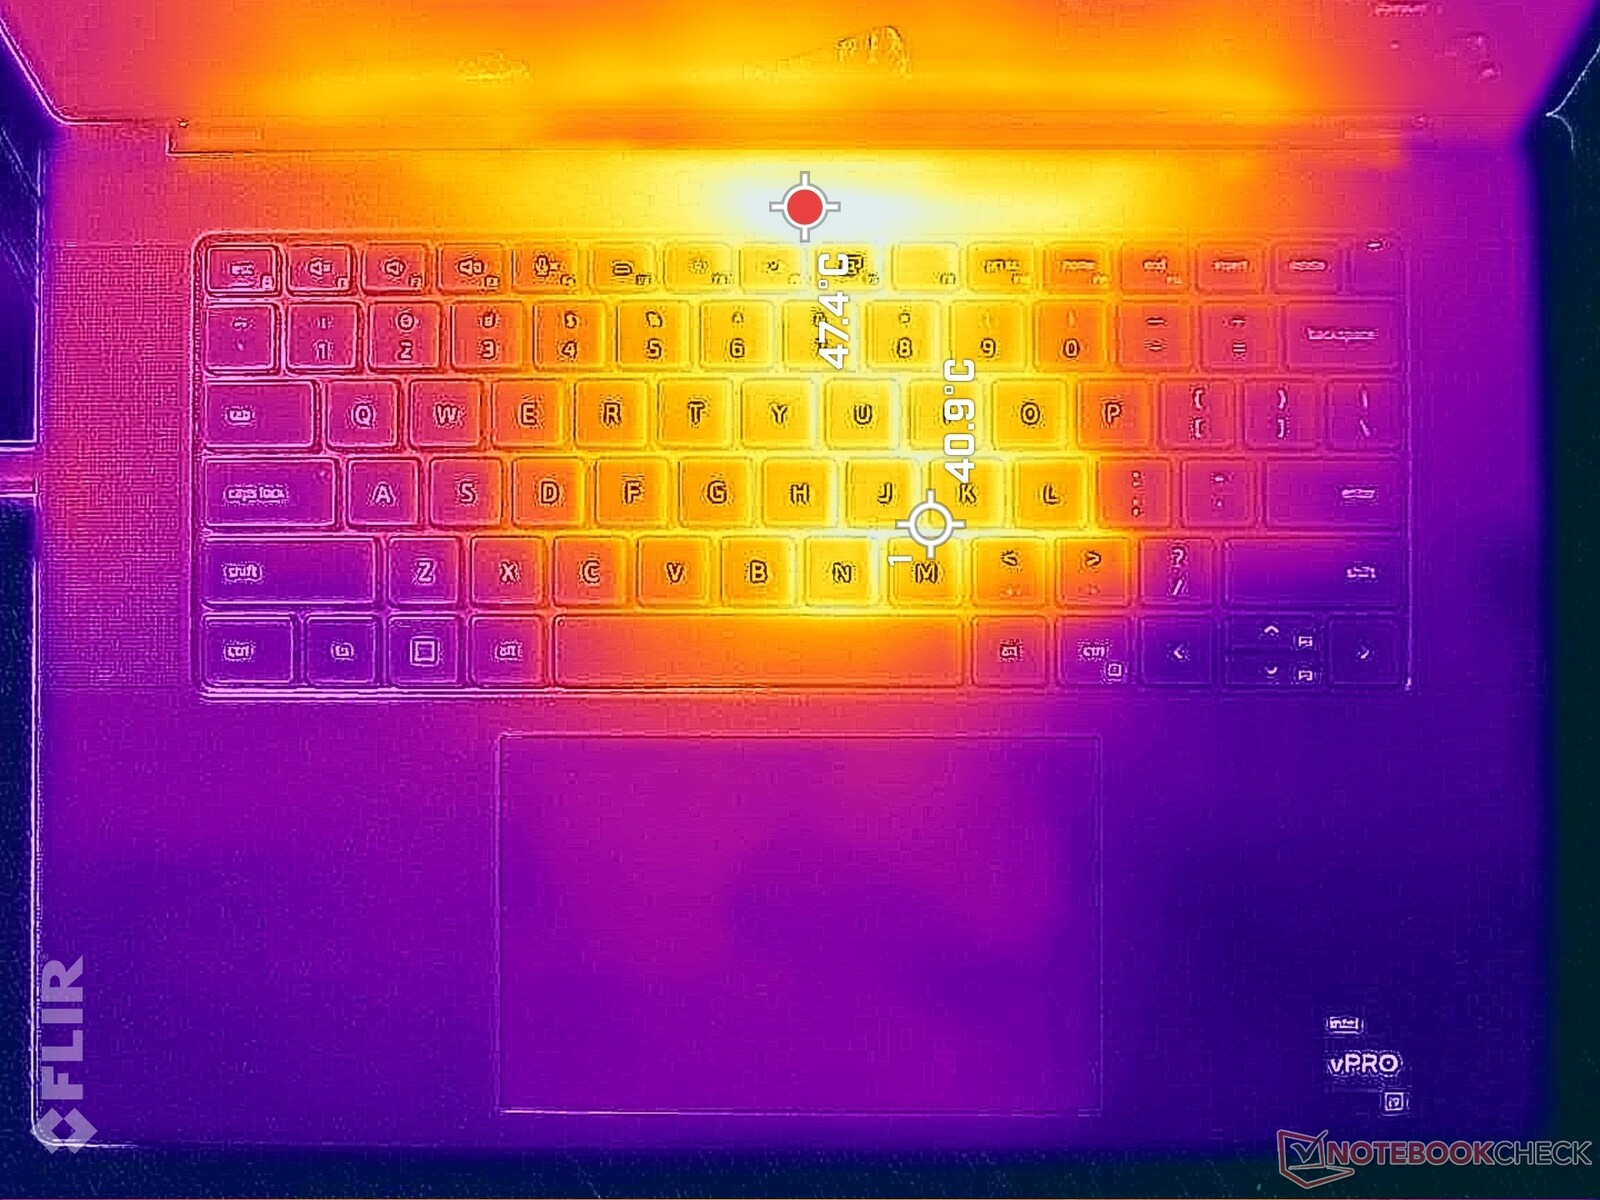
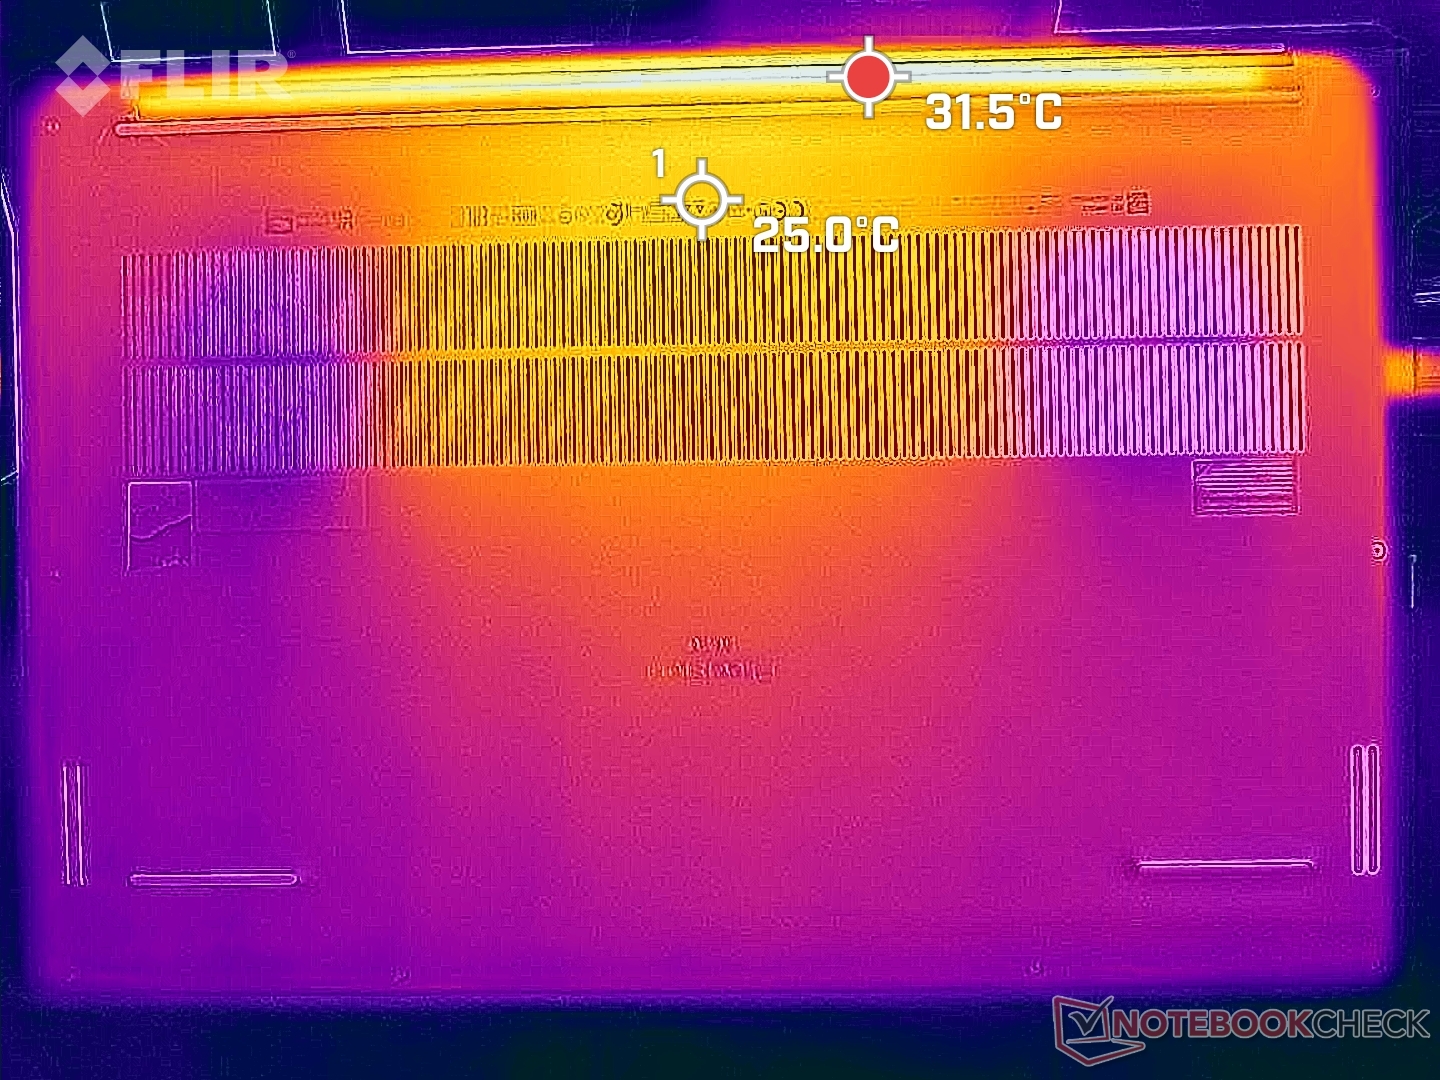
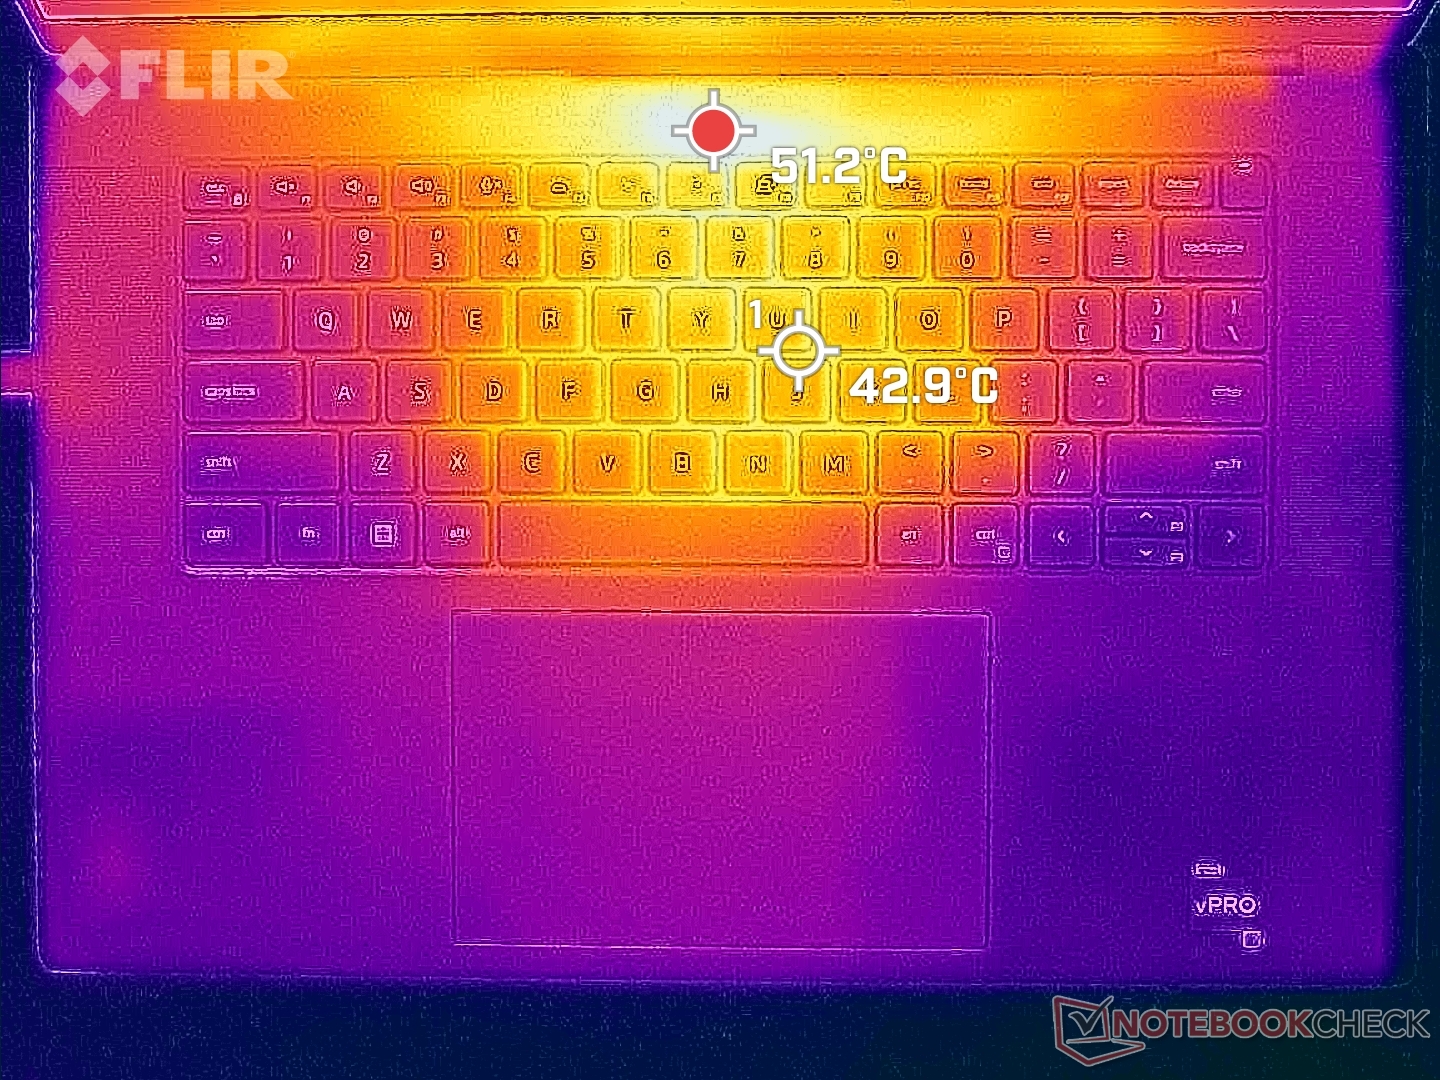
Temperatura
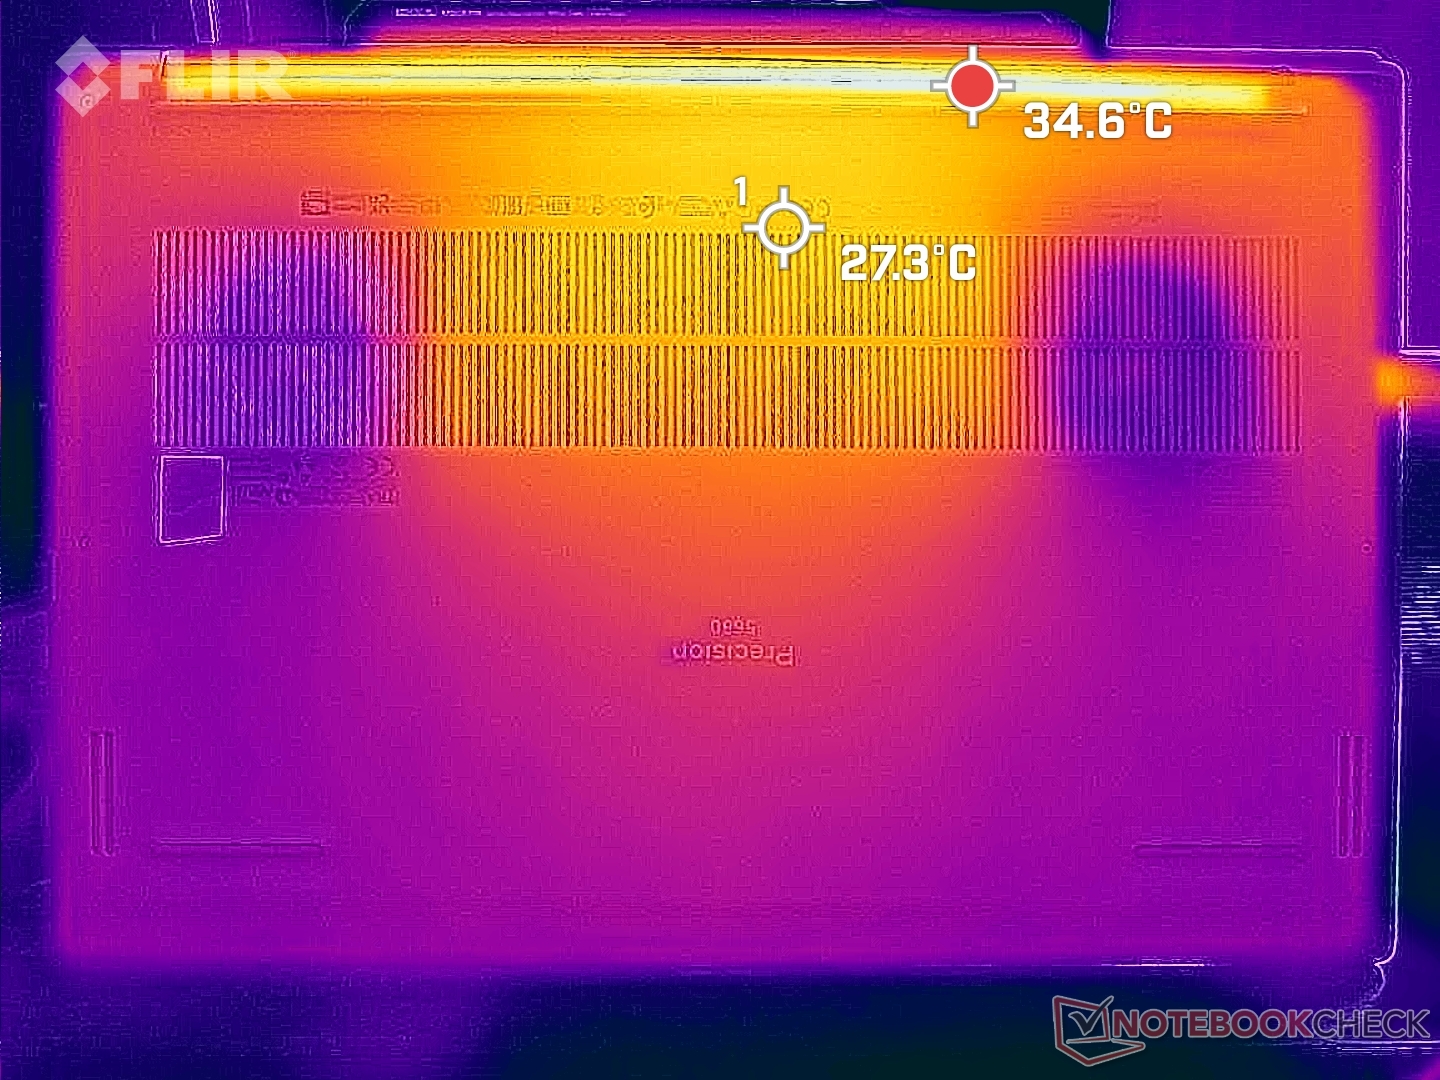
Temperatury powierzchni podczas pracy na biegu jałowym są wyższe niż oczekiwano, ponieważ wentylatory mają tendencję do pracy na biegu jałowym, dopóki nie są potrzebne. Gorące punkty mogą być ciepłe nawet do 37 C i 32 C odpowiednio na górnej i dolnej stronie, w porównaniu do poniżej 30 C na powierzchniExpertBook B6 Flip.
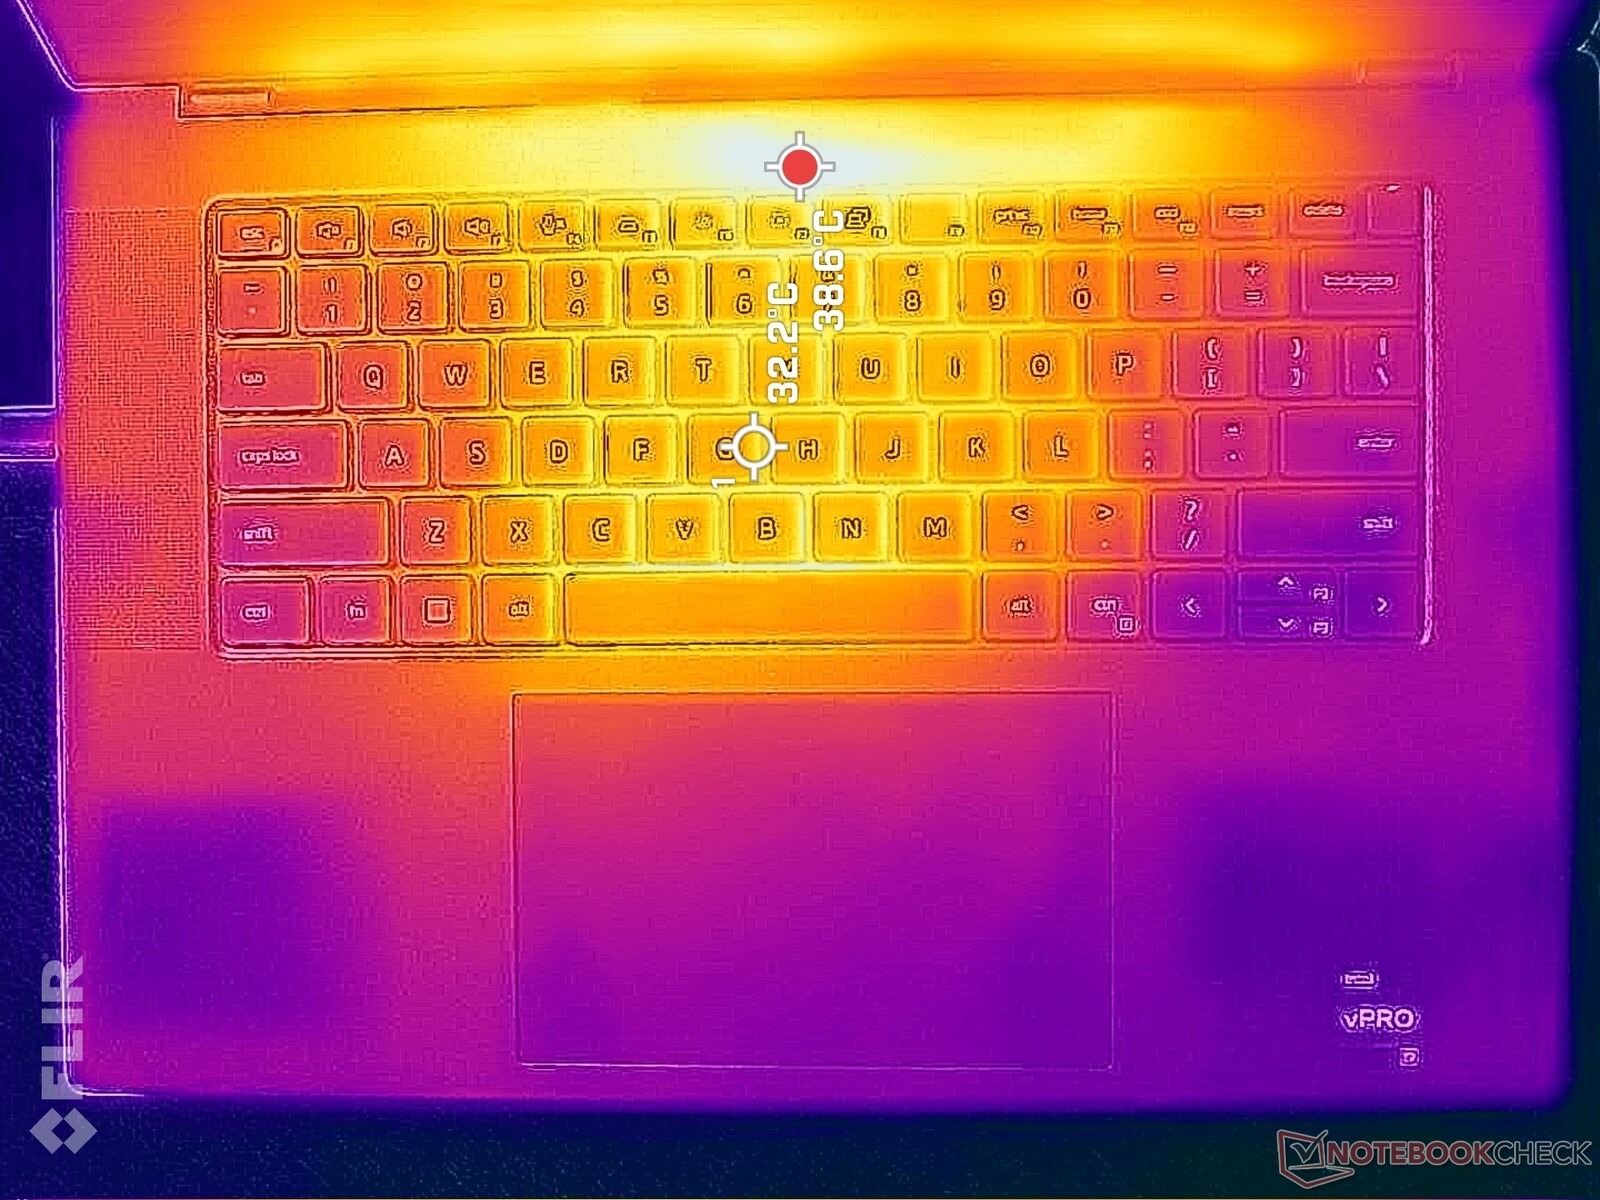
Podczas pracy z bardziej wymagającymi obciążeniami, środek klawiatury może osiągnąć ponad 50 C, podczas gdy dolna powierzchnia ledwo się nagrzewa, częściowo ze względu na izolatory Gore. Palce i dłonie tylko sporadycznie dotykają środka klawiatury, więc gorące punkty generalnie nie wpływają na komfort.
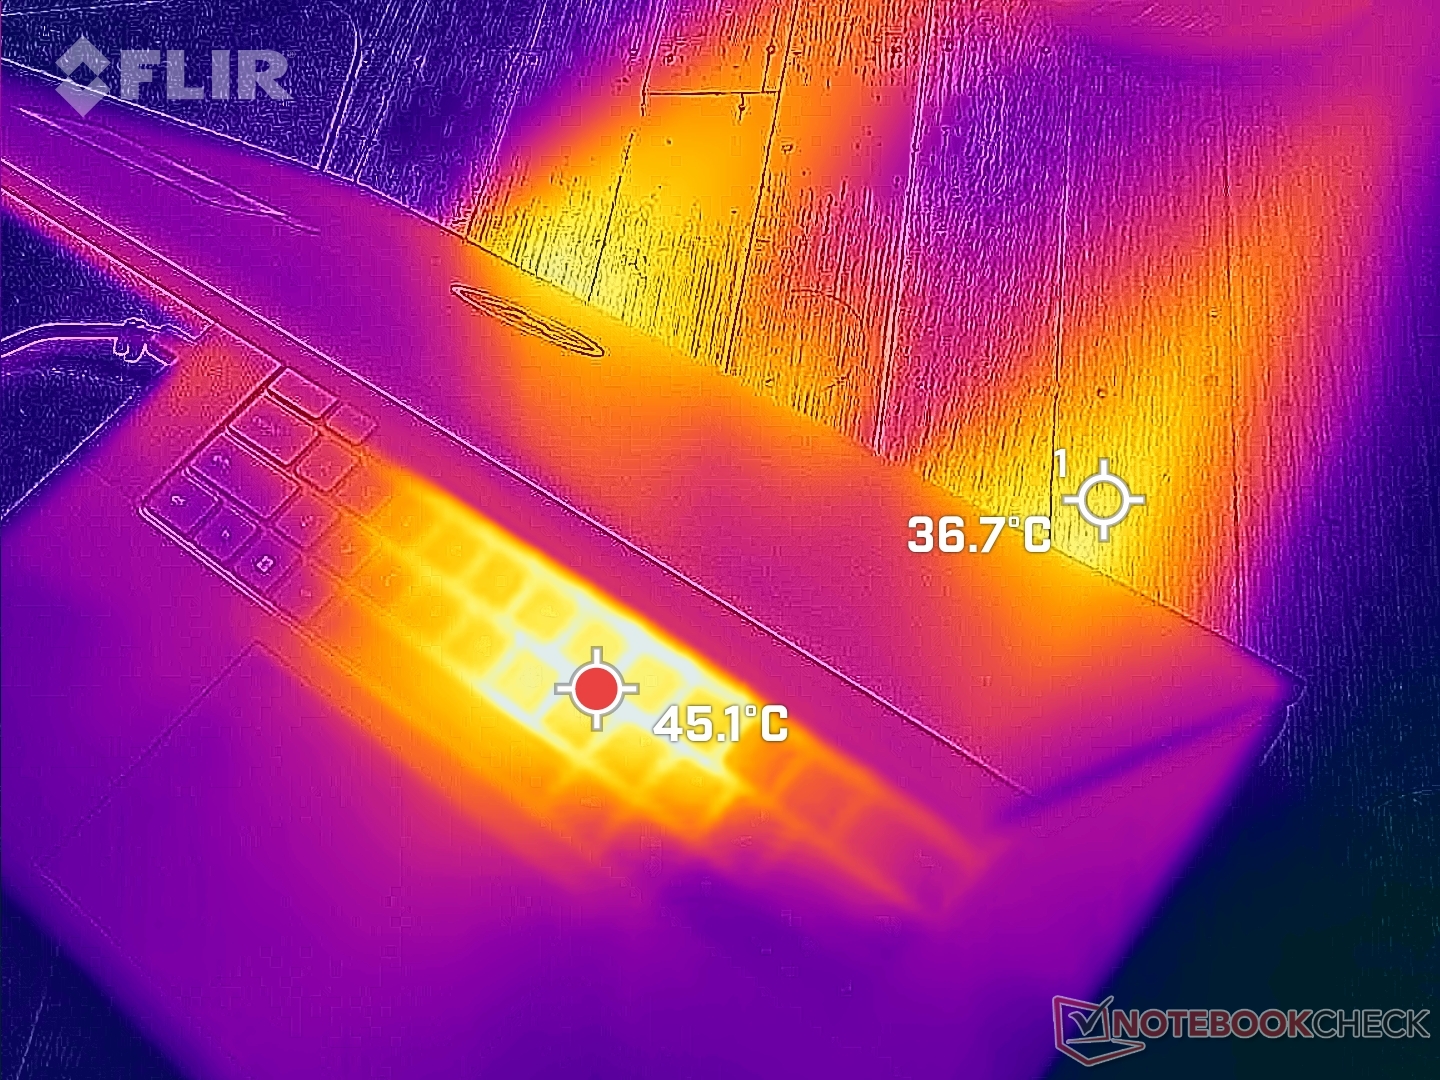
(-) Maksymalna temperatura w górnej części wynosi 50.2 °C / 122 F, w porównaniu do średniej 38.2 °C / 101 F , począwszy od 22.2 do 69.8 °C dla klasy Workstation.
(+) Dno nagrzewa się maksymalnie do 32 °C / 90 F, w porównaniu do średniej 41.1 °C / 106 F
(+) W stanie bezczynności średnia temperatura górnej części wynosi 30.1 °C / 86 F, w porównaniu ze średnią temperaturą urządzenia wynoszącą 32 °C / ### class_avg_f### F.
(±) Podczas gry w Wiedźmina 3 średnia temperatura górnej części wynosi 34.6 °C / 94 F, w porównaniu do średniej temperatury urządzenia wynoszącej 32 °C / ## #class_avg_f### F.
(+) Podpórki pod nadgarstki i touchpad są chłodniejsze niż temperatura skóry i maksymalnie 27.6 °C / 81.7 F i dlatego są chłodne w dotyku.
(±) Średnia temperatura obszaru podparcia dłoni w podobnych urządzeniach wynosiła 27.8 °C / 82 F (+0.2 °C / 0.3 F).
| Dell Precision 5000 5680 Intel Core i9-13900H, NVIDIA RTX 5000 Ada Generation Laptop | Dell Precision 7000 7670 Performance Intel Core i9-12950HX, NVIDIA RTX A5500 Laptop GPU | HP ZBook Fury 16 G9 Intel Core i9-12950HX, NVIDIA RTX A5500 Laptop GPU | Lenovo ThinkPad P16 G1 RTX A5500 Intel Core i9-12950HX, NVIDIA RTX A5500 Laptop GPU | MSI CreatorPro Z16P B12UKST Intel Core i7-12700H, NVIDIA RTX A3000 Laptop GPU | Asus ExpertBook B6 Flip B6602FC2 Intel Core i9-12950HX, NVIDIA RTX A2000 Laptop GPU | |
|---|---|---|---|---|---|---|
| Heat | -12% | -3% | -13% | -19% | -8% | |
| Maximum Upper Side * (°C) | 50.2 | 53 -6% | 43.2 14% | 44.8 11% | 56.3 -12% | 48.4 4% |
| Maximum Bottom * (°C) | 32 | 43.2 -35% | 50.4 -58% | 49.8 -56% | 68.3 -113% | 52.3 -63% |
| Idle Upper Side * (°C) | 37.4 | 36.8 2% | 28.6 24% | 30.6 18% | 25.2 33% | 27.8 26% |
| Idle Bottom * (°C) | 31.2 | 33.8 -8% | 28.2 10% | 38.6 -24% | 25.9 17% | 30.3 3% |
* ... im mniej tym lepiej
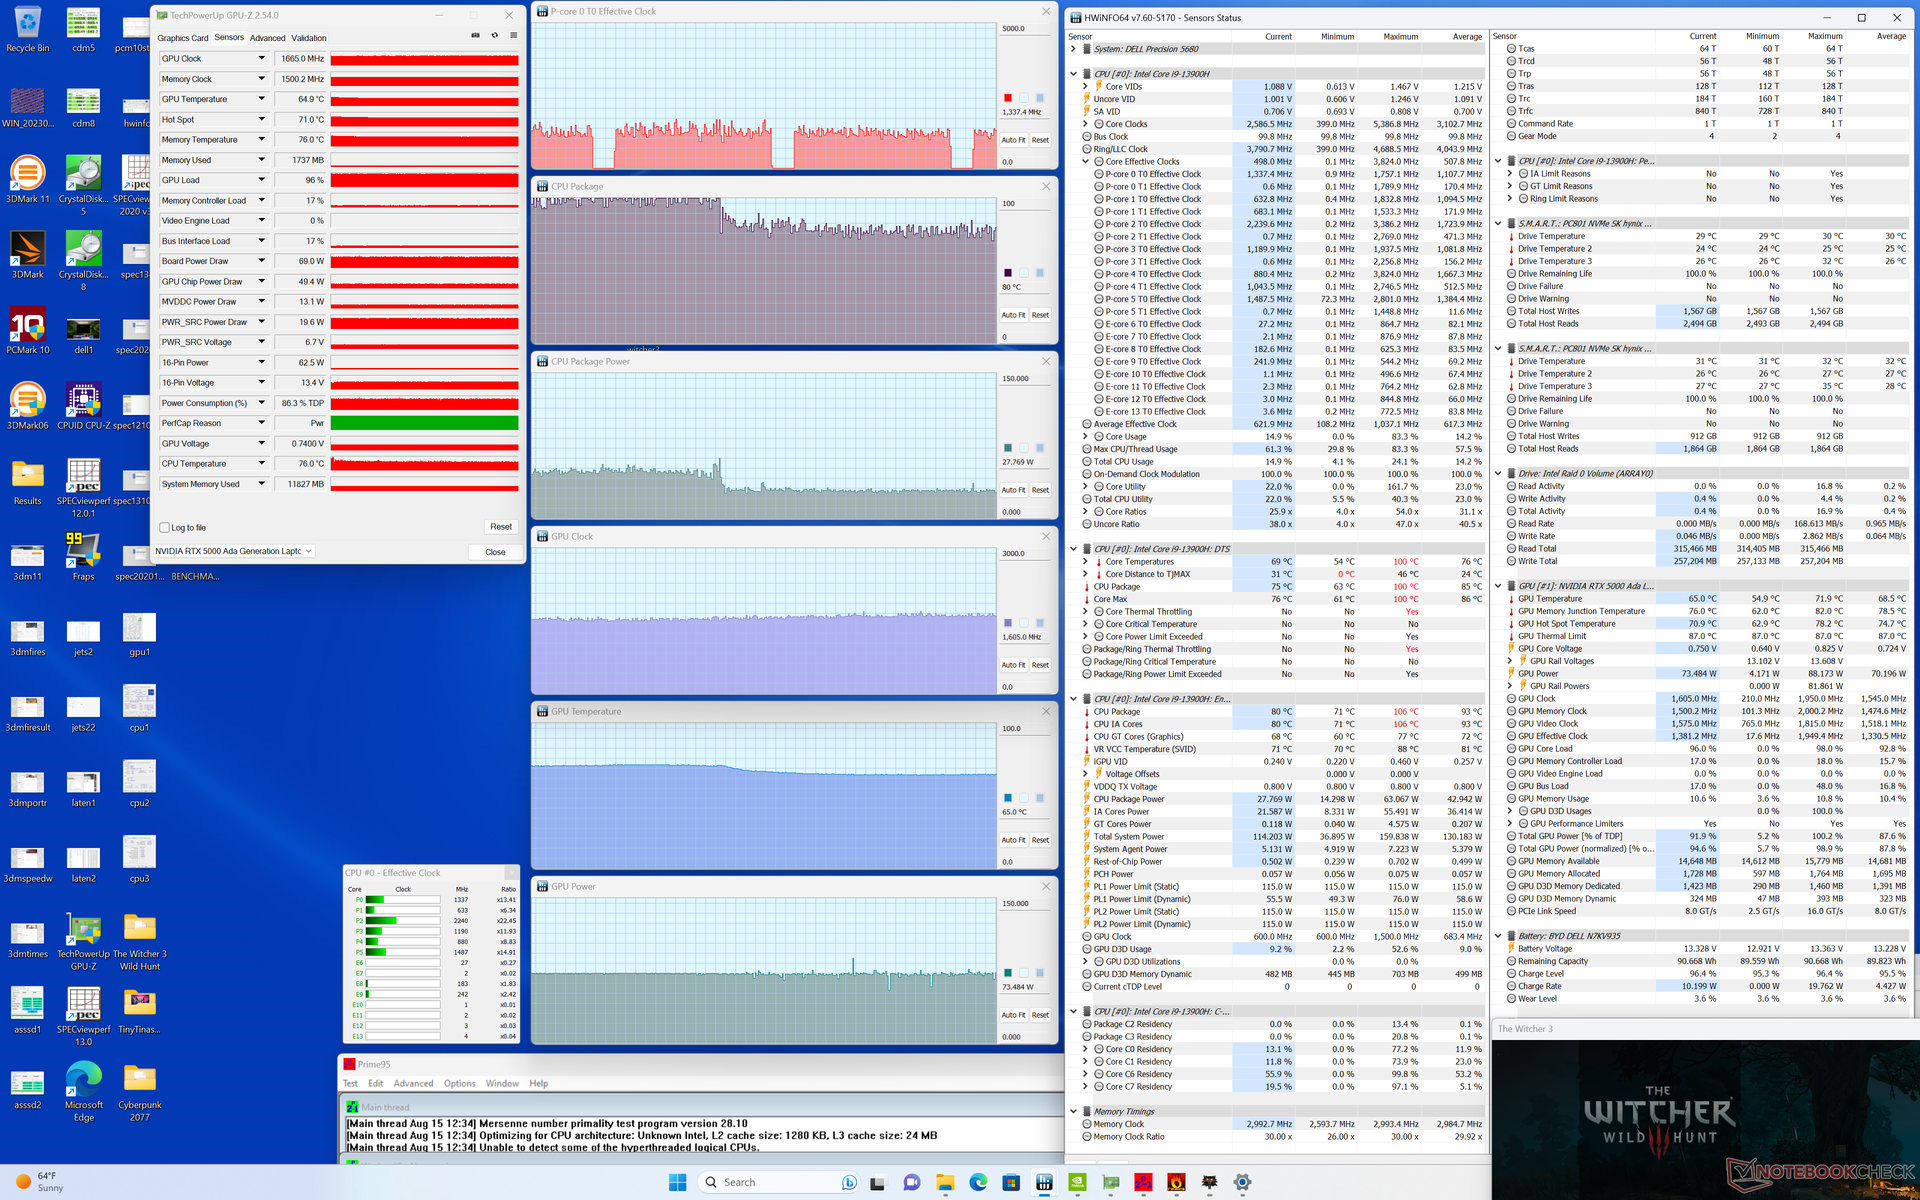
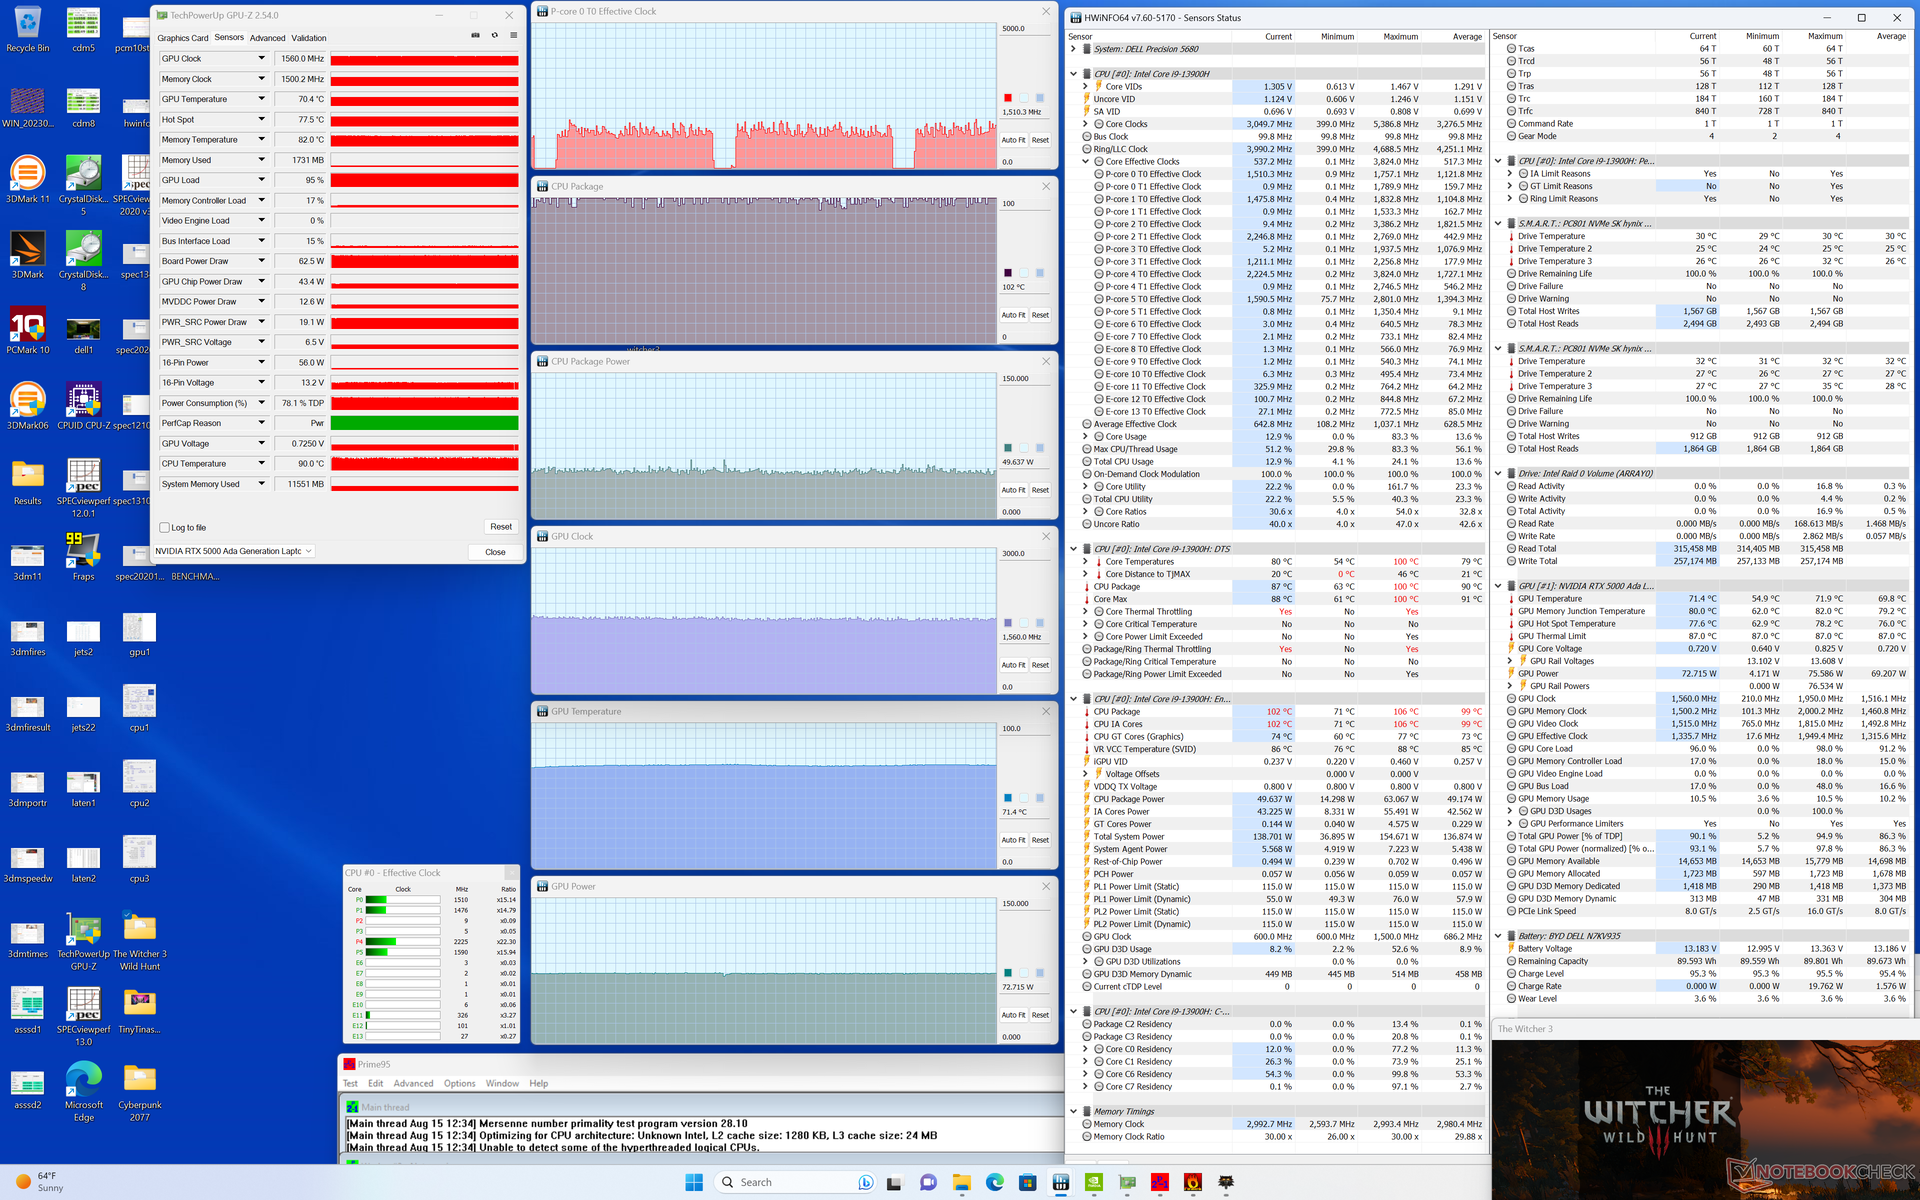
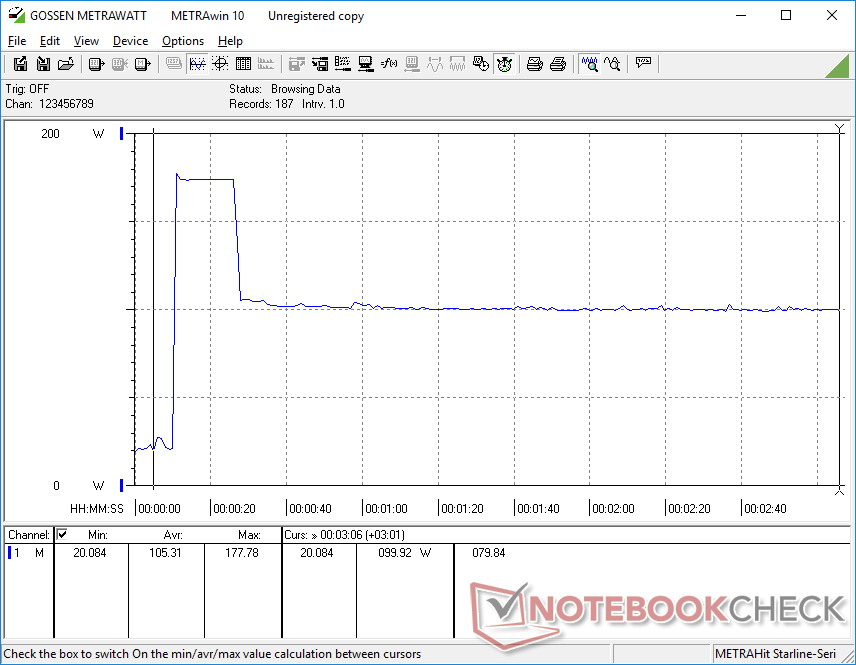
Test warunków skrajnych
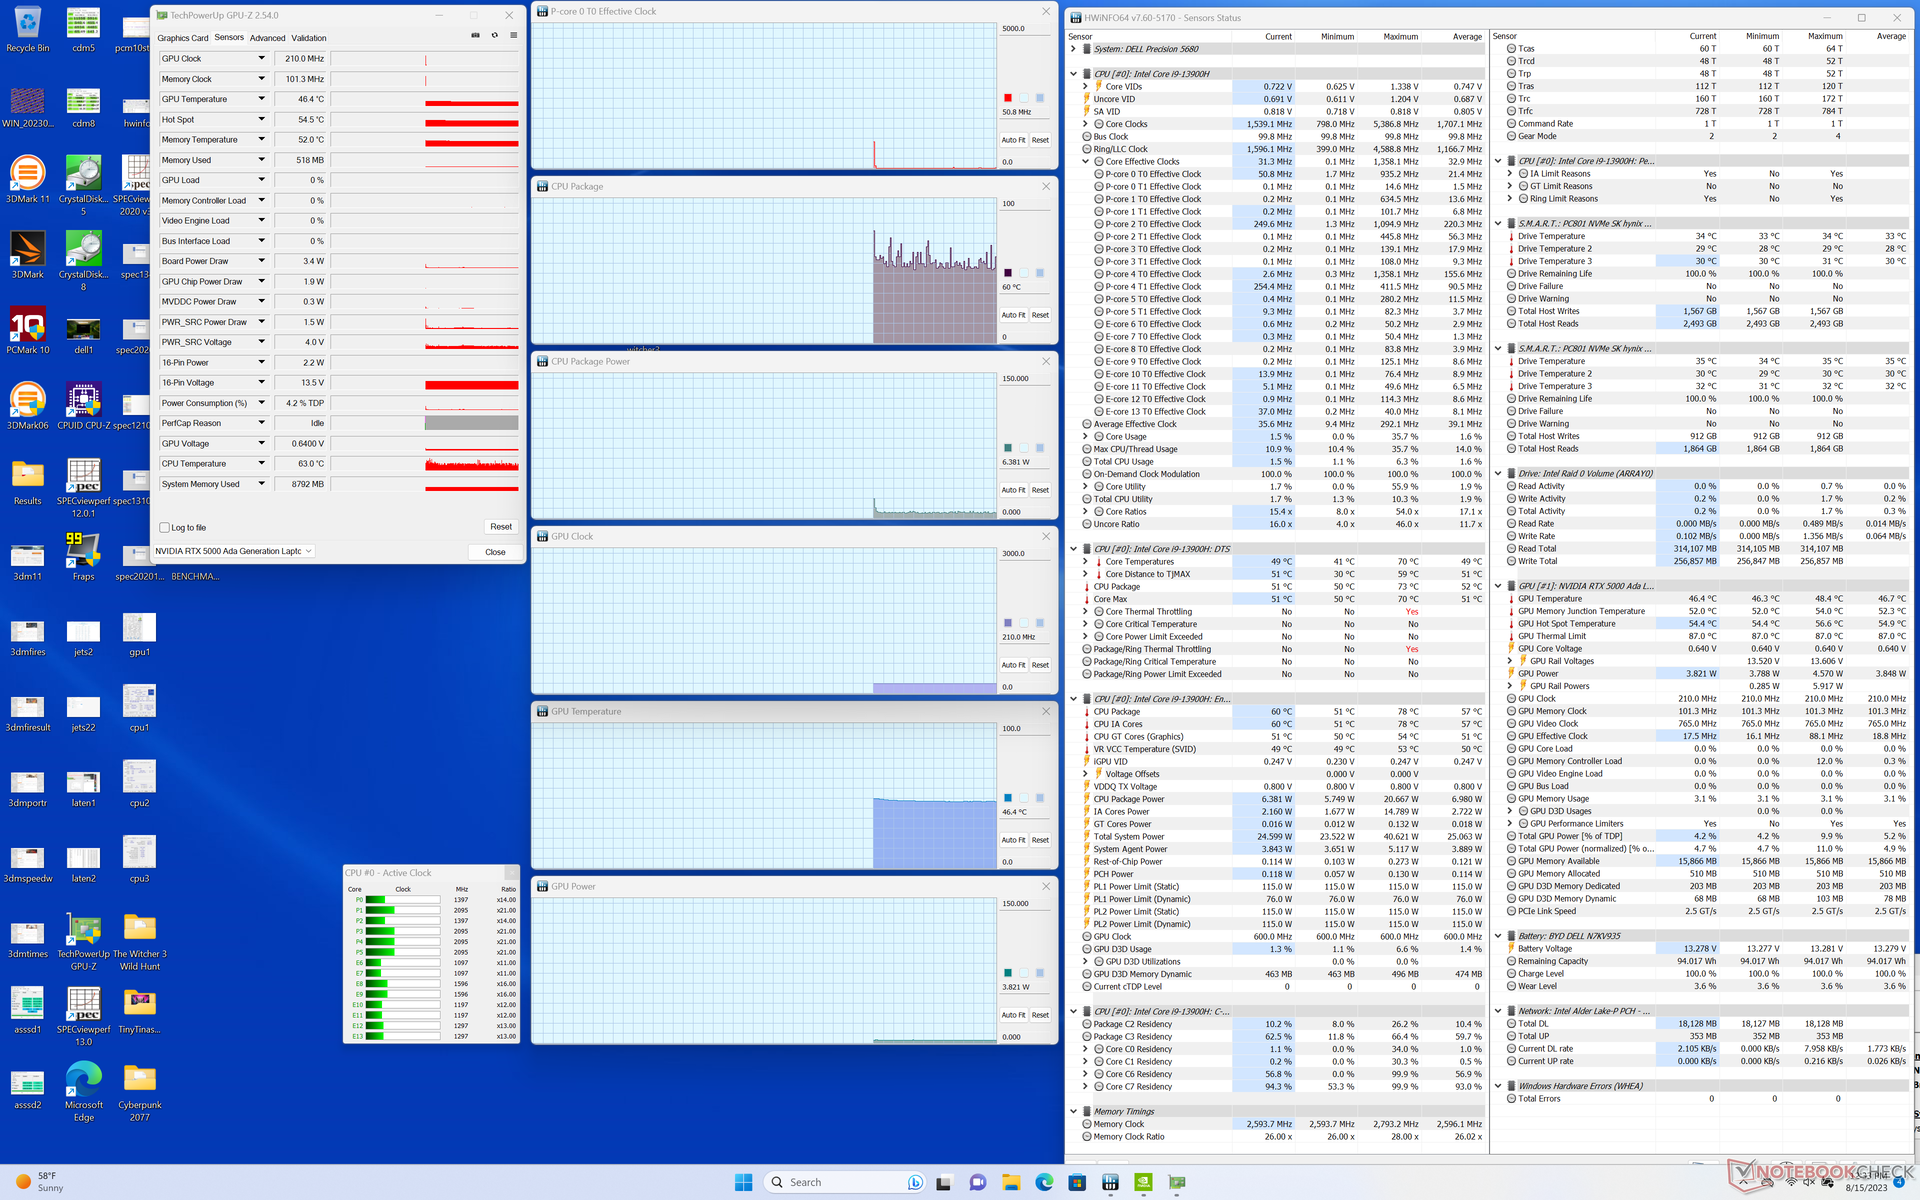
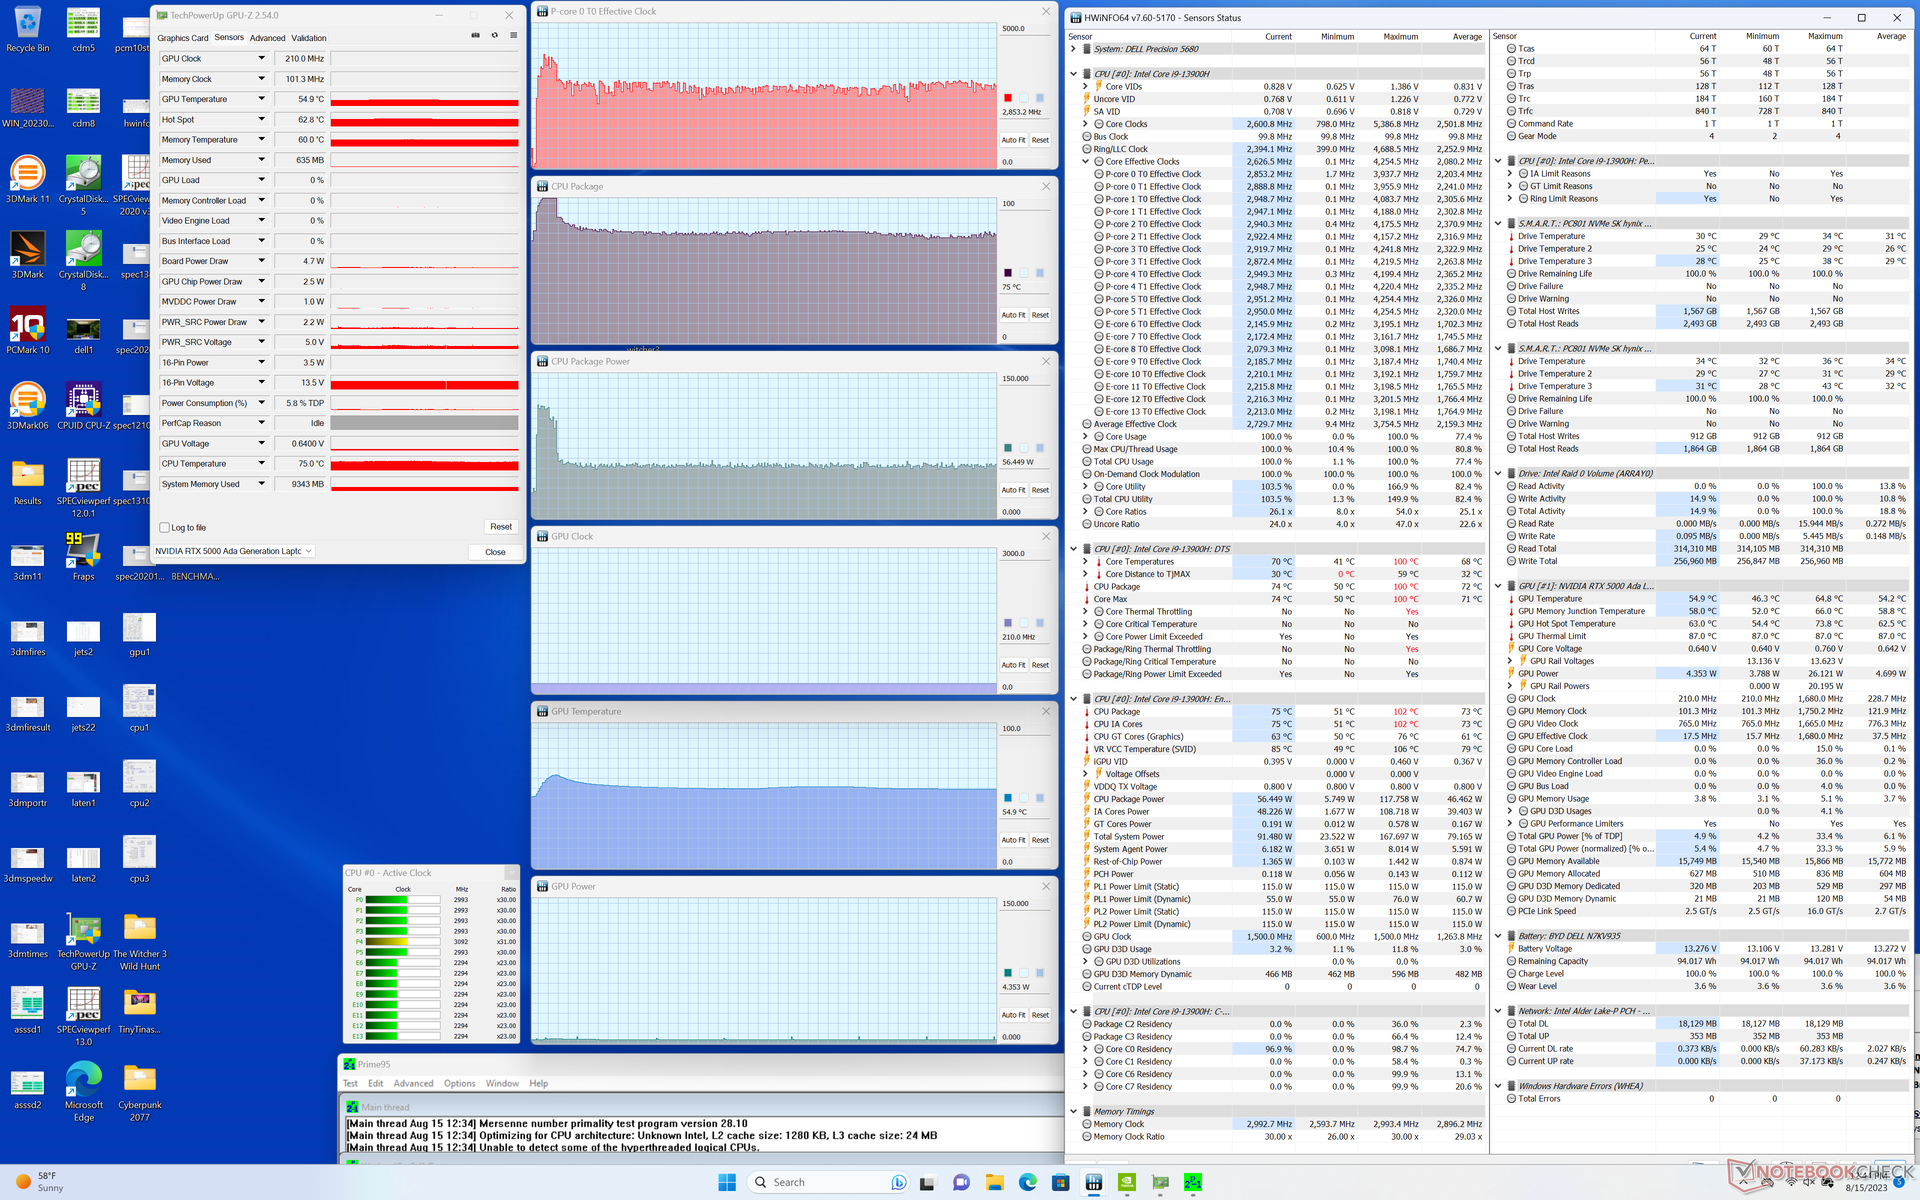
Po uruchomieniu stresu Prime95, procesor zwiększyłby taktowanie do 3,9 GHz, 117 W i 100 C, trwając tylko przez około 15 sekund. Następnie potencjał Turbo Boost spadłby, a następnie ustabilizował się na poziomie około 2,8 GHz i 56 W przy bardziej rozsądnej temperaturze rdzenia wynoszącej 75 C. Maksymalne Turbo Boost nie jest zatem zrównoważone na Precision 5680, nawet po ustawieniu trybu Performance.
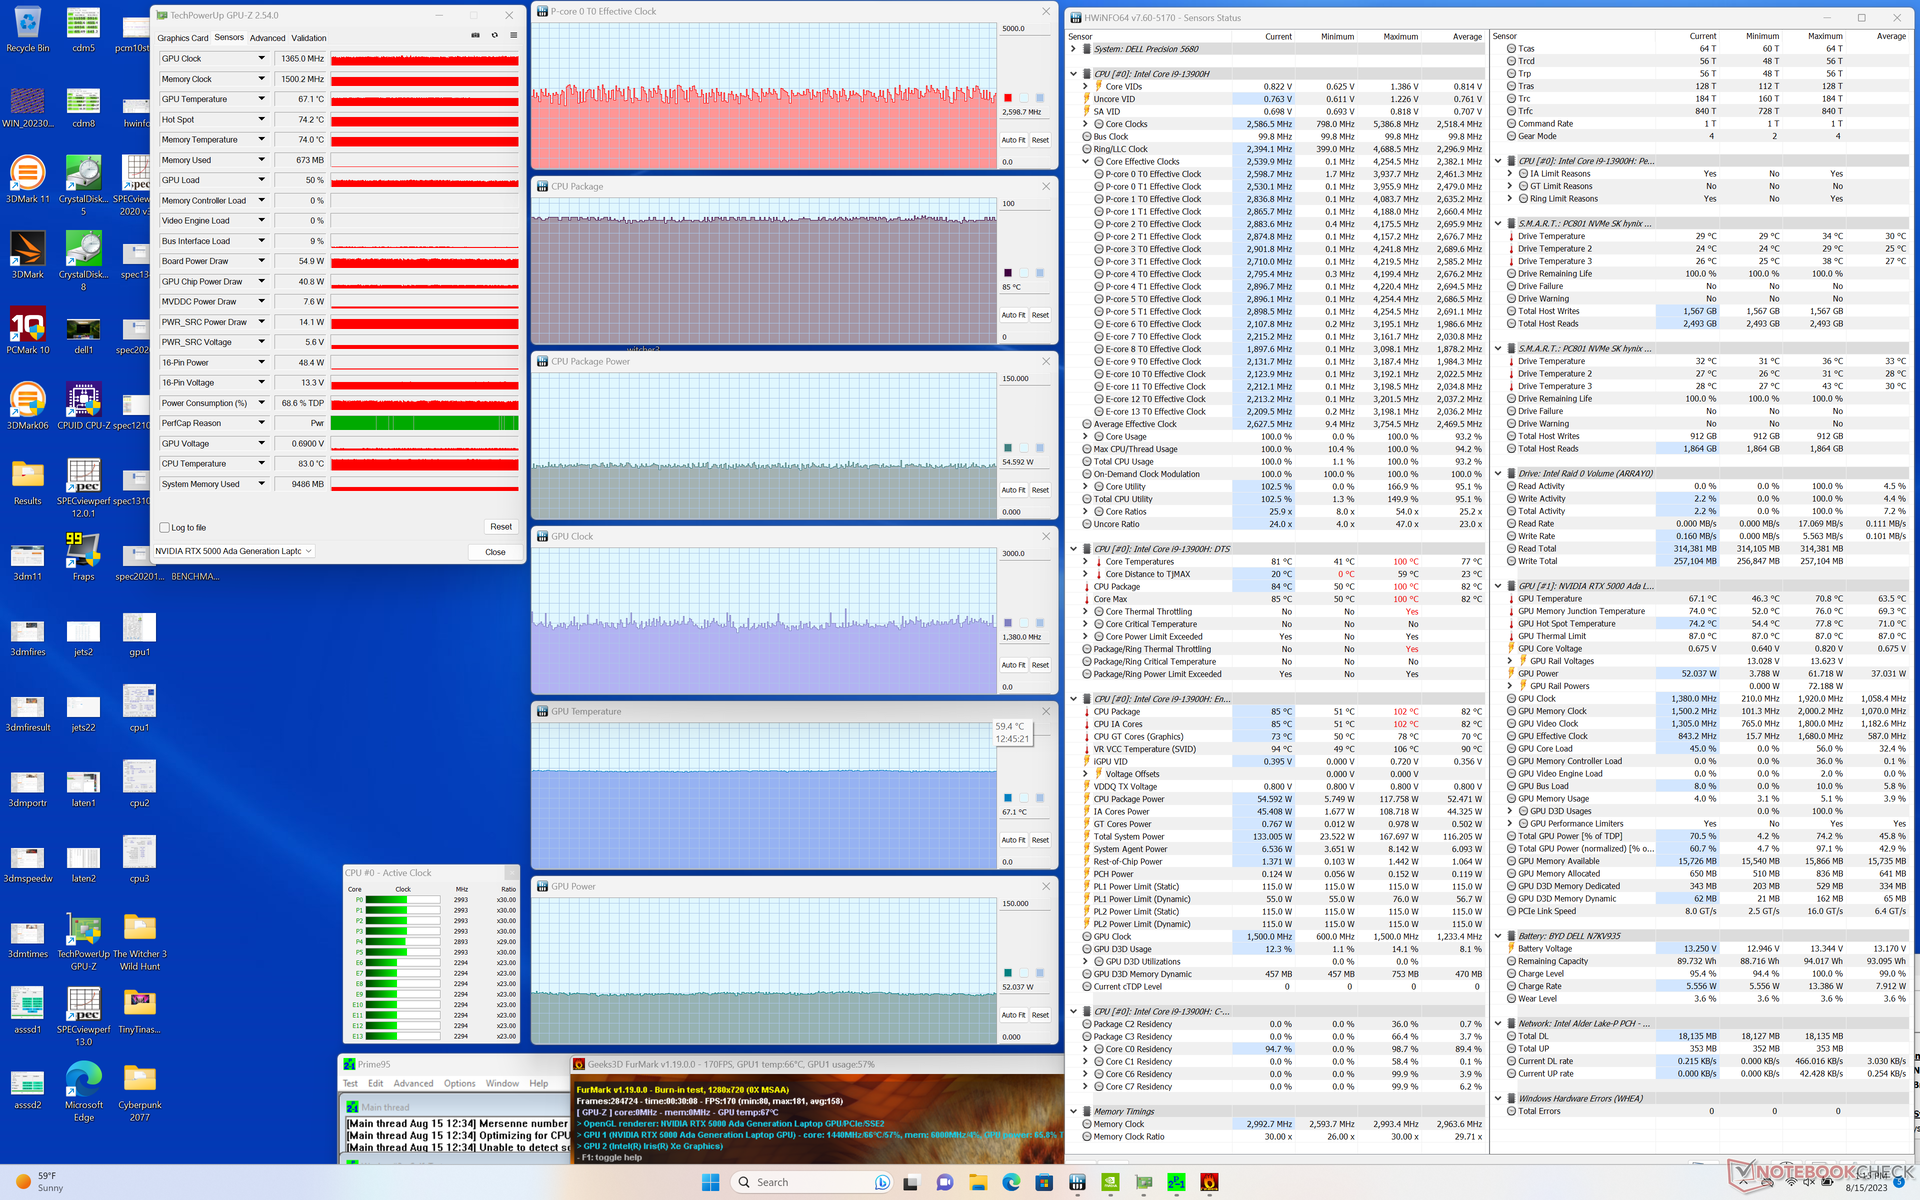
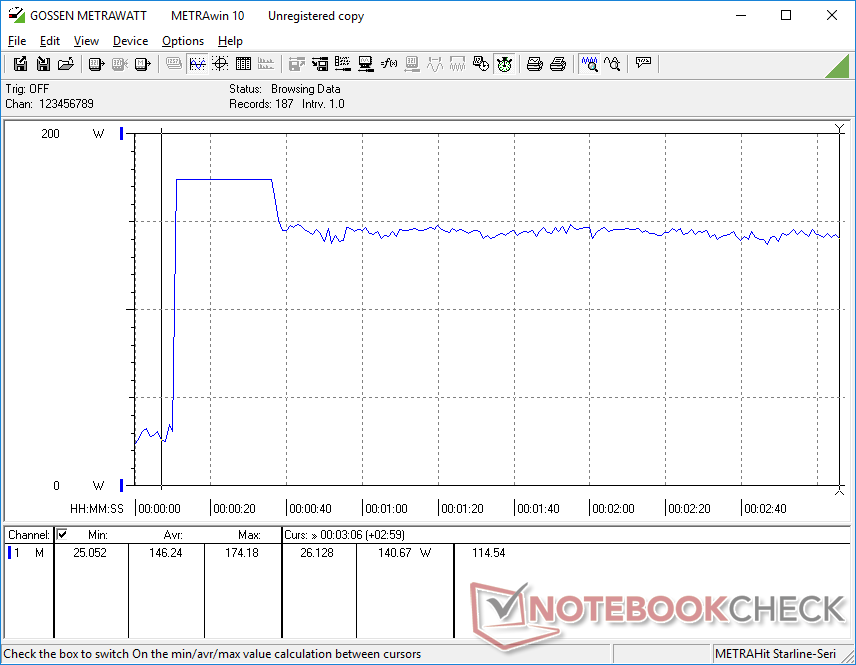
Uruchomienie trybu zrównoważonego zamiast trybu wydajności nie ma negatywnego wpływu na wydajność GPU, jak wspomniano powyżej. Zegar GPU, temperatura i pobór mocy podczas pracy w trybie Witcher 3 w trybie Performance ustabilizowałyby się odpowiednio na poziomie 1560 MHz, 72 C i 63 W, w porównaniu do 1665 MHz, 65 C i 69 W w trybie Balanced. Największą różnicą między trybami Zrównoważonym i Wydajnościowym wydaje się być temperatura procesora, która może sięgać nawet 100+ C w trybie Wydajnościowym dla wyższego potencjału Turbo Boost w porównaniu do zaledwie ~80 C w trybie Zrównoważonym.
Należy zauważyć, że jesteśmy w stanie osiągnąć maksymalny pobór mocy karty graficznej na poziomie 75 W, mimo że docelowy TGP wynosi 95 W zgodnie z panelem sterowania Nvidia.
| Taktowanie CPU (GHz) | Taktowanie GPU (MHz) | Średnia temperatura CPU (°C) | Średnia temperatura GPU (°C) | |
| System w stanie spoczynku | -- | -- | 60 | 46 |
| Prime95Stress | ~2.8 | -- | 75 | 55 |
| Prime95+ FurMark Stress | ~2.6 | 1365 | 85 | 67 |
| Witcher 3 Obciążenie(tryb wydajności) | ~1,5 | 1560 | 100 | 72 |
| Witcher 3 Obciążenie (trybzrównoważony) | ~1,3 | 1665 | 80 | 65 |
Głośniki
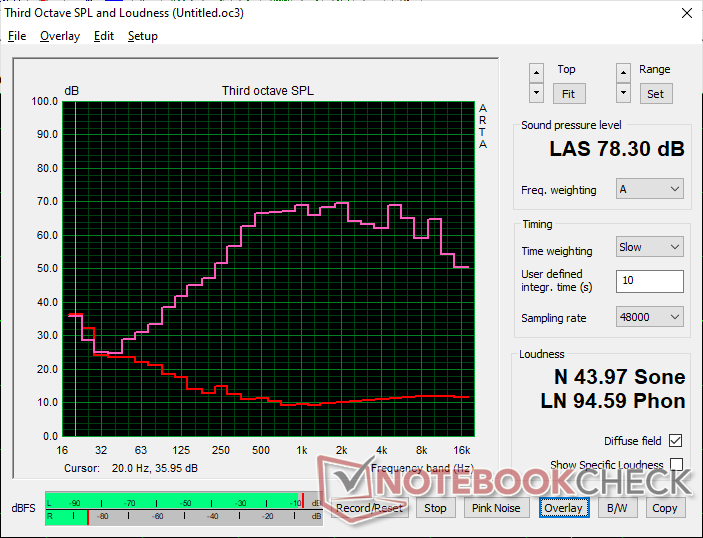
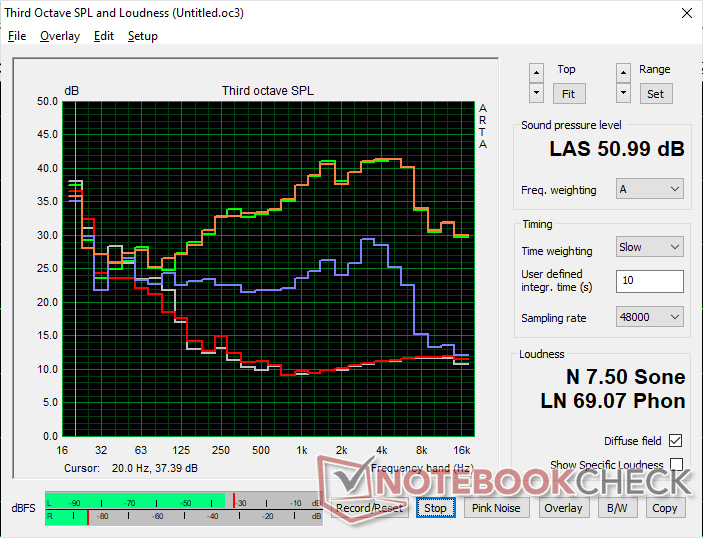
Dell Precision 5000 5680 analiza dźwięku
(±) | głośność głośnika jest średnia, ale dobra (78.3 dB)
Bas 100 - 315 Hz
(-) | prawie brak basu - średnio 16.4% niższa od mediany
(±) | liniowość basu jest średnia (7.5% delta do poprzedniej częstotliwości)
Średnie 400 - 2000 Hz
(+) | zbalansowane środki średnie - tylko 3.9% od mediany
(+) | średnie są liniowe (4.5% delta do poprzedniej częstotliwości)
Wysokie 2–16 kHz
(+) | zrównoważone maksima - tylko 2.2% od mediany
(±) | liniowość wysokich wartości jest średnia (8.3% delta do poprzedniej częstotliwości)
Ogólnie 100 - 16.000 Hz
(±) | liniowość ogólnego dźwięku jest średnia (15.5% różnicy w stosunku do mediany)
W porównaniu do tej samej klasy
» 35% wszystkich testowanych urządzeń w tej klasie było lepszych, 10% podobnych, 55% gorszych
» Najlepszy miał deltę 7%, średnia wynosiła ###średnia###%, najgorsza wynosiła 35%
W porównaniu do wszystkich testowanych urządzeń
» 23% wszystkich testowanych urządzeń było lepszych, 4% podobnych, 73% gorszych
» Najlepszy miał deltę 4%, średnia wynosiła ###średnia###%, najgorsza wynosiła 134%
Apple MacBook Pro 16 2021 M1 Pro analiza dźwięku
(+) | głośniki mogą odtwarzać stosunkowo głośno (84.7 dB)
Bas 100 - 315 Hz
(+) | dobry bas - tylko 3.8% od mediany
(+) | bas jest liniowy (5.2% delta do poprzedniej częstotliwości)
Średnie 400 - 2000 Hz
(+) | zbalansowane środki średnie - tylko 1.3% od mediany
(+) | średnie są liniowe (2.1% delta do poprzedniej częstotliwości)
Wysokie 2–16 kHz
(+) | zrównoważone maksima - tylko 1.9% od mediany
(+) | wzloty są liniowe (2.7% delta do poprzedniej częstotliwości)
Ogólnie 100 - 16.000 Hz
(+) | ogólny dźwięk jest liniowy (4.6% różnicy w stosunku do mediany)
W porównaniu do tej samej klasy
» 0% wszystkich testowanych urządzeń w tej klasie było lepszych, 0% podobnych, 100% gorszych
» Najlepszy miał deltę 5%, średnia wynosiła ###średnia###%, najgorsza wynosiła 45%
W porównaniu do wszystkich testowanych urządzeń
» 0% wszystkich testowanych urządzeń było lepszych, 0% podobnych, 100% gorszych
» Najlepszy miał deltę 4%, średnia wynosiła ###średnia###%, najgorsza wynosiła 134%
Zarządzanie energią - Ada Lovelace błyszczy
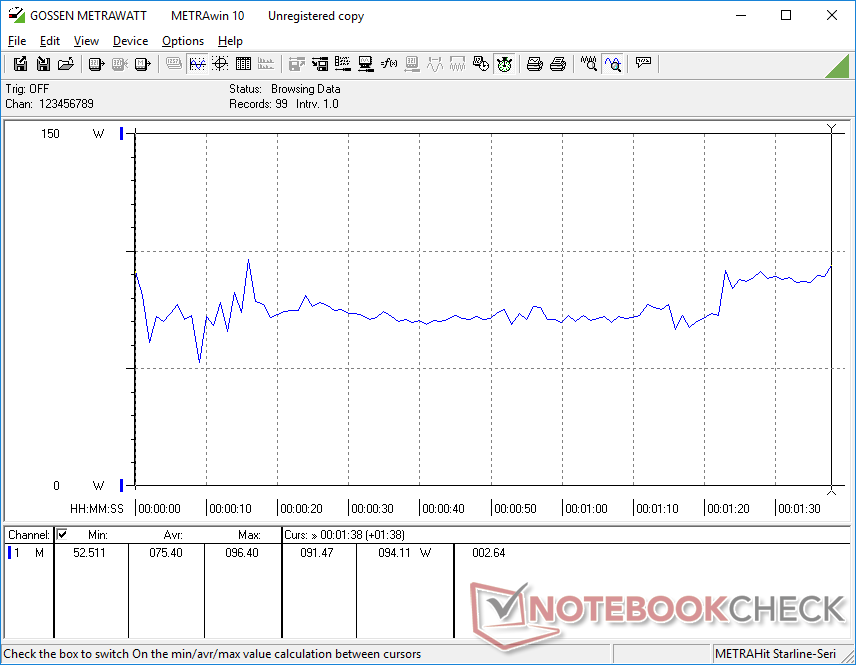
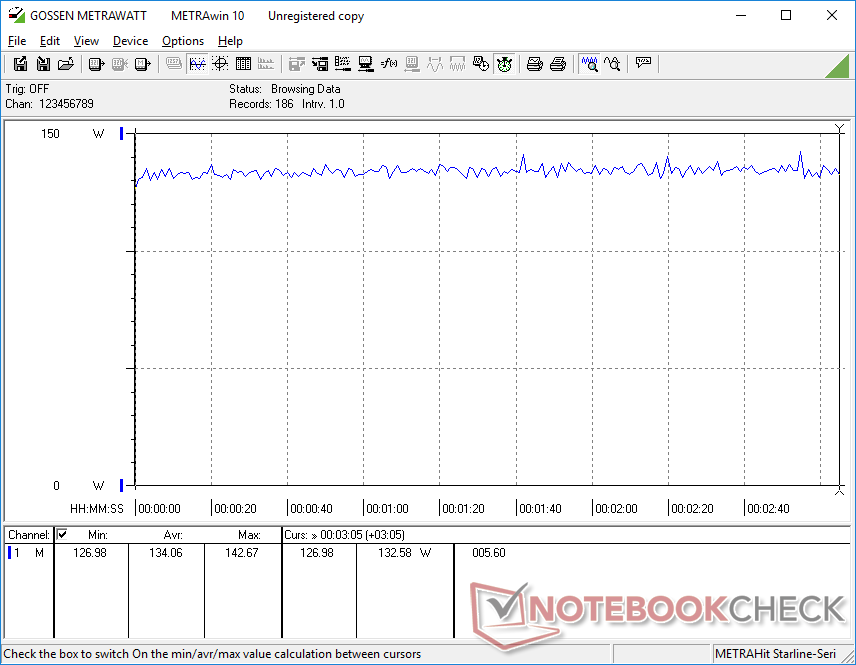
Zużycie energii
Wydajność w przeliczeniu na wat jest znacznie wyższa niż w przypadku większości innych stacji roboczych, ponieważ nasz Precision wykorzystuje procesor graficzny Ada Lovelace nowszej generacji. Uruchamianie Witcher 3zużyłoby zaledwie 134 W w naszym systemie w porównaniu do 159 W i 189 W w systemie Precision 7670 Performance i HP ZBook Fury 16 G9, mimo że nasz procesor graficzny RTX 5000 przewyższałby ich procesory graficzne RTX A5500, jak wspomniano powyżej.
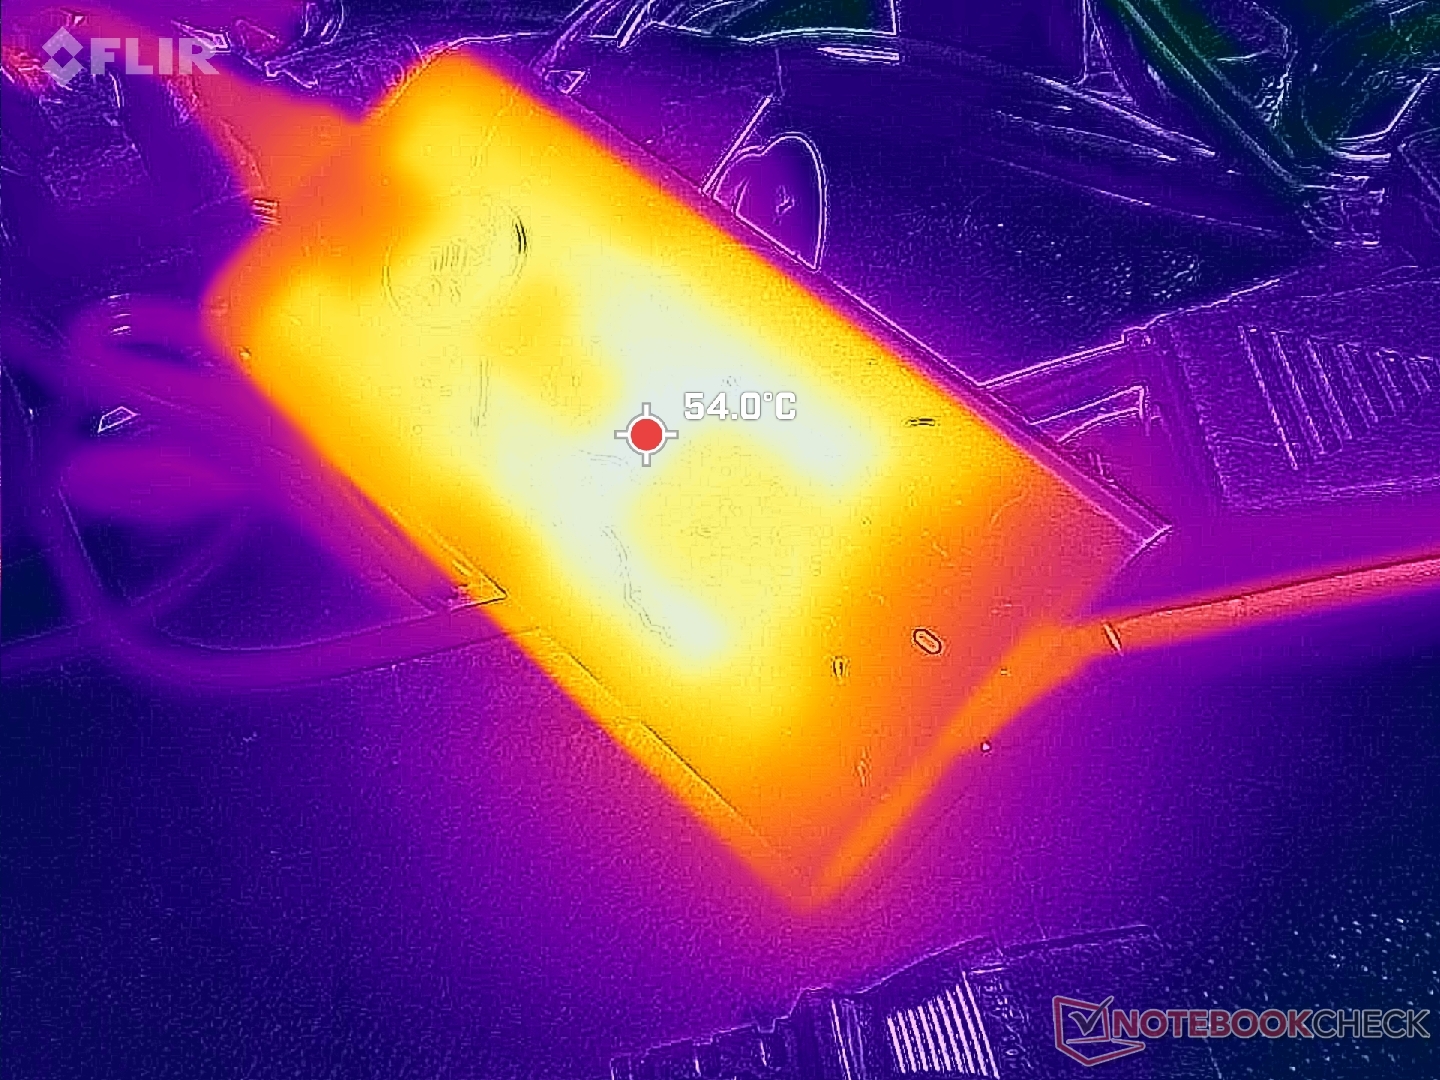
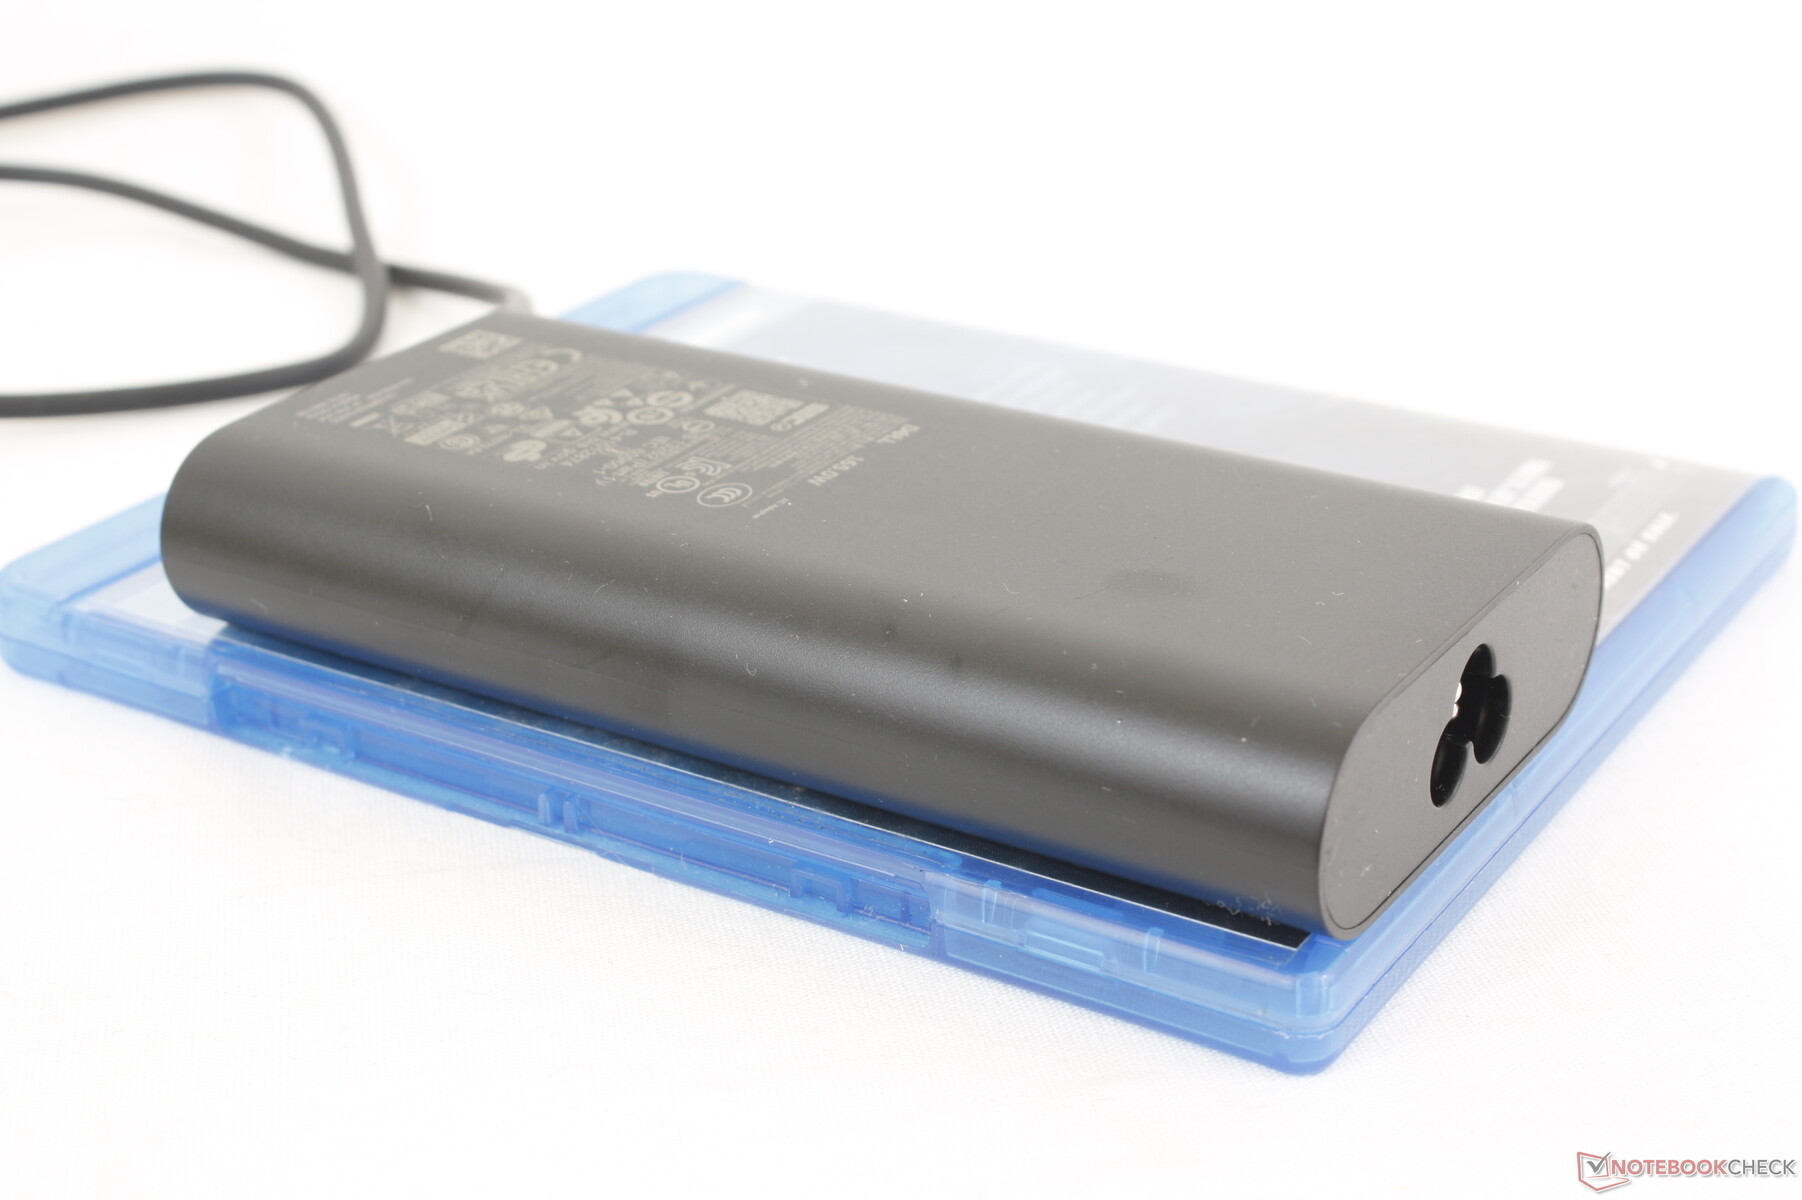
Stosunkowo niewielki (~13,5 x 6,5 x 2,2 cm) zasilacz sieciowy USB-C o mocy 165 W również zasługuje na wzmiankę ze względu na wysoką moc wyjściową. Większość istniejących adapterów USB-C jest ograniczona do zaledwie 100 W do maksymalnie 140 W, co czyni nasz 165 W adapter jednym z najbardziej wszechstronnych. Ten nowy adapter bezpośrednio rozwiązuje problemy z ładowaniem baterii których doświadczyliśmy w starszym modelu Precision 7000, który był dostarczany z mniej wydajnym adapterem USB-C o mocy 130 W.
| wyłączony / stan wstrzymania | |
| luz | |
| obciążenie |
|
Legenda:
min: | |
| Dell Precision 5000 5680 i9-13900H, RTX 5000 Ada Generation Laptop, 2x SK hynix PC801 HFS512GEJ9X101N RAID 0, OLED, 3840x2400, 16" | Dell Precision 7000 7670 Performance i9-12950HX, RTX A5500 Laptop GPU, , OLED, 3840x2400, 16" | HP ZBook Fury 16 G9 i9-12950HX, RTX A5500 Laptop GPU, Micron 3400 1TB MTFDKBA1T0TFH, IPS, 3840x2400, 16" | Lenovo ThinkPad P16 G1 RTX A5500 i9-12950HX, RTX A5500 Laptop GPU, WDC PC SN810 2TB, IPS, 3840x2400, 16" | MSI CreatorPro Z16P B12UKST i7-12700H, RTX A3000 Laptop GPU, Samsung PM9A1 MZVL21T0HCLR, IPS, 2560x1600, 16" | Asus ExpertBook B6 Flip B6602FC2 i9-12950HX, RTX A2000 Laptop GPU, Samsung PM9A1 MZVL21T0HCLR, IPS, 2560x1600, 16" | |
|---|---|---|---|---|---|---|
| Power Consumption | -99% | -86% | -53% | -18% | -35% | |
| Idle Minimum * (Watt) | 8 | 16.4 -105% | 19.5 -144% | 7.5 6% | 10.8 -35% | 10.5 -31% |
| Idle Average * (Watt) | 10.4 | 35.9 -245% | 29 -179% | 20.1 -93% | 16.3 -57% | 11.9 -14% |
| Idle Maximum * (Watt) | 30.5 | 47 -54% | 40.7 -33% | 40 -31% | 16.9 45% | 18 41% |
| Load Average * (Watt) | 75.4 | 147.1 -95% | 142.1 -88% | 137 -82% | 111.7 -48% | 182 -141% |
| Witcher 3 ultra * (Watt) | 134 | 158.8 -19% | 188.6 -41% | 208 -55% | 152.1 -14% | 177.5 -32% |
| Load Maximum * (Watt) | 175 | 311 -78% | 224.4 -28% | 285.9 -63% | 177.4 -1% | 229 -31% |
* ... im mniej tym lepiej
Power Consumption Witcher 3 / Stresstest
Power Consumption external Monitor
Żywotność baterii
Czas pracy na baterii jest doskonały, biorąc pod uwagę wysoką wydajność i wymagający panel OLED 4K. Jesteśmy w stanie zarejestrować prawie 10 godzin rzeczywistego przeglądania sieci WLAN w profilu zrównoważonym z aktywnym iGPU, w porównaniu do prawie połowy tego czasu w przypadku alternatyw, takich jak Lenovo ThinkPad P16 G1 lubMSI CreatorPro Z16P.
Ładowanie od stanu pustego do pełnej pojemności zajmuje około 2 godzin przy użyciu dołączonego zasilacza sieciowego o mocy 165 W. Nasz zewnętrzny zasilacz USB-C o mocy 65 W również może naładować system, aczkolwiek w wolniejszym tempie.
| Dell Precision 5000 5680 i9-13900H, RTX 5000 Ada Generation Laptop, 98 Wh | Dell Precision 7000 7670 Performance i9-12950HX, RTX A5500 Laptop GPU, 93 Wh | HP ZBook Fury 16 G9 i9-12950HX, RTX A5500 Laptop GPU, 95 Wh | Lenovo ThinkPad P16 G1 RTX A5500 i9-12950HX, RTX A5500 Laptop GPU, 94 Wh | MSI CreatorPro Z16P B12UKST i7-12700H, RTX A3000 Laptop GPU, 90 Wh | Asus ExpertBook B6 Flip B6602FC2 i9-12950HX, RTX A2000 Laptop GPU, 90 Wh | |
|---|---|---|---|---|---|---|
| Czasy pracy | -53% | -46% | -41% | -41% | -14% | |
| Reader / Idle (h) | 17.9 | 5.3 -70% | 12.5 -30% | |||
| WiFi v1.3 (h) | 9.9 | 4.7 -53% | 6 -39% | 5.8 -41% | 5.8 -41% | 8.7 -12% |
| Load (h) | 1.7 | 1.2 -29% | 1.7 0% | |||
| H.264 (h) | 5.8 |
Za
Przeciw
Werdykt - potężniejszy niż się wydaje
Precision 5680 to jedna z najsmuklejszych i najszybszych mobilnych stacji roboczych w całej ofercie firmy Dell. Przenośna konstrukcja, adapter USB-C o mocy 165 W, doskonały wyświetlacz OLED 4K i potężny procesor graficzny RTX 5000 wyróżniają się jako najmocniejsze cechy tego modelu. Zwłaszcza ten ostatni jest odpowiedzialny za znaczny wzrost wydajności i wydłużenie czasu pracy na baterii w porównaniu z większością innych stacji roboczych ze względu na architekturę Ada Lovelace i bardzo wysoką wydajność na wat.
Precision 5680 oferuje jedną z najwyższych wydajności na wat w rosnącej kategorii cienkich i lekkich stacji roboczych
.
Hardkorowi użytkownicy stacji roboczych mogą nadal preferować większe i grubsze modele, takie jak HP ZBook Fury 16 lub Precision 7670 ponieważ smukła konstrukcja Precision 5680 rezygnuje z niektórych kluczowych funkcji, takich jak rozszerzalna pamięć RAM, WAN, ECC RAM i szersze opcje portów. Jego okropny clickpad nie jest tak dokładny jak touchpady w HP czy Lenovo ThinkPad P16 Lenovo ThinkPad P16 które mają rzeczywiste przyciski myszy dla lepszej kontroli.
Cena i dostępność
Dell wysyła obecnie model Precision 5680 w cenie od 2490 USD do ponad 6500 USD.
Dell Precision 5000 5680
- 18/08/2023 v7 (old)
Allen Ngo
Przezroczystość
Wyboru urządzeń do recenzji dokonuje nasza redakcja. Próbka testowa została udostępniona autorowi jako pożyczka od producenta lub sprzedawcy detalicznego na potrzeby tej recenzji. Pożyczkodawca nie miał wpływu na tę recenzję, producent nie otrzymał też kopii tej recenzji przed publikacją. Nie było obowiązku publikowania tej recenzji. Jako niezależna firma medialna, Notebookcheck nie podlega władzy producentów, sprzedawców detalicznych ani wydawców.
Tak testuje Notebookcheck
Każdego roku Notebookcheck niezależnie sprawdza setki laptopów i smartfonów, stosując standardowe procedury, aby zapewnić porównywalność wszystkich wyników. Od około 20 lat stale rozwijamy nasze metody badawcze, ustanawiając przy tym standardy branżowe. W naszych laboratoriach testowych doświadczeni technicy i redaktorzy korzystają z wysokiej jakości sprzętu pomiarowego. Testy te obejmują wieloetapowy proces walidacji. Nasz kompleksowy system ocen opiera się na setkach uzasadnionych pomiarów i benchmarków, co pozwala zachować obiektywizm.Price comparison

