Recenzja laptopa Asus ZenBook 14X (2023): Ultrabook OLED na granicy możliwości

Asus nieznacznie odświeżył Asus ZenBook 14X, dzięki czemu wygląda teraz bardzo podobnie do kompaktowego 13-calowego ultrabooka ZenBook S13. Waga 14-calowca z wyjątkowo dobrą obudową jest jednak znacznie wyższa i wynosi 1,56 kilograma. W zamian Asus instaluje znacznie wydajniejszy procesor Intel Core i9-13900H oraz, w razie potrzeby, kartę graficzną Nvidia GeForce RTX 3050. Podobnie jak w poprzedniku, zainstalowano wyświetlacz OLED 2,8K, który został ulepszony z 90 Hz do bardzo dobrych 120 Hz.
Ponieważ nie ma wielu konkurentów z wyświetlaczem OLED w segmencie 14-calowym, uwzględniliśmy również konkurentów IPS do porównania. Interesujący jest tutaj tablet Asus ROG Flow Z13 GZ301V, który jest wyposażony w ten sam potężny procesor Intel Core i9.
Potencjalni konkurenci w porównaniu
Ocena | Data | Model | Waga | Wysokość | Rozmiar | Rezolucja | Cena |
|---|---|---|---|---|---|---|---|
| 88.5 % v7 (old) | 06/2023 | Asus ZenBook 14X UX3404VC i9-13900H, Iris Xe G7 96EUs | 1.6 kg | 16.9 mm | 14.50" | 2880x1800 | |
| 91.9 % v7 (old) | 07/2024 | Apple MacBook Pro 13 2022 M2 M2, M2 10-Core GPU | 1.4 kg | 15.6 mm | 13.30" | 2560x1600 | |
| 89.2 % v7 (old) | 04/2023 | Lenovo Slim Pro 7 14ARP8 R7 7735HS, GeForce RTX 3050 6GB Laptop GPU | 1.6 kg | 15.6 mm | 14.50" | 2560x1600 | |
| 89.1 % v7 (old) | 04/2023 | Asus ROG Flow Z13 GZ301V i9-13900H, GeForce RTX 4060 Laptop GPU | 1.6 kg | 14.2 mm | 13.40" | 2560x1600 | |
| 87.3 % v7 (old) | 09/2022 | Dell XPS 13 Plus 9320 i7-1280P OLED i7-1280P, Iris Xe G7 96EUs | 1.3 kg | 15.28 mm | 13.40" | 3456x2160 | |
| 87.2 % v7 (old) | 09/2022 | Dell Inspiron 14 Plus 7420 i7-12700H, GeForce RTX 3050 4GB Laptop GPU | 1.7 kg | 18.87 mm | 14.00" | 2240x1400 | |
| 86.6 % v7 (old) | 10/2022 | LG Gram 14Z90Q i5-1240P, Iris Xe G7 80EUs | 980 g | 16.8 mm | 14.00" | 1920x1200 |
Obudowa - nie ma lepszej jakości niż ta
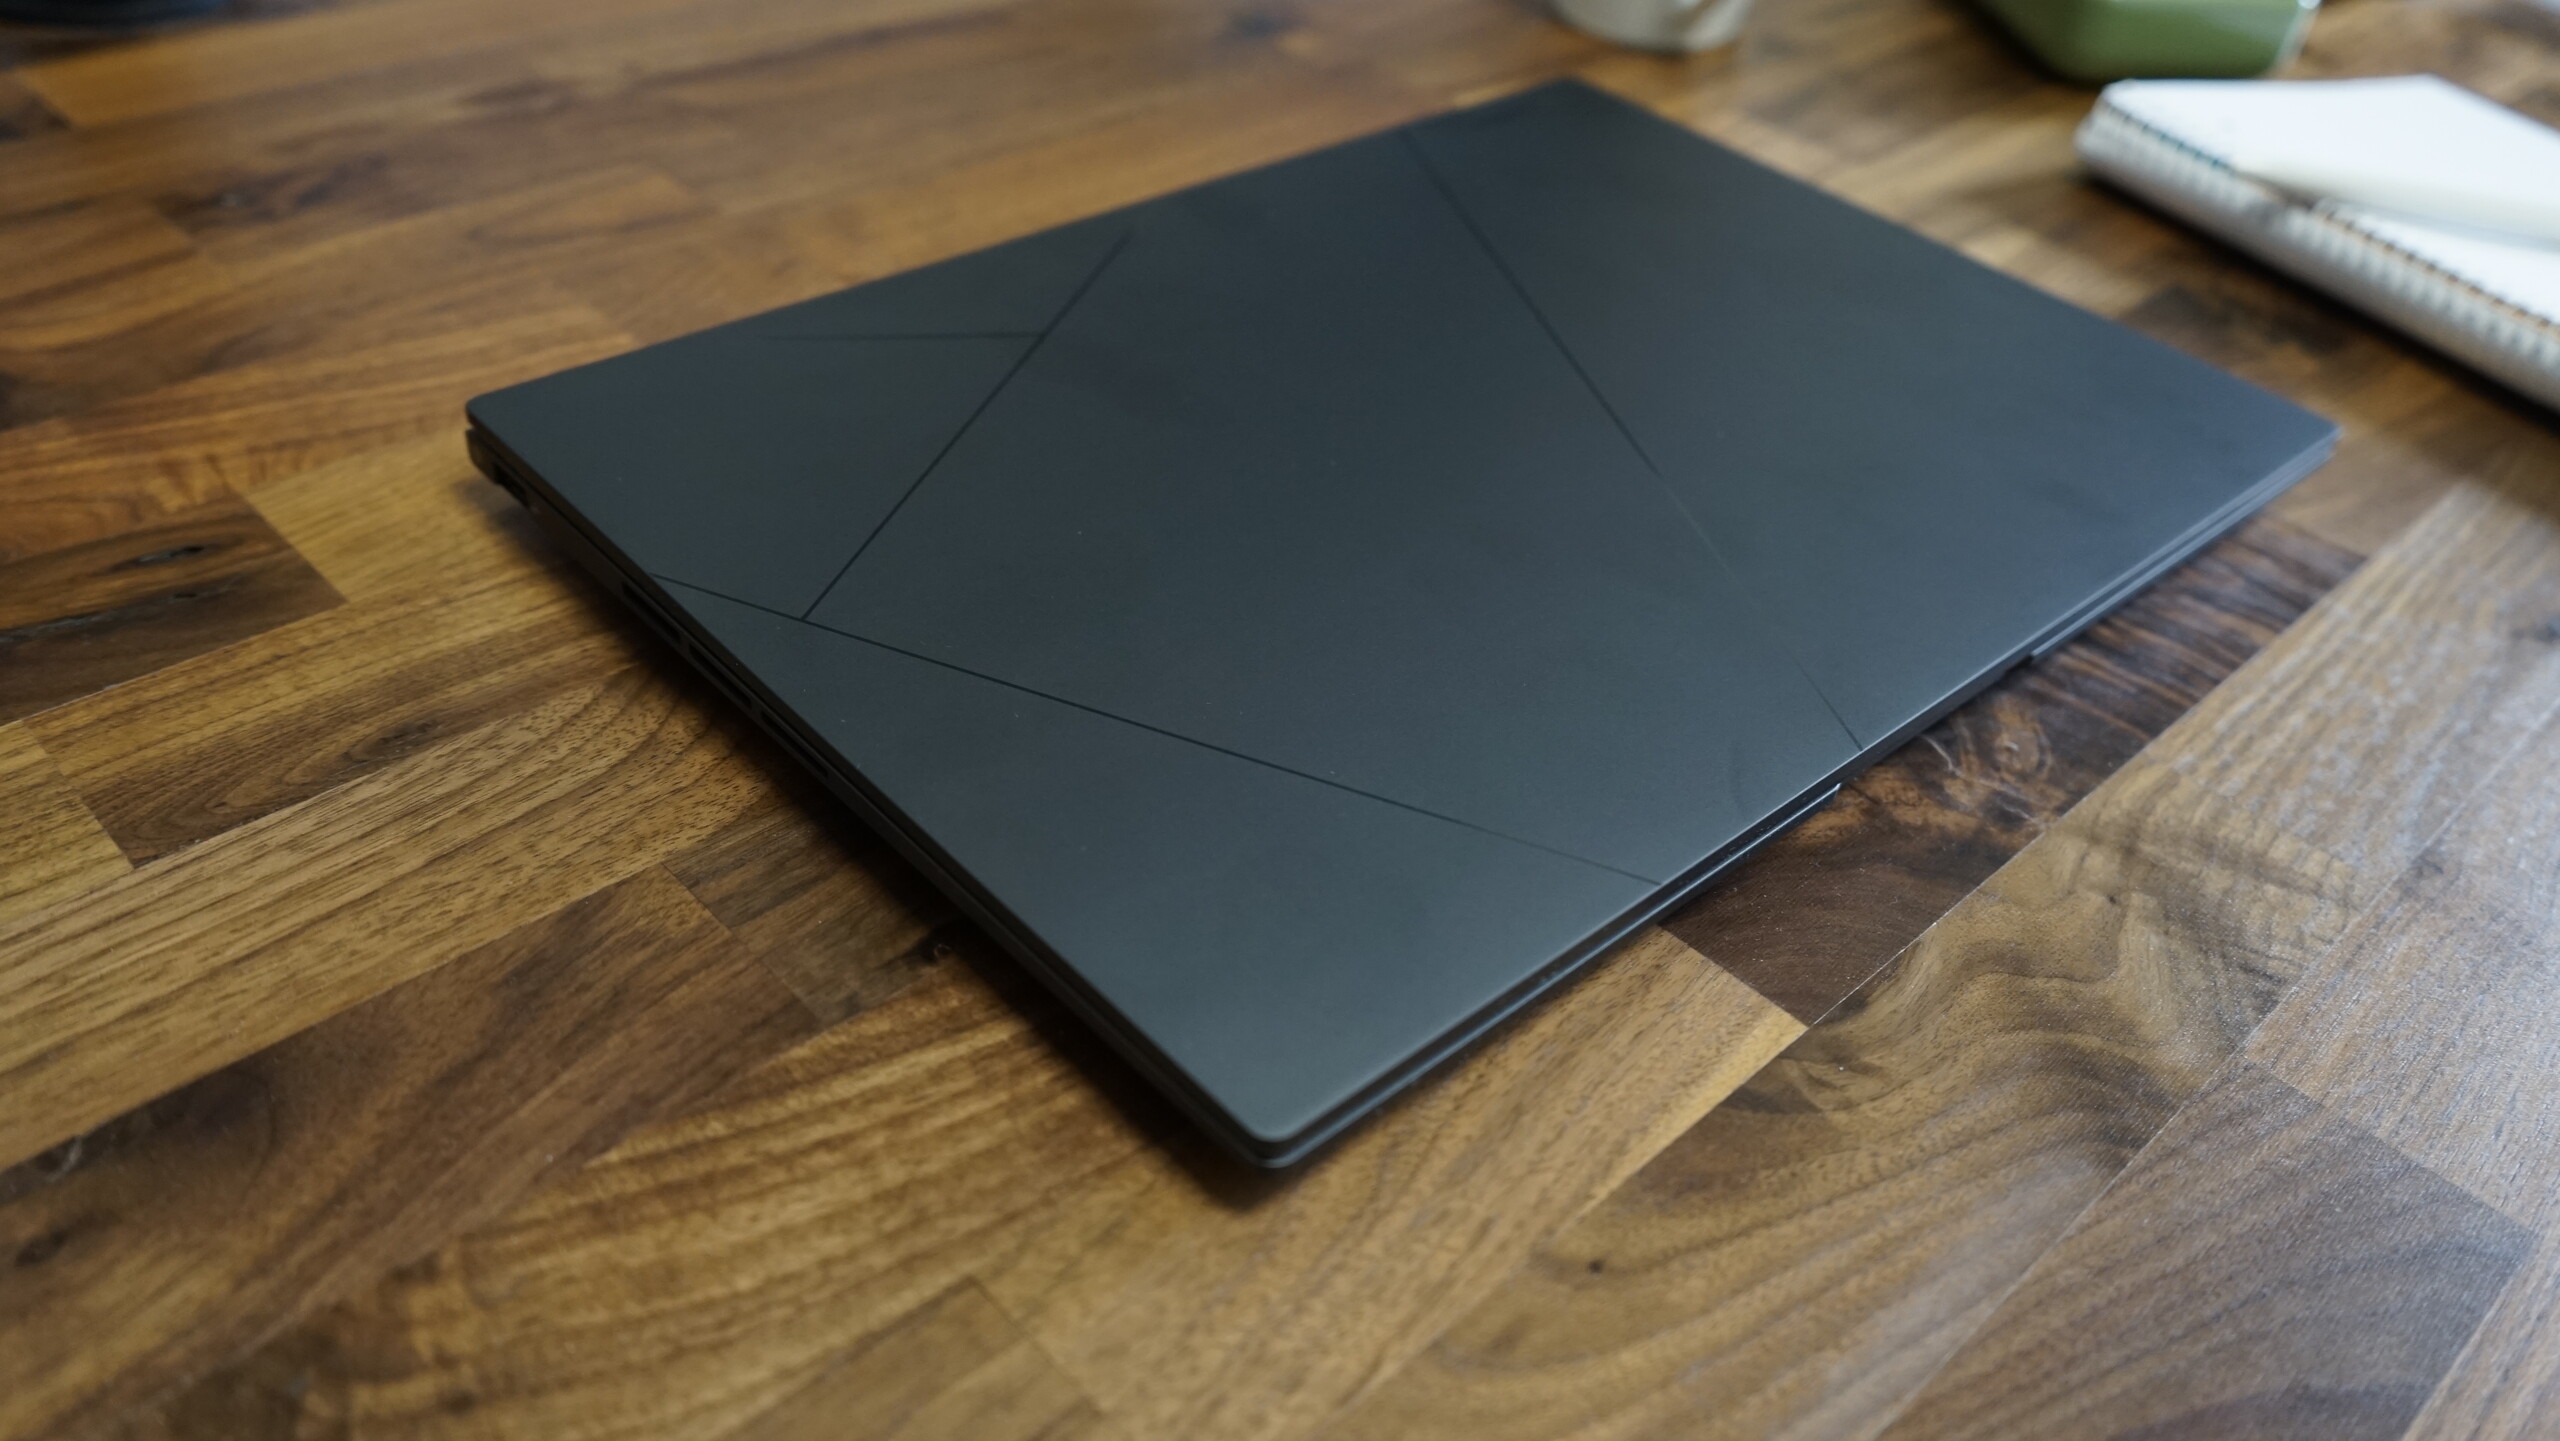
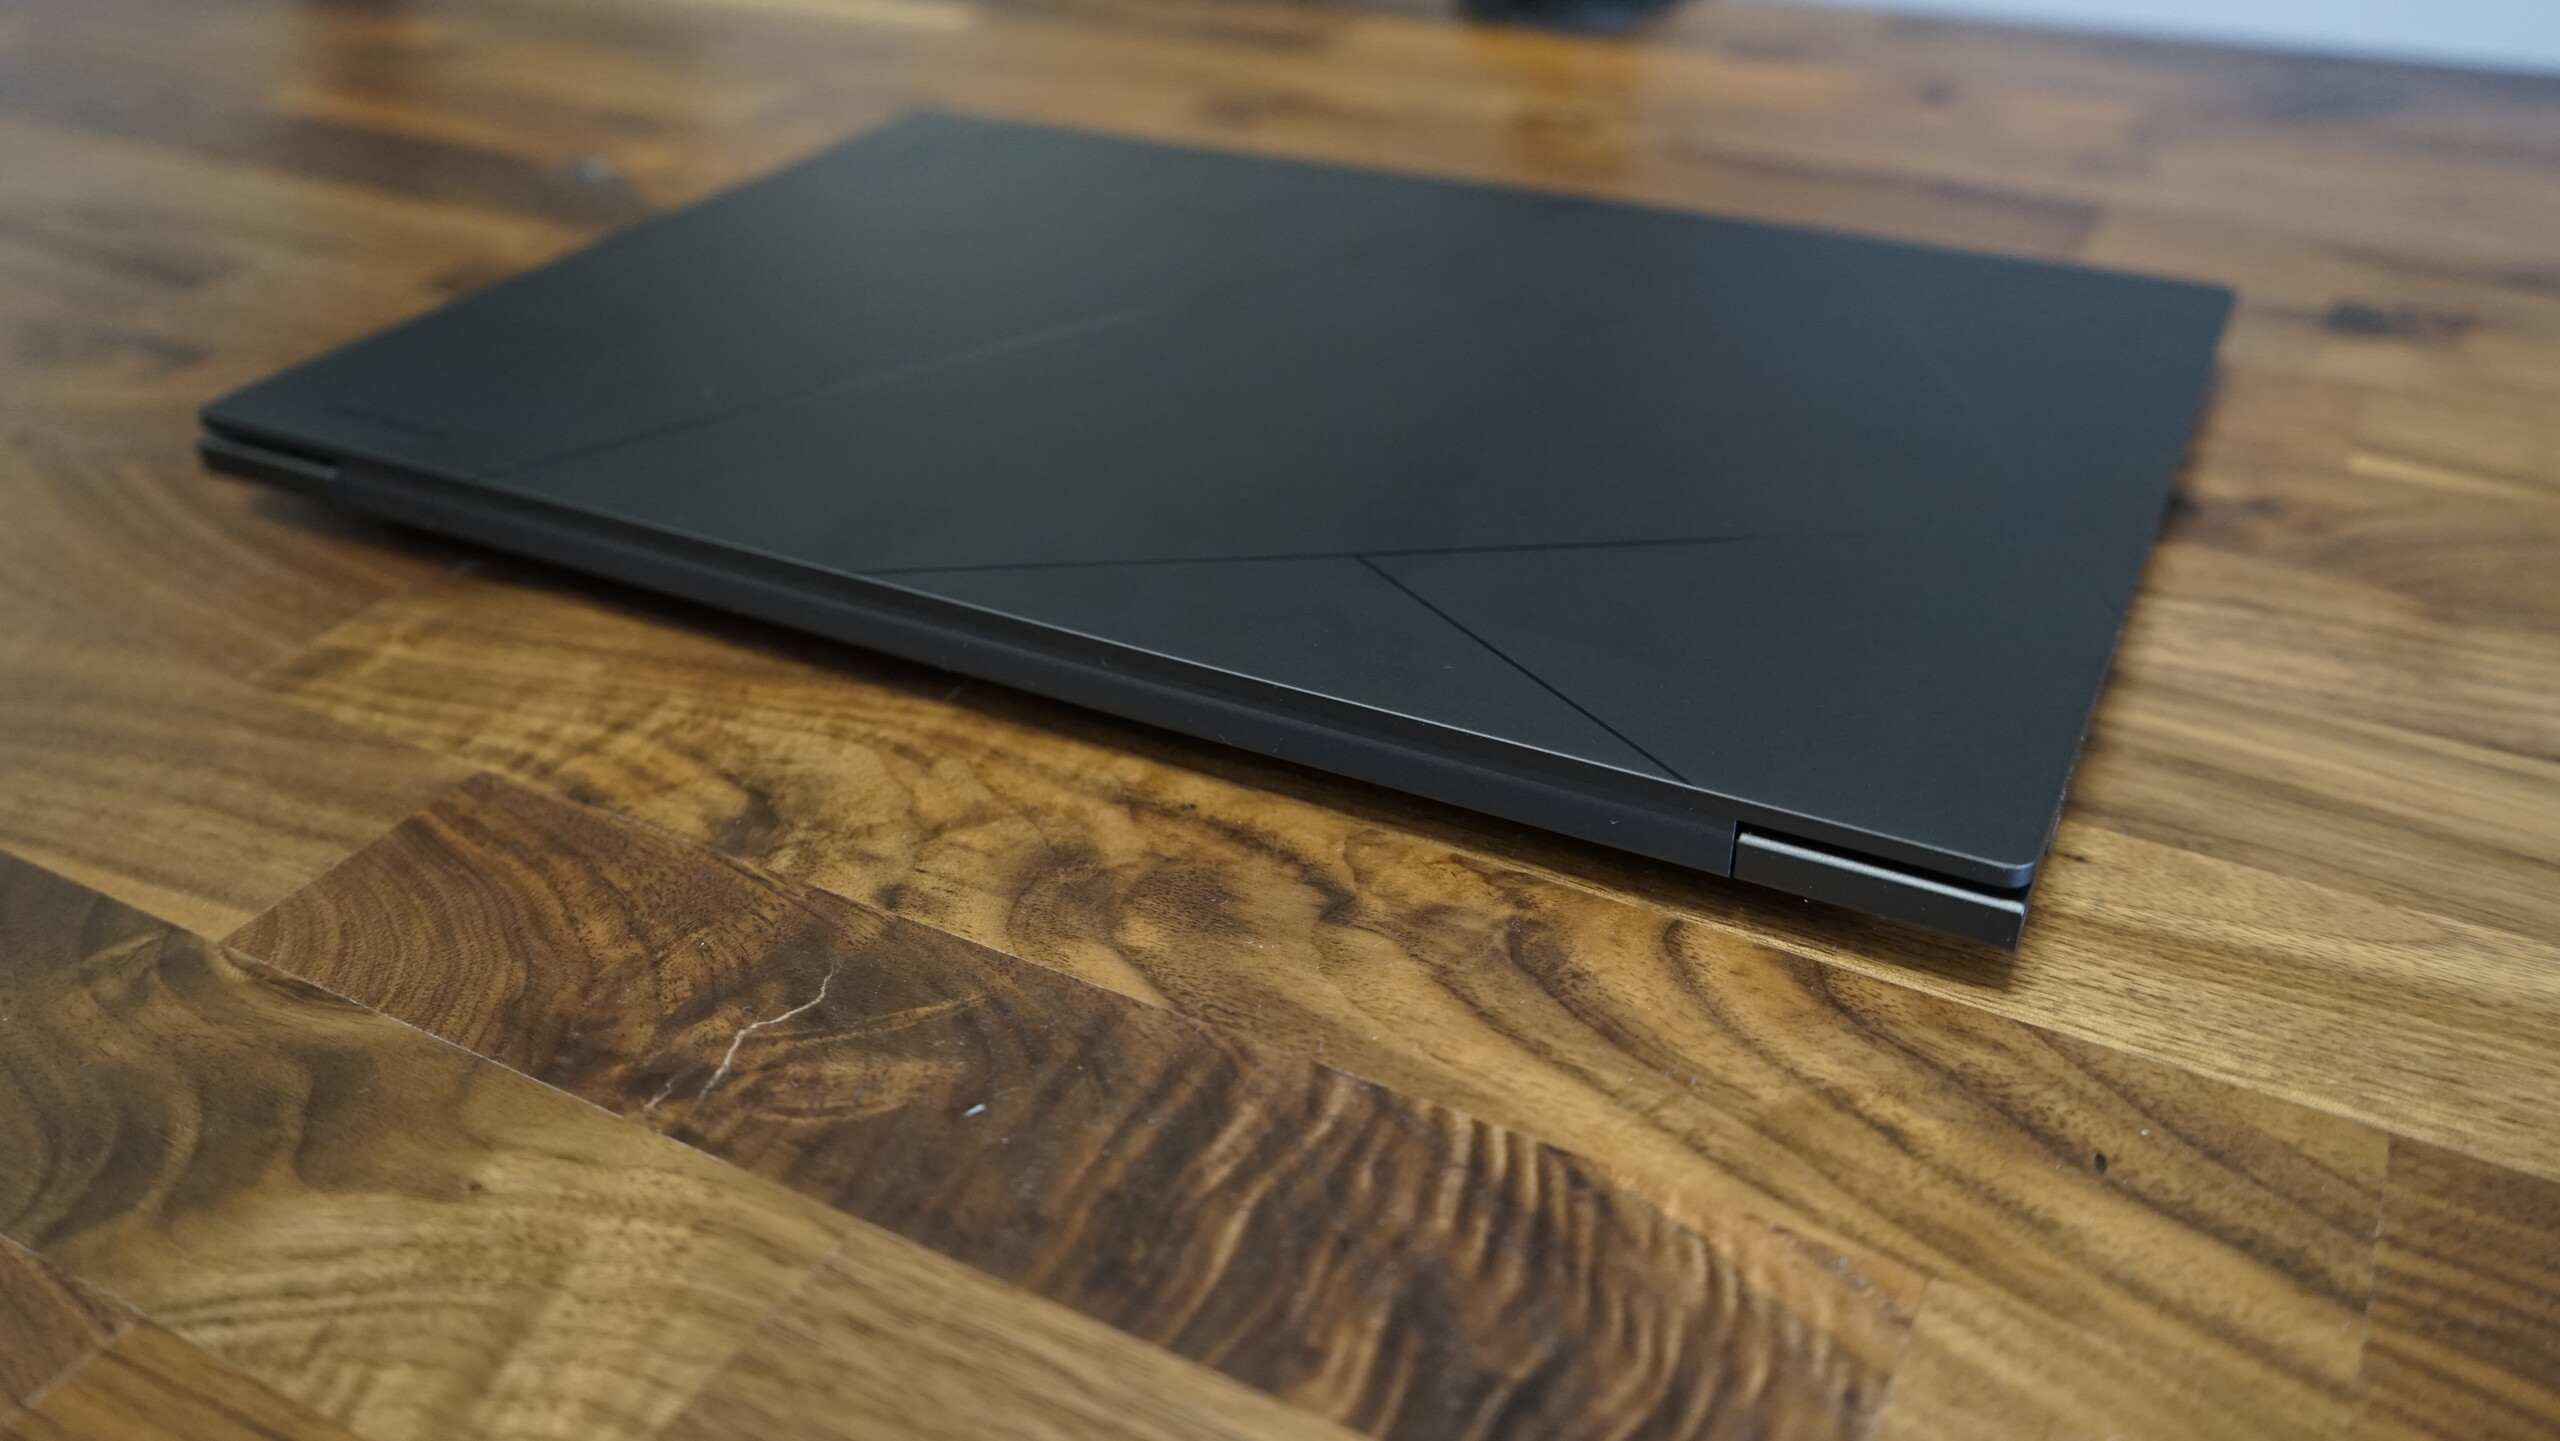
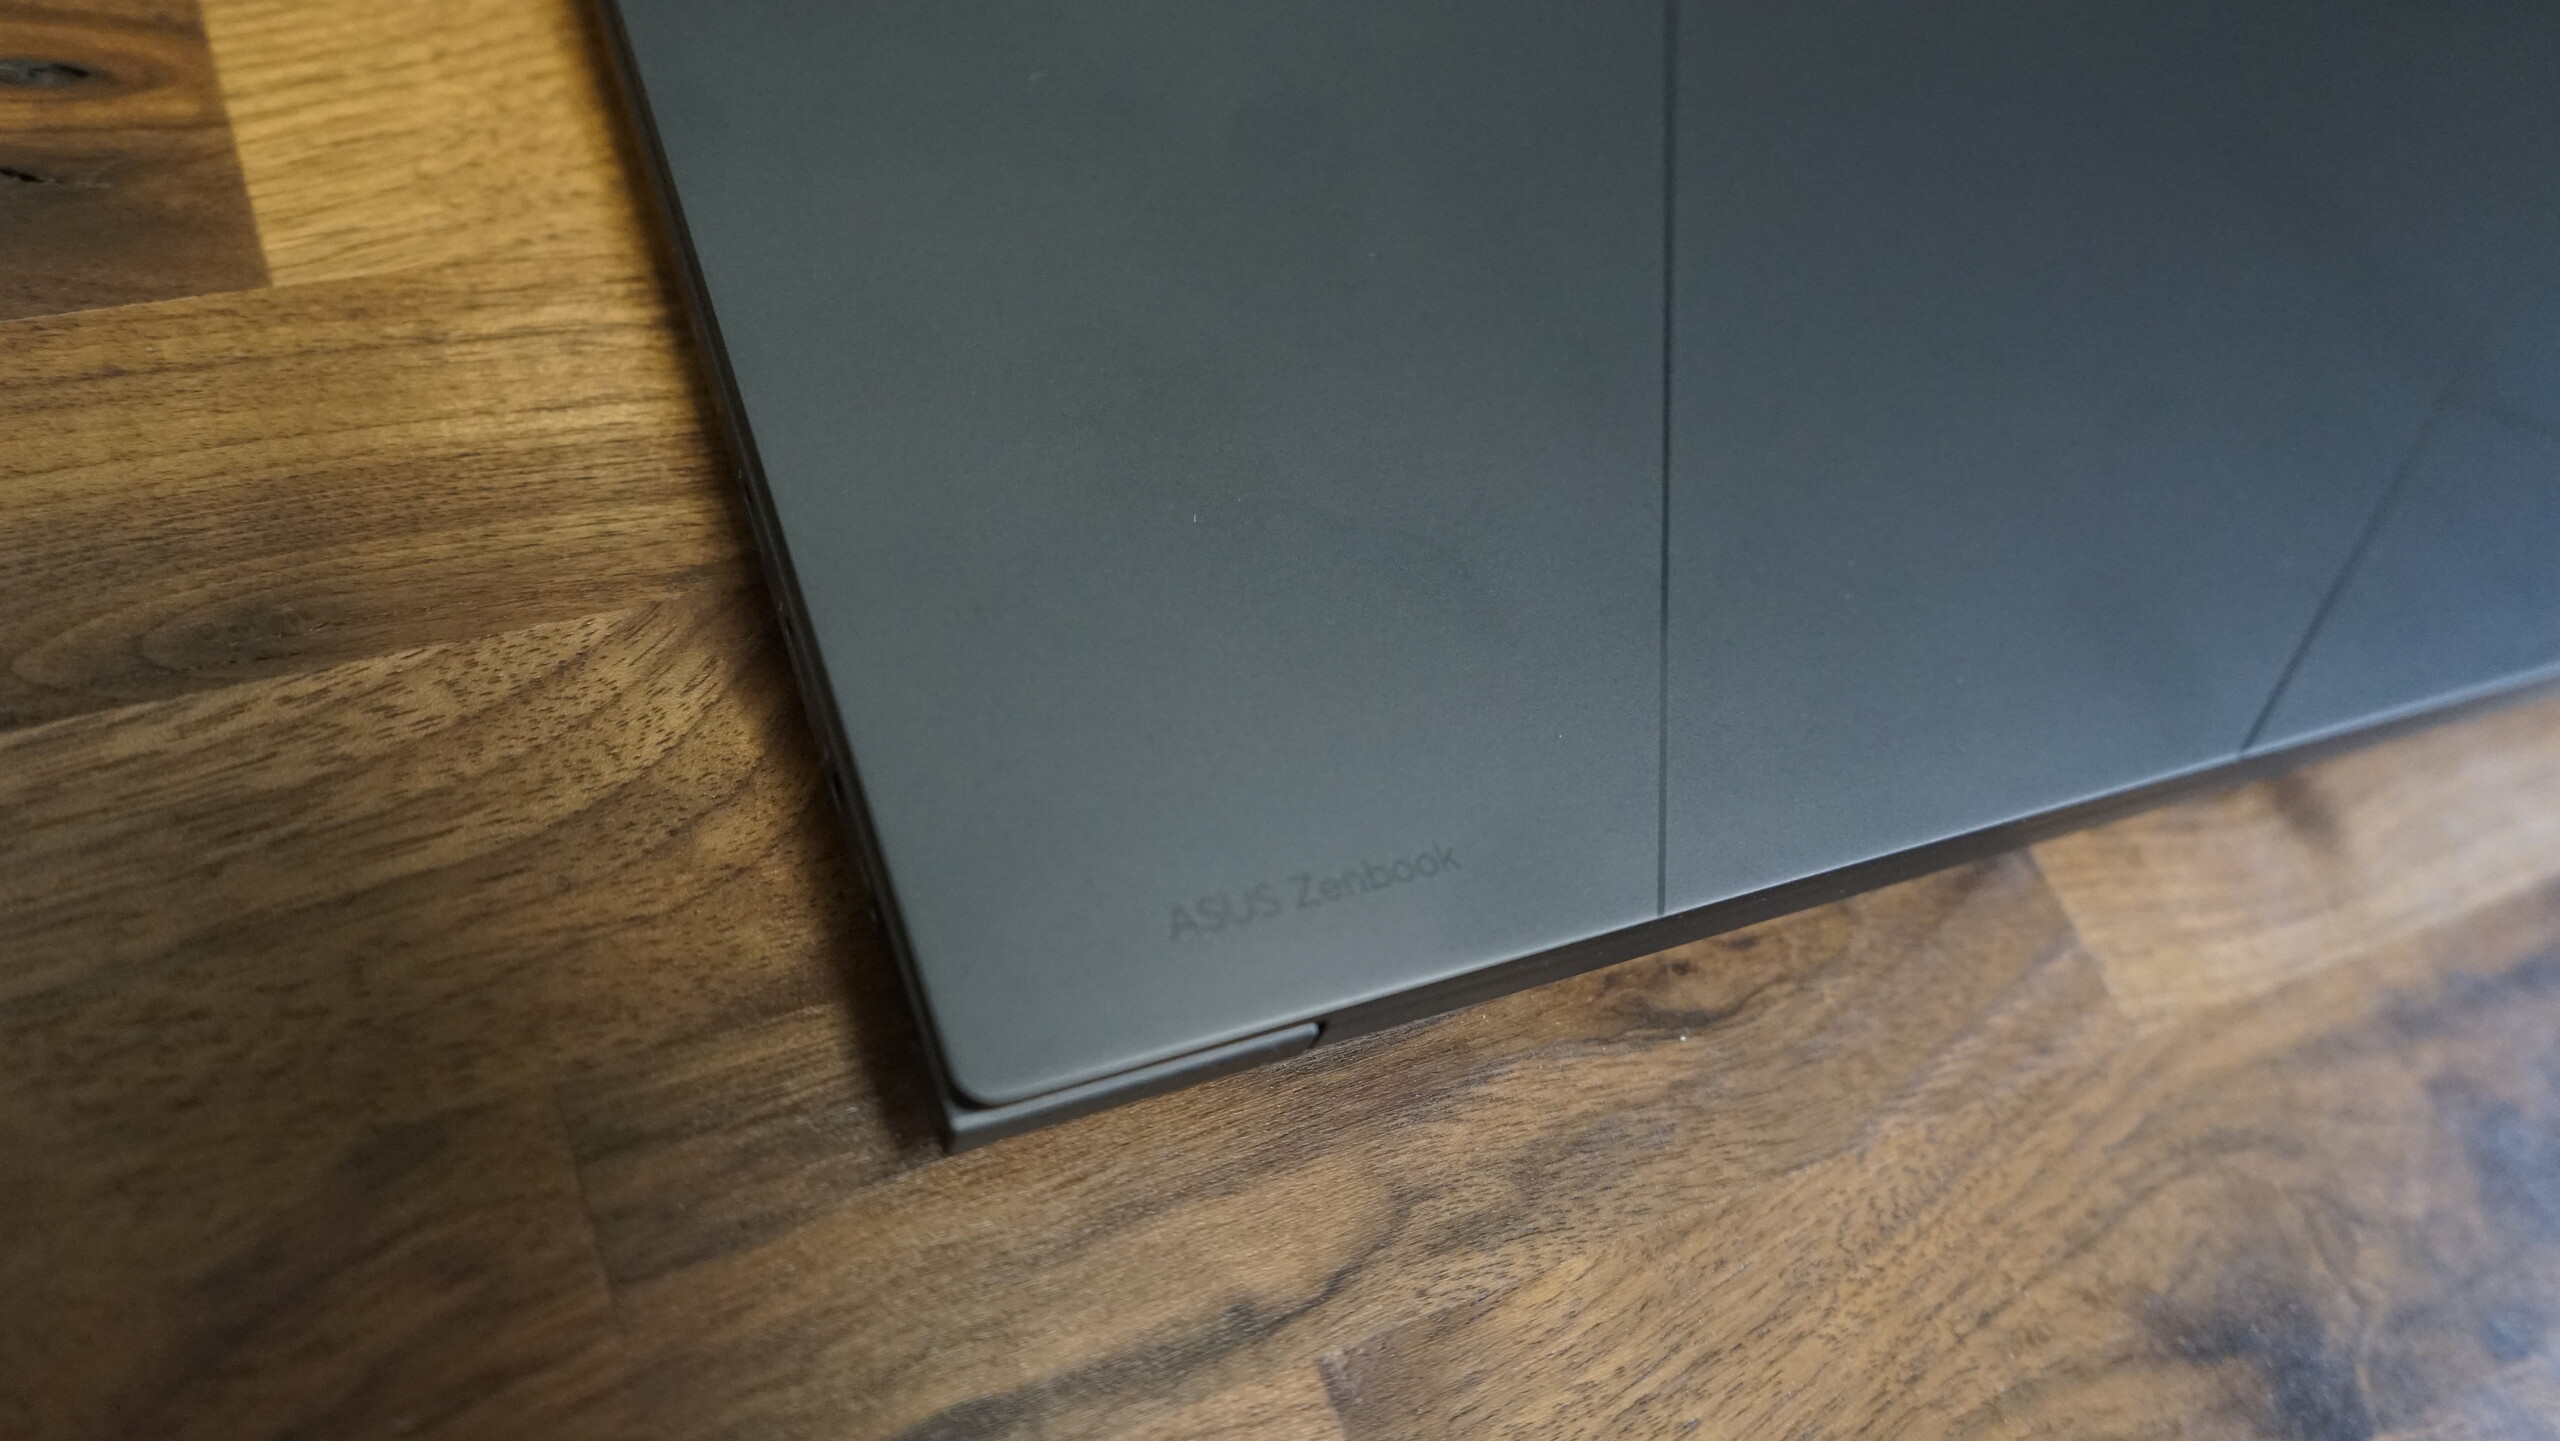
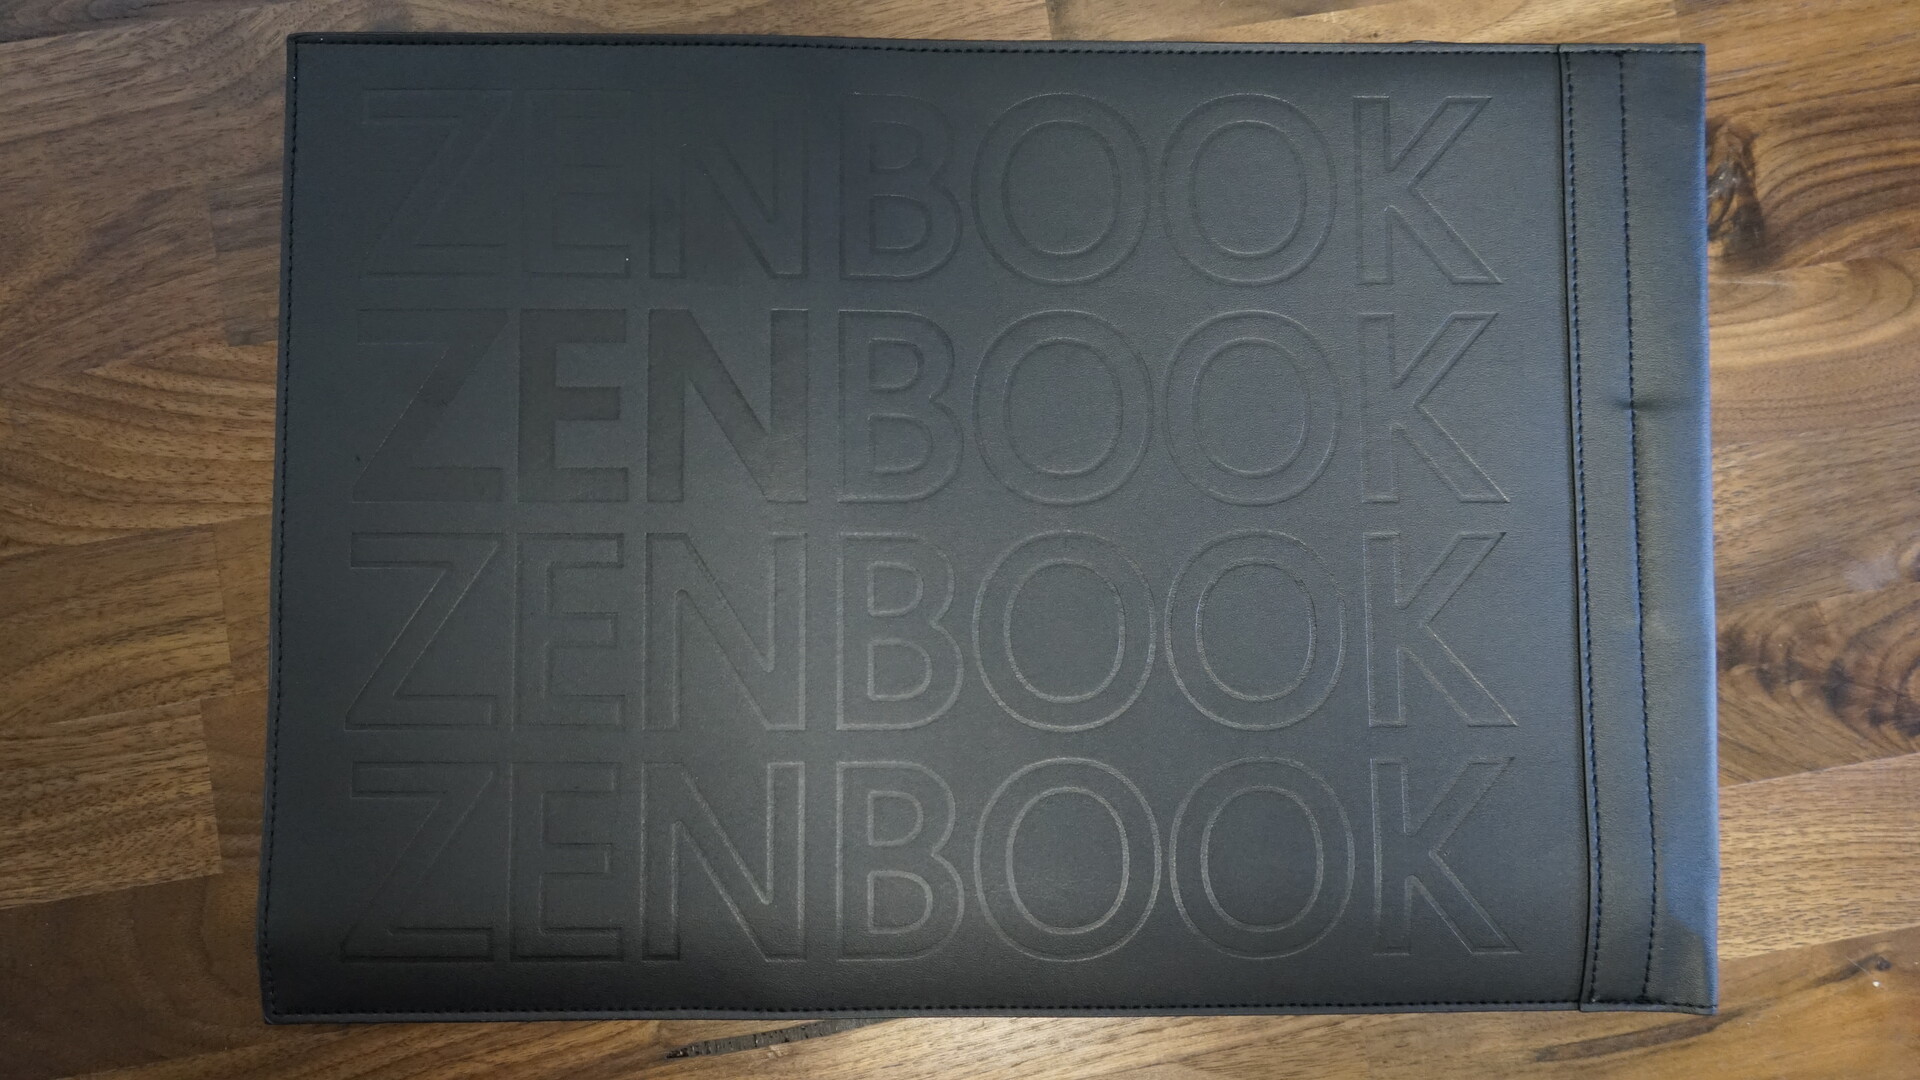
Obudowa nowego Asusa ZenBook 14X w dużym stopniu przypomina poprzednika, ale mimo to różni się nieco konstrukcją. Cała obudowa wykonana jest z aluminium, dzięki czemu jest szczególnie wytrzymała i odporna na skręcanie, co znajduje również odzwierciedlenie w wyższej wadze. Pokrywy nie można wypaczyć bez użycia siły i zawiera to samo logo ProArt, co ZenBook S 13 z 2023 roku. Nowy ZenBook jest dostępny w kolorze Sandstone Beige lub Inkwell Grey. Szary wariant z naszej recenzji wygląda na wysokiej jakości i elegancki, ale szybko widać na nim odciski palców
Po zamknięciu pokrywa jest przytrzymywana magnetycznie do podstawy. Zawiasy, podobnie jak reszta obudowy, są wysokiej jakości i szczelne. Niemniej jednak możliwe jest otwarcie laptopa jedną ręką. Pomimo ciasnych zawiasów wyświetlacz nie kołysze się podczas pisania, ponieważ podstawa jest wystarczająco ciężka i stabilna.
Solidna konstrukcja rozciąga się również na obszar klawiatury. Tutaj również ZenBook jest niezwykle wytrzymały, a obszar klawiatury nigdzie się nie ugina.
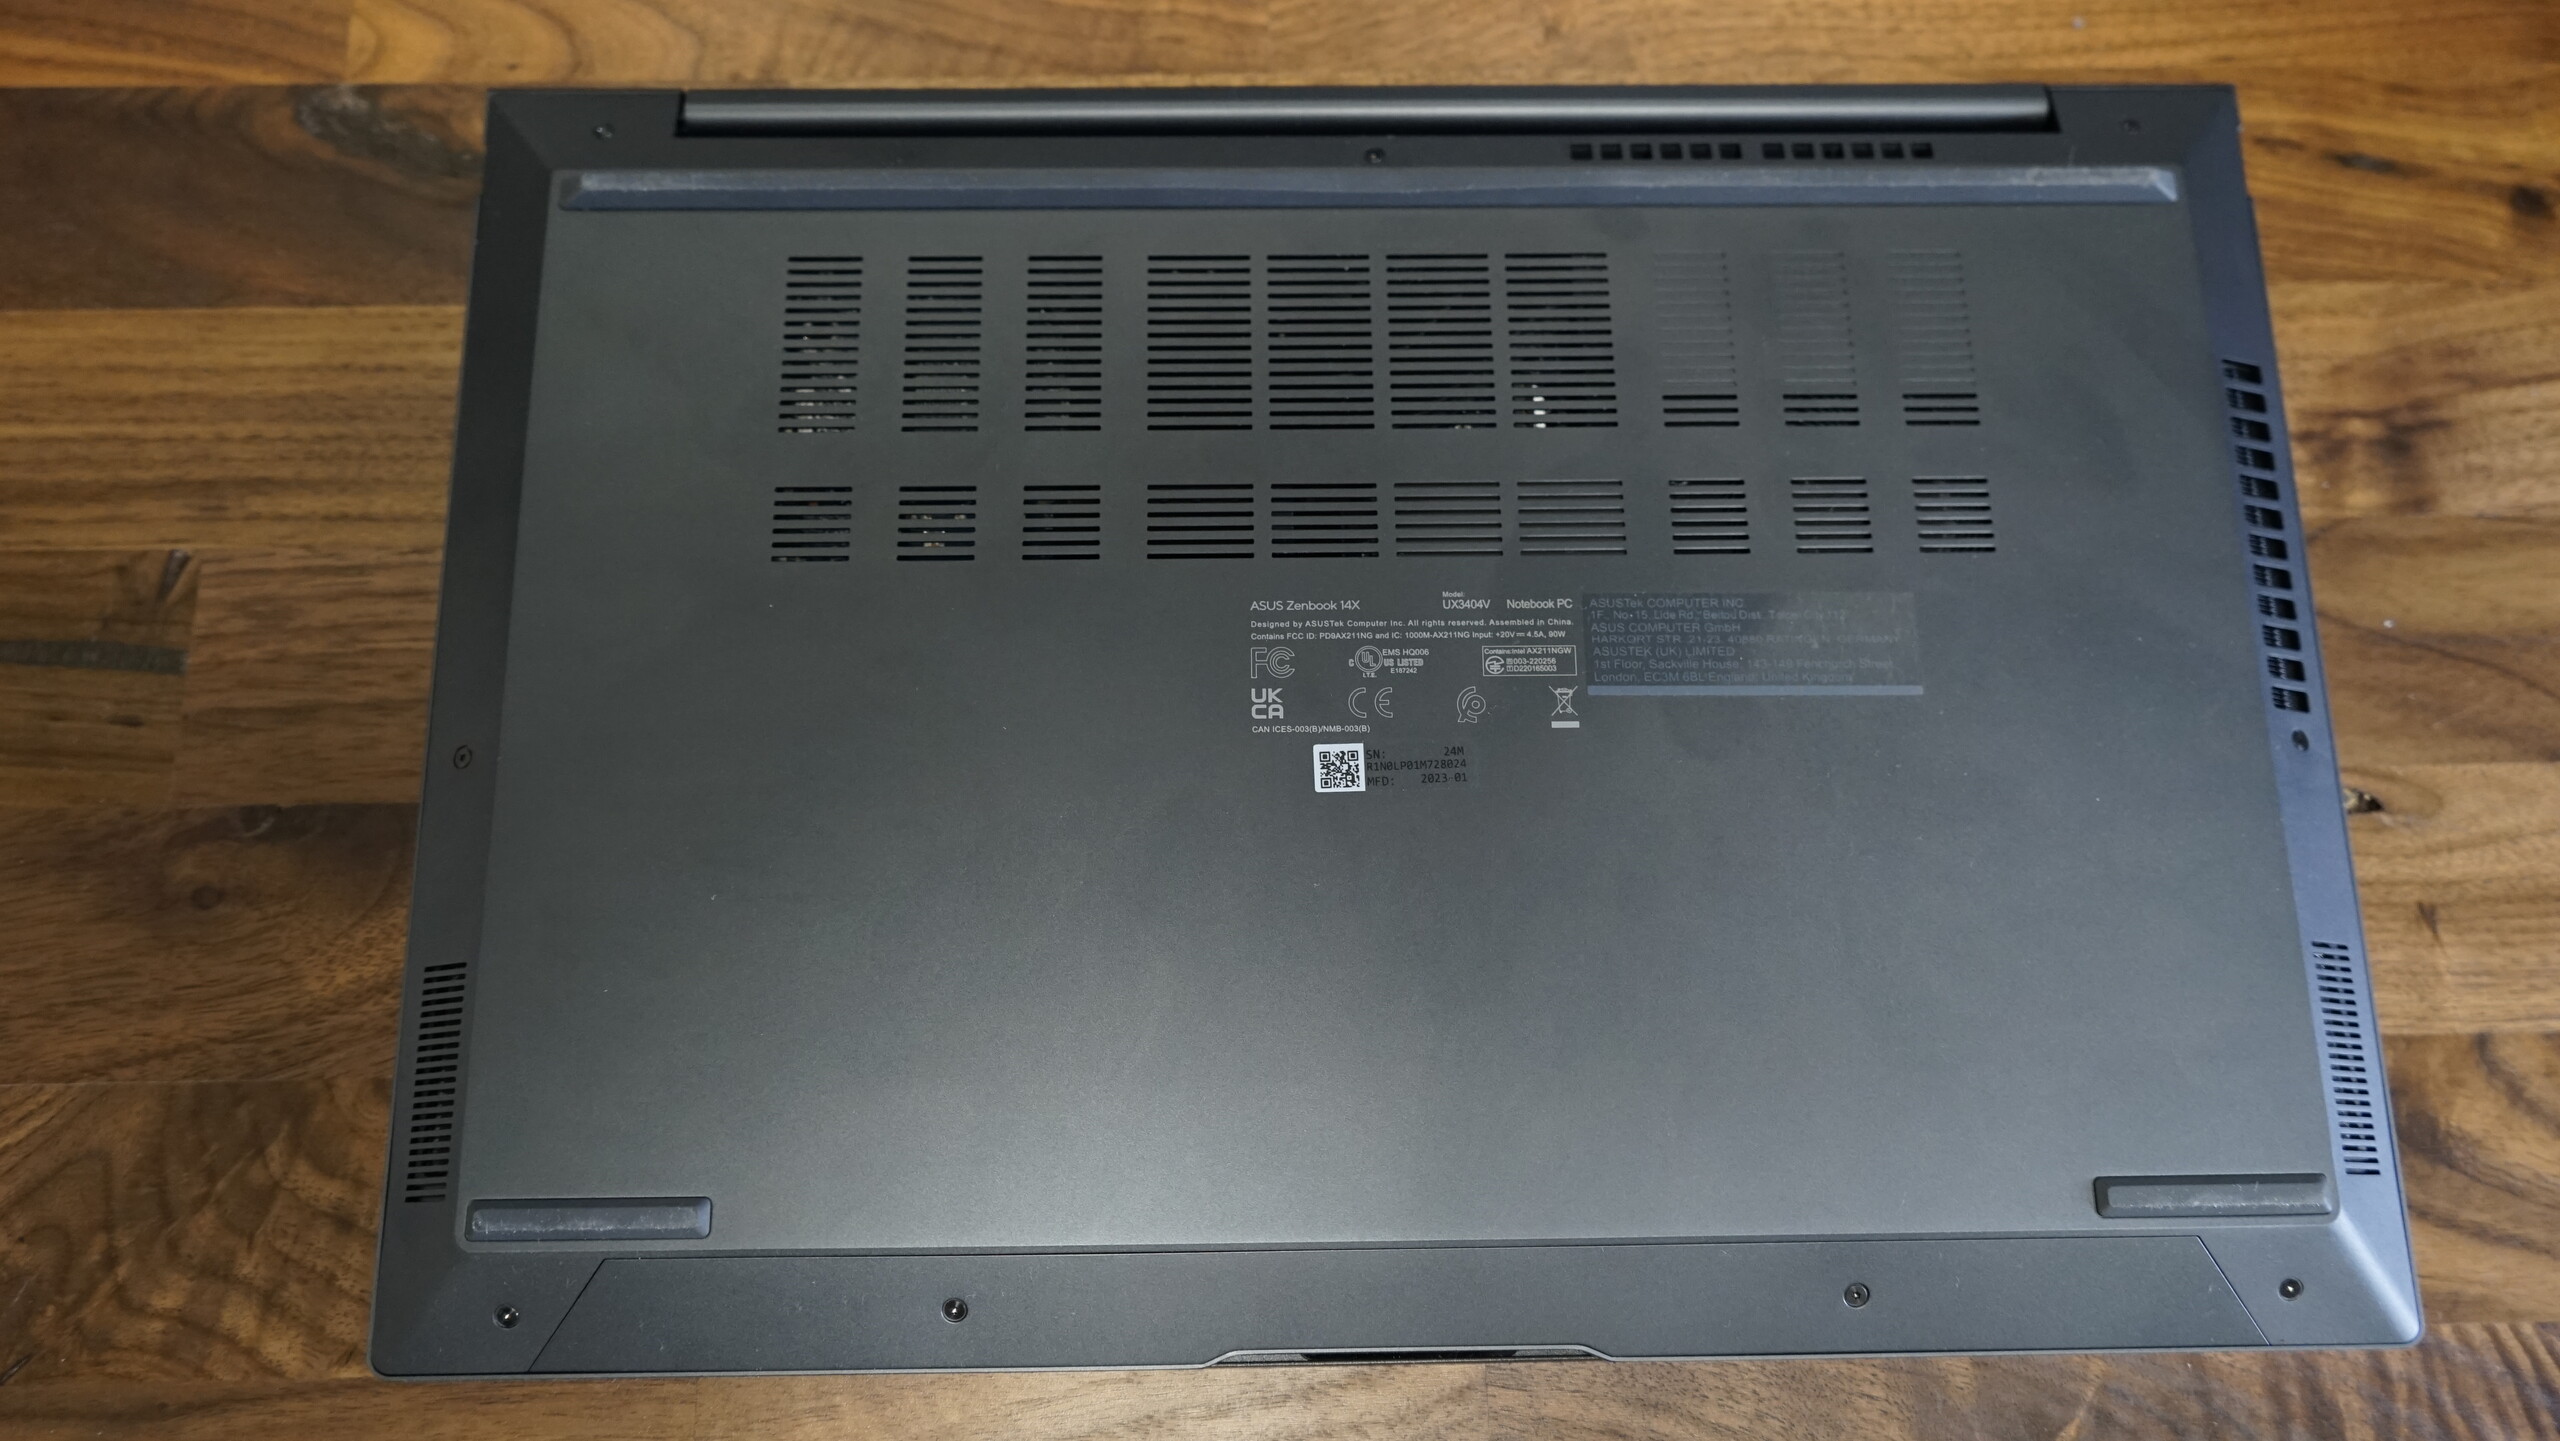
W przeciwieństwie do ZenBooka S 13 z 2023 roku, nowy ZenBook 14X nie wykorzystuje mechanizmu ErgoLift, a raczej powraca do klasycznej konstrukcji. Stosunkowo duże nóżki na spodzie zapewniają wystarczająco dużo miejsca, aby wentylatory mogły pracować bez ograniczeń.
Poprzednia wersja ZenBook 14X ważyła więcej niż wiele innych subnotebooków - 1,406 kg. ZenBook 14X z 2023 r. podnosi tę wartość i waży teraz 1,56 kg. W polu porównawczym, Lenovo Slim Pro 7 14ARP8 i Dell Inspiron 14 Plus 7420są jeszcze wyższe, a Asus ROG Flow Z13 GZ301Vz tym samym procesorem Intel Core i9 waży prawie dokładnie tyle samo, bo 1,551 kg. Mierząc 16,9 mm, ZenBook 14X plasuje się w połowie stawki i nie jest tak ponadprzeciętny pod względem głębokości.
Sprzęt
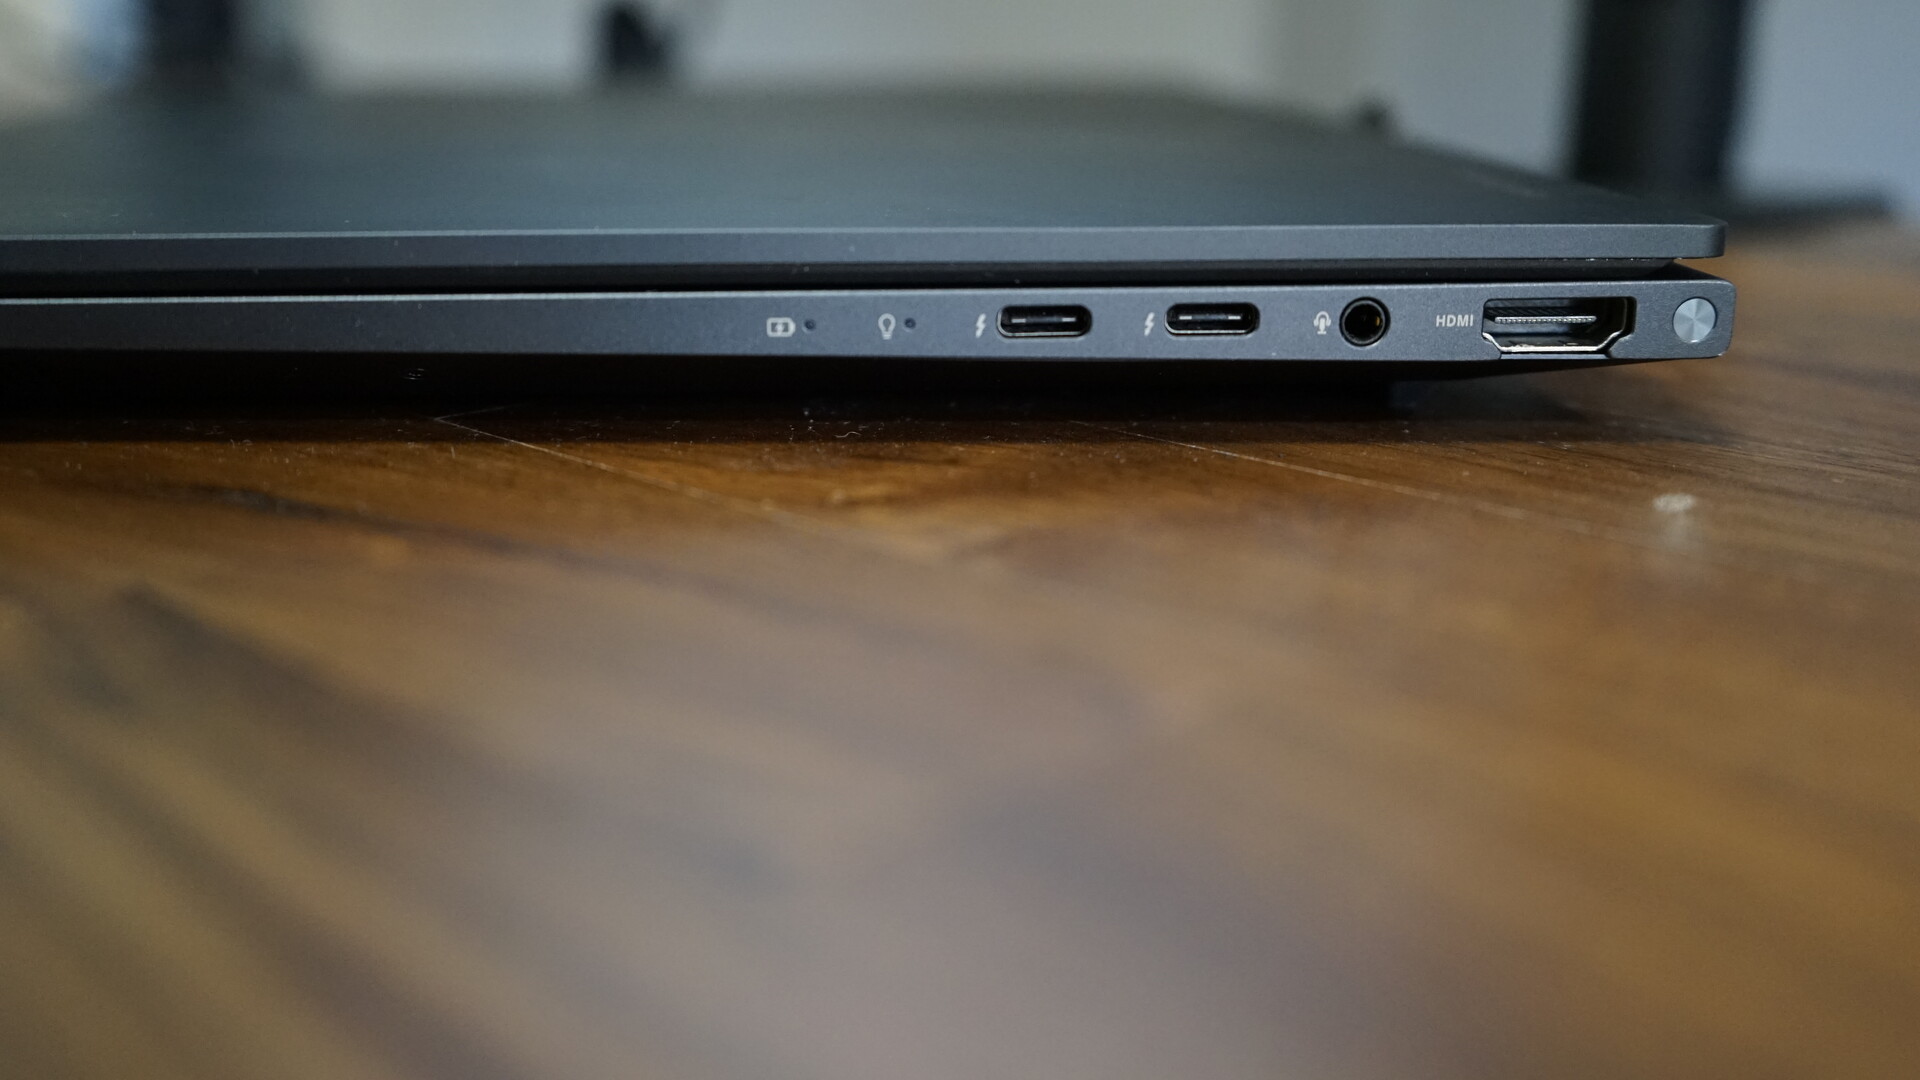
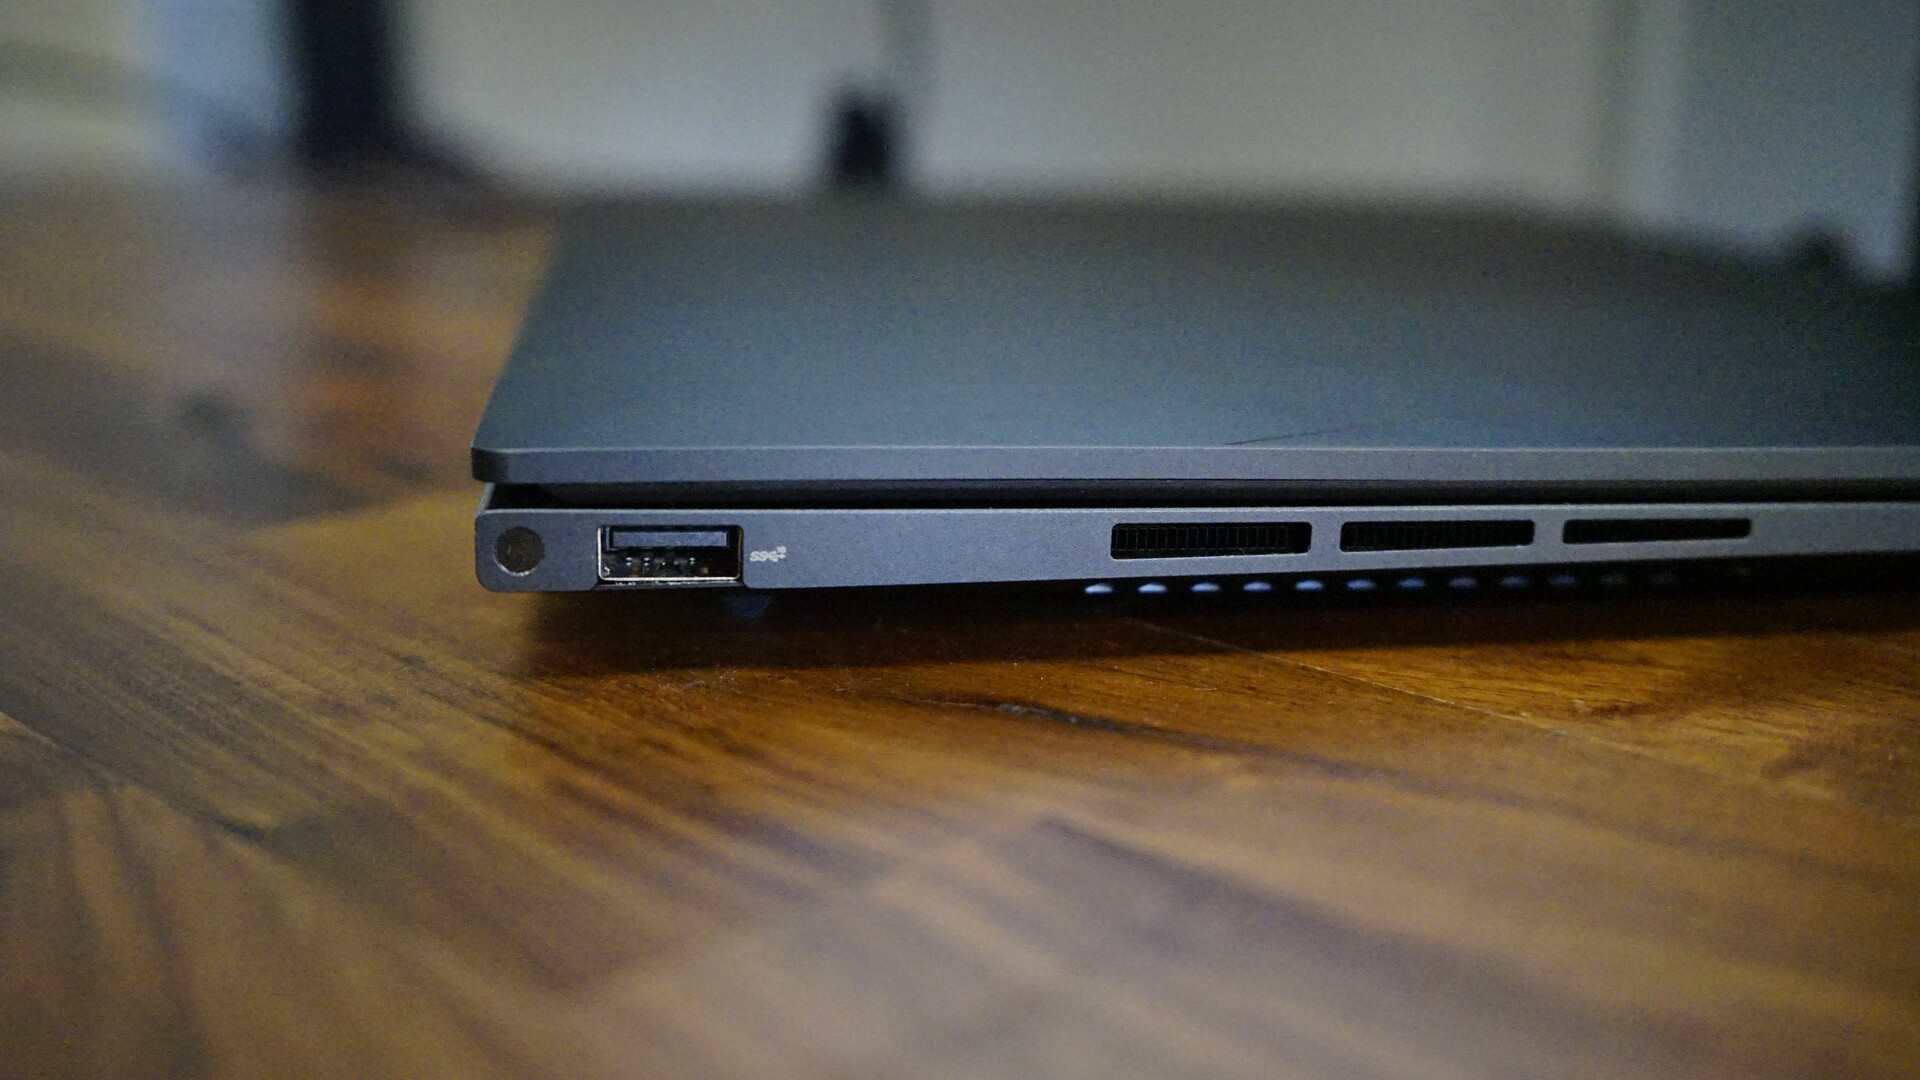
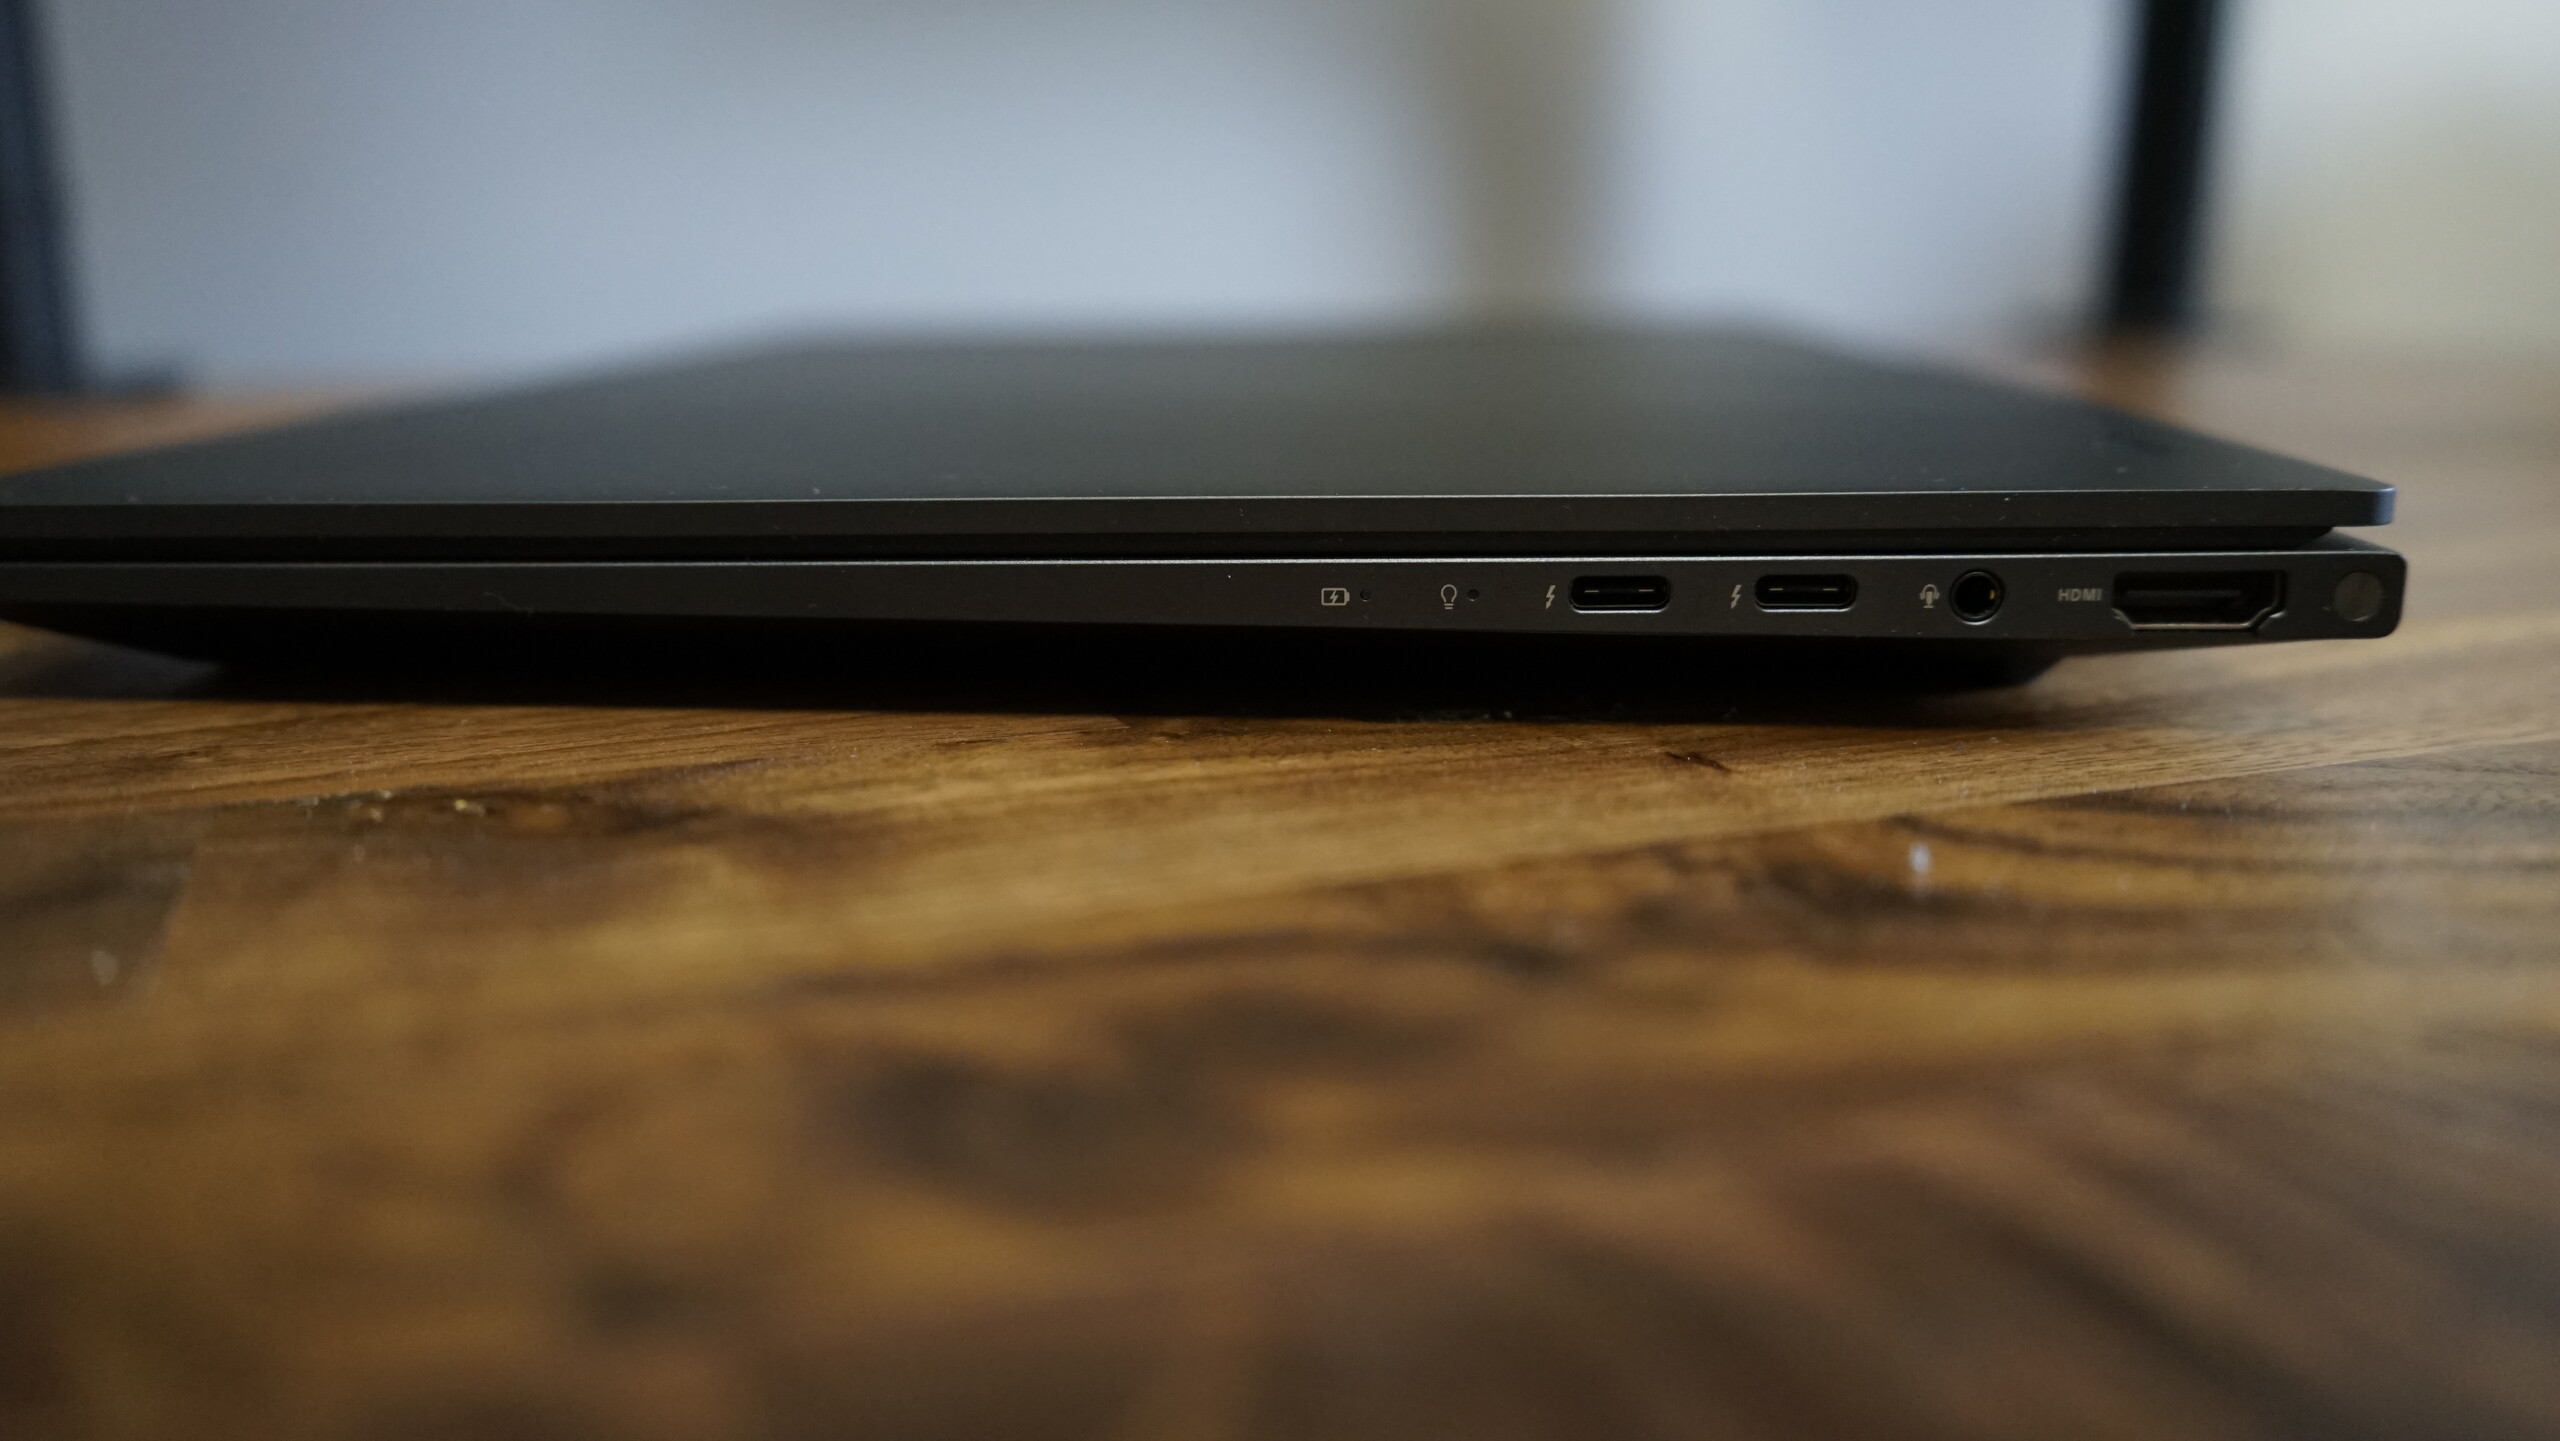
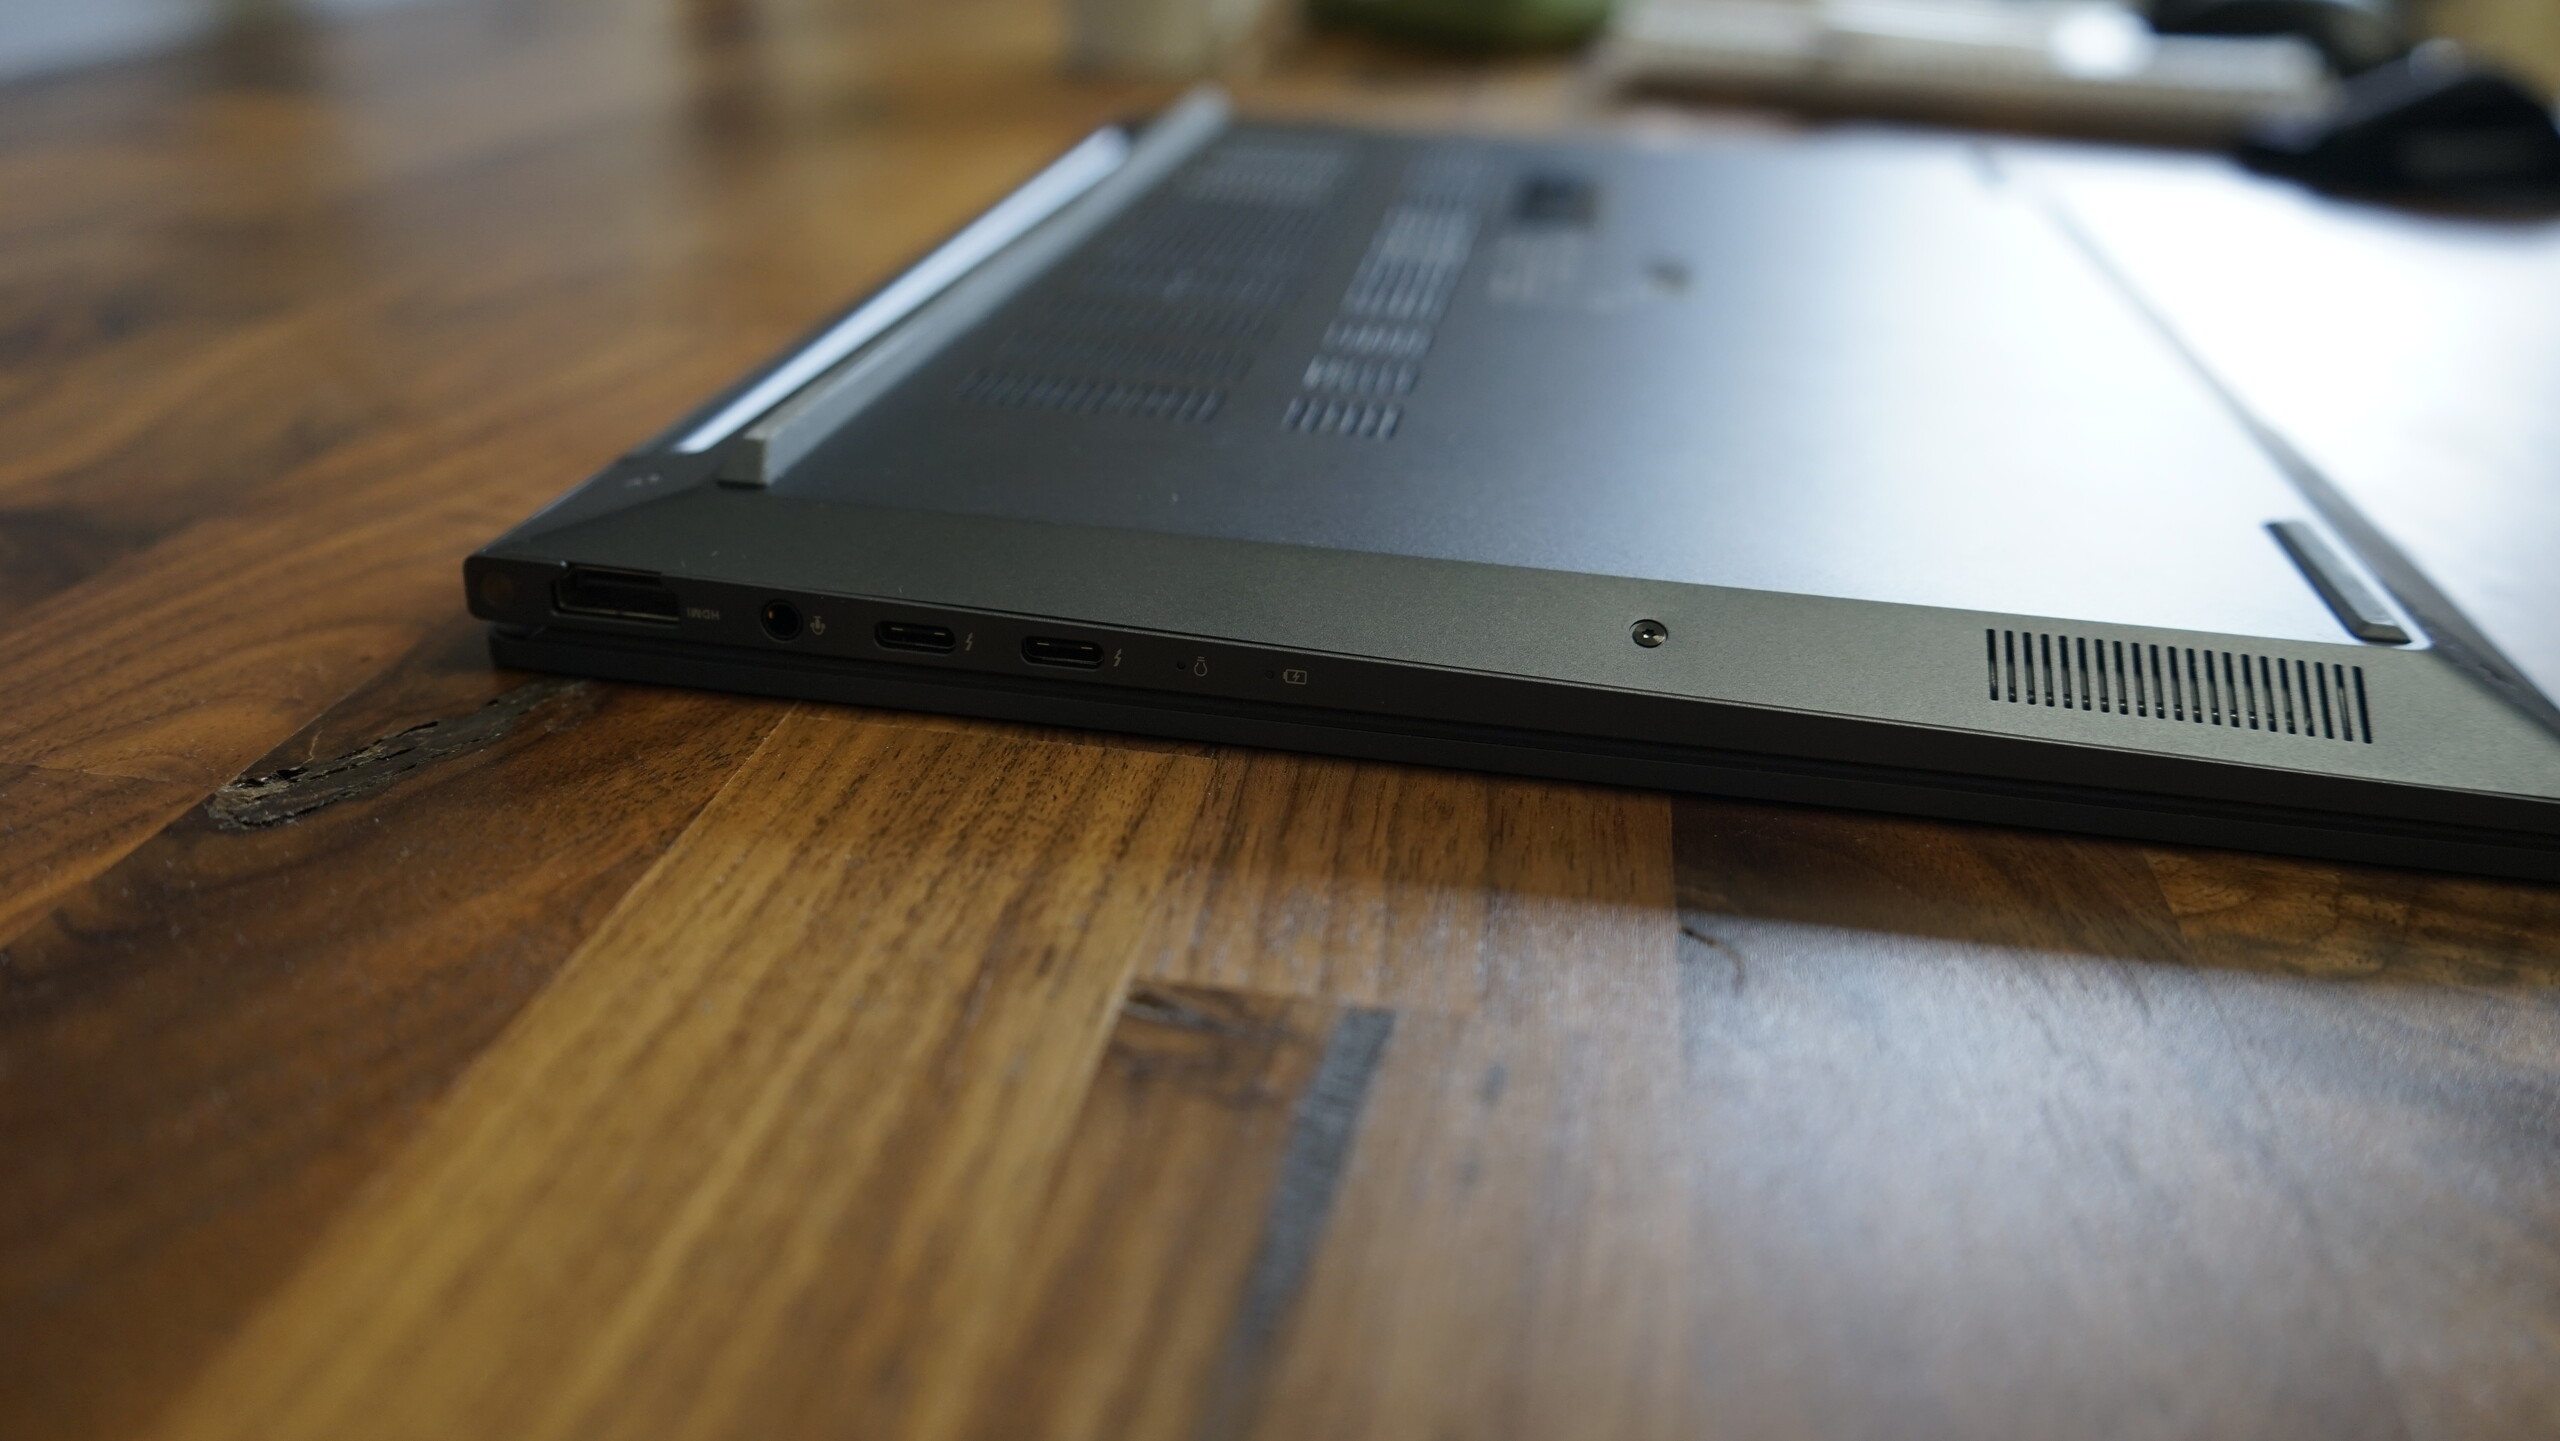
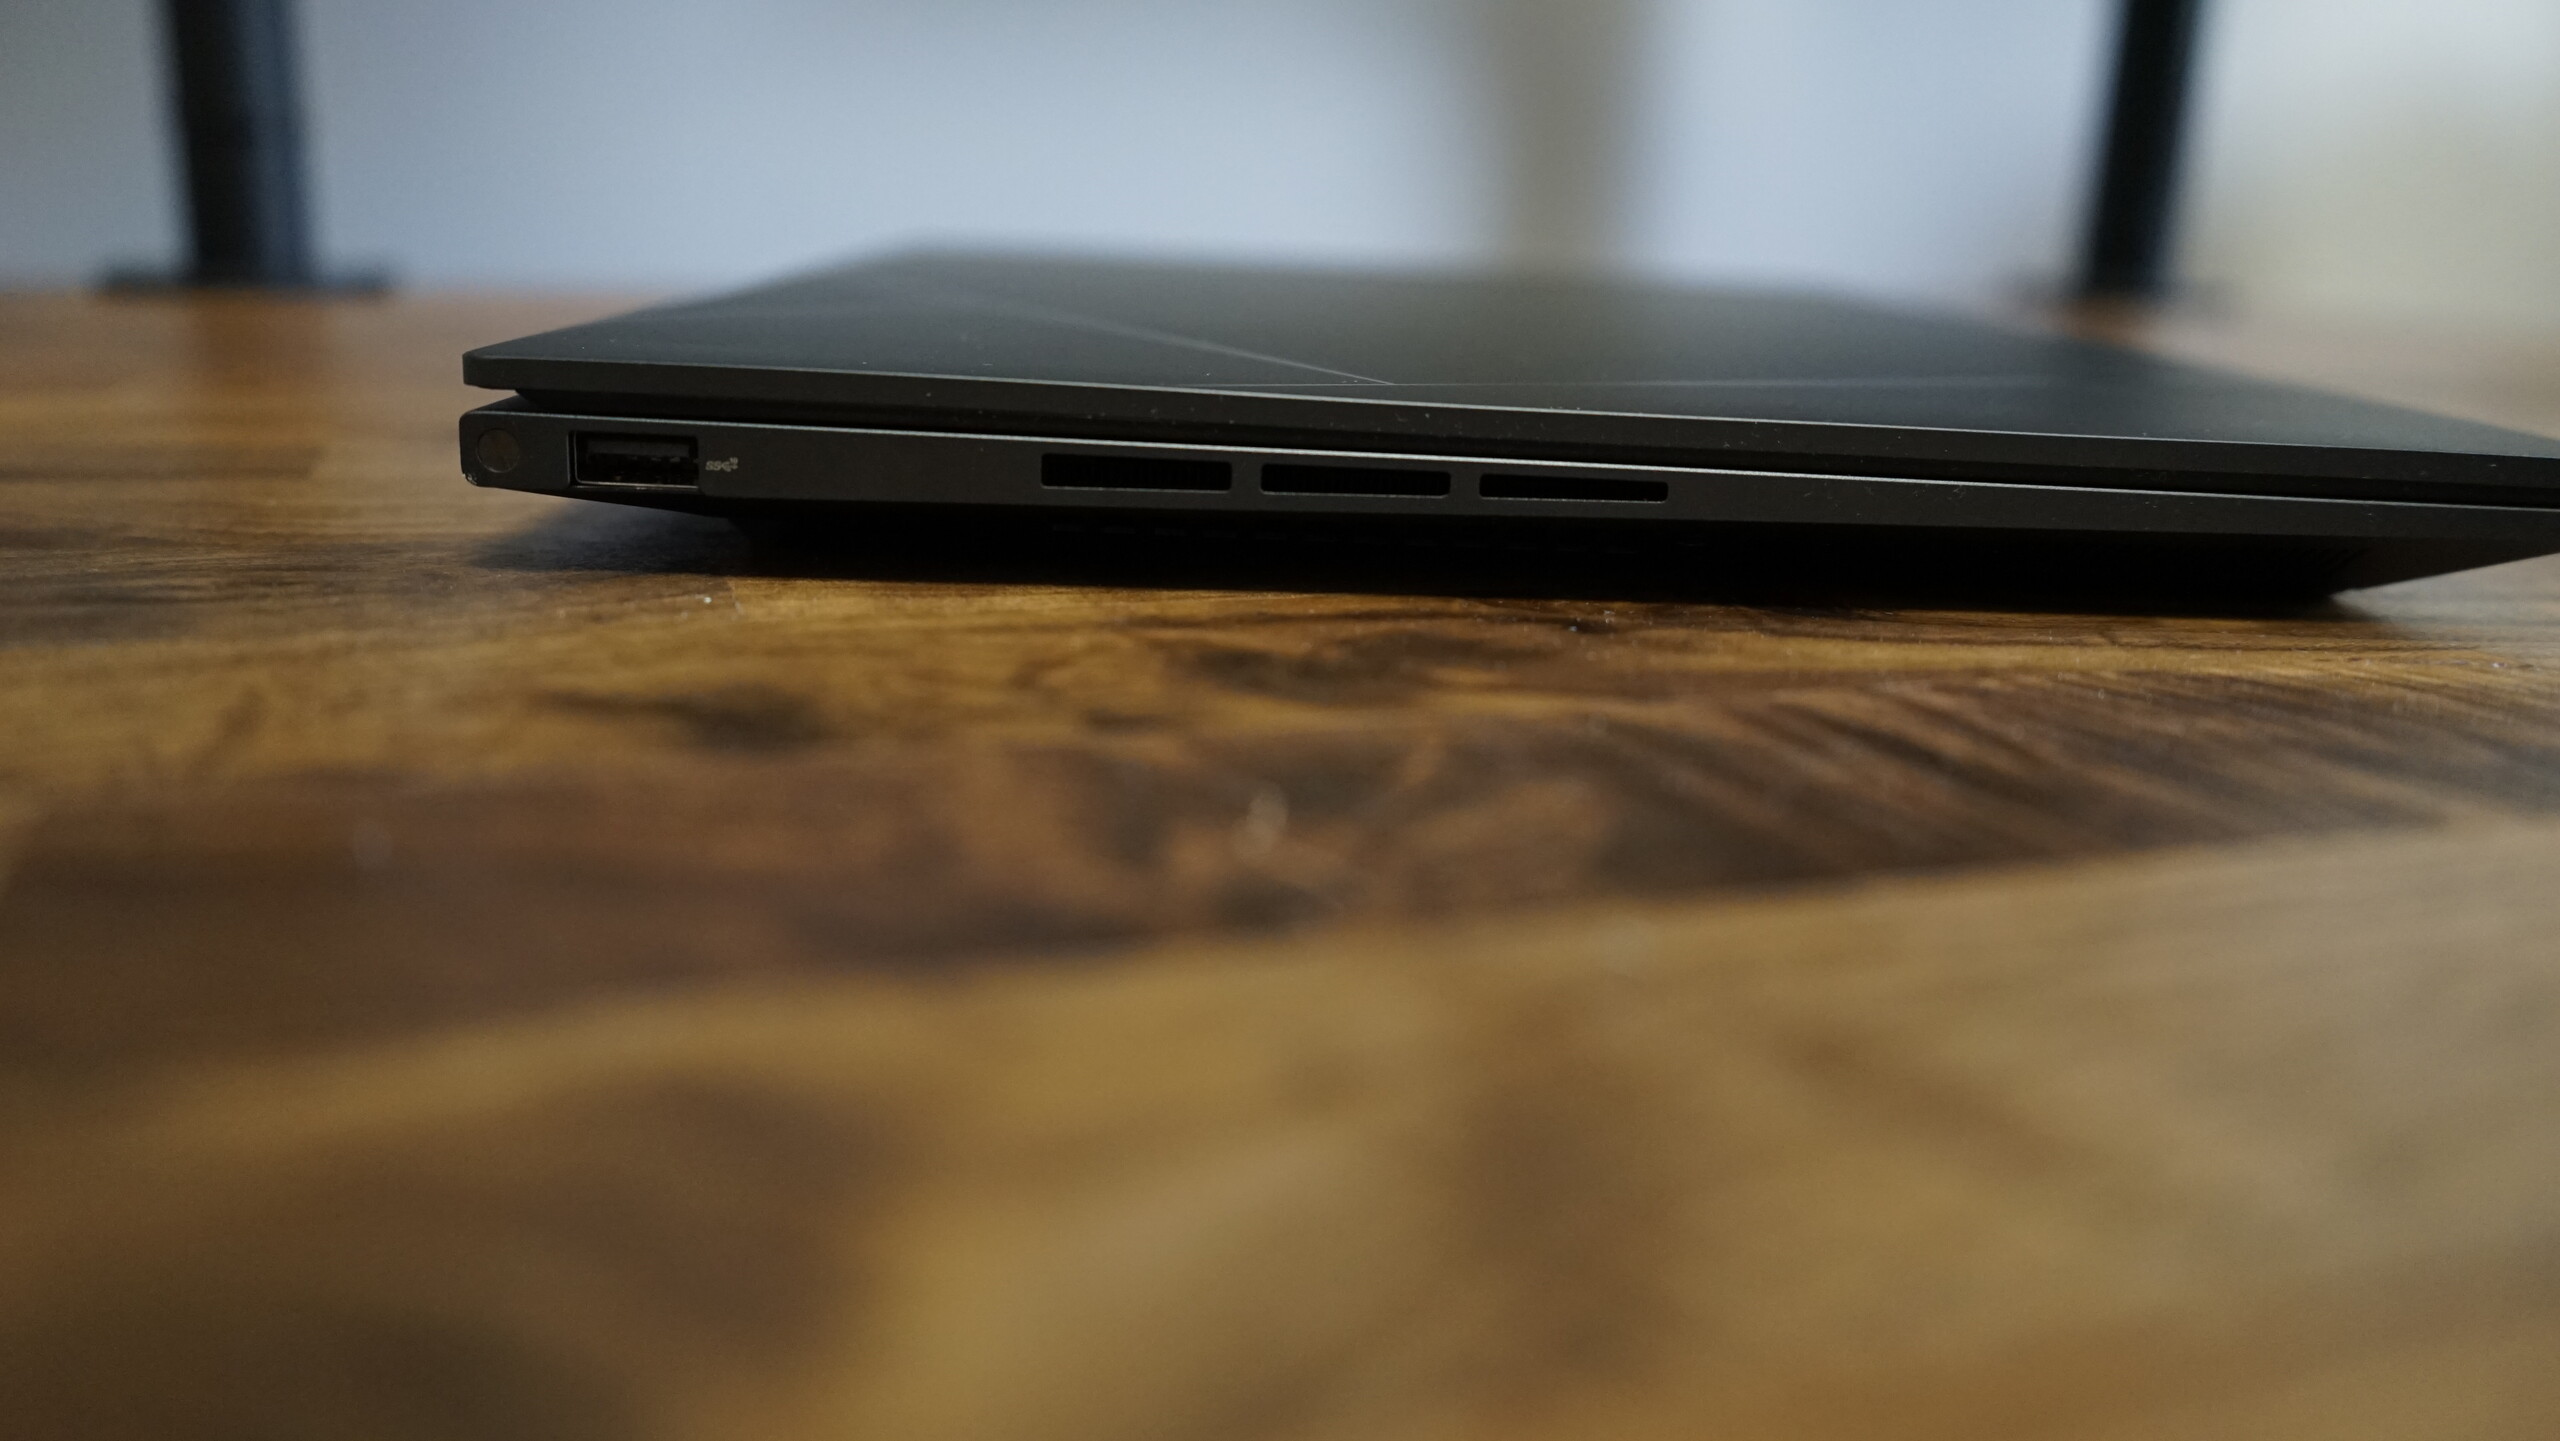
W porównaniu do poprzednika, czytnik microSD nie jest już niestety dostępny. Położenie pozostałych portów również uległo zmianie. Po lewej stronie znajduje się teraz tylko jeden port USB 3.2 Gen 2 Type-A. Wszystkie pozostałe porty, tj. dwa porty Thunderbolt, jeden port HDMI 2.1 i port combo audio znajdują się teraz po prawej stronie. Oba porty Thunderbolt mogą być używane do ładowania, więc wolelibyśmy jeden po obu stronach.
Komunikacja
Zainstalowany moduł Intel Wi-Fi 6E-AX211 jest wymienny i zapewnia solidne wyniki bez problemów z łącznością. Wyniki karty są ponadprzeciętne dla tego modelu. Moduł obsługuje nie tylko najnowszy standard WLAN Wi-Fi 6E, ale również Bluetooth 5.2.
Kamera internetowa
Asus ulepszył kamerę internetową z poprzedniego modelu i oferuje teraz Full HD zamiast 720p. Windows Hello jest możliwe dzięki zintegrowanemu czujnikowi podczerwieni do rozpoznawania twarzy. W porównaniu do zeszłego roku, jakość obrazu jest znacznie lepsza, ale wyniki zależą w dużej mierze od warunków oświetleniowych.


Akcesoria
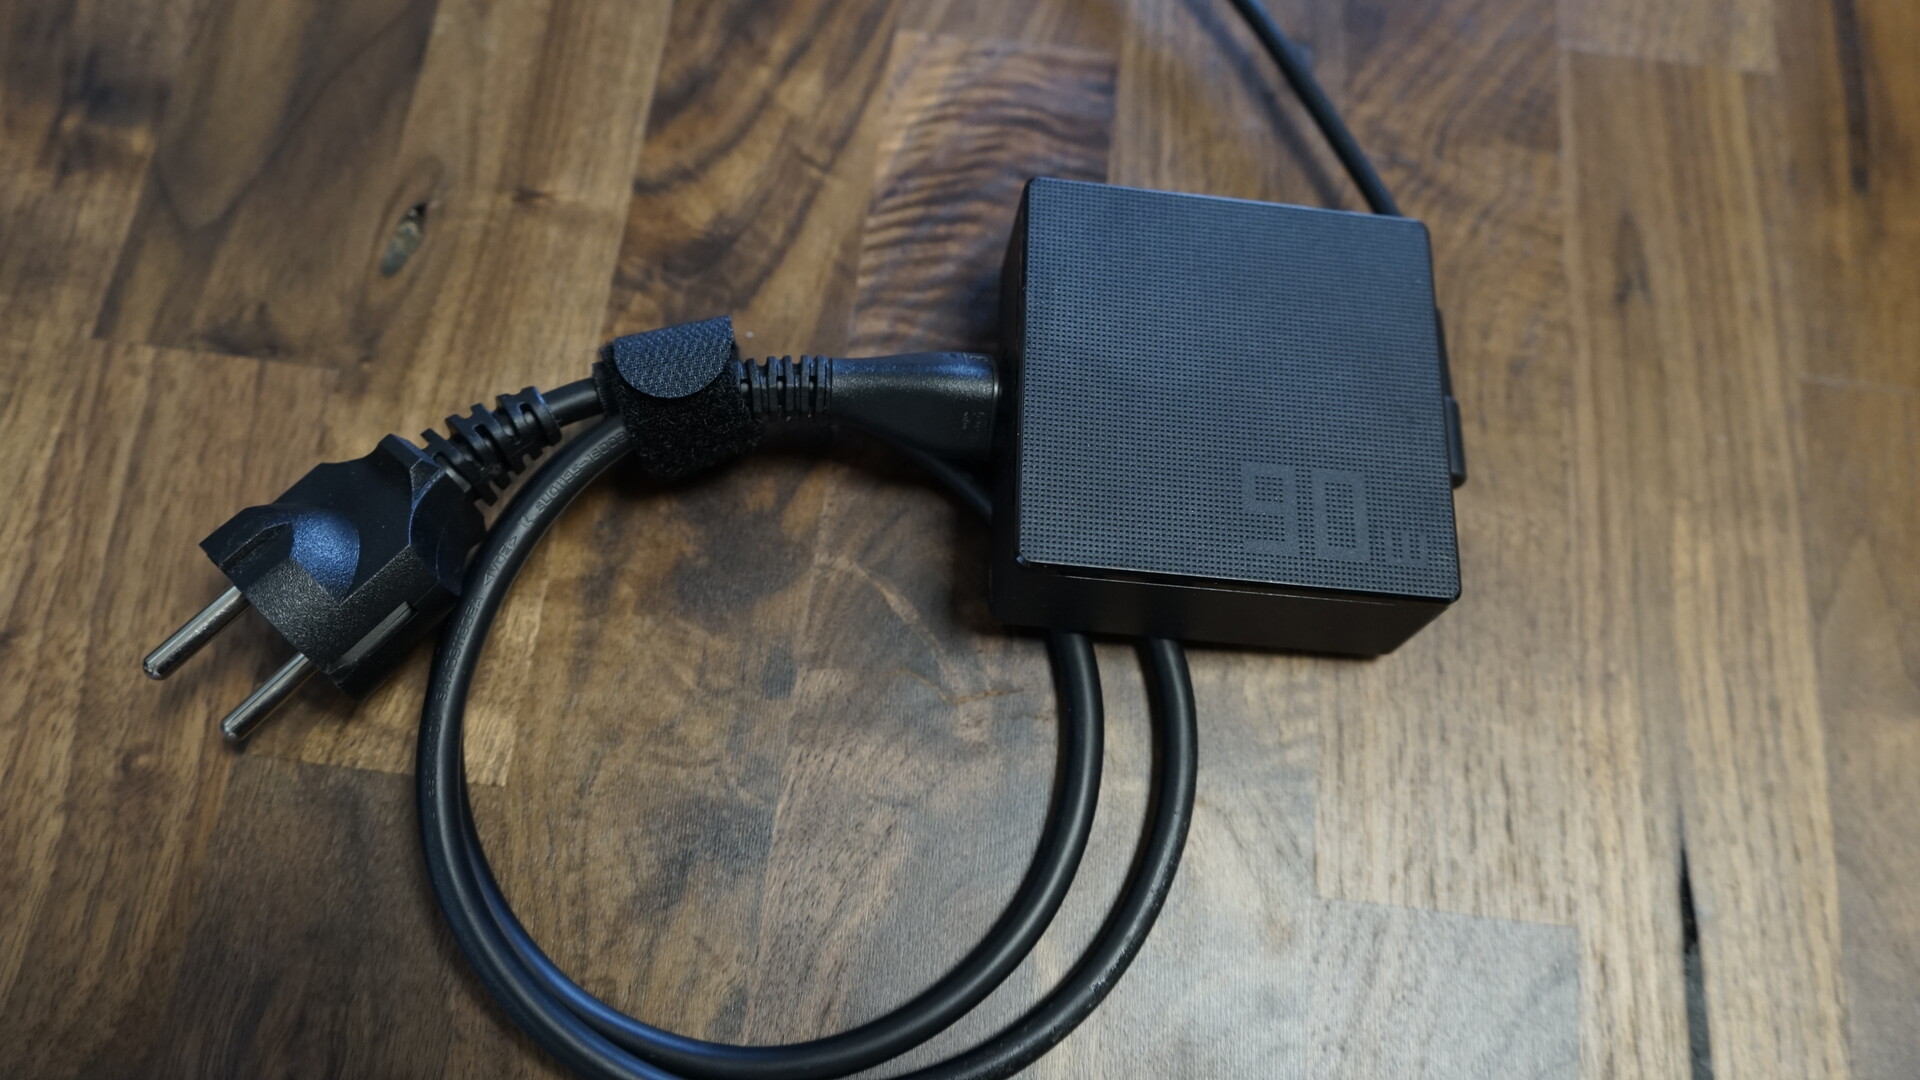
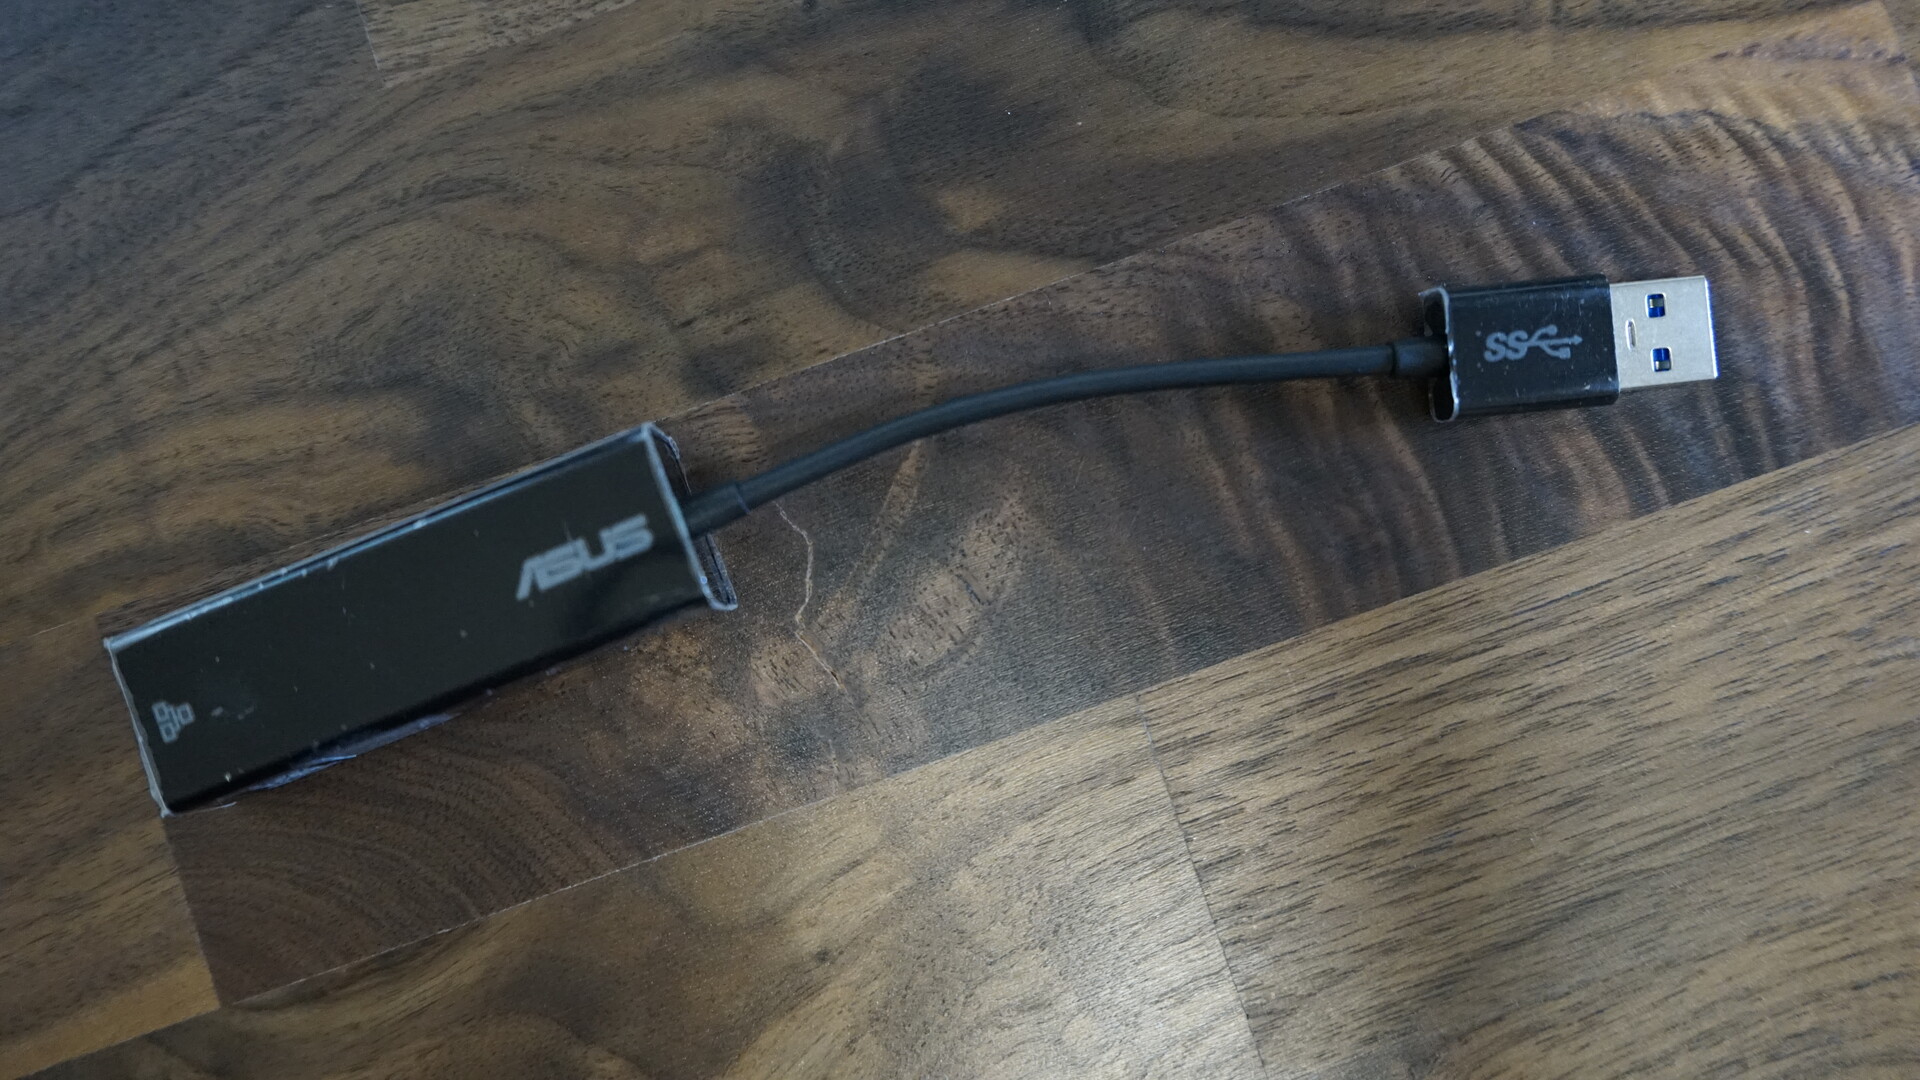
Akcesoria Asus ZenBook 14X składają się z kompaktowego 90-watowego zasilacza, adaptera Ethernet USB Type-A i praktycznego etui ochronnego. Etui ochronne jest wykonane z tworzywa sztucznego z miękką w dotyku wewnętrzną wyściółką.
Konserwacja
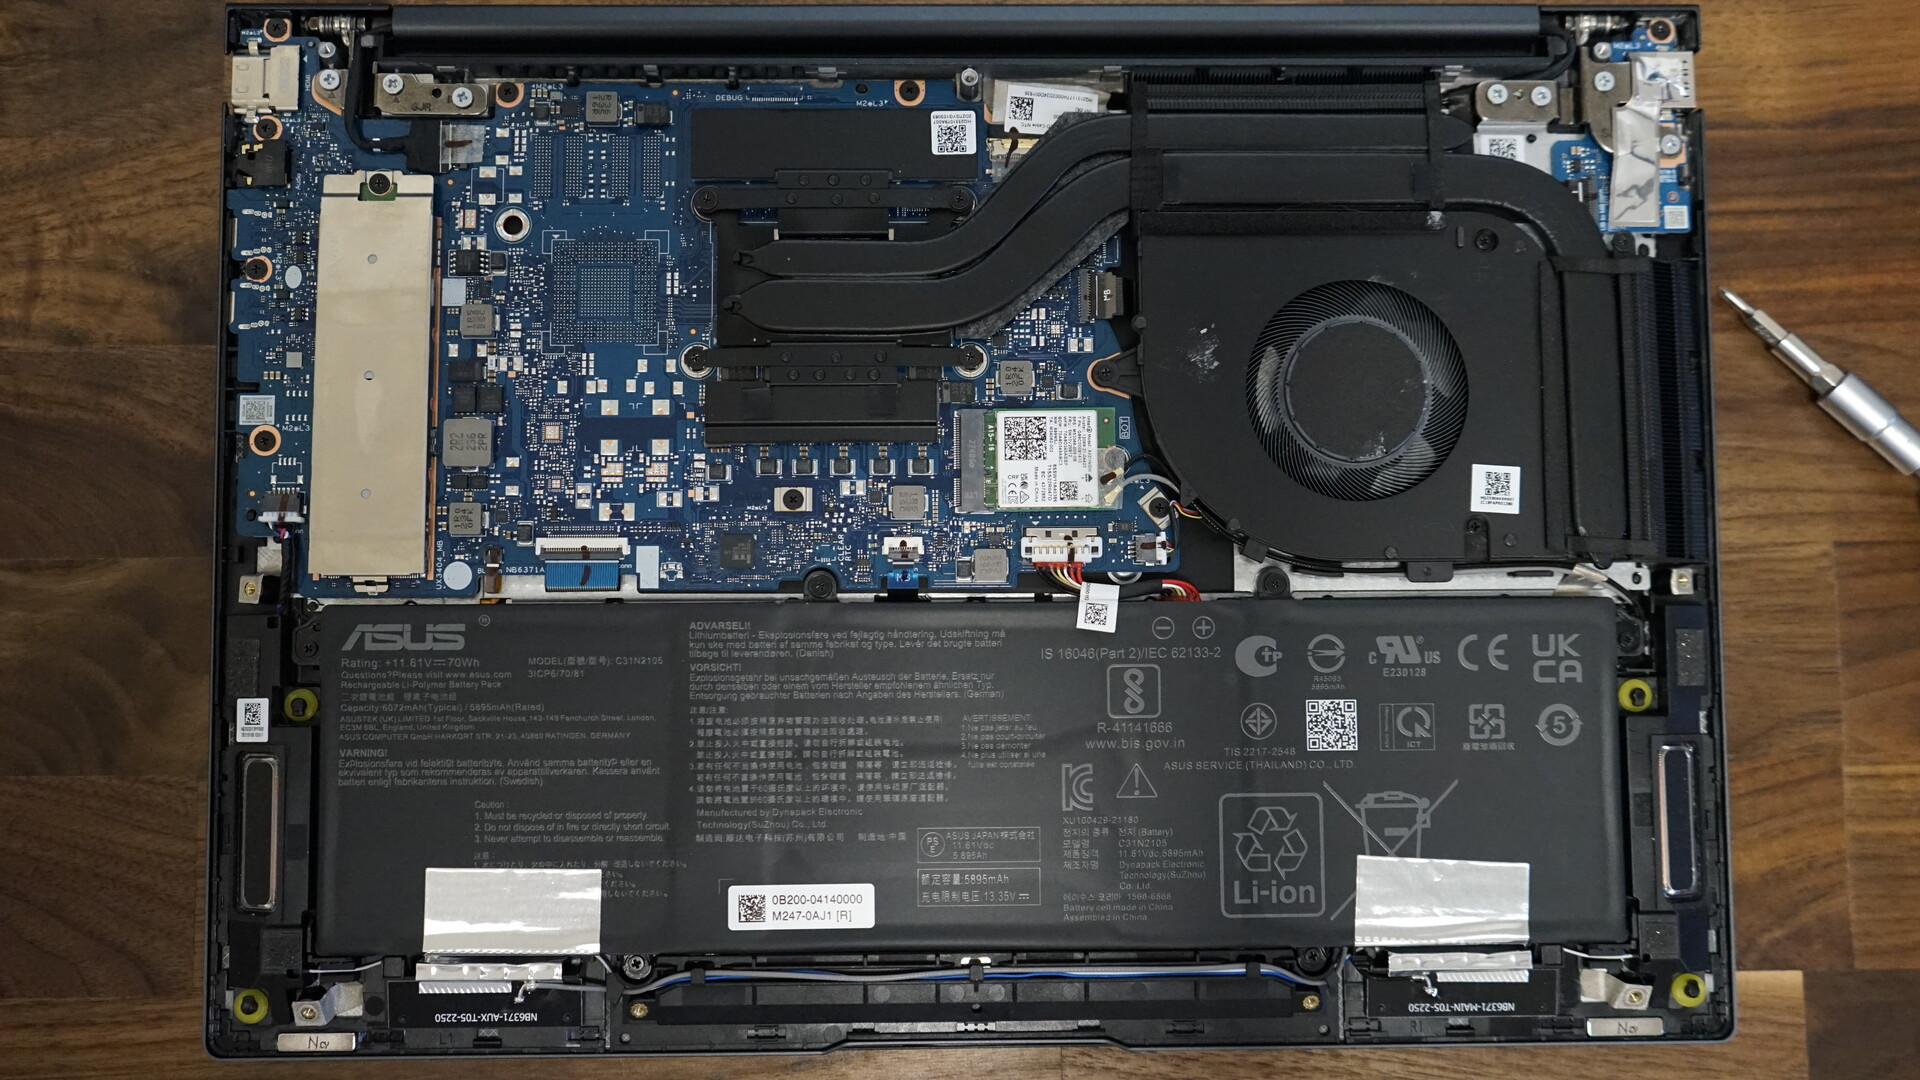
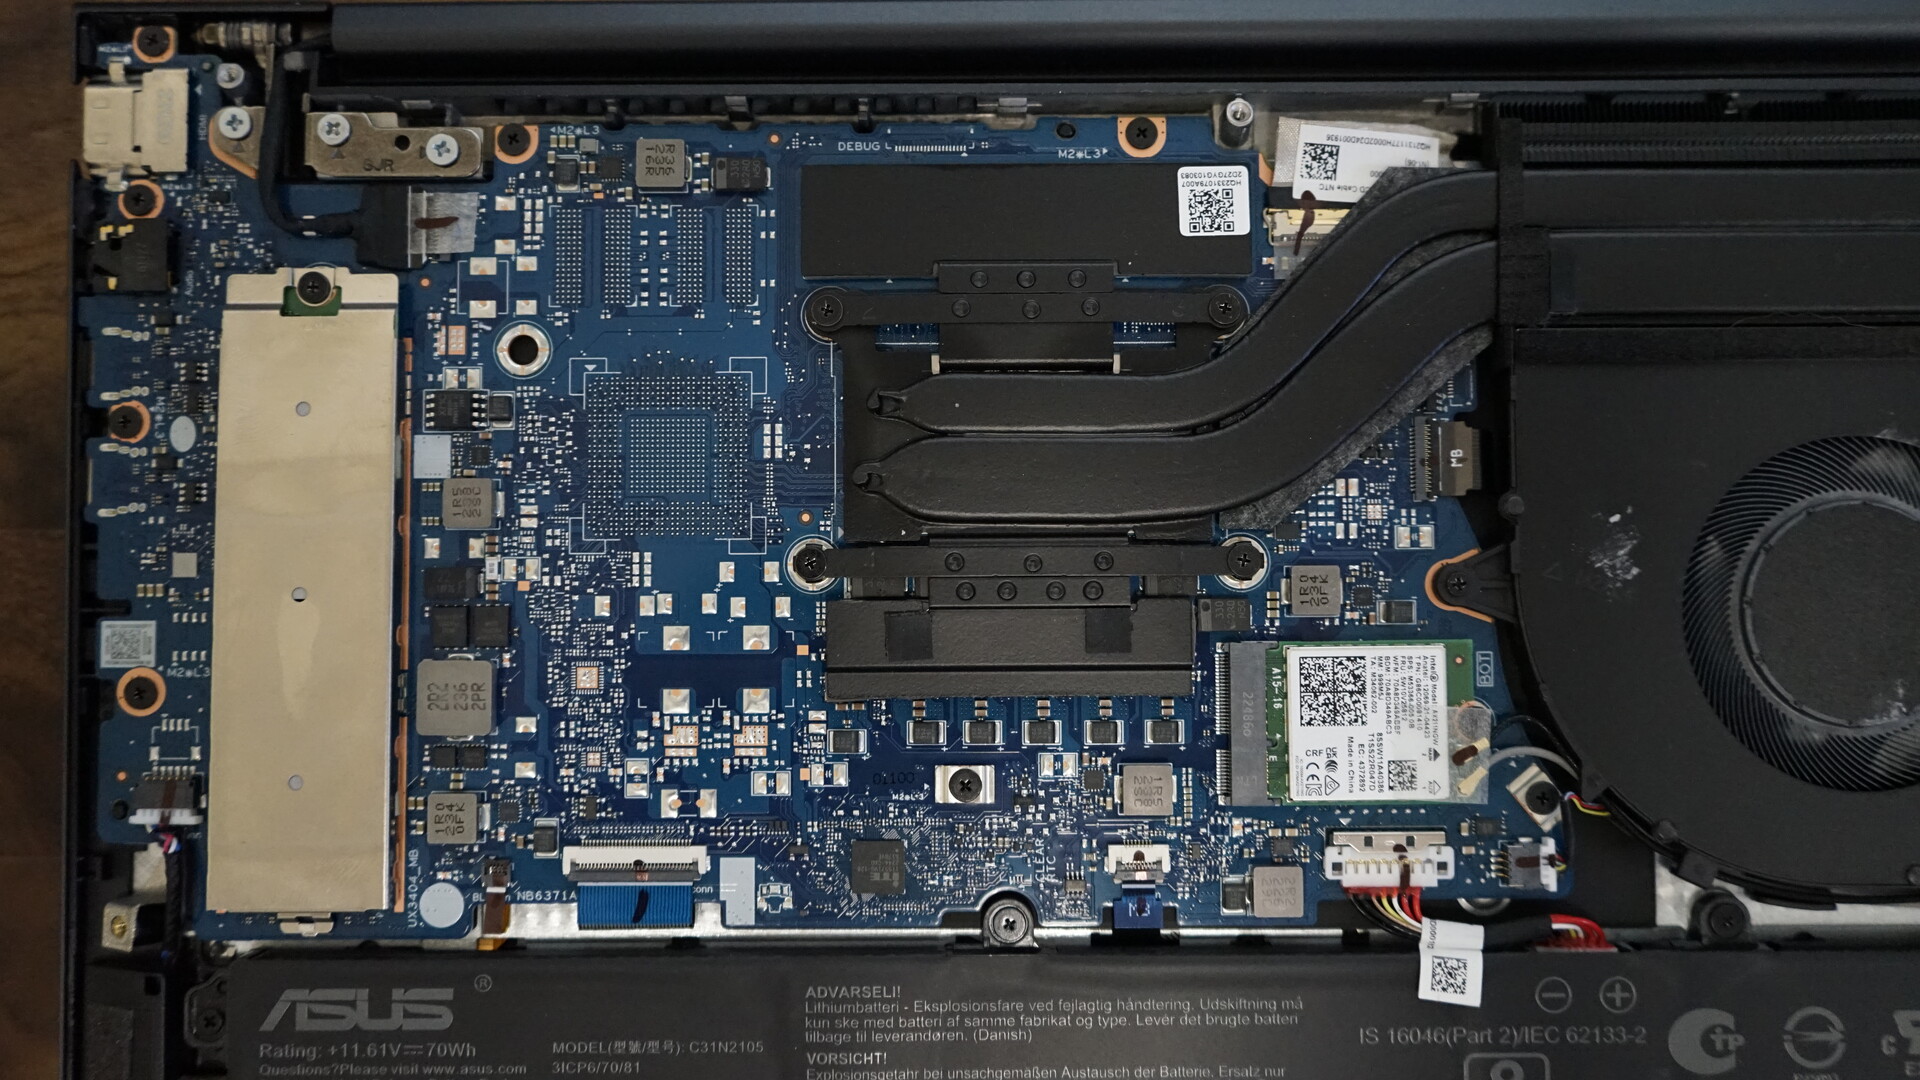
Otwarcie ZenBooka jest stosunkowo proste i od spodu trzeba odkręcić tylko dziewięć łatwo dostępnych śrubek. Moduł Wi-Fi, bateria i dysk SSD są wymienne, podczas gdy pamięć RAM jest przylutowana. Wewnętrzna struktura ujawnia również różnicę w chłodzeniu w porównaniu do poprzednika, ponieważ w modelu 2023 zainstalowano tylko jeden wentylator.
Gwarancja
Asus zapewnia dwuletnią gwarancję odbioru i zwrotu w Niemczech. Może się to różnić w innych krajach, więc zainteresowani nabywcy powinni dokładnie sprawdzić przed zakupem.
Urządzenia wejściowe
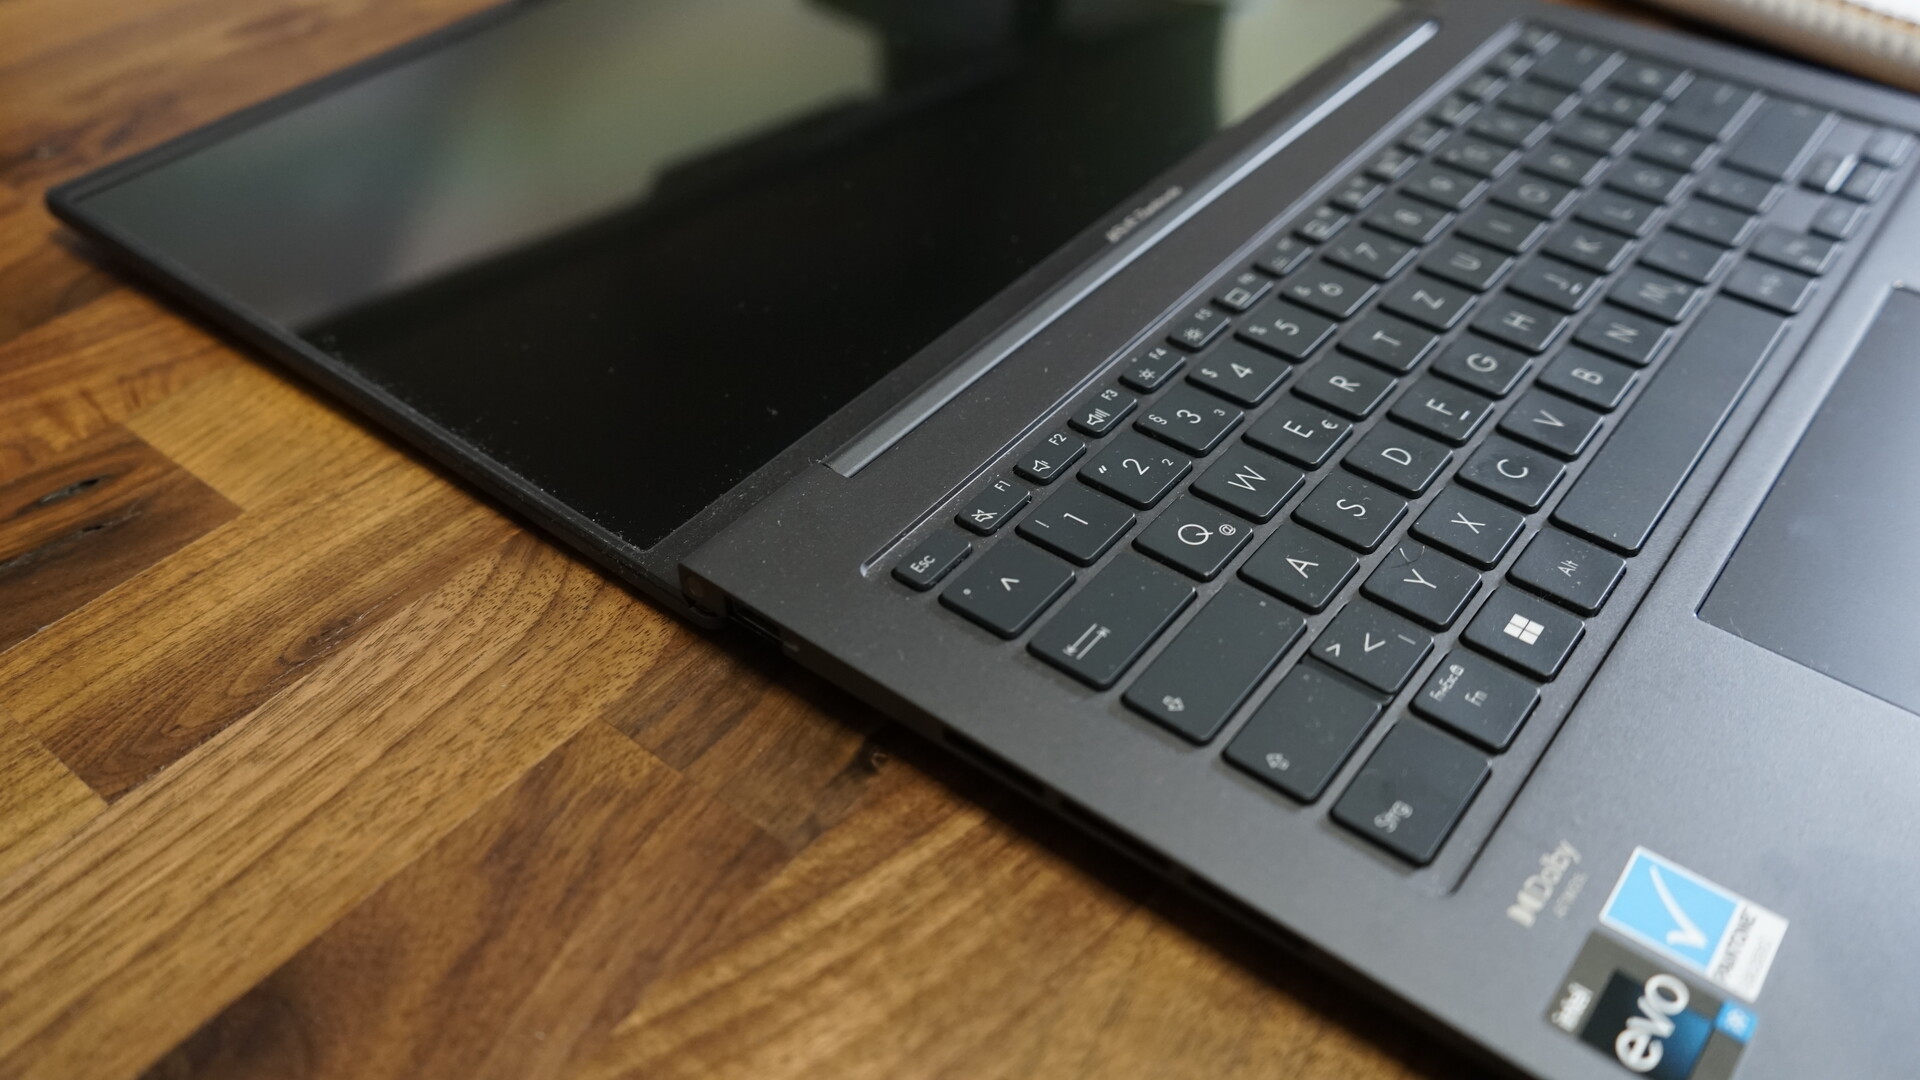
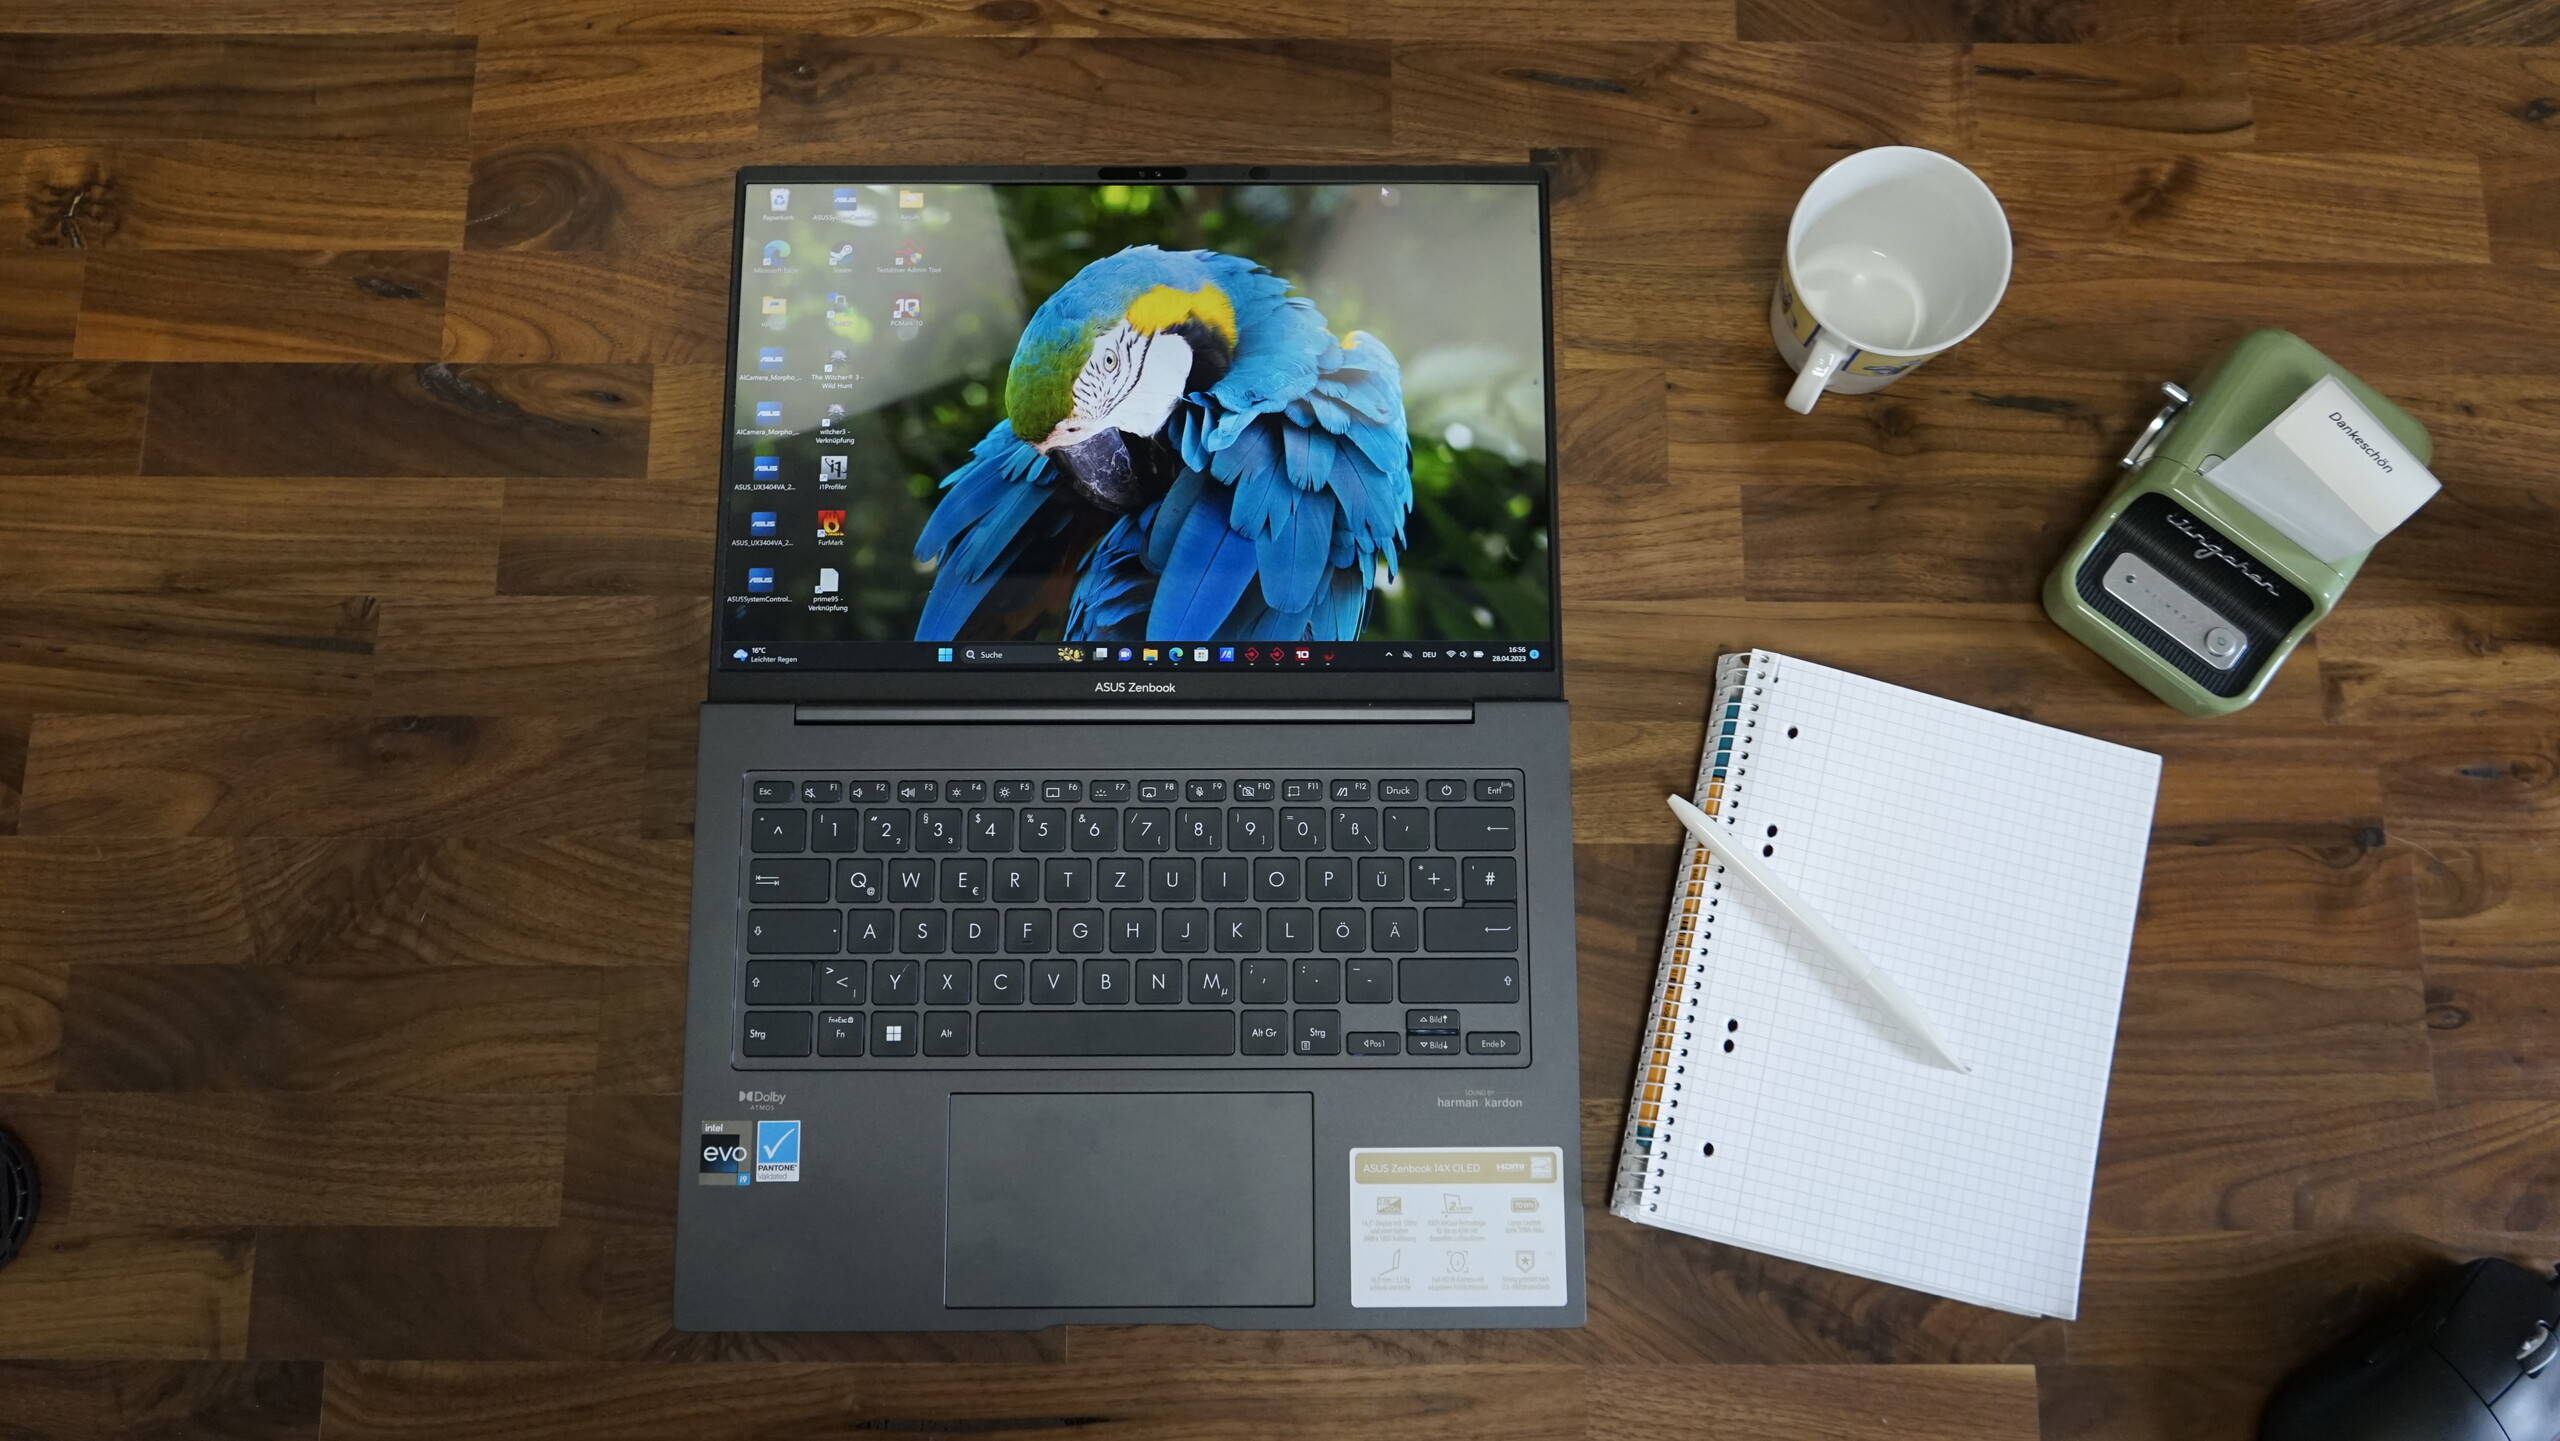
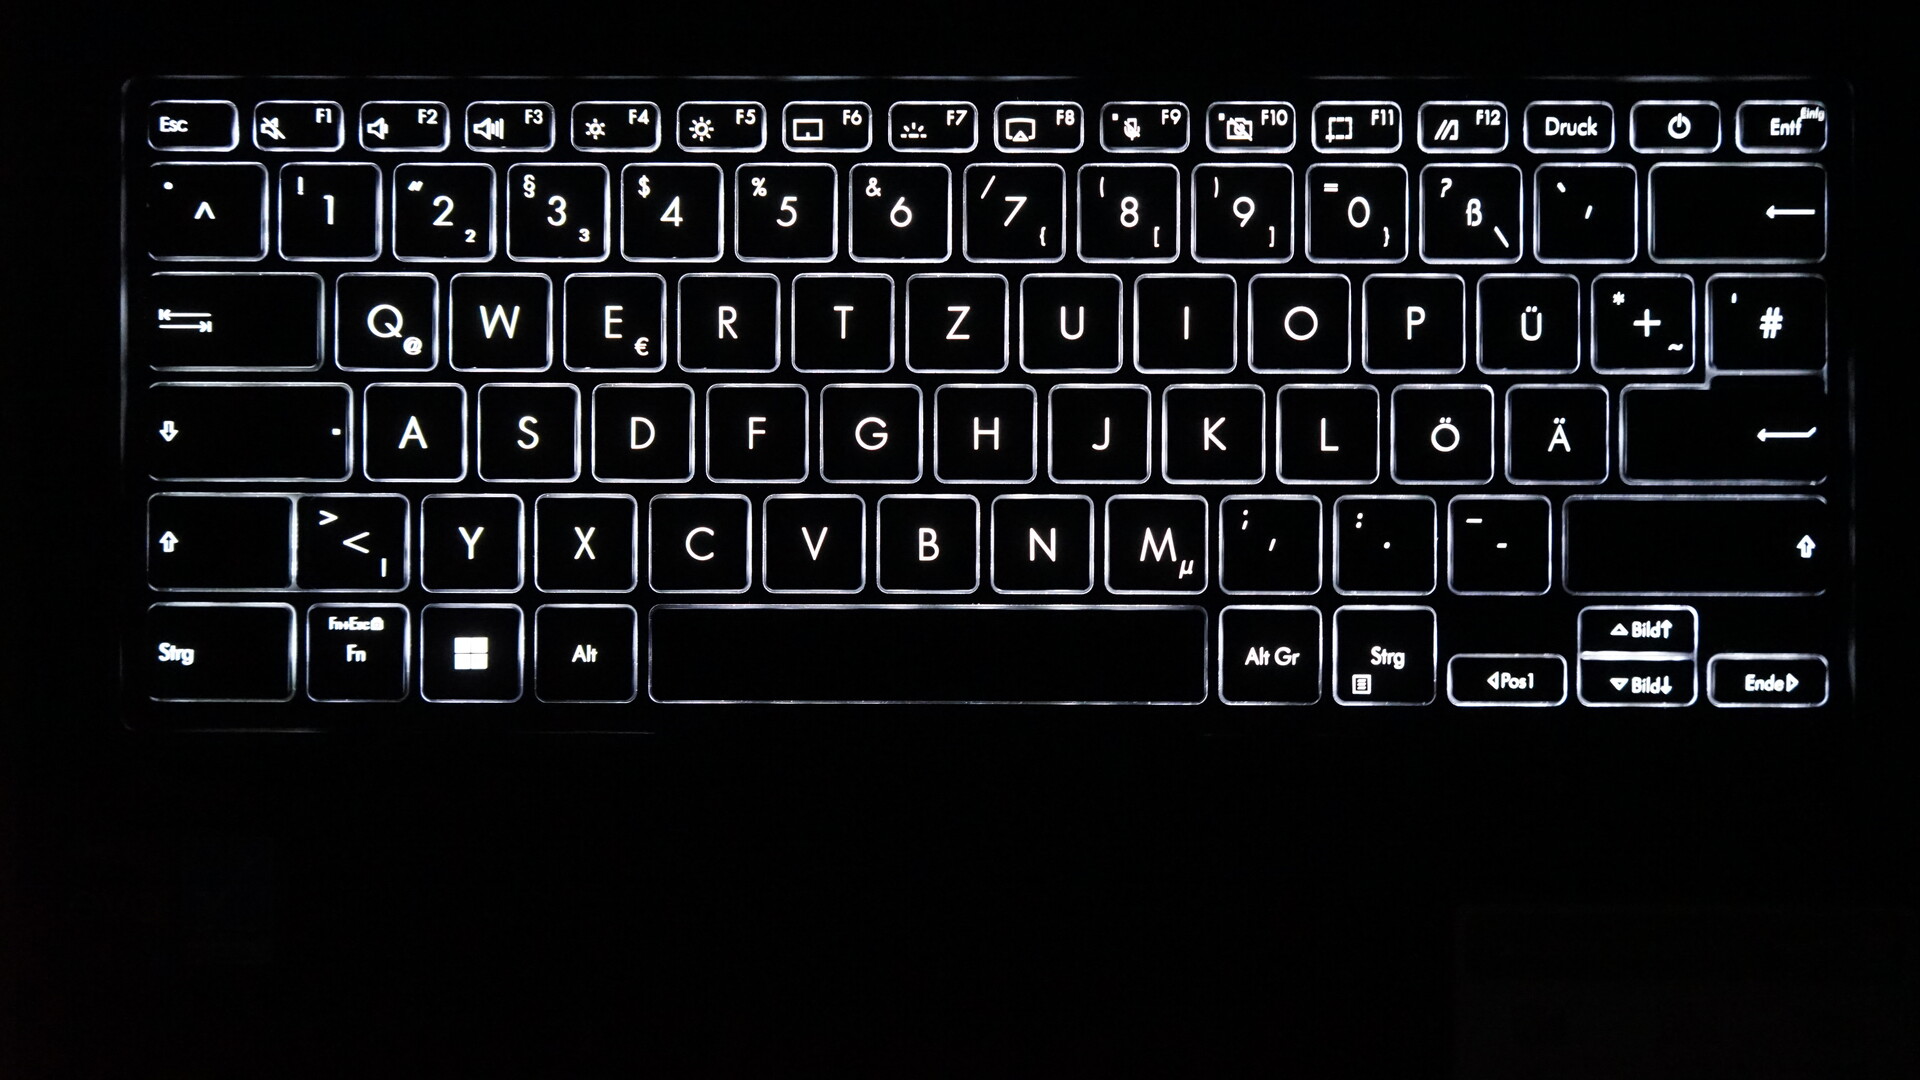
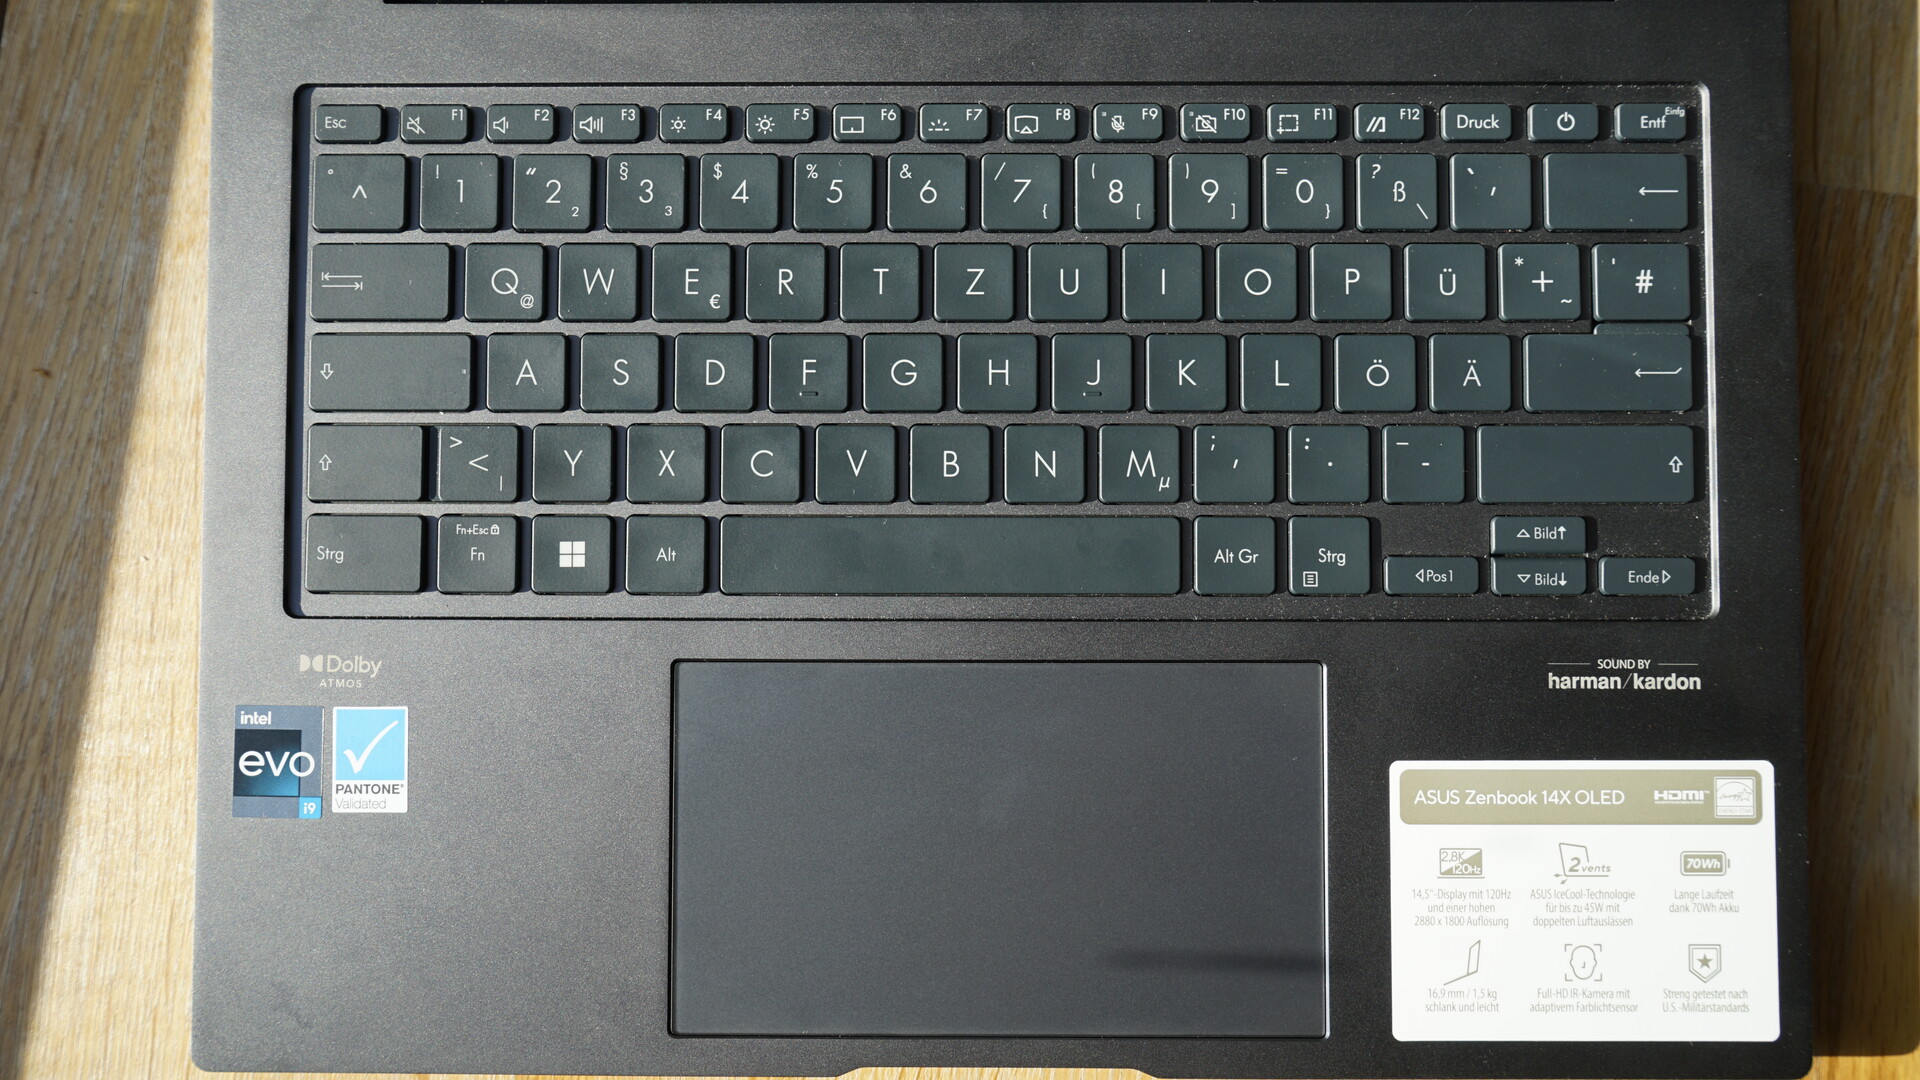
Klawiatura modelu 2023 jest pozbawiona dedykowanych klawiszy obrazu i klawisza zakończenia. Zamiast tego znajdują się one jako drugorzędna funkcja na klawiszach strzałek. Same klawisze są matowe i antypoślizgowe z bardzo wyraźnym punktem nacisku, solidnym skokiem i mocnym skokiem. Wrażenia z pisania opisalibyśmy jako bardzo wyraźne, a hałas podczas pisania jest umiarkowany do cichego. Białe podświetlenie ma trzy poziomy, a światło jest bardzo równomiernie rozłożone, dzięki czemu praca w ciemniejszym otoczeniu nie stanowi problemu. Odstępy między klawiszami wynoszą 2,5 mm, podobnie jak w poprzednim modelu, co zapewnia przyjemne pisanie bez ograniczeń. Solidna podstawa ZenBooka jest również zauważalna podczas pisania, zapewniając stabilną i nieugiętą powierzchnię
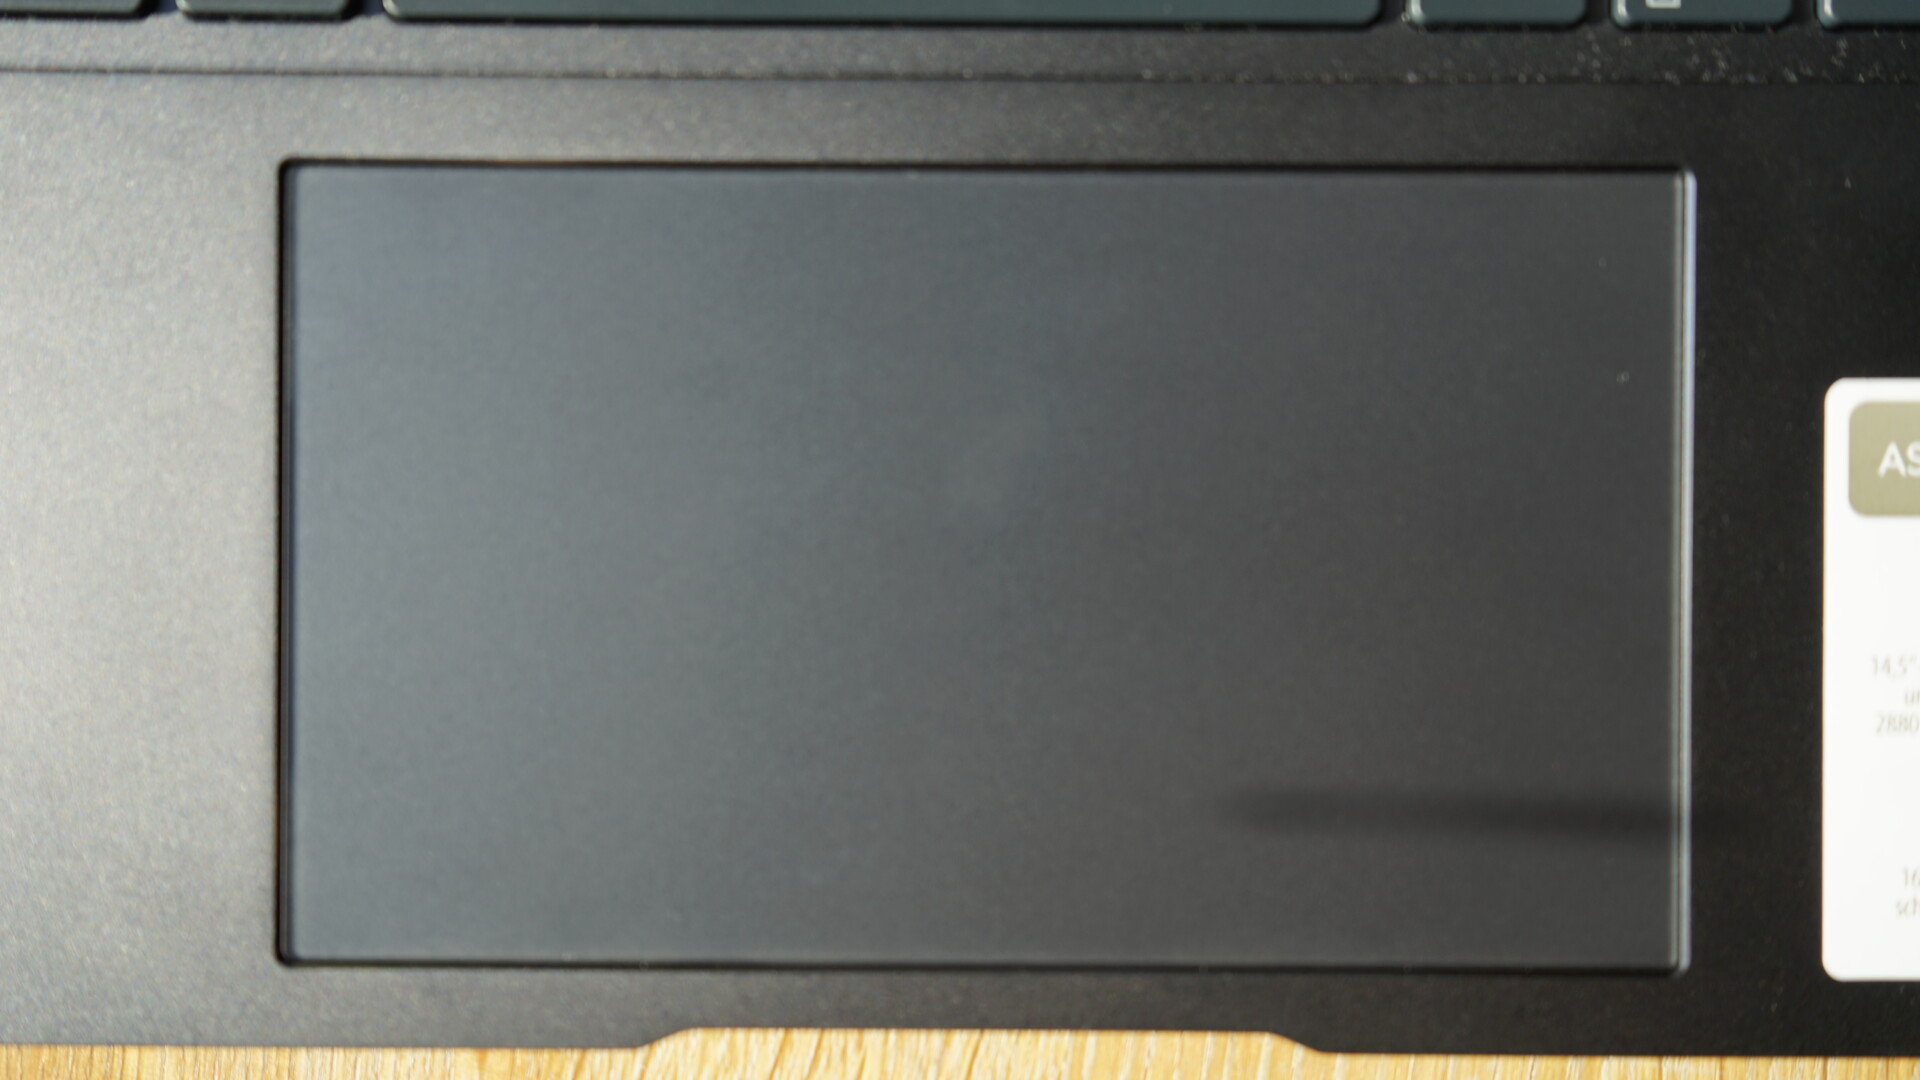
Klawiatura ma wymiary 13 x 7,6 cm, a zatem jest wystarczająco duża, aby wykonywać ruchy wskaźnikiem i gesty nawet czterema palcami. Właściwości ślizgowe są bardzo dobre, a kliknięcia po obu stronach są stabilne i wysokiej jakości z solidnym dźwiękiem kliknięcia. Numpad, zintegrowany z touchpadem zeszłorocznego urządzenia, nie jest już dostępny jako taki w naszym recenzowanym urządzeniu.
Wyświetlacz - 2,8K i 120 Hz
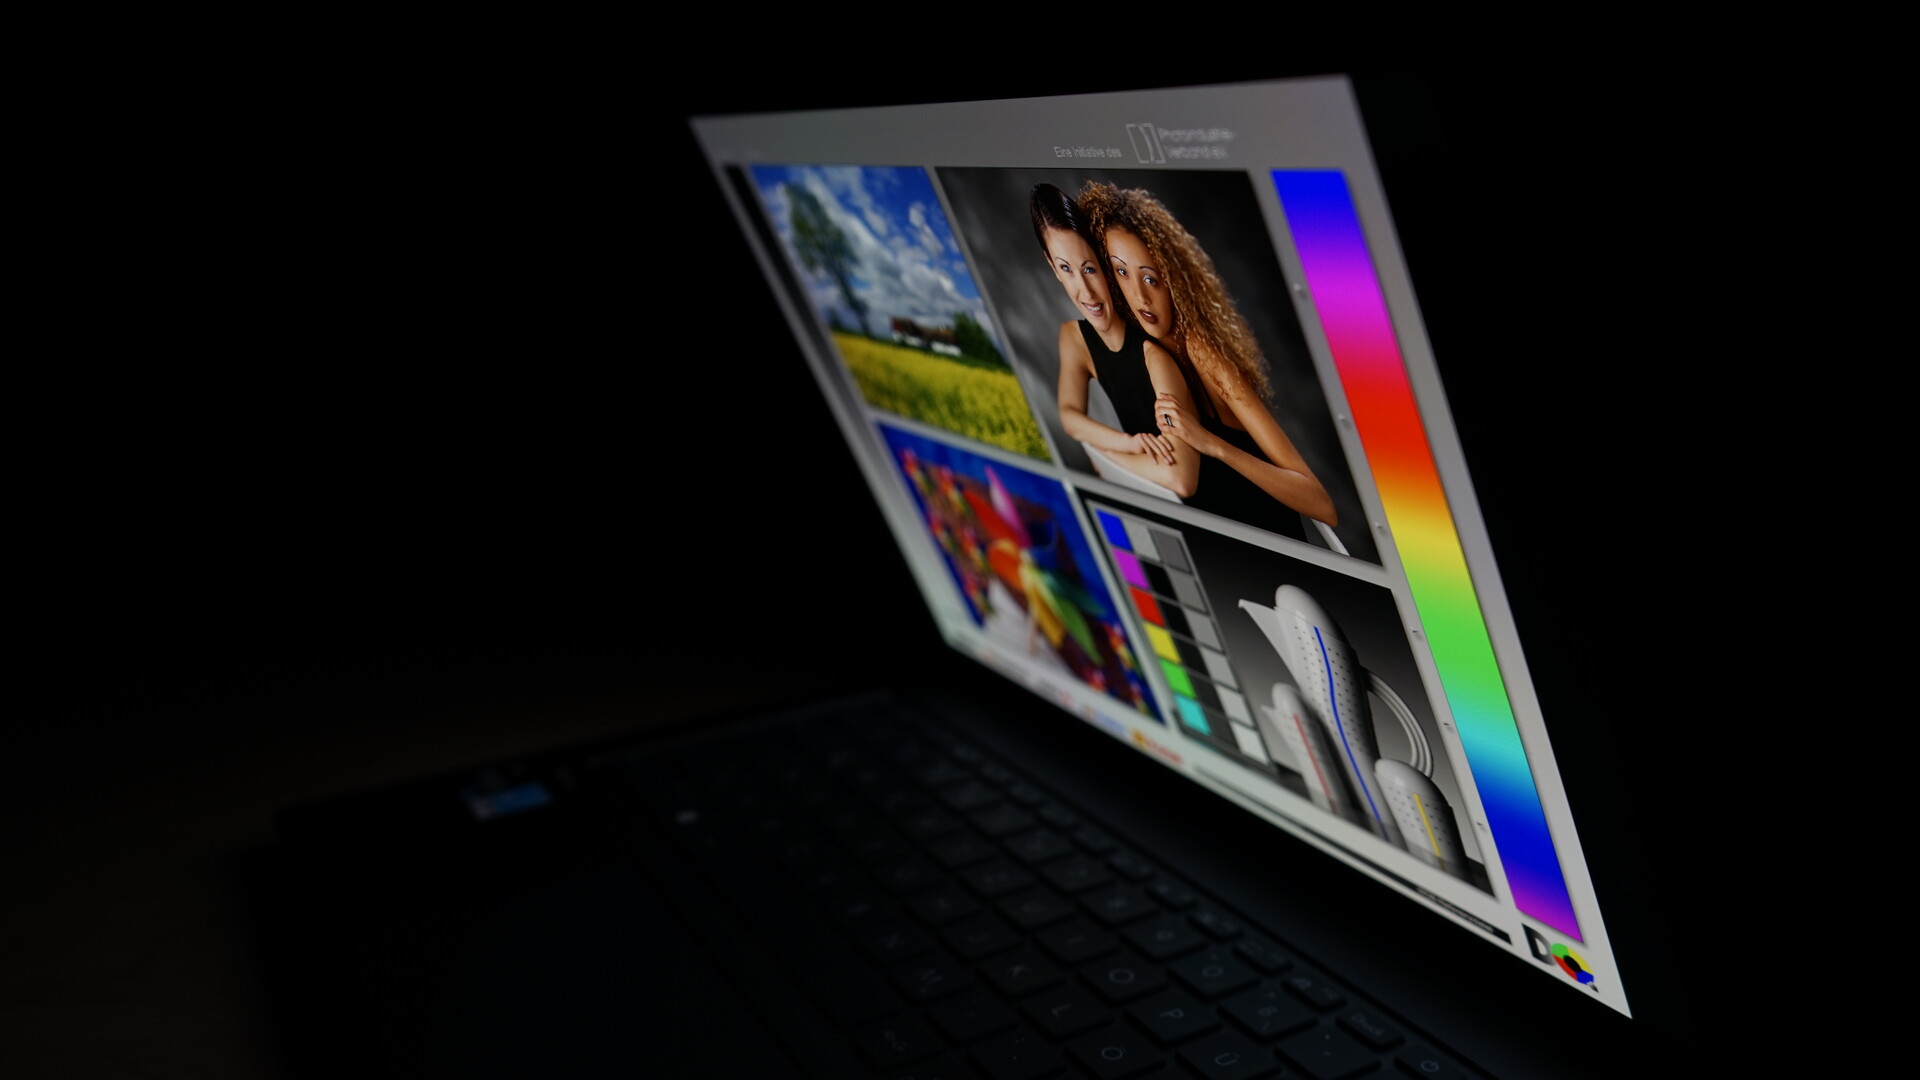
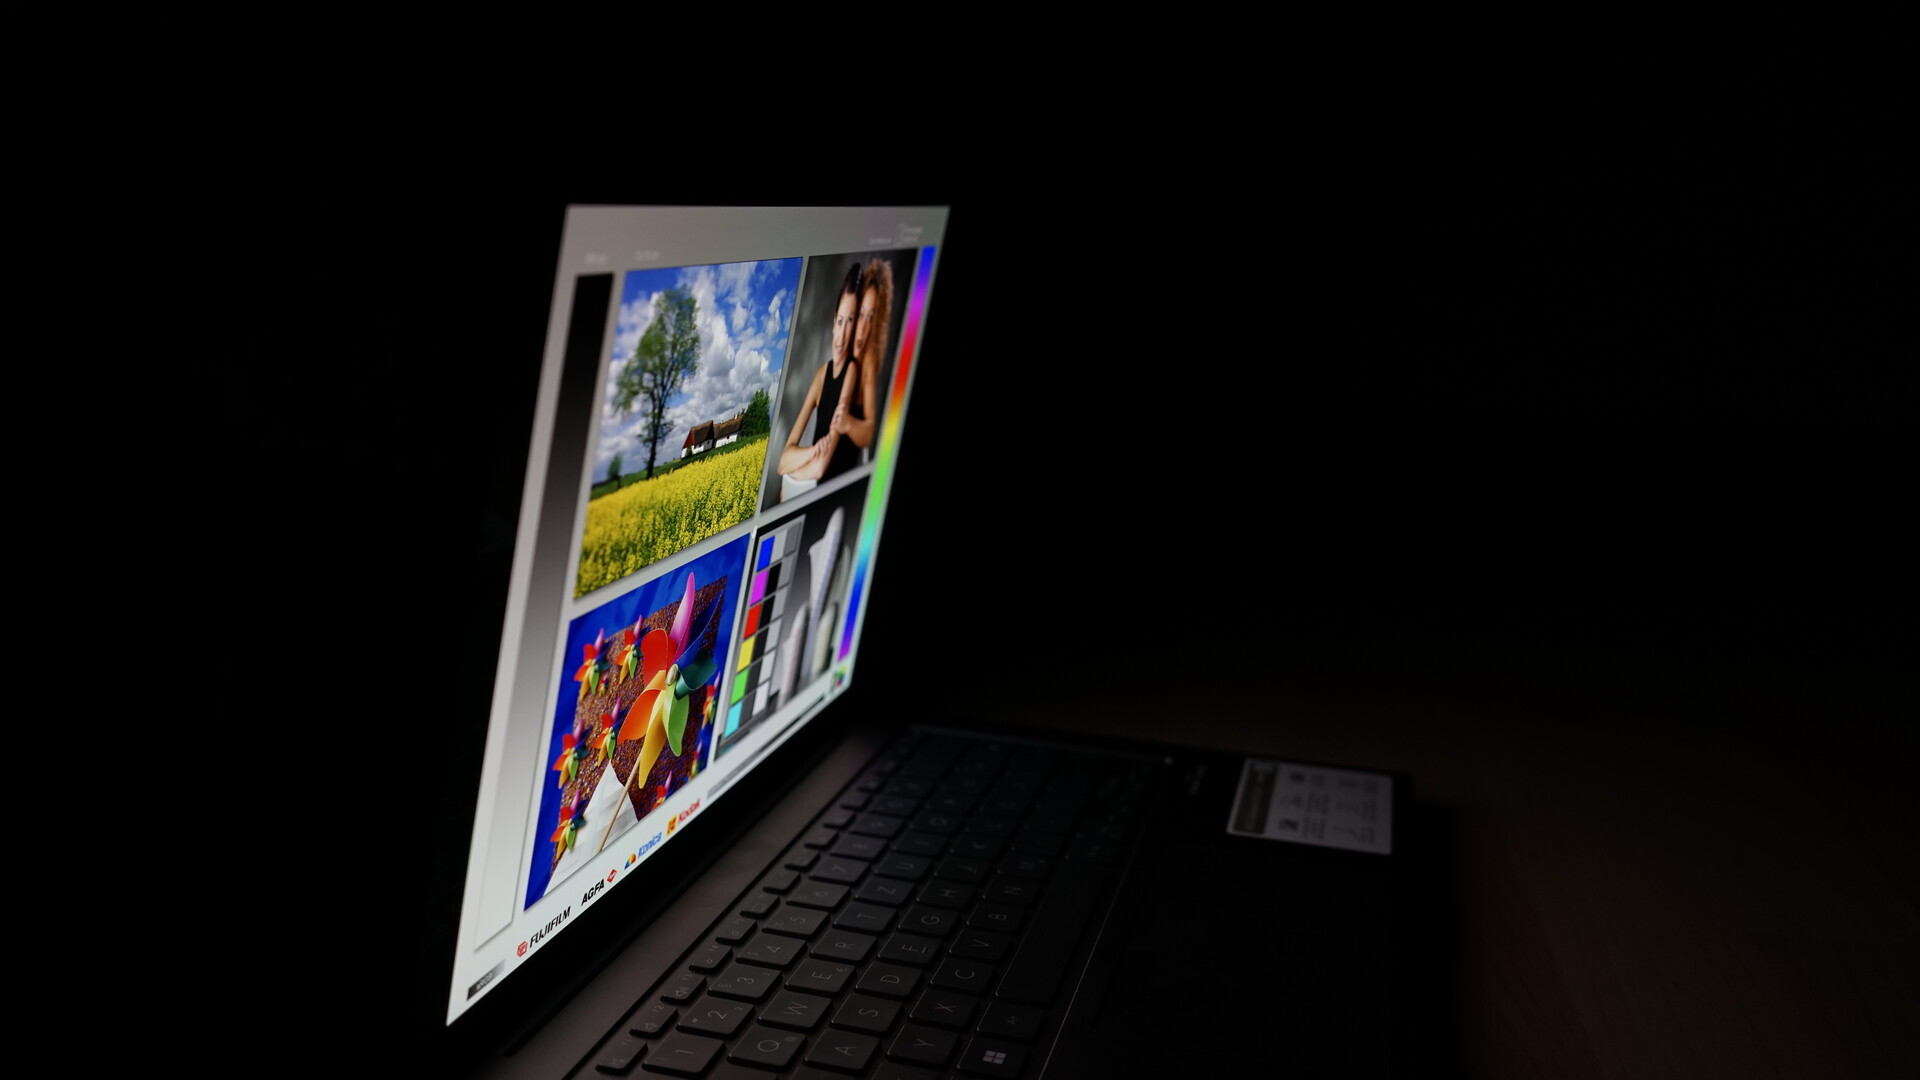
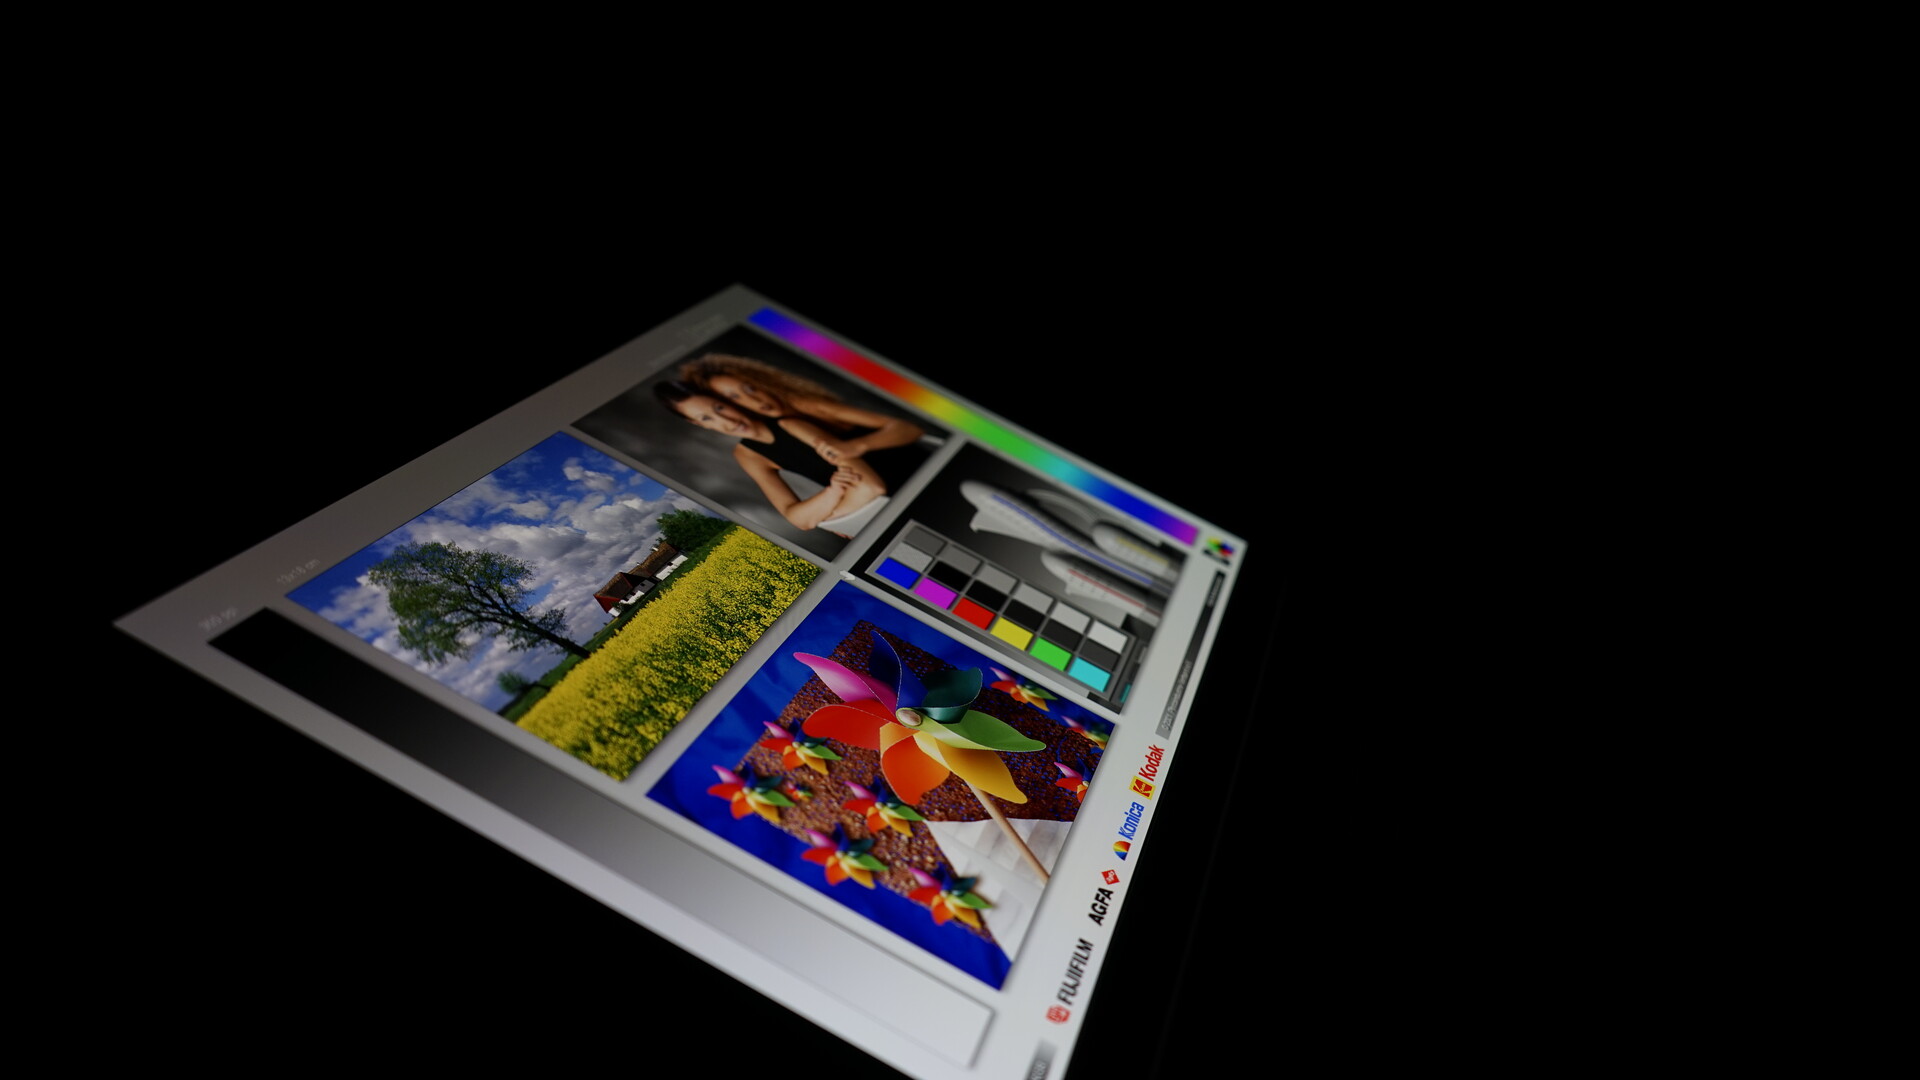
Gwiazdą Asusa ZenBook 14X jest 14-calowy panel OLED. Błyszczący wyświetlacz oferuje rozdzielczość 2880 x 1800 w formacie 16:10, częstotliwość odświeżania 120 Hz i czas reakcji wynoszący zaledwie 2 milisekundy. Testowany przez nas wariant jest wariantem bezdotykowym. Alternatywnie, Asus oferuje również wyświetlacz z funkcją dotykową
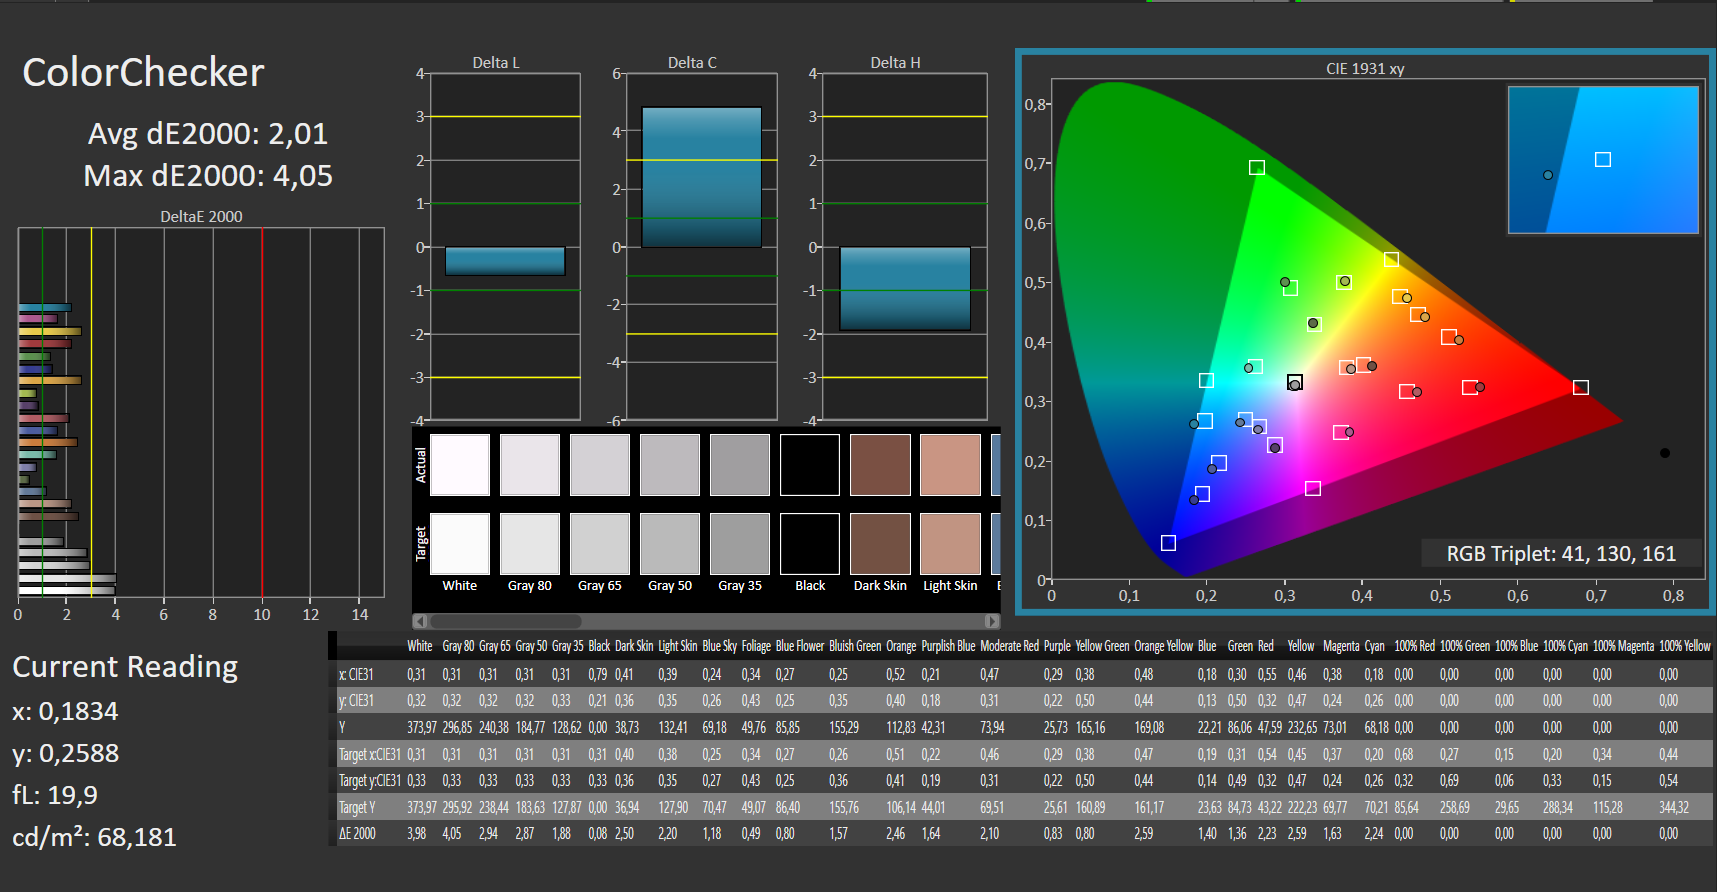
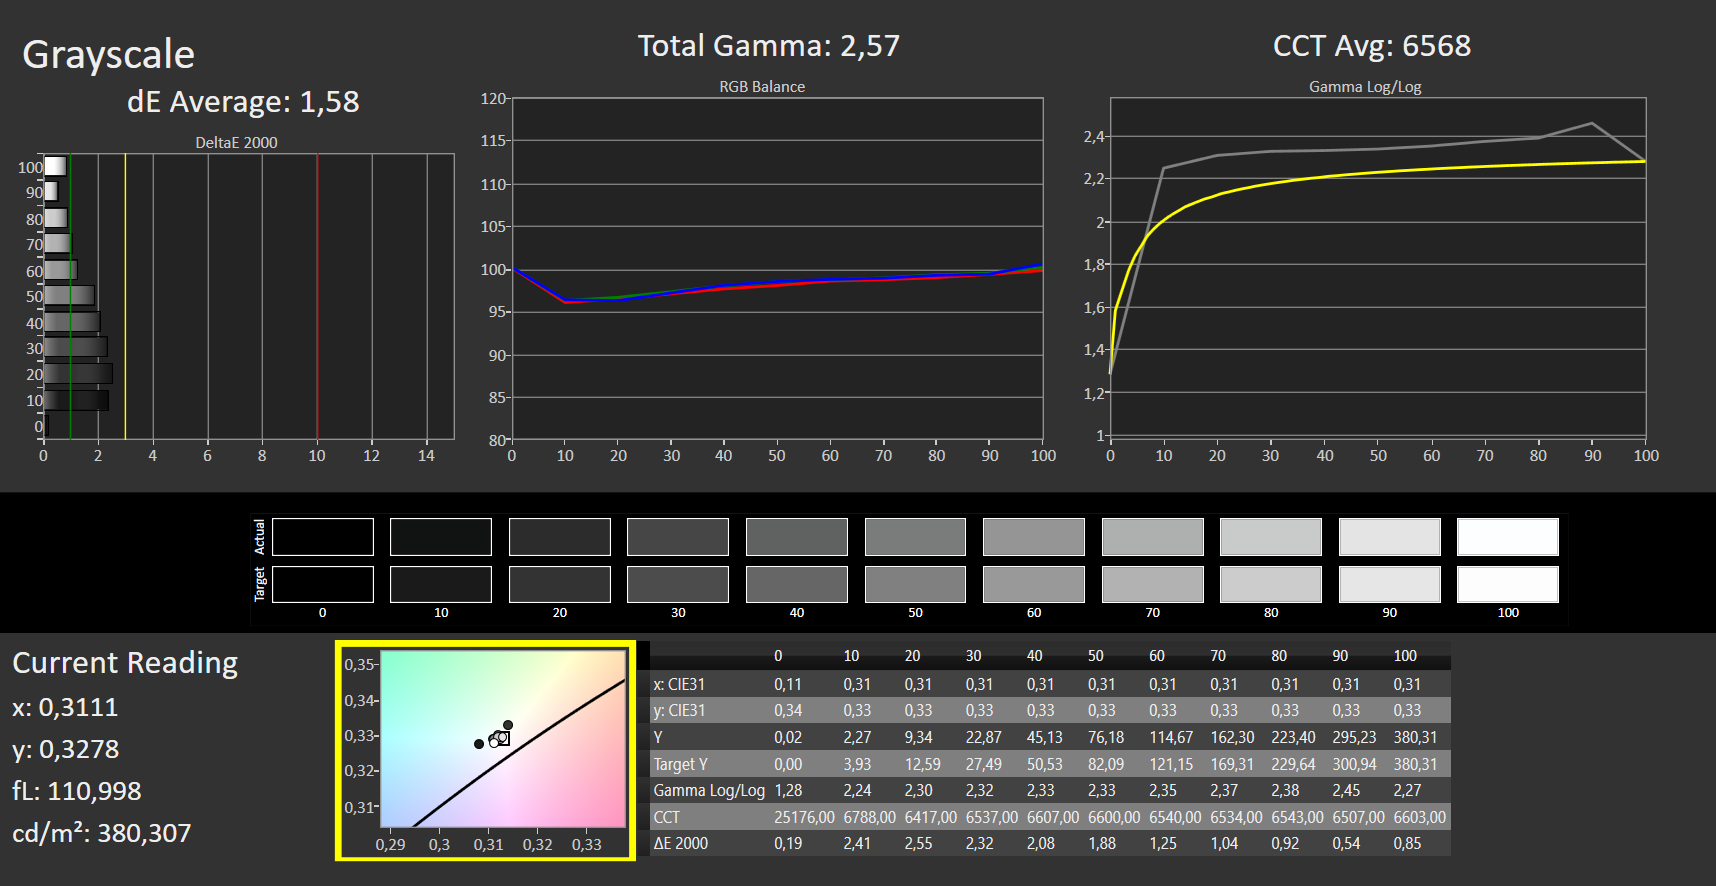
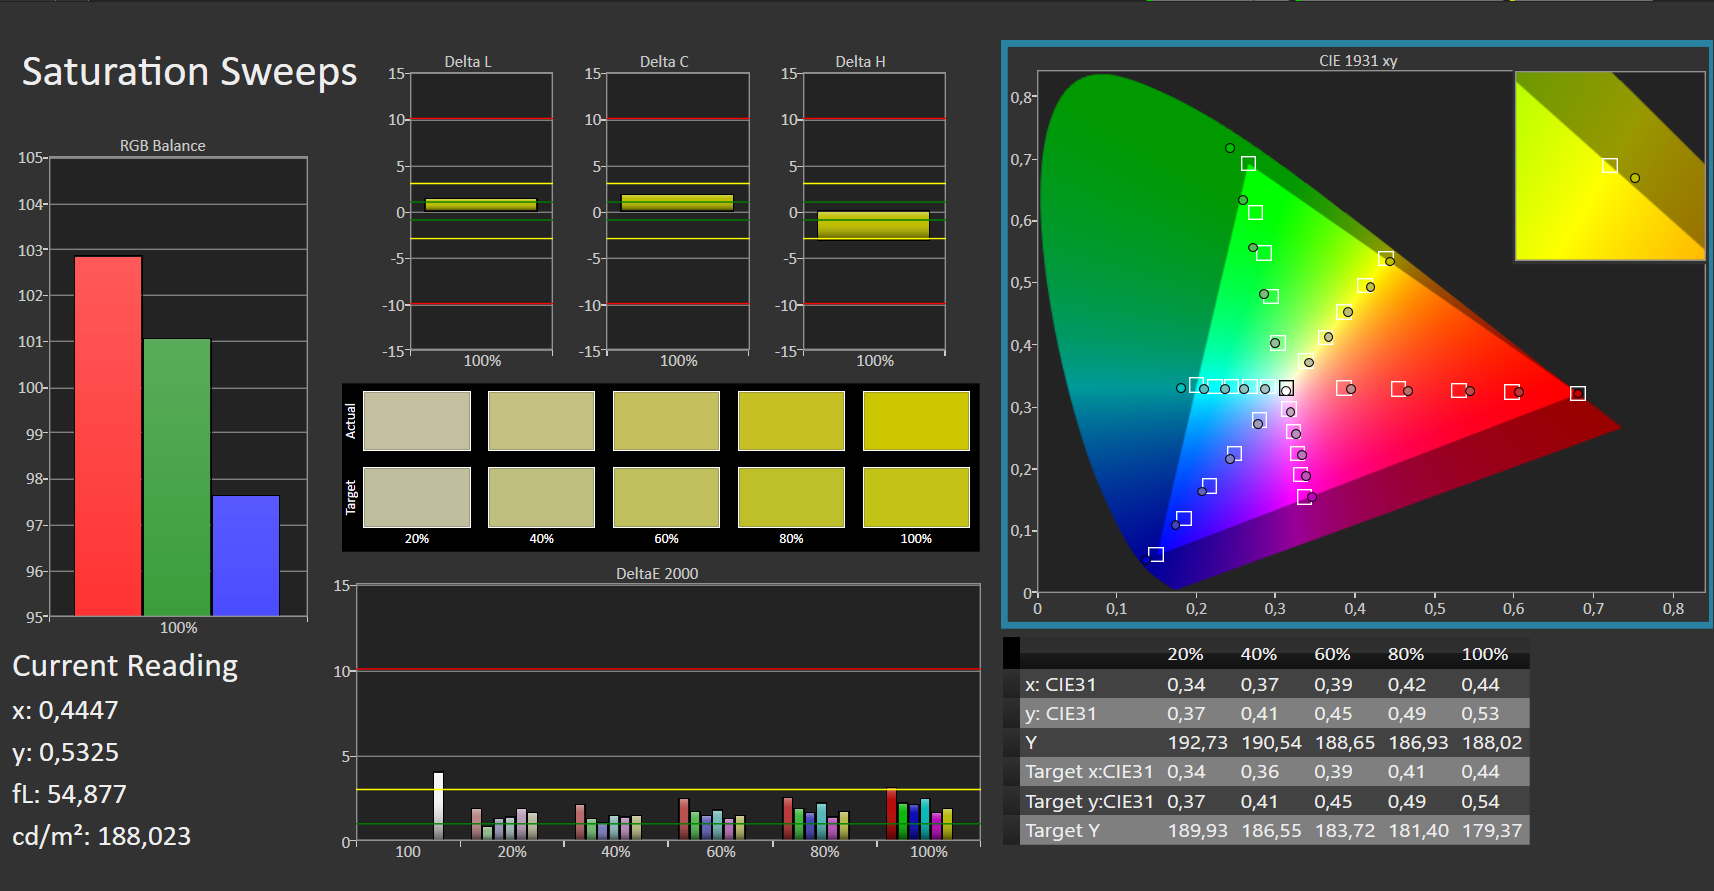
Według Asusa, 100% gama kolorów DCI-P3 jest dana, ale nasze pomiary dały "tylko" 99%. Z kolei przestrzeń kolorów sRGB osiąga 100% pokrycia, a przestrzeń kolorów AdobeRGB 95%. Według producenta jasność wyświetlacza szacowana jest średnio na 400 nitów. Zmierzyliśmy średnio 376 cd/m2 i maksymalnie 381 cd/m2, więc nie możemy w pełni potwierdzić twierdzenia Asusa. Jak zwykle w przypadku paneli OLED, podświetlenie rozkłada się równomiernie na poziomie 98%.
Niższe ustawienia jasności zmniejszają ryzyko wypalenia wyświetlaczy OLED, a funkcja przesunięcia pikseli jest domyślnie aktywowana za pośrednictwem aplikacji MyAsus. Dzięki temu wszystkie piksele są zawsze w minimalnym ruchu, co pozwala uniknąć statycznych obrazów. Ustawienie można dezaktywować za pośrednictwem aplikacji, ale nie zauważyliśmy, aby funkcja była aktywowana podczas naszych testów.
| |||||||||||||||||||||||||
rozświetlenie: 98 %
na akumulatorze: 376 cd/m²
kontrast: 37200:1 (czerń: 0.01 cd/m²)
ΔE ColorChecker Calman: 2.01 | ∀{0.5-29.43 Ø4.72}
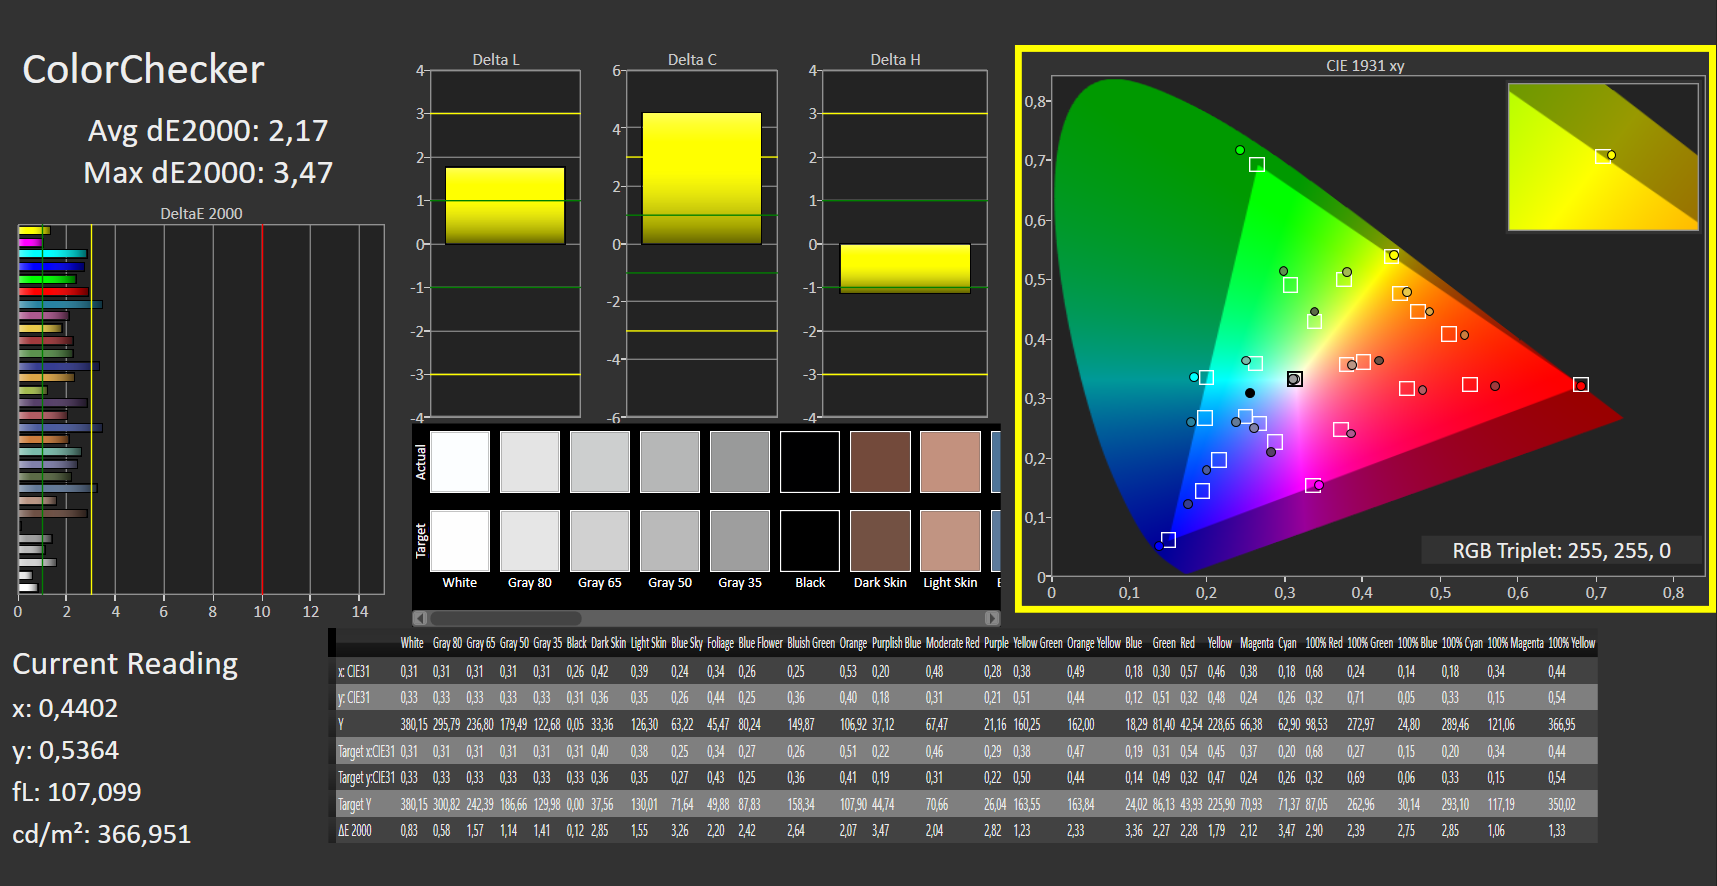
calibrated: 2.17
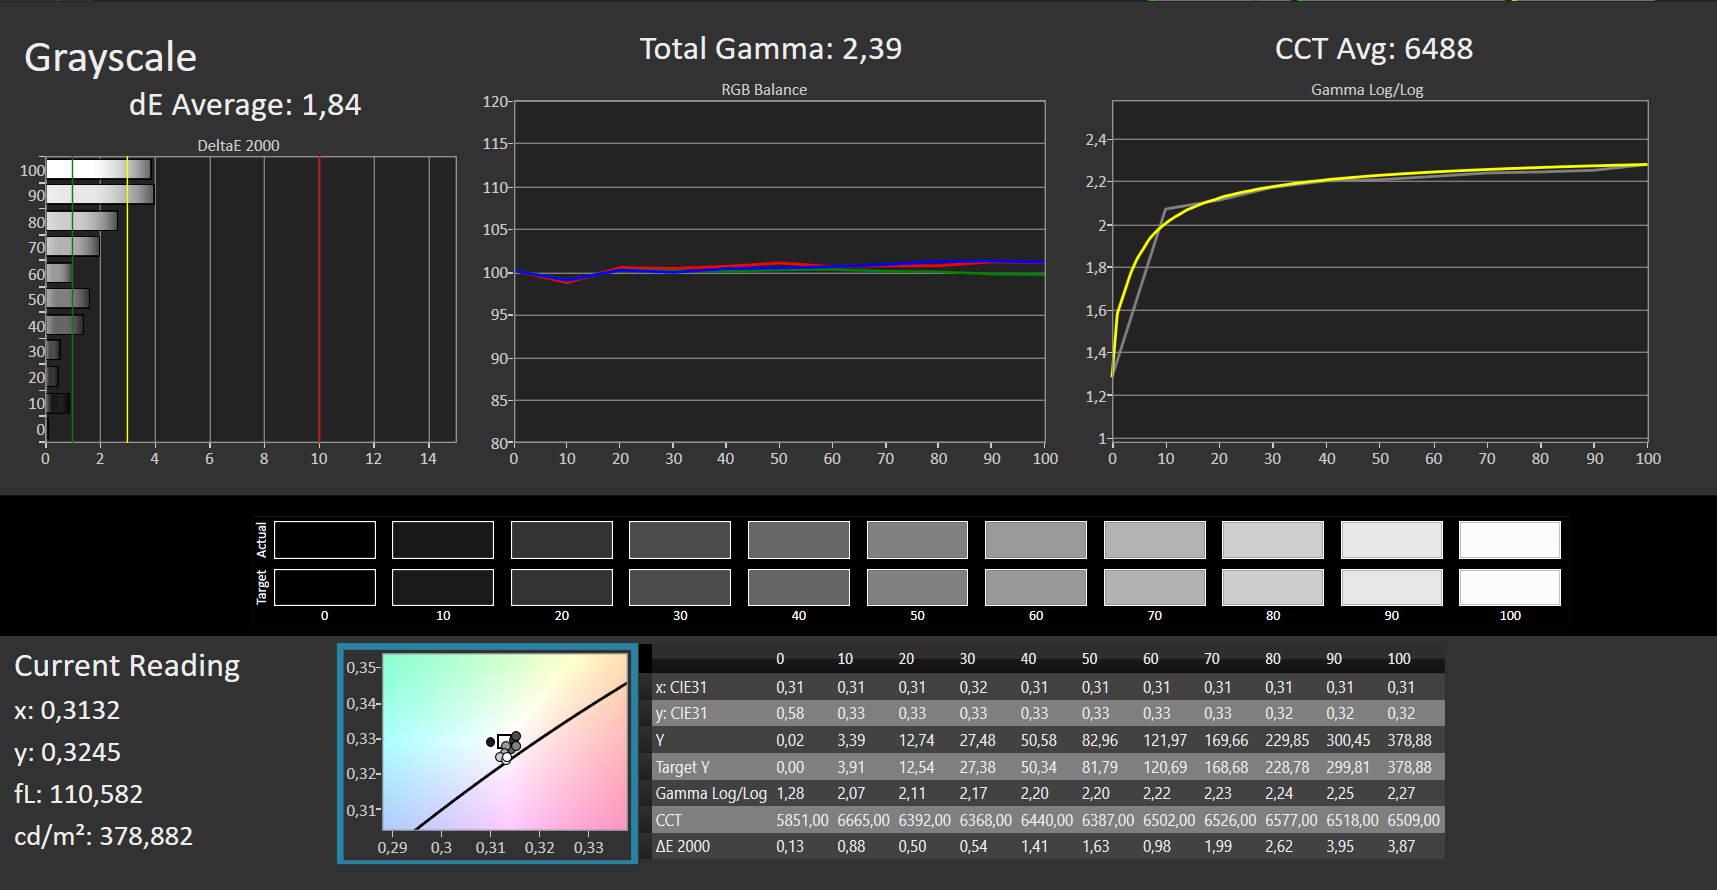
ΔE Greyscale Calman: 1.84 | ∀{0.09-98 Ø4.97}
95% AdobeRGB 1998 (Argyll 3D)
100% sRGB (Argyll 3D)
99% Display P3 (Argyll 3D)
Gamma: 2.39
CCT: 6488 K
| Asus ZenBook 14X UX3404VC Samsung, OLED, 2880x1800, 14.5" | Apple MacBook Pro 13 2022 M2 IPS, 2560x1600, 13.3" | Dell XPS 13 Plus 9320 i7-1280P OLED Samsung 134XK04, OLED, 3456x2160, 13.4" | Lenovo Slim Pro 7 14ARP8 LEN89C1, IPS, 2560x1600, 14.5" | LG Gram 14Z90Q LG LP140WU1-SPF1, IPS, 1920x1200, 14" | Dell Inspiron 14 Plus 7420 InfoVision 140NWHE, IPS, 2240x1400, 14" | Asus ROG Flow Z13 GZ301V TL134ADXP01-0, IPS, 2560x1600, 13.4" | |
|---|---|---|---|---|---|---|---|
| Display | -2% | 2% | -16% | -4% | -20% | -4% | |
| Display P3 Coverage (%) | 99 | 98.8 0% | 99.5 1% | 72.9 -26% | 98.4 -1% | 68.8 -31% | 97 -2% |
| sRGB Coverage (%) | 100 | 100 0% | 100 0% | 98.2 -2% | 99.9 0% | 99.3 -1% | 99.9 0% |
| AdobeRGB 1998 Coverage (%) | 95 | 87.9 -7% | 98.4 4% | 74.6 -21% | 85.9 -10% | 69.5 -27% | 85.3 -10% |
| Response Times | -1645% | -18% | -1178% | -1700% | -1290% | -225% | |
| Response Time Grey 50% / Grey 80% * (ms) | 2 ? | 42 ? -2000% | 2.6 ? -30% | 31.8 ? -1490% | 47.5 ? -2275% | 32.8 ? -1540% | 6.5 ? -225% |
| Response Time Black / White * (ms) | 2 ? | 27.8 ? -1290% | 2.1 ? -5% | 19.3 ? -865% | 24.5 ? -1125% | 22.8 ? -1040% | 6.5 ? -225% |
| PWM Frequency (Hz) | 250 ? | 117780 ? | 59.5 | ||||
| Screen | -319% | -13% | -368% | -324% | -334% | -482% | |
| Brightness middle (cd/m²) | 372 | 514 38% | 371.8 0% | 344.7 -7% | 341 -8% | 331.1 -11% | 537 44% |
| Brightness (cd/m²) | 376 | 497 32% | 374 -1% | 334 -11% | 305 -19% | 326 -13% | 511 36% |
| Brightness Distribution (%) | 98 | 93 -5% | 98 0% | 92 -6% | 87 -11% | 85 -13% | 88 -10% |
| Black Level * (cd/m²) | 0.01 | 0.31 -3000% | 0.31 -3000% | 0.26 -2500% | 0.29 -2800% | 0.45 -4400% | |
| Contrast (:1) | 37200 | 1658 -96% | 1112 -97% | 1312 -96% | 1142 -97% | 1193 -97% | |
| Colorchecker dE 2000 * | 2.01 | 1.1 45% | 2.37 -18% | 3.01 -50% | 3.11 -55% | 2.23 -11% | 1.49 26% |
| Colorchecker dE 2000 max. * | 4.05 | 2.3 43% | 6.1 -51% | 6.3 -56% | 8.29 -105% | 5.44 -34% | 3.68 9% |
| Colorchecker dE 2000 calibrated * | 2.17 | 0.6 72% | 0.83 62% | 0.83 62% | 0.63 71% | 1.12 48% | |
| Greyscale dE 2000 * | 1.84 | 1.8 2% | 2 -9% | 4.6 -150% | 5.3 -188% | 3.6 -96% | 1.66 10% |
| Gamma | 2.39 92% | 2.23 99% | 2.29 96% | 2.28 96% | 2.037 108% | 2.21 100% | 2.43 91% |
| CCT | 6488 100% | 6764 96% | 6261 104% | 6420 101% | 7571 86% | 6022 108% | 6772 96% |
| Całkowita średnia (program / ustawienia) | -655% /
-440% | -10% /
-10% | -521% /
-409% | -676% /
-452% | -548% /
-403% | -237% /
-343% |
* ... im mniej tym lepiej
Jak zwykle w przypadku wyświetlaczy OLED, kontrast jest doskonały. Czerń na ZenBook 14X jest bogata, a kolory żywe. Wyświetlacz OLED jest również wyraźnie lepszy od wyświetlaczy IPS w porównywalnych urządzeniach pod względem czasu reakcji. Ustawienia obrazu i wyświetlania można indywidualnie dostosować za pomocą oprogramowania MyAsus.

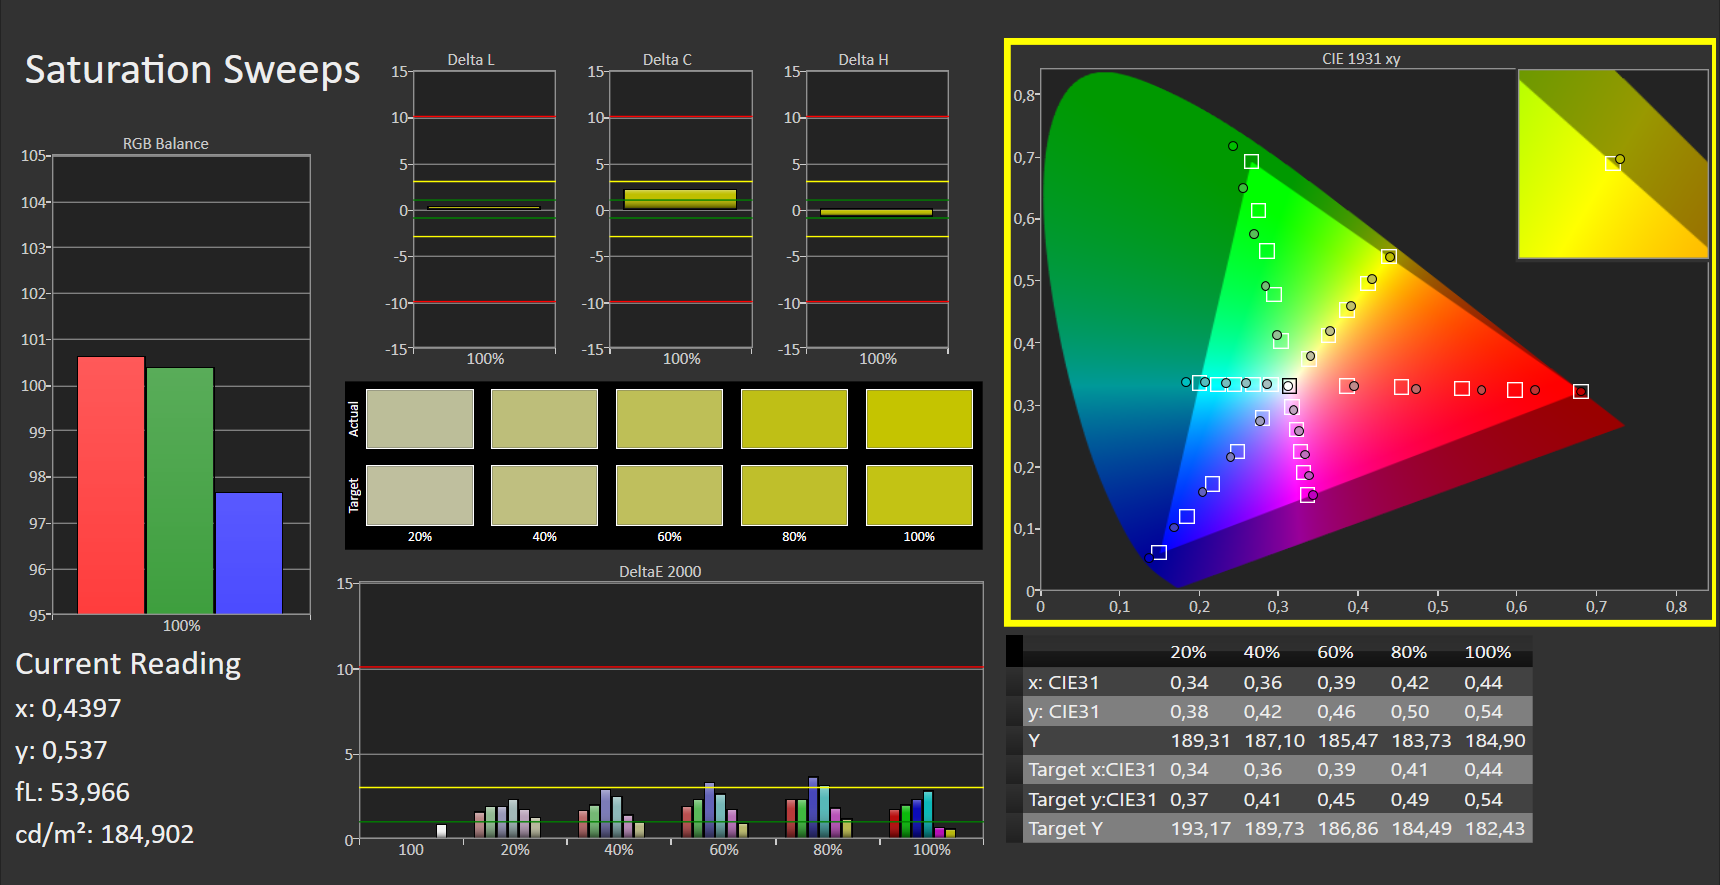
Nasze pomiary DeltaE skali szarości i kolorów dały bardzo dobre wartości między 1,8 a 2,0 przed kalibracją. Kalibracja poprawiła DeltaE skali szarości do 1,6, podczas gdy DeltaE kolorów pogorszyła się do 2,2. Wyniki te sugerują, że wyświetlacz jest już skalibrowany i dalsza kalibracja nie oferuje tutaj żadnej wartości dodanej.
Wyświetl czasy reakcji
| ↔ Czas reakcji od czerni do bieli | ||
|---|---|---|
| 2 ms ... wzrost ↗ i spadek ↘ łącznie | ↗ 1 ms wzrost |  |
| ↘ 1 ms upadek | ||
| W naszych testach ekran wykazuje bardzo szybką reakcję i powinien bardzo dobrze nadawać się do szybkich gier. Dla porównania, wszystkie testowane urządzenia wahają się od 0.1 (minimum) do 240 (maksimum) ms. » 11 % wszystkich urządzeń jest lepszych. Oznacza to, że zmierzony czas reakcji jest lepszy od średniej wszystkich testowanych urządzeń (19.8 ms). | ||
| ↔ Czas reakcji 50% szarości do 80% szarości | ||
| 2 ms ... wzrost ↗ i spadek ↘ łącznie | ↗ 1 ms wzrost |  |
| ↘ 1 ms upadek | ||
| W naszych testach ekran wykazuje bardzo szybką reakcję i powinien bardzo dobrze nadawać się do szybkich gier. Dla porównania, wszystkie testowane urządzenia wahają się od 0.165 (minimum) do 636 (maksimum) ms. » 10 % wszystkich urządzeń jest lepszych. Oznacza to, że zmierzony czas reakcji jest lepszy od średniej wszystkich testowanych urządzeń (31 ms). | ||
Migotanie ekranu / PWM (modulacja szerokości impulsu)
| Wykryto migotanie ekranu/wykryto PWM | 250 Hz | ≤ 70 % ustawienia jasności |  |
Podświetlenie wyświetlacza miga z częstotliwością 250 Hz (najgorszy przypadek, np. przy użyciu PWM) Wykryto migotanie przy ustawieniu jasności 70 % i poniżej. Powyżej tego ustawienia jasności nie powinno być żadnego migotania ani PWM. Częstotliwość 250 Hz jest stosunkowo niska, więc wrażliwi użytkownicy prawdopodobnie zauważą migotanie i odczują zmęczenie oczu przy podanym ustawieniu jasności i poniżej. Dla porównania: 52 % wszystkich testowanych urządzeń nie używa PWM do przyciemniania wyświetlacza. Jeśli wykryto PWM, zmierzono średnio 7753 (minimum: 5 - maksimum: 343500) Hz. | |||


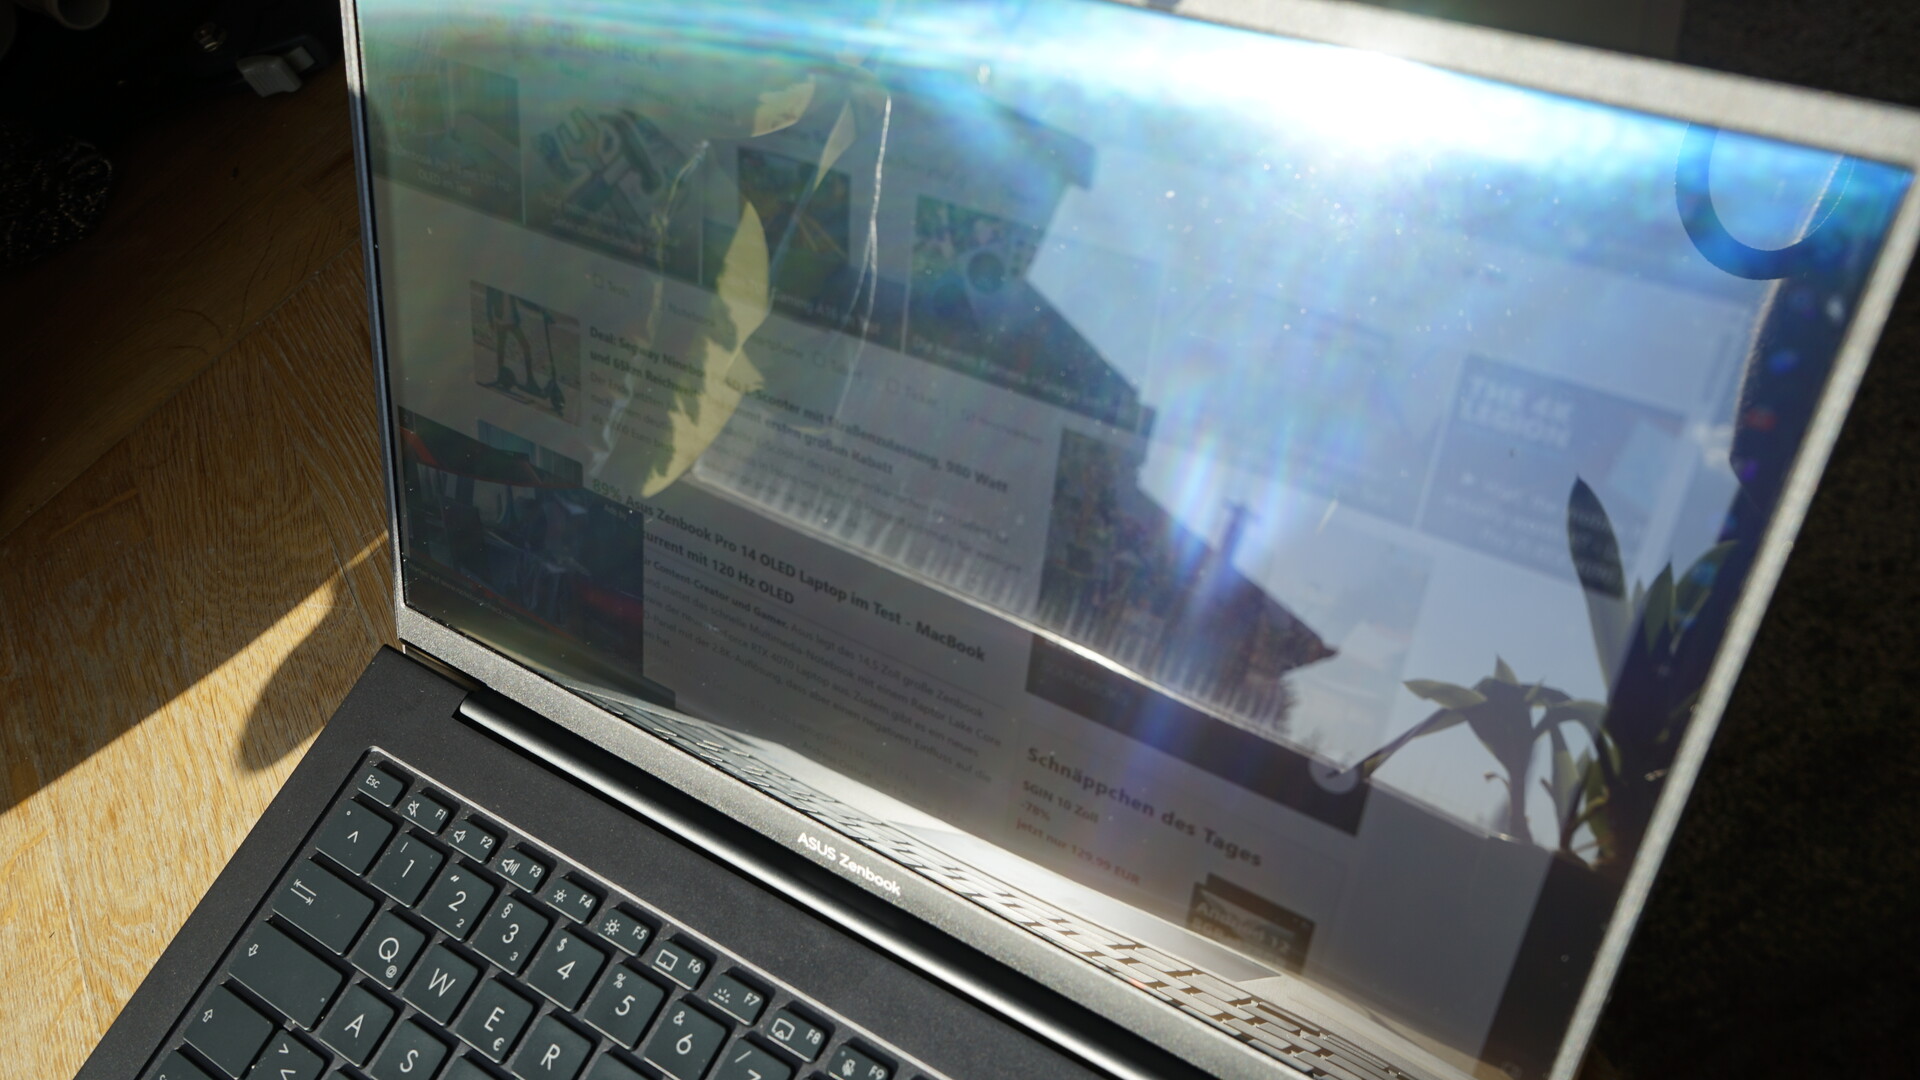
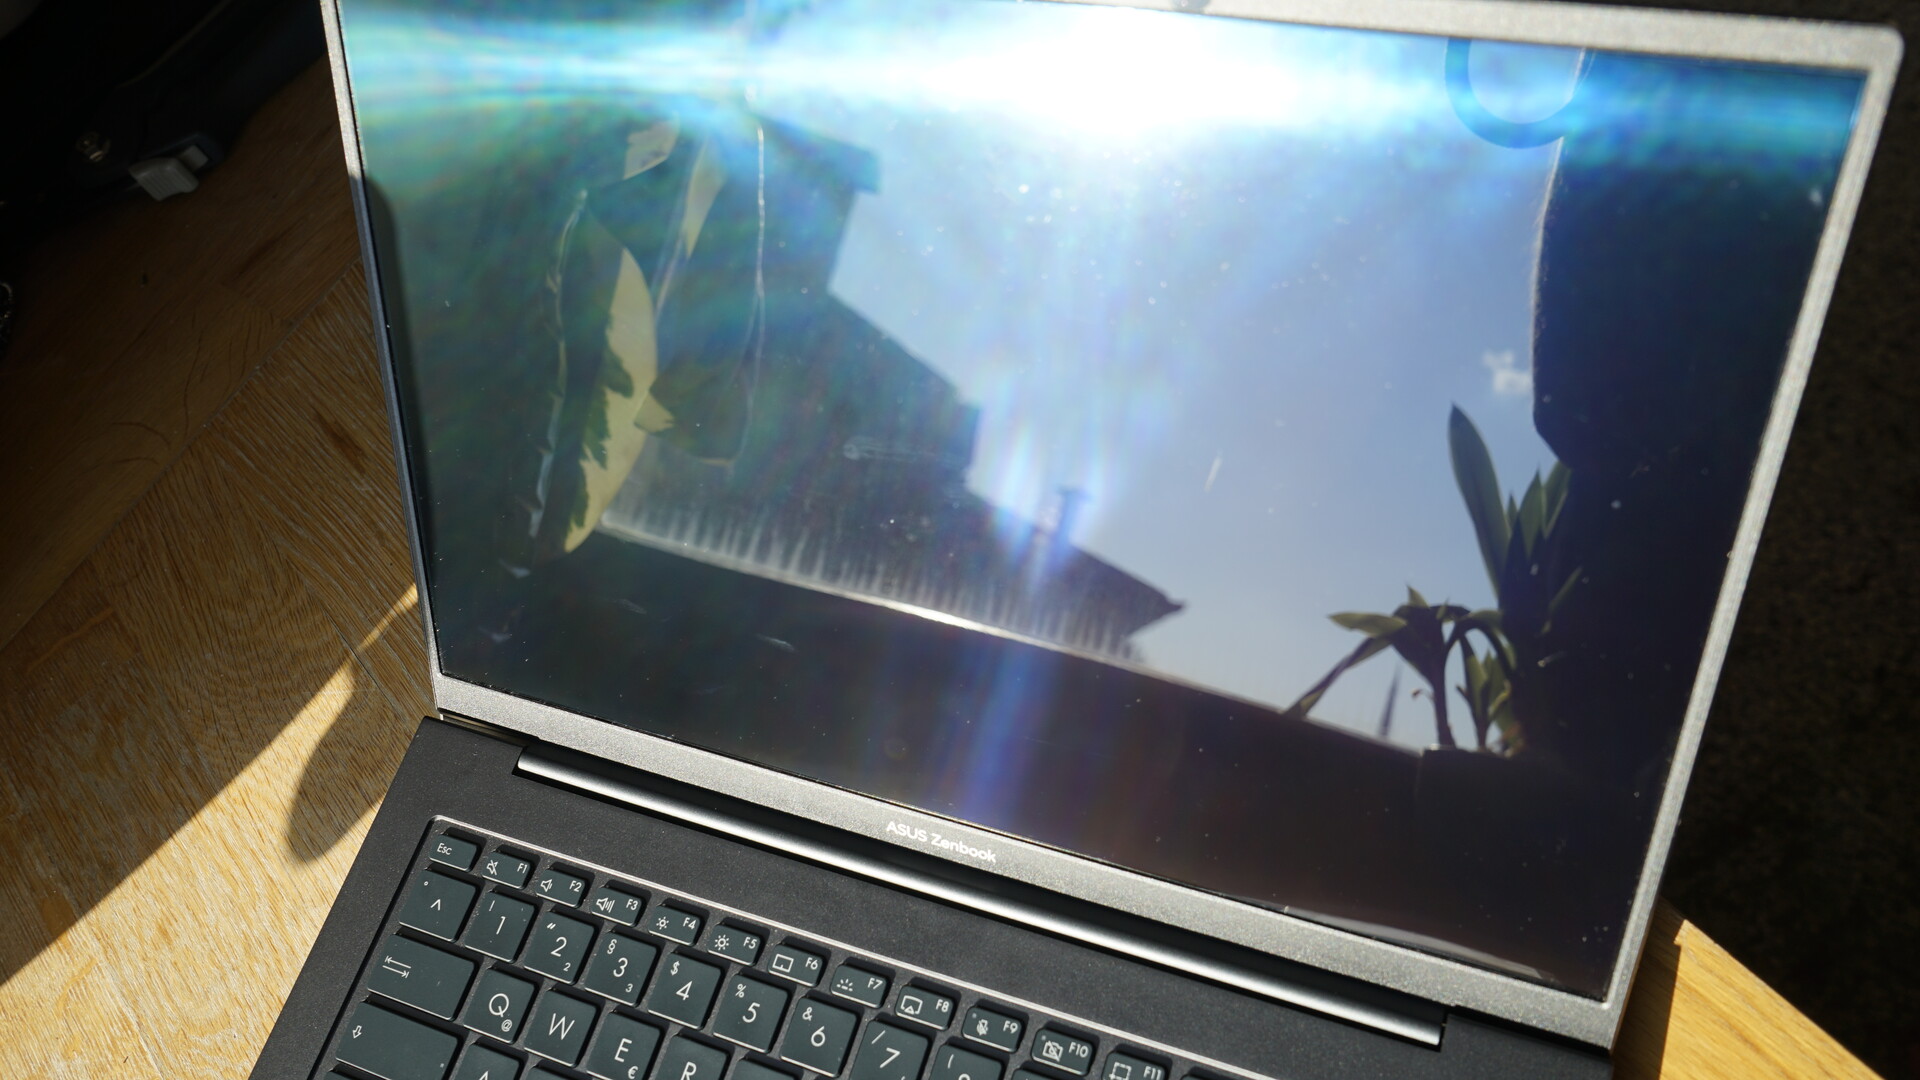
Wyświetlacz OLED w Asusie ZenBook 14X ma problemy w bezpośrednim świetle słonecznym. Wyświetlacz typu glare z trudem sobie tutaj radzi i komfortowe oglądanie ekranu nie jest już możliwe. Nieco wyższa jasność szczytowa w porównaniu do poprzednika również nie pomaga.
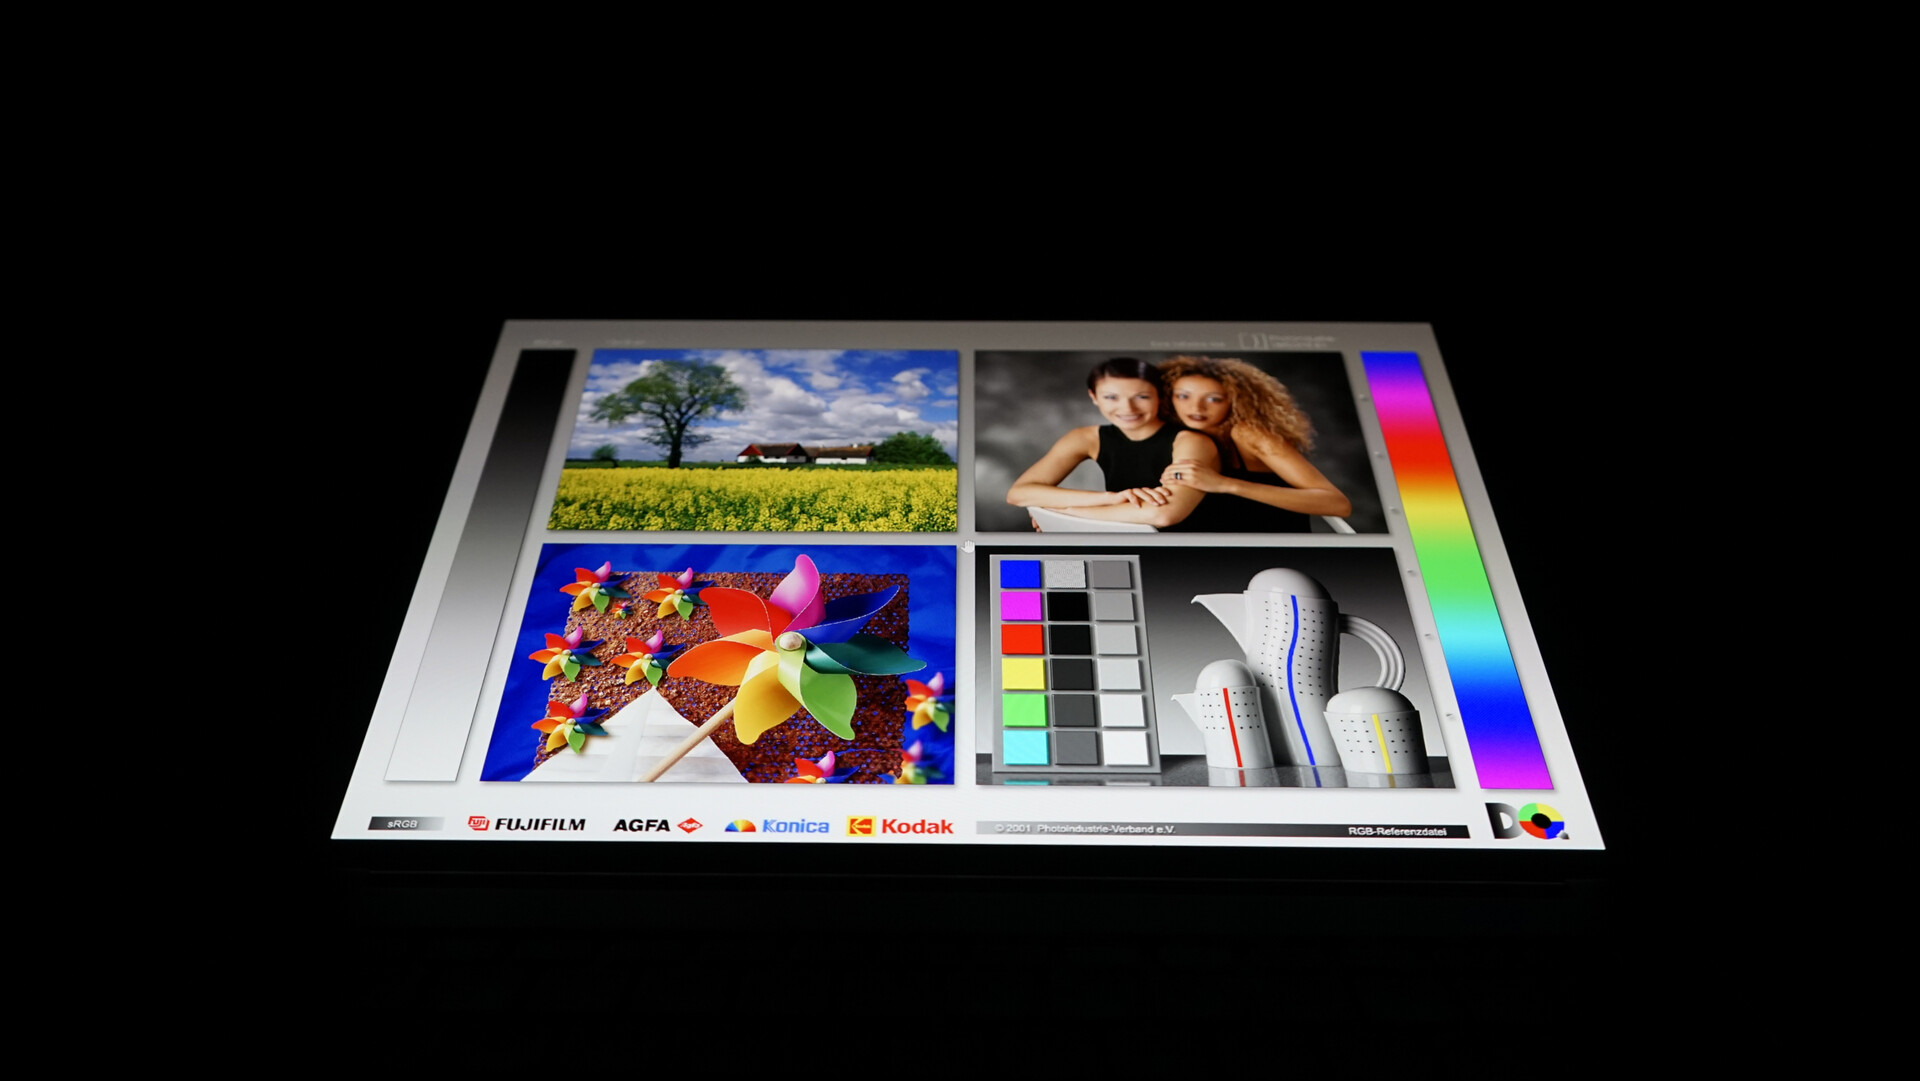
Jak zwykle w przypadku paneli OLED, nie ma co krytykować stabilności kąta widzenia. Kolory i jasność pozostają idealnie stabilne, nawet przy bardzo stromych kątach. Jak zwykle w przypadku paneli OLED, pewien niebieski odcień jest widoczny pod bardzo stromymi kątami.
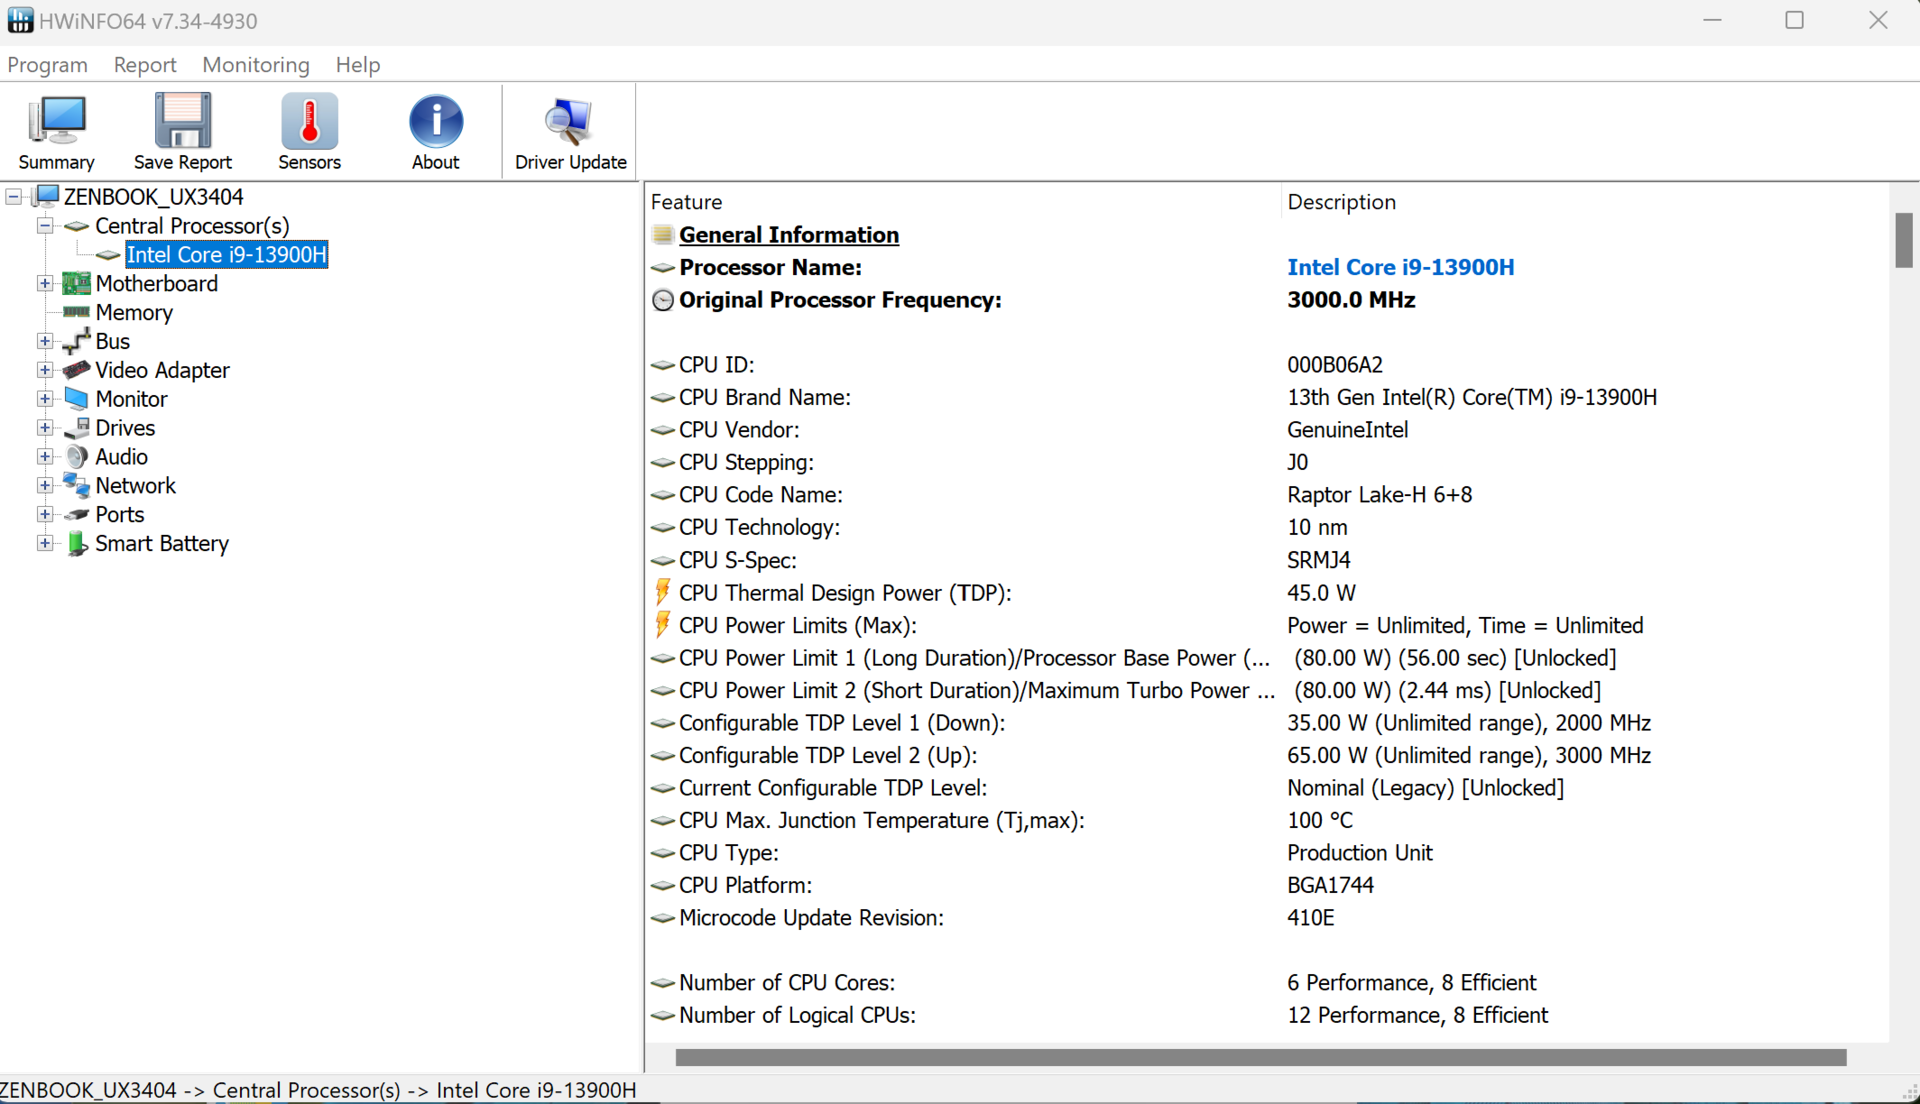
Wydajność - Wydajny procesor Intel i9-13900H
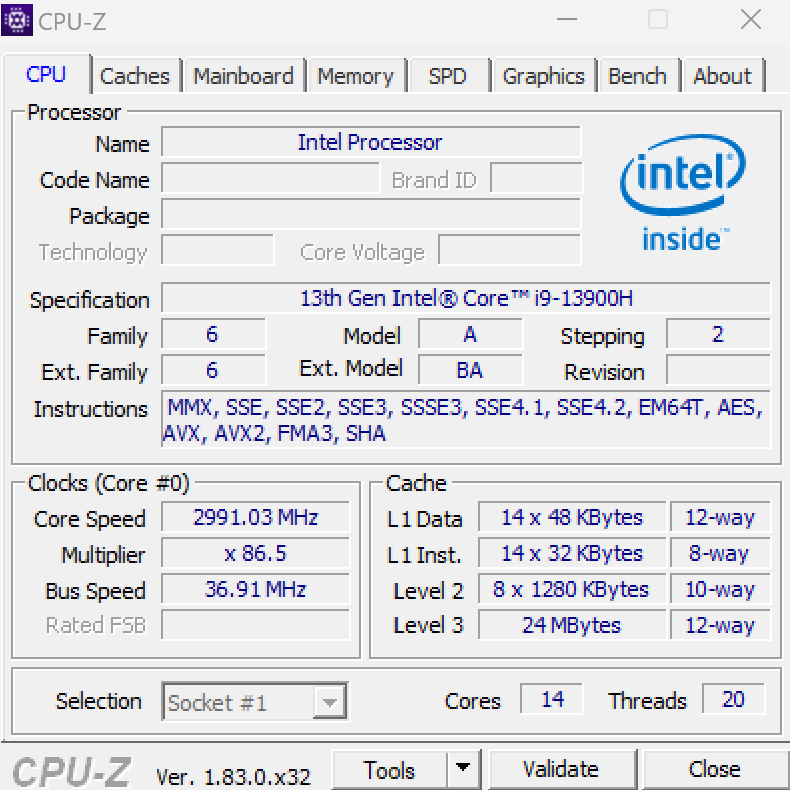
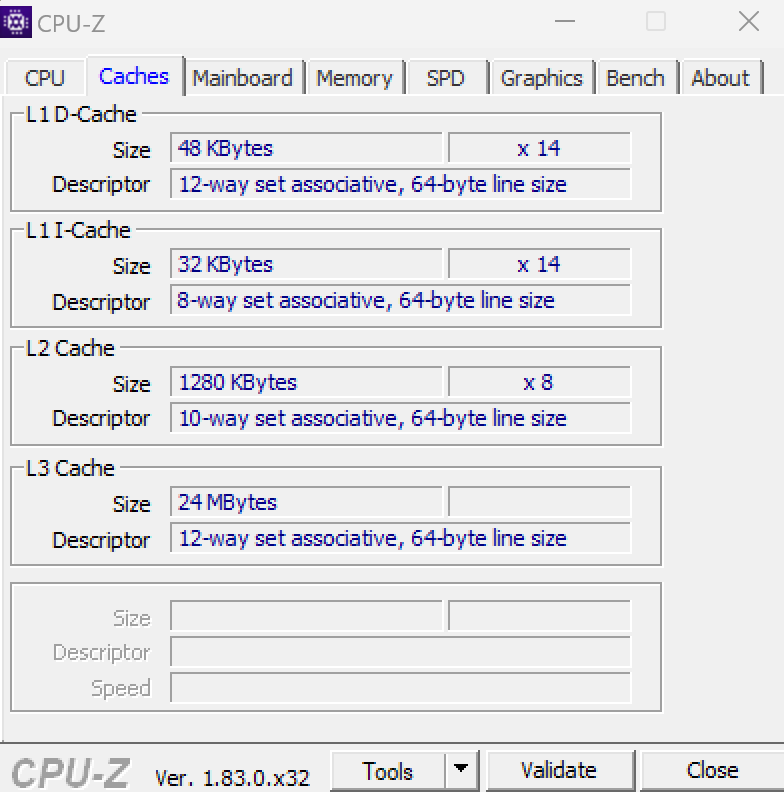
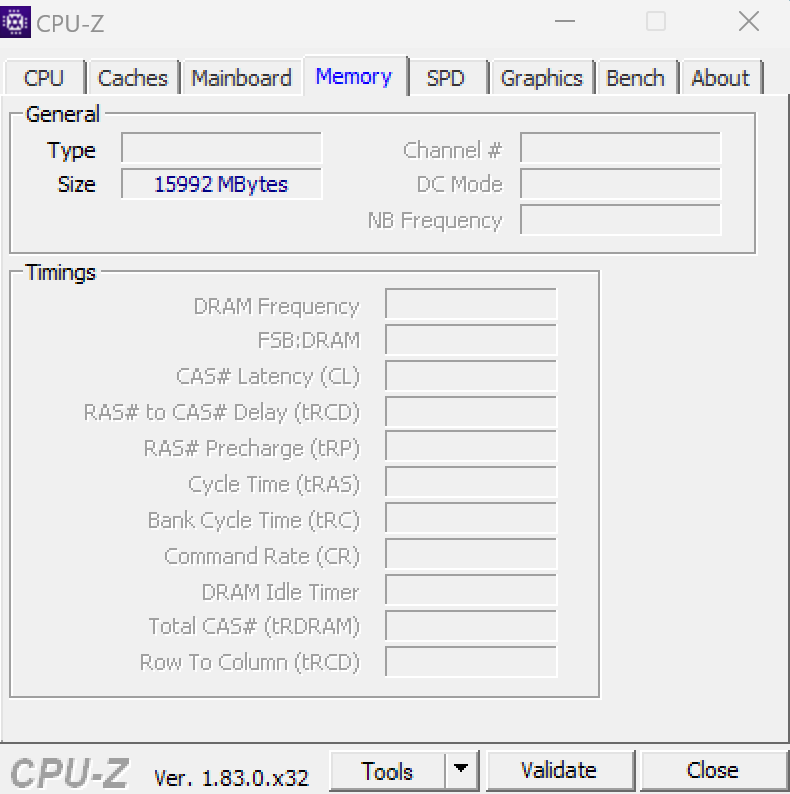
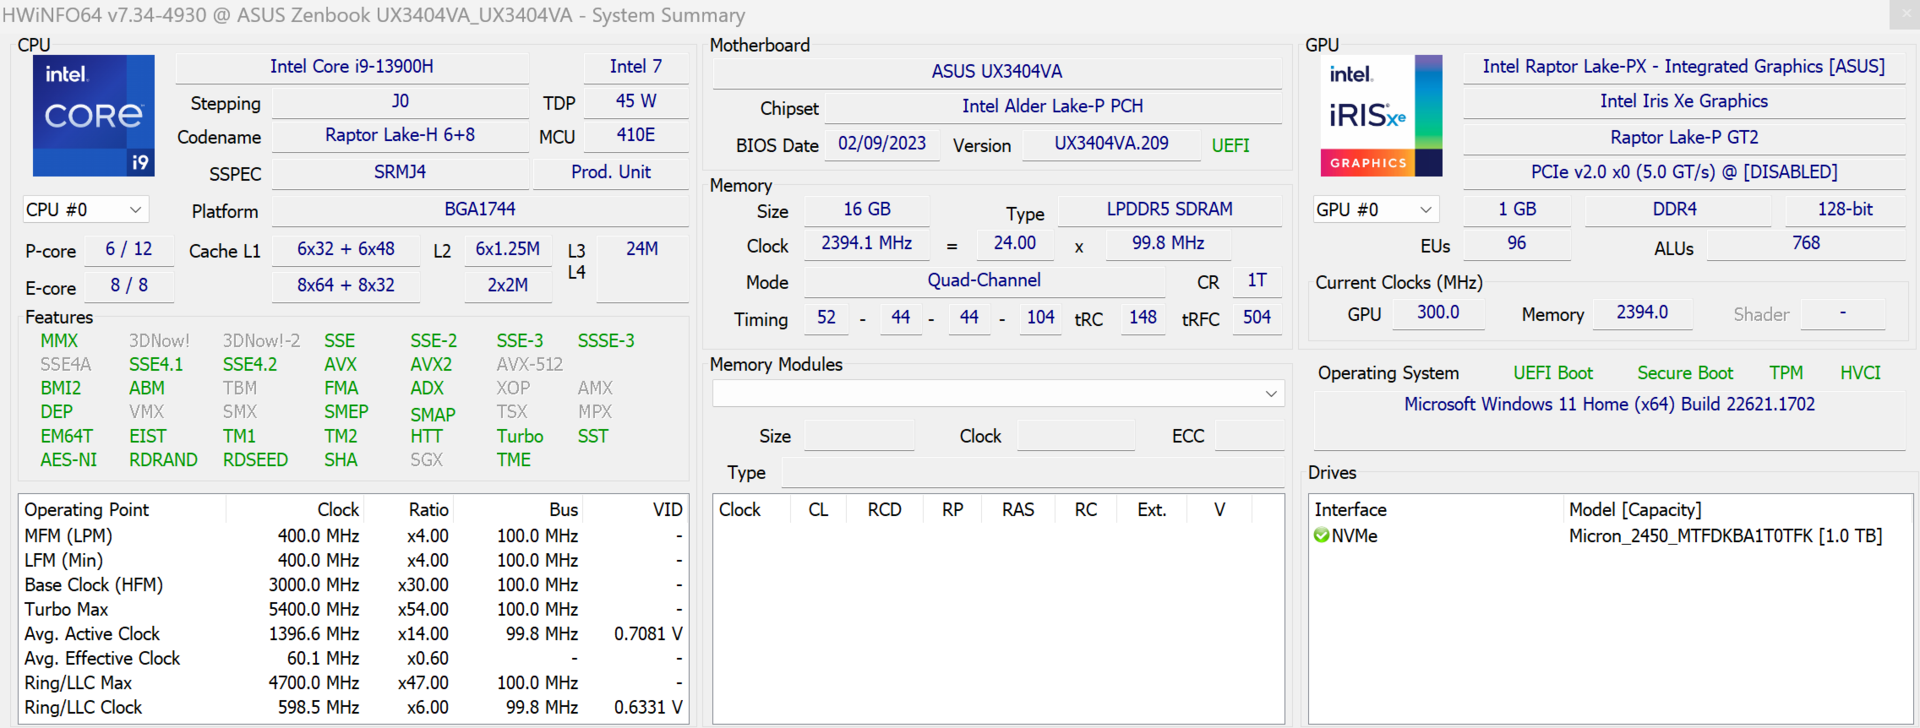
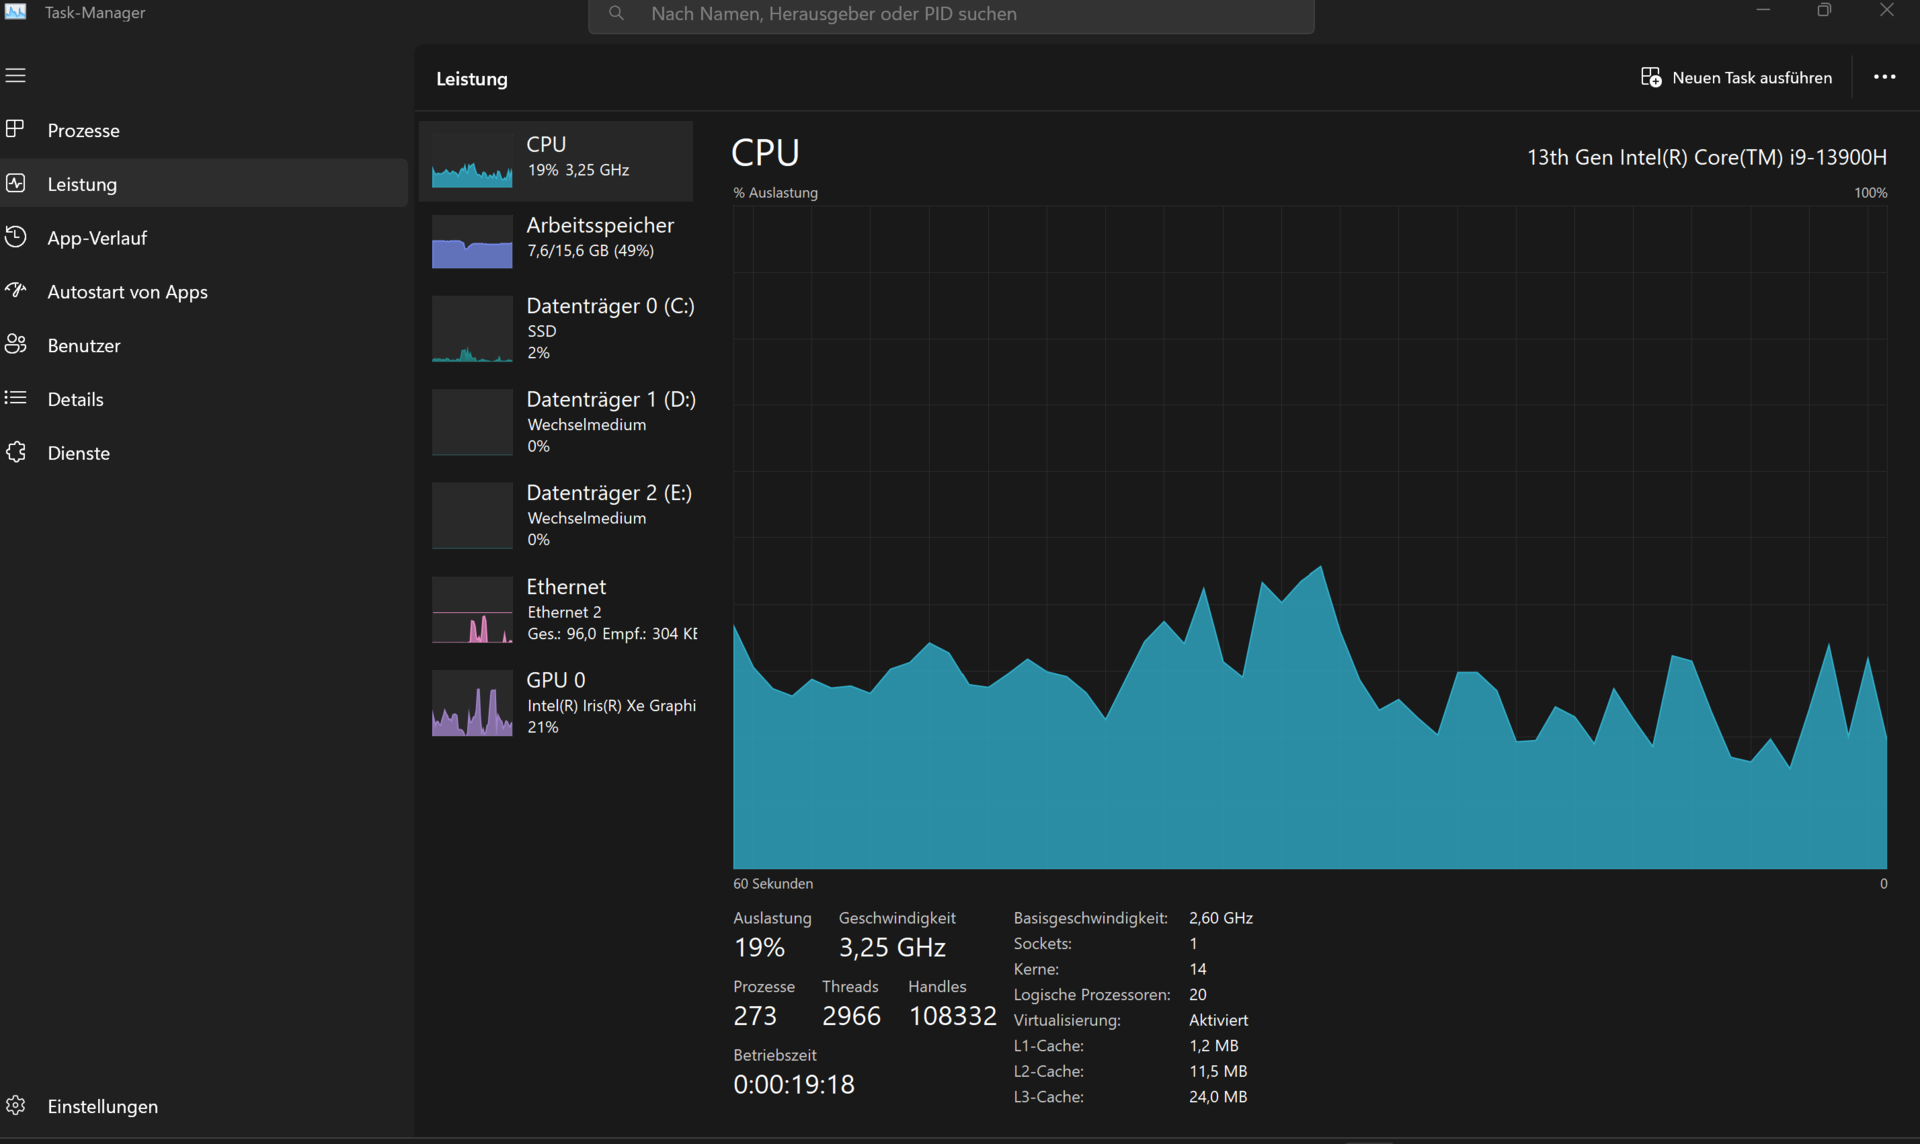
Asus instaluje procesor Intel CoreIntel Core i9-13900Hw nowym ZenBooku 14X, który, z wyjątkiem Asus ROG Flow Z13jest spotykany tylko w większych notebookach. Nasz model testowy to wariant bez dedykowanej karty graficznej. Stąd też zastosowano tu wyłącznie wewnętrzną grafikę Intel Iris X. Pozostałe wyposażenie obejmuje 16 GB pamięci RAM LPDDR5 (na pokładzie) i dysk twardy M.2 NVME PCIe o pojemności 1 TB.
Warunki testowania
Za pośrednictwem aplikacji MyAsus można wybrać trzy różne profile wydajności dla ZenBook 14X: Silent, Standard i Performance. Ten ostatni może być używany tylko z podłączonym zasilaczem. Benchmarki zostały uruchomione w trybie Performance , podczas gdy testy wytrzymałości baterii zostały przeprowadzone w trybie Silent . Tryb Performance został wykorzystany do testu maksymalnego zużycia energii, a emisja hałasu została sprawdzona dla wszystkich trzech trybów.
| Tryb wydajności | Tryb standardowy | Tryb cichy | |
|---|---|---|---|
| CPU PL1 (HWInfo) | 80 watów | 80 watów | 40 watów |
| CPU PL2 (HWInfo) | 80 watów | 80 watów | 80 watów |
Procesor
Intel Core i9-13900H to wysokiej klasy mobilny procesor z serii Raptor Lake H. Procesor łączy w sobie 6 wydajnych rdzeni z 8 wydajnymi rdzeniami. Ponieważ rdzenie P obsługują hiperwątkowość, procesor ma 20 wątków. Podczas gdy taktowanie rdzeni P wynosi od 2,6 do 5,4 GHz, taktowanie rdzeni E wynosi od 1,9 do 4,1 GHz
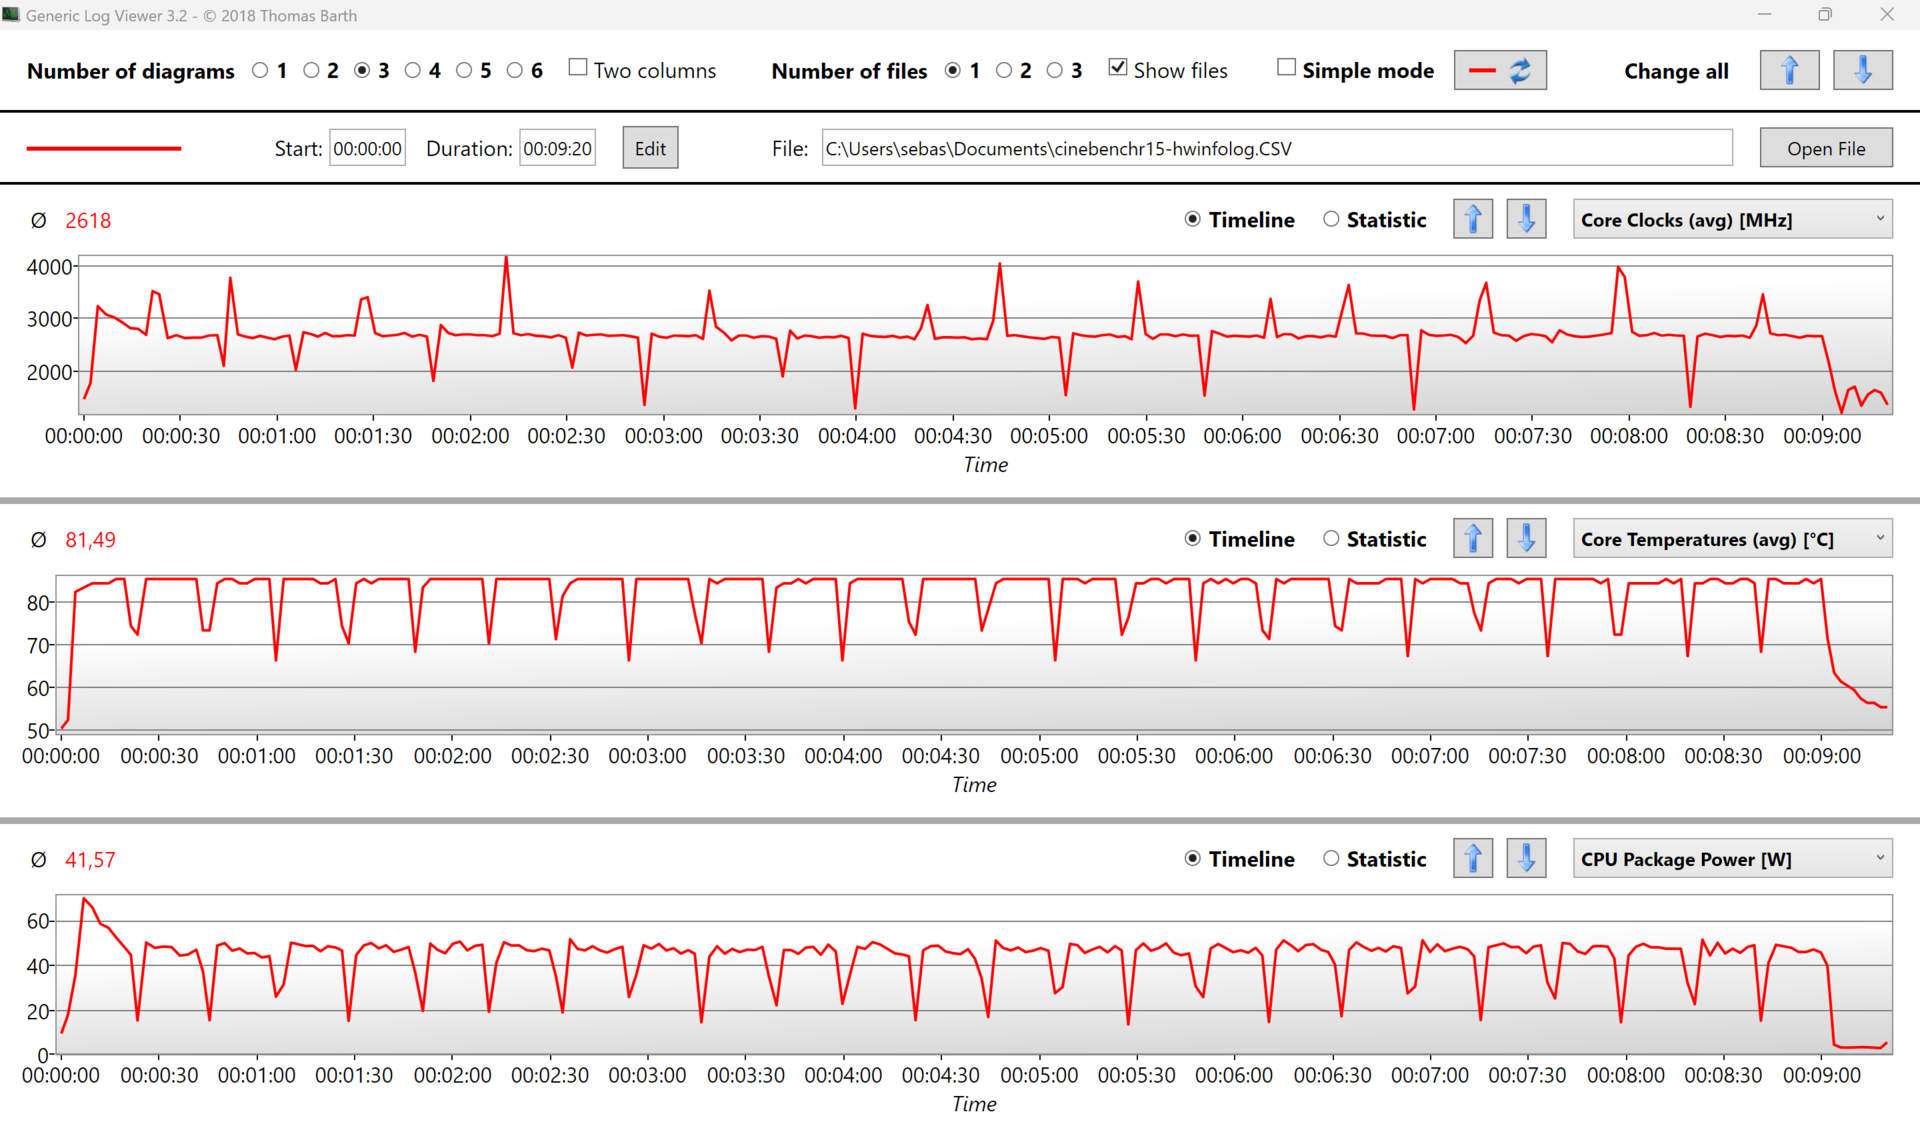
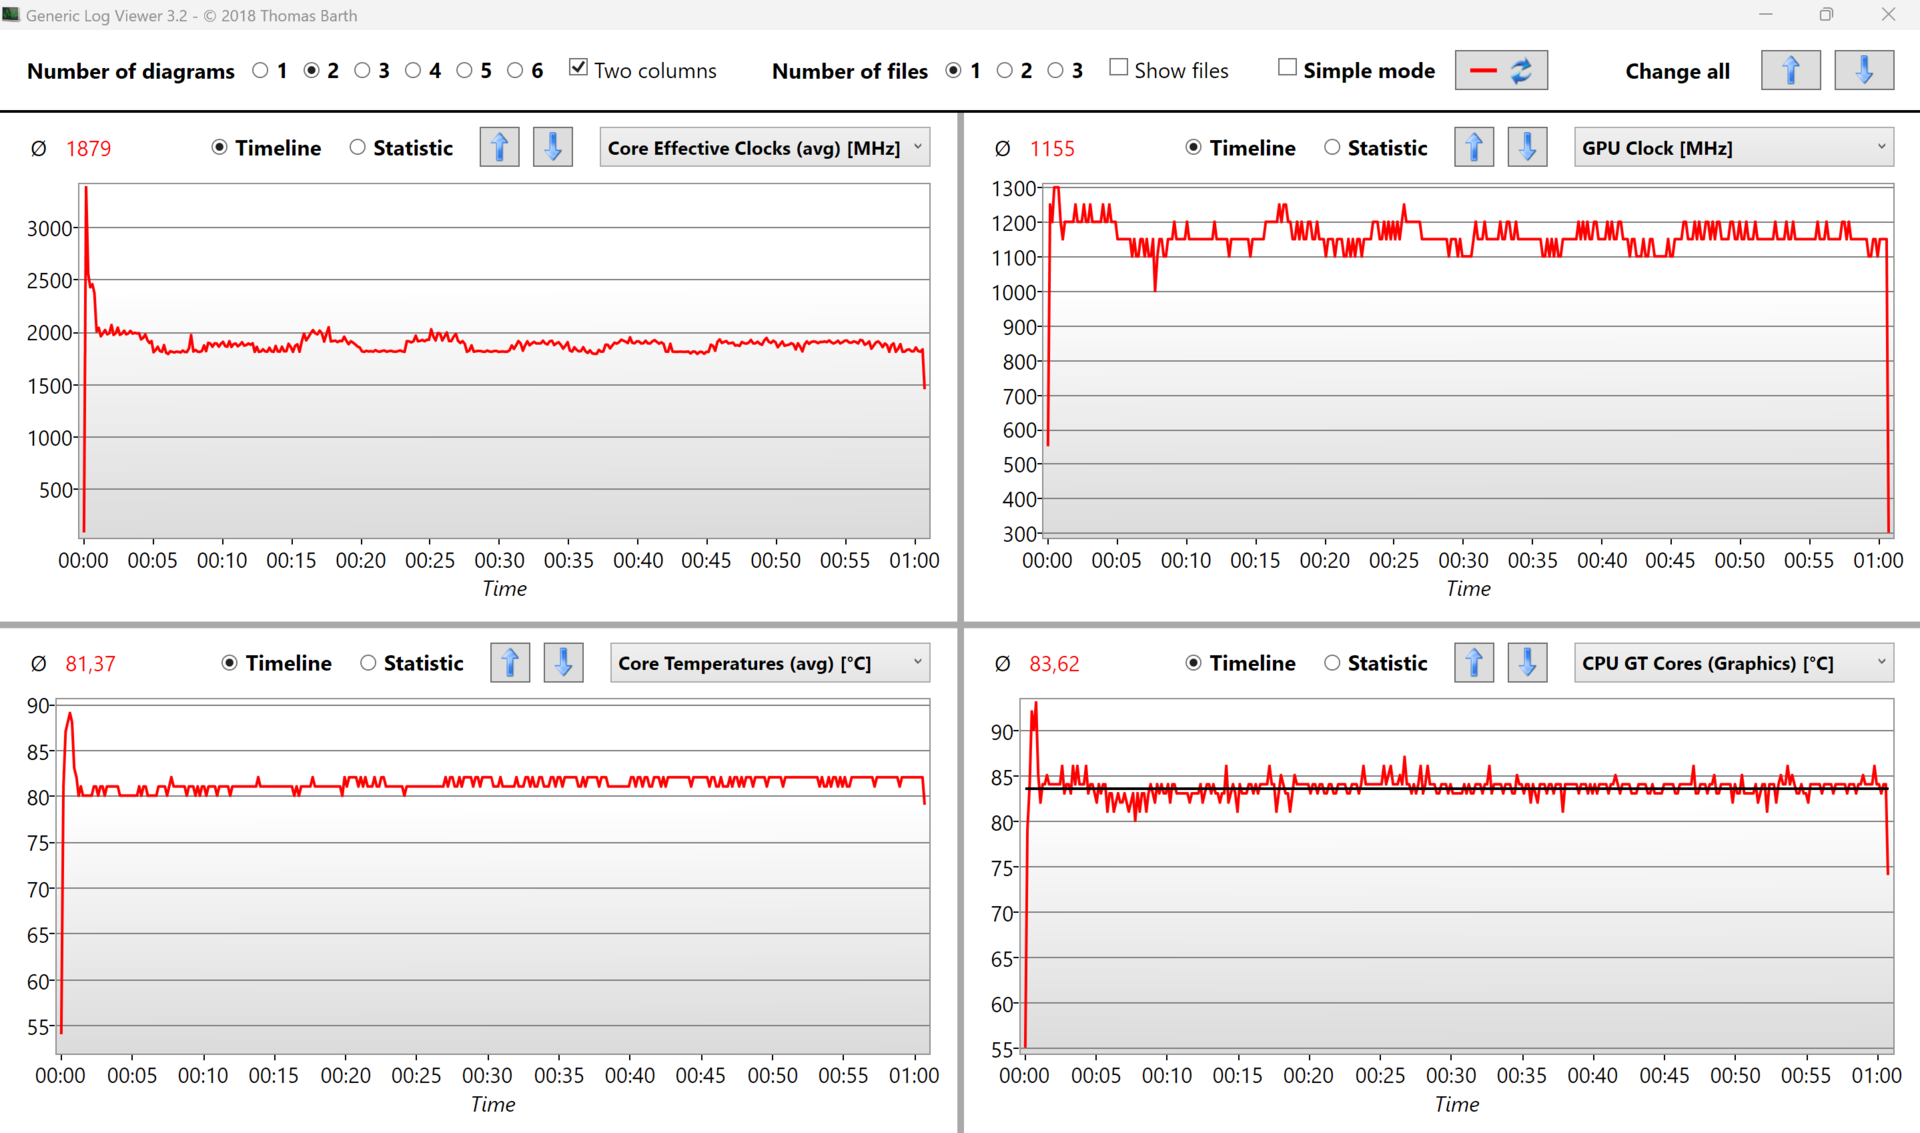
W pętli Cinebench można zaobserwować gwałtowny spadek wyniku po pierwszym uruchomieniu, który następnie na krótko stabilizuje się między 2250 a 2300 punktami, ale spada ponownie po piątym uruchomieniu, a następnie osiada na poziomie około 2150 punktów. Jak na niewielką obudowę ZenBooka, byłby to nadal dobry wynik, gdyby nie Asus ROG Flow Z13, który z tym samym procesorem radzi sobie lepiej jako tablet. Ponieważ procesor szybko osiąga 99°C pod obciążeniem, można założyć, że rozwiązanie z jednym wentylatorem ogranicza tutaj wydajność.
Procesor może zużywać prawie 80 watów przez krótki czas, ale po pierwszym uruchomieniu wynosi średnio około 40 watów. Po około 10 minutach zużycie spada jednak do około 20 watów. W rezultacie średnia wynosi 36 watów przy stałym obciążeniu. Pętla Cinebench pokazuje, że procesor Intela jest również w stanie utrzymać wysoką wydajność przy stałym obciążeniu.
Cinebench R15 Multi Sustained Load
Cinebench R23: Multi Core | Single Core
Cinebench R20: CPU (Multi Core) | CPU (Single Core)
Cinebench R15: CPU Multi 64Bit | CPU Single 64Bit
Blender: v2.79 BMW27 CPU
7-Zip 18.03: 7z b 4 | 7z b 4 -mmt1
Geekbench 5.5: Multi-Core | Single-Core
HWBOT x265 Benchmark v2.2: 4k Preset
LibreOffice : 20 Documents To PDF
R Benchmark 2.5: Overall mean
| CPU Performance rating | |
| Asus ROG Flow Z13 GZ301V | |
| Przeciętny Intel Core i9-13900H | |
| Asus ZenBook 14X UX3404VC | |
| Dell Inspiron 14 Plus 7420 | |
| Dell XPS 13 Plus 9320 i7-1280P OLED | |
| Średnia w klasie Subnotebook | |
| Lenovo Slim Pro 7 14ARP8 | |
| Apple MacBook Pro 13 2022 M2 -5! | |
| LG Gram 14Z90Q | |
| Cinebench R23 / Multi Core | |
| Asus ROG Flow Z13 GZ301V | |
| Przeciętny Intel Core i9-13900H (11997 - 20385, n=28) | |
| Asus ZenBook 14X UX3404VC | |
| Dell Inspiron 14 Plus 7420 | |
| Lenovo Slim Pro 7 14ARP8 | |
| Średnia w klasie Subnotebook (1555 - 21812, n=59, ostatnie 2 lata) | |
| Dell XPS 13 Plus 9320 i7-1280P OLED | |
| Apple MacBook Pro 13 2022 M2 | |
| LG Gram 14Z90Q | |
| Cinebench R23 / Single Core | |
| Asus ROG Flow Z13 GZ301V | |
| Asus ZenBook 14X UX3404VC | |
| Przeciętny Intel Core i9-13900H (1297 - 2054, n=26) | |
| Dell Inspiron 14 Plus 7420 | |
| Średnia w klasie Subnotebook (358 - 2213, n=60, ostatnie 2 lata) | |
| Dell XPS 13 Plus 9320 i7-1280P OLED | |
| Apple MacBook Pro 13 2022 M2 | |
| Lenovo Slim Pro 7 14ARP8 | |
| LG Gram 14Z90Q | |
| Cinebench R20 / CPU (Multi Core) | |
| Asus ROG Flow Z13 GZ301V | |
| Przeciętny Intel Core i9-13900H (4935 - 7716, n=25) | |
| Asus ZenBook 14X UX3404VC | |
| Dell Inspiron 14 Plus 7420 | |
| Lenovo Slim Pro 7 14ARP8 | |
| Średnia w klasie Subnotebook (579 - 8541, n=56, ostatnie 2 lata) | |
| Dell XPS 13 Plus 9320 i7-1280P OLED | |
| Apple MacBook Pro 13 2022 M2 | |
| LG Gram 14Z90Q | |
| Cinebench R20 / CPU (Single Core) | |
| Asus ROG Flow Z13 GZ301V | |
| Asus ZenBook 14X UX3404VC | |
| Przeciętny Intel Core i9-13900H (428 - 792, n=25) | |
| Dell Inspiron 14 Plus 7420 | |
| Średnia w klasie Subnotebook (128 - 832, n=56, ostatnie 2 lata) | |
| Dell XPS 13 Plus 9320 i7-1280P OLED | |
| Lenovo Slim Pro 7 14ARP8 | |
| LG Gram 14Z90Q | |
| Apple MacBook Pro 13 2022 M2 | |
| Cinebench R15 / CPU Multi 64Bit | |
| Asus ROG Flow Z13 GZ301V | |
| Przeciętny Intel Core i9-13900H (2061 - 3100, n=26) | |
| Asus ZenBook 14X UX3404VC | |
| Dell Inspiron 14 Plus 7420 | |
| Lenovo Slim Pro 7 14ARP8 | |
| Średnia w klasie Subnotebook (327 - 3345, n=56, ostatnie 2 lata) | |
| Dell XPS 13 Plus 9320 i7-1280P OLED | |
| Apple MacBook Pro 13 2022 M2 | |
| LG Gram 14Z90Q | |
| Cinebench R15 / CPU Single 64Bit | |
| Asus ROG Flow Z13 GZ301V | |
| Przeciętny Intel Core i9-13900H (211 - 297, n=26) | |
| Asus ZenBook 14X UX3404VC | |
| Średnia w klasie Subnotebook (72.4 - 322, n=56, ostatnie 2 lata) | |
| Dell Inspiron 14 Plus 7420 | |
| Dell XPS 13 Plus 9320 i7-1280P OLED | |
| Apple MacBook Pro 13 2022 M2 | |
| Lenovo Slim Pro 7 14ARP8 | |
| LG Gram 14Z90Q | |
| Blender / v2.79 BMW27 CPU | |
| Apple MacBook Pro 13 2022 M2 | |
| LG Gram 14Z90Q | |
| Średnia w klasie Subnotebook (159 - 2271, n=57, ostatnie 2 lata) | |
| Dell XPS 13 Plus 9320 i7-1280P OLED | |
| Dell Inspiron 14 Plus 7420 | |
| Lenovo Slim Pro 7 14ARP8 | |
| Asus ZenBook 14X UX3404VC | |
| Przeciętny Intel Core i9-13900H (166 - 268, n=24) | |
| Asus ROG Flow Z13 GZ301V | |
| 7-Zip 18.03 / 7z b 4 | |
| Asus ROG Flow Z13 GZ301V | |
| Przeciętny Intel Core i9-13900H (45045 - 79032, n=25) | |
| Asus ZenBook 14X UX3404VC | |
| Dell Inspiron 14 Plus 7420 | |
| Lenovo Slim Pro 7 14ARP8 | |
| Dell XPS 13 Plus 9320 i7-1280P OLED | |
| Średnia w klasie Subnotebook (11668 - 77867, n=56, ostatnie 2 lata) | |
| LG Gram 14Z90Q | |
| 7-Zip 18.03 / 7z b 4 -mmt1 | |
| Asus ROG Flow Z13 GZ301V | |
| Asus ZenBook 14X UX3404VC | |
| Przeciętny Intel Core i9-13900H (3665 - 6600, n=25) | |
| Dell Inspiron 14 Plus 7420 | |
| Średnia w klasie Subnotebook (2643 - 6699, n=58, ostatnie 2 lata) | |
| Dell XPS 13 Plus 9320 i7-1280P OLED | |
| Lenovo Slim Pro 7 14ARP8 | |
| LG Gram 14Z90Q | |
| Geekbench 5.5 / Multi-Core | |
| Asus ROG Flow Z13 GZ301V | |
| Przeciętny Intel Core i9-13900H (9094 - 15410, n=26) | |
| Asus ZenBook 14X UX3404VC | |
| Dell Inspiron 14 Plus 7420 | |
| Dell XPS 13 Plus 9320 i7-1280P OLED | |
| Średnia w klasie Subnotebook (2557 - 17218, n=47, ostatnie 2 lata) | |
| Lenovo Slim Pro 7 14ARP8 | |
| Apple MacBook Pro 13 2022 M2 | |
| LG Gram 14Z90Q | |
| Geekbench 5.5 / Single-Core | |
| Asus ROG Flow Z13 GZ301V | |
| Asus ZenBook 14X UX3404VC | |
| Apple MacBook Pro 13 2022 M2 | |
| Średnia w klasie Subnotebook (726 - 2224, n=47, ostatnie 2 lata) | |
| Przeciętny Intel Core i9-13900H (1140 - 2043, n=26) | |
| Dell XPS 13 Plus 9320 i7-1280P OLED | |
| Dell Inspiron 14 Plus 7420 | |
| LG Gram 14Z90Q | |
| Lenovo Slim Pro 7 14ARP8 | |
| HWBOT x265 Benchmark v2.2 / 4k Preset | |
| Asus ROG Flow Z13 GZ301V | |
| Przeciętny Intel Core i9-13900H (14.1 - 22.3, n=25) | |
| Asus ZenBook 14X UX3404VC | |
| Lenovo Slim Pro 7 14ARP8 | |
| Dell Inspiron 14 Plus 7420 | |
| Dell XPS 13 Plus 9320 i7-1280P OLED | |
| Średnia w klasie Subnotebook (0.97 - 25.1, n=56, ostatnie 2 lata) | |
| LG Gram 14Z90Q | |
| LibreOffice / 20 Documents To PDF | |
| Lenovo Slim Pro 7 14ARP8 | |
| Średnia w klasie Subnotebook (39.9 - 220, n=55, ostatnie 2 lata) | |
| LG Gram 14Z90Q | |
| Dell XPS 13 Plus 9320 i7-1280P OLED | |
| Dell Inspiron 14 Plus 7420 | |
| Asus ZenBook 14X UX3404VC | |
| Przeciętny Intel Core i9-13900H (34.4 - 82.8, n=25) | |
| Asus ROG Flow Z13 GZ301V | |
| R Benchmark 2.5 / Overall mean | |
| Lenovo Slim Pro 7 14ARP8 | |
| LG Gram 14Z90Q | |
| Średnia w klasie Subnotebook (0.4024 - 1.456, n=57, ostatnie 2 lata) | |
| Dell XPS 13 Plus 9320 i7-1280P OLED | |
| Dell Inspiron 14 Plus 7420 | |
| Przeciętny Intel Core i9-13900H (0.4052 - 0.723, n=25) | |
| Asus ZenBook 14X UX3404VC | |
| Asus ROG Flow Z13 GZ301V | |
* ... im mniej tym lepiej
AIDA64: FP32 Ray-Trace | FPU Julia | CPU SHA3 | CPU Queen | FPU SinJulia | FPU Mandel | CPU AES | CPU ZLib | FP64 Ray-Trace | CPU PhotoWorxx
| Performance rating | |
| Asus ROG Flow Z13 GZ301V | |
| Przeciętny Intel Core i9-13900H | |
| Lenovo Slim Pro 7 14ARP8 | |
| Asus ZenBook 14X UX3404VC | |
| Dell Inspiron 14 Plus 7420 | |
| Średnia w klasie Subnotebook | |
| Dell XPS 13 Plus 9320 i7-1280P OLED | |
| LG Gram 14Z90Q | |
| AIDA64 / FP32 Ray-Trace | |
| Asus ROG Flow Z13 GZ301V | |
| Lenovo Slim Pro 7 14ARP8 | |
| Przeciętny Intel Core i9-13900H (6788 - 19557, n=25) | |
| Asus ZenBook 14X UX3404VC | |
| Średnia w klasie Subnotebook (1135 - 32888, n=57, ostatnie 2 lata) | |
| Dell Inspiron 14 Plus 7420 | |
| Dell XPS 13 Plus 9320 i7-1280P OLED | |
| LG Gram 14Z90Q | |
| AIDA64 / FPU Julia | |
| Lenovo Slim Pro 7 14ARP8 | |
| Asus ROG Flow Z13 GZ301V | |
| Przeciętny Intel Core i9-13900H (22551 - 95579, n=25) | |
| Asus ZenBook 14X UX3404VC | |
| Średnia w klasie Subnotebook (5218 - 123315, n=57, ostatnie 2 lata) | |
| Dell Inspiron 14 Plus 7420 | |
| Dell XPS 13 Plus 9320 i7-1280P OLED | |
| LG Gram 14Z90Q | |
| AIDA64 / CPU SHA3 | |
| Przeciętny Intel Core i9-13900H (2491 - 4270, n=25) | |
| Asus ROG Flow Z13 GZ301V | |
| Asus ZenBook 14X UX3404VC | |
| Lenovo Slim Pro 7 14ARP8 | |
| Średnia w klasie Subnotebook (444 - 5287, n=57, ostatnie 2 lata) | |
| Dell Inspiron 14 Plus 7420 | |
| Dell XPS 13 Plus 9320 i7-1280P OLED | |
| LG Gram 14Z90Q | |
| AIDA64 / CPU Queen | |
| Asus ROG Flow Z13 GZ301V | |
| Asus ZenBook 14X UX3404VC | |
| Przeciętny Intel Core i9-13900H (65121 - 120936, n=25) | |
| Dell Inspiron 14 Plus 7420 | |
| Dell XPS 13 Plus 9320 i7-1280P OLED | |
| Lenovo Slim Pro 7 14ARP8 | |
| LG Gram 14Z90Q | |
| Średnia w klasie Subnotebook (10579 - 95002, n=49, ostatnie 2 lata) | |
| AIDA64 / FPU SinJulia | |
| Lenovo Slim Pro 7 14ARP8 | |
| Asus ROG Flow Z13 GZ301V | |
| Przeciętny Intel Core i9-13900H (6108 - 11631, n=25) | |
| Asus ZenBook 14X UX3404VC | |
| Dell Inspiron 14 Plus 7420 | |
| Dell XPS 13 Plus 9320 i7-1280P OLED | |
| Średnia w klasie Subnotebook (744 - 18418, n=57, ostatnie 2 lata) | |
| LG Gram 14Z90Q | |
| AIDA64 / FPU Mandel | |
| Lenovo Slim Pro 7 14ARP8 | |
| Asus ROG Flow Z13 GZ301V | |
| Przeciętny Intel Core i9-13900H (11283 - 48474, n=25) | |
| Asus ZenBook 14X UX3404VC | |
| Średnia w klasie Subnotebook (3341 - 65433, n=57, ostatnie 2 lata) | |
| Dell Inspiron 14 Plus 7420 | |
| Dell XPS 13 Plus 9320 i7-1280P OLED | |
| LG Gram 14Z90Q | |
| AIDA64 / CPU AES | |
| Przeciętny Intel Core i9-13900H (3691 - 149377, n=25) | |
| Asus ROG Flow Z13 GZ301V | |
| Asus ZenBook 14X UX3404VC | |
| Dell Inspiron 14 Plus 7420 | |
| Dell XPS 13 Plus 9320 i7-1280P OLED | |
| Średnia w klasie Subnotebook (638 - 96917, n=57, ostatnie 2 lata) | |
| Lenovo Slim Pro 7 14ARP8 | |
| LG Gram 14Z90Q | |
| AIDA64 / CPU ZLib | |
| Asus ROG Flow Z13 GZ301V | |
| Przeciętny Intel Core i9-13900H (789 - 1254, n=25) | |
| Asus ZenBook 14X UX3404VC | |
| Dell Inspiron 14 Plus 7420 | |
| Lenovo Slim Pro 7 14ARP8 | |
| Średnia w klasie Subnotebook (164.9 - 1379, n=57, ostatnie 2 lata) | |
| Dell XPS 13 Plus 9320 i7-1280P OLED | |
| LG Gram 14Z90Q | |
| AIDA64 / FP64 Ray-Trace | |
| Asus ROG Flow Z13 GZ301V | |
| Przeciętny Intel Core i9-13900H (3655 - 10716, n=25) | |
| Lenovo Slim Pro 7 14ARP8 | |
| Asus ZenBook 14X UX3404VC | |
| Średnia w klasie Subnotebook (610 - 17495, n=57, ostatnie 2 lata) | |
| Dell Inspiron 14 Plus 7420 | |
| Dell XPS 13 Plus 9320 i7-1280P OLED | |
| LG Gram 14Z90Q | |
| AIDA64 / CPU PhotoWorxx | |
| Dell XPS 13 Plus 9320 i7-1280P OLED | |
| Średnia w klasie Subnotebook (6569 - 85600, n=57, ostatnie 2 lata) | |
| Asus ROG Flow Z13 GZ301V | |
| Asus ZenBook 14X UX3404VC | |
| Przeciętny Intel Core i9-13900H (10871 - 50488, n=25) | |
| Dell Inspiron 14 Plus 7420 | |
| Lenovo Slim Pro 7 14ARP8 | |
| LG Gram 14Z90Q | |
Wydajność systemu
Nasze subiektywne wrażenia z wydajności ZenBook 14X są bardzo dobre i nie zarejestrowaliśmy żadnych ograniczeń ani zauważalnych opóźnień w naszych testach. Wyniki w syntetycznych benchmarkach mieszczą się w średnim zakresie, ale w porównaniu do zeszłorocznego wariantu ZenBooka z AMD, tutaj osiągnięto znacznie lepszy wynik.
CrossMark: Overall | Productivity | Creativity | Responsiveness
| PCMark 10 / Score | |
| Asus ROG Flow Z13 GZ301V | |
| Średnia w klasie Subnotebook (4920 - 9939, n=44, ostatnie 2 lata) | |
| Dell Inspiron 14 Plus 7420 | |
| Lenovo Slim Pro 7 14ARP8 | |
| Asus ZenBook 14X UX3404VC | |
| Przeciętny Intel Core i9-13900H, Intel Iris Xe Graphics G7 96EUs (5944 - 6802, n=8) | |
| Dell XPS 13 Plus 9320 i7-1280P OLED | |
| LG Gram 14Z90Q | |
| PCMark 10 / Essentials | |
| Asus ROG Flow Z13 GZ301V | |
| Przeciętny Intel Core i9-13900H, Intel Iris Xe Graphics G7 96EUs (10347 - 12286, n=8) | |
| Asus ZenBook 14X UX3404VC | |
| Dell XPS 13 Plus 9320 i7-1280P OLED | |
| Średnia w klasie Subnotebook (8552 - 11646, n=44, ostatnie 2 lata) | |
| Dell Inspiron 14 Plus 7420 | |
| Lenovo Slim Pro 7 14ARP8 | |
| LG Gram 14Z90Q | |
| PCMark 10 / Productivity | |
| Asus ROG Flow Z13 GZ301V | |
| Średnia w klasie Subnotebook (5435 - 16606, n=44, ostatnie 2 lata) | |
| Dell Inspiron 14 Plus 7420 | |
| Lenovo Slim Pro 7 14ARP8 | |
| Asus ZenBook 14X UX3404VC | |
| Przeciętny Intel Core i9-13900H, Intel Iris Xe Graphics G7 96EUs (7319 - 8526, n=8) | |
| Dell XPS 13 Plus 9320 i7-1280P OLED | |
| LG Gram 14Z90Q | |
| PCMark 10 / Digital Content Creation | |
| Asus ROG Flow Z13 GZ301V | |
| Średnia w klasie Subnotebook (5722 - 13779, n=44, ostatnie 2 lata) | |
| Lenovo Slim Pro 7 14ARP8 | |
| Dell Inspiron 14 Plus 7420 | |
| Przeciętny Intel Core i9-13900H, Intel Iris Xe Graphics G7 96EUs (7527 - 8155, n=8) | |
| Asus ZenBook 14X UX3404VC | |
| Dell XPS 13 Plus 9320 i7-1280P OLED | |
| LG Gram 14Z90Q | |
| CrossMark / Overall | |
| Asus ROG Flow Z13 GZ301V | |
| Przeciętny Intel Core i9-13900H, Intel Iris Xe Graphics G7 96EUs (1766 - 2146, n=7) | |
| Asus ZenBook 14X UX3404VC | |
| Dell XPS 13 Plus 9320 i7-1280P OLED | |
| Dell Inspiron 14 Plus 7420 | |
| Średnia w klasie Subnotebook (365 - 2356, n=59, ostatnie 2 lata) | |
| Apple MacBook Pro 13 2022 M2 | |
| Lenovo Slim Pro 7 14ARP8 | |
| CrossMark / Productivity | |
| Asus ROG Flow Z13 GZ301V | |
| Przeciętny Intel Core i9-13900H, Intel Iris Xe Graphics G7 96EUs (1684 - 2064, n=7) | |
| Asus ZenBook 14X UX3404VC | |
| Dell XPS 13 Plus 9320 i7-1280P OLED | |
| Dell Inspiron 14 Plus 7420 | |
| Średnia w klasie Subnotebook (364 - 2277, n=59, ostatnie 2 lata) | |
| Apple MacBook Pro 13 2022 M2 | |
| Lenovo Slim Pro 7 14ARP8 | |
| CrossMark / Creativity | |
| Asus ROG Flow Z13 GZ301V | |
| Asus ZenBook 14X UX3404VC | |
| Przeciętny Intel Core i9-13900H, Intel Iris Xe Graphics G7 96EUs (1789 - 2224, n=7) | |
| Dell XPS 13 Plus 9320 i7-1280P OLED | |
| Dell Inspiron 14 Plus 7420 | |
| Średnia w klasie Subnotebook (372 - 2743, n=59, ostatnie 2 lata) | |
| Apple MacBook Pro 13 2022 M2 | |
| Lenovo Slim Pro 7 14ARP8 | |
| CrossMark / Responsiveness | |
| Przeciętny Intel Core i9-13900H, Intel Iris Xe Graphics G7 96EUs (1474 - 2171, n=7) | |
| Asus ROG Flow Z13 GZ301V | |
| Asus ZenBook 14X UX3404VC | |
| Dell XPS 13 Plus 9320 i7-1280P OLED | |
| Dell Inspiron 14 Plus 7420 | |
| Średnia w klasie Subnotebook (312 - 1854, n=59, ostatnie 2 lata) | |
| Lenovo Slim Pro 7 14ARP8 | |
| Apple MacBook Pro 13 2022 M2 | |
| PCMark 10 Score | 6330 pkt. | |
Pomoc | ||
| AIDA64 / Memory Copy | |
| Średnia w klasie Subnotebook (14554 - 131023, n=57, ostatnie 2 lata) | |
| Asus ZenBook 14X UX3404VC | |
| Przeciętny Intel Core i9-13900H (37448 - 74486, n=25) | |
| AIDA64 / Memory Read | |
| Średnia w klasie Subnotebook (15948 - 127174, n=57, ostatnie 2 lata) | |
| Przeciętny Intel Core i9-13900H (41599 - 75433, n=25) | |
| Asus ZenBook 14X UX3404VC | |
| AIDA64 / Memory Write | |
| Średnia w klasie Subnotebook (15709 - 135141, n=57, ostatnie 2 lata) | |
| Asus ZenBook 14X UX3404VC | |
| Przeciętny Intel Core i9-13900H (36152 - 88505, n=25) | |
| AIDA64 / Memory Latency | |
| Średnia w klasie Subnotebook (6.1 - 159.9, n=55, ostatnie 2 lata) | |
| Asus ZenBook 14X UX3404VC | |
| Przeciętny Intel Core i9-13900H (75.8 - 102.3, n=25) | |
* ... im mniej tym lepiej
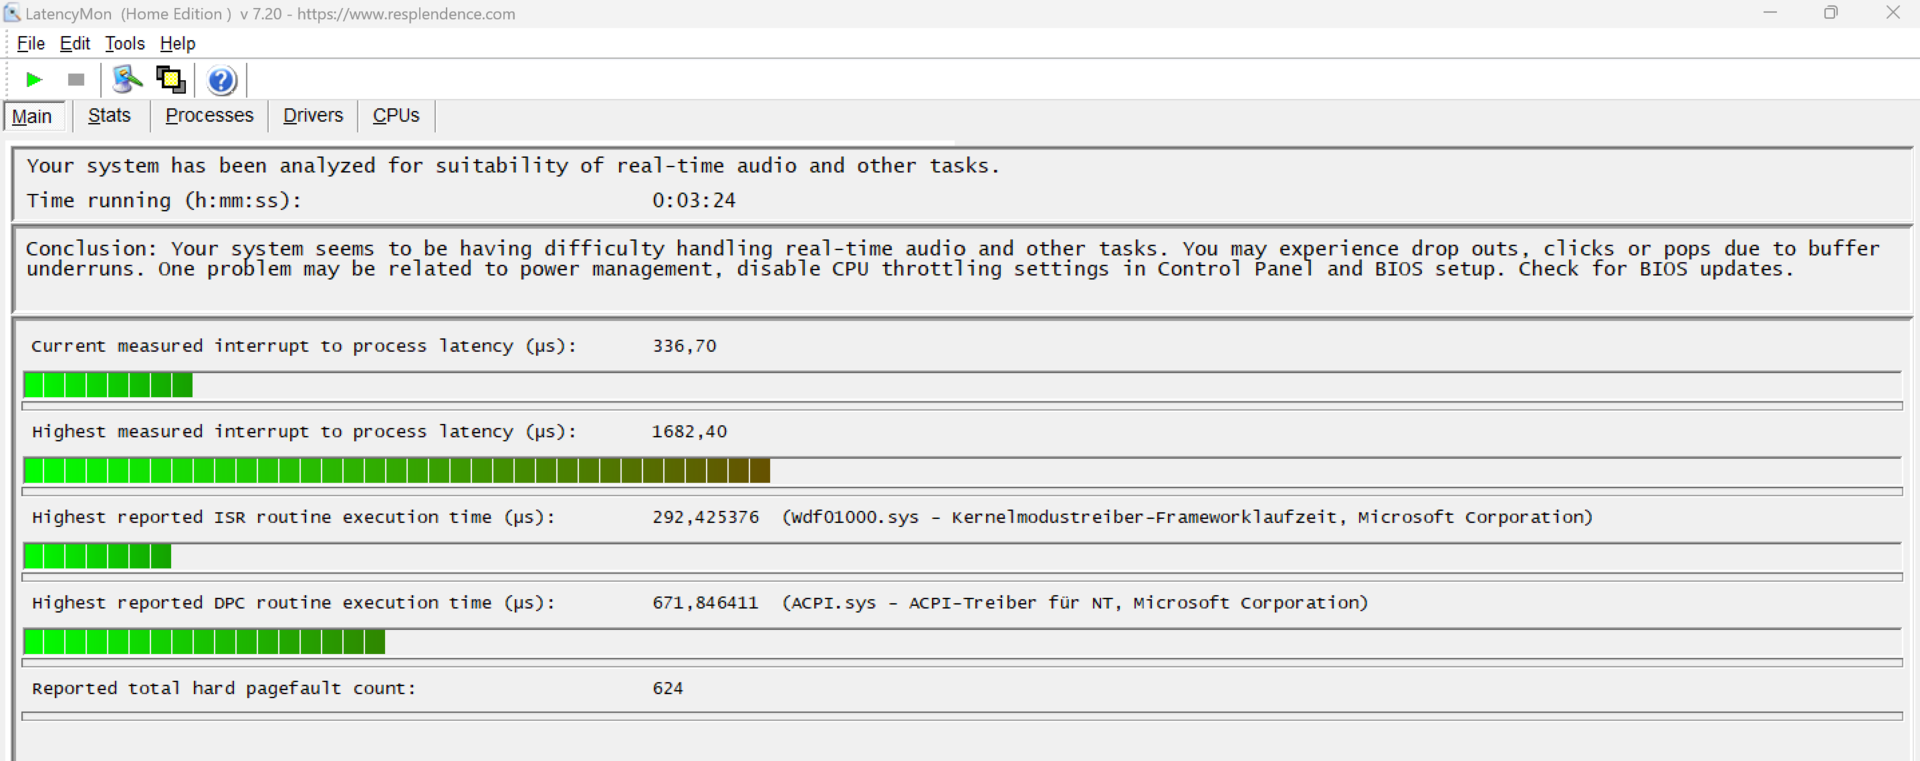
Opóźnienie DPC
Nasz standardowy test opóźnień (przeglądanie stron internetowych, odtwarzanie YouTube 4K, obciążenie procesora) ujawnił anomalie. Dlatego też system nie nadaje się do edycji wideo i audio w czasie rzeczywistym bez ograniczeń. Może się to zmienić wraz z nadchodzącymi wersjami BIOS-u i sterowników urządzeń.
| DPC Latencies / LatencyMon - interrupt to process latency (max), Web, Youtube, Prime95 | |
| Asus ROG Flow Z13 GZ301V | |
| Asus ZenBook 14X UX3404VC | |
| Lenovo Slim Pro 7 14ARP8 | |
| LG Gram 14Z90Q | |
| Dell Inspiron 14 Plus 7420 | |
| Dell XPS 13 Plus 9320 i7-1280P OLED | |
* ... im mniej tym lepiej
Urządzenia pamięci masowej
Asus instaluje w ZenBook 14X dysk SSD Micron 2450 PCIe 4.0 o pojemności 1 TB. 862 GB z tego jest dostępne przy pierwszym włączeniu. Dysk SSD wypada dobrze w porównaniu do średniej dla subnotebooków, ale nasza tabela benchmarków pokazuje wyraźne wady w porównaniu do porównywalnych urządzeń.

* ... im mniej tym lepiej
Sustained Read Performance: DiskSpd Read Loop, Queue Depth 8
Karta graficzna
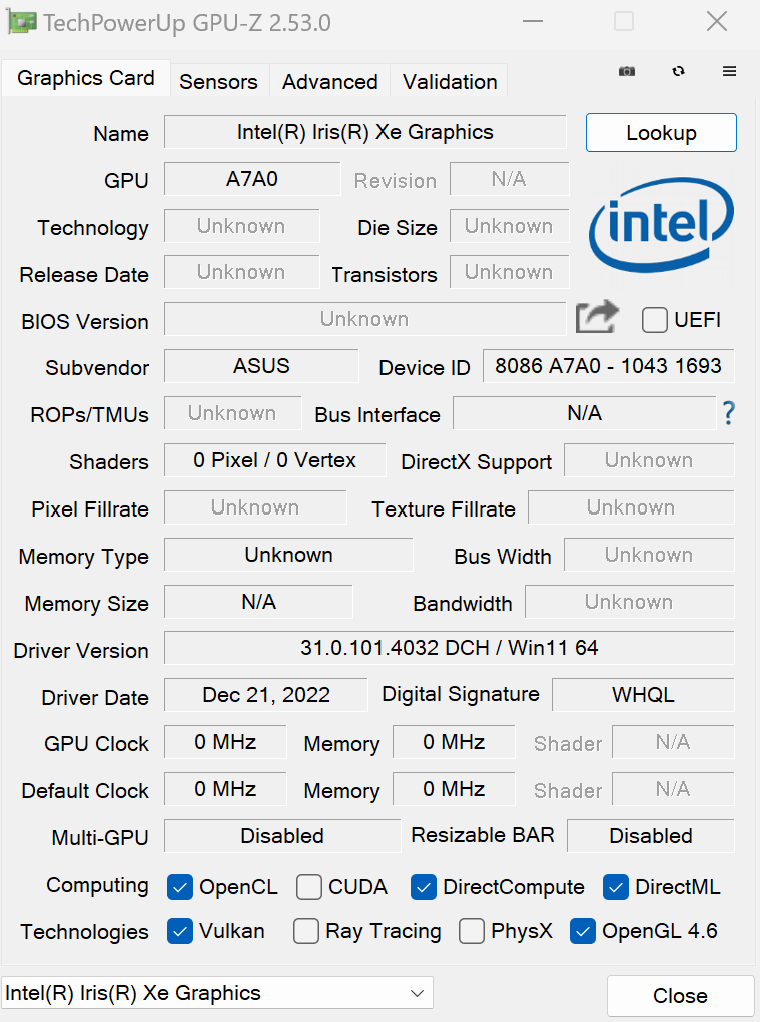
Asus ZenBook 14X wykorzystuje dobrze znaną zintegrowaną grafikę Iris XE Graphics G7 od Intela w szybszej wersji z 96 EU i maksymalnym taktowaniem 1300 MHz. IGPU z łatwością wystarcza do codziennych zadań, ale w przypadku bardziej wymagających usług, takich jak gry, trzeba pójść na wyraźne kompromisy. Poprzednik oparty na AMD radzi sobie tutaj lepiej dzięki Radeon RX Vega 8.
Warto jednak zauważyć, że iGPU w nowym Asusie ZenBook 14X wypada o solidne 14% lepiej niż przeciętny Intel Iris Xe Graphics G7.
| 3DMark Cloud Gate Standard Score | 22427 pkt. | |
| 3DMark Fire Strike Score | 5160 pkt. | |
Pomoc | ||
| Blender - v3.3 Classroom CPU | |
| Przeciętny Intel Iris Xe Graphics G7 96EUs (336 - 1259, n=109) | |
| Średnia w klasie Subnotebook (241 - 861, n=59, ostatnie 2 lata) | |
| Asus ZenBook 14X UX3404VC | |
* ... im mniej tym lepiej
Wydajność w grach
Jak wspomniano wcześniej, wydajność iGPU Intela w grach pozostaje mierna. AMD wyraźnie ma tutaj przewagę dziękiRadeon 680M i 780Mstarsze gry są grywalne w niższych rozdzielczościach i obniżonych ustawieniach graficznych, ale potencjał wyświetlacza 120 Hz w Asus ZenBook 14X w żadnym wypadku nie jest tutaj wyczerpany. Jeśli zależy nam na większej wydajności, możemy wyposażyć ZenBooka w dedykowaną kartę graficzną Nvidia GeForce RTX 3050, który sprawia, że większość gier jest grywalna, przynajmniej przy niższych ustawieniach graficznych.
| The Witcher 3 - 1920x1080 Ultra Graphics & Postprocessing (HBAO+) | |
| Asus ROG Flow Z13 GZ301V | |
| Lenovo Slim Pro 7 14ARP8 | |
| Dell Inspiron 14 Plus 7420 | |
| Średnia w klasie Subnotebook (13.9 - 34.6, n=13, ostatnie 2 lata) | |
| Asus ZenBook 14X UX3404VC | |
| Dell XPS 13 Plus 9320 i7-1280P OLED | |
| LG Gram 14Z90Q | |
| GTA V - 1920x1080 Highest AA:4xMSAA + FX AF:16x | |
| Asus ROG Flow Z13 GZ301V | |
| Lenovo Slim Pro 7 14ARP8 | |
| Dell Inspiron 14 Plus 7420 | |
| Średnia w klasie Subnotebook (10.7 - 43.7, n=55, ostatnie 2 lata) | |
| Dell XPS 13 Plus 9320 i7-1280P OLED | |
| Asus ZenBook 14X UX3404VC | |
| Final Fantasy XV Benchmark - 1920x1080 High Quality | |
| Asus ROG Flow Z13 GZ301V | |
| Lenovo Slim Pro 7 14ARP8 | |
| Dell Inspiron 14 Plus 7420 | |
| Średnia w klasie Subnotebook (11.6 - 54.5, n=53, ostatnie 2 lata) | |
| Dell XPS 13 Plus 9320 i7-1280P OLED | |
| LG Gram 14Z90Q | |
| Strange Brigade - 1920x1080 ultra AA:ultra AF:16 | |
| Asus ROG Flow Z13 GZ301V | |
| Dell Inspiron 14 Plus 7420 | |
| Średnia w klasie Subnotebook (19 - 101.3, n=49, ostatnie 2 lata) | |
| Dell XPS 13 Plus 9320 i7-1280P OLED | |
| Asus ZenBook 14X UX3404VC | |
| Asus ZenBook 14X UX3404VC | |
| Dota 2 Reborn - 1920x1080 ultra (3/3) best looking | |
| Asus ROG Flow Z13 GZ301V | |
| Dell Inspiron 14 Plus 7420 | |
| Lenovo Slim Pro 7 14ARP8 | |
| Asus ZenBook 14X UX3404VC | |
| Średnia w klasie Subnotebook (13 - 97, n=60, ostatnie 2 lata) | |
| Dell XPS 13 Plus 9320 i7-1280P OLED | |
| LG Gram 14Z90Q | |
Procesor graficzny iGPU w ZenBook 14X działa stabilnie w teście Wiedźmina. Uruchomienie Witcher 3 (w pętli) na ustawieniach Ultra i w rozdzielczości FHD dało średnio 17 kl.
Witcher 3 FPS chart
| low | med. | high | ultra | QHD | |
|---|---|---|---|---|---|
| GTA V (2015) | 116.7 | 103.9 | 25.2 | 10.6 | 6.79 |
| The Witcher 3 (2015) | 87 | 59 | 33 | 17 | |
| Dota 2 Reborn (2015) | 126.5 | 94.1 | 74.9 | 68.3 | |
| X-Plane 11.11 (2018) | 50.8 | 41.8 | 34.5 | ||
| Far Cry 5 (2018) | 55 | 30 | 28 | 26 | 17 |
| Strange Brigade (2018) | 99.7 | 42.5 | 34 | 27.2 | 19.6 |
| F1 22 (2022) | 52.8 | 48.7 | 34.1 | 26.1 | 18.7 |
Emisje
Hałas - Niepozornie cichy
Przy maksymalnym poziomie 45,5 dB(A), ZenBook 14X jest zdecydowanie jednym z cichszych subnotebooków na rynku. Wentylatory są ledwo słyszalne w codziennym użytkowaniu, a urządzenie utrzymuje się średnio poniżej 40 dB(A), nawet pod obciążeniem. Ponieważ jednak zainstalowano tylko jeden wentylator (w porównaniu do zeszłorocznego modelu), układ chłodzenia jest nieco słabszy, co ogranicza Intel Core i9-13900H. W trybie wydajności wentylator obraca się również częściej podczas normalnych zadań biurowych i nigdy nie pozostaje całkowicie cichy w trybie standardowym
Z drugiej strony, tryb cichy można aktywować, aby uzyskać niewielki spadek wydajności, w którym subnotebook jest ledwo słyszalny.
Hałas
| luz |
| 25.2 / 25.2 / 26.5 dB |
| obciążenie |
| 39.8 / 45.5 dB |
 | ||
30 dB cichy 40 dB(A) słyszalny 50 dB(A) irytujący |
||
min: | ||
| Asus ZenBook 14X UX3404VC Iris Xe G7 96EUs, i9-13900H, Micron 2450 1TB MTFDKBA1T0TFK | Apple MacBook Pro 13 2022 M2 M2 10-Core GPU, M2, Apple SSD AP1024Z | Dell XPS 13 Plus 9320 i7-1280P OLED Iris Xe G7 96EUs, i7-1280P, WDC PC SN810 512GB | Lenovo Slim Pro 7 14ARP8 GeForce RTX 3050 6GB Laptop GPU, R7 7735HS, SK hynix PC801 HFS512GEJ9X115N | LG Gram 14Z90Q Iris Xe G7 80EUs, i5-1240P, Samsung PM9A1 MZVL2512HCJQ | Dell Inspiron 14 Plus 7420 GeForce RTX 3050 4GB Laptop GPU, i7-12700H, SK Hynix BC711 512GB HFM512GD3GX013N | Asus ROG Flow Z13 GZ301V GeForce RTX 4060 Laptop GPU, i9-13900H, WD PC SN740 SDDPTQD-1T00 | |
|---|---|---|---|---|---|---|---|
| Noise | 10% | 10% | 5% | 3% | 1% | 5% | |
| wyłączone / środowisko * (dB) | 25.2 | 23.9 5% | 23.4 7% | 22.7 10% | 25 1% | 23.2 8% | 24 5% |
| Idle Minimum * (dB) | 25.2 | 23.9 5% | 23.4 7% | 22.8 10% | 26 -3% | 23.2 8% | 24 5% |
| Idle Average * (dB) | 25.2 | 23.9 5% | 23.4 7% | 22.8 10% | 27 -7% | 23.2 8% | 24 5% |
| Idle Maximum * (dB) | 26.5 | 23.9 10% | 23.4 12% | 22.8 14% | 28 -6% | 23.2 12% | 24 9% |
| Load Average * (dB) | 39.8 | 23.9 40% | 35 12% | 43.8 -10% | 35 12% | 47.5 -19% | 38.61 3% |
| Load Maximum * (dB) | 45.5 | 49 -8% | 39.9 12% | 47.1 -4% | 36 21% | 51.7 -14% | 43.59 4% |
| Witcher 3 ultra * (dB) | 34.6 | 41.6 | 43.8 | 36 | 51.7 | 41.24 |
* ... im mniej tym lepiej
Temperatura
W codziennym użytkowaniu (biuro, internet) temperatury utrzymują się w niepozornym zakresie i tylko środkowy obszar nad klawiaturą robi się nieco cieplejszy pod obciążeniem. Pojedynczy wentylator zasysa powietrze od spodu i odprowadza ciepło odpadowe po lewej stronie i z tyłu. W związku z tym podpórka pod nadgarstki zawsze pozostaje chłodna, podczas gdy klawiatura oscyluje wokół 31°C, co nie okazało się niewygodne.
(+) Maksymalna temperatura w górnej części wynosi 38.9 °C / 102 F, w porównaniu do średniej 35.9 °C / 97 F , począwszy od 21.4 do 59 °C dla klasy Subnotebook.
(±) Dno nagrzewa się maksymalnie do 43.4 °C / 110 F, w porównaniu do średniej 39.2 °C / 103 F
(+) W stanie bezczynności średnia temperatura górnej części wynosi 31.1 °C / 88 F, w porównaniu ze średnią temperaturą urządzenia wynoszącą 30.8 °C / ### class_avg_f### F.
(±) Podczas gry w Wiedźmina 3 średnia temperatura górnej części wynosi 32.7 °C / 91 F, w porównaniu do średniej temperatury urządzenia wynoszącej 30.8 °C / ## #class_avg_f### F.
(+) Podparcia dłoni i touchpad osiągają maksymalną temperaturę skóry (33.9 °C / 93 F) i dlatego nie są gorące.
(-) Średnia temperatura obszaru podparcia dłoni w podobnych urządzeniach wynosiła 28.2 °C / 82.8 F (-5.7 °C / -10.2 F).
| Asus ZenBook 14X UX3404VC Intel Core i9-13900H, Intel Iris Xe Graphics G7 96EUs | Apple MacBook Pro 13 2022 M2 Apple M2, Apple M2 10-Core GPU | Lenovo Slim Pro 7 14ARP8 AMD Ryzen 7 7735HS, NVIDIA GeForce RTX 3050 6GB Laptop GPU | LG Gram 14Z90Q Intel Core i5-1240P, Intel Iris Xe Graphics G7 80EUs | Dell Inspiron 14 Plus 7420 Intel Core i7-12700H, NVIDIA GeForce RTX 3050 4GB Laptop GPU | Asus ROG Flow Z13 GZ301V Intel Core i9-13900H, NVIDIA GeForce RTX 4060 Laptop GPU | |
|---|---|---|---|---|---|---|
| Heat | 10% | 9% | 6% | 12% | 5% | |
| Maximum Upper Side * (°C) | 38.9 | 45.1 -16% | 42.2 -8% | 43 -11% | 40 -3% | 42 -8% |
| Maximum Bottom * (°C) | 43.4 | 43 1% | 49 -13% | 45 -4% | 36.4 16% | 47 -8% |
| Idle Upper Side * (°C) | 33.5 | 25.2 25% | 24.4 27% | 27 19% | 27 19% | 27 19% |
| Idle Bottom * (°C) | 35.3 | 25.4 28% | 25.2 29% | 28 21% | 29.2 17% | 30 15% |
* ... im mniej tym lepiej
Test obciążeniowy - zbyt niska częstotliwość taktowania
Na początku testu warunków skrajnych (Prime95 i Furmark) taktowanie procesora przez chwilę wynosiło 3,5 GHz, a iGPU 1,3 GHz. Jednakże, częstotliwości taktowania spadają bezpośrednio potem, tak że CPU osiąga 1,9 GHz, a iGPU 1,2 GHz. Test warunków skrajnych reprezentuje ekstremalny scenariusz, w którym sprawdzamy, czy system może pozostać stabilny pod pełnym obciążeniem.
Głośniki
Jak na laptopa z systemem Windows, głośniki sprawują się dobrze: basy i niskie tony są nawet zauważalne. Głośniki znajdują się pod podpórką pod nadgarstki i strzelają w dół, wykorzystując powierzchnię jako reflektor. Jeśli laptop zostanie umieszczony na przykład na tkaninie lub podkładce pod mysz, jakość dźwięku znacznie się pogorszy.
Podwójny mikrofon działa dobrze i nagrywa głos bez szumów, więc jakość jest wystarczająca do połączeń wideo i konferencji. Odgłosy pisania na klawiaturze są słyszalne podczas nagrywania dźwięku, ale nie są irytujące.
Asus ZenBook 14X UX3404VC analiza dźwięku
(+) | głośniki mogą odtwarzać stosunkowo głośno (86.4 dB)
Bas 100 - 315 Hz
(-) | prawie brak basu - średnio 16.3% niższa od mediany
(-) | bas nie jest liniowy (15.8% delta do poprzedniej częstotliwości)
Średnie 400 - 2000 Hz
(+) | zbalansowane środki średnie - tylko 1.2% od mediany
(+) | średnie są liniowe (3.1% delta do poprzedniej częstotliwości)
Wysokie 2–16 kHz
(+) | zrównoważone maksima - tylko 4.1% od mediany
(+) | wzloty są liniowe (3.4% delta do poprzedniej częstotliwości)
Ogólnie 100 - 16.000 Hz
(+) | ogólny dźwięk jest liniowy (11.3% różnicy w stosunku do mediany)
W porównaniu do tej samej klasy
» 11% wszystkich testowanych urządzeń w tej klasie było lepszych, 2% podobnych, 86% gorszych
» Najlepszy miał deltę 5%, średnia wynosiła ###średnia###%, najgorsza wynosiła 53%
W porównaniu do wszystkich testowanych urządzeń
» 7% wszystkich testowanych urządzeń było lepszych, 2% podobnych, 91% gorszych
» Najlepszy miał deltę 4%, średnia wynosiła ###średnia###%, najgorsza wynosiła 134%
Apple MacBook Pro 16 2021 M1 Pro analiza dźwięku
(+) | głośniki mogą odtwarzać stosunkowo głośno (84.7 dB)
Bas 100 - 315 Hz
(+) | dobry bas - tylko 3.8% od mediany
(+) | bas jest liniowy (5.2% delta do poprzedniej częstotliwości)
Średnie 400 - 2000 Hz
(+) | zbalansowane środki średnie - tylko 1.3% od mediany
(+) | średnie są liniowe (2.1% delta do poprzedniej częstotliwości)
Wysokie 2–16 kHz
(+) | zrównoważone maksima - tylko 1.9% od mediany
(+) | wzloty są liniowe (2.7% delta do poprzedniej częstotliwości)
Ogólnie 100 - 16.000 Hz
(+) | ogólny dźwięk jest liniowy (4.6% różnicy w stosunku do mediany)
W porównaniu do tej samej klasy
» 0% wszystkich testowanych urządzeń w tej klasie było lepszych, 0% podobnych, 100% gorszych
» Najlepszy miał deltę 5%, średnia wynosiła ###średnia###%, najgorsza wynosiła 45%
W porównaniu do wszystkich testowanych urządzeń
» 0% wszystkich testowanych urządzeń było lepszych, 0% podobnych, 100% gorszych
» Najlepszy miał deltę 4%, średnia wynosiła ###średnia###%, najgorsza wynosiła 134%
Zarządzanie energią
Zużycie energii
Na biegu jałowym nowy model jest mniej więcej tak samo oszczędny jak poprzednik AMD; maksymalny pobór mocy na biegu jałowym wynosi nieco poniżej 12 watów. Mieści się to w granicach modeli z wyświetlaczem OLED, ale zużycie watów wzrasta w obecności jaśniejszej zawartości obrazu.
Pod maksymalnym obciążeniem w grach z Witcher 3 Ultra, zmierzyliśmy nieco poniżej 43 watów, o 6 watów mniej niż porównywalny Dell XPS 13 Plus 9320 OLED z tym samym iGPU. Jednak test obciążeniowy z Prime95 i Furmark pokazuje, że 90-watowy zasilacz jest zbyt ciasny, ponieważ na początku krótko zmierzyliśmy 95 watów. Faza ta nie trwa jednak długo, a pobór mocy ustabilizował się na poziomie 65 W, a następnie 45 W, więc słabszy zasilacz nie powinien być zbyt dużym problemem. Niemniej jednak, 100-watowy zasilacz z poprzedniego modelu byłby tutaj lepszym wyborem.
| wyłączony / stan wstrzymania | |
| luz | |
| obciążenie |
|
Legenda:
min: | |
| Asus ZenBook 14X UX3404VC i9-13900H, Iris Xe G7 96EUs, Micron 2450 1TB MTFDKBA1T0TFK, OLED, 2880x1800, 14.5" | Apple MacBook Pro 13 2022 M2 M2, M2 10-Core GPU, Apple SSD AP1024Z, IPS, 2560x1600, 13.3" | Lenovo Slim Pro 7 14ARP8 R7 7735HS, GeForce RTX 3050 6GB Laptop GPU, SK hynix PC801 HFS512GEJ9X115N, IPS, 2560x1600, 14.5" | Asus ROG Flow Z13 GZ301V i9-13900H, GeForce RTX 4060 Laptop GPU, WD PC SN740 SDDPTQD-1T00, IPS, 2560x1600, 13.4" | Dell XPS 13 Plus 9320 i7-1280P OLED i7-1280P, Iris Xe G7 96EUs, WDC PC SN810 512GB, OLED, 3456x2160, 13.4" | Dell Inspiron 14 Plus 7420 i7-12700H, GeForce RTX 3050 4GB Laptop GPU, SK Hynix BC711 512GB HFM512GD3GX013N, IPS, 2240x1400, 14" | LG Gram 14Z90Q i5-1240P, Iris Xe G7 80EUs, Samsung PM9A1 MZVL2512HCJQ, IPS, 1920x1200, 14" | Przeciętny Intel Iris Xe Graphics G7 96EUs | Średnia w klasie Subnotebook | |
|---|---|---|---|---|---|---|---|---|---|
| Power Consumption | 33% | -56% | -65% | -7% | -72% | 20% | 3% | 23% | |
| Idle Minimum * (Watt) | 6 | 1.77 70% | 7.6 -27% | 8.5 -42% | 6.5 -8% | 6.3 -5% | 3 50% | 5.51 ? 8% | 3.78 ? 37% |
| Idle Average * (Watt) | 7 | 6.7 4% | 12.2 -74% | 12.4 -77% | 7.8 -11% | 10.3 -47% | 6 14% | 8.66 ? -24% | 6.57 ? 6% |
| Idle Maximum * (Watt) | 11.8 | 6.9 42% | 12.8 -8% | 13.3 -13% | 13 -10% | 20 -69% | 12 -2% | 10.9 ? 8% | 7.94 ? 33% |
| Load Average * (Watt) | 44 | 30.9 30% | 76.5 -74% | 93 -111% | 56.6 -29% | 106.2 -141% | 40 9% | 45.6 ? -4% | 41.9 ? 5% |
| Witcher 3 ultra * (Watt) | 42.6 | 38.9 9% | 89.5 -110% | 87.8 -106% | 49.2 -15% | 96.1 -126% | 36.5 14% | ||
| Load Maximum * (Watt) | 95 | 56 41% | 135.7 -43% | 135 -42% | 63 34% | 136.5 -44% | 63 34% | 67.8 ? 29% | 64.4 ? 32% |
* ... im mniej tym lepiej
Power consumption Witcher 3 / Stress test
Power consumption with an external monitor
Akkulaufzeit
Czas pracy na baterii Asusa ZenBook 14X jest naprawdę długi, biorąc pod uwagę wysokiej klasy procesor Intel Core i9. W naszym teście WLAN, 14-calowy laptop osiągnął czas pracy wynoszący dokładnie 10 godzin. Ten test wykorzystuje skrypt do pomiaru obciążenia podczas uzyskiwania dostępu do stron internetowych
Apple MacBook Pro 13 2022 M2, Lenovo Slim Pro 7 14ARP8 i LG Gram 14Z90Q wypadają lepiej w naszej tabeli porównawczej, ale nie mają wyświetlaczy OLED. W porównaniu do Dell XPS 13 Plus 9320 z wyświetlaczem OLED, mocna wydajność baterii ZenBooka jest wyraźnie zauważalna, ponieważ model Dell wytrzymuje tylko około 5:30 godzin
.| Asus ZenBook 14X UX3404VC i9-13900H, Iris Xe G7 96EUs, 70 Wh | Apple MacBook Pro 13 2022 M2 M2, M2 10-Core GPU, 58.2 Wh | Dell XPS 13 Plus 9320 i7-1280P OLED i7-1280P, Iris Xe G7 96EUs, 55 Wh | Lenovo Slim Pro 7 14ARP8 R7 7735HS, GeForce RTX 3050 6GB Laptop GPU, 73 Wh | LG Gram 14Z90Q i5-1240P, Iris Xe G7 80EUs, 72 Wh | Dell Inspiron 14 Plus 7420 i7-12700H, GeForce RTX 3050 4GB Laptop GPU, 64 Wh | Asus ROG Flow Z13 GZ301V i9-13900H, GeForce RTX 4060 Laptop GPU, 56 Wh | Średnia w klasie Subnotebook | |
|---|---|---|---|---|---|---|---|---|
| Czasy pracy | 91% | -42% | 5% | 49% | -36% | -46% | 40% | |
| Reader / Idle (h) | 17.6 | 28.9 64% | 11.9 -32% | 28.6 ? 63% | ||||
| WiFi v1.3 (h) | 10 | 19.1 91% | 5.8 -42% | 10.5 5% | 11.9 19% | 7.2 -28% | 5 -50% | 14 ? 40% |
| Load (h) | 1.7 | 2.8 65% | 0.9 -47% | 1 -41% | 1.969 ? 16% | |||
| H.264 (h) | 19.2 | 4.7 | 15.4 ? | |||||
| Witcher 3 ultra (h) | 0.8 |
Za
Przeciw
Werdykt - Nowy procesor nie jest w stanie w pełni rozwinąć skrzydeł
ZenBook 14X to ogólnie bardzo solidny laptop, który psuje jedynie nieco rozczarowująca wydajność procesora. Zdecydowanie przydałby mu się dodatkowy wentylator, taki jak w w zeszłorocznym modelu. Z drugiej strony, wyświetlacz OLED 120 Hz, szybki czas reakcji i ponadprzeciętny czas pracy na baterii to bardzo pozytywne aspekty. Pomimo zainstalowanego procesora Intel Core i9-13900H, w naszym teście WLAN zmierzyliśmy dokładnie 10 godzin. Wartości DeltaE wyświetlacza są poniżej 3, więc subnotebook nadaje się do edycji zdjęć i wideo.
Jakość aluminiowej obudowy jest również doskonała i zapewnia ponadprzeciętną stabilność, co jest również zauważalne podczas pisania na klawiaturze. Różnorodność portów jest solidna, ale gorsza od poprzednika, ponieważ pominięto czytnik microSD. Rozmieszczenie portów również nie jest idealne.
Nowy ZenBook 14X Asusa to solidny, wszechstronny laptop z bardzo dobrym czasem pracy na baterii, znakomitym wyświetlaczem OLED i solidną wydajnością.
Hałas wentylatora jest umiarkowany, a urządzenie pozostaje w dużej mierze niesłyszalne podczas normalnych zadań biurowych dzięki opcji trybu cichego w aplikacji MyAsus.
Cena podstawowej konfiguracji wzrosła w porównaniu do poprzednika zarówno w wersji AMD, jak i Intel. Nasz recenzowany wariant, bez dedykowanej karty graficznej, kosztuje 1699 EUR (~1850 USD). Jeśli zamiast tego chcesz Nvidia GeForce RTX 3050, będziesz musiał wydać dodatkowe 400 EUR (440 USD).
Jeśli wyświetlacz OLED nie odgrywa głównej roli w wyborze notebooka, istnieją dwa tańsze 14-calowe urządzenia w postaci Lenovo Slim Pro 7 14ARP8 i Dell Inspiron 14 Plus 7420, które oferują lepszą wydajność graficzną dzięki AMD Radeon 680M w Lenovo lub RTX 3050 w Dell.
Cena i dostępność
W Stanach Zjednoczonych podstawowa konfiguracja Asusa Zenbook 14X UX3404 jest wyceniona na $1,799.00 w sklepie internetowym Asusa.
Asus ZenBook 14X UX3404VC
- 01/06/2023 v7 (old)
Philip Macdonald
Przezroczystość
Wyboru urządzeń do recenzji dokonuje nasza redakcja. Próbka testowa została udostępniona autorowi jako pożyczka od producenta lub sprzedawcy detalicznego na potrzeby tej recenzji. Pożyczkodawca nie miał wpływu na tę recenzję, producent nie otrzymał też kopii tej recenzji przed publikacją. Nie było obowiązku publikowania tej recenzji. Jako niezależna firma medialna, Notebookcheck nie podlega władzy producentów, sprzedawców detalicznych ani wydawców.
Tak testuje Notebookcheck
Każdego roku Notebookcheck niezależnie sprawdza setki laptopów i smartfonów, stosując standardowe procedury, aby zapewnić porównywalność wszystkich wyników. Od około 20 lat stale rozwijamy nasze metody badawcze, ustanawiając przy tym standardy branżowe. W naszych laboratoriach testowych doświadczeni technicy i redaktorzy korzystają z wysokiej jakości sprzętu pomiarowego. Testy te obejmują wieloetapowy proces walidacji. Nasz kompleksowy system ocen opiera się na setkach uzasadnionych pomiarów i benchmarków, co pozwala zachować obiektywizm.Price comparison

