Dzięki przyzwoitemu rozwiązaniu chłodzącemu i długoterminowemu limitowi mocy procesora wynoszącemu 37 W, VivoBook 15X VivoBook 15X OLED M3504YA jest jednym z najszybszych laptopów zbudowanych wokół 7530U, jakie znamy. Może być o około 40% szybszy w obciążeniach związanych z procesorem niż najwolniejszy system z tym samym układem w naszej bazie danych, według stanu na sierpień 2023 roku.
Ten Ryzen ma domyślne TDP na poziomie 15 W (znane również jako Power Limit 1).
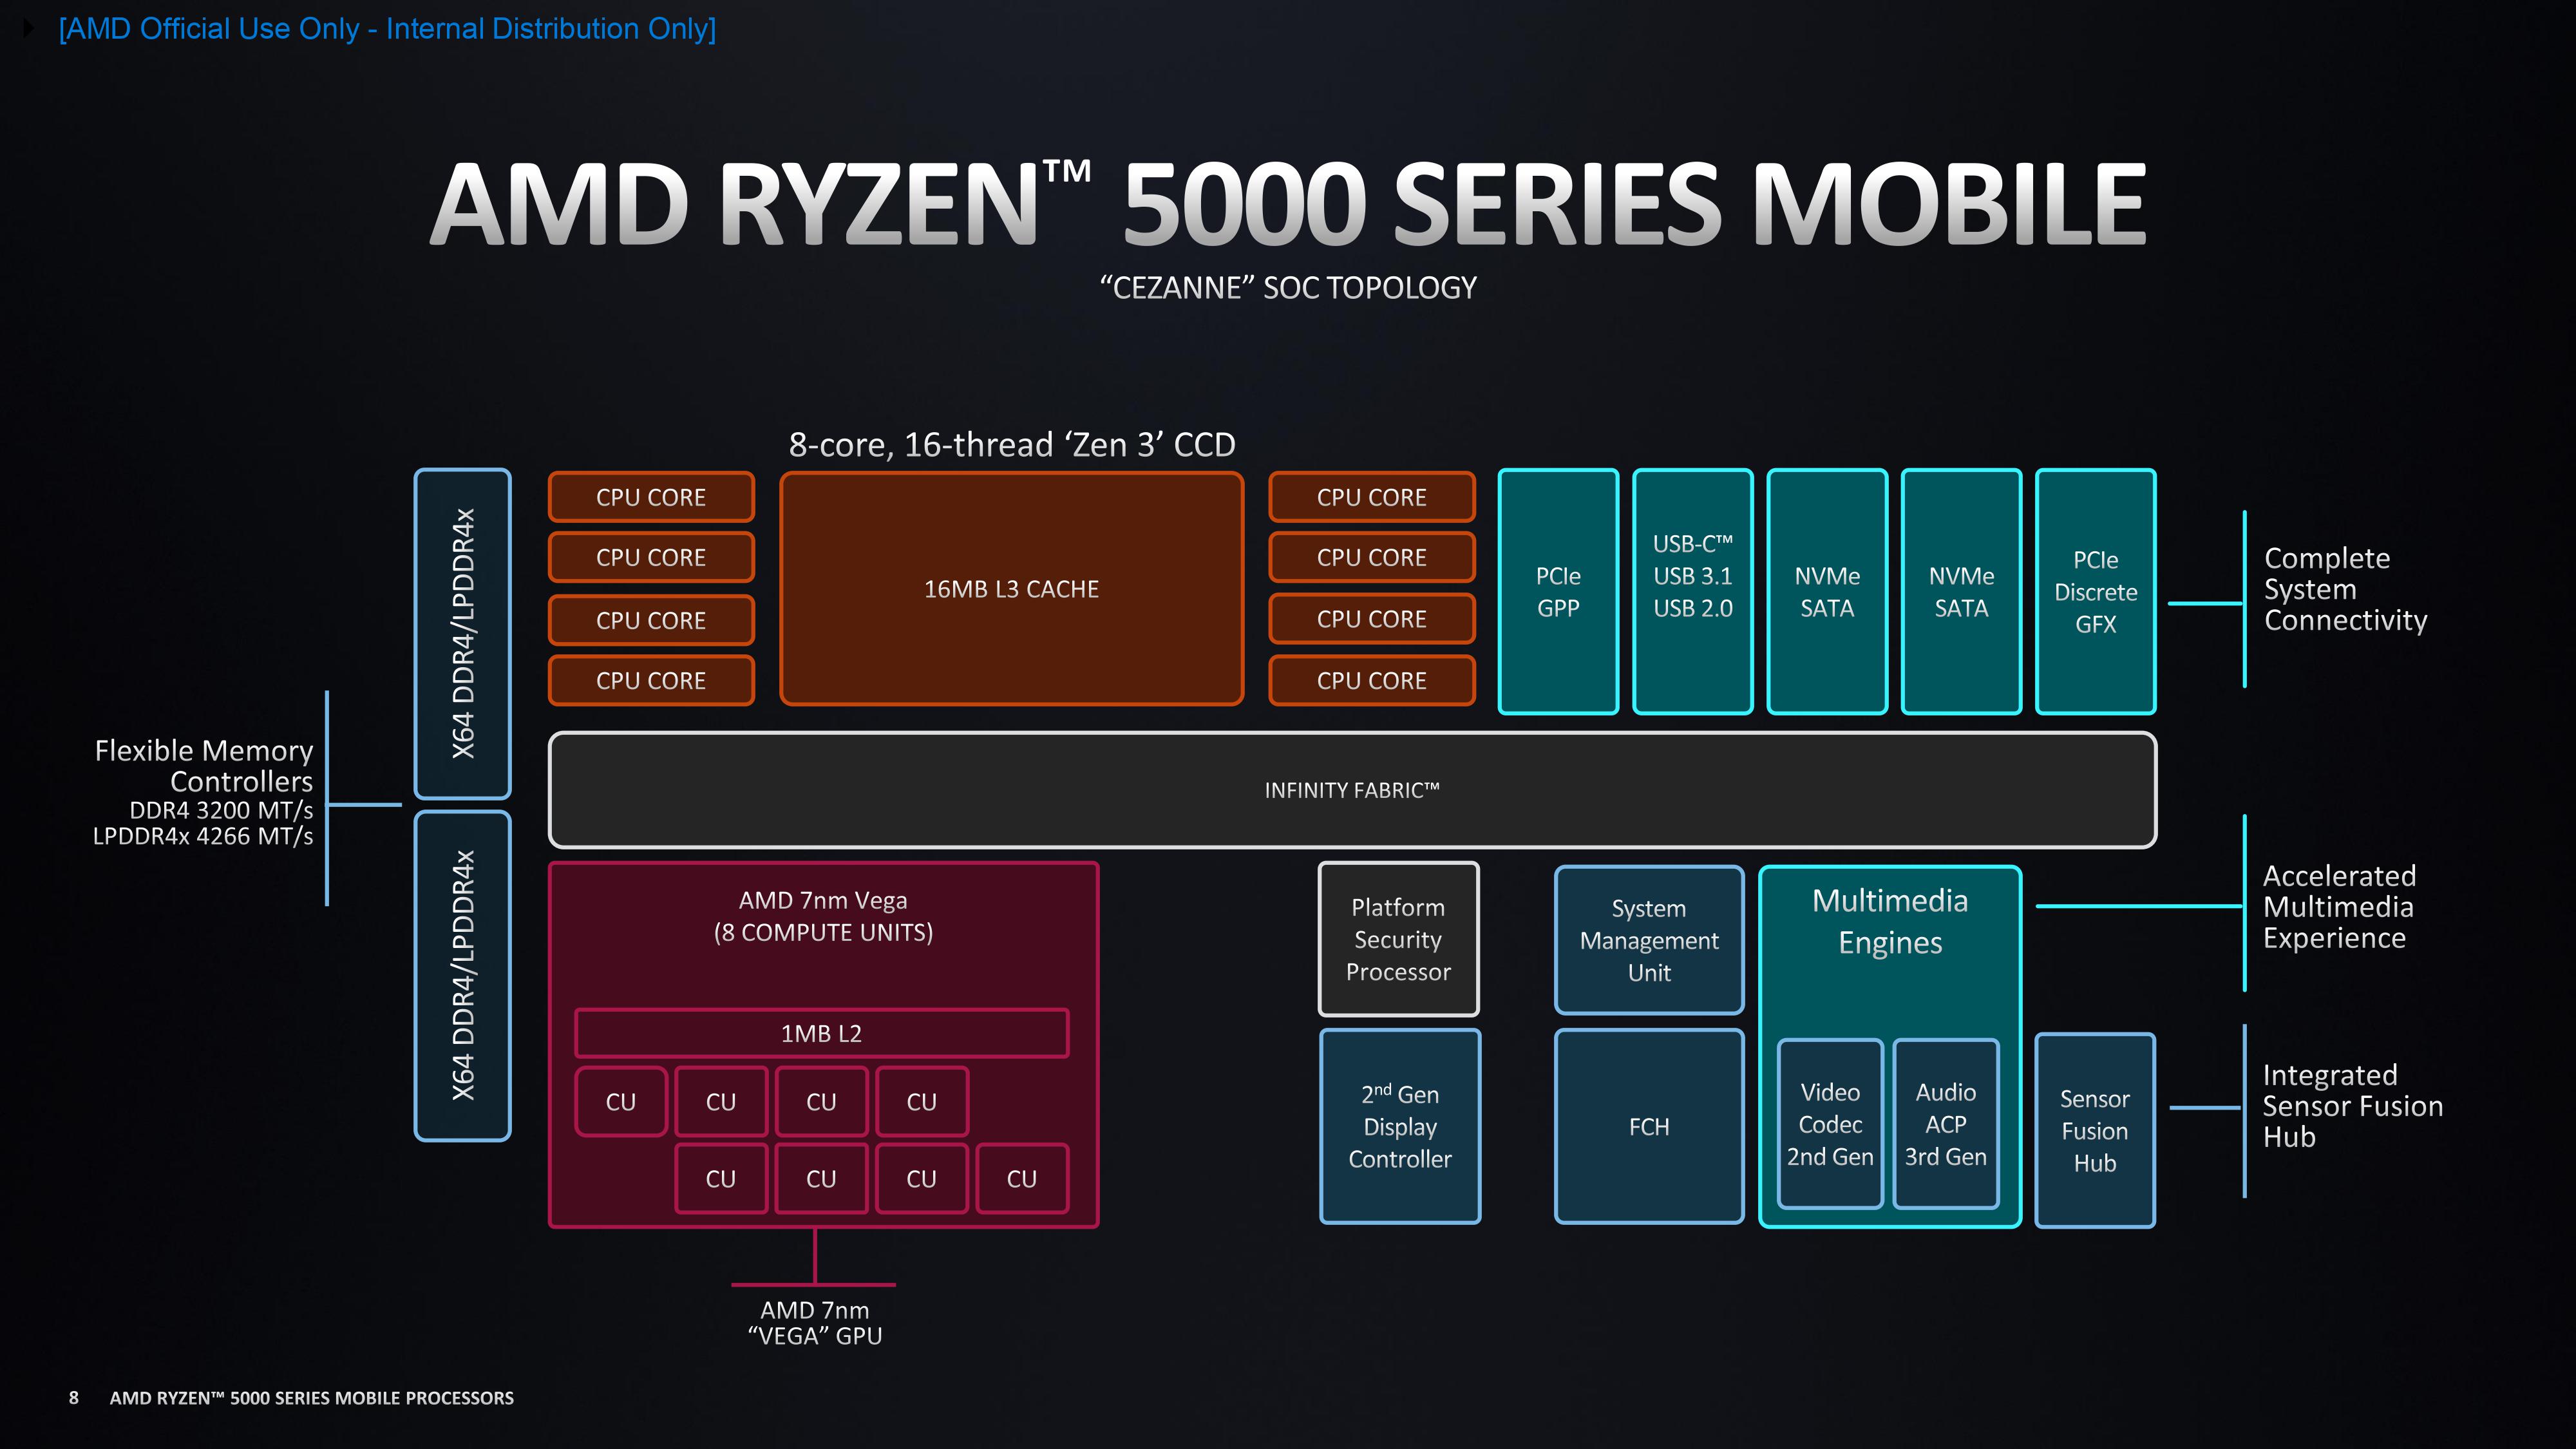
Nazwa robocza Barcelo-U Refresh Seria AMD Cezanne (Zen 3, Ryzen 5000) Rodzina: Cezanne (Zen 3, Ryzen 5000) Barcelo-U Refresh Taktowanie 2000 - 4500 MHz Pamięć 1. poziomu 384 KB Pamięć 2. poziomu 3 MB Pamięć 3. poziomu 16 MB Liczba rdzeni / wątków 6 / 12 TDP (Thermal Design Power) 15 W Technologia wytwarzania 7 nm Maks. temperatura 95 °C Gniazdo FP6 Cechy DDR4-3200/LPDDR4x-4266 RAM (incl. ECC), PCIe 3, MMX, SSE, SSE2, SSE3, SSSE3, SSE4A, SSE4.1, SSE4.2, AVX, AVX2, BMI2, ABM, FMA, ADX, SMEP, SMAP, SMT, CPB, AES-NI, RDRAND, RDSEED, SHA, SME GPU AMD Radeon RX Vega 7 ( - 2000 MHz)64-bity obsługa 64-bitów Architecture x86 Data premiery 05/01/2023 Odnośnik do produktu (zewn.) www.amd.com
Performance Rating - CB R15 + R20 + 7-Zip + X265 + Blender + 3DM11 CPU
...
Intel Core i5-11500B
...
max:
Cinebench 2026 - Cinebench 2026 CPU Single Thread
Intel Core Ultra 5 115U
...
Apple M5 Pro 18-Core
Cinebench 2026 - Cinebench 2026 CPU Multi
Intel Core Ultra 5 115U
AMD Ryzen 7 4700U
Apple M1
...
Apple M5 Pro 18-Core
max:
Cinebench 2024 - Cinebench 2024 CPU Single Core
min: 83 przeciętny: 84 mediana: 84 (10%) maks: 85 Points
...
Intel Core i5-11500B
...
Apple M5 Pro 18-Core
Cinebench 2024 - Cinebench 2024 CPU Multi Core
min: 398 przeciętny: 426.5 mediana: 426.5 (8%) maks: 455 Points
...
Apple M1
Intel Core i5-11500B
...
Apple M5 Pro 18-Core
max:
Cinebench R23 - Cinebench R23 Multi Core
min: 6931 przeciętny: 8313 mediana: 8361 (8%) maks: 9347 Points
CPU TDP ? TDP 15 W TDP 20 W TDP 23 W TDP 25 W TDP 28 W TDP 37 W TDP 38 W 100% 74% 91% 89% 84% 89% 99% 100%
...
Intel Core i7-10875H
AMD Ryzen 5 4600H
Intel Core i5-1245U
Intel Core i5-11500B
AMD Ryzen 7 PRO 4750U
AMD Ryzen 7 4800U
...
AMD Ryzen 9 9955HX3D
max:
Cinebench R23 - Cinebench R23 Single Core
min: 1371 przeciętny: 1437 mediana: 1441 (59%) maks: 1470 Points
CPU TDP ? TDP 15 W TDP 20 W TDP 23 W TDP 25 W TDP 28 W TDP 37 W TDP 38 W 98% 95% 97% 98% 99% 98% 100% 100%
...
Intel Core i7-1165G7
Intel Core i7-1185G7
...
Apple M5 10-Core
Cinebench R20 - Cinebench R20 CPU (Single Core)
min: 528 przeciętny: 561 mediana: 564 (61%) maks: 574 Points
CPU TDP ? TDP 15 W TDP 20 W TDP 23 W TDP 25 W TDP 28 W TDP 37 W TDP 38 W 99% 95% 97% 98% 99% 98% 100% 99%
...
Intel Core i7-1165G7
Intel Core i7-1185G7
Intel Core i5-11500B
...
max:
Cinebench R20 - Cinebench R20 CPU (Multi Core)
min: 2780 przeciętny: 3246 mediana: 3281 (8%) maks: 3655 Points
CPU TDP ? TDP 15 W TDP 20 W TDP 23 W TDP 25 W TDP 28 W TDP 37 W TDP 38 W 99% 77% 84% 90% 83% 90% 99% 100%
...
AMD Ryzen 7 4800U
AMD Ryzen 5 4600H
Intel Core i5-11500B
...
AMD Ryzen 9 9955HX3D
max:
Cinebench R15 - Cinebench R15 CPU Multi 64 Bit
min: 1101 przeciętny: 1408 mediana: 1415 (9%) maks: 1599 Points
CPU TDP ? TDP 15 W TDP 20 W TDP 23 W TDP 25 W TDP 28 W TDP 37 W TDP 38 W 100% 75% 81% 94% 83% 88% 96% 100%
...
Intel Core i5-11500B
AMD Ryzen 7 PRO 4750U
AMD Ryzen 5 4600H
AMD Ryzen 7 4800U
...
AMD Ryzen 9 9955HX3D
max:
0 35 70 105 140 175 210 245 280 315 350 385 420 455 490 525 560 595 630 665 700 735 770 805 840 875 910 945 980 1015 1050 1085 1120 1155 1190 1225 1260 1295 1330 1365 1400 1435 1470 1505 1540 1575 Tooltip Geekom A5 Pro: Ø1095 (1078.55-1234.53)
Lenovo ThinkPad L13 Yoga G4 21FSS00100: Ø1082 (1000.35-1289.24)
Dell Inspiron 14 7435 2-in-1: Ø1242 (1217.69-1302.59)
HP ProBook 445 G10: Ø1302 (1245.87-1328.42)
Dell Inspiron 16 7635 2-in-1: Ø1360 (1321.57-1414.73)
Lenovo ThinkPad L14 G4 21H6S00900: Ø1246 (1194.78-1499.93)
Asus VivoBook 15X OLED M3504YA: Ø1457 (1395.38-1541.07)
Lenovo IdeaPad Flex 5 14ABR G8: Ø1381 (1296.43-1597.38)
Lenovo ThinkBook 16 G6 ABP: Ø1519 (1483.51-1598.53)
Cinebench R15 - Cinebench R15 CPU Single 64 Bit
min: 213 przeciętny: 229.7 mediana: 231 (63%) maks: 237 Points
CPU TDP ? TDP 15 W TDP 20 W TDP 23 W TDP 25 W TDP 28 W TDP 37 W TDP 38 W 96% 94% 97% 97% 99% 97% 100% 99%
...
Intel Core i7-1265U
...
max:
Intel Core Ultra 9 285K
Cinebench R11.5 - Cinebench R11.5 CPU Multi 64 Bit
...
AMD Ryzen 7 4700U
AMD Ryzen 5 PRO 4650U
Intel Core i5-10500H
Intel Core i7-10750H
Intel Core i5-11500B
...
max:
Cinebench R11.5 - Cinebench R11.5 CPU Single 64 Bit
...
Intel Core Ultra 5 115U
...
max:
Intel Core Ultra 9 285K
Cinebench R10 - Cinebench R10 Rend. Single (32bit)
AMD Geode LX 800
...
AMD Ryzen 9 4900HS
AMD Ryzen 9 4900H
...
max:
Cinebench R10 - Cinebench R10 Rend. Multi (32bit)
...
AMD Ryzen 5 4500U
Intel Core i5-1135G7
AMD Ryzen 7 4700U
Intel Core i5-1130G7
Intel Core i5-1145G7
Intel Core i5-10400H
Intel Core i7-1160G7
Intel Core i7-1185G7
...
max:
Cinebench R10 - Cinebench R10 Rend. Multi (64bit)
...
AMD Ryzen 5 PRO 4650U
AMD Ryzen 7 4700U
Intel Core i5-11500B
...
Cinebench R10 - Cinebench R10 Rend. Single (64bit)
...
Intel Core i7-1185G7
Intel Core i7-1165G7
Intel Core i5-11500B
...
max:
wPrime 2.10 - wPrime 2.0 1024m *
...
Intel Core i5-11500B
AMD Ryzen 5 4500U
AMD Ryzen 9 9955HX3D
...
wPrime 2.10 - wPrime 2.0 32m *
...
Intel Core i7-1265U
Intel Core i5-1245U
Intel Core i7-10750H
Intel Core i7-10810U
Intel Core i7-1185G7
...
Transmeta Crusoe TM-5800
WinRAR - WinRAR 4.0
...
Intel Core i9-10885H
...
max:
7-Zip 18.03 - 7-Zip 18.03 Multi Thread 4 runs
min: 32204 przeciętny: 37701 mediana: 37554.5 (22%) maks: 42364 MIPS
CPU TDP 15 W TDP 20 W TDP 23 W TDP 25 W TDP 28 W TDP 37 W TDP 38 W 80% 87% 88% 90% 91% 97% 100%
...
Intel Core i5-1245U
Intel Core i5-11500B
AMD Ryzen 5 4600H
...
AMD Ryzen 9 9955HX3D
max:
7-Zip 18.03 - 7-Zip 18.03 Single Thread 4 runs
min: 5113 przeciętny: 5336 mediana: 5345.5 (61%) maks: 5544 MIPS
CPU TDP 15 W TDP 20 W TDP 23 W TDP 25 W TDP 28 W TDP 37 W TDP 38 W 95% 94% 96% 98% 95% 100% 97%
...
Intel Core i7-10875H
...
max:
AMD Ryzen 7 9850X3D
X264 HD Benchmark 4.0 - x264 Pass 2
...
Intel Core Ultra 5 115U
Intel Core i5-11500B
...
X264 HD Benchmark 4.0 - x264 Pass 1
...
Intel Core i7-10750H
Intel Core Ultra 5 115U
AMD Ryzen 9 4900HS
Intel Core i5-11500B
...
HWBOT x265 Benchmark v2.2 - HWBOT x265 4k Preset
min: 8.17 przeciętny: 10.2 mediana: 10.4 (18%) maks: 11.6 fps
CPU TDP 15 W TDP 20 W TDP 23 W TDP 25 W TDP 28 W TDP 37 W TDP 38 W 74% 94% 86% 86% 92% 93% 100%
...
AMD Ryzen 5 4600H
AMD Ryzen 7 4800U
Intel Core i5-11500B
...
AMD Ryzen 9 9955HX3D
max:
0 1 2 3 4 5 6 7 8 9 10 11 12 13 14 15 16 17 18 Tooltip Lenovo ThinkPad L13 Yoga G4 21FSS00100: Ø8.45 (0.46-12.3)
Geekom A5 Pro: Ø9.91 (1.18-17.8)
HP ProBook 445 G10: Ø10.1 (0.48-14.2)
Lenovo ThinkPad L14 G4 21H6S00900: Ø10.5 (0.82-15.1)
Dell Inspiron 16 7635 2-in-1: Ø11.1 (1.03-17.9)
Asus VivoBook 15X OLED M3504YA: Ø11.2 (1.04-17.9)
Dell Inspiron 14 7435 2-in-1: Ø11.4 (0.95-18.1)
Lenovo ThinkBook 16 G6 ABP: Ø11.9 (0.59-16.4)
TrueCrypt - TrueCrypt Serpent
...
Intel Core i7-10750H
Intel Core i7-10850H
AMD Ryzen 5 PRO 4650U
...
AMD Ryzen 9 9955HX3D
max:
TrueCrypt - TrueCrypt Twofish
...
AMD Ryzen 7 4700U
Intel Core Ultra 5 115U
...
AMD Ryzen 9 9955HX
max:
TrueCrypt - TrueCrypt AES
...
AMD Ryzen 7 PRO 4750U
AMD Ryzen 9 4900H
Intel Core i7-10750H
...
max:
Blender - Blender 3.3 Classroom CPU *
min: 583 przeciętny: 706 mediana: 713 (9%) maks: 820 Seconds
CPU TDP 15 W TDP 20 W TDP 23 W TDP 25 W TDP 28 W TDP 37 W TDP 38 W 100% 101% 101% 102% 102% 103% 103%
AMD Ryzen 9 9955HX3D
...
Intel Core i5-11500B
Intel Core i5-1245U
...
Intel Celeron J4125
Blender - Blender 2.79 BMW27 CPU *
min: 330 przeciętny: 386.1 mediana: 373 (3%) maks: 469 Seconds
CPU TDP 15 W TDP 20 W TDP 23 W TDP 25 W TDP 28 W TDP 37 W TDP 38 W 100% 101% 101% 101% 101% 101% 101%
Intel Core i5-1038NG7
...
Intel Core i5-11500B
Intel Core i5-10500H
Intel Core i5-1245U
Intel Core i7-10750H
...
R Benchmark 2.5 - R Benchmark 2.5 *
min: 0.515 przeciętny: 0.5 mediana: 0.5 (11%) maks: 0.567 sec
CPU TDP 15 W TDP 20 W TDP 23 W TDP 25 W TDP 28 W TDP 37 W TDP 38 W 100% 100% 100% 100% 100% 101% 100%
AMD Ryzen 9 9955HX3D
...
Intel Core i5-1240U
...
Super Pi mod 1.5 XS 1M - Super Pi mod 1.5 XS 1M *
...
Intel Core i5-10500H
Intel Core i5-10300H
...
Super Pi mod 1.5 XS 2M - Super Pi mod 1.5 XS 2M *
...
Intel Core i5-1130G7
Intel Core i5-1245U
...
3DMark Vantage - 3DM Vant. Perf. CPU no Physx
...
Intel Core i7-1265U
Intel Core i7-10750H
...
max:
3DMark 11 - 3DM11 Performance Physics
min: 10189 przeciętny: 11829 mediana: 11963 (29%) maks: 12926 Points
CPU TDP ? TDP 15 W TDP 20 W TDP 23 W TDP 25 W TDP 28 W TDP 37 W TDP 38 W 99% 86% 97% 79% 88% 100% 97% 93%
...
AMD Ryzen 5 4600H
Intel Core i7-1265U
AMD Ryzen 7 4800U
...
AMD Ryzen 9 9955HX3D
max:
AMD Ryzen 9 9950X3D
3DMark - 3DMark Ice Storm Physics
min: 66657 przeciętny: 74790 mediana: 75967 (62%) maks: 81747 Points
3DMark - 3DMark Ice Storm Extreme Physics
min: 66251 przeciętny: 75172 mediana: 75171.5 (61%) maks: 84092 Points
CPU TDP 15 W TDP 37 W 79% 100%
3DMark - 3DMark Ice Storm Unlimited Physics
min: 80961 przeciętny: 84186 mediana: 84185.5 (68%) maks: 87410 Points
CPU TDP 15 W TDP 37 W 93% 100%
AMD A6-9220e
...
AMD Ryzen 9 9955HX
...
max:
Intel Core Ultra 5 250K Plus
3DMark - 3DMark Cloud Gate Physics
min: 9155 przeciętny: 11072 mediana: 10986 (28%) maks: 12903 Points
CPU TDP 15 W TDP 20 W TDP 23 W TDP 25 W TDP 37 W 75% 95% 83% 87% 100%
...
Intel Core i7-10750H
Intel Core i5-10500H
AMD Ryzen 5 4600H
AMD Ryzen 5 4600U
...
max:
3DMark - 3DMark Fire Strike Standard Physics
min: 14264 przeciętny: 18030 mediana: 18996 (34%) maks: 20296 Points
CPU TDP ? TDP 15 W TDP 20 W TDP 23 W TDP 25 W TDP 28 W TDP 37 W TDP 38 W 98% 73% 96% 81% 88% 94% 98% 100%
AMD A6-9220e
...
AMD Ryzen 5 4600H
AMD Ryzen 7 4800U
...
max:
3DMark - 3DMark Time Spy CPU
min: 4384 przeciętny: 5331 mediana: 5561 (23%) maks: 5891 Points
CPU TDP ? TDP 15 W TDP 20 W TDP 23 W TDP 28 W TDP 37 W TDP 38 W 100% 78% 95% 79% 100% 100% 93%
...
AMD Ryzen 5 4600U
Intel Core i7-1265U
...
max:
Geekbench 6.7 - Geekbench 6.7.1 Single-Core
min: 1913 przeciętny: 1958 mediana: 1969 (45%) maks: 1991 pkt.
...
Intel Core i5-1230U
Intel Core i7-1180G7
...
Apple M5 Pro 15-Core
Geekbench 6.7 - Geekbench 6.7.1 Multi-Core
min: 6099 przeciętny: 6689 mediana: 6901 (23%) maks: 7067 pkt.
...
Intel Xeon W-10855M
AMD Ryzen 5 4600HS
Intel Core i5-10500H
Intel Core i7-1185G7
AMD Ryzen 5 4600H
Intel Core i7-10750H
Intel Core i7-10850H
...
Apple M5 Max
Geekbench 6.0 - Geekbench 6.0 Single-Core
min: 1805 przeciętny: 1860 mediana: 1857 (58%) maks: 1919 pkt.
CPU TDP 15 W TDP 23 W TDP 37 W 99% 97% 100%
...
Intel Core i7-1265U
Intel Core Ultra 5 115U
...
max:
Geekbench 6.0 - Geekbench 6.0 Multi-Core
min: 5411 przeciętny: 6202 mediana: 6298 (26%) maks: 6800 pkt.
CPU TDP 15 W TDP 23 W TDP 37 W 97% 82% 100%
...
Intel Core i5-10300H
AMD Ryzen 7 4700U
AMD Ryzen 5 4600H
Intel Core Ultra 5 115U
...
max:
Geekbench 5.5 - Geekbench 5.1 - 5.5 64 Bit Single-Core
min: 1393 przeciętny: 1470 mediana: 1482.5 (50%) maks: 1512 pkt.
CPU TDP 15 W TDP 20 W TDP 23 W TDP 25 W TDP 28 W TDP 37 W TDP 38 W 97% 99% 96% 98% 99% 100% 100%
...
Intel Core i7-1160G7
...
Apple M5 10-Core
Geekbench 5.5 - Geekbench 5.1 - 5.5 64 Bit Multi-Core
min: 5475 przeciętny: 6141 mediana: 6332.5 (11%) maks: 6648 pkt.
CPU TDP 15 W TDP 20 W TDP 23 W TDP 25 W TDP 28 W TDP 37 W TDP 38 W 90% 97% 82% 84% 100% 96% 98%
...
AMD Ryzen 7 PRO 4750U
AMD Ryzen 5 4600H
Intel Core i5-1230U
Intel Core Ultra 5 115U
Intel Core i7-10750H
Intel Core i5-10500H
Intel Xeon W-10855M
AMD Ryzen 7 4800U
AMD Ryzen 5 4600HS
...
max:
Geekbench 5.0 - Geekbench 5.0 64 Bit Single-Core
min: 1312 przeciętny: 1397 mediana: 1437 (6%) maks: 1441 pkt.
...
Intel Core i5-1140G7
Intel Core i5-1135G7
Intel Core i5-1145G7
...
max:
AMD Ryzen 7 9850X3D
Geekbench 5.0 - Geekbench 5.0 64 Bit Multi-Core
min: 6158 przeciętny: 6317 mediana: 6233 (20%) maks: 6560 pkt.
...
Intel Core Ultra 5 115U
Intel Core i5-10500H
Intel Core i7-10750H
AMD Ryzen 7 PRO 4750U
Intel Core i5-11500B
Intel Core i5-1240U
...
max:
AMD Ryzen Threadripper PRO 3995WX
Geekbench 4.4 - Geekbench 4.1 - 4.4 64 Bit Single-Core
...
Intel Core i5-1145G7
Intel Core i7-1180G7
Intel Core Ultra 5 115U
...
max:
Samsung Exynos 2600
Geekbench 4.4 - Geekbench 4.1 - 4.4 64 Bit Multi-Core
...
Intel Core Ultra 5 115U
Intel Core i7-10750H
AMD Ryzen 5 4600H
AMD Ryzen 7 PRO 4750U
Intel Core i5-10500H
AMD Ryzen 7 4800H
AMD Ryzen 7 4800U
...
max:
Mozilla Kraken 1.1 - Kraken 1.1 Total Score *
min: 614 przeciętny: 647 mediana: 630 (1%) maks: 770 ms
Apple M5 Pro 18-Core
...
Intel Core i5-1230U
Intel Core i5-11500B
Intel Core i7-1185G7
Intel Core i7-1165G7
Intel Core i5-1240U
...
max:
Apple S7
Octane V2 - Octane V2 Total Score
unknown
...
Apple M2
...
Apple M5 Pro 18-Core
WebXPRT 4 - WebXPRT 4 Score
min: 183.4 przeciętny: 206.5 mediana: 209 (52%) maks: 214 Points
...
Intel Core i5-1230U
...
Apple M5 Pro 18-Core
WebXPRT 3 - WebXPRT 3 Score
min: 244 przeciętny: 260 mediana: 261 (44%) maks: 272 Points
...
...
Apple M5 Pro 18-Core
CrossMark - CrossMark Overall
min: 1029 przeciętny: 1228 mediana: 1230 (43%) maks: 1336 Points
CPU TDP 15 W TDP 20 W TDP 23 W TDP 28 W TDP 37 W TDP 38 W 92% 91% 77% 92% 100% 99%
...
Intel Core i5-1135G7
Intel Core i5-1230U
Intel Core i5-1130G7
Intel Core i5-1145G7
...
Apple M5 Max
Power Consumption - Prime95 Power Consumption - external Monitor *
min: 27.5 przeciętny: 40.1 mediana: 39.4 (7%) maks: 52.5 Watt
CPU TDP 15 W TDP 20 W TDP 23 W TDP 25 W TDP 28 W TDP 37 W TDP 38 W 104% 103% 102% 103% 102% 100% 100%
...
Intel Core i7-1165G7
AMD Ryzen 5 3580U
...
AMD Ryzen 9 9955HX3D
max:
AMD Ryzen Threadripper PRO 3975WX
0 5 10 15 20 25 30 35 40 45 50 55 60 Tooltip Lenovo ThinkPad L13 Yoga G4 21FSS00100: Ø27.5 (27.1-28.4)
Geekom A5 Pro: Ø30.6 (24.9-43.4)
HP ProBook 445 G10: Ø35.3 (34.6-43.8)
Dell Inspiron 14 7435 2-in-1: Ø37 (36.3-46.6)
Lenovo ThinkPad L14 G4 21H6S00900: Ø41.8 (35.5-59.1)
Dell Inspiron 16 7635 2-in-1: Ø44.2 (42.8-53.7)
Asus VivoBook 15X OLED M3504YA: Ø51.6 (41.7-60.5)
Lenovo ThinkBook 16 G6 ABP: Ø52.5 (48.9-62.8)
Power Consumption - Cinebench R15 Multi Power Consumption - external Monitor *
min: 32.2 przeciętny: 44.2 mediana: 42.8 (8%) maks: 59.9 Watt
CPU TDP 15 W TDP 20 W TDP 28 W TDP 37 W TDP 38 W 106% 106% 104% 101% 100%
...
AMD Ryzen 7 PRO 4750U
Intel Core i5-8260U
Intel Core i7-1165G7
Intel Core i5-1240U
...
AMD Ryzen 9 9955HX3D
max:
0 5 10 15 20 25 30 35 40 45 50 55 60 Tooltip Dell Inspiron 14 7435 2-in-1: Ø32.2 (31.5-45.5)
Geekom A5 Pro: Ø32.6 (31-37.5)
Dell Inspiron 16 7635 2-in-1: Ø42.8 (37.6-50.8)
Asus VivoBook 15X OLED M3504YA: Ø53.6 (52-57.3)
Lenovo ThinkBook 16 G6 ABP: Ø59.9 (55.5-62.3)
Power Consumption - Idle Power Consumption - external Monitor *
min: 3.43 przeciętny: 5.4 mediana: 5.5 (4%) maks: 7.3 Watt
CPU TDP 15 W TDP 20 W TDP 23 W TDP 25 W TDP 28 W TDP 37 W TDP 38 W 101% 101% 100% 100% 102% 103% 102%
...
Intel Core i5-1230U
Intel Core i7-10810U
...
max:
0 1 2 3 4 5 6 7 8 9 10 11 Tooltip Asus VivoBook 15X OLED M3504YA: Ø3.43 (3.12-4.26)
Lenovo ThinkBook 16 G6 ABP: Ø4.06 (3.77-5.78)
Geekom A5 Pro: Ø4.27 (4-5.07)
Dell Inspiron 16 7635 2-in-1: Ø4.96 (3.99-10.8)
Lenovo ThinkPad L13 Yoga G4 21FSS00100: Ø6.03 (5.28-7.27)
Dell Inspiron 14 7435 2-in-1: Ø6.05 (5.4-9.44)
Lenovo ThinkPad L14 G4 21H6S00900: Ø6.94 (6.2-8.15)
HP ProBook 445 G10: Ø7.3 (3.44-11.3)
Power Consumption - Idle Power Consumption 150cd 1min *
min: 5.25 przeciętny: 6.5 mediana: 6.4 (5%) maks: 7.64 Watt
CPU TDP 15 W TDP 20 W TDP 23 W TDP 25 W TDP 28 W TDP 38 W 101% 101% 102% 100% 101% 101%
...
Intel Core i5-1135G7
Intel Celeron 6305
Intel Pentium Gold 7505
Intel Core i3-1005G1
Intel Core Ultra 5 115U
...
max:
0 1 2 3 4 5 6 7 8 9 10 Tooltip Lenovo ThinkPad L14 G4 21H6S00900: Ø5.25 (4.9-6.87)
Lenovo ThinkPad L13 Yoga G4 21FSS00100: Ø6.21 (5.67-10.1)
Dell Inspiron 16 7635 2-in-1: Ø6.24 (5.7-9.37)
Lenovo ThinkBook 16 G6 ABP: Ø6.55 (6.24-7.39)
Dell Inspiron 14 7435 2-in-1: Ø6.87 (6.3-8.7)
HP ProBook 445 G10: Ø7.64 (7.13-9.12)
Power Consumption - Power Efficiency - Cinebench R15 Multi external Monitor
min: 26.7 przeciętny: 32.5 mediana: 31.3 (23%) maks: 40.5 Points per Watt
CPU TDP 15 W TDP 20 W TDP 37 W TDP 38 W 83% 100% 71% 66%
...
AMD Ryzen 7 PRO 4750U
...
Intel Core i5-10200H
- Zakres wyników testów referencyjnych dla tej karty graficznej
- Średnia wartość wyników testów referencyjnych dla tej karty graficzne
* Mniejsze liczby oznaczają wyższą wydajność
log 24. 20:14:28
#0 ran 0s before starting gpusingle class +0s ... 0s
#1 no ids found in url (should be separated by "_") +0s ... 0s
#2 not redirecting to Ajax server +0s ... 0s
#3 did not recreate cache, as it is less than 5 days old! Created at Wed, 22 Jul 2026 05:29:33 +0200 +0.002s ... 0.002s
#4 no comparison url found in template nbc.compare_page_2 needed +0.016s ... 0.019s
#5 no comparison url found in template nbc.compare_page_2 needed +0s ... 0.019s
#6 no comparison url found in template nbc.compare_page_2 needed +0s ... 0.019s
#7 composed specs +0s ... 0.019s
#8 did output specs +0s ... 0.019s
#9 getting avg benchmarks for device 14958 +0.027s ... 0.047s
#10 got single benchmarks 14958 +0.023s ... 0.07s
#11 got avg benchmarks for devices +0s ... 0.07s
#12 min, max, avg, median took s +3.313s ... 3.383s
#13 no comparison url found in template nbc.compare_page_2 needed +0.314s ... 3.696s
#14 return log +0s ... 3.696s