

Notebookcheck Logo
Teaser

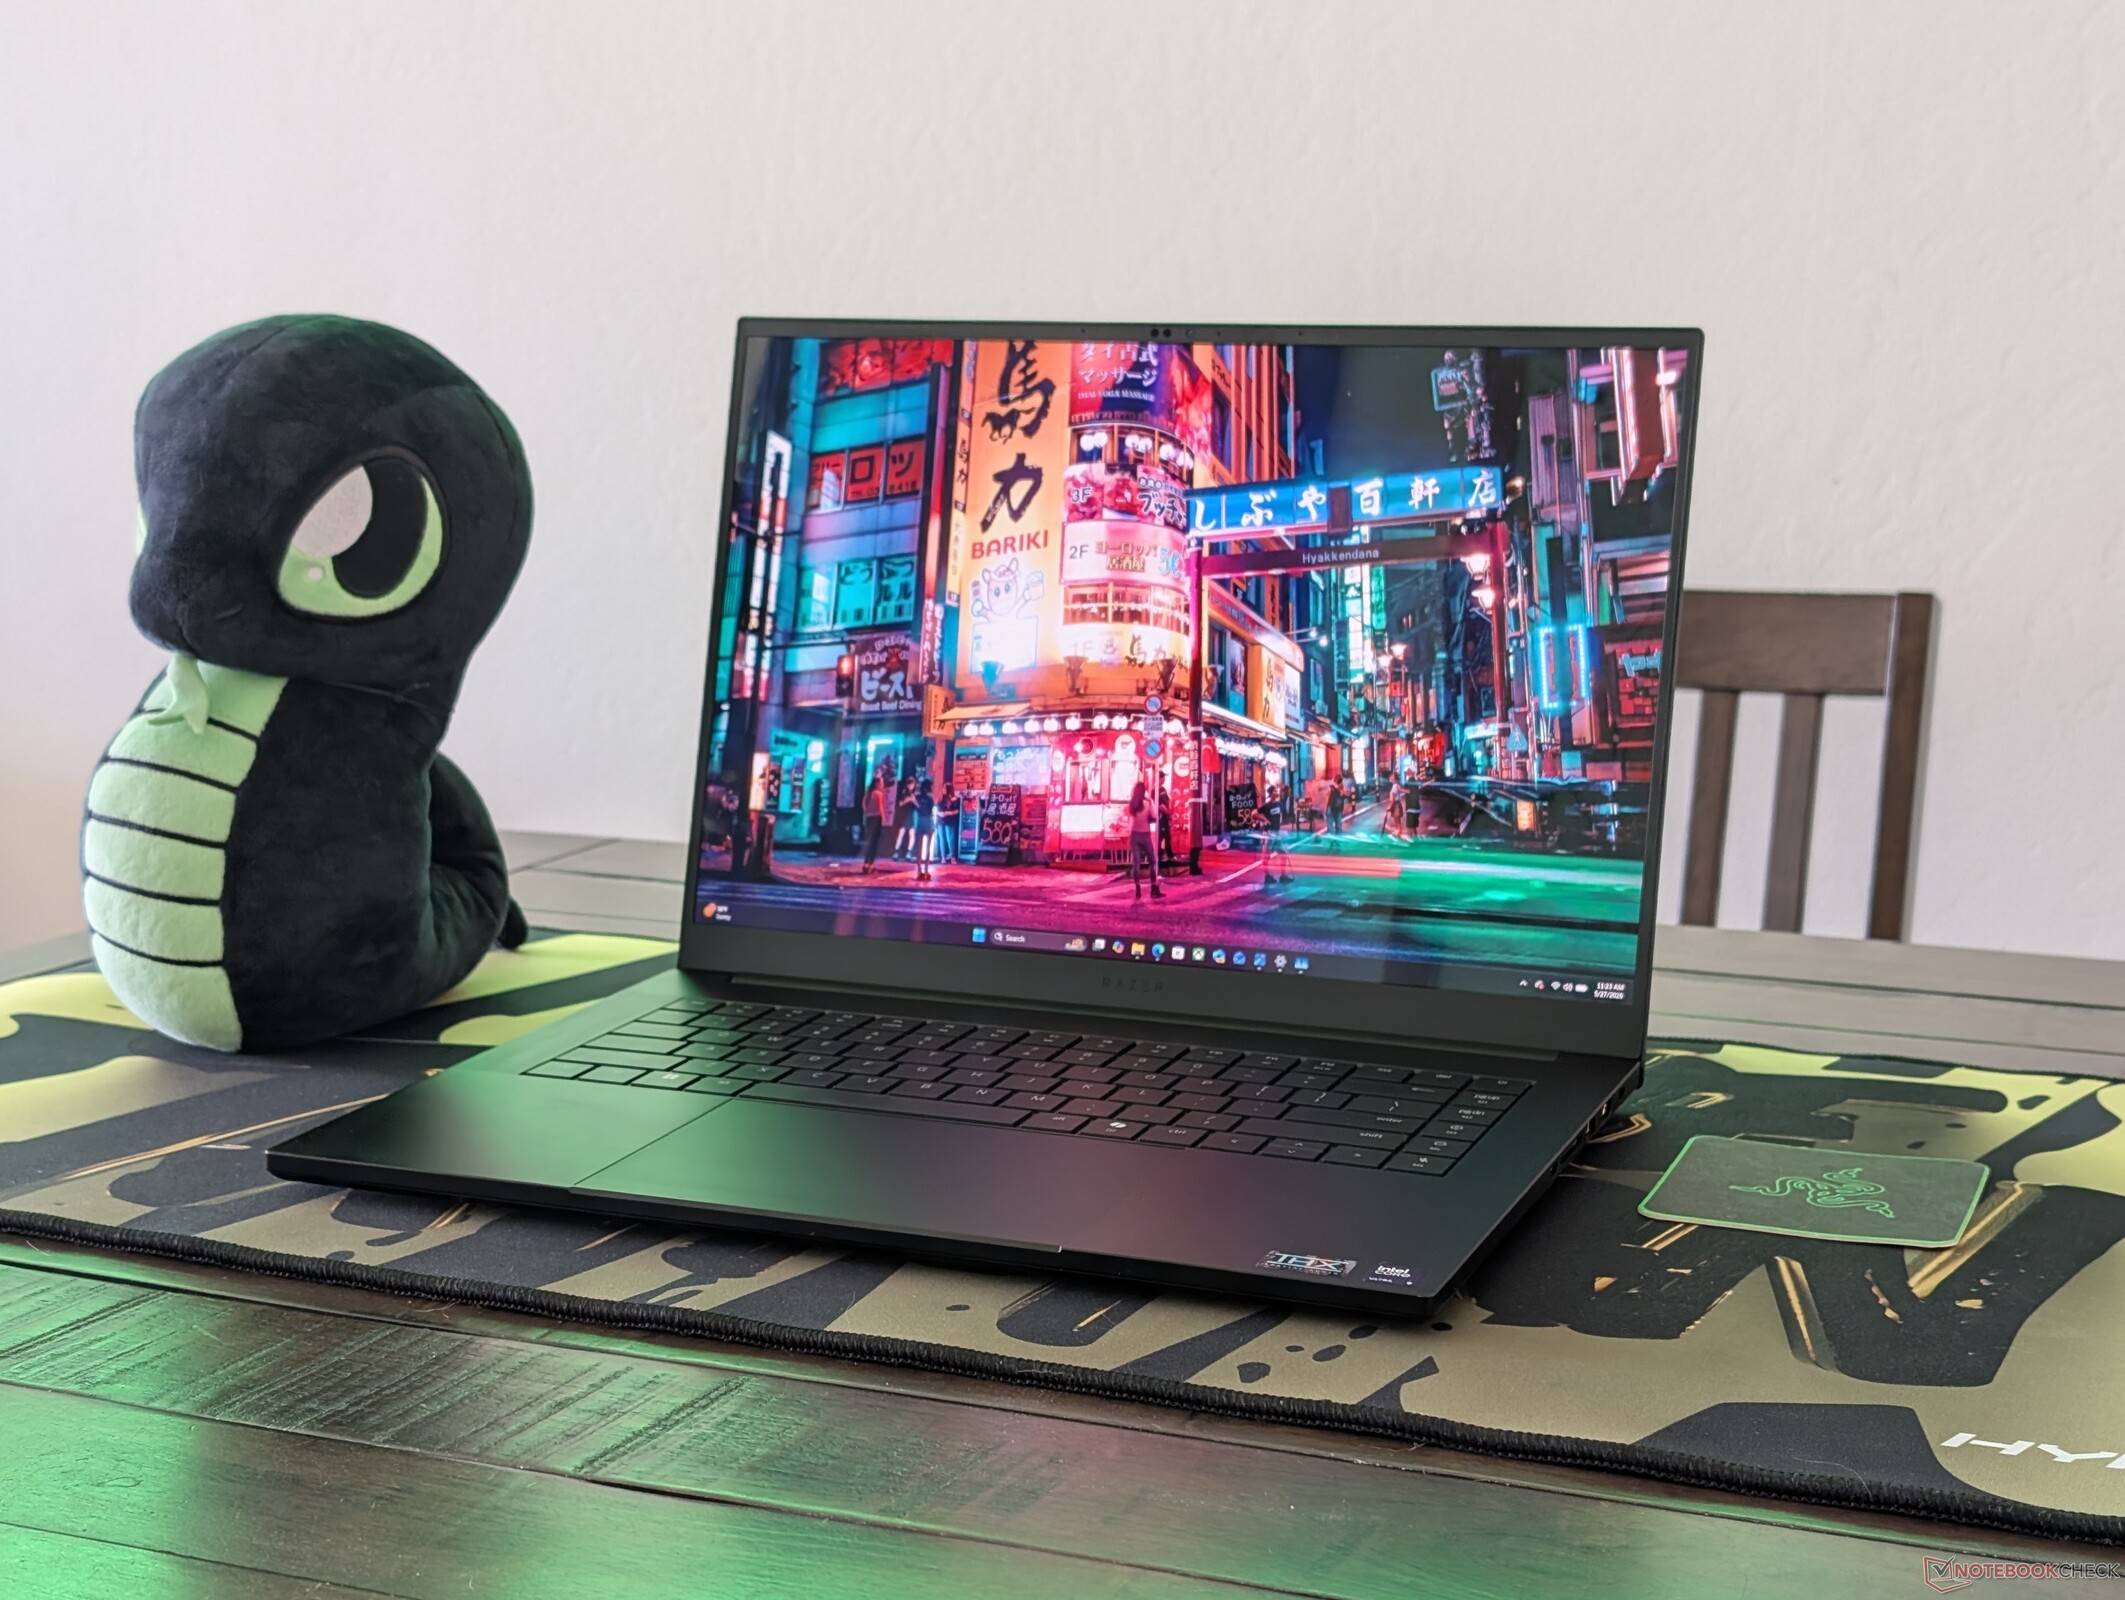
Recenzja Razer Blade 16: Intel Core Ultra zapewnia szybszą liczbę klatek na sekundę

Intel Panther Lake nad AMD Zen 5.

Wcześniej ekskluzywny dla AMD Razer Blade 16 można teraz skonfigurować z procesorami Intela, a różnice są dość zauważalne - często na lepsze. Proszę jednak być przygotowanym na zapłacenie jeszcze więcej za wszystkie ulepszenia.
Allen Ngo, 👁 Allen Ngo (tłumaczenie DeepL / Ninh Duy) Opublikowany 🇺🇸 🇳🇱 ...
Panther Lake Laptop / Notebook Gaming Geforce

Werdykt - lepiej z Intel Panther Lake

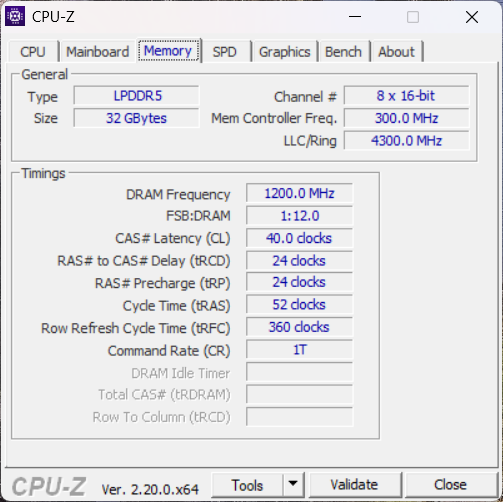
Od 2025 Blade 16 był tak ogromną aktualizacją 2024 Blade 16blade 16 z 2026 roku przynosi, co zrozumiałe, tylko mniejsze zmiany. Szybsza pamięć, lepsza obsługa HDR, nieco niższe temperatury rdzenia i bardziej wydajny procesor prowadzą do lepszej wydajności w grach dzięki temu samemu układowi GPU GeForce RTX 5090 i konstrukcji obudowy. W szczególności czas pracy na baterii jest tym razem znacznie dłuższy, co może przyciągnąć więcej studentów lub osób często podróżujących.

Główną wadą jest to, że lista ulepszeń wiąże się z bardzo zauważalnym wzrostem ceny. Podczas gdy Blade 16 z 2025 roku z Ryzen AI 9 HX i RTX 5090 został wprowadzony na rynek za 4500 USD, Blade 16 z 2026 roku z Core Ultra 9 i taką samą pojemnością GPU / RAM / SSD zostanie wprowadzony na rynek za 4900 USD. Tak więc, chociaż aktualizacje systemu w tym roku są mile widziane, wzrost ceny może być nieco trudniejszy do uzasadnienia w przypadku modelu, który już teraz sprzedaje się drożej niż większość konkurentów, w tym tych od Asusa.

Za

+ Bluetooth 6.0 i Thunderbolt 5 w standardzie
+ nieco niższe temperatury pracy
+ nieco wyższa wydajność w grach
+ dłuższa żywotność baterii WLAN z Intelem
+ ulepszona obsługa HDR

Przeciw

- nieco niższa surowa wydajność procesora niż w przypadku Ryzen AI 9 HX 370
- brak migawki prywatności lub ulepszeń kamery internetowej
- nadal brak ekranu dotykowego lub czytnika linii papilarnych
- ograniczona stabilność Turbo Boost
- brak opcji wyświetlania 4K

Cena i dostępność

Model 2026 Blade 16 w konfiguracji opisanej w niniejszej recenzji jest dostępny pod adresem i jest już dostępny w sprzedaży bezpośrednio od producenta w cenie 4900 USD.

Amazon Logo
$4,439.99
Razer Blade 16 (2025) Gaming Laptop: NVIDIA GeForce RTX 5090 - AMD Ryzen AI 9 HX 370 CPU - QHD+ 240Hz OLED Display - 32GB LPDDR5x RAM - 2TB SSD PCIe Gen4 - Windows 11 - Copilot+ PC - Chroma RGB

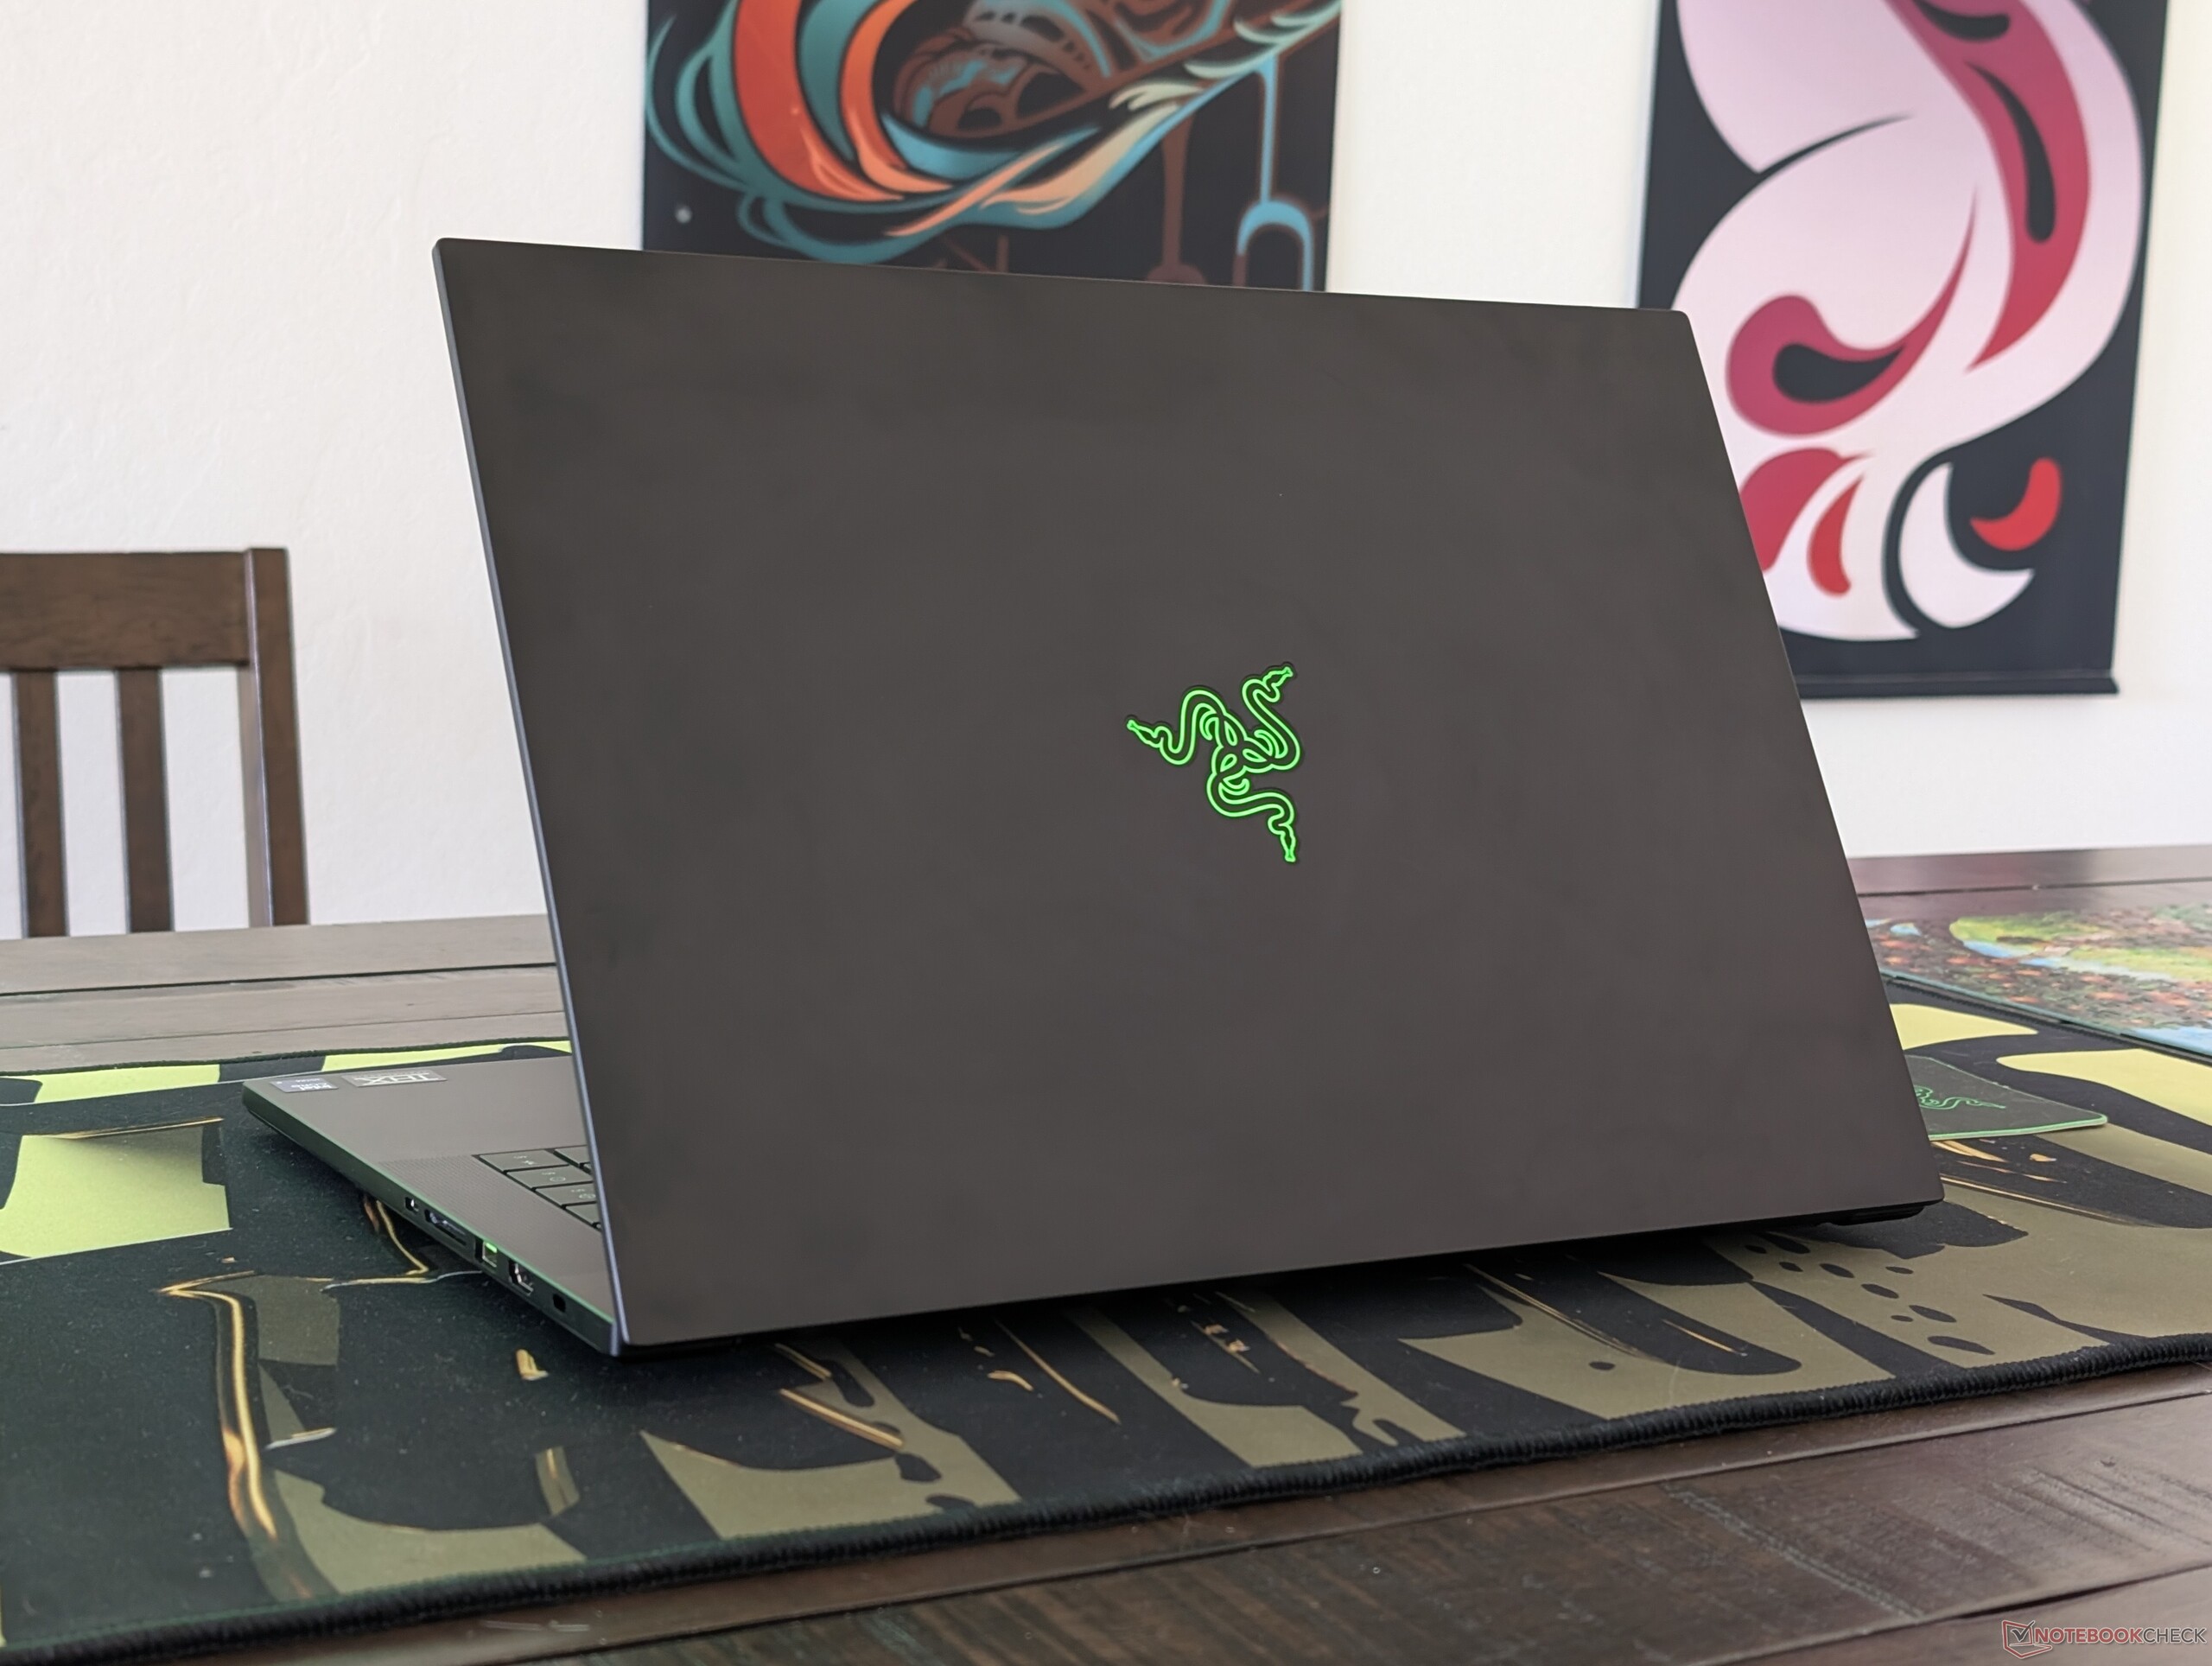
Razer Blade 16 powraca w 2026 roku z zupełnie nowymi konfiguracjami Intela, które uzupełniają opcje tylko AMD w Blade 16 2025. Modele 2025 i 2026 mają tę samą zewnętrzną konstrukcję obudowy, dlatego zalecamy zapoznanie się z naszą recenzję modelu 2025 aby dowiedzieć się więcej o fizycznych cechach Blade 16. Niemniej jednak istnieje kilka wewnętrznych ulepszeń i różnic, o których warto wspomnieć, a które zostaną szczegółowo opisane na tej stronie recenzji.

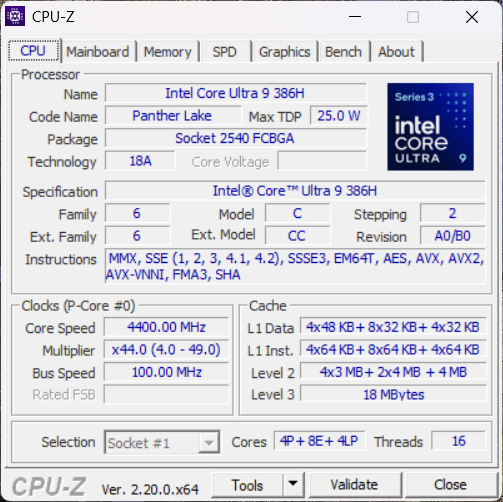
Nasza jednostka testowa to topowa konfiguracja z procesorem Panther Lake Core Ultra 9 386H, GPU GeForce RTX 5090 i wyświetlaczem OLED QHD + 240 Hz za około 4900 USD. Mniejsze konfiguracje są dostępne z RTX 5080 lub RTX 5060 w przypadku konfiguracji z Ryzen AI 9 365.

Konkurenci obejmują inne ultracienkie laptopy do gier, takie jak Alienware 16 Area-51, Lenovo Legion 9 16IRX8lub MSI Crosshair.

Więcej recenzji Razer:

Specyfikacje

Razer Blade 16 Core Ultra 9 386H (Blade 16 Rodzina)
Procesor
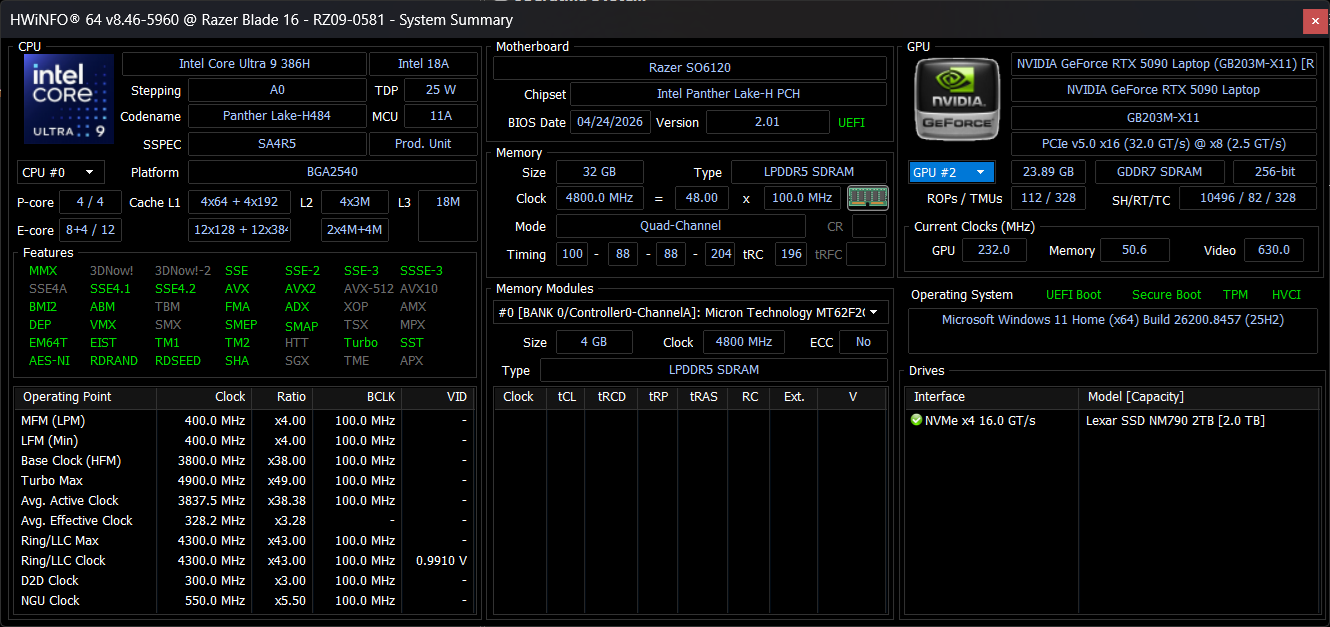
Intel Core Ultra 9 386H 16c/16t, 4 x 4.9 GHz Intel Cougar Cove P-Core, 8 x 3.9 GHz Intel Darkmont E-Core, 4 x 3.5 GHz Intel Darkmont LP E-Core, 85 W PL2 / Short Burst, 55 W PL1 / Sustained, Panther Lake
Karta grafiki
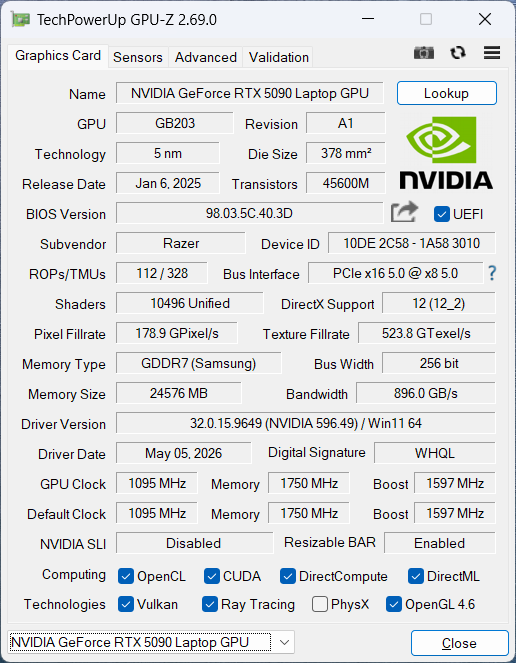
NVIDIA GeForce RTX 5090 Laptop - 24 GB VRAM, rdzeń: 1597 MHz, pamięć: 1750 MHz, 175 W TDP, GDDR7, 596.49, Advanced Optimus
Pamięć
32 GB 
, LPDDR5X-9600, Soldered, Dual-Channel
Matryca
16.00 cali 16:10, 2560 x 1600 pikseli 189 PPI, Samsung ATNA60HU06-0, OLED, refleksująca: tak, HDR, 240 Hz, Adaptive Sync
Chipset
Intel Panther Lake-H PCH
Dysk twardy
Lexar NM790 2TB, 2048 GB 
Karta dźwiękowa
Intel Panther Lake-H PCH - High Definition Audio - AVS (Audio, Voice, Speech)
Złącza
3 USB 3.1 Gen2, 2 USB4 40 Gbps, 1 Thunderbolt 4, 1 Thunderbolt 5, USB-C Power Delivery (PD), 1 HDMI, 2 DisplayPort, gniazda audio: 3.5 mm combo, czytnik kart: SDXC
Łączność
Intel Wi-Fi 7 BE213 160MHz ( be = Wi-Fi 7), Bluetooth 6.0
Gabaryty
wysokość x szerokość x głębokość (mm): 17.4 x 355 x 250.5
Akumulator
90 Wh litowo-jonowy
System operacyjny
Microsoft Windows 11 Home
Kamera
kamerka: 1080p + IR
Inne
głośniki: Six-speaker sound system, klawiatura: Chiclet, podświetlanie klawiatury: tak, Razer Synapse, 12 miesiące(y) gwarancji
Waga
2.124 kg, zasilacz: 861 g
Cena
4900 USD
Amazon
Uwaga: Producent może używać komponentów pochodzących od różnych dostawców, w tym paneli wyświetlaczy, napędów lub kart pamięci o podobnych specyfikacjach.


Przypadek

Porównanie rozmiarów

365 mm 290 mm 28.5 mm 3.3 kg364.38 mm 275.94 mm 26.65 mm 2.6 kg359 mm 266.4 mm 27.9 mm 2.5 kg357 mm 269 mm 24.9 mm 2.8 kg355 mm 250.5 mm 17.4 mm 2.1 kg355 mm 250.5 mm 17.4 mm 2.1 kg297 mm 210 mm 1 mm 5.7 g

Łączność

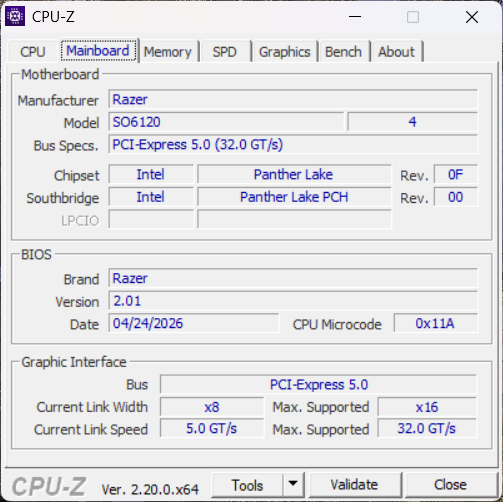
Chociaż opcje portów są wizualnie identyczne, porty USB-C obsługują teraz Thunderbolt 4 i Thunderbolt 5, zapewniając lepsze możliwości dokowania i obsługę eGPU.

Czytnik kart SD

SD Card Reader
average JPG Copy Test (av. of 3 runs)
Alienware 16 Area-51 Core Ultra 9 290HX Plus
Intel Core Ultra 9 290HX Plus (Toshiba Exceria Pro SDXC 64 GB UHS-II)
191.4 MB/s +27%
Razer Blade 16 Core Ultra 9 386H
Intel Core Ultra 9 386H (Toshiba Exceria Pro SDXC 64 GB UHS-II)
151.3 MB/s
Razer Blade 16 2025 RTX 5090
AMD Ryzen AI 9 HX 370 (Angelbird AV Pro V60)
133 MB/s -12%
maximum AS SSD Seq Read Test (1GB)
Razer Blade 16 Core Ultra 9 386H
Intel Core Ultra 9 386H (Toshiba Exceria Pro SDXC 64 GB UHS-II)
228.9 MB/s
Alienware 16 Area-51 Core Ultra 9 290HX Plus
Intel Core Ultra 9 290HX Plus (Toshiba Exceria Pro SDXC 64 GB UHS-II)
228.87 MB/s 0%
Razer Blade 16 2025 RTX 5090
AMD Ryzen AI 9 HX 370 (Angelbird AV Pro V60)
193.2 MB/s -16%

Komunikacja

Networking
iperf3 transmit AXE11000
Razer Blade 16 2025 RTX 5090
Mediatek Wi-Fi 7 MT7925 Wireless LAN Card
1781 (1669min, 1680.89P1 - 1877max) MBit/s +22%
Razer Blade 16 Core Ultra 9 386H
Intel Wi-Fi 7 BE213 160MHz
1458 (1207min - 1616max) MBit/s
Alienware 16 Area-51 Core Ultra 9 290HX Plus
Intel Killer Wi-Fi 7 BE1750W 320 MHz (BE200NGW)
1457 (1280min - 1582max) MBit/s 0%
HP Omen Max 16 ah000
Intel Wi-Fi 7 BE200 320MHz
1270 (961min - 1408max) MBit/s -13%
Lenovo Legion Pro 7i 16 Gen 10
Intel Wi-Fi 7 BE200 320MHz
1194 (998min - 1286max) MBit/s -18%
MSI Crosshair 16 HX AI D2XWGKG
Intel Wi-Fi 6E AX211
908 (545min - 976max) MBit/s -38%
iperf3 receive AXE11000
Razer Blade 16 2025 RTX 5090
Mediatek Wi-Fi 7 MT7925 Wireless LAN Card
1708 (1681min, 1682.16P1 - 1731max) MBit/s +26%
HP Omen Max 16 ah000
Intel Wi-Fi 7 BE200 320MHz
1422 (1224min - 1482max) MBit/s +5%
Razer Blade 16 Core Ultra 9 386H
Intel Wi-Fi 7 BE213 160MHz
1351 (1131min - 1477max) MBit/s
Alienware 16 Area-51 Core Ultra 9 290HX Plus
Intel Killer Wi-Fi 7 BE1750W 320 MHz (BE200NGW)
1333 (1076min - 1469max) MBit/s -1%
Lenovo Legion Pro 7i 16 Gen 10
Intel Wi-Fi 7 BE200 320MHz
1312 (1065min - 1393max) MBit/s -3%
MSI Crosshair 16 HX AI D2XWGKG
Intel Wi-Fi 6E AX211
965 (933min - 978max) MBit/s -29%
iperf3 transmit AXE11000 6GHz
MSI Crosshair 16 HX AI D2XWGKG
Intel Wi-Fi 6E AX211
1708 (1673min - 1769max) MBit/s +7%
Alienware 16 Area-51 Core Ultra 9 290HX Plus
Intel Killer Wi-Fi 7 BE1750W 320 MHz (BE200NGW)
1610 (1324min - 1718max) MBit/s +1%
Razer Blade 16 Core Ultra 9 386H
Intel Wi-Fi 7 BE213 160MHz
1597 (1410min - 1661max) MBit/s
Lenovo Legion Pro 7i 16 Gen 10
Intel Wi-Fi 7 BE200 320MHz
1402 (997min - 1490max) MBit/s -12%
HP Omen Max 16 ah000
Intel Wi-Fi 7 BE200 320MHz
1242 (1202min - 1314max) MBit/s -22%
iperf3 receive AXE11000 6GHz
Razer Blade 16 Core Ultra 9 386H
Intel Wi-Fi 7 BE213 160MHz
1736 (1708min - 1755max) MBit/s
MSI Crosshair 16 HX AI D2XWGKG
Intel Wi-Fi 6E AX211
1731 (1699min - 1756max) MBit/s 0%
Alienware 16 Area-51 Core Ultra 9 290HX Plus
Intel Killer Wi-Fi 7 BE1750W 320 MHz (BE200NGW)
1681 (1662min - 1703max) MBit/s -3%
Lenovo Legion Pro 7i 16 Gen 10
Intel Wi-Fi 7 BE200 320MHz
1564 (1521min - 1603max) MBit/s -10%
HP Omen Max 16 ah000
Intel Wi-Fi 7 BE200 320MHz
1513 (1456min - 1541max) MBit/s -13%
010020030040050060070080090010001100120013001400150016001700Tooltip
Razer Blade 16 Core Ultra 9 386H; iperf3 transmit AXE11000 6GHz; iperf 3.1.3: Ø1597 (1410-1661)
Razer Blade 16 Core Ultra 9 386H; iperf3 receive AXE11000 6GHz; iperf 3.1.3: Ø1735 (1708-1755)

Kamera internetowa

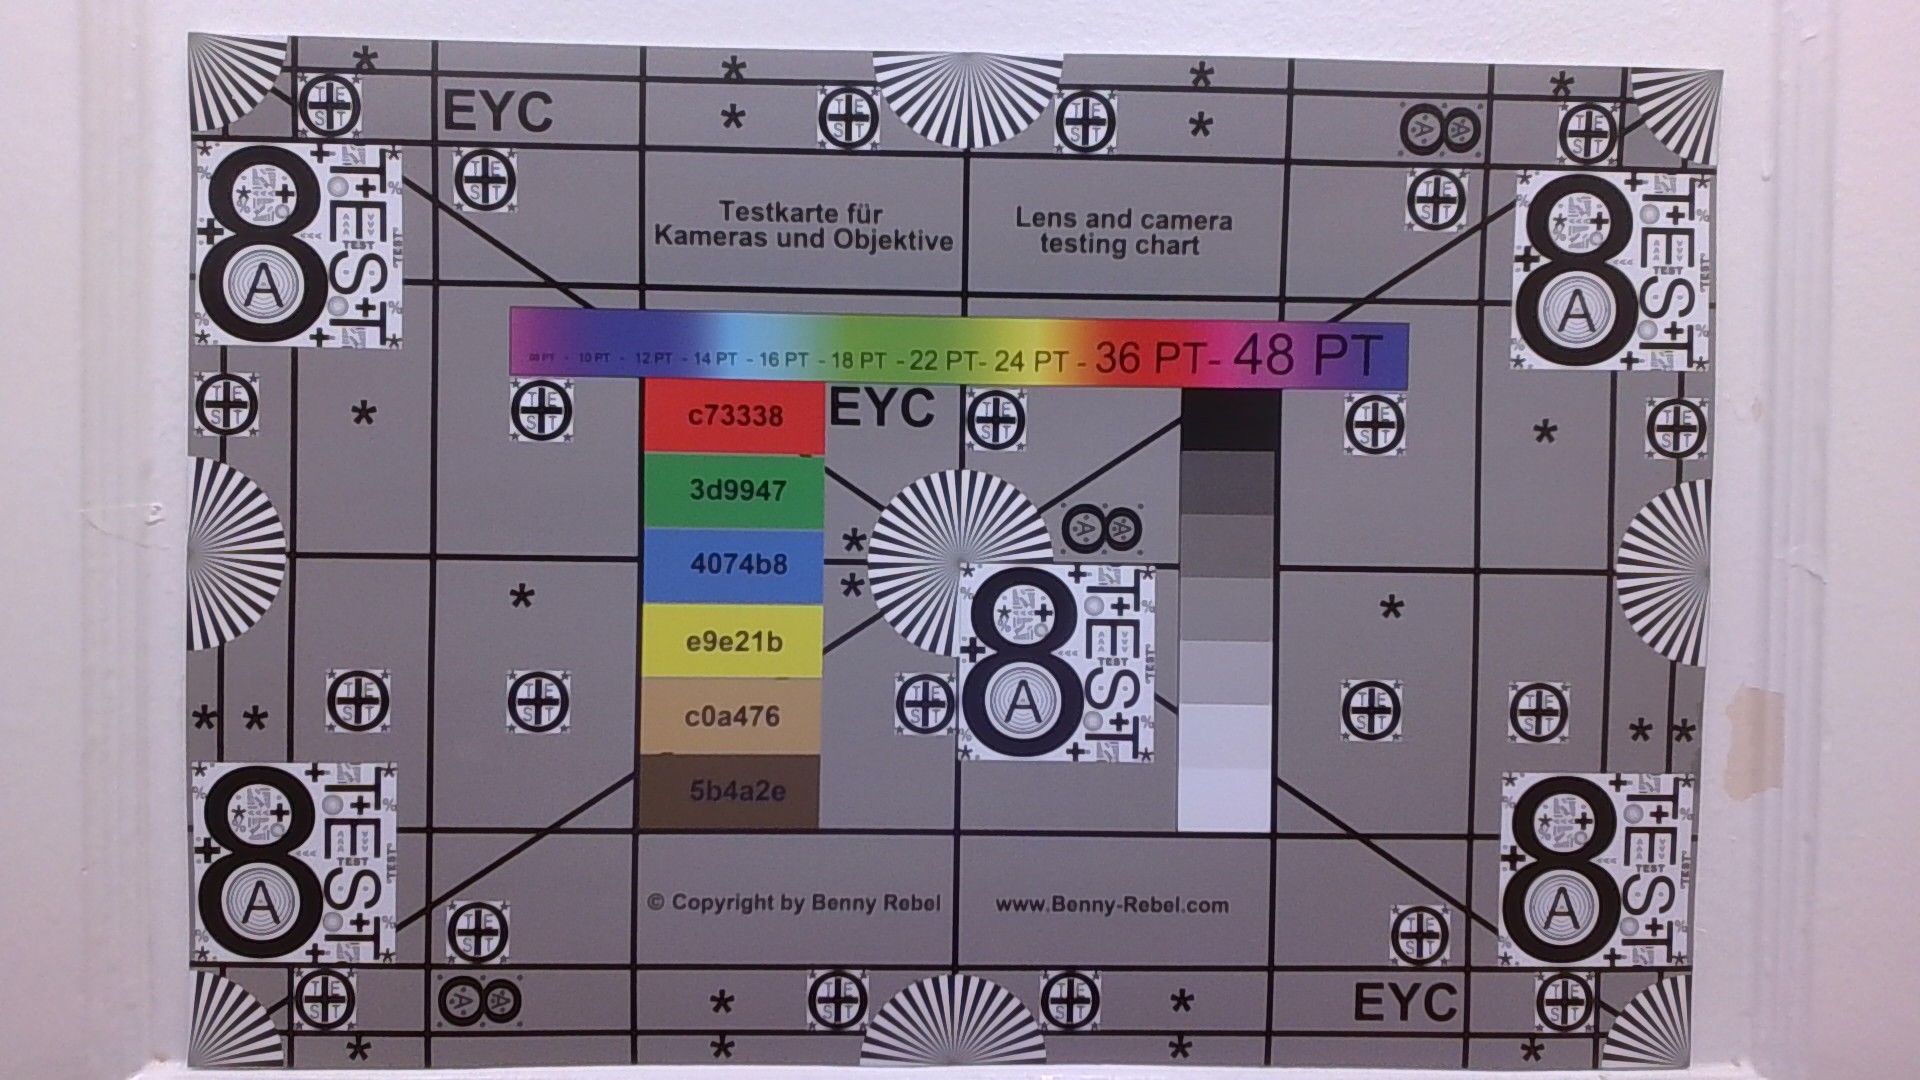
ColorChecker
8.9 ∆E
13.6 ∆E
8.4 ∆E
11.3 ∆E
8.9 ∆E
16.2 ∆E
12 ∆E
9.6 ∆E
11.2 ∆E
8.4 ∆E
12.5 ∆E
10.1 ∆E
7 ∆E
14.8 ∆E
14.1 ∆E
12.1 ∆E
13.4 ∆E
20 ∆E
2.3 ∆E
13.9 ∆E
22.7 ∆E
22.4 ∆E
18.7 ∆E
13.9 ∆E
ColorChecker Razer Blade 16 Core Ultra 9 386H: 12.77 ∆E min: 2.33 - max: 22.67 ∆E

Konserwacja

2026 Blade 16
2026 Blade 16
2025 Blade 16
2025 Blade 16

Wyświetlacz

Błyszczący OLED bez większych problemów z ziarnistością

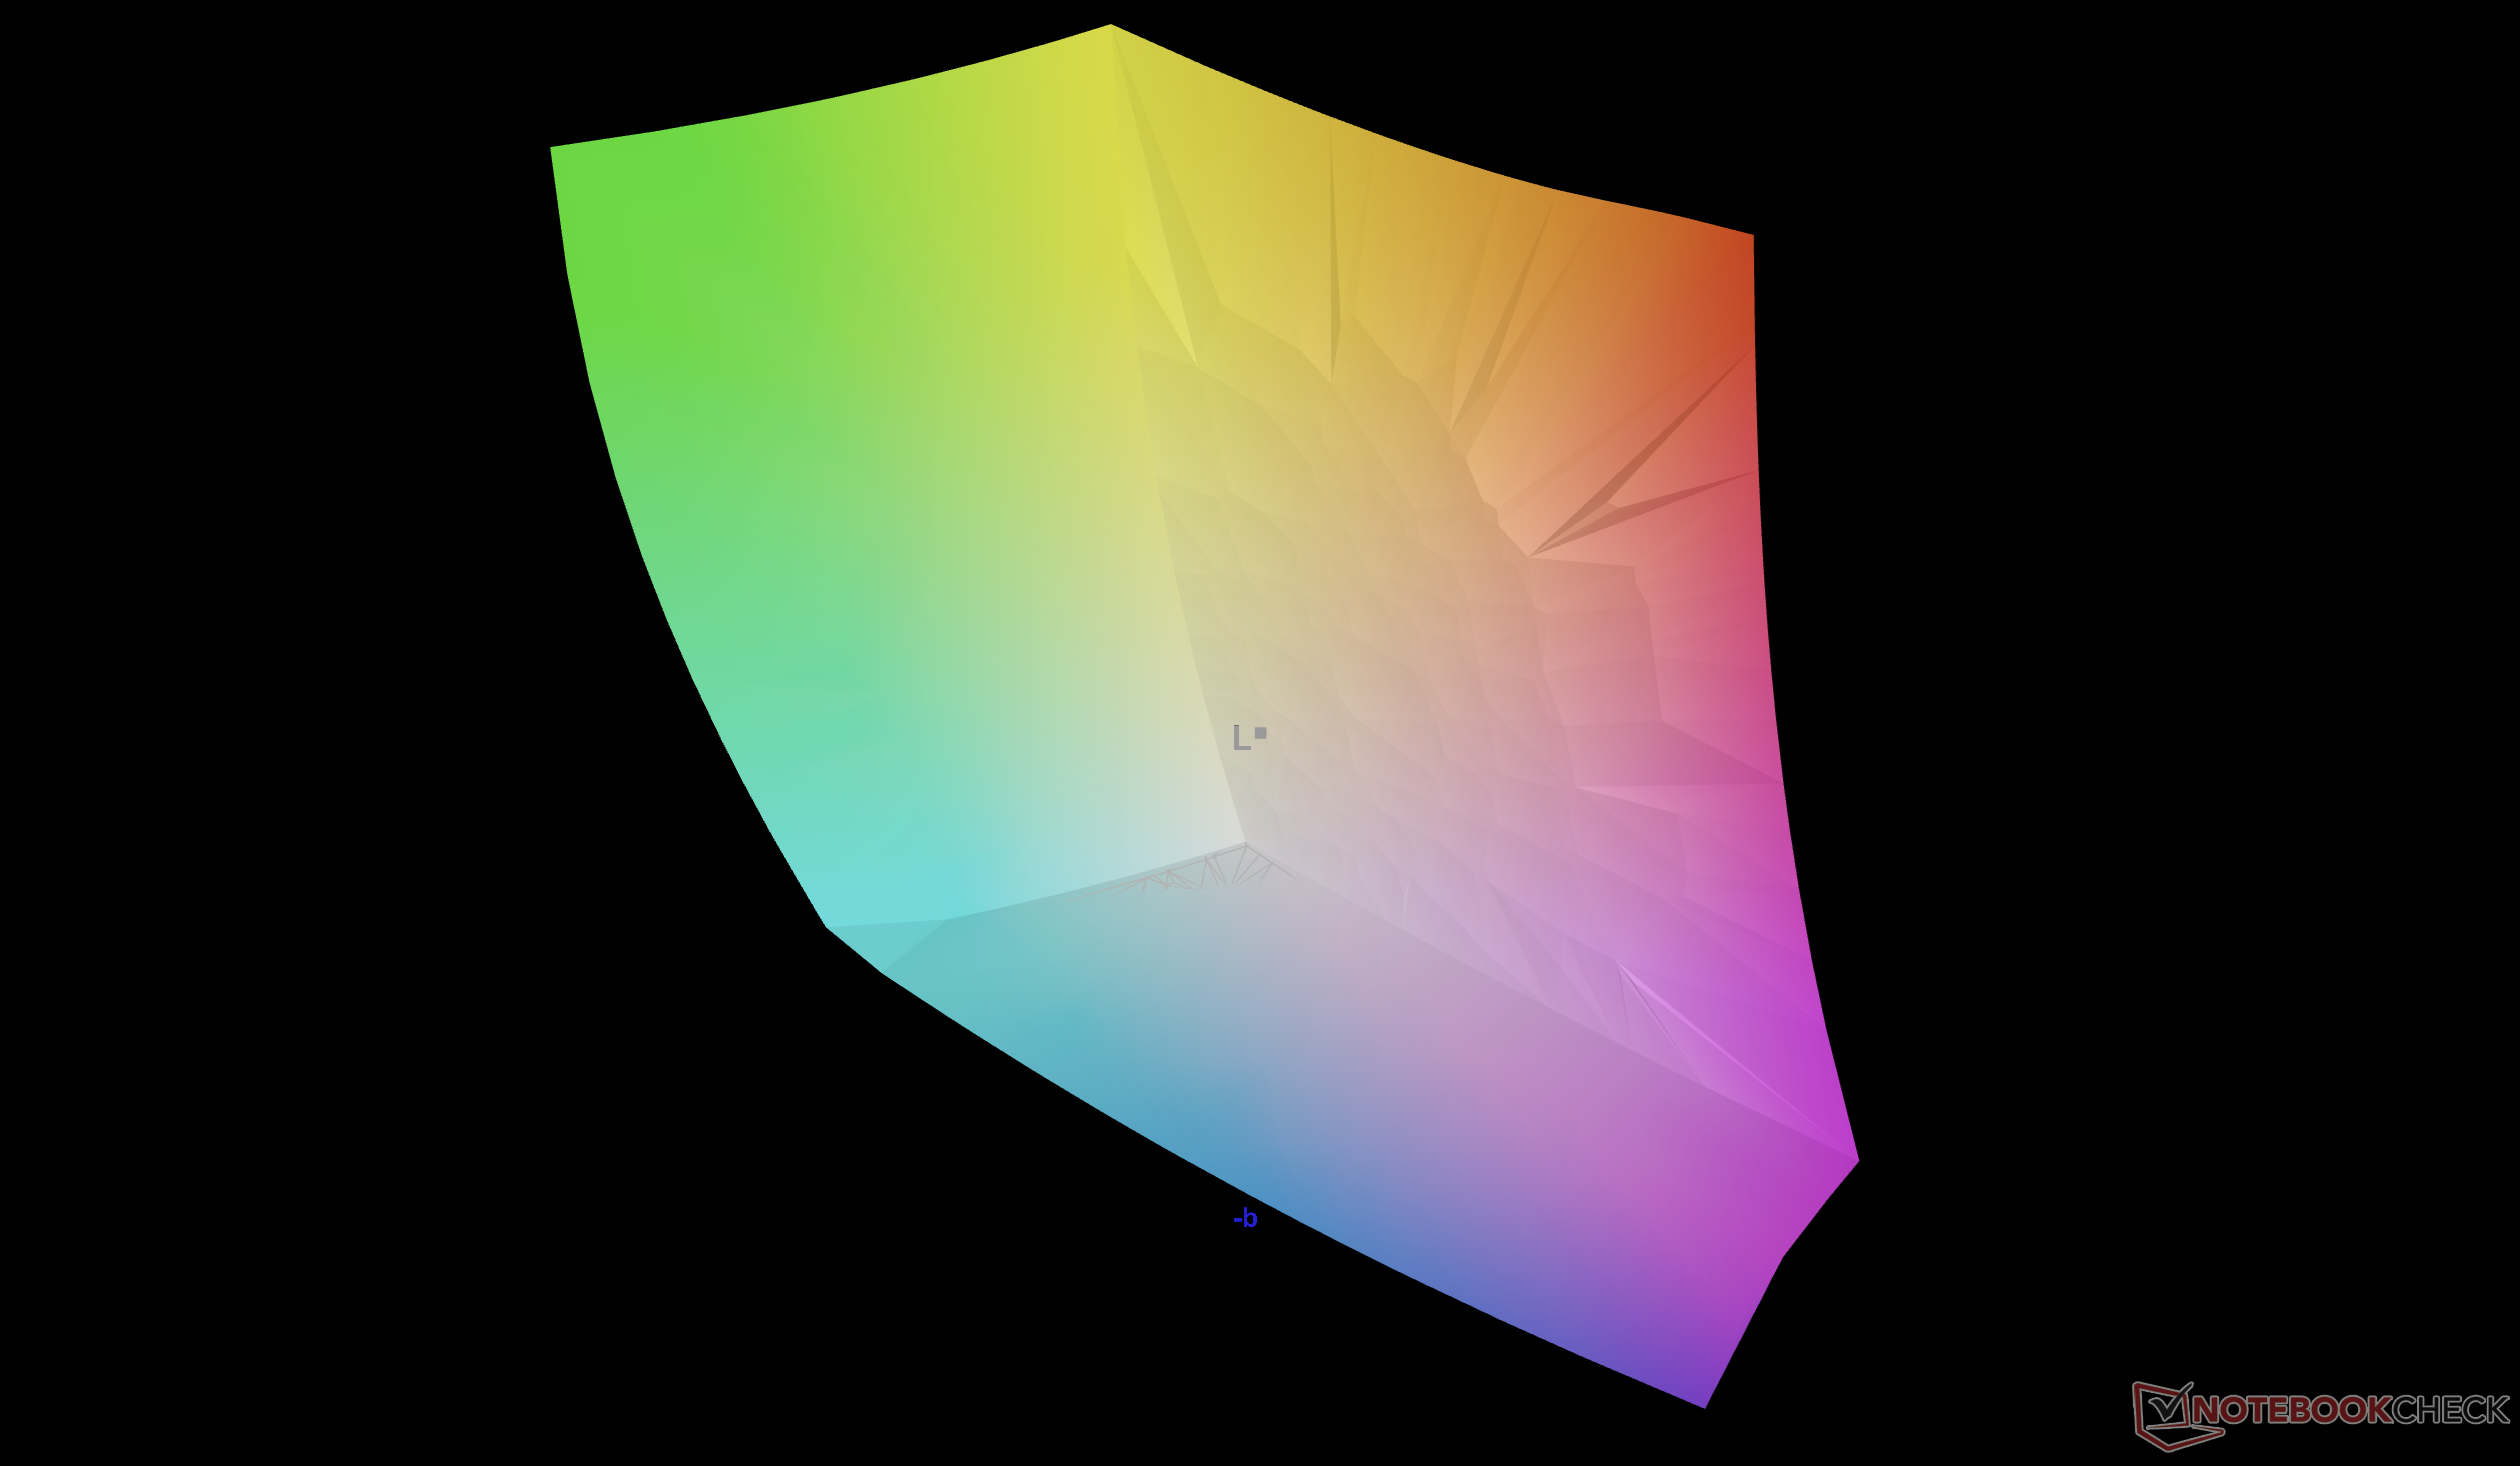
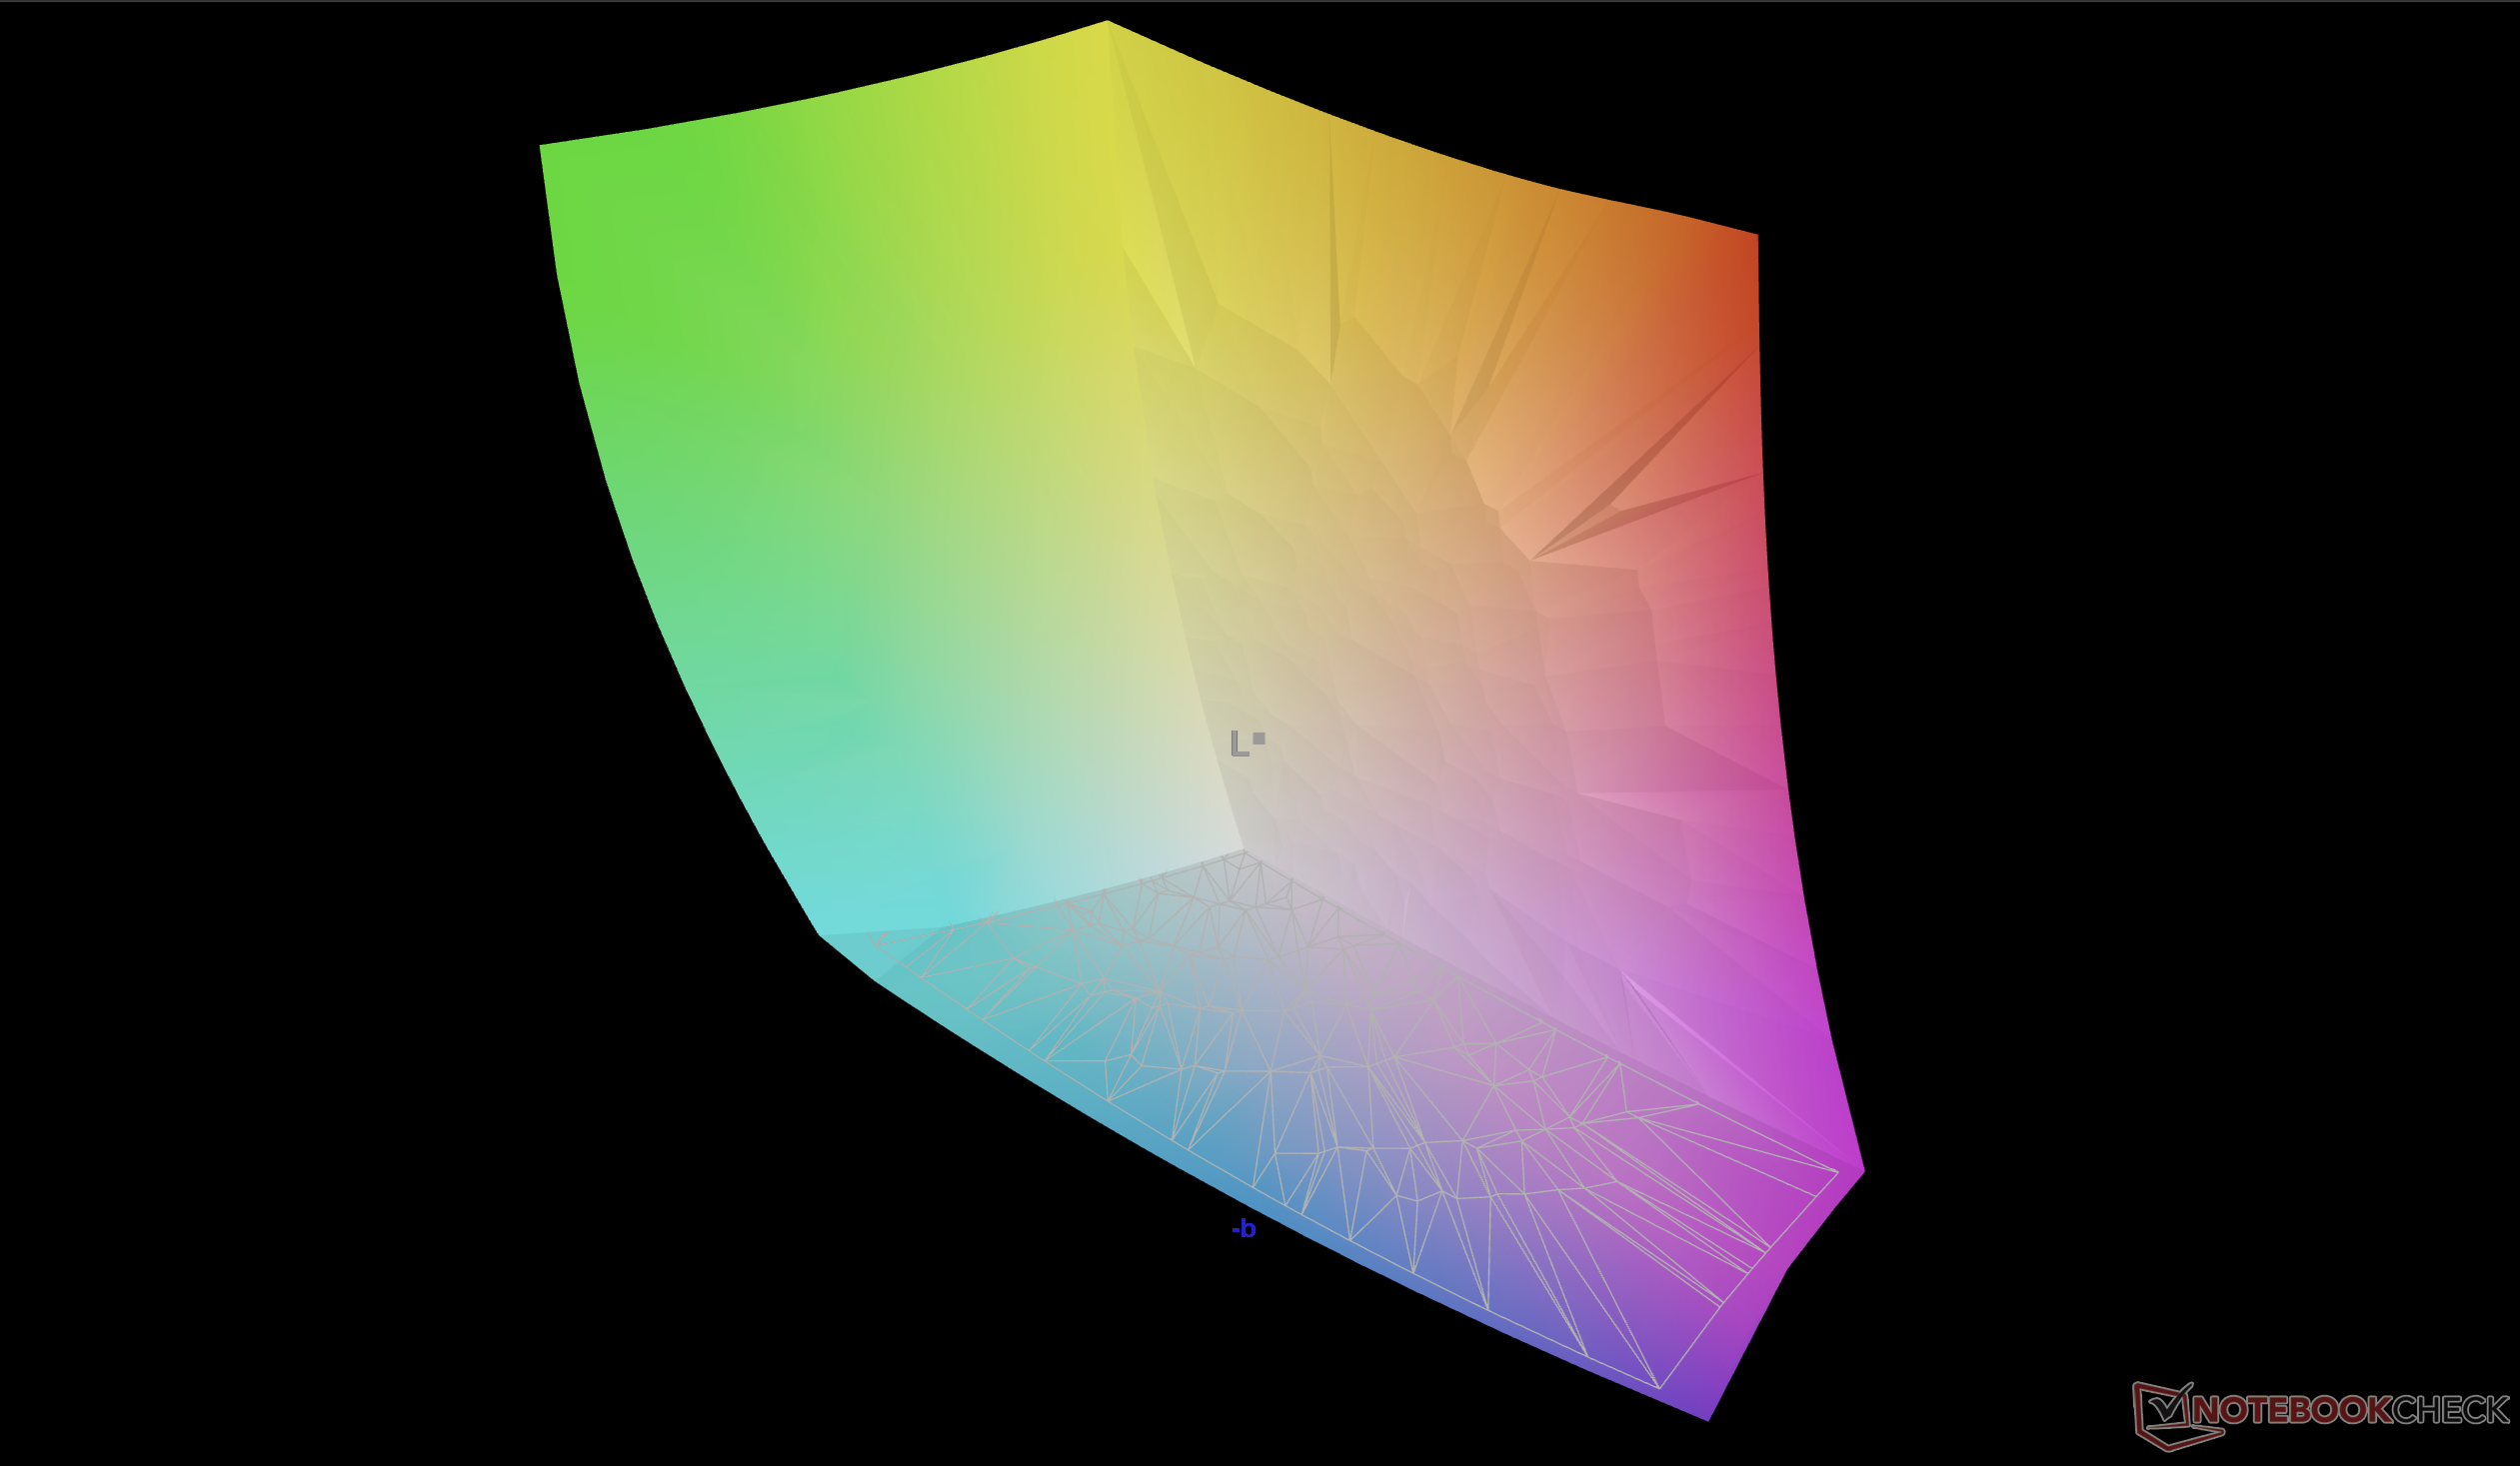
Wyświetlacz OLED nie przeszedł żadnych większych zmian, jeśli chodzi o natywną częstotliwość odświeżania, rozdzielczość, kolory P3, a nawet producenta panelu, zapewniając identyczne wrażenia wizualne jak Blade 16 z 2025 roku. Wyświetlacz Blade 16 2026 jest jednak jaśniejszy w trybie SDR, a zwłaszcza w trybie HDR (500 nitów do 1000 nitów), co znacznie poprawia obsługę odtwarzania HDR.

467.8
cd/m²
462.5
cd/m²
466.4
cd/m²
462.5
cd/m²
462.2
cd/m²
468
cd/m²
460.2
cd/m²
461.7
cd/m²
472.9
cd/m²
podświetlenie ekranu
Samsung ATNA60HU06-0 testowany z X-Rite i1Pro 3
maksimum: 472.9 cd/m² (Nits) średnia: 464.9 cd/m² Minimum: 4.18 cd/m²
rozświetlenie: 97 %
na akumulatorze: 462.2 cd/m²
kontrast: ∞:1 (czerń: 0 cd/m²)
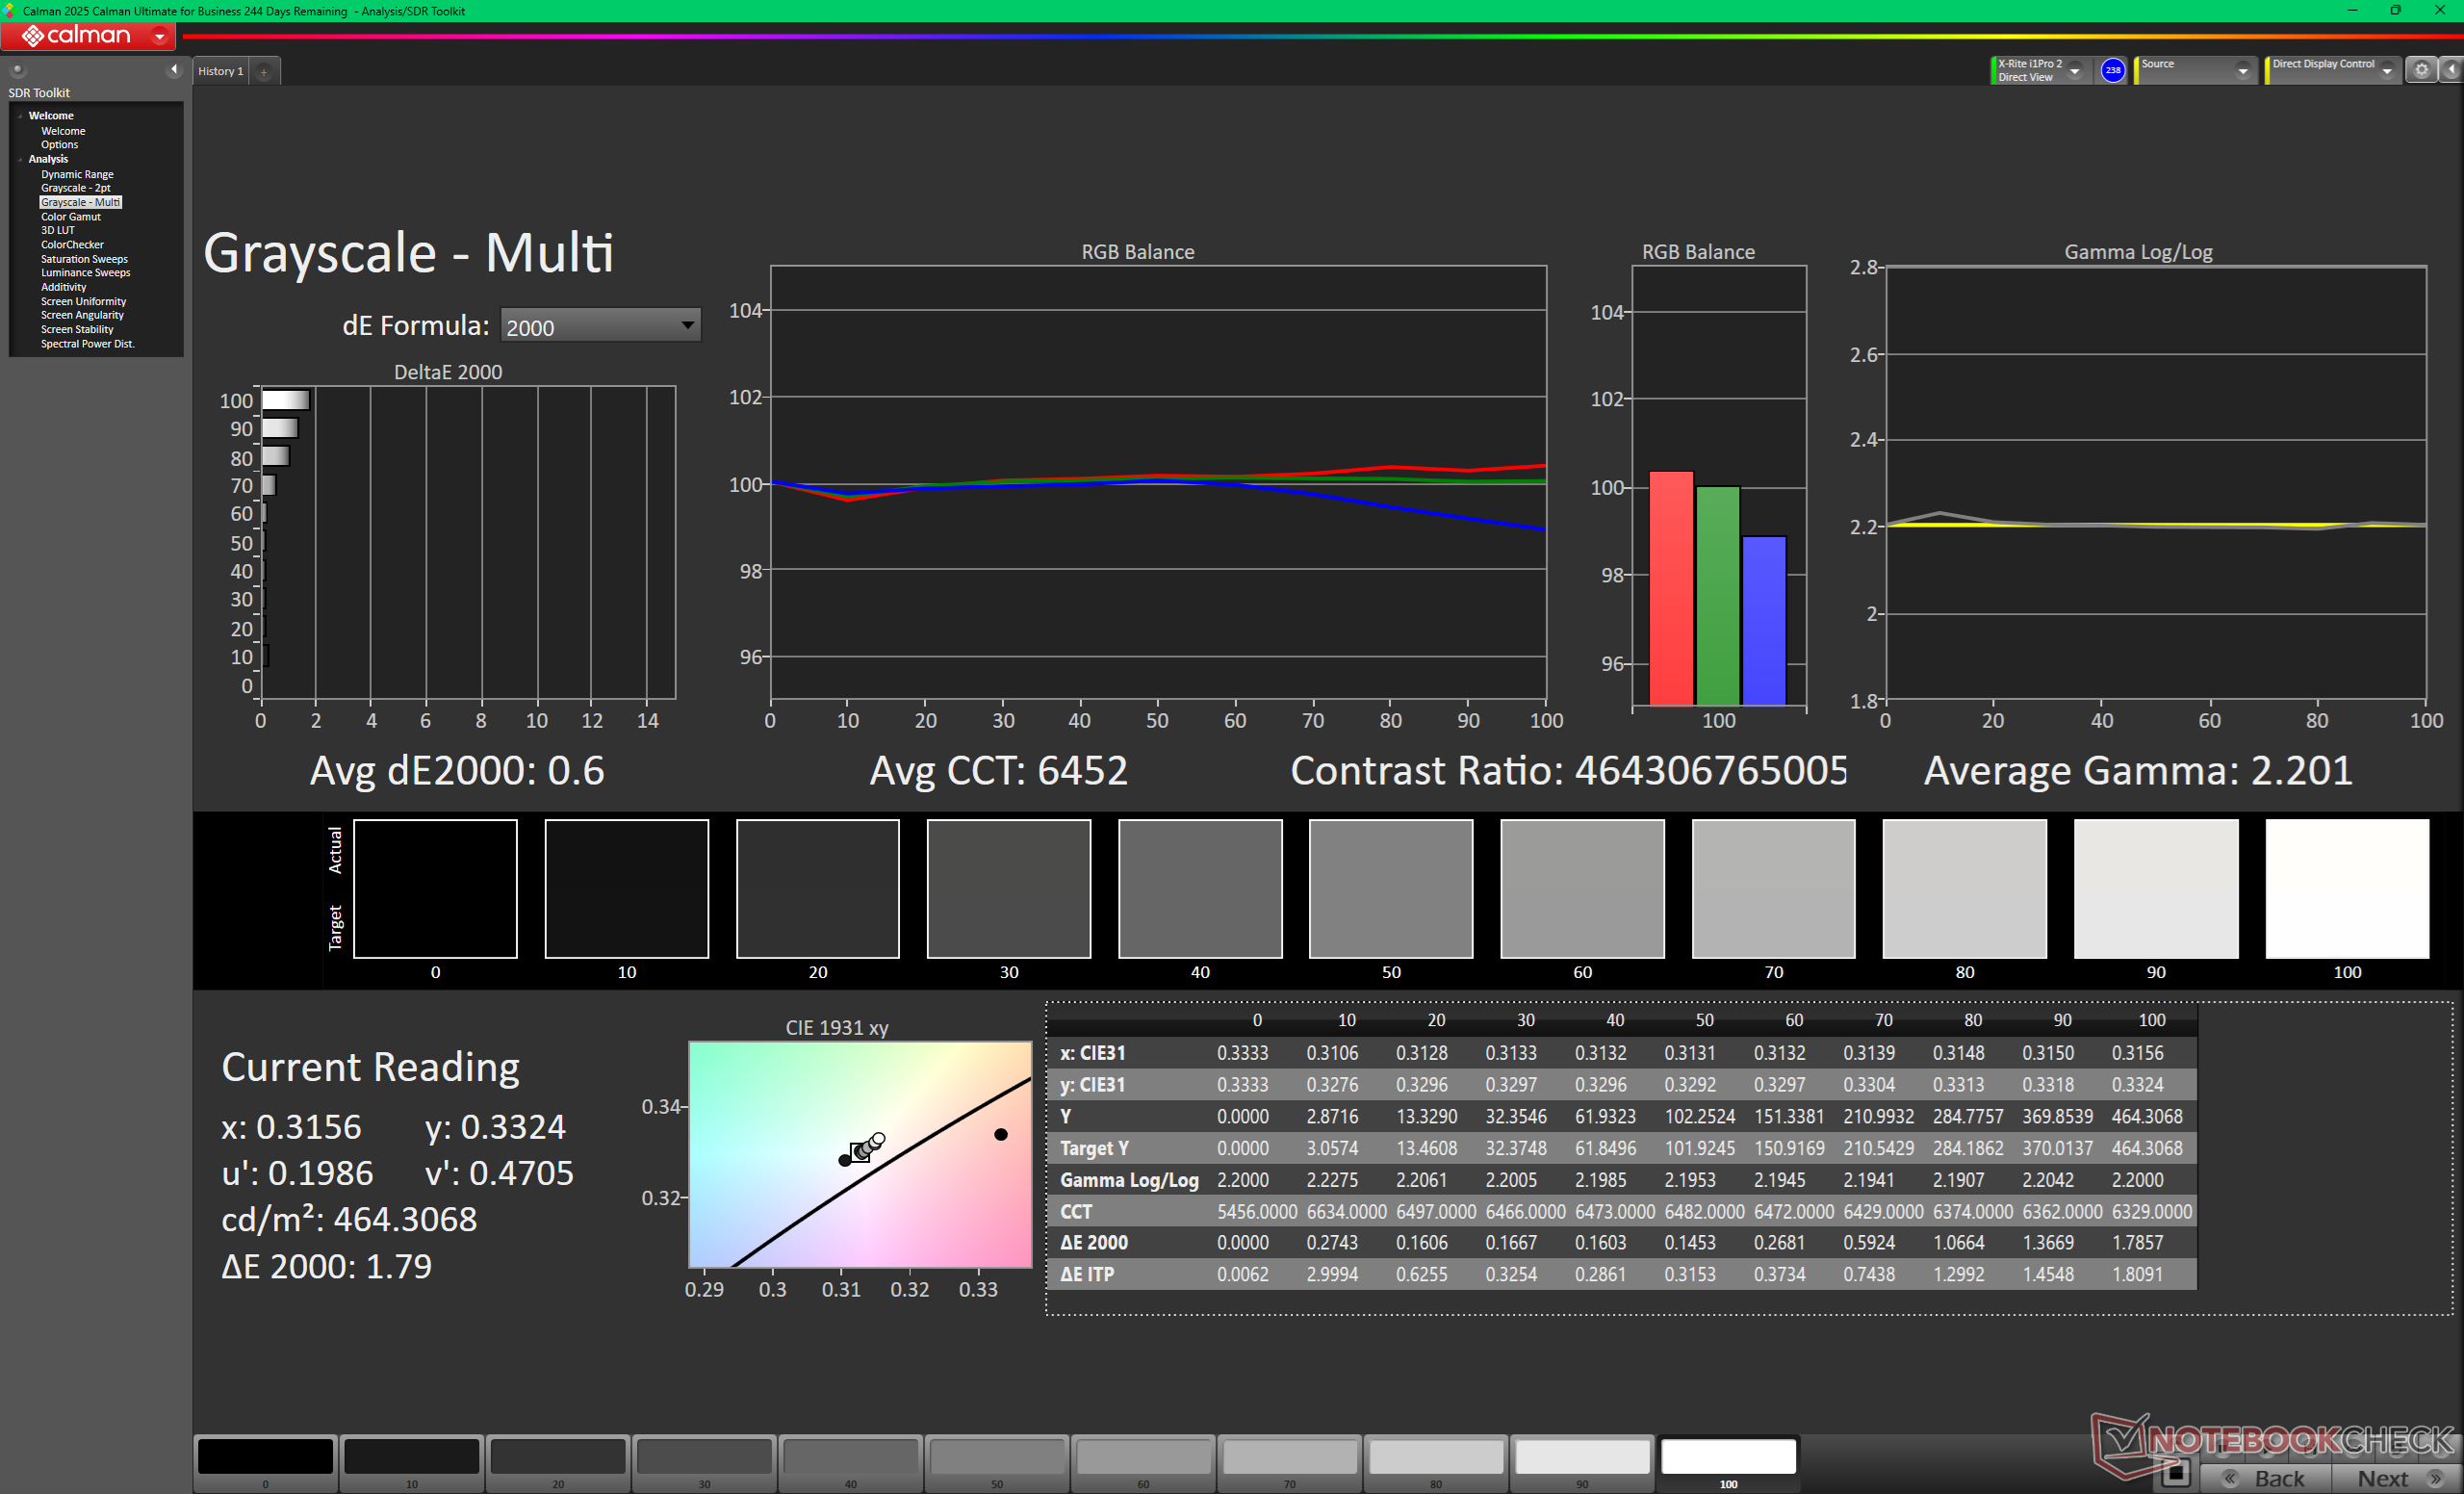
ΔE ColorChecker Calman: 3.03 | ∀{0.5-29.43 Ø4.73}
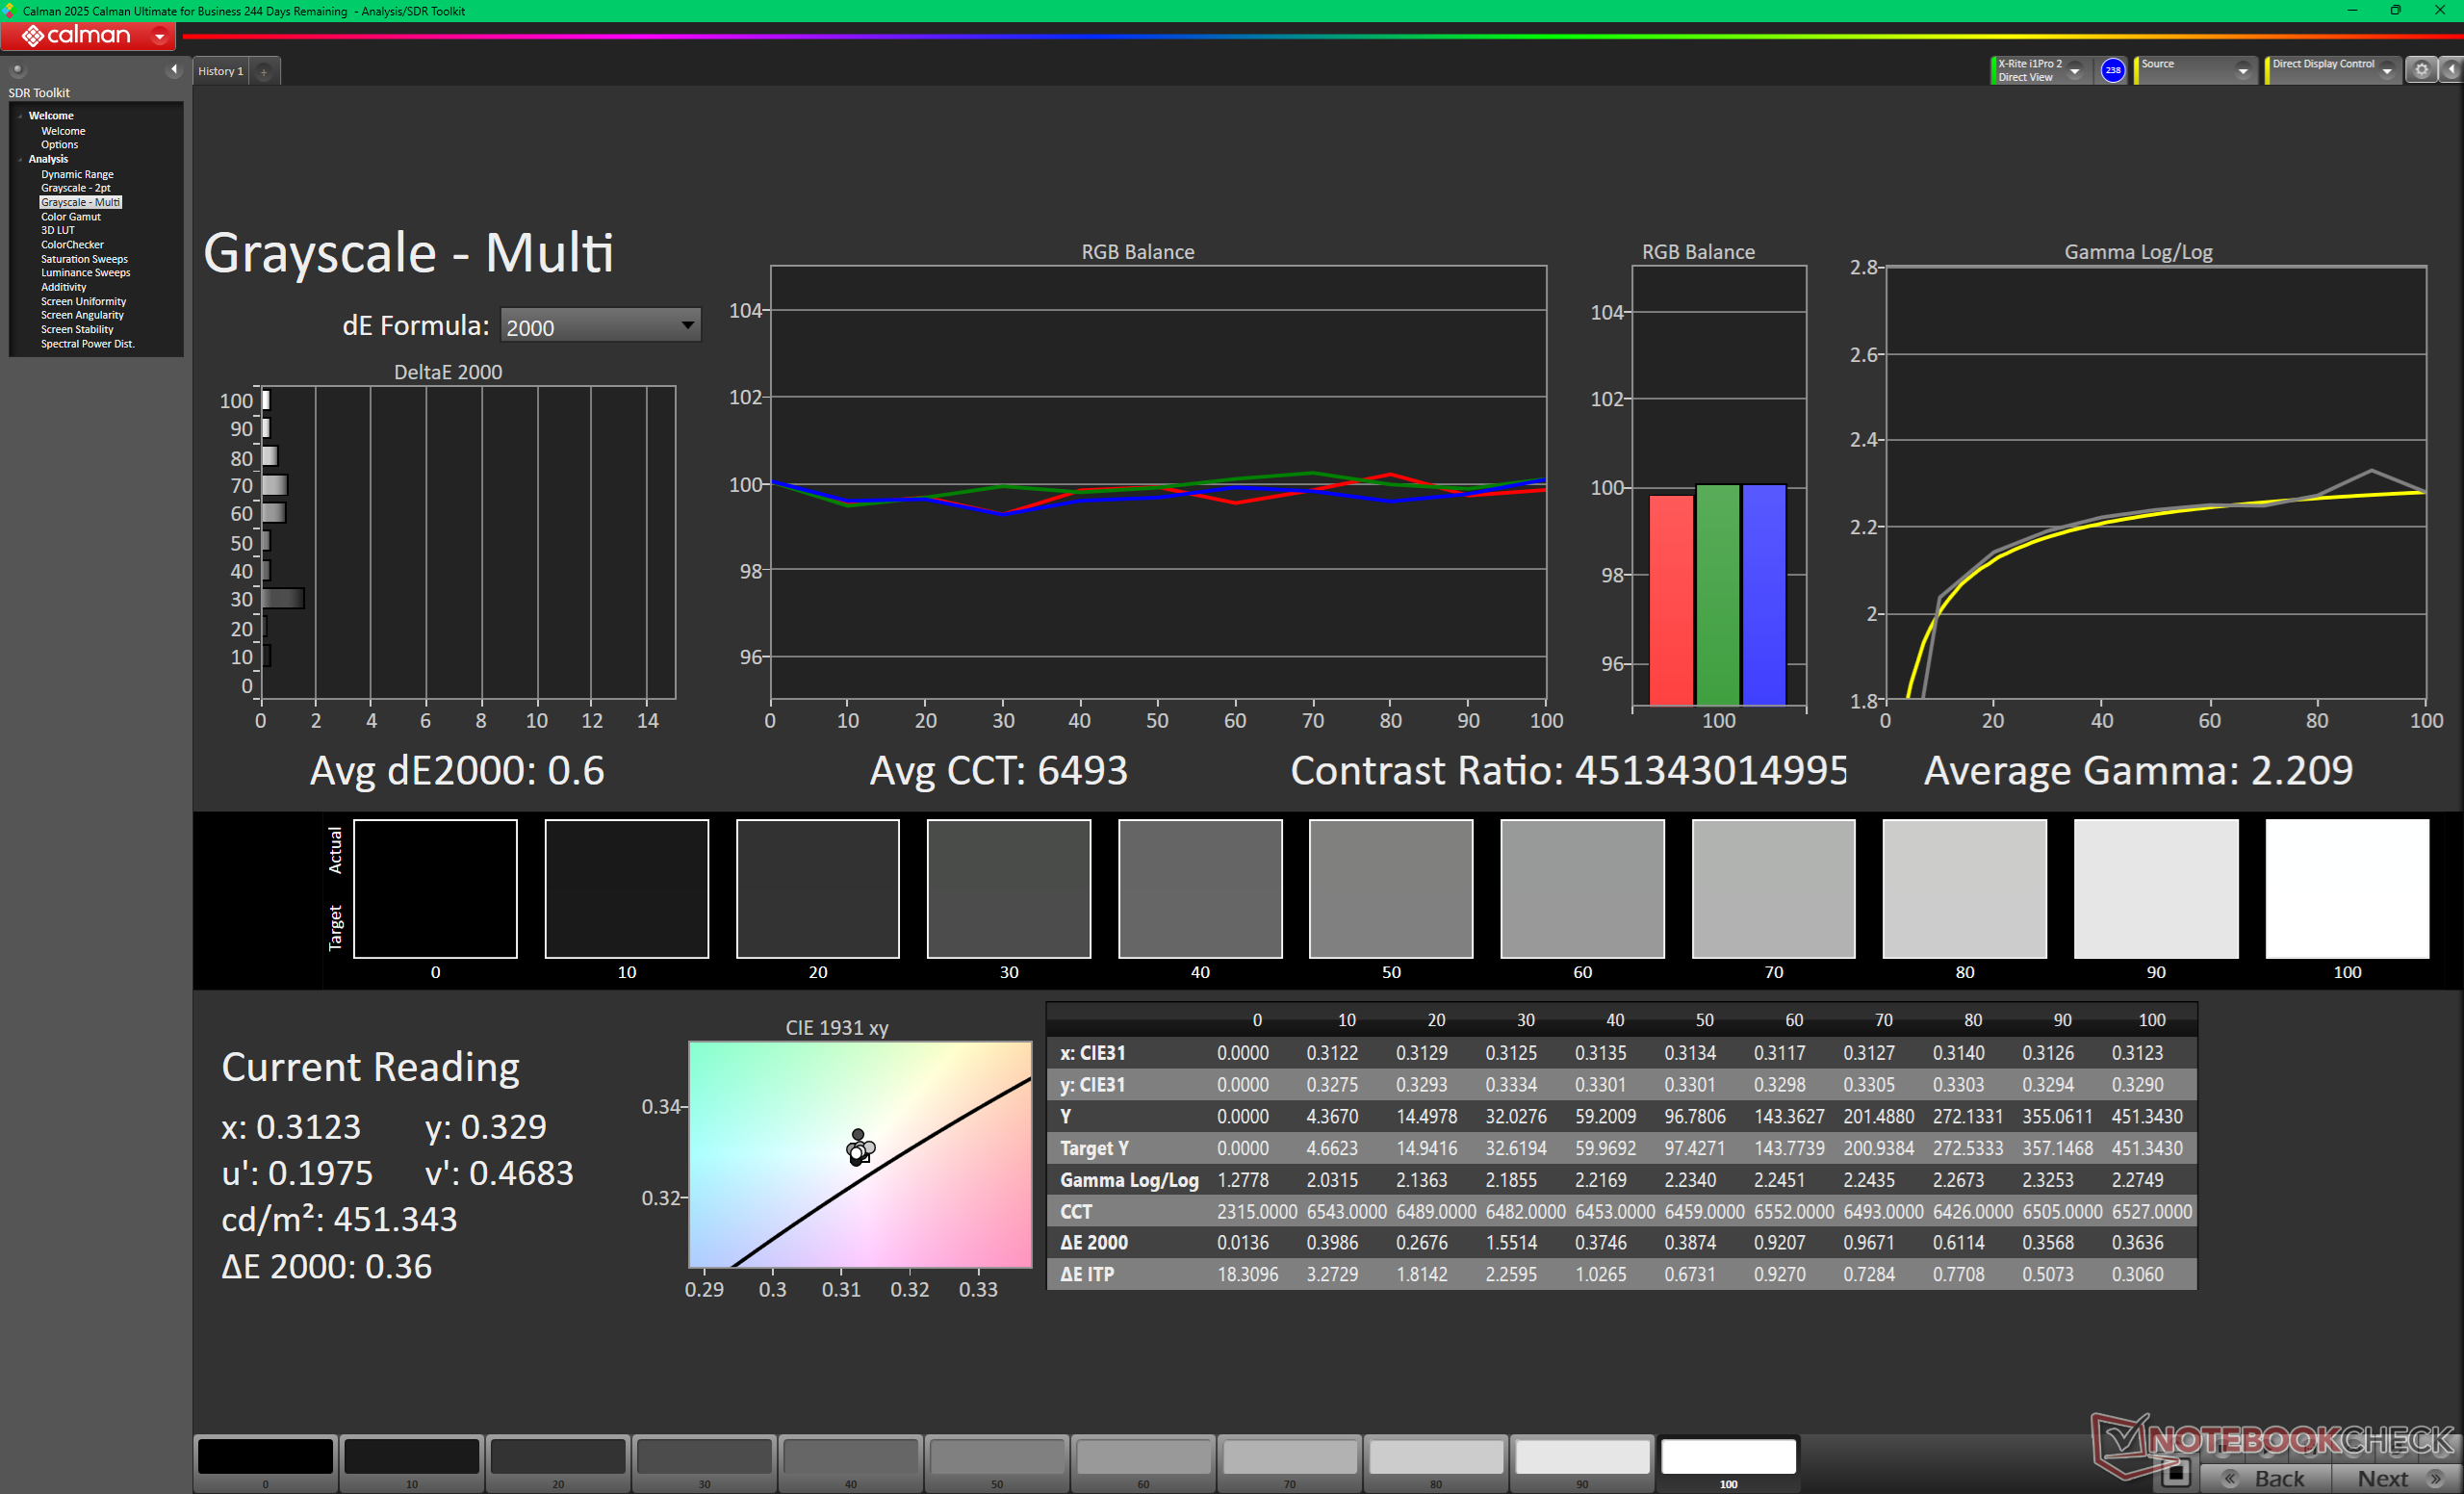
calibrated: 0.6
ΔE Greyscale Calman: 0.6 | ∀{0.09-98 Ø4.98}
93.5% AdobeRGB 1998 (Argyll 3D)
100% sRGB (Argyll 3D)
99.7% Display P3 (Argyll 3D)
Gamma: 2.2
CCT: 6452 K
Razer Blade 16 Core Ultra 9 386H
Samsung ATNA60HU06-0, OLED, 2560x1600, 16", 240 Hz
Razer Blade 16 2025 RTX 5090
ATNA60DL04-0, OLED, 2560x1600, 16", 240 Hz
Alienware 16 Area-51 Core Ultra 9 290HX Plus
Samsung 160HU05, OLED, 2560x1600, 16", 240 Hz
Lenovo Legion Pro 7i 16 Gen 10
Samsung ATNA60HU01-0, OLED, 2560x1600, 16", 240 Hz
HP Omen Max 16 ah000
Samsung ATNA60DL02-0, OLED, 2560x1600, 16", 240 Hz
MSI Crosshair 16 HX AI D2XWGKG
AUO B160QAN02.3, IPS, 2560x1600, 16", 240 Hz
Display
-4%
1%
0%
2%
-5%
Display P3 Coverage (%)
99.7
96.1
-4%
99.6
0%
99.5
0%
99.7
0%
95.5
-4%
sRGB Coverage (%)
100
99.9
0%
100
0%
100
0%
100
0%
99.7
0%
AdobeRGB 1998 Coverage (%)
93.5
85
-9%
95.6
2%
94.4
1%
98.2
5%
83.9
-10%
Response Times
9%
0%
0%
-6%
-1427%
Response Time Grey 50% / Grey 80% * (ms)
0.28 ?(0.15, 0.13)
0.2 ?(0.1, 0.1)
29%
0.29 ?(0.15, 0.14)
-4%
0.28 ?(0.14, 0.14)
-0%
0.29 ?(0.15, 0.14)
-4%
3.59 ?(1.51, 2.08)
-1182%
Response Time Black / White * (ms)
0.4 ?(0.2, 0.2)
0.25 ?(0.13, 0.12)
37%
0.41 ?(0.2, 0.21)
-2%
0.43 ?(0.22, 0.21)
-8%
0.47 ?(0.25, 0.22)
-17%
7.09 ?(3.52, 3.57)
-1672%
PWM Frequency (Hz)
1441
960 ?(100)
1440 ?(100)
1438 ?(100)
960 ?(100)
PWM Amplitude * (%)
32
44
-38%
30
6%
29
9%
31
3%
Screen
-21%
9%
-15%
-32%
-203%
Brightness middle (cd/m²)
462.2
391
-15%
383.3
-17%
490.4
6%
376.5
-19%
472
2%
Brightness (cd/m²)
465
393
-15%
387
-17%
498
7%
382
-18%
438
-6%
Brightness Distribution (%)
97
98
1%
97
0%
97
0%
96
-1%
88
-9%
Black Level * (cd/m²)
0.4
Colorchecker dE 2000 *
3.03
1.2
60%
0.87
71%
3.2
-6%
3.67
-21%
6.07
-100%
Colorchecker dE 2000 max. *
5.84
3.2
45%
2.23
62%
6.04
-3%
7.24
-24%
9.76
-67%
Colorchecker dE 2000 calibrated *
0.6
0.61
-2%
0.84
-40%
0.94
-57%
2.25
-275%
Greyscale dE 2000 *
0.6
1.8
-200%
0.8
-33%
1
-67%
1.1
-83%
6.4
-967%
Gamma
2.2 100%
2.2 100%
2.19 100%
2.24 98%
2.25 98%
2.52 87%
CCT
6452 101%
6493 100%
6395 102%
6373 102%
6319 103%
7987 81%
Contrast (:1)
1180
Całkowita średnia (program / ustawienia)
-5% / -9%
3% / 5%
-5% / -8%
-12% / -18%
-545% / -358%

* ... im mniej tym lepiej

vs. sRGB
vs. sRGB
vs. P3
vs. P3
Skala szarości przed kalibracją (P3)
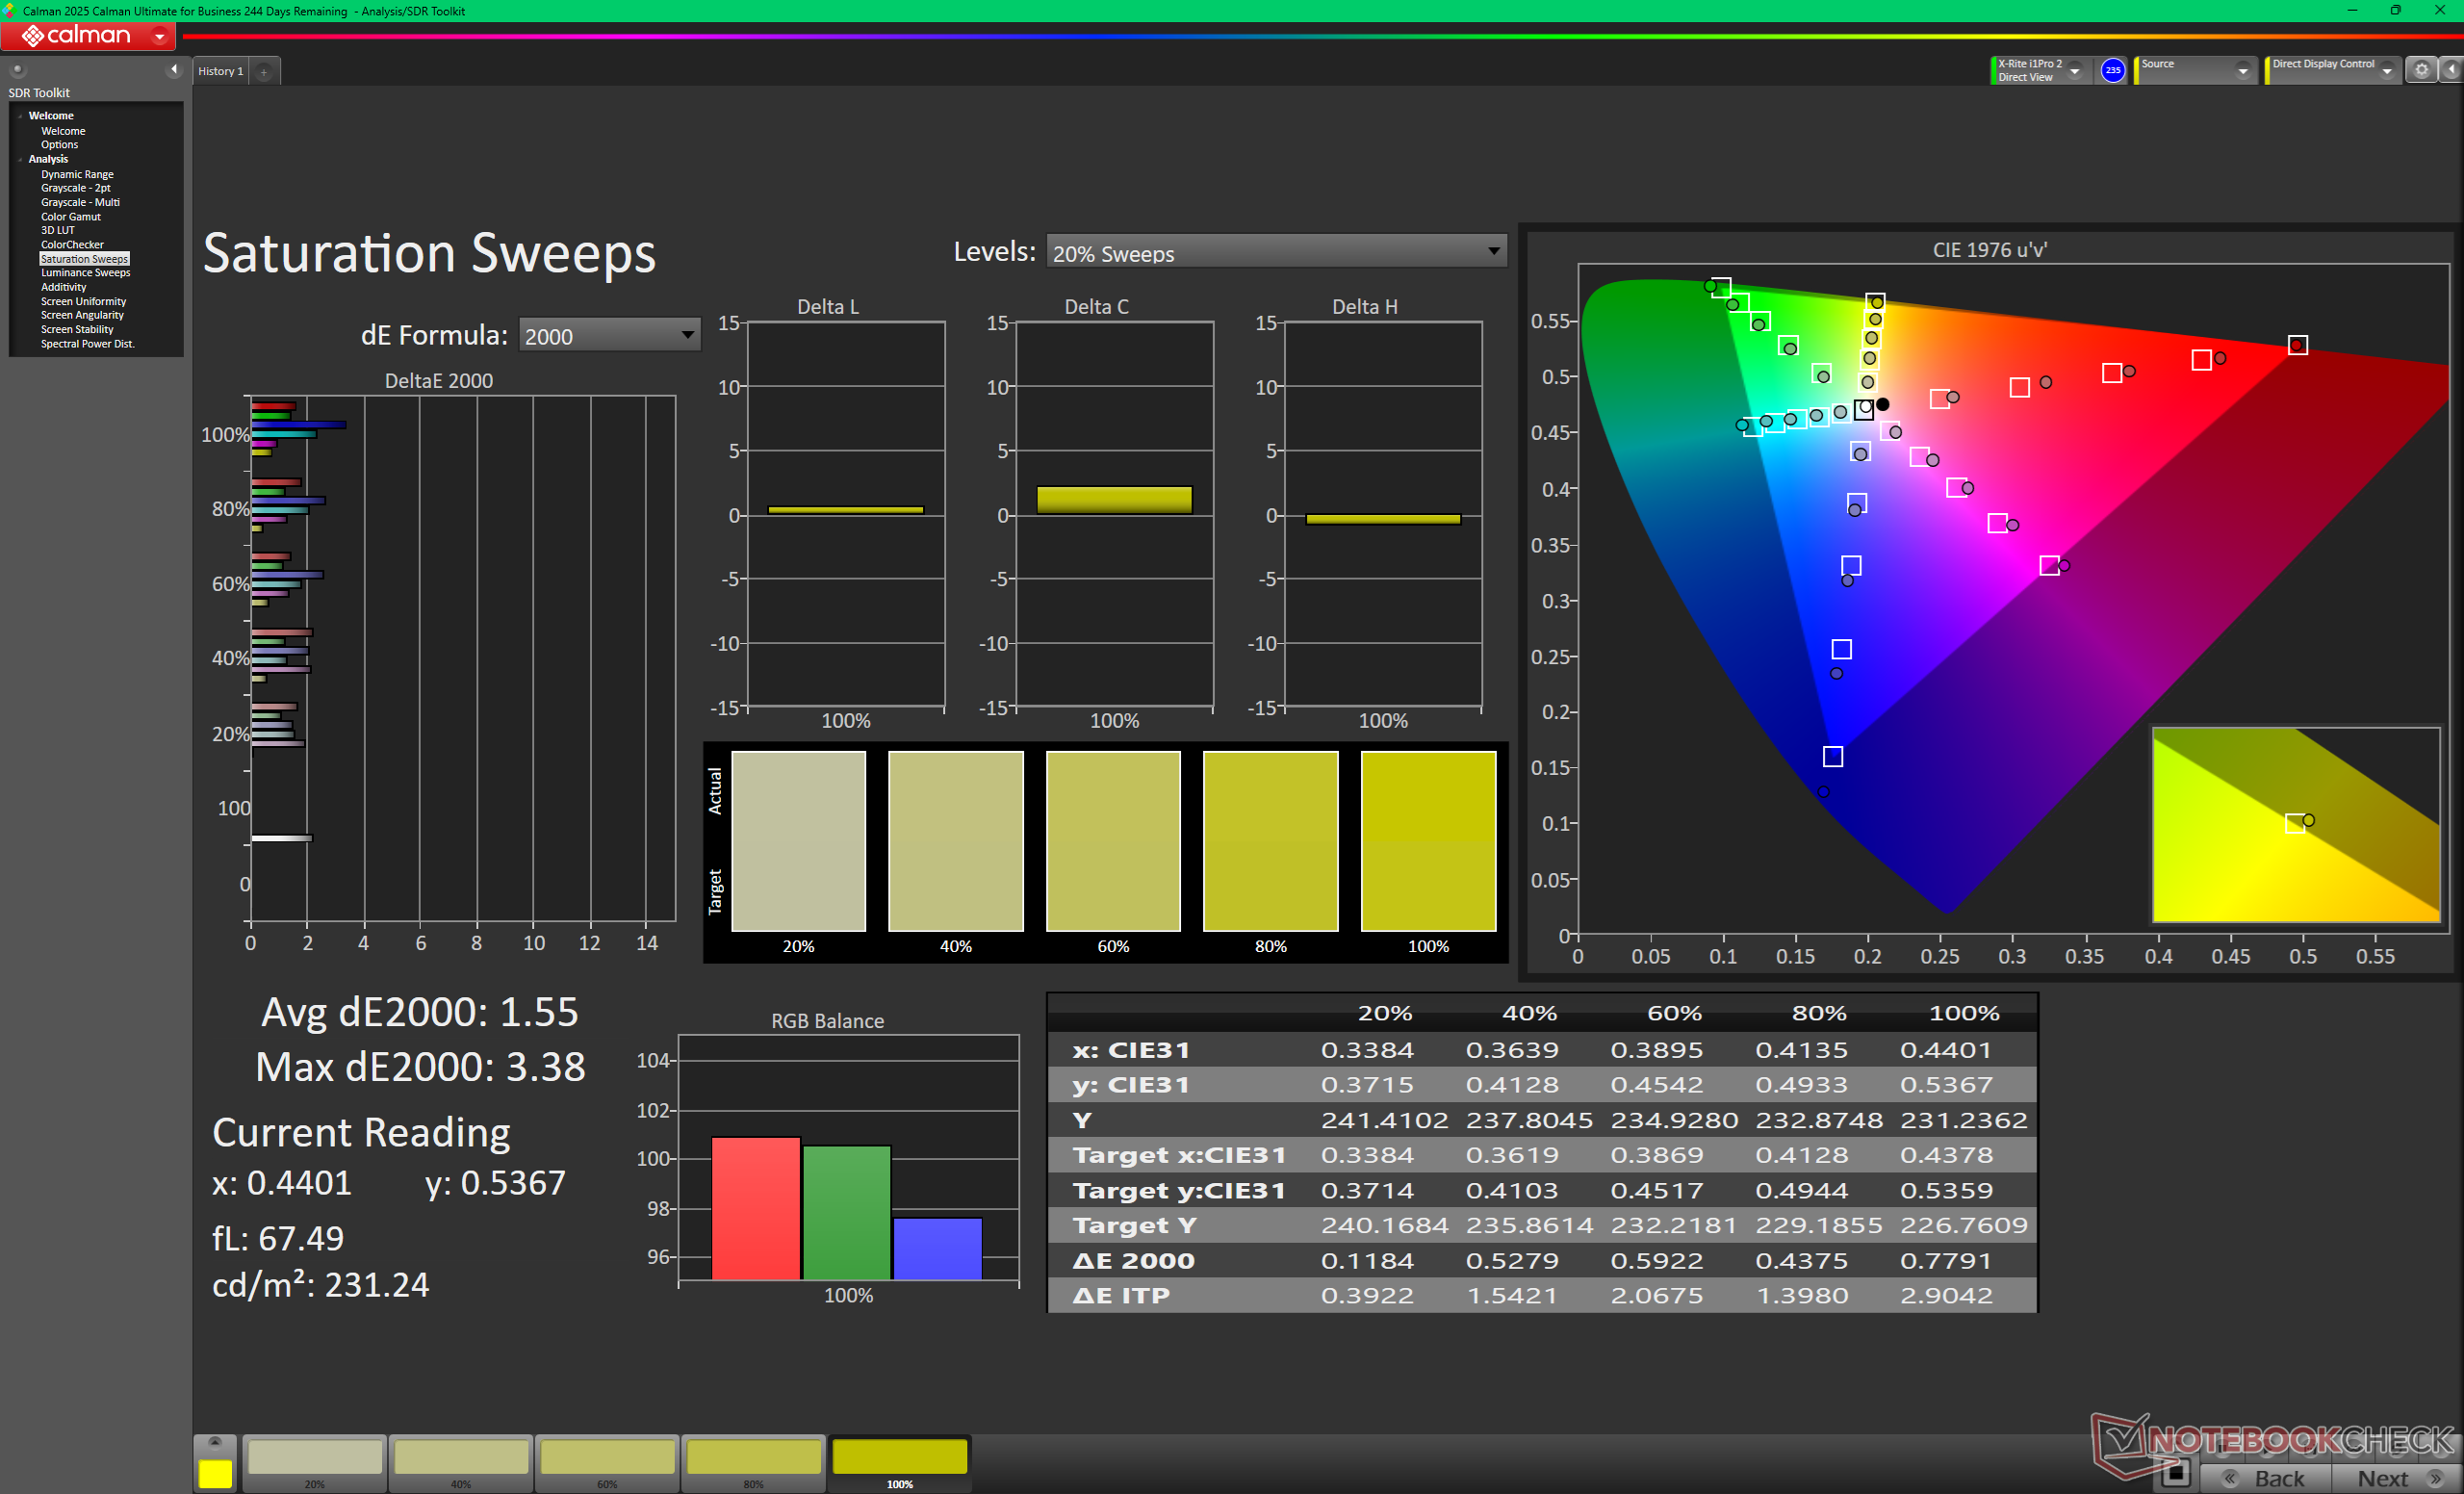
Pomiary nasycenia przed kalibracją (P3)
ColorChecker przed kalibracją (P3)
Skala szarości po kalibracji (P3)
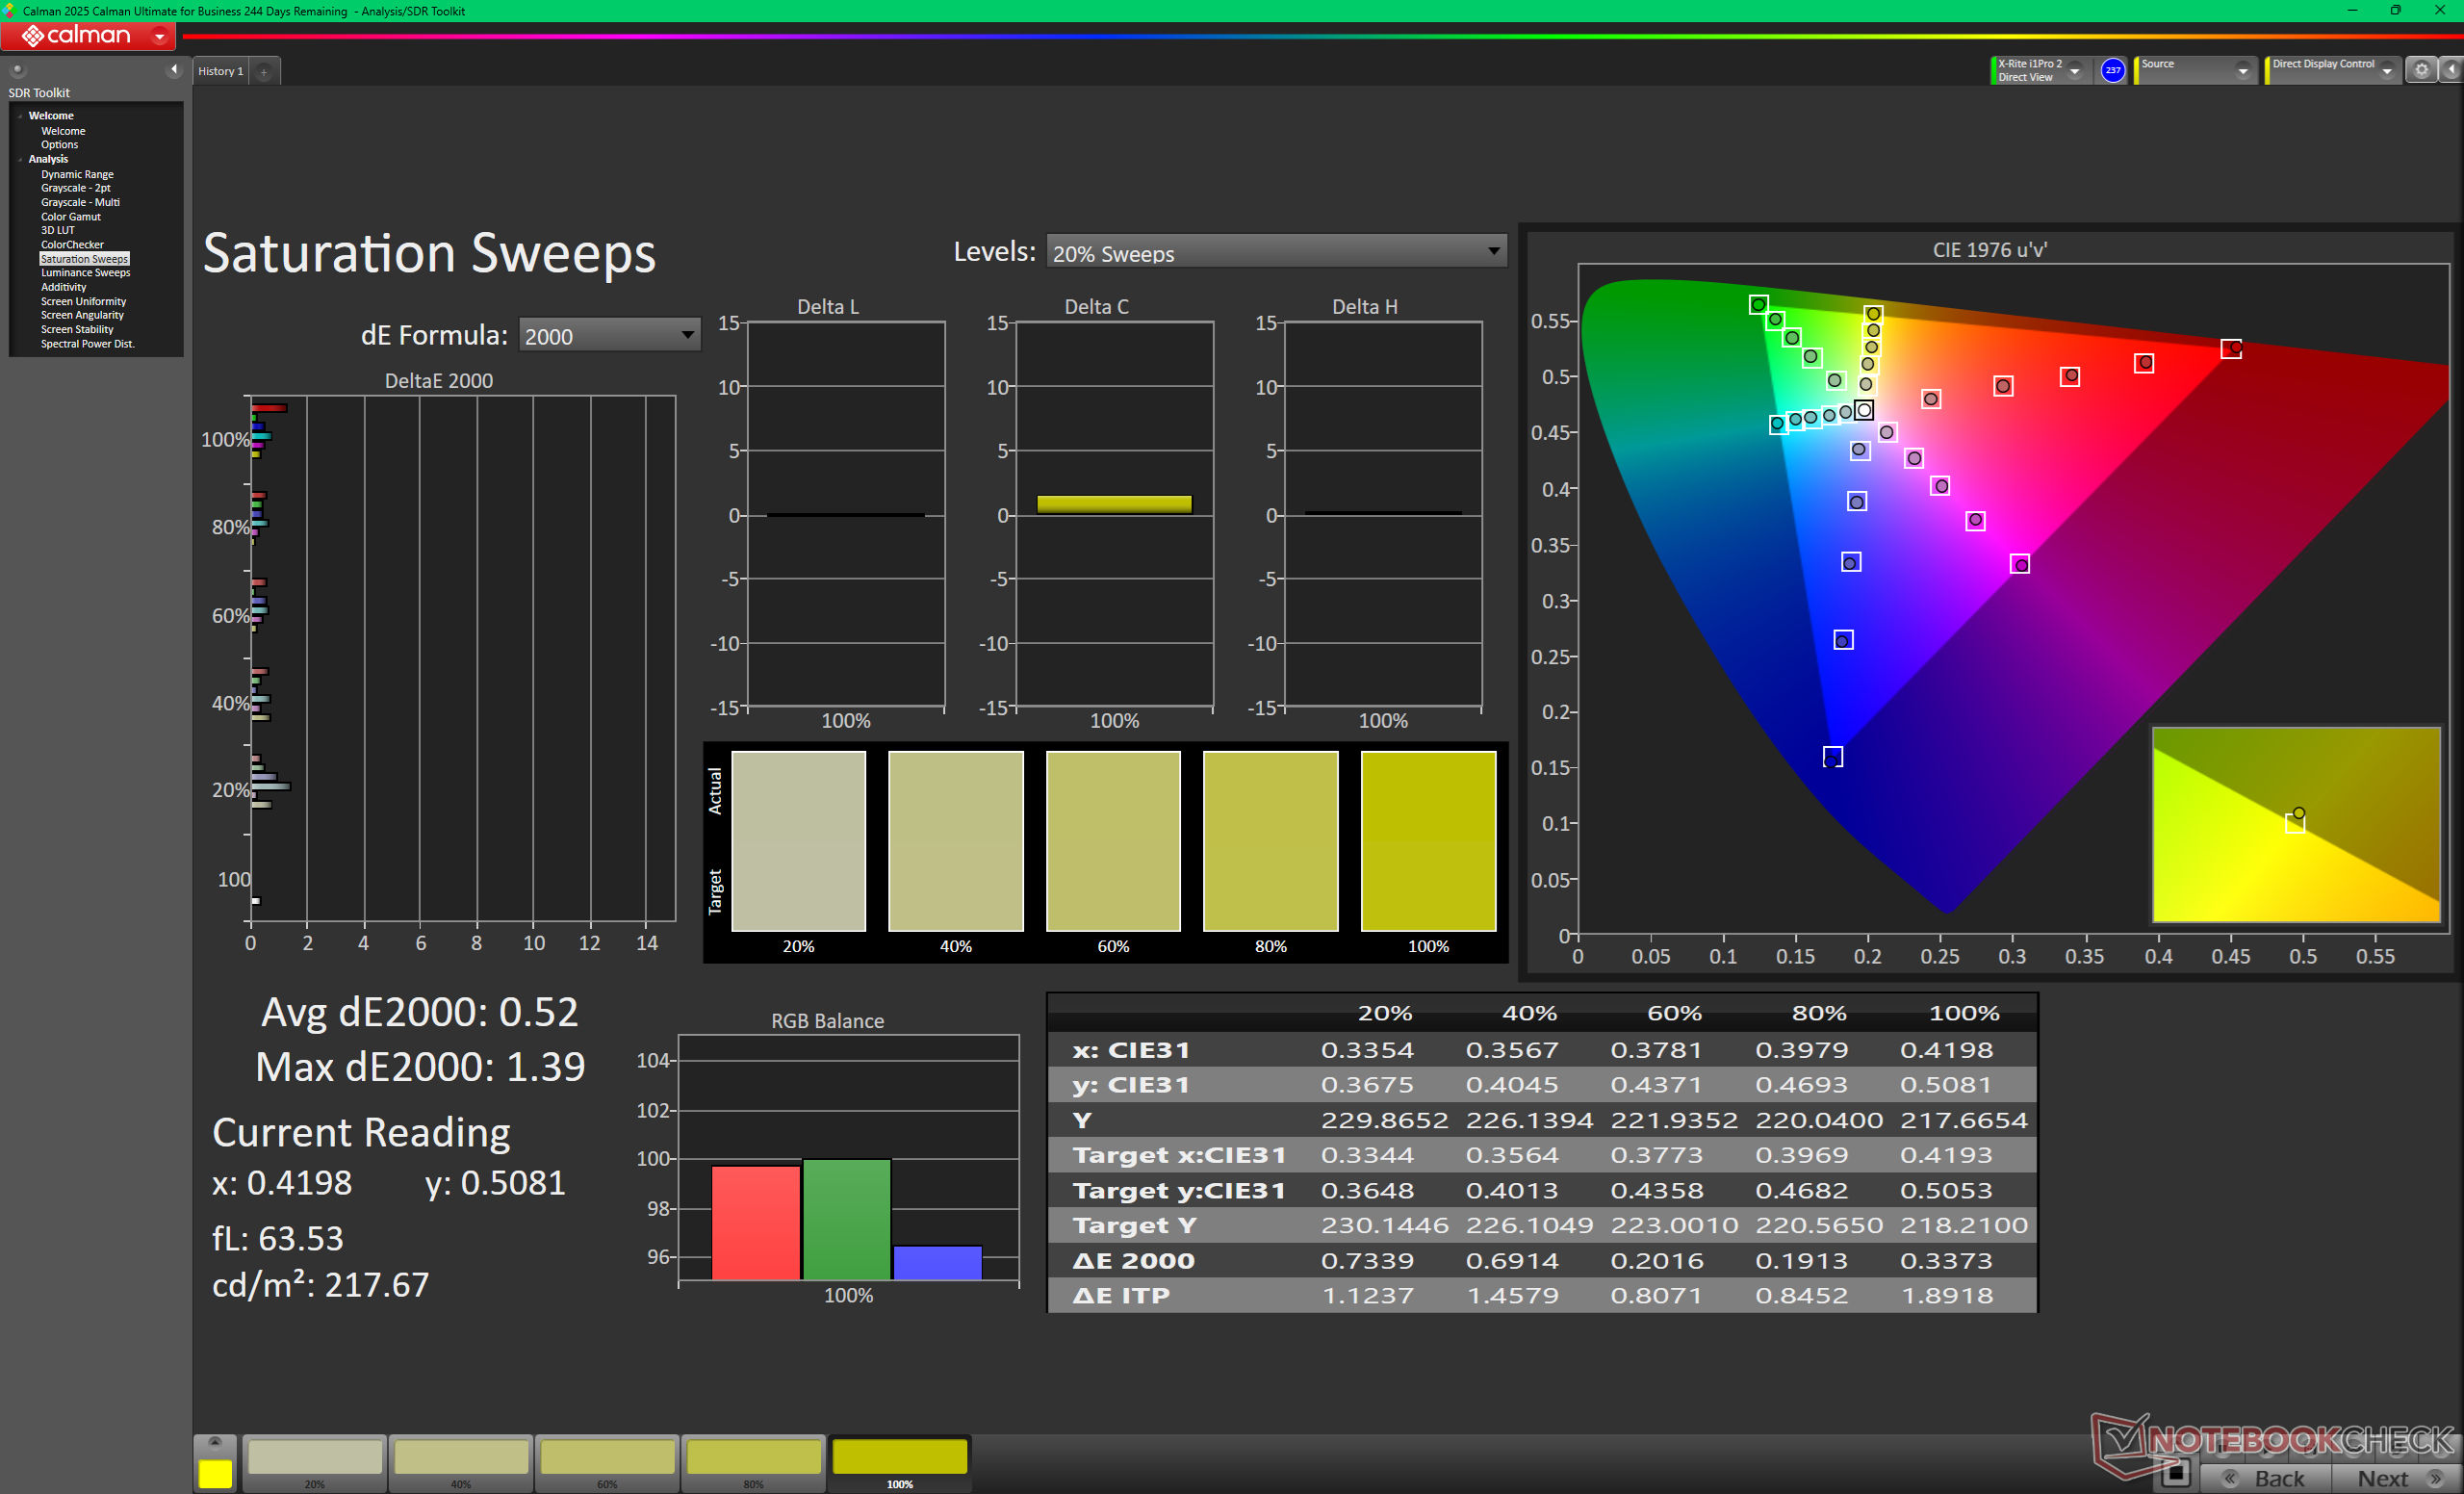
Przemiatanie nasycenia po kalibracji (P3)
ColorChecker po kalibracji (P3)

Wyświetl czasy reakcji

Czasy reakcji wyświetlacza pokazują, jak szybko ekran może zmieniać kolor z jednego koloru na drugi. Długi czas reakcji może powodować powstawanie powidoków i sprawiać, że poruszające się obiekty będą niewyraźne (duchy). Gracze szybkich tytułów 3D powinni zwrócić szczególną uwagę na szybki czas reakcji.
       Czas reakcji od czerni do bieli
0.4 ms ... wzrost ↗ i spadek ↘ łącznie↗ 0.2 ms wzrost
↘ 0.2 ms upadek
W naszych testach ekran wykazuje bardzo szybką reakcję i powinien bardzo dobrze nadawać się do szybkich gier.
Dla porównania, wszystkie testowane urządzenia wahają się od 0.1 (minimum) do 240 (maksimum) ms. » 0 % wszystkich urządzeń jest lepszych.
Oznacza to, że zmierzony czas reakcji jest lepszy od średniej wszystkich testowanych urządzeń (19.9 ms).
       Czas reakcji 50% szarości do 80% szarości
0.28 ms ... wzrost ↗ i spadek ↘ łącznie↗ 0.15 ms wzrost
↘ 0.13 ms upadek
W naszych testach ekran wykazuje bardzo szybką reakcję i powinien bardzo dobrze nadawać się do szybkich gier.
Dla porównania, wszystkie testowane urządzenia wahają się od 0.165 (minimum) do 636 (maksimum) ms. » 0 % wszystkich urządzeń jest lepszych.
Oznacza to, że zmierzony czas reakcji jest lepszy od średniej wszystkich testowanych urządzeń (31.1 ms).

Migotanie ekranu / PWM (modulacja szerokości impulsu)

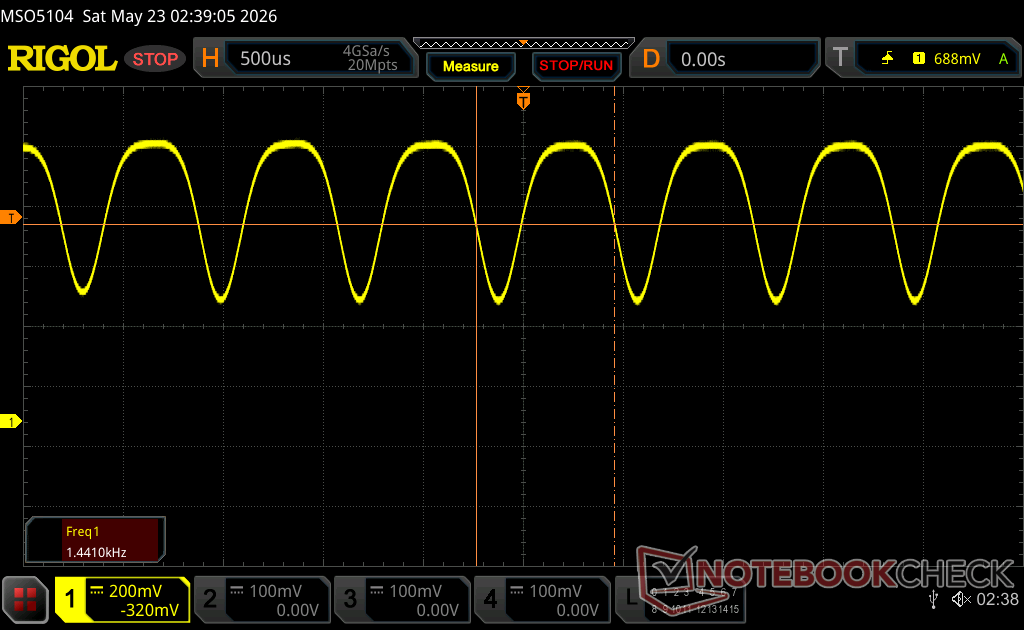
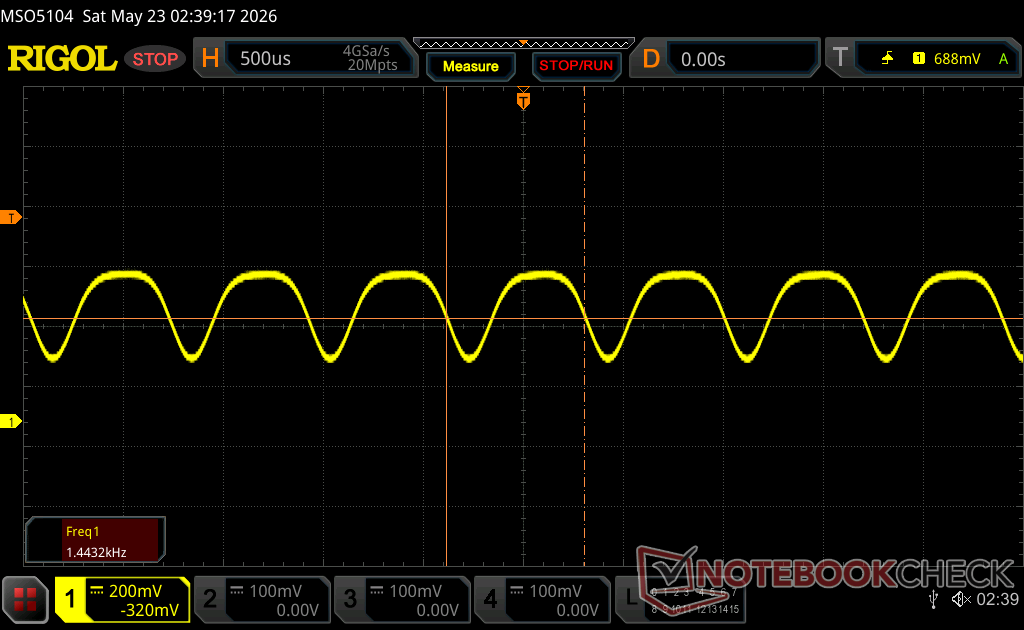
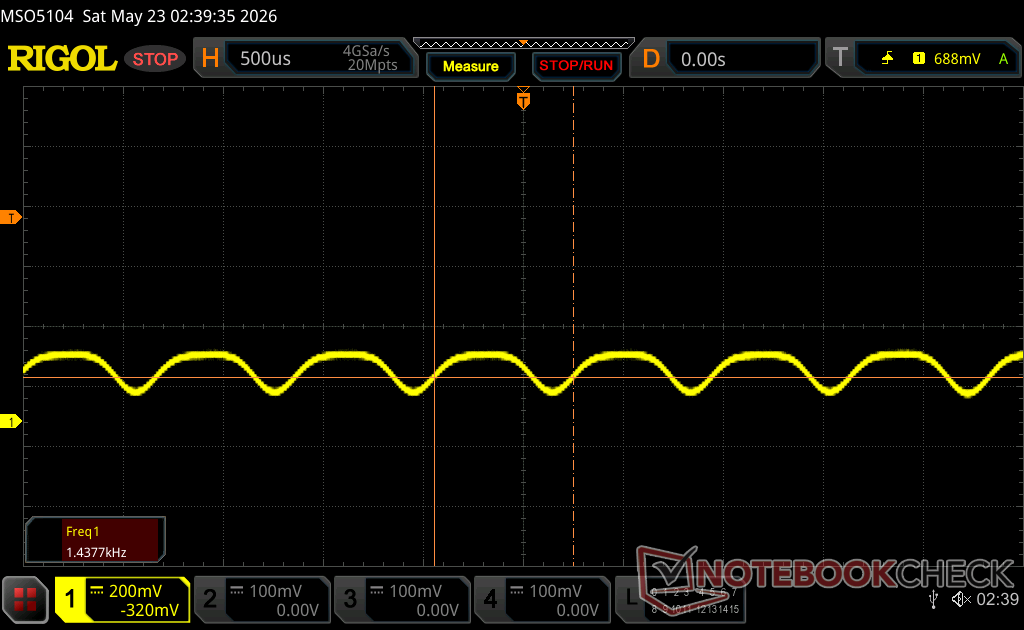
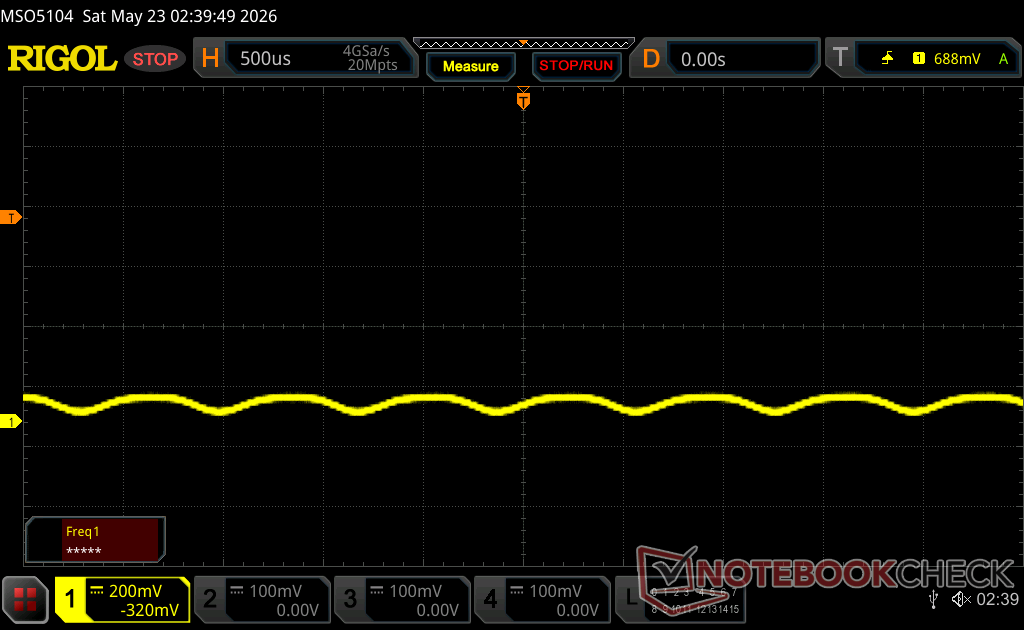
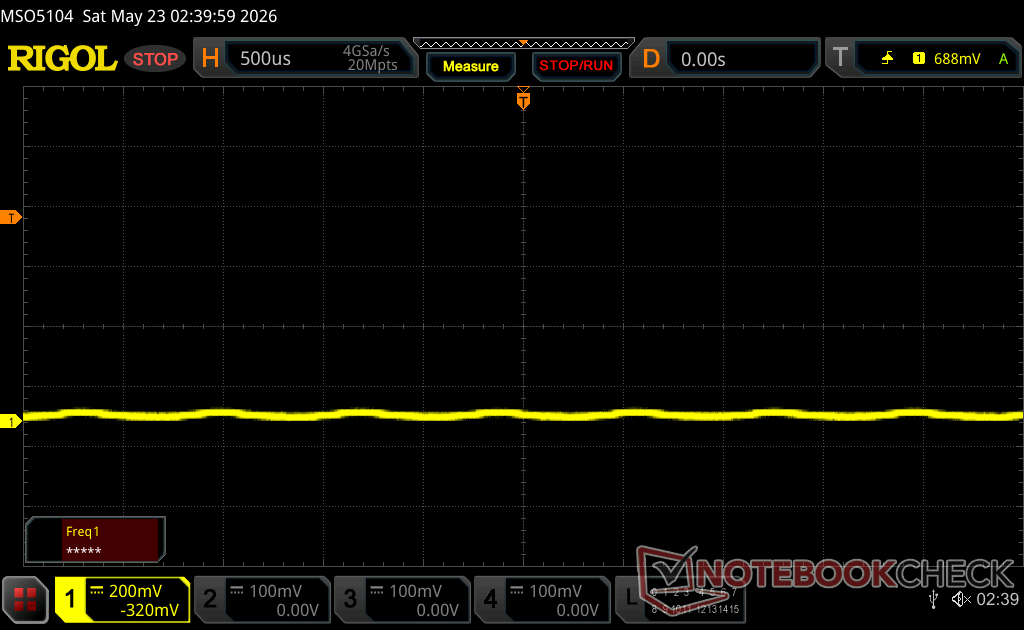
Aby przyciemnić ekran, niektóre notebooki po prostu w krótkich odstępach czasu włączają i wyłączają podświetlenie — jest to metoda zwana modulacją szerokości impulsu (PWM). W idealnym przypadku ta częstotliwość cykli powinna być niewykrywalna dla ludzkiego oka. Jeśli wspomniana częstotliwość jest zbyt niska, użytkownicy o wrażliwych oczach mogą odczuwać zmęczenie lub bóle głowy, a nawet całkowicie zauważyć migotanie.
Wykryto migotanie ekranu/wykryto PWM 1441 Hz
Amplitude: 32 %

Podświetlenie wyświetlacza miga z częstotliwością 1441 Hz (najgorszy przypadek, np. przy użyciu PWM) .

Częstotliwość 1441 Hz jest dość wysoka, więc większość użytkowników wrażliwych na PWM nie powinna zauważyć żadnego migotania.

Dla porównania: 52 % wszystkich testowanych urządzeń nie używa PWM do przyciemniania wyświetlacza. Jeśli wykryto PWM, zmierzono średnio 7822 (minimum: 1.31 - maksimum: 343500) Hz.

100 procent jasności
75 procent jasności
75 procent jasności
50 procent jasności
50 procent jasności
25 procent jasności
25 procent jasności
0 procent jasności
0 procent jasności
Na zewnątrz w świetle słonecznym
Na zewnątrz w cieniu
Na zewnątrz w świetle słonecznym
Szerokie kąty widzenia OLED

Wydajność

Warunki testowania

Przed uruchomieniem poniższych testów ustawiliśmy Synapse na tryb wydajności, a GPU na tryb dyskretny.

Procesor

The Core Ultra 9 386H jest około 10 do 15 procent wolniejszy niż Ryzen AI 9 HX 370 w zeszłorocznym Blade 16, aby być bardziej zgodnym z Ryzen AI 9 365. Wydajność spadłaby również nieznacznie o około 8 procent podczas uruchamiania CineBench R15 xT w pętli, jak pokazano na poniższym wykresie ze względu na ograniczenia Turbo Boost.

Cinebench R15 Multi Loop

012024036048060072084096010801200132014401560168018001920204021602280240025202640276028803000312032403360348036003720384039604080420043204440456046804800492050405160528054005520564057605880Tooltip
Razer Blade 16 Core Ultra 9 386H Intel Core Ultra 9 386H: Ø2941 (2806.23-3172.09)
Razer Blade 16 2025 RTX 5090 AMD Ryzen AI 9 HX 370: Ø3489 (3470.41-3505.08)
Alienware 16 Area-51 Core Ultra 9 290HX Plus Intel Core Ultra 9 290HX Plus: Ø5863 (5365.53-5919.79)
Lenovo Legion Pro 7i 16 Gen 10 Intel Core Ultra 9 275HX: Ø5698 (5601.46-5746.3)
HP Omen Max 16 ah000 Intel Core Ultra 9 275HX: Ø5145 (5108.56-5171.97)
MSI Crosshair 16 HX AI D2XWGKG Intel Core Ultra 9 275HX: Ø5246 (4918.23-5393.74)
CPU Performance rating: Percent
Cinebench R23: Multi Core | Single Core
Cinebench R20: CPU (Multi Core) | CPU (Single Core)
Cinebench R15: CPU Multi 64Bit | CPU Single 64Bit
Blender: v2.79 BMW27 CPU
7-Zip 18.03: 7z b 4 | 7z b 4 -mmt1
Geekbench 6.6: Multi-Core | Single-Core
Geekbench 5.5: Multi-Core | Single-Core
HWBOT x265 Benchmark v2.2: 4k Preset
LibreOffice : 20 Documents To PDF
R Benchmark 2.5: Overall mean
CPU Performance rating
Alienware 16 Area-51 Core Ultra 9 290HX Plus
Intel Core Ultra 9 290HX Plus
86.2 pt
Schenker XMG APEX 16 MAX
AMD Ryzen 9 9955HX
85.4 pt
Lenovo Legion Pro 7i 16 Gen 10
Intel Core Ultra 9 275HX
82.7 pt
Lenovo Legion 7 16IAX10
Intel Core Ultra 7 255HX
76.4 pt
Lenovo Legion 9 16IRX8
Intel Core i9-13980HX
75.8 pt
Razer Blade 16 2025 RTX 5090
AMD Ryzen AI 9 HX 370
66.4 pt
Razer Blade 16 Core Ultra 9 386H
Intel Core Ultra 9 386H
64.6 pt
Przeciętny Intel Core Ultra 9 386H
 
63.8 pt
Razer Blade 16 RTX 5080
AMD Ryzen AI 9 365
60.6 pt
Alienware x16 R2 P120F
Intel Core Ultra 9 185H
50.4 pt
Maingear ML-16 MK2
Intel Core Ultra 7 155H
48.6 pt
Cinebench R23 / Multi Core
Alienware 16 Area-51 Core Ultra 9 290HX Plus
Intel Core Ultra 9 290HX Plus
39514 (38155.7min - 39513.8max) Points +90%
Lenovo Legion Pro 7i 16 Gen 10
Intel Core Ultra 9 275HX
36597 (34151.5min - 36596.9max) Points +76%
Schenker XMG APEX 16 MAX
AMD Ryzen 9 9955HX
35960 Points +73%
Lenovo Legion 7 16IAX10
Intel Core Ultra 7 255HX
32612 (28349min - 32612.1max) Points +57%
Lenovo Legion 9 16IRX8
Intel Core i9-13980HX
29892 (28505.8min - 29891.7max) Points +44%
Razer Blade 16 2025 RTX 5090
AMD Ryzen AI 9 HX 370
23805 Points +15%
Razer Blade 16 Core Ultra 9 386H
Intel Core Ultra 9 386H
20750 (18849.5min - 20749.6max) Points
Razer Blade 16 RTX 5080
AMD Ryzen AI 9 365
20649 (19603.2min - 20649.2max) Points 0%
Przeciętny Intel Core Ultra 9 386H
  (20344 - 20841, n=3)
20645 Points -1%
Alienware x16 R2 P120F
Intel Core Ultra 9 185H
18338 (17139.2min - 18337.8max) Points -12%
Maingear ML-16 MK2
Intel Core Ultra 7 155H
17231 (12872.9min - 17231.1max) Points -17%
Cinebench R23 / Single Core
Alienware 16 Area-51 Core Ultra 9 290HX Plus
Intel Core Ultra 9 290HX Plus
2319 Points +11%
Lenovo Legion Pro 7i 16 Gen 10
Intel Core Ultra 9 275HX
2195 Points +5%
Schenker XMG APEX 16 MAX
AMD Ryzen 9 9955HX
2172 Points +4%
Lenovo Legion 7 16IAX10
Intel Core Ultra 7 255HX
2160 Points +3%
Lenovo Legion 9 16IRX8
Intel Core i9-13980HX
2129 Points +2%
Razer Blade 16 Core Ultra 9 386H
Intel Core Ultra 9 386H
2087 Points
Przeciętny Intel Core Ultra 9 386H
  (2057 - 2101, n=3)
2082 Points 0%
Razer Blade 16 2025 RTX 5090
AMD Ryzen AI 9 HX 370
2039 Points -2%
Razer Blade 16 RTX 5080
AMD Ryzen AI 9 365
2001 Points -4%
Maingear ML-16 MK2
Intel Core Ultra 7 155H
1650 Points -21%
Alienware x16 R2 P120F
Intel Core Ultra 9 185H
1620 Points -22%
Cinebench R20 / CPU (Multi Core)
Alienware 16 Area-51 Core Ultra 9 290HX Plus
Intel Core Ultra 9 290HX Plus
15299 Points +87%
Lenovo Legion Pro 7i 16 Gen 10
Intel Core Ultra 9 275HX
14183 Points +74%
Schenker XMG APEX 16 MAX
AMD Ryzen 9 9955HX
13963 Points +71%
Lenovo Legion 7 16IAX10
Intel Core Ultra 7 255HX
12839 Points +57%
Lenovo Legion 9 16IRX8
Intel Core i9-13980HX
11155 Points +37%
Razer Blade 16 2025 RTX 5090
AMD Ryzen AI 9 HX 370
9250 Points +13%
Razer Blade 16 Core Ultra 9 386H
Intel Core Ultra 9 386H
8162 Points
Przeciętny Intel Core Ultra 9 386H
  (7913 - 8299, n=3)
8125 Points 0%
Razer Blade 16 RTX 5080
AMD Ryzen AI 9 365
8070 Points -1%
Alienware x16 R2 P120F
Intel Core Ultra 9 185H
7081 Points -13%
Maingear ML-16 MK2
Intel Core Ultra 7 155H
6789 Points -17%
Cinebench R20 / CPU (Single Core)
Alienware 16 Area-51 Core Ultra 9 290HX Plus
Intel Core Ultra 9 290HX Plus
878 Points +10%
Schenker XMG APEX 16 MAX
AMD Ryzen 9 9955HX
856 Points +8%
Lenovo Legion 7 16IAX10
Intel Core Ultra 7 255HX
832 Points +5%
Lenovo Legion Pro 7i 16 Gen 10
Intel Core Ultra 9 275HX
831 Points +5%
Razer Blade 16 2025 RTX 5090
AMD Ryzen AI 9 HX 370
800 Points +1%
Razer Blade 16 Core Ultra 9 386H
Intel Core Ultra 9 386H
795 Points
Przeciętny Intel Core Ultra 9 386H
  (787 - 796, n=3)
793 Points 0%
Razer Blade 16 RTX 5080
AMD Ryzen AI 9 365
785 Points -1%
Lenovo Legion 9 16IRX8
Intel Core i9-13980HX
723 Points -9%
Maingear ML-16 MK2
Intel Core Ultra 7 155H
634 Points -20%
Alienware x16 R2 P120F
Intel Core Ultra 9 185H
622 Points -22%
Cinebench R15 / CPU Multi 64Bit
Alienware 16 Area-51 Core Ultra 9 290HX Plus
Intel Core Ultra 9 290HX Plus
5920 (5365.53min - 5919.79max) Points +87%
Lenovo Legion Pro 7i 16 Gen 10
Intel Core Ultra 9 275HX
5746 (5601.46min - 5746.3max) Points +81%
Schenker XMG APEX 16 MAX
AMD Ryzen 9 9955HX
5624 (5340.45min - 5623.51max) Points +77%
Lenovo Legion 7 16IAX10
Intel Core Ultra 7 255HX
4916 (4426.25min - 4915.82max) Points +55%
Lenovo Legion 9 16IRX8
Intel Core i9-13980HX
4566 (4337.45min - 4565.69max) Points +44%
Razer Blade 16 2025 RTX 5090
AMD Ryzen AI 9 HX 370
3505 (3470.41min - 3505.08max) Points +10%
Przeciętny Intel Core Ultra 9 386H
  (3172 - 3303, n=3)
3251 Points +2%
Razer Blade 16 Core Ultra 9 386H
Intel Core Ultra 9 386H
3172 (2806.23min - 3172.09max) Points
Razer Blade 16 RTX 5080
AMD Ryzen AI 9 365
3075 (2877.08min - 3075.03max) Points -3%
Alienware x16 R2 P120F
Intel Core Ultra 9 185H
2857 (2708.56min - 2857.35max) Points -10%
Maingear ML-16 MK2
Intel Core Ultra 7 155H
2705 (1976.58min - 2705.26max) Points -15%
Cinebench R15 / CPU Single 64Bit
Lenovo Legion Pro 7i 16 Gen 10
Intel Core Ultra 9 275HX
336 Points +7%
Schenker XMG APEX 16 MAX
AMD Ryzen 9 9955HX
336 Points +7%
Lenovo Legion 7 16IAX10
Intel Core Ultra 7 255HX
327 Points +4%
Alienware 16 Area-51 Core Ultra 9 290HX Plus
Intel Core Ultra 9 290HX Plus
324 Points +4%
Razer Blade 16 Core Ultra 9 386H
Intel Core Ultra 9 386H
313 Points
Razer Blade 16 2025 RTX 5090
AMD Ryzen AI 9 HX 370
310 Points -1%
Razer Blade 16 RTX 5080
AMD Ryzen AI 9 365
306 Points -2%
Lenovo Legion 9 16IRX8
Intel Core i9-13980HX
303 Points -3%
Przeciętny Intel Core Ultra 9 386H
  (249 - 314, n=3)
292 Points -7%
Maingear ML-16 MK2
Intel Core Ultra 7 155H
242 Points -23%
Alienware x16 R2 P120F
Intel Core Ultra 9 185H
238 Points -24%
Blender / v2.79 BMW27 CPU
Maingear ML-16 MK2
Intel Core Ultra 7 155H
226 Seconds * -32%
Alienware x16 R2 P120F
Intel Core Ultra 9 185H
178 Seconds * -4%
Razer Blade 16 Core Ultra 9 386H
Intel Core Ultra 9 386H
171 Seconds *
Przeciętny Intel Core Ultra 9 386H
  (156 - 171, n=3)
162.3 Seconds * +5%
Razer Blade 16 RTX 5080
AMD Ryzen AI 9 365
160 Seconds * +6%
Razer Blade 16 2025 RTX 5090
AMD Ryzen AI 9 HX 370
140 Seconds * +18%
Lenovo Legion 7 16IAX10
Intel Core Ultra 7 255HX
110 Seconds * +36%
Lenovo Legion 9 16IRX8
Intel Core i9-13980HX
103 Seconds * +40%
Lenovo Legion Pro 7i 16 Gen 10
Intel Core Ultra 9 275HX
90 Seconds * +47%
Alienware 16 Area-51 Core Ultra 9 290HX Plus
Intel Core Ultra 9 290HX Plus
88 Seconds * +49%
Schenker XMG APEX 16 MAX
AMD Ryzen 9 9955HX
85 Seconds * +50%
7-Zip 18.03 / 7z b 4
Schenker XMG APEX 16 MAX
AMD Ryzen 9 9955HX
139824 MIPS +95%
Lenovo Legion Pro 7i 16 Gen 10
Intel Core Ultra 9 275HX
117940 MIPS +65%
Lenovo Legion 9 16IRX8
Intel Core i9-13980HX
117479 MIPS +64%
Alienware 16 Area-51 Core Ultra 9 290HX Plus
Intel Core Ultra 9 290HX Plus
116793 MIPS +63%
Lenovo Legion 7 16IAX10
Intel Core Ultra 7 255HX
97739 MIPS +36%
Razer Blade 16 2025 RTX 5090
AMD Ryzen AI 9 HX 370
83714 MIPS +17%
Przeciętny Intel Core Ultra 9 386H
  (71479 - 72596, n=3)
71910 MIPS 0%
Razer Blade 16 RTX 5080
AMD Ryzen AI 9 365
71722 MIPS 0%
Razer Blade 16 Core Ultra 9 386H
Intel Core Ultra 9 386H
71655 MIPS
Alienware x16 R2 P120F
Intel Core Ultra 9 185H
67227 MIPS -6%
Maingear ML-16 MK2
Intel Core Ultra 7 155H
64182 MIPS -10%
7-Zip 18.03 / 7z b 4 -mmt1
Schenker XMG APEX 16 MAX
AMD Ryzen 9 9955HX
7374 MIPS +16%
Lenovo Legion 9 16IRX8
Intel Core i9-13980HX
6965 MIPS +9%
Alienware 16 Area-51 Core Ultra 9 290HX Plus
Intel Core Ultra 9 290HX Plus
6685 MIPS +5%
Lenovo Legion Pro 7i 16 Gen 10
Intel Core Ultra 9 275HX
6607 MIPS +4%
Lenovo Legion 7 16IAX10
Intel Core Ultra 7 255HX
6515 MIPS +2%
Razer Blade 16 Core Ultra 9 386H
Intel Core Ultra 9 386H
6367 MIPS
Przeciętny Intel Core Ultra 9 386H
  (6118 - 6493, n=3)
6326 MIPS -1%
Razer Blade 16 2025 RTX 5090
AMD Ryzen AI 9 HX 370
6252 MIPS -2%
Razer Blade 16 RTX 5080
AMD Ryzen AI 9 365
6036 MIPS -5%
Maingear ML-16 MK2
Intel Core Ultra 7 155H
5047 MIPS -21%
Alienware x16 R2 P120F
Intel Core Ultra 9 185H
4502 MIPS -29%
Geekbench 6.6 / Multi-Core
Alienware 16 Area-51 Core Ultra 9 290HX Plus
Intel Core Ultra 9 290HX Plus
20920 Points +24%
Schenker XMG APEX 16 MAX
AMD Ryzen 9 9955HX
19725 Points +17%
Lenovo Legion Pro 7i 16 Gen 10
Intel Core Ultra 9 275HX
19081 Points +13%
Lenovo Legion 9 16IRX8
Intel Core i9-13980HX
17472 Points +3%
Lenovo Legion 7 16IAX10
Intel Core Ultra 7 255HX
17431 Points +3%
Razer Blade 16 Core Ultra 9 386H
Intel Core Ultra 9 386H
16903 Points
Przeciętny Intel Core Ultra 9 386H
  (15407 - 17405, n=5)
16500 Points -2%
Razer Blade 16 2025 RTX 5090
AMD Ryzen AI 9 HX 370
15671 Points -7%
Razer Blade 16 RTX 5080
AMD Ryzen AI 9 365
15010 Points -11%
Alienware x16 R2 P120F
Intel Core Ultra 9 185H
12825 Points -24%
Maingear ML-16 MK2
Intel Core Ultra 7 155H
11941 Points -29%
Geekbench 6.6 / Single-Core
Schenker XMG APEX 16 MAX
AMD Ryzen 9 9955HX
3259 Points +13%
Alienware 16 Area-51 Core Ultra 9 290HX Plus
Intel Core Ultra 9 290HX Plus
3170 Points +10%
Lenovo Legion Pro 7i 16 Gen 10
Intel Core Ultra 9 275HX
3052 Points +6%
Lenovo Legion 9 16IRX8
Intel Core i9-13980HX
2961 Points +3%
Razer Blade 16 2025 RTX 5090
AMD Ryzen AI 9 HX 370
2942 Points +2%
Lenovo Legion 7 16IAX10
Intel Core Ultra 7 255HX
2935 Points +2%
Razer Blade 16 RTX 5080
AMD Ryzen AI 9 365
2920 Points +1%
Razer Blade 16 Core Ultra 9 386H
Intel Core Ultra 9 386H
2886 Points
Przeciętny Intel Core Ultra 9 386H
  (2845 - 2913, n=5)
2882 Points 0%
Maingear ML-16 MK2
Intel Core Ultra 7 155H
2238 Points -22%
Alienware x16 R2 P120F
Intel Core Ultra 9 185H
2199 Points -24%
Geekbench 5.5 / Multi-Core
Alienware 16 Area-51 Core Ultra 9 290HX Plus
Intel Core Ultra 9 290HX Plus
24443 Points +44%
Schenker XMG APEX 16 MAX
AMD Ryzen 9 9955HX
22716 Points +33%
Lenovo Legion Pro 7i 16 Gen 10
Intel Core Ultra 9 275HX
22414 Points +32%
Lenovo Legion 9 16IRX8
Intel Core i9-13980HX
20639 Points +21%
Lenovo Legion 7 16IAX10
Intel Core Ultra 7 255HX
19099 Points +12%
Przeciętny Intel Core Ultra 9 386H
  (17017 - 17246, n=3)
17142 Points +1%
Razer Blade 16 Core Ultra 9 386H
Intel Core Ultra 9 386H
17017 Points
Razer Blade 16 2025 RTX 5090
AMD Ryzen AI 9 HX 370
15407 Points -9%
Razer Blade 16 RTX 5080
AMD Ryzen AI 9 365
14182 Points -17%
Alienware x16 R2 P120F
Intel Core Ultra 9 185H
12759 Points -25%
Maingear ML-16 MK2
Intel Core Ultra 7 155H
12228 Points -28%
Geekbench 5.5 / Single-Core
Schenker XMG APEX 16 MAX
AMD Ryzen 9 9955HX
2474 Points +17%
Alienware 16 Area-51 Core Ultra 9 290HX Plus
Intel Core Ultra 9 290HX Plus
2311 Points +10%
Lenovo Legion Pro 7i 16 Gen 10
Intel Core Ultra 9 275HX
2199 Points +4%
Razer Blade 16 2025 RTX 5090
AMD Ryzen AI 9 HX 370
2136 Points +1%
Lenovo Legion 9 16IRX8
Intel Core i9-13980HX
2135 Points +1%
Przeciętny Intel Core Ultra 9 386H
  (2109 - 2145, n=3)
2129 Points +1%
Lenovo Legion 7 16IAX10
Intel Core Ultra 7 255HX
2112 Points 0%
Razer Blade 16 Core Ultra 9 386H
Intel Core Ultra 9 386H
2109 Points
Razer Blade 16 RTX 5080
AMD Ryzen AI 9 365
2100 Points 0%
Alienware x16 R2 P120F
Intel Core Ultra 9 185H
1700 Points -19%
Maingear ML-16 MK2
Intel Core Ultra 7 155H
1637 Points -22%
HWBOT x265 Benchmark v2.2 / 4k Preset
Alienware 16 Area-51 Core Ultra 9 290HX Plus
Intel Core Ultra 9 290HX Plus
40.9 fps +67%
Schenker XMG APEX 16 MAX
AMD Ryzen 9 9955HX
39.7 fps +62%
Lenovo Legion Pro 7i 16 Gen 10
Intel Core Ultra 9 275HX
38.9 fps +59%
Lenovo Legion 7 16IAX10
Intel Core Ultra 7 255HX
35 fps +43%
Lenovo Legion 9 16IRX8
Intel Core i9-13980HX
31.7 fps +29%
Razer Blade 16 2025 RTX 5090
AMD Ryzen AI 9 HX 370
28.7 fps +17%
Przeciętny Intel Core Ultra 9 386H
  (24.5 - 24.8, n=3)
24.7 fps +1%
Razer Blade 16 RTX 5080
AMD Ryzen AI 9 365
24.5 fps 0%
Razer Blade 16 Core Ultra 9 386H
Intel Core Ultra 9 386H
24.5 fps
Alienware x16 R2 P120F
Intel Core Ultra 9 185H
20.7 fps -16%
Maingear ML-16 MK2
Intel Core Ultra 7 155H
17.9 fps -27%
LibreOffice / 20 Documents To PDF
Razer Blade 16 RTX 5080
AMD Ryzen AI 9 365
60 s * -56%
Schenker XMG APEX 16 MAX
AMD Ryzen 9 9955HX
48.7 s * -26%
Razer Blade 16 2025 RTX 5090
AMD Ryzen AI 9 HX 370
46.8 s * -22%
Alienware x16 R2 P120F
Intel Core Ultra 9 185H
45.9 s * -19%
Maingear ML-16 MK2
Intel Core Ultra 7 155H
43.1 s * -12%
Przeciętny Intel Core Ultra 9 386H
  (38.5 - 46.8, n=3)
42.3 s * -10%
Alienware 16 Area-51 Core Ultra 9 290HX Plus
Intel Core Ultra 9 290HX Plus
38.9 s * -1%
Razer Blade 16 Core Ultra 9 386H
Intel Core Ultra 9 386H
38.5 s *
Lenovo Legion Pro 7i 16 Gen 10
Intel Core Ultra 9 275HX
36.9 s * +4%
Lenovo Legion 7 16IAX10
Intel Core Ultra 7 255HX
35.4 s * +8%
Lenovo Legion 9 16IRX8
Intel Core i9-13980HX
35 s * +9%
R Benchmark 2.5 / Overall mean
Maingear ML-16 MK2
Intel Core Ultra 7 155H
0.505 sec * -23%
Alienware x16 R2 P120F
Intel Core Ultra 9 185H
0.503 sec * -23%
Lenovo Legion 7 16IAX10
Intel Core Ultra 7 255HX
0.4287 sec * -5%
Przeciętny Intel Core Ultra 9 386H
  (0.4096 - 0.4384, n=3)
0.4267 sec * -4%
Lenovo Legion Pro 7i 16 Gen 10
Intel Core Ultra 9 275HX
0.4132 sec * -1%
Razer Blade 16 RTX 5080
AMD Ryzen AI 9 365
0.411 sec * -0%
Razer Blade 16 Core Ultra 9 386H
Intel Core Ultra 9 386H
0.4096 sec *
Razer Blade 16 2025 RTX 5090
AMD Ryzen AI 9 HX 370
0.3979 sec * +3%
Alienware 16 Area-51 Core Ultra 9 290HX Plus
Intel Core Ultra 9 290HX Plus
0.3951 sec * +4%
Lenovo Legion 9 16IRX8
Intel Core i9-13980HX
0.3797 sec * +7%
Schenker XMG APEX 16 MAX
AMD Ryzen 9 9955HX
0.3439 sec * +16%

* ... im mniej tym lepiej

Cinebench R15 CPU Multi 64Bit
3172 Points
Cinebench R15 OpenGL 64Bit
269 fps
Cinebench R15 Ref. Match 64Bit
99.6 %
Cinebench R15 CPU Single 64Bit
313 Points
Cinebench R20 CPU (Multi Core)
8162 Points
Cinebench R20 CPU (Single Core)
795 Points
Cinebench R23 Multi Core
20750 Points
Cinebench R23 Single Core
2087 Points
Cinebench 2024 CPU Single Core
126.8 Points
Cinebench 2024 CPU Multi Core
1172 Points
Pomoc
Performance rating
Alienware 16 Area-51 Core Ultra 9 290HX Plus -1!
Intel Core Ultra 9 290HX Plus, GeForce RTX 5080 Laptop
93.1 pt
Lenovo Legion Pro 7i 16 Gen 10 -1!
Intel Core Ultra 9 275HX, GeForce RTX 5080 Laptop
88.3 pt
MSI Crosshair 16 HX AI D2XWGKG -1!
Intel Core Ultra 9 275HX, GeForce RTX 5070 Laptop
83.5 pt
HP Omen Max 16 ah000 -1!
Intel Core Ultra 9 275HX, GeForce RTX 5090 Laptop
81.8 pt
Razer Blade 16 2025 RTX 5090 -1!
AMD Ryzen AI 9 HX 370, GeForce RTX 5090 Laptop
74.3 pt
Razer Blade 16 Core Ultra 9 386H -1!
Intel Core Ultra 9 386H, GeForce RTX 5090 Laptop
57.4 pt
Przeciętny Intel Core Ultra 9 386H -1!
 
57.2 pt
AIDA64 / FP32 Ray-Trace
Alienware 16 Area-51 Core Ultra 9 290HX Plus
Intel Core Ultra 9 290HX Plus, GeForce RTX 5080 Laptop (v8.20.8100)
39607 KRay/s +92%
Razer Blade 16 2025 RTX 5090
AMD Ryzen AI 9 HX 370, GeForce RTX 5090 Laptop (v6.92.6600)
37324 KRay/s +81%
Lenovo Legion Pro 7i 16 Gen 10
Intel Core Ultra 9 275HX, GeForce RTX 5080 Laptop (v6.92.6600)
35760 KRay/s +74%
MSI Crosshair 16 HX AI D2XWGKG
Intel Core Ultra 9 275HX, GeForce RTX 5070 Laptop (v6.92.6600)
35418 KRay/s +72%
HP Omen Max 16 ah000
Intel Core Ultra 9 275HX, GeForce RTX 5090 Laptop (v6.92.6600)
34180 KRay/s +66%
Przeciętny Intel Core Ultra 9 386H
  (20588 - 21727, n=3)
21037 KRay/s +2%
Razer Blade 16 Core Ultra 9 386H
Intel Core Ultra 9 386H, GeForce RTX 5090 Laptop (v8.20.8100)
20588 KRay/s
AIDA64 / FPU Julia
Alienware 16 Area-51 Core Ultra 9 290HX Plus
Intel Core Ultra 9 290HX Plus, GeForce RTX 5080 Laptop (v8.20.8100)
204103 Points +85%
Lenovo Legion Pro 7i 16 Gen 10
Intel Core Ultra 9 275HX, GeForce RTX 5080 Laptop (v6.92.6600)
183428 Points +66%
MSI Crosshair 16 HX AI D2XWGKG
Intel Core Ultra 9 275HX, GeForce RTX 5070 Laptop (v6.92.6600)
178891 Points +62%
HP Omen Max 16 ah000
Intel Core Ultra 9 275HX, GeForce RTX 5090 Laptop (v6.92.6600)
173656 Points +58%
Razer Blade 16 2025 RTX 5090
AMD Ryzen AI 9 HX 370, GeForce RTX 5090 Laptop (v6.92.6600)
142039 Points +29%
Przeciętny Intel Core Ultra 9 386H
  (109555 - 113595, n=3)
111108 Points +1%
Razer Blade 16 Core Ultra 9 386H
Intel Core Ultra 9 386H, GeForce RTX 5090 Laptop (v8.20.8100)
110173 Points
AIDA64 / CPU SHA3
Alienware 16 Area-51 Core Ultra 9 290HX Plus
Intel Core Ultra 9 290HX Plus, GeForce RTX 5080 Laptop (v8.20.8100)
9516 MB/s +73%
Lenovo Legion Pro 7i 16 Gen 10
Intel Core Ultra 9 275HX, GeForce RTX 5080 Laptop (v6.92.6600)
8828 MB/s +60%
MSI Crosshair 16 HX AI D2XWGKG
Intel Core Ultra 9 275HX, GeForce RTX 5070 Laptop (v6.92.6600)
8466 MB/s +53%
HP Omen Max 16 ah000
Intel Core Ultra 9 275HX, GeForce RTX 5090 Laptop (v6.92.6600)
8315 MB/s +51%
Razer Blade 16 2025 RTX 5090
AMD Ryzen AI 9 HX 370, GeForce RTX 5090 Laptop (v6.92.6600)
5824 MB/s +6%
Razer Blade 16 Core Ultra 9 386H
Intel Core Ultra 9 386H, GeForce RTX 5090 Laptop (v8.20.8100)
5516 MB/s
Przeciętny Intel Core Ultra 9 386H
  (5379 - 5604, n=3)
5500 MB/s 0%
AIDA64 / CPU Queen
Lenovo Legion Pro 7i 16 Gen 10
Intel Core Ultra 9 275HX, GeForce RTX 5080 Laptop (v6.92.6600)
137820 Points
MSI Crosshair 16 HX AI D2XWGKG
Intel Core Ultra 9 275HX, GeForce RTX 5070 Laptop (v6.92.6600)
131131 Points
HP Omen Max 16 ah000
Intel Core Ultra 9 275HX, GeForce RTX 5090 Laptop (v6.92.6600)
128670 Points
Razer Blade 16 2025 RTX 5090
AMD Ryzen AI 9 HX 370, GeForce RTX 5090 Laptop (v6.92.6600)
88891 Points
AIDA64 / FPU SinJulia
Razer Blade 16 2025 RTX 5090
AMD Ryzen AI 9 HX 370, GeForce RTX 5090 Laptop (v6.92.6600)
19115 Points +163%
Lenovo Legion Pro 7i 16 Gen 10
Intel Core Ultra 9 275HX, GeForce RTX 5080 Laptop (v6.92.6600)
13969 Points +92%
Alienware 16 Area-51 Core Ultra 9 290HX Plus
Intel Core Ultra 9 290HX Plus, GeForce RTX 5080 Laptop (v8.20.8100)
13612 Points +87%
MSI Crosshair 16 HX AI D2XWGKG
Intel Core Ultra 9 275HX, GeForce RTX 5070 Laptop (v6.92.6600)
12998 Points +79%
HP Omen Max 16 ah000
Intel Core Ultra 9 275HX, GeForce RTX 5090 Laptop (v6.92.6600)
12272 Points +69%
Przeciętny Intel Core Ultra 9 386H
  (7267 - 7332, n=3)
7308 Points +1%
Razer Blade 16 Core Ultra 9 386H
Intel Core Ultra 9 386H, GeForce RTX 5090 Laptop (v8.20.8100)
7267 Points
AIDA64 / FPU Mandel
Alienware 16 Area-51 Core Ultra 9 290HX Plus
Intel Core Ultra 9 290HX Plus, GeForce RTX 5080 Laptop (v8.20.8100)
106285 Points +82%
Lenovo Legion Pro 7i 16 Gen 10
Intel Core Ultra 9 275HX, GeForce RTX 5080 Laptop (v6.92.6600)
95742 Points +64%
MSI Crosshair 16 HX AI D2XWGKG
Intel Core Ultra 9 275HX, GeForce RTX 5070 Laptop (v6.92.6600)
93713 Points +61%
HP Omen Max 16 ah000
Intel Core Ultra 9 275HX, GeForce RTX 5090 Laptop (v6.92.6600)
90980 Points +56%
Razer Blade 16 2025 RTX 5090
AMD Ryzen AI 9 HX 370, GeForce RTX 5090 Laptop (v6.92.6600)
75107 Points +29%
Przeciętny Intel Core Ultra 9 386H
  (58275 - 61578, n=3)
59670 Points +2%
Razer Blade 16 Core Ultra 9 386H
Intel Core Ultra 9 386H, GeForce RTX 5090 Laptop (v8.20.8100)
58275 Points
AIDA64 / CPU AES
Lenovo Legion Pro 7i 16 Gen 10
Intel Core Ultra 9 275HX, GeForce RTX 5080 Laptop (v6.92.6600)
134042 MB/s +90%
Alienware 16 Area-51 Core Ultra 9 290HX Plus
Intel Core Ultra 9 290HX Plus, GeForce RTX 5080 Laptop (v8.20.8100)
130696 MB/s +86%
MSI Crosshair 16 HX AI D2XWGKG
Intel Core Ultra 9 275HX, GeForce RTX 5070 Laptop (v6.92.6600)
124637 MB/s +77%
HP Omen Max 16 ah000
Intel Core Ultra 9 275HX, GeForce RTX 5090 Laptop (v6.92.6600)
118108 MB/s +68%
Razer Blade 16 2025 RTX 5090
AMD Ryzen AI 9 HX 370, GeForce RTX 5090 Laptop (v6.92.6600)
82547 MB/s +17%
Razer Blade 16 Core Ultra 9 386H
Intel Core Ultra 9 386H, GeForce RTX 5090 Laptop (v8.20.8100)
70408 MB/s
Przeciętny Intel Core Ultra 9 386H
  (69610 - 70433, n=3)
70150 MB/s 0%
AIDA64 / CPU ZLib
Alienware 16 Area-51 Core Ultra 9 290HX Plus
Intel Core Ultra 9 290HX Plus, GeForce RTX 5080 Laptop (v8.20.8100)
2162 MB/s +70%
Lenovo Legion Pro 7i 16 Gen 10
Intel Core Ultra 9 275HX, GeForce RTX 5080 Laptop (v6.92.6600)
2067 MB/s +63%
MSI Crosshair 16 HX AI D2XWGKG
Intel Core Ultra 9 275HX, GeForce RTX 5070 Laptop (v6.92.6600)
1987 MB/s +56%
HP Omen Max 16 ah000
Intel Core Ultra 9 275HX, GeForce RTX 5090 Laptop (v6.92.6600)
1896 MB/s +49%
Razer Blade 16 2025 RTX 5090
AMD Ryzen AI 9 HX 370, GeForce RTX 5090 Laptop (v6.92.6600)
1514 MB/s +19%
Razer Blade 16 Core Ultra 9 386H
Intel Core Ultra 9 386H, GeForce RTX 5090 Laptop (v8.20.8100)
1271 MB/s
Przeciętny Intel Core Ultra 9 386H
  (1245 - 1271, n=3)
1259 MB/s -1%
AIDA64 / FP64 Ray-Trace
Alienware 16 Area-51 Core Ultra 9 290HX Plus
Intel Core Ultra 9 290HX Plus, GeForce RTX 5080 Laptop (v8.20.8100)
21472 KRay/s +114%
Razer Blade 16 2025 RTX 5090
AMD Ryzen AI 9 HX 370, GeForce RTX 5090 Laptop (v6.92.6600)
20284 KRay/s +102%
Lenovo Legion Pro 7i 16 Gen 10
Intel Core Ultra 9 275HX, GeForce RTX 5080 Laptop (v6.92.6600)
19630 KRay/s +96%
MSI Crosshair 16 HX AI D2XWGKG
Intel Core Ultra 9 275HX, GeForce RTX 5070 Laptop (v6.92.6600)
19183 KRay/s +91%
HP Omen Max 16 ah000
Intel Core Ultra 9 275HX, GeForce RTX 5090 Laptop (v6.92.6600)
18490 KRay/s +84%
Przeciętny Intel Core Ultra 9 386H
  (10023 - 11627, n=3)
10922 KRay/s +9%
Razer Blade 16 Core Ultra 9 386H
Intel Core Ultra 9 386H, GeForce RTX 5090 Laptop (v8.20.8100)
10023 KRay/s
AIDA64 / CPU PhotoWorxx
Razer Blade 16 Core Ultra 9 386H
Intel Core Ultra 9 386H, GeForce RTX 5090 Laptop (v8.20.8100)
89891 MPixel/s
Przeciętny Intel Core Ultra 9 386H
  (74945 - 89891, n=3)
83001 MPixel/s -8%
Alienware 16 Area-51 Core Ultra 9 290HX Plus
Intel Core Ultra 9 290HX Plus, GeForce RTX 5080 Laptop (v8.20.8100)
55731 MPixel/s -38%
Lenovo Legion Pro 7i 16 Gen 10
Intel Core Ultra 9 275HX, GeForce RTX 5080 Laptop (v6.92.6600)
53522 MPixel/s -40%
Razer Blade 16 2025 RTX 5090
AMD Ryzen AI 9 HX 370, GeForce RTX 5090 Laptop (v6.92.6600)
51417 MPixel/s -43%
HP Omen Max 16 ah000
Intel Core Ultra 9 275HX, GeForce RTX 5090 Laptop (v6.92.6600)
49039 MPixel/s -45%
MSI Crosshair 16 HX AI D2XWGKG
Intel Core Ultra 9 275HX, GeForce RTX 5070 Laptop (v6.92.6600)
39052 MPixel/s -57%
AIDA64 / CPU CheckMate
Alienware 16 Area-51 Core Ultra 9 290HX Plus
Intel Core Ultra 9 290HX Plus, GeForce RTX 5080 Laptop (v8.20.8100)
8106 MP/s +68%
Razer Blade 16 Core Ultra 9 386H
Intel Core Ultra 9 386H, GeForce RTX 5090 Laptop (v8.20.8100)
4811 MP/s
Przeciętny Intel Core Ultra 9 386H
  (4689 - 4826, n=3)
4775 MP/s -1%

Wydajność systemu

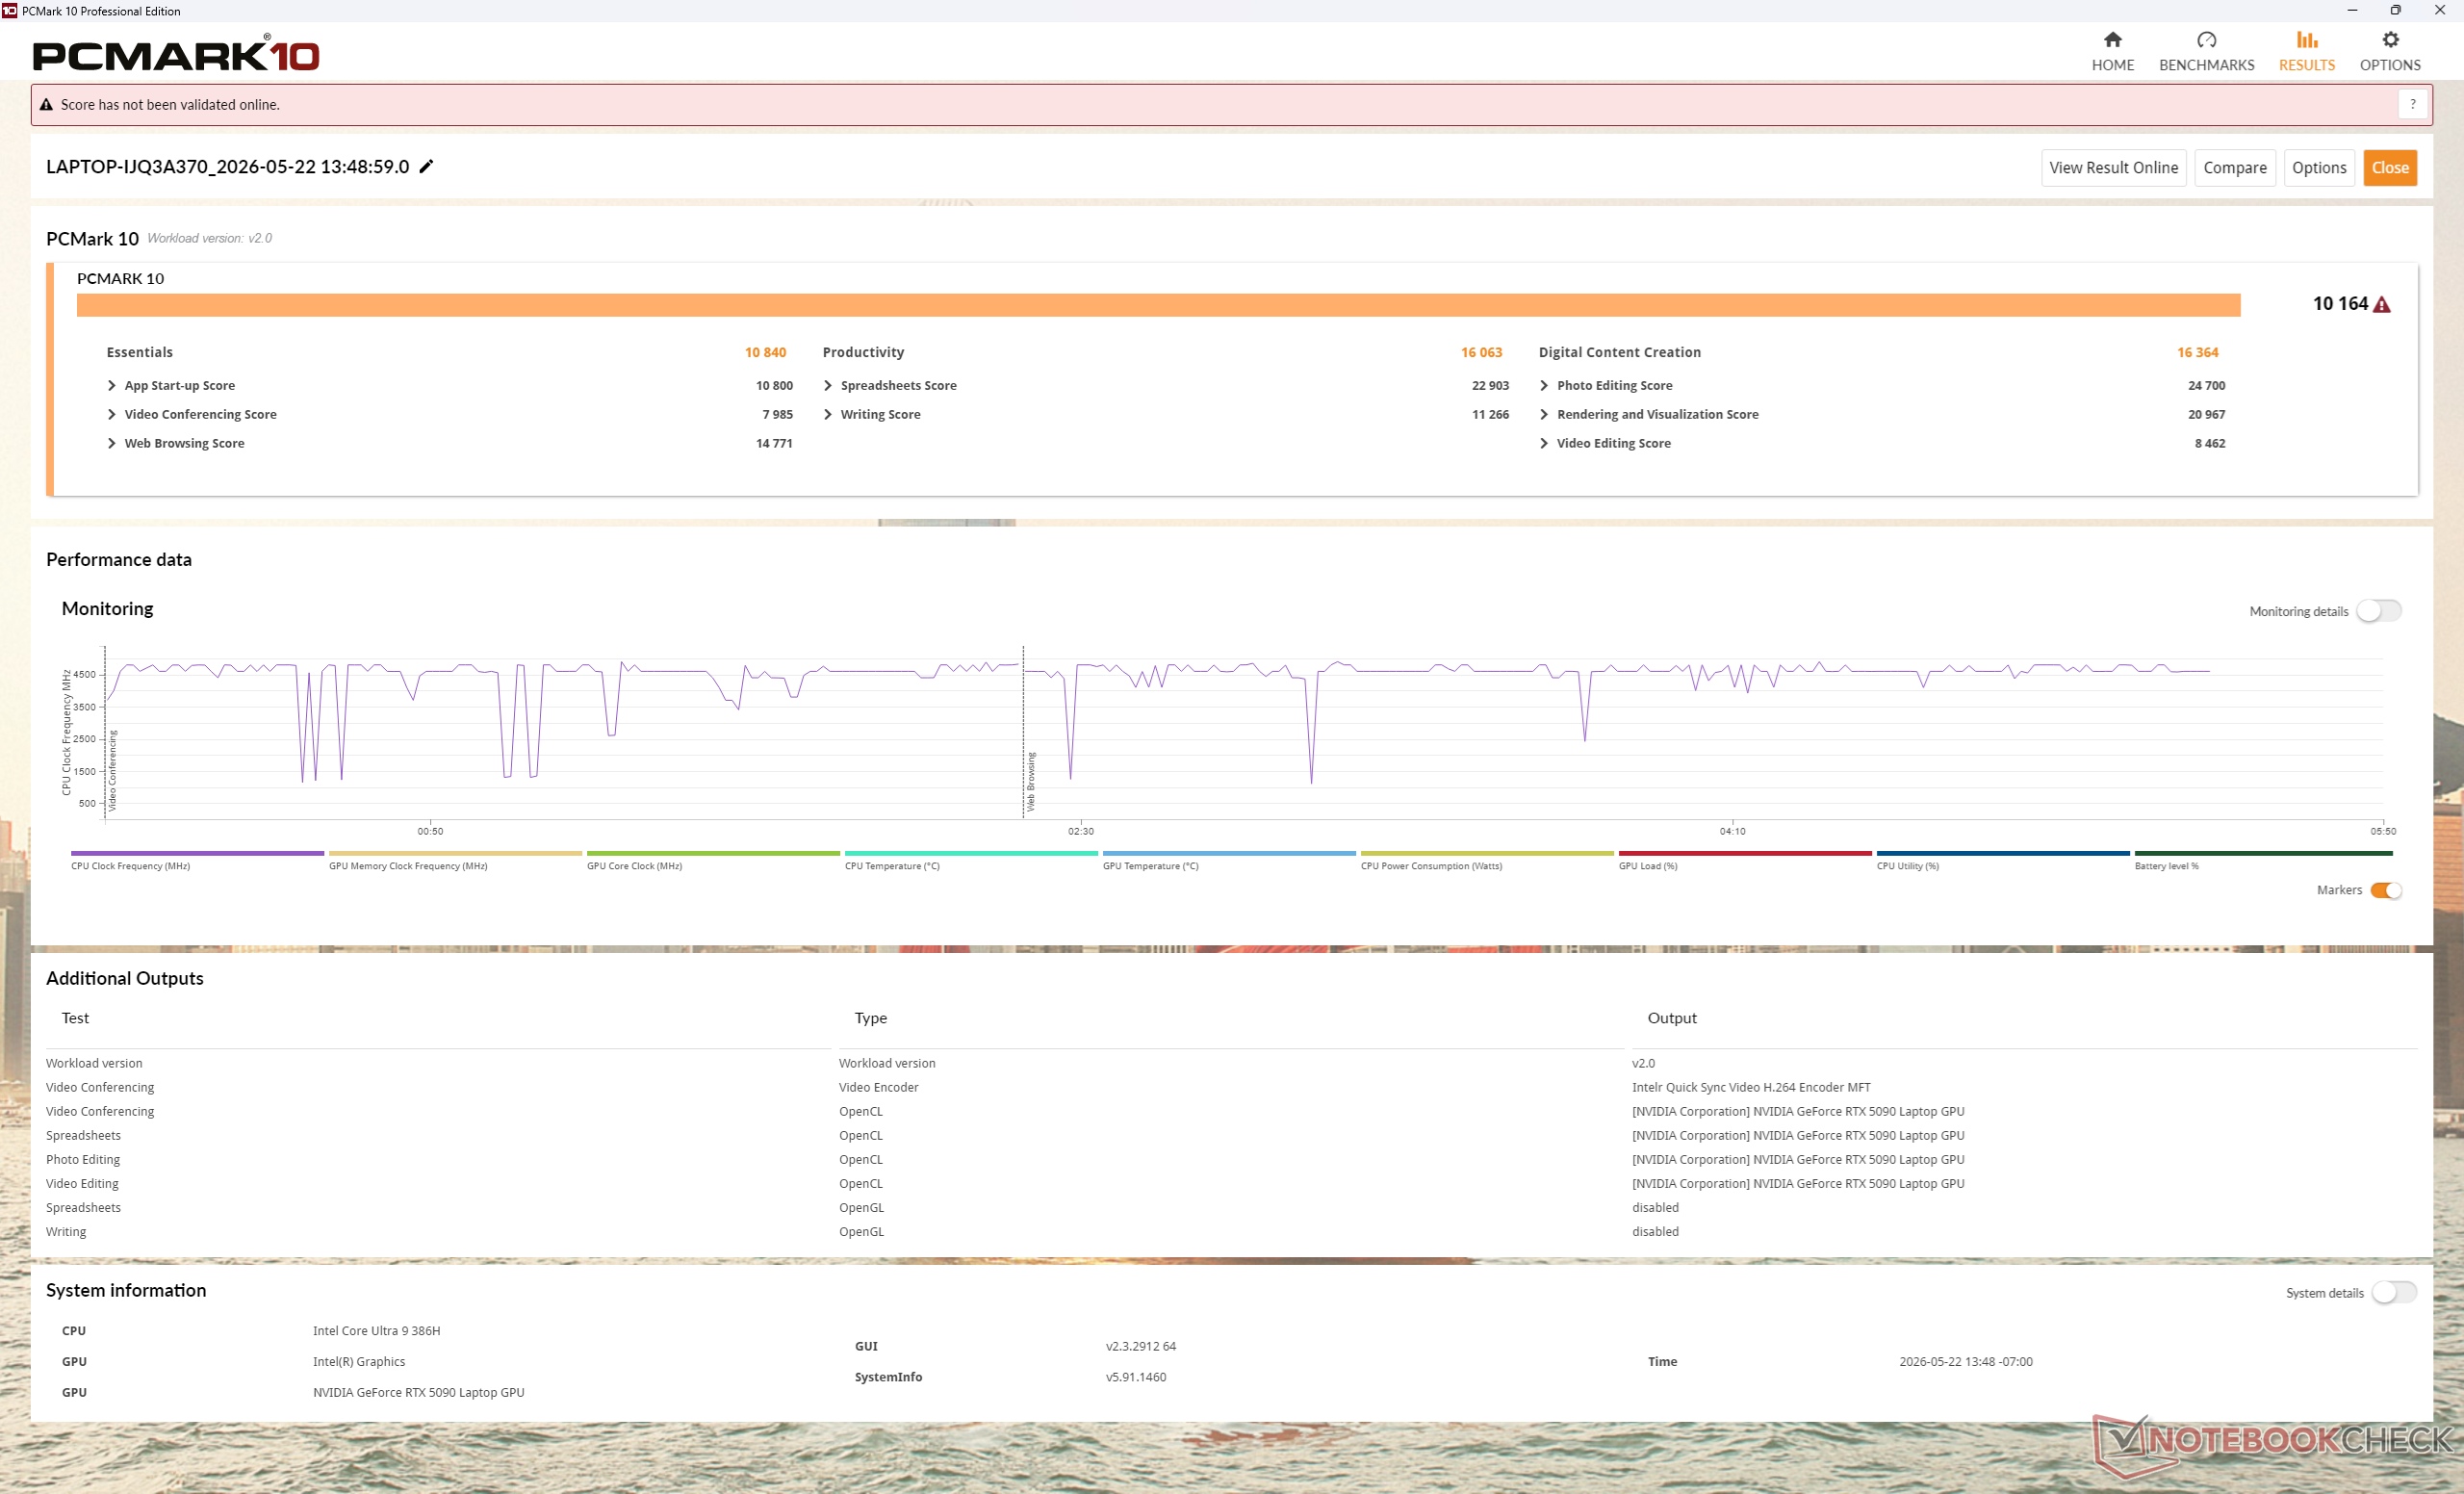
Wyniki PCMark konsekwentnie wyprzedzają oparte na AMD 2025 Blade 16
Performance rating: Percent
PCMark 10: Score | Essentials | Productivity | Digital Content Creation
CrossMark: Overall | Productivity | Creativity | Responsiveness
WebXPRT 3: Overall
WebXPRT 4: Overall
Mozilla Kraken 1.1: Total
Performance rating
Alienware 16 Area-51 Core Ultra 9 290HX Plus
GeForce RTX 5080 Laptop, Ultra 9 290HX Plus, SK hynix PCB01 HFS001TFM9X186N
92 pt
Razer Blade 16 Core Ultra 9 386H
GeForce RTX 5090 Laptop, Ultra 9 386H, Lexar NM790 2TB
79.6 pt
Lenovo Legion Pro 7i 16 Gen 10
GeForce RTX 5080 Laptop, Ultra 9 275HX, SK Hynix HFS001TEJ9X115N
77.1 pt
Przeciętny Intel Core Ultra 9 386H, NVIDIA GeForce RTX 5090 Laptop
 
76.8 pt
MSI Crosshair 16 HX AI D2XWGKG
GeForce RTX 5070 Laptop, Ultra 9 275HX, Micron 2500 1TB MTFDKBA1T0QGN
74.5 pt
HP Omen Max 16 ah000 -1!
GeForce RTX 5090 Laptop, Ultra 9 275HX, WDC PC SN810 2TB
73.8 pt
Razer Blade 16 2025 RTX 5090 -4!
GeForce RTX 5090 Laptop, Ryzen AI 9 HX 370, SSSTC CA6-8D2048
64.8 pt
PCMark 10 / Score
Alienware 16 Area-51 Core Ultra 9 290HX Plus
GeForce RTX 5080 Laptop, Ultra 9 290HX Plus, SK hynix PCB01 HFS001TFM9X186N
11574 Points +14%
Razer Blade 16 Core Ultra 9 386H
GeForce RTX 5090 Laptop, Ultra 9 386H, Lexar NM790 2TB
10164 Points
Przeciętny Intel Core Ultra 9 386H, NVIDIA GeForce RTX 5090 Laptop
  (9457 - 10164, n=2)
9811 Points -3%
Lenovo Legion Pro 7i 16 Gen 10
GeForce RTX 5080 Laptop, Ultra 9 275HX, SK Hynix HFS001TEJ9X115N
9153 Points -10%
HP Omen Max 16 ah000
GeForce RTX 5090 Laptop, Ultra 9 275HX, WDC PC SN810 2TB
8794 Points -13%
Razer Blade 16 2025 RTX 5090
GeForce RTX 5090 Laptop, Ryzen AI 9 HX 370, SSSTC CA6-8D2048
8254 Points -19%
MSI Crosshair 16 HX AI D2XWGKG
GeForce RTX 5070 Laptop, Ultra 9 275HX, Micron 2500 1TB MTFDKBA1T0QGN
8149 Points -20%
PCMark 10 / Essentials
Alienware 16 Area-51 Core Ultra 9 290HX Plus
GeForce RTX 5080 Laptop, Ultra 9 290HX Plus, SK hynix PCB01 HFS001TFM9X186N
11887 Points +10%
Lenovo Legion Pro 7i 16 Gen 10
GeForce RTX 5080 Laptop, Ultra 9 275HX, SK Hynix HFS001TEJ9X115N
11215 Points +3%
HP Omen Max 16 ah000
GeForce RTX 5090 Laptop, Ultra 9 275HX, WDC PC SN810 2TB
10969 Points +1%
Razer Blade 16 Core Ultra 9 386H
GeForce RTX 5090 Laptop, Ultra 9 386H, Lexar NM790 2TB
10840 Points
MSI Crosshair 16 HX AI D2XWGKG
GeForce RTX 5070 Laptop, Ultra 9 275HX, Micron 2500 1TB MTFDKBA1T0QGN
10767 Points -1%
Razer Blade 16 2025 RTX 5090
GeForce RTX 5090 Laptop, Ryzen AI 9 HX 370, SSSTC CA6-8D2048
10626 Points -2%
Przeciętny Intel Core Ultra 9 386H, NVIDIA GeForce RTX 5090 Laptop
  (9755 - 10840, n=2)
10298 Points -5%
PCMark 10 / Productivity
Alienware 16 Area-51 Core Ultra 9 290HX Plus
GeForce RTX 5080 Laptop, Ultra 9 290HX Plus, SK hynix PCB01 HFS001TFM9X186N
18766 Points +17%
Przeciętny Intel Core Ultra 9 386H, NVIDIA GeForce RTX 5090 Laptop
  (16063 - 16479, n=2)
16271 Points +1%
Razer Blade 16 Core Ultra 9 386H
GeForce RTX 5090 Laptop, Ultra 9 386H, Lexar NM790 2TB
16063 Points
Razer Blade 16 2025 RTX 5090
GeForce RTX 5090 Laptop, Ryzen AI 9 HX 370, SSSTC CA6-8D2048
10341 Points -36%
Lenovo Legion Pro 7i 16 Gen 10
GeForce RTX 5080 Laptop, Ultra 9 275HX, SK Hynix HFS001TEJ9X115N
9590 Points -40%
HP Omen Max 16 ah000
GeForce RTX 5090 Laptop, Ultra 9 275HX, WDC PC SN810 2TB
9122 Points -43%
MSI Crosshair 16 HX AI D2XWGKG
GeForce RTX 5070 Laptop, Ultra 9 275HX, Micron 2500 1TB MTFDKBA1T0QGN
8307 Points -48%
PCMark 10 / Digital Content Creation
Lenovo Legion Pro 7i 16 Gen 10
GeForce RTX 5080 Laptop, Ultra 9 275HX, SK Hynix HFS001TEJ9X115N
19351 Points +18%
Alienware 16 Area-51 Core Ultra 9 290HX Plus
GeForce RTX 5080 Laptop, Ultra 9 290HX Plus, SK hynix PCB01 HFS001TFM9X186N
18861 Points +15%
HP Omen Max 16 ah000
GeForce RTX 5090 Laptop, Ultra 9 275HX, WDC PC SN810 2TB
18445 Points +13%
MSI Crosshair 16 HX AI D2XWGKG
GeForce RTX 5070 Laptop, Ultra 9 275HX, Micron 2500 1TB MTFDKBA1T0QGN
16417 Points 0%
Razer Blade 16 Core Ultra 9 386H
GeForce RTX 5090 Laptop, Ultra 9 386H, Lexar NM790 2TB
16364 Points
Przeciętny Intel Core Ultra 9 386H, NVIDIA GeForce RTX 5090 Laptop
  (14280 - 16364, n=2)
15322 Points -6%
Razer Blade 16 2025 RTX 5090
GeForce RTX 5090 Laptop, Ryzen AI 9 HX 370, SSSTC CA6-8D2048
13889 Points -15%
CrossMark / Overall
Alienware 16 Area-51 Core Ultra 9 290HX Plus
GeForce RTX 5080 Laptop, Ultra 9 290HX Plus, SK hynix PCB01 HFS001TFM9X186N
2409 Points +10%
Razer Blade 16 Core Ultra 9 386H
GeForce RTX 5090 Laptop, Ultra 9 386H, Lexar NM790 2TB
2185 Points
Przeciętny Intel Core Ultra 9 386H, NVIDIA GeForce RTX 5090 Laptop
  (2073 - 2185, n=2)
2129 Points -3%
MSI Crosshair 16 HX AI D2XWGKG
GeForce RTX 5070 Laptop, Ultra 9 275HX, Micron 2500 1TB MTFDKBA1T0QGN
2107 Points -4%
Lenovo Legion Pro 7i 16 Gen 10
GeForce RTX 5080 Laptop, Ultra 9 275HX, SK Hynix HFS001TEJ9X115N
2017 Points -8%
HP Omen Max 16 ah000
GeForce RTX 5090 Laptop, Ultra 9 275HX, WDC PC SN810 2TB
1995 Points -9%
CrossMark / Productivity
Alienware 16 Area-51 Core Ultra 9 290HX Plus
GeForce RTX 5080 Laptop, Ultra 9 290HX Plus, SK hynix PCB01 HFS001TFM9X186N
2216 Points +12%
Razer Blade 16 Core Ultra 9 386H
GeForce RTX 5090 Laptop, Ultra 9 386H, Lexar NM790 2TB
1972 Points
MSI Crosshair 16 HX AI D2XWGKG
GeForce RTX 5070 Laptop, Ultra 9 275HX, Micron 2500 1TB MTFDKBA1T0QGN
1970 Points 0%
Przeciętny Intel Core Ultra 9 386H, NVIDIA GeForce RTX 5090 Laptop
  (1876 - 1972, n=2)
1924 Points -2%
Lenovo Legion Pro 7i 16 Gen 10
GeForce RTX 5080 Laptop, Ultra 9 275HX, SK Hynix HFS001TEJ9X115N
1922 Points -3%
HP Omen Max 16 ah000
GeForce RTX 5090 Laptop, Ultra 9 275HX, WDC PC SN810 2TB
1847 Points -6%
CrossMark / Creativity
Alienware 16 Area-51 Core Ultra 9 290HX Plus
GeForce RTX 5080 Laptop, Ultra 9 290HX Plus, SK hynix PCB01 HFS001TFM9X186N
2648 Points +4%
Razer Blade 16 Core Ultra 9 386H
GeForce RTX 5090 Laptop, Ultra 9 386H, Lexar NM790 2TB
2558 Points
Przeciętny Intel Core Ultra 9 386H, NVIDIA GeForce RTX 5090 Laptop
  (2420 - 2558, n=2)
2489 Points -3%
MSI Crosshair 16 HX AI D2XWGKG
GeForce RTX 5070 Laptop, Ultra 9 275HX, Micron 2500 1TB MTFDKBA1T0QGN
2380 Points -7%
Lenovo Legion Pro 7i 16 Gen 10
GeForce RTX 5080 Laptop, Ultra 9 275HX, SK Hynix HFS001TEJ9X115N
2288 Points -11%
HP Omen Max 16 ah000
GeForce RTX 5090 Laptop, Ultra 9 275HX, WDC PC SN810 2TB
2285 Points -11%
CrossMark / Responsiveness
Alienware 16 Area-51 Core Ultra 9 290HX Plus
GeForce RTX 5080 Laptop, Ultra 9 290HX Plus, SK hynix PCB01 HFS001TFM9X186N
2334 Points +26%
Razer Blade 16 Core Ultra 9 386H
GeForce RTX 5090 Laptop, Ultra 9 386H, Lexar NM790 2TB
1854 Points
Przeciętny Intel Core Ultra 9 386H, NVIDIA GeForce RTX 5090 Laptop
  (1755 - 1854, n=2)
1805 Points -3%
MSI Crosshair 16 HX AI D2XWGKG
GeForce RTX 5070 Laptop, Ultra 9 275HX, Micron 2500 1TB MTFDKBA1T0QGN
1790 Points -3%
HP Omen Max 16 ah000
GeForce RTX 5090 Laptop, Ultra 9 275HX, WDC PC SN810 2TB
1673 Points -10%
Lenovo Legion Pro 7i 16 Gen 10
GeForce RTX 5080 Laptop, Ultra 9 275HX, SK Hynix HFS001TEJ9X115N
1597 Points -14%
WebXPRT 3 / Overall
Alienware 16 Area-51 Core Ultra 9 290HX Plus
GeForce RTX 5080 Laptop, Ultra 9 290HX Plus, SK hynix PCB01 HFS001TFM9X186N
381 Points +17%
HP Omen Max 16 ah000
GeForce RTX 5090 Laptop, Ultra 9 275HX, WDC PC SN810 2TB
359 Points +10%
Lenovo Legion Pro 7i 16 Gen 10
GeForce RTX 5080 Laptop, Ultra 9 275HX, SK Hynix HFS001TEJ9X115N
359 Points +10%
MSI Crosshair 16 HX AI D2XWGKG
GeForce RTX 5070 Laptop, Ultra 9 275HX, Micron 2500 1TB MTFDKBA1T0QGN
331 Points +2%
Razer Blade 16 Core Ultra 9 386H
GeForce RTX 5090 Laptop, Ultra 9 386H, Lexar NM790 2TB
325 Points
Razer Blade 16 2025 RTX 5090
GeForce RTX 5090 Laptop, Ryzen AI 9 HX 370, SSSTC CA6-8D2048
321 Points -1%
Przeciętny Intel Core Ultra 9 386H, NVIDIA GeForce RTX 5090 Laptop
  (307 - 325, n=2)
316 Points -3%
WebXPRT 4 / Overall
Alienware 16 Area-51 Core Ultra 9 290HX Plus
GeForce RTX 5080 Laptop, Ultra 9 290HX Plus, SK hynix PCB01 HFS001TFM9X186N
354 Points +18%
Lenovo Legion Pro 7i 16 Gen 10
GeForce RTX 5080 Laptop, Ultra 9 275HX, SK Hynix HFS001TEJ9X115N
333 Points +11%
MSI Crosshair 16 HX AI D2XWGKG
GeForce RTX 5070 Laptop, Ultra 9 275HX, Micron 2500 1TB MTFDKBA1T0QGN
315 Points +5%
Razer Blade 16 Core Ultra 9 386H
GeForce RTX 5090 Laptop, Ultra 9 386H, Lexar NM790 2TB
301 Points
Przeciętny Intel Core Ultra 9 386H, NVIDIA GeForce RTX 5090 Laptop
  (242 - 301, n=2)
272 Points -10%
Razer Blade 16 2025 RTX 5090
GeForce RTX 5090 Laptop, Ryzen AI 9 HX 370, SSSTC CA6-8D2048
268 Points -11%
Mozilla Kraken 1.1 / Total
Razer Blade 16 Core Ultra 9 386H
GeForce RTX 5090 Laptop, Ultra 9 386H, Lexar NM790 2TB
456 ms *
Przeciętny Intel Core Ultra 9 386H, NVIDIA GeForce RTX 5090 Laptop
  (444 - 456, n=2)
450 ms * +1%
Razer Blade 16 2025 RTX 5090
GeForce RTX 5090 Laptop, Ryzen AI 9 HX 370, SSSTC CA6-8D2048
429 ms * +6%
HP Omen Max 16 ah000
GeForce RTX 5090 Laptop, Ultra 9 275HX, WDC PC SN810 2TB
420 ms * +8%
Lenovo Legion Pro 7i 16 Gen 10
GeForce RTX 5080 Laptop, Ultra 9 275HX, SK Hynix HFS001TEJ9X115N
408 ms * +11%
MSI Crosshair 16 HX AI D2XWGKG
GeForce RTX 5070 Laptop, Ultra 9 275HX, Micron 2500 1TB MTFDKBA1T0QGN
407 ms * +11%
Alienware 16 Area-51 Core Ultra 9 290HX Plus
GeForce RTX 5080 Laptop, Ultra 9 290HX Plus, SK hynix PCB01 HFS001TFM9X186N
391 ms * +14%

* ... im mniej tym lepiej

PCMark 10 Score
10164 pkt.
Pomoc
AIDA64 / Memory Copy
Razer Blade 16 Core Ultra 9 386H
Intel Core Ultra 9 386H, GeForce RTX 5090 Laptop
129946 MB/s
Przeciętny Intel Core Ultra 9 386H
  (107528 - 129946, n=3)
119050 MB/s -8%
Razer Blade 16 2025 RTX 5090
AMD Ryzen AI 9 HX 370, GeForce RTX 5090 Laptop
93640 MB/s -28%
Alienware 16 Area-51 Core Ultra 9 290HX Plus
Intel Core Ultra 9 290HX Plus, GeForce RTX 5080 Laptop
85698 MB/s -34%
Lenovo Legion Pro 7i 16 Gen 10
Intel Core Ultra 9 275HX, GeForce RTX 5080 Laptop
85644 MB/s -34%
HP Omen Max 16 ah000
Intel Core Ultra 9 275HX, GeForce RTX 5090 Laptop
77500 MB/s -40%
MSI Crosshair 16 HX AI D2XWGKG
Intel Core Ultra 9 275HX, GeForce RTX 5070 Laptop
68559 MB/s -47%
AIDA64 / Memory Read
Razer Blade 16 Core Ultra 9 386H
Intel Core Ultra 9 386H, GeForce RTX 5090 Laptop
118858 MB/s
Przeciętny Intel Core Ultra 9 386H
  (99207 - 118858, n=3)
110173 MB/s -7%
Razer Blade 16 2025 RTX 5090
AMD Ryzen AI 9 HX 370, GeForce RTX 5090 Laptop
102937 MB/s -13%
Lenovo Legion Pro 7i 16 Gen 10
Intel Core Ultra 9 275HX, GeForce RTX 5080 Laptop
95542 MB/s -20%
Alienware 16 Area-51 Core Ultra 9 290HX Plus
Intel Core Ultra 9 290HX Plus, GeForce RTX 5080 Laptop
93496 MB/s -21%
HP Omen Max 16 ah000
Intel Core Ultra 9 275HX, GeForce RTX 5090 Laptop
84473 MB/s -29%
MSI Crosshair 16 HX AI D2XWGKG
Intel Core Ultra 9 275HX, GeForce RTX 5070 Laptop
83924 MB/s -29%
AIDA64 / Memory Write
Razer Blade 16 Core Ultra 9 386H
Intel Core Ultra 9 386H, GeForce RTX 5090 Laptop
135096 MB/s
Przeciętny Intel Core Ultra 9 386H
  (106443 - 135096, n=3)
120735 MB/s -11%
Razer Blade 16 2025 RTX 5090
AMD Ryzen AI 9 HX 370, GeForce RTX 5090 Laptop
103860 MB/s -23%
Lenovo Legion Pro 7i 16 Gen 10
Intel Core Ultra 9 275HX, GeForce RTX 5080 Laptop
84581 MB/s -37%
Alienware 16 Area-51 Core Ultra 9 290HX Plus
Intel Core Ultra 9 290HX Plus, GeForce RTX 5080 Laptop
81688 MB/s -40%
HP Omen Max 16 ah000
Intel Core Ultra 9 275HX, GeForce RTX 5090 Laptop
77637 MB/s -43%
MSI Crosshair 16 HX AI D2XWGKG
Intel Core Ultra 9 275HX, GeForce RTX 5070 Laptop
66719 MB/s -51%
AIDA64 / Memory Latency
HP Omen Max 16 ah000
Intel Core Ultra 9 275HX, GeForce RTX 5090 Laptop
118.7 ns * -36%
MSI Crosshair 16 HX AI D2XWGKG
Intel Core Ultra 9 275HX, GeForce RTX 5070 Laptop
111.5 ns * -28%
Lenovo Legion Pro 7i 16 Gen 10
Intel Core Ultra 9 275HX, GeForce RTX 5080 Laptop
109.3 ns * -25%
Alienware 16 Area-51 Core Ultra 9 290HX Plus
Intel Core Ultra 9 290HX Plus, GeForce RTX 5080 Laptop
105.5 ns * -21%
Razer Blade 16 2025 RTX 5090
AMD Ryzen AI 9 HX 370, GeForce RTX 5090 Laptop
103.6 ns * -19%
Przeciętny Intel Core Ultra 9 386H
  (87.2 - 105.9, n=3)
94.3 ns * -8%
Razer Blade 16 Core Ultra 9 386H
Intel Core Ultra 9 386H, GeForce RTX 5090 Laptop
87.2 ns *

* ... im mniej tym lepiej

Opóźnienie DPC
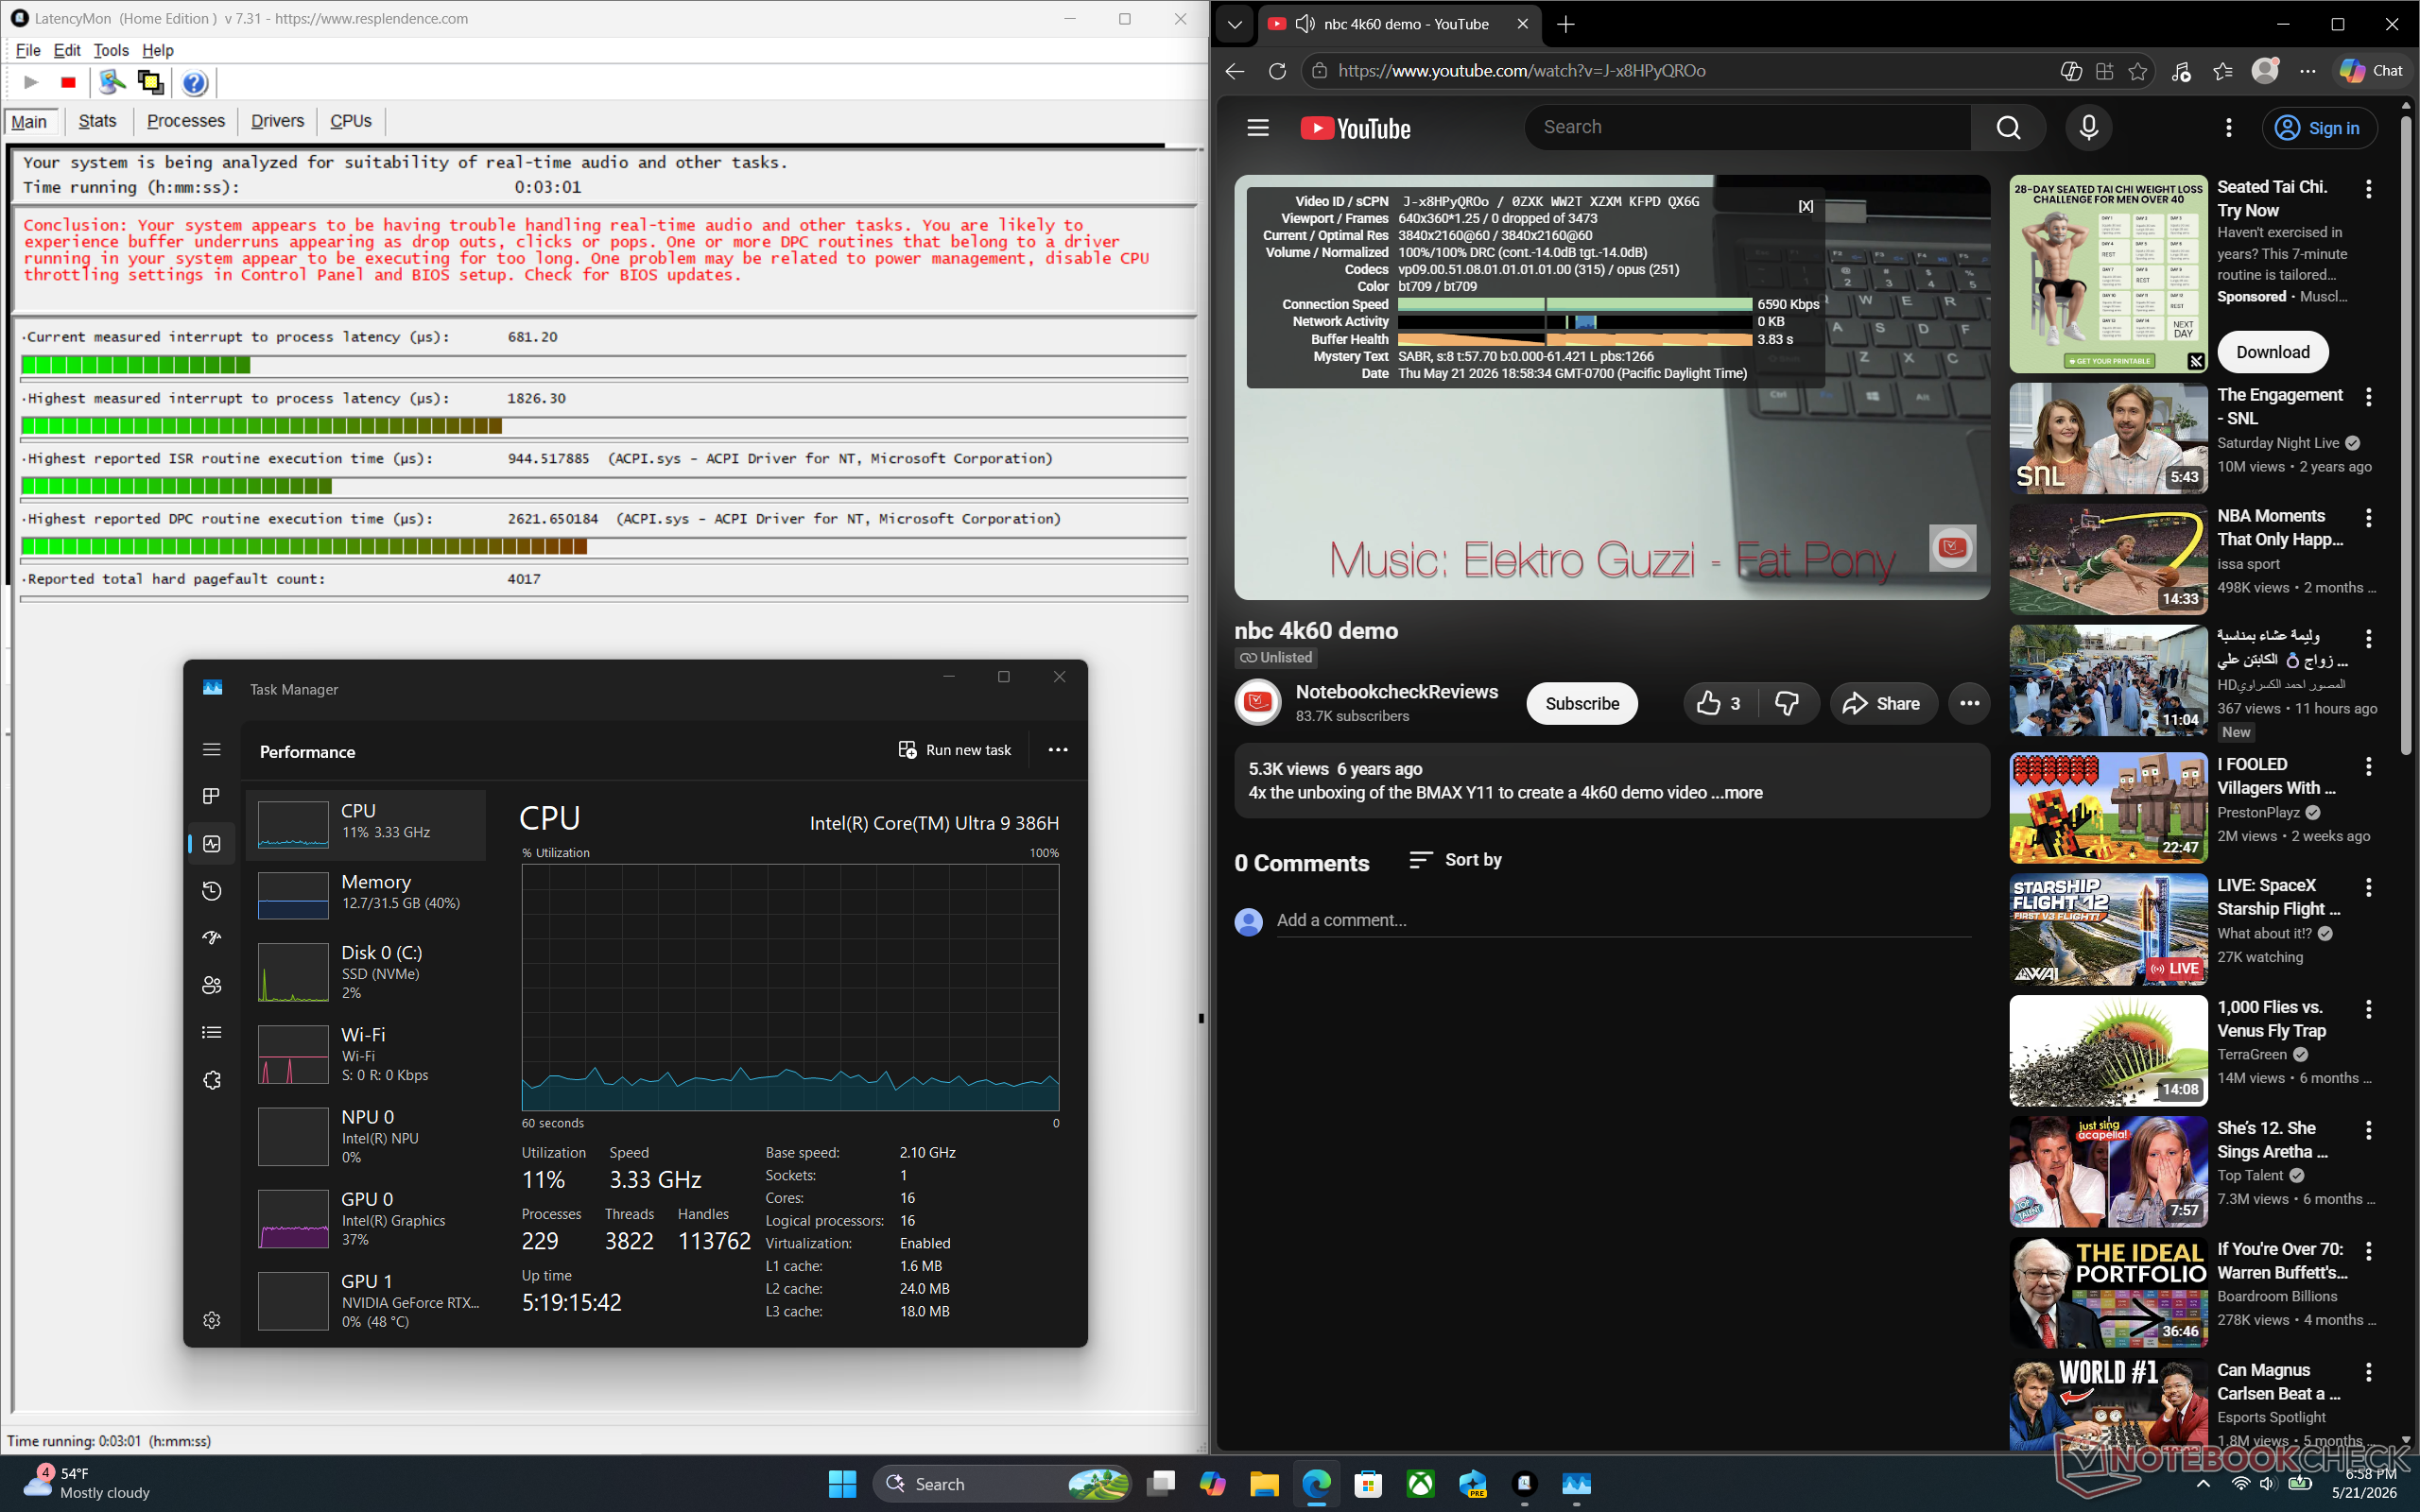
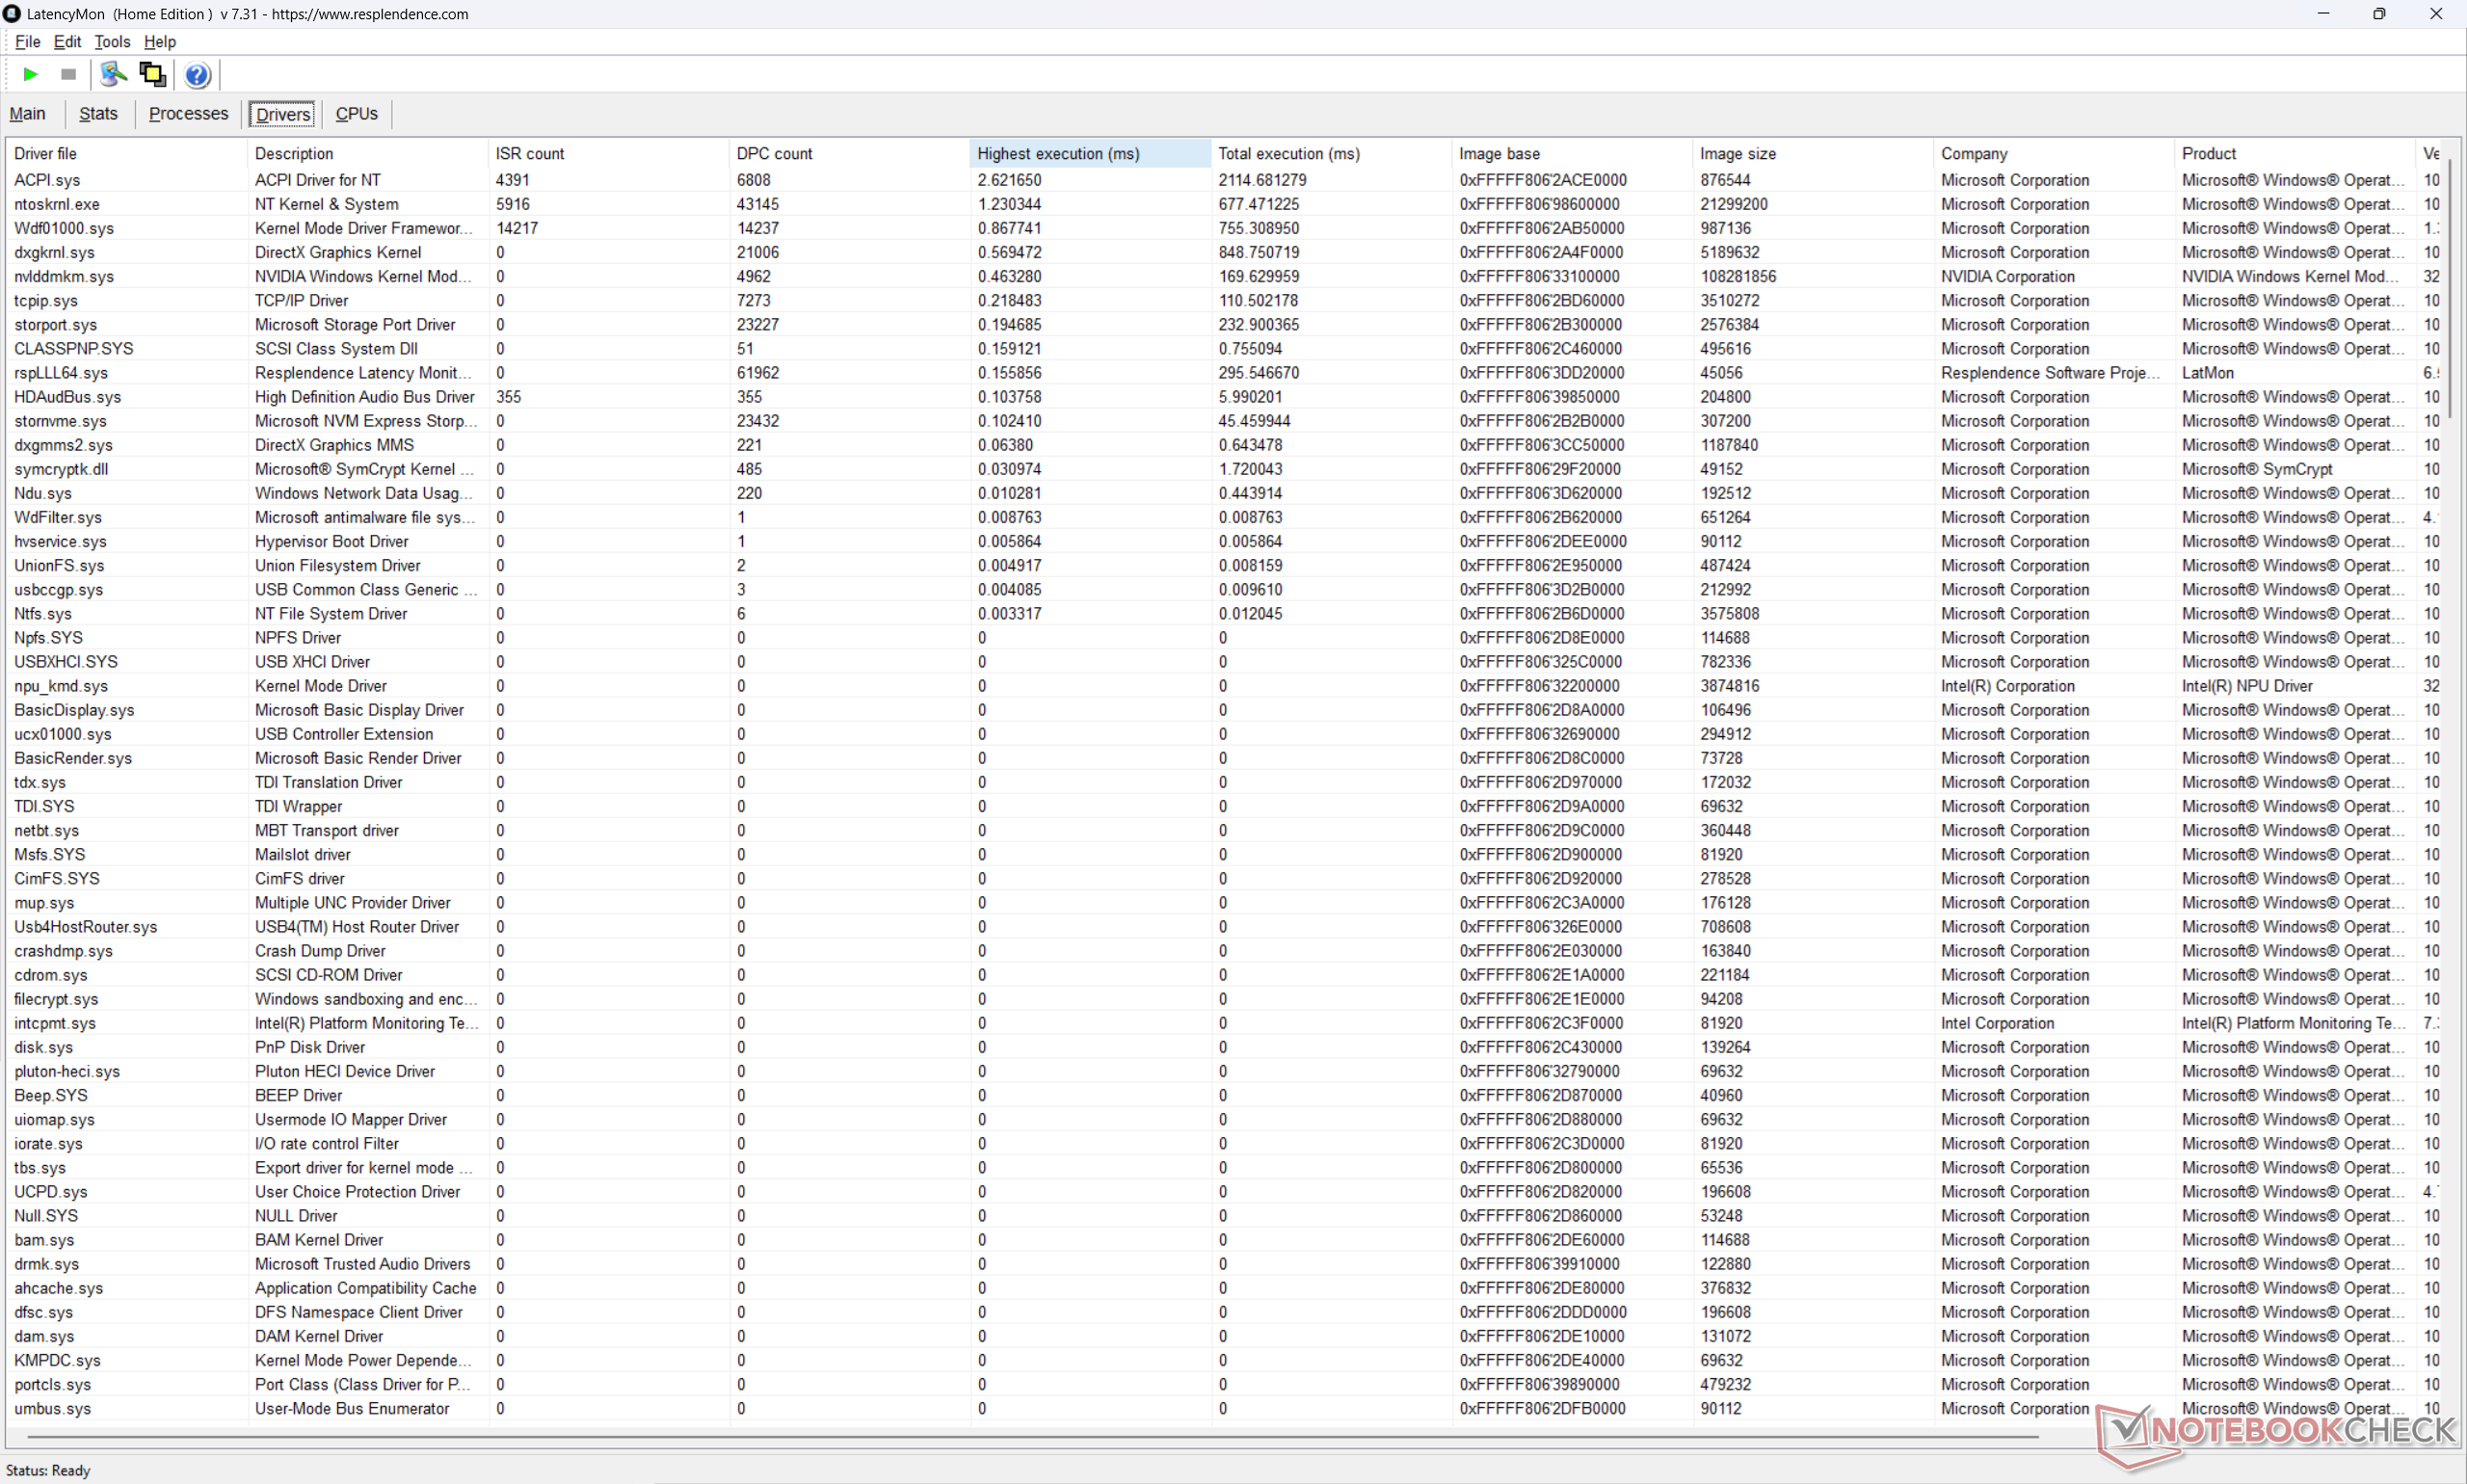
LatencyMon ujawnia niewielkie problemy z DPC, ale poza tym nie ma spadków klatek podczas odtwarzania wideo 4K60
Lista kierowców
Lista kierowców
DPC Latencies / LatencyMon - interrupt to process latency (max), Web, Youtube, Prime95
Alienware 16 Area-51 Core Ultra 9 290HX Plus
GeForce RTX 5080 Laptop, Ultra 9 290HX Plus, SK hynix PCB01 HFS001TFM9X186N
3489.1 μs * -91%
Razer Blade 16 Core Ultra 9 386H
GeForce RTX 5090 Laptop, Ultra 9 386H, Lexar NM790 2TB
1826.3 μs *
HP Omen Max 16 ah000
GeForce RTX 5090 Laptop, Ultra 9 275HX, WDC PC SN810 2TB
1516.1 μs * +17%
MSI Crosshair 16 HX AI D2XWGKG
GeForce RTX 5070 Laptop, Ultra 9 275HX, Micron 2500 1TB MTFDKBA1T0QGN
1094 μs * +40%
Razer Blade 16 2025 RTX 5090
GeForce RTX 5090 Laptop, Ryzen AI 9 HX 370, SSSTC CA6-8D2048
492.6 μs * +73%
Lenovo Legion Pro 7i 16 Gen 10
GeForce RTX 5080 Laptop, Ultra 9 275HX, SK Hynix HFS001TEJ9X115N
464.2 μs * +75%

* ... im mniej tym lepiej

Urządzenia pamięci masowej
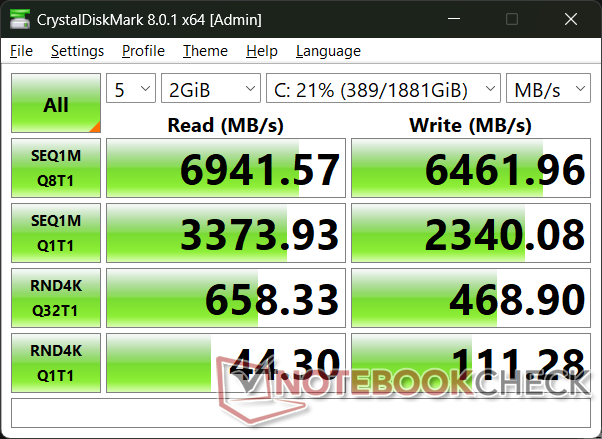
CDM 8
CDM 8
AS SSD
AS SSD
Lexar NM790 2TB
CDM 5/6 Read Seq Q32T1: 6995 MB/s
CDM 5/6 Write Seq Q32T1: 6096 MB/s
CDM 5/6 Read 4K Q32T1: 657.4 MB/s
CDM 5/6 Write 4K Q32T1: 484.7 MB/s
CDM 5 Read Seq: 3331 MB/s
CDM 5 Write Seq: 2502 MB/s
CDM 5/6 Read 4K: 43.91 MB/s
CDM 5/6 Write 4K: 110.3 MB/s
Drive Performance rating - Percent
Alienware 16 Area-51 Core Ultra 9 290HX Plus
SK hynix PCB01 HFS001TFM9X186N
96.8 pt
Razer Blade 16 2025 RTX 5090
SSSTC CA6-8D2048
54.6 pt
Lenovo Legion Pro 7i 16 Gen 10
SK Hynix HFS001TEJ9X115N
54.1 pt
MSI Crosshair 16 HX AI D2XWGKG
Micron 2500 1TB MTFDKBA1T0QGN
46.1 pt
HP Omen Max 16 ah000
WDC PC SN810 2TB
41.8 pt
Razer Blade 16 Core Ultra 9 386H
Lexar NM790 2TB
35.4 pt
DiskSpd
seq read
Alienware 16 Area-51 Core Ultra 9 290HX Plus
SK hynix PCB01 HFS001TFM9X186N
9494 (9407.46min - 9494.44max) MB/s +335%
Lenovo Legion Pro 7i 16 Gen 10
SK Hynix HFS001TEJ9X115N
3998 (3658.3min - 3998.4max) MB/s +83%
Razer Blade 16 2025 RTX 5090
SSSTC CA6-8D2048
3790 (2816.71min - 3789.94max) MB/s +74%
HP Omen Max 16 ah000
WDC PC SN810 2TB
3415 (3349.37min - 3415.42max) MB/s +56%
Razer Blade 16 Core Ultra 9 386H
Lexar NM790 2TB
2184 (2156.5min - 2184.39max) MB/s
MSI Crosshair 16 HX AI D2XWGKG
Micron 2500 1TB MTFDKBA1T0QGN
1079 (297.62min - 1078.51max) MB/s -51%
seq write
Alienware 16 Area-51 Core Ultra 9 290HX Plus
SK hynix PCB01 HFS001TFM9X186N
9832 (9798.01min - 9832.34max) MB/s +198%
Razer Blade 16 2025 RTX 5090
SSSTC CA6-8D2048
3362 (2028.5min - 3361.51max) MB/s +2%
Razer Blade 16 Core Ultra 9 386H
Lexar NM790 2TB
3302 (1890.37min - 3302.39max) MB/s
MSI Crosshair 16 HX AI D2XWGKG
Micron 2500 1TB MTFDKBA1T0QGN
2793 (2710.36min - 2793.06max) MB/s -15%
HP Omen Max 16 ah000
WDC PC SN810 2TB
2570 (2187.36min - 2569.74max) MB/s -22%
Lenovo Legion Pro 7i 16 Gen 10
SK Hynix HFS001TEJ9X115N
1922 (1819.62min - 1921.76max) MB/s -42%
seq q8 t1 read
Alienware 16 Area-51 Core Ultra 9 290HX Plus
SK hynix PCB01 HFS001TFM9X186N
13867 (12274.8min - 13866.7max) MB/s +98%
Lenovo Legion Pro 7i 16 Gen 10
SK Hynix HFS001TEJ9X115N
7069 (5962.41min - 7069.08max) MB/s +1%
Razer Blade 16 Core Ultra 9 386H
Lexar NM790 2TB
6991 (6203.59min - 6991.49max) MB/s
Razer Blade 16 2025 RTX 5090
SSSTC CA6-8D2048
6780 (5762.77min - 6780.16max) MB/s -3%
HP Omen Max 16 ah000
WDC PC SN810 2TB
6766 (5345.22min - 6765.62max) MB/s -3%
MSI Crosshair 16 HX AI D2XWGKG
Micron 2500 1TB MTFDKBA1T0QGN
6745 (5542.14min - 6744.65max) MB/s -4%
seq q8 t1 write
Alienware 16 Area-51 Core Ultra 9 290HX Plus
SK hynix PCB01 HFS001TFM9X186N
12690 (12611.6min - 12689.7max) MB/s +99%
Razer Blade 16 Core Ultra 9 386H
Lexar NM790 2TB
6384 (2633.81min - 6383.97max) MB/s
Lenovo Legion Pro 7i 16 Gen 10
SK Hynix HFS001TEJ9X115N
6169 (6112.09min - 6168.56max) MB/s -3%
MSI Crosshair 16 HX AI D2XWGKG
Micron 2500 1TB MTFDKBA1T0QGN
5580 (5352.56min - 5579.64max) MB/s -13%
HP Omen Max 16 ah000
WDC PC SN810 2TB
5187 (5110.55min - 5187.31max) MB/s -19%
Razer Blade 16 2025 RTX 5090
SSSTC CA6-8D2048
4844 (4270.43min - 4843.96max) MB/s -24%
4k q1 t1 read
Alienware 16 Area-51 Core Ultra 9 290HX Plus
SK hynix PCB01 HFS001TFM9X186N
111.2 (110.81min - 111.23max) MB/s +84%
MSI Crosshair 16 HX AI D2XWGKG
Micron 2500 1TB MTFDKBA1T0QGN
70.8 (70min - 70.76max) MB/s +17%
Razer Blade 16 2025 RTX 5090
SSSTC CA6-8D2048
69.2 (68.61min - 69.17max) MB/s +14%
Lenovo Legion Pro 7i 16 Gen 10
SK Hynix HFS001TEJ9X115N
68.3 (67.41min - 68.26max) MB/s +13%
Razer Blade 16 Core Ultra 9 386H
Lexar NM790 2TB
60.5 (59.31min - 60.47max) MB/s
HP Omen Max 16 ah000
WDC PC SN810 2TB
57.4 (57.08min - 57.42max) MB/s -5%
4k q1 t1 write
Alienware 16 Area-51 Core Ultra 9 290HX Plus
SK hynix PCB01 HFS001TFM9X186N
334 (326.58min - 333.71max) MB/s +74%
Razer Blade 16 2025 RTX 5090
SSSTC CA6-8D2048
265 (258.55min - 264.55max) MB/s +38%
Razer Blade 16 Core Ultra 9 386H
Lexar NM790 2TB
192.1 (191.3min - 192.14max) MB/s
MSI Crosshair 16 HX AI D2XWGKG
Micron 2500 1TB MTFDKBA1T0QGN
179.3 (176.29min - 179.31max) MB/s -7%
Lenovo Legion Pro 7i 16 Gen 10
SK Hynix HFS001TEJ9X115N
153.8 (106.82min - 153.79max) MB/s -20%
HP Omen Max 16 ah000
WDC PC SN810 2TB
149.4 (92.02min - 149.43max) MB/s -22%
4k q32 t16 read
Alienware 16 Area-51 Core Ultra 9 290HX Plus
SK hynix PCB01 HFS001TFM9X186N
7357 (7227.79min - 7356.85max) MB/s +730%
Lenovo Legion Pro 7i 16 Gen 10
SK Hynix HFS001TEJ9X115N
4760 (4699.8min - 4760.03max) MB/s +437%
Razer Blade 16 2025 RTX 5090
SSSTC CA6-8D2048
3189 (3182.48min - 3189.1max) MB/s +260%
HP Omen Max 16 ah000
WDC PC SN810 2TB
982 (747.27min - 982.13max) MB/s +11%
Razer Blade 16 Core Ultra 9 386H
Lexar NM790 2TB
886 (853.99min - 885.71max) MB/s
MSI Crosshair 16 HX AI D2XWGKG
Micron 2500 1TB MTFDKBA1T0QGN
710 (698.38min - 710.41max) MB/s -20%
4k q32 t16 write
Alienware 16 Area-51 Core Ultra 9 290HX Plus
SK hynix PCB01 HFS001TFM9X186N
4595 (4538.14min - 4594.84max) MB/s +812%
Lenovo Legion Pro 7i 16 Gen 10
SK Hynix HFS001TEJ9X115N
4433 (4354.58min - 4433.43max) MB/s +780%
Razer Blade 16 2025 RTX 5090
SSSTC CA6-8D2048
2210 (729.15min - 2210.24max) MB/s +338%
MSI Crosshair 16 HX AI D2XWGKG
Micron 2500 1TB MTFDKBA1T0QGN
577 (574.03min - 577.25max) MB/s +14%
HP Omen Max 16 ah000
WDC PC SN810 2TB
520 (486.41min - 520.16max) MB/s +3%
Razer Blade 16 Core Ultra 9 386H
Lexar NM790 2TB
504 (484.83min - 503.6max) MB/s
AS SSD
Score Total
Alienware 16 Area-51 Core Ultra 9 290HX Plus
SK hynix PCB01 HFS001TFM9X186N
14159 Points +245%
Razer Blade 16 2025 RTX 5090
SSSTC CA6-8D2048
7379 Points +80%
MSI Crosshair 16 HX AI D2XWGKG
Micron 2500 1TB MTFDKBA1T0QGN
7019 Points +71%
Lenovo Legion Pro 7i 16 Gen 10
SK Hynix HFS001TEJ9X115N
6515 Points +59%
HP Omen Max 16 ah000
WDC PC SN810 2TB
5355 Points +30%
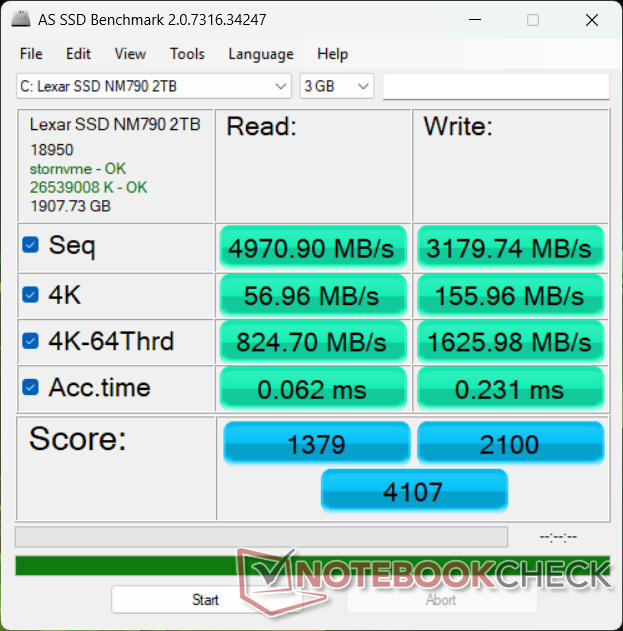
Razer Blade 16 Core Ultra 9 386H
Lexar NM790 2TB
4107 Points
Score Read
Alienware 16 Area-51 Core Ultra 9 290HX Plus
SK hynix PCB01 HFS001TFM9X186N
5082 Points +269%
Lenovo Legion Pro 7i 16 Gen 10
SK Hynix HFS001TEJ9X115N
3234 Points +135%
Razer Blade 16 2025 RTX 5090
SSSTC CA6-8D2048
3215 Points +133%
MSI Crosshair 16 HX AI D2XWGKG
Micron 2500 1TB MTFDKBA1T0QGN
1623 Points +18%
HP Omen Max 16 ah000
WDC PC SN810 2TB
1569 Points +14%
Razer Blade 16 Core Ultra 9 386H
Lexar NM790 2TB
1379 Points
Score Write
Alienware 16 Area-51 Core Ultra 9 290HX Plus
SK hynix PCB01 HFS001TFM9X186N
6457 Points +207%
MSI Crosshair 16 HX AI D2XWGKG
Micron 2500 1TB MTFDKBA1T0QGN
4682 Points +123%
HP Omen Max 16 ah000
WDC PC SN810 2TB
3074 Points +46%
Razer Blade 16 2025 RTX 5090
SSSTC CA6-8D2048
2571 Points +22%
Razer Blade 16 Core Ultra 9 386H
Lexar NM790 2TB
2100 Points
Lenovo Legion Pro 7i 16 Gen 10
SK Hynix HFS001TEJ9X115N
1837 Points -13%
Seq Read
Alienware 16 Area-51 Core Ultra 9 290HX Plus
SK hynix PCB01 HFS001TFM9X186N
10090.72 MB/s +103%
Lenovo Legion Pro 7i 16 Gen 10
SK Hynix HFS001TEJ9X115N
5688.57 MB/s +14%
MSI Crosshair 16 HX AI D2XWGKG
Micron 2500 1TB MTFDKBA1T0QGN
5392.36 MB/s +8%
HP Omen Max 16 ah000
WDC PC SN810 2TB
5105.48 MB/s +3%
Razer Blade 16 2025 RTX 5090
SSSTC CA6-8D2048
5081 MB/s +2%
Razer Blade 16 Core Ultra 9 386H
Lexar NM790 2TB
4970.9 MB/s
Seq Write
Alienware 16 Area-51 Core Ultra 9 290HX Plus
SK hynix PCB01 HFS001TFM9X186N
10725.9 MB/s +237%
Razer Blade 16 2025 RTX 5090
SSSTC CA6-8D2048
4160 MB/s +31%
Razer Blade 16 Core Ultra 9 386H
Lexar NM790 2TB
3179.74 MB/s
HP Omen Max 16 ah000
WDC PC SN810 2TB
3100.36 MB/s -2%
MSI Crosshair 16 HX AI D2XWGKG
Micron 2500 1TB MTFDKBA1T0QGN
2769.06 MB/s -13%
Lenovo Legion Pro 7i 16 Gen 10
SK Hynix HFS001TEJ9X115N
1587.46 MB/s -50%
4K Read
Alienware 16 Area-51 Core Ultra 9 290HX Plus
SK hynix PCB01 HFS001TFM9X186N
95.48 MB/s +68%
MSI Crosshair 16 HX AI D2XWGKG
Micron 2500 1TB MTFDKBA1T0QGN
67.41 MB/s +18%
Razer Blade 16 2025 RTX 5090
SSSTC CA6-8D2048
64.4 MB/s +13%
Lenovo Legion Pro 7i 16 Gen 10
SK Hynix HFS001TEJ9X115N
63.16 MB/s +11%
Razer Blade 16 Core Ultra 9 386H
Lexar NM790 2TB
56.96 MB/s
HP Omen Max 16 ah000
WDC PC SN810 2TB
54.74 MB/s -4%
4K Write
MSI Crosshair 16 HX AI D2XWGKG
Micron 2500 1TB MTFDKBA1T0QGN
278.63 MB/s +79%
Lenovo Legion Pro 7i 16 Gen 10
SK Hynix HFS001TEJ9X115N
250.73 MB/s +61%
Alienware 16 Area-51 Core Ultra 9 290HX Plus
SK hynix PCB01 HFS001TFM9X186N
244.41 MB/s +57%
Razer Blade 16 2025 RTX 5090
SSSTC CA6-8D2048
230 MB/s +47%
HP Omen Max 16 ah000
WDC PC SN810 2TB
185.44 MB/s +19%
Razer Blade 16 Core Ultra 9 386H
Lexar NM790 2TB
155.96 MB/s
4K-64 Read
Alienware 16 Area-51 Core Ultra 9 290HX Plus
SK hynix PCB01 HFS001TFM9X186N
3977.11 MB/s +382%
Razer Blade 16 2025 RTX 5090
SSSTC CA6-8D2048
2642 MB/s +220%
Lenovo Legion Pro 7i 16 Gen 10
SK Hynix HFS001TEJ9X115N
2602.02 MB/s +216%
MSI Crosshair 16 HX AI D2XWGKG
Micron 2500 1TB MTFDKBA1T0QGN
1015.98 MB/s +23%
HP Omen Max 16 ah000
WDC PC SN810 2TB
1004.03 MB/s +22%
Razer Blade 16 Core Ultra 9 386H
Lexar NM790 2TB
824.7 MB/s
4K-64 Write
Alienware 16 Area-51 Core Ultra 9 290HX Plus
SK hynix PCB01 HFS001TFM9X186N
5139.71 MB/s +216%
MSI Crosshair 16 HX AI D2XWGKG
Micron 2500 1TB MTFDKBA1T0QGN
4126.89 MB/s +154%
HP Omen Max 16 ah000
WDC PC SN810 2TB
2578.56 MB/s +59%
Razer Blade 16 2025 RTX 5090
SSSTC CA6-8D2048
1926 MB/s +18%
Razer Blade 16 Core Ultra 9 386H
Lexar NM790 2TB
1625.98 MB/s
Lenovo Legion Pro 7i 16 Gen 10
SK Hynix HFS001TEJ9X115N
1427.9 MB/s -12%
Access Time Read
MSI Crosshair 16 HX AI D2XWGKG
Micron 2500 1TB MTFDKBA1T0QGN
0.111 ms * -79%
Razer Blade 16 Core Ultra 9 386H
Lexar NM790 2TB
0.062 ms *
HP Omen Max 16 ah000
WDC PC SN810 2TB
0.054 ms * +13%
Razer Blade 16 2025 RTX 5090
SSSTC CA6-8D2048
0.051 ms * +18%
Lenovo Legion Pro 7i 16 Gen 10
SK Hynix HFS001TEJ9X115N
0.033 ms * +47%
Alienware 16 Area-51 Core Ultra 9 290HX Plus
SK hynix PCB01 HFS001TFM9X186N
0.032 ms * +48%
Access Time Write
Razer Blade 16 Core Ultra 9 386H
Lexar NM790 2TB
0.231 ms *
Lenovo Legion Pro 7i 16 Gen 10
SK Hynix HFS001TEJ9X115N
0.073 ms * +68%
HP Omen Max 16 ah000
WDC PC SN810 2TB
0.06 ms * +74%
Alienware 16 Area-51 Core Ultra 9 290HX Plus
SK hynix PCB01 HFS001TFM9X186N
0.046 ms * +80%
Razer Blade 16 2025 RTX 5090
SSSTC CA6-8D2048
0.021 ms * +91%
MSI Crosshair 16 HX AI D2XWGKG
Micron 2500 1TB MTFDKBA1T0QGN
0.014 ms * +94%

* ... im mniej tym lepiej

Dławienie dysku: Pętla odczytu DiskSpd, głębokość kolejki 8

0145290435580725870101511601305145015951740188520302175232024652610275529003045319033353480362537703915406042054350449546404785493050755220536555105655580059456090623563806525667068156960Tooltip
Razer Blade 16 Core Ultra 9 386H Lexar NM790 2TB; diskspd 2.0.17 f: Ø6976 (6019.87-7001.76)
Razer Blade 16 2025 RTX 5090 SSSTC CA6-8D2048; diskspd 2.0.17 f: Ø6908 (5460.14-6935.25)

Wydajność GPU

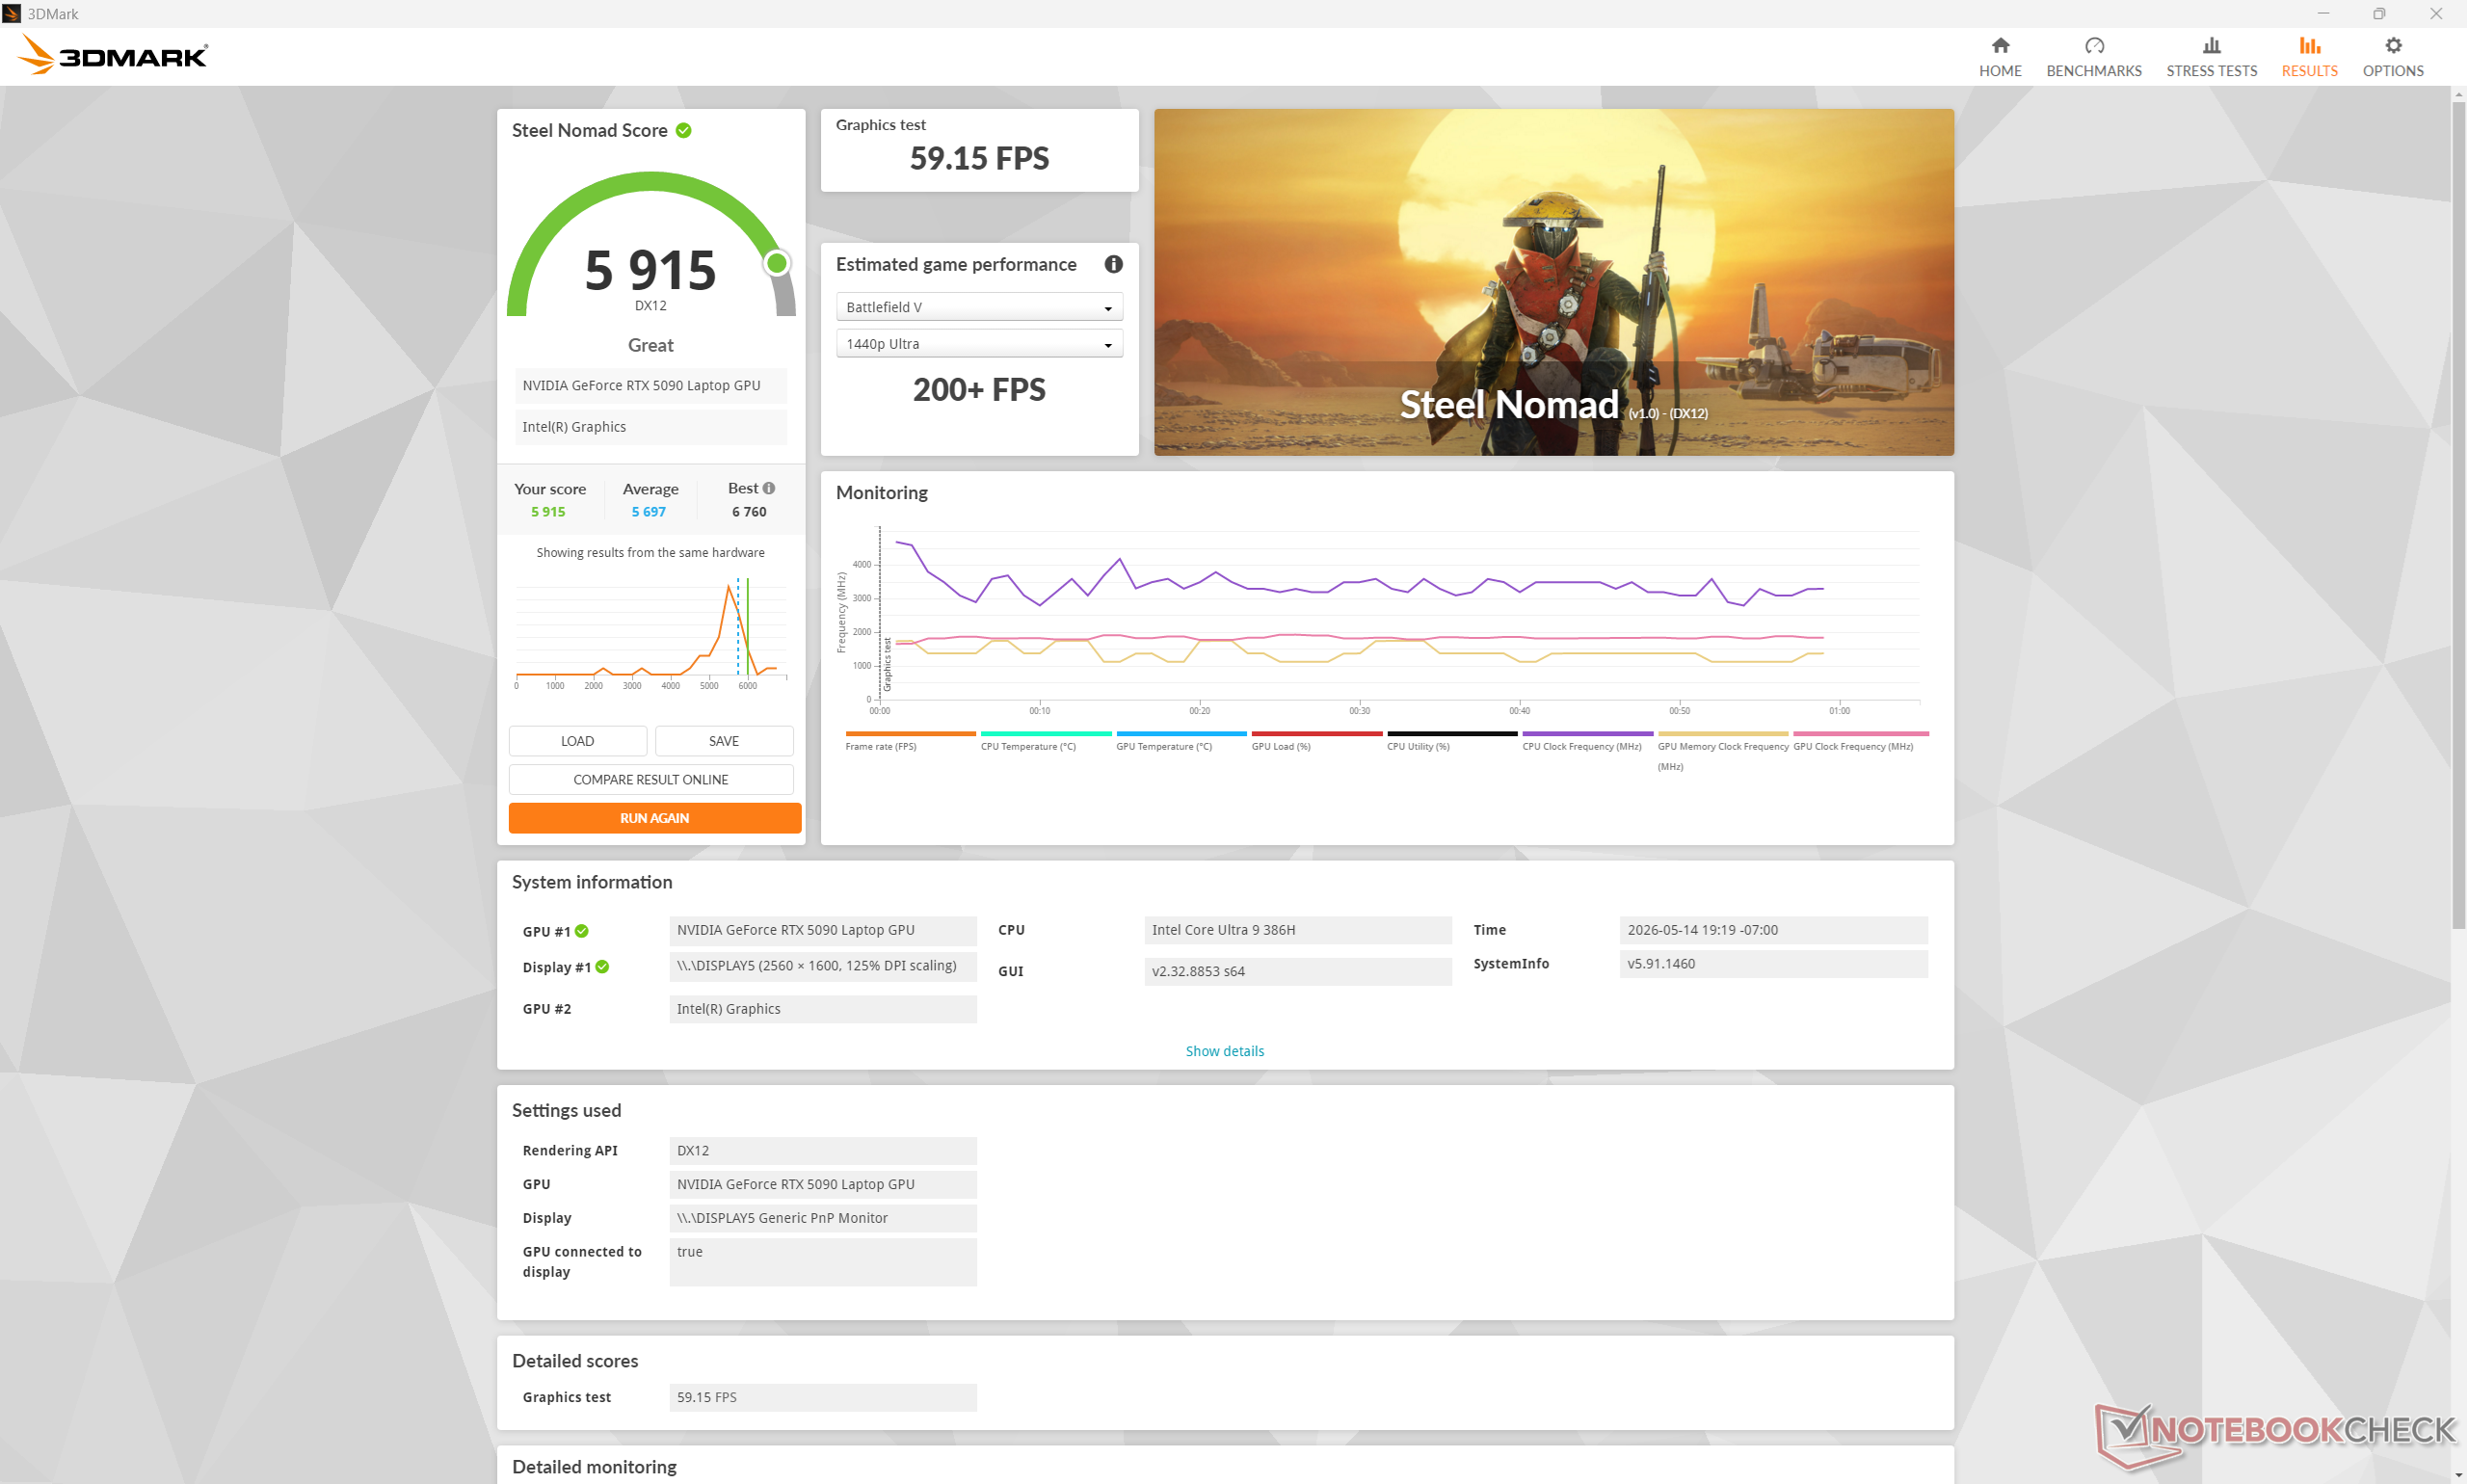
The GeForce RTX 5090 w naszym Blade 16 osiąga wydajność w granicach 1 procenta przeciętnego laptopa w naszej bazie danych z dokładnie tą samą opcją GPU. Grubsze laptopy, takie jak Lenovo Legion 9 18 mogą działać do 10 procent szybciej niż nasz Razer, jeśli są skonfigurowane z tym samym GPU.

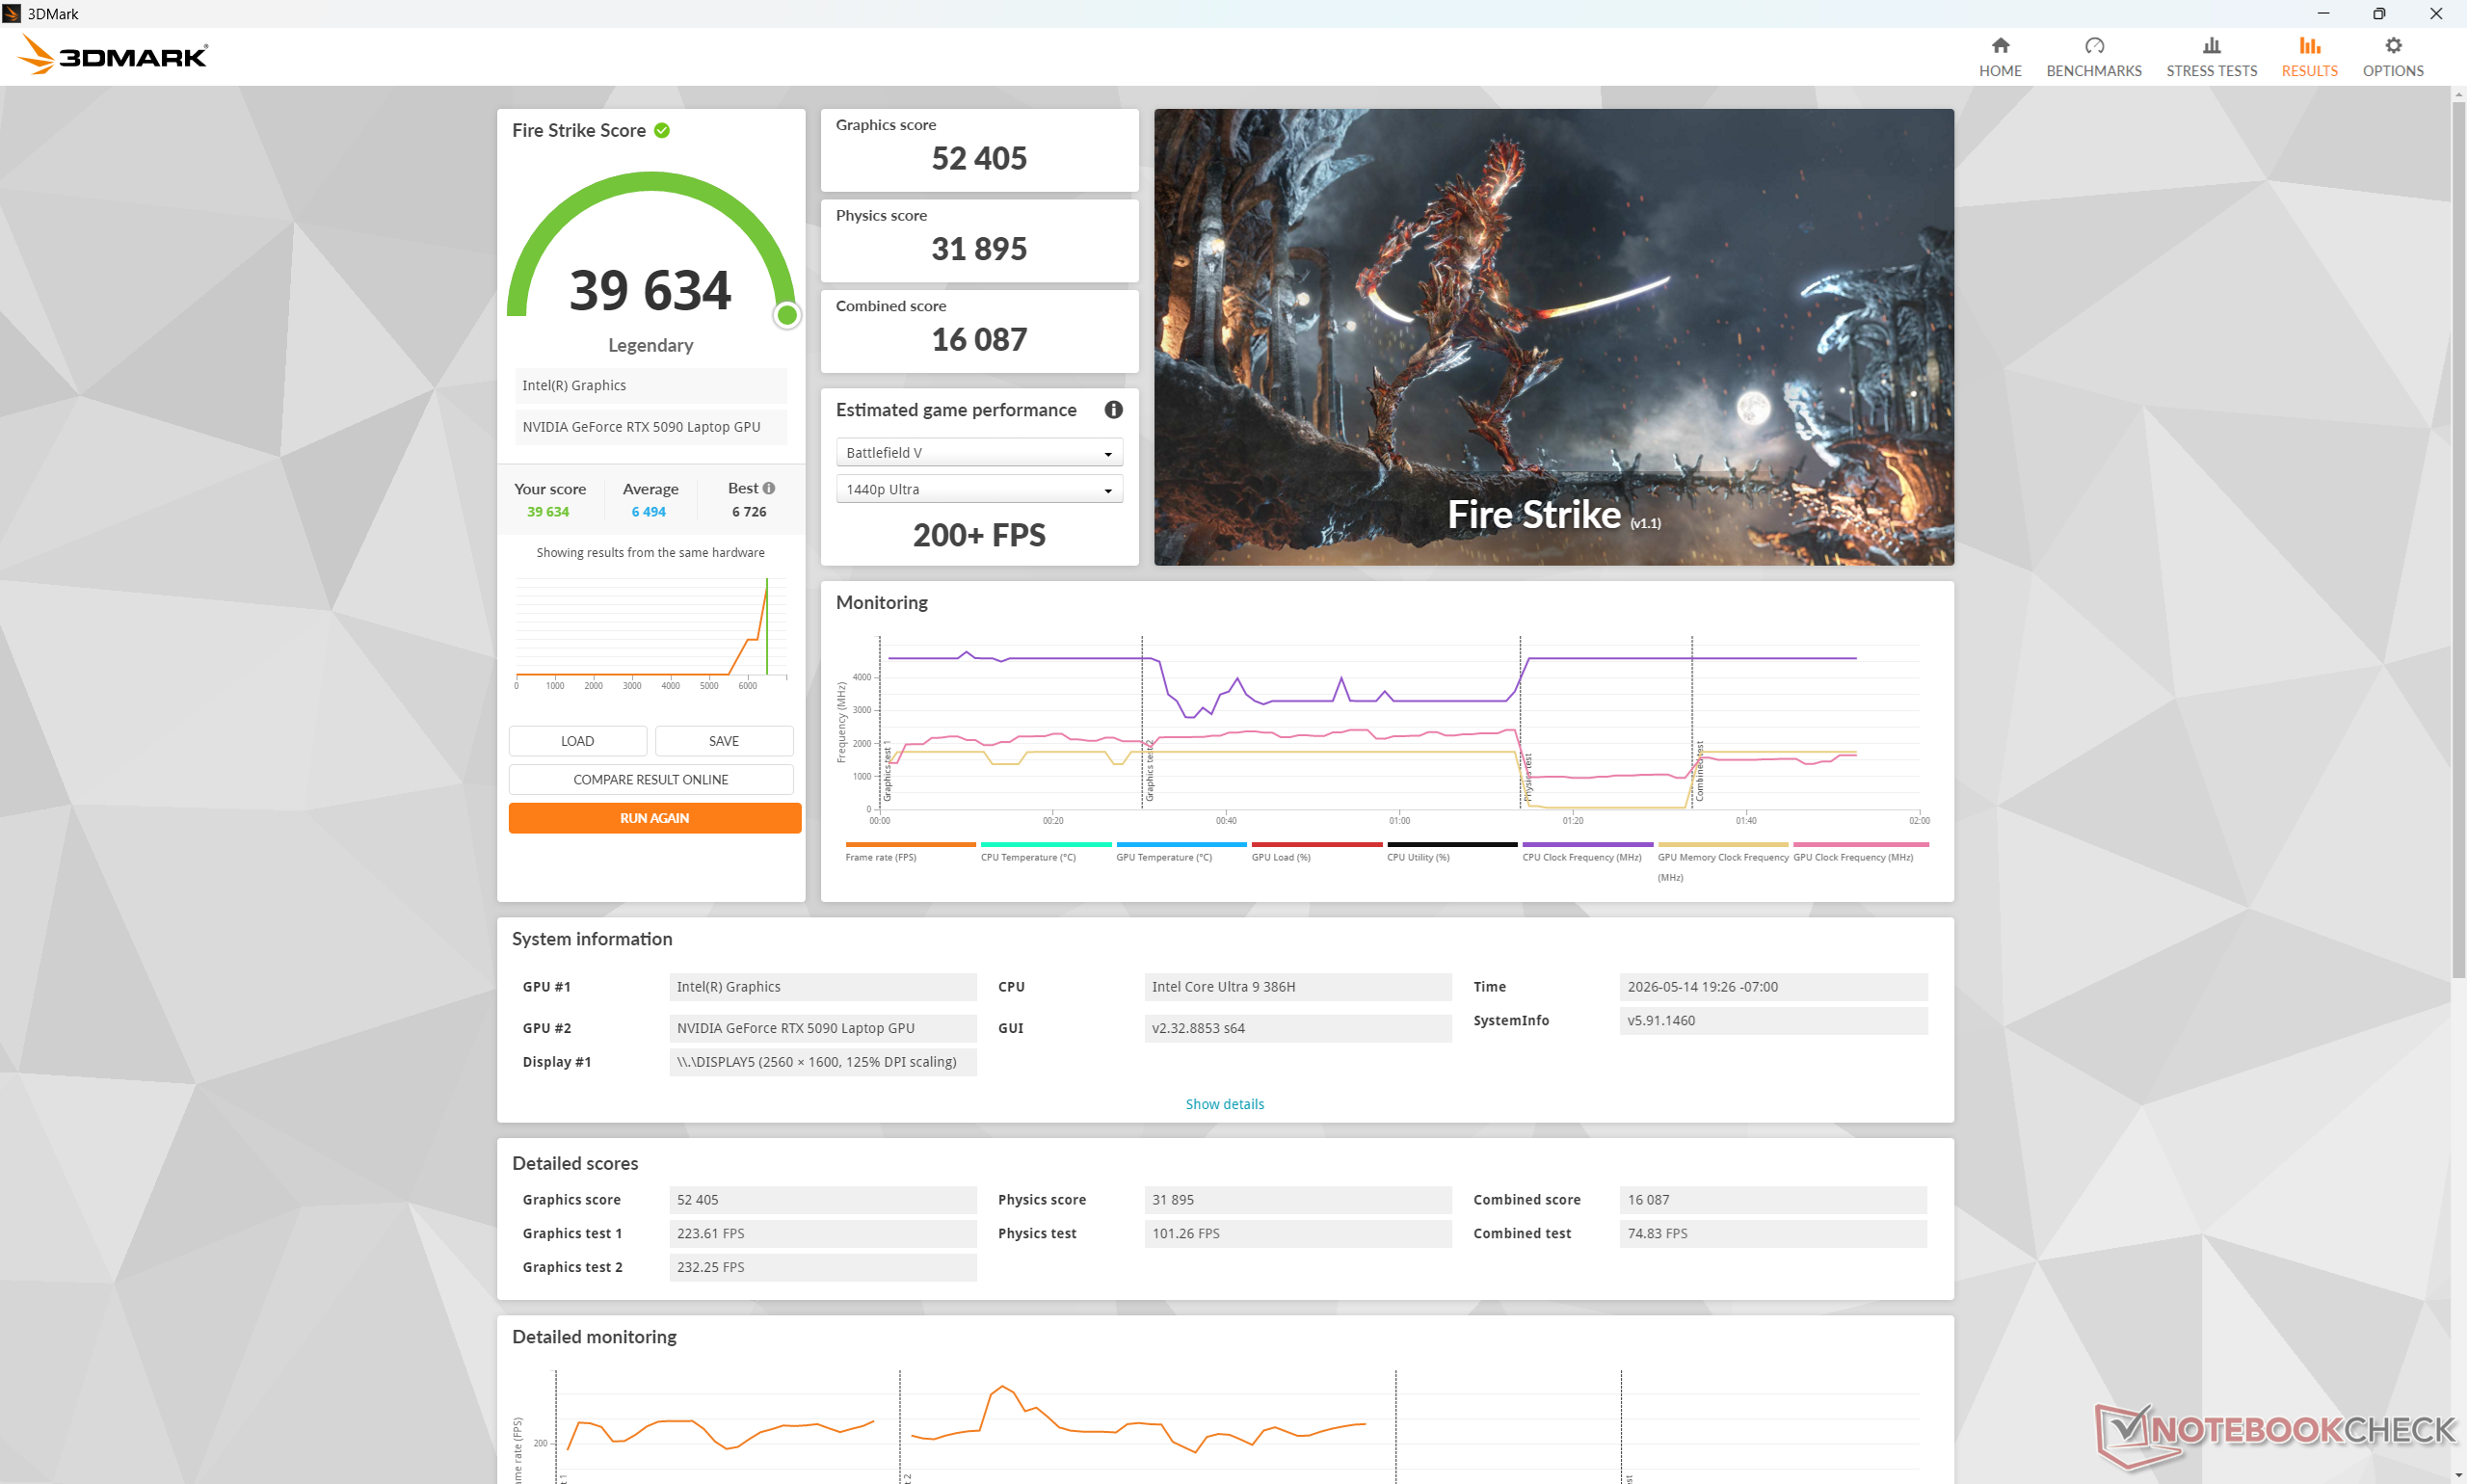
Przejście z trybu wydajności do trybu zrównoważonego lub trybu cichego wpłynęłoby na wydajność odpowiednio o około 5 procent i 15 procent, jak pokazuje nasza tabela wyników Fire Strike poniżej.

Profil zasilaniaWynik grafikiWynik fizykiWynik łączny
Tryb wydajności524053189516087
Tryb zrównoważony50375 (-4%)31874 (-0%)15922 (-1%)
Zasilanie bateryjne13799 (-74%)24300 (-24%)11871 (-26%)
Tryb cichy45285 (-14%)26717 (-16%)12713 (-21%)
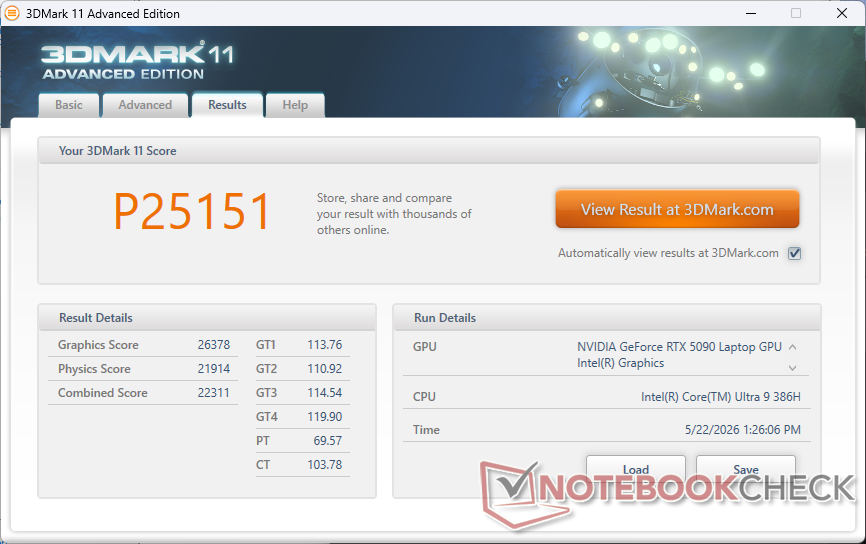
3DMark 11
3DMark 11
Fire Strike
Fire Strike
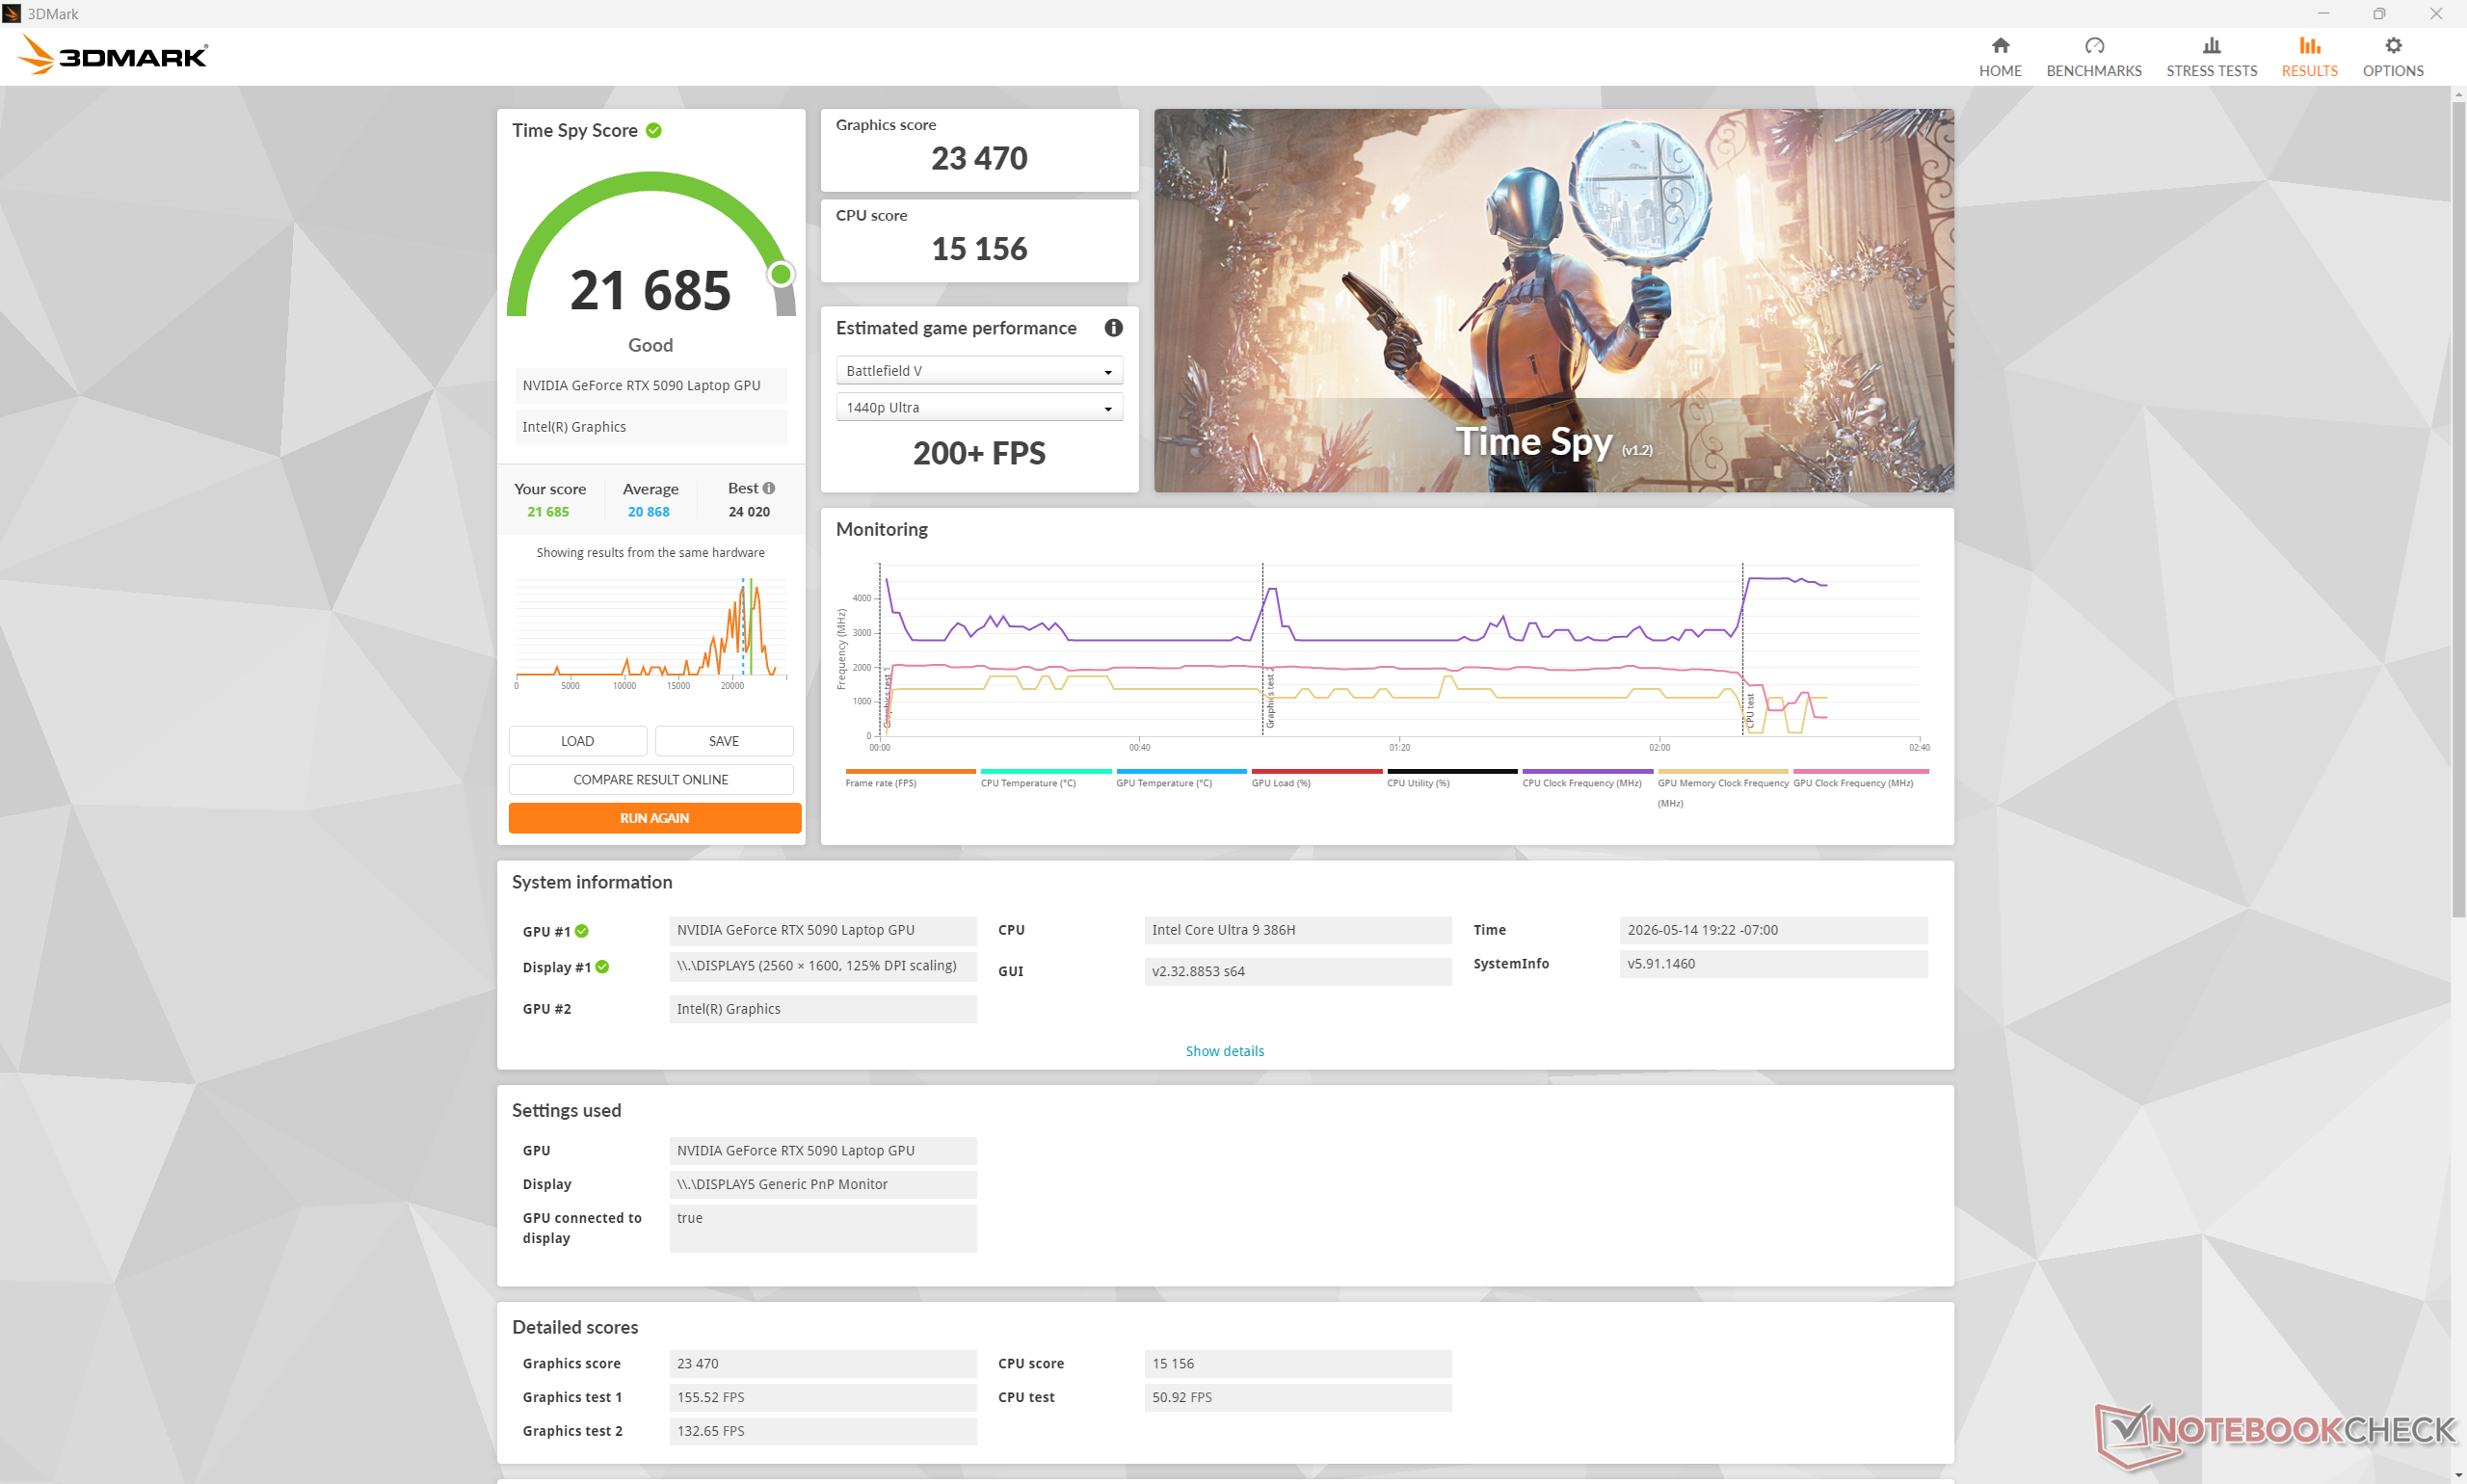
Time Spy
Time Spy
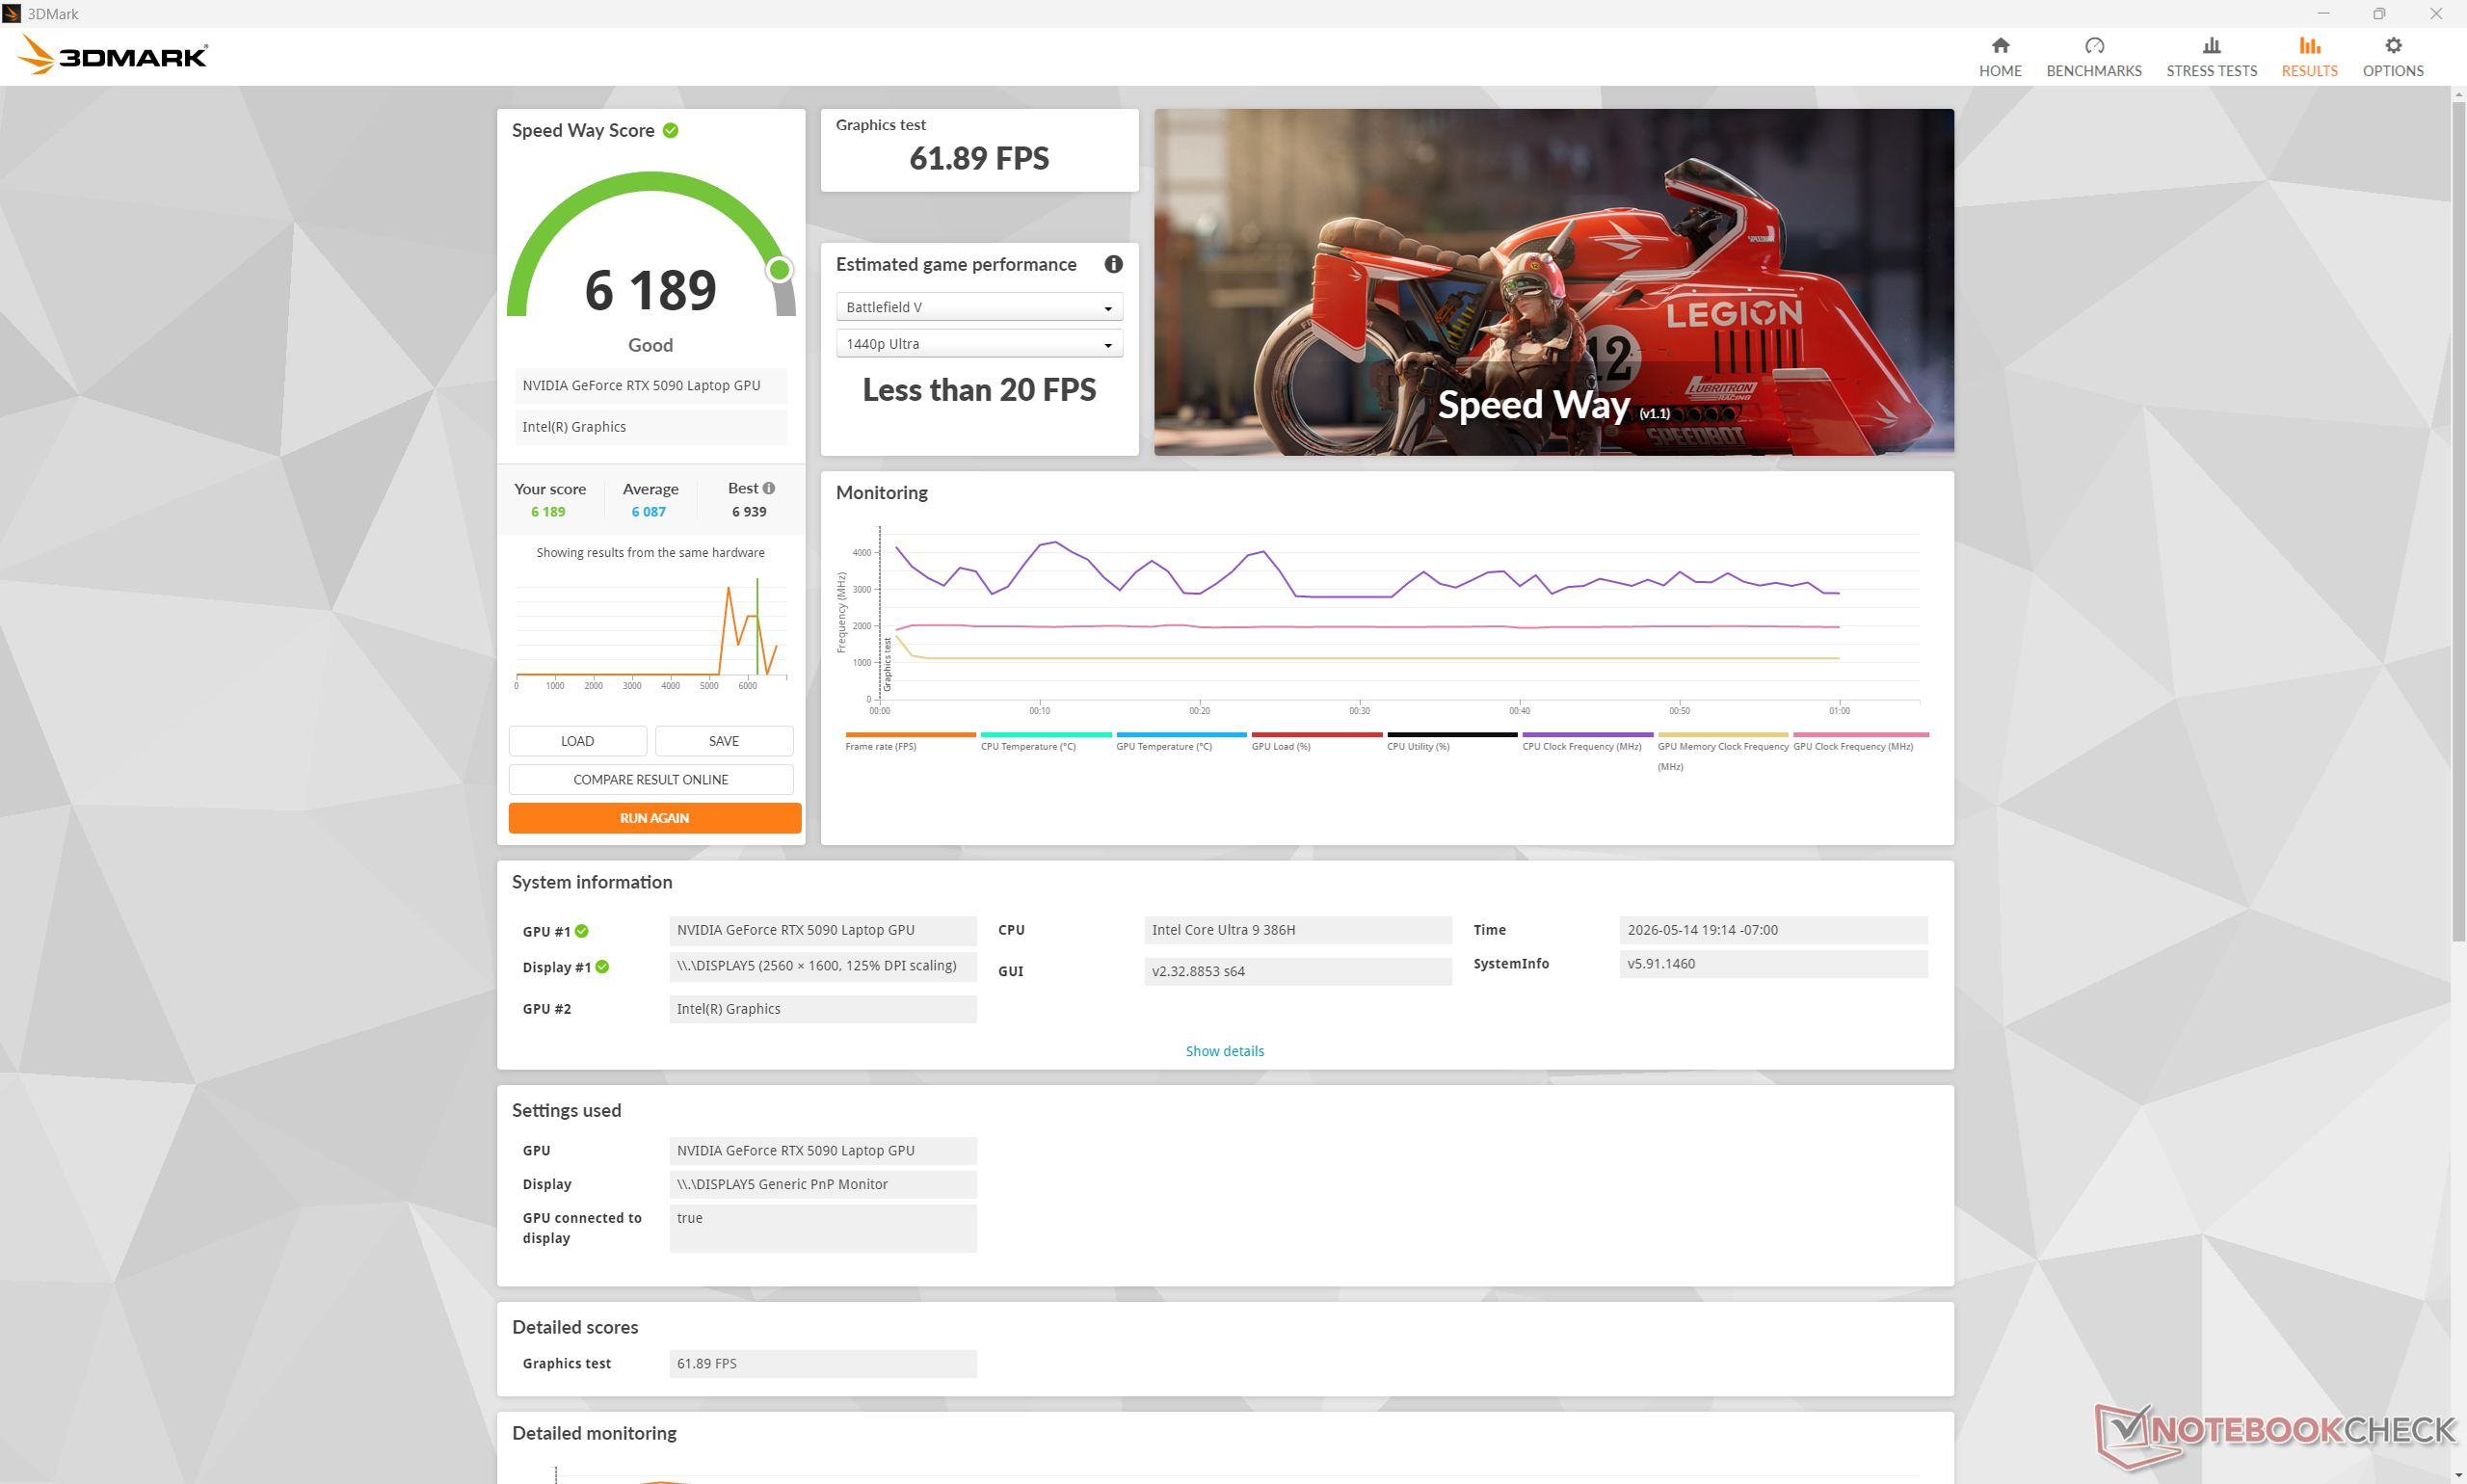
Speed Way
Speed Way
Steel Nomad
Steel Nomad
3DMark Performance rating - Percent
NVIDIA GeForce RTX 5090 Founders Edition
NVIDIA GeForce RTX 5090, AMD Ryzen 7 9800X3D
99.8 pt
Lenovo Legion Pro 7i 16 Gen 10 -1!
NVIDIA GeForce RTX 5080 Laptop, Intel Core Ultra 9 275HX
48.2 pt
Przeciętny NVIDIA GeForce RTX 5090 Laptop
 
47.9 pt
Razer Blade 16 Core Ultra 9 386H
NVIDIA GeForce RTX 5090 Laptop, Intel Core Ultra 9 386H
47.8 pt
Lenovo Legion 9 16IRX8 -1!
NVIDIA GeForce RTX 4090 Laptop GPU, Intel Core i9-13980HX
45.7 pt
Razer Blade 16 2025 RTX 5090
NVIDIA GeForce RTX 5090 Laptop, AMD Ryzen AI 9 HX 370
45.3 pt
Alienware 16 Area-51 Core Ultra 9 290HX Plus
NVIDIA GeForce RTX 5080 Laptop, Intel Core Ultra 9 290HX Plus
45 pt
Alienware x16 R2 P120F -1!
NVIDIA GeForce RTX 4080 Laptop GPU, Intel Core Ultra 9 185H
39.1 pt
Schenker XMG APEX 16 MAX -1!
NVIDIA GeForce RTX 5070 Ti Laptop, AMD Ryzen 9 9955HX
37.9 pt
Lenovo Legion 7 16IAX10
NVIDIA GeForce RTX 5060 Laptop, Intel Core Ultra 7 255HX
26.3 pt
Maingear ML-16 MK2
NVIDIA GeForce RTX 4070 Laptop GPU, Intel Core Ultra 7 155H
22.3 pt
3DMark
1920x1080 Fire Strike Graphics
NVIDIA GeForce RTX 5090 Founders Edition
NVIDIA GeForce RTX 5090, AMD Ryzen 7 9800X3D
107701 Points +106%
Razer Blade 16 Core Ultra 9 386H
NVIDIA GeForce RTX 5090 Laptop, Intel Core Ultra 9 386H
52405 Points
Razer Blade 16 2025 RTX 5090
NVIDIA GeForce RTX 5090 Laptop, AMD Ryzen AI 9 HX 370
52065 Points -1%
Przeciętny NVIDIA GeForce RTX 5090 Laptop
  (42175 - 62849, n=26)
51698 Points -1%
Lenovo Legion Pro 7i 16 Gen 10
NVIDIA GeForce RTX 5080 Laptop, Intel Core Ultra 9 275HX
49153 Points -6%
Alienware 16 Area-51 Core Ultra 9 290HX Plus
NVIDIA GeForce RTX 5080 Laptop, Intel Core Ultra 9 290HX Plus
48214 Points -8%
Lenovo Legion 9 16IRX8
NVIDIA GeForce RTX 4090 Laptop GPU, Intel Core i9-13980HX
46386 Points -11%
Schenker XMG APEX 16 MAX
NVIDIA GeForce RTX 5070 Ti Laptop, AMD Ryzen 9 9955HX
44206 Points -16%
Alienware x16 R2 P120F
NVIDIA GeForce RTX 4080 Laptop GPU, Intel Core Ultra 9 185H
42558 Points -19%
Lenovo Legion 7 16IAX10
NVIDIA GeForce RTX 5060 Laptop, Intel Core Ultra 7 255HX
33912 Points -35%
Maingear ML-16 MK2
NVIDIA GeForce RTX 4070 Laptop GPU, Intel Core Ultra 7 155H
28464 Points -46%
2560x1440 Time Spy Graphics
NVIDIA GeForce RTX 5090 Founders Edition
NVIDIA GeForce RTX 5090, AMD Ryzen 7 9800X3D
48663 Points +107%
Przeciętny NVIDIA GeForce RTX 5090 Laptop
  (19216 - 26212, n=24)
23690 Points +1%
Razer Blade 16 Core Ultra 9 386H
NVIDIA GeForce RTX 5090 Laptop, Intel Core Ultra 9 386H
23470 Points
Lenovo Legion Pro 7i 16 Gen 10
NVIDIA GeForce RTX 5080 Laptop, Intel Core Ultra 9 275HX
23003 Points -2%
Alienware 16 Area-51 Core Ultra 9 290HX Plus
NVIDIA GeForce RTX 5080 Laptop, Intel Core Ultra 9 290HX Plus
22247 Points -5%
Razer Blade 16 2025 RTX 5090
NVIDIA GeForce RTX 5090 Laptop, AMD Ryzen AI 9 HX 370
22082 Points -6%
Lenovo Legion 9 16IRX8
NVIDIA GeForce RTX 4090 Laptop GPU, Intel Core i9-13980HX
21391 Points -9%
Alienware x16 R2 P120F
NVIDIA GeForce RTX 4080 Laptop GPU, Intel Core Ultra 9 185H
18627 Points -21%
Schenker XMG APEX 16 MAX
NVIDIA GeForce RTX 5070 Ti Laptop, AMD Ryzen 9 9955HX
17914 Points -24%
Lenovo Legion 7 16IAX10
NVIDIA GeForce RTX 5060 Laptop, Intel Core Ultra 7 255HX
12297 Points -48%
Maingear ML-16 MK2
NVIDIA GeForce RTX 4070 Laptop GPU, Intel Core Ultra 7 155H
10691 Points -54%
2560x1440 Time Spy Score
NVIDIA GeForce RTX 5090 Founders Edition
NVIDIA GeForce RTX 5090, AMD Ryzen 7 9800X3D
37087 Points +71%
Lenovo Legion Pro 7i 16 Gen 10
NVIDIA GeForce RTX 5080 Laptop, Intel Core Ultra 9 275HX
21992 Points +1%
Przeciętny NVIDIA GeForce RTX 5090 Laptop
  (16828 - 24432, n=24)
21712 Points 0%
Razer Blade 16 Core Ultra 9 386H
NVIDIA GeForce RTX 5090 Laptop, Intel Core Ultra 9 386H
21685 Points
Alienware 16 Area-51 Core Ultra 9 290HX Plus
NVIDIA GeForce RTX 5080 Laptop, Intel Core Ultra 9 290HX Plus
21384 Points -1%
Lenovo Legion 9 16IRX8
NVIDIA GeForce RTX 4090 Laptop GPU, Intel Core i9-13980HX
20744 Points -4%
Razer Blade 16 2025 RTX 5090
NVIDIA GeForce RTX 5090 Laptop, AMD Ryzen AI 9 HX 370
18898 Points -13%
Alienware x16 R2 P120F
NVIDIA GeForce RTX 4080 Laptop GPU, Intel Core Ultra 9 185H
17164 Points -21%
Schenker XMG APEX 16 MAX
NVIDIA GeForce RTX 5070 Ti Laptop, AMD Ryzen 9 9955HX
17095 Points -21%
Lenovo Legion 7 16IAX10
NVIDIA GeForce RTX 5060 Laptop, Intel Core Ultra 7 255HX
12787 Points -41%
Maingear ML-16 MK2
NVIDIA GeForce RTX 4070 Laptop GPU, Intel Core Ultra 7 155H
10759 Points -50%
2560x1440 Speed Way Score
NVIDIA GeForce RTX 5090 Founders Edition
NVIDIA GeForce RTX 5090, AMD Ryzen 7 9800X3D
14516 Points +135%
Przeciętny NVIDIA GeForce RTX 5090 Laptop
  (5579 - 6643, n=12)
6270 Points +1%
Razer Blade 16 Core Ultra 9 386H
NVIDIA GeForce RTX 5090 Laptop, Intel Core Ultra 9 386H
6189 Points
Razer Blade 16 2025 RTX 5090
NVIDIA GeForce RTX 5090 Laptop, AMD Ryzen AI 9 HX 370
6163 Points 0%
Lenovo Legion Pro 7i 16 Gen 10
NVIDIA GeForce RTX 5080 Laptop, Intel Core Ultra 9 275HX
5918 Points -4%
Alienware 16 Area-51 Core Ultra 9 290HX Plus
NVIDIA GeForce RTX 5080 Laptop, Intel Core Ultra 9 290HX Plus
5842 Points -6%
Lenovo Legion 9 16IRX8
NVIDIA GeForce RTX 4090 Laptop GPU, Intel Core i9-13980HX
5765 Points -7%
Alienware x16 R2 P120F
NVIDIA GeForce RTX 4080 Laptop GPU, Intel Core Ultra 9 185H
4688 Points -24%
Lenovo Legion 7 16IAX10
NVIDIA GeForce RTX 5060 Laptop, Intel Core Ultra 7 255HX
2985 Points -52%
Maingear ML-16 MK2
NVIDIA GeForce RTX 4070 Laptop GPU, Intel Core Ultra 7 155H
2620 Points -58%
Steel Nomad Score
NVIDIA GeForce RTX 5090 Founders Edition
NVIDIA GeForce RTX 5090, AMD Ryzen 7 9800X3D
14376 Points +143%
NVIDIA GeForce RTX 5090 Founders Edition
NVIDIA GeForce RTX 5090, AMD Ryzen 7 9800X3D
14142 Points +139%
Razer Blade 16 Core Ultra 9 386H
NVIDIA GeForce RTX 5090 Laptop, Intel Core Ultra 9 386H
5915 Points
Przeciętny NVIDIA GeForce RTX 5090 Laptop
  (4791 - 6500, n=19)
5899 Points 0%
Razer Blade 16 2025 RTX 5090
NVIDIA GeForce RTX 5090 Laptop, AMD Ryzen AI 9 HX 370
5652 Points -4%
Alienware 16 Area-51 Core Ultra 9 290HX Plus
NVIDIA GeForce RTX 5080 Laptop, Intel Core Ultra 9 290HX Plus
5265 Points -11%
Schenker XMG APEX 16 MAX
NVIDIA GeForce RTX 5070 Ti Laptop, AMD Ryzen 9 9955HX
3953 Points -33%
Lenovo Legion 7 16IAX10
NVIDIA GeForce RTX 5060 Laptop, Intel Core Ultra 7 255HX
2806 Points -53%
Maingear ML-16 MK2
NVIDIA GeForce RTX 4070 Laptop GPU, Intel Core Ultra 7 155H
2329 Points -61%
3DMark 11 Performance
25151 pkt.
3DMark Cloud Gate Standard Score
64882 pkt.
3DMark Fire Strike Score
39634 pkt.
3DMark Time Spy Score
21685 pkt.
3DMark Steel Nomad Score
5915 pkt.
Pomoc
Blender
v3.3 Classroom OPTIX/RTX
Maingear ML-16 MK2
NVIDIA GeForce RTX 4070 Laptop GPU, Intel Core Ultra 7 155H
21 Seconds * -110%
Lenovo Legion 7 16IAX10
NVIDIA GeForce RTX 5060 Laptop, Intel Core Ultra 7 255HX
21 Seconds * -110%
Schenker XMG APEX 16 MAX
NVIDIA GeForce RTX 5070 Ti Laptop, AMD Ryzen 9 9955HX
16 Seconds * -60%
Alienware x16 R2 P120F
NVIDIA GeForce RTX 4080 Laptop GPU, Intel Core Ultra 9 185H
15 Seconds * -50%
Razer Blade 16 2025 RTX 5090
NVIDIA GeForce RTX 5090 Laptop, AMD Ryzen AI 9 HX 370
13 Seconds * -30%
Lenovo Legion Pro 7i 16 Gen 10
NVIDIA GeForce RTX 5080 Laptop, Intel Core Ultra 9 275HX
12 Seconds * -20%
Przeciętny NVIDIA GeForce RTX 5090 Laptop
  (9 - 18, n=20)
11.8 Seconds * -18%
Alienware 16 Area-51 Core Ultra 9 290HX Plus
NVIDIA GeForce RTX 5080 Laptop, Intel Core Ultra 9 290HX Plus
11 Seconds * -10%
Lenovo Legion 9 16IRX8
NVIDIA GeForce RTX 4090 Laptop GPU, Intel Core i9-13980HX
10 Seconds * -0%
Razer Blade 16 Core Ultra 9 386H
NVIDIA GeForce RTX 5090 Laptop, Intel Core Ultra 9 386H
10 Seconds *
v3.3 Classroom CUDA
Lenovo Legion 7 16IAX10
NVIDIA GeForce RTX 5060 Laptop, Intel Core Ultra 7 255HX
38 Seconds * -124%
Maingear ML-16 MK2
NVIDIA GeForce RTX 4070 Laptop GPU, Intel Core Ultra 7 155H
34 Seconds * -100%
Schenker XMG APEX 16 MAX
NVIDIA GeForce RTX 5070 Ti Laptop, AMD Ryzen 9 9955HX
27 Seconds * -59%
Alienware x16 R2 P120F
NVIDIA GeForce RTX 4080 Laptop GPU, Intel Core Ultra 9 185H
22 Seconds * -29%
Razer Blade 16 2025 RTX 5090
NVIDIA GeForce RTX 5090 Laptop, AMD Ryzen AI 9 HX 370
19 Seconds * -12%
Alienware 16 Area-51 Core Ultra 9 290HX Plus
NVIDIA GeForce RTX 5080 Laptop, Intel Core Ultra 9 290HX Plus
19 Seconds * -12%
Lenovo Legion Pro 7i 16 Gen 10
NVIDIA GeForce RTX 5080 Laptop, Intel Core Ultra 9 275HX
18 Seconds * -6%
Przeciętny NVIDIA GeForce RTX 5090 Laptop
  (15 - 37, n=19)
17.8 Seconds * -5%
Razer Blade 16 Core Ultra 9 386H
NVIDIA GeForce RTX 5090 Laptop, Intel Core Ultra 9 386H
17 Seconds *
Lenovo Legion 9 16IRX8
NVIDIA GeForce RTX 4090 Laptop GPU, Intel Core i9-13980HX
16 Seconds * +6%
v3.3 Classroom CPU
Maingear ML-16 MK2
NVIDIA GeForce RTX 4070 Laptop GPU, Intel Core Ultra 7 155H
408 Seconds * -45%
Alienware x16 R2 P120F
NVIDIA GeForce RTX 4080 Laptop GPU, Intel Core Ultra 9 185H
305 Seconds * -8%
Razer Blade 16 Core Ultra 9 386H
NVIDIA GeForce RTX 5090 Laptop, Intel Core Ultra 9 386H
282 Seconds *
Razer Blade 16 2025 RTX 5090
NVIDIA GeForce RTX 5090 Laptop, AMD Ryzen AI 9 HX 370
210 Seconds * +26%
Lenovo Legion 9 16IRX8
NVIDIA GeForce RTX 4090 Laptop GPU, Intel Core i9-13980HX
194 Seconds * +31%
Lenovo Legion 7 16IAX10
NVIDIA GeForce RTX 5060 Laptop, Intel Core Ultra 7 255HX
181 Seconds * +36%
Przeciętny NVIDIA GeForce RTX 5090 Laptop
  (123 - 282, n=20)
169.3 Seconds * +40%
Lenovo Legion Pro 7i 16 Gen 10
NVIDIA GeForce RTX 5080 Laptop, Intel Core Ultra 9 275HX
148 Seconds * +48%
Alienware 16 Area-51 Core Ultra 9 290HX Plus
NVIDIA GeForce RTX 5080 Laptop, Intel Core Ultra 9 290HX Plus
137 Seconds * +51%
Schenker XMG APEX 16 MAX
NVIDIA GeForce RTX 5070 Ti Laptop, AMD Ryzen 9 9955HX
130 Seconds * +54%
v4.3 Barbershop CPU
Razer Blade 16 Core Ultra 9 386H
NVIDIA GeForce RTX 5090 Laptop, Intel Core Ultra 9 386H
1400 Seconds *
Przeciętny NVIDIA GeForce RTX 5090 Laptop
  (635 - 1400, n=9)
905 Seconds * +35%
Lenovo Legion 7 16IAX10
NVIDIA GeForce RTX 5060 Laptop, Intel Core Ultra 7 255HX
902 Seconds * +36%
Lenovo Legion Pro 7i 16 Gen 10
NVIDIA GeForce RTX 5080 Laptop, Intel Core Ultra 9 275HX
744 Seconds * +47%
Alienware 16 Area-51 Core Ultra 9 290HX Plus
NVIDIA GeForce RTX 5080 Laptop, Intel Core Ultra 9 290HX Plus
678 Seconds * +52%
v4.3 Barbershop OPTIX
Lenovo Legion 7 16IAX10
NVIDIA GeForce RTX 5060 Laptop, Intel Core Ultra 7 255HX
94 Seconds * -92%
Przeciętny NVIDIA GeForce RTX 5090 Laptop
  (46 - 286, n=11)
71.1 Seconds * -45%
Alienware 16 Area-51 Core Ultra 9 290HX Plus
NVIDIA GeForce RTX 5080 Laptop, Intel Core Ultra 9 290HX Plus
52 Seconds * -6%
Lenovo Legion Pro 7i 16 Gen 10
NVIDIA GeForce RTX 5080 Laptop, Intel Core Ultra 9 275HX
51 Seconds * -4%
Razer Blade 16 Core Ultra 9 386H
NVIDIA GeForce RTX 5090 Laptop, Intel Core Ultra 9 386H
49 Seconds *
Razer Blade 16 2025 RTX 5090
NVIDIA GeForce RTX 5090 Laptop, AMD Ryzen AI 9 HX 370
48 Seconds * +2%

* ... im mniej tym lepiej

Wydajność w grach

Średnia liczba klatek na sekundę w naszym Blade 16 z procesorem Intela konsekwentnie przewyższała zeszłoroczny Blade 16 z procesorem AMD o około 5 do 20 procent w zależności od tytułu i ustawień. Wyniki są godne uwagi, ponieważ sam Core Ultra 9 386H nie jest szybszy niż Ryzen AI 9 HX 370, jeśli chodzi o surowe wielowątkowe obciążenia.

Performance rating - Percent
Lenovo Legion Pro 7i 16 Gen 10 -1!
Intel Core Ultra 9 275HX, NVIDIA GeForce RTX 5080 Laptop
99.4 pt
Alienware 16 Area-51 Core Ultra 9 290HX Plus -1!
Intel Core Ultra 9 290HX Plus, NVIDIA GeForce RTX 5080 Laptop
96.6 pt
HP Omen Max 16 ah000 -2!
Intel Core Ultra 9 275HX, NVIDIA GeForce RTX 5090 Laptop
90.8 pt
Razer Blade 16 Core Ultra 9 386H
Intel Core Ultra 9 386H, NVIDIA GeForce RTX 5090 Laptop
80.3 pt
MSI Crosshair 16 HX AI D2XWGKG
Intel Core Ultra 9 275HX, NVIDIA GeForce RTX 5070 Laptop
74 pt
Razer Blade 16 2025 RTX 5090
AMD Ryzen AI 9 HX 370, NVIDIA GeForce RTX 5090 Laptop
71.2 pt
Cyberpunk 2077 - 1920x1080 Ultra Preset (FSR off)
Lenovo Legion Pro 7i 16 Gen 10
Intel Core Ultra 9 275HX, NVIDIA GeForce RTX 5080 Laptop
156.2 (125.7min, 114.4P1) fps +12%
Alienware 16 Area-51 Core Ultra 9 290HX Plus
Intel Core Ultra 9 290HX Plus, NVIDIA GeForce RTX 5080 Laptop
153.3 (121.2min, 109.6P1) fps +10%
HP Omen Max 16 ah000
Intel Core Ultra 9 275HX, NVIDIA GeForce RTX 5090 Laptop
151.9 (117.7min, 106.2P1) fps +9%
Razer Blade 16 Core Ultra 9 386H
Intel Core Ultra 9 386H, NVIDIA GeForce RTX 5090 Laptop
139.5 (100.7min, 89.2P1) fps
MSI Crosshair 16 HX AI D2XWGKG
Intel Core Ultra 9 275HX, NVIDIA GeForce RTX 5070 Laptop
107.1 (87.1min) fps -23%
Razer Blade 16 2025 RTX 5090
AMD Ryzen AI 9 HX 370, NVIDIA GeForce RTX 5090 Laptop
105.3 (74.7min) fps -25%
Baldur's Gate 3 - 1920x1080 Ultra Preset AA:T
Lenovo Legion Pro 7i 16 Gen 10
Intel Core Ultra 9 275HX, NVIDIA GeForce RTX 5080 Laptop
211.5 fps +5%
Razer Blade 16 Core Ultra 9 386H
Intel Core Ultra 9 386H, NVIDIA GeForce RTX 5090 Laptop
202 (12.2min, 112.6P0.1, 152.7P1) fps
Razer Blade 16 2025 RTX 5090
AMD Ryzen AI 9 HX 370, NVIDIA GeForce RTX 5090 Laptop
162 fps -20%
MSI Crosshair 16 HX AI D2XWGKG
Intel Core Ultra 9 275HX, NVIDIA GeForce RTX 5070 Laptop
131 (109.2min, 110.4P0.1, 112.9P1) fps -35%
GTA V - 1920x1080 Highest AA:4xMSAA + FX AF:16x
Alienware 16 Area-51 Core Ultra 9 290HX Plus
Intel Core Ultra 9 290HX Plus, NVIDIA GeForce RTX 5080 Laptop
168.1 (3.31min, 111.1P1) fps +63%
MSI Crosshair 16 HX AI D2XWGKG
Intel Core Ultra 9 275HX, NVIDIA GeForce RTX 5070 Laptop
142.3 (4.22min, 100P1) fps +38%
Razer Blade 16 2025 RTX 5090
AMD Ryzen AI 9 HX 370, NVIDIA GeForce RTX 5090 Laptop
121.6 (8.28min, 83.3P1) fps +18%
Razer Blade 16 Core Ultra 9 386H
Intel Core Ultra 9 386H, NVIDIA GeForce RTX 5090 Laptop
102.9 (8.02min, 55.6P1) fps
Final Fantasy XV Benchmark - 1920x1080 High Quality
Lenovo Legion Pro 7i 16 Gen 10
Intel Core Ultra 9 275HX, NVIDIA GeForce RTX 5080 Laptop
210 fps +20%
HP Omen Max 16 ah000
Intel Core Ultra 9 275HX, NVIDIA GeForce RTX 5090 Laptop
203 fps +16%
Alienware 16 Area-51 Core Ultra 9 290HX Plus
Intel Core Ultra 9 290HX Plus, NVIDIA GeForce RTX 5080 Laptop
201 fps +15%
Razer Blade 16 Core Ultra 9 386H
Intel Core Ultra 9 386H, NVIDIA GeForce RTX 5090 Laptop
175.5 fps
Razer Blade 16 2025 RTX 5090
AMD Ryzen AI 9 HX 370, NVIDIA GeForce RTX 5090 Laptop
147.4 fps -16%
MSI Crosshair 16 HX AI D2XWGKG
Intel Core Ultra 9 275HX, NVIDIA GeForce RTX 5070 Laptop
141.9 fps -19%
Strange Brigade - 1920x1080 ultra AA:ultra AF:16
Lenovo Legion Pro 7i 16 Gen 10
Intel Core Ultra 9 275HX, NVIDIA GeForce RTX 5080 Laptop
434 (21.5min, 322P1) fps +33%
Alienware 16 Area-51 Core Ultra 9 290HX Plus
Intel Core Ultra 9 290HX Plus, NVIDIA GeForce RTX 5080 Laptop
413 (96.6min, 299P1) fps +27%
HP Omen Max 16 ah000
Intel Core Ultra 9 275HX, NVIDIA GeForce RTX 5090 Laptop
382 (118.7min, 248P1) fps +17%
Razer Blade 16 Core Ultra 9 386H
Intel Core Ultra 9 386H, NVIDIA GeForce RTX 5090 Laptop
326 (72.8min, 230P1) fps
Razer Blade 16 2025 RTX 5090
AMD Ryzen AI 9 HX 370, NVIDIA GeForce RTX 5090 Laptop
319 (126.4min, 227P1) fps -2%
MSI Crosshair 16 HX AI D2XWGKG
Intel Core Ultra 9 275HX, NVIDIA GeForce RTX 5070 Laptop
259 (168.9min, 192.7P1) fps -21%
Dota 2 Reborn - 1920x1080 ultra (3/3) best looking
Lenovo Legion Pro 7i 16 Gen 10
Intel Core Ultra 9 275HX, NVIDIA GeForce RTX 5080 Laptop
188.9 (155.7min) fps +23%
Alienware 16 Area-51 Core Ultra 9 290HX Plus
Intel Core Ultra 9 290HX Plus, NVIDIA GeForce RTX 5080 Laptop
170.9 (144.5min) fps +11%
MSI Crosshair 16 HX AI D2XWGKG
Intel Core Ultra 9 275HX, NVIDIA GeForce RTX 5070 Laptop
170 (145.1min) fps +11%
HP Omen Max 16 ah000
Intel Core Ultra 9 275HX, NVIDIA GeForce RTX 5090 Laptop
161 (134.6min) fps +5%
Razer Blade 16 Core Ultra 9 386H
Intel Core Ultra 9 386H, NVIDIA GeForce RTX 5090 Laptop
153.8 (132.8min) fps
Razer Blade 16 2025 RTX 5090
AMD Ryzen AI 9 HX 370, NVIDIA GeForce RTX 5090 Laptop
137.1 (113.2min) fps -11%
X-Plane 11.11 - 1920x1080 high (fps_test=3)
Alienware 16 Area-51 Core Ultra 9 290HX Plus
Intel Core Ultra 9 290HX Plus, NVIDIA GeForce RTX 5080 Laptop
129.5 fps +31%
Lenovo Legion Pro 7i 16 Gen 10
Intel Core Ultra 9 275HX, NVIDIA GeForce RTX 5080 Laptop
124.5 fps +26%
HP Omen Max 16 ah000
Intel Core Ultra 9 275HX, NVIDIA GeForce RTX 5090 Laptop
112.6 fps +14%
MSI Crosshair 16 HX AI D2XWGKG
Intel Core Ultra 9 275HX, NVIDIA GeForce RTX 5070 Laptop
111 fps +13%
Razer Blade 16 Core Ultra 9 386H
Intel Core Ultra 9 386H, NVIDIA GeForce RTX 5090 Laptop
98.5 fps
Razer Blade 16 2025 RTX 5090
AMD Ryzen AI 9 HX 370, NVIDIA GeForce RTX 5090 Laptop
85.2 fps -14%
Assassin's Creed Shadows
1920x1080 Ultra High
NVIDIA GeForce RTX 5090 Founders Edition
AMD Ryzen 7 9800X3D, NVIDIA GeForce RTX 5090
95 (31min, 71P0.1, 81P1) fps +42%
Razer Blade 16 Core Ultra 9 386H
Intel Core Ultra 9 386H, NVIDIA GeForce RTX 5090 Laptop
67 (22min) fps
Przeciętny NVIDIA GeForce RTX 5090 Laptop
  (44 - 76, n=17)
66.4 fps -1%
Razer Blade 16 2025 RTX 5090
AMD Ryzen AI 9 HX 370, NVIDIA GeForce RTX 5090 Laptop
64 (27min, 35P0.1, 49P1) fps -4%
Lenovo Legion Pro 7i 16 Gen 10
Intel Core Ultra 9 275HX, NVIDIA GeForce RTX 5080 Laptop
64 (43min) fps -4%
Alienware 16 Area-51 Core Ultra 9 290HX Plus
Intel Core Ultra 9 290HX Plus, NVIDIA GeForce RTX 5080 Laptop
59 (26min) fps -12%
Lenovo Legion 7 16IAX10
Intel Core Ultra 7 255HX, NVIDIA GeForce RTX 5060 Laptop
40 (32min) fps -40%
2560x1440 Ultra High
NVIDIA GeForce RTX 5090 Founders Edition
AMD Ryzen 7 9800X3D, NVIDIA GeForce RTX 5090
85 (66min, 70P0.1, 74P1) fps +52%
Razer Blade 16 Core Ultra 9 386H
Intel Core Ultra 9 386H, NVIDIA GeForce RTX 5090 Laptop
56 (44min) fps
Przeciętny NVIDIA GeForce RTX 5090 Laptop
  (37 - 64, n=18)
55.1 fps -2%
Lenovo Legion Pro 7i 16 Gen 10
Intel Core Ultra 9 275HX, NVIDIA GeForce RTX 5080 Laptop
55 (41min) fps -2%
Alienware 16 Area-51 Core Ultra 9 290HX Plus
Intel Core Ultra 9 290HX Plus, NVIDIA GeForce RTX 5080 Laptop
51 (37min) fps -9%
Razer Blade 16 2025 RTX 5090
AMD Ryzen AI 9 HX 370, NVIDIA GeForce RTX 5090 Laptop
50 (31min, 33P0.1, 39P1) fps -11%
Lenovo Legion 7 16IAX10
Intel Core Ultra 7 255HX, NVIDIA GeForce RTX 5060 Laptop
34 (13min) fps -39%
3840x2160 Ultra High
NVIDIA GeForce RTX 5090 Founders Edition
AMD Ryzen 7 9800X3D, NVIDIA GeForce RTX 5090
64 (51min, 53P0.1, 55P1) fps +52%
Razer Blade 16 Core Ultra 9 386H
Intel Core Ultra 9 386H, NVIDIA GeForce RTX 5090 Laptop
42 (33min) fps
Przeciętny NVIDIA GeForce RTX 5090 Laptop
  (35 - 46, n=14)
40.6 fps -3%
Lenovo Legion Pro 7i 16 Gen 10
Intel Core Ultra 9 275HX, NVIDIA GeForce RTX 5080 Laptop
40 (28min) fps -5%
Alienware 16 Area-51 Core Ultra 9 290HX Plus
Intel Core Ultra 9 290HX Plus, NVIDIA GeForce RTX 5080 Laptop
37 (28min) fps -12%
Razer Blade 16 2025 RTX 5090
AMD Ryzen AI 9 HX 370, NVIDIA GeForce RTX 5090 Laptop
35 (16min, 22P0.1, 27P1) fps -17%
2560x1440 Ultra High + DLSS Quality
NVIDIA GeForce RTX 5090 Founders Edition
AMD Ryzen 7 9800X3D, NVIDIA GeForce RTX 5090
101 (71min, 80P0.1, 86P1) fps +53%
Razer Blade 16 Core Ultra 9 386H
Intel Core Ultra 9 386H, NVIDIA GeForce RTX 5090 Laptop
66 (50min) fps
Lenovo Legion Pro 7i 16 Gen 10
Intel Core Ultra 9 275HX, NVIDIA GeForce RTX 5080 Laptop
65 (46min) fps -2%
Przeciętny NVIDIA GeForce RTX 5090 Laptop
  (45 - 76, n=9)
64.3 fps -3%
Razer Blade 16 2025 RTX 5090
AMD Ryzen AI 9 HX 370, NVIDIA GeForce RTX 5090 Laptop
62 (29min, 37P0.1, 46P1) fps -6%
Alienware 16 Area-51 Core Ultra 9 290HX Plus
Intel Core Ultra 9 290HX Plus, NVIDIA GeForce RTX 5080 Laptop
59 (43min) fps -11%
Lenovo Legion 7 16IAX10
Intel Core Ultra 7 255HX, NVIDIA GeForce RTX 5060 Laptop
41 (26min) fps -38%
3840x2160 Ultra High + DLSS Quality
NVIDIA GeForce RTX 5090 Founders Edition
AMD Ryzen 7 9800X3D, NVIDIA GeForce RTX 5090
84 (61min, 70P0.1, 75P1) fps +58%
Lenovo Legion Pro 7i 16 Gen 10
Intel Core Ultra 9 275HX, NVIDIA GeForce RTX 5080 Laptop
55 (43min) fps +4%
Przeciętny NVIDIA GeForce RTX 5090 Laptop
  (47 - 61, n=9)
54.3 fps +2%
Razer Blade 16 Core Ultra 9 386H
Intel Core Ultra 9 386H, NVIDIA GeForce RTX 5090 Laptop
53 (37min) fps
Alienware 16 Area-51 Core Ultra 9 290HX Plus
Intel Core Ultra 9 290HX Plus, NVIDIA GeForce RTX 5080 Laptop
49 (36min) fps -8%
Razer Blade 16 2025 RTX 5090
AMD Ryzen AI 9 HX 370, NVIDIA GeForce RTX 5090 Laptop
47 (25min, 29P0.1, 37P1) fps -11%
2560x1440 Ultra High + GI + DLSS Quality + FG
NVIDIA GeForce RTX 5090 Founders Edition
AMD Ryzen 7 9800X3D, NVIDIA GeForce RTX 5090
162 (122min, 132P0.1, 139P1) fps +80%
Przeciętny NVIDIA GeForce RTX 5090 Laptop
  (87 - 108, n=7)
98.6 fps +10%
Razer Blade 16 Core Ultra 9 386H
Intel Core Ultra 9 386H, NVIDIA GeForce RTX 5090 Laptop
90 (73min) fps
Razer Blade 16 2025 RTX 5090
AMD Ryzen AI 9 HX 370, NVIDIA GeForce RTX 5090 Laptop
87 (66min, 68P0.1, 71P1) fps -3%
Alienware 16 Area-51 Core Ultra 9 290HX Plus
Intel Core Ultra 9 290HX Plus, NVIDIA GeForce RTX 5080 Laptop
83 (65min) fps -8%
Lenovo Legion 7 16IAX10
Intel Core Ultra 7 255HX, NVIDIA GeForce RTX 5060 Laptop
55 (46min) fps -39%
3840x2160 Ultra High + GI + DLSS Quality + FG
NVIDIA GeForce RTX 5090 Founders Edition
AMD Ryzen 7 9800X3D, NVIDIA GeForce RTX 5090
135 (102min, 111P0.1, 118P1) fps +88%
Przeciętny NVIDIA GeForce RTX 5090 Laptop
  (66 - 84, n=7)
75.9 fps +5%
Razer Blade 16 Core Ultra 9 386H
Intel Core Ultra 9 386H, NVIDIA GeForce RTX 5090 Laptop
72 (59min) fps
Razer Blade 16 2025 RTX 5090
AMD Ryzen AI 9 HX 370, NVIDIA GeForce RTX 5090 Laptop
66 (52min, 53P0.1, 56P1) fps -8%
Alienware 16 Area-51 Core Ultra 9 290HX Plus
Intel Core Ultra 9 290HX Plus, NVIDIA GeForce RTX 5080 Laptop
66 (52min) fps -8%
Black Myth: Wukong
1920x1080 cinematic TSR 100
NVIDIA GeForce RTX 5090 Founders Edition
AMD Ryzen 7 9800X3D, NVIDIA GeForce RTX 5090
102 (19min) fps +79%
Przeciętny NVIDIA GeForce RTX 5090 Laptop
  (55 - 74, n=7)
62 fps +9%
Lenovo Legion Pro 7i 16 Gen 10
Intel Core Ultra 9 275HX, NVIDIA GeForce RTX 5080 Laptop
58 (50min) fps +2%
Razer Blade 16 2025 RTX 5090
AMD Ryzen AI 9 HX 370, NVIDIA GeForce RTX 5090 Laptop
57 (15min, 51P1) fps 0%
Razer Blade 16 Core Ultra 9 386H
Intel Core Ultra 9 386H, NVIDIA GeForce RTX 5090 Laptop
57 (47min) fps
Alienware 16 Area-51 Core Ultra 9 290HX Plus
Intel Core Ultra 9 290HX Plus, NVIDIA GeForce RTX 5080 Laptop
55 (12min) fps -4%
Lenovo Legion 7 16IAX10
Intel Core Ultra 7 255HX, NVIDIA GeForce RTX 5060 Laptop
32 (28min) fps -44%
2560x1440 cinematic TSR 100
NVIDIA GeForce RTX 5090 Founders Edition
AMD Ryzen 7 9800X3D, NVIDIA GeForce RTX 5090
85 (66min) fps +98%
Przeciętny NVIDIA GeForce RTX 5090 Laptop
  (42 - 50, n=7)
46 fps +7%
Razer Blade 16 2025 RTX 5090
AMD Ryzen AI 9 HX 370, NVIDIA GeForce RTX 5090 Laptop
44 (38min, 40P1) fps +2%
Lenovo Legion Pro 7i 16 Gen 10
Intel Core Ultra 9 275HX, NVIDIA GeForce RTX 5080 Laptop
44 (39min) fps +2%
Razer Blade 16 Core Ultra 9 386H
Intel Core Ultra 9 386H, NVIDIA GeForce RTX 5090 Laptop
43 (38min) fps
Alienware 16 Area-51 Core Ultra 9 290HX Plus
Intel Core Ultra 9 290HX Plus, NVIDIA GeForce RTX 5080 Laptop
42 (37min) fps -2%
Lenovo Legion 7 16IAX10
Intel Core Ultra 7 255HX, NVIDIA GeForce RTX 5060 Laptop
23 (20min) fps -47%
3840x2160 cinematic TSR 100
NVIDIA GeForce RTX 5090 Founders Edition
AMD Ryzen 7 9800X3D, NVIDIA GeForce RTX 5090
57 (46min) fps +119%
Przeciętny NVIDIA GeForce RTX 5090 Laptop
  (26 - 33, n=7)
28.4 fps +9%
Razer Blade 16 2025 RTX 5090
AMD Ryzen AI 9 HX 370, NVIDIA GeForce RTX 5090 Laptop
27 (22min, 25P1) fps +4%
Lenovo Legion Pro 7i 16 Gen 10
Intel Core Ultra 9 275HX, NVIDIA GeForce RTX 5080 Laptop
26 (21min) fps 0%
Razer Blade 16 Core Ultra 9 386H
Intel Core Ultra 9 386H, NVIDIA GeForce RTX 5090 Laptop
26 (21min) fps
Alienware 16 Area-51 Core Ultra 9 290HX Plus
Intel Core Ultra 9 290HX Plus, NVIDIA GeForce RTX 5080 Laptop
24 (20min) fps -8%
2560x1440 cinematic DLSS 68
NVIDIA GeForce RTX 5090 Founders Edition
AMD Ryzen 7 9800X3D, NVIDIA GeForce RTX 5090
107 (74min) fps +67%
Przeciętny NVIDIA GeForce RTX 5090 Laptop
  (62 - 73, n=7)
67 fps +5%
Razer Blade 16 2025 RTX 5090
AMD Ryzen AI 9 HX 370, NVIDIA GeForce RTX 5090 Laptop
64 (53min, 57P1) fps 0%
Razer Blade 16 Core Ultra 9 386H
Intel Core Ultra 9 386H, NVIDIA GeForce RTX 5090 Laptop
64 (47min) fps
Lenovo Legion Pro 7i 16 Gen 10
Intel Core Ultra 9 275HX, NVIDIA GeForce RTX 5080 Laptop
62 (53min) fps -3%
Alienware 16 Area-51 Core Ultra 9 290HX Plus
Intel Core Ultra 9 290HX Plus, NVIDIA GeForce RTX 5080 Laptop
61 (47min) fps -5%
Lenovo Legion 7 16IAX10
Intel Core Ultra 7 255HX, NVIDIA GeForce RTX 5060 Laptop
36 (31min) fps -44%
3840x2160 cinematic DLSS 68
NVIDIA GeForce RTX 5090 Founders Edition
AMD Ryzen 7 9800X3D, NVIDIA GeForce RTX 5090
85 (62min) fps +89%
Przeciętny NVIDIA GeForce RTX 5090 Laptop
  (43 - 52, n=5)
47 fps +4%
Razer Blade 16 2025 RTX 5090
AMD Ryzen AI 9 HX 370, NVIDIA GeForce RTX 5090 Laptop
46 (41min, 42P1) fps +2%
Lenovo Legion Pro 7i 16 Gen 10
Intel Core Ultra 9 275HX, NVIDIA GeForce RTX 5080 Laptop
45 (39min) fps 0%
Razer Blade 16 Core Ultra 9 386H
Intel Core Ultra 9 386H, NVIDIA GeForce RTX 5090 Laptop
45 (38min) fps
Alienware 16 Area-51 Core Ultra 9 290HX Plus
Intel Core Ultra 9 290HX Plus, NVIDIA GeForce RTX 5080 Laptop
42 (37min) fps -7%
3840x2160 cinematic RT: Very High DLSS 68 FG
NVIDIA GeForce RTX 5090 Founders Edition
AMD Ryzen 7 9800X3D, NVIDIA GeForce RTX 5090
95 (81min) fps +111%
Razer Blade 16 Core Ultra 9 386H
Intel Core Ultra 9 386H, NVIDIA GeForce RTX 5090 Laptop
45 (38min) fps
Przeciętny NVIDIA GeForce RTX 5090 Laptop
  (43 - 47, n=6)
44.8 fps 0%
Lenovo Legion Pro 7i 16 Gen 10
Intel Core Ultra 9 275HX, NVIDIA GeForce RTX 5080 Laptop
43 (36min) fps -4%
Alienware 16 Area-51 Core Ultra 9 290HX Plus
Intel Core Ultra 9 290HX Plus, NVIDIA GeForce RTX 5080 Laptop
41 (35min) fps -9%
2560x1440 cinematic RT: Very High DLSS 68 FG
NVIDIA GeForce RTX 5090 Founders Edition
AMD Ryzen 7 9800X3D, NVIDIA GeForce RTX 5090
145 (72min) fps +79%
Razer Blade 16 Core Ultra 9 386H
Intel Core Ultra 9 386H, NVIDIA GeForce RTX 5090 Laptop
81 (58min) fps
Przeciętny NVIDIA GeForce RTX 5090 Laptop
  (76 - 85, n=7)
80.3 fps -1%
Razer Blade 16 2025 RTX 5090
AMD Ryzen AI 9 HX 370, NVIDIA GeForce RTX 5090 Laptop
76 (59min, 68P1) fps -6%
Lenovo Legion Pro 7i 16 Gen 10
Intel Core Ultra 9 275HX, NVIDIA GeForce RTX 5080 Laptop
74 (63min) fps -9%
Alienware 16 Area-51 Core Ultra 9 290HX Plus
Intel Core Ultra 9 290HX Plus, NVIDIA GeForce RTX 5080 Laptop
74 (62min) fps -9%
Lenovo Legion 7 16IAX10
Intel Core Ultra 7 255HX, NVIDIA GeForce RTX 5060 Laptop
31 (19min) fps -62%
3840x2160 cinematic RT: Very High
Razer Blade 16 Core Ultra 9 386H
Intel Core Ultra 9 386H, NVIDIA GeForce RTX 5090 Laptop
13 (10min) fps
Przeciętny NVIDIA GeForce RTX 5090 Laptop
  (n=1)
13 fps 0%
Alienware 16 Area-51 Core Ultra 9 290HX Plus
Intel Core Ultra 9 290HX Plus, NVIDIA GeForce RTX 5080 Laptop
11 (9min) fps -15%
F1 24
1920x1080 Ultra High Preset AA:T AF:16x
NVIDIA GeForce RTX 5090 Founders Edition
AMD Ryzen 7 9800X3D, NVIDIA GeForce RTX 5090
286 (99min, 138P1) fps +116%
Przeciętny NVIDIA GeForce RTX 5090 Laptop
  (107.5 - 158.3, n=20)
140.7 fps +6%
Alienware 16 Area-51 Core Ultra 9 290HX Plus
Intel Core Ultra 9 290HX Plus, NVIDIA GeForce RTX 5080 Laptop
136.9 (79min, 98P1) fps +3%
Razer Blade 16 2025 RTX 5090
AMD Ryzen AI 9 HX 370, NVIDIA GeForce RTX 5090 Laptop
133 (55min, 67P1) fps +1%
Razer Blade 16 Core Ultra 9 386H
Intel Core Ultra 9 386H, NVIDIA GeForce RTX 5090 Laptop
132.3 (59min, 70P1) fps
Schenker XMG APEX 16 MAX
AMD Ryzen 9 9955HX, NVIDIA GeForce RTX 5070 Ti Laptop
110.6 (70min, 84P1) fps -16%
Lenovo Legion 7 16IAX10
Intel Core Ultra 7 255HX, NVIDIA GeForce RTX 5060 Laptop
71.6 (58min, 57P1) fps -46%
2560x1440 Ultra High Preset AA:T AF:16x
NVIDIA GeForce RTX 5090 Founders Edition
AMD Ryzen 7 9800X3D, NVIDIA GeForce RTX 5090
215 (86min, 113P1) fps +127%
Przeciętny NVIDIA GeForce RTX 5090 Laptop
  (72.5 - 106.9, n=21)
96.4 fps +2%
Razer Blade 16 2025 RTX 5090
AMD Ryzen AI 9 HX 370, NVIDIA GeForce RTX 5090 Laptop
94.9 (50min, 66P1) fps 0%
Razer Blade 16 Core Ultra 9 386H
Intel Core Ultra 9 386H, NVIDIA GeForce RTX 5090 Laptop
94.7 (57min, 67P1) fps
Alienware 16 Area-51 Core Ultra 9 290HX Plus
Intel Core Ultra 9 290HX Plus, NVIDIA GeForce RTX 5080 Laptop
89.2 (71min, 72P1) fps -6%
Schenker XMG APEX 16 MAX
AMD Ryzen 9 9955HX, NVIDIA GeForce RTX 5070 Ti Laptop
72 (58min, 58P1) fps -24%
Lenovo Legion 7 16IAX10
Intel Core Ultra 7 255HX, NVIDIA GeForce RTX 5060 Laptop
45.7 (39min, 38P1) fps -52%
3840x2160 Ultra High Preset AA:T AF:16x
NVIDIA GeForce RTX 5090 Founders Edition
AMD Ryzen 7 9800X3D, NVIDIA GeForce RTX 5090
123.2 (96min, 88P1) fps +155%
Przeciętny NVIDIA GeForce RTX 5090 Laptop
  (39.3 - 54.2, n=15)
49.2 fps +2%
Razer Blade 16 2025 RTX 5090
AMD Ryzen AI 9 HX 370, NVIDIA GeForce RTX 5090 Laptop
48.8 (41min, 40P1) fps +1%
Razer Blade 16 Core Ultra 9 386H
Intel Core Ultra 9 386H, NVIDIA GeForce RTX 5090 Laptop
48.4 (36min, 39P1) fps
Alienware 16 Area-51 Core Ultra 9 290HX Plus
Intel Core Ultra 9 290HX Plus, NVIDIA GeForce RTX 5080 Laptop
44.8 (38min, 37P1) fps -7%
3840x2160 Ultra High Preset + Quality DLSS AF:16x
NVIDIA GeForce RTX 5090 Founders Edition
AMD Ryzen 7 9800X3D, NVIDIA GeForce RTX 5090
187.2 (95min, 106P1) fps +131%
Przeciętny NVIDIA GeForce RTX 5090 Laptop
  (66 - 90.9, n=12)
81.8 fps +1%
Razer Blade 16 Core Ultra 9 386H
Intel Core Ultra 9 386H, NVIDIA GeForce RTX 5090 Laptop
81 (56min, 65P1) fps
Razer Blade 16 2025 RTX 5090
AMD Ryzen AI 9 HX 370, NVIDIA GeForce RTX 5090 Laptop
80.5 (55min, 62P1) fps -1%
Alienware 16 Area-51 Core Ultra 9 290HX Plus
Intel Core Ultra 9 290HX Plus, NVIDIA GeForce RTX 5080 Laptop
76.5 (60min, 63P1) fps -6%
2560x1440 Ultra High Preset + Quality DLSS AF:16x
NVIDIA GeForce RTX 5090 Founders Edition
AMD Ryzen 7 9800X3D, NVIDIA GeForce RTX 5090
258 (100min, 124P1) fps +94%
Alienware 16 Area-51 Core Ultra 9 290HX Plus
Intel Core Ultra 9 290HX Plus, NVIDIA GeForce RTX 5080 Laptop
141.2 (79min, 90P1) fps +6%
Przeciętny NVIDIA GeForce RTX 5090 Laptop
  (105.5 - 159.3, n=15)
136 fps +2%
Razer Blade 16 Core Ultra 9 386H
Intel Core Ultra 9 386H, NVIDIA GeForce RTX 5090 Laptop
132.8 (57min, 72P1) fps
Razer Blade 16 2025 RTX 5090
AMD Ryzen AI 9 HX 370, NVIDIA GeForce RTX 5090 Laptop
130.7 (55min, 67P1) fps -2%
Schenker XMG APEX 16 MAX
AMD Ryzen 9 9955HX, NVIDIA GeForce RTX 5070 Ti Laptop
112.4 (67min, 80P1) fps -15%
Lenovo Legion 7 16IAX10
Intel Core Ultra 7 255HX, NVIDIA GeForce RTX 5060 Laptop
71.4 (59min, 57P1) fps -46%
Cyberpunk 2077
1920x1080 Ultra Preset (FSR off)
NVIDIA GeForce RTX 5090 Founders Edition
AMD Ryzen 7 9800X3D, NVIDIA GeForce RTX 5090
220 (152.4min) fps +58%
Lenovo Legion Pro 7i 16 Gen 10
Intel Core Ultra 9 275HX, NVIDIA GeForce RTX 5080 Laptop
156.2 (125.7min, 114.4P1) fps +12%
Alienware 16 Area-51 Core Ultra 9 290HX Plus
Intel Core Ultra 9 290HX Plus, NVIDIA GeForce RTX 5080 Laptop
153.3 (121.2min, 109.6P1) fps +10%
Przeciętny NVIDIA GeForce RTX 5090 Laptop
  (91.4 - 169.9, n=24)
146.3 fps +5%
Razer Blade 16 Core Ultra 9 386H
Intel Core Ultra 9 386H, NVIDIA GeForce RTX 5090 Laptop
139.5 (100.7min, 89.2P1) fps
Lenovo Legion 9 16IRX8
Intel Core i9-13980HX, NVIDIA GeForce RTX 4090 Laptop GPU
131.22 (31.65min) fps -6%
Schenker XMG APEX 16 MAX
AMD Ryzen 9 9955HX, NVIDIA GeForce RTX 5070 Ti Laptop
128 (103min) fps -8%
Razer Blade 16 2025 RTX 5090
AMD Ryzen AI 9 HX 370, NVIDIA GeForce RTX 5090 Laptop
105.3 (74.7min) fps -25%
Alienware x16 R2 P120F
Intel Core Ultra 9 185H, NVIDIA GeForce RTX 4080 Laptop GPU
99.7 (13.5min) fps -29%
Lenovo Legion 7 16IAX10
Intel Core Ultra 7 255HX, NVIDIA GeForce RTX 5060 Laptop
94.9 (77.7min, 74.2P1) fps -32%
Maingear ML-16 MK2
Intel Core Ultra 7 155H, NVIDIA GeForce RTX 4070 Laptop GPU
76.4 (63.2min) fps -45%
3840x2160 Ultra Preset DLSS4 quality no FG
Razer Blade 16 Core Ultra 9 386H
Intel Core Ultra 9 386H, NVIDIA GeForce RTX 5090 Laptop
60.9 (53.8min, 52P1) fps
Przeciętny NVIDIA GeForce RTX 5090 Laptop
  (n=1)
60.9 fps 0%
Alienware 16 Area-51 Core Ultra 9 290HX Plus
Intel Core Ultra 9 290HX Plus, NVIDIA GeForce RTX 5080 Laptop
57.8 (51.8min, 49.6P1) fps -5%
2560x1440 Ultra Preset DLSS4 quality no FG
Przeciętny NVIDIA GeForce RTX 5090 Laptop
  (94.1 - 136.6, n=16)
119.7 fps +3%
Alienware 16 Area-51 Core Ultra 9 290HX Plus
Intel Core Ultra 9 290HX Plus, NVIDIA GeForce RTX 5080 Laptop
119.1 (102.2min, 97.5P1) fps +2%
Lenovo Legion Pro 7i 16 Gen 10
Intel Core Ultra 9 275HX, NVIDIA GeForce RTX 5080 Laptop
119 (102.5min, 98.2P1) fps +2%
Razer Blade 16 Core Ultra 9 386H
Intel Core Ultra 9 386H, NVIDIA GeForce RTX 5090 Laptop
116.6 (94.5min, 85.9P1) fps
Razer Blade 16 2025 RTX 5090
AMD Ryzen AI 9 HX 370, NVIDIA GeForce RTX 5090 Laptop
104.6 (74.9min) fps -10%
Schenker XMG APEX 16 MAX
AMD Ryzen 9 9955HX, NVIDIA GeForce RTX 5070 Ti Laptop
96.1 (82.8min) fps -18%
Lenovo Legion 7 16IAX10
Intel Core Ultra 7 255HX, NVIDIA GeForce RTX 5060 Laptop
69.6 (59.5min, 56.2P1) fps -40%
2560x1440 Ultra Preset (FSR off)
NVIDIA GeForce RTX 5090 Founders Edition
AMD Ryzen 7 9800X3D, NVIDIA GeForce RTX 5090
205 (154.1min) fps +94%
Przeciętny NVIDIA GeForce RTX 5090 Laptop
  (83.2 - 122.8, n=26)
108.2 fps +2%
Razer Blade 16 Core Ultra 9 386H
Intel Core Ultra 9 386H, NVIDIA GeForce RTX 5090 Laptop
105.8 (84.1min, 74.9P1) fps
Alienware 16 Area-51 Core Ultra 9 290HX Plus
Intel Core Ultra 9 290HX Plus, NVIDIA GeForce RTX 5080 Laptop
101.7 (84.5min, 81.3P1) fps -4%
Lenovo Legion Pro 7i 16 Gen 10
Intel Core Ultra 9 275HX, NVIDIA GeForce RTX 5080 Laptop
99.8 (85.5min, 81.6P1) fps -6%
Razer Blade 16 2025 RTX 5090
AMD Ryzen AI 9 HX 370, NVIDIA GeForce RTX 5090 Laptop
98.6 (74.5min) fps -7%
Lenovo Legion 9 16IRX8
Intel Core i9-13980HX, NVIDIA GeForce RTX 4090 Laptop GPU
89.55 (28.01min) fps -15%
Schenker XMG APEX 16 MAX
AMD Ryzen 9 9955HX, NVIDIA GeForce RTX 5070 Ti Laptop
82.9 (69.5min) fps -22%
Alienware x16 R2 P120F
Intel Core Ultra 9 185H, NVIDIA GeForce RTX 4080 Laptop GPU
75.4 (25.4min) fps -29%
Lenovo Legion 7 16IAX10
Intel Core Ultra 7 255HX, NVIDIA GeForce RTX 5060 Laptop
59.2 (50.6min, 49.1P1) fps -44%
Maingear ML-16 MK2
Intel Core Ultra 7 155H, NVIDIA GeForce RTX 4070 Laptop GPU
44.3 (37.2min) fps -58%
3840x2160 Ultra Preset (FSR off)
NVIDIA GeForce RTX 5090 Founders Edition
AMD Ryzen 7 9800X3D, NVIDIA GeForce RTX 5090
108.6 (85.8min) fps +113%
Przeciętny NVIDIA GeForce RTX 5090 Laptop
  (39.6 - 55.1, n=17)
51.5 fps +1%
Razer Blade 16 Core Ultra 9 386H
Intel Core Ultra 9 386H, NVIDIA GeForce RTX 5090 Laptop
50.9 (42.2min, 39.9P1) fps
Razer Blade 16 2025 RTX 5090
AMD Ryzen AI 9 HX 370, NVIDIA GeForce RTX 5090 Laptop
50.7 (42.1min) fps 0%
Lenovo Legion Pro 7i 16 Gen 10
Intel Core Ultra 9 275HX, NVIDIA GeForce RTX 5080 Laptop
47.1 (38.4min, 36P1) fps -7%
Alienware 16 Area-51 Core Ultra 9 290HX Plus
Intel Core Ultra 9 290HX Plus, NVIDIA GeForce RTX 5080 Laptop
46.4 (38.4min, 36P1) fps -9%
Alienware x16 R2 P120F
Intel Core Ultra 9 185H, NVIDIA GeForce RTX 4080 Laptop GPU
32.5 (11.5min) fps -36%
1920x1080 Ray Tracing Ultra Preset (DLSS off)
Przeciętny NVIDIA GeForce RTX 5090 Laptop
  (72.5 - 84.9, n=5)
79.4 fps +10%
Lenovo Legion Pro 7i 16 Gen 10
Intel Core Ultra 9 275HX, NVIDIA GeForce RTX 5080 Laptop
73.4 (63.1min, 60.1P1) fps +1%
Razer Blade 16 Core Ultra 9 386H
Intel Core Ultra 9 386H, NVIDIA GeForce RTX 5090 Laptop
72.5 (61.9min, 56.4P1) fps
Alienware 16 Area-51 Core Ultra 9 290HX Plus
Intel Core Ultra 9 290HX Plus, NVIDIA GeForce RTX 5080 Laptop
72.3 (61.9min, 58.9P1) fps 0%
Alienware x16 R2 P120F
Intel Core Ultra 9 185H, NVIDIA GeForce RTX 4080 Laptop GPU
58.4 (15.2min) fps -19%
Lenovo Legion 7 16IAX10
Intel Core Ultra 7 255HX, NVIDIA GeForce RTX 5060 Laptop
39.8 (33.8min, 31.8P1) fps -45%
Maingear ML-16 MK2
Intel Core Ultra 7 155H, NVIDIA GeForce RTX 4070 Laptop GPU
36 (30.5min) fps -50%
3840x2160 Ray Tracing Overdrive Preset + DLSS 4 Transformer Quality + Frame Generation MFG 4x
NVIDIA GeForce RTX 5090 Founders Edition
AMD Ryzen 7 9800X3D, NVIDIA GeForce RTX 5090
209 (192.8min) fps +132%
Razer Blade 16 Core Ultra 9 386H
Intel Core Ultra 9 386H, NVIDIA GeForce RTX 5090 Laptop
89.9 (81.3min) fps
Przeciętny NVIDIA GeForce RTX 5090 Laptop
  (73.9 - 97.8, n=11)
89.3 fps -1%
Lenovo Legion Pro 7i 16 Gen 10
Intel Core Ultra 9 275HX, NVIDIA GeForce RTX 5080 Laptop
84.4 (73min) fps -6%
Razer Blade 16 2025 RTX 5090
AMD Ryzen AI 9 HX 370, NVIDIA GeForce RTX 5090 Laptop
83.7 (72.7min) fps -7%
Alienware 16 Area-51 Core Ultra 9 290HX Plus
Intel Core Ultra 9 290HX Plus, NVIDIA GeForce RTX 5080 Laptop
83.3 (72.2min) fps -7%
3840x2160 Ray Tracing Overdrive Preset + DLSS 4 Transformer Quality + Frame Generation (M)FG 2x
NVIDIA GeForce RTX 5090 Founders Edition
AMD Ryzen 7 9800X3D, NVIDIA GeForce RTX 5090
114.4 (104.7min) fps +133%
Razer Blade 16 Core Ultra 9 386H
Intel Core Ultra 9 386H, NVIDIA GeForce RTX 5090 Laptop
49.1 (44.2min) fps
Przeciętny NVIDIA GeForce RTX 5090 Laptop
  (41 - 53.2, n=11)
49.1 fps 0%
Razer Blade 16 2025 RTX 5090
AMD Ryzen AI 9 HX 370, NVIDIA GeForce RTX 5090 Laptop
46.2 (39.8min) fps -6%
Alienware 16 Area-51 Core Ultra 9 290HX Plus
Intel Core Ultra 9 290HX Plus, NVIDIA GeForce RTX 5080 Laptop
45.2 (39min) fps -8%
Lenovo Legion Pro 7i 16 Gen 10
Intel Core Ultra 9 275HX, NVIDIA GeForce RTX 5080 Laptop
41.7 (36.9min) fps -15%
3840x2160 Ray Tracing Overdrive Preset + DLSS 4 Transformer Quality (no FG)
NVIDIA GeForce RTX 5090 Founders Edition
AMD Ryzen 7 9800X3D, NVIDIA GeForce RTX 5090
62.6 (56.2min) fps +124%
Razer Blade 16 Core Ultra 9 386H
Intel Core Ultra 9 386H, NVIDIA GeForce RTX 5090 Laptop
28 (24min, 22.7P1) fps
Przeciętny NVIDIA GeForce RTX 5090 Laptop
  (22.6 - 30, n=11)
27.9 fps 0%
Razer Blade 16 2025 RTX 5090
AMD Ryzen AI 9 HX 370, NVIDIA GeForce RTX 5090 Laptop
26.1 (22.3min) fps -7%
Lenovo Legion Pro 7i 16 Gen 10
Intel Core Ultra 9 275HX, NVIDIA GeForce RTX 5080 Laptop
25.3 (20.9min, 19.5P1) fps -10%
Alienware 16 Area-51 Core Ultra 9 290HX Plus
Intel Core Ultra 9 290HX Plus, NVIDIA GeForce RTX 5080 Laptop
24.8 (20.5min, 18.9P1) fps -11%
3840x2160 Ray Tracing Overdrive Preset (no DLSS, no FG)
NVIDIA GeForce RTX 5090 Founders Edition
AMD Ryzen 7 9800X3D, NVIDIA GeForce RTX 5090
34.2 (30.4min) fps +157%
Razer Blade 16 Core Ultra 9 386H
Intel Core Ultra 9 386H, NVIDIA GeForce RTX 5090 Laptop
13.3 (11.3min, 10.9P1) fps
Przeciętny NVIDIA GeForce RTX 5090 Laptop
  (11.1 - 13.9, n=10)
13.2 fps -1%
Lenovo Legion Pro 7i 16 Gen 10
Intel Core Ultra 9 275HX, NVIDIA GeForce RTX 5080 Laptop
12 (9.92min, 9.15P1) fps -10%
Alienware 16 Area-51 Core Ultra 9 290HX Plus
Intel Core Ultra 9 290HX Plus, NVIDIA GeForce RTX 5080 Laptop
11.6 (9.32min, 8.79P1) fps -13%
3840x2160 Ray Tracing Ultra Preset (DLSS off, no Path Tracing)
Przeciętny NVIDIA GeForce RTX 5090 Laptop
  (23.1 - 26.1, n=9)
24.8 fps +7%
Razer Blade 16 2025 RTX 5090
AMD Ryzen AI 9 HX 370, NVIDIA GeForce RTX 5090 Laptop
23.4 (20.5min) fps +1%
Razer Blade 16 Core Ultra 9 386H
Intel Core Ultra 9 386H, NVIDIA GeForce RTX 5090 Laptop
23.1 (20.4min, 19P1) fps
Alienware 16 Area-51 Core Ultra 9 290HX Plus
Intel Core Ultra 9 290HX Plus, NVIDIA GeForce RTX 5080 Laptop
22.1 (19.4min, 18.4P1) fps -4%
Lenovo Legion Pro 7i 16 Gen 10
Intel Core Ultra 9 275HX, NVIDIA GeForce RTX 5080 Laptop
21.4 (19min, 5.52P1) fps -7%
Alienware x16 R2 P120F
Intel Core Ultra 9 185H, NVIDIA GeForce RTX 4080 Laptop GPU
16 (13.3min) fps -31%
Baldur's Gate 3
1920x1080 Ultra Preset AA:T
NVIDIA GeForce RTX 5090 Founders Edition
AMD Ryzen 7 9800X3D, NVIDIA GeForce RTX 5090
343 (73.3min, 152.6P0.1, 216P1) fps +70%
Lenovo Legion Pro 7i 16 Gen 10
Intel Core Ultra 9 275HX, NVIDIA GeForce RTX 5080 Laptop
211.5 fps +5%
Razer Blade 16 Core Ultra 9 386H
Intel Core Ultra 9 386H, NVIDIA GeForce RTX 5090 Laptop
202 (12.2min, 112.6P0.1, 152.7P1) fps
Przeciętny NVIDIA GeForce RTX 5090 Laptop
  (118.8 - 237, n=23)
193.3 fps -4%
Razer Blade 16 2025 RTX 5090
AMD Ryzen AI 9 HX 370, NVIDIA GeForce RTX 5090 Laptop
162 fps -20%
Alienware x16 R2 P120F
Intel Core Ultra 9 185H, NVIDIA GeForce RTX 4080 Laptop GPU
159.4 fps -21%
Schenker XMG APEX 16 MAX
AMD Ryzen 9 9955HX, NVIDIA GeForce RTX 5070 Ti Laptop
155.6 (107.2min, 130P0.1, 140P1) fps -23%
Lenovo Legion 7 16IAX10
Intel Core Ultra 7 255HX, NVIDIA GeForce RTX 5060 Laptop
111.2 fps -45%
Maingear ML-16 MK2
Intel Core Ultra 7 155H, NVIDIA GeForce RTX 4070 Laptop GPU
106.8 fps -47%
2560x1440 Ultra Preset + Quality DLSS
Przeciętny NVIDIA GeForce RTX 5090 Laptop
  (192 - 237, n=4)
208 fps +4%
Razer Blade 16 Core Ultra 9 386H
Intel Core Ultra 9 386H, NVIDIA GeForce RTX 5090 Laptop
199.8 (14.6min, 122P0.1, 150.7P1) fps
Lenovo Legion 7 16IAX10
Intel Core Ultra 7 255HX, NVIDIA GeForce RTX 5060 Laptop
119.1 fps -40%
2560x1440 Ultra Preset AA:T
NVIDIA GeForce RTX 5090 Founders Edition
AMD Ryzen 7 9800X3D, NVIDIA GeForce RTX 5090
277 (113.3min, 164.7P0.1, 212P1) fps +76%
Razer Blade 16 Core Ultra 9 386H
Intel Core Ultra 9 386H, NVIDIA GeForce RTX 5090 Laptop
157.3 (113.3min, 121.2P0.1, 137.3P1) fps
Lenovo Legion Pro 7i 16 Gen 10
Intel Core Ultra 9 275HX, NVIDIA GeForce RTX 5080 Laptop
155.8 fps -1%
Przeciętny NVIDIA GeForce RTX 5090 Laptop
  (103.1 - 174.8, n=24)
146.8 fps -7%
Razer Blade 16 2025 RTX 5090
AMD Ryzen AI 9 HX 370, NVIDIA GeForce RTX 5090 Laptop
138.8 fps -12%
Alienware x16 R2 P120F
Intel Core Ultra 9 185H, NVIDIA GeForce RTX 4080 Laptop GPU
124.3 fps -21%
Schenker XMG APEX 16 MAX
AMD Ryzen 9 9955HX, NVIDIA GeForce RTX 5070 Ti Laptop
110.5 (92.1min, 95.8P0.1, 99P1) fps -30%
Lenovo Legion 7 16IAX10
Intel Core Ultra 7 255HX, NVIDIA GeForce RTX 5060 Laptop
78.4 fps -50%
Maingear ML-16 MK2
Intel Core Ultra 7 155H, NVIDIA GeForce RTX 4070 Laptop GPU
70.6 fps -55%
3840x2160 Ultra Preset AA:T
NVIDIA GeForce RTX 5090 Founders Edition
AMD Ryzen 7 9800X3D, NVIDIA GeForce RTX 5090
172 (96.1min, 153.6P0.1, 157.7P1) fps +104%
Razer Blade 16 Core Ultra 9 386H
Intel Core Ultra 9 386H, NVIDIA GeForce RTX 5090 Laptop
84.5 (74.5min, 75.6P0.1, 76.5P1) fps
Przeciętny NVIDIA GeForce RTX 5090 Laptop
  (62.2 - 94, n=16)
82.8 fps -2%
Lenovo Legion Pro 7i 16 Gen 10
Intel Core Ultra 9 275HX, NVIDIA GeForce RTX 5080 Laptop
81.1 fps -4%
Razer Blade 16 2025 RTX 5090
AMD Ryzen AI 9 HX 370, NVIDIA GeForce RTX 5090 Laptop
79.1 fps -6%
Alienware x16 R2 P120F
Intel Core Ultra 9 185H, NVIDIA GeForce RTX 4080 Laptop GPU
65 fps -23%
3840x2160 Ultra Preset + Quality DLSS
NVIDIA GeForce RTX 5090 Founders Edition
AMD Ryzen 7 9800X3D, NVIDIA GeForce RTX 5090
245 (113.4min, 161P0.1, 221P1) fps +82%
Razer Blade 16 Core Ultra 9 386H
Intel Core Ultra 9 386H, NVIDIA GeForce RTX 5090 Laptop
134.9 (106.5min, 113P0.1, 123.8P1) fps
Lenovo Legion Pro 7i 16 Gen 10
Intel Core Ultra 9 275HX, NVIDIA GeForce RTX 5080 Laptop
132.4 fps -2%
Przeciętny NVIDIA GeForce RTX 5090 Laptop
  (124.2 - 149.3, n=10)
131.3 fps -3%
Razer Blade 16 2025 RTX 5090
AMD Ryzen AI 9 HX 370, NVIDIA GeForce RTX 5090 Laptop
124.2 fps -8%
Alienware x16 R2 P120F
Intel Core Ultra 9 185H, NVIDIA GeForce RTX 4080 Laptop GPU
104.4 fps -23%
Final Fantasy XV Benchmark
1920x1080 High Quality
NVIDIA GeForce RTX 5090 Founders Edition
AMD Ryzen 7 9800X3D, NVIDIA GeForce RTX 5090
234 fps +33%
Lenovo Legion Pro 7i 16 Gen 10
Intel Core Ultra 9 275HX, NVIDIA GeForce RTX 5080 Laptop
210 fps +20%
Alienware 16 Area-51 Core Ultra 9 290HX Plus
Intel Core Ultra 9 290HX Plus, NVIDIA GeForce RTX 5080 Laptop
201 fps +15%
Przeciętny NVIDIA GeForce RTX 5090 Laptop
  (144.4 - 215, n=21)
192 fps +9%
Lenovo Legion 9 16IRX8
Intel Core i9-13980HX, NVIDIA GeForce RTX 4090 Laptop GPU
181.3 fps +3%
Razer Blade 16 Core Ultra 9 386H
Intel Core Ultra 9 386H, NVIDIA GeForce RTX 5090 Laptop
175.5 fps
Schenker XMG APEX 16 MAX
AMD Ryzen 9 9955HX, NVIDIA GeForce RTX 5070 Ti Laptop
158.2 fps -10%
Razer Blade 16 2025 RTX 5090
AMD Ryzen AI 9 HX 370, NVIDIA GeForce RTX 5090 Laptop
147.4 fps -16%
Alienware x16 R2 P120F
Intel Core Ultra 9 185H, NVIDIA GeForce RTX 4080 Laptop GPU
139.8 fps -20%
Lenovo Legion 7 16IAX10
Intel Core Ultra 7 255HX, NVIDIA GeForce RTX 5060 Laptop
133.6 fps -24%
Maingear ML-16 MK2
Intel Core Ultra 7 155H, NVIDIA GeForce RTX 4070 Laptop GPU
110.6 fps -37%
2560x1440 High Quality
NVIDIA GeForce RTX 5090 Founders Edition
AMD Ryzen 7 9800X3D, NVIDIA GeForce RTX 5090
234 fps +52%
Lenovo Legion Pro 7i 16 Gen 10
Intel Core Ultra 9 275HX, NVIDIA GeForce RTX 5080 Laptop
173.1 fps +12%
Przeciętny NVIDIA GeForce RTX 5090 Laptop
  (123.4 - 184.3, n=23)
163.7 fps +6%
Lenovo Legion 9 16IRX8
Intel Core i9-13980HX, NVIDIA GeForce RTX 4090 Laptop GPU
158.4 fps +3%
Alienware 16 Area-51 Core Ultra 9 290HX Plus
Intel Core Ultra 9 290HX Plus, NVIDIA GeForce RTX 5080 Laptop
157.5 fps +2%
Razer Blade 16 Core Ultra 9 386H
Intel Core Ultra 9 386H, NVIDIA GeForce RTX 5090 Laptop
154.1 fps
Razer Blade 16 2025 RTX 5090
AMD Ryzen AI 9 HX 370, NVIDIA GeForce RTX 5090 Laptop
139.5 fps -9%
Schenker XMG APEX 16 MAX
AMD Ryzen 9 9955HX, NVIDIA GeForce RTX 5070 Ti Laptop
121.8 fps -21%
Alienware x16 R2 P120F
Intel Core Ultra 9 185H, NVIDIA GeForce RTX 4080 Laptop GPU
120.8 fps -22%
Lenovo Legion 7 16IAX10
Intel Core Ultra 7 255HX, NVIDIA GeForce RTX 5060 Laptop
95.8 fps -38%
Maingear ML-16 MK2
Intel Core Ultra 7 155H, NVIDIA GeForce RTX 4070 Laptop GPU
80 fps -48%
3840x2160 High Quality
NVIDIA GeForce RTX 5090 Founders Edition
AMD Ryzen 7 9800X3D, NVIDIA GeForce RTX 5090
198.8 fps +108%
Przeciętny NVIDIA GeForce RTX 5090 Laptop
  (83.4 - 111.8, n=15)
102.6 fps +7%
Lenovo Legion Pro 7i 16 Gen 10
Intel Core Ultra 9 275HX, NVIDIA GeForce RTX 5080 Laptop
101.3 fps +6%
Razer Blade 16 2025 RTX 5090
AMD Ryzen AI 9 HX 370, NVIDIA GeForce RTX 5090 Laptop
96.8 fps +1%
Razer Blade 16 Core Ultra 9 386H
Intel Core Ultra 9 386H, NVIDIA GeForce RTX 5090 Laptop
95.5 fps
Alienware 16 Area-51 Core Ultra 9 290HX Plus
Intel Core Ultra 9 290HX Plus, NVIDIA GeForce RTX 5080 Laptop
93.6 fps -2%
Alienware x16 R2 P120F
Intel Core Ultra 9 185H, NVIDIA GeForce RTX 4080 Laptop GPU
70.2 fps -26%

Cyberpunk 2077 ultra FPS Chart

05101520253035404550556065707580859095100105110115120125130Tooltip
Razer Blade 16 Core Ultra 9 386H Ultra 9 386H, GeForce RTX 5090 Laptop: Ø130.2 (113.3-134)
Razer Blade 16 2025 RTX 5090 Ryzen AI 9 HX 370, GeForce RTX 5090 Laptop: Ø107.9 (97.6-110.3)
lowmed.highultraQHD DLSSQHD4K DLSS4K
GTA V (2015) 162.5 170.5 156.2 102.9 62.7 178.6
Dota 2 Reborn (2015) 189.5 169.1 162.3 153.8 147.6
Final Fantasy XV Benchmark (2018) 222 218 175.5 154.1 95.5
X-Plane 11.11 (2018) 121.8 120 98.5 84.6
Strange Brigade (2018) 504 374 353 326 310 174.9
Baldur's Gate 3 (2023) 183.2 177.5 195.5 202 199.8 157.3 134.9 84.5
Cyberpunk 2077 (2023) 161.6 159.5 149.4 139.5 116.6 105.8 60.9 50.9
F1 24 (2024) 254 247 258 132.3 132.8 94.7 81 48.4
Black Myth: Wukong (2024) 97 57 64 43 45 26
Assassin's Creed Shadows (2025) 86 67 66 56 53 42

Emisje

Hałas systemowy

Hałas i zachowanie wentylatorów nie zmieniły się zauważalnie w porównaniu do zeszłorocznej wersji AMD, jeśli w ogóle, pomimo nieco szybszej wydajności w grach wspomnianej powyżej. Podczas gry w Cyberpunk 2077 średnia głośność wentylatorów wynosi 53,6 dB(A), 49,7 dB(A) i 45 dB(A), odpowiednio w trybach Performance, Balanced i Quiet.
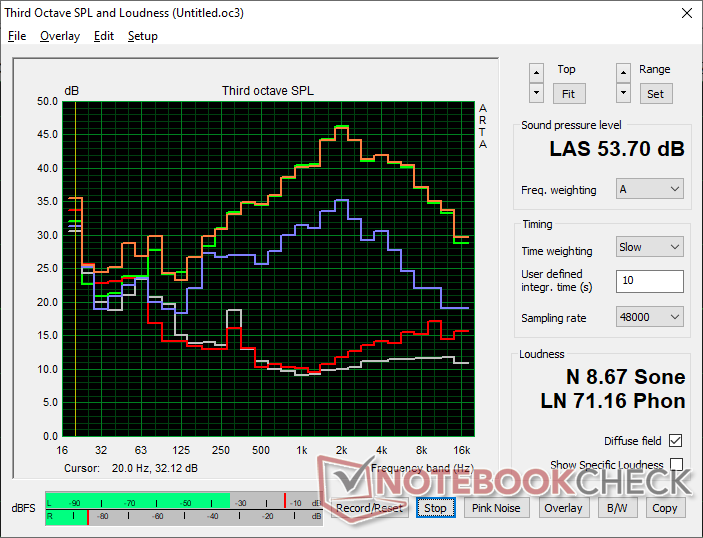
Profil hałasu wentylatora (Biały: Tło, Czerwony: System w stanie bezczynności, Niebieski: Zużycie 3DMark 06, Pomarańczowy: Cyberpunk 2077, Zielony: Prime95+FurMark stress)

Hałas

luz
23.4 / 25.4 / 29.3 dB
obciążenie
42.6 / 53.7 dB
  red to green bar
 
 
30 dB
cichy
40 dB(A)
słyszalny
50 dB(A)
irytujący
 
min: dark, med: mid, max: light   Earthworks M23R, Arta (odległość 15 cm)   hałas otoczenia: 23.1 dB(A)
dB(A) 0102030405060708090Deep BassMiddle BassHigh BassLower RangeMidsHigher MidsLower HighsMid HighsUpper HighsSuper Highs2035.631.333.730.632.12525.625.225.624.322.73124.51922.82020.84025.320.923.118.821.35028.822.623.621.123.96326.923.523.723.423.98029.92016.920.827.810024.41914.219.724.212523.418.414.215.124.516026.722.113.513.926.720029.827.4131428.42503126.71313.53131533.12716.218.933.440034.927.113.11334.850034.625.710.311.234.46303627.610.810.135.880038.73010.29.838.6100040.131.510.19.240.4125040.431.19.59.340.7160044.233.610.79.844.420004635.311.910.146.3250044.132.412.710.444.2315041.329.213.611.24140004230.714.111.241.950004127.813.911.540.8630040.424.615.611.540.2800037.122.115.211.63710000352217.211.734.81250033.819.114.511.733.31600029.719.115.710.828.8SPL53.642.625.423.353.7N8.73.90.60.58.7median 36median 27.1median 13.5median 11.5median 35.8Delta5.142.21.95hearing rangehide median Fan NoiseRazer Blade 16 Core Ultra 9 386H
Razer Blade 16 Core Ultra 9 386H
Ultra 9 386H, GeForce RTX 5090 Laptop
Razer Blade 16 2025 RTX 5090
Ryzen AI 9 HX 370, GeForce RTX 5090 Laptop
Alienware 16 Area-51 Core Ultra 9 290HX Plus
Ultra 9 290HX Plus, GeForce RTX 5080 Laptop
Lenovo Legion Pro 7i 16 Gen 10
Ultra 9 275HX, GeForce RTX 5080 Laptop
HP Omen Max 16 ah000
Ultra 9 275HX, GeForce RTX 5090 Laptop
MSI Crosshair 16 HX AI D2XWGKG
Ultra 9 275HX, GeForce RTX 5070 Laptop
Noise
-4%
4%
8%
-9%
-11%
wyłączone / środowisko * (dB)
23.1
24.1
-4%
23.1
-0%
22.9
1%
22.8
1%
25.56
-11%
Idle Minimum * (dB)
23.4
24.1
-3%
23.2
1%
22.9
2%
29
-24%
28.3
-21%
Idle Average * (dB)
25.4
30.6
-20%
28.2
-11%
22.9
10%
29
-14%
28.3
-11%
Idle Maximum * (dB)
29.3
30.6
-4%
28.3
3%
26.3
10%
29
1%
28.3
3%
Load Average * (dB)
42.6
45.5
-7%
28.8
32%
27.8
35%
47.7
-12%
50.26
-18%
Cyberpunk 2077 ultra * (dB)
53.6
48.2
10%
49
9%
54.2
-1%
54.8
-2%
57.8
-8%
Load Maximum * (dB)
53.7
53.4
1%
57.1
-6%
53.9
-0%
61.1
-14%
57.95
-8%

* ... im mniej tym lepiej

Temperatura

Tylny układ wydechowy
Zasilacz AC osiąga ponad 46 C podczas pracy z wymagającymi obciążeniami
 41.4 °C45.6 °C41.8 °C 
 28.8 °C41.4 °C35.2 °C 
 27.8 °C34.6 °C31.8 °C 
maks. w ogóle: 45.6 °C
średnia: 36.5 °C
39.2 °C46.8 °C36.4 °C
41.8 °C47 °C38.2 °C
32.8 °C33.4 °C29.8 °C
maks. w ogóle: 47 °C
średnia: 38.4 °C
zasilacz  45 °C | temperatura otoczenia 20 °C | Fluke 62 Mini IR Thermometer
(±) Średnia temperatura górnej części przy maksymalnym obciążeniu wynosi 36.5 °C / 98 F, w porównaniu do średniej 33.9 °C / ###class_avg_f# ## F dla urządzeń w klasie Gaming.
(-) Maksymalna temperatura w górnej części wynosi 45.6 °C / 114 F, w porównaniu do średniej 40.4 °C / 105 F , począwszy od 21.2 do 68.8 °C dla klasy Gaming.
(-) Dno nagrzewa się maksymalnie do 47 °C / 117 F, w porównaniu do średniej 43.2 °C / 110 F
(+) W stanie bezczynności średnia temperatura górnej części wynosi 30.2 °C / 86 F, w porównaniu ze średnią temperaturą urządzenia wynoszącą 33.9 °C / ### class_avg_f### F.
(±) 3: The average temperature for the upper side is 34.5 °C / 94 F, compared to the average of 33.9 °C / 93 F for the class Gaming.
(+) Podparcia dłoni i touchpad osiągają maksymalną temperaturę skóry (34.6 °C / 94.3 F) i dlatego nie są gorące.
(-) Średnia temperatura obszaru podparcia dłoni w podobnych urządzeniach wynosiła 28.8 °C / 83.8 F (-5.8 °C / -10.5 F).
System bezczynny (pokrywa C)
System bezczynny (pokrywa D)
Cyberpunk 2077 stres (okładka C)
Cyberpunk 2077 stres (okładka D)
Prime95+FurMark stress (okładka C)
Prime95+FurMark stres (okładka D)
Razer Blade 16 Core Ultra 9 386H
Ultra 9 386H, GeForce RTX 5090 Laptop
Razer Blade 16 2025 RTX 5090
Ryzen AI 9 HX 370, GeForce RTX 5090 Laptop
Alienware 16 Area-51 Core Ultra 9 290HX Plus
Ultra 9 290HX Plus, GeForce RTX 5080 Laptop
Lenovo Legion Pro 7i 16 Gen 10
Ultra 9 275HX, GeForce RTX 5080 Laptop
HP Omen Max 16 ah000
Ultra 9 275HX, GeForce RTX 5090 Laptop
MSI Crosshair 16 HX AI D2XWGKG
Ultra 9 275HX, GeForce RTX 5070 Laptop
Heat
5%
13%
10%
13%
11%
Maximum Upper Side * (°C)
45.6
48.3
-6%
45.2
1%
42.6
7%
42.8
6%
44.8
2%
Maximum Bottom * (°C)
47
53.3
-13%
37.4
20%
41.2
12%
50.2
-7%
43.4
8%
Idle Upper Side * (°C)
35.2
28.3
20%
31.6
10%
32.6
7%
27.6
22%
31.2
11%
Idle Bottom * (°C)
37.6
30.3
19%
30.2
20%
32.4
14%
26.2
30%
28.8
23%

* ... im mniej tym lepiej

Test warunków skrajnych

Procesor zwiększał taktowanie do 3,2 GHz i 81 W podczas inicjowania stresu Prime95, zanim osiągnął 91 C około 60 sekund później. Następnie spadał on do 2,8 GHz i 56 W, aby utrzymać łatwiejszą do opanowania temperaturę rdzenia na poziomie 74 C.

Podczas uruchamiania Cyberpunk 2077, GPU ustabilizowałoby się na poziomie 142 W, 115 W i 90 W, odpowiednio w trybach Wydajność, Zrównoważony i Cichy. Ogólne temperatury rdzenia są o kilka stopni C niższe w porównaniu do konfiguracji Ryzen AI 9 HX 370 z 2025 roku.
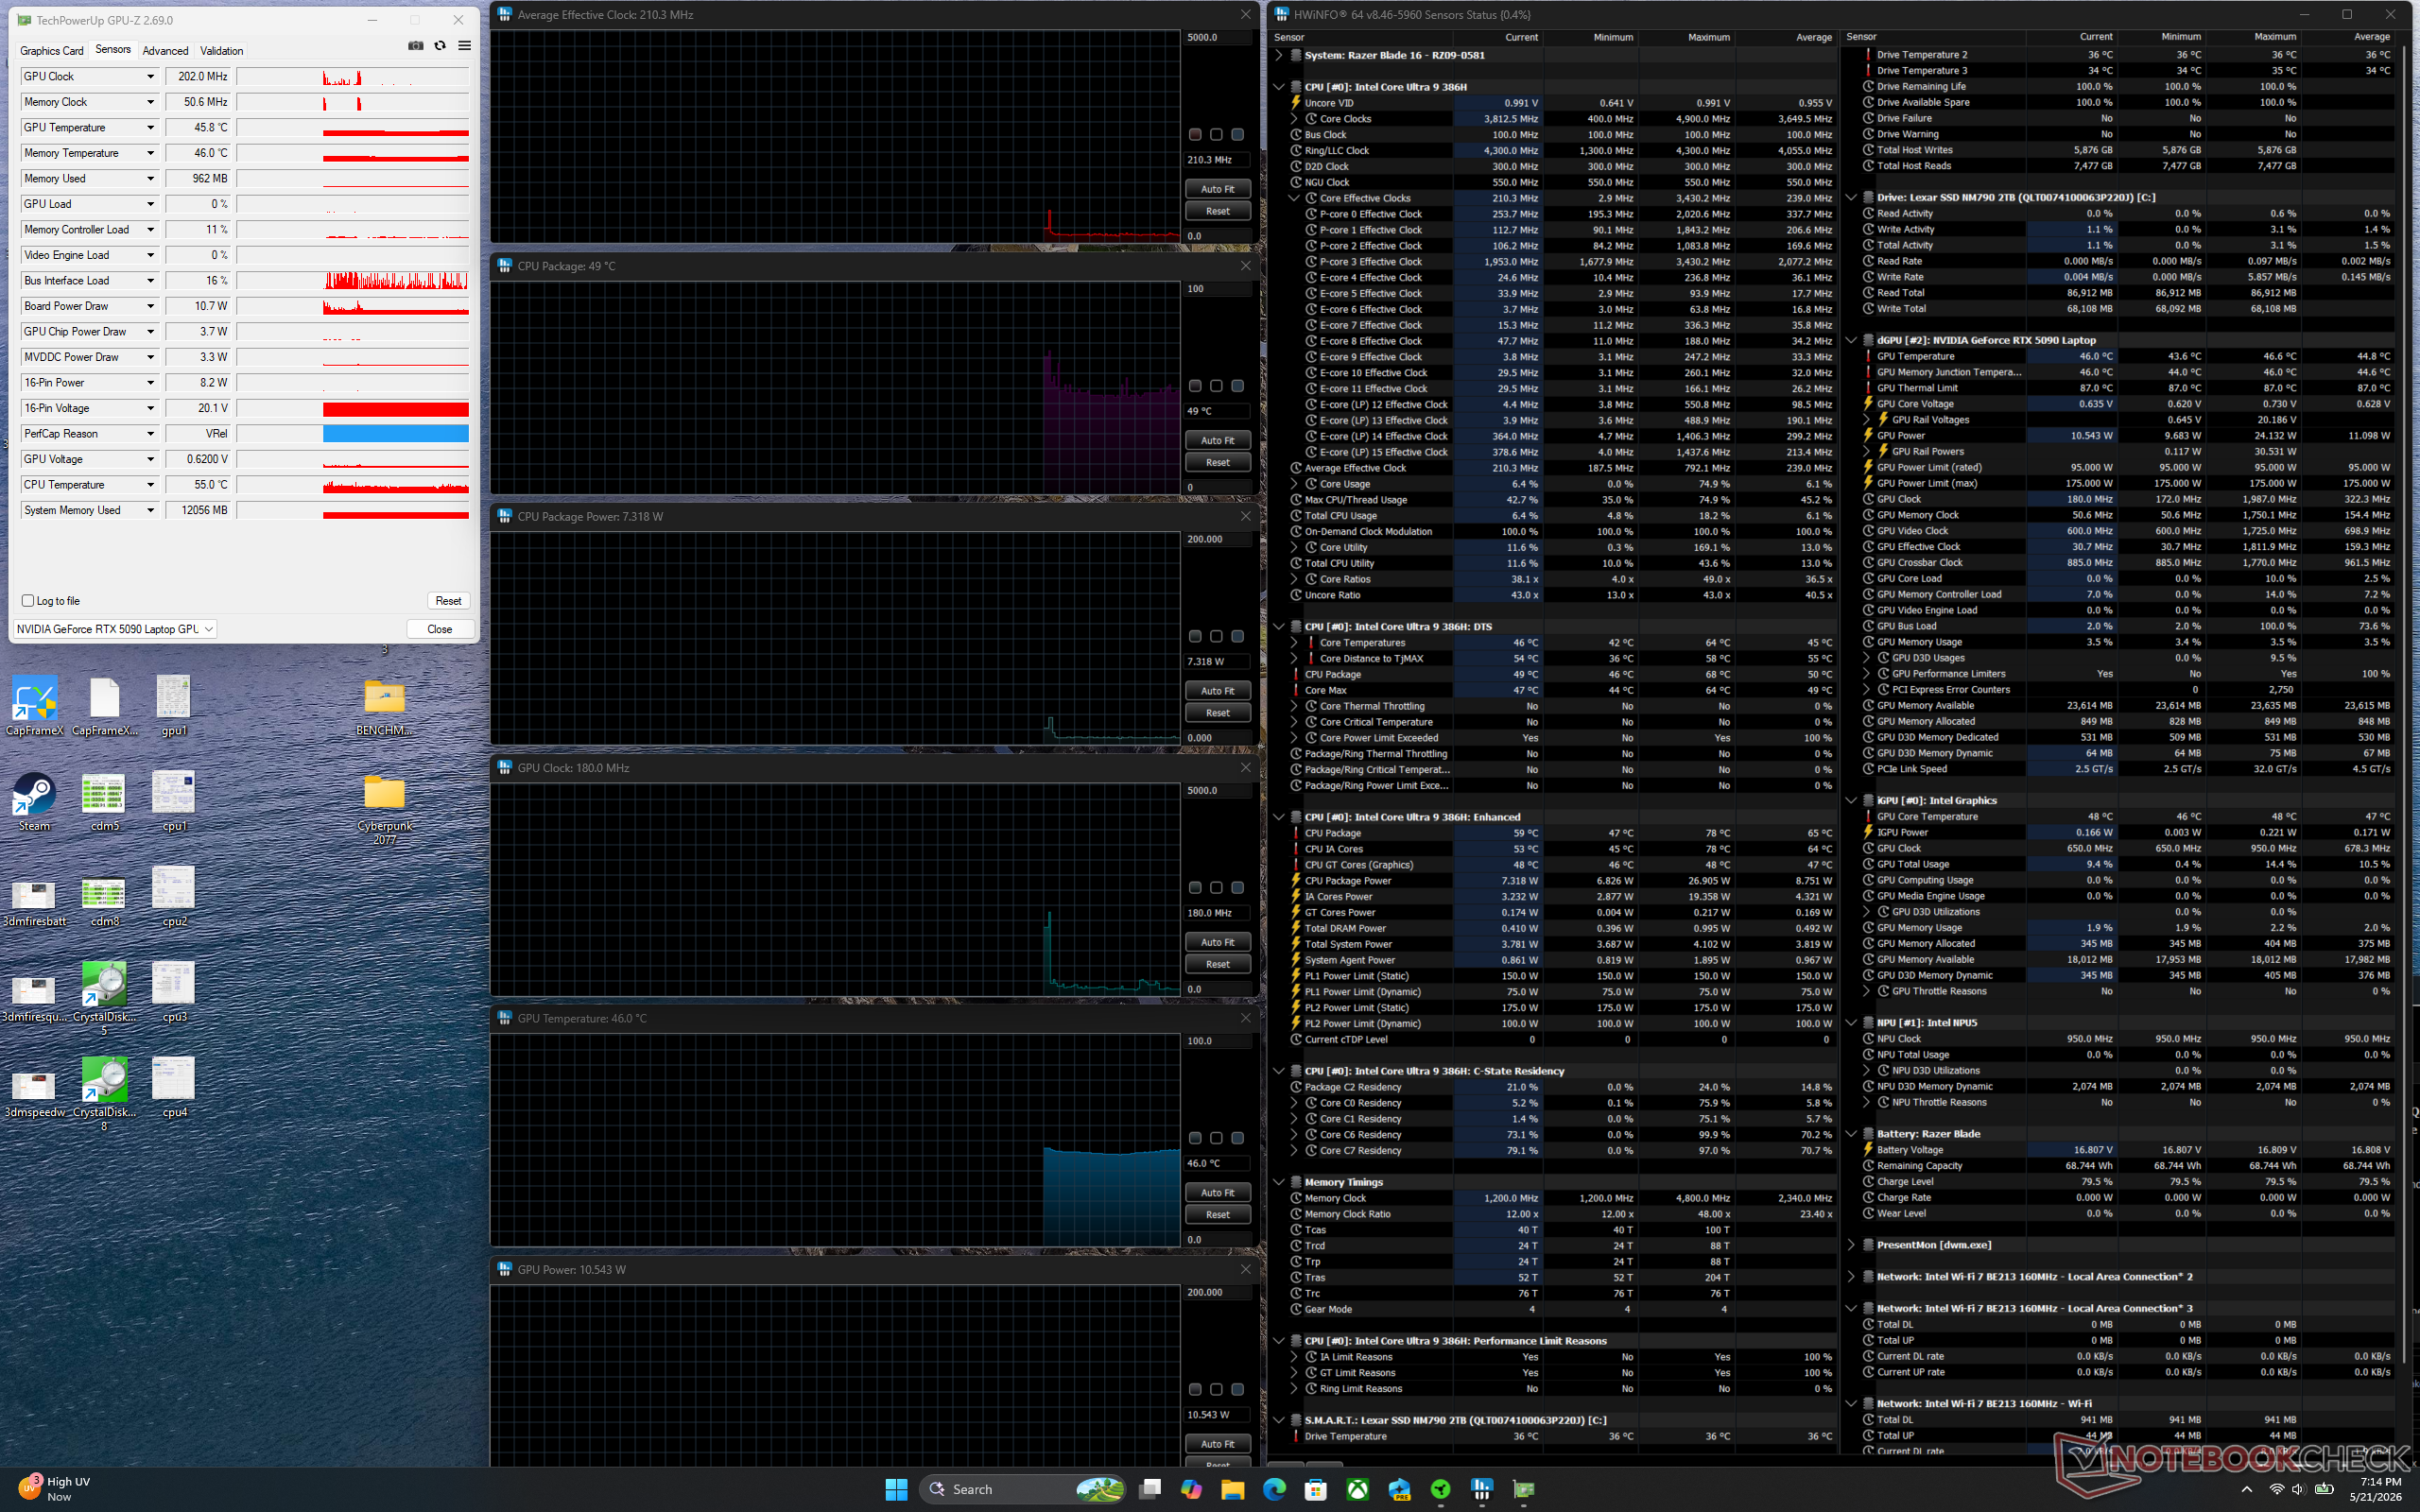
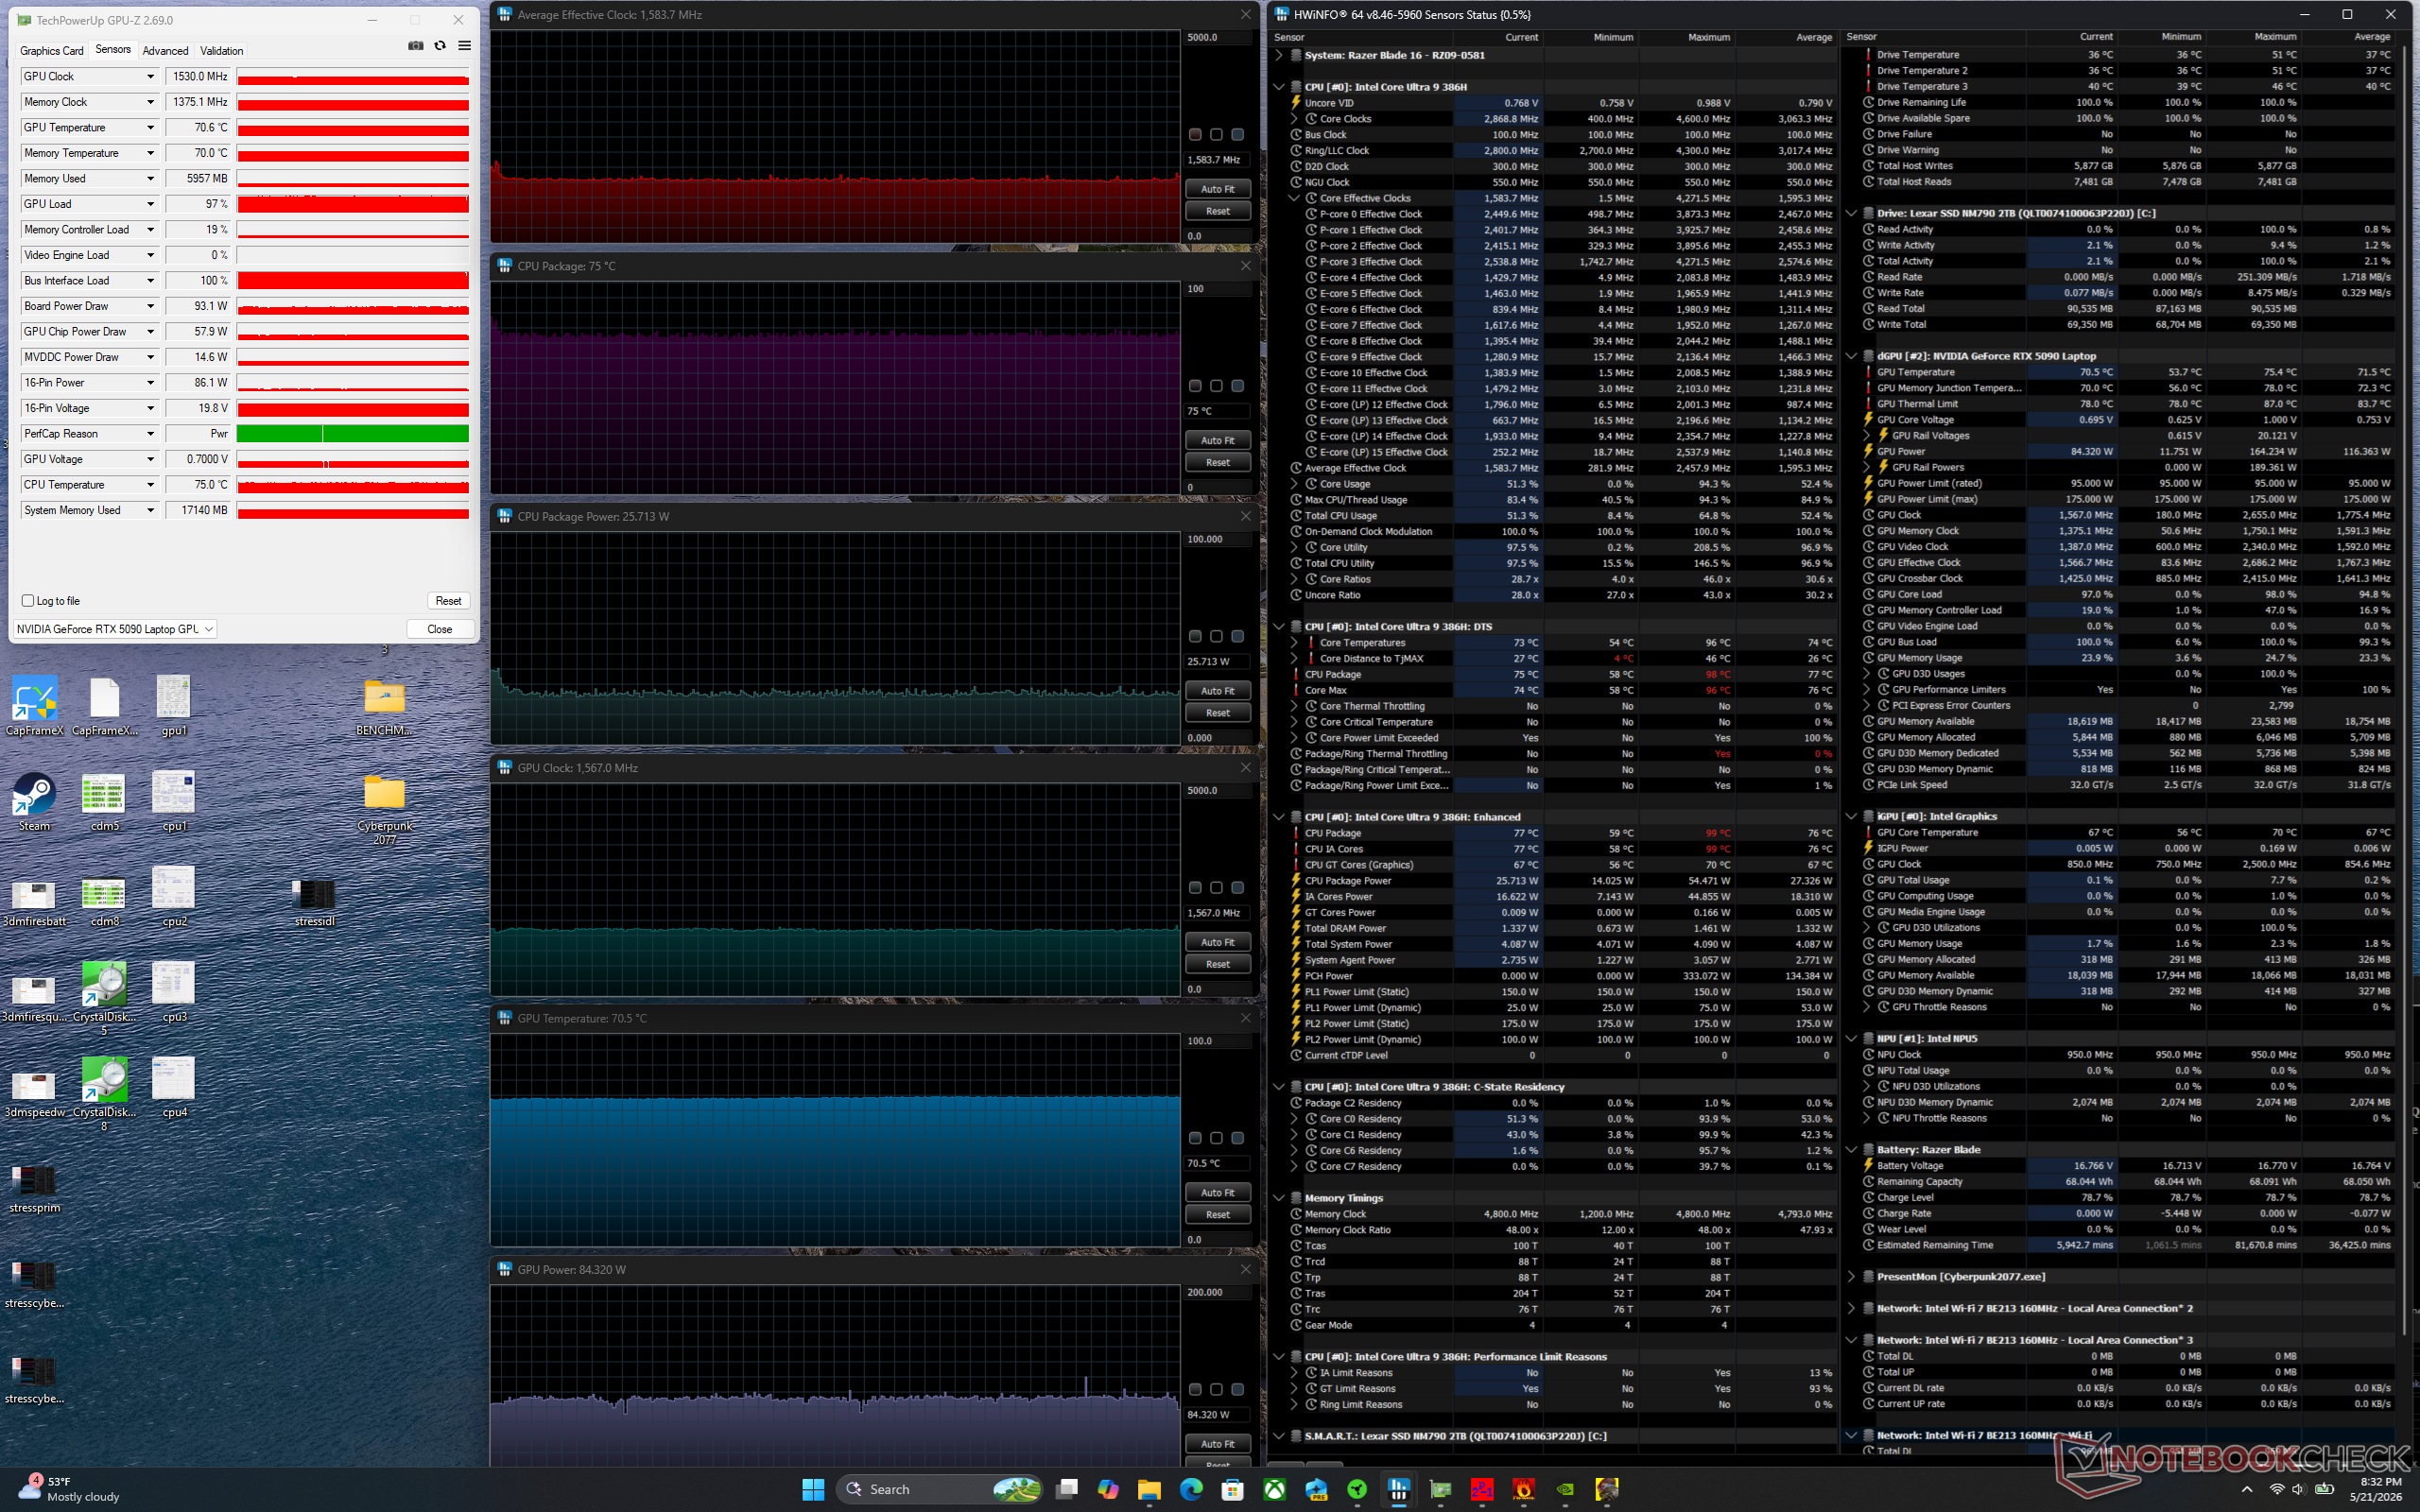
System bezczynny
System bezczynny
Cyberpunk 2077 stres (tryb cichy)
Stres Prime95
Stres Prime95
Cyberpunk 2077 stres (tryb zrównoważony)
Stres Prime95+FurMark
Cyberpunk 2077 stres (tryb wydajności)
Średnie taktowanieCPU (GHz) Taktowanie GPU (MHz) Średnia temperatura CPU (°C) Średnia temperatura GPU (°C)
System w stanie spoczynku -- -- 49 46
Prime95 Stress 2.8 -- 74 51
Prime95 + FurMark Stress 2.6 1635 89 75
Cyberpunk 2077 Stres (tryb cichy) 1.6 1567 75 71
Cyberpunk 2077 Stress (tryb zrównoważony) 1.5 1762 74 71
Cyberpunk 2077 Stress (tryb wydajności) 1.7 2032 80 75

Głośniki

Szeroka krzywa różowego szumu reprezentuje dobry balans i bas w stosunku do rozmiaru
dB(A) 0102030405060708090Deep BassMiddle BassHigh BassLower RangeMidsHigher MidsLower HighsMid HighsUpper HighsSuper Highs2027.833.727.82523.225.623.23120.622.820.6402123.1215027.423.627.46337.423.737.48045.616.945.610049.914.249.912555.314.255.316060.813.560.820063.81363.825066.31366.331568.716.268.740070.713.170.750068.510.368.563070.110.870.180072.210.272.2100071.910.171.9125071.79.571.716007210.772200070.211.970.2250070.412.770.4315066.313.666.3400071.214.171.2500069.413.969.4630066.115.666.1800060.915.260.91000064.517.264.51250065.714.565.71600064.615.764.6SPL81.925.481.9N56.70.656.7median 68.5median 13.5median 68.5Delta3.42.23.426.325.821.422.12624.925.127.622.532.523.448.72655.818.860.922.167.2267019.372.317.674.217.774.319.575.31571.711.871.311.27410.574.21072.710.17210.67210.97511.374.811.671.71269.71269.612.371.112.669.61270.111.269.824.784.70.666.6median 12median 71.73.42.2hearing rangehide median Pink NoiseRazer Blade 16 Core Ultra 9 386HApple MacBook Pro 16 2021 M1 Pro
Wykres częstotliwości (pola wyboru można zaznaczyć i odznaczyć, aby porównać urządzenia)
Razer Blade 16 Core Ultra 9 386H analiza dźwięku

(±) | głośność głośnika jest średnia, ale dobra (81.9 dB)
Bas 100 - 315 Hz
(±) | zredukowany bas - średnio 7.8% niższy od mediany
(±) | liniowość basu jest średnia (7% delta do poprzedniej częstotliwości)
Średnie 400 - 2000 Hz
(+) | zbalansowane środki średnie - tylko 2.4% od mediany
(+) | średnie są liniowe (2.4% delta do poprzedniej częstotliwości)
Wysokie 2–16 kHz
(+) | zrównoważone maksima - tylko 3.1% od mediany
(+) | wzloty są liniowe (6% delta do poprzedniej częstotliwości)
Ogólnie 100 - 16.000 Hz
(+) | ogólny dźwięk jest liniowy (8.7% różnicy w stosunku do mediany)
W porównaniu do tej samej klasy
» 2% wszystkich testowanych urządzeń w tej klasie było lepszych, 1% podobnych, 97% gorszych
» Najlepszy miał deltę 6%, średnia wynosiła ###średnia###%, najgorsza wynosiła 132%
W porównaniu do wszystkich testowanych urządzeń
» 3% wszystkich testowanych urządzeń było lepszych, 1% podobnych, 97% gorszych
» Najlepszy miał deltę 4%, średnia wynosiła ###średnia###%, najgorsza wynosiła 134%

Apple MacBook Pro 16 2021 M1 Pro analiza dźwięku

(+) | głośniki mogą odtwarzać stosunkowo głośno (84.7 dB)
Bas 100 - 315 Hz
(+) | dobry bas - tylko 3.8% od mediany
(+) | bas jest liniowy (5.2% delta do poprzedniej częstotliwości)
Średnie 400 - 2000 Hz
(+) | zbalansowane środki średnie - tylko 1.3% od mediany
(+) | średnie są liniowe (2.1% delta do poprzedniej częstotliwości)
Wysokie 2–16 kHz
(+) | zrównoważone maksima - tylko 1.9% od mediany
(+) | wzloty są liniowe (2.7% delta do poprzedniej częstotliwości)
Ogólnie 100 - 16.000 Hz
(+) | ogólny dźwięk jest liniowy (4.6% różnicy w stosunku do mediany)
W porównaniu do tej samej klasy
» 0% wszystkich testowanych urządzeń w tej klasie było lepszych, 0% podobnych, 100% gorszych
» Najlepszy miał deltę 5%, średnia wynosiła ###średnia###%, najgorsza wynosiła 45%
W porównaniu do wszystkich testowanych urządzeń
» 0% wszystkich testowanych urządzeń było lepszych, 0% podobnych, 100% gorszych
» Najlepszy miał deltę 4%, średnia wynosiła ###średnia###%, najgorsza wynosiła 134%

Zarządzanie energią

Zużycie energii

Zużycie energii na biegu jałowym na komputerze stacjonarnym może wynosić nawet 4,4 W, co jest zauważalnie niższe niż w przypadku zasilanego przez AMD Blade 16. W przeciwnym razie zużycie energii może być wyższe w grach o ponad 20 W lub 30 W, co jest zgodne z ogólnie szybszą liczbą klatek na sekundę.
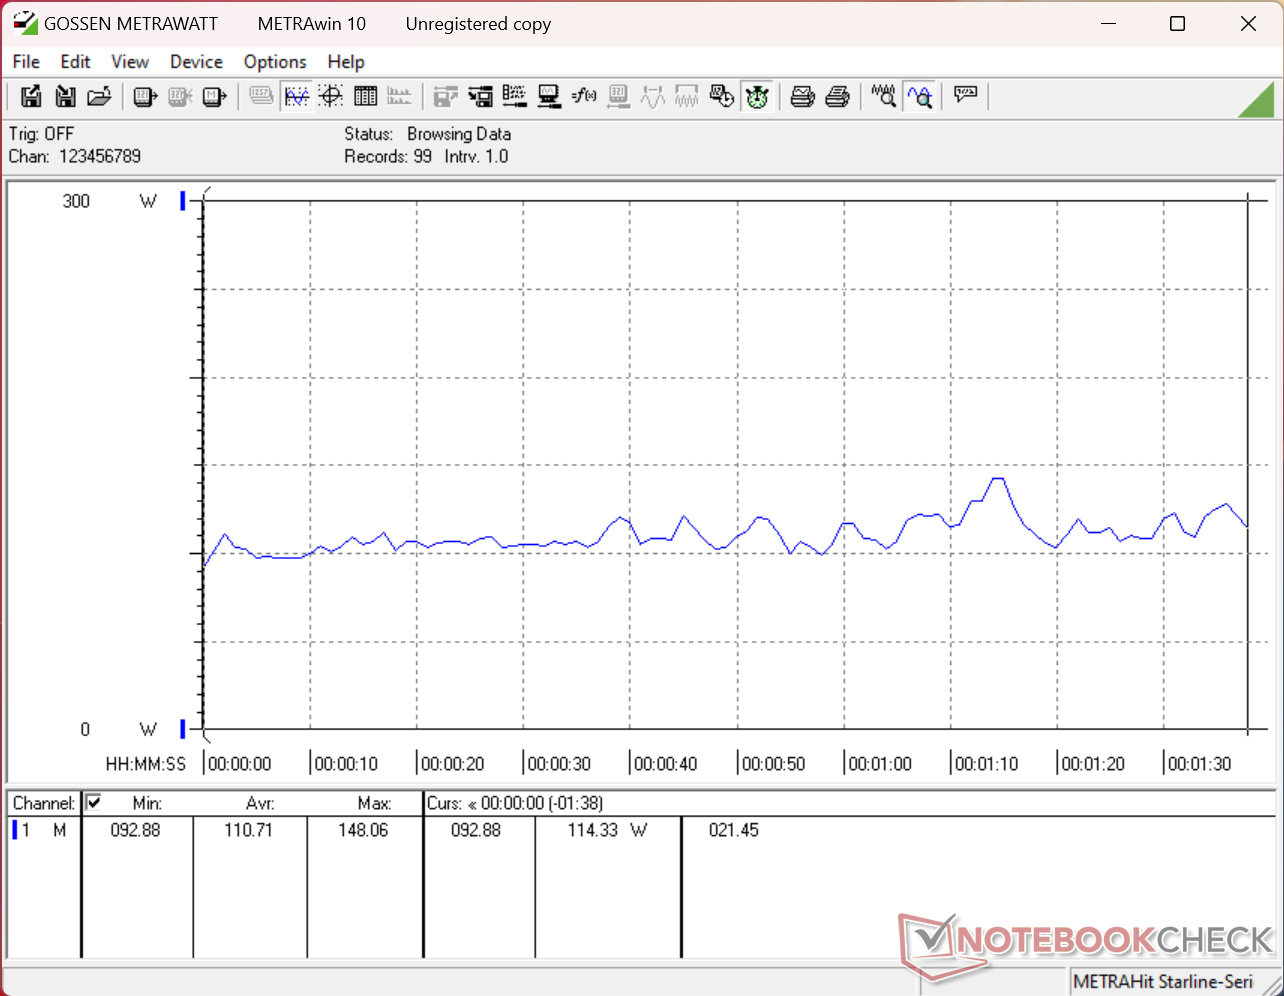
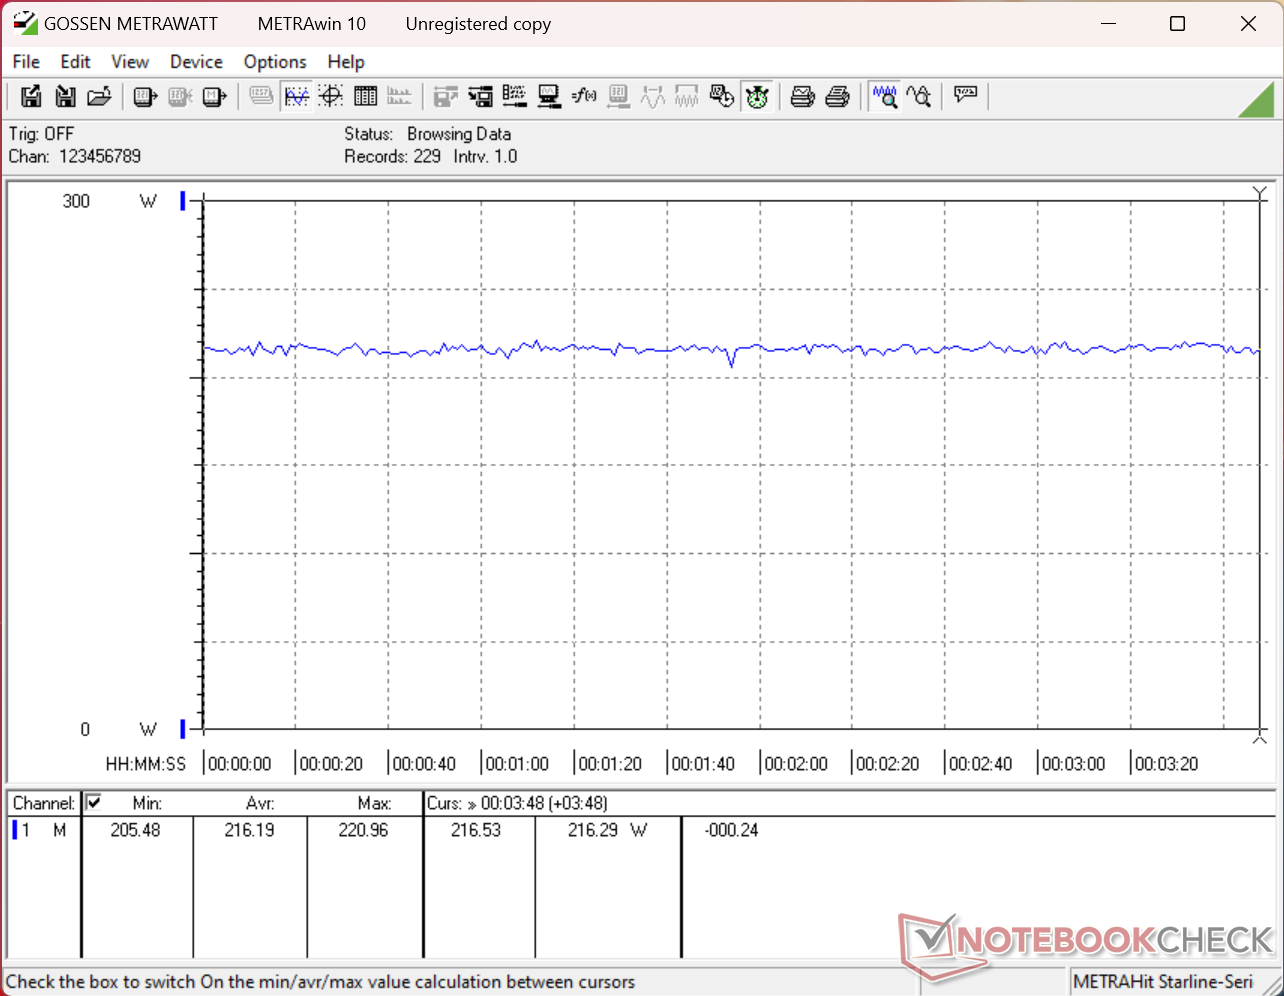
zużycie 3DMark 06
zużycie 3DMark 06
Cyberpunk 2077 1080p Ultra zużycie
Zużycie energii wzrosło do 134 W podczas inicjowania stresu Prime95, a następnie spadło do 93 W około 60 sekund później z powodu ograniczonego potencjału Turbo Boost
Prime95+FurMark stres zainicjowany w 10s mark
Pobór mocy
wyłączony / stan wstrzymaniadarklight 0.04 / 3.1 W
luzdarkmidlight 4.4 / 22.3 / 30.4 W
obciążenie midlight 110.7 / 251.3 W
 color bar
Legenda: min: dark, med: mid, max: light        Metrahit Energy
Razer Blade 16 Core Ultra 9 386H
Ultra 9 386H, GeForce RTX 5090 Laptop, Lexar NM790 2TB, OLED, 2560x1600, 16"
Razer Blade 16 2025 RTX 5090
Ryzen AI 9 HX 370, GeForce RTX 5090 Laptop, SSSTC CA6-8D2048, OLED, 2560x1600, 16"
Alienware 16 Area-51 Core Ultra 9 290HX Plus
Ultra 9 290HX Plus, GeForce RTX 5080 Laptop, SK hynix PCB01 HFS001TFM9X186N, OLED, 2560x1600, 16"
Lenovo Legion Pro 7i 16 Gen 10
Ultra 9 275HX, GeForce RTX 5080 Laptop, SK Hynix HFS001TEJ9X115N, OLED, 2560x1600, 16"
HP Omen Max 16 ah000
Ultra 9 275HX, GeForce RTX 5090 Laptop, WDC PC SN810 2TB, OLED, 2560x1600, 16"
MSI Crosshair 16 HX AI D2XWGKG
Ultra 9 275HX, GeForce RTX 5070 Laptop, Micron 2500 1TB MTFDKBA1T0QGN, IPS, 2560x1600, 16"
Power Consumption
-4%
-96%
-120%
-36%
-84%
Idle Minimum * (Watt)
4.4
10.9
-148%
23.9
-443%
28.5
-548%
9.9
-125%
26.2
-495%
Idle Average * (Watt)
22.3
13.5
39%
25.2
-13%
38.8
-74%
28.6
-28%
33.8
-52%
Idle Maximum * (Watt)
30.4
13.7
55%
49.6
-63%
45.6
-50%
47.1
-55%
34
-12%
Load Average * (Watt)
110.7
120.2
-9%
141.2
-28%
132.2
-19%
141.8
-28%
112
-1%
Cyberpunk 2077 ultra * (Watt)
216
178.2
17%
298
-38%
318
-47%
253
-17%
224
-4%
Cyberpunk 2077 ultra external monitor * (Watt)
216
177.6
18%
297
-38%
319
-48%
230
-6%
220
-2%
Load Maximum * (Watt)
251.3
246.1
2%
372.8
-48%
384
-53%
233
7%
315
-25%

* ... im mniej tym lepiej

Pobór mocy Cyberpunk / Test warunków skrajnych

0102030405060708090100110120130140150160170180190200210220230240250Tooltip
Razer Blade 16 Core Ultra 9 386H Ultra 9 386H, GeForce RTX 5090 Laptop; 1280x720 Prime95 28.10 and Furmark 1.25: Ø161.4 (125.9-251)
Razer Blade 16 2025 RTX 5090 Ryzen AI 9 HX 370, GeForce RTX 5090 Laptop; 1280x720 Prime95 28.10 and Furmark 1.25: Ø225 (215-246)
Razer Blade 16 Core Ultra 9 386H Ultra 9 386H, GeForce RTX 5090 Laptop; Idle 150cd/m2: Ø5.15 (0.0006-6.38)
Razer Blade 16 2025 RTX 5090 Ryzen AI 9 HX 370, GeForce RTX 5090 Laptop; Idle 150cd/m2: Ø12.8 (7.68-16.5)
Razer Blade 16 Core Ultra 9 386H Ultra 9 386H, GeForce RTX 5090 Laptop; Cyberpunk 2077 FHD ultra no FSR 150cd: Ø216 (205-221)
Razer Blade 16 2025 RTX 5090 Ryzen AI 9 HX 370, GeForce RTX 5090 Laptop; Cyberpunk 2077 FHD ultra no FSR 150cd: Ø178.2 (174.3-182.6)

Zużycie energii przez monitor zewnętrzny

05101520253035404550556065707580859095100105110115120125130135140145150155160165170175180185190195200205210215220Tooltip
Razer Blade 16 Core Ultra 9 386H Ultra 9 386H, GeForce RTX 5090 Laptop; Prime95 V2810 Stress (external Monitor): Ø104.6 (91.3-134.1)
Razer Blade 16 2025 RTX 5090 Ryzen AI 9 HX 370, GeForce RTX 5090 Laptop; Prime95 V2810 Stress (external Monitor): Ø100.6 (97.6-122.6)
Razer Blade 16 Core Ultra 9 386H Ultra 9 386H, GeForce RTX 5090 Laptop; Cinebench R15 Multi (external Monitor): Ø104.8 (103.4-105.8)
Razer Blade 16 2025 RTX 5090 Ryzen AI 9 HX 370, GeForce RTX 5090 Laptop; Cinebench R15 Multi (external Monitor): Ø130.3 (107.6-145.5)
Razer Blade 16 Core Ultra 9 386H Ultra 9 386H, GeForce RTX 5090 Laptop; Cinebench R23 Single (external Monitor): Ø37.6 (33.6-74.9)
Razer Blade 16 2025 RTX 5090 Ryzen AI 9 HX 370, GeForce RTX 5090 Laptop; Cinebench R23 Single (external Monitor): Ø31.8 (27.3-73.9)
Razer Blade 16 Core Ultra 9 386H Ultra 9 386H, GeForce RTX 5090 Laptop; Cinebench R23 Multi (external Monitor): Ø120.7 (117.1-122.7)
Razer Blade 16 2025 RTX 5090 Ryzen AI 9 HX 370, GeForce RTX 5090 Laptop; Cinebench R23 Multi (external Monitor): Ø103.2 (99.8-106.4)
Razer Blade 16 Core Ultra 9 386H Ultra 9 386H, GeForce RTX 5090 Laptop; 1280x720 FurMark 1.19 GPU Stress Test (external Monitor): Ø206 (179.6-214)
Razer Blade 16 2025 RTX 5090 Ryzen AI 9 HX 370, GeForce RTX 5090 Laptop; 1280x720 FurMark 1.19 GPU Stress Test (external Monitor): Ø195.4 (160-203)
Razer Blade 16 Core Ultra 9 386H Ultra 9 386H, GeForce RTX 5090 Laptop; Idle 1min (external Monitor): Ø4.54 (0.00227-6.34)
Razer Blade 16 2025 RTX 5090 Ryzen AI 9 HX 370, GeForce RTX 5090 Laptop; Idle 1min (external Monitor): Ø7.63 (6.03-12.4)
Razer Blade 16 Core Ultra 9 386H Ultra 9 386H, GeForce RTX 5090 Laptop; Cyberpunk 2077 FHD ultra no FSR (external Monitor): Ø216 (201-223)
Razer Blade 16 2025 RTX 5090 Ryzen AI 9 HX 370, GeForce RTX 5090 Laptop; Cyberpunk 2077 FHD ultra no FSR (external Monitor): Ø177.6 (171.1-181.9)

Żywotność baterii

Czas działania sieci WLAN jest tym razem o kilka godzin dłuższy ze względu na lepszą wydajność procesora przy niższych obciążeniach.

Wydajność akumulatora
WiFi Websurfing
11h 41min
Razer Blade 16 Core Ultra 9 386H
Ultra 9 386H, GeForce RTX 5090 Laptop, 90 Wh
Razer Blade 16 2025 RTX 5090
Ryzen AI 9 HX 370, GeForce RTX 5090 Laptop, 90 Wh
Alienware 16 Area-51 Core Ultra 9 290HX Plus
Ultra 9 290HX Plus, GeForce RTX 5080 Laptop, 96 Wh
Lenovo Legion Pro 7i 16 Gen 10
Ultra 9 275HX, GeForce RTX 5080 Laptop, 99 Wh
HP Omen Max 16 ah000
Ultra 9 275HX, GeForce RTX 5090 Laptop, 83 Wh
MSI Crosshair 16 HX AI D2XWGKG
Ultra 9 275HX, GeForce RTX 5070 Laptop, 90 Wh
Czasy pracy
-32%
-73%
-54%
-50%
-5%
WiFi v1.3 (h)
11.7
7.9
-32%
3.2
-73%
5.4
-54%
5.8
-50%
11.1
-5%
H.264 (h)
9.9
14.2
Cyberpunk 2077 ultra 150cd (h)
1.2
Load (h)
0.8
1.2
Reader / Idle (h)
8.7

Ocena Notebookcheck

Razer Blade 16 2026 z procesorem Intela jest wydajniejszy i nieco szybszy w grach niż zeszłoroczna wersja z procesorem AMD, ale jego cena jest również znacznie wyższa.

Razer Blade 16 Core Ultra 9 386H - 27/05/2026 v8
Allen Ngo

Wykonanie
90 / 98 → 92%
Klawiatura
86%
Myszka
93%
Komunikacja
76 / 80 → 95%
Waga
62 / 10-68 → 90%
Akumulator
89 / 95 → 93%
Wyświetlacz
83%
Wydajność w grach
92%
Wydajność w programach użytkowych
90%
AI Performance
98%
Temperatura
88 / 95 → 92%
Hałas
69 / 90 → 76%
Głośniki
86%
Kamerka
34 / 75 → 45%
Średnio
65%
88%
Gaming - Ważona średnia
CO2 Emissions
No Data
Materials
0%
Packaging
50%
Power Use
81.1%
Repairability
40%
Software Updates
22.3%
Recycle Logo Total Sustainability Score: 32.2%

Potencjalni konkurenci w porównaniu

Obraz
Model / recenzja
Cena
Waga
Wysokość
Ekran
1.
87.7%
Razer Blade 16 Core Ultra 9 386H
Intel Core Ultra 9 386H ⎘
NVIDIA GeForce RTX 5090 Laptop ⎘
32 GB Pamięć, 2048 GB SSD
Amazon:
1. $4,439.99
Razer Blade 16 (2025) Gaming...
2. $3,999.99
Razer Blade 16 Gaming Laptop...
Cena katalogowa: 4900 USD
2.1 kg17.4 mm16.00"
2560x1600
189 PPI
OLED
2.
87%
Razer Blade 16 2025 RTX 5090
AMD Ryzen AI 9 HX 370 ⎘
NVIDIA GeForce RTX 5090 Laptop ⎘
32 GB Pamięć, 2048 GB SSD
Amazon: Cena katalogowa: 4399€2.1 kg17.4 mm16.00"
2560x1600
189 PPI
OLED
3.
88.1%
Alienware 16 Area-51 Core Ultra 9 290HX Plus
Intel Core Ultra 9 290HX Plus ⎘
NVIDIA GeForce RTX 5080 Laptop ⎘
32 GB Pamięć,  SSD
Amazon:
Cena katalogowa: 4000 USD
3.3 kg28.5 mm16.00"
2560x1600
189 PPI
OLED
4.
87.5%
Lenovo Legion Pro 7i 16 Gen 10
Intel Core Ultra 9 275HX ⎘
NVIDIA GeForce RTX 5080 Laptop ⎘
32 GB Pamięć, 1024 GB SSD
Amazon: Cena katalogowa: 4200 USD2.6 kg26.65 mm16.00"
2560x1600
189 PPI
OLED
5.
81.9%
HP Omen Max 16 ah000
Intel Core Ultra 9 275HX ⎘
NVIDIA GeForce RTX 5090 Laptop ⎘
32 GB Pamięć, 2048 GB SSD
Amazon: Cena katalogowa: 3800 USD2.8 kg24.9 mm16.00"
2560x1600
189 PPI
OLED
6.
81.9%
MSI Crosshair 16 HX AI D2XWGKG
Intel Core Ultra 9 275HX ⎘
NVIDIA GeForce RTX 5070 Laptop ⎘
16 GB Pamięć, 1024 GB SSD
Amazon: Cena katalogowa: 2500 EUR2.5 kg27.9 mm16.00"
2560x1600
189 PPI
IPS

Przezroczystość

Wyboru urządzeń do recenzji dokonuje nasza redakcja. Próbka testowa została udostępniona autorowi jako pożyczka od producenta lub sprzedawcy detalicznego na potrzeby tej recenzji. Pożyczkodawca nie miał wpływu na tę recenzję, producent nie otrzymał też kopii tej recenzji przed publikacją. Nie było obowiązku publikowania tej recenzji. Jako niezależna firma medialna, Notebookcheck nie podlega władzy producentów, sprzedawców detalicznych ani wydawców.

Tak testuje Notebookcheck

Każdego roku Notebookcheck niezależnie sprawdza setki laptopów i smartfonów, stosując standardowe procedury, aby zapewnić porównywalność wszystkich wyników. Od około 20 lat stale rozwijamy nasze metody badawcze, ustanawiając przy tym standardy branżowe. W naszych laboratoriach testowych doświadczeni technicy i redaktorzy korzystają z wysokiej jakości sprzętu pomiarowego. Testy te obejmują wieloetapowy proces walidacji. Nasz kompleksowy system ocen opiera się na setkach uzasadnionych pomiarów i benchmarków, co pozwala zachować obiektywizm.
Google LogoAdd as a preferred source on Google
Mail Logo
> laptopy testy i recenzje notebooki > Laptopy > Recenzja Razer Blade 16: Intel Core Ultra zapewnia szybszą liczbę klatek na sekundę
Allen Ngo, 2026-05-28 (Update: 2026-05-28)