
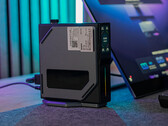
Recenzja Acemagic S1 mini PC - mały i ekonomiczny komputer biurowy z procesorem Intel N95, 1 TB pamięci masowej i wyświetlaczem
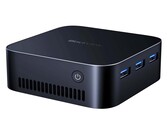
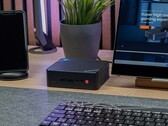
Dzięki S1, Acemagic ma w swoim portfolio kompaktowy komputer, który nadaje się do prostego, codziennego użytku biurowego, a Intel N95 zapewnia dobrą podstawę. Pomysłowe pomysły Acemagic często pomagają wyróżnić się z tłumu pod względem wzornictwa i funkcjonalności. Dotyczy to również S1, który ma wyświetlacz wbudowany z przodu. Proszę czytać dalej, aby dowiedzieć się, jak dobrze urządzenie trzyma się w naszej recenzji.
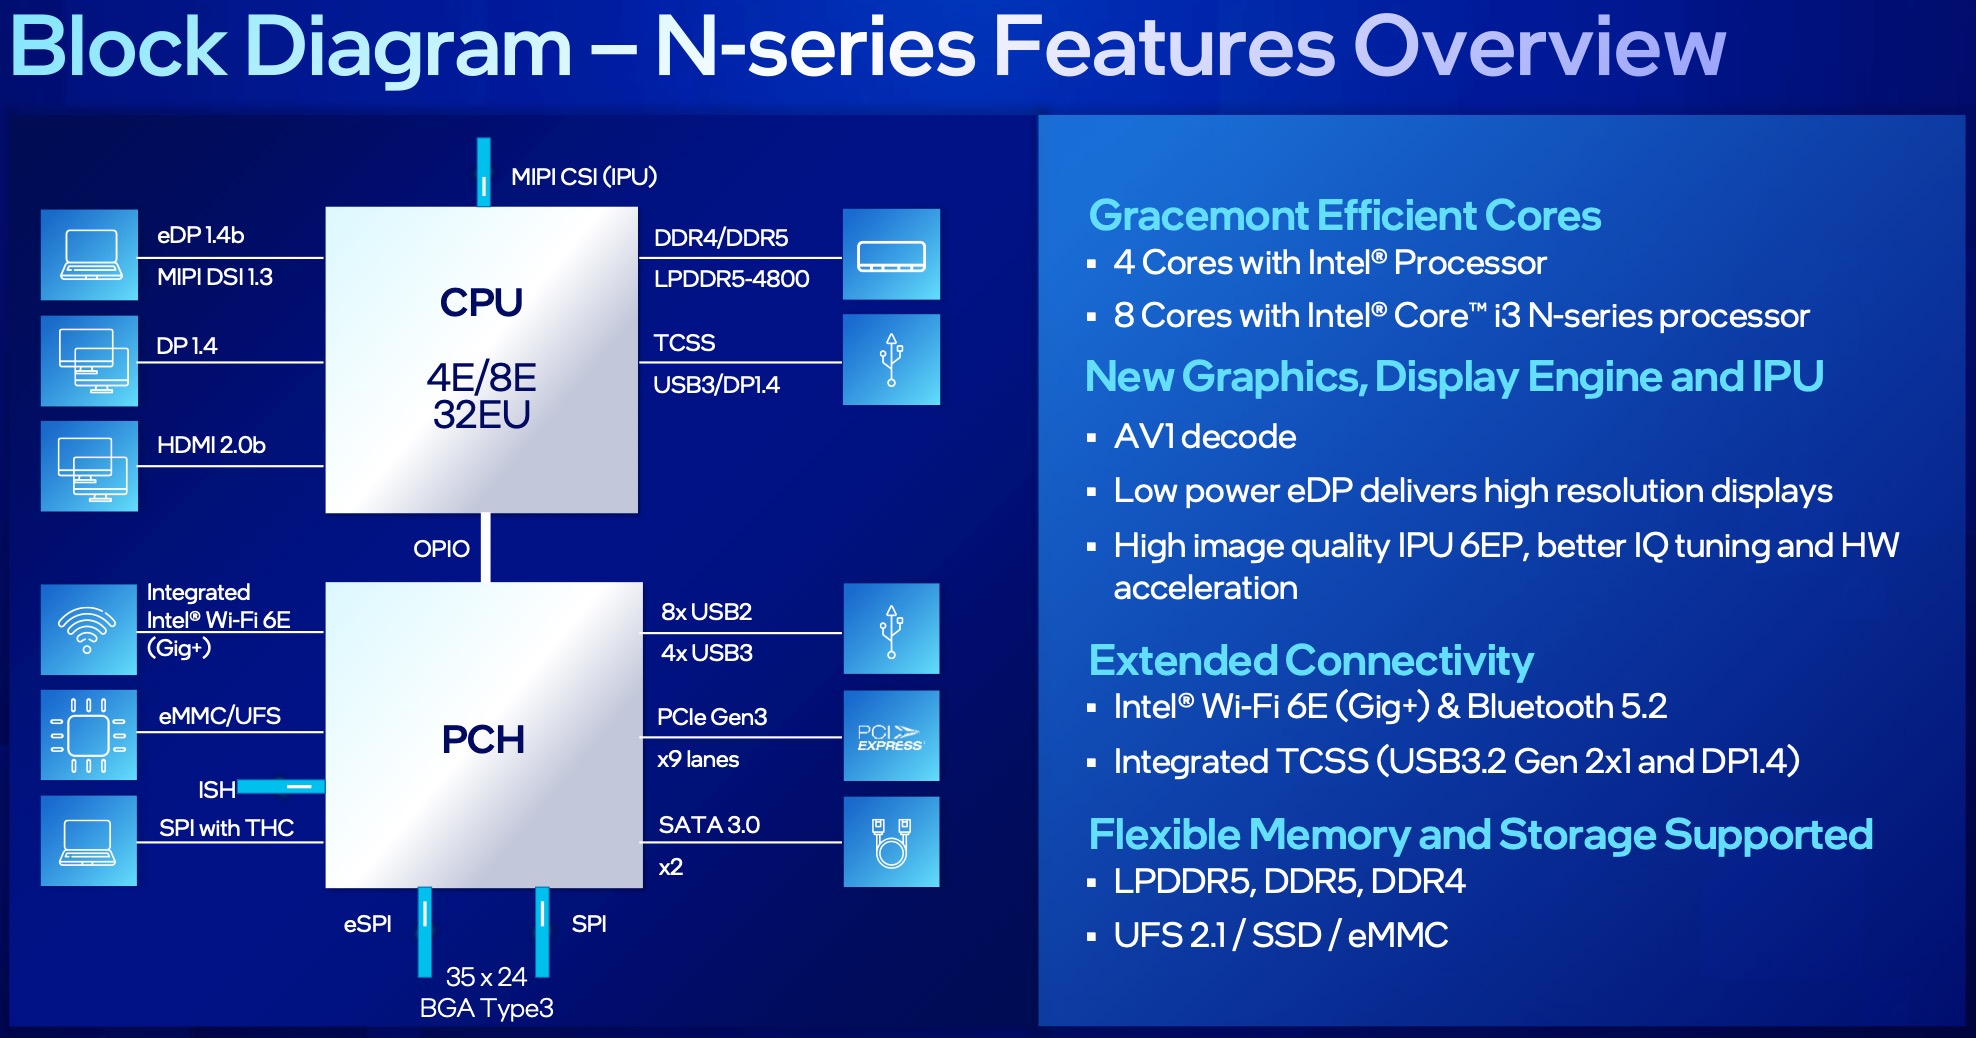
Intel Processor N95, UHD Graphics 24EUs (Alder Lake-N), 440 g