Recenzja Lenovo Legion Pro 7 16 (2024): Śmietanka towarzyska wśród laptopów z RTX 4080
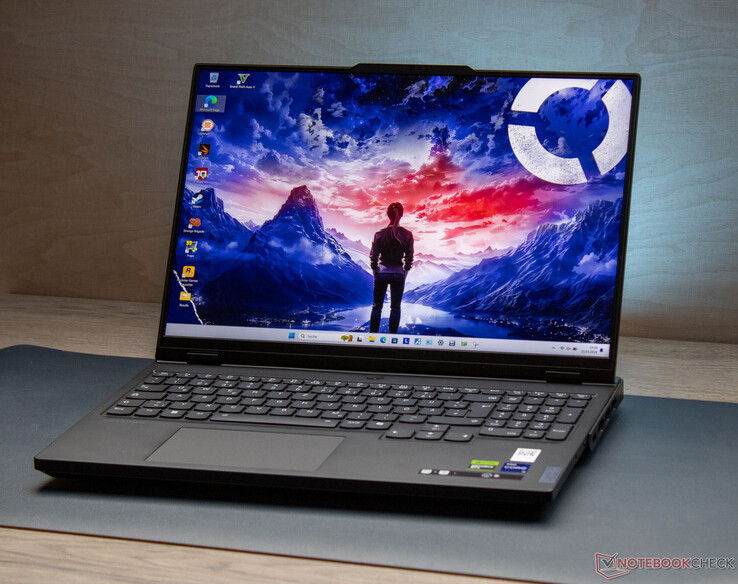
Legion Pro 7 - 16-calowy laptop skierowany do graczy i twórców - znajduje się w górnej części spektrum wydajności. I jest wyposażony w odpowiednio mocny sprzęt, wyposażony w Core i9-14900HX, a GeForce RTX 4080, 32 GB pamięci RAM i jasny, wiernie odwzorowujący kolory wyświetlacz IPS (pokrycie DCI-P3, Dolby Vision, G-Sync) o proporcjach 16:10. Legion Pro konkuruje z takimi urządzeniami jak MSI Vector 16 HX A14V, Alienware Alienware m16 R1 AMD, HP HP Omen 16 (2024).
Legion Pro 7 16IRX9H jest następcą modelu Legion Pro 7 16IRX8H i ma tę samą konstrukcję zewnętrzną. Proszę odnieść się do naszej recenzji 16IRX8H aby uzyskać więcej informacji na temat obudowy, funkcji i urządzeń wejściowych.
Potencjalni konkurenci w porównaniu
Ocena | Data | Model | Waga | Wysokość | Rozmiar | Rezolucja | Cena |
|---|---|---|---|---|---|---|---|
| 89.5 % v7 (old) | 03/2024 | Lenovo Legion Pro 7 16IRX9H i9-14900HX, GeForce RTX 4080 Laptop GPU | 2.7 kg | 21.95 mm | 16.00" | 2560x1600 | |
| 89.2 % v7 (old) | 08/2023 | Alienware m16 R1 AMD R9 7845HX, GeForce RTX 4080 Laptop GPU | 3.1 kg | 25.4 mm | 16.00" | 2560x1600 | |
| 88 % v7 (old) | 02/2024 | MSI Vector 16 HX A14V i9-14900HX, GeForce RTX 4080 Laptop GPU | 2.7 kg | 28.55 mm | 16.00" | 2560x1600 | |
| 86.7 % v7 (old) | 02/2024 | HP Omen 16 (2024) i9-14900HX, GeForce RTX 4080 Laptop GPU | 2.4 kg | 23.5 mm | 16.10" | 2560x1440 |
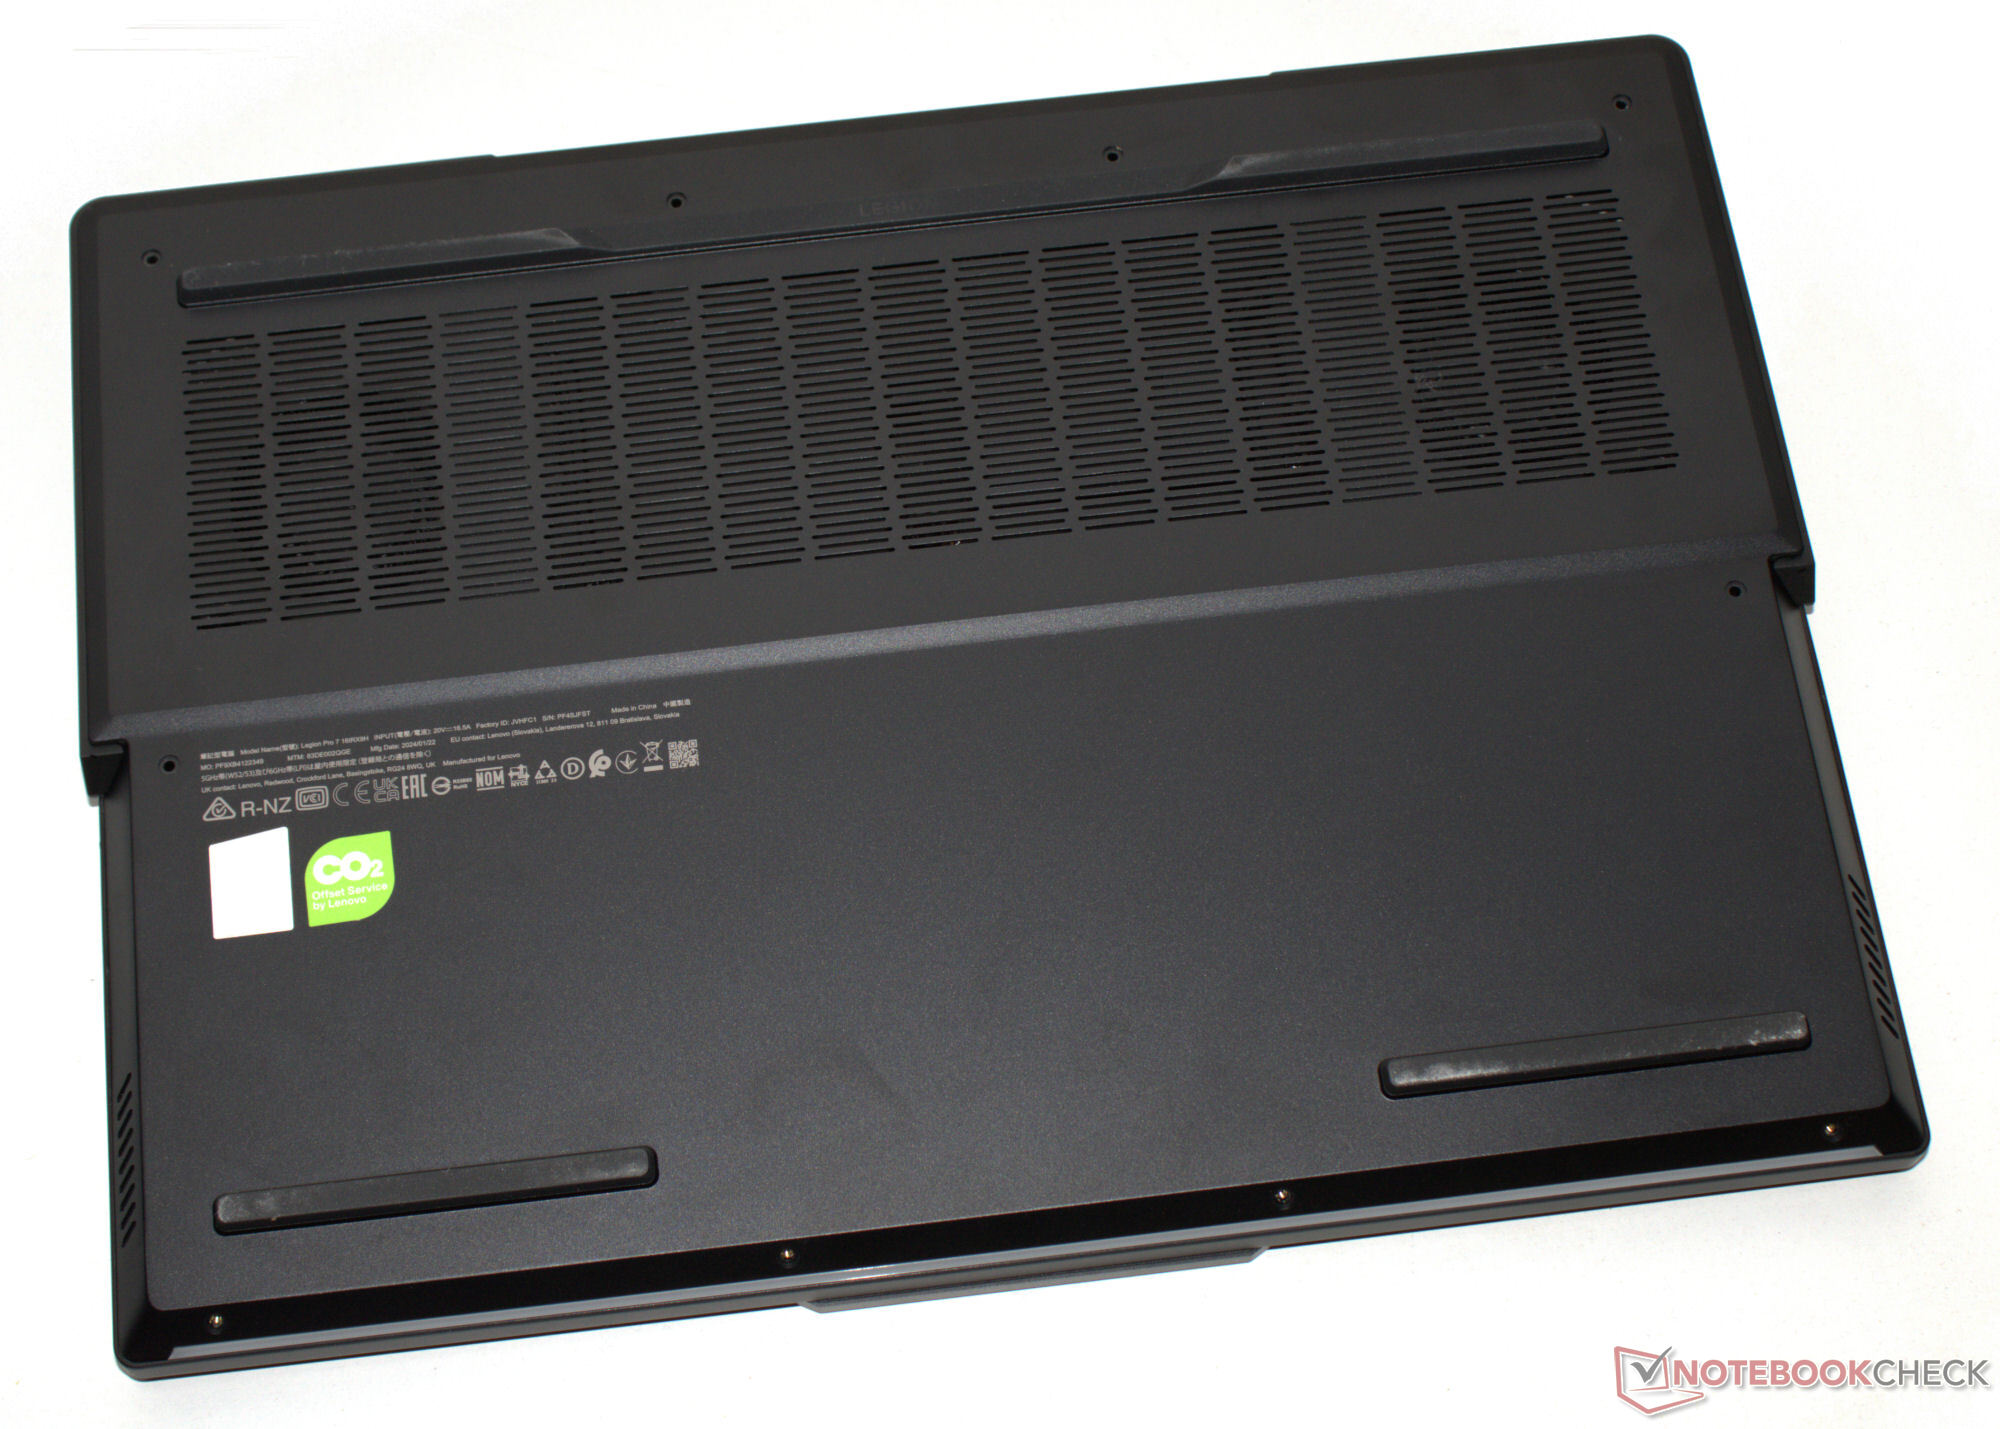
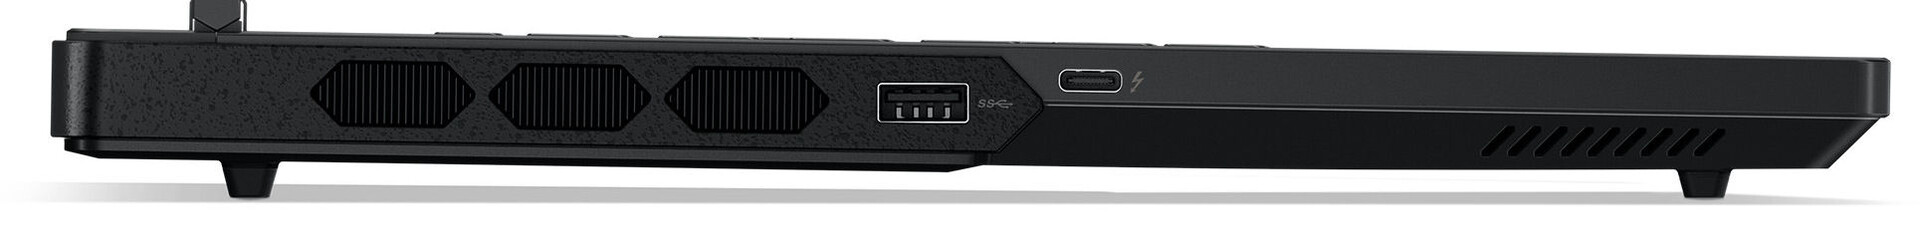
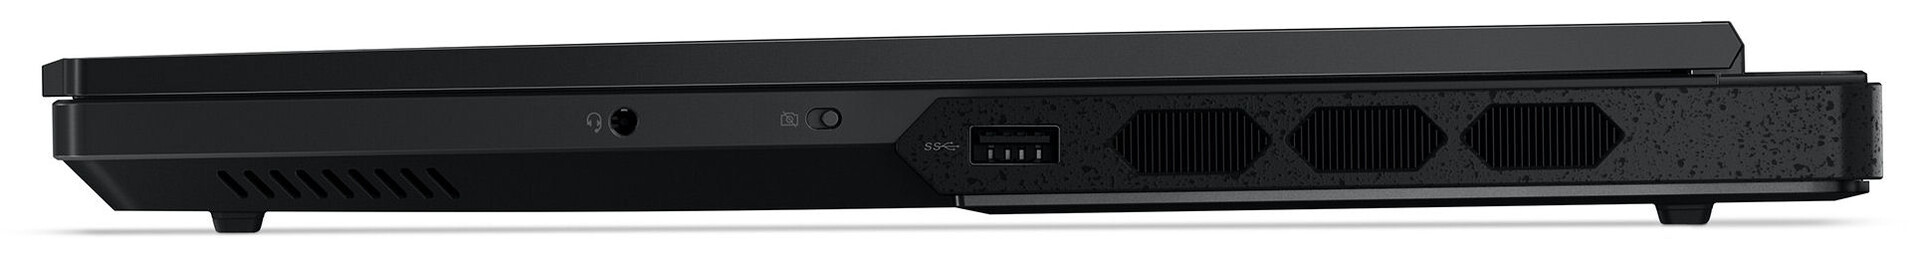
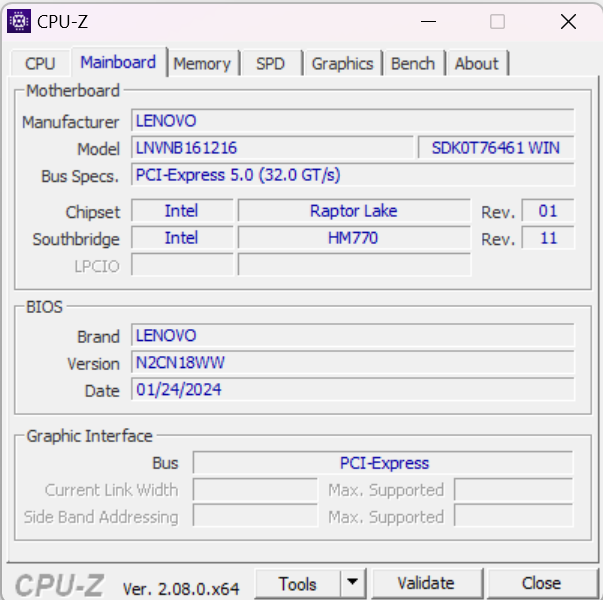
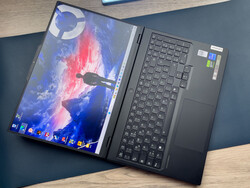
Obudowa i specyfikacje - W zestawie z Thunderbolt 4
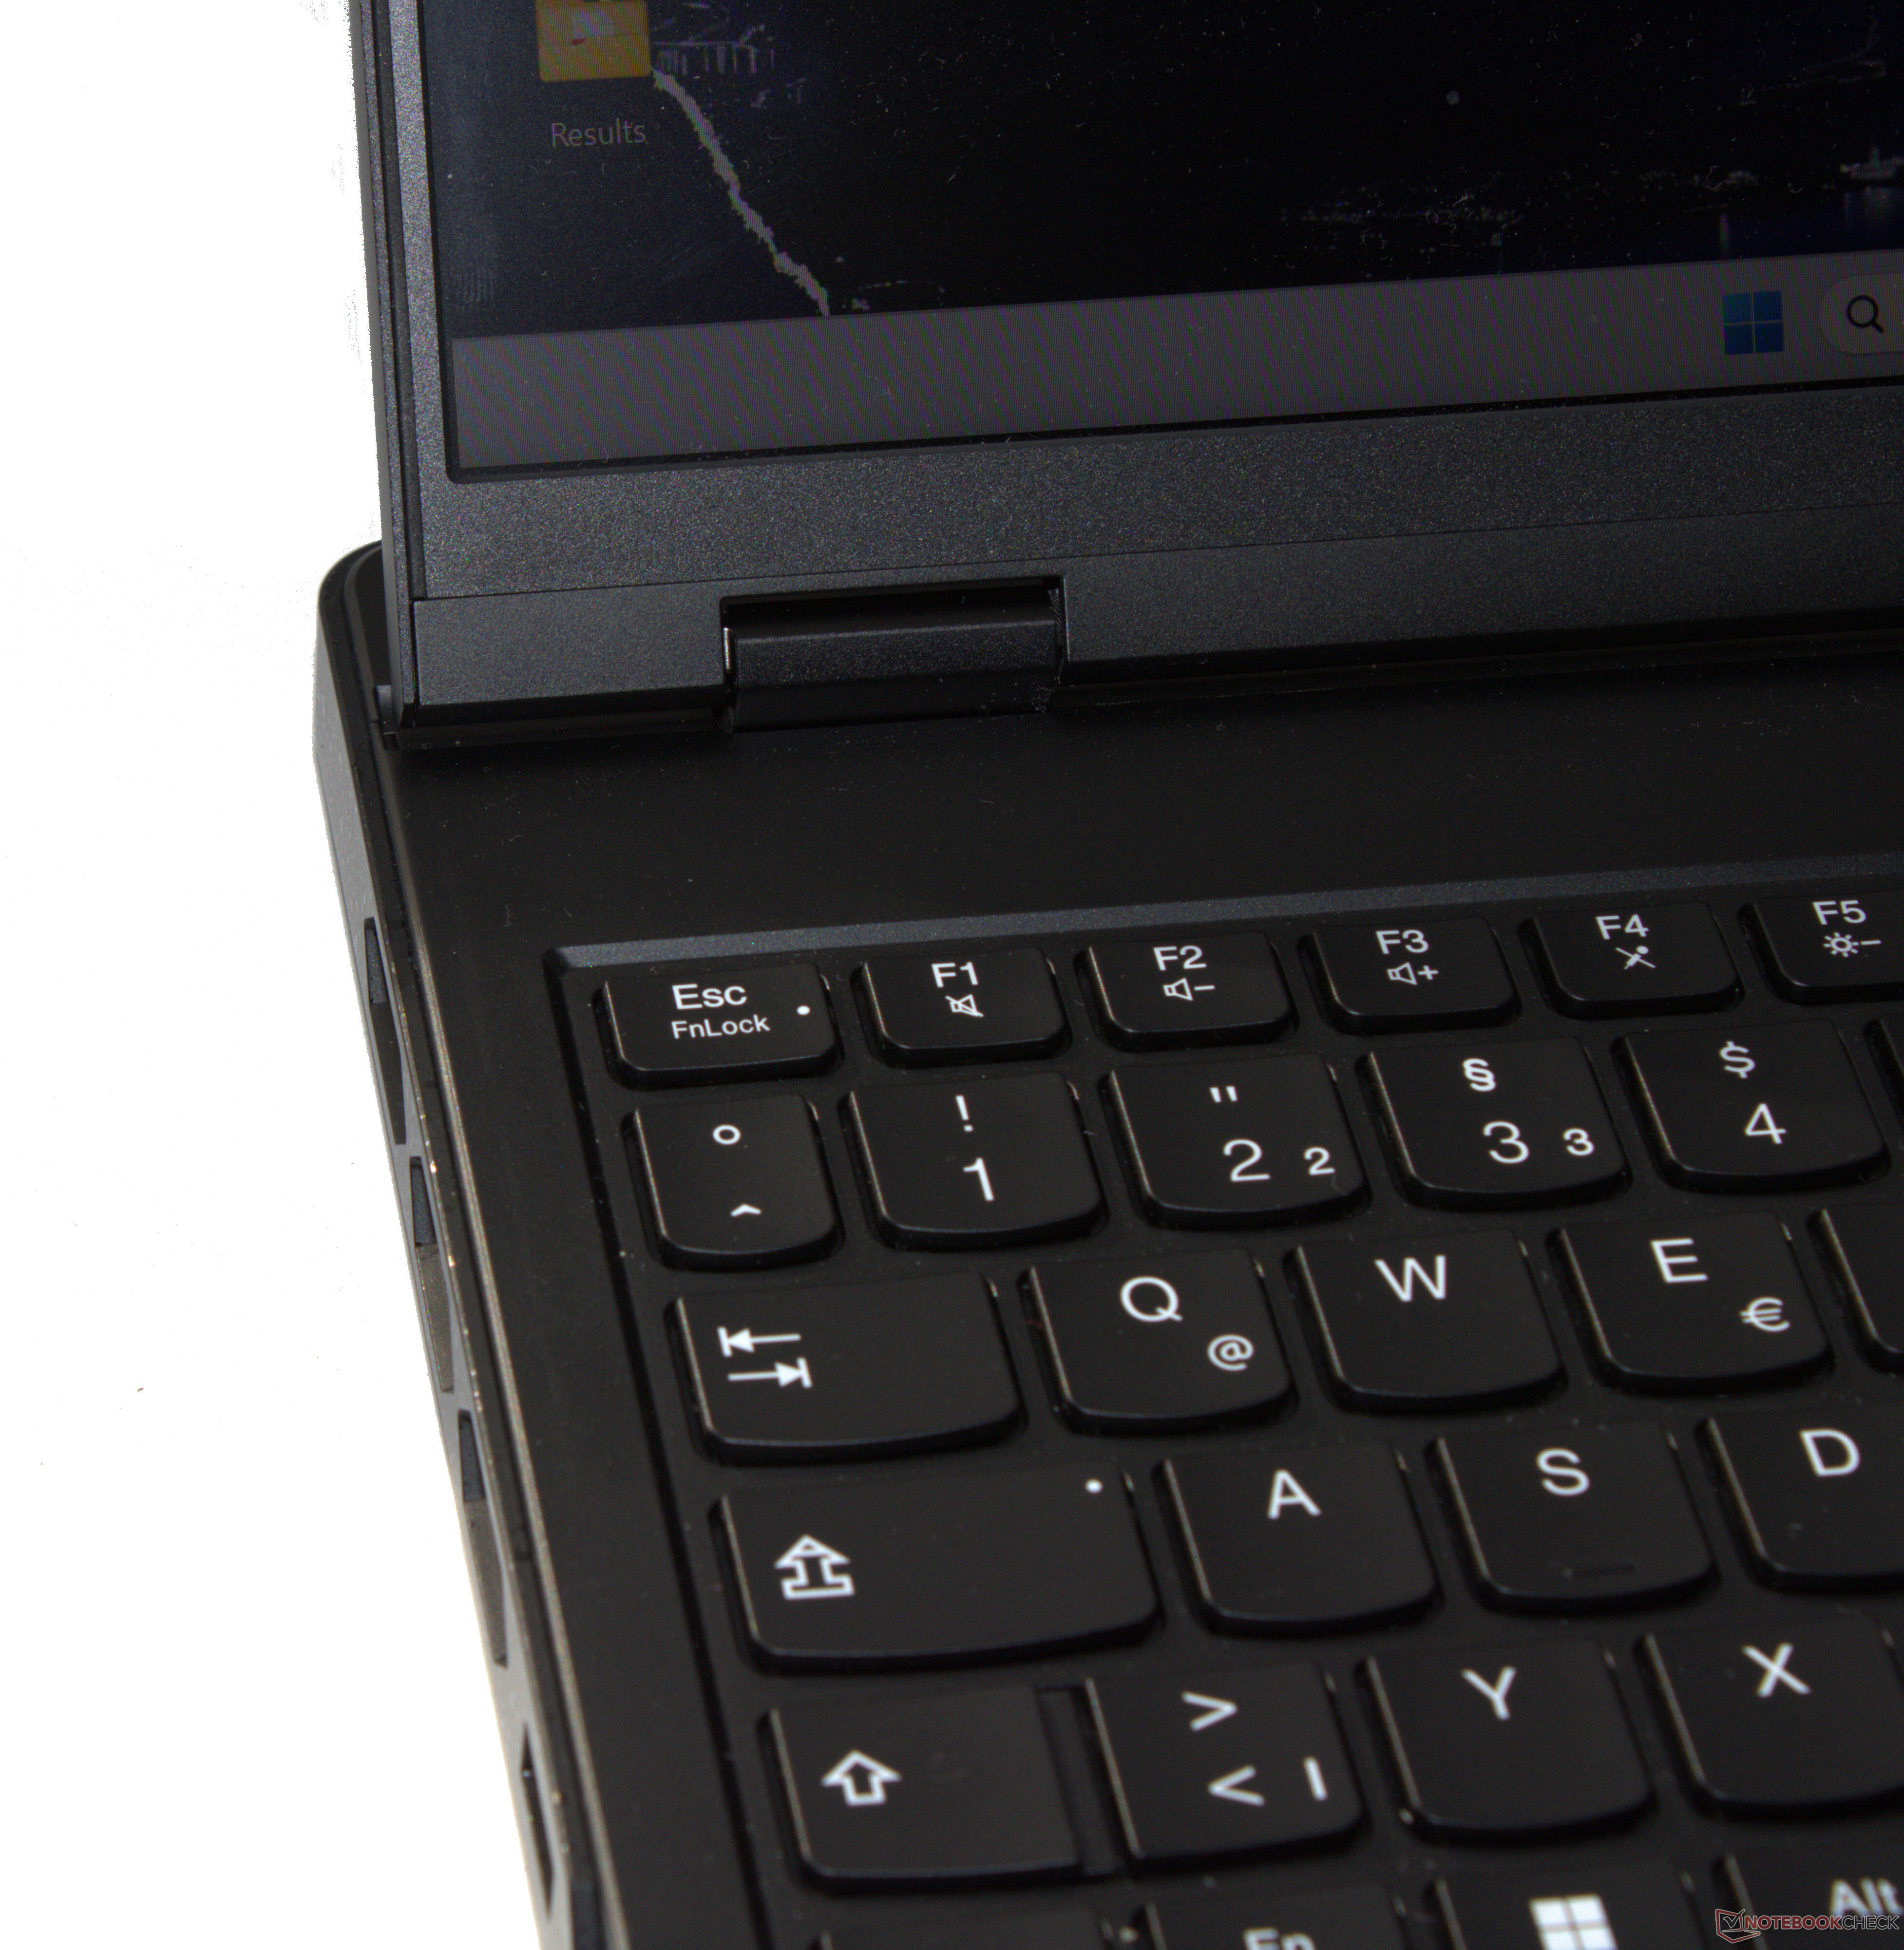
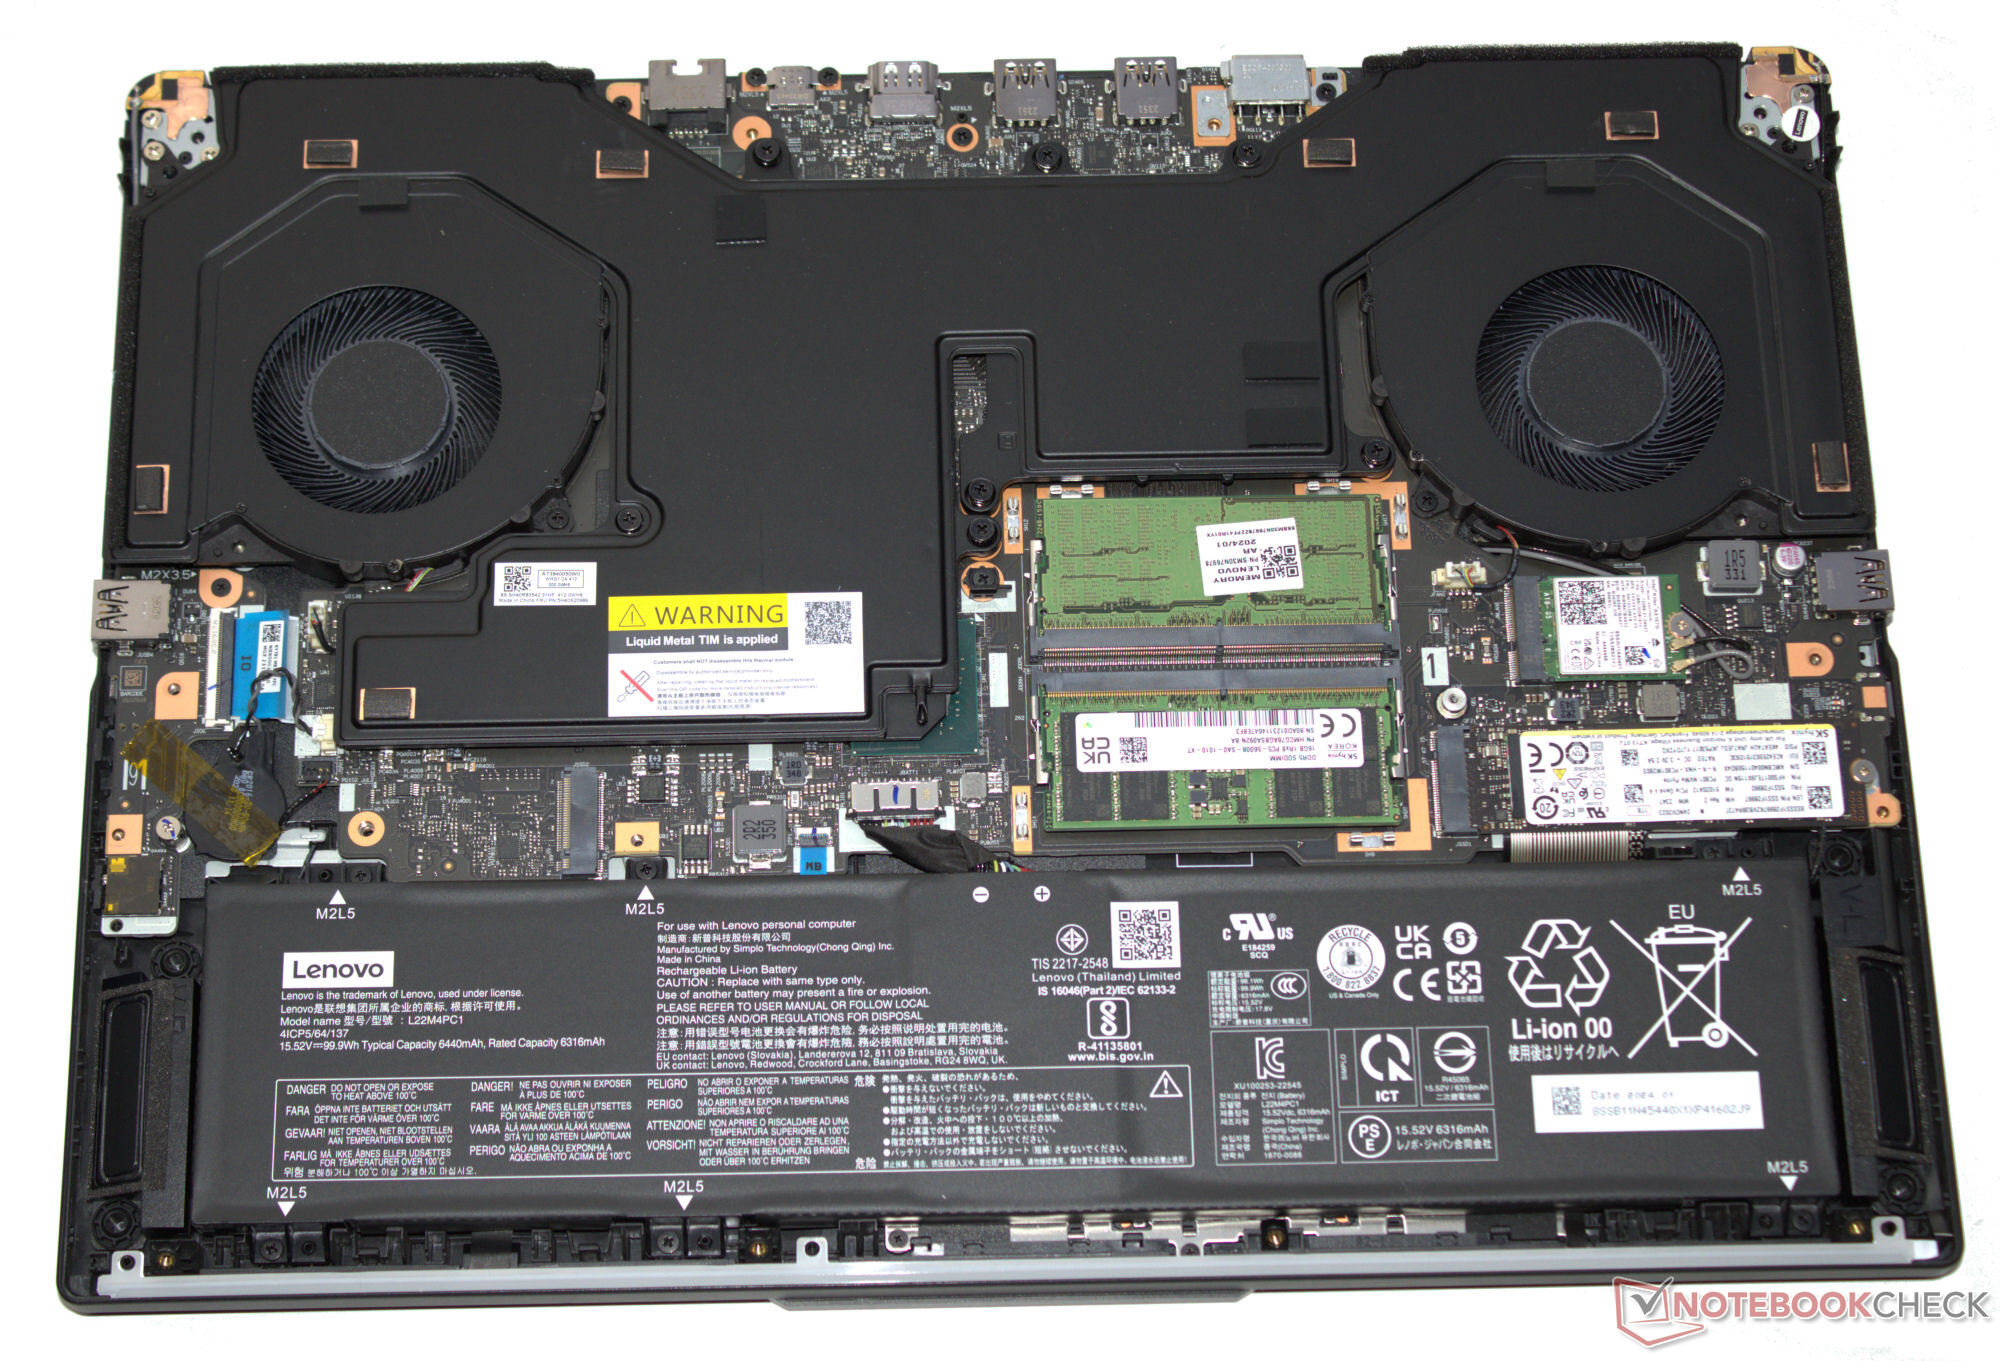
Sprzęt Legionjest zapakowany w solidną, matowo-czarną aluminiową obudowę o gładkiej powierzchni. Podświetlenie klawiatury i pasek LED skierowany w stronę użytkownika dodają nieco kolorytu. Sztywne zawiasy o maksymalnym kącie otwarcia 180 stopni zasługują na kciuk w górę. Bateria (przykręcana, a nie przyklejana) i reszta podzespołów wewnętrznych są dostępne po zdjęciu dolnej pokrywy.
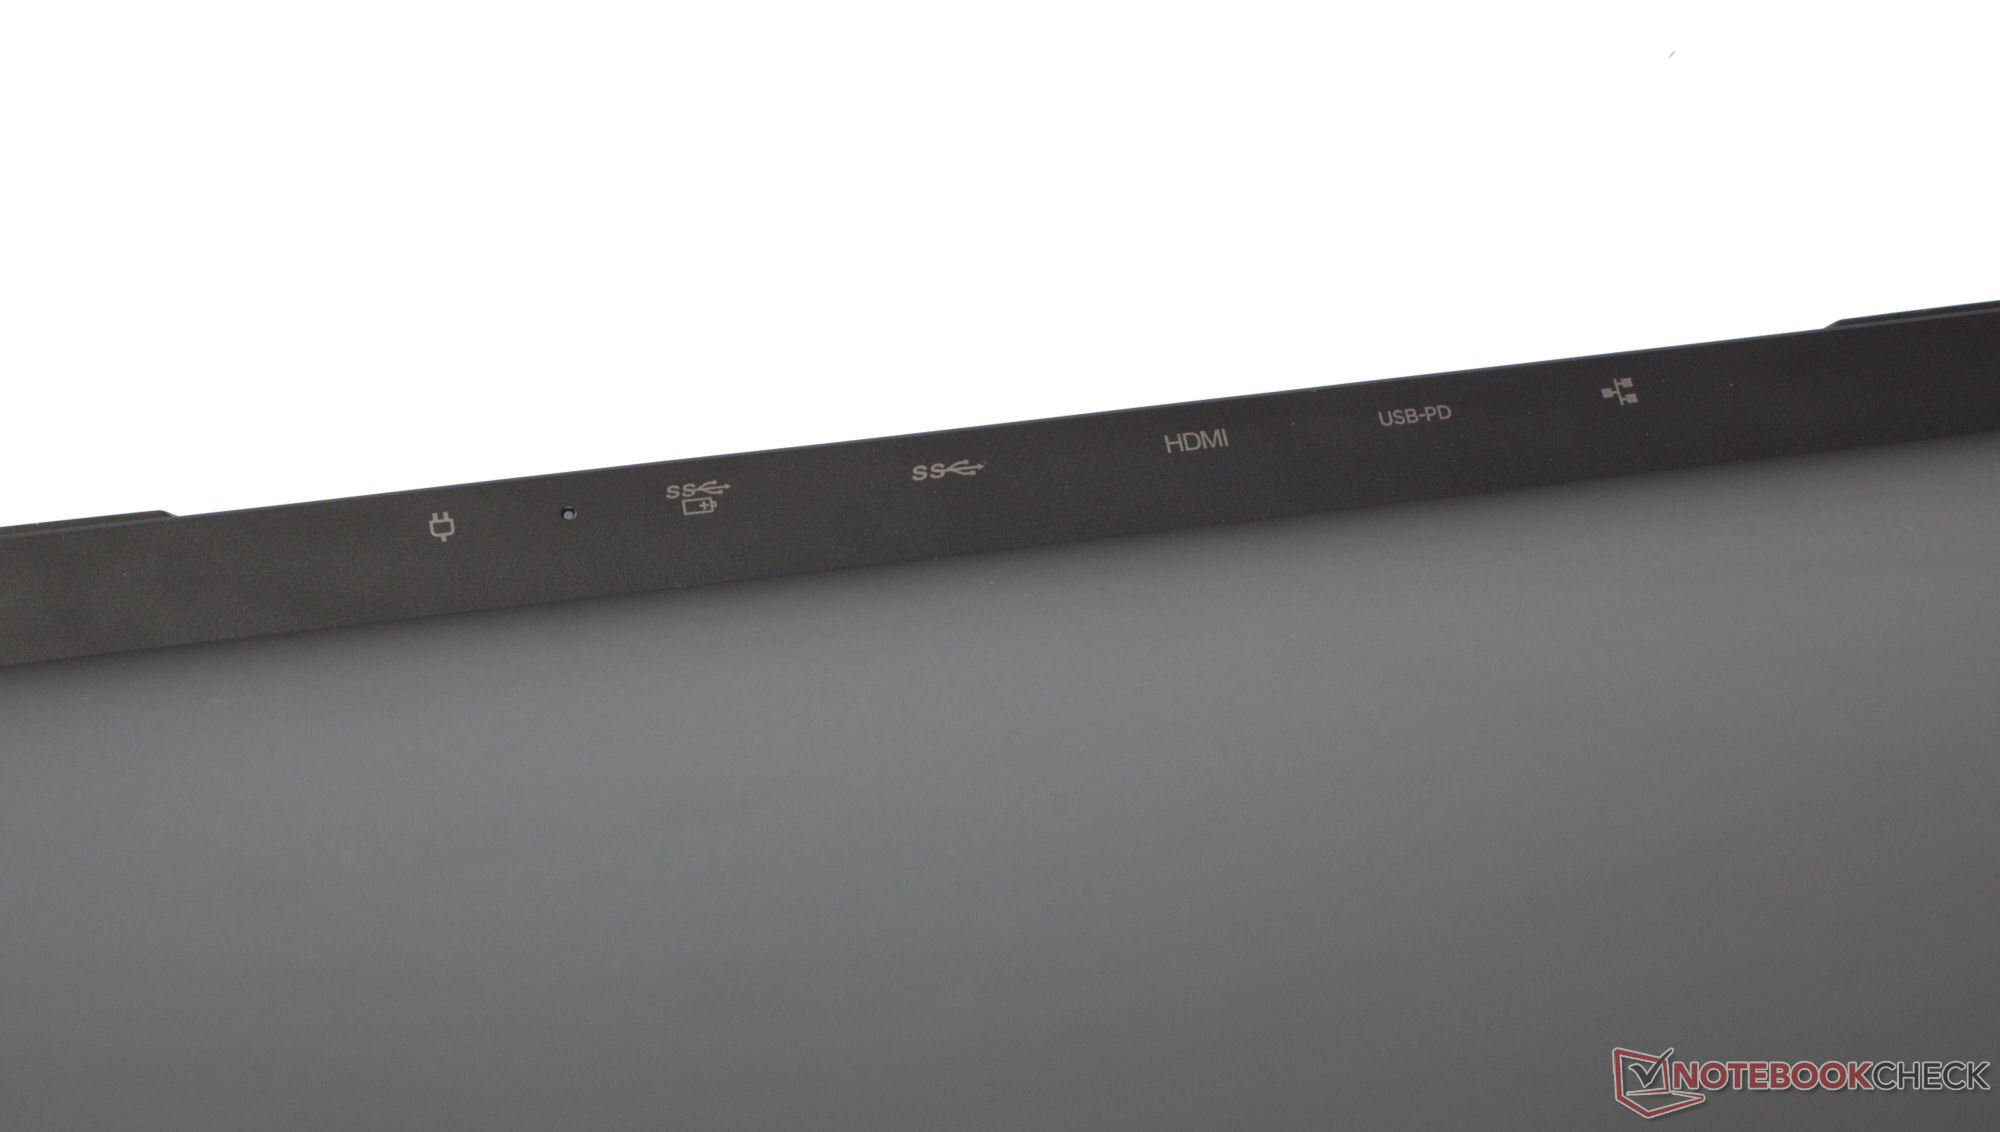
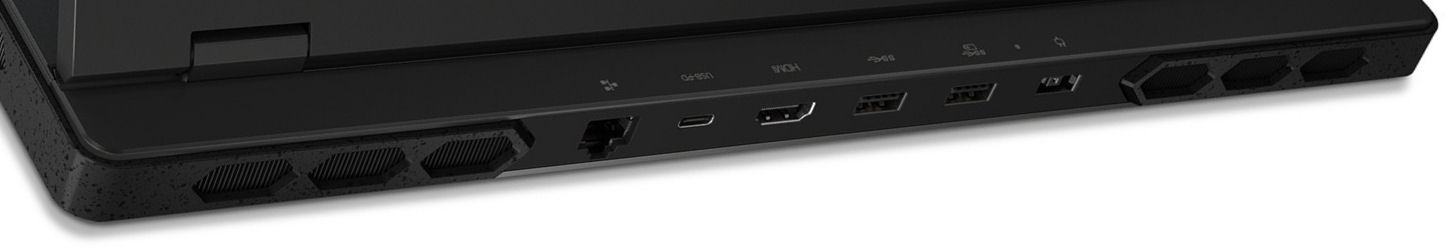
Laptop nie jest pozbawiony działu I/O, oferując cztery porty USB-A (USB 3.2 Gen 1) i dwa porty USB-C (1x Thunderbolt 4, 1 x USB 3.2 Gen 2; 1x PD, 2x DP). Łącznie oferuje trzy wyjścia wideo (1x HDMI, 2x DP). Kamera internetowa 2,1 MP 1080p jest wyposażona w migawkę prywatności i zapewnia bardzo przyzwoite rezultaty. Na pokładzie nie ma żadnego czytnika kart pamięci.
W optymalnych warunkach (tj. brak innych urządzeń Wi-Fi w pobliżu, niewielka odległość między laptopem a serwerem PC), Legion Pro 7 osiągał znakomite prędkości transmisji danych Wi-Fi. Notebook wykorzystuje układ Killer AX1675i Wi-Fi 6E (aka Intel AX211). Za łączność przewodową odpowiada kontroler Realtek RTL8168/8111.
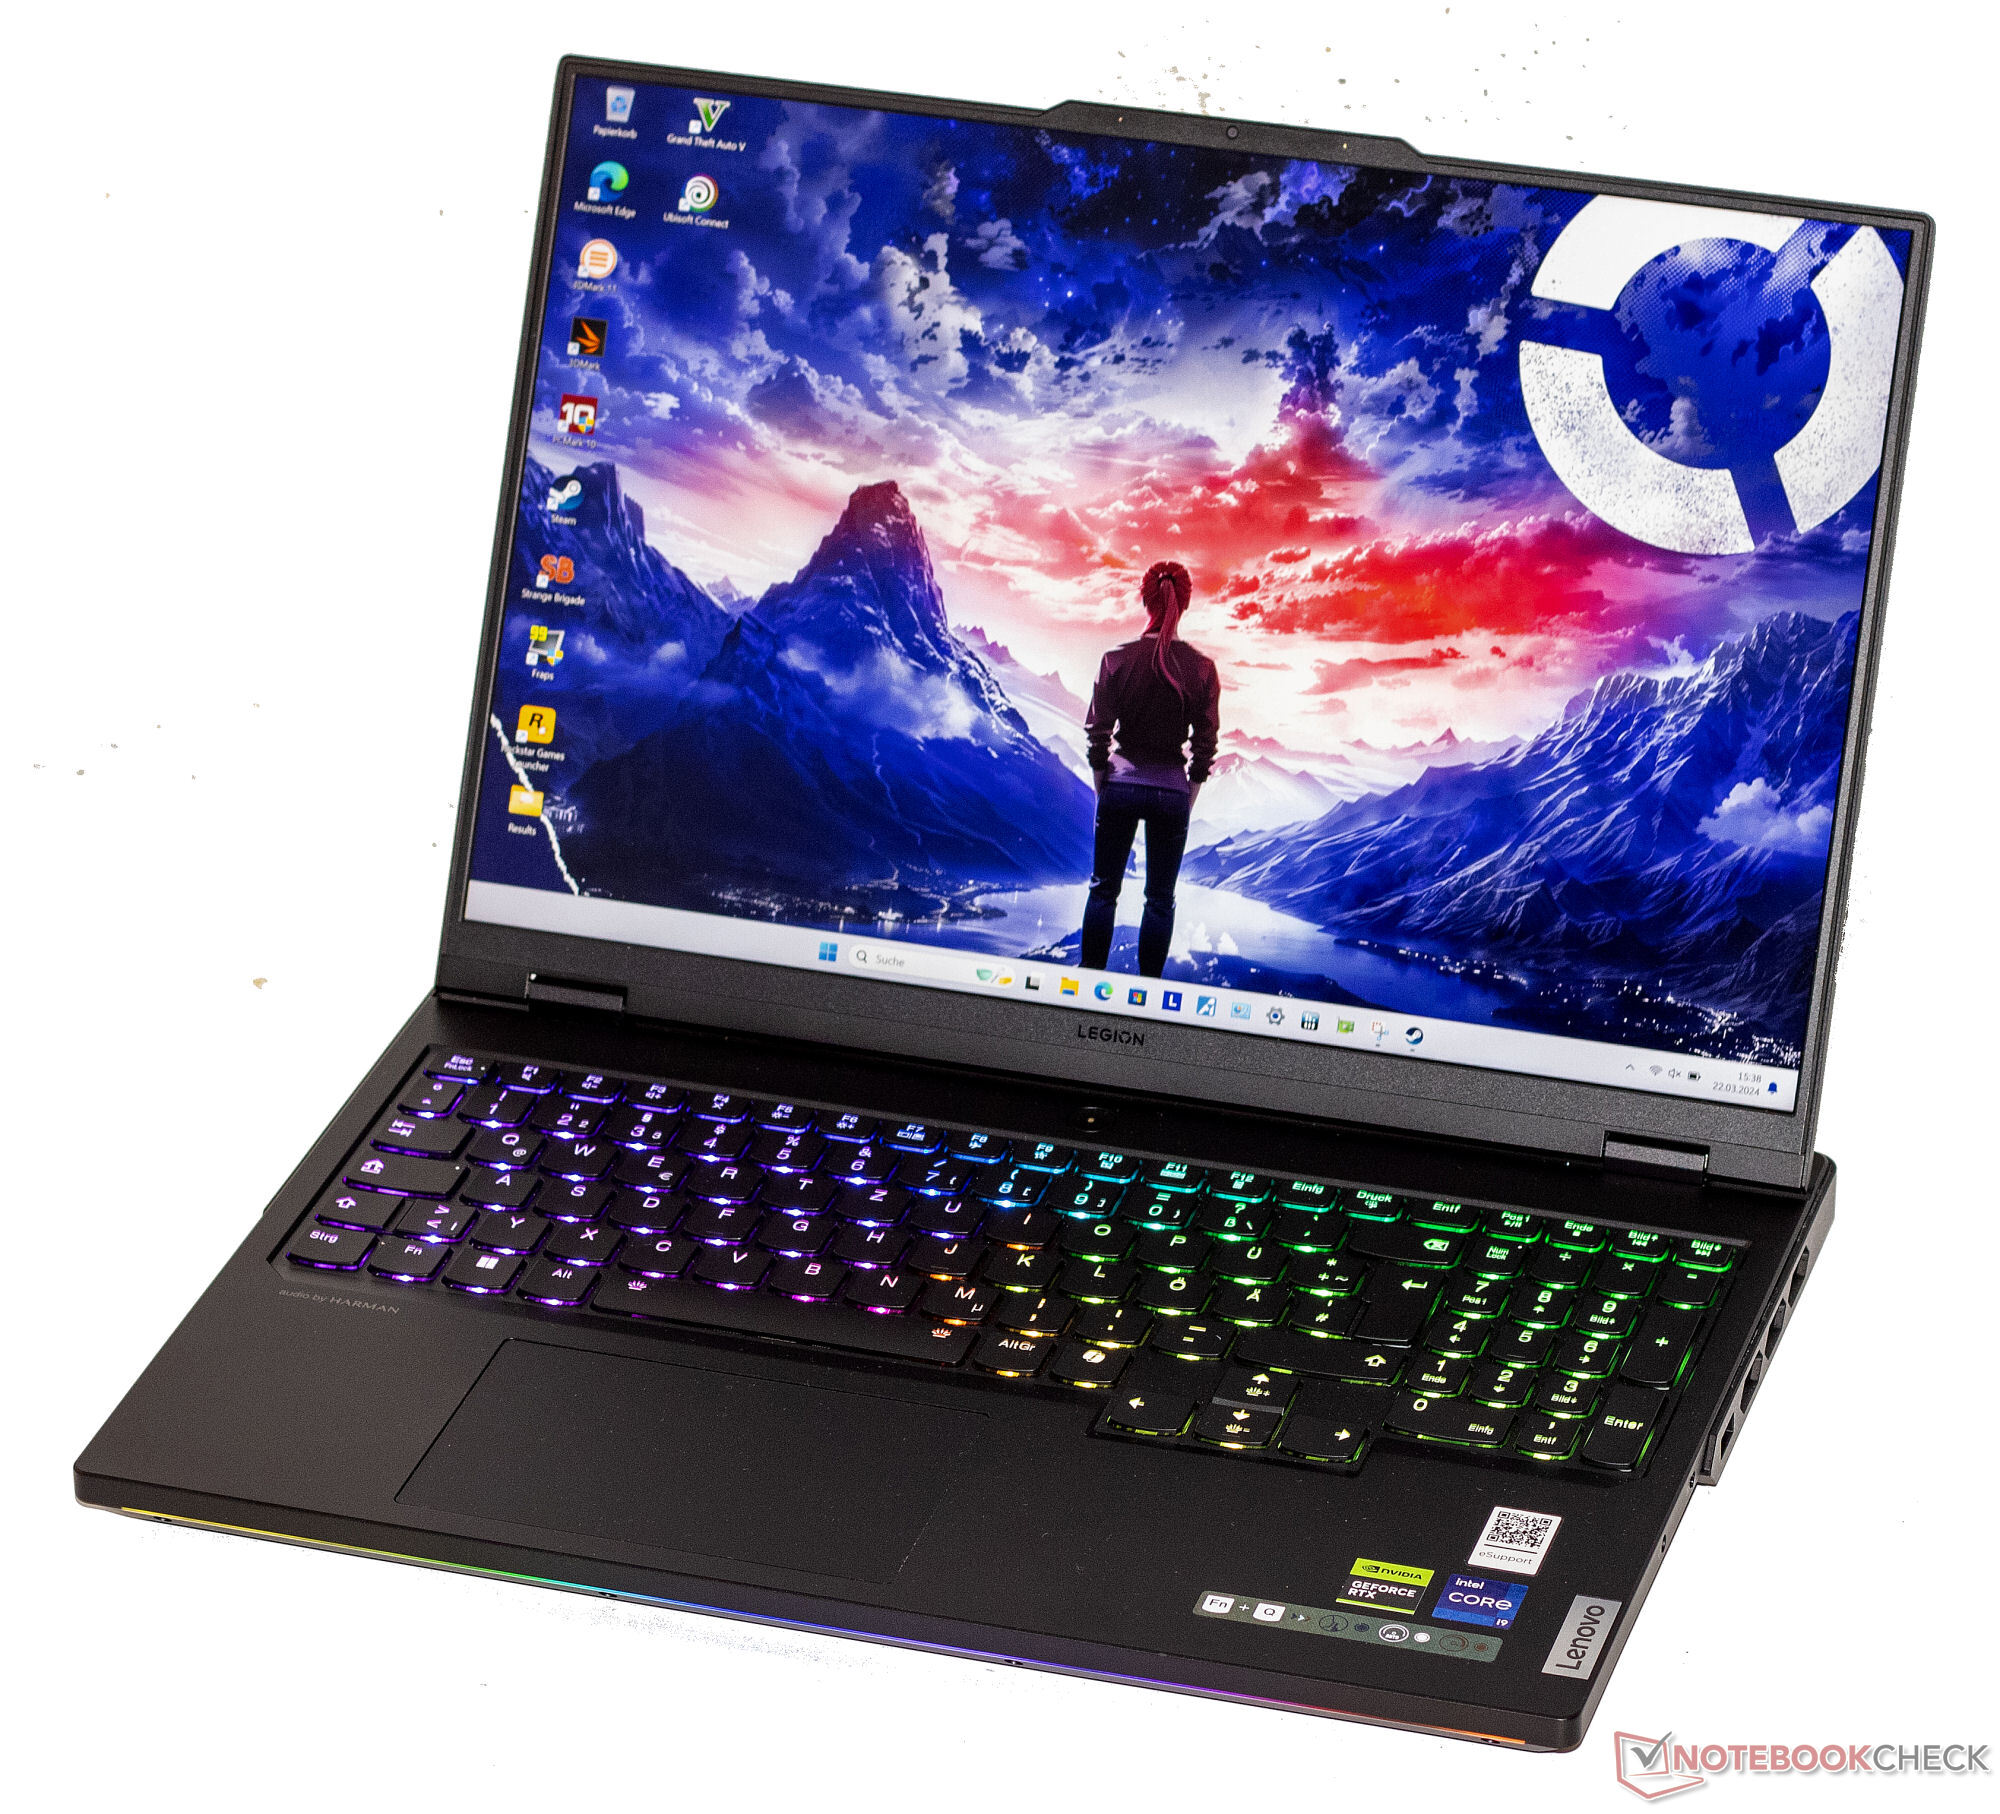
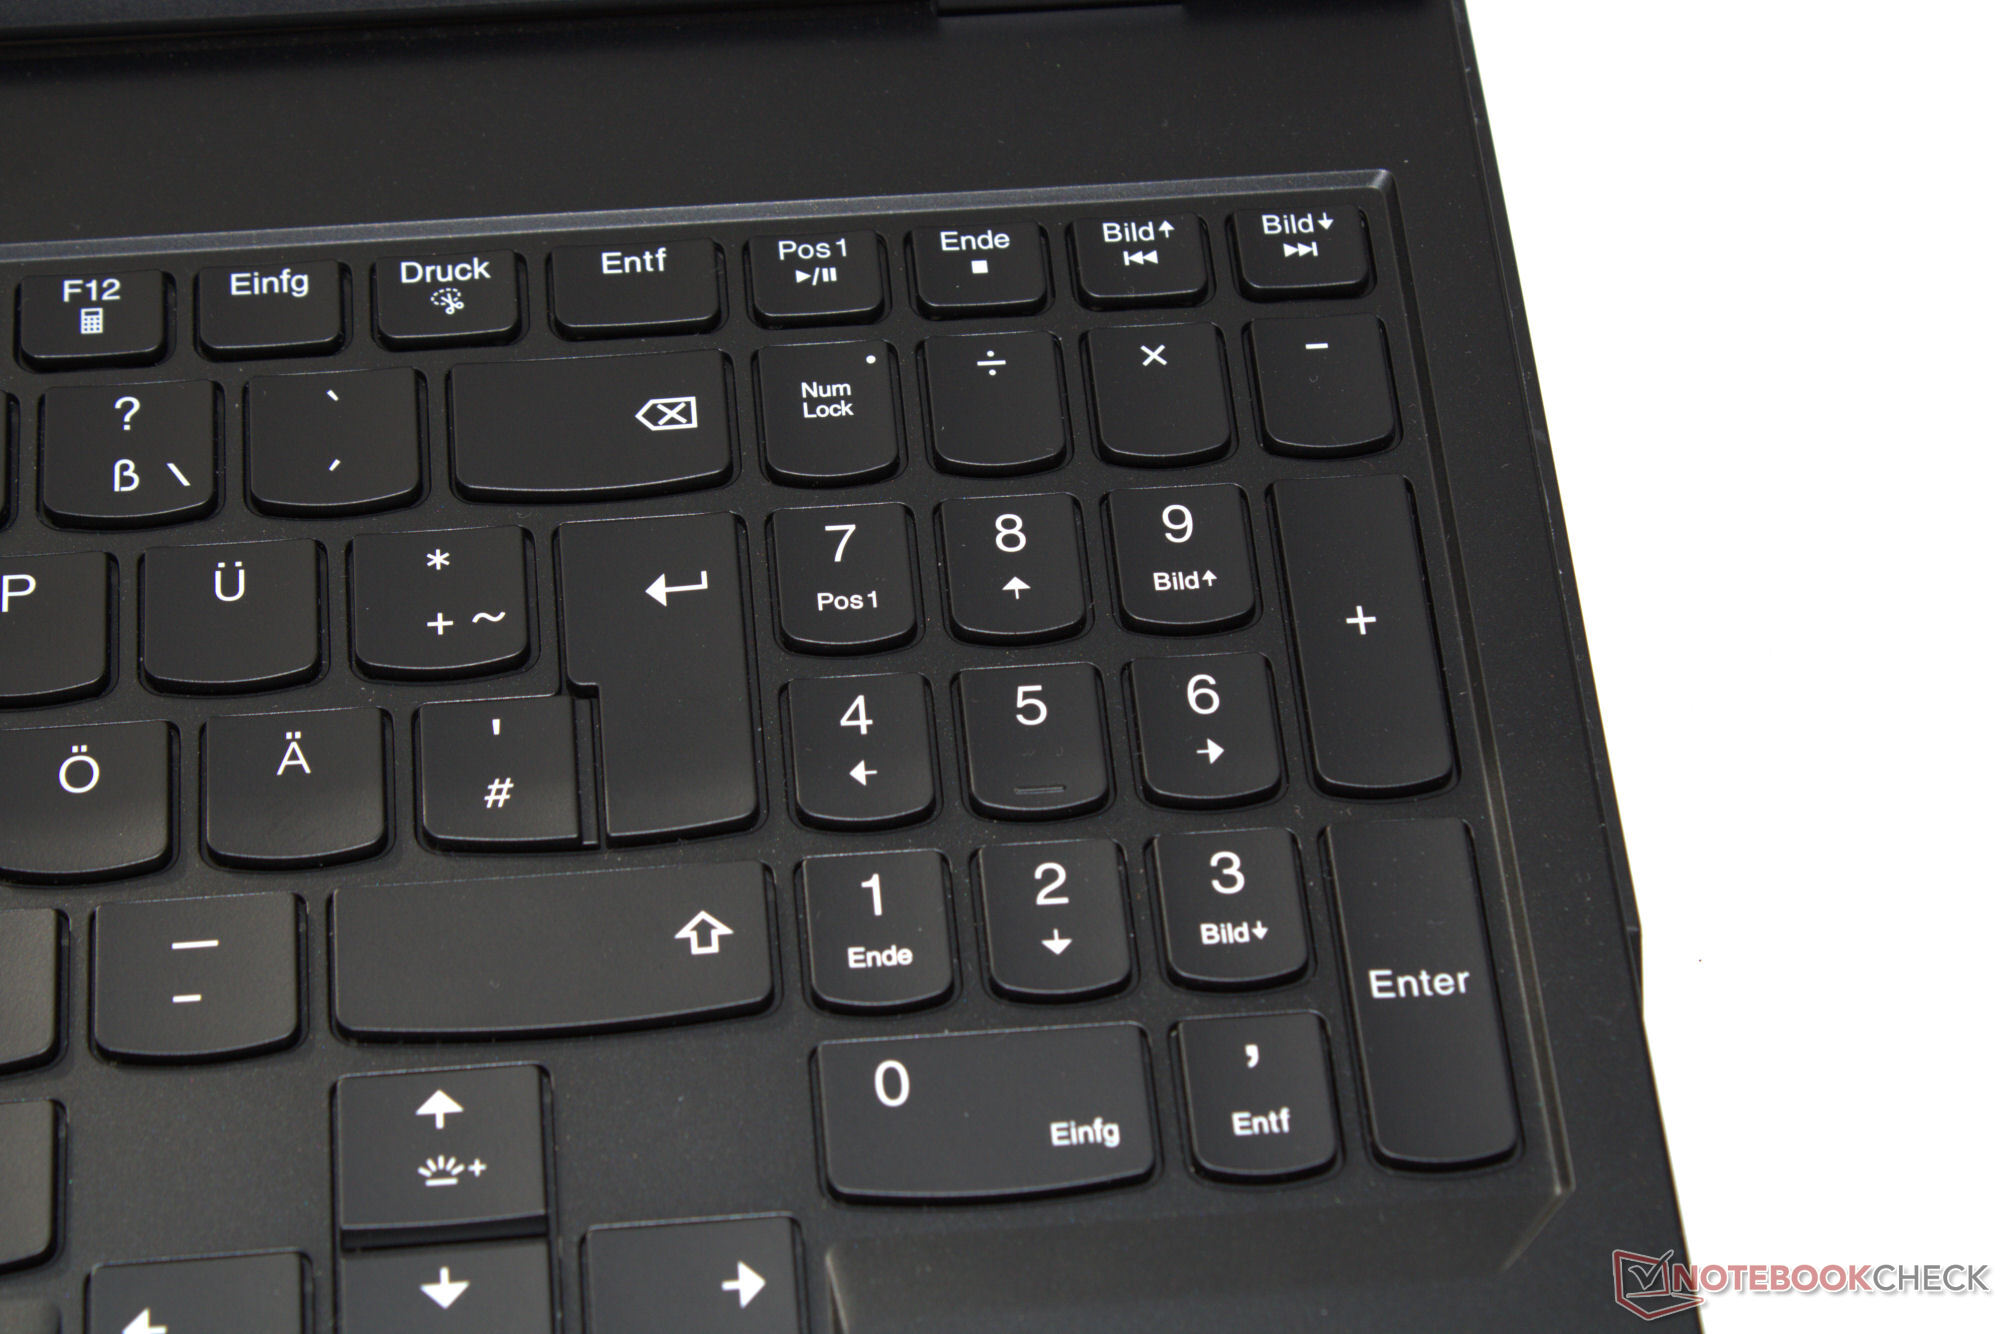
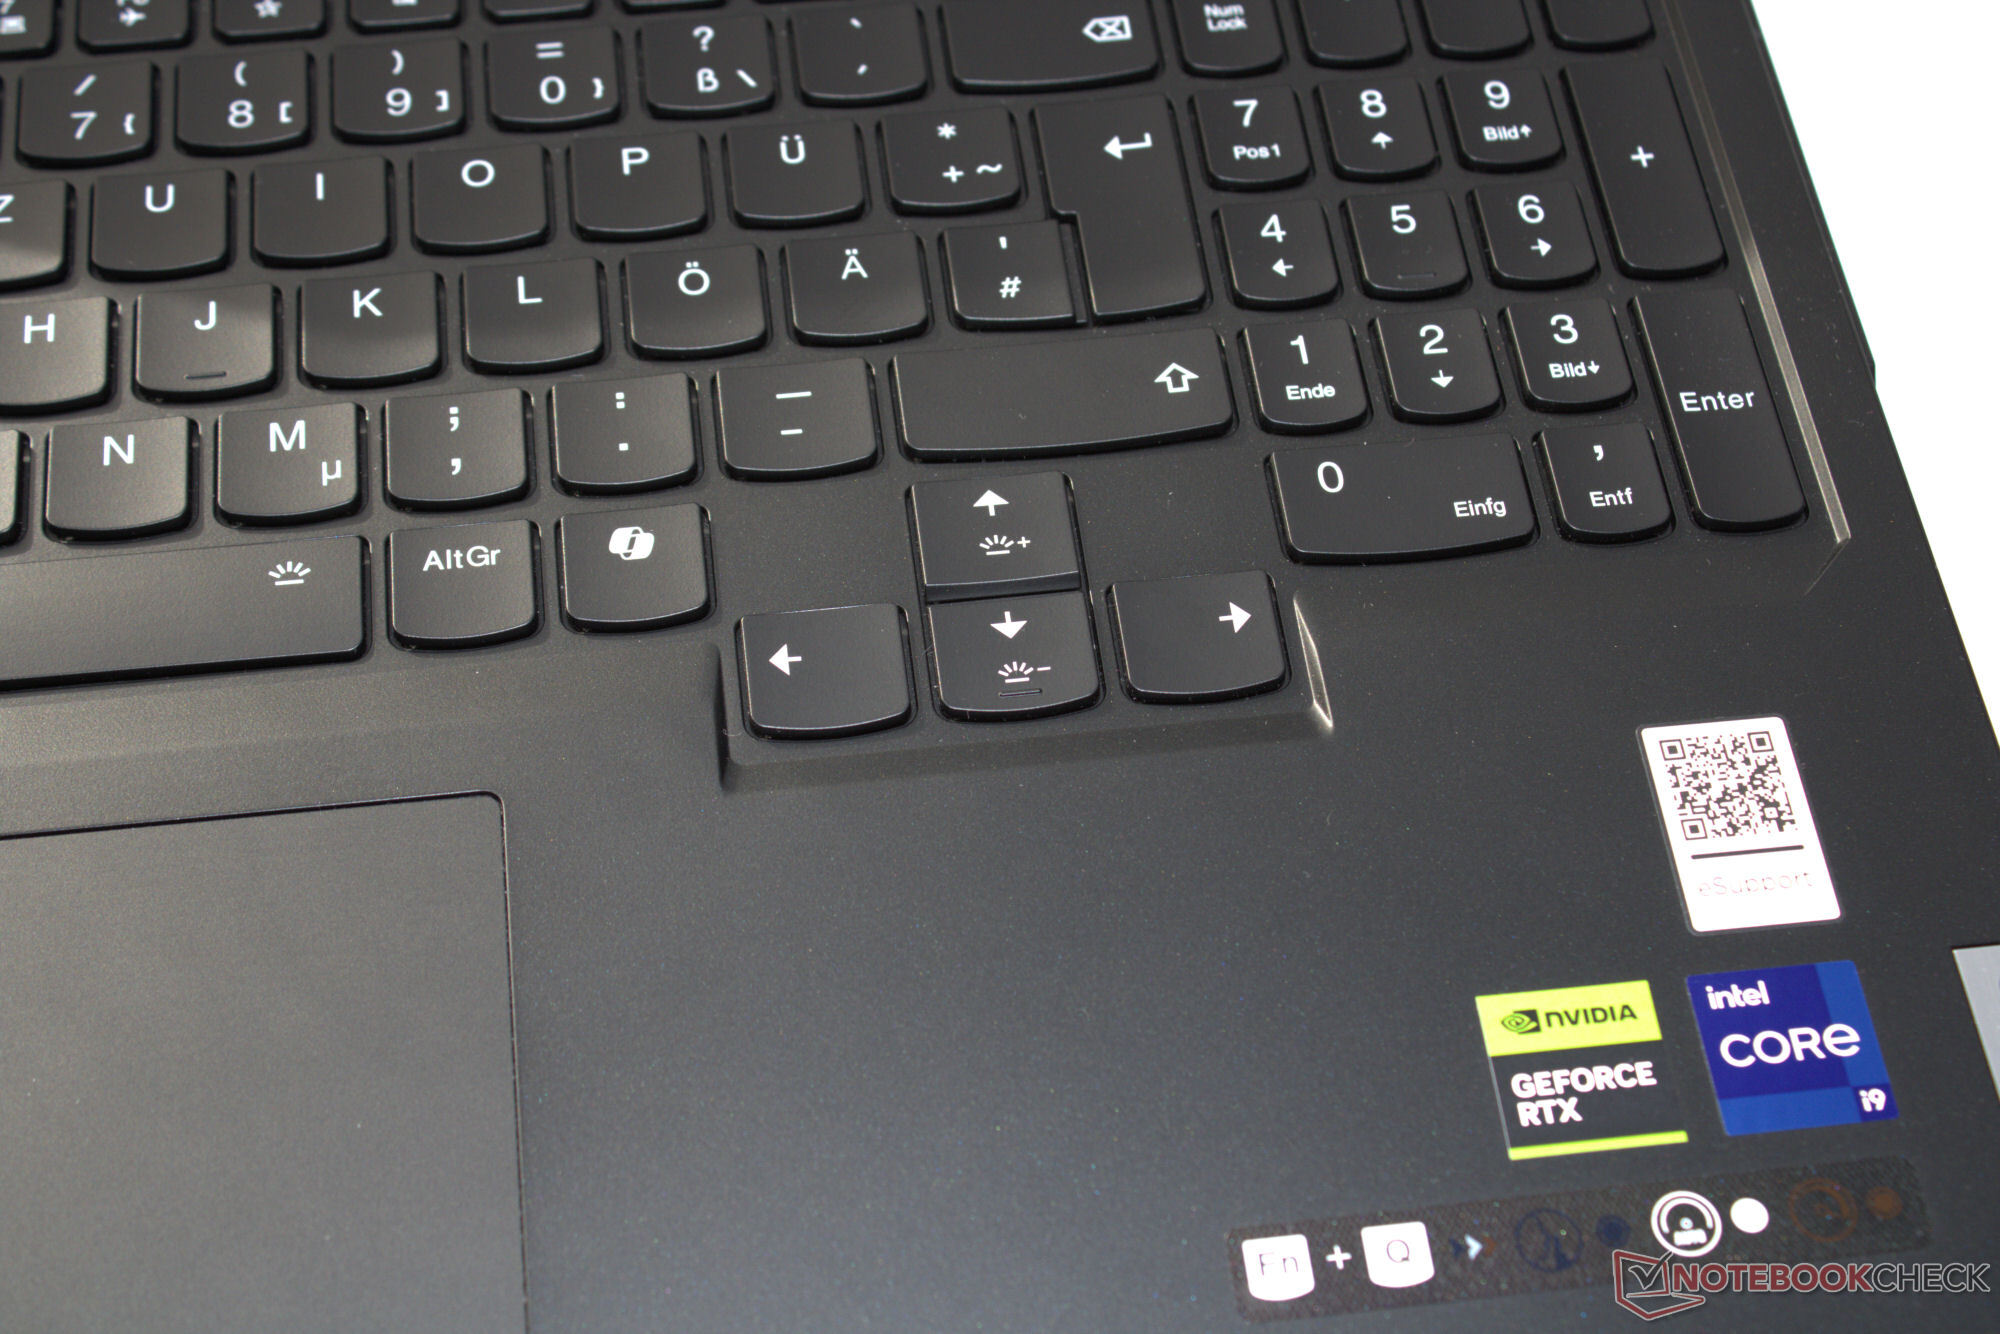
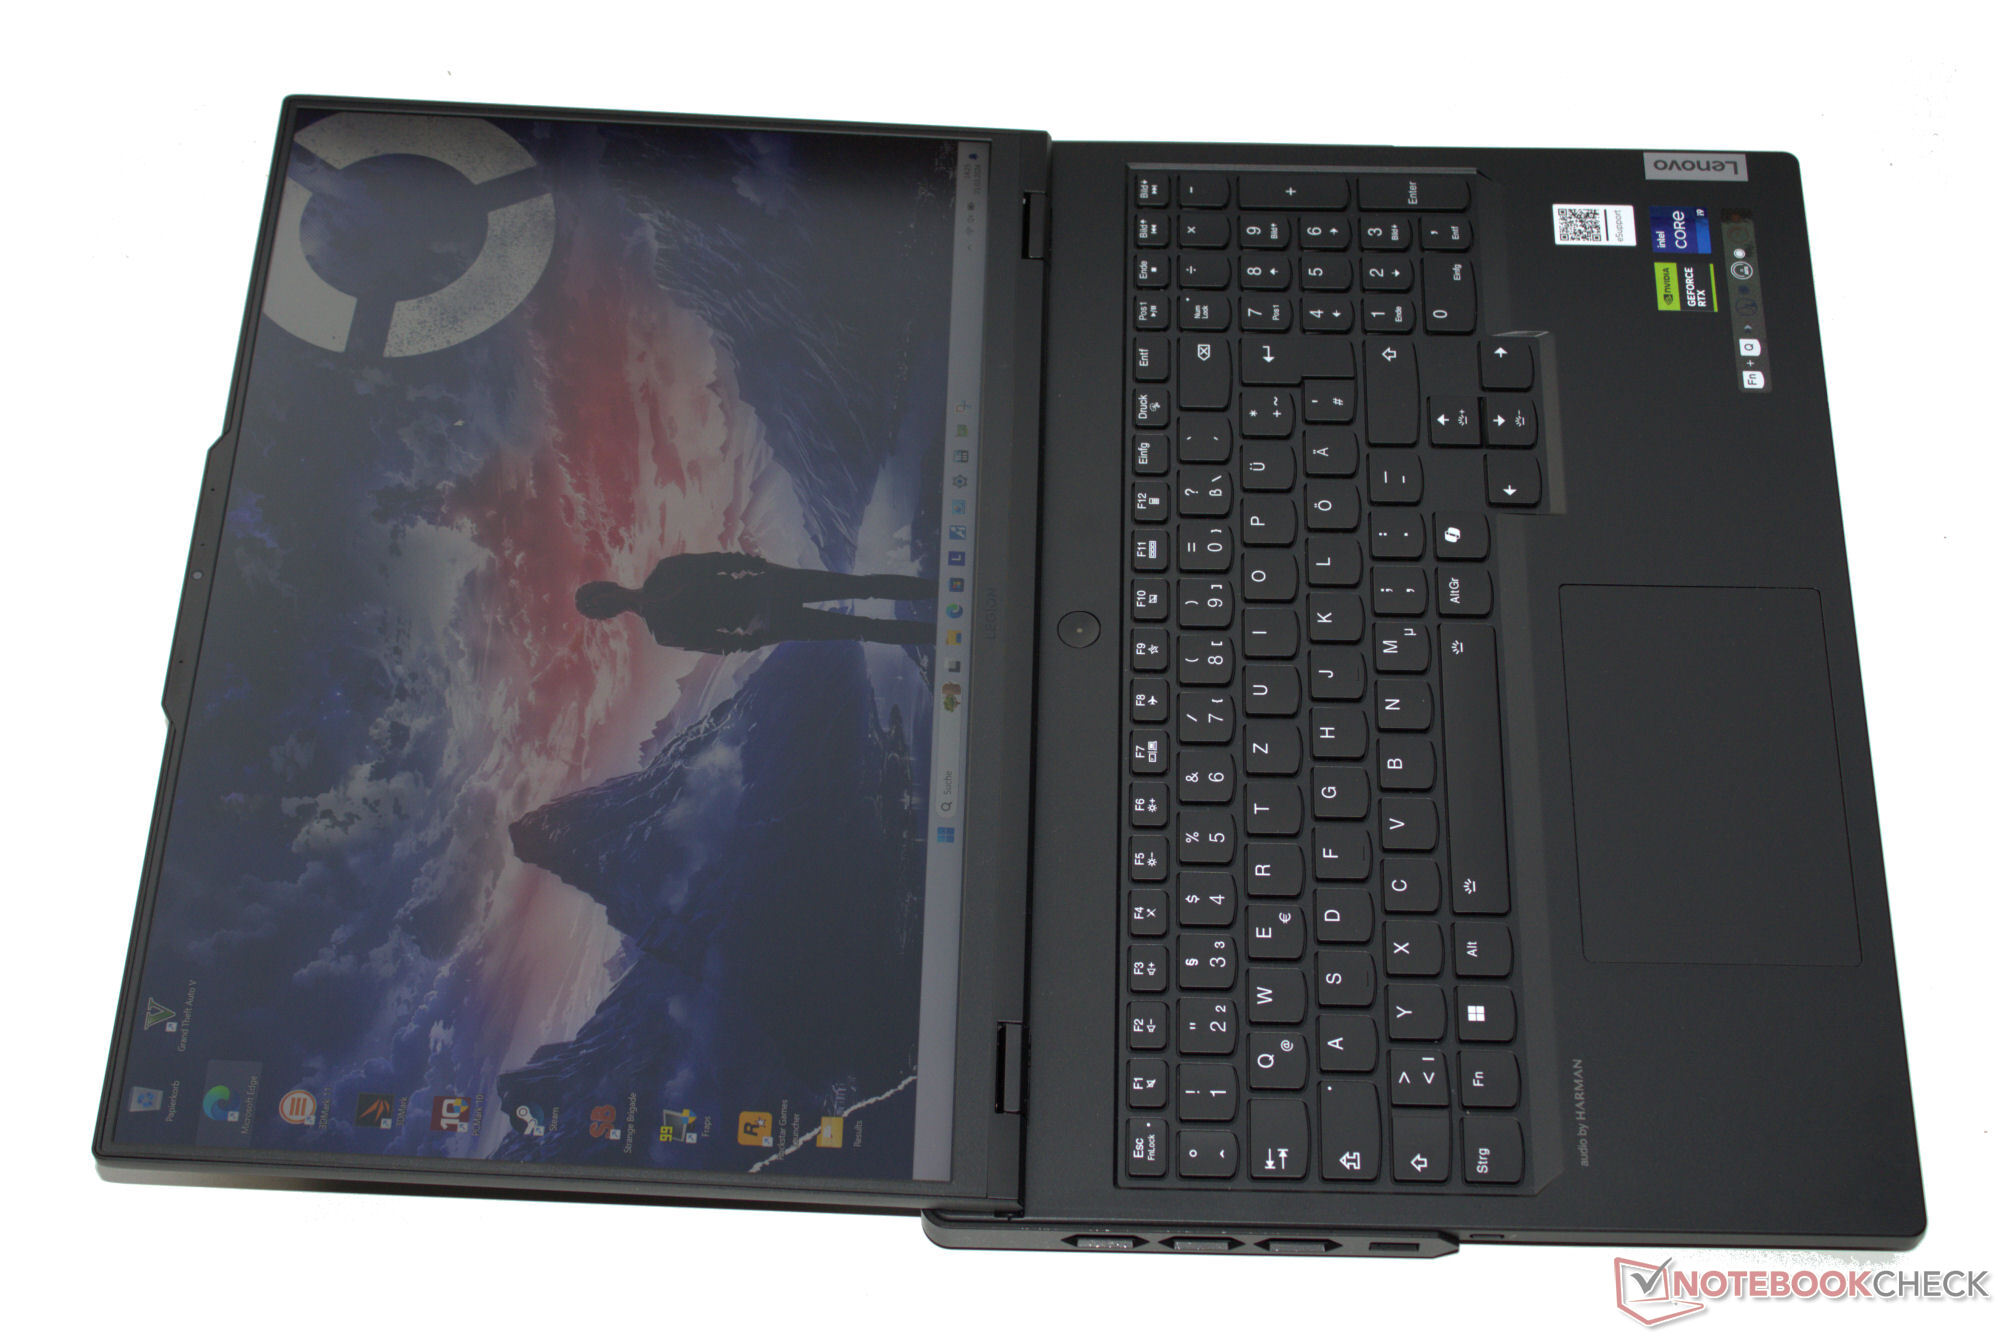


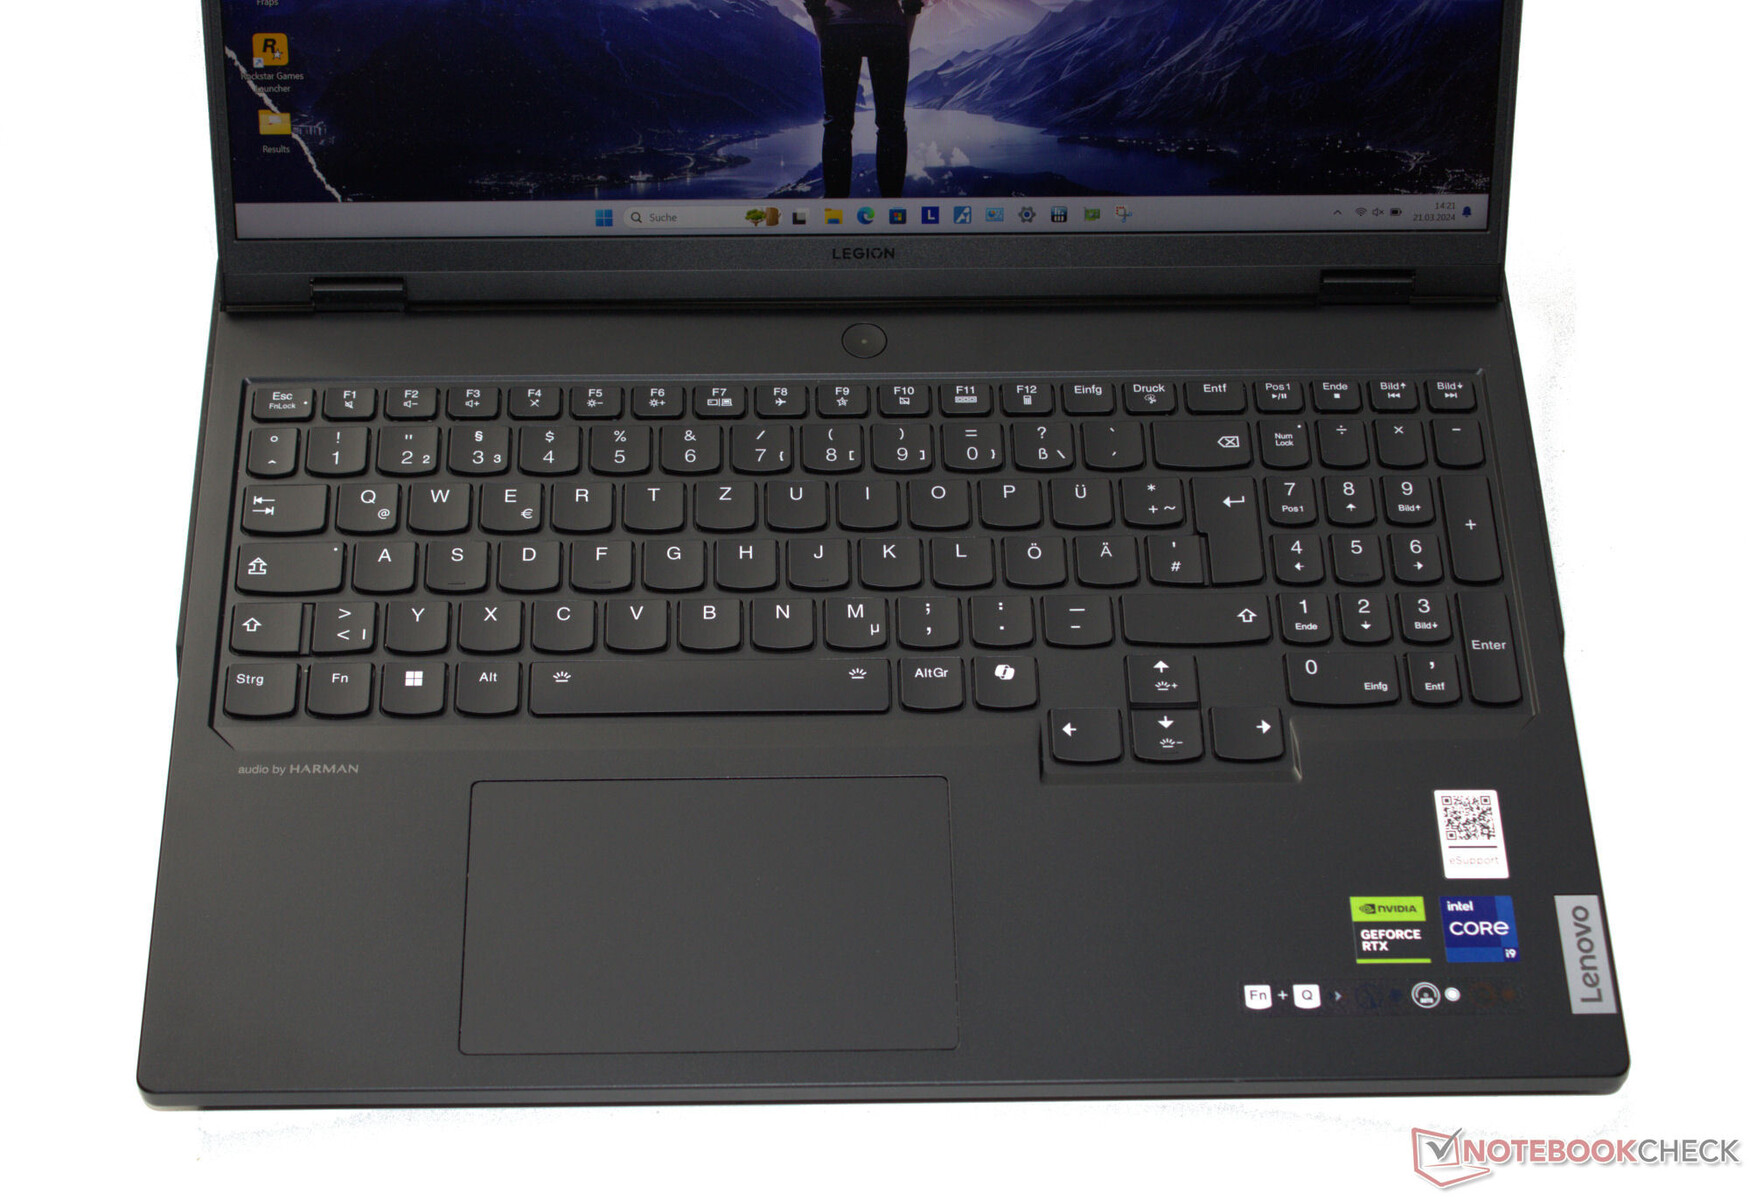
Urządzenia wejściowe - Wyposażone w wyraźną klawiaturę
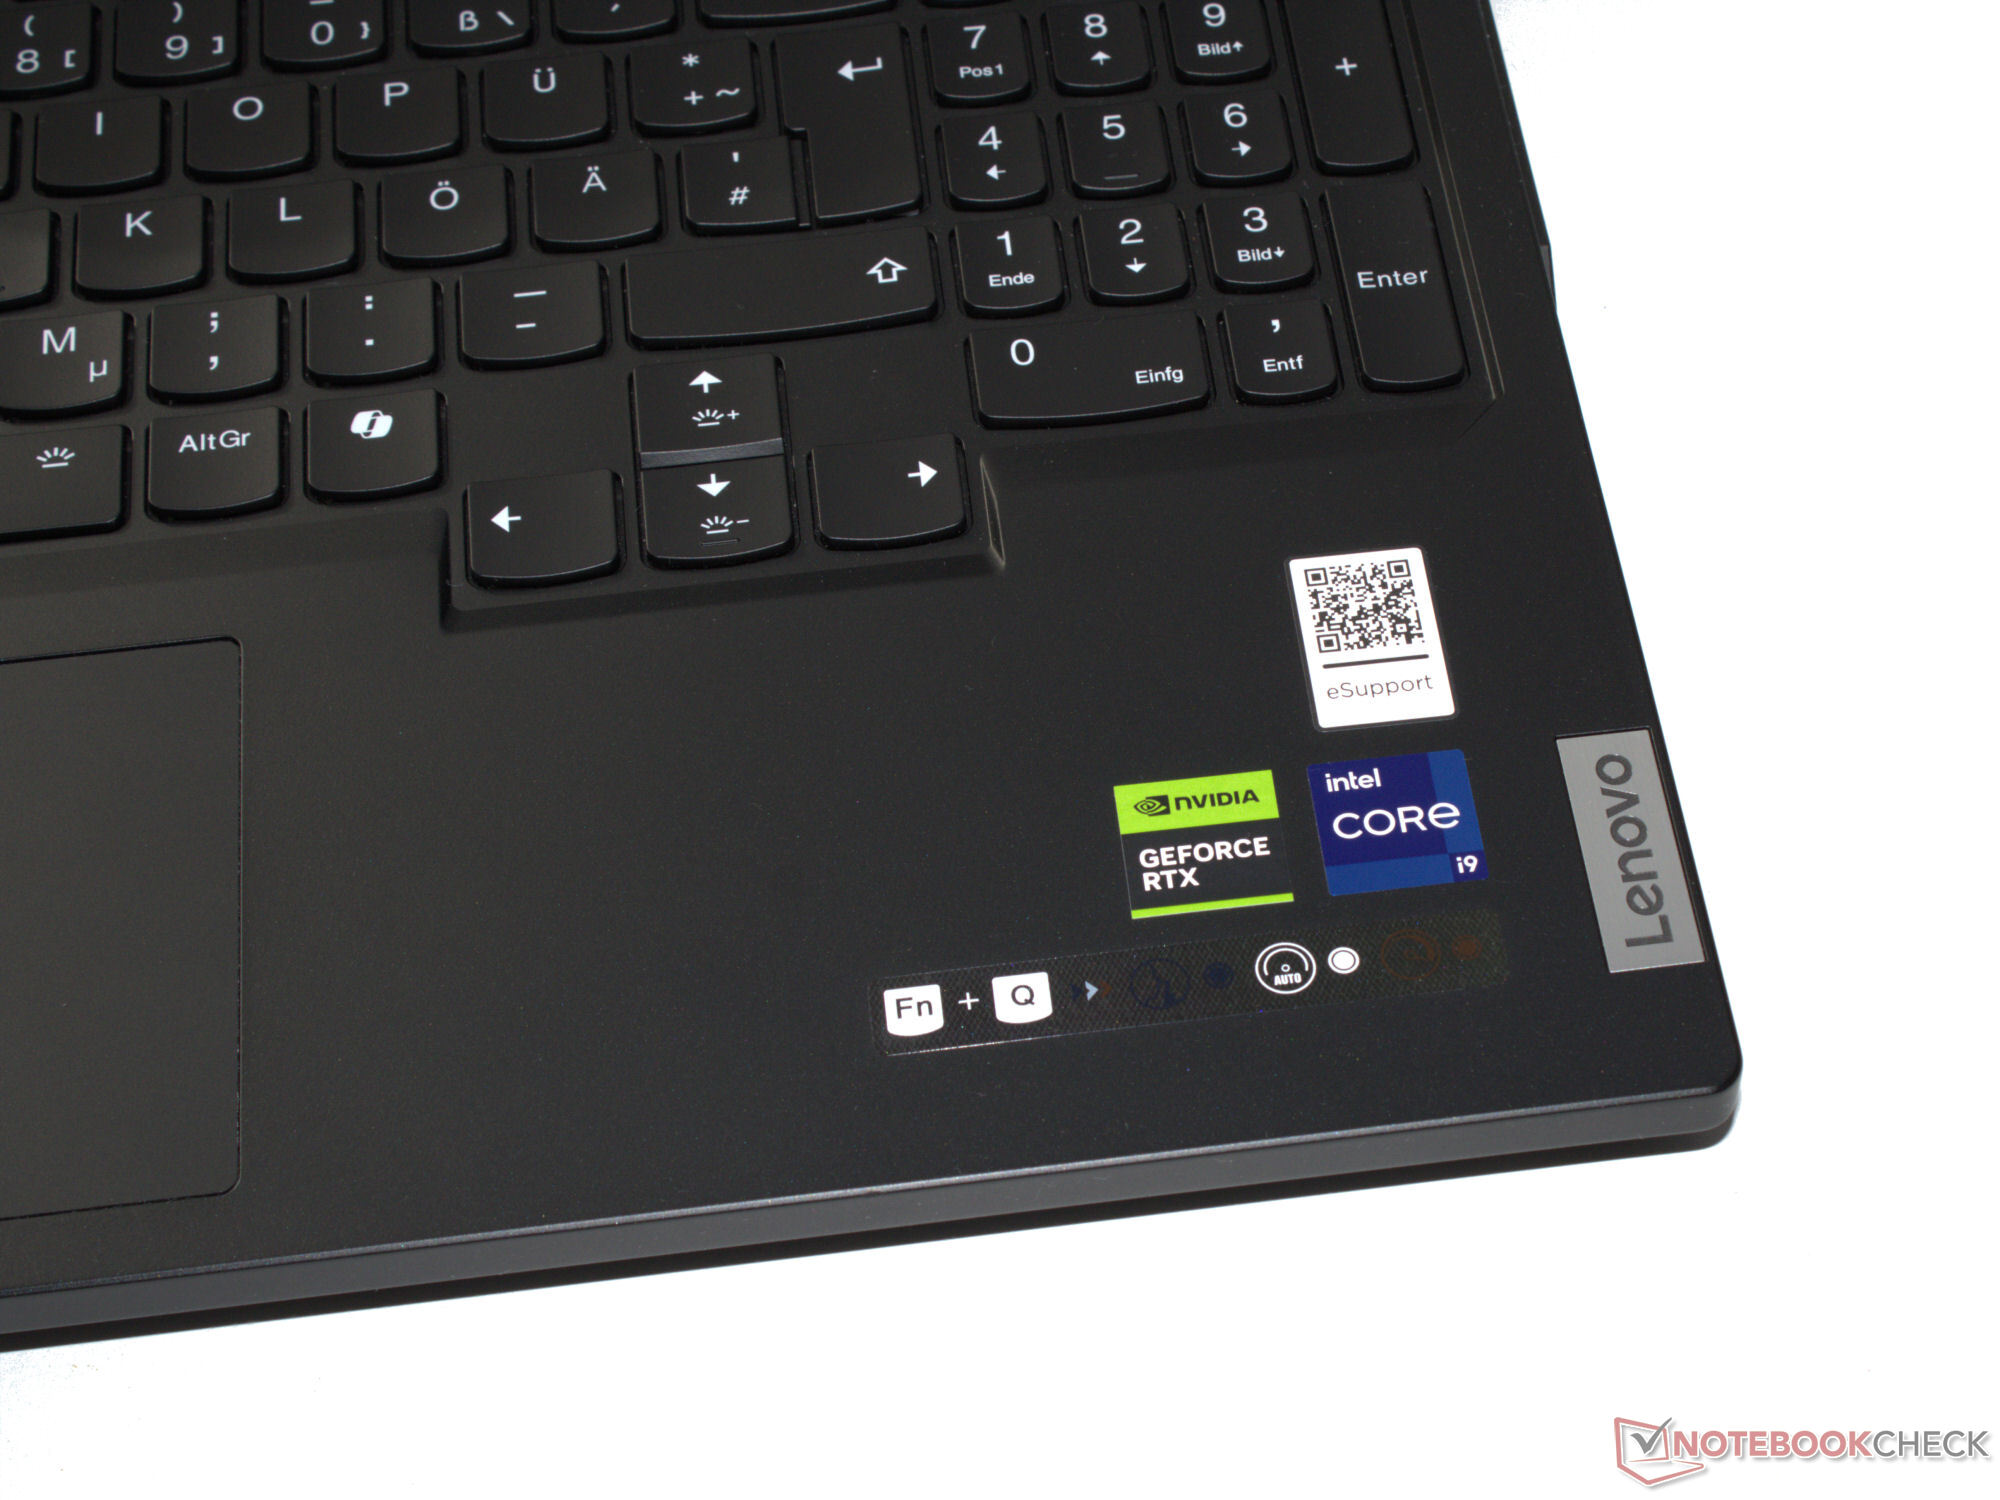
Wklęsłe klawisze typu chiclet z podświetleniem RGB mają przyjemnie twardy opór i wyraźny punkt aktywacji. Klawiatura ugina się bardzo nieznacznie podczas pisania, ale nie ma to wpływu na komfort pisania. Klawisze strzałek są pełnowymiarowe. Do sterowania myszą laptop posiada wielodotykowy clickpad (o wymiarach ok. 12 x 7,5 cm lub 4,7 x 3,0 cala) z krótkim skokiem i wyraźnym punktem kliknięcia.
Wyświetlacz - 16:10, DCI-P3, Dolby Vision
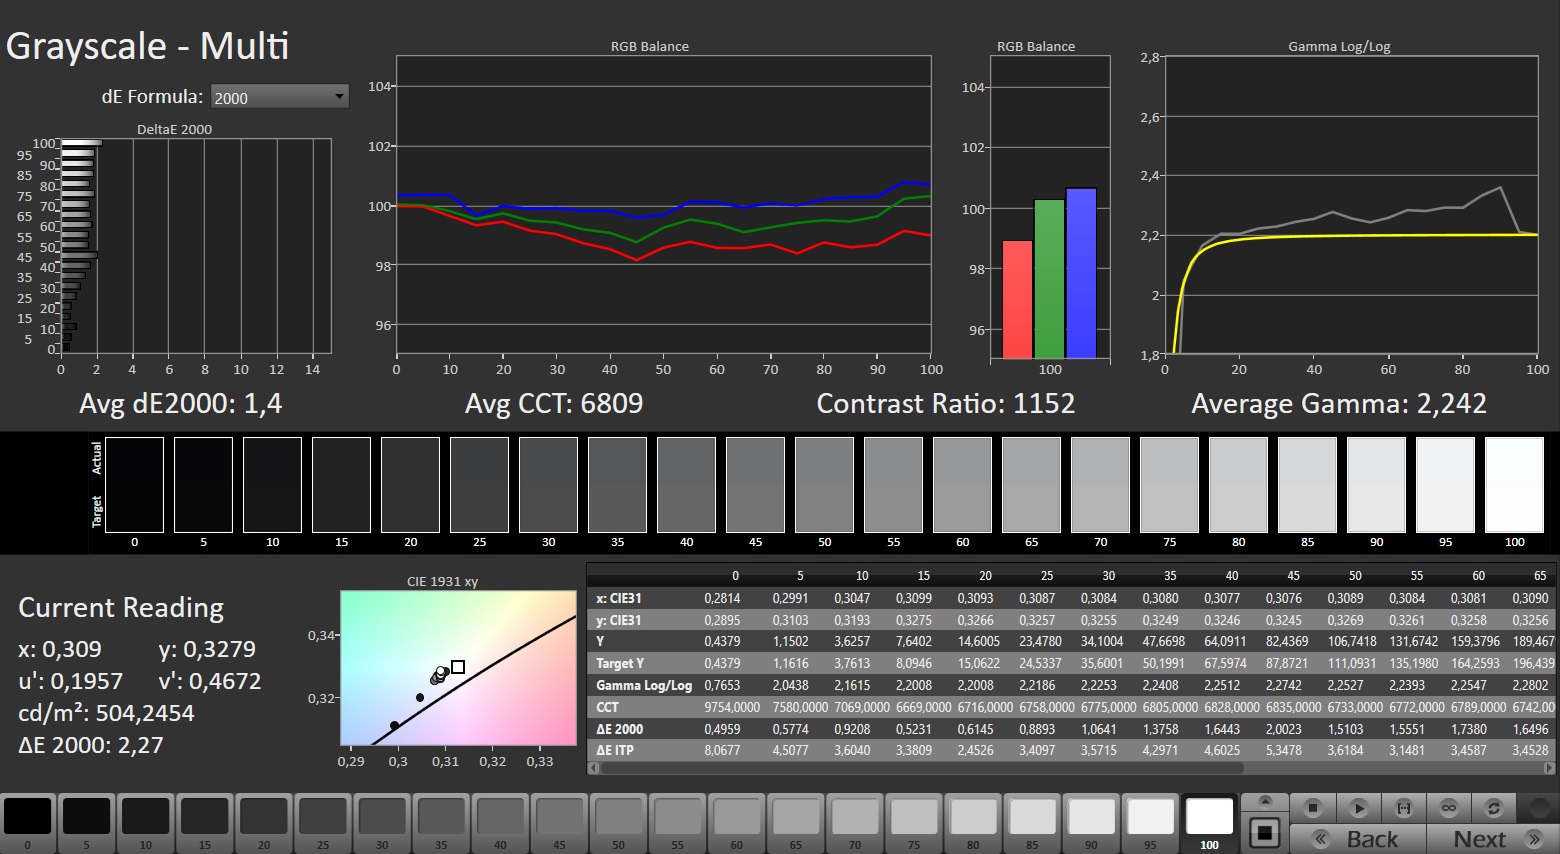
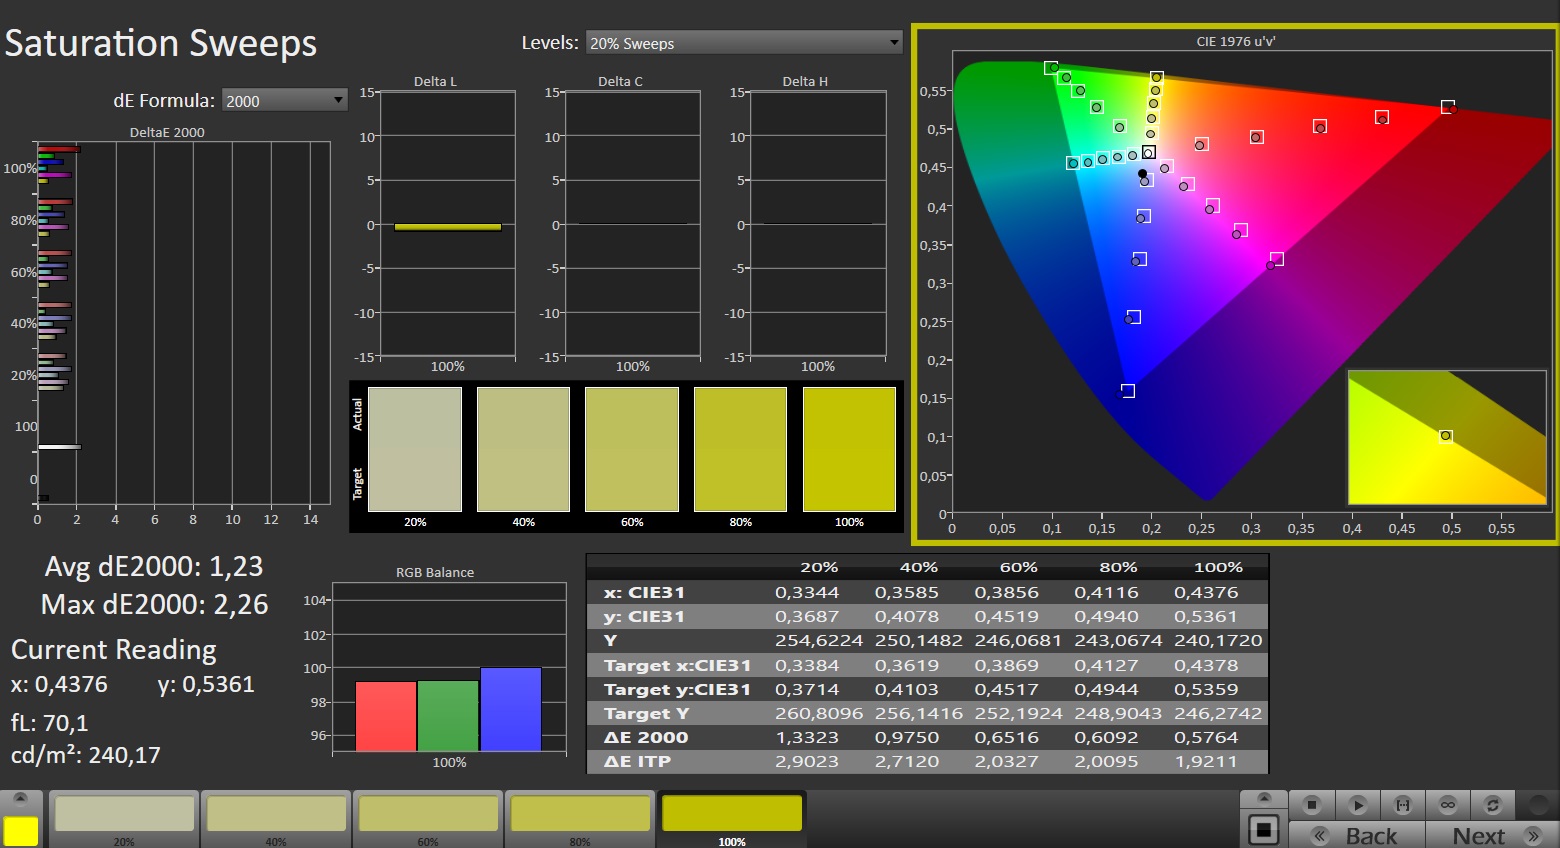
16-calowy matowy wyświetlacz IPS (rozdzielczość 2560 x 1600) o proporcjach 16:10 może pochwalić się obsługą G-Sync, Dolby Vision, krótkim czasem reakcji i brakiem migotania PWM. Jasność i kontrast panelu 240 Hz również osiągnęły poziomy, które można uznać za dobre (odpowiednio > 300 cd/m² i 1000:1). Lenovo nie oferuje żadnych innych opcji wyświetlania.
| |||||||||||||||||||||||||
rozświetlenie: 88 %
na akumulatorze: 487 cd/m²
kontrast: 1160:1 (czerń: 0.42 cd/m²)
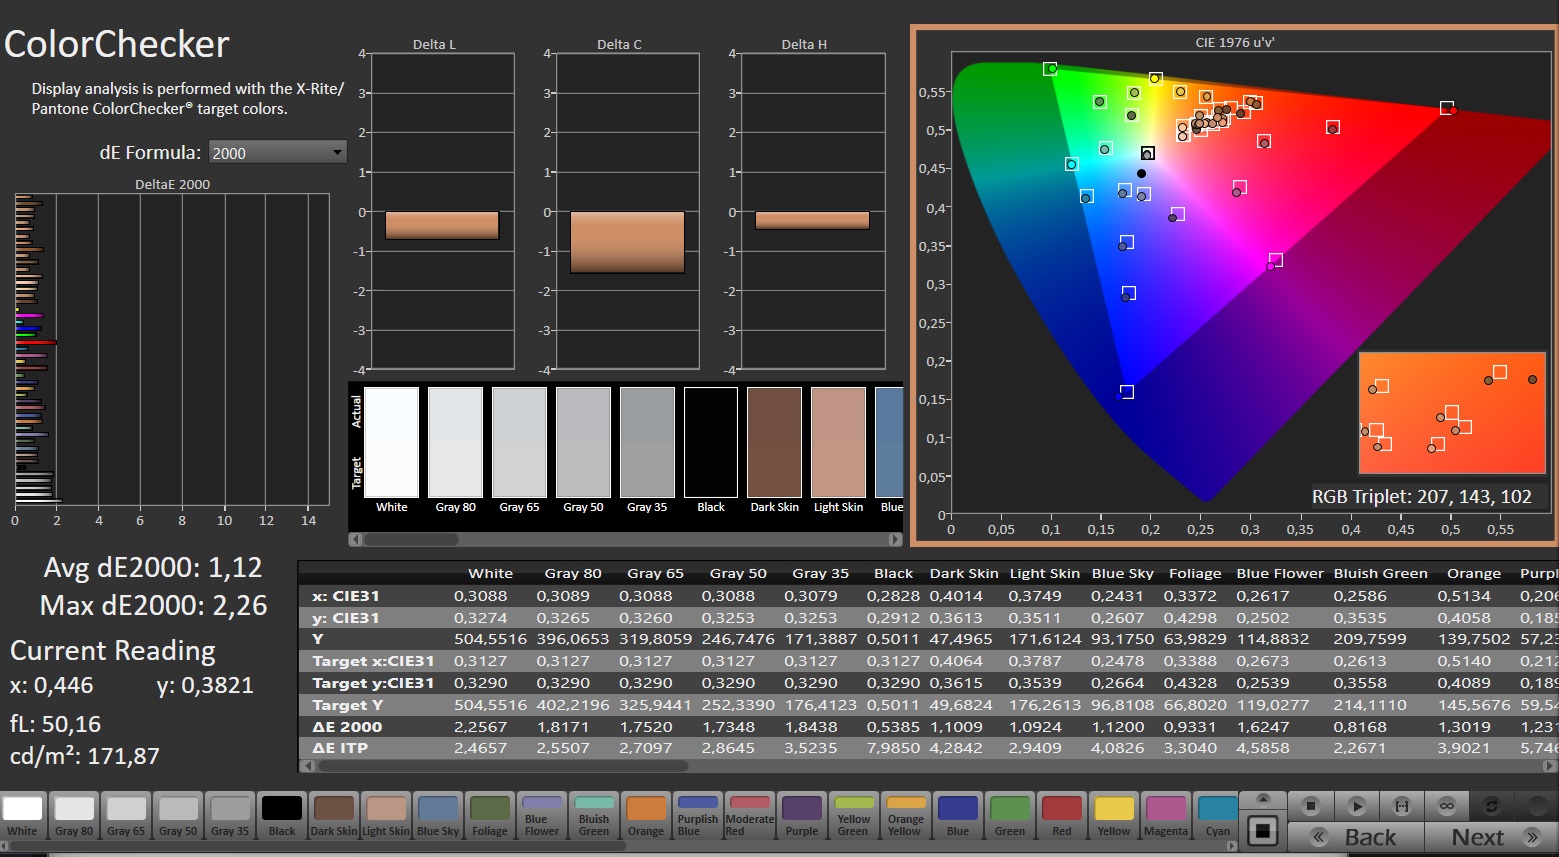
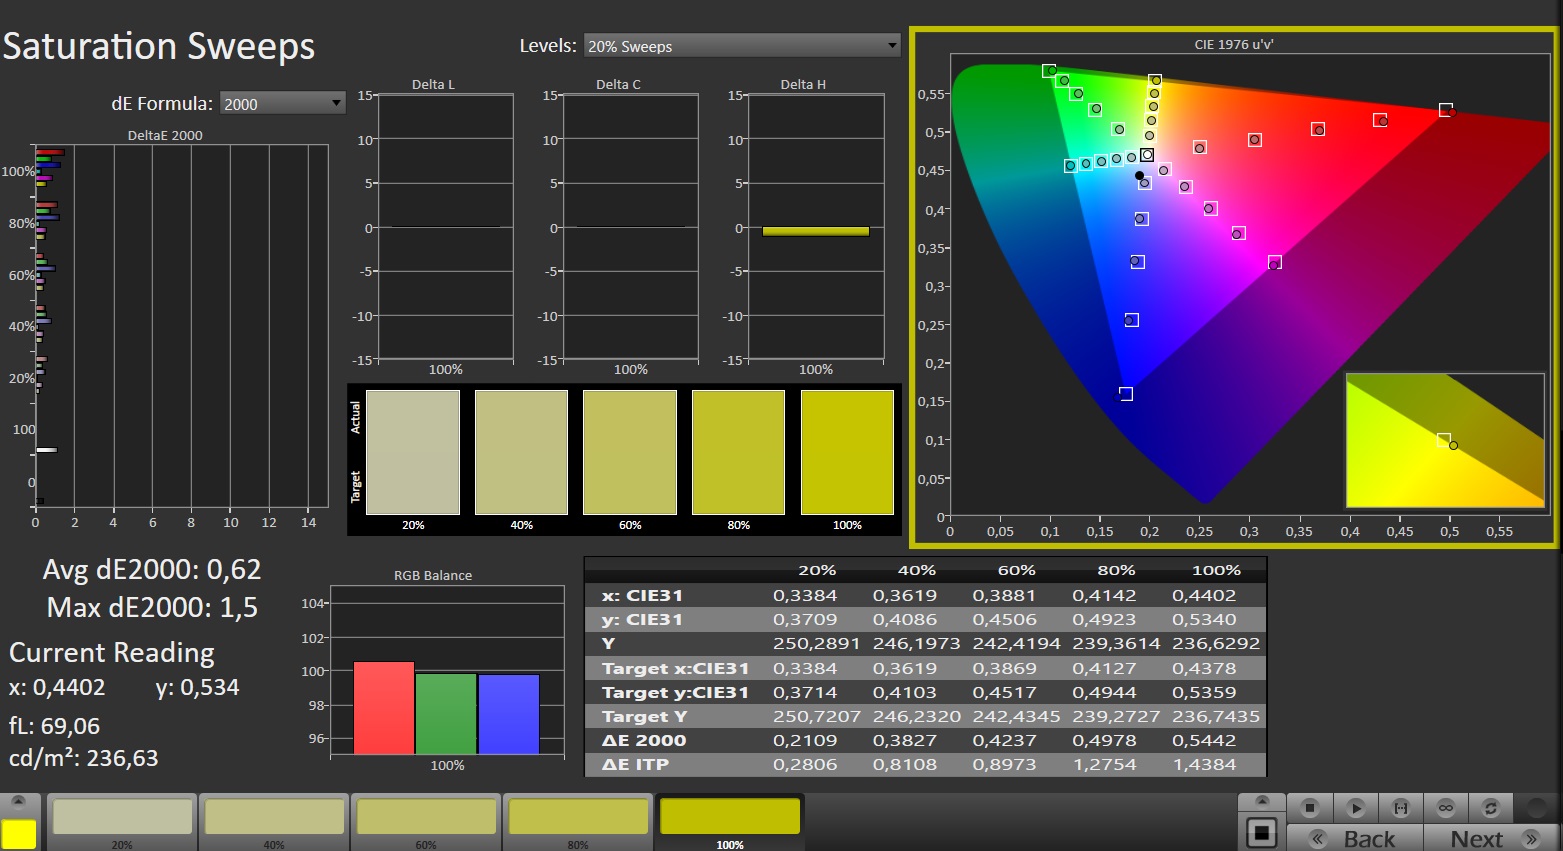
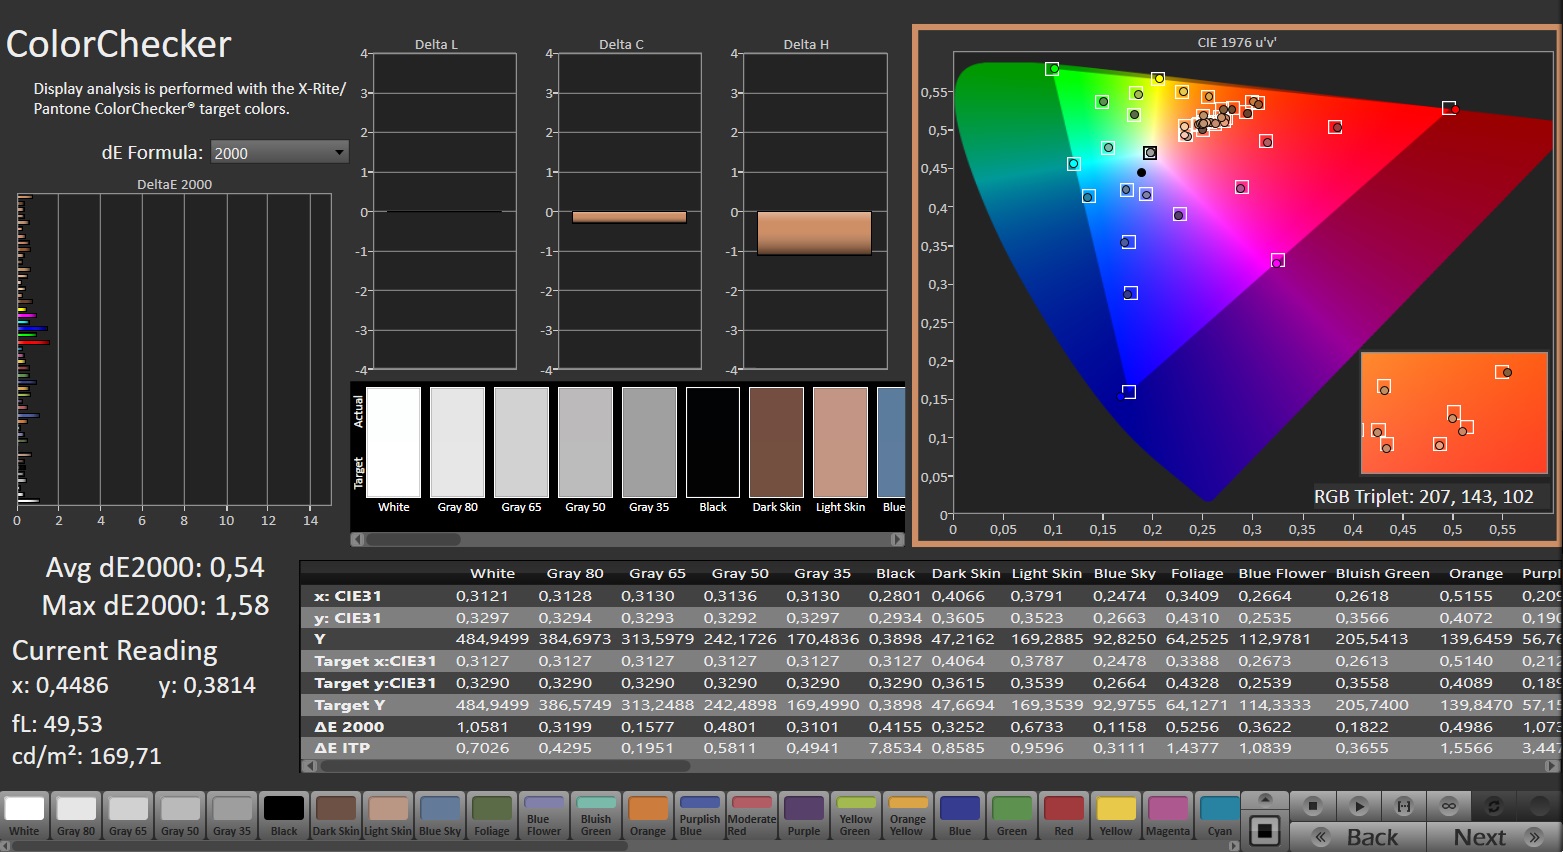
ΔE ColorChecker Calman: 1.12 | ∀{0.5-29.43 Ø4.71}
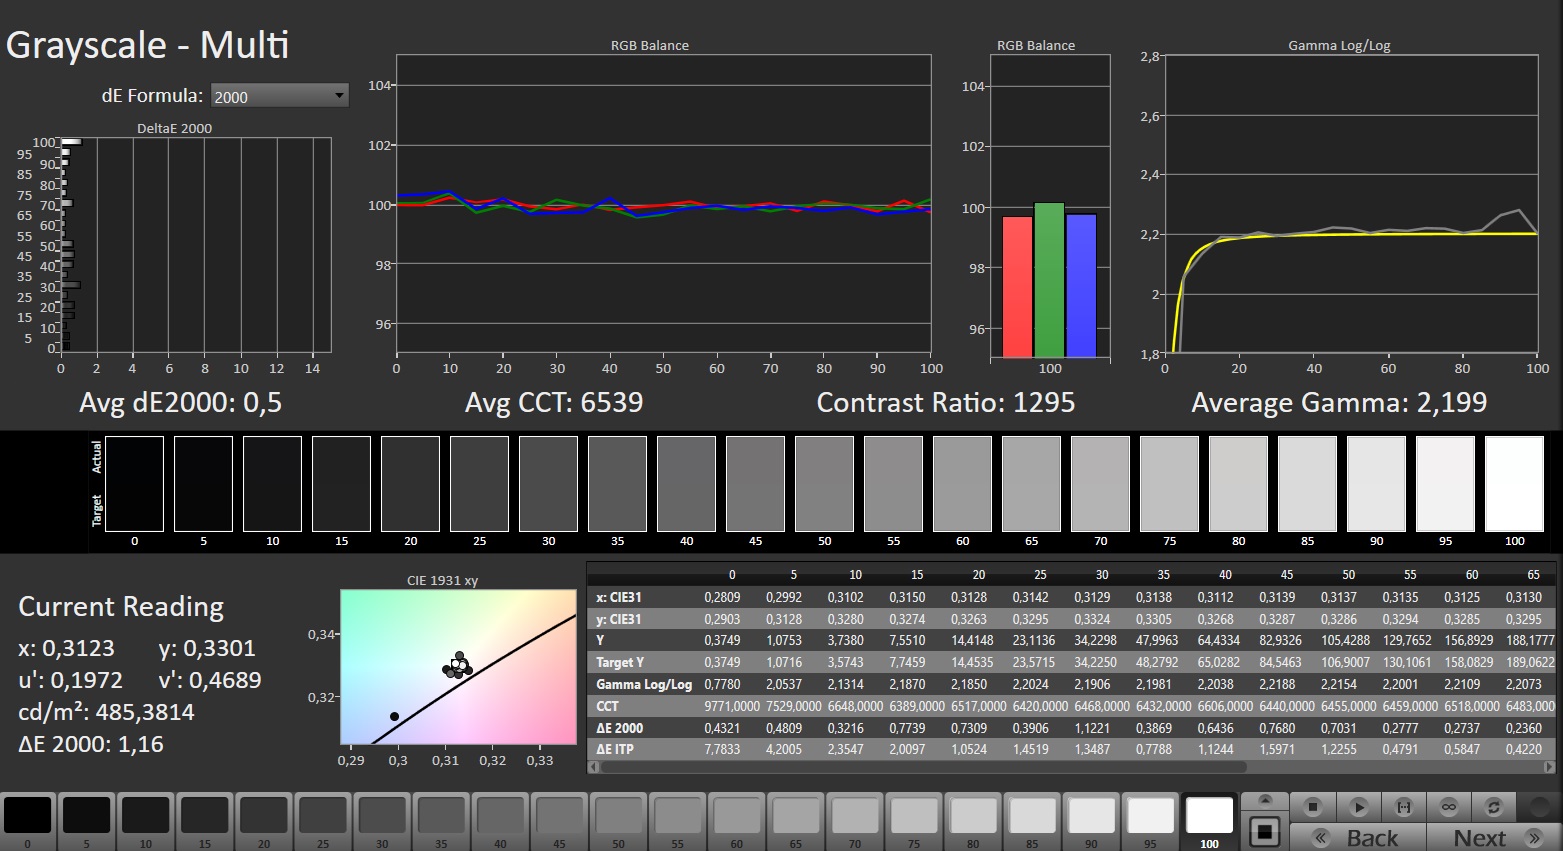
calibrated: 0.54
ΔE Greyscale Calman: 1.4 | ∀{0.09-98 Ø4.96}
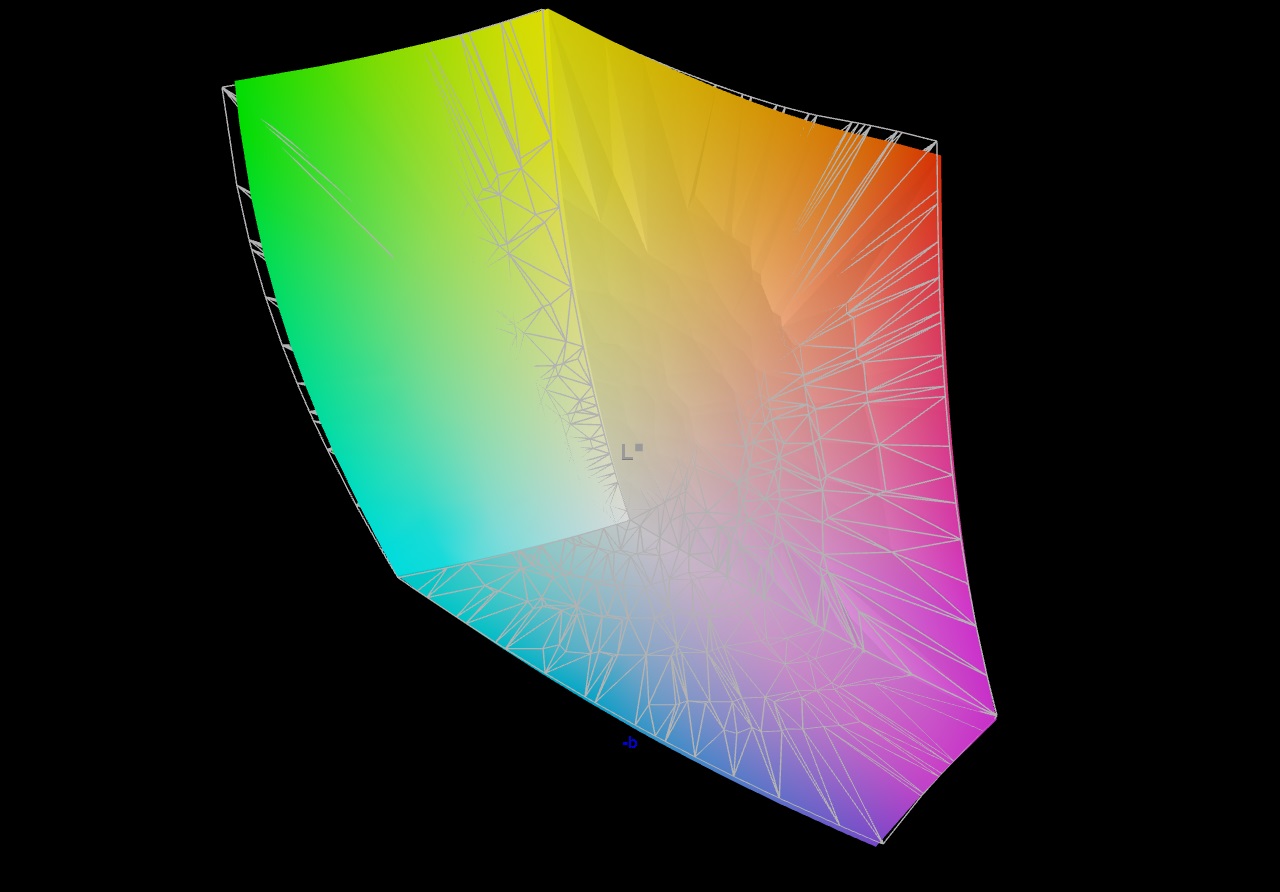
86.7% AdobeRGB 1998 (Argyll 3D)
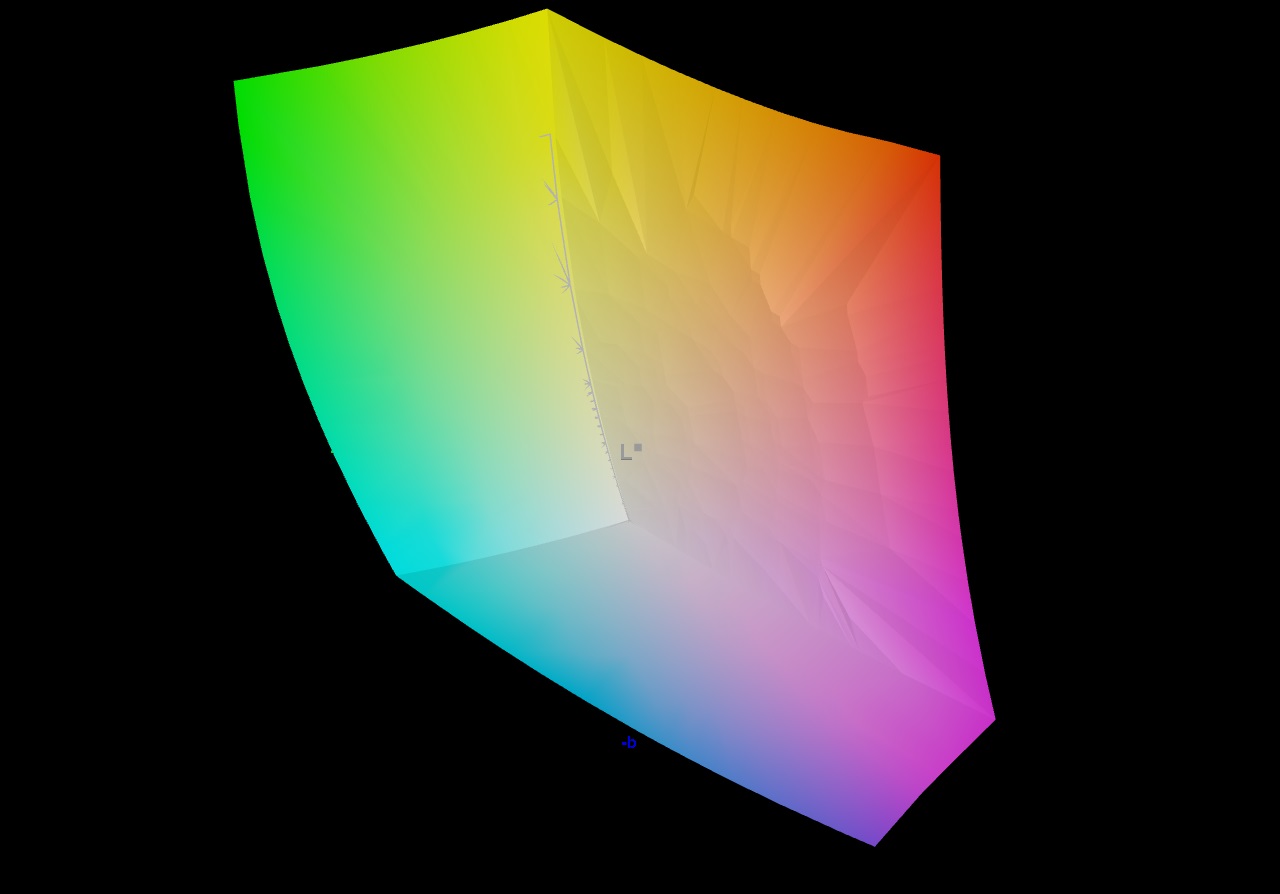
99.9% sRGB (Argyll 3D)
98.5% Display P3 (Argyll 3D)
Gamma: 2.242
CCT: 6809 K
| Lenovo Legion Pro 7 16IRX9H BOE CQ NE16QDM-NZB, IPS, 2560x1600, 16" | Alienware m16 R1 AMD BOE NE16NZ4, IPS, 2560x1600, 16" | MSI Vector 16 HX A14V Chi Mei N160GME-GTB, IPS, 2560x1600, 16" | HP Omen 16 (2024) BOE BOE0B7D, IPS, 2560x1440, 16.1" | Lenovo Legion Pro 7 16IRX8H MNG007DA2-3 (CSO1628), IPS, 2560x1600, 16" | |
|---|---|---|---|---|---|
| Display | 1% | -1% | -17% | -16% | |
| Display P3 Coverage (%) | 98.5 | 98.6 0% | 95.4 -3% | 68.6 -30% | 69.1 -30% |
| sRGB Coverage (%) | 99.9 | 99.9 0% | 99.7 0% | 98.6 -1% | 99.7 0% |
| AdobeRGB 1998 Coverage (%) | 86.7 | 88.9 3% | 85.4 -1% | 70.6 -19% | 71.2 -18% |
| Response Times | 3% | -21% | -36% | 0% | |
| Response Time Grey 50% / Grey 80% * (ms) | 12.6 ? | 5.1 ? 60% | 5.7 ? 55% | 14.1 ? -12% | 12.3 ? 2% |
| Response Time Black / White * (ms) | 5.8 ? | 9 ? -55% | 11.4 ? -97% | 9.3 ? -60% | 5.9 ? -2% |
| PWM Frequency (Hz) | |||||
| Screen | -109% | -73% | -46% | 3% | |
| Brightness middle (cd/m²) | 487 | 329 -32% | 557.2 14% | 292 -40% | 511 5% |
| Brightness (cd/m²) | 460 | 317 -31% | 506 10% | 291 -37% | 469 2% |
| Brightness Distribution (%) | 88 | 89 1% | 83 -6% | 85 -3% | 86 -2% |
| Black Level * (cd/m²) | 0.42 | 0.32 24% | 0.41 2% | 0.24 43% | 0.4 5% |
| Contrast (:1) | 1160 | 1028 -11% | 1359 17% | 1217 5% | 1278 10% |
| Colorchecker dE 2000 * | 1.12 | 3.71 -231% | 2.91 -160% | 2.36 -111% | 0.95 15% |
| Colorchecker dE 2000 max. * | 2.26 | 7.23 -220% | 5.94 -163% | 4.08 -81% | 2.07 8% |
| Colorchecker dE 2000 calibrated * | 0.54 | 2.82 -422% | 1.63 -202% | 0.93 -72% | 0.91 -69% |
| Greyscale dE 2000 * | 1.4 | 2.2 -57% | 3.8 -171% | 3 -114% | 0.6 57% |
| Gamma | 2.242 98% | 2.3 96% | 2.23 99% | 2.101 105% | 2.176 101% |
| CCT | 6809 95% | 6270 104% | 6408 101% | 5976 109% | 6545 99% |
| Całkowita średnia (program / ustawienia) | -35% /
-69% | -32% /
-50% | -33% /
-38% | -4% /
-1% |
* ... im mniej tym lepiej
Ekran miał fantastyczne odwzorowanie kolorów już po wyjęciu z pudełka. Delta E wynosiła około 1,1, spełniając docelowy poziom poniżej 3. Kalibracja wyświetlacza zmniejszyła średnią różnicę kolorów do 0,54 i zapewniła bardziej zrównoważoną skalę szarości. Panel jest w stanie w pełni pokryć gamut sRGB i DCI-P3, ale nie przestrzeń barw AdobeRGB. Jest to podobne do tego, co oferują wyświetlacze w większości konkurencyjnych laptopów.

Wyświetl czasy reakcji
| ↔ Czas reakcji od czerni do bieli | ||
|---|---|---|
| 5.8 ms ... wzrost ↗ i spadek ↘ łącznie | ↗ 2.1 ms wzrost | 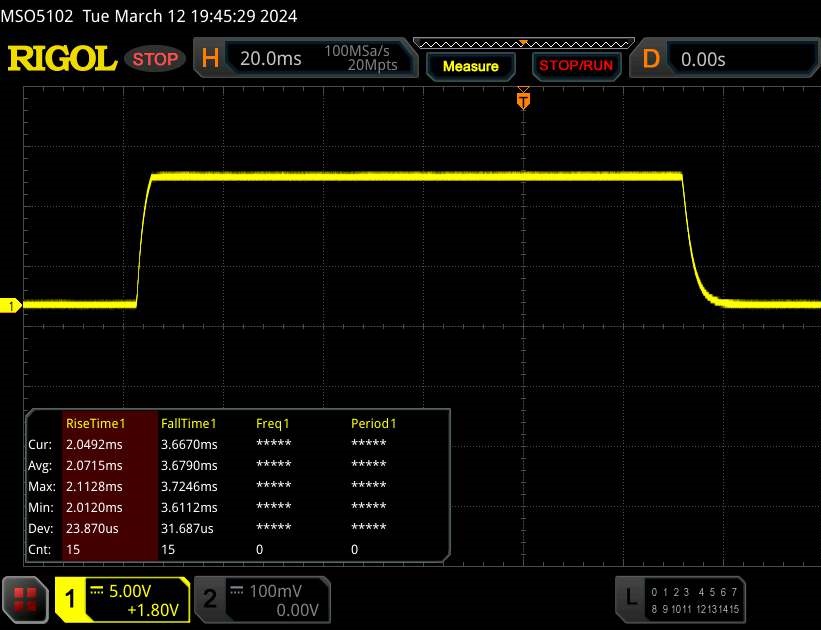 |
| ↘ 3.7 ms upadek | ||
| W naszych testach ekran wykazuje bardzo szybką reakcję i powinien bardzo dobrze nadawać się do szybkich gier. Dla porównania, wszystkie testowane urządzenia wahają się od 0.1 (minimum) do 240 (maksimum) ms. » 18 % wszystkich urządzeń jest lepszych. Oznacza to, że zmierzony czas reakcji jest lepszy od średniej wszystkich testowanych urządzeń (19.8 ms). | ||
| ↔ Czas reakcji 50% szarości do 80% szarości | ||
| 12.6 ms ... wzrost ↗ i spadek ↘ łącznie | ↗ 6 ms wzrost | 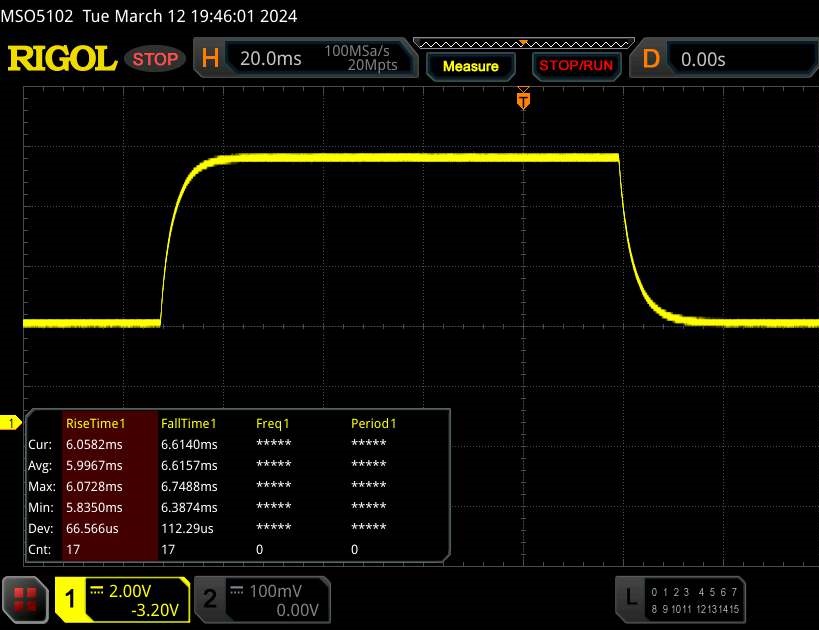 |
| ↘ 6.6 ms upadek | ||
| W naszych testach ekran wykazuje dobry współczynnik reakcji, ale może być zbyt wolny dla graczy rywalizujących ze sobą. Dla porównania, wszystkie testowane urządzenia wahają się od 0.165 (minimum) do 636 (maksimum) ms. » 26 % wszystkich urządzeń jest lepszych. Oznacza to, że zmierzony czas reakcji jest lepszy od średniej wszystkich testowanych urządzeń (31 ms). | ||
Migotanie ekranu / PWM (modulacja szerokości impulsu)
| Migotanie ekranu/nie wykryto PWM | 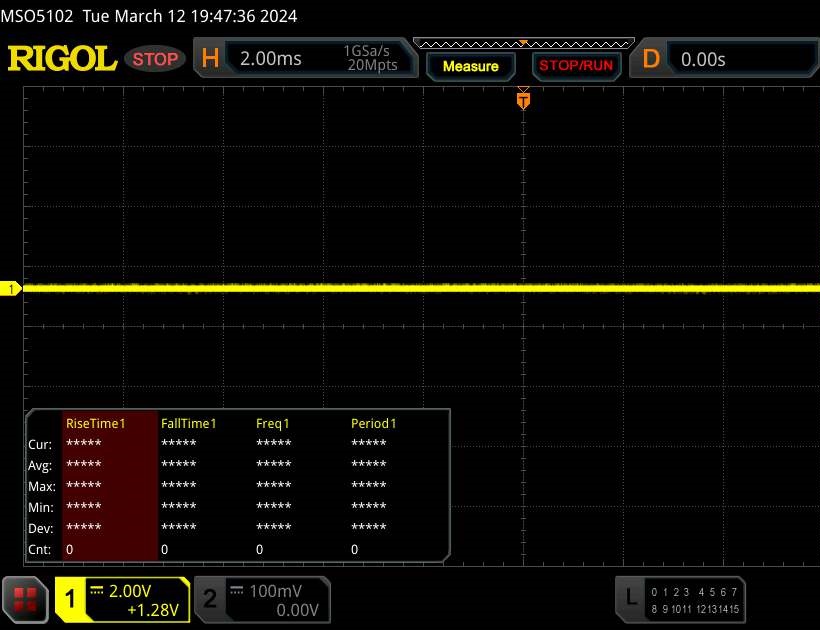 | ||
Dla porównania: 52 % wszystkich testowanych urządzeń nie używa PWM do przyciemniania wyświetlacza. Jeśli wykryto PWM, zmierzono średnio 7757 (minimum: 5 - maksimum: 343500) Hz. | |||
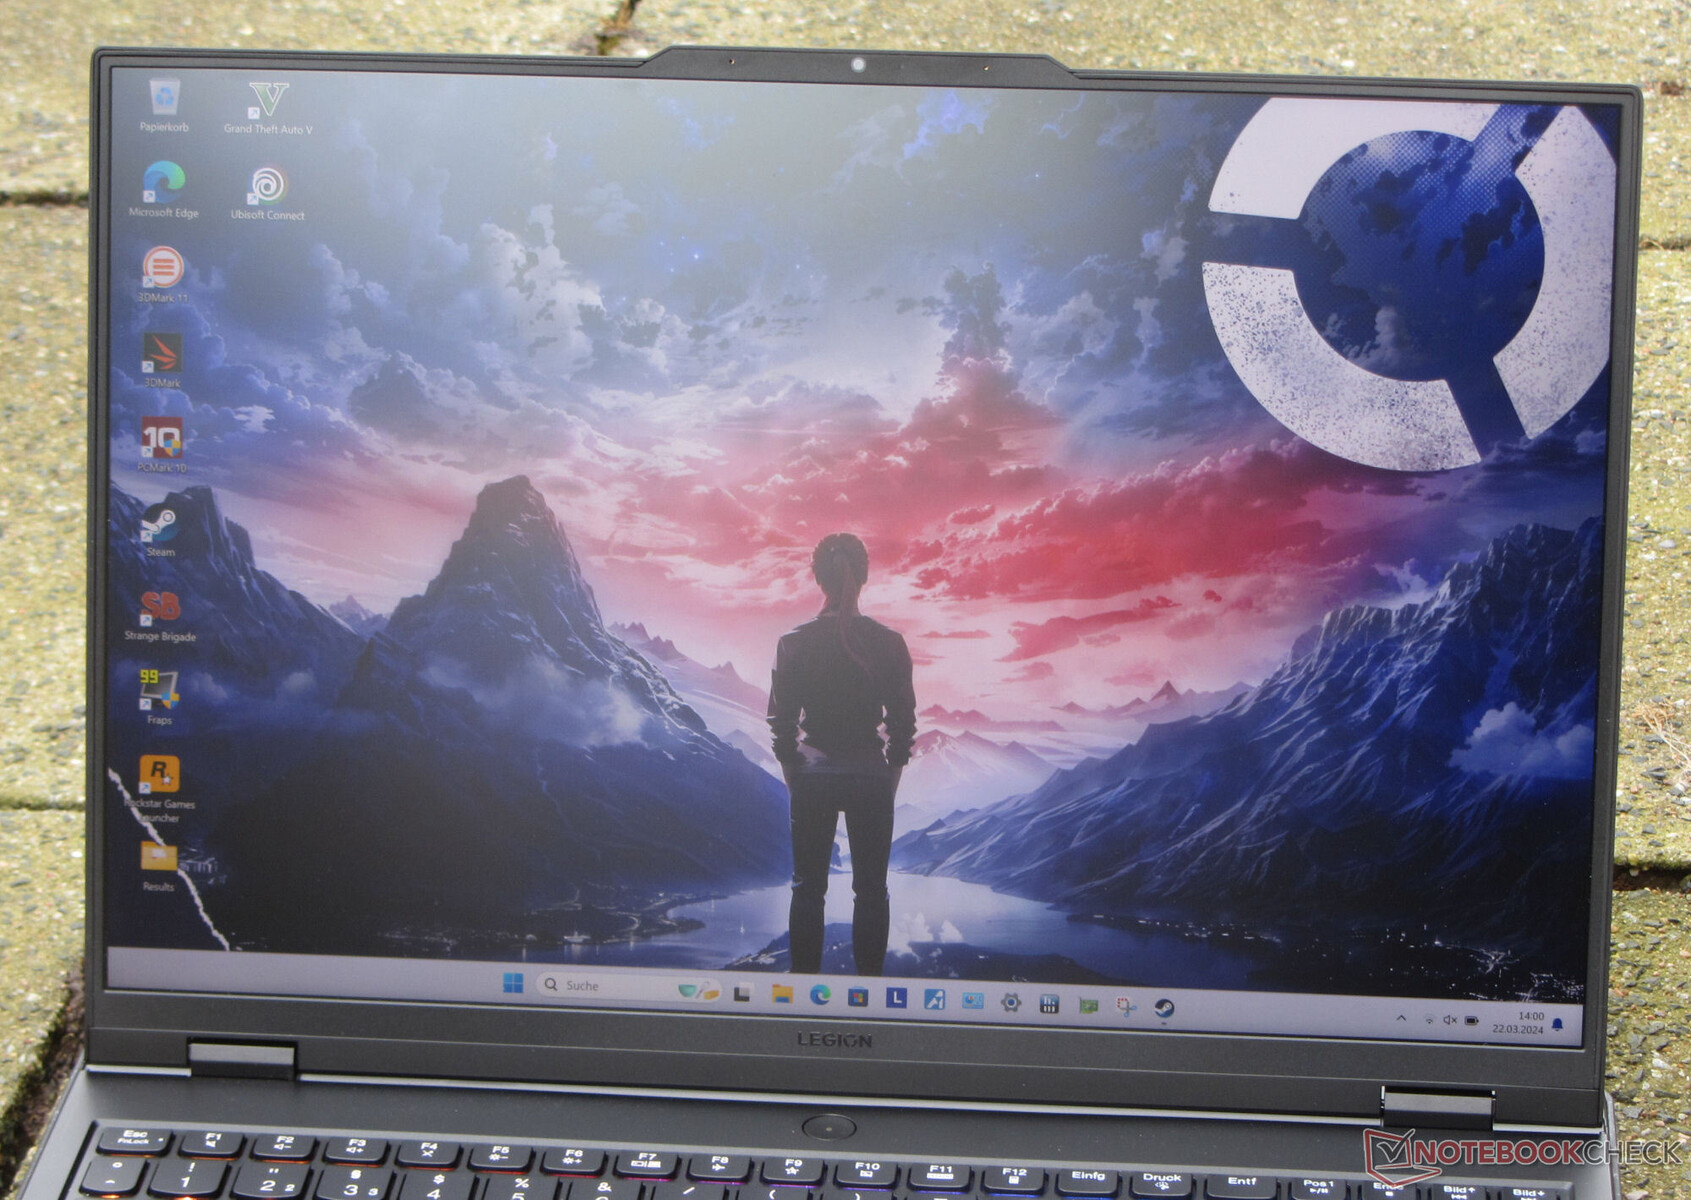
Panel IPS ma szeroki kąt widzenia i jest czytelny z każdej pozycji. Możliwe jest korzystanie z ekranu na zewnątrz, pod warunkiem, że słońce nie jest zbyt jasne.
Leistung - Wysokiej klasy sprzęt od Intela i Nvidii
Lenovo Legion Pro 7 to wydajny 16-calowy notebook stworzony z myślą o graczach i twórcach. Niezbędną moc obliczeniową zapewniają procesory Raptor Lake i Ada Lovelace. Recenzowany przez nas model można nabyć za nieco poniżej 3000 euro (ok. 3245 USD) ze zniżką edukacyjną. W chwili pisania niniejszej recenzji nie były jeszcze dostępne żadne inne warianty.
Warunki testu
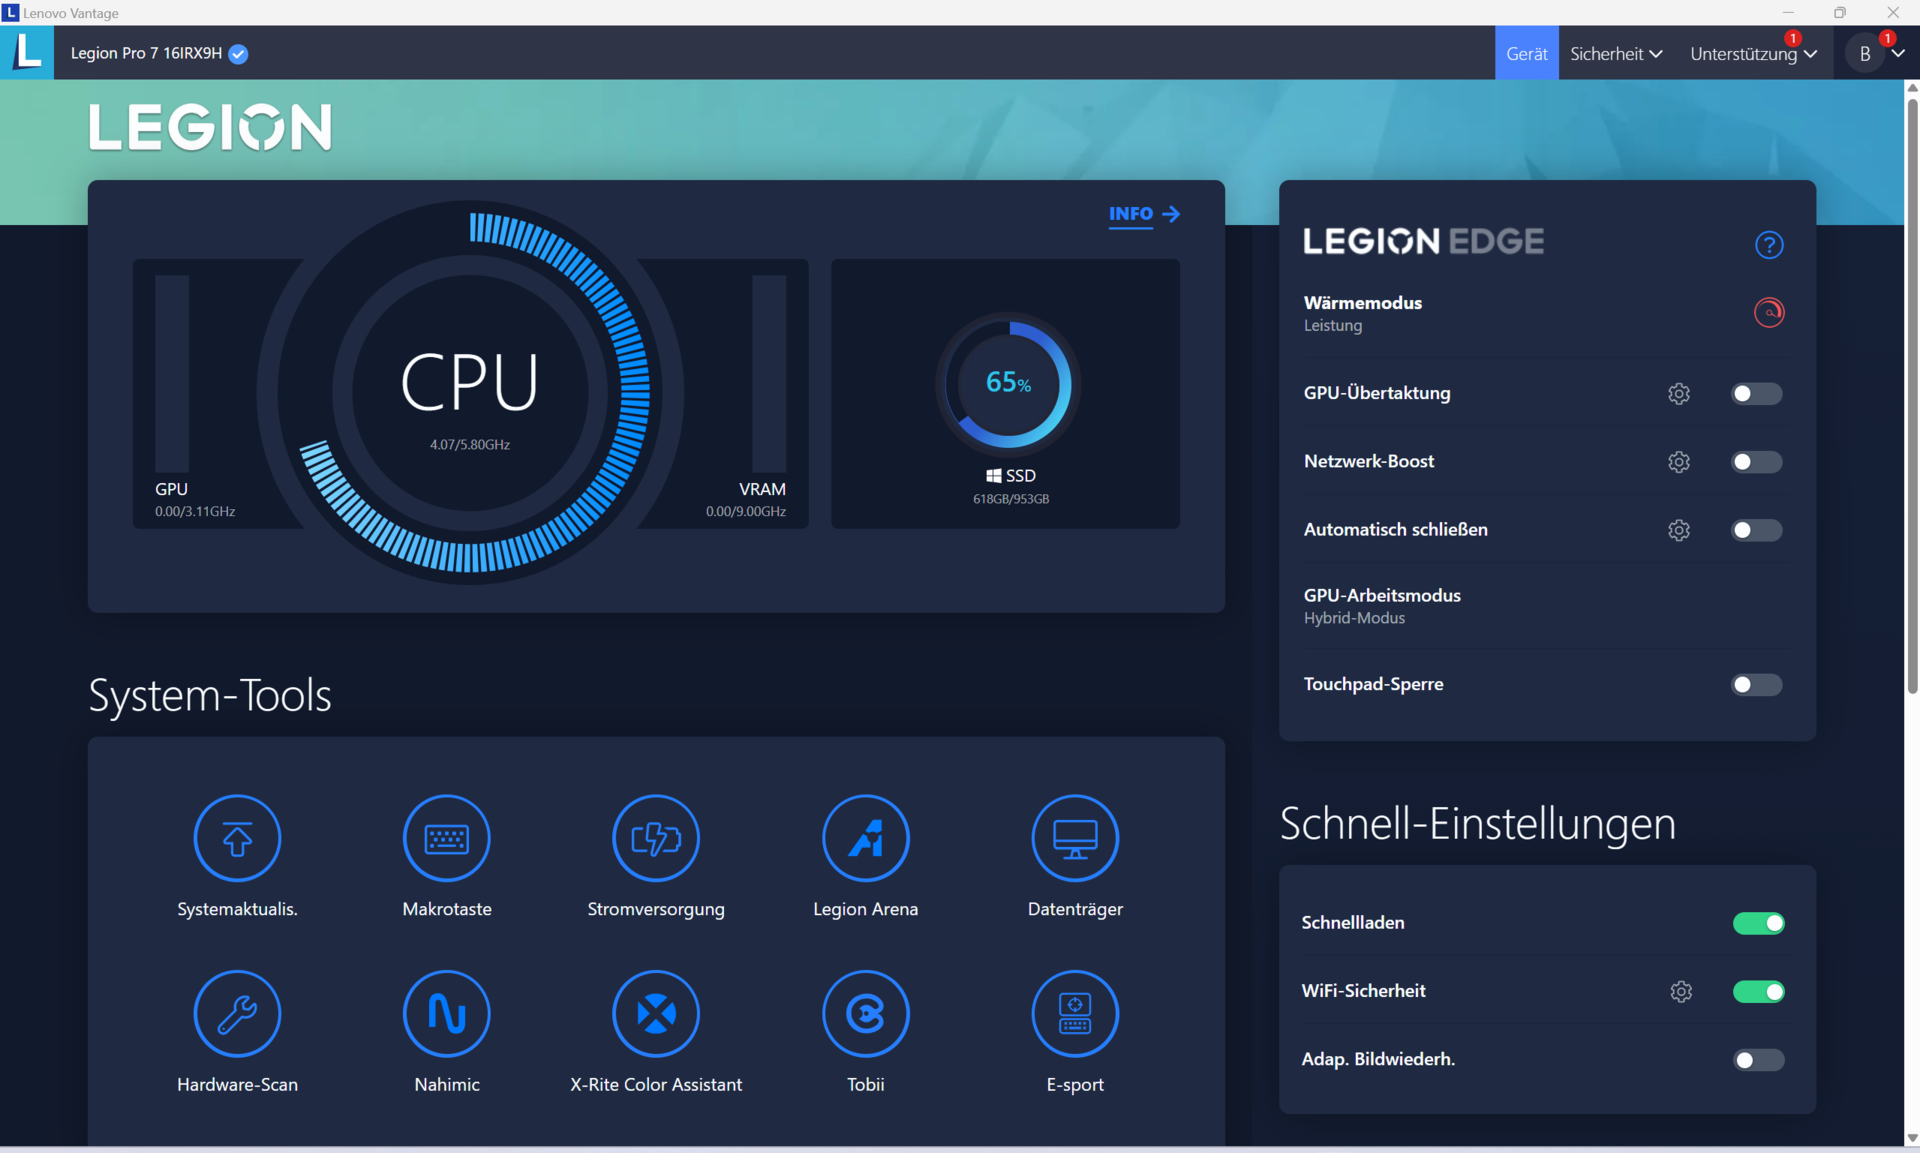
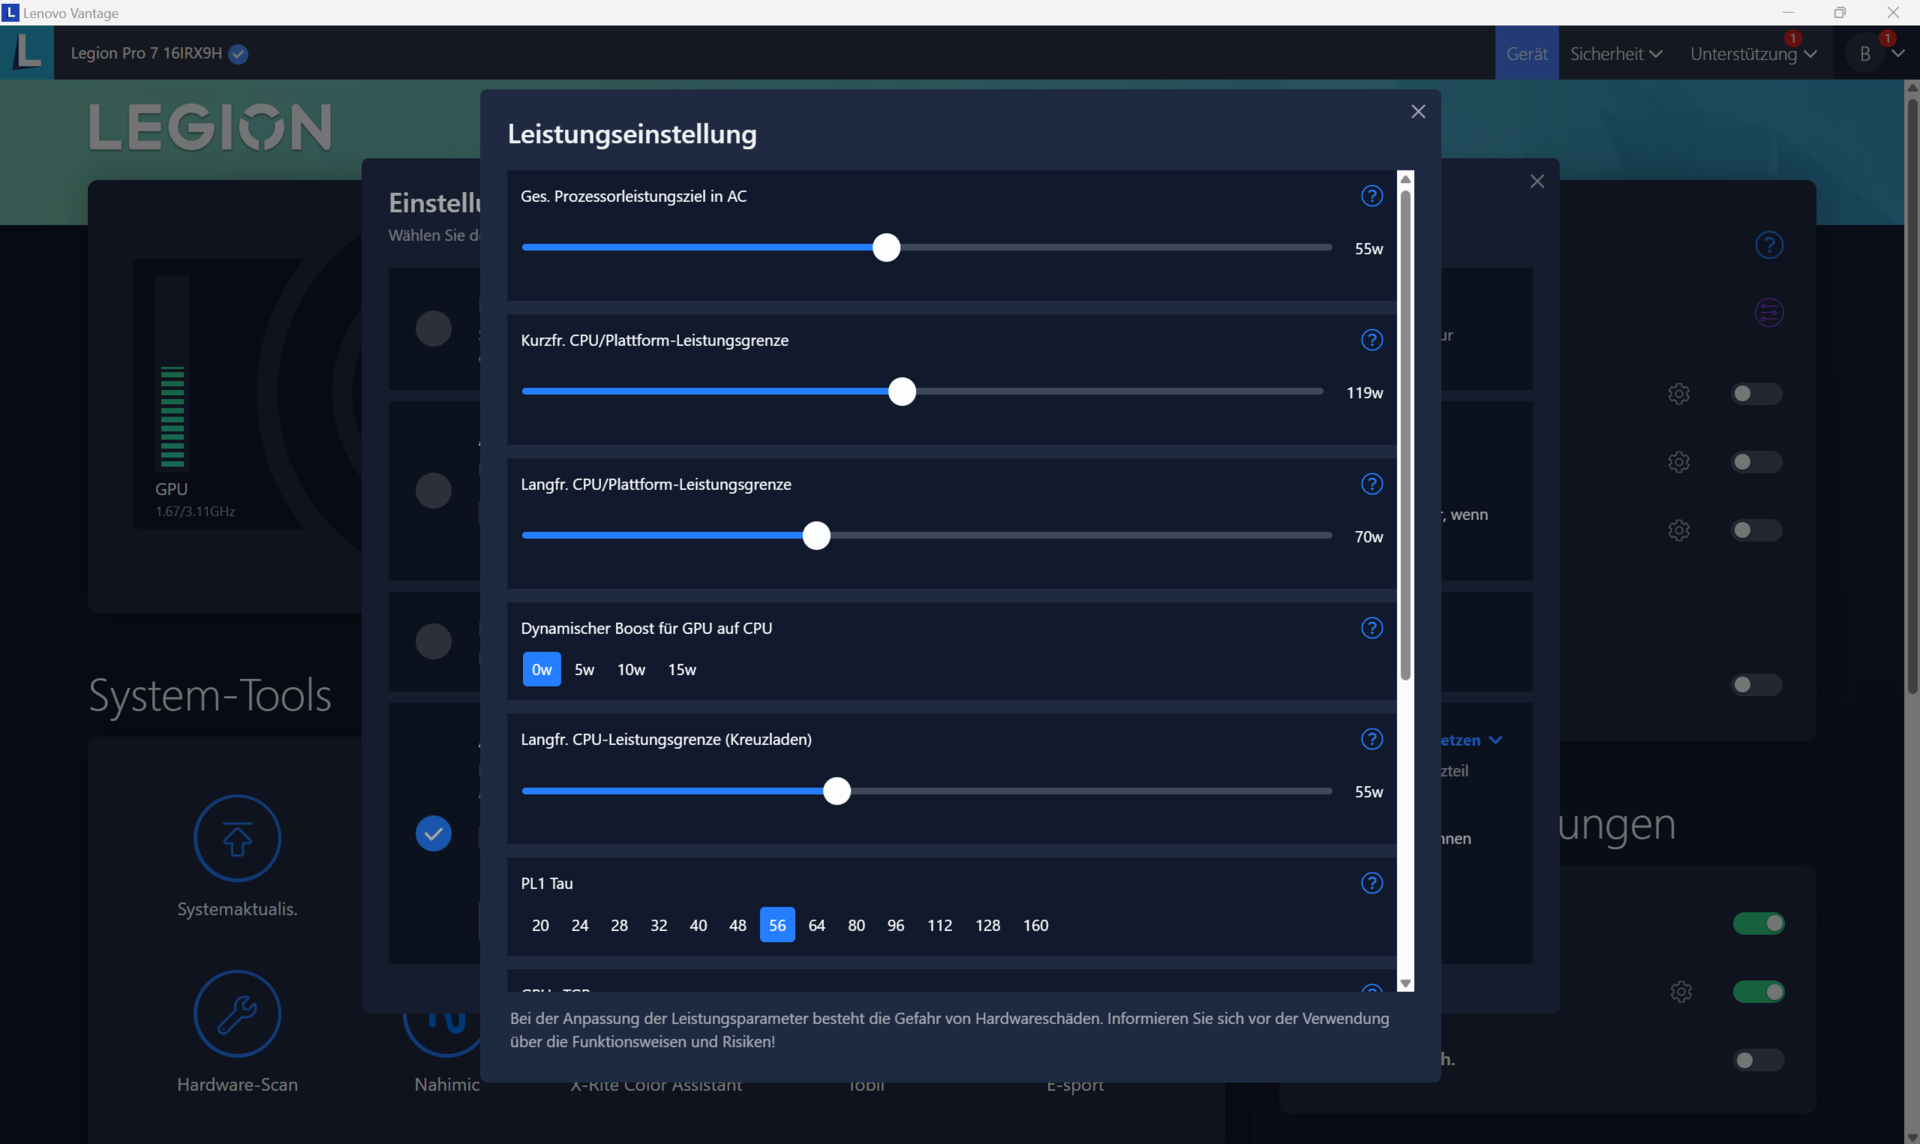
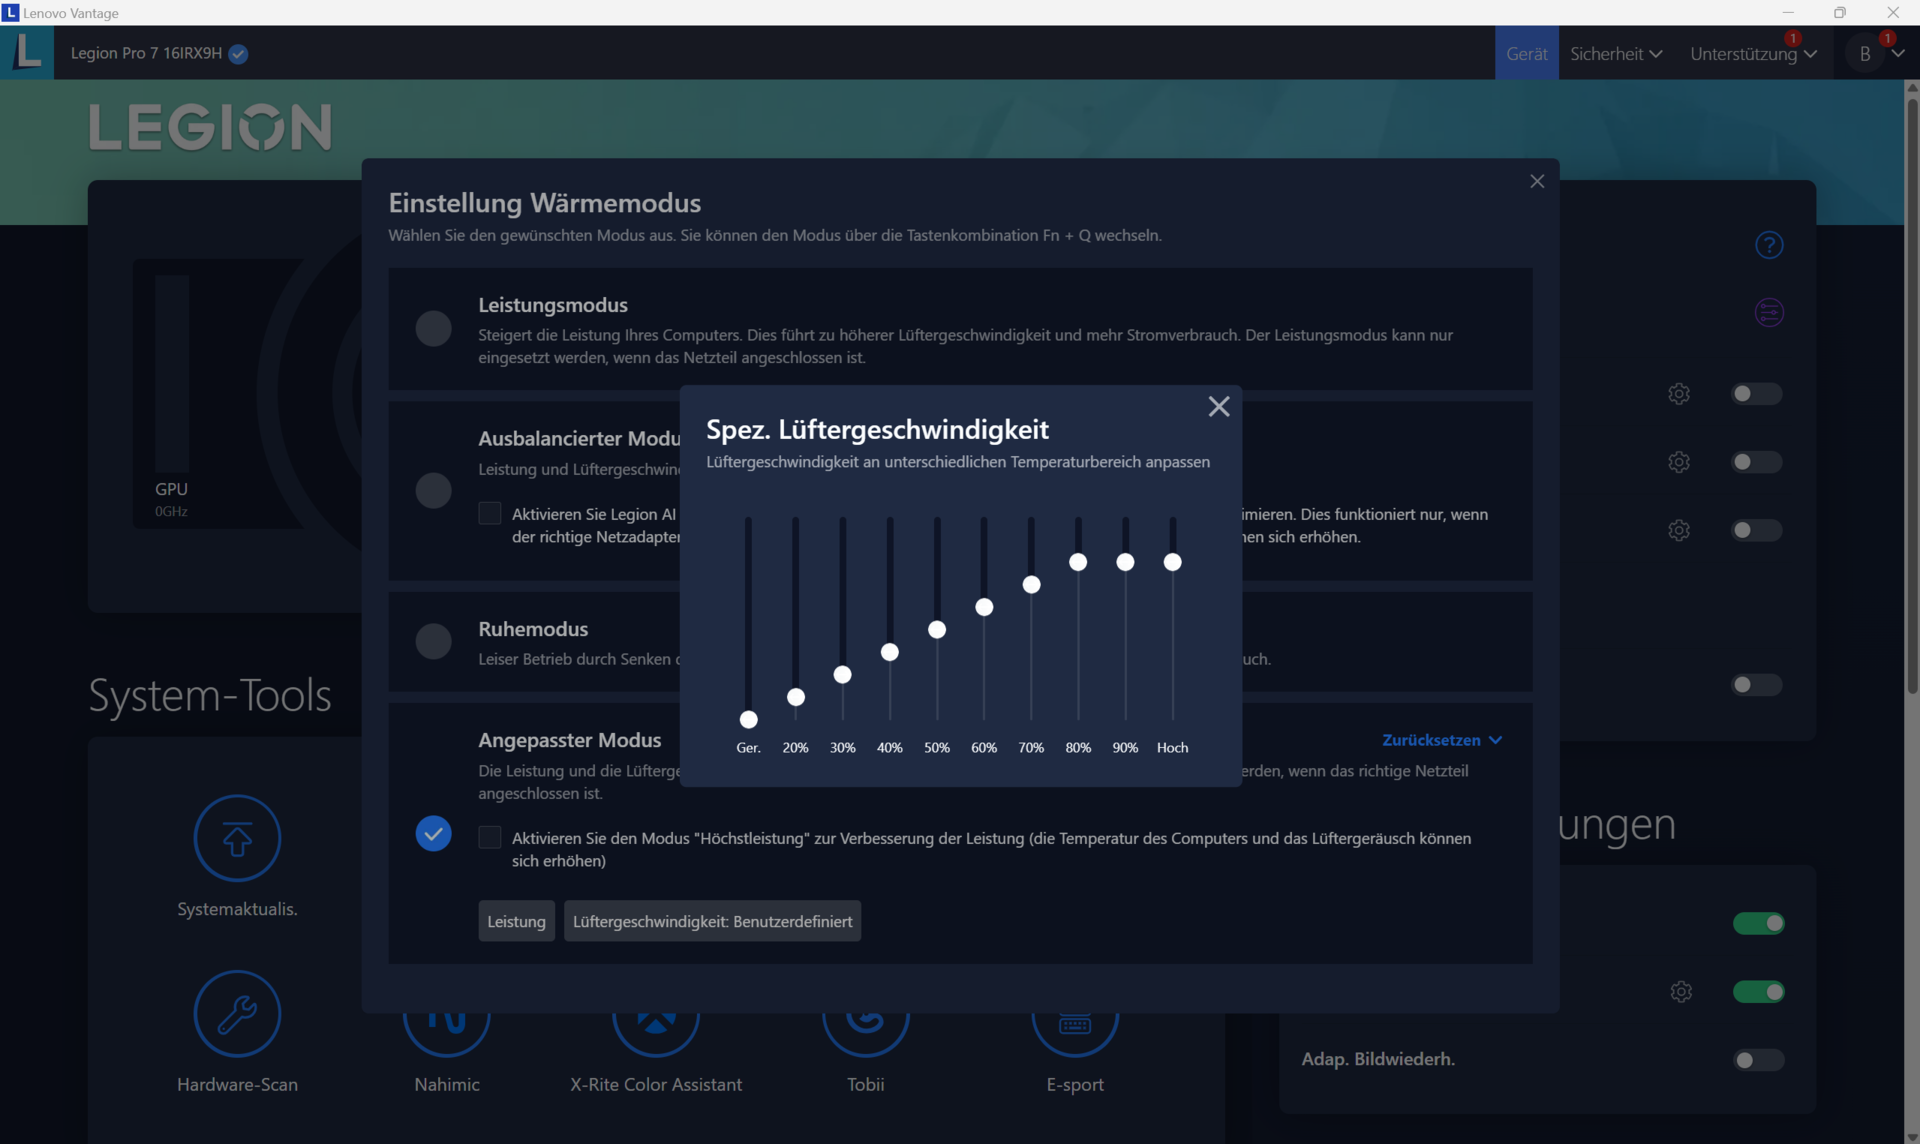
Notebook oferuje trzy tryby wydajności specyficzne dla producenta (patrz tabela). Można przełączać się między nimi za pomocą kombinacji klawiszy Fn + Q. W naszych testach wydajności i baterii korzystaliśmy odpowiednio z trybu Performance i Quiet.
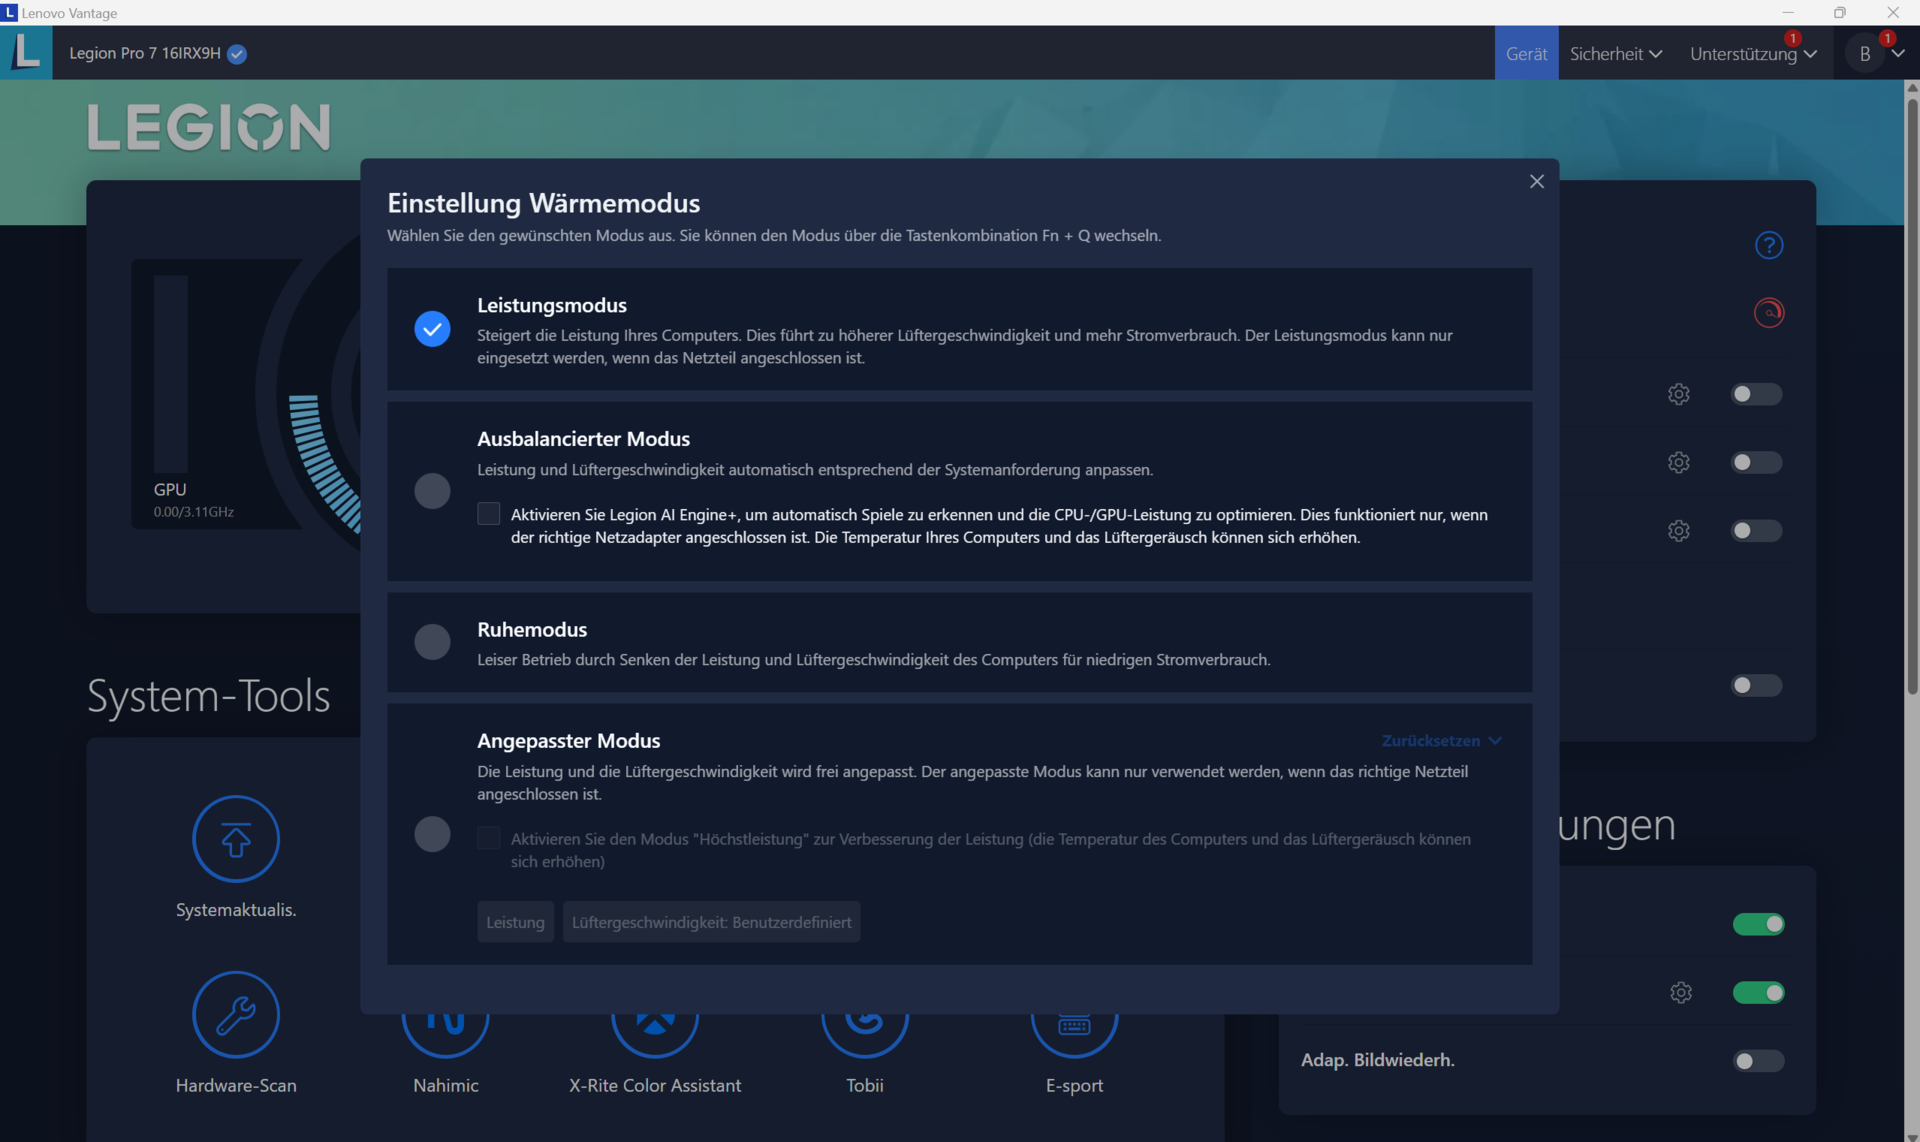
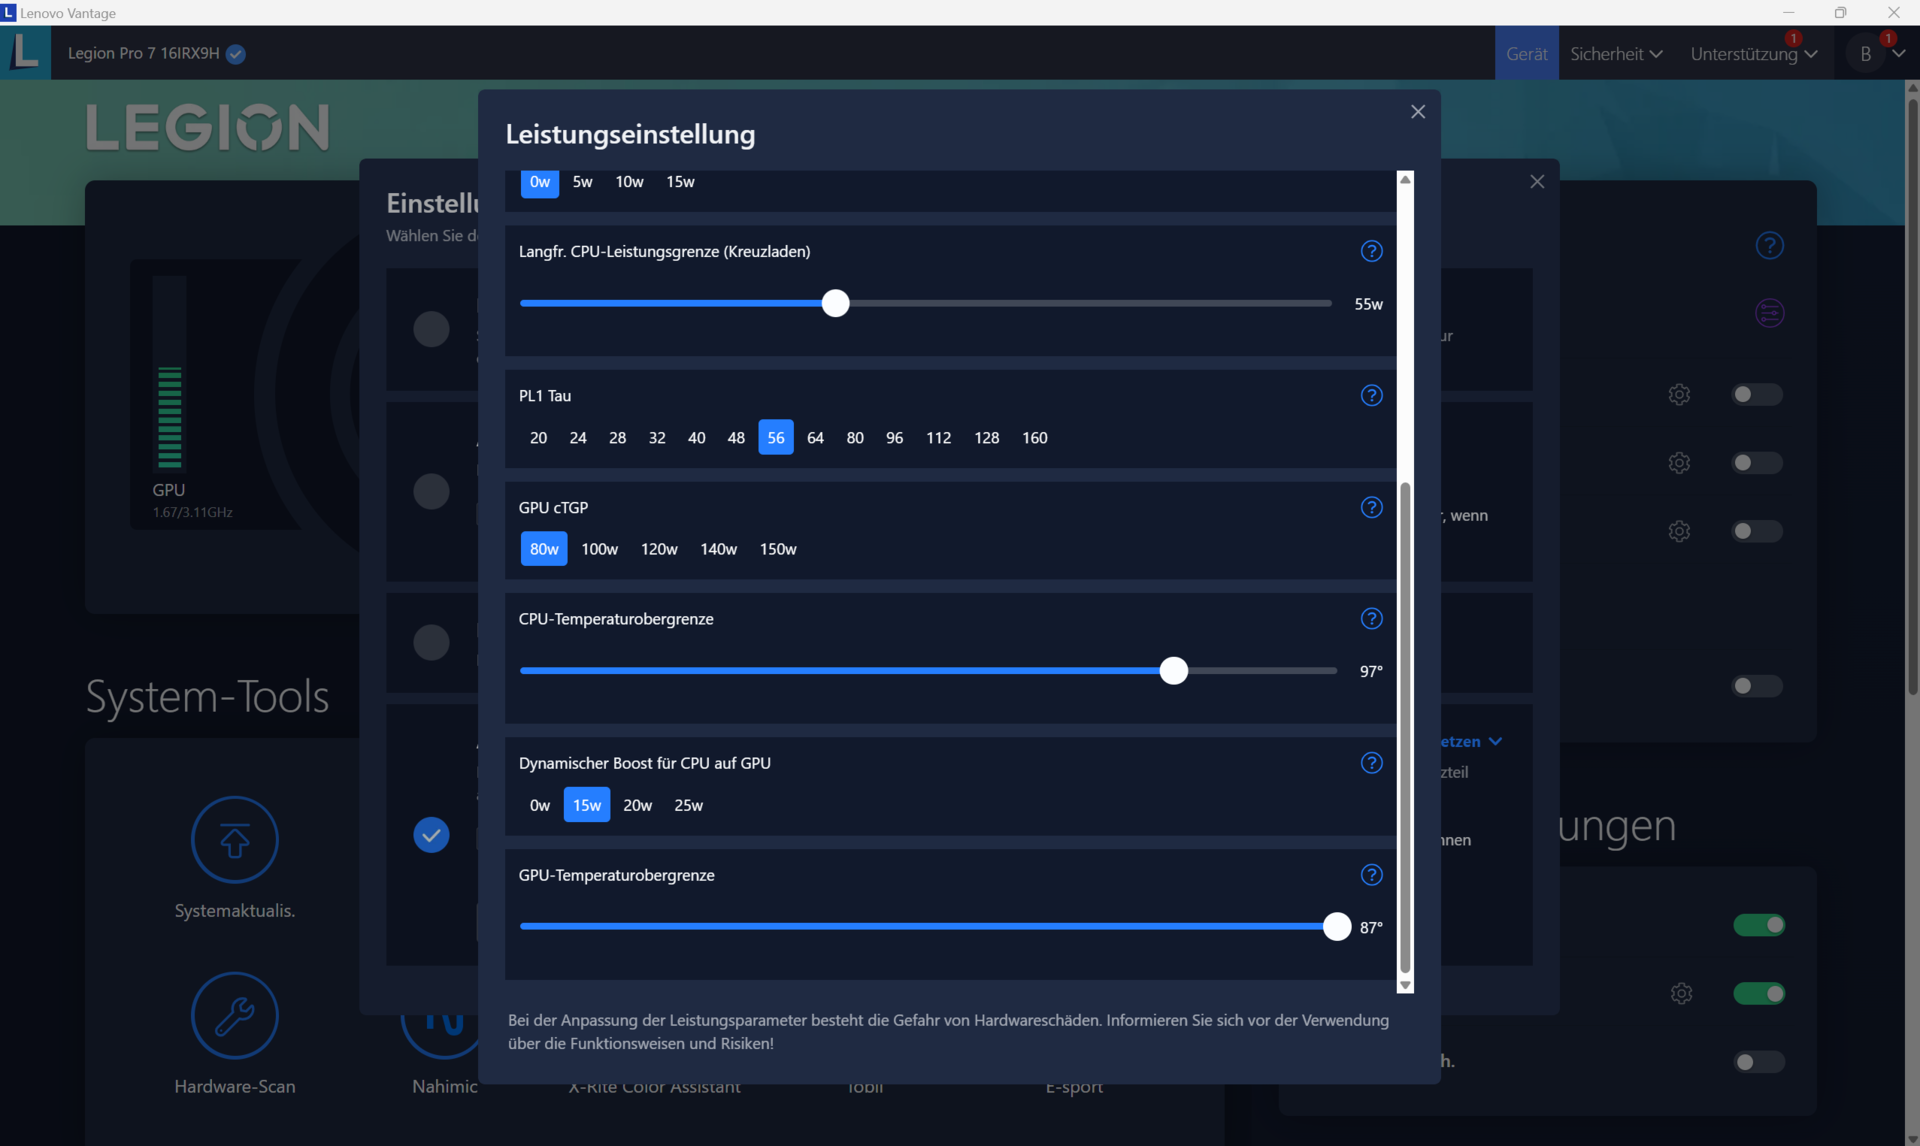
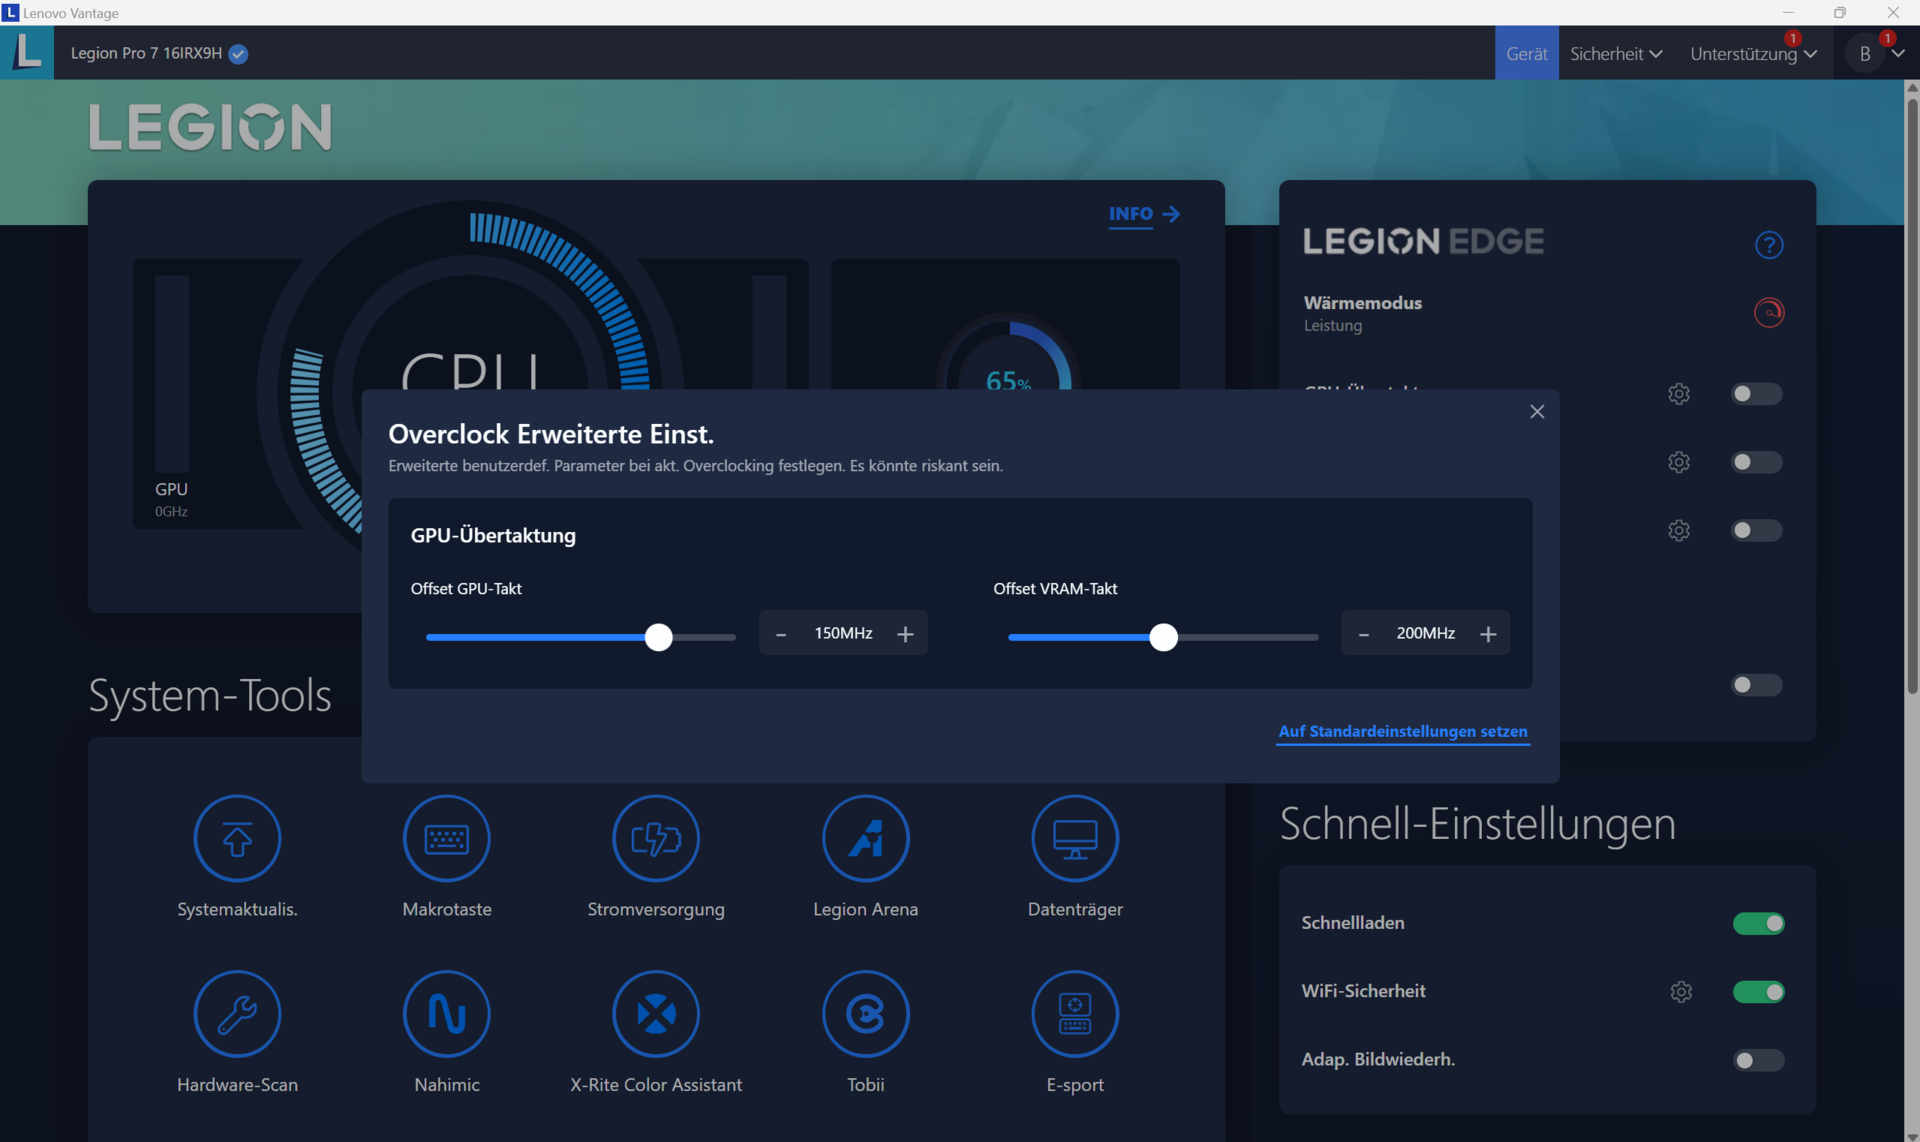
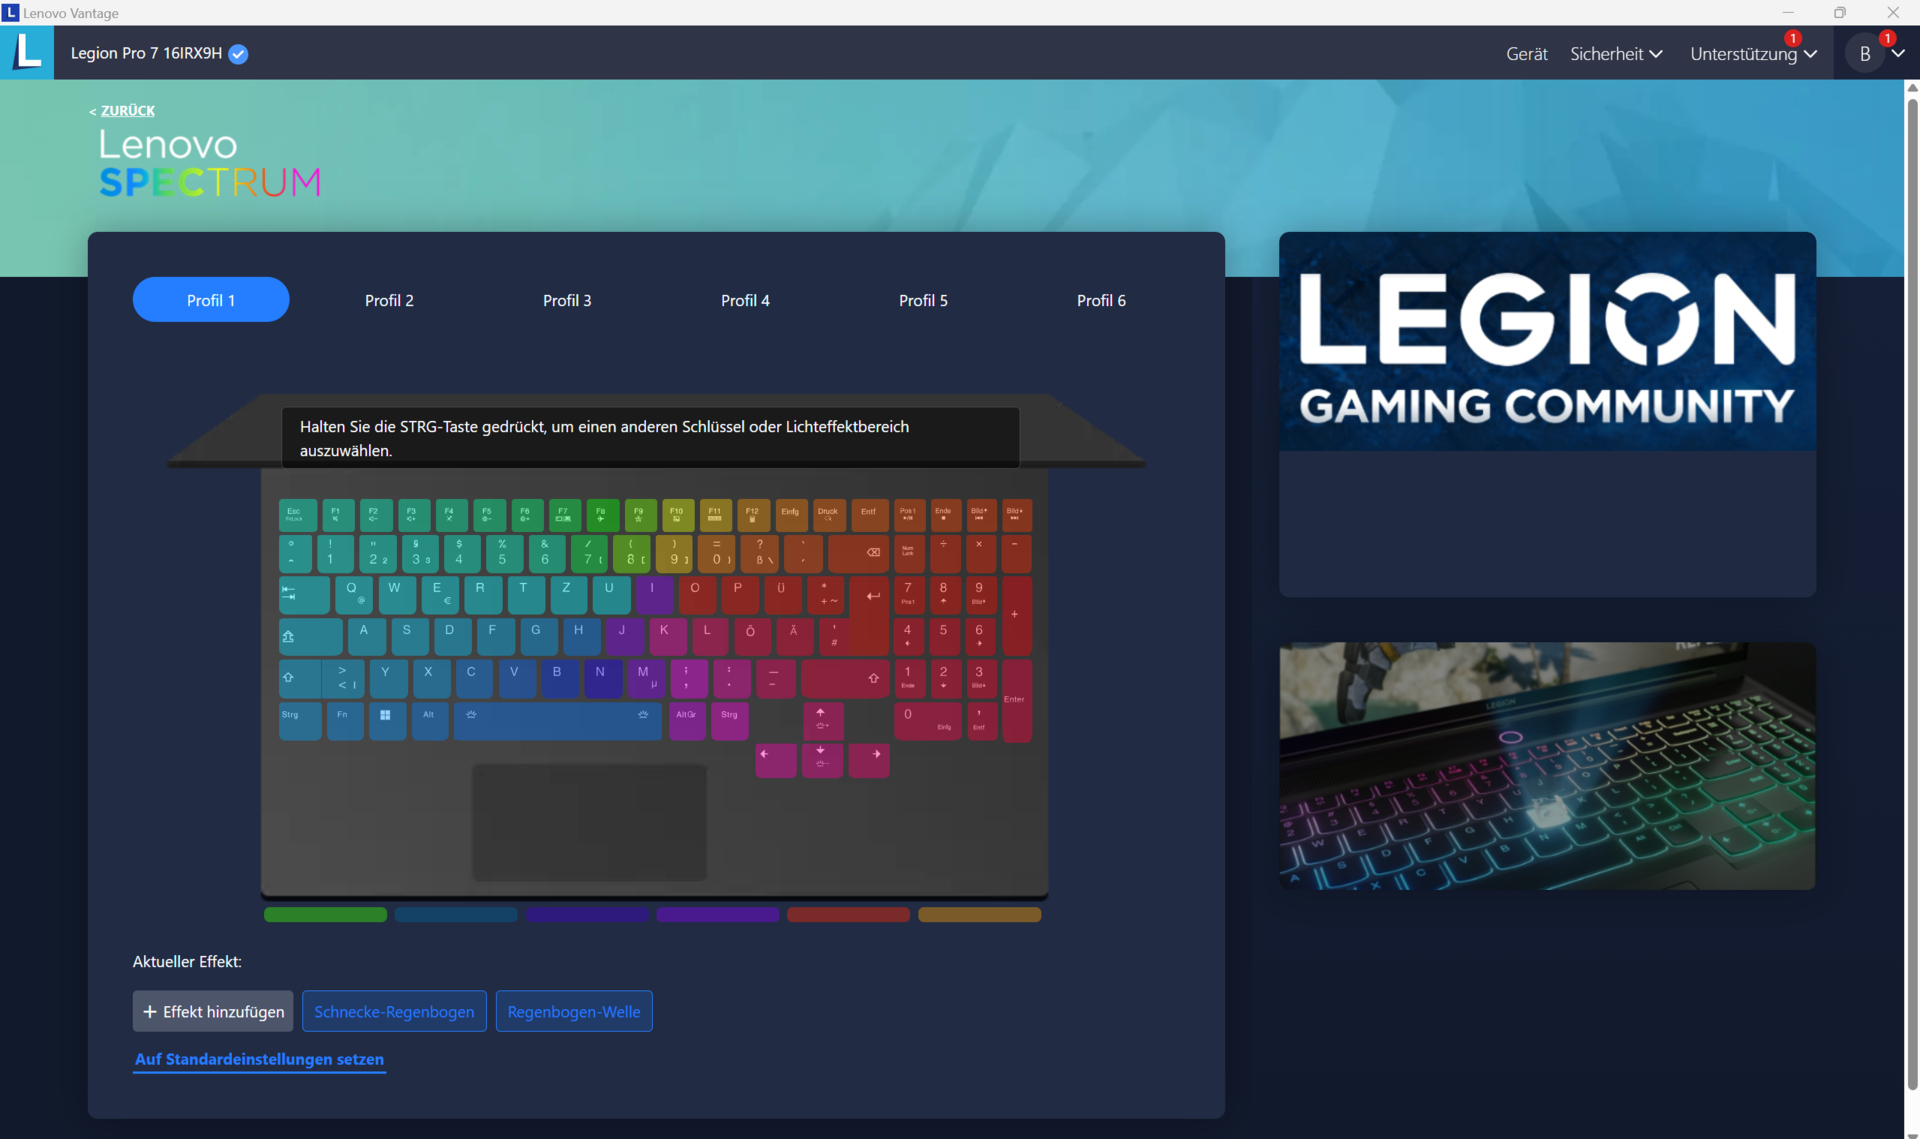
Istnieje również czwarty tryb dostępny w Lenovo Vantage (centrum sterowania laptopa): Tryb niestandardowy. Tryb ten pozwala określić ustawienia wydajności procesora (limit mocy) i karty graficznej (TGP, Dynamic Boost i limit temperatury), a także dostosować prędkość wentylatora. Ponadto możliwe jest podkręcanie GPU i pamięci graficznej niezależnie od wybranego profilu.
| Tryb wydajności | Tryb zrównoważony | Tryb cichy | |
|---|---|---|---|
| Limit mocy 1 (HWInfo) | 130 Watt | 80 Watt | 55 Watt |
| Limit mocy 2 (HWInfo) | 185 Watt | 119 Watt | 65 Watt |
| Hałas (Witcher 3) | 54 dB(A) | 45 dB(A) | 33 dB(A) |
| Wydajność (Witcher 3) | ~184 fps | ~160 fps | 40 fps (zablokowane) |
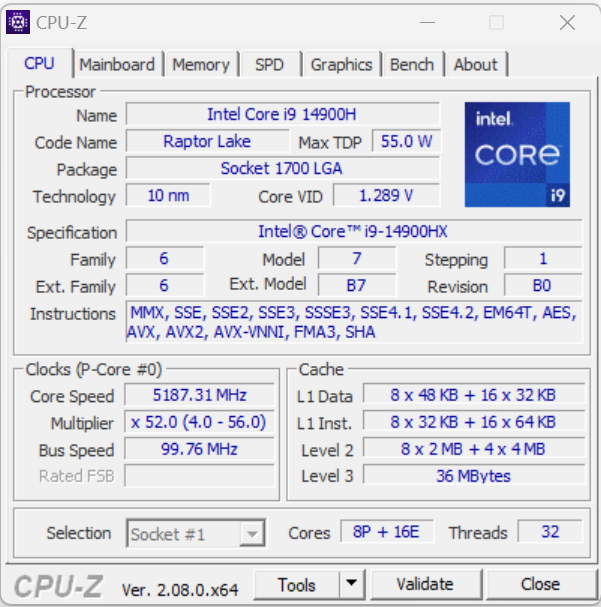
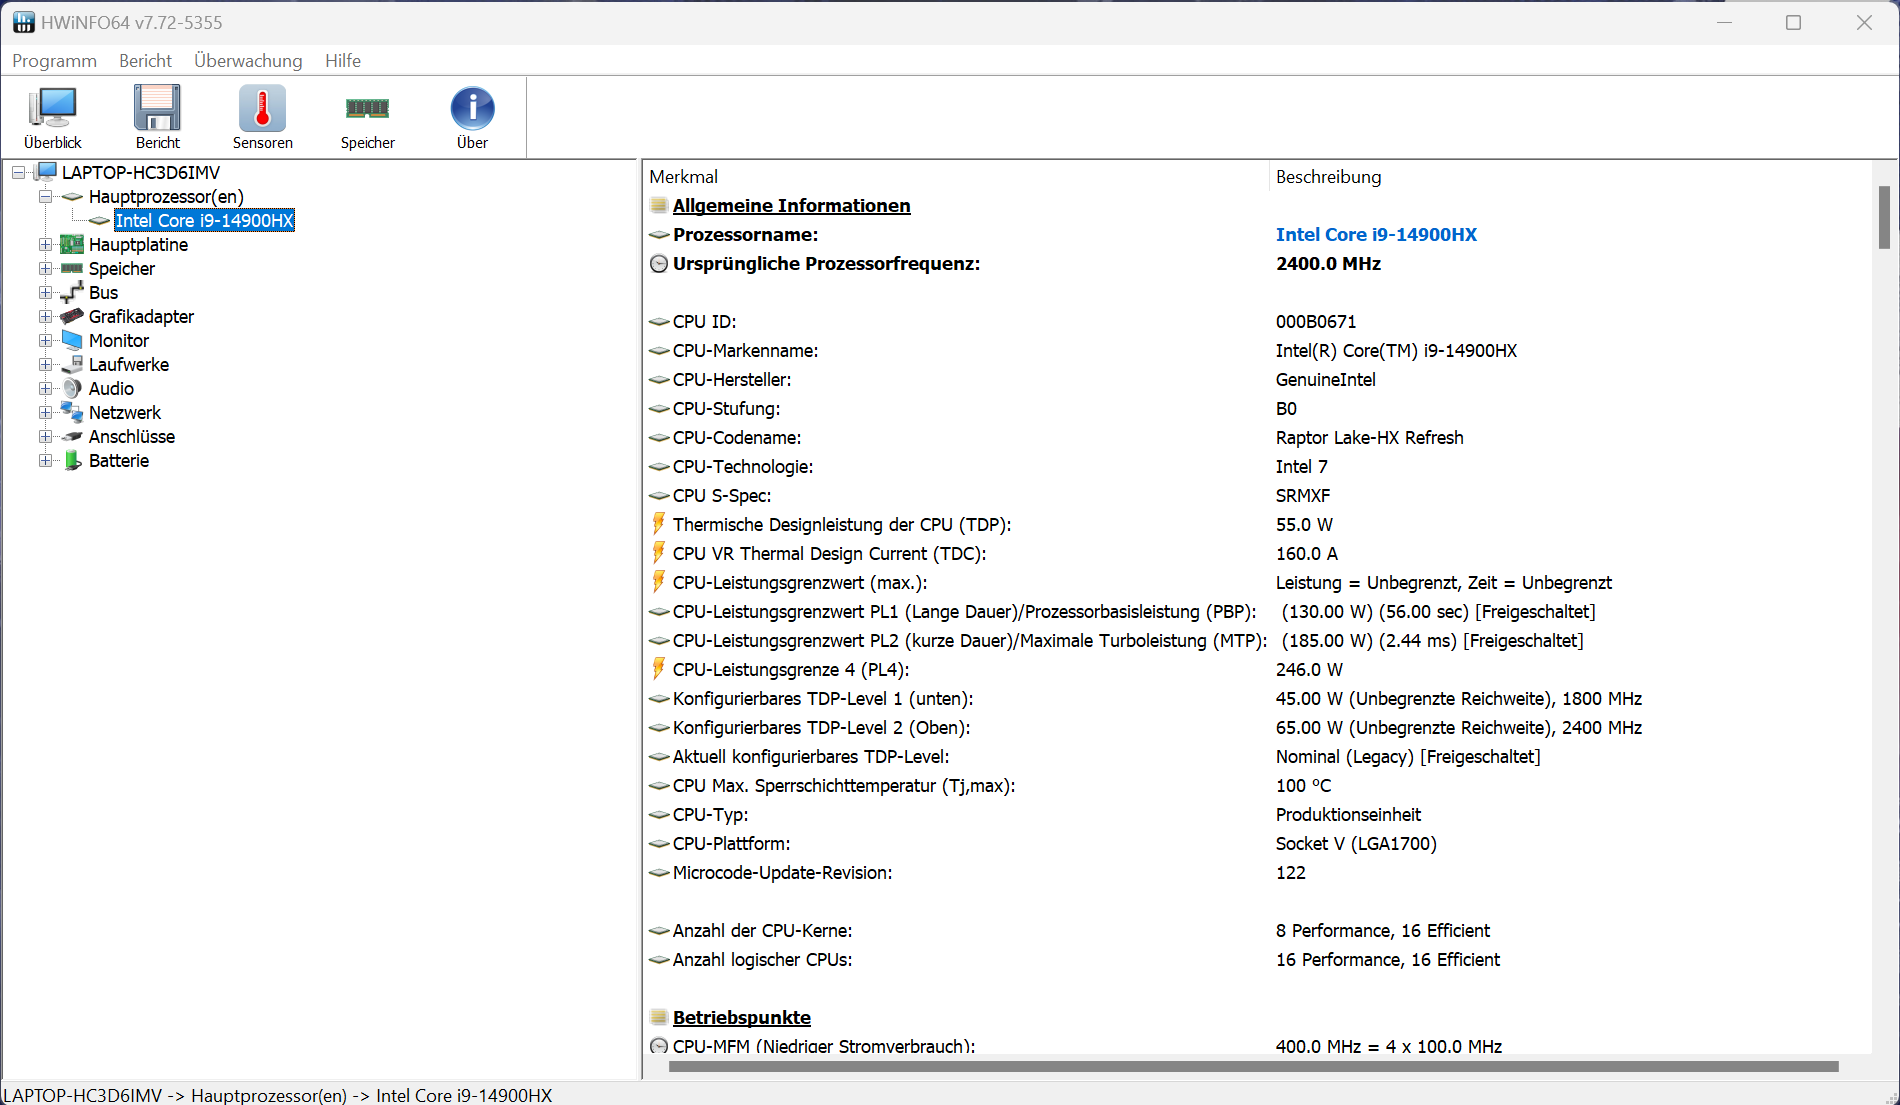
Procesor
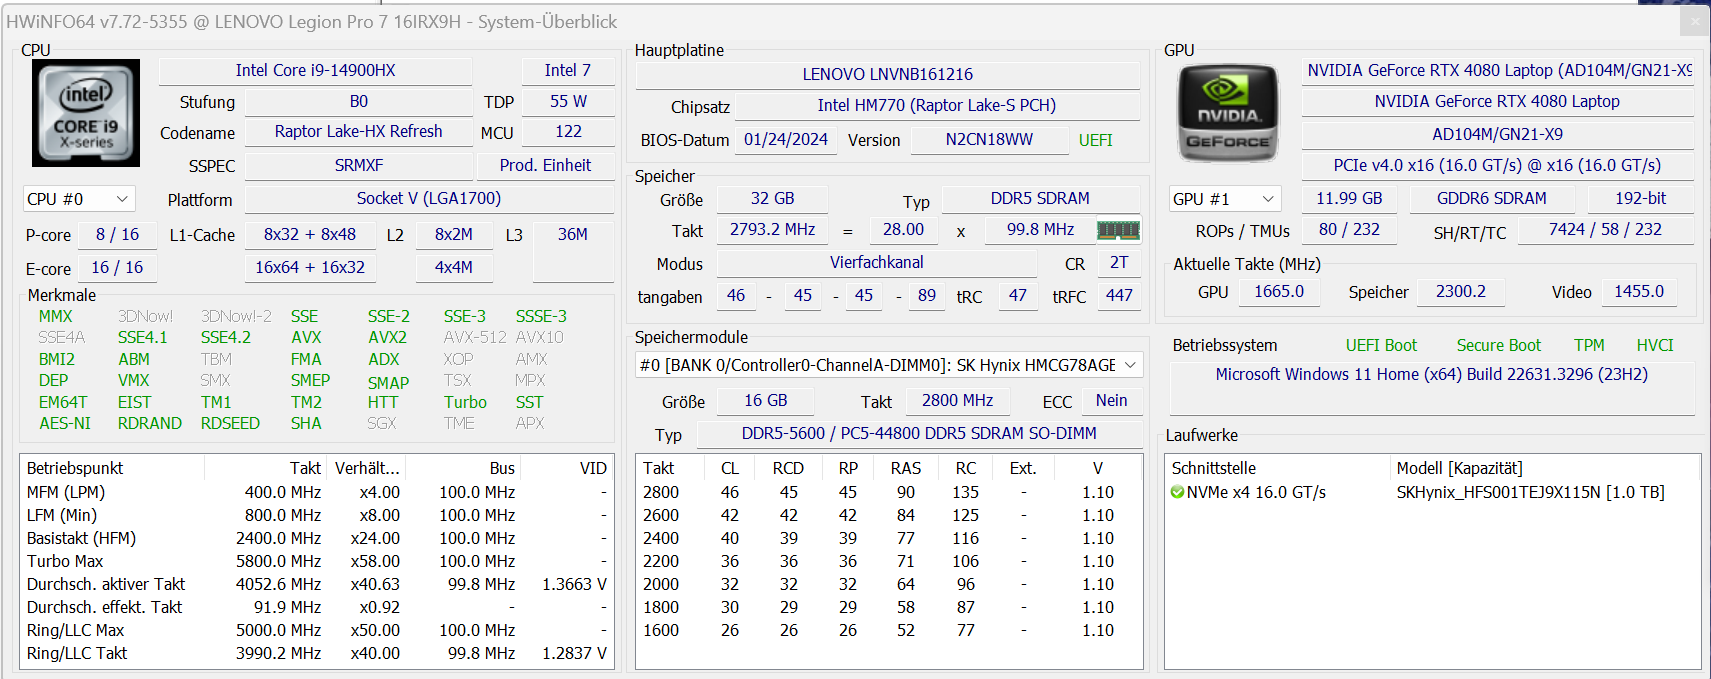
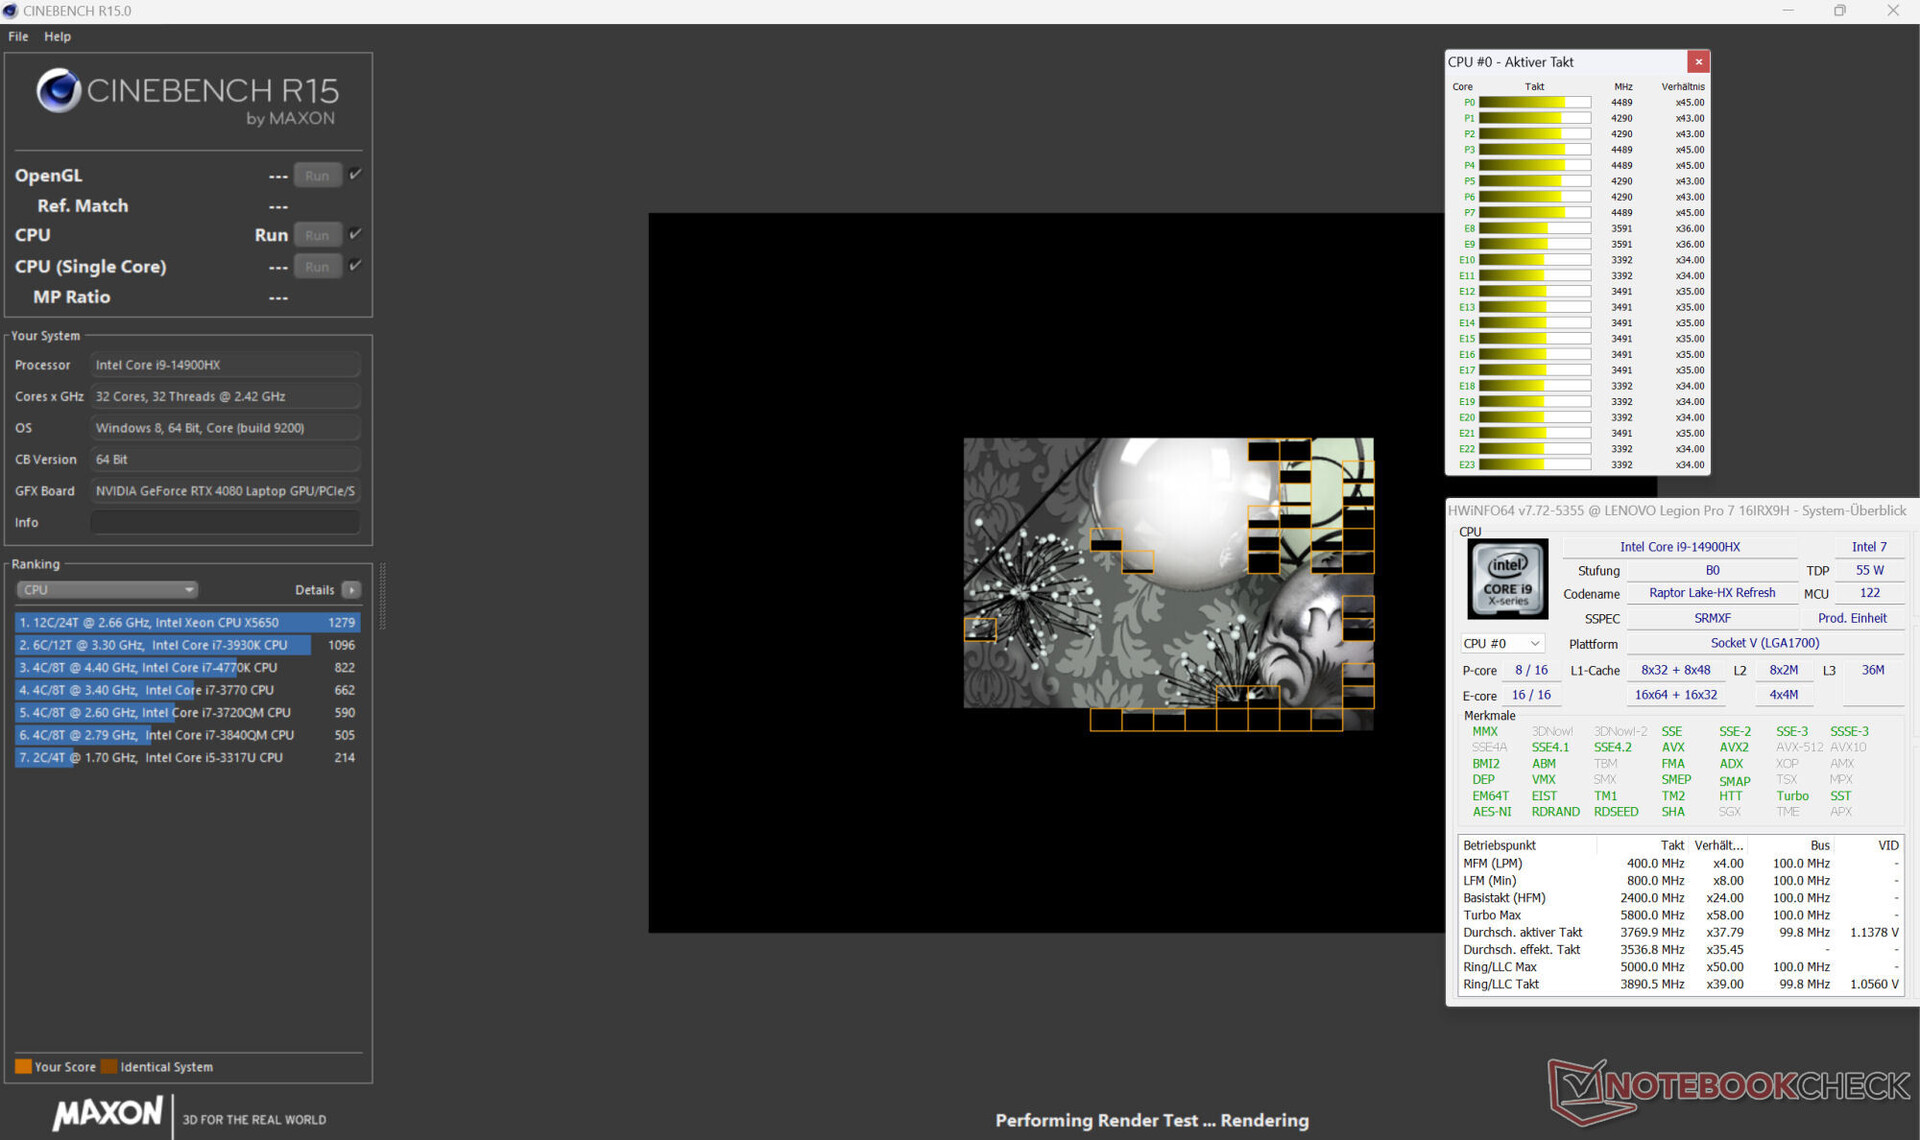
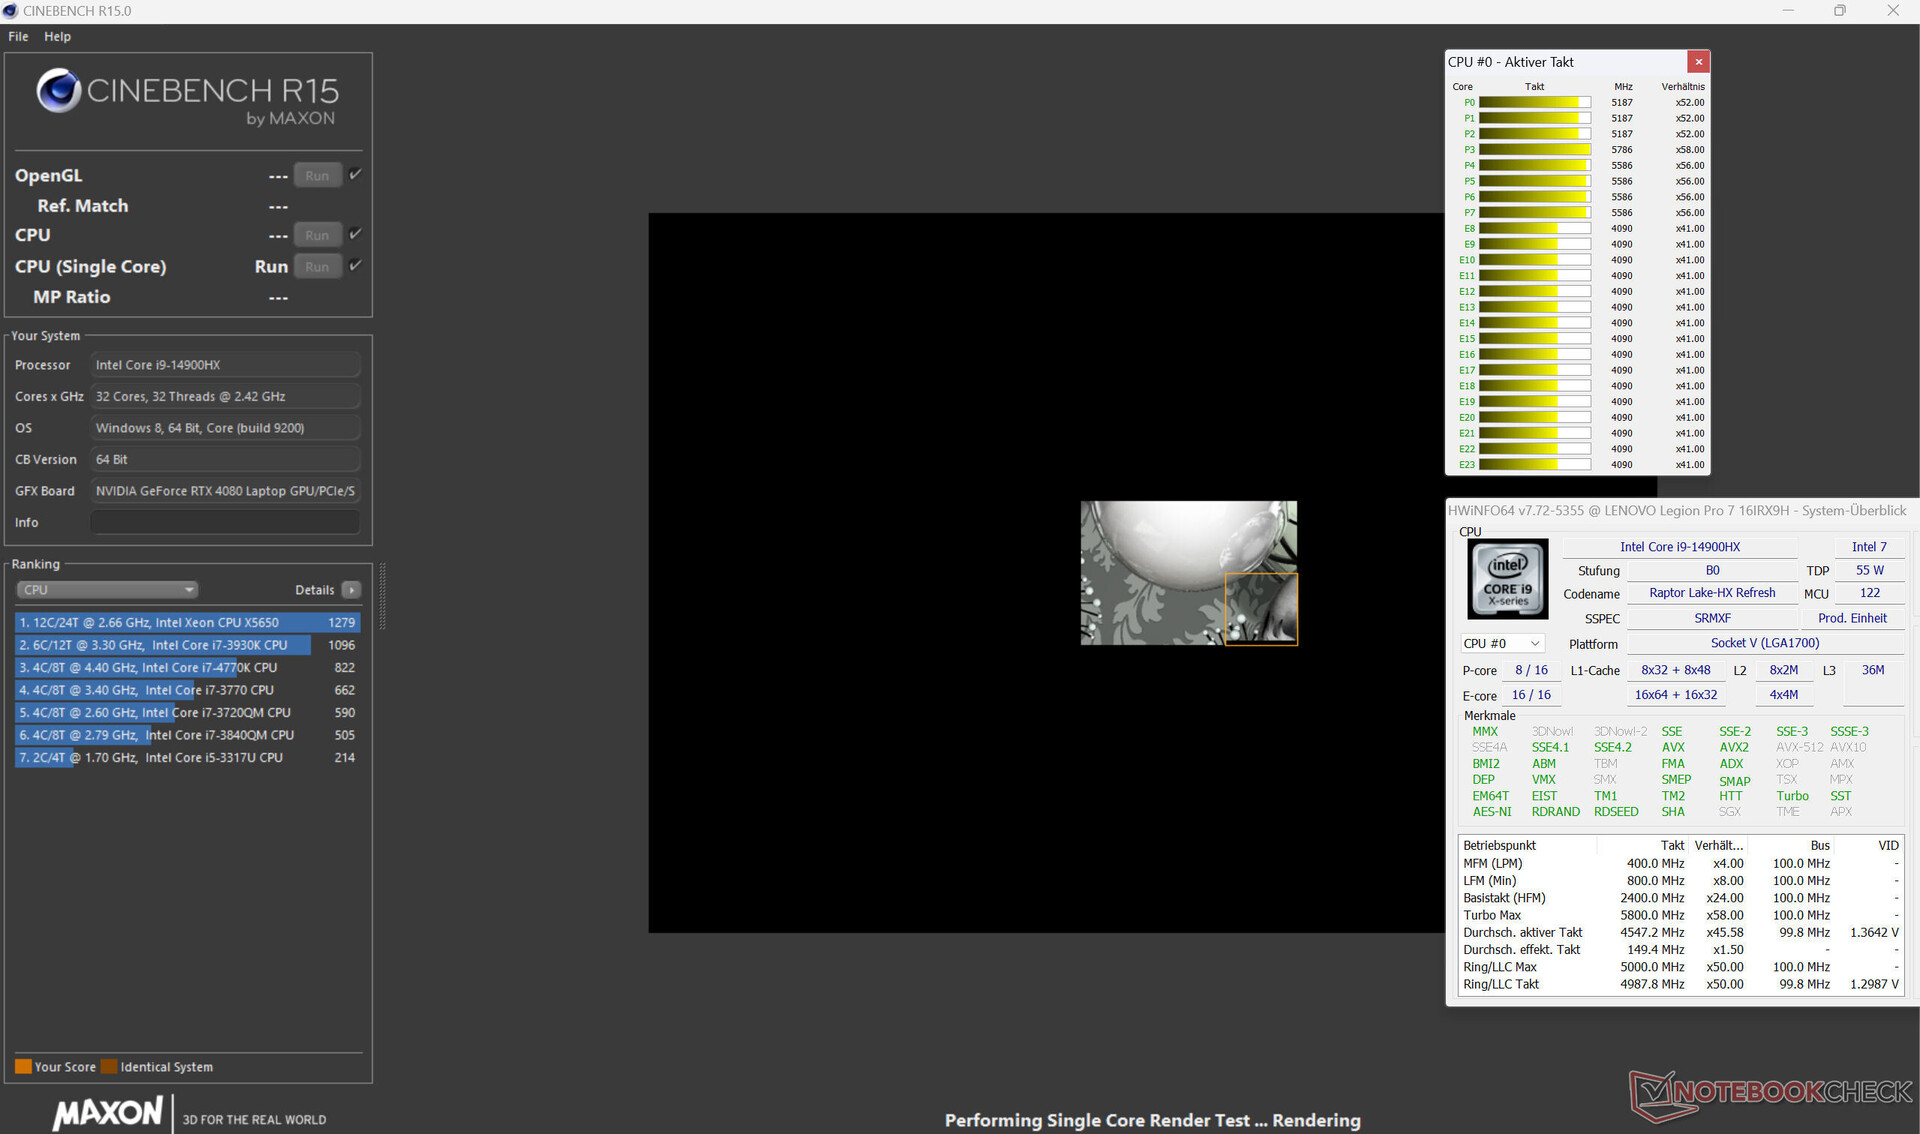
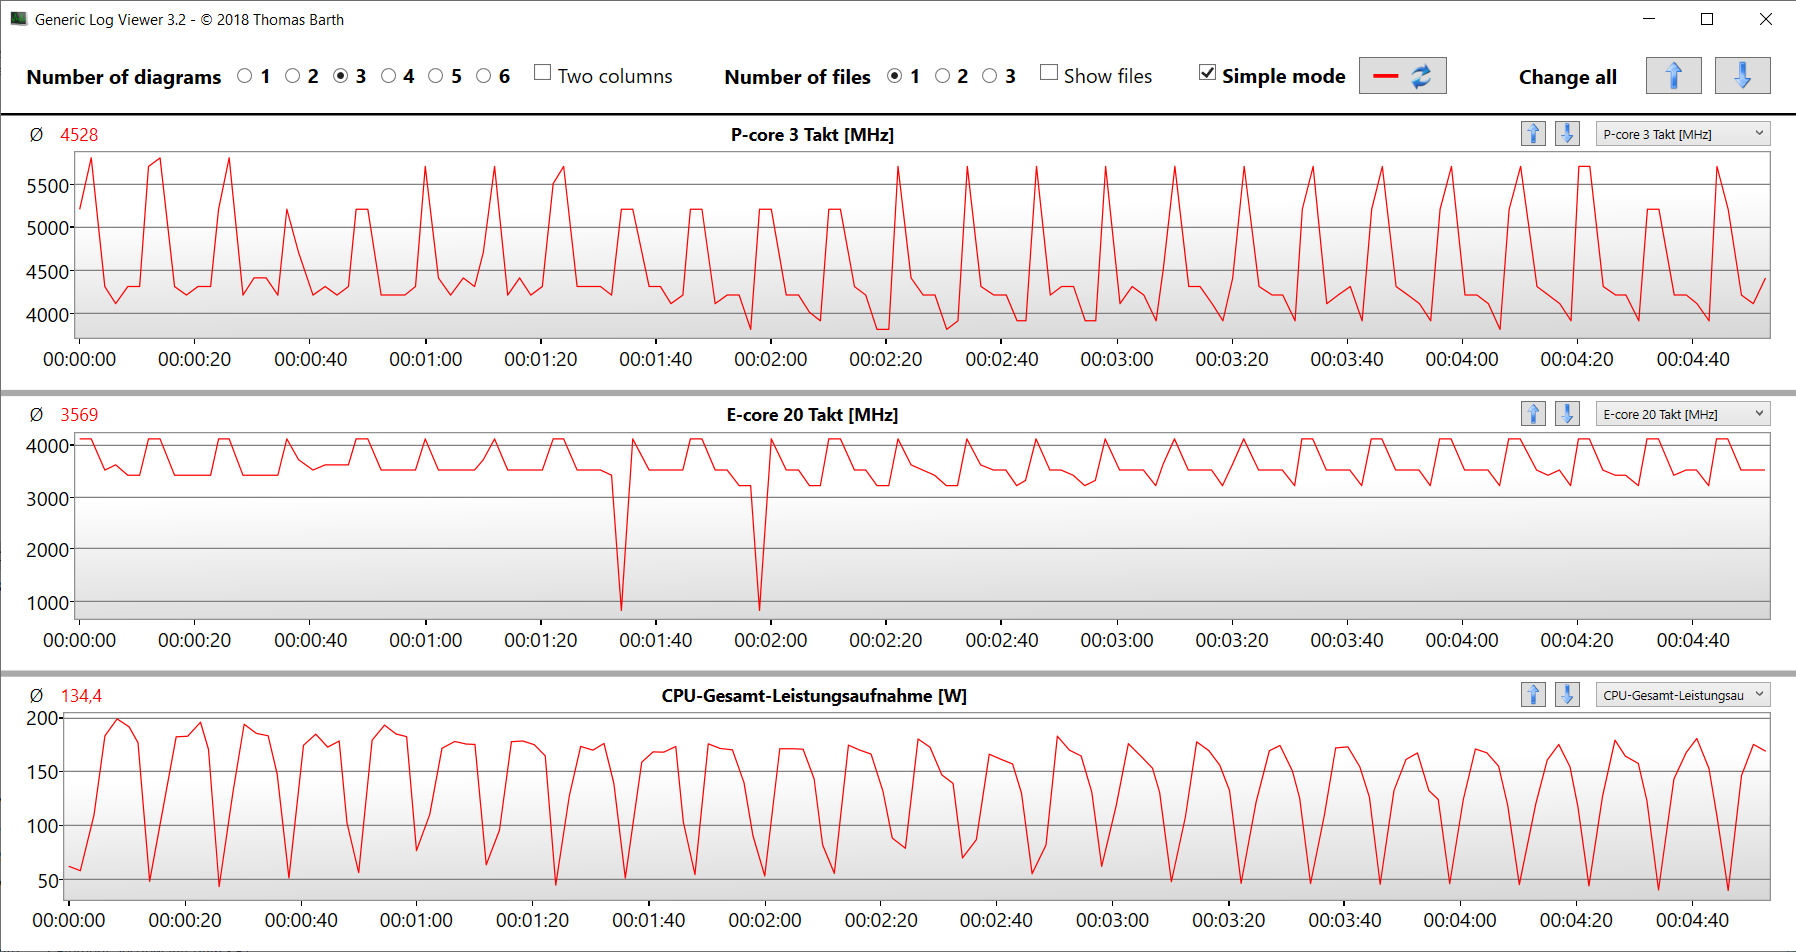
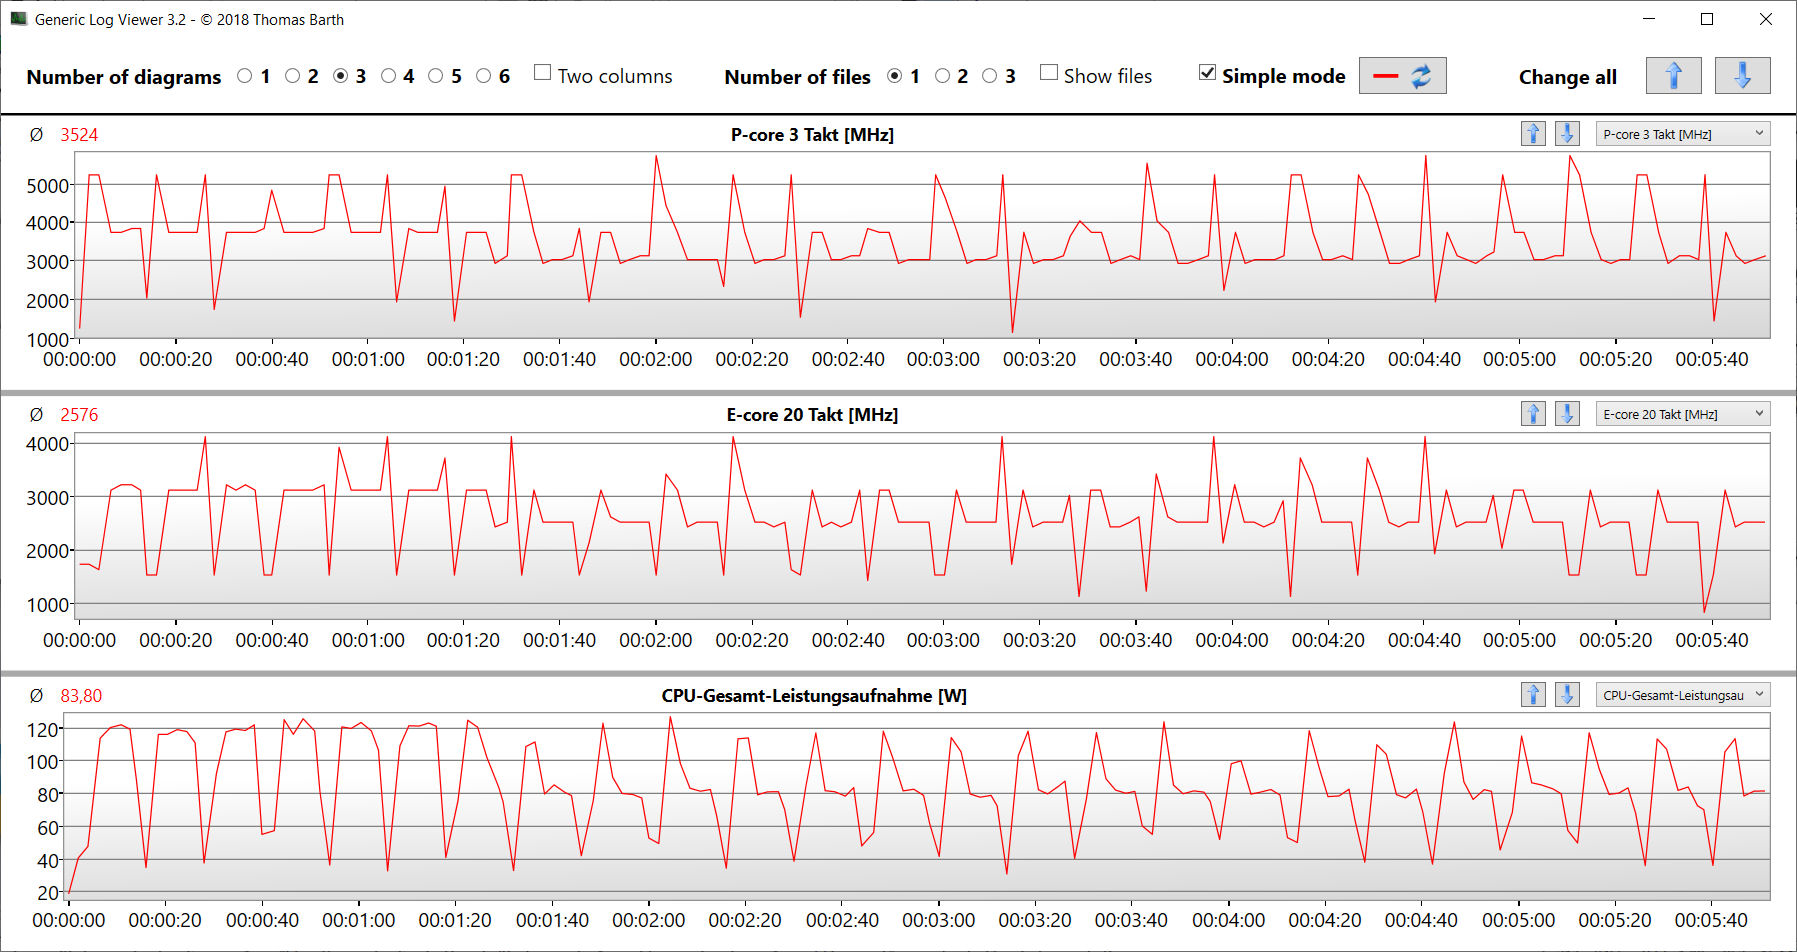
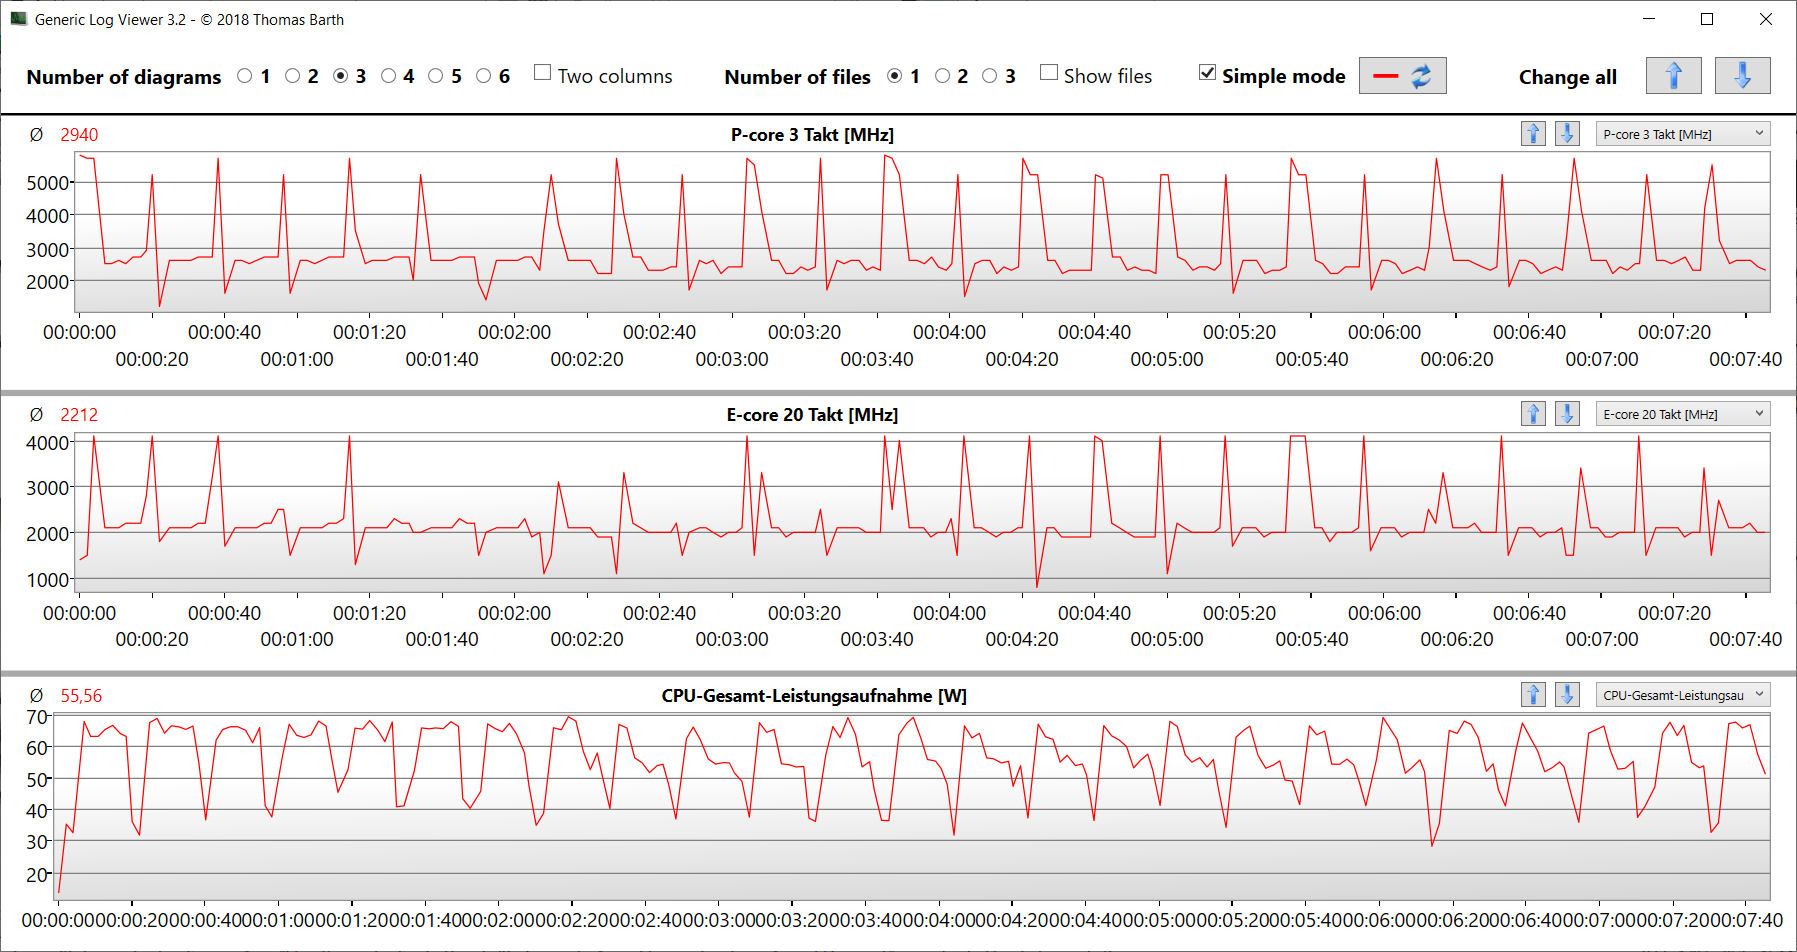
24 rdzenie CPU (8P + 16E = 32 wątki) w procesorze Core i9-14900HX (Raptor Lake) osiągały szczytowe taktowania na poziomie 5,8 GHz (P) i 4,1 GHz (E). Procesor poradził sobie ze stałym obciążeniem wielowątkowym (uruchomienie Cinebench 15 w pętli) przy niezmiennie wysokich prędkościach zegara. W trybie Performance uzyskane wyniki benchmarków przewyższają średnie możliwości procesora. Na zasilaniu bateryjnym wydajność jednowątkowa nie spadła znacząco (307 punktów w CB15), ale wydajność wielowątkowa znacznie spadła (2482 punkty w CB15).
Więcej informacji na temat Core i9 znajdą Państwo na stronie w tej analizie.
Cinebench R15 Multi Sustained load
* ... im mniej tym lepiej
AIDA64: FP32 Ray-Trace | FPU Julia | CPU SHA3 | CPU Queen | FPU SinJulia | FPU Mandel | CPU AES | CPU ZLib | FP64 Ray-Trace | CPU PhotoWorxx
| Performance rating | |
| Alienware m16 R1 AMD | |
| MSI Vector 16 HX A14V | |
| Lenovo Legion Pro 7 16IRX9H | |
| Lenovo Legion Pro 7 16IRX8H | |
| Średnia w klasie Gaming | |
| Przeciętny Intel Core i9-14900HX | |
| HP Omen 16 (2024) | |
| AIDA64 / FP32 Ray-Trace | |
| Alienware m16 R1 AMD | |
| Średnia w klasie Gaming (10227 - 85542, n=105, ostatnie 2 lata) | |
| MSI Vector 16 HX A14V | |
| Lenovo Legion Pro 7 16IRX9H | |
| Lenovo Legion Pro 7 16IRX8H | |
| Przeciętny Intel Core i9-14900HX (13098 - 33474, n=36) | |
| HP Omen 16 (2024) | |
| AIDA64 / FPU Julia | |
| Alienware m16 R1 AMD | |
| MSI Vector 16 HX A14V | |
| Średnia w klasie Gaming (51376 - 238426, n=105, ostatnie 2 lata) | |
| Lenovo Legion Pro 7 16IRX9H | |
| Lenovo Legion Pro 7 16IRX8H | |
| Przeciętny Intel Core i9-14900HX (67573 - 166040, n=36) | |
| HP Omen 16 (2024) | |
| AIDA64 / CPU SHA3 | |
| Alienware m16 R1 AMD | |
| Lenovo Legion Pro 7 16IRX9H | |
| MSI Vector 16 HX A14V | |
| Lenovo Legion Pro 7 16IRX8H | |
| Średnia w klasie Gaming (2180 - 10115, n=105, ostatnie 2 lata) | |
| Przeciętny Intel Core i9-14900HX (3589 - 7979, n=36) | |
| HP Omen 16 (2024) | |
| AIDA64 / CPU Queen | |
| Alienware m16 R1 AMD | |
| Lenovo Legion Pro 7 16IRX9H | |
| MSI Vector 16 HX A14V | |
| Przeciętny Intel Core i9-14900HX (118405 - 148966, n=36) | |
| Lenovo Legion Pro 7 16IRX8H | |
| HP Omen 16 (2024) | |
| Średnia w klasie Gaming (49785 - 173351, n=90, ostatnie 2 lata) | |
| AIDA64 / FPU SinJulia | |
| Alienware m16 R1 AMD | |
| Lenovo Legion Pro 7 16IRX9H | |
| MSI Vector 16 HX A14V | |
| Lenovo Legion Pro 7 16IRX8H | |
| Przeciętny Intel Core i9-14900HX (10475 - 18517, n=36) | |
| Średnia w klasie Gaming (4424 - 33636, n=105, ostatnie 2 lata) | |
| HP Omen 16 (2024) | |
| AIDA64 / FPU Mandel | |
| Alienware m16 R1 AMD | |
| Średnia w klasie Gaming (25115 - 128721, n=105, ostatnie 2 lata) | |
| MSI Vector 16 HX A14V | |
| Lenovo Legion Pro 7 16IRX9H | |
| Lenovo Legion Pro 7 16IRX8H | |
| Przeciętny Intel Core i9-14900HX (32543 - 83662, n=36) | |
| HP Omen 16 (2024) | |
| AIDA64 / CPU AES | |
| Przeciętny Intel Core i9-14900HX (86964 - 241777, n=36) | |
| Lenovo Legion Pro 7 16IRX9H | |
| MSI Vector 16 HX A14V | |
| Lenovo Legion Pro 7 16IRX8H | |
| Alienware m16 R1 AMD | |
| Średnia w klasie Gaming (39258 - 247074, n=105, ostatnie 2 lata) | |
| HP Omen 16 (2024) | |
| AIDA64 / CPU ZLib | |
| Lenovo Legion Pro 7 16IRX9H | |
| MSI Vector 16 HX A14V | |
| Lenovo Legion Pro 7 16IRX8H | |
| Przeciętny Intel Core i9-14900HX (1054 - 2292, n=36) | |
| Alienware m16 R1 AMD | |
| Średnia w klasie Gaming (574 - 2531, n=105, ostatnie 2 lata) | |
| HP Omen 16 (2024) | |
| AIDA64 / FP64 Ray-Trace | |
| Alienware m16 R1 AMD | |
| Średnia w klasie Gaming (5509 - 45446, n=105, ostatnie 2 lata) | |
| MSI Vector 16 HX A14V | |
| Lenovo Legion Pro 7 16IRX9H | |
| Lenovo Legion Pro 7 16IRX8H | |
| Przeciętny Intel Core i9-14900HX (6809 - 18349, n=36) | |
| HP Omen 16 (2024) | |
| AIDA64 / CPU PhotoWorxx | |
| HP Omen 16 (2024) | |
| MSI Vector 16 HX A14V | |
| Lenovo Legion Pro 7 16IRX8H | |
| Lenovo Legion Pro 7 16IRX9H | |
| Przeciętny Intel Core i9-14900HX (23903 - 54702, n=36) | |
| Średnia w klasie Gaming (12271 - 89891, n=105, ostatnie 2 lata) | |
| Alienware m16 R1 AMD | |
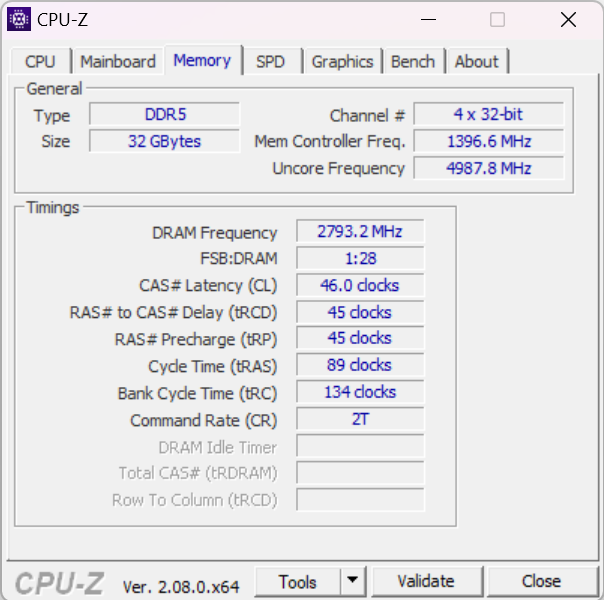
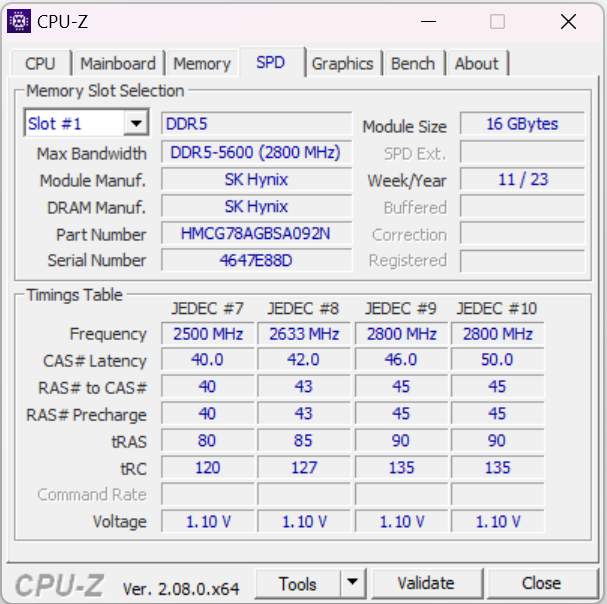
Wydajność systemu
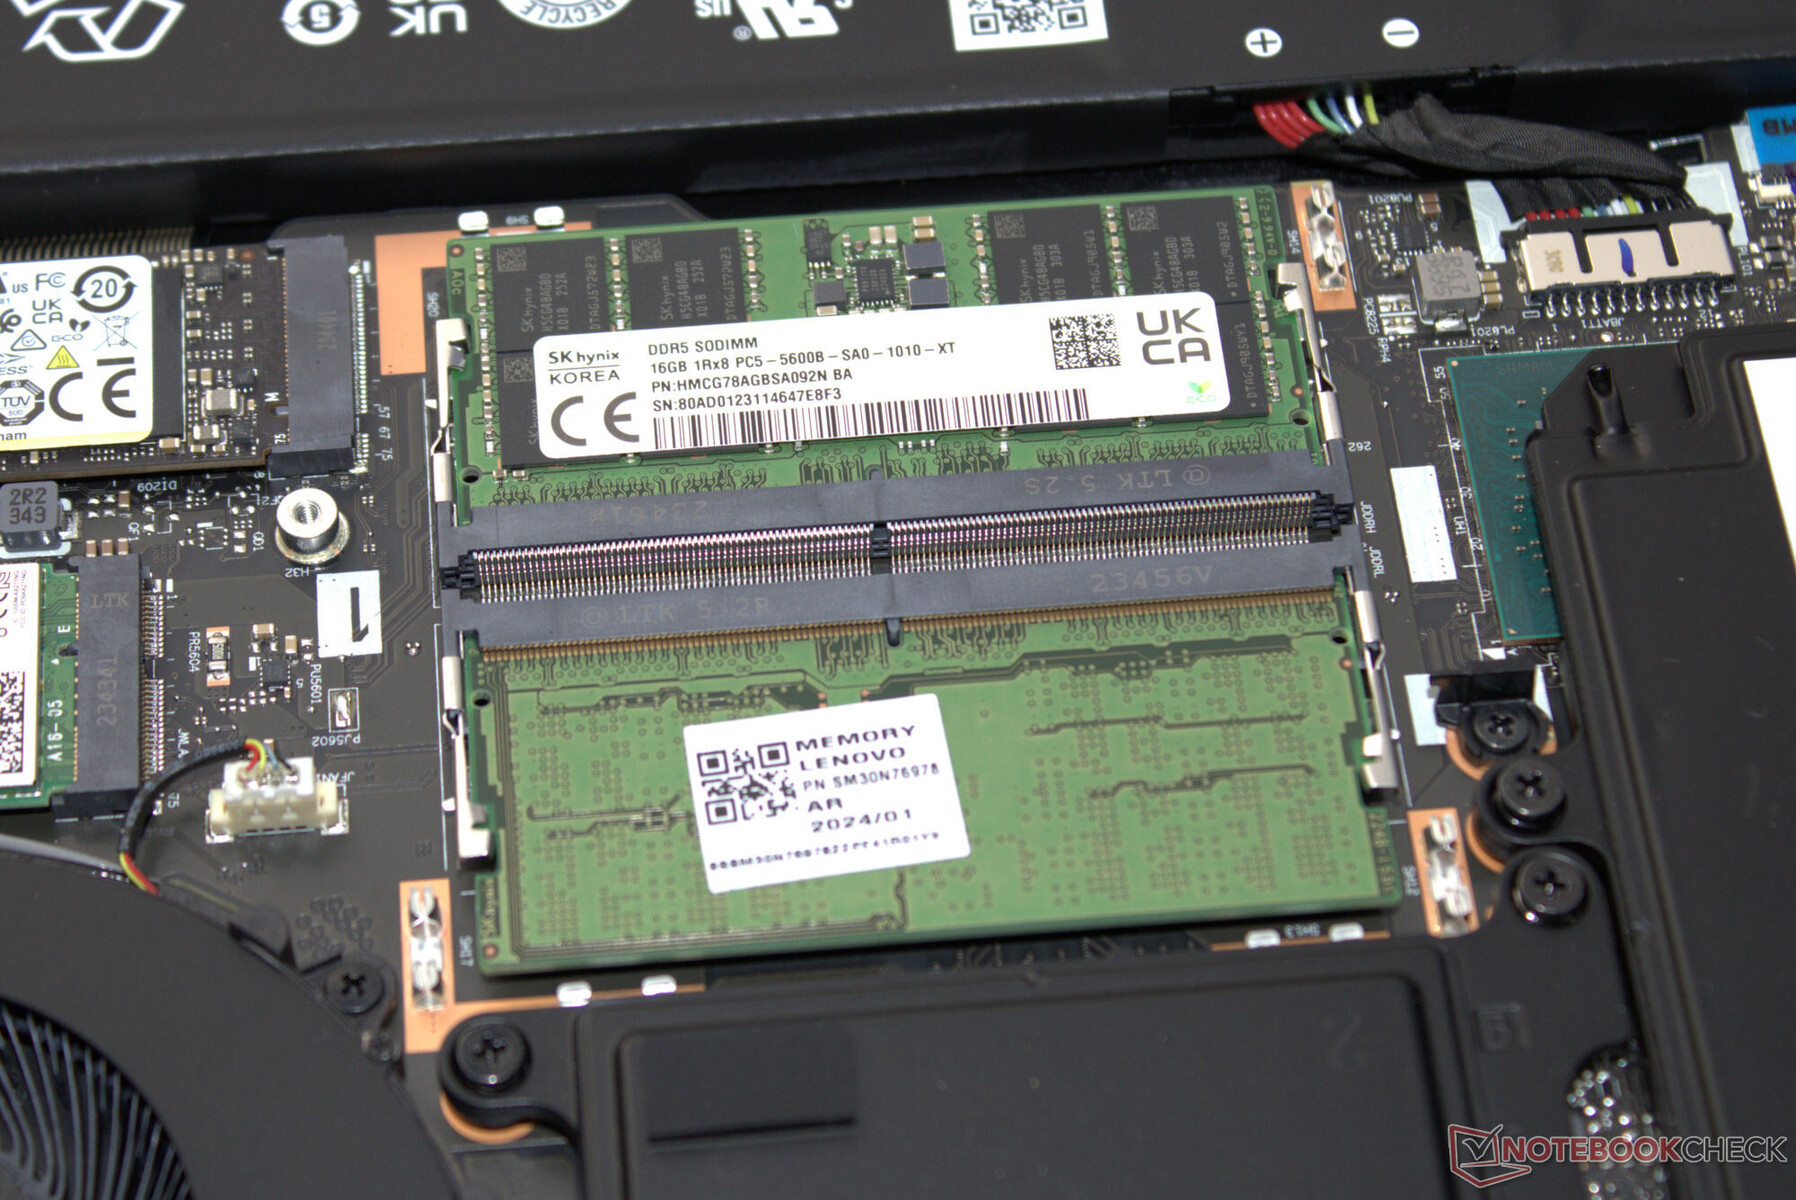
Płynnie działającemu systemowi nie brakuje wydajności obliczeniowej. Legion Pro 7 bez trudu radzi sobie z takimi zadaniami jak granie, strumieniowanie i renderowanie. Szybkość transferu pamięci jest na normalnym poziomie dla DDR5-5600 RAM.
CrossMark: Overall | Productivity | Creativity | Responsiveness
WebXPRT 3: Overall
WebXPRT 4: Overall
Mozilla Kraken 1.1: Total
| PCMark 10 / Score | |
| Lenovo Legion Pro 7 16IRX9H | |
| HP Omen 16 (2024) | |
| Alienware m16 R1 AMD | |
| Przeciętny Intel Core i9-14900HX, NVIDIA GeForce RTX 4080 Laptop GPU (7703 - 9223, n=7) | |
| MSI Vector 16 HX A14V | |
| Średnia w klasie Gaming (5828 - 12414, n=93, ostatnie 2 lata) | |
| Lenovo Legion Pro 7 16IRX8H | |
| PCMark 10 / Essentials | |
| Lenovo Legion Pro 7 16IRX9H | |
| Lenovo Legion Pro 7 16IRX8H | |
| Przeciętny Intel Core i9-14900HX, NVIDIA GeForce RTX 4080 Laptop GPU (11255 - 12600, n=7) | |
| Alienware m16 R1 AMD | |
| MSI Vector 16 HX A14V | |
| HP Omen 16 (2024) | |
| Średnia w klasie Gaming (8810 - 11935, n=97, ostatnie 2 lata) | |
| PCMark 10 / Productivity | |
| HP Omen 16 (2024) | |
| Lenovo Legion Pro 7 16IRX9H | |
| Średnia w klasie Gaming (6845 - 25323, n=95, ostatnie 2 lata) | |
| Lenovo Legion Pro 7 16IRX8H | |
| Alienware m16 R1 AMD | |
| Przeciętny Intel Core i9-14900HX, NVIDIA GeForce RTX 4080 Laptop GPU (6662 - 11410, n=7) | |
| MSI Vector 16 HX A14V | |
| PCMark 10 / Digital Content Creation | |
| MSI Vector 16 HX A14V | |
| Alienware m16 R1 AMD | |
| Przeciętny Intel Core i9-14900HX, NVIDIA GeForce RTX 4080 Laptop GPU (14211 - 16246, n=7) | |
| HP Omen 16 (2024) | |
| Lenovo Legion Pro 7 16IRX9H | |
| Średnia w klasie Gaming (7602 - 19954, n=95, ostatnie 2 lata) | |
| Lenovo Legion Pro 7 16IRX8H | |
| CrossMark / Overall | |
| Lenovo Legion Pro 7 16IRX9H | |
| HP Omen 16 (2024) | |
| MSI Vector 16 HX A14V | |
| Przeciętny Intel Core i9-14900HX, NVIDIA GeForce RTX 4080 Laptop GPU (1992 - 2334, n=7) | |
| Alienware m16 R1 AMD | |
| Średnia w klasie Gaming (1366 - 2409, n=94, ostatnie 2 lata) | |
| CrossMark / Productivity | |
| Lenovo Legion Pro 7 16IRX9H | |
| HP Omen 16 (2024) | |
| MSI Vector 16 HX A14V | |
| Przeciętny Intel Core i9-14900HX, NVIDIA GeForce RTX 4080 Laptop GPU (1812 - 2204, n=7) | |
| Alienware m16 R1 AMD | |
| Średnia w klasie Gaming (1386 - 2254, n=94, ostatnie 2 lata) | |
| CrossMark / Creativity | |
| Lenovo Legion Pro 7 16IRX9H | |
| MSI Vector 16 HX A14V | |
| Przeciętny Intel Core i9-14900HX, NVIDIA GeForce RTX 4080 Laptop GPU (2327 - 2500, n=7) | |
| HP Omen 16 (2024) | |
| Średnia w klasie Gaming (1343 - 2786, n=94, ostatnie 2 lata) | |
| Alienware m16 R1 AMD | |
| CrossMark / Responsiveness | |
| Lenovo Legion Pro 7 16IRX9H | |
| HP Omen 16 (2024) | |
| MSI Vector 16 HX A14V | |
| Przeciętny Intel Core i9-14900HX, NVIDIA GeForce RTX 4080 Laptop GPU (1520 - 2254, n=7) | |
| Alienware m16 R1 AMD | |
| Średnia w klasie Gaming (1226 - 2334, n=94, ostatnie 2 lata) | |
| WebXPRT 3 / Overall | |
| Lenovo Legion Pro 7 16IRX8H | |
| Lenovo Legion Pro 7 16IRX8H | |
| Alienware m16 R1 AMD | |
| Lenovo Legion Pro 7 16IRX9H | |
| Przeciętny Intel Core i9-14900HX, NVIDIA GeForce RTX 4080 Laptop GPU (310 - 345, n=7) | |
| HP Omen 16 (2024) | |
| MSI Vector 16 HX A14V | |
| Średnia w klasie Gaming (220 - 532, n=98, ostatnie 2 lata) | |
| WebXPRT 4 / Overall | |
| Lenovo Legion Pro 7 16IRX9H | |
| Przeciętny Intel Core i9-14900HX, NVIDIA GeForce RTX 4080 Laptop GPU (300 - 321, n=7) | |
| HP Omen 16 (2024) | |
| Lenovo Legion Pro 7 16IRX8H | |
| MSI Vector 16 HX A14V | |
| Średnia w klasie Gaming (165 - 354, n=98, ostatnie 2 lata) | |
| Alienware m16 R1 AMD | |
| Mozilla Kraken 1.1 / Total | |
| Alienware m16 R1 AMD | |
| Średnia w klasie Gaming (391 - 590, n=100, ostatnie 2 lata) | |
| Lenovo Legion Pro 7 16IRX8H | |
| Lenovo Legion Pro 7 16IRX8H | |
| MSI Vector 16 HX A14V | |
| Przeciętny Intel Core i9-14900HX, NVIDIA GeForce RTX 4080 Laptop GPU (437 - 446, n=7) | |
| Lenovo Legion Pro 7 16IRX9H | |
| HP Omen 16 (2024) | |
* ... im mniej tym lepiej
| PCMark 10 Score | 8923 pkt. | |
Pomoc | ||
| AIDA64 / Memory Copy | |
| HP Omen 16 (2024) | |
| Lenovo Legion Pro 7 16IRX9H | |
| MSI Vector 16 HX A14V | |
| Przeciętny Intel Core i9-14900HX (38028 - 83392, n=36) | |
| Średnia w klasie Gaming (21750 - 129946, n=105, ostatnie 2 lata) | |
| Alienware m16 R1 AMD | |
| AIDA64 / Memory Read | |
| HP Omen 16 (2024) | |
| Lenovo Legion Pro 7 16IRX9H | |
| MSI Vector 16 HX A14V | |
| Przeciętny Intel Core i9-14900HX (43306 - 87568, n=36) | |
| Średnia w klasie Gaming (22956 - 118858, n=105, ostatnie 2 lata) | |
| Alienware m16 R1 AMD | |
| AIDA64 / Memory Write | |
| HP Omen 16 (2024) | |
| MSI Vector 16 HX A14V | |
| Średnia w klasie Gaming (22297 - 135096, n=105, ostatnie 2 lata) | |
| Przeciętny Intel Core i9-14900HX (37146 - 80589, n=36) | |
| Lenovo Legion Pro 7 16IRX9H | |
| Alienware m16 R1 AMD | |
| AIDA64 / Memory Latency | |
| Średnia w klasie Gaming (75.3 - 259, n=105, ostatnie 2 lata) | |
| Alienware m16 R1 AMD | |
| Przeciętny Intel Core i9-14900HX (76.1 - 105, n=36) | |
| HP Omen 16 (2024) | |
| MSI Vector 16 HX A14V | |
| Lenovo Legion Pro 7 16IRX9H | |
* ... im mniej tym lepiej
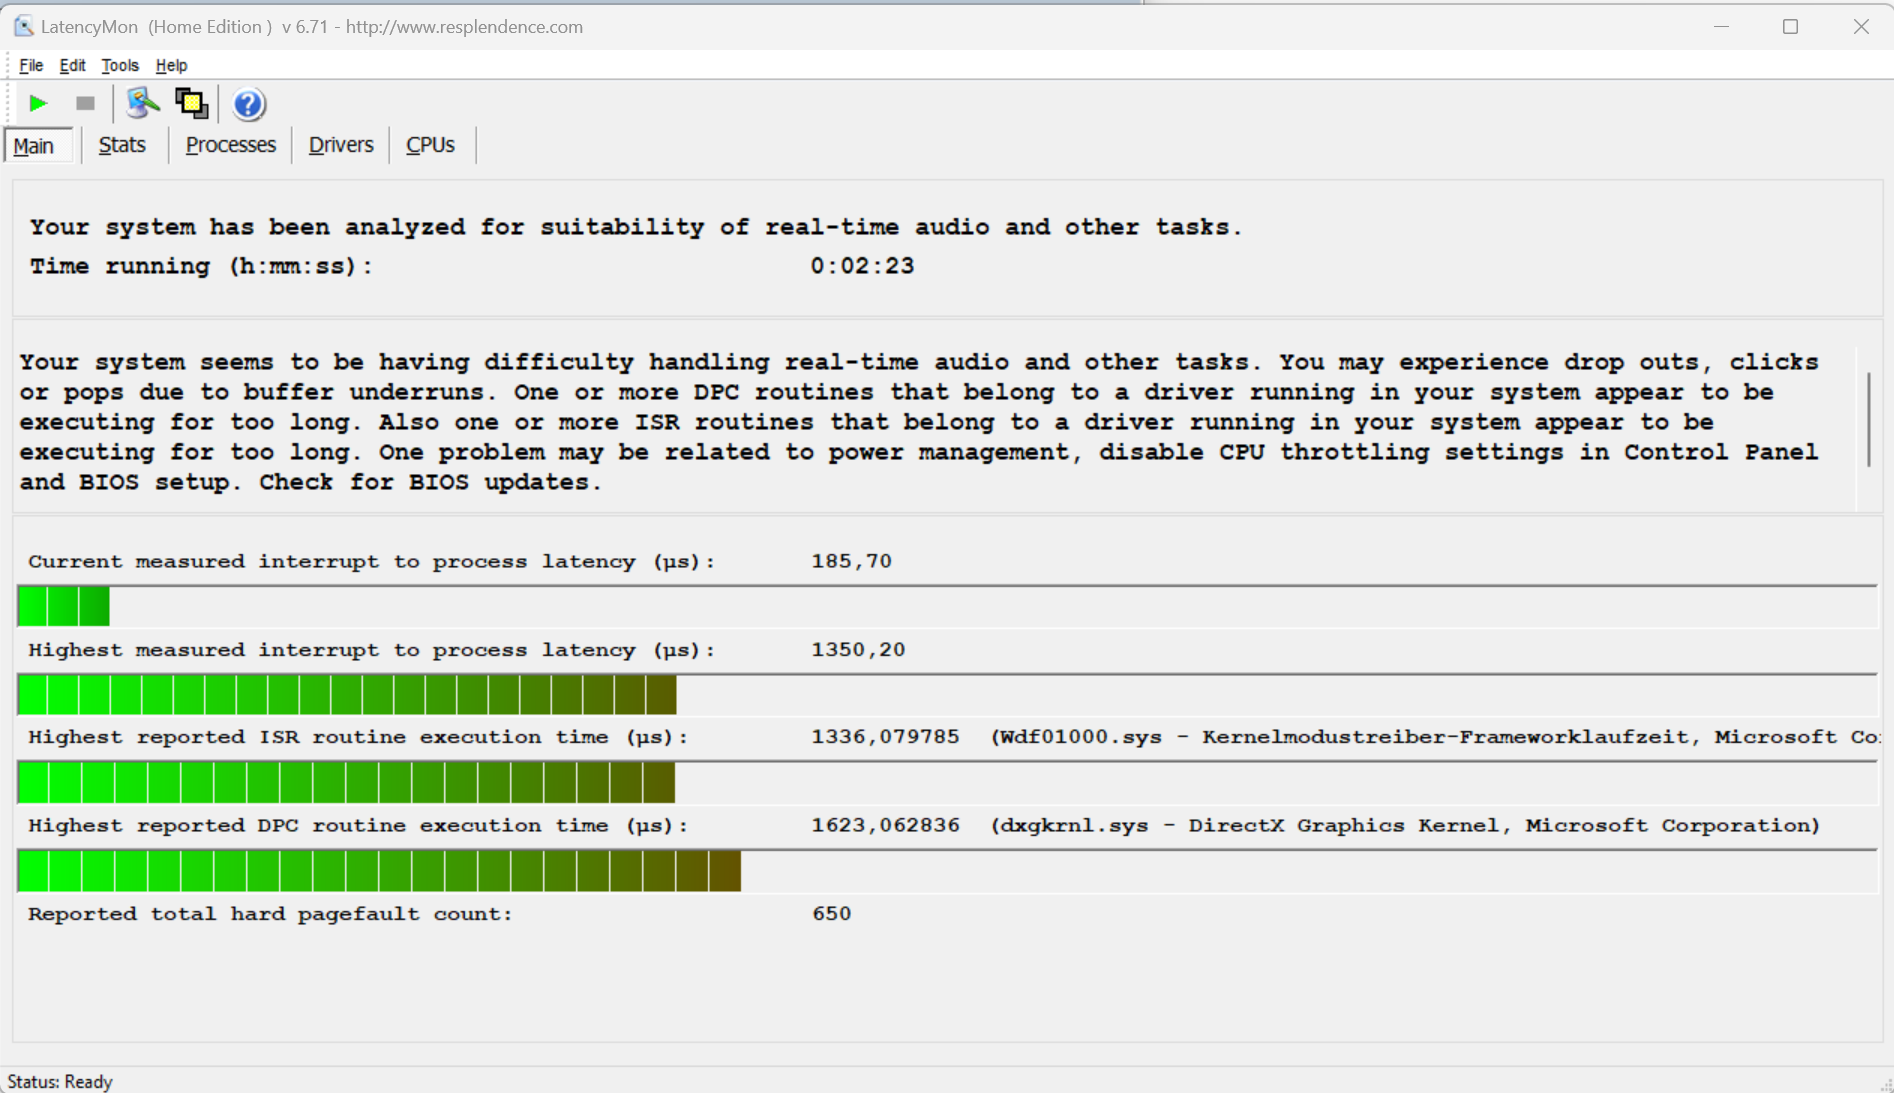
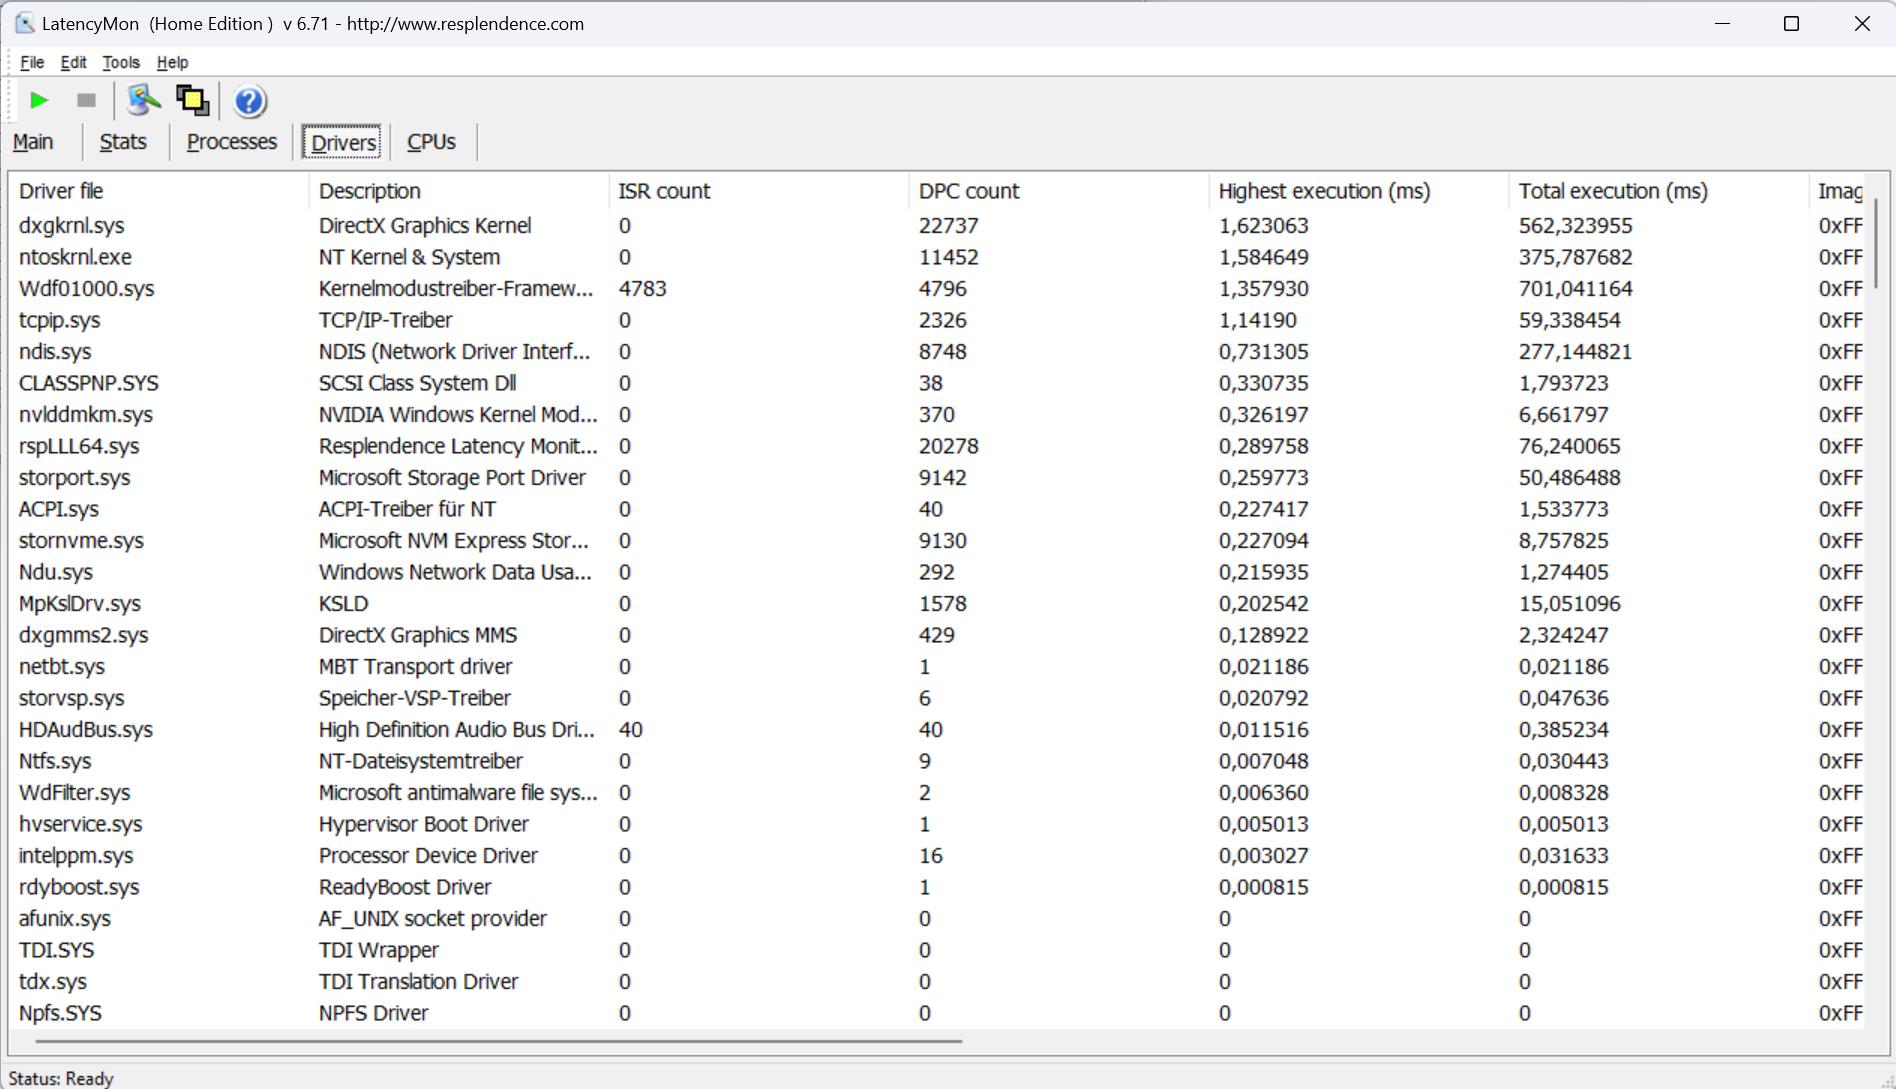
Opóźnienie DPC
Latency Monitor wykrył pewne problemy podczas testu opóźnień (przeglądanie stron internetowych, odtwarzanie wideo 4K, wysokie obciążenie Prime95). System nie wydaje się być odpowiedni do zadań wideo i audio w czasie rzeczywistym. Miejmy nadzieję, że przyszłe aktualizacje oprogramowania będą w stanie poprawić sytuację.
| DPC Latencies / LatencyMon - interrupt to process latency (max), Web, Youtube, Prime95 | |
| Alienware m16 R1 AMD | |
| MSI Vector 16 HX A14V | |
| Lenovo Legion Pro 7 16IRX9H | |
| HP Omen 16 (2024) | |
| Lenovo Legion Pro 7 16IRX8H | |
* ... im mniej tym lepiej
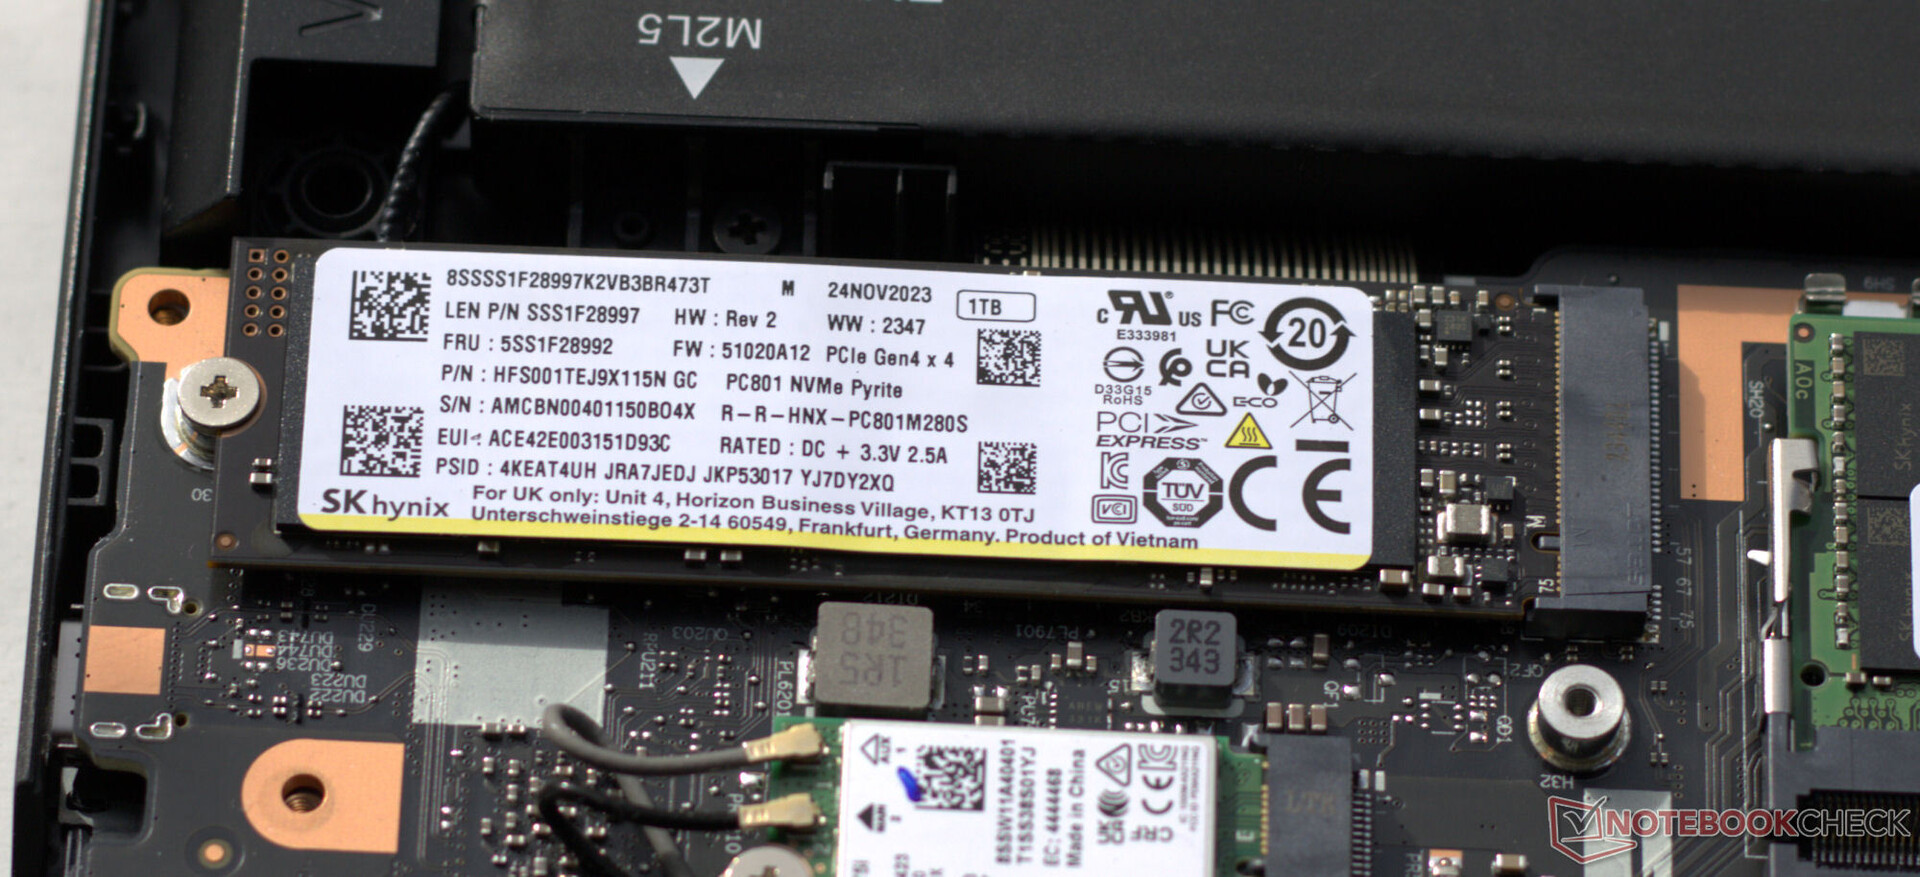
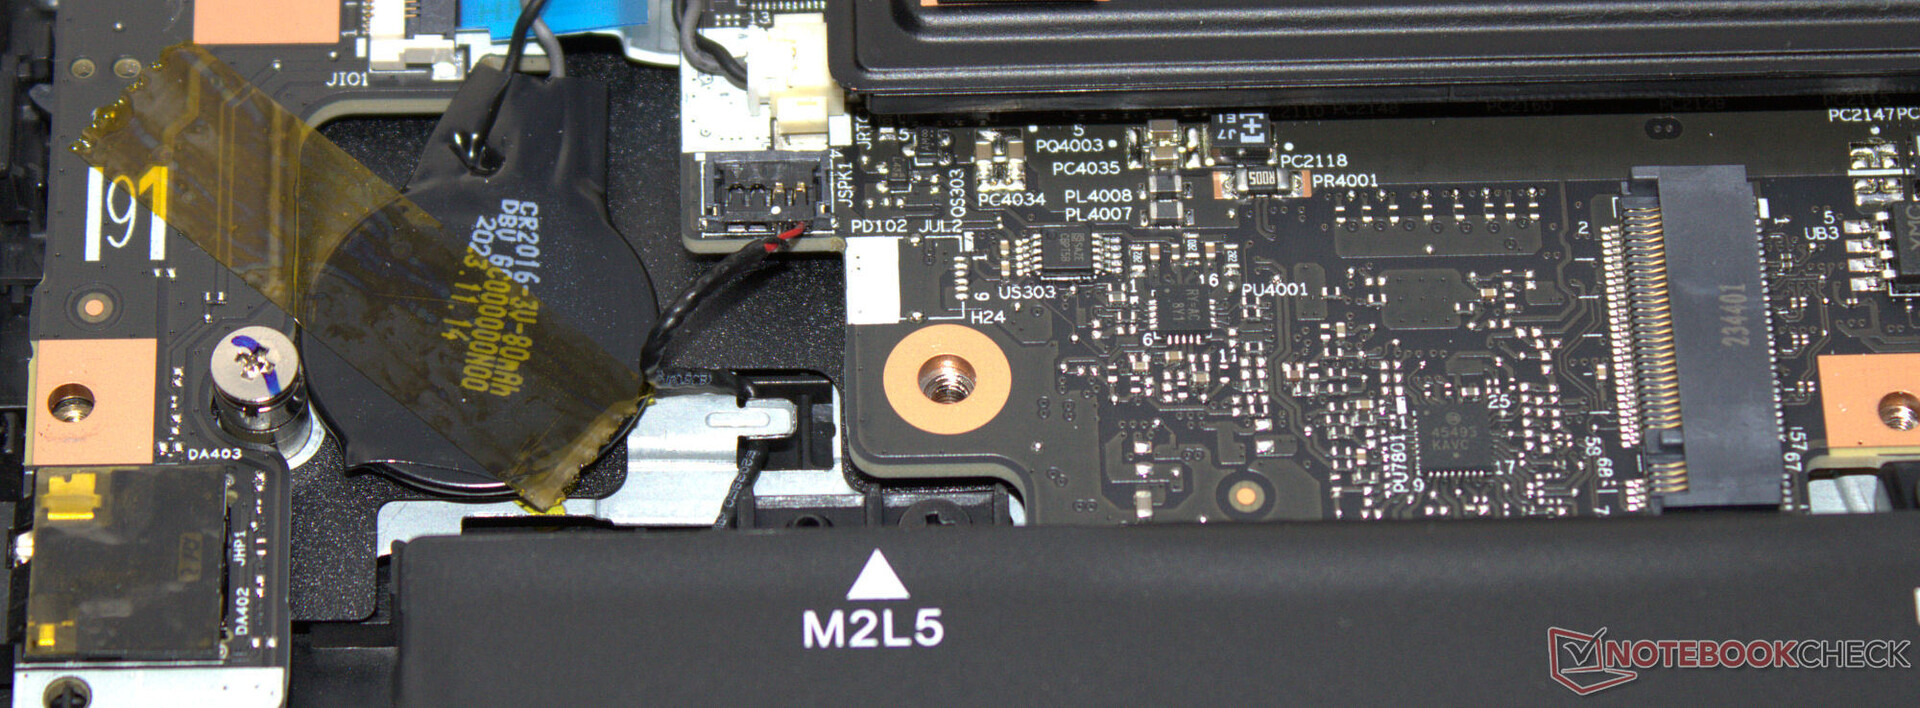
Pamięć masowa
Na stronie Legion znalazło się miejsce dla dwóch dysków SSD PCIe 4.0. Dysk SK Hynix M.2 2280 SSD (1 TB) w naszej jednostce testowej zapewnił doskonałe prędkości odczytu i zapisu. Kolejnym pozytywnym aspektem jest fakt, że podczas naszych testów nie wystąpiło zjawisko dławienia termicznego.

* ... im mniej tym lepiej
Sustained load Read: DiskSpd Read Loop, Queue Depth 8
Karta graficzna
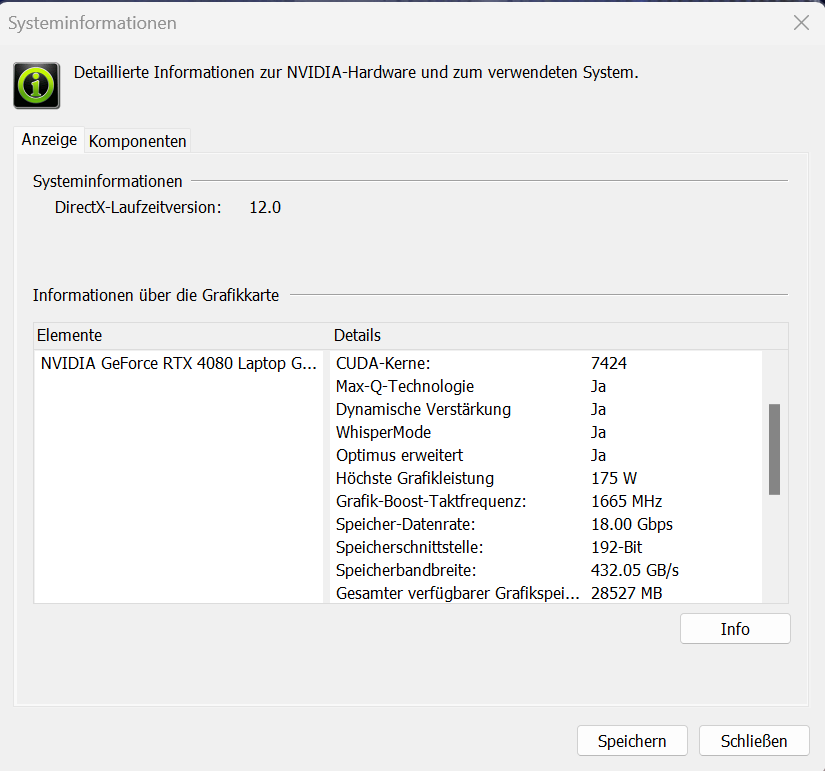
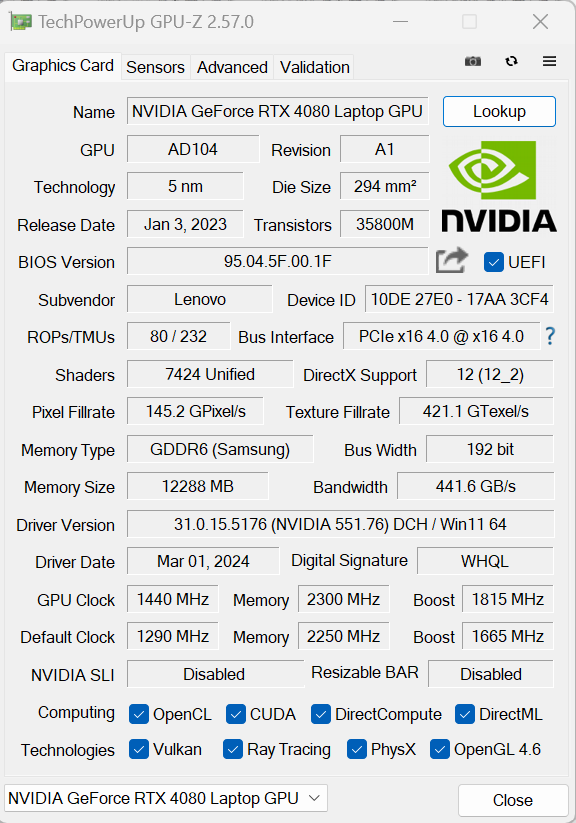
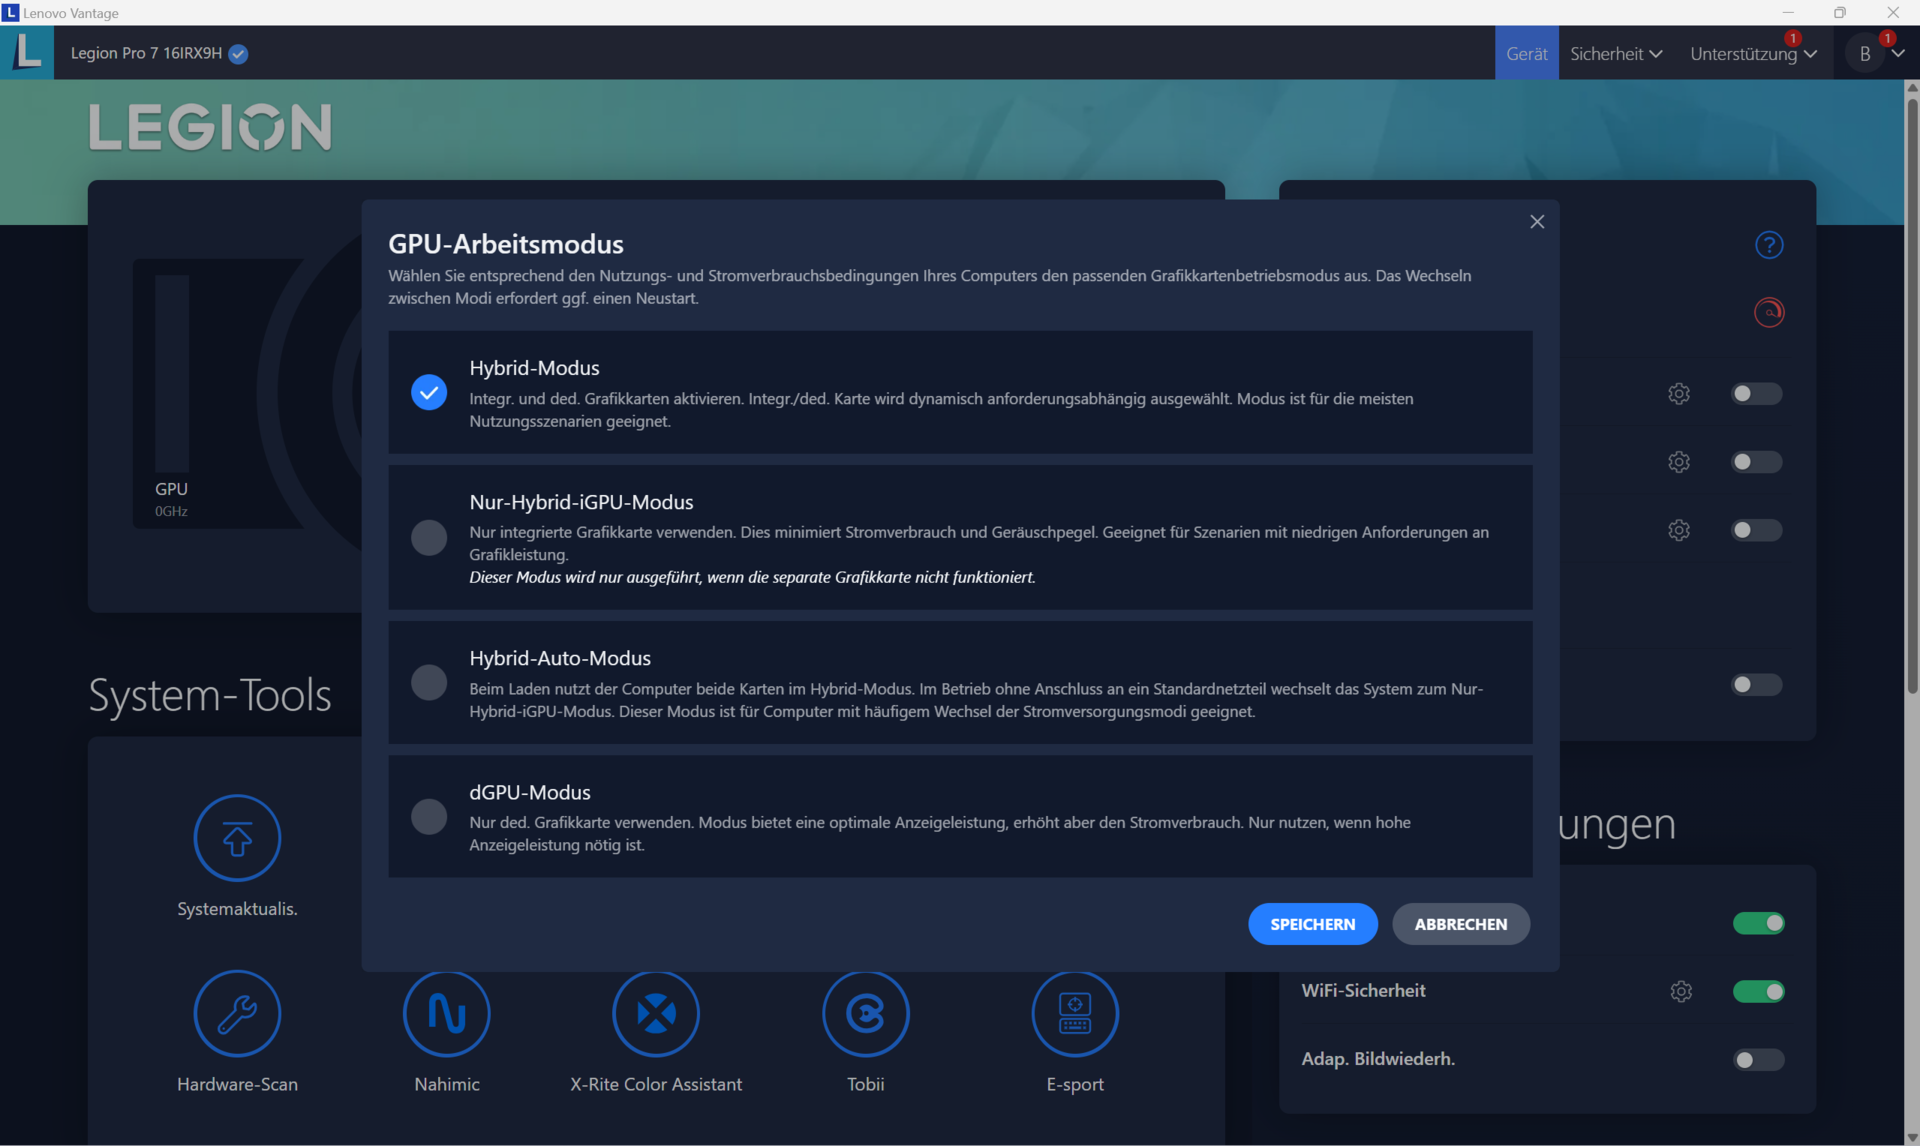
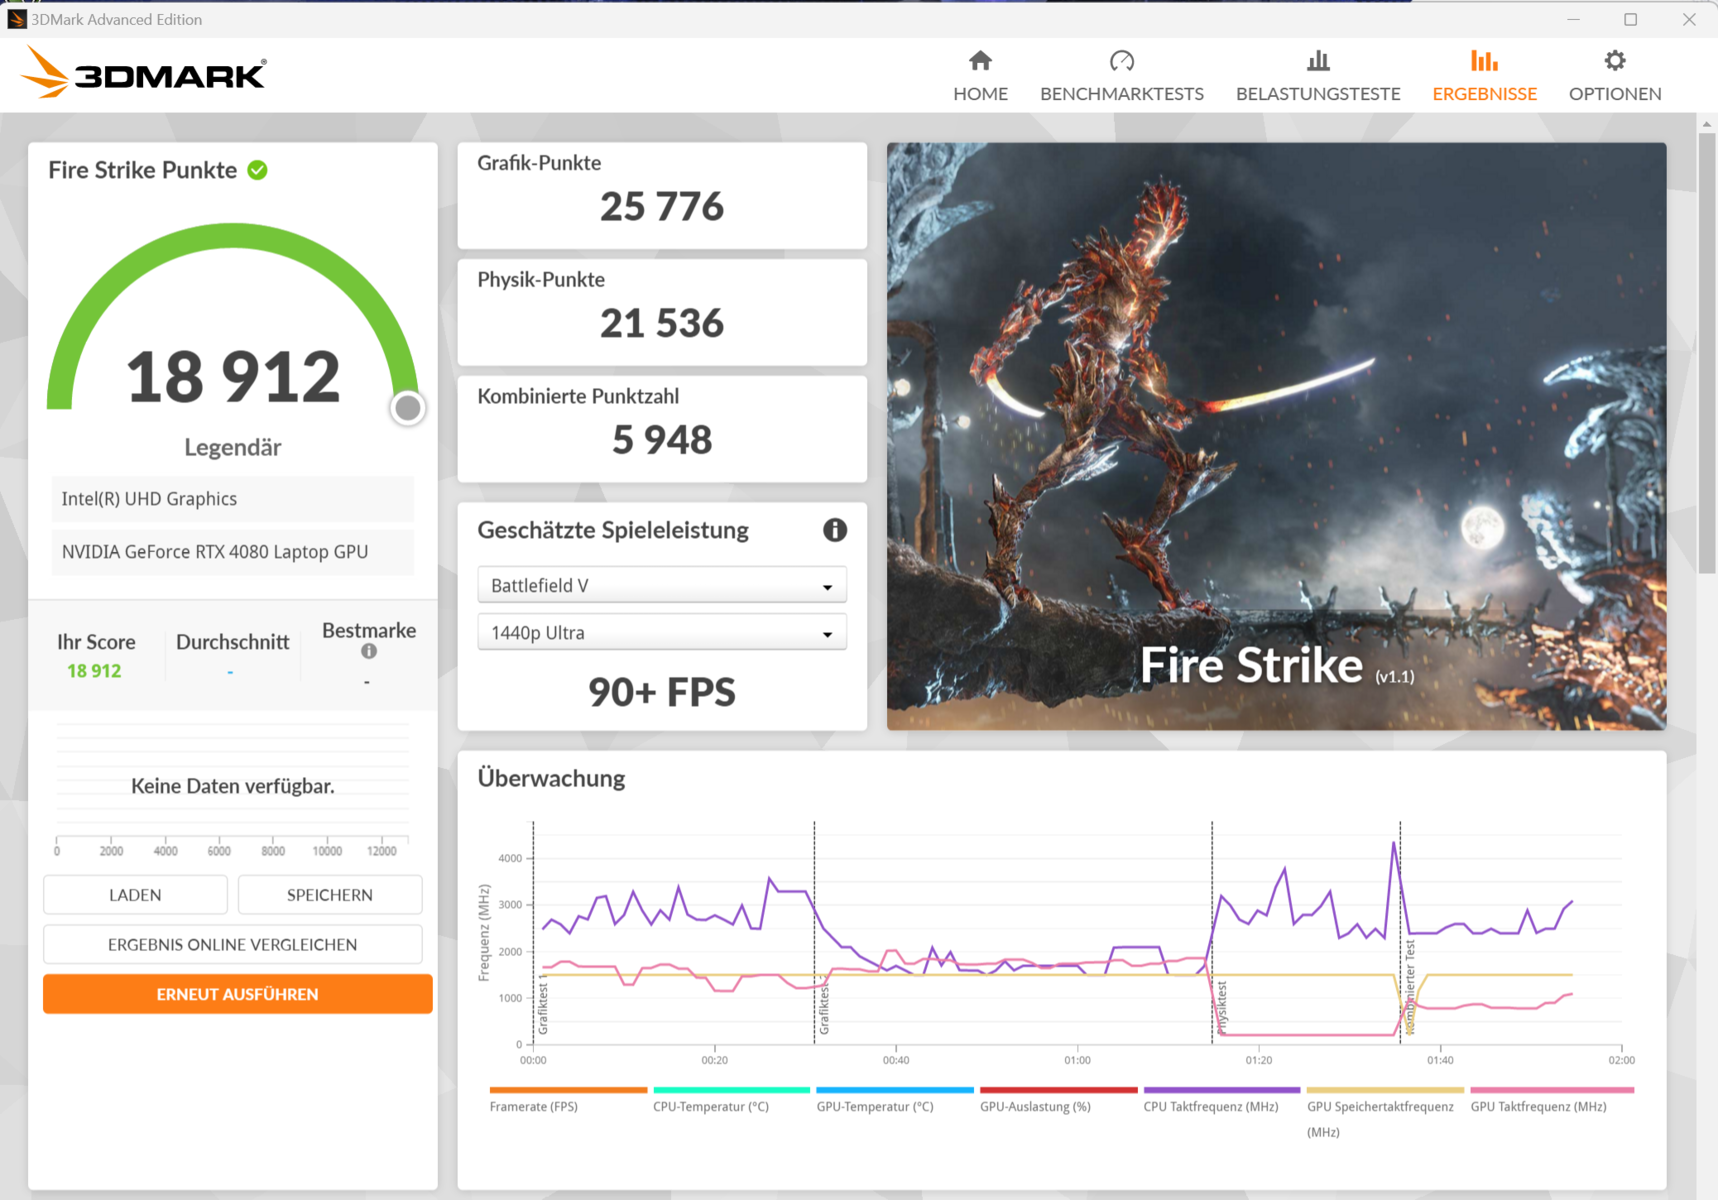
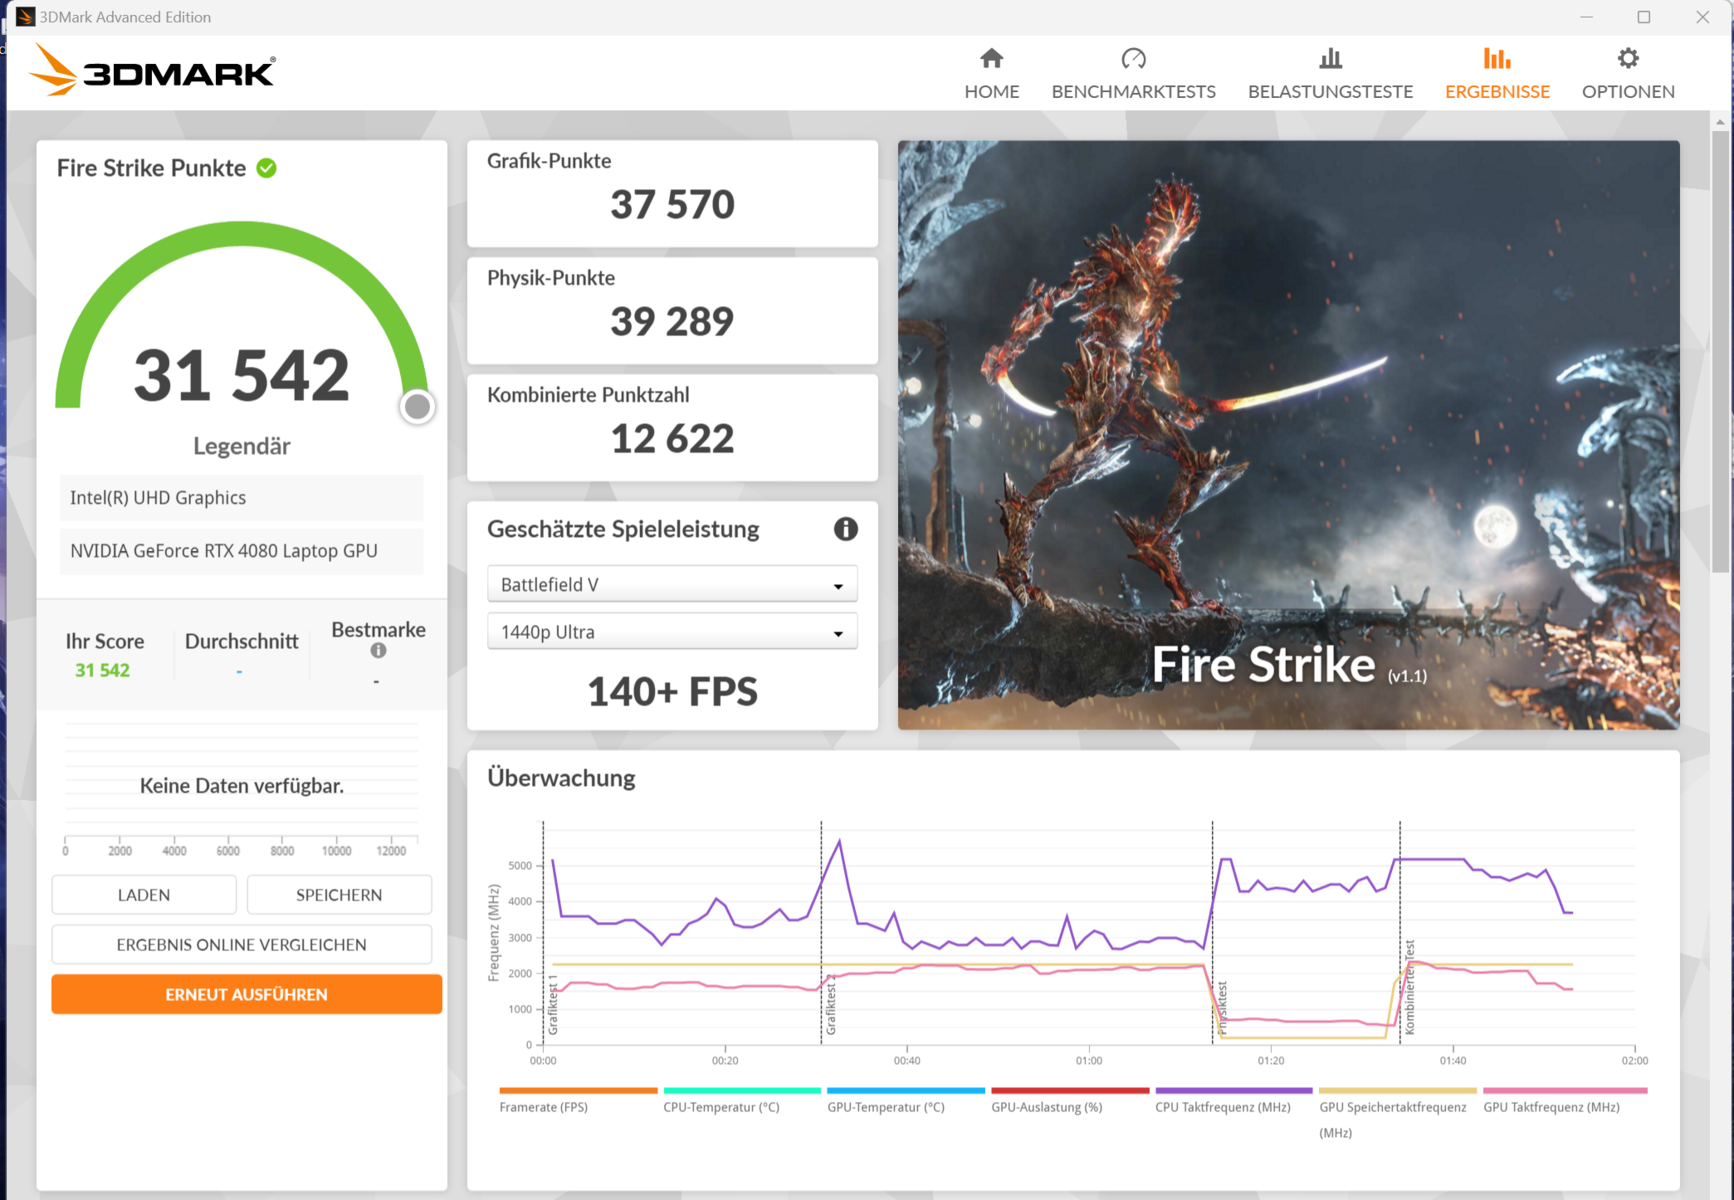
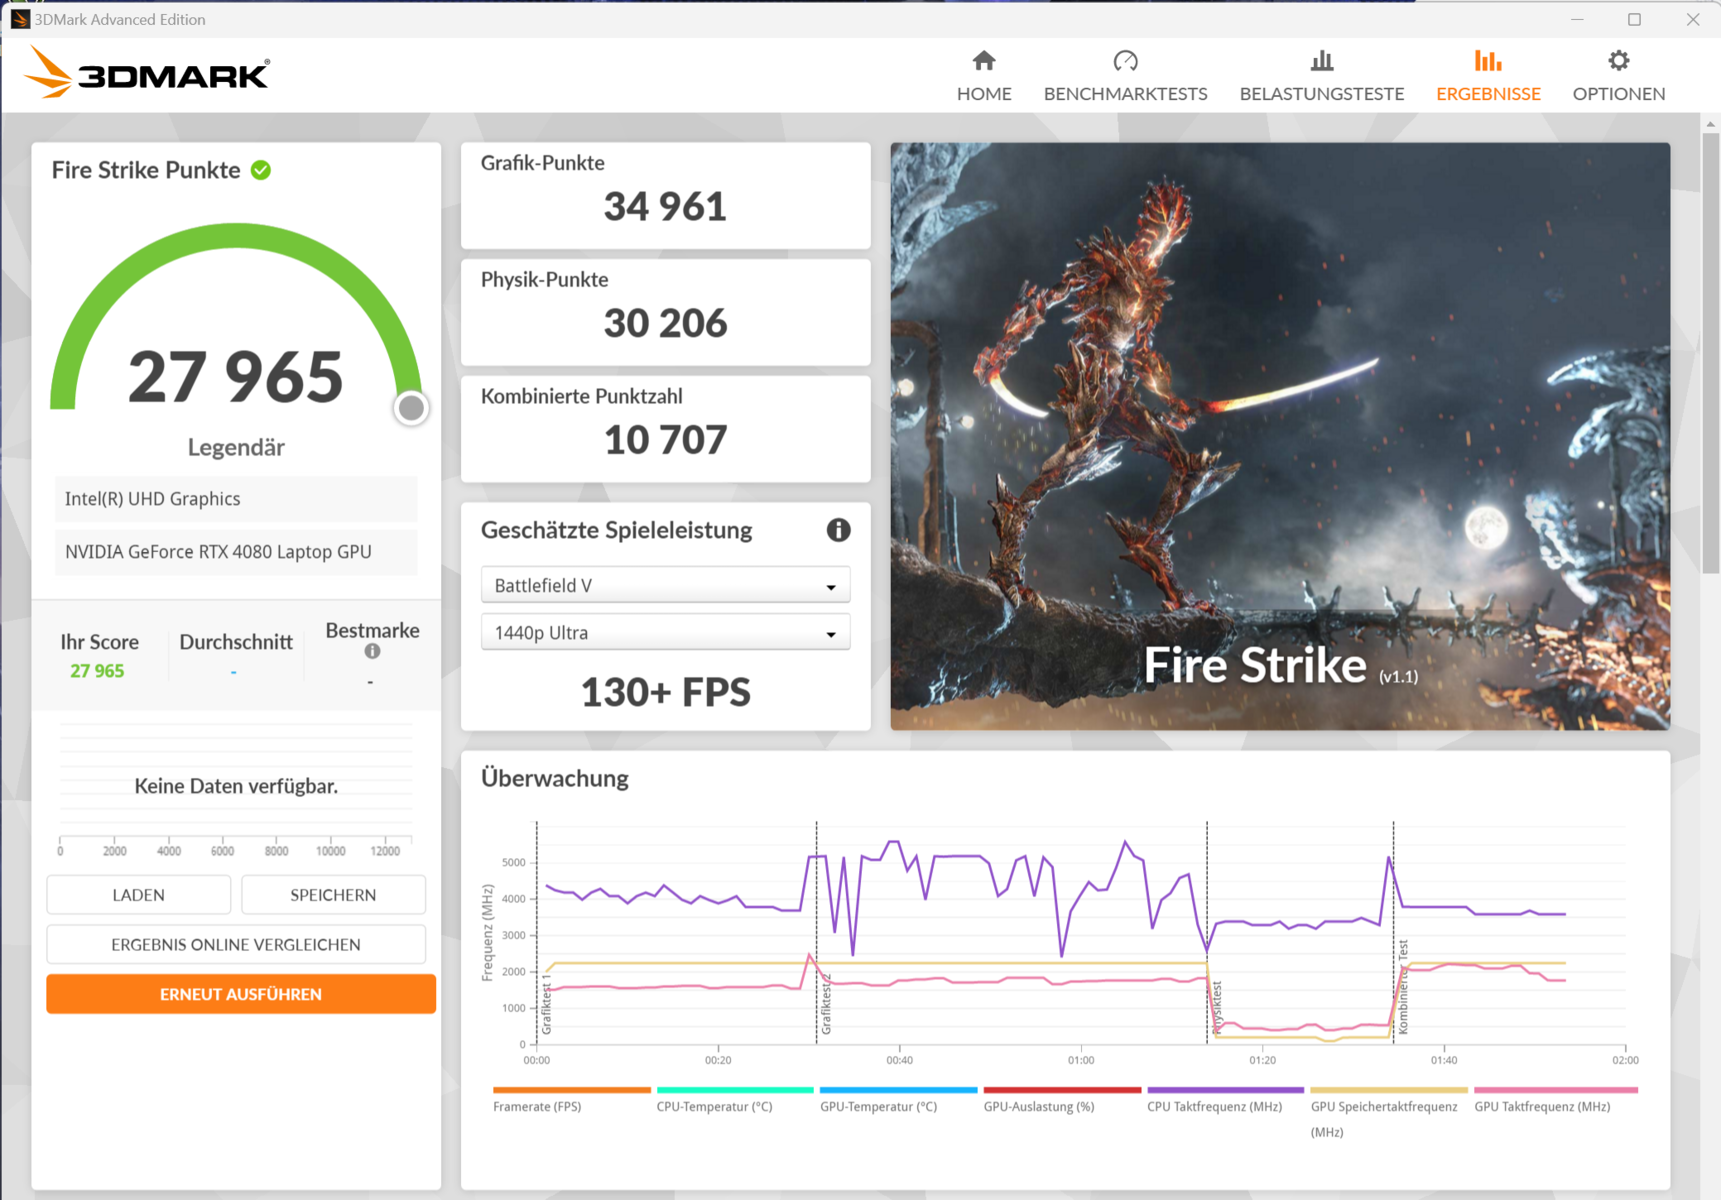
Lenovo wyposażyło Legion Pro 7 w kartę graficzną GeForce RTX 4080 (7 424 jednostki cieniujące, 192-bitowa magistrala pamięci, 12 GB pamięci GDDR6, 175 W), który jest obecnie numerem dwa w mobilnej linii GPU Nvidii. Wyniki benchmarków i liczba klatek na sekundę uzyskane w naszych testach przewyższają średnie możliwości RTX 4080 Laptop. Niektóre z tych wyników są najlepszymi, jakie do tej pory widzieliśmy z RTX 4080. Przełączanie między trybem tylko dGPU a trybem Optimus nie wymaga ponownego uruchamiania; obsługiwany jest również tryb Advanced Optimus.
Karta graficzna jest wystarczająco wydajna do grania w rozdzielczości QHD przy wysokich i maksymalnych ustawieniach. Z pomocą DLSS 3 i Frame Generation można również uzyskać wyższe rozdzielczości przy maksymalnych ustawieniach i z włączonym ray tracingiem - ale tylko w grach, które obsługują te funkcje.
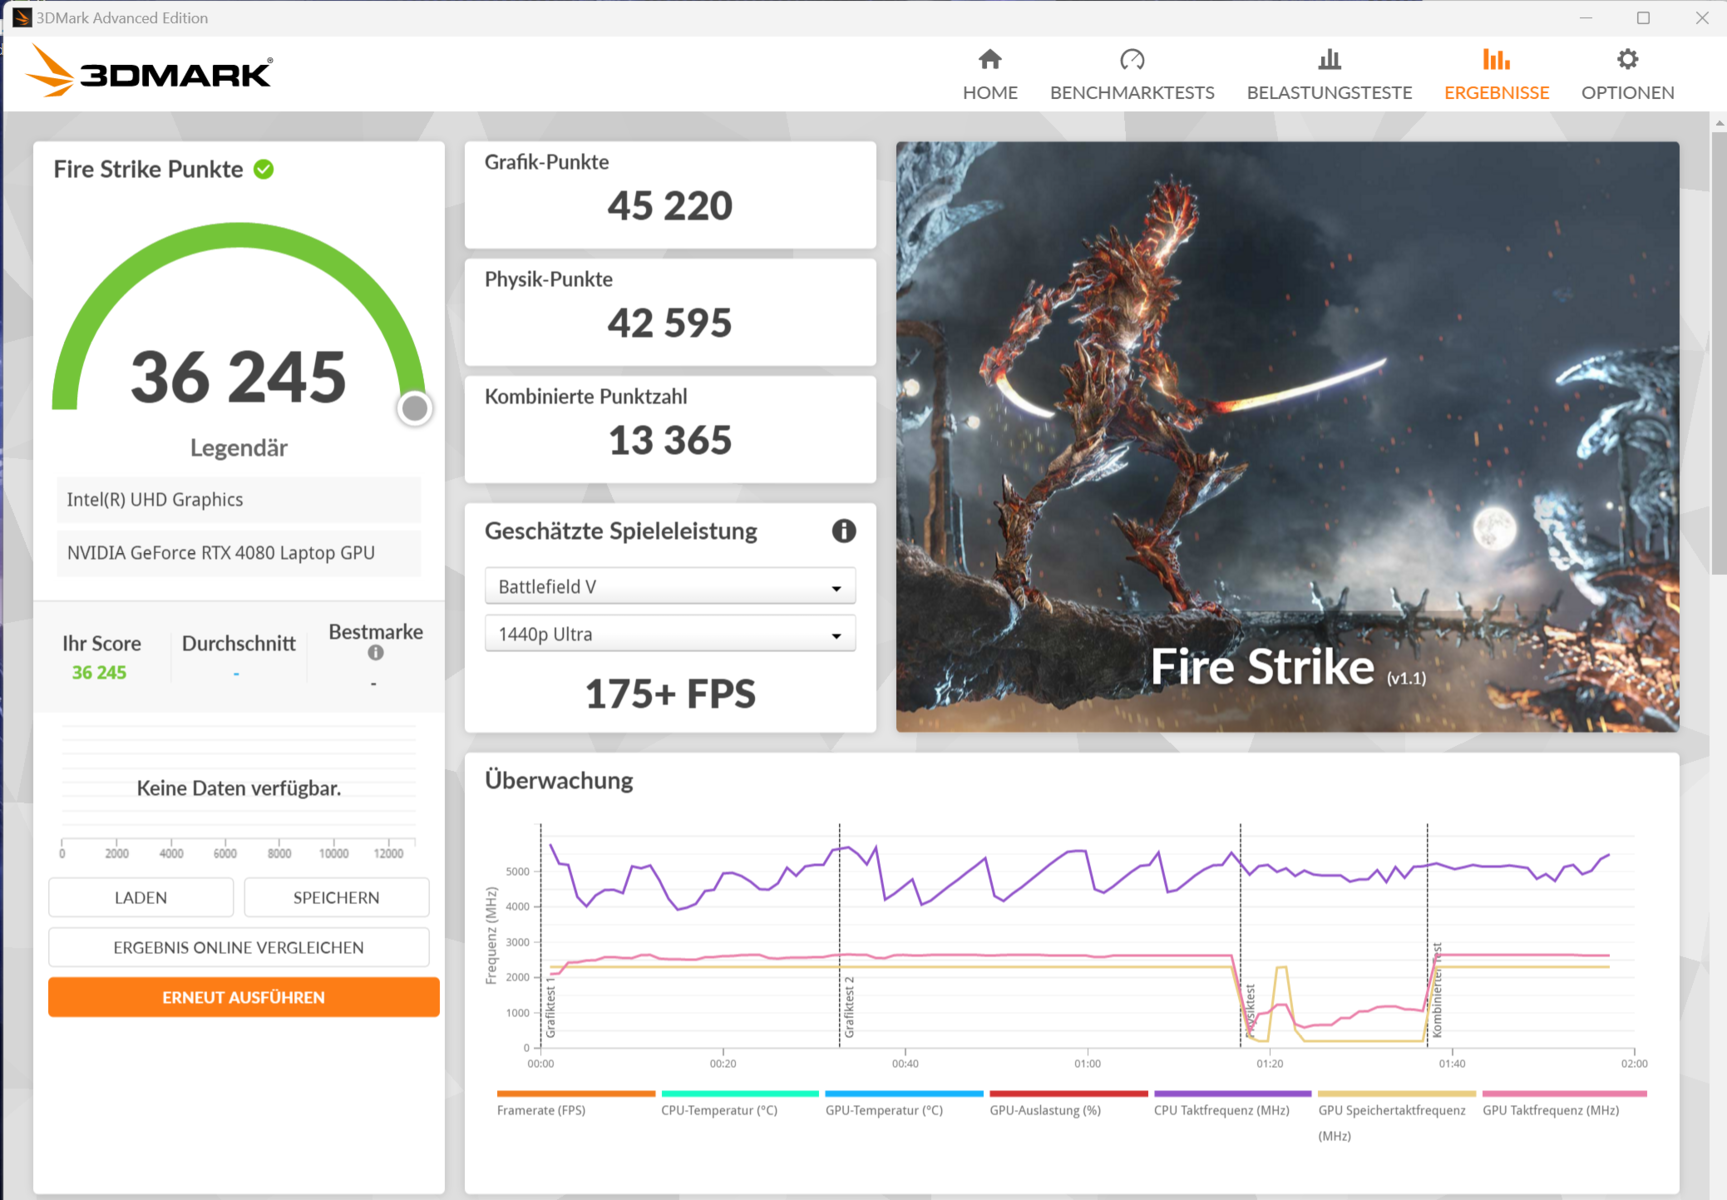
| 3DMark 11 Performance | 46847 pkt. | |
| 3DMark Fire Strike Score | 36245 pkt. | |
| 3DMark Time Spy Score | 19518 pkt. | |
Pomoc | ||
* ... im mniej tym lepiej
| Performance rating - Percent | |
| Lenovo Legion Pro 7 16IRX9H | |
| MSI Vector 16 HX A14V | |
| Alienware m16 R1 AMD -1! | |
| Przeciętny NVIDIA GeForce RTX 4080 Laptop GPU | |
| Średnia w klasie Gaming | |
| HP Omen 16 (2024) | |
| The Witcher 3 - 1920x1080 Ultra Graphics & Postprocessing (HBAO+) | |
| Średnia w klasie Gaming (104.7 - 240, n=7, ostatnie 2 lata) | |
| Lenovo Legion Pro 7 16IRX9H | |
| MSI Vector 16 HX A14V | |
| Alienware m16 R1 AMD | |
| Przeciętny NVIDIA GeForce RTX 4080 Laptop GPU (130.4 - 186.1, n=20) | |
| HP Omen 16 (2024) | |
| GTA V - 1920x1080 Highest AA:4xMSAA + FX AF:16x | |
| Lenovo Legion Pro 7 16IRX9H | |
| MSI Vector 16 HX A14V | |
| Średnia w klasie Gaming (48.3 - 186.9, n=94, ostatnie 2 lata) | |
| Przeciętny NVIDIA GeForce RTX 4080 Laptop GPU (102.9 - 152.7, n=21) | |
| HP Omen 16 (2024) | |
| Final Fantasy XV Benchmark - 1920x1080 High Quality | |
| MSI Vector 16 HX A14V | |
| Lenovo Legion Pro 7 16IRX9H | |
| Alienware m16 R1 AMD | |
| Przeciętny NVIDIA GeForce RTX 4080 Laptop GPU (129 - 182.1, n=23) | |
| Średnia w klasie Gaming (41 - 215, n=95, ostatnie 2 lata) | |
| HP Omen 16 (2024) | |
| Strange Brigade - 1920x1080 ultra AA:ultra AF:16 | |
| Alienware m16 R1 AMD | |
| MSI Vector 16 HX A14V | |
| Lenovo Legion Pro 7 16IRX9H | |
| Przeciętny NVIDIA GeForce RTX 4080 Laptop GPU (239 - 357, n=22) | |
| Średnia w klasie Gaming (76.3 - 458, n=87, ostatnie 2 lata) | |
| HP Omen 16 (2024) | |
| Dota 2 Reborn - 1920x1080 ultra (3/3) best looking | |
| Lenovo Legion Pro 7 16IRX9H | |
| MSI Vector 16 HX A14V | |
| Alienware m16 R1 AMD | |
| Przeciętny NVIDIA GeForce RTX 4080 Laptop GPU (133 - 194.7, n=23) | |
| HP Omen 16 (2024) | |
| Średnia w klasie Gaming (84.8 - 248, n=107, ostatnie 2 lata) | |
| Call of Duty Modern Warfare 3 2023 - 1920x1080 Extreme Preset | |
| Przeciętny NVIDIA GeForce RTX 4080 Laptop GPU (153 - 171, n=3) | |
| Lenovo Legion Pro 7 16IRX9H | |
| Średnia w klasie Gaming (27 - 95, n=2, ostatnie 2 lata) | |
| Skull & Bones | |
| 1920x1080 Ultra High Preset AA:T | |
| Lenovo Legion Pro 7 16IRX9H | |
| Przeciętny NVIDIA GeForce RTX 4080 Laptop GPU (96 - 115, n=3) | |
| 2560x1440 Ultra High Preset AA:T | |
| Lenovo Legion Pro 7 16IRX9H | |
| Przeciętny NVIDIA GeForce RTX 4080 Laptop GPU (76 - 91, n=3) | |
| Assassin's Creed Mirage | |
| 1920x1080 Ultra High Preset (Adaptive Quality Off) | |
| Lenovo Legion Pro 7 16IRX9H | |
| Przeciętny NVIDIA GeForce RTX 4080 Laptop GPU (129 - 157, n=3) | |
| 2560x1440 Ultra High Preset (Adaptive Quality Off) | |
| Lenovo Legion Pro 7 16IRX9H | |
| Przeciętny NVIDIA GeForce RTX 4080 Laptop GPU (112 - 136, n=3) | |
| Avatar Frontiers of Pandora | |
| 1920x1080 Ultra Preset AA:T | |
| Przeciętny NVIDIA GeForce RTX 4080 Laptop GPU (87 - 97, n=4) | |
| Lenovo Legion Pro 7 16IRX9H | |
| Średnia w klasie Gaming (n=1ostatnie 2 lata) | |
| 2560x1440 Ultra Preset AA:T | |
| Przeciętny NVIDIA GeForce RTX 4080 Laptop GPU (59 - 66, n=4) | |
| Lenovo Legion Pro 7 16IRX9H | |
| Średnia w klasie Gaming (n=1ostatnie 2 lata) | |
| Last Epoch | |
| 1920x1080 Ultra Preset AA:T | |
| Lenovo Legion Pro 7 16IRX9H | |
| Przeciętny NVIDIA GeForce RTX 4080 Laptop GPU (156.5 - 204, n=2) | |
| Średnia w klasie Gaming (n=1ostatnie 2 lata) | |
| 2560x1440 Ultra Preset AA:T | |
| Lenovo Legion Pro 7 16IRX9H | |
| Przeciętny NVIDIA GeForce RTX 4080 Laptop GPU (127.4 - 139, n=2) | |
| Średnia w klasie Gaming (n=1ostatnie 2 lata) | |
| Alone in the Dark | |
| 1920x1080 Cinematic Preset | |
| Lenovo Legion Pro 7 16IRX9H | |
| Przeciętny NVIDIA GeForce RTX 4080 Laptop GPU (120 - 176.4, n=2) | |
| 2560x1440 Cinematic Preset | |
| Lenovo Legion Pro 7 16IRX9H | |
| Przeciętny NVIDIA GeForce RTX 4080 Laptop GPU (86 - 91.6, n=2) | |
| Horizon Forbidden West | |
| 1920x1080 Very High Preset AA:T | |
| Lenovo Legion Pro 7 16IRX9H | |
| Przeciętny NVIDIA GeForce RTX 4080 Laptop GPU (89.2 - 103.5, n=2) | |
| Średnia w klasie Gaming (14.7 - 140.3, n=12, ostatnie 2 lata) | |
| 2560x1440 Very High Preset AA:T | |
| Lenovo Legion Pro 7 16IRX9H | |
| Przeciętny NVIDIA GeForce RTX 4080 Laptop GPU (71 - 83.7, n=2) | |
| Średnia w klasie Gaming (45.7 - 100.9, n=9, ostatnie 2 lata) | |
Witcher 3 FPS chart
| low | med. | high | ultra | QHD | |
|---|---|---|---|---|---|
| GTA V (2015) | 187.2 | 186.6 | 186.5 | 152 | 135.3 |
| The Witcher 3 (2015) | 628.4 | 518.3 | 342.2 | 186.1 | 142.6 |
| Dota 2 Reborn (2015) | 229 | 211 | 197.3 | 183.5 | |
| Final Fantasy XV Benchmark (2018) | 232 | 211 | 173.1 | 139.3 | |
| X-Plane 11.11 (2018) | 196.4 | 162.3 | 127.5 | ||
| Strange Brigade (2018) | 538 | 446 | 377 | 339 | 243 |
| Cyberpunk 2077 (2023) | 152.3 | 137.2 | 126.7 | 118.3 | 79.1 |
| Assassin's Creed Mirage (2023) | 208 | 207 | 199 | 157 | 136 |
| Call of Duty Modern Warfare 3 2023 (2023) | 224 | 205 | 164 | 153 | 110 |
| Avatar Frontiers of Pandora (2023) | 141 | 130 | 114 | 89 | 59 |
| Skull & Bones (2024) | 161 | 151 | 135 | 112 | 89 |
| Last Epoch (2024) | 248 | 237 | 229 | 204 | 139 |
| Alone in the Dark (2024) | 249 | 230 | 214 | 176.4 | 91.6 |
| Horizon Forbidden West (2024) | 153.3 | 145.5 | 108.1 | 103.5 | 83.7 |
Emisje i zarządzanie energią - laptop Lenovo może pracować cicho
Emisja hałasu
Poziom hałasu osiągnął nawet 56 dB(A) pod obciążeniem w trybie Performance. Tryb zrównoważony oferuje niezły kompromis między hałasem a wydajnością; tryb cichy oszczędza nerwy, ale powoduje znaczny spadek wydajności. Laptop jest zazwyczaj cichy, a czasami nawet bezgłośny w stanie spoczynku i podczas codziennego użytkowania (np. aplikacje biurowe, przeglądanie Internetu). Szkoda, że od czasu do czasu zauważyliśmy (delikatny) elektroniczny szum dochodzący z wnętrza naszego egzemplarza testowego.
Hałas
| luz |
| 25 / 30 / 45 dB |
| obciążenie |
| 50 / 56 dB |
 | ||
30 dB cichy 40 dB(A) słyszalny 50 dB(A) irytujący |
||
min: | ||
| Lenovo Legion Pro 7 16IRX9H i9-14900HX, GeForce RTX 4080 Laptop GPU | Alienware m16 R1 AMD R9 7845HX, GeForce RTX 4080 Laptop GPU | MSI Vector 16 HX A14V i9-14900HX, GeForce RTX 4080 Laptop GPU | HP Omen 16 (2024) i9-14900HX, GeForce RTX 4080 Laptop GPU | Lenovo Legion Pro 7 16IRX8H i9-13900HX, GeForce RTX 4080 Laptop GPU | |
|---|---|---|---|---|---|
| Noise | 13% | -7% | 7% | 4% | |
| wyłączone / środowisko * (dB) | 24 | 22.9 5% | 23.2 3% | 25 -4% | 24 -0% |
| Idle Minimum * (dB) | 25 | 22.9 8% | 33.5 -34% | 29 -16% | 26 -4% |
| Idle Average * (dB) | 30 | 29.7 1% | 33.5 -12% | 30 -0% | 28 7% |
| Idle Maximum * (dB) | 45 | 29.7 34% | 33.5 26% | 31 31% | 34 24% |
| Load Average * (dB) | 50 | 29.8 40% | 52.1 -4% | 46 8% | 47 6% |
| Witcher 3 ultra * (dB) | 54 | 54.7 -1% | 62 -15% | 47 13% | 55 -2% |
| Load Maximum * (dB) | 56 | 54.7 2% | 62 -11% | 47 16% | 56 -0% |
* ... im mniej tym lepiej
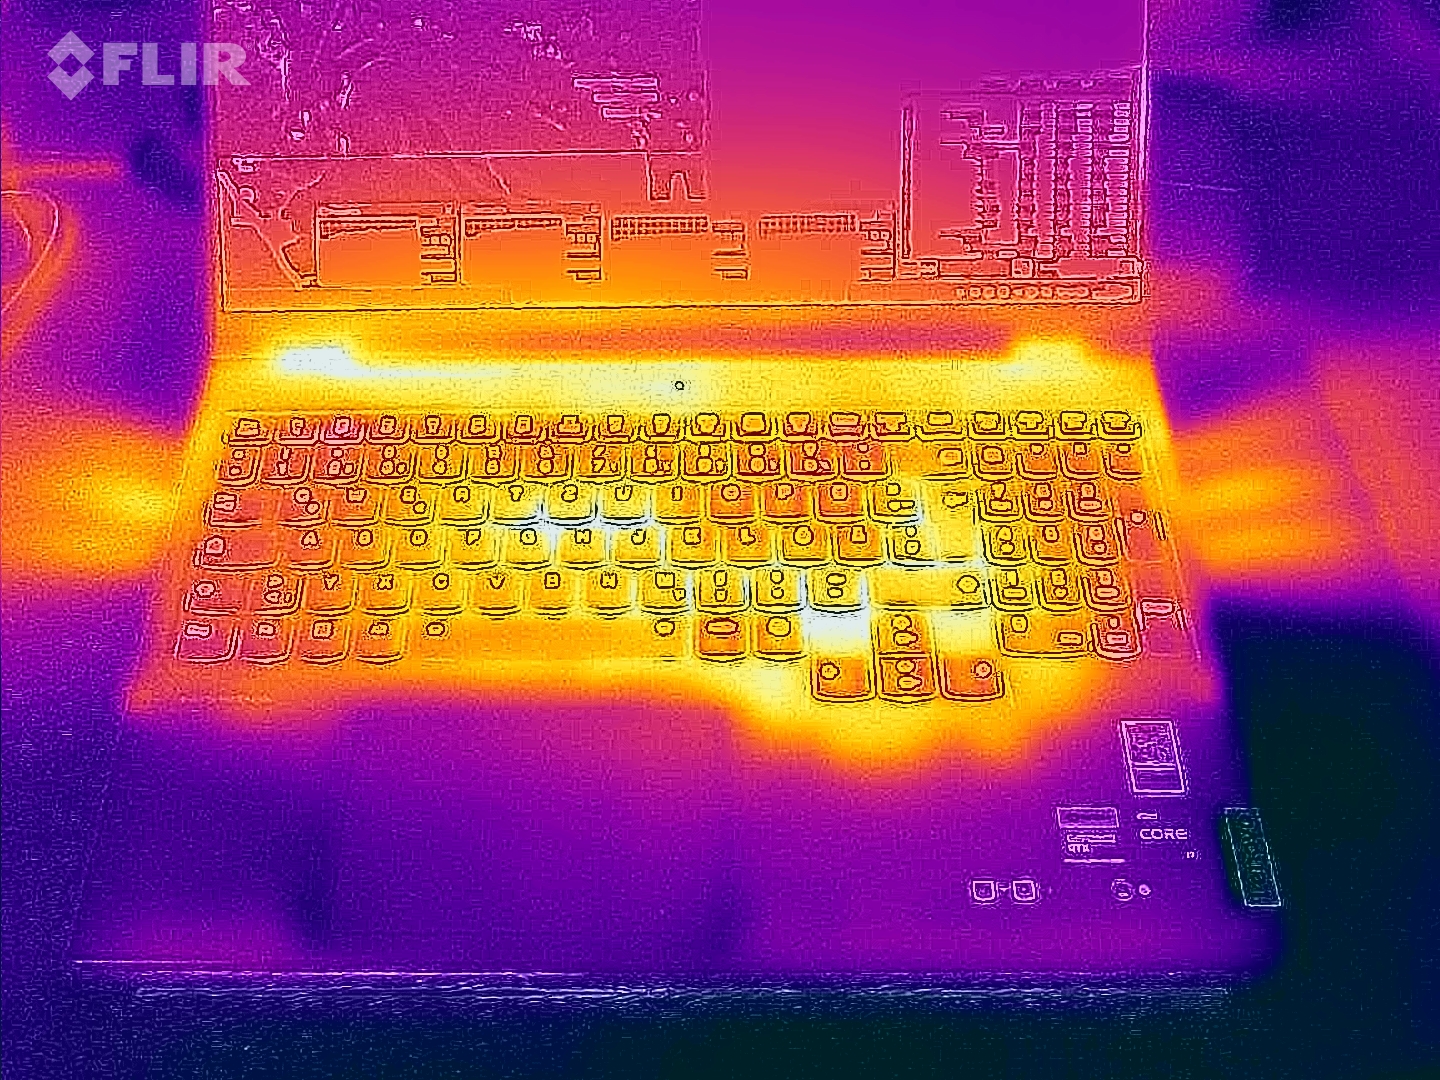
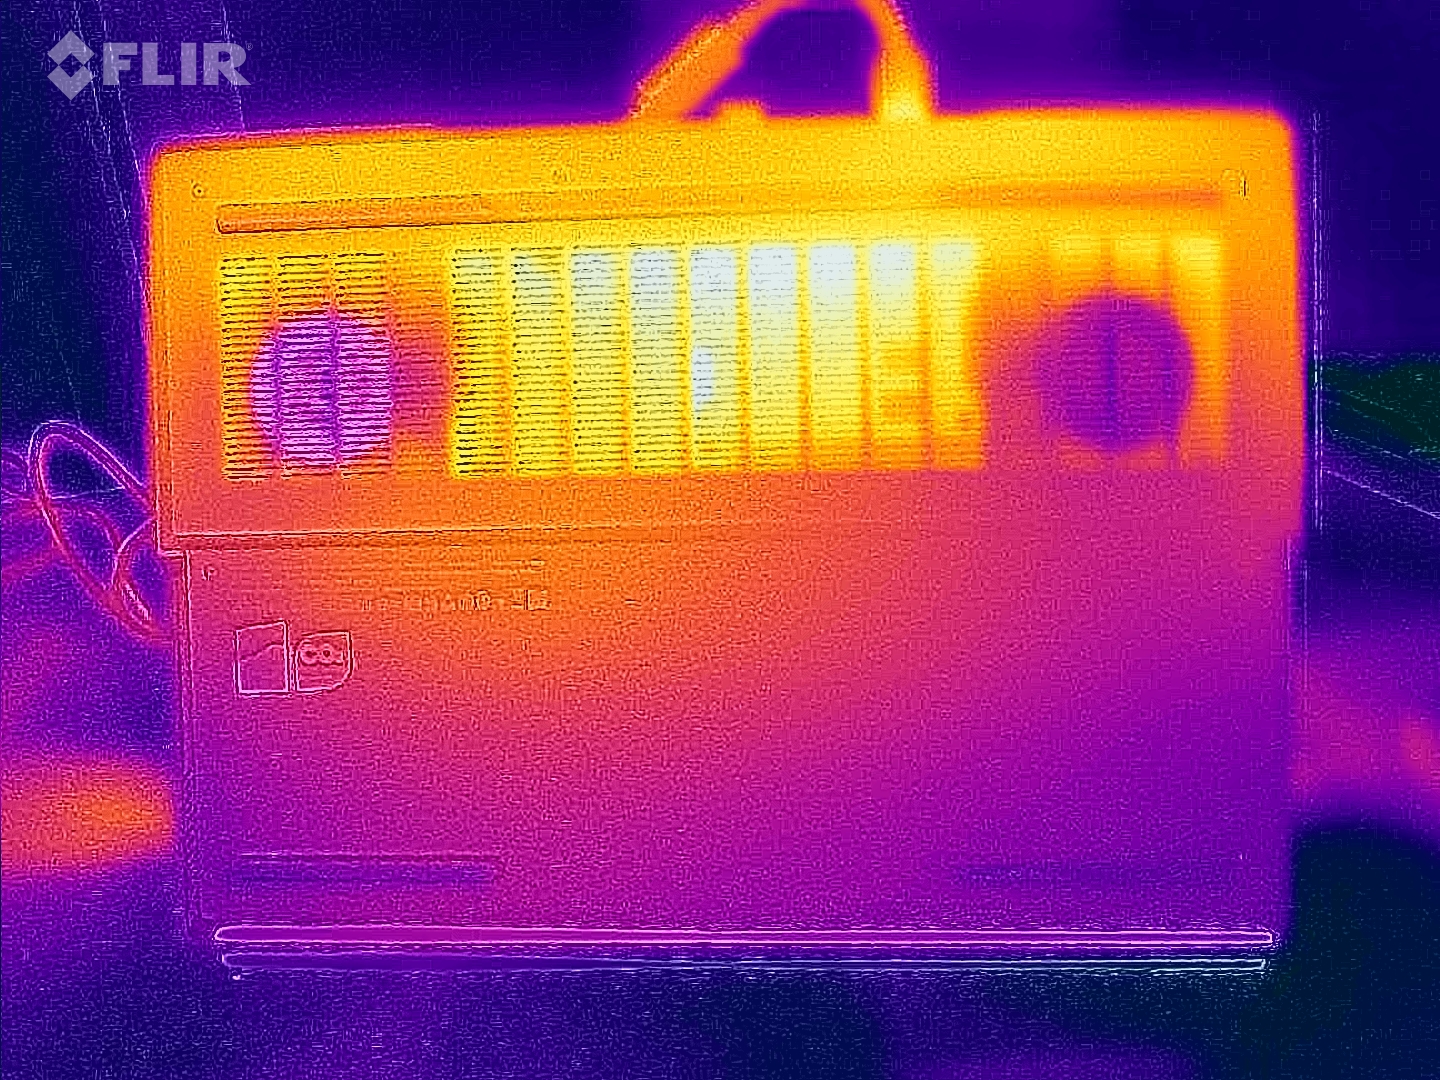
Temperatura
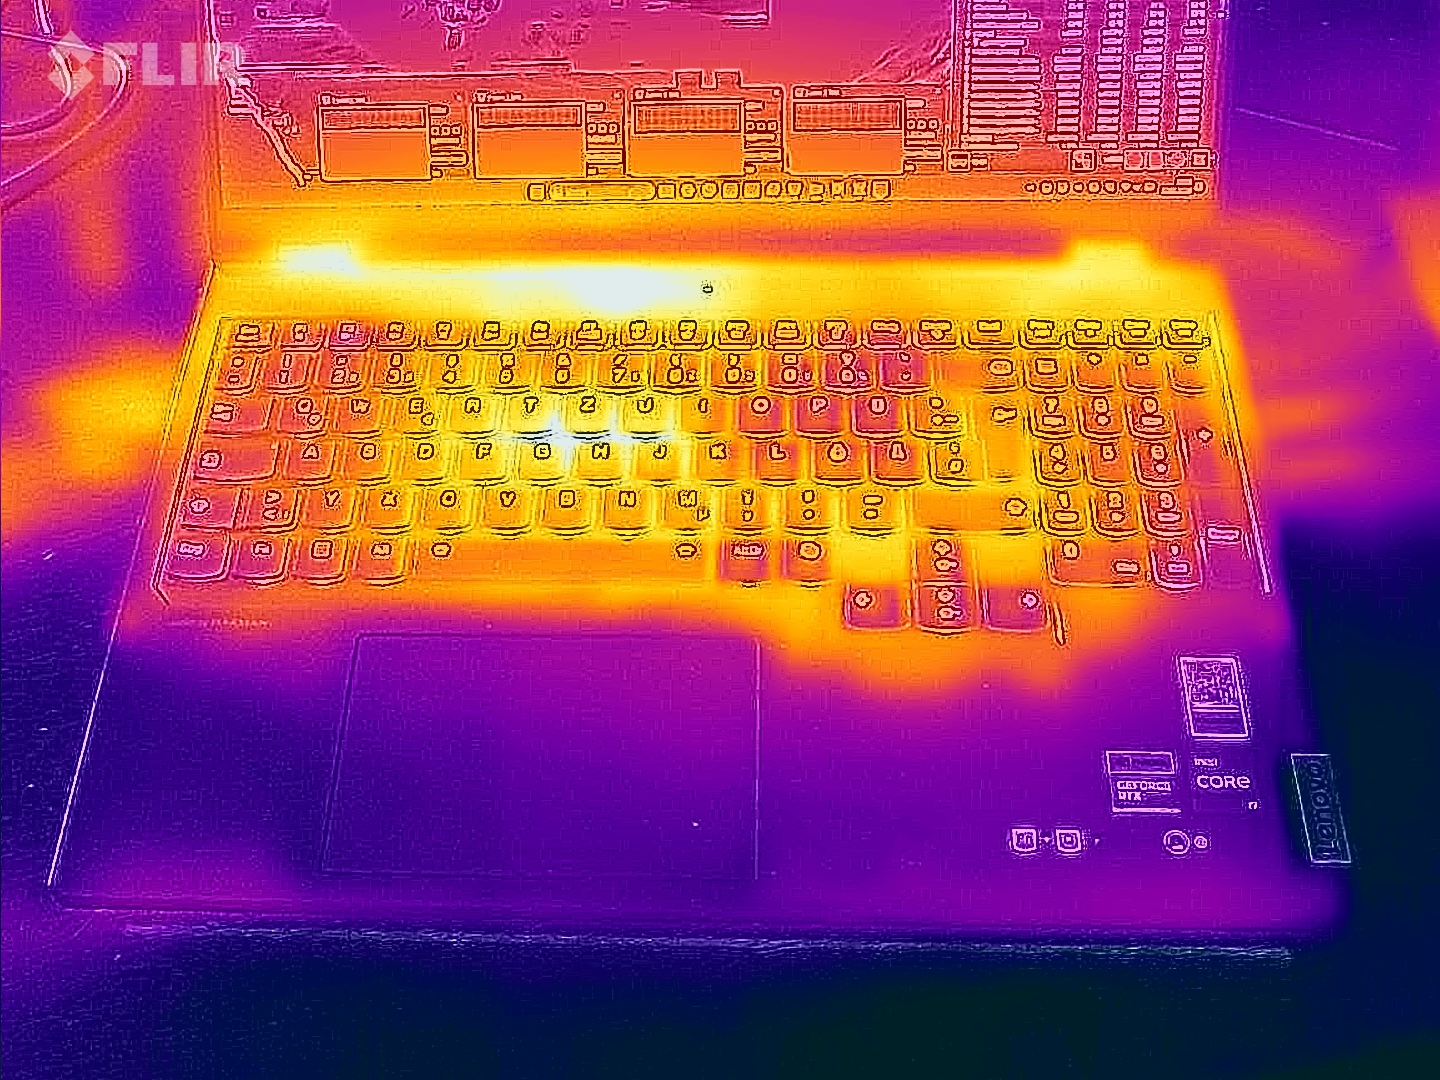
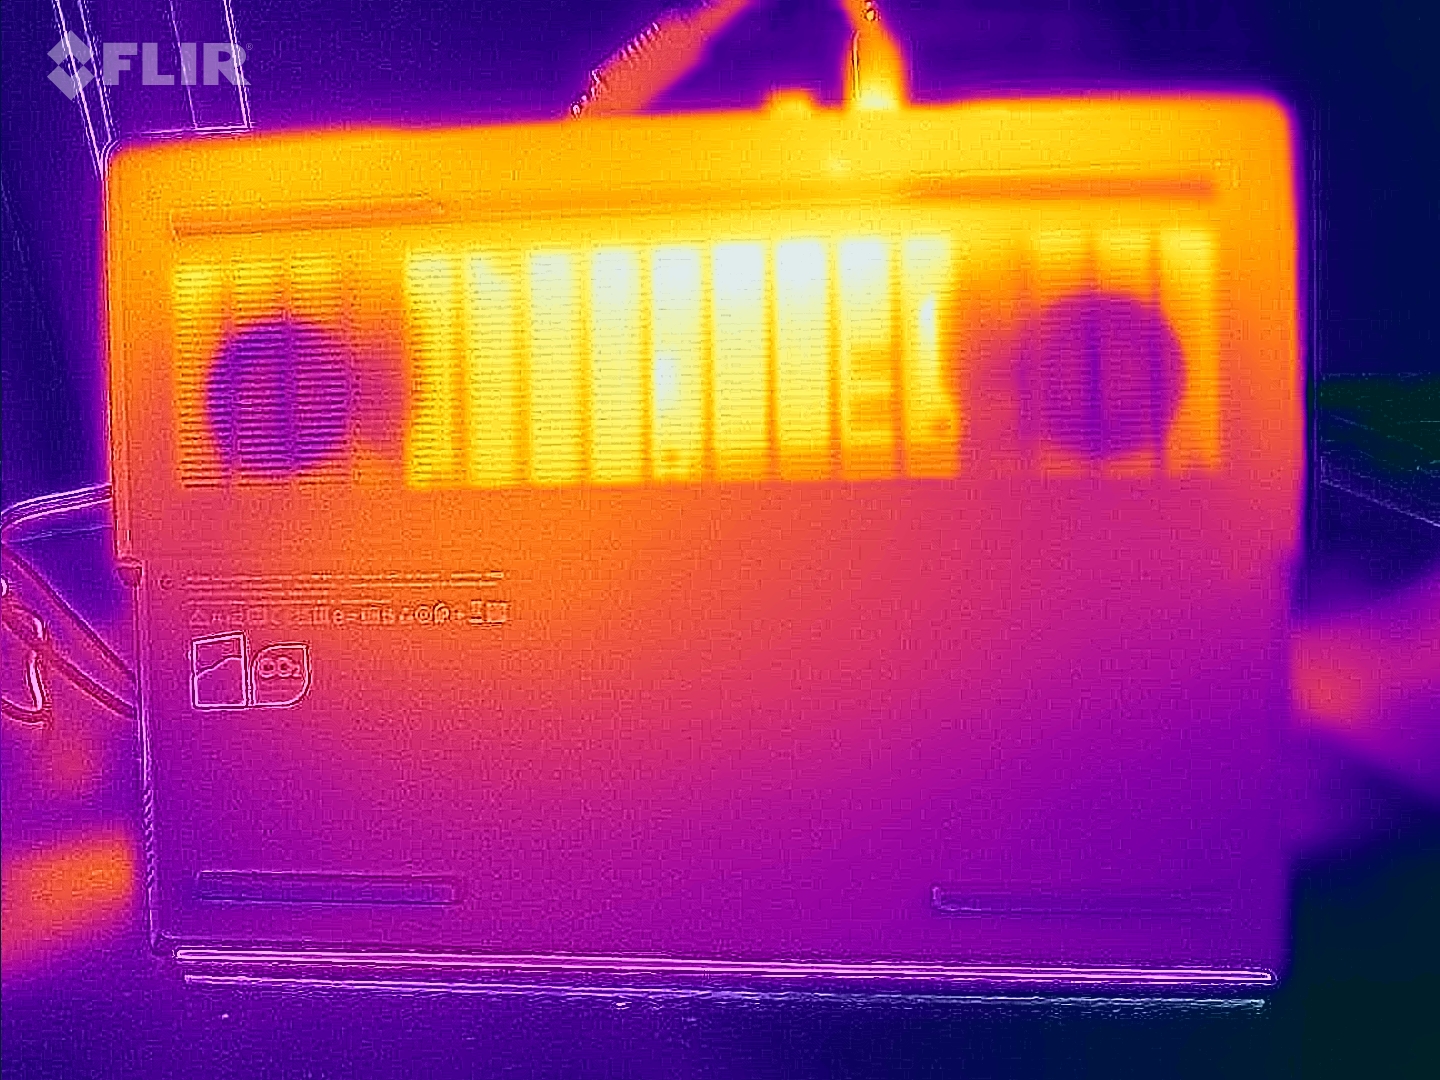
Notebook stał się zauważalnie cieplejszy podczas testu obciążeniowego i testu Witcher 3. Niektóre miejsca na obudowie przekroczyły nawet 50°C (122°F). Temperatura obudowy utrzymywała się w komfortowym zakresie w codziennym użytkowaniu, takim jak aplikacje biurowe i przeglądanie Internetu.
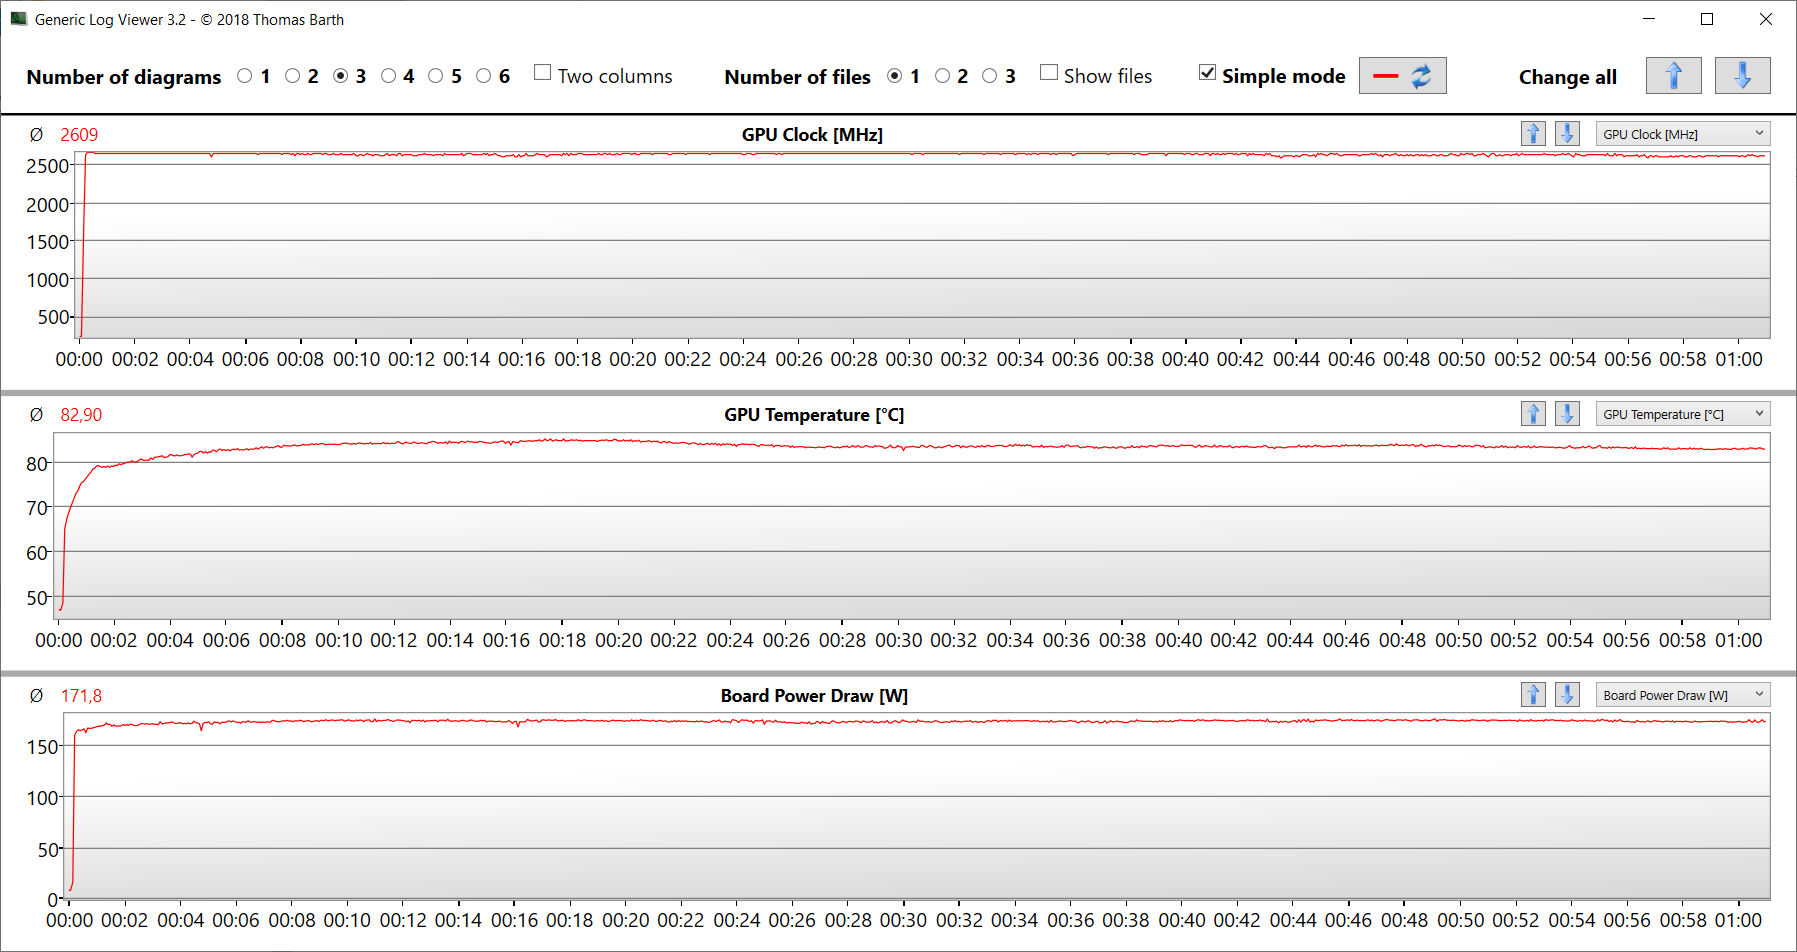
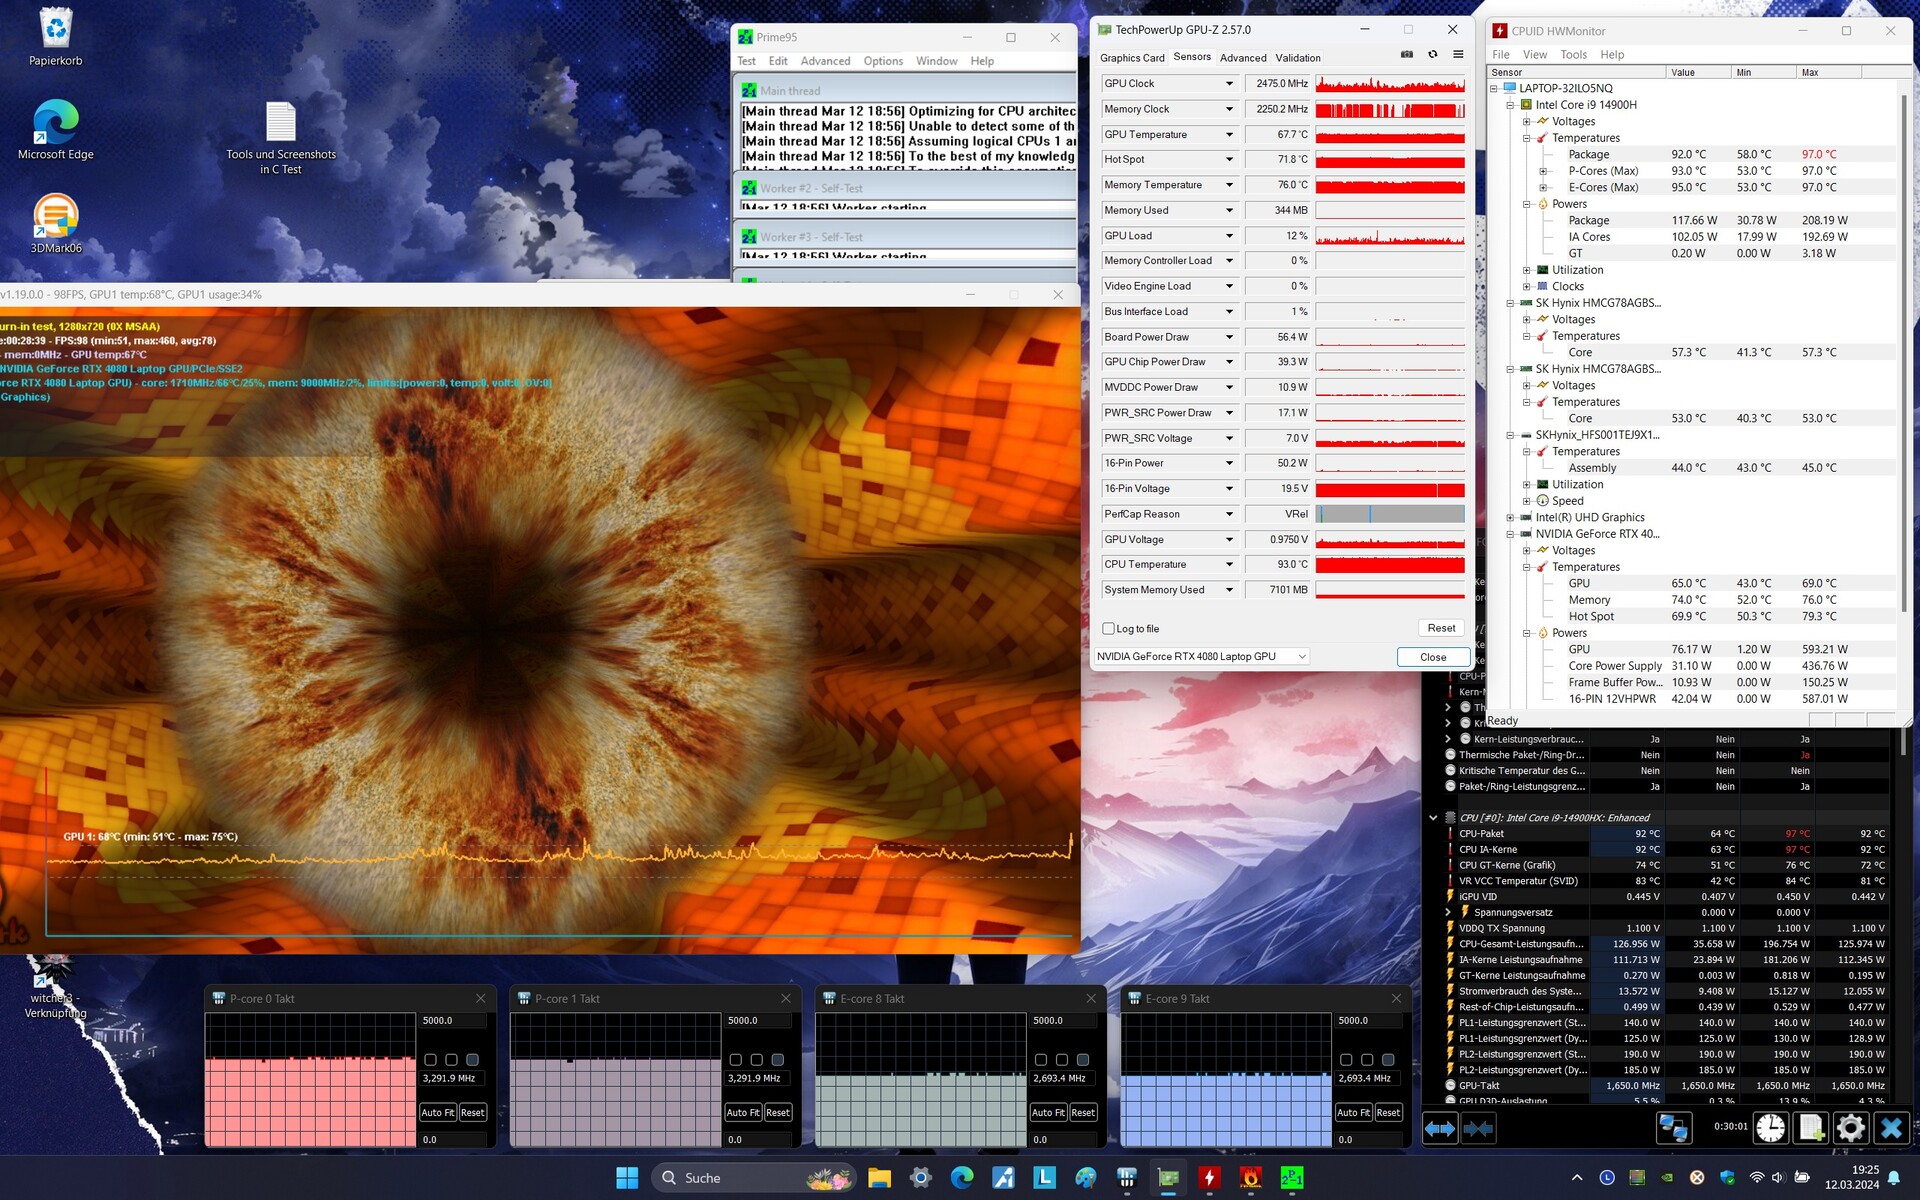
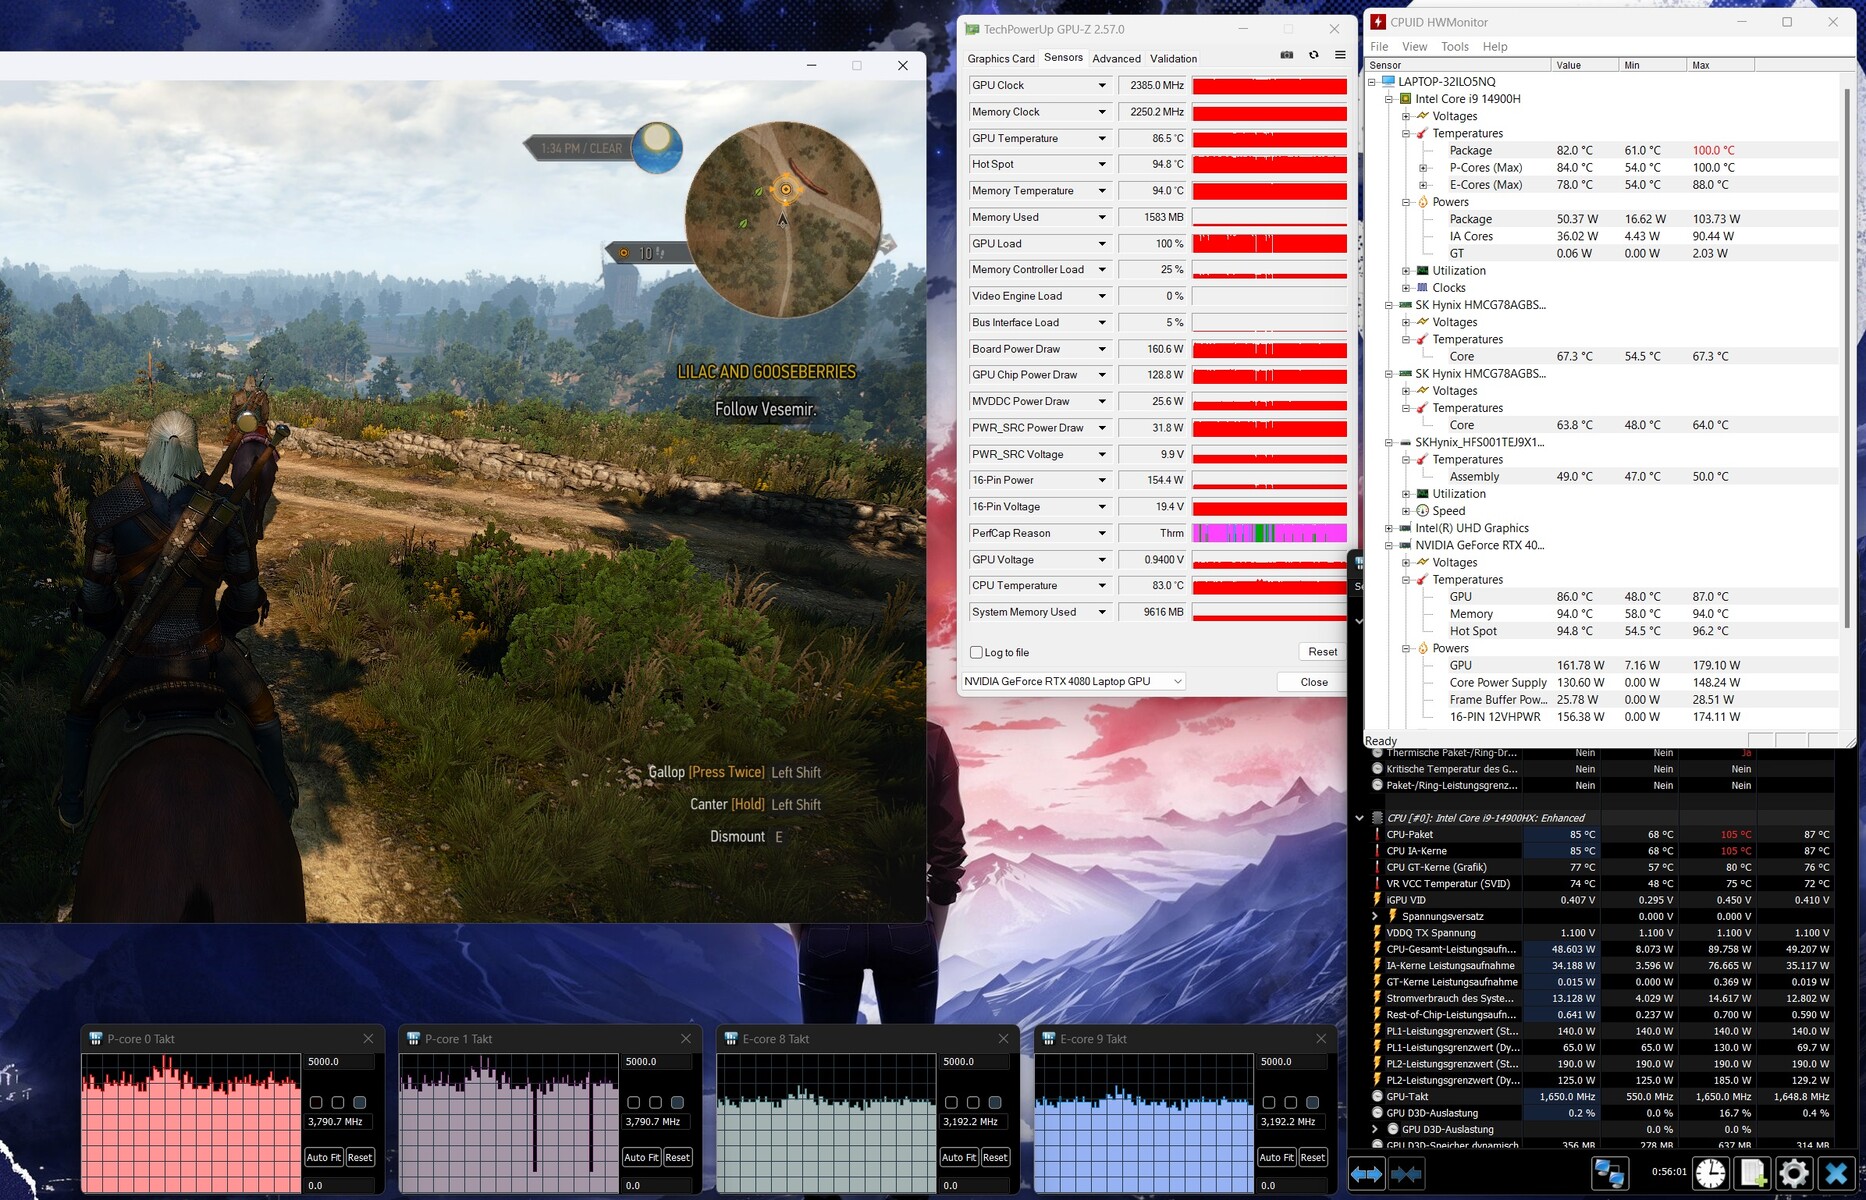
Nasz test warunków skrajnych polega na jednoczesnym uruchomieniu Prime95 i FurMark przez dłuższy czas i ma na celu określenie stabilności systemu pod pełnym obciążeniem. Zarówno CPU, jak i GPU były w stanie utrzymać wysokie taktowanie podczas testu.
(-) Maksymalna temperatura w górnej części wynosi 46 °C / 115 F, w porównaniu do średniej 40.4 °C / 105 F , począwszy od 21.2 do 68.8 °C dla klasy Gaming.
(-) Dno nagrzewa się maksymalnie do 49 °C / 120 F, w porównaniu do średniej 43.2 °C / 110 F
(±) W stanie bezczynności średnia temperatura górnej części wynosi 33.3 °C / 92 F, w porównaniu ze średnią temperaturą urządzenia wynoszącą 33.9 °C / ### class_avg_f### F.
(-) Podczas gry w Wiedźmina 3 średnia temperatura górnej części wynosi 42.7 °C / 109 F, w porównaniu do średniej temperatury urządzenia wynoszącej 33.9 °C / ## #class_avg_f### F.
(-) Podpórki pod nadgarstki i touchpad mogą się bardzo nagrzać w dotyku, maksymalnie do 40 °C / 104 F.
(-) Średnia temperatura obszaru podparcia dłoni w podobnych urządzeniach wynosiła 28.8 °C / 83.8 F (-11.2 °C / -20.2 F).
| Lenovo Legion Pro 7 16IRX9H i9-14900HX, GeForce RTX 4080 Laptop GPU | Alienware m16 R1 AMD R9 7845HX, GeForce RTX 4080 Laptop GPU | MSI Vector 16 HX A14V i9-14900HX, GeForce RTX 4080 Laptop GPU | HP Omen 16 (2024) i9-14900HX, GeForce RTX 4080 Laptop GPU | Lenovo Legion Pro 7 16IRX8H i9-13900HX, GeForce RTX 4080 Laptop GPU | |
|---|---|---|---|---|---|
| Heat | 5% | 26% | 12% | 1% | |
| Maximum Upper Side * (°C) | 46 | 48 -4% | 36.4 21% | 47 -2% | 48 -4% |
| Maximum Bottom * (°C) | 49 | 39 20% | 35.6 27% | 57 -16% | 49 -0% |
| Idle Upper Side * (°C) | 38 | 37 3% | 26.6 30% | 25 34% | 40 -5% |
| Idle Bottom * (°C) | 37 | 36.2 2% | 27 27% | 26 30% | 33 11% |
* ... im mniej tym lepiej
Głośniki
Głośniki stereo zapewniają doskonały dźwięk.
Lenovo Legion Pro 7 16IRX9H analiza dźwięku
(+) | głośniki mogą odtwarzać stosunkowo głośno (84 dB)
Bas 100 - 315 Hz
(±) | zredukowany bas - średnio 8.9% niższy od mediany
(±) | liniowość basu jest średnia (7.4% delta do poprzedniej częstotliwości)
Średnie 400 - 2000 Hz
(+) | zbalansowane środki średnie - tylko 2.8% od mediany
(+) | średnie są liniowe (4% delta do poprzedniej częstotliwości)
Wysokie 2–16 kHz
(+) | zrównoważone maksima - tylko 3% od mediany
(+) | wzloty są liniowe (5% delta do poprzedniej częstotliwości)
Ogólnie 100 - 16.000 Hz
(+) | ogólny dźwięk jest liniowy (8.4% różnicy w stosunku do mediany)
W porównaniu do tej samej klasy
» 2% wszystkich testowanych urządzeń w tej klasie było lepszych, 1% podobnych, 97% gorszych
» Najlepszy miał deltę 6%, średnia wynosiła ###średnia###%, najgorsza wynosiła 132%
W porównaniu do wszystkich testowanych urządzeń
» 2% wszystkich testowanych urządzeń było lepszych, 1% podobnych, 97% gorszych
» Najlepszy miał deltę 4%, średnia wynosiła ###średnia###%, najgorsza wynosiła 134%
HP Omen 16 (2024) analiza dźwięku
(±) | głośność głośnika jest średnia, ale dobra (78 dB)
Bas 100 - 315 Hz
(-) | prawie brak basu - średnio 15.2% niższa od mediany
(±) | liniowość basu jest średnia (14.3% delta do poprzedniej częstotliwości)
Średnie 400 - 2000 Hz
(+) | zbalansowane środki średnie - tylko 4.8% od mediany
(+) | średnie są liniowe (5% delta do poprzedniej częstotliwości)
Wysokie 2–16 kHz
(+) | zrównoważone maksima - tylko 2% od mediany
(+) | wzloty są liniowe (4.1% delta do poprzedniej częstotliwości)
Ogólnie 100 - 16.000 Hz
(+) | ogólny dźwięk jest liniowy (14.7% różnicy w stosunku do mediany)
W porównaniu do tej samej klasy
» 29% wszystkich testowanych urządzeń w tej klasie było lepszych, 7% podobnych, 64% gorszych
» Najlepszy miał deltę 6%, średnia wynosiła ###średnia###%, najgorsza wynosiła 132%
W porównaniu do wszystkich testowanych urządzeń
» 19% wszystkich testowanych urządzeń było lepszych, 4% podobnych, 77% gorszych
» Najlepszy miał deltę 4%, średnia wynosiła ###średnia###%, najgorsza wynosiła 134%
Zużycie energii
Jeśli chodzi o zużycie energii, nie ma żadnych niespodzianek. Poziomy zużycia są na typowym poziomie dla sprzętu znajdującego się w środku. Legion Pro 7 ukończył nasz test Witcher 3 i test warunków skrajnych ze stałym poziomem zużycia energii. Dołączona 330-watowa ładowarka jest wystarczająco mocna dla laptopa.
| wyłączony / stan wstrzymania | |
| luz | |
| obciążenie |
|
Legenda:
min: | |
Power consumption Witcher 3 / Stress test
Power consumption with external monitor
Żywotność baterii
16-calowy laptop wytrzymał 6h 13min w naszym realistycznym teście Wi-Fi, który symuluje obciążenie poprzez dostęp do stron internetowych za pomocą skryptu. Legion ma najlepszy czas pracy na baterii spośród wszystkich urządzeń w naszym porównaniu.
Za
Przeciw
Werdykt - mocny laptop z wyższej półki

Wraz z Legion Pro 7, Lenovo dostarczyło potężny 16-calowy notebook dla graczy i twórców. Na pokładzie laptopa znajduje się 16-calowy wyświetlacz QHD+ (2560 x 1600 pikseli, DCI-P3, G-Sync, HDR, 240 Hz) o przyjaznych dla użytkownika proporcjach 16:10.
Lenovo Legion Pro 7 16IRX9H oferuje dużą moc w rozsądnej cenie.
Znajdujące się wewnątrz GeForce RTX 4080 i Core i9-14900HX zdołały osiągnąć swoje nowe najlepsze wyniki w niektórych testach - oba chipy są niewątpliwie w stanie pracować na pełnych obrotach przez cały czas. Nie da się obejść wysokich ilości ciepła i hałasu typowych dla tej klasy laptopów. Dostępny jest jednak tryb cichy, który łagodzi ten problem - kosztem wydajności.
Dwa porty USB-C (1x Thunderbolt 4, 1x USB 3.2 Gen 2) ułatwiają integrację laptopa z istniejącą konfiguracją roboczą i otwierają opcje rozbudowy (np. zewnętrzne GPU, stacje dokujące). Oba porty są w stanie wyprowadzić sygnał DisplayPort, a jeden z nich obsługuje nawet Power Delivery. Czas pracy na baterii jest całkiem przyzwoity.
Alternatywą wartą rozważenia jest MSI Vector 16 HX A14V. Dorównuje on Legion pod względem wydajności, ale ma nieco gorszy czas pracy na baterii.
Cena i dostępność
W Europie, prezentowany tutaj model Lenovo Legion Pro 7 jest dostępny w cenie od €2,999 (US$3,245) Campuspoint.de i Notebooksbilliger.de po uwzględnieniu specjalnych zniżek dla studentów i nauczycieli.
Choć nowy Legion Pro 7 nie jest jeszcze dostępny w Stanach Zjednoczonych, jego poprzednika można znaleźć za około 2 490 USD na Amazon US. Ten konkretny model ma Core i9-13900HX ostatniej generacji, ale poza tym jest w dużej mierze taki sam.
Lenovo Legion Pro 7 16IRX9H
- 25/03/2024 v7 (old)
Sascha Mölck
Przezroczystość
Wyboru urządzeń do recenzji dokonuje nasza redakcja. Próbka testowa została udostępniona autorowi jako pożyczka od producenta lub sprzedawcy detalicznego na potrzeby tej recenzji. Pożyczkodawca nie miał wpływu na tę recenzję, producent nie otrzymał też kopii tej recenzji przed publikacją. Nie było obowiązku publikowania tej recenzji. Jako niezależna firma medialna, Notebookcheck nie podlega władzy producentów, sprzedawców detalicznych ani wydawców.
Tak testuje Notebookcheck
Każdego roku Notebookcheck niezależnie sprawdza setki laptopów i smartfonów, stosując standardowe procedury, aby zapewnić porównywalność wszystkich wyników. Od około 20 lat stale rozwijamy nasze metody badawcze, ustanawiając przy tym standardy branżowe. W naszych laboratoriach testowych doświadczeni technicy i redaktorzy korzystają z wysokiej jakości sprzętu pomiarowego. Testy te obejmują wieloetapowy proces walidacji. Nasz kompleksowy system ocen opiera się na setkach uzasadnionych pomiarów i benchmarków, co pozwala zachować obiektywizm.Price comparison

