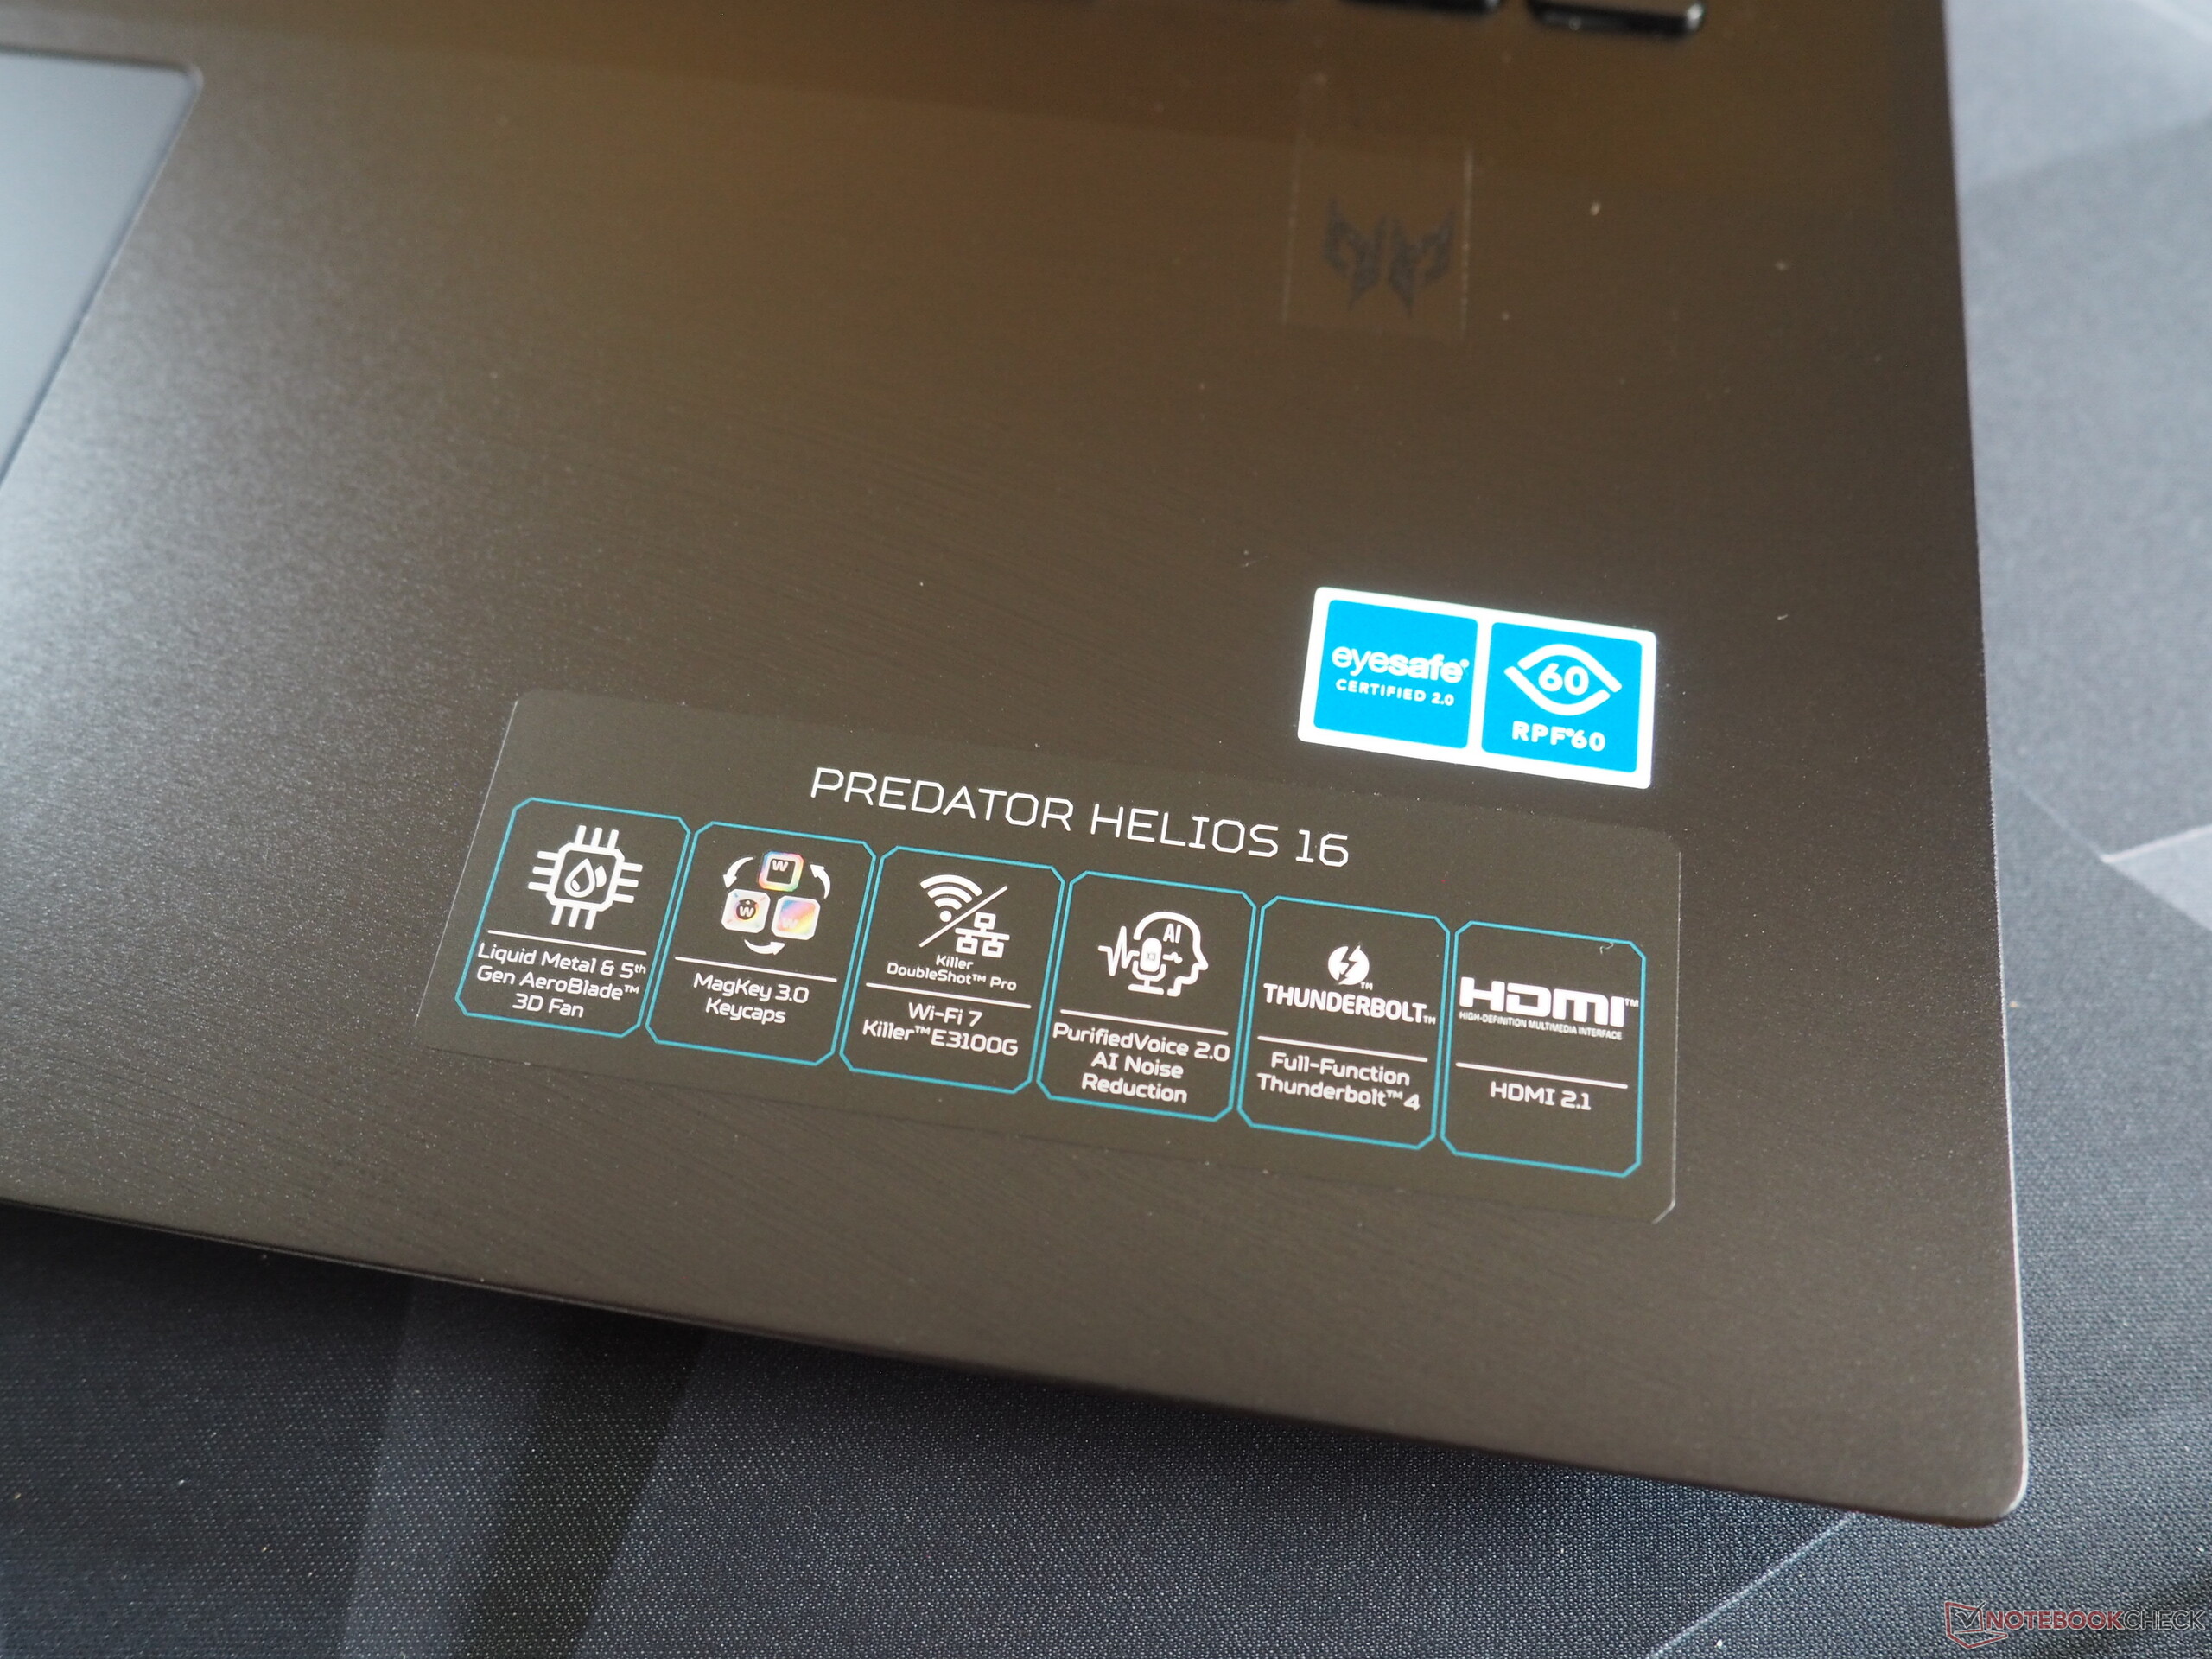
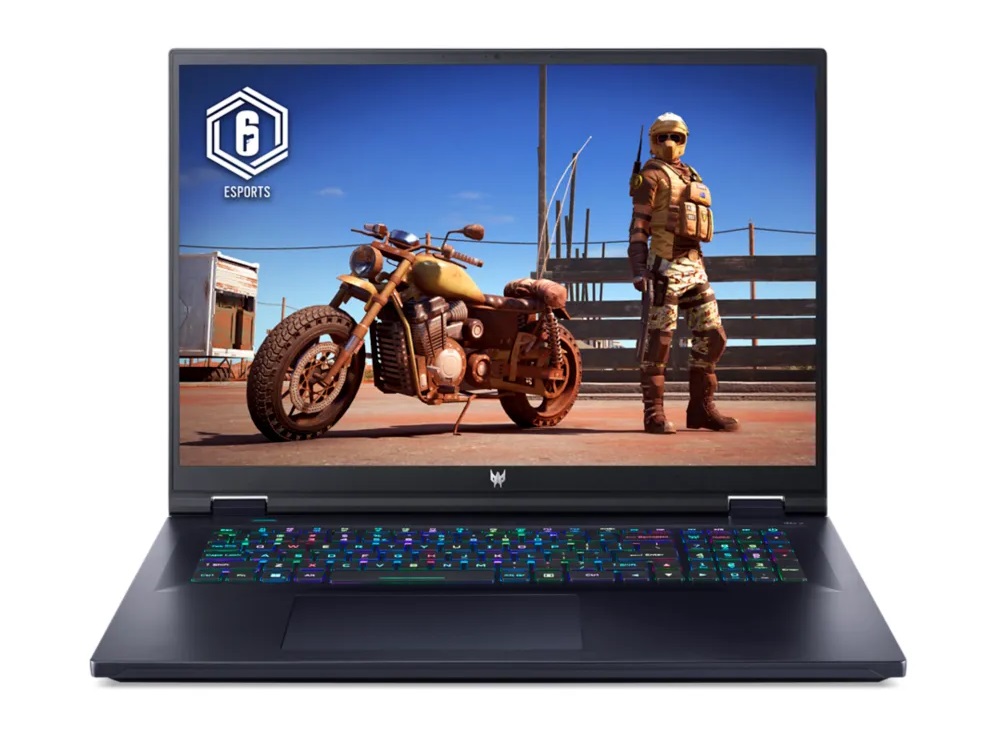
Recenzja laptopa Acer Predator Helios 18 2024: Nowy sprzęt dla 18-calowych graczy

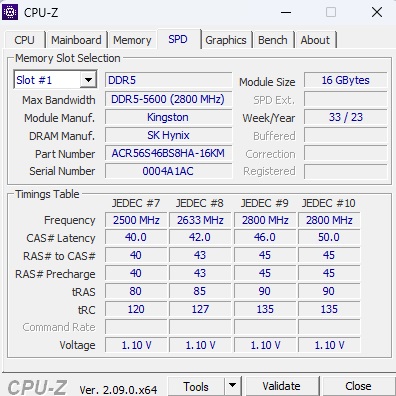
W 2023 roku Acer rozpoczął sprzedaż 18-calowych laptopów. Podczas gdy nasze pierwsze urządzenie testowe było wyposażone w procesor Core i9-13900HX i kartę GeForce RTX 4080natomiast konfiguracja testowa następcy tego modelu została wyposażona w Core i9-14900HX i GeForce RTX 4090. Jedną z rzeczy, która pozostała niezmieniona, jest potężny panel Mini-LED laptopa, który robi wrażenie niemal całkowicie bez kompromisów (więcej na ten temat wkrótce). Acer zainstalował 2x 16 GB pamięci RAM DDR5-5600 i dwa dyski NVMe-SSD w formacie RAID-0 (M.2 2280) o pojemności 1 TB każdy. W momencie przeprowadzania testów laptop nie był jeszcze dostępny w Stanach Zjednoczonych, więc nie możemy jeszcze podać żadnych informacji na temat jego MRSP.
Konkurentami Predator Helios 18 są 18-calowe monitory dla graczy, takie jak MSI Titan 18 HX A14i Asus ROG Strix Scar 18 G834 i Alienware m18 R1-które zostały wymienione w tabelach jako urządzenia porównawcze.
Potencjalni konkurenci w porównaniu
Ocena | Data | Model | Waga | Wysokość | Rozmiar | Rezolucja | Cena |
|---|---|---|---|---|---|---|---|
| 87.1 % v7 (old) | 03/2024 | Acer Predator Helios 18 PH18-72-98MW i9-14900HX, GeForce RTX 4090 Laptop GPU | 3.3 kg | 29.5 mm | 18.00" | 2560x1600 | |
| 88.8 % v7 (old) | 01/2024 | MSI Titan 18 HX A14VIG i9-14900HX, GeForce RTX 4090 Laptop GPU | 3.6 kg | 32.1 mm | 18.00" | 3840x2400 | |
| 88.3 % v7 (old) | 02/2024 | Asus ROG Strix Scar 18 G834JYR (2024) i9-14900HX, GeForce RTX 4090 Laptop GPU | 3.1 kg | 30.8 mm | 18.00" | 2560x1600 | |
| 88.3 % v7 (old) | 10/2023 | Acer Predator Helios 18 N23Q2 i9-13900HX, GeForce RTX 4080 Laptop GPU | 3.2 kg | 29.15 mm | 18.00" | 2560x1600 | |
| 89.2 % v7 (old) | 11/2023 | Alienware m18 R1 AMD R9 7945HX, Radeon RX 7900M | 3.9 kg | 26.7 mm | 18.00" | 1920x1200 |
Sprawa
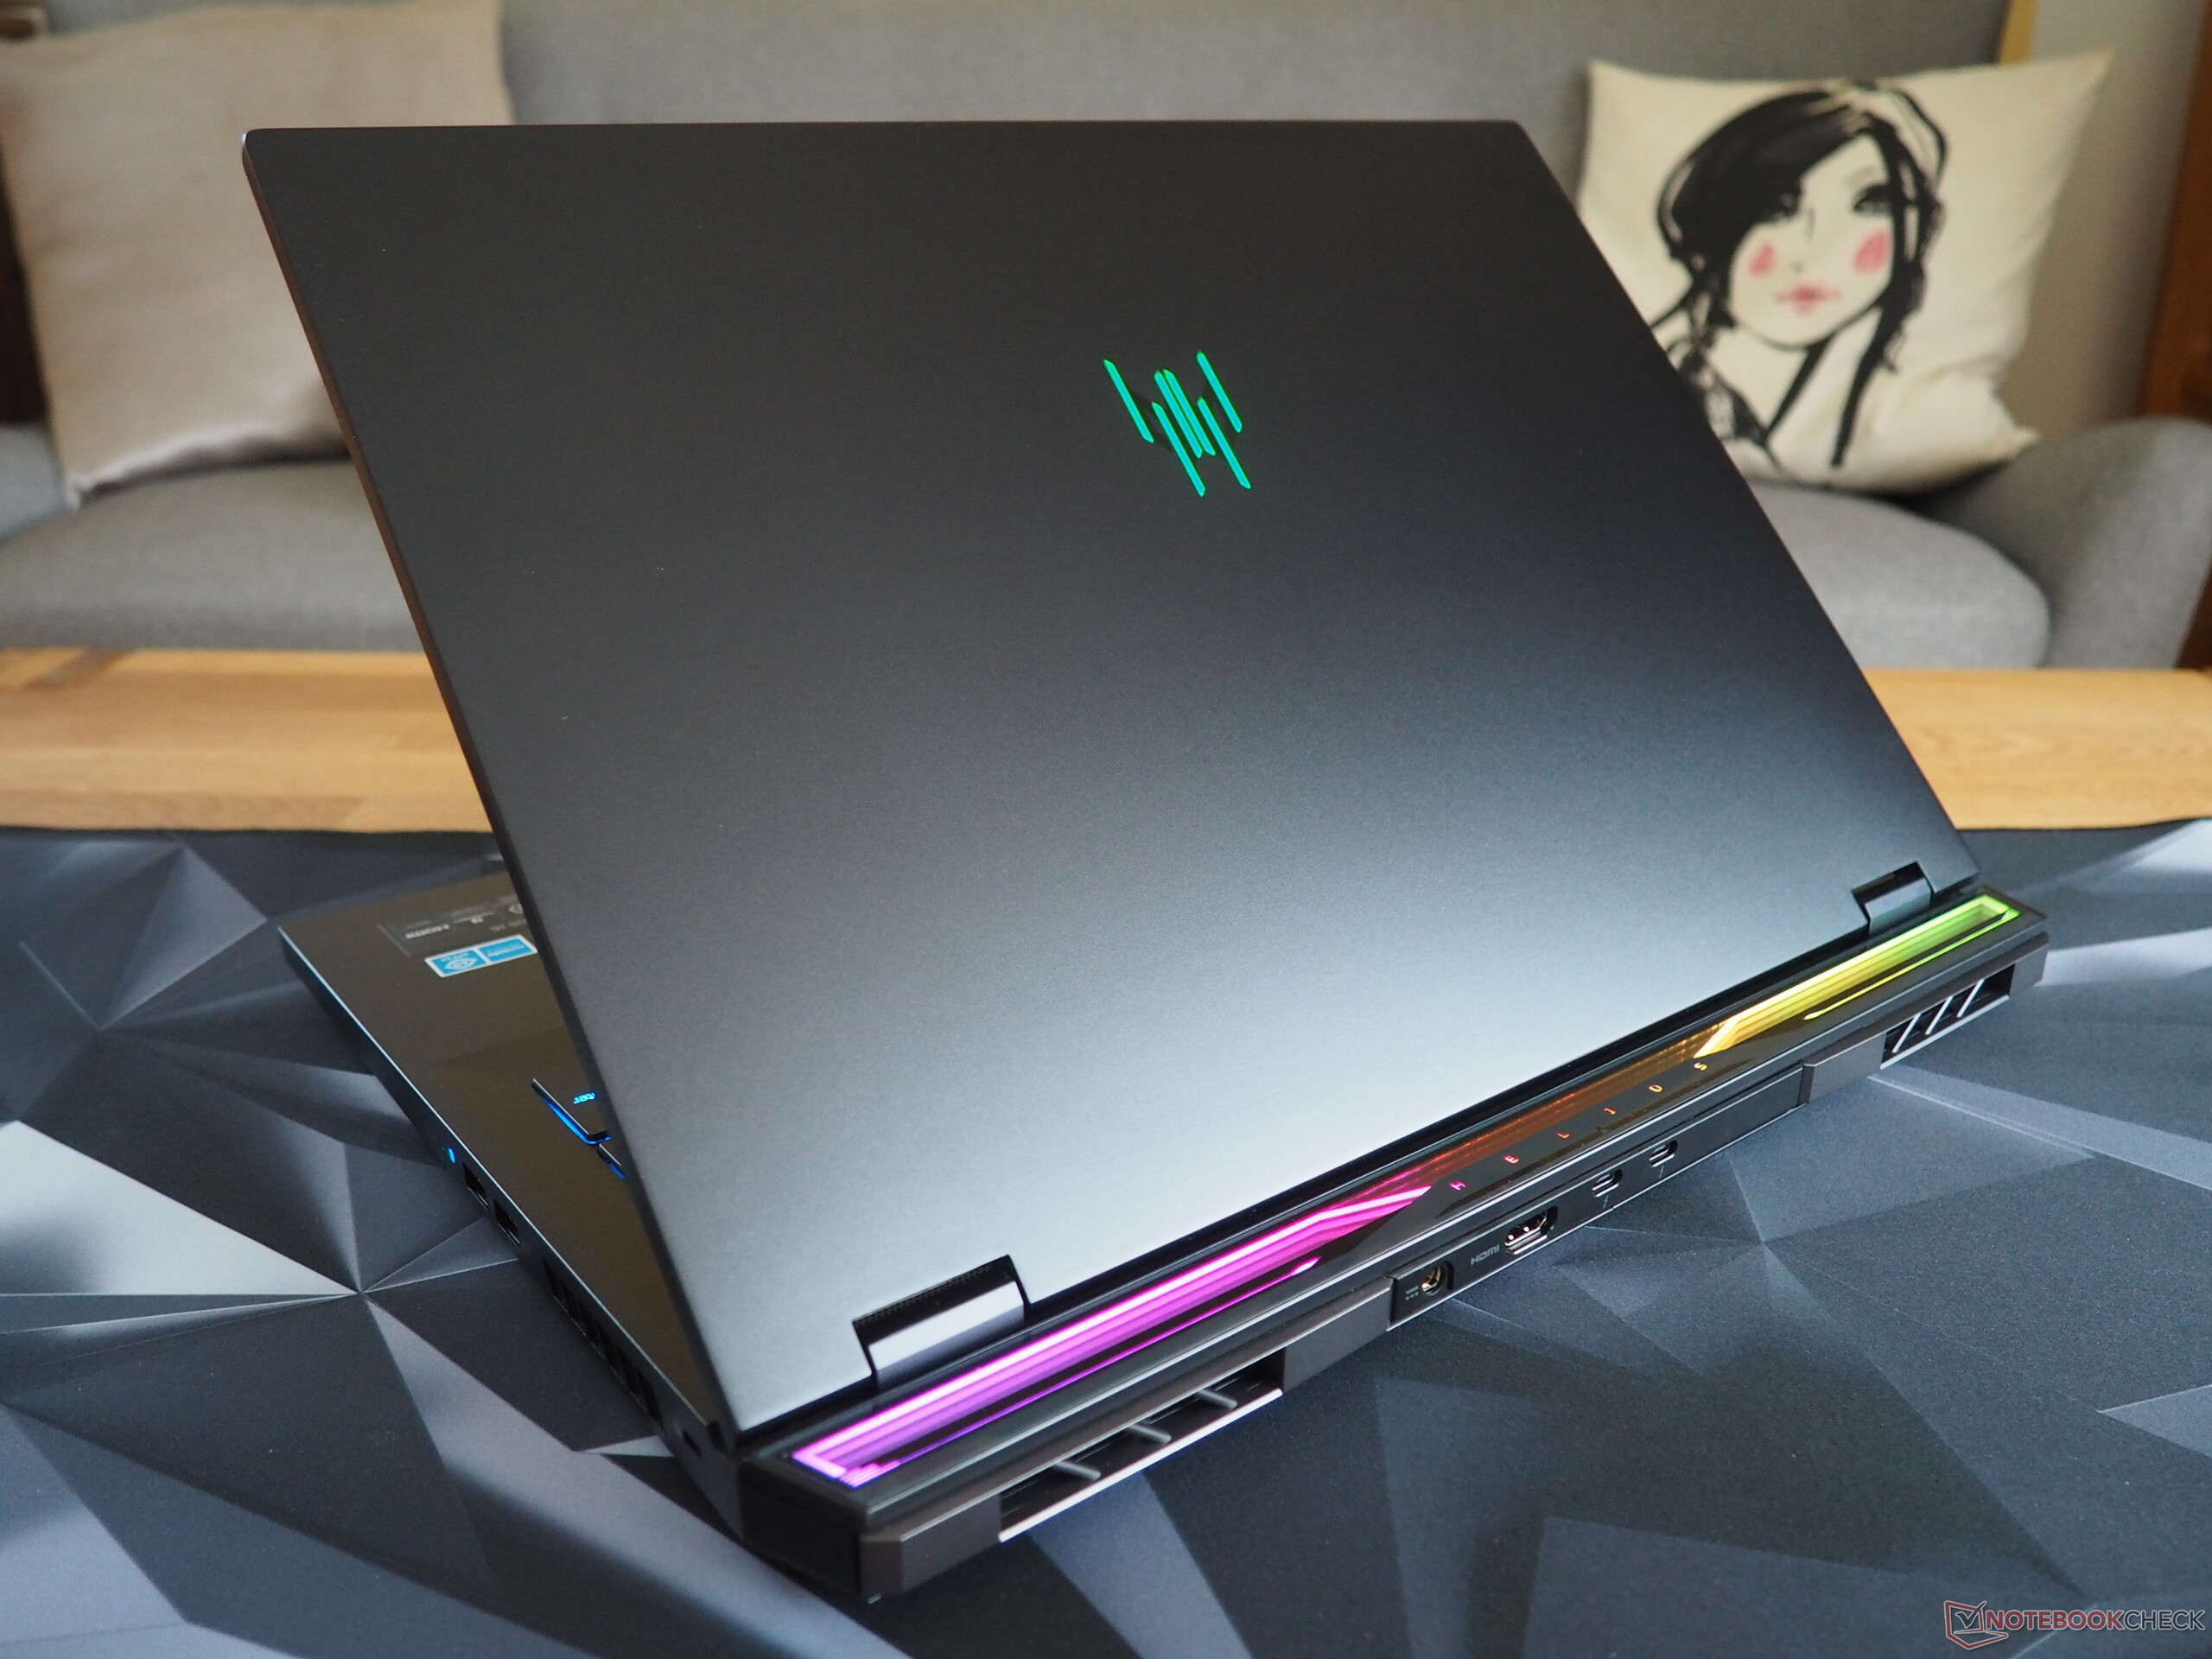
Jeśli chodzi o obudowę urządzenia, to Acer pozostał wierny swojemu poprzednikowi - choć po bliższym przyjrzeniu się można zauważyć kilka zmian. Producent wymienił model klawiatury i przeprojektował stylowy pasek świetlny z tyłu. Laptop nadal sprawia wrażenie wysokiej jakości, ponieważ zarówno jego pokrywa, jak i górna część jednostki bazowej są wykonane z metalu. Nie mamy również nic negatywnego do powiedzenia na temat budowy urządzenia. Jeśli już, Acer mógłby poprawić zawiasy laptopa, ponieważ czasami mogą być nieco chybotliwe. Chociaż pokrywa mogłaby być bardziej stabilna, a niektóre części klawiatury mogą zostać wepchnięte po wystarczająco mocnym naciśnięciu, nadal ocenilibyśmy jego obudowę jako stabilną. Jej design nie jest ani nudny, ani przesadnie zabawny.

Jeśli chodzi o wagę, Predator Helios 18 wypada przeciętnie. Jego 3,3 kg to więcej niż Asus ROG Strix Scar 18, ale mniej niż MSI Titan 18 i Alienware m18.
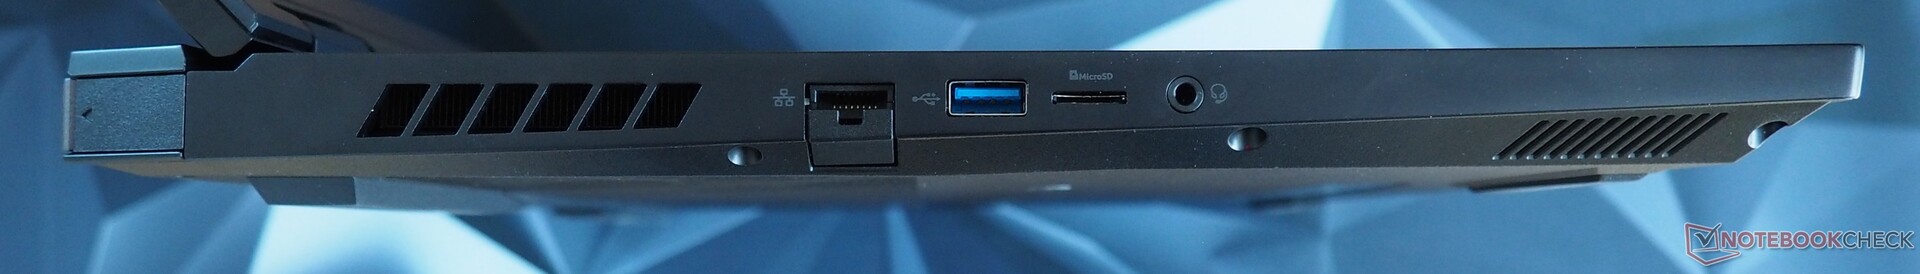
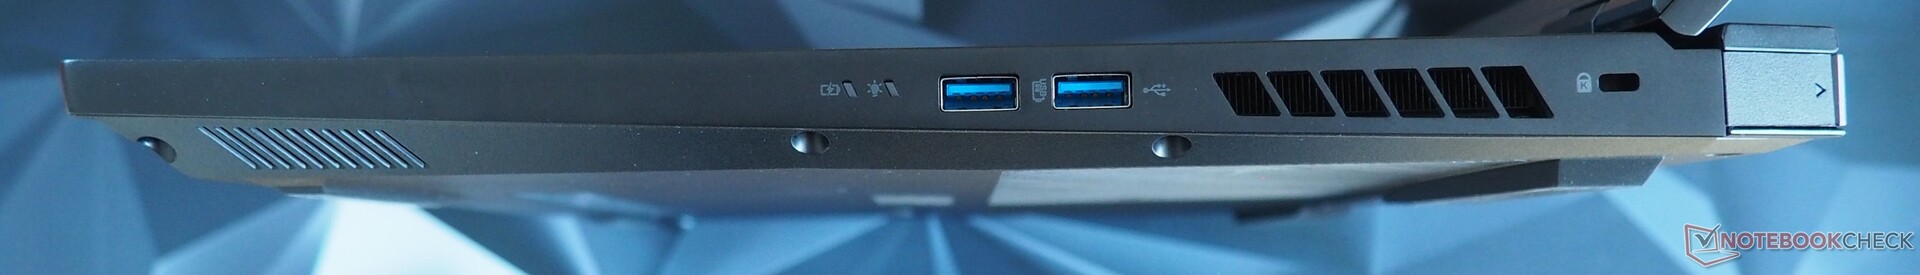
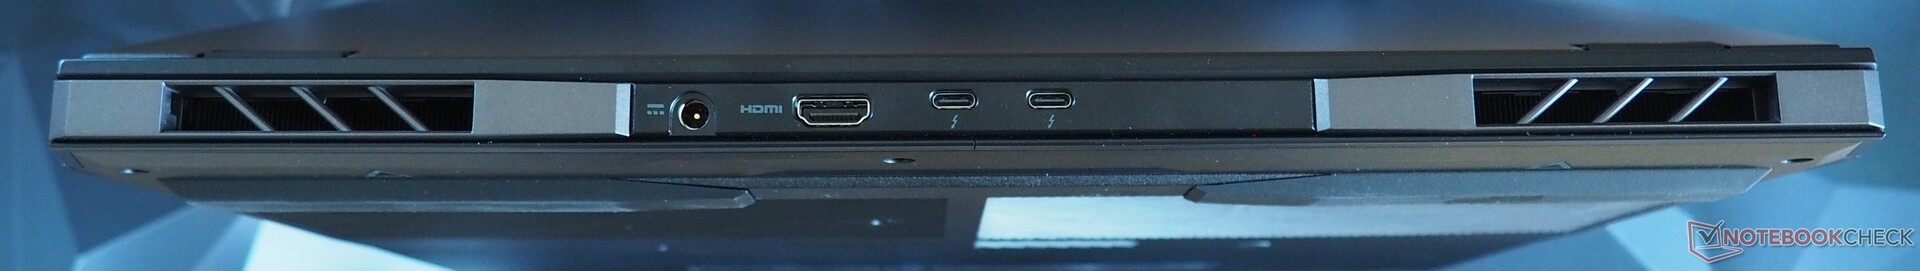
Łączność
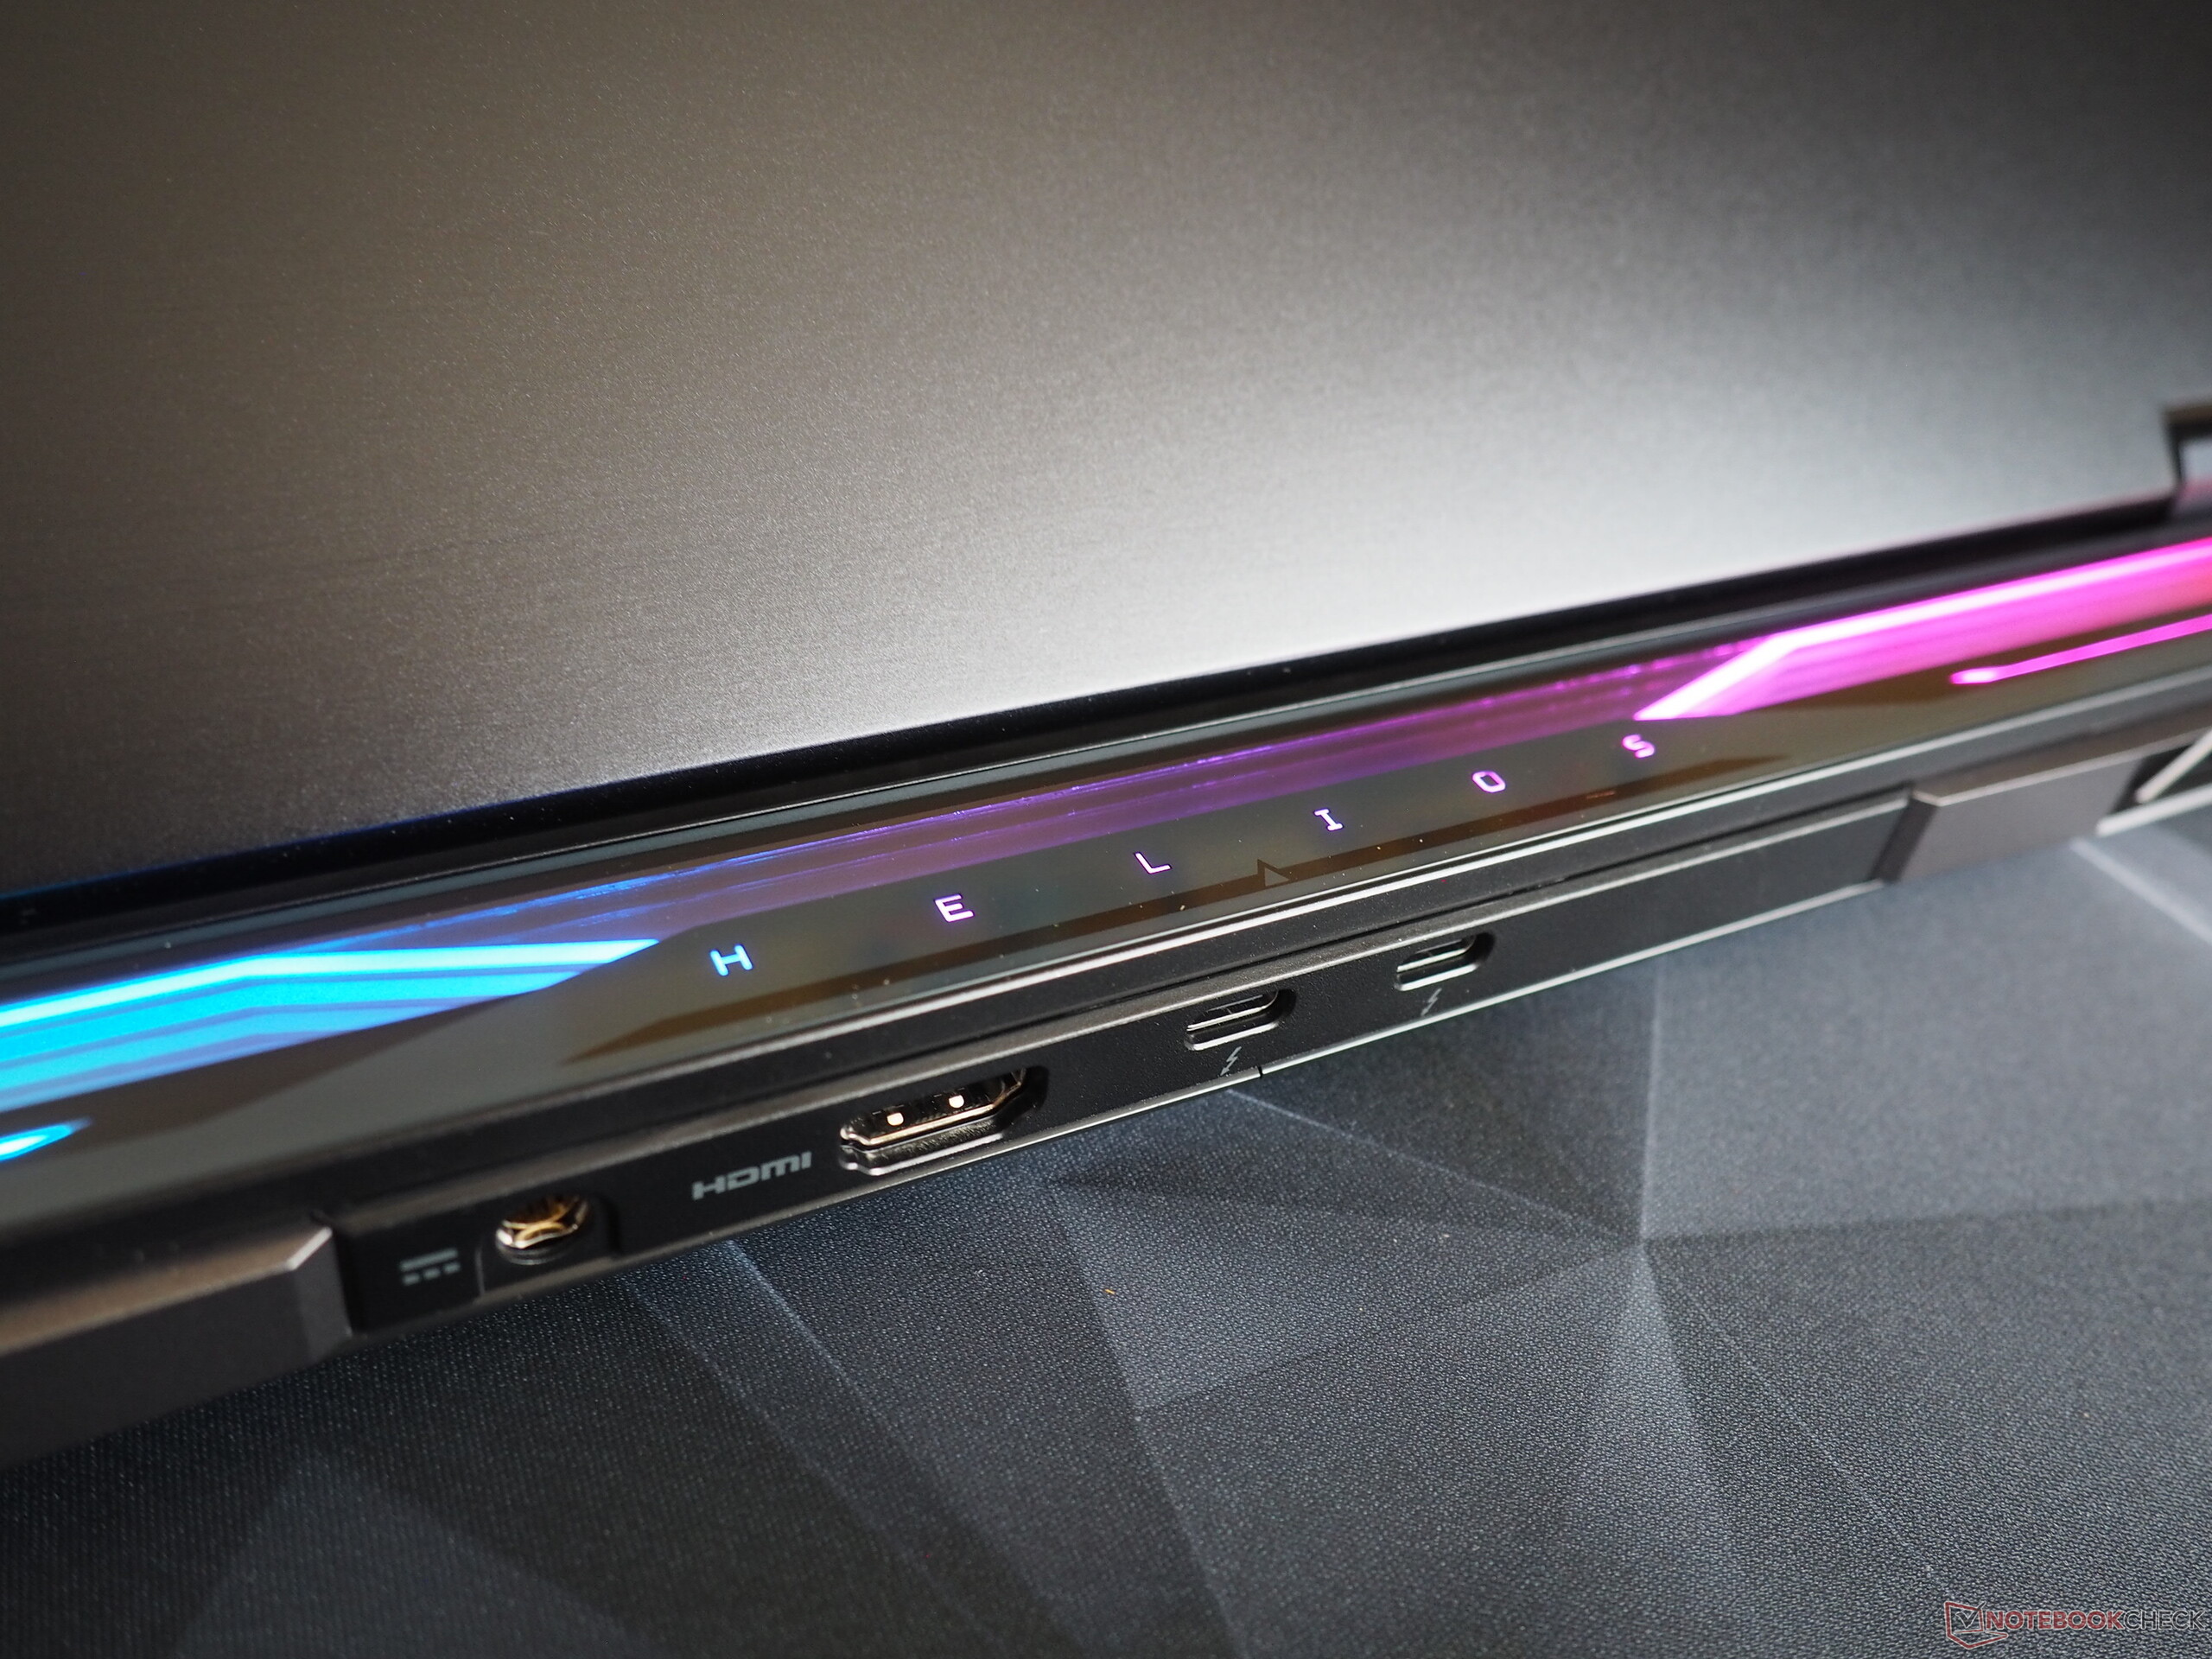
Opcje łączności urządzenia są nowoczesne. Podczas gdy z tyłu znajduje się wyjście HDMI 2.1 i dwa porty Thunderbolt 4 (w tym DisplayPort i Power Delivery), po prawej stronie znajdują się dwa porty USB 3.2 Gen-2 (typ A) i gniazdo na blokadę Kensington. Całość uzupełnia port RJ45, port USB 3.0 (typ A), czytnik kart microSD i gniazdo audio po lewej stronie.
Czytnik kart SD
Zainstalowany czytnik kart osiąga przeciętne prędkości. Jedynie Alienware m18, który był w stanie w pewnym stopniu wykorzystać naszą kartę referencyjną, zaimponował nam pod tym względem.
| SD Card Reader | |
| average JPG Copy Test (av. of 3 runs) | |
| Alienware m18 R1 AMD (Toshiba Exceria Pro SDXC 64 GB UHS-II) | |
| Średnia w klasie Gaming (20.9 - 210, n=54, ostatnie 2 lata) | |
| Acer Predator Helios 18 PH18-72-98MW (AV PRO microSD 128 GB V60) | |
| MSI Titan 18 HX A14VIG (Toshiba Exceria Pro SDXC 64 GB UHS-II) | |
| Acer Predator Helios 18 N23Q2 | |
| maximum AS SSD Seq Read Test (1GB) | |
| Alienware m18 R1 AMD (Toshiba Exceria Pro SDXC 64 GB UHS-II) | |
| Średnia w klasie Gaming (25.5 - 261, n=51, ostatnie 2 lata) | |
| MSI Titan 18 HX A14VIG (Toshiba Exceria Pro SDXC 64 GB UHS-II) | |
| Acer Predator Helios 18 PH18-72-98MW (AV PRO microSD 128 GB V60) | |
| Acer Predator Helios 18 N23Q2 | |
Komunikacja
Nowy Helios 18 ma najnowocześniejszy układ Wi-Fi 7, który możemy przetestować tylko w ograniczonym zakresie ze względu na brak odpowiedniego sprzętu. W naszych standardowych testach moduł Wi-Fi zapewniał solidną wydajność (wysyłanie) aż do bardzo dobrej wydajności (odbieranie).
Kamera internetowa
Dzięki rozdzielczości Full HD, zainstalowana kamera internetowa jest nieco ostrzejsza niż w większości laptopów - ale jak to często bywa, wciąż jest miejsce na poprawę, jeśli chodzi o dokładność kolorów.

")
")
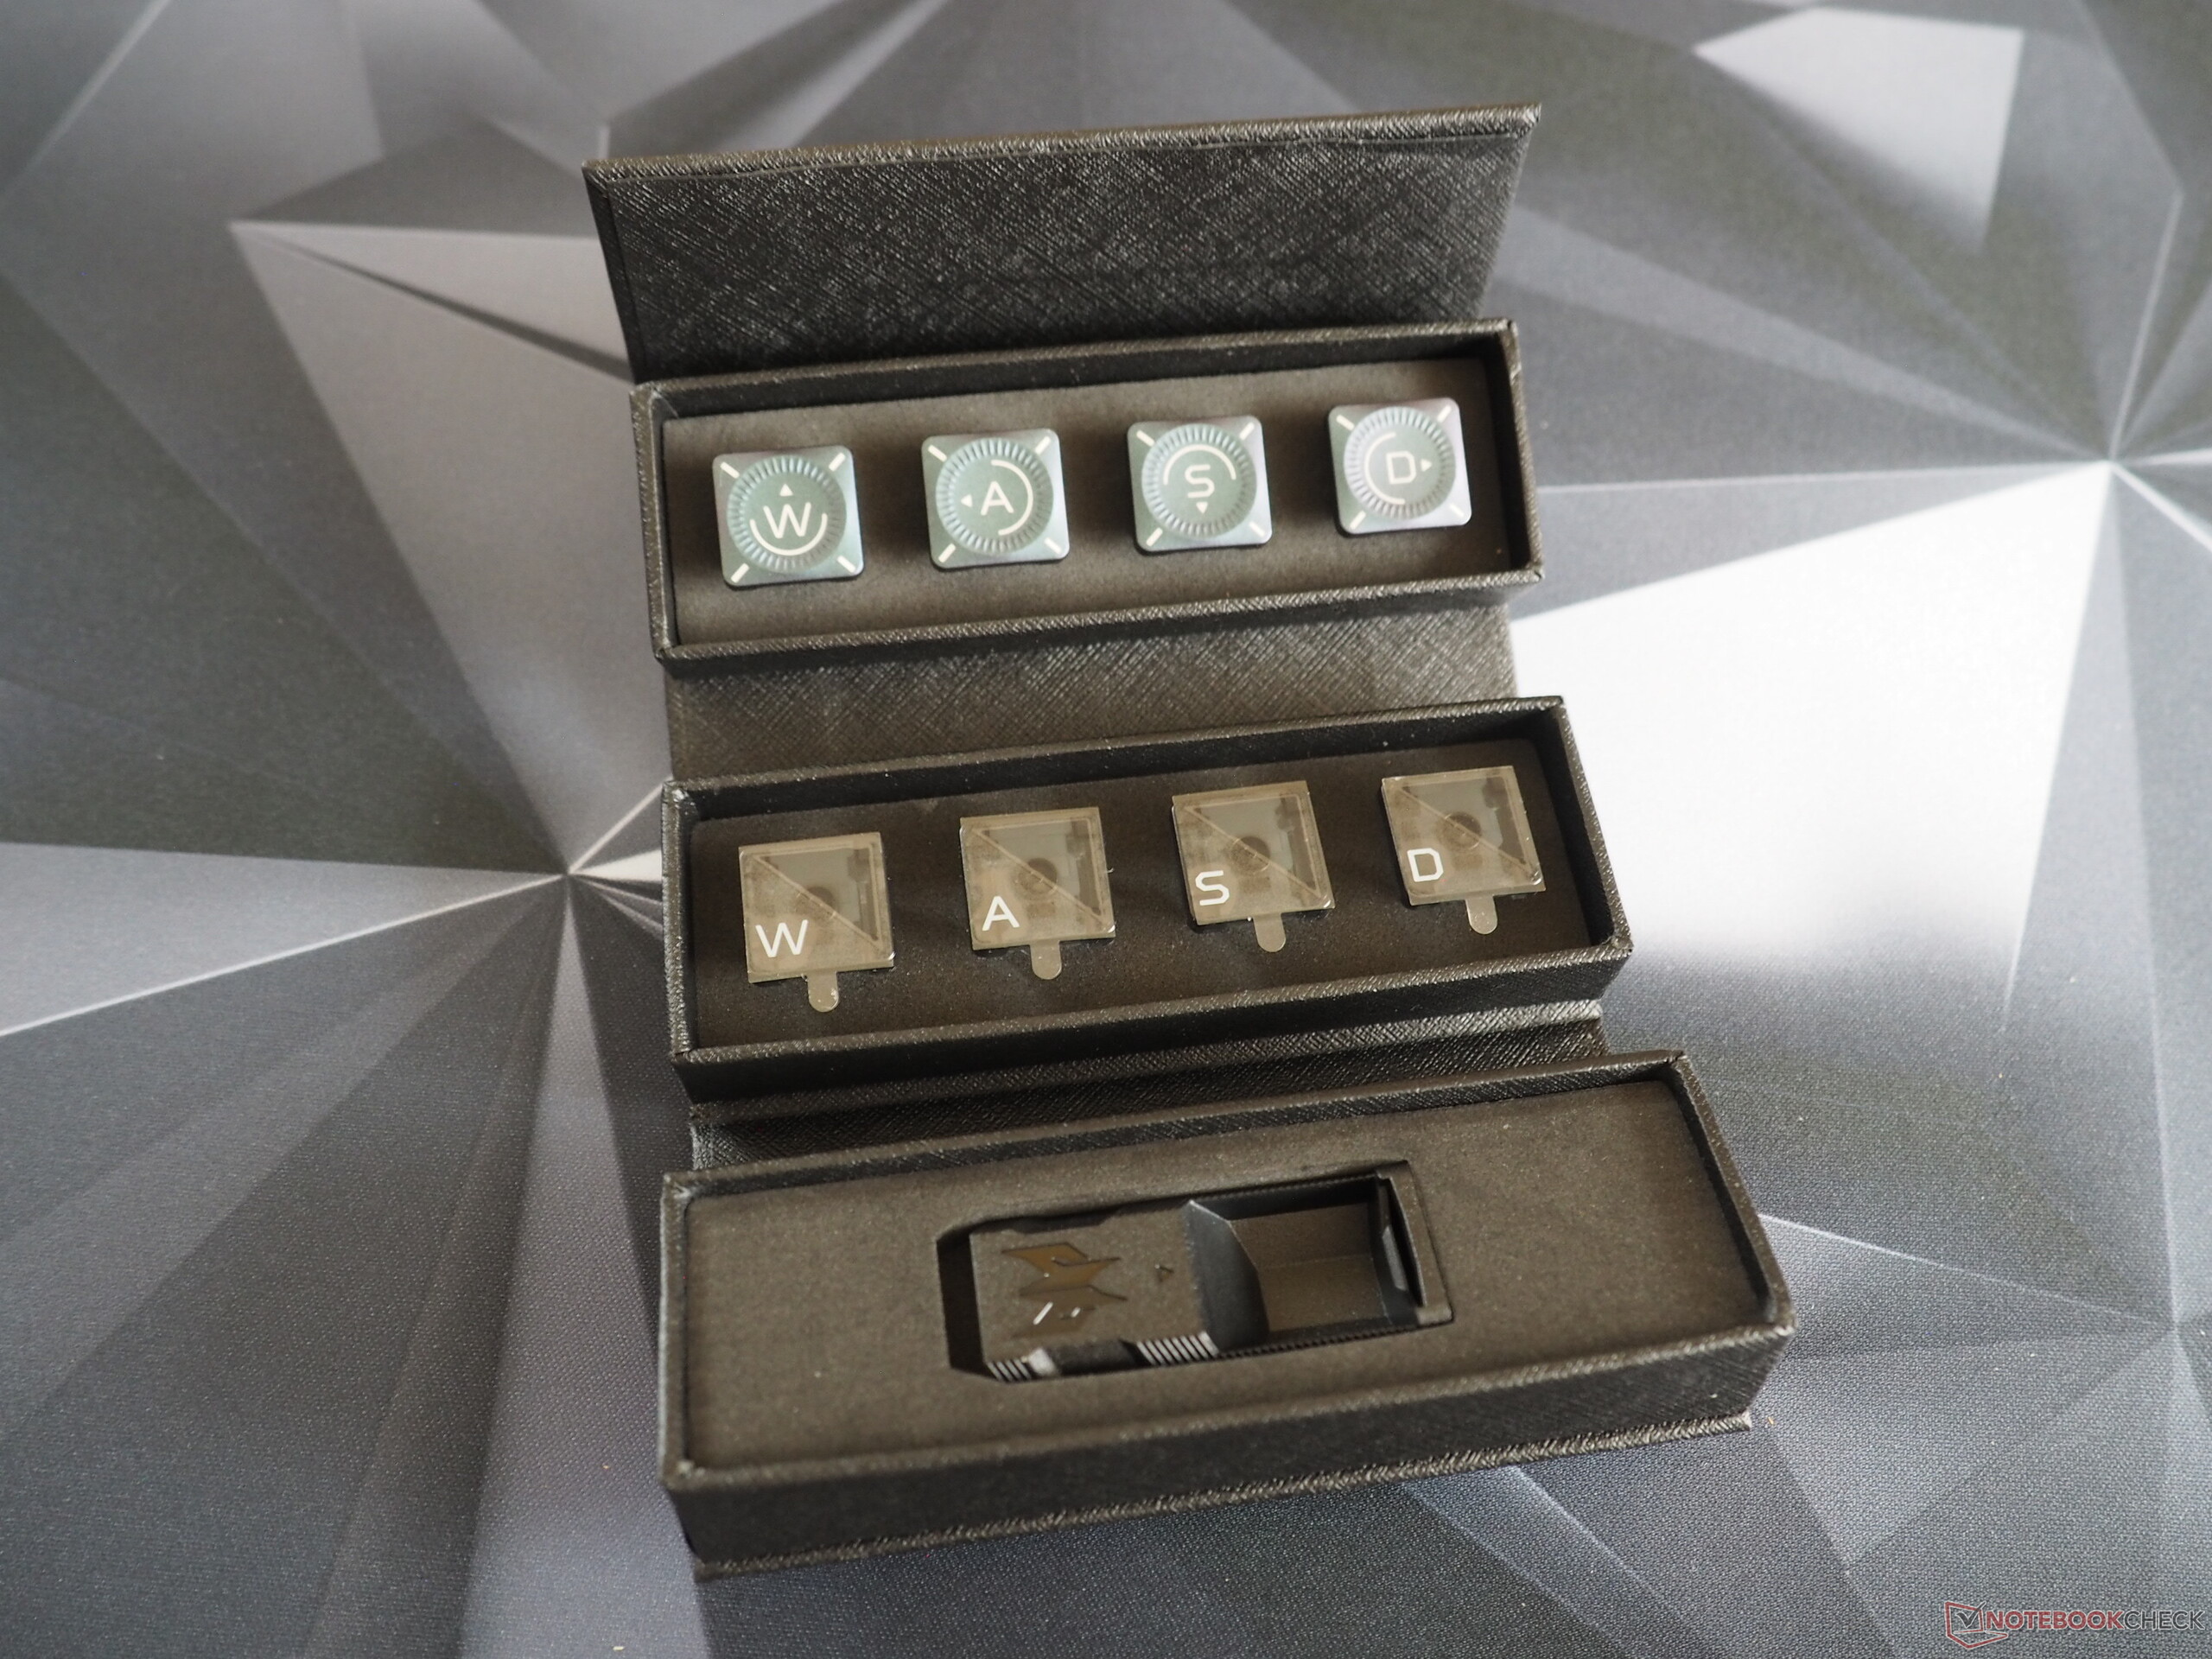
Akcesoria
Predator Helios 18 może pochwalić się ciekawą funkcją specjalną: Jego pudełko zawiera nie tylko wymienne kratki wentylatora z tyłu urządzenia, ale otrzymują Państwo również dwa zestawy różnych klawiszy WASD i kilka dźwigni klawiszy. Zgodnie z oczekiwaniami, dostarczony 330-watowy zasilacz jest dość nieporęczny.
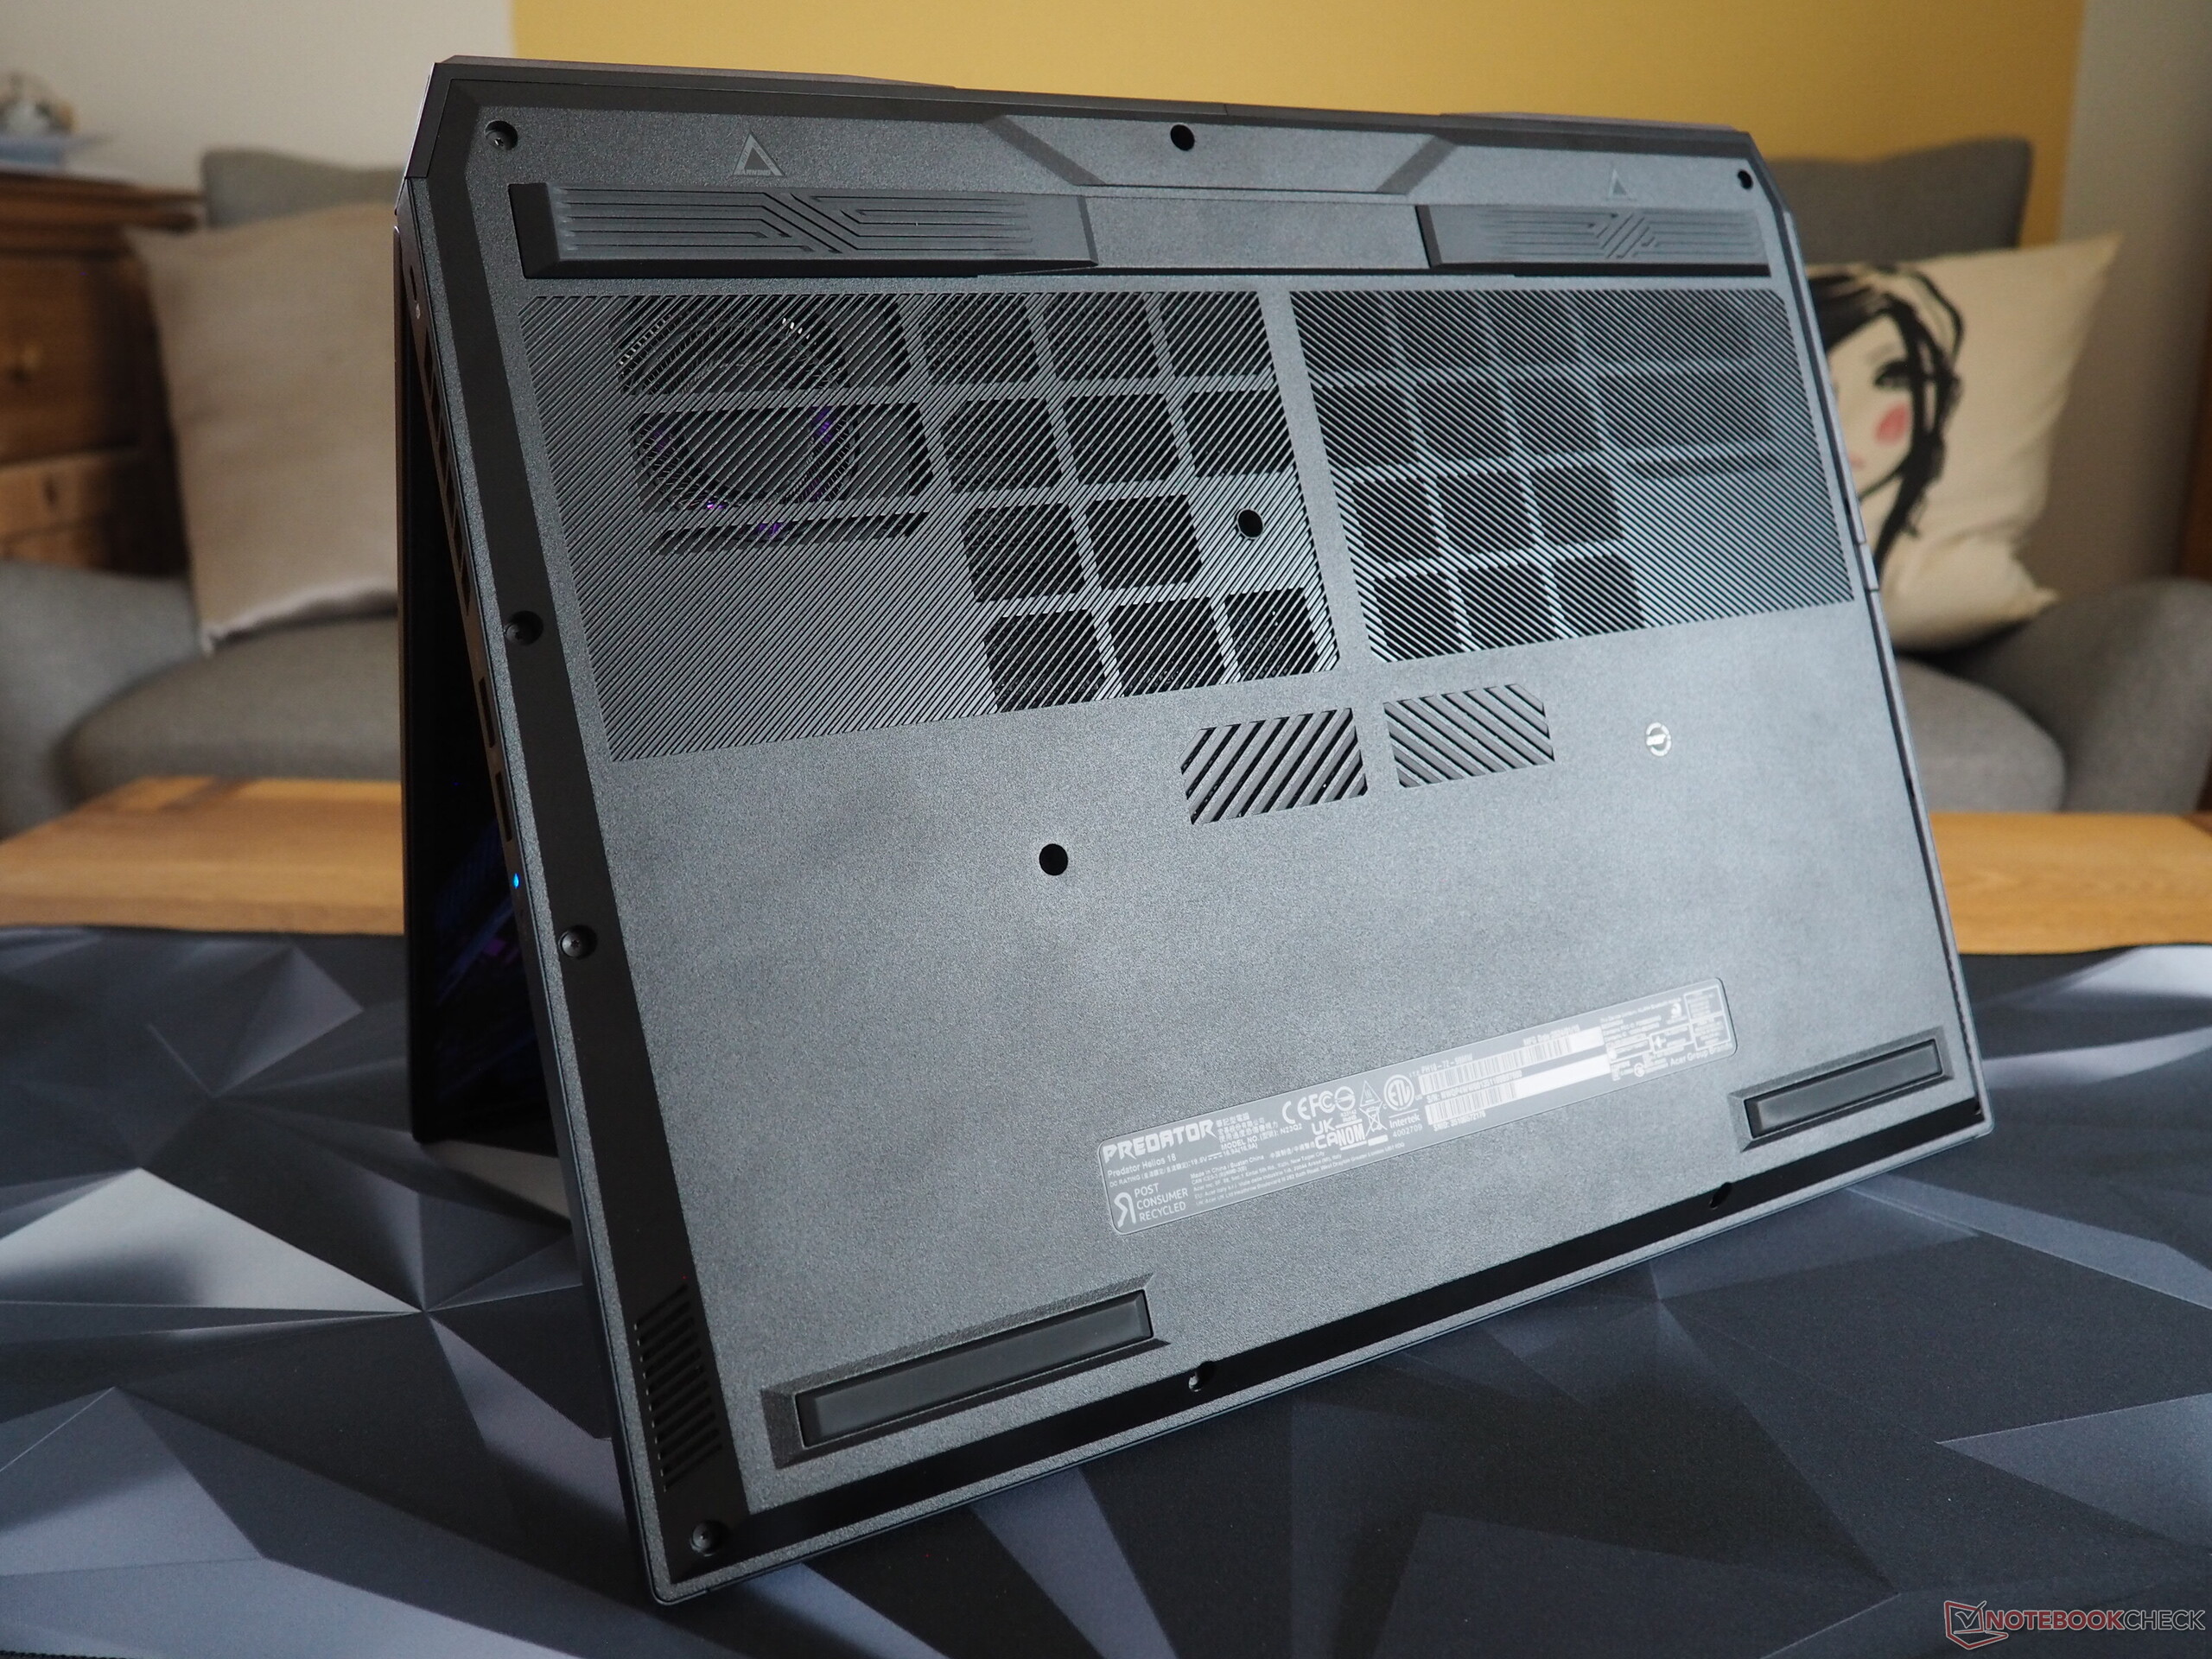
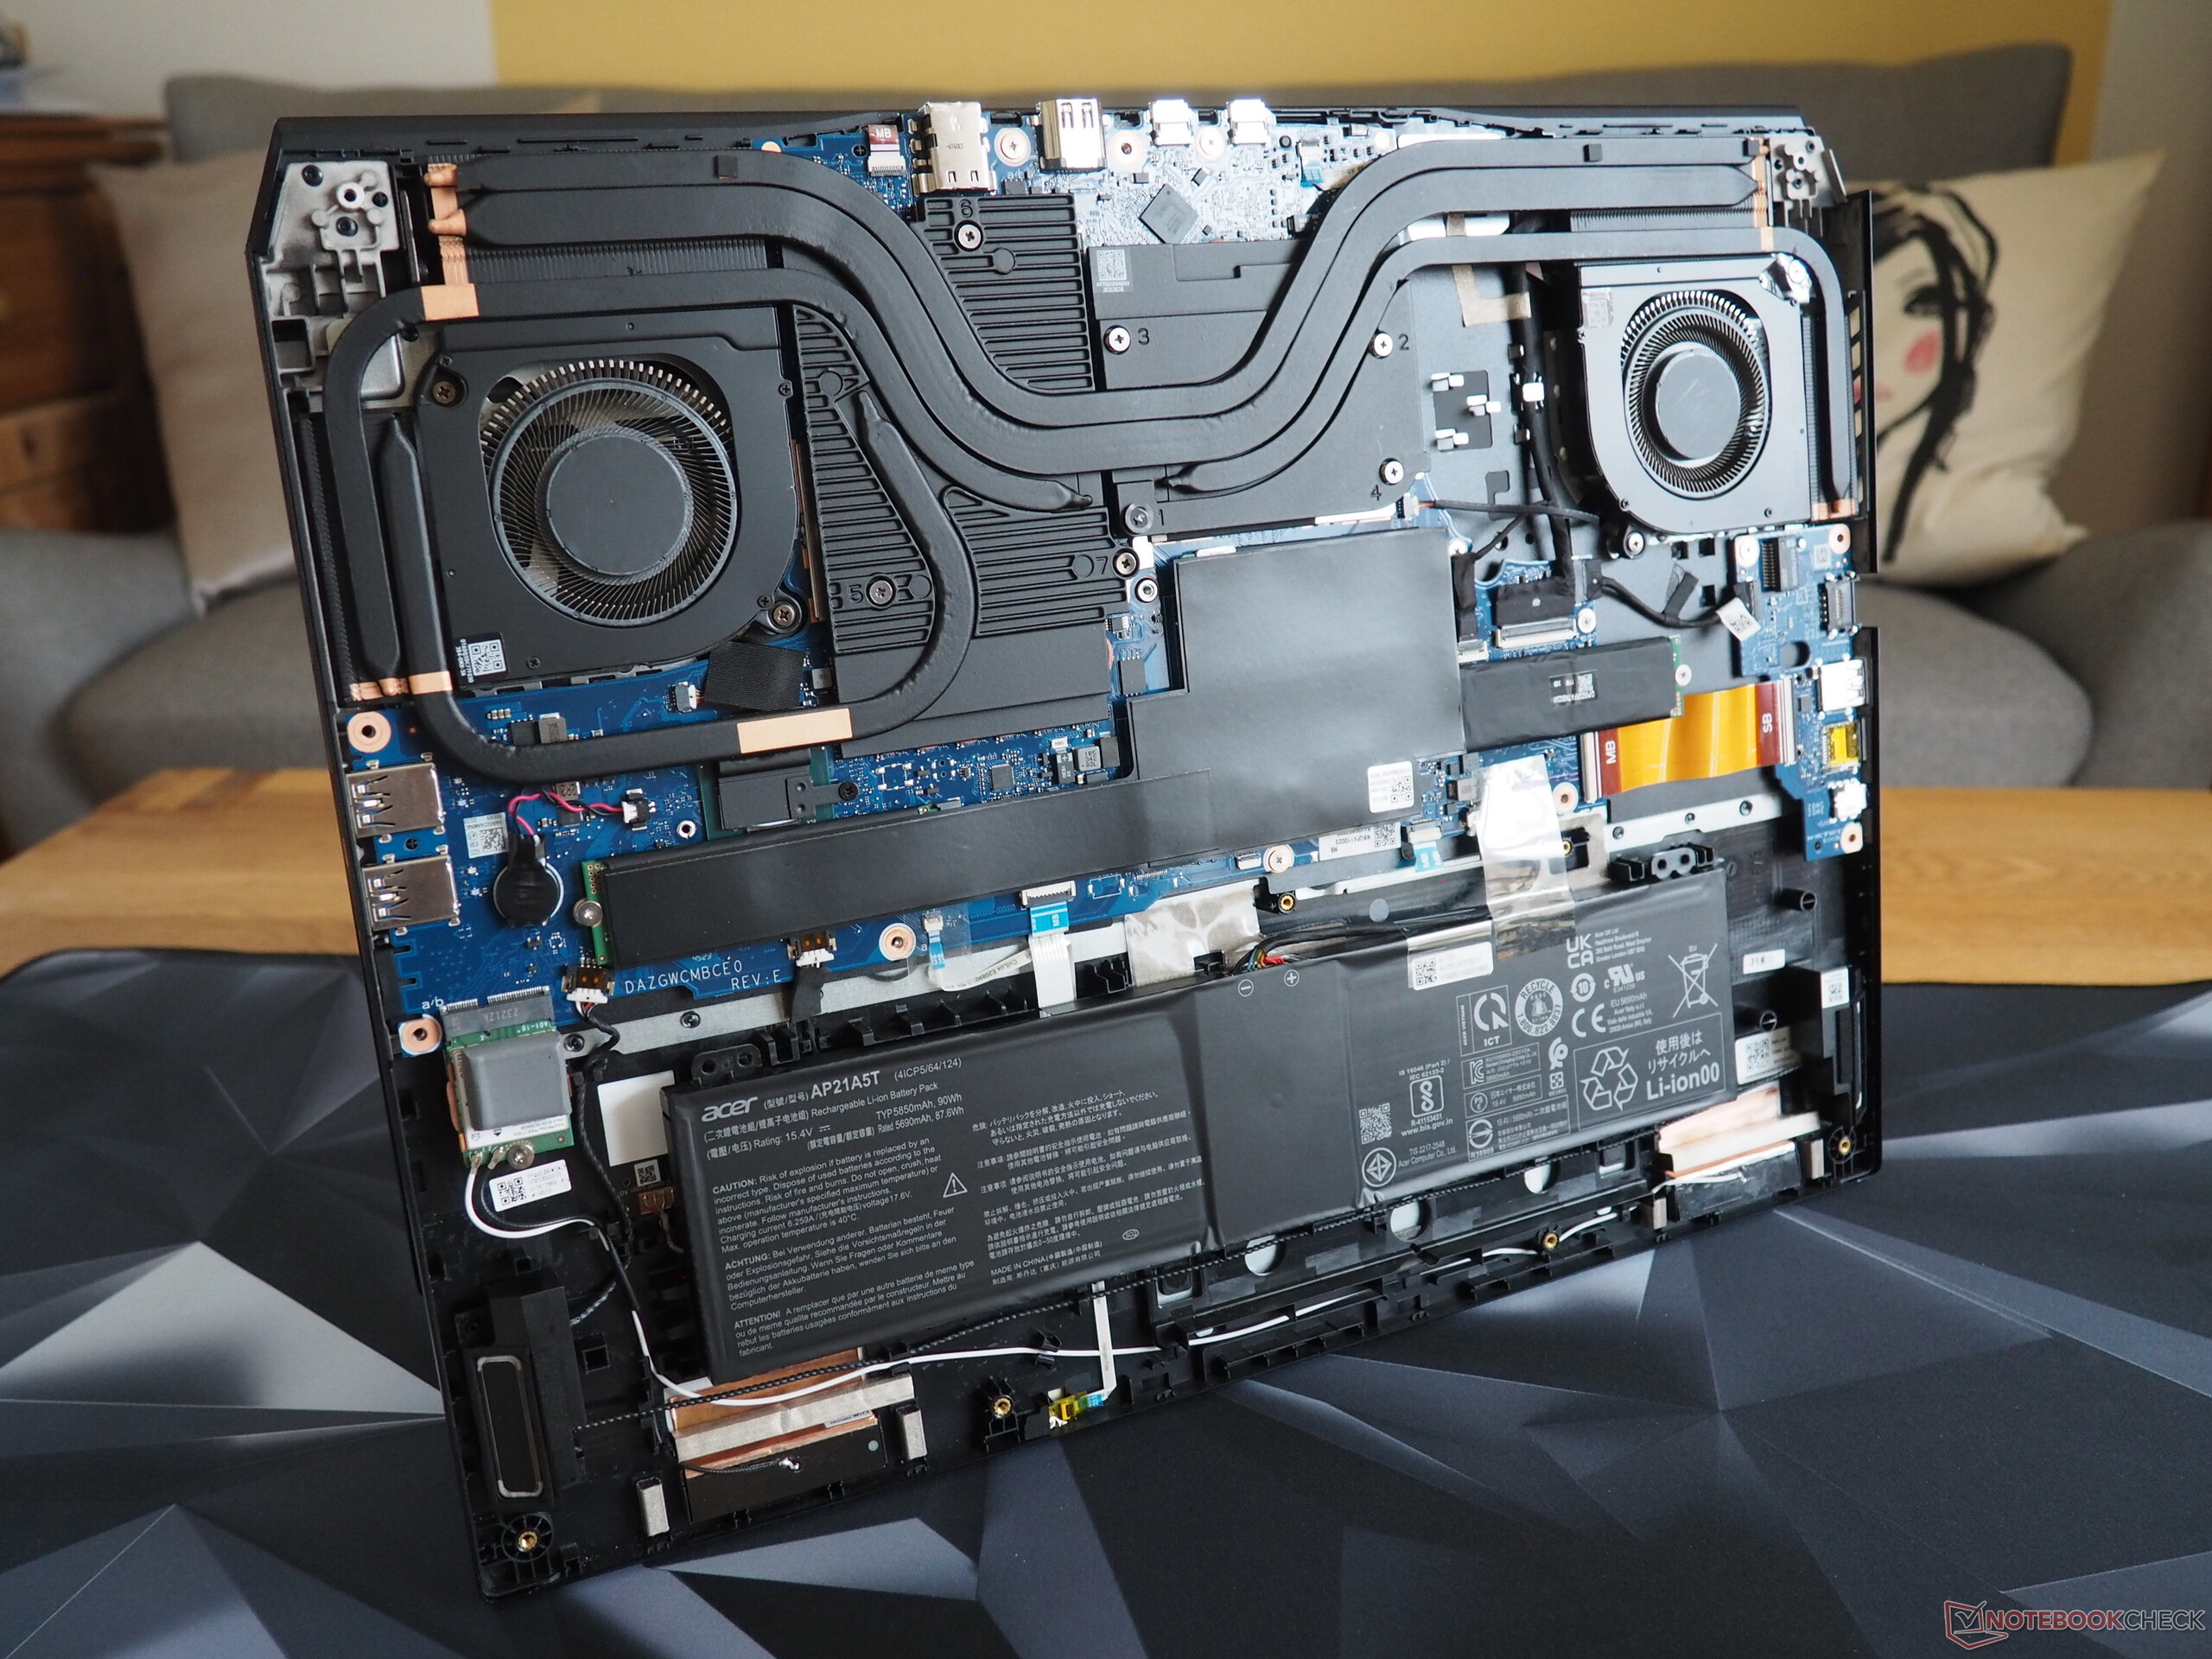
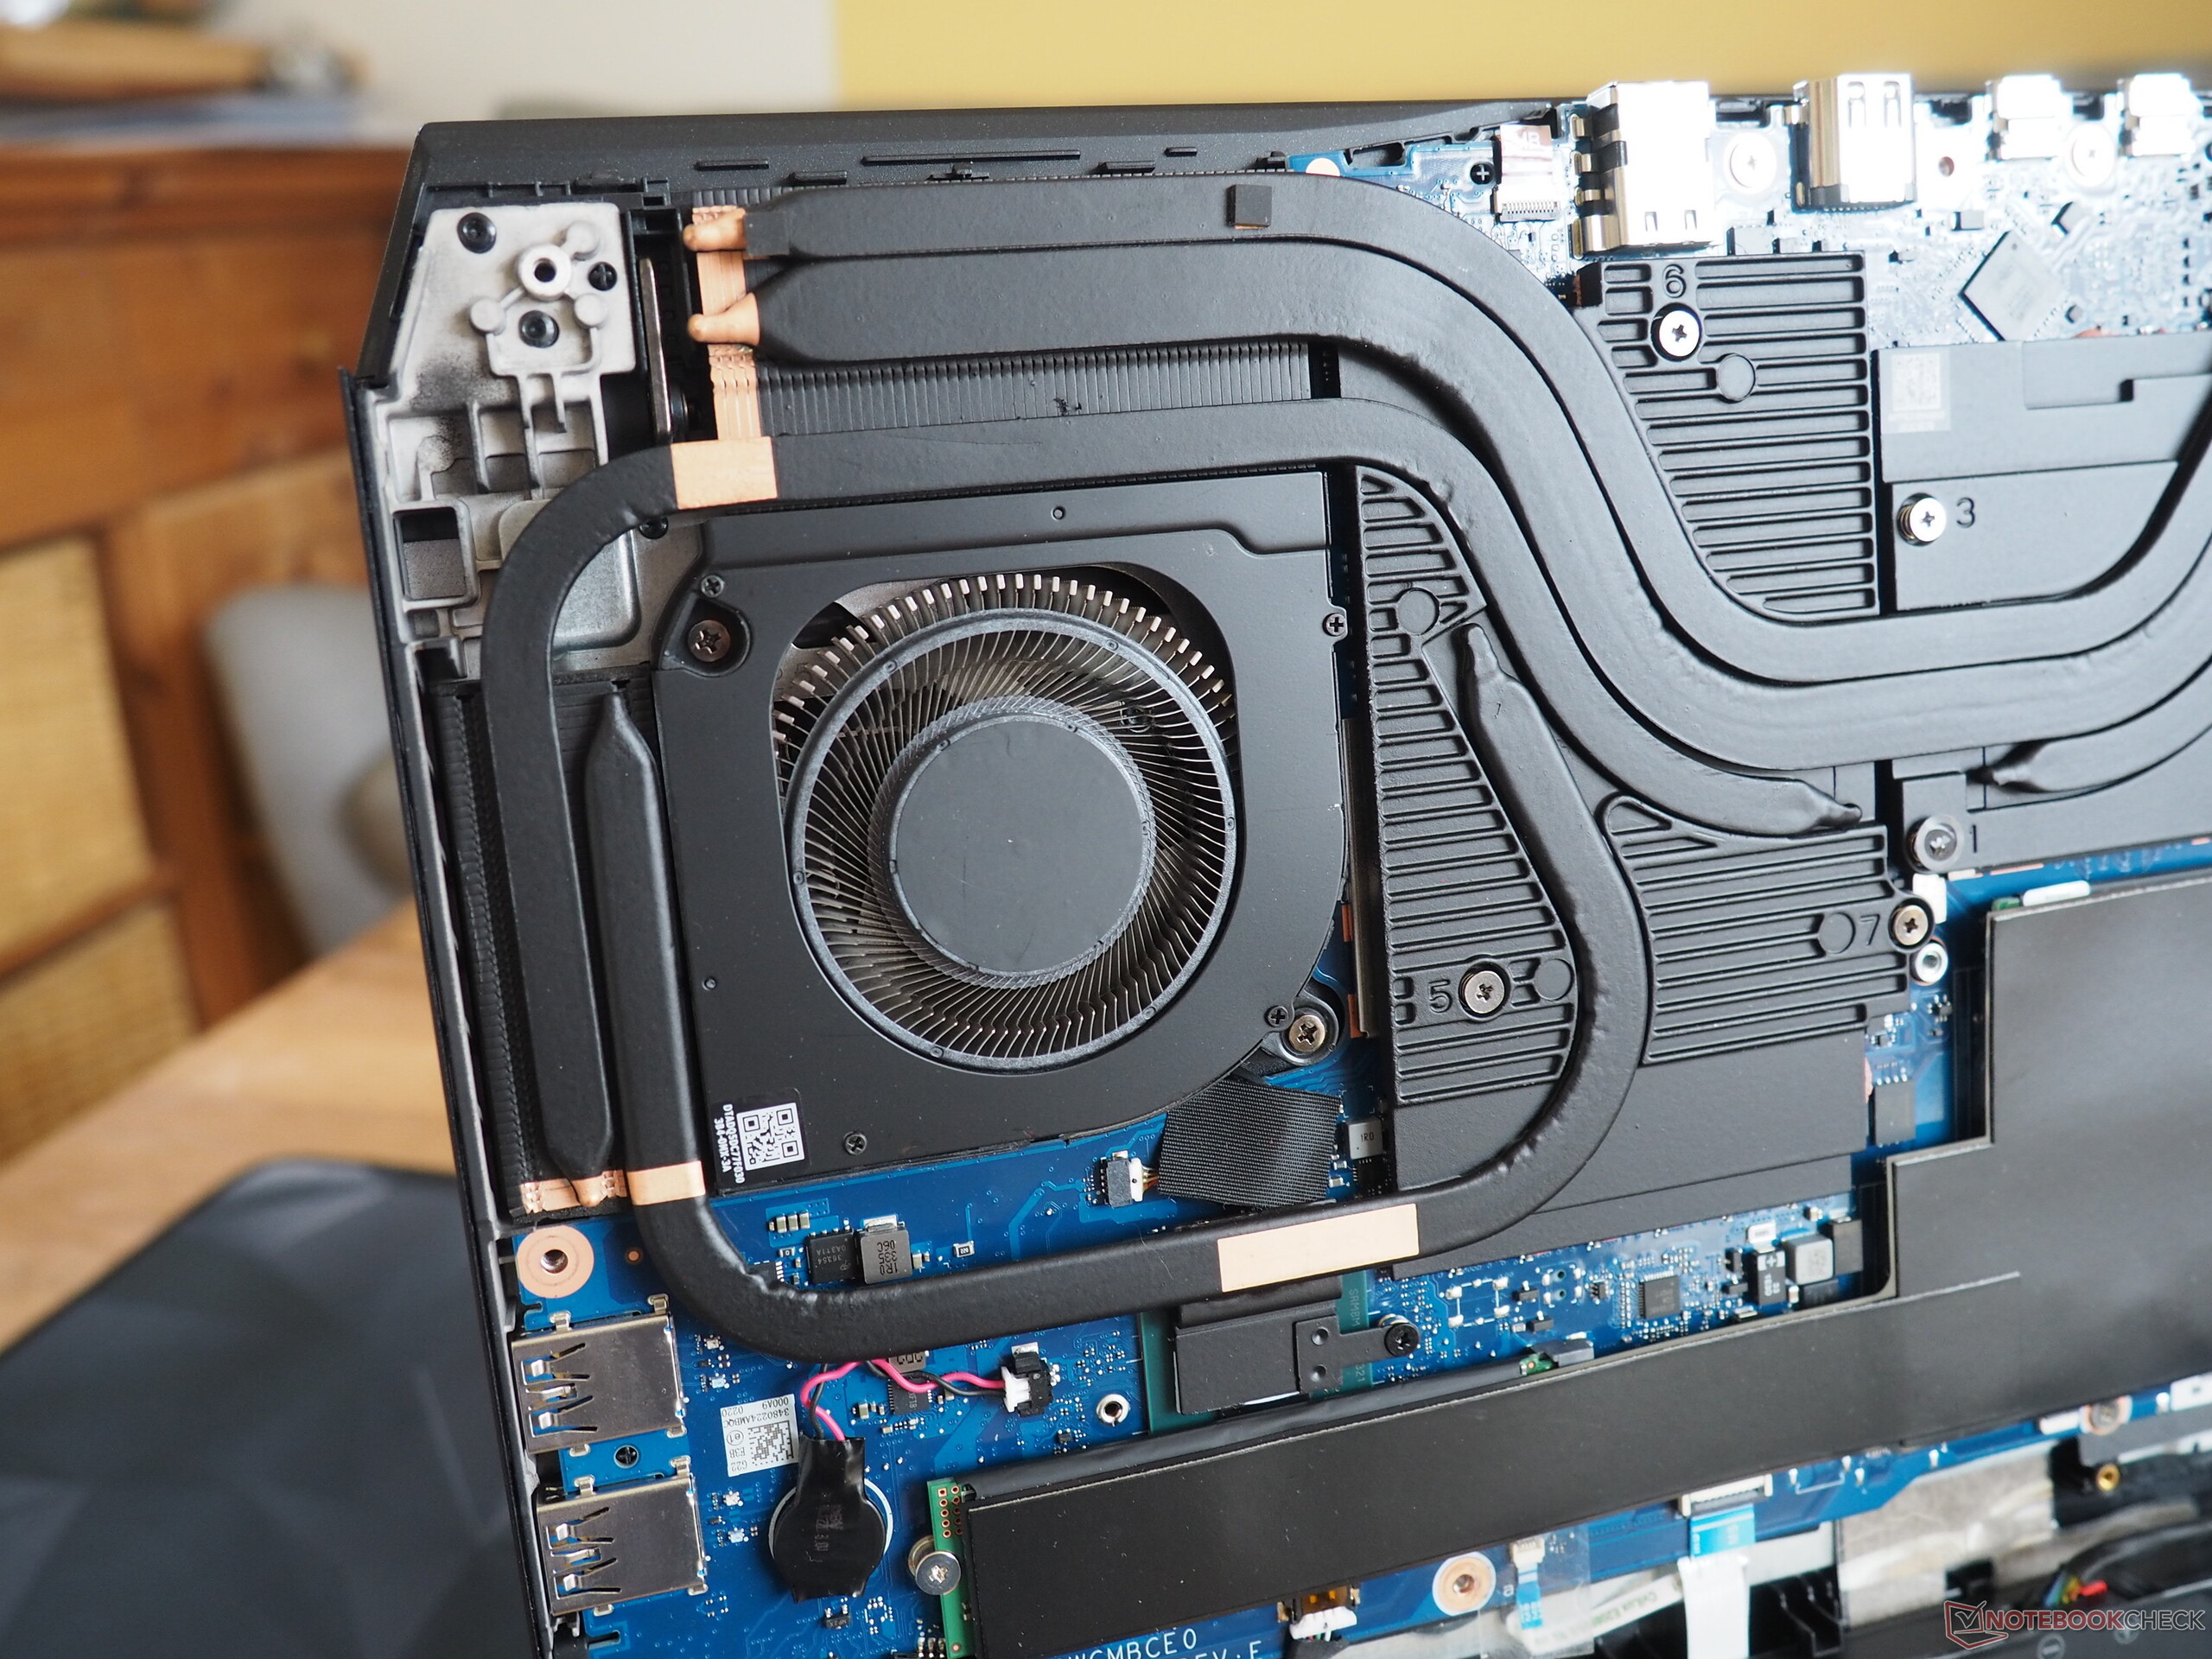
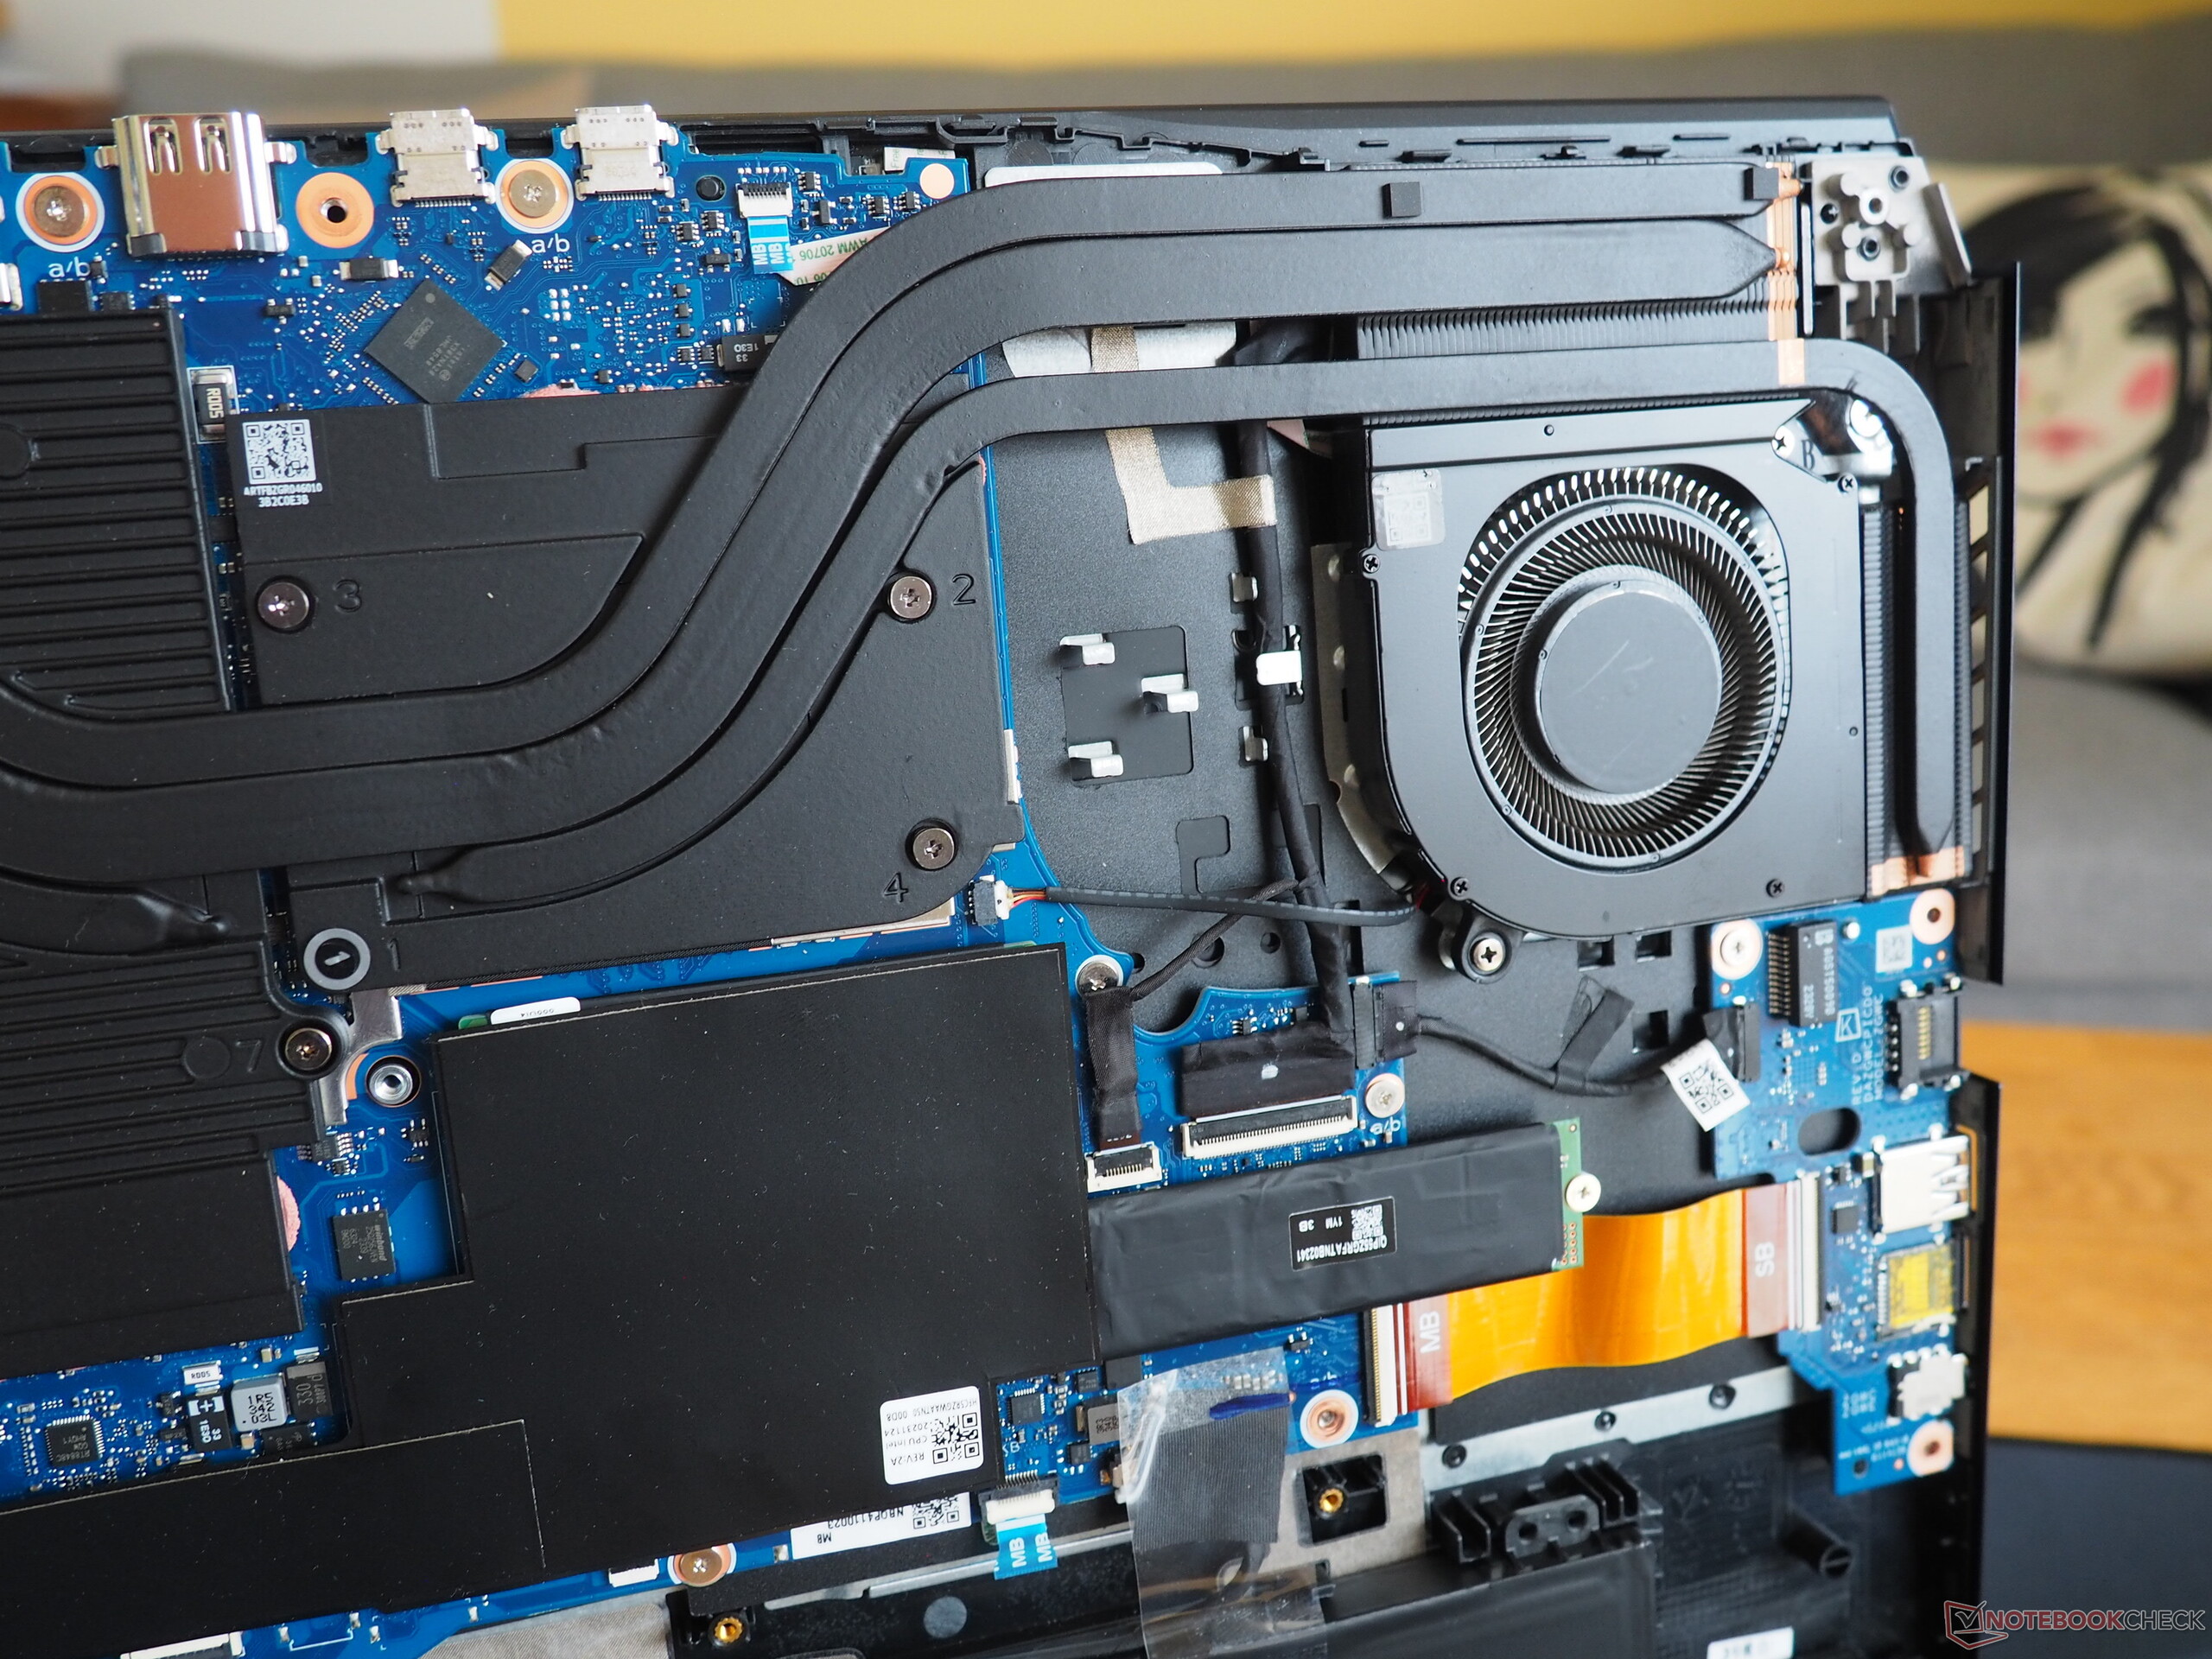
Konserwacja
Jego opcje konserwacji pozostawiły nas z mieszanymi uczuciami. Odkręcenie 14 śrub Torx i podważenie dolnej płyty zajmuje sporo czasu, a dodatkowo Acer może nawet odstraszyć wielu użytkowników poprzez zastosowanie plomby gwarancyjnej (zakrywającej jedną śrubę). Wewnątrz mamy przynajmniej dostęp do układu chłodzenia, baterii, modułu WLAN, pamięci RAM i dysku SSD. Te dwa ostatnie są jednak przykryte foliami i podkładkami, co nie ułatwia ich wymiany.
Gwarancja
Laptop objęty jest 24-miesięczną gwarancją.
Urządzenia wejściowe
Klawiatura
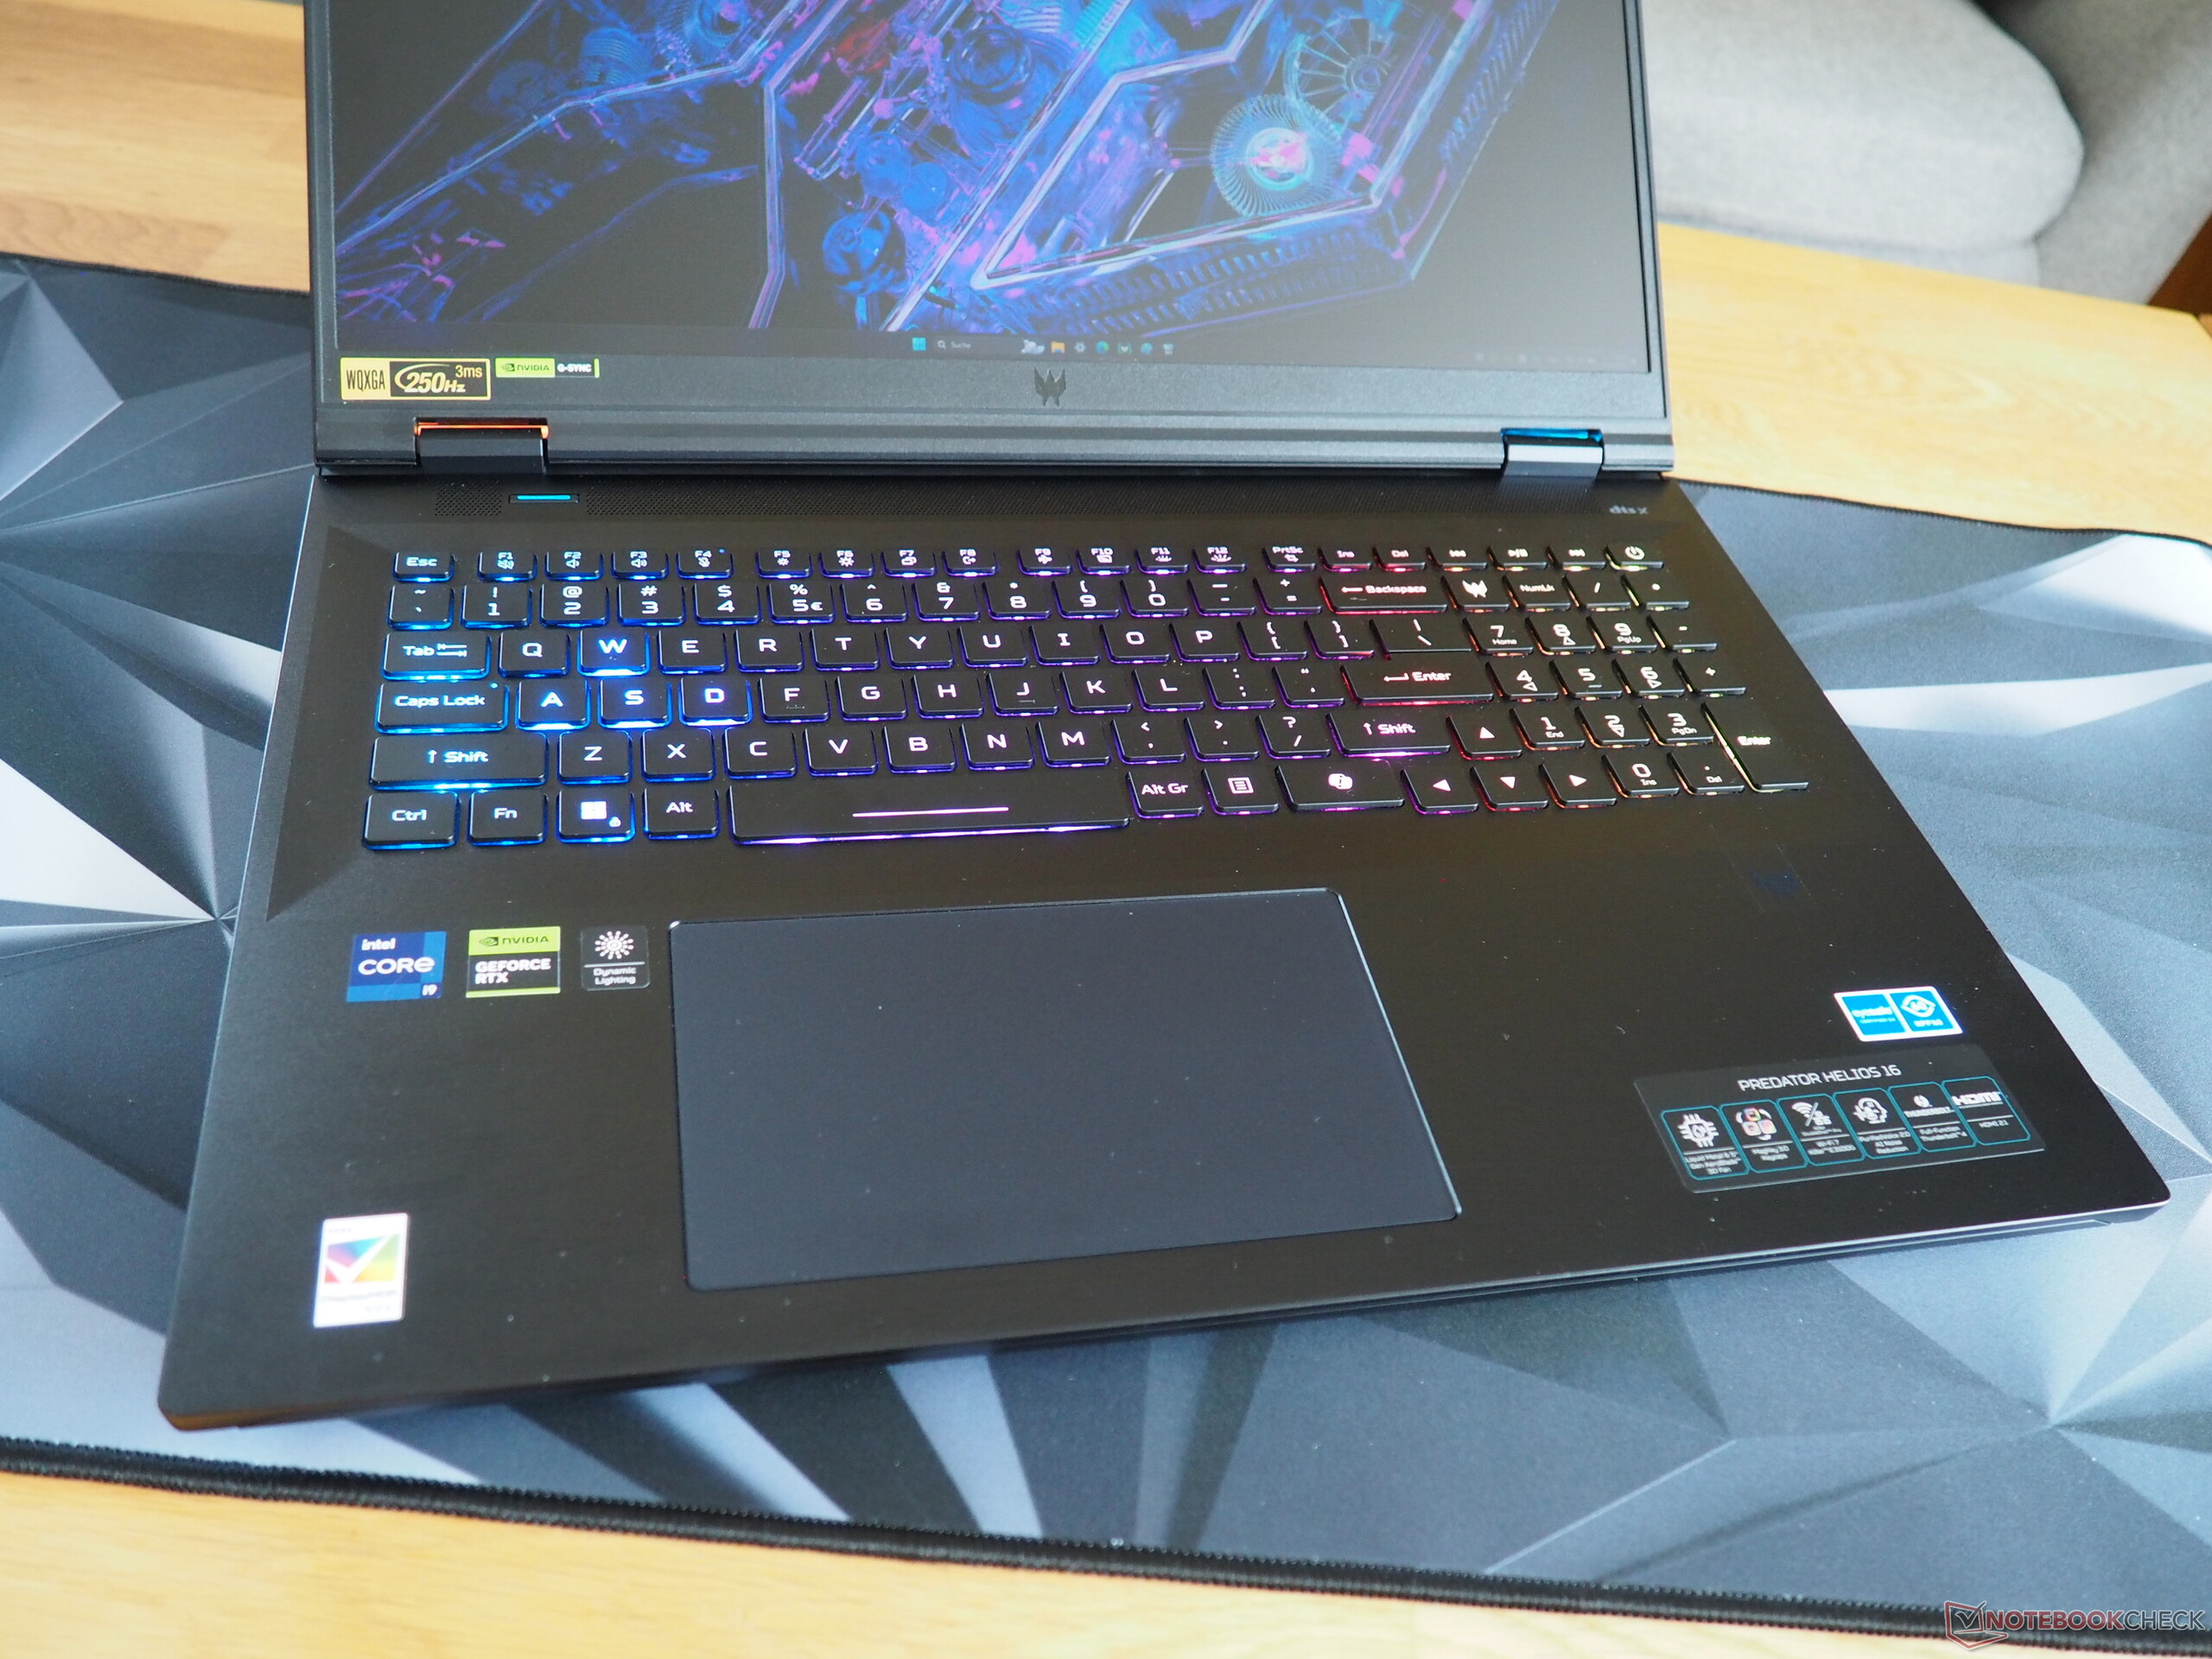
Gracze będą podekscytowani, widząc w szczególności rozbudowane podświetlenie laptopa (pojedynczy klawisz RGB), które w naszych oczach mogłoby być nieco bardziej równomierne. Jak na klasyczną klawiaturę z gumową kopułką, pisze się na niej zaskakująco dobrze - jest tylko trochę głośna. Poza kilkoma szczegółami (zmodyfikowana klawiatura numeryczna), jej układ jest dobry. W przeciwieństwie do innych producentów, Acer nie eksperymentował zbytnio i większość funkcji jest przydatna. Producent zasługuje również na pochwałę za duży rozmiar klawiszy laptopa (np. duże klawisze strzałek).
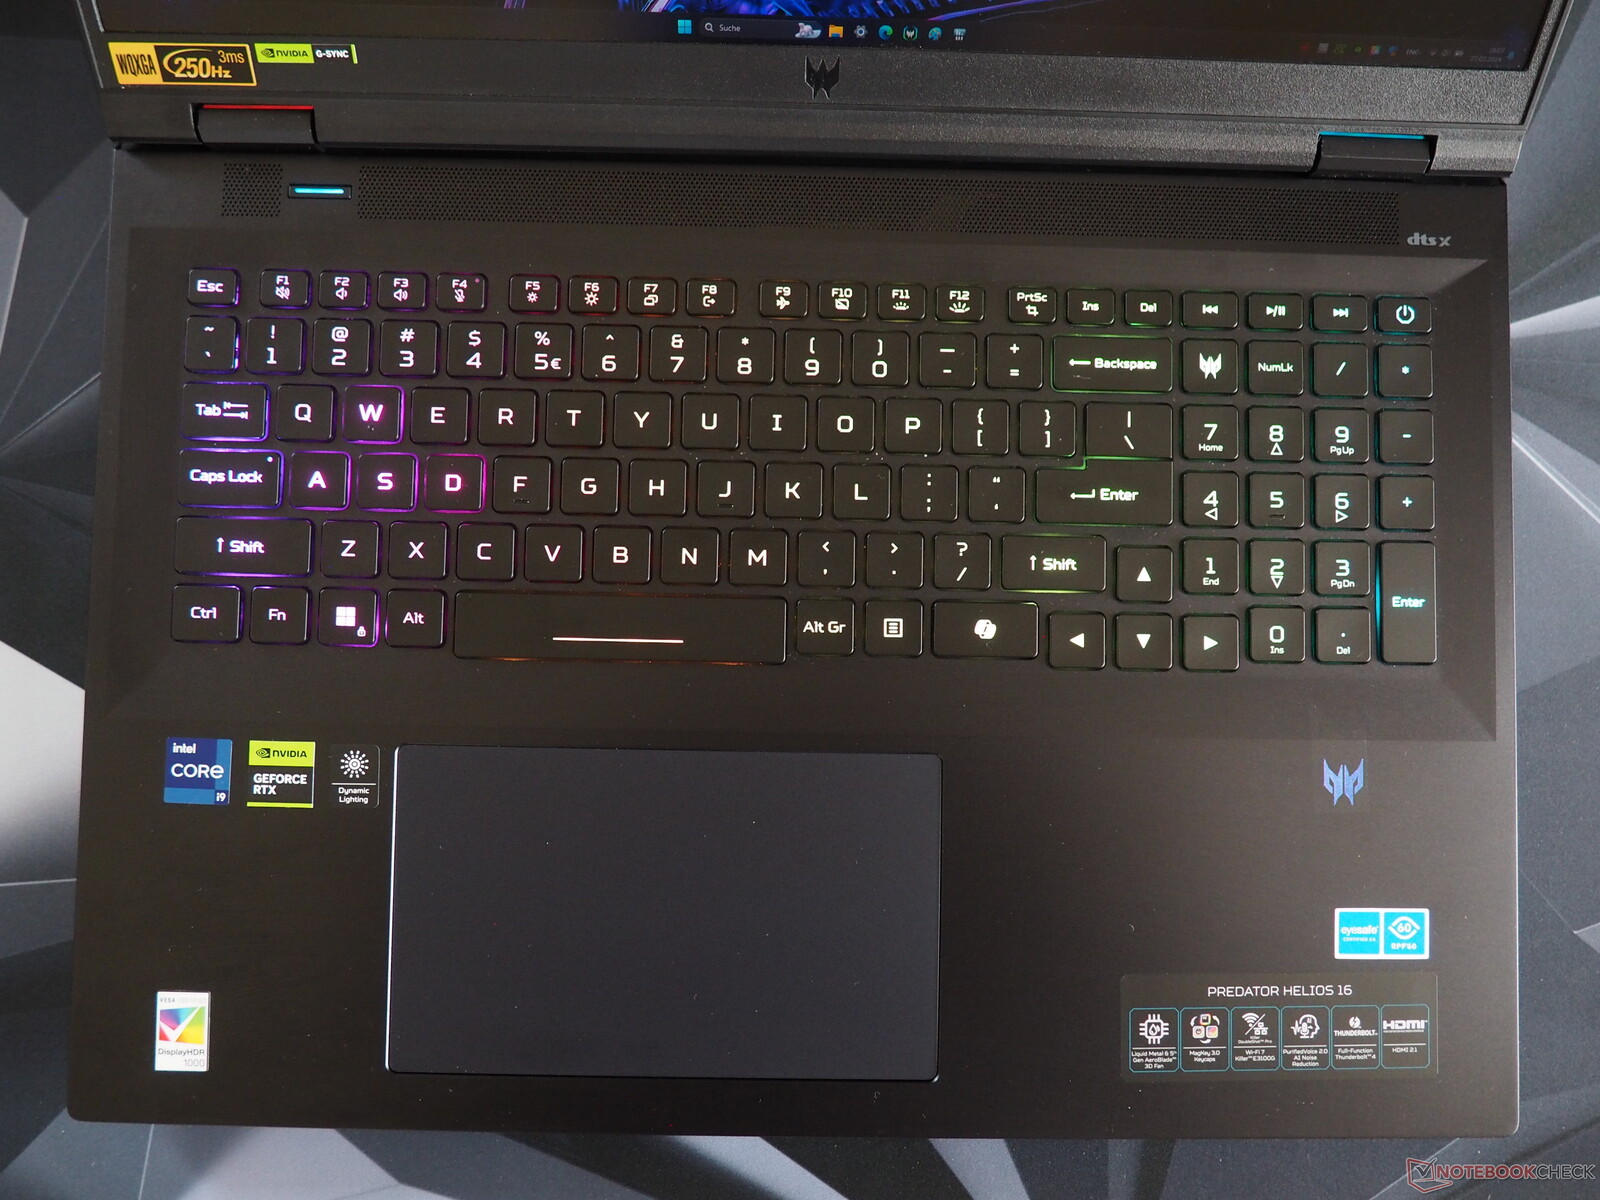
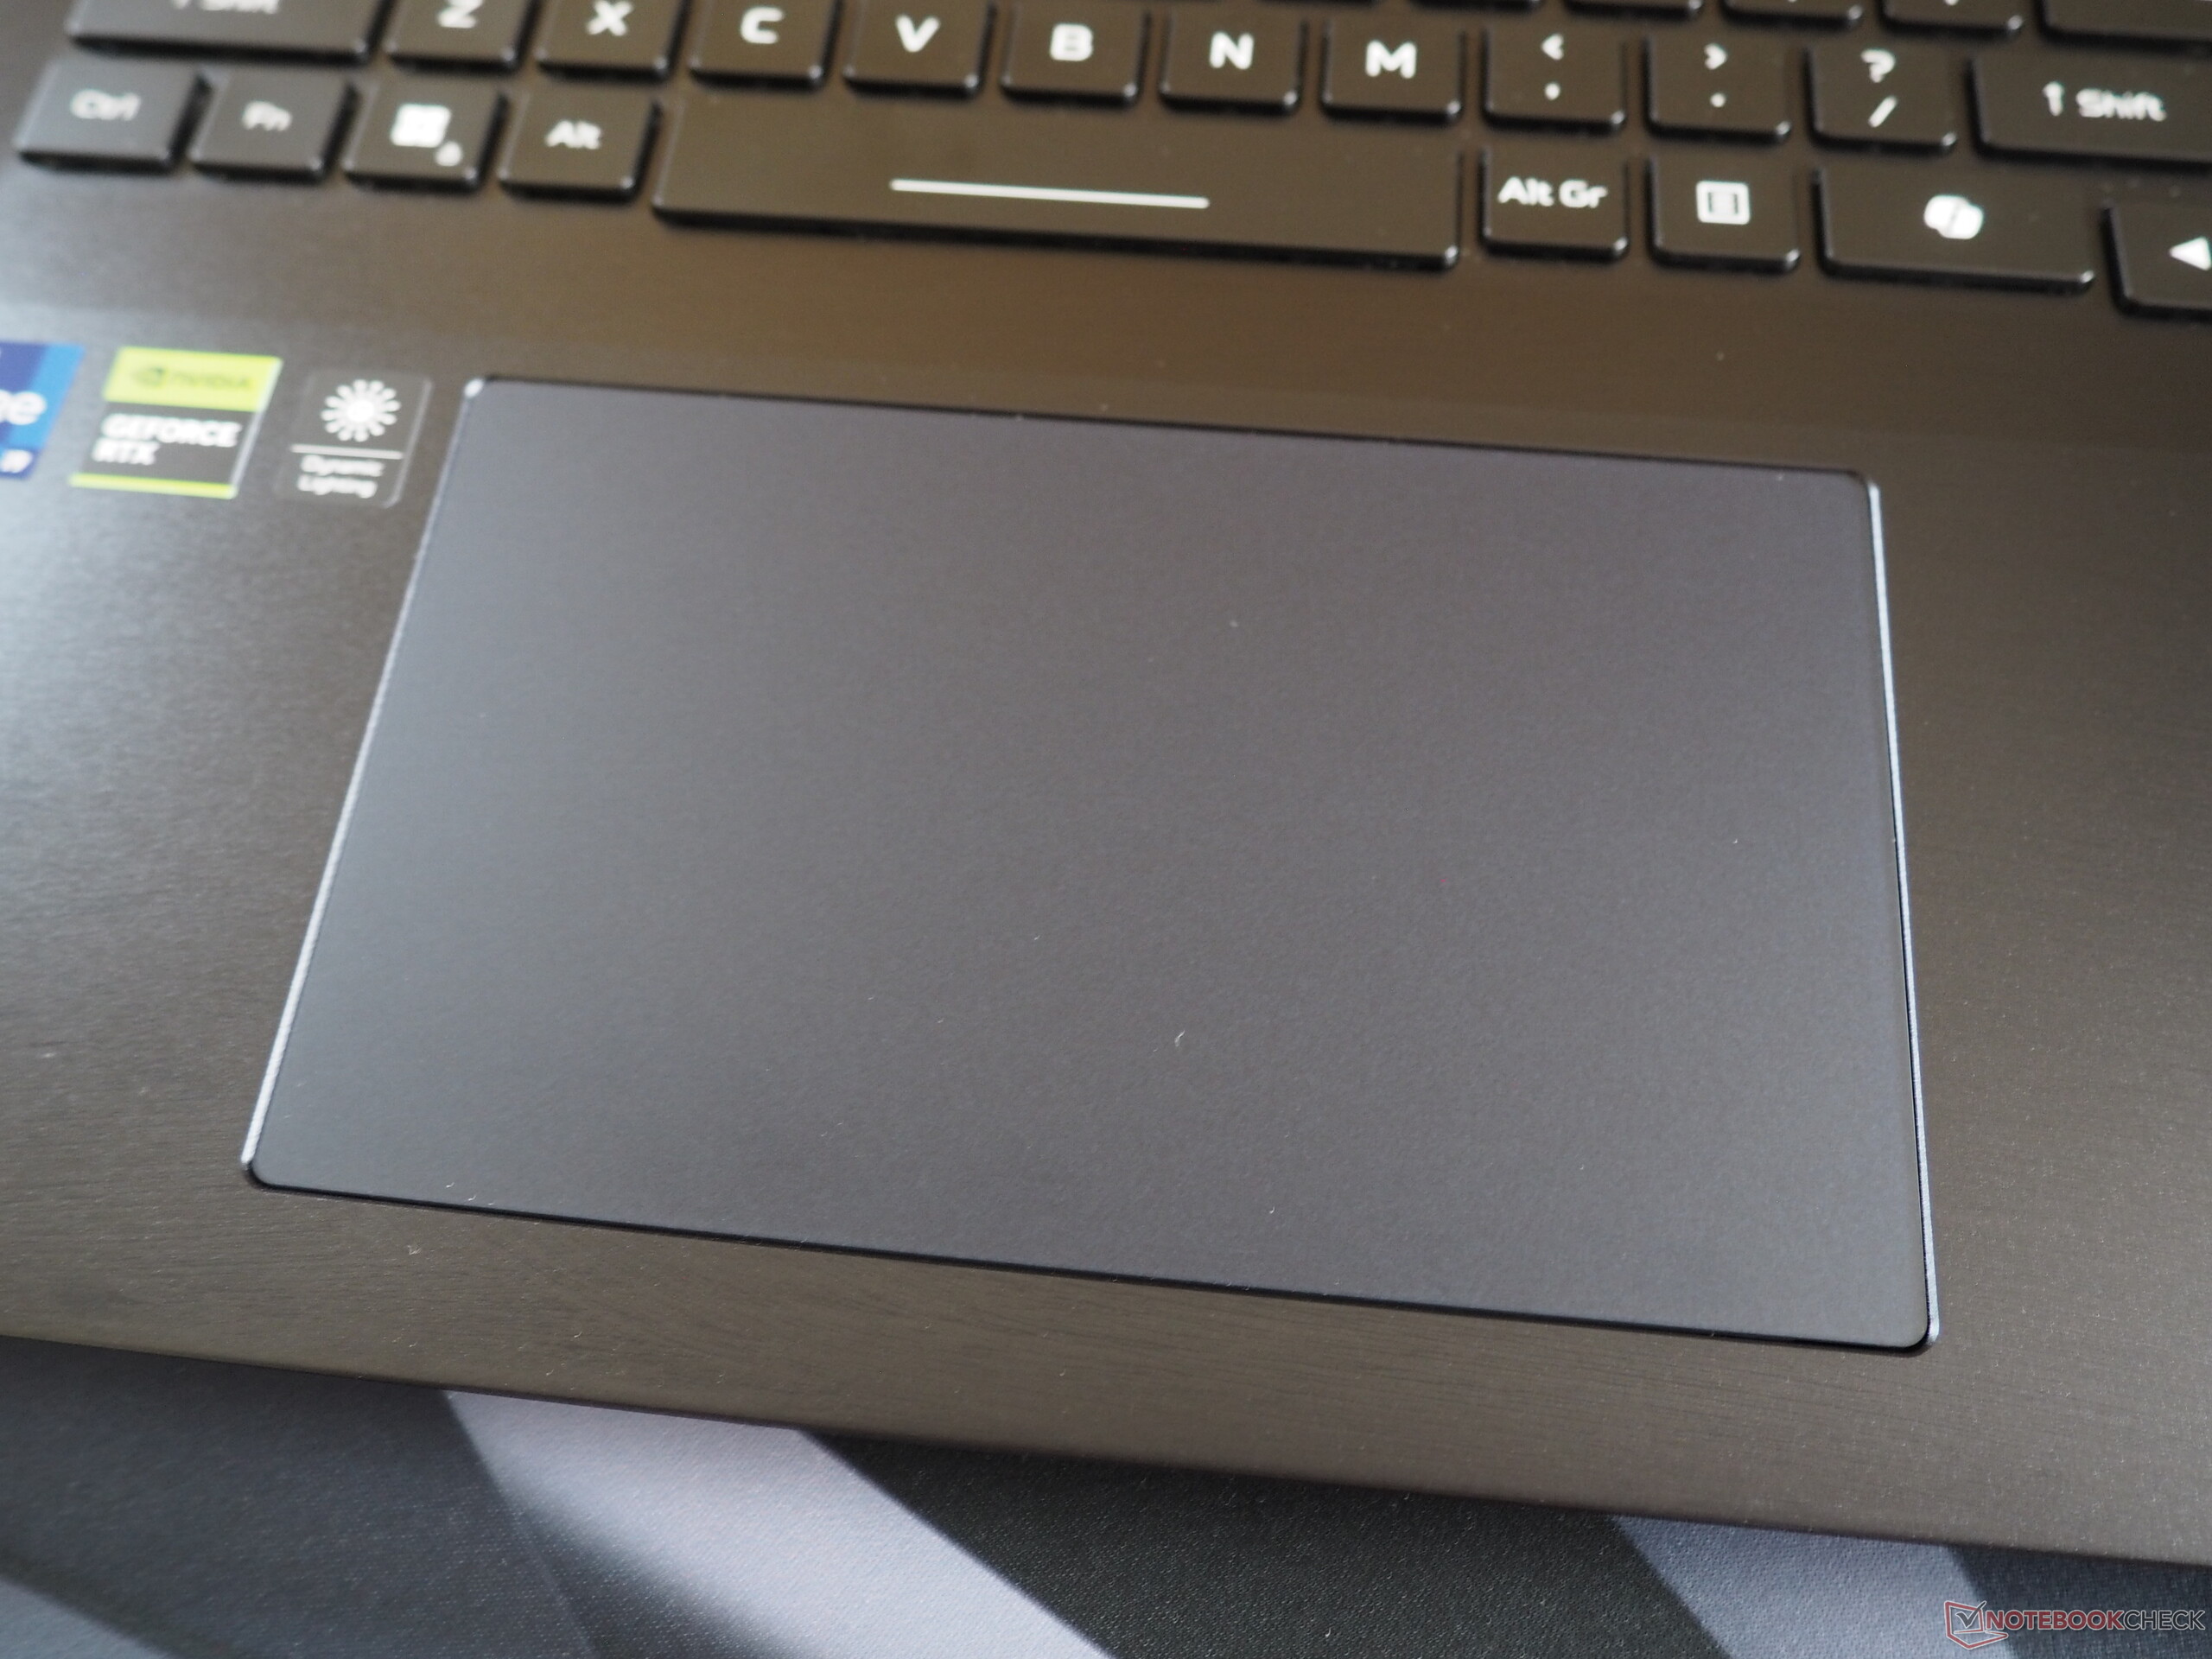
Panel dotykowy
Jego touchpad jest również niemal bezbłędny. Jego rozmiar 15 x 9 cm jest duży i pozwala na długie ruchy bez konieczności podnoszenia palca. Ponadto jego gładka powierzchnia zapewnia dobre przesuwanie palców po podkładce. Nie zauważyliśmy niczego niepozornego, jeśli chodzi o obsługę gestów i precyzję.
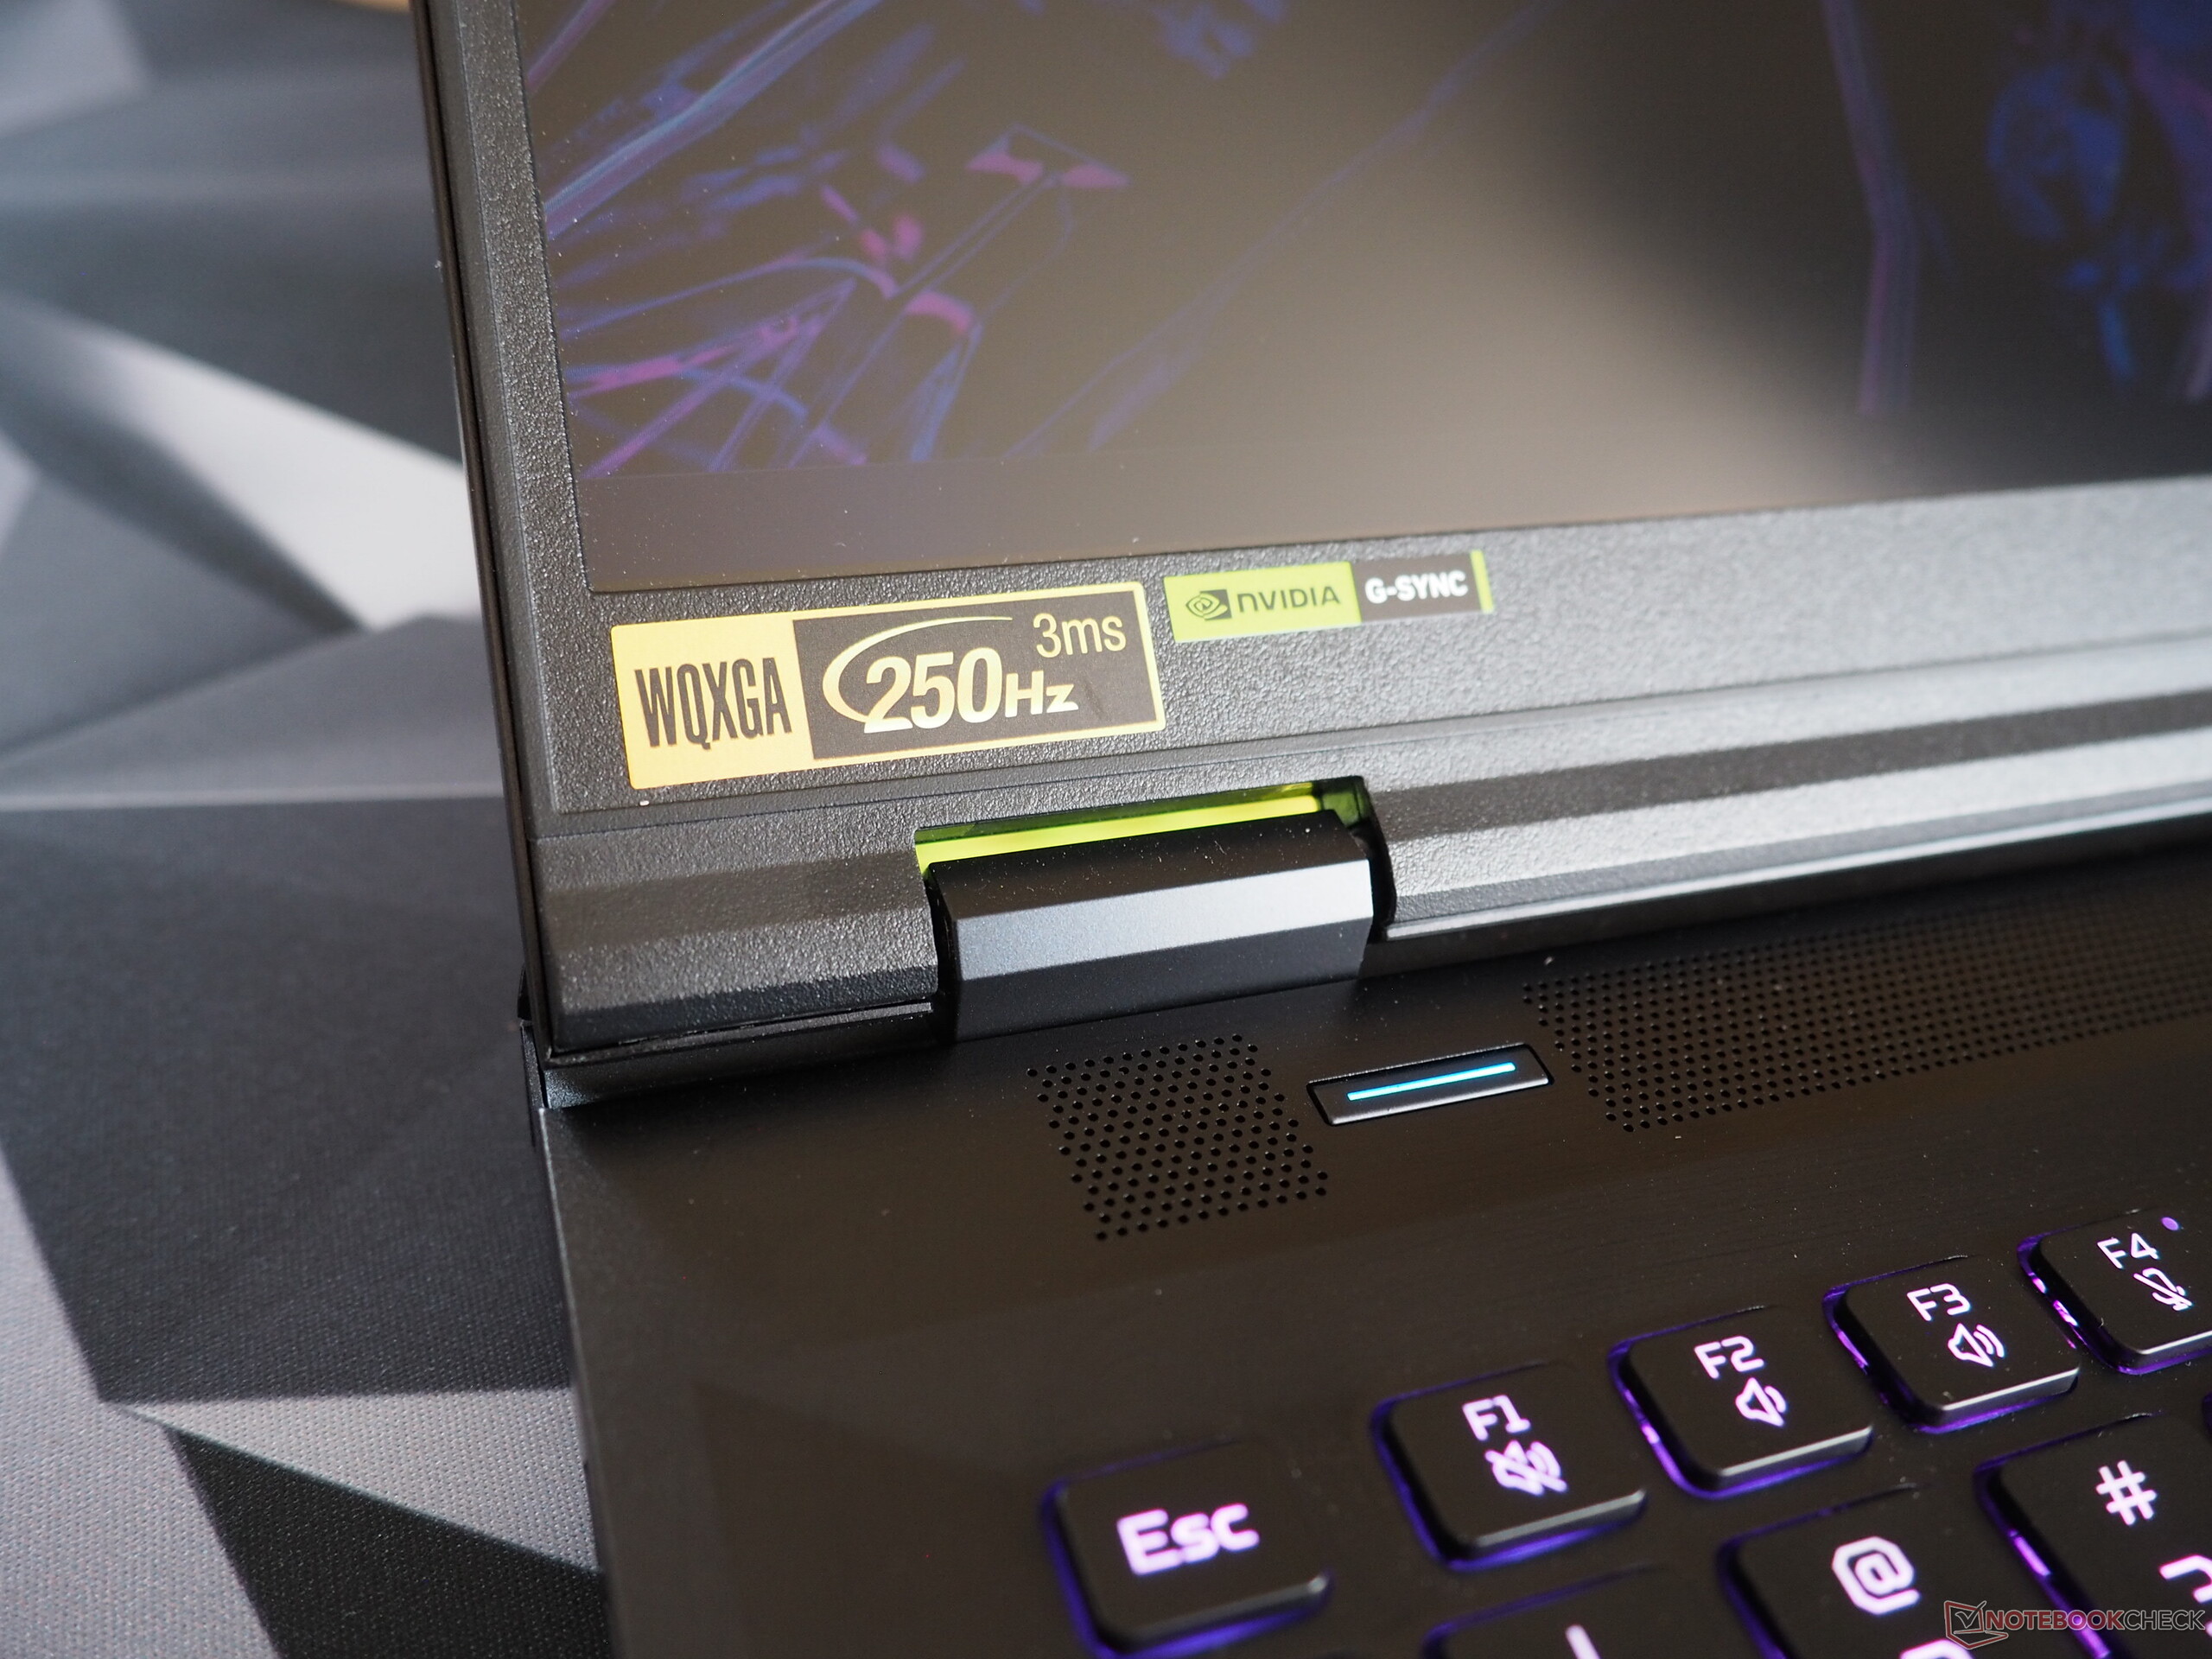
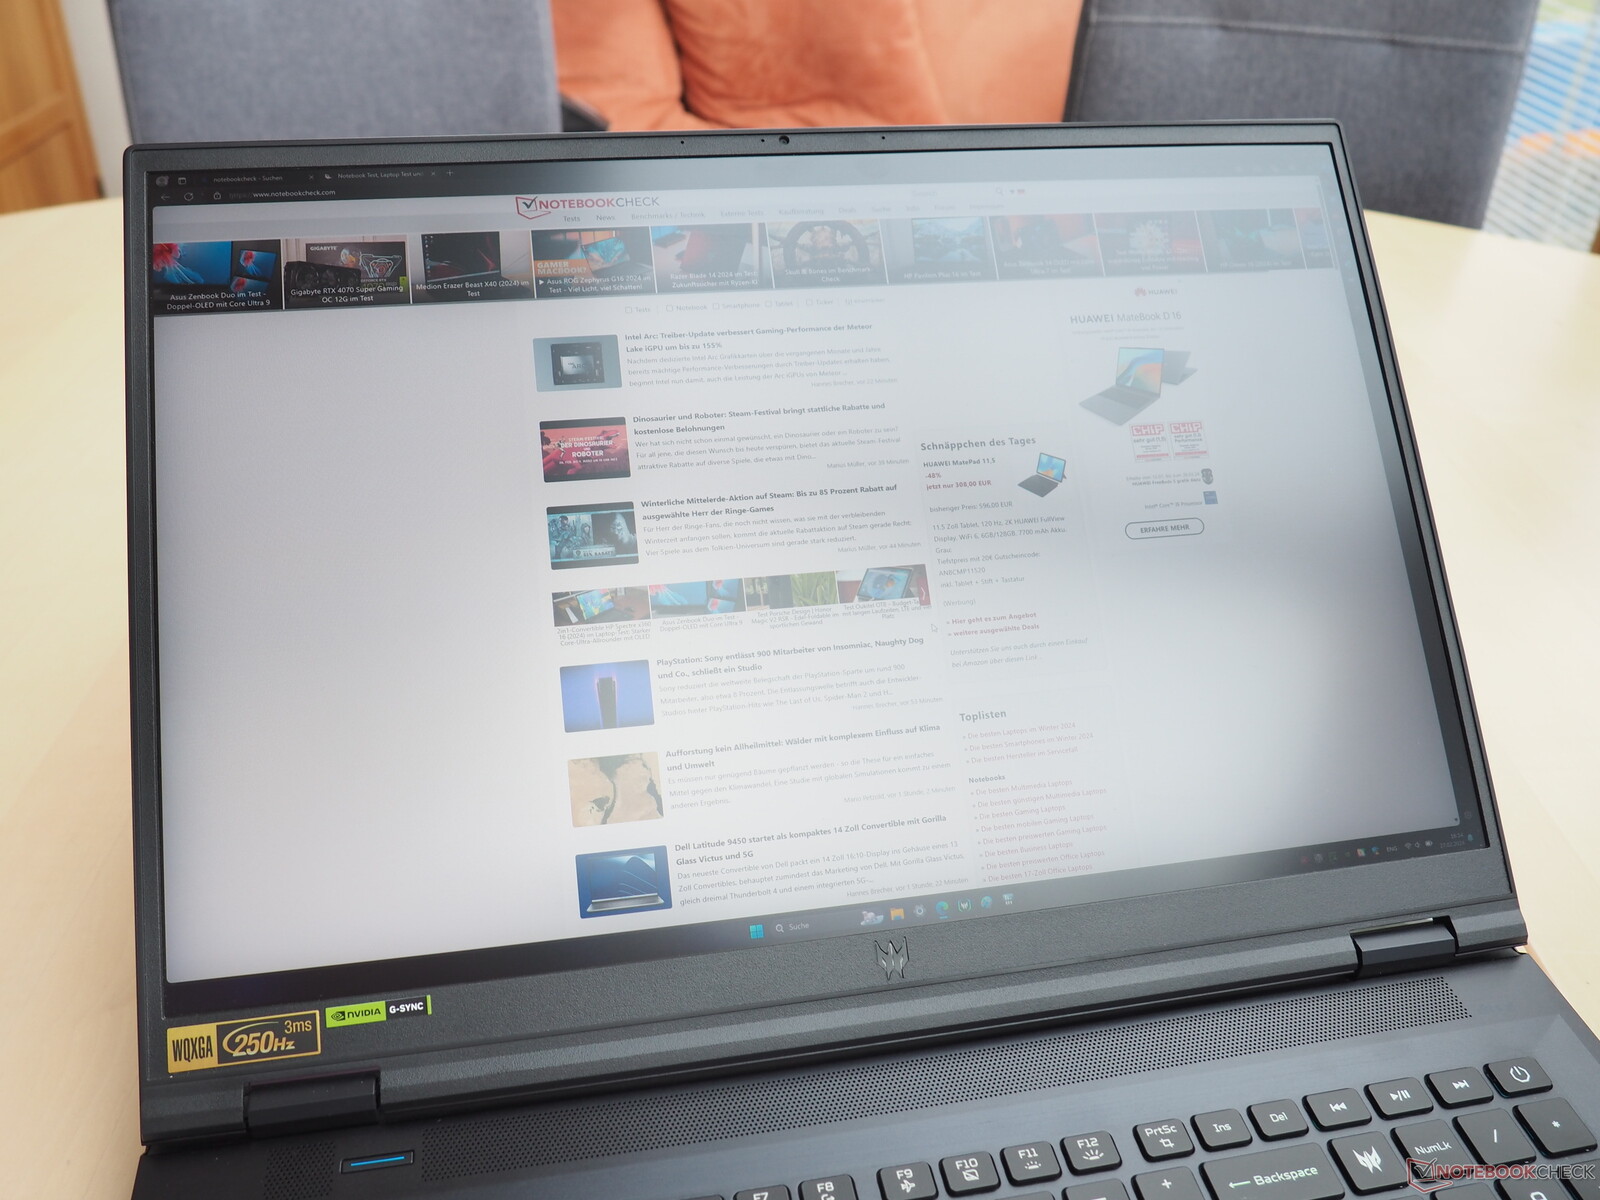
Wyświetlacz
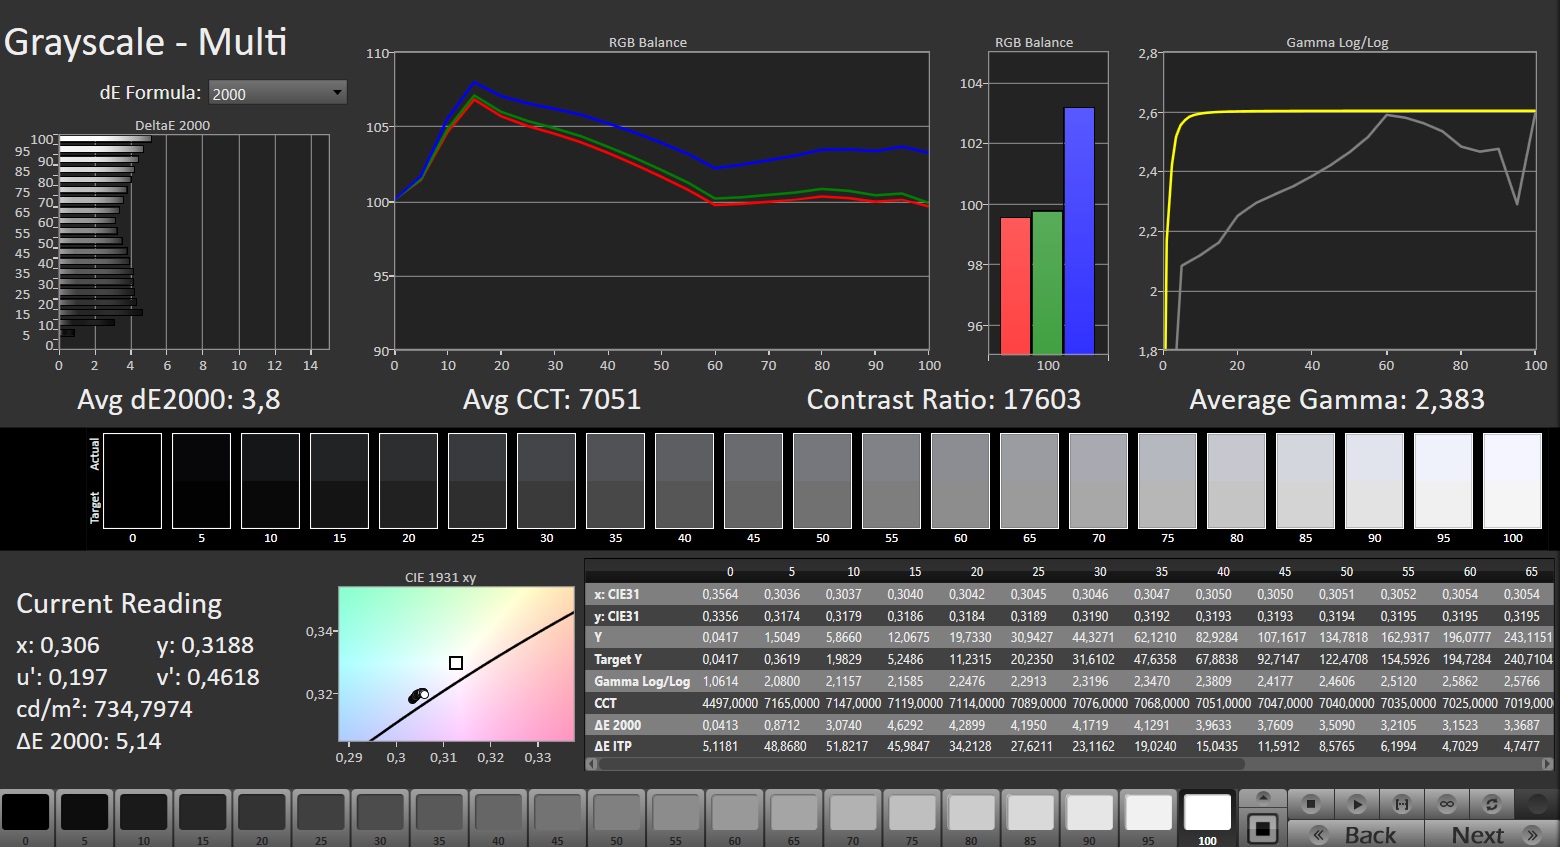
Wersja 2024 odziedziczyła po swoim poprzedniku wyświetlacz Mini-LED (WQXGA, 16:10, 250 Hz, HDR1000). Jeśli pominąć jego migotanie na wszystkich poziomach jasności (które na szczęście powinno okazać się problemem tylko dla wrażliwych użytkowników), technologia ta ma wyraźne zalety w porównaniu ze standardowym panelem IPS.
| |||||||||||||||||||||||||
rozświetlenie: 93 %
na akumulatorze: 722 cd/m²
kontrast: 18050:1 (czerń: 0.04 cd/m²)
ΔE ColorChecker Calman: 3.4 | ∀{0.5-29.43 Ø4.71}
calibrated: 1.6
ΔE Greyscale Calman: 3.8 | ∀{0.09-98 Ø4.96}
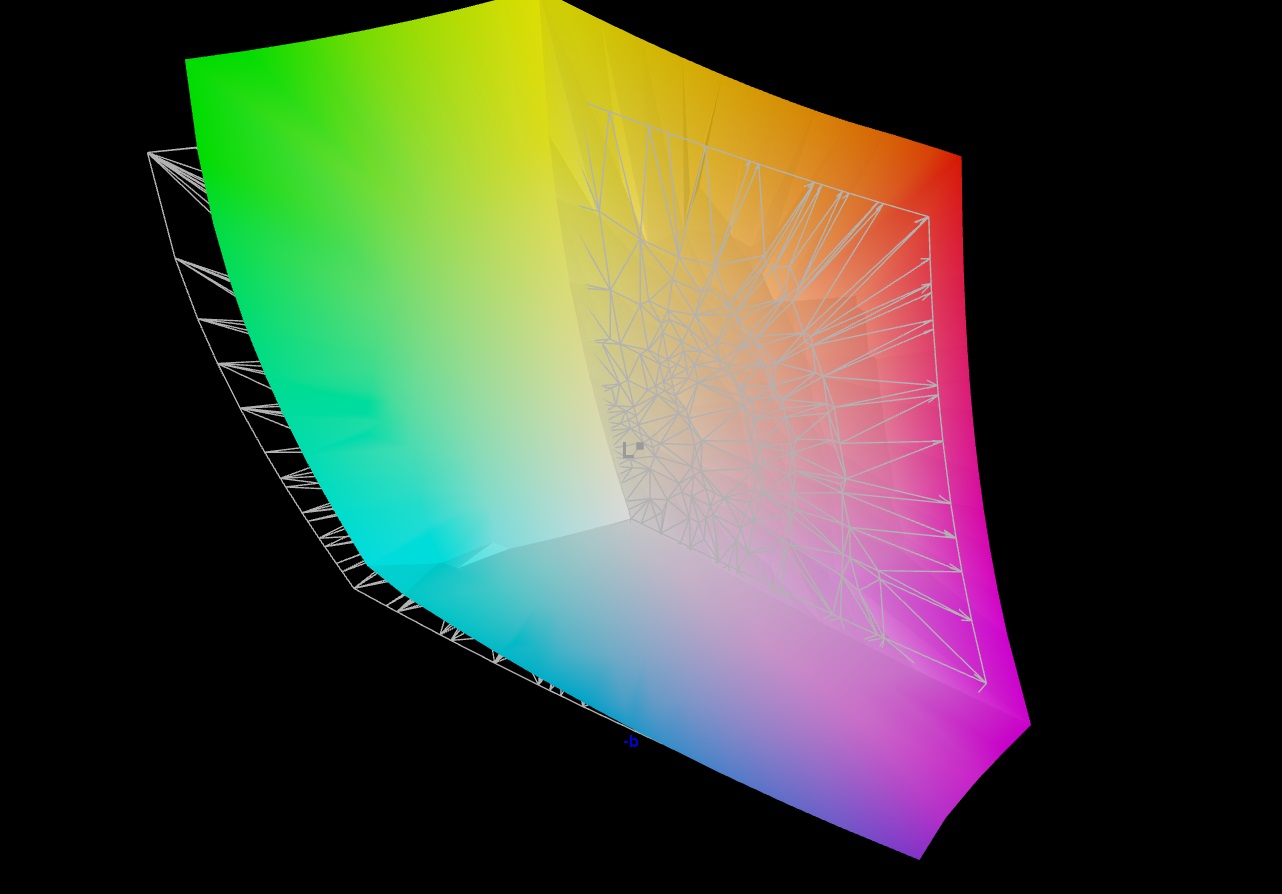
91.6% AdobeRGB 1998 (Argyll 3D)
100% sRGB (Argyll 3D)
99.7% Display P3 (Argyll 3D)
Gamma: 2.383
CCT: 7051 K
| Acer Predator Helios 18 PH18-72-98MW B180QAN01.2 (AUO45A8), Mini-LED, 2560x1600, 18" | MSI Titan 18 HX A14VIG AU Optronics B180ZAN01.0, Mini-LED, 3840x2400, 18" | Asus ROG Strix Scar 18 G834JYR (2024) BOE NE180QDM-NM1, Mini LED, 2560x1600, 18" | Acer Predator Helios 18 N23Q2 AUO45A8 (B180QAN01.2), IPS, 2560x1600, 18" | Alienware m18 R1 AMD BOE NE18NZ1, IPS, 1920x1200, 18" | |
|---|---|---|---|---|---|
| Display | -3% | -1% | 0% | -1% | |
| Display P3 Coverage (%) | 99.7 | 98.1 -2% | 99.9 0% | 99.8 0% | 98.5 -1% |
| sRGB Coverage (%) | 100 | 99.8 0% | 100 0% | 100 0% | 99.7 0% |
| AdobeRGB 1998 Coverage (%) | 91.6 | 86.2 -6% | 90 -2% | 91.8 0% | 88.7 -3% |
| Response Times | -187% | -6% | 2% | 55% | |
| Response Time Grey 50% / Grey 80% * (ms) | 8 ? | 8.6 ? -8% | 12 ? -50% | 7.6 ? 5% | 2.8 ? 65% |
| Response Time Black / White * (ms) | 17.6 ? | 81.8 ? -365% | 10.7 ? 39% | 17.8 ? -1% | 9.6 ? 45% |
| PWM Frequency (Hz) | 4832 ? | 2592 ? | 5733 ? | 2509 | |
| Screen | -24% | 17% | -82% | -54% | |
| Brightness middle (cd/m²) | 722 | 467.5 -35% | 937 30% | 360 -50% | 319.6 -56% |
| Brightness (cd/m²) | 724 | 459 -37% | 934 29% | 355 -51% | 304 -58% |
| Brightness Distribution (%) | 93 | 90 -3% | 89 -4% | 92 -1% | 87 -6% |
| Black Level * (cd/m²) | 0.04 | 0.066 -65% | 0.21 -425% | 0.25 -525% | |
| Contrast (:1) | 18050 | 14197 -21% | 1714 -91% | 1278 -93% | |
| Colorchecker dE 2000 * | 3.4 | 3.77 -11% | 1.52 55% | 3.82 -12% | 1.22 64% |
| Colorchecker dE 2000 max. * | 5.32 | 6.12 -15% | 2.82 47% | 7.38 -39% | 3.1 42% |
| Colorchecker dE 2000 calibrated * | 1.6 | 2.94 -84% | 1.21 24% | 2.24 -40% | 0.47 71% |
| Greyscale dE 2000 * | 3.8 | 3.2 16% | 1.7 55% | 5.06 -33% | 0.8 79% |
| Gamma | 2.383 92% | 2.43 91% | 2.042 108% | 2.52 87% | 2.23 99% |
| CCT | 7051 92% | 6478 100% | 6578 99% | 5657 115% | 6471 100% |
| Całkowita średnia (program / ustawienia) | -71% /
-46% | 3% /
10% | -27% /
-53% | 0% /
-27% |
* ... im mniej tym lepiej
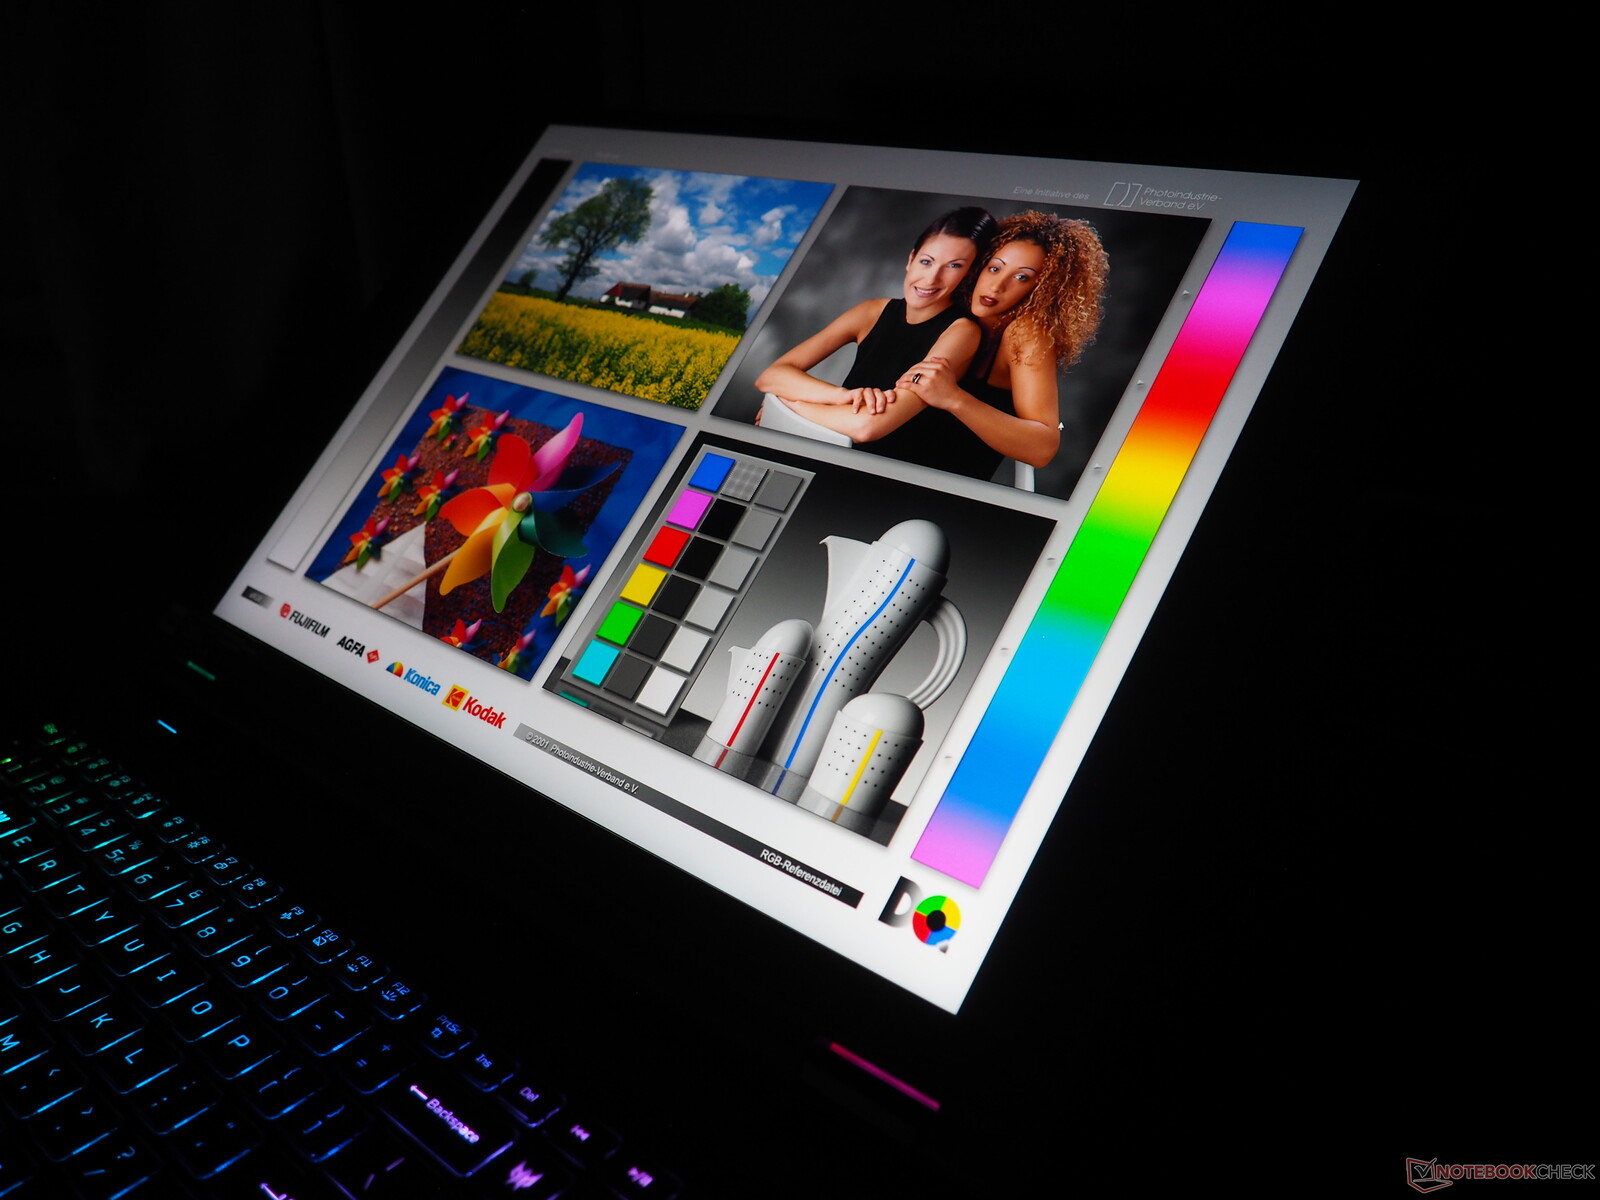
Począwszy od imponującej jasności: Średnio 724 cd/m² oznacza, że mogą Państwo korzystać z urządzenia nawet w bardzo jasnym otoczeniu (czyli na zewnątrz). W połączeniu z wyjątkowo niską wartością czerni wynoszącą około 0,04 cd/m², ekran zapewnia doskonały kontrast wynoszący około 18 000:1. Do tego dochodzi szerokie pokrycie przestrzeni kolorów - choć nie jest w stanie w pełni pokryć AdobeRGB, udaje mu się pokryć 100% sRGB i DCI-P3, co jest imponujące.
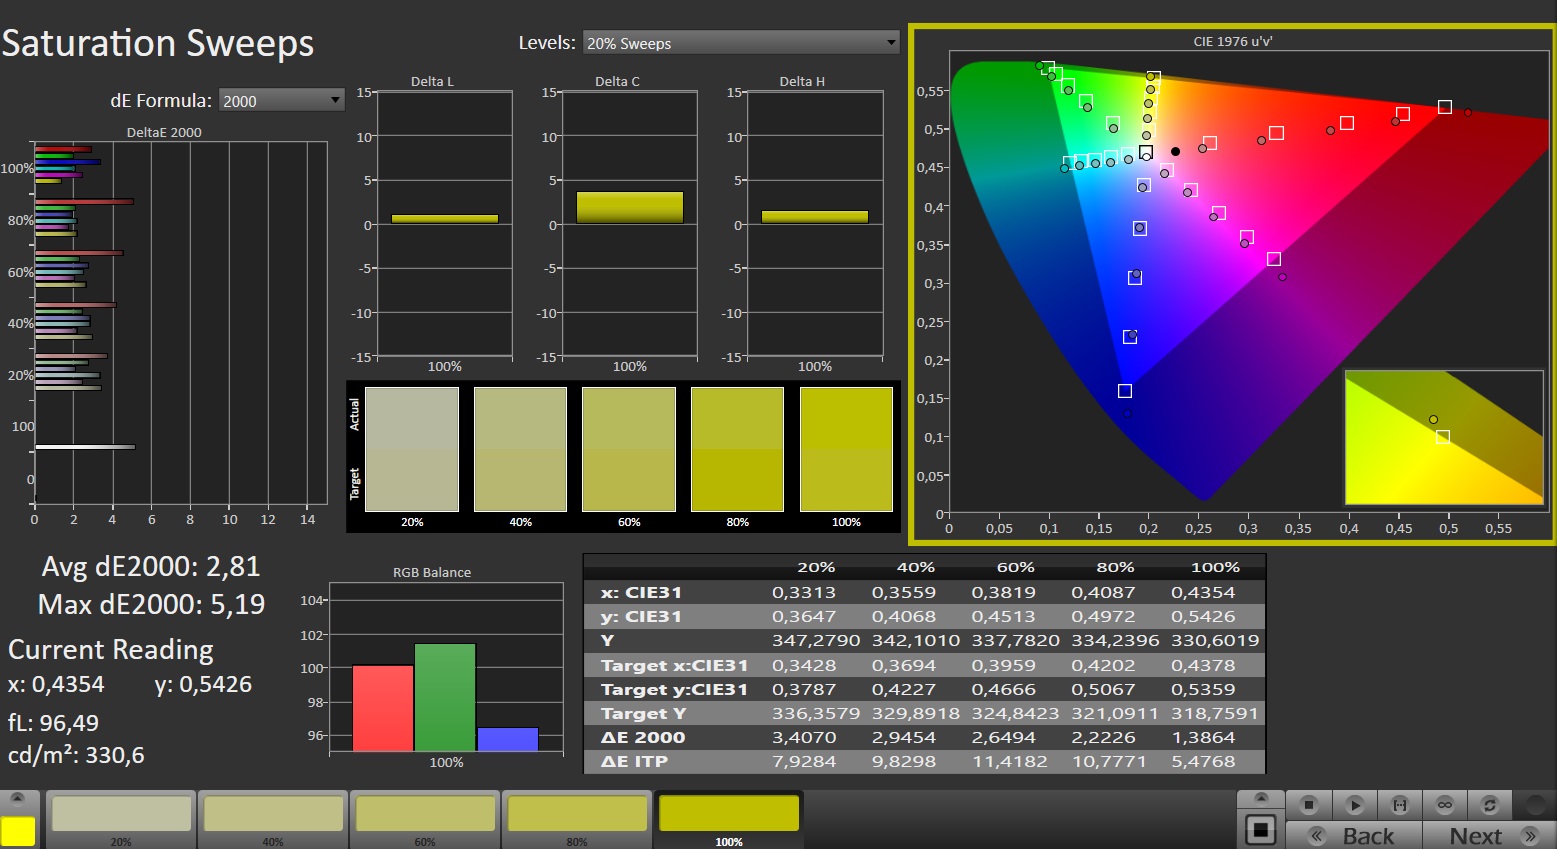
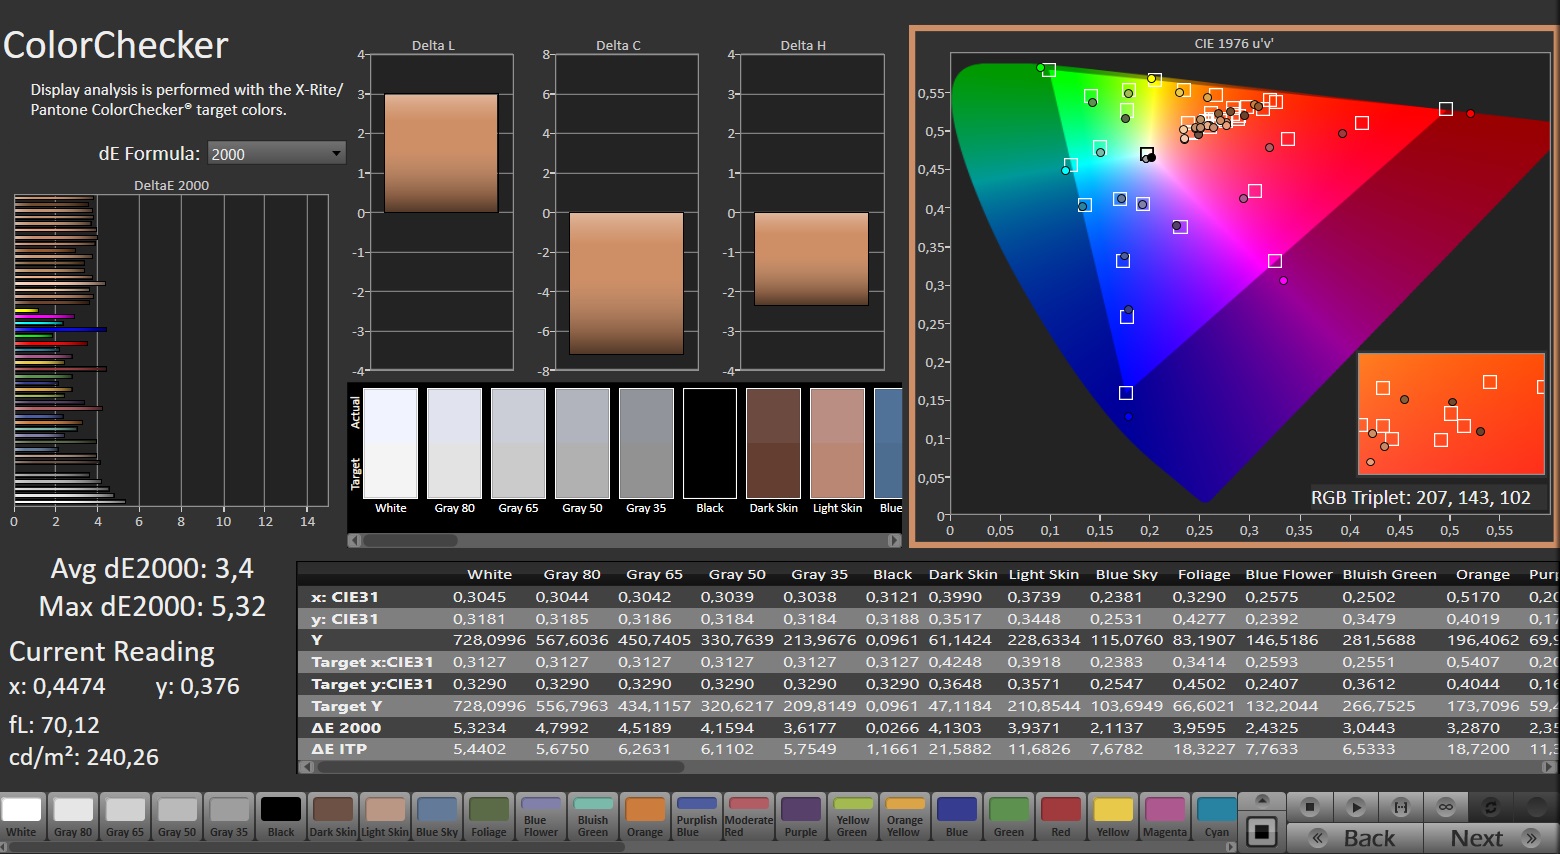
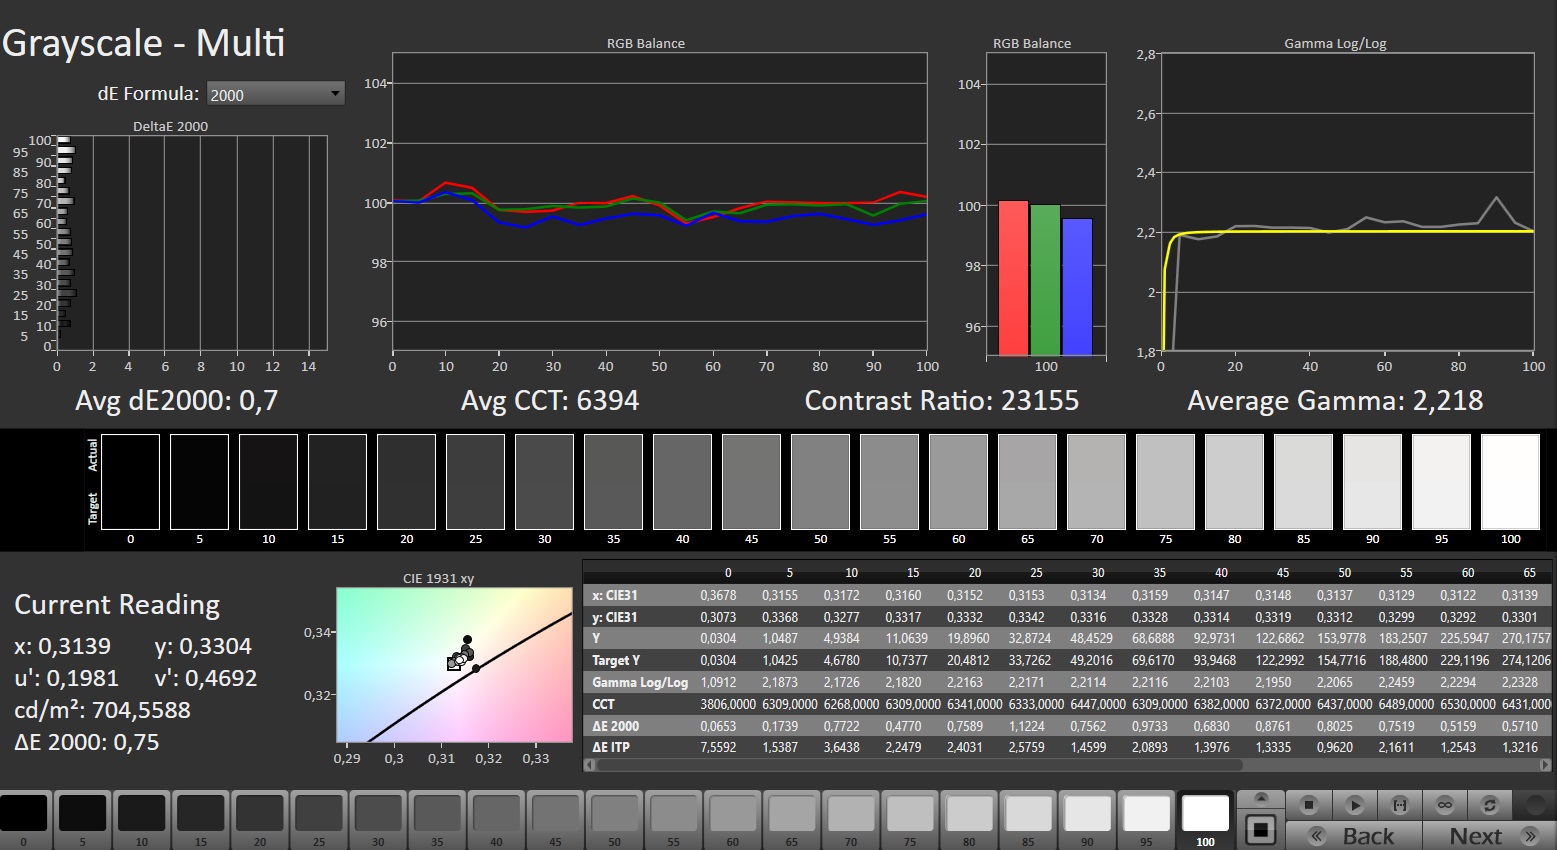
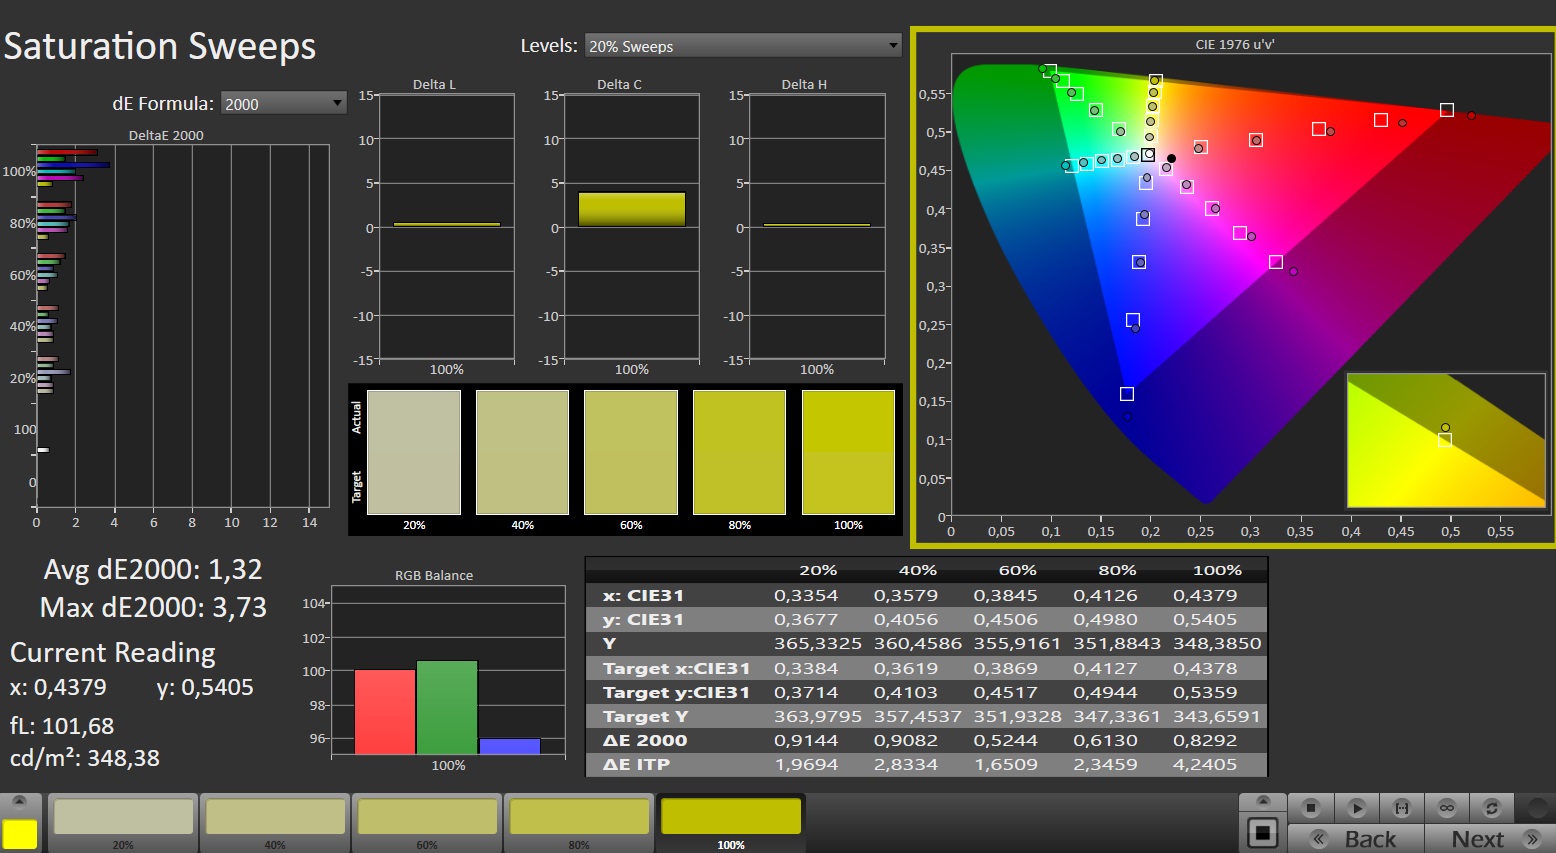
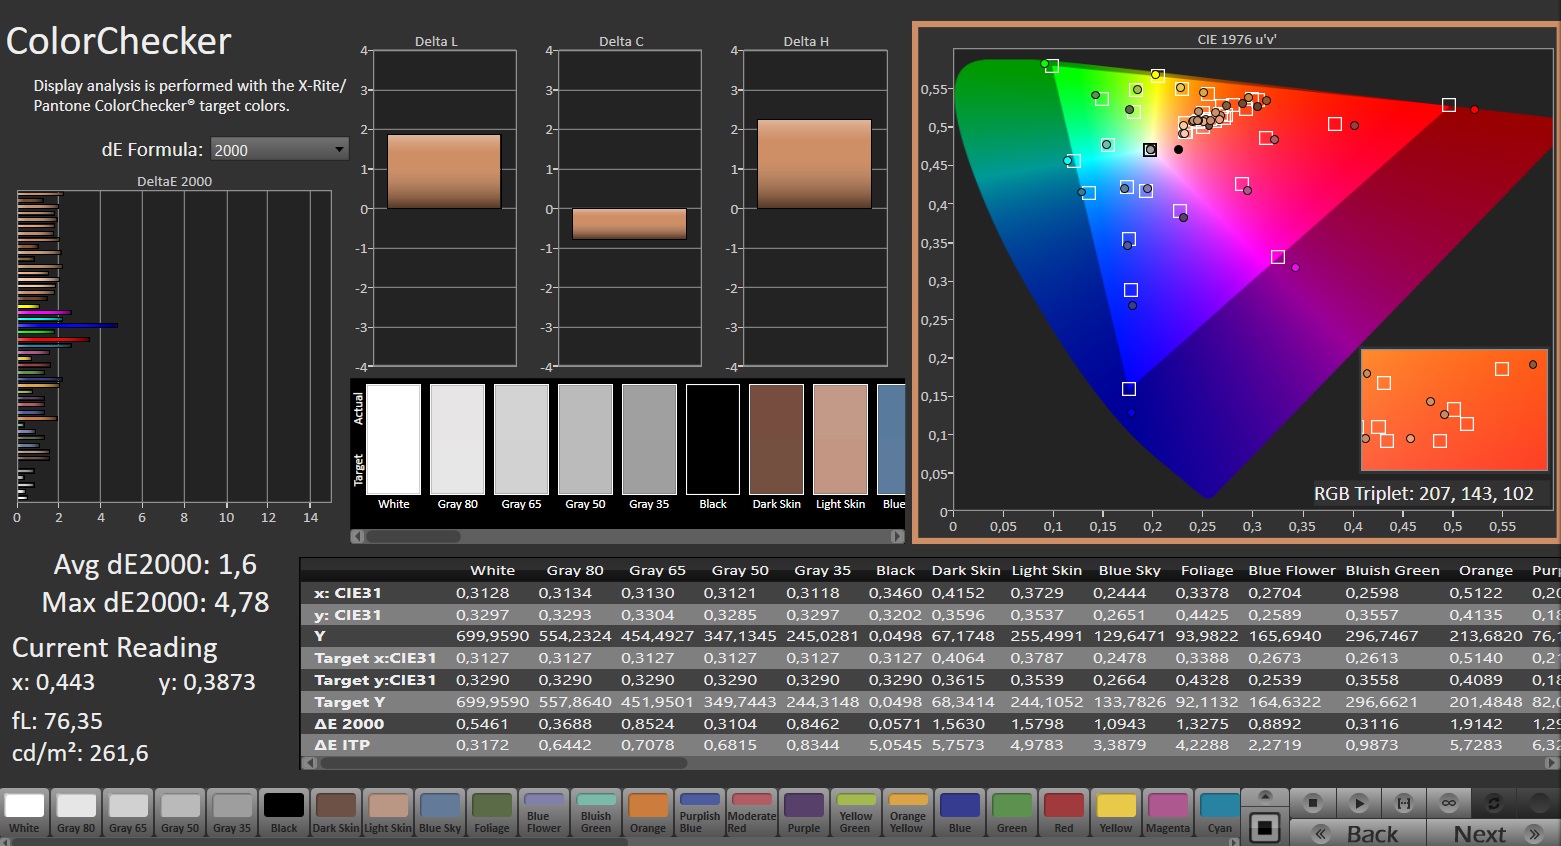
Niestety, jego dokładność kolorów nie jest najlepsza od razu po wyjęciu z pudełka, więc profesjonalni użytkownicy powinni przeprowadzić kalibrację po zakupie (nasz plik ICC jest podlinkowany powyżej).


Jego czasy reakcji są przyzwoite lub dobre, ale nie mogą się równać z panelami OLED, które dodatkowo zapewniają jeszcze lepsze kontrasty i wartości czerni. Z drugiej strony, mają one również swoje słabe strony (np. zazwyczaj odblaskową powierzchnię).
Wyświetl czasy reakcji
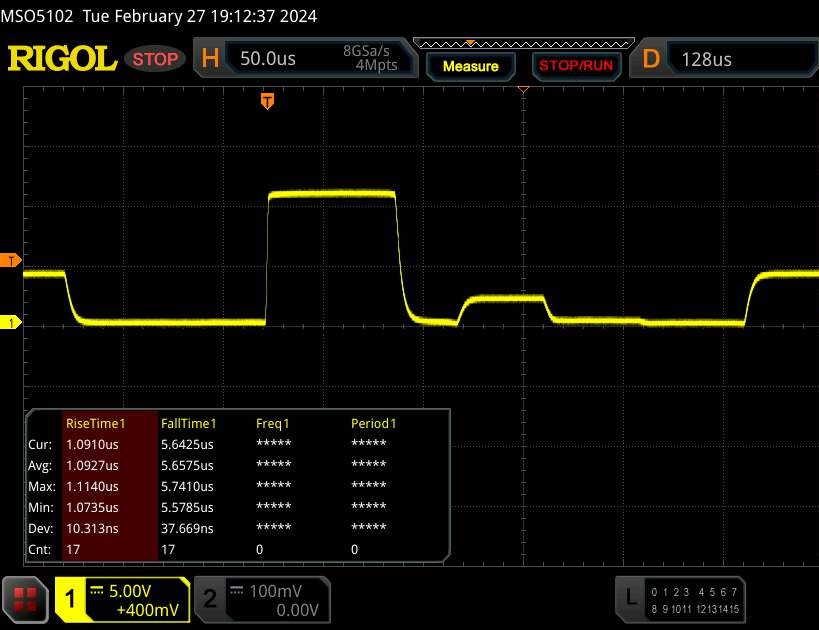
| ↔ Czas reakcji od czerni do bieli | ||
|---|---|---|
| 17.6 ms ... wzrost ↗ i spadek ↘ łącznie | ↗ 15.2 ms wzrost | 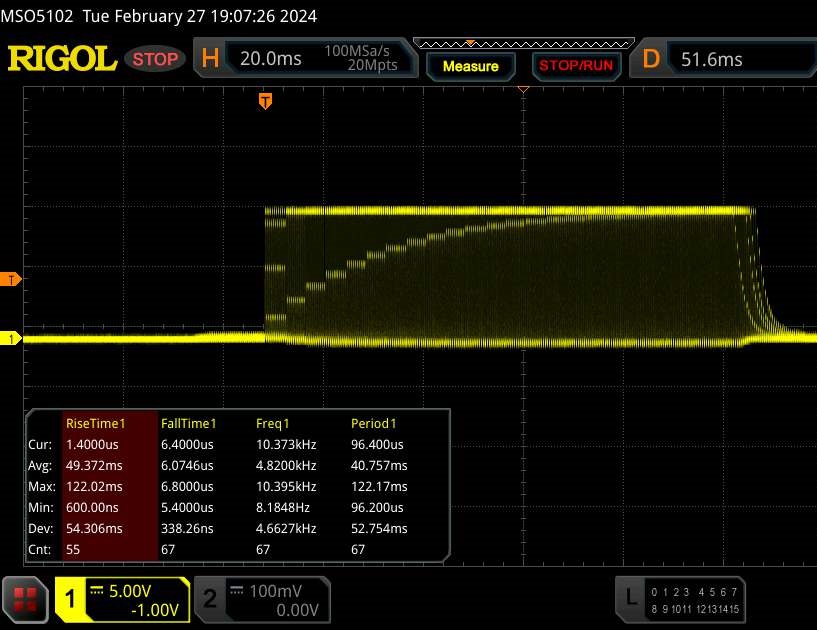 |
| ↘ 2.4 ms upadek | ||
| W naszych testach ekran wykazuje dobry współczynnik reakcji, ale może być zbyt wolny dla graczy rywalizujących ze sobą. Dla porównania, wszystkie testowane urządzenia wahają się od 0.1 (minimum) do 240 (maksimum) ms. » 40 % wszystkich urządzeń jest lepszych. Oznacza to, że zmierzony czas reakcji jest lepszy od średniej wszystkich testowanych urządzeń (19.8 ms). | ||
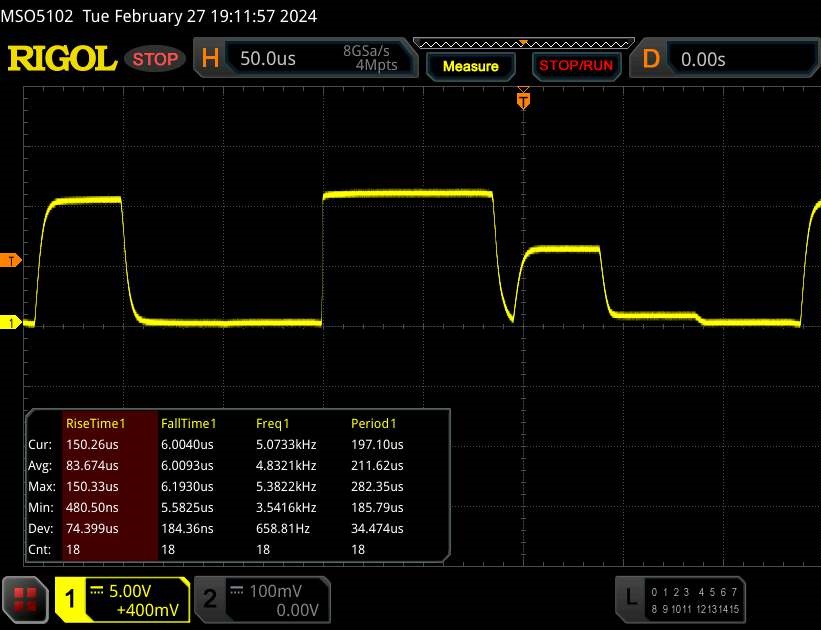
| ↔ Czas reakcji 50% szarości do 80% szarości | ||
| 8 ms ... wzrost ↗ i spadek ↘ łącznie | ↗ 4.9 ms wzrost | 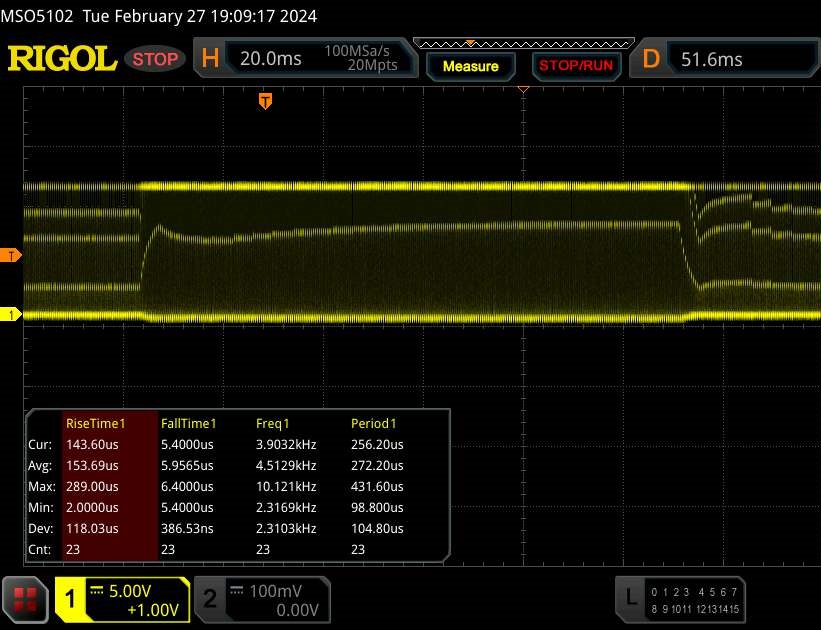 |
| ↘ 3.1 ms upadek | ||
| W naszych testach ekran wykazuje szybki czas reakcji i powinien nadawać się do gier. Dla porównania, wszystkie testowane urządzenia wahają się od 0.165 (minimum) do 636 (maksimum) ms. » 21 % wszystkich urządzeń jest lepszych. Oznacza to, że zmierzony czas reakcji jest lepszy od średniej wszystkich testowanych urządzeń (31 ms). | ||
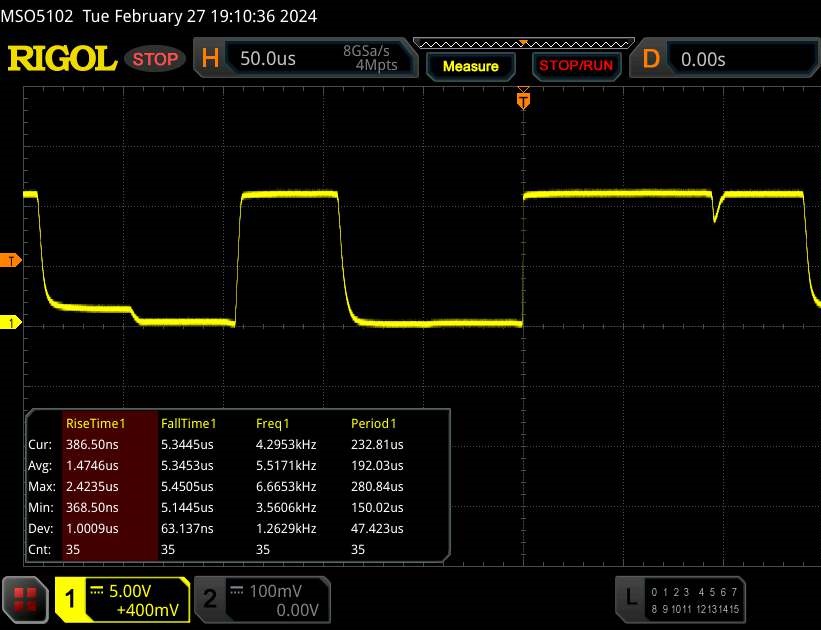
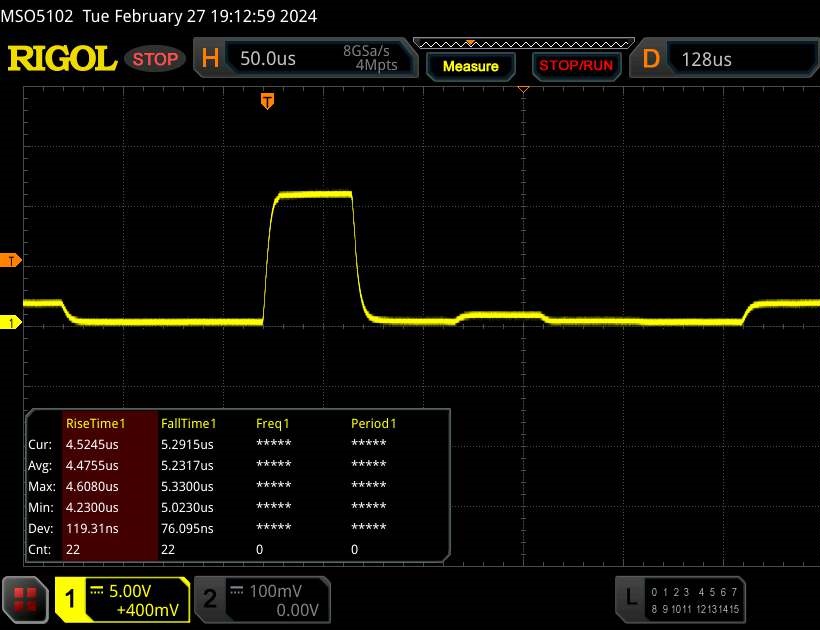
Migotanie ekranu / PWM (modulacja szerokości impulsu)
| Wykryto migotanie ekranu/wykryto PWM | 4832 Hz | ≤ 100 % ustawienia jasności | 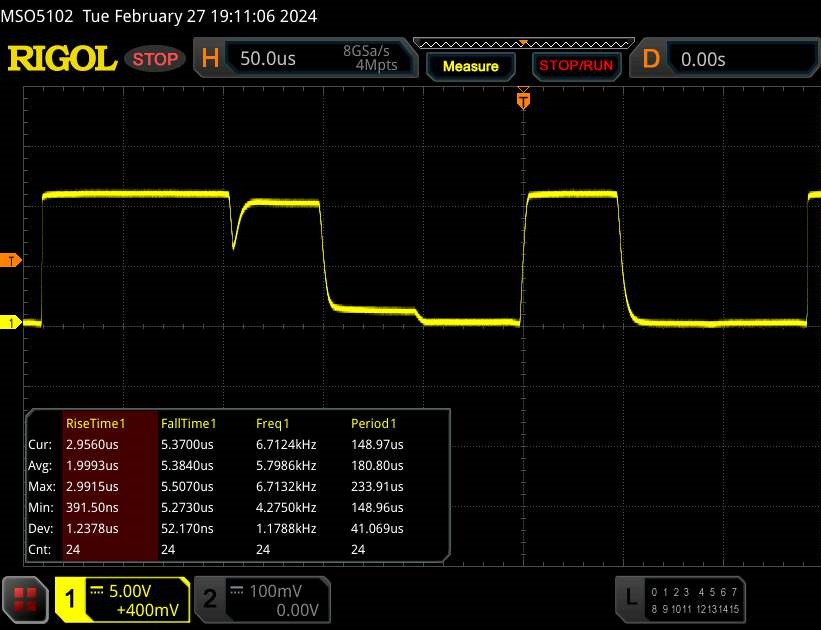 |
Podświetlenie wyświetlacza miga z częstotliwością 4832 Hz (najgorszy przypadek, np. przy użyciu PWM) Wykryto migotanie przy ustawieniu jasności 100 % i poniżej. Powyżej tego ustawienia jasności nie powinno być żadnego migotania ani PWM. Częstotliwość 4832 Hz jest dość wysoka, więc większość użytkowników wrażliwych na PWM nie powinna zauważyć żadnego migotania. Dla porównania: 52 % wszystkich testowanych urządzeń nie używa PWM do przyciemniania wyświetlacza. Jeśli wykryto PWM, zmierzono średnio 7757 (minimum: 5 - maksimum: 343500) Hz. | |||

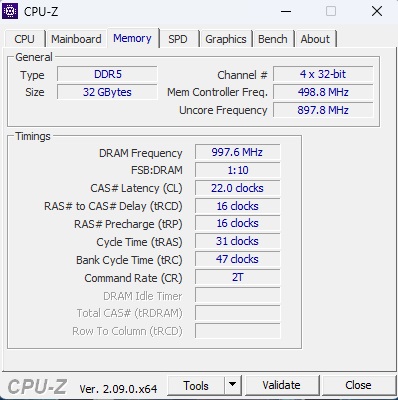
Wydajność
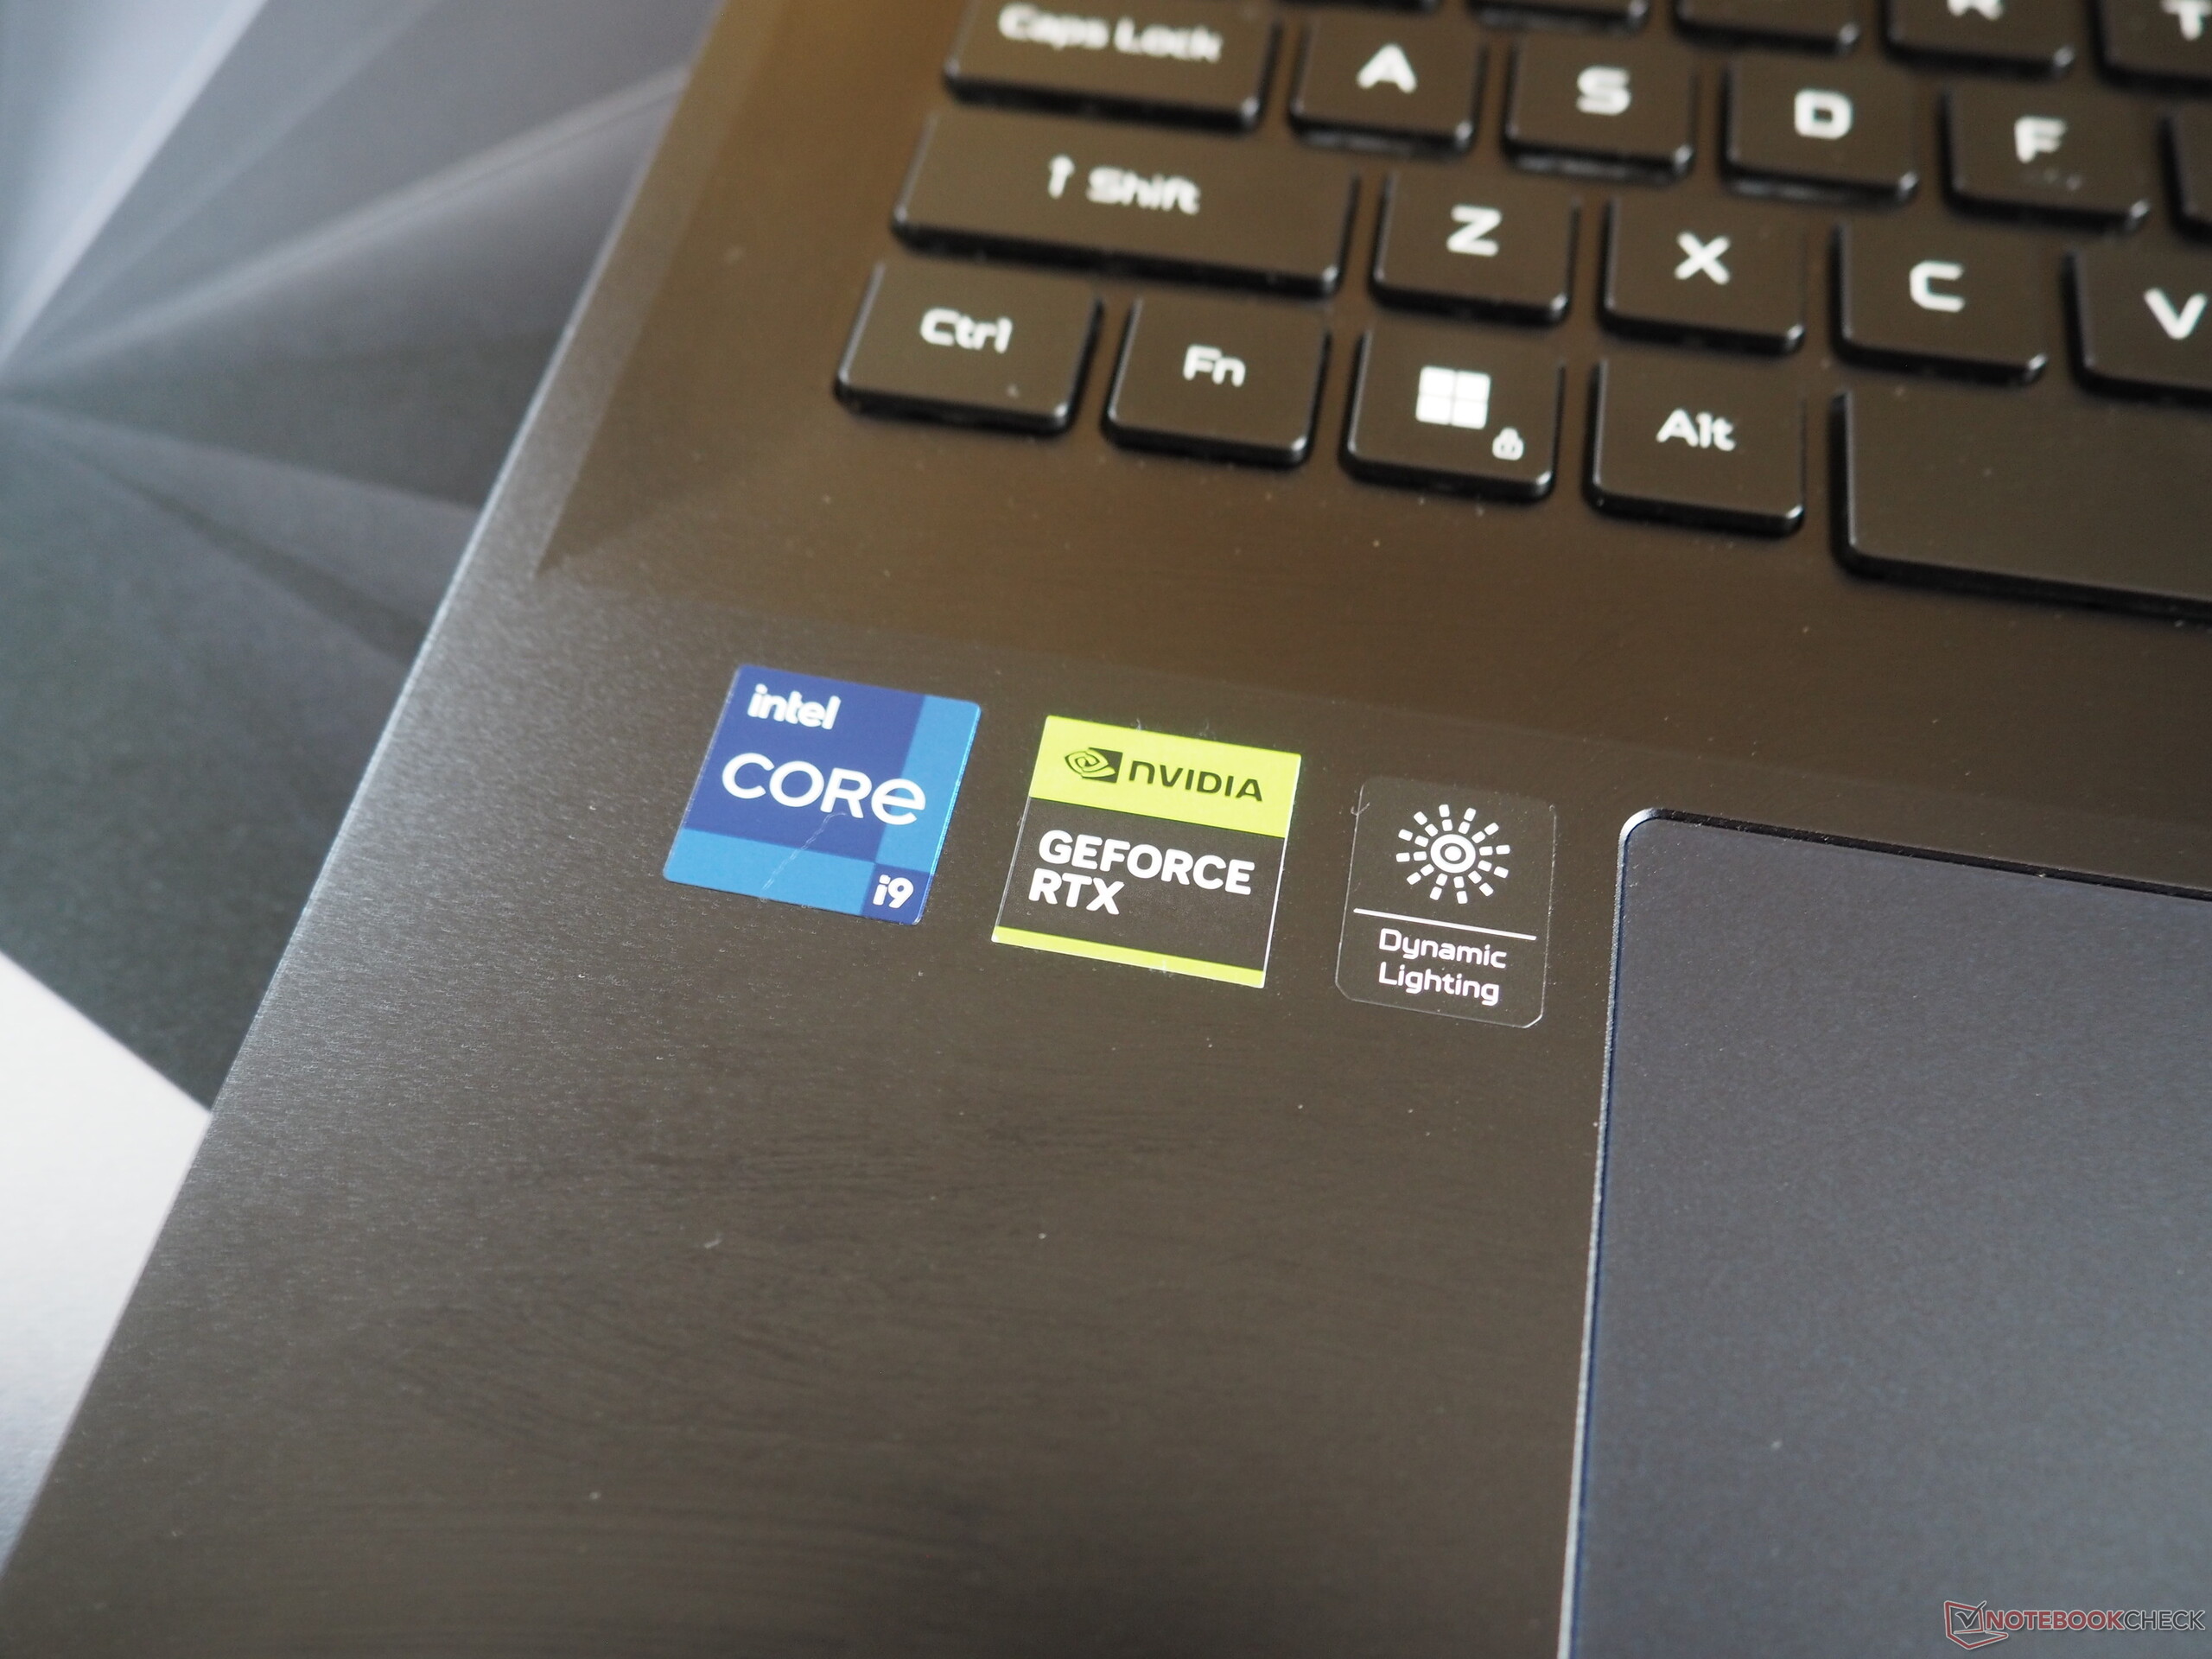
Podzespoły Predator Helios 18 to modele z najwyższej półki, jeśli chodzi o laptopy do gier. 32 GB pamięci RAM i 2 TB pamięci masowej powinny być wystarczające dla większości użytkowników w nadchodzących latach. To samo można powiedzieć o mocy procesora i karty graficznej, z których żadna nie osiągnęła jeszcze swoich limitów ze względu na umiarkowaną rozdzielczość wyświetlacza laptopa wynoszącą 2560 x 1600 pikseli.
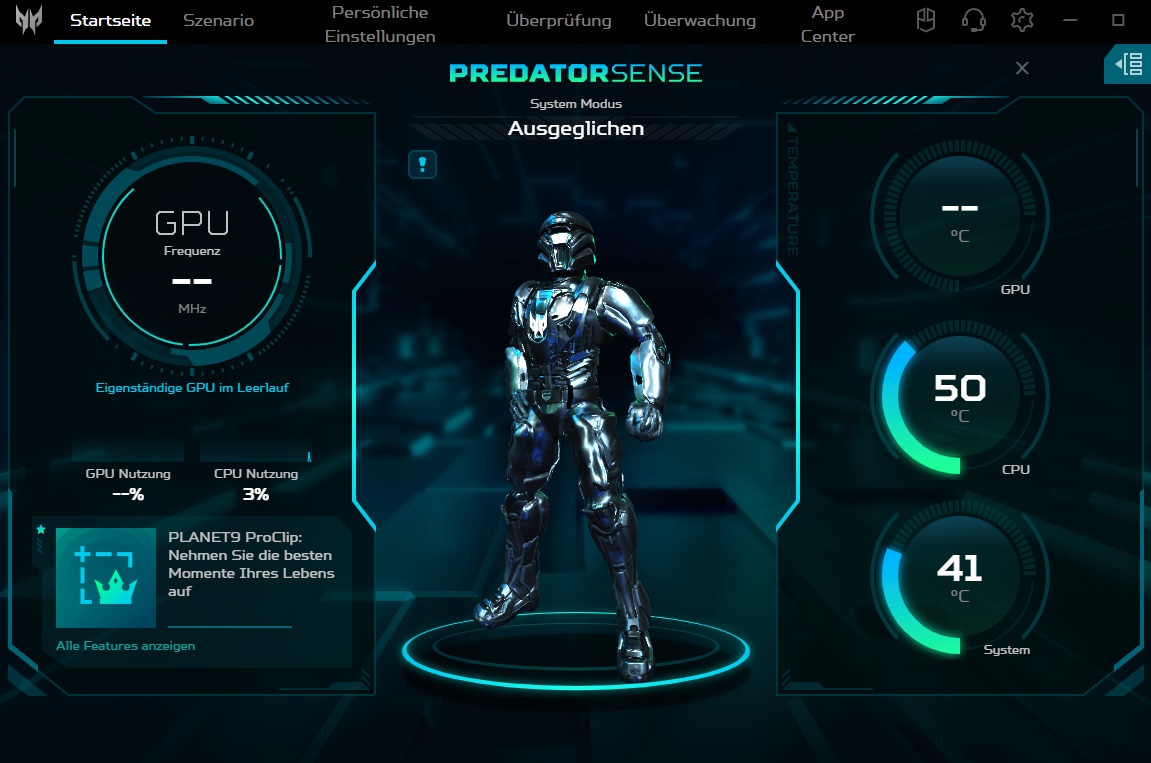
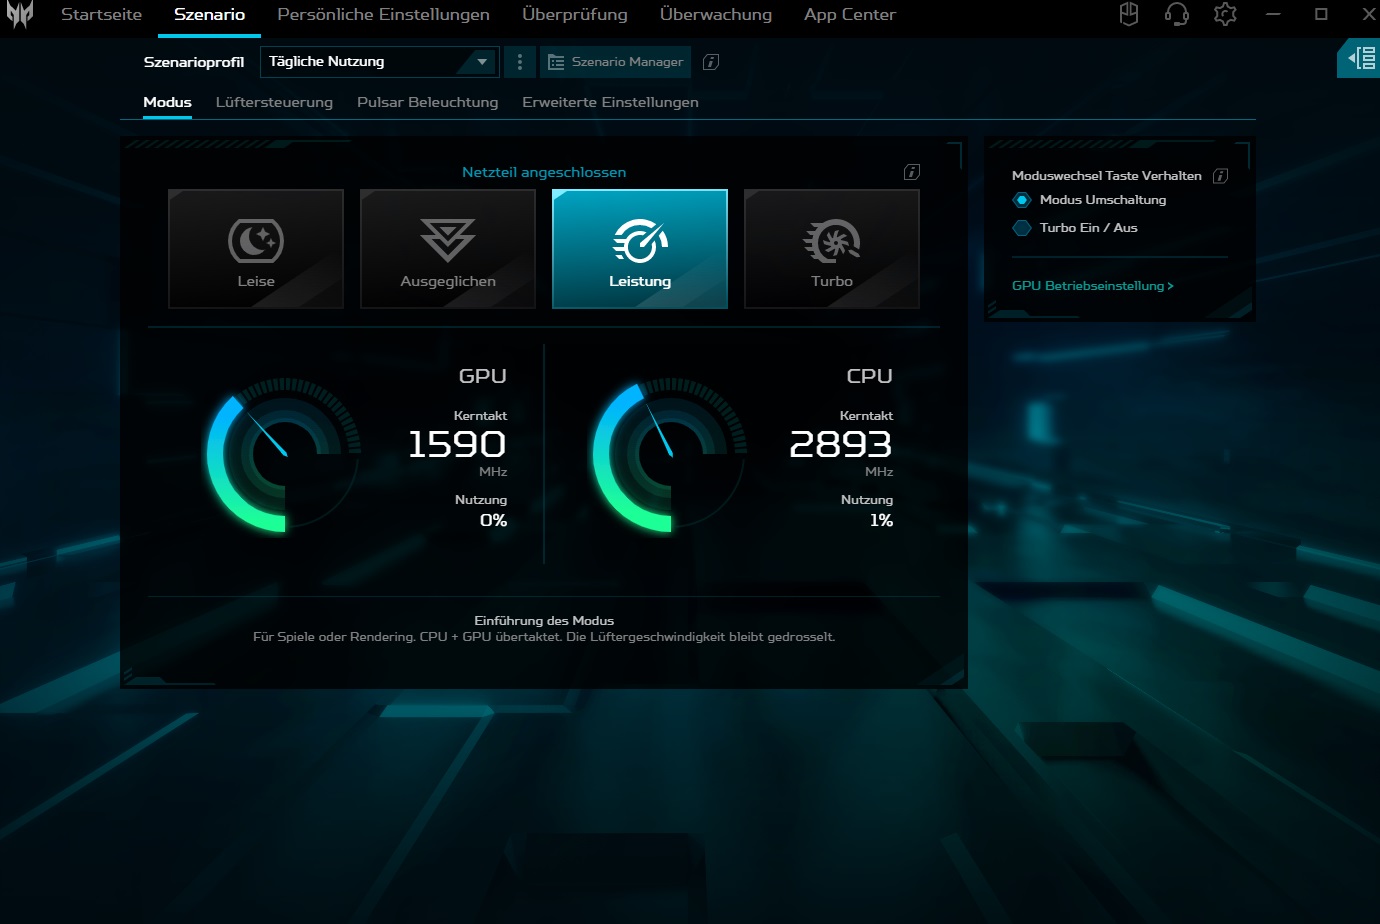
Warunki testowania
W preinstalowanym oprogramowaniu producenta (Predator Sense), w zakładce Scenariusz znajduje się kilka trybów pracy, które mają duży wpływ na wydajność i emisję hałasu. Ponieważ 18-calowy laptop jest niezwykle głośny w trybie turbo (>60 dB podczas grania), wszystkie pomiary zostały przeprowadzone w trybie wydajności. Określone wartości prędkości i emisji są zatem porównywalne z poprzednikiem tylko w ograniczonym zakresie.
| Witcher 3 (FHD/Ultra) | Cichy | Zrównoważony | Wydajność | Turbo |
| Hałas | 38 dB(A) | 43 dB(A) | 49 dB(A) | 61 dB(A) |
| Wydajność | 130 fps | 160 fps | 180 fps | 200 fps |
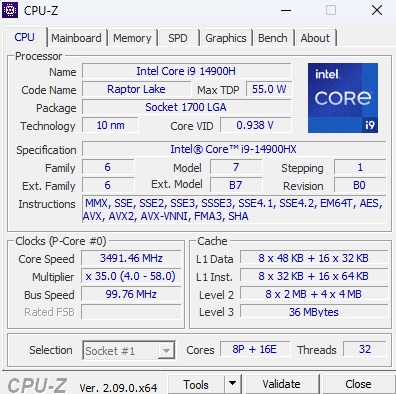
Procesor
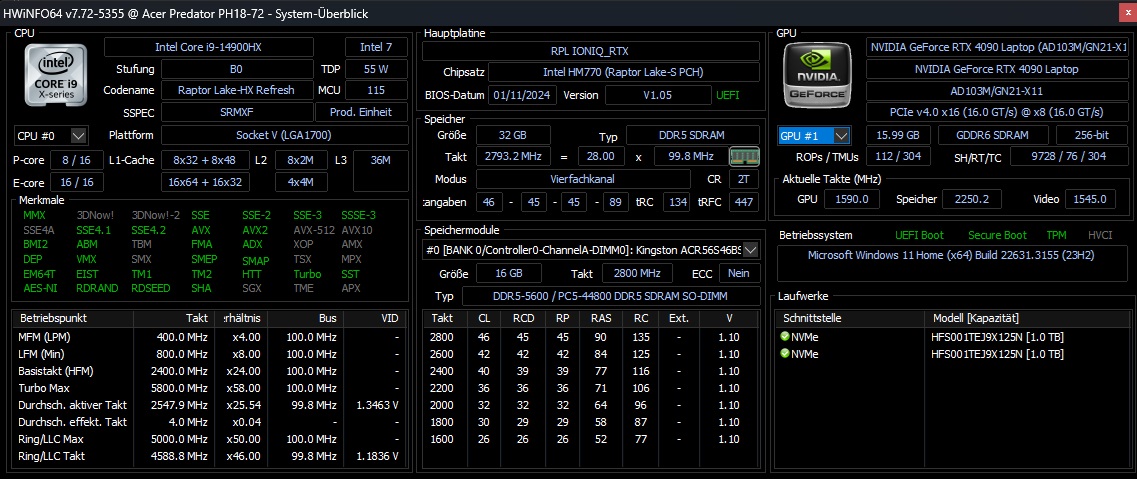
Core i9-14900HX to topowy model z serii Intel Raptor Lake i choć charakteryzuje się wysokim zużyciem energii, to zapewnia świetną wydajność. Intel wykorzystuje 8 wydajnych rdzeni z hyper threadingiem i 16 wydajnych rdzeni bez HT, co przekłada się na 32 równoległe wątki. W trybie wydajności procesor osiągnął wyniki nieco poniżej średniej (-6% w porównaniu do poprzedniej średniej). Co więcej, jego wydajność spada podczas dłuższych okresów obciążenia, co ujawniła nasza pętla Cinebench (patrz wykres). Nie miało to miejsca w przypadku żadnego z konkurencyjnych urządzeń.
Cinebench R15 Multi continuous test
* ... im mniej tym lepiej
AIDA64: FP32 Ray-Trace | FPU Julia | CPU SHA3 | CPU Queen | FPU SinJulia | FPU Mandel | CPU AES | CPU ZLib | FP64 Ray-Trace | CPU PhotoWorxx
| Performance rating | |
| Alienware m18 R1 AMD | |
| Acer Predator Helios 18 N23Q2 | |
| MSI Titan 18 HX A14VIG | |
| Asus ROG Strix Scar 18 G834JYR (2024) | |
| Średnia w klasie Gaming | |
| Przeciętny Intel Core i9-14900HX | |
| Acer Predator Helios 18 PH18-72-98MW | |
| AIDA64 / FP32 Ray-Trace | |
| Alienware m18 R1 AMD | |
| Średnia w klasie Gaming (10227 - 85542, n=105, ostatnie 2 lata) | |
| MSI Titan 18 HX A14VIG | |
| Acer Predator Helios 18 N23Q2 | |
| Asus ROG Strix Scar 18 G834JYR (2024) | |
| Przeciętny Intel Core i9-14900HX (13098 - 33474, n=36) | |
| Acer Predator Helios 18 PH18-72-98MW | |
| AIDA64 / FPU Julia | |
| Alienware m18 R1 AMD | |
| MSI Titan 18 HX A14VIG | |
| Średnia w klasie Gaming (51376 - 238426, n=105, ostatnie 2 lata) | |
| Acer Predator Helios 18 N23Q2 | |
| Asus ROG Strix Scar 18 G834JYR (2024) | |
| Przeciętny Intel Core i9-14900HX (67573 - 166040, n=36) | |
| Acer Predator Helios 18 PH18-72-98MW | |
| AIDA64 / CPU SHA3 | |
| Alienware m18 R1 AMD | |
| MSI Titan 18 HX A14VIG | |
| Acer Predator Helios 18 N23Q2 | |
| Średnia w klasie Gaming (2180 - 10115, n=105, ostatnie 2 lata) | |
| Asus ROG Strix Scar 18 G834JYR (2024) | |
| Przeciętny Intel Core i9-14900HX (3589 - 7979, n=36) | |
| Acer Predator Helios 18 PH18-72-98MW | |
| AIDA64 / CPU Queen | |
| Alienware m18 R1 AMD | |
| MSI Titan 18 HX A14VIG | |
| Asus ROG Strix Scar 18 G834JYR (2024) | |
| Acer Predator Helios 18 PH18-72-98MW | |
| Przeciętny Intel Core i9-14900HX (118405 - 148966, n=36) | |
| Acer Predator Helios 18 N23Q2 | |
| Średnia w klasie Gaming (49785 - 173351, n=90, ostatnie 2 lata) | |
| AIDA64 / FPU SinJulia | |
| Alienware m18 R1 AMD | |
| MSI Titan 18 HX A14VIG | |
| Asus ROG Strix Scar 18 G834JYR (2024) | |
| Acer Predator Helios 18 N23Q2 | |
| Przeciętny Intel Core i9-14900HX (10475 - 18517, n=36) | |
| Acer Predator Helios 18 PH18-72-98MW | |
| Średnia w klasie Gaming (4424 - 33636, n=105, ostatnie 2 lata) | |
| AIDA64 / FPU Mandel | |
| Alienware m18 R1 AMD | |
| Średnia w klasie Gaming (25115 - 128721, n=105, ostatnie 2 lata) | |
| MSI Titan 18 HX A14VIG | |
| Acer Predator Helios 18 N23Q2 | |
| Asus ROG Strix Scar 18 G834JYR (2024) | |
| Przeciętny Intel Core i9-14900HX (32543 - 83662, n=36) | |
| Acer Predator Helios 18 PH18-72-98MW | |
| AIDA64 / CPU AES | |
| Acer Predator Helios 18 N23Q2 | |
| Alienware m18 R1 AMD | |
| Przeciętny Intel Core i9-14900HX (86964 - 241777, n=36) | |
| MSI Titan 18 HX A14VIG | |
| Asus ROG Strix Scar 18 G834JYR (2024) | |
| Acer Predator Helios 18 PH18-72-98MW | |
| Średnia w klasie Gaming (39258 - 247074, n=105, ostatnie 2 lata) | |
| AIDA64 / CPU ZLib | |
| Alienware m18 R1 AMD | |
| MSI Titan 18 HX A14VIG | |
| Acer Predator Helios 18 N23Q2 | |
| Przeciętny Intel Core i9-14900HX (1054 - 2292, n=36) | |
| Asus ROG Strix Scar 18 G834JYR (2024) | |
| Acer Predator Helios 18 PH18-72-98MW | |
| Średnia w klasie Gaming (574 - 2531, n=105, ostatnie 2 lata) | |
| AIDA64 / FP64 Ray-Trace | |
| Alienware m18 R1 AMD | |
| Średnia w klasie Gaming (5509 - 45446, n=105, ostatnie 2 lata) | |
| MSI Titan 18 HX A14VIG | |
| Acer Predator Helios 18 N23Q2 | |
| Asus ROG Strix Scar 18 G834JYR (2024) | |
| Przeciętny Intel Core i9-14900HX (6809 - 18349, n=36) | |
| Acer Predator Helios 18 PH18-72-98MW | |
| AIDA64 / CPU PhotoWorxx | |
| Acer Predator Helios 18 N23Q2 | |
| Asus ROG Strix Scar 18 G834JYR (2024) | |
| Acer Predator Helios 18 PH18-72-98MW | |
| Przeciętny Intel Core i9-14900HX (23903 - 54702, n=36) | |
| Średnia w klasie Gaming (12271 - 89891, n=105, ostatnie 2 lata) | |
| Alienware m18 R1 AMD | |
| MSI Titan 18 HX A14VIG | |
Wydajność systemu
Wydajność systemu również nie wystarczyła do zajęcia pierwszego miejsca. Jego całkowity wynik PCMark 10 jest porównywalny do wyniku poprzednika. Pamięć RAM urządzenia zapewnia typowe poziomy wydajności dla pamięci RAM DDR5-5600.
CrossMark: Overall | Productivity | Creativity | Responsiveness
WebXPRT 3: Overall
WebXPRT 4: Overall
Mozilla Kraken 1.1: Total
| PCMark 10 / Score | |
| Alienware m18 R1 AMD | |
| MSI Titan 18 HX A14VIG | |
| Asus ROG Strix Scar 18 G834JYR (2024) | |
| Przeciętny Intel Core i9-14900HX, NVIDIA GeForce RTX 4090 Laptop GPU (8230 - 9234, n=13) | |
| Acer Predator Helios 18 N23Q2 | |
| Średnia w klasie Gaming (5828 - 12414, n=93, ostatnie 2 lata) | |
| Acer Predator Helios 18 PH18-72-98MW | |
| PCMark 10 / Essentials | |
| Alienware m18 R1 AMD | |
| MSI Titan 18 HX A14VIG | |
| Asus ROG Strix Scar 18 G834JYR (2024) | |
| Przeciętny Intel Core i9-14900HX, NVIDIA GeForce RTX 4090 Laptop GPU (10778 - 11628, n=13) | |
| Acer Predator Helios 18 PH18-72-98MW | |
| Acer Predator Helios 18 N23Q2 | |
| Średnia w klasie Gaming (8810 - 11935, n=97, ostatnie 2 lata) | |
| PCMark 10 / Productivity | |
| Alienware m18 R1 AMD | |
| Średnia w klasie Gaming (6845 - 25323, n=95, ostatnie 2 lata) | |
| Przeciętny Intel Core i9-14900HX, NVIDIA GeForce RTX 4090 Laptop GPU (9458 - 11759, n=13) | |
| Asus ROG Strix Scar 18 G834JYR (2024) | |
| Acer Predator Helios 18 N23Q2 | |
| MSI Titan 18 HX A14VIG | |
| Acer Predator Helios 18 PH18-72-98MW | |
| PCMark 10 / Digital Content Creation | |
| Alienware m18 R1 AMD | |
| MSI Titan 18 HX A14VIG | |
| Asus ROG Strix Scar 18 G834JYR (2024) | |
| Przeciętny Intel Core i9-14900HX, NVIDIA GeForce RTX 4090 Laptop GPU (13219 - 16462, n=13) | |
| Acer Predator Helios 18 N23Q2 | |
| Średnia w klasie Gaming (7602 - 19954, n=95, ostatnie 2 lata) | |
| Acer Predator Helios 18 PH18-72-98MW | |
| CrossMark / Overall | |
| Asus ROG Strix Scar 18 G834JYR (2024) | |
| Acer Predator Helios 18 N23Q2 | |
| Przeciętny Intel Core i9-14900HX, NVIDIA GeForce RTX 4090 Laptop GPU (1877 - 2344, n=10) | |
| Średnia w klasie Gaming (1366 - 2409, n=94, ostatnie 2 lata) | |
| Alienware m18 R1 AMD | |
| MSI Titan 18 HX A14VIG | |
| CrossMark / Productivity | |
| Acer Predator Helios 18 N23Q2 | |
| Asus ROG Strix Scar 18 G834JYR (2024) | |
| Przeciętny Intel Core i9-14900HX, NVIDIA GeForce RTX 4090 Laptop GPU (1738 - 2162, n=10) | |
| Średnia w klasie Gaming (1386 - 2254, n=94, ostatnie 2 lata) | |
| Alienware m18 R1 AMD | |
| MSI Titan 18 HX A14VIG | |
| CrossMark / Creativity | |
| Asus ROG Strix Scar 18 G834JYR (2024) | |
| Acer Predator Helios 18 N23Q2 | |
| Przeciętny Intel Core i9-14900HX, NVIDIA GeForce RTX 4090 Laptop GPU (2195 - 2660, n=10) | |
| Średnia w klasie Gaming (1343 - 2786, n=94, ostatnie 2 lata) | |
| Alienware m18 R1 AMD | |
| MSI Titan 18 HX A14VIG | |
| CrossMark / Responsiveness | |
| Acer Predator Helios 18 N23Q2 | |
| Asus ROG Strix Scar 18 G834JYR (2024) | |
| Przeciętny Intel Core i9-14900HX, NVIDIA GeForce RTX 4090 Laptop GPU (1478 - 2327, n=10) | |
| Średnia w klasie Gaming (1226 - 2334, n=94, ostatnie 2 lata) | |
| Alienware m18 R1 AMD | |
| MSI Titan 18 HX A14VIG | |
| WebXPRT 3 / Overall | |
| Alienware m18 R1 AMD | |
| MSI Titan 18 HX A14VIG | |
| Przeciętny Intel Core i9-14900HX, NVIDIA GeForce RTX 4090 Laptop GPU (279 - 339, n=10) | |
| Asus ROG Strix Scar 18 G834JYR (2024) | |
| Acer Predator Helios 18 N23Q2 | |
| Średnia w klasie Gaming (220 - 532, n=98, ostatnie 2 lata) | |
| WebXPRT 4 / Overall | |
| Asus ROG Strix Scar 18 G834JYR (2024) | |
| Alienware m18 R1 AMD | |
| Przeciętny Intel Core i9-14900HX, NVIDIA GeForce RTX 4090 Laptop GPU (246 - 309, n=8) | |
| MSI Titan 18 HX A14VIG | |
| Średnia w klasie Gaming (165 - 354, n=98, ostatnie 2 lata) | |
| Mozilla Kraken 1.1 / Total | |
| Alienware m18 R1 AMD | |
| Średnia w klasie Gaming (391 - 590, n=100, ostatnie 2 lata) | |
| Acer Predator Helios 18 N23Q2 | |
| Przeciętny Intel Core i9-14900HX, NVIDIA GeForce RTX 4090 Laptop GPU (428 - 535, n=11) | |
| MSI Titan 18 HX A14VIG | |
| Asus ROG Strix Scar 18 G834JYR (2024) | |
| Acer Predator Helios 18 PH18-72-98MW | |
* ... im mniej tym lepiej
| PCMark 10 Score | 8230 pkt. | |
Pomoc | ||
| AIDA64 / Memory Copy | |
| Asus ROG Strix Scar 18 G834JYR (2024) | |
| Acer Predator Helios 18 N23Q2 | |
| Acer Predator Helios 18 PH18-72-98MW | |
| Przeciętny Intel Core i9-14900HX (38028 - 83392, n=36) | |
| Średnia w klasie Gaming (21750 - 129946, n=105, ostatnie 2 lata) | |
| MSI Titan 18 HX A14VIG | |
| Alienware m18 R1 AMD | |
| AIDA64 / Memory Read | |
| Asus ROG Strix Scar 18 G834JYR (2024) | |
| Acer Predator Helios 18 N23Q2 | |
| Acer Predator Helios 18 PH18-72-98MW | |
| Przeciętny Intel Core i9-14900HX (43306 - 87568, n=36) | |
| Średnia w klasie Gaming (22956 - 118858, n=105, ostatnie 2 lata) | |
| Alienware m18 R1 AMD | |
| MSI Titan 18 HX A14VIG | |
| AIDA64 / Memory Write | |
| Asus ROG Strix Scar 18 G834JYR (2024) | |
| Średnia w klasie Gaming (22297 - 135096, n=105, ostatnie 2 lata) | |
| Acer Predator Helios 18 N23Q2 | |
| Przeciętny Intel Core i9-14900HX (37146 - 80589, n=36) | |
| Acer Predator Helios 18 PH18-72-98MW | |
| Alienware m18 R1 AMD | |
| MSI Titan 18 HX A14VIG | |
| AIDA64 / Memory Latency | |
| Średnia w klasie Gaming (75.3 - 259, n=105, ostatnie 2 lata) | |
| MSI Titan 18 HX A14VIG | |
| Alienware m18 R1 AMD | |
| Przeciętny Intel Core i9-14900HX (76.1 - 105, n=36) | |
| Acer Predator Helios 18 N23Q2 | |
| Acer Predator Helios 18 PH18-72-98MW | |
| Asus ROG Strix Scar 18 G834JYR (2024) | |
* ... im mniej tym lepiej
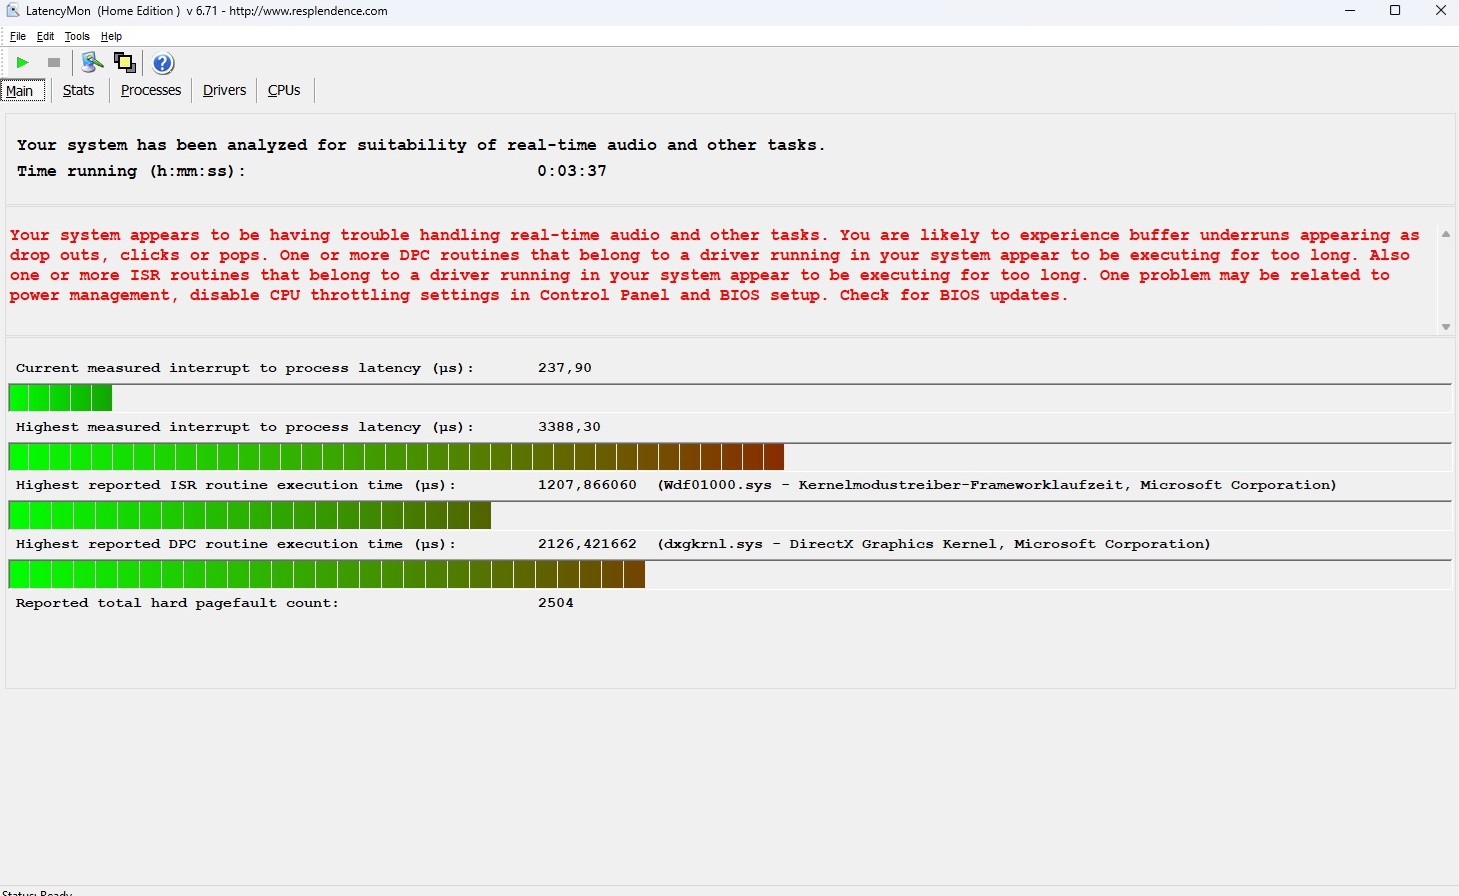
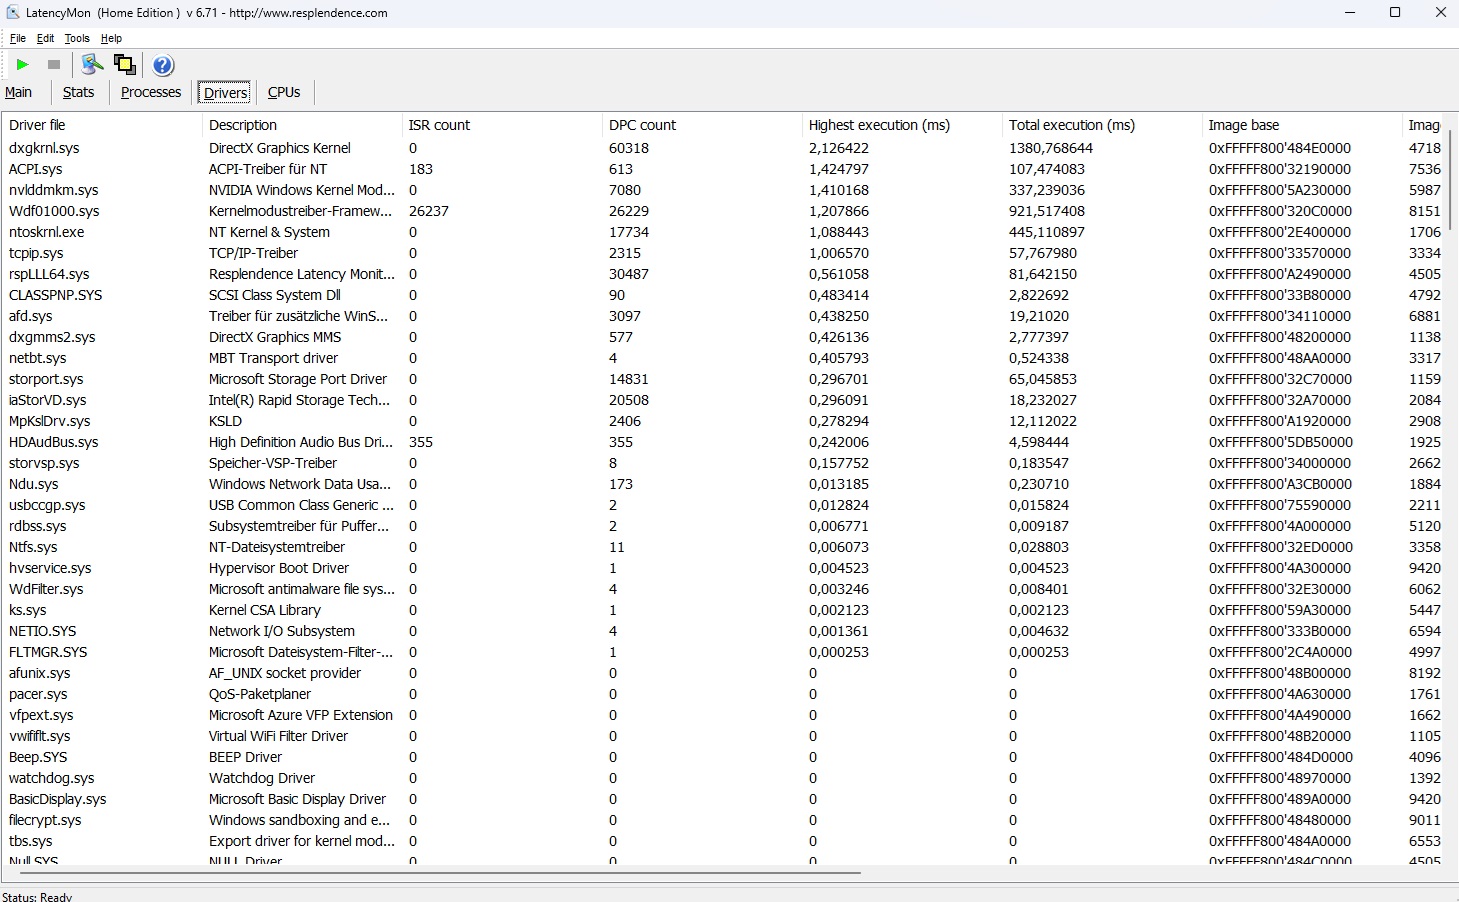
Opóźnienie DPC
Opóźnienia laptopa mogą być znacznie niższe niż w starym Heliosie 18, ale według narzędzia LatencyMon są one nadal zbyt wysokie dla niektórych obszarów zastosowań (edycja audio i wideo w czasie rzeczywistym).
| DPC Latencies / LatencyMon - interrupt to process latency (max), Web, Youtube, Prime95 | |
| Acer Predator Helios 18 N23Q2 | |
| Acer Predator Helios 18 PH18-72-98MW | |
| MSI Titan 18 HX A14VIG | |
| Alienware m18 R1 AMD | |
| Asus ROG Strix Scar 18 G834JYR (2024) | |
* ... im mniej tym lepiej
Urządzenia pamięci masowej
Jak wspomnieliśmy we wstępie, Acer połączył dwa dyski SSD NVMe w macierz Raid 0. Na pierwszy rzut oka zapewnia to pierwszorzędne wyniki, jeśli chodzi o szybkość sekwencyjnego odczytu i zapisu. Jednak chłodzenie laptopa wydaje się być mniej niż idealne, ponieważ zauważyliśmy pewne sporadyczne wahania wydajności po pewnym czasie podczas naszego testu w pętli.

* ... im mniej tym lepiej
Reading continuous performance: DiskSpd Read Loop, Queue Depth 8
Karta graficzna
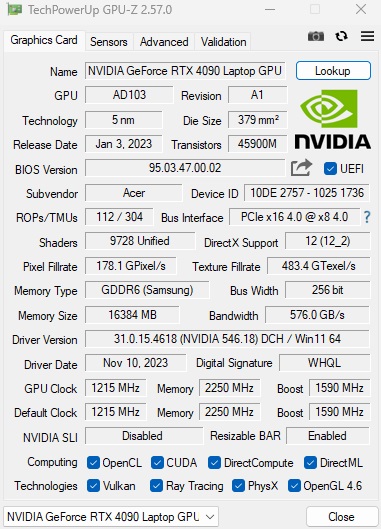
Karta graficzna GeForce RTX 4090 oparta na architekturze Ada Lovelace jest obecnie najpotężniejszą kartą graficzną Nvidii do laptopów. Jej 9 728 jednostek cieniujących jest tak samo hojnych, jak 16 GB pamięci VRAM GDDR6, zwłaszcza że Acer wybrał maksymalne 175 watów jako TGP. Mimo to, wydajność GPU w trybie wydajności jest niższa od tego, co mogłoby być możliwe. Analogicznie do testów CPU, osiągnął on o 6 procent mniej w porównaniu do poprzedniej średniej RTX 4090.
| 3DMark 11 Performance | 44065 pkt. | |
| 3DMark Cloud Gate Standard Score | 59876 pkt. | |
| 3DMark Fire Strike Score | 33907 pkt. | |
| 3DMark Time Spy Score | 18542 pkt. | |
Pomoc | ||
* ... im mniej tym lepiej
Wydajność w grach
Testy porównawcze w grach przedstawiają podobny obraz. Tutaj również RTX 4090 nie był w stanie wykorzystać swojego pełnego potencjału. Niemniej jednak wystarczyło to do uruchomienia wszystkich nowoczesnych gier z pełnymi detalami w natywnej rozdzielczości 2560 x 1600 pikseli. Sprawy komplikują się dopiero podczas grania w wyjątkowo wymagające lub słabo zoptymalizowane gry, takie jak Lords of the Fallen. DLSS może tutaj pomóc, a ta ostatnia gra działa na przykład z prędkością 72 klatek na sekundę zamiast 43 klatek na sekundę (ustawienie jakości) w QHD/Ultra. Często RTX 4090 ma również wystarczające rezerwy dla ekranu 4K (zobacz Strona GPU).
| The Witcher 3 - 1920x1080 Ultra Graphics & Postprocessing (HBAO+) | |
| MSI Titan 18 HX A14VIG | |
| Przeciętny NVIDIA GeForce RTX 4090 Laptop GPU (139.2 - 216, n=35) | |
| Średnia w klasie Gaming (104.7 - 240, n=7, ostatnie 2 lata) | |
| Asus ROG Strix Scar 18 G834JYR (2024) | |
| Acer Predator Helios 18 PH18-72-98MW | |
| Acer Predator Helios 18 N23Q2 | |
| Alienware m18 R1 AMD | |
| Skull & Bones - 2560x1440 Ultra High Preset AA:T | |
| Przeciętny NVIDIA GeForce RTX 4090 Laptop GPU (85 - 98, n=3) | |
| Asus ROG Zephyrus M16 | |
| Acer Predator Helios 18 PH18-72-98MW | |
| Prince of Persia The Lost Crown - 2560x1440 Ultra Preset AA:SM | |
| Asus ROG Zephyrus M16 | |
| Przeciętny NVIDIA GeForce RTX 4090 Laptop GPU (355 - 356, n=2) | |
| Acer Predator Helios 18 PH18-72-98MW | |
| Średnia w klasie Gaming (352 - 357, n=4, ostatnie 2 lata) | |
| Lords of the Fallen - 2560x1440 Ultra Preset | |
| XMG Neo 17 E23 | |
| Przeciętny NVIDIA GeForce RTX 4090 Laptop GPU (43 - 51.9, n=2) | |
| Acer Predator Helios 18 PH18-72-98MW | |
| Counter-Strike 2 - 2560x1440 Very High Preset | |
| XMG Neo 17 E23 | |
| Przeciętny NVIDIA GeForce RTX 4090 Laptop GPU (156.6 - 188.7, n=2) | |
| Acer Predator Helios 18 PH18-72-98MW | |
| Średnia w klasie Gaming (15.7 - 224, n=5, ostatnie 2 lata) | |
| Lies of P - 2560x1440 Best Preset | |
| XMG Neo 17 E23 | |
| Przeciętny NVIDIA GeForce RTX 4090 Laptop GPU (136.4 - 173.1, n=2) | |
| Acer Predator Helios 18 PH18-72-98MW | |
| EA Sports WRC - 2560x1440 Ultra Preset AA:Epic AF:16x | |
| XMG Neo 17 E23 | |
| Przeciętny NVIDIA GeForce RTX 4090 Laptop GPU (97.9 - 103, n=2) | |
| Acer Predator Helios 18 PH18-72-98MW | |
| Armored Core 6 - 2560x1440 Maximum Preset | |
| XMG Neo 17 E23 | |
| Przeciętny NVIDIA GeForce RTX 4090 Laptop GPU (92 - 114.7, n=2) | |
| Acer Predator Helios 18 PH18-72-98MW | |
| Średnia w klasie Gaming (n=1ostatnie 2 lata) | |
| Atlas Fallen - 2560x1440 Very High Preset | |
| XMG Neo 17 E23 | |
| Przeciętny NVIDIA GeForce RTX 4090 Laptop GPU (128.3 - 171.1, n=2) | |
| Acer Predator Helios 18 PH18-72-98MW | |
Aby sprawdzić, jak wydajność GPU zachowuje się w dłuższym okresie czasu, zestawiliśmy Heliosa 18 z grą fabularną The Witcher 3 na około 60 minut. Wynik: Nie odnotowaliśmy absolutnie żadnych spadków liczby klatek na sekundę.
Witcher 3 FPS diagram
| low | med. | high | ultra | QHD | |
|---|---|---|---|---|---|
| GTA V (2015) | 180.4 | 134 | 126.4 | ||
| The Witcher 3 (2015) | 180 | ||||
| Dota 2 Reborn (2015) | 226 | 205 | 192.8 | 178.3 | |
| Final Fantasy XV Benchmark (2018) | 157.1 | 131.9 | |||
| X-Plane 11.11 (2018) | 183.7 | 148.3 | 114.5 | ||
| Far Cry 5 (2018) | 146 | 123 | 115 | ||
| Strange Brigade (2018) | 329 | 305 | 243 | ||
| Atlas Fallen (2023) | 182 | 161 | 128.3 | ||
| Armored Core 6 (2023) | 109.3 | 103.5 | 92 | ||
| The Crew Motorfest (2023) | 60 | 60 | 60 | ||
| Lies of P (2023) | 208 | 187 | 136.4 | ||
| Counter-Strike 2 (2023) | 234 | 189.7 | 156.6 | ||
| Lords of the Fallen (2023) | 87.3 | 64.2 | 43 | ||
| EA Sports WRC (2023) | 135.2 | 115.1 | 97.9 | ||
| Prince of Persia The Lost Crown (2024) | 357 | 356 | 355 | ||
| Skull & Bones (2024) | 133 | 106 | 85 | ||
| Last Epoch (2024) | 203 | 190 | 145.5 |
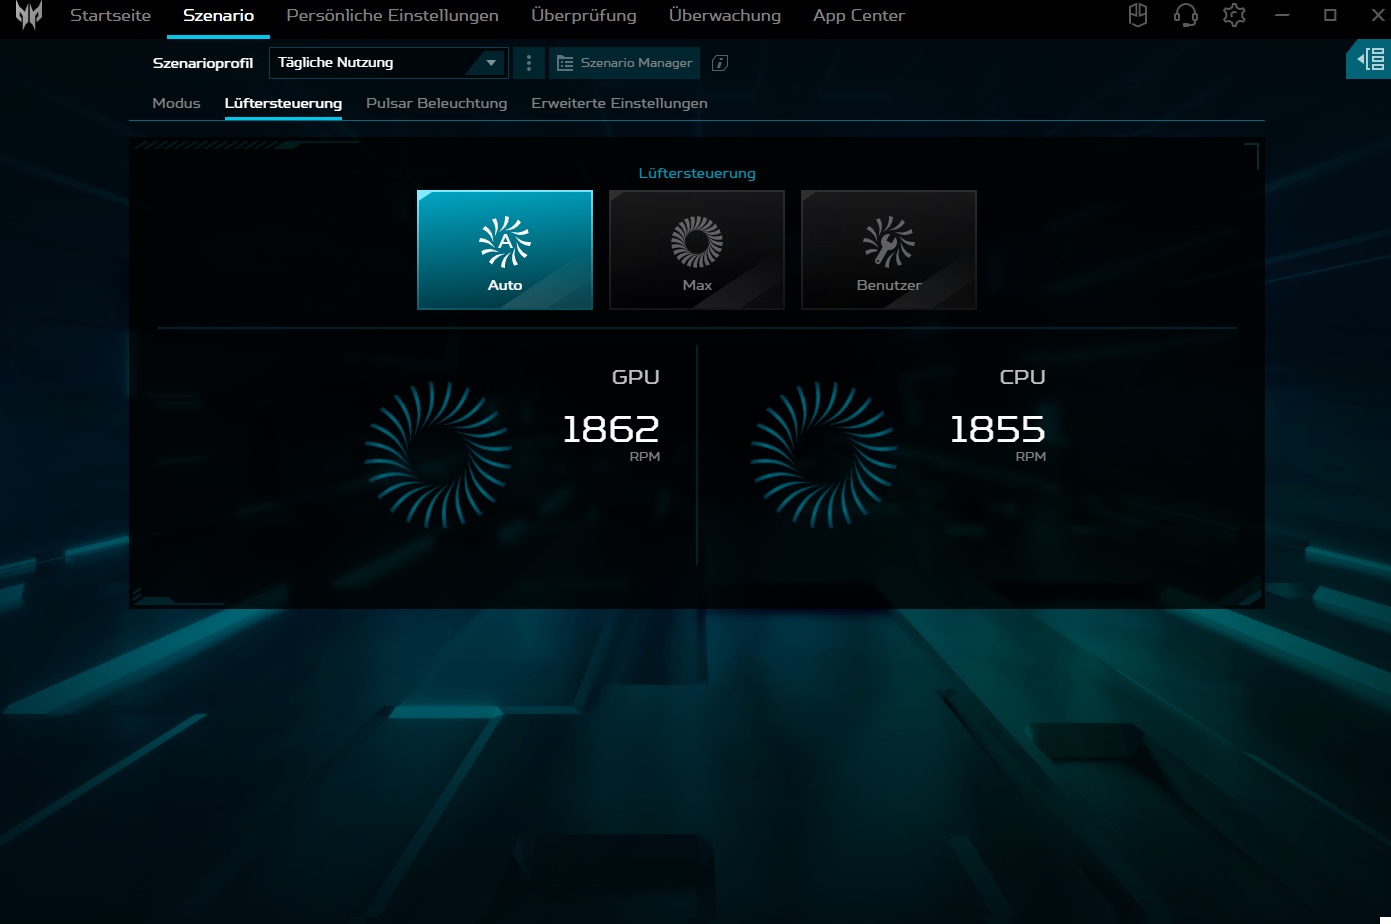
Emisje
Emisja hałasu
Jedną z największych słabości Predator Helios 18 jest skromna kontrola wentylatorów. W trybie zrównoważonym wentylatory czasami zaczynają się niepotrzebnie obracać, gdy laptop pracuje na biegu jałowym. W trybie wydajności i turbo takie zachowanie zdarza się jeszcze częściej i intensywniej. Pod obciążeniem 18-calowe urządzenie nie zachowuje się nadzwyczajnie. W użytkowaniu 3D tryb wydajnościowy skutkuje słyszalnymi, ale nie przesadzonymi wartościami od 48 do 51 dB(A).
Hałas
| luz |
| 30 / 36 / 44 dB |
| obciążenie |
| 48 / 51 dB |
 | ||
30 dB cichy 40 dB(A) słyszalny 50 dB(A) irytujący |
||
min: | ||
| Acer Predator Helios 18 PH18-72-98MW i9-14900HX, GeForce RTX 4090 Laptop GPU | MSI Titan 18 HX A14VIG i9-14900HX, GeForce RTX 4090 Laptop GPU | Asus ROG Strix Scar 18 G834JYR (2024) i9-14900HX, GeForce RTX 4090 Laptop GPU | Acer Predator Helios 18 N23Q2 i9-13900HX, GeForce RTX 4080 Laptop GPU | Alienware m18 R1 AMD R9 7945HX, Radeon RX 7900M | |
|---|---|---|---|---|---|
| Noise | 12% | 8% | 12% | 15% | |
| wyłączone / środowisko * (dB) | 25 | 22.8 9% | 24 4% | 23 8% | 22.4 10% |
| Idle Minimum * (dB) | 30 | 23.8 21% | 27 10% | 23 23% | 23 23% |
| Idle Average * (dB) | 36 | 23.8 34% | 28 22% | 23 36% | 23.4 35% |
| Idle Maximum * (dB) | 44 | 28 36% | 32 27% | 23 48% | 33.5 24% |
| Load Average * (dB) | 48 | 38 21% | 50 -4% | 45.26 6% | 33.5 30% |
| Witcher 3 ultra * (dB) | 49 | 57.3 -17% | 50 -2% | 59.82 -22% | 53.6 -9% |
| Load Maximum * (dB) | 51 | 62.8 -23% | 52 -2% | 59.94 -18% | 53.6 -5% |
* ... im mniej tym lepiej
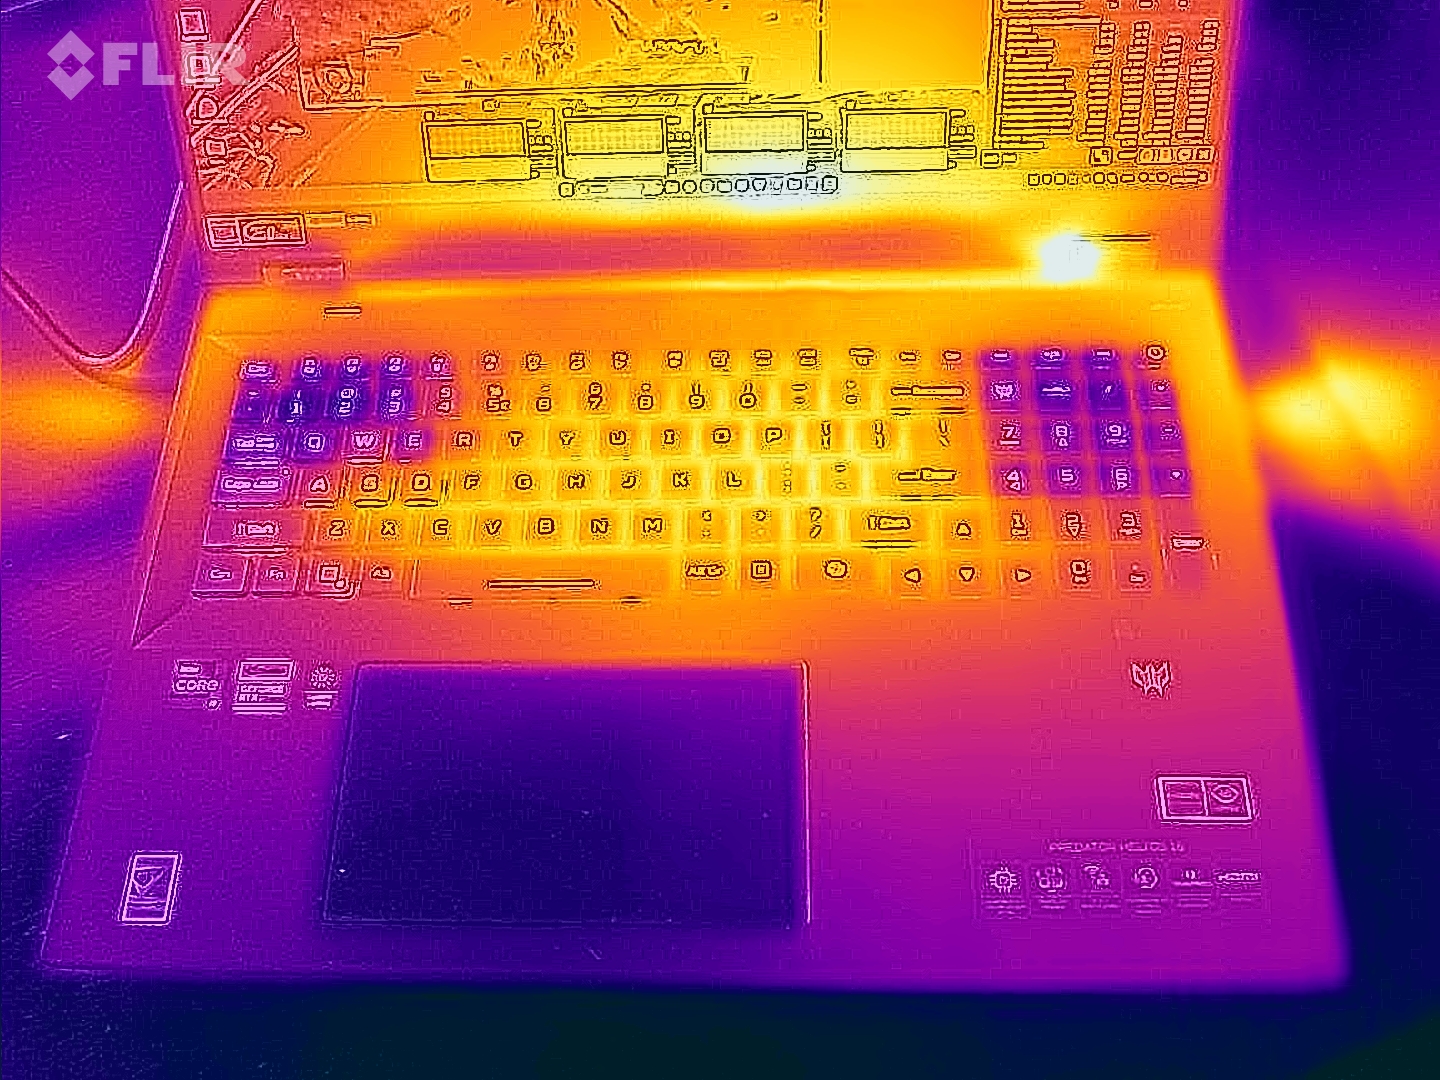
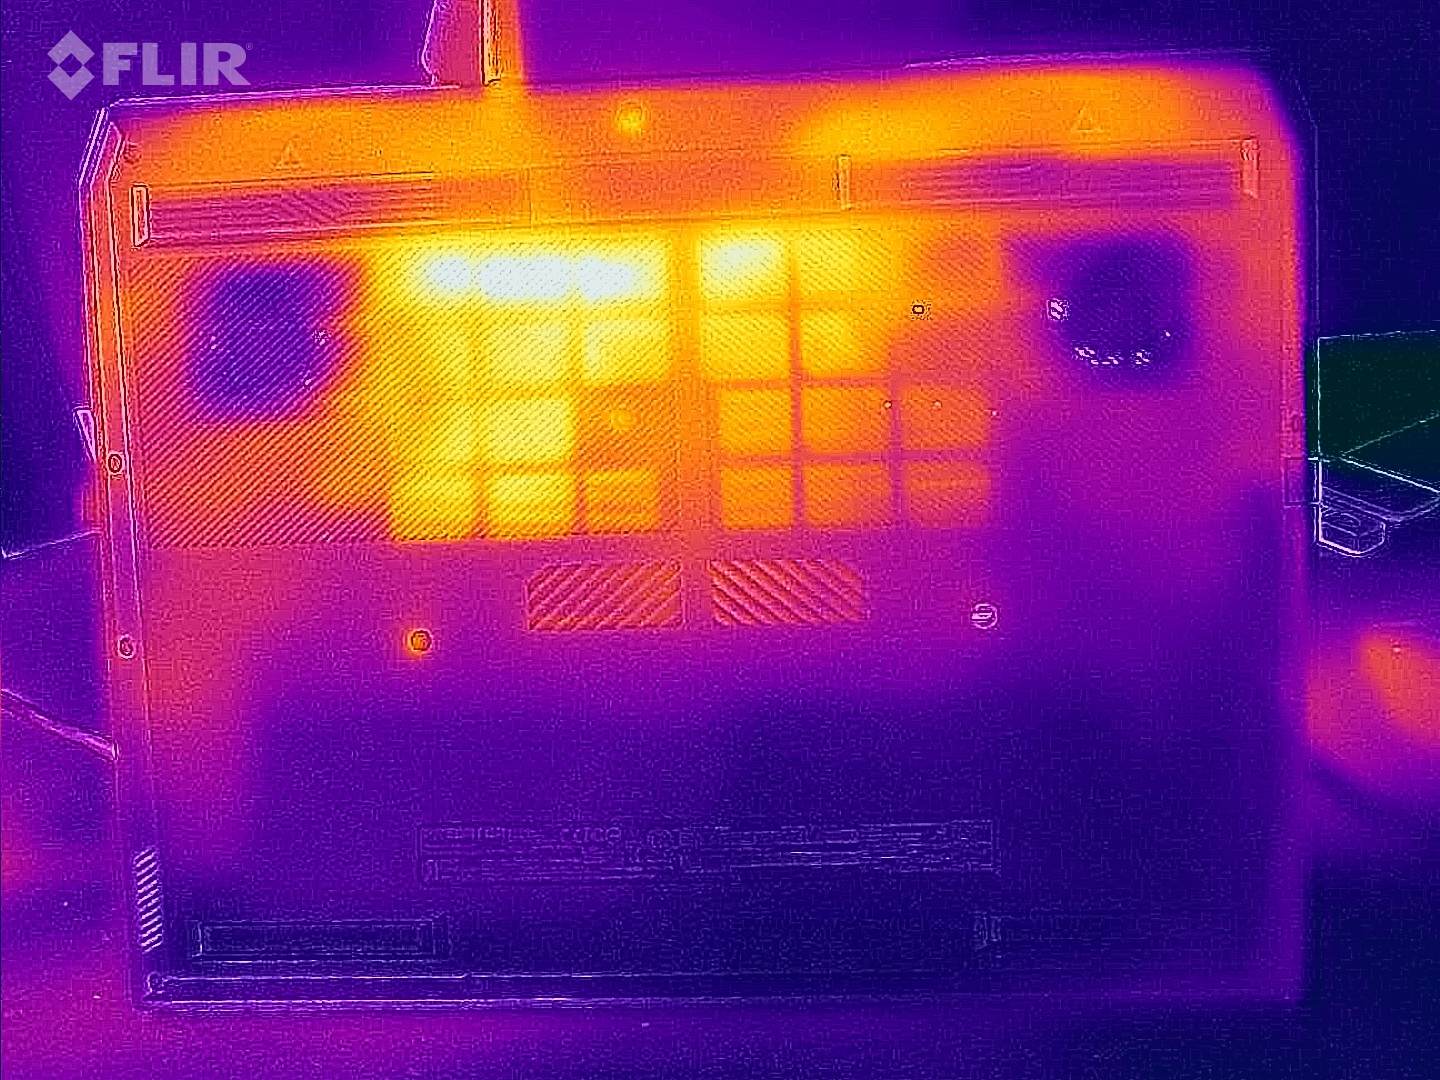
Temperatura
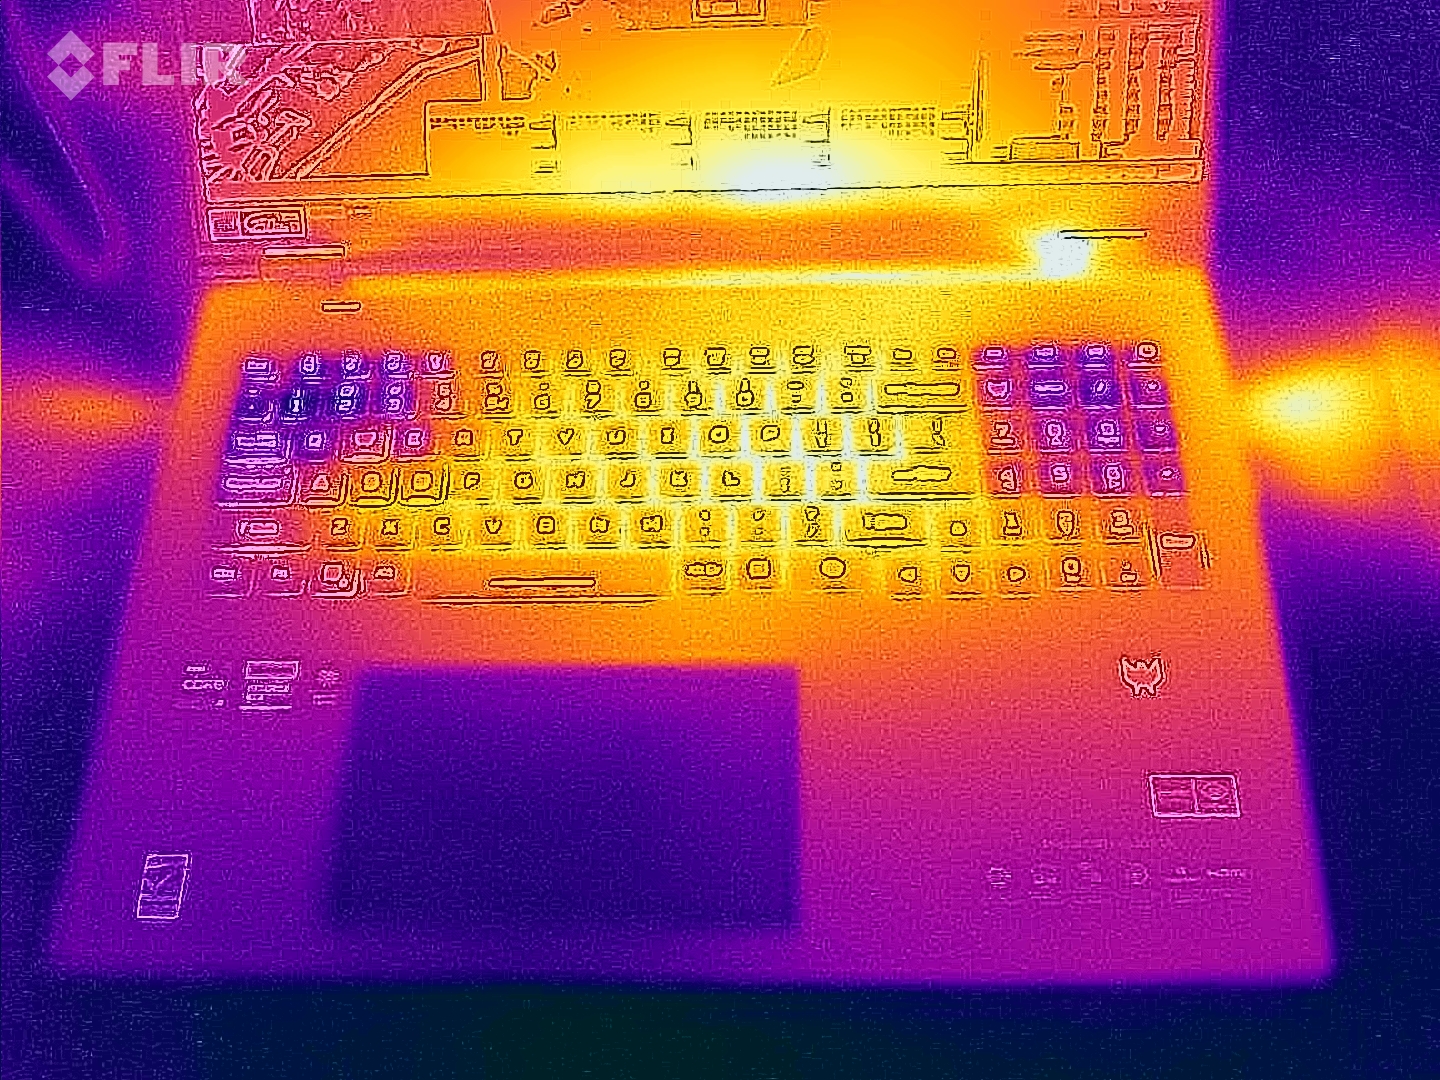
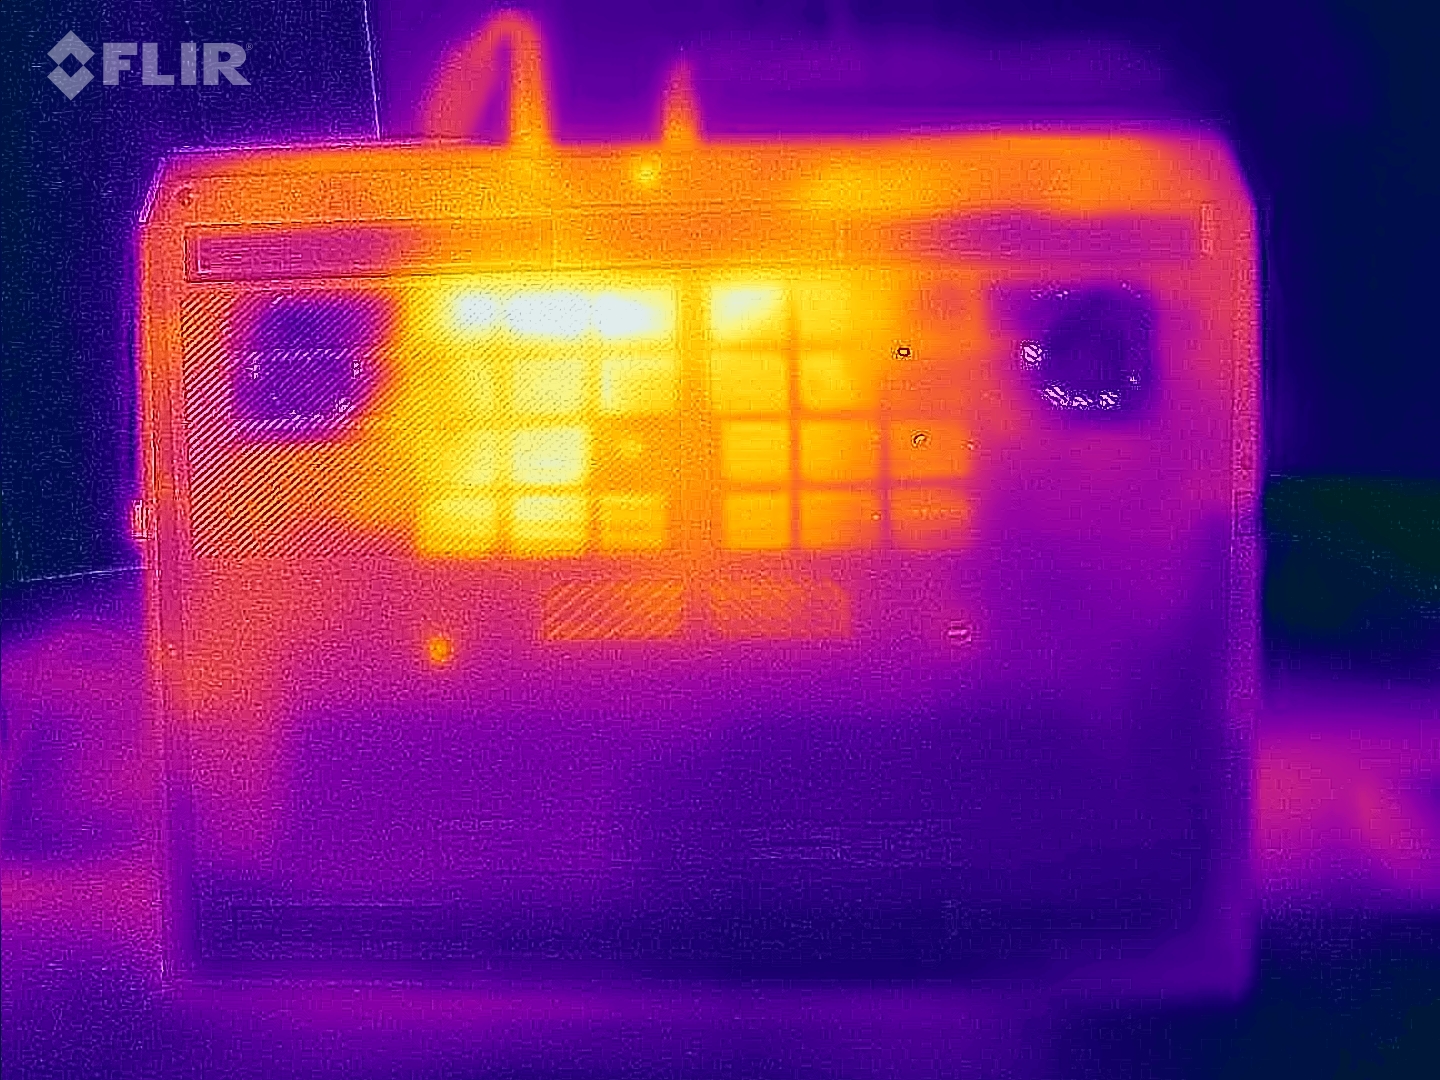
Spód obudowy laptopa nagrzewa się najbardziej. Po 60 minutach naszego testu obciążeniowego zmierzyliśmy ponad 50 °C na niektórych częściach, co oznacza, że nie będzie można grać z urządzeniem siedzącym na kolanach. Góra pozostaje znacznie chłodniejsza, z wartościami dochodzącymi do 43 °C. W stanie spoczynku wartości są dość umiarkowane - odnotowaliśmy średnio 29 ° C (góra) i 30 ° C (dół), co jest absolutnie w porządku.
(±) Maksymalna temperatura w górnej części wynosi 43 °C / 109 F, w porównaniu do średniej 40.4 °C / 105 F , począwszy od 21.2 do 68.8 °C dla klasy Gaming.
(-) Dno nagrzewa się maksymalnie do 59 °C / 138 F, w porównaniu do średniej 43.2 °C / 110 F
(+) W stanie bezczynności średnia temperatura górnej części wynosi 29.2 °C / 85 F, w porównaniu ze średnią temperaturą urządzenia wynoszącą 33.9 °C / ### class_avg_f### F.
(-) Podczas gry w Wiedźmina 3 średnia temperatura górnej części wynosi 38.9 °C / 102 F, w porównaniu do średniej temperatury urządzenia wynoszącej 33.9 °C / ## #class_avg_f### F.
(+) Podparcia dłoni i touchpad osiągają maksymalną temperaturę skóry (33 °C / 91.4 F) i dlatego nie są gorące.
(-) Średnia temperatura obszaru podparcia dłoni w podobnych urządzeniach wynosiła 28.8 °C / 83.8 F (-4.2 °C / -7.6 F).
| Acer Predator Helios 18 PH18-72-98MW i9-14900HX, GeForce RTX 4090 Laptop GPU | MSI Titan 18 HX A14VIG i9-14900HX, GeForce RTX 4090 Laptop GPU | Asus ROG Strix Scar 18 G834JYR (2024) i9-14900HX, GeForce RTX 4090 Laptop GPU | Acer Predator Helios 18 N23Q2 i9-13900HX, GeForce RTX 4080 Laptop GPU | Alienware m18 R1 AMD R9 7945HX, Radeon RX 7900M | |
|---|---|---|---|---|---|
| Heat | 8% | 6% | 1% | 14% | |
| Maximum Upper Side * (°C) | 43 | 37.8 12% | 49 -14% | 35 19% | 40.2 7% |
| Maximum Bottom * (°C) | 59 | 37.6 36% | 47 20% | 56 5% | 37.4 37% |
| Idle Upper Side * (°C) | 32 | 34.8 -9% | 29 9% | 34 -6% | 31.6 1% |
| Idle Bottom * (°C) | 34 | 36 -6% | 31 9% | 39 -15% | 30.6 10% |
* ... im mniej tym lepiej
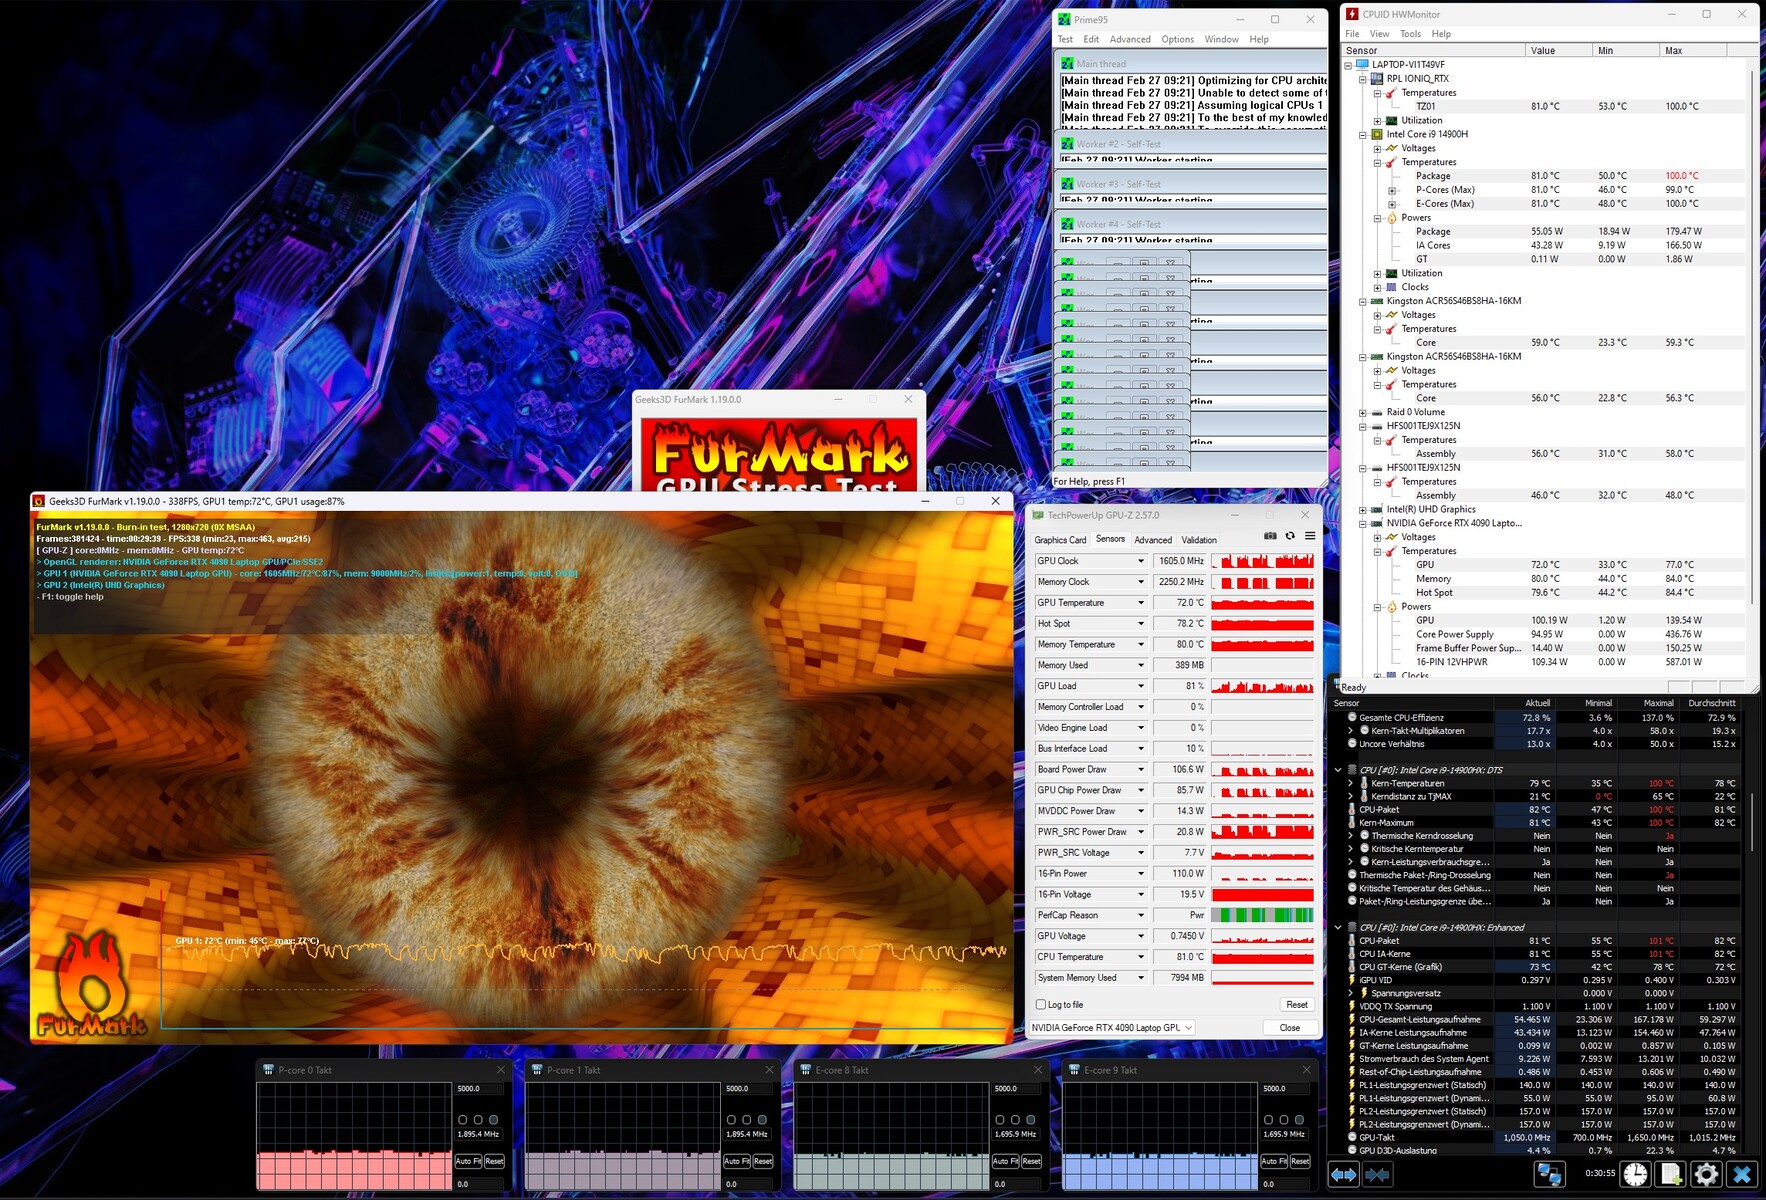
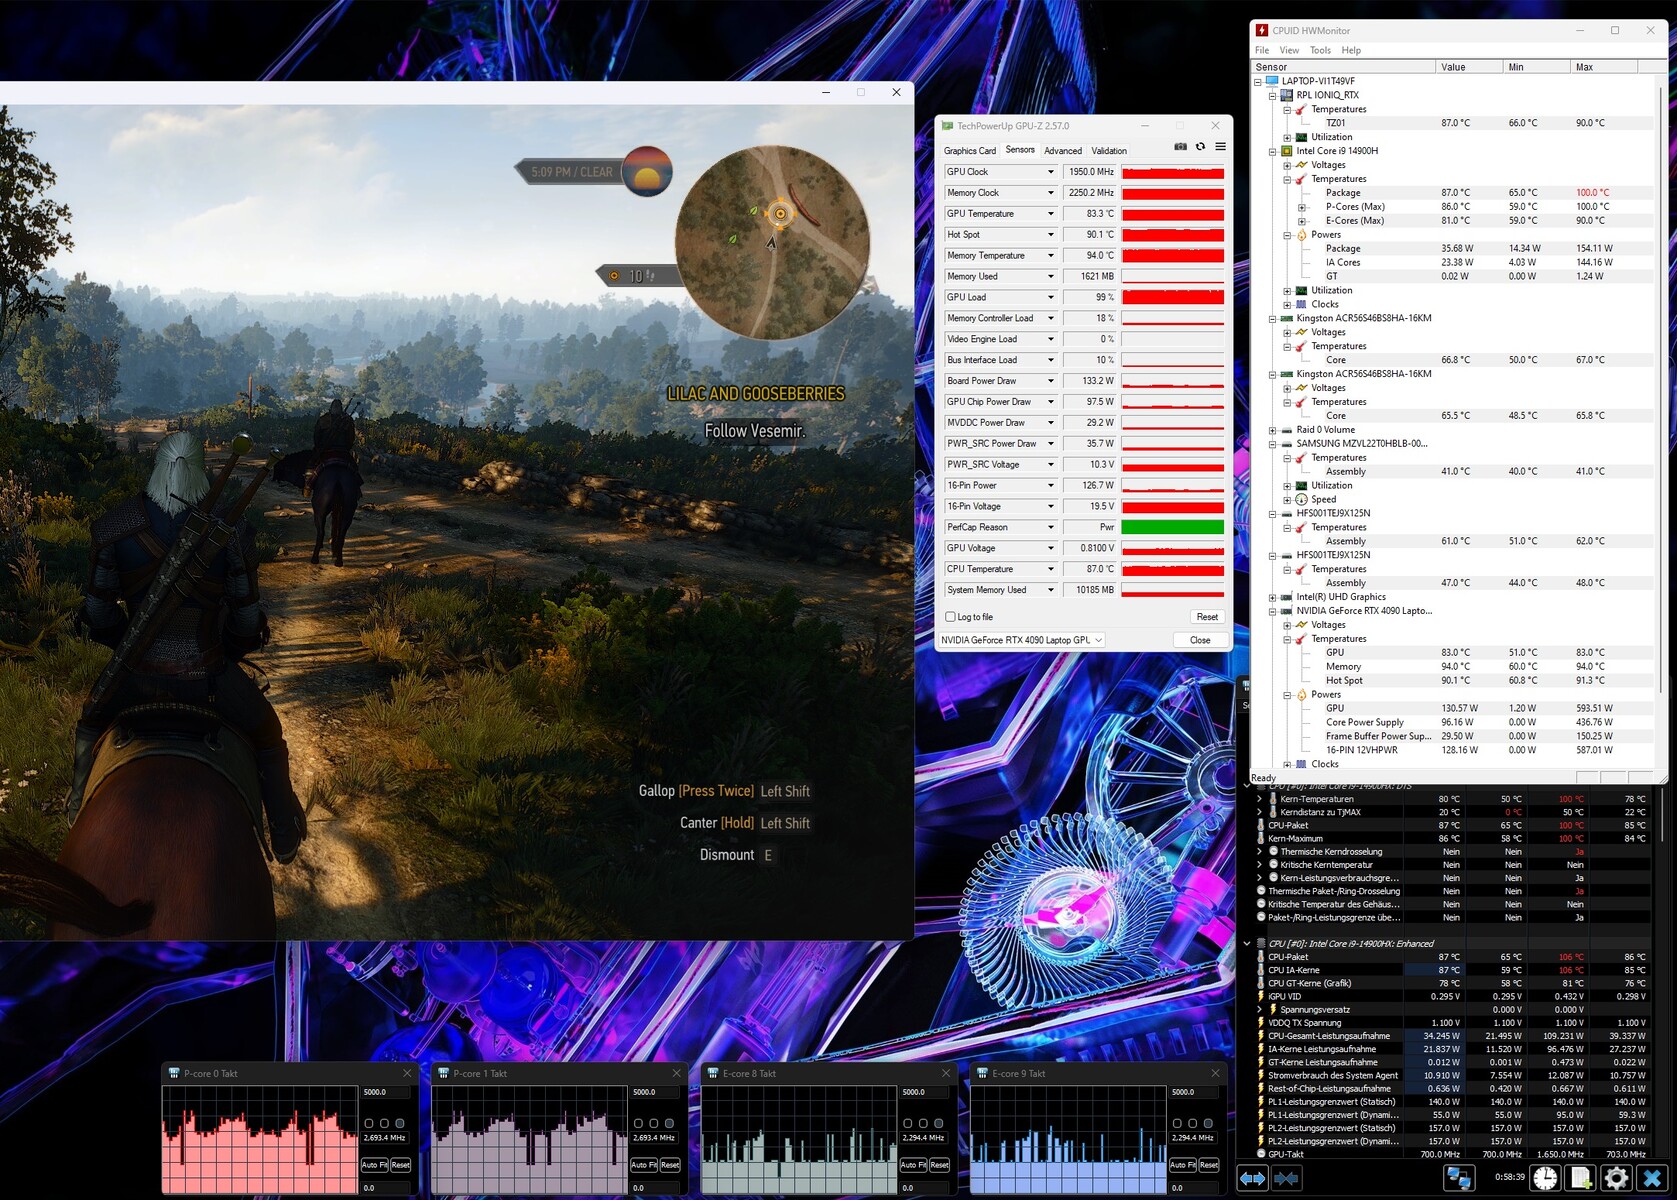
Test warunków skrajnych
Nasz test obciążeniowy przy użyciu narzędzi Furmark i Prime95 nie doprowadził komponentów do granic możliwości. Podczas gdy Core i9-14900HX ustabilizował się na poziomie około 81 °C, GeForce RTX 4090 osiągnął około 72 °C (hotspot 78 °C). Sprzęt może jednak nagrzewać się bardziej w trybie gamingowym ze względu na wyższe częstotliwości taktowania. W The Witcher 3 nasze narzędzia zmierzyły około 87 °C (CPU) i 83 °C (GPU).
Głośniki
Nasza analiza audio potwierdziła, że nowy Predator Helios 18 brzmi lepiej niż jego poprzednik. Chociaż basy nadal mogłyby być mocniejsze, średnie i wysokie tony są teraz bardziej wyraziste. Maksymalna głośność 85 dB(A) również powinna być wystarczająca dla większości użytkowników.
Acer Predator Helios 18 PH18-72-98MW analiza dźwięku
(+) | głośniki mogą odtwarzać stosunkowo głośno (85 dB)
Bas 100 - 315 Hz
(-) | prawie brak basu - średnio 21.1% niższa od mediany
(±) | liniowość basu jest średnia (10.7% delta do poprzedniej częstotliwości)
Średnie 400 - 2000 Hz
(+) | zbalansowane środki średnie - tylko 2.9% od mediany
(+) | średnie są liniowe (5.6% delta do poprzedniej częstotliwości)
Wysokie 2–16 kHz
(+) | zrównoważone maksima - tylko 2.7% od mediany
(+) | wzloty są liniowe (3.6% delta do poprzedniej częstotliwości)
Ogólnie 100 - 16.000 Hz
(+) | ogólny dźwięk jest liniowy (13.6% różnicy w stosunku do mediany)
W porównaniu do tej samej klasy
» 20% wszystkich testowanych urządzeń w tej klasie było lepszych, 7% podobnych, 73% gorszych
» Najlepszy miał deltę 6%, średnia wynosiła ###średnia###%, najgorsza wynosiła 132%
W porównaniu do wszystkich testowanych urządzeń
» 15% wszystkich testowanych urządzeń było lepszych, 4% podobnych, 82% gorszych
» Najlepszy miał deltę 4%, średnia wynosiła ###średnia###%, najgorsza wynosiła 134%
MSI Titan 18 HX A14VIG analiza dźwięku
(+) | głośniki mogą odtwarzać stosunkowo głośno (89.2 dB)
Bas 100 - 315 Hz
(-) | prawie brak basu - średnio 17.6% niższa od mediany
(±) | liniowość basu jest średnia (8% delta do poprzedniej częstotliwości)
Średnie 400 - 2000 Hz
(+) | zbalansowane środki średnie - tylko 1.8% od mediany
(+) | średnie są liniowe (3.7% delta do poprzedniej częstotliwości)
Wysokie 2–16 kHz
(+) | zrównoważone maksima - tylko 1.2% od mediany
(+) | wzloty są liniowe (2% delta do poprzedniej częstotliwości)
Ogólnie 100 - 16.000 Hz
(+) | ogólny dźwięk jest liniowy (9.9% różnicy w stosunku do mediany)
W porównaniu do tej samej klasy
» 5% wszystkich testowanych urządzeń w tej klasie było lepszych, 2% podobnych, 94% gorszych
» Najlepszy miał deltę 6%, średnia wynosiła ###średnia###%, najgorsza wynosiła 132%
W porównaniu do wszystkich testowanych urządzeń
» 4% wszystkich testowanych urządzeń było lepszych, 1% podobnych, 95% gorszych
» Najlepszy miał deltę 4%, średnia wynosiła ###średnia###%, najgorsza wynosiła 134%
Asus ROG Strix Scar 18 G834JYR (2024) analiza dźwięku
(+) | głośniki mogą odtwarzać stosunkowo głośno (82 dB)
Bas 100 - 315 Hz
(±) | zredukowany bas - średnio 5.6% niższy od mediany
(+) | bas jest liniowy (6.8% delta do poprzedniej częstotliwości)
Średnie 400 - 2000 Hz
(±) | wyższe średnie - średnio 5.7% wyższe niż mediana
(+) | średnie są liniowe (2.8% delta do poprzedniej częstotliwości)
Wysokie 2–16 kHz
(±) | obniżone maksima - średnio 7.2% niższe od mediany
(±) | liniowość wysokich wartości jest średnia (7.2% delta do poprzedniej częstotliwości)
Ogólnie 100 - 16.000 Hz
(+) | ogólny dźwięk jest liniowy (13% różnicy w stosunku do mediany)
W porównaniu do tej samej klasy
» 18% wszystkich testowanych urządzeń w tej klasie było lepszych, 3% podobnych, 79% gorszych
» Najlepszy miał deltę 6%, średnia wynosiła ###średnia###%, najgorsza wynosiła 132%
W porównaniu do wszystkich testowanych urządzeń
» 13% wszystkich testowanych urządzeń było lepszych, 3% podobnych, 85% gorszych
» Najlepszy miał deltę 4%, średnia wynosiła ###średnia###%, najgorsza wynosiła 134%
Acer Predator Helios 18 N23Q2 analiza dźwięku
(+) | głośniki mogą odtwarzać stosunkowo głośno (82.74 dB)
Bas 100 - 315 Hz
(-) | prawie brak basu - średnio 17.6% niższa od mediany
(±) | liniowość basu jest średnia (9.8% delta do poprzedniej częstotliwości)
Średnie 400 - 2000 Hz
(±) | wyższe średnie - średnio 9.1% wyższe niż mediana
(±) | liniowość środka jest średnia (8.8% delta do poprzedniej częstotliwości)
Wysokie 2–16 kHz
(±) | wyższe maksima - średnio 5.3% wyższe od mediany
(+) | wzloty są liniowe (6.4% delta do poprzedniej częstotliwości)
Ogólnie 100 - 16.000 Hz
(±) | liniowość ogólnego dźwięku jest średnia (20.3% różnicy w stosunku do mediany)
W porównaniu do tej samej klasy
» 72% wszystkich testowanych urządzeń w tej klasie było lepszych, 6% podobnych, 23% gorszych
» Najlepszy miał deltę 6%, średnia wynosiła ###średnia###%, najgorsza wynosiła 132%
W porównaniu do wszystkich testowanych urządzeń
» 53% wszystkich testowanych urządzeń było lepszych, 8% podobnych, 39% gorszych
» Najlepszy miał deltę 4%, średnia wynosiła ###średnia###%, najgorsza wynosiła 134%
Alienware m18 R1 AMD analiza dźwięku
(+) | głośniki mogą odtwarzać stosunkowo głośno (84.2 dB)
Bas 100 - 315 Hz
(-) | prawie brak basu - średnio 22.7% niższa od mediany
(-) | bas nie jest liniowy (15.8% delta do poprzedniej częstotliwości)
Średnie 400 - 2000 Hz
(+) | zbalansowane środki średnie - tylko 1.5% od mediany
(+) | średnie są liniowe (3.8% delta do poprzedniej częstotliwości)
Wysokie 2–16 kHz
(+) | zrównoważone maksima - tylko 3.6% od mediany
(+) | wzloty są liniowe (5.5% delta do poprzedniej częstotliwości)
Ogólnie 100 - 16.000 Hz
(±) | liniowość ogólnego dźwięku jest średnia (16.5% różnicy w stosunku do mediany)
W porównaniu do tej samej klasy
» 42% wszystkich testowanych urządzeń w tej klasie było lepszych, 7% podobnych, 51% gorszych
» Najlepszy miał deltę 6%, średnia wynosiła ###średnia###%, najgorsza wynosiła 132%
W porównaniu do wszystkich testowanych urządzeń
» 28% wszystkich testowanych urządzeń było lepszych, 6% podobnych, 66% gorszych
» Najlepszy miał deltę 4%, średnia wynosiła ###średnia###%, najgorsza wynosiła 134%
Zarządzanie energią
Zużycie energii
Acer mógłby nieco dopracować zużycie energii przez urządzenie. Pomimo aktywnego przełączania grafiki, 18-calowy laptop wymaga dość dużo energii w trybie bezczynności, a mianowicie od 31 do 43 watów. Większość konkurentów, a także stary Helios radzą sobie pod tym względem znacznie lepiej. W naszym urządzeniu testowym mógł również wystąpić błąd.
| wyłączony / stan wstrzymania | |
| luz | |
| obciążenie |
|
Legenda:
min: | |
| Acer Predator Helios 18 PH18-72-98MW i9-14900HX, GeForce RTX 4090 Laptop GPU | MSI Titan 18 HX A14VIG i9-14900HX, GeForce RTX 4090 Laptop GPU | Asus ROG Strix Scar 18 G834JYR (2024) i9-14900HX, GeForce RTX 4090 Laptop GPU | Acer Predator Helios 18 N23Q2 i9-13900HX, GeForce RTX 4080 Laptop GPU | Alienware m18 R1 AMD R9 7945HX, Radeon RX 7900M | Średnia w klasie Gaming | |
|---|---|---|---|---|---|---|
| Power Consumption | -3% | 24% | 22% | -34% | 38% | |
| Idle Minimum * (Watt) | 31 | 13.2 57% | 14 55% | 16 48% | 30.3 2% | 13 ? 58% |
| Idle Average * (Watt) | 35 | 25.4 27% | 17 51% | 19 46% | 55.6 -59% | 19 ? 46% |
| Idle Maximum * (Watt) | 43 | 53.5 -24% | 24 44% | 21.3 50% | 101.1 -135% | 24.6 ? 43% |
| Load Average * (Watt) | 144 | 151.4 -5% | 143 1% | 124 14% | 160.3 -11% | 110.7 ? 23% |
| Witcher 3 ultra * (Watt) | 228 | 336 -47% | 251 -10% | 289 -27% | 216 5% | |
| Load Maximum * (Watt) | 318 | 395.2 -24% | 302 5% | 319 -0% | 332.1 -4% | 259 ? 19% |
* ... im mniej tym lepiej
Power consumption Witcher 3 / stress test
Power consumption with external monitor
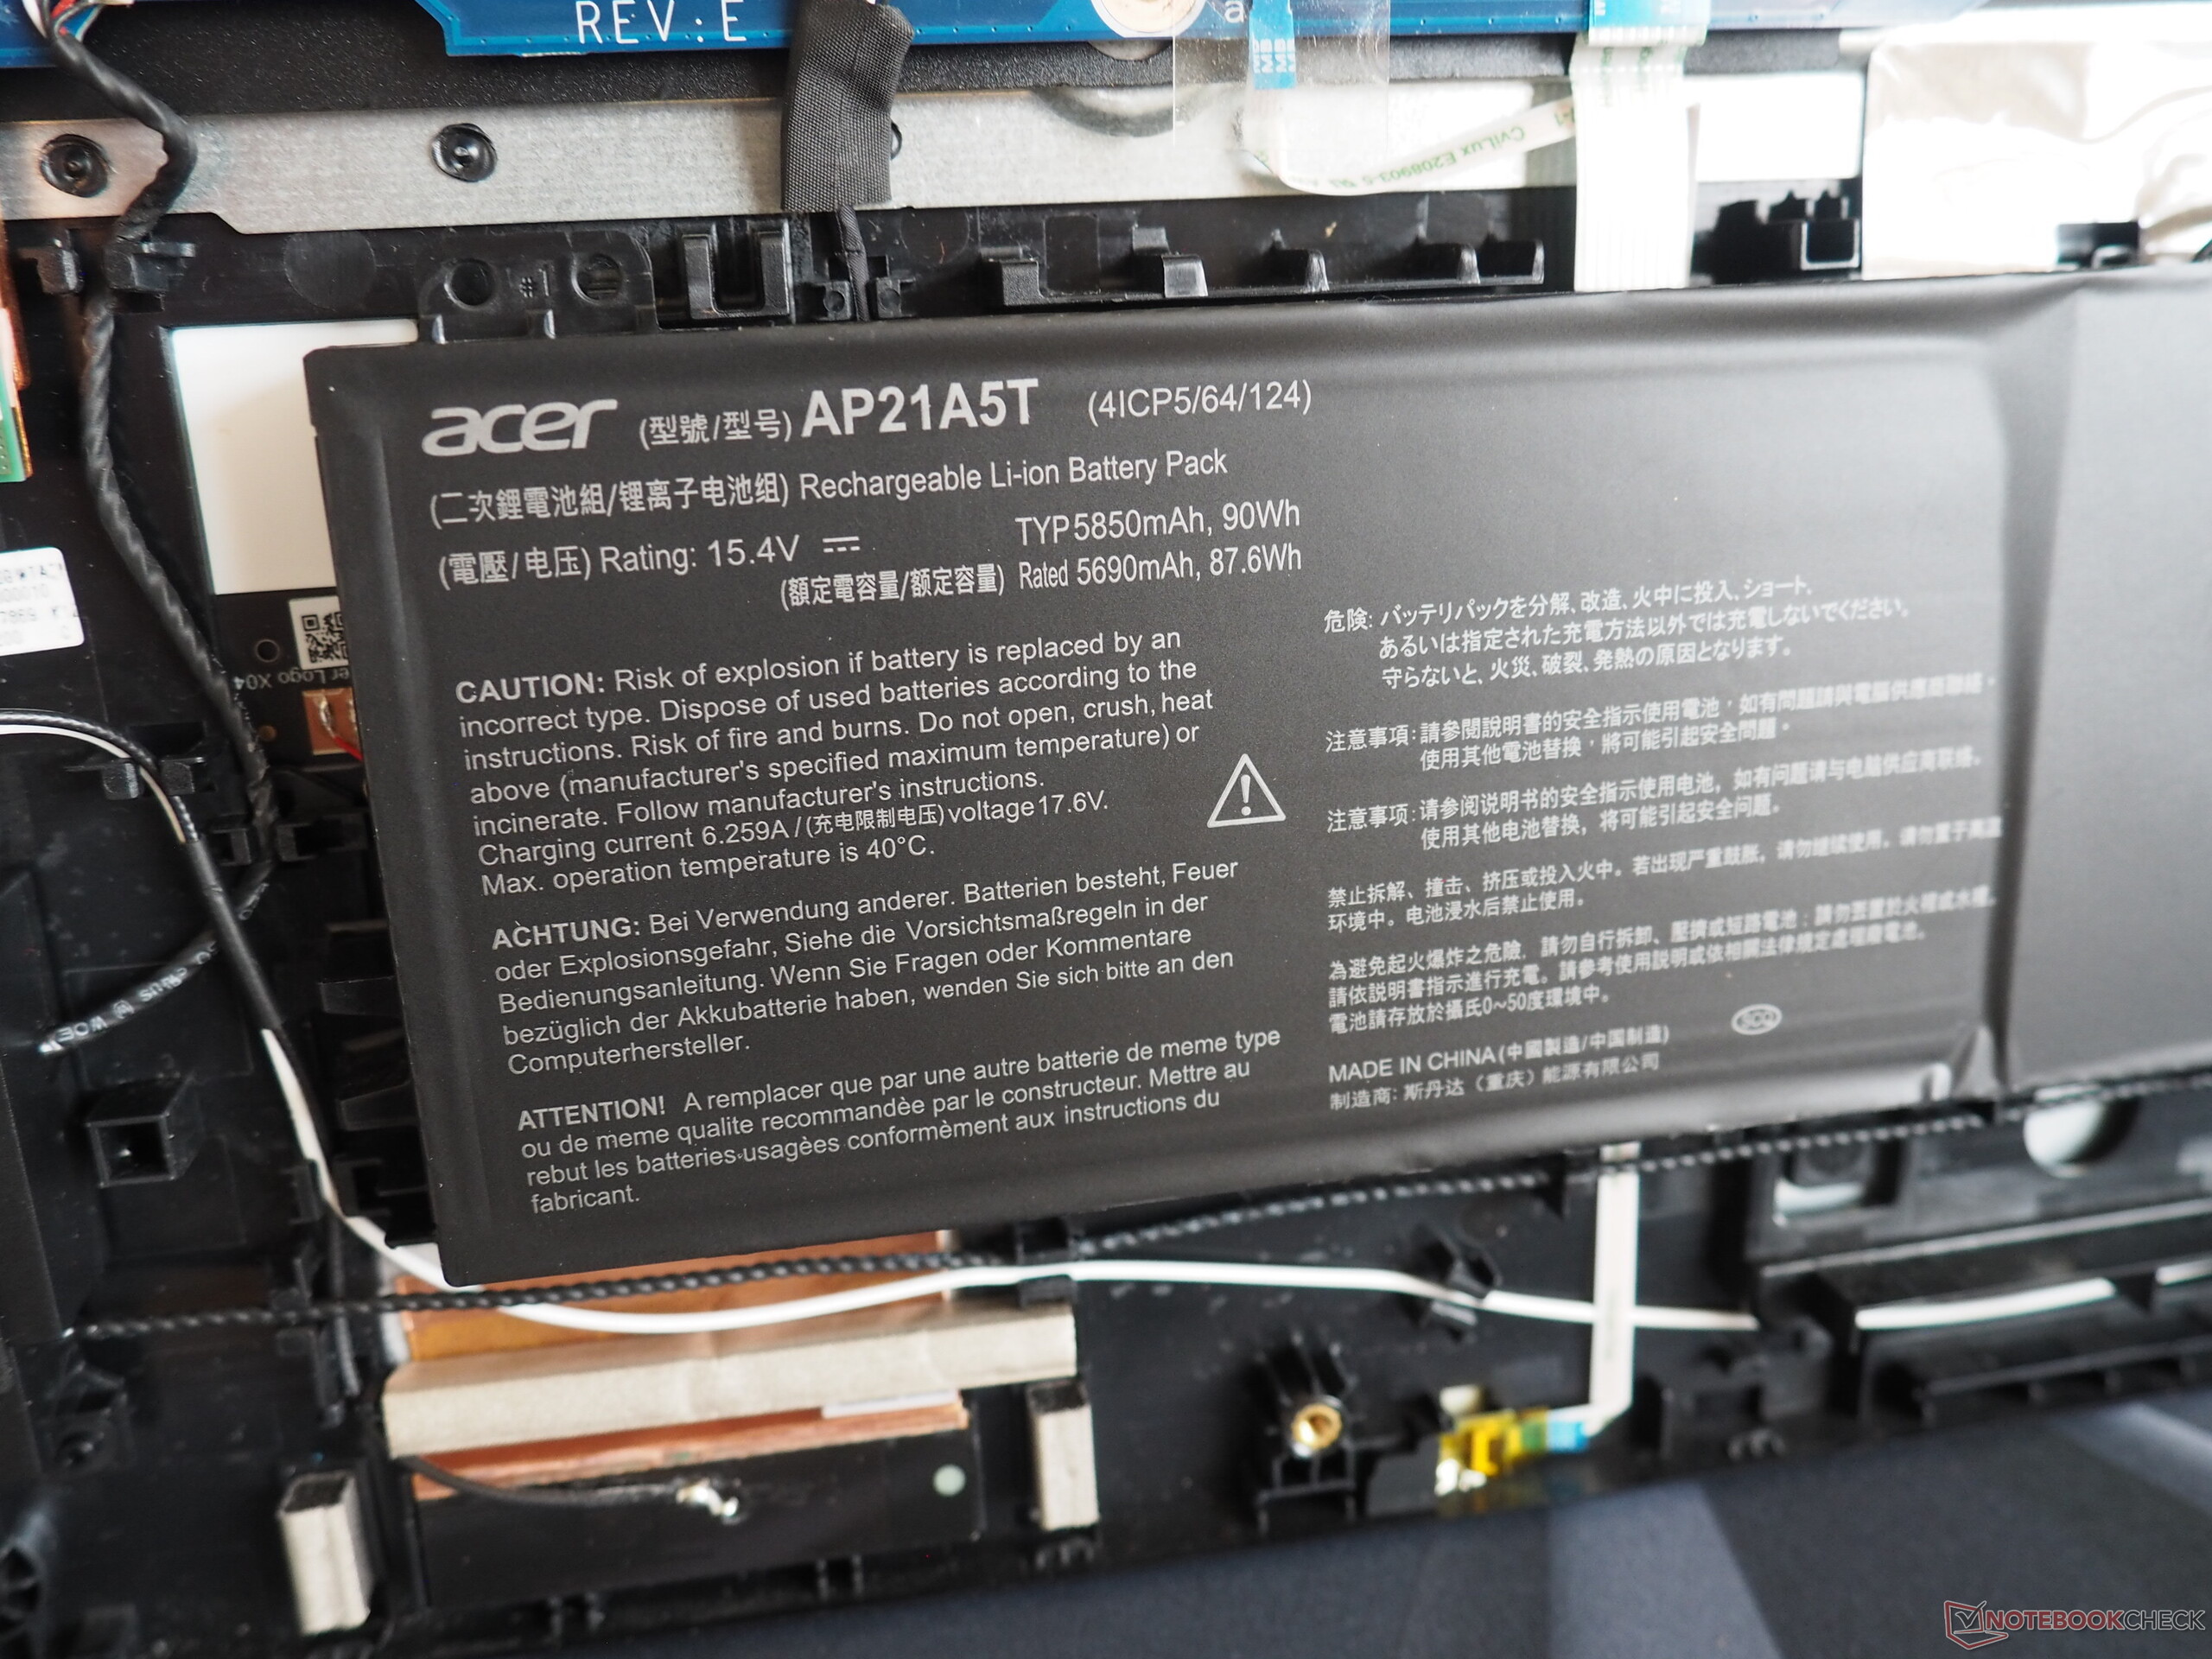
Czas trwania
Wysokie zapotrzebowanie na energię przekłada się na bardzo skromny czas pracy na baterii. W naszym teście WLAN z jasnością zredukowaną do 150 cd/m², Predator Helios 18 wytrzymał tylko nieco ponad 3 godziny. Dla porównania, ROG Strix Scar 18 wytrzymał ponad 7 godzin. Ogólnie rzecz biorąc, bateria o pojemności 90 Wh nie jest wcale mała.
| Acer Predator Helios 18 PH18-72-98MW i9-14900HX, GeForce RTX 4090 Laptop GPU, 90 Wh | MSI Titan 18 HX A14VIG i9-14900HX, GeForce RTX 4090 Laptop GPU, 99.9 Wh | Asus ROG Strix Scar 18 G834JYR (2024) i9-14900HX, GeForce RTX 4090 Laptop GPU, 90 Wh | Acer Predator Helios 18 N23Q2 i9-13900HX, GeForce RTX 4080 Laptop GPU, 90 Wh | Alienware m18 R1 AMD R9 7945HX, Radeon RX 7900M, 97 Wh | Średnia w klasie Gaming | |
|---|---|---|---|---|---|---|
| Czasy pracy | 20% | 80% | 47% | -46% | 80% | |
| WiFi v1.3 (h) | 3.2 | 4.2 31% | 7.7 141% | 4.4 38% | 1.4 -56% | 7.11 ? 122% |
| Load (h) | 1.1 | 1.2 9% | 1.3 18% | 1.7 55% | 0.7 -36% | 1.502 ? 37% |
| Reader / Idle (h) | 5.9 | 10.2 | 4.5 | 8.27 ? | ||
| H.264 (h) | 7.5 | 4.8 | 8.32 ? |
Za
Przeciw
Werdykt
Wersja 2024 jest bardziej subtelną aktualizacją istniejącej wersji Predator Helios 18.
Pod względem wydajności jest to Core i9-14900HX i GeForce RTX 4090 prawie nie różnią się od starego Core i9-13900HX i GeForce RTX 4080. Z drugiej strony, jego wyświetlacz WQXGA-MiniLED o proporcjach 16:10 nadal zapewnia imponującą jakość obrazu (jasność, kontrast, przestrzeń kolorów itp.). Do tego dochodzą świetne urządzenia wejściowe i nowoczesne opcje łączności (2x Thunderbolt 4).
Wymagający gracze z odpowiednim budżetem z pewnością otrzymają wszechstronny, beztroski pakiet.
W obecnym stanie Predator Helios 18 nie otrzymał jednak oceny "bardzo dobrej". Oprócz kontroli wentylatora (która czasami powoduje irytujące obroty), Acer mógłby również zrewidować zużycie energii w stanie bezczynności laptopa, co obecnie nadal prowadzi do skromnych czasów pracy.
Wielu konkurentów może nie być obecnie na rynku, ale są one co najmniej na równi z urządzeniem - niezależnie od tego, czy jest to MSI Titan 18 czy Asus ROG Strix Scar 18.
Cena i dostępność
W chwili pisania tego tekstu, Predator Helios 18 z procesorem Core i9-14900HX i kartą graficzną GeForce RTX 4090 nie jest jeszcze dostępny w sprzedaży w Stanach Zjednoczonych.
Acer Predator Helios 18 PH18-72-98MW
- 27/02/2024 v7 (old)
Florian Glaser
Przezroczystość
Wyboru urządzeń do recenzji dokonuje nasza redakcja. Próbka testowa została udostępniona autorowi jako pożyczka od producenta lub sprzedawcy detalicznego na potrzeby tej recenzji. Pożyczkodawca nie miał wpływu na tę recenzję, producent nie otrzymał też kopii tej recenzji przed publikacją. Nie było obowiązku publikowania tej recenzji. Jako niezależna firma medialna, Notebookcheck nie podlega władzy producentów, sprzedawców detalicznych ani wydawców.
Tak testuje Notebookcheck
Każdego roku Notebookcheck niezależnie sprawdza setki laptopów i smartfonów, stosując standardowe procedury, aby zapewnić porównywalność wszystkich wyników. Od około 20 lat stale rozwijamy nasze metody badawcze, ustanawiając przy tym standardy branżowe. W naszych laboratoriach testowych doświadczeni technicy i redaktorzy korzystają z wysokiej jakości sprzętu pomiarowego. Testy te obejmują wieloetapowy proces walidacji. Nasz kompleksowy system ocen opiera się na setkach uzasadnionych pomiarów i benchmarków, co pozwala zachować obiektywizm.Price comparison

