Recenzja laptopa MSI Vector 16 HX: Wydajność Tytana bez ceny Tytana

Maingear Vector Pro MG-VCP17 laptop review: 165 W GeForce RTX 3080 for ultrathin sizeMSI Vector 16 HX jest następcą zeszłorocznego modelu GP68, wprowadzając nowe opcje procesorów Intel Raptor Lake-HX 14. generacji i zmienioną konstrukcję obudowy w stosunku do starzejącego się 15,6-calowego GP66. Model ten zadebiutował na początku tego roku na targach CES 2024 wraz z wieloma innymi zapowiedziami, takimi jak MSI Claw i Titan 18 HX.
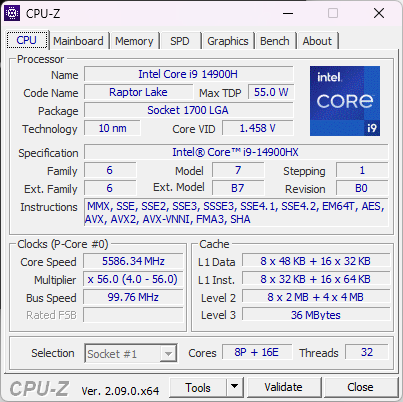
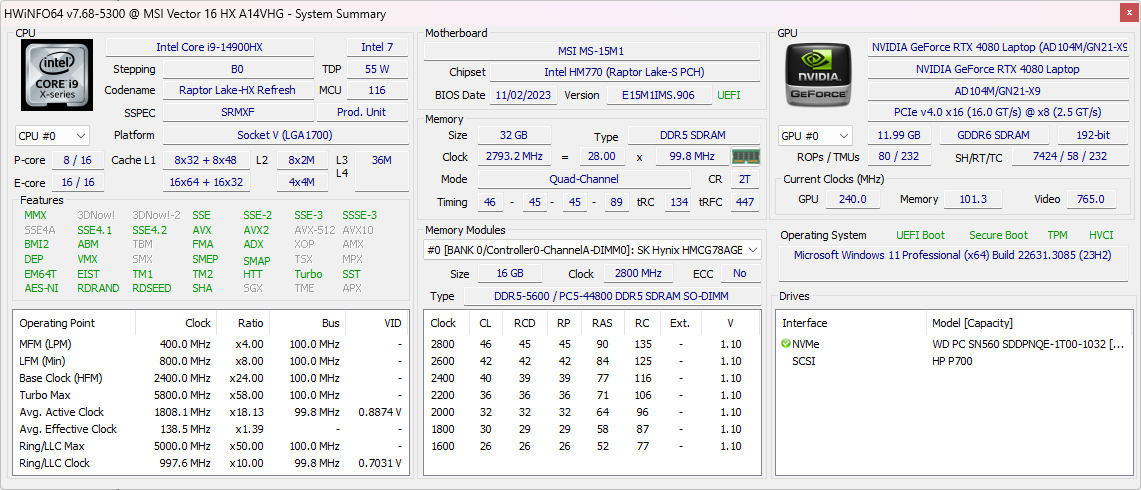
Nasza recenzja to wysokiej klasy konfiguracja z procesorem Core i9-14900HX, kartą graficzną RTX 4080 175
GeForce i wyświetlaczem IPS 1600p 240 Hz w cenie detalicznej około 2700 USD. Inne konfiguracje można znaleźć z grafiką RTX 4090, 4070 lub 4060 i wyświetlaczem 1200p 144 Hz, ale obecnie wszystkie opcje obejmują ten sam procesor Core i9-14900HX.
Alternatywy dla Vector 16 HX obejmują inne 16-calowe laptopy do gier ze średniej i wyższej półki, takie jak Lenovo Legion 5i 16,Asus TUF Gaming A16 , Alienware m16 R1lub HP Omen 16.
Więcej recenzji MSI:
Potencjalni konkurenci w porównaniu
Ocena | Data | Model | Waga | Wysokość | Rozmiar | Rezolucja | Cena |
|---|---|---|---|---|---|---|---|
| 88 % v7 (old) | 02/2024 | MSI Vector 16 HX A14V i9-14900HX, GeForce RTX 4080 Laptop GPU | 2.7 kg | 28.55 mm | 16.00" | 2560x1600 | |
| 86.9 % v7 (old) | MSI Vector GP66 12UGS i9-12900H, GeForce RTX 3070 Ti Laptop GPU | 2.3 kg | 23.4 mm | 15.60" | 1920x1080 | ||
| 89.1 % v7 (old) | 02/2024 | Lenovo Legion 5 16IRX G9 i7-14650HX, GeForce RTX 4060 Laptop GPU | 2.4 kg | 25.2 mm | 16.00" | 2560x1600 | |
| 85.1 % v7 (old) | 09/2023 | HP Victus 16-r0077ng i7-13700H, GeForce RTX 4070 Laptop GPU | 2.4 kg | 24 mm | 16.10" | 1920x1080 | |
| 86.9 % v7 (old) | 06/2023 | Asus TUF Gaming A16 FA617XS R9 7940HS, Radeon RX 7600S | 2.2 kg | 22.1 mm | 16.00" | 1920x1200 | |
| 86.1 % v7 (old) | 10/2022 | Dell G16 7620 i7-12700H, GeForce RTX 3060 Laptop GPU | 2.6 kg | 26.9 mm | 16.00" | 2560x1600 |
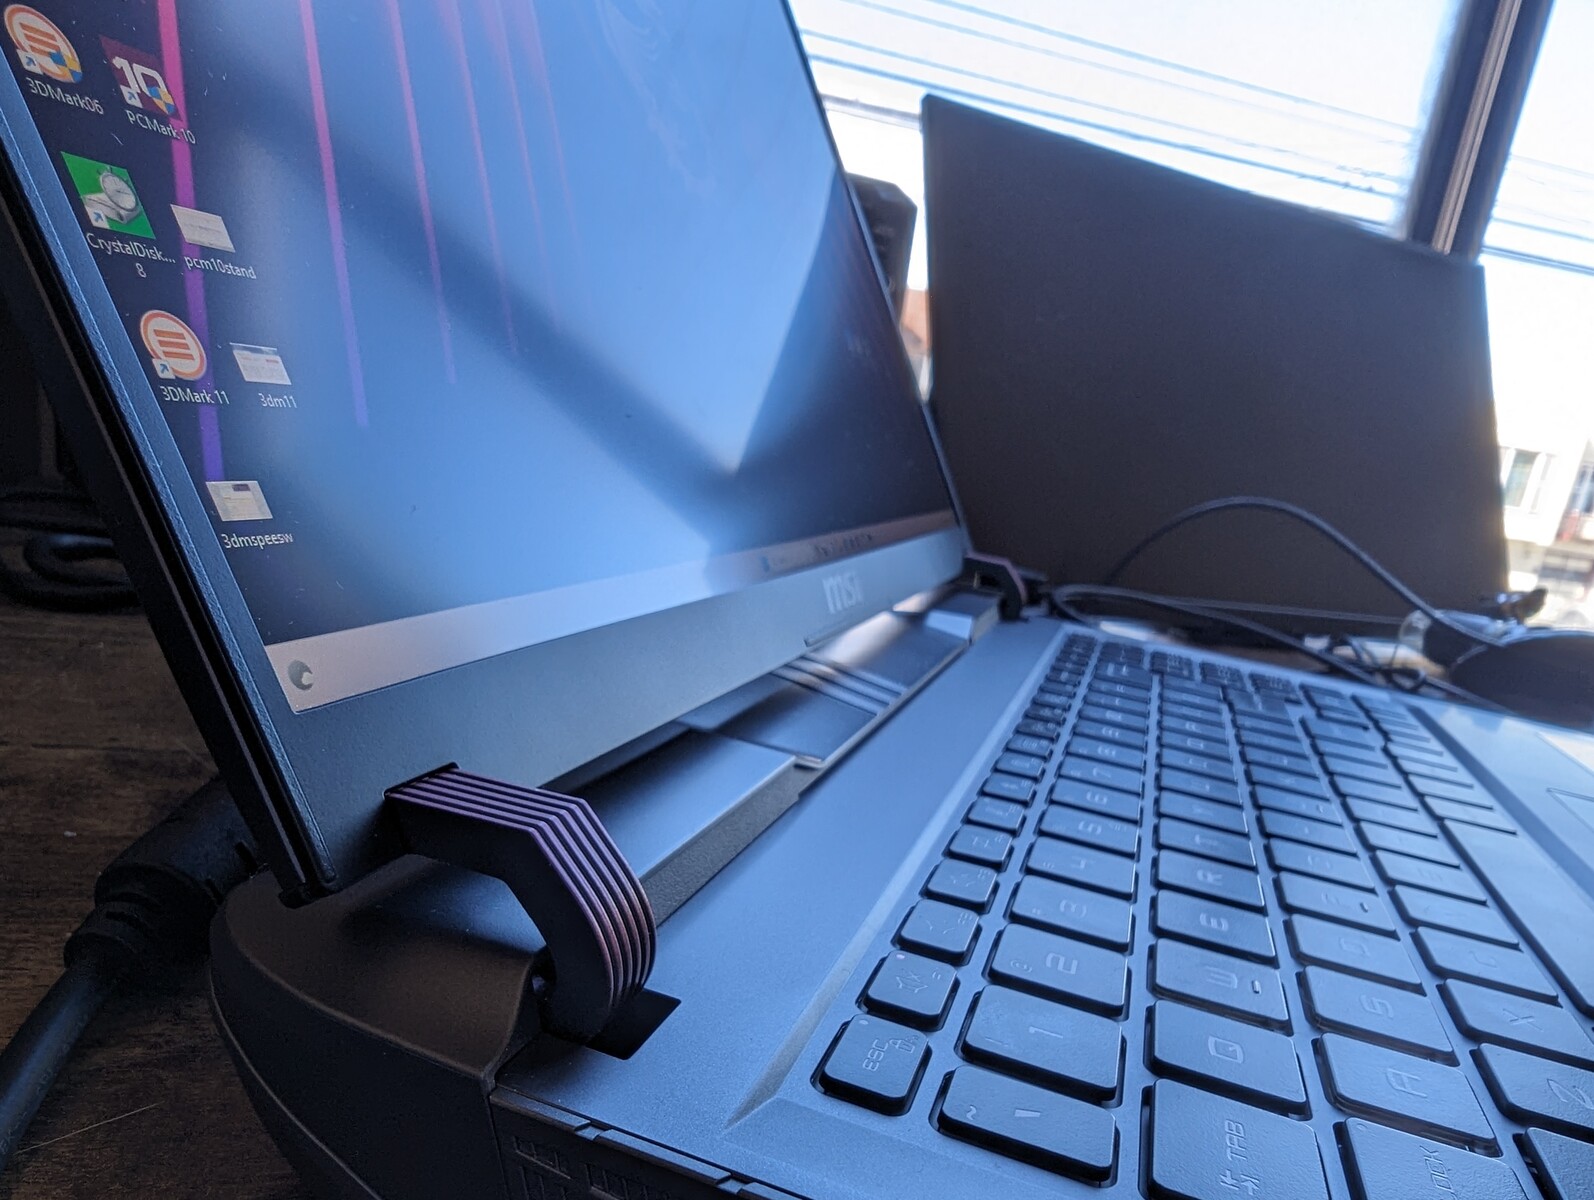
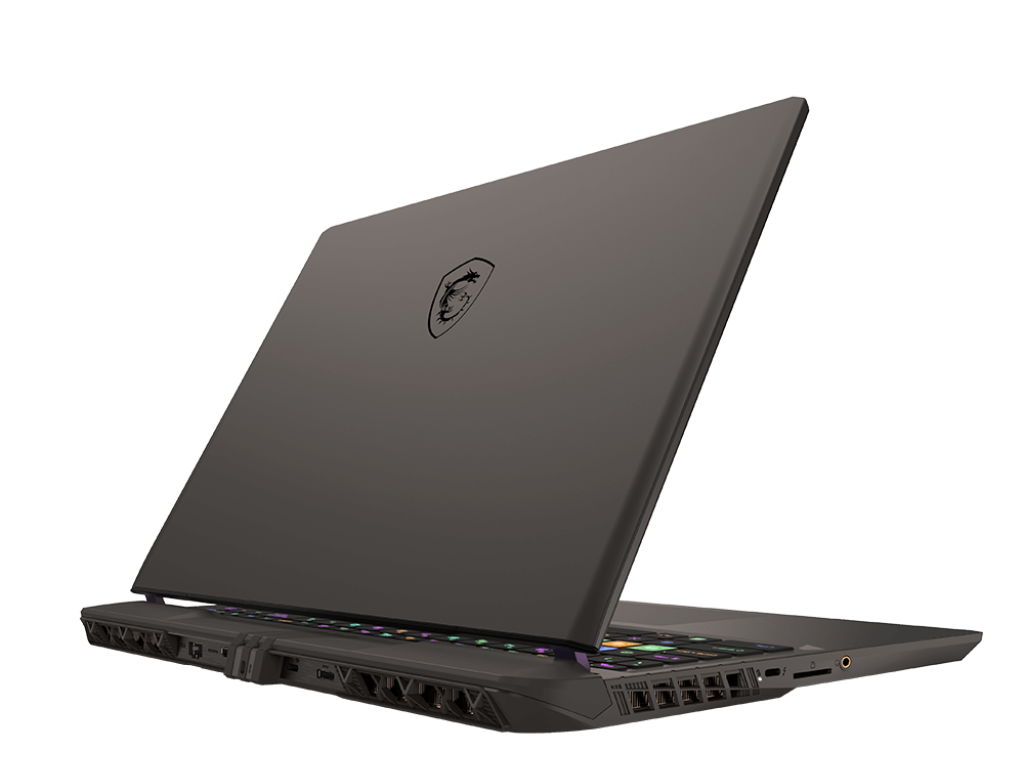
Obudowa - mocna, ale nic wyszukanego
Poza zewnętrzną pokrywą ze stopu metalu, większość podstawy jest wykonana z tworzywa sztucznego, co zapewnia mniej luksusowe wrażenia w porównaniu do droższego Titan HX. Seria Vector nie powinna być topowa, ale mimo wszystko oczekujemy nieco więcej, biorąc pod uwagę cenę wywoławczą wynoszącą około 2000 USD. Jego klawiatura i dolny panel nie są tak wysokiej jakości, jak w przypadku alternatyw, takich jak Razer Blade 16 lub Alienware m16 R1.
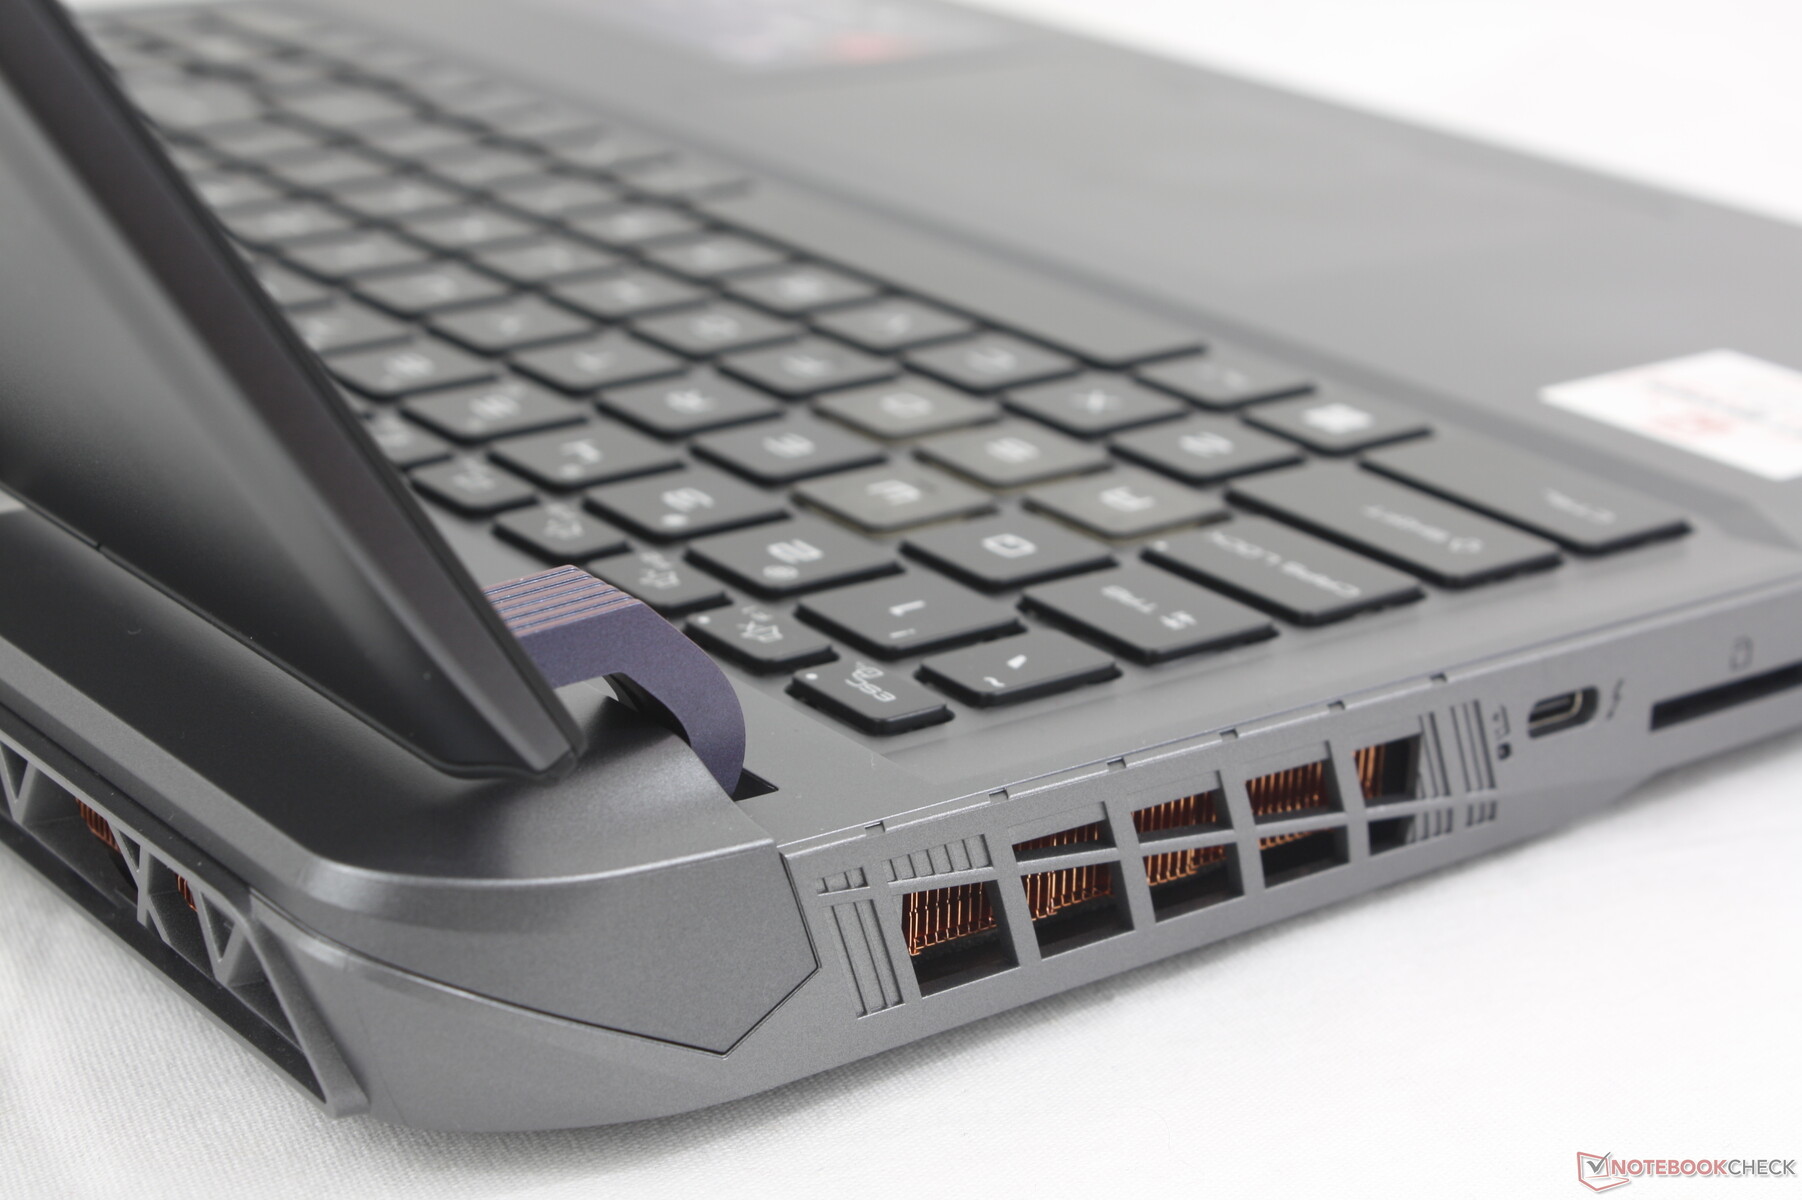
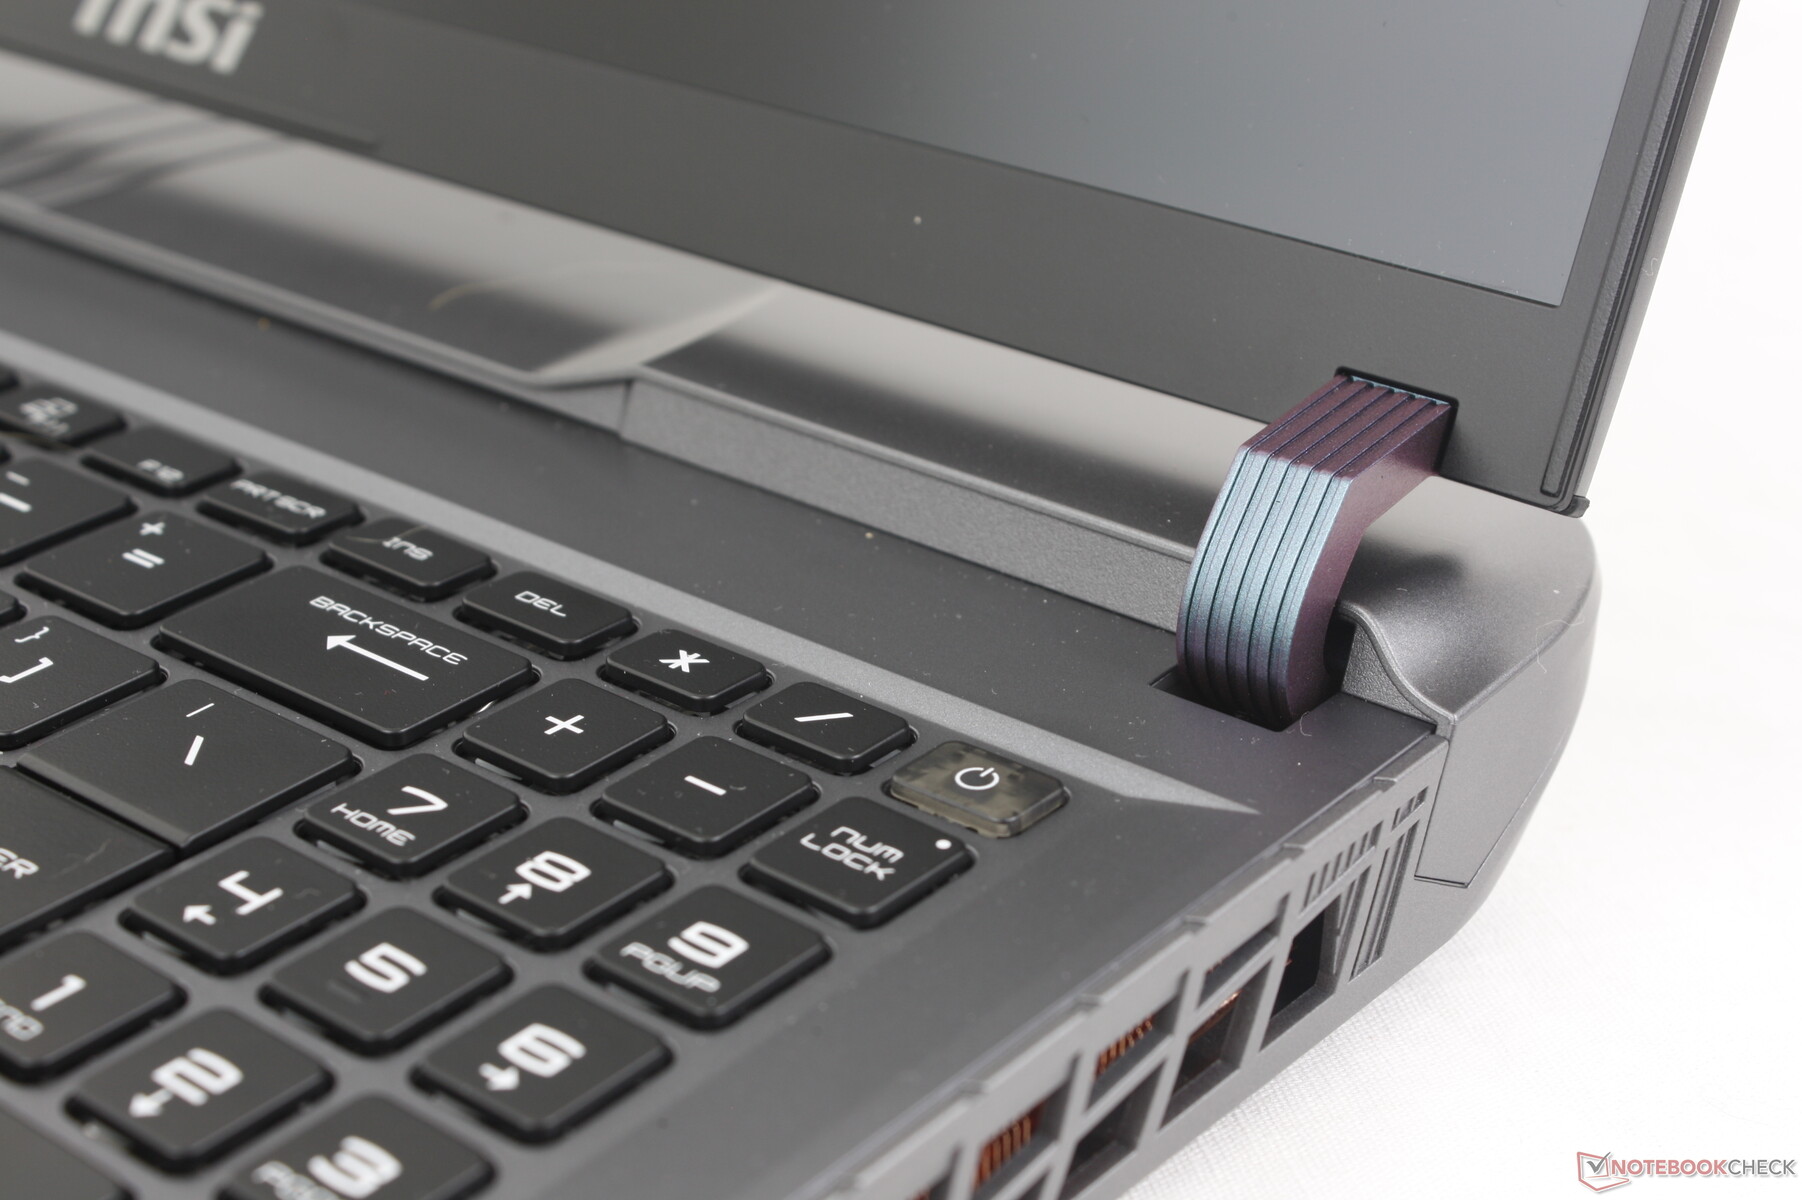
Na szczęście sztywność obudowy jest doskonała od góry do dołu, w tym pokrywy, gdzie jest zauważalnie słabsza w innych laptopach. W szczególności przeprojektowane zawiasy są teraz znacznie większe i mocniejsze niż wcześniej, aby przypominać zawiasy na Asus Strix Scar 17. Jednak ich krzywizna ogranicza maksymalny kąt, pod jakim można otworzyć wyświetlacz, do zaledwie 130 stopni.
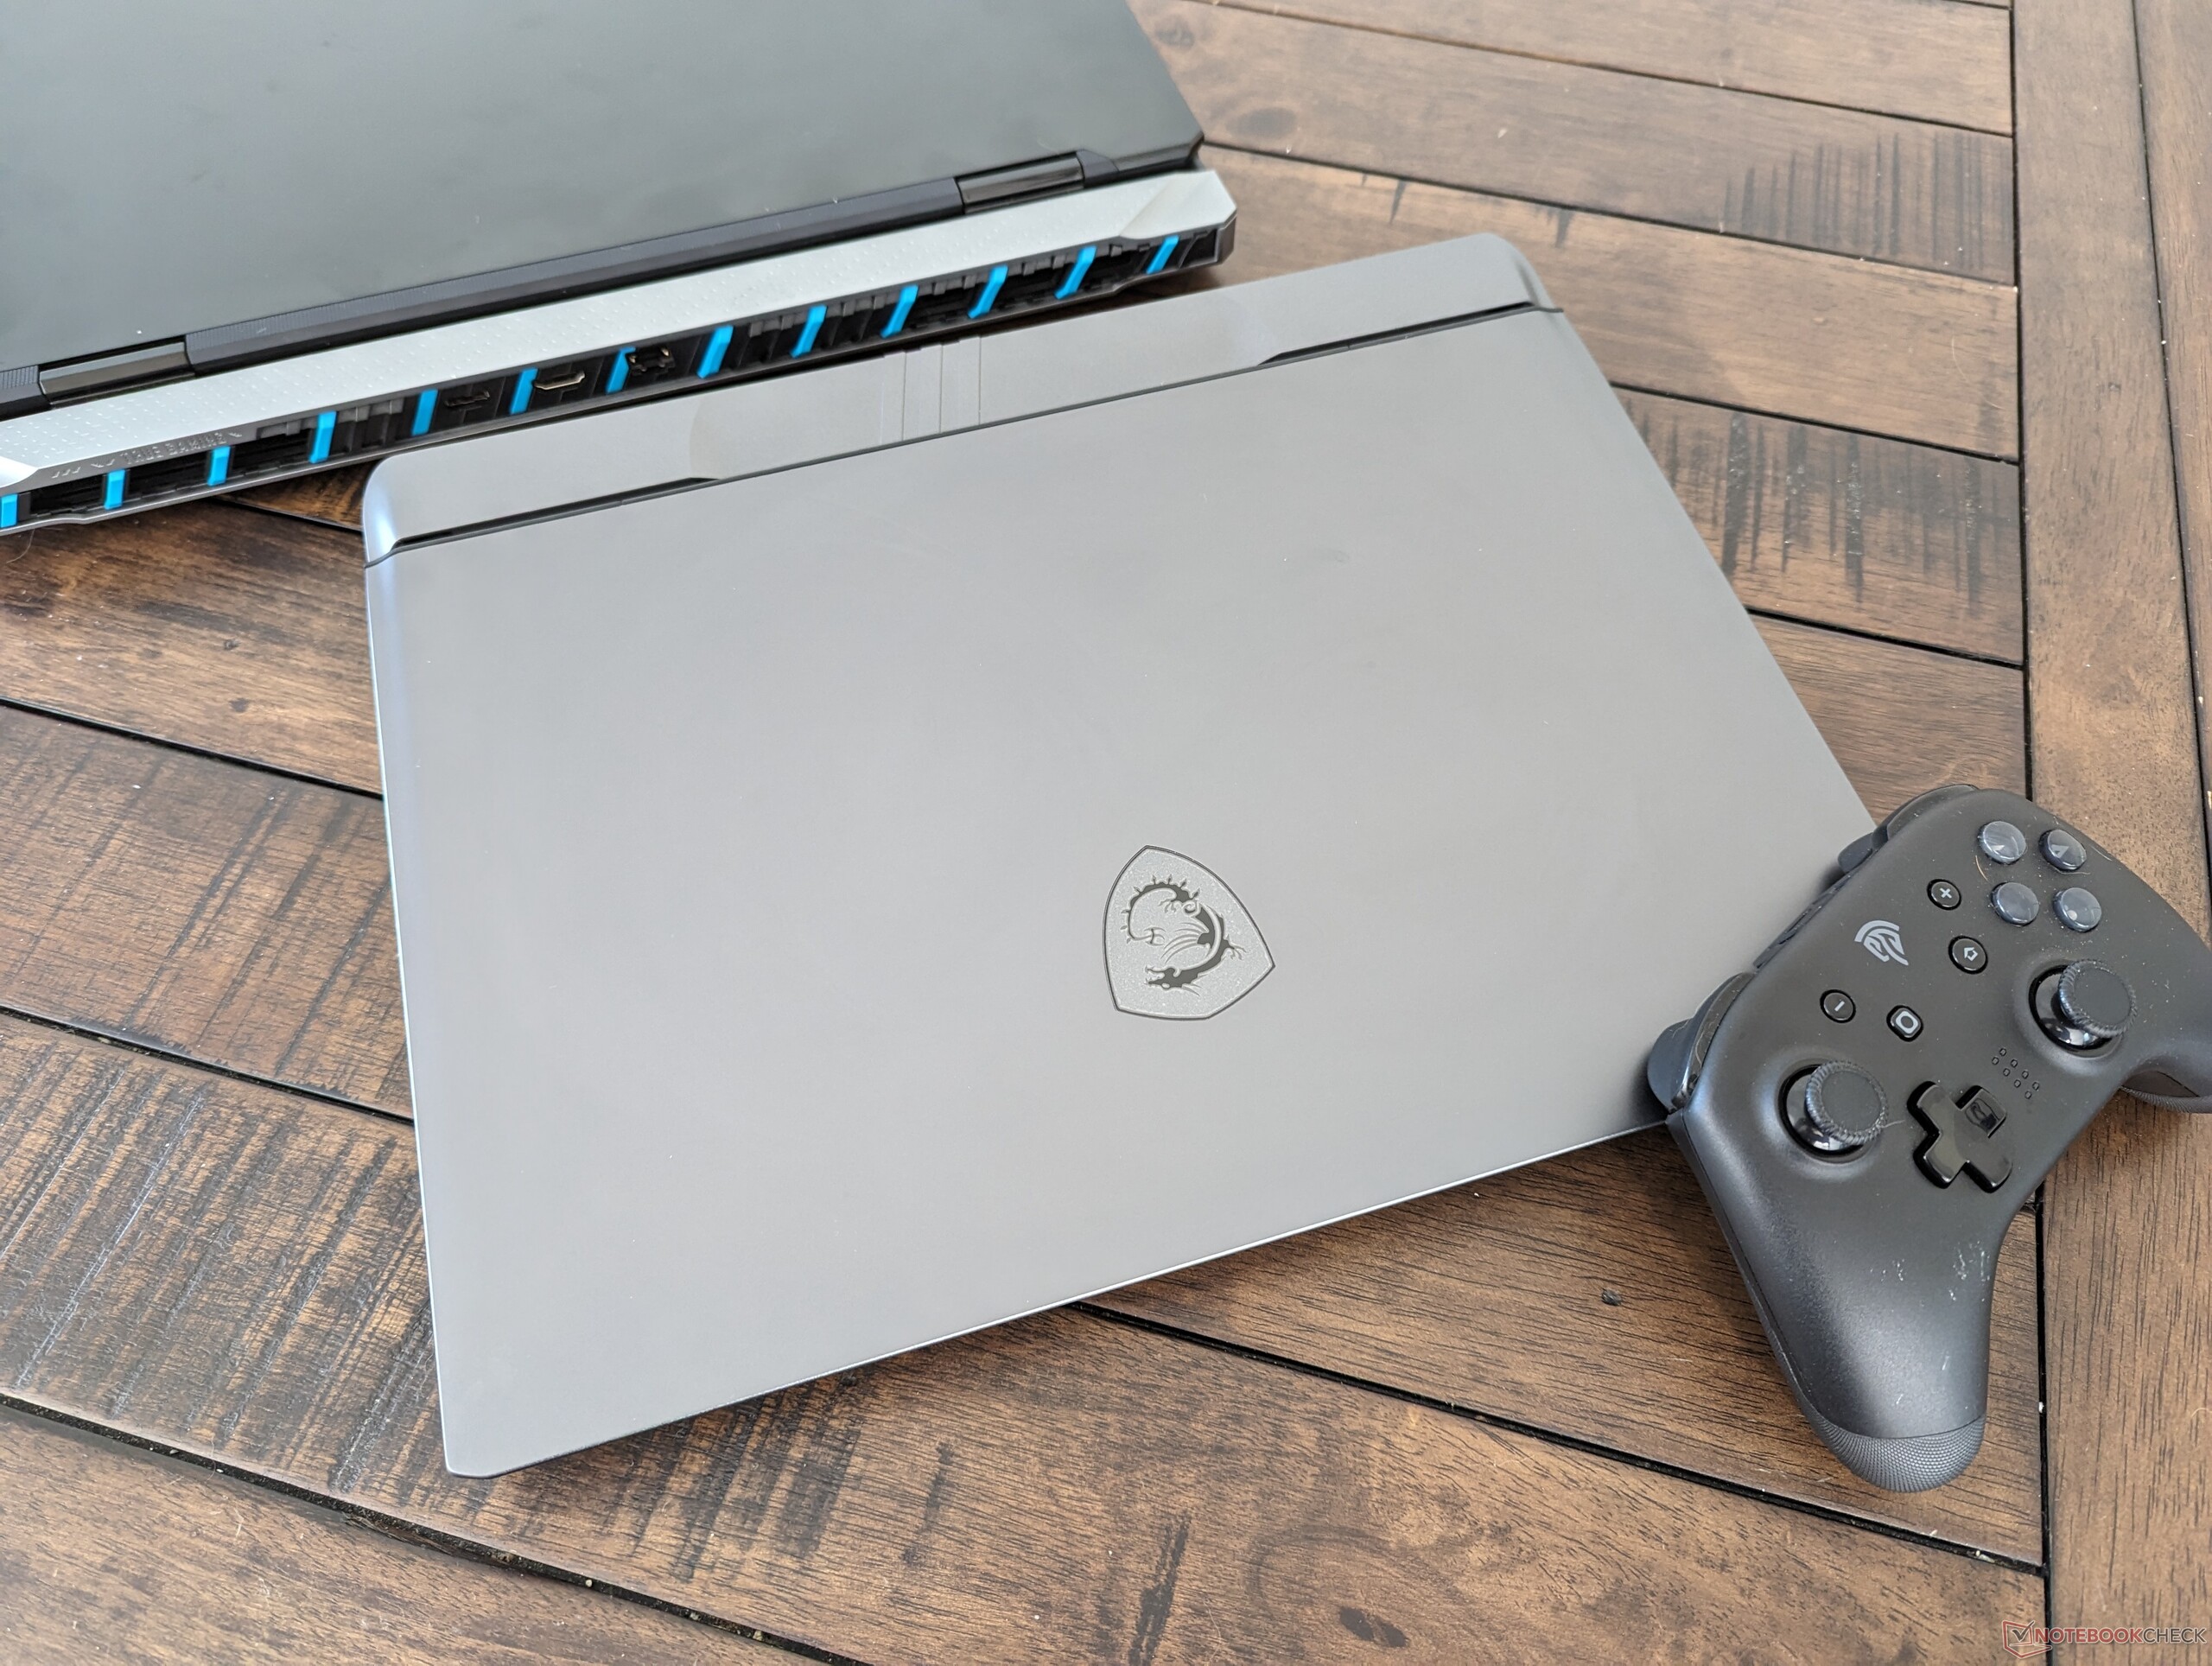
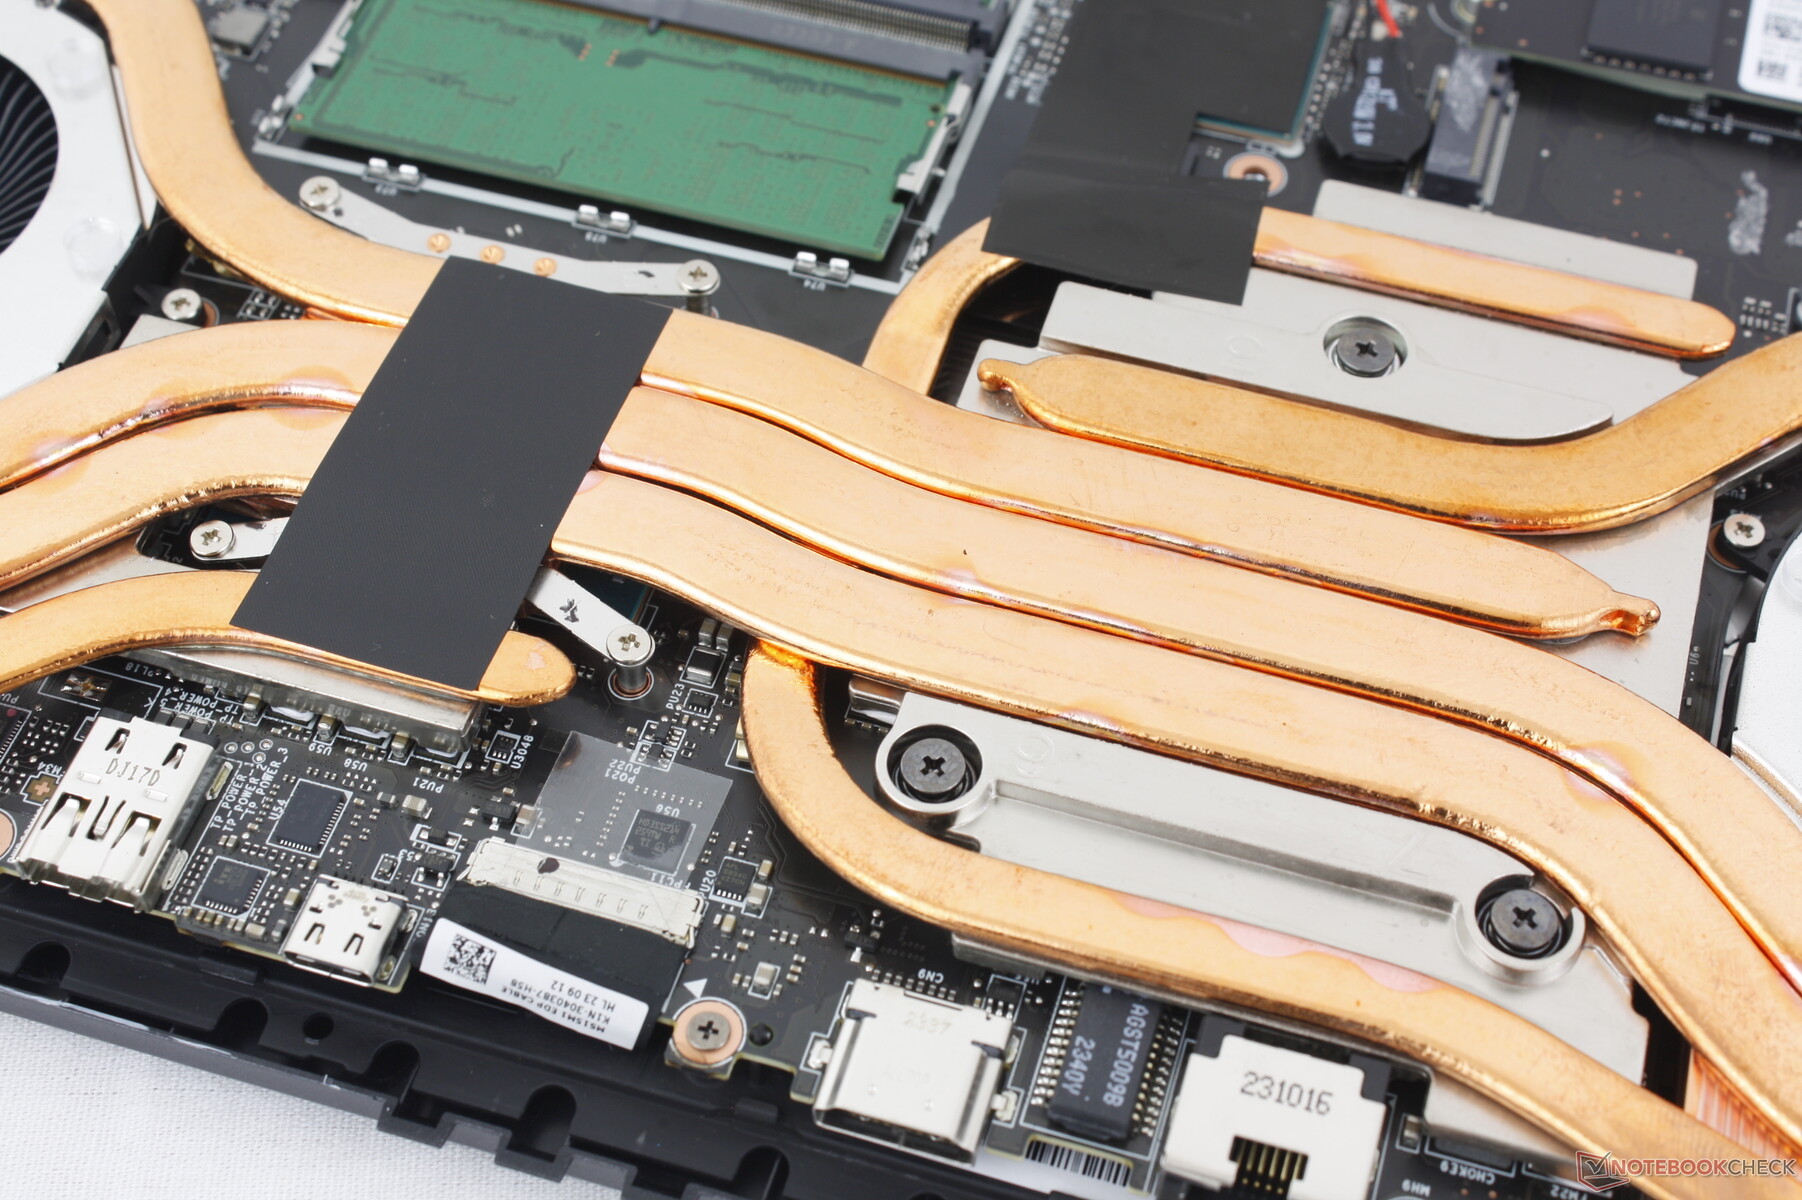
Vector 16 HX to duży laptop i nie da się tego obejść. Jego ambitny cel 175 W TGP (lub 240 W w połączeniu z procesorem) wymaga mocniejszego rozwiązania chłodzącego i większej konstrukcji obudowy niż większość innych 16-calowych modeli. MSI jest nawet większy i cięższy niż zeszłoroczny Dell G16 7620 który był już dość sporych rozmiarów. Na szczęście nie jest tak ciężki jak 18-calowy Razer Blade 18 lub Asus ROG Strix Scar 18ale nie jest też do końca przenośny.
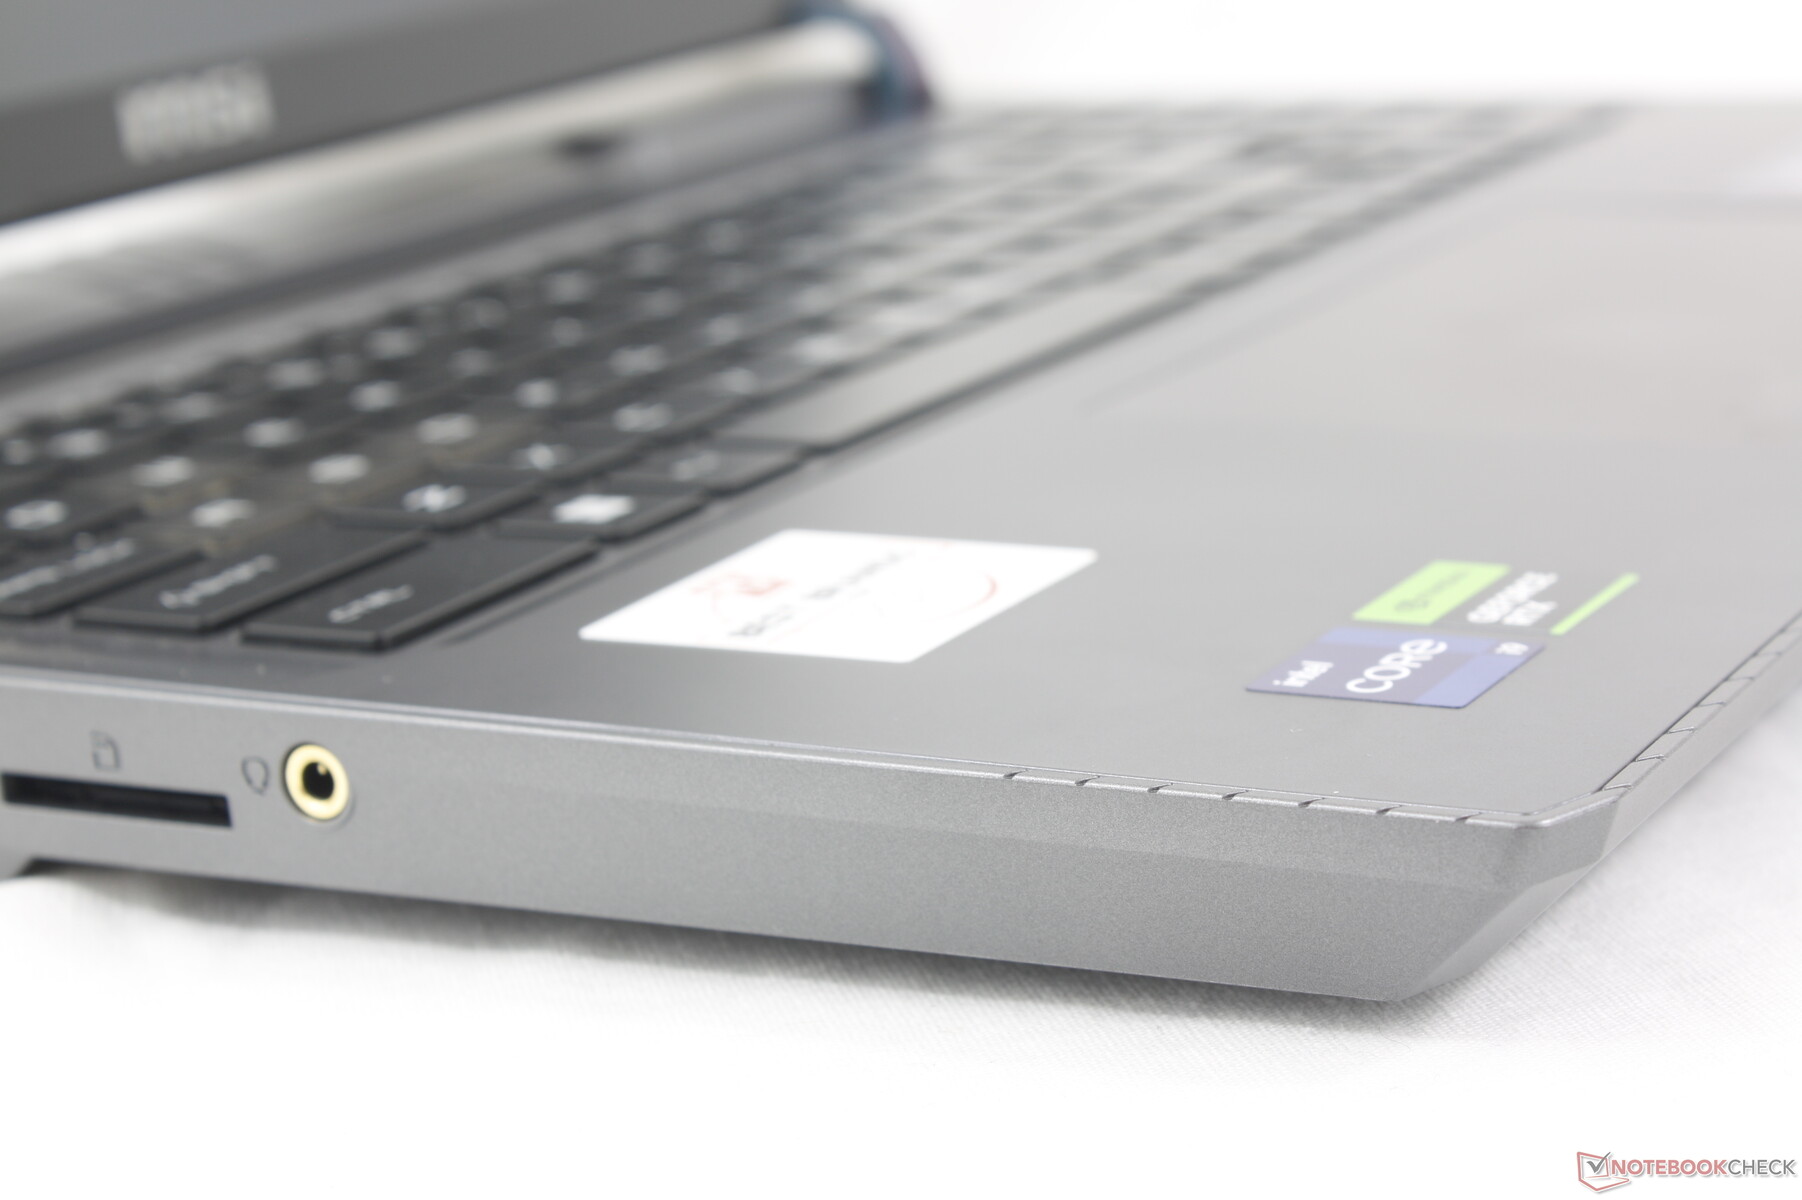
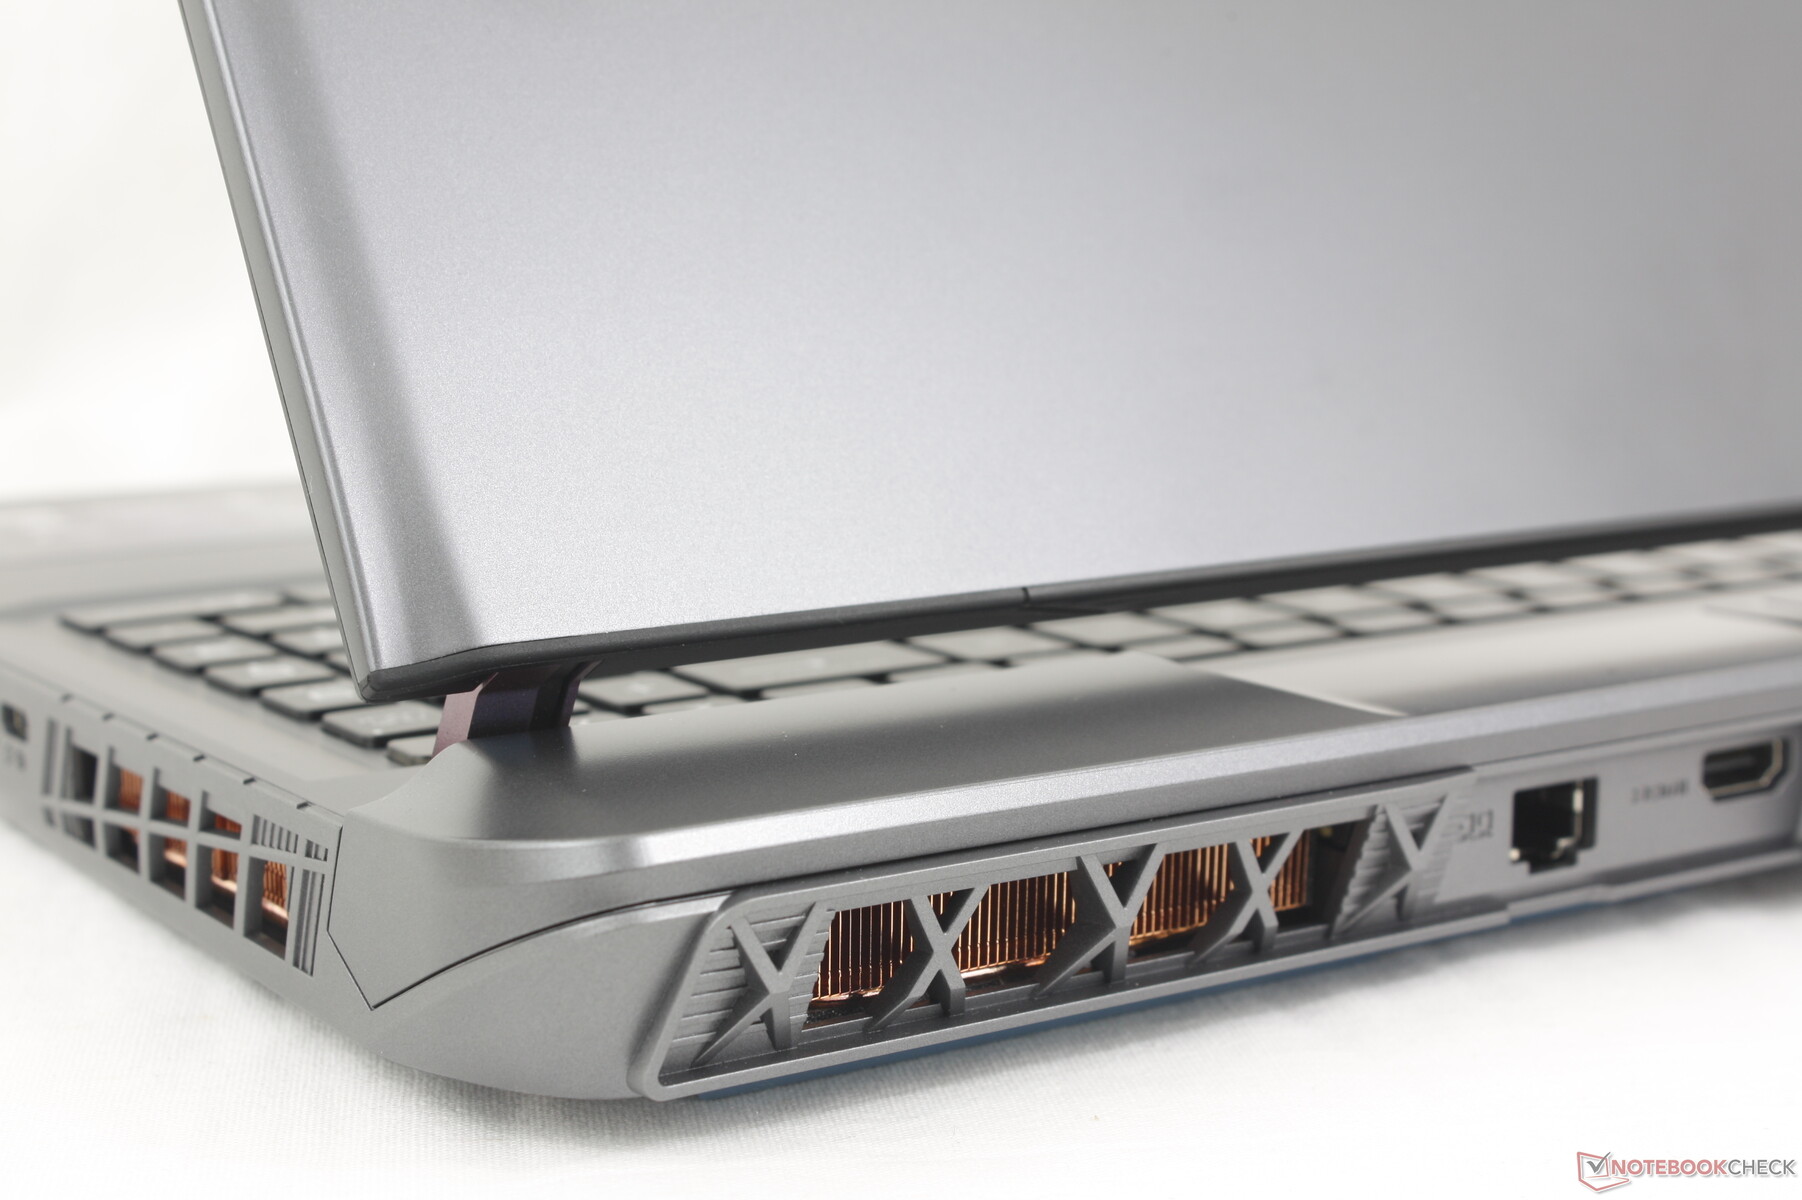
Łączność
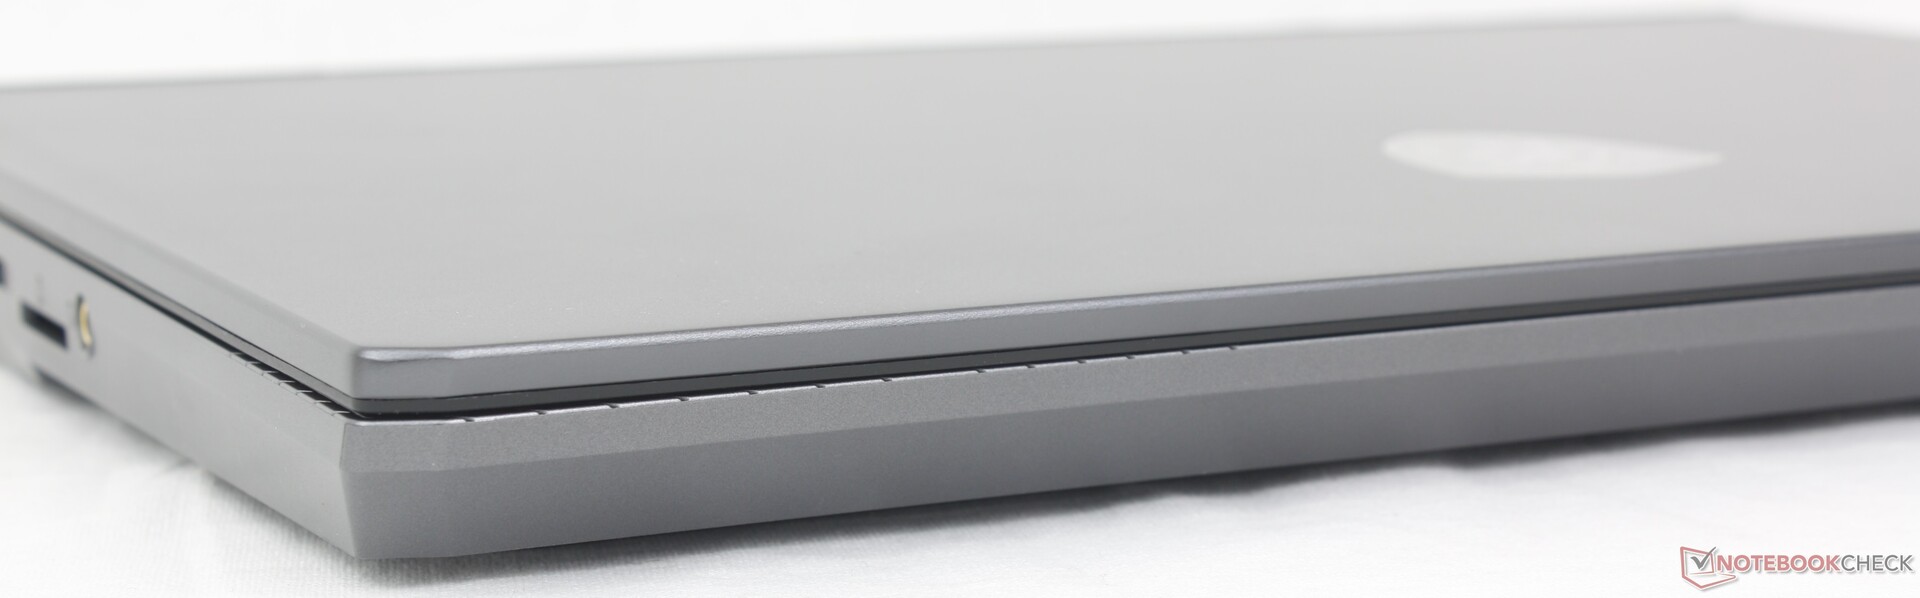
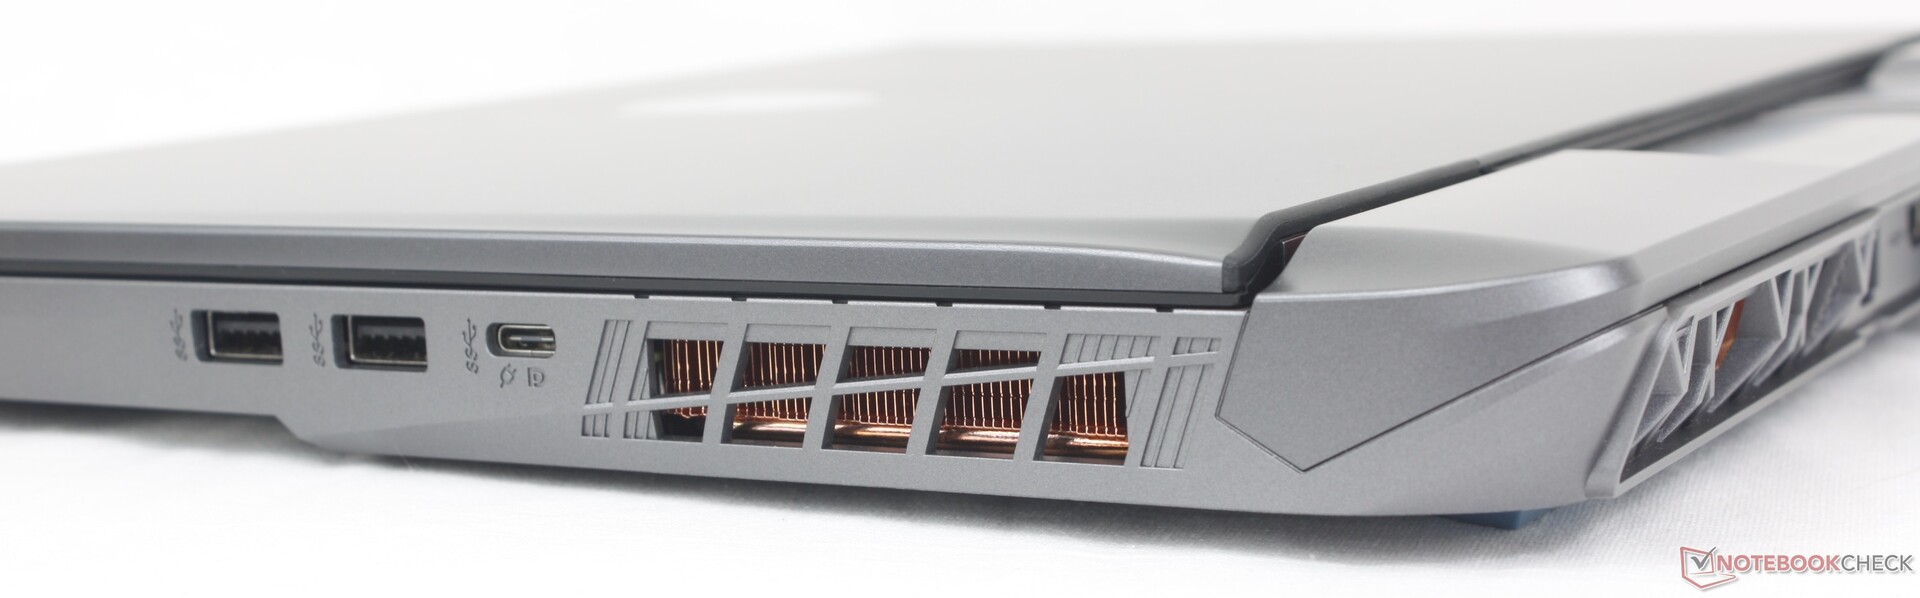
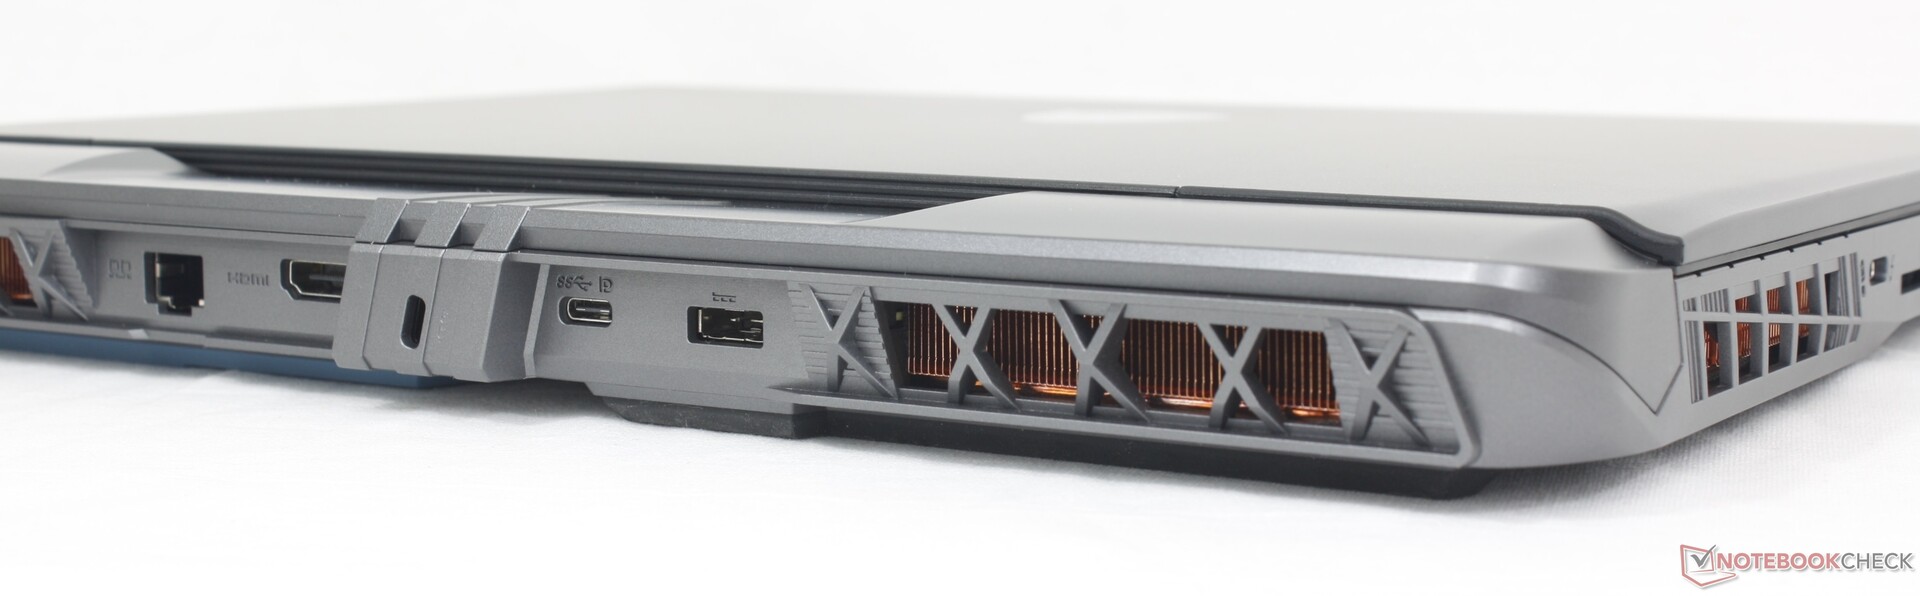
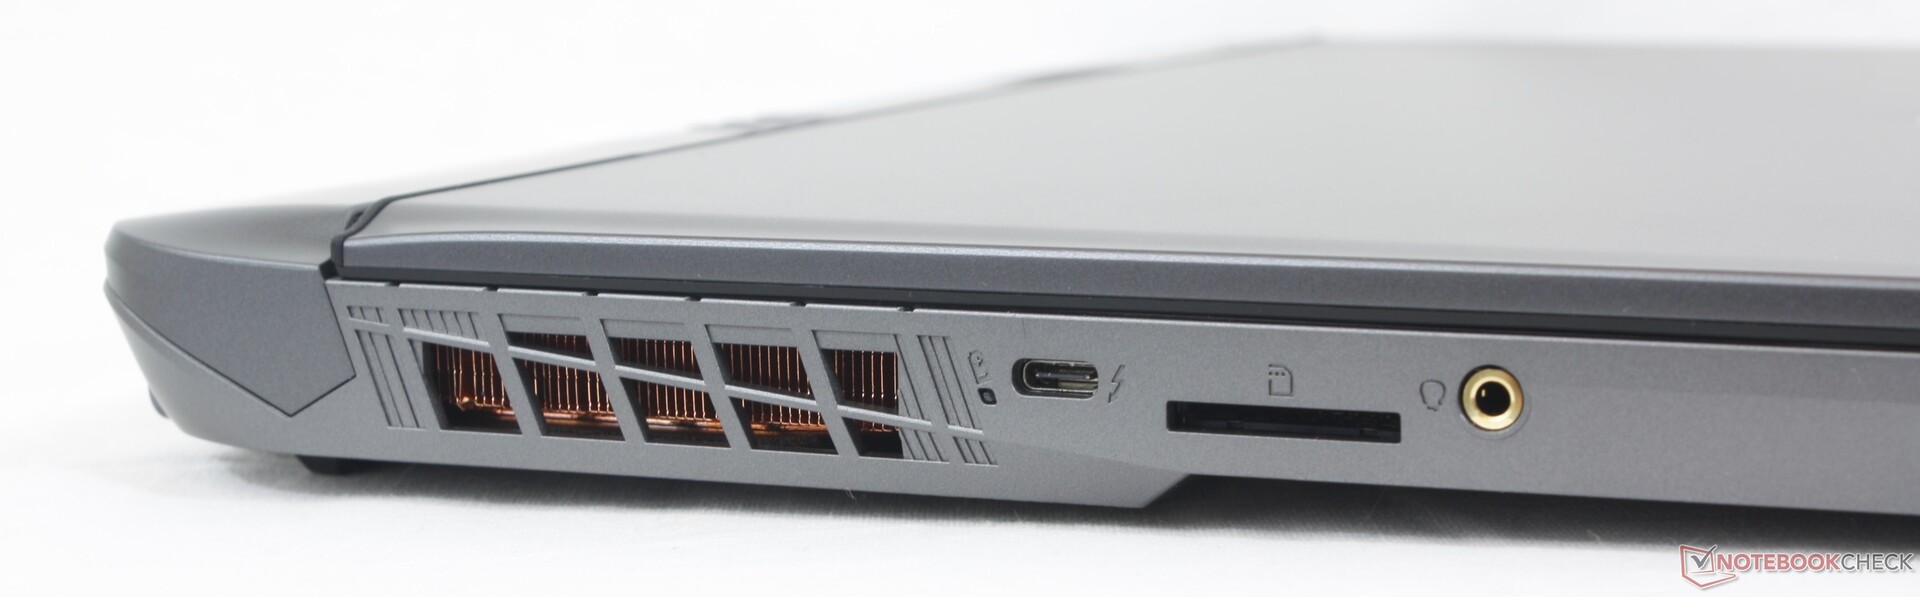
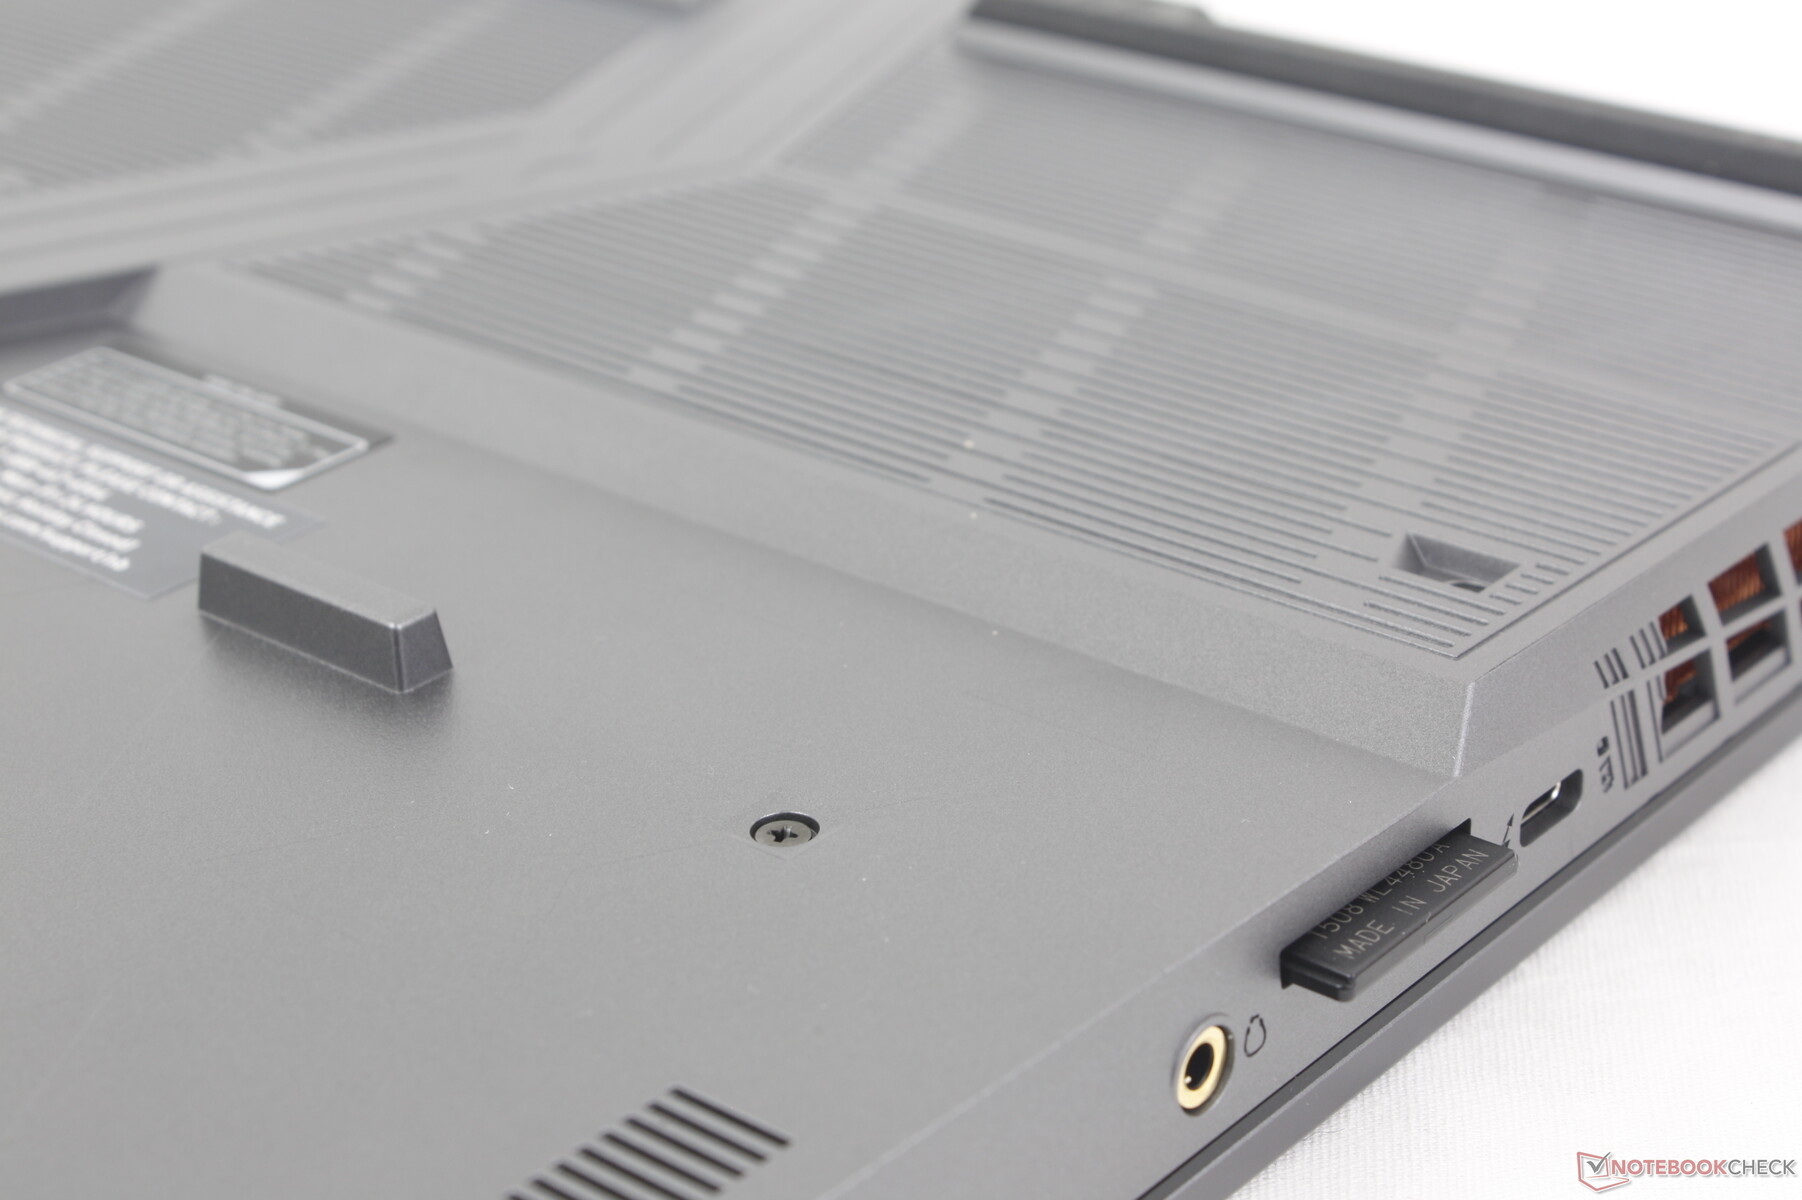
MSI zmieniło porty w porównaniu do GP66. Nowością w Vector 16 HX jest czytnik kart SD i dodatkowe porty USB-C, teraz z odpowiednią obsługą Thunderbolt. W zamian jednak nowszy model ma mniej portów USB-A i zrezygnował z dedykowanego mini-DisplayPort. To nadal wypada korzystnie na tle konkurentów, takich jak Dell G16 lub Asus TUF Gaming A16 które mają mniej portów USB-C lub nie mają czytnika kart SD.
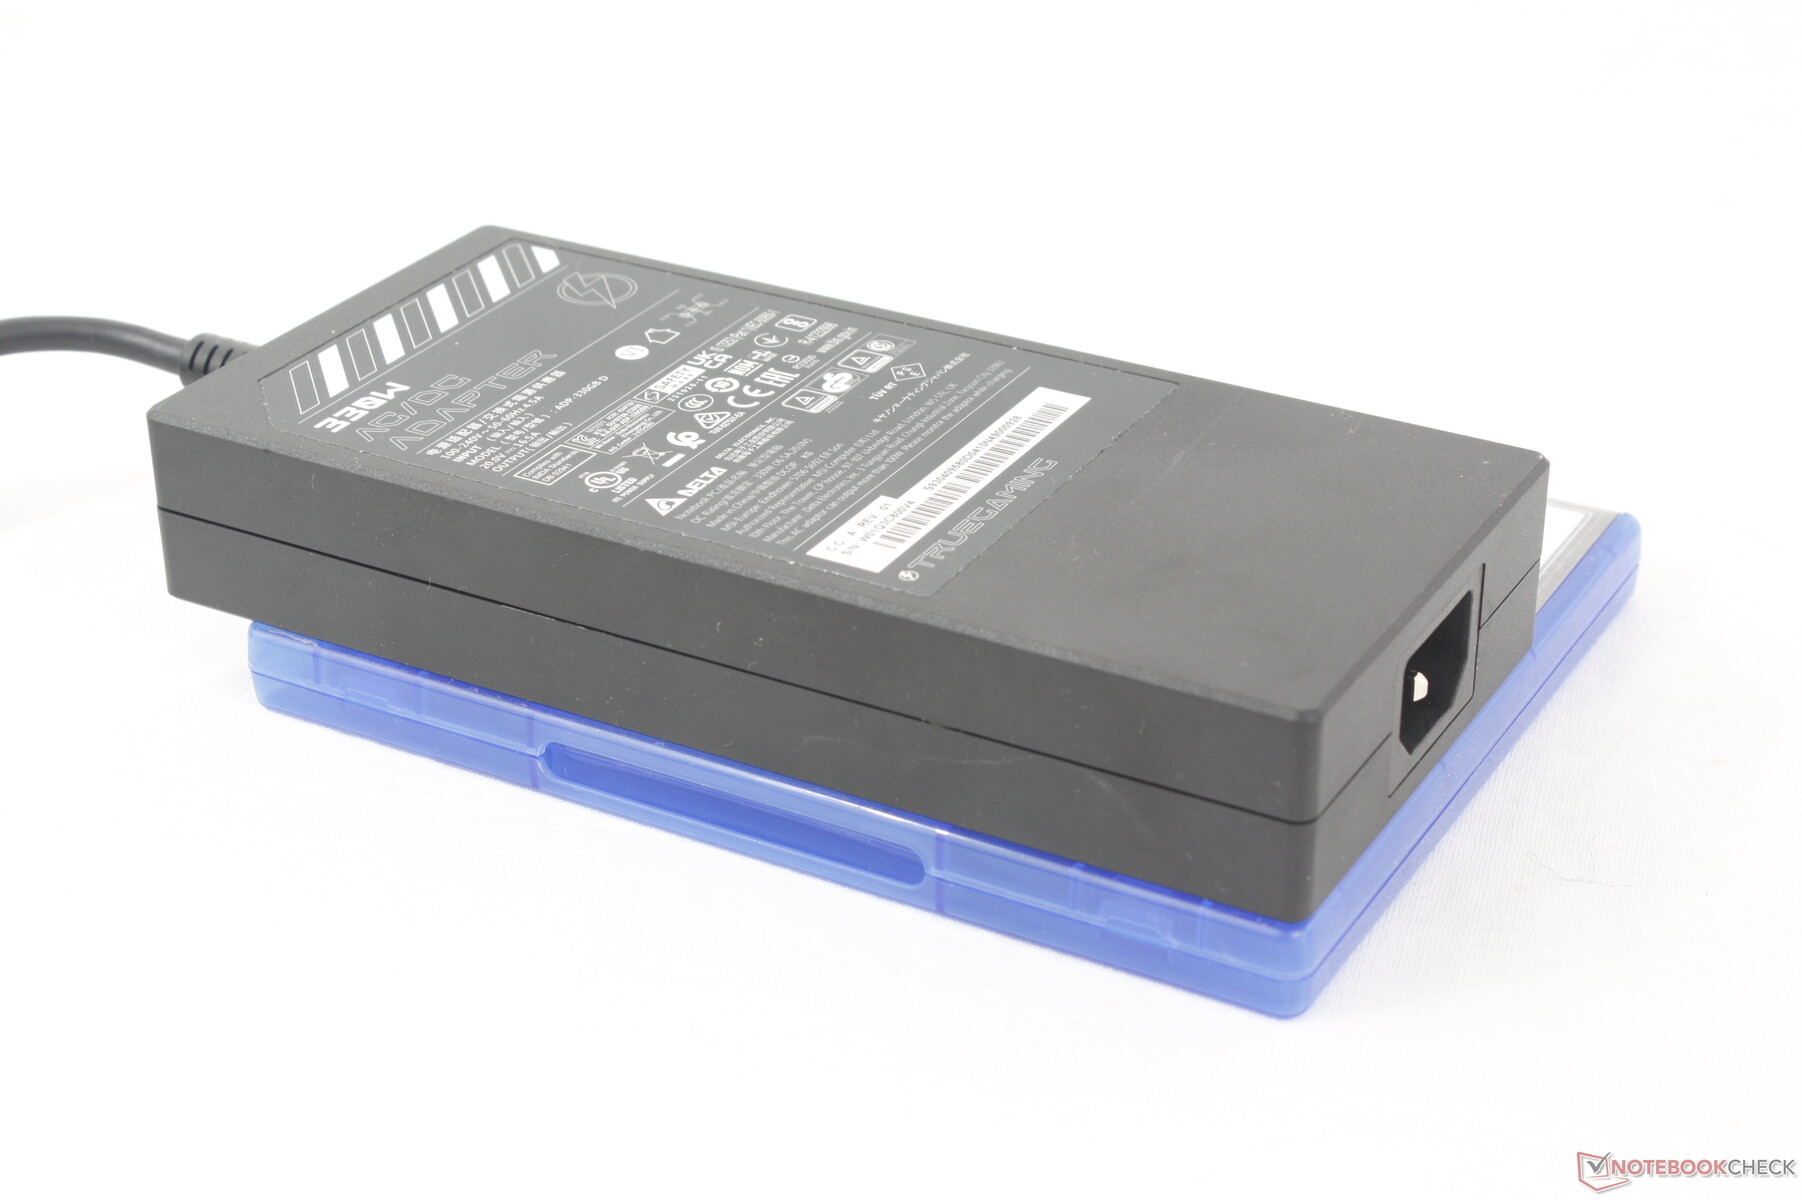
Proszę zauważyć, że port zasilacza sieciowego jest identyczny jak w Titan 18 HX, mimo że rozmiary zasilaczy mogą się różnić.
Czytnik kart SD
Szybkość transferu ze zintegrowanego czytnika kart SD jest przyzwoita i wynosi około 90 MB/s, co oznacza, że jest od 2x do 3x szybsza niż w przypadku czytnika kart znajdującego się w nowych laptopach Lenovo Lenovo Legion 5 16. Jednak czytnik w MSI nie jest sprężynowy, więc włożona karta SD może być trudna do wyjęcia większymi palcami.
| SD Card Reader | |
| average JPG Copy Test (av. of 3 runs) | |
| MSI Vector 16 HX A14V (Toshiba Exceria Pro SDXC 64 GB UHS-II) | |
| Lenovo Legion 5 16IRX G9 | |
| maximum AS SSD Seq Read Test (1GB) | |
| MSI Vector 16 HX A14V (Toshiba Exceria Pro SDXC 64 GB UHS-II) | |
| Lenovo Legion 5 16IRX G9 | |
Komunikacja
Killer BE1750x jest kompatybilny z Wi-Fi 7 i Bluetooth 5.4, mimo że routery Wi-Fi 7 nie są jeszcze popularne. Jego włączenie jest zatem bardziej związane z zabezpieczeniem na przyszłość, ponieważ większość użytkowników nie ma obecnie routerów Wi-Fi 7. Niemniej jednak szybkość transferu jest stabilna i niezawodna po sparowaniu z naszym routerem testowym Asus AXE11000 Wi-Fi 6E.
| Networking | |
| iperf3 transmit AX12 | |
| MSI Vector GP66 12UGS | |
| iperf3 receive AX12 | |
| MSI Vector GP66 12UGS | |
| iperf3 transmit AXE11000 | |
| Lenovo Legion 5 16IRX G9 | |
| MSI Vector 16 HX A14V | |
| Dell G16 7620 | |
| Asus TUF Gaming A16 FA617XS | |
| HP Victus 16-r0077ng | |
| iperf3 receive AXE11000 | |
| Lenovo Legion 5 16IRX G9 | |
| MSI Vector 16 HX A14V | |
| Dell G16 7620 | |
| Asus TUF Gaming A16 FA617XS | |
| HP Victus 16-r0077ng | |
| iperf3 transmit AXE11000 6GHz | |
| MSI Vector 16 HX A14V | |
| iperf3 receive AXE11000 6GHz | |
| MSI Vector 16 HX A14V | |
Kamera internetowa
Zintegrowana kamera internetowa ma marne 1 MP, ponieważ Vector nie jest przeznaczony do częstych wideokonferencji. Podczerwień również nie jest obsługiwana, ale przynajmniej zawiera fizyczną migawkę dla celów prywatności.


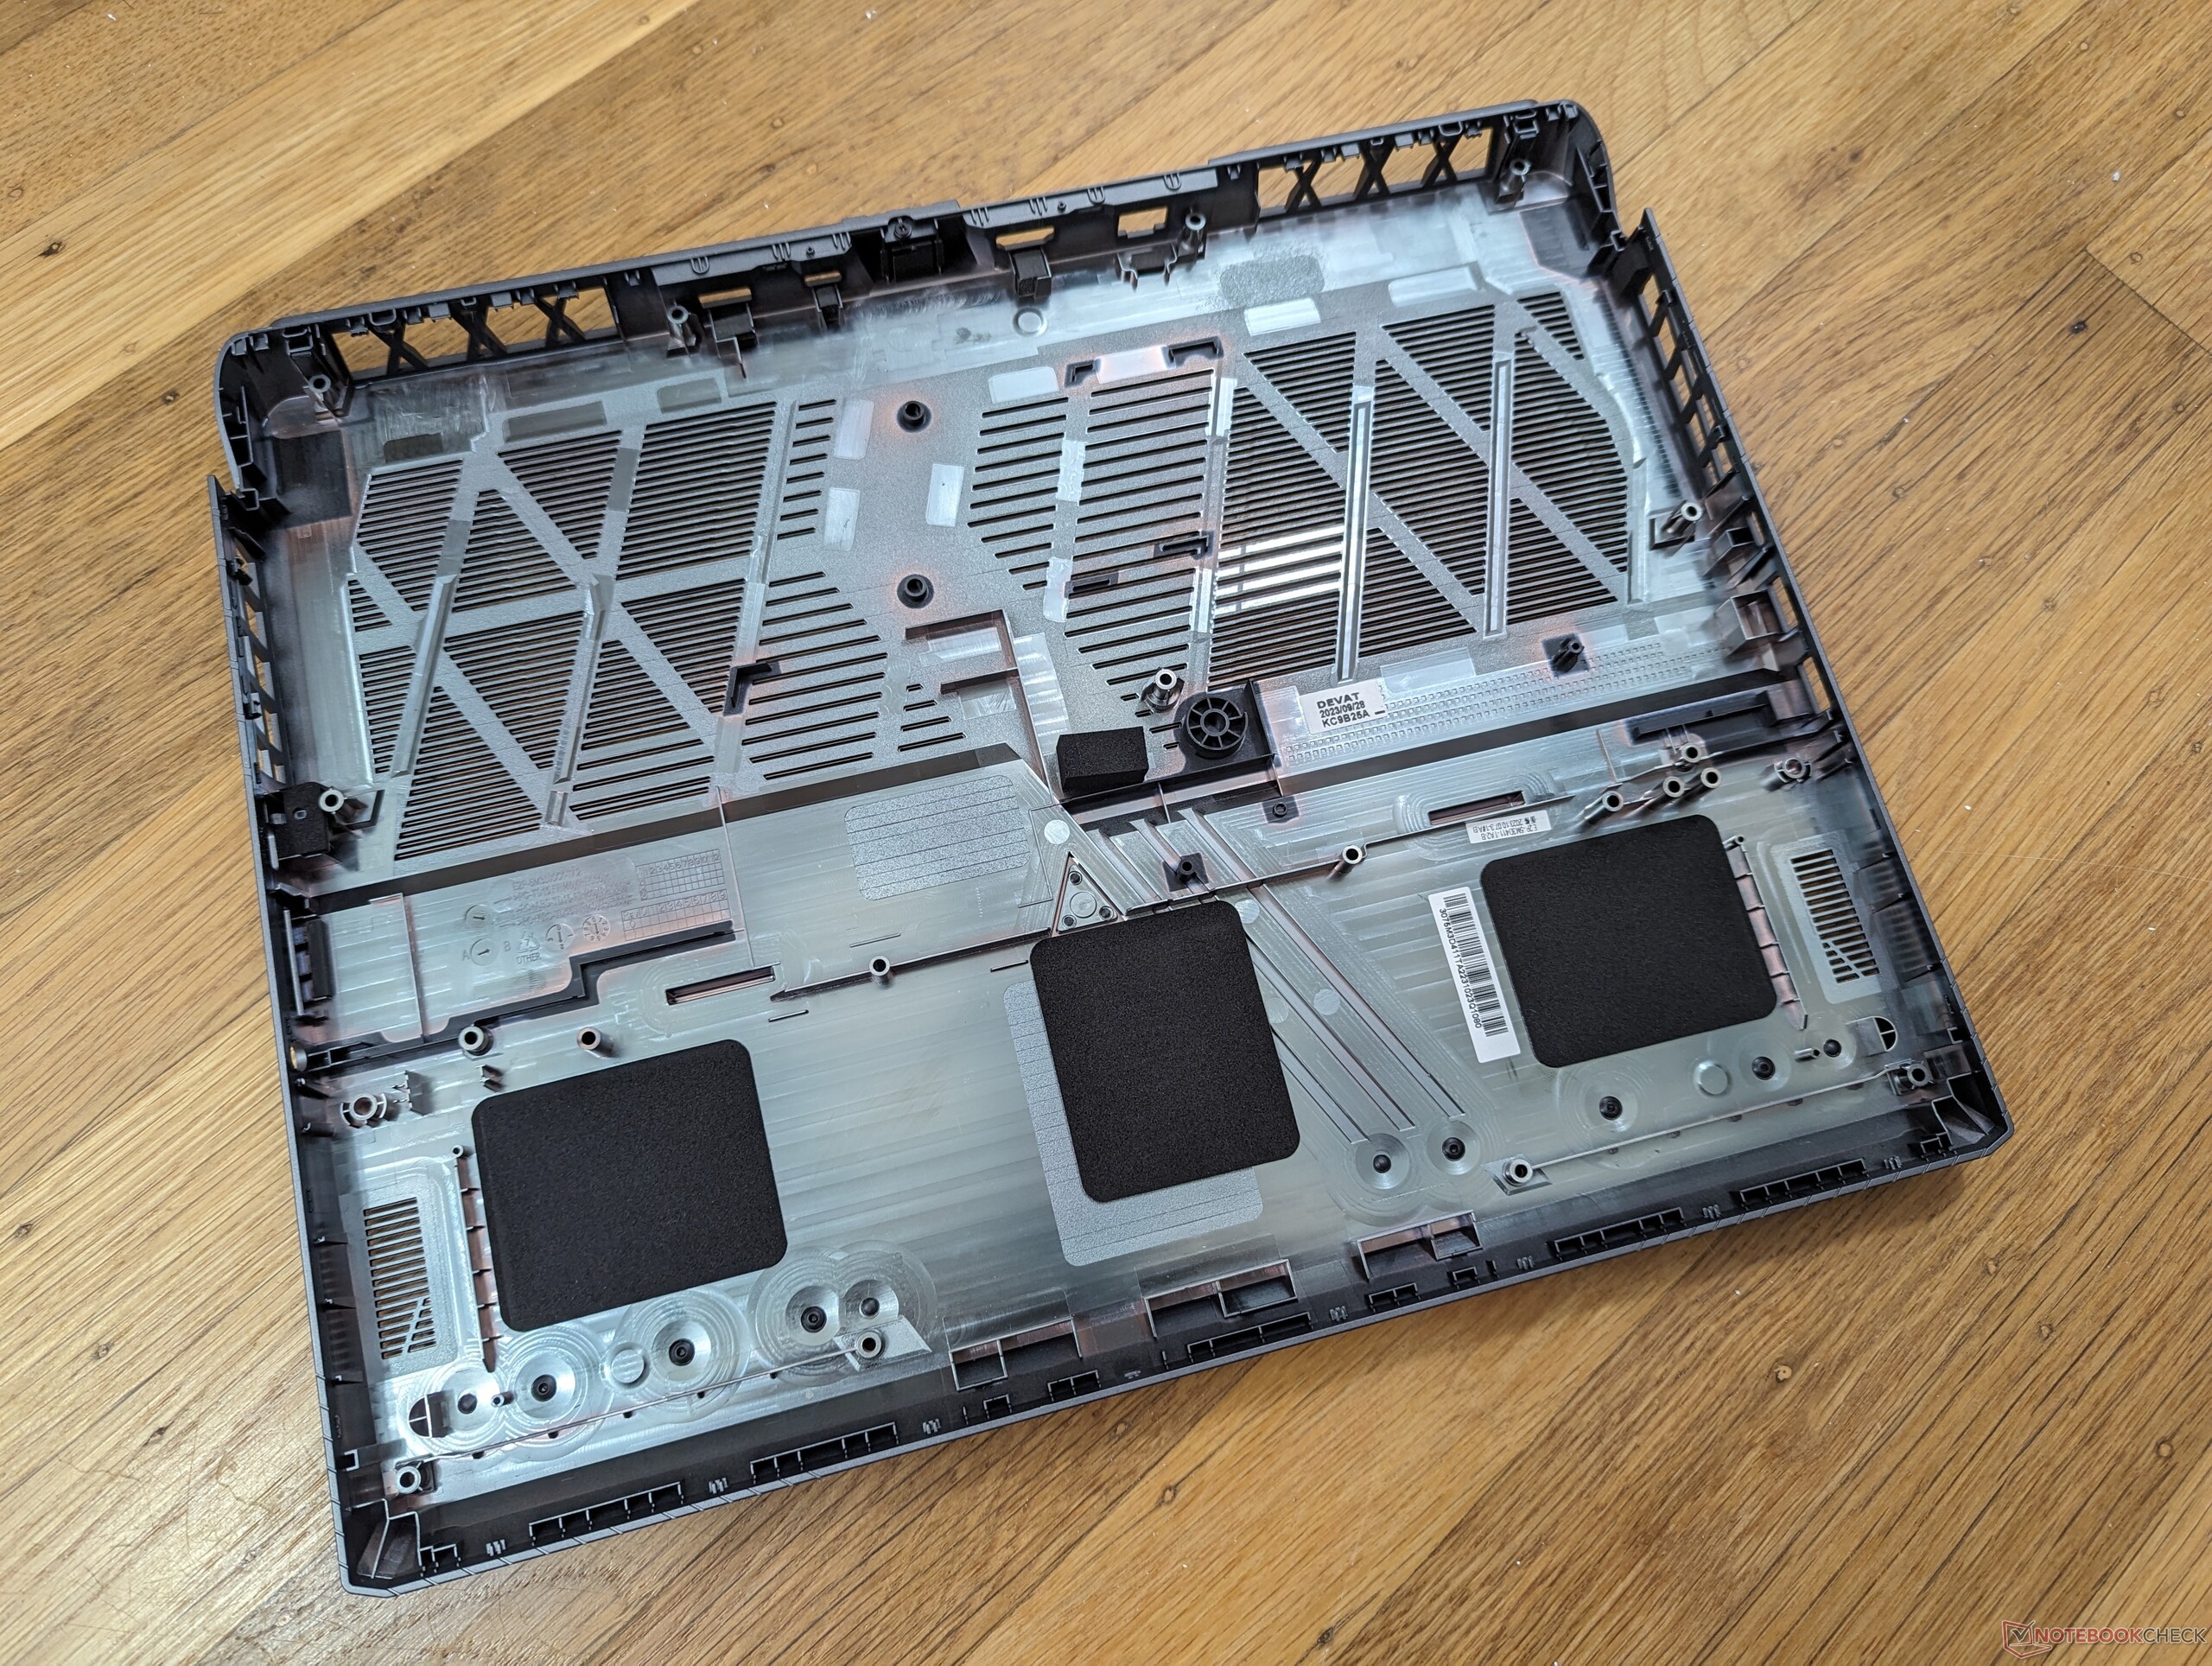
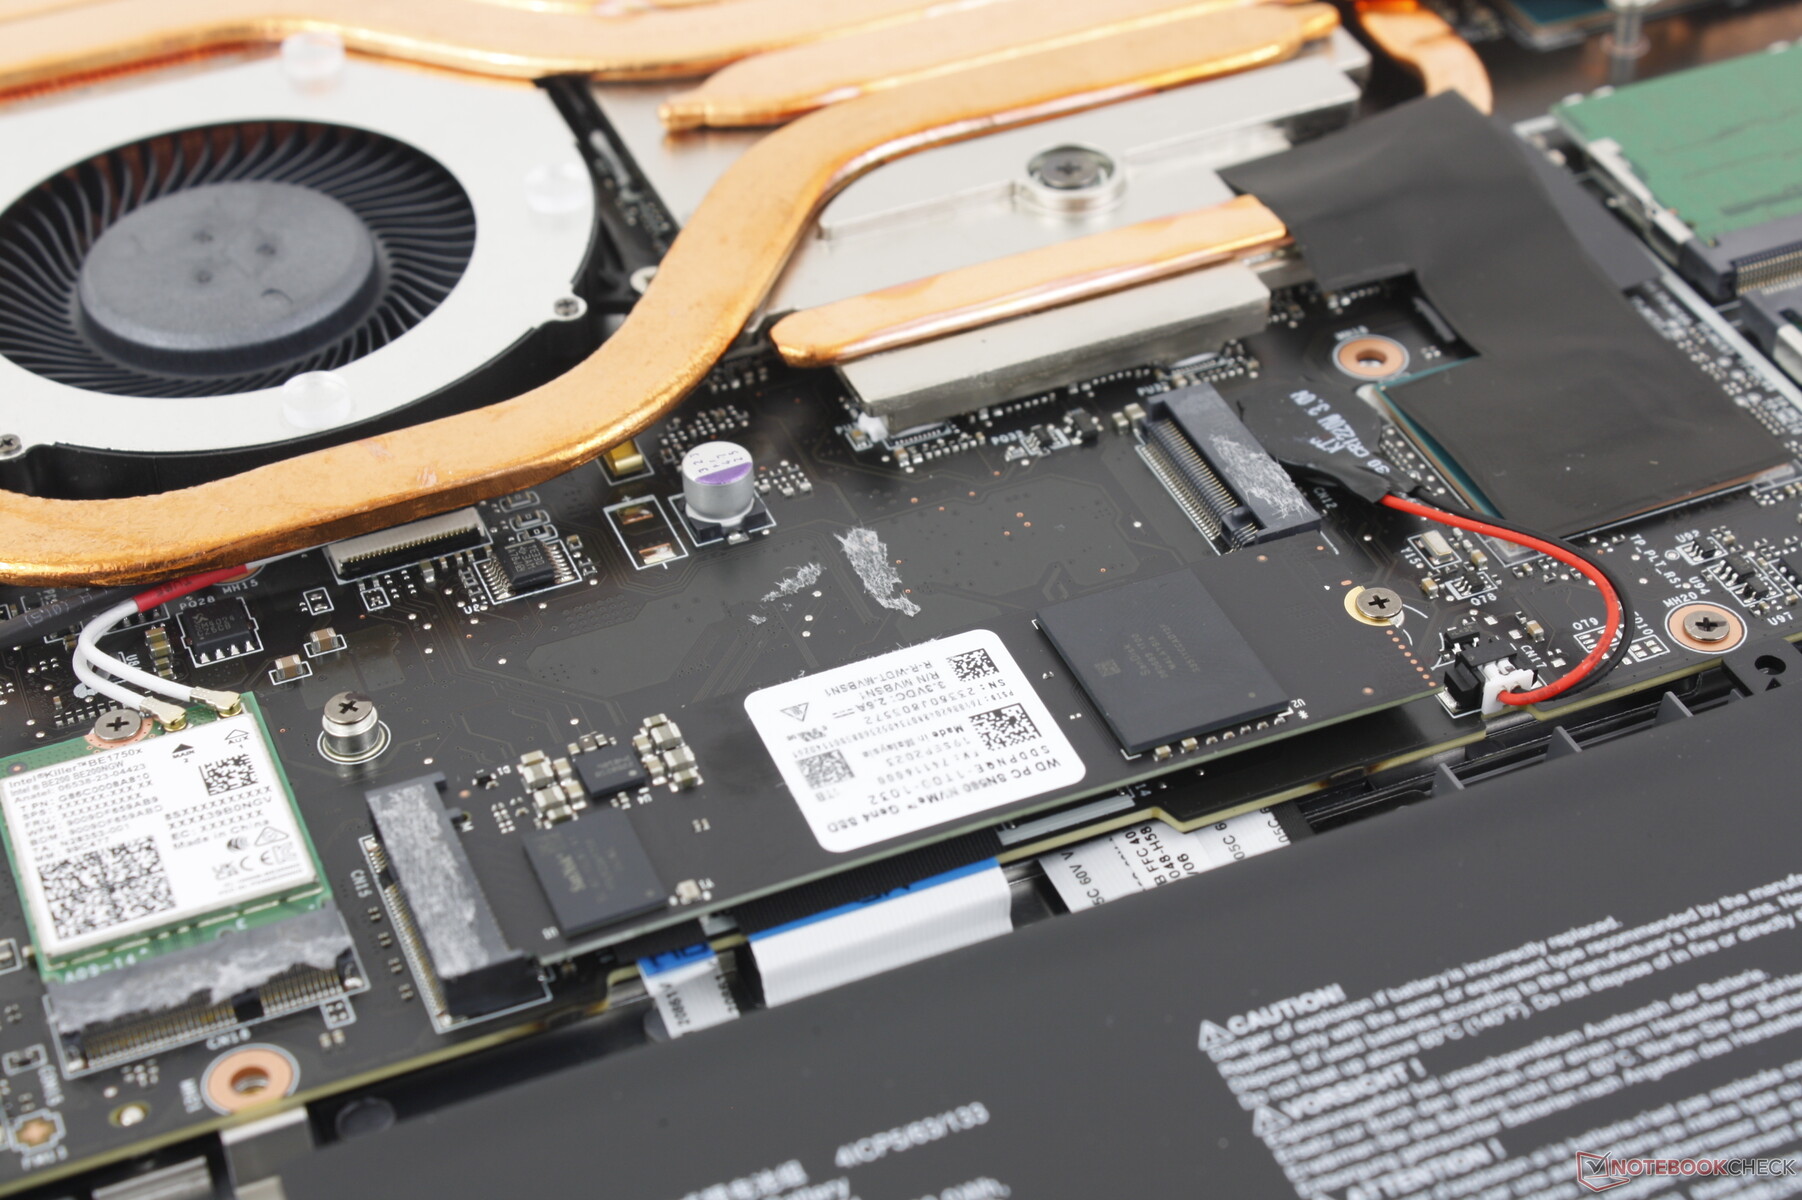
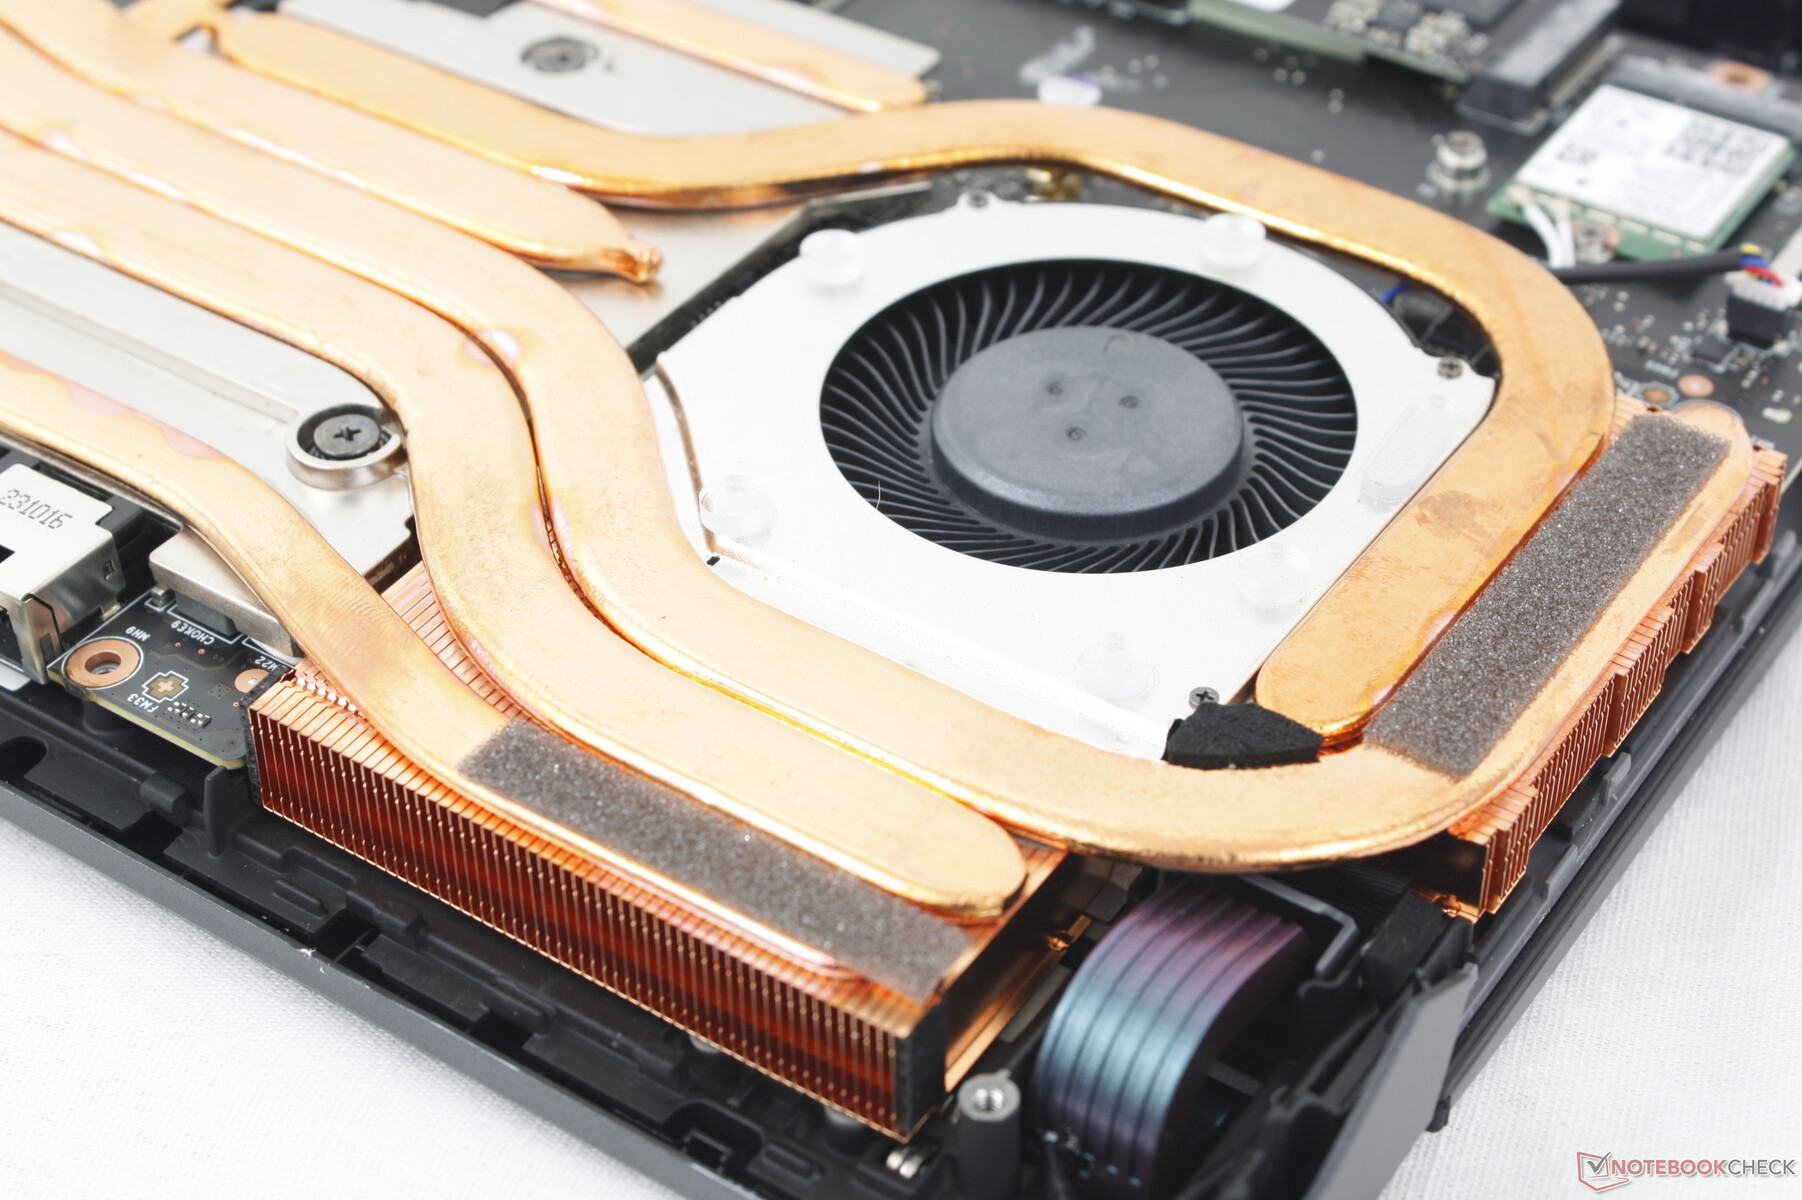
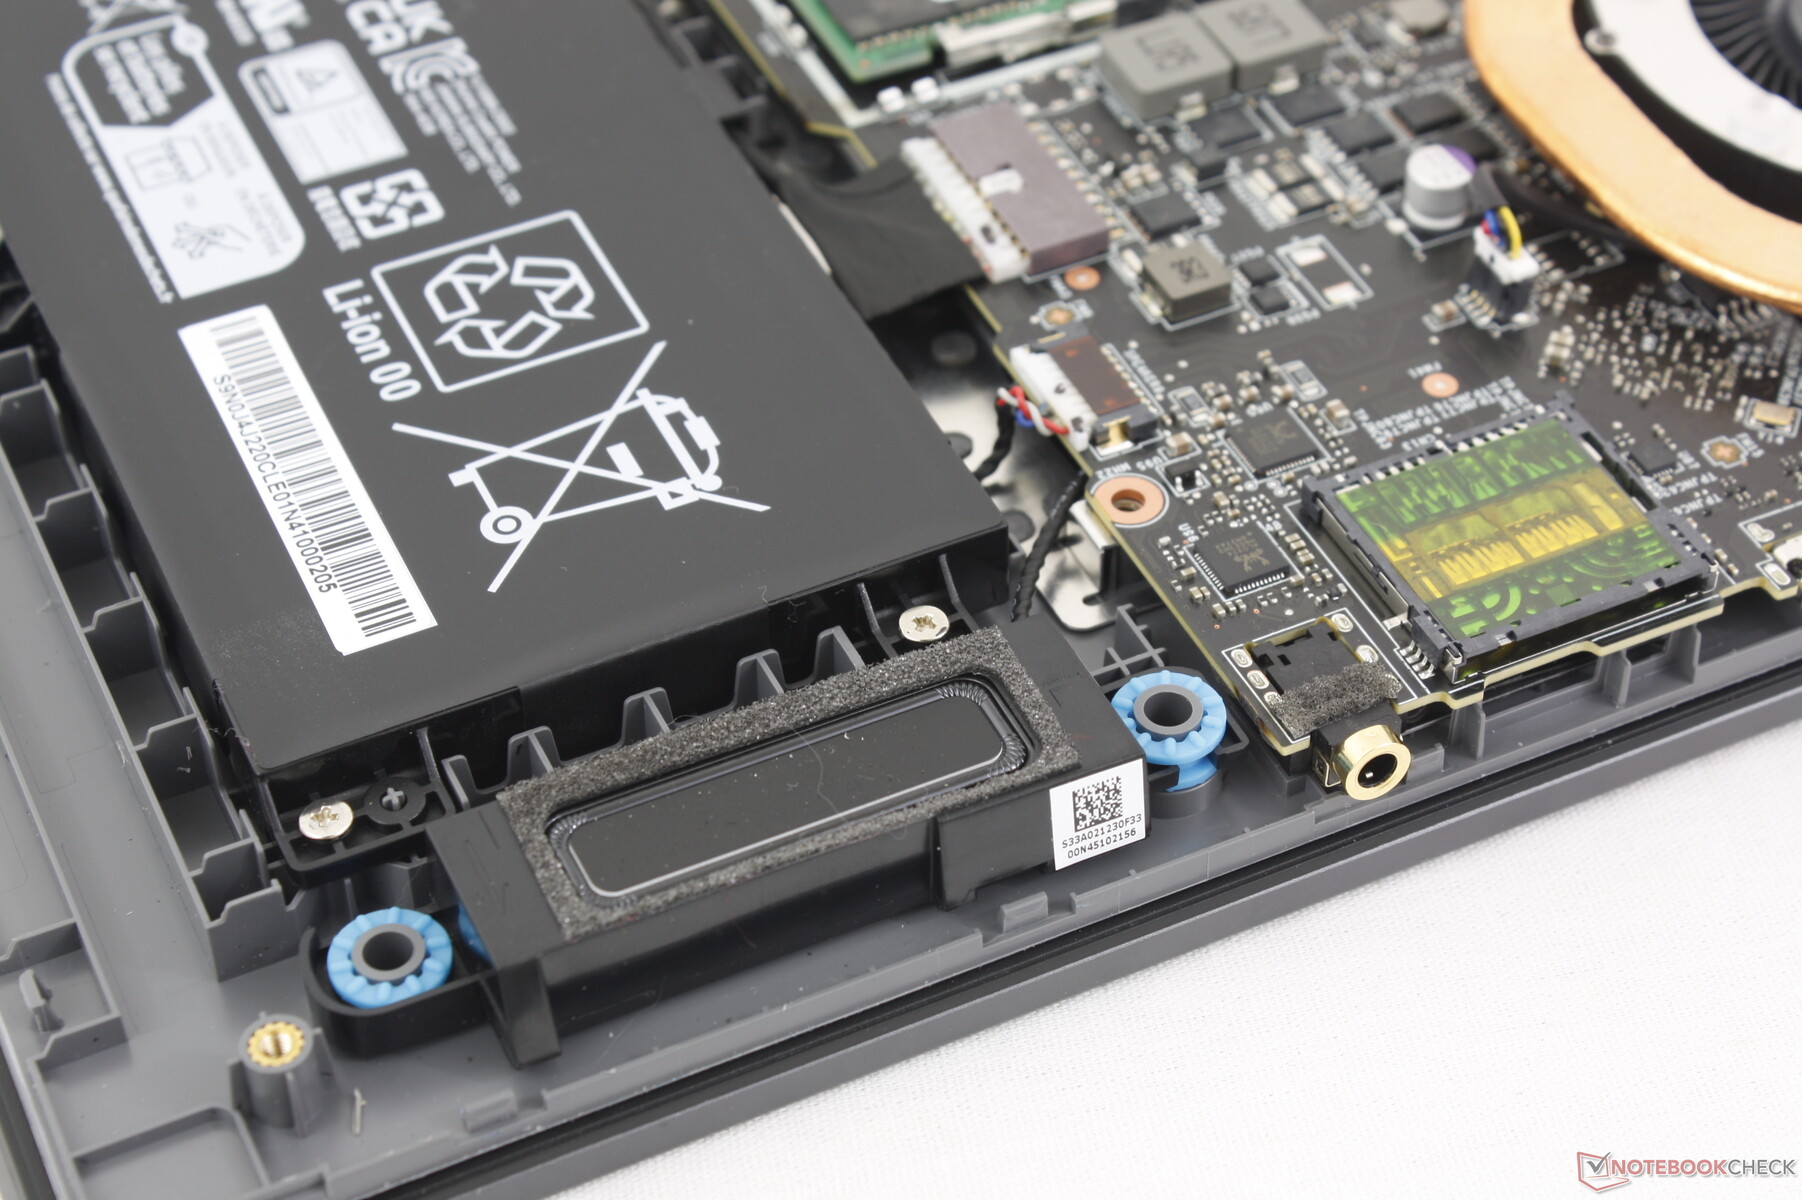
Konserwacja
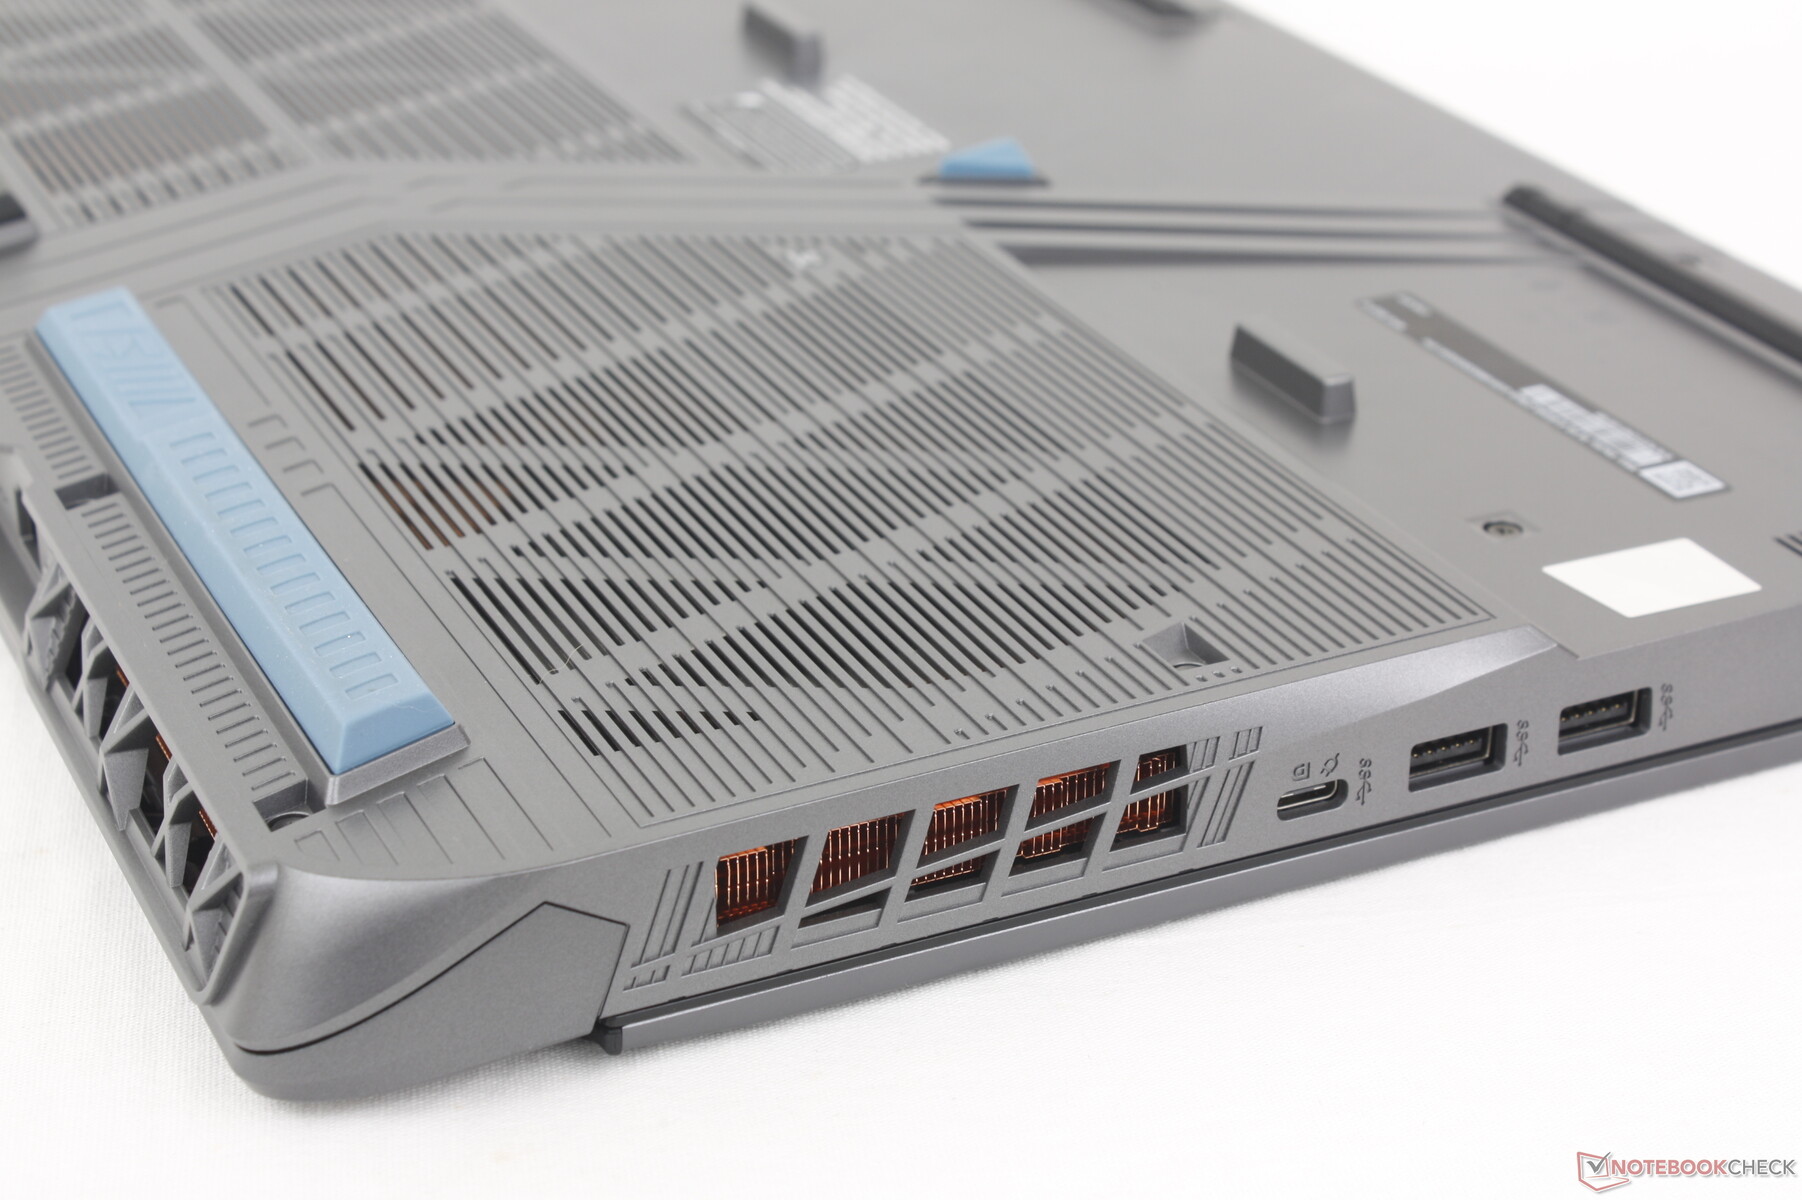
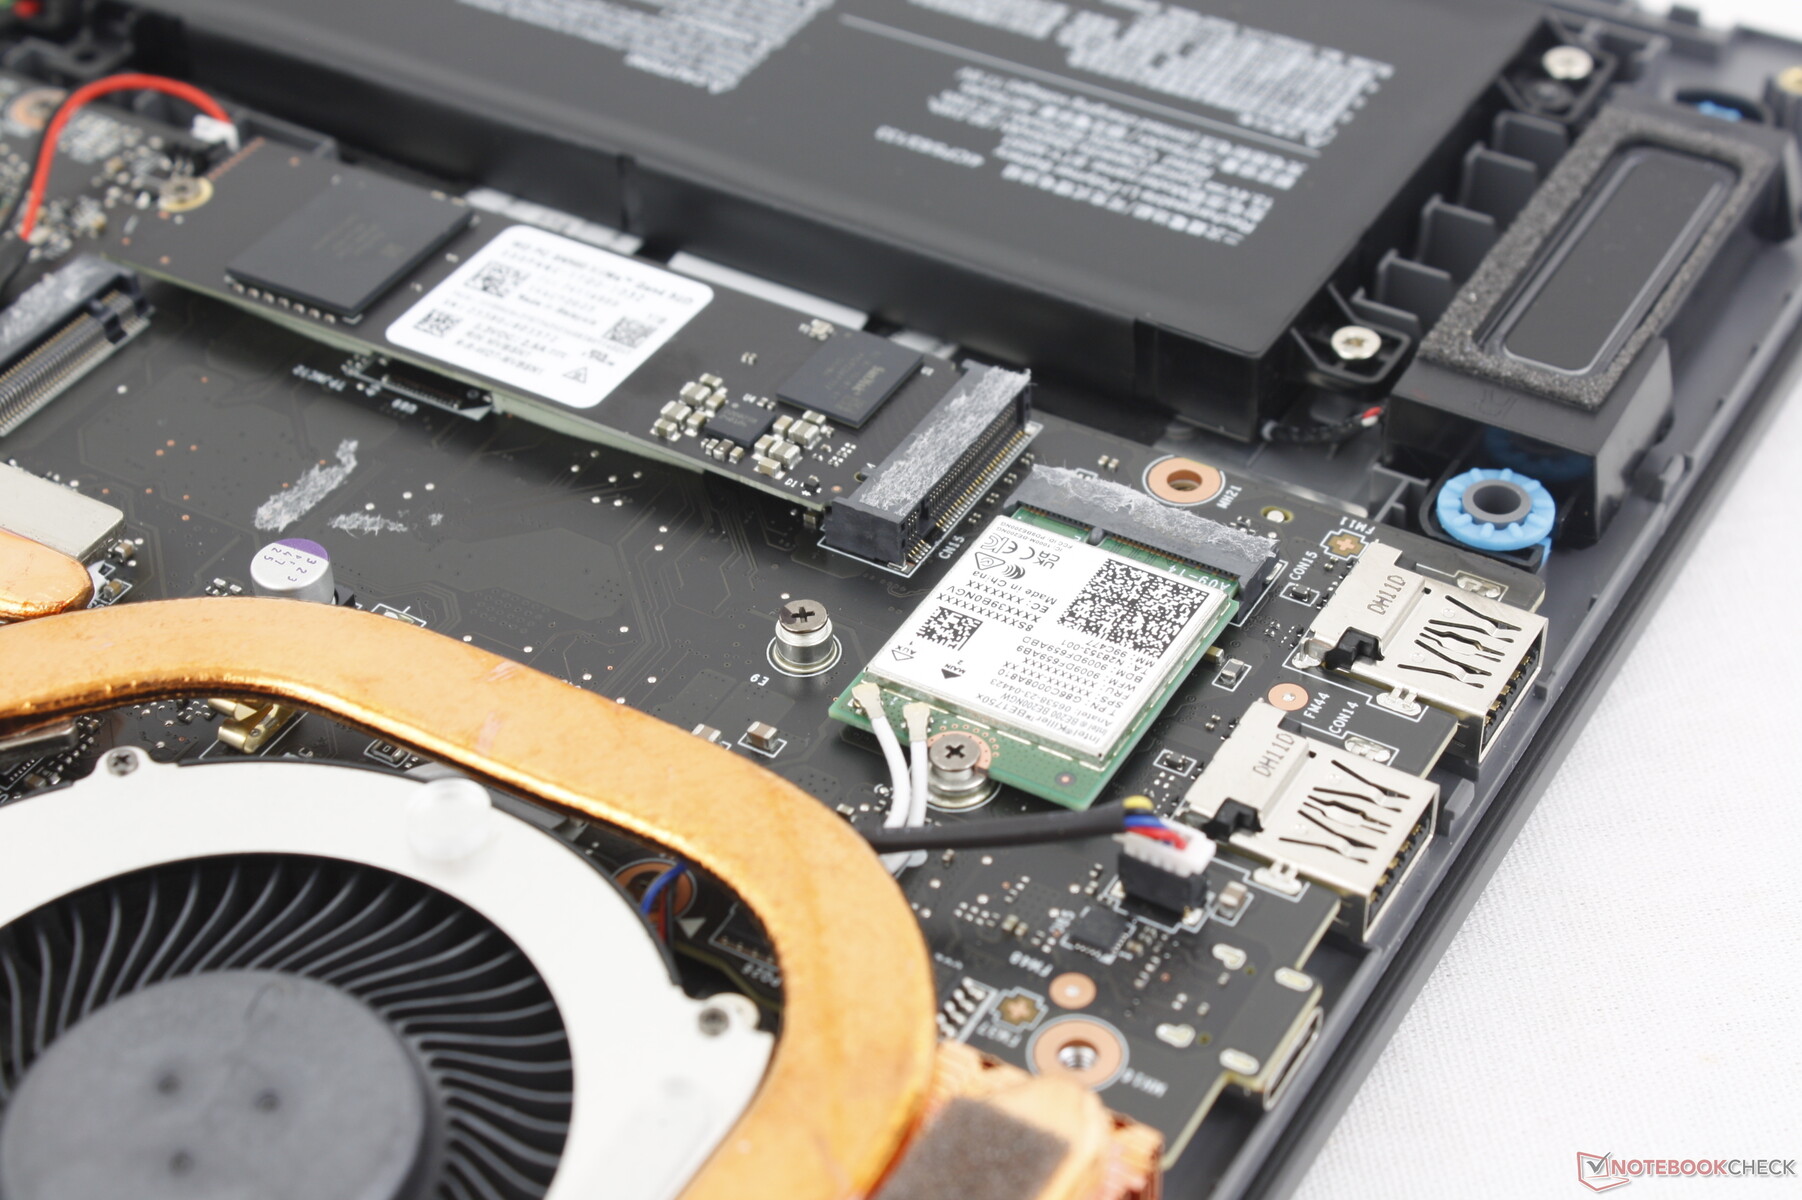
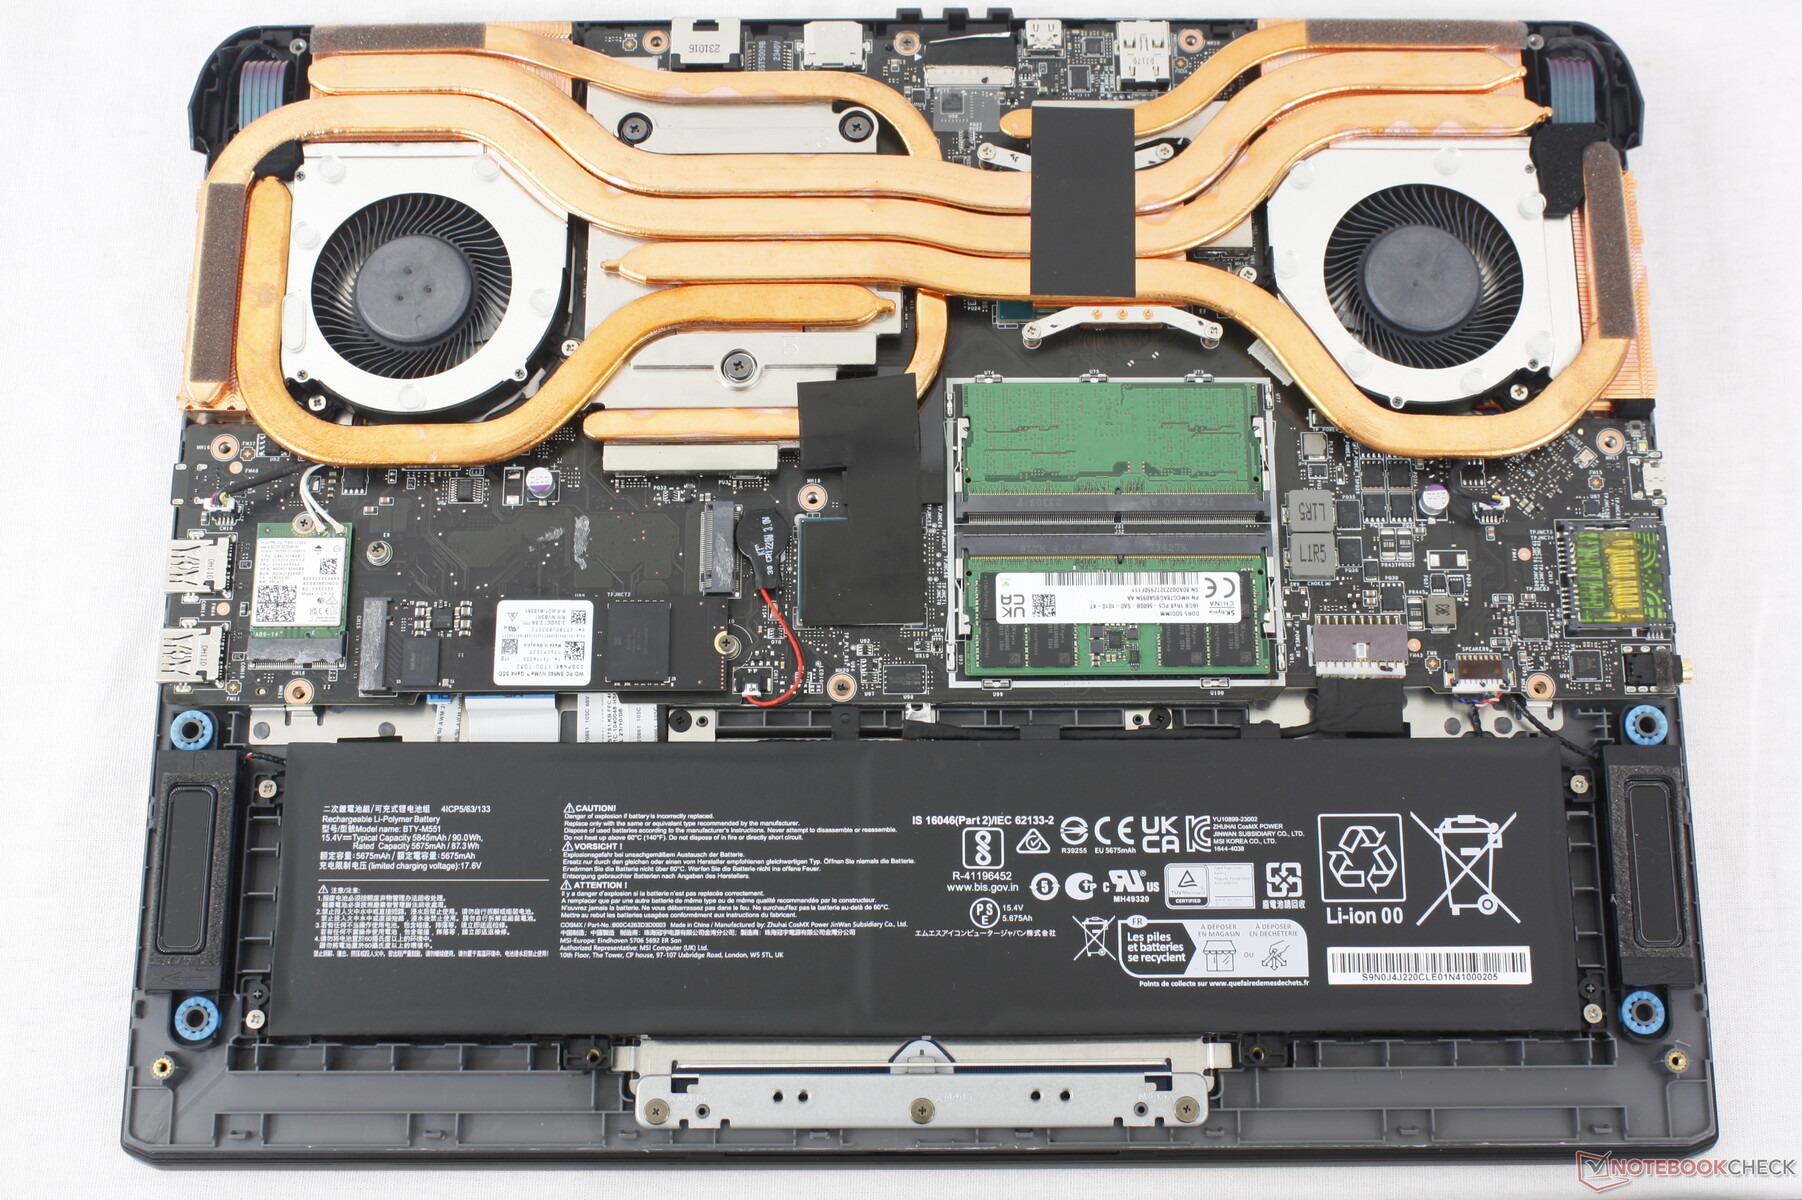
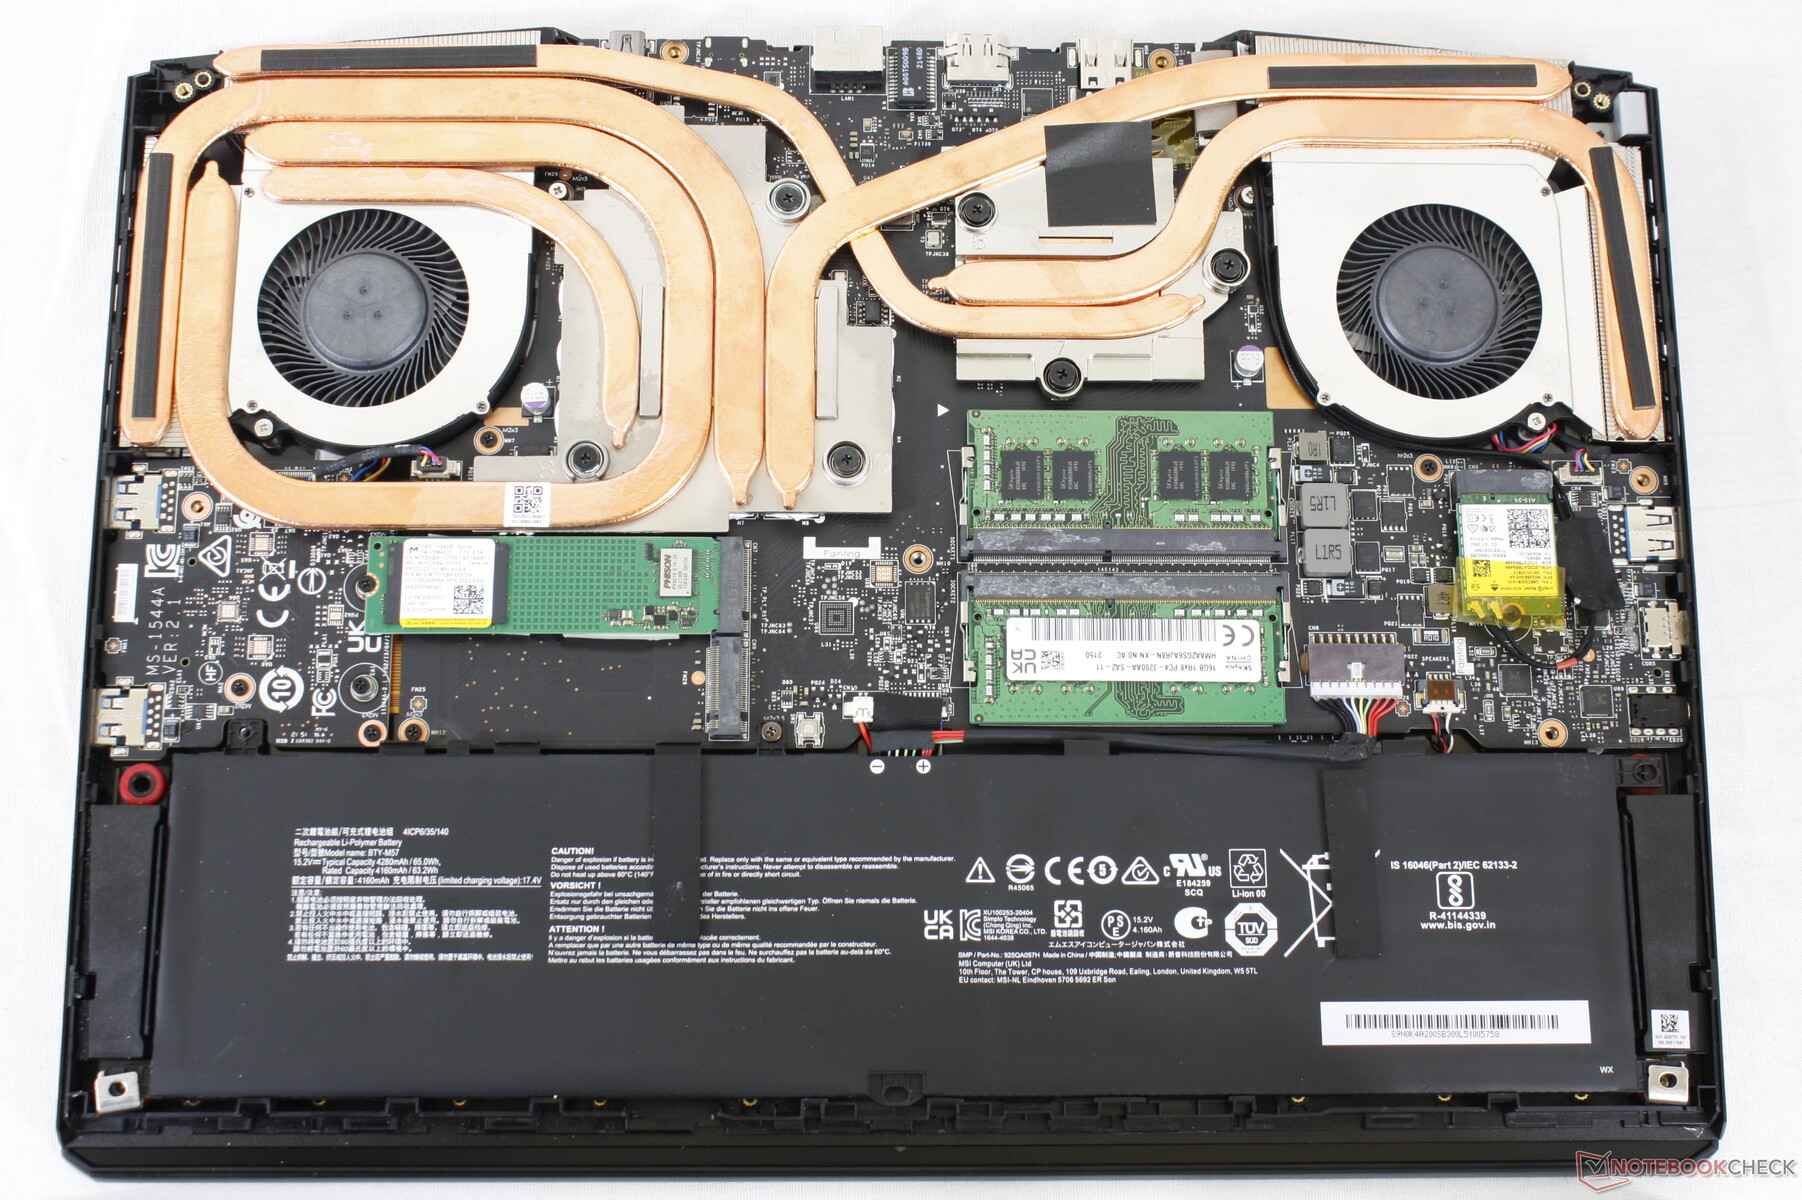
Dolny panel jest przymocowany za pomocą 13 śrub krzyżakowych. Niestety, demontaż panelu może być trudny, ponieważ krawędzie i rogi mają znaczne zakrzywienia, które sprawiają, że proces ten jest bardziej kłopotliwy niż powinien. Dla porównania, dolny panel na Razer Blade 16 jest znacznie bardziej płaski i ma mniej zatrzasków ułatwiających demontaż. Podczas serwisowania Vector 16 HX zaleca się użycie płaskiej krawędzi.
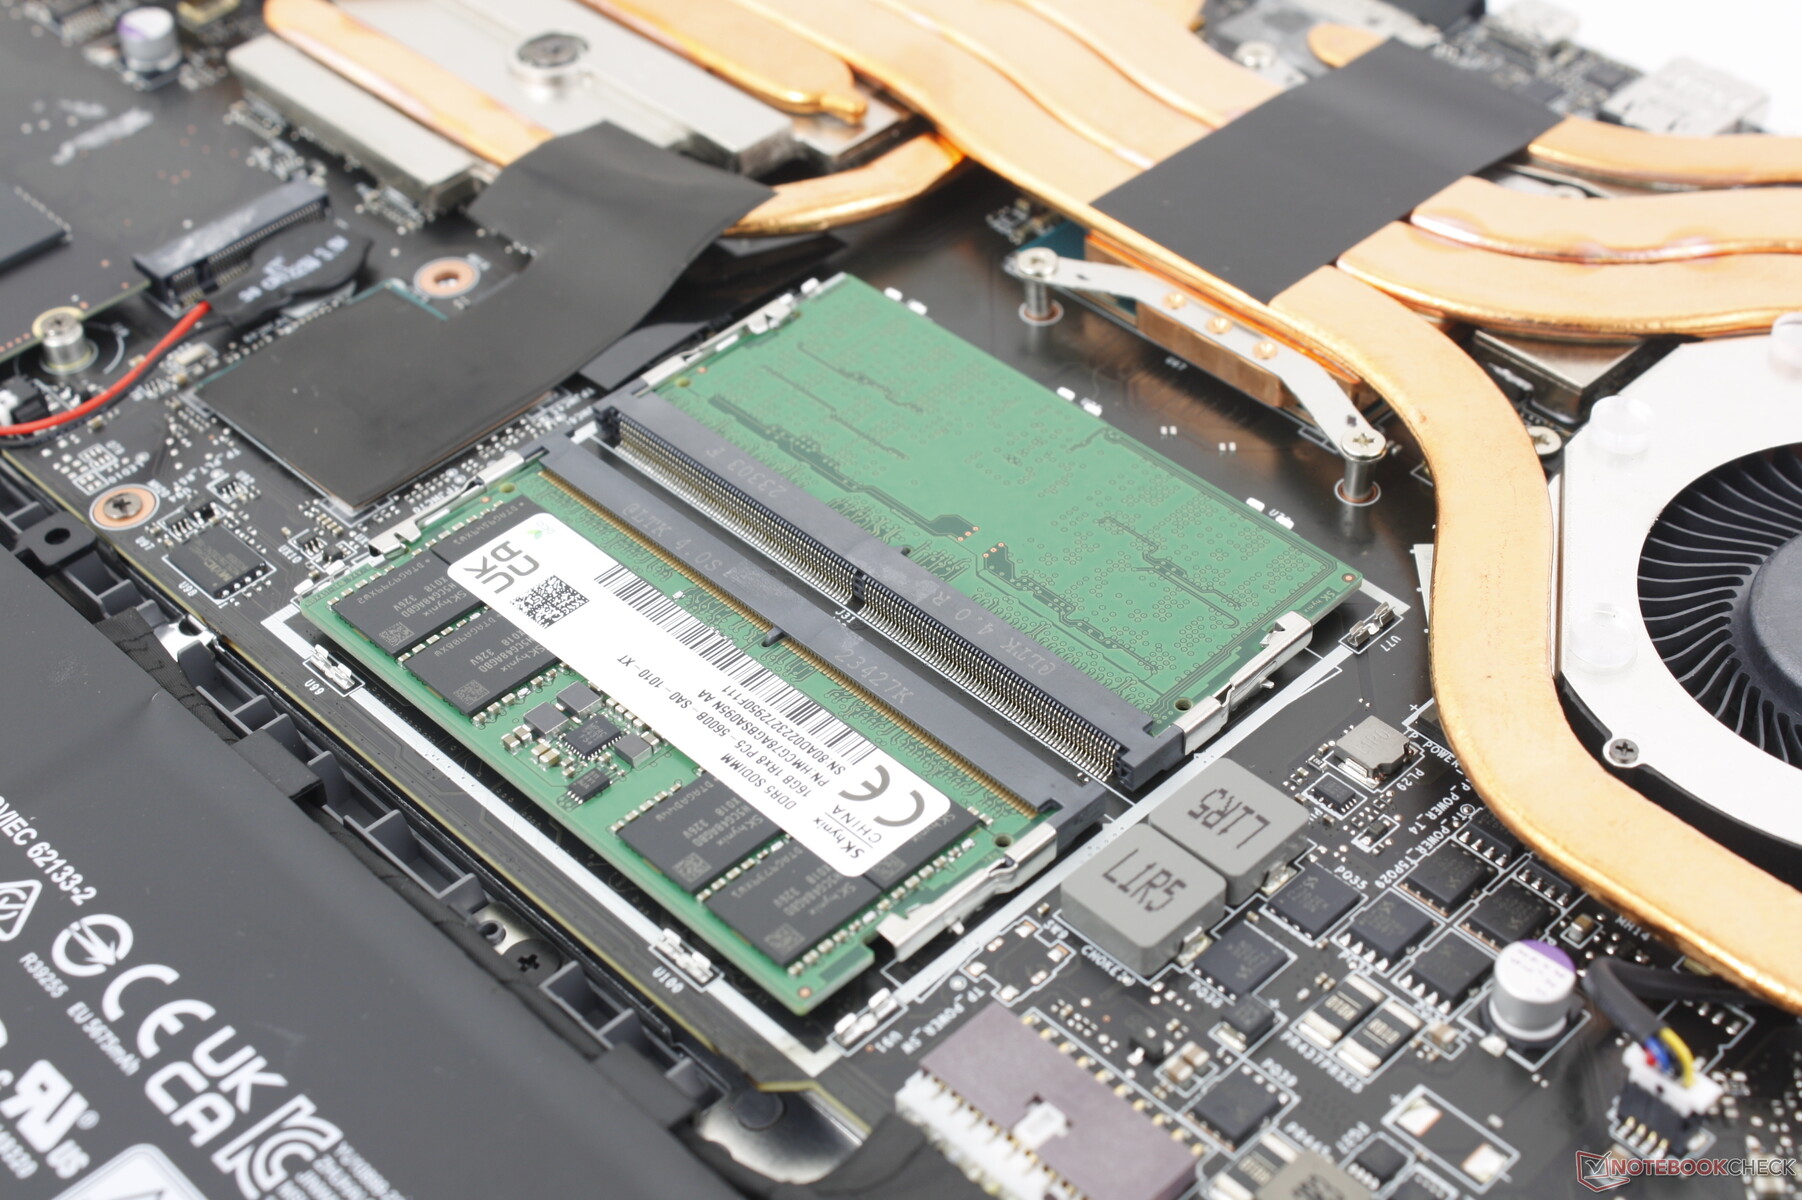
Po wejściu do środka, użytkownicy będą mieli dostęp do 2x zatok pamięci masowej M.2, 2x slotów SODIMM, baterii i modułu WLAN, podobnie jak w starszej konstrukcji Vector GP66.
Akcesoria i gwarancja
W pudełku nie ma żadnych dodatków poza zasilaczem sieciowym i dokumentacją. W przypadku zakupu w Stanach Zjednoczonych obowiązuje standardowa roczna ograniczona gwarancja producenta.
Urządzenia wejściowe - proste i funkcjonalne
Klawiatura
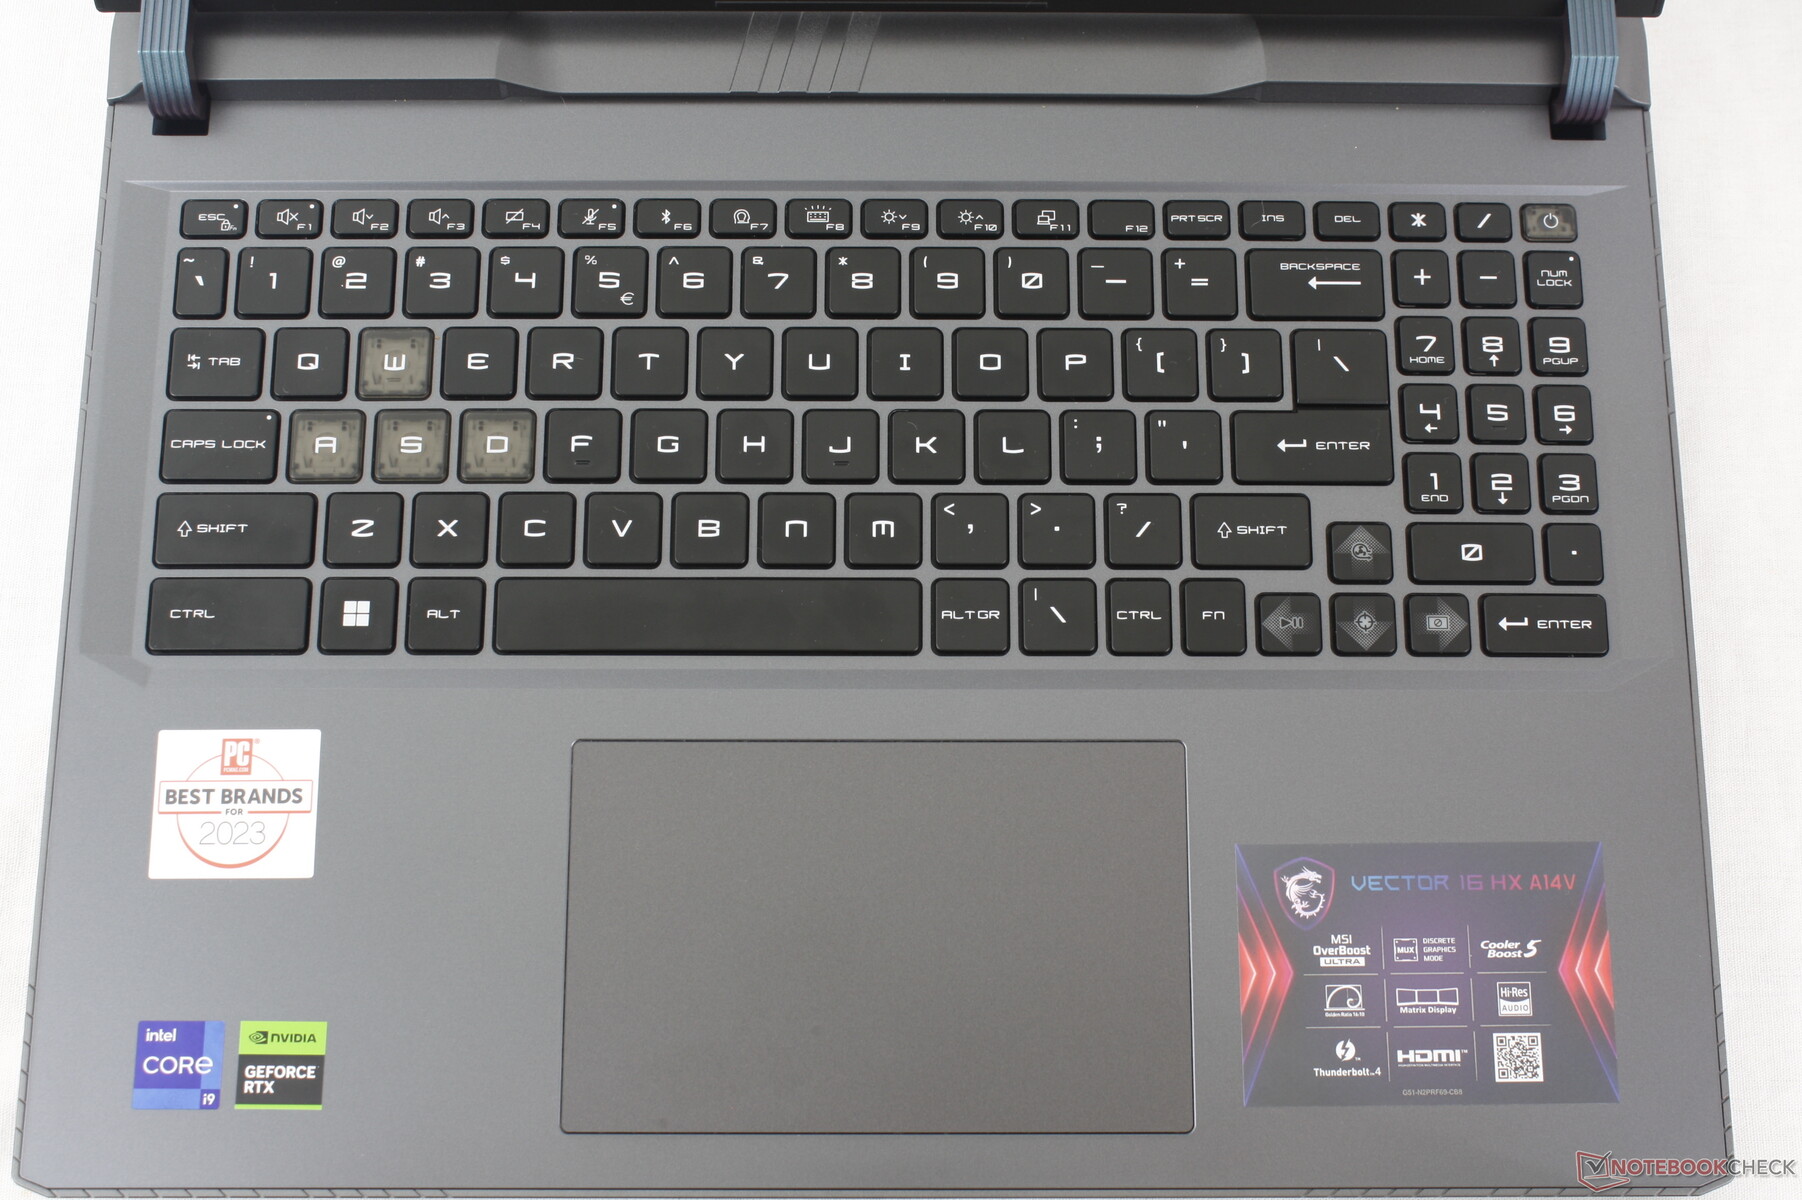
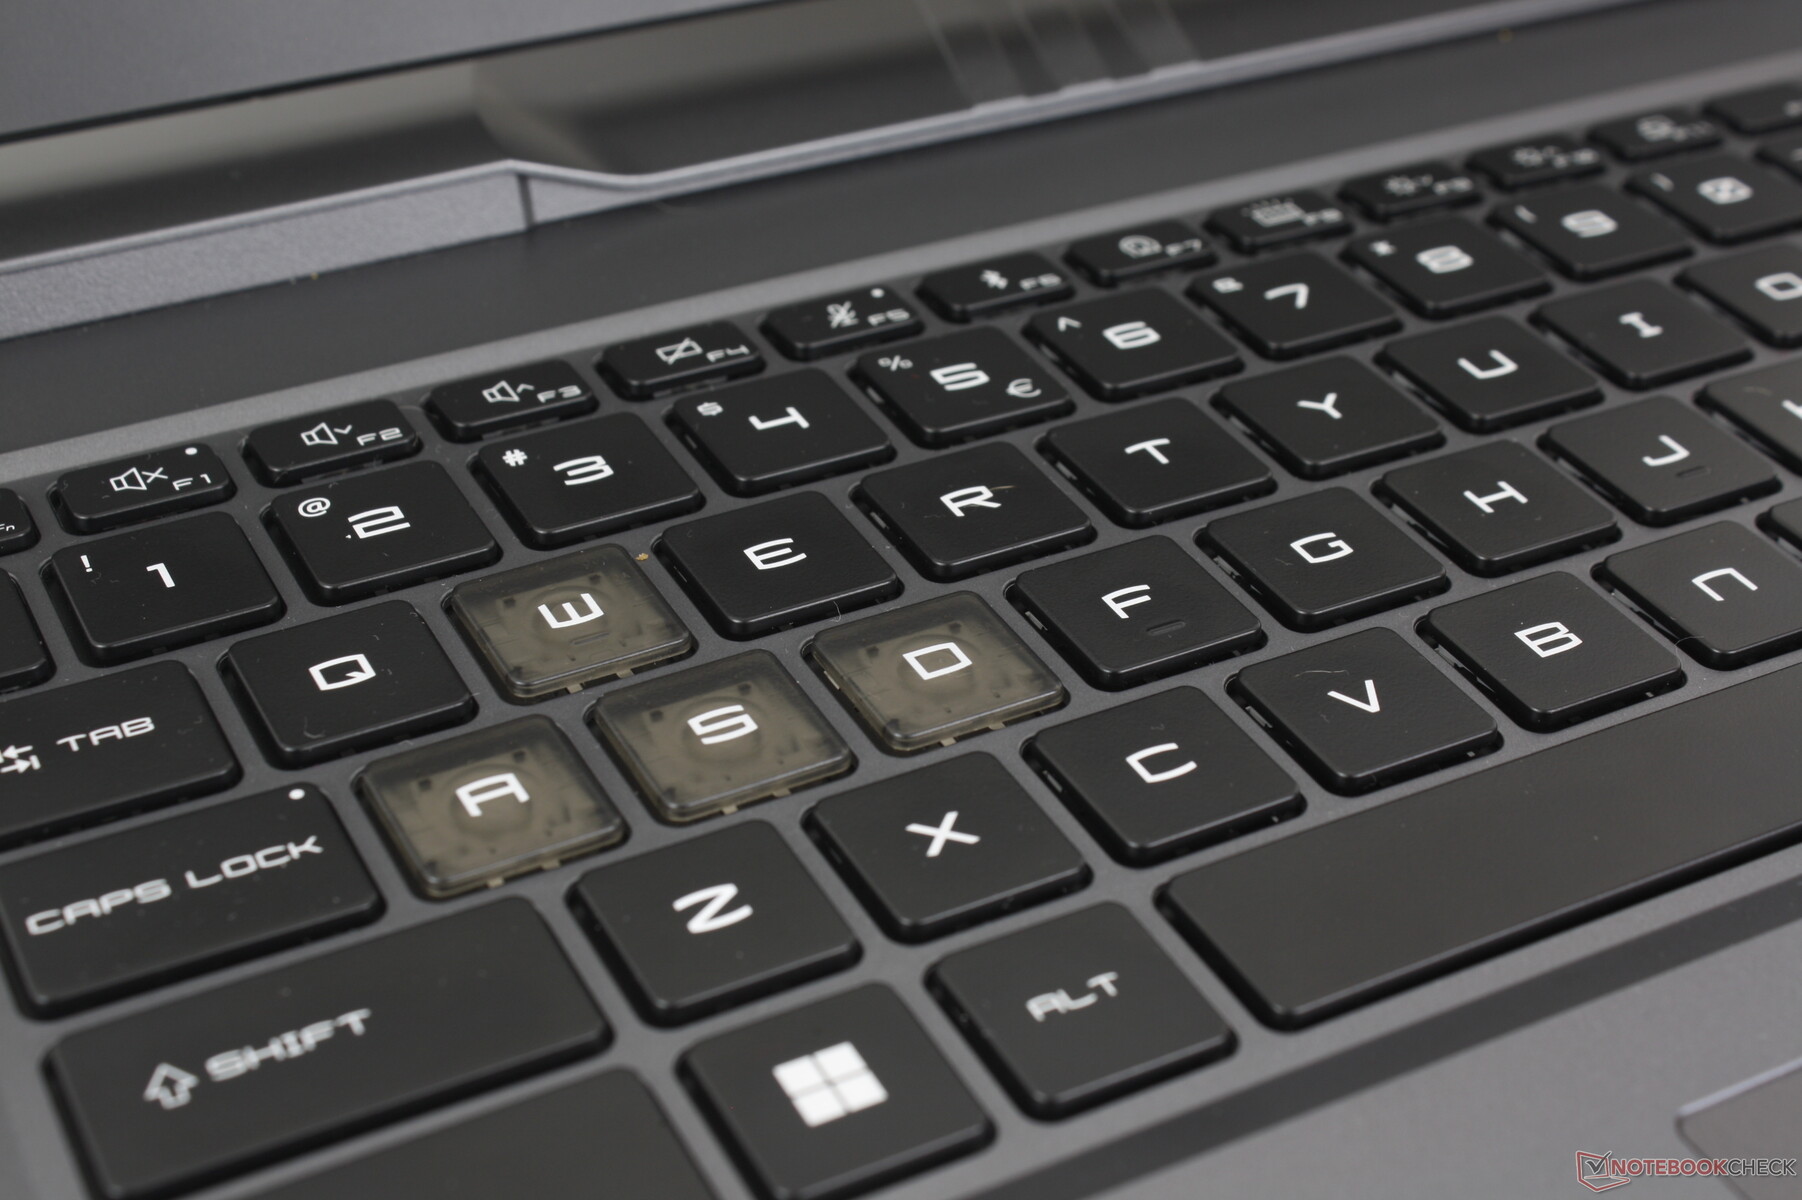
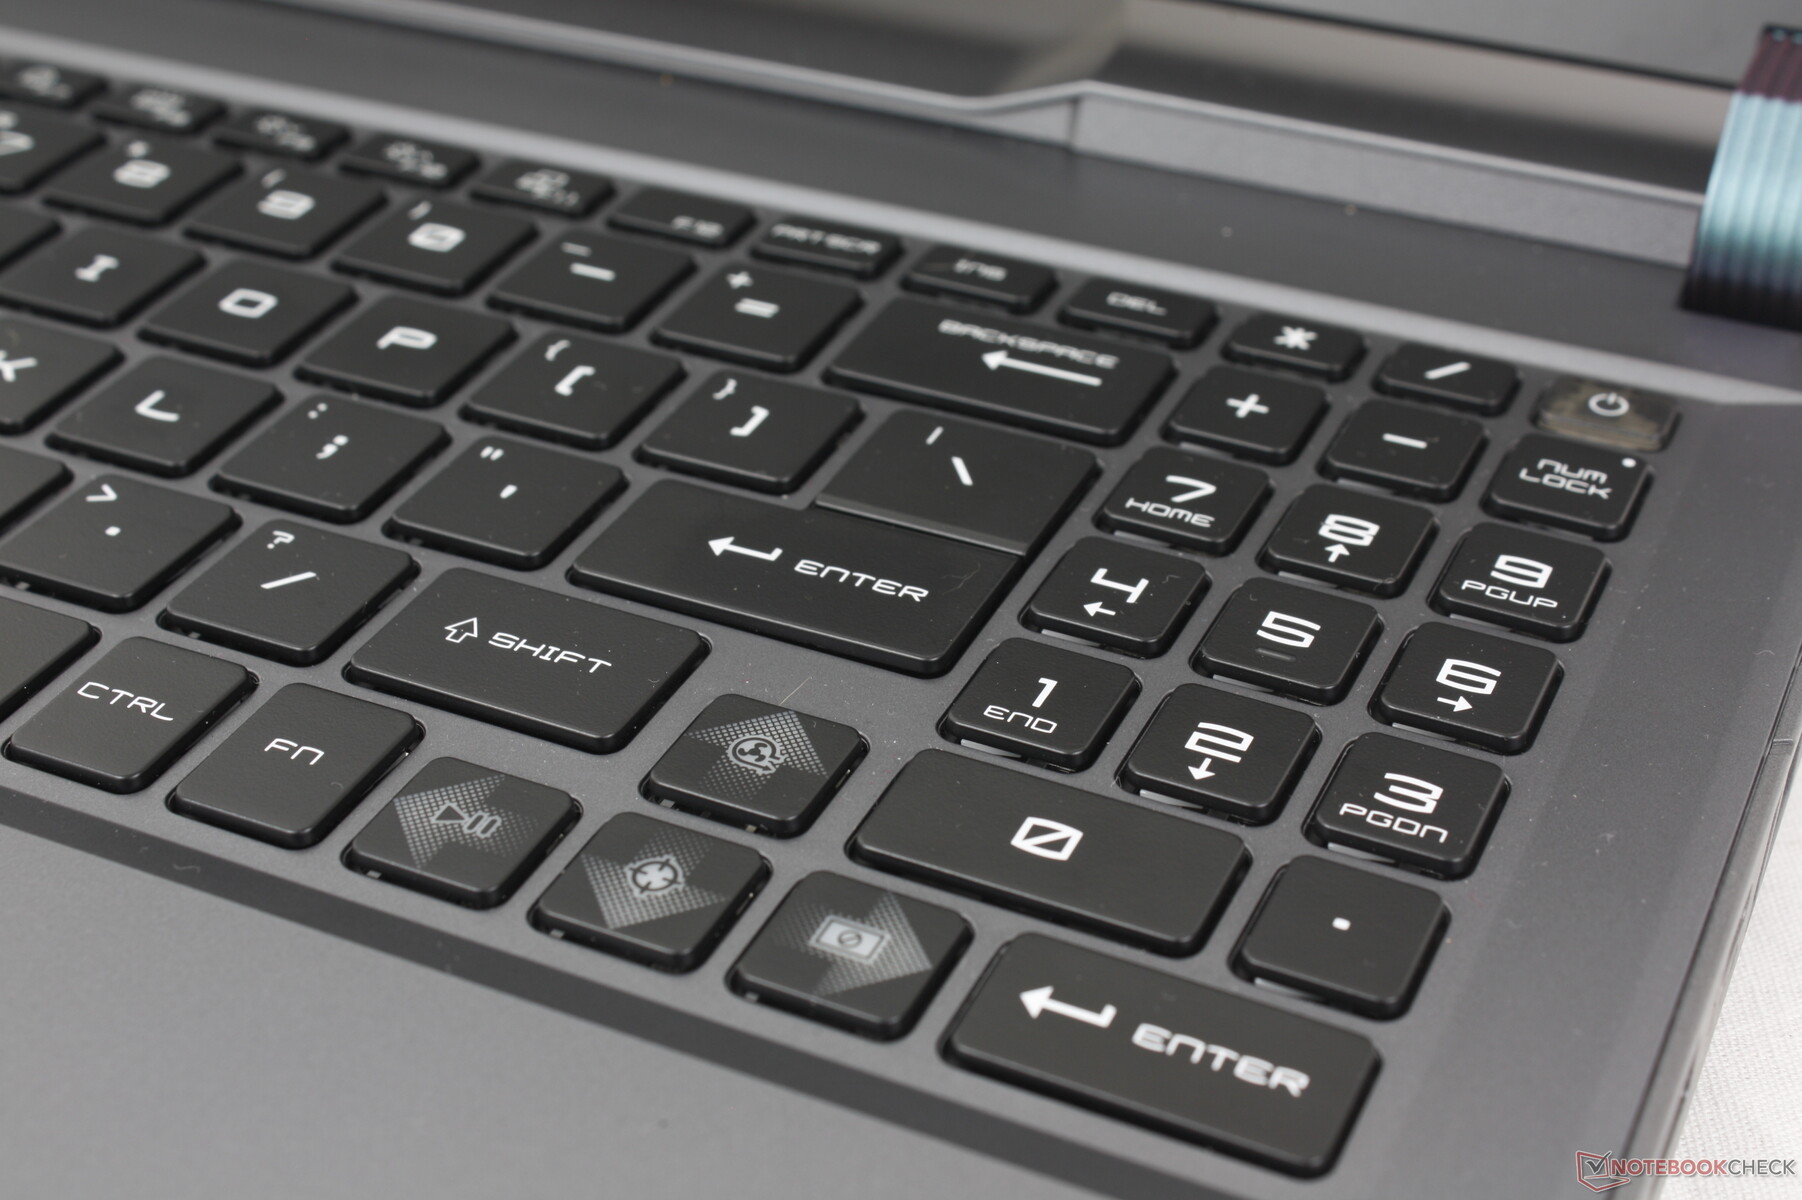
MSI zmieniło układ klawiatury w porównaniu do starszego modelu Vector GP66 . Niewygodne klawisze Fn/Ctrl w GP66 są teraz odpowiednio rozdzielone, a także pojawił się nowy numpad, podczas gdy wiele innych laptopów do gier zazwyczaj całkowicie pomija numpad. Niestety, klawisze strzałek są mniejsze niż wcześniej, a wąskie klawisze numpada nie są zbyt wygodne w użyciu. Ich implementacja sprawia więc wrażenie przemyślanej w porównaniu do większych i wygodniejszych klawiszy QWERTY.
Podświetlenie RGB dla każdego klawisza jest standardem, aby podświetlić wszystkie klawisze i symbole.
Panel dotykowy
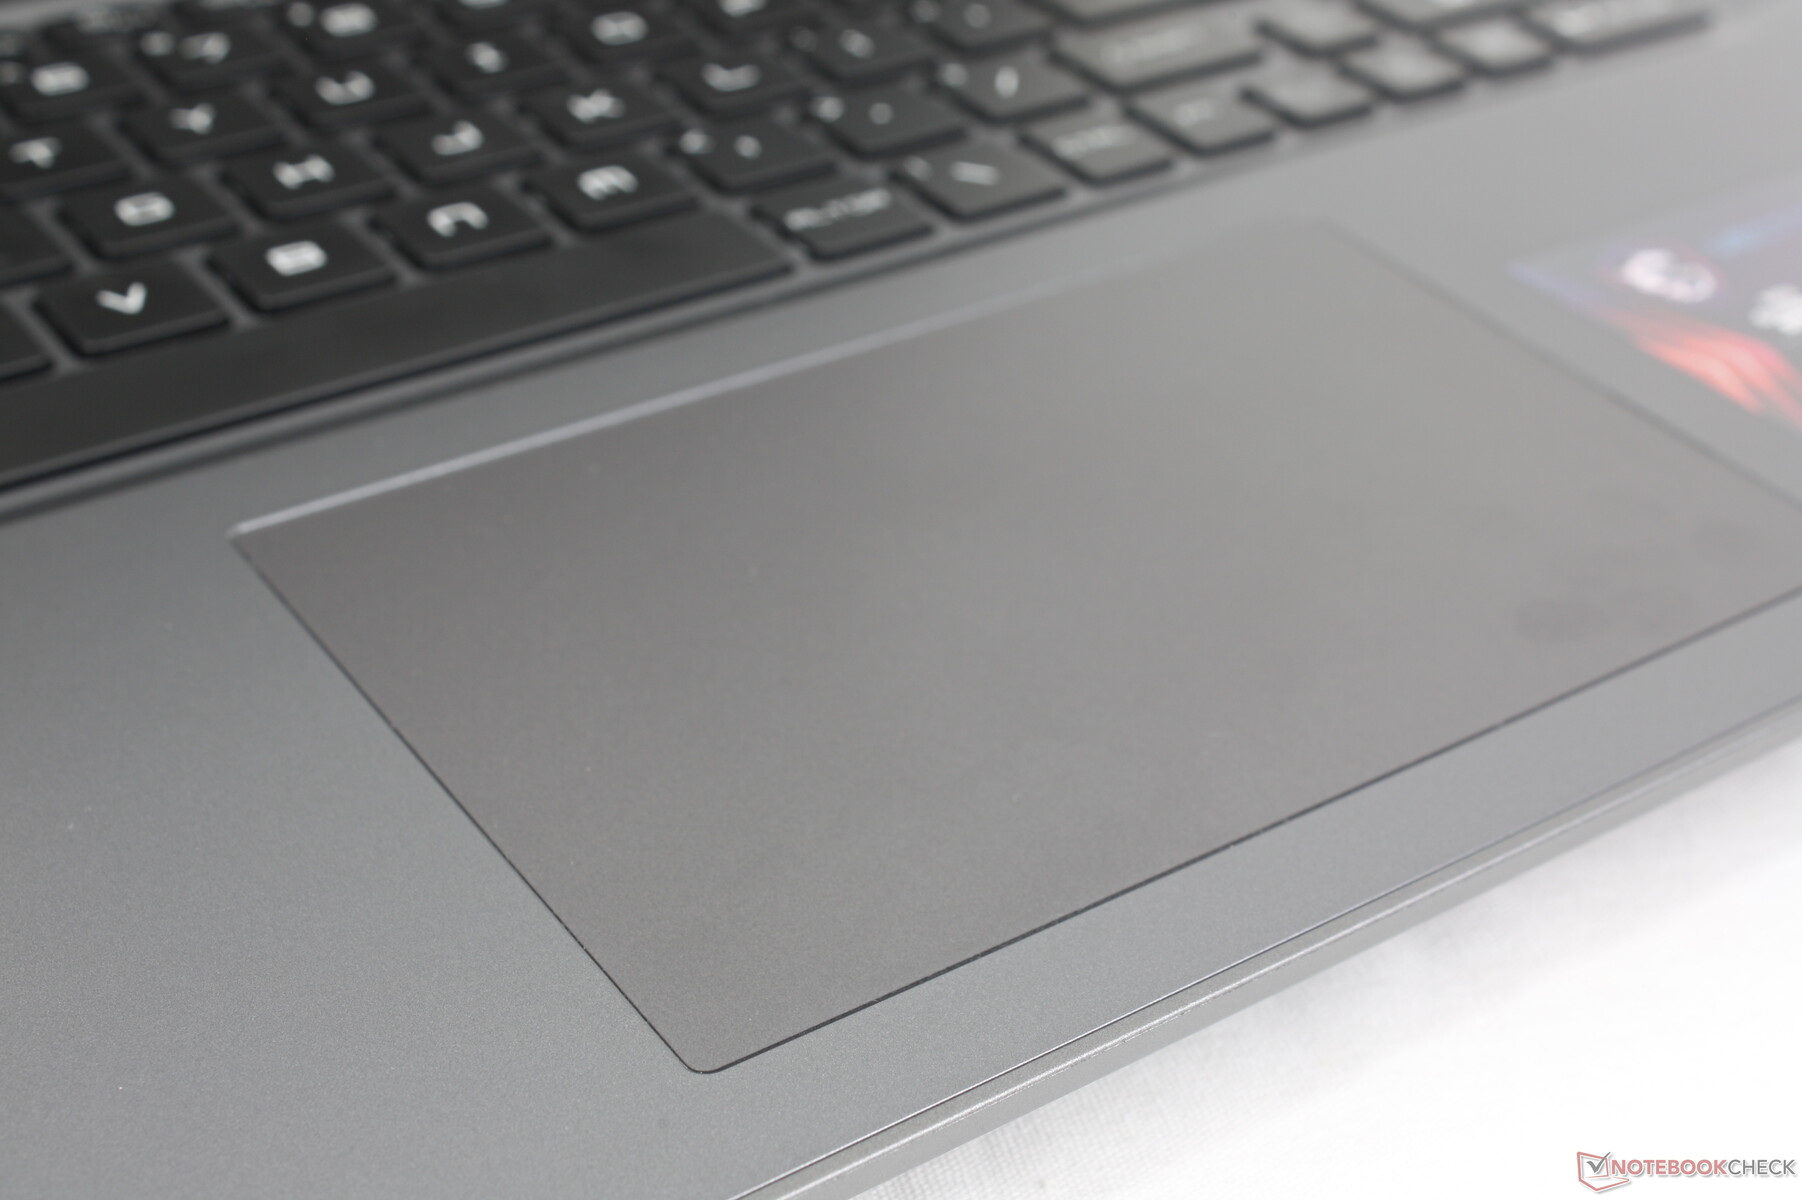
Przy wymiarach około 13,2 x 8,2 cm, clickpad jest bardziej przestronny niż w Dell G16 7620 (10,5 x 6 cm) i starszym Vector GP66 (10,5 x 6,5 cm). Trakcja jest bardzo płynna, z bardzo niewielkim zacinaniem się podczas ślizgania się przy mniejszych prędkościach. Sprzężenie zwrotne podczas naciskania jest również dość mocne, pomimo stosunkowo cichego stukotu. Clickpady są zwykle słabe w laptopach do gier, ale cieszymy się, że w Vector 16 HX jest on w połowie przyzwoity.
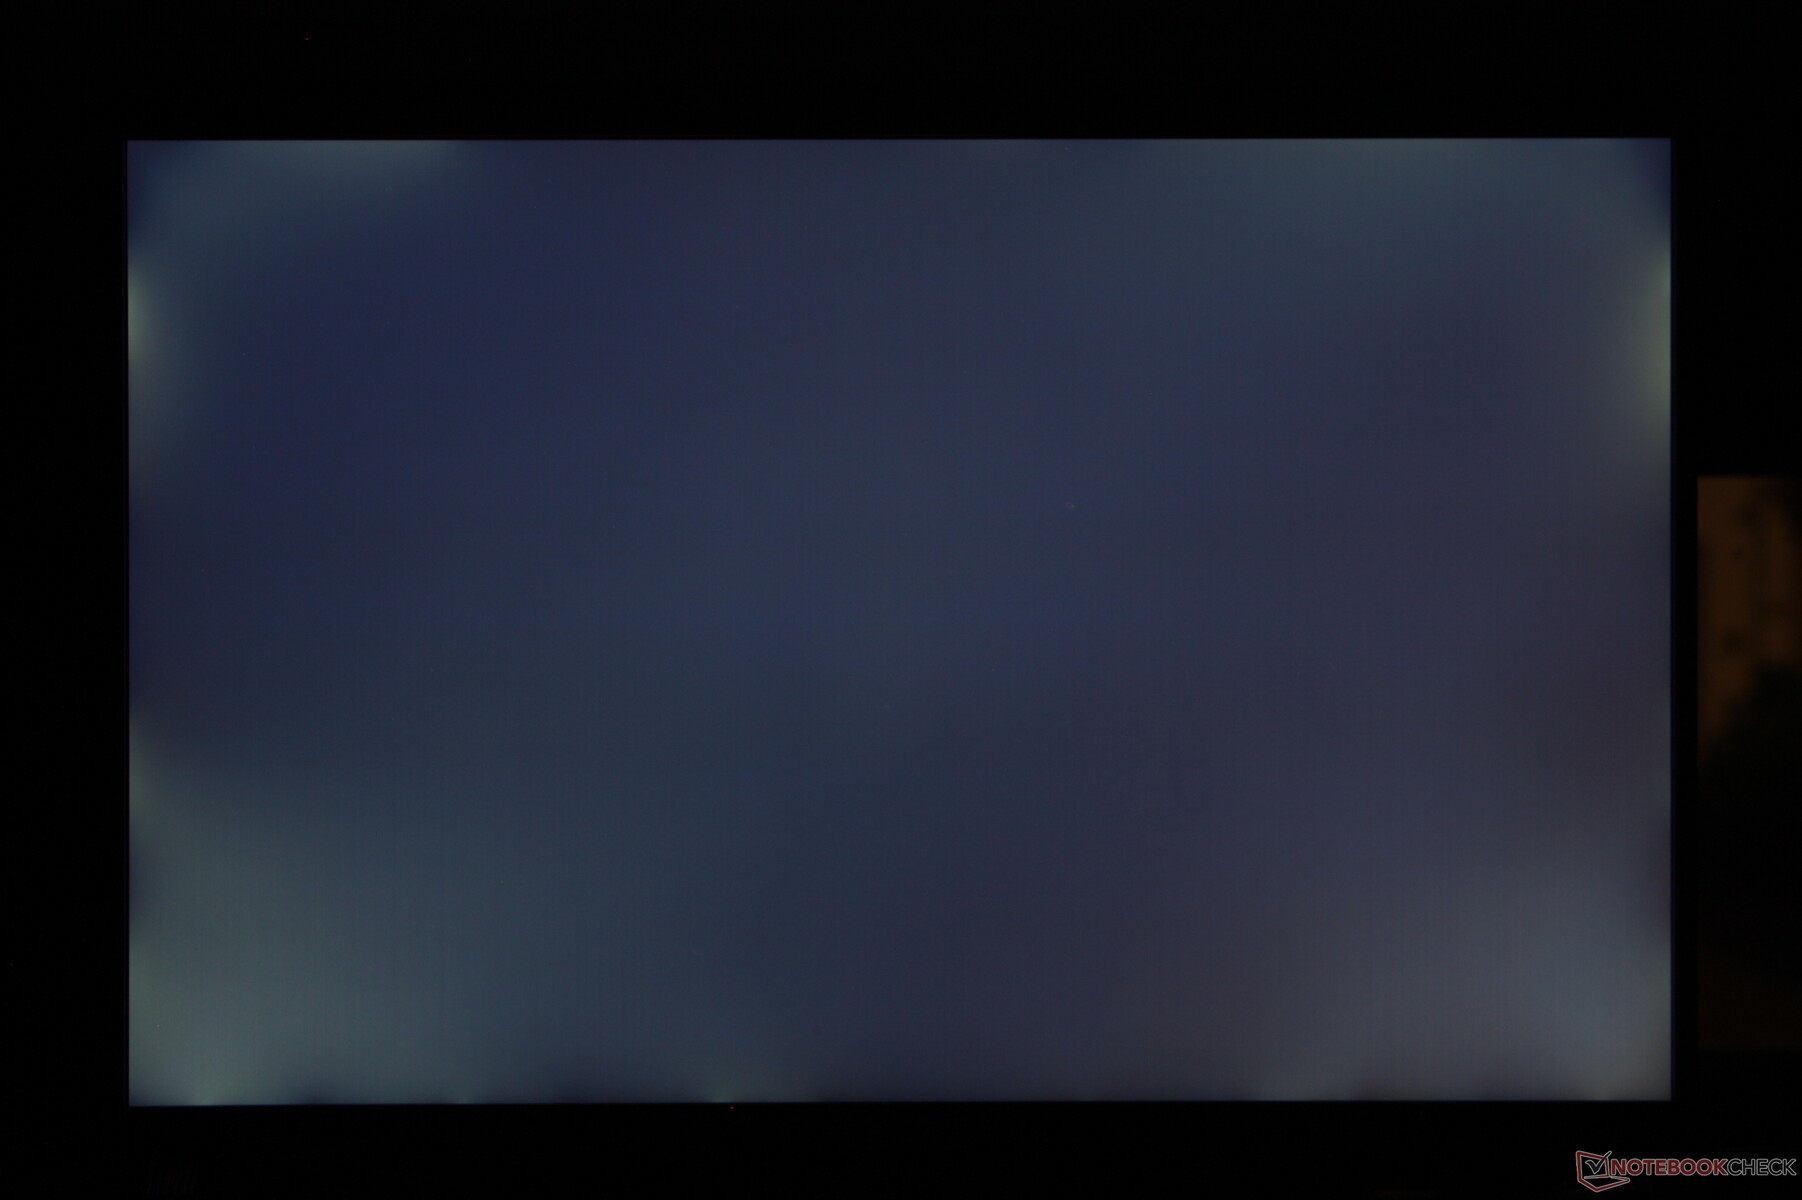
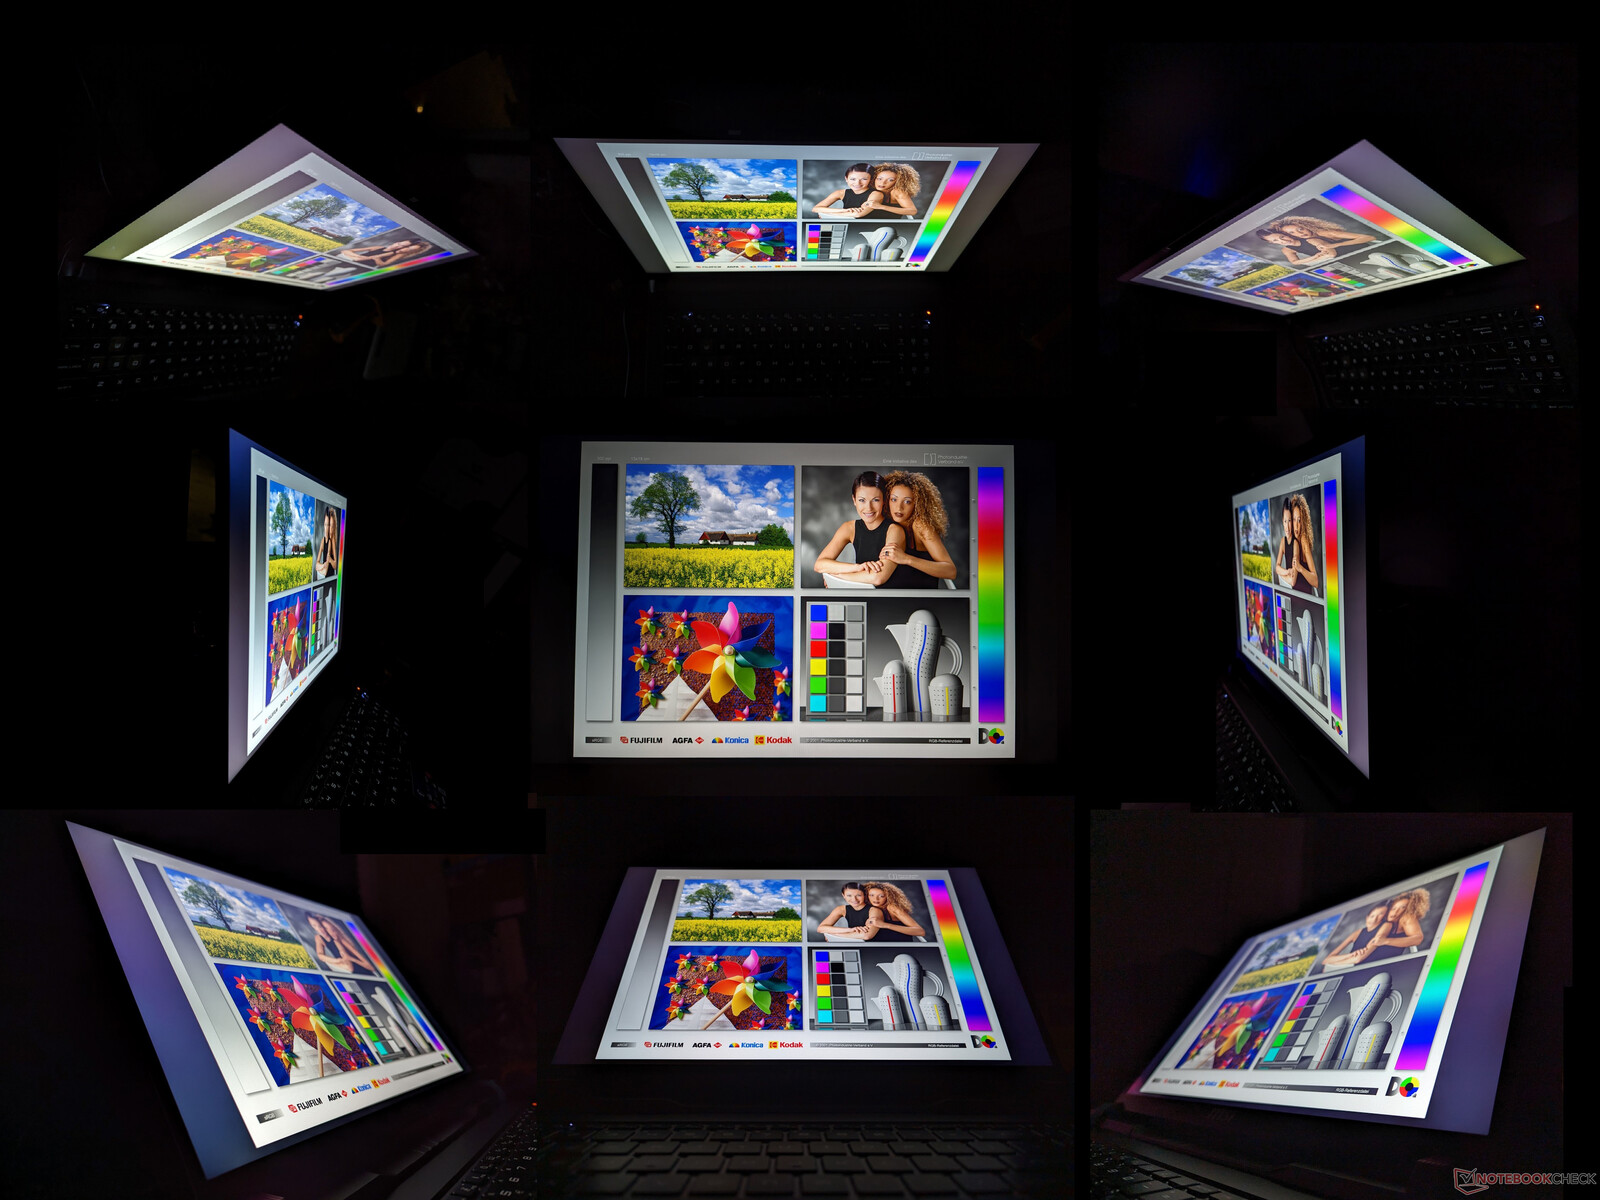
Wyświetlacz - wszystkie IPS bez G-Sync
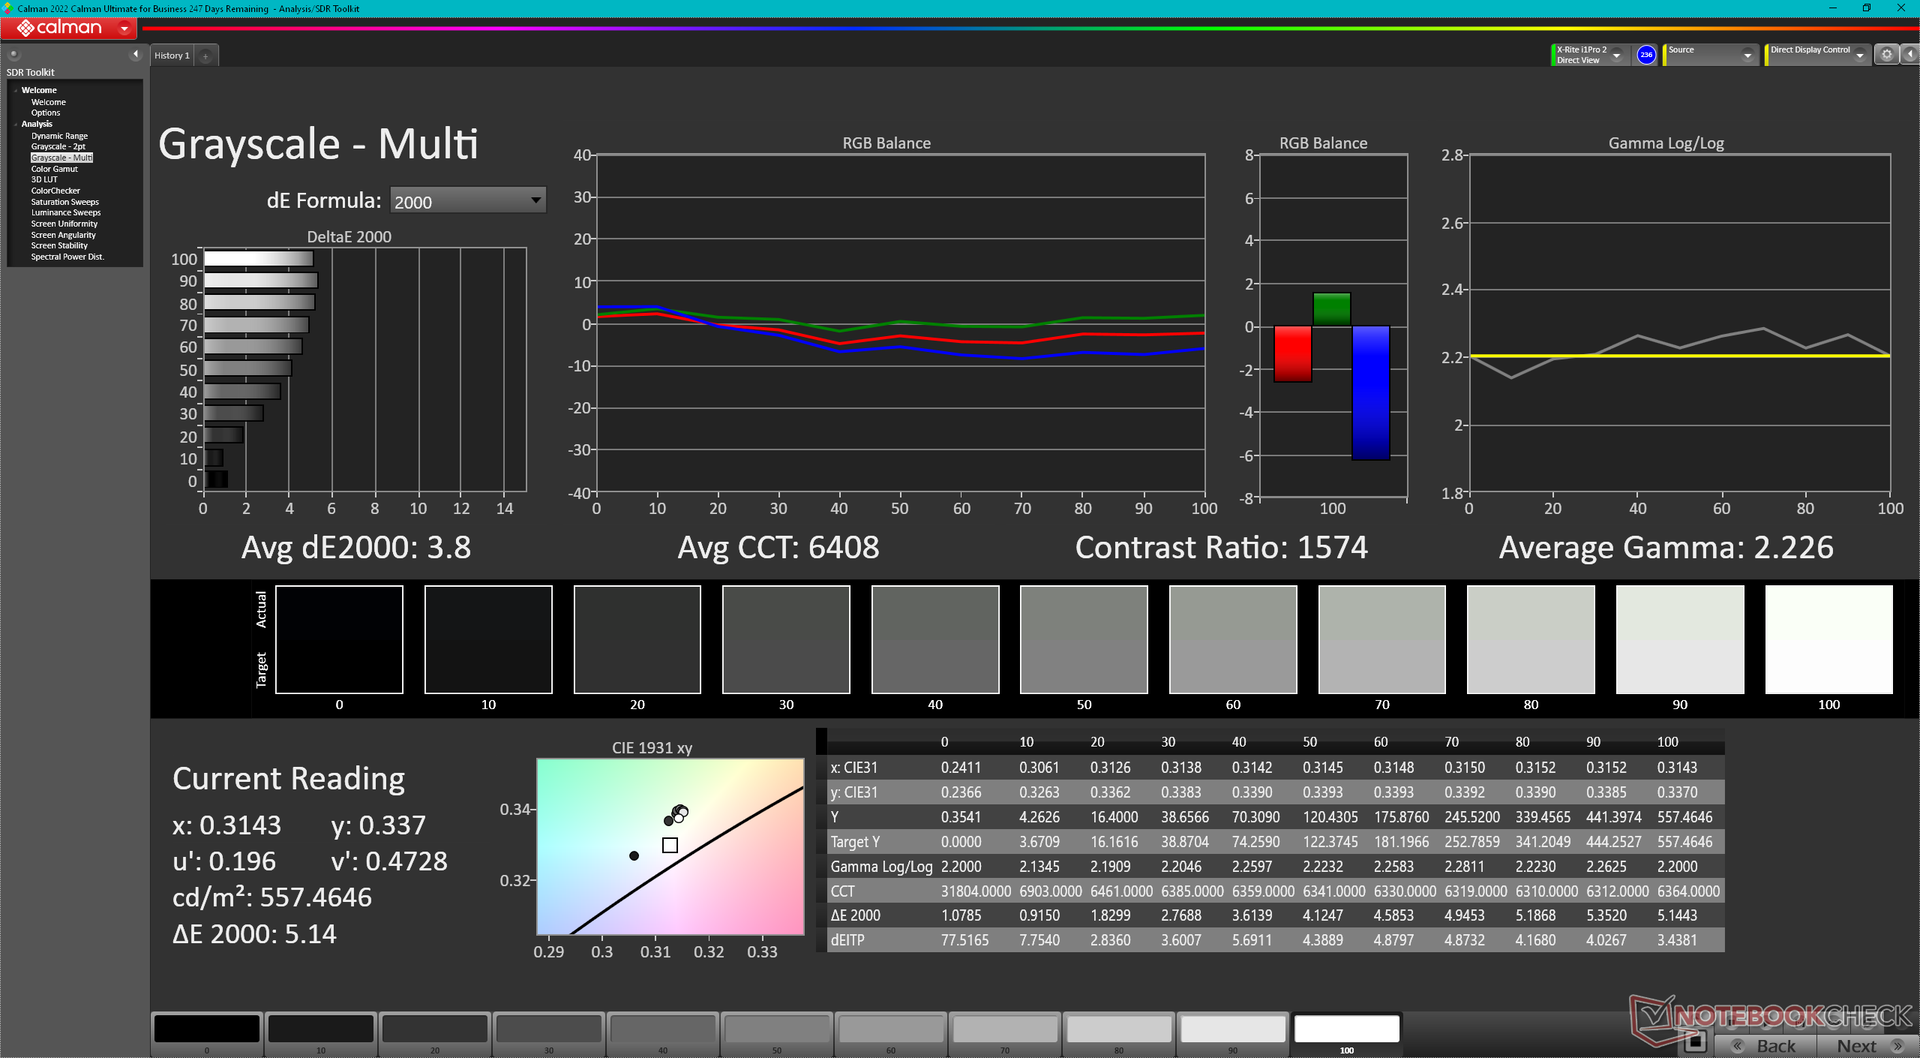
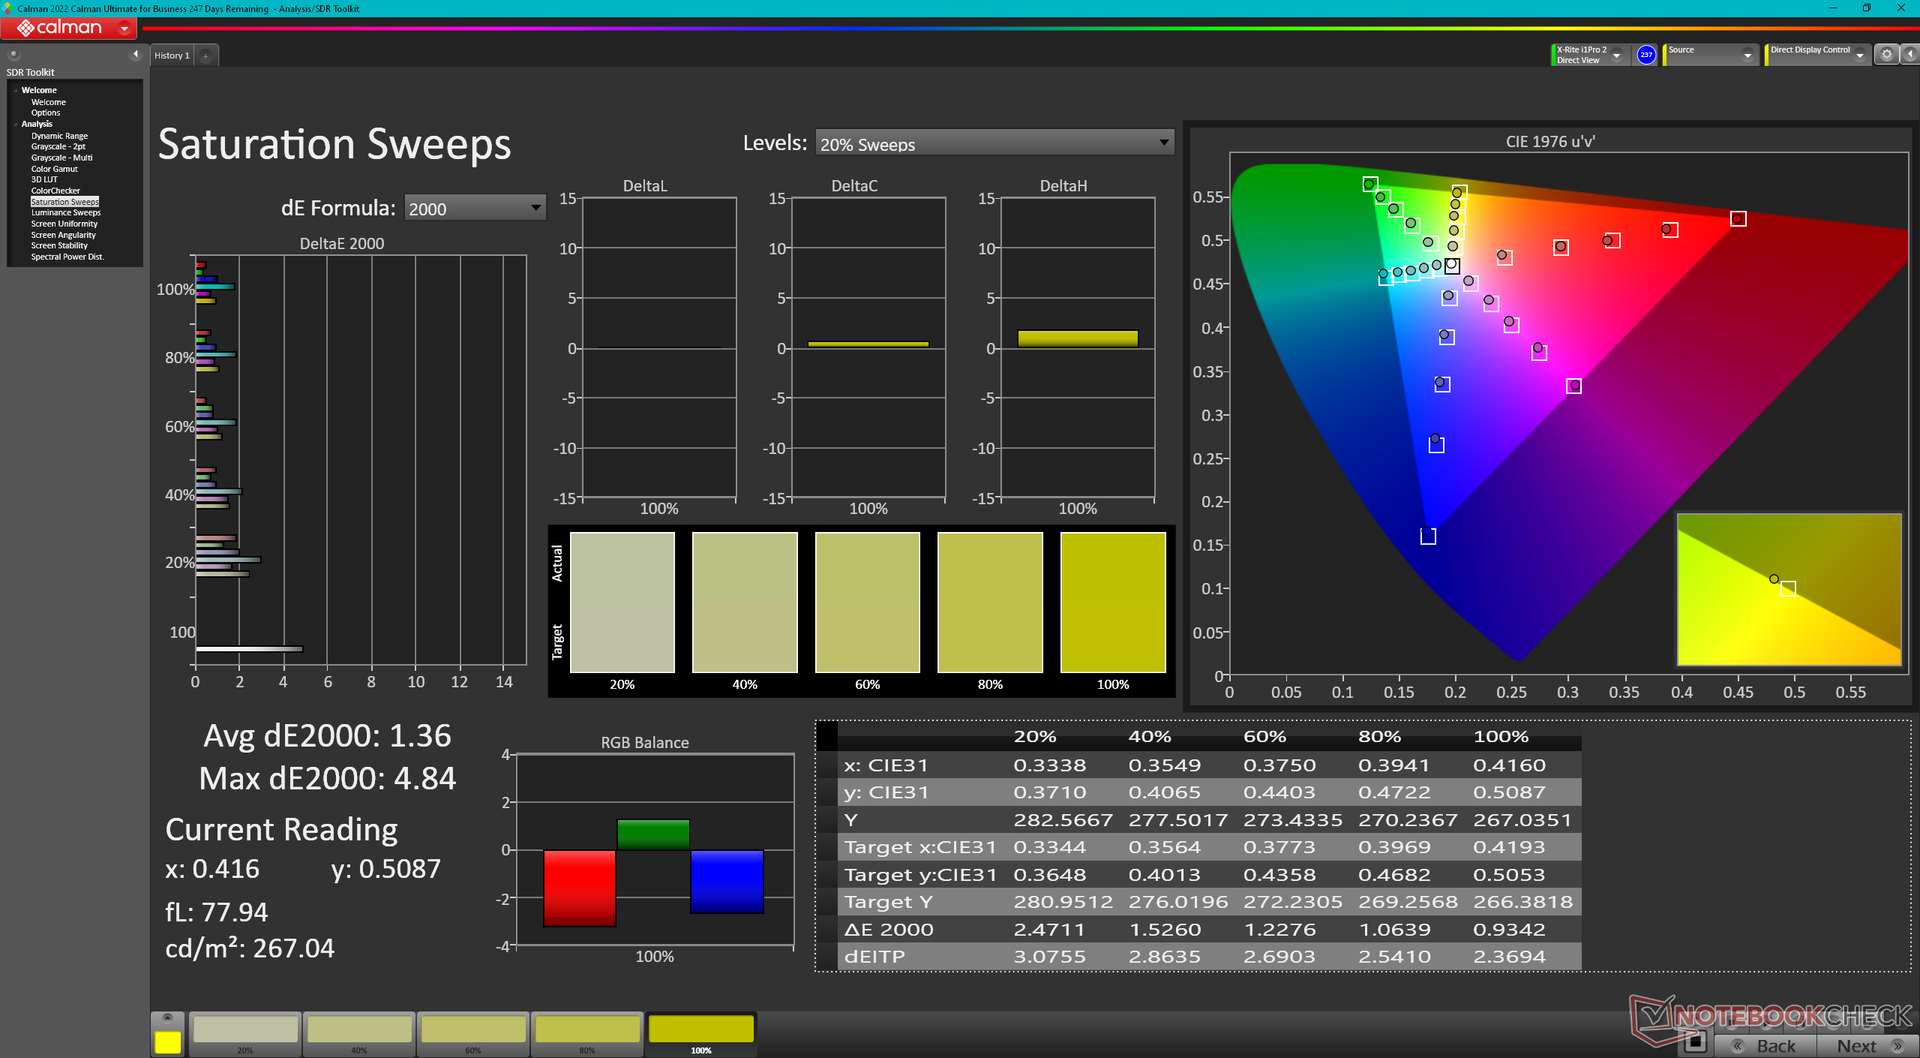
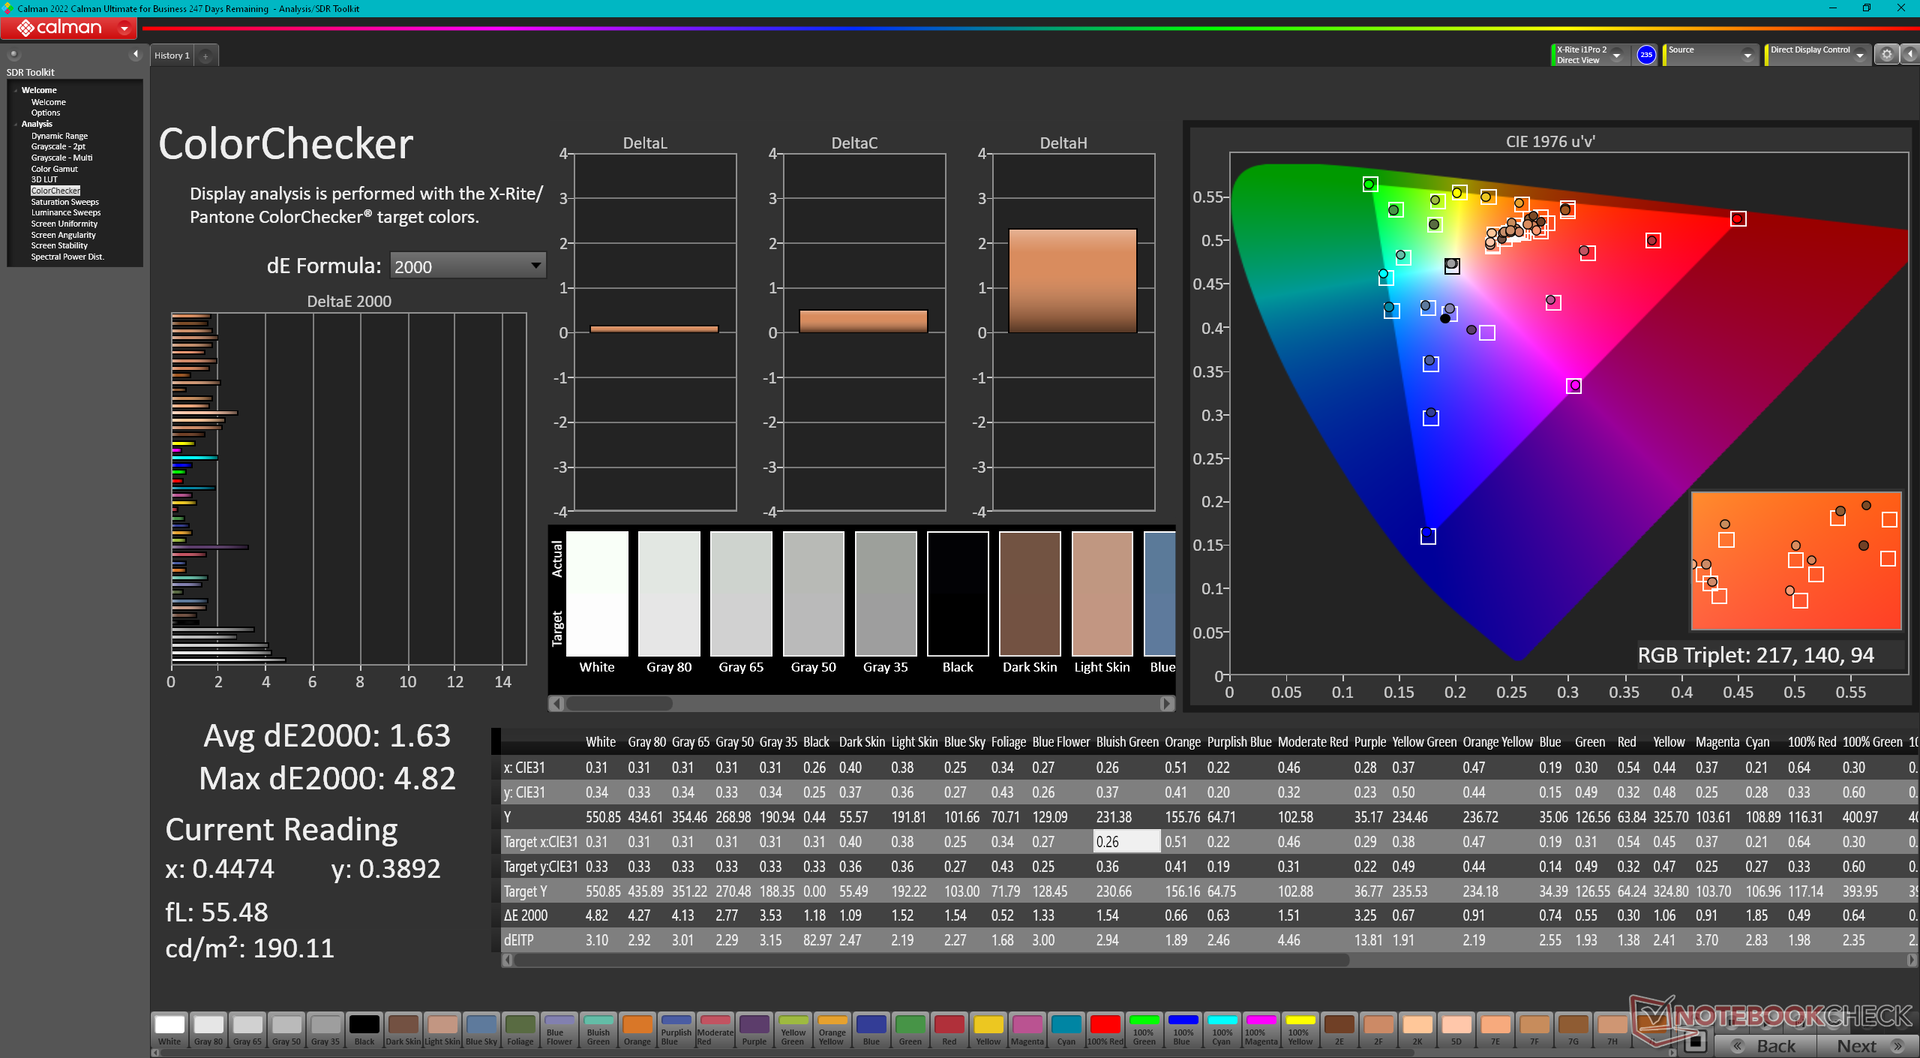
Jest to pierwszy system w naszej bazie danych wyposażony w wysokiej klasy panel Chi Mei N160GME-GTB. Jego właściwości są bardzo podobne do NE160QDM-NZ3, który można znaleźć w najnowszym Lenovo Legion 5 16 ale z jednym znaczącym ulepszeniem: pełnym pokryciem DCI-P3 zamiast tylko sRGB. W przeciwnym razie użytkownicy mogą spodziewać się tej samej szybkiej natywnej częstotliwości odświeżania 240 Hz, współczynnika kontrastu ~ 1300: 1 i krótkich czasów reakcji, co w maszynie Lenovo.
G-Sync jest wyraźnie nieobecny we wszystkich obecnych konfiguracjach Vector 16 HX. Częstotliwość odświeżania jest również ustalona na 60 Hz lub 240 Hz, podczas gdy panele ze zmienną częstotliwością odświeżania stają się powszechne.
Proszę pamiętać, że tańsza konfiguracja 1200p 144 Hz prawdopodobnie będzie miała inne atrybuty niż nasza konfiguracja 1600p 240 Hz pod względem jasności, kolorów i nie tylko.


| |||||||||||||||||||||||||
rozświetlenie: 83 %
na akumulatorze: 557.2 cd/m²
kontrast: 1359:1 (czerń: 0.41 cd/m²)
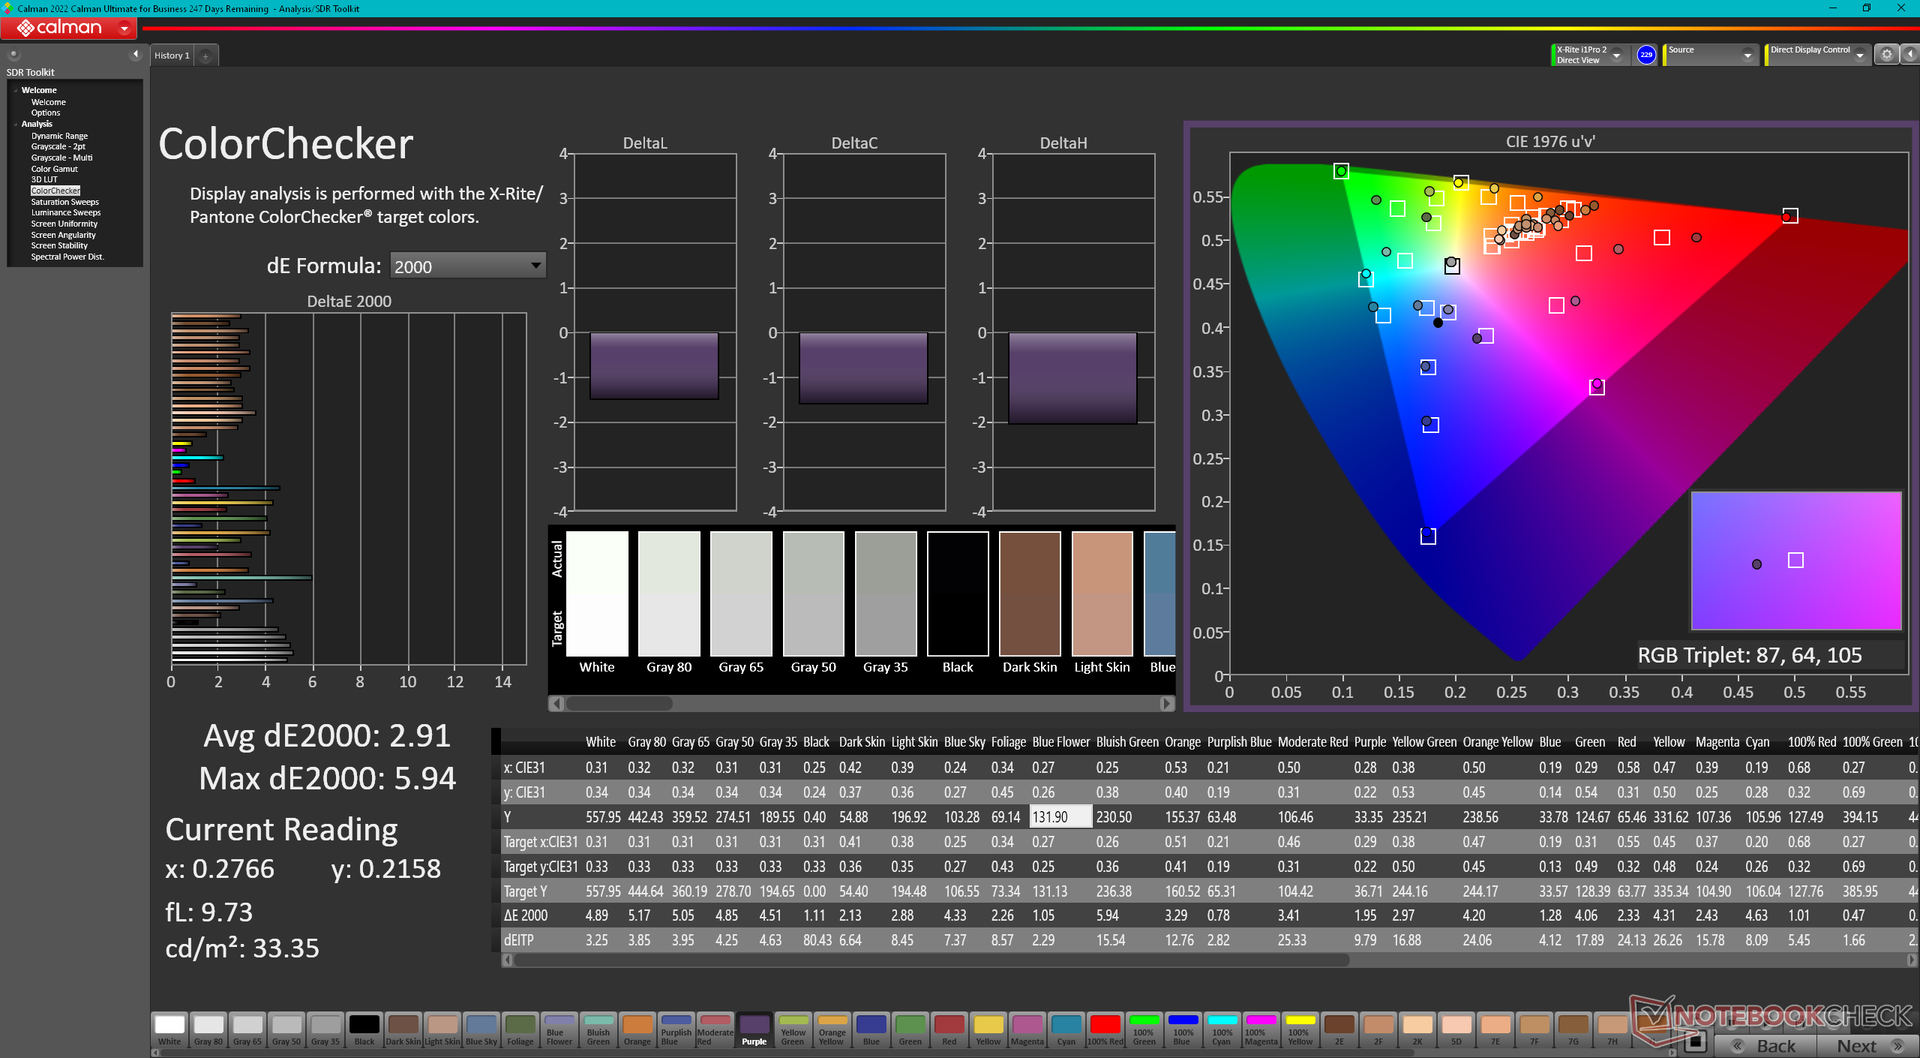
ΔE ColorChecker Calman: 2.91 | ∀{0.5-29.43 Ø4.71}
calibrated: 1.63
ΔE Greyscale Calman: 3.8 | ∀{0.09-98 Ø4.96}
85.4% AdobeRGB 1998 (Argyll 3D)
99.7% sRGB (Argyll 3D)
95.4% Display P3 (Argyll 3D)
Gamma: 2.23
CCT: 6408 K
| MSI Vector 16 HX A14V Chi Mei N160GME-GTB, IPS, 2560x1600, 16" | MSI Vector GP66 12UGS BOE NE156FHM-NZ3, IPS, 1920x1080, 15.6" | Lenovo Legion 5 16IRX G9 NE160QDM-NZ3, IPS, 2560x1600, 16" | HP Victus 16-r0077ng CMN162D, IPS, 1920x1080, 16.1" | Asus TUF Gaming A16 FA617XS BOE NE160WUM-NX2, IPS, 1920x1200, 16" | Dell G16 7620 BOE NE16QDM, IPS, 2560x1600, 16" | |
|---|---|---|---|---|---|---|
| Display | -14% | -12% | -17% | -15% | -16% | |
| Display P3 Coverage (%) | 95.4 | 70.1 -27% | 72.4 -24% | 66.7 -30% | 69.3 -27% | 68.3 -28% |
| sRGB Coverage (%) | 99.7 | 99.5 0% | 100 0% | 98 -2% | 97.3 -2% | 98 -2% |
| AdobeRGB 1998 Coverage (%) | 85.4 | 72.1 -16% | 74.1 -13% | 69 -19% | 70.7 -17% | 70.5 -17% |
| Response Times | 7% | -48% | -53% | -81% | -21% | |
| Response Time Grey 50% / Grey 80% * (ms) | 5.7 ? | 5.8 ? -2% | 12.5 ? -119% | 13.3 ? -133% | 15.6 ? -174% | 8.6 ? -51% |
| Response Time Black / White * (ms) | 11.4 ? | 9.6 ? 16% | 8.7 ? 24% | 8.2 ? 28% | 10 ? 12% | 10.4 ? 9% |
| PWM Frequency (Hz) | ||||||
| Screen | -3% | 29% | 17% | 13% | 5% | |
| Brightness middle (cd/m²) | 557.2 | 353.1 -37% | 526 -6% | 308 -45% | 301 -46% | 369.4 -34% |
| Brightness (cd/m²) | 506 | 325 -36% | 500 -1% | 285 -44% | 294 -42% | 348 -31% |
| Brightness Distribution (%) | 83 | 85 2% | 87 5% | 85 2% | 94 13% | 83 0% |
| Black Level * (cd/m²) | 0.41 | 0.38 7% | 0.33 20% | 0.25 39% | 0.21 49% | 0.32 22% |
| Contrast (:1) | 1359 | 929 -32% | 1594 17% | 1232 -9% | 1433 5% | 1154 -15% |
| Colorchecker dE 2000 * | 2.91 | 2.24 23% | 1.2 59% | 1.3 55% | 1.79 38% | 1.78 39% |
| Colorchecker dE 2000 max. * | 5.94 | 5 16% | 2.1 65% | 2.76 54% | 3.48 41% | 4.41 26% |
| Colorchecker dE 2000 calibrated * | 1.63 | 1.02 37% | 1 39% | 0.92 44% | 1.2 26% | 1.22 25% |
| Greyscale dE 2000 * | 3.8 | 4 -5% | 1.3 66% | 1.7 55% | 2.5 34% | 3.2 16% |
| Gamma | 2.23 99% | 2.24 98% | 2.23 99% | 2.167 102% | 2.265 97% | 2.2 100% |
| CCT | 6408 101% | 6864 95% | 6391 102% | 6767 96% | 6157 106% | 6750 96% |
| Całkowita średnia (program / ustawienia) | -3% /
-4% | -10% /
9% | -18% /
-0% | -28% /
-6% | -11% /
-3% |
* ... im mniej tym lepiej
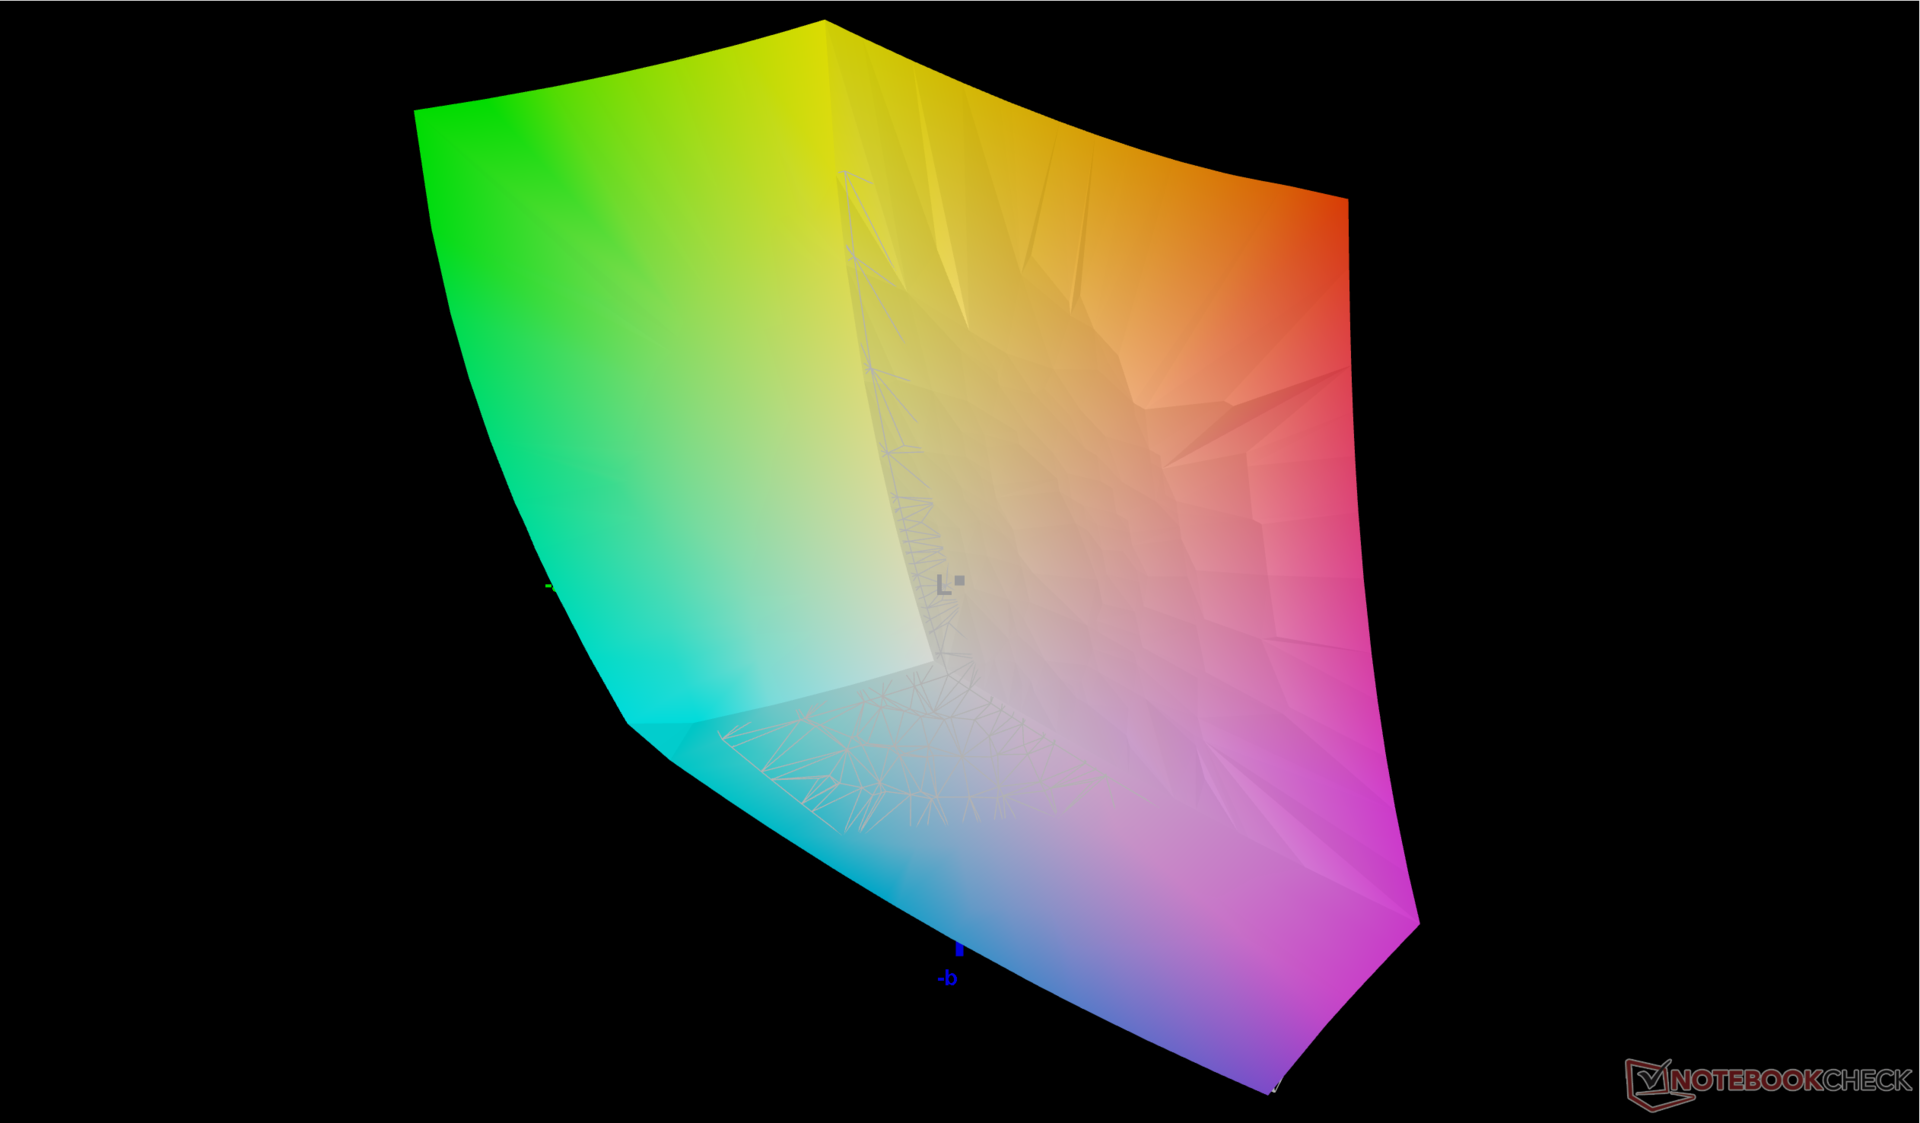
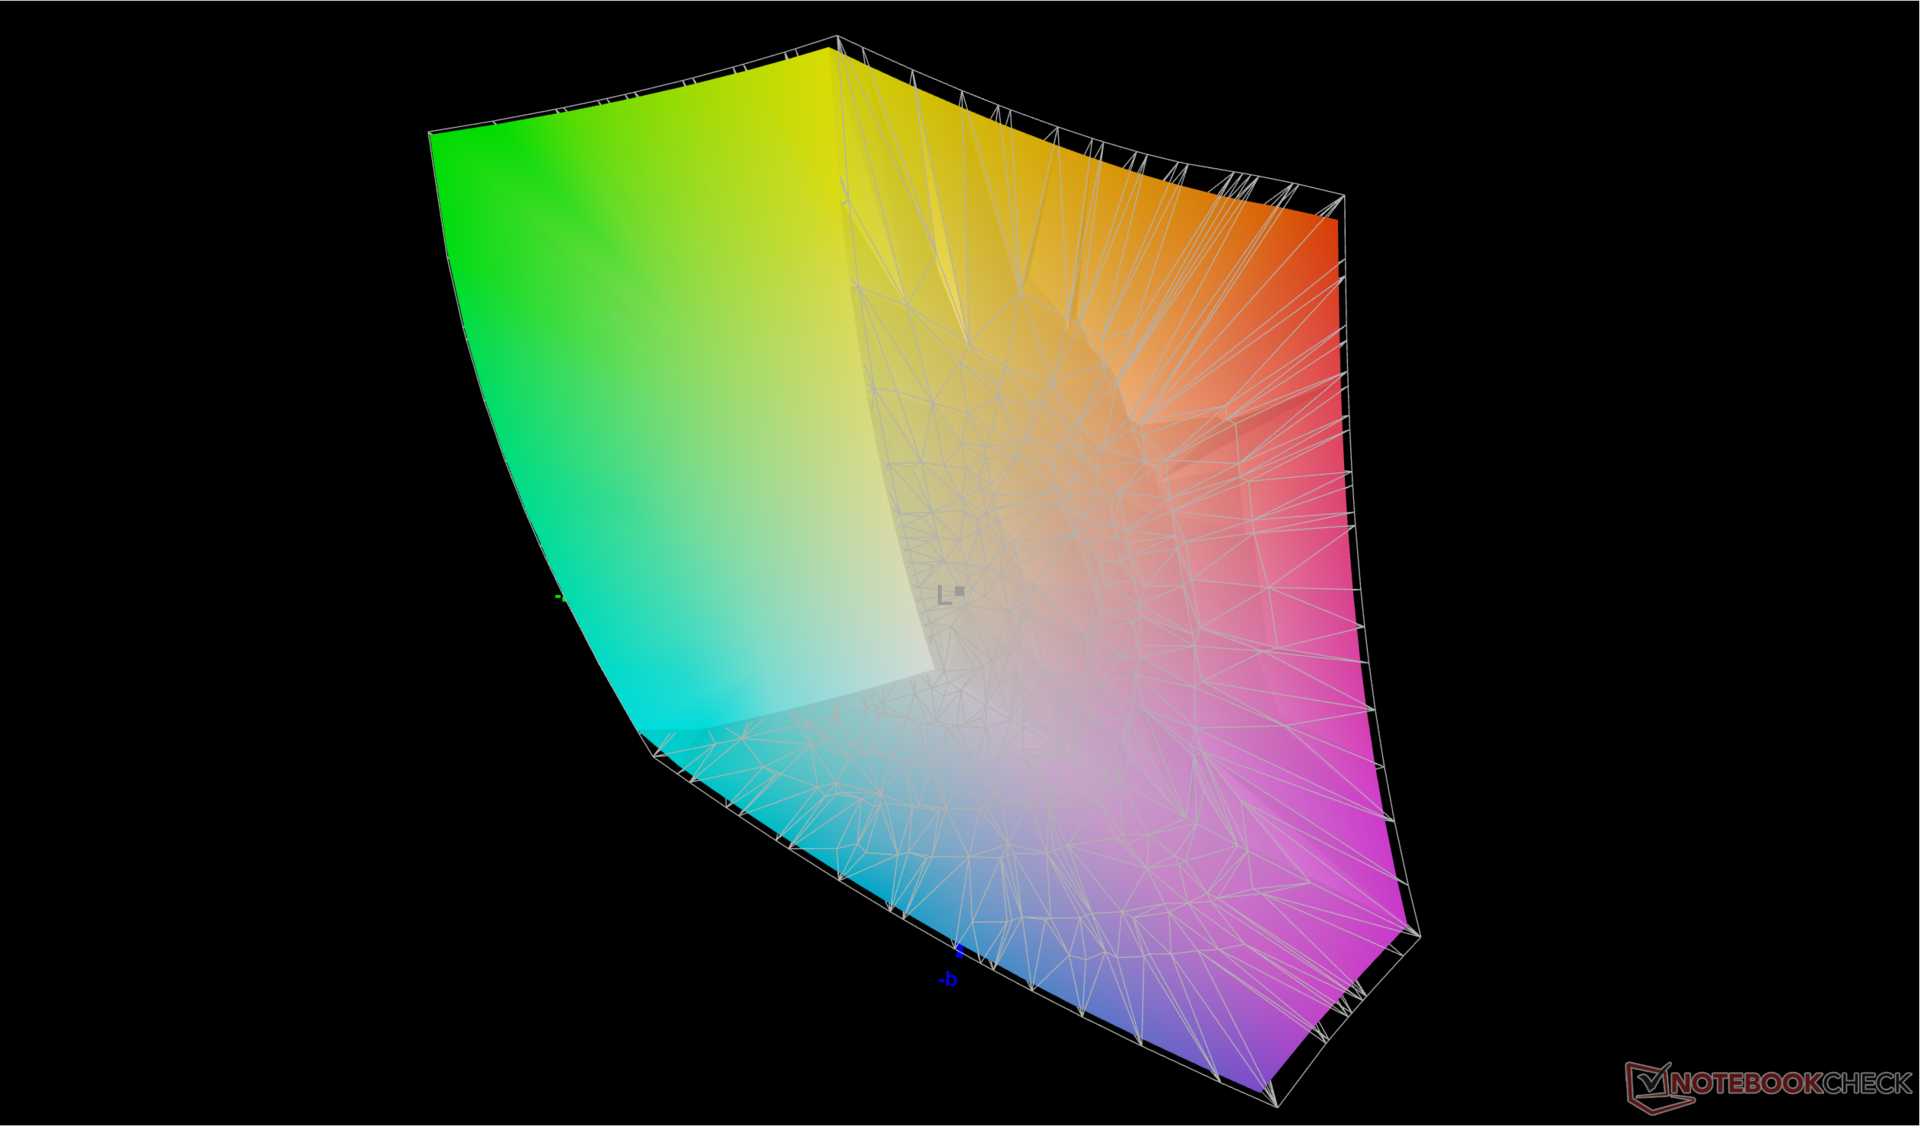
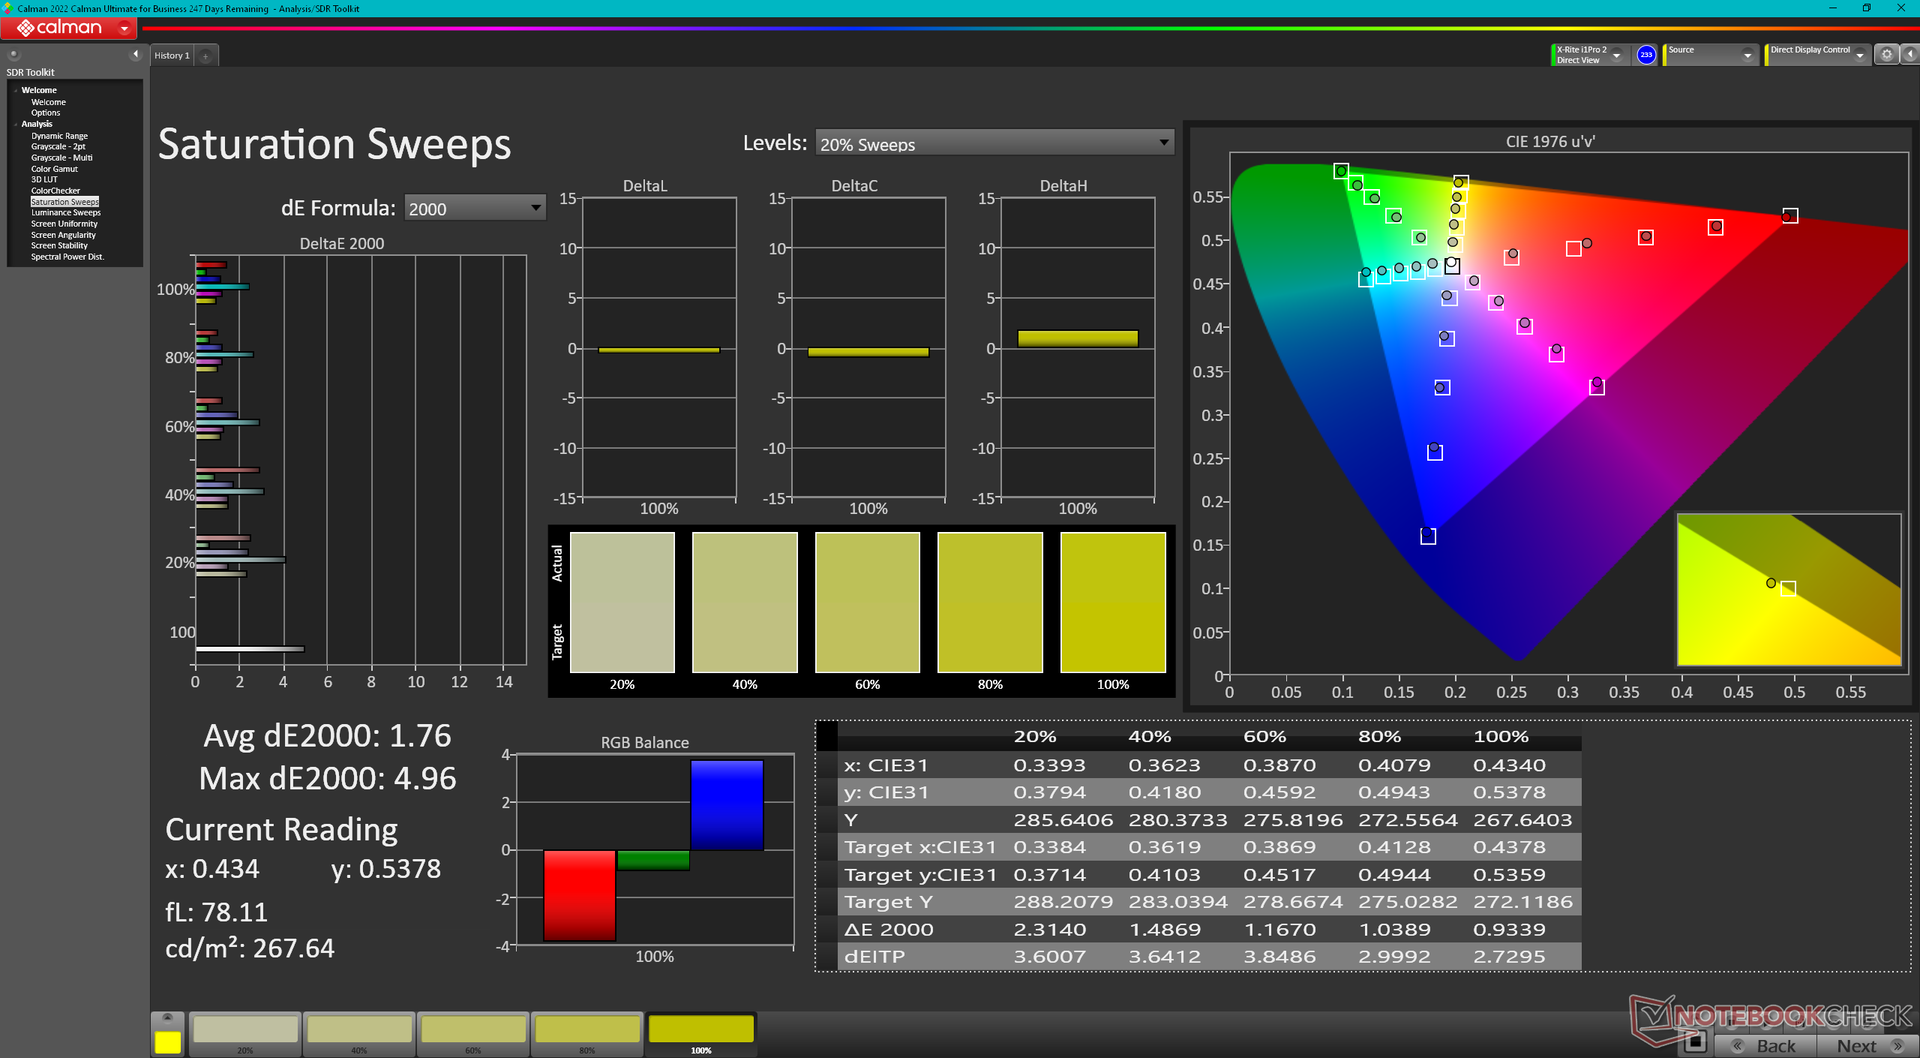
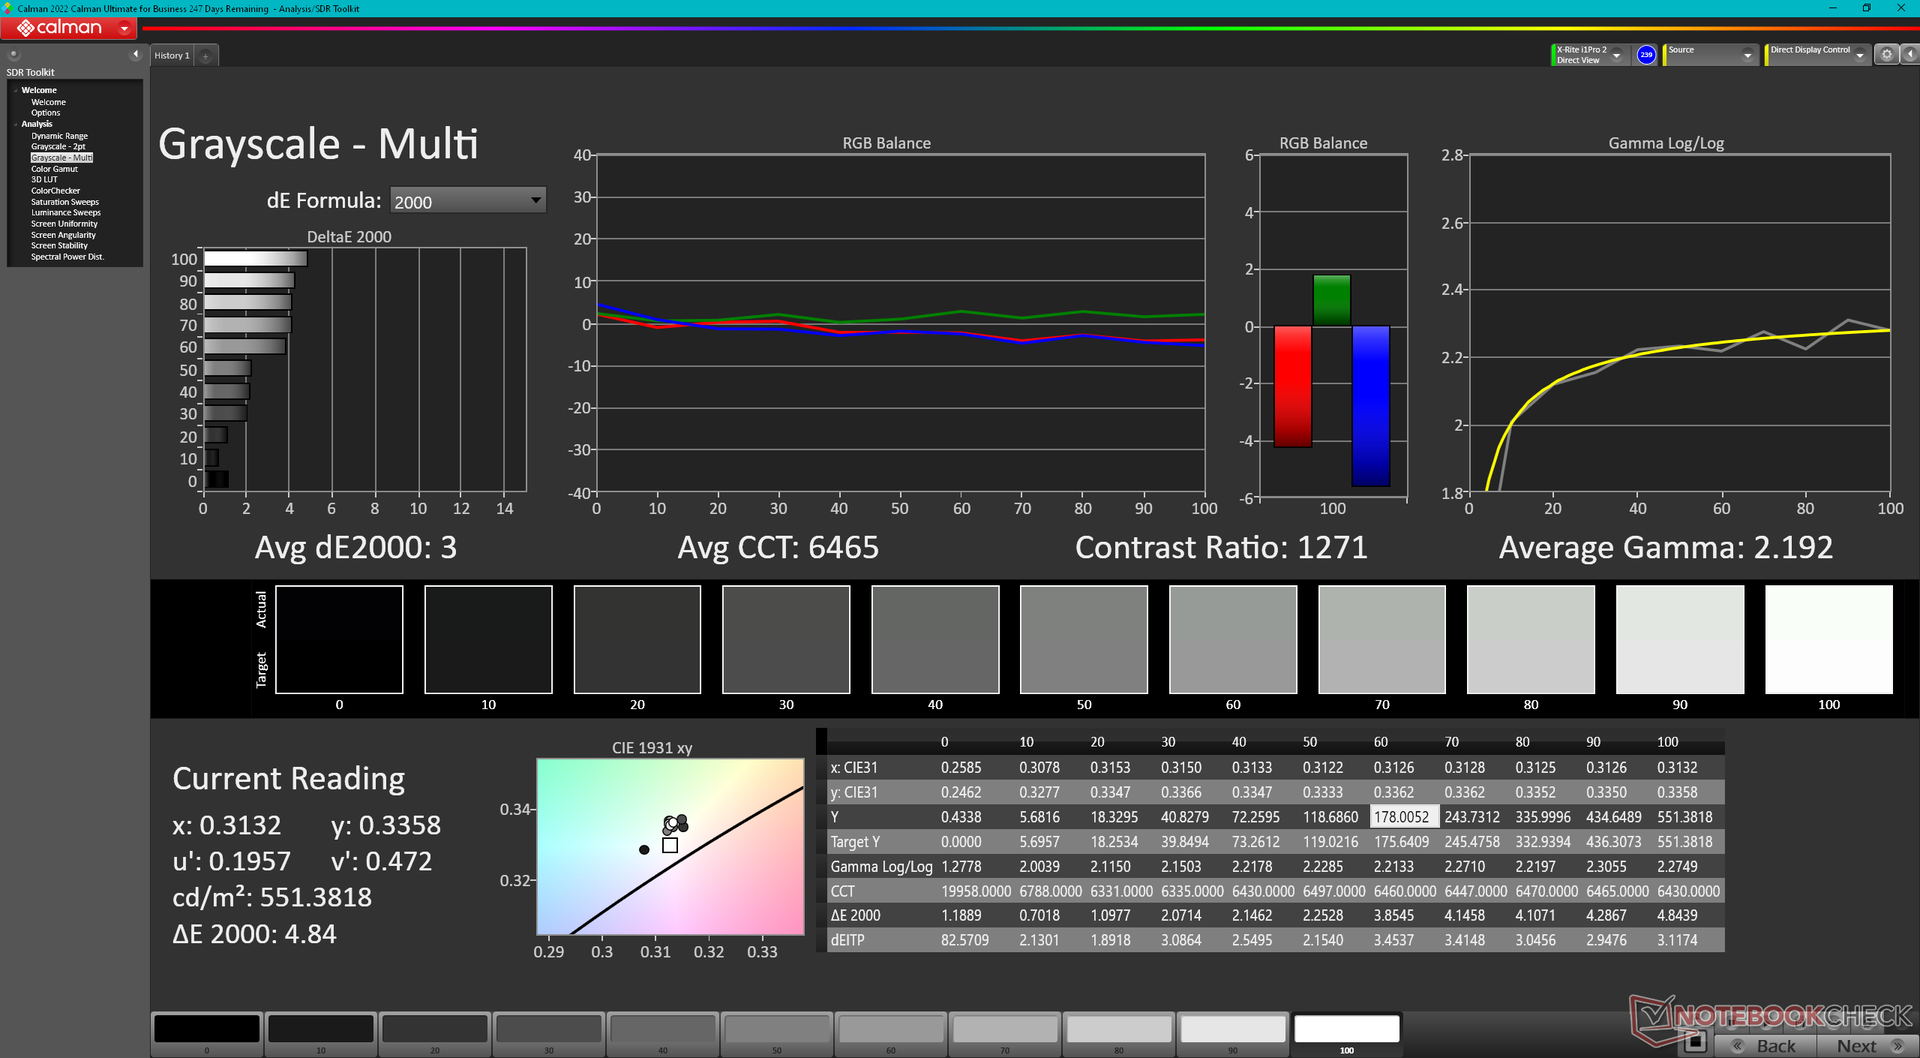
Chociaż wyświetlacz nie jest fabrycznie skalibrowany, jego kolory są już stosunkowo dokładne. Średnie wartości deltaE dla skali szarości i kolorów wynoszą odpowiednio tylko 3,8 i 2,91 w porównaniu do standardu P3. Nasz skalibrowany profil ICM jest dostępny bezpłatnie powyżej, aby poprawić dokładność bliżej standardu deltaE <2.
Wyświetl czasy reakcji
| ↔ Czas reakcji od czerni do bieli | ||
|---|---|---|
| 11.4 ms ... wzrost ↗ i spadek ↘ łącznie | ↗ 6.5 ms wzrost | 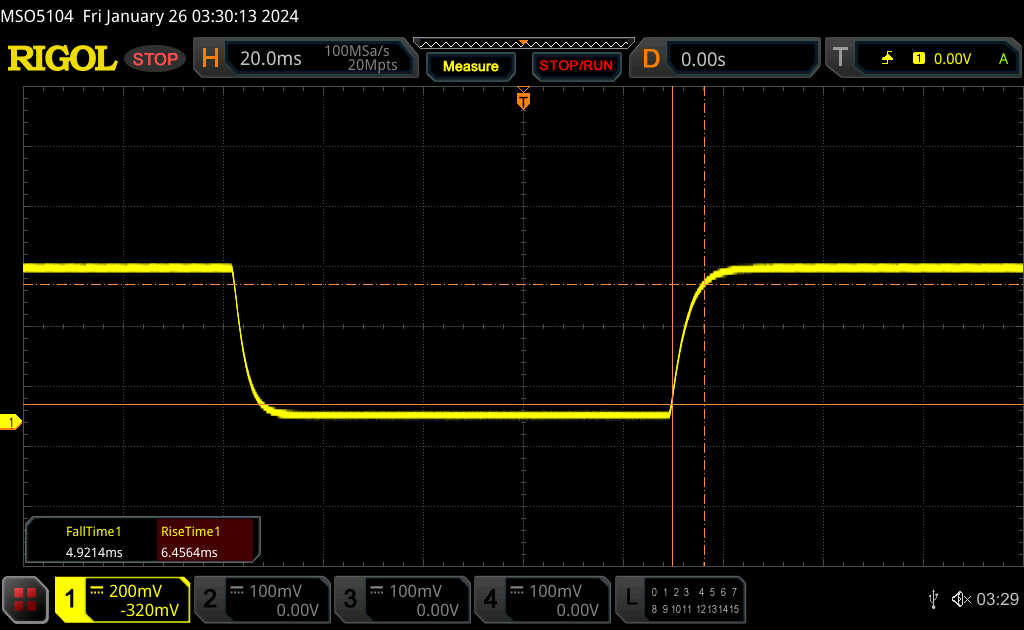 |
| ↘ 4.9 ms upadek | ||
| W naszych testach ekran wykazuje dobry współczynnik reakcji, ale może być zbyt wolny dla graczy rywalizujących ze sobą. Dla porównania, wszystkie testowane urządzenia wahają się od 0.1 (minimum) do 240 (maksimum) ms. » 31 % wszystkich urządzeń jest lepszych. Oznacza to, że zmierzony czas reakcji jest lepszy od średniej wszystkich testowanych urządzeń (19.8 ms). | ||
| ↔ Czas reakcji 50% szarości do 80% szarości | ||
| 5.7 ms ... wzrost ↗ i spadek ↘ łącznie | ↗ 2.8 ms wzrost | 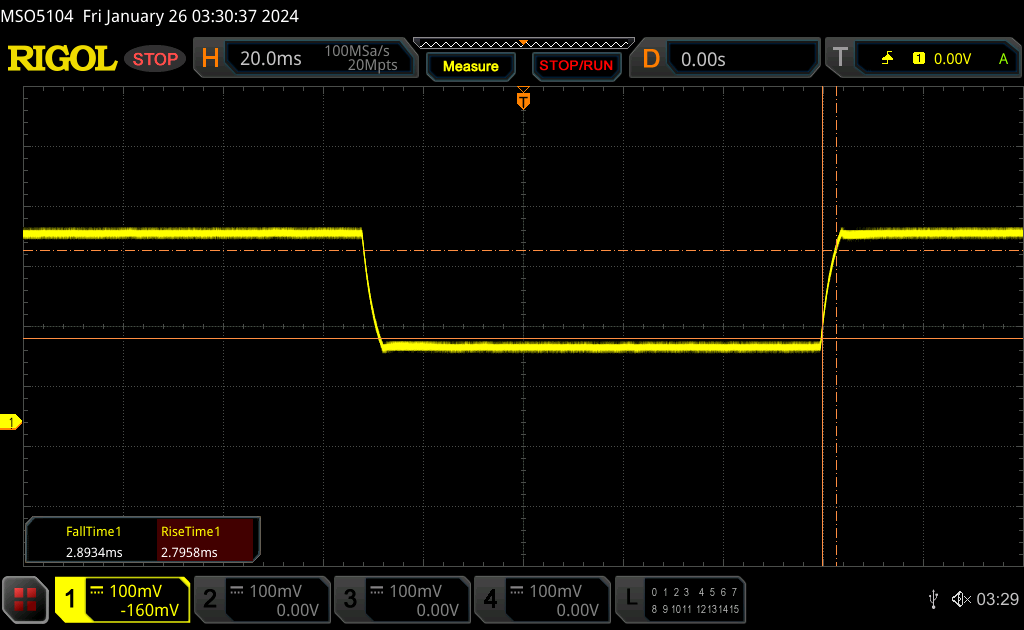 |
| ↘ 2.9 ms upadek | ||
| W naszych testach ekran wykazuje bardzo szybką reakcję i powinien bardzo dobrze nadawać się do szybkich gier. Dla porównania, wszystkie testowane urządzenia wahają się od 0.165 (minimum) do 636 (maksimum) ms. » 18 % wszystkich urządzeń jest lepszych. Oznacza to, że zmierzony czas reakcji jest lepszy od średniej wszystkich testowanych urządzeń (30.9 ms). | ||
Migotanie ekranu / PWM (modulacja szerokości impulsu)
| Migotanie ekranu/nie wykryto PWM | 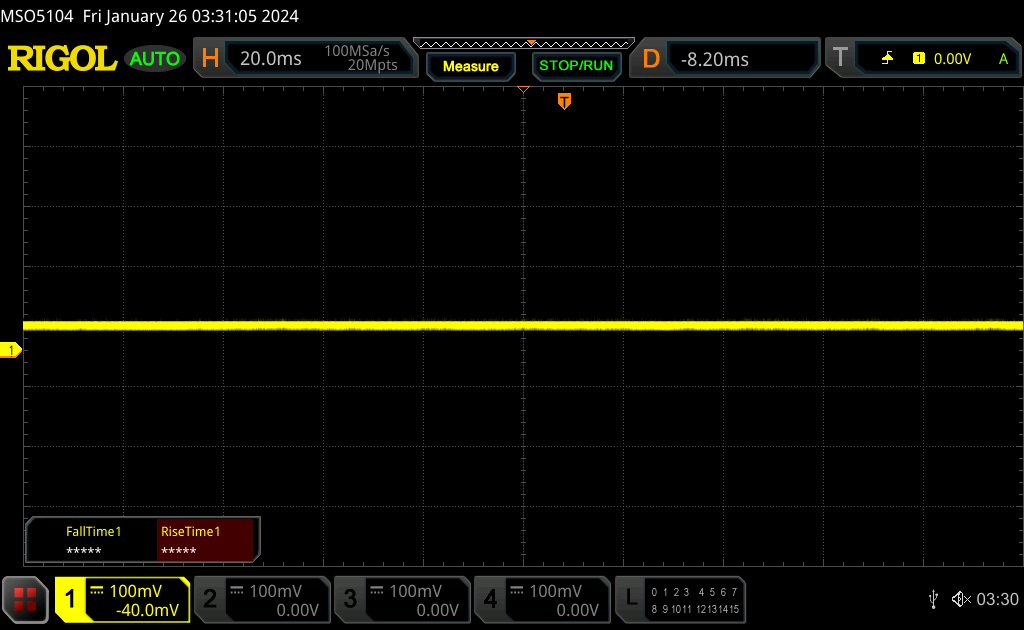 | ||
Dla porównania: 52 % wszystkich testowanych urządzeń nie używa PWM do przyciemniania wyświetlacza. Jeśli wykryto PWM, zmierzono średnio 7744 (minimum: 5 - maksimum: 343500) Hz. | |||
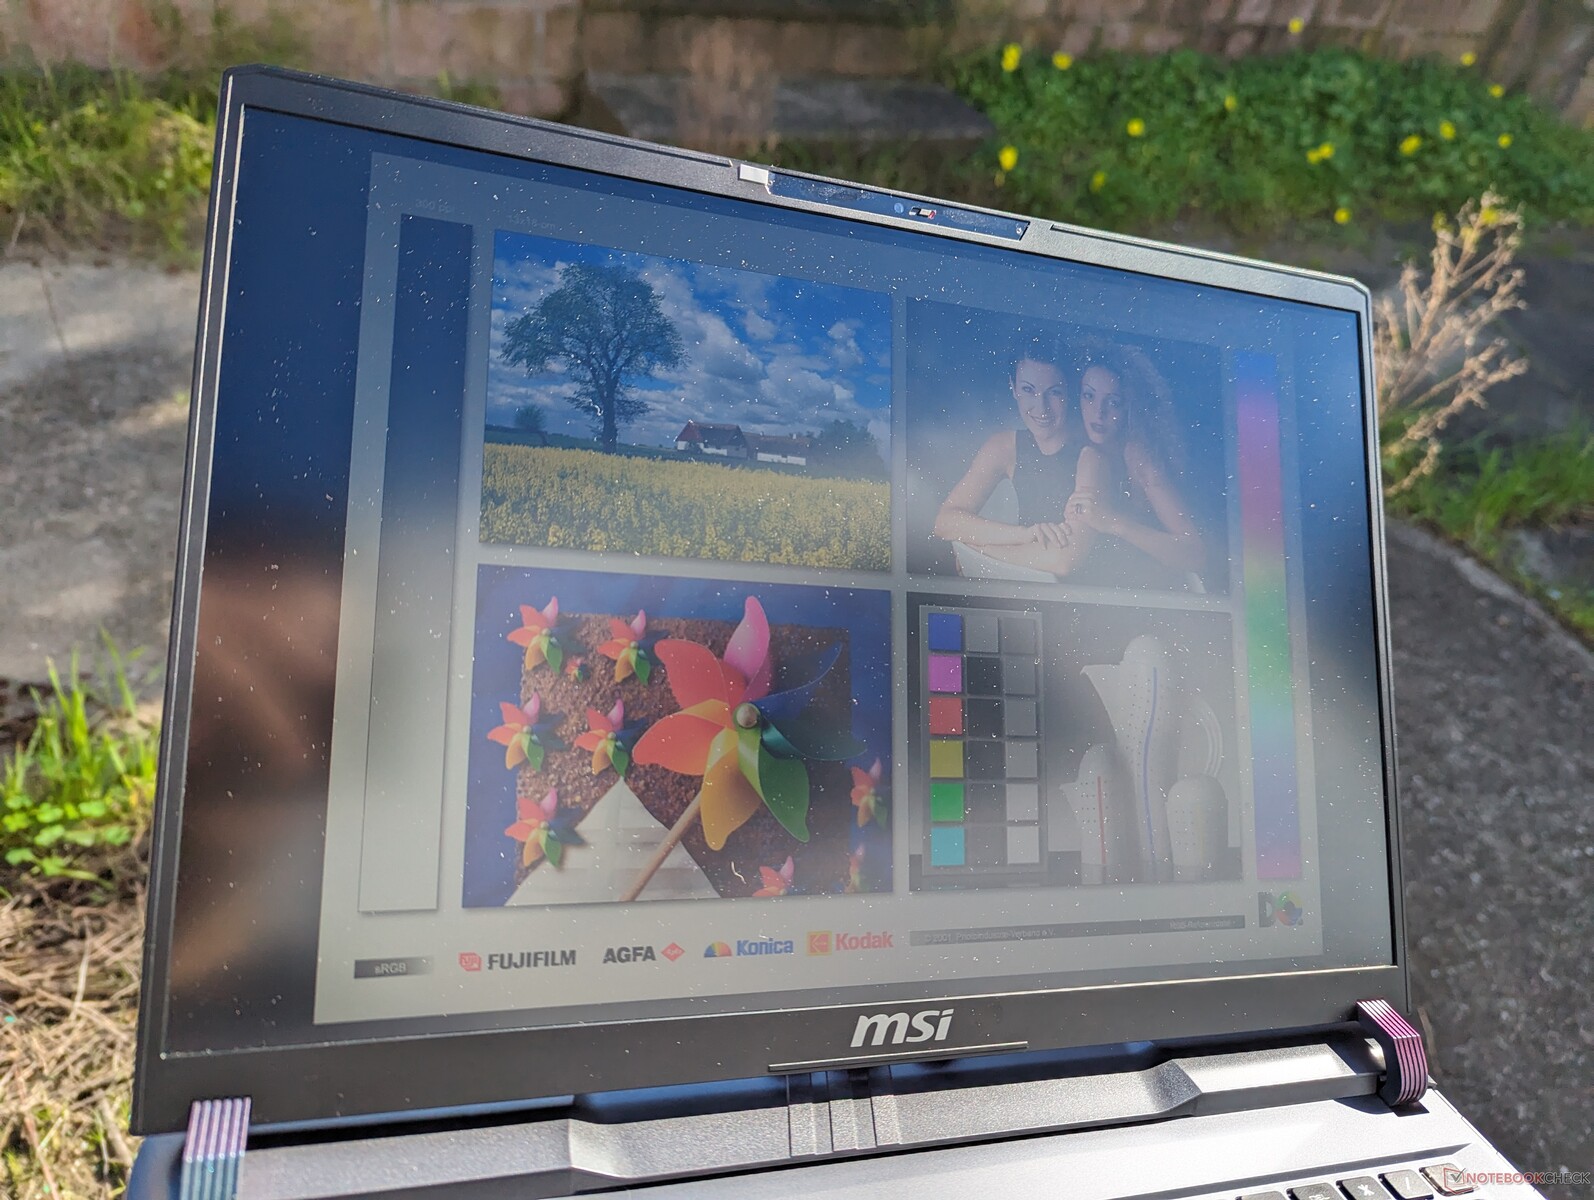
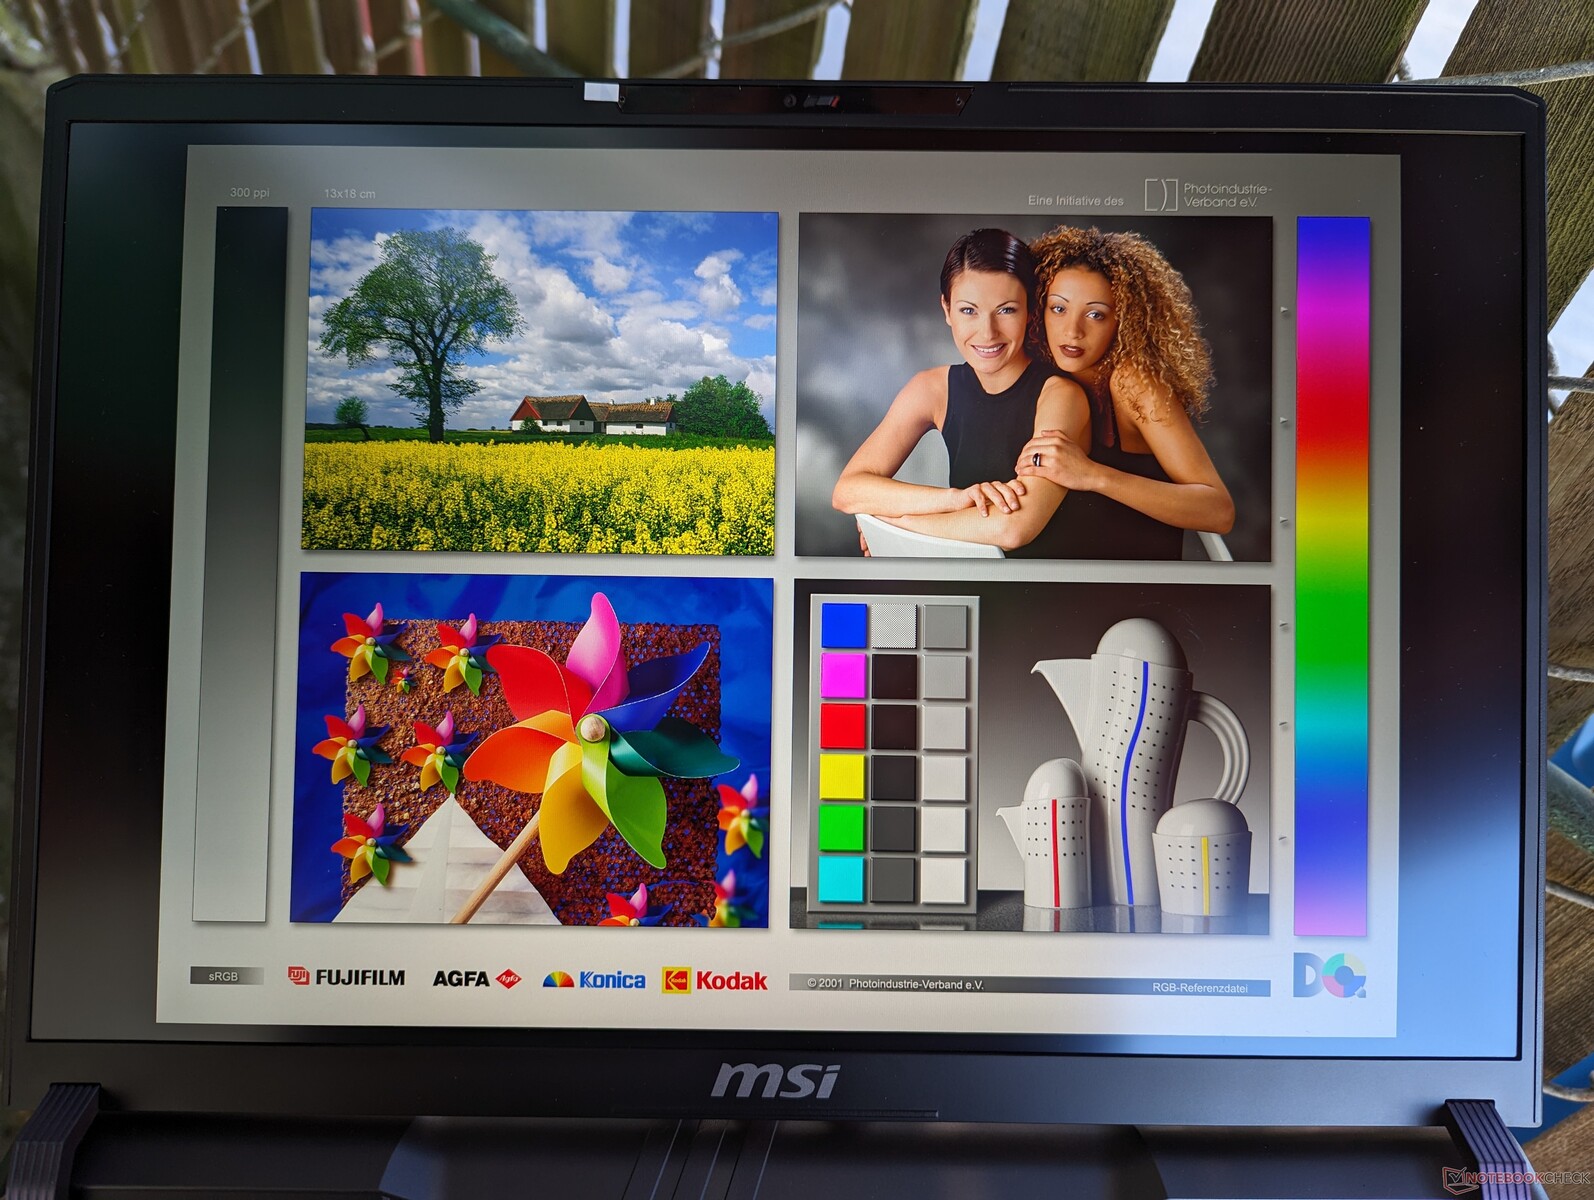
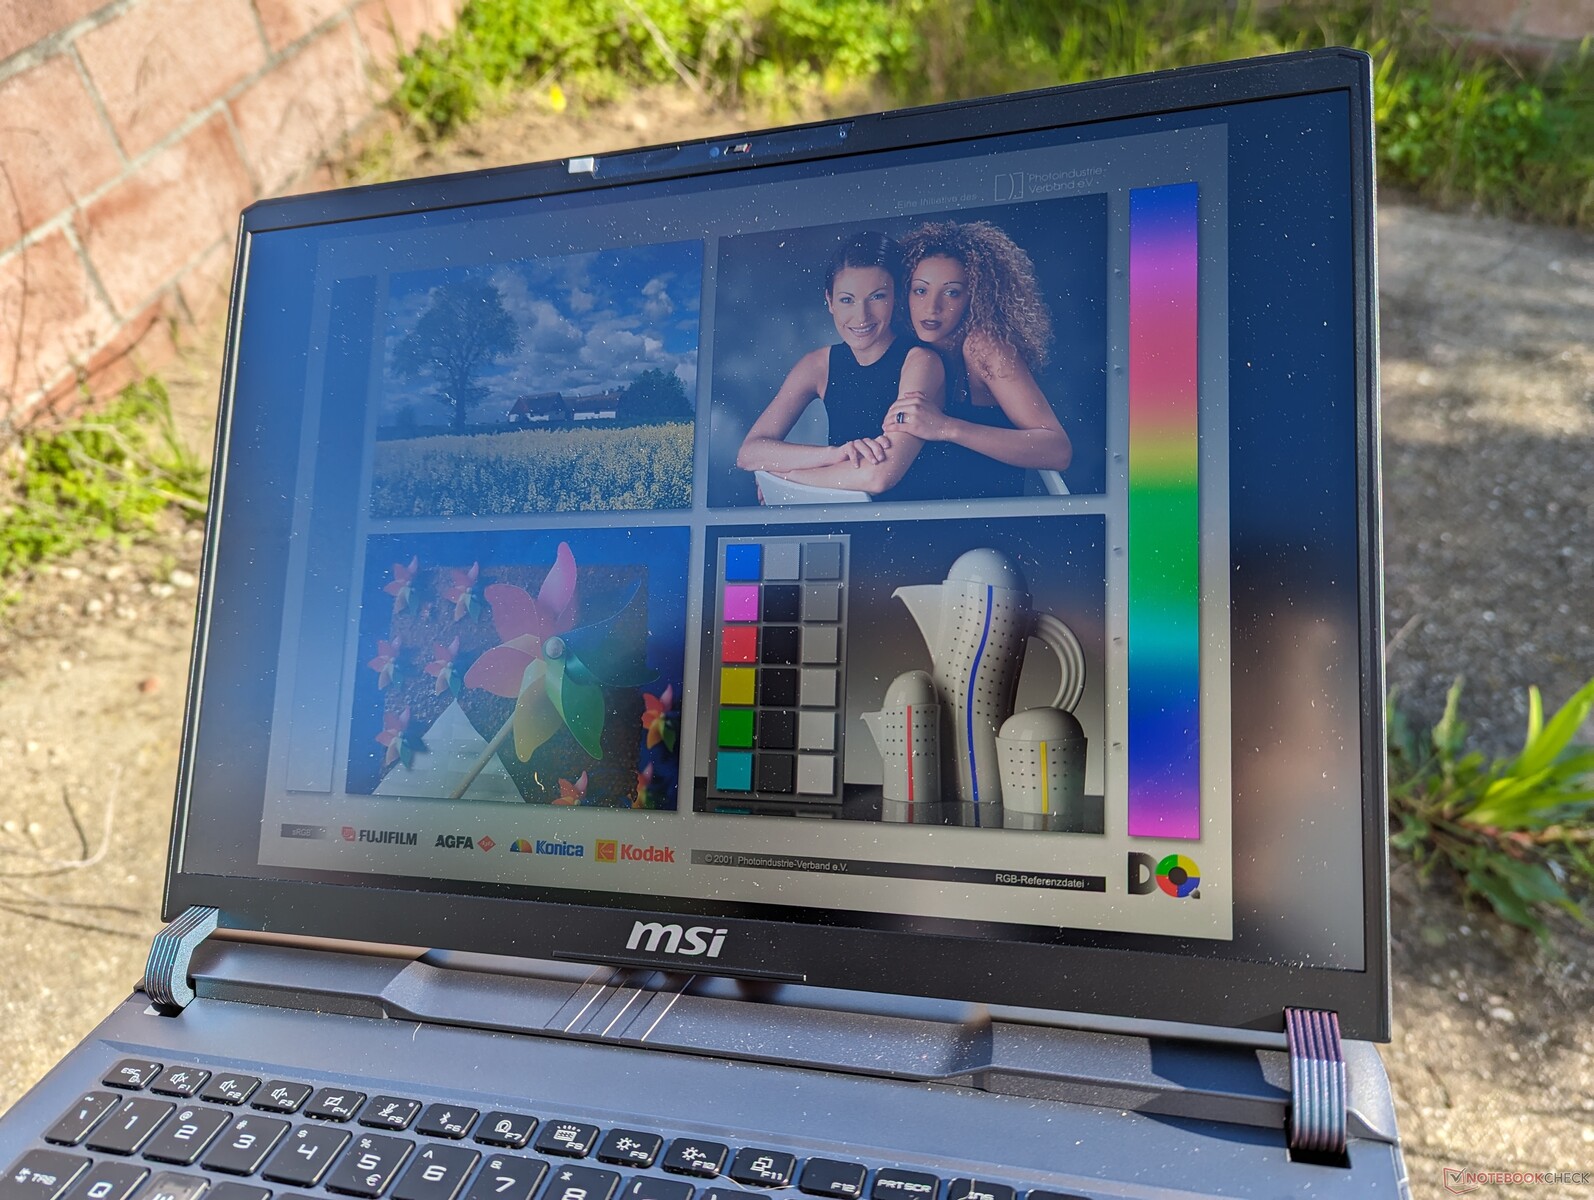
Matowy wyświetlacz jest stosunkowo jasny jak na panel IPS i ma około 550 nitów, w porównaniu do zaledwie 300 nitów w modelu HP Victus 16 lub Asus TUF Gaming A16. Widoczność jest znośna w cieniu, ale w jaśniejszych warunkach zewnętrznych ekran jest nadal zbyt ciemny.
Wydajność
Warunki testowania
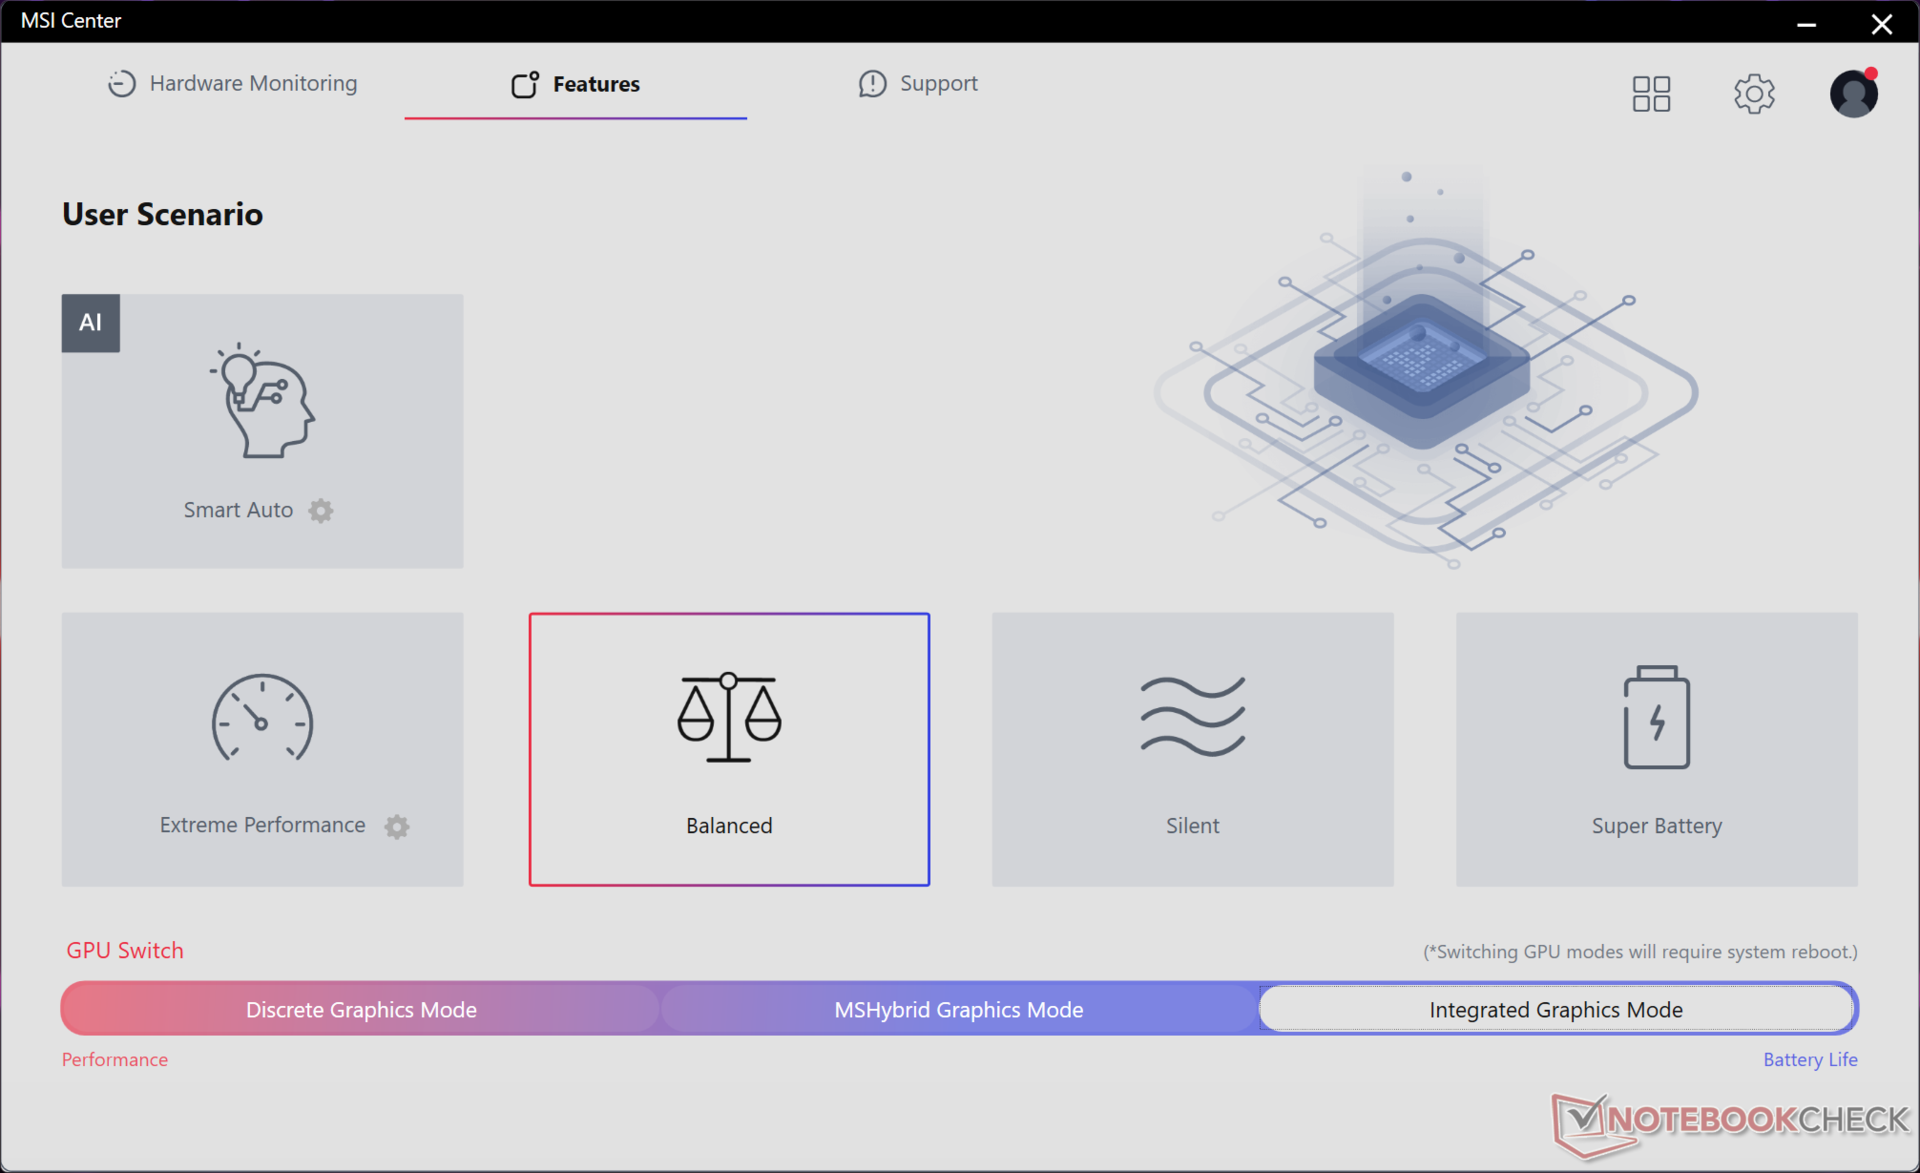
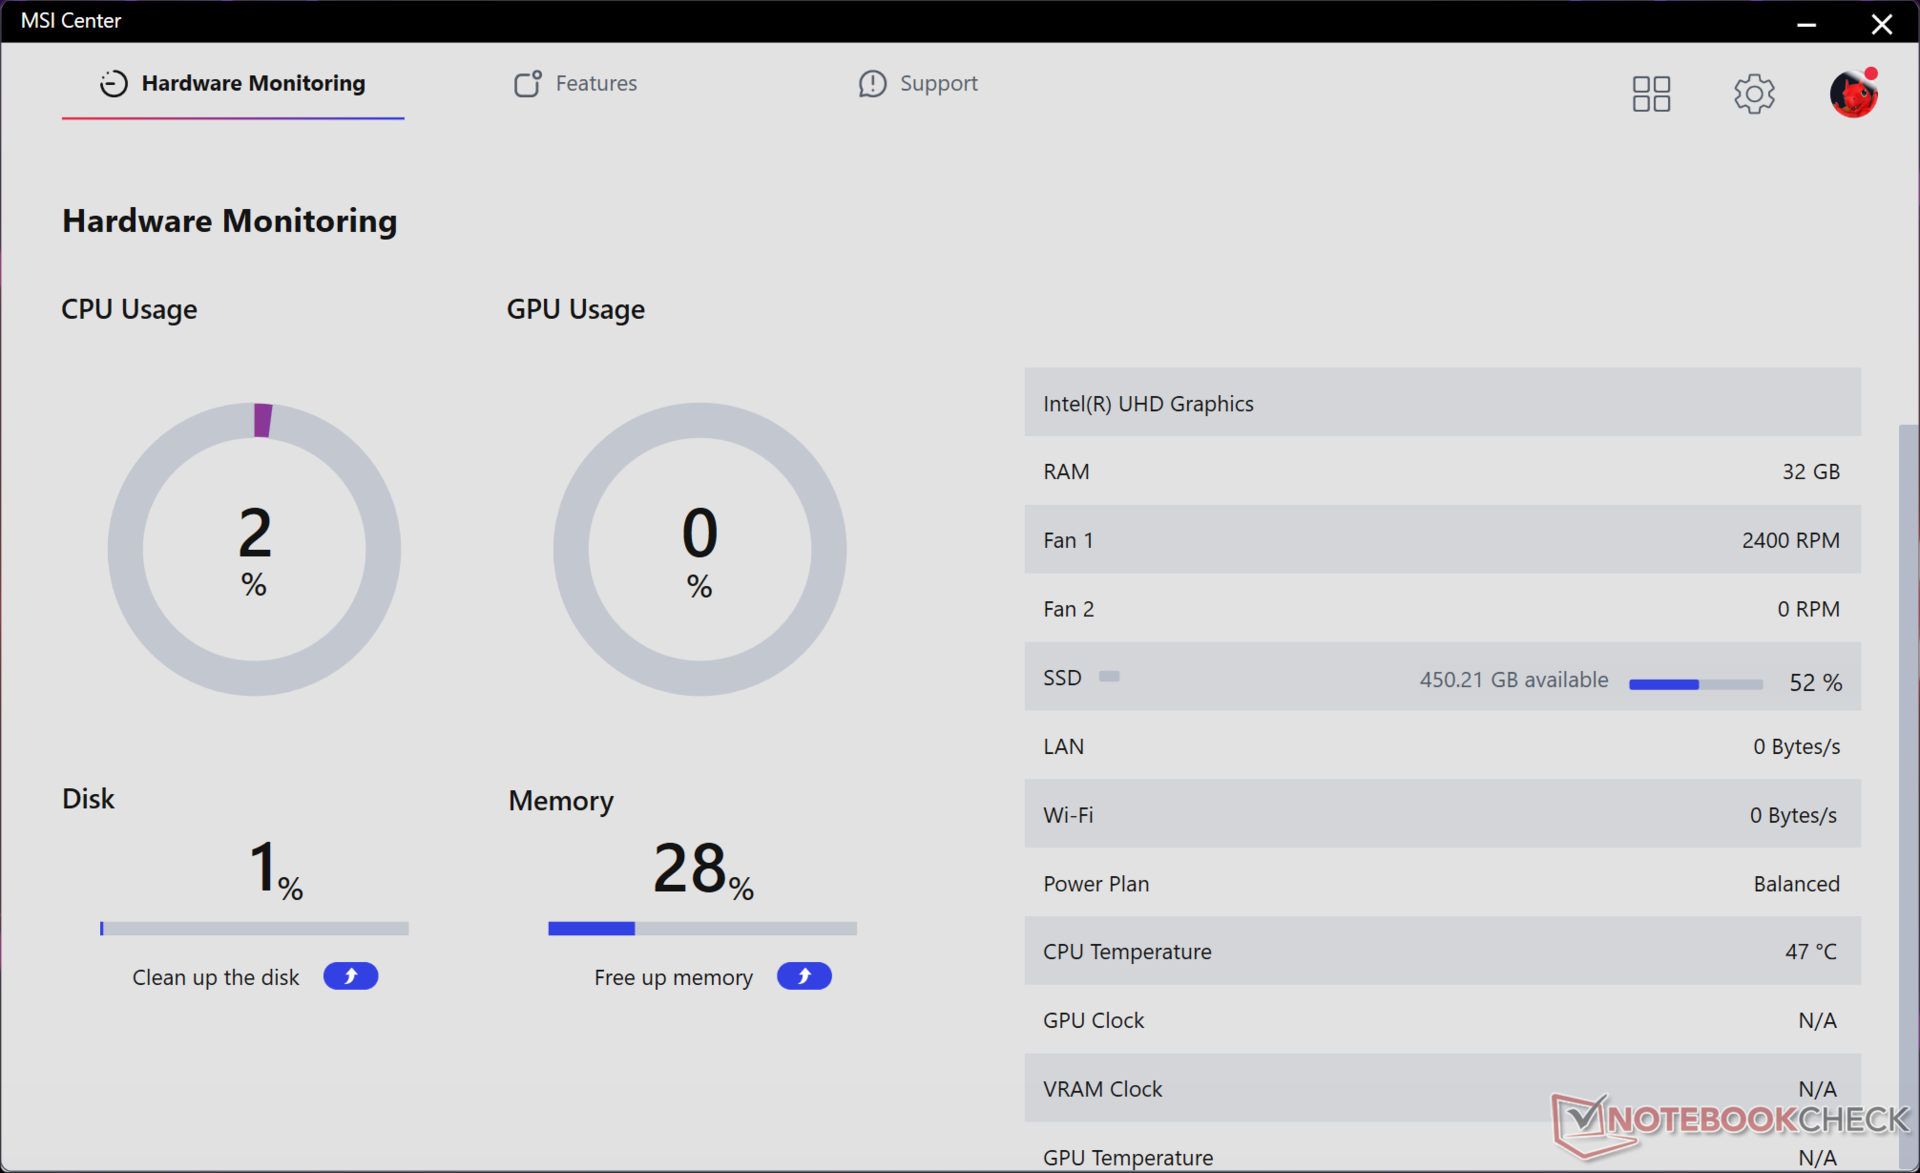
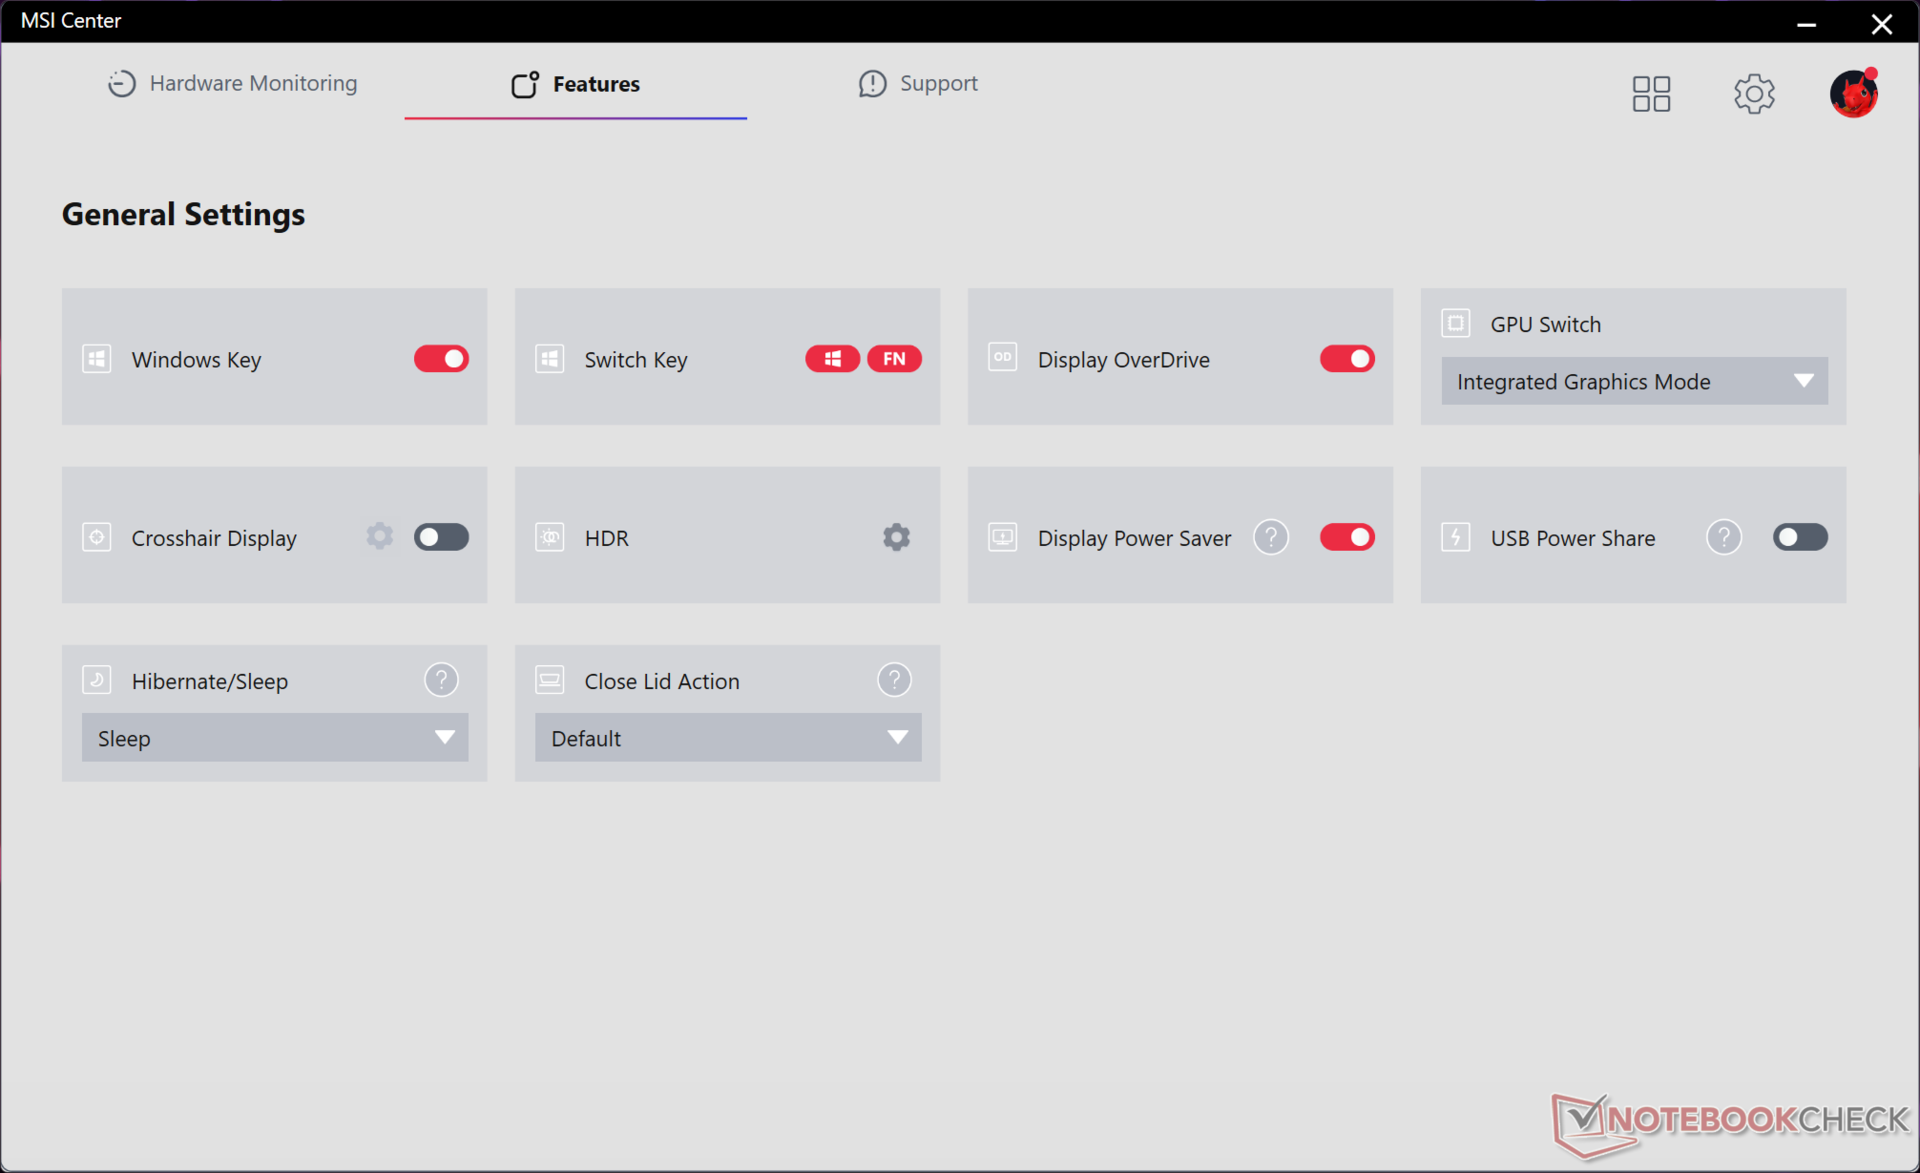
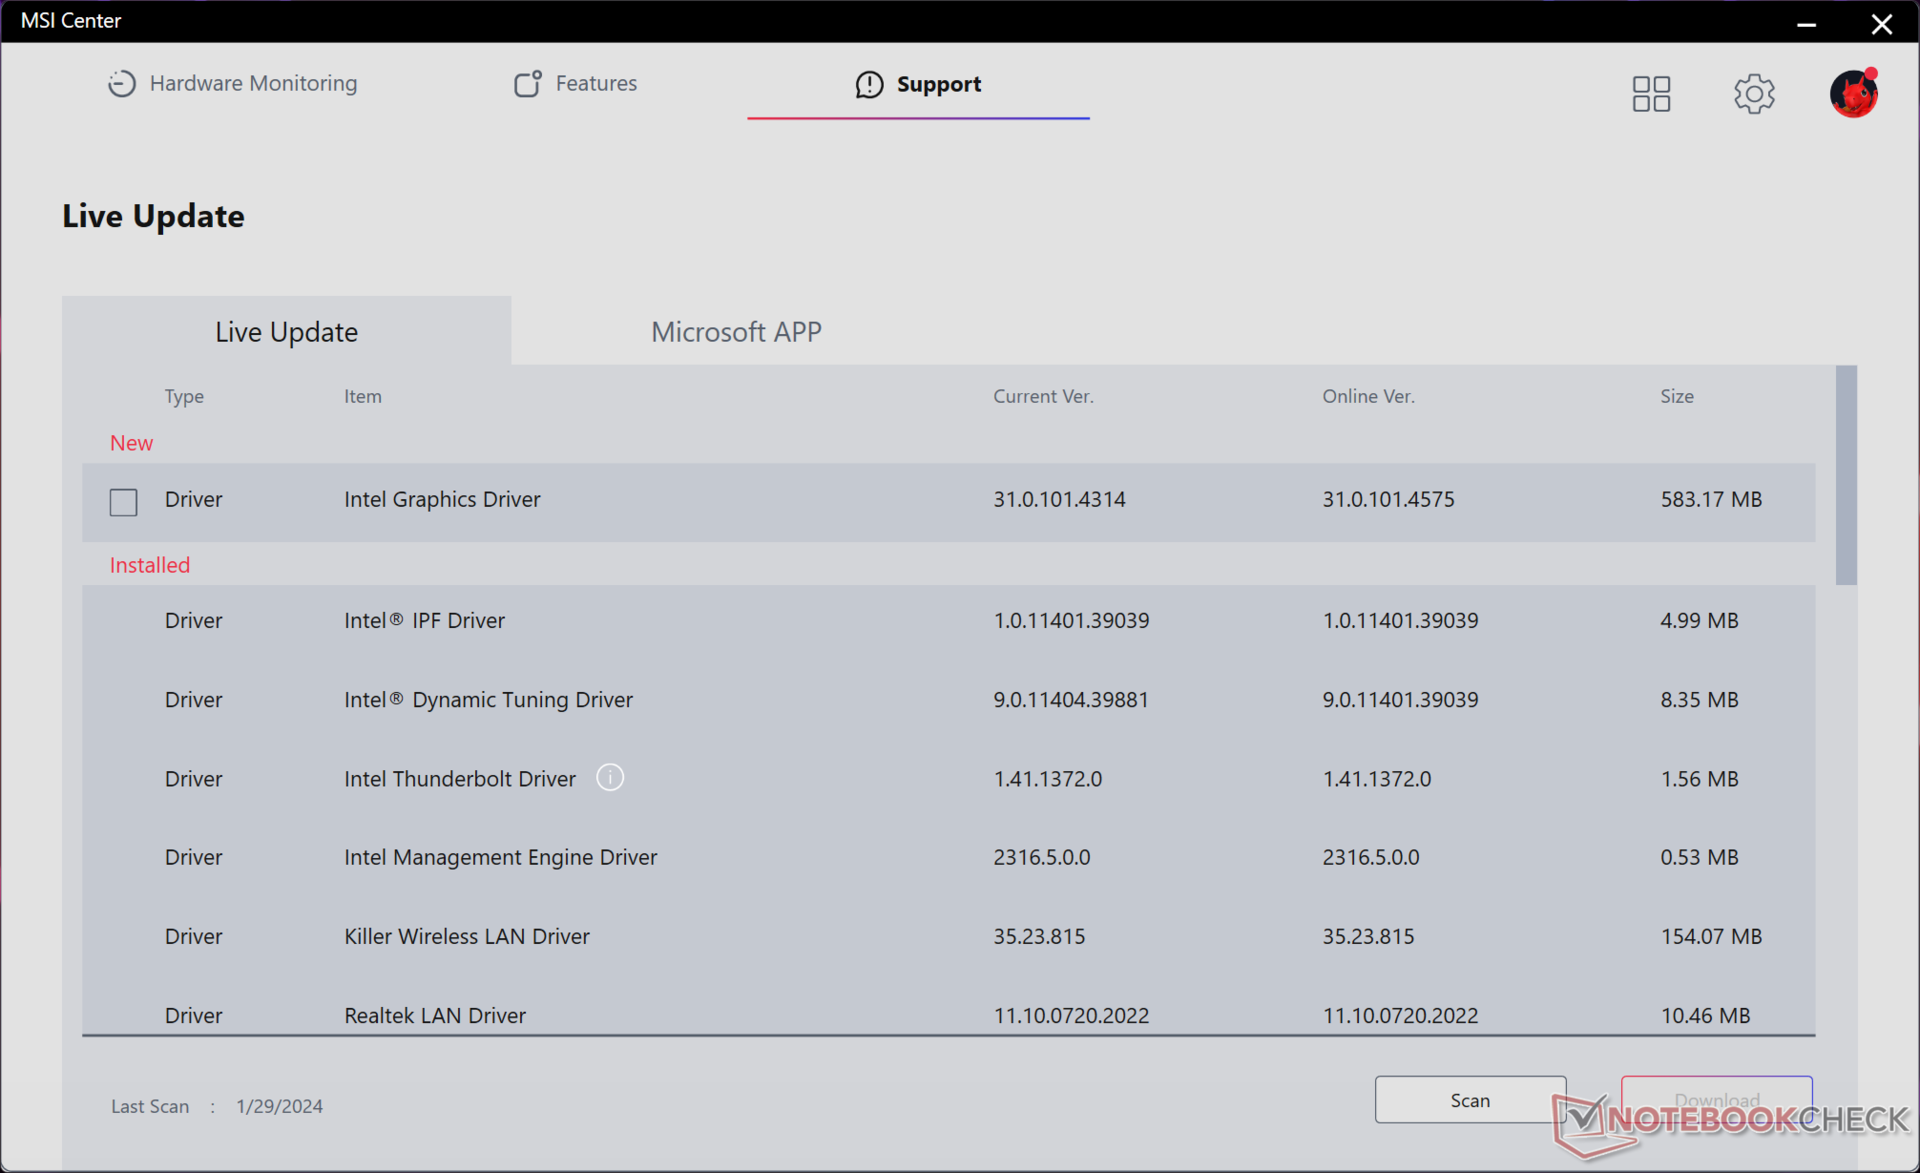
Przed wykonaniem poniższych testów ustawiliśmy naszą jednostkę w trybie dGPU i trybie Extreme Performance z aktywnym Cooler Boost. Właściciele powinni zapoznać się z preinstalowanym oprogramowaniem MSI Center, ponieważ jest to centrum aktualizacji systemu, jego parametrów, przełączania funkcji oraz dostosowywania ustawień MUX i profili zasilania. Przełączanie między trybami dGPU i iGPU wymaga ponownego uruchomienia komputera, co może trwać nawet dłużej niż zwykły zimny rozruch.
Procesor
Podobnie jak to, co odkryliśmy w Titan 18 HX, procesor Core i9-14900HX to tylko niewielki wzrost w stosunku do ostatniej generacji Core i9-13980HX nawet o 10 procent. Korzyści w ujęciu rok do roku są zatem jedynie marginalne, zwłaszcza że w odświeżonej serii Raptor Lake-HX 14. generacji zabrakło nowej dedykowanej jednostki NPU, którą można znaleźć w serii Meteor Lake 14. generacji. Oczywiście Core i9-13980HX był jednym z najszybszych procesorów mobilnych w 2023 roku, więc Core i9-14900HX nie jest absolutnie garbaty. Użytkownicy przesiadający się z laptopów do gier Intel 12. generacji lub starszych nadal powinni zauważyć znaczny wzrost wydajności.
Cinebench R15 Multi Loop
Cinebench R23: Multi Core | Single Core
Cinebench R20: CPU (Multi Core) | CPU (Single Core)
Cinebench R15: CPU Multi 64Bit | CPU Single 64Bit
Blender: v2.79 BMW27 CPU
7-Zip 18.03: 7z b 4 | 7z b 4 -mmt1
Geekbench 6.7: Multi-Core | Single-Core
Geekbench 5.5: Multi-Core | Single-Core
HWBOT x265 Benchmark v2.2: 4k Preset
LibreOffice : 20 Documents To PDF
R Benchmark 2.5: Overall mean
| CPU Performance rating | |
| MSI Vector 16 HX A14V | |
| Asus Zephyrus Duo 16 GX650PY-NM006W -2! | |
| Przeciętny Intel Core i9-14900HX | |
| Alienware m16 R1 AMD | |
| Lenovo Legion 5 16IRX G9 | |
| Alienware m16 R1 Intel | |
| Lenovo Legion Pro 5 16ARX8 -2! | |
| Asus TUF Gaming A16 FA617XS -2! | |
| MSI Vector GP66 12UGS -2! | |
| Lenovo Legion Slim 7 16APH8 | |
| Lenovo LOQ 16IRH8 | |
| Dell G16 7620 -2! | |
| HP Victus 16-r0077ng | |
| Cinebench R23 / Multi Core | |
| Asus Zephyrus Duo 16 GX650PY-NM006W | |
| MSI Vector 16 HX A14V | |
| Przeciętny Intel Core i9-14900HX (17078 - 36249, n=37) | |
| Alienware m16 R1 AMD | |
| Lenovo Legion 5 16IRX G9 | |
| Alienware m16 R1 Intel | |
| Lenovo Legion Pro 5 16ARX8 | |
| Dell G16 7620 | |
| Asus TUF Gaming A16 FA617XS | |
| MSI Vector GP66 12UGS | |
| Lenovo Legion Slim 7 16APH8 | |
| HP Victus 16-r0077ng | |
| Lenovo LOQ 16IRH8 | |
| Cinebench R23 / Single Core | |
| MSI Vector 16 HX A14V | |
| Przeciętny Intel Core i9-14900HX (1720 - 2245, n=37) | |
| Lenovo Legion 5 16IRX G9 | |
| Asus Zephyrus Duo 16 GX650PY-NM006W | |
| Alienware m16 R1 Intel | |
| MSI Vector GP66 12UGS | |
| Lenovo LOQ 16IRH8 | |
| Alienware m16 R1 AMD | |
| Lenovo Legion Pro 5 16ARX8 | |
| Asus TUF Gaming A16 FA617XS | |
| Lenovo Legion Slim 7 16APH8 | |
| Dell G16 7620 | |
| HP Victus 16-r0077ng | |
| Cinebench R20 / CPU (Multi Core) | |
| Asus Zephyrus Duo 16 GX650PY-NM006W | |
| MSI Vector 16 HX A14V | |
| Przeciętny Intel Core i9-14900HX (6579 - 13832, n=37) | |
| Alienware m16 R1 AMD | |
| Lenovo Legion 5 16IRX G9 | |
| Alienware m16 R1 Intel | |
| Lenovo Legion Pro 5 16ARX8 | |
| MSI Vector GP66 12UGS | |
| Dell G16 7620 | |
| Asus TUF Gaming A16 FA617XS | |
| Lenovo Legion Slim 7 16APH8 | |
| HP Victus 16-r0077ng | |
| Lenovo LOQ 16IRH8 | |
| Cinebench R20 / CPU (Single Core) | |
| MSI Vector 16 HX A14V | |
| Przeciętny Intel Core i9-14900HX (657 - 859, n=37) | |
| Asus Zephyrus Duo 16 GX650PY-NM006W | |
| Lenovo Legion 5 16IRX G9 | |
| Alienware m16 R1 Intel | |
| MSI Vector GP66 12UGS | |
| Alienware m16 R1 AMD | |
| Lenovo Legion Pro 5 16ARX8 | |
| Lenovo LOQ 16IRH8 | |
| Asus TUF Gaming A16 FA617XS | |
| Lenovo Legion Slim 7 16APH8 | |
| Dell G16 7620 | |
| HP Victus 16-r0077ng | |
| Cinebench R15 / CPU Multi 64Bit | |
| Asus Zephyrus Duo 16 GX650PY-NM006W | |
| MSI Vector 16 HX A14V | |
| Przeciętny Intel Core i9-14900HX (3263 - 5589, n=38) | |
| Alienware m16 R1 AMD | |
| Lenovo Legion 5 16IRX G9 | |
| Alienware m16 R1 Intel | |
| Lenovo Legion Pro 5 16ARX8 | |
| Asus TUF Gaming A16 FA617XS | |
| Dell G16 7620 | |
| Lenovo Legion Slim 7 16APH8 | |
| Lenovo LOQ 16IRH8 | |
| MSI Vector GP66 12UGS | |
| HP Victus 16-r0077ng | |
| Cinebench R15 / CPU Single 64Bit | |
| MSI Vector 16 HX A14V | |
| Asus Zephyrus Duo 16 GX650PY-NM006W | |
| Przeciętny Intel Core i9-14900HX (247 - 323, n=37) | |
| Alienware m16 R1 AMD | |
| Lenovo Legion Pro 5 16ARX8 | |
| Lenovo Legion 5 16IRX G9 | |
| Asus TUF Gaming A16 FA617XS | |
| Alienware m16 R1 Intel | |
| MSI Vector GP66 12UGS | |
| Lenovo Legion Slim 7 16APH8 | |
| Lenovo LOQ 16IRH8 | |
| Dell G16 7620 | |
| HP Victus 16-r0077ng | |
| Blender / v2.79 BMW27 CPU | |
| Lenovo LOQ 16IRH8 | |
| HP Victus 16-r0077ng | |
| MSI Vector GP66 12UGS | |
| Lenovo Legion Slim 7 16APH8 | |
| Asus TUF Gaming A16 FA617XS | |
| Dell G16 7620 | |
| Lenovo Legion Pro 5 16ARX8 | |
| Alienware m16 R1 Intel | |
| Lenovo Legion 5 16IRX G9 | |
| Przeciętny Intel Core i9-14900HX (91 - 206, n=37) | |
| Alienware m16 R1 AMD | |
| MSI Vector 16 HX A14V | |
| Asus Zephyrus Duo 16 GX650PY-NM006W | |
| 7-Zip 18.03 / 7z b 4 | |
| Asus Zephyrus Duo 16 GX650PY-NM006W | |
| MSI Vector 16 HX A14V | |
| Przeciętny Intel Core i9-14900HX (66769 - 136645, n=37) | |
| Alienware m16 R1 AMD | |
| Lenovo Legion 5 16IRX G9 | |
| Alienware m16 R1 Intel | |
| Lenovo Legion Pro 5 16ARX8 | |
| Lenovo Legion Slim 7 16APH8 | |
| Asus TUF Gaming A16 FA617XS | |
| MSI Vector GP66 12UGS | |
| HP Victus 16-r0077ng | |
| Dell G16 7620 | |
| Lenovo LOQ 16IRH8 | |
| 7-Zip 18.03 / 7z b 4 -mmt1 | |
| Asus Zephyrus Duo 16 GX650PY-NM006W | |
| Lenovo Legion Pro 5 16ARX8 | |
| MSI Vector 16 HX A14V | |
| Przeciętny Intel Core i9-14900HX (5452 - 7545, n=37) | |
| Alienware m16 R1 AMD | |
| Lenovo Legion 5 16IRX G9 | |
| Asus TUF Gaming A16 FA617XS | |
| Lenovo Legion Slim 7 16APH8 | |
| Alienware m16 R1 Intel | |
| MSI Vector GP66 12UGS | |
| Lenovo LOQ 16IRH8 | |
| HP Victus 16-r0077ng | |
| Dell G16 7620 | |
| Geekbench 6.7 / Multi-Core | |
| MSI Vector 16 HX A14V | |
| Przeciętny Intel Core i9-14900HX (13158 - 19665, n=37) | |
| Lenovo Legion 5 16IRX G9 | |
| Alienware m16 R1 Intel | |
| Lenovo LOQ 16IRH8 | |
| Lenovo Legion Slim 7 16APH8 | |
| Alienware m16 R1 AMD | |
| HP Victus 16-r0077ng | |
| Geekbench 6.7 / Single-Core | |
| MSI Vector 16 HX A14V | |
| Przeciętny Intel Core i9-14900HX (2419 - 3129, n=37) | |
| Lenovo Legion 5 16IRX G9 | |
| Alienware m16 R1 AMD | |
| Alienware m16 R1 Intel | |
| Lenovo Legion Slim 7 16APH8 | |
| Lenovo LOQ 16IRH8 | |
| HP Victus 16-r0077ng | |
| Geekbench 5.5 / Multi-Core | |
| MSI Vector 16 HX A14V | |
| Asus Zephyrus Duo 16 GX650PY-NM006W | |
| Przeciętny Intel Core i9-14900HX (8618 - 23194, n=37) | |
| Lenovo Legion 5 16IRX G9 | |
| Alienware m16 R1 AMD | |
| Alienware m16 R1 Intel | |
| MSI Vector GP66 12UGS | |
| Lenovo Legion Pro 5 16ARX8 | |
| Lenovo LOQ 16IRH8 | |
| Asus TUF Gaming A16 FA617XS | |
| Lenovo Legion Slim 7 16APH8 | |
| Dell G16 7620 | |
| HP Victus 16-r0077ng | |
| Geekbench 5.5 / Single-Core | |
| Asus Zephyrus Duo 16 GX650PY-NM006W | |
| MSI Vector 16 HX A14V | |
| Przeciętny Intel Core i9-14900HX (1669 - 2210, n=37) | |
| Lenovo Legion Pro 5 16ARX8 | |
| Asus TUF Gaming A16 FA617XS | |
| Alienware m16 R1 AMD | |
| Lenovo Legion Slim 7 16APH8 | |
| Lenovo Legion 5 16IRX G9 | |
| MSI Vector GP66 12UGS | |
| Alienware m16 R1 Intel | |
| Lenovo LOQ 16IRH8 | |
| HP Victus 16-r0077ng | |
| Dell G16 7620 | |
| HWBOT x265 Benchmark v2.2 / 4k Preset | |
| Asus Zephyrus Duo 16 GX650PY-NM006W | |
| MSI Vector 16 HX A14V | |
| Alienware m16 R1 AMD | |
| Przeciętny Intel Core i9-14900HX (16.8 - 38.9, n=37) | |
| Lenovo Legion 5 16IRX G9 | |
| Lenovo Legion Pro 5 16ARX8 | |
| Alienware m16 R1 Intel | |
| Asus TUF Gaming A16 FA617XS | |
| Lenovo Legion Slim 7 16APH8 | |
| MSI Vector GP66 12UGS | |
| Dell G16 7620 | |
| Lenovo LOQ 16IRH8 | |
| HP Victus 16-r0077ng | |
| LibreOffice / 20 Documents To PDF | |
| Lenovo Legion Slim 7 16APH8 | |
| HP Victus 16-r0077ng | |
| Asus Zephyrus Duo 16 GX650PY-NM006W | |
| Dell G16 7620 | |
| MSI Vector 16 HX A14V | |
| Lenovo LOQ 16IRH8 | |
| Alienware m16 R1 Intel | |
| Lenovo Legion 5 16IRX G9 | |
| Przeciętny Intel Core i9-14900HX (19 - 85.1, n=37) | |
| Asus TUF Gaming A16 FA617XS | |
| MSI Vector GP66 12UGS | |
| Alienware m16 R1 AMD | |
| Lenovo Legion Pro 5 16ARX8 | |
| R Benchmark 2.5 / Overall mean | |
| Dell G16 7620 | |
| HP Victus 16-r0077ng | |
| Lenovo LOQ 16IRH8 | |
| Lenovo Legion Slim 7 16APH8 | |
| Alienware m16 R1 Intel | |
| Alienware m16 R1 AMD | |
| Asus TUF Gaming A16 FA617XS | |
| MSI Vector GP66 12UGS | |
| Lenovo Legion Pro 5 16ARX8 | |
| Lenovo Legion 5 16IRX G9 | |
| Asus Zephyrus Duo 16 GX650PY-NM006W | |
| Przeciętny Intel Core i9-14900HX (0.3604 - 0.4859, n=37) | |
| MSI Vector 16 HX A14V | |
Cinebench R23: Multi Core | Single Core
Cinebench R20: CPU (Multi Core) | CPU (Single Core)
Cinebench R15: CPU Multi 64Bit | CPU Single 64Bit
Blender: v2.79 BMW27 CPU
7-Zip 18.03: 7z b 4 | 7z b 4 -mmt1
Geekbench 6.7: Multi-Core | Single-Core
Geekbench 5.5: Multi-Core | Single-Core
HWBOT x265 Benchmark v2.2: 4k Preset
LibreOffice : 20 Documents To PDF
R Benchmark 2.5: Overall mean
* ... im mniej tym lepiej
AIDA64: FP32 Ray-Trace | FPU Julia | CPU SHA3 | CPU Queen | FPU SinJulia | FPU Mandel | CPU AES | CPU ZLib | FP64 Ray-Trace | CPU PhotoWorxx
| Performance rating | |
| MSI Vector 16 HX A14V | |
| Przeciętny Intel Core i9-14900HX | |
| Asus TUF Gaming A16 FA617XS | |
| Lenovo Legion 5 16IRX G9 | |
| Dell G16 7620 | |
| HP Victus 16-r0077ng | |
| MSI Vector GP66 12UGS | |
| AIDA64 / FP32 Ray-Trace | |
| MSI Vector 16 HX A14V | |
| Asus TUF Gaming A16 FA617XS | |
| Przeciętny Intel Core i9-14900HX (13098 - 33474, n=36) | |
| Lenovo Legion 5 16IRX G9 | |
| Dell G16 7620 | |
| HP Victus 16-r0077ng | |
| MSI Vector GP66 12UGS | |
| AIDA64 / FPU Julia | |
| MSI Vector 16 HX A14V | |
| Przeciętny Intel Core i9-14900HX (67573 - 166040, n=36) | |
| Asus TUF Gaming A16 FA617XS | |
| Lenovo Legion 5 16IRX G9 | |
| Dell G16 7620 | |
| HP Victus 16-r0077ng | |
| MSI Vector GP66 12UGS | |
| AIDA64 / CPU SHA3 | |
| MSI Vector 16 HX A14V | |
| Przeciętny Intel Core i9-14900HX (3589 - 7979, n=36) | |
| Asus TUF Gaming A16 FA617XS | |
| Lenovo Legion 5 16IRX G9 | |
| Dell G16 7620 | |
| HP Victus 16-r0077ng | |
| MSI Vector GP66 12UGS | |
| AIDA64 / CPU Queen | |
| MSI Vector 16 HX A14V | |
| Przeciętny Intel Core i9-14900HX (118405 - 148966, n=36) | |
| Asus TUF Gaming A16 FA617XS | |
| MSI Vector GP66 12UGS | |
| Dell G16 7620 | |
| Lenovo Legion 5 16IRX G9 | |
| HP Victus 16-r0077ng | |
| AIDA64 / FPU SinJulia | |
| MSI Vector 16 HX A14V | |
| Asus TUF Gaming A16 FA617XS | |
| Przeciętny Intel Core i9-14900HX (10475 - 18517, n=36) | |
| Lenovo Legion 5 16IRX G9 | |
| Dell G16 7620 | |
| MSI Vector GP66 12UGS | |
| HP Victus 16-r0077ng | |
| AIDA64 / FPU Mandel | |
| MSI Vector 16 HX A14V | |
| Asus TUF Gaming A16 FA617XS | |
| Przeciętny Intel Core i9-14900HX (32543 - 83662, n=36) | |
| Lenovo Legion 5 16IRX G9 | |
| HP Victus 16-r0077ng | |
| Dell G16 7620 | |
| MSI Vector GP66 12UGS | |
| AIDA64 / CPU AES | |
| Przeciętny Intel Core i9-14900HX (86964 - 241777, n=36) | |
| MSI Vector 16 HX A14V | |
| MSI Vector GP66 12UGS | |
| Lenovo Legion 5 16IRX G9 | |
| Asus TUF Gaming A16 FA617XS | |
| Dell G16 7620 | |
| HP Victus 16-r0077ng | |
| AIDA64 / CPU ZLib | |
| MSI Vector 16 HX A14V | |
| Przeciętny Intel Core i9-14900HX (1054 - 2292, n=36) | |
| Lenovo Legion 5 16IRX G9 | |
| Asus TUF Gaming A16 FA617XS | |
| MSI Vector GP66 12UGS | |
| Dell G16 7620 | |
| HP Victus 16-r0077ng | |
| AIDA64 / FP64 Ray-Trace | |
| MSI Vector 16 HX A14V | |
| Asus TUF Gaming A16 FA617XS | |
| Przeciętny Intel Core i9-14900HX (6809 - 18349, n=36) | |
| Lenovo Legion 5 16IRX G9 | |
| Dell G16 7620 | |
| HP Victus 16-r0077ng | |
| MSI Vector GP66 12UGS | |
| AIDA64 / CPU PhotoWorxx | |
| MSI Vector 16 HX A14V | |
| Przeciętny Intel Core i9-14900HX (23903 - 54702, n=36) | |
| HP Victus 16-r0077ng | |
| Dell G16 7620 | |
| Lenovo Legion 5 16IRX G9 | |
| Asus TUF Gaming A16 FA617XS | |
| MSI Vector GP66 12UGS | |
Wydajność systemu
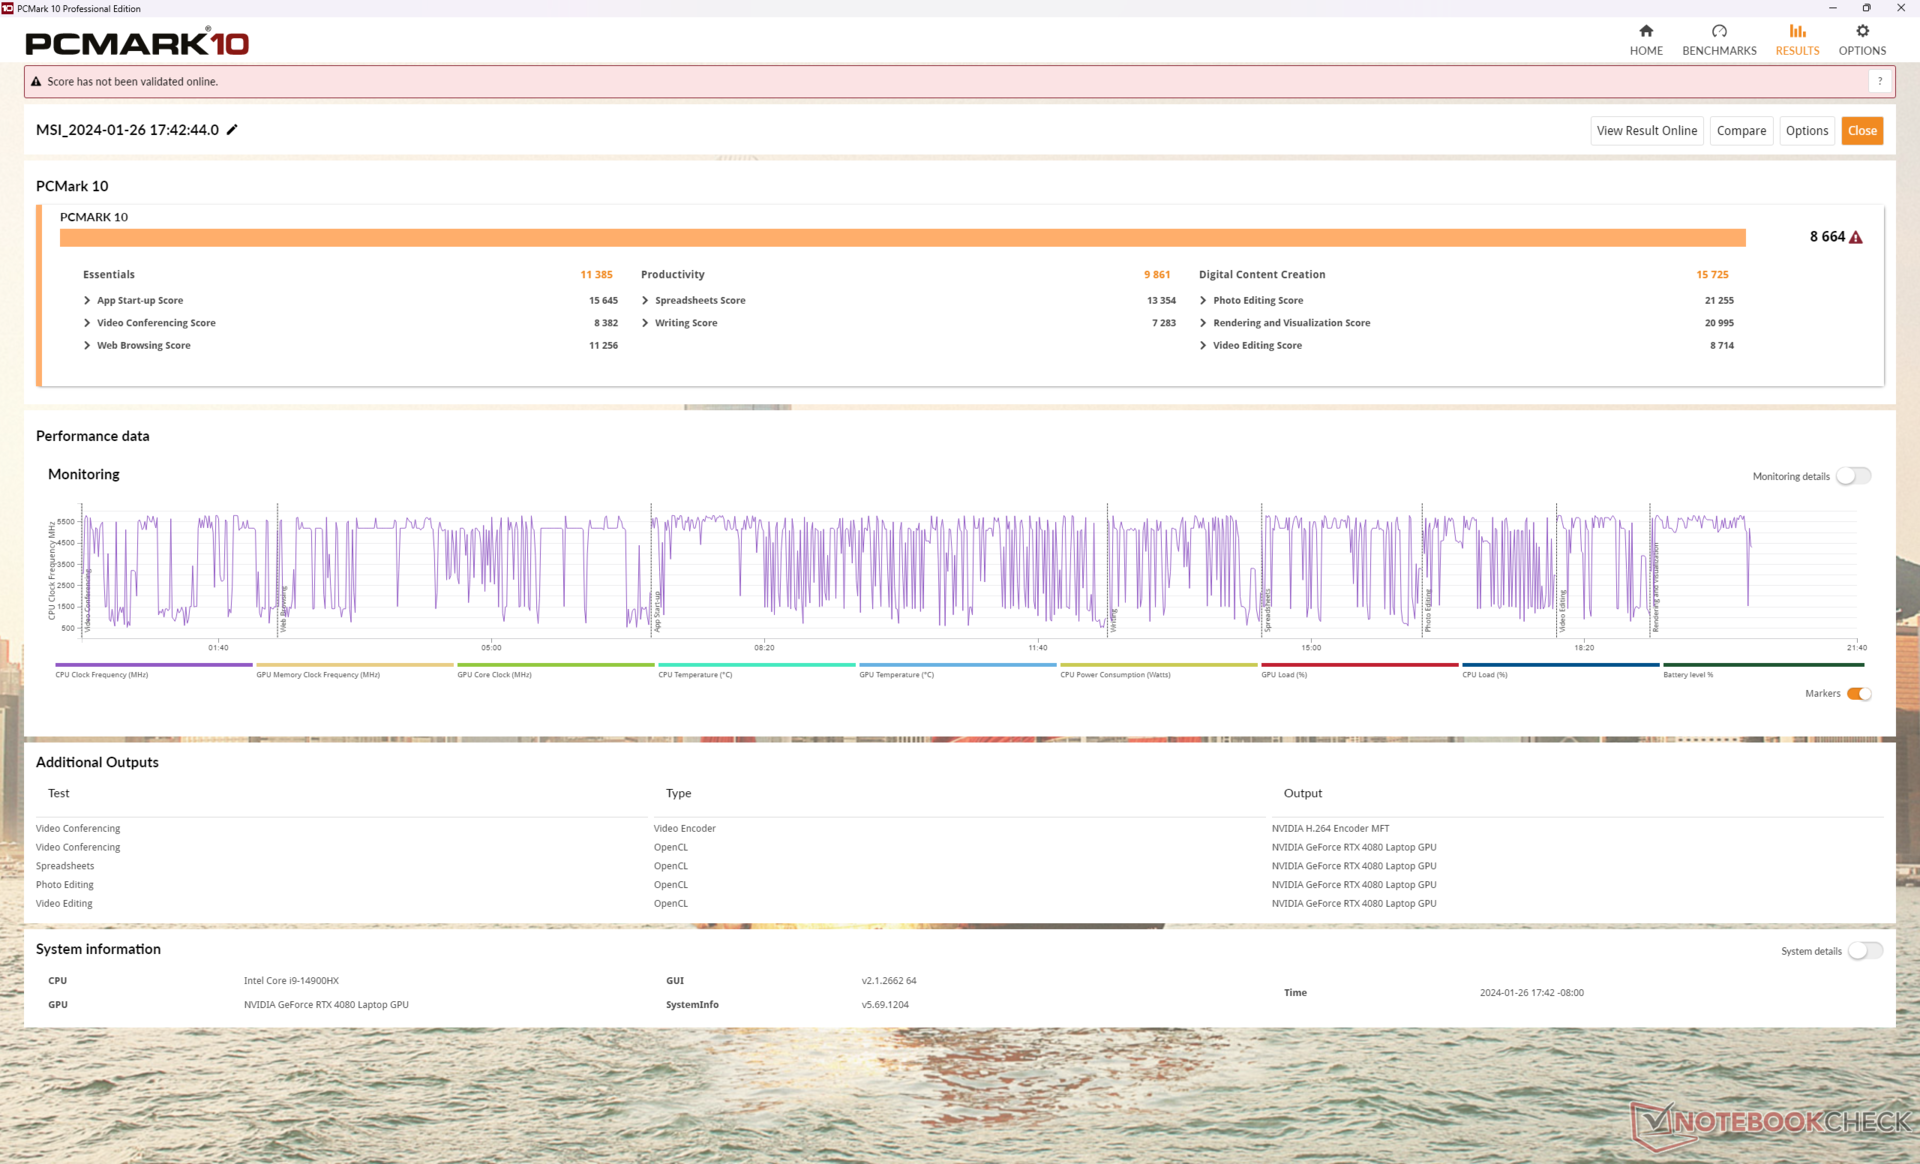
Wyniki w teście PCMark są jednymi z najwyższych spośród wszystkich laptopów do gier z wyższej średniej półki, a to za sprawą nowego procesora 14. generacji i karty graficznej RTX 4080 o pełnej mocy 175 W GeForce. Wydajność pamięci RAM jest również szybsza niż oczekiwano, a prędkości odczytu i zapisu są o około 70 procent szybsze niż w przypadku starszej konstrukcji Vector GP66.
CrossMark: Overall | Productivity | Creativity | Responsiveness
WebXPRT 3: Overall
WebXPRT 4: Overall
Mozilla Kraken 1.1: Total
| PCMark 10 / Score | |
| Przeciętny Intel Core i9-14900HX, NVIDIA GeForce RTX 4080 Laptop GPU (7703 - 9223, n=7) | |
| MSI Vector 16 HX A14V | |
| MSI Vector GP66 12UGS | |
| Asus TUF Gaming A16 FA617XS | |
| Lenovo Legion 5 16IRX G9 | |
| Dell G16 7620 | |
| HP Victus 16-r0077ng | |
| PCMark 10 / Essentials | |
| Przeciętny Intel Core i9-14900HX, NVIDIA GeForce RTX 4080 Laptop GPU (11255 - 12600, n=7) | |
| MSI Vector 16 HX A14V | |
| MSI Vector GP66 12UGS | |
| Asus TUF Gaming A16 FA617XS | |
| Lenovo Legion 5 16IRX G9 | |
| HP Victus 16-r0077ng | |
| Dell G16 7620 | |
| PCMark 10 / Productivity | |
| Asus TUF Gaming A16 FA617XS | |
| Przeciętny Intel Core i9-14900HX, NVIDIA GeForce RTX 4080 Laptop GPU (6662 - 11410, n=7) | |
| MSI Vector GP66 12UGS | |
| MSI Vector 16 HX A14V | |
| Lenovo Legion 5 16IRX G9 | |
| HP Victus 16-r0077ng | |
| Dell G16 7620 | |
| PCMark 10 / Digital Content Creation | |
| MSI Vector 16 HX A14V | |
| Przeciętny Intel Core i9-14900HX, NVIDIA GeForce RTX 4080 Laptop GPU (14211 - 16246, n=7) | |
| MSI Vector GP66 12UGS | |
| Lenovo Legion 5 16IRX G9 | |
| Asus TUF Gaming A16 FA617XS | |
| Dell G16 7620 | |
| HP Victus 16-r0077ng | |
| CrossMark / Overall | |
| MSI Vector 16 HX A14V | |
| Przeciętny Intel Core i9-14900HX, NVIDIA GeForce RTX 4080 Laptop GPU (1992 - 2334, n=7) | |
| Lenovo Legion 5 16IRX G9 | |
| Dell G16 7620 | |
| Asus TUF Gaming A16 FA617XS | |
| CrossMark / Productivity | |
| MSI Vector 16 HX A14V | |
| Przeciętny Intel Core i9-14900HX, NVIDIA GeForce RTX 4080 Laptop GPU (1812 - 2204, n=7) | |
| Lenovo Legion 5 16IRX G9 | |
| Asus TUF Gaming A16 FA617XS | |
| Dell G16 7620 | |
| CrossMark / Creativity | |
| MSI Vector 16 HX A14V | |
| Przeciętny Intel Core i9-14900HX, NVIDIA GeForce RTX 4080 Laptop GPU (2327 - 2500, n=7) | |
| Lenovo Legion 5 16IRX G9 | |
| Asus TUF Gaming A16 FA617XS | |
| Dell G16 7620 | |
| CrossMark / Responsiveness | |
| MSI Vector 16 HX A14V | |
| Przeciętny Intel Core i9-14900HX, NVIDIA GeForce RTX 4080 Laptop GPU (1520 - 2254, n=7) | |
| Lenovo Legion 5 16IRX G9 | |
| Dell G16 7620 | |
| Asus TUF Gaming A16 FA617XS | |
| WebXPRT 3 / Overall | |
| Przeciętny Intel Core i9-14900HX, NVIDIA GeForce RTX 4080 Laptop GPU (310 - 345, n=7) | |
| MSI Vector 16 HX A14V | |
| Lenovo Legion 5 16IRX G9 | |
| MSI Vector GP66 12UGS | |
| HP Victus 16-r0077ng | |
| HP Victus 16-r0077ng | |
| Dell G16 7620 | |
| WebXPRT 4 / Overall | |
| Przeciętny Intel Core i9-14900HX, NVIDIA GeForce RTX 4080 Laptop GPU (300 - 321, n=7) | |
| MSI Vector 16 HX A14V | |
| Lenovo Legion 5 16IRX G9 | |
| Asus TUF Gaming A16 FA617XS | |
| Dell G16 7620 | |
| HP Victus 16-r0077ng | |
| HP Victus 16-r0077ng | |
| Mozilla Kraken 1.1 / Total | |
| Dell G16 7620 | |
| HP Victus 16-r0077ng | |
| HP Victus 16-r0077ng | |
| MSI Vector GP66 12UGS | |
| Asus TUF Gaming A16 FA617XS | |
| Lenovo Legion 5 16IRX G9 | |
| MSI Vector 16 HX A14V | |
| Przeciętny Intel Core i9-14900HX, NVIDIA GeForce RTX 4080 Laptop GPU (437 - 446, n=7) | |
* ... im mniej tym lepiej
| PCMark 10 Score | 8664 pkt. | |
Pomoc | ||
| AIDA64 / Memory Copy | |
| MSI Vector 16 HX A14V | |
| Przeciętny Intel Core i9-14900HX (38028 - 83392, n=36) | |
| HP Victus 16-r0077ng | |
| Lenovo Legion 5 16IRX G9 | |
| Asus TUF Gaming A16 FA617XS | |
| Dell G16 7620 | |
| MSI Vector GP66 12UGS | |
| AIDA64 / Memory Read | |
| MSI Vector 16 HX A14V | |
| Przeciętny Intel Core i9-14900HX (43306 - 87568, n=36) | |
| Lenovo Legion 5 16IRX G9 | |
| HP Victus 16-r0077ng | |
| Dell G16 7620 | |
| Asus TUF Gaming A16 FA617XS | |
| MSI Vector GP66 12UGS | |
| AIDA64 / Memory Write | |
| MSI Vector 16 HX A14V | |
| Asus TUF Gaming A16 FA617XS | |
| Przeciętny Intel Core i9-14900HX (37146 - 80589, n=36) | |
| HP Victus 16-r0077ng | |
| Dell G16 7620 | |
| Lenovo Legion 5 16IRX G9 | |
| MSI Vector GP66 12UGS | |
| AIDA64 / Memory Latency | |
| Dell G16 7620 | |
| HP Victus 16-r0077ng | |
| MSI Vector GP66 12UGS | |
| Asus TUF Gaming A16 FA617XS | |
| Lenovo Legion 5 16IRX G9 | |
| Przeciętny Intel Core i9-14900HX (76.1 - 105, n=36) | |
| MSI Vector 16 HX A14V | |
* ... im mniej tym lepiej
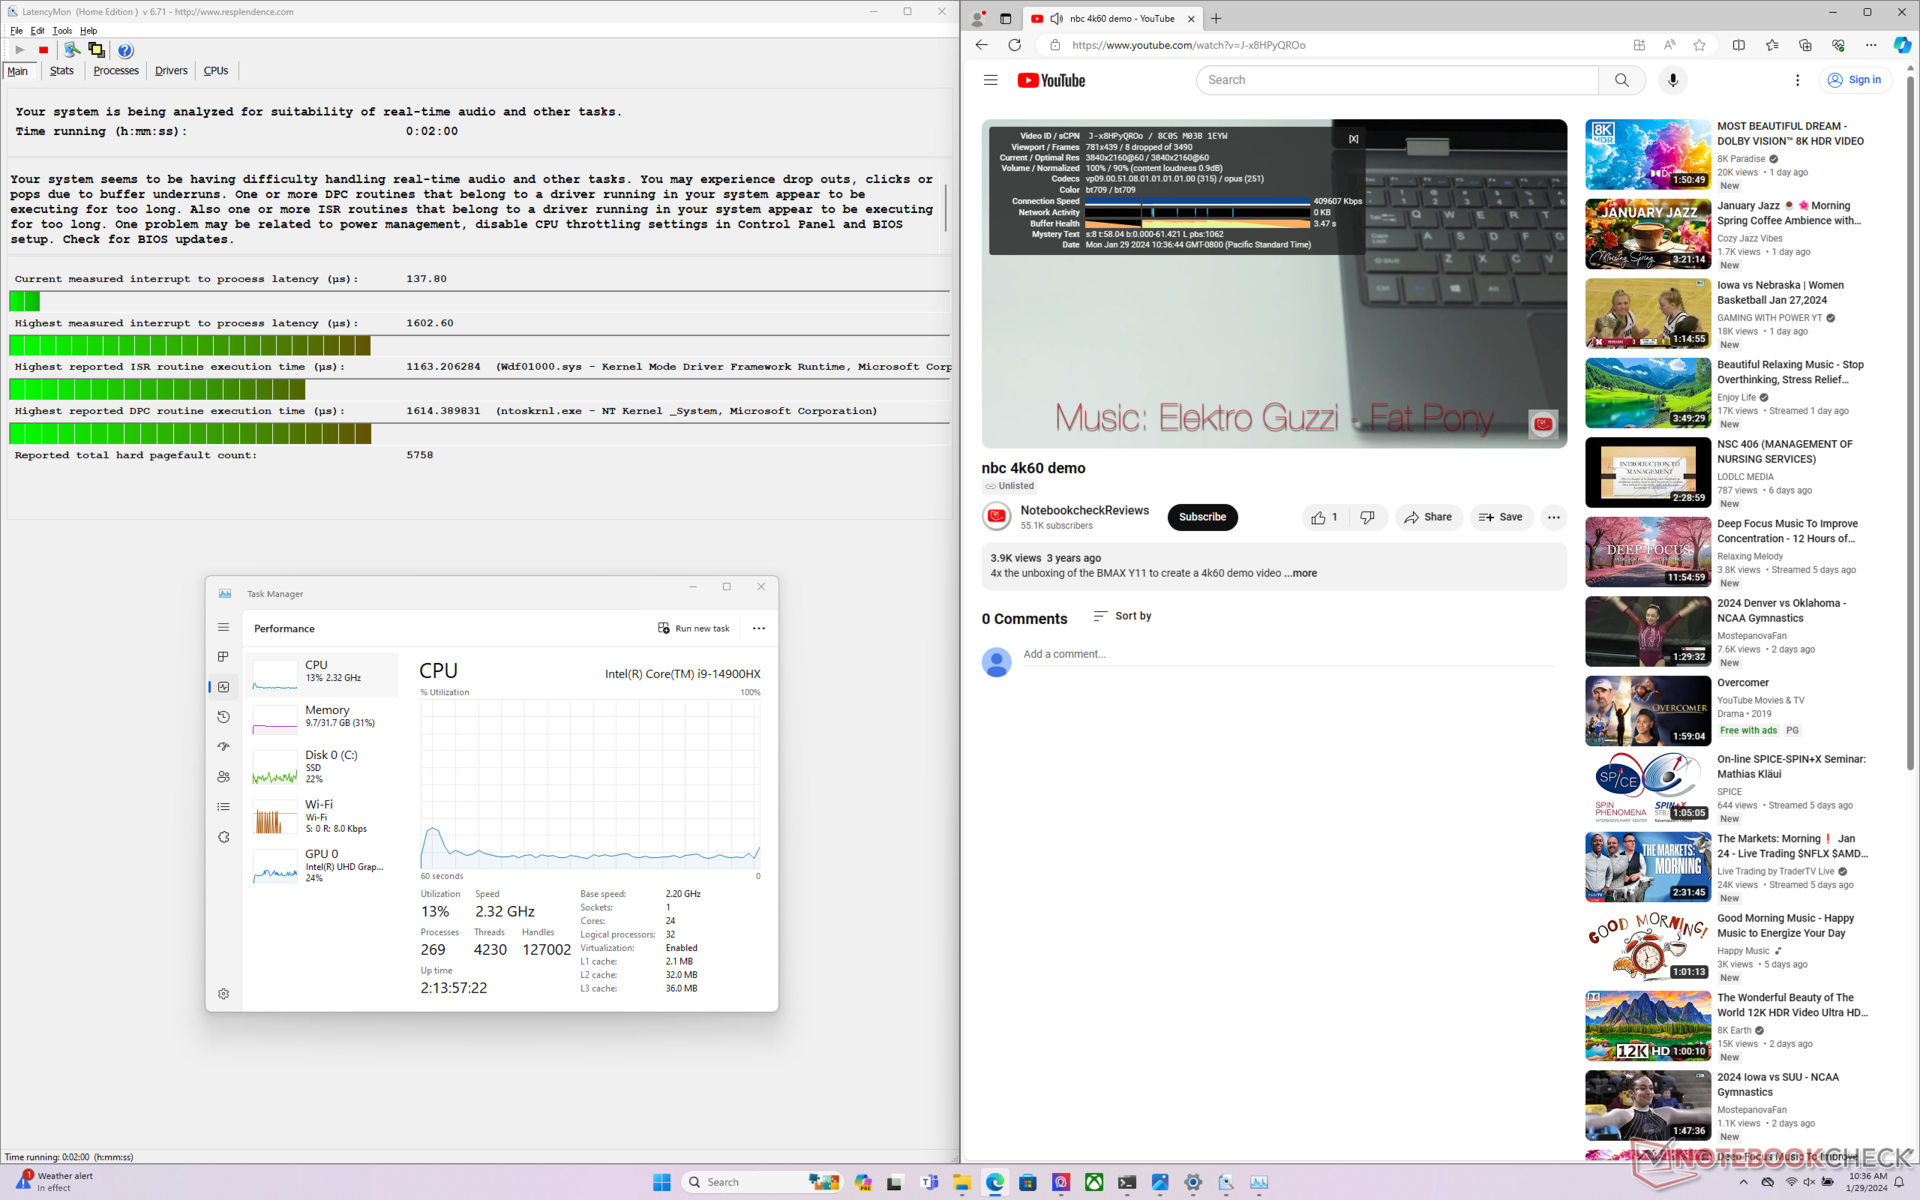
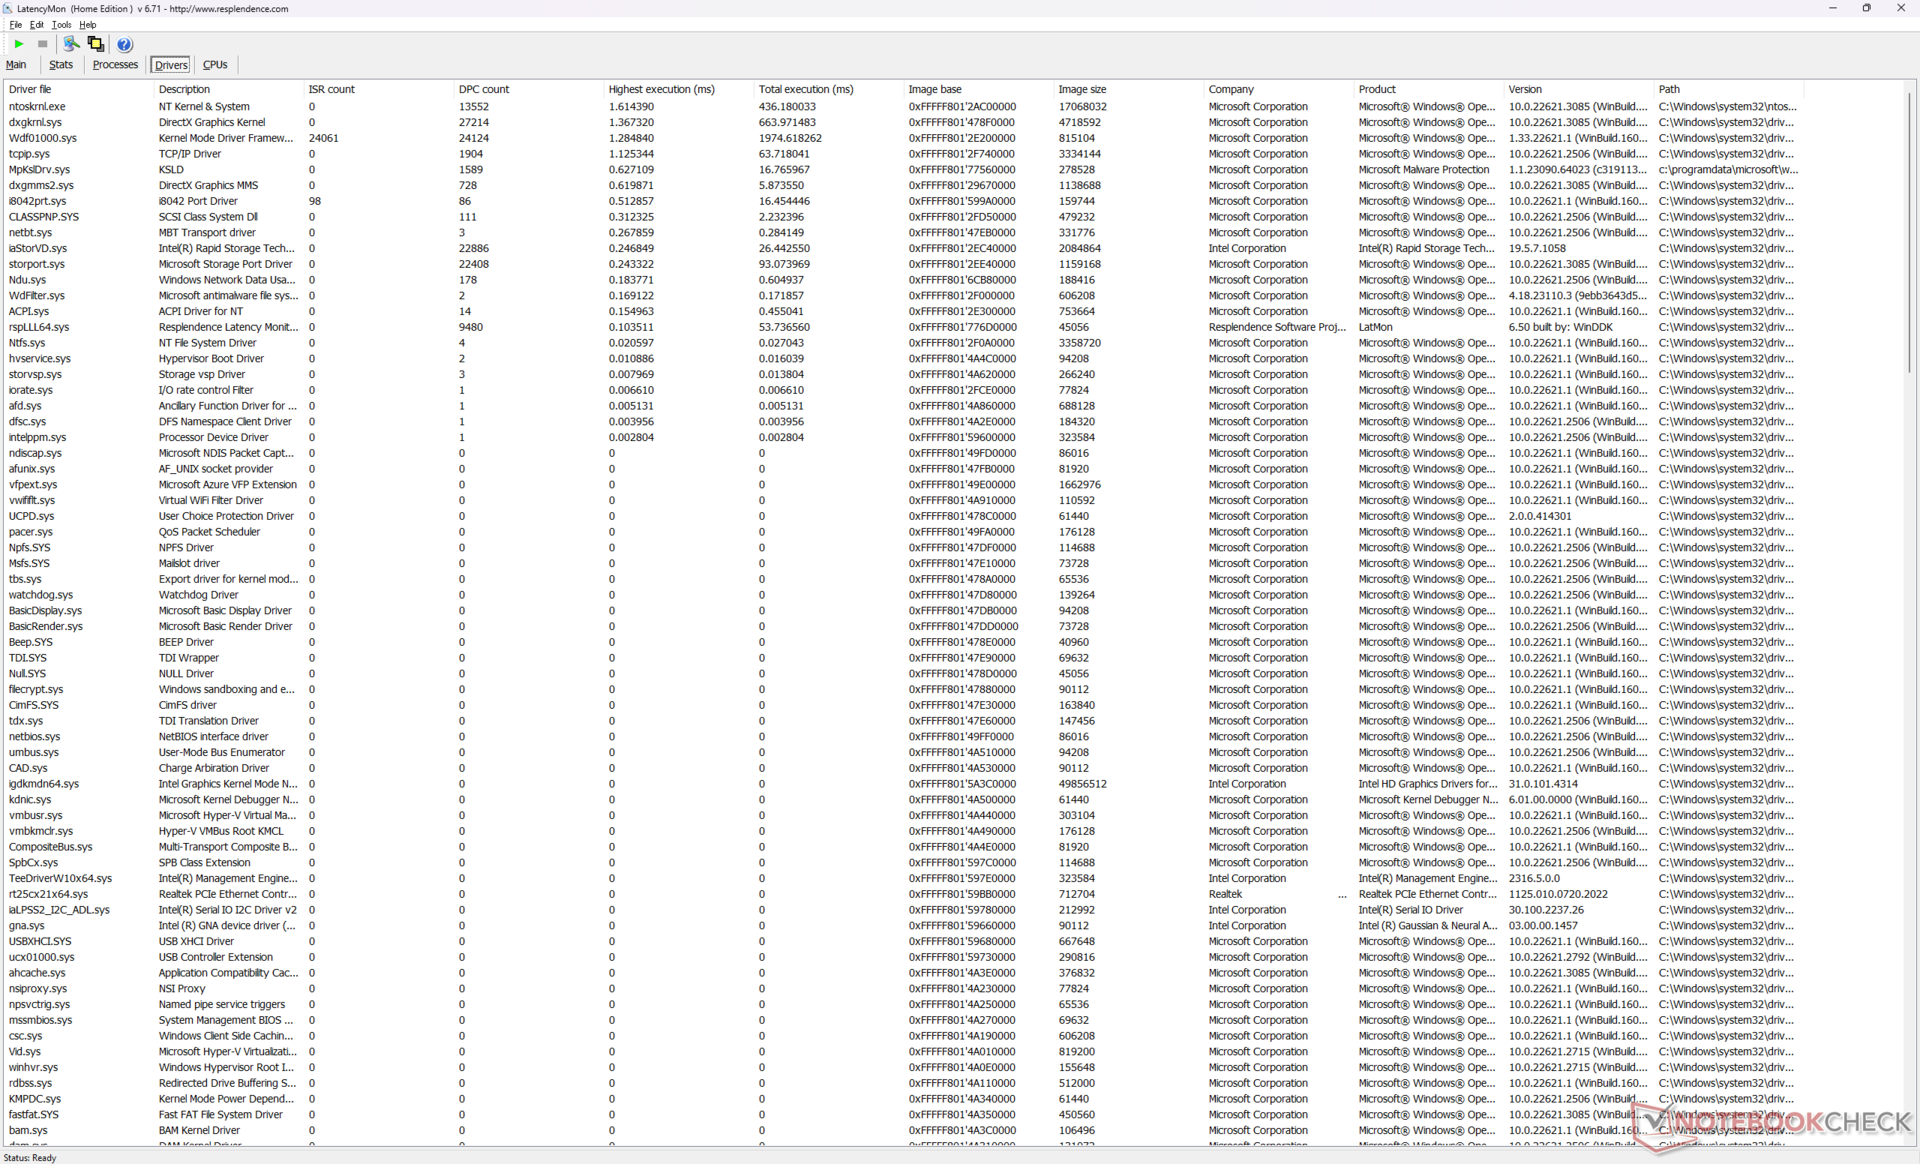
Opóźnienie DPC
LatencyMon ujawnia problemy z DPC podczas otwierania wielu kart na naszej stronie głównej, a także 8 spadków klatek podczas minutowego filmu testowego 4K60. Zrzucone klatki pojawiały się w niemal regularnych odstępach czasu, co sugeruje problem związany z aktywnością w tle lub sterownikiem.
| DPC Latencies / LatencyMon - interrupt to process latency (max), Web, Youtube, Prime95 | |
| MSI Vector GP66 12UGS | |
| Lenovo Legion 5 16IRX G9 | |
| HP Victus 16-r0077ng | |
| MSI Vector 16 HX A14V | |
| Asus TUF Gaming A16 FA617XS | |
| Dell G16 7620 | |
* ... im mniej tym lepiej
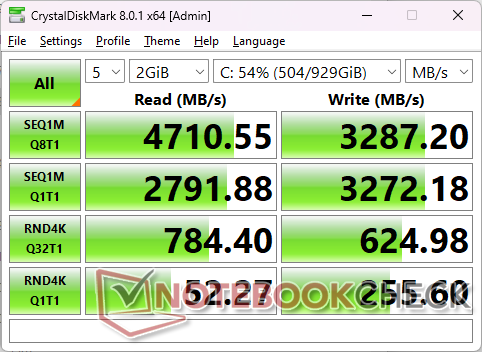
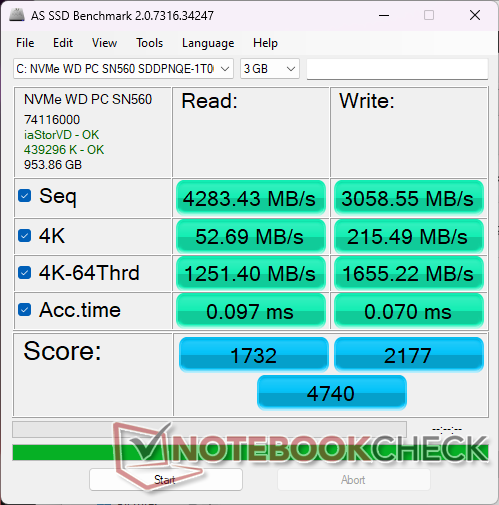
Urządzenia pamięci masowej
Nasza jednostka testowa została skonfigurowana z dyskiem klasy średniej o pojemności 1 TB Western Digital PC SN560 PCIe4 x4 NVMe SSD w celu zapewnienia stałego transferu na poziomie około 4900 MB/s, nawet pod obciążeniem. Model ten obsługuje również dyski SSD PCIe5 x4, podobnie jak większy Titan 18 HX, ale niska dostępność dysków SSD PCIe5 oznacza, że zdecydowana większość konfiguracji na wolności jest obecnie dostarczana tylko z dyskami PCIe4.

| Drive Performance rating - Percent | |
| Lenovo Legion 5 16IRX G9 | |
| Dell G16 7620 | |
| MSI Vector GP66 12UGS | |
| HP Victus 16-r0077ng | |
| MSI Vector 16 HX A14V | |
| Asus TUF Gaming A16 FA617XS | |
* ... im mniej tym lepiej
Disk Throttling: DiskSpd Read Loop, Queue Depth 8
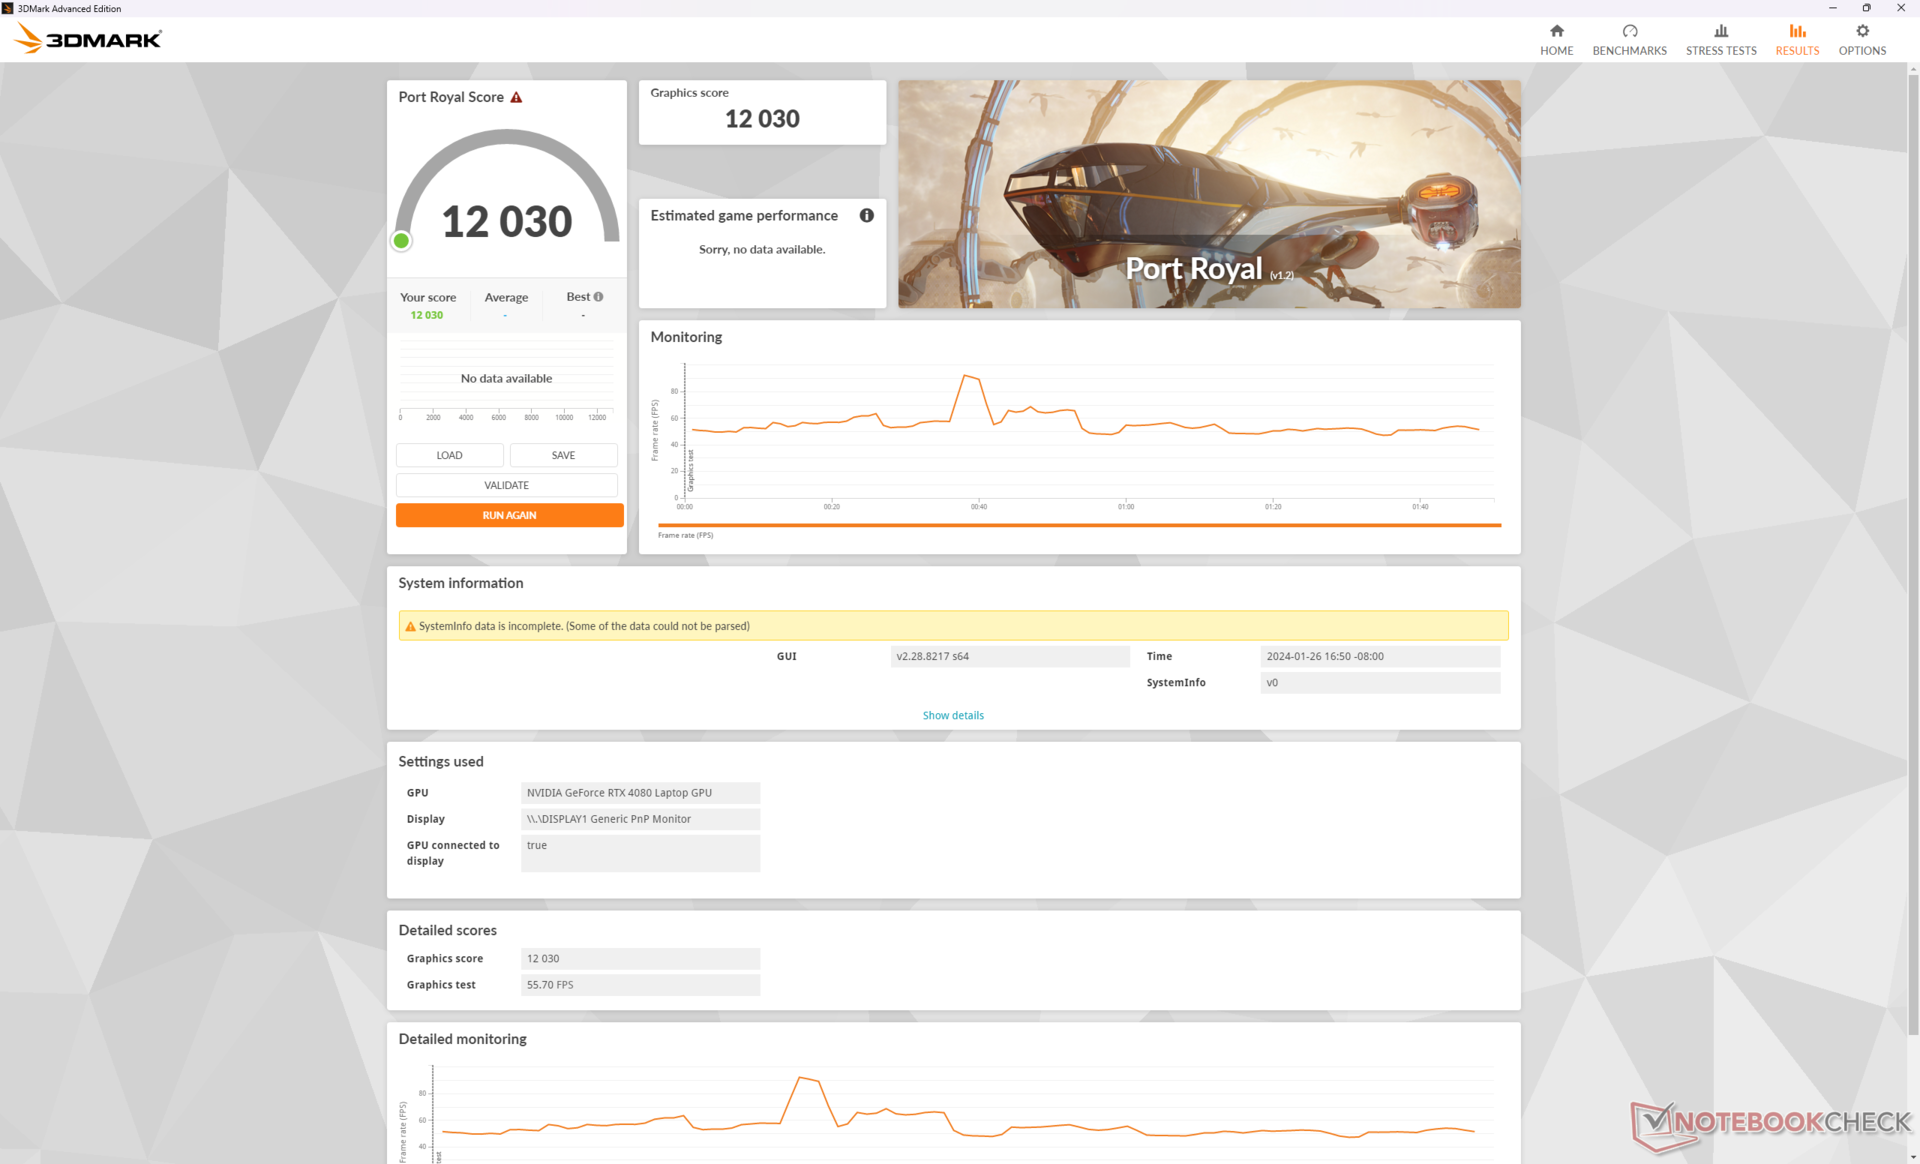
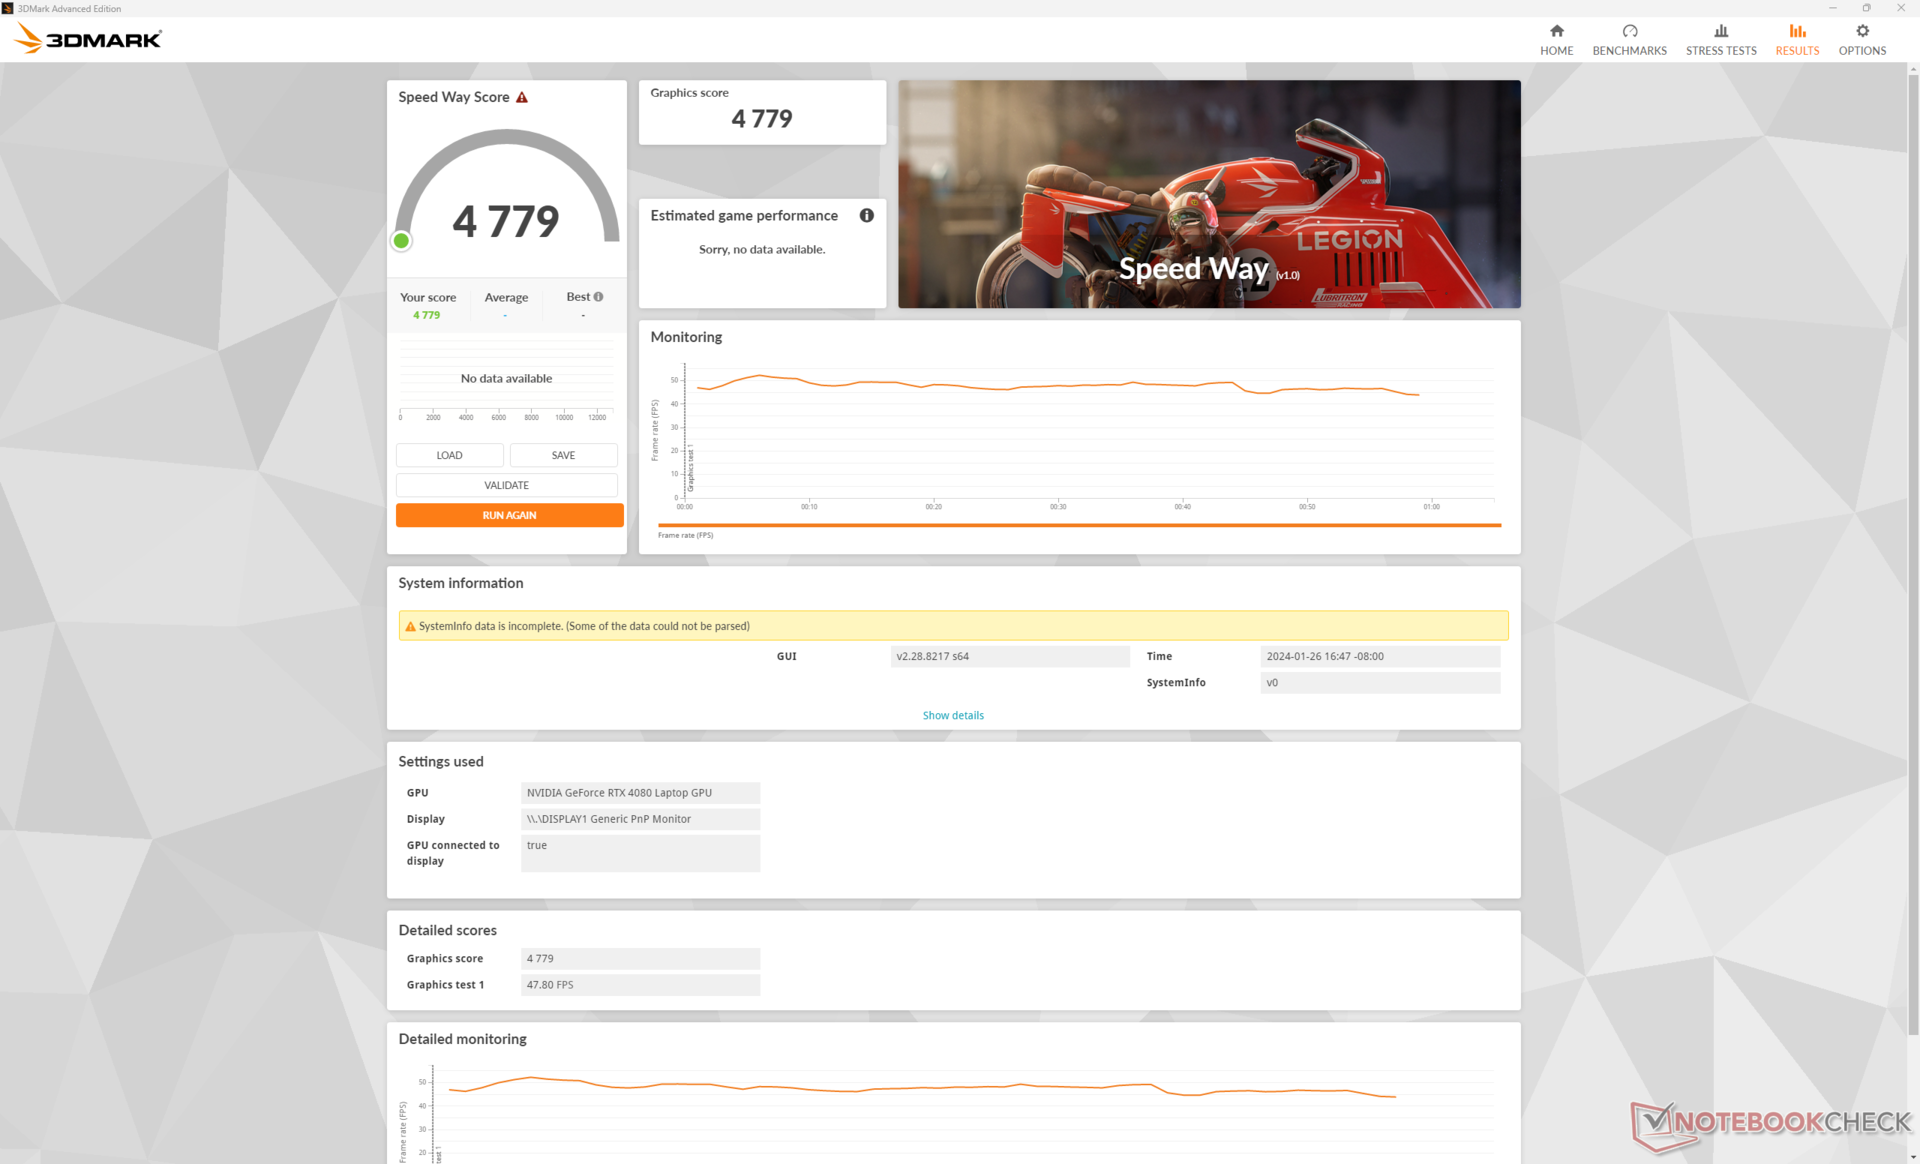
Wydajność GPU - tam, gdzie Vector błyszczy
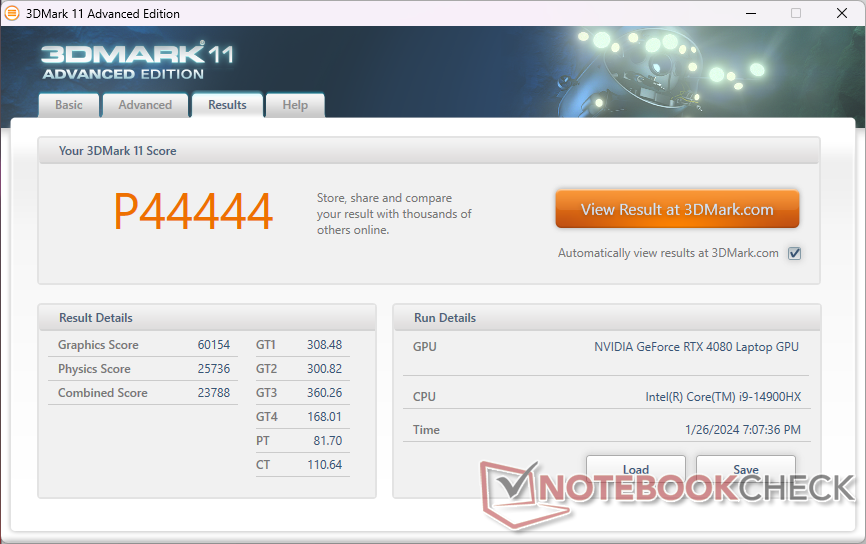
Podczas gdy większość innych laptopów do gier celuje w niższe wartości TGP, w tym wychodzący GP66, Vector 16 HX celuje w maksymalne 175 W dla szybszej wydajności. W rezultacie nasz system MSI jest o około 8 do 10 procent szybszy niż przeciętny laptop w naszej bazie danych wyposażony w tę samą mobilną kartę graficzną GeForce RTX 4080 GPU. Nie jest to aż tak duży margines, ale zaawansowani użytkownicy i gracze, którzy chcą wycisnąć jak najwięcej wydajności GPU ze swoich maszyn, będą chcieli rozważyć Vector 16 HX zamiast alternatyw z tymi samymi opcjami graficznymi, takimi jak HP Omen 16.
Aktualizacja do RTX 4090 powinna zwiększyć wydajność graficzną o około 10 procent, podczas gdy spadek do konfiguracji RTX 4070 i RTX 4060 powinien zmniejszyć wydajność odpowiednio o około 30 do 35 procent i 40 do 45 procent.
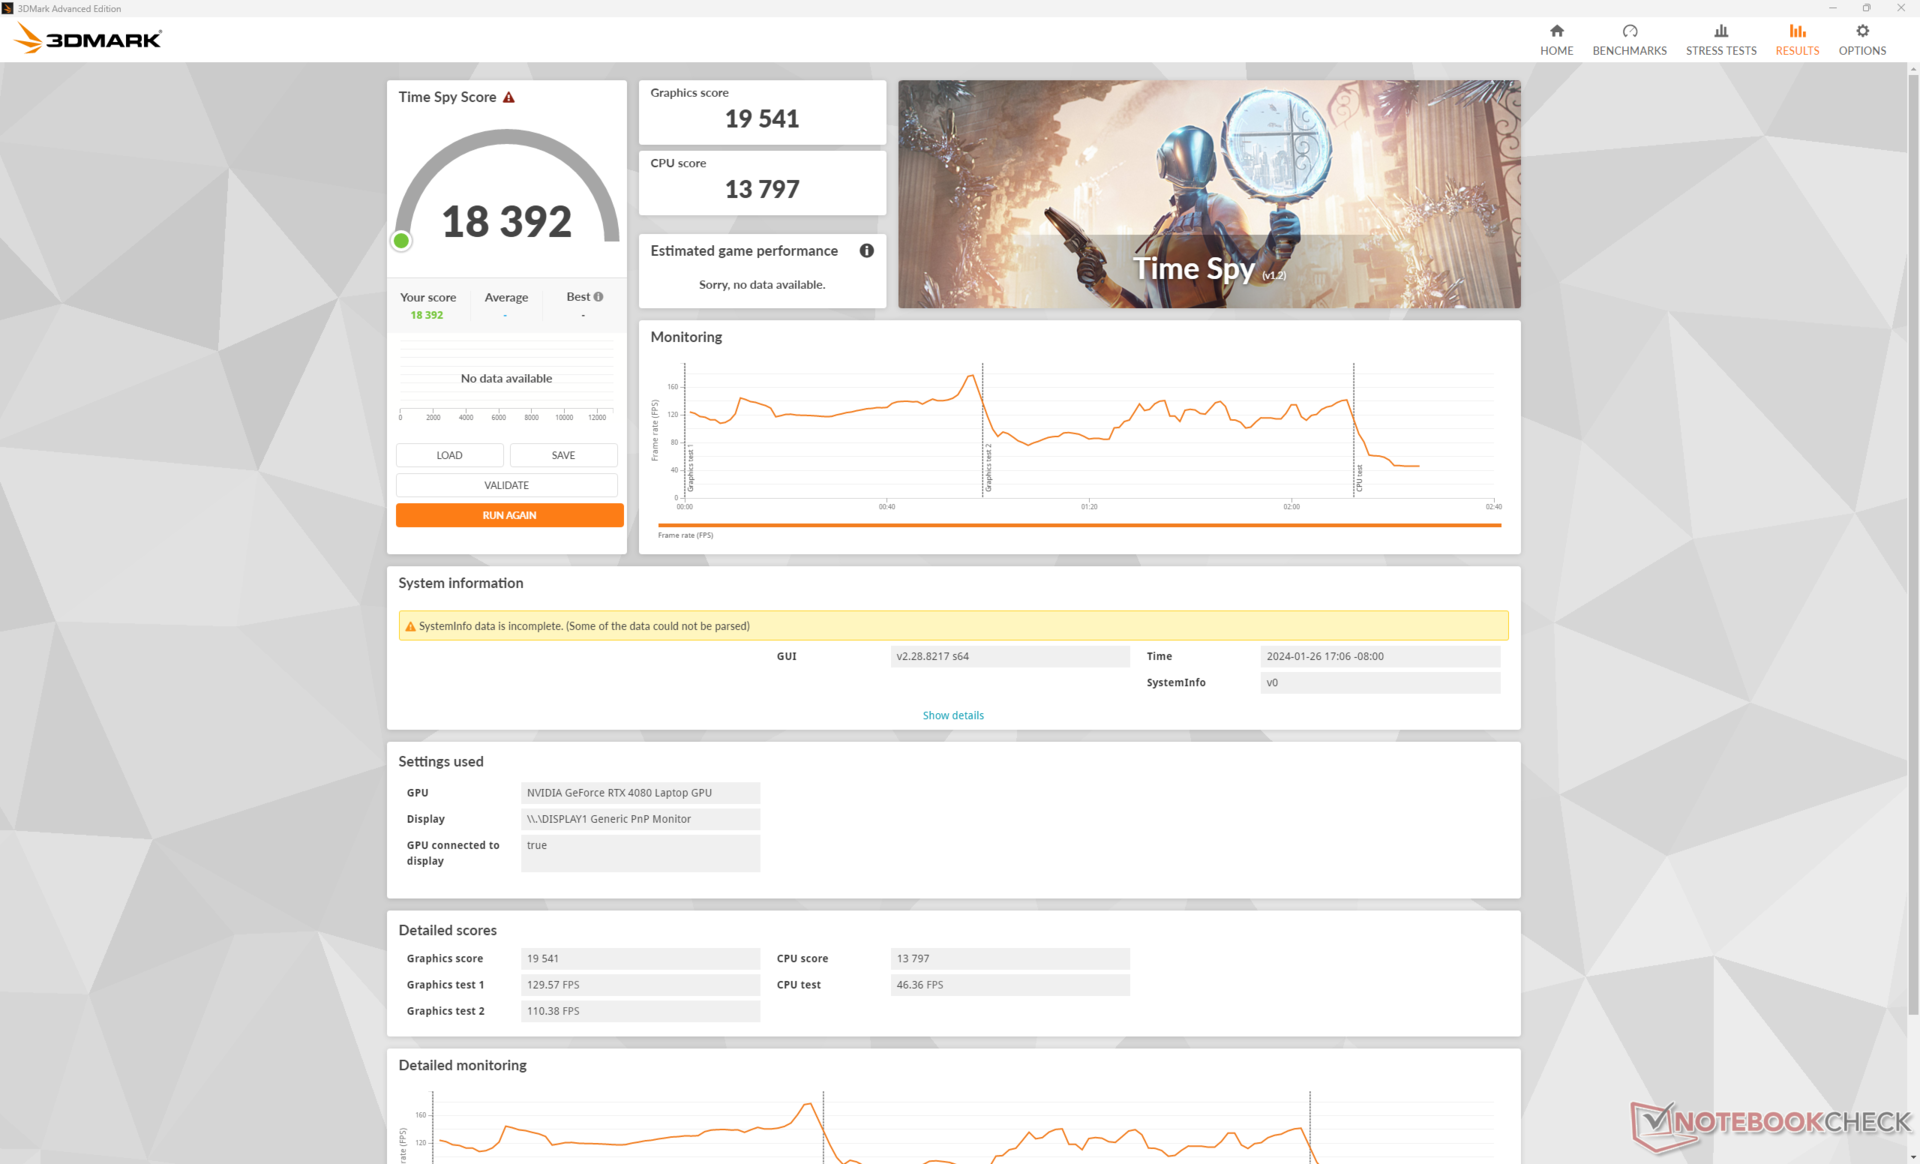
| Profil zasilania | Wynik fizyki | Wynik grafiki | Łączny wynik |
| Ekstremalna wydajność (z włączonym Cooler Boost) | 13797 | 19541 | 18392 |
| Ekstremalna wydajność (z wyłączonym Cooler Boost) | 14118 (-0%) | 19471 (-0%) | 18423 (-0%) |
| Tryb zrównoważony | 13858 (-0%) | 16466 (-16%) | 16013 (-13%) |
| Zasilanie bateryjne | 8307 (-40%) | 8955 (-54%) | 8851 (-52%) |
Podobnie jak w przypadku innych gamingowych laptopów MSI z funkcją Cooler Boost, funkcja ta wydaje się nie wpływać na wydajność, o ile korzystamy z trybu Ekstremalnej wydajności w oparciu o nasze wyniki Time Spy w powyższej tabeli. Przejście w tryb zrównoważony spowoduje jednak spadek wydajności graficznej o około 16 procent.
| 3DMark Performance rating - Percent | |
| KFA2 GeForce RTX 4080 SG | |
| Asus Zephyrus Duo 16 GX650PY-NM006W -1! | |
| Alienware m18 R1 AMD -1! | |
| MSI Vector 16 HX A14V | |
| Alienware m16 R1 AMD | |
| Przeciętny NVIDIA GeForce RTX 4080 Laptop GPU | |
| Lenovo Legion Pro 5 16ARX8 | |
| MSI Vector GP66 12UGS -1! | |
| Lenovo Legion 5 16IRX G9 -1! | |
| Alienware m16 R1 Intel -1! | |
| Framework Laptop 16 | |
| Asus TUF Gaming A16 FA617XS -1! | |
| Dell G16 7620 -1! | |
| Lenovo ThinkPad Z16 Gen 2 -1! | |
| 3DMark 11 Performance | 44444 pkt. | |
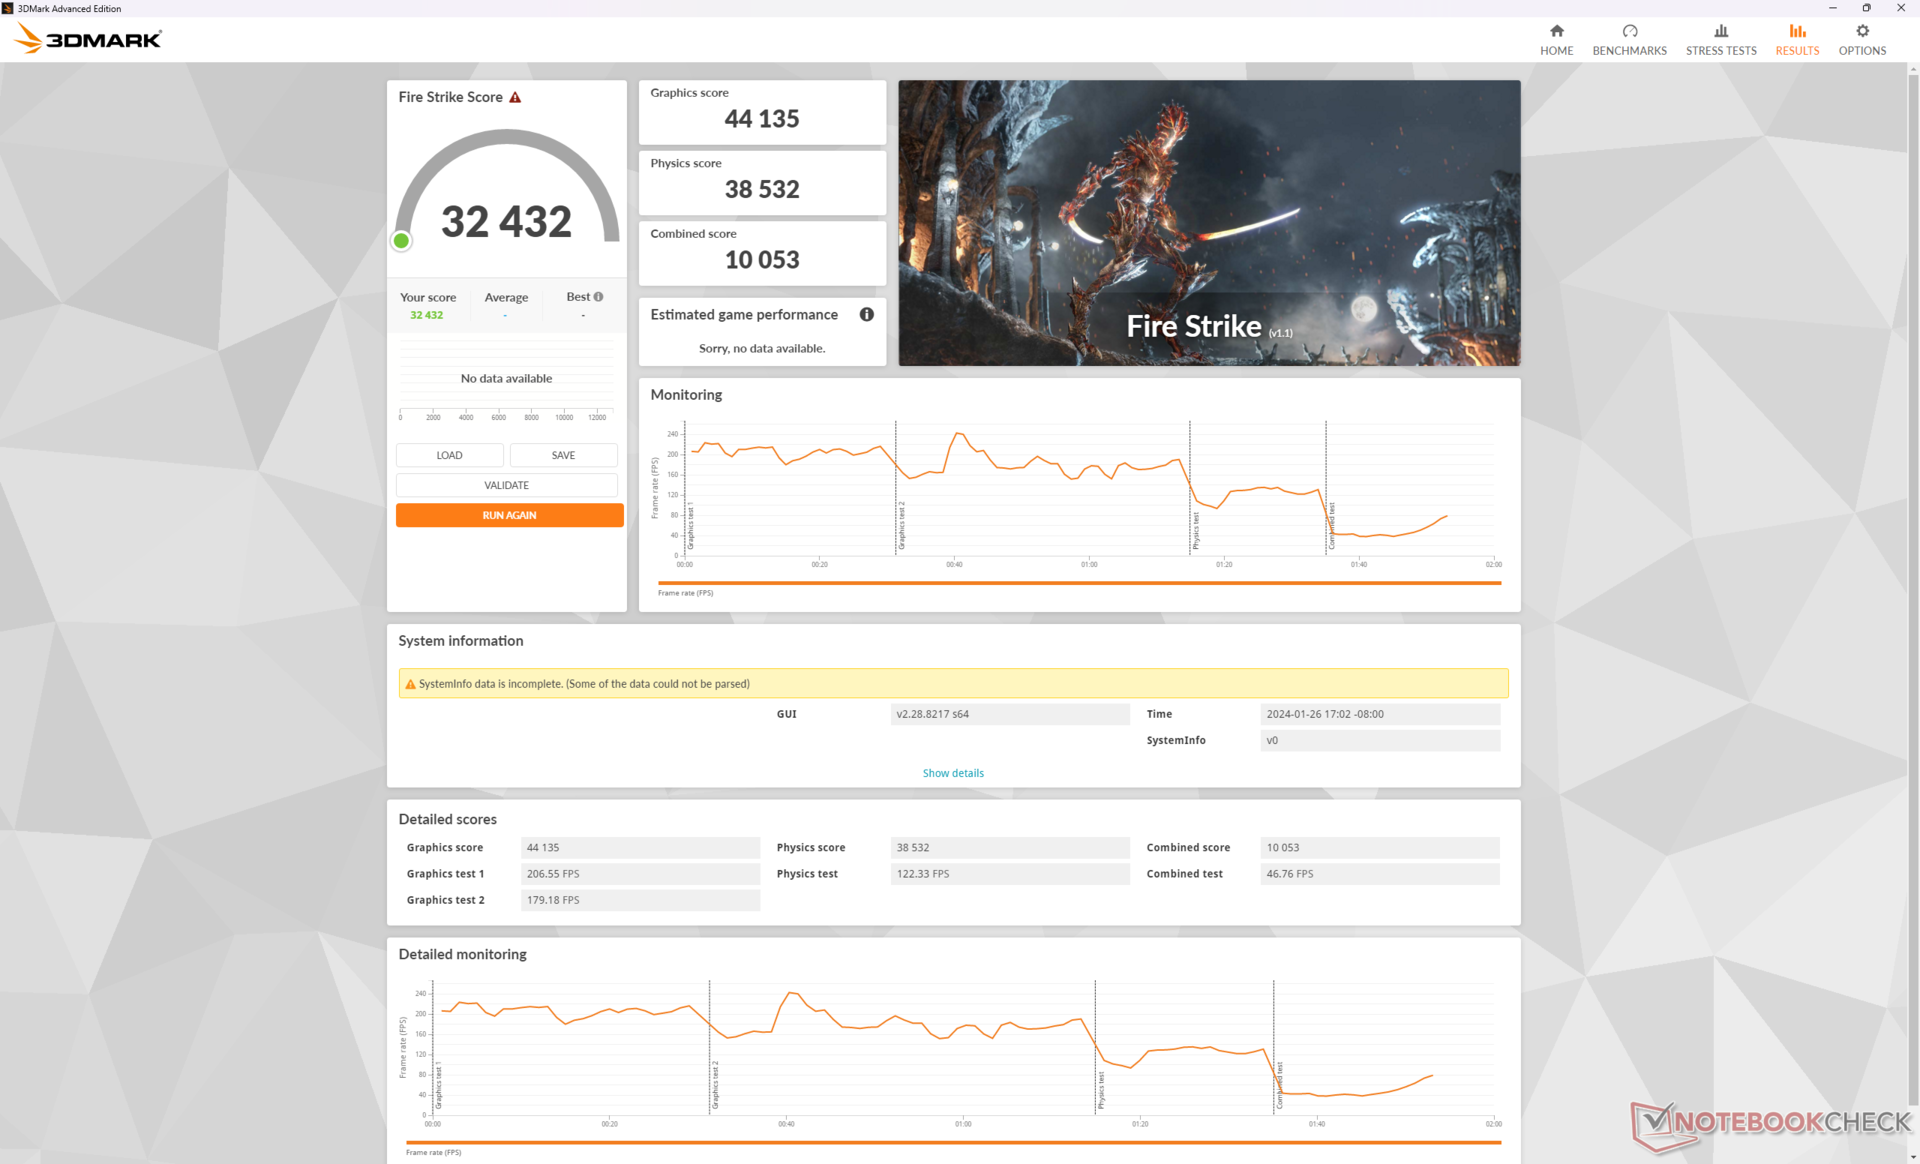
| 3DMark Fire Strike Score | 32432 pkt. | |
| 3DMark Time Spy Score | 18392 pkt. | |
Pomoc | ||
* ... im mniej tym lepiej
Wydajność w grach
Wszystkie obecne tytuły działają płynnie w natywnej rozdzielczości 1600p przy większości ustawień na maksimum. Warto jednak rozważyć włączenie v-sync lub ograniczenie liczby klatek na sekundę do 120 ze względu na brak G-Sync. Baldur's Gate, na przykład, osiąga średnio 129 FPS przy 1440p, co może skutkować rozrywaniem ekranu na wyświetlaczu 240 Hz, jeśli odblokowana zostanie liczba klatek na sekundę.
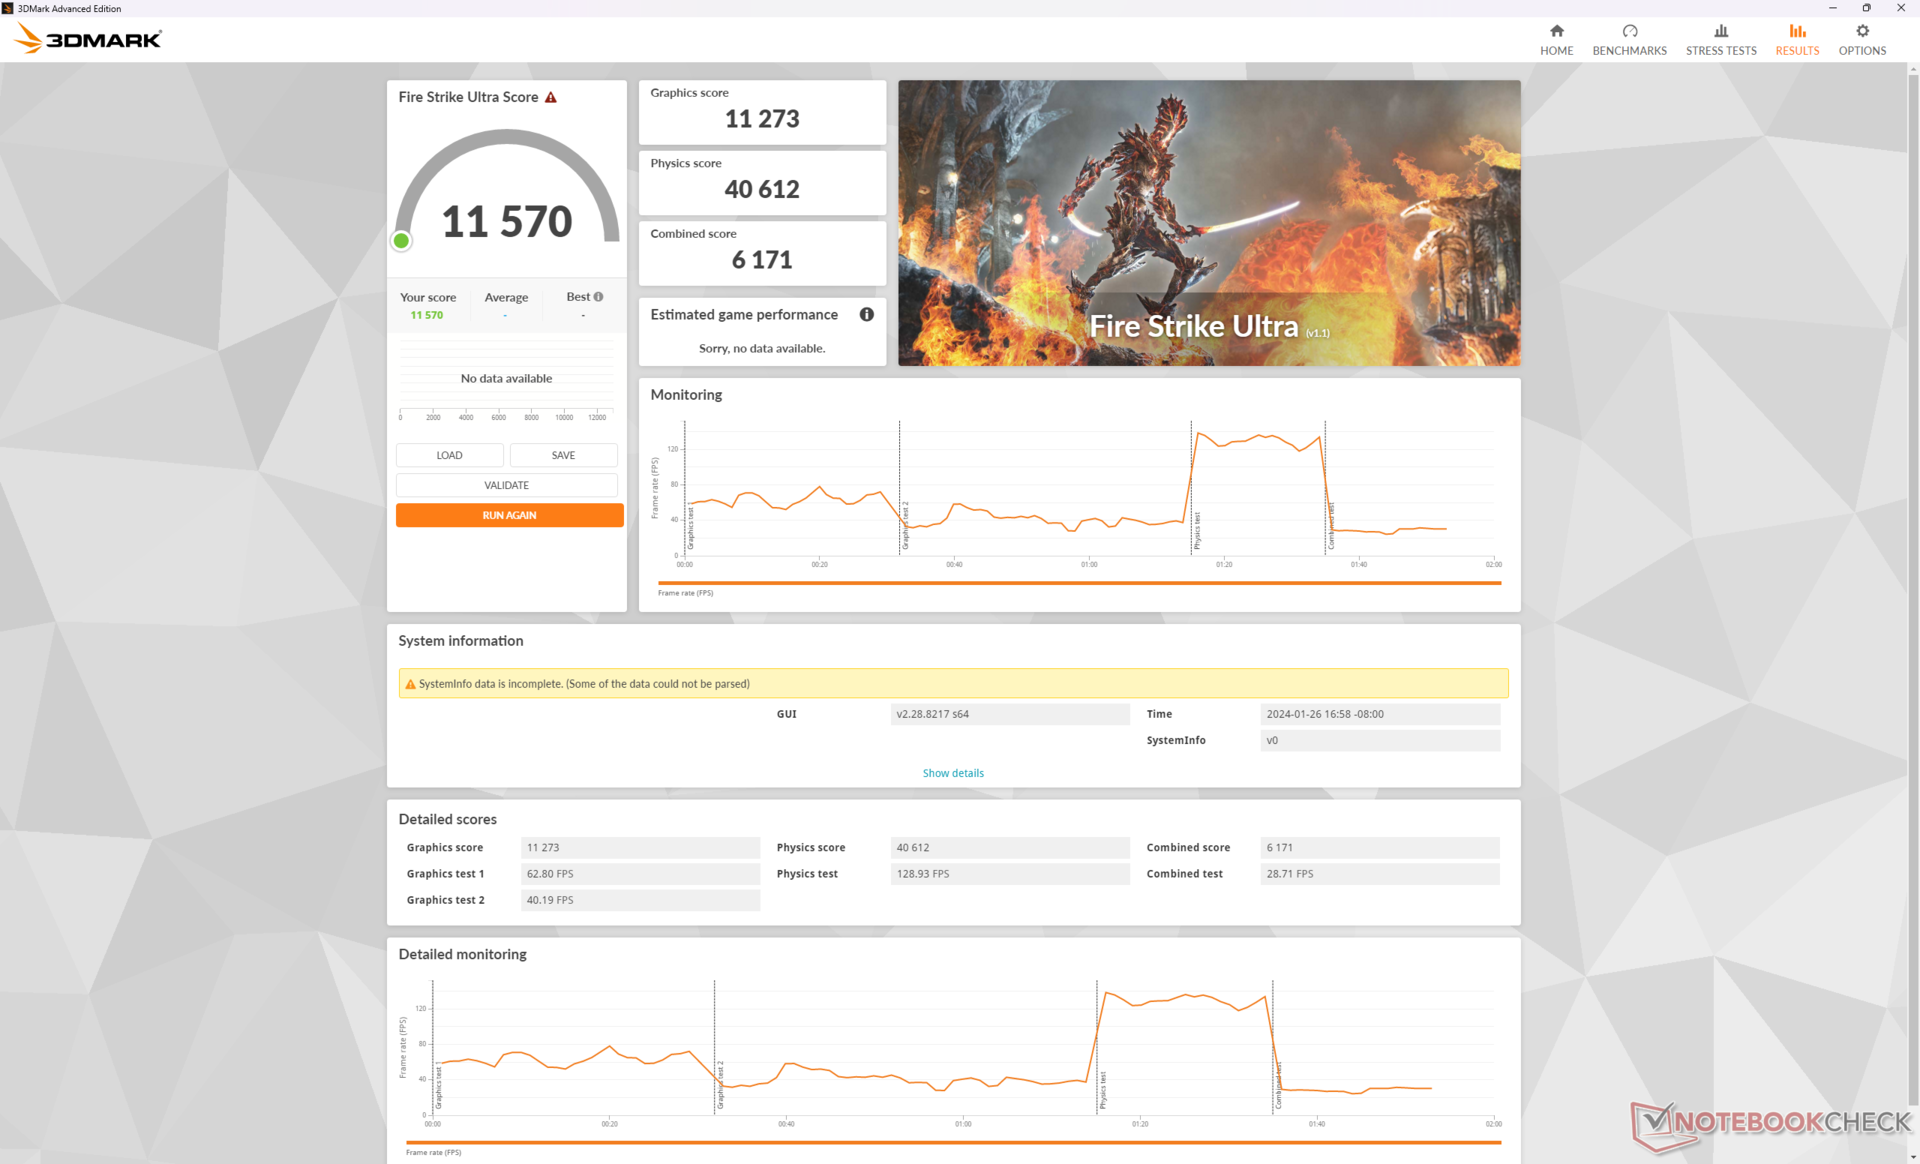
DLSS jest zalecany w przypadku grania w 4K, ponieważ mobilny RTX 4080 jest znacznie słabszy niż jego desktopowy odpowiednik. Średnia liczba klatek na sekundę w grze Cyberpunk 2077 wyniosłaby zaledwie 18,5 FPS przy natywnych ustawieniach 4K Ultra RT, ale włączenie zarówno DLSS Auto, jak i generowania klatek zwiększyłoby średnią do 75,8 FPS.
| Performance rating - Percent | |
| MSI Vector 16 HX A14V | |
| Lenovo Legion 5 16IRX G9 | |
| MSI Vector GP66 12UGS | |
| HP Victus 16-r0077ng | |
| Dell G16 7620 | |
| Asus TUF Gaming A16 FA617XS | |
| The Witcher 3 - 1920x1080 Ultra Graphics & Postprocessing (HBAO+) | |
| MSI Vector 16 HX A14V | |
| MSI Vector GP66 12UGS | |
| HP Victus 16-r0077ng | |
| Asus TUF Gaming A16 FA617XS | |
| Lenovo Legion 5 16IRX G9 | |
| Dell G16 7620 | |
| GTA V - 1920x1080 Highest AA:4xMSAA + FX AF:16x | |
| MSI Vector 16 HX A14V | |
| MSI Vector GP66 12UGS | |
| Lenovo Legion 5 16IRX G9 | |
| HP Victus 16-r0077ng | |
| Dell G16 7620 | |
| Asus TUF Gaming A16 FA617XS | |
| Final Fantasy XV Benchmark - 1920x1080 High Quality | |
| MSI Vector 16 HX A14V | |
| MSI Vector GP66 12UGS | |
| HP Victus 16-r0077ng | |
| Lenovo Legion 5 16IRX G9 | |
| Dell G16 7620 | |
| Asus TUF Gaming A16 FA617XS | |
| Strange Brigade - 1920x1080 ultra AA:ultra AF:16 | |
| MSI Vector 16 HX A14V | |
| MSI Vector GP66 12UGS | |
| Lenovo Legion 5 16IRX G9 | |
| HP Victus 16-r0077ng | |
| Asus TUF Gaming A16 FA617XS | |
| Dell G16 7620 | |
| Dota 2 Reborn - 1920x1080 ultra (3/3) best looking | |
| MSI Vector 16 HX A14V | |
| Lenovo Legion 5 16IRX G9 | |
| MSI Vector GP66 12UGS | |
| Dell G16 7620 | |
| HP Victus 16-r0077ng | |
| Asus TUF Gaming A16 FA617XS | |
| X-Plane 11.11 - 1920x1080 high (fps_test=3) | |
| MSI Vector 16 HX A14V | |
| Lenovo Legion 5 16IRX G9 | |
| MSI Vector GP66 12UGS | |
| Dell G16 7620 | |
| HP Victus 16-r0077ng | |
| Asus TUF Gaming A16 FA617XS | |
| Baldur's Gate 3 | |
| 1920x1080 High Preset AA:T | |
| MSI Vector 16 HX A14V | |
| Przeciętny NVIDIA GeForce RTX 4080 Laptop GPU (122.2 - 183.5, n=4) | |
| Framework Laptop 16 | |
| Lenovo ThinkPad Z16 Gen 2 | |
| 1920x1080 Ultra Preset AA:T | |
| MSI Vector 16 HX A14V | |
| Przeciętny NVIDIA GeForce RTX 4080 Laptop GPU (111.8 - 181.2, n=7) | |
| Framework Laptop 16 | |
| Lenovo ThinkPad Z16 Gen 2 | |
| 2560x1440 Ultra Preset AA:T | |
| MSI Vector 16 HX A14V | |
| Przeciętny NVIDIA GeForce RTX 4080 Laptop GPU (88.3 - 129.3, n=7) | |
| Framework Laptop 16 | |
| Lenovo ThinkPad Z16 Gen 2 | |
| 3840x2160 Ultra Preset AA:T | |
| MSI Vector 16 HX A14V | |
| Przeciętny NVIDIA GeForce RTX 4080 Laptop GPU (48.8 - 68.4, n=5) | |
| Framework Laptop 16 | |
Witcher 3 FPS Chart
| low | med. | high | ultra | QHD | 4K | |
|---|---|---|---|---|---|---|
| GTA V (2015) | 187.1 | 185.7 | 181.9 | 136.5 | 128.8 | 158.6 |
| The Witcher 3 (2015) | 640 | 513.3 | 384.6 | 183.3 | 121.2 | |
| Dota 2 Reborn (2015) | 217 | 194.8 | 186.7 | 175 | 168.4 | |
| Final Fantasy XV Benchmark (2018) | 232 | 219 | 178.8 | 142 | 79.5 | |
| X-Plane 11.11 (2018) | 204 | 177.4 | 137.7 | 118.1 | ||
| Far Cry 5 (2018) | 180 | 167 | 161 | 154 | 97 | |
| Strange Brigade (2018) | 505 | 405 | 378 | 349 | 248 | 123.2 |
| Tiny Tina's Wonderlands (2022) | 344 | 297.1 | 212.8 | 167.1 | 114.8 | 60.3 |
| F1 22 (2022) | 339 | 324 | 297 | 81.2 | 76.9 | 39.6 |
| Baldur's Gate 3 (2023) | 228.5 | 204.3 | 183.5 | 181.2 | 129.3 | 68.4 |
| Cyberpunk 2077 (2023) | 143.4 | 135.3 | 127.1 | 118.6 | 79.4 | 36.6 |
Emisje - głośne i dumne
Hałas systemowy
System jest dość głośny nawet podczas pracy na biegu jałowym na pulpicie na profilach zasilania Zrównoważony lub Cichy. Hałas wentylatora podczas pracy Witcher 3 w trybie Ekstremalnej wydajności oscylowałby na poziomie 62 dB(A) niezależnie od ustawienia Cooler Boost. Zakres 60+ dB(A) jest domem dla niektórych z najgłośniejszych laptopów w naszej bazie danych, do tego stopnia, że słuchawki są zalecane dla lepszych wrażeń z gry.
Granie w trybie zrównoważonym znacznie obniży pułap hałasu wentylatora do zakresu 54 dB(A). Chociaż nadal jest głośno, nie jest tak źle, jak w trybie ekstremalnej wydajności. Użytkownicy mogą zatem chcieć grać w trybie zrównoważonym zamiast w trybie ekstremalnej wydajności, nawet jeśli wiąże się to z 16-procentowym spadkiem wydajności GPU, jak wspomniano powyżej.
Hałas
| luz |
| 33.5 / 33.5 / 33.5 dB |
| obciążenie |
| 52.1 / 62 dB |
 | ||
30 dB cichy 40 dB(A) słyszalny 50 dB(A) irytujący |
||
min: | ||
| MSI Vector 16 HX A14V GeForce RTX 4080 Laptop GPU, i9-14900HX, WD PC SN560 SDDPNQE-1T00 | MSI Vector GP66 12UGS GeForce RTX 3070 Ti Laptop GPU, i9-12900H | Lenovo Legion 5 16IRX G9 GeForce RTX 4060 Laptop GPU, i7-14650HX, Samsung PM9A1 MZVL21T0HCLR | HP Victus 16-r0077ng GeForce RTX 4070 Laptop GPU, i7-13700H, Kioxia XG8 KXG80ZNV1T02 | Asus TUF Gaming A16 FA617XS Radeon RX 7600S, R9 7940HS, Micron 2400 MTFDKBA512QFM | Dell G16 7620 GeForce RTX 3060 Laptop GPU, i7-12700H, WDC PC SN810 512GB | |
|---|---|---|---|---|---|---|
| Noise | 17% | 11% | 14% | 15% | 18% | |
| wyłączone / środowisko * (dB) | 23.2 | 22.9 1% | 24 -3% | 25 -8% | 25 -8% | 23.2 -0% |
| Idle Minimum * (dB) | 33.5 | 23.4 30% | 24 28% | 28 16% | 25 25% | 28.3 16% |
| Idle Average * (dB) | 33.5 | 23.4 30% | 28.8 14% | 29 13% | 26 22% | 28.8 14% |
| Idle Maximum * (dB) | 33.5 | 27.4 18% | 32 4% | 30 10% | 28 16% | 28.9 14% |
| Load Average * (dB) | 52.1 | 36 31% | 45.5 13% | 43 17% | 43 17% | 32.4 38% |
| Witcher 3 ultra * (dB) | 62 | 58.2 6% | 53.1 14% | 46 26% | 51 18% | 48.3 22% |
| Load Maximum * (dB) | 62 | 58 6% | 55.7 10% | 48 23% | 53 15% | 48.1 22% |
* ... im mniej tym lepiej
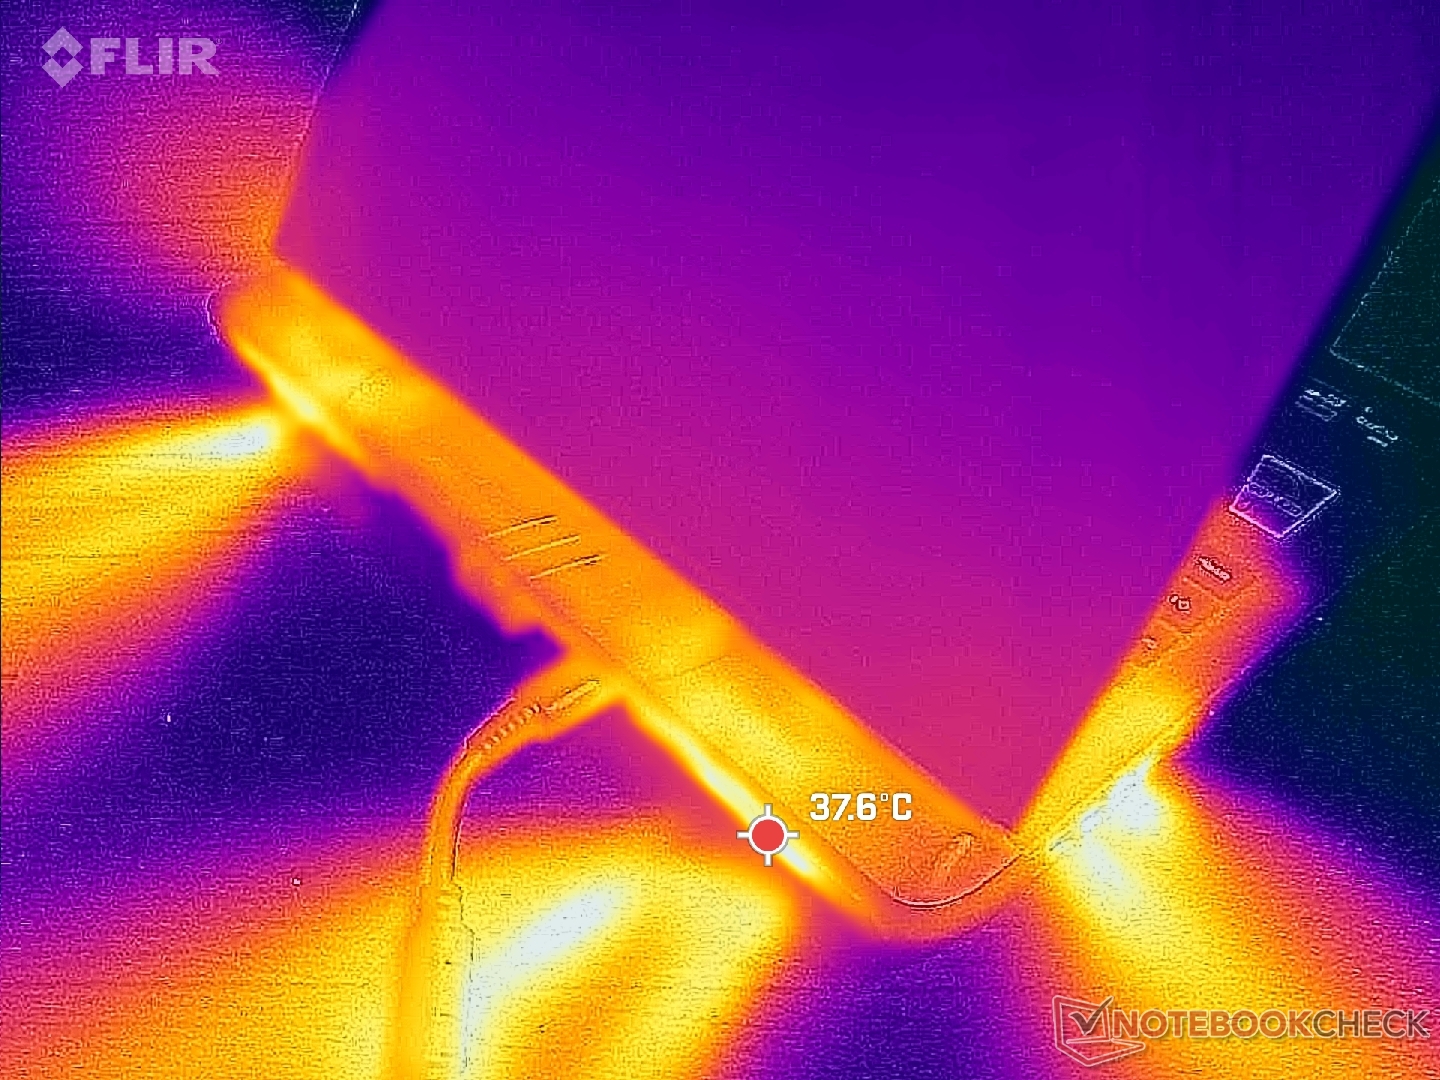
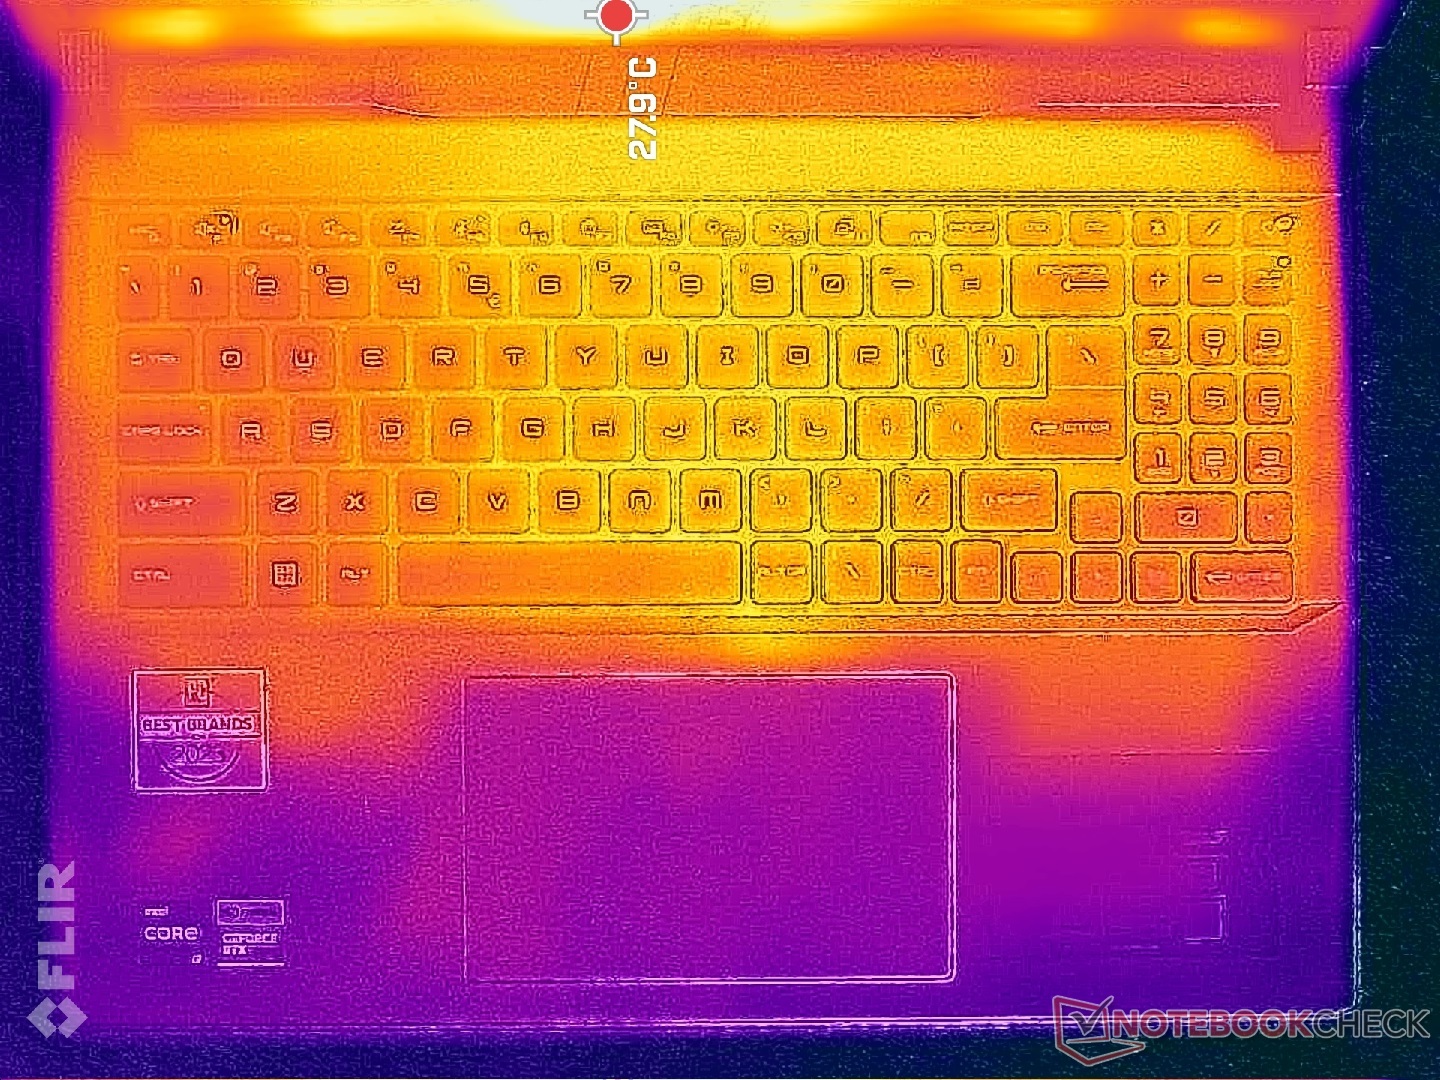
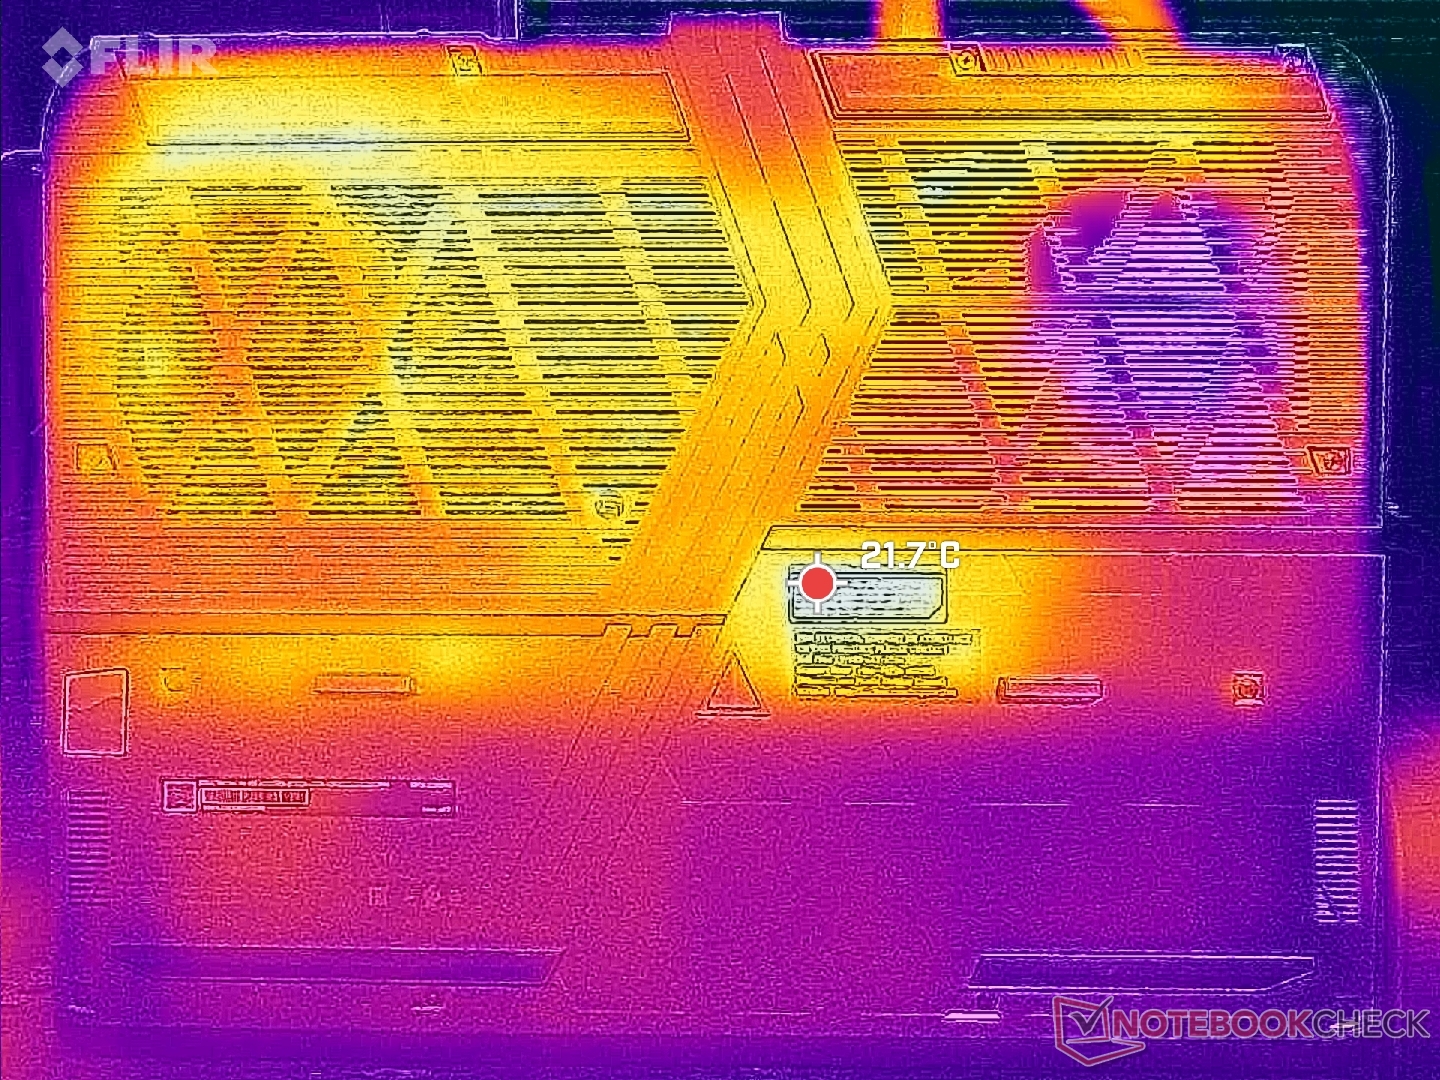
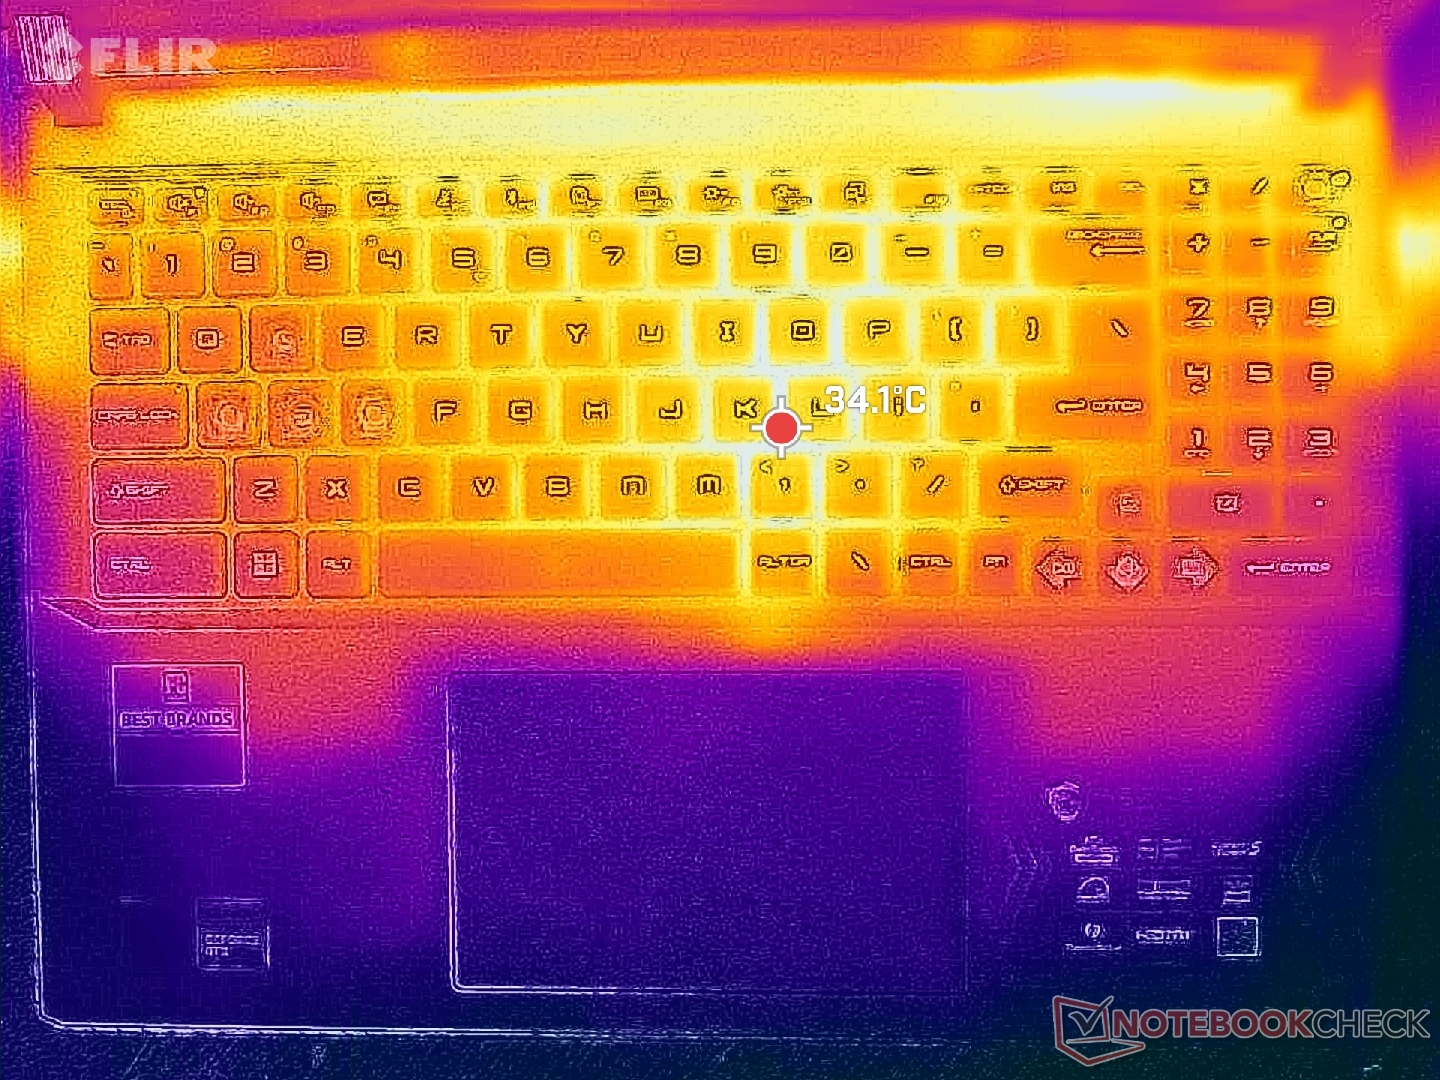
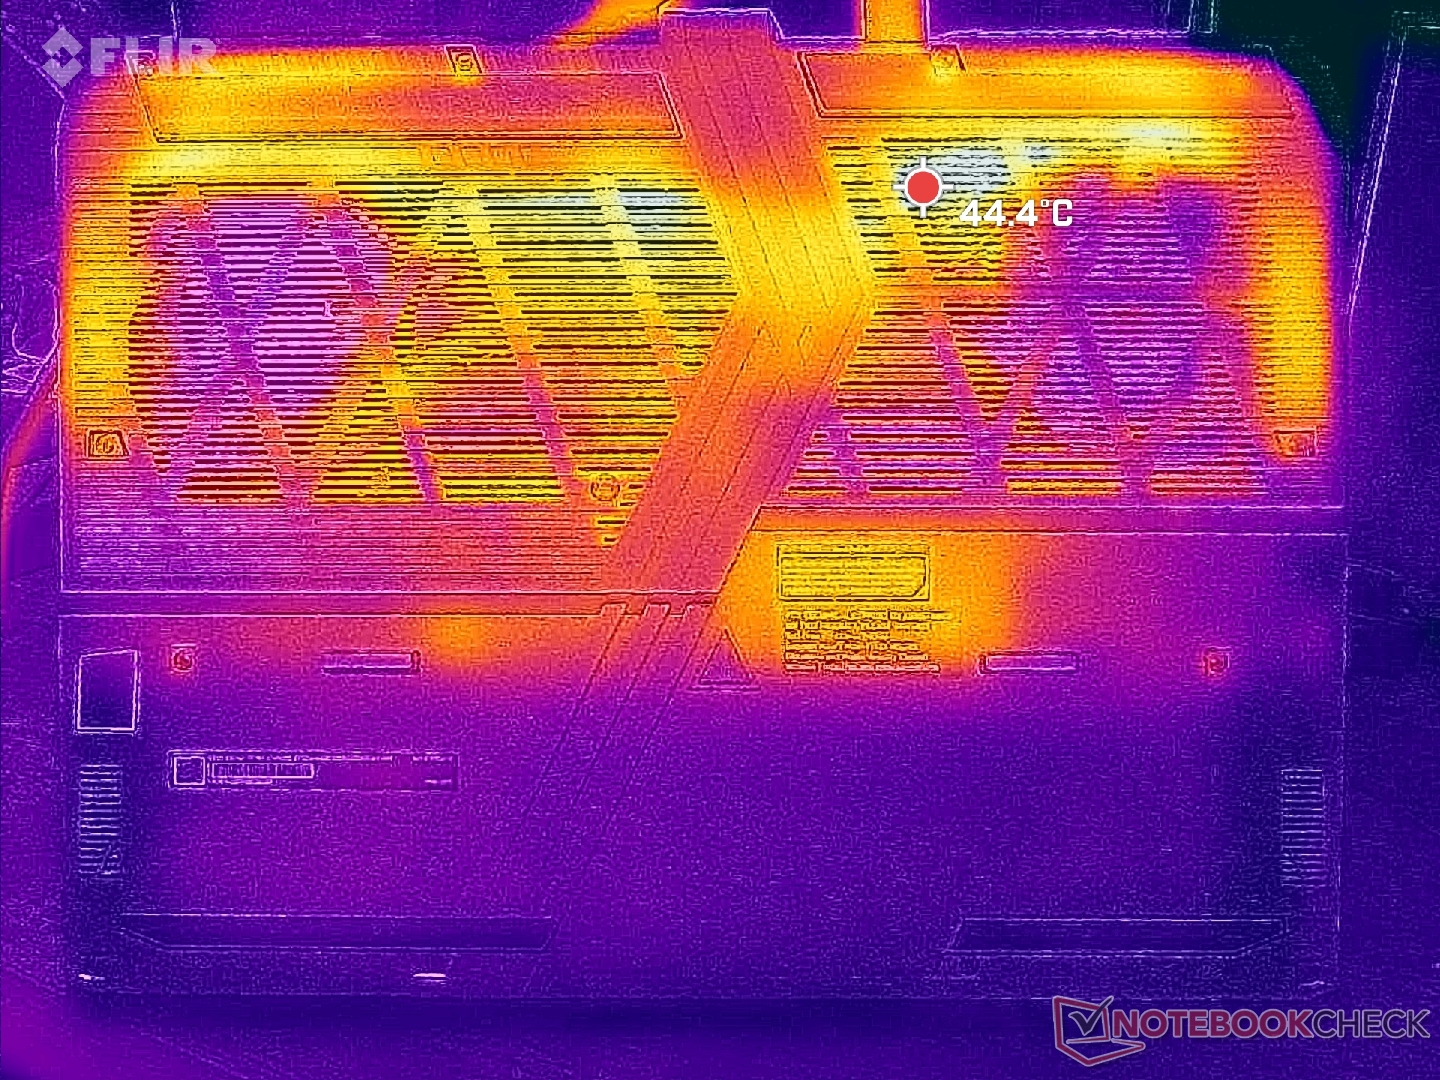
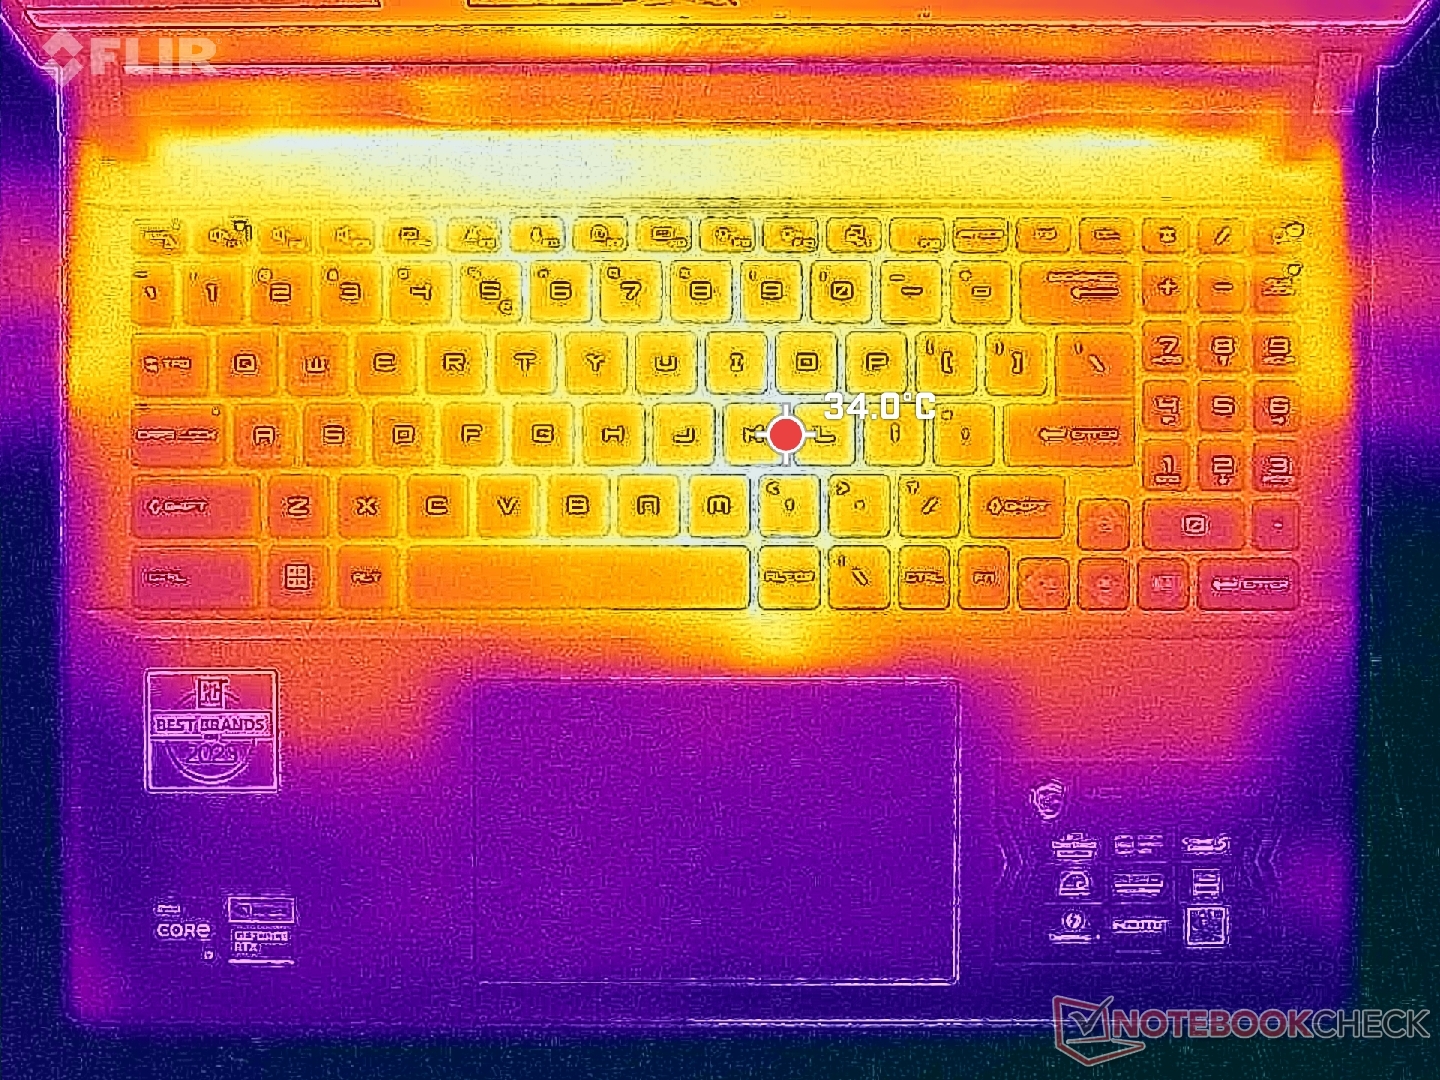
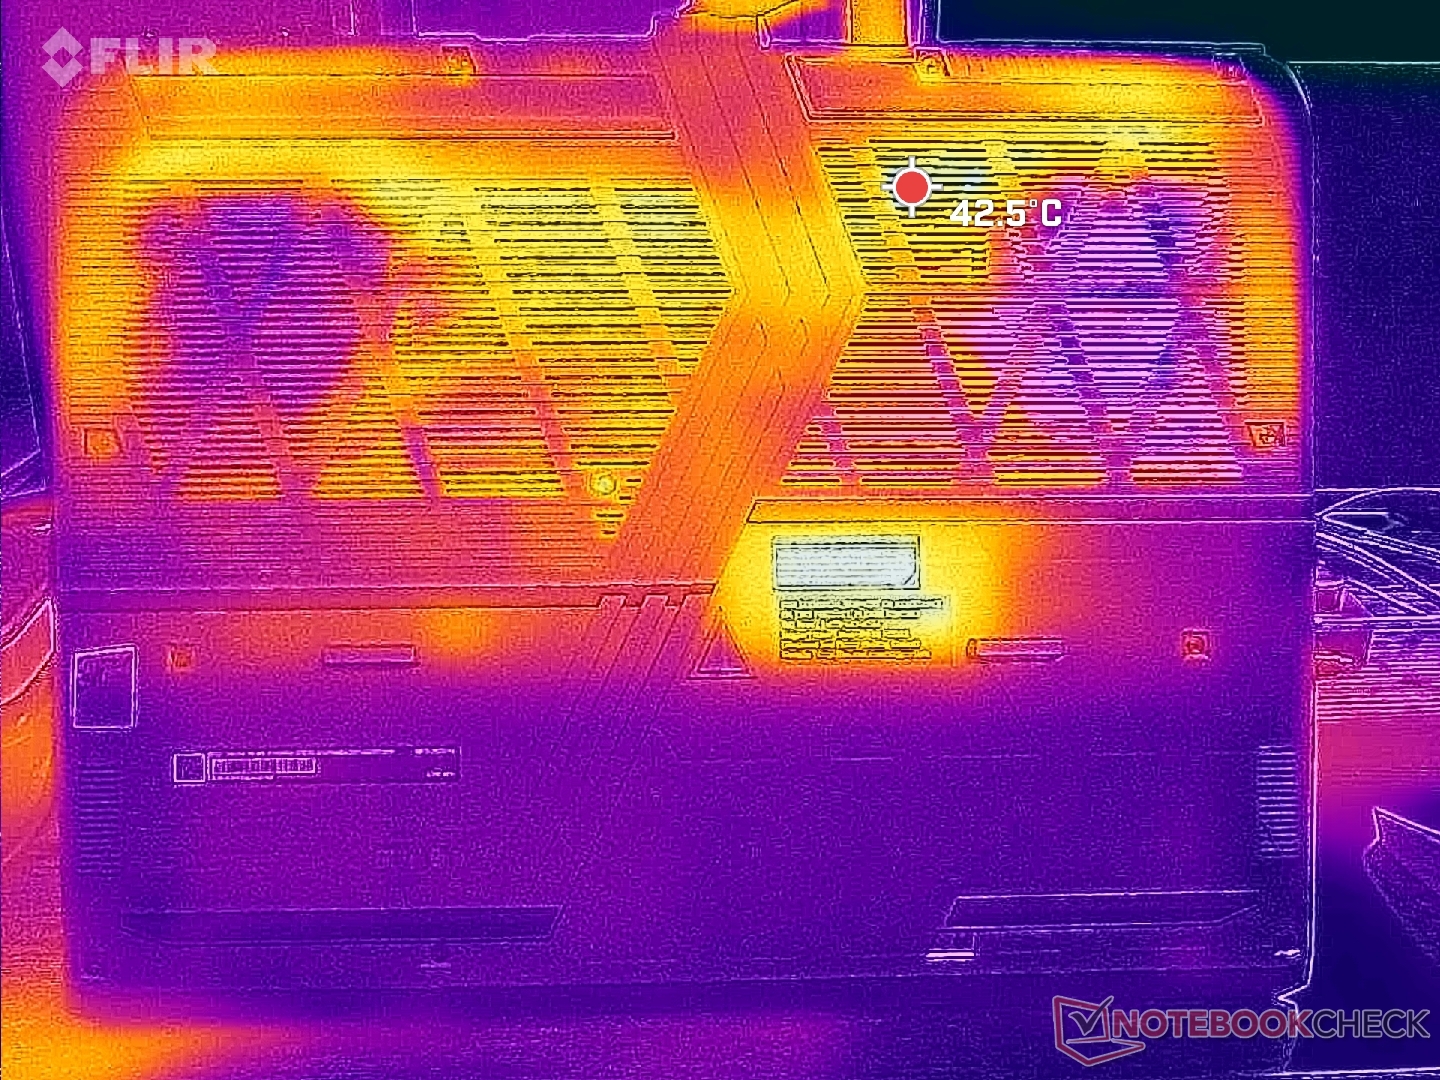
Temperatura
Temperatury powierzchniowe są niższe niż w przypadku większości innych laptopów do gier dzięki plastikowej podstawie, licznym kratkom wentylacyjnym i grubej konstrukcji obudowy. W rzeczywistości jest to jeden z najchłodniejszych laptopów do gier, jakie testowaliśmy z RTX 4080. Podczas pracy Witcher 3gorący punkt na środku klawiatury osiągnąłby tylko 34 C w porównaniu do 39 C na Legion 5i 16 G9 lub starszym Vector GP66.
(+) Maksymalna temperatura w górnej części wynosi 36.4 °C / 98 F, w porównaniu do średniej 40.4 °C / 105 F , począwszy od 21.2 do 68.8 °C dla klasy Gaming.
(+) Dno nagrzewa się maksymalnie do 35.6 °C / 96 F, w porównaniu do średniej 43.2 °C / 110 F
(+) W stanie bezczynności średnia temperatura górnej części wynosi 24.5 °C / 76 F, w porównaniu ze średnią temperaturą urządzenia wynoszącą 33.9 °C / ### class_avg_f### F.
(+) Podczas gry w Wiedźmina 3 średnia temperatura górnej części wynosi 30.4 °C / 87 F, w porównaniu do średniej temperatury urządzenia wynoszącej 33.9 °C / ## #class_avg_f### F.
(+) Podpórki pod nadgarstki i touchpad są chłodniejsze niż temperatura skóry i maksymalnie 24 °C / 75.2 F i dlatego są chłodne w dotyku.
(+) Średnia temperatura obszaru podparcia dłoni w podobnych urządzeniach wynosiła 28.8 °C / 83.8 F (+4.8 °C / 8.6 F).
| MSI Vector 16 HX A14V Intel Core i9-14900HX, NVIDIA GeForce RTX 4080 Laptop GPU | MSI Vector GP66 12UGS Intel Core i9-12900H, NVIDIA GeForce RTX 3070 Ti Laptop GPU | Lenovo Legion 5 16IRX G9 Intel Core i7-14650HX, NVIDIA GeForce RTX 4060 Laptop GPU | HP Victus 16-r0077ng Intel Core i7-13700H, NVIDIA GeForce RTX 4070 Laptop GPU | Asus TUF Gaming A16 FA617XS AMD Ryzen 9 7940HS, AMD Radeon RX 7600S | Dell G16 7620 Intel Core i7-12700H, NVIDIA GeForce RTX 3060 Laptop GPU | |
|---|---|---|---|---|---|---|
| Heat | -25% | -20% | -35% | -26% | -15% | |
| Maximum Upper Side * (°C) | 36.4 | 40.2 -10% | 40.4 -11% | 51 -40% | 53 -46% | 47.6 -31% |
| Maximum Bottom * (°C) | 35.6 | 43.8 -23% | 43.8 -23% | 54 -52% | 48 -35% | 54 -52% |
| Idle Upper Side * (°C) | 26.6 | 34.8 -31% | 30.3 -14% | 37 -39% | 30 -13% | 23 14% |
| Idle Bottom * (°C) | 27 | 37 -37% | 35.3 -31% | 29 -7% | 30 -11% | 24.6 9% |
* ... im mniej tym lepiej
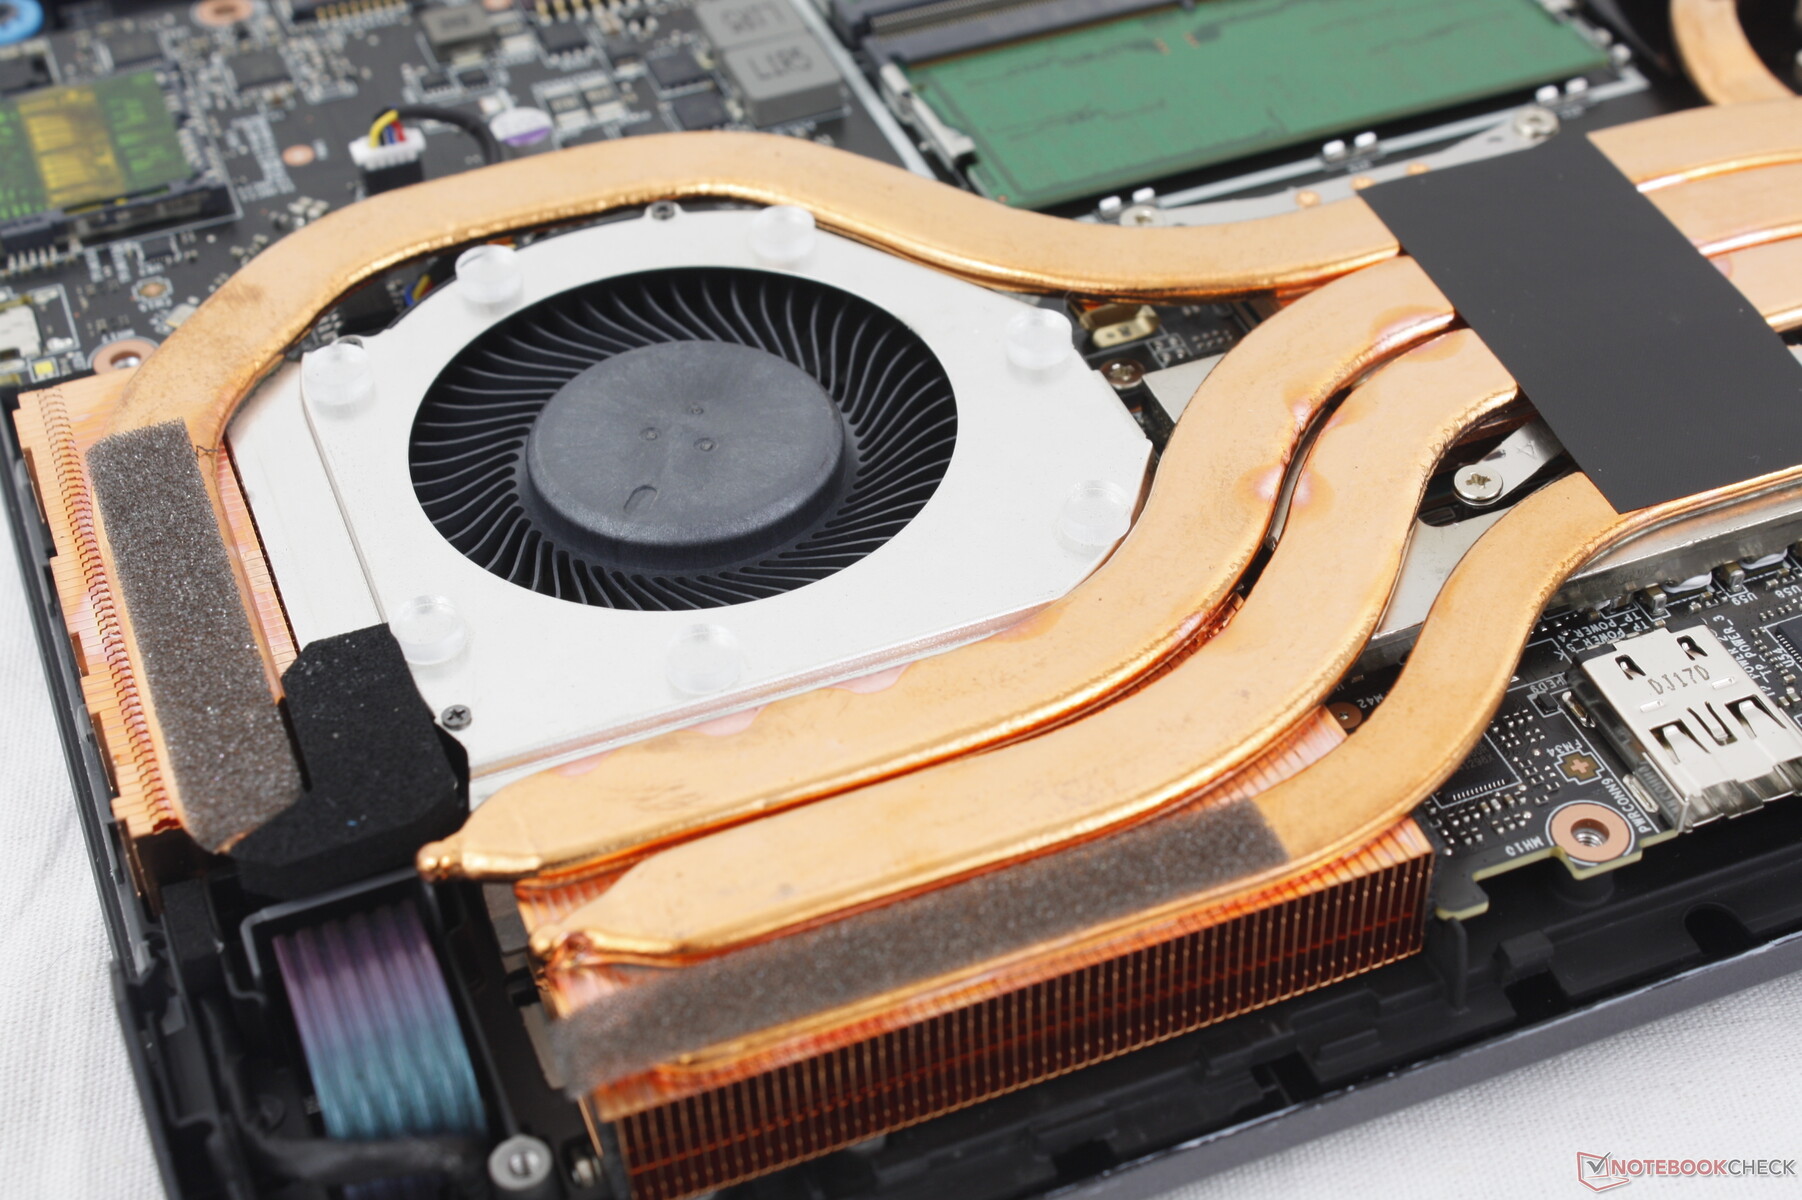
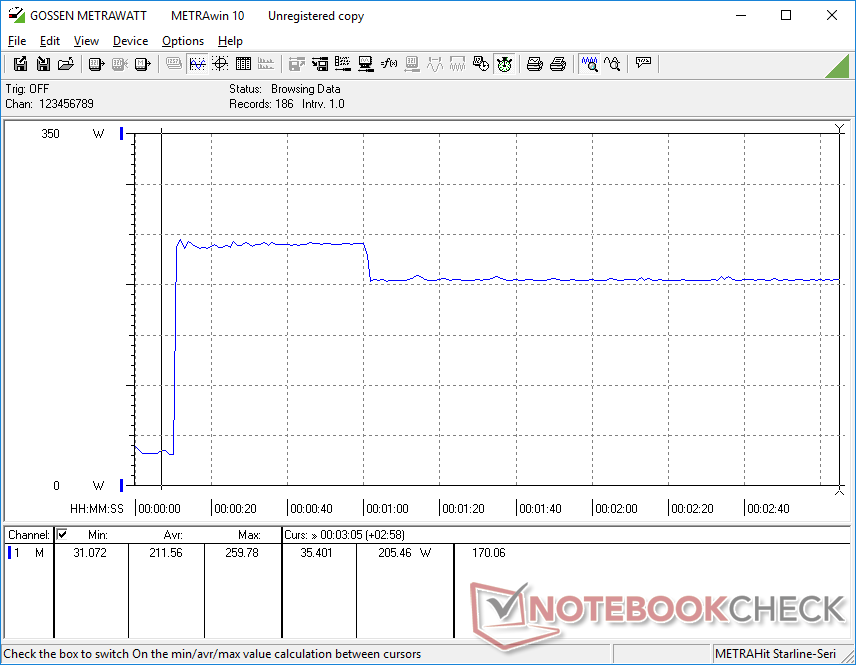
Test warunków skrajnych
Po zainicjowaniu stresu Prime95, procesor zwiększyłby taktowanie do 4,2 GHz i 180 W, aż temperatura rdzenia osiągnęłaby 87 C około minutę później. Następnie temperatura spadłaby do ~3,3 GHz, 140 W i 82 C. Wyniki pozostałyby takie same nawet po włączeniu funkcji Cooler Boost.
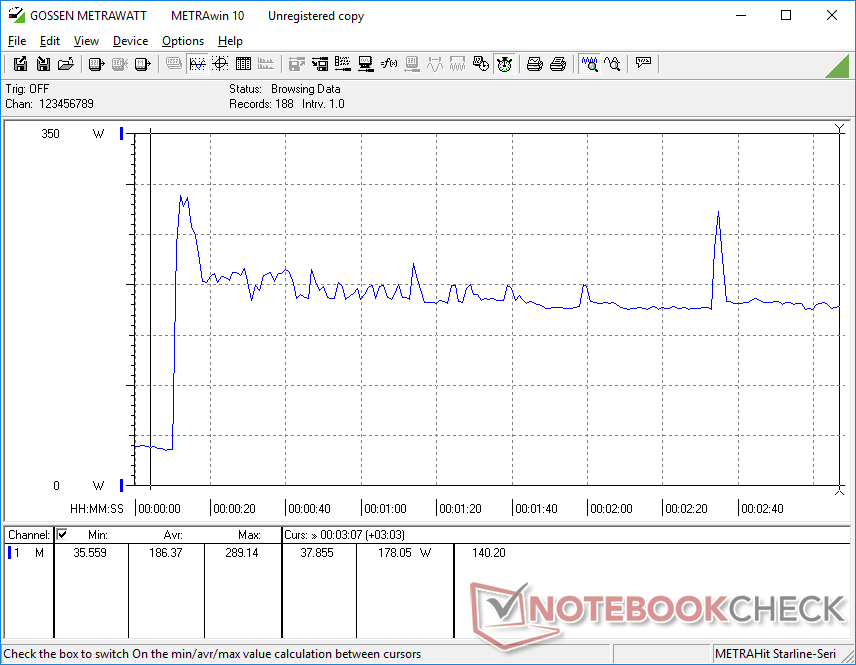
Uruchomienie strony Witcher 3 w trybie Extreme Performance w celu odwzorowania typowych obciążeń w grach spowodowałoby stałe wartości taktowania GPU wynoszące 2535 MHz, temperaturę rdzenia 77 C i pobór mocy płyty 165 W według HWiNFO. Wyniki pozostałyby prawie takie same niezależnie od ustawienia Cooler Boost. Zejście do cichszego trybu Balanced zmniejszyłoby jednak taktowanie GPU i pobór mocy z płyty głównej do odpowiednio 2055 MHz i 120 W, co odzwierciedla znaczny spadek wydajności wspomniany w naszej sekcji Wydajność GPU powyżej.
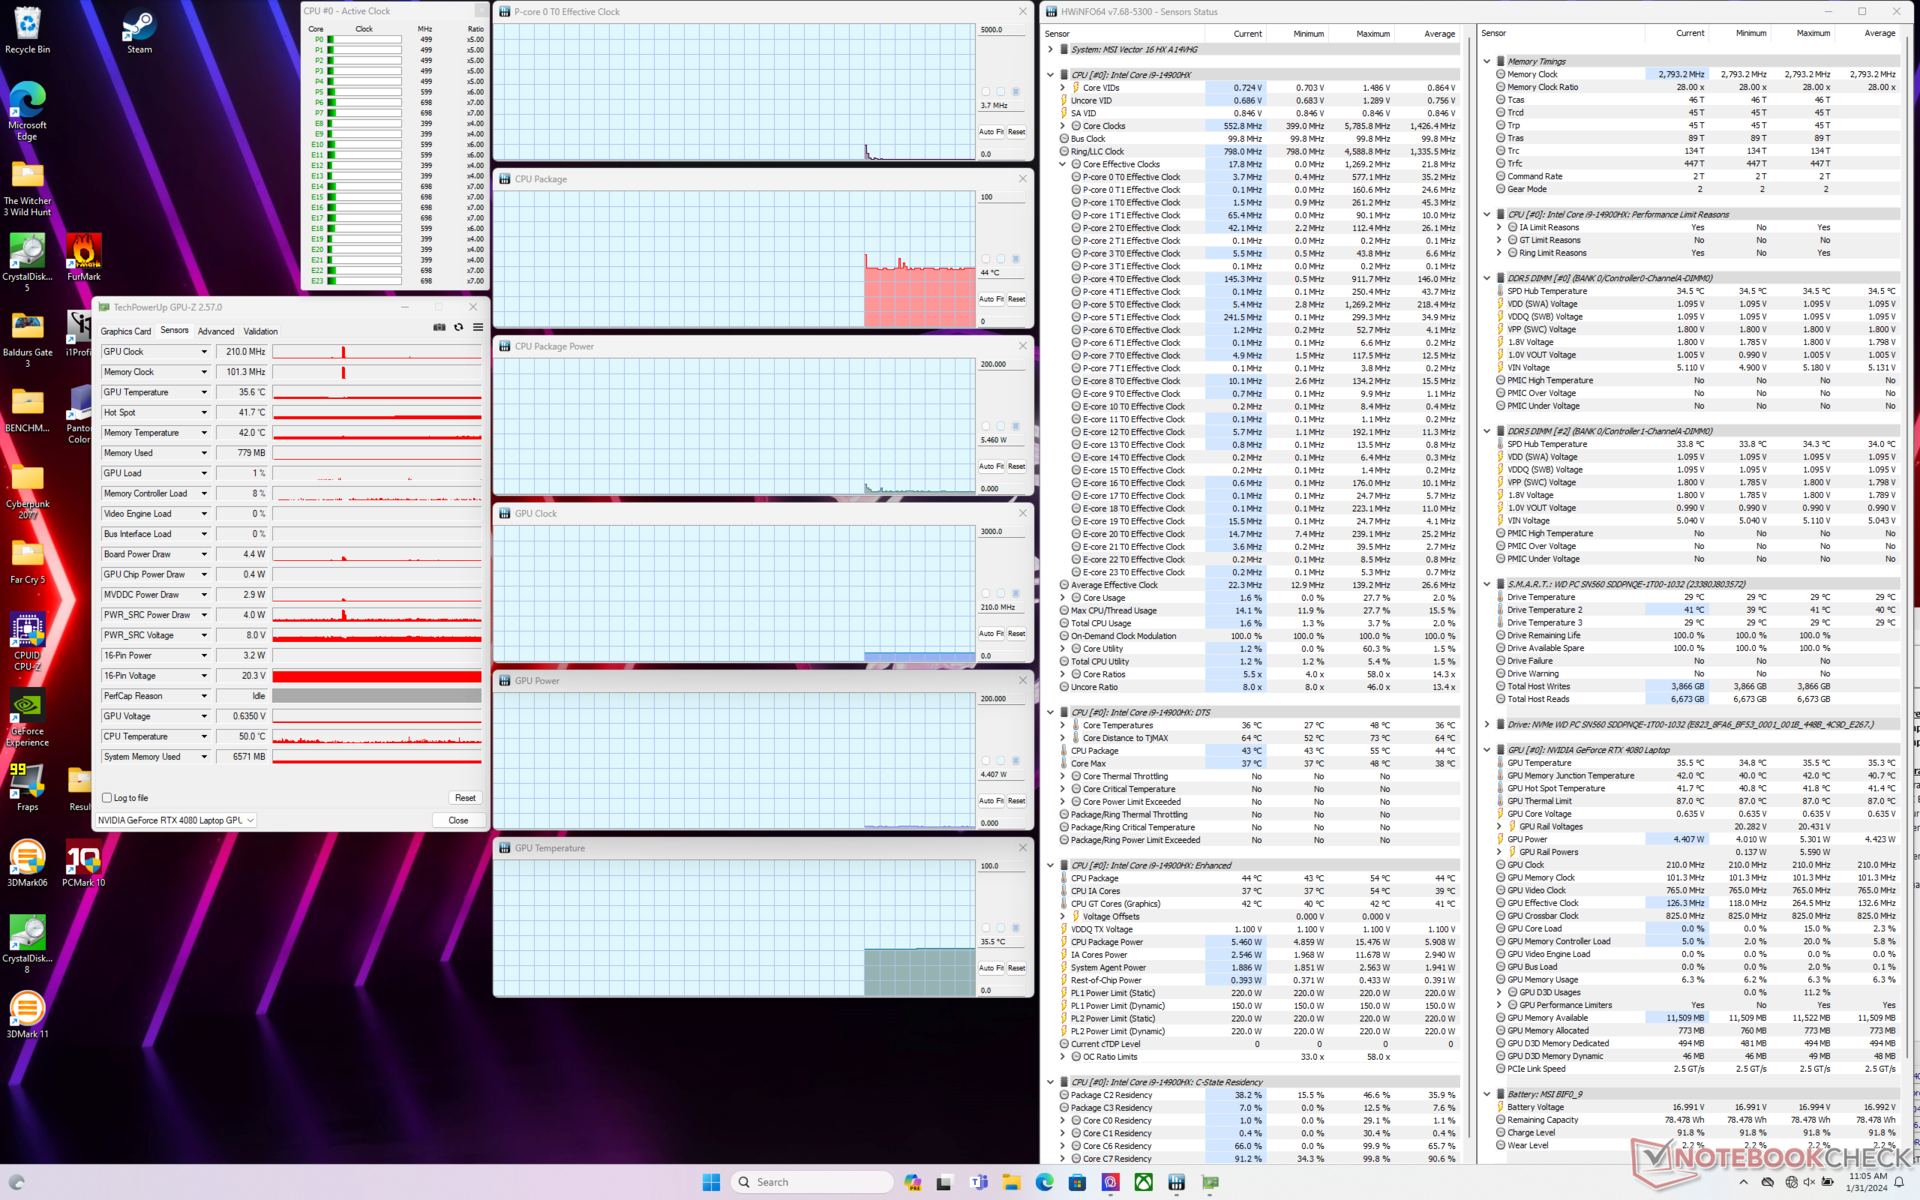
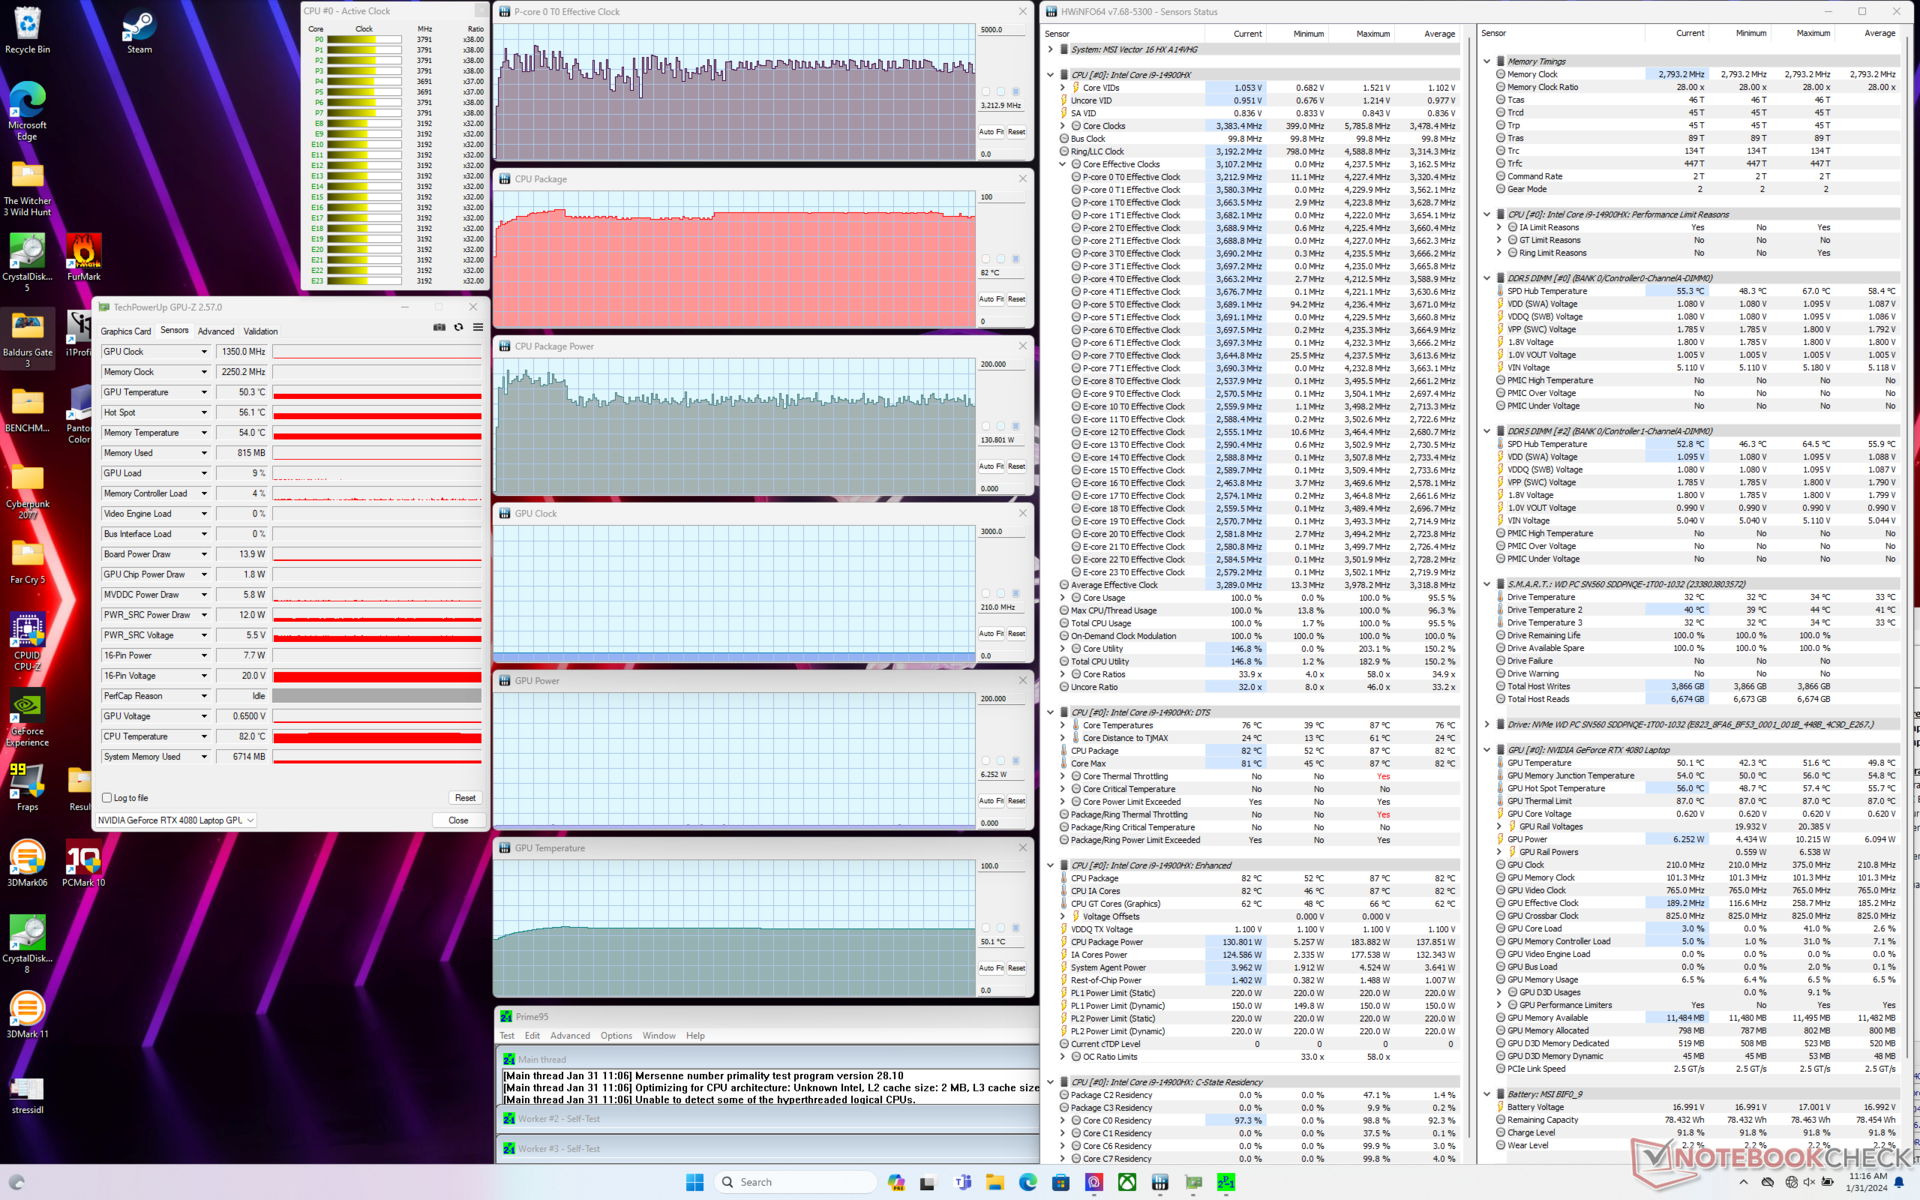
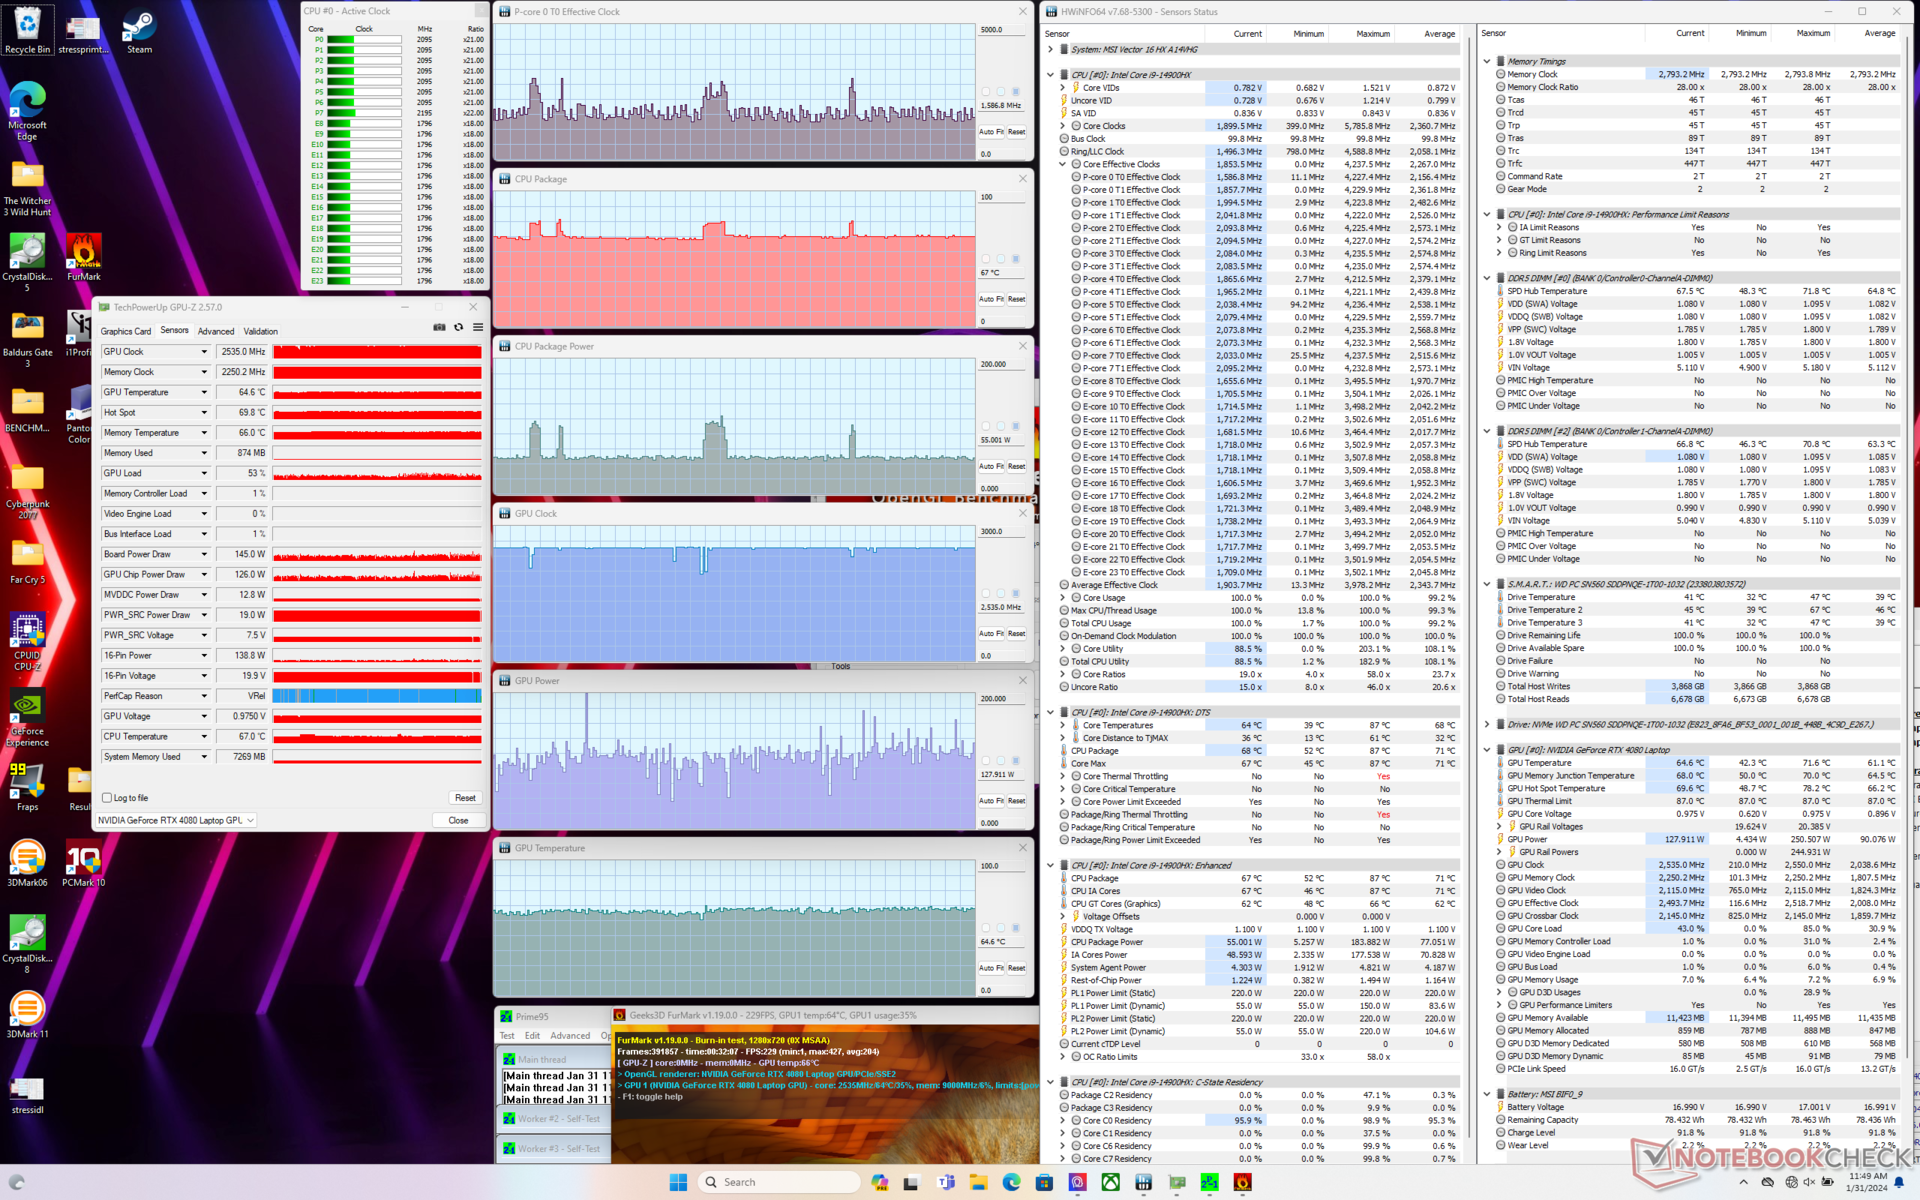
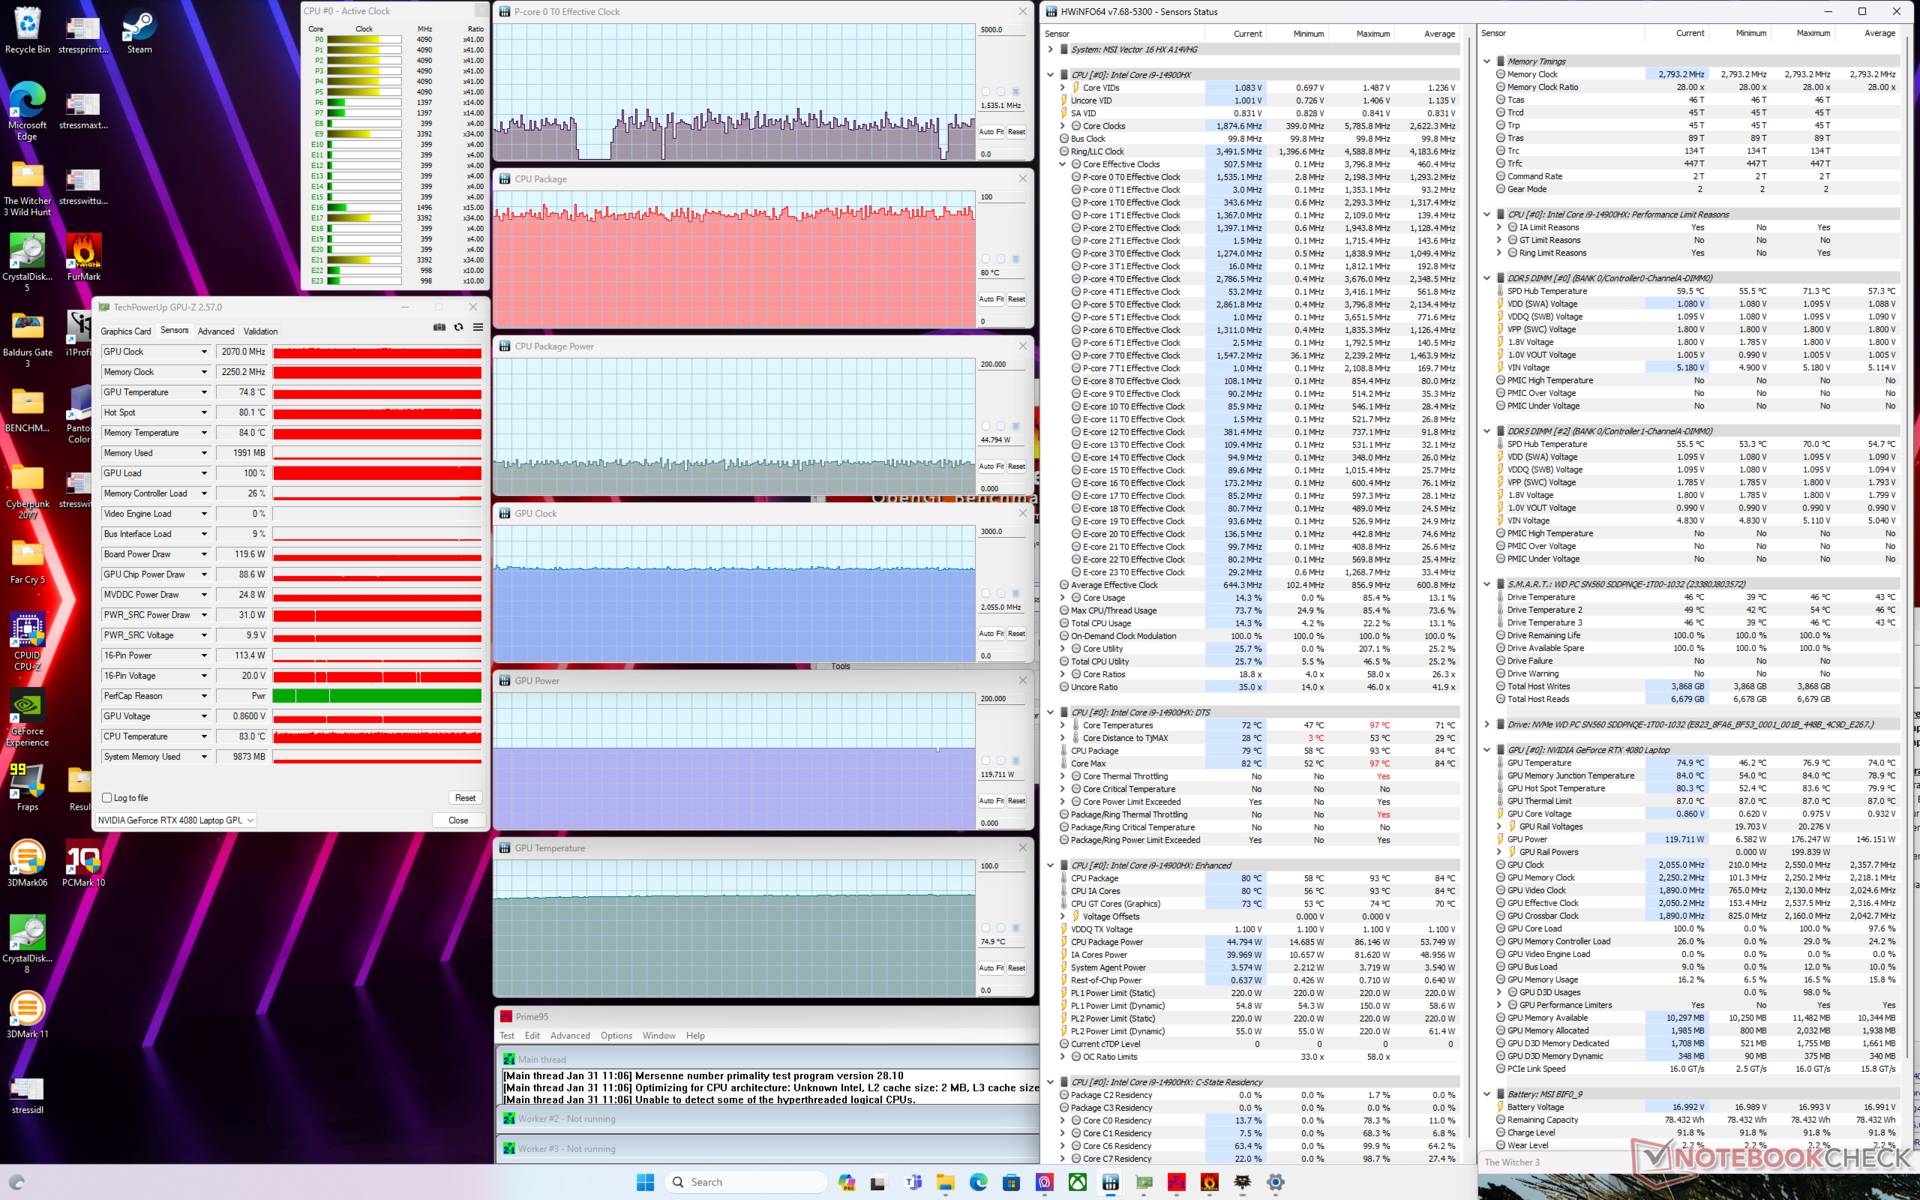
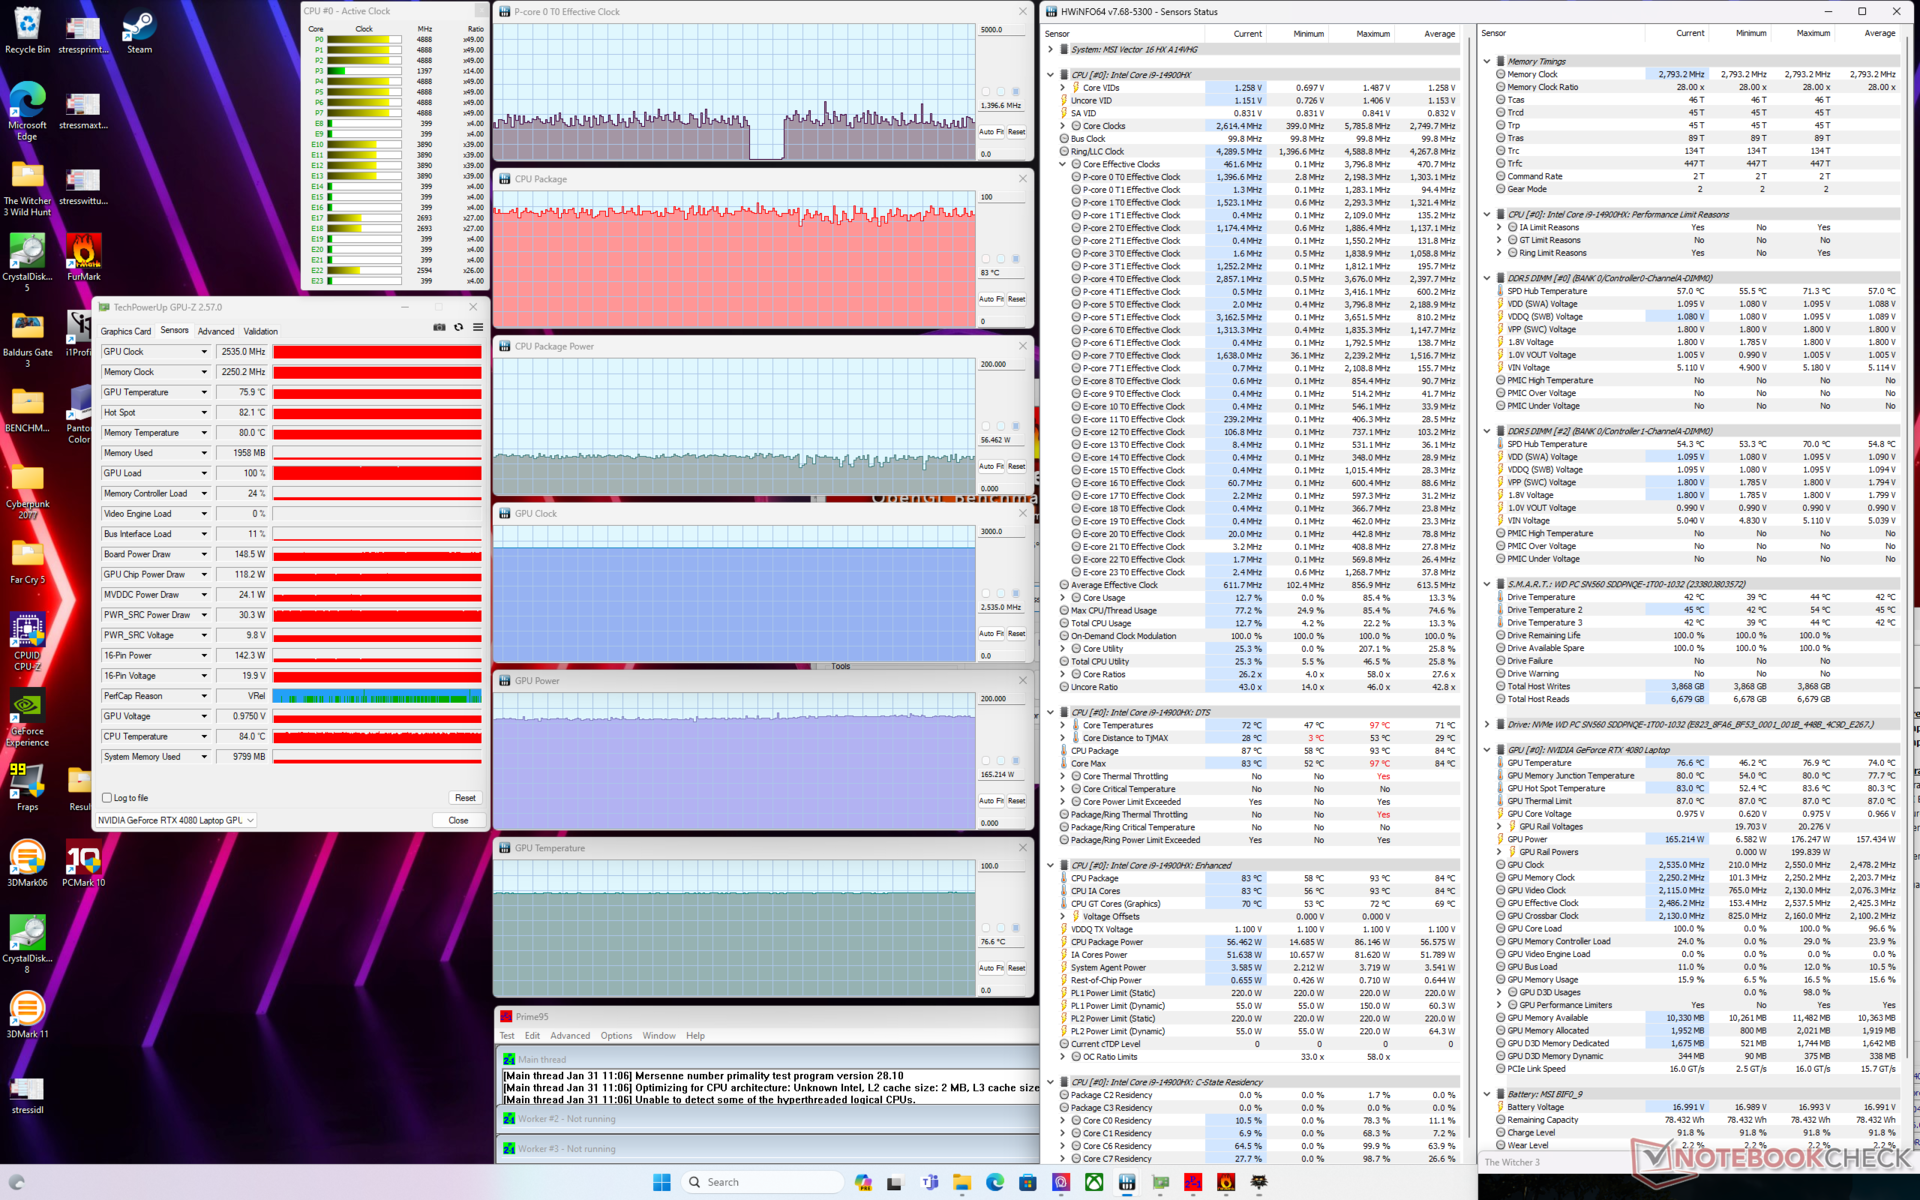
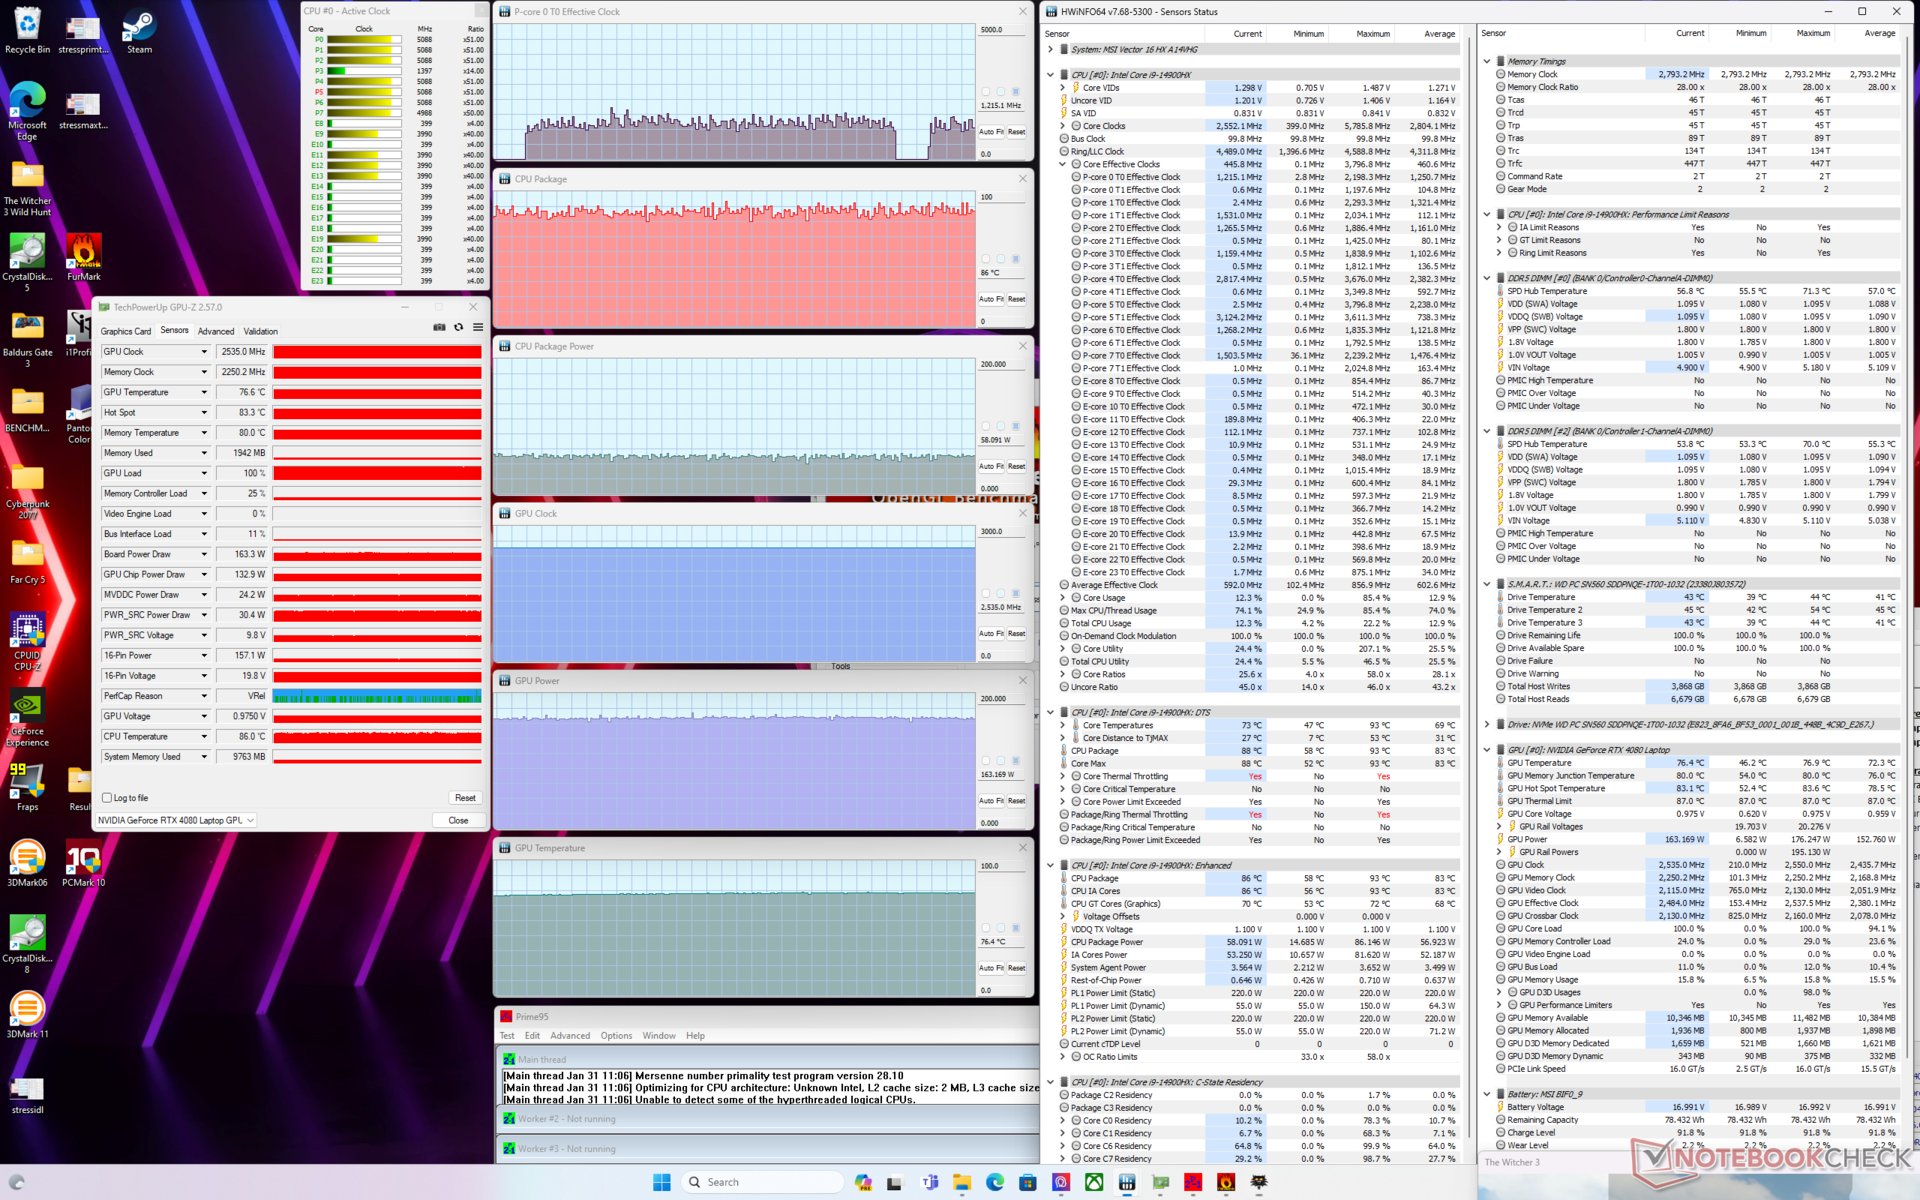
| Taktowanie CPU (GHz) | Taktowanie GPU (MHz) | Średnia temperatura CPU (°C) | Średnia temperatura GPU (°C) | |
| System w stanie spoczynku | -- | -- | 44 | 36 |
| Prime95Stress | 3.3 | -- | 82 | 50 |
| Prime95+ FurMark Stress (Ekstremalna wydajność z włączonym Cooler Boost) | ~1.7 | 2535 | 67 | 65 |
| Witcher 3 Stres(tryb zrównoważony) | ~1,5 | 2055 | 81 | 75 |
| Witcher 3 Stres (Ekstremalna wydajnośćz wyłączonym Cooler Boost) | ~1.5 | 2535 | 83 | 77 |
| Witcher 3 Stres (Ekstremalna wydajnośćz włączoną funkcją Cooler Boost) | ~1.5 | 2535 | 85 | 77 |
Głośniki
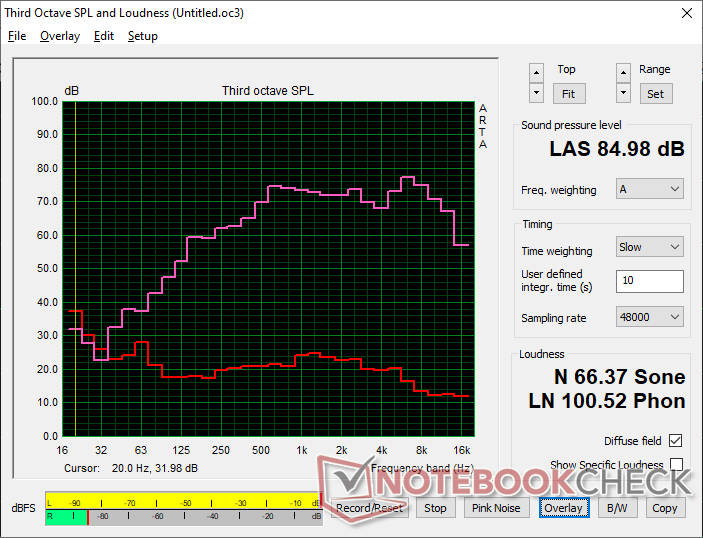
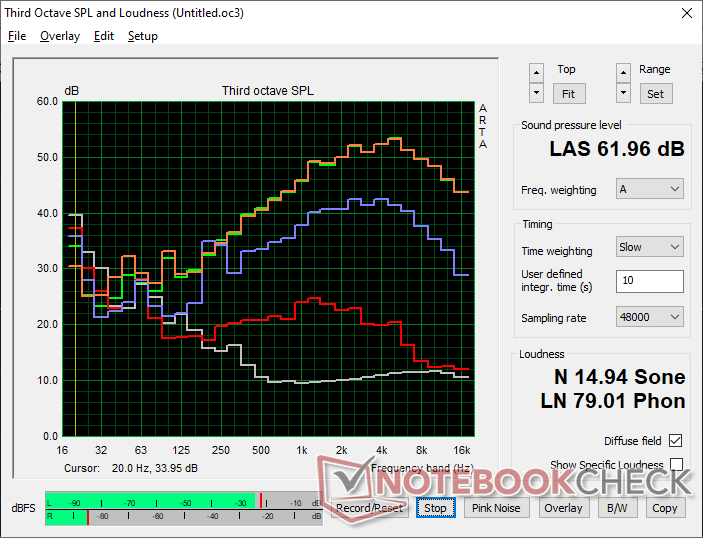
MSI Vector 16 HX A14V analiza dźwięku
(+) | głośniki mogą odtwarzać stosunkowo głośno (85 dB)
Bas 100 - 315 Hz
(±) | zredukowany bas - średnio 12.7% niższy od mediany
(+) | bas jest liniowy (6.8% delta do poprzedniej częstotliwości)
Średnie 400 - 2000 Hz
(+) | zbalansowane środki średnie - tylko 3% od mediany
(+) | średnie są liniowe (3.6% delta do poprzedniej częstotliwości)
Wysokie 2–16 kHz
(+) | zrównoważone maksima - tylko 3.1% od mediany
(+) | wzloty są liniowe (6.7% delta do poprzedniej częstotliwości)
Ogólnie 100 - 16.000 Hz
(+) | ogólny dźwięk jest liniowy (12.6% różnicy w stosunku do mediany)
W porównaniu do tej samej klasy
» 16% wszystkich testowanych urządzeń w tej klasie było lepszych, 4% podobnych, 81% gorszych
» Najlepszy miał deltę 6%, średnia wynosiła ###średnia###%, najgorsza wynosiła 132%
W porównaniu do wszystkich testowanych urządzeń
» 11% wszystkich testowanych urządzeń było lepszych, 3% podobnych, 86% gorszych
» Najlepszy miał deltę 4%, średnia wynosiła ###średnia###%, najgorsza wynosiła 134%
Apple MacBook Pro 16 2021 M1 Pro analiza dźwięku
(+) | głośniki mogą odtwarzać stosunkowo głośno (84.7 dB)
Bas 100 - 315 Hz
(+) | dobry bas - tylko 3.8% od mediany
(+) | bas jest liniowy (5.2% delta do poprzedniej częstotliwości)
Średnie 400 - 2000 Hz
(+) | zbalansowane środki średnie - tylko 1.3% od mediany
(+) | średnie są liniowe (2.1% delta do poprzedniej częstotliwości)
Wysokie 2–16 kHz
(+) | zrównoważone maksima - tylko 1.9% od mediany
(+) | wzloty są liniowe (2.7% delta do poprzedniej częstotliwości)
Ogólnie 100 - 16.000 Hz
(+) | ogólny dźwięk jest liniowy (4.6% różnicy w stosunku do mediany)
W porównaniu do tej samej klasy
» 0% wszystkich testowanych urządzeń w tej klasie było lepszych, 0% podobnych, 100% gorszych
» Najlepszy miał deltę 5%, średnia wynosiła ###średnia###%, najgorsza wynosiła 45%
W porównaniu do wszystkich testowanych urządzeń
» 0% wszystkich testowanych urządzeń było lepszych, 0% podobnych, 100% gorszych
» Najlepszy miał deltę 4%, średnia wynosiła ###średnia###%, najgorsza wynosiła 134%
Zarządzanie energią
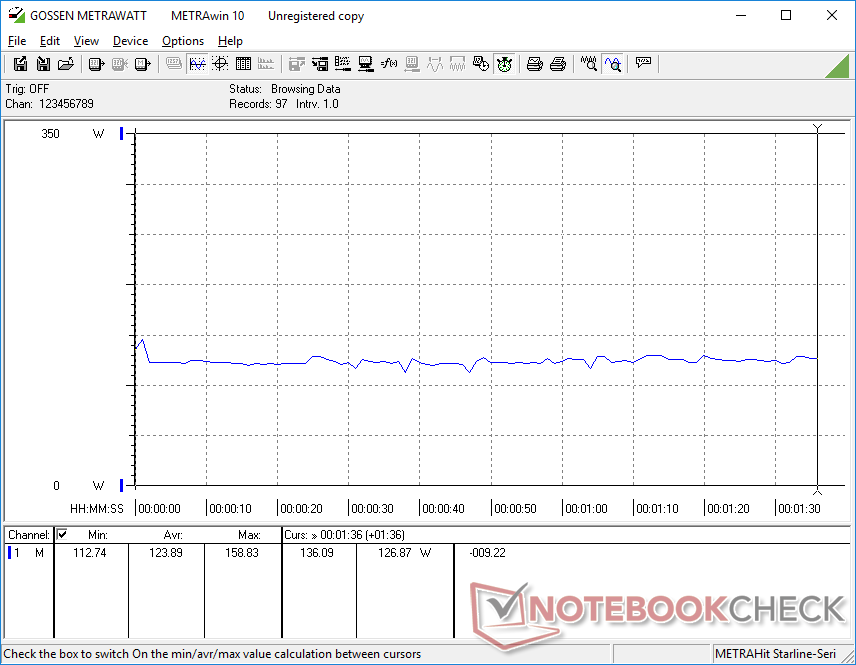
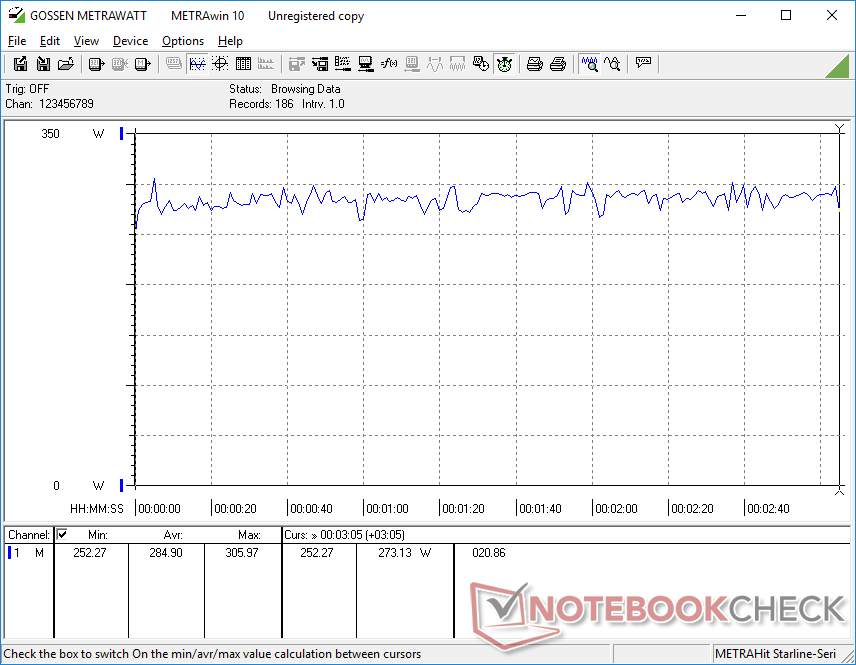
Zużycie energii
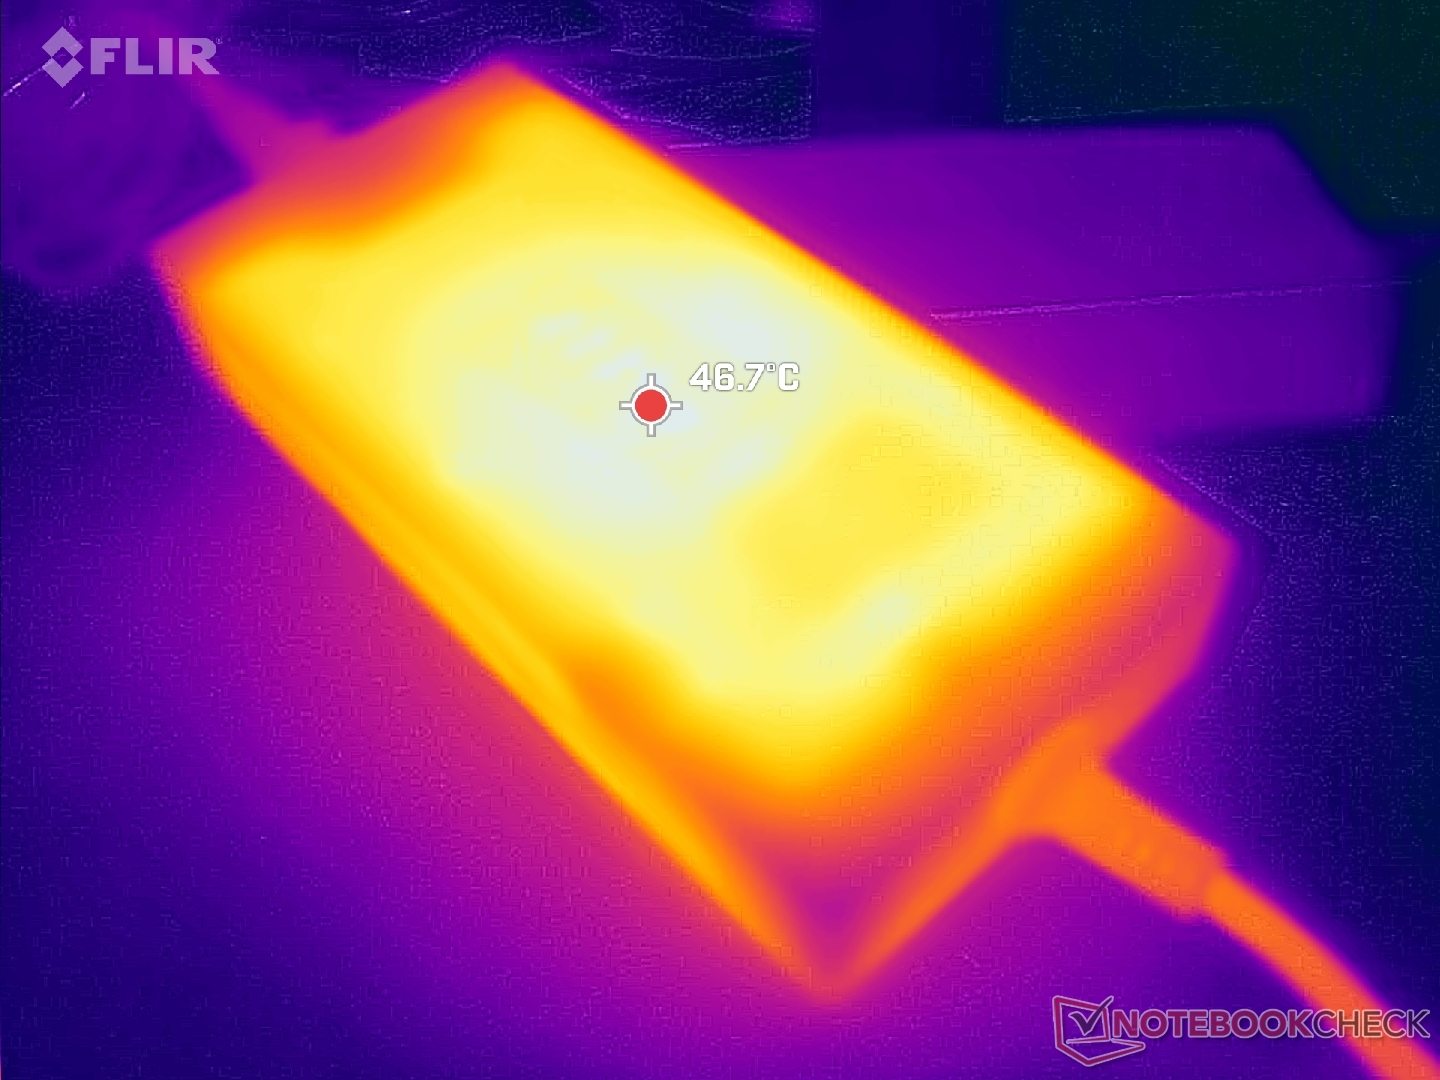
Vector 16 HX może być szybszy niż poprzedni Vector GP66, ale jest też znacznie bardziej energochłonny. Uruchamianie Witcher 3 i Prime95 wymaga odpowiednio 27% i 58% więcej mocy w porównaniu do starszego modelu. Mimo to, przyrost wydajności jest znacznie większy niż przyrost mocy, co przekłada się na wyższą wydajność w przeliczeniu na wat.
System jest dostarczany z zasilaczem o mocy 280 W lub 330 W, w zależności od konfiguracji. Nowy zasilacz o mocy 330 W jest stosunkowo smukły i ma wymiary ~18,5 x 8,5 x 3,2 cm, czyli mniej więcej tyle samo, co zasilacz 280 W o wymiarach ~18 x 8,5 x 3,5 cm dla starszego modelu GP66.
| wyłączony / stan wstrzymania | |
| luz | |
| obciążenie |
|
Legenda:
min: | |
| MSI Vector 16 HX A14V i9-14900HX, GeForce RTX 4080 Laptop GPU, WD PC SN560 SDDPNQE-1T00, IPS, 2560x1600, 16" | MSI Vector GP66 12UGS i9-12900H, GeForce RTX 3070 Ti Laptop GPU, , IPS, 1920x1080, 15.6" | Lenovo Legion 5 16IRX G9 i7-14650HX, GeForce RTX 4060 Laptop GPU, Samsung PM9A1 MZVL21T0HCLR, IPS, 2560x1600, 16" | HP Victus 16-r0077ng i7-13700H, GeForce RTX 4070 Laptop GPU, Kioxia XG8 KXG80ZNV1T02, IPS, 1920x1080, 16.1" | Asus TUF Gaming A16 FA617XS R9 7940HS, Radeon RX 7600S, Micron 2400 MTFDKBA512QFM, IPS, 1920x1200, 16" | Dell G16 7620 i7-12700H, GeForce RTX 3060 Laptop GPU, WDC PC SN810 512GB, IPS, 2560x1600, 16" | |
|---|---|---|---|---|---|---|
| Power Consumption | -2% | 20% | 38% | 47% | 18% | |
| Idle Minimum * (Watt) | 15.8 | 17.5 -11% | 15.4 3% | 8 49% | 7 56% | 14.4 9% |
| Idle Average * (Watt) | 23.3 | 20.1 14% | 19.7 15% | 13 44% | 10 57% | 17.8 24% |
| Idle Maximum * (Watt) | 30 | 47.3 -58% | 20.7 31% | 22 27% | 15 50% | 31.5 -5% |
| Load Average * (Watt) | 123.9 | 107.3 13% | 102.6 17% | 86 31% | 86 31% | 101.2 18% |
| Witcher 3 ultra * (Watt) | 285 | 225 21% | 191.3 33% | 141.8 50% | 160.6 44% | 176.9 38% |
| Load Maximum * (Watt) | 306 | 277.7 9% | 246.6 19% | 233 24% | 172 44% | 242.9 21% |
* ... im mniej tym lepiej
Power Consumption Witcher 3 / Stresstest
Power Consumption external Monitor
Żywotność baterii
Podczas gdy pojemność baterii znacznie wzrosła z 65 Wh do 90 Wh w porównaniu do starszej konstrukcji Vector GP66, rzeczywiste czasy pracy nie uległy zmianie. Przeglądanie sieci WLAN na zrównoważonym profilu zasilania z aktywną kartą graficzną iGPU nadal trwa około 5,5 godziny przed automatycznym wyłączeniem. Inne 16-calowe systemy, takie jak Lenovo Legion 5 16 lub HP Victus 16 są w stanie wytrzymać cztery godziny dłużej.
Ładowanie od stanu pustego do pełnej pojemności zajmuje prawie 2,5 godziny przy użyciu dołączonego zasilacza sieciowego. System można ładować przez USB-C przez port wzdłuż prawej krawędzi.
| MSI Vector 16 HX A14V i9-14900HX, GeForce RTX 4080 Laptop GPU, 90 Wh | MSI Vector GP66 12UGS i9-12900H, GeForce RTX 3070 Ti Laptop GPU, 65 Wh | Lenovo Legion 5 16IRX G9 i7-14650HX, GeForce RTX 4060 Laptop GPU, 80 Wh | HP Victus 16-r0077ng i7-13700H, GeForce RTX 4070 Laptop GPU, 83 Wh | Asus TUF Gaming A16 FA617XS R9 7940HS, Radeon RX 7600S, 90 Wh | Dell G16 7620 i7-12700H, GeForce RTX 3060 Laptop GPU, 84 Wh | |
|---|---|---|---|---|---|---|
| Czasy pracy | -17% | -4% | 29% | 60% | -31% | |
| Reader / Idle (h) | 10.7 | 7.9 -26% | 20.3 90% | 7.1 -34% | ||
| WiFi v1.3 (h) | 5.5 | 5.7 4% | 7.4 35% | 7.1 29% | 12.4 125% | 5 -9% |
| Load (h) | 1.4 | 1 -29% | 0.8 -43% | 0.9 -36% | 0.7 -50% | |
| H.264 (h) | 9.6 | 12.4 |
Za
Przeciw
Werdykt - Fast And Chonky
Laptopy do gier stanowią cienką granicę między przenośnością a wydajnością, przy czym obecny trend skłania się ku przenośności. MSI Vector 16 HX bezwstydnie faworyzuje wydajność, nawet jeśli oznacza to grubszy, większy i głośniejszy system. Rzeczywiście, jest to jeden z największych i najgłośniejszych 16-calowych laptopów do gier dostępnych obecnie na rynku.
MSI Vector 16 HX nie jest nieśmiały, jeśli chodzi o hałas wentylatora lub rozmiar. Z kolei pod względem wydajności przewyższa inne laptopy do gier z tym samym procesorem graficznym GeForce RTX 4080 lub 4090.
Duży rozmiar i głośne wentylatory nie poszły na marne, ponieważ model ten wyróżnia się pod względem wydajności. Procesor graficzny RTX 4080 o mocy 175 W GeForce PROCESOR GRAFICZNY RTX 4080 jest o około 10 procent szybszy niż przeciętnie, dzięki czemu dorównuje nawet niektórym laptopom wyposażonym w RTX 4090. Sam ten fakt prawdopodobnie przyciągnie łowców wydajności, którzy nie mają nic przeciwko poświęceniu odrobiny przenośności dla tej dodatkowej mocy. Gruba obudowa jest również sztywna i ma mocną pokrywę, czego nie można powiedzieć o wielu cieńszych alternatywach.
Kilka aspektów z pewnością mogłoby być lepszych. Jeśli MSI chce pozostać przy dużej konstrukcji, należy ułatwić serwisowanie i rozważyć chłodzenie cieczą lub komorę parową w celu zmniejszenia hałasu wentylatora. Klawiatura numeryczna lub przynajmniej klawisze strzałek powinny być większe, podobnie jak klawisze strzałek w Lenovo Lenovo Legion 5 16.
Cena i dostępność
MSI Vector 16 HX A14V
- 03/02/2024 v7 (old)
Allen Ngo
Przezroczystość
Wyboru urządzeń do recenzji dokonuje nasza redakcja. Próbka testowa została udostępniona autorowi jako pożyczka od producenta lub sprzedawcy detalicznego na potrzeby tej recenzji. Pożyczkodawca nie miał wpływu na tę recenzję, producent nie otrzymał też kopii tej recenzji przed publikacją. Nie było obowiązku publikowania tej recenzji. Jako niezależna firma medialna, Notebookcheck nie podlega władzy producentów, sprzedawców detalicznych ani wydawców.
Tak testuje Notebookcheck
Każdego roku Notebookcheck niezależnie sprawdza setki laptopów i smartfonów, stosując standardowe procedury, aby zapewnić porównywalność wszystkich wyników. Od około 20 lat stale rozwijamy nasze metody badawcze, ustanawiając przy tym standardy branżowe. W naszych laboratoriach testowych doświadczeni technicy i redaktorzy korzystają z wysokiej jakości sprzętu pomiarowego. Testy te obejmują wieloetapowy proces walidacji. Nasz kompleksowy system ocen opiera się na setkach uzasadnionych pomiarów i benchmarków, co pozwala zachować obiektywizm.Price comparison

