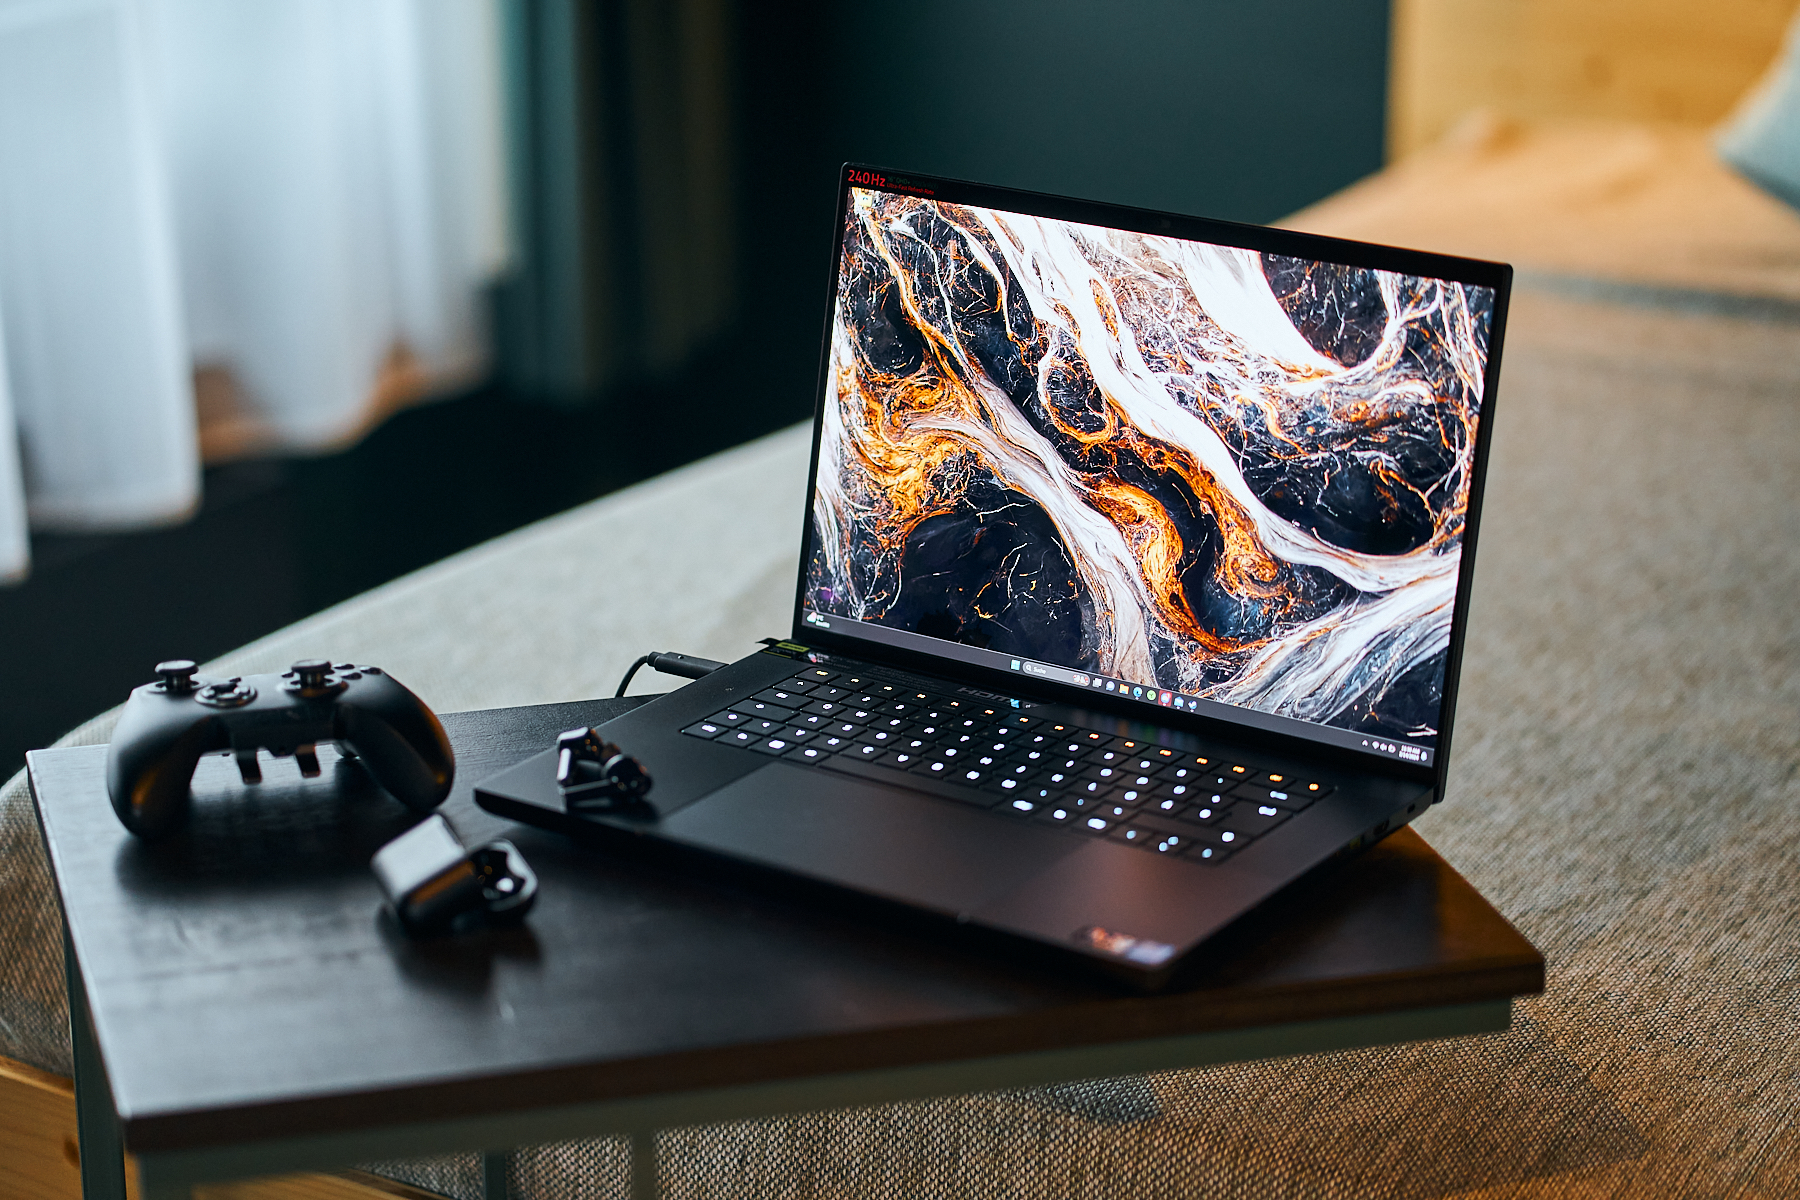
Recenzja laptopa Razer Blade 16 (2024): Teraz z superszybkim Samsung OLED

Co nowego znajdziemy w Razer Blade w porównaniu do jego zeszłorocznego poprzednika? W skrócie: WiFi 7, Intel Gen 14 i wyświetlacz OLED. Ten ostatni jest tym, co Razer reklamuje jako swoją wielką nowość. Mimo to zachowano i tak już doskonałe opcje Mini-LED poprzedniego modelu, co oznacza, że mogą Państwo teraz wybierać między OLED i Mini-LED. W niniejszej recenzji przyjrzymy się więc bardzo dokładnie wyświetlaczowi laptopa. Ponadto sprawdzimy, jaką wydajność może zapewnić Intel Gen 14 wewnątrz Blade 16 w porównaniu do Gen 13.
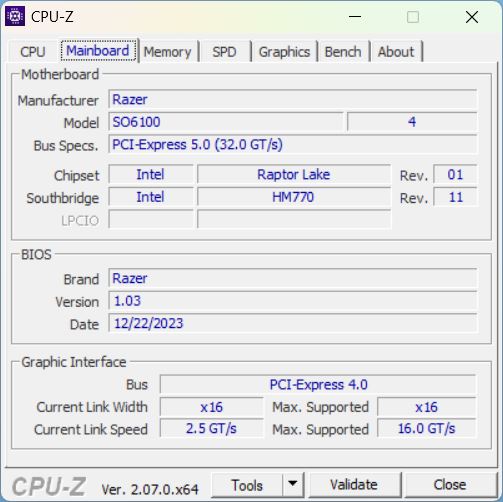
Nasz Razer Blade 16 2024 będzie konkurował z innymi 16-calowymi laptopami dla graczy z RTX 4090, przede wszystkim z flagowym Lenovo Legion 9i Gen 8 16IRX8- ale także Schenker XMG Neo 16 E23 i Asus ROG Zephyrus M16. Oczywiście porównamy go również z jego poprzednikiem Razer Blade 16 Early 2023 RTX 4090 Review: Bestia Core i9-13950HX z pierwszym na świecie dwutrybowym wyświetlaczem mini-LED UHD+ z procesorem Gen-13-HX i RTX 4090. Aby przynajmniej jeden laptop z nowym procesorem Gen-14 znalazł się w polu porównawczym, zestawimy go również z Lenovo Legion 5i 16 G9 z i7-14650HX.
Potencjalni konkurenci w porównaniu
Ocena | Data | Model | Waga | Wysokość | Rozmiar | Rezolucja | Cena |
|---|---|---|---|---|---|---|---|
| 91.1 % v7 (old) | 02/2024 | Razer Blade 16 2024, RTX 4090 i9-14900HX, GeForce RTX 4090 Laptop GPU | 2.5 kg | 22 mm | 16.00" | 2560x1600 | |
| 89.8 % v7 (old) | 03/2023 | Razer Blade 16 Early 2023 RTX 4090 i9-13950HX, GeForce RTX 4090 Laptop GPU | 2.5 kg | 21.99 mm | 16.00" | 3840x2400 | |
| 90.2 % v7 (old) | 10/2023 | Lenovo Legion 9 16IRX8 i9-13980HX, GeForce RTX 4090 Laptop GPU | 2.6 kg | 22.7 mm | 16.00" | 3200x2000 | |
| 87.7 % v7 (old) | Schenker XMG Neo 16 E23 i9-13900HX, GeForce RTX 4090 Laptop GPU | 2.5 kg | 29.9 mm | 16.00" | 2560x1600 | ||
| 89.1 % v7 (old) | 02/2024 | Lenovo Legion 5 16IRX G9 i7-14650HX, GeForce RTX 4060 Laptop GPU | 2.4 kg | 25.2 mm | 16.00" | 2560x1600 |
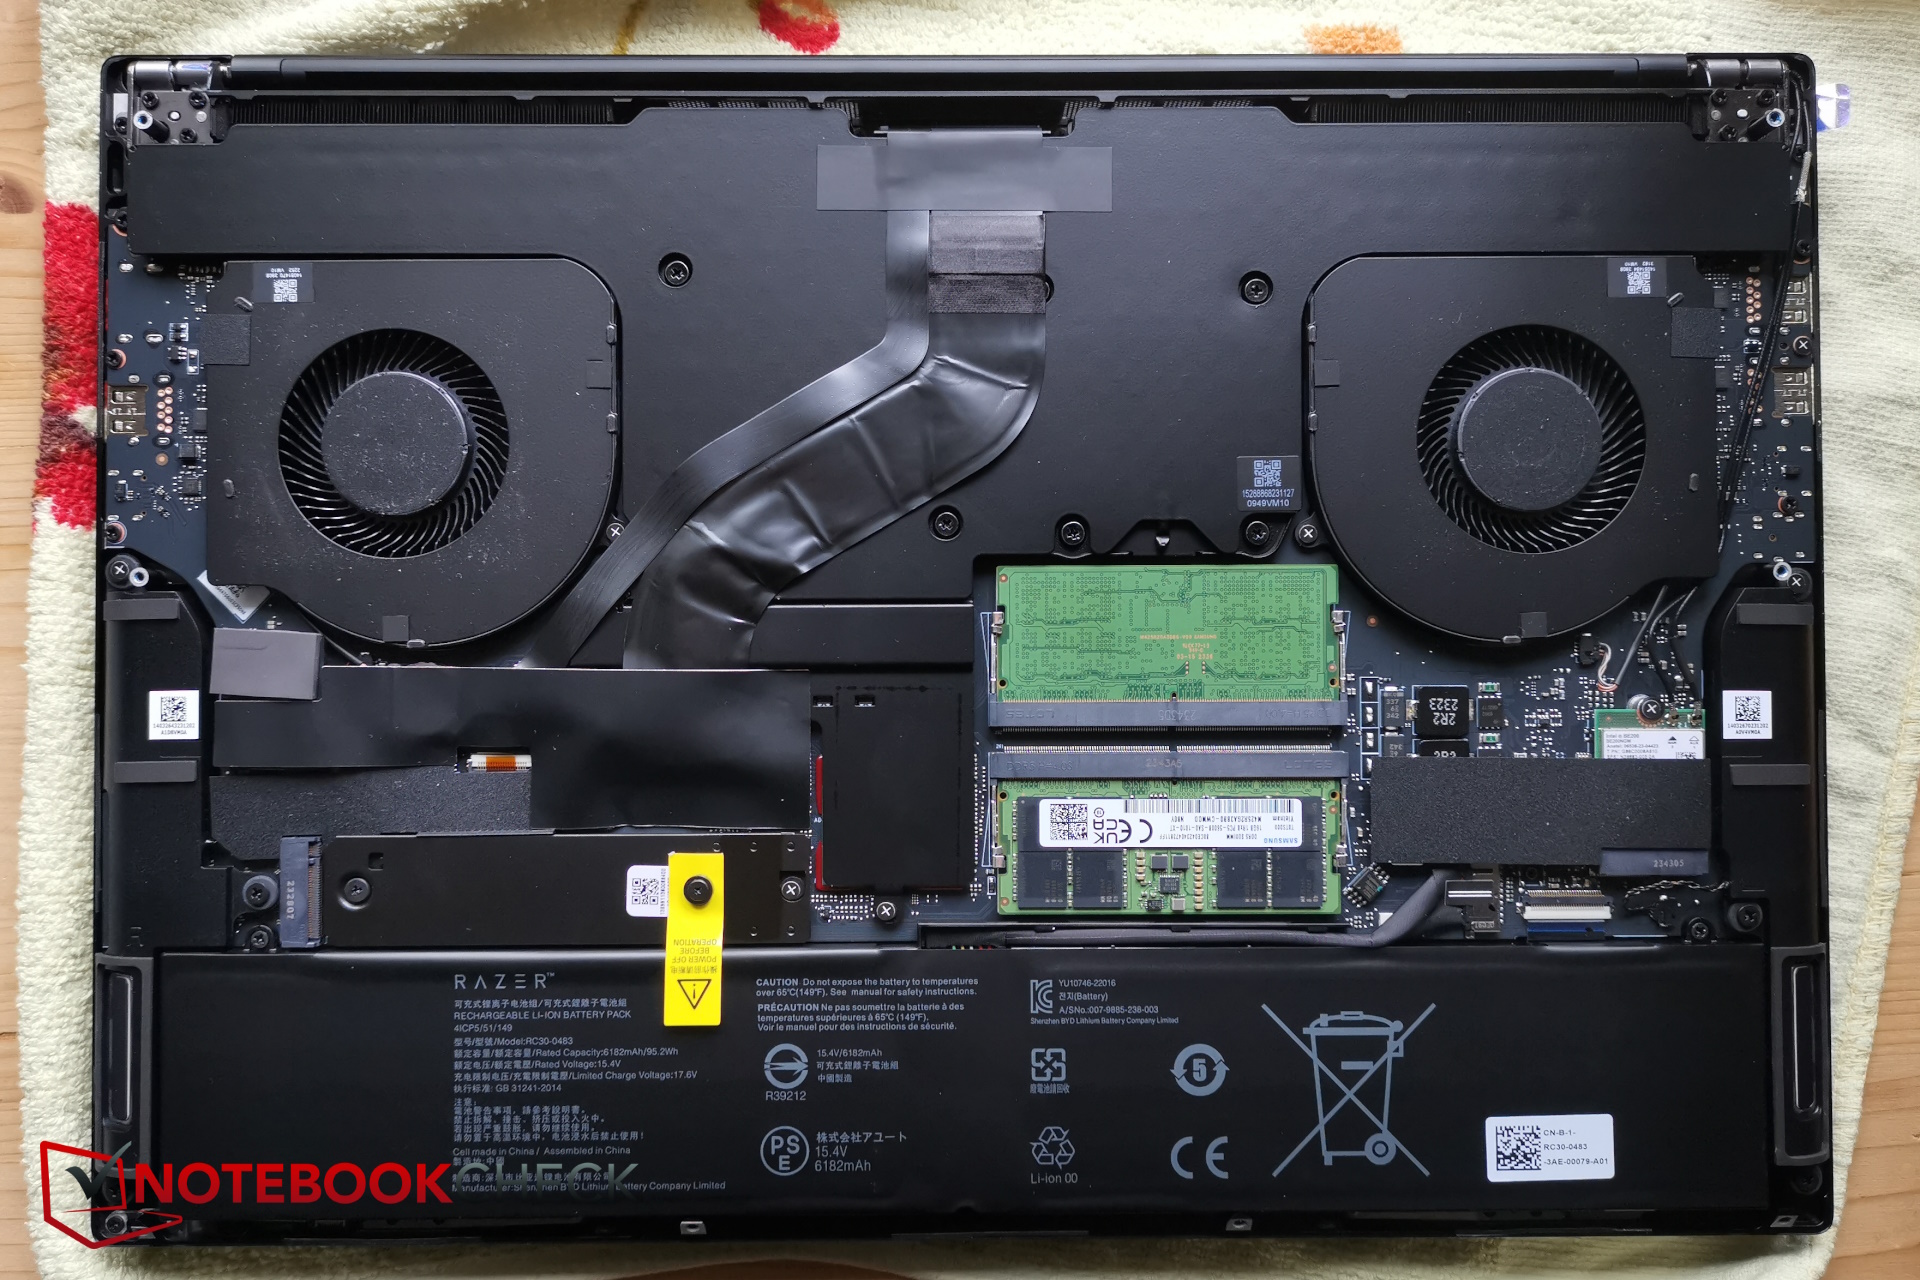
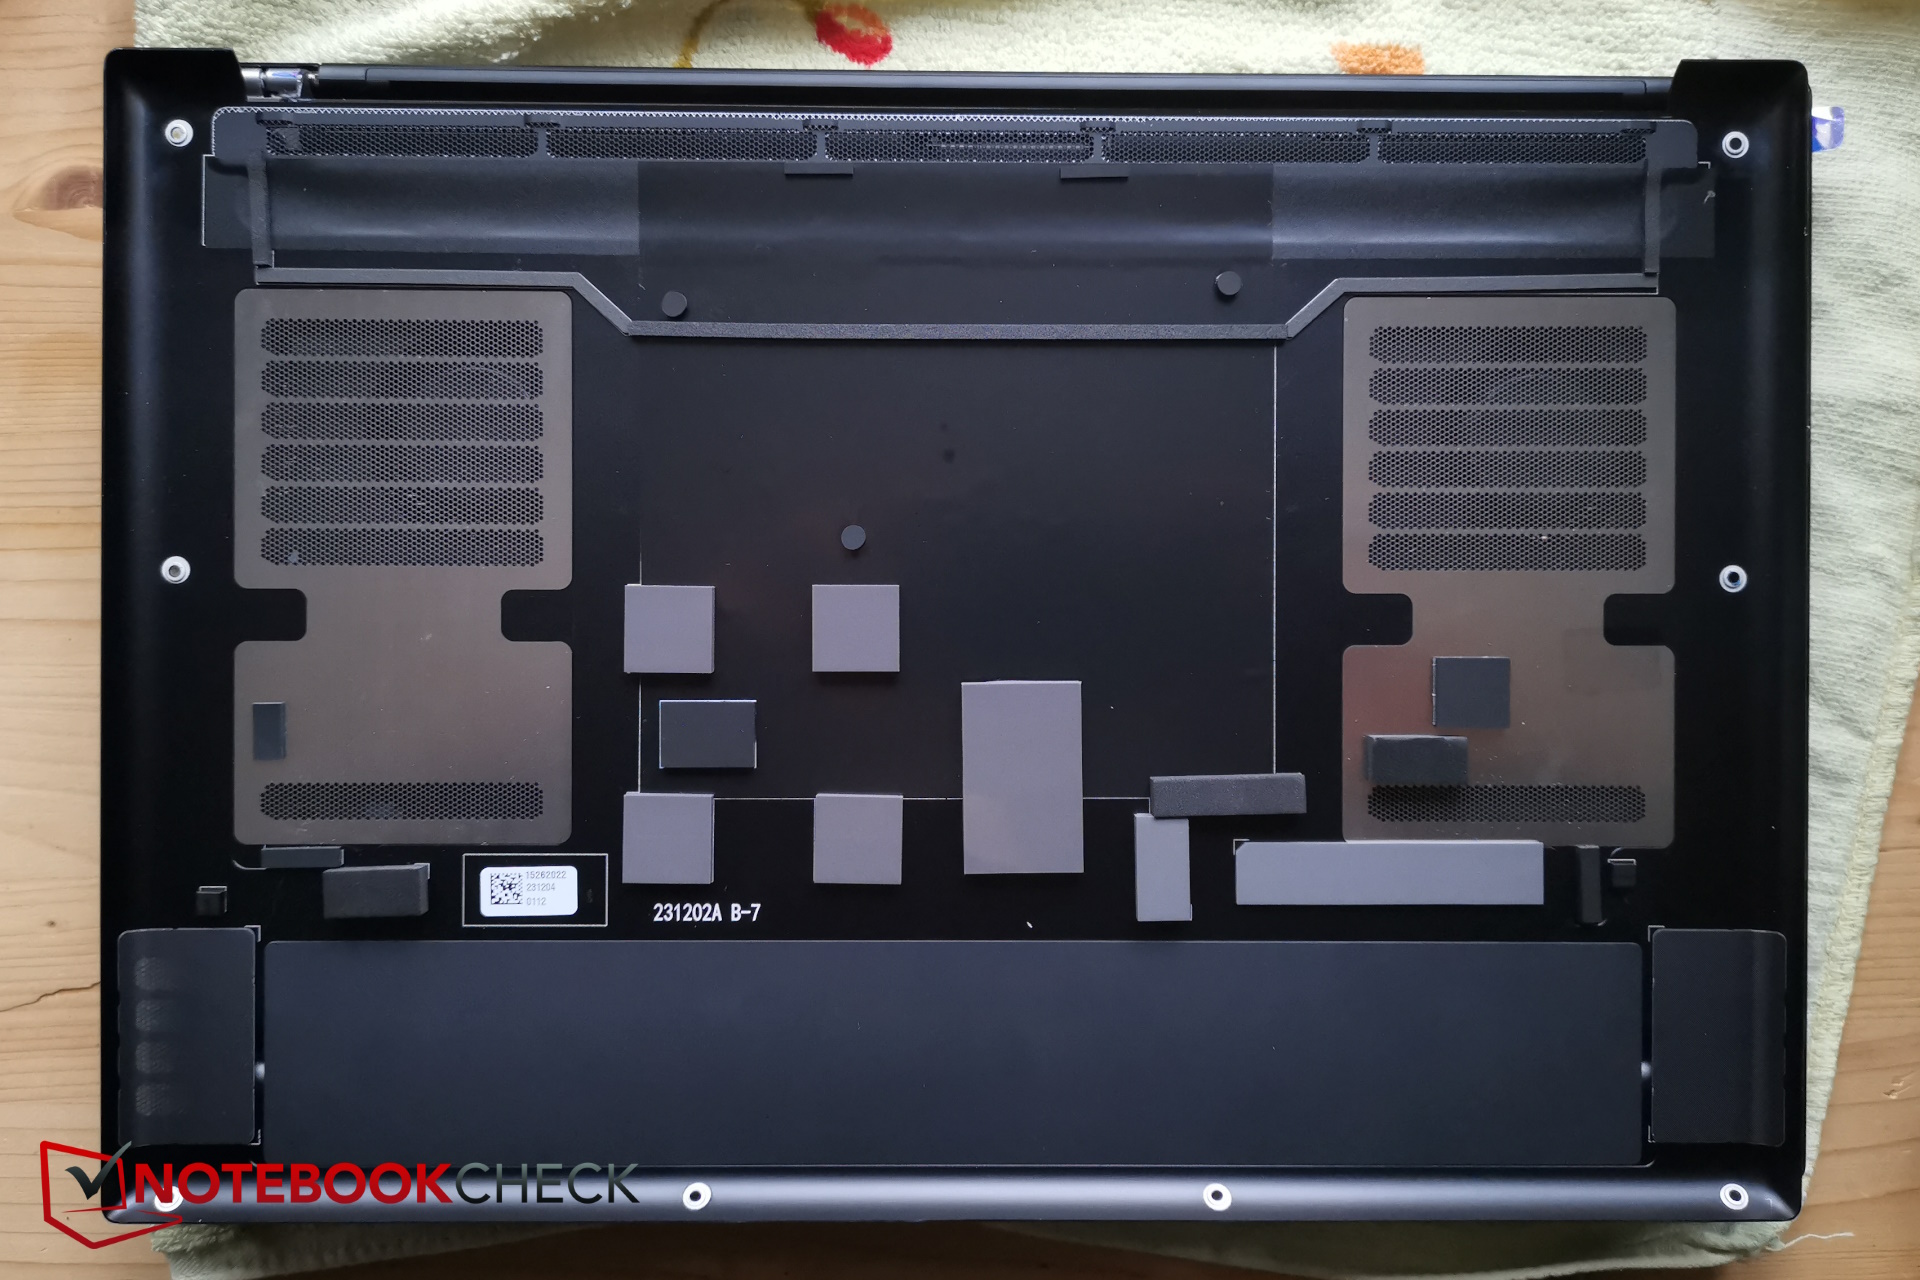
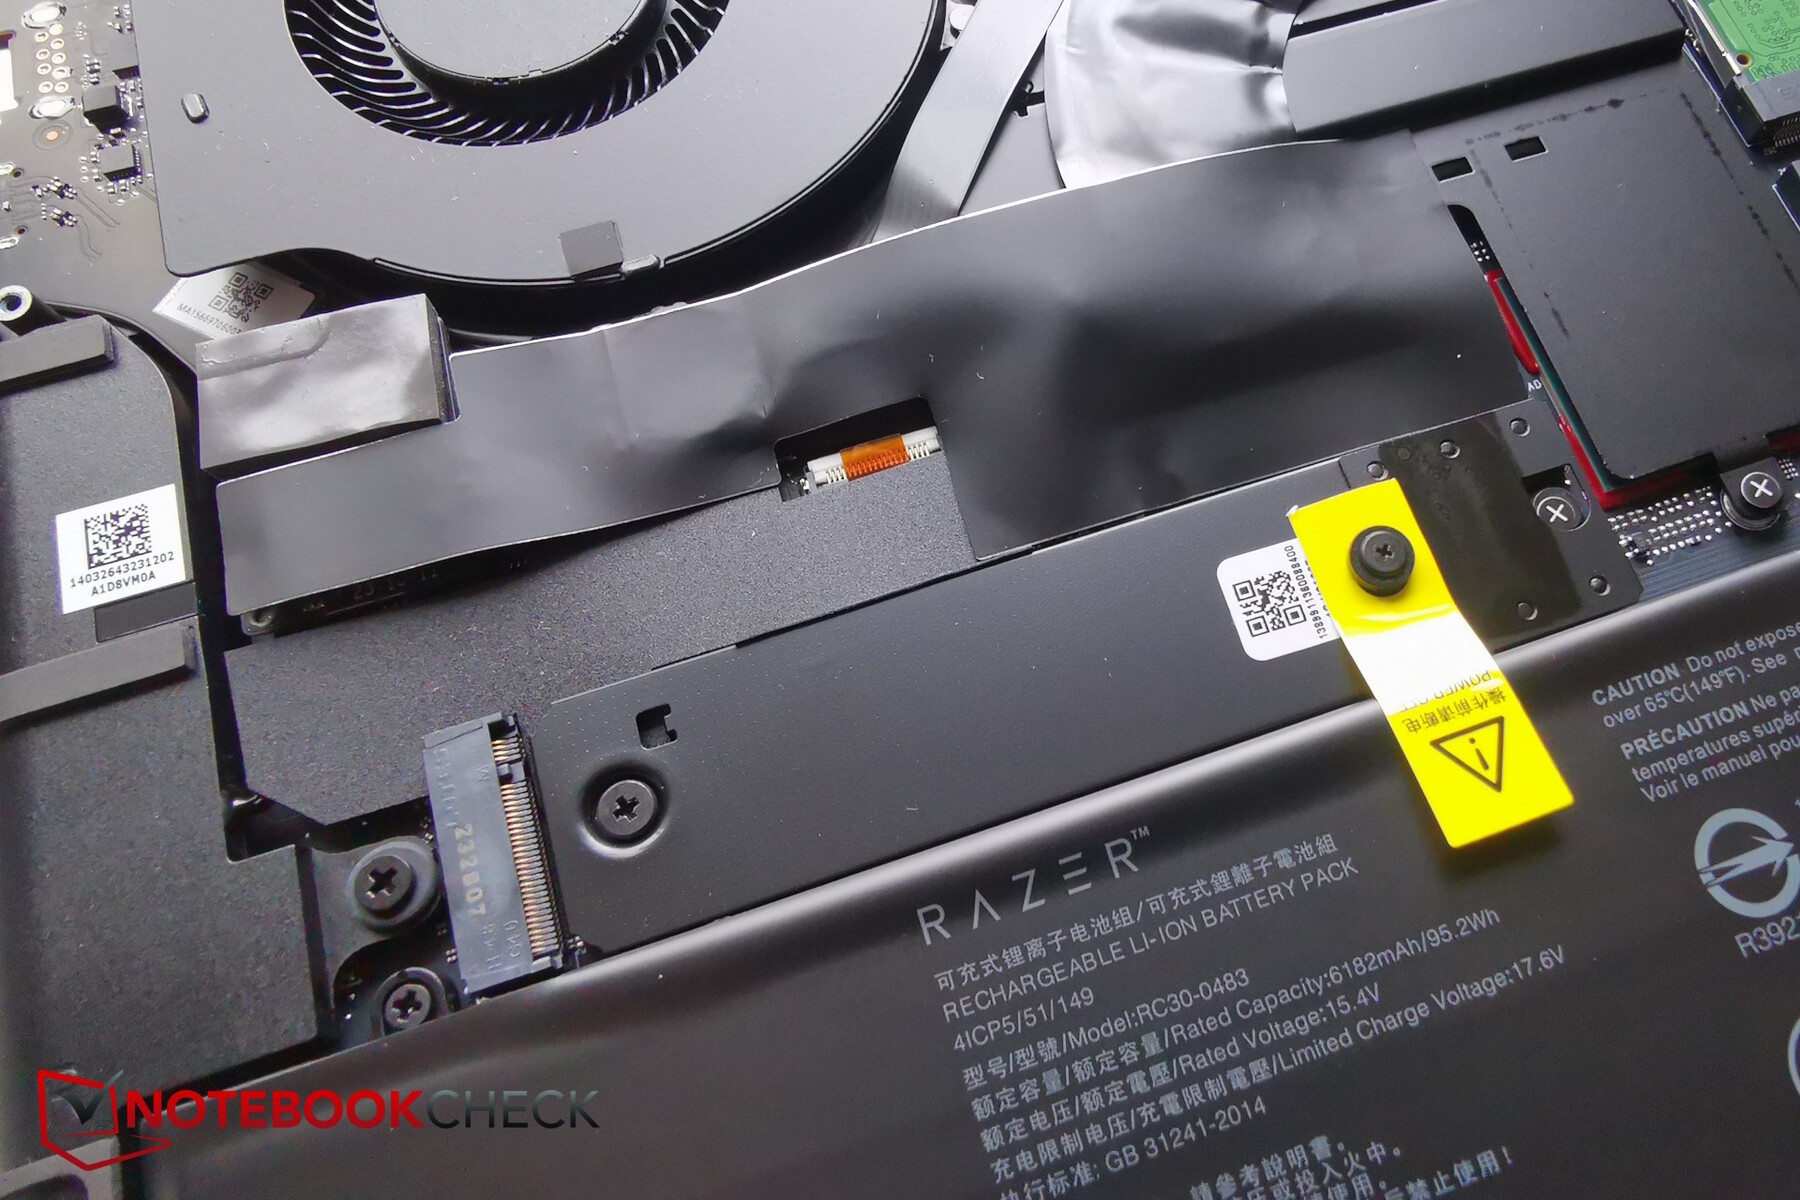
Obudowa i łączność - Metalowa obudowa unibody z tytanową płytką
Praktycznie nic nie zmieniło się w obudowie laptopa - sprzęt nadal mieści się w aluminiowej obudowie unibody, a tytanowa płyta znajduje się z przodu podstawy, aby poprawić jej wytrzymałość. Zarówno obudowa, jak i klawiatura nadal są prawdziwymi magnesami na odciski palców.
Wprowadzono jednak jedną zmianę: teraz mogą Państwo wybrać edycję "Mercury" Blade, która charakteryzuje się lekkim designem.
Więcej informacji na temat obudowy urządzenia, łączności i urządzeń wejściowych można znaleźć w naszych recenzjach modeli 2023.


| SD Card Reader | |
| average JPG Copy Test (av. of 3 runs) | |
| Razer Blade 16 Early 2023 RTX 4090 (Angelbird AV PRO 128 GB V60) | |
| Razer Blade 16 2024, RTX 4090 | |
| Średnia w klasie Gaming (20.9 - 210, n=54, ostatnie 2 lata) | |
| Lenovo Legion 9 16IRX8 (Toshiba Exceria Pro SDXC 64 GB UHS-II) | |
| Schenker XMG Neo 16 E23 (AV PRO microSD 128 GB V60) | |
| Lenovo Legion 5 16IRX G9 | |
| maximum AS SSD Seq Read Test (1GB) | |
| Razer Blade 16 Early 2023 RTX 4090 (Angelbird AV PRO 128 GB V60) | |
| Razer Blade 16 2024, RTX 4090 | |
| Średnia w klasie Gaming (25.5 - 261, n=51, ostatnie 2 lata) | |
| Lenovo Legion 9 16IRX8 (Toshiba Exceria Pro SDXC 64 GB UHS-II) | |
| Schenker XMG Neo 16 E23 (AV PRO microSD 128 GB V60) | |
| Lenovo Legion 5 16IRX G9 | |


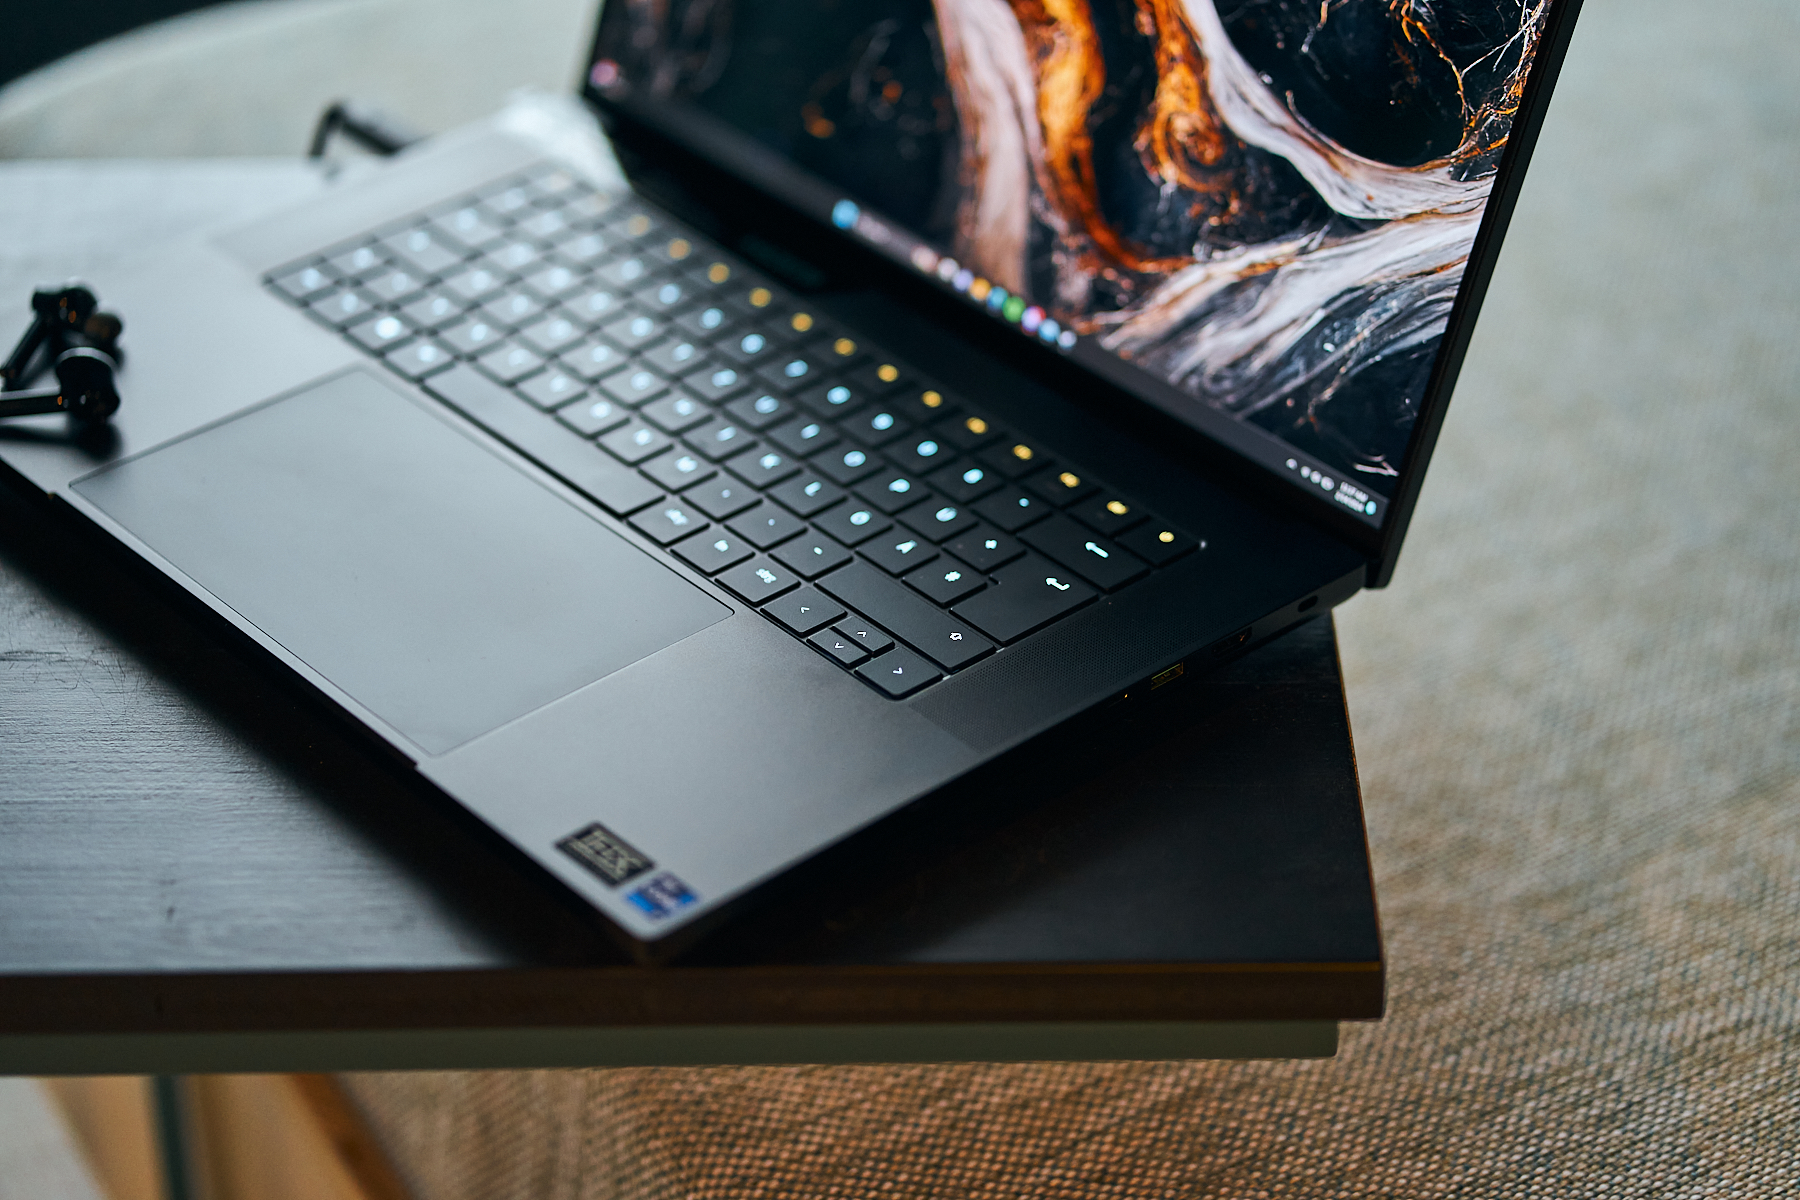
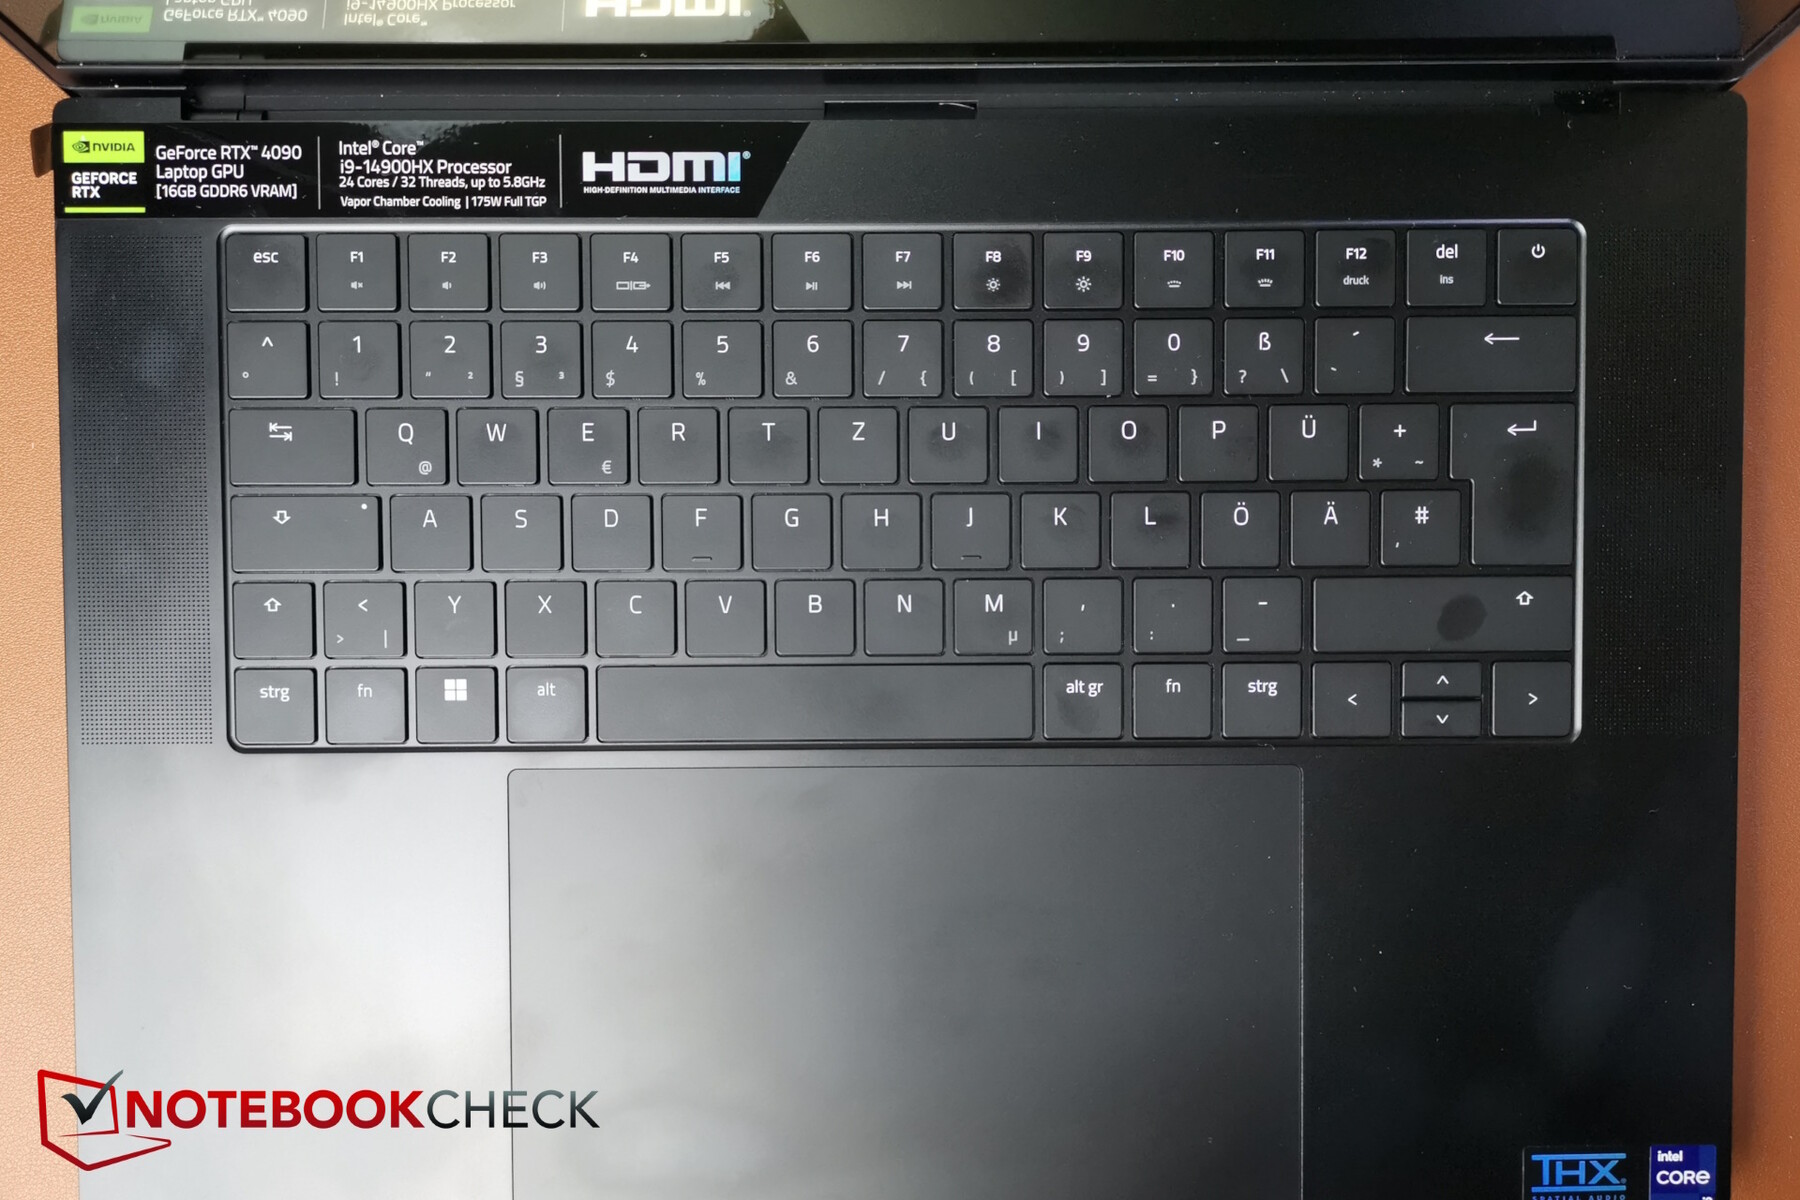
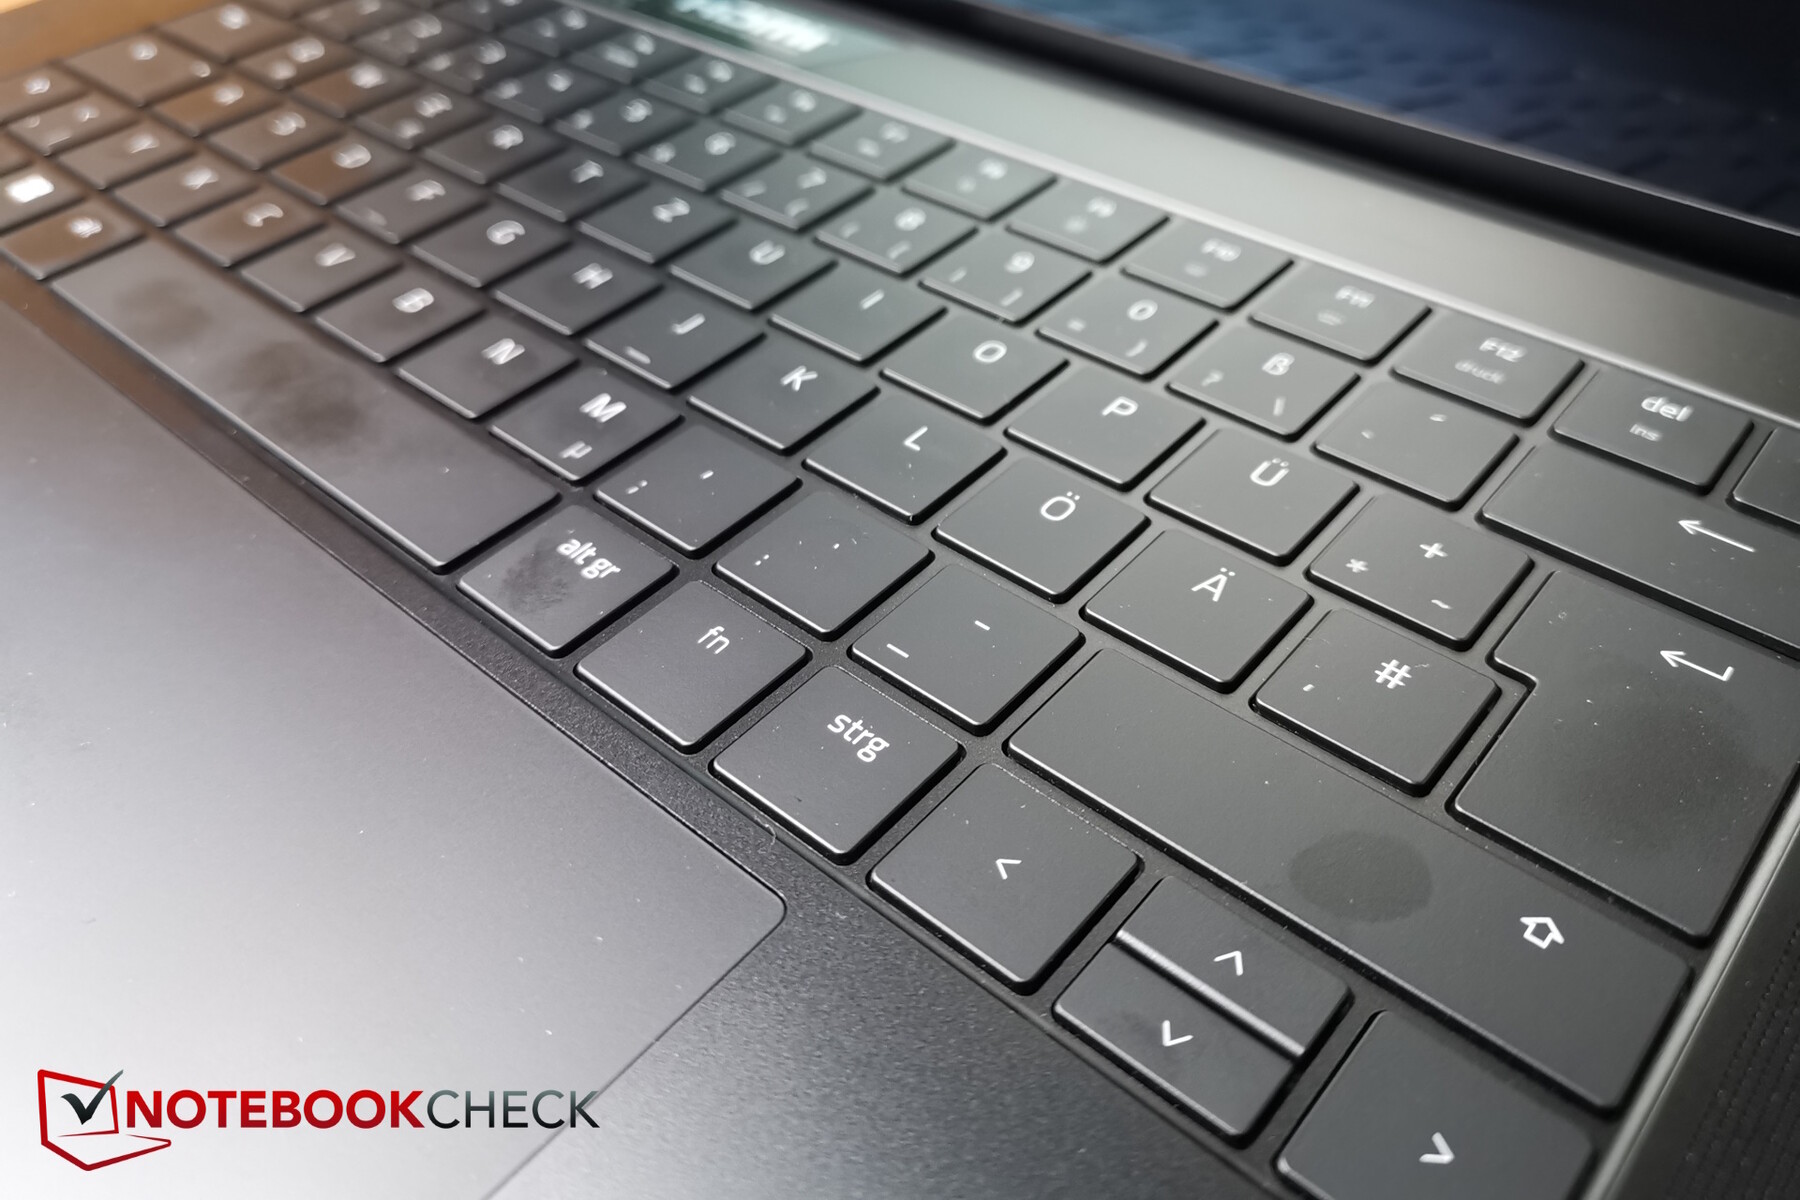
Urządzenia wejściowe - Touchpad jest prawie za duży?
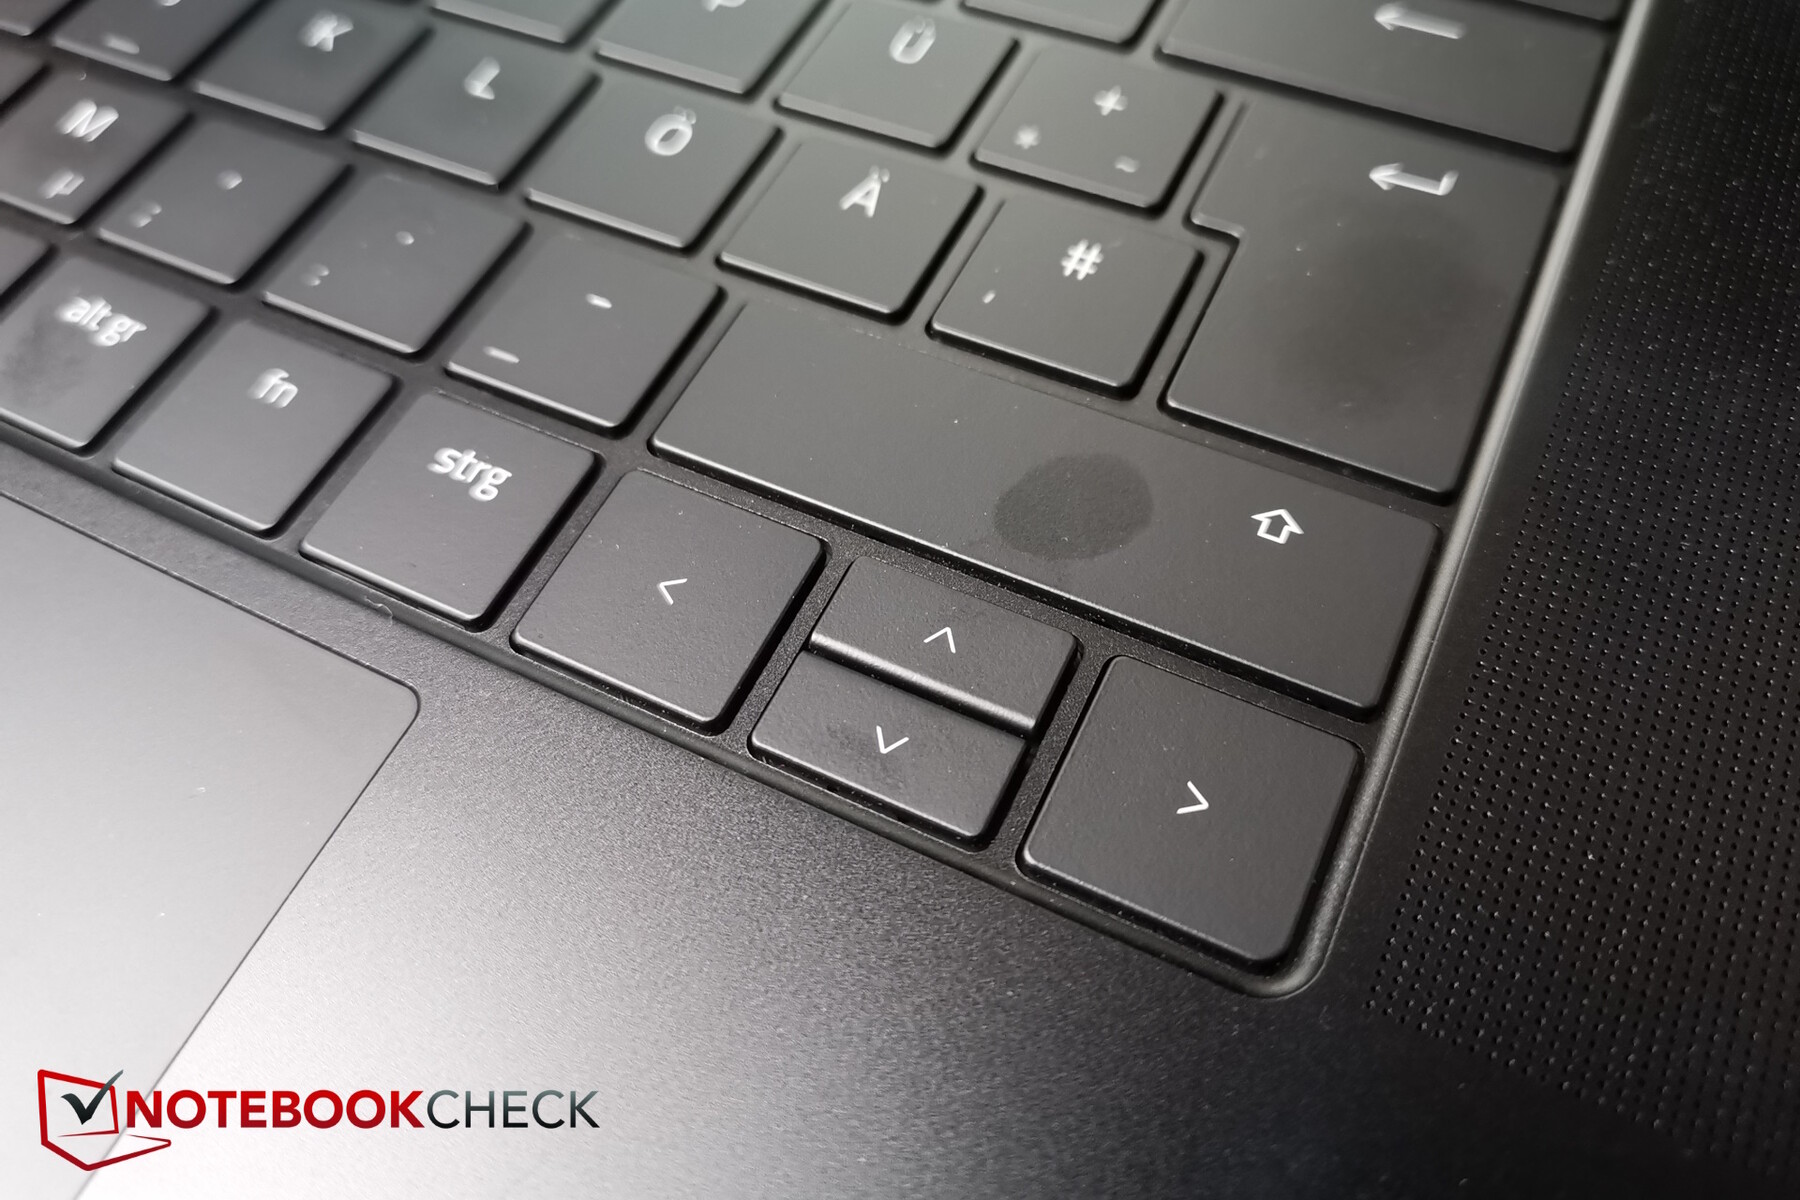
Klawisze membranowe laptopa są dość duże i mają niewielki odstęp między sobą. Z kolei Razer zrezygnował z instalacji klawiatury numerycznej.
Skok klawiszy jest krótki do przeciętnego, a ich feedback przyzwoity. Niestety, klawisze strzałek góra/dół są o połowę niższe, ale poza tym układ jest przyjemny i przestronny.
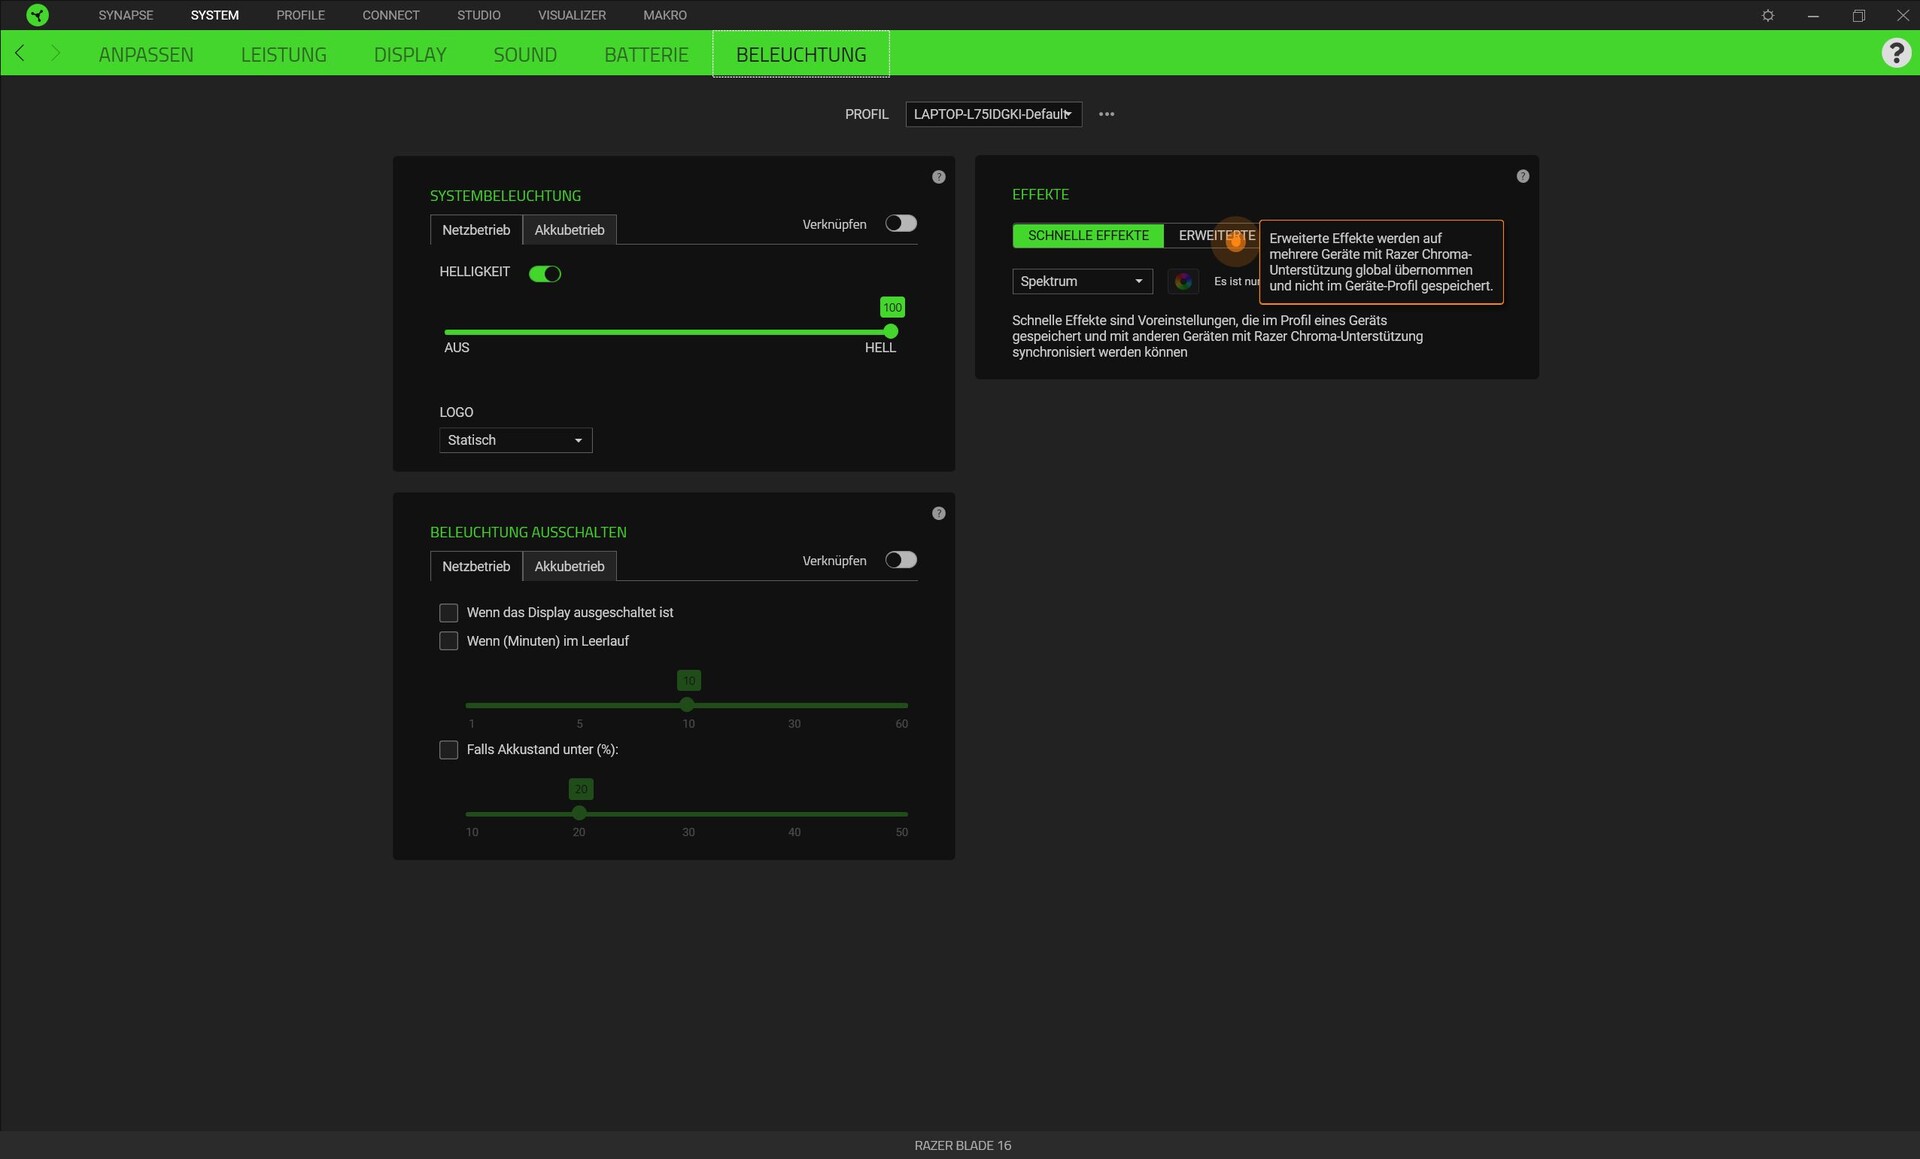
Podświetlenie RGB poszczególnych przycisków (Razer Chroma) można w szerokim zakresie konfigurować za pośrednictwem aplikacji Synapse, co jest typowe dla Razera.
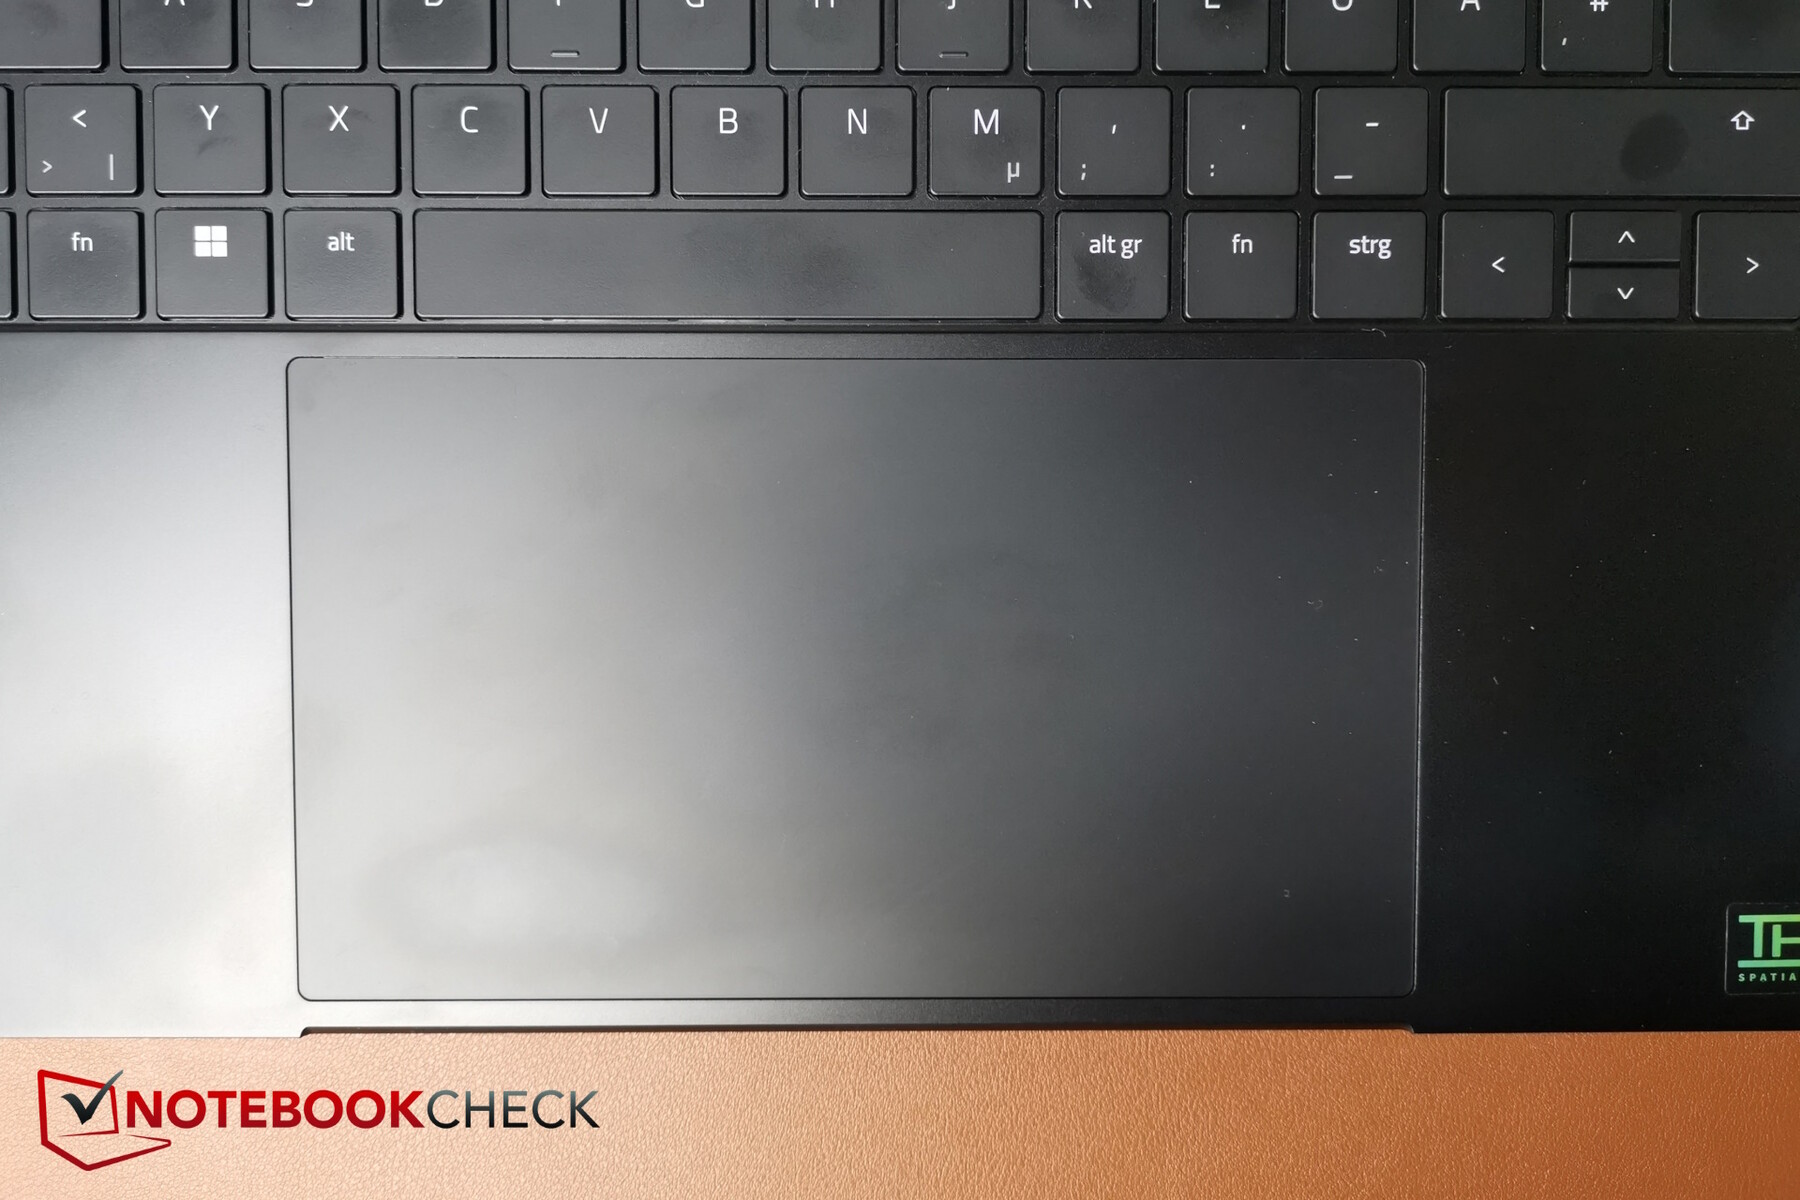
Touchpad jest ogromny! Tak duży, że podpórki pod nadgarstki obok niego wydają się zbyt małe. Prowadzi to czasami do niepowodzenia wprowadzania danych z touchpada, ponieważ dłoń przypadkowo dotknęła podkładki, gdy po prostu spoczywała na boku. W tym aspekcie przydałoby się mniej.
Wyświetlacz - Blade 16 z OLED czy Mini-LED?
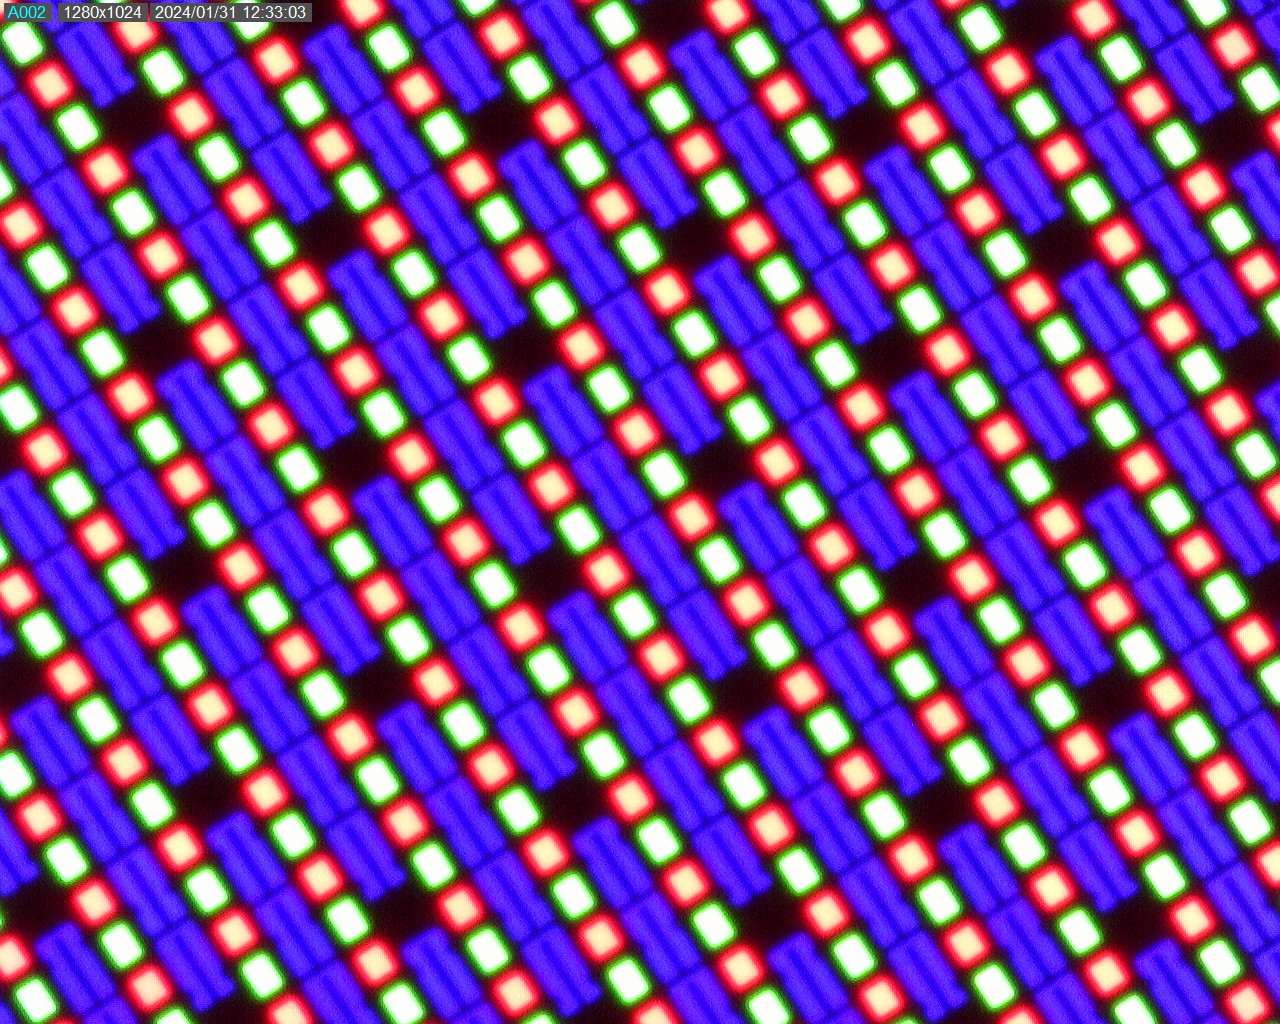
Nowy Samsung OLED został zainstalowany w naszym modelu testowym, o którym Razer mówi tak wysoko. Wciąż można jednak zdecydować się na laptopa z dobrym wyświetlaczem Mini-LED. Klient staje przed trudną decyzją, gdyż oba typy paneli mają swoje wady i zalety.
Mini-LED-y potrafią osiągnąć nawet 1000 nitów (HDR), a poprzednik jeszcze ponad 700 nitów w trybie SDR. Nasz OLED "tylko" osiągał średnio 420 nitów, ale za to cechował się doskonałą wartością czerni i w efekcie wysokimi kontrastami. Potrafi doskonale przyciemnić poszczególne obszary na wyświetlaczu.
Wyświetlacz Mini-LED oferuje dwa natywne tryby rozdzielczości, a mianowicie FHD+ i UHD+. OLED jest "ograniczony" do 1600p (QHD+), ale ma niezwykle szybki czas reakcji od 0,2 (szary do szarego) do 0,4 milisekundy (czarny do białego). Bez względu na to, który wyświetlacz ostatecznie wybierzesz, z pewnością nie dostaniesz złego z Razer.
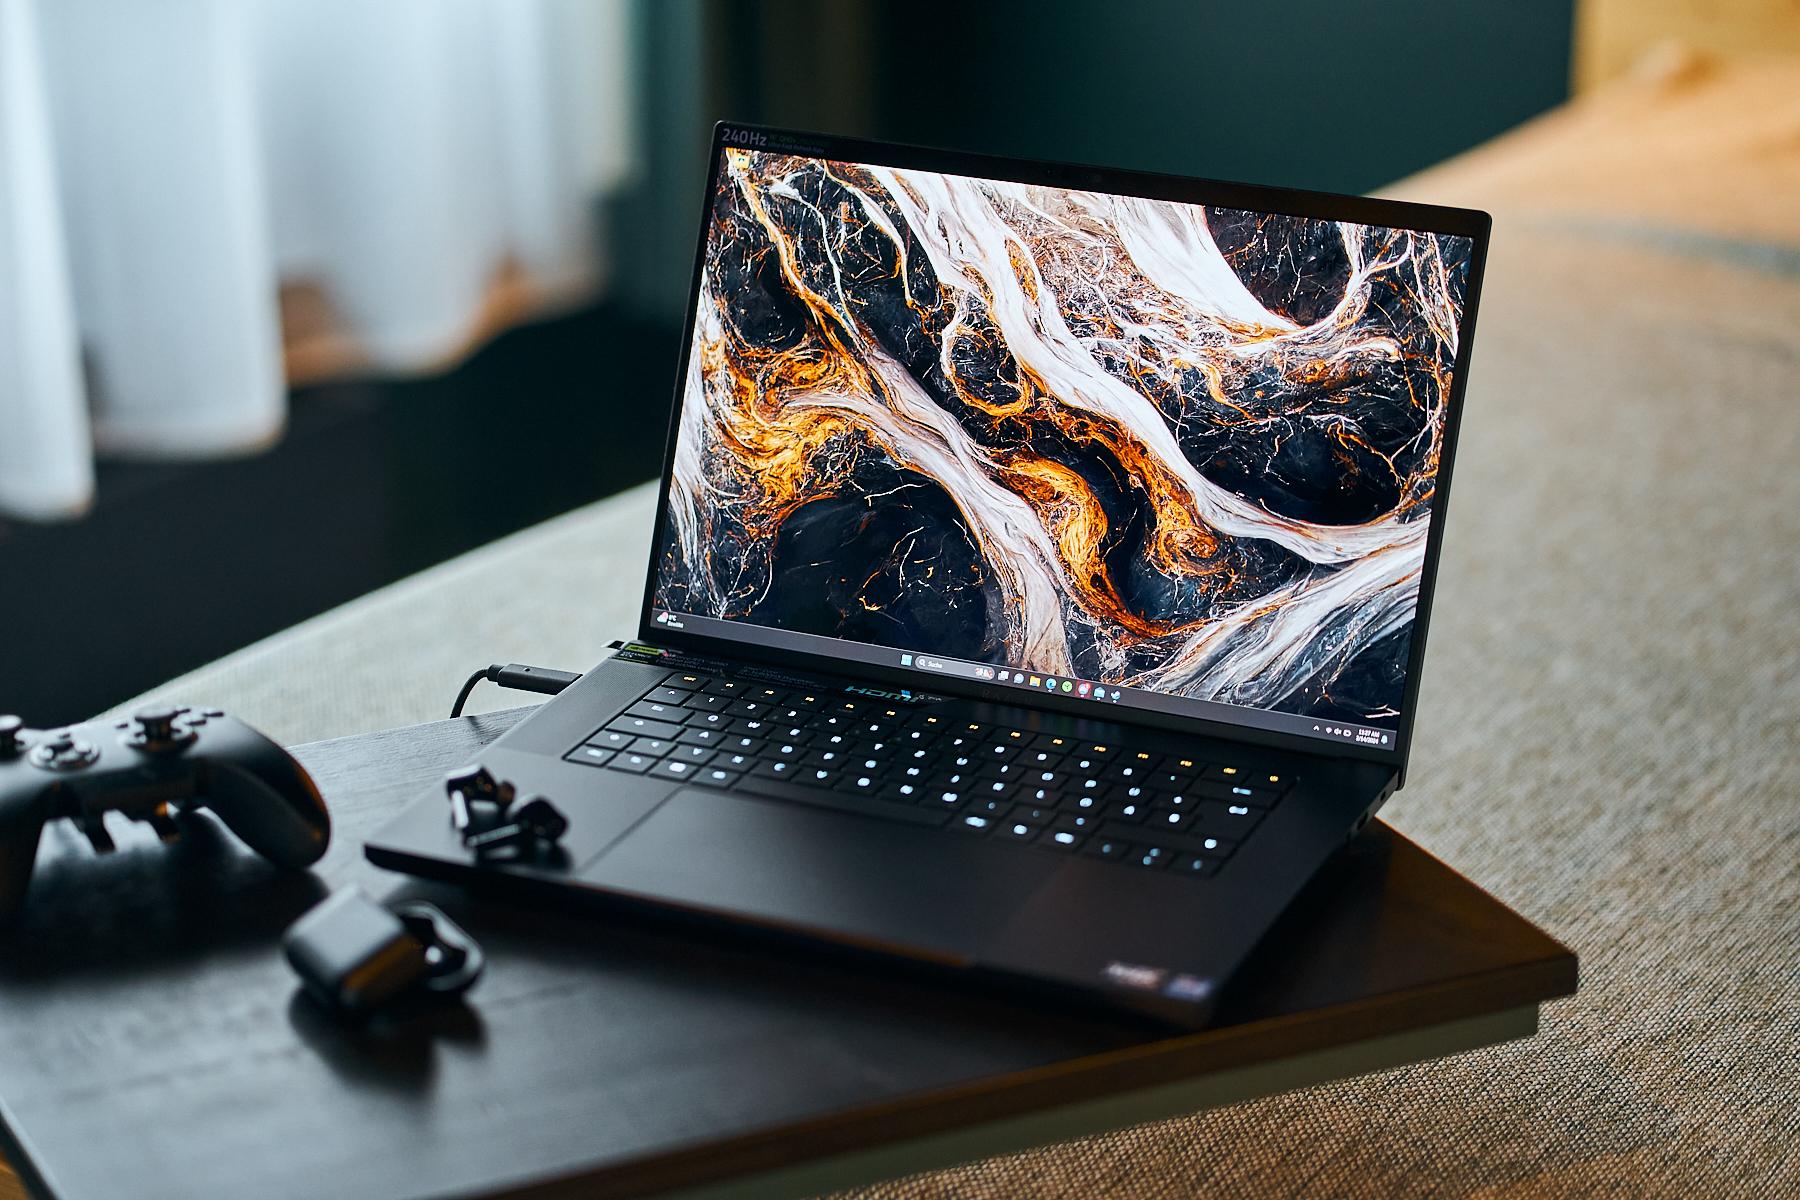
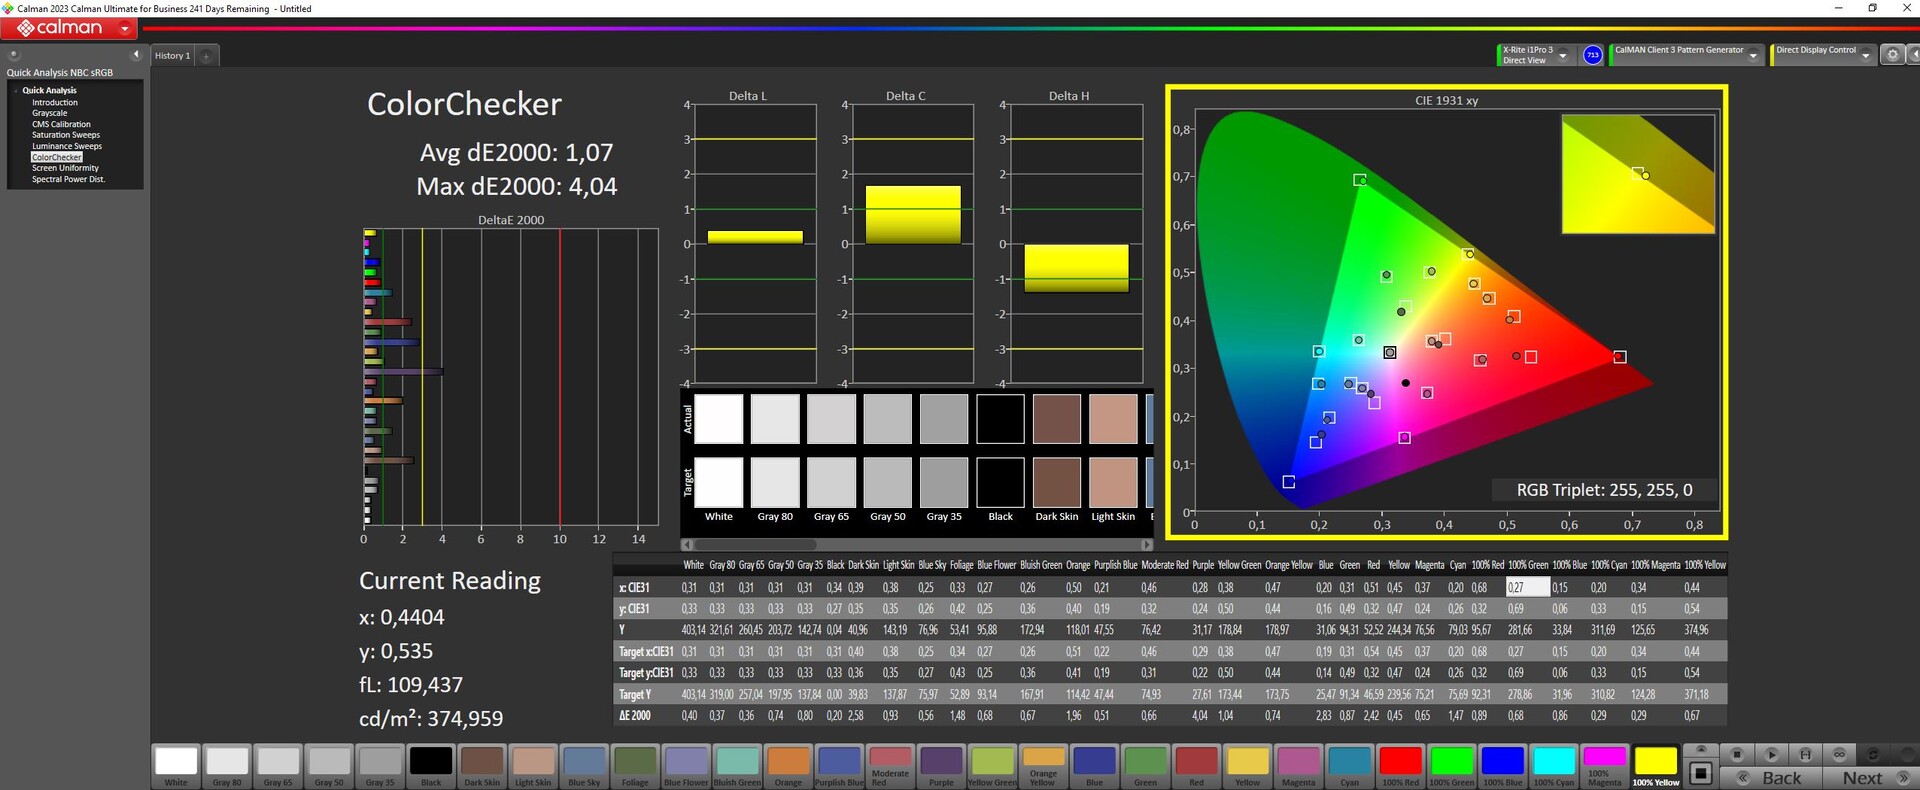
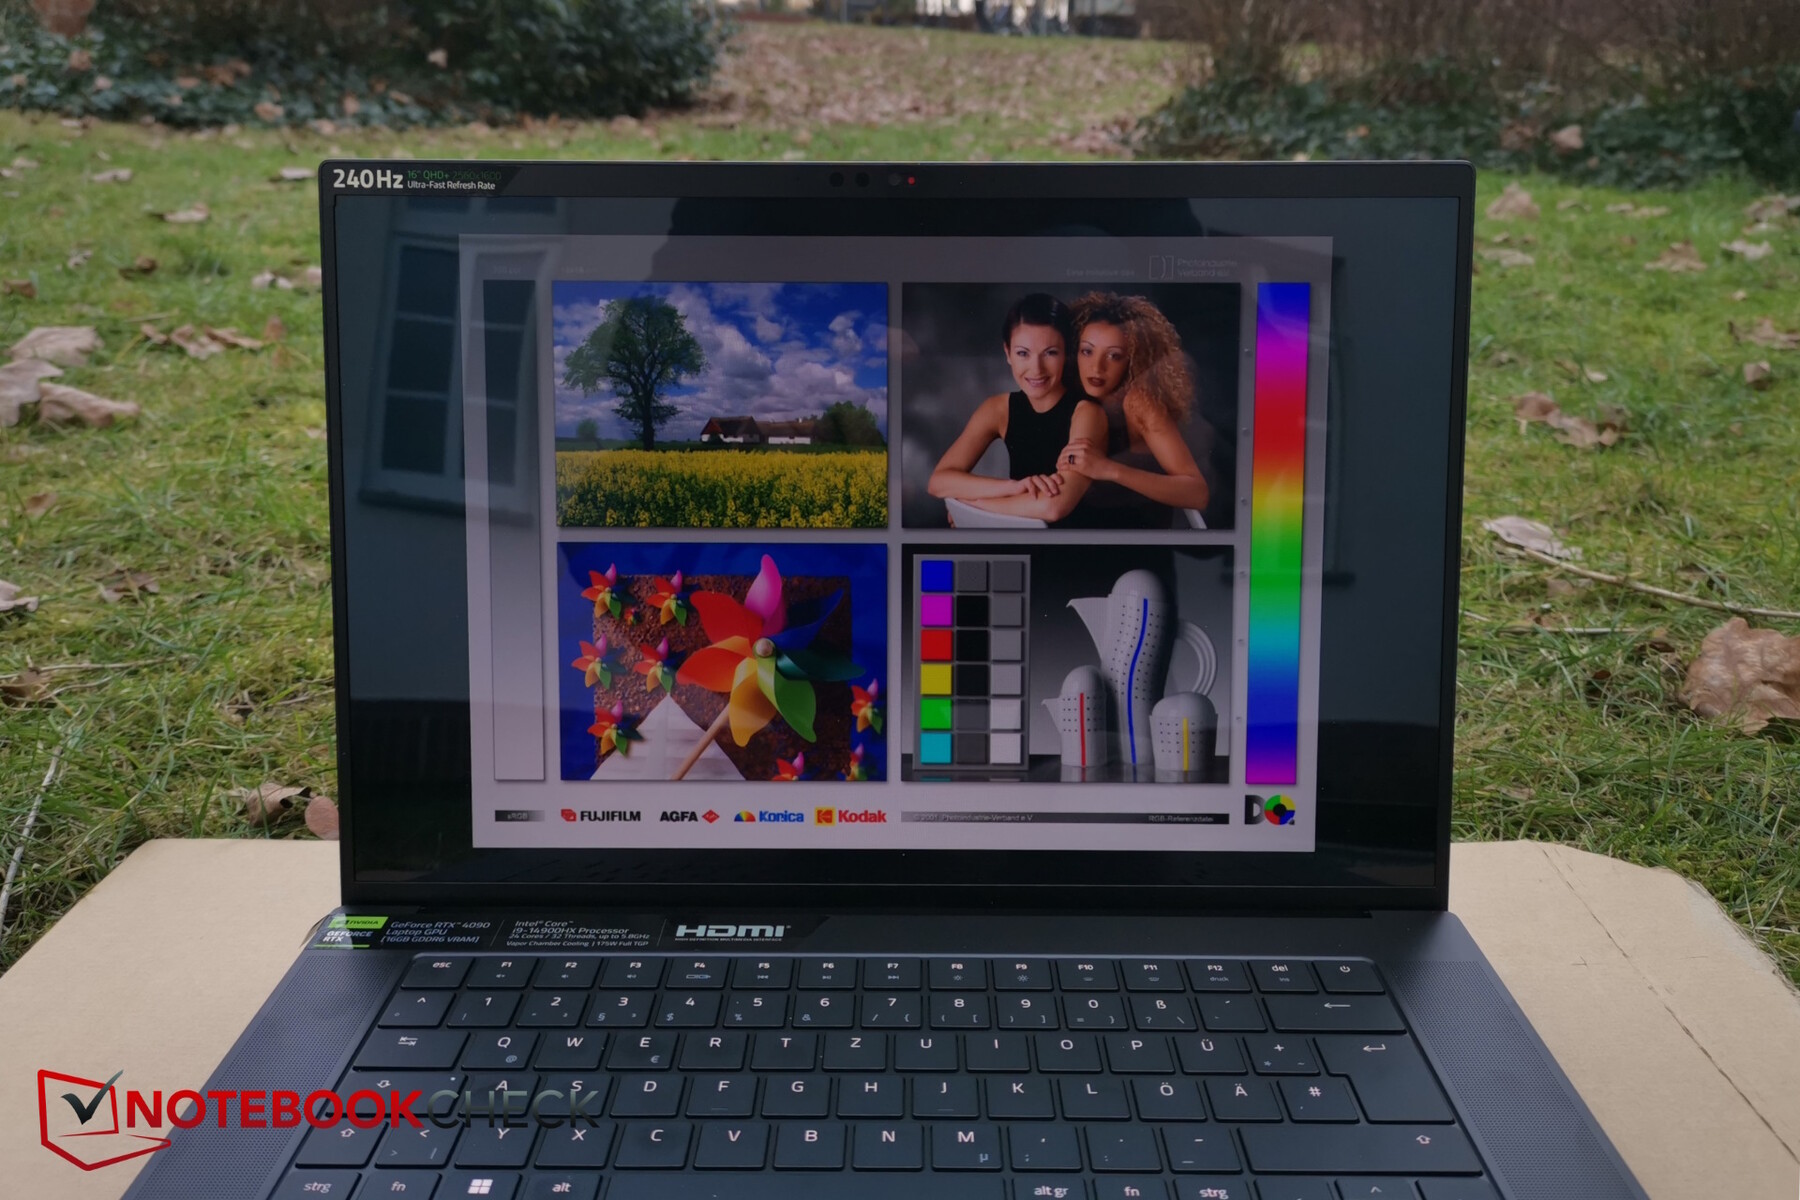
Samsung OLED w naszym testowym modelu Blade ma odblaskową, przezroczystą powierzchnię. Razer reklamuje ten model różnego rodzaju certyfikatami, w tym VESA ClearMR 11000 (najwyższa klarowność wyświetlania ruchomych obiektów na ekranie przy 240 Hz), Calman Verified (kalibracja kolorów) i VESA DisplayHDR True Black 500.
Oprócz licznych certyfikatów, 16:10 OLED o rozdzielczości 2560 x 1600 pikseli jest gotowy do G-Sync i jest wstępnie skalibrowany. W przypadku OLED-ów nie występuje zjawisko krwawienia podświetlenia.
| |||||||||||||||||||||||||
rozświetlenie: 98 %
na akumulatorze: 416 cd/m²
kontrast: 20900:1 (czerń: 0.02 cd/m²)
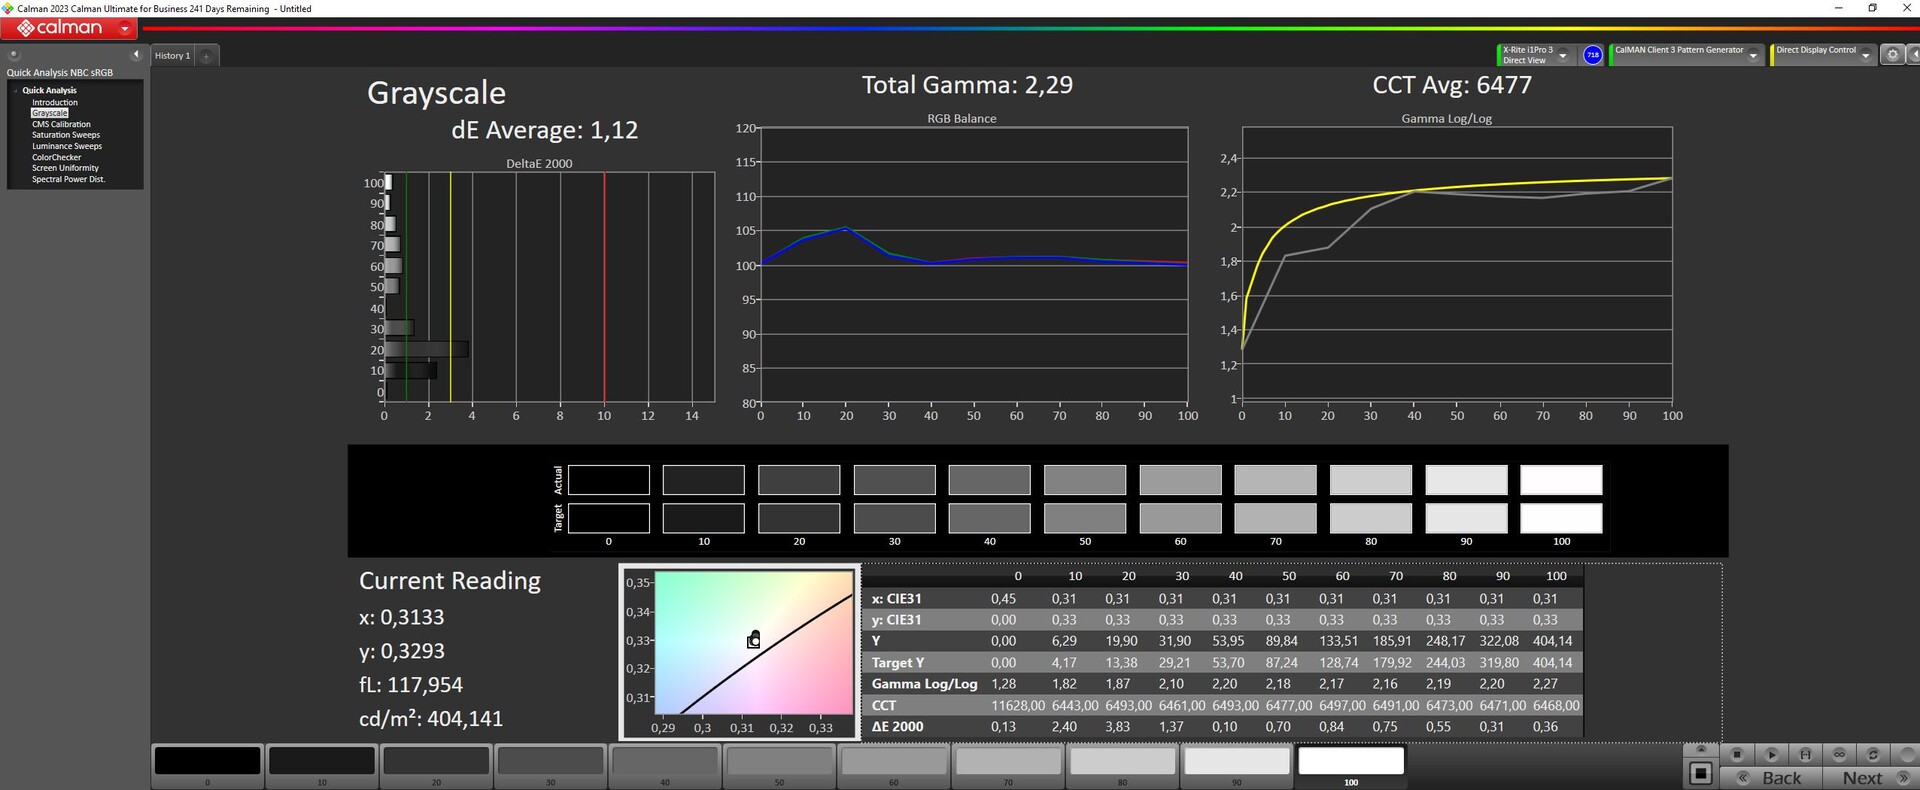
ΔE ColorChecker Calman: 1.07 | ∀{0.5-29.43 Ø4.73}
calibrated: 1.07
ΔE Greyscale Calman: 1.12 | ∀{0.09-98 Ø4.97}
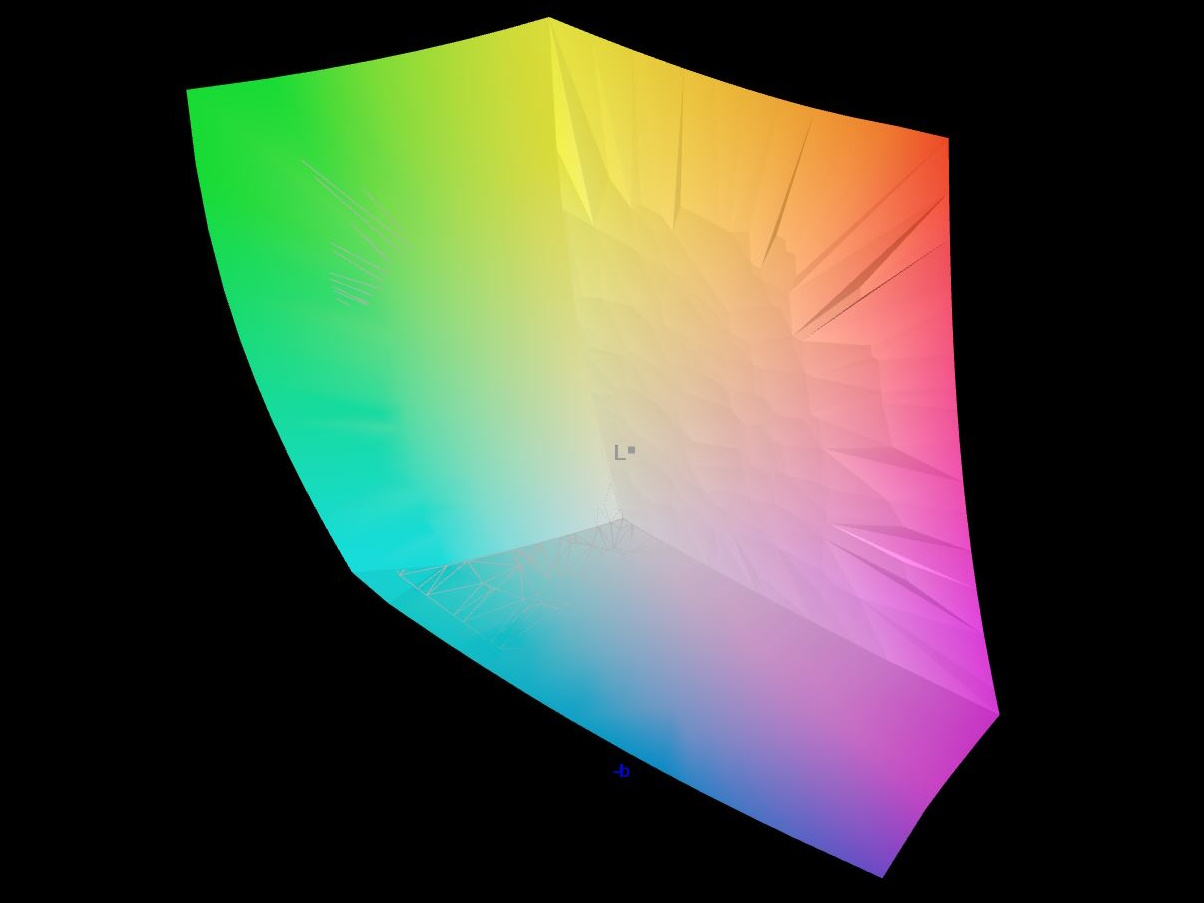
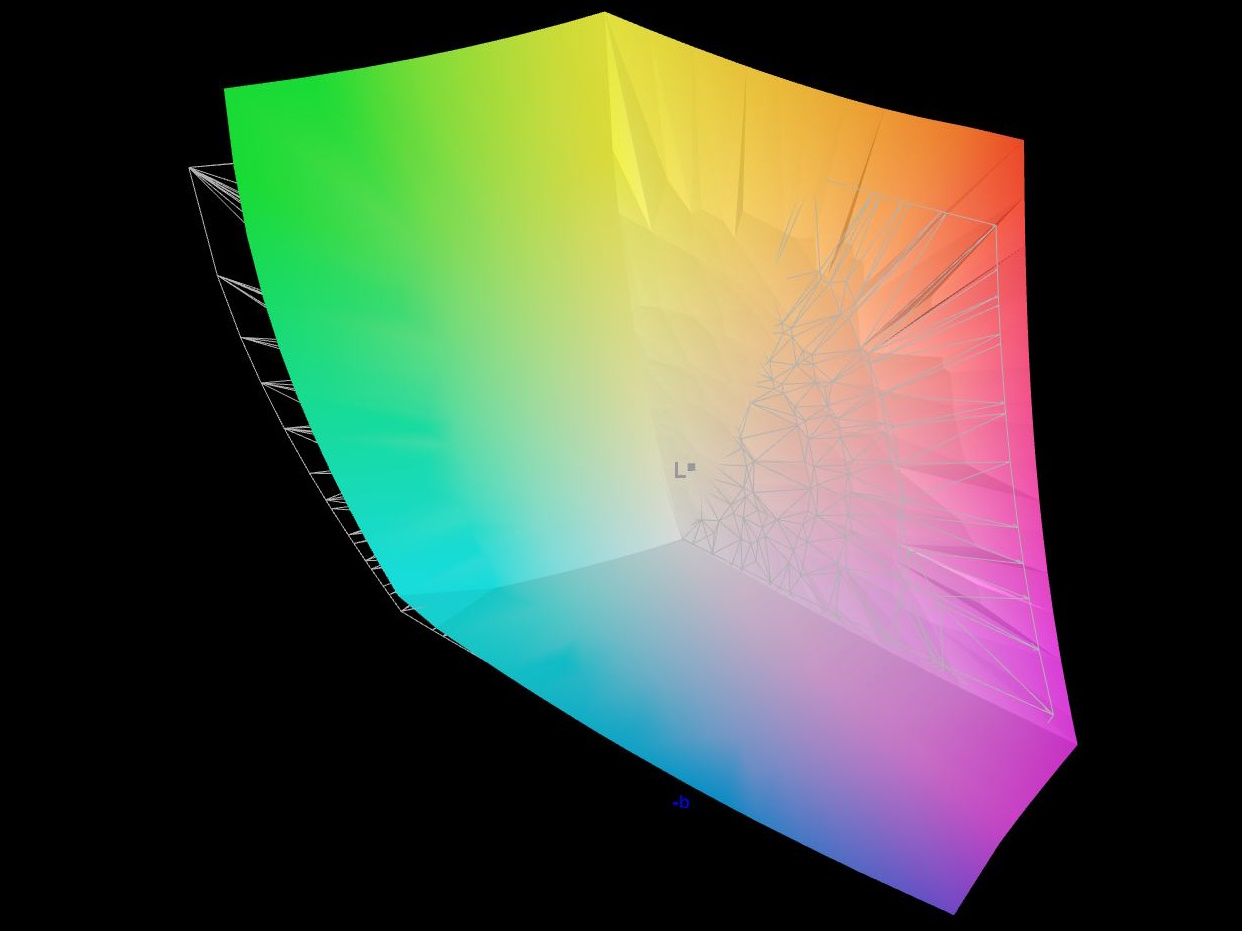
95.6% AdobeRGB 1998 (Argyll 3D)
99.9% sRGB (Argyll 3D)
99.1% Display P3 (Argyll 3D)
Gamma: 2.29
CCT: 6417 K
| Razer Blade 16 2024, RTX 4090 Samsung SDC41AB (ATNA60DL03-0), OLED, 2560x1600, 16" | Razer Blade 16 Early 2023 RTX 4090 AUO B160ZAN01.U, mini-LED, 3840x2400, 16" | Lenovo Legion 9 16IRX8 CSOT T3 MNG007ZA2-2, Mini-LED, 3200x2000, 16" | Schenker XMG Neo 16 E23 BOE0AF0 NE160QDM-NZ1, IPS, 2560x1600, 16" | Lenovo Legion 5 16IRX G9 NE160QDM-NZ3, IPS, 2560x1600, 16" | |
|---|---|---|---|---|---|
| Display | -1% | -4% | -21% | -16% | |
| Display P3 Coverage (%) | 99.1 | 99.9 1% | 97.2 -2% | 67.3 -32% | 72.4 -27% |
| sRGB Coverage (%) | 99.9 | 100 0% | 99.9 0% | 96.7 -3% | 100 0% |
| AdobeRGB 1998 Coverage (%) | 95.6 | 90.9 -5% | 87 -9% | 68.9 -28% | 74.1 -22% |
| Response Times | -9780% | -4121% | -3996% | -3592% | |
| Response Time Grey 50% / Grey 80% * (ms) | 0.24 ? | 10.2 ? -4150% | 13.3 ? -5442% | 14.5 ? -5942% | 12.5 ? -5108% |
| Response Time Black / White * (ms) | 0.4 ? | 62.04 ? -15410% | 11.6 ? -2800% | 8.6 ? -2050% | 8.7 ? -2075% |
| PWM Frequency (Hz) | 960 | 2420 ? | 4742 | ||
| Screen | -42% | -49% | -201% | -176% | |
| Brightness middle (cd/m²) | 418 | 730 75% | 674.9 61% | 372 -11% | 526 26% |
| Brightness (cd/m²) | 420 | 729 74% | 682 62% | 349 -17% | 500 19% |
| Brightness Distribution (%) | 98 | 94 -4% | 96 -2% | 88 -10% | 87 -11% |
| Black Level * (cd/m²) | 0.02 | 0.0045 78% | 0.04 -100% | 0.32 -1500% | 0.33 -1550% |
| Contrast (:1) | 20900 | 162222 676% | 16873 -19% | 1163 -94% | 1594 -92% |
| Colorchecker dE 2000 * | 1.07 | 5.65 -428% | 2.56 -139% | 2.06 -93% | 1.2 -12% |
| Colorchecker dE 2000 max. * | 4.04 | 10.11 -150% | 4.16 -3% | 3 26% | 2.1 48% |
| Colorchecker dE 2000 calibrated * | 1.07 | 1.85 -73% | 2.47 -131% | 1.5 -40% | 1 7% |
| Greyscale dE 2000 * | 1.12 | 8.1 -623% | 3 -168% | 1.9 -70% | 1.3 -16% |
| Gamma | 2.29 96% | 1.98 111% | 2.38 92% | 2.312 95% | 2.23 99% |
| CCT | 6417 101% | 5874 111% | 6799 96% | 6747 96% | 6391 102% |
| Całkowita średnia (program / ustawienia) | -3274% /
-1424% | -1391% /
-621% | -1406% /
-705% | -1261% /
-630% |
* ... im mniej tym lepiej
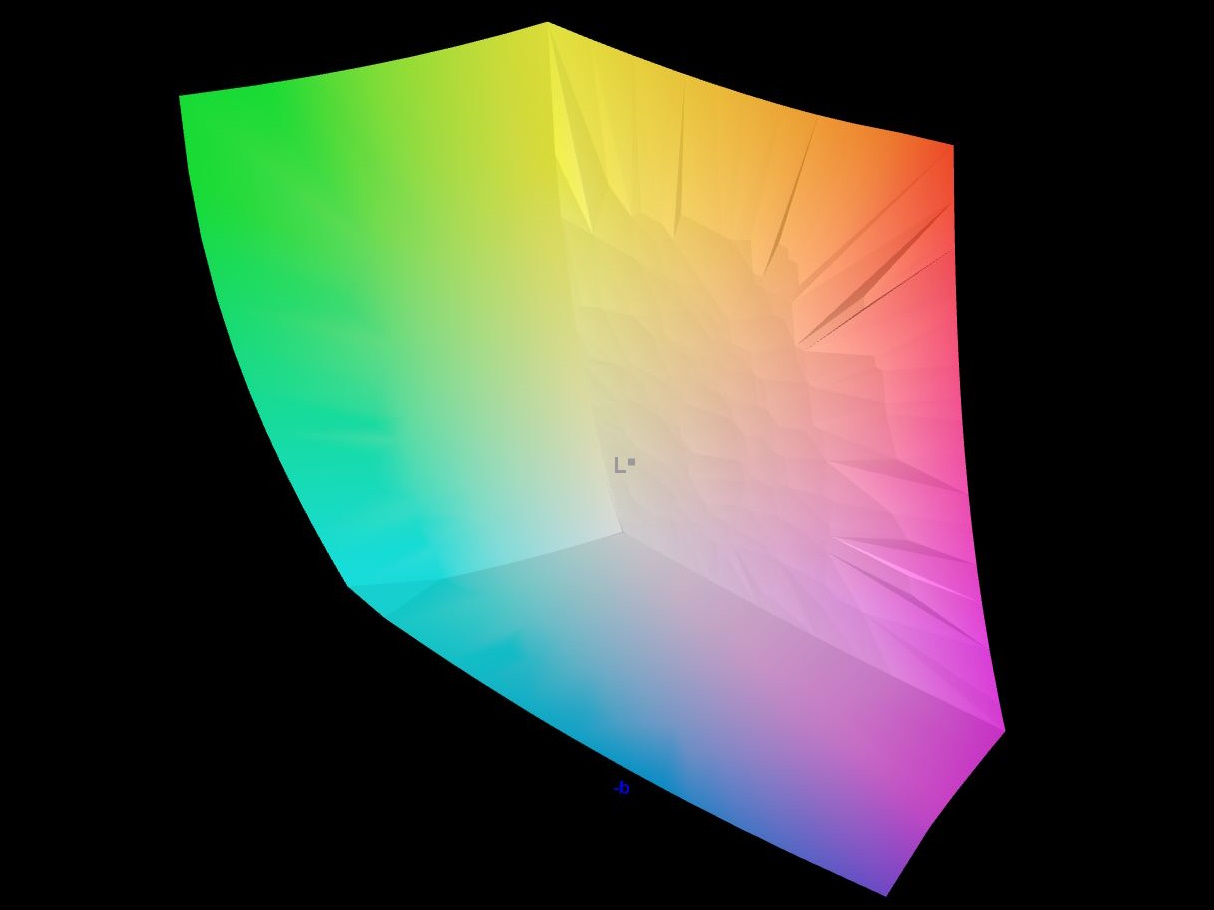
Zgodnie z obietnicą, panel pokrywa DisplayP3 praktycznie w całości i oczywiście również sRGB. Ponadto AdobeRGB jest pokryte w około 96 procentach.
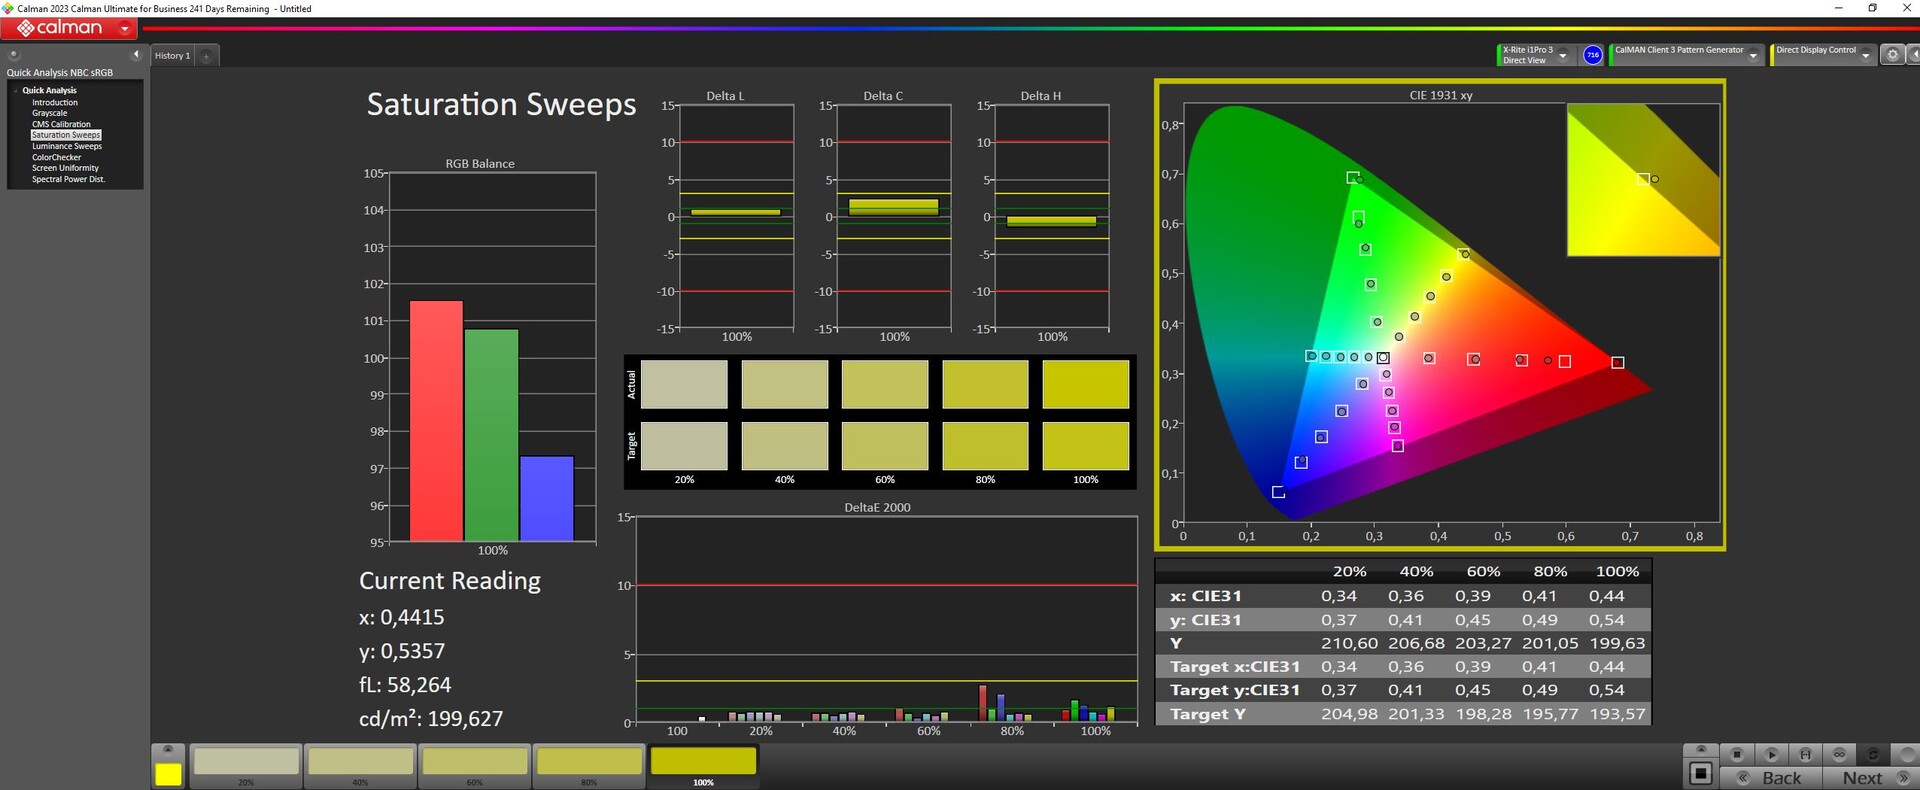
Według Razera, każdy 16-calowy model Blade jest fabrycznie skalibrowany i nasze pomiary to potwierdziły. Jego skala szarości i odchylenia kolorów są bardzo niskie - tylko około 1. Oznacza to, że Blade 16 jest idealny do edycji zdjęć i filmów.
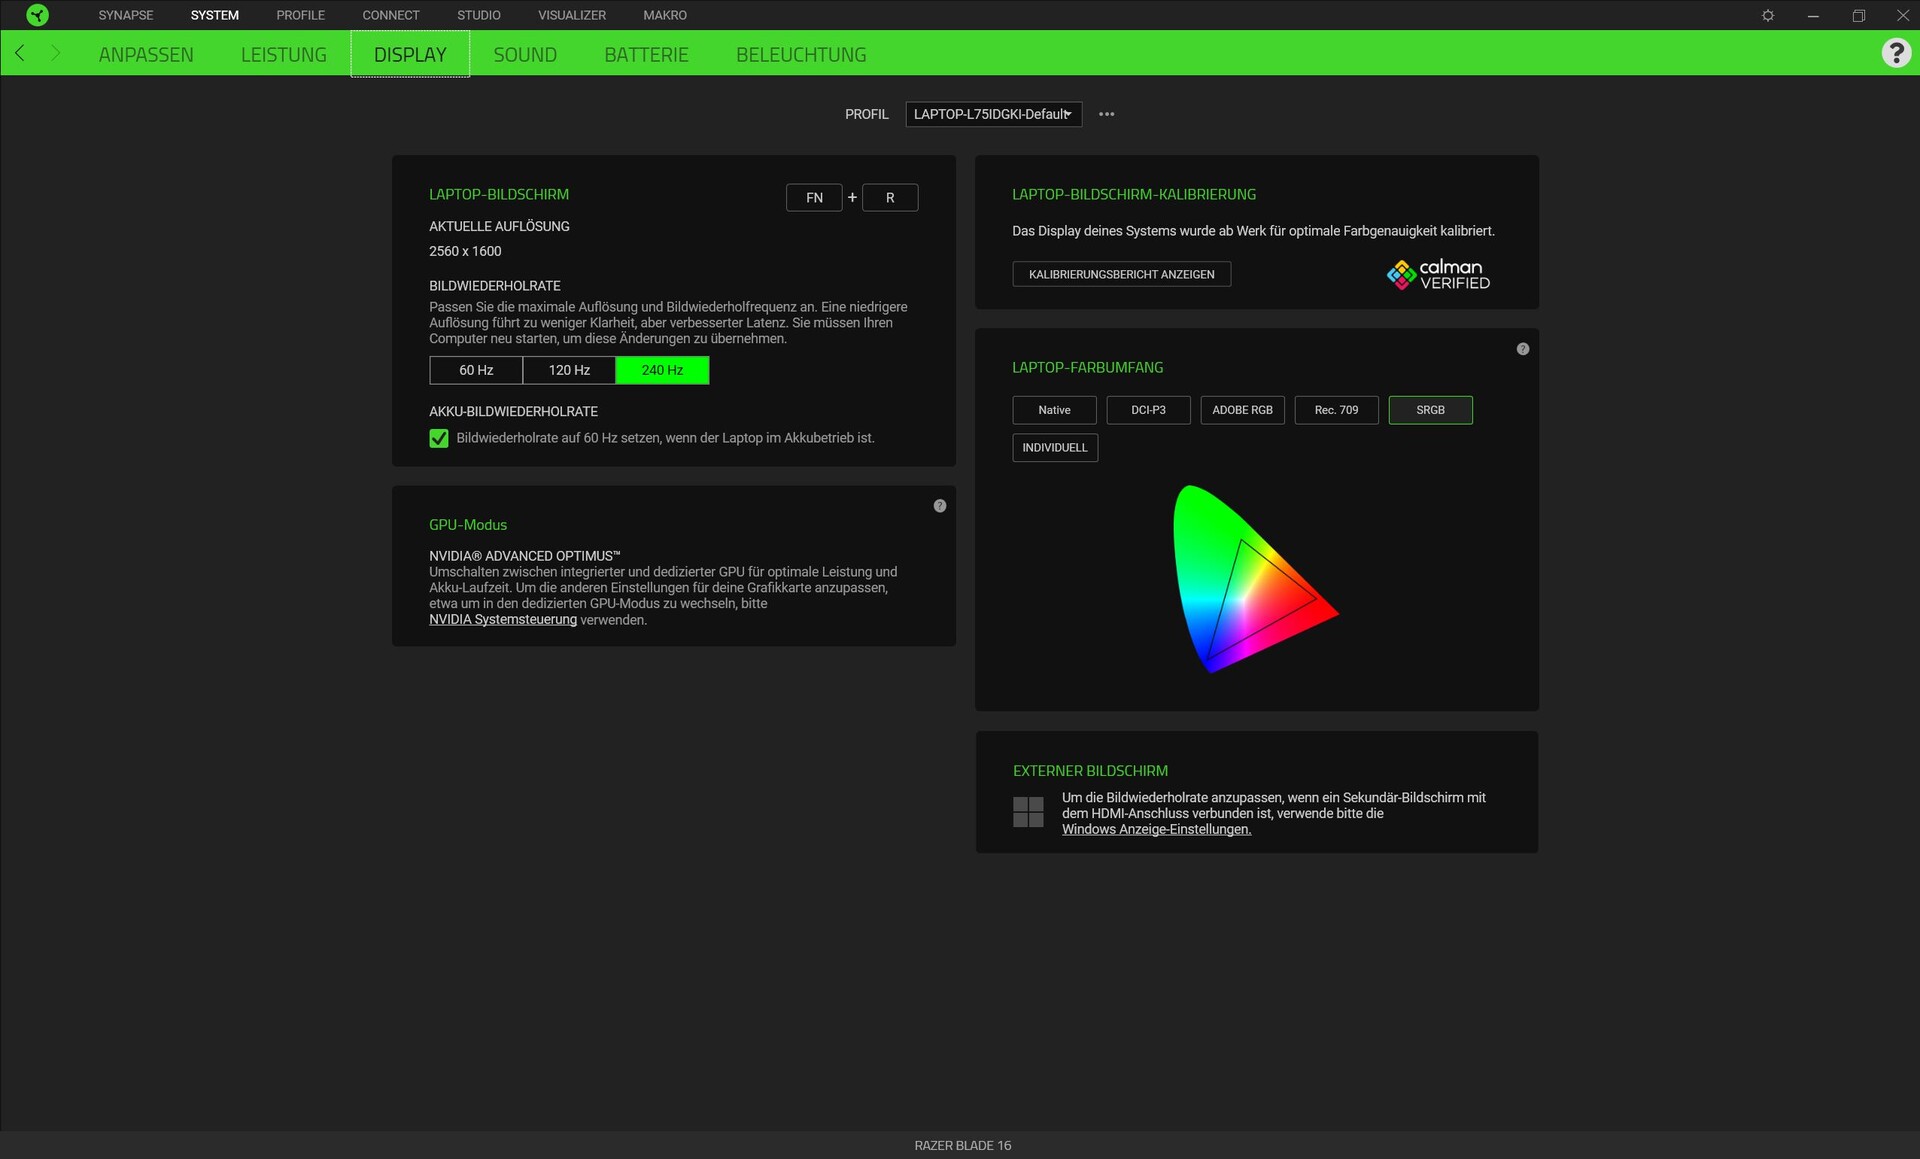
Producent skonfigurował również kilka profili kolorów w oprogramowaniu Synapse, a mianowicie DCI-P3, Adobe RGB, Rec. 709 i sRGB. Istnieje również opcja indywidualnego dostosowania trybu kolorów, a także natywny tryb kolorów. Do naszych pomiarów wybraliśmy DCI-P3.
Ogólnie rzecz biorąc, sklasyfikowalibyśmy panel OLED jako nieco lepszy od wyświetlacza Mini-LED, co jest szczególnie związane z doskonałym pokryciem przestrzeni kolorów, dokładnością kolorów, głęboką czernią, wysokim kontrastem i szybkim czasem reakcji.
Wyświetl czasy reakcji
| ↔ Czas reakcji od czerni do bieli | ||
|---|---|---|
| 0.4 ms ... wzrost ↗ i spadek ↘ łącznie | ↗ 0.2 ms wzrost | 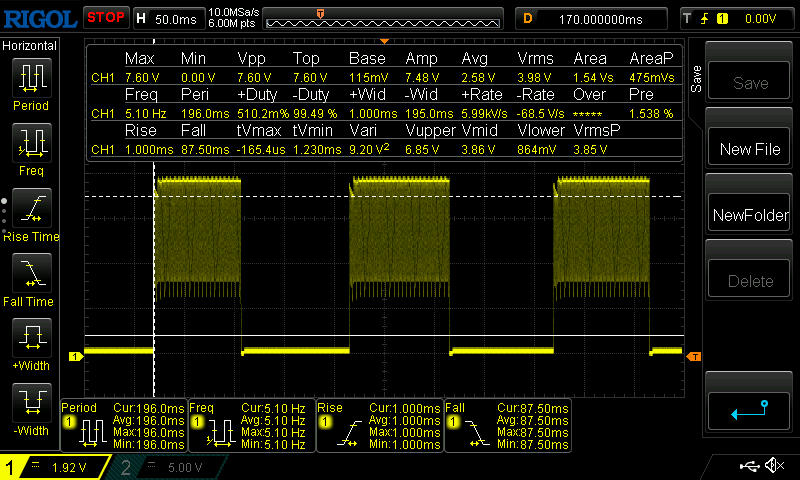 |
| ↘ 0.2 ms upadek | ||
| W naszych testach ekran wykazuje bardzo szybką reakcję i powinien bardzo dobrze nadawać się do szybkich gier. Dla porównania, wszystkie testowane urządzenia wahają się od 0.1 (minimum) do 240 (maksimum) ms. » 0 % wszystkich urządzeń jest lepszych. Oznacza to, że zmierzony czas reakcji jest lepszy od średniej wszystkich testowanych urządzeń (19.9 ms). | ||
| ↔ Czas reakcji 50% szarości do 80% szarości | ||
| 0.24 ms ... wzrost ↗ i spadek ↘ łącznie | ↗ 0.15 ms wzrost | 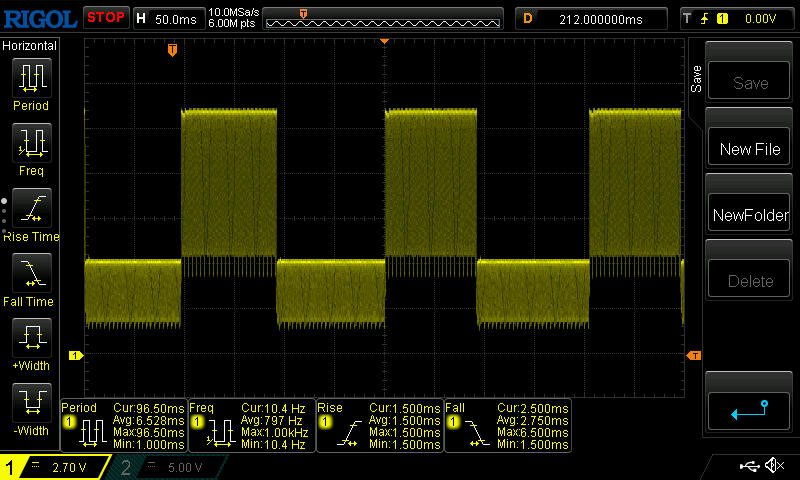 |
| ↘ 0.09 ms upadek | ||
| W naszych testach ekran wykazuje bardzo szybką reakcję i powinien bardzo dobrze nadawać się do szybkich gier. Dla porównania, wszystkie testowane urządzenia wahają się od 0.165 (minimum) do 636 (maksimum) ms. » 0 % wszystkich urządzeń jest lepszych. Oznacza to, że zmierzony czas reakcji jest lepszy od średniej wszystkich testowanych urządzeń (31.1 ms). | ||
Migotanie ekranu / PWM (modulacja szerokości impulsu)
| Wykryto migotanie ekranu/wykryto PWM | 960 Hz | 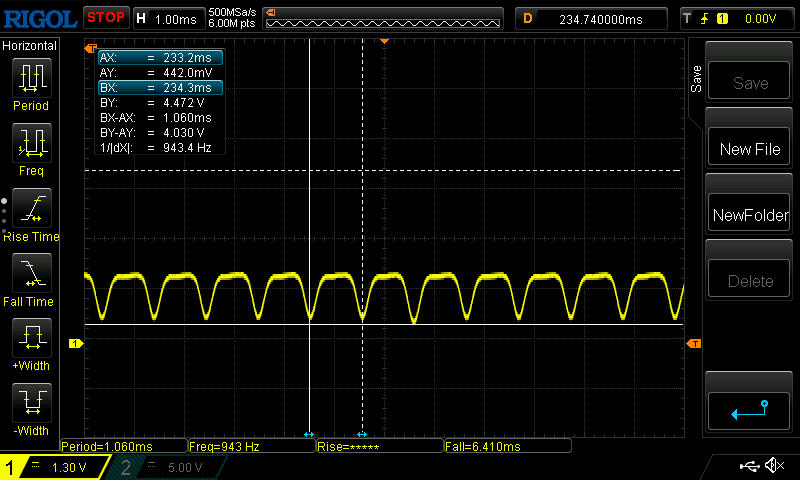 | |
Podświetlenie wyświetlacza miga z częstotliwością 960 Hz (najgorszy przypadek, np. przy użyciu PWM) . Częstotliwość 960 Hz jest dość wysoka, więc większość użytkowników wrażliwych na PWM nie powinna zauważyć żadnego migotania. Dla porównania: 52 % wszystkich testowanych urządzeń nie używa PWM do przyciemniania wyświetlacza. Jeśli wykryto PWM, zmierzono średnio 7784 (minimum: 5 - maksimum: 343500) Hz. | |||
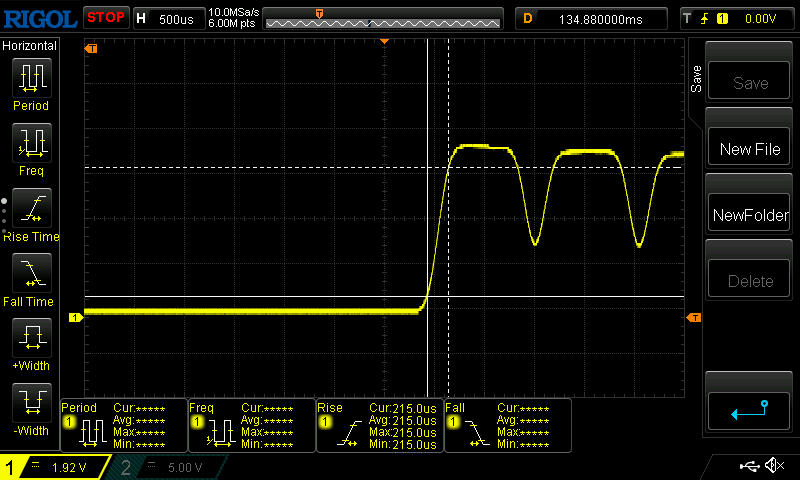
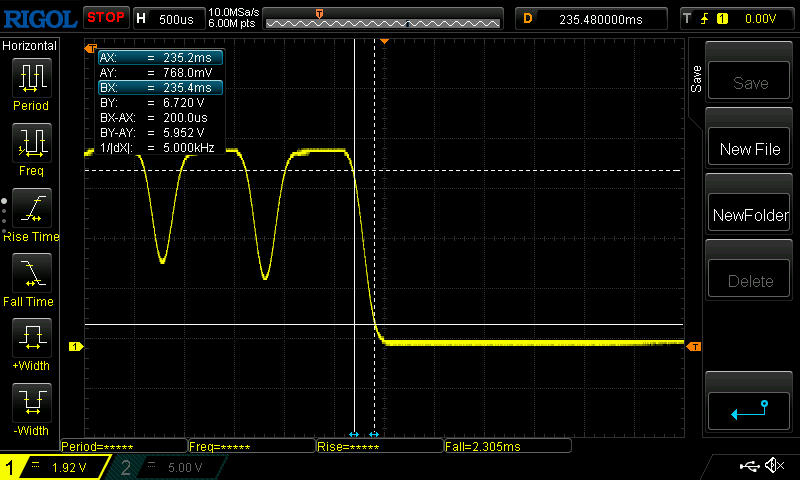
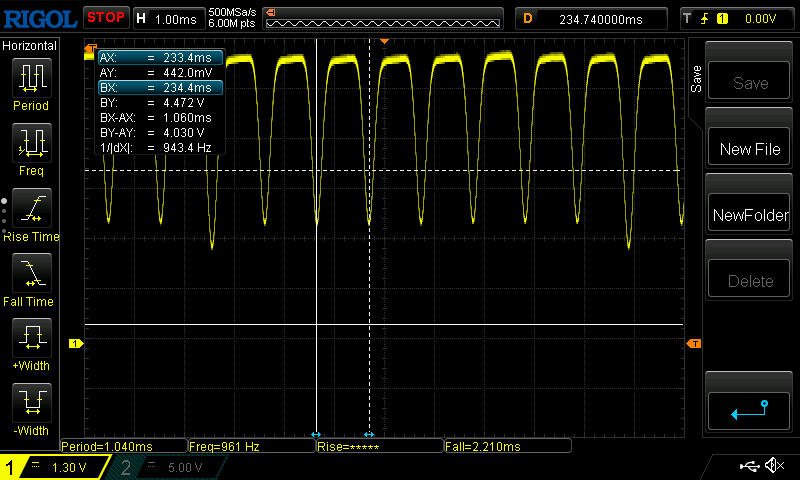
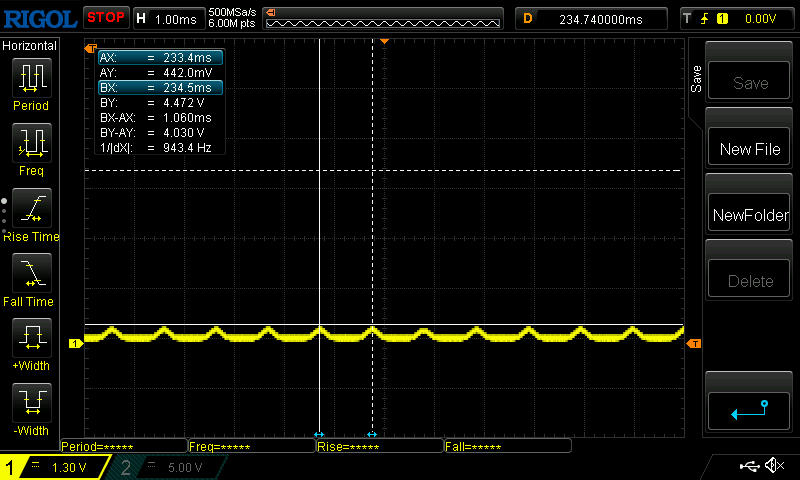
Czasy reakcji laptopa wynoszące 0,2 i 0,4 ms są bardzo szybkie - zbyt szybkie dla automatycznego trybu nagrywania naszego urządzenia testowego. Poniżej znajduje się nasze ręczne nagranie czasów narastania i opadania.
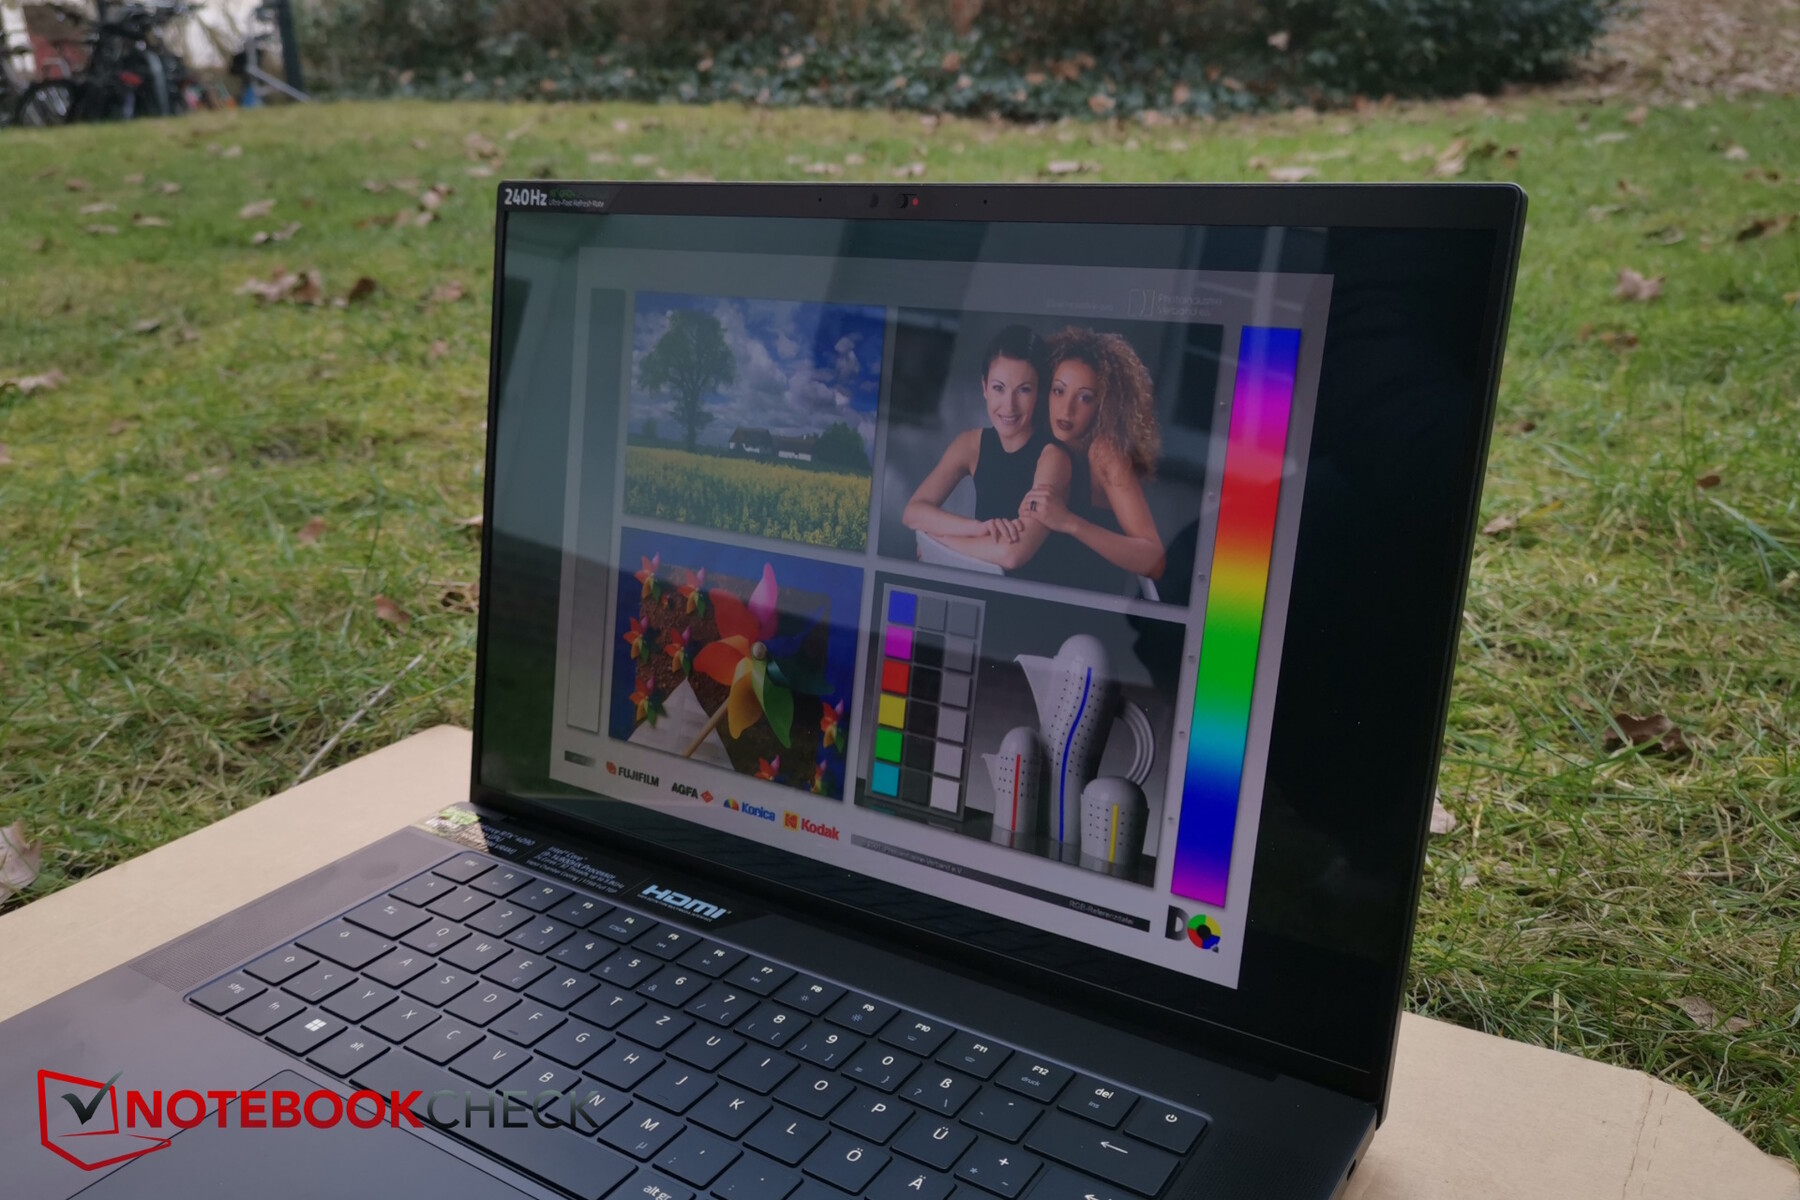
Na zewnątrz korzystanie z Blade 16 może być nieco trudne ze względu na jego odblaskową powierzchnię. Mimo to, silny kontrast nieco to rekompensuje. W cieniu, praca na zewnątrz powinna być w porządku.

Wydajność - stagnacja pomimo nowej generacji procesorów
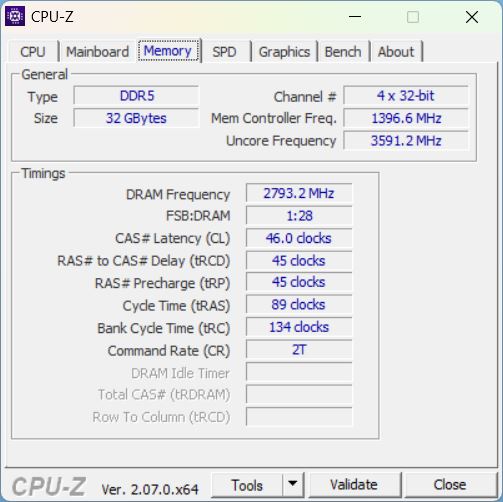
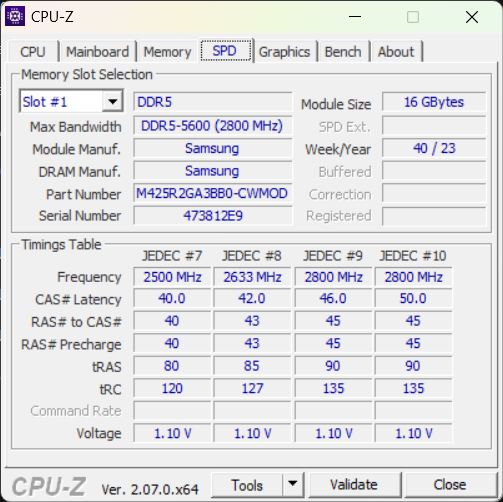
Dzięki potężnym RTX 4090 i nie mniej potężnym Intel Core i9-14900HXblade 16 jest oczywiście skierowany przede wszystkim do graczy. Ale dzięki dobremu ekranowi i eleganckiemu, cienkiemu designowi Razer zawsze celował również w kreatywnych profesjonalistów. 32 GB pamięci RAM, WiFi 7 i dysk SSD o pojemności 2 TB uzupełniają funkcje naszej próbki testowej.
Warunki testowania
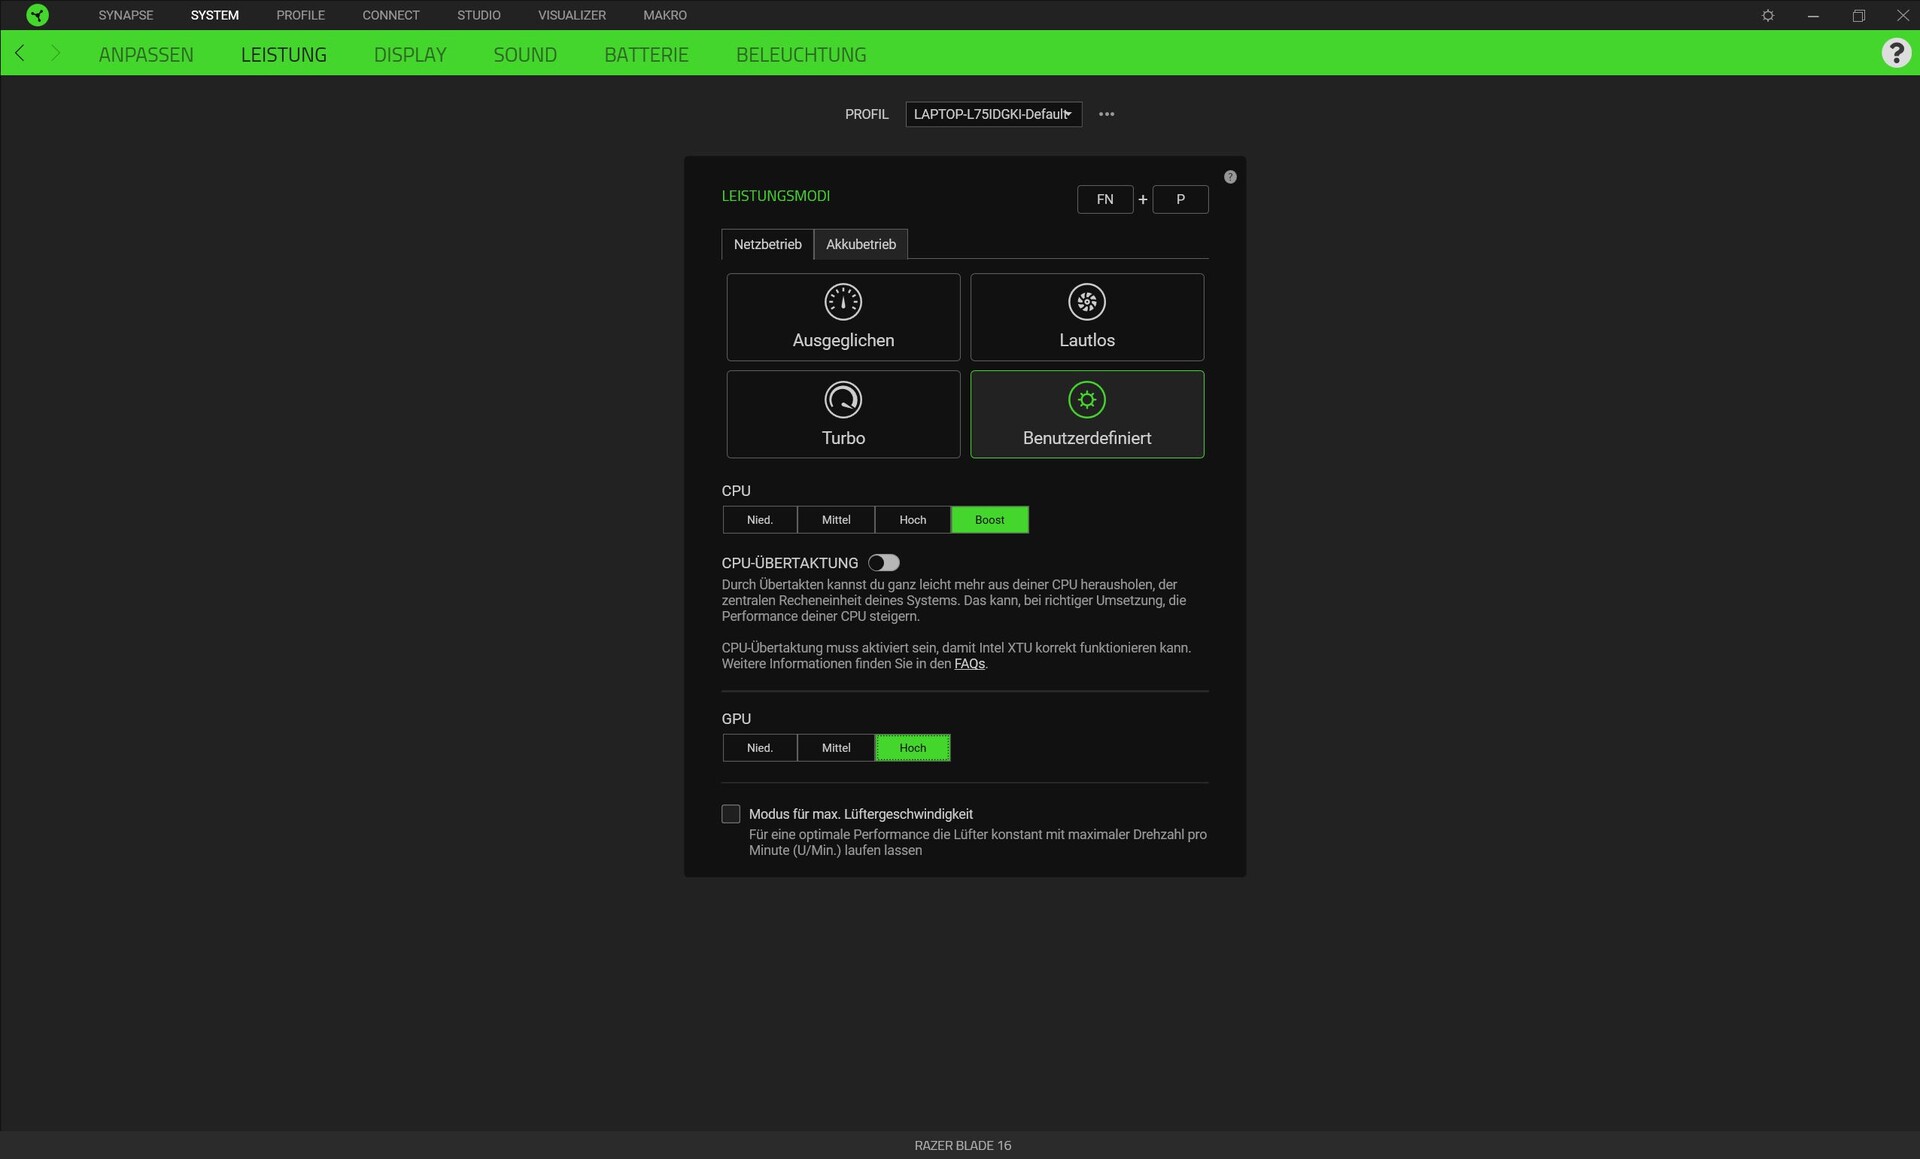
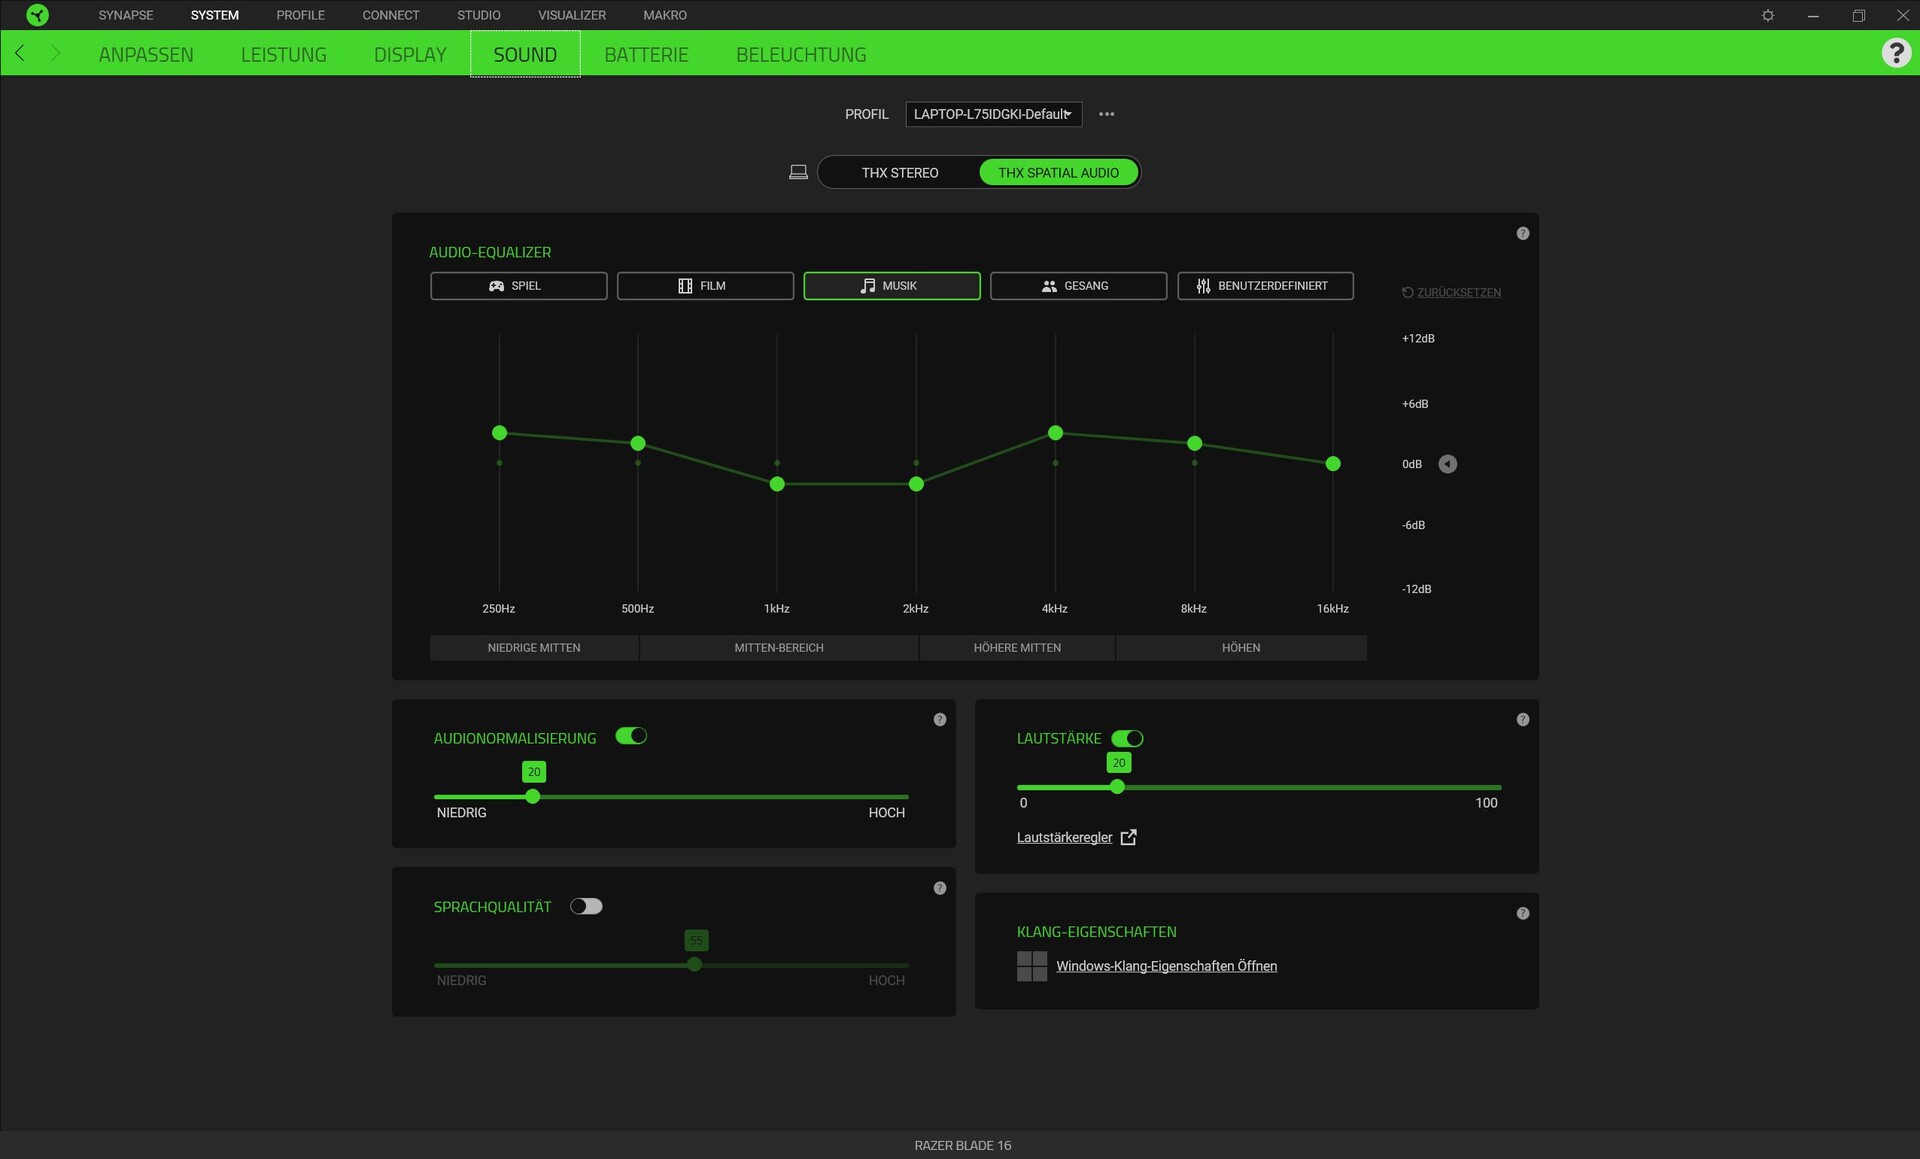
Razer Synapse służy jako centrum dowodzenia i kontroli w modelach Blade. Pozwala ustawić jeden z czterech trybów wydajności(cichy, zrównoważony, turbo, niestandardowy), a także efekty świetlne i dokonać dalszych regulacji.
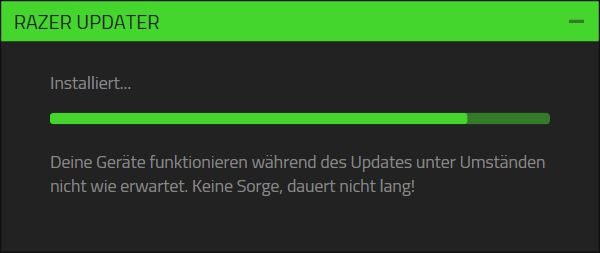
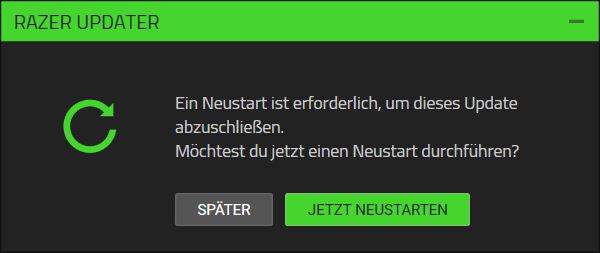
Czasami oprogramowanie musi się zaktualizować, co zajmuje niezwykle dużo czasu; musieliśmy nawet ponownie uruchomić urządzenie, co było nieco irytujące. Opcje nie są dostępne podczas długiej, niechcianej aktualizacji. Ekran główny również nie jest najlepszy. Chociaż oprogramowanie zapamiętuje ostatnią kartę otwartą podczas sesji Windows (np. wydajność), zawsze musimy ponownie uruchomić urządzenie, zanim uzyskamy dostęp do ekranu głównego. Tutaj musimy najpierw wybrać nasze urządzenie (nawet jeśli jest to nasze jedyne urządzenie Razer), a następnie kliknąć odpowiednią zakładkę; domyślnie wybrana jest "personalizacja" (ustaw klawisze funkcyjne) - zakładka, która jest prawdopodobnie rzadko używana.
W naszych testach porównawczych użyliśmy trybu niestandardowego, aby zmaksymalizować wydajność procesora i karty graficznej. Wentylatory pozostawiliśmy jednak włączone automatycznie, gdyż w przeciwnym razie zawsze rozkręcałyby się do maksymalnej głośności. Czasami pojawiały się problemy z przełączaniem grafiki, które zawodziło w przypadku niektórych aplikacji. Na przykład 3DMark 06 uruchamiał się tylko w trybie dGPU.
Procesor
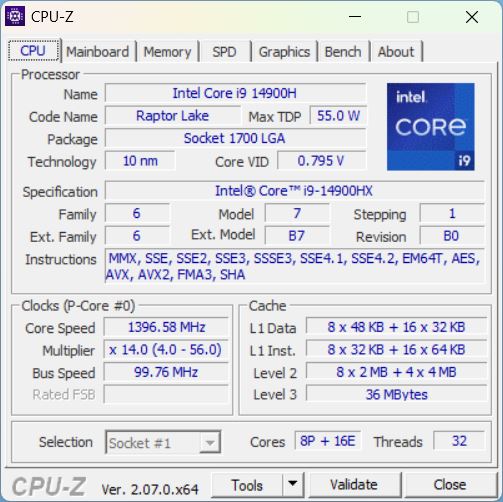
Procesor Core i9-14900HX to obecnie najlepszy układ z serii Raptor-Lake-Refresh dla laptopów. W porównaniu do zeszłorocznego Raptor Lake, architektura pozostała jednak taka sama - tylko częstotliwość taktowania turbo jest teraz nieco wyższa. Taktowanie wynosi teraz do 5,8 GHz, a oprócz tego flagowy procesor Intela posiada 24 rdzenie (8 rdzeni P, 16 rdzeni E; 32 wątki).
Podczas pętli Cinebench R15, procesor zapewniał bardzo wysoką i stałą wydajność bez typowego spadku wydajności po pierwszych 1 do 3 przebiegach. Mimo to Legion 9 z zeszłorocznym topowym modelem Core i9-13980HXbył równie szybki, a inne topowe procesory Intela 13. generacji plasowały się tuż za nim. Słabszy i7-14650HX w ramach obecnej serii Legion 5 został nieco bardziej w tyle. W porównaniu do swojego poprzednikawyniki obecnego procesora były o około 8 procent lepsze. Pomimo tej doskonałej wydajności, nie ma zbyt wielu argumentów przemawiających za wydaniem dużych pieniędzy na Intel Gen 14, ponieważ Gen 13 jest prawie identycznie szybki. Proszę spojrzeć na naszą analizie nowych procesorów Gen-14 aby uzyskać więcej informacji.
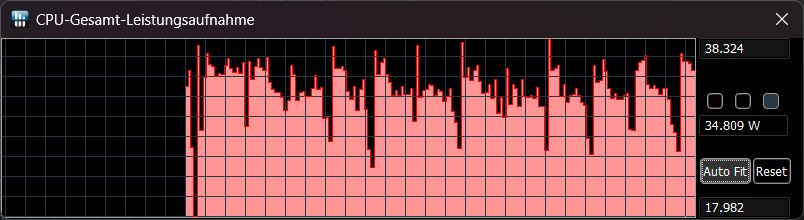
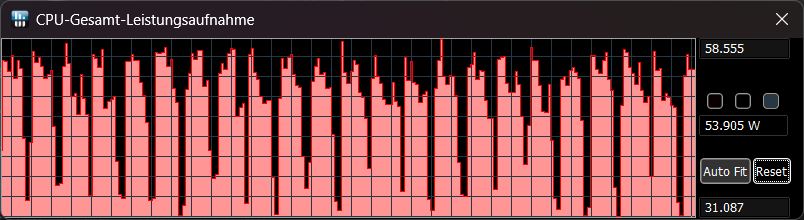
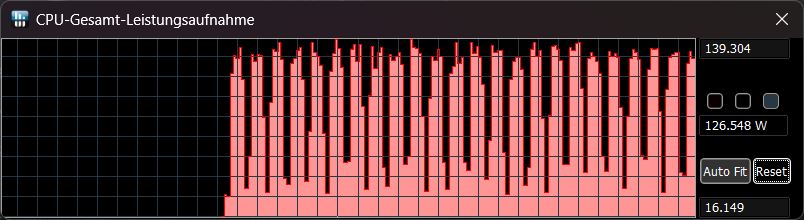
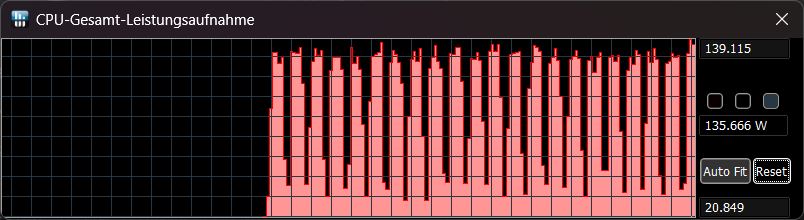
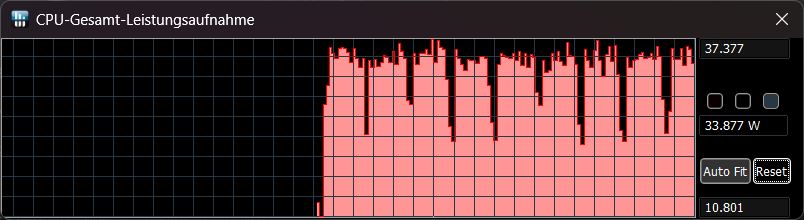
W poniższej tabeli wyszczególniliśmy zużycie energii podczas testu Cinebench R15 przy użyciu różnych trybów wydajności, a zrzuty ekranu po prawej stronie ilustrują te wartości. Jeśli odłączyliśmy zasilanie, Synapse automatycznie przełączył się w tryb zrównoważony, którego nie można było zmienić. Jednak wartości TDP były nawet niższe niż w tym samym trybie po podłączeniu - są raczej bardziej zbliżone do wartości w trybie cichym.
| Tryb/wartość wydajności | Wynik Cinebench R15, pierwsze uruchomienie | TDP na początku uruchomienia | TDP na końcu uruchomienia |
|---|---|---|---|
| Zdefiniowany przez użytkownika (boost/high) | 4,456 | 139 | 135 |
| Turbo | 4,305 | 139 | 126 |
| Zrównoważony | 2,678 | 58 | 54 |
| Silent | 1,888 | 38 | 35 |
| Bateria | 1,835 | 37 | 34 |
Cinebench R15 Multi continuous test
Cinebench R23: Multi Core | Single Core
Cinebench R20: CPU (Multi Core) | CPU (Single Core)
Cinebench R15: CPU Multi 64Bit | CPU Single 64Bit
Blender: v2.79 BMW27 CPU
7-Zip 18.03: 7z b 4 | 7z b 4 -mmt1
Geekbench 6.7: Multi-Core | Single-Core
Geekbench 5.5: Multi-Core | Single-Core
HWBOT x265 Benchmark v2.2: 4k Preset
LibreOffice : 20 Documents To PDF
R Benchmark 2.5: Overall mean
| CPU Performance rating | |
| Lenovo Legion 9 16IRX8 | |
| Razer Blade 16 2024, RTX 4090 | |
| Przeciętny Intel Core i9-14900HX | |
| Schenker XMG Neo 16 E23 -2! | |
| Razer Blade 16 Early 2023 RTX 4090 -2! | |
| Średnia w klasie Gaming | |
| Lenovo Legion 5 16IRX G9 | |
| Cinebench R23 / Multi Core | |
| Lenovo Legion 9 16IRX8 | |
| Schenker XMG Neo 16 E23 | |
| Razer Blade 16 2024, RTX 4090 | |
| Przeciętny Intel Core i9-14900HX (17078 - 36249, n=37) | |
| Razer Blade 16 Early 2023 RTX 4090 | |
| Średnia w klasie Gaming (10488 - 40970, n=110, ostatnie 2 lata) | |
| Lenovo Legion 5 16IRX G9 | |
| Cinebench R23 / Single Core | |
| Przeciętny Intel Core i9-14900HX (1720 - 2245, n=37) | |
| Lenovo Legion 9 16IRX8 | |
| Razer Blade 16 2024, RTX 4090 | |
| Schenker XMG Neo 16 E23 | |
| Średnia w klasie Gaming (1166 - 2356, n=110, ostatnie 2 lata) | |
| Lenovo Legion 5 16IRX G9 | |
| Razer Blade 16 Early 2023 RTX 4090 | |
| Cinebench R20 / CPU (Multi Core) | |
| Lenovo Legion 9 16IRX8 | |
| Schenker XMG Neo 16 E23 | |
| Przeciętny Intel Core i9-14900HX (6579 - 13832, n=37) | |
| Razer Blade 16 2024, RTX 4090 | |
| Razer Blade 16 Early 2023 RTX 4090 | |
| Średnia w klasie Gaming (4029 - 16108, n=109, ostatnie 2 lata) | |
| Lenovo Legion 5 16IRX G9 | |
| Cinebench R20 / CPU (Single Core) | |
| Przeciętny Intel Core i9-14900HX (657 - 859, n=37) | |
| Razer Blade 16 2024, RTX 4090 | |
| Schenker XMG Neo 16 E23 | |
| Średnia w klasie Gaming (442 - 895, n=109, ostatnie 2 lata) | |
| Razer Blade 16 Early 2023 RTX 4090 | |
| Lenovo Legion 5 16IRX G9 | |
| Lenovo Legion 9 16IRX8 | |
| Cinebench R15 / CPU Multi 64Bit | |
| Schenker XMG Neo 16 E23 | |
| Lenovo Legion 9 16IRX8 | |
| Razer Blade 16 2024, RTX 4090 | |
| Przeciętny Intel Core i9-14900HX (3263 - 5589, n=38) | |
| Razer Blade 16 Early 2023 RTX 4090 | |
| Średnia w klasie Gaming (1578 - 6271, n=109, ostatnie 2 lata) | |
| Lenovo Legion 5 16IRX G9 | |
| Cinebench R15 / CPU Single 64Bit | |
| Razer Blade 16 2024, RTX 4090 | |
| Przeciętny Intel Core i9-14900HX (247 - 323, n=37) | |
| Lenovo Legion 9 16IRX8 | |
| Schenker XMG Neo 16 E23 | |
| Średnia w klasie Gaming (188.8 - 343, n=109, ostatnie 2 lata) | |
| Lenovo Legion 5 16IRX G9 | |
| Razer Blade 16 Early 2023 RTX 4090 | |
| Blender / v2.79 BMW27 CPU | |
| Średnia w klasie Gaming (80 - 330, n=107, ostatnie 2 lata) | |
| Lenovo Legion 5 16IRX G9 | |
| Przeciętny Intel Core i9-14900HX (91 - 206, n=37) | |
| Razer Blade 16 Early 2023 RTX 4090 | |
| Schenker XMG Neo 16 E23 | |
| Razer Blade 16 2024, RTX 4090 | |
| Lenovo Legion 9 16IRX8 | |
| 7-Zip 18.03 / 7z b 4 | |
| Lenovo Legion 9 16IRX8 | |
| Razer Blade 16 2024, RTX 4090 | |
| Schenker XMG Neo 16 E23 | |
| Przeciętny Intel Core i9-14900HX (66769 - 136645, n=37) | |
| Razer Blade 16 Early 2023 RTX 4090 | |
| Lenovo Legion 5 16IRX G9 | |
| Średnia w klasie Gaming (33491 - 148086, n=108, ostatnie 2 lata) | |
| 7-Zip 18.03 / 7z b 4 -mmt1 | |
| Schenker XMG Neo 16 E23 | |
| Przeciętny Intel Core i9-14900HX (5452 - 7545, n=37) | |
| Razer Blade 16 2024, RTX 4090 | |
| Lenovo Legion 9 16IRX8 | |
| Razer Blade 16 Early 2023 RTX 4090 | |
| Lenovo Legion 5 16IRX G9 | |
| Średnia w klasie Gaming (4199 - 7436, n=108, ostatnie 2 lata) | |
| Geekbench 6.7 / Multi-Core | |
| Razer Blade 16 2024, RTX 4090 | |
| Lenovo Legion 9 16IRX8 | |
| Przeciętny Intel Core i9-14900HX (13158 - 19665, n=37) | |
| Lenovo Legion 5 16IRX G9 | |
| Średnia w klasie Gaming (6625 - 22104, n=109, ostatnie 2 lata) | |
| Geekbench 6.7 / Single-Core | |
| Przeciętny Intel Core i9-14900HX (2419 - 3129, n=37) | |
| Razer Blade 16 2024, RTX 4090 | |
| Lenovo Legion 9 16IRX8 | |
| Średnia w klasie Gaming (1490 - 3259, n=109, ostatnie 2 lata) | |
| Lenovo Legion 5 16IRX G9 | |
| Geekbench 5.5 / Multi-Core | |
| Schenker XMG Neo 16 E23 | |
| Lenovo Legion 9 16IRX8 | |
| Przeciętny Intel Core i9-14900HX (8618 - 23194, n=37) | |
| Razer Blade 16 2024, RTX 4090 | |
| Średnia w klasie Gaming (6460 - 27010, n=108, ostatnie 2 lata) | |
| Lenovo Legion 5 16IRX G9 | |
| Razer Blade 16 Early 2023 RTX 4090 | |
| Geekbench 5.5 / Single-Core | |
| Lenovo Legion 9 16IRX8 | |
| Razer Blade 16 2024, RTX 4090 | |
| Przeciętny Intel Core i9-14900HX (1669 - 2210, n=37) | |
| Średnia w klasie Gaming (986 - 2474, n=108, ostatnie 2 lata) | |
| Schenker XMG Neo 16 E23 | |
| Razer Blade 16 Early 2023 RTX 4090 | |
| Lenovo Legion 5 16IRX G9 | |
| HWBOT x265 Benchmark v2.2 / 4k Preset | |
| Lenovo Legion 9 16IRX8 | |
| Schenker XMG Neo 16 E23 | |
| Razer Blade 16 Early 2023 RTX 4090 | |
| Razer Blade 16 2024, RTX 4090 | |
| Przeciętny Intel Core i9-14900HX (16.8 - 38.9, n=37) | |
| Średnia w klasie Gaming (11.5 - 44.3, n=108, ostatnie 2 lata) | |
| Lenovo Legion 5 16IRX G9 | |
| LibreOffice / 20 Documents To PDF | |
| Razer Blade 16 Early 2023 RTX 4090 | |
| Średnia w klasie Gaming (19 - 88.8, n=108, ostatnie 2 lata) | |
| Razer Blade 16 2024, RTX 4090 | |
| Lenovo Legion 5 16IRX G9 | |
| Przeciętny Intel Core i9-14900HX (19 - 85.1, n=37) | |
| Schenker XMG Neo 16 E23 | |
| Lenovo Legion 9 16IRX8 | |
| R Benchmark 2.5 / Overall mean | |
| Średnia w klasie Gaming (0.3439 - 0.759, n=109, ostatnie 2 lata) | |
| Lenovo Legion 5 16IRX G9 | |
| Razer Blade 16 Early 2023 RTX 4090 | |
| Przeciętny Intel Core i9-14900HX (0.3604 - 0.4859, n=37) | |
| Lenovo Legion 9 16IRX8 | |
| Razer Blade 16 2024, RTX 4090 | |
| Schenker XMG Neo 16 E23 | |
* ... im mniej tym lepiej
AIDA64: FP32 Ray-Trace | FPU Julia | CPU SHA3 | CPU Queen | FPU SinJulia | FPU Mandel | CPU AES | CPU ZLib | FP64 Ray-Trace | CPU PhotoWorxx
| Performance rating | |
| Lenovo Legion 9 16IRX8 | |
| Razer Blade 16 2024, RTX 4090 | |
| Średnia w klasie Gaming | |
| Schenker XMG Neo 16 E23 | |
| Przeciętny Intel Core i9-14900HX | |
| Razer Blade 16 Early 2023 RTX 4090 | |
| Lenovo Legion 5 16IRX G9 | |
| AIDA64 / FP32 Ray-Trace | |
| Średnia w klasie Gaming (10227 - 85542, n=107, ostatnie 2 lata) | |
| Lenovo Legion 9 16IRX8 | |
| Razer Blade 16 2024, RTX 4090 | |
| Przeciętny Intel Core i9-14900HX (13098 - 33474, n=36) | |
| Schenker XMG Neo 16 E23 | |
| Lenovo Legion 5 16IRX G9 | |
| Razer Blade 16 Early 2023 RTX 4090 | |
| AIDA64 / FPU Julia | |
| Średnia w klasie Gaming (51376 - 238426, n=107, ostatnie 2 lata) | |
| Lenovo Legion 9 16IRX8 | |
| Razer Blade 16 2024, RTX 4090 | |
| Przeciętny Intel Core i9-14900HX (67573 - 166040, n=36) | |
| Schenker XMG Neo 16 E23 | |
| Razer Blade 16 Early 2023 RTX 4090 | |
| Lenovo Legion 5 16IRX G9 | |
| AIDA64 / CPU SHA3 | |
| Lenovo Legion 9 16IRX8 | |
| Razer Blade 16 2024, RTX 4090 | |
| Średnia w klasie Gaming (2180 - 9817, n=107, ostatnie 2 lata) | |
| Przeciętny Intel Core i9-14900HX (3589 - 7979, n=36) | |
| Schenker XMG Neo 16 E23 | |
| Razer Blade 16 Early 2023 RTX 4090 | |
| Lenovo Legion 5 16IRX G9 | |
| AIDA64 / CPU Queen | |
| Razer Blade 16 2024, RTX 4090 | |
| Przeciętny Intel Core i9-14900HX (118405 - 148966, n=36) | |
| Razer Blade 16 Early 2023 RTX 4090 | |
| Schenker XMG Neo 16 E23 | |
| Lenovo Legion 9 16IRX8 | |
| Średnia w klasie Gaming (49785 - 173351, n=98, ostatnie 2 lata) | |
| Lenovo Legion 5 16IRX G9 | |
| AIDA64 / FPU SinJulia | |
| Razer Blade 16 2024, RTX 4090 | |
| Lenovo Legion 9 16IRX8 | |
| Przeciętny Intel Core i9-14900HX (10475 - 18517, n=36) | |
| Schenker XMG Neo 16 E23 | |
| Średnia w klasie Gaming (4424 - 33636, n=107, ostatnie 2 lata) | |
| Razer Blade 16 Early 2023 RTX 4090 | |
| Lenovo Legion 5 16IRX G9 | |
| AIDA64 / FPU Mandel | |
| Średnia w klasie Gaming (25115 - 128721, n=107, ostatnie 2 lata) | |
| Lenovo Legion 9 16IRX8 | |
| Razer Blade 16 2024, RTX 4090 | |
| Przeciętny Intel Core i9-14900HX (32543 - 83662, n=36) | |
| Schenker XMG Neo 16 E23 | |
| Lenovo Legion 5 16IRX G9 | |
| Razer Blade 16 Early 2023 RTX 4090 | |
| AIDA64 / CPU AES | |
| Schenker XMG Neo 16 E23 | |
| Razer Blade 16 Early 2023 RTX 4090 | |
| Przeciętny Intel Core i9-14900HX (86964 - 241777, n=36) | |
| Lenovo Legion 9 16IRX8 | |
| Razer Blade 16 2024, RTX 4090 | |
| Średnia w klasie Gaming (39258 - 247074, n=107, ostatnie 2 lata) | |
| Lenovo Legion 5 16IRX G9 | |
| AIDA64 / CPU ZLib | |
| Lenovo Legion 9 16IRX8 | |
| Razer Blade 16 2024, RTX 4090 | |
| Przeciętny Intel Core i9-14900HX (1054 - 2292, n=36) | |
| Schenker XMG Neo 16 E23 | |
| Razer Blade 16 Early 2023 RTX 4090 | |
| Średnia w klasie Gaming (574 - 2531, n=107, ostatnie 2 lata) | |
| Lenovo Legion 5 16IRX G9 | |
| AIDA64 / FP64 Ray-Trace | |
| Średnia w klasie Gaming (5509 - 45446, n=107, ostatnie 2 lata) | |
| Lenovo Legion 9 16IRX8 | |
| Razer Blade 16 2024, RTX 4090 | |
| Przeciętny Intel Core i9-14900HX (6809 - 18349, n=36) | |
| Schenker XMG Neo 16 E23 | |
| Lenovo Legion 5 16IRX G9 | |
| Razer Blade 16 Early 2023 RTX 4090 | |
| AIDA64 / CPU PhotoWorxx | |
| Razer Blade 16 Early 2023 RTX 4090 | |
| Lenovo Legion 9 16IRX8 | |
| Razer Blade 16 2024, RTX 4090 | |
| Schenker XMG Neo 16 E23 | |
| Przeciętny Intel Core i9-14900HX (23903 - 54702, n=36) | |
| Średnia w klasie Gaming (12271 - 89891, n=107, ostatnie 2 lata) | |
| Lenovo Legion 5 16IRX G9 | |
Wydajność systemu
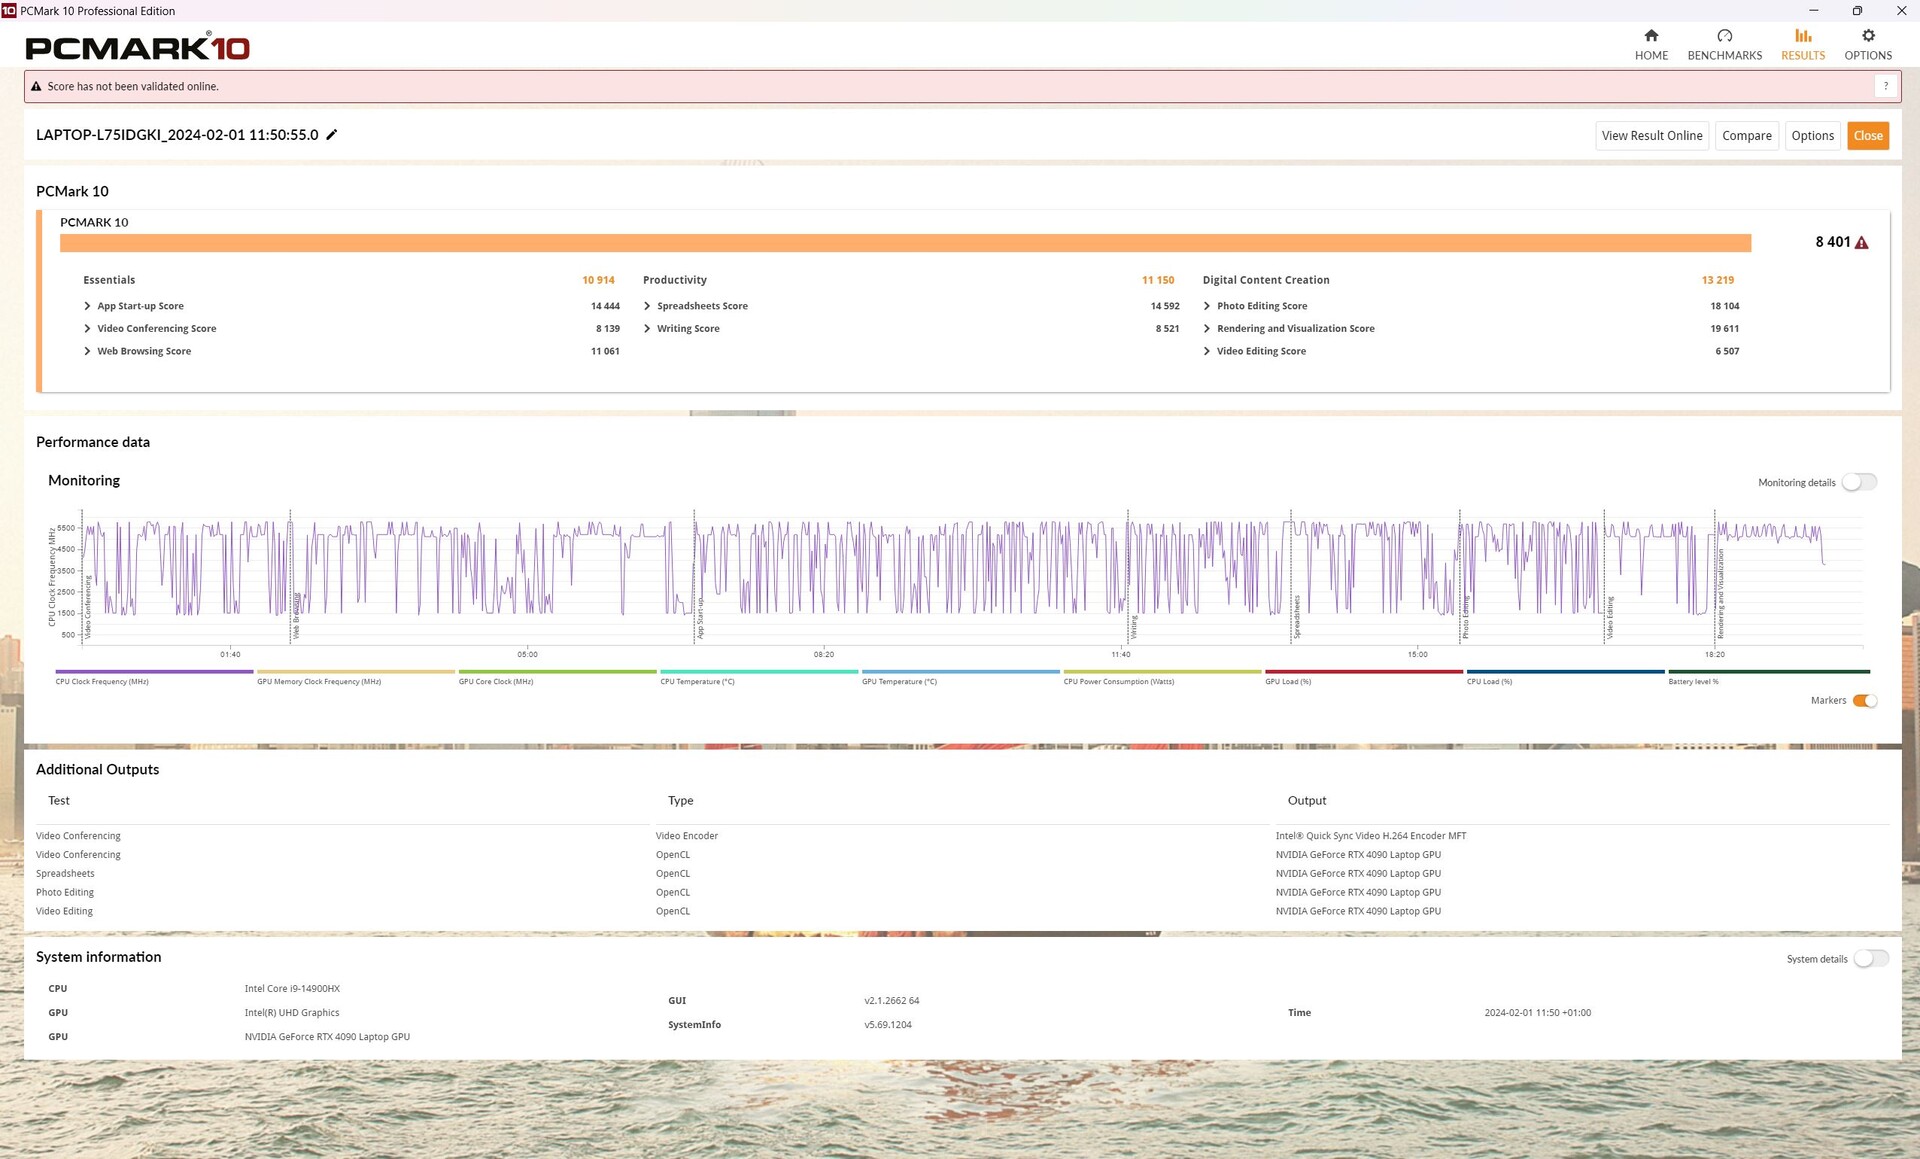
W CrossMark, Blade 16 objął prowadzenie nad urządzeniami porównawczymi, podczas gdy w PCMark 10, gracz znalazł się około 3 procent za przeciętnym laptopem z tą samą kombinacją CPU/GPU. W sumie wszystkie urządzenia porównawcze osiągnęły podobne wartości.
Subiektywnie rzecz biorąc, system działa płynnie - jedynie przełączanie grafiki powoduje, że zawiesza się na kilka sekund podczas uruchamiania aplikacji, ale dzieje się tak również w przypadku wielu innych graczy z dGPU.
CrossMark: Overall | Productivity | Creativity | Responsiveness
WebXPRT 3: Overall
WebXPRT 4: Overall
Mozilla Kraken 1.1: Total
| PCMark 10 / Score | |
| Lenovo Legion 9 16IRX8 | |
| Przeciętny Intel Core i9-14900HX, NVIDIA GeForce RTX 4090 Laptop GPU (8230 - 9234, n=13) | |
| Razer Blade 16 2024, RTX 4090 | |
| Schenker XMG Neo 16 E23 | |
| Średnia w klasie Gaming (5828 - 11574, n=94, ostatnie 2 lata) | |
| Lenovo Legion 5 16IRX G9 | |
| Razer Blade 16 Early 2023 RTX 4090 | |
| PCMark 10 / Essentials | |
| Lenovo Legion 9 16IRX8 | |
| Przeciętny Intel Core i9-14900HX, NVIDIA GeForce RTX 4090 Laptop GPU (10778 - 11628, n=13) | |
| Schenker XMG Neo 16 E23 | |
| Razer Blade 16 2024, RTX 4090 | |
| Razer Blade 16 Early 2023 RTX 4090 | |
| Lenovo Legion 5 16IRX G9 | |
| Średnia w klasie Gaming (8810 - 12600, n=98, ostatnie 2 lata) | |
| PCMark 10 / Productivity | |
| Razer Blade 16 2024, RTX 4090 | |
| Lenovo Legion 9 16IRX8 | |
| Średnia w klasie Gaming (6845 - 18766, n=96, ostatnie 2 lata) | |
| Przeciętny Intel Core i9-14900HX, NVIDIA GeForce RTX 4090 Laptop GPU (9458 - 11759, n=13) | |
| Schenker XMG Neo 16 E23 | |
| Lenovo Legion 5 16IRX G9 | |
| Razer Blade 16 Early 2023 RTX 4090 | |
| PCMark 10 / Digital Content Creation | |
| Lenovo Legion 9 16IRX8 | |
| Przeciętny Intel Core i9-14900HX, NVIDIA GeForce RTX 4090 Laptop GPU (13219 - 16462, n=13) | |
| Schenker XMG Neo 16 E23 | |
| Średnia w klasie Gaming (7602 - 19657, n=96, ostatnie 2 lata) | |
| Razer Blade 16 2024, RTX 4090 | |
| Razer Blade 16 Early 2023 RTX 4090 | |
| Lenovo Legion 5 16IRX G9 | |
| CrossMark / Overall | |
| Razer Blade 16 2024, RTX 4090 | |
| Przeciętny Intel Core i9-14900HX, NVIDIA GeForce RTX 4090 Laptop GPU (1877 - 2344, n=10) | |
| Schenker XMG Neo 16 E23 | |
| Lenovo Legion 5 16IRX G9 | |
| Razer Blade 16 Early 2023 RTX 4090 | |
| Średnia w klasie Gaming (1366 - 2409, n=96, ostatnie 2 lata) | |
| Lenovo Legion 9 16IRX8 | |
| CrossMark / Productivity | |
| Razer Blade 16 2024, RTX 4090 | |
| Przeciętny Intel Core i9-14900HX, NVIDIA GeForce RTX 4090 Laptop GPU (1738 - 2162, n=10) | |
| Schenker XMG Neo 16 E23 | |
| Lenovo Legion 5 16IRX G9 | |
| Razer Blade 16 Early 2023 RTX 4090 | |
| Średnia w klasie Gaming (1386 - 2254, n=96, ostatnie 2 lata) | |
| Lenovo Legion 9 16IRX8 | |
| CrossMark / Creativity | |
| Schenker XMG Neo 16 E23 | |
| Razer Blade 16 2024, RTX 4090 | |
| Przeciętny Intel Core i9-14900HX, NVIDIA GeForce RTX 4090 Laptop GPU (2195 - 2660, n=10) | |
| Lenovo Legion 5 16IRX G9 | |
| Lenovo Legion 9 16IRX8 | |
| Średnia w klasie Gaming (1343 - 2729, n=96, ostatnie 2 lata) | |
| Razer Blade 16 Early 2023 RTX 4090 | |
| CrossMark / Responsiveness | |
| Lenovo Legion 5 16IRX G9 | |
| Przeciętny Intel Core i9-14900HX, NVIDIA GeForce RTX 4090 Laptop GPU (1478 - 2327, n=10) | |
| Razer Blade 16 2024, RTX 4090 | |
| Razer Blade 16 Early 2023 RTX 4090 | |
| Schenker XMG Neo 16 E23 | |
| Średnia w klasie Gaming (1226 - 2334, n=96, ostatnie 2 lata) | |
| Lenovo Legion 9 16IRX8 | |
| WebXPRT 3 / Overall | |
| Lenovo Legion 9 16IRX8 | |
| Schenker XMG Neo 16 E23 | |
| Razer Blade 16 2024, RTX 4090 | |
| Przeciętny Intel Core i9-14900HX, NVIDIA GeForce RTX 4090 Laptop GPU (279 - 339, n=10) | |
| Średnia w klasie Gaming (242 - 532, n=99, ostatnie 2 lata) | |
| Lenovo Legion 5 16IRX G9 | |
| Razer Blade 16 Early 2023 RTX 4090 | |
| Razer Blade 16 Early 2023 RTX 4090 | |
| WebXPRT 4 / Overall | |
| Lenovo Legion 9 16IRX8 | |
| Schenker XMG Neo 16 E23 | |
| Przeciętny Intel Core i9-14900HX, NVIDIA GeForce RTX 4090 Laptop GPU (246 - 309, n=8) | |
| Średnia w klasie Gaming (176.4 - 354, n=99, ostatnie 2 lata) | |
| Razer Blade 16 Early 2023 RTX 4090 | |
| Razer Blade 16 Early 2023 RTX 4090 | |
| Razer Blade 16 Early 2023 RTX 4090 | |
| Lenovo Legion 5 16IRX G9 | |
| Mozilla Kraken 1.1 / Total | |
| Lenovo Legion 5 16IRX G9 | |
| Razer Blade 16 Early 2023 RTX 4090 | |
| Razer Blade 16 Early 2023 RTX 4090 | |
| Średnia w klasie Gaming (391 - 590, n=104, ostatnie 2 lata) | |
| Przeciętny Intel Core i9-14900HX, NVIDIA GeForce RTX 4090 Laptop GPU (428 - 535, n=11) | |
| Schenker XMG Neo 16 E23 | |
| Razer Blade 16 2024, RTX 4090 | |
| Lenovo Legion 9 16IRX8 | |
* ... im mniej tym lepiej
| PCMark 10 Score | 8401 pkt. | |
Pomoc | ||
| AIDA64 / Memory Copy | |
| Razer Blade 16 2024, RTX 4090 | |
| Razer Blade 16 Early 2023 RTX 4090 | |
| Lenovo Legion 9 16IRX8 | |
| Schenker XMG Neo 16 E23 | |
| Przeciętny Intel Core i9-14900HX (38028 - 83392, n=36) | |
| Średnia w klasie Gaming (21750 - 129946, n=107, ostatnie 2 lata) | |
| Lenovo Legion 5 16IRX G9 | |
| AIDA64 / Memory Read | |
| Razer Blade 16 2024, RTX 4090 | |
| Lenovo Legion 9 16IRX8 | |
| Razer Blade 16 Early 2023 RTX 4090 | |
| Schenker XMG Neo 16 E23 | |
| Przeciętny Intel Core i9-14900HX (43306 - 87568, n=36) | |
| Średnia w klasie Gaming (22956 - 118858, n=107, ostatnie 2 lata) | |
| Lenovo Legion 5 16IRX G9 | |
| AIDA64 / Memory Write | |
| Razer Blade 16 Early 2023 RTX 4090 | |
| Średnia w klasie Gaming (22297 - 135096, n=107, ostatnie 2 lata) | |
| Lenovo Legion 9 16IRX8 | |
| Razer Blade 16 2024, RTX 4090 | |
| Przeciętny Intel Core i9-14900HX (37146 - 80589, n=36) | |
| Schenker XMG Neo 16 E23 | |
| Lenovo Legion 5 16IRX G9 | |
| AIDA64 / Memory Latency | |
| Średnia w klasie Gaming (75.3 - 259, n=107, ostatnie 2 lata) | |
| Lenovo Legion 5 16IRX G9 | |
| Razer Blade 16 Early 2023 RTX 4090 | |
| Schenker XMG Neo 16 E23 | |
| Przeciętny Intel Core i9-14900HX (76.1 - 105, n=36) | |
| Lenovo Legion 9 16IRX8 | |
| Razer Blade 16 2024, RTX 4090 | |
* ... im mniej tym lepiej
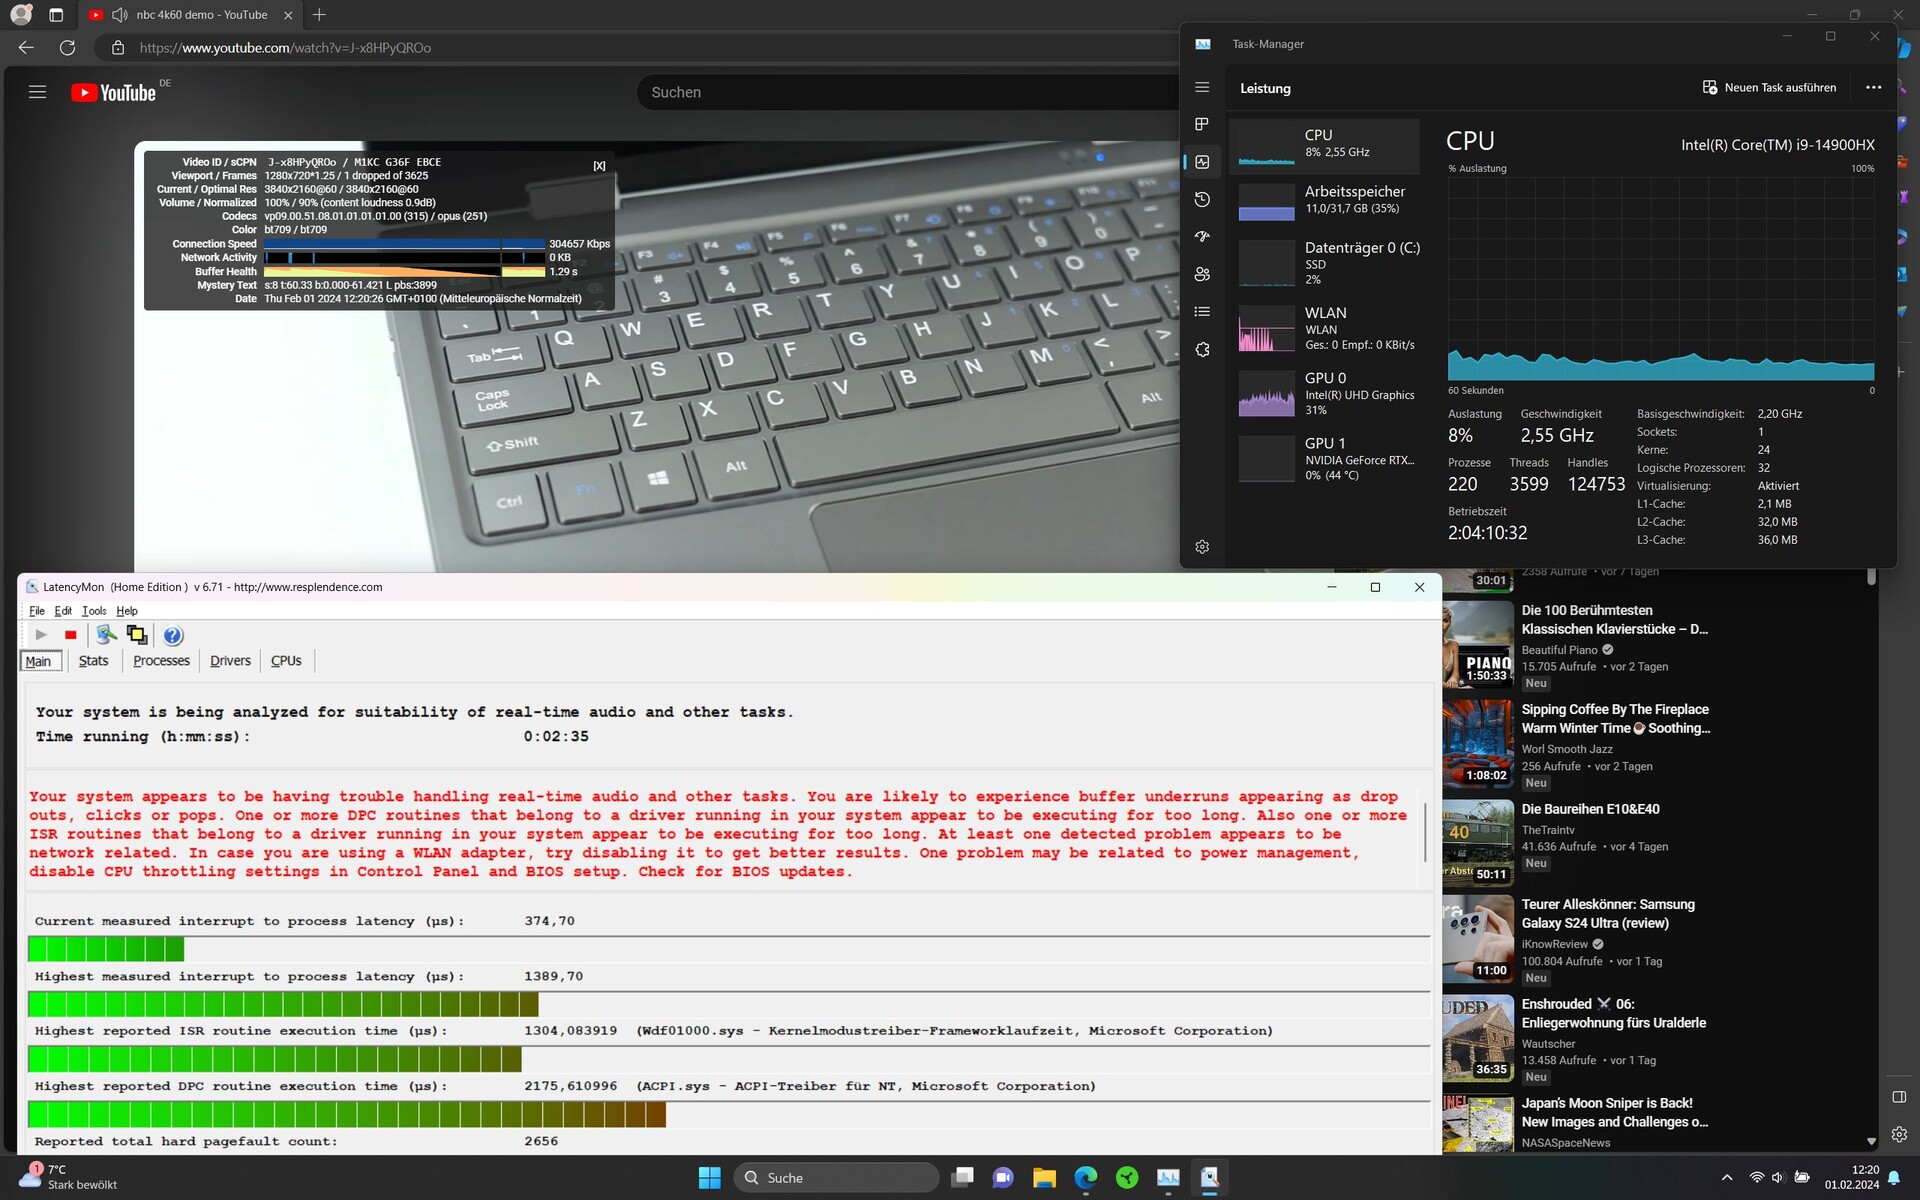
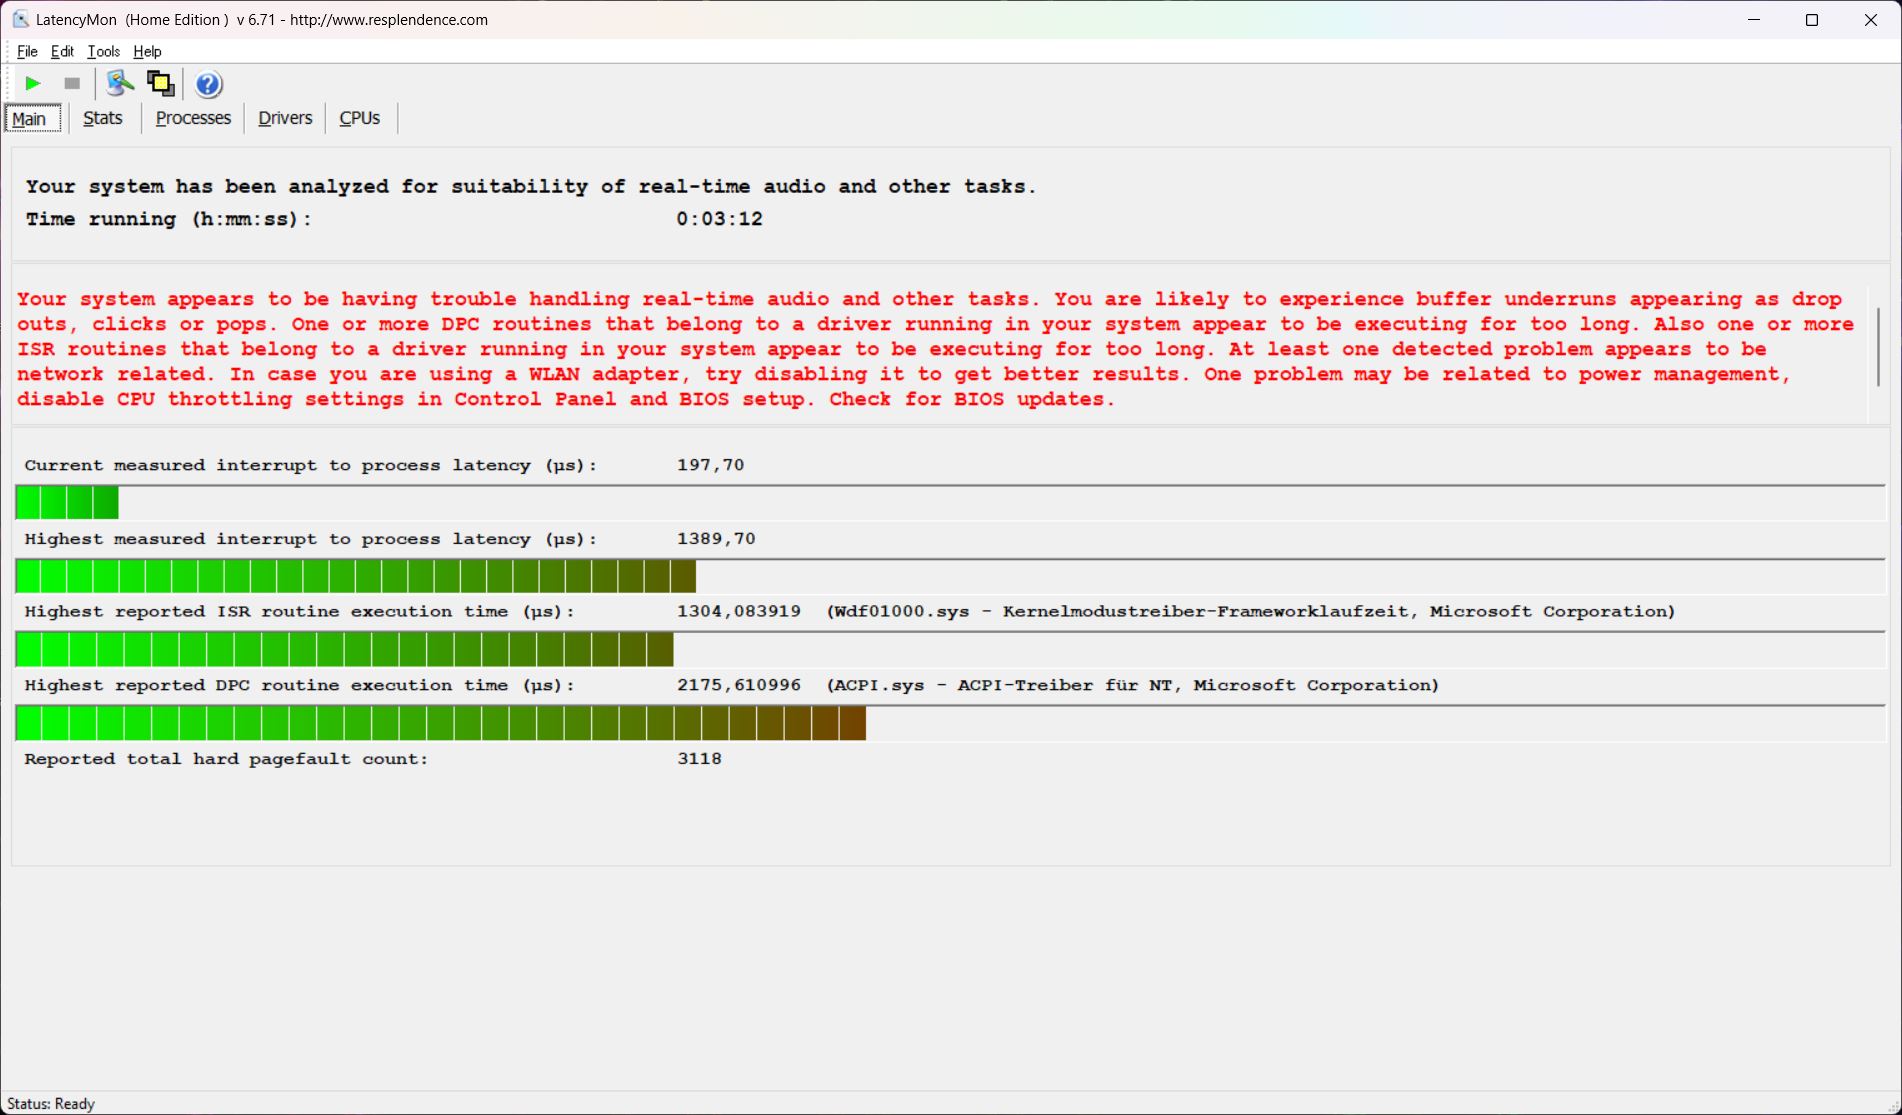
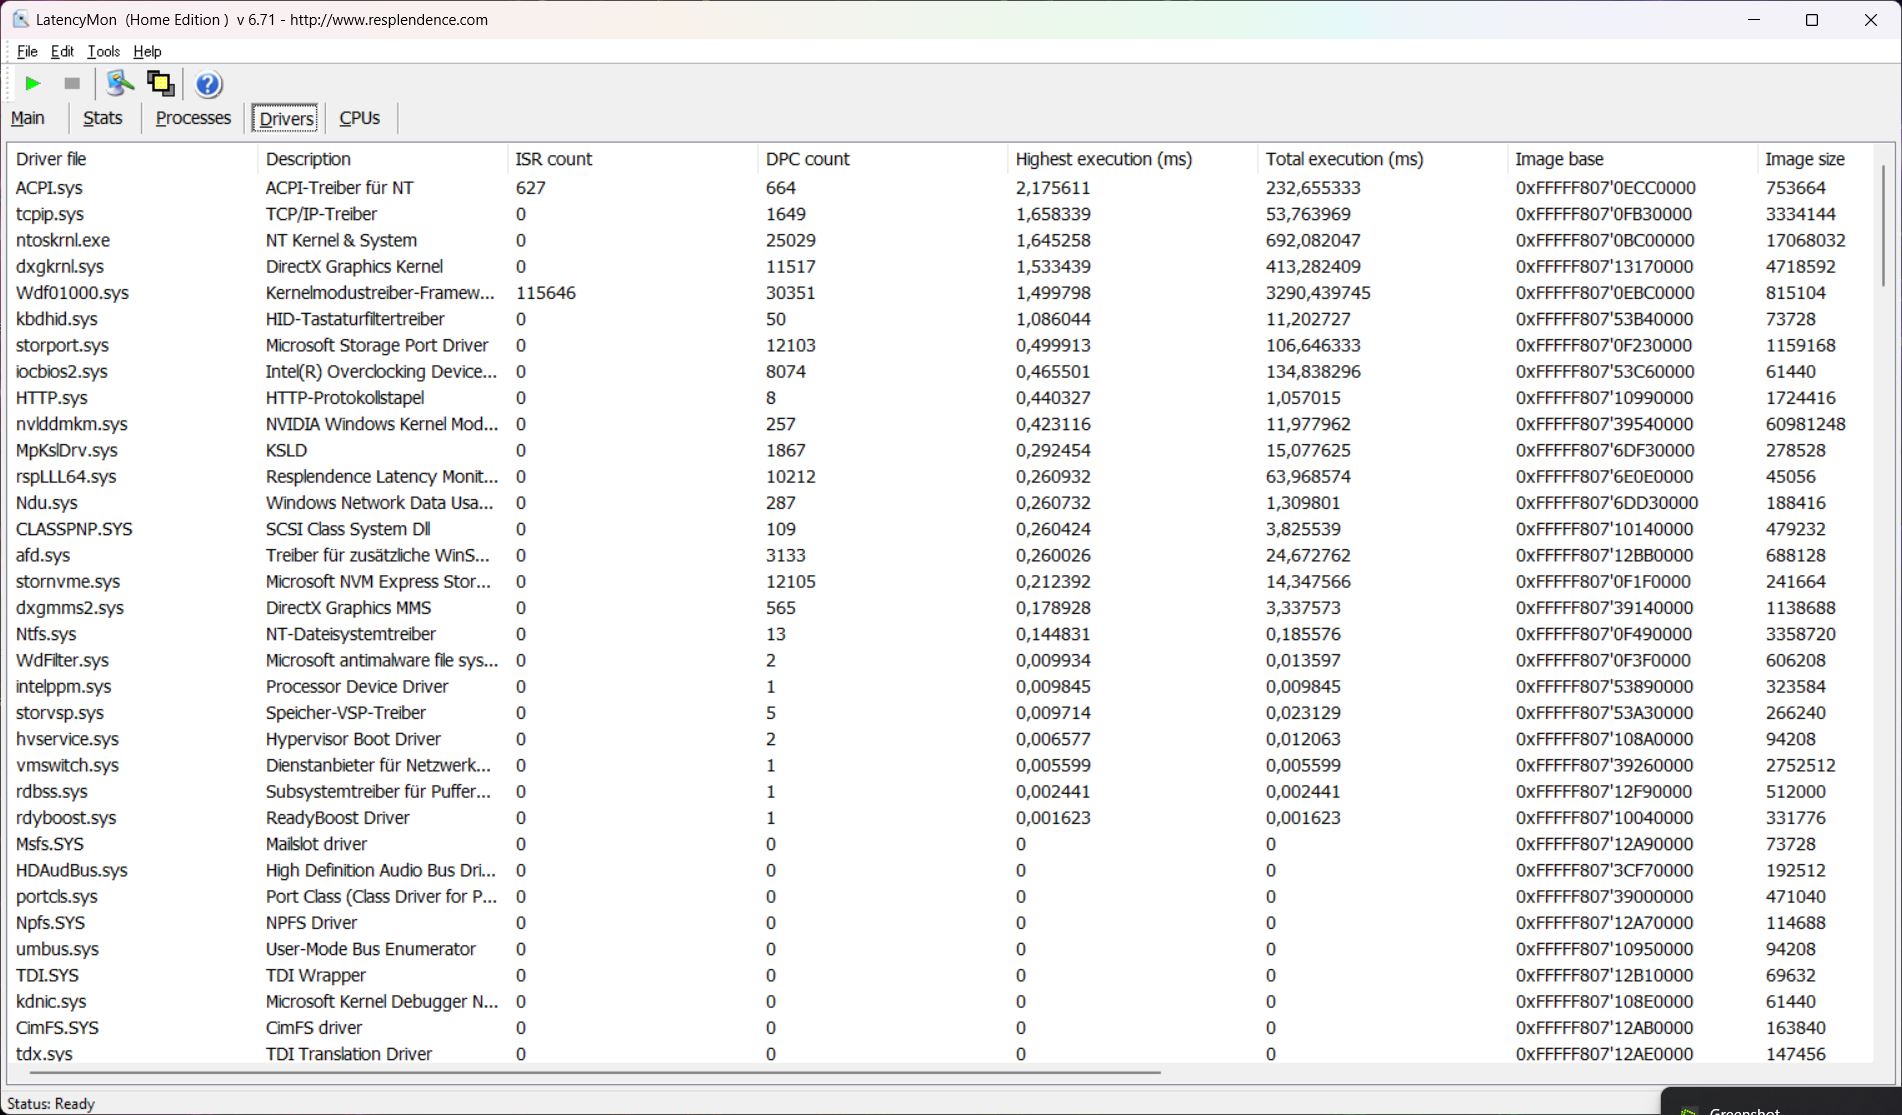
Opóźnienie DPC
Oprogramowanie LatencyMon wykryło niewielkie opóźnienia zaraz po otwarciu przeglądarki. Zwiększyły się one po otwarciu kilku kart na naszej stronie internetowej. Nasz film 4K/60 fps na YouTube był odtwarzany płynnie, ale z jedną utraconą klatką.
| DPC Latencies / LatencyMon - interrupt to process latency (max), Web, Youtube, Prime95 | |
| Razer Blade 16 Early 2023 RTX 4090 | |
| Razer Blade 16 Early 2023 RTX 4090 | |
| Schenker XMG Neo 16 E23 | |
| Lenovo Legion 9 16IRX8 | |
| Lenovo Legion 5 16IRX G9 | |
| Razer Blade 16 2024, RTX 4090 | |
* ... im mniej tym lepiej
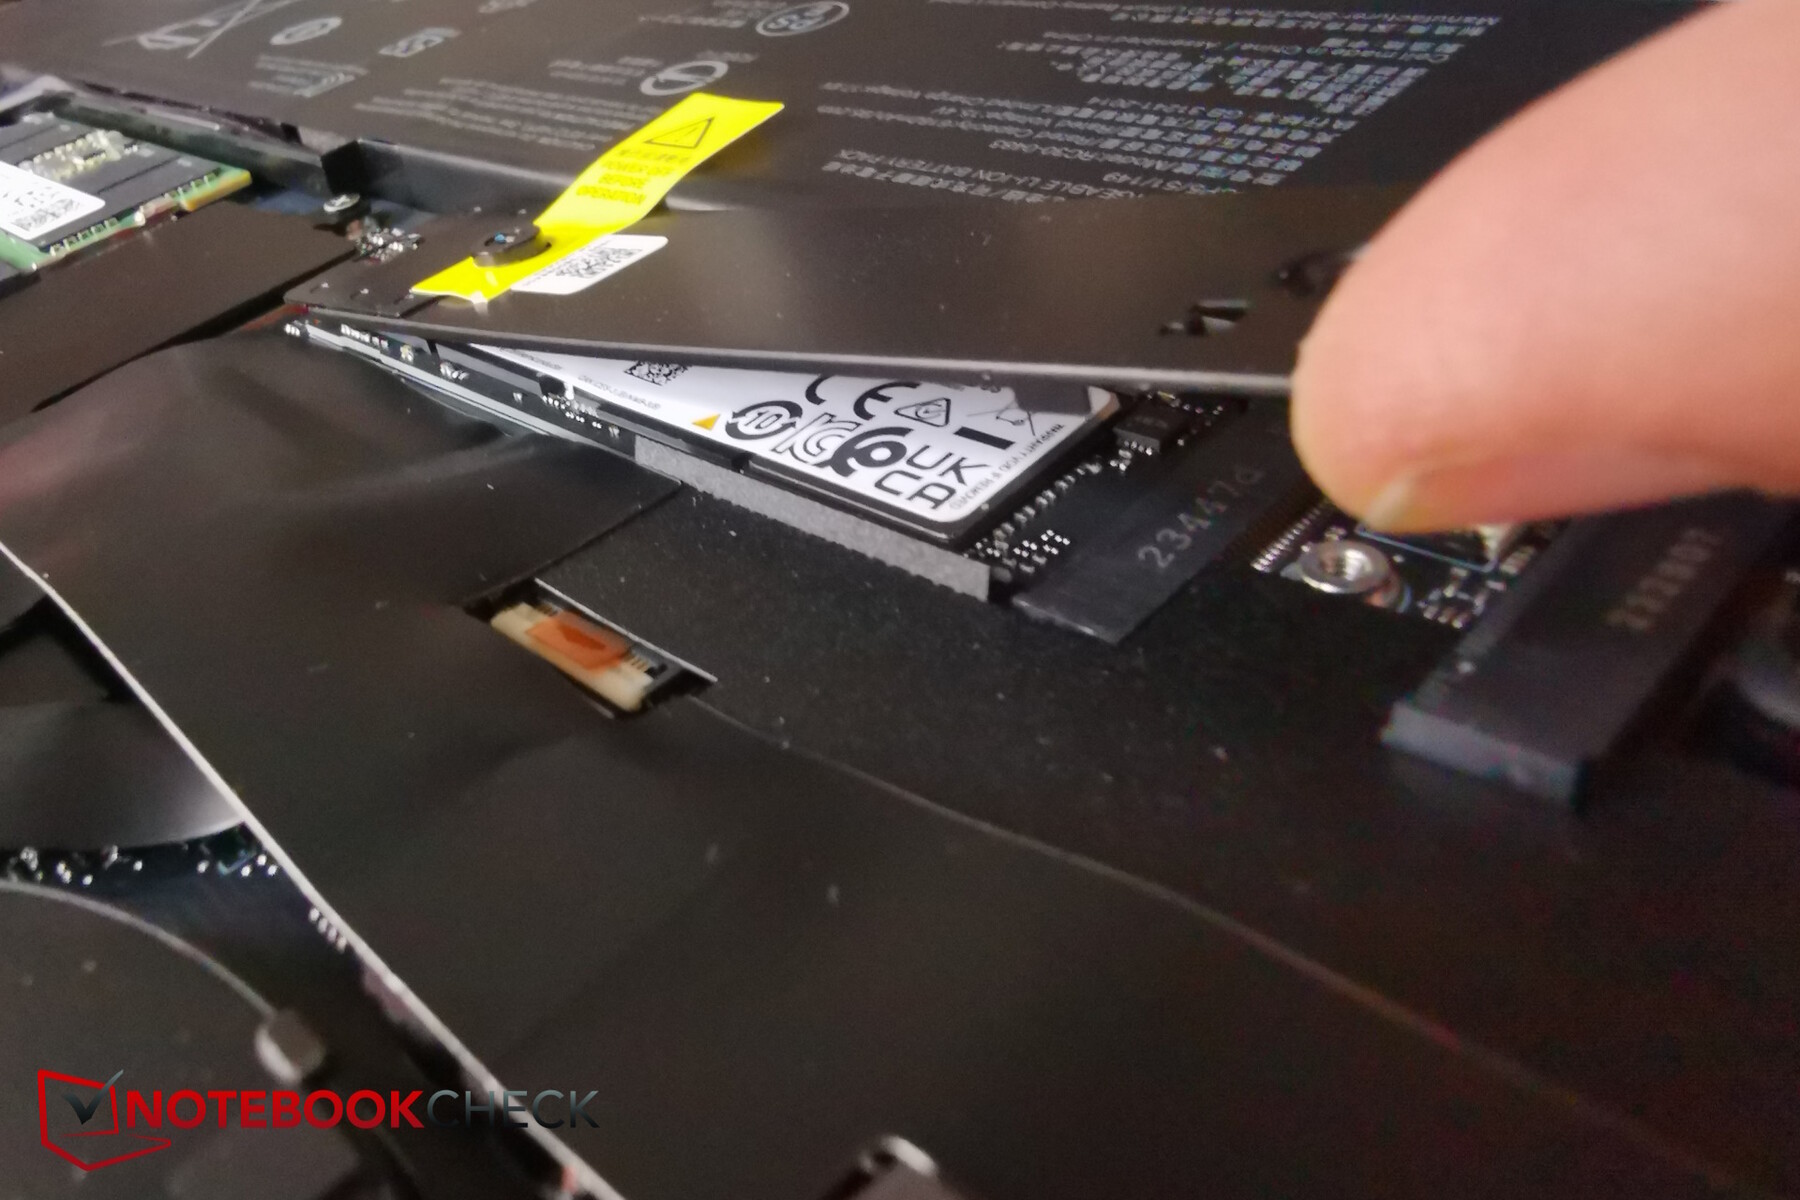
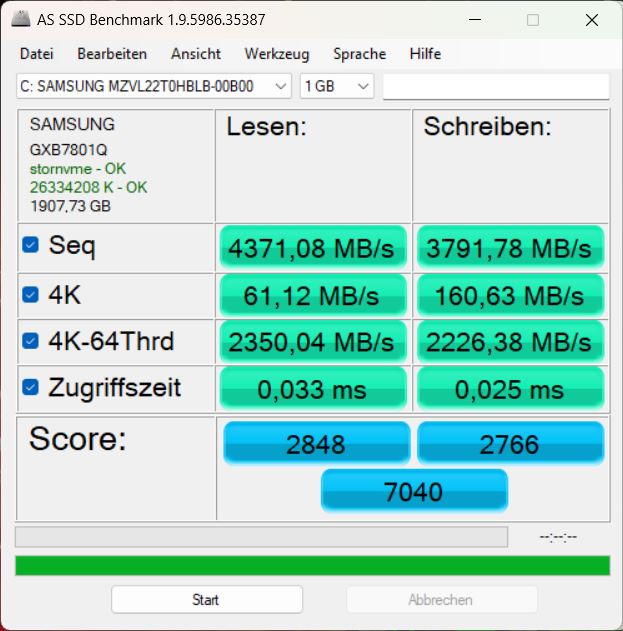
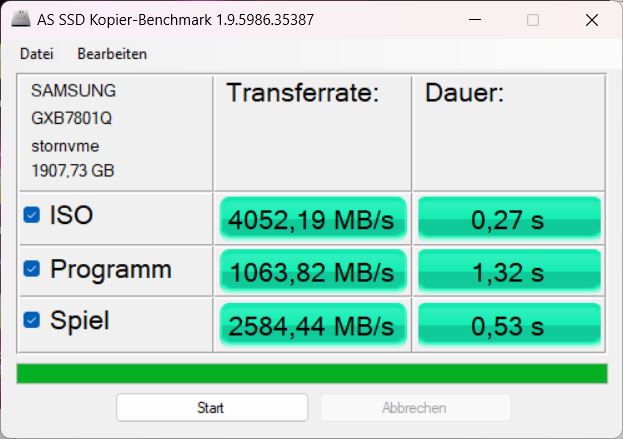
Urządzenia pamięci masowej
Razer zainstalował 2-TB PCIe-4-NVMe SSD od Samsunga w naszym urządzeniu testowym. Stosunkowo szybkie urządzenie pamięci masowej osiągnęło pozycję 13 w naszym liście najlepszych. W Blade dysk SSD najpierw działał z optymalną prędkością, ale nie był w stanie utrzymać jej na stałym poziomie przez dłuższy czas - jego szybkość transferu spadła o około 30 procent po pewnym czasie z powodu dławienia termicznego. Niemniej jednak, Razer powinien naprawdę podjąć kroki w celu zapewnienia, że dławienie termiczne nie wystąpi na początku.

| Drive Performance rating - Percent | |
| Lenovo Legion 5 16IRX G9 | |
| Przeciętny Samsung PM9A1 MZVL22T0HBLB | |
| Razer Blade 16 2024, RTX 4090 | |
| Średnia w klasie Gaming | |
| Razer Blade 16 Early 2023 RTX 4090 | |
| Lenovo Legion 9 16IRX8 | |
| Schenker XMG Neo 16 E23 | |
* ... im mniej tym lepiej
Reading continuous performance: DiskSpd Read Loop, Queue Depth 8
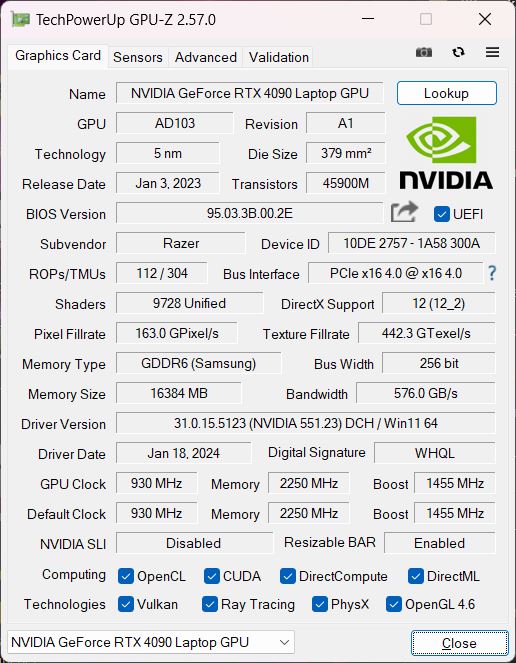
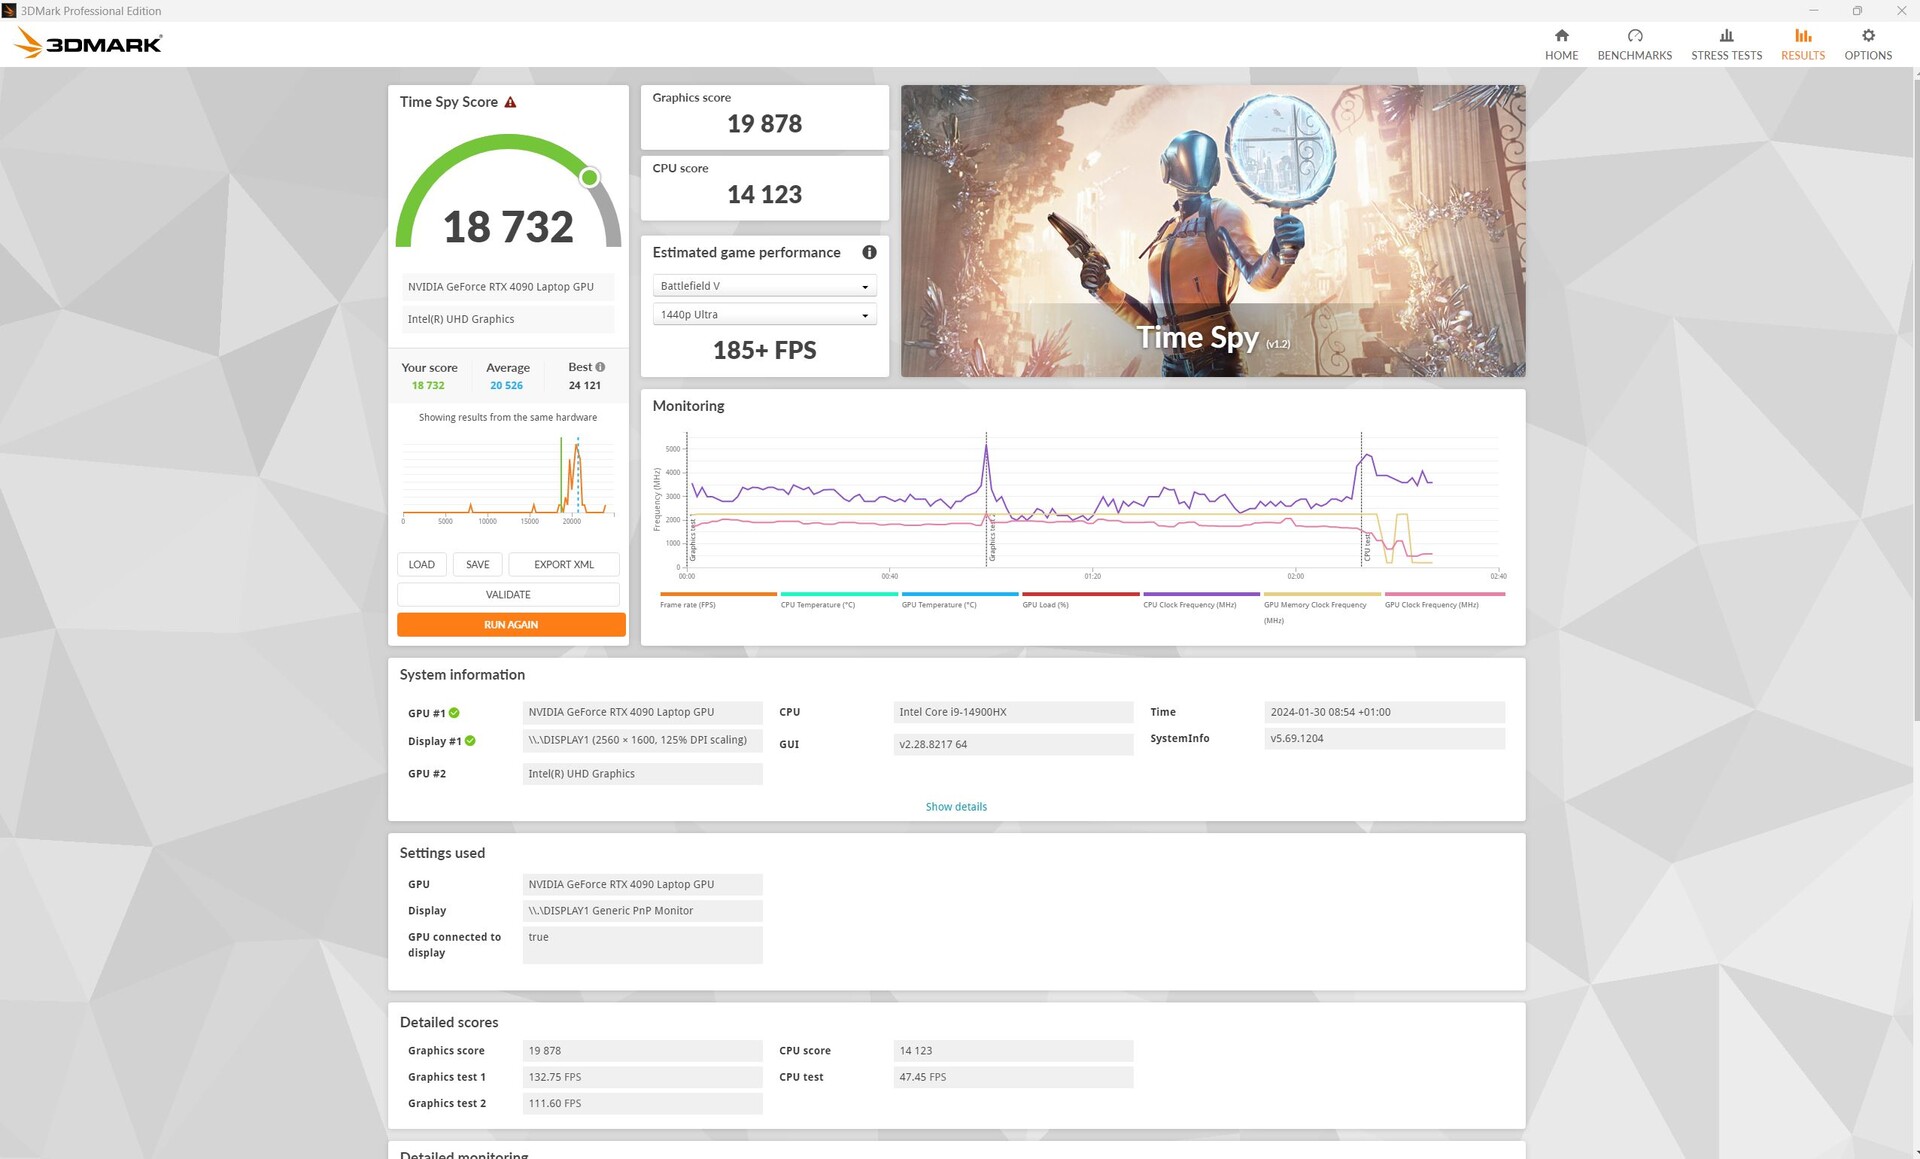
Karta graficzna
Karta graficzna RTX 4090 jest obecnie najpotężniejszym GPU dla laptopów. Wewnątrz Blade 16 może on nawet wykorzystać maksymalne 175 watów (150 watów + 25 watów Dynamic Boost, w zależności od trybu). Posiada również 16 GB pamięci RAM.
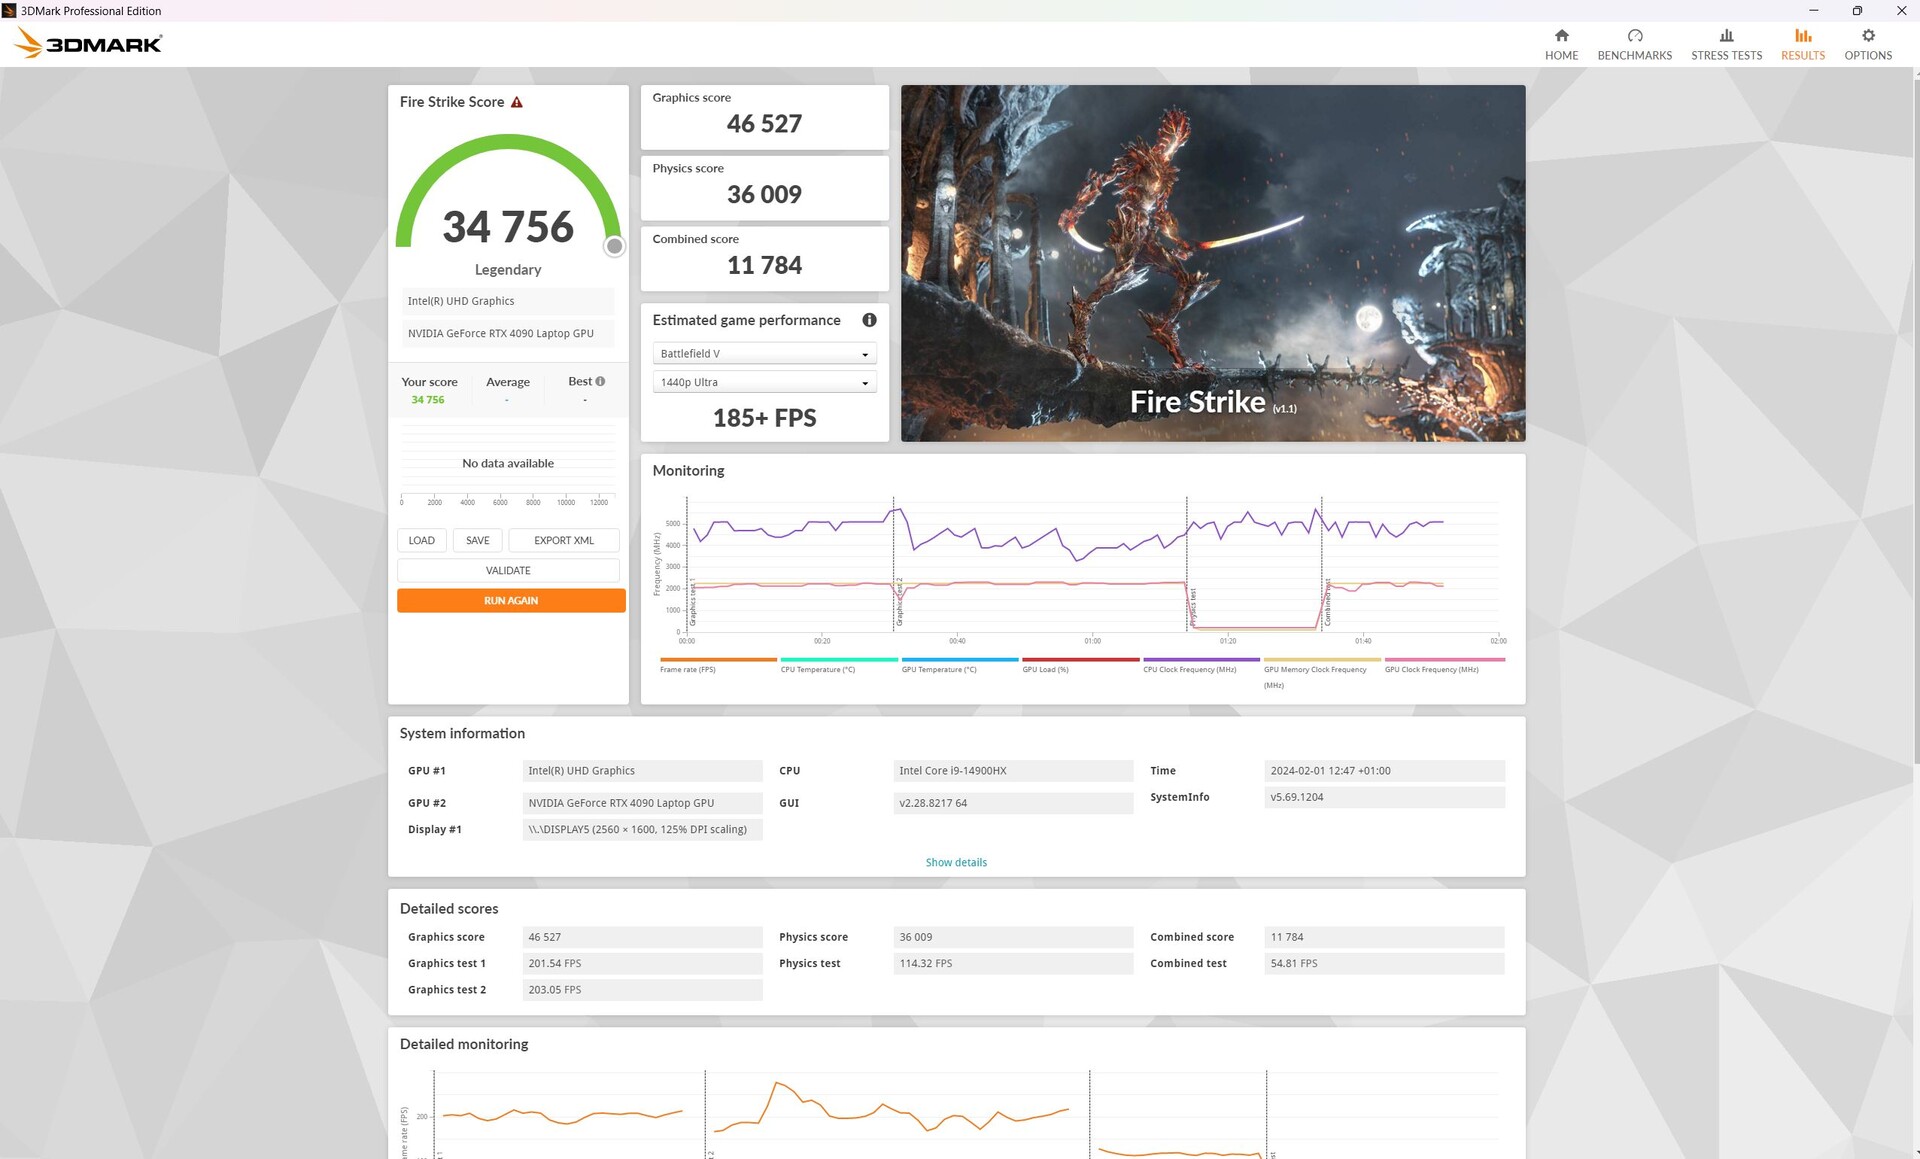
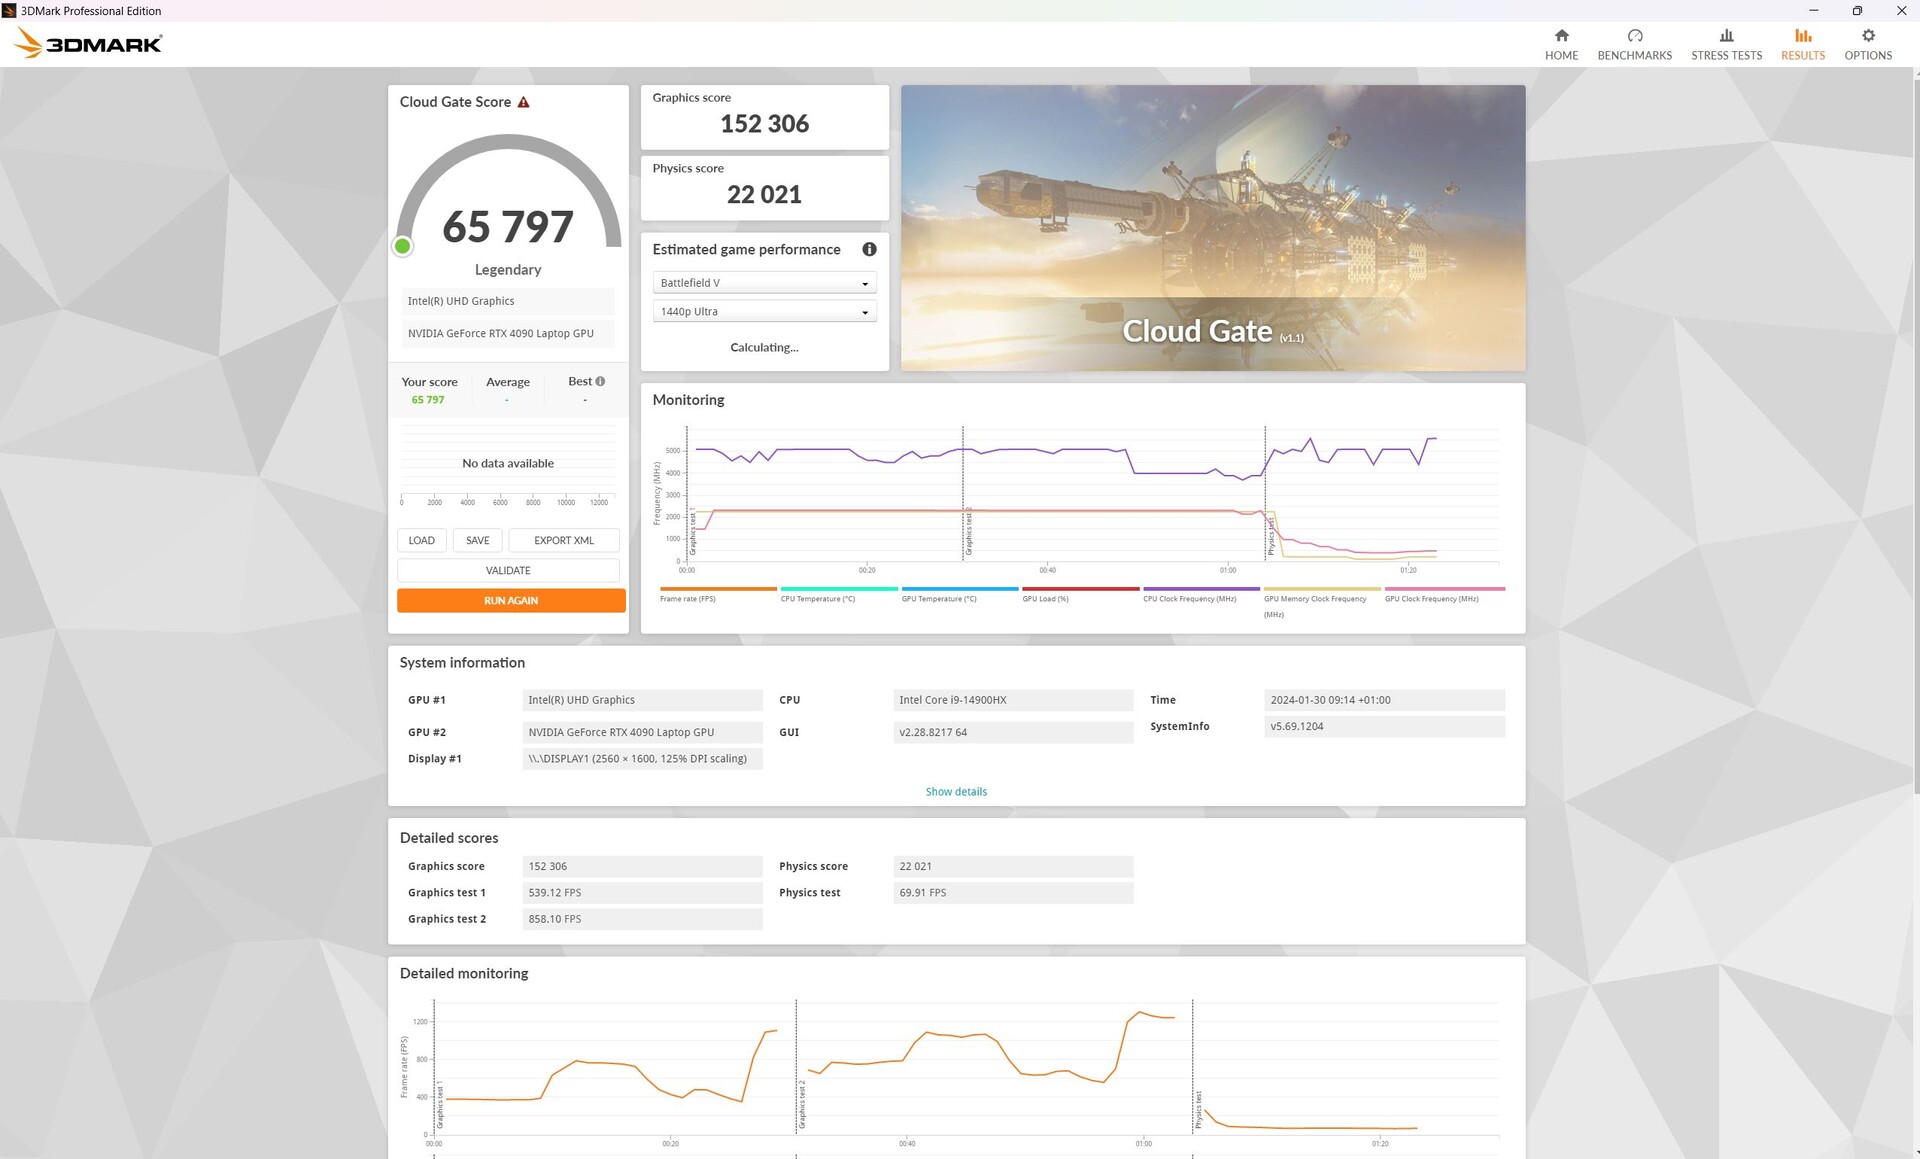
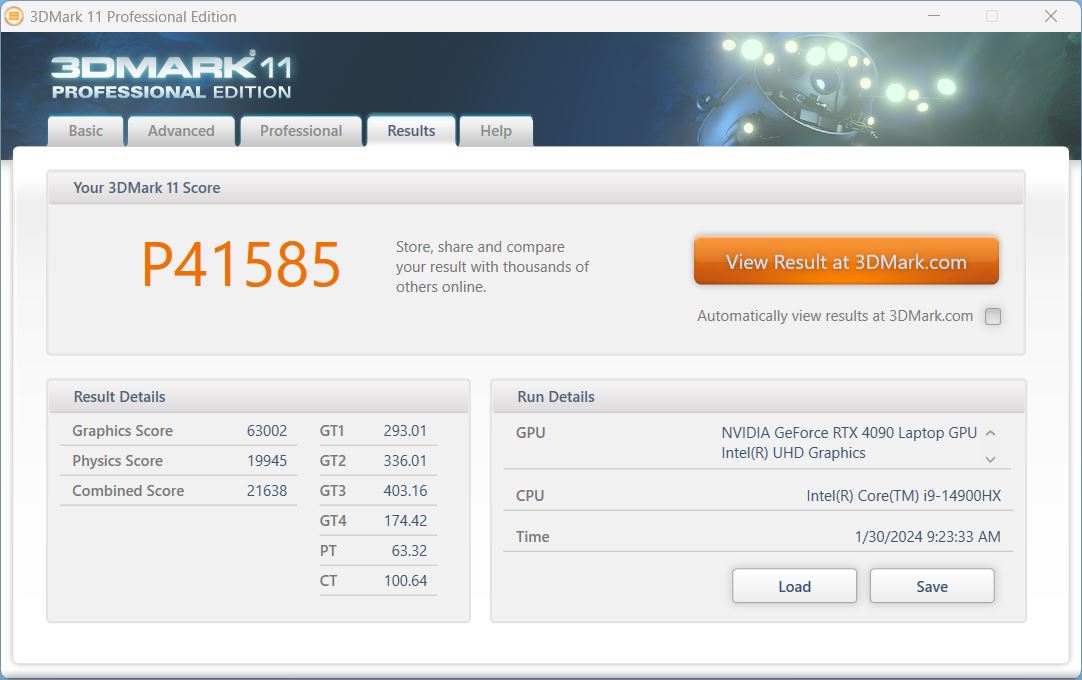
W syntetycznych benchmarkach 3DMark konkurenci RTX-4090 wypadli podobnie dobrze - tylko XMG Neo 16 E23 był o około 7 procent szybszy. Podsumowując, RTX 4090 w Blade 16 osiągnął wyniki porównywalne ze średnią wszystkich laptopów w naszej bazie danych wyposażonych w RTX 4090. W porównaniu do 2023 Blade 16wypadł tylko o 5 procent lepiej.
Powtórzenie kolejnego uruchomienia Fire-Strike w trybie bateryjnym doprowadziło do spadku wyniku graficznego laptopa aż o 85 procent!
| 3DMark Performance rating - Percent | |
| Schenker XMG Neo 16 E23 | |
| Razer Blade 16 2024, RTX 4090 | |
| Lenovo Legion 9 16IRX8 -1! | |
| Przeciętny NVIDIA GeForce RTX 4090 Laptop GPU | |
| Razer Blade 16 Early 2023 RTX 4090 | |
| Średnia w klasie Gaming | |
| Lenovo Legion 5 16IRX G9 -1! | |
| 3DMark 11 - 1280x720 Performance GPU | |
| Schenker XMG Neo 16 E23 | |
| Razer Blade 16 2024, RTX 4090 | |
| Przeciętny NVIDIA GeForce RTX 4090 Laptop GPU (54073 - 73027, n=42) | |
| Lenovo Legion 9 16IRX8 | |
| Razer Blade 16 Early 2023 RTX 4090 | |
| Średnia w klasie Gaming (21841 - 80022, n=106, ostatnie 2 lata) | |
| Lenovo Legion 5 16IRX G9 | |
| 3DMark | |
| 1280x720 Cloud Gate Standard Graphics | |
| Razer Blade 16 2024, RTX 4090 | |
| Średnia w klasie Gaming (86886 - 223650, n=61, ostatnie 2 lata) | |
| Schenker XMG Neo 16 E23 | |
| Przeciętny NVIDIA GeForce RTX 4090 Laptop GPU (95671 - 164399, n=14) | |
| Razer Blade 16 Early 2023 RTX 4090 | |
| 1920x1080 Fire Strike Graphics | |
| Schenker XMG Neo 16 E23 | |
| Razer Blade 16 2024, RTX 4090 | |
| Lenovo Legion 9 16IRX8 | |
| Przeciętny NVIDIA GeForce RTX 4090 Laptop GPU (40259 - 53059, n=41) | |
| Razer Blade 16 Early 2023 RTX 4090 | |
| Średnia w klasie Gaming (12242 - 62849, n=118, ostatnie 2 lata) | |
| Lenovo Legion 5 16IRX G9 | |
| 2560x1440 Time Spy Graphics | |
| Schenker XMG Neo 16 E23 | |
| Lenovo Legion 9 16IRX8 | |
| Przeciętny NVIDIA GeForce RTX 4090 Laptop GPU (16950 - 23292, n=43) | |
| Razer Blade 16 2024, RTX 4090 | |
| Razer Blade 16 Early 2023 RTX 4090 | |
| Średnia w klasie Gaming (5012 - 26212, n=117, ostatnie 2 lata) | |
| Lenovo Legion 5 16IRX G9 | |
| 3DMark 11 Performance | 44454 pkt. | |
| 3DMark Cloud Gate Standard Score | 65797 pkt. | |
| 3DMark Fire Strike Score | 34756 pkt. | |
| 3DMark Time Spy Score | 18732 pkt. | |
Pomoc | ||
* ... im mniej tym lepiej
Gaming
W grach laptop prezentował się podobnie. Ponownie, Blade osiągnął przewagę około 7 procent w porównaniu do swojego poprzednika. Inni konkurenci ostatniej generacji, tacy jak XMG Neo 16 lub Legion 9 w rzeczywistości nawet wyprzedziły Blade'a w grach.
Ogólnie rzecz biorąc, Blade 16 ma wystarczającą moc, aby wyświetlać wszystkie gry w 4K. Jednak jego liczba klatek na sekundę czasami spadała poniżej 60 klatek na sekundę podczas uruchamiania Dying Light .
Podczas grania w Cyberpunk 2077 1.6, nowy Blade 16 zarządzał około 52 klatkami na sekundę w 4K Ultra. W 4K jego liczba klatek na sekundę spadła do wartości niemożliwych do odtworzenia przy maksymalnej jakości RT, najlepszym GPU lub nie.
Nawet z DLSS lub Frame Generation (FG), nie można dorównać częstotliwości odświeżania wyświetlacza - przynajmniej w natywnej rozdzielczości 1600p. W Cyberpunk zmierzyliśmy 53,42 klatek na sekundę (DLSS) i około 85 klatek na sekundę (FG). W Call of Duty: Modern Warfare III system osiągnął 161 klatek na sekundę (DLSS) i 183 klatki na sekundę (FG), a w Alan Wake II zmierzyliśmy 73,5 (DLSS) i 112,6 klatek na sekundę (FG).
Poniższa tabela przedstawia wartości FPS, zużycia energii i głośności dla The Witcher 3 FHD Ultra przy użyciu różnych trybów wydajności.
| Tryb/wartość wydajności | Witcher 3 fps (Max / Avg) | emisja hałasu w dB | pobór mocy w watach |
|---|---|---|---|
| Zdefiniowane przez użytkownika (boost/high) | 211 / 193 | 46.81 | 243 |
| Turbo | 203 / 191 | 46.81 | 242 |
| Zrównoważony | 177 / 169 | 42.99 | 196 |
| Cichy | 141 / 132 | 32.16 | 141 |
| Performance rating - Percent | |
| Lenovo Legion 9 16IRX8 | |
| Schenker XMG Neo 16 E23 | |
| Razer Blade 16 2024, RTX 4090 | |
| Razer Blade 16 Early 2023 RTX 4090 | |
| Średnia w klasie Gaming | |
| Lenovo Legion 5 16IRX G9 | |
| The Witcher 3 - 1920x1080 Ultra Graphics & Postprocessing (HBAO+) | |
| Schenker XMG Neo 16 E23 | |
| Lenovo Legion 9 16IRX8 | |
| Razer Blade 16 2024, RTX 4090 | |
| Razer Blade 16 Early 2023 RTX 4090 | |
| Średnia w klasie Gaming (95 - 240, n=8, ostatnie 2 lata) | |
| Lenovo Legion 5 16IRX G9 | |
| GTA V - 1920x1080 Highest AA:4xMSAA + FX AF:16x | |
| Lenovo Legion 9 16IRX8 | |
| Schenker XMG Neo 16 E23 | |
| Razer Blade 16 2024, RTX 4090 | |
| Średnia w klasie Gaming (48.3 - 186.9, n=100, ostatnie 2 lata) | |
| Razer Blade 16 Early 2023 RTX 4090 | |
| Lenovo Legion 5 16IRX G9 | |
| Final Fantasy XV Benchmark - 1920x1080 High Quality | |
| Schenker XMG Neo 16 E23 | |
| Lenovo Legion 9 16IRX8 | |
| Średnia w klasie Gaming (41 - 215, n=101, ostatnie 2 lata) | |
| Razer Blade 16 2024, RTX 4090 | |
| Razer Blade 16 Early 2023 RTX 4090 | |
| Lenovo Legion 5 16IRX G9 | |
| Strange Brigade - 1920x1080 ultra AA:ultra AF:16 | |
| Lenovo Legion 9 16IRX8 | |
| Schenker XMG Neo 16 E23 | |
| Razer Blade 16 2024, RTX 4090 | |
| Razer Blade 16 Early 2023 RTX 4090 | |
| Średnia w klasie Gaming (76.3 - 456, n=91, ostatnie 2 lata) | |
| Lenovo Legion 5 16IRX G9 | |
| Dota 2 Reborn - 1920x1080 ultra (3/3) best looking | |
| Lenovo Legion 9 16IRX8 | |
| Razer Blade 16 2024, RTX 4090 | |
| Razer Blade 16 Early 2023 RTX 4090 | |
| Schenker XMG Neo 16 E23 | |
| Lenovo Legion 5 16IRX G9 | |
| Średnia w klasie Gaming (84.8 - 248, n=110, ostatnie 2 lata) | |
| X-Plane 11.11 - 1920x1080 high (fps_test=3) | |
| Razer Blade 16 2024, RTX 4090 | |
| Lenovo Legion 9 16IRX8 | |
| Razer Blade 16 Early 2023 RTX 4090 | |
| Schenker XMG Neo 16 E23 | |
| Lenovo Legion 5 16IRX G9 | |
| Średnia w klasie Gaming (52.1 - 143.5, n=113, ostatnie 2 lata) | |
| Cyberpunk 2077 1.6 | |
| 1920x1080 Ultra Preset | |
| Schenker XMG Neo 16 E23 | |
| Lenovo Legion 9 16IRX8 | |
| Przeciętny NVIDIA GeForce RTX 4090 Laptop GPU (91 - 159.7, n=20) | |
| Razer Blade 16 2024, RTX 4090 | |
| Razer Blade 16 Early 2023 RTX 4090 | |
| 2560x1440 Ultra Preset | |
| Schenker XMG Neo 16 E23 | |
| Lenovo Legion 9 16IRX8 | |
| Przeciętny NVIDIA GeForce RTX 4090 Laptop GPU (75.7 - 116, n=21) | |
| Razer Blade 16 Early 2023 RTX 4090 | |
| Razer Blade 16 2024, RTX 4090 | |
| 3840x2160 Ultra Preset | |
| Przeciętny NVIDIA GeForce RTX 4090 Laptop GPU (38.8 - 56, n=16) | |
| Razer Blade 16 2024, RTX 4090 | |
| Razer Blade 16 Early 2023 RTX 4090 | |
| 1920x1080 Ray Tracing Ultra Preset (DLSS off) | |
| Przeciętny NVIDIA GeForce RTX 4090 Laptop GPU (56.5 - 74, n=8) | |
| Razer Blade 16 Early 2023 RTX 4090 | |
| Razer Blade 16 2024, RTX 4090 | |
| 3840x2160 Ray Tracing Ultra Preset (DLSS off) | |
| Razer Blade 16 Early 2023 RTX 4090 | |
| Przeciętny NVIDIA GeForce RTX 4090 Laptop GPU (16.5 - 22.4, n=7) | |
| Razer Blade 16 2024, RTX 4090 | |
Witcher 3 FPS diagram
| low | med. | high | ultra | QHD DLSS | QHD | 4K DLSS | 4K | |
|---|---|---|---|---|---|---|---|---|
| GTA V (2015) | 184 | 181.9 | 181.6 | 138.1 | 126.9 | 168 | ||
| The Witcher 3 (2015) | 567 | 425 | 354 | 200 | 164 | |||
| Dota 2 Reborn (2015) | 233 | 210 | 201 | 188.1 | 187.3 | |||
| Final Fantasy XV Benchmark (2018) | 171.7 | 155.7 | 137.5 | 126.8 | ||||
| X-Plane 11.11 (2018) | 204 | 182.3 | 146.2 | 145.5 | ||||
| Far Cry 5 (2018) | 173 | 140 | 134 | 127 | 125 | 103 | ||
| Strange Brigade (2018) | 487 | 372 | 368 | 359.8 | 279 | 157 | ||
| Dying Light 2 (2022) | 223.1 | 196.6 | 155.6 | 117.3 | 59.8 | |||
| Cyberpunk 2077 1.6 (2022) | 146.7 | 138.51 | 123.6 | 103.58 | 86.59 | 46.1 | ||
| F1 23 (2023) | 113.2 | 72.4 | 36.9 | |||||
| Baldur's Gate 3 (2023) | 175.8 | 134 | 74 | |||||
| Cyberpunk 2077 (2023) | 95.35 | 83.39 | 39.61 | |||||
| Assassin's Creed Mirage (2023) | 130 | 117 | 74 | |||||
| Alan Wake 2 (2023) | 108.6 | 78.4 | 41.6 | |||||
| Call of Duty Modern Warfare 3 2023 (2023) | 179 | 138 | 91 | |||||
| Avatar Frontiers of Pandora (2023) | 98 | 67 | 34 | |||||
| Black Myth: Wukong (2024) | 53 | 58 | 39 | 23 | ||||
| Call of Duty Black Ops 6 (2024) | 124 | 111 | 103 | 71 | 68 | |||
| Indiana Jones and the Great Circle (2024) | 122.4 | 109.3 | 95.4 | 58 | ||||
| Monster Hunter Wilds (2025) | 70.56 | 70.41 | 63.11 | 40.46 | ||||
| Assassin's Creed Shadows (2025) | 64 | 58 | 52 | 34 |
Emisja i moc - Razer Blade oferuje wiele opcji personalizacji
Emisja hałasu
W trybie niestandardowym ze zmaksymalizowaną wydajnością CPU i GPU, wentylatory czasami stały w miejscu, ale przeważnie szumiały na poziomie około 27 dB - nawet w stanie bezczynności.
W scenariuszu średniego obciążenia (3DMark 06) przyspieszyły w dwóch krokach. W pierwszych 30 sekundach powoli wzrastały i utrzymywały ten średni poziom hałasu przez około minutę, zanim ponownie wzrosły do ponad 43 dB. Dla przykładu, znacznie tańszy Dell G16 pozostał znacznie cichszy, nie zmieniając głośności wyjściowej 27 dB przez cały czas trwania testu. Poprzednik laptopa również pozostał cichszy w tym scenariuszu.
Tryb Turbo nie przyniósł żadnych korzyści pod względem wydajności lub emisji hałasu, jeśli spojrzeć na wyniki Witcher 3 ale Blade jest lepiej chłodzony.
Pomimo prawie takiej samej wydajności, nowy Blade jest minimalnie głośniejszy od swojego poprzednika nawet przy maksymalnym obciążeniu. Konkurencja jest jednak jeszcze głośniejsza podczas grania.
Hałas
| luz |
| 23 / 23 / 27.66 dB |
| obciążenie |
| 43.76 / 50.37 dB |
 | ||
30 dB cichy 40 dB(A) słyszalny 50 dB(A) irytujący |
||
min: | ||
| Razer Blade 16 2024, RTX 4090 GeForce RTX 4090 Laptop GPU, i9-14900HX, Samsung PM9A1 MZVL22T0HBLB | Razer Blade 16 Early 2023 RTX 4090 GeForce RTX 4090 Laptop GPU, i9-13950HX, SSSTC CA6-8D1024 | Lenovo Legion 9 16IRX8 GeForce RTX 4090 Laptop GPU, i9-13980HX, 2x SK Hynix HFS001TEJ9X115N (RAID 0) | Schenker XMG Neo 16 E23 GeForce RTX 4090 Laptop GPU, i9-13900HX, Crucial P5 Plus 1TB CT1000P5PSSD8 | Lenovo Legion 5 16IRX G9 GeForce RTX 4060 Laptop GPU, i7-14650HX, Samsung PM9A1 MZVL21T0HCLR | |
|---|---|---|---|---|---|
| Noise | 4% | -2% | -30% | -11% | |
| wyłączone / środowisko * (dB) | 23 | 20.84 9% | 23.7 -3% | 25 -9% | 24 -4% |
| Idle Minimum * (dB) | 23 | 23.65 -3% | 24 -4% | 31 -35% | 24 -4% |
| Idle Average * (dB) | 23 | 23.65 -3% | 24 -4% | 33 -43% | 28.8 -25% |
| Idle Maximum * (dB) | 27.66 | 23.65 14% | 30.4 -10% | 42 -52% | 32 -16% |
| Load Average * (dB) | 43.76 | 43.35 1% | 30.4 31% | 58 -33% | 45.5 -4% |
| Witcher 3 ultra * (dB) | 46.81 | 46.7 -0% | 52.2 -12% | 57 -22% | 53.1 -13% |
| Load Maximum * (dB) | 50.37 | 46.72 7% | 54.9 -9% | 59 -17% | 55.7 -11% |
* ... im mniej tym lepiej
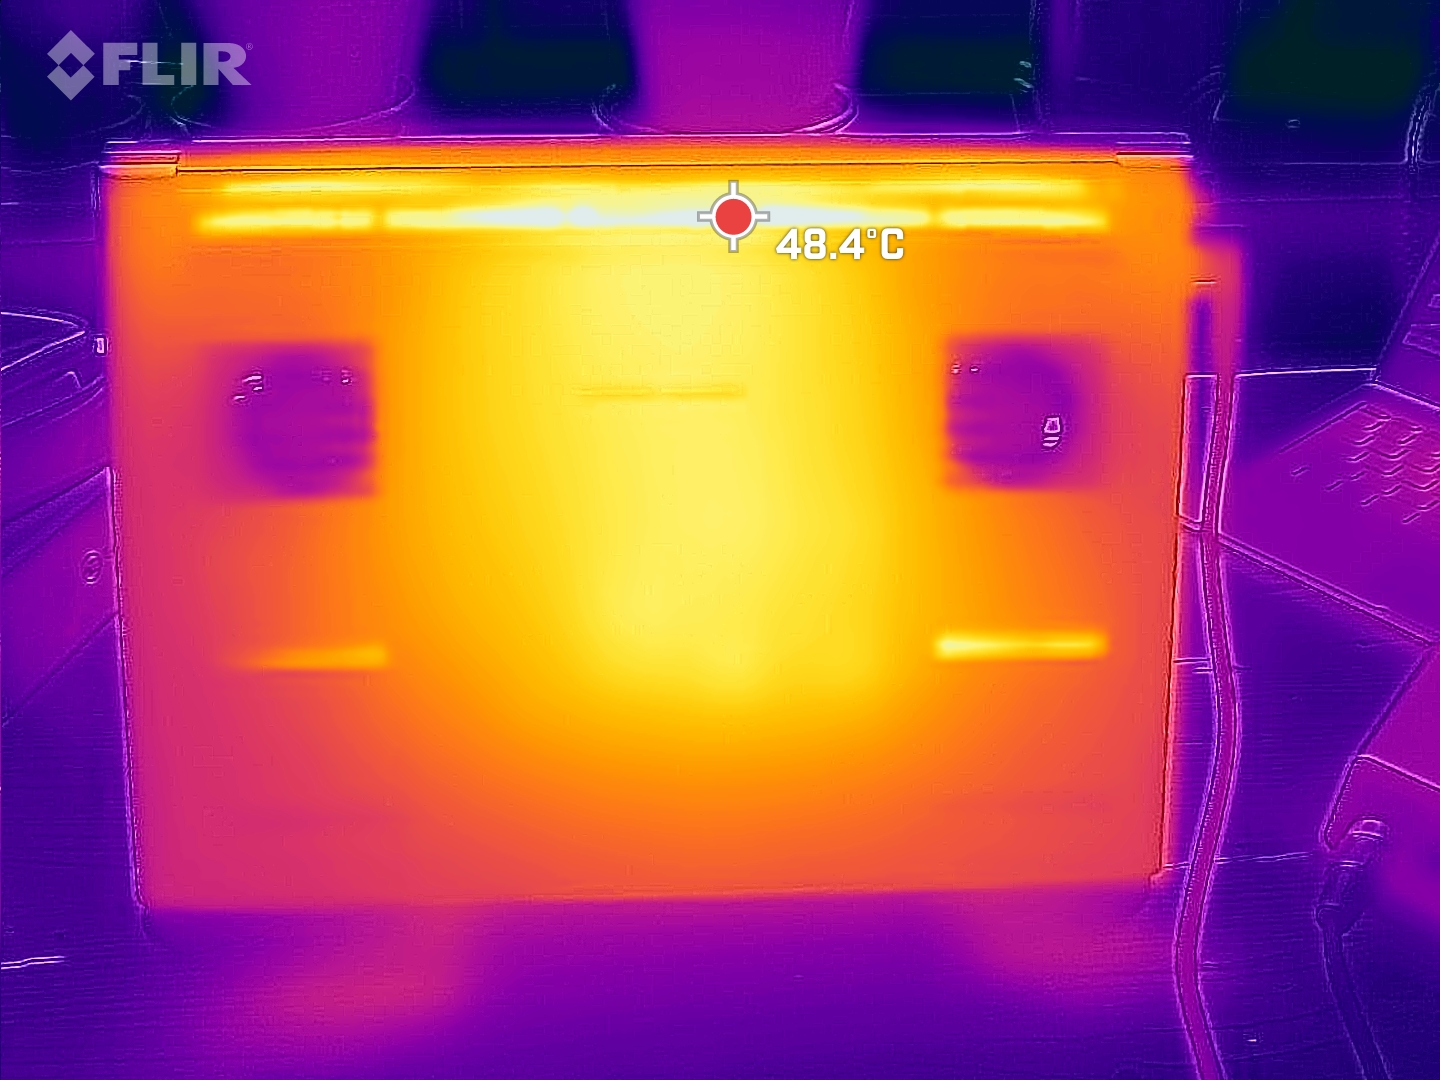
Temperatura
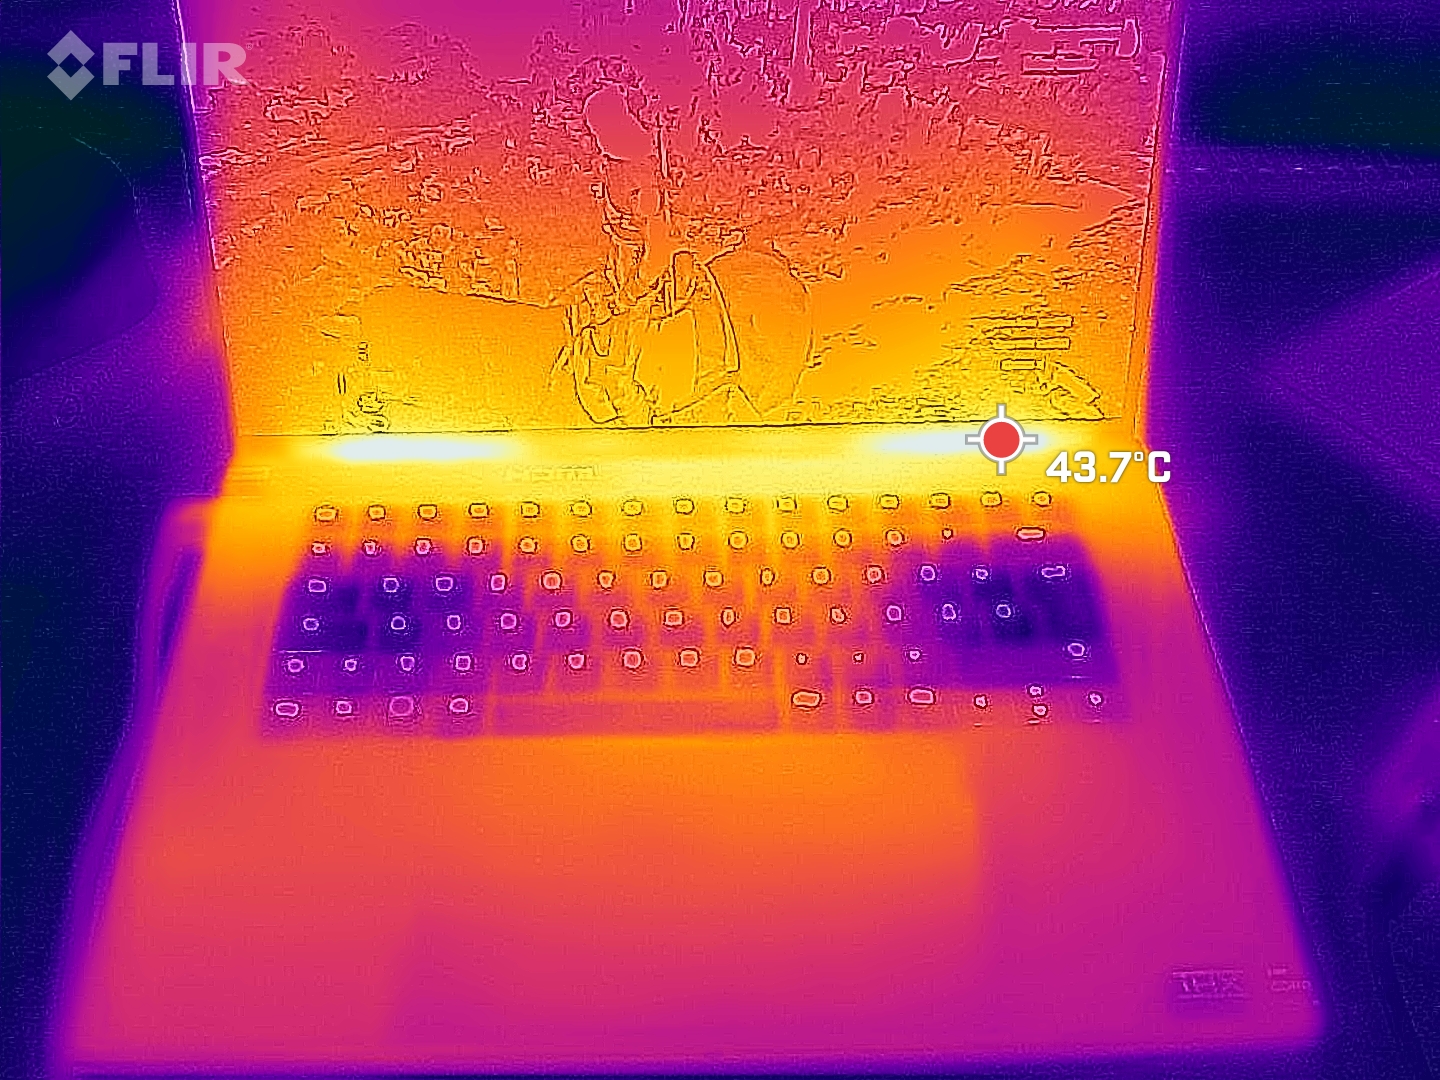
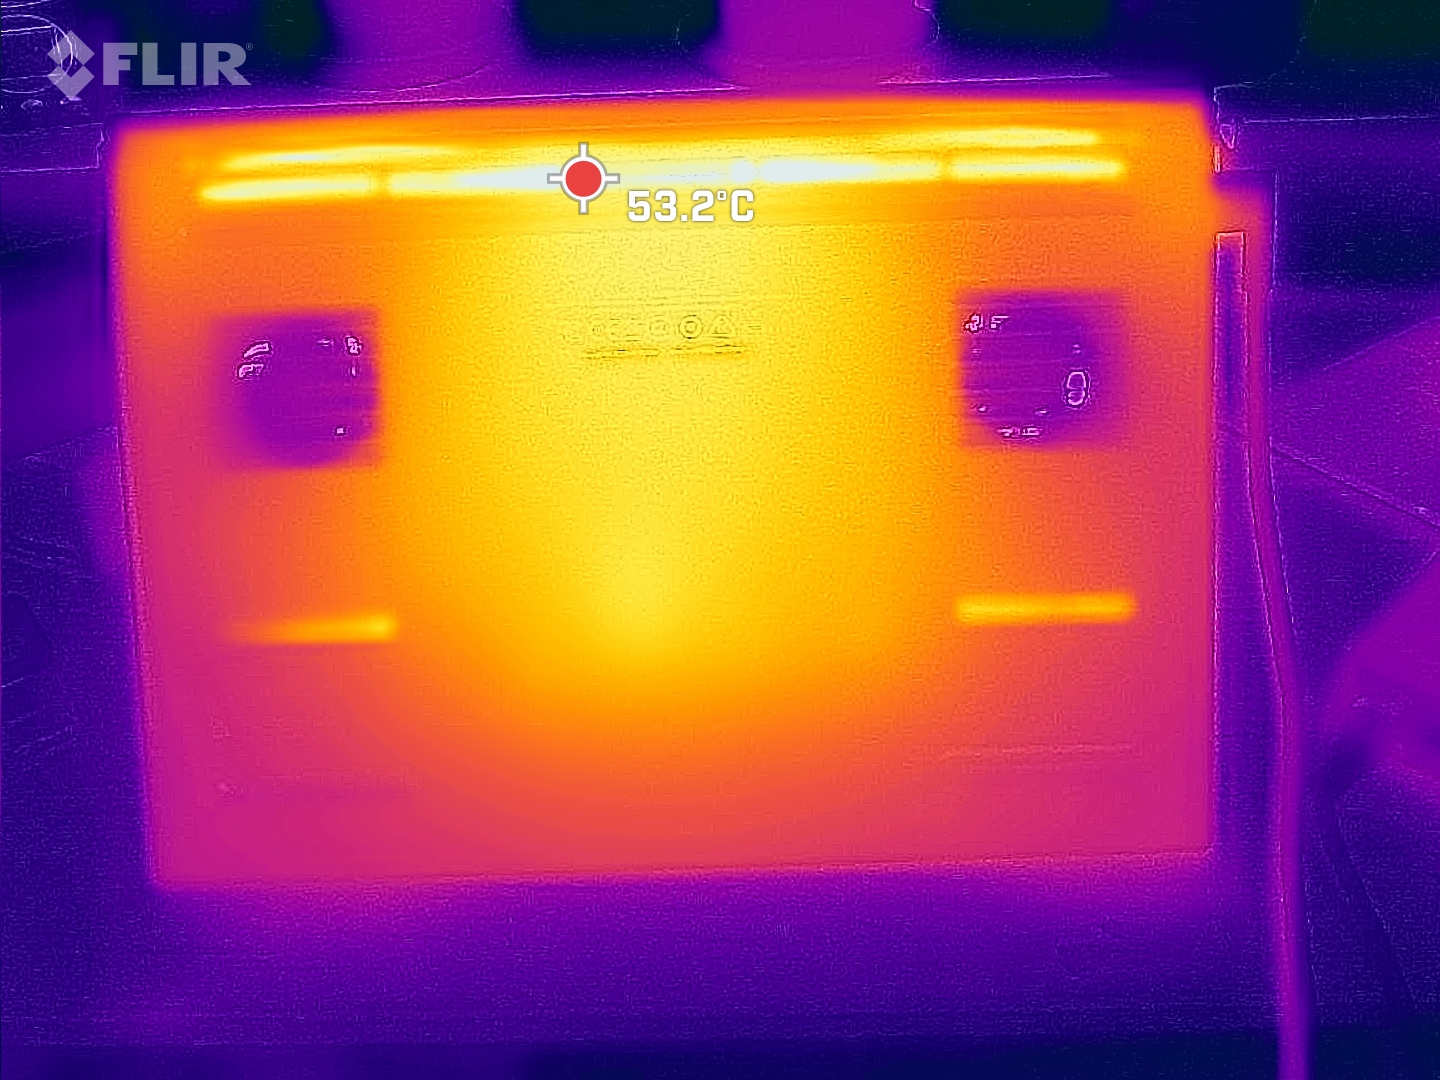
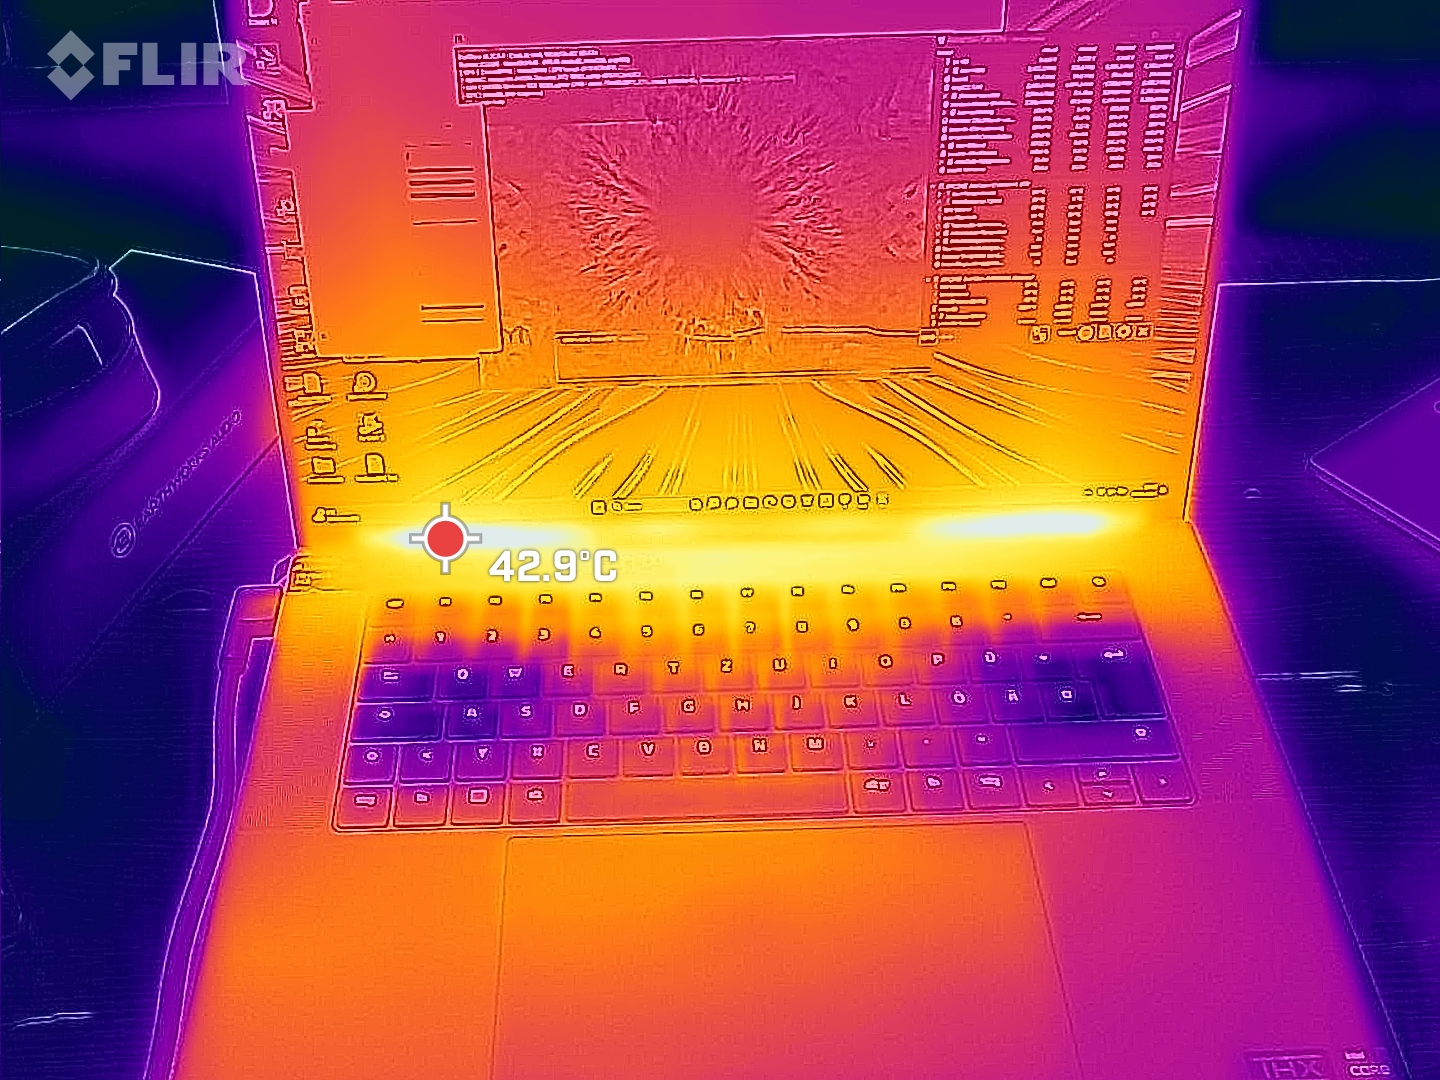
Przy maksymalnym obciążeniu zmierzyliśmy gorące punkty do 47 °C. Jest to zbyt wysoka temperatura, aby ustawić urządzenie na kolanach, ale nadal stosunkowo chłodna w porównaniu do konkurencji.
(±) Maksymalna temperatura w górnej części wynosi 45 °C / 113 F, w porównaniu do średniej 40.4 °C / 105 F , począwszy od 21.2 do 68.8 °C dla klasy Gaming.
(±) Dno nagrzewa się maksymalnie do 45 °C / 113 F, w porównaniu do średniej 43.2 °C / 110 F
(+) W stanie bezczynności średnia temperatura górnej części wynosi 26.8 °C / 80 F, w porównaniu ze średnią temperaturą urządzenia wynoszącą 33.9 °C / ### class_avg_f### F.
(±) Podczas gry w Wiedźmina 3 średnia temperatura górnej części wynosi 35.9 °C / 97 F, w porównaniu do średniej temperatury urządzenia wynoszącej 33.9 °C / ## #class_avg_f### F.
(+) Podparcia dłoni i touchpad osiągają maksymalną temperaturę skóry (34 °C / 93.2 F) i dlatego nie są gorące.
(-) Średnia temperatura obszaru podparcia dłoni w podobnych urządzeniach wynosiła 28.8 °C / 83.8 F (-5.2 °C / -9.4 F).
| Razer Blade 16 2024, RTX 4090 Intel Core i9-14900HX, NVIDIA GeForce RTX 4090 Laptop GPU | Razer Blade 16 Early 2023 RTX 4090 Intel Core i9-13950HX, NVIDIA GeForce RTX 4090 Laptop GPU | Lenovo Legion 9 16IRX8 Intel Core i9-13980HX, NVIDIA GeForce RTX 4090 Laptop GPU | Schenker XMG Neo 16 E23 Intel Core i9-13900HX, NVIDIA GeForce RTX 4090 Laptop GPU | Lenovo Legion 5 16IRX G9 Intel Core i7-14650HX, NVIDIA GeForce RTX 4060 Laptop GPU | |
|---|---|---|---|---|---|
| Heat | -10% | -12% | -2% | -2% | |
| Maximum Upper Side * (°C) | 45 | 52 -16% | 49.6 -10% | 50 -11% | 40.4 10% |
| Maximum Bottom * (°C) | 45 | 47.6 -6% | 48.6 -8% | 51 -13% | 43.8 3% |
| Idle Upper Side * (°C) | 29 | 33 -14% | 33.2 -14% | 28 3% | 30.3 -4% |
| Idle Bottom * (°C) | 30 | 30.6 -2% | 34.2 -14% | 26 13% | 35.3 -18% |
* ... im mniej tym lepiej
Głośniki
W przeciwieństwie do wielu innych laptopów do gier, Blade 16 posiada cztery głośniki, dwa wysokotonowe i dwa niskotonowe. Zapewnia to słuchaczowi zrównoważone wysokie i średnie tony i - w przeciwieństwie do wielu konkurentów - nawet basy są zauważalne.
Ma to jednak swoje ograniczenia i głośniki nadal nie są nadmiernie głośne. Do podłączenia urządzeń analogowych dostępne jest tylko złącze jack 3,5 mm.
Razer Blade 16 2024, RTX 4090 analiza dźwięku
(±) | głośność głośnika jest średnia, ale dobra (81.16 dB)
Bas 100 - 315 Hz
(±) | zredukowany bas - średnio 8.2% niższy od mediany
(±) | liniowość basu jest średnia (7.4% delta do poprzedniej częstotliwości)
Średnie 400 - 2000 Hz
(+) | zbalansowane środki średnie - tylko 3.3% od mediany
(+) | średnie są liniowe (5.9% delta do poprzedniej częstotliwości)
Wysokie 2–16 kHz
(+) | zrównoważone maksima - tylko 1.6% od mediany
(+) | wzloty są liniowe (3.1% delta do poprzedniej częstotliwości)
Ogólnie 100 - 16.000 Hz
(+) | ogólny dźwięk jest liniowy (9.2% różnicy w stosunku do mediany)
W porównaniu do tej samej klasy
» 3% wszystkich testowanych urządzeń w tej klasie było lepszych, 1% podobnych, 95% gorszych
» Najlepszy miał deltę 6%, średnia wynosiła ###średnia###%, najgorsza wynosiła 132%
W porównaniu do wszystkich testowanych urządzeń
» 3% wszystkich testowanych urządzeń było lepszych, 1% podobnych, 96% gorszych
» Najlepszy miał deltę 4%, średnia wynosiła ###średnia###%, najgorsza wynosiła 134%
Lenovo Legion 9 16IRX8 analiza dźwięku
(+) | głośniki mogą odtwarzać stosunkowo głośno (82.8 dB)
Bas 100 - 315 Hz
(±) | zredukowany bas - średnio 13.5% niższy od mediany
(±) | liniowość basu jest średnia (9% delta do poprzedniej częstotliwości)
Średnie 400 - 2000 Hz
(+) | zbalansowane środki średnie - tylko 1.5% od mediany
(+) | średnie są liniowe (5.7% delta do poprzedniej częstotliwości)
Wysokie 2–16 kHz
(+) | zrównoważone maksima - tylko 2.4% od mediany
(+) | wzloty są liniowe (3.7% delta do poprzedniej częstotliwości)
Ogólnie 100 - 16.000 Hz
(+) | ogólny dźwięk jest liniowy (11% różnicy w stosunku do mediany)
W porównaniu do tej samej klasy
» 7% wszystkich testowanych urządzeń w tej klasie było lepszych, 3% podobnych, 89% gorszych
» Najlepszy miał deltę 6%, średnia wynosiła ###średnia###%, najgorsza wynosiła 132%
W porównaniu do wszystkich testowanych urządzeń
» 6% wszystkich testowanych urządzeń było lepszych, 2% podobnych, 92% gorszych
» Najlepszy miał deltę 4%, średnia wynosiła ###średnia###%, najgorsza wynosiła 134%
Zużycie energii
Nowy Blade poczynił ogromne postępy w zakresie zużycia energii. Zwłaszcza na biegu jałowym zużycie energii spada do oczekiwanego poziomu; poprzedni model był w tym scenariuszu niezwykle energochłonny.
Nawet podczas grania w Wiedźmina zużycie energii nieznacznie spadło, pomimo takiej samej, jeśli nie nieco lepszej wydajności. Jedynie teoretyczny, tymczasowy maksymalny pobór mocy wynoszący 328 W jest teraz wyższy.
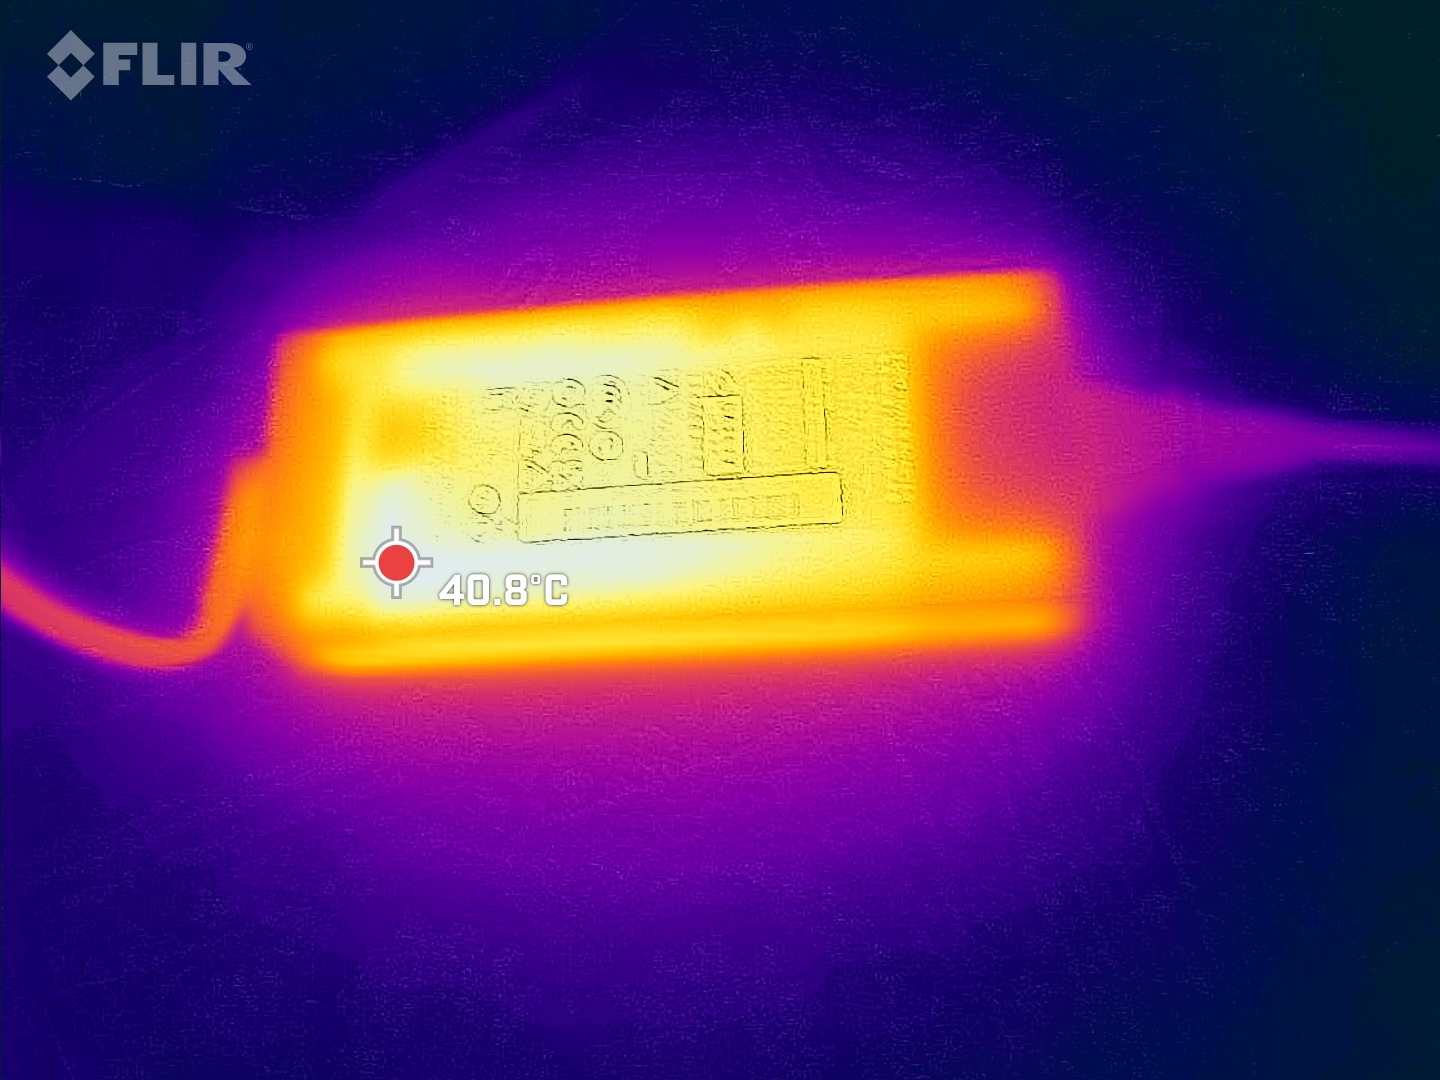
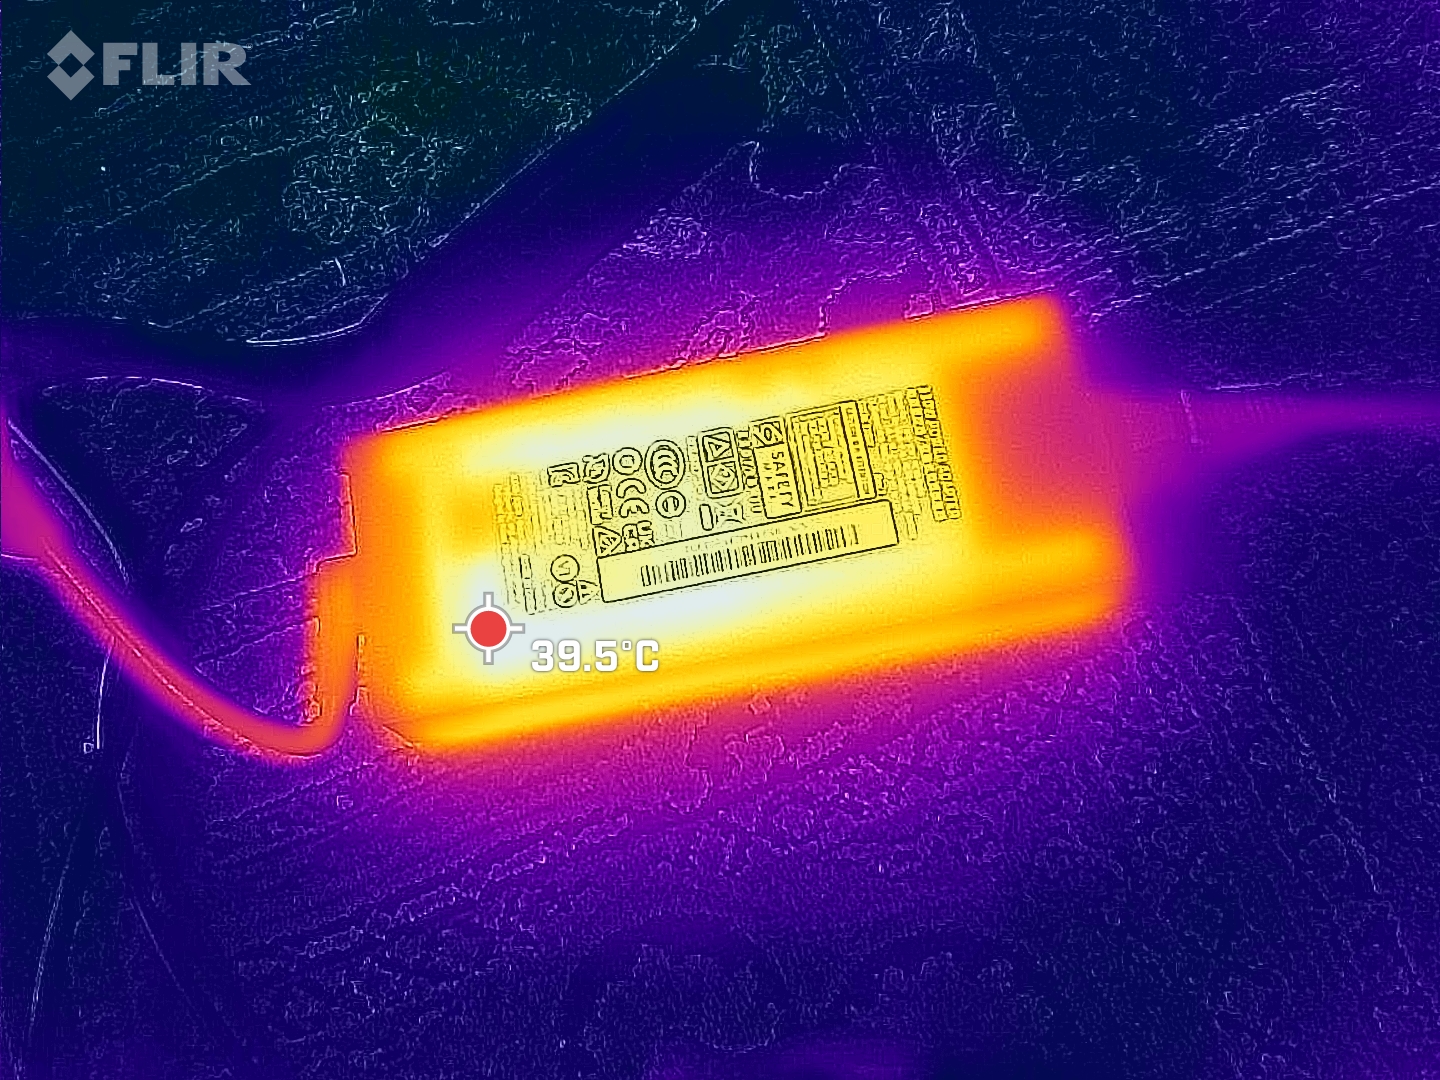
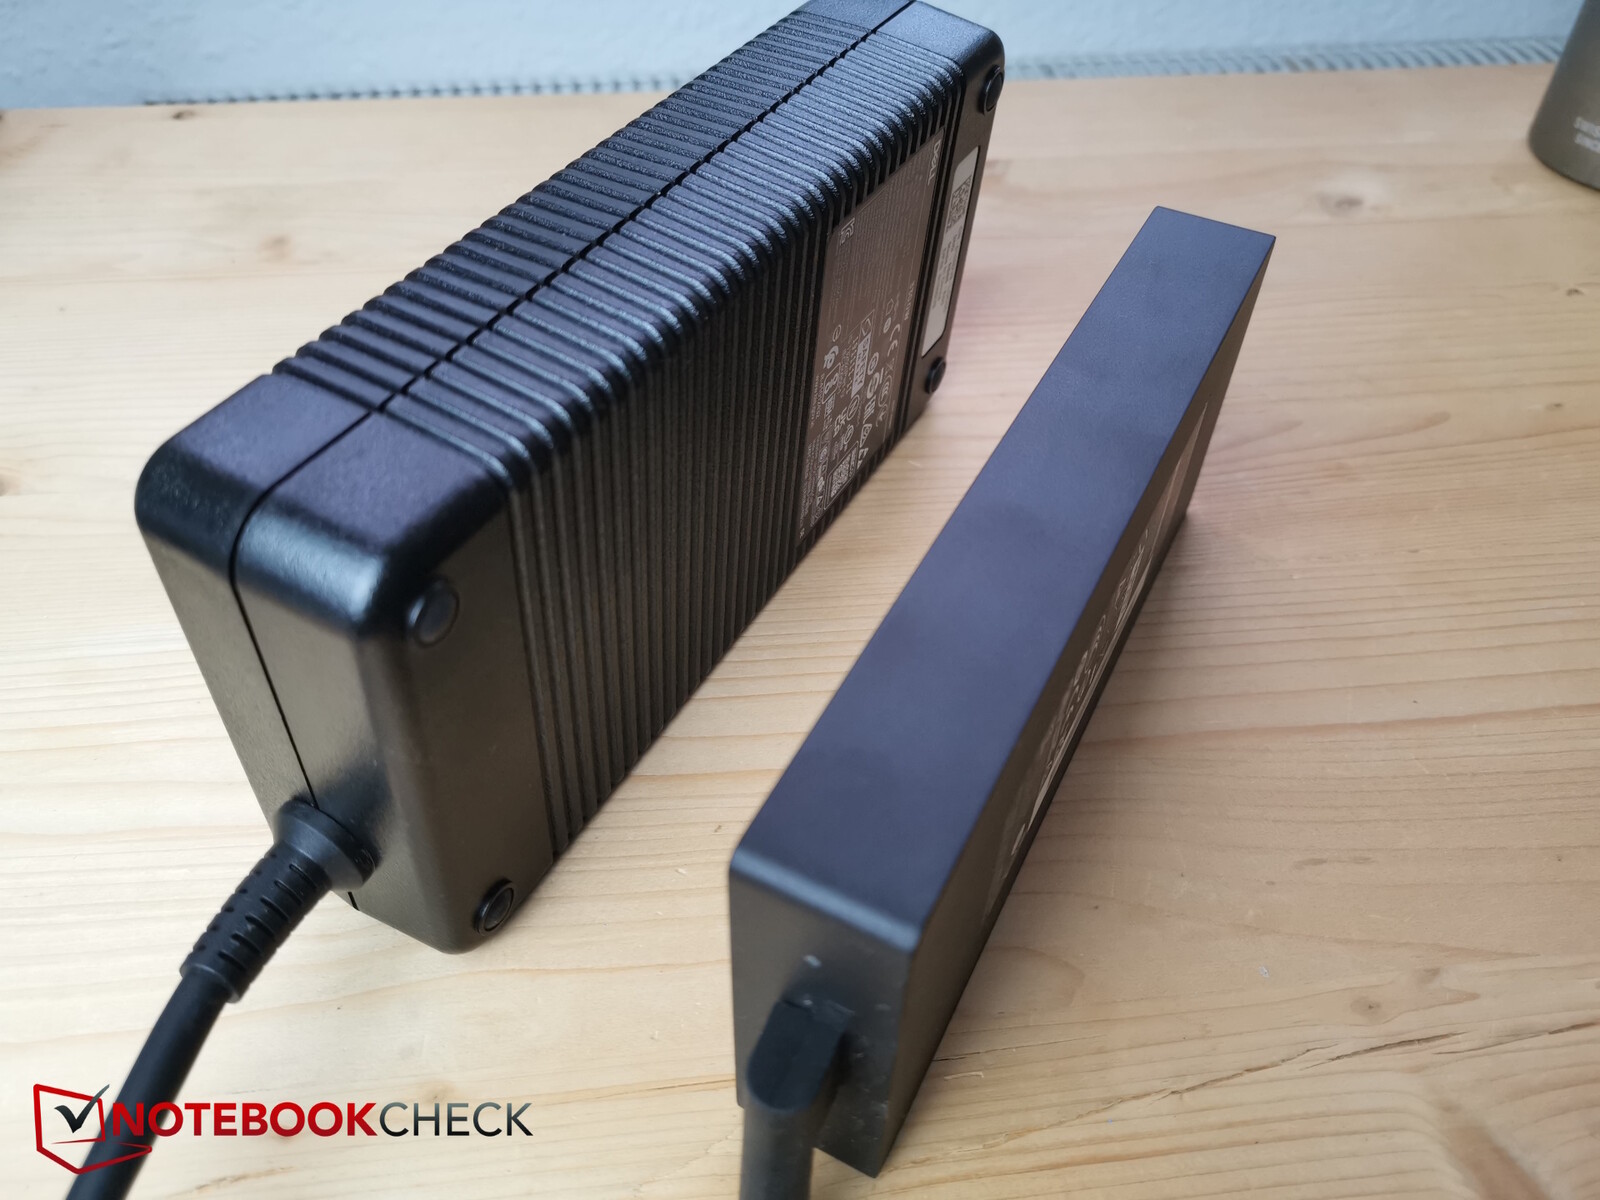
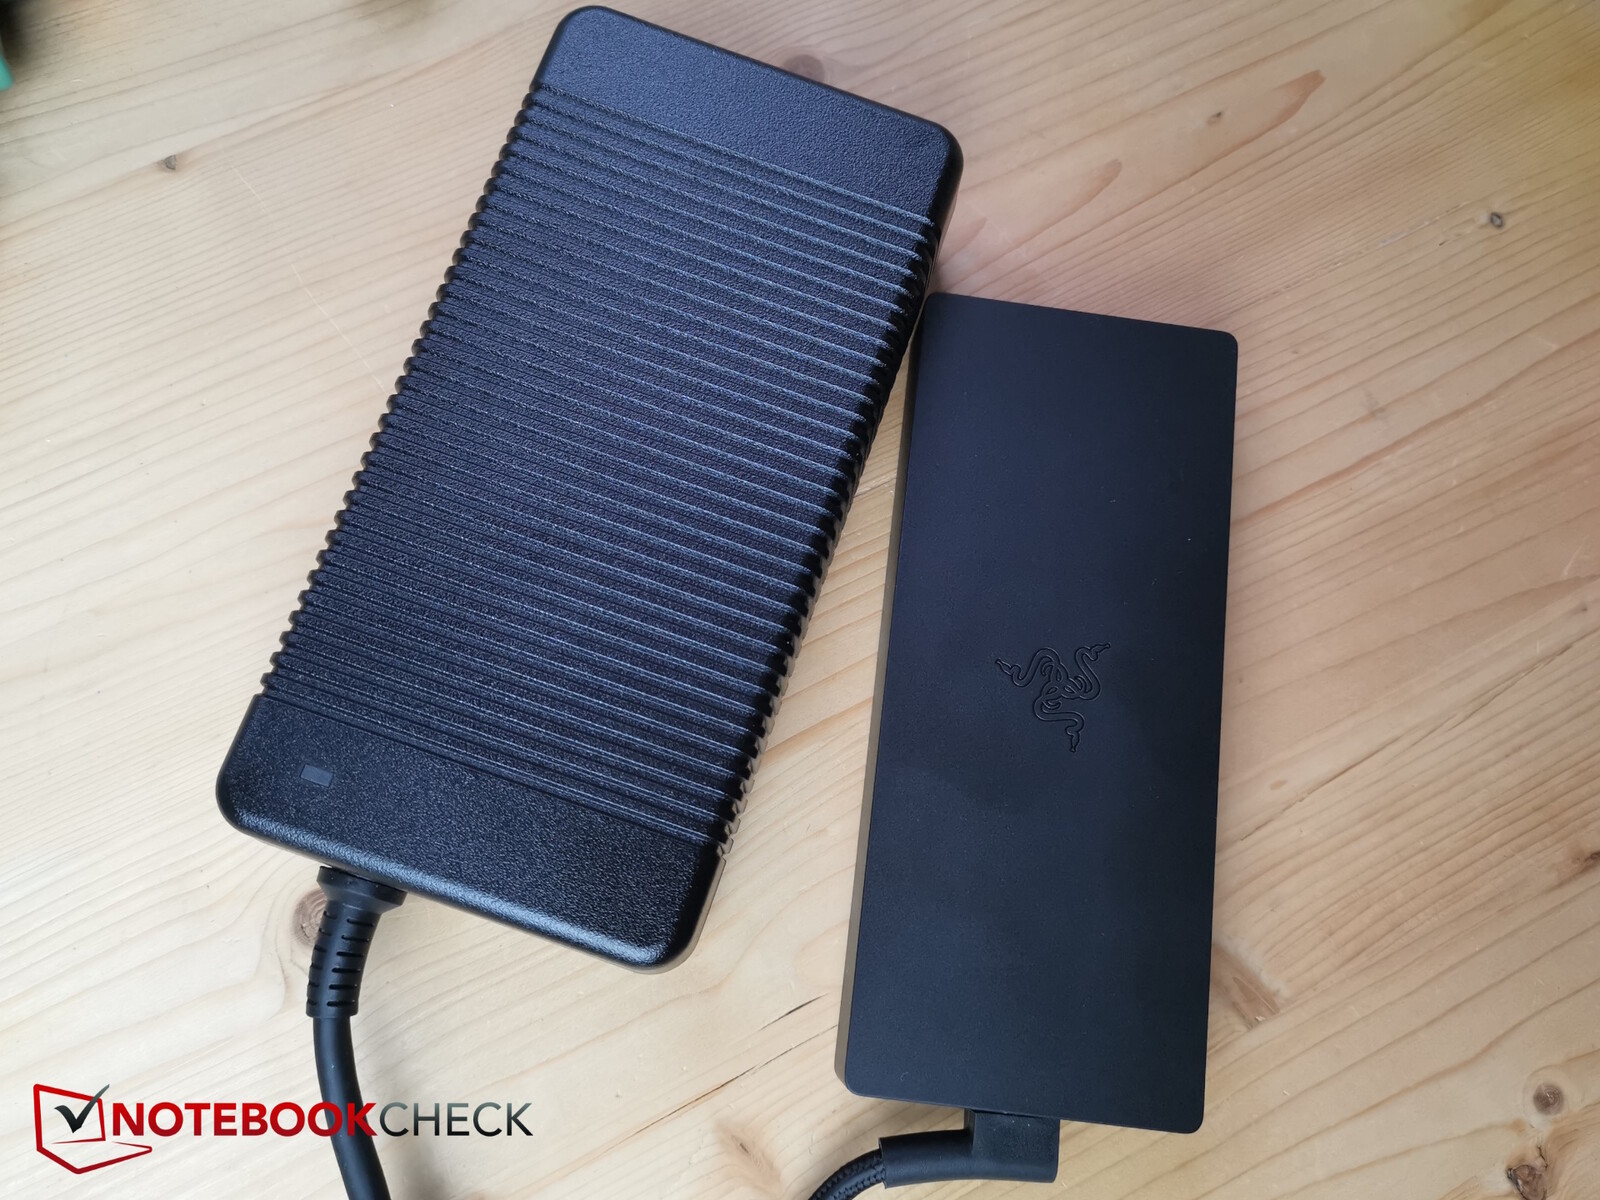
Razer słusznie jest dumny ze swoich zasilaczy, które są często mniejsze niż porównywalne rozwiązania od generycznych producentów zewnętrznych, zapewniając jednocześnie taką samą wydajność. Dołączony do zestawu 330-watowy zasilacz ma odpowiedni rozmiar, aby pochłonąć szczytowe obciążenia i według Razera pozwolił zaoszczędzić około 60 procent rozmiaru w porównaniu z porównywalnymi rozwiązaniami. W rzeczywistości zasilacz Razer jest znacznie mniejszy niż 330-watowy zasilacz dostarczany z Dell G16 (2024).
| wyłączony / stan wstrzymania | |
| luz | |
| obciążenie |
|
Legenda:
min: | |
| Razer Blade 16 2024, RTX 4090 i9-14900HX, GeForce RTX 4090 Laptop GPU, Samsung PM9A1 MZVL22T0HBLB, OLED, 2560x1600, 16" | Razer Blade 16 Early 2023 RTX 4090 i9-13950HX, GeForce RTX 4090 Laptop GPU, SSSTC CA6-8D1024, mini-LED, 3840x2400, 16" | Lenovo Legion 9 16IRX8 i9-13980HX, GeForce RTX 4090 Laptop GPU, 2x SK Hynix HFS001TEJ9X115N (RAID 0), Mini-LED, 3200x2000, 16" | Schenker XMG Neo 16 E23 i9-13900HX, GeForce RTX 4090 Laptop GPU, Crucial P5 Plus 1TB CT1000P5PSSD8, IPS, 2560x1600, 16" | Lenovo Legion 5 16IRX G9 i7-14650HX, GeForce RTX 4060 Laptop GPU, Samsung PM9A1 MZVL21T0HCLR, IPS, 2560x1600, 16" | Przeciętny NVIDIA GeForce RTX 4090 Laptop GPU | Średnia w klasie Gaming | |
|---|---|---|---|---|---|---|---|
| Power Consumption | -41% | -69% | -6% | 10% | -20% | 6% | |
| Idle Minimum * (Watt) | 16.9 | 27.5 -63% | 32.3 -91% | 8 53% | 15.4 9% | 16.2 ? 4% | 13.2 ? 22% |
| Idle Average * (Watt) | 17.8 | 34.4 -93% | 42.6 -139% | 18 -1% | 19.7 -11% | 23.1 ? -30% | 18.9 ? -6% |
| Idle Maximum * (Watt) | 19.6 | 35.4 -81% | 57.9 -195% | 28 -43% | 20.7 -6% | 34.2 ? -74% | 24.3 ? -24% |
| Load Average * (Watt) | 128 | 147.8 -15% | 121 5% | 133 -4% | 102.6 20% | 130.5 ? -2% | 108.3 ? 15% |
| Witcher 3 ultra * (Watt) | 243 | 256 -5% | 254 -5% | 294 -21% | 191.3 21% | ||
| Load Maximum * (Watt) | 328 | 286.7 13% | 297.7 9% | 399 -22% | 246.6 25% | 324 ? 1% | 254 ? 23% |
* ... im mniej tym lepiej
Power consumption Witcher 3 / stress test
Power consumption with external monitor
Czas trwania
Pojemność baterii laptopa pozostała taka sama i wynosi 95,2 Ah. To samo można powiedzieć o czasie pracy. Zmierzyliśmy około 5,5 godziny surfowania i 6,5 godziny oglądania wideo.
| Razer Blade 16 2024, RTX 4090 i9-14900HX, GeForce RTX 4090 Laptop GPU, 95.2 Wh | Razer Blade 16 Early 2023 RTX 4090 i9-13950HX, GeForce RTX 4090 Laptop GPU, 95.2 Wh | Lenovo Legion 9 16IRX8 i9-13980HX, GeForce RTX 4090 Laptop GPU, 99.9 Wh | Schenker XMG Neo 16 E23 i9-13900HX, GeForce RTX 4090 Laptop GPU, 99 Wh | Lenovo Legion 5 16IRX G9 i7-14650HX, GeForce RTX 4060 Laptop GPU, 80 Wh | Średnia w klasie Gaming | |
|---|---|---|---|---|---|---|
| Czasy pracy | 8% | -37% | -1% | 8% | 17% | |
| H.264 (h) | 7.6 | 8.4 11% | 5.8 -24% | 9.6 26% | 8.26 ? 9% | |
| WiFi v1.3 (h) | 5.5 | 5.8 5% | 2.7 -51% | 6.7 22% | 7.4 35% | 7.04 ? 28% |
| Load (h) | 1.3 | 1.4 8% | 1 -23% | 0.8 -38% | 1.47 ? 13% | |
| Witcher 3 ultra (h) | 1.6 | 1.4 | ||||
| Reader / Idle (h) | 6.7 | 8.71 ? |
Za
Przeciw
Werdykt - Niewiele argumentów przemawiających za aktualizacją z modelu 2023

Razer Blade 16 to po raz kolejny bardzo udany laptop do gier. Jest kompaktowy, smukły, a jednocześnie wydajny i ma wysokiej jakości wykończenie. Dzięki szybkiemu i pięknemu wyświetlaczowi OLED konfiguracje zostały wzbogacone o piękną alternatywę ekranu.
Jednak właściciele modeli 2023, które również są wyposażone w bardzo dobre wyświetlacze Mini-LED, nie mają tak naprawdę żadnego powodu do aktualizacji - jego wydajność została ledwo poprawiona dzięki Raptor Lake Refresh i nie dodano żadnych niezbędnych funkcji do tego modelu.
Podobnie jak jego poprzednik, Razer Blade 16 w wersji 2024 to bardzo udany high-endowy gracz. Nie ma jednak prawie żadnych powodów, aby dokonać aktualizacji z prawie równoważnego poprzednika.
Cena i dostępność
Nowy Blade 16 można obecnie znaleźć na Amazon w cenie 4 699,99 USD.
Razer Blade 16 2024, RTX 4090
- 19/02/2024 v7 (old)
Christian Hintze
Przezroczystość
Wyboru urządzeń do recenzji dokonuje nasza redakcja. Próbka testowa została udostępniona autorowi jako pożyczka od producenta lub sprzedawcy detalicznego na potrzeby tej recenzji. Pożyczkodawca nie miał wpływu na tę recenzję, producent nie otrzymał też kopii tej recenzji przed publikacją. Nie było obowiązku publikowania tej recenzji. Jako niezależna firma medialna, Notebookcheck nie podlega władzy producentów, sprzedawców detalicznych ani wydawców.
Tak testuje Notebookcheck
Każdego roku Notebookcheck niezależnie sprawdza setki laptopów i smartfonów, stosując standardowe procedury, aby zapewnić porównywalność wszystkich wyników. Od około 20 lat stale rozwijamy nasze metody badawcze, ustanawiając przy tym standardy branżowe. W naszych laboratoriach testowych doświadczeni technicy i redaktorzy korzystają z wysokiej jakości sprzętu pomiarowego. Testy te obejmują wieloetapowy proces walidacji. Nasz kompleksowy system ocen opiera się na setkach uzasadnionych pomiarów i benchmarków, co pozwala zachować obiektywizm.Price comparison

