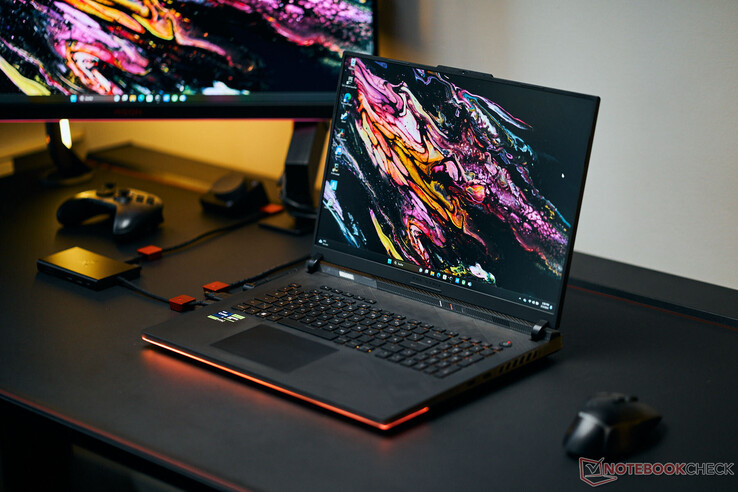
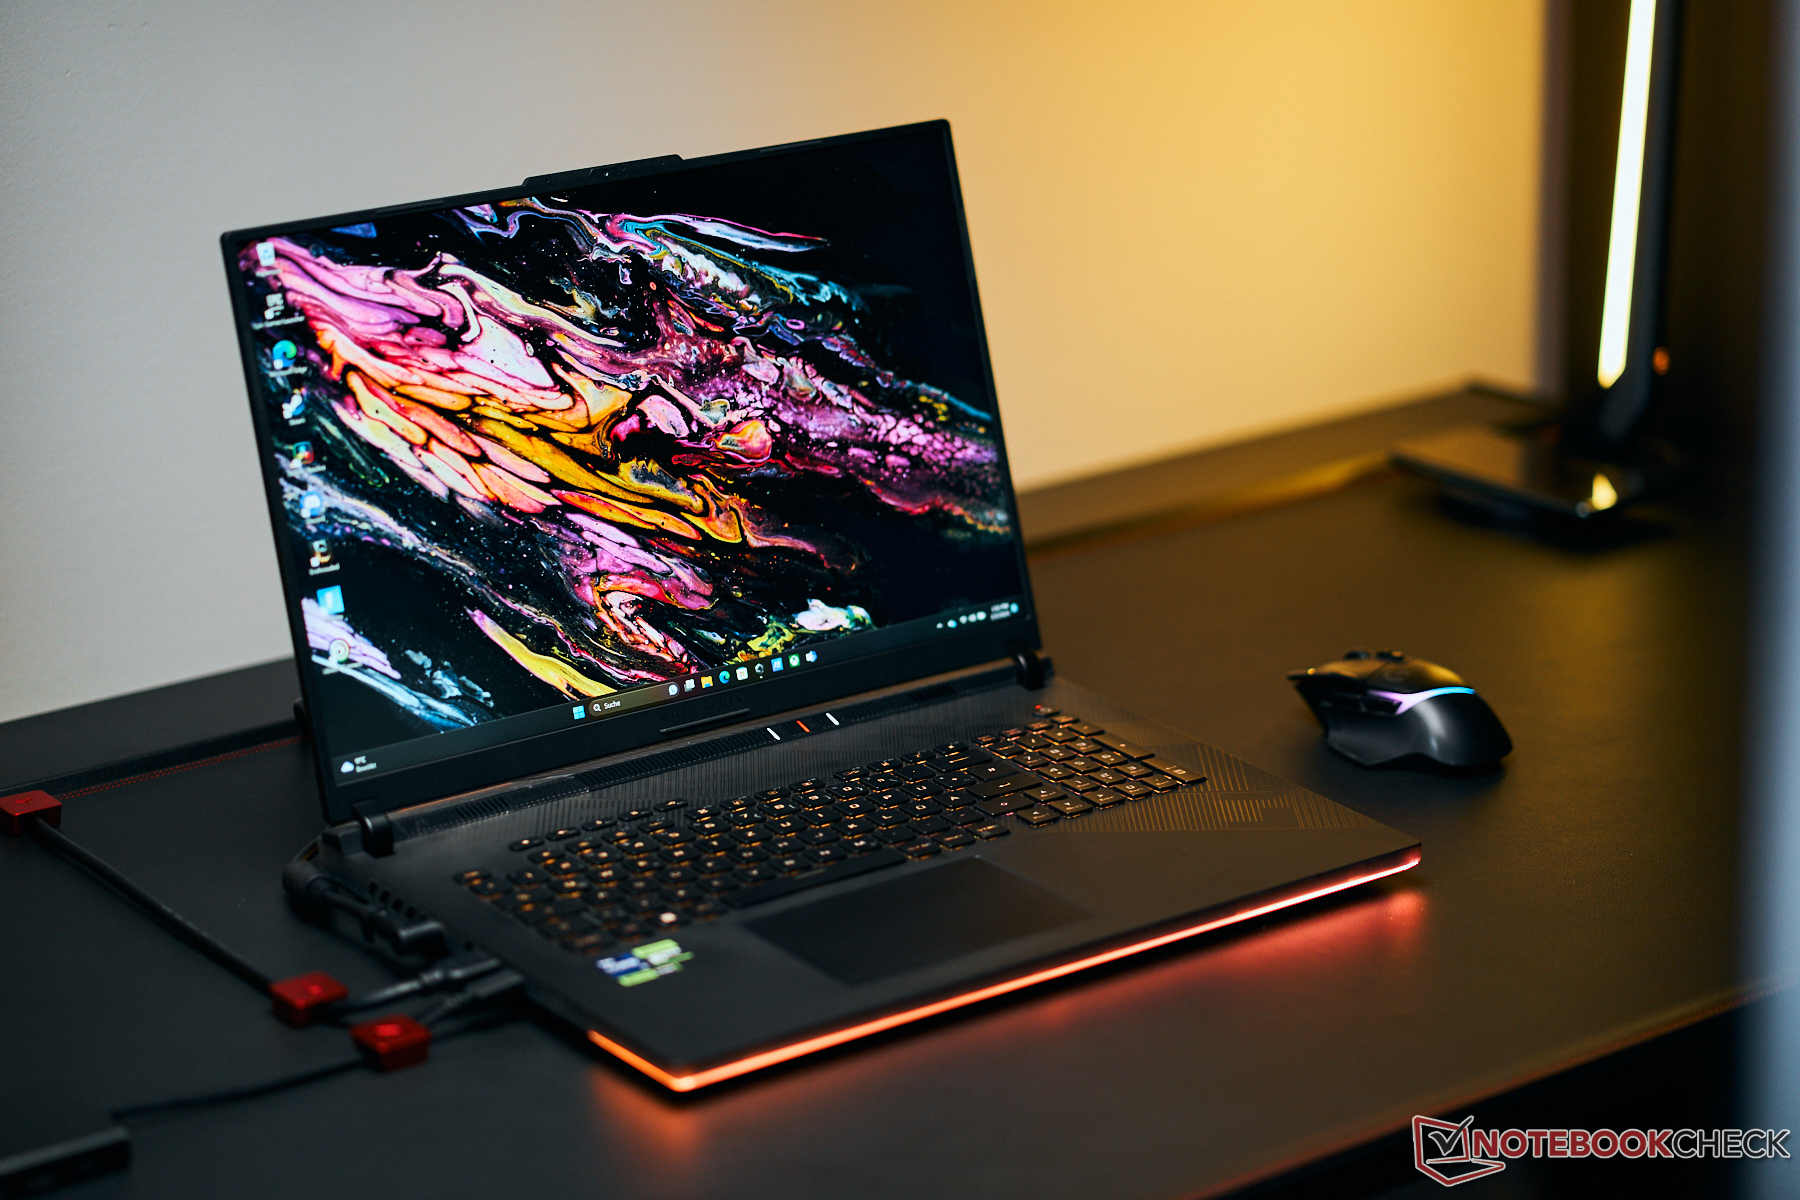
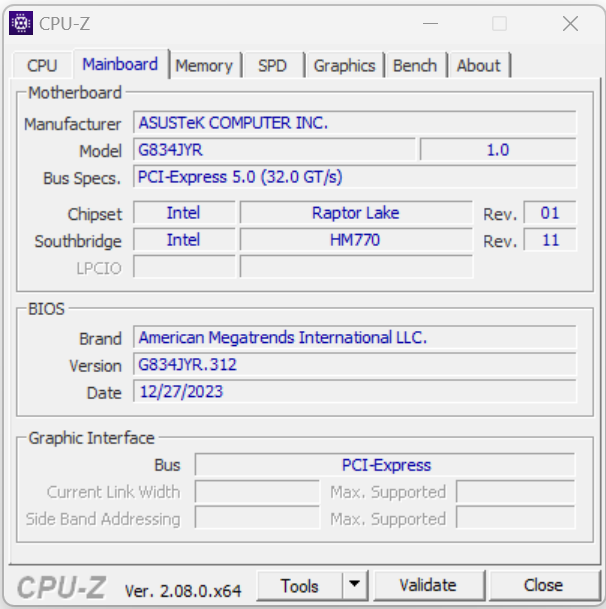
Recenzja Asus ROG Strix Scar 18 (2024): Laptop do gier z RTX 4090 i panelem mini-LED
Dzięki ROG Strix Scar 18, ASUS celuje w graczy i twórców, którym nie brakuje niezbędnych funduszy: Nasza testowa konfiguracja mistrza high-endu jest dostępna od około 4500 euro (~4848 USD). Cena jest tak wysoka dzięki potężnemu sprzętowi i bardzo jasnemu wyświetlaczowi mini-LED w formacie 16:10 z dokładnymi kolorami i przekątną 18 cali. Wśród konkurentów znajdują się takie urządzenia jak Alienware m18 R1, Acer Predator Acer Predator Helios 18, Razer Razer Blade 18i MSI Titan 18 HX A14VIG.
Laptop jest rodzeństwem modelu Scar 18 który testowaliśmy w zeszłym roku i ma identyczną budowę. Poza wyświetlaczem, generacja procesora stanowi jedyną zmianę, z Raptor Lake Refresh zastępującym Raptor Lake.
Potencjalni konkurenci w porównaniu
Ocena | Data | Model | Waga | Wysokość | Rozmiar | Rezolucja | Cena |
|---|---|---|---|---|---|---|---|
| 88.3 % v7 (old) | 02/2024 | Asus ROG Strix Scar 18 G834JYR (2024) i9-14900HX, GeForce RTX 4090 Laptop GPU | 3.1 kg | 30.8 mm | 18.00" | 2560x1600 | |
| 89.2 % v7 (old) | 11/2023 | Alienware m18 R1 AMD R9 7945HX, Radeon RX 7900M | 3.9 kg | 26.7 mm | 18.00" | 1920x1200 | |
| 90.7 % v7 (old) | 04/2023 | Alienware m18 R1 i9-13980HX, GeForce RTX 4090 Laptop GPU | 3.9 kg | 26.7 mm | 18.00" | 1920x1200 | |
| 88.3 % v7 (old) | 10/2023 | Acer Predator Helios 18 N23Q2 i9-13900HX, GeForce RTX 4080 Laptop GPU | 3.2 kg | 29.15 mm | 18.00" | 2560x1600 | |
| 91.4 % v7 (old) | 02/2023 | Razer Blade 18 RTX 4070 i9-13950HX, GeForce RTX 4070 Laptop GPU | 3 kg | 21.9 mm | 18.00" | 2560x1600 | |
| 88.8 % v7 (old) | 01/2024 | MSI Titan 18 HX A14VIG i9-14900HX, GeForce RTX 4090 Laptop GPU | 3.6 kg | 32.1 mm | 18.00" | 3840x2400 |
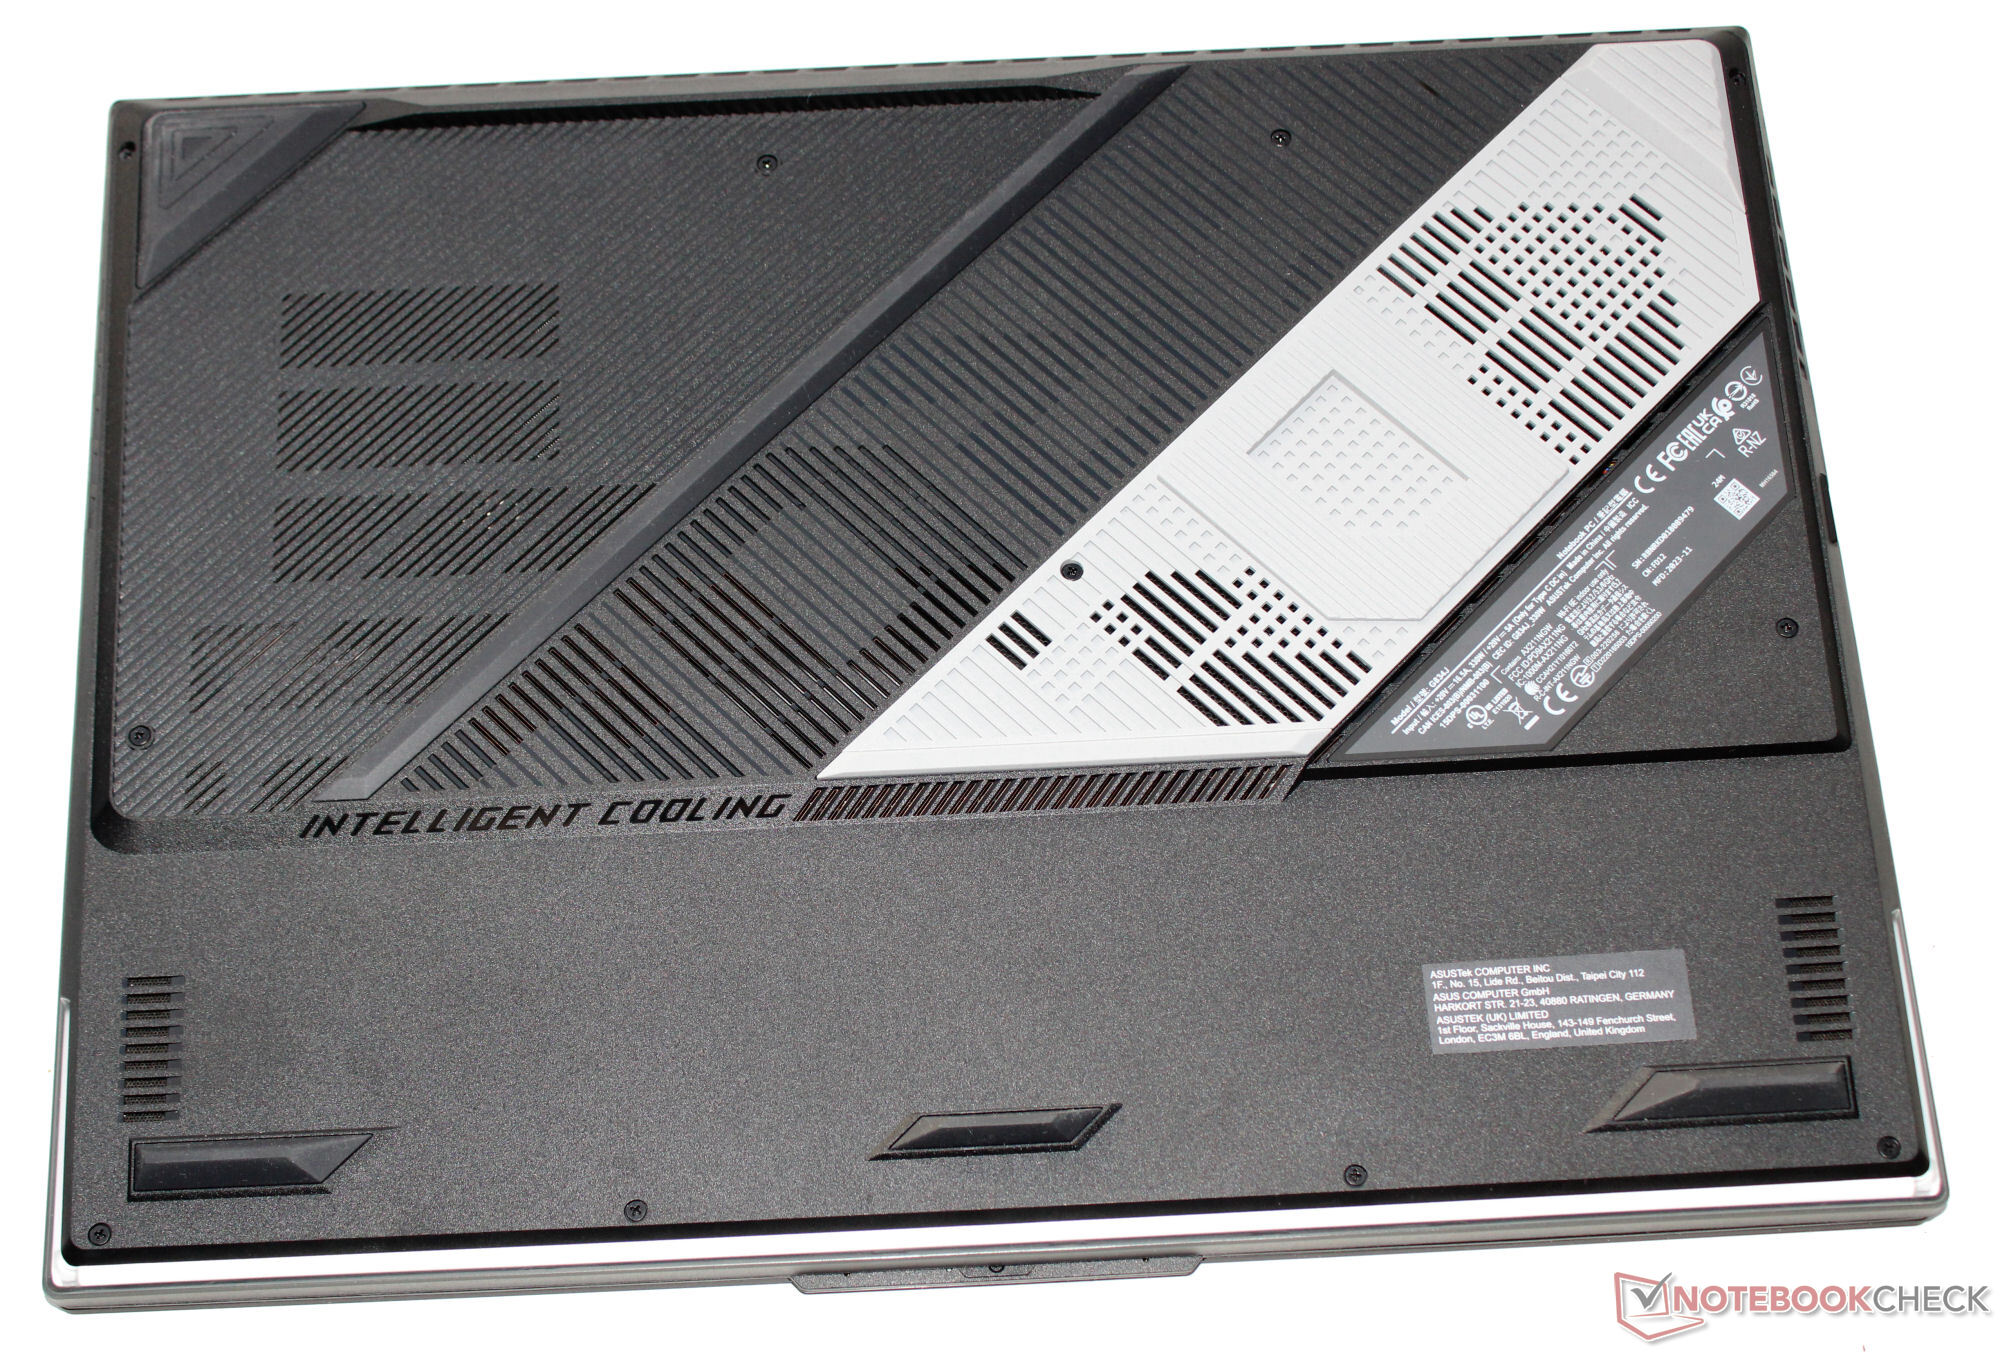
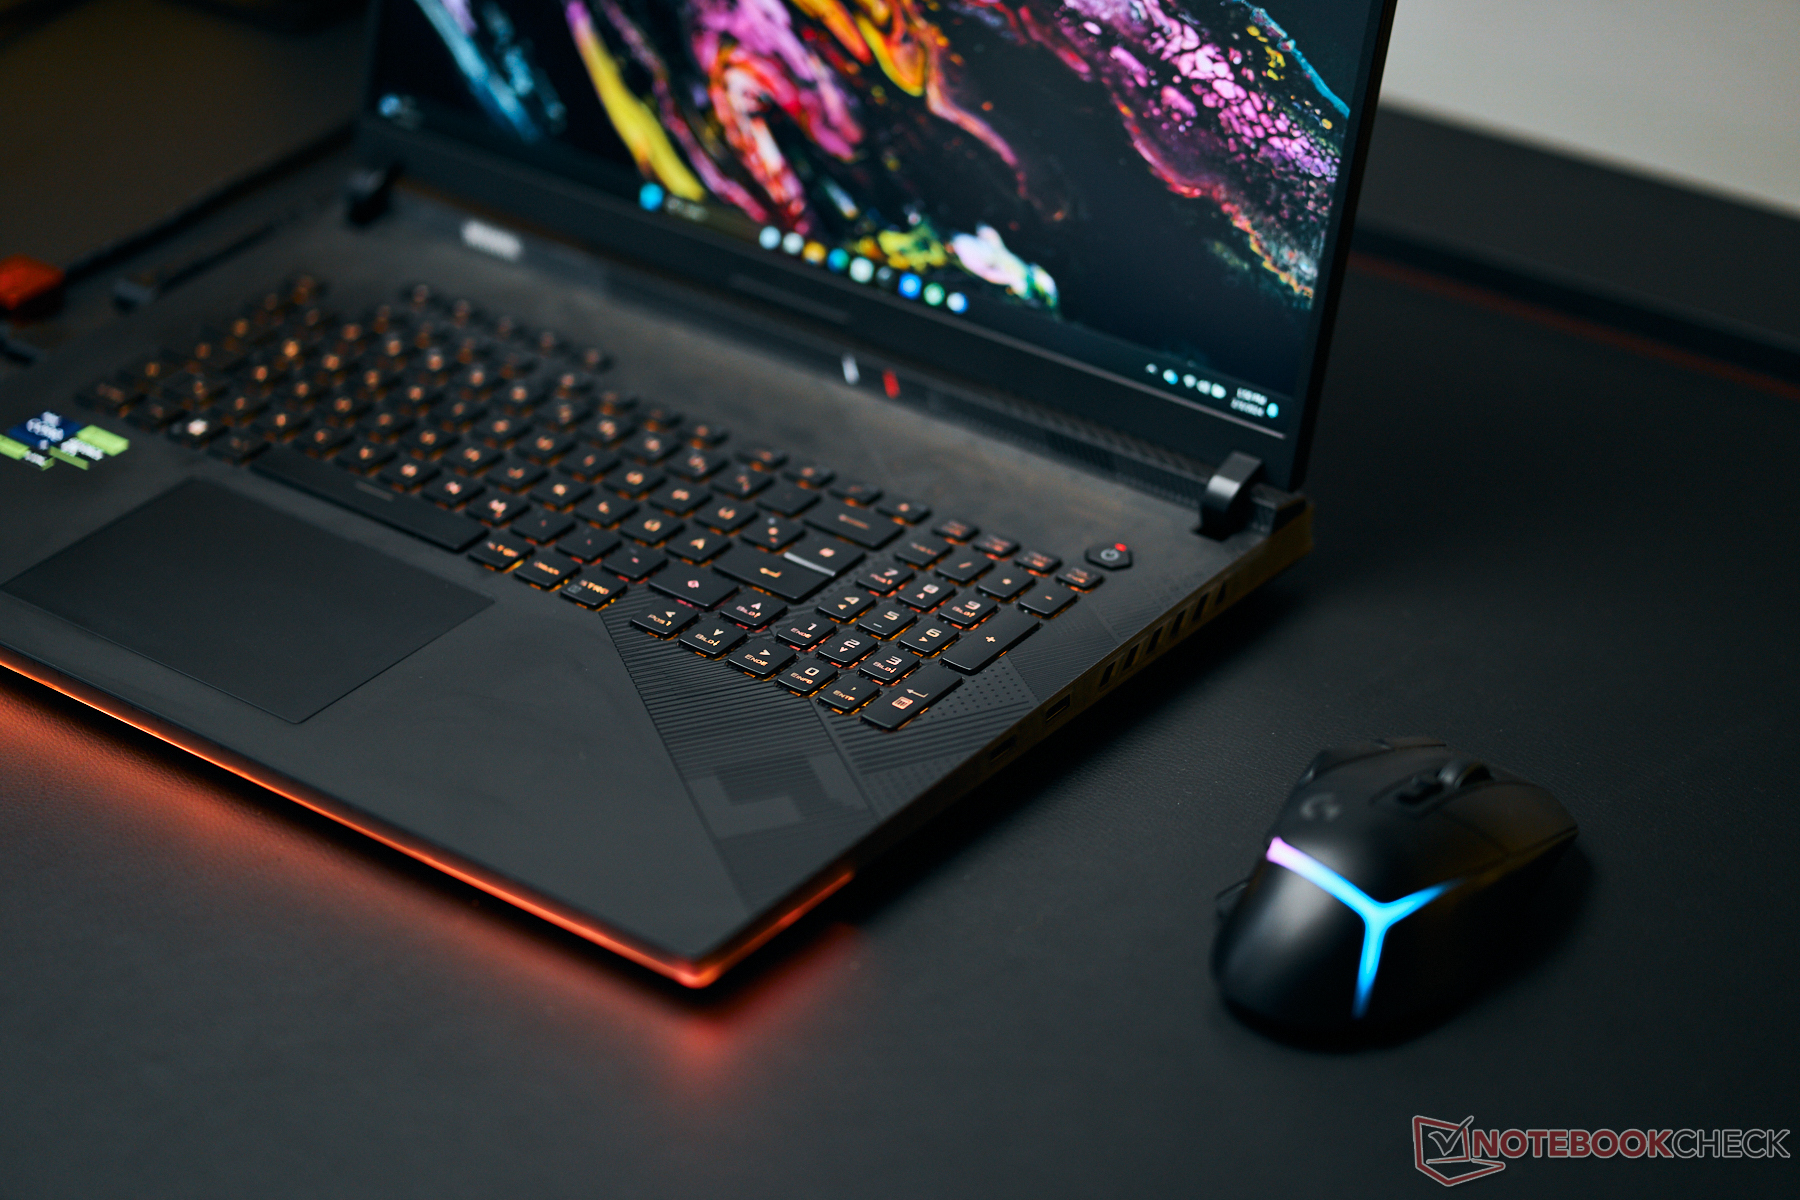
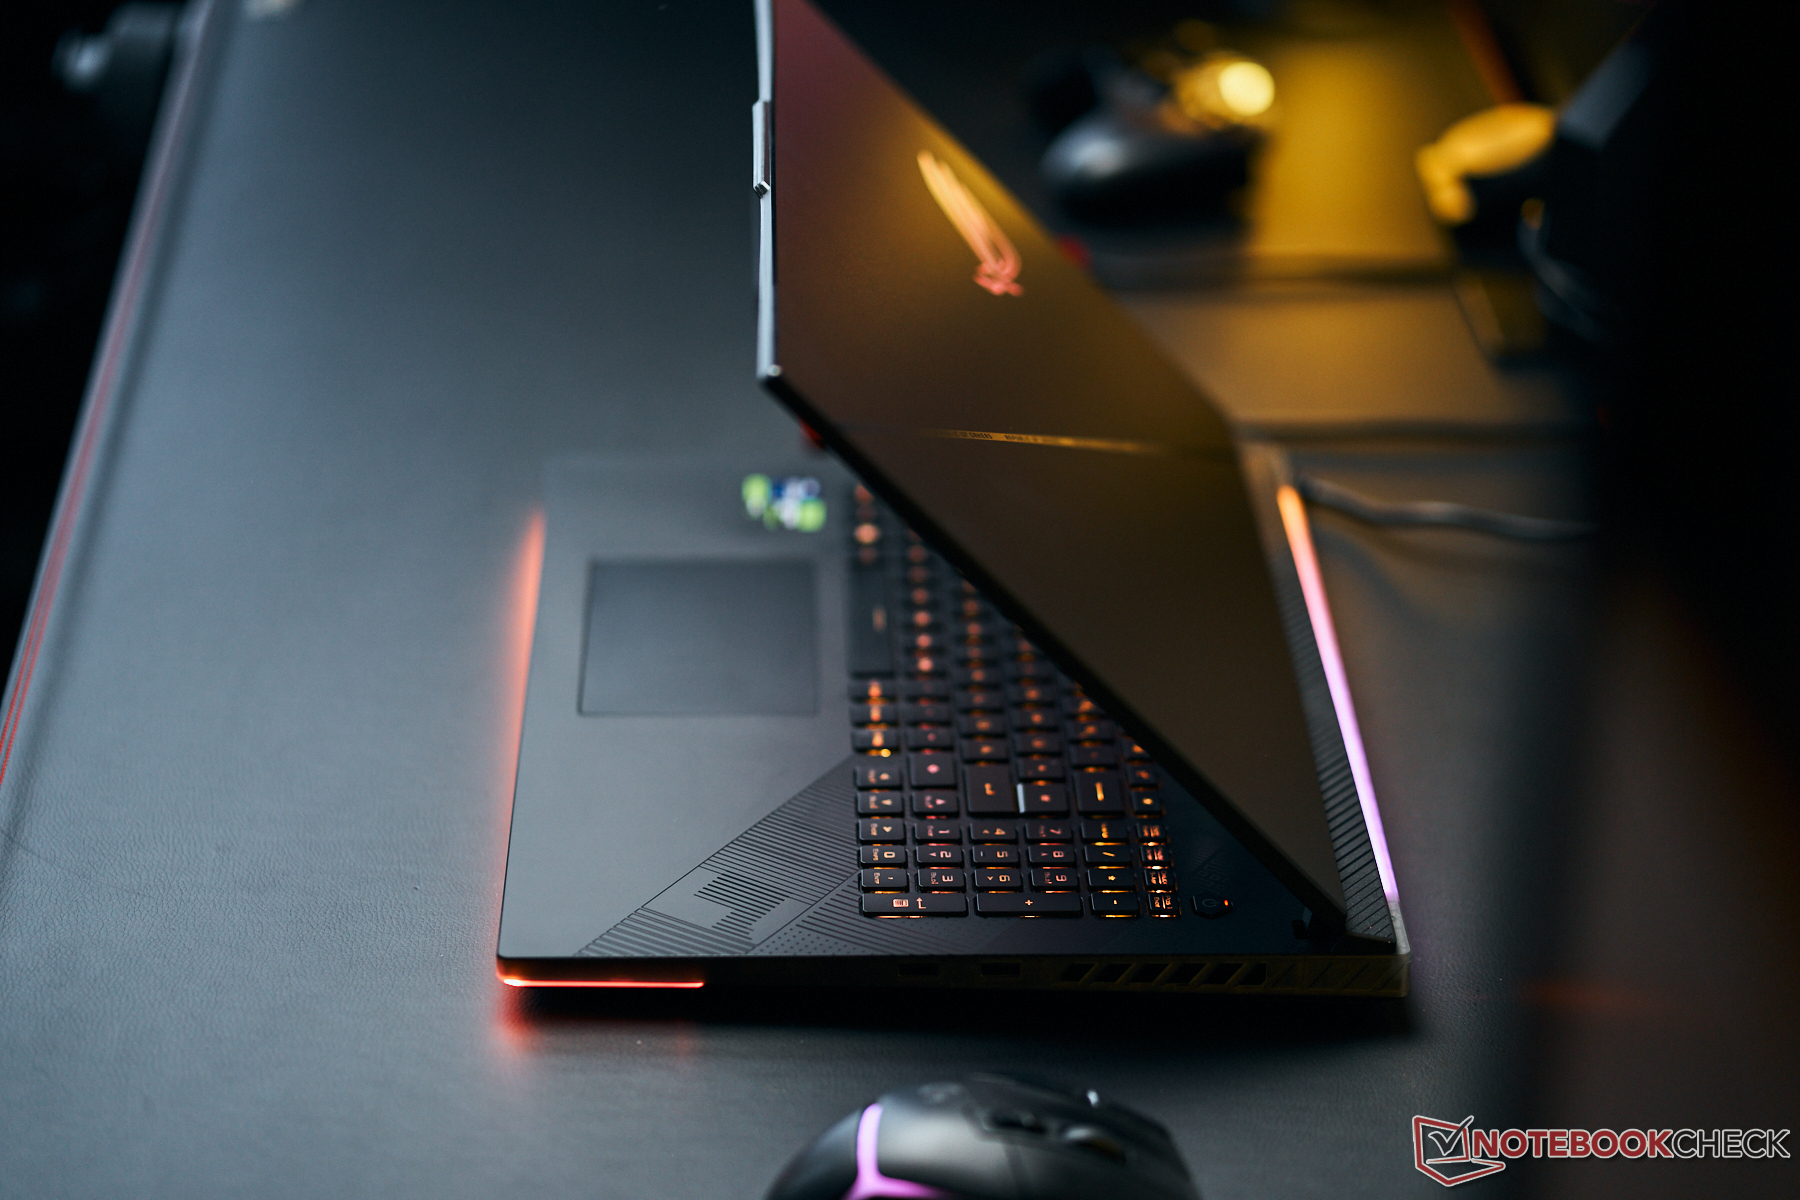
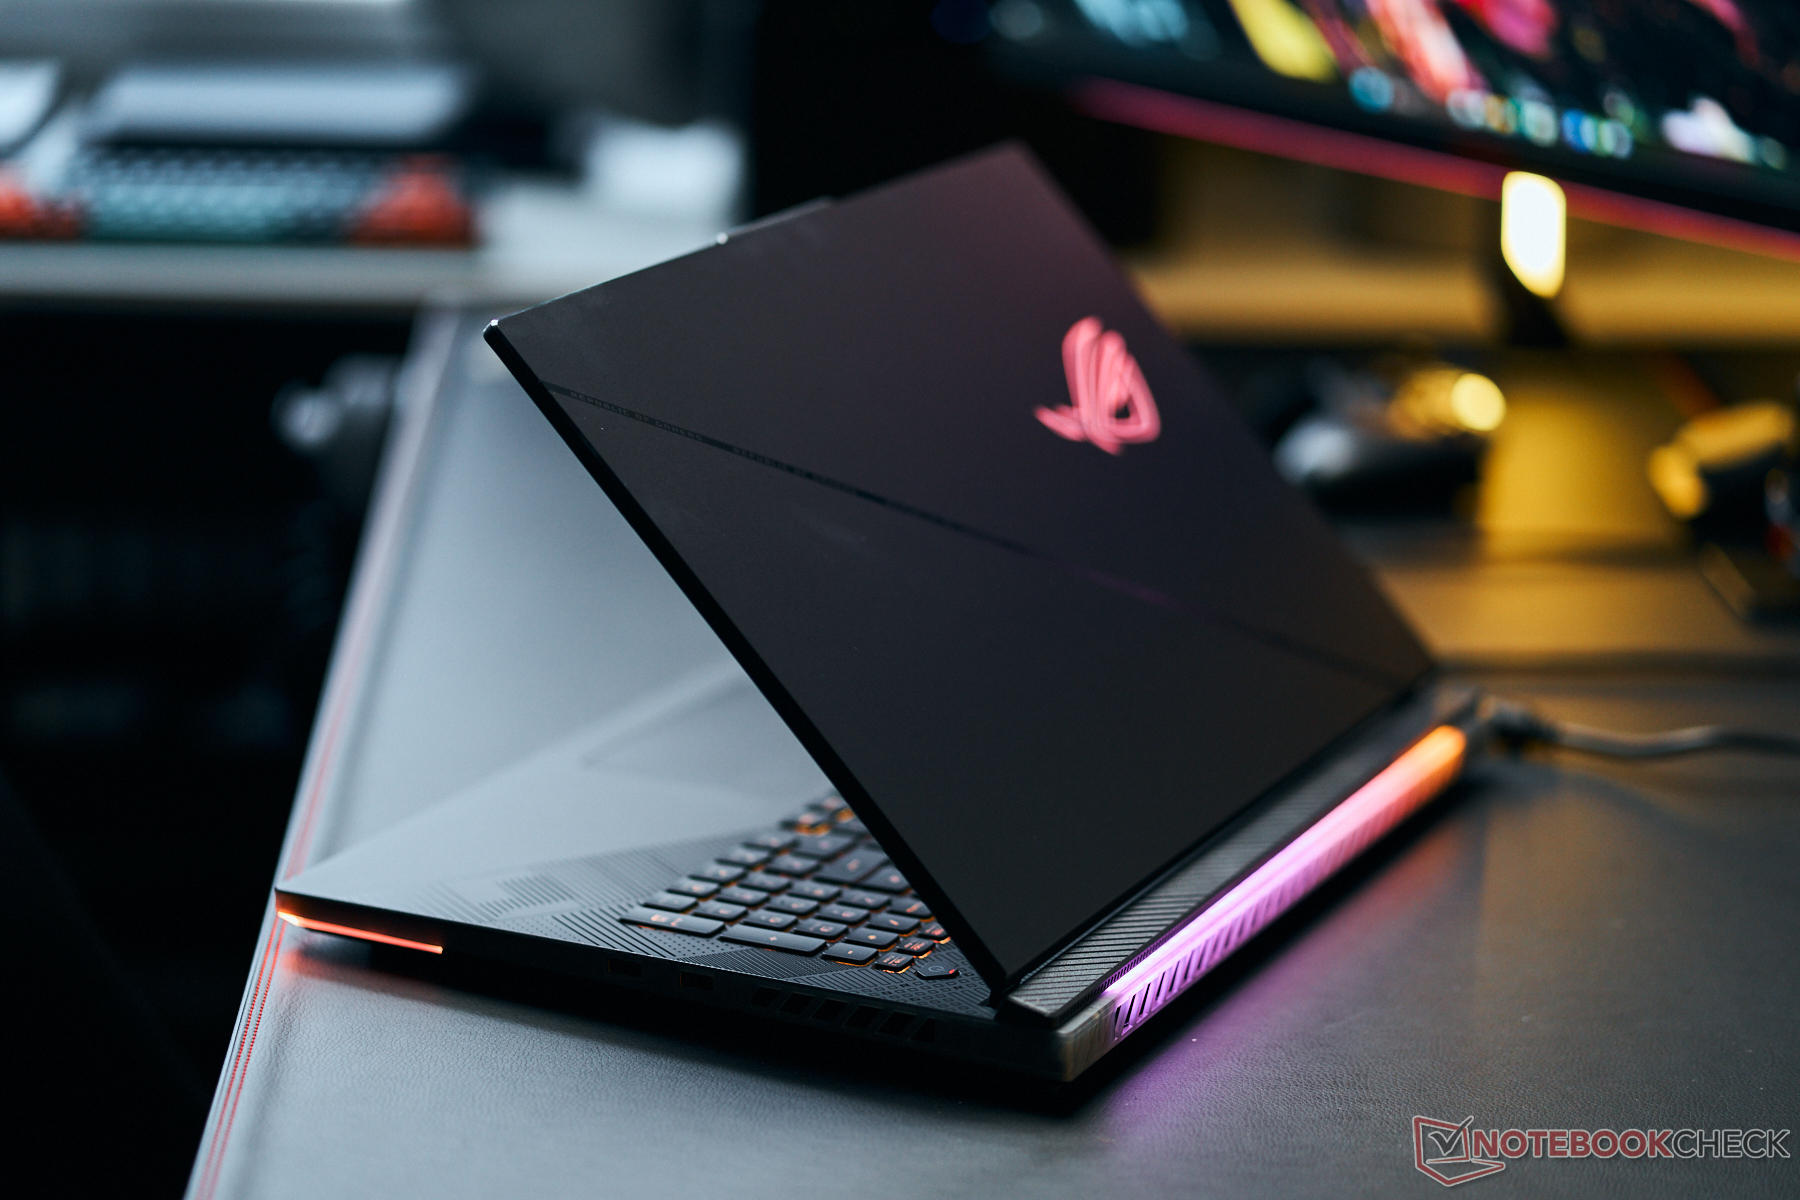
Obudowa - dużo plastiku i niewiele aluminium
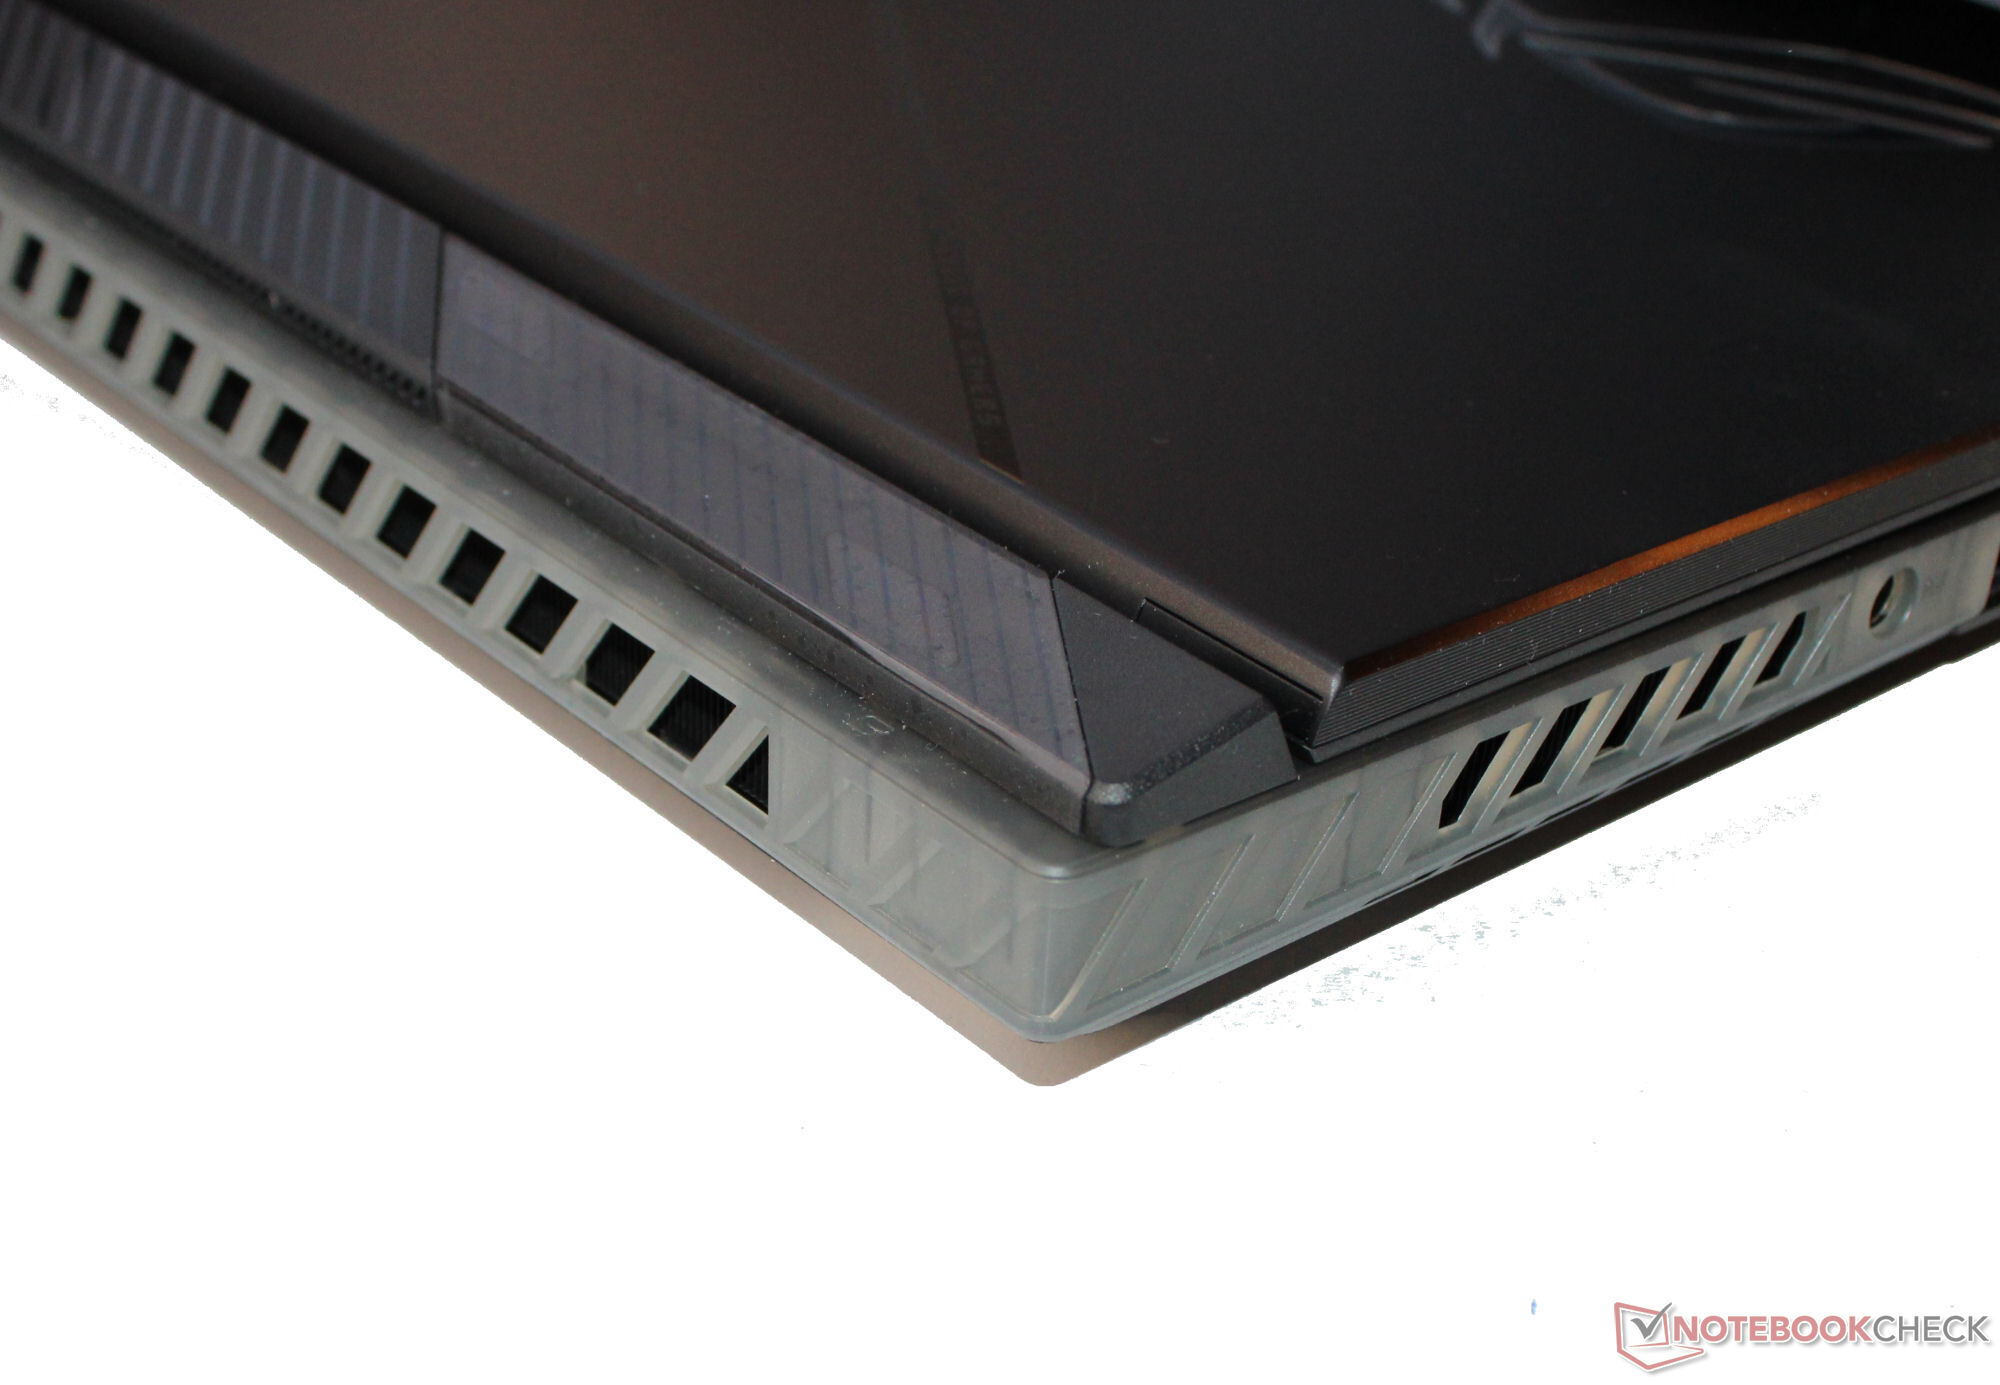
Pomimo wysokiego poziomu cenowego, użycie wysokiej jakości materiałów pozostaje ograniczone, z tylną częścią pokrywy wyświetlacza Scar wykonaną z aluminium i resztą komponentów wykonanych z tworzywa sztucznego. Niektóre części plastiku (nad klawiaturą i na krótszych bokach) przepuszczają trochę światła. Paski LED z przodu i z tyłu oraz podświetlane logo na pokrywie wyświetlacza ożywiają czarną obudowę.
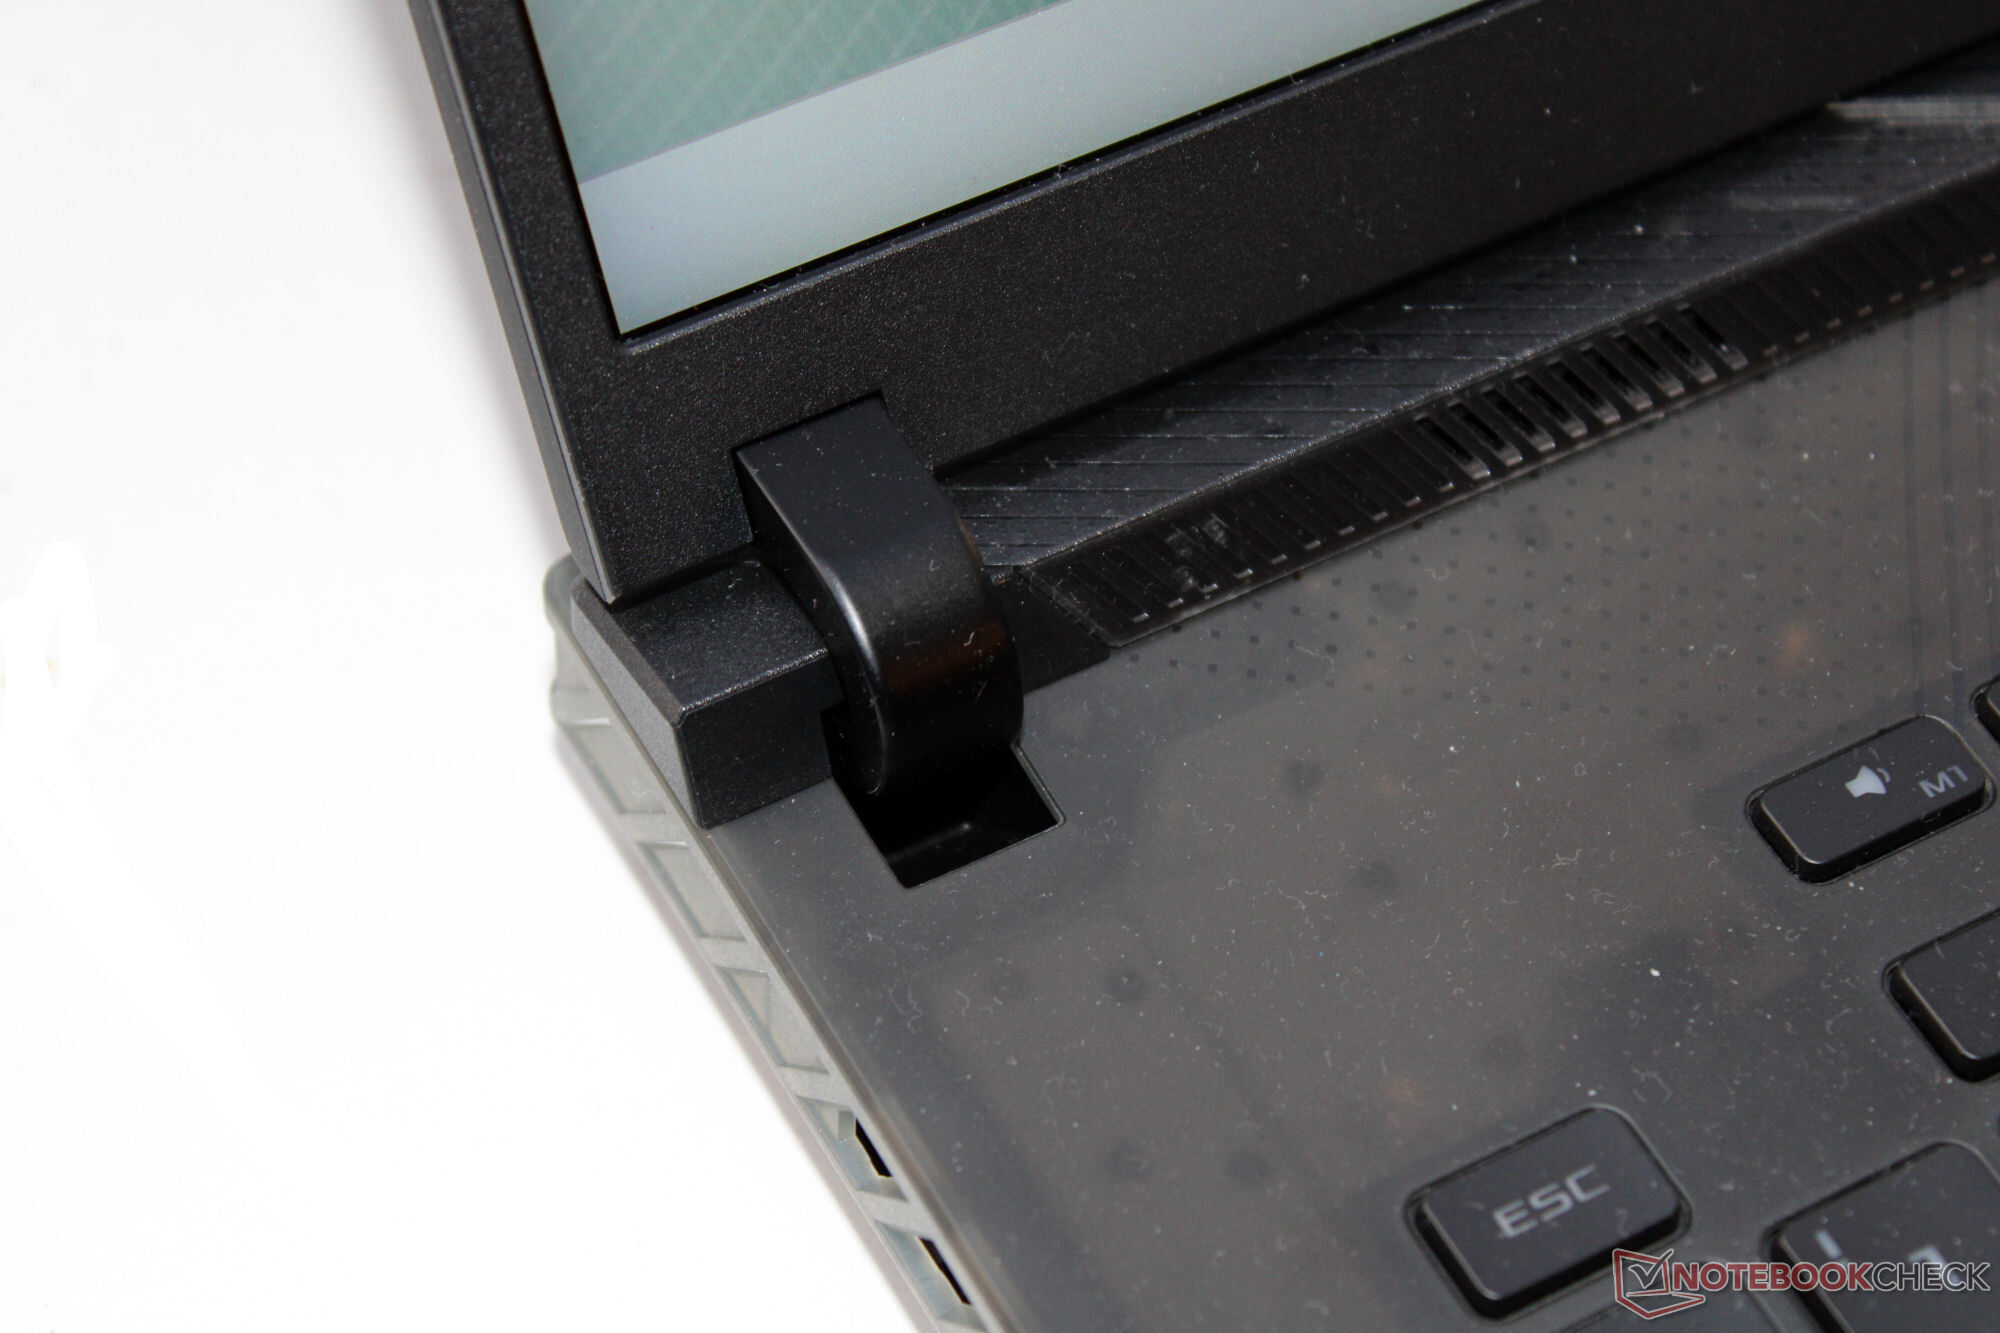
Nie widzimy żadnych wad w wykonaniu, a szczeliny materiałowe są niewielkie i równe. Podczas gdy pokrywę można tylko lekko przekręcić, reakcja jednostki bazowej jest bardziej wyraźna. Drogi laptop kosztujący kilka tysięcy euro powinien radzić sobie tutaj lepiej. Nacisk na pokrywę wyświetlacza nie powoduje żadnych artefaktów obrazu. Zawiasy mocno trzymają pokrywę w miejscu, ale wyświetlacz nadal lekko się chwieje podczas przesuwania laptopa. Maksymalny kąt otwarcia wynosi 130 stopni i można go otworzyć jedną ręką.
Scar 18 jest jednym z najbardziej kompaktowych i najlżejszych urządzeń w naszym polu porównawczym i ustępuje tylko Blade 18 pod tym względem.
Sprzęt - Asus Strix oferuje Thunderbolt 4
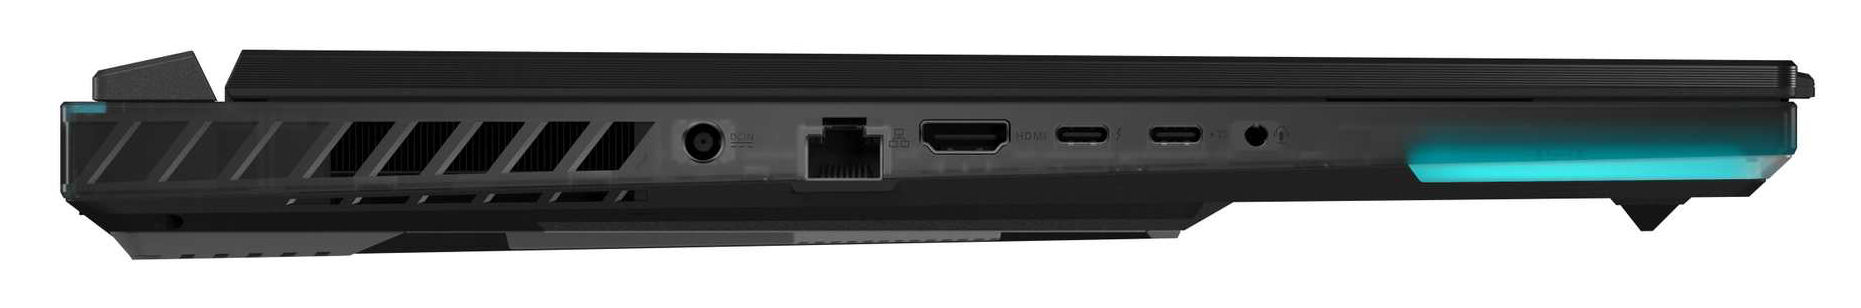
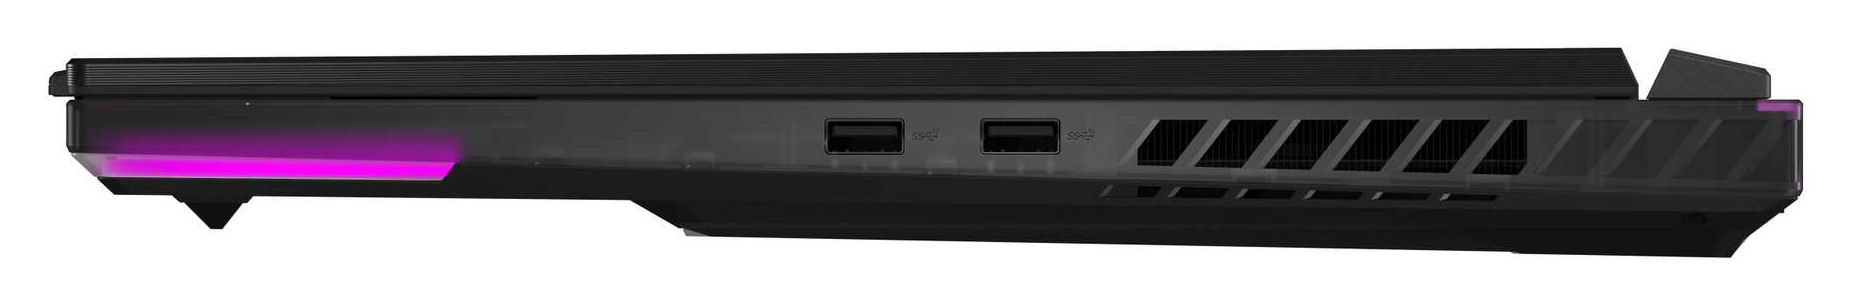
Laptop Asusa oferuje dwa porty USB-A (USB 3.2 Gen 2) i dwa porty USB-C (1x Thunderbolt 4, 1x USB 3.2 Gen 2). Oba porty USB-C są w stanie wyprowadzić sygnał DisplayPort, a port USB 3.2 Gen 2 obsługuje również funkcję Power Delivery. Złącza uzupełniają port HDMI, port audio i port Gigabit Ethernet. Laptop nie posiada czytnika kart pamięci.
Z tyłu laptopa nie ma żadnych portów, a wszystkie są umieszczone po lewej i prawej stronie obudowy. Kable biegnące do tyłu blokowałyby niektóre otwory wentylatorów po bokach laptopa. Tak jest na przykład w przypadku kabla zasilającego (kątowa wtyczka zasilania). Użytkownicy praworęczni mogą być poirytowani jedynie portami USB-A, które umieszczono tylko po prawej stronie.
Komunikacja
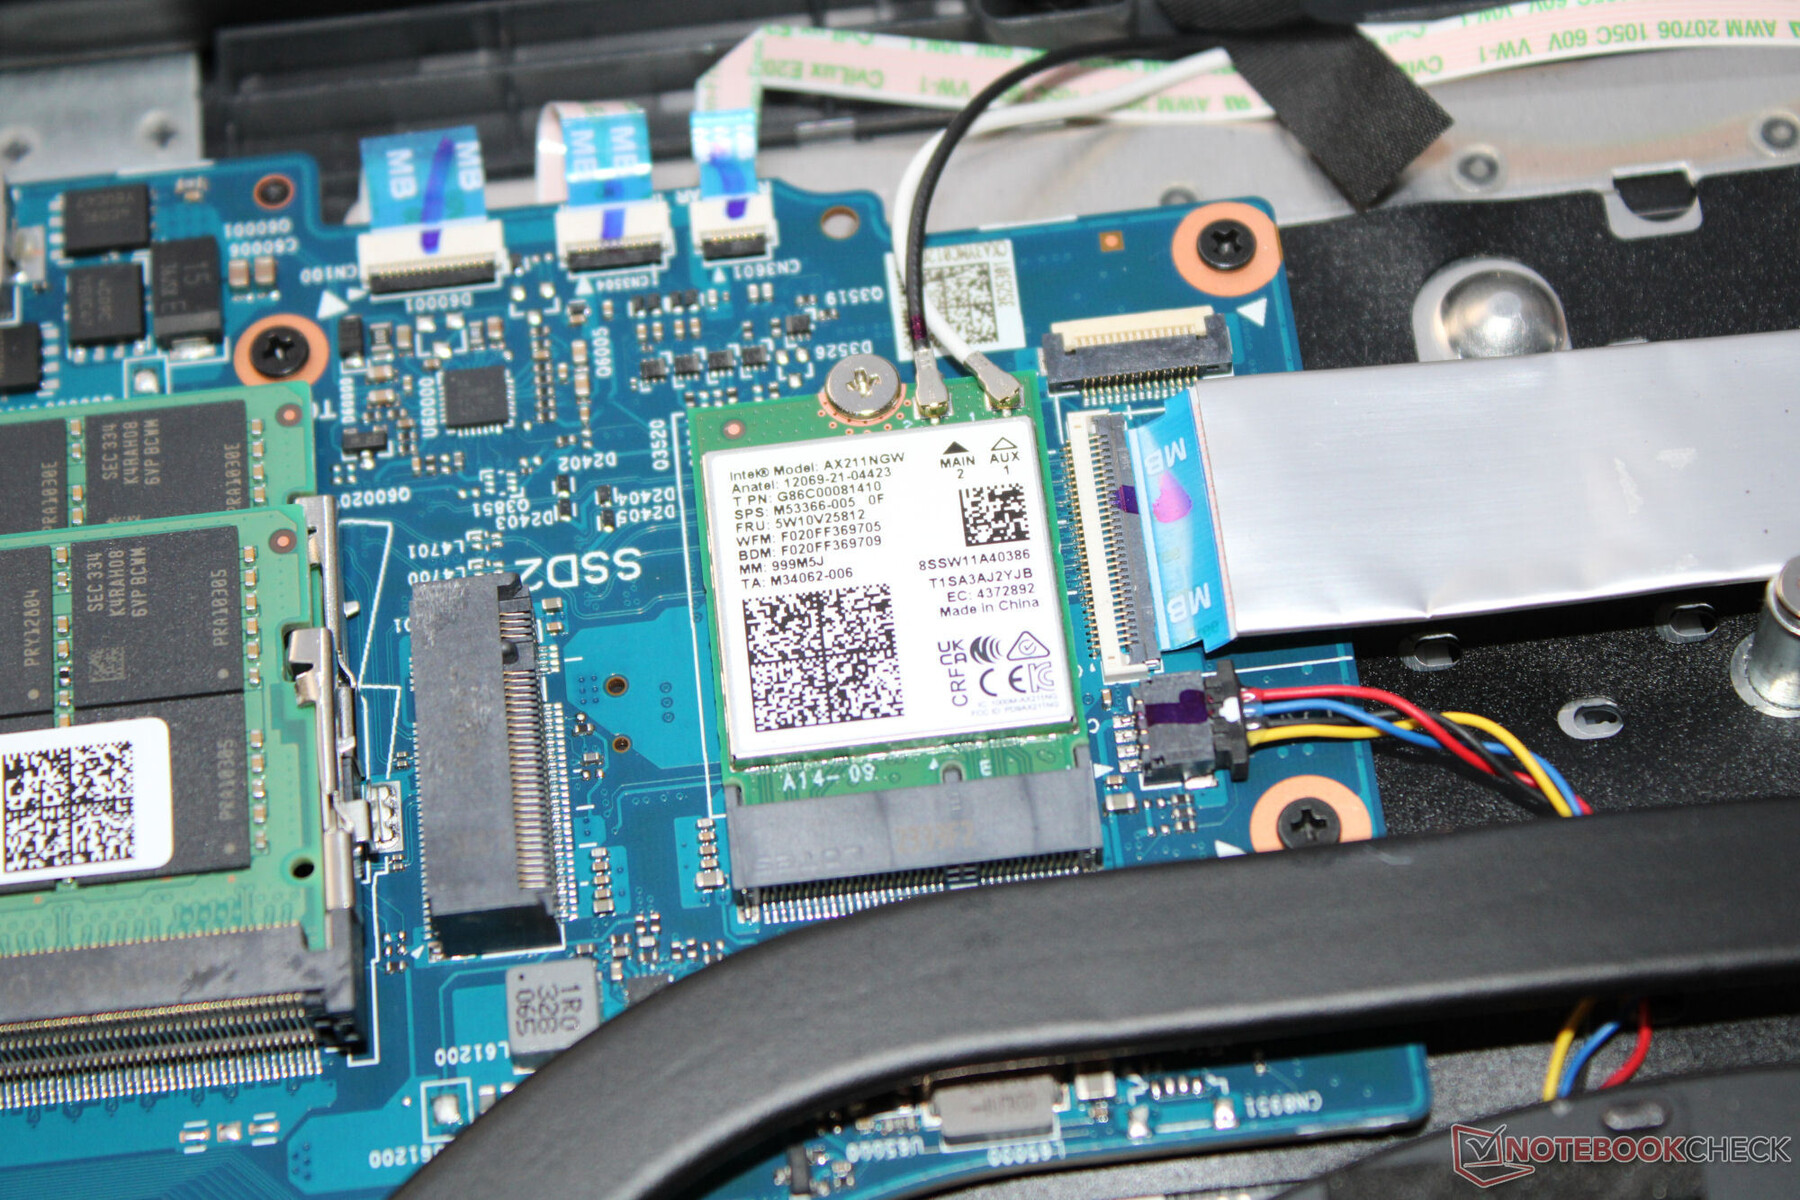
W optymalnych warunkach (brak innych urządzeń Wi-Fi w pobliżu, niewielka odległość między laptopem a komputerem serwerowym), laptop osiąga dobre lub bardzo dobre prędkości transferu Wi-Fi. Strix wykorzystuje układ Wi-Fi 6E (Intel AX211), a połączenia przewodowe obsługiwane są przez kontroler Realtek (RTL8125; 2,5 Gbit/s).
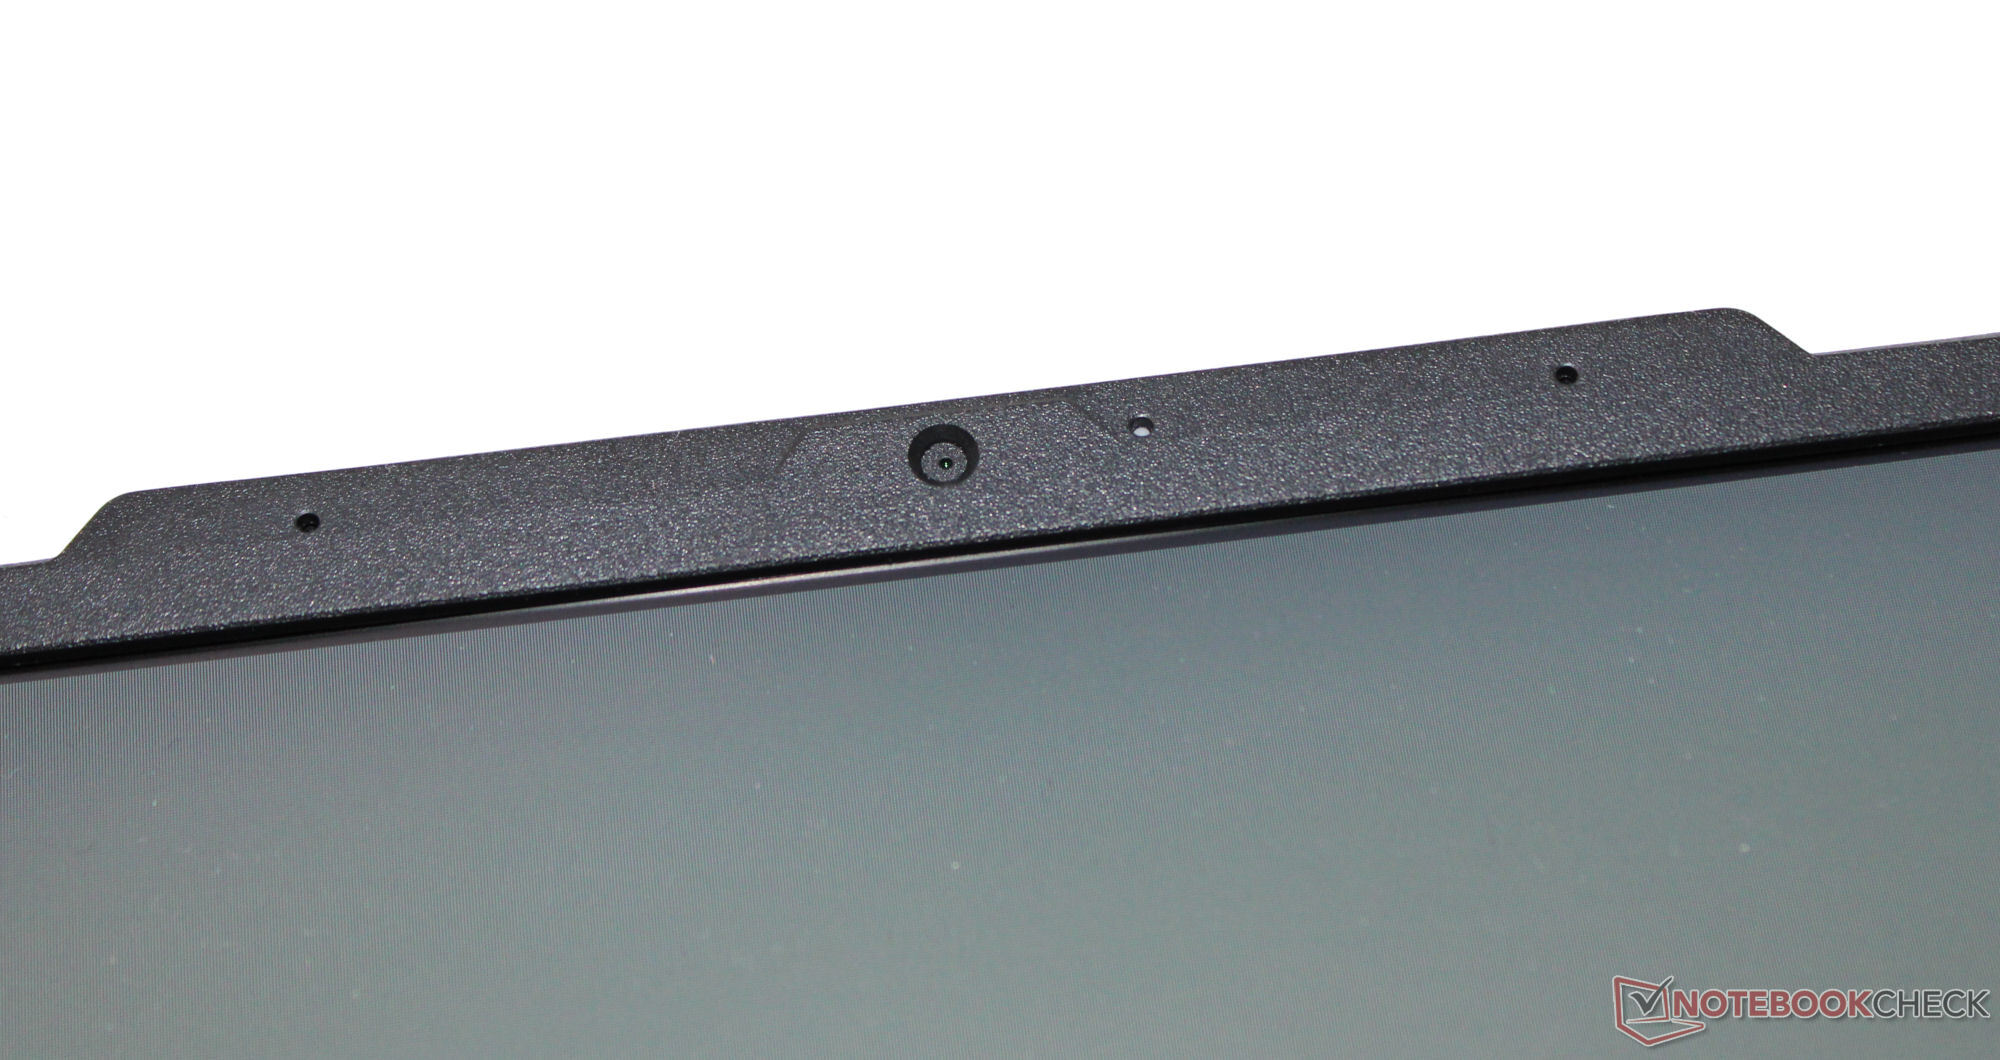
Kamera internetowa
Podczas gdy Asus w większości przypadków stosuje sprzęt najwyższej jakości, kamera internetowa jest wyjątkiem, z zaledwie skromnym modelem 0,9 MP (maks. 1280x720 pikseli). Jakość obrazu jest nieprzekonująca, ale odchylenie kolorów wynoszące około 8 (docelowe DeltaE < 3) jest nadal w porządku. Kamera nie posiada ręcznej migawki.

 GeForce RTX 4090 Laptop GPU, i9-14900HX, Samsung PM9A1a MZVL22T0HDLB")
 GeForce RTX 4090 Laptop GPU, i9-14900HX, Samsung PM9A1a MZVL22T0HDLB")
Akcesoria
Laptop nie zawiera żadnych dodatkowych akcesoriów poza zwykłymi dokumentami.
Konserwacja
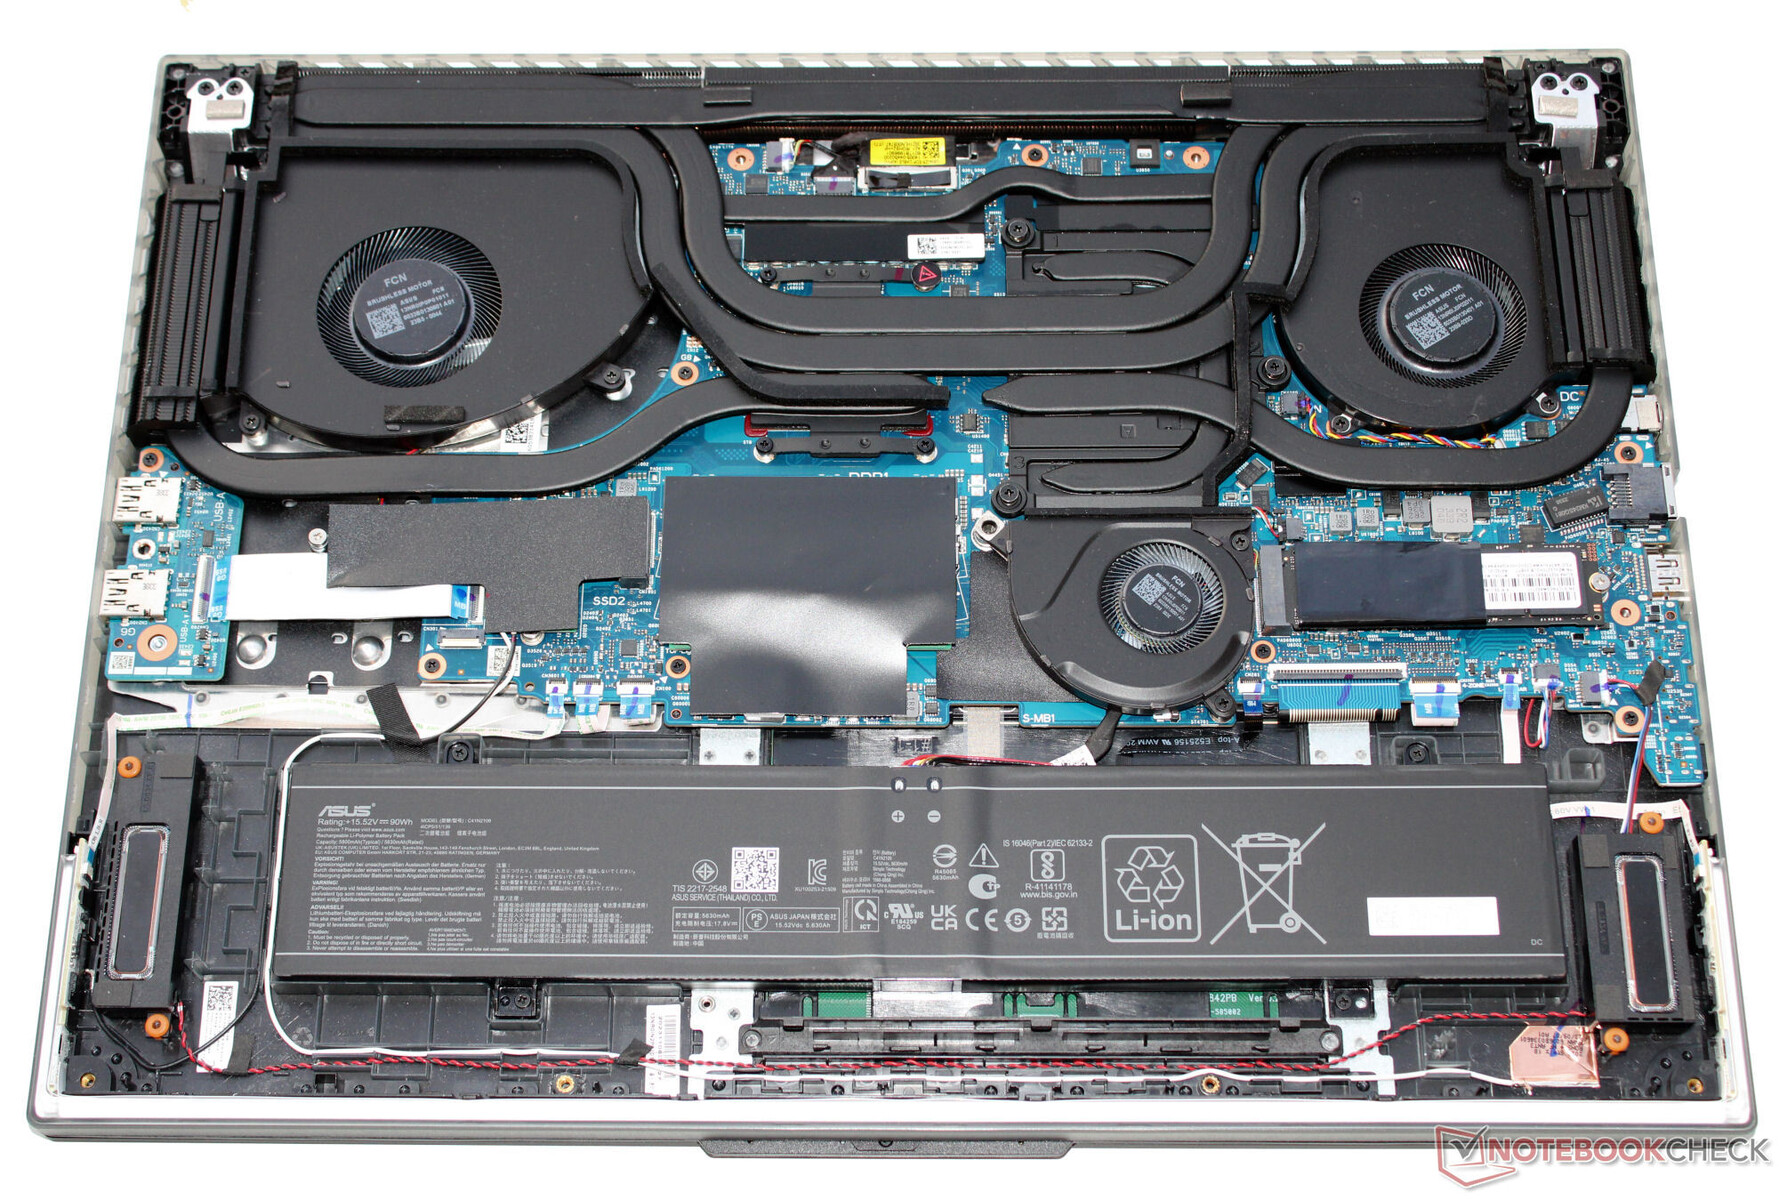
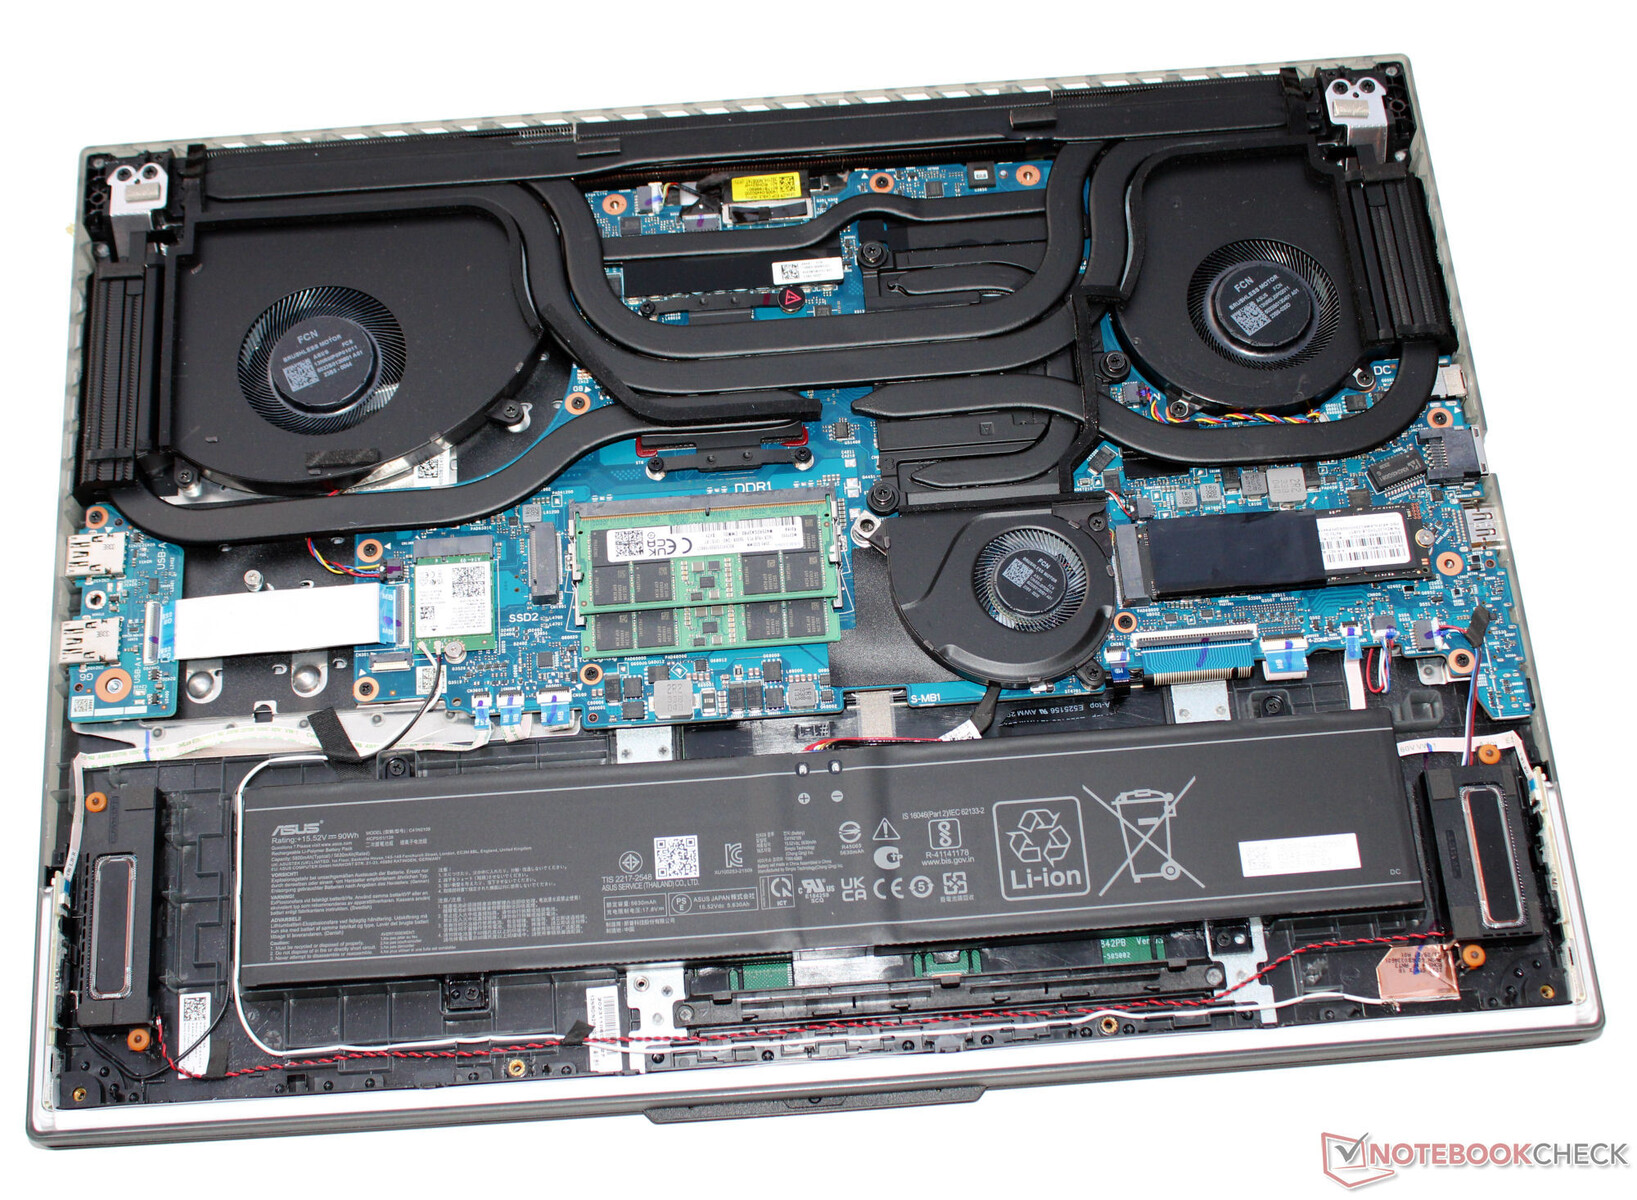
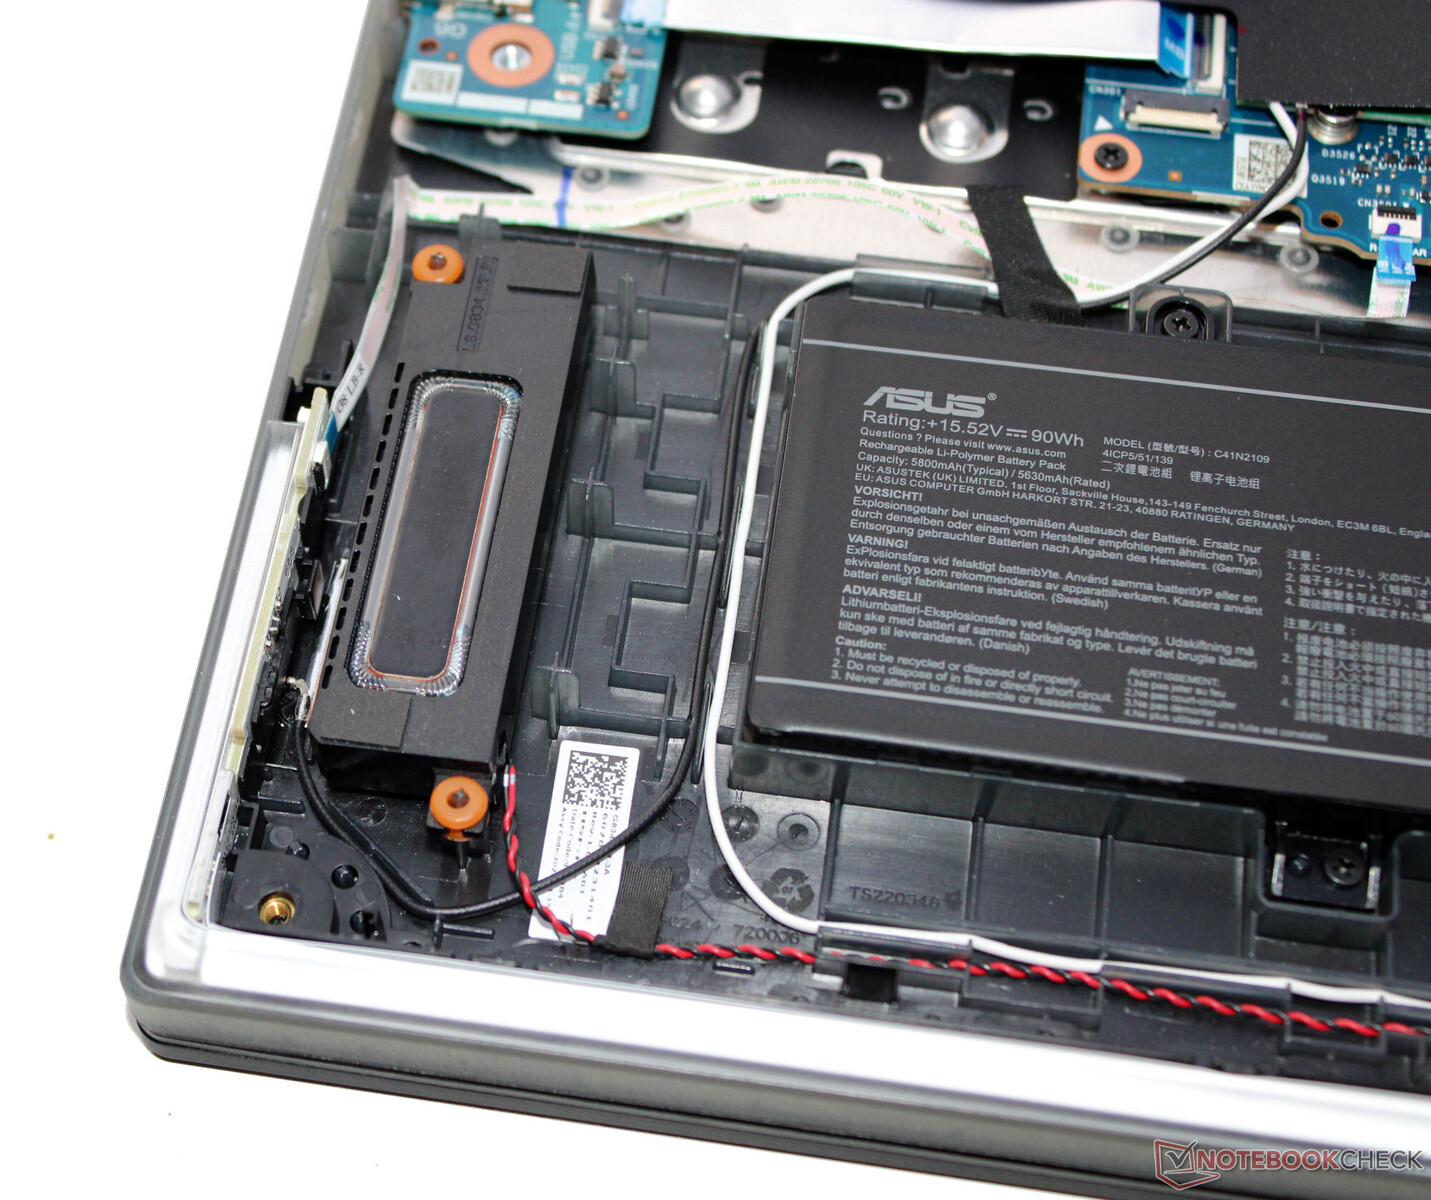
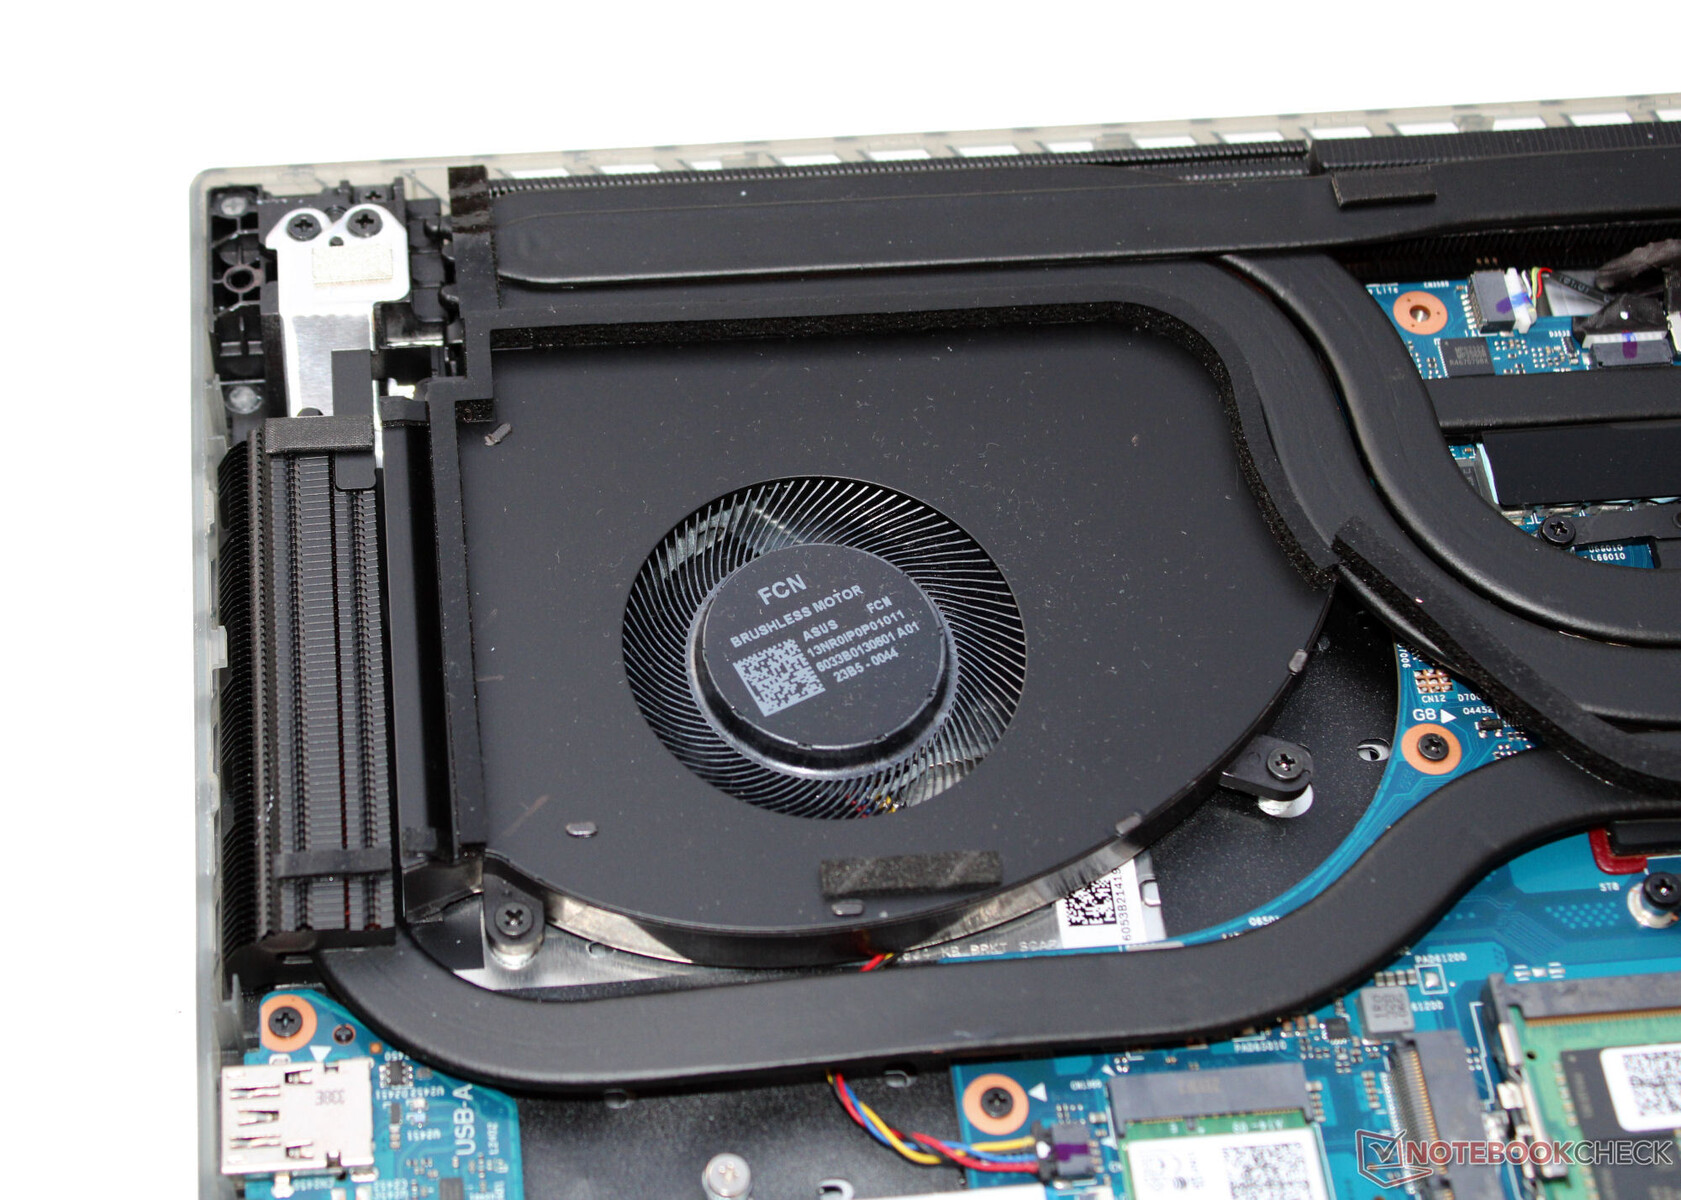
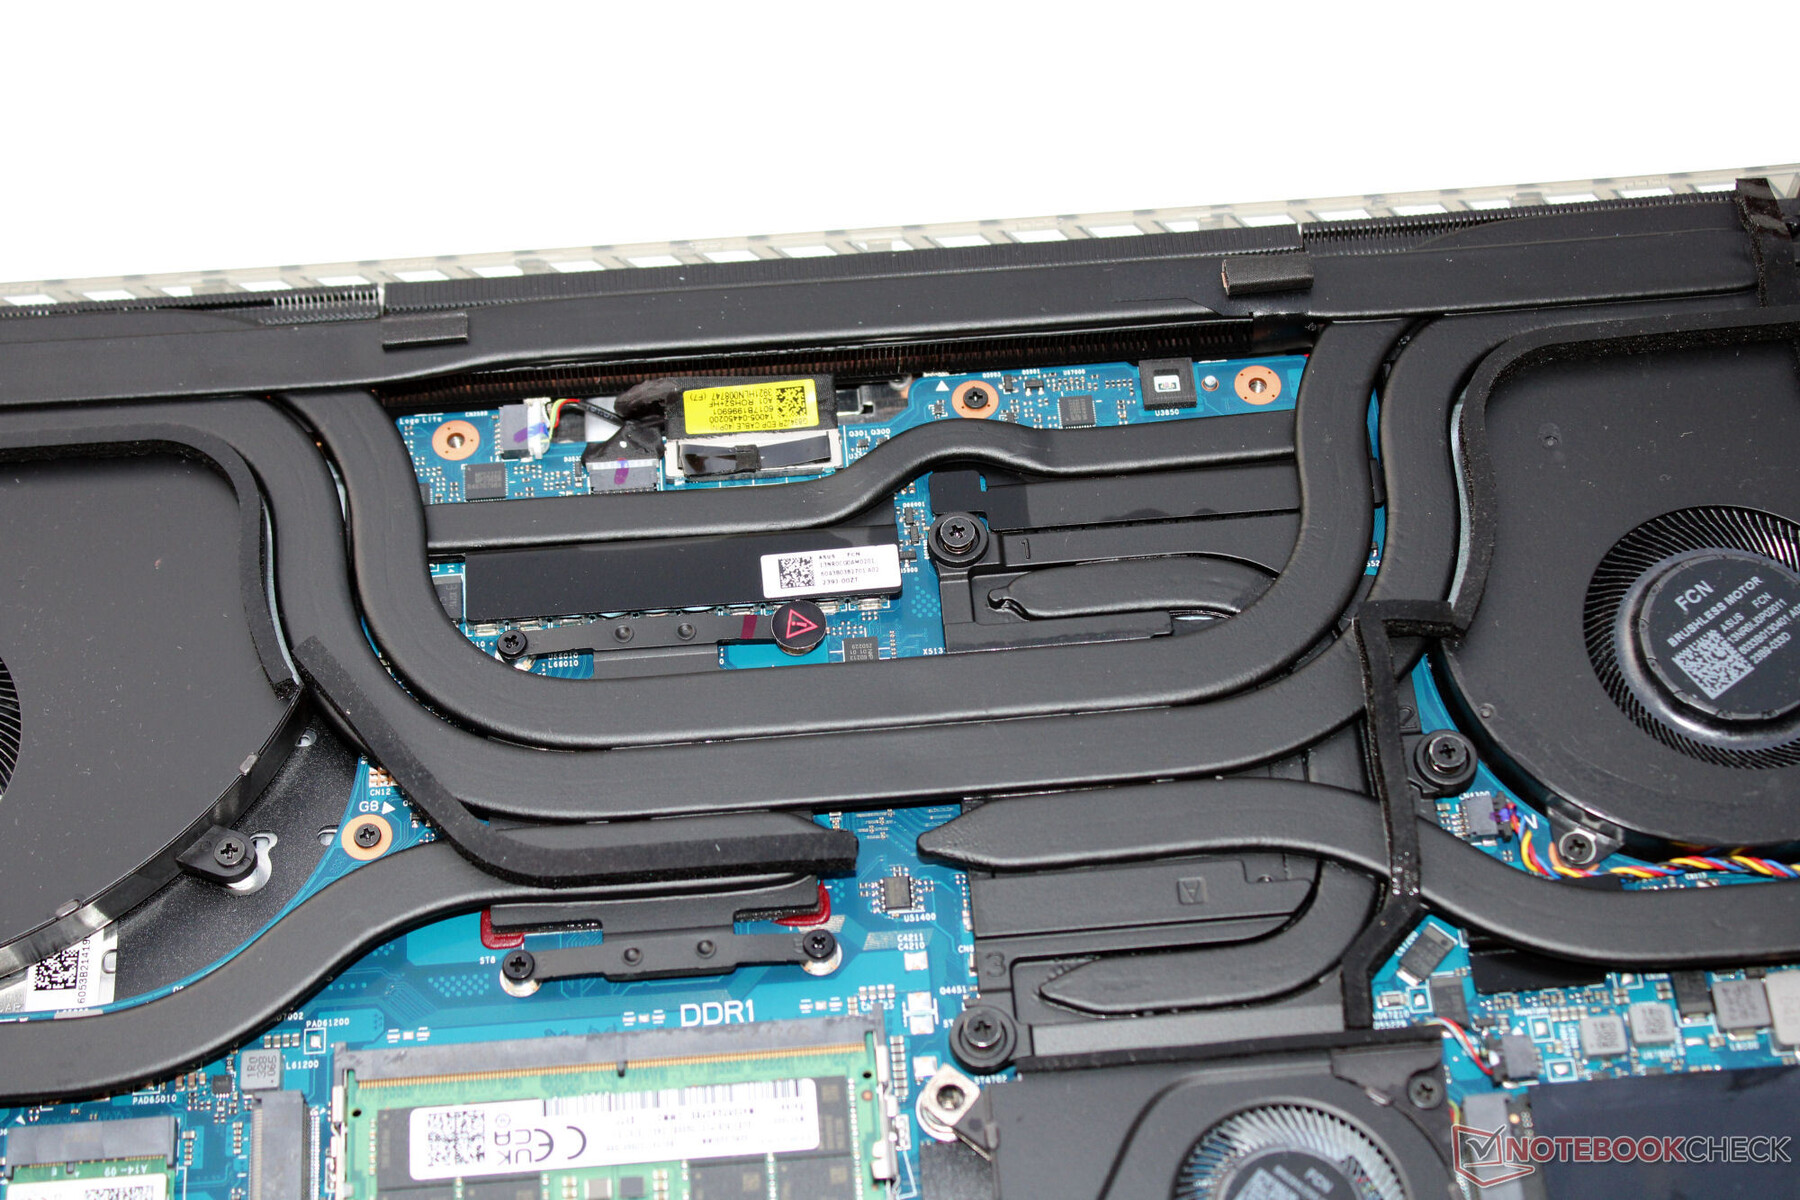
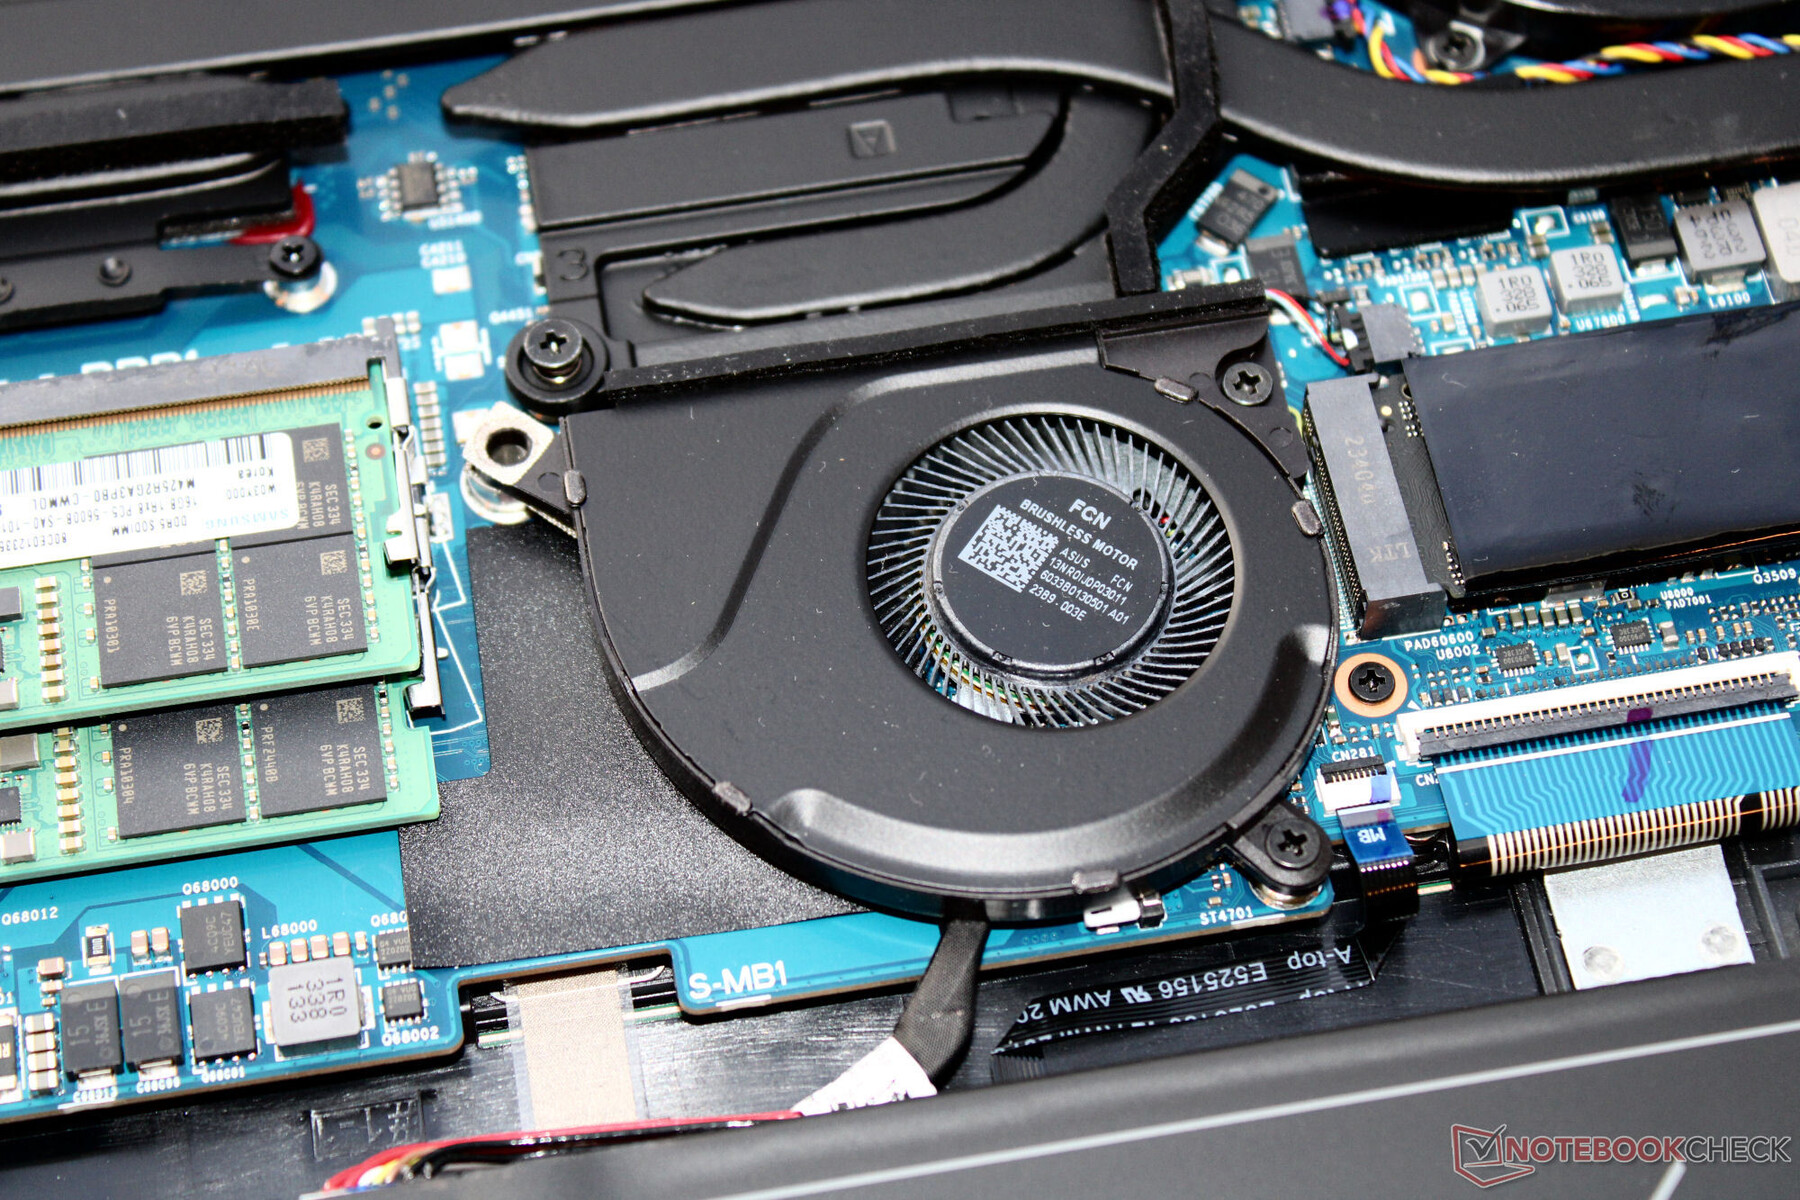
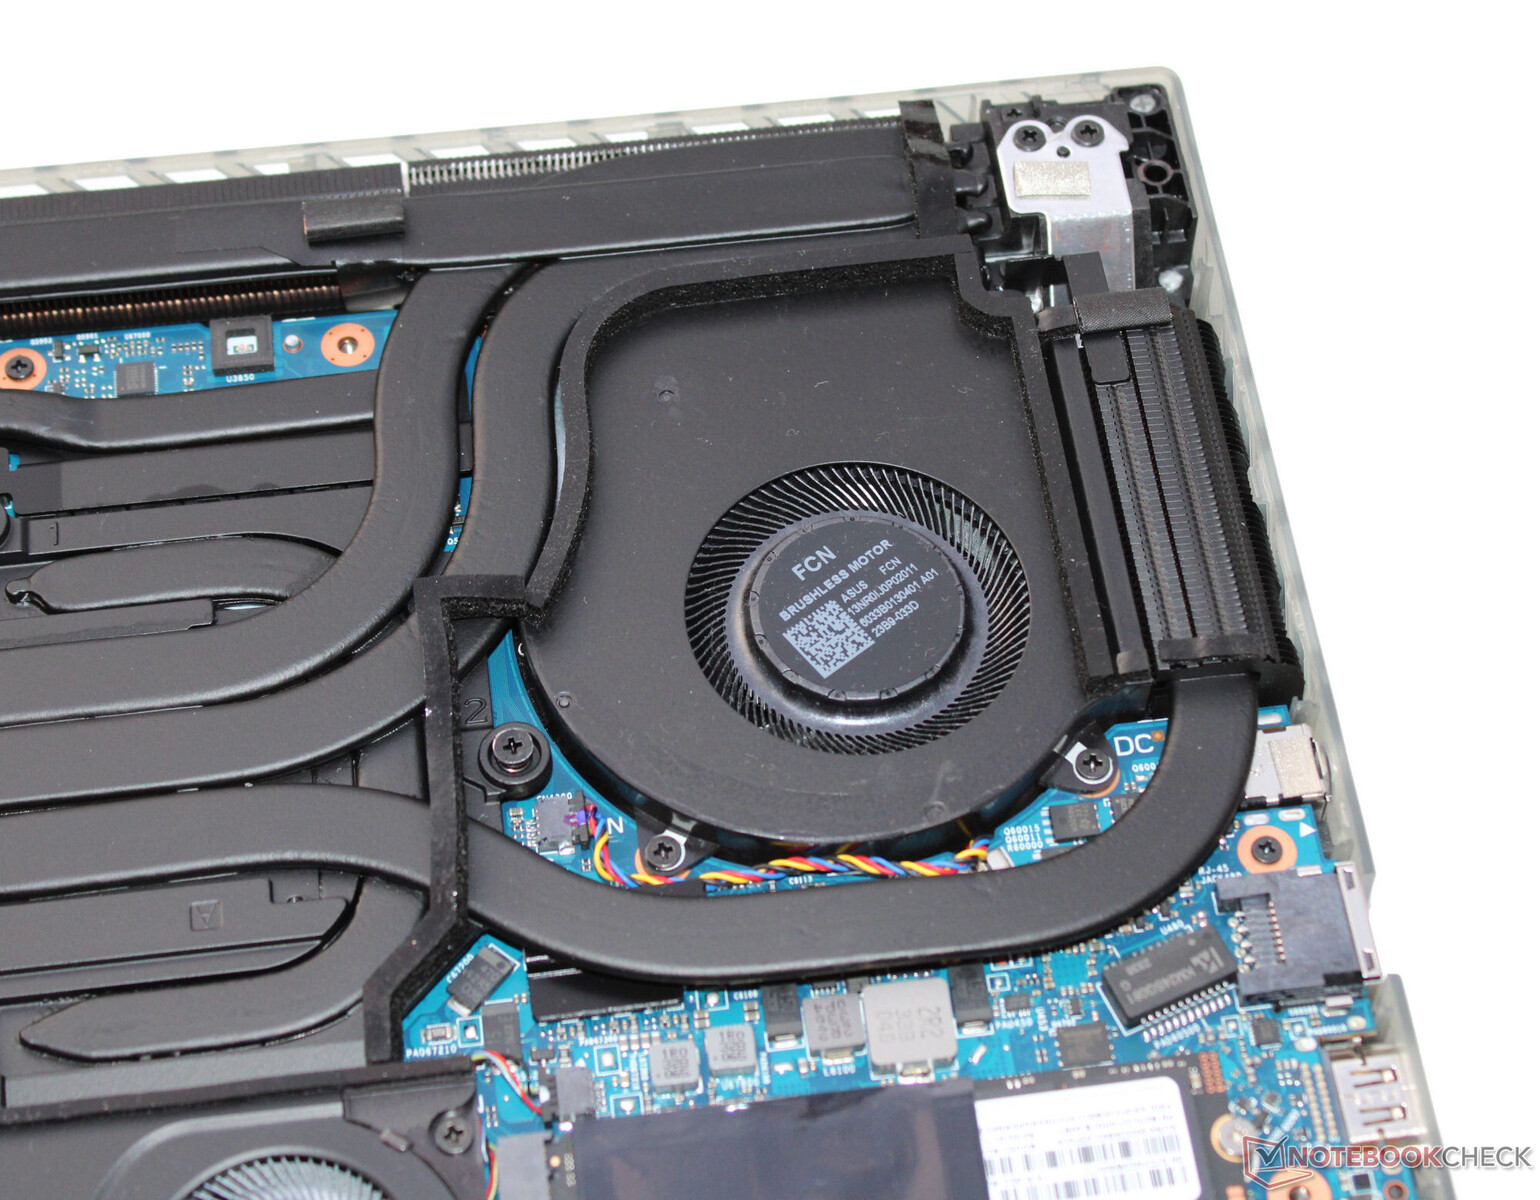
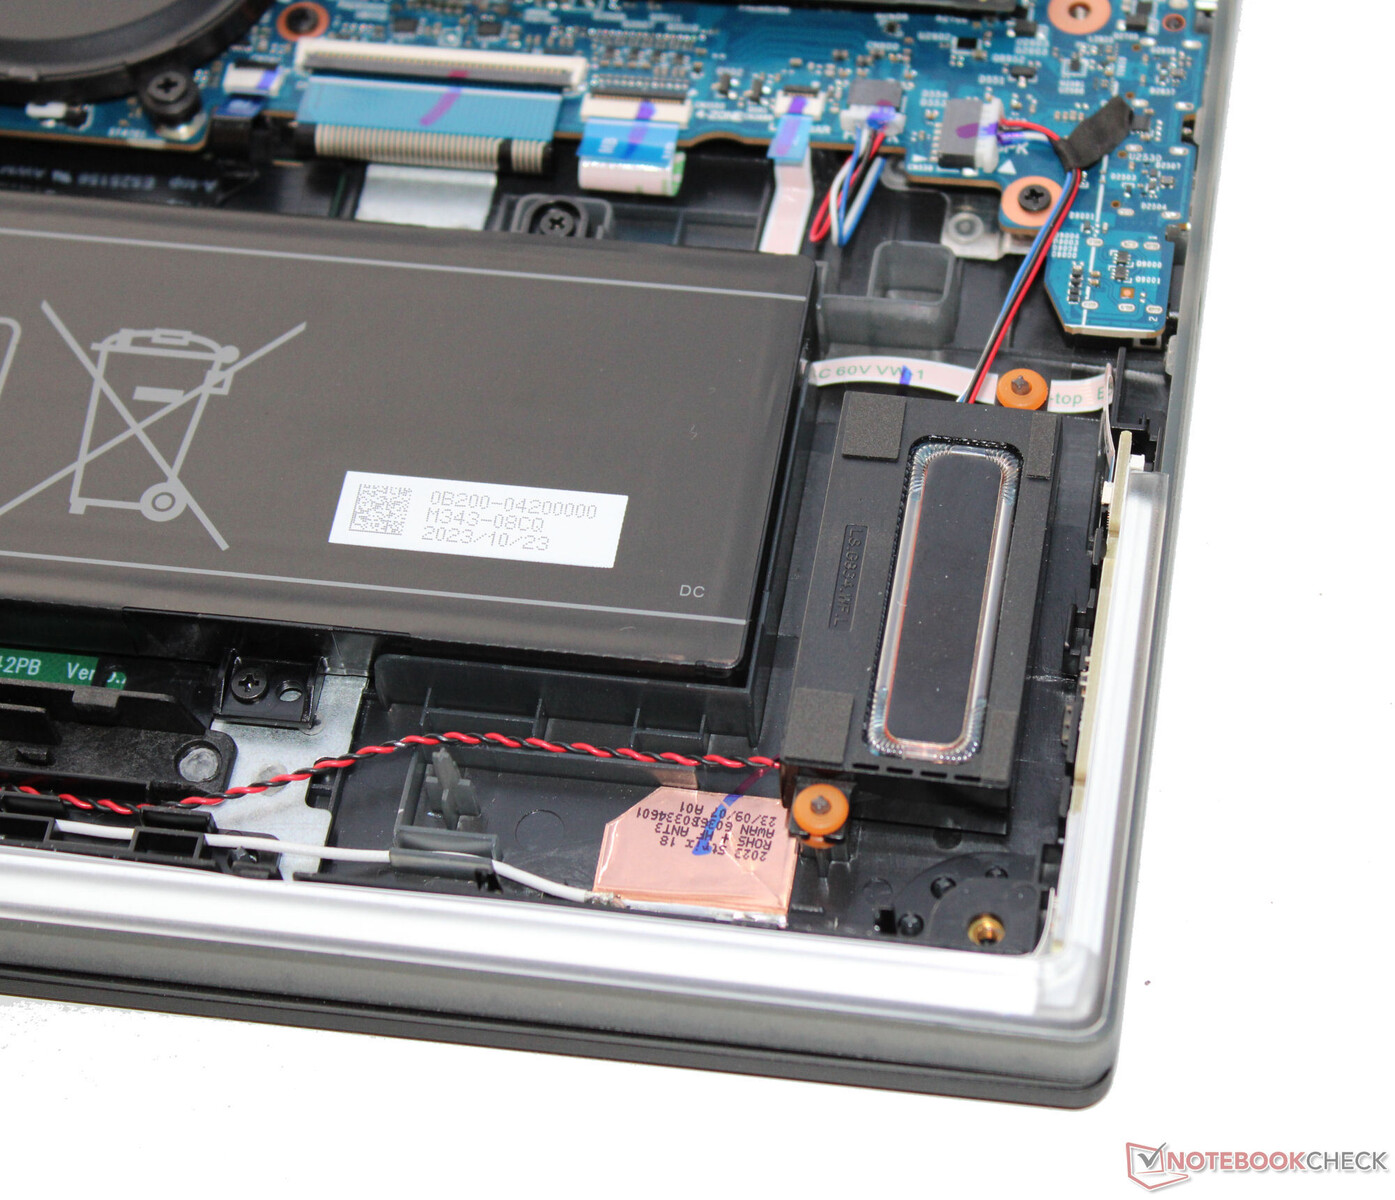
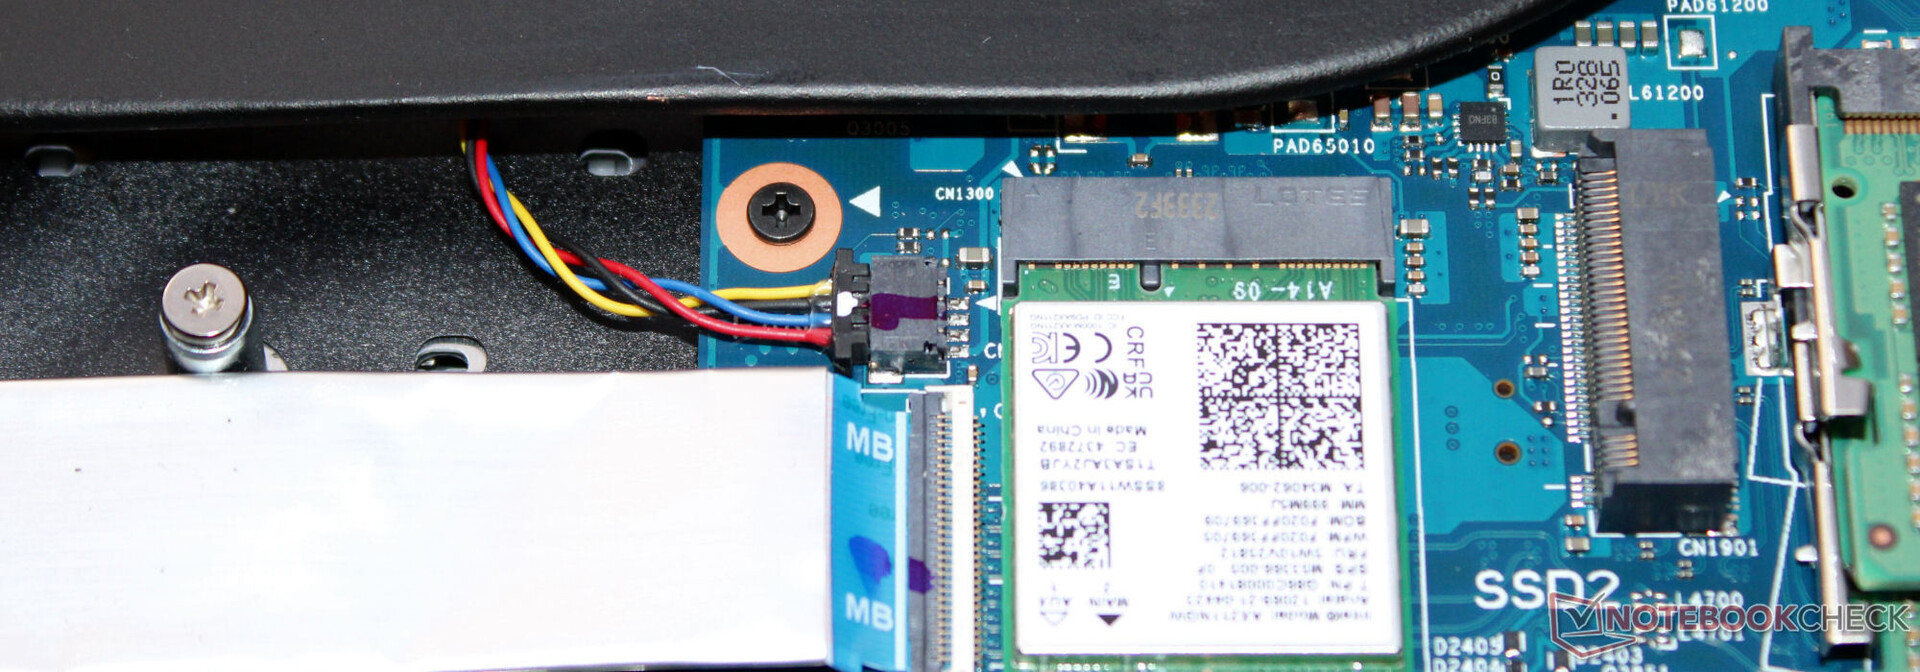
Aby otworzyć laptopa, należy odkręcić wszystkie śruby na spodzie obudowy. Następnie można podnieść płytę obudowy za pomocą narzędzia do podważania. Po zdjęciu płyty obudowy uzyskuje się dostęp do banków pamięci masowej (zajętych), dysku SSD (PCIe 4, M.2-2280), drugiego gniazda SSD (PCIe 4, M.2-2280), modułu WLAN, baterii BIOS-u, wentylatorów i akumulatora (przykręconego, a nie przyklejonego).
Klawiatury nie da się łatwo wymienić. W tym celu trzeba by wymienić całą górną część podstawy, co wymagałoby całkowitego rozebrania laptopa.
Gwarancja
Asus oferuje dwuletnią gwarancję na 18-calowy laptop w Niemczech. Przedłużenie gwarancji do trzech lat kosztowałoby około 200 euro (~ 215 USD).
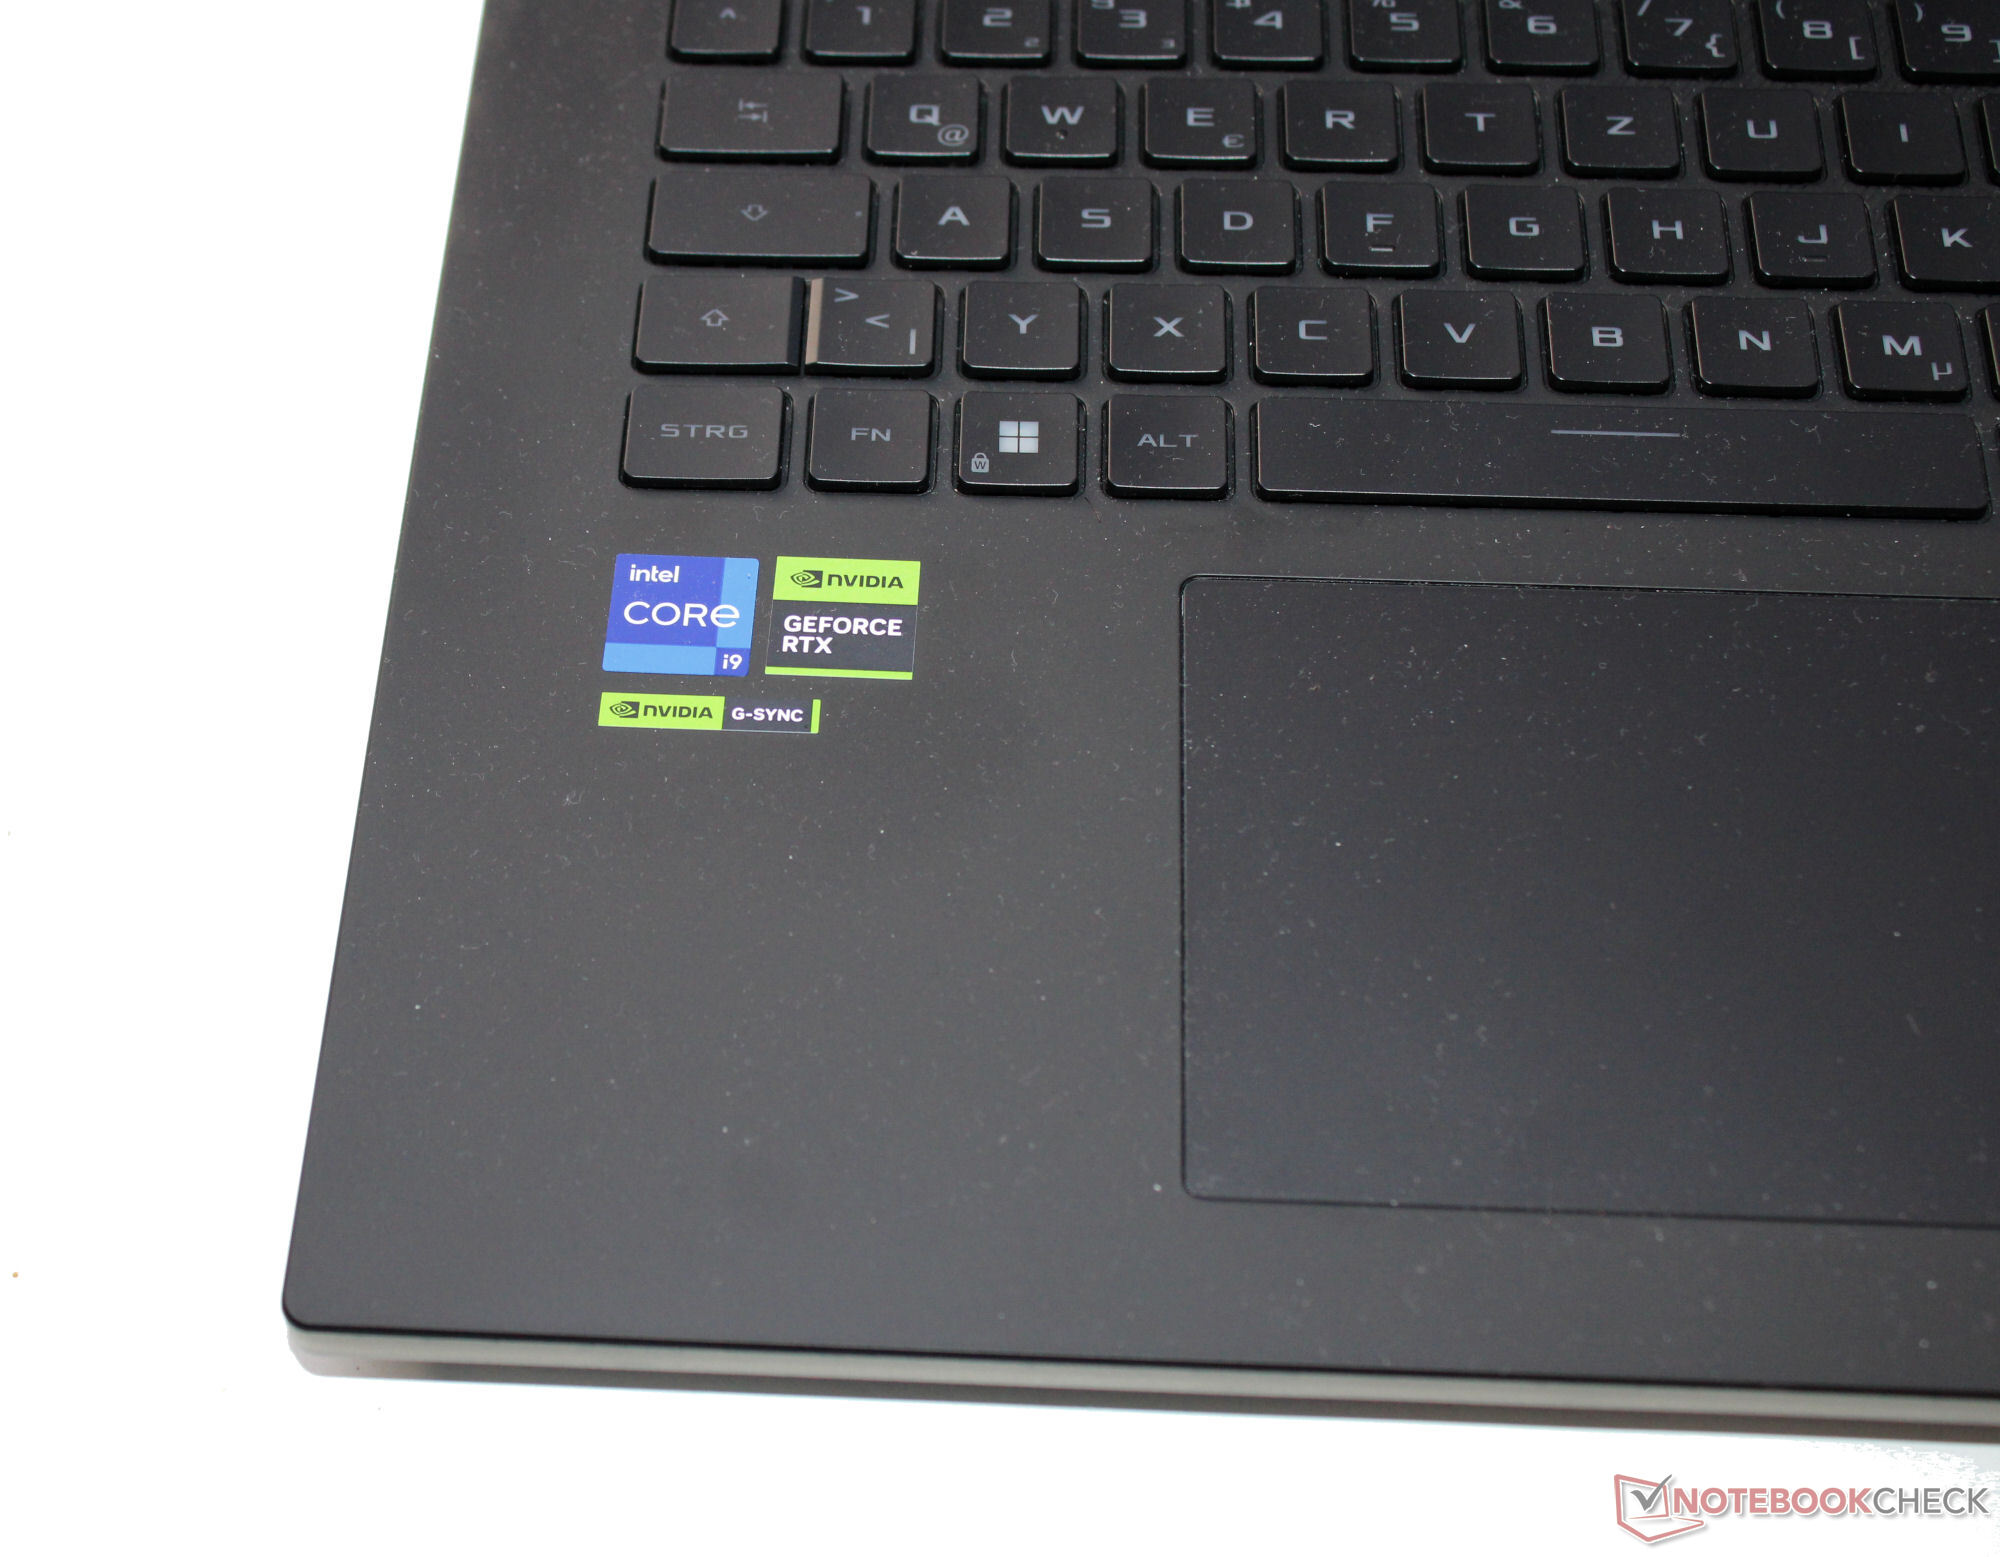
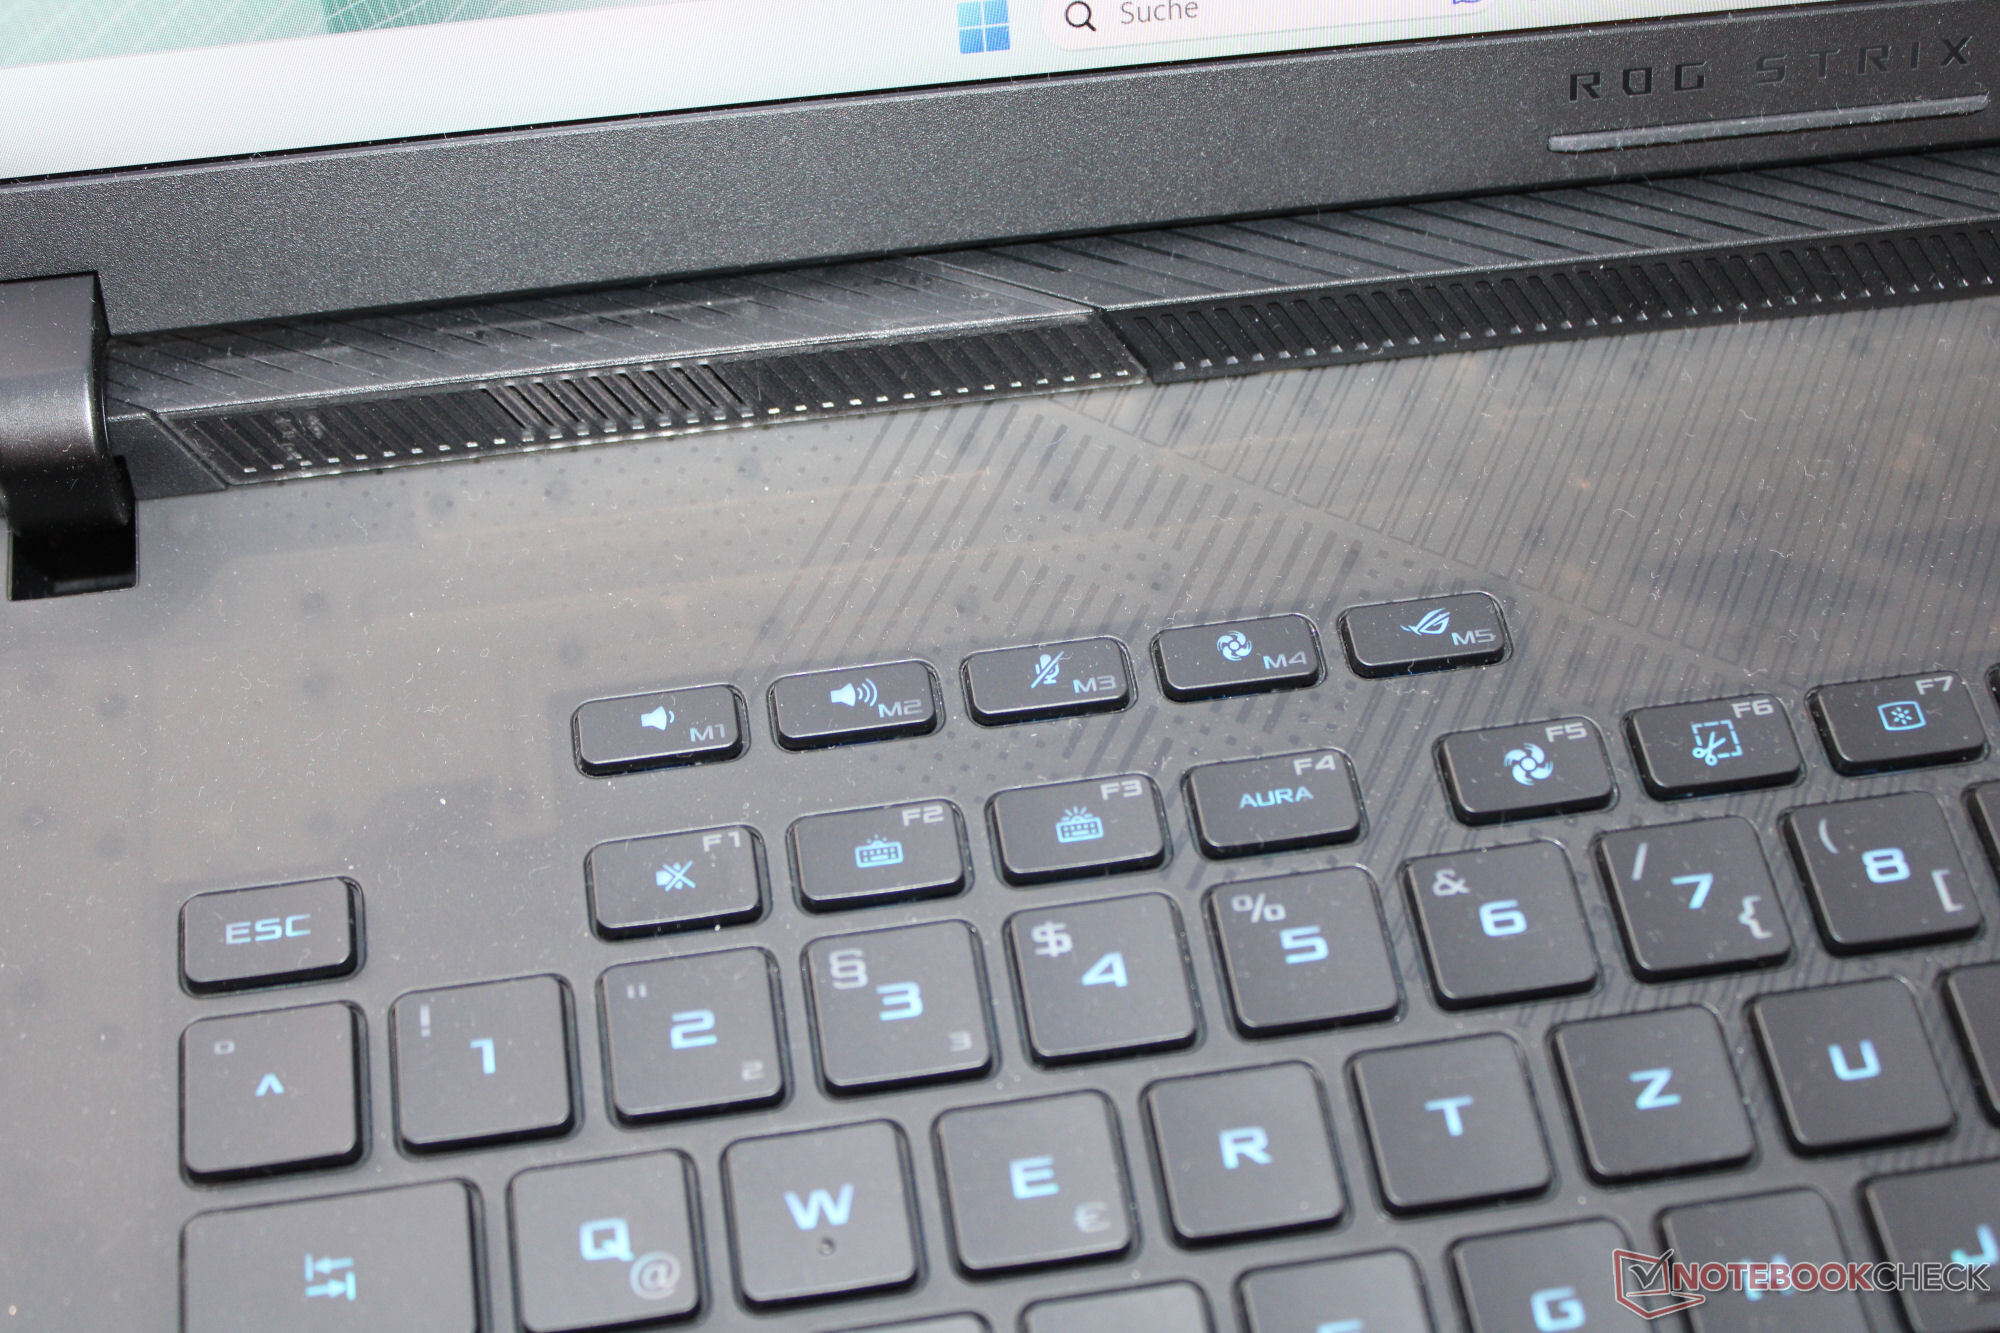
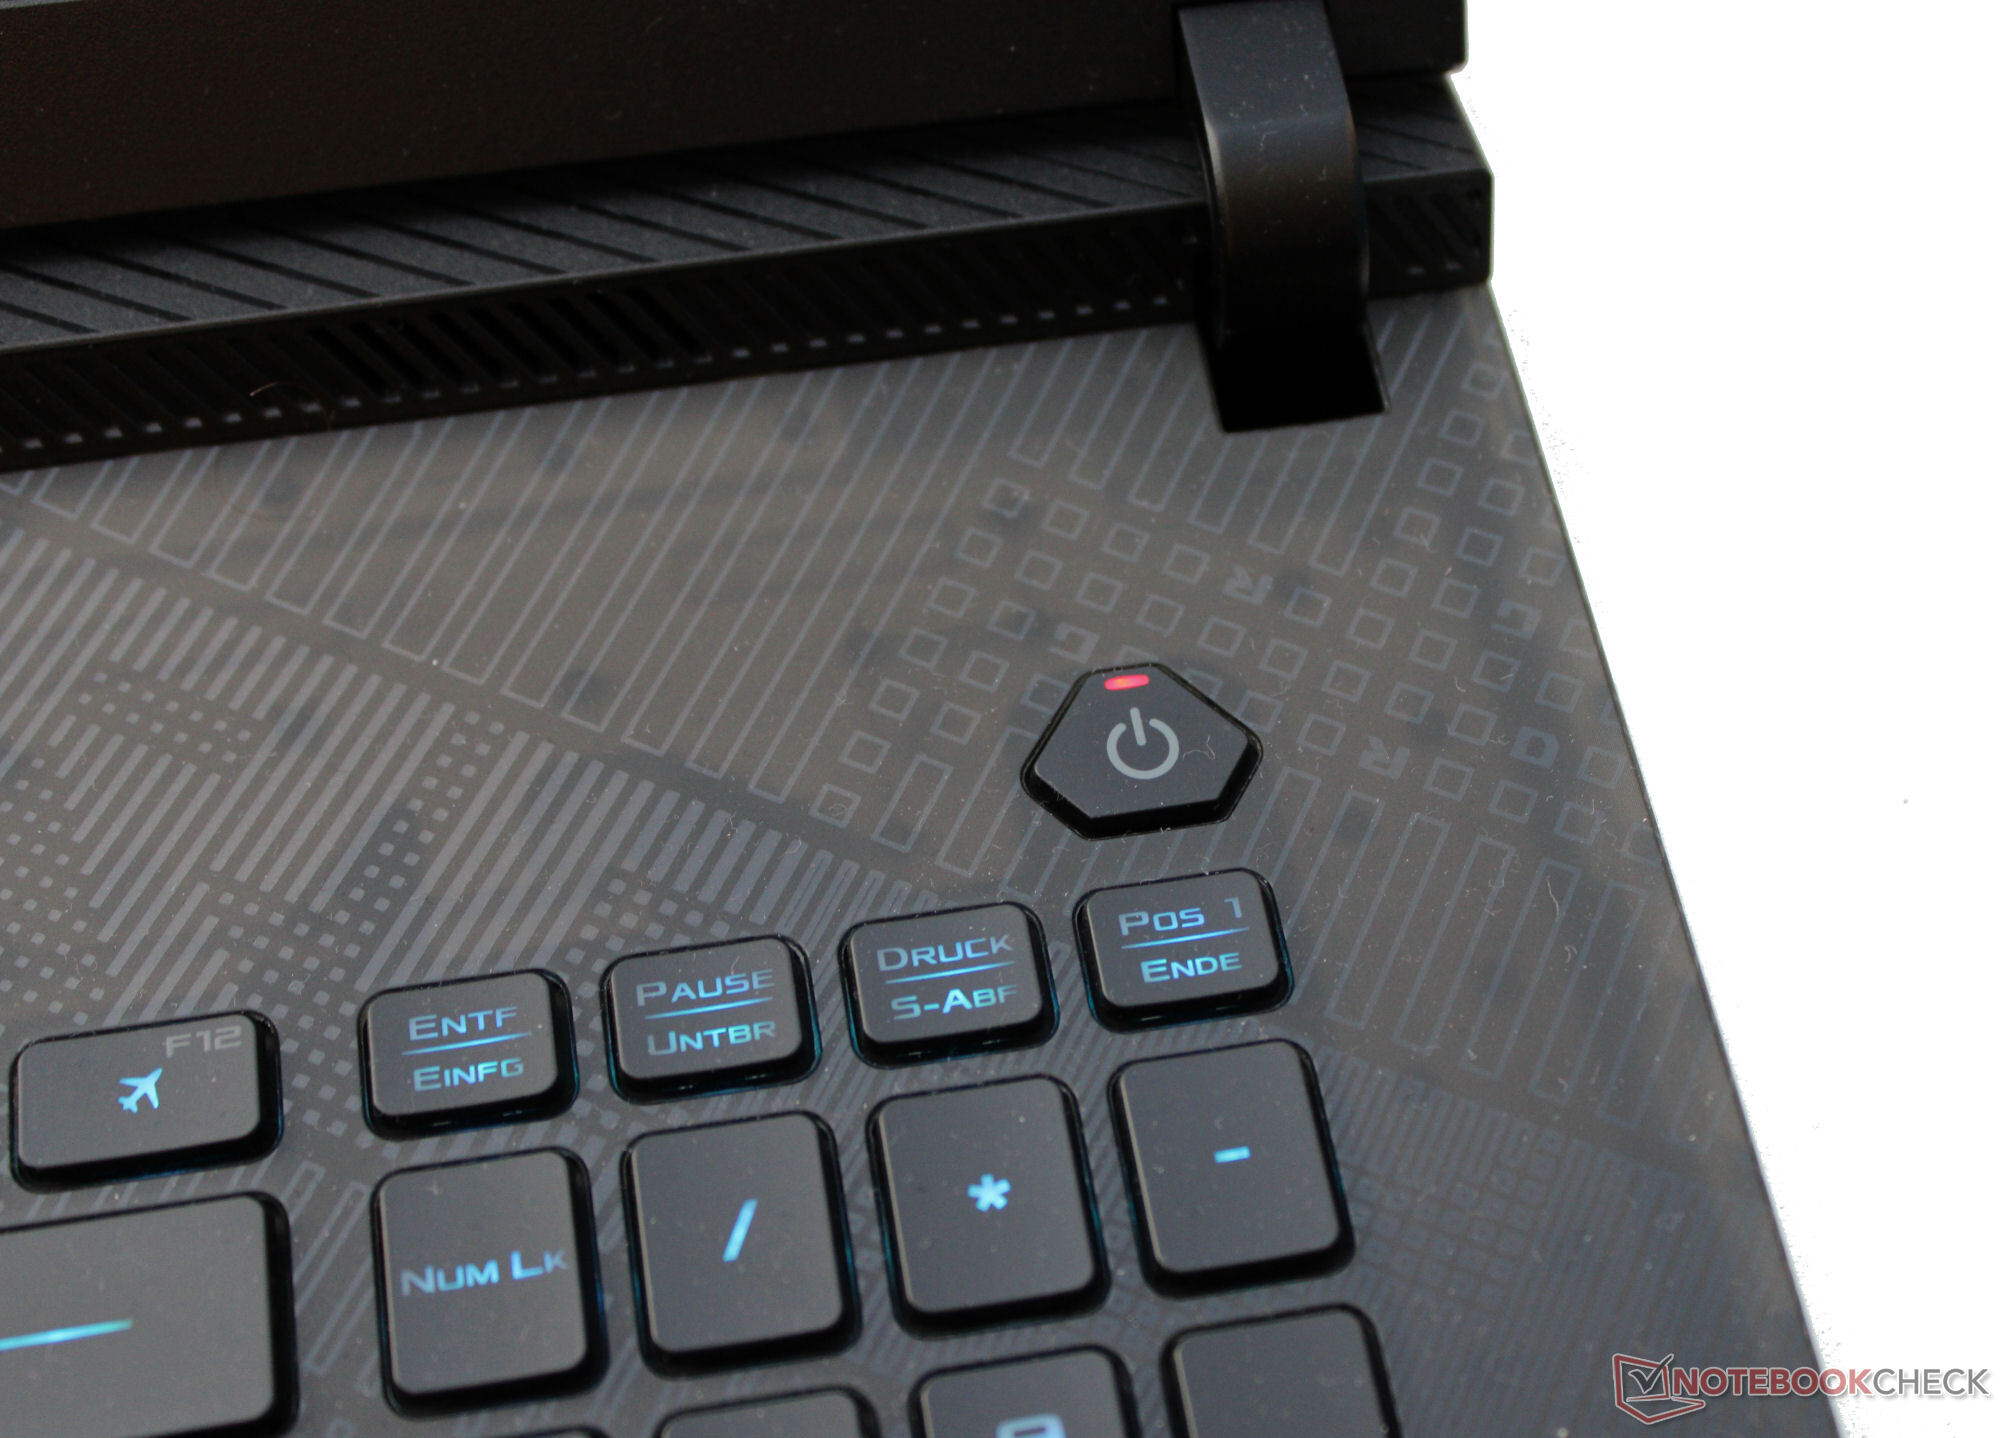
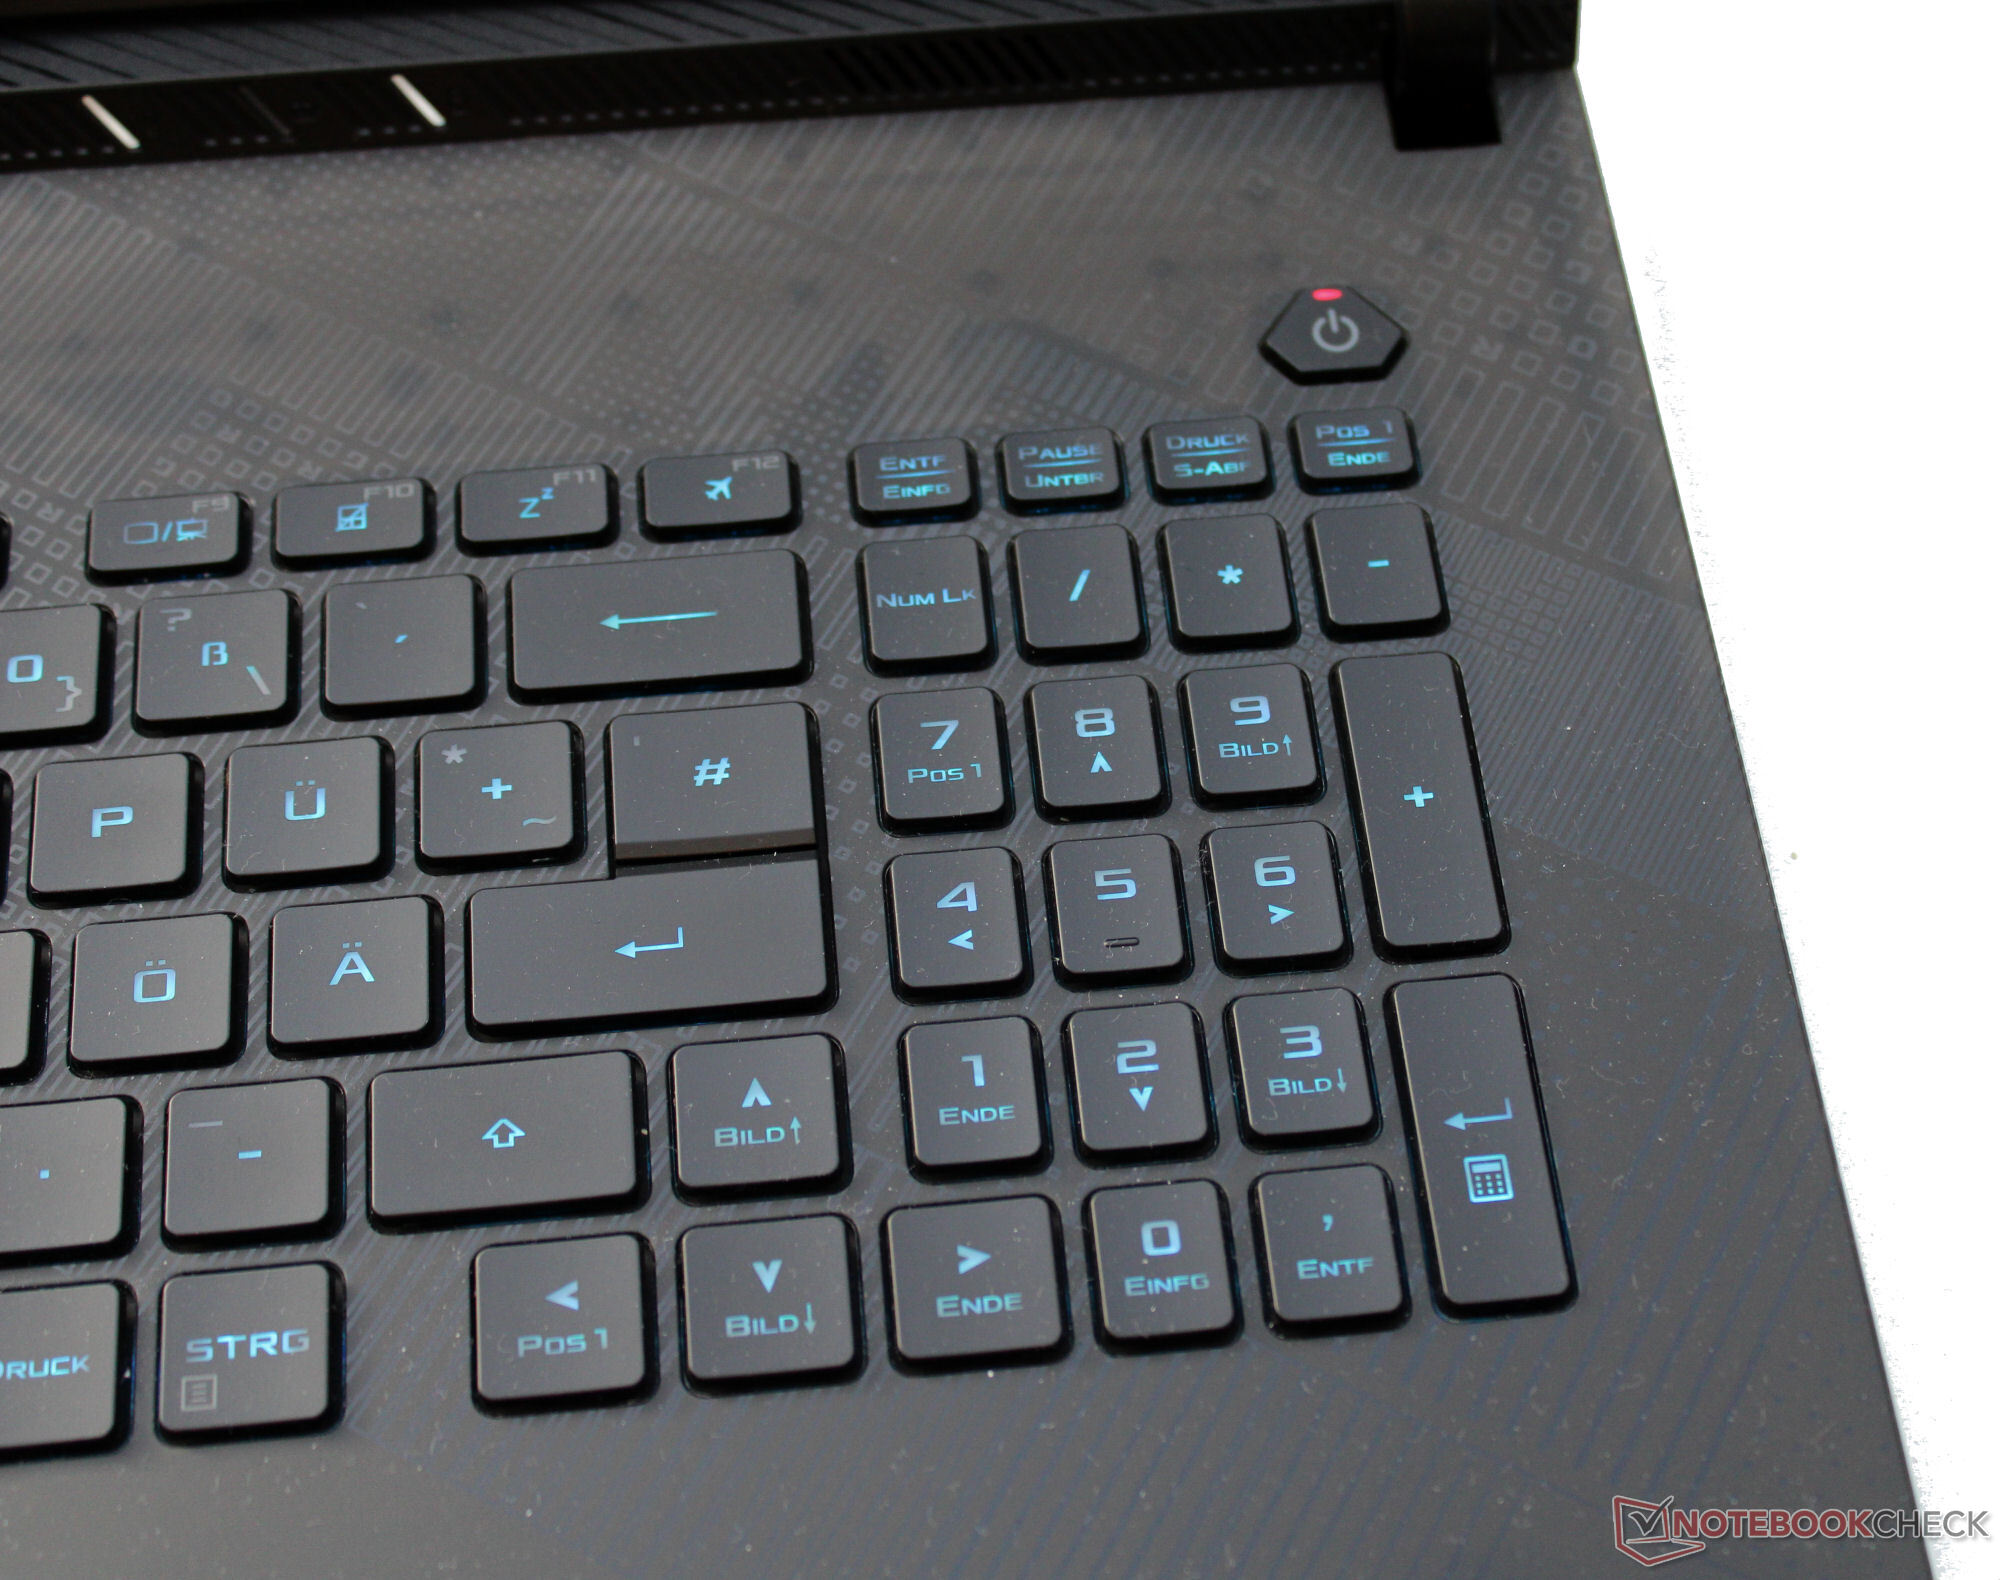
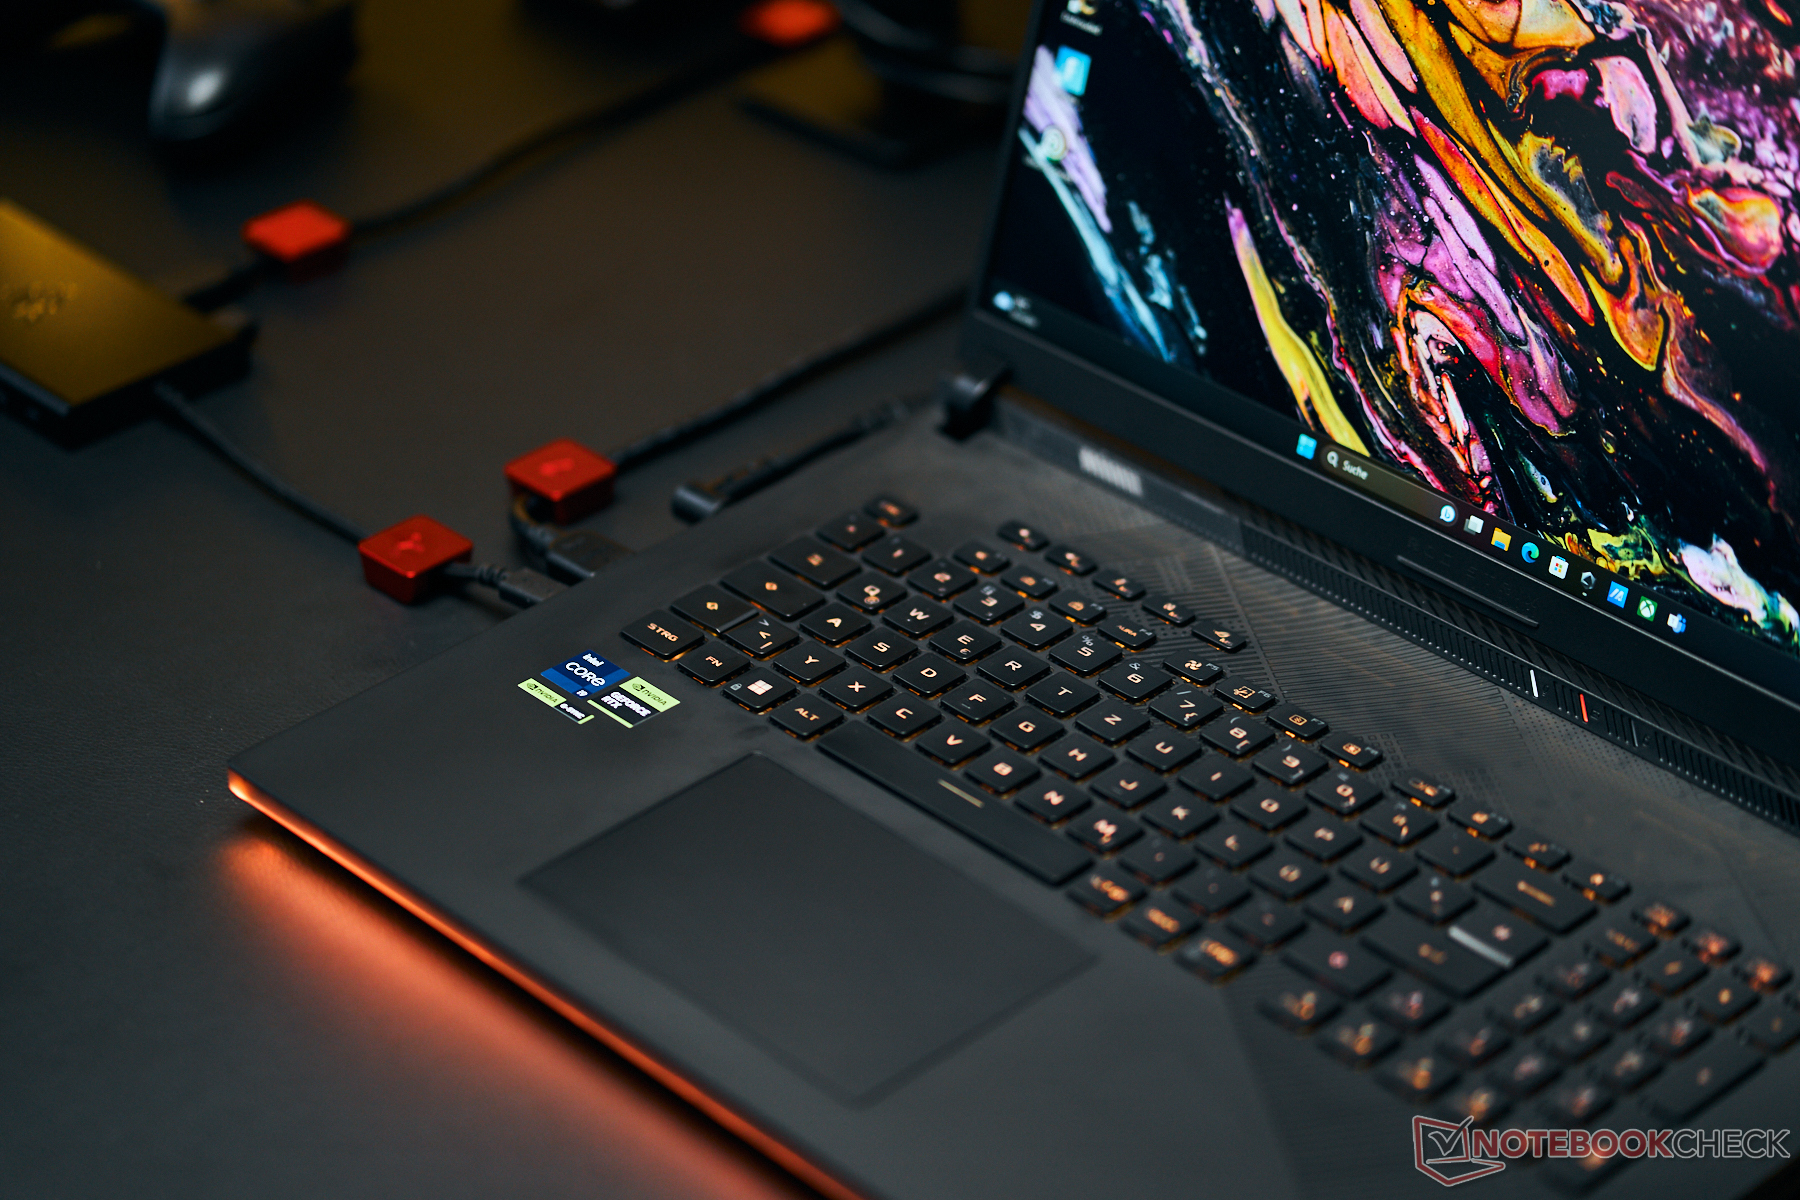
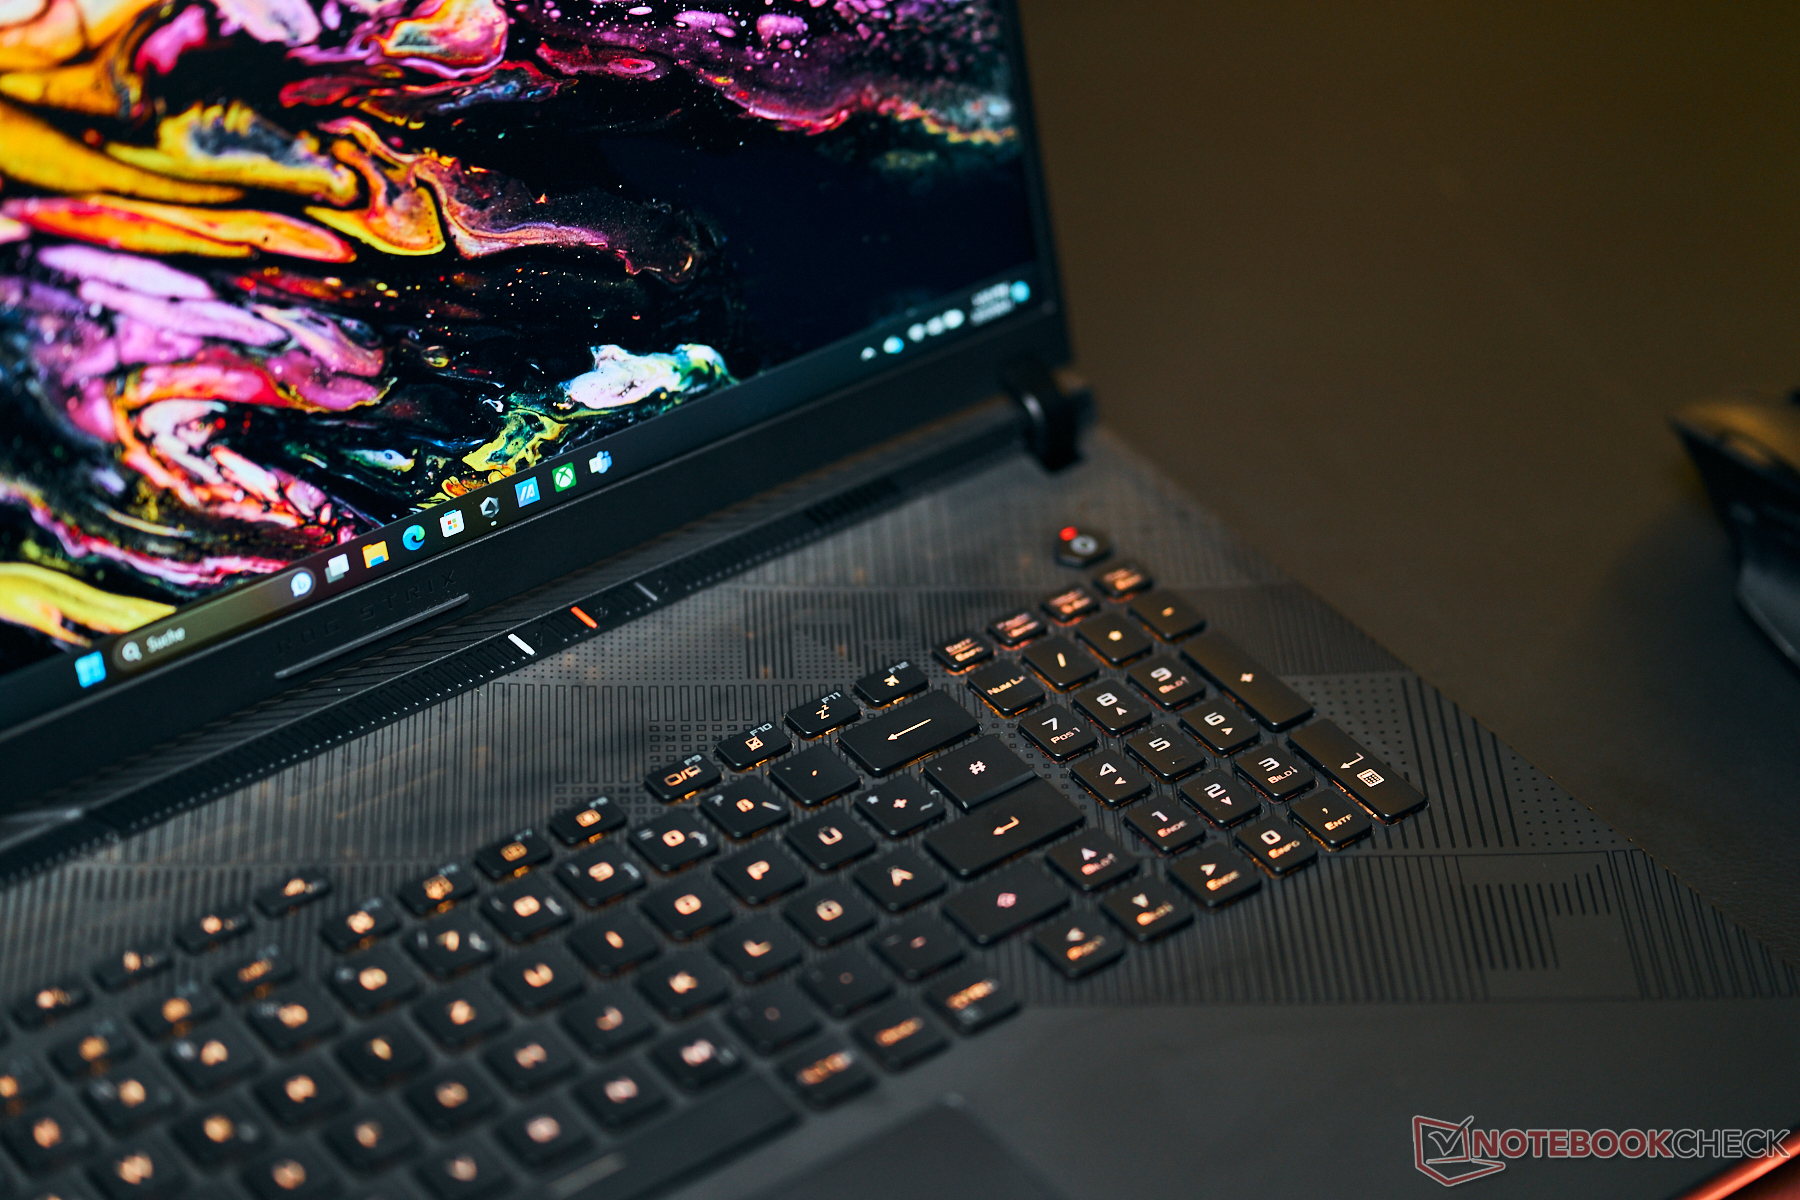
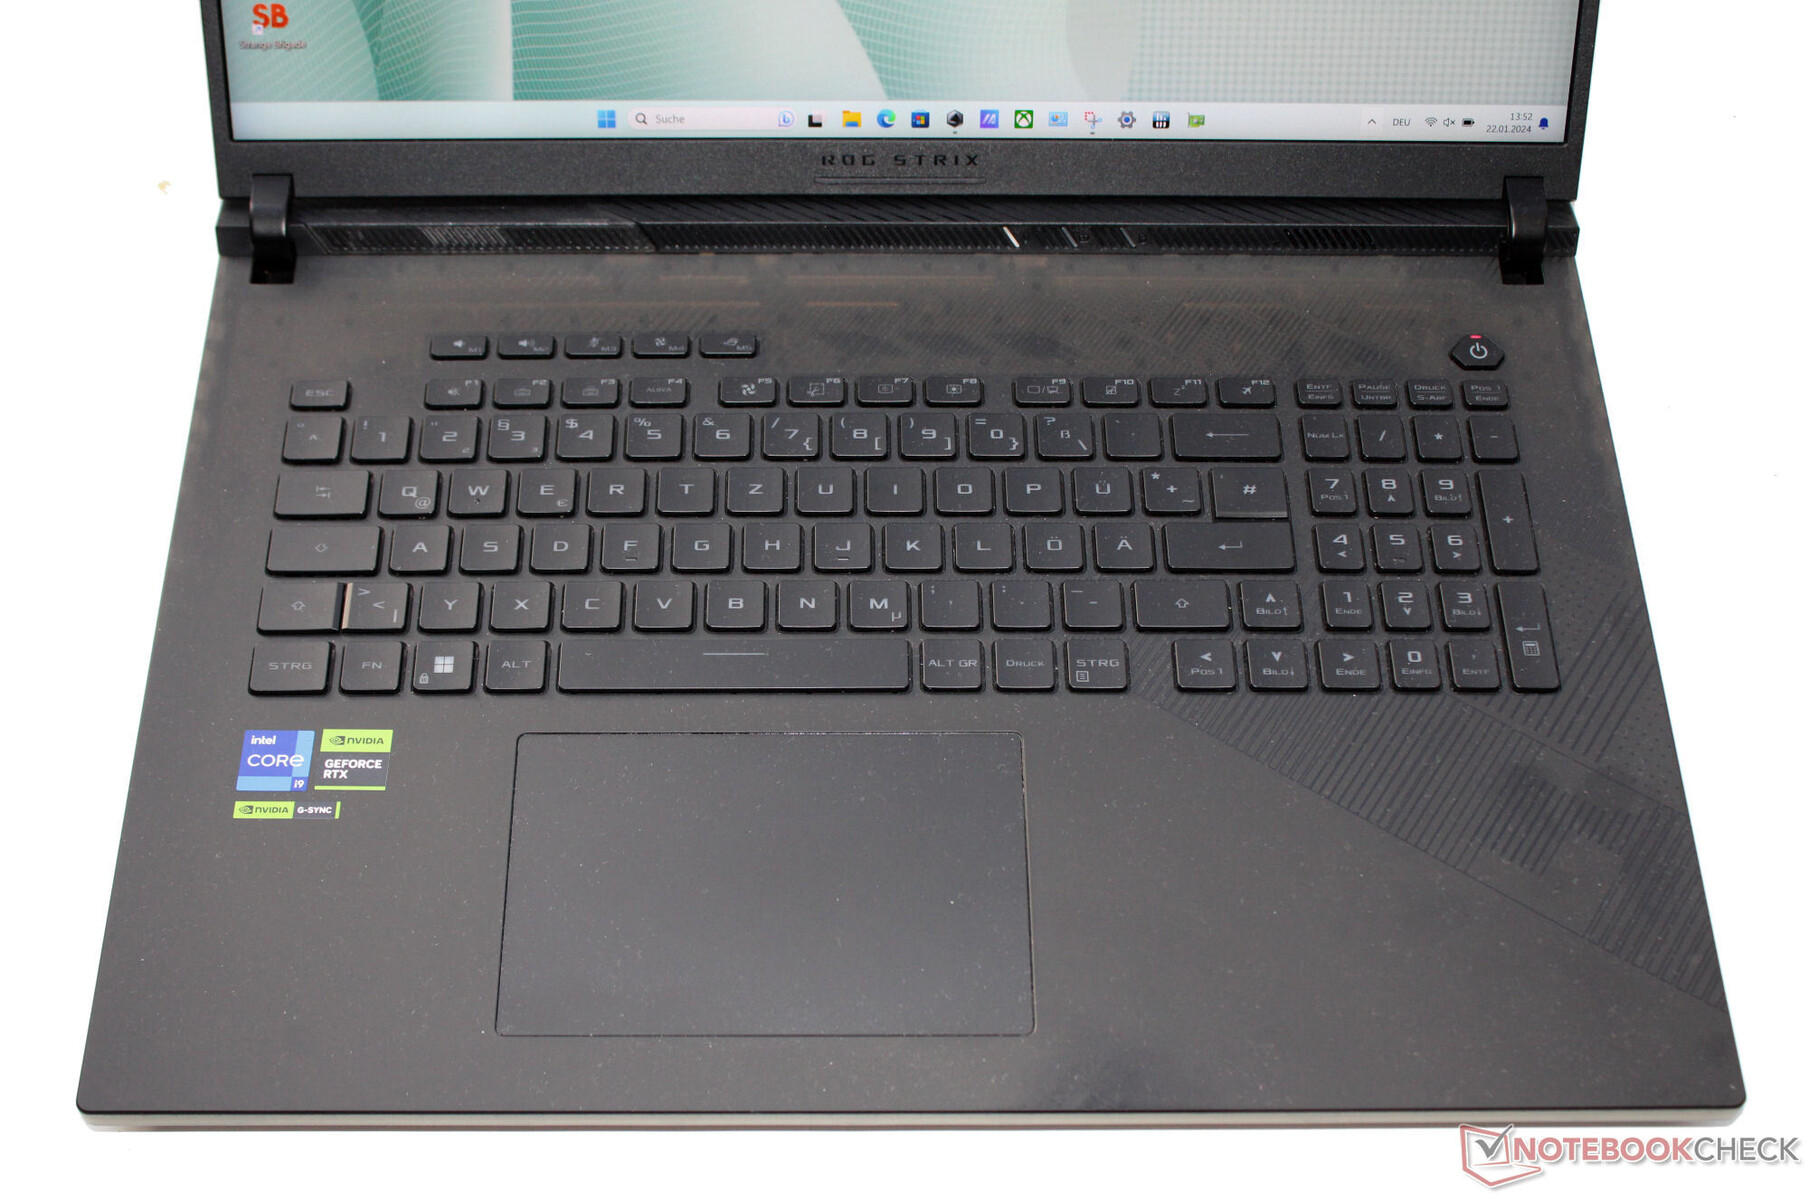
Urządzenia wejściowe - komputer Asus z pojedynczym klawiszem z podświetleniem RGB
Klawiatura
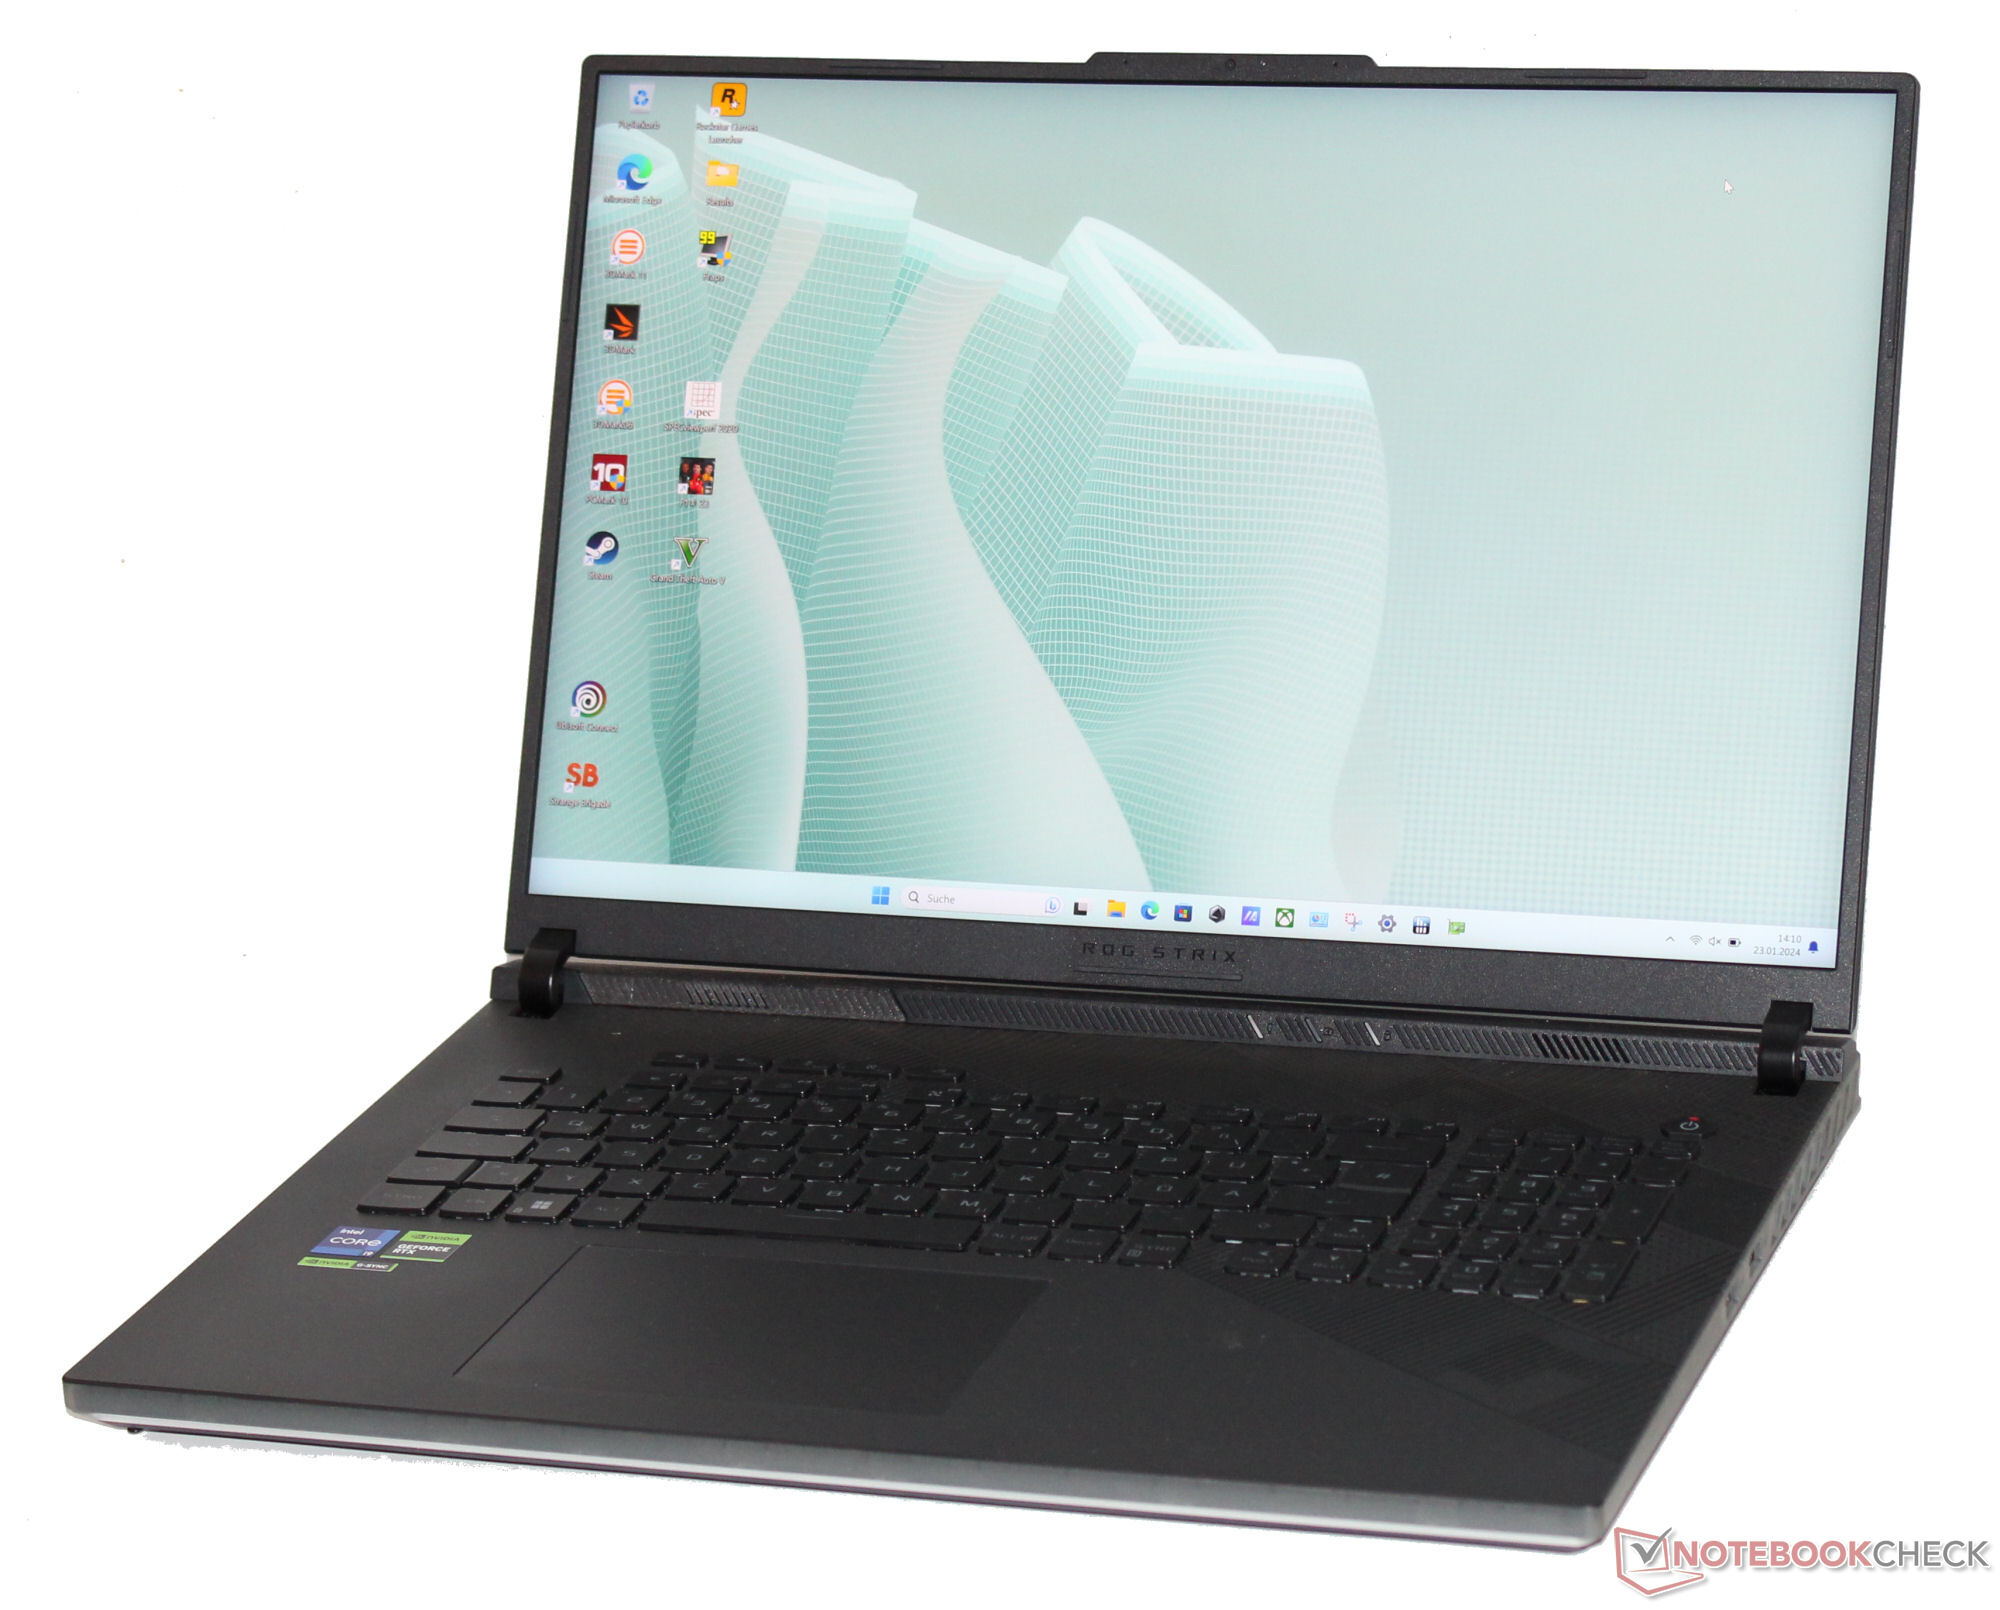
Wklęsłe klawisze podświetlanej klawiatury typu chiclet oferują średni skok i wyraźny punkt nacisku. Opór klawiszy jest w zasadzie w porządku, ale subiektywnie mógłby okazać się nieco bardziej wyraźny. Podczas pisania prawa połowa klawiatury wykazuje pewne ugięcie, które w najlepszym wypadku jest minimalne. Nie okazało się to jednak żadną przeszkodą. Pozytywnym aspektem jest to, że wszystkie cztery klawisze strzałek mają regularny rozmiar. Ogólnie rzecz biorąc, Asus dostarcza klawiaturę, która nadaje się do codziennych zadań.
Panel dotykowy
Podkładka ClickPad (~13 x 8,5 cm, ~5,1 x 3,35 cala), której gładka powierzchnia ułatwia przesuwanie palców, służy jako zamiennik myszy. Oferuje krótki skok i wyraźny punkt nacisku.
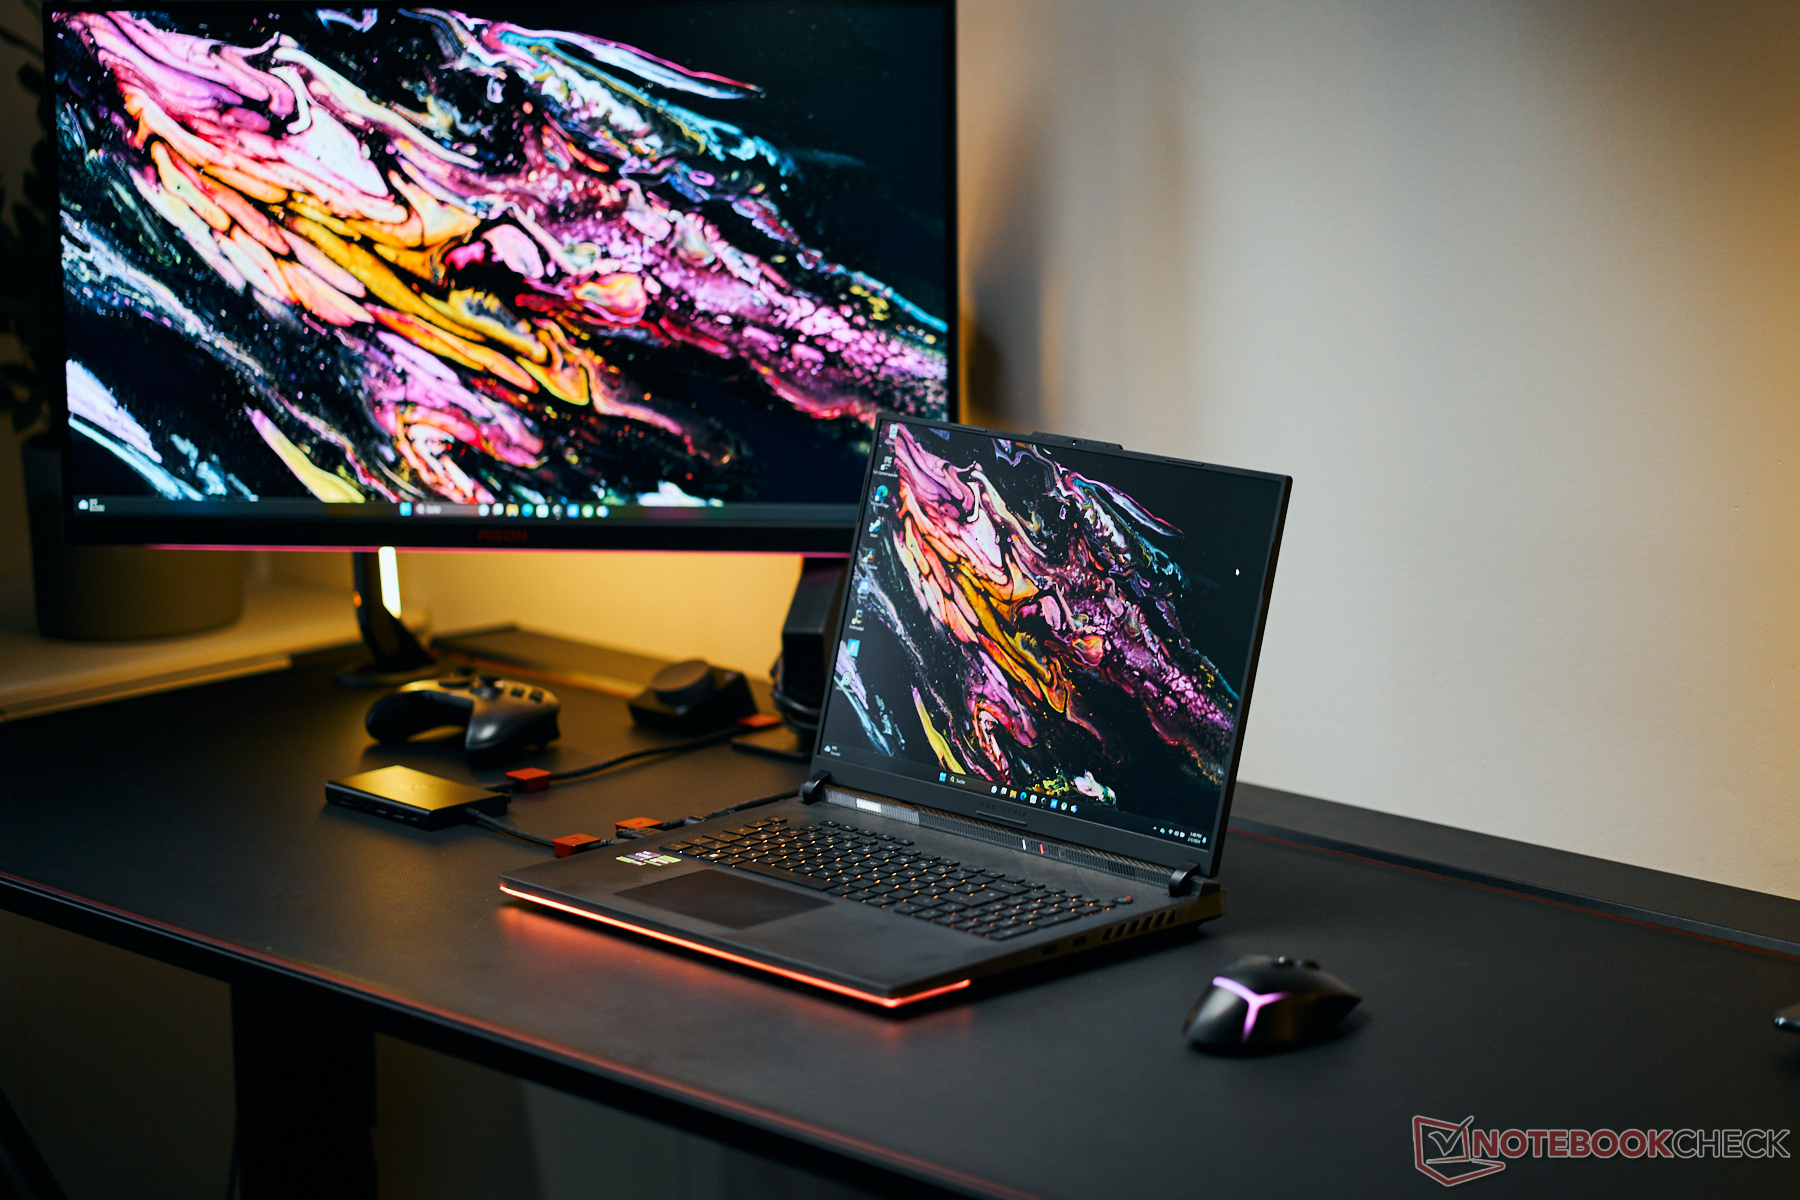
Wyświetlacz - Mini-LED z pokryciem przestrzeni kolorów DCI-P3
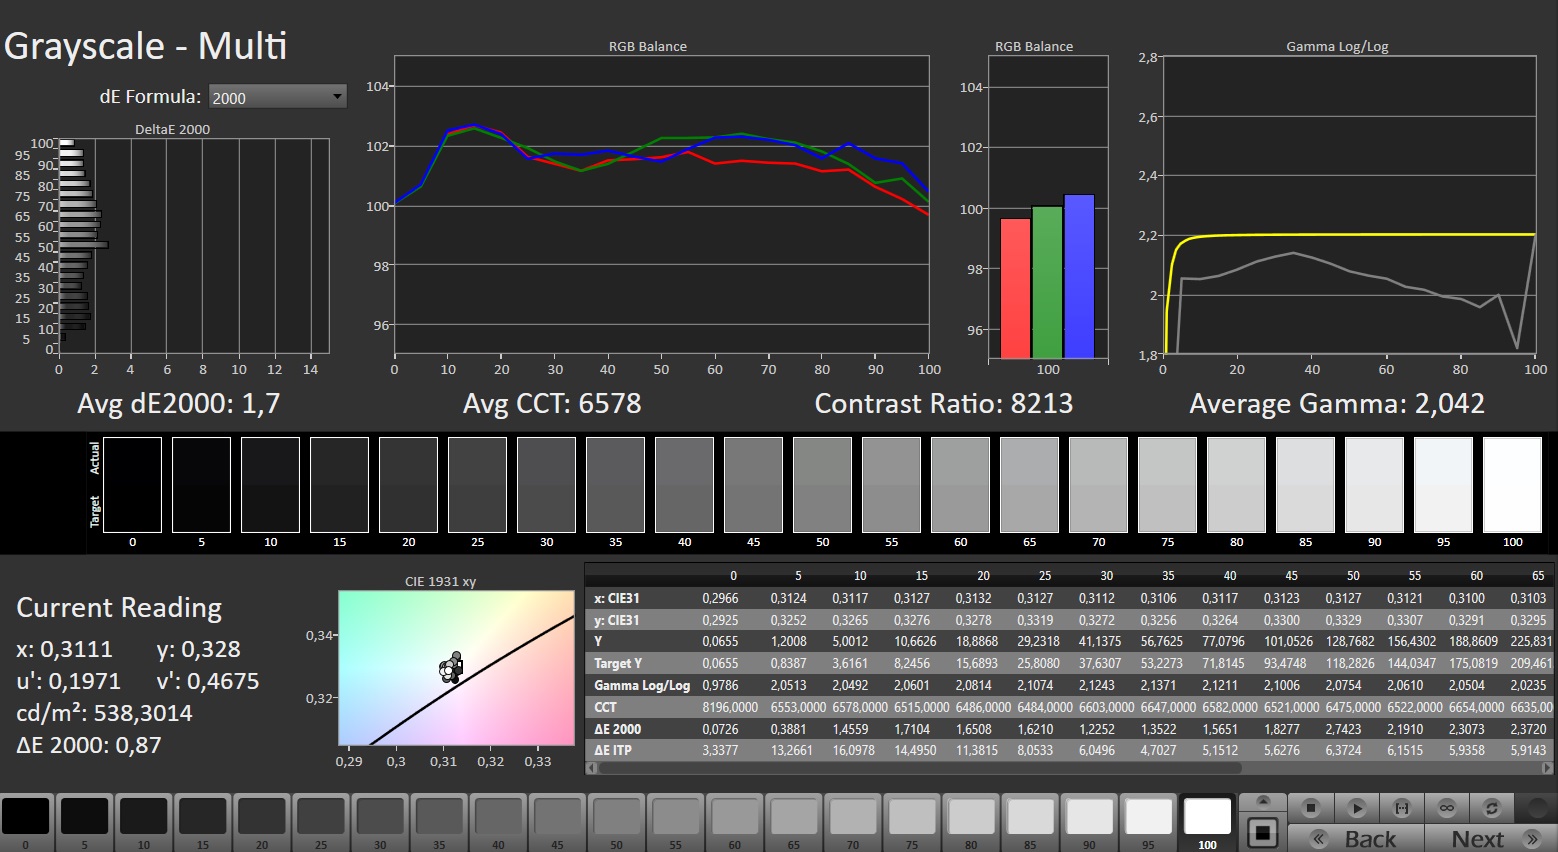
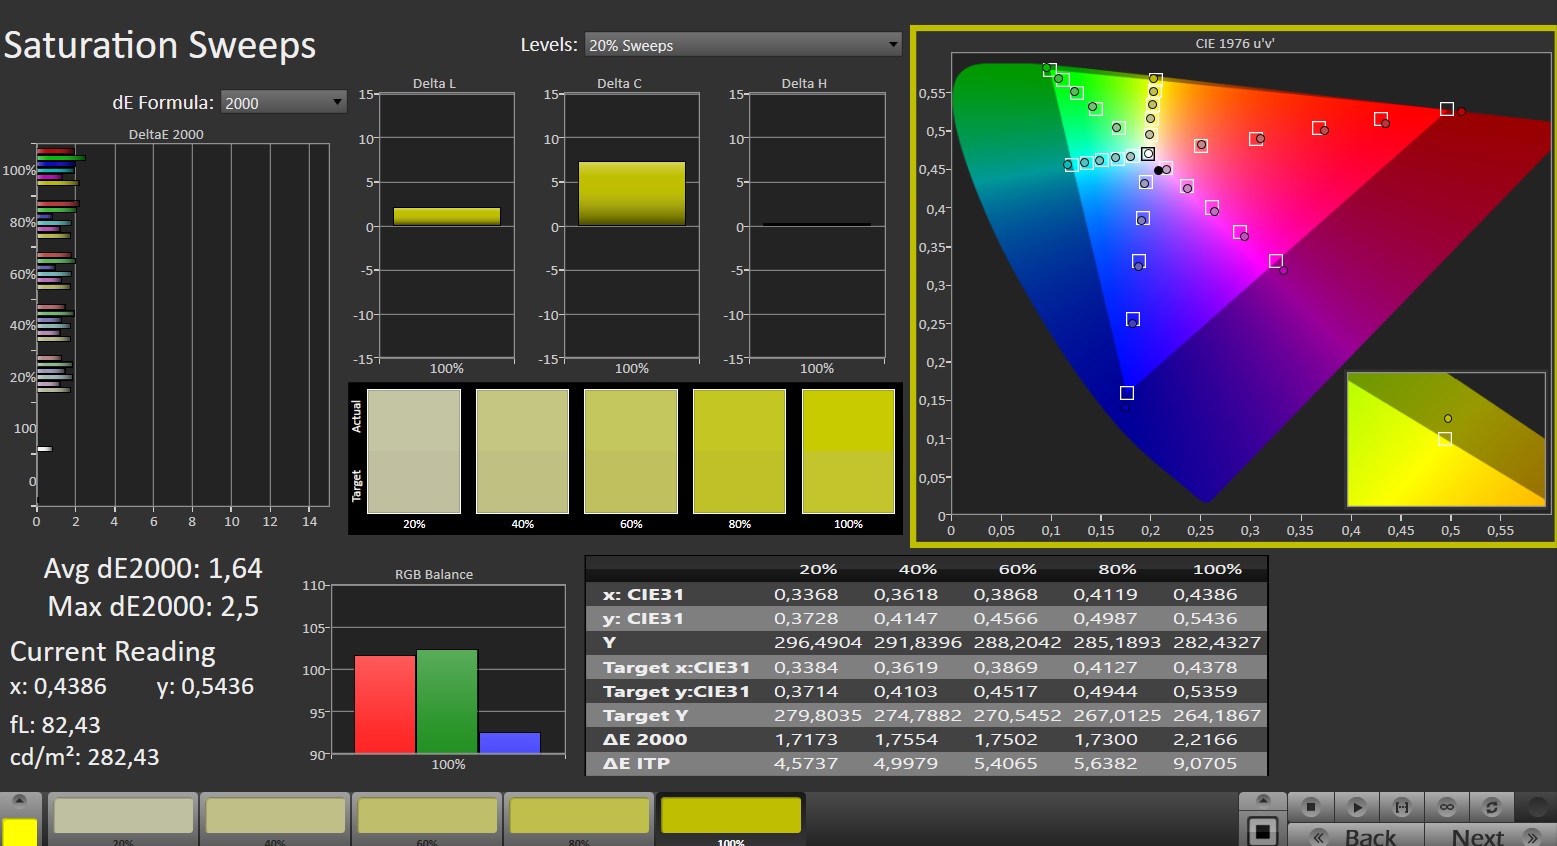
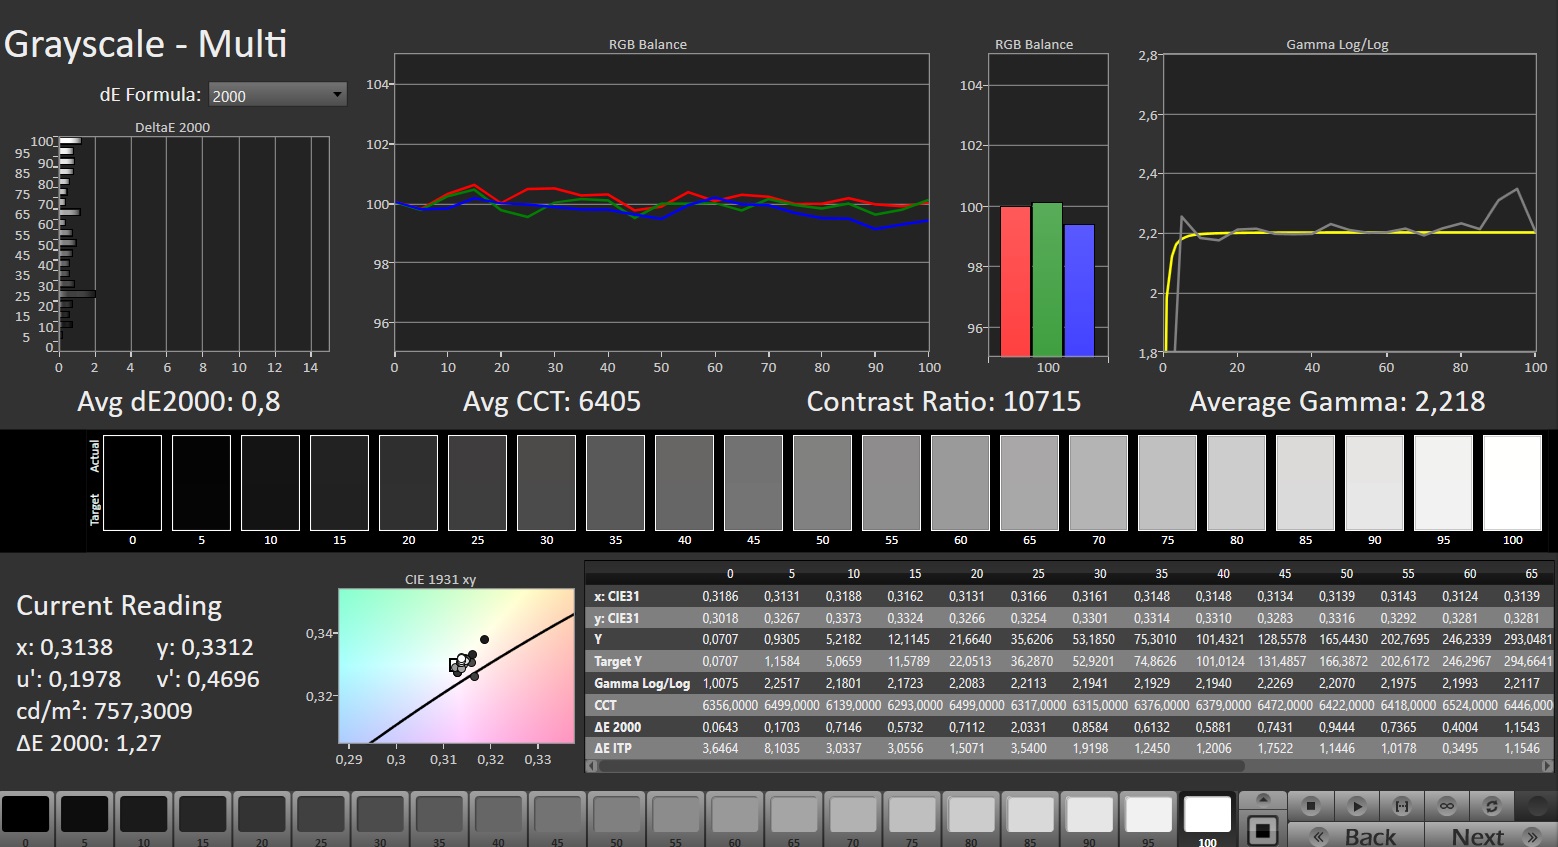
Scar 18 oferuje 18-calowy wyświetlacz mini-LED (2560x1600 pikseli) w formacie 16:10. Jego pozytywne aspekty obejmują wysoką jasność, doskonały kontrast i wartość czerni oraz matową powierzchnię. Szybki panel 240 Hz obsługuje również HDR i G-Sync.
Z drugiej strony, wyświetlacz nie jest całkowicie wolny od migotania PWM, choć nie powinno to odgrywać większej roli w codziennej pracy: Zmierzyliśmy migotanie o wysokiej częstotliwości (5,733 Hz) przy wartościach jasności mniejszych niż 94 cd/m².
| |||||||||||||||||||||||||
rozświetlenie: 89 %
na akumulatorze: 937 cd/m²
kontrast: 14197:1 (czerń: 0.066 cd/m²)
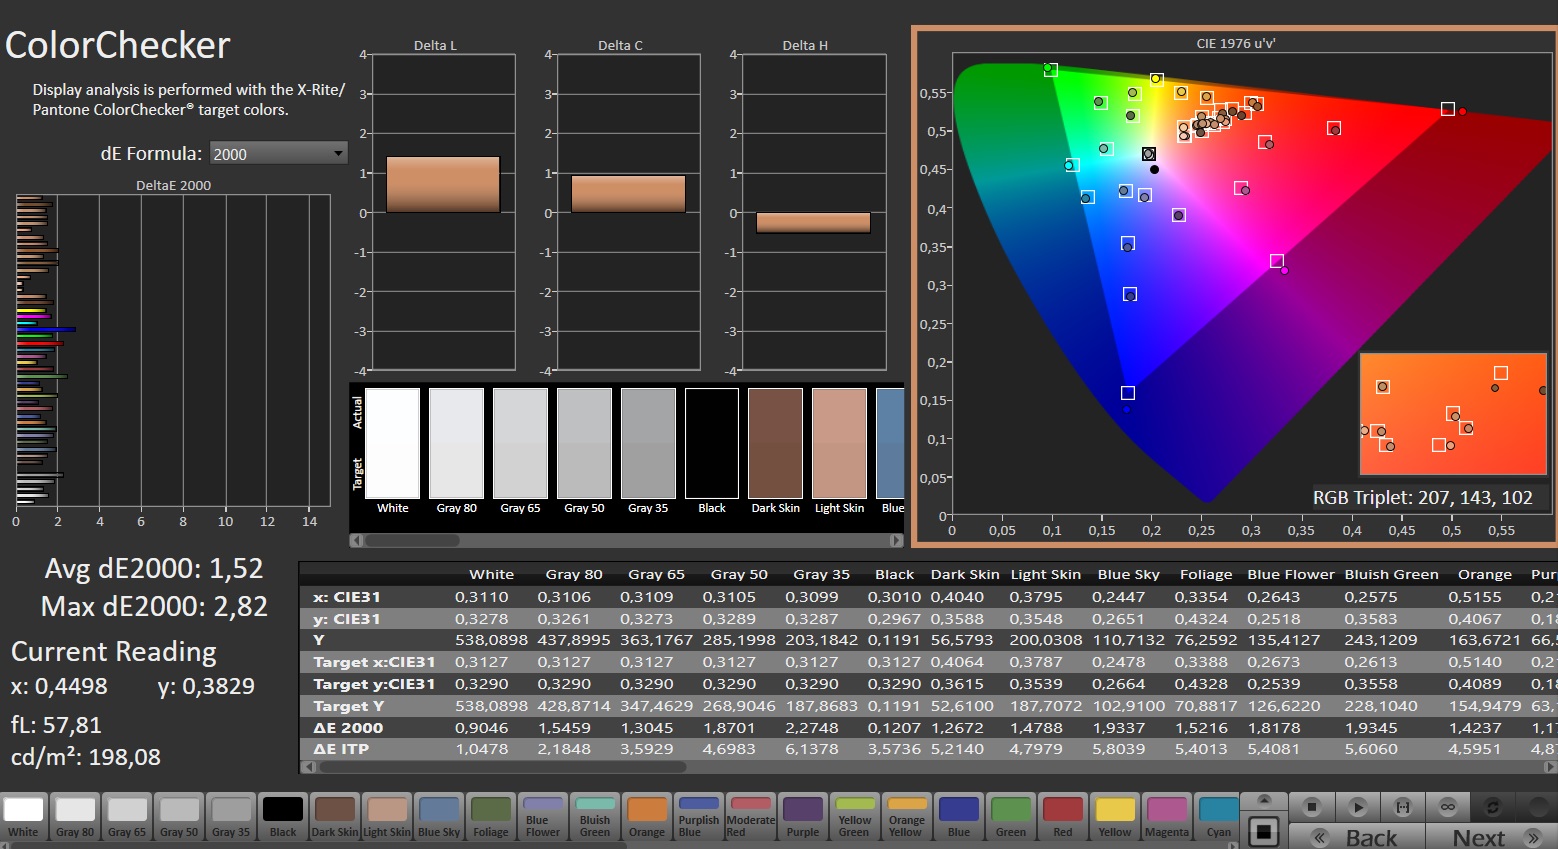
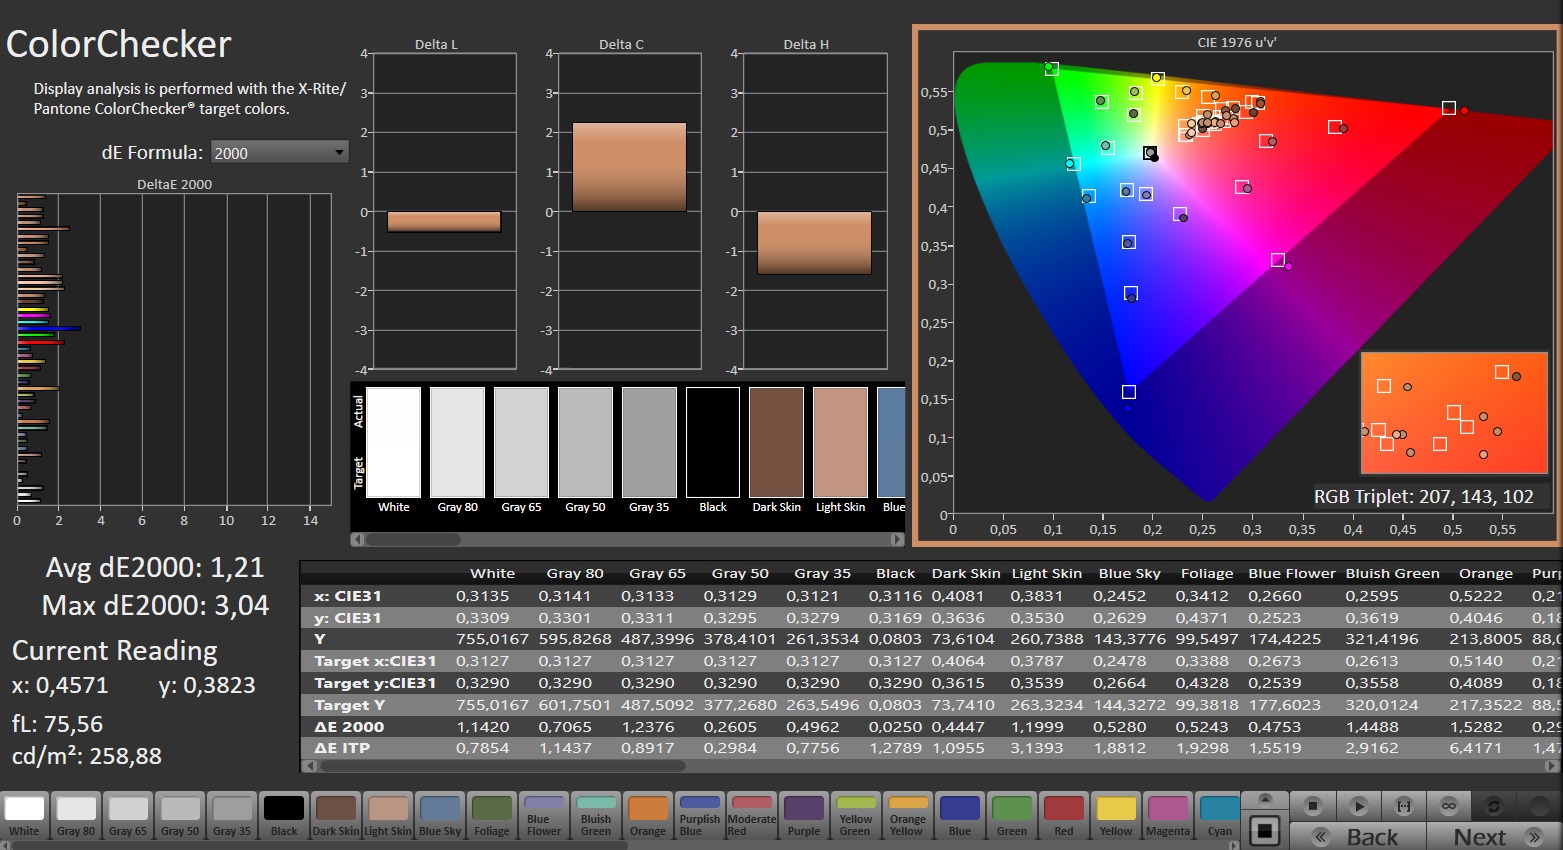
ΔE ColorChecker Calman: 1.52 | ∀{0.5-29.43 Ø4.73}
calibrated: 1.21
ΔE Greyscale Calman: 1.7 | ∀{0.09-98 Ø4.97}
90% AdobeRGB 1998 (Argyll 3D)
100% sRGB (Argyll 3D)
99.9% Display P3 (Argyll 3D)
Gamma: 2.042
CCT: 6578 K
| Asus ROG Strix Scar 18 G834JYR (2024) BOE NE180QDM-NM1, Mini LED, 2560x1600, 18" | Alienware m18 R1 AMD BOE NE18NZ1, IPS, 1920x1200, 18" | Alienware m18 R1 Chi Mei 180JME, IPS, 1920x1200, 18" | Acer Predator Helios 18 N23Q2 AUO45A8 (B180QAN01.2), IPS, 2560x1600, 18" | Razer Blade 18 RTX 4070 AU Optronics B180QAN01.0, IPS, 2560x1600, 18" | MSI Titan 18 HX A14VIG AU Optronics B180ZAN01.0, Mini-LED, 3840x2400, 18" | Asus ROG Strix Scar 18 2023 G834JY-N6005W NE180QDM-NZ2, IPS, 2560x1600, 18" | |
|---|---|---|---|---|---|---|---|
| Display | -1% | -1% | 1% | -3% | -2% | -3% | |
| Display P3 Coverage (%) | 99.9 | 98.5 -1% | 97.7 -2% | 99.8 0% | 96.9 -3% | 98.1 -2% | 97.2 -3% |
| sRGB Coverage (%) | 100 | 99.7 0% | 100 0% | 100 0% | 99.8 0% | 99.8 0% | 99.9 0% |
| AdobeRGB 1998 Coverage (%) | 90 | 88.7 -1% | 89.8 0% | 91.8 2% | 85.3 -5% | 86.2 -4% | 84.9 -6% |
| Response Times | 44% | 41% | -15% | 45% | -318% | 37% | |
| Response Time Grey 50% / Grey 80% * (ms) | 12 ? | 2.8 ? 77% | 3 ? 75% | 7.6 ? 37% | 4.2 ? 65% | 8.6 ? 28% | 5.41 ? 55% |
| Response Time Black / White * (ms) | 10.7 ? | 9.6 ? 10% | 9.9 ? 7% | 17.8 ? -66% | 8 ? 25% | 81.8 ? -664% | 8.62 ? 19% |
| PWM Frequency (Hz) | 5733 ? | 2509 | 2592 ? | ||||
| Screen | -42% | -64% | -114% | -142% | -85% | -211% | |
| Brightness middle (cd/m²) | 937 | 319.6 -66% | 372.8 -60% | 360 -62% | 549.6 -41% | 467.5 -50% | 490 -48% |
| Brightness (cd/m²) | 934 | 304 -67% | 367 -61% | 355 -62% | 524 -44% | 459 -51% | 468 -50% |
| Brightness Distribution (%) | 89 | 87 -2% | 97 9% | 92 3% | 89 0% | 90 1% | 86 -3% |
| Black Level * (cd/m²) | 0.066 | 0.25 -279% | 0.32 -385% | 0.21 -218% | 0.53 -703% | 0.54 -718% | |
| Contrast (:1) | 14197 | 1278 -91% | 1165 -92% | 1714 -88% | 1037 -93% | 907 -94% | |
| Colorchecker dE 2000 * | 1.52 | 1.22 20% | 1.92 -26% | 3.82 -151% | 3.32 -118% | 3.77 -148% | 4.97 -227% |
| Colorchecker dE 2000 max. * | 2.82 | 3.1 -10% | 3.65 -29% | 7.38 -162% | 6.63 -135% | 6.12 -117% | 11.02 -291% |
| Colorchecker dE 2000 calibrated * | 1.21 | 0.47 61% | 0.51 58% | 2.24 -85% | 2.7 -123% | 2.94 -143% | 2.97 -145% |
| Greyscale dE 2000 * | 1.7 | 0.8 53% | 1.5 12% | 5.06 -198% | 2 -18% | 3.2 -88% | 7.2 -324% |
| Gamma | 2.042 108% | 2.23 99% | 2.34 94% | 2.52 87% | 2.29 96% | 2.43 91% | 2.161 102% |
| CCT | 6578 99% | 6471 100% | 6607 98% | 5657 115% | 6319 103% | 6478 100% | 6515 100% |
| Całkowita średnia (program / ustawienia) | 0% /
-21% | -8% /
-35% | -43% /
-75% | -33% /
-85% | -135% /
-103% | -59% /
-131% |
* ... im mniej tym lepiej
Dokładność odwzorowania kolorów jest zapewniona dzięki całkowitemu pokryciu przestrzeni kolorów sRGB i DCI-P3 oraz przestrzeni kolorów Adobe RGB do 90%. Dzięki certyfikacji Pantone, odwzorowanie kolorów jest bardzo dobre już w stanie dostawy, a przy odchyleniu 1,52 osiągnięto cel DeltaE < 3. Chociaż dodatkowa kalibracja nadal zapewnia niewielką poprawę, dotyczy to przede wszystkim bardziej zrównoważonej skali szarości.

Wyświetl czasy reakcji
| ↔ Czas reakcji od czerni do bieli | ||
|---|---|---|
| 10.7 ms ... wzrost ↗ i spadek ↘ łącznie | ↗ 7.6 ms wzrost |  |
| ↘ 3.1 ms upadek | ||
| W naszych testach ekran wykazuje dobry współczynnik reakcji, ale może być zbyt wolny dla graczy rywalizujących ze sobą. Dla porównania, wszystkie testowane urządzenia wahają się od 0.1 (minimum) do 240 (maksimum) ms. » 29 % wszystkich urządzeń jest lepszych. Oznacza to, że zmierzony czas reakcji jest lepszy od średniej wszystkich testowanych urządzeń (19.9 ms). | ||
| ↔ Czas reakcji 50% szarości do 80% szarości | ||
| 12 ms ... wzrost ↗ i spadek ↘ łącznie | ↗ 8 ms wzrost | |
| ↘ 4 ms upadek | ||
| W naszych testach ekran wykazuje dobry współczynnik reakcji, ale może być zbyt wolny dla graczy rywalizujących ze sobą. Dla porównania, wszystkie testowane urządzenia wahają się od 0.165 (minimum) do 636 (maksimum) ms. » 25 % wszystkich urządzeń jest lepszych. Oznacza to, że zmierzony czas reakcji jest lepszy od średniej wszystkich testowanych urządzeń (31.1 ms). | ||
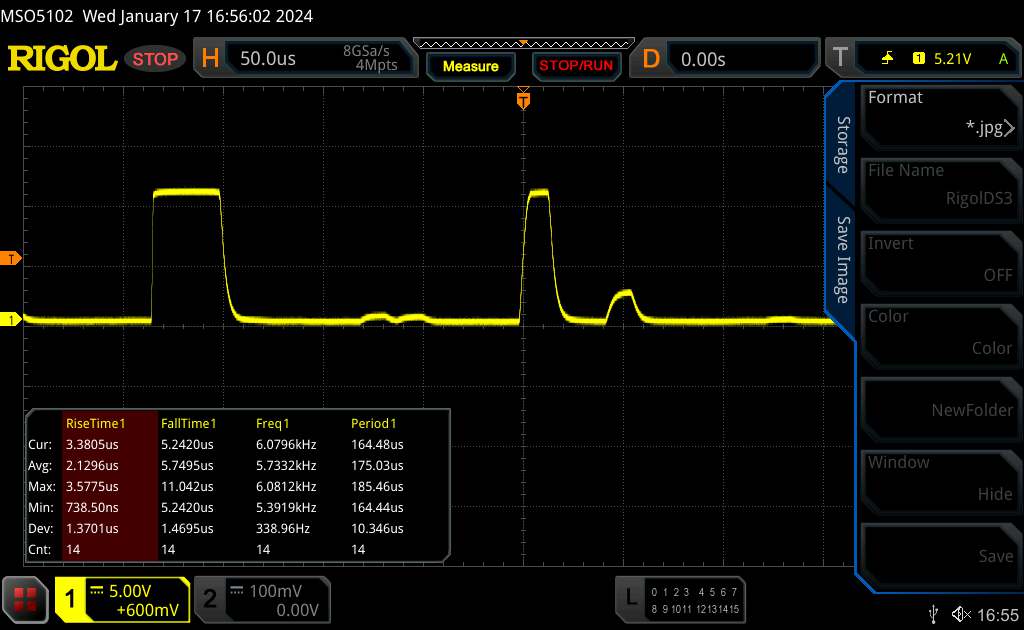
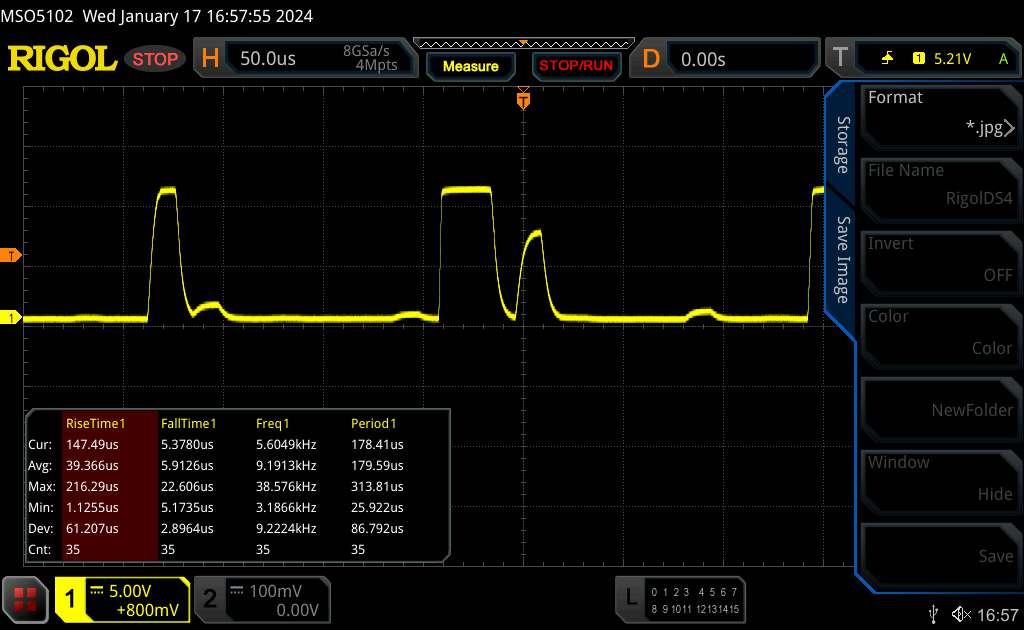
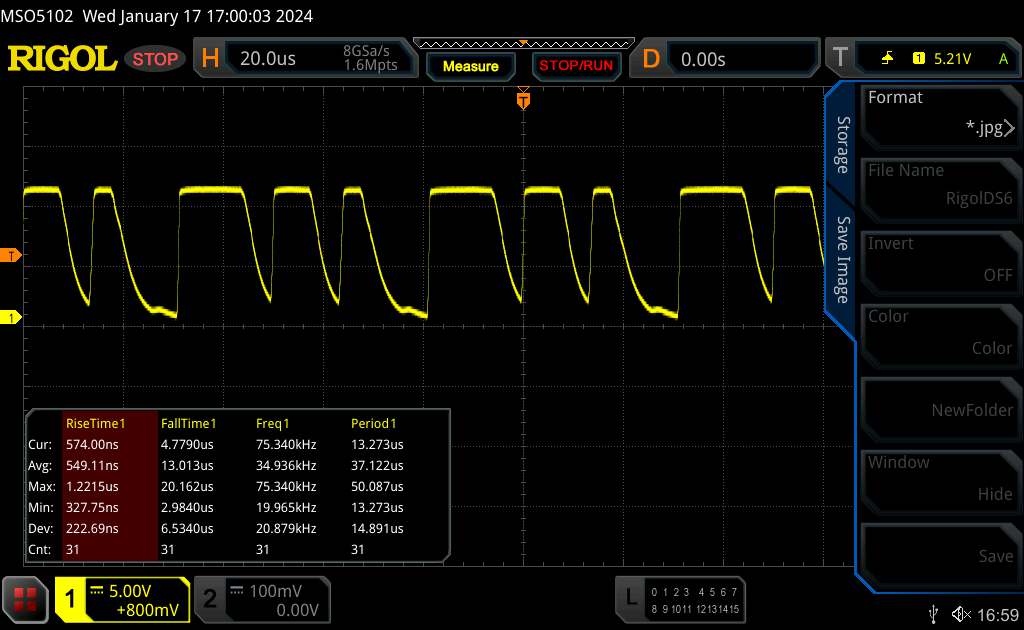
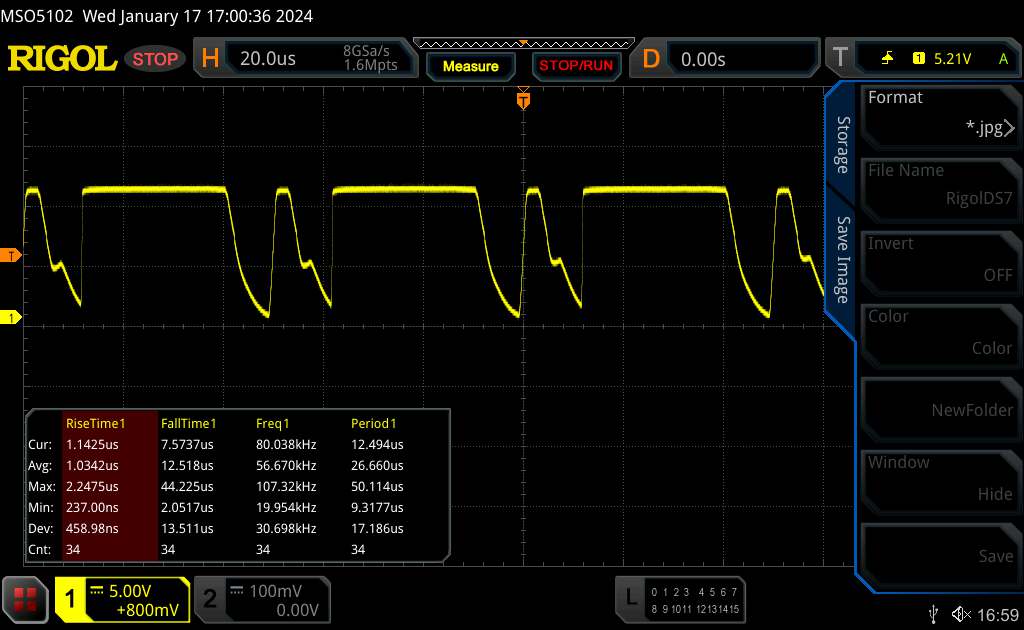
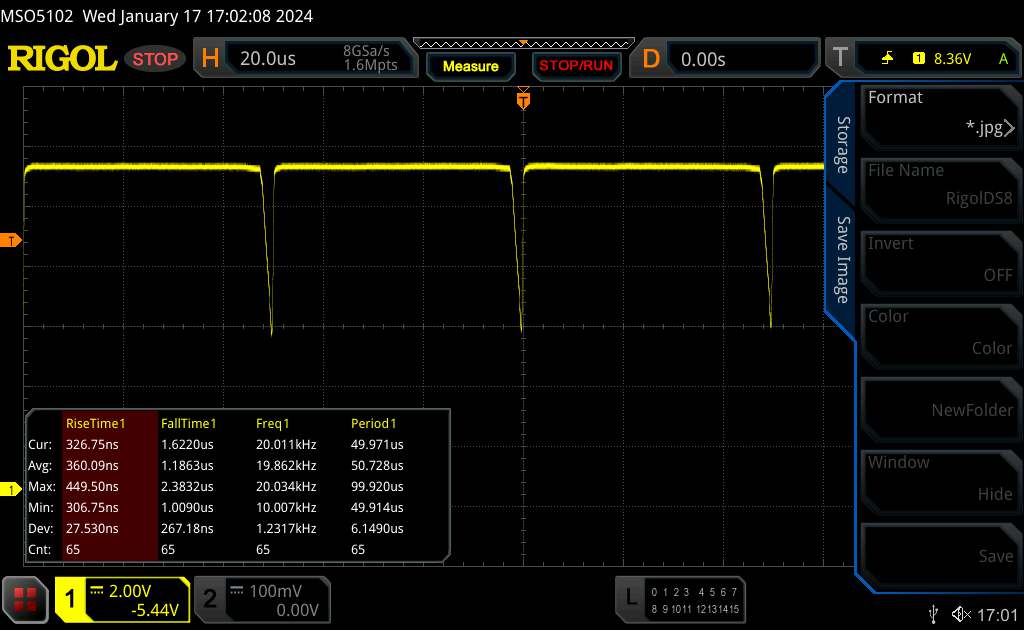
Migotanie ekranu / PWM (modulacja szerokości impulsu)
| Wykryto migotanie ekranu/wykryto PWM | 5733 Hz | |
| ≤ 94 jasność cd/m² | ||
Podświetlenie wyświetlacza miga z częstotliwością 5733 Hz (najgorszy przypadek, np. przy użyciu PWM) Wykryto migotanie przy ustawieniu jasności 94 cd/m² i poniżej. Powyżej tego ustawienia jasności nie powinno być żadnego migotania ani PWM. Częstotliwość 5733 Hz jest dość wysoka, więc większość użytkowników wrażliwych na PWM nie powinna zauważyć żadnego migotania. Migotanie występuje przy stosunkowo niskich ustawieniach jasności, dlatego długotrwałe użytkowanie przy tym ustawieniu jasności lub niższym może powodować zmęczenie oczu. Dla porównania: 52 % wszystkich testowanych urządzeń nie używa PWM do przyciemniania wyświetlacza. Jeśli wykryto PWM, zmierzono średnio 7798 (minimum: 5 - maksimum: 343500) Hz. | ||
Panel IPS ma stabilne kąty widzenia i może być odczytywany pod niemal każdym kątem. Wysoka maksymalna jasność pozwala również na odczytywanie zawartości ekranu na zewnątrz.

Wydajność - Scar 18 oferuje wysokiej klasy sprzęt
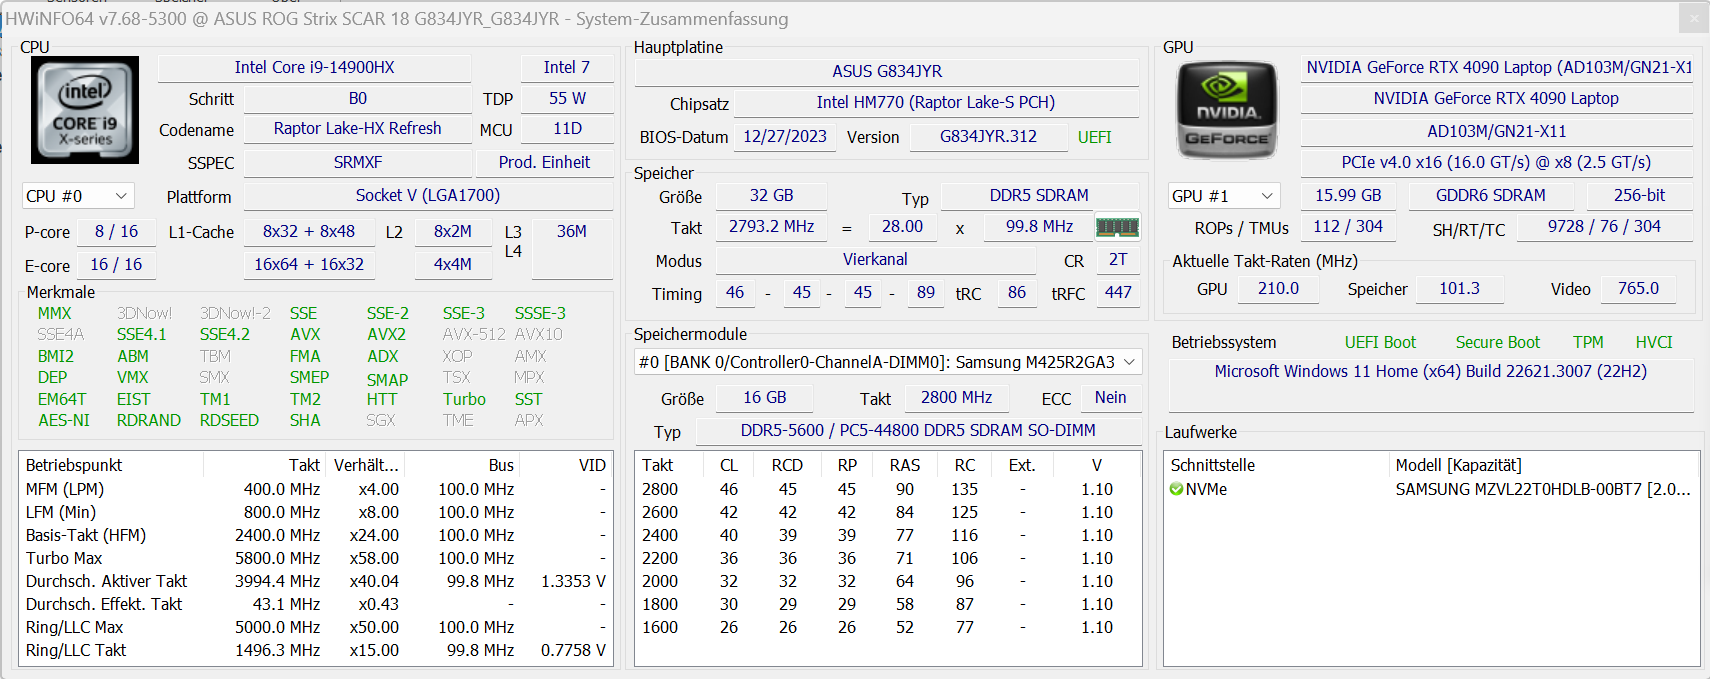
Asus ROG Strix Scar 18 to wysokiej klasy laptop w formacie 18-calowym. Niezbędną wydajność obliczeniową zapewnia układ Raptor Lake Refresh i sprzęt Ada Lovelace. Ceny zaczynają się od 3600 euro (~3878 USD), a nasza obecna jednostka testowa jest dostępna za około 4500 euro (~4848 USD).
Warunki testu
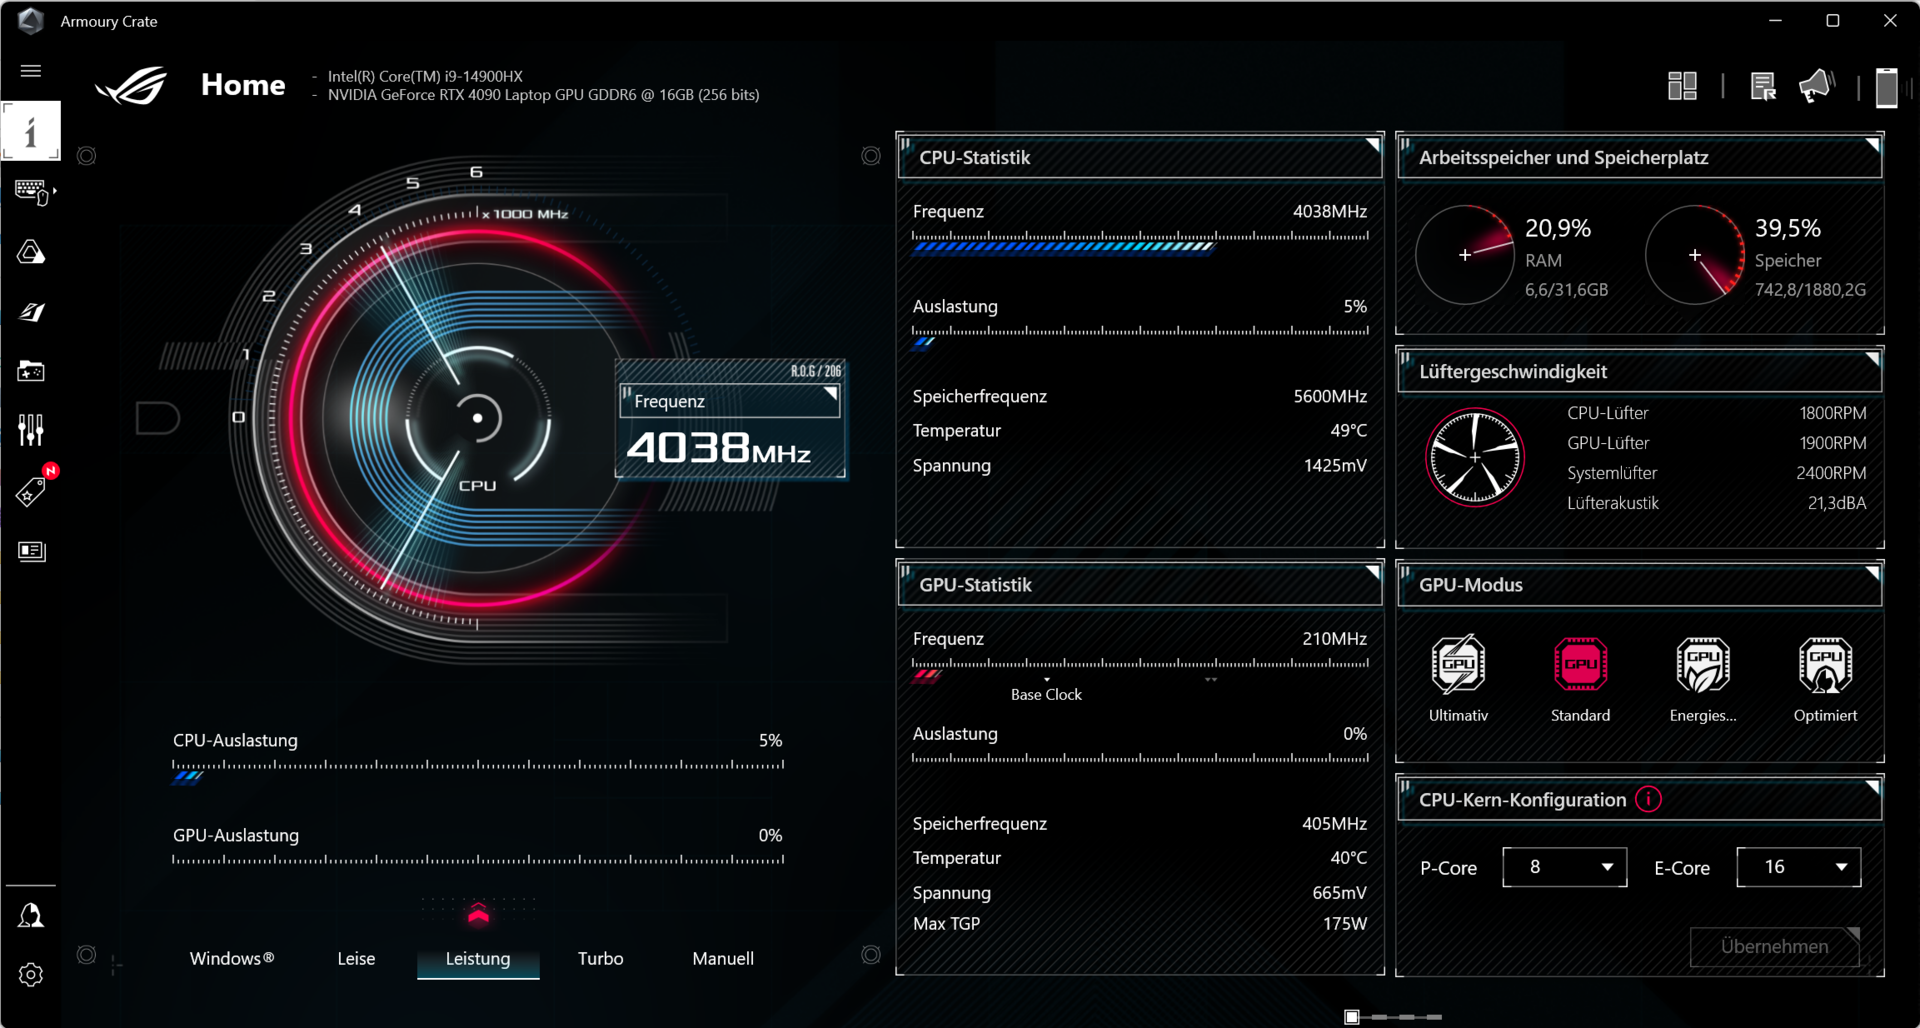
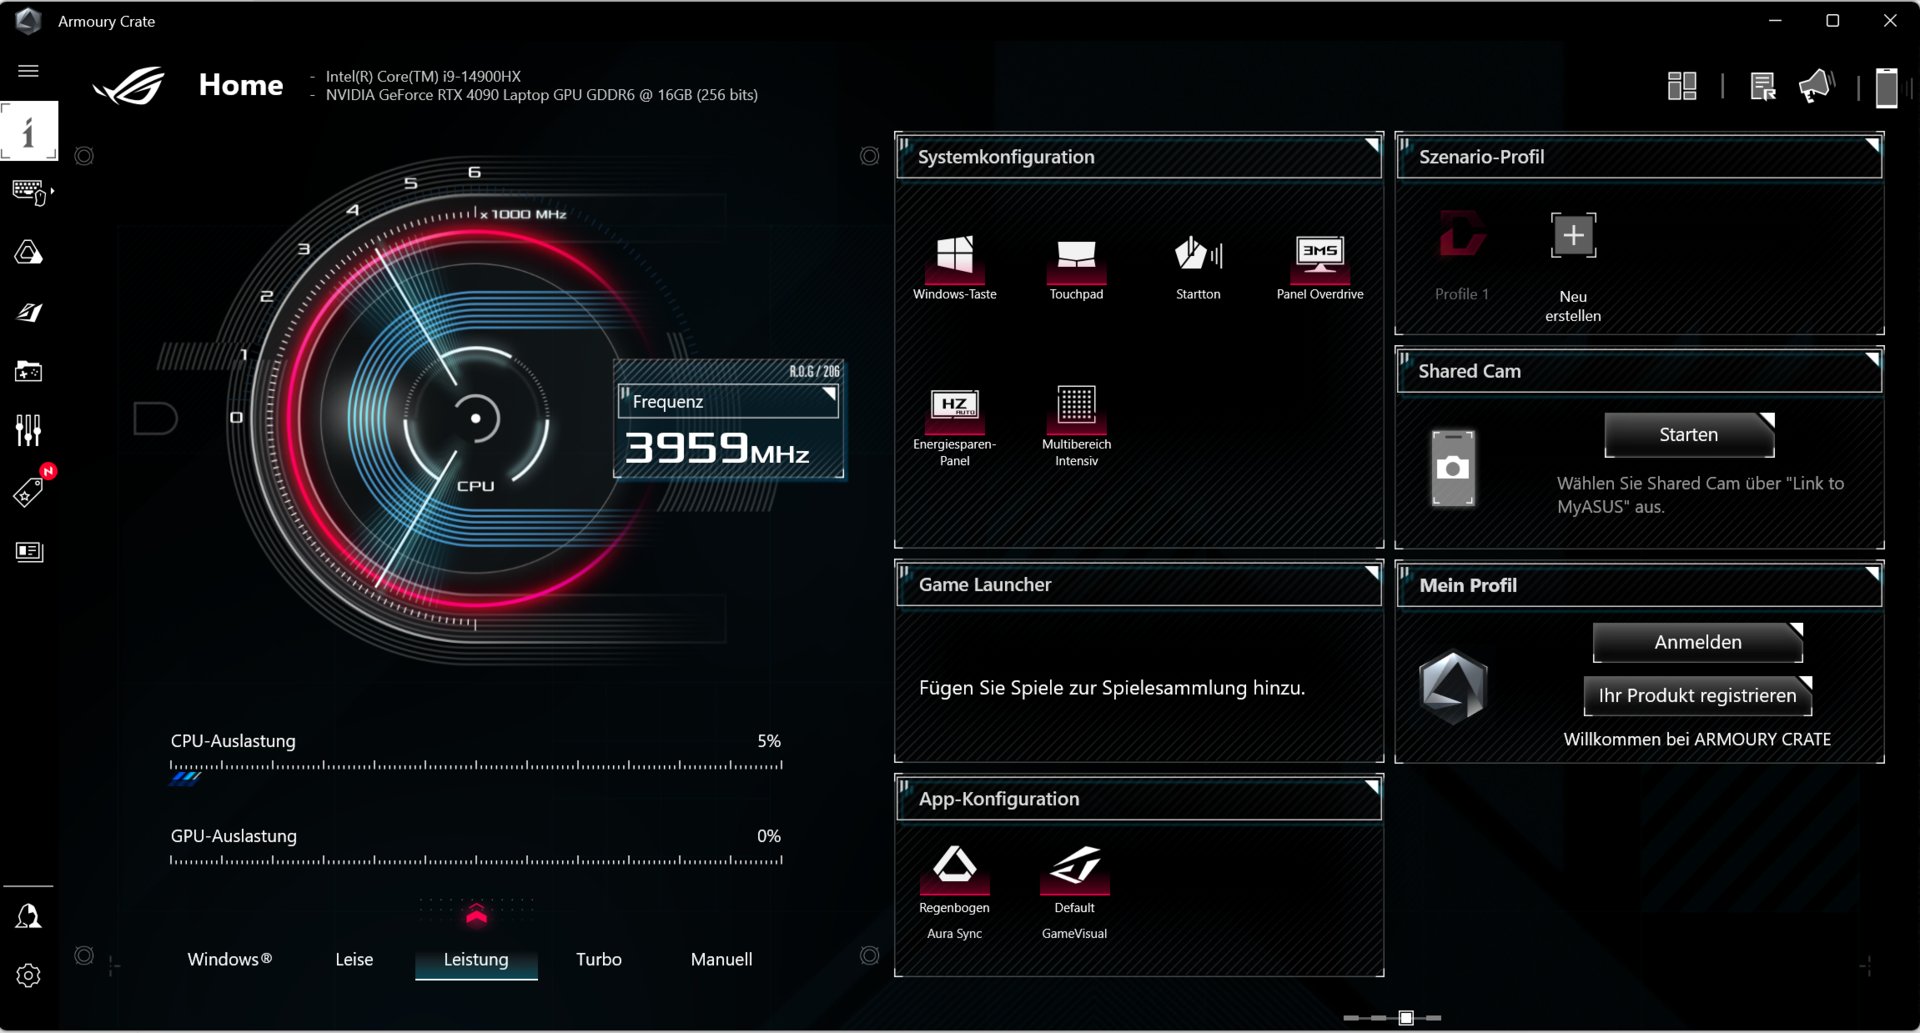
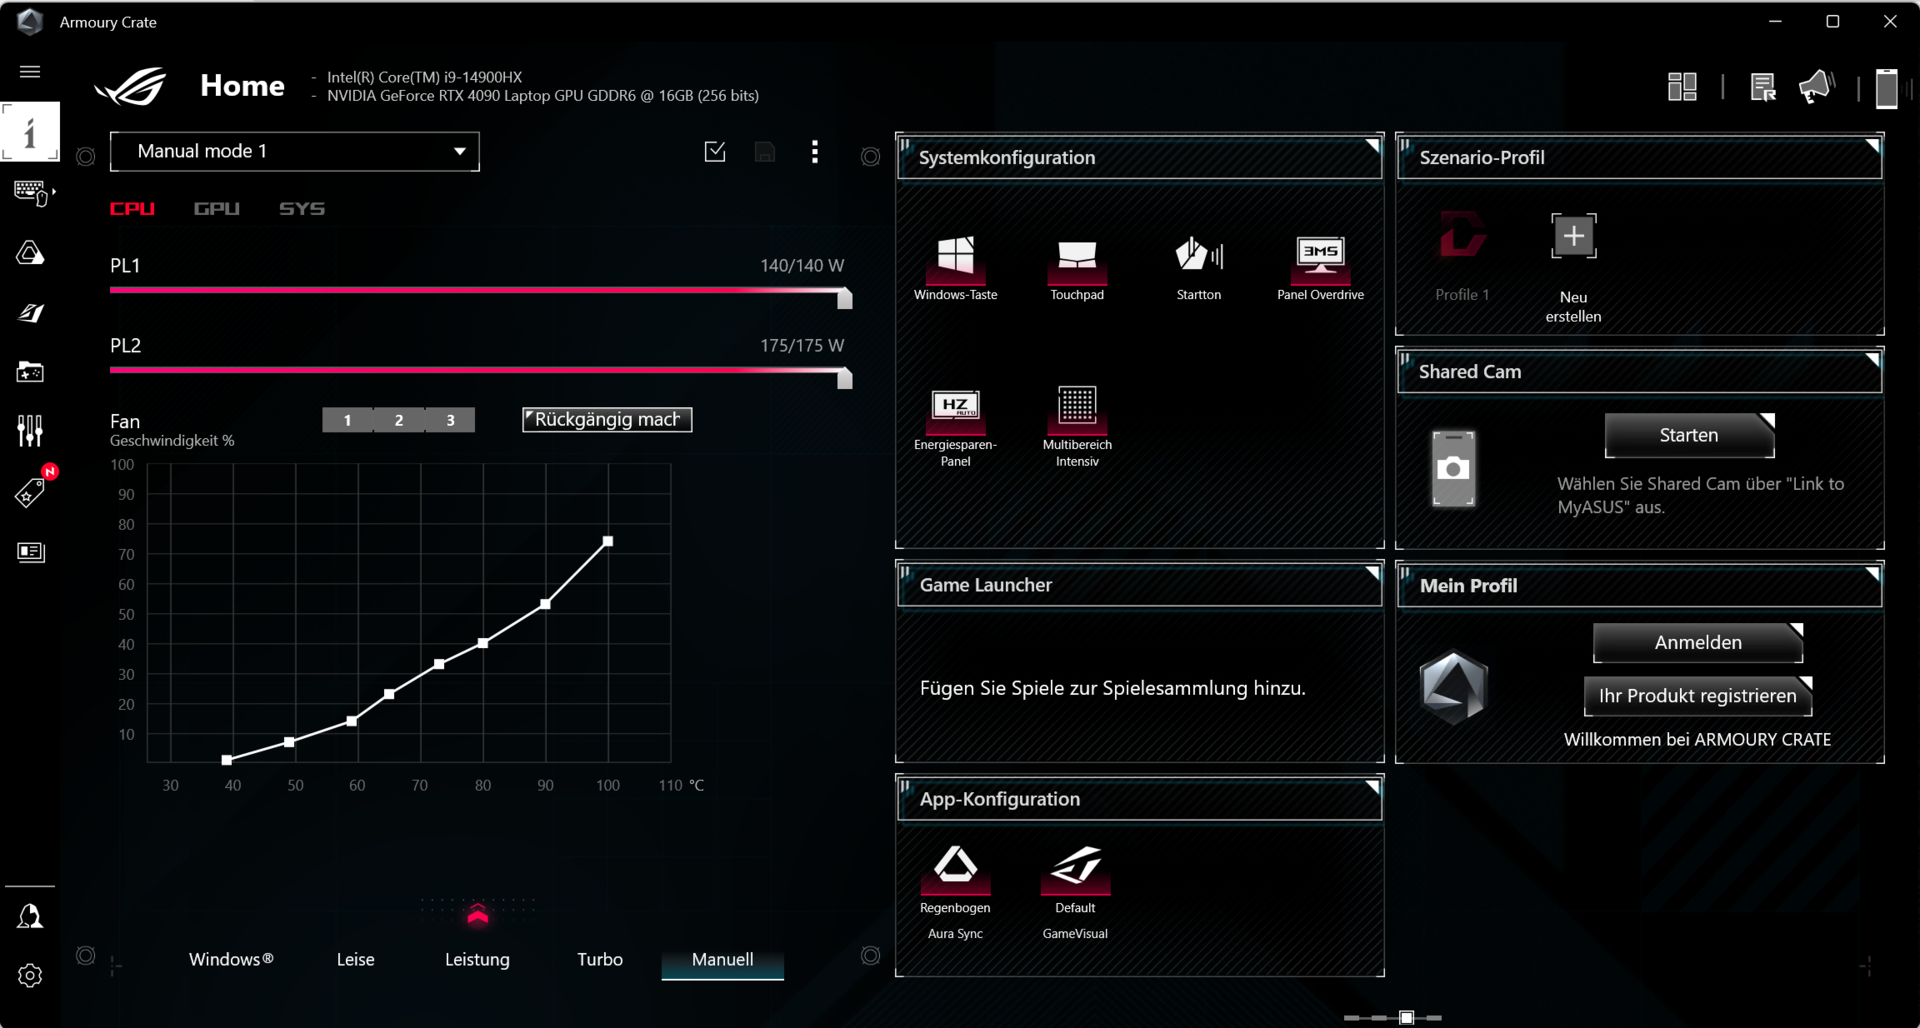
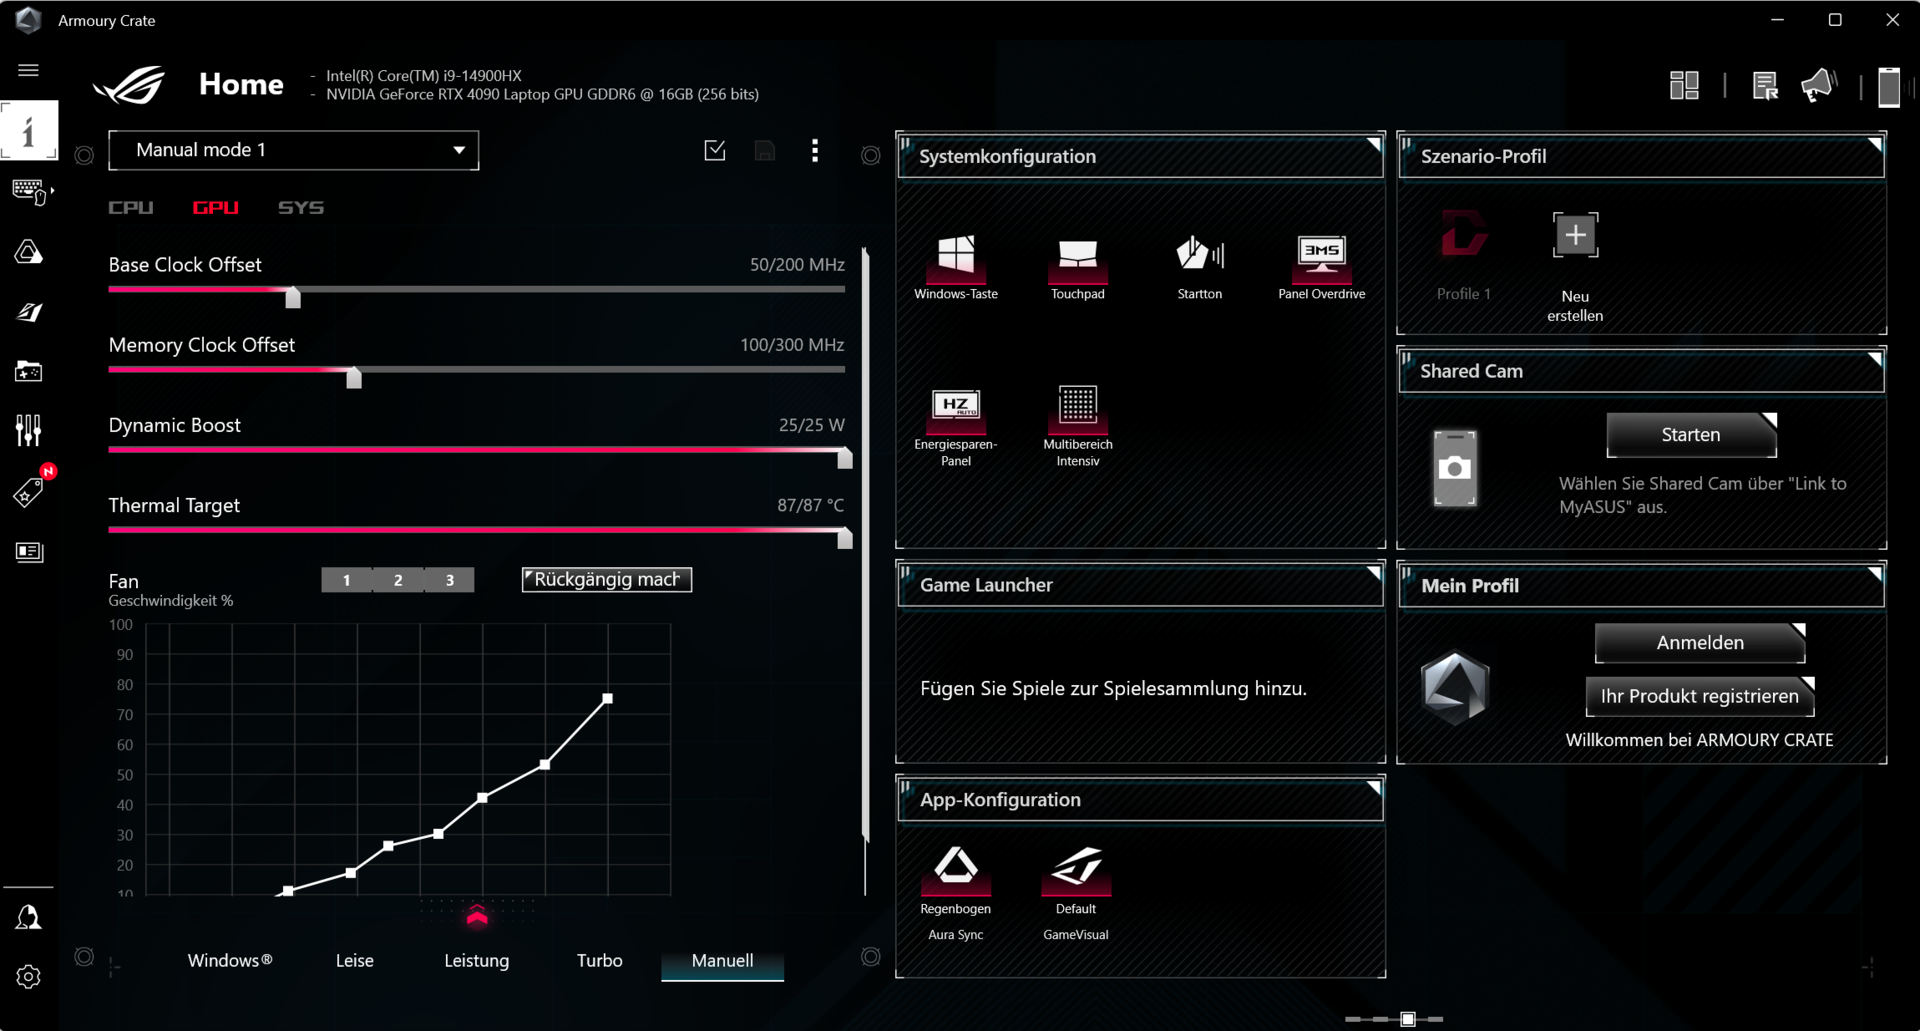
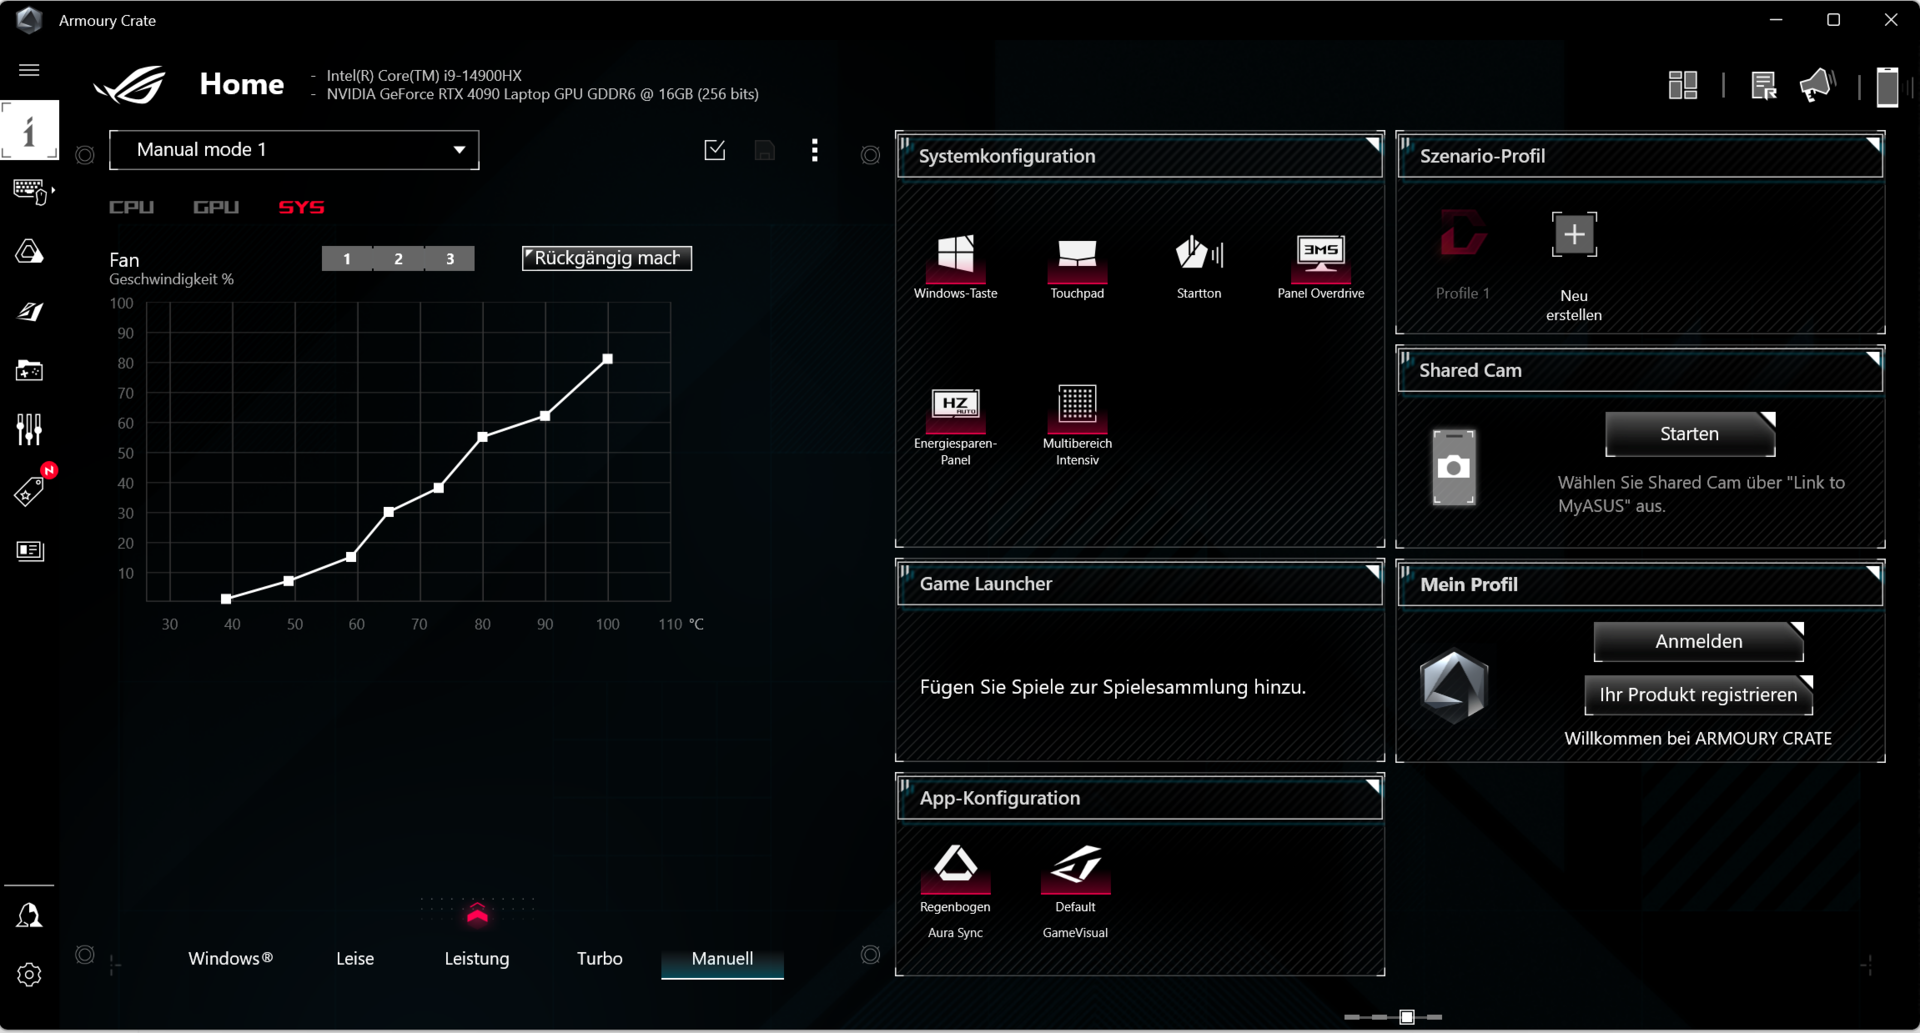
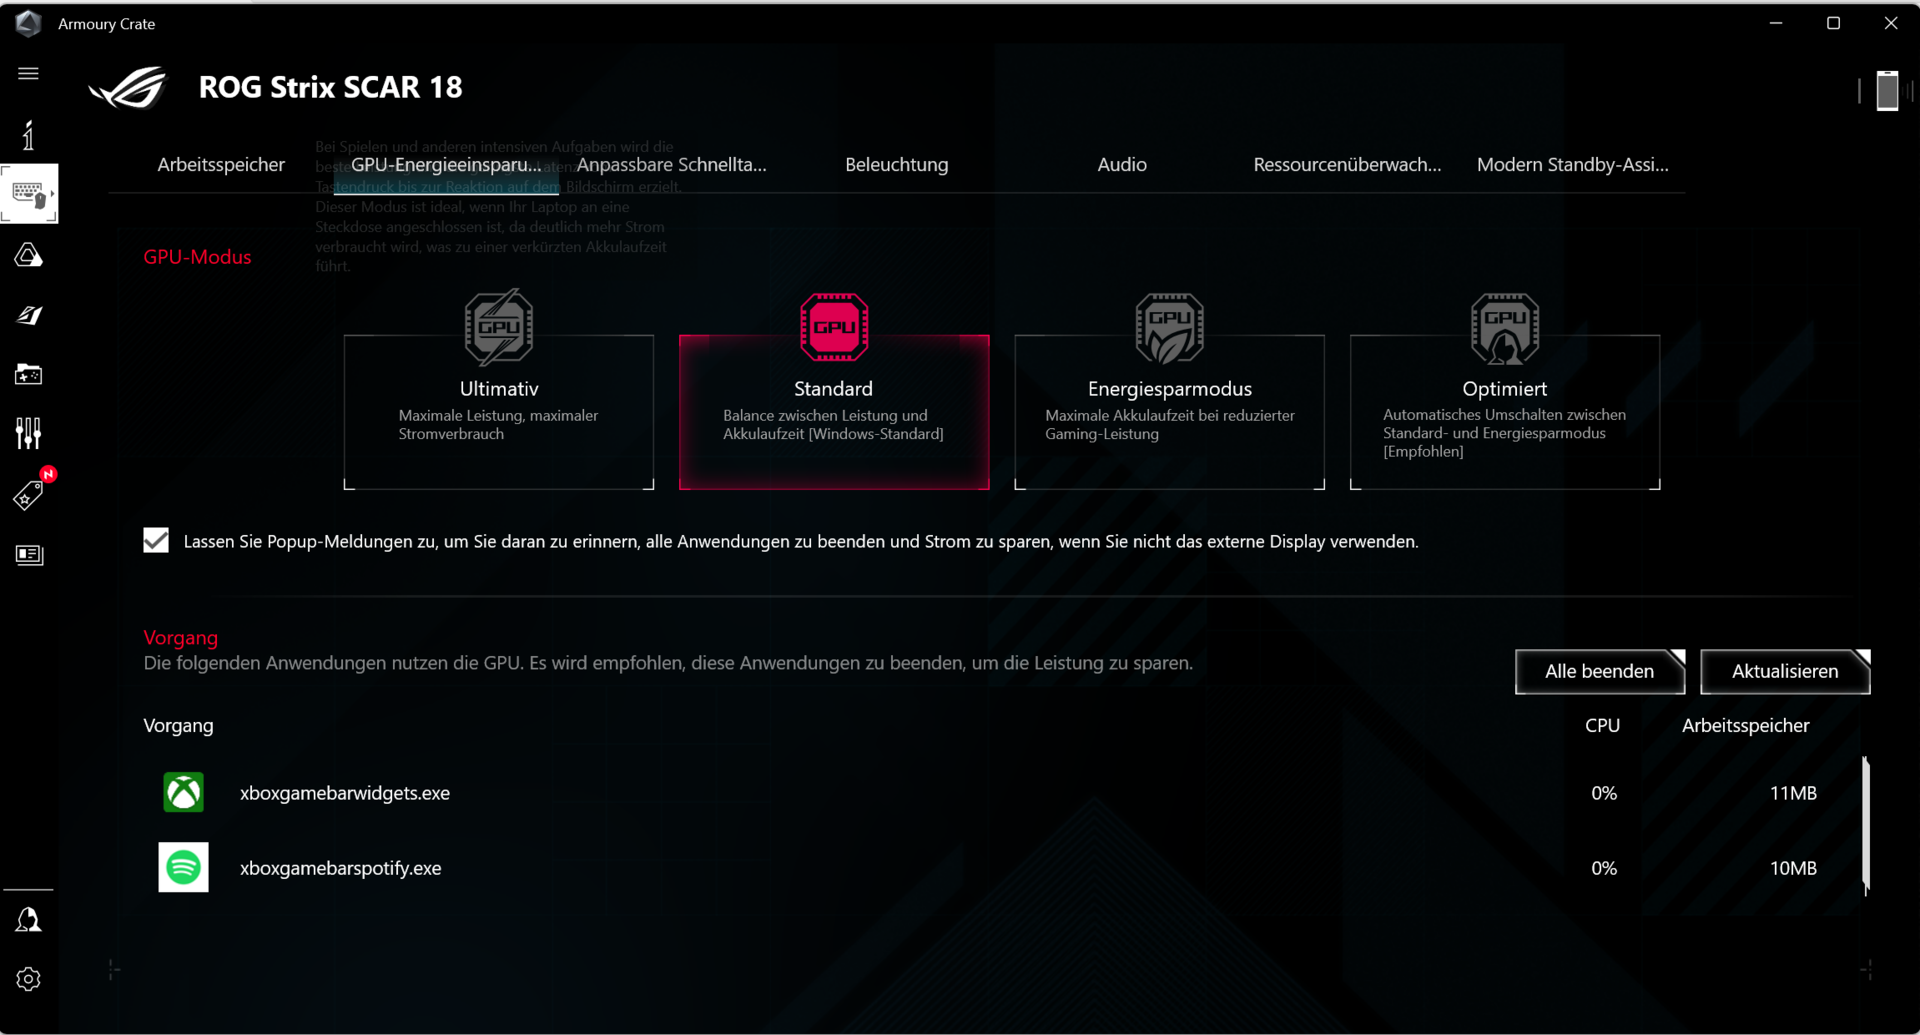
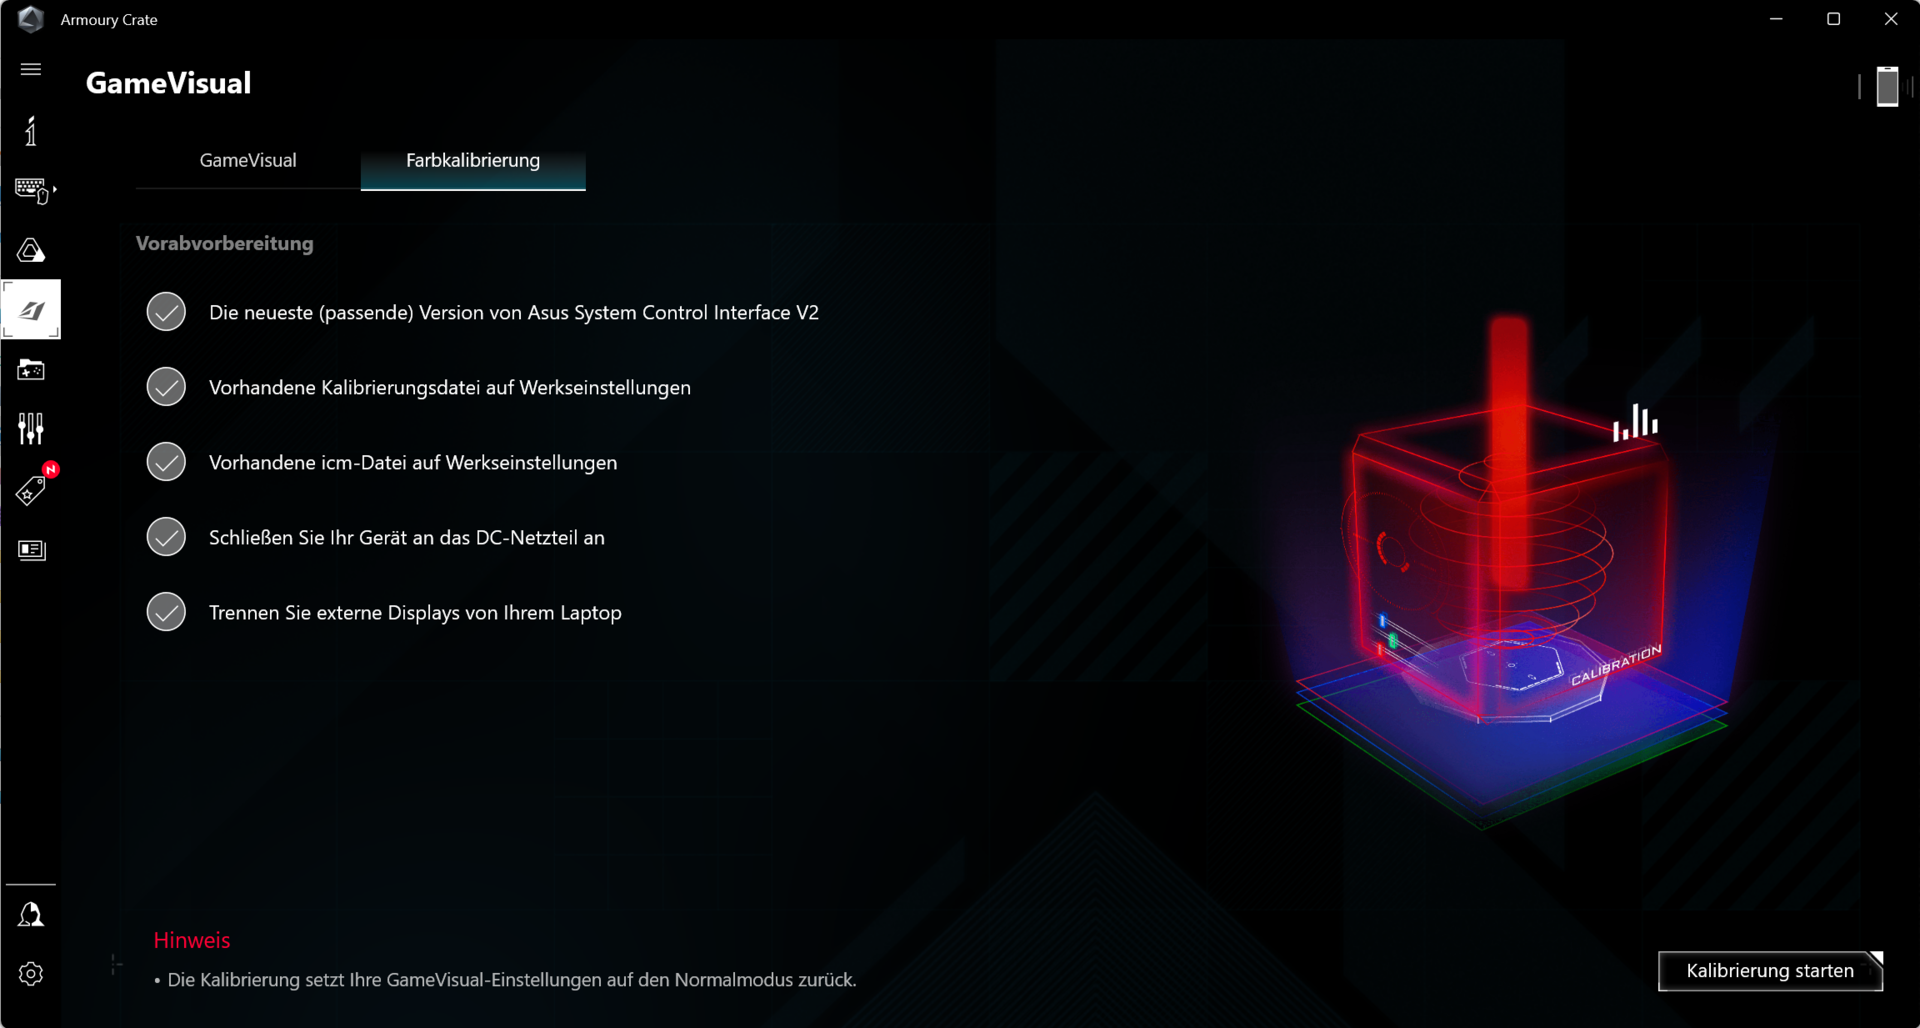
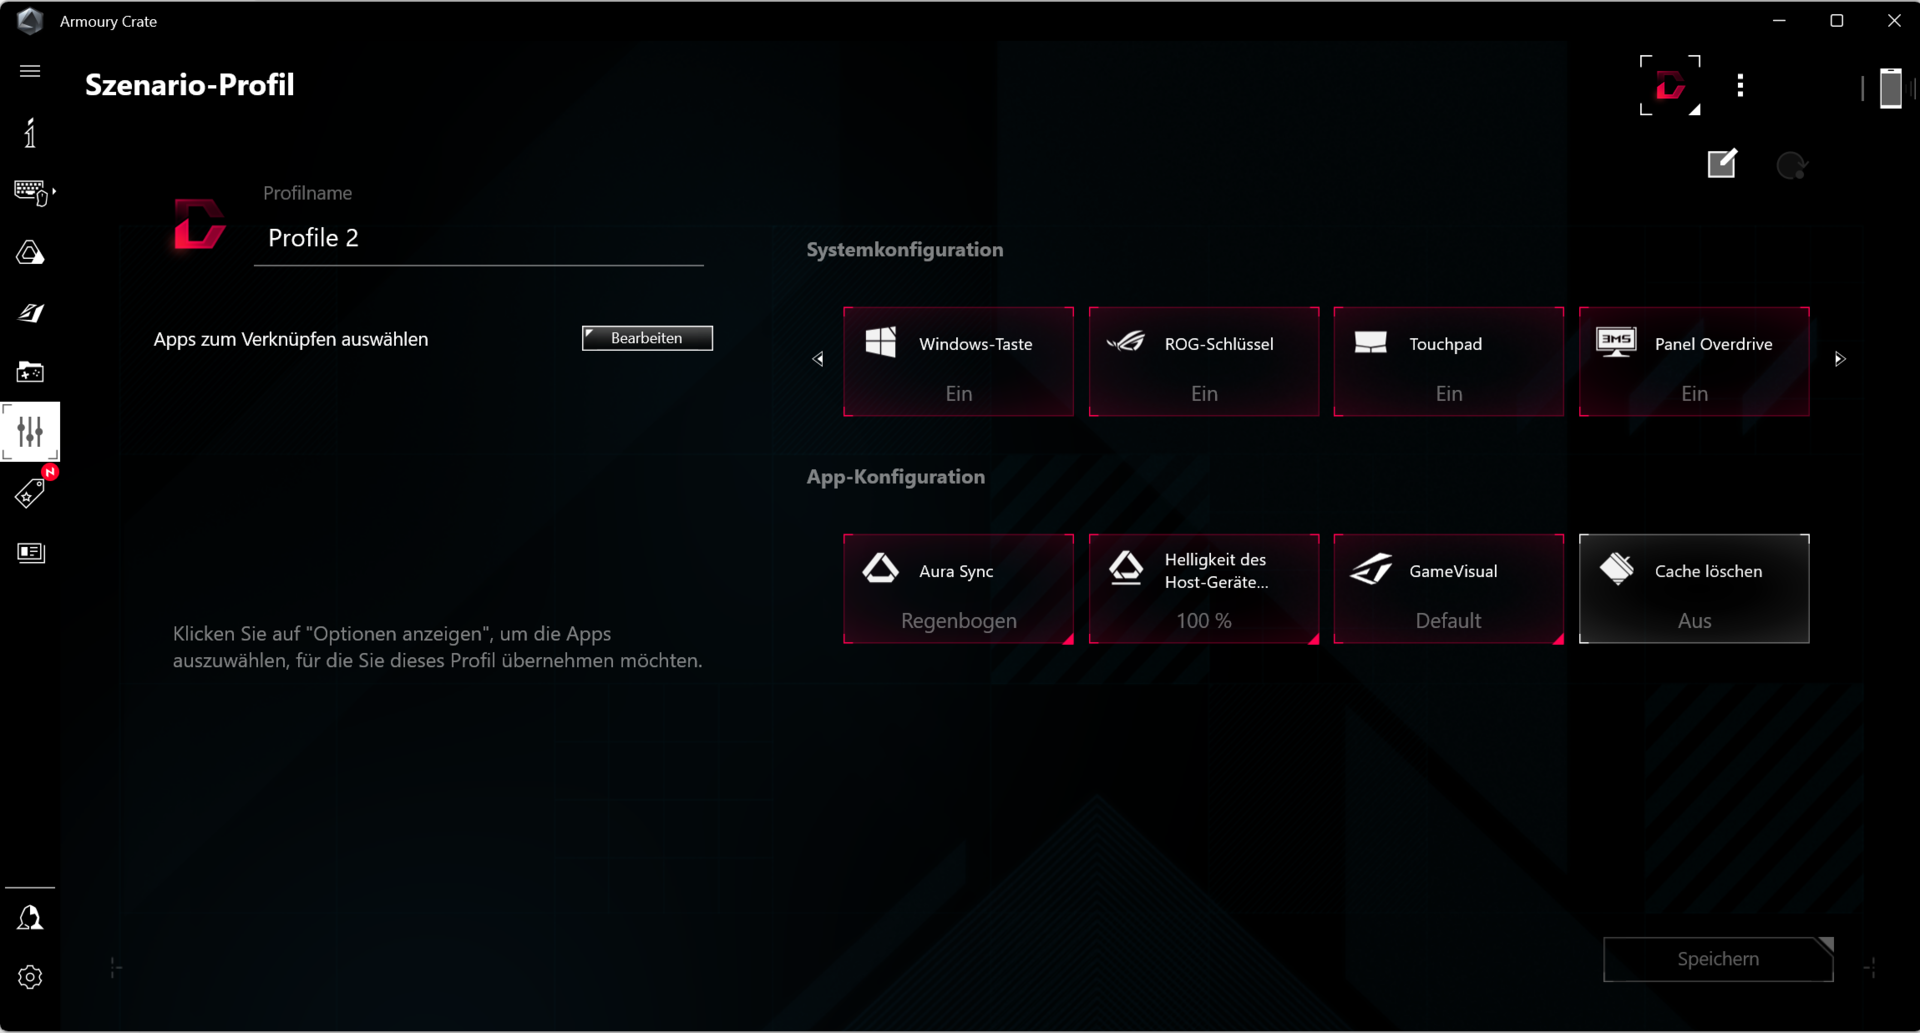
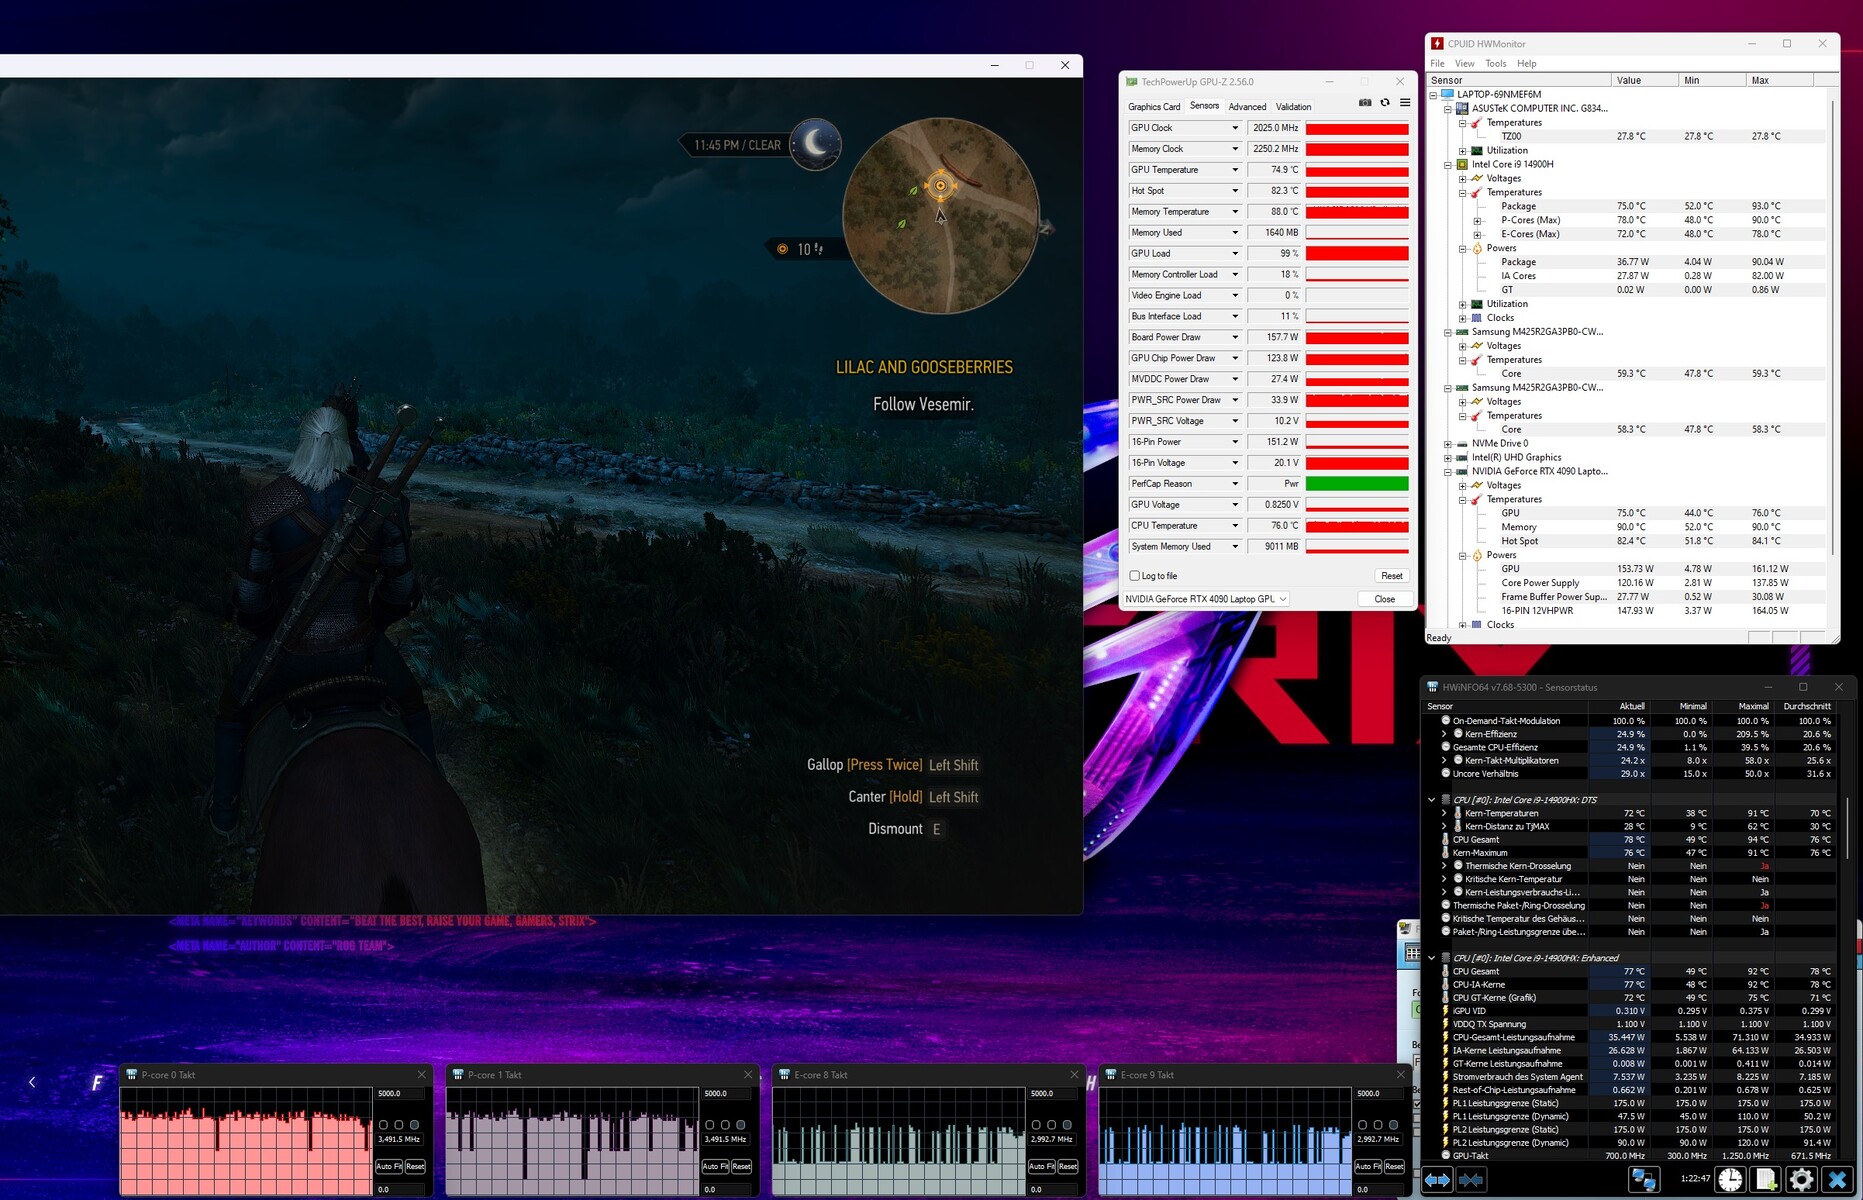
Dostępne są trzy tryby zasilania wstępnie skonfigurowane przez Asusa (patrz tabela) i można przełączać się między nimi za pomocą kombinacji klawiszy Fn + F5. Używamy "Wydajności" do naszych testów porównawczych i "Cichego" do naszych testów baterii. Tryb GPU jest ustawiony na "Standardowy". Centrum sterowania ("Armory Crate") laptopa umożliwia tworzenie indywidualnych profili ("Manual"), w tym ustawianie limitów mocy, Dynamic Boost i krzywych wentylatora.
| Wydajność | Turbo | Silent | |
|---|---|---|---|
| Limit mocy 1 (HWInfo) | 110 Watt | 175 Watt | 65 Watt |
| Limit mocy 2 (HWInfo) | 120 Watt | 175 Watt | 100 Watt |
| Hałas (The Witcher 3) | 50 dB(A) | 56 dB(A) | 35 dB(A) |
| Wydajność (The Witcher 3) | ~188 fps | ~183 fps | ~68 fps |
Procesor
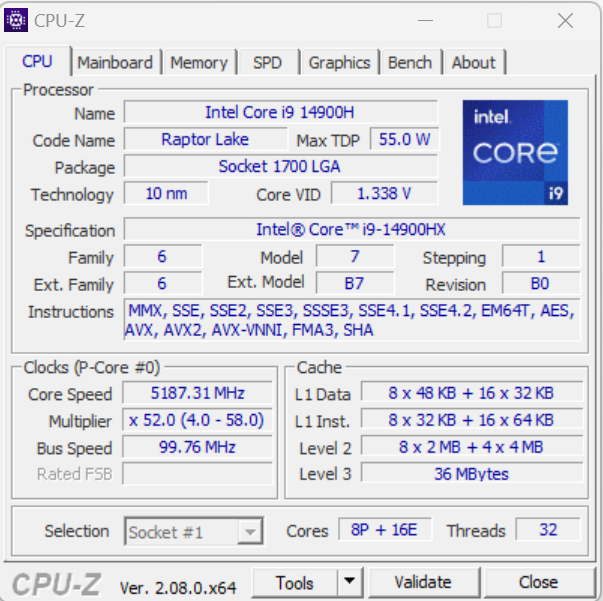
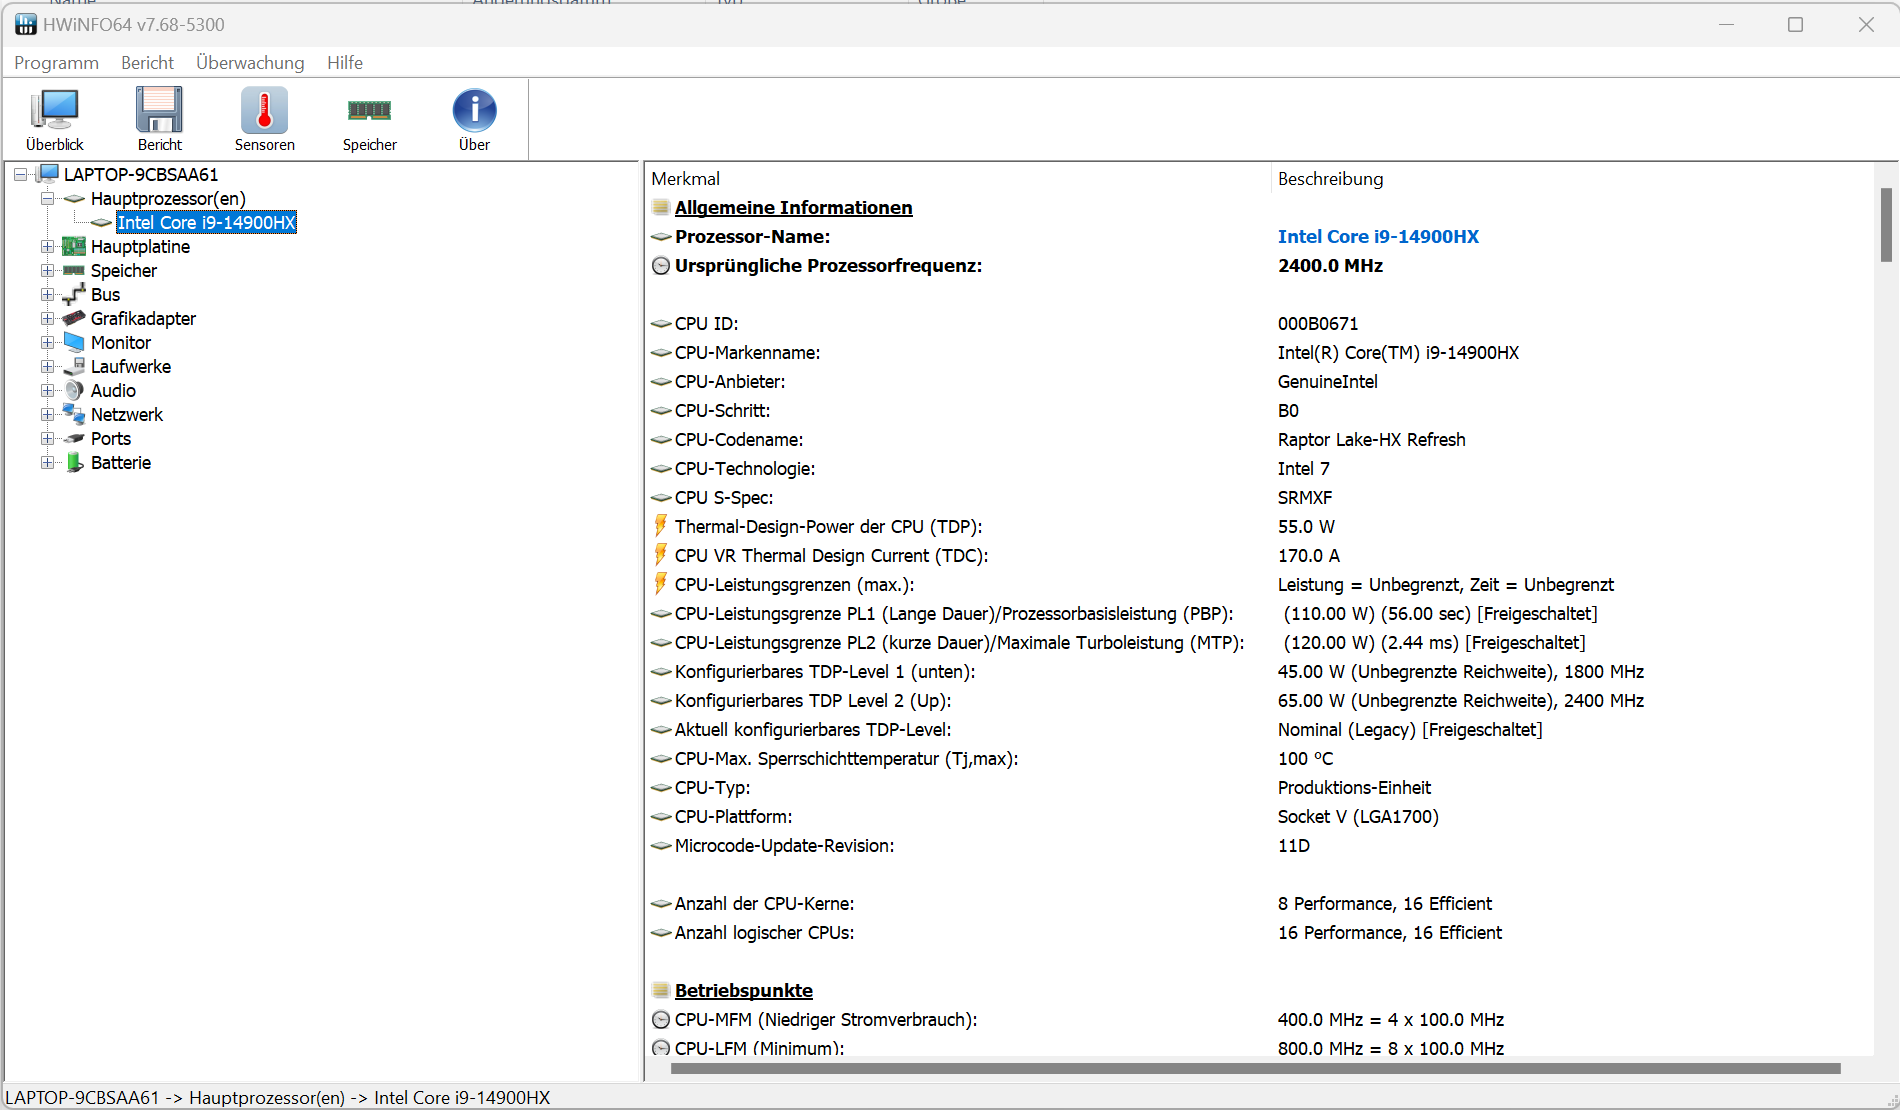
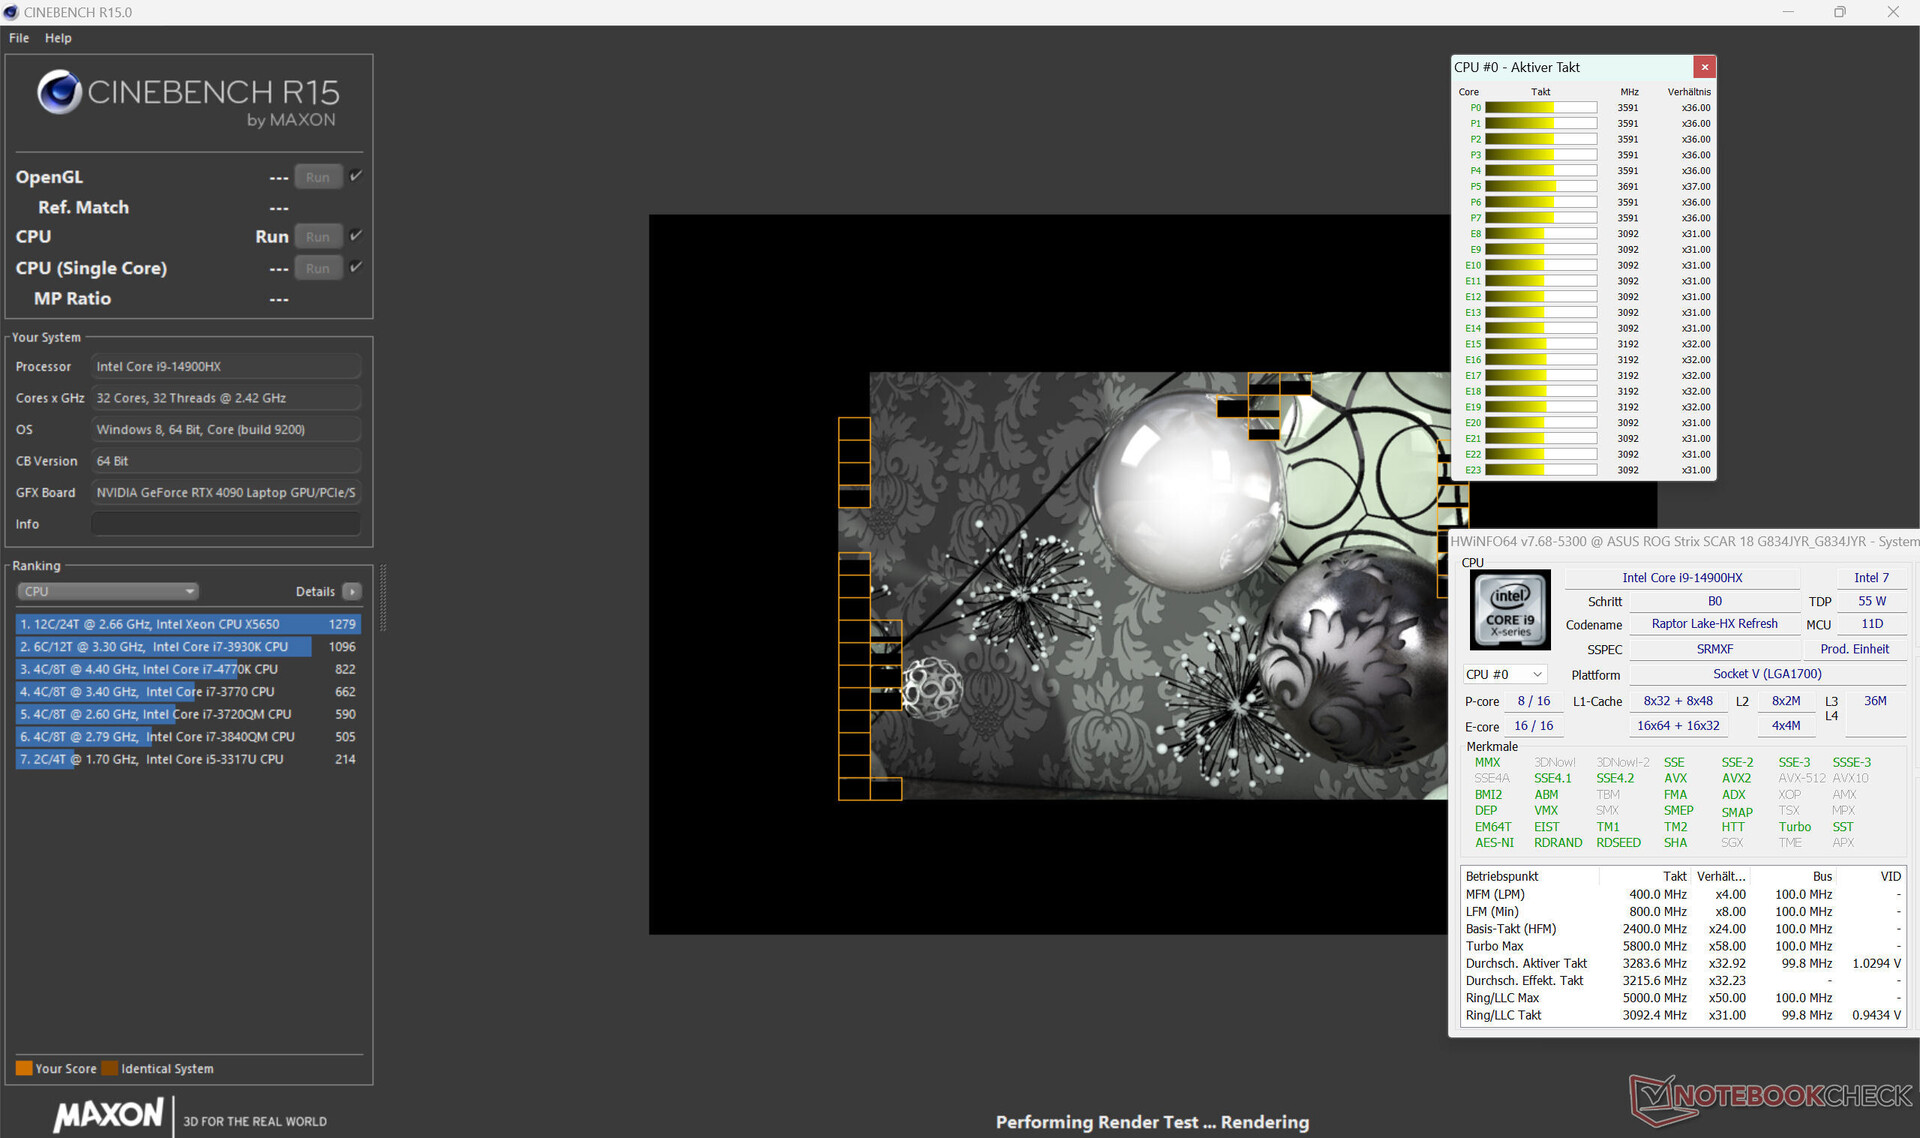
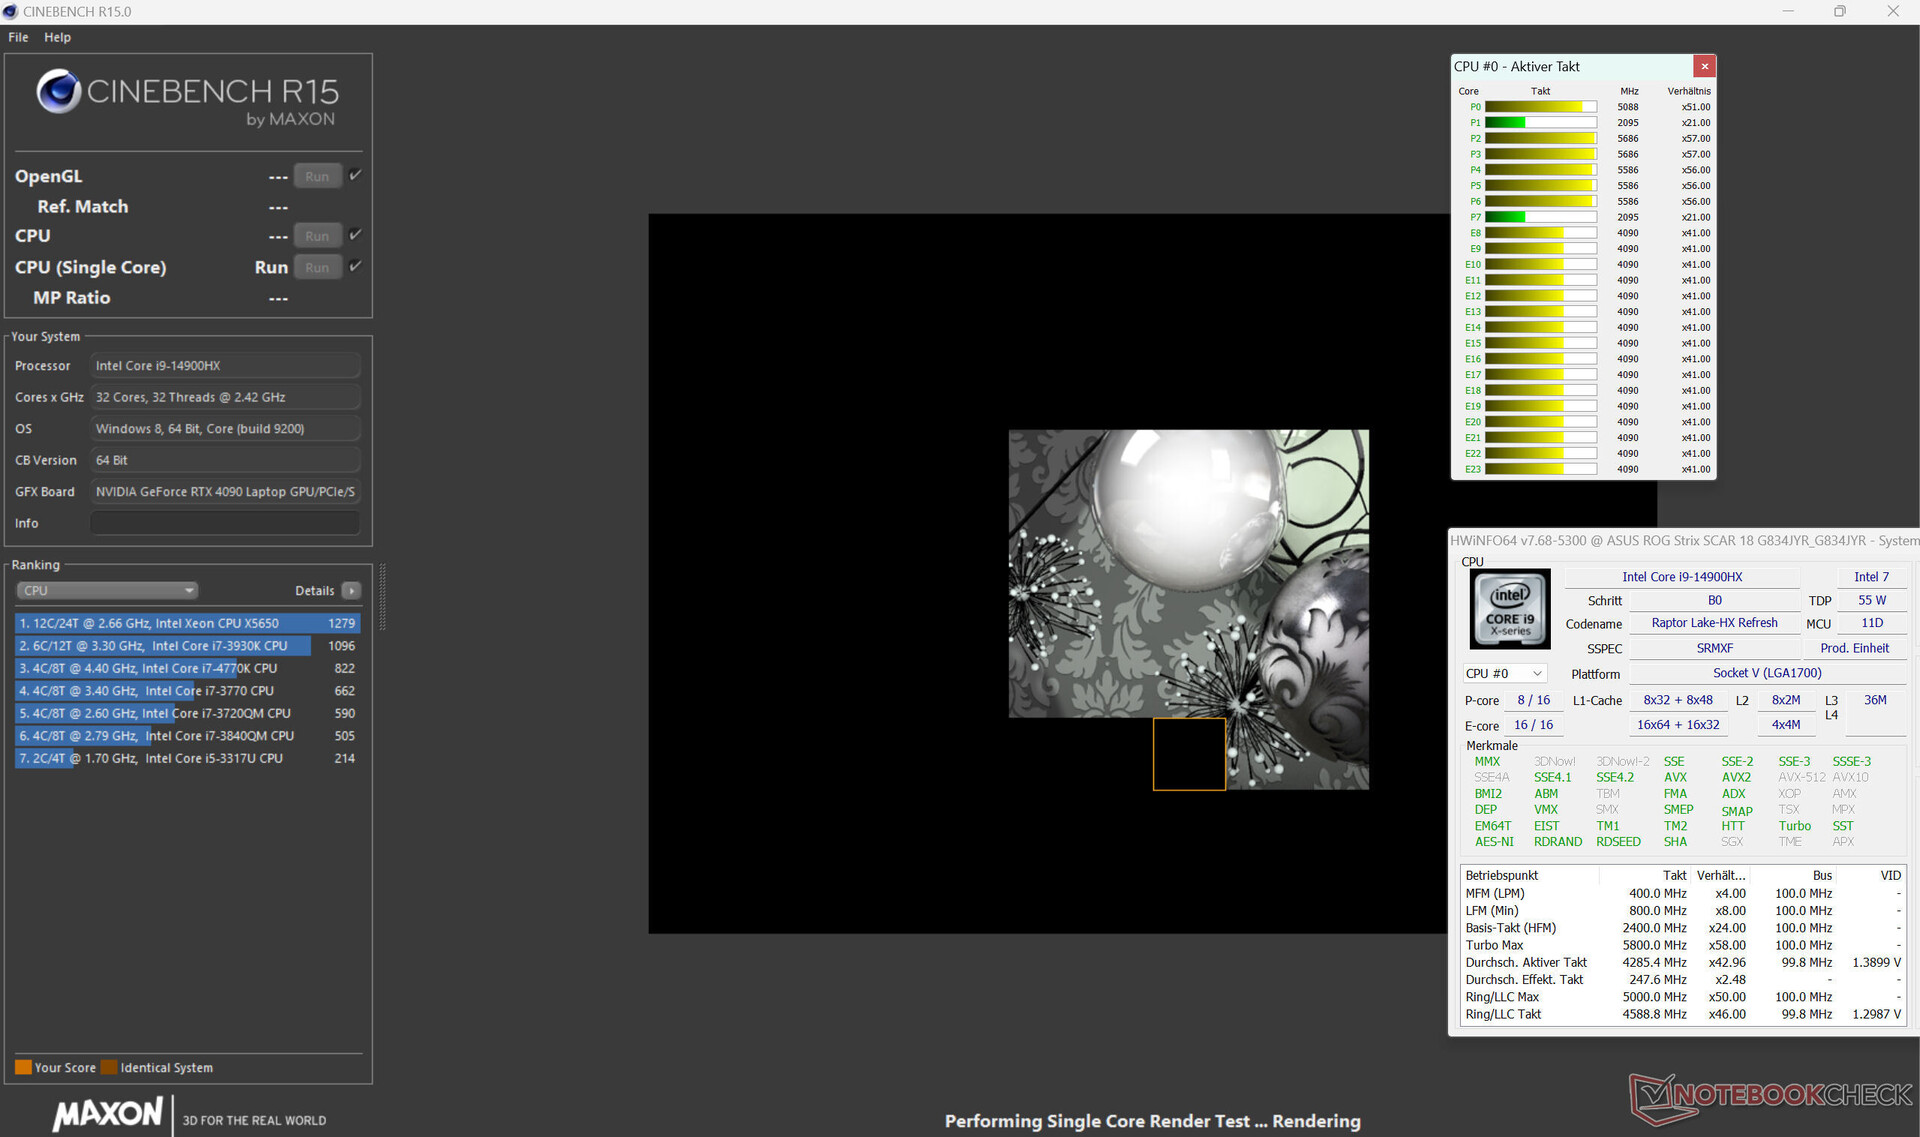
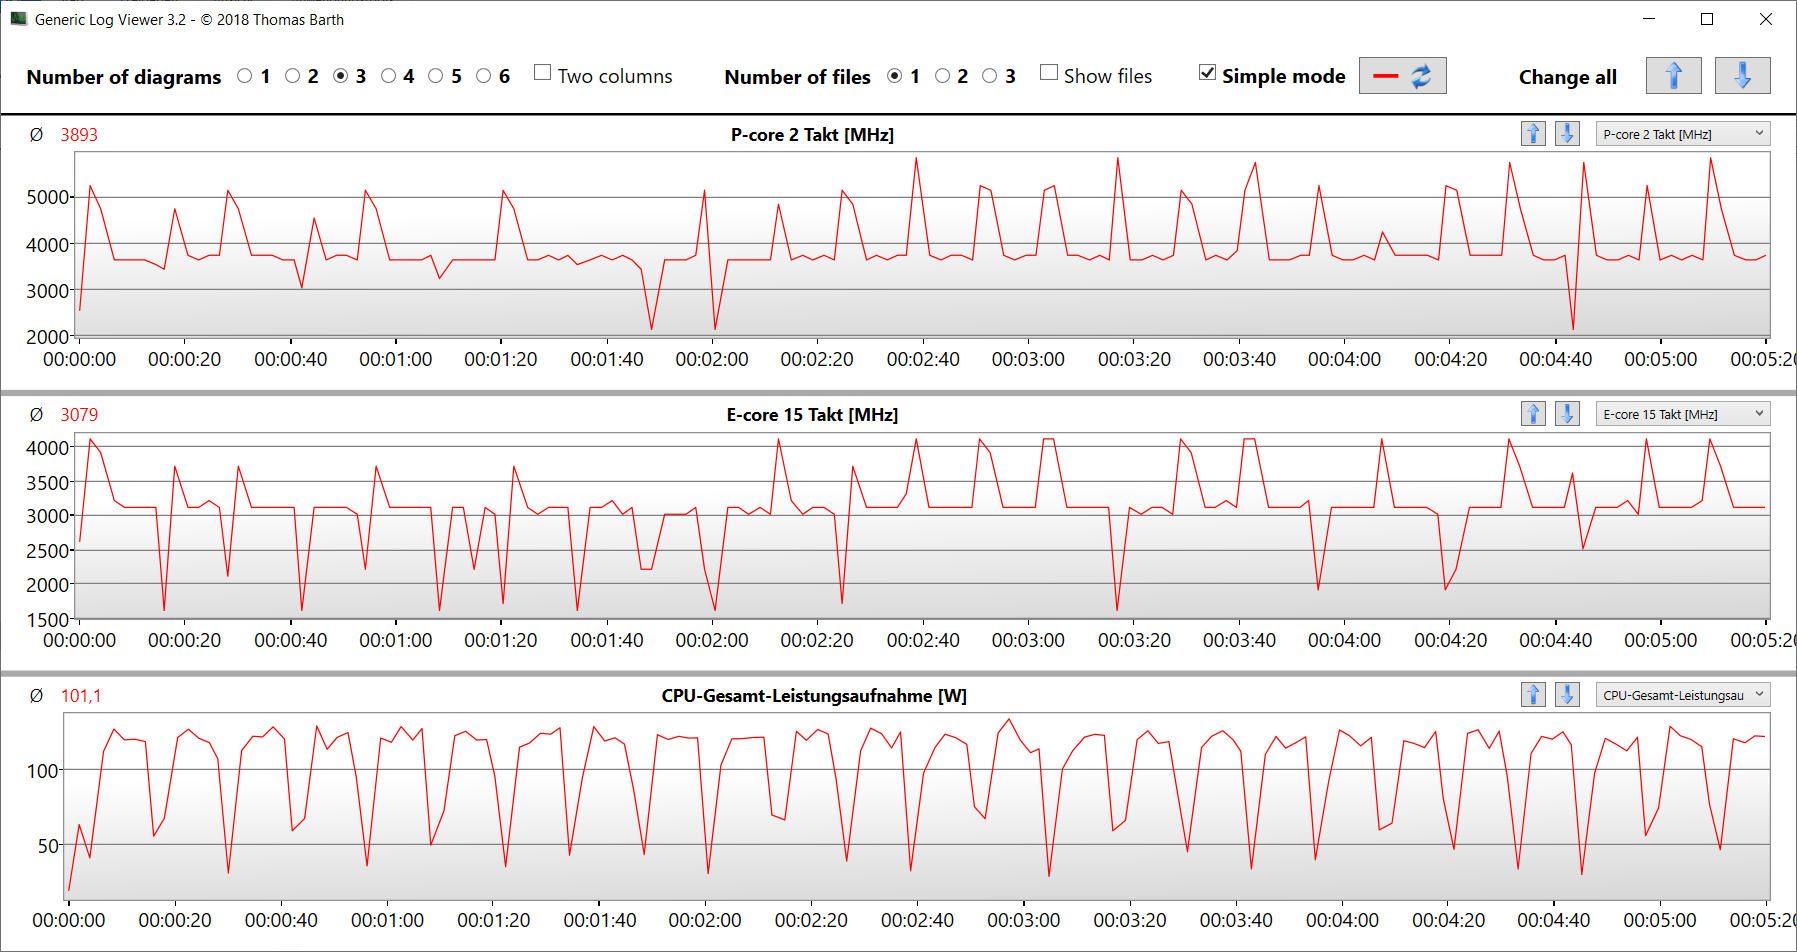
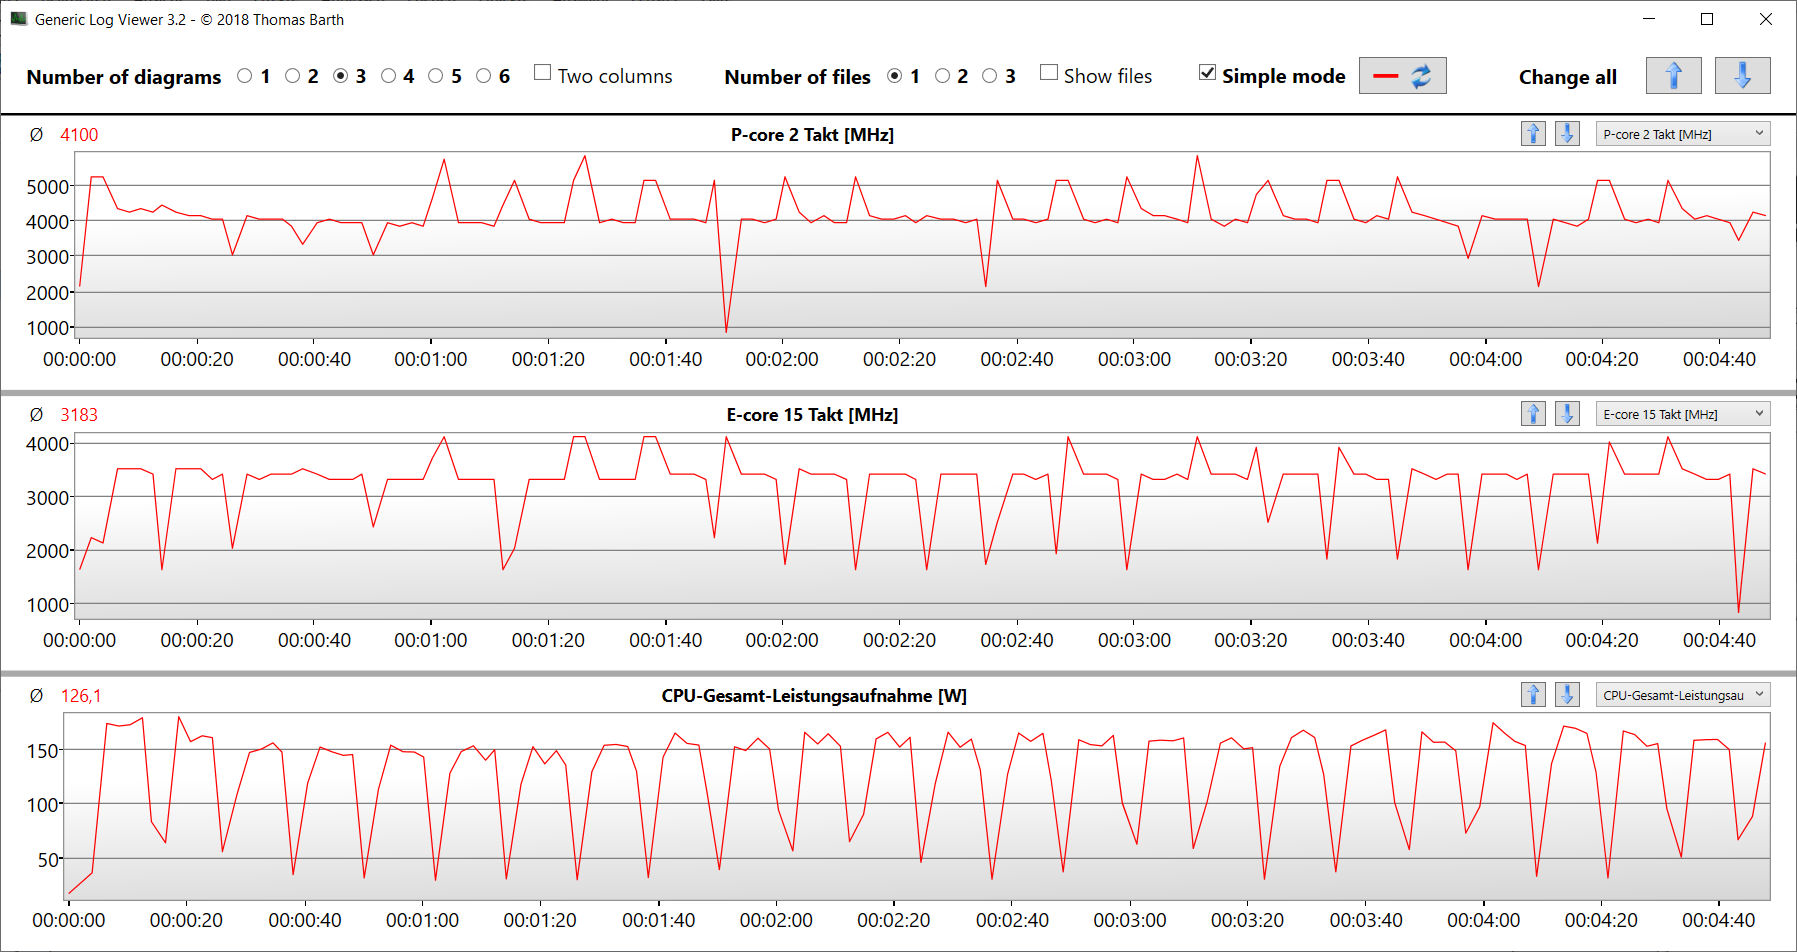
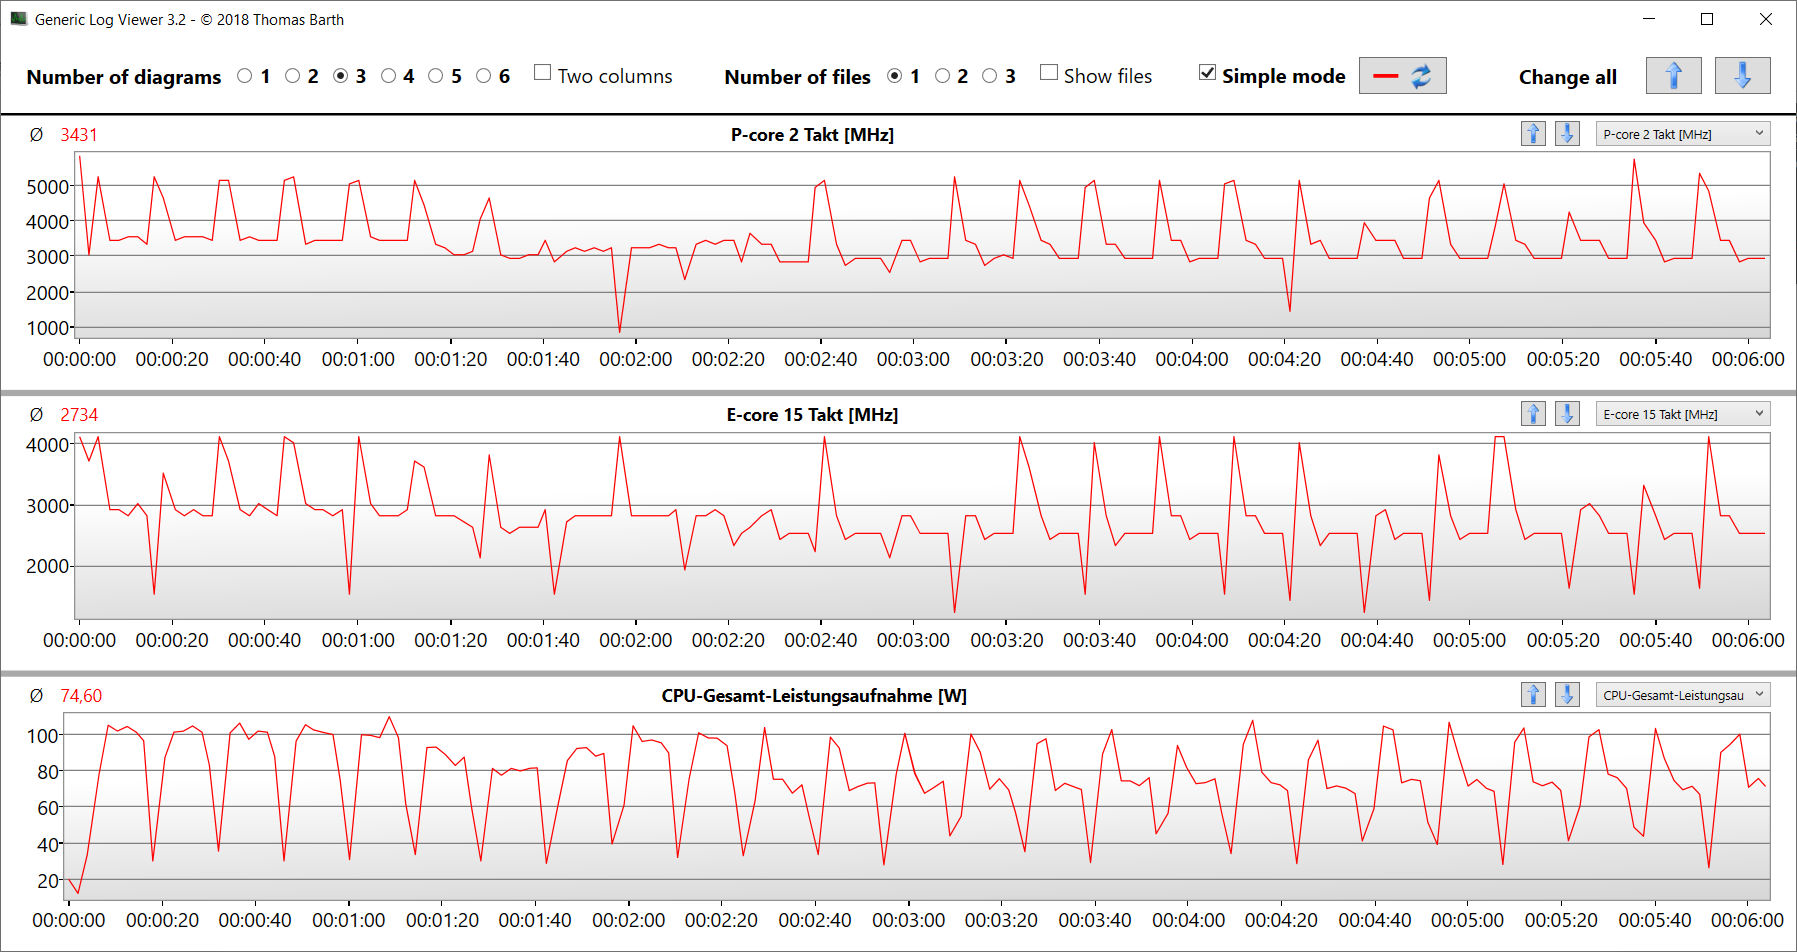
24 rdzenie CPU (8P + 16E = 32 wątki) procesora Core i9-14900HX (Raptor Lake) osiągają maksymalne taktowania na poziomie 5,8 GHz (rdzenie P) i 4,1 GHz (rdzenie E). Procesor reaguje na stałe obciążenie wielowątkowe (CB15 Loop) z prędkością Turbo, która pozostaje stale wysoka. Więcej informacji na temat Core i9 znajdą Państwo w naszej analizie.
Wybór profilu zasilania tylko w ograniczonym stopniu wpływa na wydajność jednowątkową, ale ma większy wpływ na wydajność wielowątkową. Wybranie opcji "Performance" skutkuje wartościami benchmarkowymi, które są poniżej średniej CPU ustalonej do tej pory, podczas gdy "Turbo" zwiększa wyniki nieco powyżej średniej. Wydajność jednowątkowa, która jest bardziej istotna w codziennej pracy, waha się na tym samym poziomie przy zasilaniu sieciowym i bateryjnym, ale wydajność wielowątkowa znacznie spada przy zasilaniu bateryjnym.
Cinebench R15 Multi Constant Load Test
| CPU Performance rating - Percent | |
| Alienware m18 R1 AMD | |
| Asus ROG Strix Scar 18 G834JYR (2024) | |
| Asus ROG Strix Scar 18 2023 G834JY-N6005W -2! | |
| Alienware m18 R1 -2! | |
| MSI Titan 18 HX A14VIG | |
| Acer Predator Helios 18 N23Q2 | |
| Asus ROG Strix Scar 18 G834JYR (2024) | |
| Przeciętny Intel Core i9-14900HX | |
| Razer Blade 18 RTX 4070 -2! | |
| Średnia w klasie Gaming | |
| Cinebench R20 | |
| CPU (Multi Core) | |
| Alienware m18 R1 AMD | |
| Alienware m18 R1 | |
| Asus ROG Strix Scar 18 G834JYR (2024) (Turbo) | |
| MSI Titan 18 HX A14VIG | |
| Asus ROG Strix Scar 18 2023 G834JY-N6005W | |
| Acer Predator Helios 18 N23Q2 | |
| Przeciętny Intel Core i9-14900HX (6579 - 13832, n=37) | |
| Razer Blade 18 RTX 4070 | |
| Asus ROG Strix Scar 18 G834JYR (2024) | |
| Średnia w klasie Gaming (4029 - 16108, n=112, ostatnie 2 lata) | |
| CPU (Single Core) | |
| Asus ROG Strix Scar 18 G834JYR (2024) (Turbo) | |
| Asus ROG Strix Scar 18 G834JYR (2024) | |
| Asus ROG Strix Scar 18 2023 G834JY-N6005W | |
| Przeciętny Intel Core i9-14900HX (657 - 859, n=37) | |
| MSI Titan 18 HX A14VIG | |
| Alienware m18 R1 | |
| Acer Predator Helios 18 N23Q2 | |
| Razer Blade 18 RTX 4070 | |
| Średnia w klasie Gaming (442 - 895, n=112, ostatnie 2 lata) | |
| Alienware m18 R1 AMD | |
| Cinebench R15 | |
| CPU Multi 64Bit | |
| Alienware m18 R1 AMD | |
| Alienware m18 R1 | |
| MSI Titan 18 HX A14VIG | |
| Asus ROG Strix Scar 18 2023 G834JY-N6005W | |
| Asus ROG Strix Scar 18 G834JYR (2024) (Turbo) | |
| Acer Predator Helios 18 N23Q2 | |
| Razer Blade 18 RTX 4070 | |
| Przeciętny Intel Core i9-14900HX (3263 - 5589, n=38) | |
| Asus ROG Strix Scar 18 G834JYR (2024) | |
| Średnia w klasie Gaming (1578 - 6271, n=113, ostatnie 2 lata) | |
| CPU Single 64Bit | |
| Asus ROG Strix Scar 18 2023 G834JY-N6005W | |
| Alienware m18 R1 AMD | |
| Asus ROG Strix Scar 18 G834JYR (2024) (Turbo) | |
| Przeciętny Intel Core i9-14900HX (247 - 323, n=37) | |
| Alienware m18 R1 | |
| Asus ROG Strix Scar 18 G834JYR (2024) | |
| MSI Titan 18 HX A14VIG | |
| Razer Blade 18 RTX 4070 | |
| Acer Predator Helios 18 N23Q2 | |
| Średnia w klasie Gaming (188.8 - 343, n=112, ostatnie 2 lata) | |
| Blender - v2.79 BMW27 CPU | |
| Średnia w klasie Gaming (80 - 330, n=110, ostatnie 2 lata) | |
| Przeciętny Intel Core i9-14900HX (91 - 206, n=37) | |
| Asus ROG Strix Scar 18 G834JYR (2024) | |
| Razer Blade 18 RTX 4070 | |
| Asus ROG Strix Scar 18 G834JYR (2024) (Turbo) | |
| Acer Predator Helios 18 N23Q2 | |
| MSI Titan 18 HX A14VIG | |
| Asus ROG Strix Scar 18 2023 G834JY-N6005W | |
| Alienware m18 R1 | |
| Alienware m18 R1 AMD | |
| Geekbench 6.7 | |
| Multi-Core | |
| Asus ROG Strix Scar 18 G834JYR (2024) (6.2.1, Turbo) | |
| Acer Predator Helios 18 N23Q2 | |
| Asus ROG Strix Scar 18 G834JYR (2024) (6.2.1) | |
| Przeciętny Intel Core i9-14900HX (13158 - 19665, n=37) | |
| MSI Titan 18 HX A14VIG (6.2.1) | |
| Alienware m18 R1 AMD | |
| Średnia w klasie Gaming (6625 - 22104, n=112, ostatnie 2 lata) | |
| Single-Core | |
| Asus ROG Strix Scar 18 G834JYR (2024) (6.2.1, Turbo) | |
| Asus ROG Strix Scar 18 G834JYR (2024) (6.2.1) | |
| Przeciętny Intel Core i9-14900HX (2419 - 3129, n=37) | |
| Acer Predator Helios 18 N23Q2 | |
| Alienware m18 R1 AMD | |
| MSI Titan 18 HX A14VIG (6.2.1) | |
| Średnia w klasie Gaming (1490 - 3259, n=112, ostatnie 2 lata) | |
| HWBOT x265 Benchmark v2.2 - 4k Preset | |
| Alienware m18 R1 AMD | |
| Asus ROG Strix Scar 18 2023 G834JY-N6005W | |
| Alienware m18 R1 | |
| Asus ROG Strix Scar 18 G834JYR (2024) (Turbo) | |
| Razer Blade 18 RTX 4070 | |
| MSI Titan 18 HX A14VIG | |
| Acer Predator Helios 18 N23Q2 | |
| Przeciętny Intel Core i9-14900HX (16.8 - 38.9, n=37) | |
| Asus ROG Strix Scar 18 G834JYR (2024) | |
| Średnia w klasie Gaming (11.5 - 44.3, n=111, ostatnie 2 lata) | |
| LibreOffice - 20 Documents To PDF | |
| Acer Predator Helios 18 N23Q2 | |
| Średnia w klasie Gaming (19 - 88.8, n=111, ostatnie 2 lata) | |
| Alienware m18 R1 | |
| MSI Titan 18 HX A14VIG (6.3.4.2) | |
| Asus ROG Strix Scar 18 G834JYR (2024) (6.3.4.2) | |
| Razer Blade 18 RTX 4070 | |
| Przeciętny Intel Core i9-14900HX (19 - 85.1, n=37) | |
| Alienware m18 R1 AMD (6.3.4.2) | |
| Asus ROG Strix Scar 18 G834JYR (2024) (6.3.4.2, Turbo) | |
| Asus ROG Strix Scar 18 2023 G834JY-N6005W | |
| R Benchmark 2.5 - Overall mean | |
| Średnia w klasie Gaming (0.3439 - 0.759, n=112, ostatnie 2 lata) | |
| Alienware m18 R1 AMD | |
| Acer Predator Helios 18 N23Q2 | |
| Razer Blade 18 RTX 4070 | |
| Asus ROG Strix Scar 18 G834JYR (2024) | |
| Alienware m18 R1 | |
| MSI Titan 18 HX A14VIG | |
| Przeciętny Intel Core i9-14900HX (0.3604 - 0.4859, n=37) | |
| Asus ROG Strix Scar 18 2023 G834JY-N6005W | |
| Asus ROG Strix Scar 18 G834JYR (2024) (Turbo) | |
* ... im mniej tym lepiej
AIDA64: FP32 Ray-Trace | FPU Julia | CPU SHA3 | CPU Queen | FPU SinJulia | FPU Mandel | CPU AES | CPU ZLib | FP64 Ray-Trace | CPU PhotoWorxx
| Performance rating | |
| Alienware m18 R1 AMD | |
| Acer Predator Helios 18 N23Q2 | |
| Alienware m18 R1 | |
| MSI Titan 18 HX A14VIG | |
| Asus ROG Strix Scar 18 2023 G834JY-N6005W | |
| Asus ROG Strix Scar 18 G834JYR (2024) | |
| Razer Blade 18 RTX 4070 | |
| Asus ROG Strix Scar 18 G834JYR (2024) | |
| Przeciętny Intel Core i9-14900HX | |
| Średnia w klasie Gaming | |
| AIDA64 / FP32 Ray-Trace | |
| Alienware m18 R1 AMD (v6.85.6300) | |
| Średnia w klasie Gaming (10227 - 85542, n=110, ostatnie 2 lata) | |
| Alienware m18 R1 (v6.85.6300) | |
| MSI Titan 18 HX A14VIG (v6.92.6600) | |
| Asus ROG Strix Scar 18 2023 G834JY-N6005W (v6.85.6300) | |
| Acer Predator Helios 18 N23Q2 (v6.85.6300) | |
| Asus ROG Strix Scar 18 G834JYR (2024) (v6.92.6600, Turbo) | |
| Razer Blade 18 RTX 4070 (v6.85.6300) | |
| Asus ROG Strix Scar 18 G834JYR (2024) (v6.92.6600) | |
| Przeciętny Intel Core i9-14900HX (13098 - 33474, n=36) | |
| AIDA64 / FPU Julia | |
| Alienware m18 R1 AMD (v6.85.6300) | |
| MSI Titan 18 HX A14VIG (v6.92.6600) | |
| Alienware m18 R1 (v6.85.6300) | |
| Asus ROG Strix Scar 18 2023 G834JY-N6005W (v6.85.6300) | |
| Asus ROG Strix Scar 18 G834JYR (2024) (v6.92.6600, Turbo) | |
| Acer Predator Helios 18 N23Q2 (v6.85.6300) | |
| Średnia w klasie Gaming (51376 - 238426, n=110, ostatnie 2 lata) | |
| Razer Blade 18 RTX 4070 (v6.85.6300) | |
| Asus ROG Strix Scar 18 G834JYR (2024) (v6.92.6600) | |
| Przeciętny Intel Core i9-14900HX (67573 - 166040, n=36) | |
| AIDA64 / CPU SHA3 | |
| Alienware m18 R1 AMD (v6.85.6300) | |
| MSI Titan 18 HX A14VIG (v6.92.6600) | |
| Alienware m18 R1 (v6.85.6300) | |
| Asus ROG Strix Scar 18 2023 G834JY-N6005W (v6.85.6300) | |
| Acer Predator Helios 18 N23Q2 (v6.85.6300) | |
| Asus ROG Strix Scar 18 G834JYR (2024) (v6.92.6600, Turbo) | |
| Razer Blade 18 RTX 4070 (v6.85.6300) | |
| Asus ROG Strix Scar 18 G834JYR (2024) (v6.92.6600) | |
| Przeciętny Intel Core i9-14900HX (3589 - 7979, n=36) | |
| Średnia w klasie Gaming (2180 - 9817, n=110, ostatnie 2 lata) | |
| AIDA64 / CPU Queen | |
| Alienware m18 R1 AMD (v6.85.6300) | |
| MSI Titan 18 HX A14VIG (v6.92.6600) | |
| Alienware m18 R1 (v6.85.6300) | |
| Asus ROG Strix Scar 18 G834JYR (2024) (v6.92.6600) | |
| Asus ROG Strix Scar 18 G834JYR (2024) (v6.92.6600, Turbo) | |
| Asus ROG Strix Scar 18 2023 G834JY-N6005W (v6.85.6300) | |
| Przeciętny Intel Core i9-14900HX (118405 - 148966, n=36) | |
| Razer Blade 18 RTX 4070 (v6.85.6300) | |
| Acer Predator Helios 18 N23Q2 (v6.85.6300) | |
| Średnia w klasie Gaming (49785 - 173351, n=101, ostatnie 2 lata) | |
| AIDA64 / FPU SinJulia | |
| Alienware m18 R1 AMD (v6.85.6300) | |
| MSI Titan 18 HX A14VIG (v6.92.6600) | |
| Asus ROG Strix Scar 18 2023 G834JY-N6005W (v6.85.6300) | |
| Alienware m18 R1 (v6.85.6300) | |
| Asus ROG Strix Scar 18 G834JYR (2024) (v6.92.6600, Turbo) | |
| Asus ROG Strix Scar 18 G834JYR (2024) (v6.92.6600) | |
| Razer Blade 18 RTX 4070 (v6.85.6300) | |
| Acer Predator Helios 18 N23Q2 (v6.85.6300) | |
| Przeciętny Intel Core i9-14900HX (10475 - 18517, n=36) | |
| Średnia w klasie Gaming (4424 - 33636, n=110, ostatnie 2 lata) | |
| AIDA64 / FPU Mandel | |
| Alienware m18 R1 AMD (v6.85.6300) | |
| Alienware m18 R1 (v6.85.6300) | |
| MSI Titan 18 HX A14VIG (v6.92.6600) | |
| Asus ROG Strix Scar 18 2023 G834JY-N6005W (v6.85.6300) | |
| Średnia w klasie Gaming (25115 - 128721, n=110, ostatnie 2 lata) | |
| Acer Predator Helios 18 N23Q2 (v6.85.6300) | |
| Asus ROG Strix Scar 18 G834JYR (2024) (v6.92.6600, Turbo) | |
| Razer Blade 18 RTX 4070 (v6.85.6300) | |
| Asus ROG Strix Scar 18 G834JYR (2024) (v6.92.6600) | |
| Przeciętny Intel Core i9-14900HX (32543 - 83662, n=36) | |
| AIDA64 / CPU AES | |
| Acer Predator Helios 18 N23Q2 (v6.85.6300) | |
| Alienware m18 R1 AMD (v6.85.6300) | |
| Przeciętny Intel Core i9-14900HX (86964 - 241777, n=36) | |
| MSI Titan 18 HX A14VIG (v6.92.6600) | |
| Alienware m18 R1 (v6.85.6300) | |
| Asus ROG Strix Scar 18 2023 G834JY-N6005W (v6.85.6300) | |
| Asus ROG Strix Scar 18 G834JYR (2024) (v6.92.6600, Turbo) | |
| Asus ROG Strix Scar 18 G834JYR (2024) (v6.92.6600) | |
| Razer Blade 18 RTX 4070 (v6.85.6300) | |
| Średnia w klasie Gaming (39258 - 247074, n=110, ostatnie 2 lata) | |
| AIDA64 / CPU ZLib | |
| Alienware m18 R1 AMD (v6.85.6300) | |
| MSI Titan 18 HX A14VIG (v6.92.6600) | |
| Asus ROG Strix Scar 18 2023 G834JY-N6005W (v6.85.6300) | |
| Alienware m18 R1 (v6.85.6300) | |
| Acer Predator Helios 18 N23Q2 (v6.85.6300) | |
| Asus ROG Strix Scar 18 G834JYR (2024) (v6.92.6600, Turbo) | |
| Razer Blade 18 RTX 4070 (v6.85.6300) | |
| Przeciętny Intel Core i9-14900HX (1054 - 2292, n=36) | |
| Asus ROG Strix Scar 18 G834JYR (2024) | |
| Średnia w klasie Gaming (574 - 2531, n=110, ostatnie 2 lata) | |
| AIDA64 / FP64 Ray-Trace | |
| Alienware m18 R1 AMD (v6.85.6300) | |
| Średnia w klasie Gaming (5509 - 45446, n=110, ostatnie 2 lata) | |
| Alienware m18 R1 (v6.85.6300) | |
| MSI Titan 18 HX A14VIG (v6.92.6600) | |
| Asus ROG Strix Scar 18 2023 G834JY-N6005W (v6.85.6300) | |
| Acer Predator Helios 18 N23Q2 (v6.85.6300) | |
| Asus ROG Strix Scar 18 G834JYR (2024) (v6.92.6600, Turbo) | |
| Razer Blade 18 RTX 4070 (v6.85.6300) | |
| Asus ROG Strix Scar 18 G834JYR (2024) (v6.92.6600) | |
| Przeciętny Intel Core i9-14900HX (6809 - 18349, n=36) | |
| AIDA64 / CPU PhotoWorxx | |
| Alienware m18 R1 (v6.85.6300) | |
| Acer Predator Helios 18 N23Q2 (v6.85.6300) | |
| Asus ROG Strix Scar 18 G834JYR (2024) (v6.92.6600) | |
| Asus ROG Strix Scar 18 G834JYR (2024) (v6.92.6600, Turbo) | |
| Razer Blade 18 RTX 4070 (v6.85.6300) | |
| Przeciętny Intel Core i9-14900HX (23903 - 54702, n=36) | |
| Średnia w klasie Gaming (12271 - 89891, n=110, ostatnie 2 lata) | |
| Asus ROG Strix Scar 18 2023 G834JY-N6005W (v6.85.6300) | |
| Alienware m18 R1 AMD (v6.85.6300) | |
| MSI Titan 18 HX A14VIG (v6.92.6600) | |
Wydajność systemu
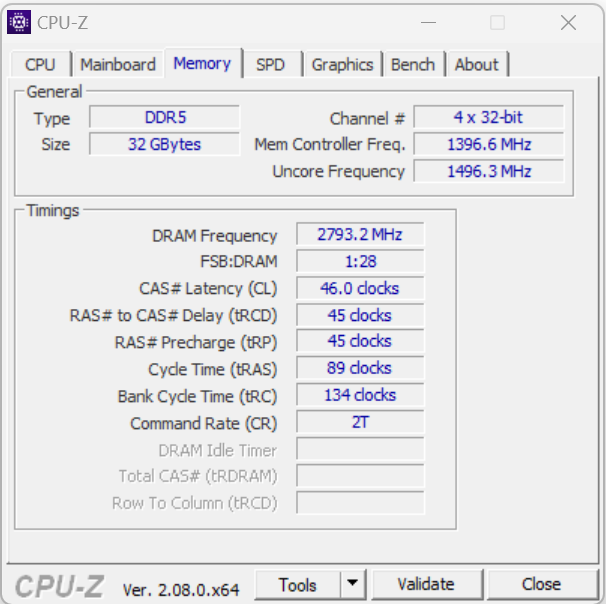
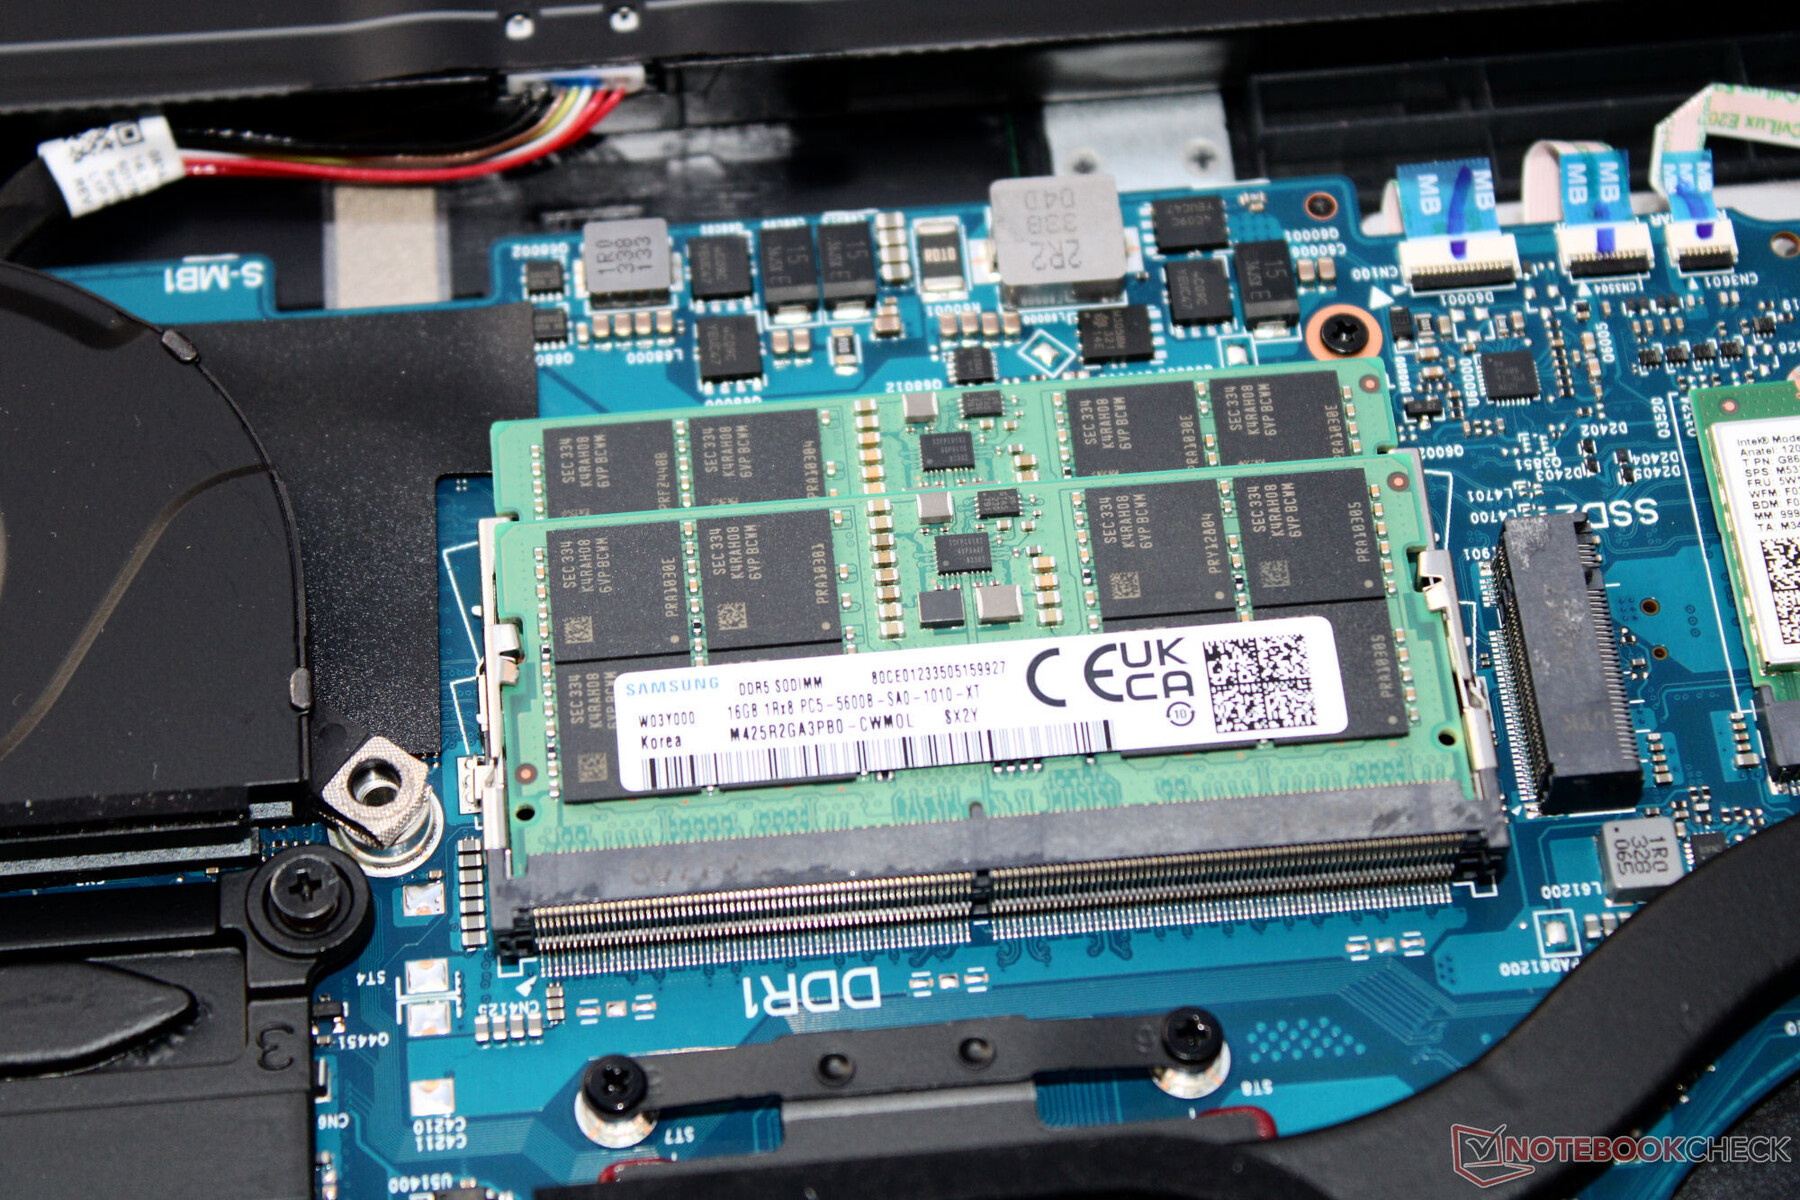
Płynnie działający system nie wykazuje żadnych braków w wydajności obliczeniowej, a laptop bezbłędnie radzi sobie z grami, renderowaniem i innymi zadaniami. Prędkości transferu pamięci roboczej są na normalnym poziomie dla pamięci RAM DDR5-5600.
CrossMark: Overall | Productivity | Creativity | Responsiveness
WebXPRT 3: Overall
WebXPRT 4: Overall
Mozilla Kraken 1.1: Total
| PCMark 10 / Score | |
| Alienware m18 R1 AMD | |
| MSI Titan 18 HX A14VIG | |
| Asus ROG Strix Scar 18 G834JYR (2024) | |
| Asus ROG Strix Scar 18 2023 G834JY-N6005W | |
| Alienware m18 R1 | |
| Przeciętny Intel Core i9-14900HX, NVIDIA GeForce RTX 4090 Laptop GPU (8230 - 9234, n=13) | |
| Acer Predator Helios 18 N23Q2 | |
| Średnia w klasie Gaming (5828 - 11574, n=96, ostatnie 2 lata) | |
| Razer Blade 18 RTX 4070 | |
| PCMark 10 / Essentials | |
| Alienware m18 R1 AMD | |
| Razer Blade 18 RTX 4070 | |
| MSI Titan 18 HX A14VIG | |
| Asus ROG Strix Scar 18 G834JYR (2024) | |
| Alienware m18 R1 | |
| Przeciętny Intel Core i9-14900HX, NVIDIA GeForce RTX 4090 Laptop GPU (10778 - 11628, n=13) | |
| Acer Predator Helios 18 N23Q2 | |
| Średnia w klasie Gaming (8810 - 12600, n=100, ostatnie 2 lata) | |
| PCMark 10 / Productivity | |
| Alienware m18 R1 AMD | |
| Średnia w klasie Gaming (6845 - 18766, n=98, ostatnie 2 lata) | |
| Przeciętny Intel Core i9-14900HX, NVIDIA GeForce RTX 4090 Laptop GPU (9458 - 11759, n=13) | |
| Asus ROG Strix Scar 18 G834JYR (2024) | |
| Acer Predator Helios 18 N23Q2 | |
| MSI Titan 18 HX A14VIG | |
| Alienware m18 R1 | |
| Razer Blade 18 RTX 4070 | |
| PCMark 10 / Digital Content Creation | |
| Alienware m18 R1 AMD | |
| MSI Titan 18 HX A14VIG | |
| Alienware m18 R1 | |
| Asus ROG Strix Scar 18 G834JYR (2024) | |
| Przeciętny Intel Core i9-14900HX, NVIDIA GeForce RTX 4090 Laptop GPU (13219 - 16462, n=13) | |
| Acer Predator Helios 18 N23Q2 | |
| Średnia w klasie Gaming (7602 - 19657, n=98, ostatnie 2 lata) | |
| Razer Blade 18 RTX 4070 | |
| CrossMark / Overall | |
| Asus ROG Strix Scar 18 G834JYR (2024) | |
| Acer Predator Helios 18 N23Q2 | |
| Alienware m18 R1 | |
| Razer Blade 18 RTX 4070 | |
| Przeciętny Intel Core i9-14900HX, NVIDIA GeForce RTX 4090 Laptop GPU (1877 - 2344, n=10) | |
| Asus ROG Strix Scar 18 2023 G834JY-N6005W | |
| Średnia w klasie Gaming (1366 - 2409, n=98, ostatnie 2 lata) | |
| Alienware m18 R1 AMD | |
| MSI Titan 18 HX A14VIG | |
| CrossMark / Productivity | |
| Acer Predator Helios 18 N23Q2 | |
| Asus ROG Strix Scar 18 G834JYR (2024) | |
| Alienware m18 R1 | |
| Razer Blade 18 RTX 4070 | |
| Przeciętny Intel Core i9-14900HX, NVIDIA GeForce RTX 4090 Laptop GPU (1738 - 2162, n=10) | |
| Asus ROG Strix Scar 18 2023 G834JY-N6005W | |
| Średnia w klasie Gaming (1386 - 2254, n=98, ostatnie 2 lata) | |
| Alienware m18 R1 AMD | |
| MSI Titan 18 HX A14VIG | |
| CrossMark / Creativity | |
| Asus ROG Strix Scar 18 G834JYR (2024) | |
| Alienware m18 R1 | |
| Asus ROG Strix Scar 18 2023 G834JY-N6005W | |
| Acer Predator Helios 18 N23Q2 | |
| Razer Blade 18 RTX 4070 | |
| Przeciętny Intel Core i9-14900HX, NVIDIA GeForce RTX 4090 Laptop GPU (2195 - 2660, n=10) | |
| Średnia w klasie Gaming (1343 - 2729, n=98, ostatnie 2 lata) | |
| Alienware m18 R1 AMD | |
| MSI Titan 18 HX A14VIG | |
| CrossMark / Responsiveness | |
| Acer Predator Helios 18 N23Q2 | |
| Asus ROG Strix Scar 18 G834JYR (2024) | |
| Alienware m18 R1 | |
| Razer Blade 18 RTX 4070 | |
| Przeciętny Intel Core i9-14900HX, NVIDIA GeForce RTX 4090 Laptop GPU (1478 - 2327, n=10) | |
| Średnia w klasie Gaming (1226 - 2334, n=98, ostatnie 2 lata) | |
| Asus ROG Strix Scar 18 2023 G834JY-N6005W | |
| Alienware m18 R1 AMD | |
| MSI Titan 18 HX A14VIG | |
| WebXPRT 3 / Overall | |
| Alienware m18 R1 AMD | |
| Razer Blade 18 RTX 4070 | |
| Alienware m18 R1 | |
| Asus ROG Strix Scar 18 2023 G834JY-N6005W | |
| MSI Titan 18 HX A14VIG | |
| Przeciętny Intel Core i9-14900HX, NVIDIA GeForce RTX 4090 Laptop GPU (279 - 339, n=10) | |
| Asus ROG Strix Scar 18 G834JYR (2024) | |
| Acer Predator Helios 18 N23Q2 | |
| Średnia w klasie Gaming (242 - 532, n=101, ostatnie 2 lata) | |
| WebXPRT 4 / Overall | |
| Asus ROG Strix Scar 18 2023 G834JY-N6005W | |
| Alienware m18 R1 | |
| Asus ROG Strix Scar 18 G834JYR (2024) | |
| Razer Blade 18 RTX 4070 | |
| Alienware m18 R1 AMD | |
| Przeciętny Intel Core i9-14900HX, NVIDIA GeForce RTX 4090 Laptop GPU (246 - 309, n=8) | |
| MSI Titan 18 HX A14VIG | |
| Średnia w klasie Gaming (176.4 - 354, n=101, ostatnie 2 lata) | |
| Mozilla Kraken 1.1 / Total | |
| Średnia w klasie Gaming (391 - 590, n=106, ostatnie 2 lata) | |
| Razer Blade 18 RTX 4070 | |
| Alienware m18 R1 AMD | |
| Alienware m18 R1 | |
| Acer Predator Helios 18 N23Q2 | |
| Przeciętny Intel Core i9-14900HX, NVIDIA GeForce RTX 4090 Laptop GPU (428 - 535, n=11) | |
| MSI Titan 18 HX A14VIG | |
| Asus ROG Strix Scar 18 G834JYR (2024) | |
| Asus ROG Strix Scar 18 2023 G834JY-N6005W | |
* ... im mniej tym lepiej
| PCMark 10 Score | 8801 pkt. | |
Pomoc | ||
| AIDA64 / Memory Copy | |
| Asus ROG Strix Scar 18 G834JYR (2024) | |
| Alienware m18 R1 | |
| Acer Predator Helios 18 N23Q2 | |
| Razer Blade 18 RTX 4070 | |
| Przeciętny Intel Core i9-14900HX (38028 - 83392, n=36) | |
| Średnia w klasie Gaming (21750 - 129946, n=110, ostatnie 2 lata) | |
| Asus ROG Strix Scar 18 2023 G834JY-N6005W | |
| MSI Titan 18 HX A14VIG | |
| Alienware m18 R1 AMD | |
| AIDA64 / Memory Read | |
| Alienware m18 R1 | |
| Asus ROG Strix Scar 18 G834JYR (2024) | |
| Acer Predator Helios 18 N23Q2 | |
| Razer Blade 18 RTX 4070 | |
| Przeciętny Intel Core i9-14900HX (43306 - 87568, n=36) | |
| Asus ROG Strix Scar 18 2023 G834JY-N6005W | |
| Średnia w klasie Gaming (22956 - 118858, n=110, ostatnie 2 lata) | |
| Alienware m18 R1 AMD | |
| MSI Titan 18 HX A14VIG | |
| AIDA64 / Memory Write | |
| Alienware m18 R1 | |
| Asus ROG Strix Scar 18 G834JYR (2024) | |
| Średnia w klasie Gaming (22297 - 135096, n=110, ostatnie 2 lata) | |
| Razer Blade 18 RTX 4070 | |
| Acer Predator Helios 18 N23Q2 | |
| Przeciętny Intel Core i9-14900HX (37146 - 80589, n=36) | |
| Asus ROG Strix Scar 18 2023 G834JY-N6005W | |
| Alienware m18 R1 AMD | |
| MSI Titan 18 HX A14VIG | |
| AIDA64 / Memory Latency | |
| Średnia w klasie Gaming (75.3 - 259, n=110, ostatnie 2 lata) | |
| MSI Titan 18 HX A14VIG | |
| Alienware m18 R1 AMD | |
| Asus ROG Strix Scar 18 2023 G834JY-N6005W | |
| Przeciętny Intel Core i9-14900HX (76.1 - 105, n=36) | |
| Razer Blade 18 RTX 4070 | |
| Acer Predator Helios 18 N23Q2 | |
| Asus ROG Strix Scar 18 G834JYR (2024) | |
| Alienware m18 R1 | |
* ... im mniej tym lepiej
Opóźnienia DPC
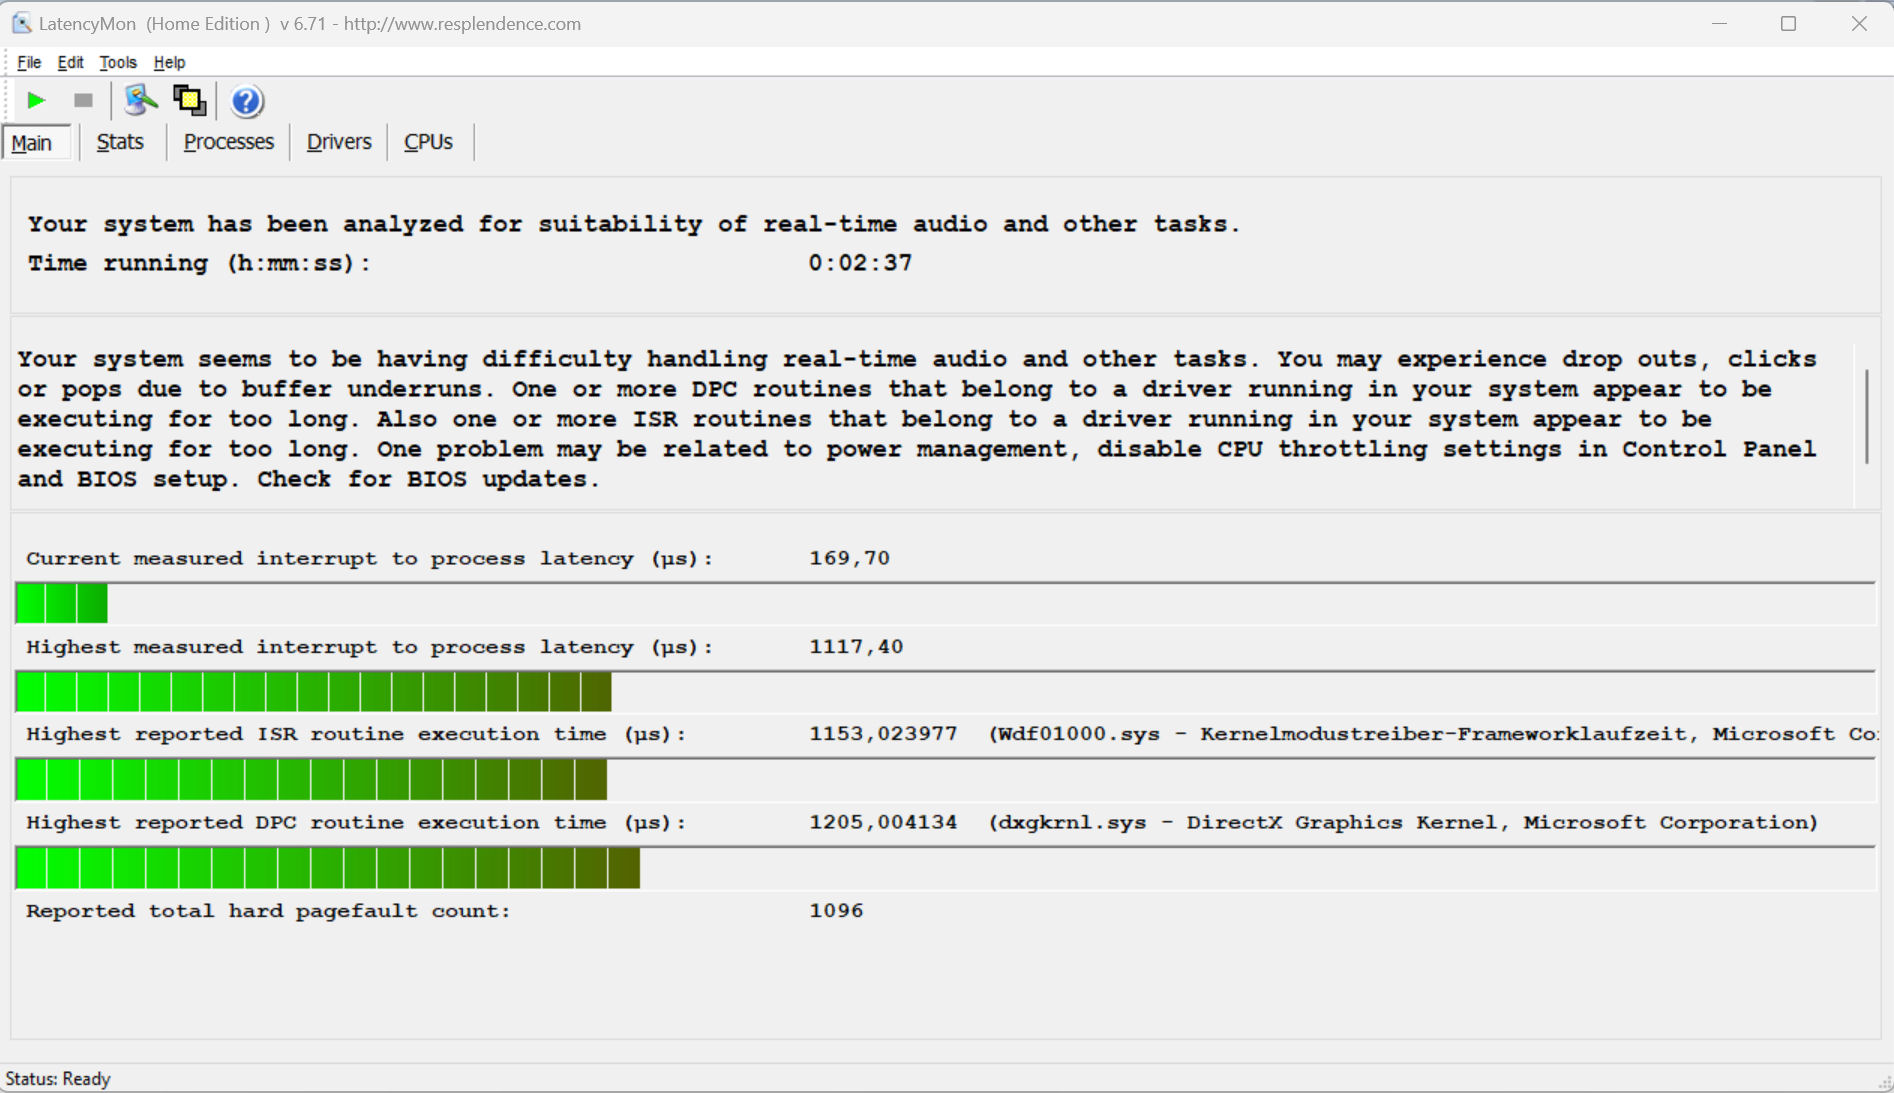
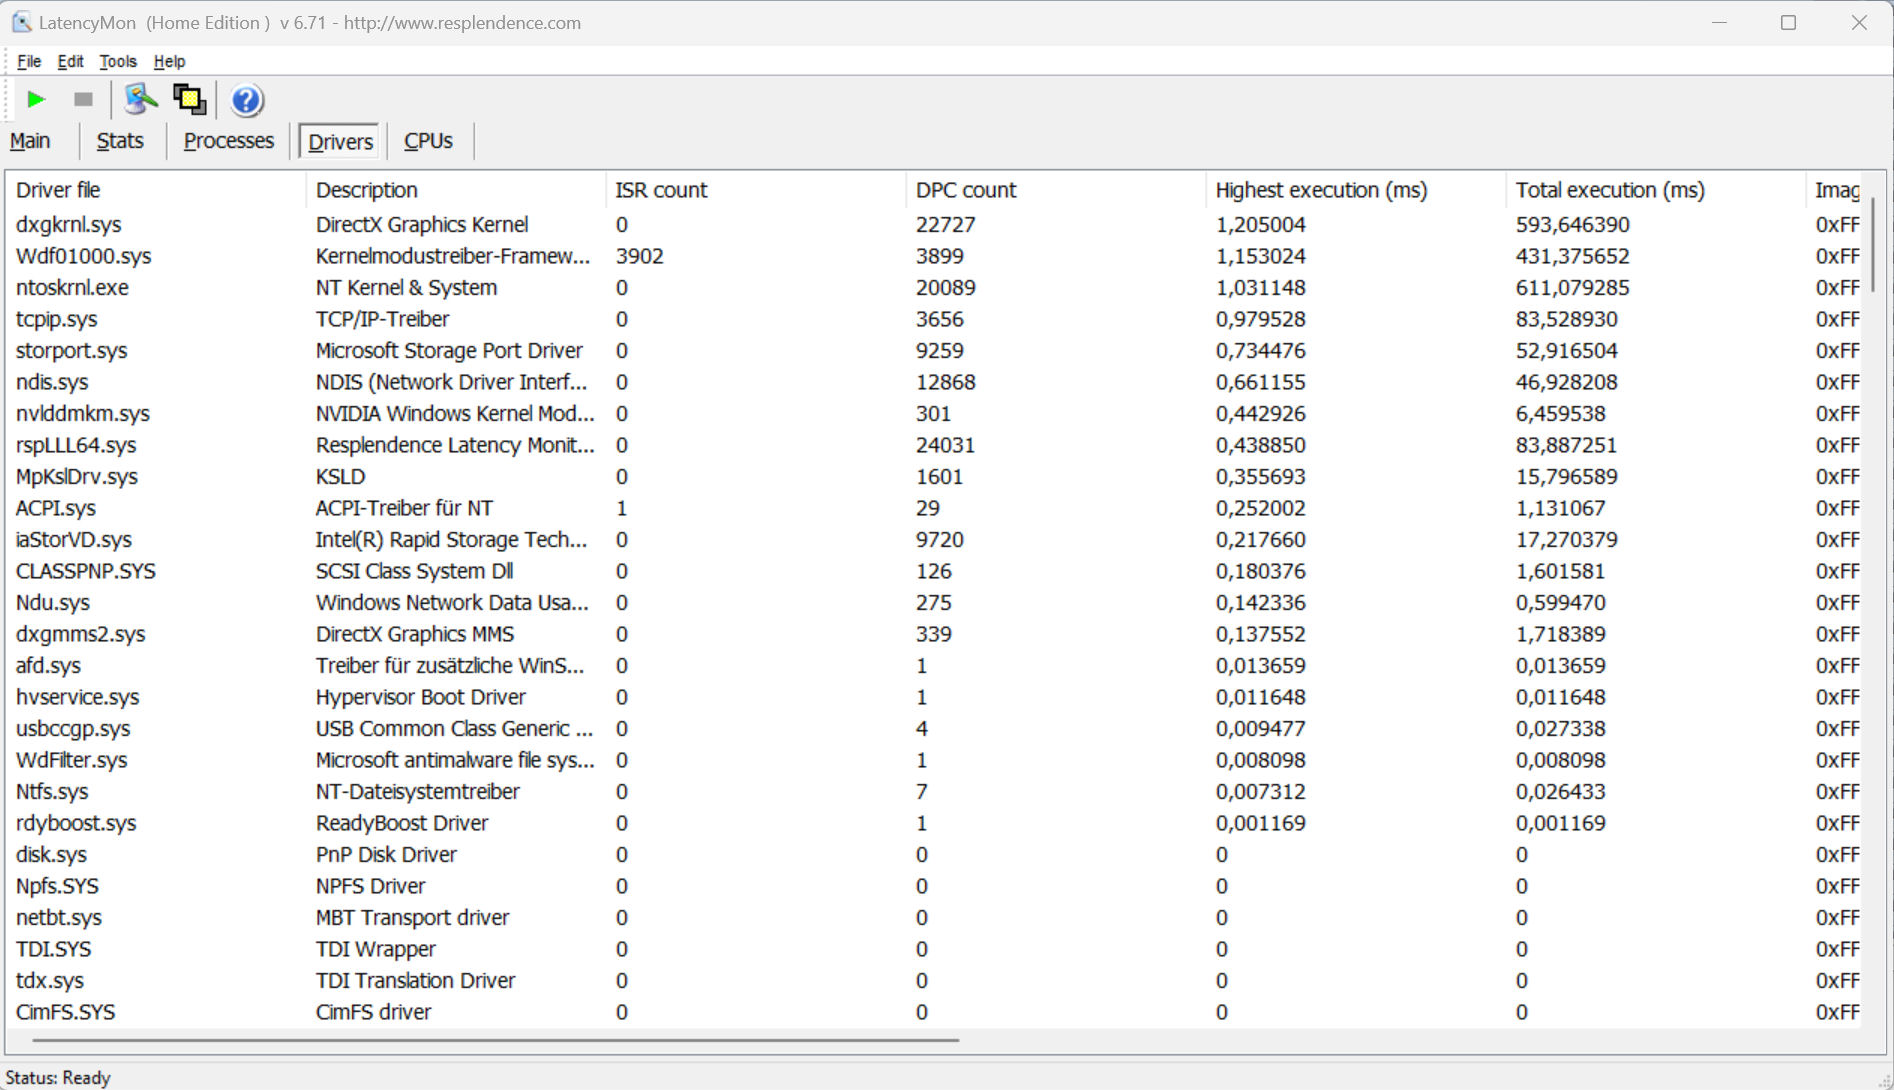
Standardowy test Latency Monitor (z przeglądaniem stron internetowych, odtwarzaniem wideo 4k i wysokim obciążeniem Prime95) ujawnia pewne rzucające się w oczy zachowanie, a system nie wydaje się być przystosowany do przetwarzania wideo i audio w czasie rzeczywistym. Przyszłe aktualizacje oprogramowania mogą przynieść pewne ulepszenia lub nawet pogorszyć sytuację.
| DPC Latencies / LatencyMon - interrupt to process latency (max), Web, Youtube, Prime95 | |
| Acer Predator Helios 18 N23Q2 | |
| Alienware m18 R1 | |
| MSI Titan 18 HX A14VIG | |
| Razer Blade 18 RTX 4070 | |
| Alienware m18 R1 AMD | |
| Asus ROG Strix Scar 18 G834JYR (2024) | |
| Asus ROG Strix Scar 18 2023 G834JY-N6005W | |
* ... im mniej tym lepiej
Rozwiązanie pamięci masowej
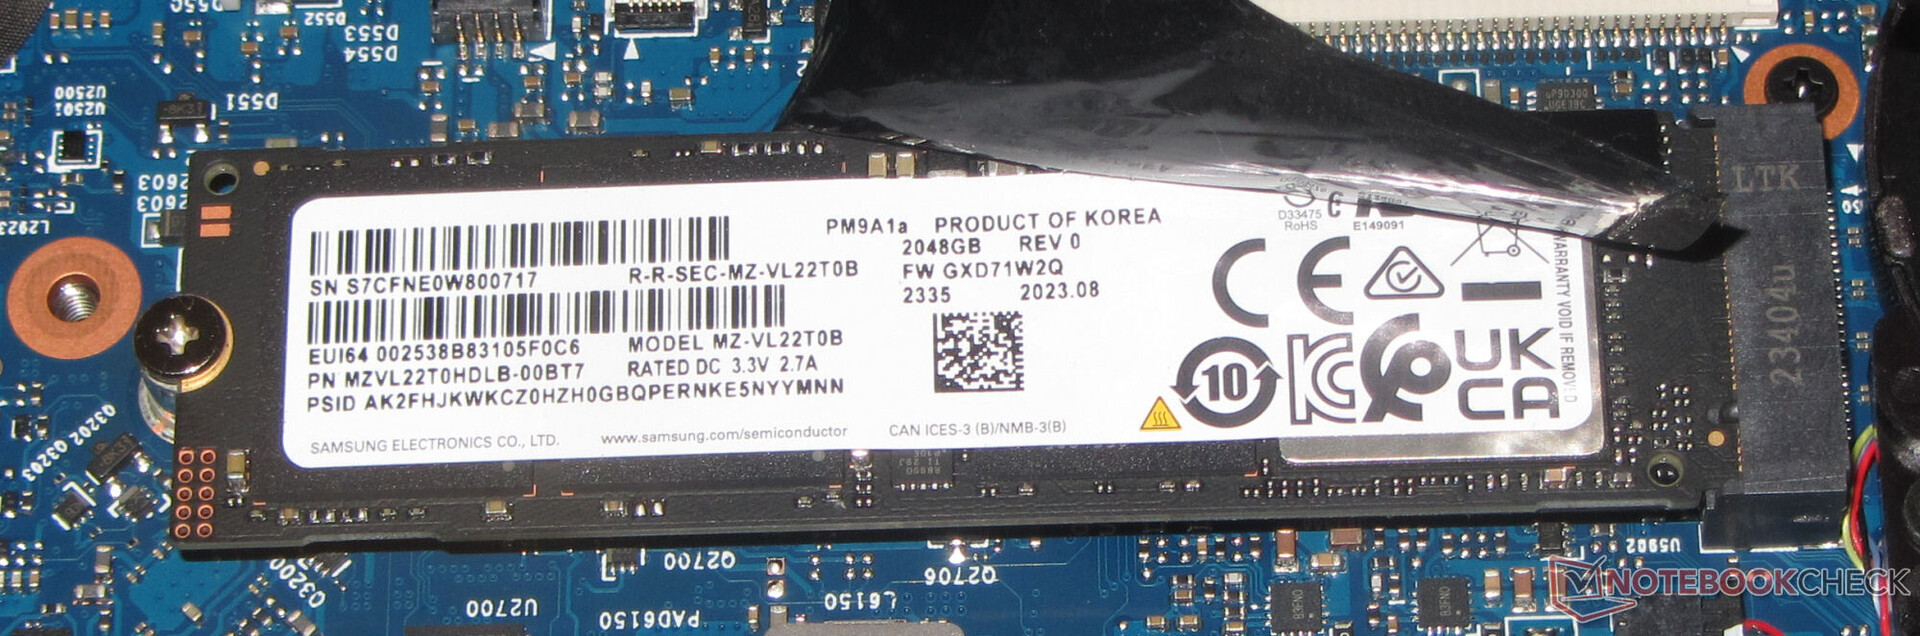
Scar 18 może obsługiwać łącznie dwa dyski SSD PCIe 4 w formacie M.2-2280, z obsługą RAID-0. Dysk SSD Samsung o pojemności 2 TB w naszej jednostce testowej zapewnia doskonałą szybkość transmisji danych. Kolejnym pozytywnym aspektem jest brak jakiegokolwiek termicznego throttlingu.

* ... im mniej tym lepiej
Disk Throttling: DiskSpd Read Loop, Queue Depth 8
Karta graficzna
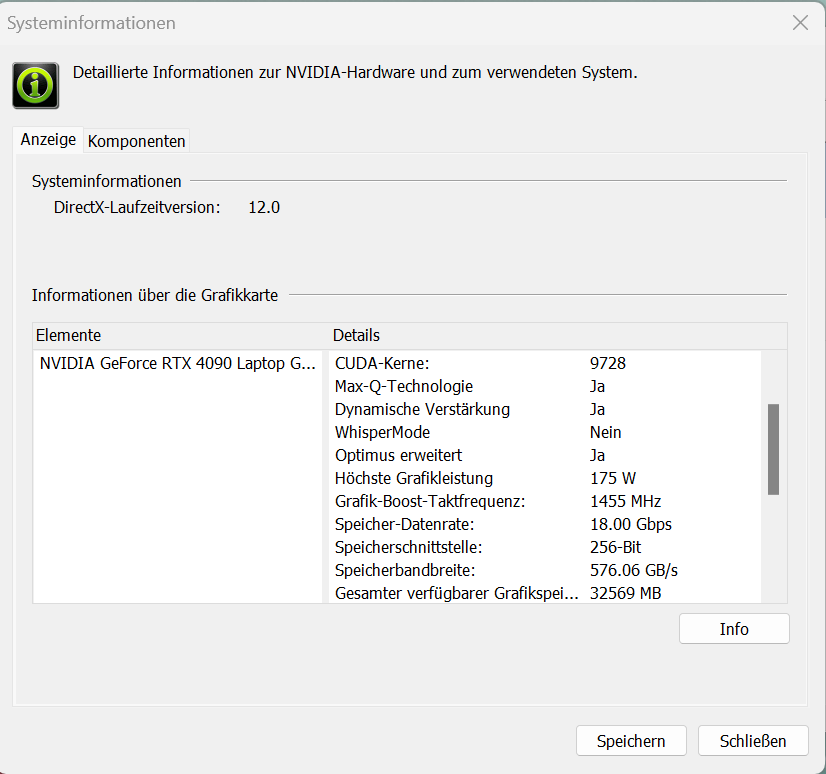
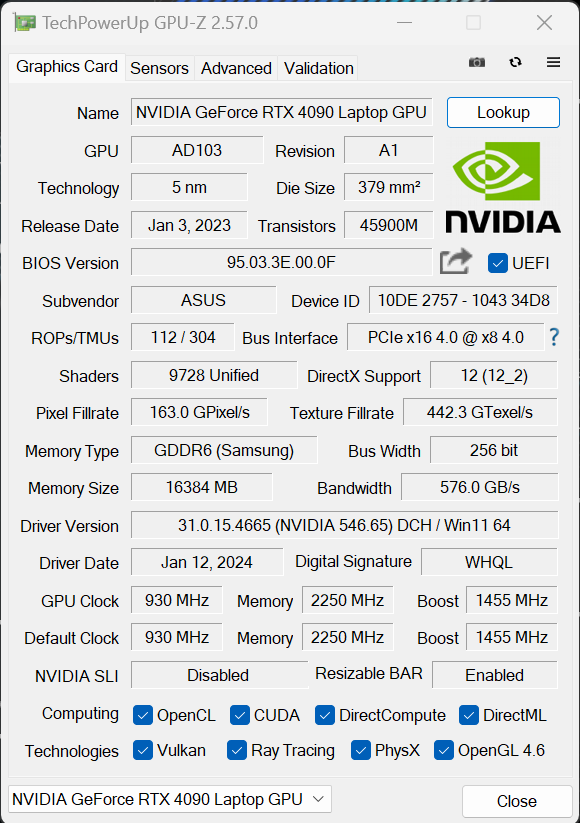
Z GeForce RTX 4090asus wykorzystuje topowy obecnie model Nvidii wśród mobilnych GPU. Oferuje on 9 728 jednostek cieniujących, 256-bitową magistralę pamięci, a także może korzystać z szybkiej pamięci GDDR6 (16 384 MB). RTX 4090 ma maksymalne TGP na poziomie 175 W (150 W + 25 W Dynamic Boost) - więcej nie jest możliwe.
W trybie "Performance" wyniki benchmarków wahają się poniżej średniej ustalonej dla RTX 4090 do tej pory, podczas gdy "Turbo" skutkuje wartościami na tym samym poziomie co średnia. Zaawansowany Optimus jest obsługiwany, a przełączanie między dGPU i Optimusem nie wymaga ponownego uruchomienia komputera.

| 3DMark 11 Performance | 42985 pkt. | |
| 3DMark Cloud Gate Standard Score | 65110 pkt. | |
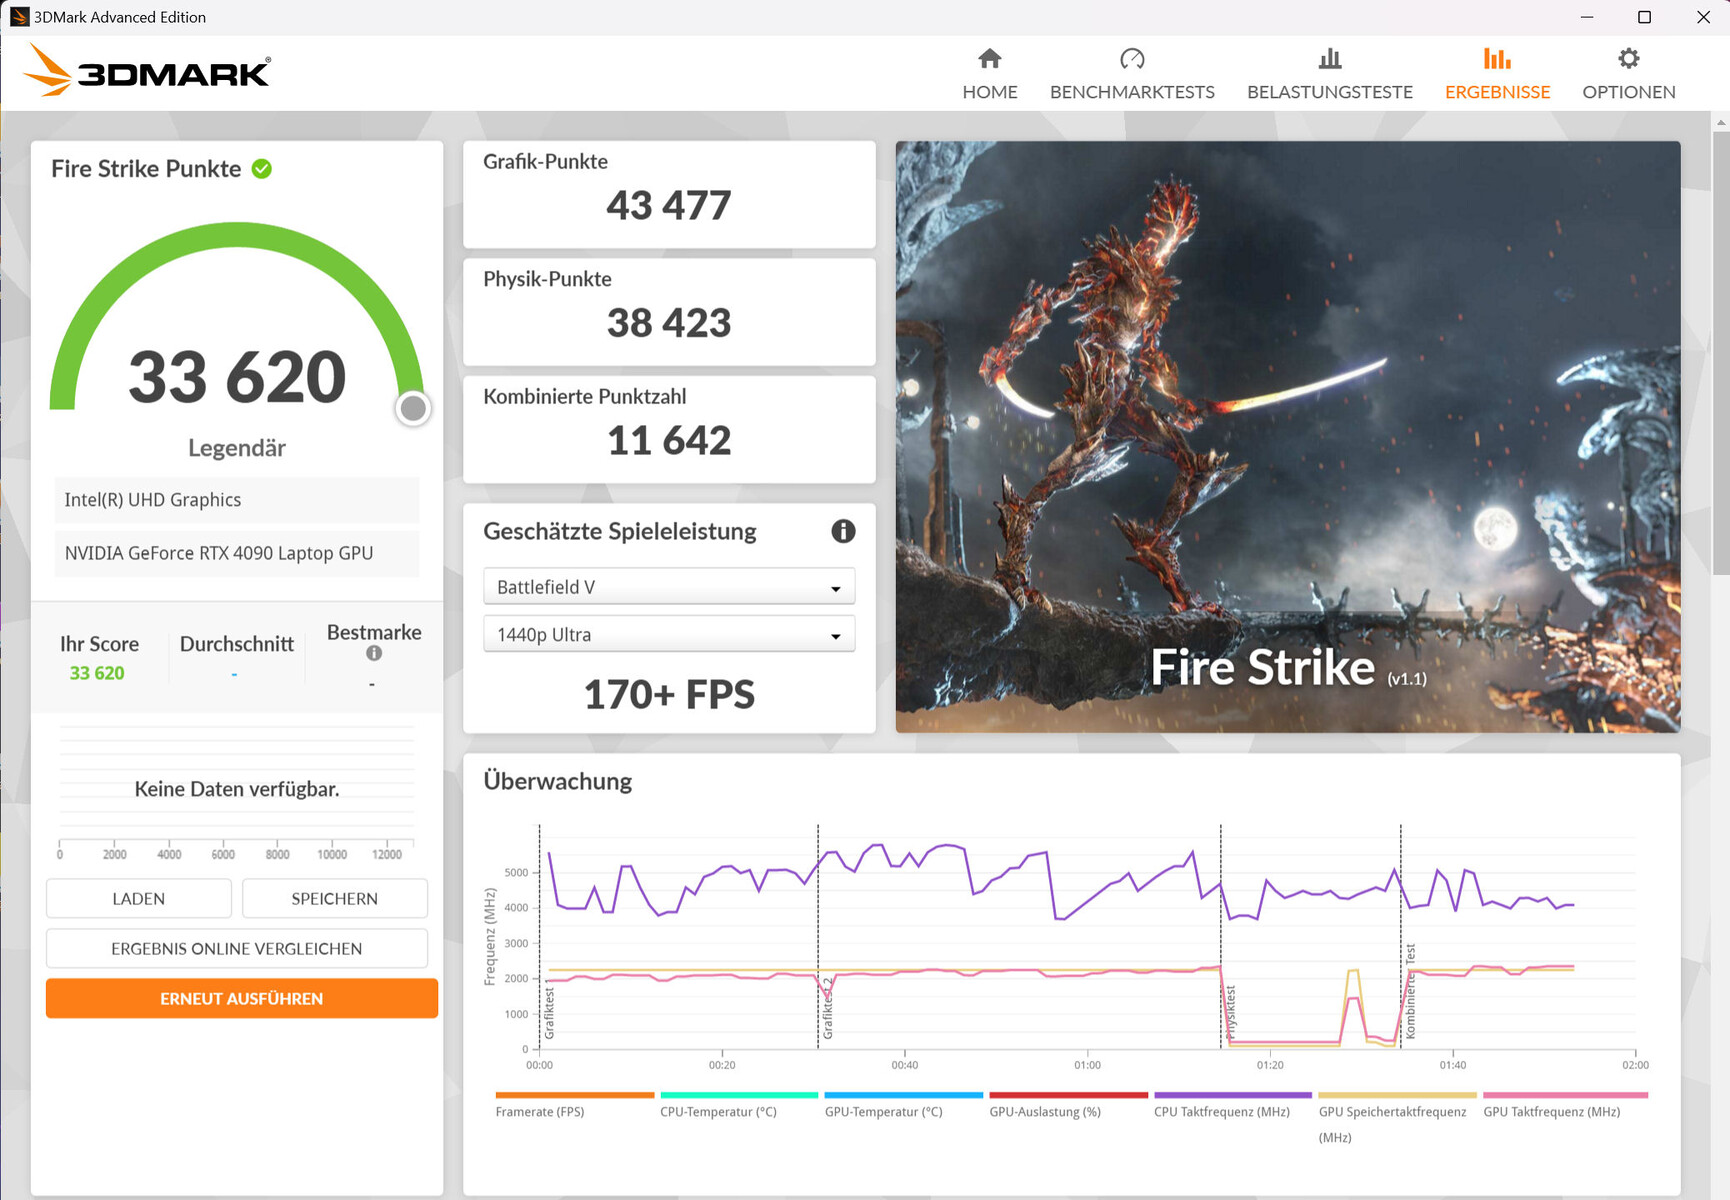
| 3DMark Fire Strike Score | 33620 pkt. | |
| 3DMark Time Spy Score | 19507 pkt. | |
Pomoc | ||
| V-Ray Benchmark Next 4.10 | |
| GPU | |
| Asus ROG Strix Scar 18 2023 G834JY-N6005W (v4.10.07 ) | |
| Przeciętny NVIDIA GeForce RTX 4090 Laptop GPU (873 - 1334, n=30) | |
| Asus ROG Strix Scar 18 G834JYR (2024) (v4.10.07 ) | |
| Acer Predator Helios 18 N23Q2 (v4.10.07 ) | |
| Średnia w klasie Gaming (427 - 1333, n=106, ostatnie 2 lata) | |
| CPU | |
| Asus ROG Strix Scar 18 2023 G834JY-N6005W (v4.10.07 ) | |
| Acer Predator Helios 18 N23Q2 (v4.10.07 ) | |
| Przeciętny NVIDIA GeForce RTX 4090 Laptop GPU (18206 - 37629, n=30) | |
| Asus ROG Strix Scar 18 G834JYR (2024) (v4.10.07 ) | |
| Średnia w klasie Gaming (10048 - 45327, n=105, ostatnie 2 lata) | |
* ... im mniej tym lepiej
Wydajność w grach
Scar 18 umożliwia granie w rozdzielczości QHD+ przy maksymalnych ustawieniach. Wyższych rozdzielczości można używać po podłączeniu odpowiedniego monitora. Gry z obsługą DLSS 3 i Frame Generation pozwalają na maksymalne ustawienia i dodatkowe efekty raytracingu w rozdzielczości 4k.
W trybie "Wydajność" liczba klatek na sekundę w testowanych przez nas grach waha się poniżej ustalonej do tej pory średniej dla RTX 4090. Wybranie opcji "Turbo" może skutkować niewielkim wzrostem, to samo dotyczy trybu GPU "Ultimate".
| The Witcher 3 - 1920x1080 Ultra Graphics & Postprocessing (HBAO+) | |
| Alienware m18 R1 | |
| MSI Titan 18 HX A14VIG | |
| Przeciętny NVIDIA GeForce RTX 4090 Laptop GPU (139.2 - 216, n=35) | |
| Asus ROG Strix Scar 18 G834JYR (2024) | |
| Acer Predator Helios 18 N23Q2 | |
| Średnia w klasie Gaming (95 - 240, n=8, ostatnie 2 lata) | |
| Alienware m18 R1 AMD | |
| Razer Blade 18 RTX 4070 | |
| Call of Duty Modern Warfare 3 2023 | |
| 1920x1080 Extreme Preset | |
| Przeciętny NVIDIA GeForce RTX 4090 Laptop GPU (148 - 205, n=7) | |
| Asus ROG Strix Scar 18 G834JYR (2024) | |
| Średnia w klasie Gaming (27 - 95, n=3, ostatnie 2 lata) | |
| 2560x1440 Extreme Preset | |
| Asus ROG Strix Scar 18 G834JYR (2024) | |
| Przeciętny NVIDIA GeForce RTX 4090 Laptop GPU (113 - 162, n=7) | |
| Średnia w klasie Gaming (54 - 66, n=2, ostatnie 2 lata) | |
| The Finals | |
| 1920x1080 Epic Preset | |
| Asus ROG Strix Scar 18 G834JYR (2024) | |
| Przeciętny NVIDIA GeForce RTX 4090 Laptop GPU (174.1 - 211, n=2) | |
| Średnia w klasie Gaming (n=1ostatnie 2 lata) | |
| 2560x1440 Epic Preset | |
| Asus ROG Strix Scar 18 G834JYR (2024) | |
| Przeciętny NVIDIA GeForce RTX 4090 Laptop GPU (137.2 - 147.4, n=2) | |
| Średnia w klasie Gaming (n=1ostatnie 2 lata) | |
| 1920x1080 Epic Preset + Epic RTX Global Illumination | |
| Asus ROG Strix Scar 18 G834JYR (2024) | |
| Przeciętny NVIDIA GeForce RTX 4090 Laptop GPU (159.8 - 190.8, n=2) | |
| Palworld | |
| 1920x1080 Epic Preset AA:TSR | |
| Asus ROG Strix Scar 18 G834JYR (2024) | |
| Przeciętny NVIDIA GeForce RTX 4090 Laptop GPU (138.8 - 150.9, n=2) | |
| Średnia w klasie Gaming (n=1ostatnie 2 lata) | |
| 2560x1440 Epic Preset AA:TSR | |
| Asus ROG Strix Scar 18 G834JYR (2024) | |
| Przeciętny NVIDIA GeForce RTX 4090 Laptop GPU (110.5 - 119.8, n=2) | |
| Enshrouded | |
| 1920x1080 Max. Quality AA:FX | |
| Przeciętny NVIDIA GeForce RTX 4090 Laptop GPU (79 - 101.5, n=3) | |
| Asus ROG Strix Scar 18 G834JYR (2024) | |
| Średnia w klasie Gaming (n=1ostatnie 2 lata) | |
| 2560x1440 Max. Quality AA:FX | |
| Asus ROG Strix Scar 18 G834JYR (2024) | |
| Przeciętny NVIDIA GeForce RTX 4090 Laptop GPU (61.8 - 76, n=3) | |
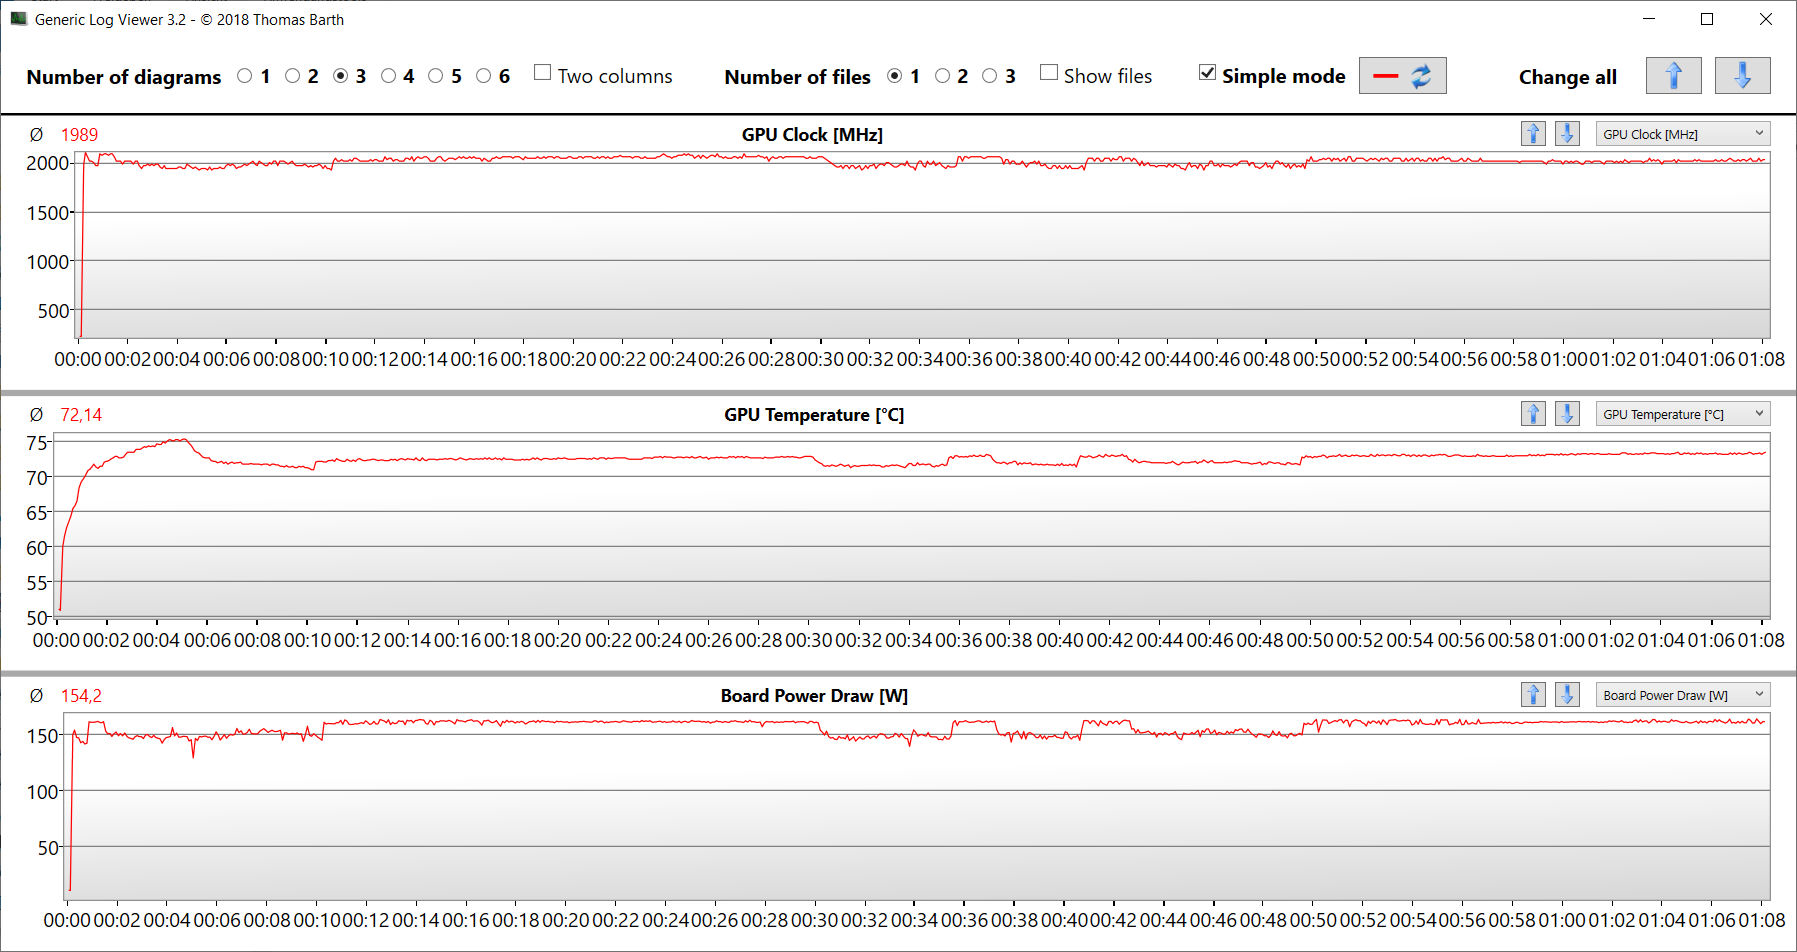
Aby ocenić, czy liczba klatek na sekundę pozostaje w miarę stała przez dłuższy czas, uruchomiliśmy grę "The Witcher 3" na około 60 minut w rozdzielczości Full-HD przy maksymalnych ustawieniach jakości. Postać w grze nie jest poruszana. Nie zaobserwowaliśmy żadnego spadku liczby klatek na sekundę.
The Witcher 3 FPS Chart
| low | med. | high | ultra | QHD | |
|---|---|---|---|---|---|
| GTA V (2015) | 187.5 | 187.1 | 181.2 | 136 | 129.6 |
| The Witcher 3 (2015) | 579.6 | 501.7 | 342.8 | 189.4 | 151.5 |
| Dota 2 Reborn (2015) | 219 | 194.5 | 173.9 | 161.3 | |
| Final Fantasy XV Benchmark (2018) | 221 | 198.1 | 166.1 | 143.6 | |
| X-Plane 11.11 (2018) | 197.9 | 172.4 | 136.8 | ||
| Far Cry 5 (2018) | 176 | 163 | 156 | 145 | 145 |
| Strange Brigade (2018) | 429 | 350 | 341 | 331 | 279 |
| Starfield (2023) | 112.7 | 100 | 84.2 | 78.4 | 66 |
| Cyberpunk 2077 (2023) | 134.8 | 121.5 | 117.7 | 112.1 | 83.8 |
| Call of Duty Modern Warfare 3 2023 (2023) | 229 | 210 | 169 | 162 | 162 |
| The Finals (2023) | 228 | 216 | 214 | 211 | 147.4 |
| Palworld (2024) | 211 | 180.9 | 151.3 | 150.9 | 119.8 |
| Enshrouded (2024) | 135.2 | 120.1 | 100.8 | 87.6 | 68.9 |
Emisje - G834JYR może pracować cicho
Emisja hałasu
Przy pełnym obciążeniu poziom hałasu wzrasta do 52 dB(A) w trybie "Performance". W trybie "Turbo" wartość ta wzrasta jeszcze nieznacznie, a porównanie z modelem Scar 18 z 2023 roku pokazuje to samo. Jego działanie może być również ogólnie cichsze: jeśli zrezygnujesz z wydajności, wybierając tryb "Silent", poziom hałasu spadnie do 35 dB(A). Podczas bezczynności lub codziennej pracy (biuro, Internet) często działa tylko jeden z dwóch wentylatorów, a czasami oba pozostają ciche, szczególnie w przypadku korzystania z profilu "Silent".
Hałas
| luz |
| 27 / 28 / 32 dB |
| obciążenie |
| 50 / 52 dB |
 | ||
30 dB cichy 40 dB(A) słyszalny 50 dB(A) irytujący |
||
min: | ||
| Asus ROG Strix Scar 18 G834JYR (2024) i9-14900HX, GeForce RTX 4090 Laptop GPU | Alienware m18 R1 AMD R9 7945HX, Radeon RX 7900M | Alienware m18 R1 i9-13980HX, GeForce RTX 4090 Laptop GPU | Acer Predator Helios 18 N23Q2 i9-13900HX, GeForce RTX 4080 Laptop GPU | Razer Blade 18 RTX 4070 i9-13950HX, GeForce RTX 4070 Laptop GPU | MSI Titan 18 HX A14VIG i9-14900HX, GeForce RTX 4090 Laptop GPU | Asus ROG Strix Scar 18 2023 G834JY-N6005W i9-13980HX, GeForce RTX 4090 Laptop GPU | |
|---|---|---|---|---|---|---|---|
| Noise | 8% | 12% | 6% | 10% | 5% | 2% | |
| wyłączone / środowisko * (dB) | 24 | 22.4 7% | 22.8 5% | 23 4% | 23.5 2% | 22.8 5% | 23.9 -0% |
| Idle Minimum * (dB) | 27 | 23 15% | 23 15% | 23 15% | 23.8 12% | 23.8 12% | 23.9 11% |
| Idle Average * (dB) | 28 | 23.4 16% | 23 18% | 23 18% | 23.8 15% | 23.8 15% | 32.6 -16% |
| Idle Maximum * (dB) | 32 | 33.5 -5% | 23 28% | 23 28% | 26.8 16% | 28 12% | 32.6 -2% |
| Load Average * (dB) | 50 | 33.5 33% | 35.6 29% | 45.26 9% | 37.3 25% | 38 24% | 35.9 28% |
| Witcher 3 ultra * (dB) | 50 | 53.6 -7% | 51.3 -3% | 59.82 -20% | 48 4% | 57.3 -15% | |
| Load Maximum * (dB) | 52 | 53.6 -3% | 56.7 -9% | 59.94 -15% | 53.5 -3% | 62.8 -21% | 55.8 -7% |
* ... im mniej tym lepiej
Temperatury
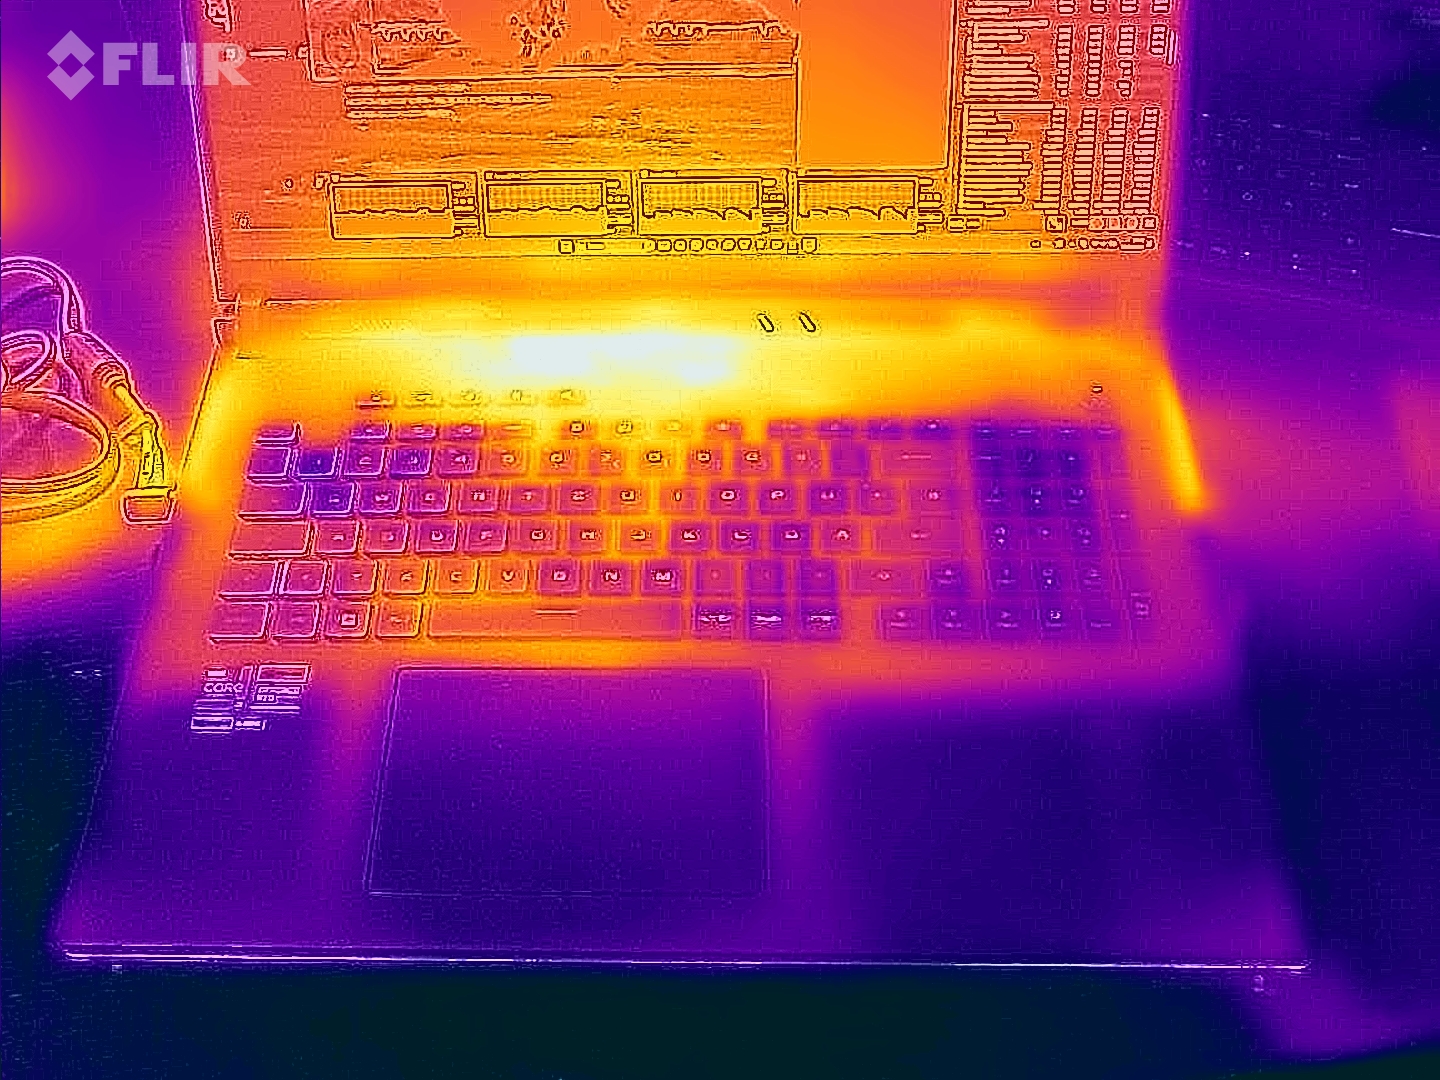
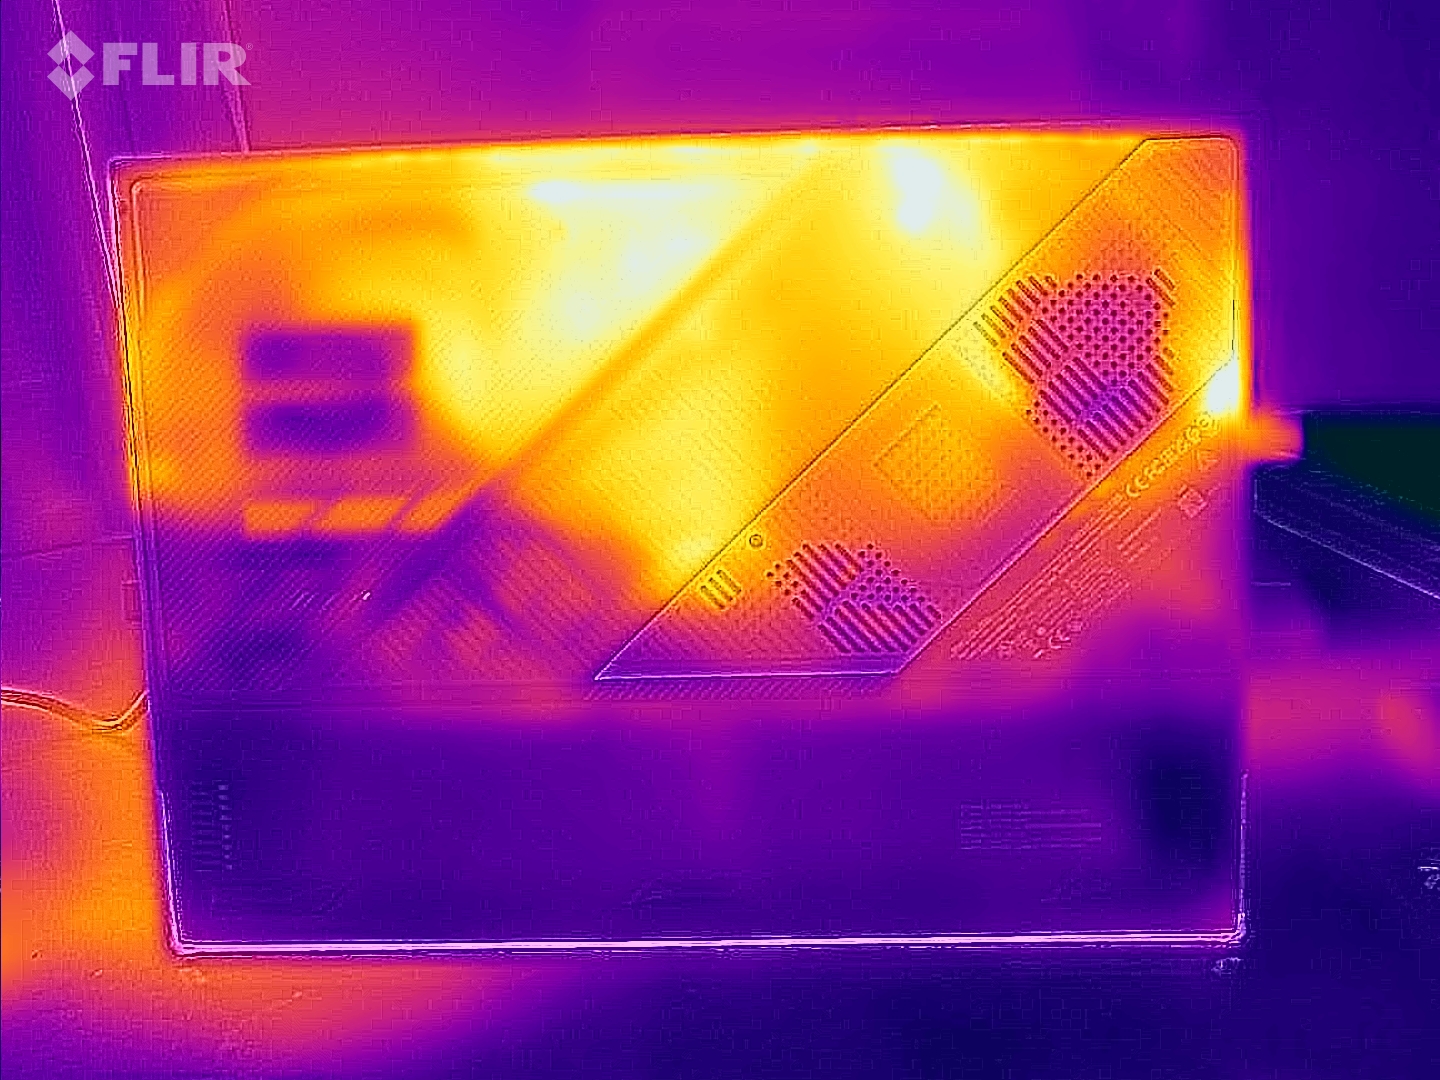
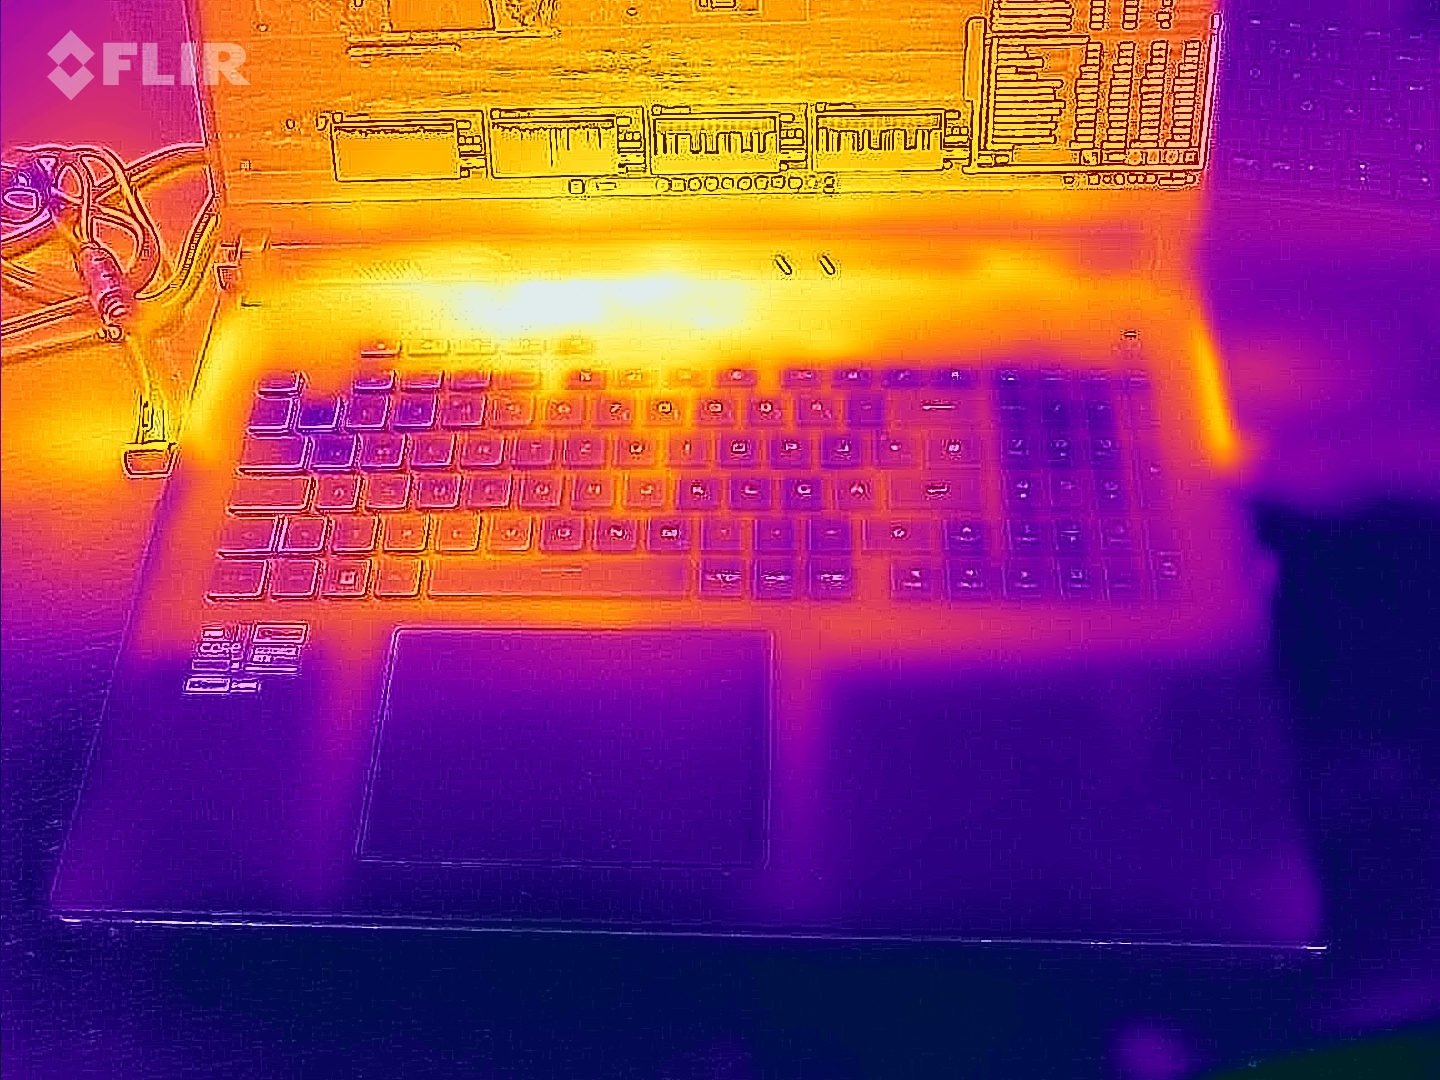
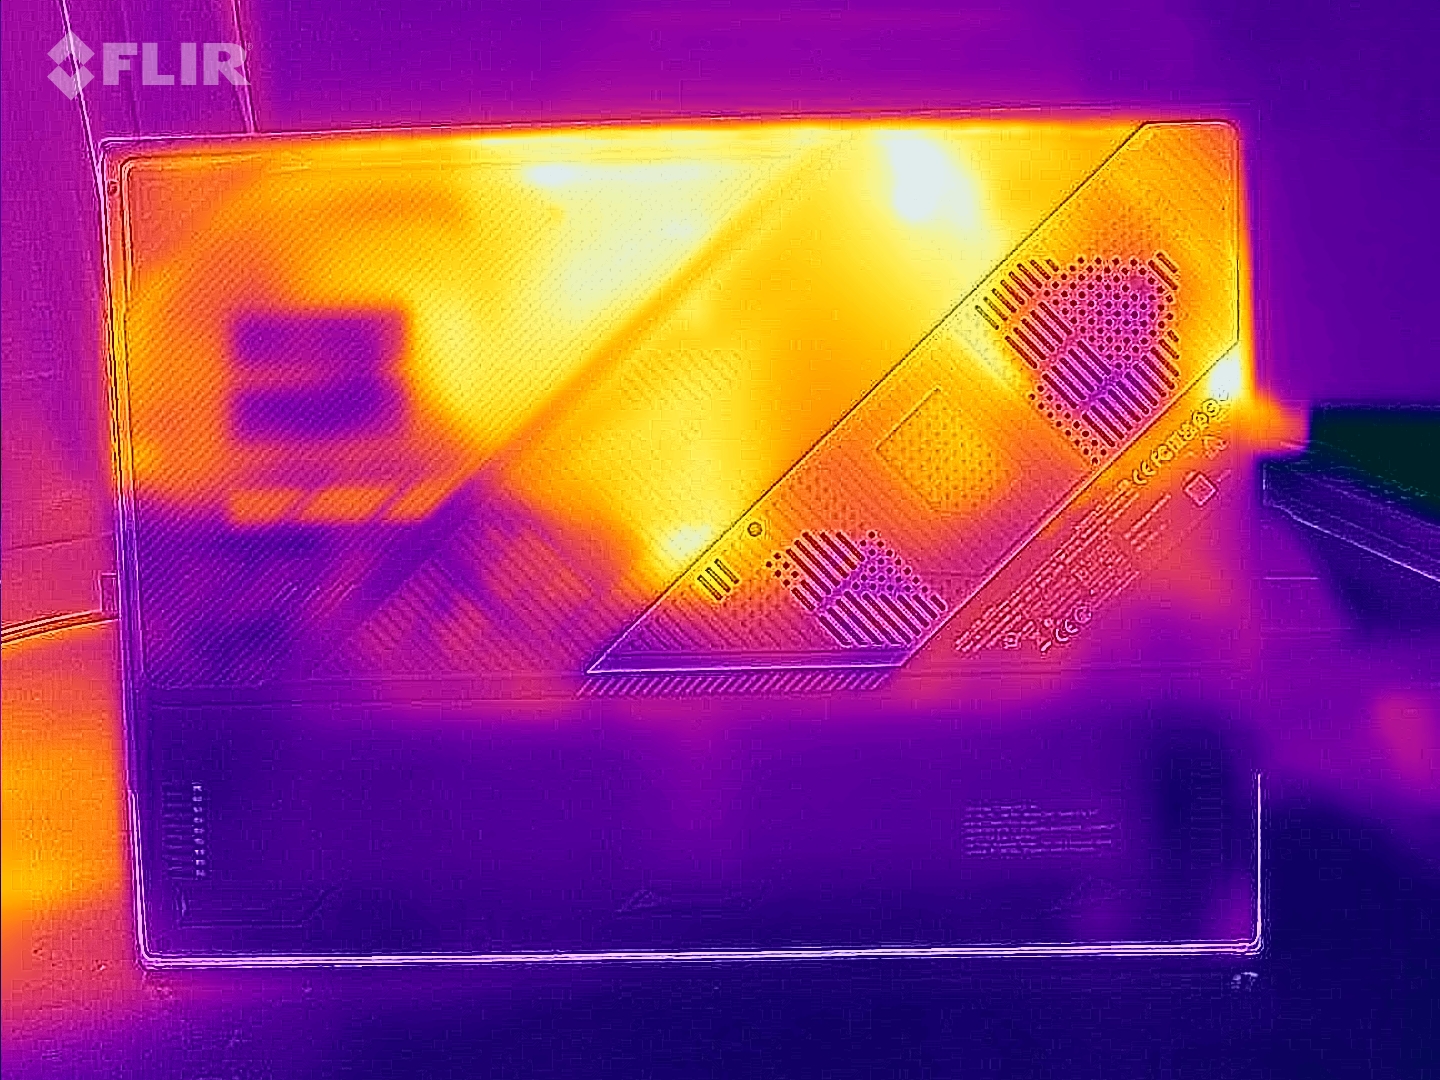
Test obciążeniowy i test Witcher 3 powodują zauważalne, ale nie nadmierne nagrzewanie się laptopa. W niektórych miejscach osiągane są wartości powyżej 50 ºC (122 ºF). Jednak podczas codziennej pracy (Office, Internet) temperatury pozostają w zielonym zakresie.
(-) Maksymalna temperatura w górnej części wynosi 49 °C / 120 F, w porównaniu do średniej 40.4 °C / 105 F , począwszy od 21.2 do 68.8 °C dla klasy Gaming.
(-) Dno nagrzewa się maksymalnie do 47 °C / 117 F, w porównaniu do średniej 43.2 °C / 110 F
(+) W stanie bezczynności średnia temperatura górnej części wynosi 27.3 °C / 81 F, w porównaniu ze średnią temperaturą urządzenia wynoszącą 33.9 °C / ### class_avg_f### F.
(-) Podczas gry w Wiedźmina 3 średnia temperatura górnej części wynosi 39.1 °C / 102 F, w porównaniu do średniej temperatury urządzenia wynoszącej 33.9 °C / ## #class_avg_f### F.
(+) Podparcia dłoni i touchpad osiągają maksymalną temperaturę skóry (35 °C / 95 F) i dlatego nie są gorące.
(-) Średnia temperatura obszaru podparcia dłoni w podobnych urządzeniach wynosiła 28.8 °C / 83.8 F (-6.2 °C / -11.2 F).
| Asus ROG Strix Scar 18 G834JYR (2024) Intel Core i9-14900HX, NVIDIA GeForce RTX 4090 Laptop GPU | Alienware m18 R1 AMD AMD Ryzen 9 7945HX, AMD Radeon RX 7900M | Alienware m18 R1 Intel Core i9-13980HX, NVIDIA GeForce RTX 4090 Laptop GPU | Acer Predator Helios 18 N23Q2 Intel Core i9-13900HX, NVIDIA GeForce RTX 4080 Laptop GPU | Razer Blade 18 RTX 4070 Intel Core i9-13950HX, NVIDIA GeForce RTX 4070 Laptop GPU | MSI Titan 18 HX A14VIG Intel Core i9-14900HX, NVIDIA GeForce RTX 4090 Laptop GPU | Asus ROG Strix Scar 18 2023 G834JY-N6005W Intel Core i9-13980HX, NVIDIA GeForce RTX 4090 Laptop GPU | |
|---|---|---|---|---|---|---|---|
| Heat | 8% | 13% | -8% | 7% | 2% | -3% | |
| Maximum Upper Side * (°C) | 49 | 40.2 18% | 39 20% | 35 29% | 39.2 20% | 37.8 23% | 54 -10% |
| Maximum Bottom * (°C) | 47 | 37.4 20% | 36.4 23% | 56 -19% | 35.6 24% | 37.6 20% | 46 2% |
| Idle Upper Side * (°C) | 29 | 31.6 -9% | 29.2 -1% | 34 -17% | 31.8 -10% | 34.8 -20% | 30 -3% |
| Idle Bottom * (°C) | 31 | 30.6 1% | 27.8 10% | 39 -26% | 33.2 -7% | 36 -16% | 31 -0% |
* ... im mniej tym lepiej
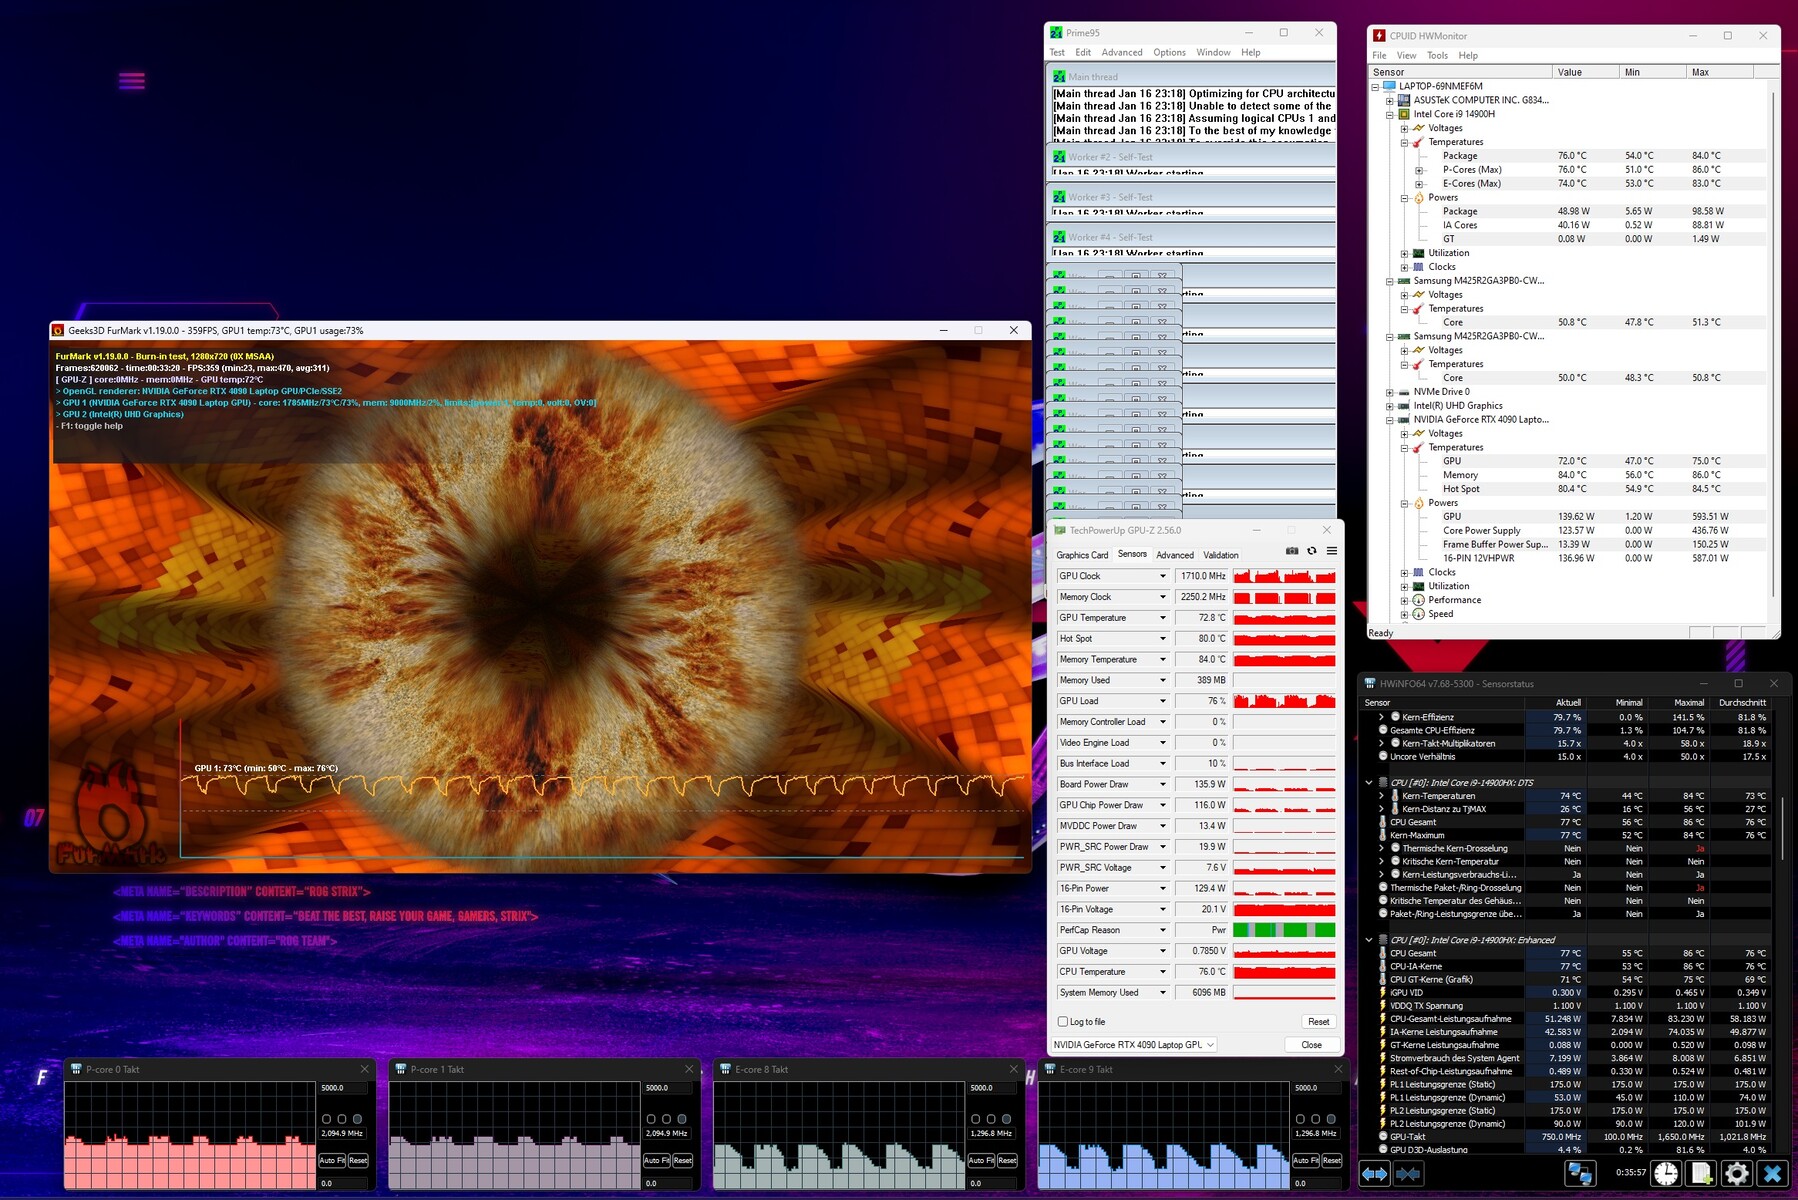
Test warunków skrajnych
Test warunków skrajnych (z ciągle działającymi programami Prime95 i Furmark) stanowi ekstremalny scenariusz oceny stabilności systemu pod pełnym obciążeniem. Procesor osiąga maksymalne prędkości od 2,5 do 2,6 GHz (rdzenie P) i od 2,2 do 2,3 GHz (rdzenie E). GPU (1,9 do 2 GHz) rozpoczyna test z prawie pełną prędkością, a prędkość nieznacznie spada w miarę kontynuowania testu. Ponadto procesor graficzny jest regularnie znacznie ograniczany.
Głośniki
Cztery głośniki generują razem bardzo przyzwoity dźwięk. Aby uzyskać jeszcze lepsze wrażenia dźwiękowe, można użyć zestawu słuchawkowego lub głośników zewnętrznych.
Asus ROG Strix Scar 18 G834JYR (2024) analiza dźwięku
(+) | głośniki mogą odtwarzać stosunkowo głośno (82 dB)
Bas 100 - 315 Hz
(±) | zredukowany bas - średnio 5.6% niższy od mediany
(+) | bas jest liniowy (6.8% delta do poprzedniej częstotliwości)
Średnie 400 - 2000 Hz
(±) | wyższe średnie - średnio 5.7% wyższe niż mediana
(+) | średnie są liniowe (2.8% delta do poprzedniej częstotliwości)
Wysokie 2–16 kHz
(±) | obniżone maksima - średnio 7.2% niższe od mediany
(±) | liniowość wysokich wartości jest średnia (7.2% delta do poprzedniej częstotliwości)
Ogólnie 100 - 16.000 Hz
(+) | ogólny dźwięk jest liniowy (13% różnicy w stosunku do mediany)
W porównaniu do tej samej klasy
» 18% wszystkich testowanych urządzeń w tej klasie było lepszych, 3% podobnych, 79% gorszych
» Najlepszy miał deltę 6%, średnia wynosiła ###średnia###%, najgorsza wynosiła 132%
W porównaniu do wszystkich testowanych urządzeń
» 13% wszystkich testowanych urządzeń było lepszych, 2% podobnych, 85% gorszych
» Najlepszy miał deltę 4%, średnia wynosiła ###średnia###%, najgorsza wynosiła 134%
MSI Titan 18 HX A14VIG analiza dźwięku
(+) | głośniki mogą odtwarzać stosunkowo głośno (89.2 dB)
Bas 100 - 315 Hz
(-) | prawie brak basu - średnio 17.6% niższa od mediany
(±) | liniowość basu jest średnia (8% delta do poprzedniej częstotliwości)
Średnie 400 - 2000 Hz
(+) | zbalansowane środki średnie - tylko 1.8% od mediany
(+) | średnie są liniowe (3.7% delta do poprzedniej częstotliwości)
Wysokie 2–16 kHz
(+) | zrównoważone maksima - tylko 1.2% od mediany
(+) | wzloty są liniowe (2% delta do poprzedniej częstotliwości)
Ogólnie 100 - 16.000 Hz
(+) | ogólny dźwięk jest liniowy (9.9% różnicy w stosunku do mediany)
W porównaniu do tej samej klasy
» 5% wszystkich testowanych urządzeń w tej klasie było lepszych, 2% podobnych, 94% gorszych
» Najlepszy miał deltę 6%, średnia wynosiła ###średnia###%, najgorsza wynosiła 132%
W porównaniu do wszystkich testowanych urządzeń
» 4% wszystkich testowanych urządzeń było lepszych, 1% podobnych, 95% gorszych
» Najlepszy miał deltę 4%, średnia wynosiła ###średnia###%, najgorsza wynosiła 134%
Zarządzanie energią - Asus ROG osiąga dość dobrą żywotność baterii
Zużycie energii
Podczas testu Witcher 3 pobór mocy pozostaje na stałym, oczekiwanym poziomie, natomiast podczas testu obciążeniowego pobór mocy zmienia się. Zmienność tę można przypisać znacznemu zmniejszeniu prędkości GPU, które występuje regularnie. Ładowarka o mocy 330 W zapewnia wystarczającą ilość energii.
| wyłączony / stan wstrzymania | |
| luz | |
| obciążenie |
|
Legenda:
min: | |
| Asus ROG Strix Scar 18 G834JYR (2024) i9-14900HX, GeForce RTX 4090 Laptop GPU | Alienware m18 R1 AMD R9 7945HX, Radeon RX 7900M | Alienware m18 R1 i9-13980HX, GeForce RTX 4090 Laptop GPU | Acer Predator Helios 18 N23Q2 i9-13900HX, GeForce RTX 4080 Laptop GPU | Razer Blade 18 RTX 4070 i9-13950HX, GeForce RTX 4070 Laptop GPU | MSI Titan 18 HX A14VIG i9-14900HX, GeForce RTX 4090 Laptop GPU | Asus ROG Strix Scar 18 2023 G834JY-N6005W i9-13980HX, GeForce RTX 4090 Laptop GPU | Średnia w klasie Gaming | |
|---|---|---|---|---|---|---|---|---|
| Power Consumption | -112% | -48% | -4% | -40% | -40% | -35% | 6% | |
| Idle Minimum * (Watt) | 14 | 30.3 -116% | 21.6 -54% | 16 -14% | 24.5 -75% | 13.2 6% | 17.3 -24% | 13.3 ? 5% |
| Idle Average * (Watt) | 17 | 55.6 -227% | 25.2 -48% | 19 -12% | 34.1 -101% | 25.4 -49% | 27 -59% | 19 ? -12% |
| Idle Maximum * (Watt) | 24 | 101.1 -321% | 56.7 -136% | 21.3 11% | 47.7 -99% | 53.5 -123% | 46 -92% | 24.5 ? -2% |
| Load Average * (Watt) | 143 | 160.3 -12% | 164.1 -15% | 124 13% | 140 2% | 151.4 -6% | 133 7% | 108.1 ? 24% |
| Witcher 3 ultra * (Watt) | 251 | 216 14% | 311 -24% | 289 -15% | 202 20% | 336 -34% | ||
| Load Maximum * (Watt) | 302 | 332.1 -10% | 338.9 -12% | 319 -6% | 261 14% | 395.2 -31% | 329 -9% | 254 ? 16% |
* ... im mniej tym lepiej
Power Consumption The Witcher 3 / Stress Test
Power Consumption With External Monitor
Żywotność baterii
W naszym teście WLAN polegającym na ładowaniu stron internetowych za pomocą skryptu lub teście wideo polegającym na odtwarzaniu krótkiego filmu Big Buck Bunny (kodowanie H.264, FHD) w ciągłej pętli, 18-calowy laptop osiągnął czasy pracy wynoszące odpowiednio 7:41 h i 7:27 h. Tak więc Scar 18 zapewnia bardzo dobre wartości ogólne i jest w stanie przewyższyć konkurentów o znaczne marginesy, pomimo tego, że ich pojemność baterii jest częściowo większa.
| Asus ROG Strix Scar 18 G834JYR (2024) i9-14900HX, GeForce RTX 4090 Laptop GPU, 90 Wh | Alienware m18 R1 AMD R9 7945HX, Radeon RX 7900M, 97 Wh | Alienware m18 R1 i9-13980HX, GeForce RTX 4090 Laptop GPU, 97 Wh | Acer Predator Helios 18 N23Q2 i9-13900HX, GeForce RTX 4080 Laptop GPU, 90 Wh | Razer Blade 18 RTX 4070 i9-13950HX, GeForce RTX 4070 Laptop GPU, 91.7 Wh | MSI Titan 18 HX A14VIG i9-14900HX, GeForce RTX 4090 Laptop GPU, 99.9 Wh | Asus ROG Strix Scar 18 2023 G834JY-N6005W i9-13980HX, GeForce RTX 4090 Laptop GPU, 90 Wh | Średnia w klasie Gaming | |
|---|---|---|---|---|---|---|---|---|
| Czasy pracy | -61% | -45% | -16% | -26% | -32% | -15% | -0% | |
| Reader / Idle (h) | 10.2 | 4.5 -56% | 5.6 -45% | 7 -31% | 5.9 -42% | 8.71 ? -15% | ||
| H.264 (h) | 7.5 | 4.8 -36% | 7 -7% | 8.26 ? 10% | ||||
| WiFi v1.3 (h) | 7.7 | 1.4 -82% | 4.3 -44% | 4.4 -43% | 4 -48% | 4.2 -45% | 7.1 -8% | 7.01 ? -9% |
| Load (h) | 1.3 | 0.7 -46% | 0.7 -46% | 1.7 31% | 1.3 0% | 1.2 -8% | 0.9 -31% | 1.47 ? 13% |
| Witcher 3 ultra (h) | 0.9 |
Za
Przeciw
Werdykt - miejsce na poprawę
Przetwarzanie wideo i obrazu, strumieniowanie, renderowanie i granie to główne scenariusze użytkowania laptopa. Podczas gdy GeForce RTX 4090 i Core i9-14900HX zapewniają niezbędną wydajność, nie osiągają żadnych nowych rekordów. Emisje utrzymują się na wysokim poziomie, typowym dla tej klasy urządzeń.
Wraz z ROG Strix Scar 18 (2024), Asus dostarcza potężny high-endowy laptop w wysokiej cenie.
Najważniejszym elementem laptopa jest wyświetlacz mini-LED (2560x1600 pikseli, DCI-P3, Dolby Vision, 240 Hz) o przekątnej 18 cali w formacie 16:10. Jego pozytywne aspekty obejmują maksymalną jasność wynoszącą prawie 1000 cd/m², bardzo dobrą wartość czerni i wysoką dokładność odwzorowania kolorów.
Porty USB-C (1x USB 3.2 Gen 2, 1x Thunderbolt 4) ułatwiają integrację z istniejącymi konfiguracjami w miejscu pracy i otwierają pewne opcje rozbudowy, takie jak zewnętrzna karta graficzna lub stacja dokująca. Oba porty USB-C można wykorzystać do wyprowadzenia sygnału DisplayPort, a port USB 3.2 Gen 2 obsługuje również funkcję Power Delivery. Wszystko to idzie w parze z bardzo dobrym czasem pracy na baterii.
Alternatywą może być MSI Titan 18 HX A14VIGktóry jest w stanie uzyskać nieco wyższą wydajność z tej samej kombinacji CPU/GPU, oferuje wyświetlacz mini-LED 4k i jest wyposażony w dwa porty TB4. Laptop MSI nie zbliża się jednak do żywotności baterii Strixa.
Cena i dostępność
Asus ROG Strix Scar 18 (2024) jest dostępny za około $3,000 w sklepie Asus i w tej samej cenie również na przykład w Amazon. Konfiguracja podobna do naszej jednostki testowej jest dostępna za ~ 3900 USD od Amazon.
Asus ROG Strix Scar 18 G834JYR (2024)
- 07/02/2024 v7 (old)
Sascha Mölck
Przezroczystość
Wyboru urządzeń do recenzji dokonuje nasza redakcja. Próbka testowa została udostępniona autorowi jako pożyczka od producenta lub sprzedawcy detalicznego na potrzeby tej recenzji. Pożyczkodawca nie miał wpływu na tę recenzję, producent nie otrzymał też kopii tej recenzji przed publikacją. Nie było obowiązku publikowania tej recenzji. Jako niezależna firma medialna, Notebookcheck nie podlega władzy producentów, sprzedawców detalicznych ani wydawców.
Tak testuje Notebookcheck
Każdego roku Notebookcheck niezależnie sprawdza setki laptopów i smartfonów, stosując standardowe procedury, aby zapewnić porównywalność wszystkich wyników. Od około 20 lat stale rozwijamy nasze metody badawcze, ustanawiając przy tym standardy branżowe. W naszych laboratoriach testowych doświadczeni technicy i redaktorzy korzystają z wysokiej jakości sprzętu pomiarowego. Testy te obejmują wieloetapowy proces walidacji. Nasz kompleksowy system ocen opiera się na setkach uzasadnionych pomiarów i benchmarków, co pozwala zachować obiektywizm.Price comparison

