Recenzja HP Omen 16 (2024): Gamingowy notebook QHD z Core i9 i RTX 4080 za 3200 euro
Najnowsze wcielenie Omen 16 - high-endowego laptopa do gier - ma tę samą obudowę i w dużej mierze ten sam sprzęt, co jego poprzednik poprzednik. Procesor został ulepszony: Raptor Lake Refresh zastępuje oryginalny Raptor Lake. Karta graficzna GeForce RTX 4080, Core i9-14900HX i 32 GB pamięci RAM podnoszą cenę laptopa do 3200 euro (3446 USD). Omen 16 konkuruje z laptopami do gier, takimi jak MSI Vector 16 HX A14Vi Acer Predator Helios 18 i Alienware m16 R1.
Potencjalni konkurenci w porównaniu
Ocena | Data | Model | Waga | Wysokość | Rozmiar | Rezolucja | Cena |
|---|---|---|---|---|---|---|---|
| 86.7 % v7 (old) | 02/2024 | HP Omen 16 (2024) i9-14900HX, GeForce RTX 4080 Laptop GPU | 2.4 kg | 23.5 mm | 16.10" | 2560x1440 | |
| 88 % v7 (old) | 02/2024 | MSI Vector 16 HX A14V i9-14900HX, GeForce RTX 4080 Laptop GPU | 2.7 kg | 28.55 mm | 16.00" | 2560x1600 | |
| 89.2 % v7 (old) | 08/2023 | Alienware m16 R1 AMD R9 7845HX, GeForce RTX 4080 Laptop GPU | 3.1 kg | 25.4 mm | 16.00" | 2560x1600 | |
| 88.3 % v7 (old) | 10/2023 | Acer Predator Helios 18 N23Q2 i9-13900HX, GeForce RTX 4080 Laptop GPU | 3.2 kg | 29.15 mm | 18.00" | 2560x1600 |
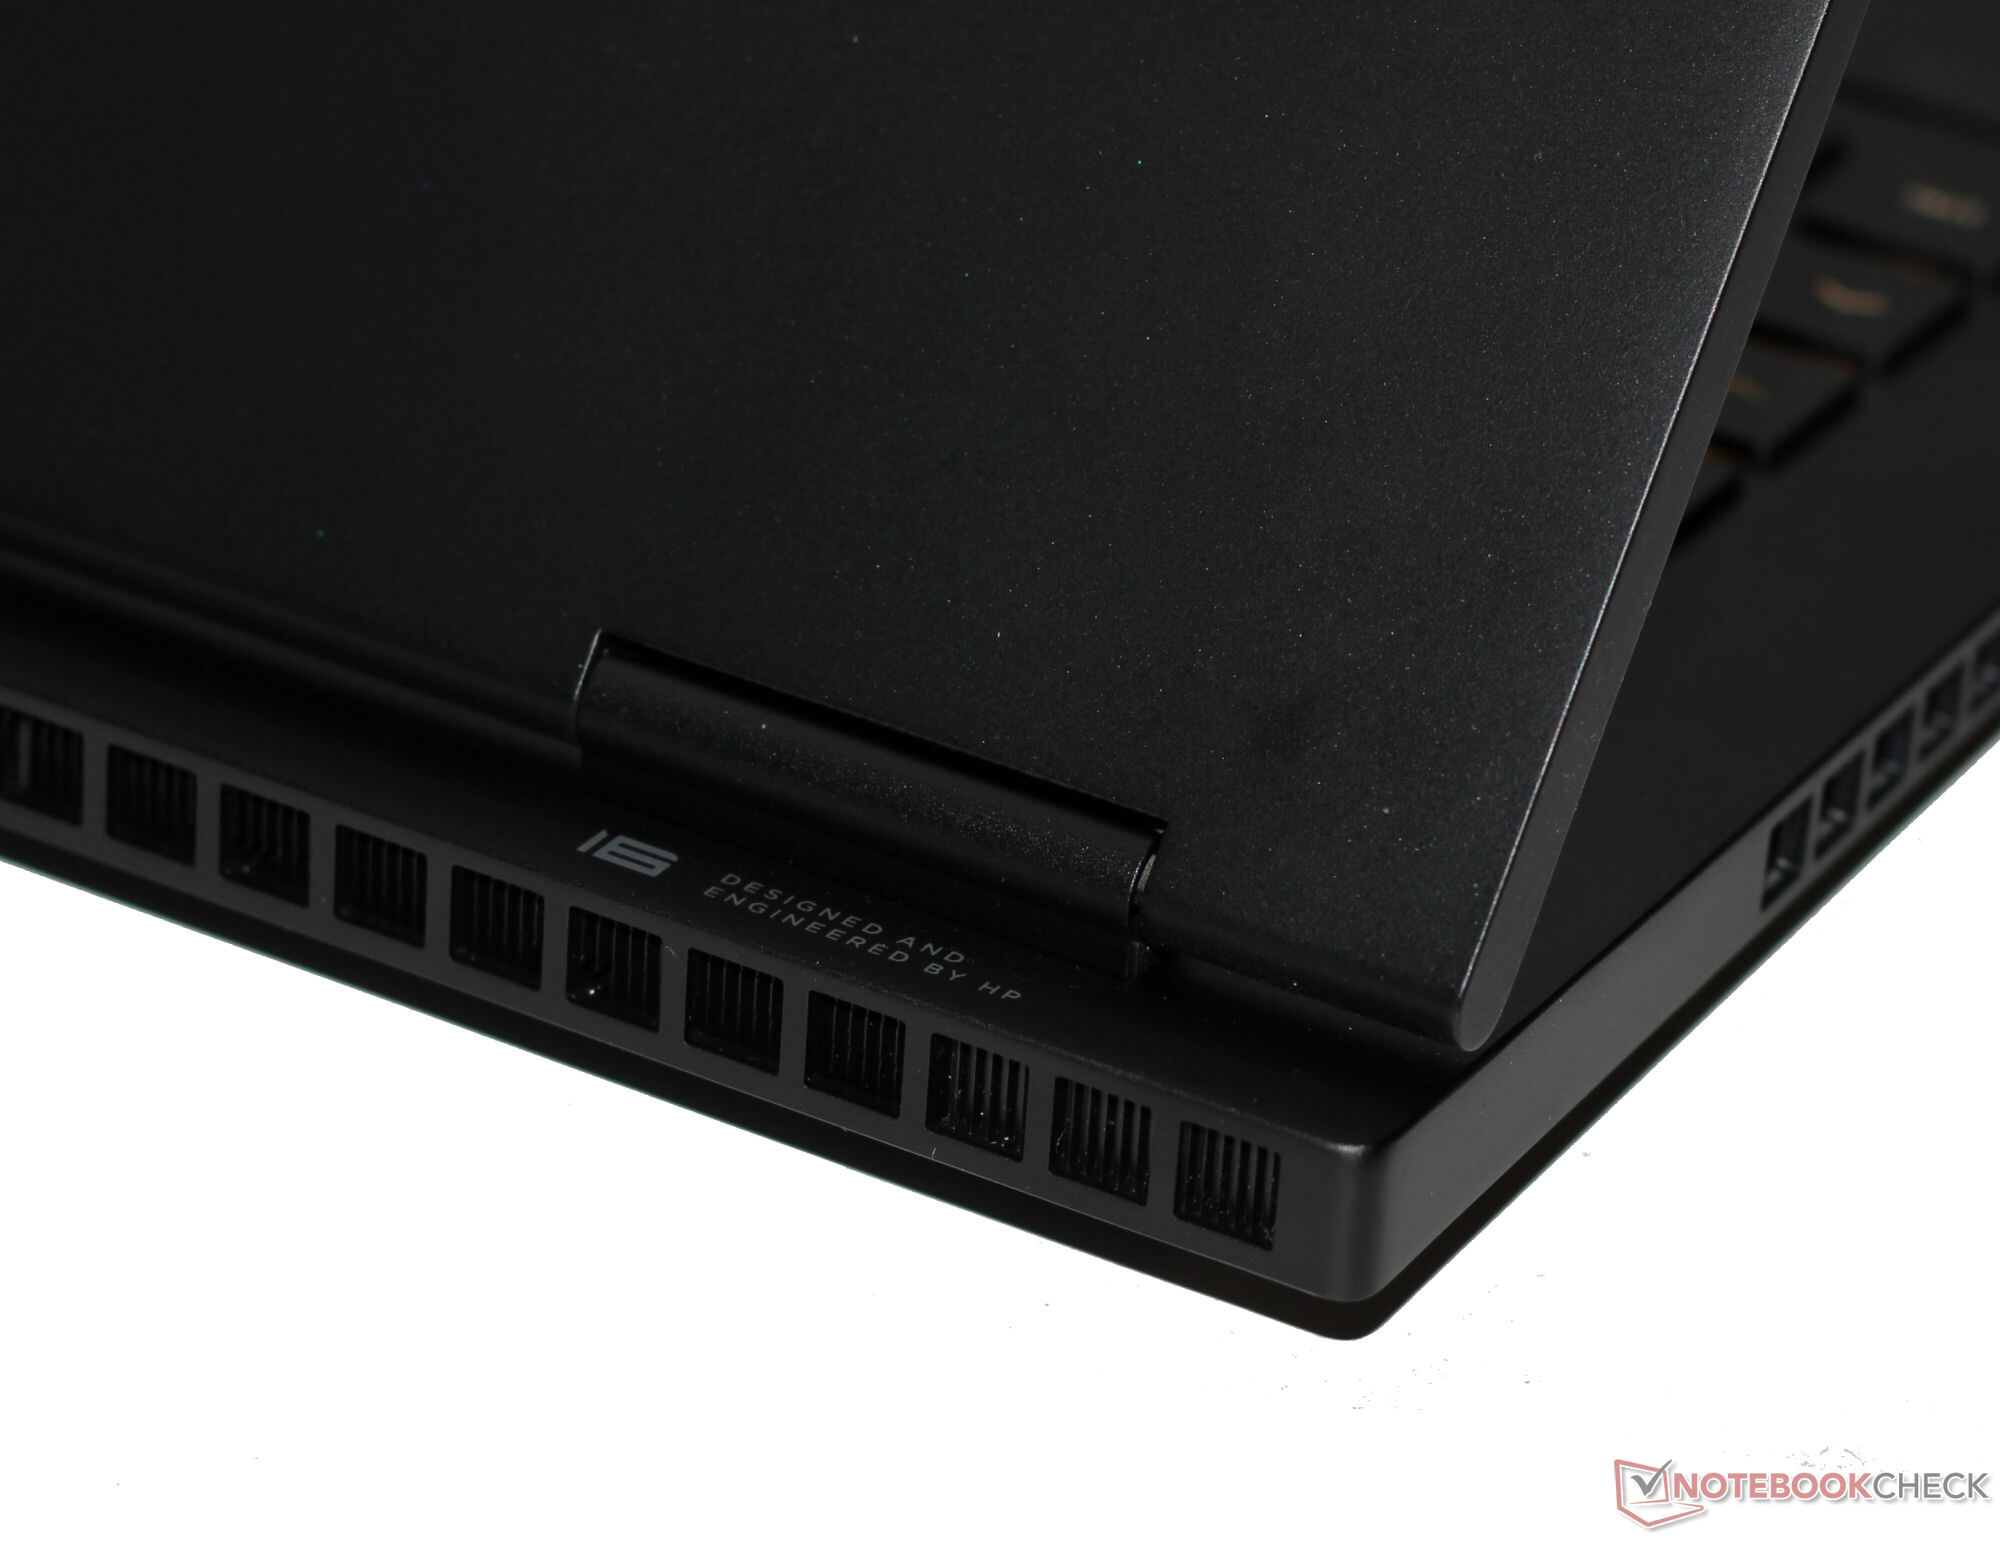
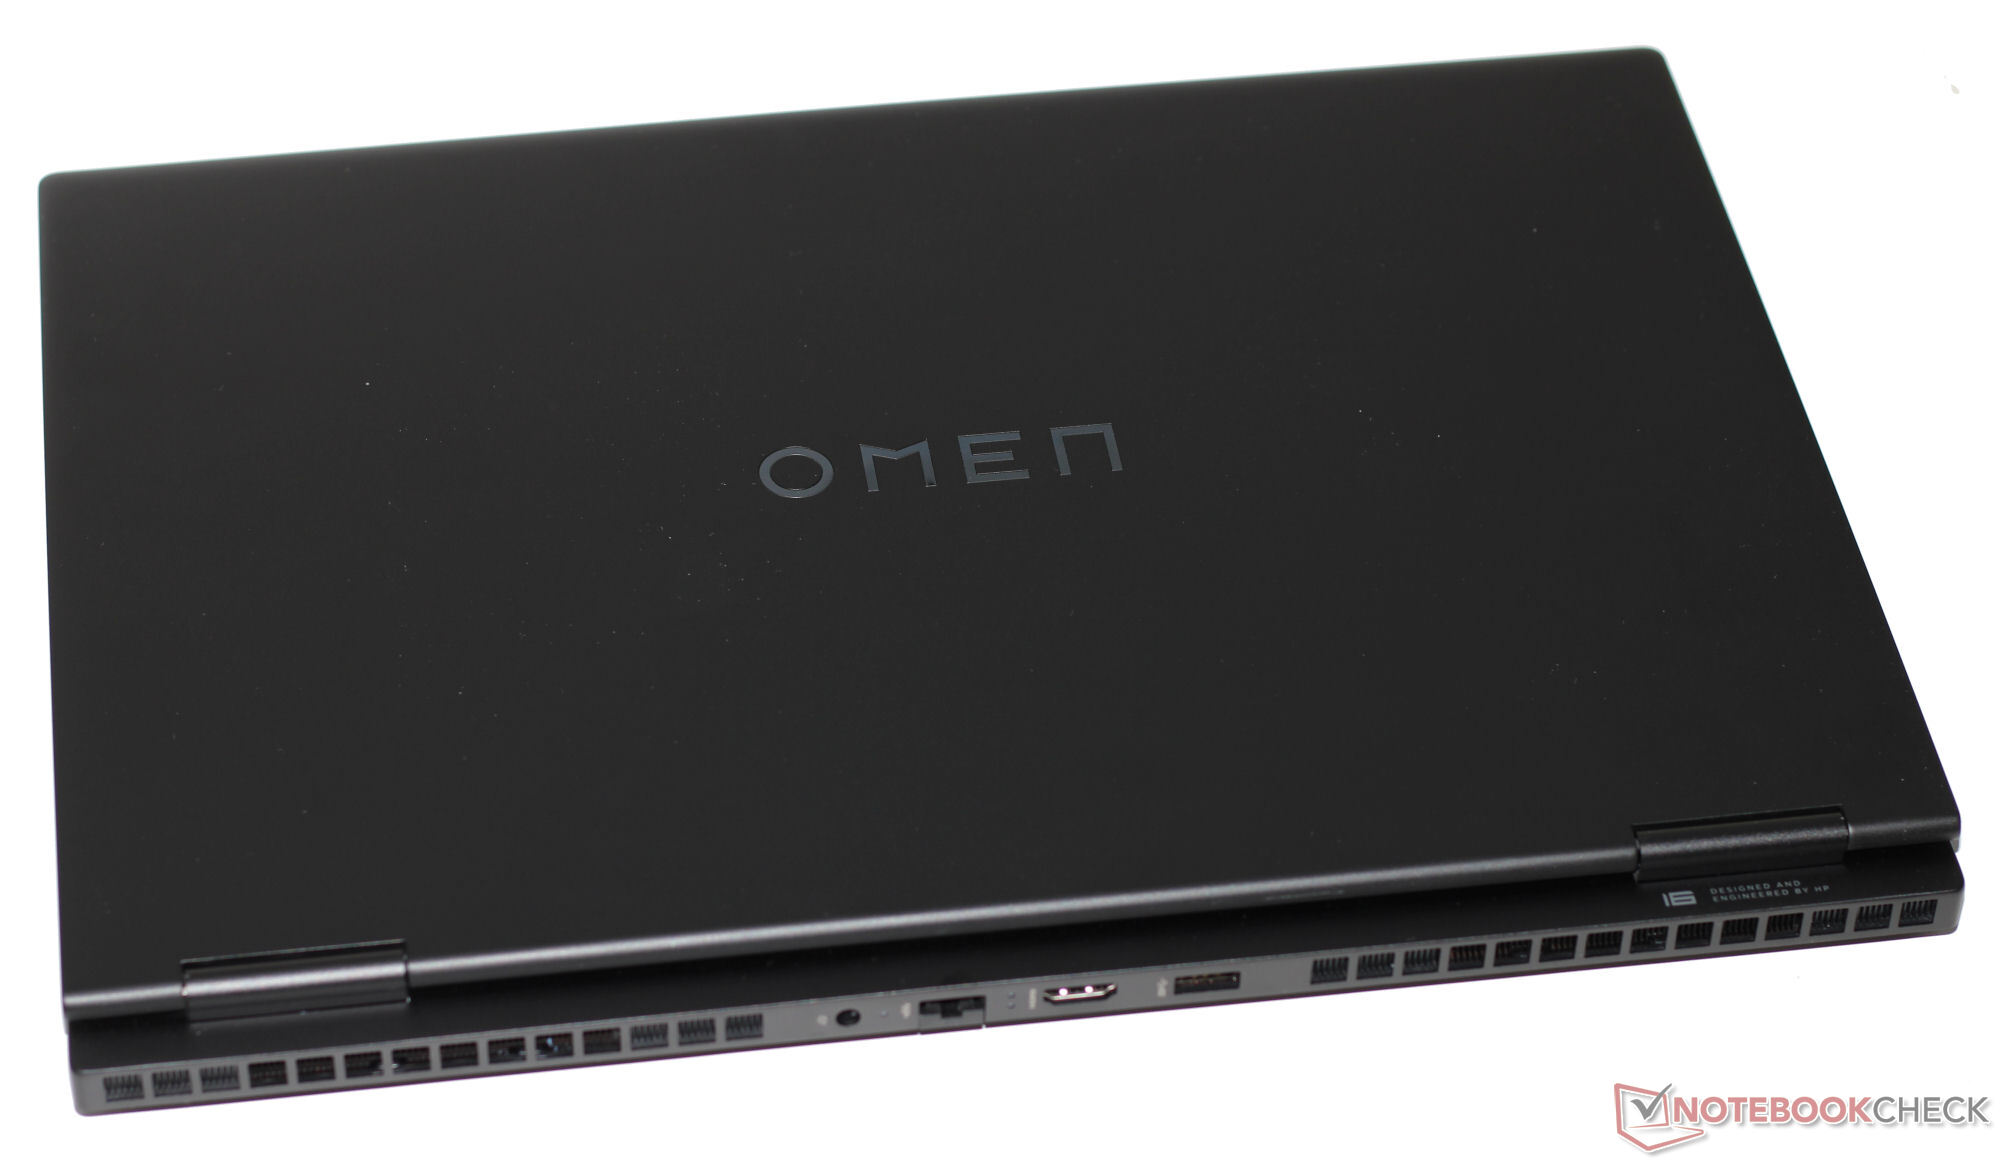
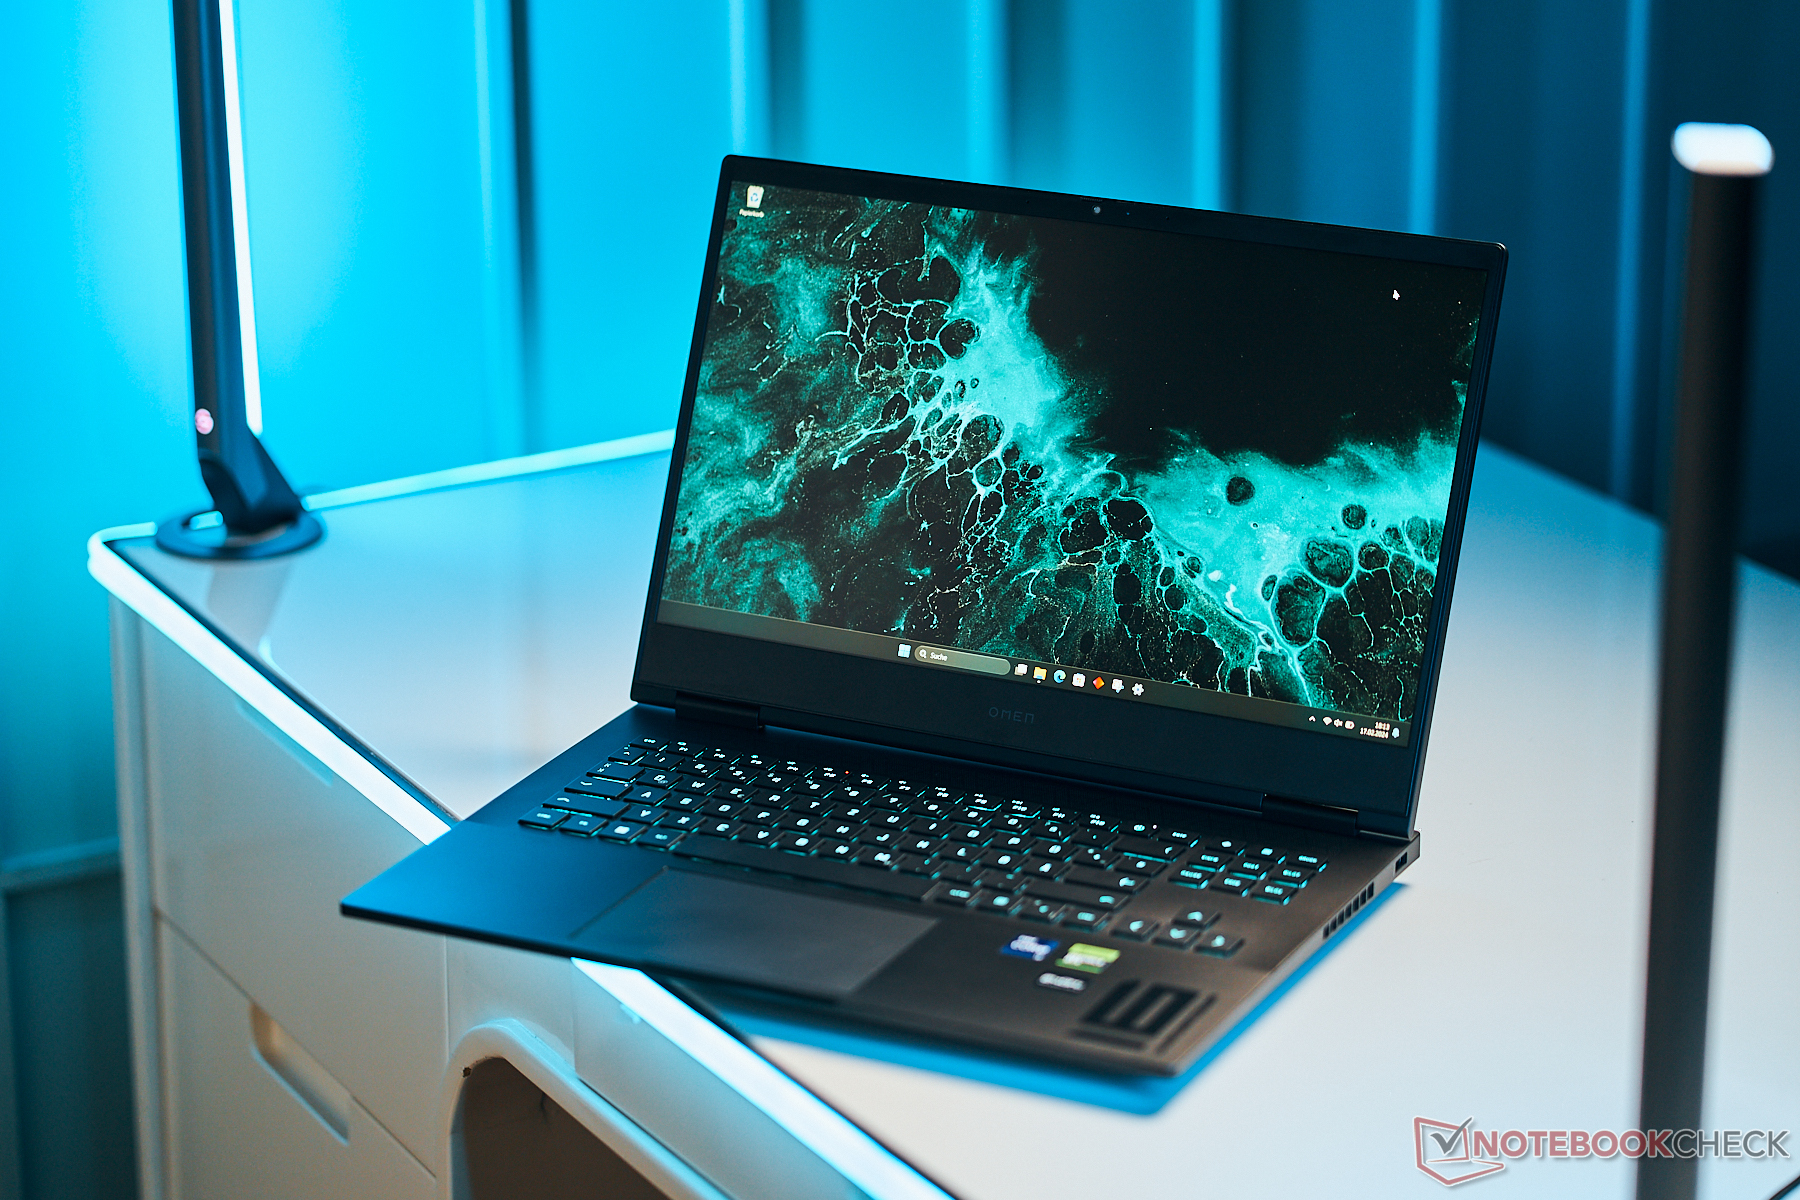
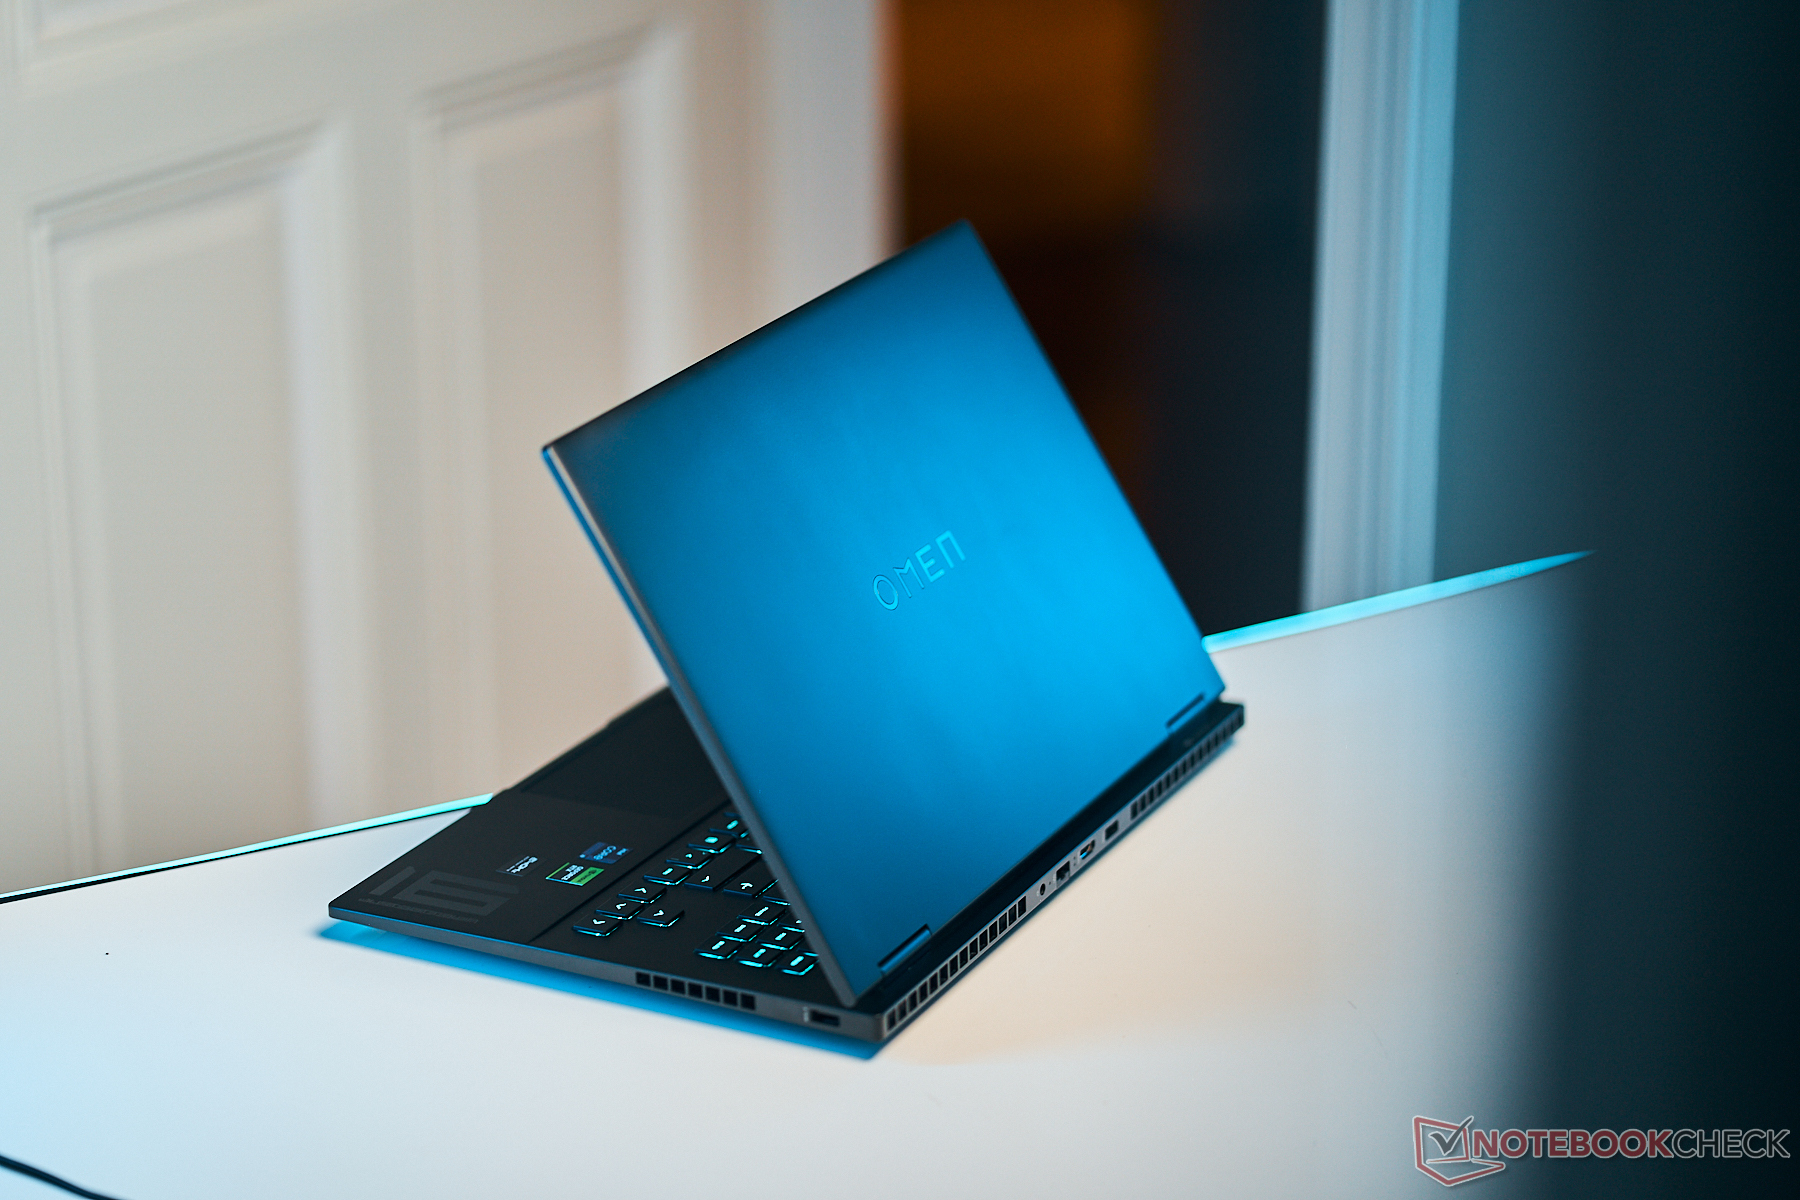
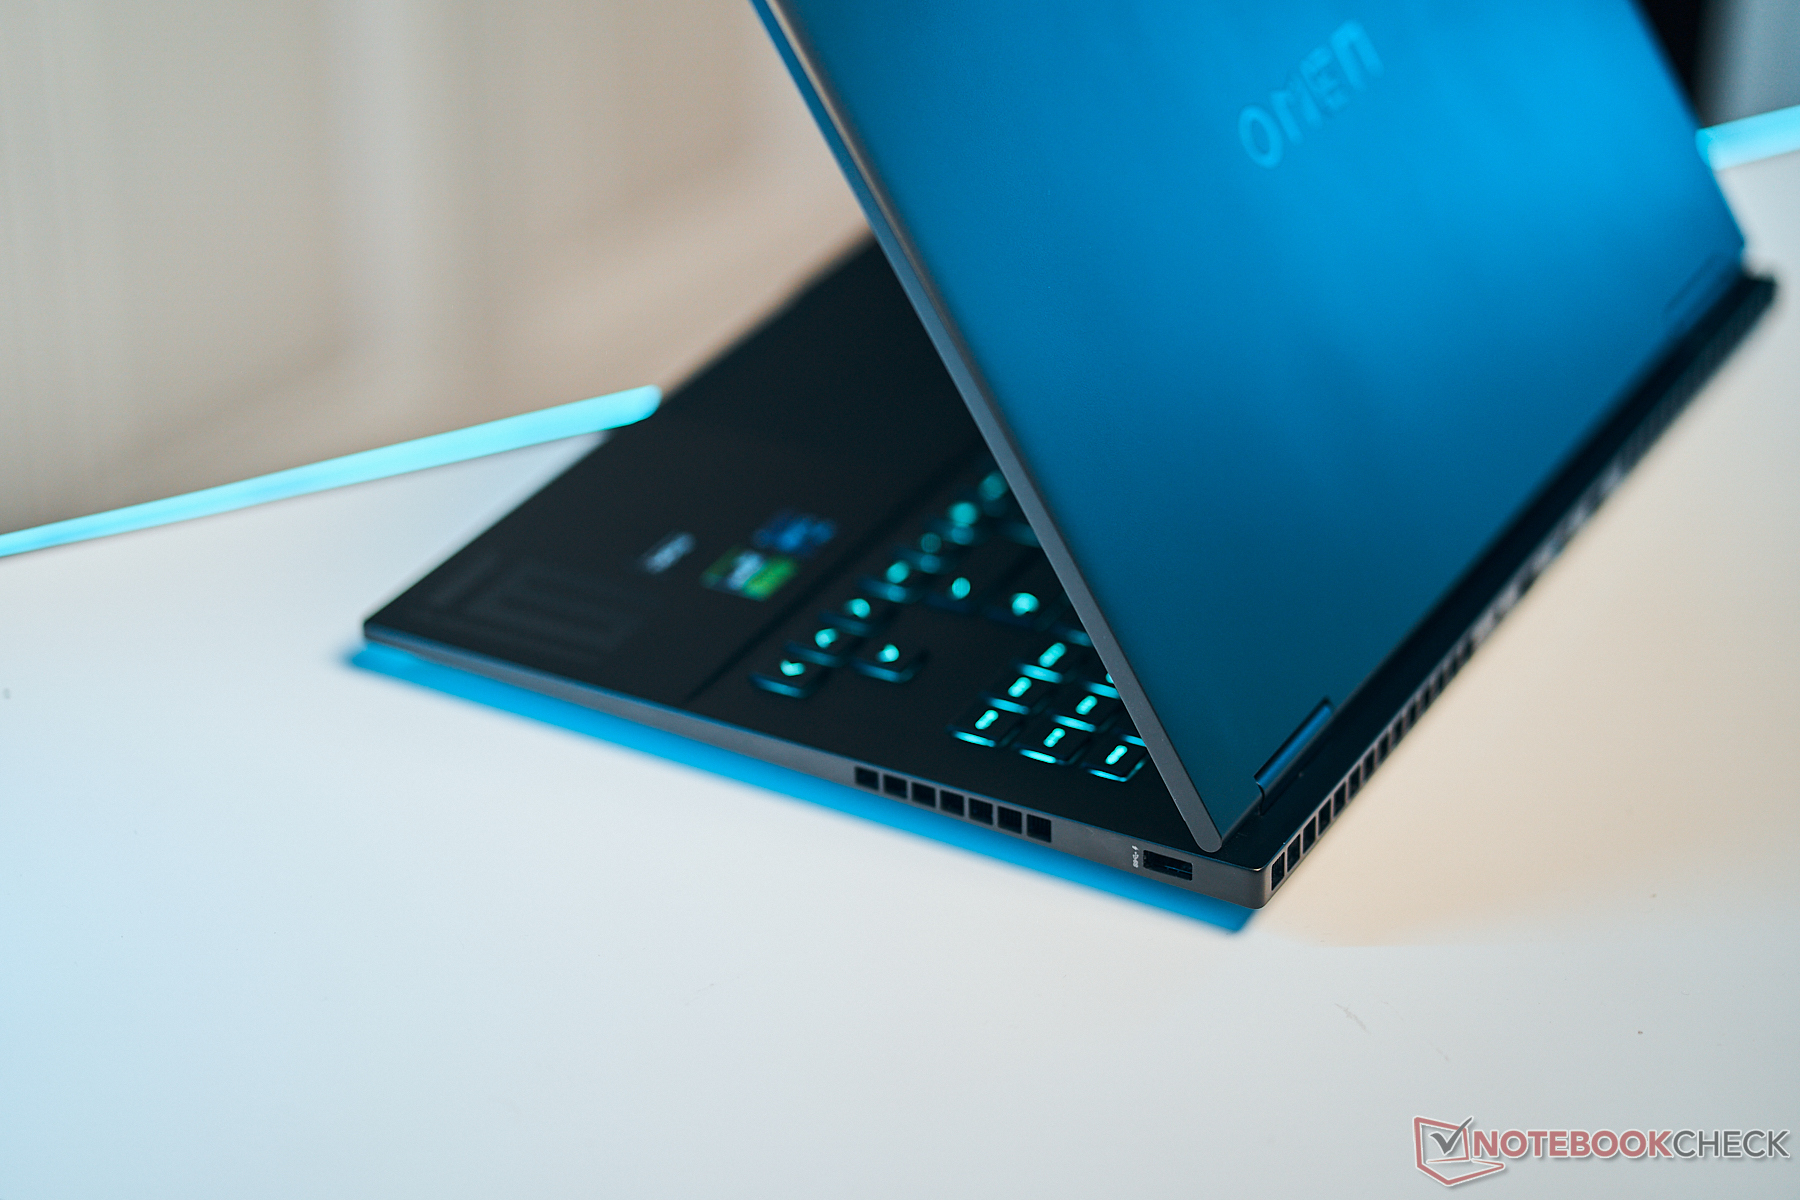
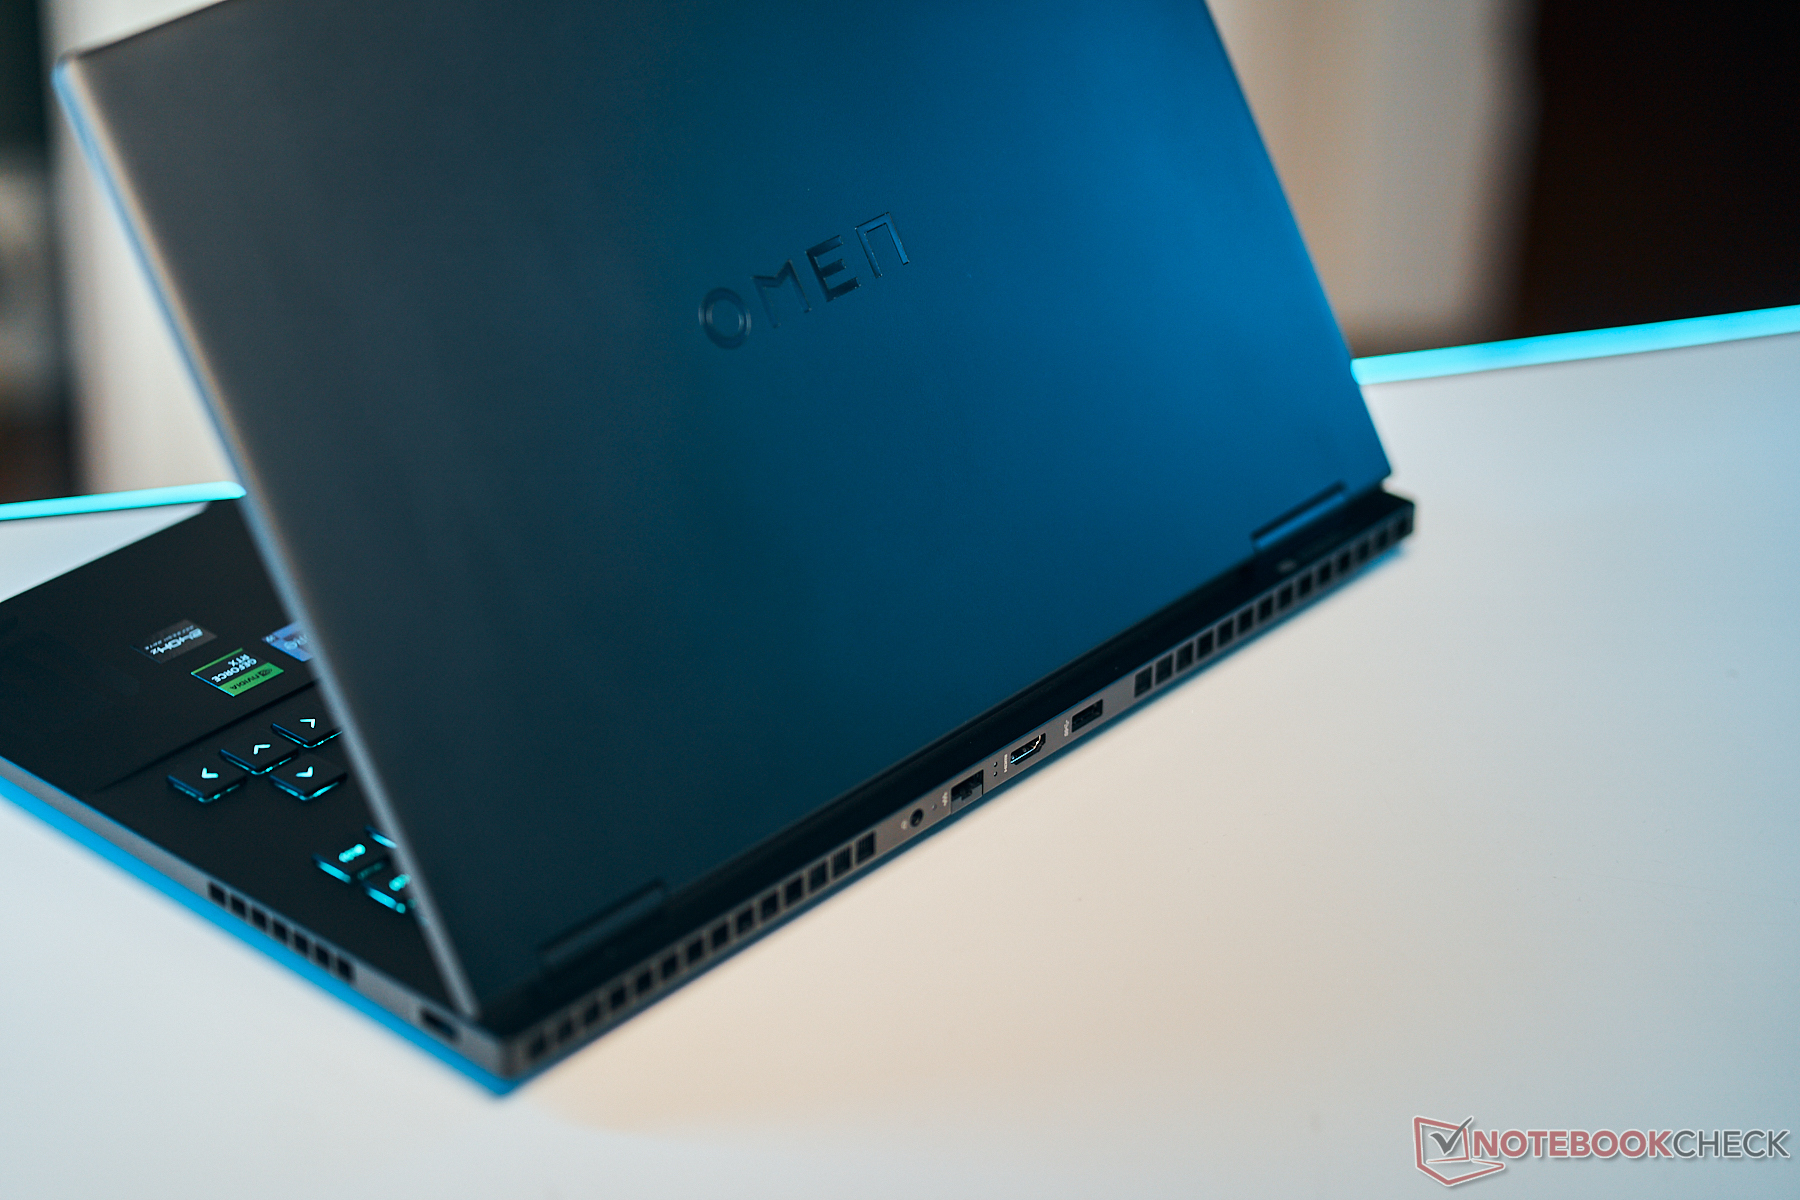
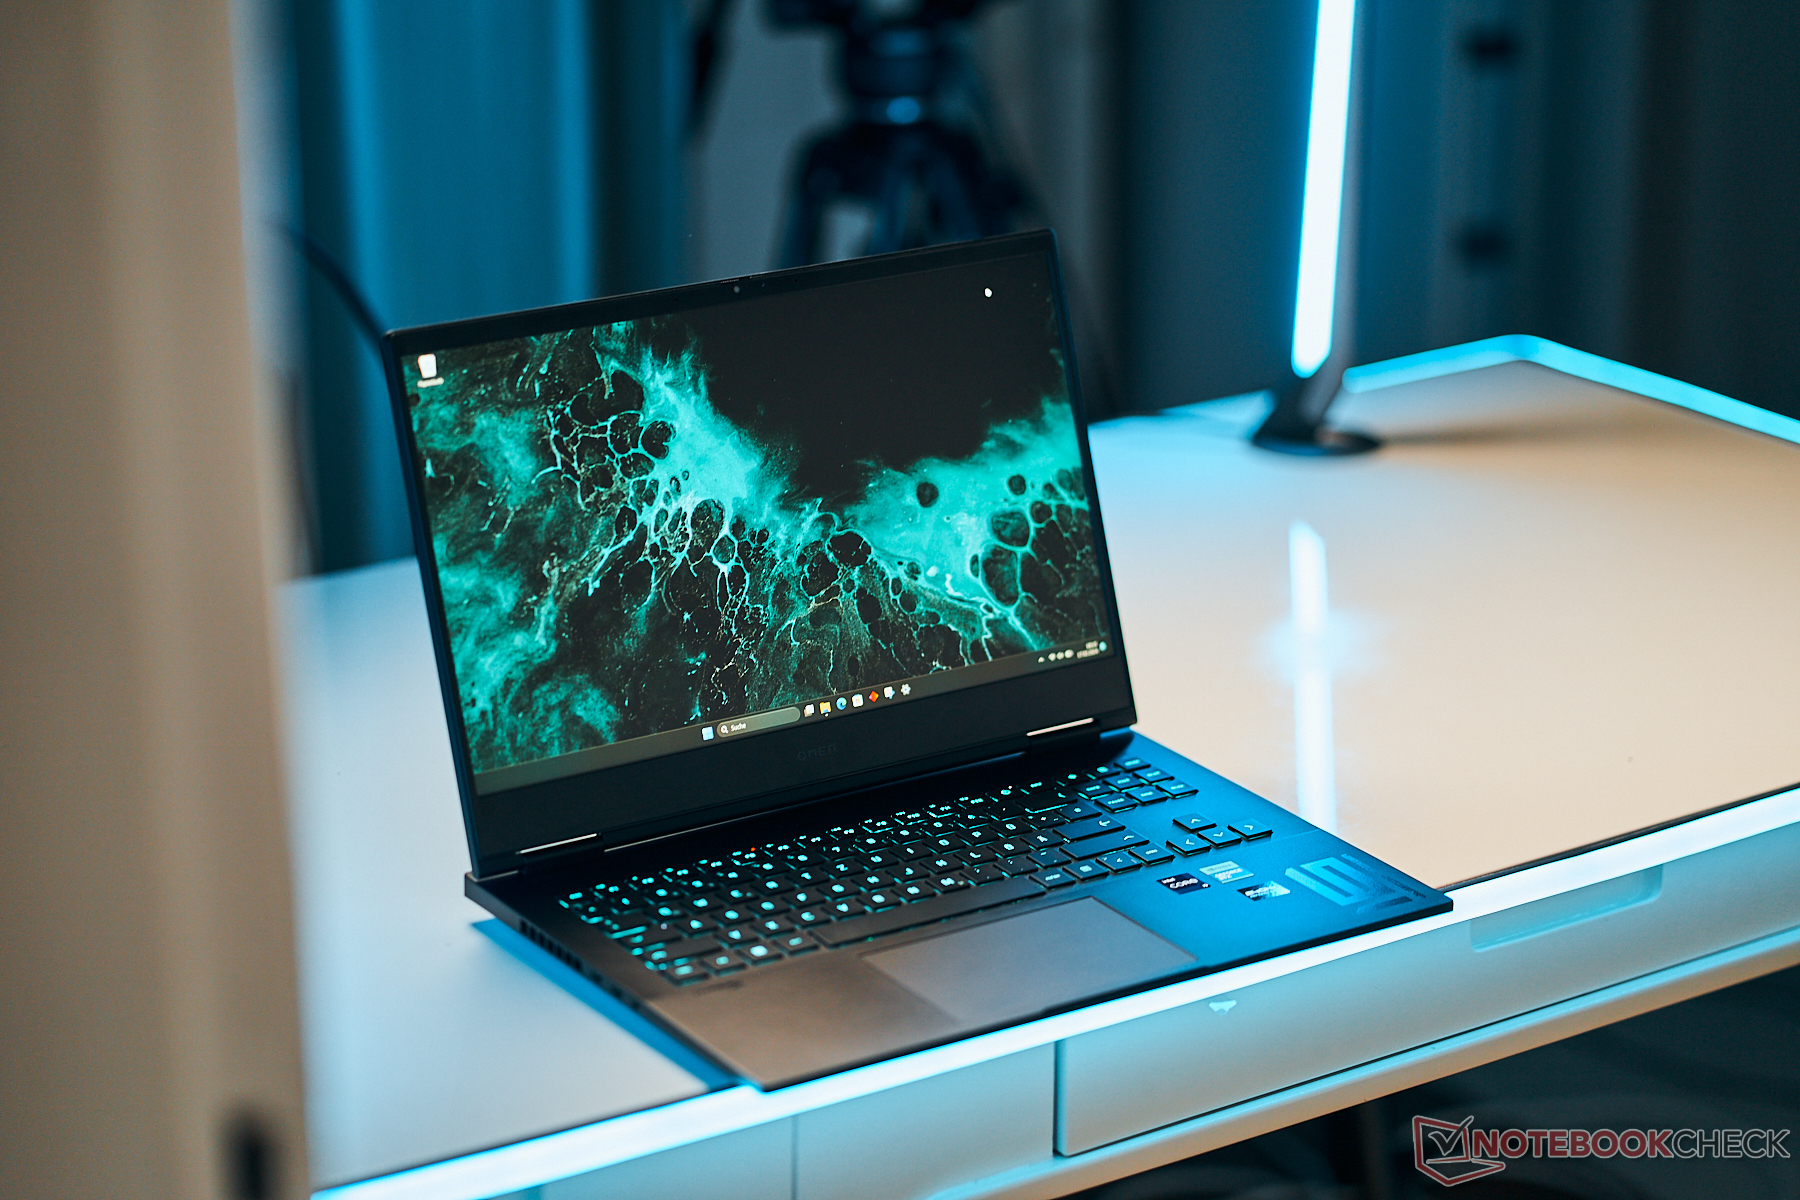
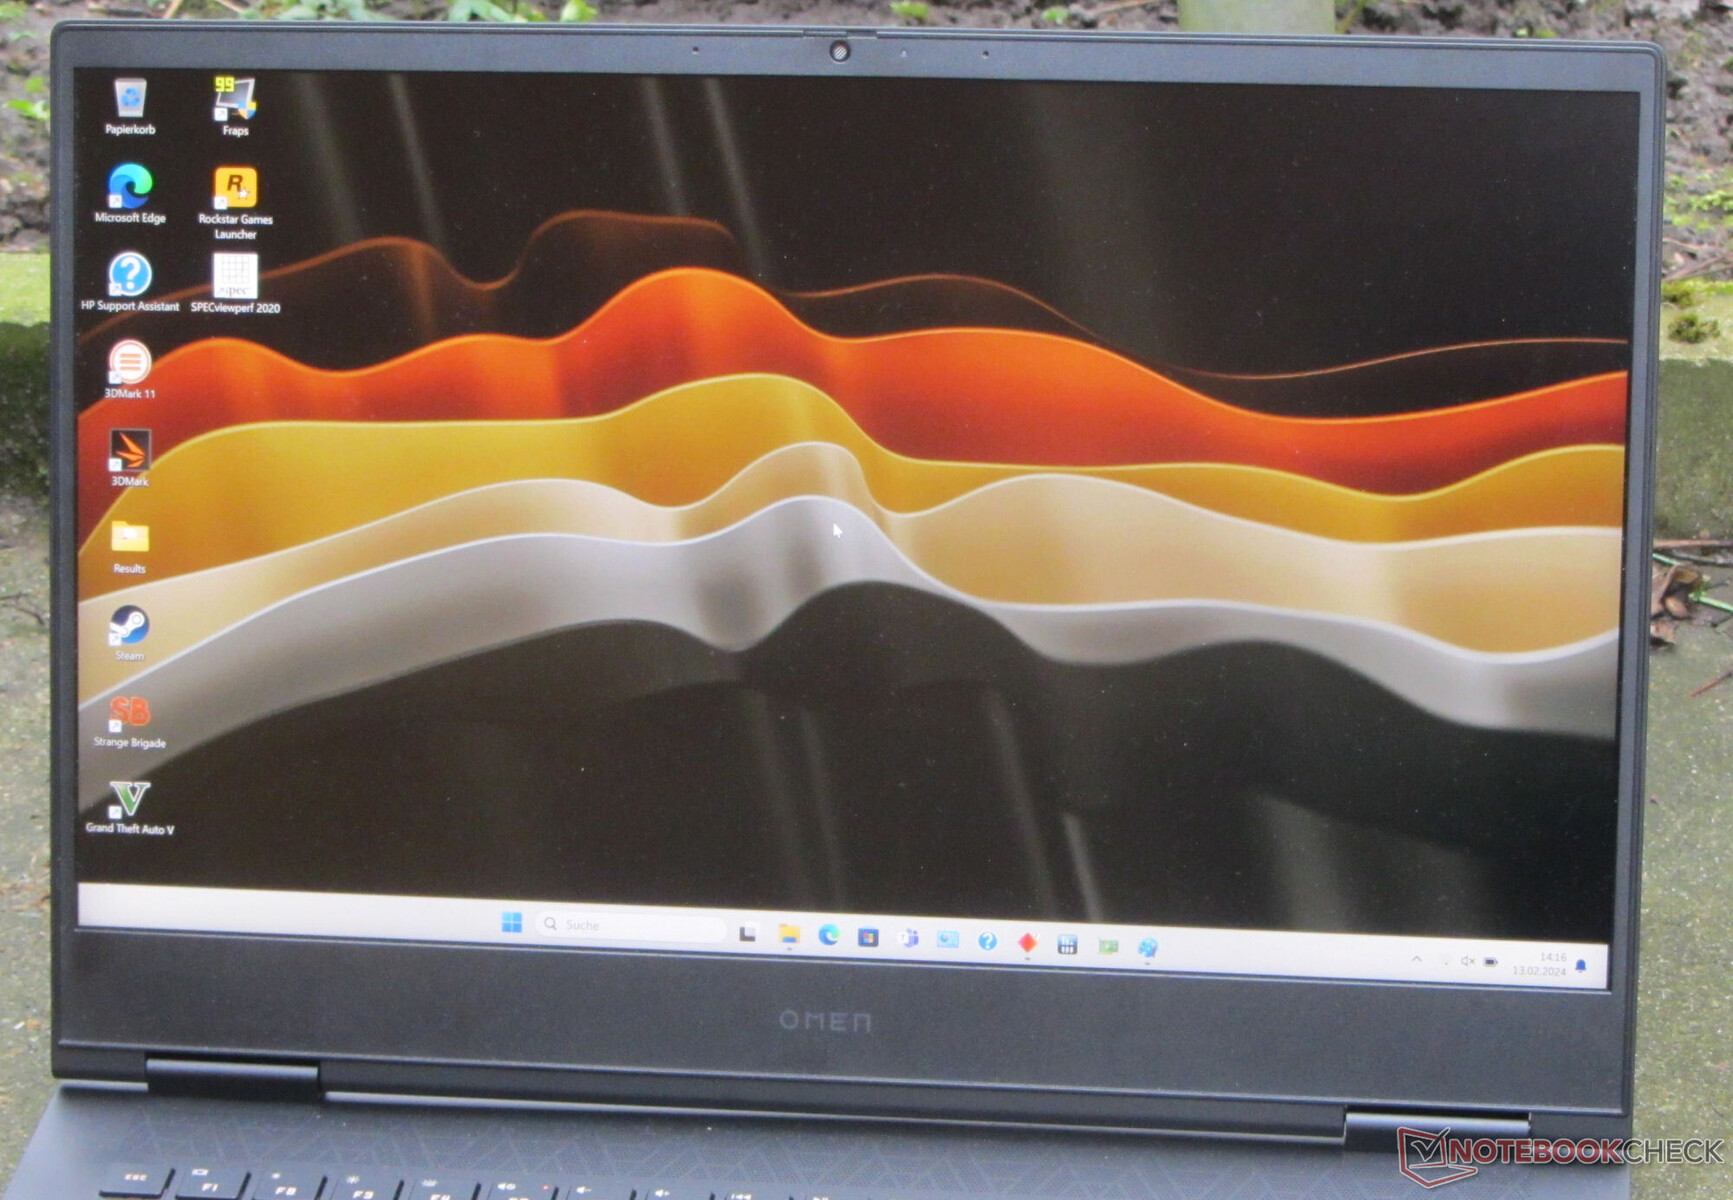
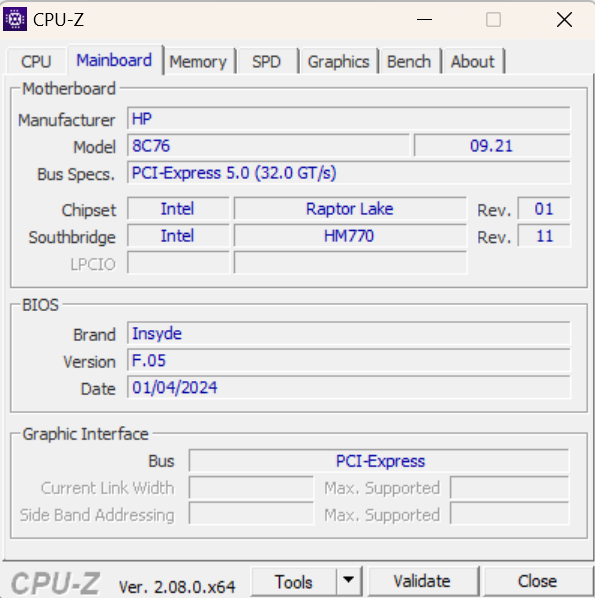
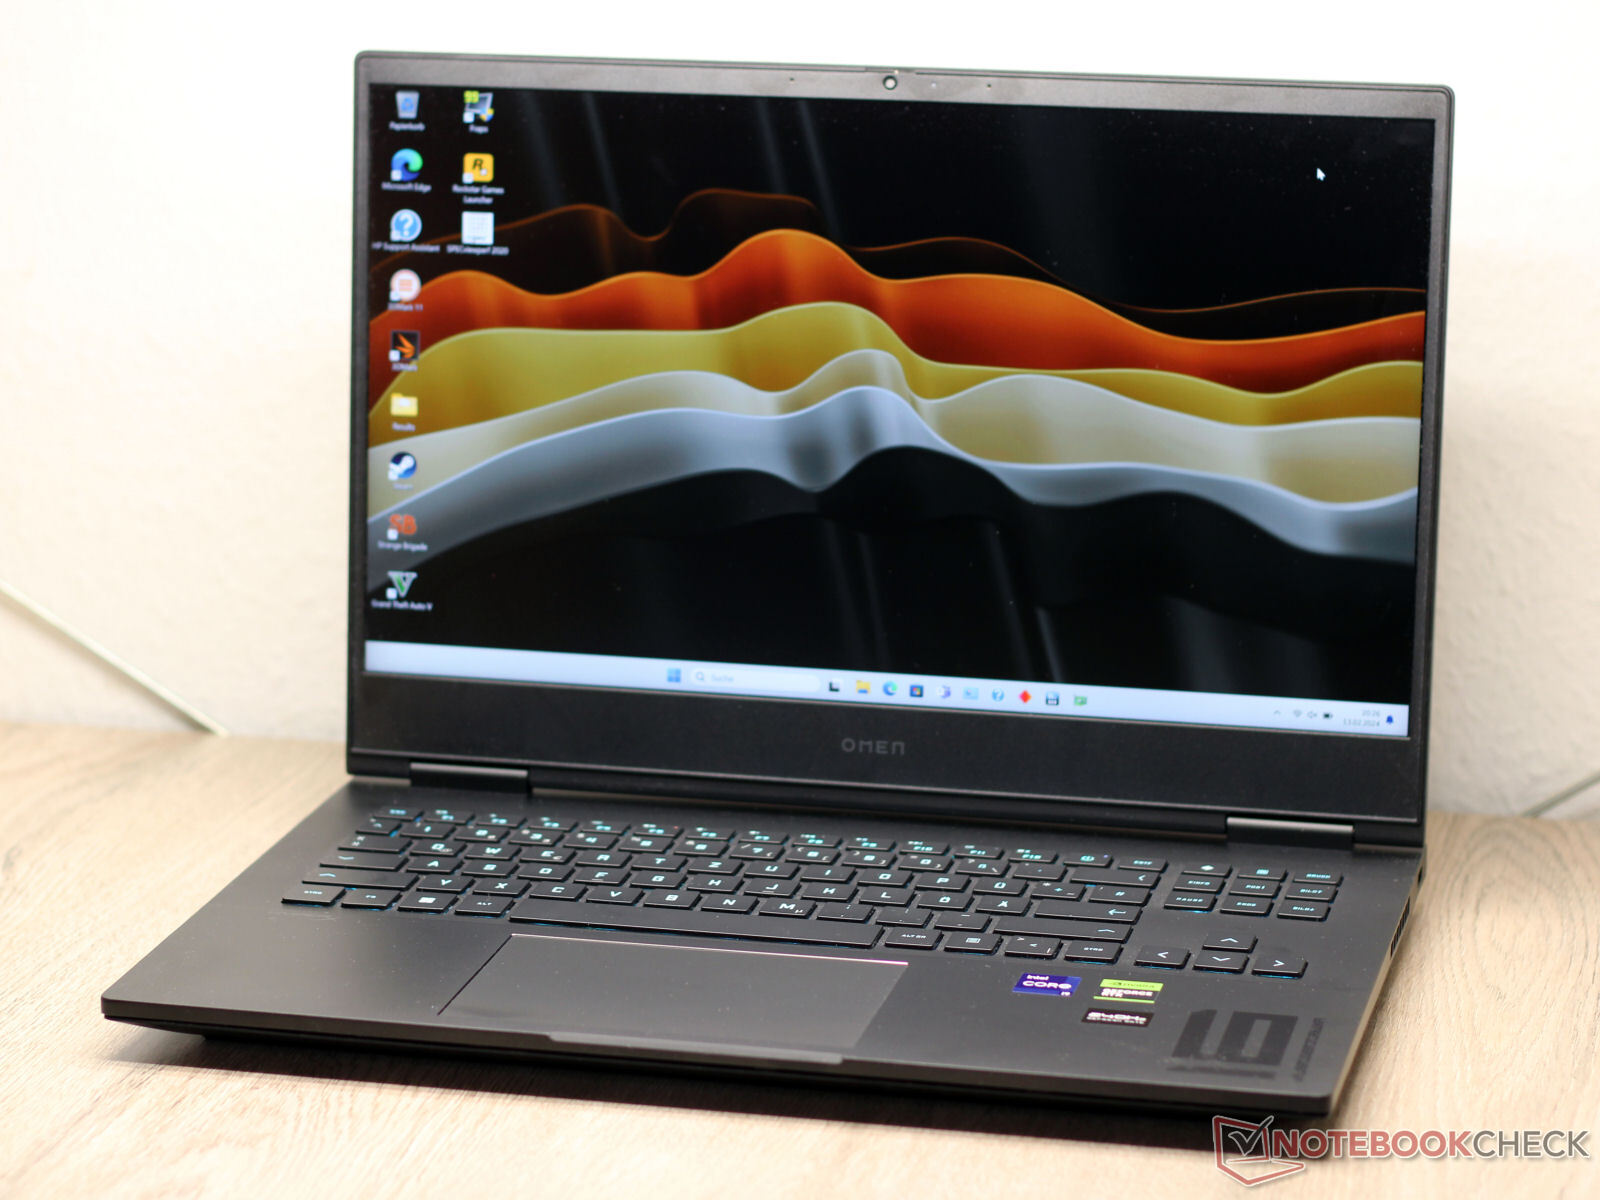
Obudowa i specyfikacje - laptop HP z Thunderbolt 4
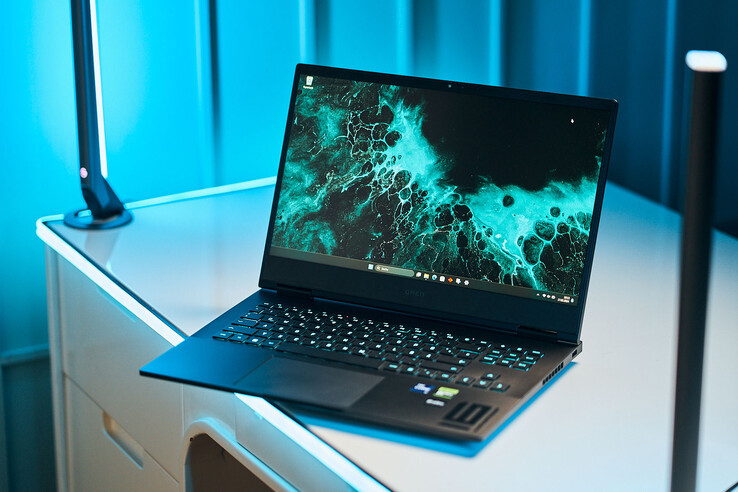
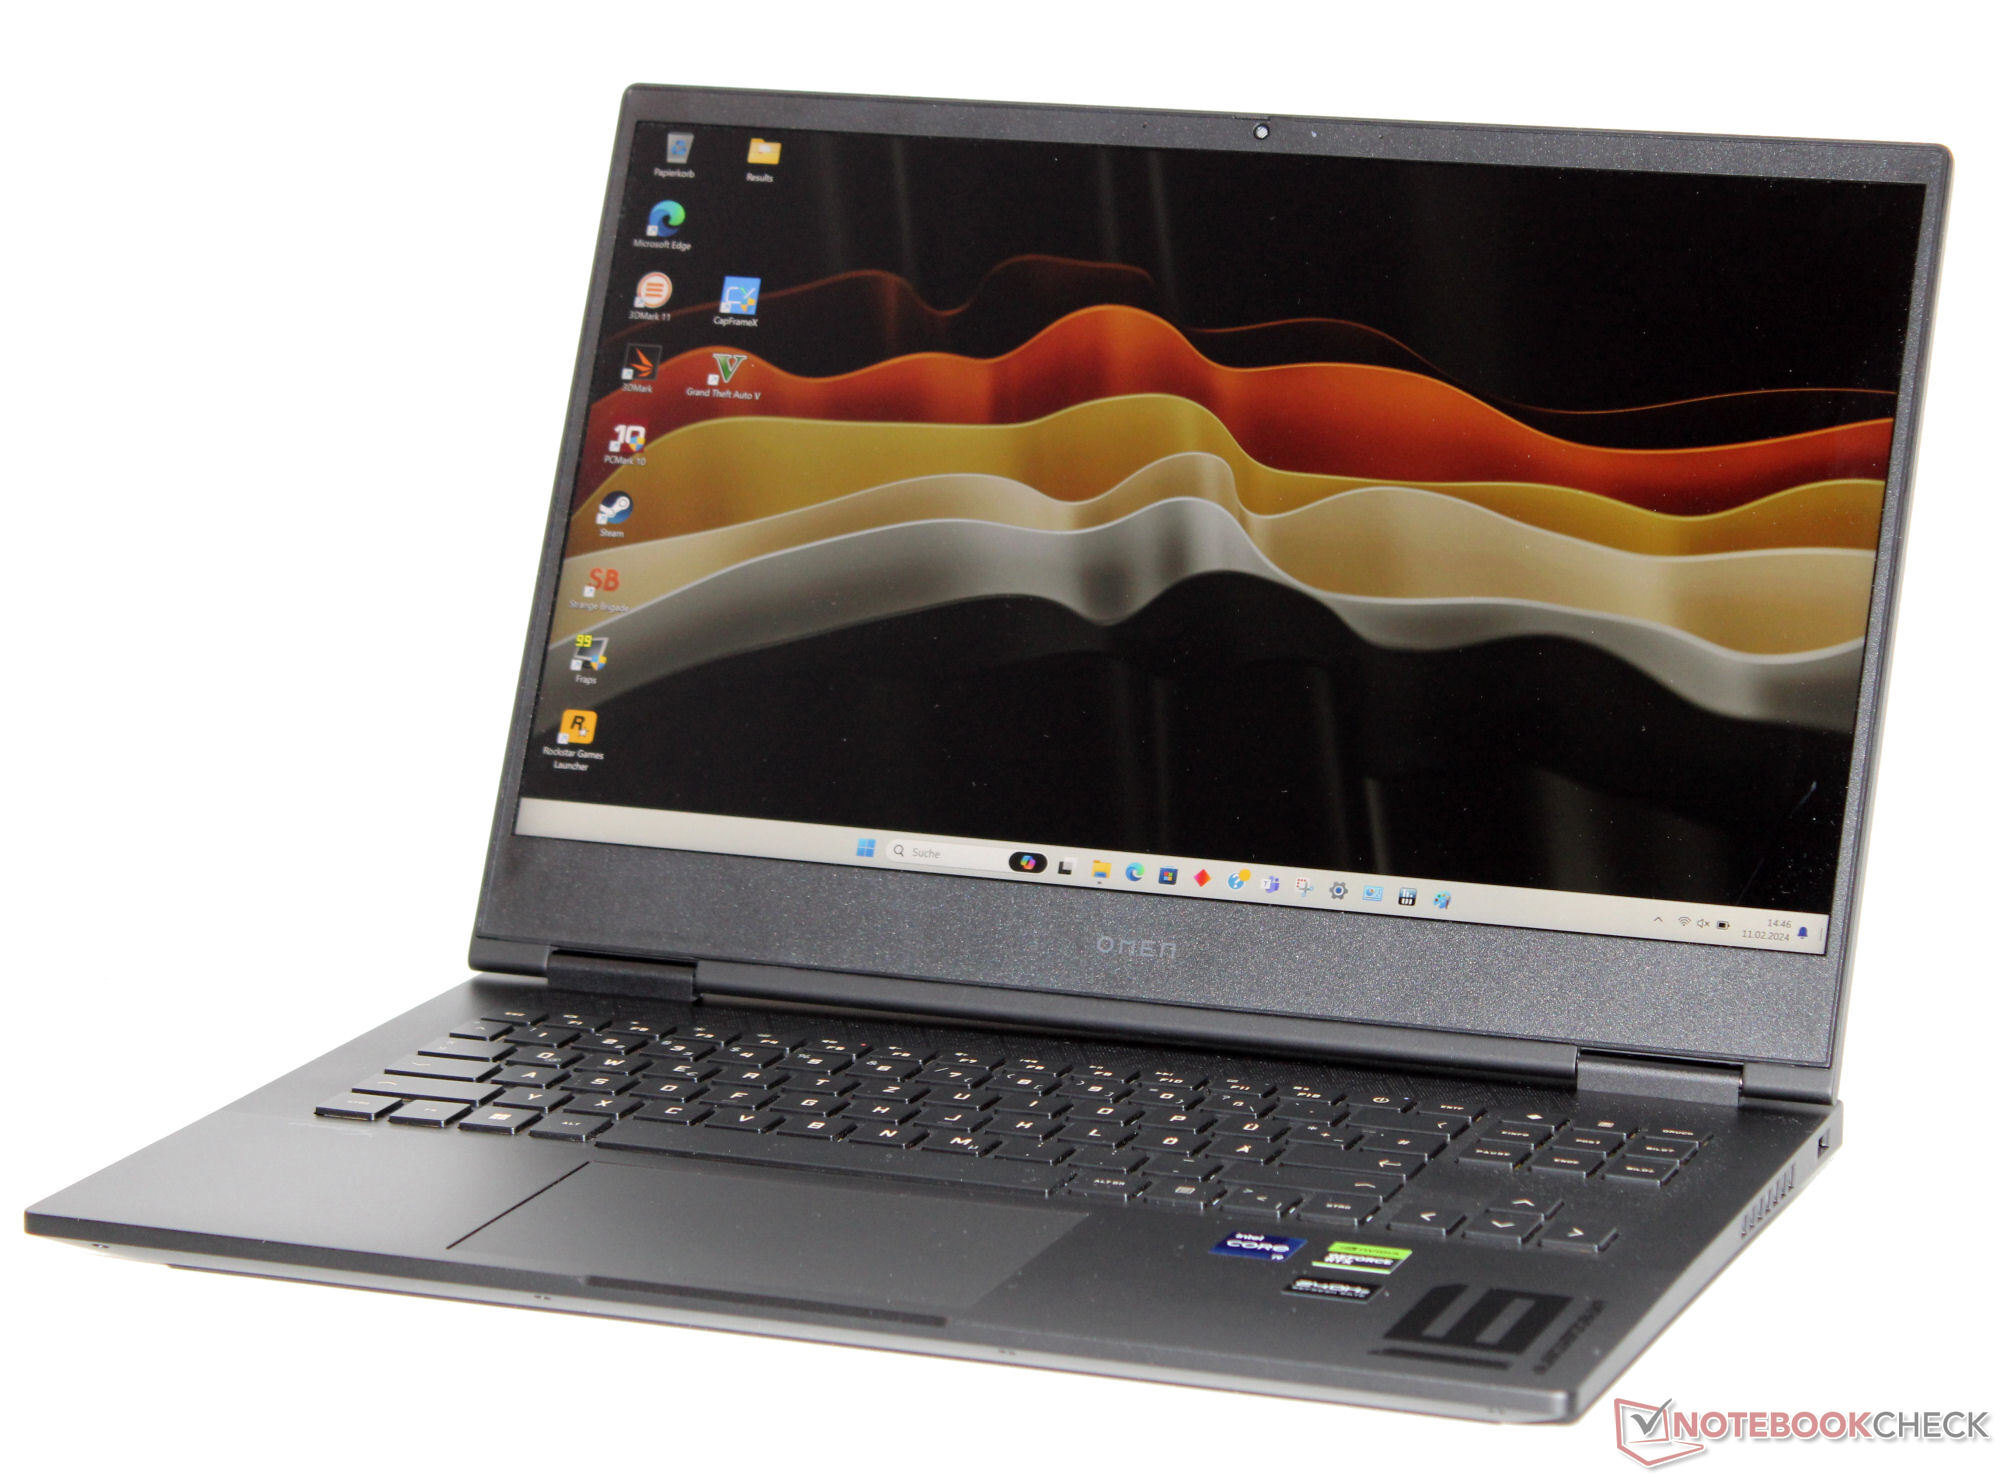
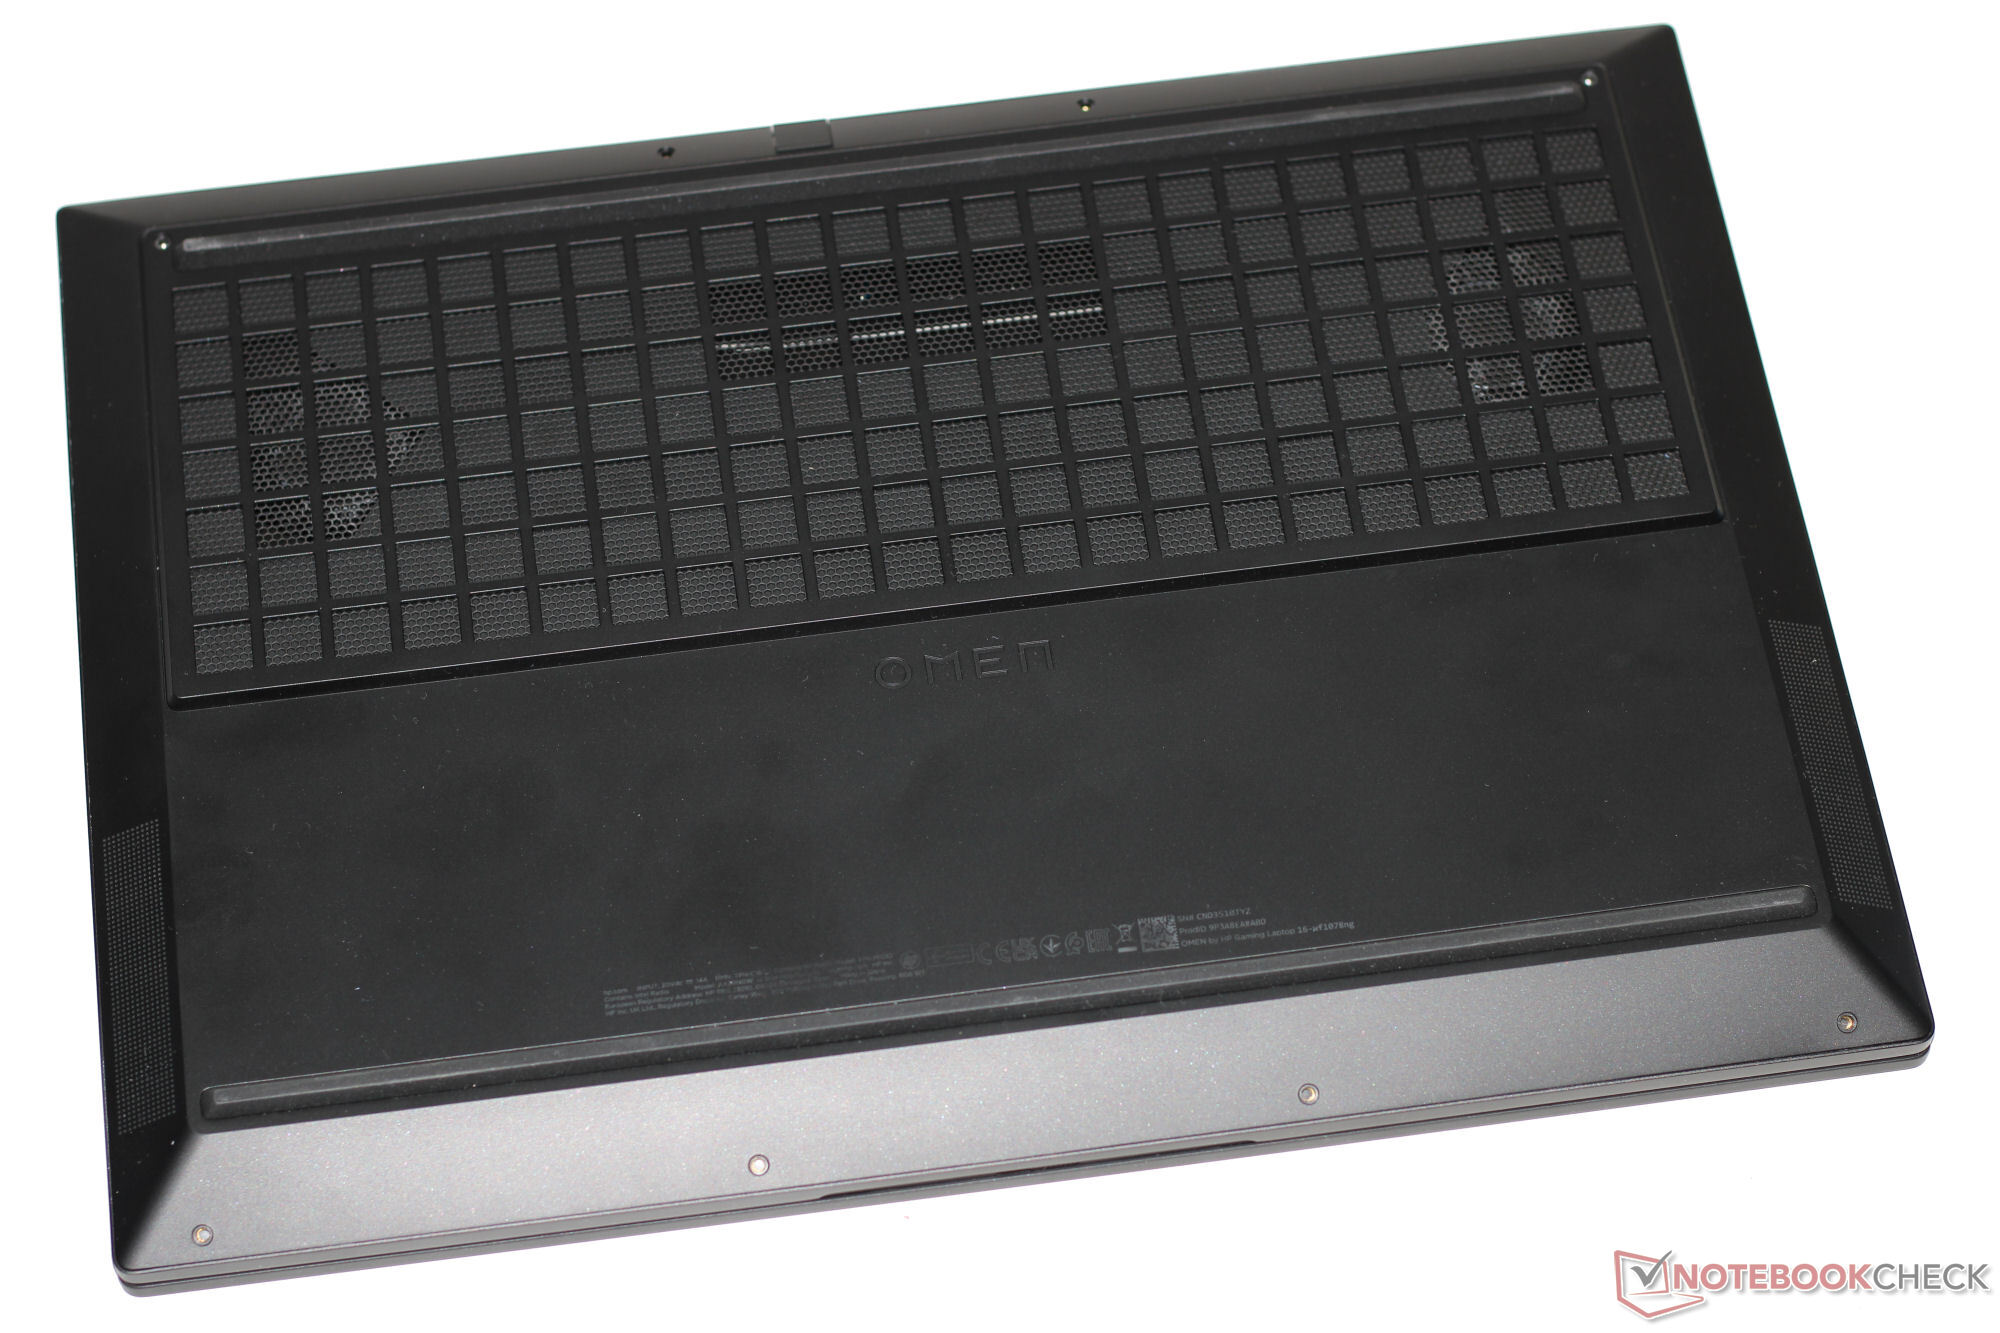
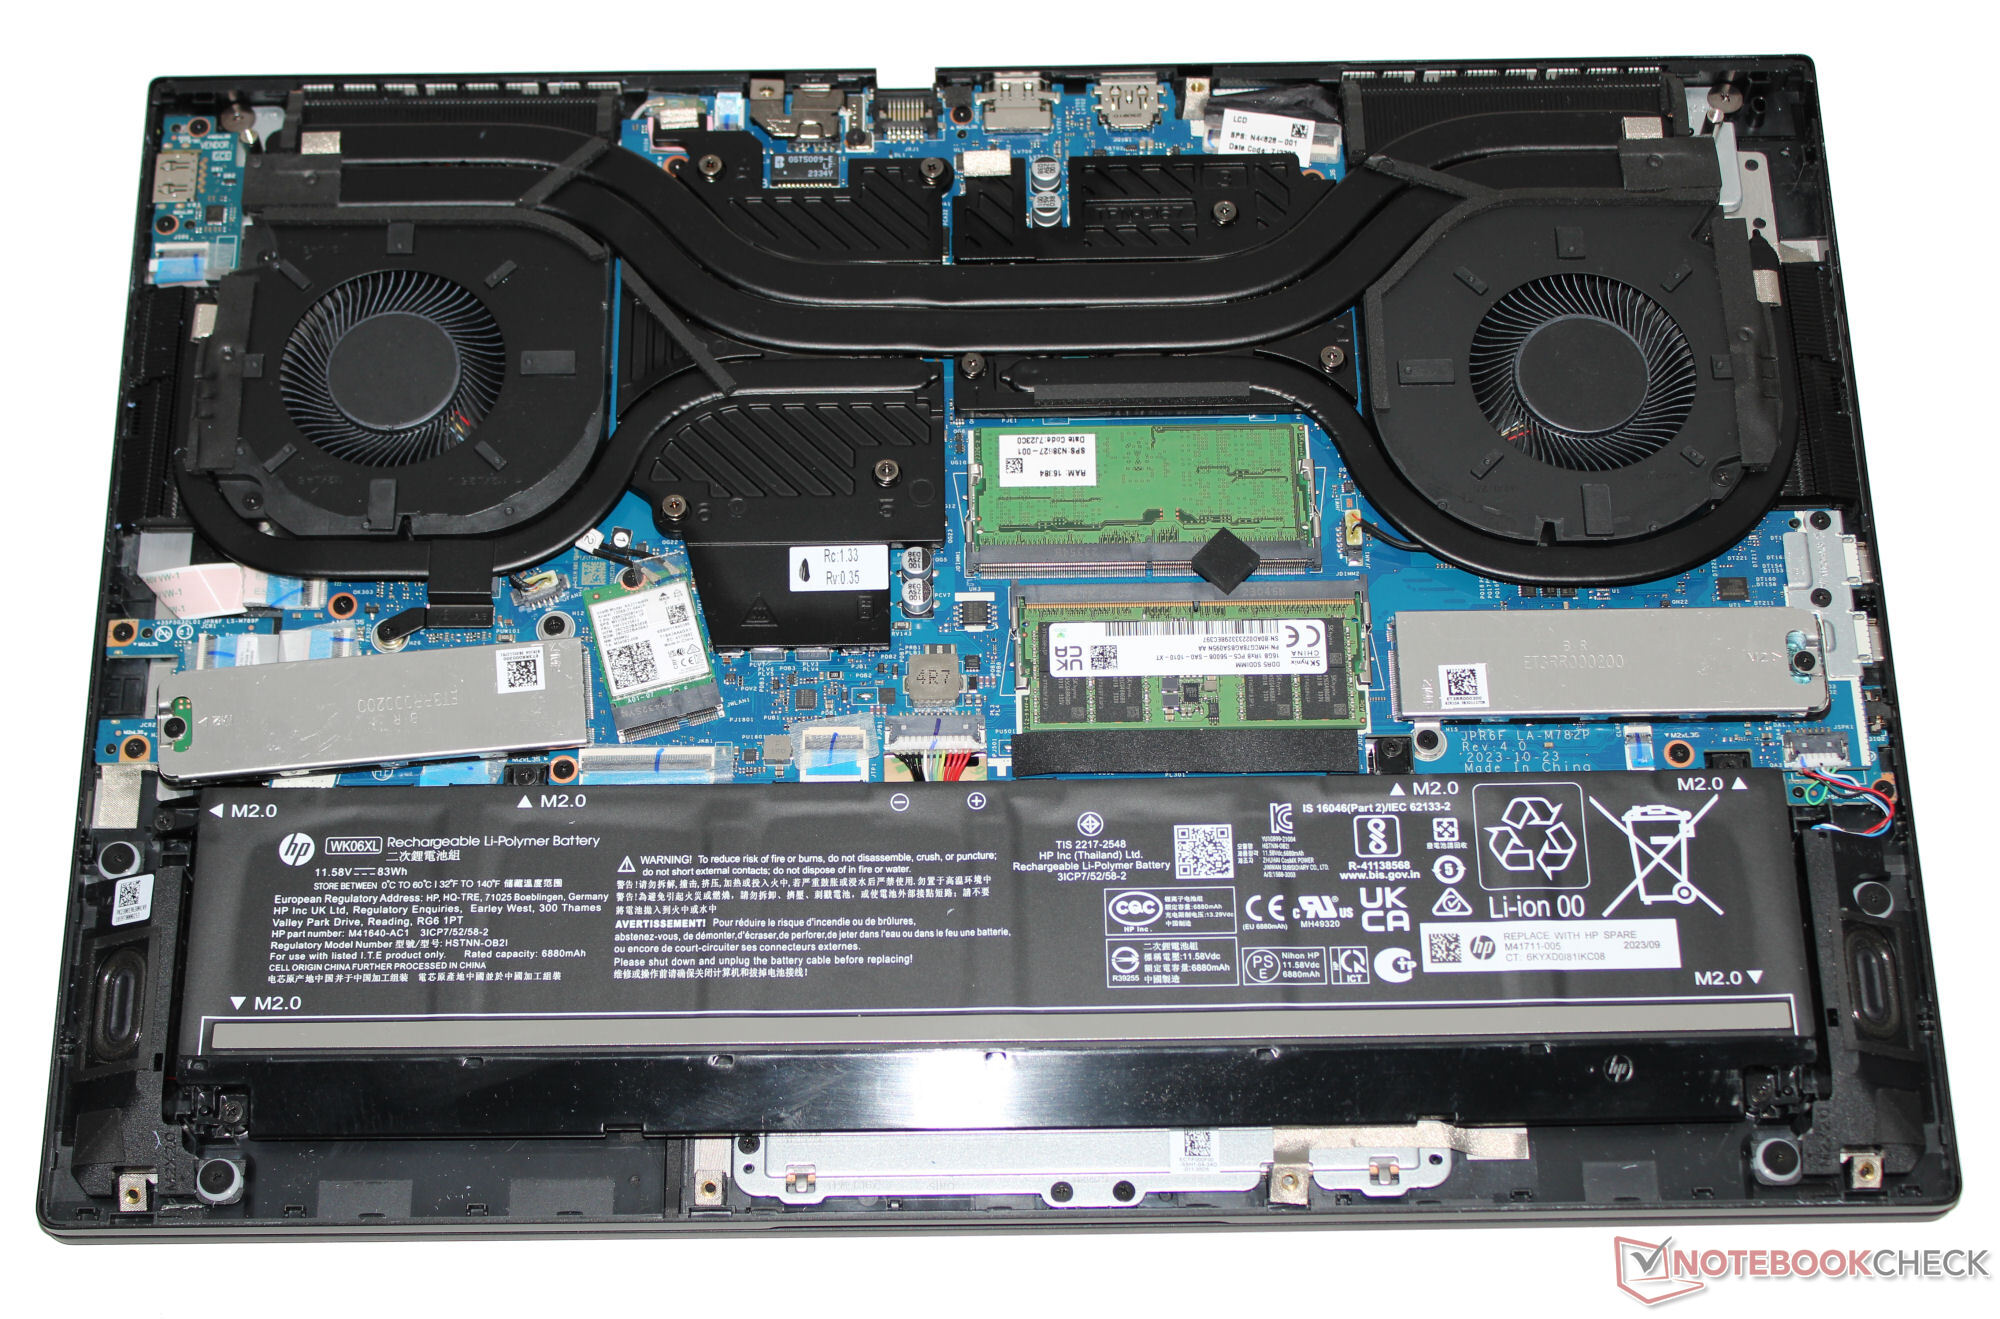
HP zachował tę samą matowo-czarną obudowę o gładkich powierzchniach, co jego poprzednik Recenzja laptopa HP Omen 16 2023: 145 W GeForce Wydajność RTX 4080 . Plastikowa pokrywa kontrastuje z aluminiową podstawą. Obudowa nie posiada żadnych efektownych wzorów ani elementów LED poza podświetleniem klawiatury. Bateria (przykręcona, a nie przyklejona) i reszta sprzętu są dostępne po zdjęciu dolnej pokrywy.
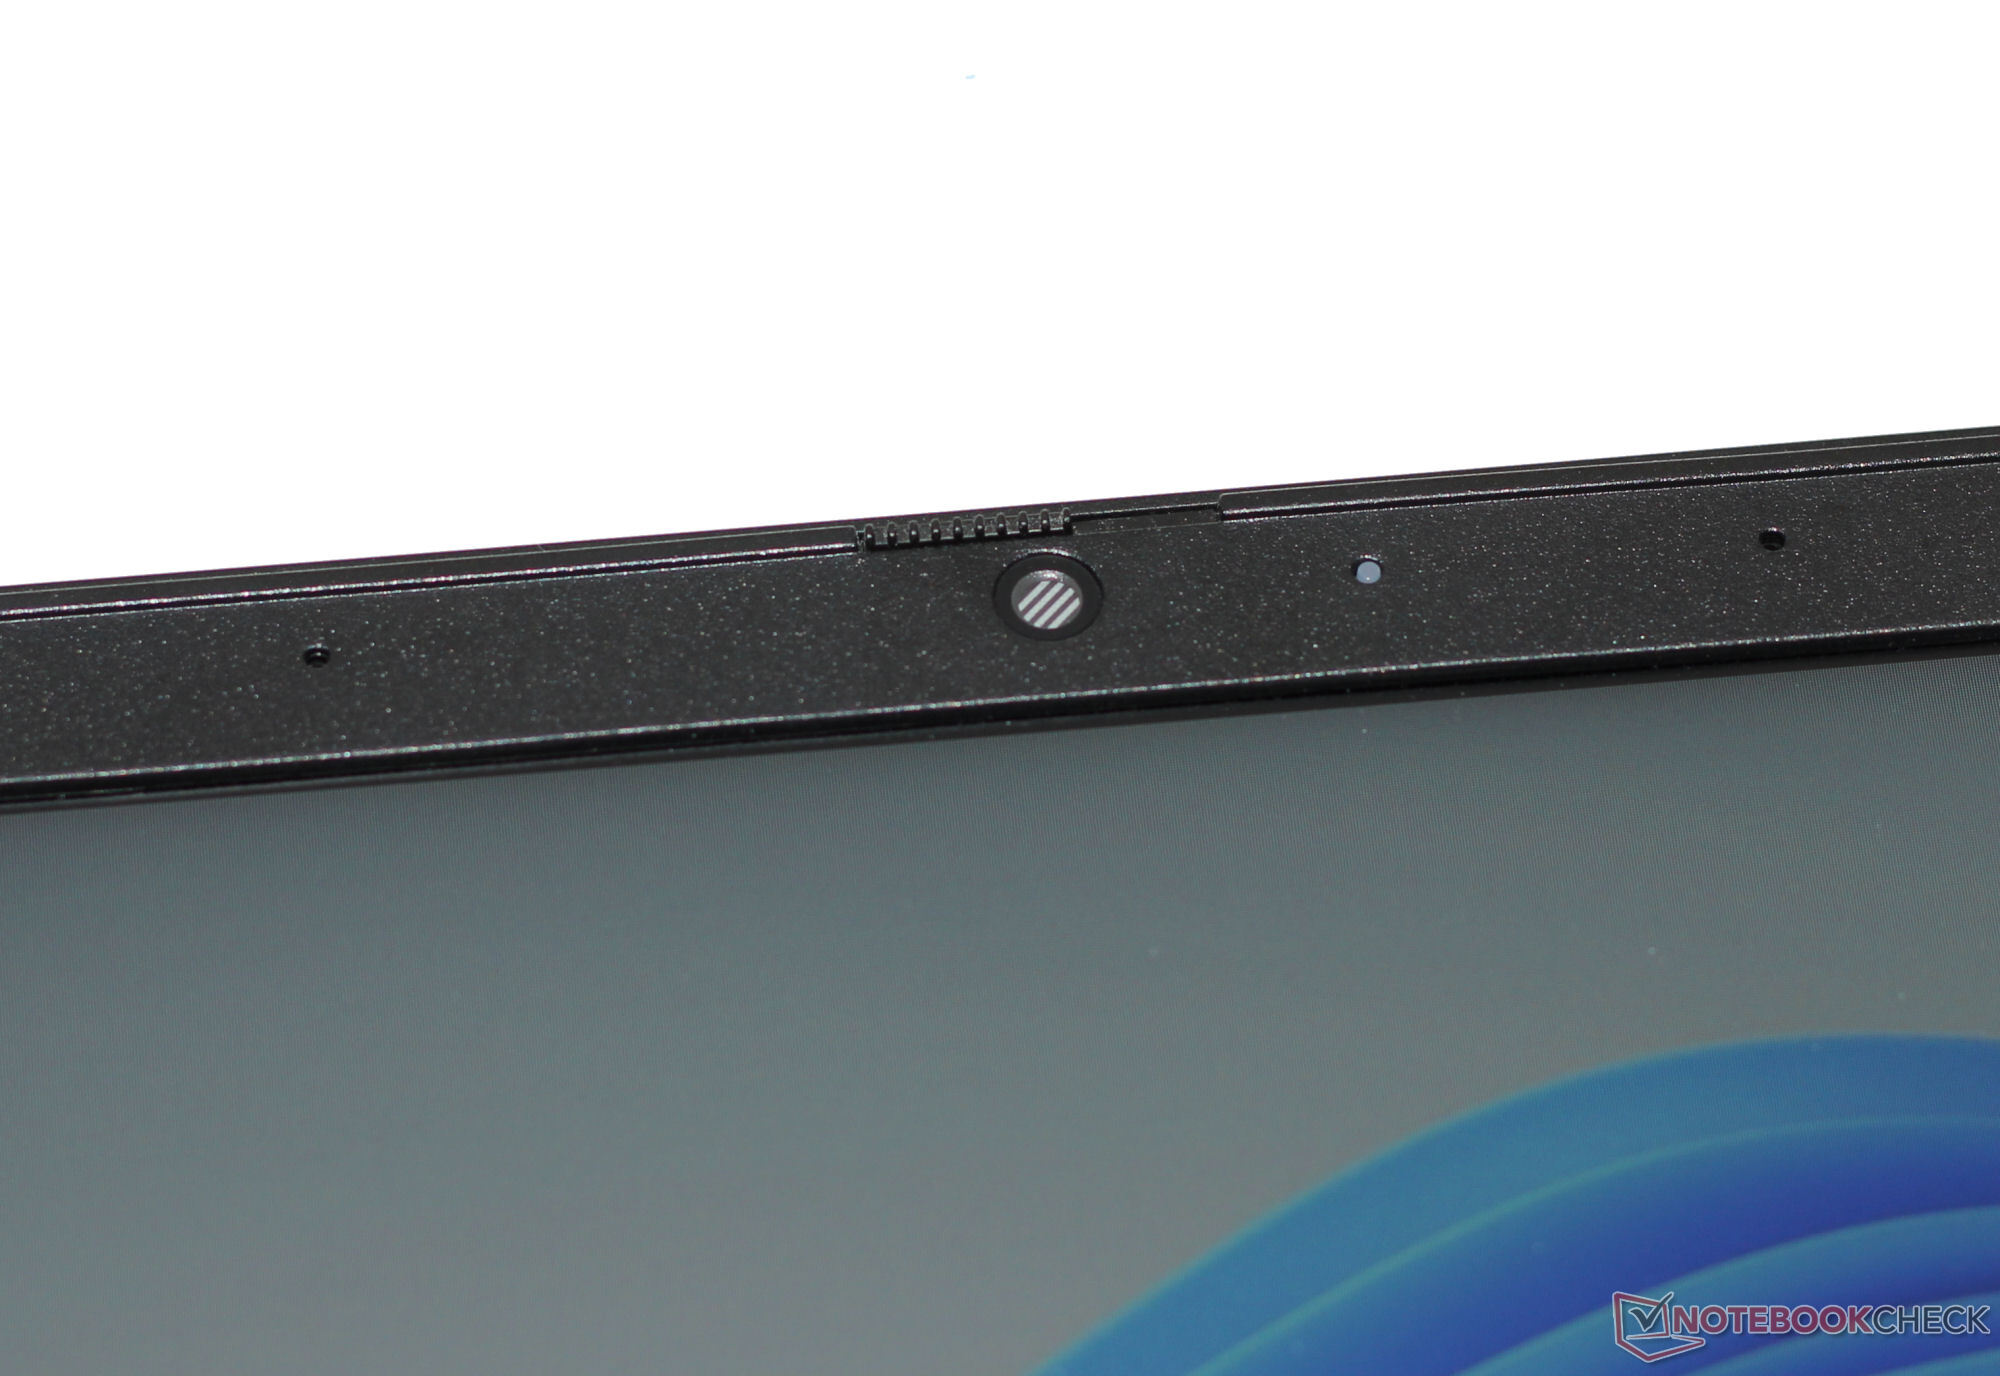
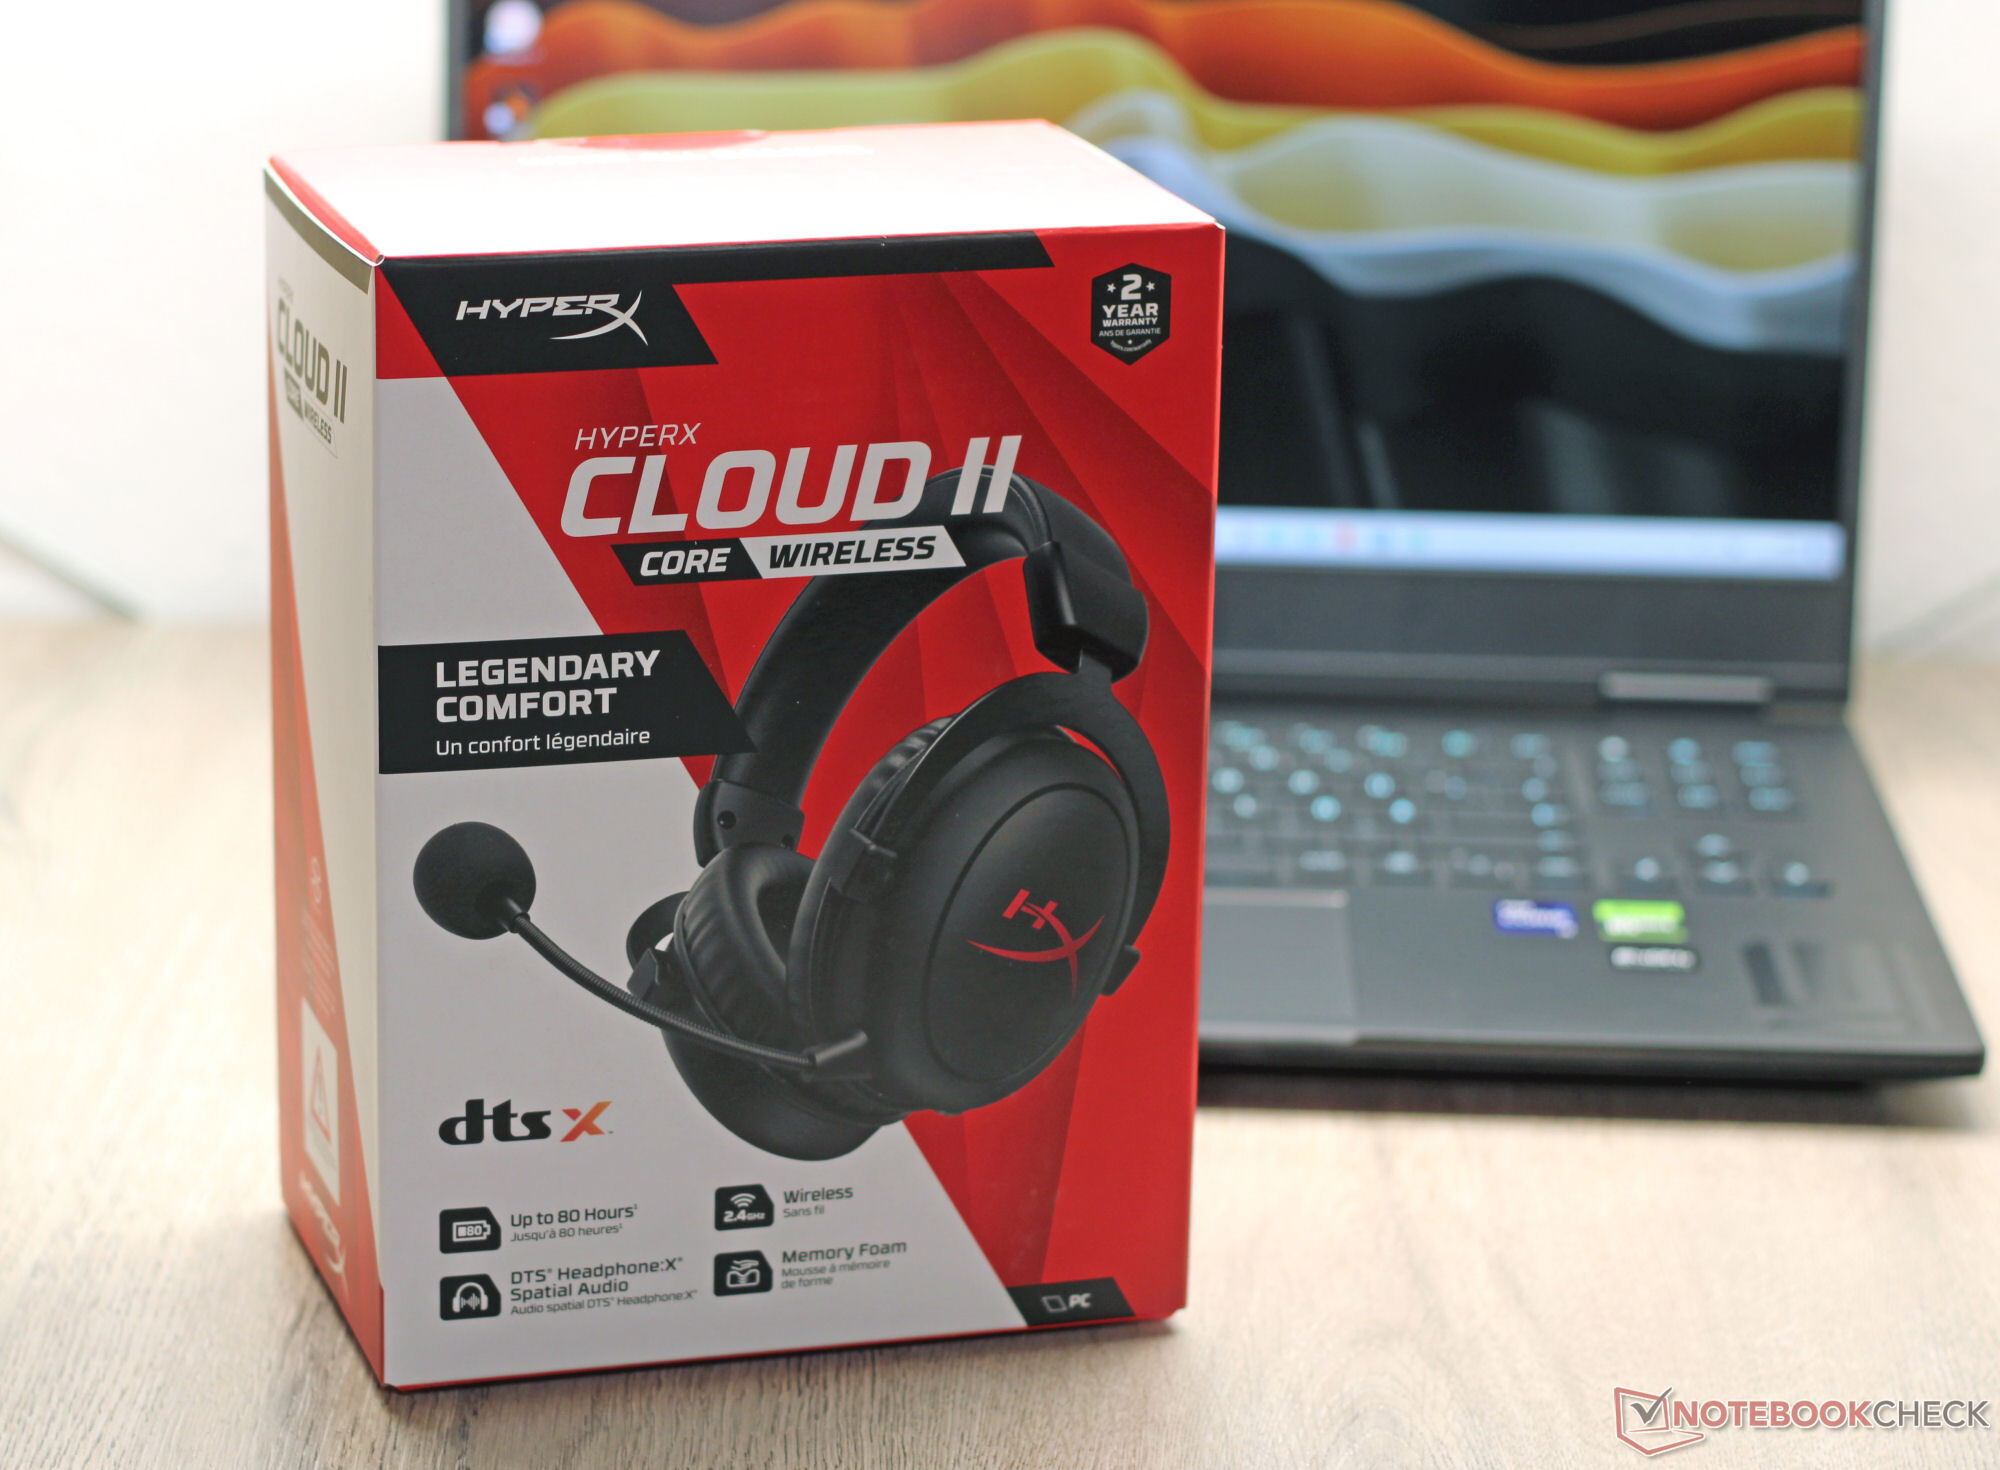
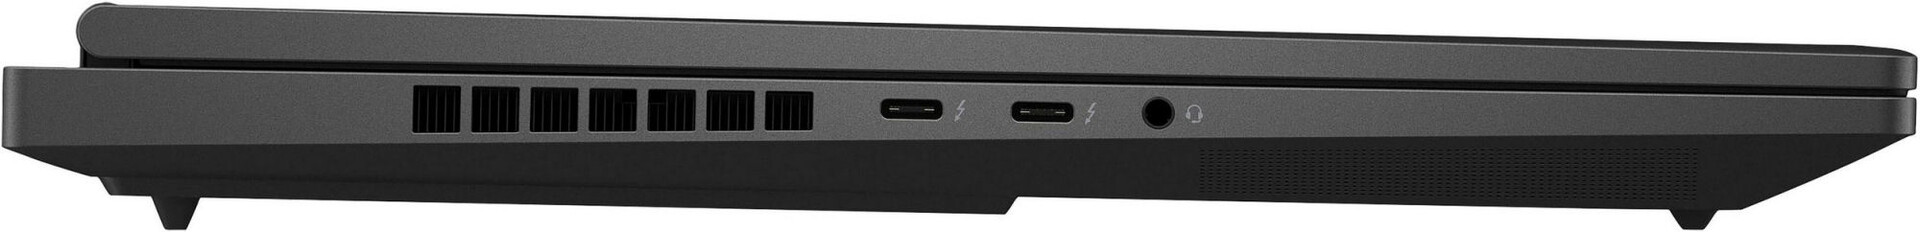
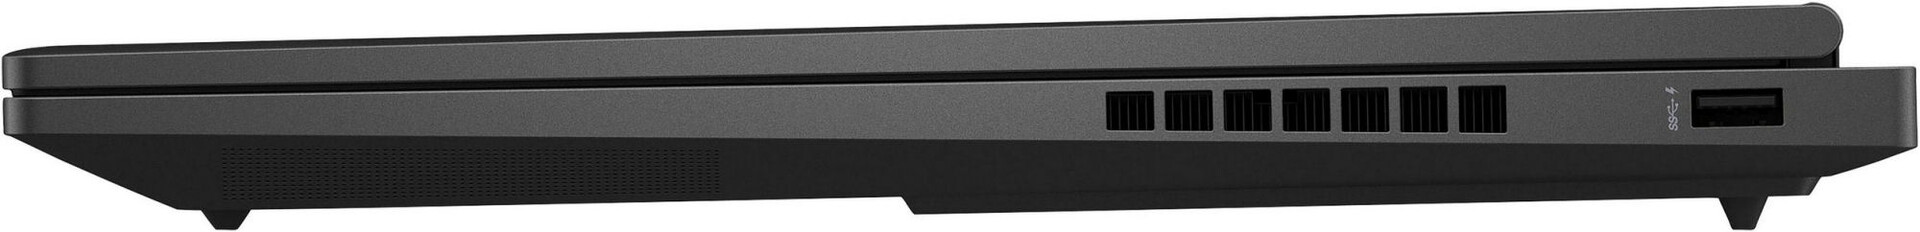
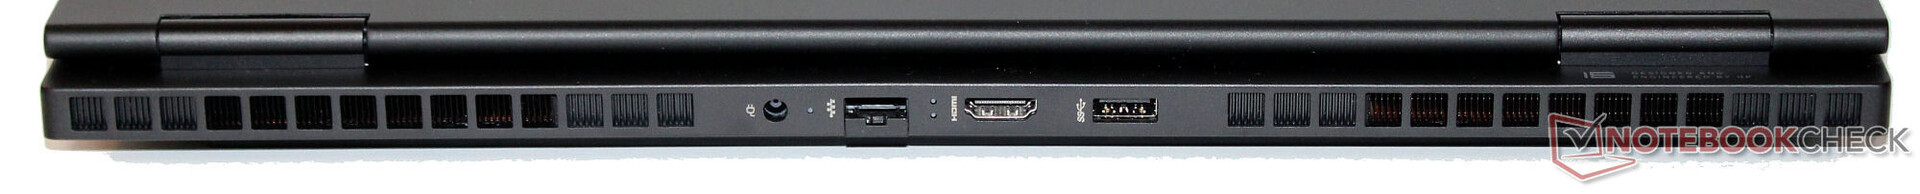
Notebook HP ma na pokładzie dwa porty USB-A (USB 3.2 Gen 1) i dwa porty USB-C (Thunderbolt 4/USB4). Te ostatnie obsługują Power Delivery i mogą wyprowadzać sygnał DisplayPort. Podsumowując, Omen 16 posiada trzy wyjścia wideo (1x HDMI, 2x DP). HP nie wyposażyło urządzenia w czytnik kart pamięci. Kamera internetowa (2,1 MP, maksymalnie 1,920 x 1,080 pikseli, z migawką prywatności) zapewnia standardową jakość obrazu. W zestawie z laptopem znajduje się bezprzewodowy zestaw słuchawkowy HyperX Cloud II Core.
Omen 16 wyposażony jest w moduł Intel Wi-Fi 6E AX211 i w optymalnych warunkach (brak urządzeń Wi-Fi w bezpośrednim otoczeniu, niewielka odległość między laptopem a komputerem serwerowym) osiąga doskonałe prędkości transferu Wi-Fi. Połączenia przewodowe obsługiwane są przez kontroler Realtek RTL8168/8111 Ethernet (1 Gbit/s).


 GeForce RTX 4080 Laptop GPU, i9-14900HX, SK hynix PC801 HFS001TEJ9X101N")
 GeForce RTX 4080 Laptop GPU, i9-14900HX, SK hynix PC801 HFS001TEJ9X101N")
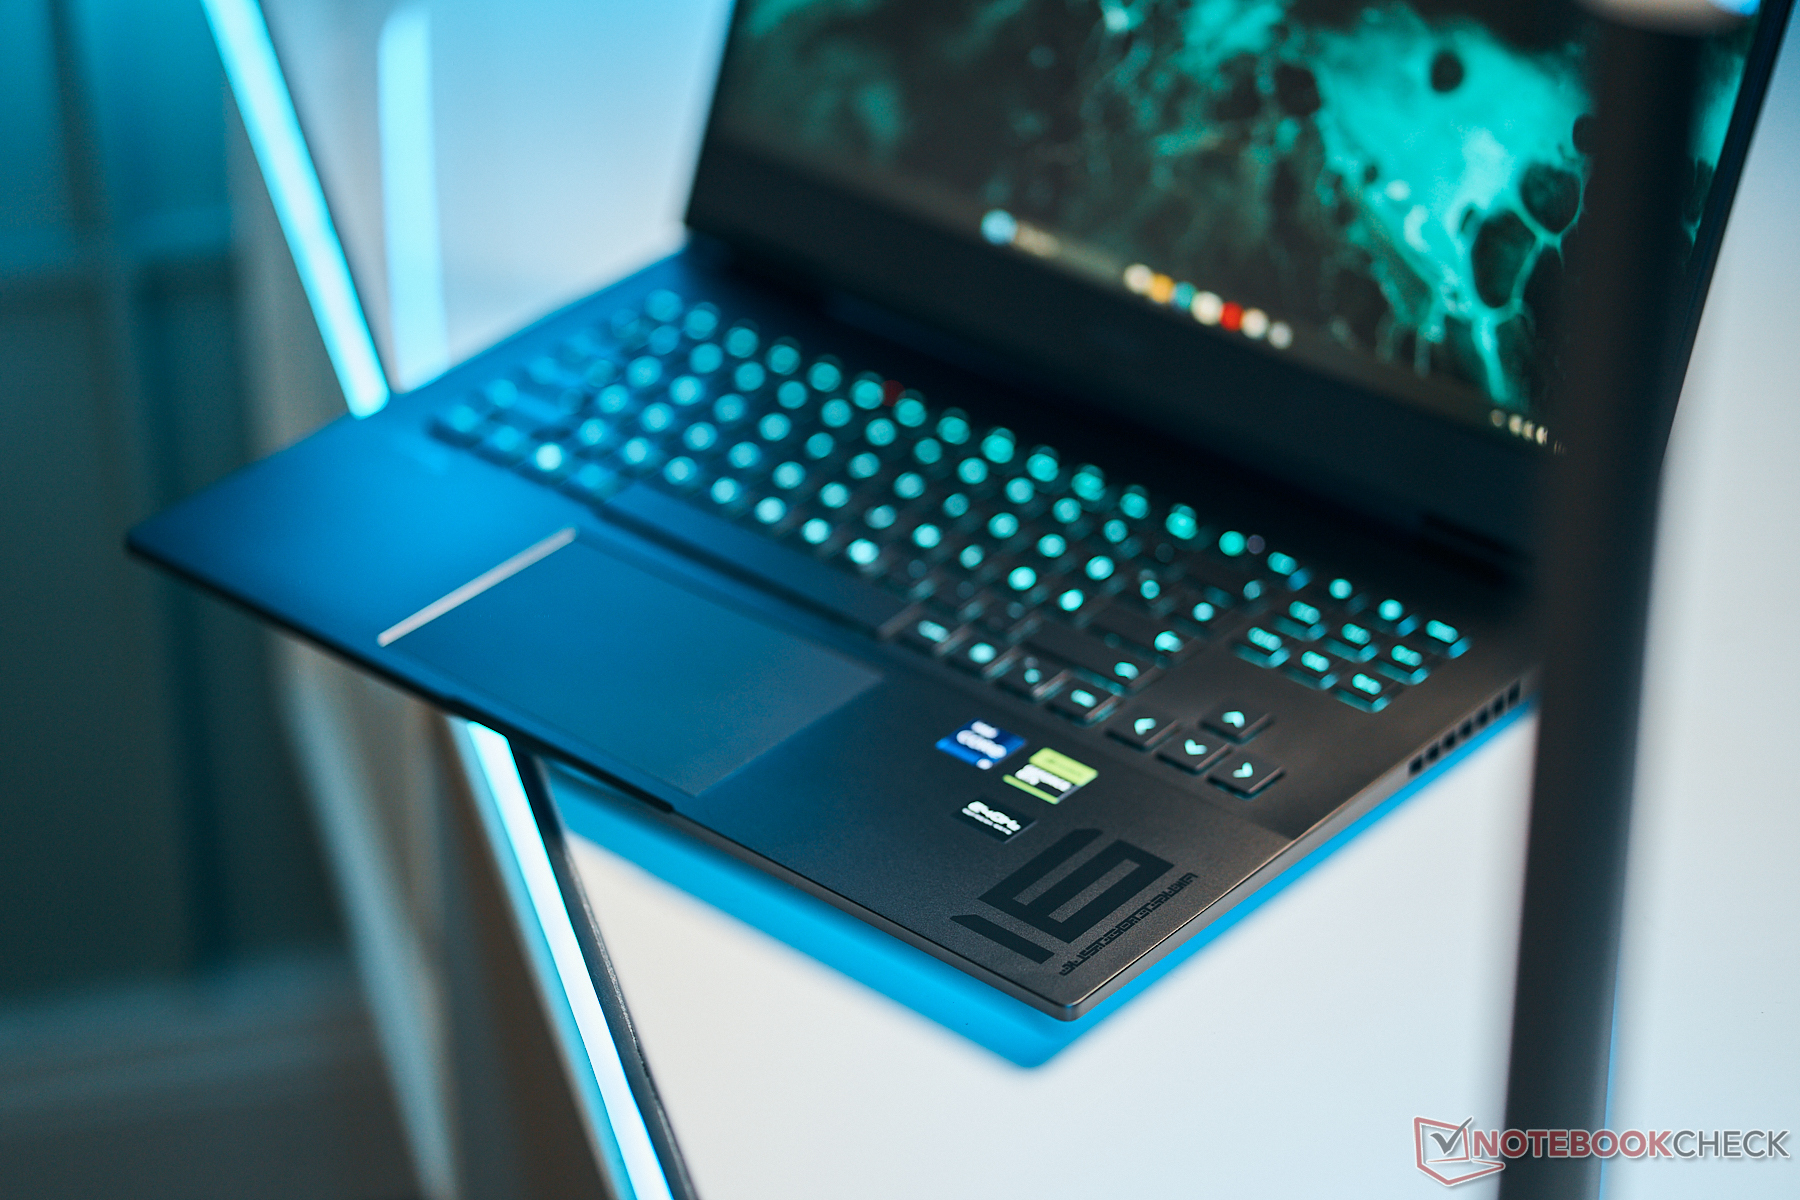
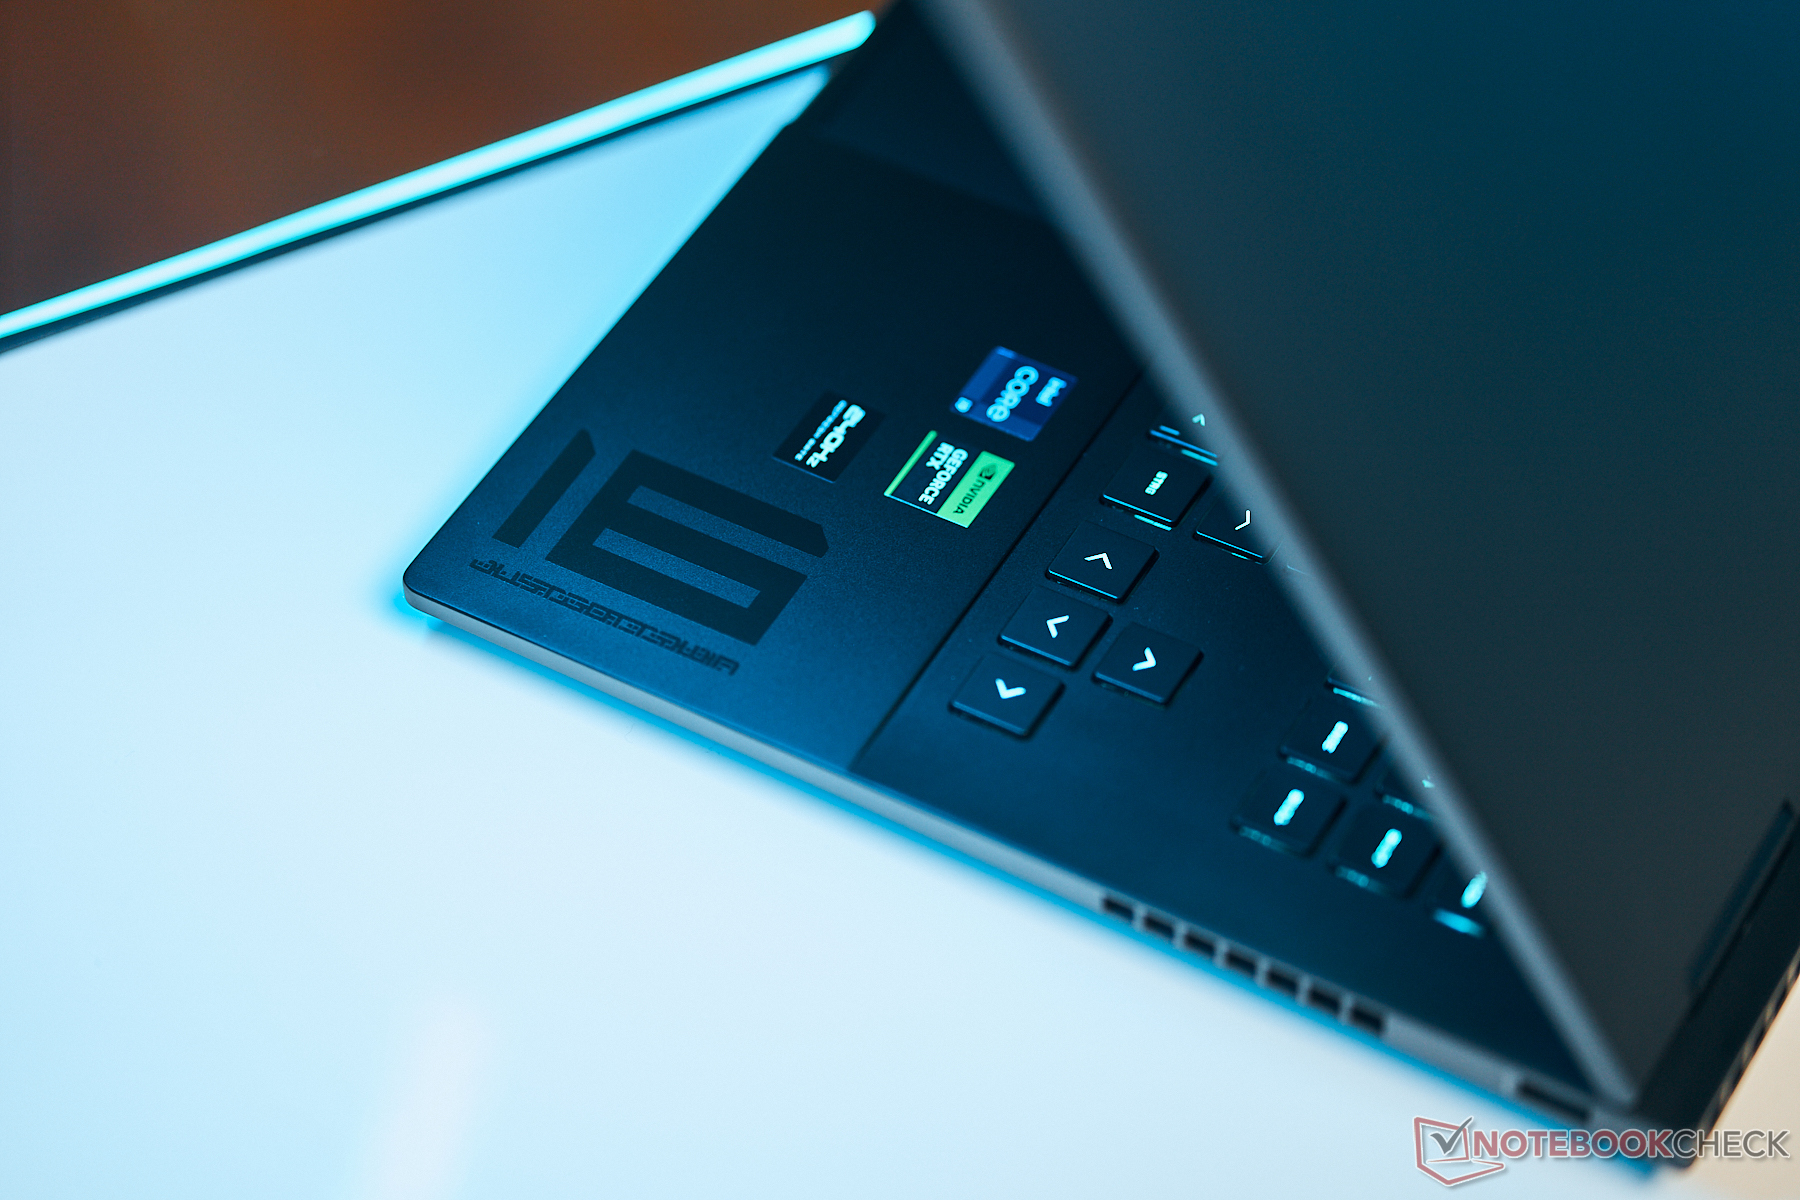
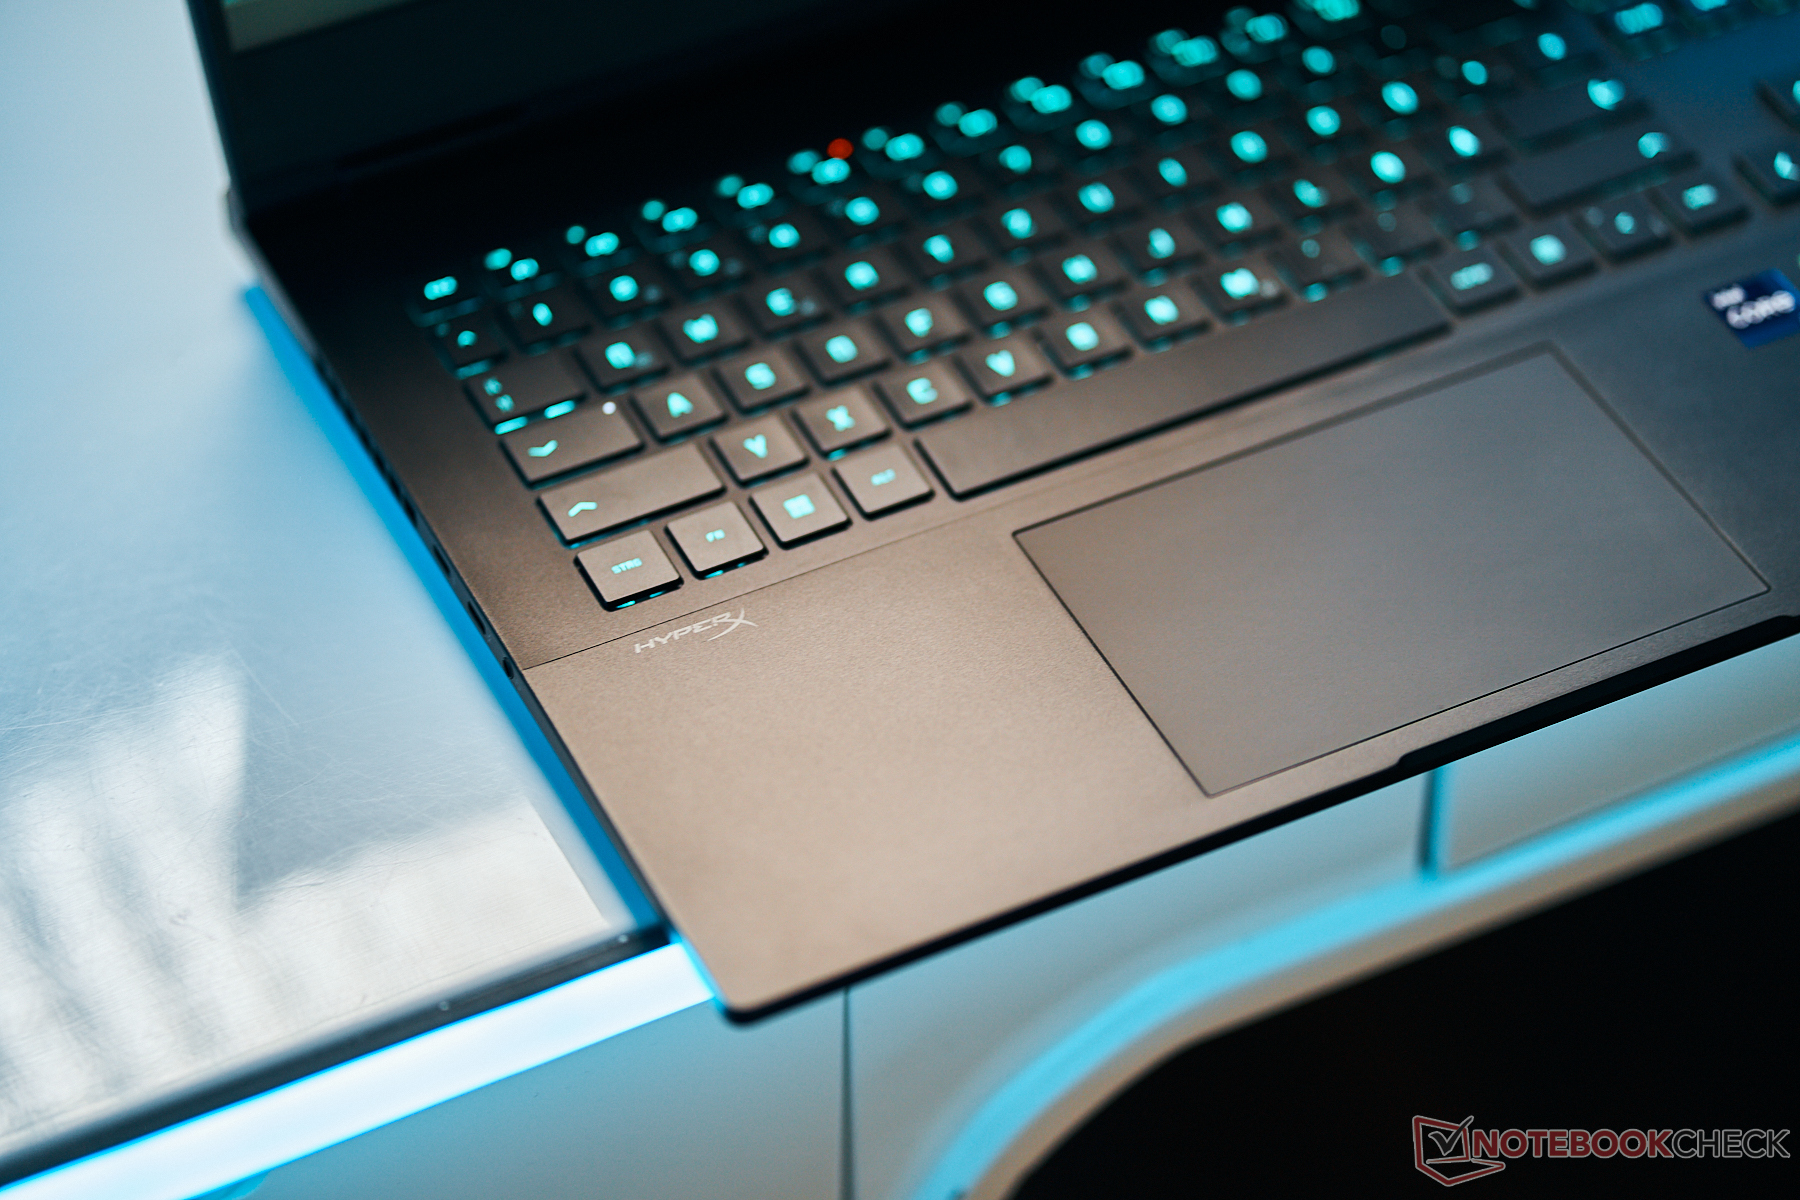
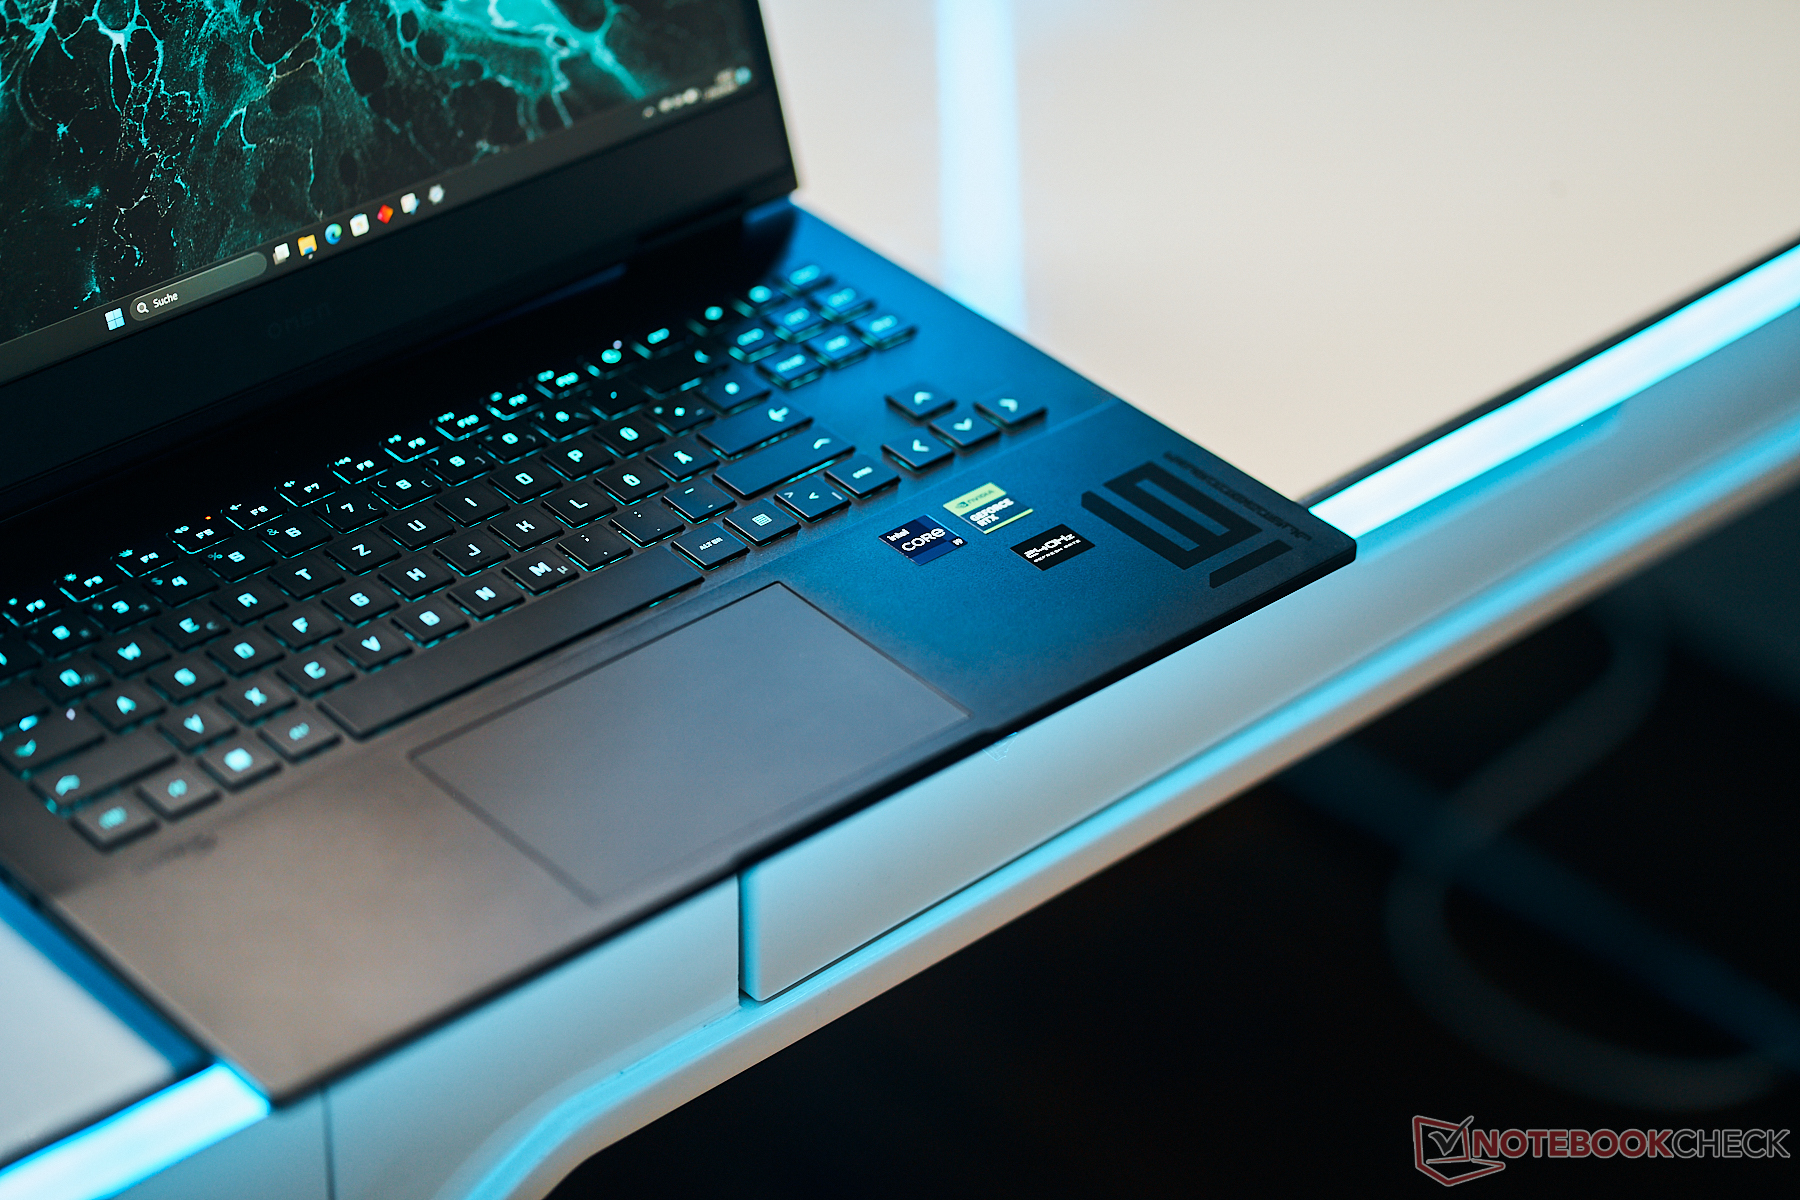
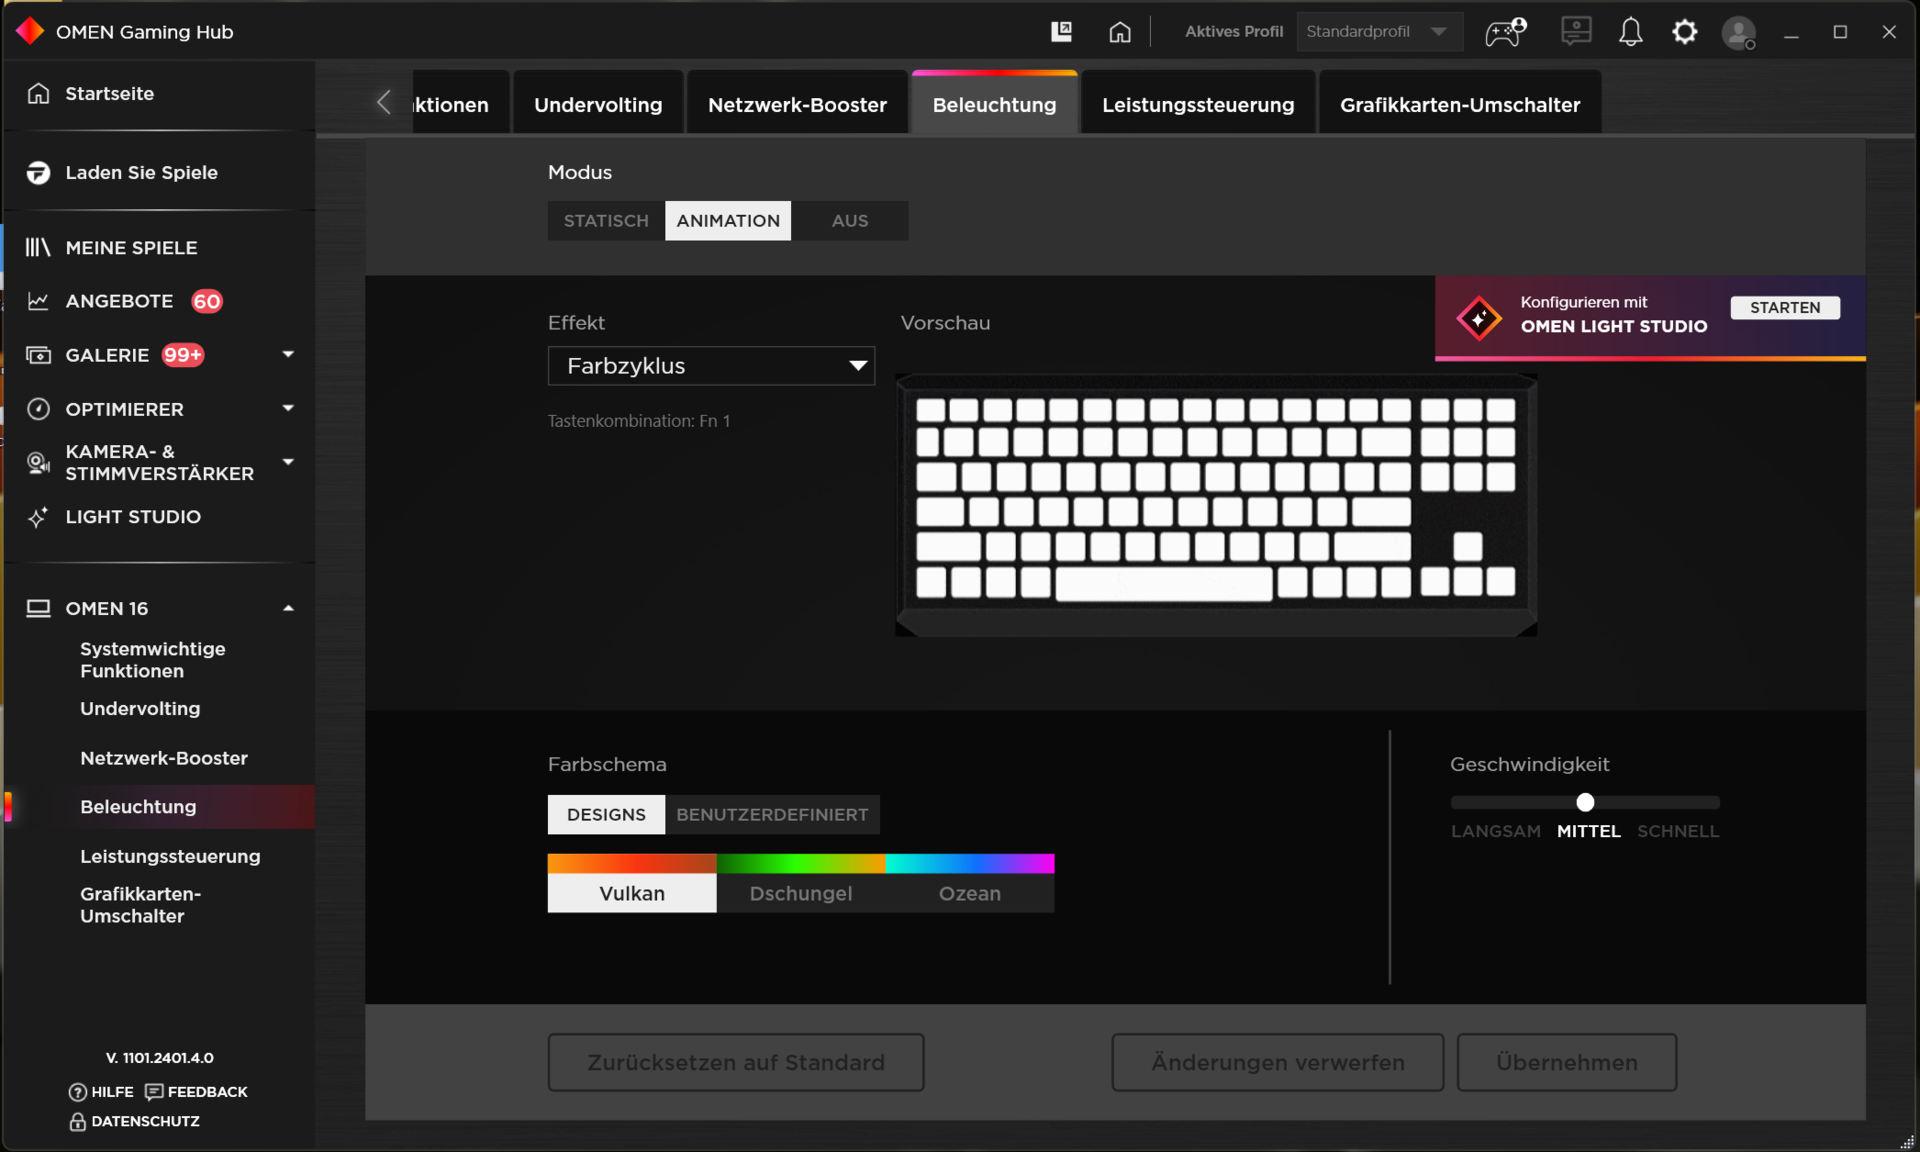
Urządzenia wejściowe - Omen oferuje podświetlenie RGB dla każdego klawisza
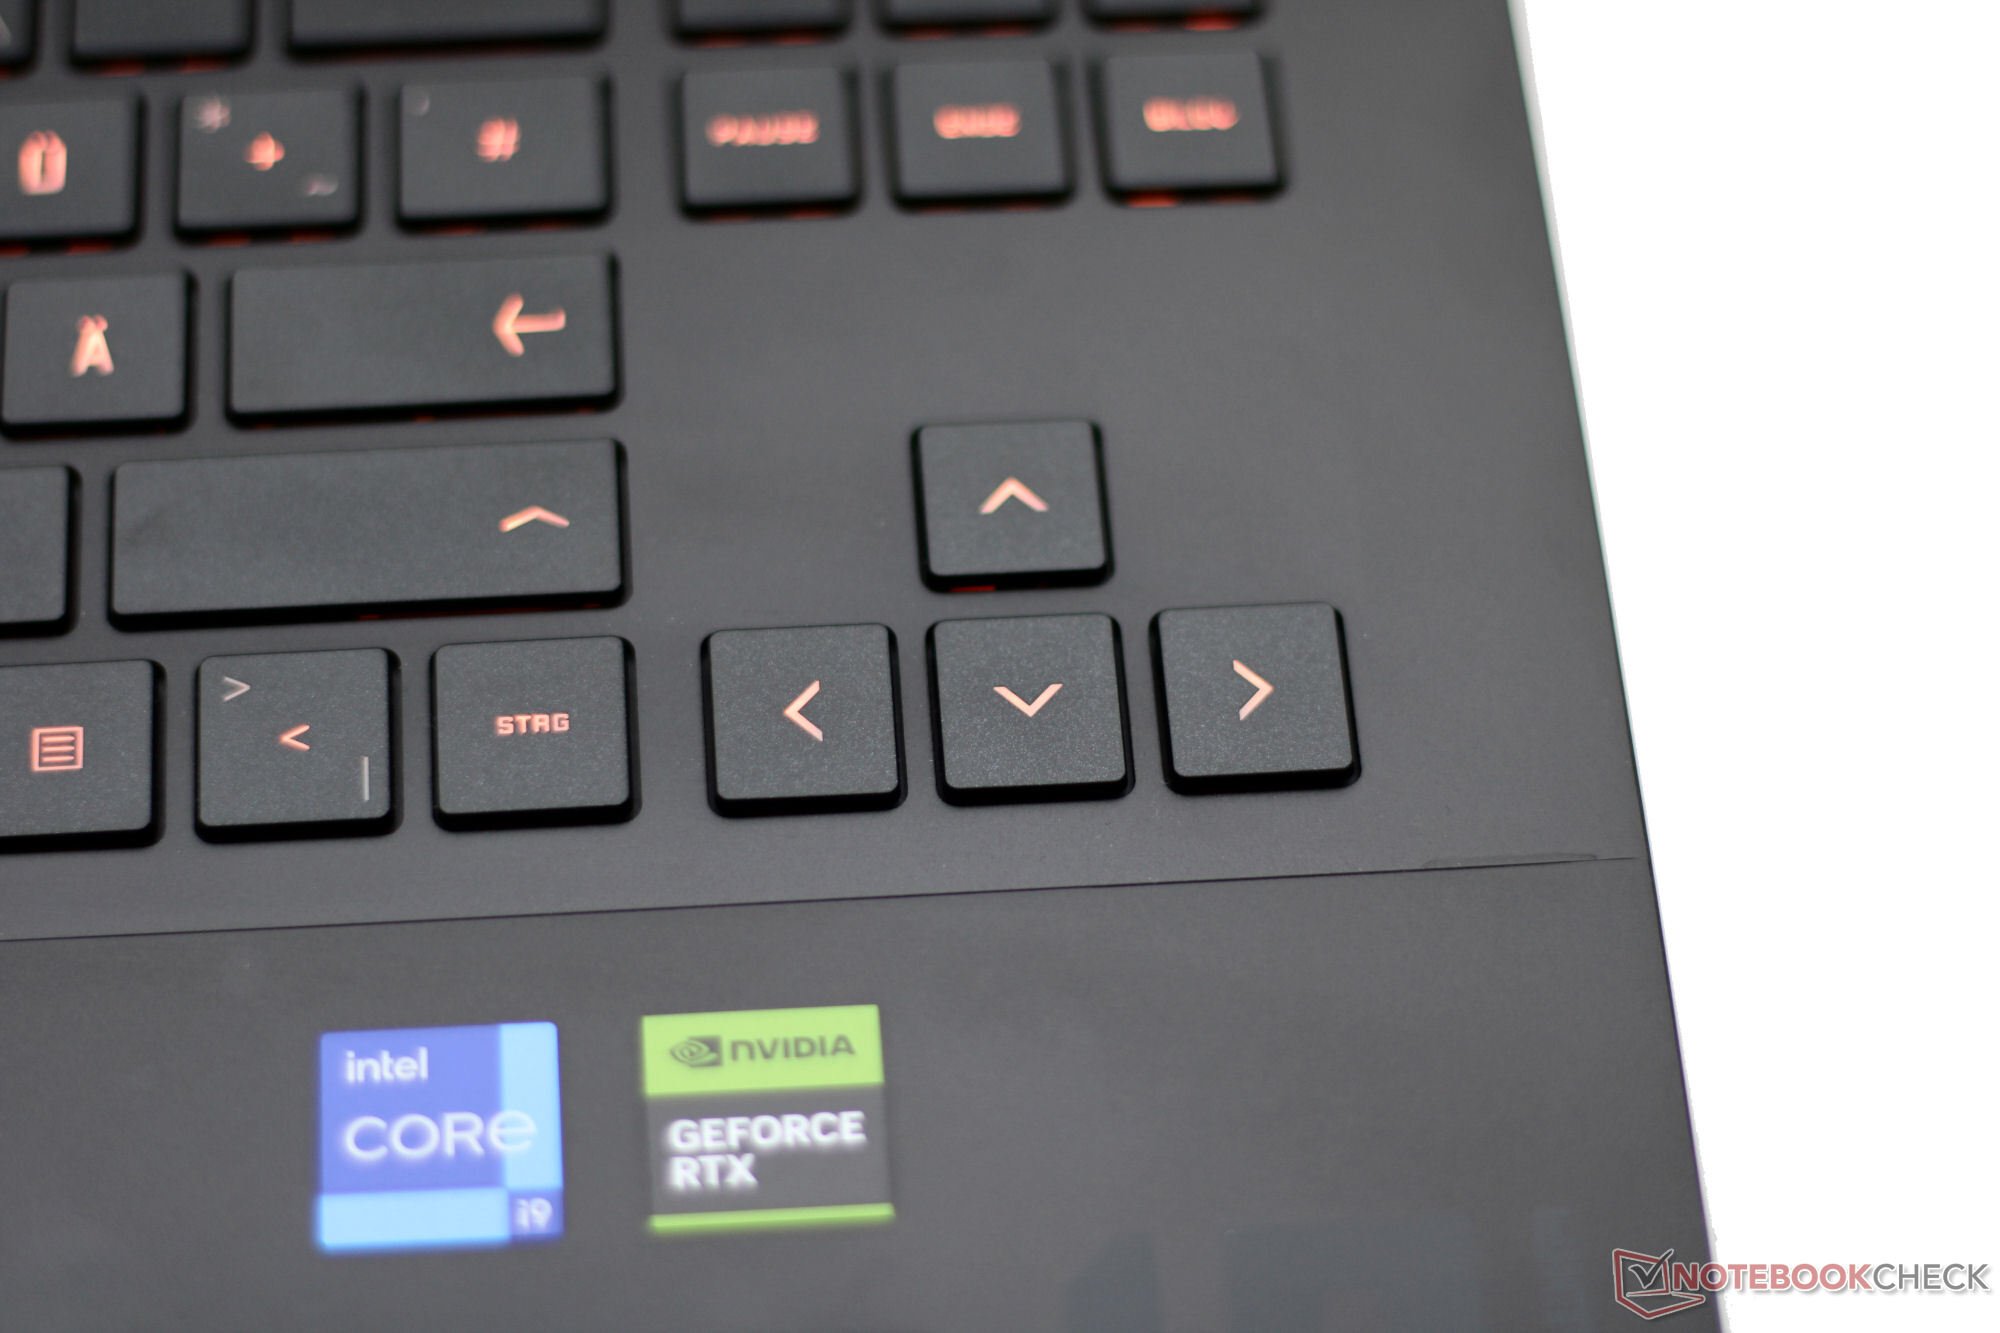
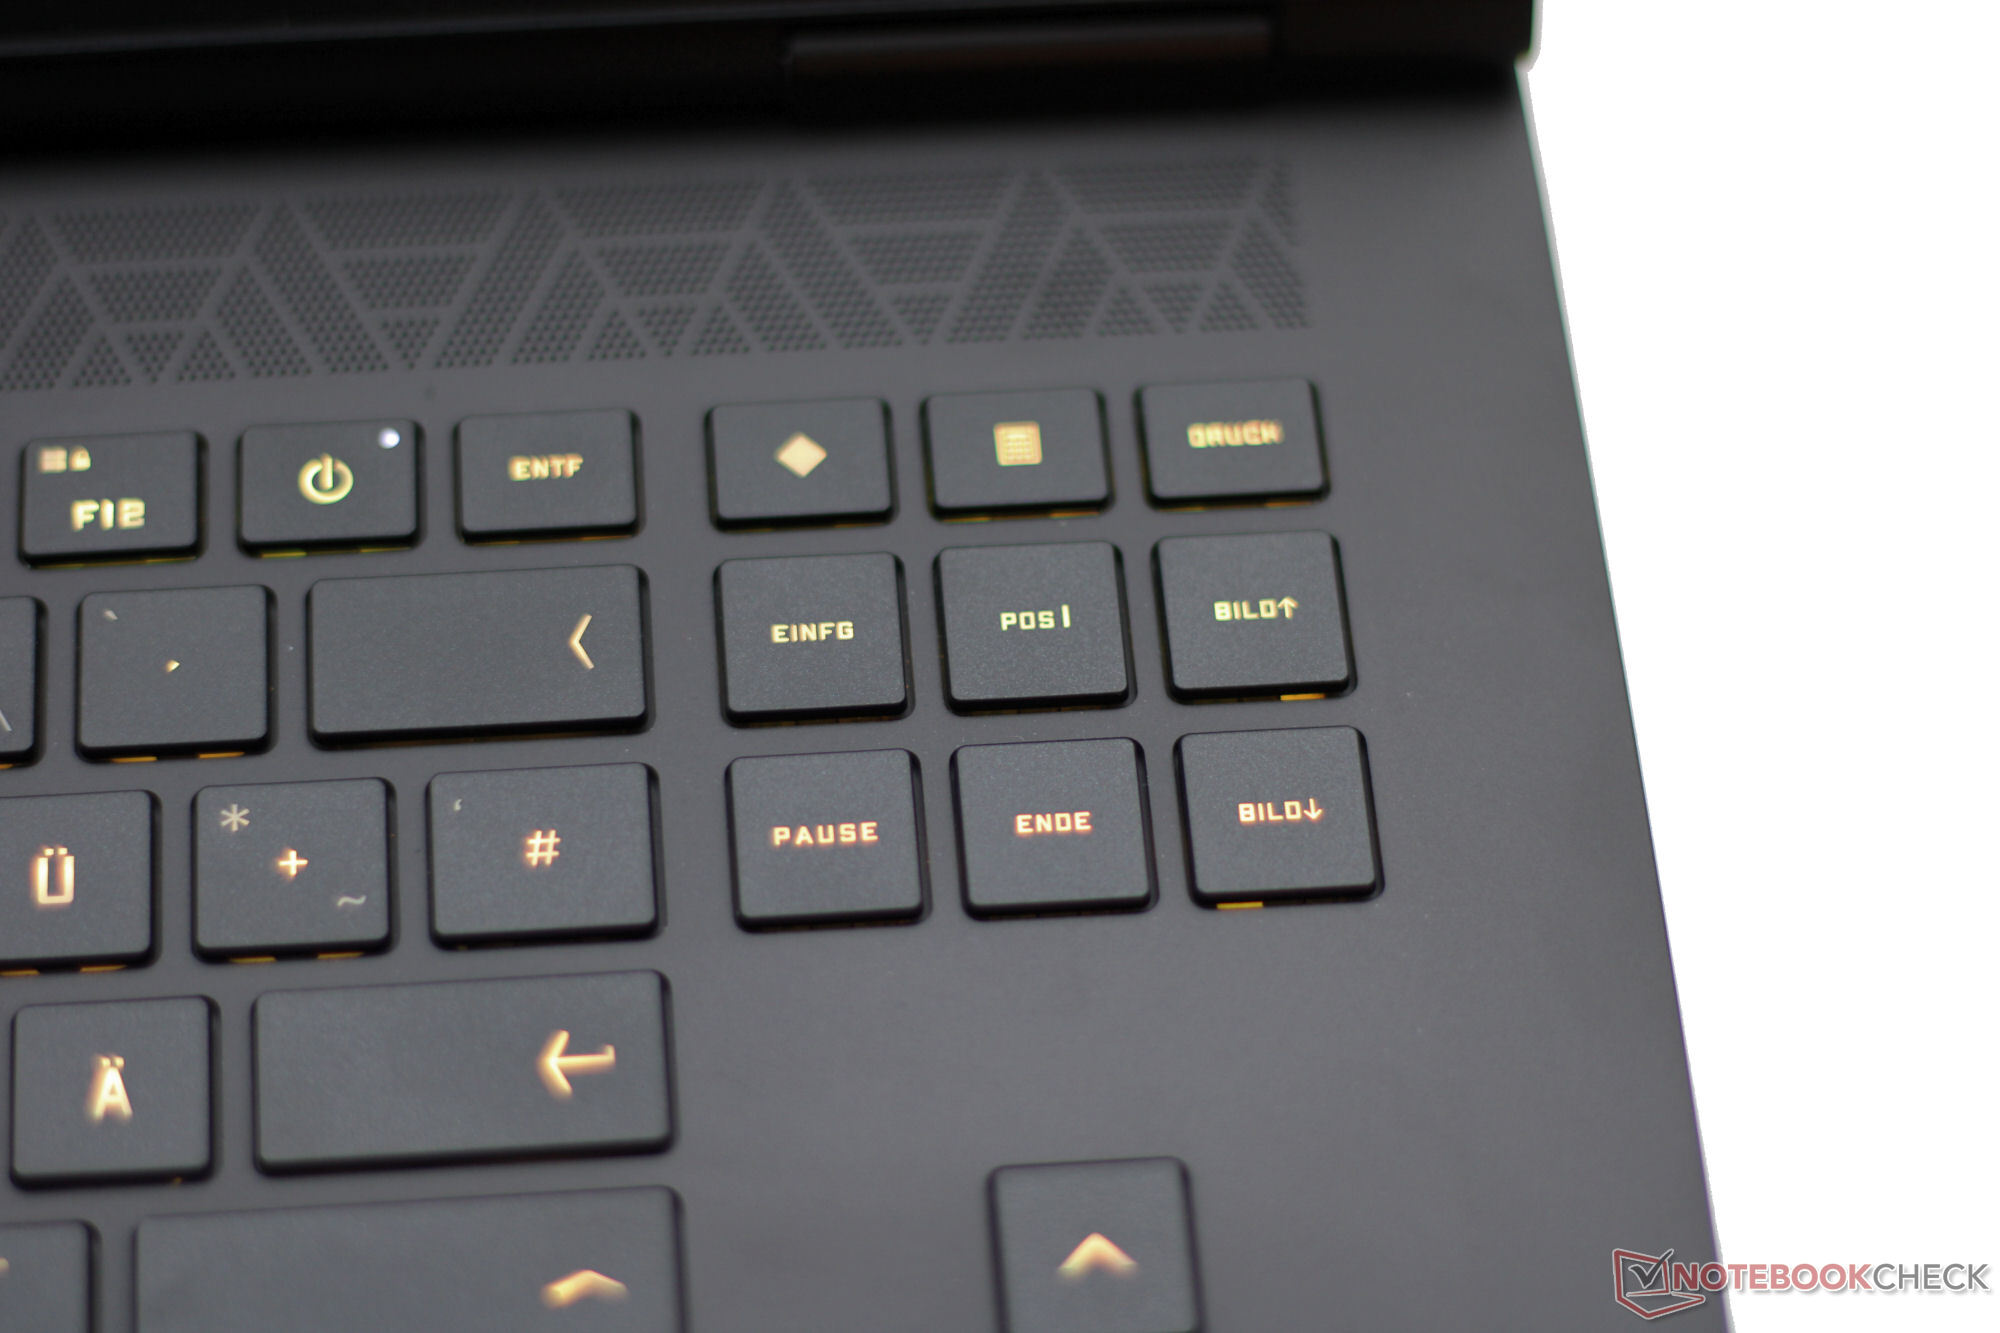
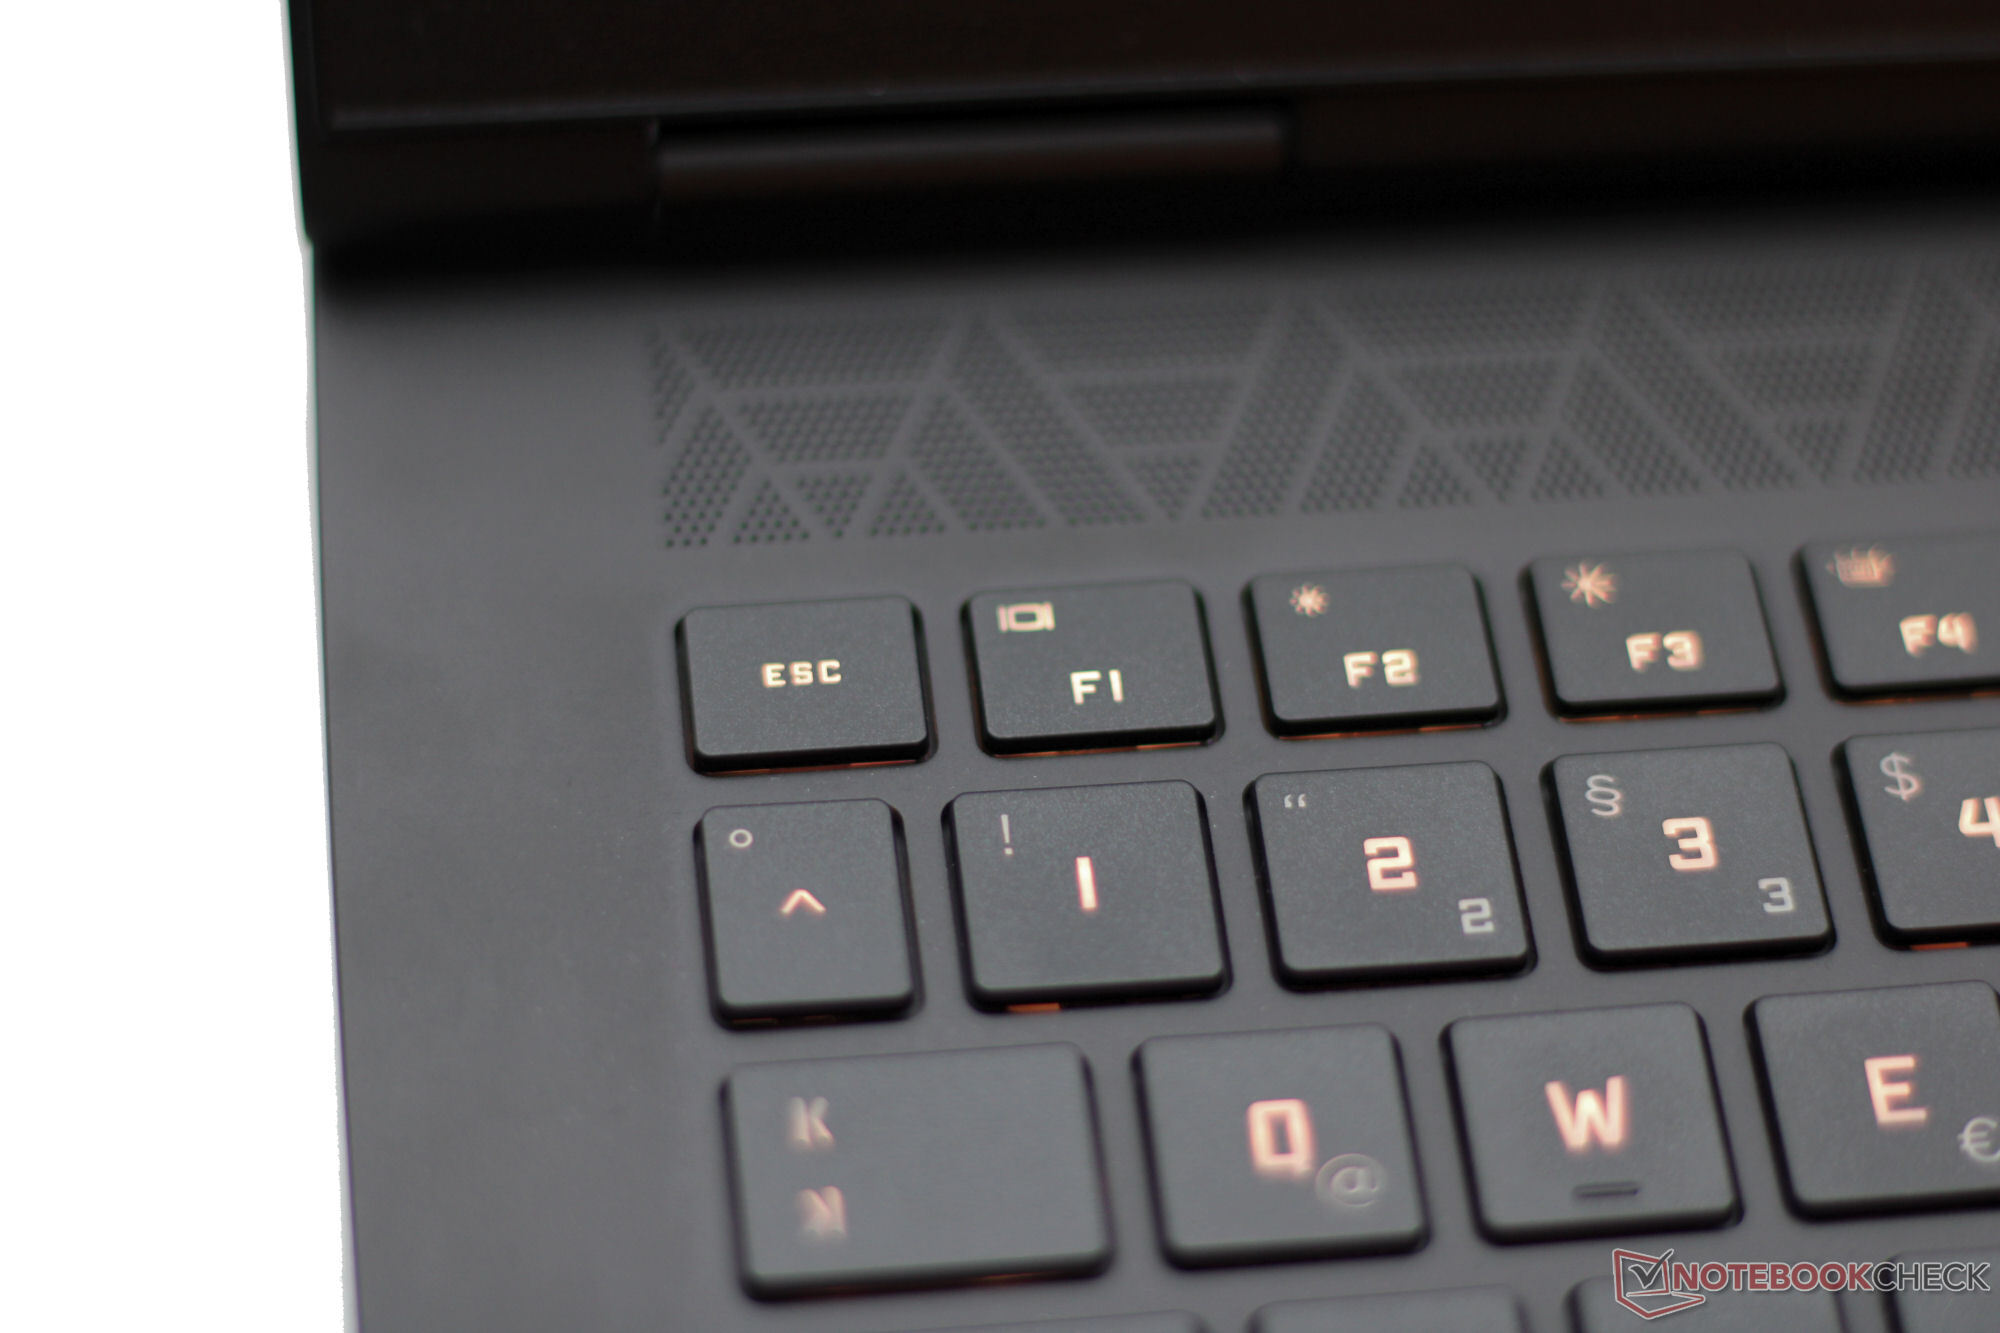
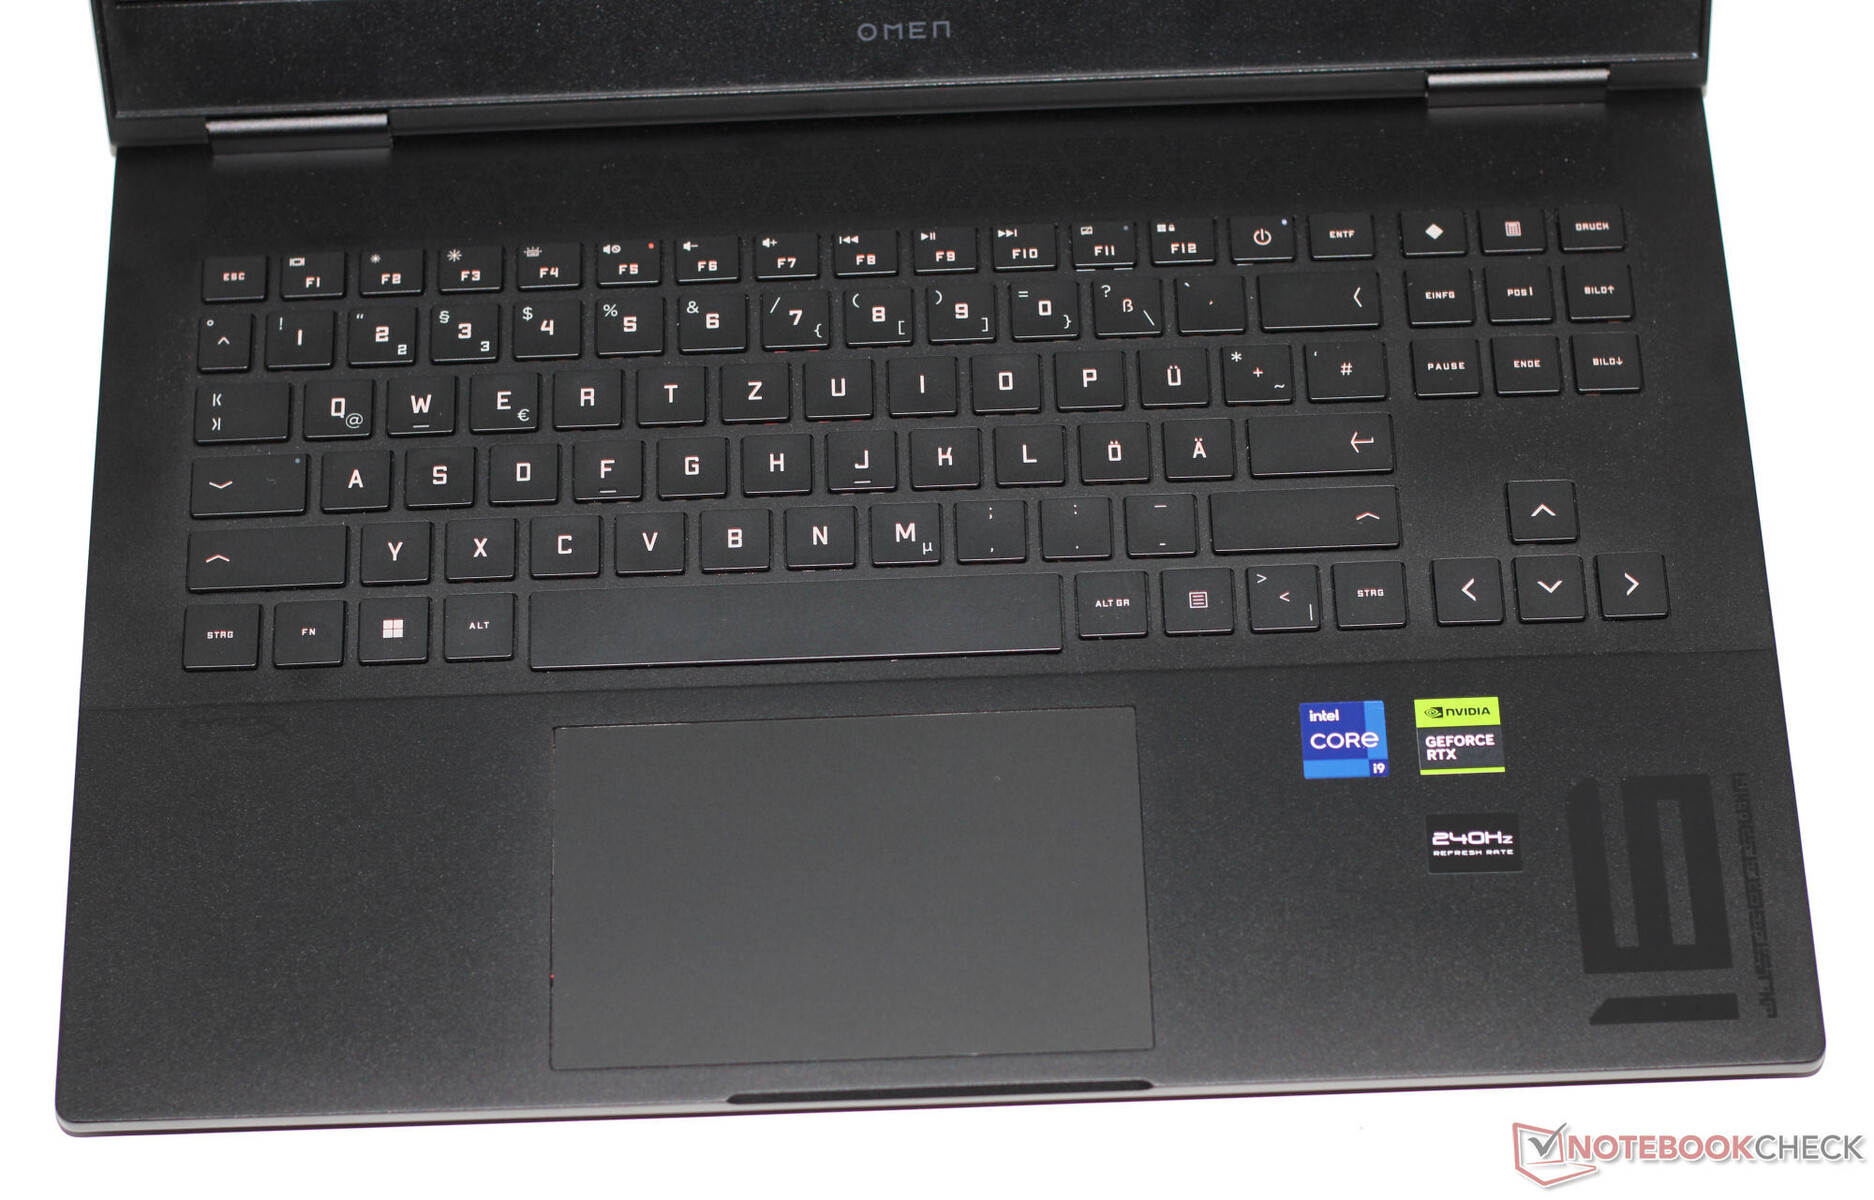
Podświetlana RGB klawiatura typu chiclet w Omen 16 nie posiada klawiatury numerycznej. Miejsce zwykle przeznaczane na klawiaturę numeryczną zajmują teraz klawisze sterujące, a także duże, oddzielne klawisze strzałek. Wklęsłe klawisze są łatwe do naciśnięcia, oferują umiarkowany skok i wyraźny punkt aktywacji, a także mają przyzwoity opór. Mierzący około 12,5 x 8 cm touchpad ma krótki skok i wyraźny punkt kliknięcia.
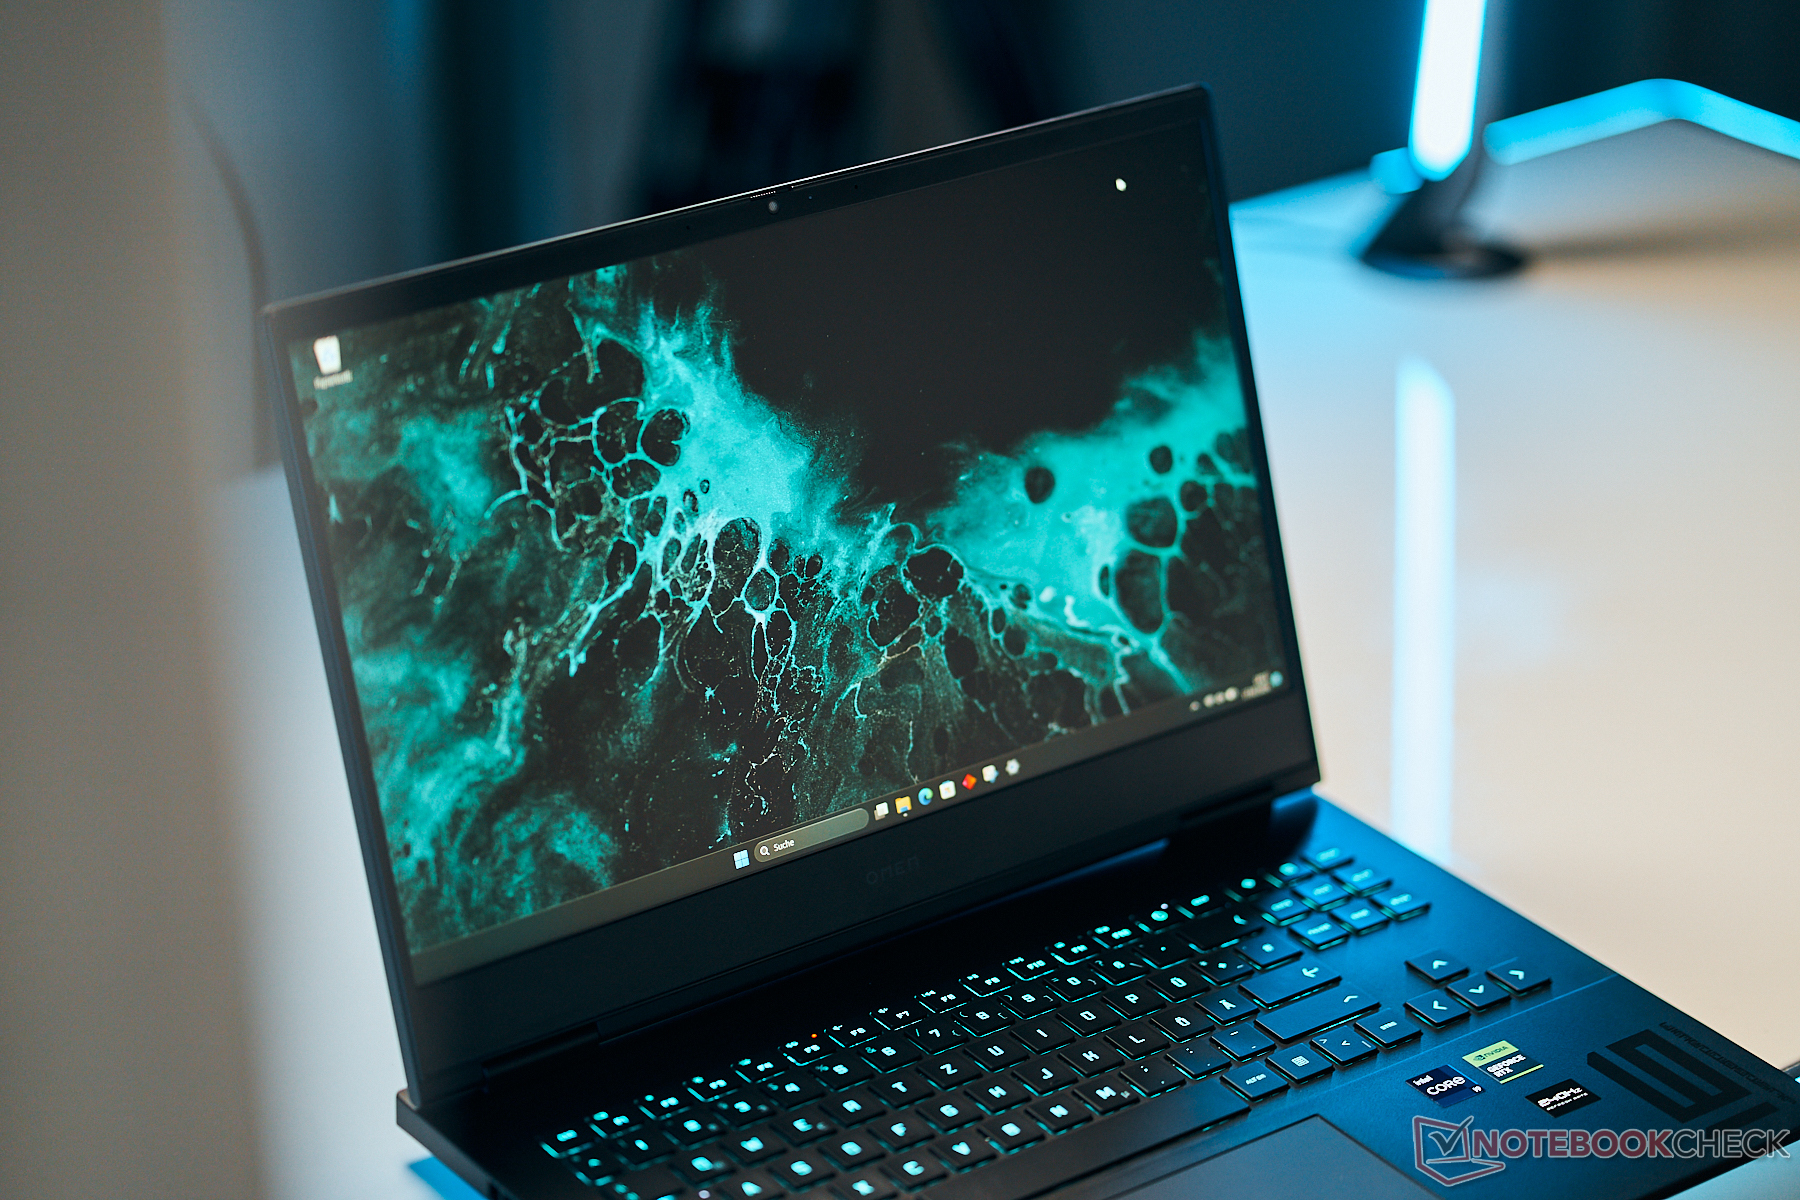
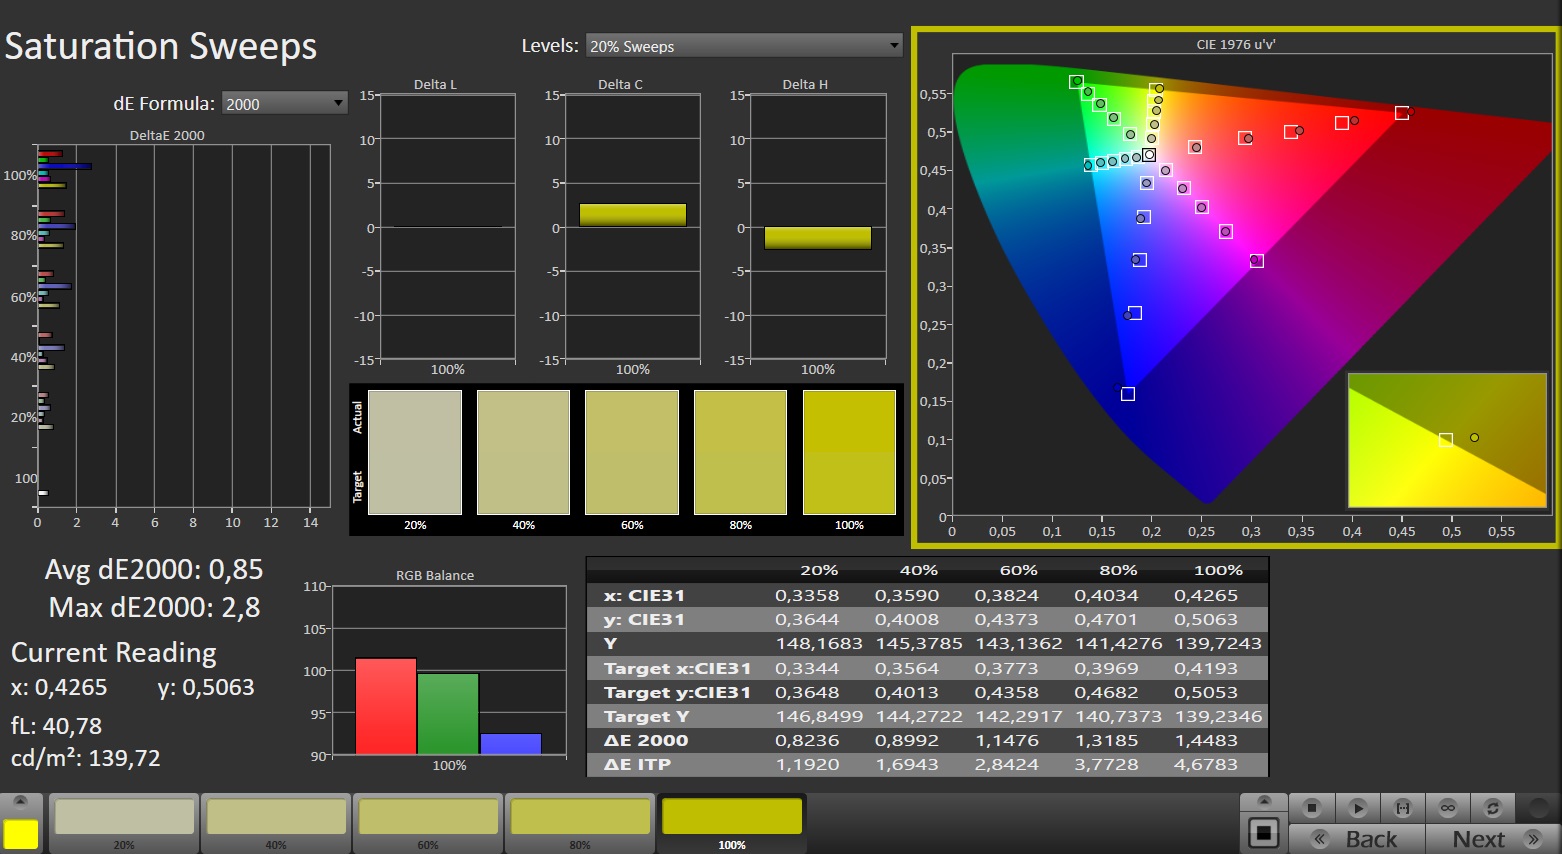
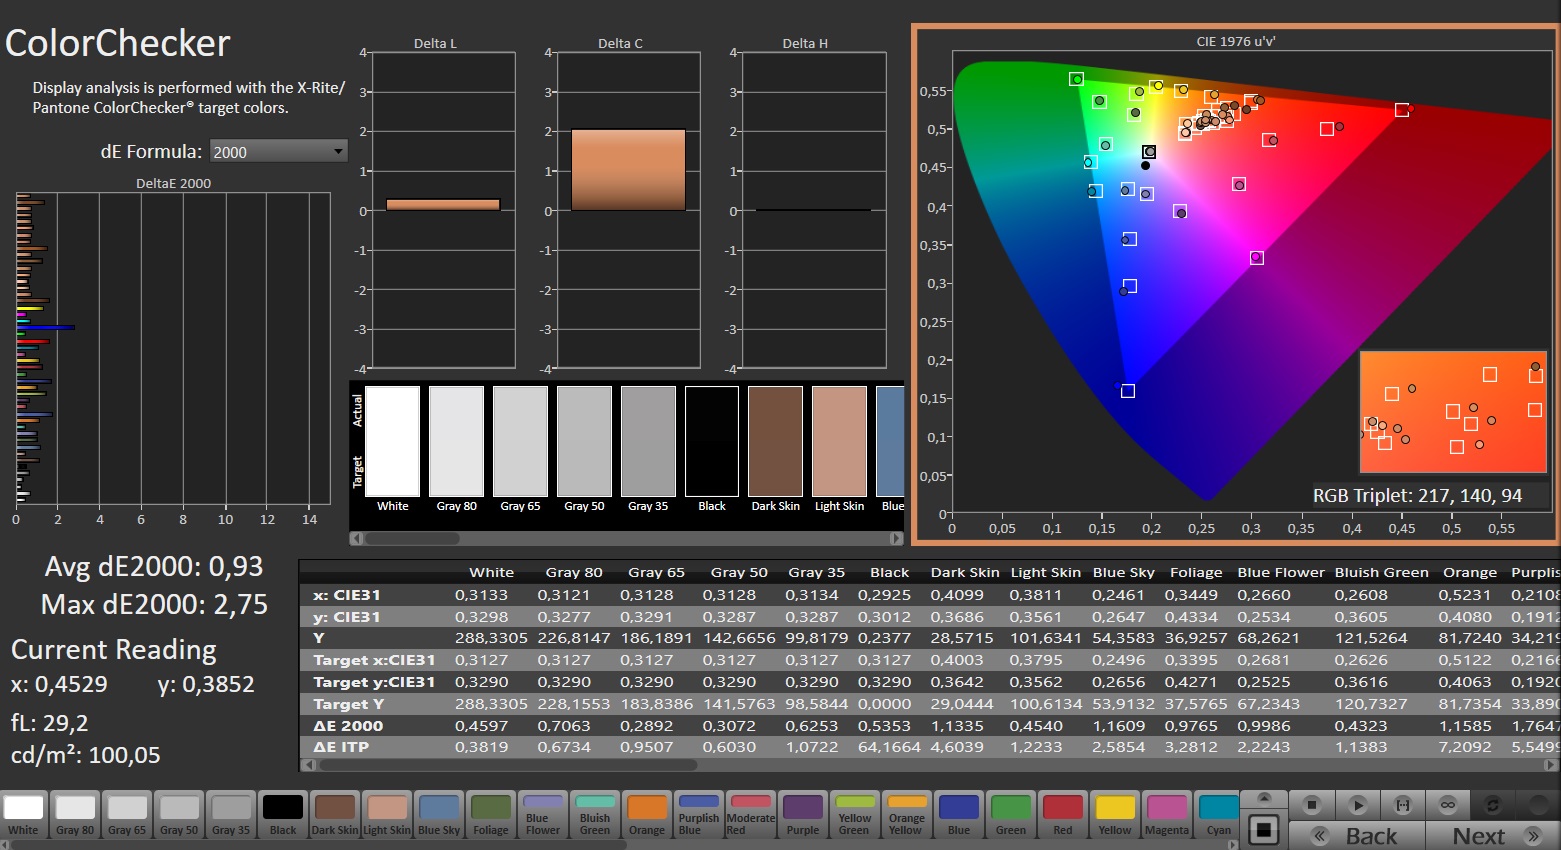
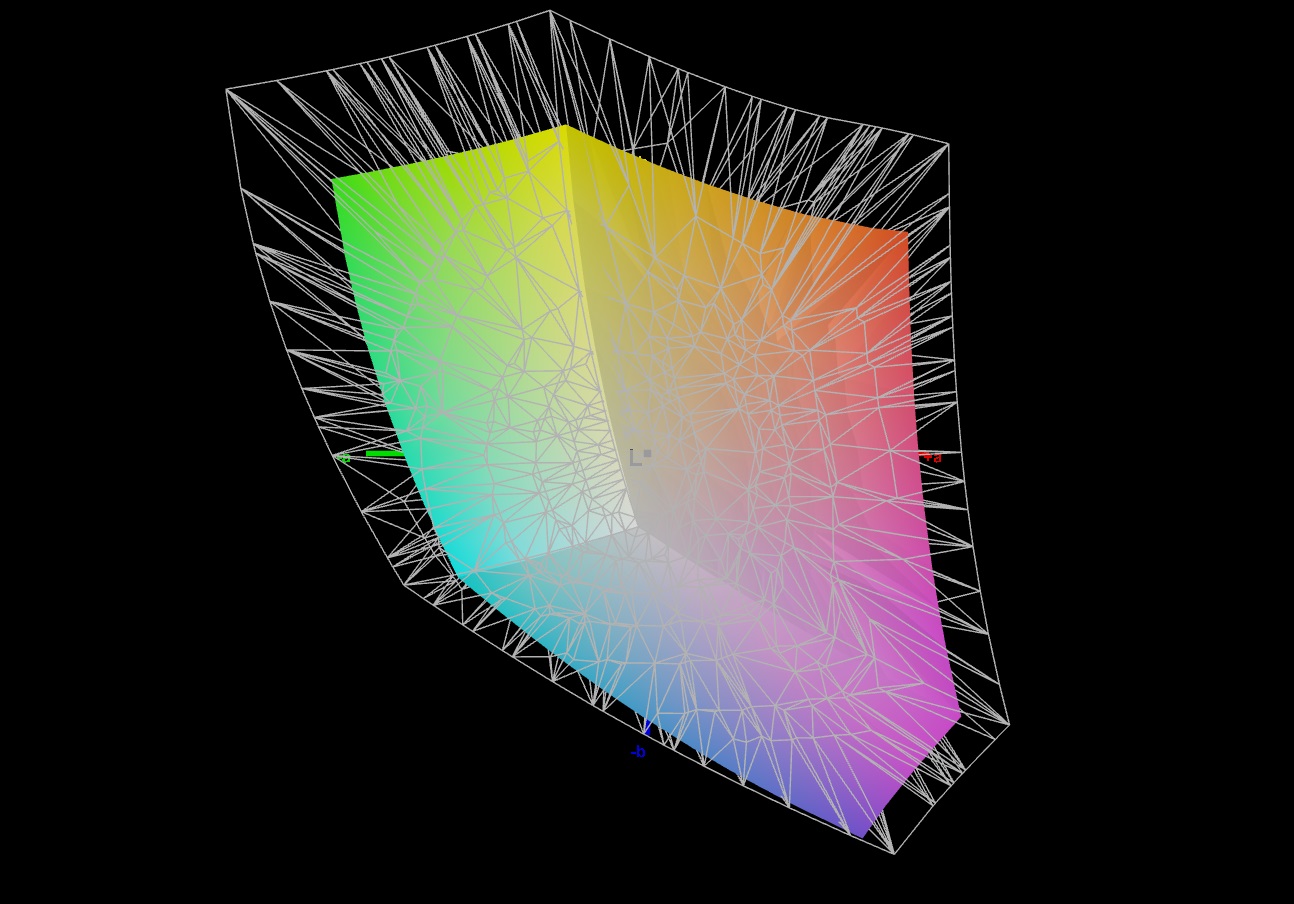
Wyświetlacz - panel QHD z pełnym pokryciem palety sRGB
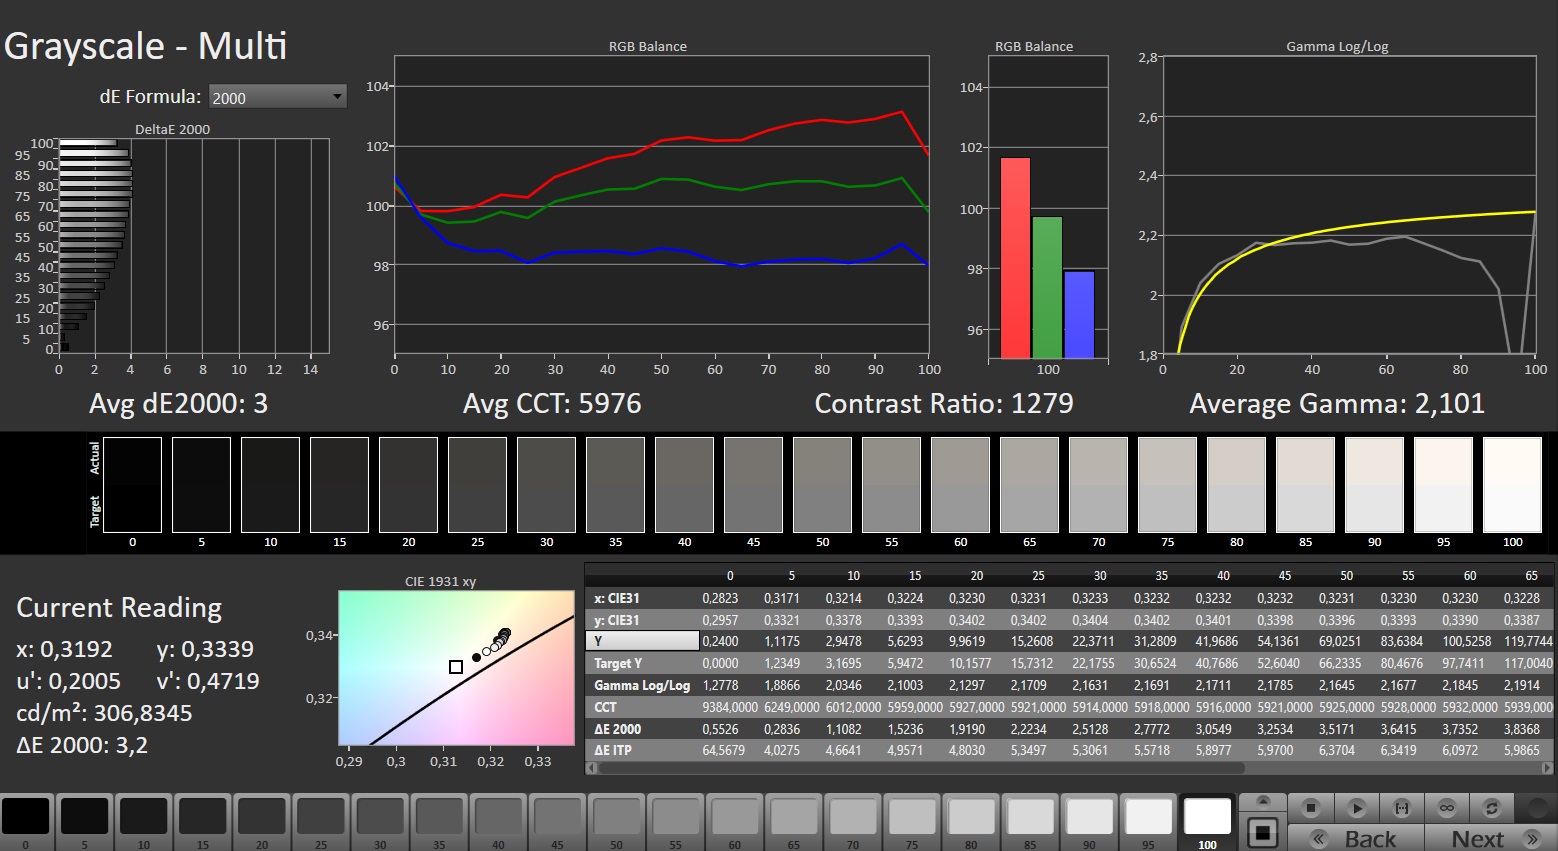
Trzeba przyznać, że 16,1-calowy wyświetlacz IPS (1440p) o proporcjach 16:9 nie wykazuje migotania PWM, obsługuje G-Sync i ma szybki czas reakcji. Chociaż współczynnik kontrastu wyświetlacza jest wystarczająco dobry (> 1000:1), szczytowa jasność jest nieco poniżej poziomu docelowego (> 300 cd/m²).

| |||||||||||||||||||||||||
rozświetlenie: 85 %
na akumulatorze: 292 cd/m²
kontrast: 1217:1 (czerń: 0.24 cd/m²)
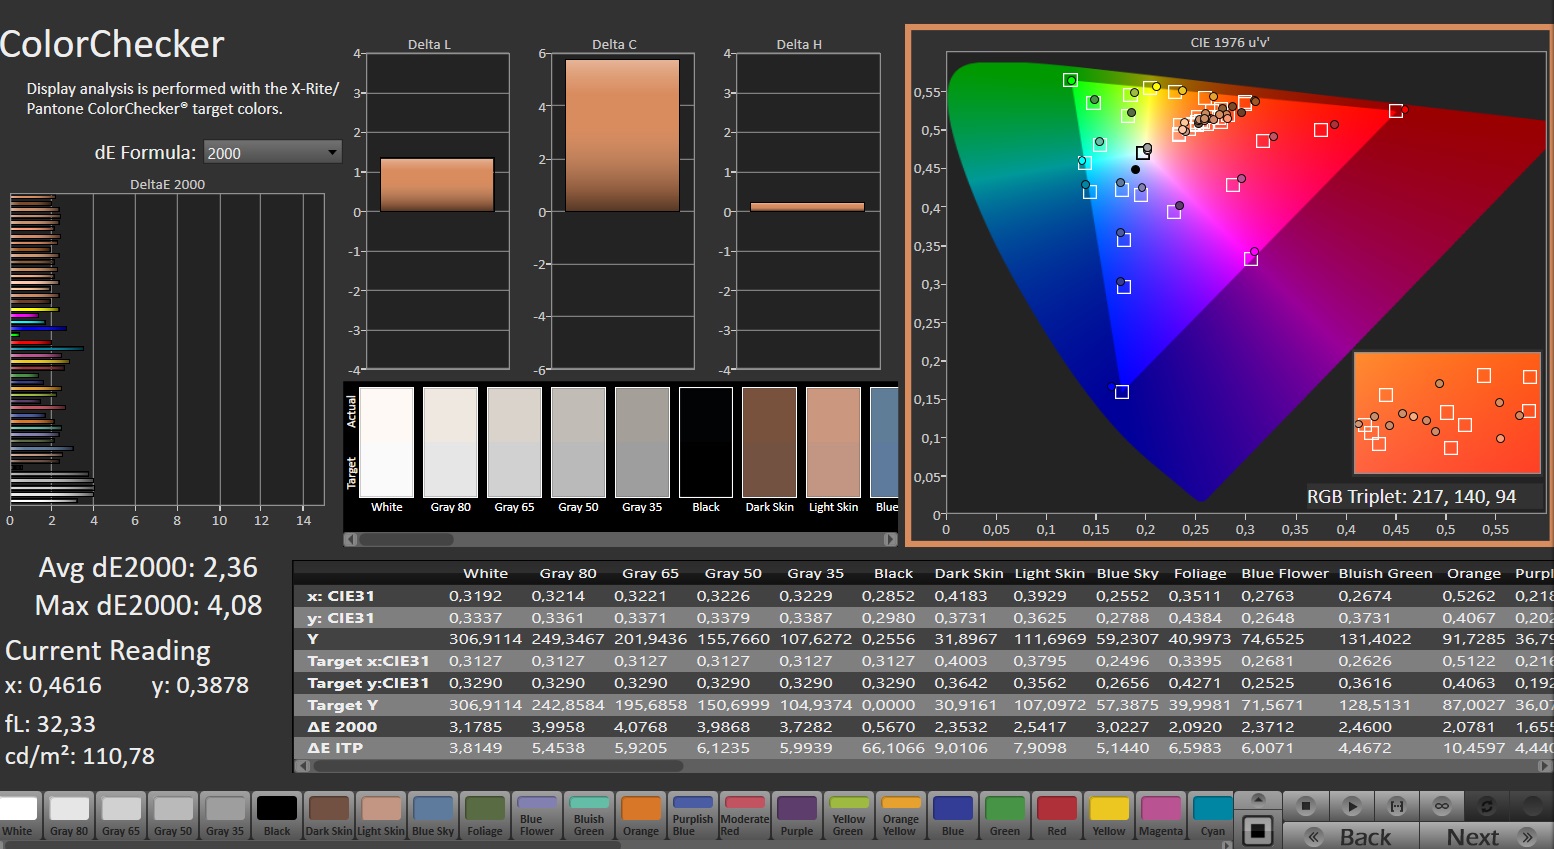
ΔE ColorChecker Calman: 2.36 | ∀{0.5-29.43 Ø4.72}
calibrated: 0.93
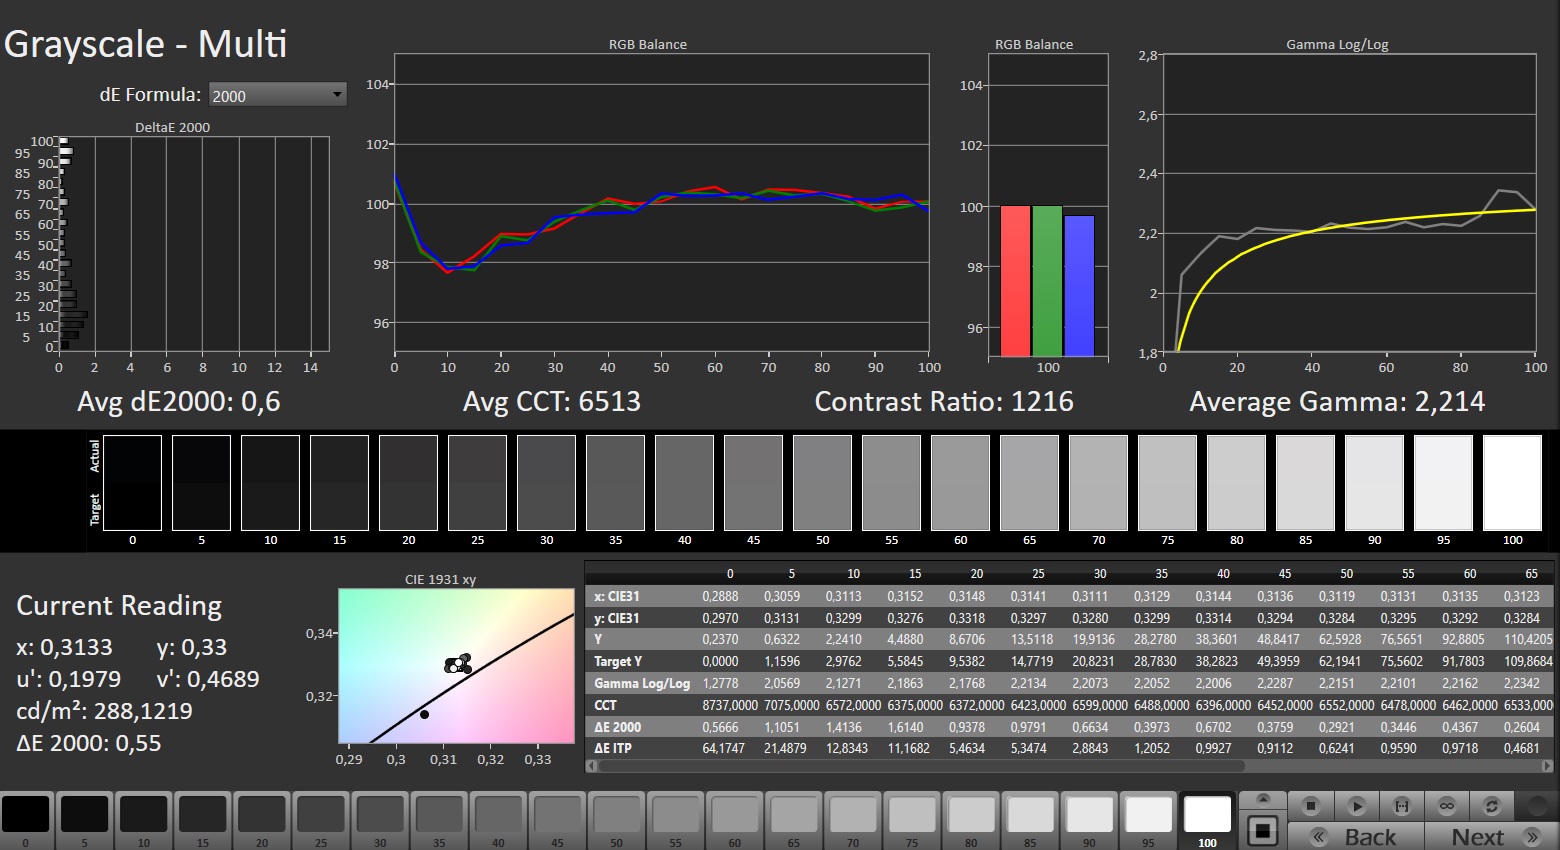
ΔE Greyscale Calman: 3 | ∀{0.09-98 Ø4.97}
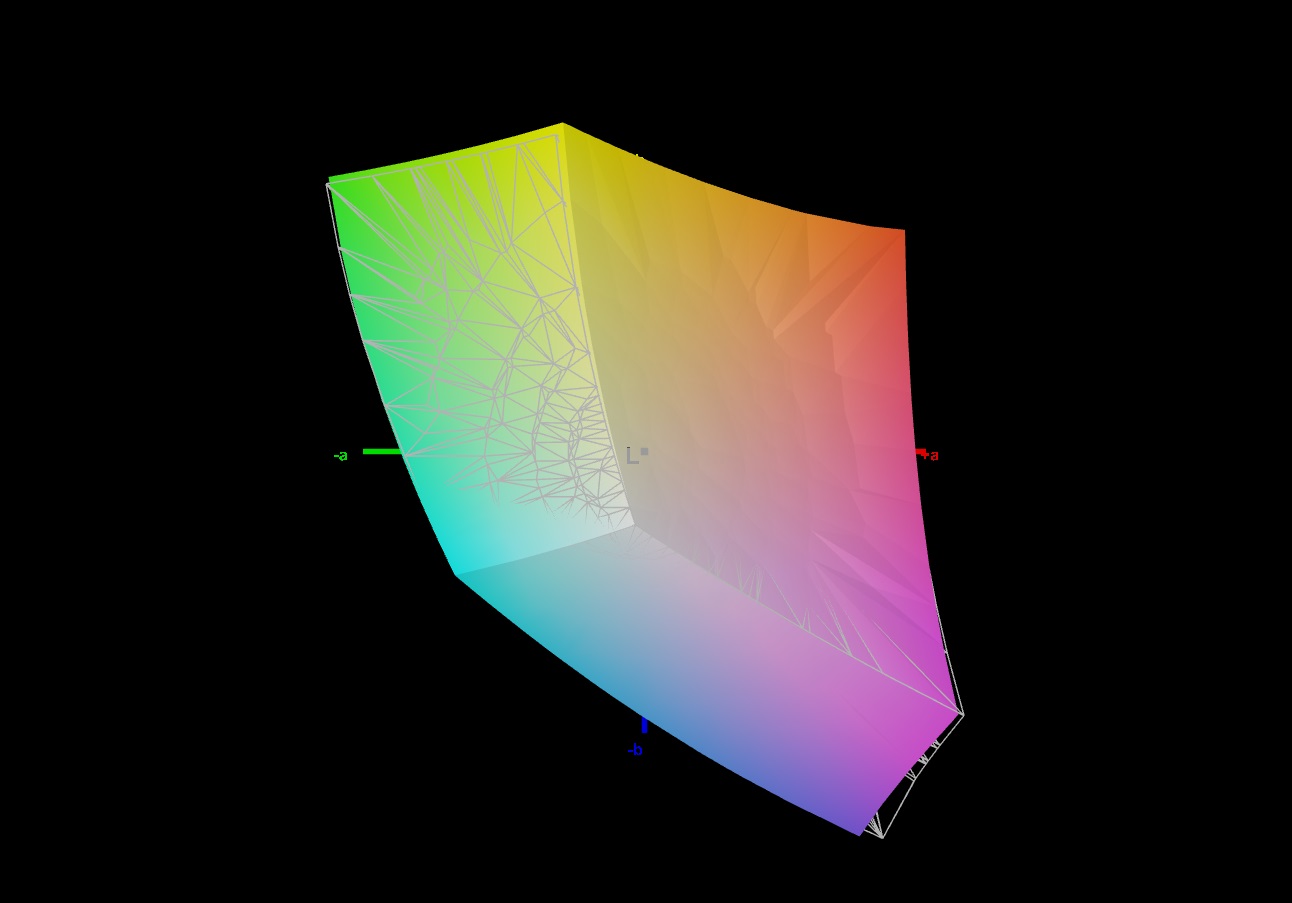
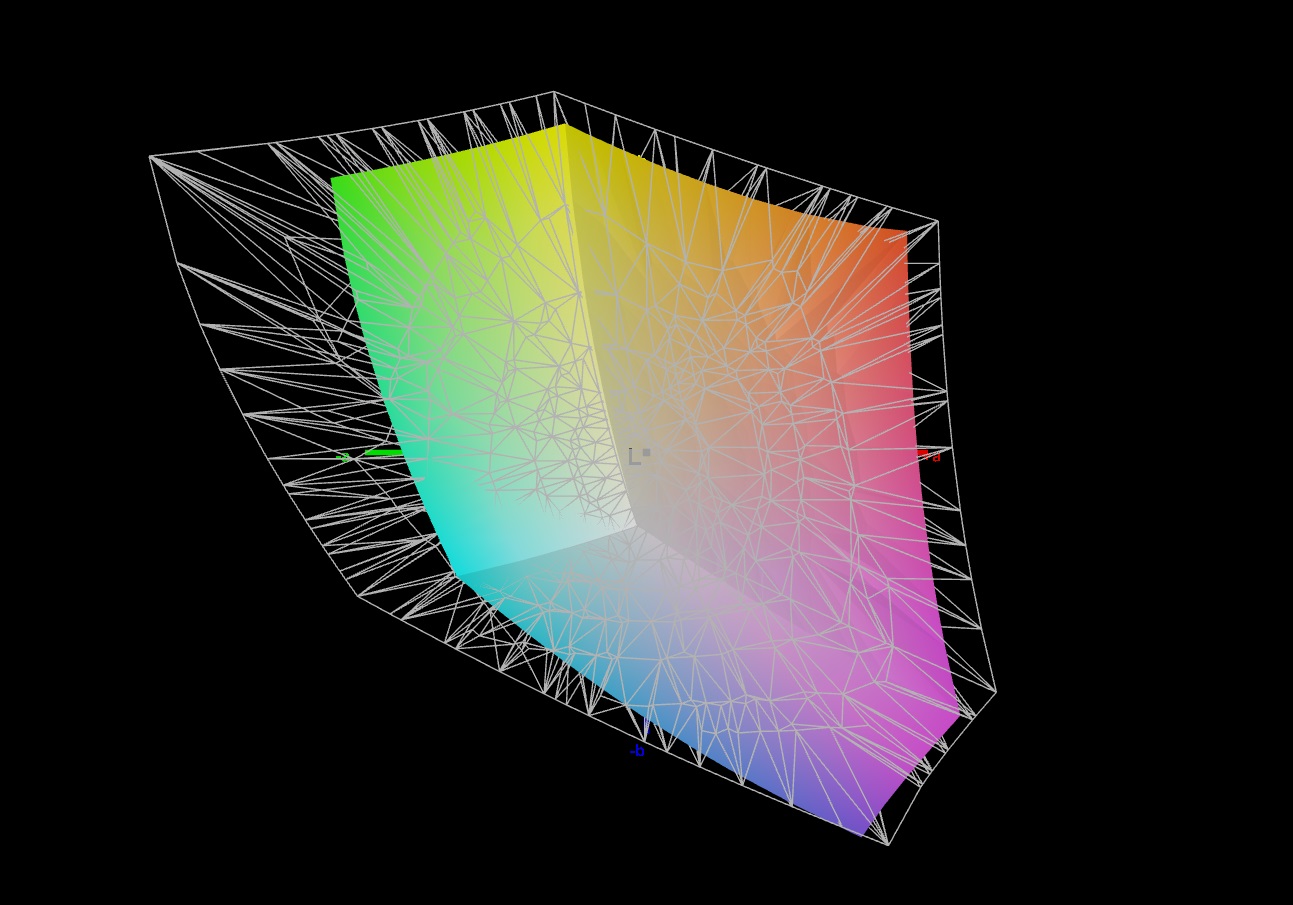
70.6% AdobeRGB 1998 (Argyll 3D)
98.6% sRGB (Argyll 3D)
68.6% Display P3 (Argyll 3D)
Gamma: 2.101
CCT: 5976 K
| HP Omen 16 (2024) BOE BOE0B7D, IPS, 2560x1440, 16.1" | MSI Vector 16 HX A14V Chi Mei N160GME-GTB, IPS, 2560x1600, 16" | Alienware m16 R1 AMD BOE NE16NZ4, IPS, 2560x1600, 16" | Acer Predator Helios 18 N23Q2 AUO45A8 (B180QAN01.2), IPS, 2560x1600, 18" | HP Omen 16-wf000 BOE0B7D, IPS, 2560x1440, 16.1" | |
|---|---|---|---|---|---|
| Display | 20% | 24% | 25% | 1% | |
| Display P3 Coverage (%) | 68.6 | 95.4 39% | 98.6 44% | 99.8 45% | 69 1% |
| sRGB Coverage (%) | 98.6 | 99.7 1% | 99.9 1% | 100 1% | 99.2 1% |
| AdobeRGB 1998 Coverage (%) | 70.6 | 85.4 21% | 88.9 26% | 91.8 30% | 71.2 1% |
| Response Times | 19% | 34% | -23% | 32% | |
| Response Time Grey 50% / Grey 80% * (ms) | 14.1 ? | 5.7 ? 60% | 5.1 ? 64% | 7.6 ? 46% | 4.6 ? 67% |
| Response Time Black / White * (ms) | 9.3 ? | 11.4 ? -23% | 9 ? 3% | 17.8 ? -91% | 9.7 ? -4% |
| PWM Frequency (Hz) | 2509 | ||||
| Screen | -7% | -37% | -27% | 1% | |
| Brightness middle (cd/m²) | 292 | 557.2 91% | 329 13% | 360 23% | 310.9 6% |
| Brightness (cd/m²) | 291 | 506 74% | 317 9% | 355 22% | 296 2% |
| Brightness Distribution (%) | 85 | 83 -2% | 89 5% | 92 8% | 91 7% |
| Black Level * (cd/m²) | 0.24 | 0.41 -71% | 0.32 -33% | 0.21 12% | 0.35 -46% |
| Contrast (:1) | 1217 | 1359 12% | 1028 -16% | 1714 41% | 888 -27% |
| Colorchecker dE 2000 * | 2.36 | 2.91 -23% | 3.71 -57% | 3.82 -62% | 2.18 8% |
| Colorchecker dE 2000 max. * | 4.08 | 5.94 -46% | 7.23 -77% | 7.38 -81% | 3.58 12% |
| Colorchecker dE 2000 calibrated * | 0.93 | 1.63 -75% | 2.82 -203% | 2.24 -141% | 0.52 44% |
| Greyscale dE 2000 * | 3 | 3.8 -27% | 2.2 27% | 5.06 -69% | 2.8 7% |
| Gamma | 2.101 105% | 2.23 99% | 2.3 96% | 2.52 87% | 2.18 101% |
| CCT | 5976 109% | 6408 101% | 6270 104% | 5657 115% | 6002 108% |
| Całkowita średnia (program / ustawienia) | 11% /
2% | 7% /
-14% | -8% /
-15% | 11% /
6% |
* ... im mniej tym lepiej
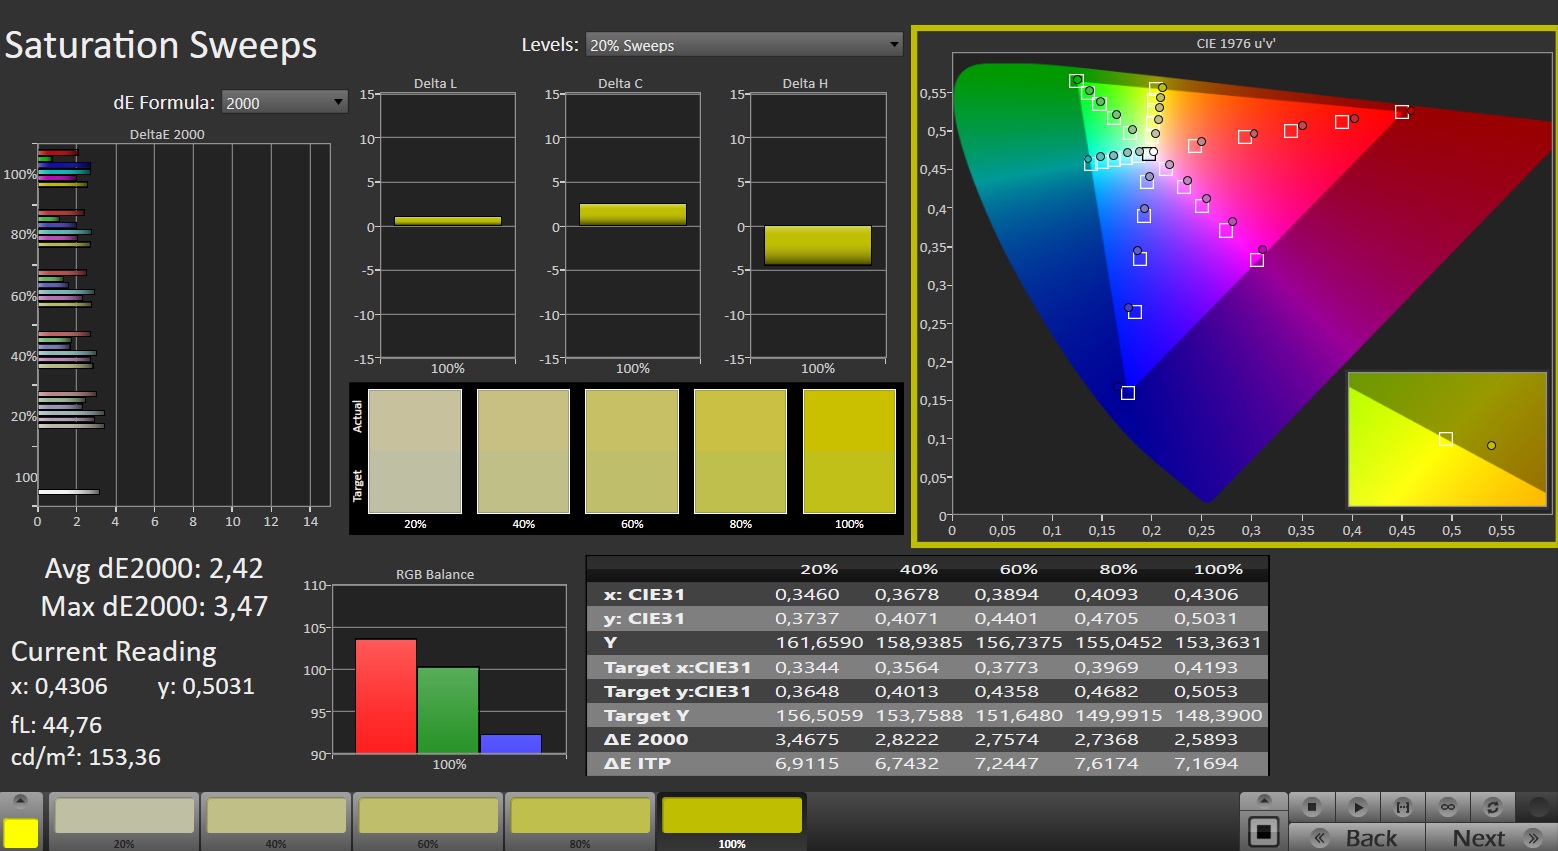
Wyświetlacz ma świetne odwzorowanie kolorów od razu po wyjęciu z pudełka. Przy średniej różnicy kolorów wynoszącej około 2,4, jest ona na poziomie, który uważamy za dobry (Delta E < 3). Kalibracja ekranu zmniejszyła średnią Delta E do 0,93 i zaowocowała bardziej zrównoważoną skalą szarości. Panel jest w stanie odwzorować pełną przestrzeń barw sRGB, ale nie ma pełnego pokrycia AdobeRGB i DCI-P3. Wyświetlacze w konkurencyjnych urządzeniach mają więcej do zaoferowania w tym dziale.
Wyświetl czasy reakcji
| ↔ Czas reakcji od czerni do bieli | ||
|---|---|---|
| 9.3 ms ... wzrost ↗ i spadek ↘ łącznie | ↗ 4.6 ms wzrost | 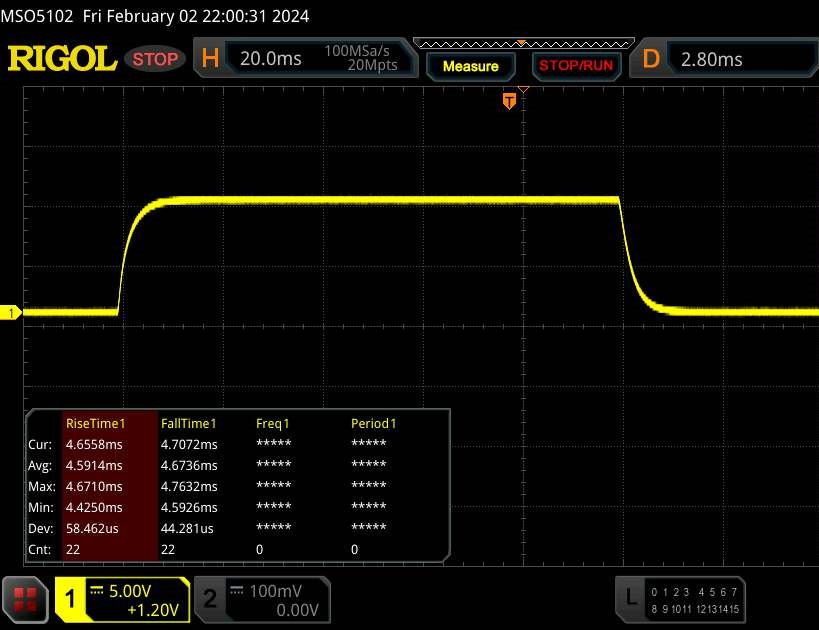 |
| ↘ 4.7 ms upadek | ||
| W naszych testach ekran wykazuje szybki czas reakcji i powinien nadawać się do gier. Dla porównania, wszystkie testowane urządzenia wahają się od 0.1 (minimum) do 240 (maksimum) ms. » 26 % wszystkich urządzeń jest lepszych. Oznacza to, że zmierzony czas reakcji jest lepszy od średniej wszystkich testowanych urządzeń (19.8 ms). | ||
| ↔ Czas reakcji 50% szarości do 80% szarości | ||
| 14.1 ms ... wzrost ↗ i spadek ↘ łącznie | ↗ 6.7 ms wzrost | 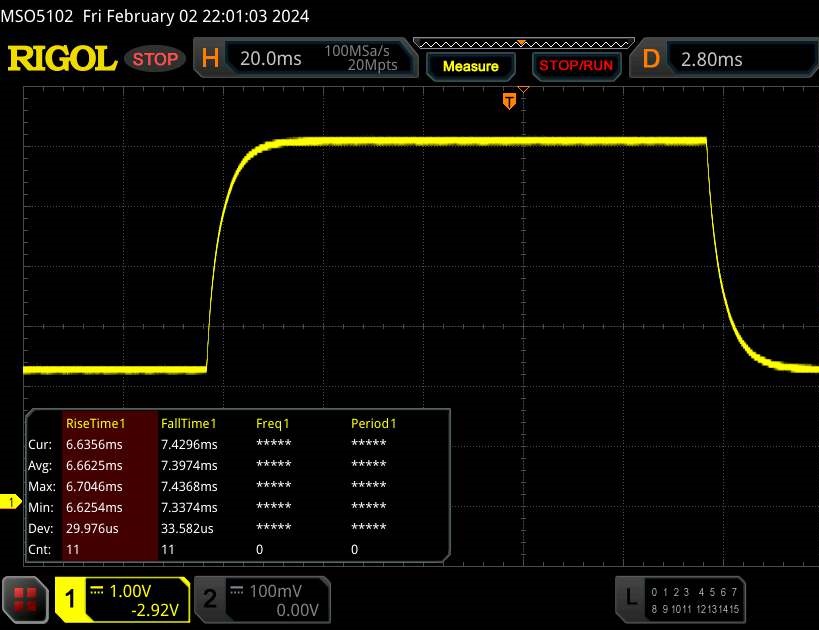 |
| ↘ 7.4 ms upadek | ||
| W naszych testach ekran wykazuje dobry współczynnik reakcji, ale może być zbyt wolny dla graczy rywalizujących ze sobą. Dla porównania, wszystkie testowane urządzenia wahają się od 0.165 (minimum) do 636 (maksimum) ms. » 28 % wszystkich urządzeń jest lepszych. Oznacza to, że zmierzony czas reakcji jest lepszy od średniej wszystkich testowanych urządzeń (31 ms). | ||
Migotanie ekranu / PWM (modulacja szerokości impulsu)
| Migotanie ekranu/nie wykryto PWM | 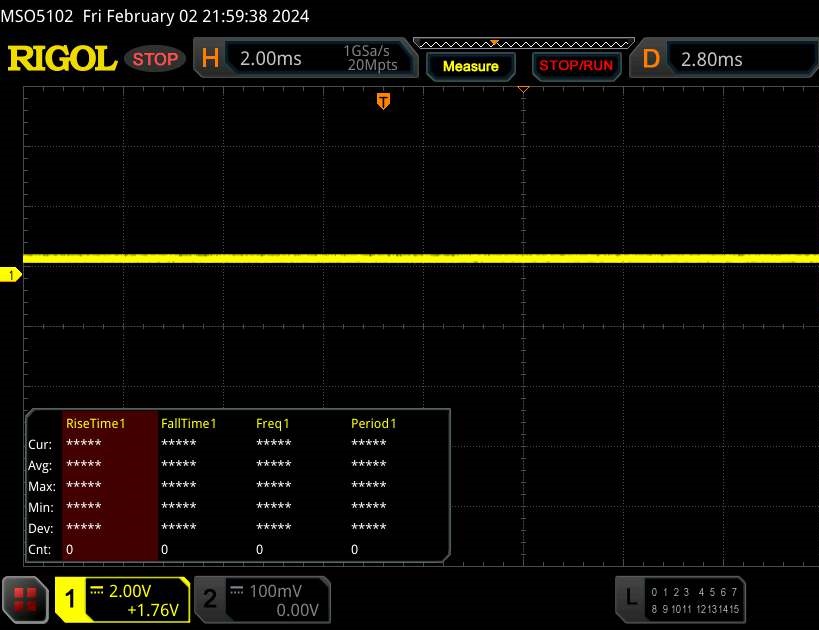 | ||
Dla porównania: 52 % wszystkich testowanych urządzeń nie używa PWM do przyciemniania wyświetlacza. Jeśli wykryto PWM, zmierzono średnio 7775 (minimum: 5 - maksimum: 343500) Hz. | |||
Szeroki kąt widzenia oznacza, że panel IPS jest czytelny z każdej pozycji. Możliwe jest również korzystanie z wyświetlacza na zewnątrz, pod warunkiem, że słońce nie jest zbyt jasne.
Wydajność - napędzana przez Raptor Lake i Adę Lovelace
HP Omen 16 to gamingowy laptop z ekranem QHD, który sprawdzi się również w innych zastosowaniach wymagających wysokiej wydajności. Niezbędną moc obliczeniową zapewniają procesory Raptor Lake i Ada Lovelace. Model Omen w specyfikacji kosztuje około 3200 euro (3446 USD). Tańsze konfiguracje dostępne są już od €1,900 (US$2,760).
Warunki testu
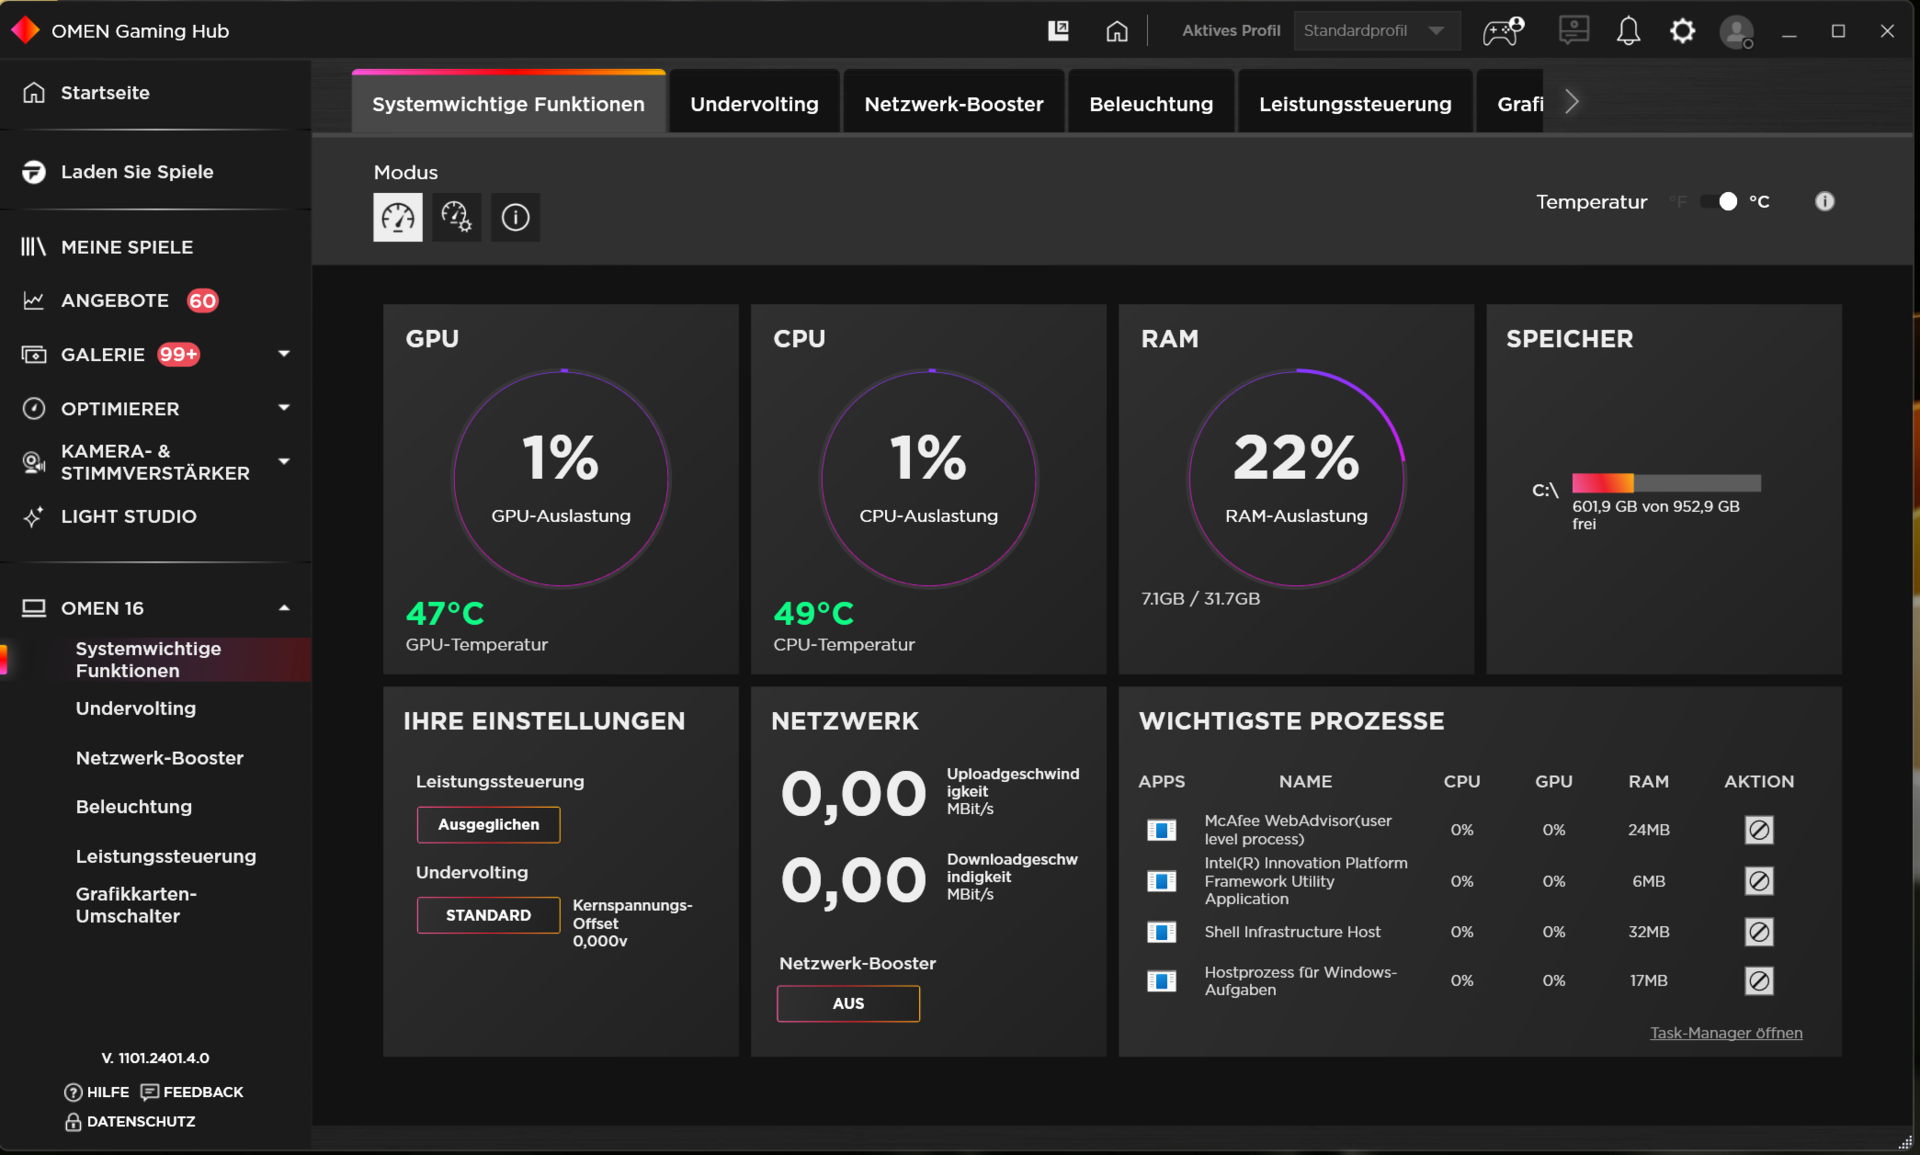
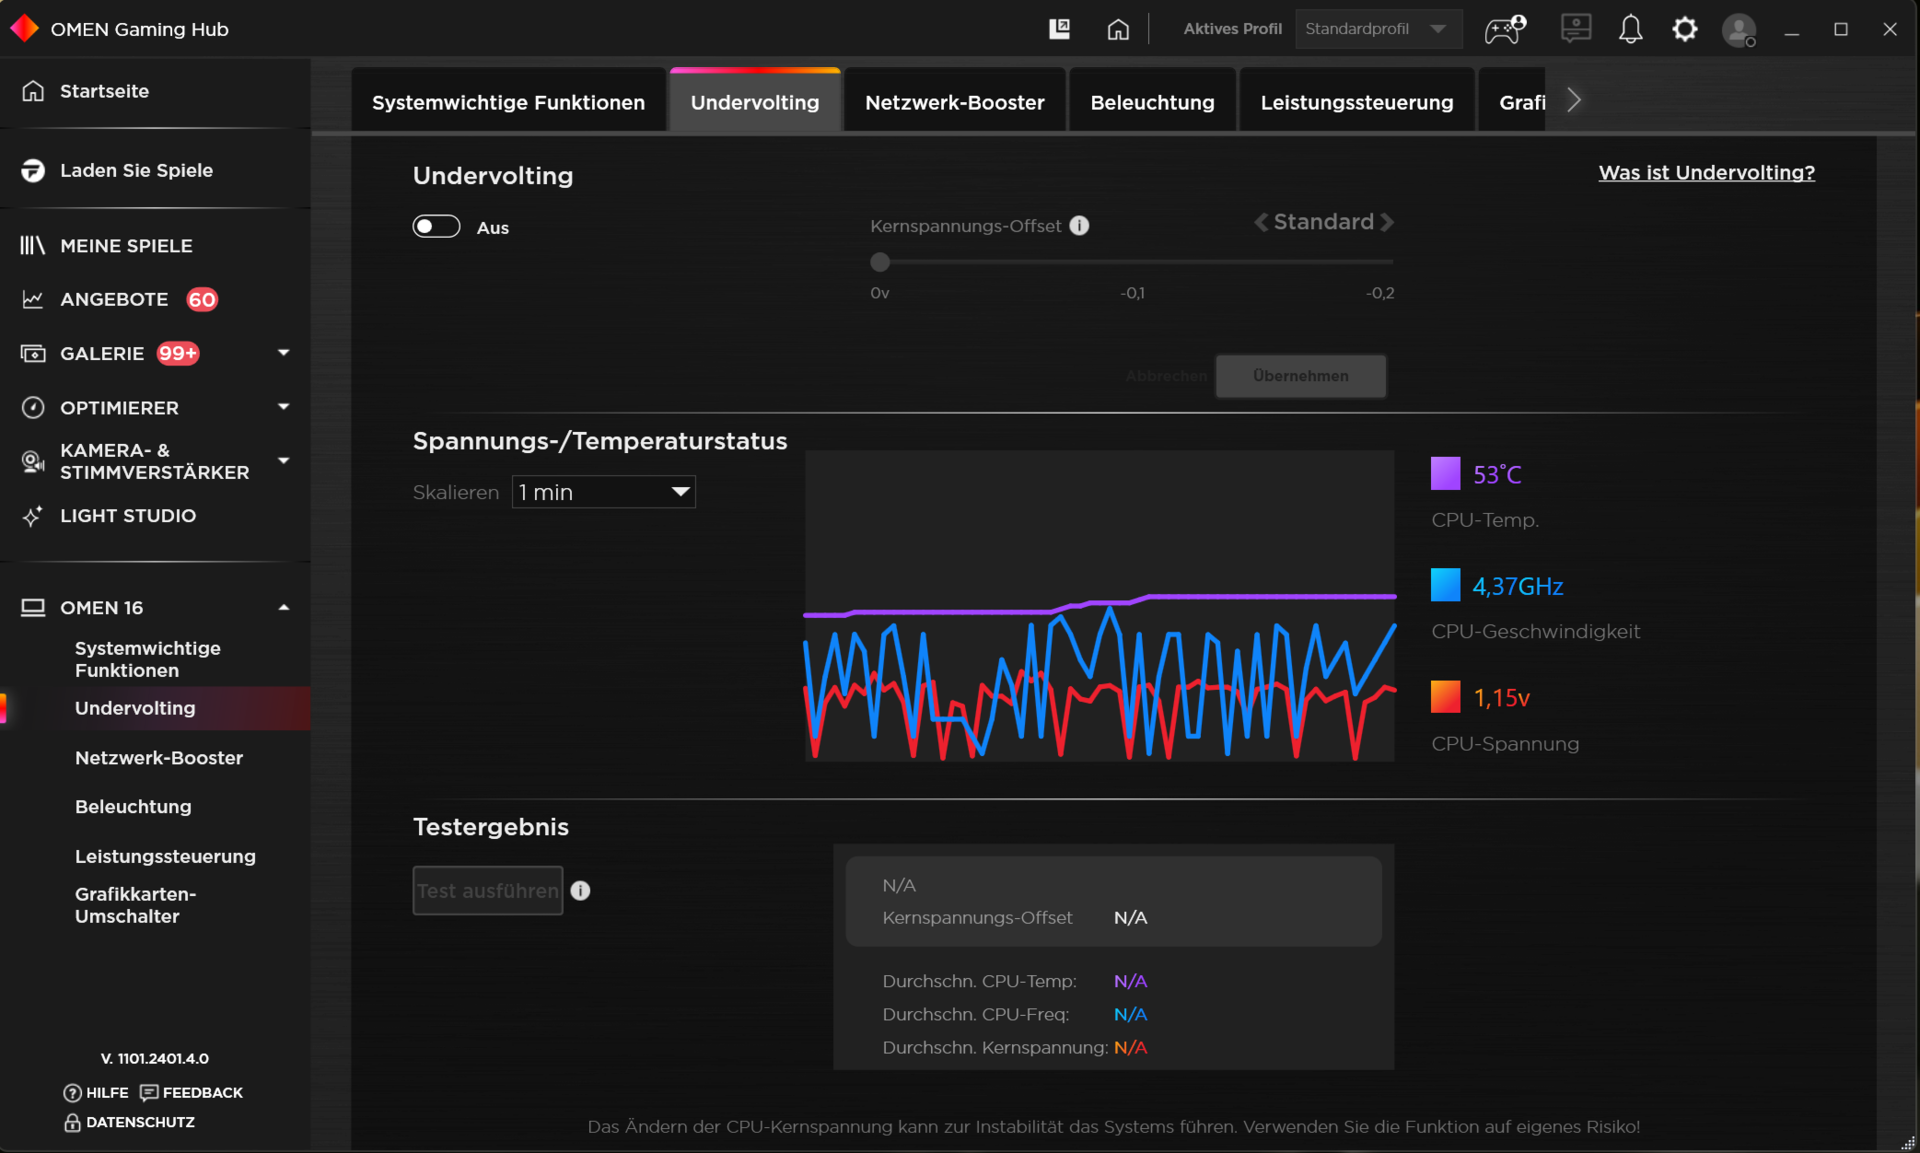
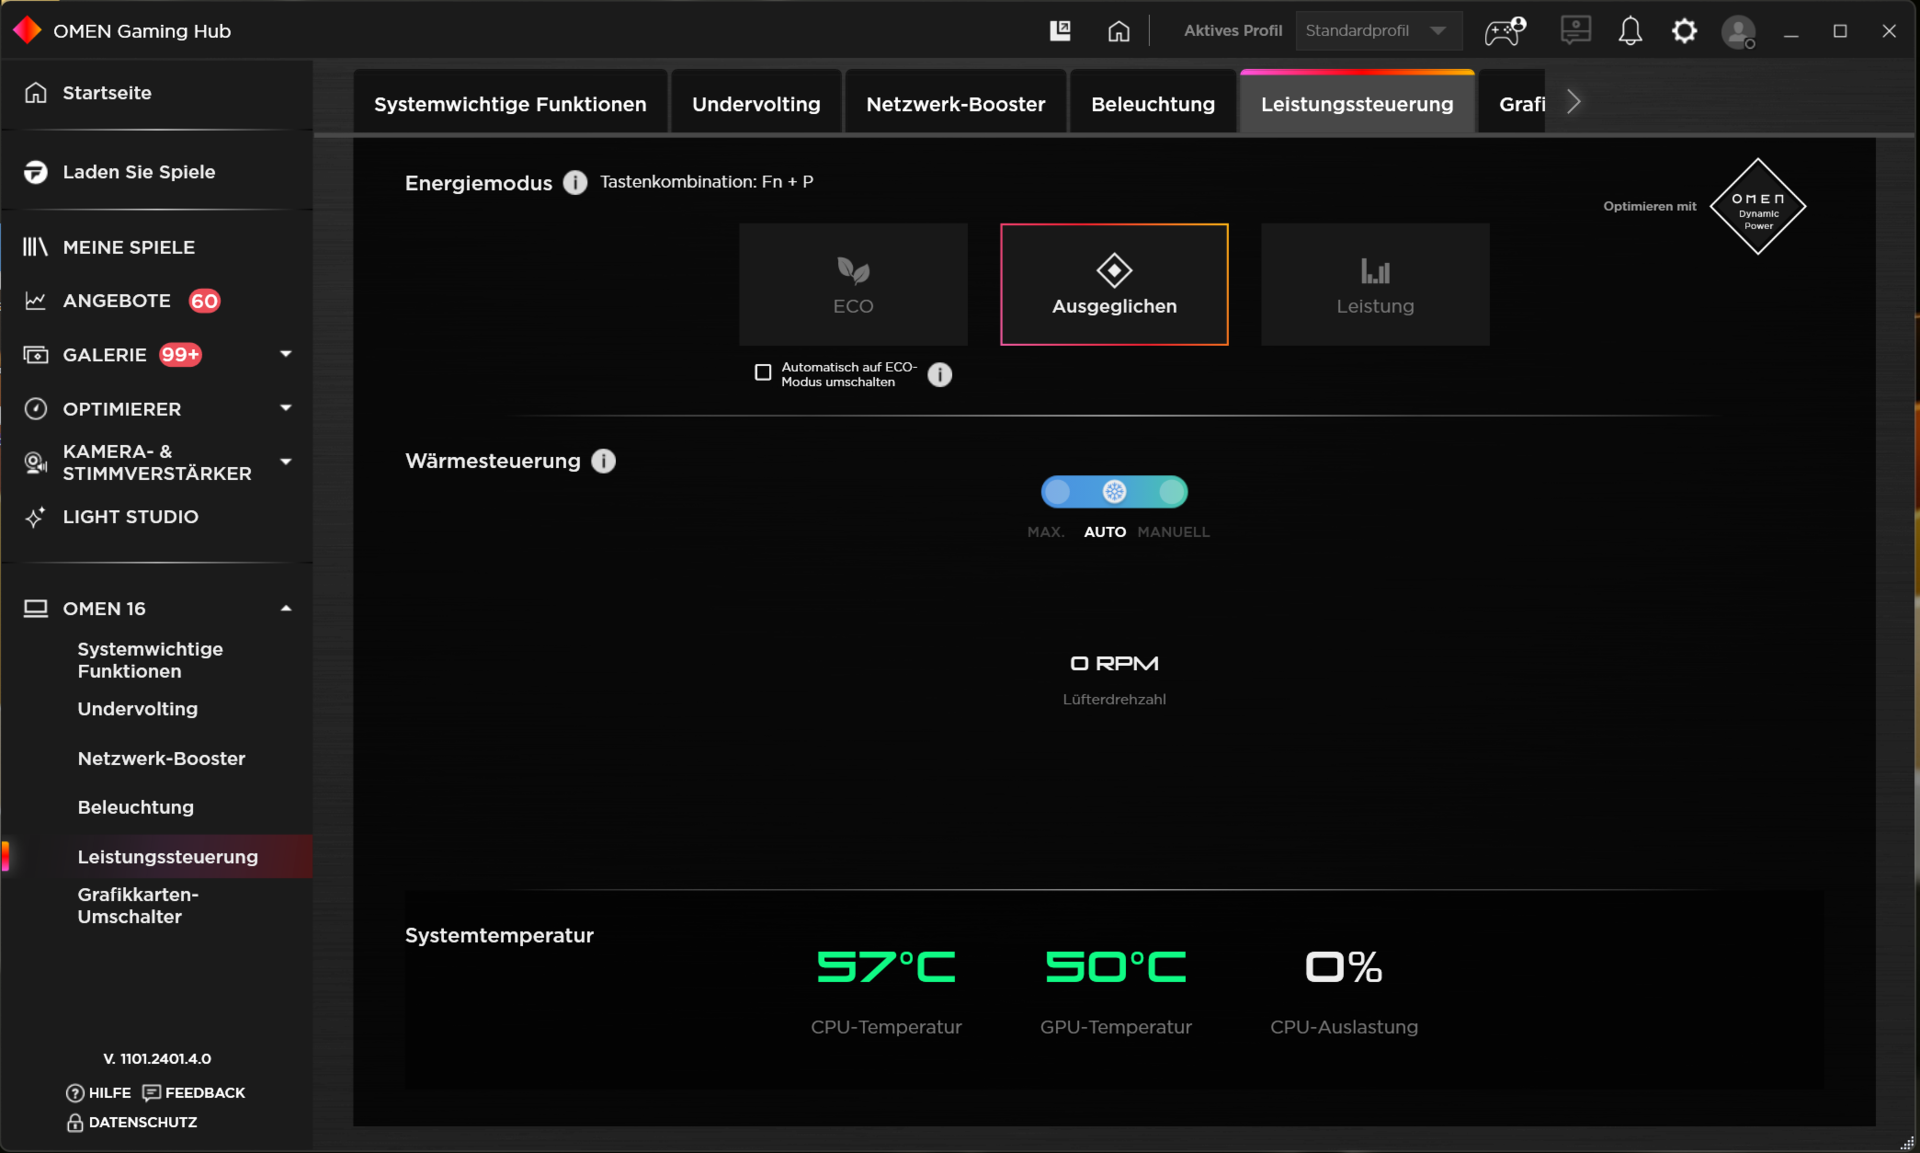
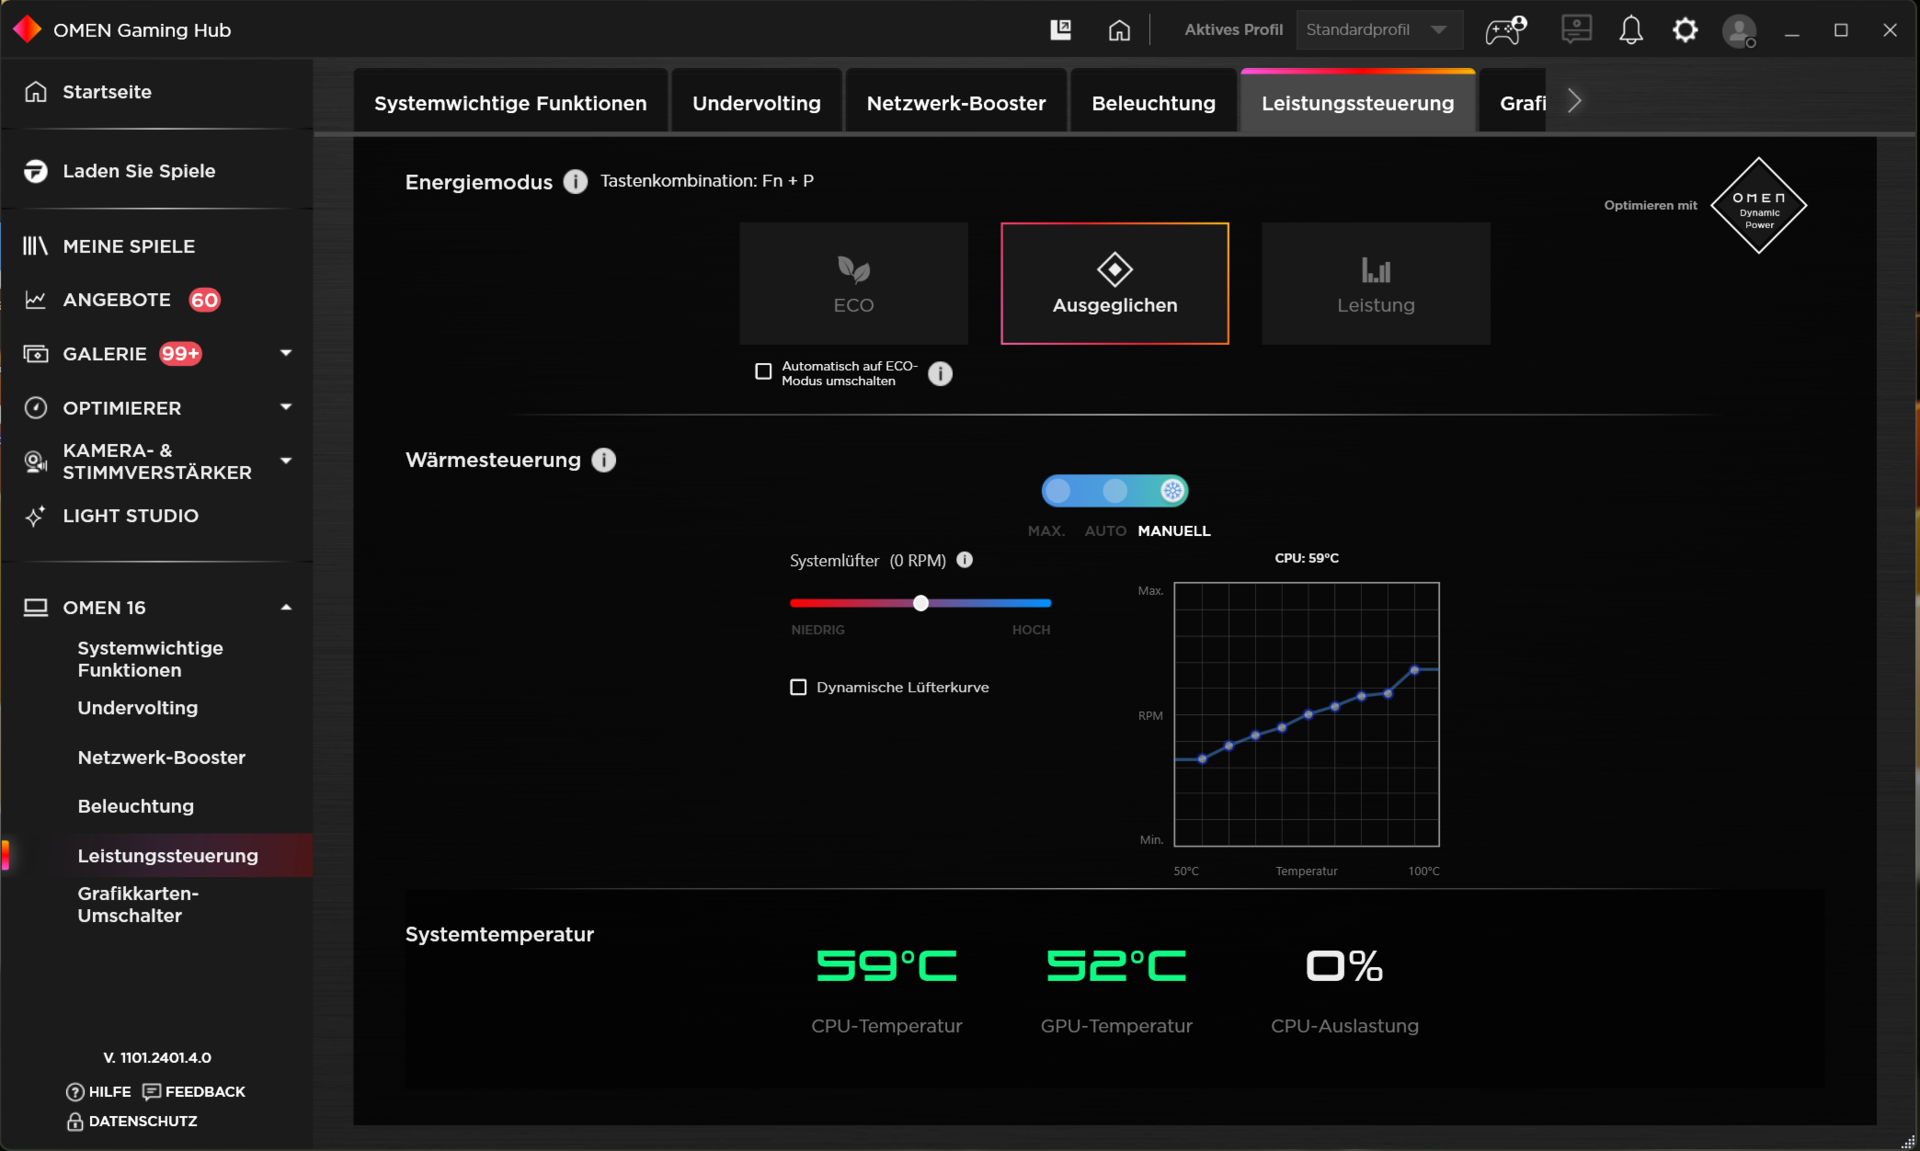
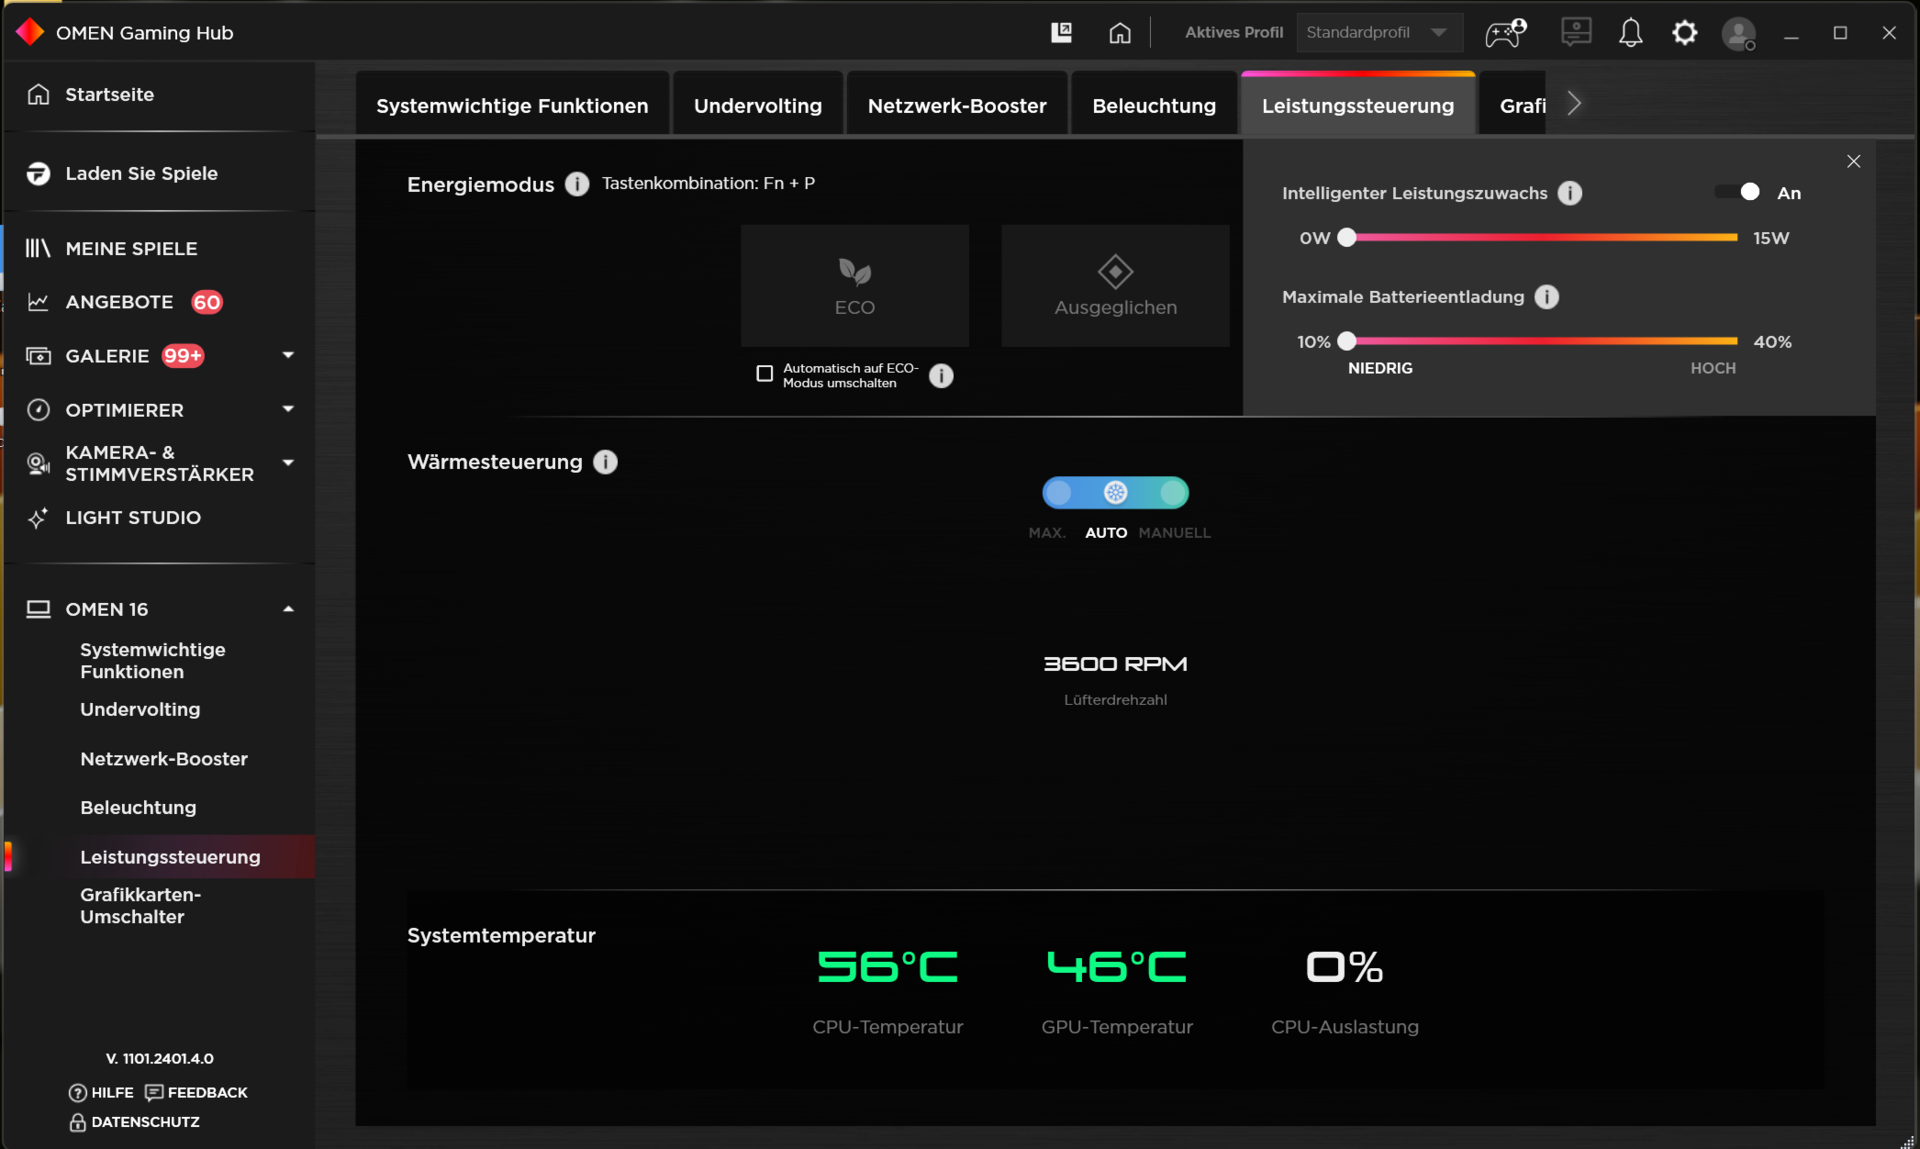
Preinstalowany Omen Gaming Hub to centrum sterowania laptopem. Oprócz wyboru trybu zasilania (patrz tabela), można użyć oprogramowania do obniżenia napięcia procesora i określenia niestandardowej krzywej wentylatora, między innymi. Naciśnięcie kombinacji klawiszy Fn + P pozwala również szybko przełączać się między trzema trybami specyficznymi dla HP. Tryby Balanced i ECO zostały wykorzystane odpowiednio w naszych testach porównawczych i testach baterii.
| Wydajność | Zrównoważona | ECO | |
|---|---|---|---|
| Limit mocy 1 (HWInfo) | 130 Watt | 130 Watt | 130 Watt |
| Limit mocy 2 (HWInfo) | 130 Watt | 130 Watt | 130 Watt |
| Hałas (Witcher 3) | 58 dB(A) | 47 dB(A) | 39 dB(A) |
| Wydajność (Witcher 3) | ~ 164 fps | ~ 142 fps | 60 fps (zablokowane) |
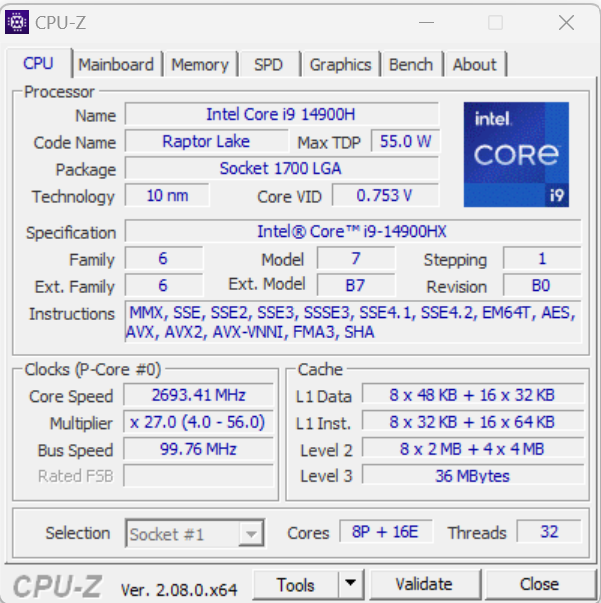
Procesor
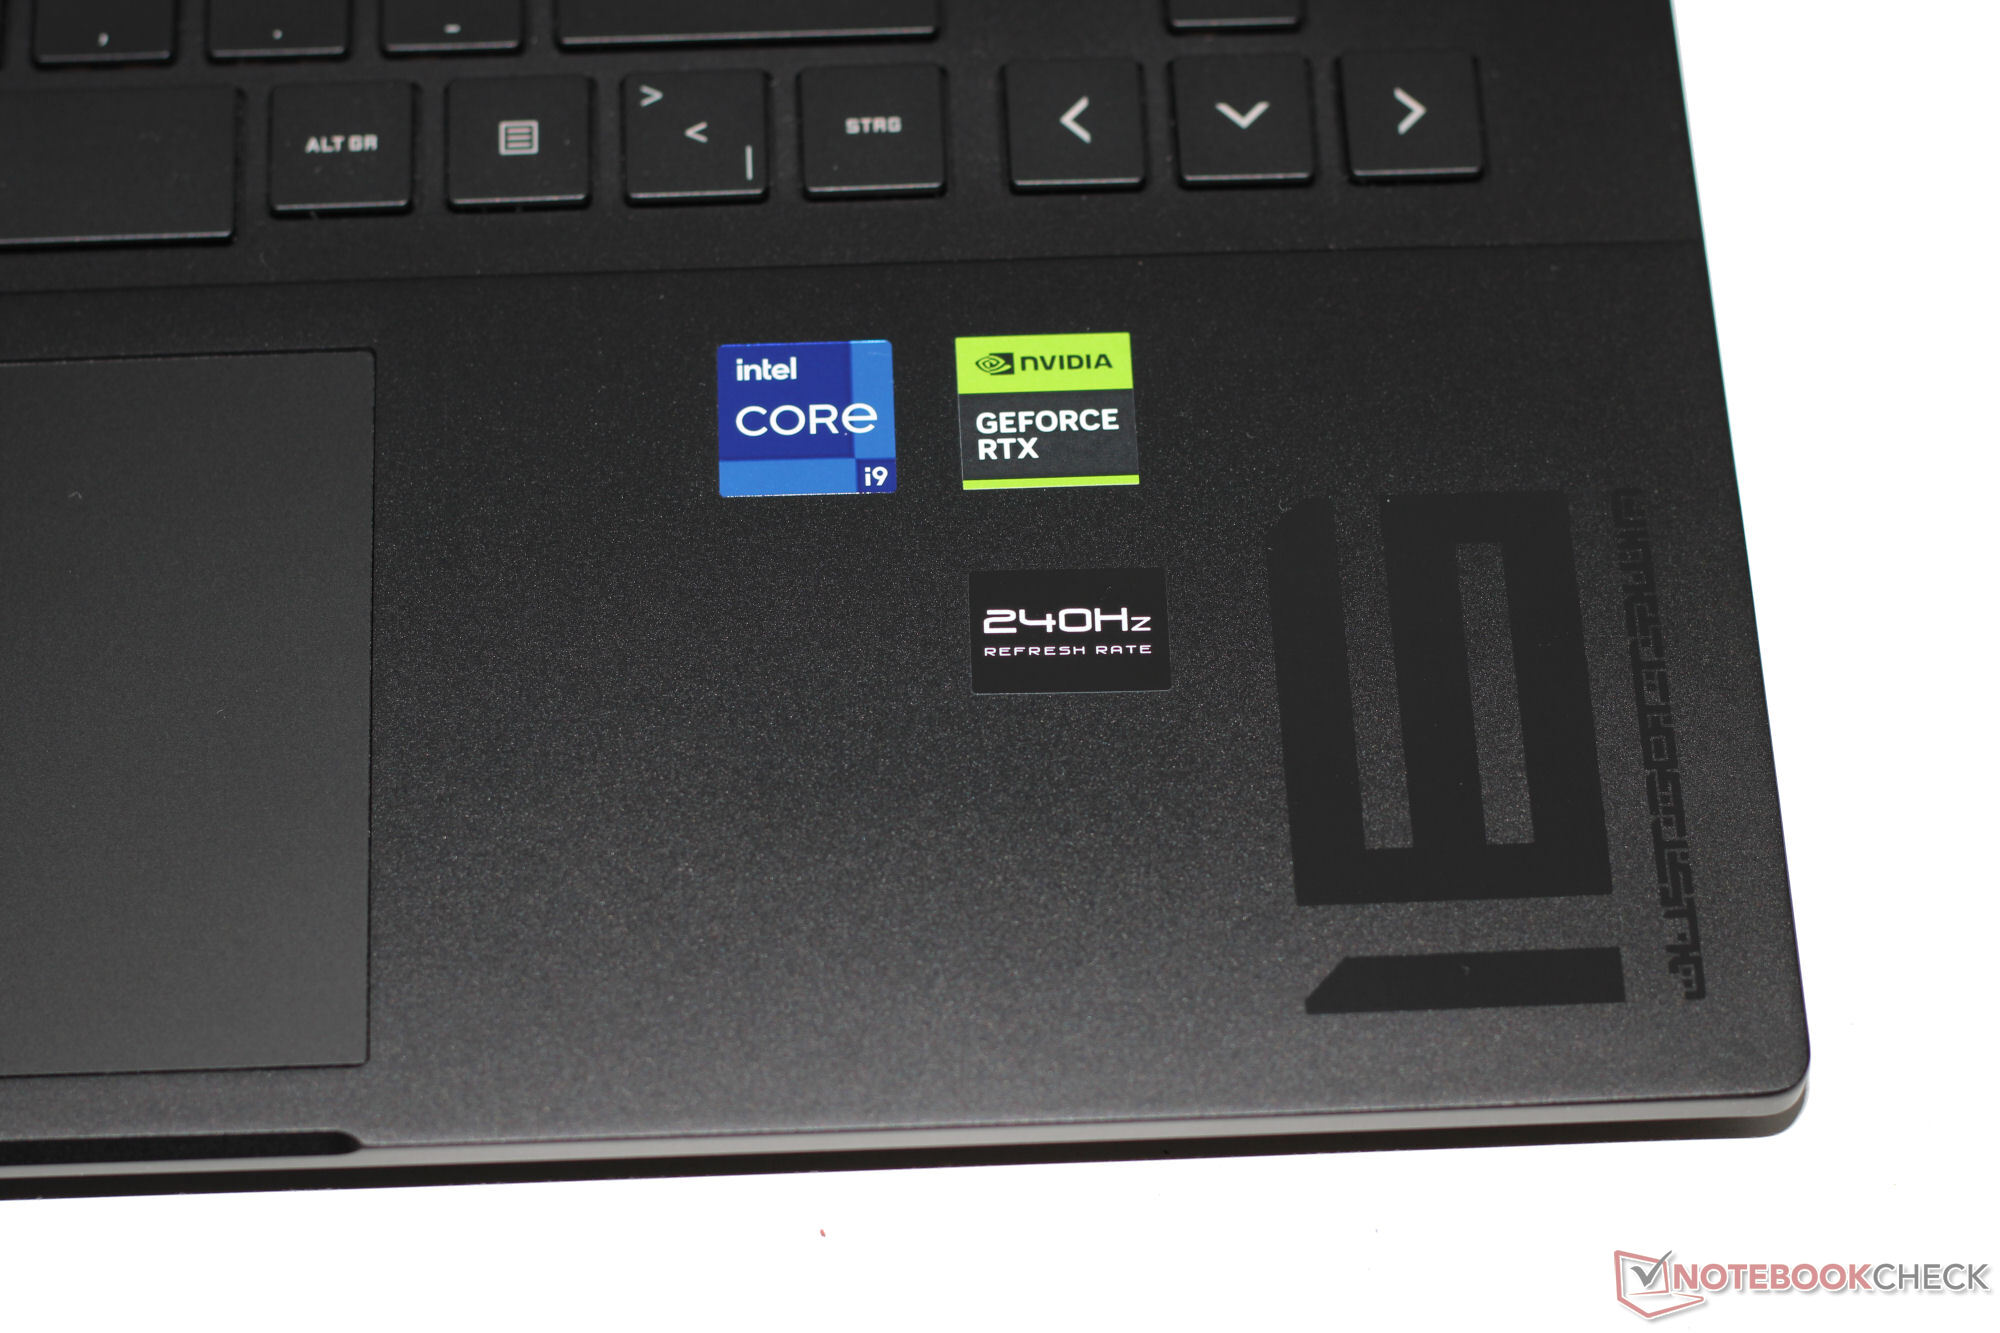
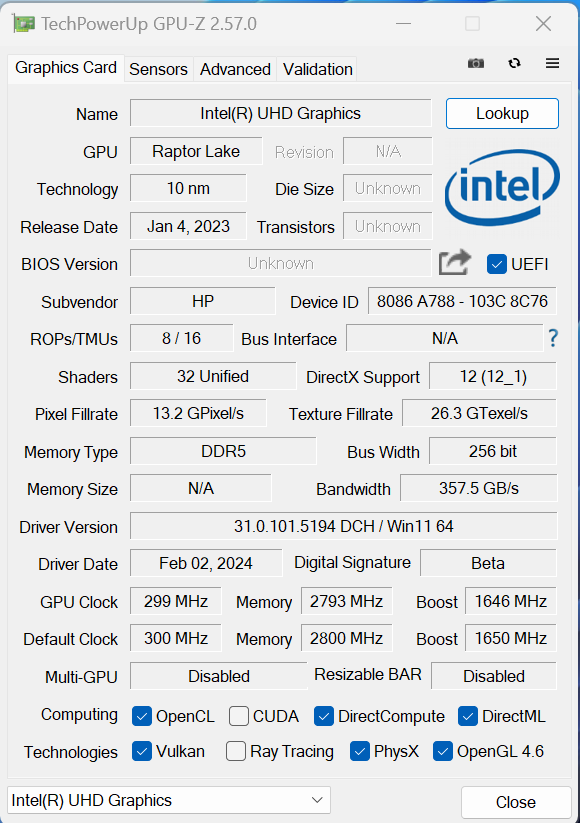
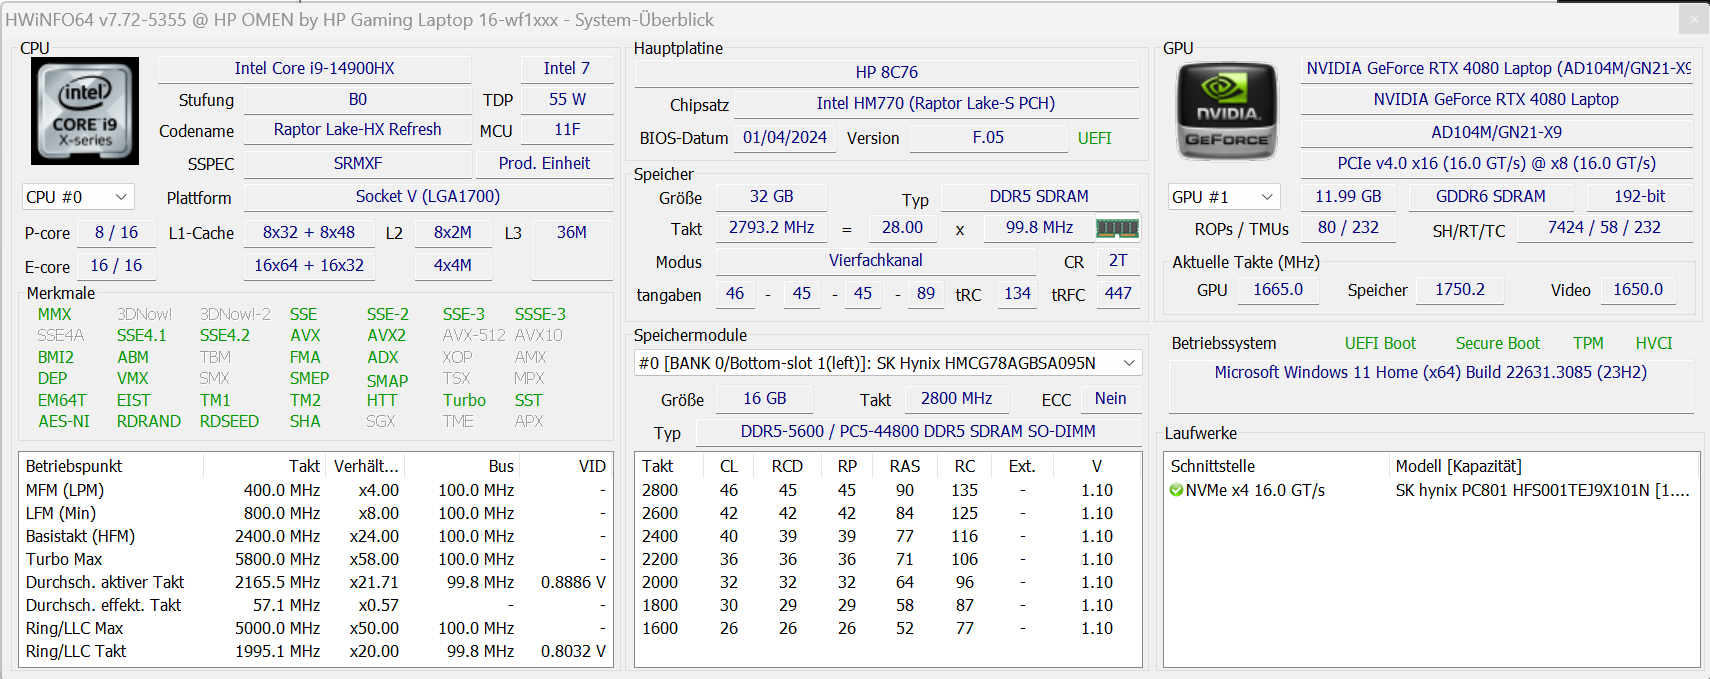
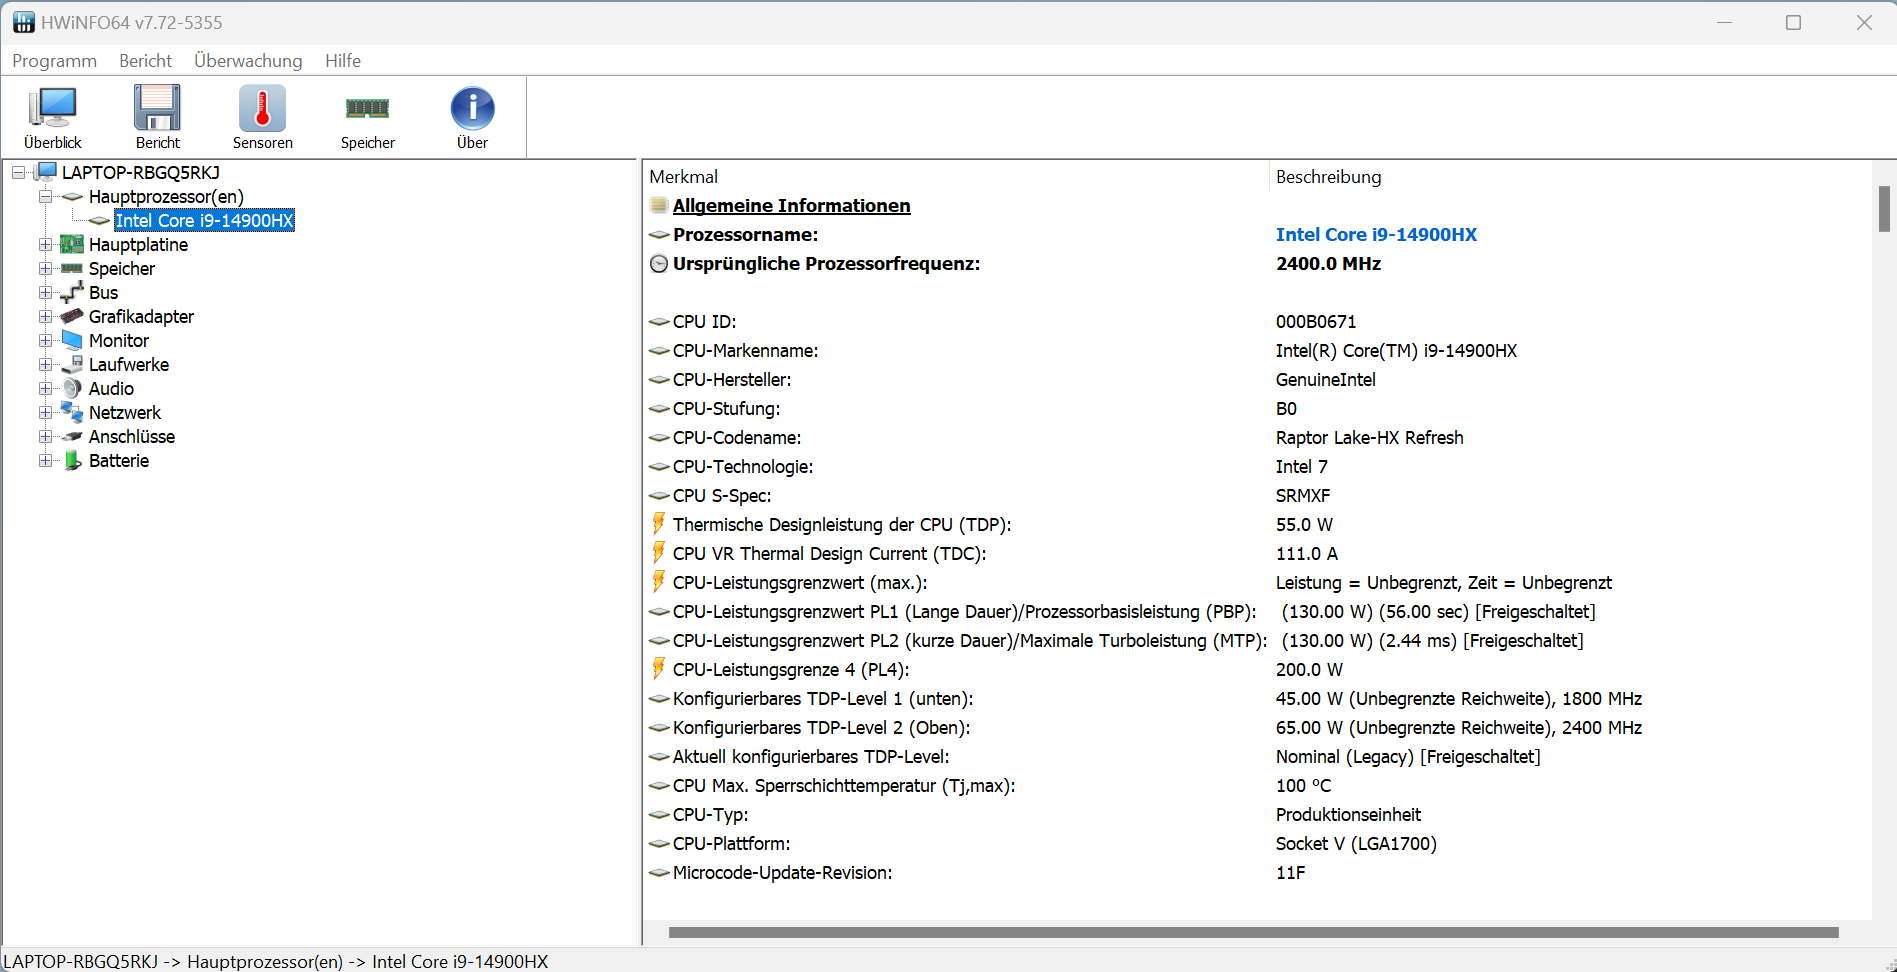
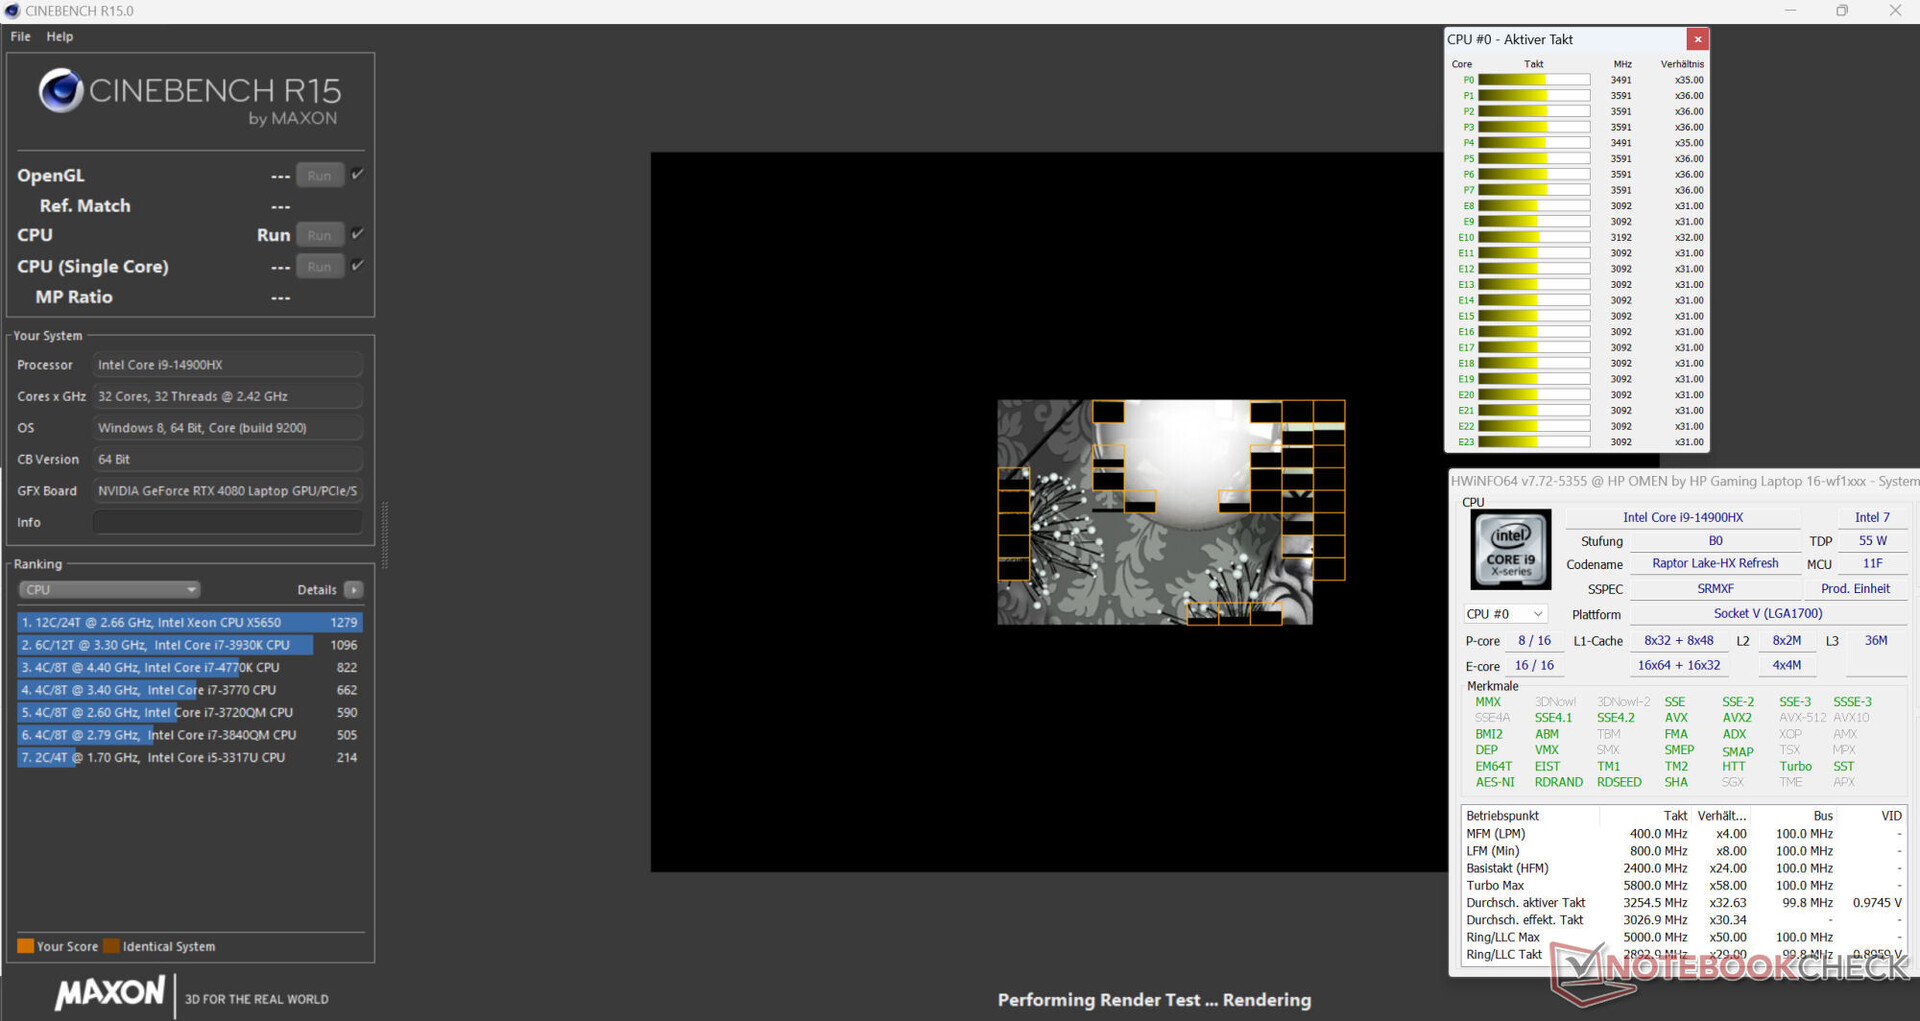
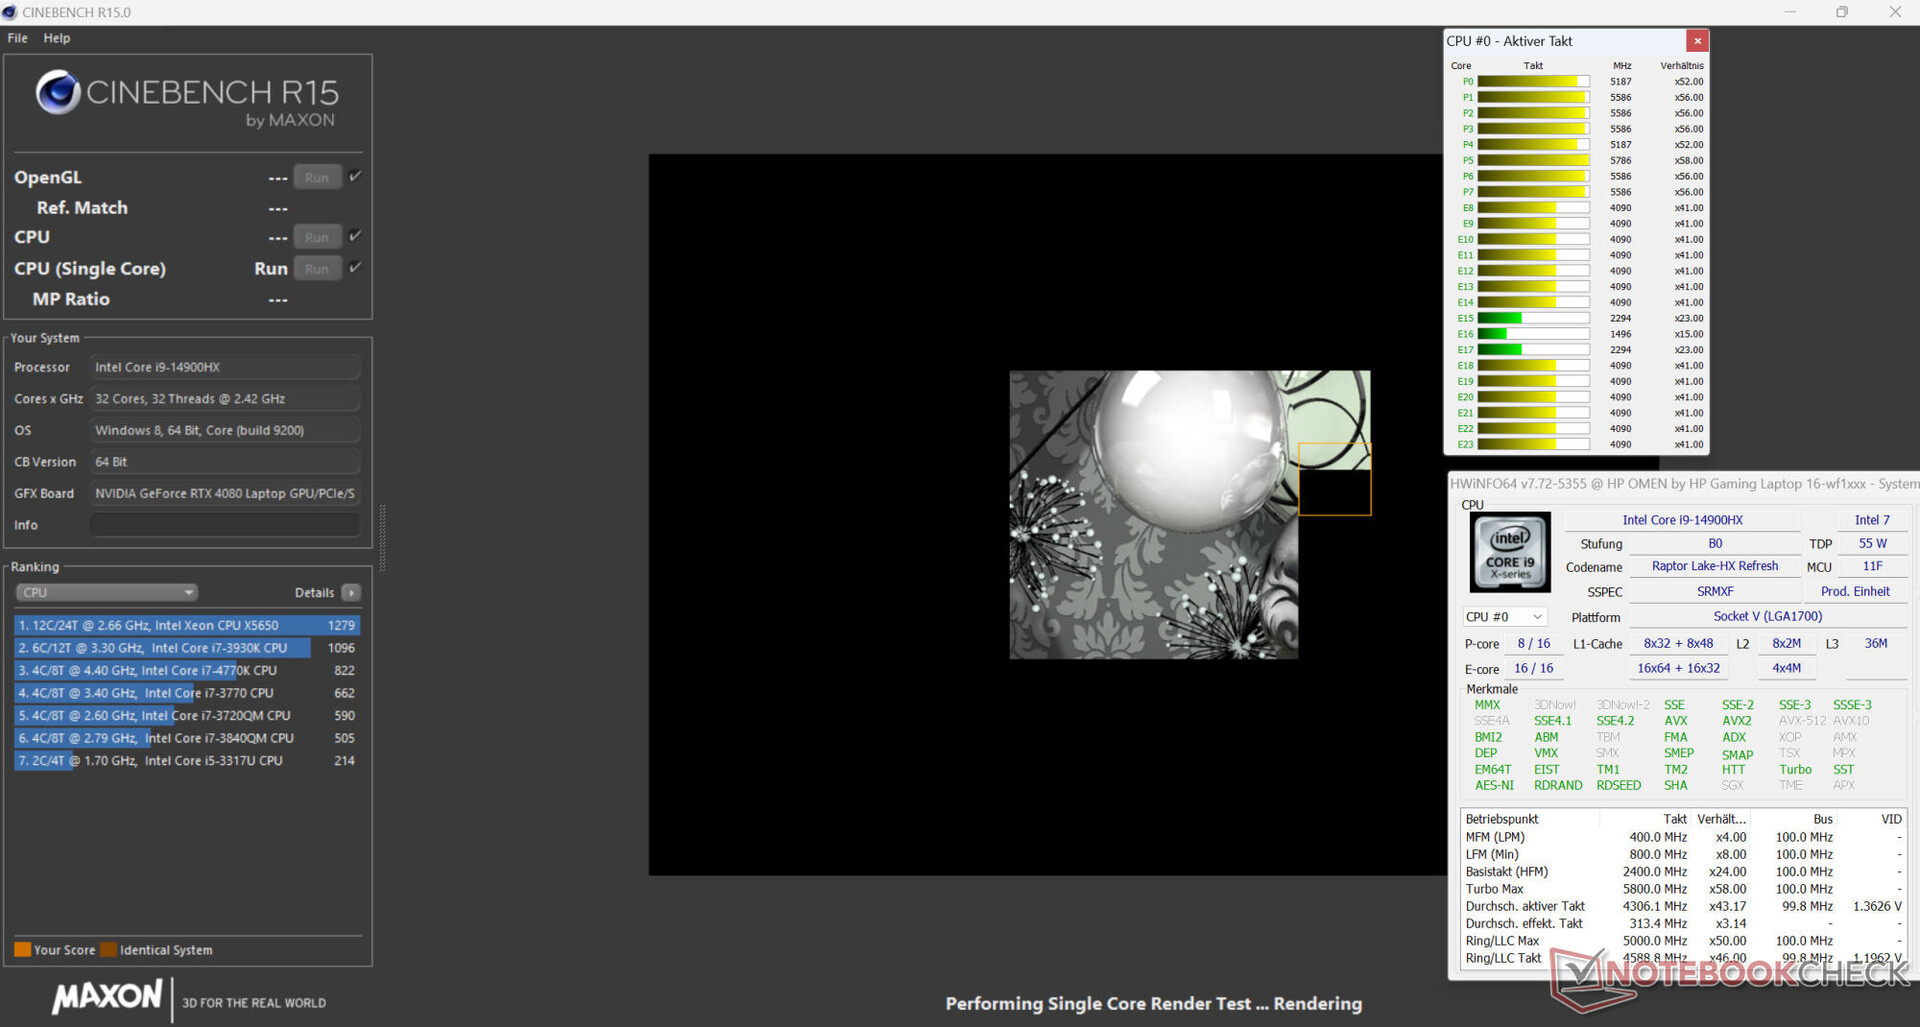
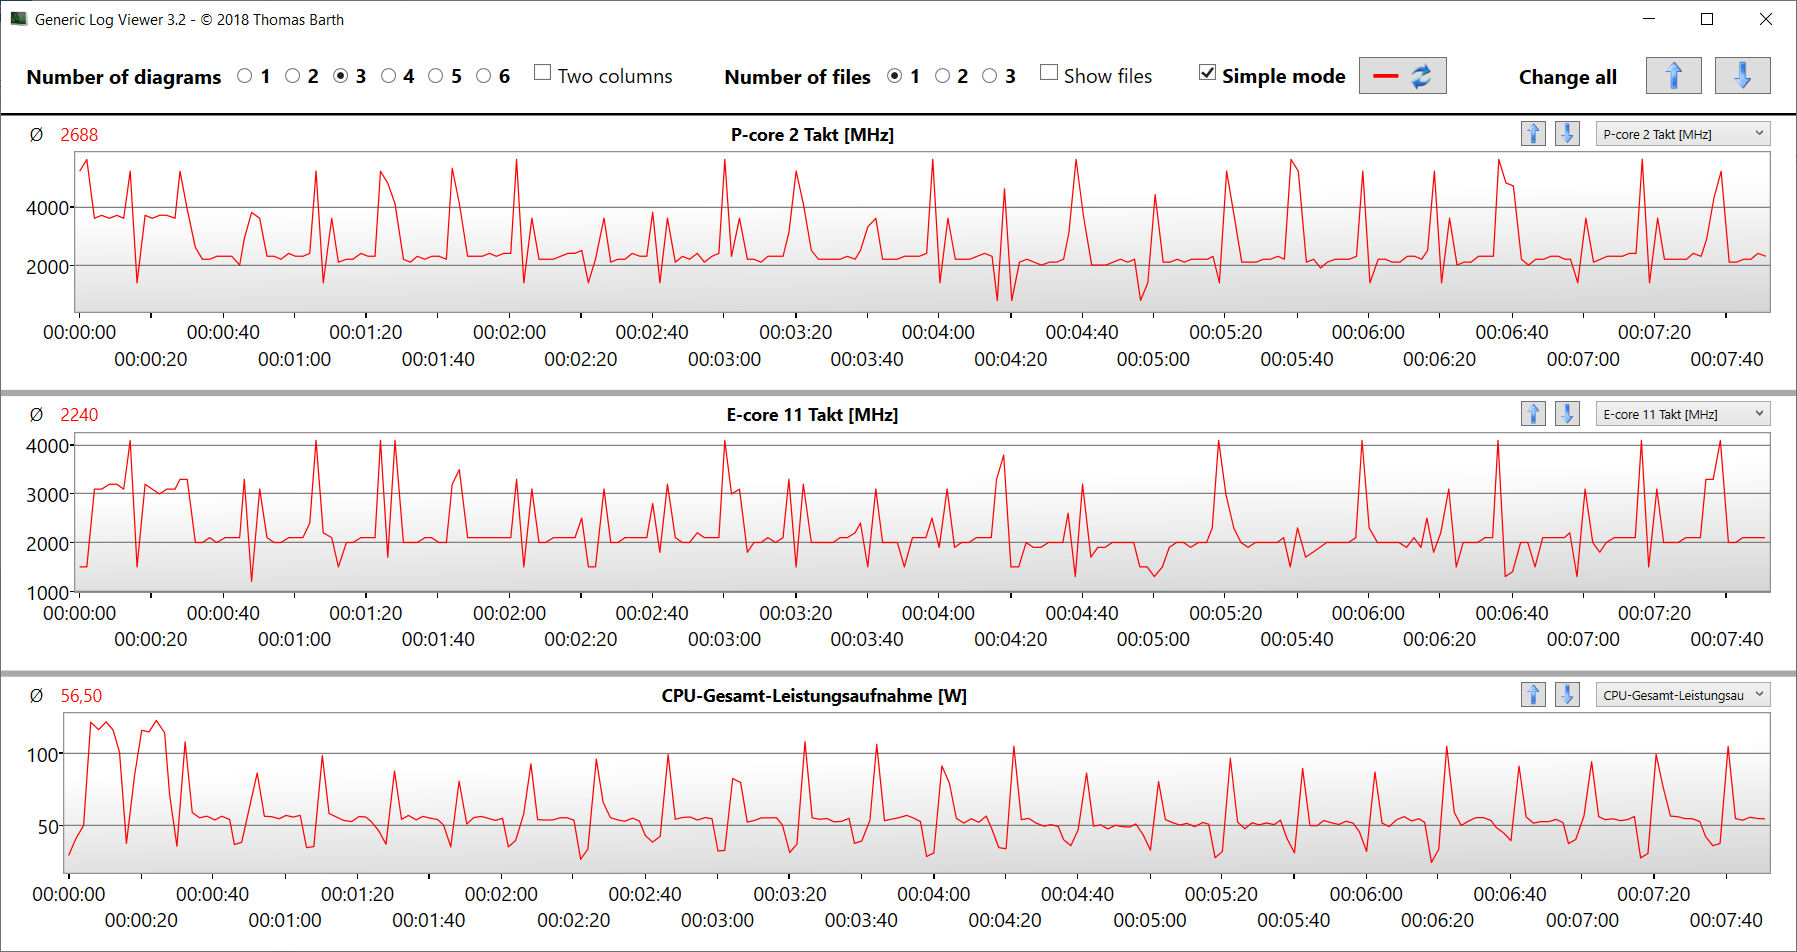
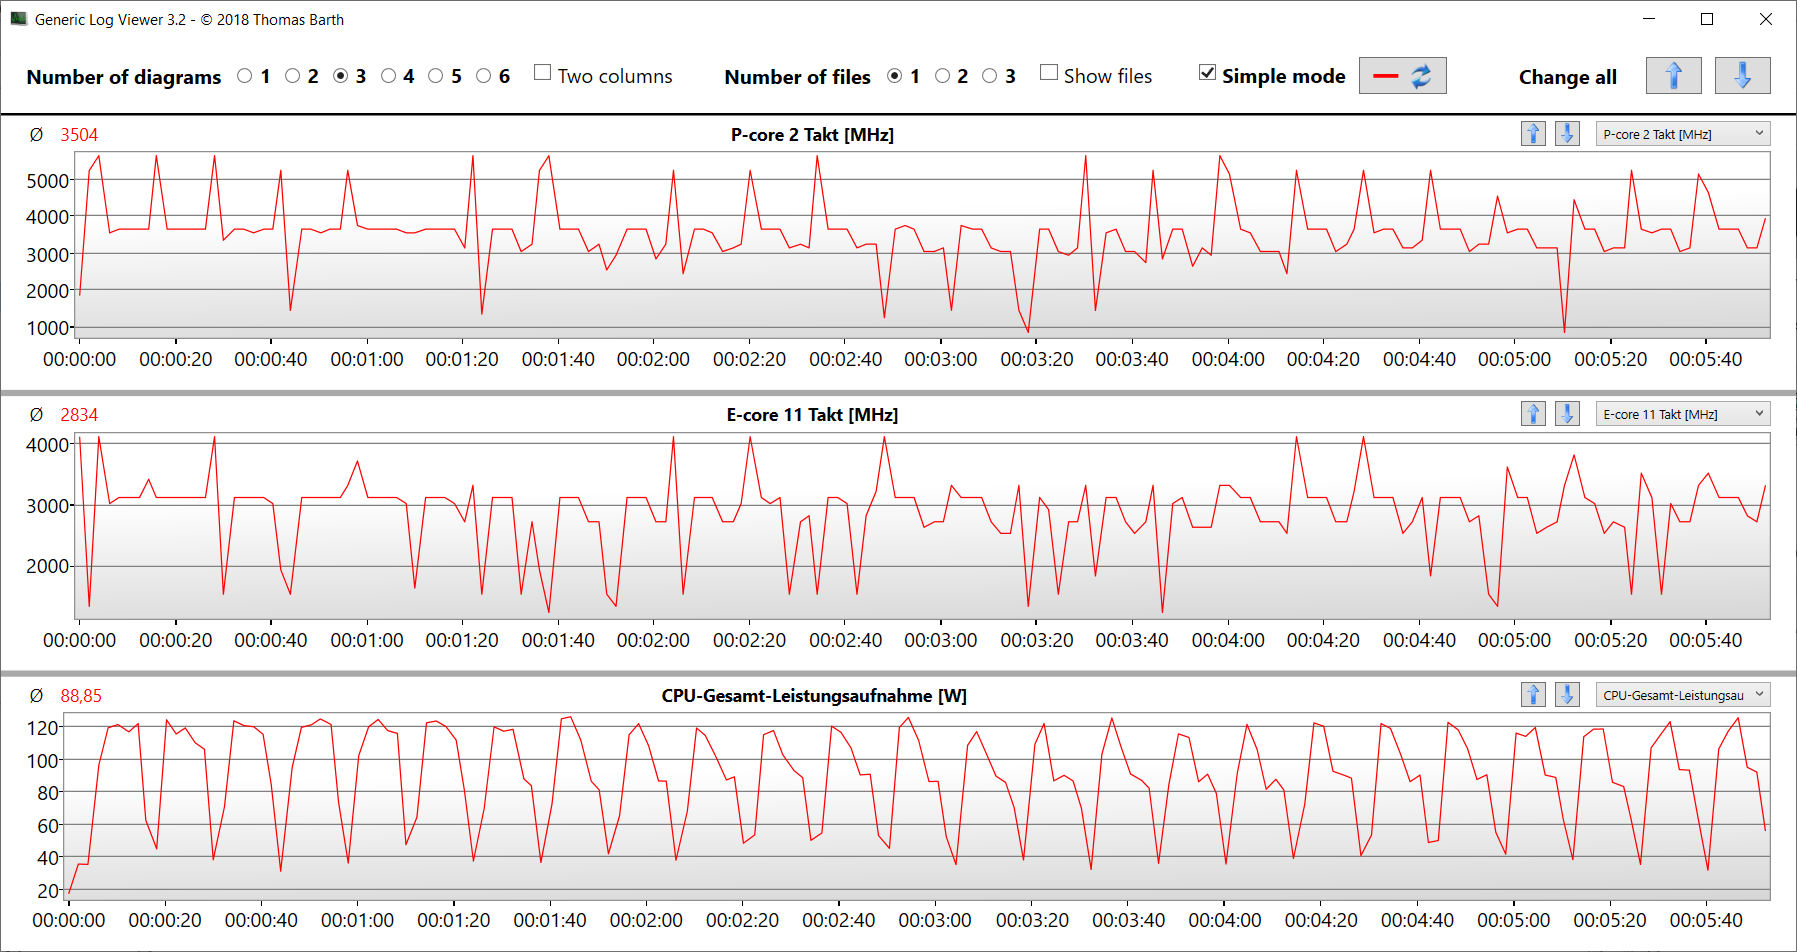
Procesor Core i9-14900HX zawiera 8 rdzeni P i 16 rdzeni E, co daje łącznie 32 wątki. Maksymalne taktowanie rdzeni P i E wynosi odpowiednio 5,8 GHz i 4,1 GHz. W trybie Balanced wyniki benchmarków są poniżej średniej CPU. Przełączenie na tryb Performance zapewnia jedynie niewielki wzrost wydajności.
Różnica powiększyła się przy długotrwałym obciążeniu wielowątkowym (pętla CB15). Na początku czwartego uruchomienia prędkość zegara znacznie spadła, po czym ustabilizowała się na względnie stałym poziomie przez resztę testu. W trybie Performance, prędkość zegara utrzymywała się na początkowym poziomie. Na zasilaniu bateryjnym, bardziej istotny wynik jednowątkowy (206 punktów; CB15) spadł o mniejszy margines niż wynik wielowątkowy (1596; CB15).
Proszę odnieść się do naszej analizy aby uzyskać więcej informacji na temat Core i9.
Cinebench R15 Multi Sustained Load
| CPU Performance rating - Percent | |
| MSI Vector 16 HX A14V | |
| Acer Predator Helios 18 N23Q2 | |
| Przeciętny Intel Core i9-14900HX | |
| HP Omen 16 (2024) | |
| HP Omen 16 (2024) | |
| Alienware m16 R1 AMD | |
| Średnia w klasie Gaming | |
| HP Omen 16-wf000 -3! | |
| Cinebench R20 | |
| CPU (Multi Core) | |
| MSI Vector 16 HX A14V | |
| Acer Predator Helios 18 N23Q2 | |
| Przeciętny Intel Core i9-14900HX (6579 - 13832, n=37) | |
| Alienware m16 R1 AMD | |
| HP Omen 16 (2024) | |
| HP Omen 16 (2024) (Leistung) | |
| Średnia w klasie Gaming (4029 - 16108, n=110, ostatnie 2 lata) | |
| HP Omen 16-wf000 | |
| CPU (Single Core) | |
| HP Omen 16 (2024) (Leistung) | |
| HP Omen 16 (2024) | |
| MSI Vector 16 HX A14V | |
| Przeciętny Intel Core i9-14900HX (657 - 859, n=37) | |
| Acer Predator Helios 18 N23Q2 | |
| Średnia w klasie Gaming (442 - 895, n=110, ostatnie 2 lata) | |
| HP Omen 16-wf000 | |
| Alienware m16 R1 AMD | |
| Cinebench R15 | |
| CPU Multi 64Bit | |
| Acer Predator Helios 18 N23Q2 | |
| MSI Vector 16 HX A14V | |
| Przeciętny Intel Core i9-14900HX (3263 - 5589, n=38) | |
| Alienware m16 R1 AMD | |
| HP Omen 16 (2024) (Leistung) | |
| HP Omen 16 (2024) | |
| Średnia w klasie Gaming (1578 - 6271, n=109, ostatnie 2 lata) | |
| HP Omen 16-wf000 | |
| CPU Single 64Bit | |
| HP Omen 16 (2024) (Leistung) | |
| HP Omen 16 (2024) | |
| MSI Vector 16 HX A14V | |
| Przeciętny Intel Core i9-14900HX (247 - 323, n=37) | |
| Alienware m16 R1 AMD | |
| Acer Predator Helios 18 N23Q2 | |
| Średnia w klasie Gaming (188.8 - 343, n=110, ostatnie 2 lata) | |
| HP Omen 16-wf000 | |
| Blender - v2.79 BMW27 CPU | |
| HP Omen 16 (2024) | |
| Średnia w klasie Gaming (80 - 330, n=108, ostatnie 2 lata) | |
| HP Omen 16 (2024) (Leistung) | |
| Przeciętny Intel Core i9-14900HX (91 - 206, n=37) | |
| Alienware m16 R1 AMD | |
| Acer Predator Helios 18 N23Q2 | |
| MSI Vector 16 HX A14V | |
| Geekbench 6.7 | |
| Multi-Core | |
| MSI Vector 16 HX A14V (6.2.1) | |
| Acer Predator Helios 18 N23Q2 | |
| Przeciętny Intel Core i9-14900HX (13158 - 19665, n=37) | |
| HP Omen 16 (2024) (6.2.1, Leistung) | |
| HP Omen 16 (2024) (6.2.1) | |
| Średnia w klasie Gaming (6625 - 22104, n=110, ostatnie 2 lata) | |
| Alienware m16 R1 AMD | |
| Single-Core | |
| HP Omen 16 (2024) (6.2.1) | |
| HP Omen 16 (2024) (6.2.1, Leistung) | |
| MSI Vector 16 HX A14V (6.2.1) | |
| Przeciętny Intel Core i9-14900HX (2419 - 3129, n=37) | |
| Acer Predator Helios 18 N23Q2 | |
| Średnia w klasie Gaming (1490 - 3259, n=110, ostatnie 2 lata) | |
| Alienware m16 R1 AMD | |
| HWBOT x265 Benchmark v2.2 - 4k Preset | |
| MSI Vector 16 HX A14V | |
| Acer Predator Helios 18 N23Q2 | |
| Alienware m16 R1 AMD | |
| Przeciętny Intel Core i9-14900HX (16.8 - 38.9, n=37) | |
| Średnia w klasie Gaming (11.5 - 44.3, n=109, ostatnie 2 lata) | |
| HP Omen 16 (2024) (Leistung) | |
| HP Omen 16 (2024) | |
| HP Omen 16-wf000 | |
| LibreOffice - 20 Documents To PDF | |
| Acer Predator Helios 18 N23Q2 | |
| Średnia w klasie Gaming (19 - 88.8, n=109, ostatnie 2 lata) | |
| MSI Vector 16 HX A14V (6.3.4.2) | |
| HP Omen 16-wf000 | |
| HP Omen 16 (2024) (6.3.4.2) | |
| HP Omen 16 (2024) (6.3.4.2, Leistung) | |
| Przeciętny Intel Core i9-14900HX (19 - 85.1, n=37) | |
| Alienware m16 R1 AMD | |
| R Benchmark 2.5 - Overall mean | |
| HP Omen 16-wf000 | |
| Średnia w klasie Gaming (0.3439 - 0.759, n=110, ostatnie 2 lata) | |
| Alienware m16 R1 AMD | |
| Acer Predator Helios 18 N23Q2 | |
| Przeciętny Intel Core i9-14900HX (0.3604 - 0.4859, n=37) | |
| MSI Vector 16 HX A14V | |
| HP Omen 16 (2024) (Leistung) | |
| HP Omen 16 (2024) | |
* ... im mniej tym lepiej
AIDA64: FP32 Ray-Trace | FPU Julia | CPU SHA3 | CPU Queen | FPU SinJulia | FPU Mandel | CPU AES | CPU ZLib | FP64 Ray-Trace | CPU PhotoWorxx
| Performance rating | |
| Alienware m16 R1 AMD | |
| Acer Predator Helios 18 N23Q2 | |
| MSI Vector 16 HX A14V | |
| Przeciętny Intel Core i9-14900HX | |
| Średnia w klasie Gaming | |
| HP Omen 16 (2024) | |
| HP Omen 16 (2024) | |
| HP Omen 16-wf000 | |
| AIDA64 / FP32 Ray-Trace | |
| Alienware m16 R1 AMD (v6.85.6300) | |
| Średnia w klasie Gaming (10227 - 85542, n=108, ostatnie 2 lata) | |
| MSI Vector 16 HX A14V (v6.92.6600) | |
| Acer Predator Helios 18 N23Q2 (v6.85.6300) | |
| Przeciętny Intel Core i9-14900HX (13098 - 33474, n=36) | |
| HP Omen 16 (2024) (v6.92.6600, Leistung) | |
| HP Omen 16-wf000 (v6.85.6300) | |
| HP Omen 16 (2024) (v6.92.6600) | |
| AIDA64 / FPU Julia | |
| Alienware m16 R1 AMD (v6.85.6300) | |
| MSI Vector 16 HX A14V (v6.92.6600) | |
| Acer Predator Helios 18 N23Q2 (v6.85.6300) | |
| Średnia w klasie Gaming (51376 - 238426, n=108, ostatnie 2 lata) | |
| Przeciętny Intel Core i9-14900HX (67573 - 166040, n=36) | |
| HP Omen 16 (2024) (v6.92.6600, Leistung) | |
| HP Omen 16-wf000 (v6.85.6300) | |
| HP Omen 16 (2024) (v6.92.6600) | |
| AIDA64 / CPU SHA3 | |
| Alienware m16 R1 AMD (v6.85.6300) | |
| MSI Vector 16 HX A14V (v6.92.6600) | |
| Acer Predator Helios 18 N23Q2 (v6.85.6300) | |
| Średnia w klasie Gaming (2180 - 9817, n=108, ostatnie 2 lata) | |
| Przeciętny Intel Core i9-14900HX (3589 - 7979, n=36) | |
| HP Omen 16 (2024) (v6.92.6600, Leistung) | |
| HP Omen 16 (2024) (v6.92.6600) | |
| HP Omen 16-wf000 (v6.85.6300) | |
| AIDA64 / CPU Queen | |
| Alienware m16 R1 AMD (v6.85.6300) | |
| MSI Vector 16 HX A14V (v6.92.6600) | |
| Przeciętny Intel Core i9-14900HX (118405 - 148966, n=36) | |
| Acer Predator Helios 18 N23Q2 (v6.85.6300) | |
| HP Omen 16 (2024) (v6.92.6600) | |
| HP Omen 16 (2024) (v6.92.6600, Leistung) | |
| Średnia w klasie Gaming (49785 - 173351, n=96, ostatnie 2 lata) | |
| HP Omen 16-wf000 (v6.85.6300) | |
| AIDA64 / FPU SinJulia | |
| Alienware m16 R1 AMD (v6.85.6300) | |
| MSI Vector 16 HX A14V (v6.92.6600) | |
| Acer Predator Helios 18 N23Q2 (v6.85.6300) | |
| Przeciętny Intel Core i9-14900HX (10475 - 18517, n=36) | |
| Średnia w klasie Gaming (4424 - 33636, n=108, ostatnie 2 lata) | |
| HP Omen 16 (2024) (v6.92.6600, Leistung) | |
| HP Omen 16 (2024) (v6.92.6600) | |
| HP Omen 16-wf000 (v6.85.6300) | |
| AIDA64 / FPU Mandel | |
| Alienware m16 R1 AMD (v6.85.6300) | |
| Średnia w klasie Gaming (25115 - 128721, n=108, ostatnie 2 lata) | |
| MSI Vector 16 HX A14V (v6.92.6600) | |
| Acer Predator Helios 18 N23Q2 (v6.85.6300) | |
| Przeciętny Intel Core i9-14900HX (32543 - 83662, n=36) | |
| HP Omen 16 (2024) (v6.92.6600, Leistung) | |
| HP Omen 16-wf000 (v6.85.6300) | |
| HP Omen 16 (2024) (v6.92.6600) | |
| AIDA64 / CPU AES | |
| Acer Predator Helios 18 N23Q2 (v6.85.6300) | |
| Przeciętny Intel Core i9-14900HX (86964 - 241777, n=36) | |
| MSI Vector 16 HX A14V (v6.92.6600) | |
| HP Omen 16 (2024) (v6.92.6600, Leistung) | |
| Alienware m16 R1 AMD (v6.85.6300) | |
| Średnia w klasie Gaming (39258 - 247074, n=108, ostatnie 2 lata) | |
| HP Omen 16-wf000 (v6.85.6300) | |
| HP Omen 16 (2024) (v6.92.6600) | |
| AIDA64 / CPU ZLib | |
| MSI Vector 16 HX A14V (v6.92.6600) | |
| Acer Predator Helios 18 N23Q2 (v6.85.6300) | |
| Przeciętny Intel Core i9-14900HX (1054 - 2292, n=36) | |
| Alienware m16 R1 AMD (v6.85.6300) | |
| HP Omen 16 (2024) (v6.92.6600, Leistung) | |
| Średnia w klasie Gaming (574 - 2531, n=108, ostatnie 2 lata) | |
| HP Omen 16-wf000 (v6.85.6300) | |
| HP Omen 16 (2024) (v6.92.6600) | |
| AIDA64 / FP64 Ray-Trace | |
| Alienware m16 R1 AMD (v6.85.6300) | |
| Średnia w klasie Gaming (5509 - 45446, n=108, ostatnie 2 lata) | |
| MSI Vector 16 HX A14V (v6.92.6600) | |
| Acer Predator Helios 18 N23Q2 (v6.85.6300) | |
| Przeciętny Intel Core i9-14900HX (6809 - 18349, n=36) | |
| HP Omen 16 (2024) (v6.92.6600, Leistung) | |
| HP Omen 16-wf000 (v6.85.6300) | |
| HP Omen 16 (2024) (v6.92.6600) | |
| AIDA64 / CPU PhotoWorxx | |
| Acer Predator Helios 18 N23Q2 (v6.85.6300) | |
| HP Omen 16 (2024) (v6.92.6600, Leistung) | |
| HP Omen 16 (2024) (v6.92.6600) | |
| MSI Vector 16 HX A14V (v6.92.6600) | |
| Przeciętny Intel Core i9-14900HX (23903 - 54702, n=36) | |
| Średnia w klasie Gaming (12271 - 89891, n=108, ostatnie 2 lata) | |
| HP Omen 16-wf000 (v6.85.6300) | |
| Alienware m16 R1 AMD (v6.85.6300) | |
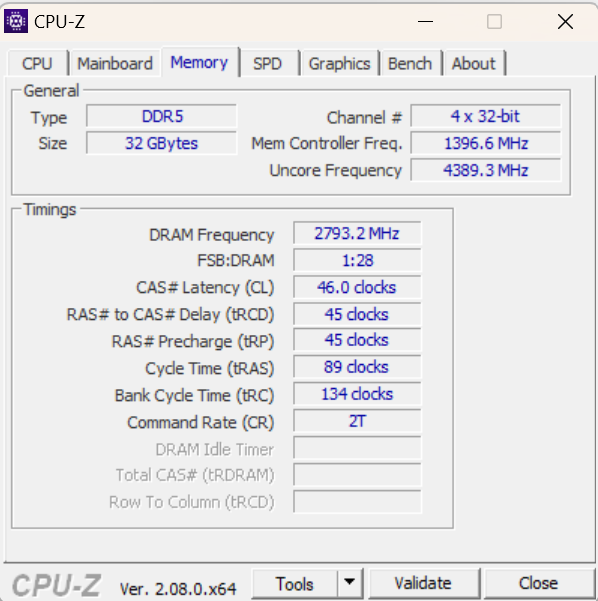
Wydajność systemu
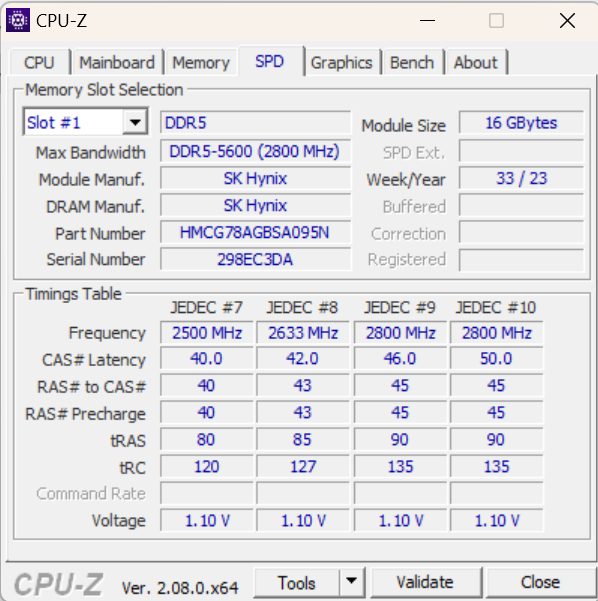
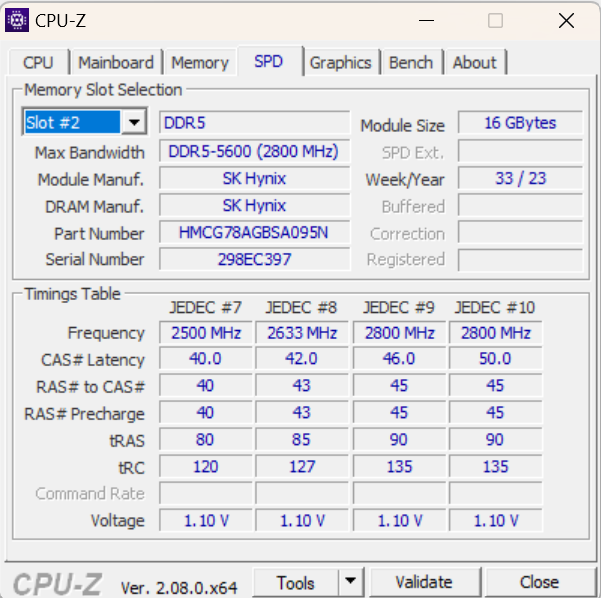
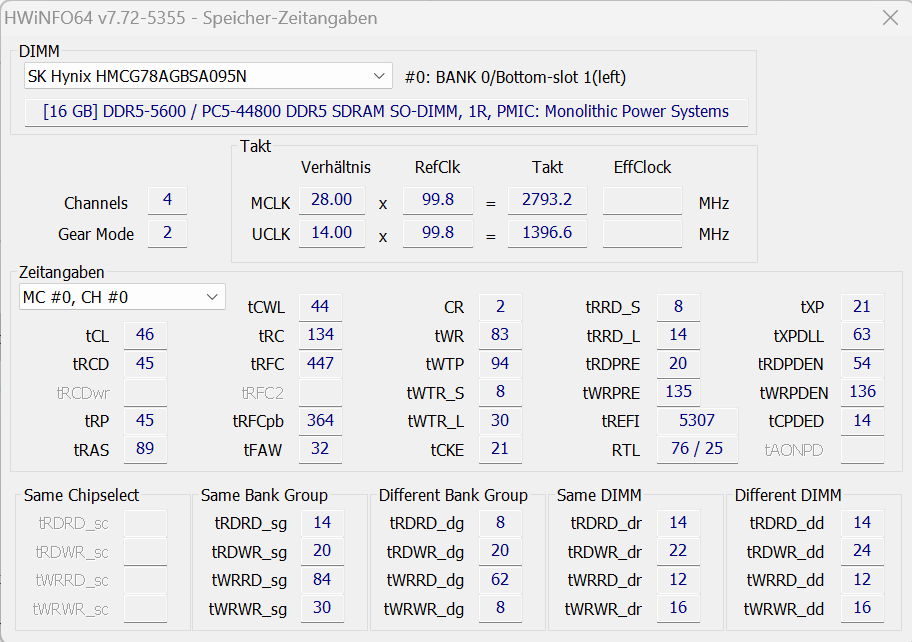
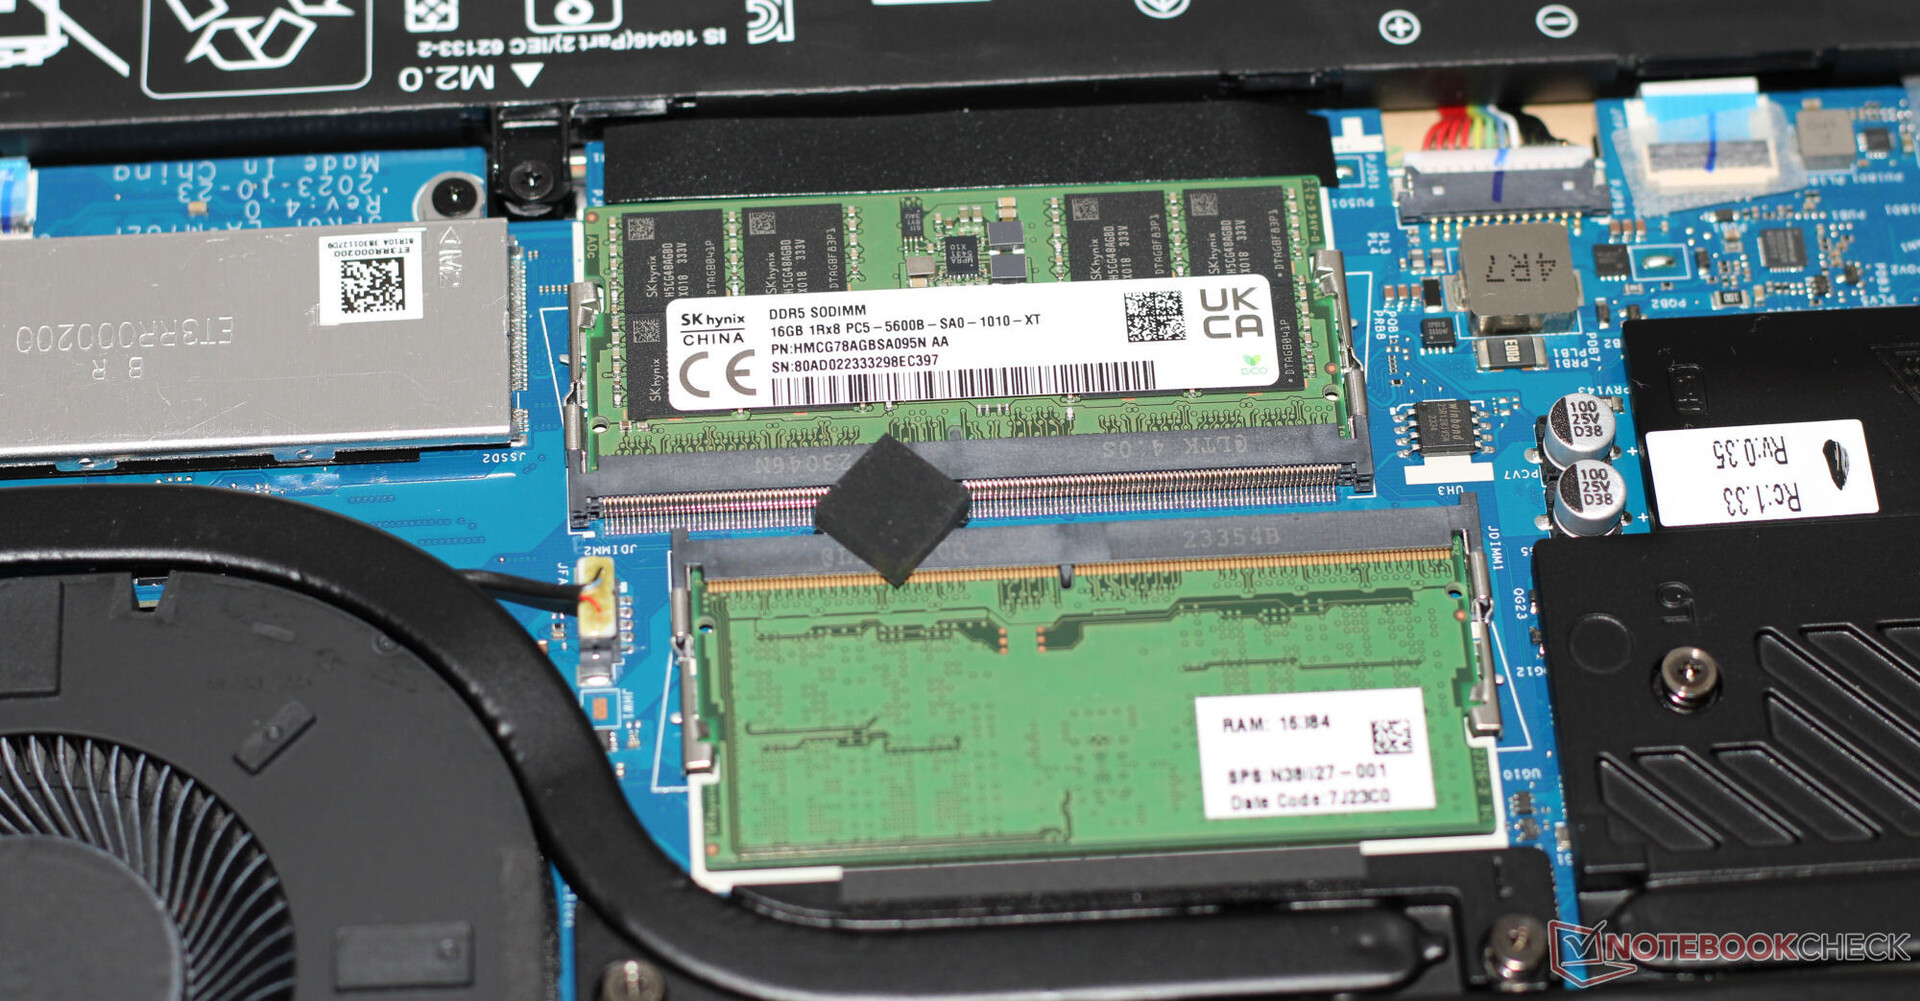
Szybki system charakteryzuje się dużą mocą obliczeniową. Sprzęt jest w stanie poradzić sobie z takimi rzeczami jak gry i renderowanie bez wysiłku. Prędkości transferu pamięci są na typowym poziomie dla DDR5-5600 RAM.
CrossMark: Overall | Productivity | Creativity | Responsiveness
WebXPRT 3: Overall
WebXPRT 4: Overall
Mozilla Kraken 1.1: Total
| PCMark 10 / Score | |
| HP Omen 16 (2024) | |
| Alienware m16 R1 AMD | |
| Przeciętny Intel Core i9-14900HX, NVIDIA GeForce RTX 4080 Laptop GPU (7703 - 9223, n=7) | |
| MSI Vector 16 HX A14V | |
| Acer Predator Helios 18 N23Q2 | |
| Średnia w klasie Gaming (5828 - 11574, n=96, ostatnie 2 lata) | |
| HP Omen 16-wf000 | |
| PCMark 10 / Essentials | |
| Przeciętny Intel Core i9-14900HX, NVIDIA GeForce RTX 4080 Laptop GPU (11255 - 12600, n=7) | |
| Alienware m16 R1 AMD | |
| MSI Vector 16 HX A14V | |
| HP Omen 16 (2024) | |
| Acer Predator Helios 18 N23Q2 | |
| Średnia w klasie Gaming (8810 - 12600, n=100, ostatnie 2 lata) | |
| HP Omen 16-wf000 | |
| PCMark 10 / Productivity | |
| HP Omen 16 (2024) | |
| Średnia w klasie Gaming (6845 - 21327, n=98, ostatnie 2 lata) | |
| Acer Predator Helios 18 N23Q2 | |
| Alienware m16 R1 AMD | |
| Przeciętny Intel Core i9-14900HX, NVIDIA GeForce RTX 4080 Laptop GPU (6662 - 11410, n=7) | |
| MSI Vector 16 HX A14V | |
| HP Omen 16-wf000 | |
| PCMark 10 / Digital Content Creation | |
| MSI Vector 16 HX A14V | |
| Alienware m16 R1 AMD | |
| Przeciętny Intel Core i9-14900HX, NVIDIA GeForce RTX 4080 Laptop GPU (14211 - 16246, n=7) | |
| HP Omen 16 (2024) | |
| Acer Predator Helios 18 N23Q2 | |
| Średnia w klasie Gaming (7602 - 19657, n=98, ostatnie 2 lata) | |
| HP Omen 16-wf000 | |
| CrossMark / Overall | |
| HP Omen 16 (2024) | |
| Acer Predator Helios 18 N23Q2 | |
| MSI Vector 16 HX A14V | |
| Przeciętny Intel Core i9-14900HX, NVIDIA GeForce RTX 4080 Laptop GPU (1992 - 2334, n=7) | |
| Alienware m16 R1 AMD | |
| Średnia w klasie Gaming (1366 - 2409, n=96, ostatnie 2 lata) | |
| HP Omen 16-wf000 | |
| CrossMark / Productivity | |
| HP Omen 16 (2024) | |
| Acer Predator Helios 18 N23Q2 | |
| MSI Vector 16 HX A14V | |
| Przeciętny Intel Core i9-14900HX, NVIDIA GeForce RTX 4080 Laptop GPU (1812 - 2204, n=7) | |
| Alienware m16 R1 AMD | |
| Średnia w klasie Gaming (1386 - 2254, n=96, ostatnie 2 lata) | |
| HP Omen 16-wf000 | |
| CrossMark / Creativity | |
| MSI Vector 16 HX A14V | |
| Acer Predator Helios 18 N23Q2 | |
| Przeciętny Intel Core i9-14900HX, NVIDIA GeForce RTX 4080 Laptop GPU (2327 - 2500, n=7) | |
| HP Omen 16 (2024) | |
| Średnia w klasie Gaming (1343 - 2729, n=96, ostatnie 2 lata) | |
| Alienware m16 R1 AMD | |
| HP Omen 16-wf000 | |
| CrossMark / Responsiveness | |
| HP Omen 16 (2024) | |
| Acer Predator Helios 18 N23Q2 | |
| MSI Vector 16 HX A14V | |
| Przeciętny Intel Core i9-14900HX, NVIDIA GeForce RTX 4080 Laptop GPU (1520 - 2254, n=7) | |
| Alienware m16 R1 AMD | |
| Średnia w klasie Gaming (1226 - 2334, n=96, ostatnie 2 lata) | |
| HP Omen 16-wf000 | |
| WebXPRT 3 / Overall | |
| Alienware m16 R1 AMD | |
| Przeciętny Intel Core i9-14900HX, NVIDIA GeForce RTX 4080 Laptop GPU (310 - 345, n=7) | |
| HP Omen 16 (2024) | |
| MSI Vector 16 HX A14V | |
| Acer Predator Helios 18 N23Q2 | |
| Średnia w klasie Gaming (220 - 532, n=101, ostatnie 2 lata) | |
| HP Omen 16-wf000 | |
| WebXPRT 4 / Overall | |
| Przeciętny Intel Core i9-14900HX, NVIDIA GeForce RTX 4080 Laptop GPU (300 - 321, n=7) | |
| HP Omen 16 (2024) | |
| MSI Vector 16 HX A14V | |
| Średnia w klasie Gaming (165 - 354, n=101, ostatnie 2 lata) | |
| Alienware m16 R1 AMD | |
| HP Omen 16-wf000 | |
| Mozilla Kraken 1.1 / Total | |
| HP Omen 16-wf000 | |
| Alienware m16 R1 AMD | |
| Średnia w klasie Gaming (391 - 590, n=106, ostatnie 2 lata) | |
| Acer Predator Helios 18 N23Q2 | |
| MSI Vector 16 HX A14V | |
| Przeciętny Intel Core i9-14900HX, NVIDIA GeForce RTX 4080 Laptop GPU (437 - 446, n=7) | |
| HP Omen 16 (2024) | |
* ... im mniej tym lepiej
| PCMark 10 Score | 8915 pkt. | |
Pomoc | ||
| AIDA64 / Memory Copy | |
| HP Omen 16 (2024) | |
| Acer Predator Helios 18 N23Q2 | |
| MSI Vector 16 HX A14V | |
| Przeciętny Intel Core i9-14900HX (38028 - 83392, n=36) | |
| Średnia w klasie Gaming (21750 - 129946, n=108, ostatnie 2 lata) | |
| HP Omen 16-wf000 | |
| Alienware m16 R1 AMD | |
| AIDA64 / Memory Read | |
| HP Omen 16 (2024) | |
| Acer Predator Helios 18 N23Q2 | |
| MSI Vector 16 HX A14V | |
| Przeciętny Intel Core i9-14900HX (43306 - 87568, n=36) | |
| Średnia w klasie Gaming (22956 - 118858, n=108, ostatnie 2 lata) | |
| HP Omen 16-wf000 | |
| Alienware m16 R1 AMD | |
| AIDA64 / Memory Write | |
| HP Omen 16 (2024) | |
| MSI Vector 16 HX A14V | |
| Średnia w klasie Gaming (22297 - 135096, n=108, ostatnie 2 lata) | |
| Acer Predator Helios 18 N23Q2 | |
| Przeciętny Intel Core i9-14900HX (37146 - 80589, n=36) | |
| HP Omen 16-wf000 | |
| Alienware m16 R1 AMD | |
| AIDA64 / Memory Latency | |
| Średnia w klasie Gaming (75.3 - 259, n=108, ostatnie 2 lata) | |
| Alienware m16 R1 AMD | |
| HP Omen 16-wf000 | |
| Przeciętny Intel Core i9-14900HX (76.1 - 105, n=36) | |
| HP Omen 16 (2024) | |
| Acer Predator Helios 18 N23Q2 | |
| MSI Vector 16 HX A14V | |
* ... im mniej tym lepiej
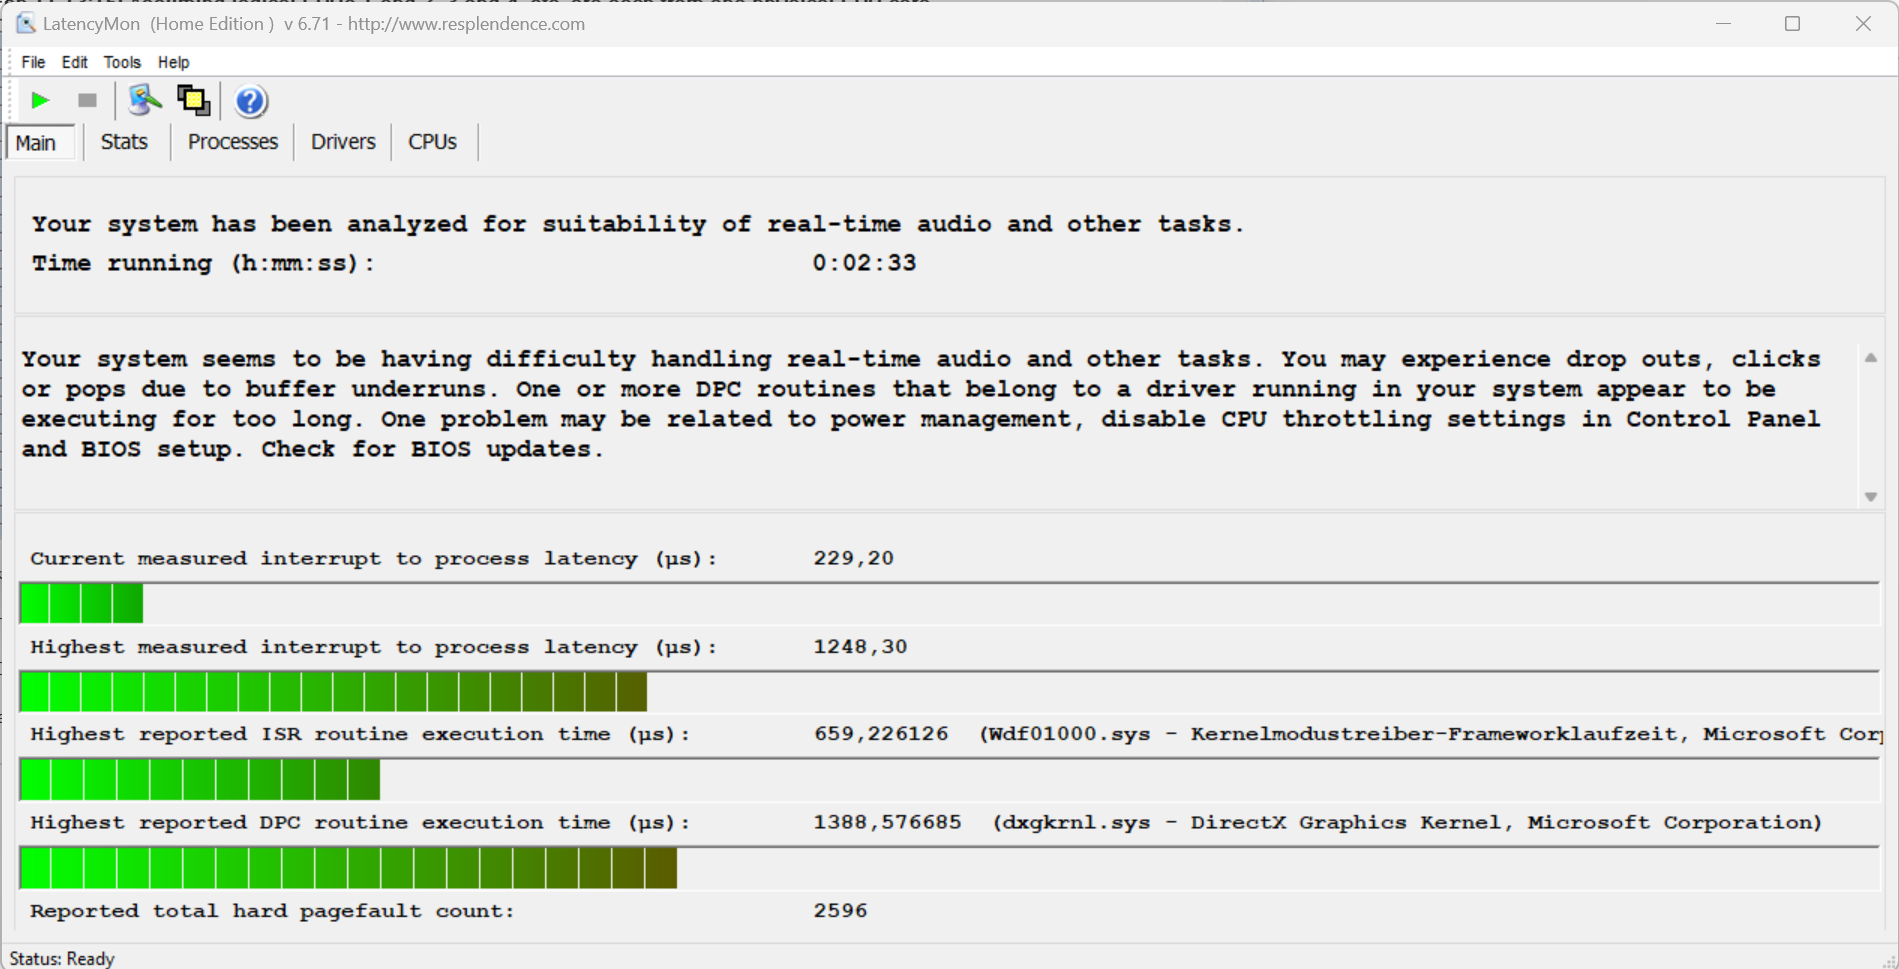
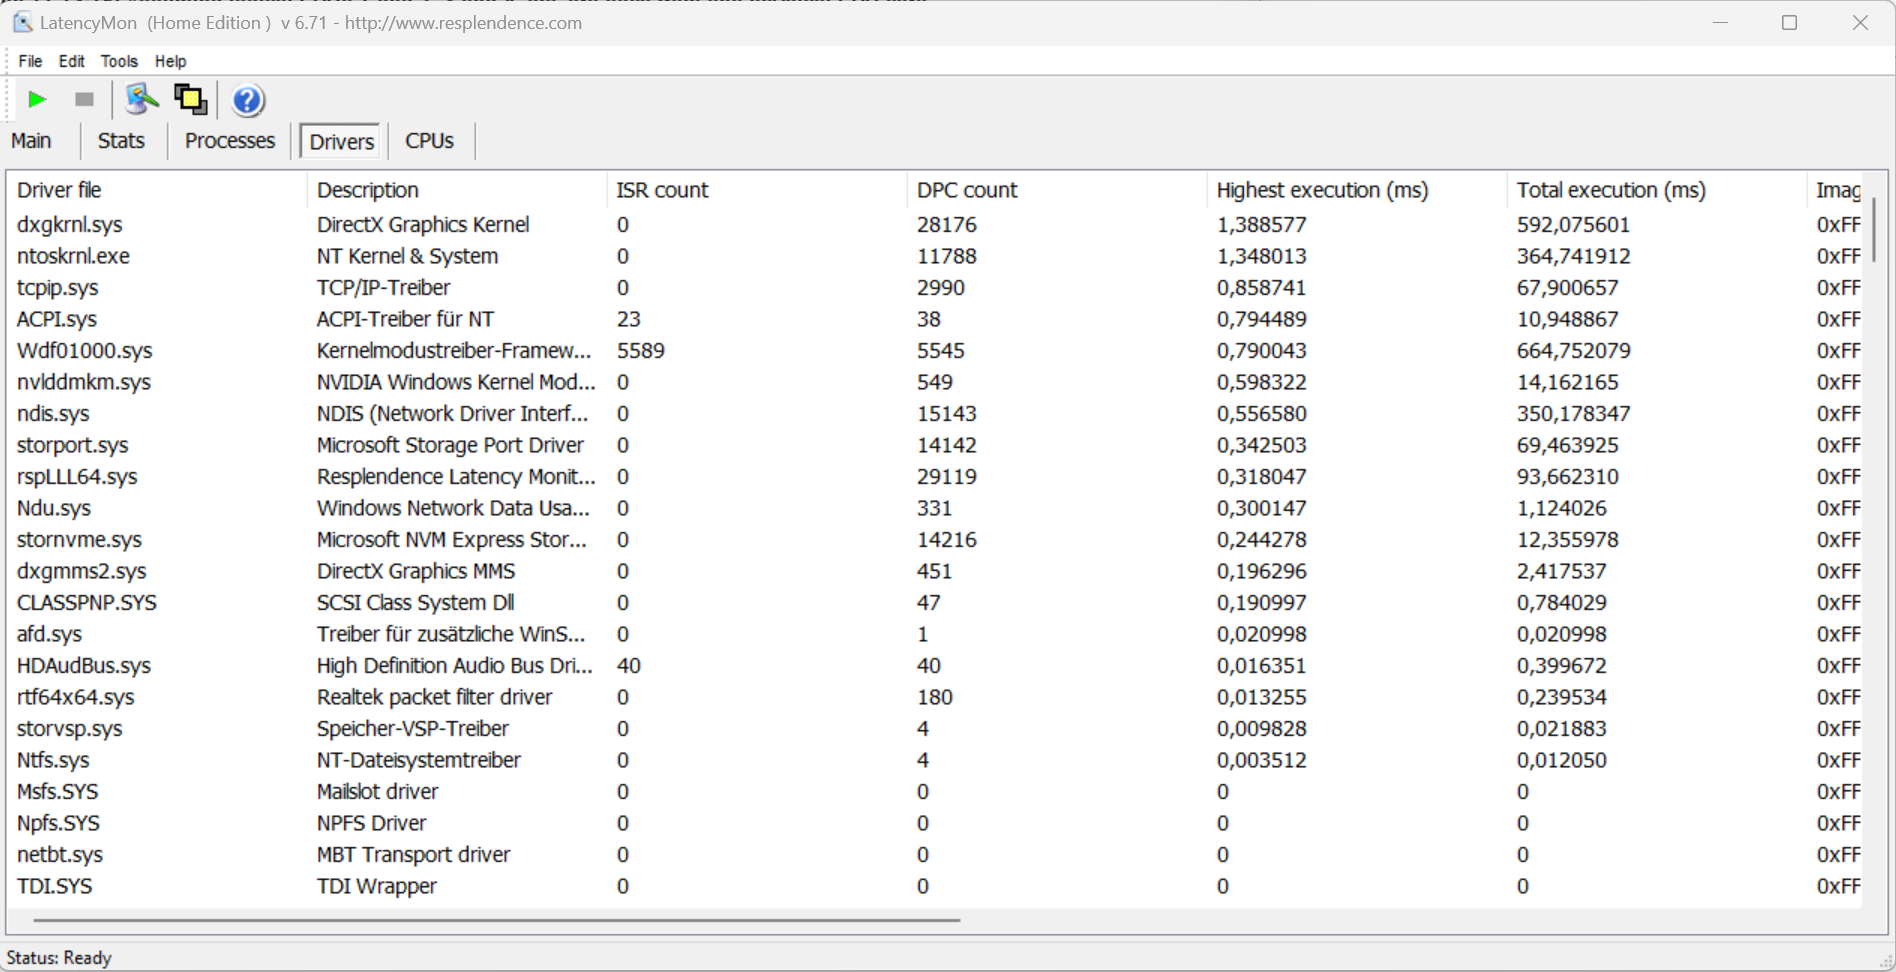
Opóźnienie DPC
Nasz standardowy test Latency Monitor (surfowanie po sieci, odtwarzanie wideo 4K i Prime95 High-load) ujawnił pewne problemy. System nie wydaje się być odpowiedni do edycji wideo i audio w czasie rzeczywistym. Miejmy nadzieję, że przyszłe aktualizacje oprogramowania przyniosą poprawę.
| DPC Latencies / LatencyMon - interrupt to process latency (max), Web, Youtube, Prime95 | |
| Acer Predator Helios 18 N23Q2 | |
| HP Omen 16-wf000 | |
| Alienware m16 R1 AMD | |
| MSI Vector 16 HX A14V | |
| HP Omen 16 (2024) | |
* ... im mniej tym lepiej
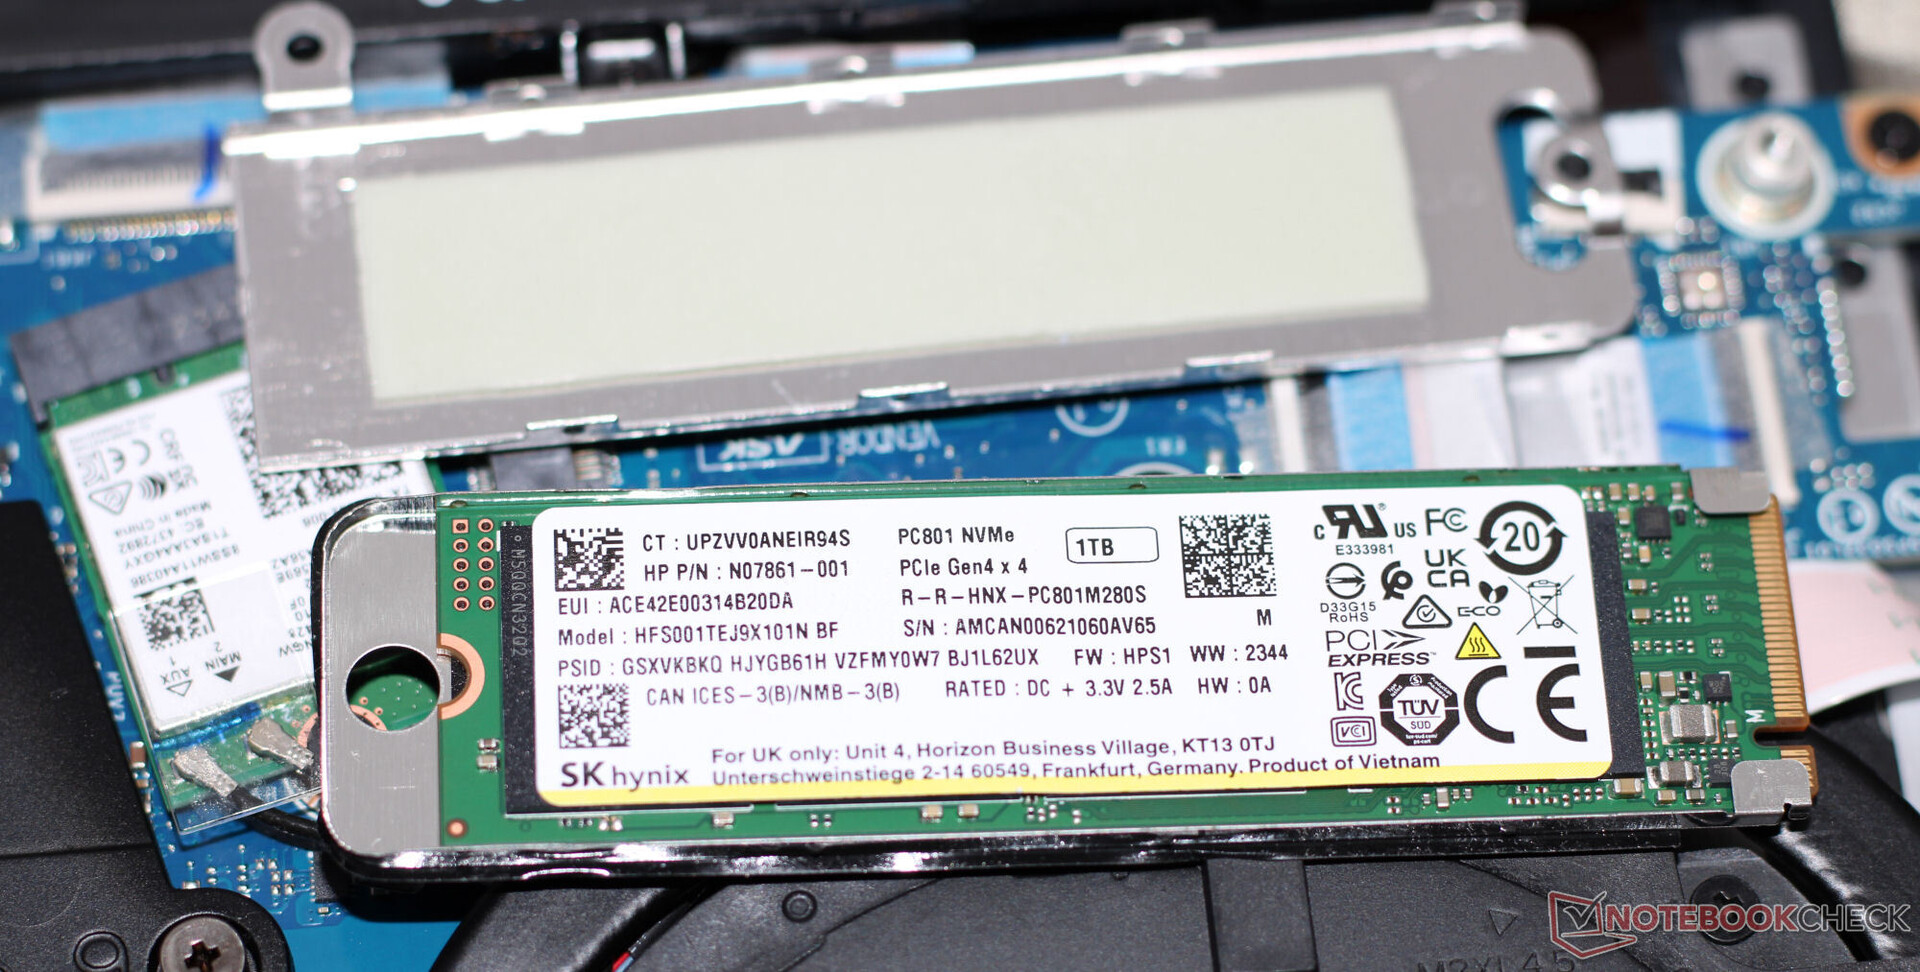
Pamięć masowa
Omen 16 może pomieścić łącznie dwa dyski SSD PCIe 4.0 M.2-2280. Dysk SK Hynix o pojemności 1 TB w naszej jednostce testowej zapewnia doskonałe prędkości transferu i nie doświadczył dławienia termicznego podczas naszych testów.

* ... im mniej tym lepiej
Sustained Load Read: DiskSpd Read Loop, Queue Depth 8
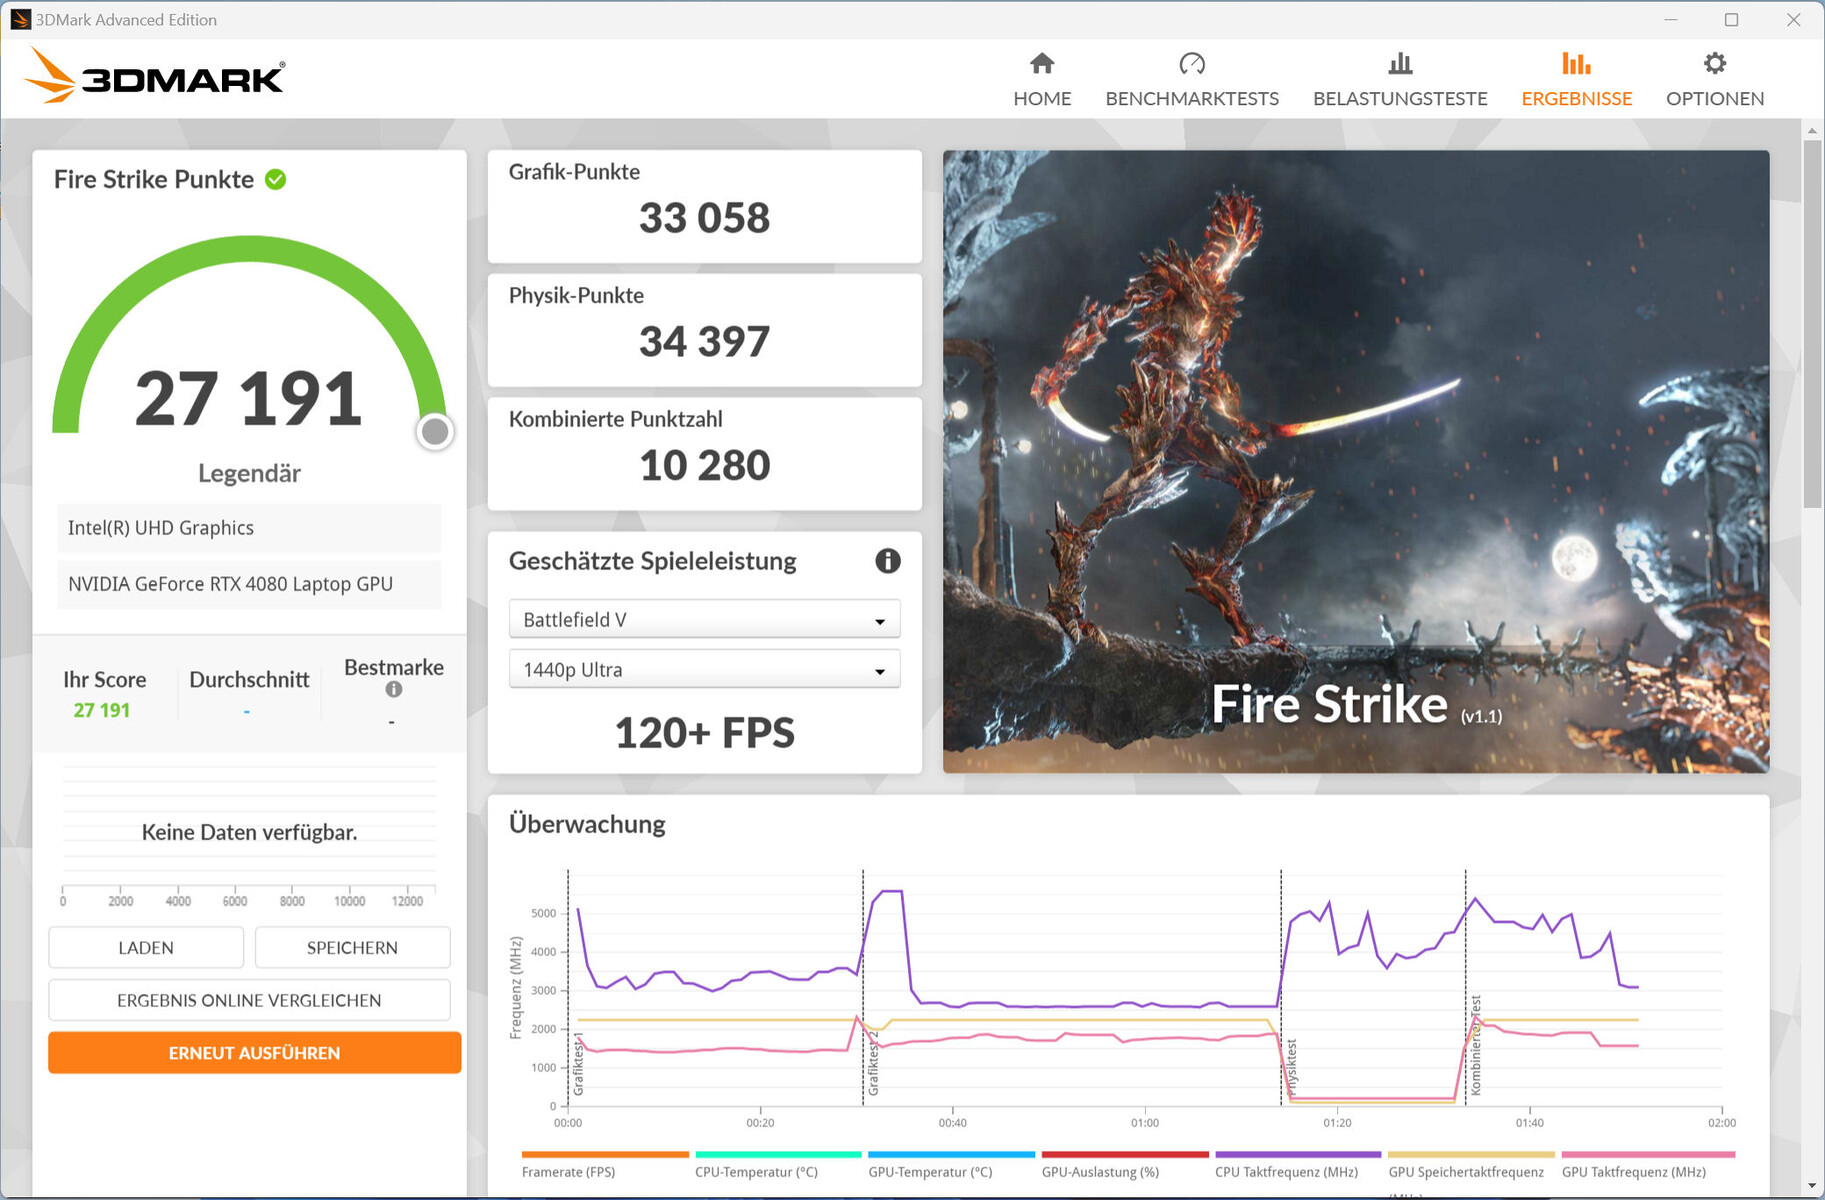
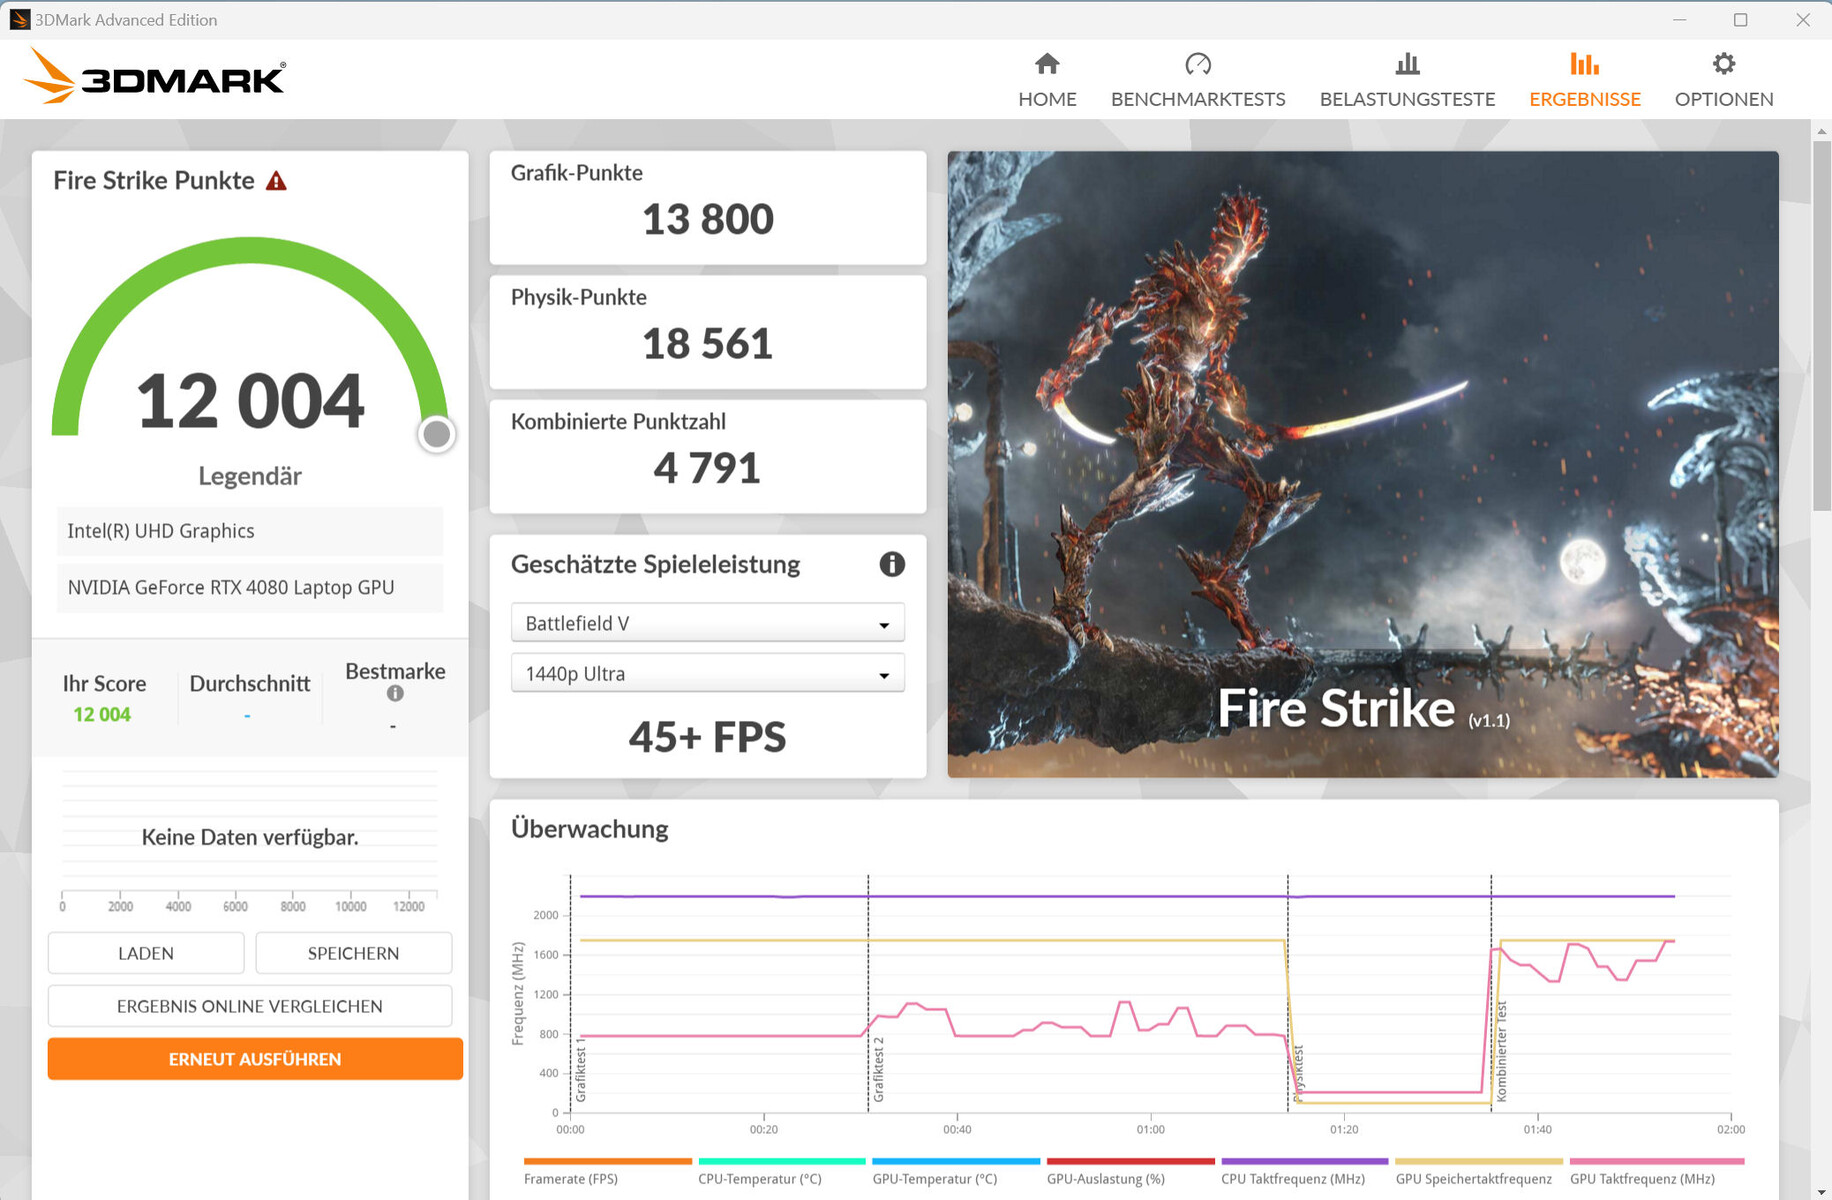
Karta graficzna
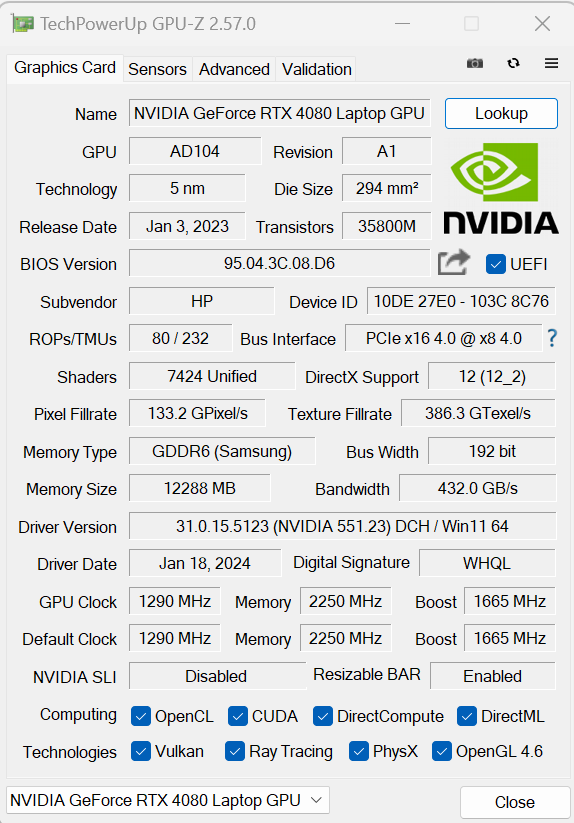
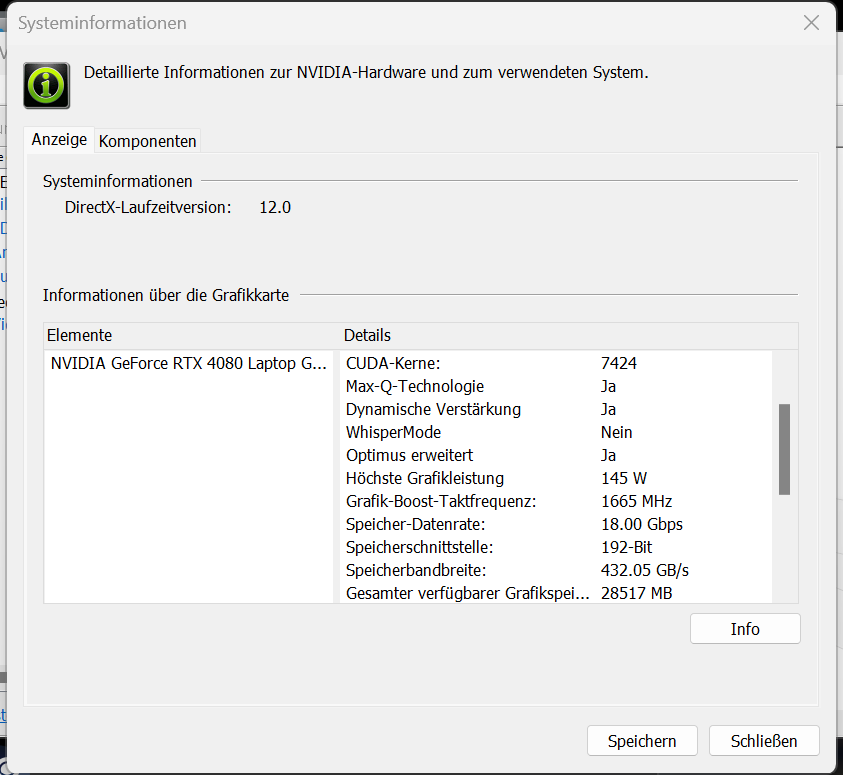
Karta graficzna GeForce RTX 4080 posiada 7 424 rdzenie CUDA, 192-bitową magistralę pamięci i 12 288 MB pamięci GDDR6. HP przyznało karcie graficznej TGP 145 watów - poniżej 175-watowego maksymalnego TGP określonego przez Nvidię.
Wyniki benchmarków i liczba klatek na sekundę uzyskane z Omen 16 są średnio poniżej tego, co widzieliśmy z RTX 4080 Laptop. Przełączenie na tryb wydajności skutkuje poprawą wydajności. GPU pozwala na grę w rozdzielczości QHD i ustawieniach od wysokich do maksymalnych. Z pomocą DLSS 3 i Frame Generation możliwe jest również włączenie maksymalnych ustawień i dodatkowych efektów ray tracingu w wyższych rozdzielczościach - choć można to zrobić tylko w grach z odpowiednim wsparciem.


| 3DMark Performance rating - Percent | |
| MSI Vector 16 HX A14V | |
| Alienware m16 R1 AMD | |
| Acer Predator Helios 18 N23Q2 | |
| Przeciętny NVIDIA GeForce RTX 4080 Laptop GPU | |
| HP Omen 16-wf000 | |
| HP Omen 16 (2024) | |
| Średnia w klasie Gaming | |
| HP Omen 16 (2024) | |
| 3DMark 11 - 1280x720 Performance GPU | |
| MSI Vector 16 HX A14V | |
| Acer Predator Helios 18 N23Q2 | |
| Przeciętny NVIDIA GeForce RTX 4080 Laptop GPU (45199 - 63128, n=24) | |
| Alienware m16 R1 AMD | |
| HP Omen 16-wf000 | |
| HP Omen 16 (2024) (Leistung) | |
| Średnia w klasie Gaming (21841 - 80022, n=107, ostatnie 2 lata) | |
| HP Omen 16 (2024) | |
| 3DMark | |
| 1920x1080 Fire Strike Graphics | |
| Alienware m16 R1 AMD | |
| MSI Vector 16 HX A14V | |
| Acer Predator Helios 18 N23Q2 | |
| Przeciętny NVIDIA GeForce RTX 4080 Laptop GPU (33058 - 45220, n=23) | |
| HP Omen 16 (2024) (Leistung) | |
| HP Omen 16-wf000 | |
| Średnia w klasie Gaming (12242 - 62849, n=119, ostatnie 2 lata) | |
| HP Omen 16 (2024) | |
| 2560x1440 Time Spy Graphics | |
| MSI Vector 16 HX A14V | |
| Alienware m16 R1 AMD | |
| Acer Predator Helios 18 N23Q2 | |
| Przeciętny NVIDIA GeForce RTX 4080 Laptop GPU (13282 - 19663, n=23) | |
| HP Omen 16-wf000 | |
| HP Omen 16 (2024) (Leistung) | |
| Średnia w klasie Gaming (5012 - 26212, n=118, ostatnie 2 lata) | |
| HP Omen 16 (2024) | |
| 3DMark 11 Performance | 35380 pkt. | |
| 3DMark Cloud Gate Standard Score | 51266 pkt. | |
| 3DMark Fire Strike Score | 27191 pkt. | |
| 3DMark Time Spy Score | 13636 pkt. | |
Pomoc | ||
| Blender | |
| v3.3 Classroom OPTIX/RTX | |
| Średnia w klasie Gaming (9 - 32, n=110, ostatnie 2 lata) | |
| HP Omen 16-wf000 (3.3.3) | |
| HP Omen 16 (2024) (3.3.3) | |
| Alienware m16 R1 AMD (3.3.3) | |
| Przeciętny NVIDIA GeForce RTX 4080 Laptop GPU (13 - 20, n=22) | |
| Acer Predator Helios 18 N23Q2 (3.3.3) | |
| MSI Vector 16 HX A14V (3.3.3) | |
| HP Omen 16 (2024) (3.3.3, Leistung) | |
| v3.3 Classroom CUDA | |
| Średnia w klasie Gaming (15 - 233, n=111, ostatnie 2 lata) | |
| HP Omen 16 (2024) (3.3.3) | |
| Alienware m16 R1 AMD (3.3.3) | |
| HP Omen 16 (2024) (3.3.3, Leistung) | |
| Przeciętny NVIDIA GeForce RTX 4080 Laptop GPU (21 - 28, n=23) | |
| HP Omen 16-wf000 (3.3.3) | |
| MSI Vector 16 HX A14V (3.3.3) | |
| Acer Predator Helios 18 N23Q2 (3.3.3) | |
| v3.3 Classroom CPU | |
| HP Omen 16-wf000 (3.3.3) | |
| HP Omen 16 (2024) (3.3.3) | |
| Średnia w klasie Gaming (122 - 565, n=106, ostatnie 2 lata) | |
| Przeciętny NVIDIA GeForce RTX 4080 Laptop GPU (177 - 337, n=23) | |
| HP Omen 16 (2024) (3.3.3, Leistung) | |
| Acer Predator Helios 18 N23Q2 (3.3.3) | |
| Alienware m16 R1 AMD (3.3.3) | |
| MSI Vector 16 HX A14V (3.3.3) | |
| Geekbench 5.5 | |
| OpenCL Score | |
| Alienware m16 R1 AMD | |
| Acer Predator Helios 18 N23Q2 | |
| Przeciętny NVIDIA GeForce RTX 4080 Laptop GPU (146413 - 189320, n=23) | |
| Średnia w klasie Gaming (80702 - 277970, n=106, ostatnie 2 lata) | |
| HP Omen 16 (2024) (Leistung) | |
| HP Omen 16-wf000 | |
| MSI Vector 16 HX A14V | |
| HP Omen 16 (2024) | |
| Vulkan Score 5.5 | |
| Średnia w klasie Gaming (9296 - 246759, n=81, ostatnie 2 lata) | |
| HP Omen 16 (2024) (Leistung) | |
| Przeciętny NVIDIA GeForce RTX 4080 Laptop GPU (9296 - 122085, n=15) | |
| HP Omen 16 (2024) | |
| HP Omen 16-wf000 | |
| MSI Vector 16 HX A14V | |
| Geekbench 6.7 | |
| GPU Vulkan | |
| HP Omen 16 (2024) (6.2.1, Leistung) | |
| HP Omen 16 (2024) (6.2.1) | |
| Przeciętny NVIDIA GeForce RTX 4080 Laptop GPU (104581 - 159261, n=11) | |
| Średnia w klasie Gaming (7562 - 231659, n=59, ostatnie 2 lata) | |
| MSI Vector 16 HX A14V (6.2.1) | |
| GPU OpenCL | |
| Alienware m16 R1 AMD | |
| Acer Predator Helios 18 N23Q2 | |
| HP Omen 16 (2024) (6.2.1, Leistung) | |
| Przeciętny NVIDIA GeForce RTX 4080 Laptop GPU (136770 - 181484, n=15) | |
| HP Omen 16 (2024) (6.2.1) | |
| Średnia w klasie Gaming (67235 - 253130, n=107, ostatnie 2 lata) | |
| MSI Vector 16 HX A14V (6.2.1) | |
| V-Ray 5 Benchmark | |
| GPU RTX | |
| Średnia w klasie Gaming (1146 - 4363, n=34, ostatnie 2 lata) | |
| MSI Vector 16 HX A14V (5.0.1) | |
| Alienware m16 R1 AMD (5.0.1) | |
| HP Omen 16 (2024) (5.0.1, Leistung) | |
| HP Omen 16-wf000 (5.0.1) | |
| Przeciętny NVIDIA GeForce RTX 4080 Laptop GPU (2128 - 2843, n=17) | |
| HP Omen 16 (2024) (5.0.1) | |
| GPU CUDA | |
| Średnia w klasie Gaming (887 - 3288, n=34, ostatnie 2 lata) | |
| Alienware m16 R1 AMD (5.0.1) | |
| MSI Vector 16 HX A14V (5.0.1) | |
| HP Omen 16-wf000 (5.0.1) | |
| Przeciętny NVIDIA GeForce RTX 4080 Laptop GPU (1647 - 2112, n=17) | |
| HP Omen 16 (2024) (5.0.1, Leistung) | |
| HP Omen 16 (2024) | |
| CPU | |
| MSI Vector 16 HX A14V (5.0.1) | |
| Alienware m16 R1 AMD (5.0.1) | |
| Średnia w klasie Gaming (5864 - 30302, n=33, ostatnie 2 lata) | |
| HP Omen 16 (2024) (5.0.1, Leistung) | |
| Przeciętny NVIDIA GeForce RTX 4080 Laptop GPU (11906 - 21823, n=17) | |
| HP Omen 16 (2024) (5.0.1) | |
| HP Omen 16-wf000 (5.0.1) | |
| V-Ray Benchmark Next 4.10 | |
| GPU | |
| Acer Predator Helios 18 N23Q2 (v4.10.07 ) | |
| Przeciętny NVIDIA GeForce RTX 4080 Laptop GPU (812 - 1036, n=16) | |
| HP Omen 16 (2024) (v4.10.07, Leistung) | |
| MSI Vector 16 HX A14V (v4.10.07 ) | |
| Średnia w klasie Gaming (427 - 1627, n=104, ostatnie 2 lata) | |
| HP Omen 16 (2024) (v4.10.07 ) | |
| CPU | |
| MSI Vector 16 HX A14V (v4.10.07 ) | |
| Acer Predator Helios 18 N23Q2 (v4.10.07 ) | |
| Przeciętny NVIDIA GeForce RTX 4080 Laptop GPU (19636 - 31653, n=16) | |
| Średnia w klasie Gaming (10048 - 45327, n=102, ostatnie 2 lata) | |
| HP Omen 16 (2024) (v4.10.07, Leistung) | |
| HP Omen 16 (2024) (v4.10.07 ) | |
* ... im mniej tym lepiej
| Performance rating - Percent | |
| Acer Predator Helios 18 N23Q2 | |
| MSI Vector 16 HX A14V | |
| Alienware m16 R1 AMD -1! | |
| HP Omen 16 (2024) | |
| Przeciętny NVIDIA GeForce RTX 4080 Laptop GPU | |
| HP Omen 16-wf000 | |
| Średnia w klasie Gaming | |
| HP Omen 16 (2024) | |
| The Witcher 3 - 1920x1080 Ultra Graphics & Postprocessing (HBAO+) | |
| MSI Vector 16 HX A14V | |
| Acer Predator Helios 18 N23Q2 | |
| Średnia w klasie Gaming (95 - 240, n=8, ostatnie 2 lata) | |
| Alienware m16 R1 AMD | |
| Przeciętny NVIDIA GeForce RTX 4080 Laptop GPU (130.4 - 186.1, n=20) | |
| HP Omen 16 (2024) (Leistung) | |
| HP Omen 16-wf000 | |
| HP Omen 16 (2024) | |
| GTA V - 1920x1080 Highest AA:4xMSAA + FX AF:16x | |
| Acer Predator Helios 18 N23Q2 | |
| MSI Vector 16 HX A14V | |
| HP Omen 16 (2024) (Leistung) | |
| Przeciętny NVIDIA GeForce RTX 4080 Laptop GPU (102.9 - 152.7, n=21) | |
| Średnia w klasie Gaming (48.3 - 186.9, n=99, ostatnie 2 lata) | |
| HP Omen 16-wf000 | |
| HP Omen 16 (2024) | |
| Final Fantasy XV Benchmark - 1920x1080 High Quality | |
| Acer Predator Helios 18 N23Q2 (1.3) | |
| MSI Vector 16 HX A14V (1.3) | |
| Alienware m16 R1 AMD (1.3) | |
| HP Omen 16 (2024) (1.3, Leistung) | |
| Przeciętny NVIDIA GeForce RTX 4080 Laptop GPU (129 - 182.1, n=23) | |
| HP Omen 16-wf000 (1.3) | |
| Średnia w klasie Gaming (41 - 215, n=100, ostatnie 2 lata) | |
| HP Omen 16 (2024) (1.3) | |
| Strange Brigade - 1920x1080 ultra AA:ultra AF:16 | |
| Alienware m16 R1 AMD (1.47.22.14 D3D12) | |
| MSI Vector 16 HX A14V (1.47.22.14 D3D12) | |
| Acer Predator Helios 18 N23Q2 (1.47.22.14 D3D12) | |
| Przeciętny NVIDIA GeForce RTX 4080 Laptop GPU (239 - 357, n=22) | |
| HP Omen 16 (2024) (1.47.22.14 D3D12, Leistung) | |
| HP Omen 16-wf000 (1.47.22.14 D3D12) | |
| Średnia w klasie Gaming (76.3 - 456, n=90, ostatnie 2 lata) | |
| HP Omen 16 (2024) (1.47.22.14 D3D12) | |
| Dota 2 Reborn - 1920x1080 ultra (3/3) best looking | |
| Acer Predator Helios 18 N23Q2 | |
| MSI Vector 16 HX A14V | |
| HP Omen 16 (2024) (Leistung) | |
| Alienware m16 R1 AMD | |
| Przeciętny NVIDIA GeForce RTX 4080 Laptop GPU (133 - 194.7, n=23) | |
| HP Omen 16 (2024) | |
| HP Omen 16-wf000 | |
| Średnia w klasie Gaming (84.8 - 248, n=111, ostatnie 2 lata) | |
| X-Plane 11.11 - 1920x1080 high (fps_test=3) | |
| Acer Predator Helios 18 N23Q2 | |
| HP Omen 16 (2024) (Leistung) | |
| MSI Vector 16 HX A14V | |
| HP Omen 16 (2024) | |
| Przeciętny NVIDIA GeForce RTX 4080 Laptop GPU (89.3 - 143.5, n=25) | |
| HP Omen 16-wf000 | |
| Alienware m16 R1 AMD | |
| Średnia w klasie Gaming (52.1 - 143.5, n=114, ostatnie 2 lata) | |
| Enshrouded | |
| 1920x1080 Max. Quality AA:FX | |
| HP Omen 16 (2024) (Leistung) | |
| Przeciętny NVIDIA GeForce RTX 4080 Laptop GPU (67.6 - 82.6, n=3) | |
| HP Omen 16 (2024) | |
| Średnia w klasie Gaming (n=1ostatnie 2 lata) | |
| 2560x1440 Max. Quality AA:FX | |
| HP Omen 16 (2024) (Leistung) | |
| Przeciętny NVIDIA GeForce RTX 4080 Laptop GPU (52.8 - 64.5, n=3) | |
| HP Omen 16 (2024) | |
| Ready or Not | |
| 2560x1440 Epic Preset | |
| Przeciętny NVIDIA GeForce RTX 4080 Laptop GPU (102.1 - 128, n=3) | |
| HP Omen 16 (2024) (Leistung) | |
| HP Omen 16 (2024) | |
| 1920x1080 Epic Preset | |
| Przeciętny NVIDIA GeForce RTX 4080 Laptop GPU (118.6 - 202, n=3) | |
| HP Omen 16 (2024) (Leistung) | |
| HP Omen 16 (2024) | |
| Helldivers 2 | |
| 2560x1440 Ultra Preset | |
| Średnia w klasie Gaming (81.3 - 140.1, n=4, ostatnie 2 lata) | |
| HP Omen 16 (2024) (Leistung) | |
| Przeciętny NVIDIA GeForce RTX 4080 Laptop GPU (85.7 - 106, n=3) | |
| HP Omen 16 (2024) | |
| 1920x1080 Ultra Preset | |
| HP Omen 16 (2024) (Leistung) | |
| Przeciętny NVIDIA GeForce RTX 4080 Laptop GPU (100.8 - 132.3, n=3) | |
| Średnia w klasie Gaming (18.4 - 153.8, n=5, ostatnie 2 lata) | |
| HP Omen 16 (2024) | |
| The Finals | |
| 1920x1080 Epic Preset + Epic RTX Global Illumination | |
| HP Omen 16 (2024) (Leistung) | |
| Przeciętny NVIDIA GeForce RTX 4080 Laptop GPU (147.8 - 181.5, n=3) | |
| HP Omen 16 (2024) | |
| 2560x1440 Epic Preset | |
| HP Omen 16 (2024) (Leistung) | |
| Przeciętny NVIDIA GeForce RTX 4080 Laptop GPU (104.7 - 128.5, n=3) | |
| HP Omen 16 (2024) | |
| Średnia w klasie Gaming (n=1ostatnie 2 lata) | |
| 1920x1080 Epic Preset | |
| HP Omen 16 (2024) (Leistung) | |
| Przeciętny NVIDIA GeForce RTX 4080 Laptop GPU (143.9 - 192.5, n=3) | |
| HP Omen 16 (2024) | |
| Średnia w klasie Gaming (n=1ostatnie 2 lata) | |
Witcher 3 FPS chart
| low | med. | high | ultra | QHD | |
|---|---|---|---|---|---|
| GTA V (2015) | 184.2 | 181.1 | 173.8 | 109.7 | 100 |
| The Witcher 3 (2015) | 485 | 384 | 246 | 142 | 102.5 |
| Dota 2 Reborn (2015) | 215 | 191.6 | 177 | 163.4 | |
| Final Fantasy XV Benchmark (2018) | 183.9 | 152.8 | 129 | 98 | |
| X-Plane 11.11 (2018) | 177.3 | 156.2 | 126.9 | ||
| Strange Brigade (2018) | 382 | 307 | 263 | 239 | 179.5 |
| Cyberpunk 2077 (2023) | 111.3 | 96.4 | 94.1 | 83.9 | 56.2 |
| The Finals (2023) | 188.9 | 179.3 | 170.7 | 143.9 | 104.7 |
| Ready or Not (2023) | 267 | 127.6 | 121.5 | 118.6 | 102.1 |
| Enshrouded (2024) | 103.3 | 90.9 | 77.7 | 67.6 | 52.8 |
| Helldivers 2 (2024) | 110.6 | 110.4 | 103.9 | 100.8 | 85.7 |
Emisje i zasilanie - Laptop HP ma przyzwoitą żywotność baterii
Emisja hałasu
W trybie zrównoważonym poziom hałasu osiągnął aż 47 dB(A) przy pełnym obciążeniu. Korzystanie z trybu Performance skutkowało znacznie wyższym poziomem hałasu wynoszącym 58 dB(A). W trybie ECO Omen 16 działał na komfortowym poziomie hałasu 39 dB(A) - kosztem wydajności.
Wentylatory kręcą się nieustannie, nawet gdy laptop pracuje na biegu jałowym lub obsługuje codzienne zadania (np. aplikacje biurowe i internetowe). Jest to spowodowane opcją HP "Fan Always On" w BIOS-ie. Jej wyłączenie pozwoli na sporadyczne zatrzymanie pracy obu wentylatorów.
Hałas
| luz |
| 29 / 30 / 31 dB |
| obciążenie |
| 46 / 47 dB |
 | ||
30 dB cichy 40 dB(A) słyszalny 50 dB(A) irytujący |
||
min: | ||
| HP Omen 16 (2024) GeForce RTX 4080 Laptop GPU, i9-14900HX, SK hynix PC801 HFS001TEJ9X101N | MSI Vector 16 HX A14V GeForce RTX 4080 Laptop GPU, i9-14900HX, WD PC SN560 SDDPNQE-1T00 | Alienware m16 R1 AMD GeForce RTX 4080 Laptop GPU, R9 7845HX, Kioxia XG8 KXG80ZNV1T02 | Acer Predator Helios 18 N23Q2 GeForce RTX 4080 Laptop GPU, i9-13900HX, Samsung PM9A1 MZVL22T0HBLB | HP Omen 16-wf000 GeForce RTX 4080 Laptop GPU, i7-13700HX, SK hynix PC801 HFS002TEJ9X101N | |
|---|---|---|---|---|---|
| Noise | -15% | 5% | 4% | -1% | |
| wyłączone / środowisko * (dB) | 25 | 23.2 7% | 22.9 8% | 23 8% | 23 8% |
| Idle Minimum * (dB) | 29 | 33.5 -16% | 22.9 21% | 23 21% | 29.6 -2% |
| Idle Average * (dB) | 30 | 33.5 -12% | 29.7 1% | 23 23% | 29.8 1% |
| Idle Maximum * (dB) | 31 | 33.5 -8% | 29.7 4% | 23 26% | 30.4 2% |
| Load Average * (dB) | 46 | 52.1 -13% | 29.8 35% | 45.26 2% | 33.8 27% |
| Witcher 3 ultra * (dB) | 47 | 62 -32% | 54.7 -16% | 59.82 -27% | 57 -21% |
| Load Maximum * (dB) | 47 | 62 -32% | 54.7 -16% | 59.94 -28% | 58.3 -24% |
* ... im mniej tym lepiej
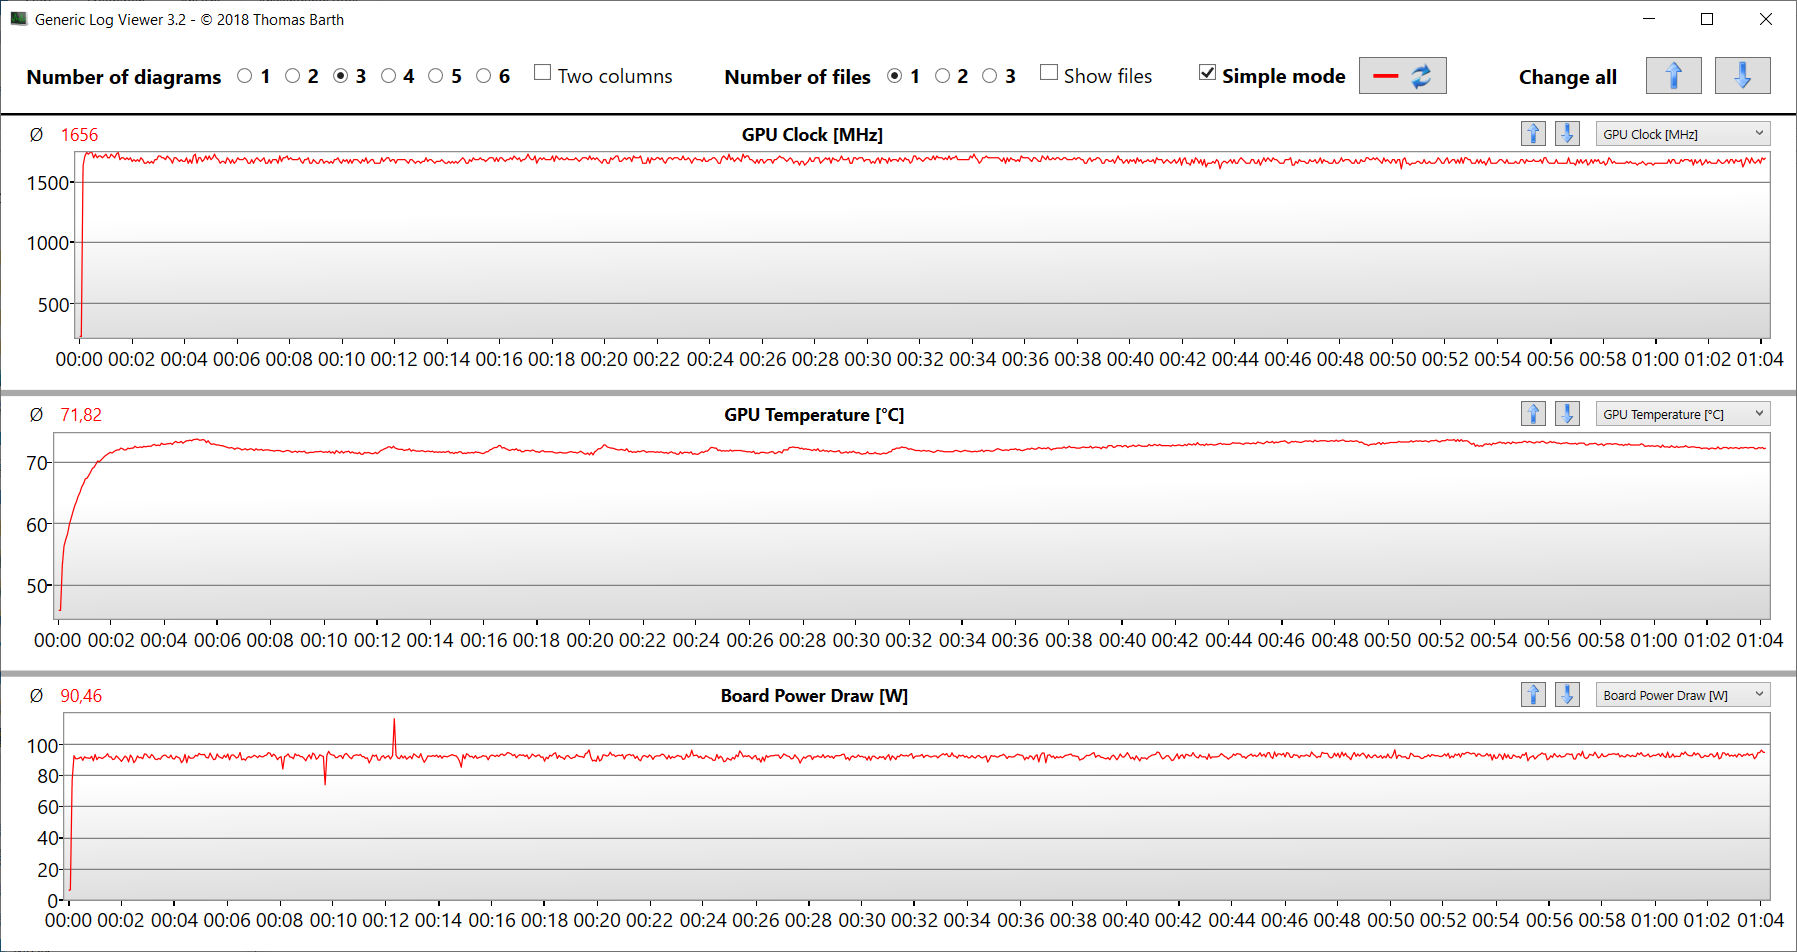
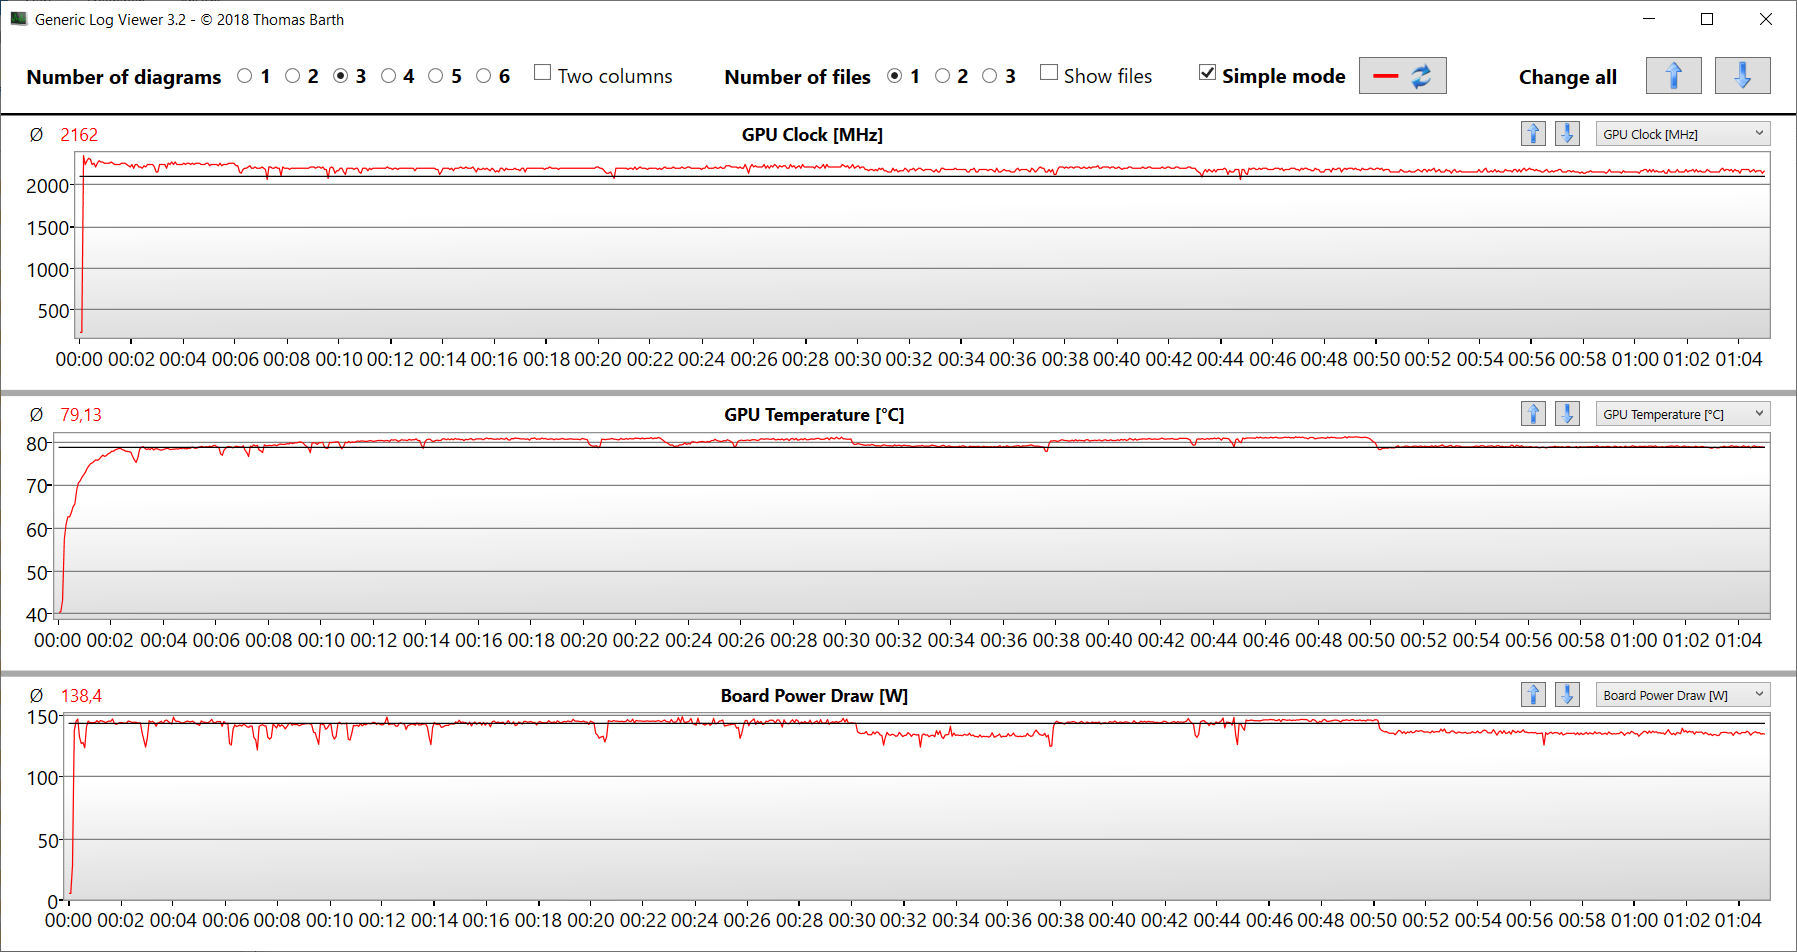
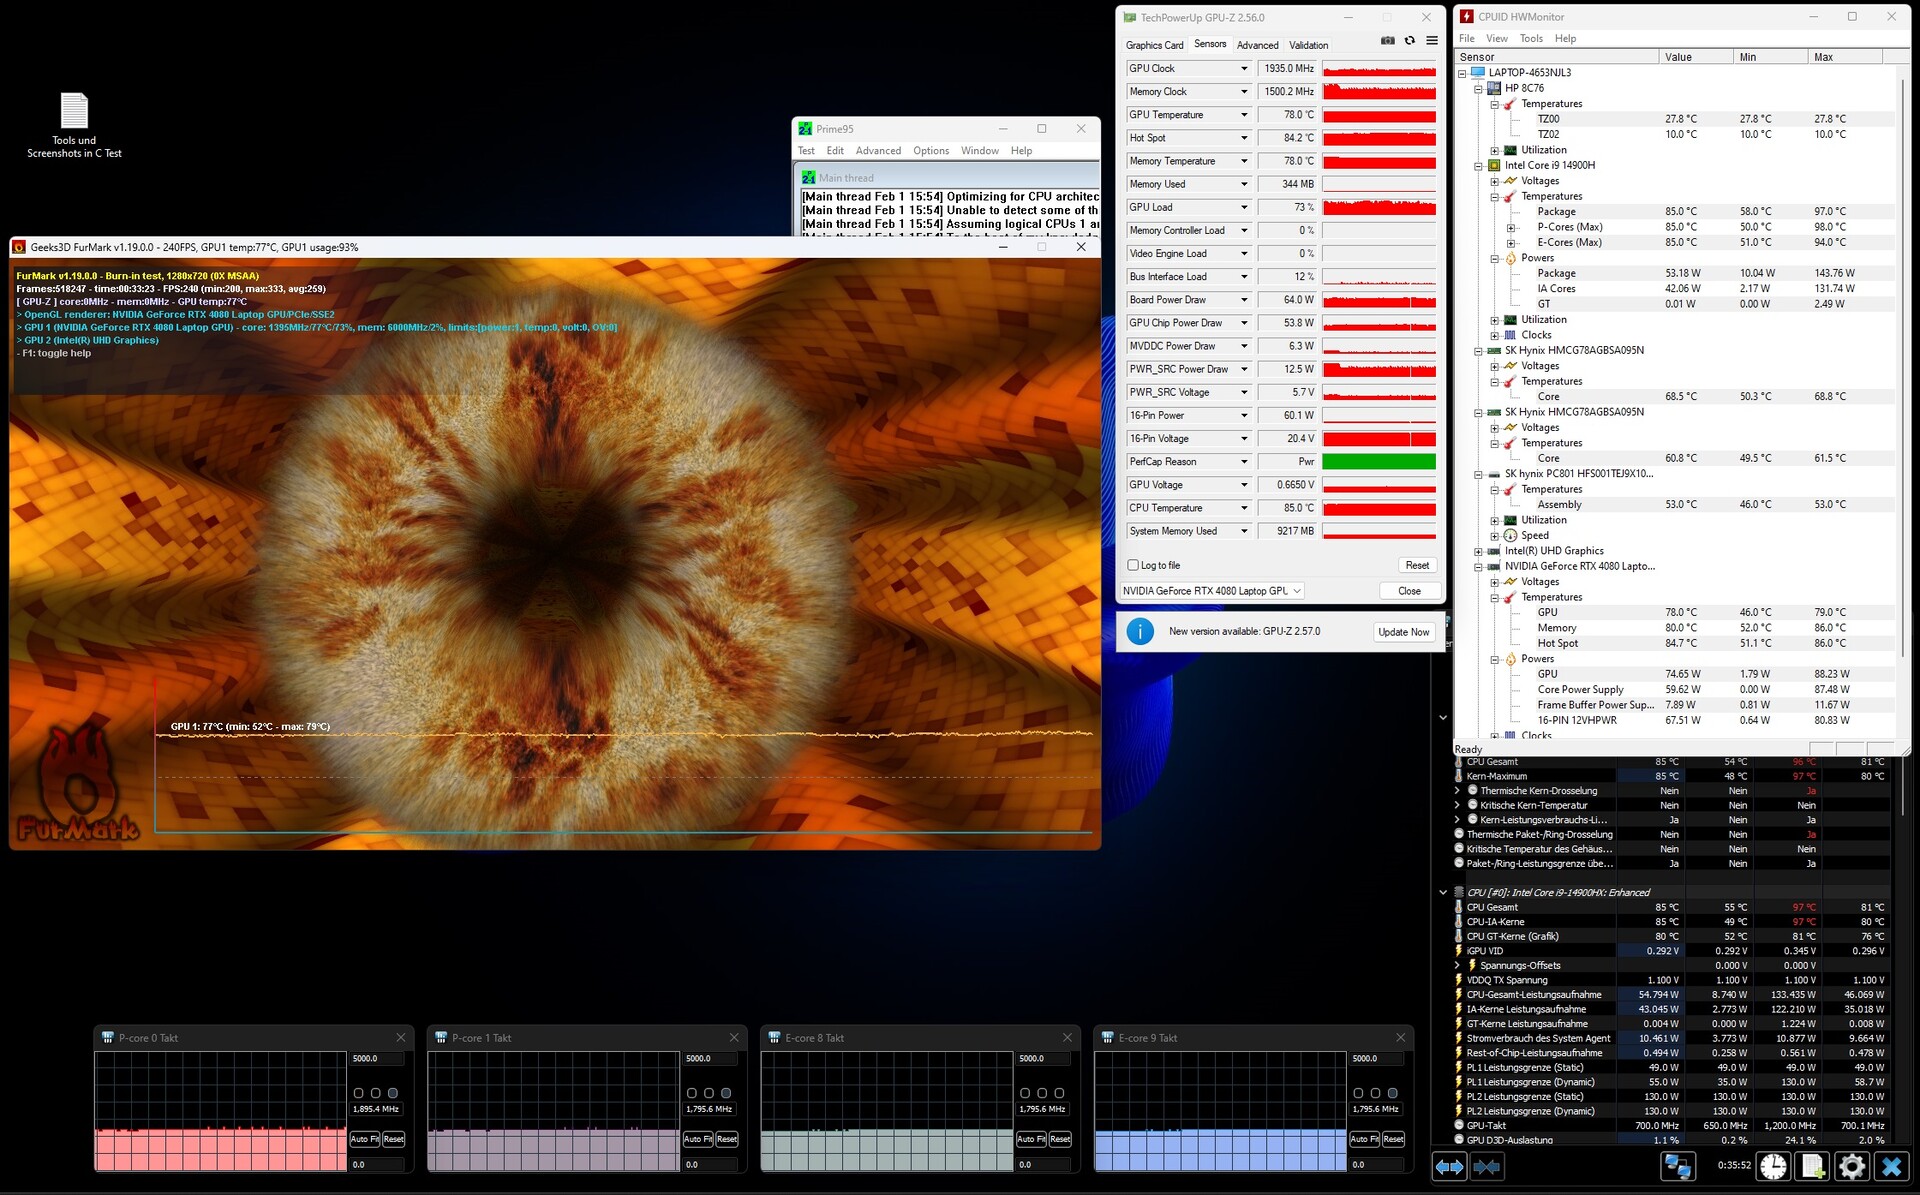
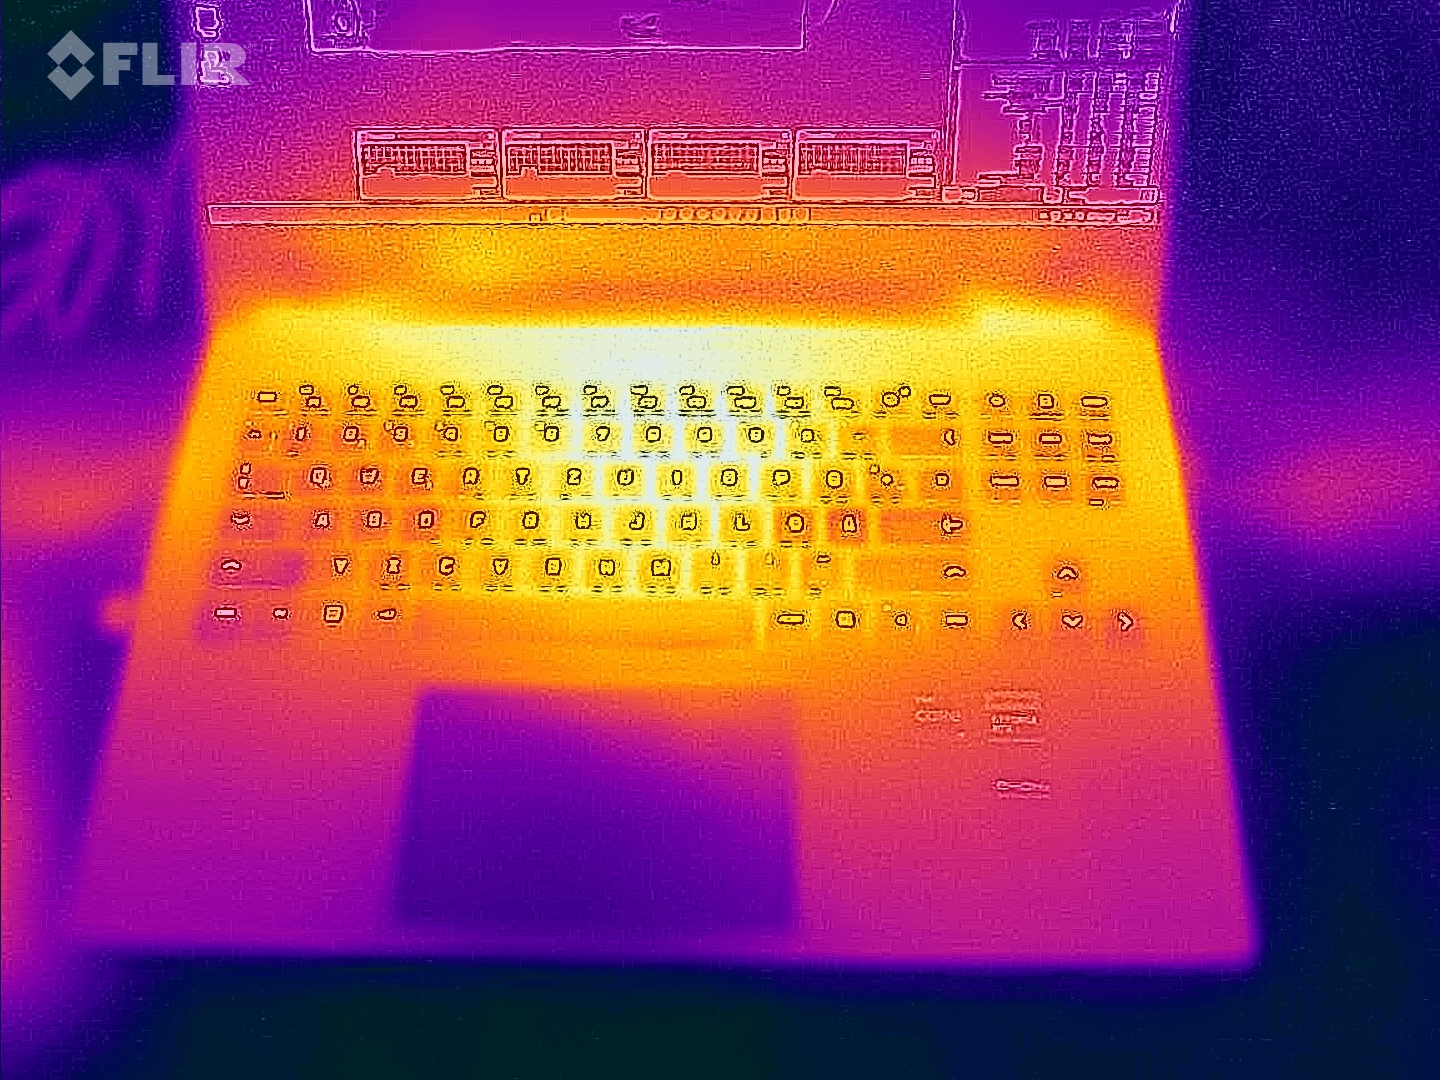
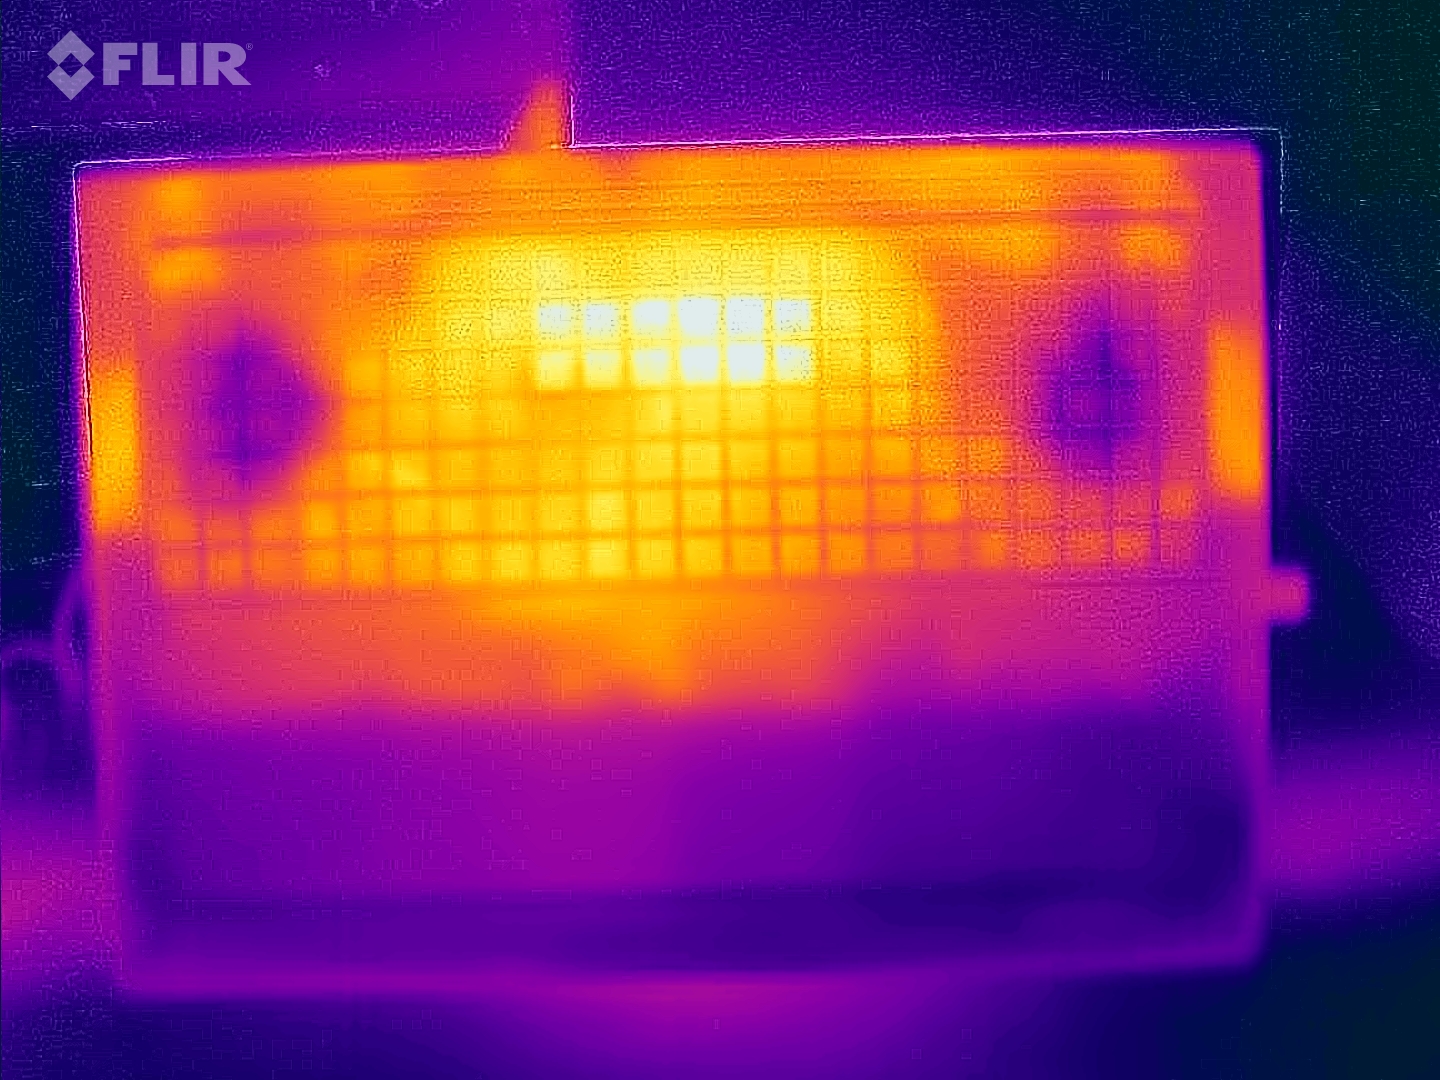
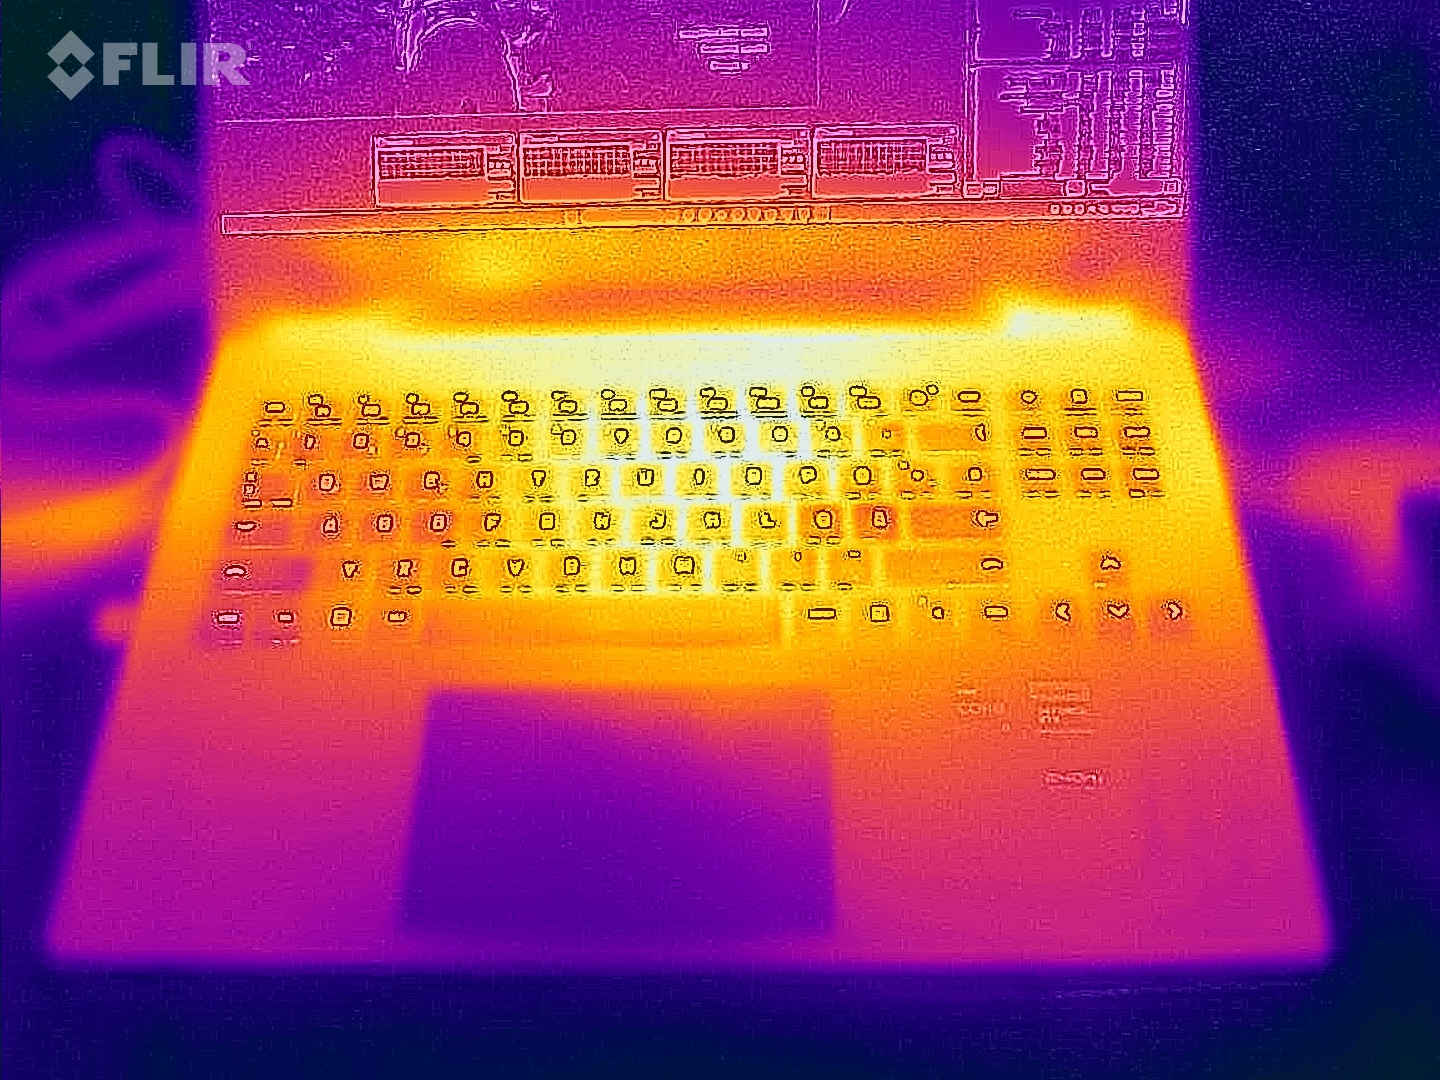
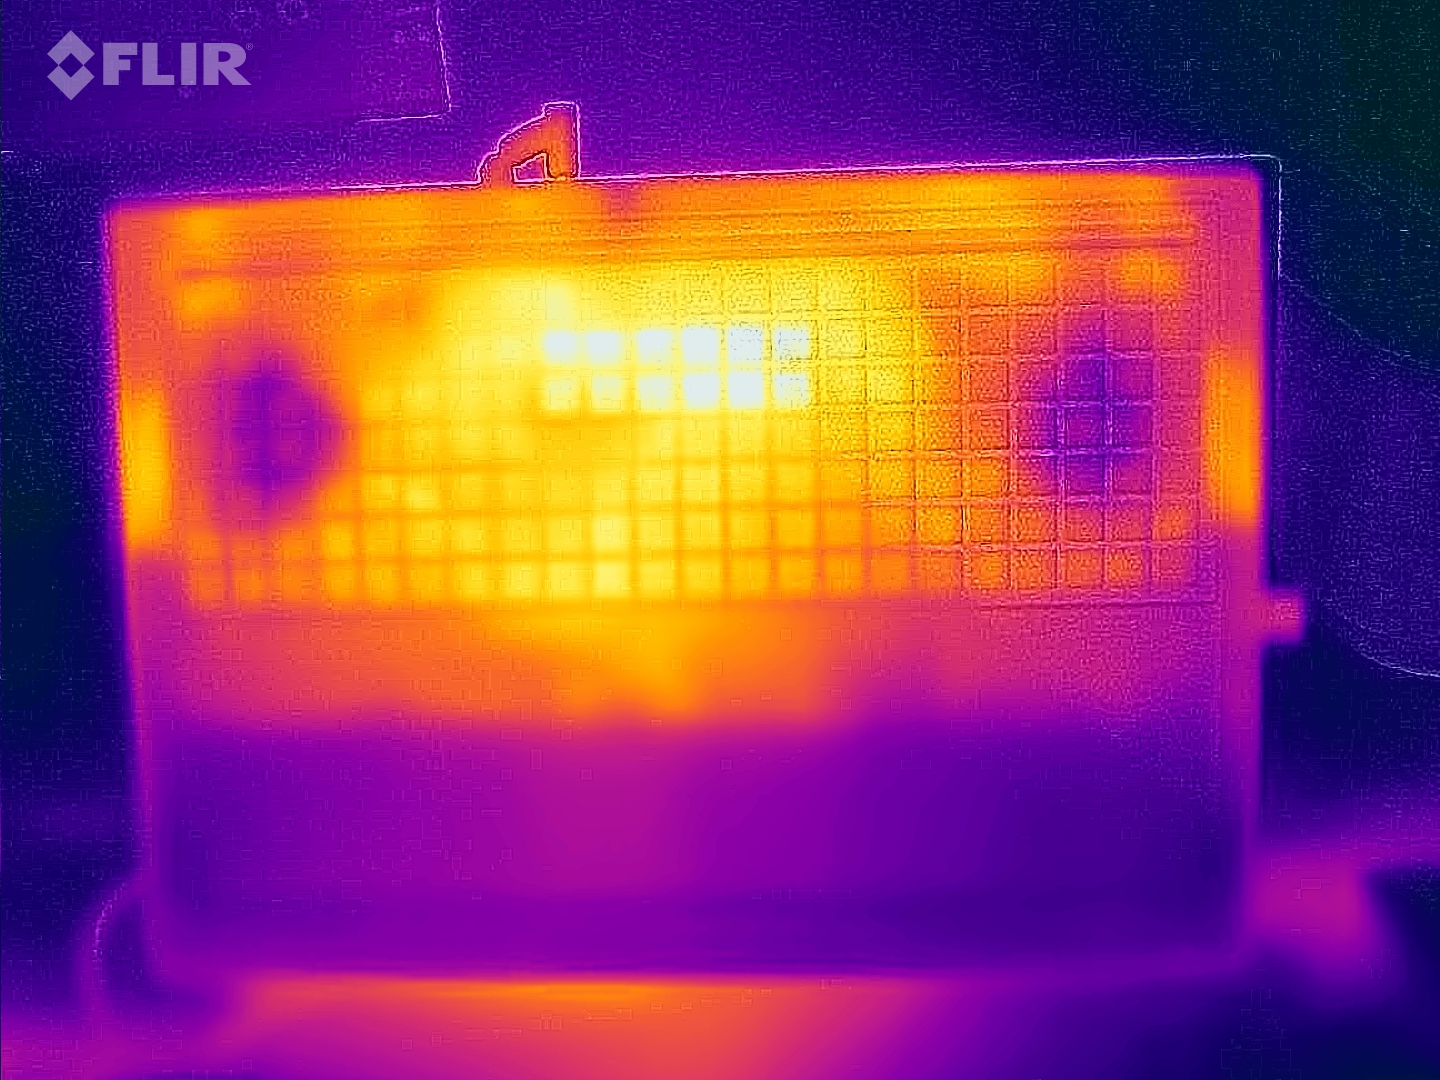
Temperatura
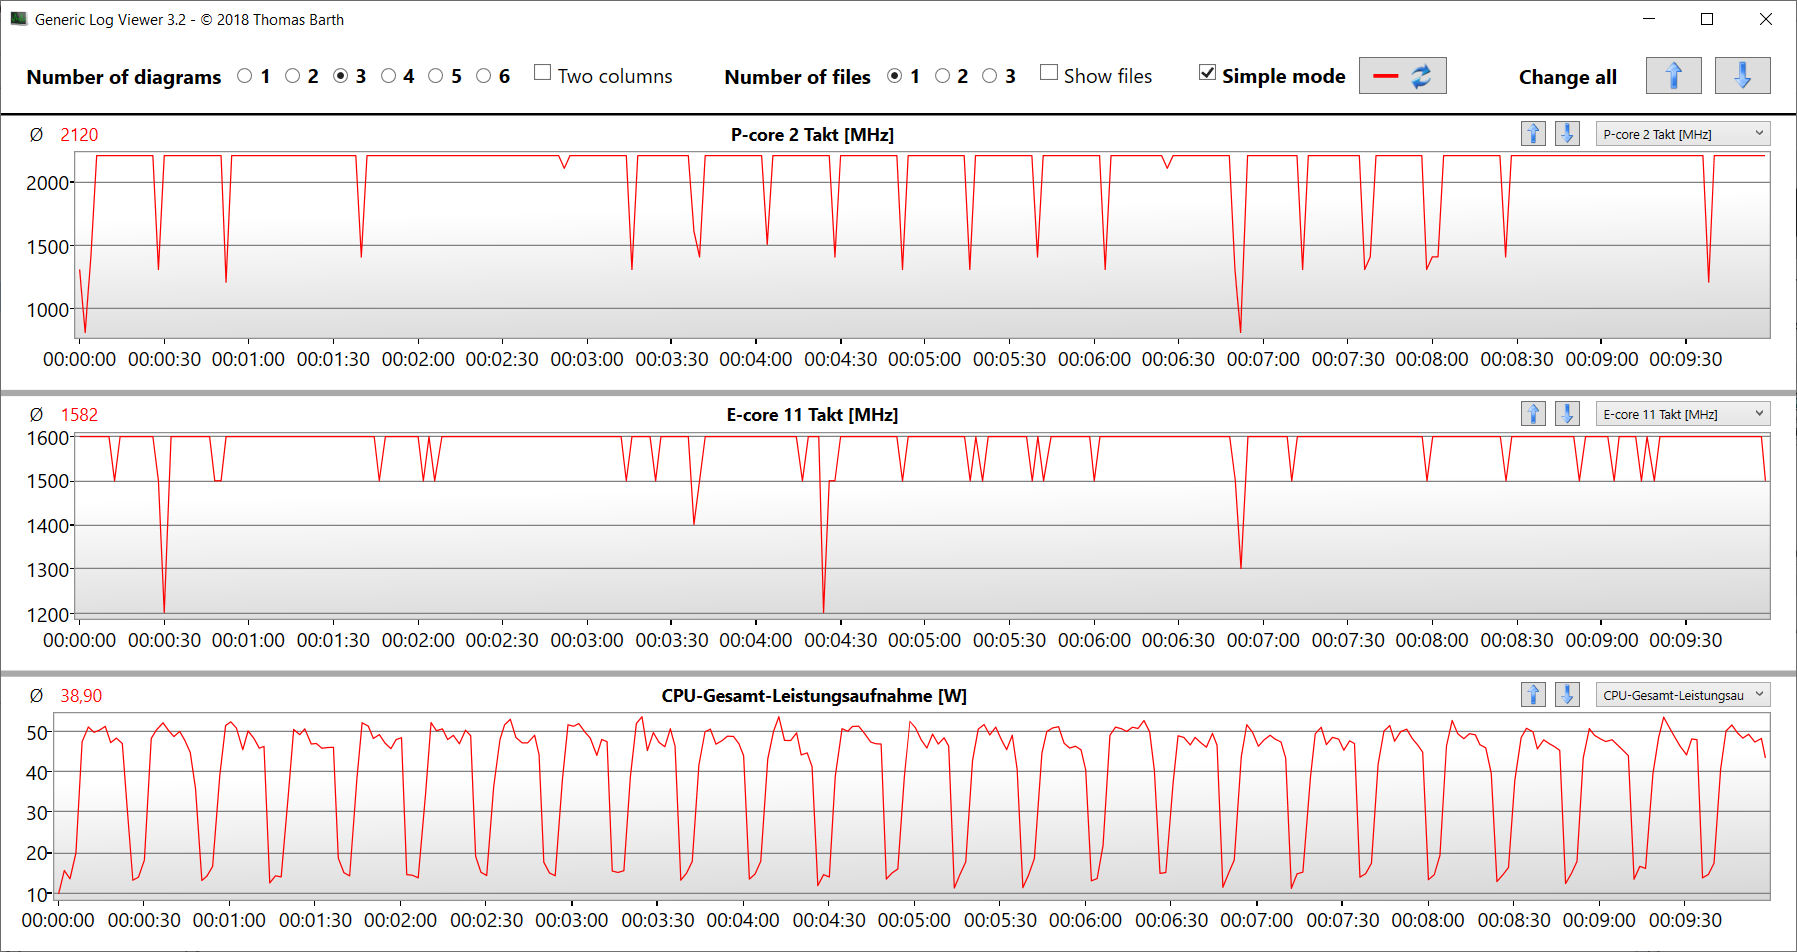
Nasz test obciążeniowy i test Witcher 3 spowodowały, że laptop stał się zauważalnie cieplejszy, a temperatura skóry przekroczyła 50°C (122°F) w niektórych miejscach. Chociaż temperatury pozostawały w akceptowalnym zakresie w codziennym użytkowaniu.
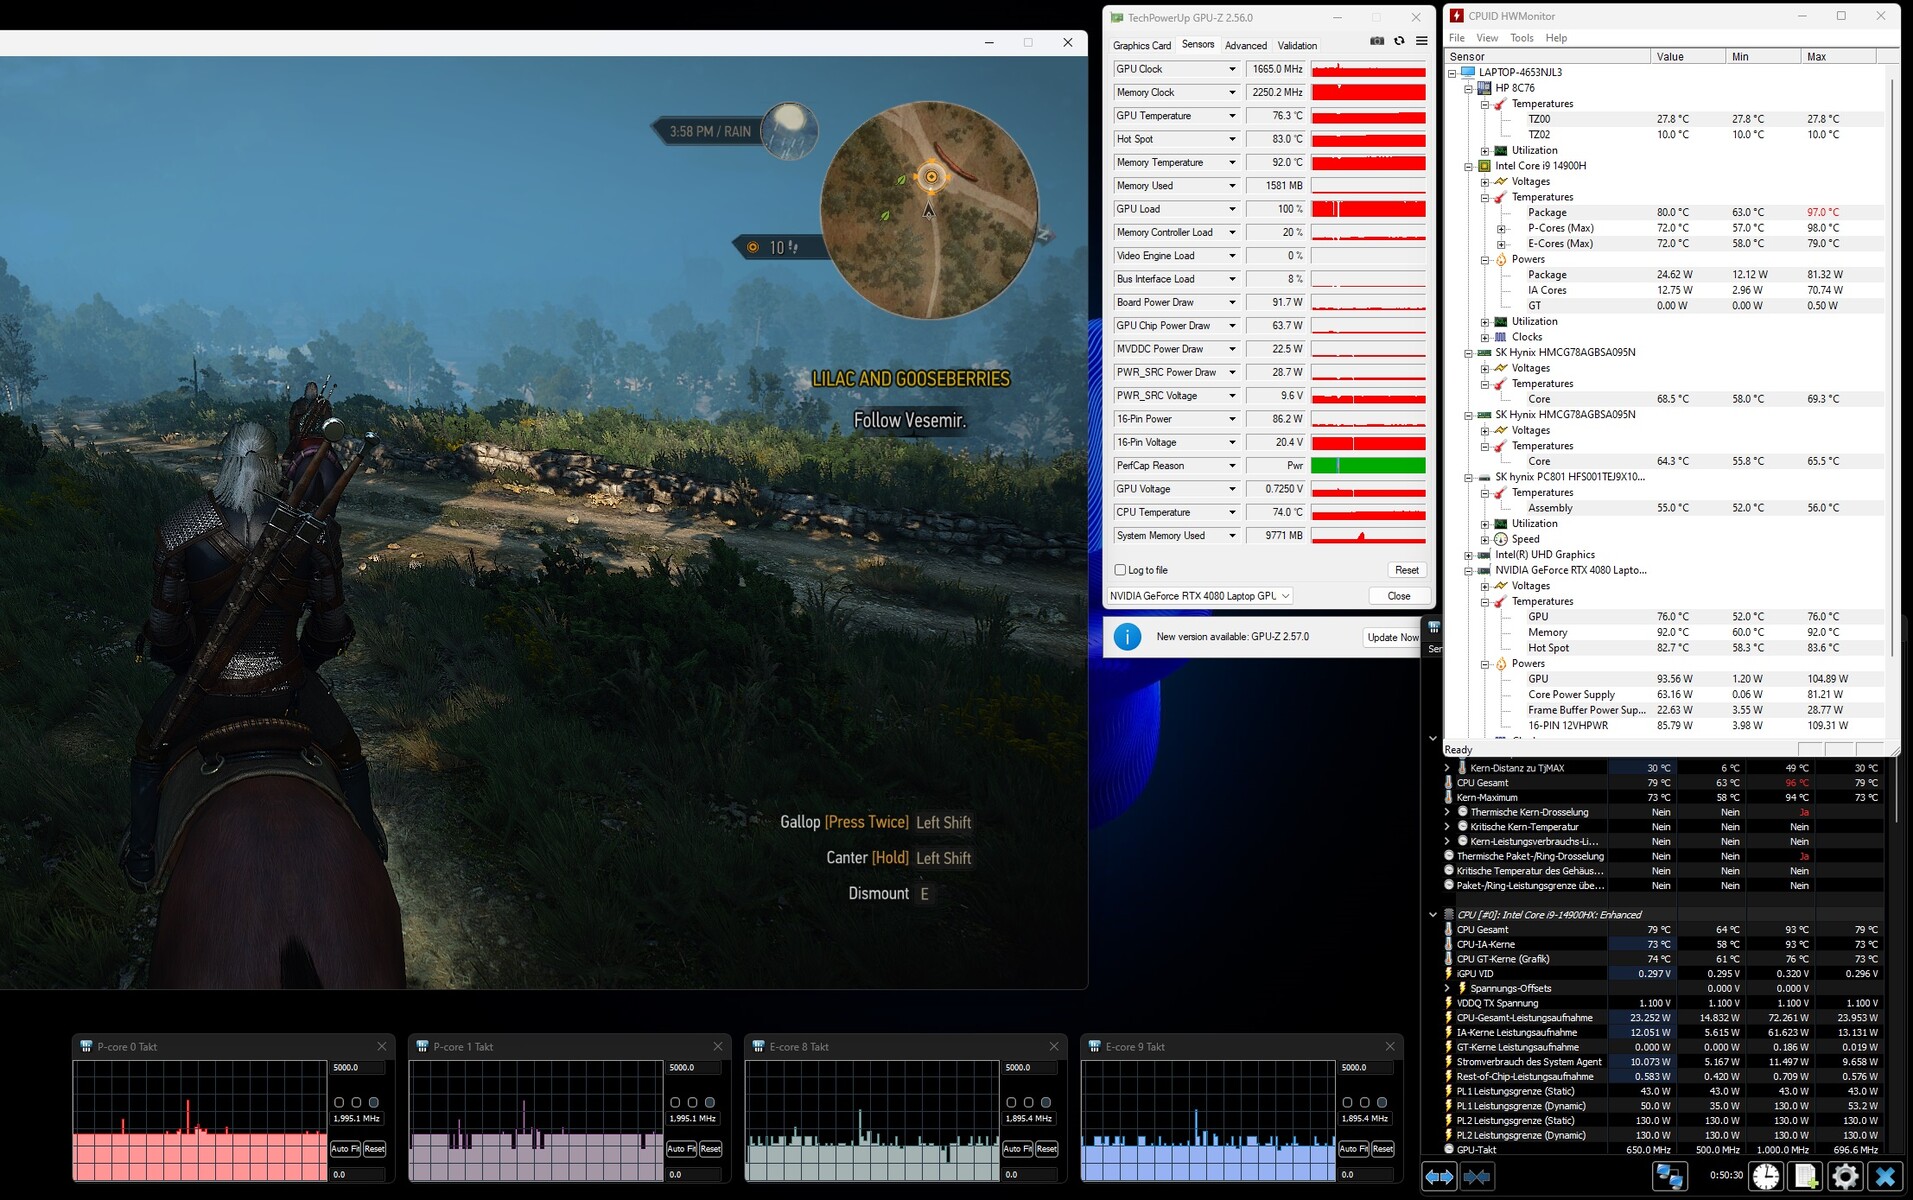
Nasz test obciążeniowy obejmuje uruchomienie Prime95 i FurMark przez dłuższy czas i stanowi ekstremalny scenariusz mający na celu ocenę stabilności systemu pod pełnym obciążeniem. Prędkości taktowania procesora dość szybko spadły z początkowych 3,4 GHz (P) i 2,9 GHz (E) do około 1,8-1,9 GHz (zarówno P, jak i E), a następnie utrzymały się na tym poziomie. GPU działał z prędkością między 1,9 a 2 GHz.
(-) Maksymalna temperatura w górnej części wynosi 47 °C / 117 F, w porównaniu do średniej 40.4 °C / 105 F , począwszy od 21.2 do 68.8 °C dla klasy Gaming.
(-) Dno nagrzewa się maksymalnie do 57 °C / 135 F, w porównaniu do średniej 43.2 °C / 110 F
(+) W stanie bezczynności średnia temperatura górnej części wynosi 23.9 °C / 75 F, w porównaniu ze średnią temperaturą urządzenia wynoszącą 33.9 °C / ### class_avg_f### F.
(-) Podczas gry w Wiedźmina 3 średnia temperatura górnej części wynosi 39.3 °C / 103 F, w porównaniu do średniej temperatury urządzenia wynoszącej 33.9 °C / ## #class_avg_f### F.
(+) Podparcia dłoni i touchpad osiągają maksymalną temperaturę skóry (35 °C / 95 F) i dlatego nie są gorące.
(-) Średnia temperatura obszaru podparcia dłoni w podobnych urządzeniach wynosiła 28.8 °C / 83.8 F (-6.2 °C / -11.2 F).
| HP Omen 16 (2024) Intel Core i9-14900HX, NVIDIA GeForce RTX 4080 Laptop GPU | MSI Vector 16 HX A14V Intel Core i9-14900HX, NVIDIA GeForce RTX 4080 Laptop GPU | Alienware m16 R1 AMD AMD Ryzen 9 7845HX, NVIDIA GeForce RTX 4080 Laptop GPU | Acer Predator Helios 18 N23Q2 Intel Core i9-13900HX, NVIDIA GeForce RTX 4080 Laptop GPU | HP Omen 16-wf000 Intel Core i7-13700HX, NVIDIA GeForce RTX 4080 Laptop GPU | |
|---|---|---|---|---|---|
| Heat | 13% | -14% | -15% | -3% | |
| Maximum Upper Side * (°C) | 47 | 36.4 23% | 48 -2% | 35 26% | 45 4% |
| Maximum Bottom * (°C) | 57 | 35.6 38% | 39 32% | 56 2% | 48.8 14% |
| Idle Upper Side * (°C) | 25 | 26.6 -6% | 37 -48% | 34 -36% | 29.2 -17% |
| Idle Bottom * (°C) | 26 | 27 -4% | 36.2 -39% | 39 -50% | 28.8 -11% |
* ... im mniej tym lepiej
Głośniki
Głośniki stereo generują ogólnie przyzwoity dźwięk, ale brakuje im basów.
HP Omen 16 (2024) analiza dźwięku
(±) | głośność głośnika jest średnia, ale dobra (78 dB)
Bas 100 - 315 Hz
(-) | prawie brak basu - średnio 15.2% niższa od mediany
(±) | liniowość basu jest średnia (14.3% delta do poprzedniej częstotliwości)
Średnie 400 - 2000 Hz
(+) | zbalansowane środki średnie - tylko 4.8% od mediany
(+) | średnie są liniowe (5% delta do poprzedniej częstotliwości)
Wysokie 2–16 kHz
(+) | zrównoważone maksima - tylko 2% od mediany
(+) | wzloty są liniowe (4.1% delta do poprzedniej częstotliwości)
Ogólnie 100 - 16.000 Hz
(+) | ogólny dźwięk jest liniowy (14.7% różnicy w stosunku do mediany)
W porównaniu do tej samej klasy
» 28% wszystkich testowanych urządzeń w tej klasie było lepszych, 7% podobnych, 64% gorszych
» Najlepszy miał deltę 6%, średnia wynosiła ###średnia###%, najgorsza wynosiła 132%
W porównaniu do wszystkich testowanych urządzeń
» 19% wszystkich testowanych urządzeń było lepszych, 4% podobnych, 77% gorszych
» Najlepszy miał deltę 4%, średnia wynosiła ###średnia###%, najgorsza wynosiła 134%
MSI Vector 16 HX A14V analiza dźwięku
(+) | głośniki mogą odtwarzać stosunkowo głośno (85 dB)
Bas 100 - 315 Hz
(±) | zredukowany bas - średnio 12.7% niższy od mediany
(+) | bas jest liniowy (6.8% delta do poprzedniej częstotliwości)
Średnie 400 - 2000 Hz
(+) | zbalansowane środki średnie - tylko 3% od mediany
(+) | średnie są liniowe (3.6% delta do poprzedniej częstotliwości)
Wysokie 2–16 kHz
(+) | zrównoważone maksima - tylko 3.1% od mediany
(+) | wzloty są liniowe (6.7% delta do poprzedniej częstotliwości)
Ogólnie 100 - 16.000 Hz
(+) | ogólny dźwięk jest liniowy (12.6% różnicy w stosunku do mediany)
W porównaniu do tej samej klasy
» 16% wszystkich testowanych urządzeń w tej klasie było lepszych, 4% podobnych, 81% gorszych
» Najlepszy miał deltę 6%, średnia wynosiła ###średnia###%, najgorsza wynosiła 132%
W porównaniu do wszystkich testowanych urządzeń
» 11% wszystkich testowanych urządzeń było lepszych, 3% podobnych, 86% gorszych
» Najlepszy miał deltę 4%, średnia wynosiła ###średnia###%, najgorsza wynosiła 134%
Zużycie energii
Omen 16 nie wykazywał żadnych problemów związanych z poborem mocy, a jego poziomy mieściły się w normalnym zakresie dla sprzętu znajdującego się w środku. Laptop pobierał stałą ilość energii podczas testu Witcher 3 i testu obciążeniowego. Ładowarka o mocy 280 W jest wystarczająco mocna dla Omena.
| wyłączony / stan wstrzymania | |
| luz | |
| obciążenie |
|
Legenda:
min: | |
Power consumption Witcher 3 / Stress test
Power consumption with external monitor
Żywotność baterii
16-calowy laptop zdołał wytrzymać 5 godzin i 52 minuty w naszym realistycznym teście Wi-Fi (dostęp do stron internetowych za pomocą skryptu symulującego obciążenie) - przyzwoity wynik. Omen zapewnił tym samym najlepszy czas pracy na baterii w naszym porównaniu i przewyższył swojego poprzednika o 45 minut.
Za
Przeciw
Werdykt - Solidna bestia do gier
Gry, streaming i renderowanie to niektóre z rzeczy, w których HP Omen 16 jest biegły. Procesor Core i9-14900HX i GeForce RTX 4080 zapewniają niezbędną wydajność, a dysk SSD PCIe 4.0 o pojemności 1 TB gwarantuje krótki czas ładowania. Emisja ciepła i hałasu jest zwykle wysoka w tej klasie laptopów. Omen 16 jest jednak w stanie utrzymać je na umiarkowanym poziomie - rezygnując z wydajności.
HP Omen 16 (2024) to solidny, wydajny laptop do gier, który skupia się na tym, co najważniejsze.
Wbrew trendowi stosowania wyświetlaczy 16:10, HP zdecydowało się pozostać przy proporcjach 16:9. 16,1-calowy panel (2560 x 1440 pikseli, sRGB, IPS, 240 Hz, G-Sync) pozostawił ogólnie świetne wrażenie. Niemniej jednak, wyświetlacz w laptopie kosztującym 3200 euro (3446 USD) powinien oferować więcej pod względem jasności i pokrycia kolorów.
Dwa porty USB-C (Thunderbolt 4) ułatwiają integrację laptopa z istniejącymi konfiguracjami stacji roboczych i otwierają opcje rozbudowy (np. zewnętrzne GPU, stacja dokująca). Oba porty mogą wyprowadzać sygnał DisplayPort i obsługują funkcję Power Delivery. Żywotność baterii laptopa jest również przyzwoita.
Laptop MSI Vector 16 HX A14V jest potencjalną alternatywą dla Omen 16. Dzięki tej samej kombinacji CPU/GPU, Vector 16 oferuje większą wydajność i ma znacznie jaśniejszy i bardziej żywy wyświetlacz (DCI-P3, 16:10). Vector ma jednak tylko jeden port Thunderbolt 4 i ekran, który nie obsługuje G-Sync.
Cena i dostępność
W Niemczech HP Omen 16-wf1078ng jest dostępny u sprzedawców detalicznych, takich jak Office-Partner.de i Otto.de w cenie 3200 euro (3446 USD). Można również znaleźć model o niższej specyfikacji z procesorem Core i7-13700HX i RTX 4060 za 1500 USD w Amazon US.
HP Omen 16 (2024)
- 16/02/2024 v7 (old)
Sascha Mölck
Przezroczystość
Wyboru urządzeń do recenzji dokonuje nasza redakcja. Próbka testowa została udostępniona autorowi jako pożyczka od producenta lub sprzedawcy detalicznego na potrzeby tej recenzji. Pożyczkodawca nie miał wpływu na tę recenzję, producent nie otrzymał też kopii tej recenzji przed publikacją. Nie było obowiązku publikowania tej recenzji. Jako niezależna firma medialna, Notebookcheck nie podlega władzy producentów, sprzedawców detalicznych ani wydawców.
Tak testuje Notebookcheck
Każdego roku Notebookcheck niezależnie sprawdza setki laptopów i smartfonów, stosując standardowe procedury, aby zapewnić porównywalność wszystkich wyników. Od około 20 lat stale rozwijamy nasze metody badawcze, ustanawiając przy tym standardy branżowe. W naszych laboratoriach testowych doświadczeni technicy i redaktorzy korzystają z wysokiej jakości sprzętu pomiarowego. Testy te obejmują wieloetapowy proces walidacji. Nasz kompleksowy system ocen opiera się na setkach uzasadnionych pomiarów i benchmarków, co pozwala zachować obiektywizm.Price comparison

