Recenzja Medion Erazer Beast X40 (2024): Wysokiej klasy laptop do gier z RTX 4090 i klawiaturą mechaniczną
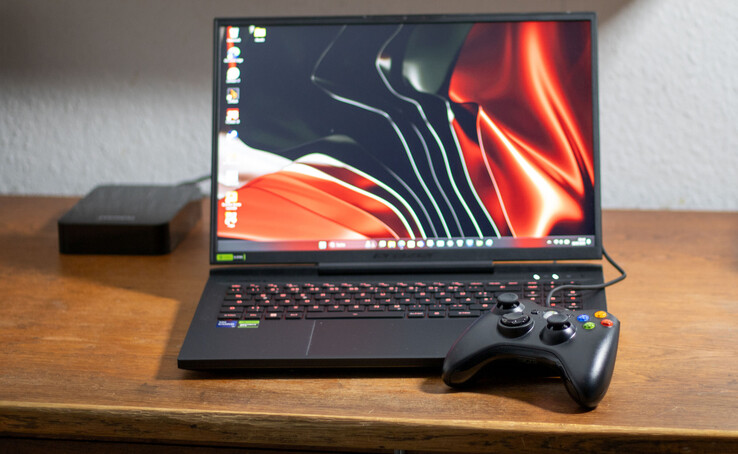
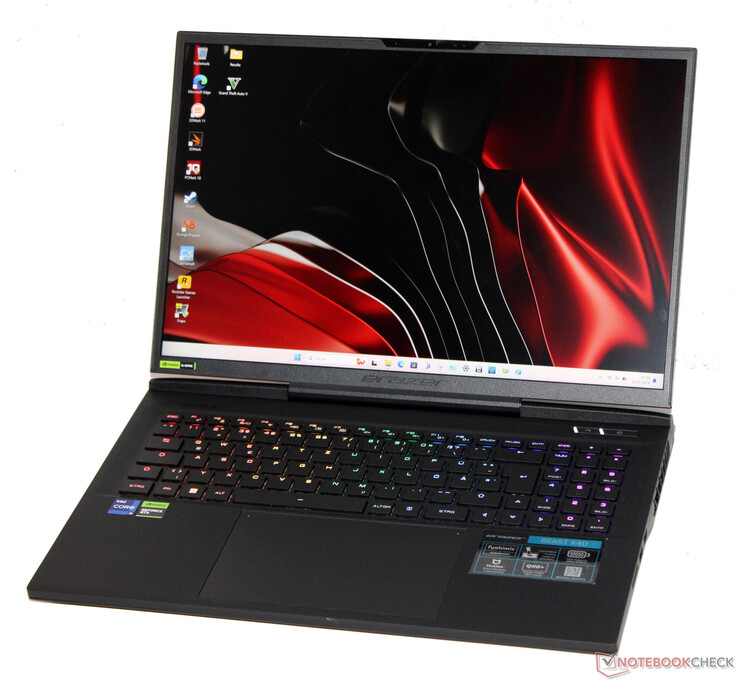
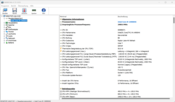
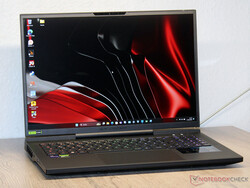
Medion Beast X40 to jeden z najpotężniejszych obecnie dostępnych laptopów. Intel Raptor Lake, Nvidia Ada Lovelace, 2 TB przestrzeni dyskowej i 32 GB pamięci RAM - wszystko to składa się na wyposażenie laptopa do streamowania, renderowania i grania, a jednocześnie kosztuje około 4000 euro.
Podobnie jak w przypadku jego poprzednikiempodstawą konstrukcji Beast X40 jest obudowa Tongfang barebone (GM7IX9N). Konkurencja obejmuje laptopy do gier, takie jak Asus ROG Strix Scar 17 G733PYVi Schenker Key 17 Pro (Early 23)i MSI Titan 18 HX A14VIG.
Potencjalni konkurenci w porównaniu
Ocena | Data | Model | Waga | Wysokość | Rozmiar | Rezolucja | Cena |
|---|---|---|---|---|---|---|---|
| 89.2 % v7 (old) | 02/2024 | Medion Erazer Beast X40 2024 i9-14900HX, GeForce RTX 4090 Laptop GPU | 2.9 kg | 36 mm | 17.00" | 2560x1600 | |
| 87.2 % v7 (old) | 08/2023 | Asus ROG Strix Scar 17 G733PYV-LL053X R9 7945HX3D, GeForce RTX 4090 Laptop GPU | 2.9 kg | 28.3 mm | 17.30" | 2560x1440 | |
| 85.5 % v7 (old) | 06/2023 | Schenker Key 17 Pro (Early 23) i9-13900HX, GeForce RTX 4090 Laptop GPU | 3.4 kg | 24.9 mm | 17.30" | 3840x2160 | |
| 88.3 % v7 (old) | 02/2024 | Asus ROG Strix Scar 18 G834JYR (2024) i9-14900HX, GeForce RTX 4090 Laptop GPU | 3.1 kg | 30.8 mm | 18.00" | 2560x1600 | |
| 88.8 % v7 (old) | 01/2024 | MSI Titan 18 HX A14VIG i9-14900HX, GeForce RTX 4090 Laptop GPU | 3.6 kg | 32.1 mm | 18.00" | 3840x2400 |
Obudowa i funkcje: Beast X40 oferuje Thunderbolt 4
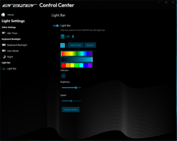
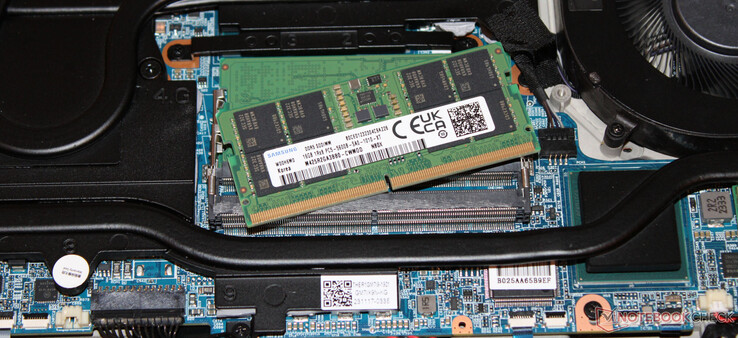
Technologia Beast X40 jest umieszczona w solidnej, elegancko zaprojektowanej, matowej czarnej metalowej obudowie o gładkich powierzchniach. Podstawa pokryta jest antypoślizgową gumową powłoką. Dwa paski LED RGB nad tylnymi wylotami powietrza, podświetlane logo pokrywy i podświetlenie klawiszy RGB dodają odrobinę koloru. Dostęp do baterii (przykręcanej, a nie przyklejanej) i innych wewnętrznych komponentów jest możliwy po zdjęciu dolnego panelu.
Erazer posiada trzy porty USB-A (2x USB 3.2 Gen 1 i 1x USB 3.2 Gen 2) oraz jeden port USB Type-C w postaci Thunderbolt 4. Mogliśmy potwierdzić, że ten ostatni może wyprowadzać sygnał DisplayPort i obsługuje Power Delivery. W sumie laptop ma dwa wyjścia wideo (HDMI 2.1 i DisplayPort).
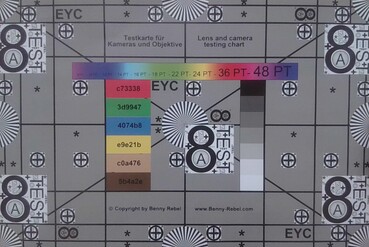
Przetestowaliśmy czytnik kart pamięci SD z naszą referencyjną kartą AV Pro SD microSD 128 GB V60 i stwierdziliśmy, że oferuje on ponadprzeciętne prędkości odczytu. Kamera internetowa 1080p jest standardowym wyposażeniem.
Erazer Beast X40 wykorzystuje układ Intel Wi-Fi 6E AX211, podczas gdy połączenia przewodowe są obsługiwane przez kontroler Realtek RTL8125 2.5 GbE. Laptop oferuje solidną wydajność Wi-Fi w naszych testach przy użyciu referencyjnego routera Asus ROG Rapture GT-AXE11000 bez innych urządzeń Wi-Fi w bezpośrednim sąsiedztwie i w niewielkiej odległości między laptopem a komputerem serwerowym.
| SD Card Reader | |
| average JPG Copy Test (av. of 3 runs) | |
| Średnia w klasie Gaming (20 - 210, n=63, ostatnie 2 lata) | |
| MSI Titan 18 HX A14VIG (Toshiba Exceria Pro SDXC 64 GB UHS-II) | |
| Medion Erazer Beast X40 (AV PRO microSD 128 GB V60) | |
| Medion Erazer Beast X40 2024 (AV PRO microSD 128 GB V60) | |
| maximum AS SSD Seq Read Test (1GB) | |
| Średnia w klasie Gaming (25.5 - 261, n=60, ostatnie 2 lata) | |
| MSI Titan 18 HX A14VIG (Toshiba Exceria Pro SDXC 64 GB UHS-II) | |
| Medion Erazer Beast X40 2024 (AV PRO microSD 128 GB V60) | |
| Medion Erazer Beast X40 (AV PRO microSD 128 GB V60) | |
Urządzenia wejściowe: Klawiatura mechaniczna z przełącznikami Cherry MX
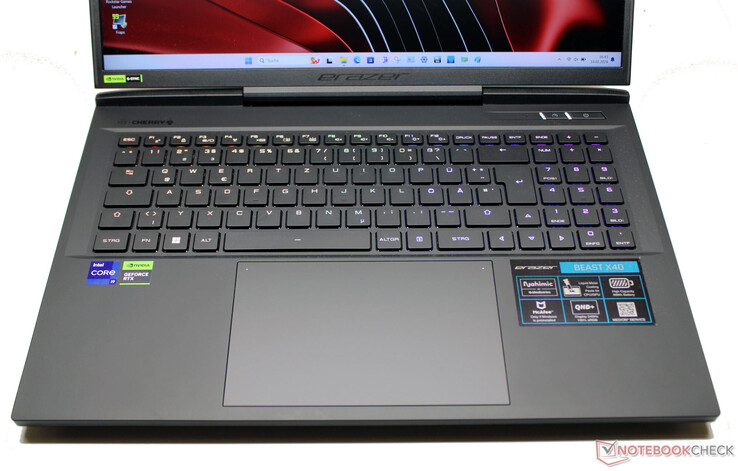
Mechaniczna klawiatura Beast X40 zdobywa punkty dzięki bogatemu odczuciu pisania i precyzyjnym wejściom. Przełączniki Cherry MX oferują średni skok oraz wyraźnie słyszalny i wyczuwalny punkt nacisku. Klawiatura numeryczna i indywidualne podświetlenie klawiszy RGB dopełniają całości.
Wielodotykowy touchpad (15,5 x 10 cm) ma krótki skok i wyraźny punkt nacisku. Można go dezaktywować całkowicie lub tylko z jednej strony (prawej).
Wyświetlacz: QHD+ z przyzwoitym pokryciem sRGB
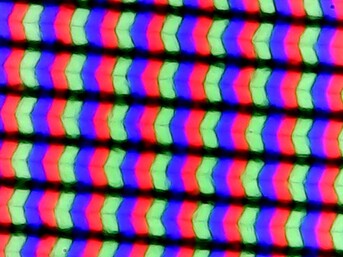
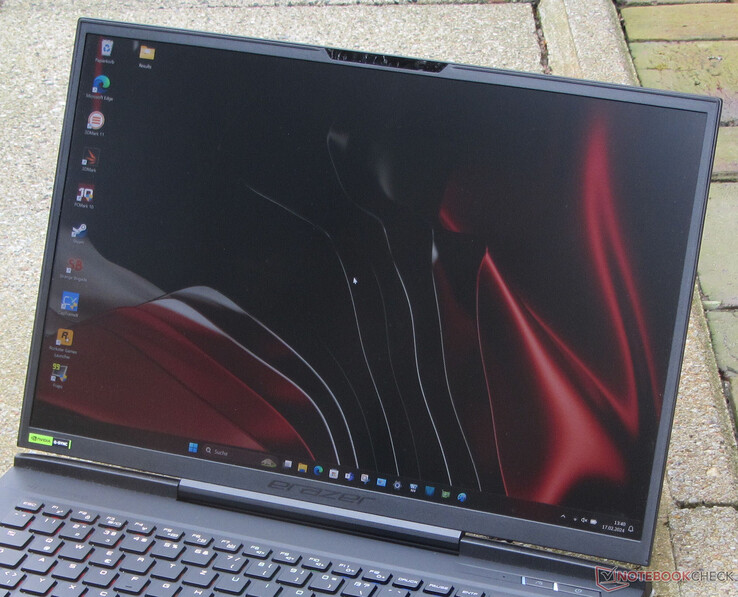
2024 Beast X40 wykorzystuje ten sam matowy wyświetlacz QHD+ 240 Hz (2560 x 1600 pikseli) opracowany przez BOE, podobnie jak 2023 Beast X40. Panel ma dobry poziom jasności, krótki czas reakcji, wysoką liczbę klatek na sekundę i nie wykazuje migotania PWM.
Medion nie oferuje obecnie innych opcji wyświetlaczy do wyboru.
| |||||||||||||||||||||||||
rozświetlenie: 87 %
na akumulatorze: 422 cd/m²
kontrast: 1005:1 (czerń: 0.42 cd/m²)
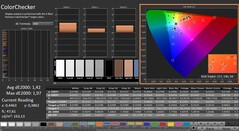
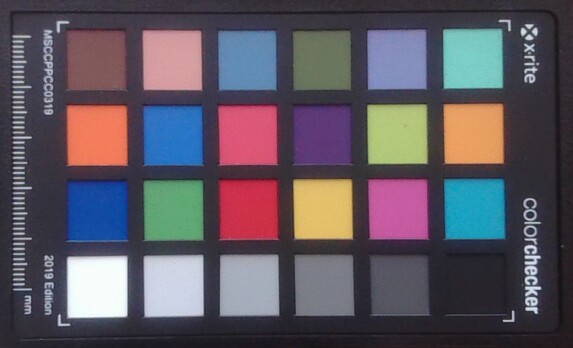
ΔE ColorChecker Calman: 1.42 | ∀{0.5-29.43 Ø4.76}
calibrated: 0.7
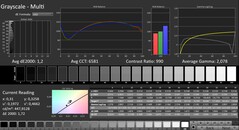
ΔE Greyscale Calman: 1.2 | ∀{0.09-98 Ø5}
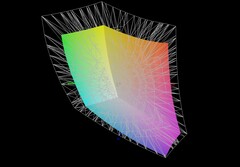
69% AdobeRGB 1998 (Argyll 3D)
99.5% sRGB (Argyll 3D)
68.1% Display P3 (Argyll 3D)
Gamma: 2.078
CCT: 6581 K
| Medion Erazer Beast X40 2024 BOE NE170QDM-NZ1, IPS, 2560x1600, 17" | Schenker Key 17 Pro (Early 23) BOE CQ NE173QUM-NY1, IPS, 3840x2160, 17.3" | Asus ROG Strix Scar 17 G733PY-XS96 NE173QHM-NZ2, IPS, 2560x1440, 17.3" | Asus ROG Strix Scar 18 G834JYR (2024) BOE NE180QDM-NM1, Mini LED, 2560x1600, 18" | MSI Titan 18 HX A14VIG AU Optronics B180ZAN01.0, Mini-LED, 3840x2400, 18" | Medion Erazer Beast X40 BOE NE170QDM-NZ1, IPS, 2560x1600, 17" | |
|---|---|---|---|---|---|---|
| Display | 21% | 23% | 26% | 23% | 1% | |
| Display P3 Coverage (%) | 68.1 | 96.4 42% | 98 44% | 99.9 47% | 98.1 44% | 68.6 1% |
| sRGB Coverage (%) | 99.5 | 99.9 0% | 100 1% | 100 1% | 99.8 0% | 99.8 0% |
| AdobeRGB 1998 Coverage (%) | 69 | 84.3 22% | 85.6 24% | 90 30% | 86.2 25% | 69.4 1% |
| Response Times | -15% | -9% | -29% | -530% | -3% | |
| Response Time Grey 50% / Grey 80% * (ms) | 11.7 ? | 14.8 ? -26% | 6.2 ? 47% | 12 ? -3% | 8.6 ? 26% | 11.3 ? 3% |
| Response Time Black / White * (ms) | 6.9 ? | 7.2 ? -4% | 11.4 ? -65% | 10.7 ? -55% | 81.8 ? -1086% | 7.5 ? -9% |
| PWM Frequency (Hz) | 5733 ? | 2592 ? | ||||
| Screen | -0% | -6% | 166% | -119% | -29% | |
| Brightness middle (cd/m²) | 422 | 487 15% | 322.5 -24% | 937 122% | 467.5 11% | 384 -9% |
| Brightness (cd/m²) | 388 | 485 25% | 317 -18% | 934 141% | 459 18% | 377 -3% |
| Brightness Distribution (%) | 87 | 87 0% | 86 -1% | 89 2% | 90 3% | 90 3% |
| Black Level * (cd/m²) | 0.42 | 0.51 -21% | 0.29 31% | 0.066 84% | 0.45 -7% | |
| Contrast (:1) | 1005 | 955 -5% | 1112 11% | 14197 1313% | 853 -15% | |
| Colorchecker dE 2000 * | 1.42 | 1.51 -6% | 1.15 19% | 1.52 -7% | 3.77 -165% | 2.05 -44% |
| Colorchecker dE 2000 max. * | 1.97 | 2.19 -11% | 3.03 -54% | 2.82 -43% | 6.12 -211% | 3.64 -85% |
| Colorchecker dE 2000 calibrated * | 0.7 | 0.56 20% | 1.21 -73% | 2.94 -320% | 0.74 -6% | |
| Greyscale dE 2000 * | 1.2 | 1.2 -0% | 1.7 -42% | 1.7 -42% | 3.2 -167% | 2.3 -92% |
| Gamma | 2.078 106% | 2.273 97% | 2.27 97% | 2.042 108% | 2.43 91% | 2.017 109% |
| CCT | 6581 99% | 6451 101% | 6299 103% | 6578 99% | 6478 100% | 6546 99% |
| Całkowita średnia (program / ustawienia) | 2% /
2% | 3% /
-1% | 54% /
108% | -209% /
-152% | -10% /
-19% |
* ... im mniej tym lepiej
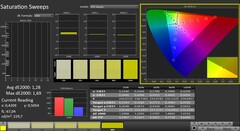
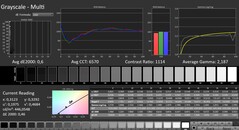
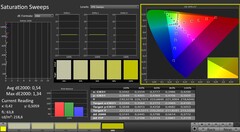
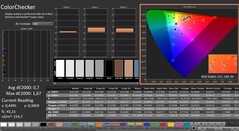
Wyświetlacz fabrycznie pokazuje dobre odwzorowanie kolorów: Przy odchyleniu około 1,4, cel (DeltaE < 3) jest spełniony. Kalibracja zmniejsza odchylenie do 0,7 i zapewnia bardziej zrównoważone odcienie szarości.
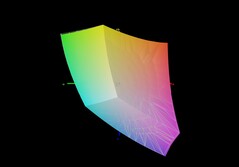
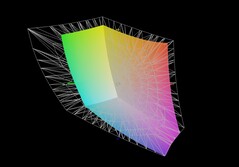
Panel może całkowicie odtworzyć przestrzeń kolorów sRGB, ale nie AdobeRGB i DCI P3. Wyświetlacze konkurencji oferują tutaj więcej.
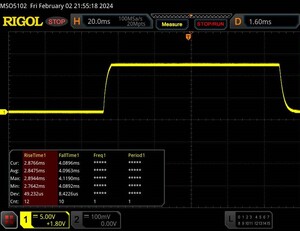
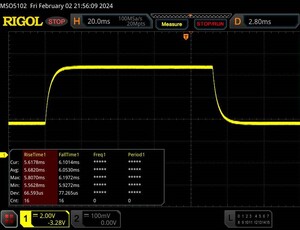
Wyświetl czasy reakcji
| ↔ Czas reakcji od czerni do bieli | ||
|---|---|---|
| 6.9 ms ... wzrost ↗ i spadek ↘ łącznie | ↗ 2.8 ms wzrost | |
| ↘ 4.1 ms upadek | ||
| W naszych testach ekran wykazuje bardzo szybką reakcję i powinien bardzo dobrze nadawać się do szybkich gier. Dla porównania, wszystkie testowane urządzenia wahają się od 0.1 (minimum) do 240 (maksimum) ms. » 20 % wszystkich urządzeń jest lepszych. Oznacza to, że zmierzony czas reakcji jest lepszy od średniej wszystkich testowanych urządzeń (20.1 ms). | ||
| ↔ Czas reakcji 50% szarości do 80% szarości | ||
| 11.7 ms ... wzrost ↗ i spadek ↘ łącznie | ↗ 5.7 ms wzrost | |
| ↘ 6 ms upadek | ||
| W naszych testach ekran wykazuje dobry współczynnik reakcji, ale może być zbyt wolny dla graczy rywalizujących ze sobą. Dla porównania, wszystkie testowane urządzenia wahają się od 0.165 (minimum) do 636 (maksimum) ms. » 24 % wszystkich urządzeń jest lepszych. Oznacza to, że zmierzony czas reakcji jest lepszy od średniej wszystkich testowanych urządzeń (31.4 ms). | ||
Migotanie ekranu / PWM (modulacja szerokości impulsu)
| Migotanie ekranu/nie wykryto PWM | |||
Dla porównania: 53 % wszystkich testowanych urządzeń nie używa PWM do przyciemniania wyświetlacza. Jeśli wykryto PWM, zmierzono średnio 8016 (minimum: 5 - maksimum: 343500) Hz. | |||
Wydajność: Medion Beast X40 jest wyposażony w wysokiej klasy sprzęt
Wysokiej klasy notebook firmy Medion sprawdzi się we wszystkich wymagających wydajności zastosowaniach (np. w grach, renderowaniu). Niezbędną moc obliczeniową zapewniają procesory Raptor Lake i Ada Lovelace. Ten model X40 jest dostępny za około 4000 euro. Tańsze wersje są dostępne już od 2500 euro. Jako opcjonalne akcesorium, Medion oferuje system chłodzenia wodnego (ok. 200 euro), który może skutkować niewielkim wzrostem wydajności i niższą emisją spalin.
Warunki testu
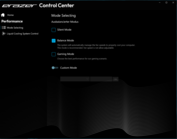
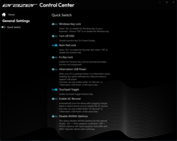
Dedykowany przycisk obok przycisku zasilania pozwala szybko przełączać się między trzema trybami wydajności specyficznymi dla producenta (patrz tabela poniżej). Wykorzystane zostały tryby "Balance Mode" (benchmarki) oraz "Silent Mode" (testy baterii).
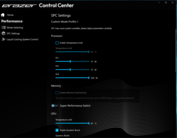
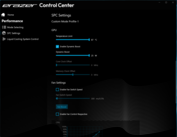
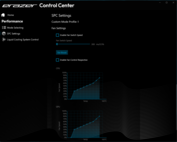
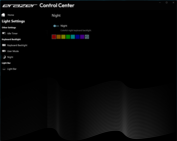
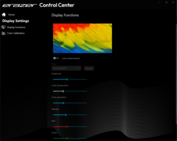
Indywidualne profile można tworzyć za pomocą preinstalowanego oprogramowania Control Center, w którym można dostosować limity mocy procesora, TGP GPU i/lub górne limity temperatury.
| Tryb gry | Tryb zrównoważony | Tryb cichy | |
|---|---|---|---|
| Limit mocy 1 (HWInfo) | 160 watów | 160 watów | 160 watów |
| Limit mocy 2 (HWInfo) | 160 Watt | 160 Watt | 160 Watt |
| Hałas (Witcher 3) | 52 dB(A) | 50 dB(A) | 34 dB(A) |
| Wydajność (Witcher 3) | ~214 fps | ~204 fps | 30 fps (zablokowane) |
Procesor
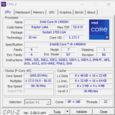
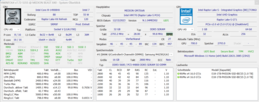
24 rdzenie CPU (8P + 16E i 32 wątki) w Raptor Lake-HX Core i9-14900HX osiągają maksymalne taktowania na poziomie 5,8 GHz (rdzeń P) i 4,1 GHz (rdzeń E). Dzięki nieco wyższym częstotliwościom taktowania, procesor zapewnia nieco wyższą wydajność niż CPU w modelu 2023 Beast X40 poprzednik z procesorem Core i9-13900HX.
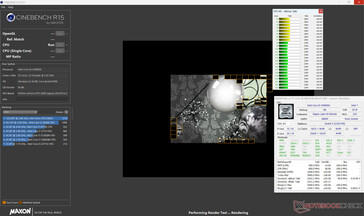
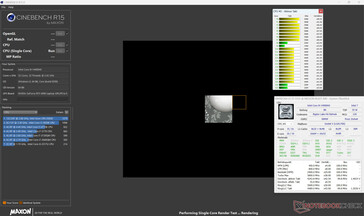
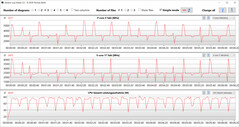
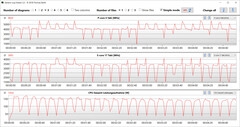
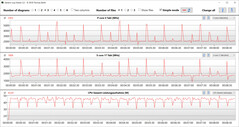
Ciągłe obciążenie wielowątkowe (pętla CB15) jest potwierdzane stałą częstotliwością taktowania - poziom zależy od trybu zasilania. "Balance Mode" dostarcza wartości benchmarkowe poniżej średniej CPU, "Gaming Mode" podnosi je powyżej niej. Wydajność jednowątkowa jest inna: jest na wysokim, niemal identycznym poziomie we wszystkich trzech profilach.
Więcej informacji na temat Core i9-14900HX znajdą Państwo w naszym artykule analitycznym Analiza Intel Raptor Lake-HX Refresh - Core i9-14900HX z większą wydajnością pojedynczego rdzenia .
Cinebench R15 Multi Dauertest
| CPU Performance rating - Percent | |
| Asus ROG Strix Scar 17 G733PYV-LL053X | |
| Medion Erazer Beast X40 2024 | |
| MSI Titan 18 HX A14VIG | |
| Asus ROG Strix Scar 18 G834JYR (2024) | |
| Przeciętny Intel Core i9-14900HX | |
| Medion Erazer Beast X40 -2! | |
| Schenker Key 17 Pro (Early 23) -2! | |
| Medion Erazer Beast X40 2024 | |
| Średnia w klasie Gaming | |
| Cinebench R20 | |
| CPU (Multi Core) | |
| Asus ROG Strix Scar 17 G733PYV-LL053X | |
| MSI Titan 18 HX A14VIG | |
| Medion Erazer Beast X40 2024 (Gaming Mode) | |
| Medion Erazer Beast X40 | |
| Przeciętny Intel Core i9-14900HX (6579 - 13832, n=37) | |
| Asus ROG Strix Scar 18 G834JYR (2024) | |
| Schenker Key 17 Pro (Early 23) | |
| Średnia w klasie Gaming (2179 - 16108, n=135, ostatnie 2 lata) | |
| Medion Erazer Beast X40 2024 | |
| CPU (Single Core) | |
| Medion Erazer Beast X40 2024 | |
| Asus ROG Strix Scar 18 G834JYR (2024) | |
| Medion Erazer Beast X40 2024 (Gaming Mode) | |
| Przeciętny Intel Core i9-14900HX (657 - 859, n=37) | |
| MSI Titan 18 HX A14VIG | |
| Schenker Key 17 Pro (Early 23) | |
| Medion Erazer Beast X40 | |
| Średnia w klasie Gaming (439 - 870, n=135, ostatnie 2 lata) | |
| Asus ROG Strix Scar 17 G733PYV-LL053X | |
| Cinebench R15 | |
| CPU Multi 64Bit | |
| Asus ROG Strix Scar 17 G733PYV-LL053X | |
| Medion Erazer Beast X40 | |
| MSI Titan 18 HX A14VIG | |
| Medion Erazer Beast X40 2024 (Gaming Mode) | |
| Przeciętny Intel Core i9-14900HX (3263 - 5589, n=38) | |
| Schenker Key 17 Pro (Early 23) | |
| Asus ROG Strix Scar 18 G834JYR (2024) | |
| Średnia w klasie Gaming (1537 - 6271, n=135, ostatnie 2 lata) | |
| Medion Erazer Beast X40 2024 | |
| CPU Single 64Bit | |
| Medion Erazer Beast X40 2024 (Gaming Mode) | |
| Medion Erazer Beast X40 2024 | |
| Asus ROG Strix Scar 17 G733PYV-LL053X | |
| Przeciętny Intel Core i9-14900HX (247 - 323, n=37) | |
| Asus ROG Strix Scar 18 G834JYR (2024) | |
| MSI Titan 18 HX A14VIG | |
| Medion Erazer Beast X40 | |
| Średnia w klasie Gaming (188.8 - 343, n=134, ostatnie 2 lata) | |
| Schenker Key 17 Pro (Early 23) | |
| Blender - v2.79 BMW27 CPU | |
| Średnia w klasie Gaming (80 - 517, n=132, ostatnie 2 lata) | |
| Medion Erazer Beast X40 2024 | |
| Przeciętny Intel Core i9-14900HX (91 - 206, n=37) | |
| Schenker Key 17 Pro (Early 23) | |
| Asus ROG Strix Scar 18 G834JYR (2024) | |
| Medion Erazer Beast X40 2024 (Gaming Mode) | |
| Medion Erazer Beast X40 | |
| MSI Titan 18 HX A14VIG | |
| Asus ROG Strix Scar 17 G733PYV-LL053X | |
| Geekbench 6.5 | |
| Multi-Core | |
| Medion Erazer Beast X40 2024 (6.2.1, Gaming Mode) | |
| Asus ROG Strix Scar 18 G834JYR (2024) (6.2.1) | |
| Przeciętny Intel Core i9-14900HX (13158 - 19665, n=37) | |
| Asus ROG Strix Scar 17 G733PYV-LL053X | |
| MSI Titan 18 HX A14VIG (6.2.1) | |
| Medion Erazer Beast X40 2024 (6.2.1) | |
| Średnia w klasie Gaming (5340 - 22104, n=134, ostatnie 2 lata) | |
| Single-Core | |
| Medion Erazer Beast X40 2024 (6.2.1, Gaming Mode) | |
| Medion Erazer Beast X40 2024 (6.2.1) | |
| Asus ROG Strix Scar 18 G834JYR (2024) (6.2.1) | |
| Przeciętny Intel Core i9-14900HX (2419 - 3129, n=37) | |
| Asus ROG Strix Scar 17 G733PYV-LL053X | |
| MSI Titan 18 HX A14VIG (6.2.1) | |
| Średnia w klasie Gaming (1490 - 3259, n=134, ostatnie 2 lata) | |
| HWBOT x265 Benchmark v2.2 - 4k Preset | |
| Asus ROG Strix Scar 17 G733PYV-LL053X | |
| Medion Erazer Beast X40 2024 (Gaming Mode) | |
| MSI Titan 18 HX A14VIG | |
| Medion Erazer Beast X40 | |
| Przeciętny Intel Core i9-14900HX (16.8 - 38.9, n=37) | |
| Asus ROG Strix Scar 18 G834JYR (2024) | |
| Schenker Key 17 Pro (Early 23) | |
| Średnia w klasie Gaming (7.7 - 44.3, n=133, ostatnie 2 lata) | |
| Medion Erazer Beast X40 2024 | |
| LibreOffice - 20 Documents To PDF | |
| Średnia w klasie Gaming (19 - 88.8, n=133, ostatnie 2 lata) | |
| MSI Titan 18 HX A14VIG (6.3.4.2) | |
| Asus ROG Strix Scar 18 G834JYR (2024) (6.3.4.2) | |
| Medion Erazer Beast X40 | |
| Medion Erazer Beast X40 2024 (6.3.4.2) | |
| Przeciętny Intel Core i9-14900HX (19 - 85.1, n=37) | |
| Schenker Key 17 Pro (Early 23) | |
| Medion Erazer Beast X40 2024 (6.3.4.2, Gaming Mode) | |
| Asus ROG Strix Scar 17 G733PYV-LL053X | |
| R Benchmark 2.5 - Overall mean | |
| Średnia w klasie Gaming (0.3439 - 0.759, n=134, ostatnie 2 lata) | |
| Asus ROG Strix Scar 17 G733PYV-LL053X | |
| Medion Erazer Beast X40 | |
| Schenker Key 17 Pro (Early 23) | |
| Asus ROG Strix Scar 18 G834JYR (2024) | |
| MSI Titan 18 HX A14VIG | |
| Przeciętny Intel Core i9-14900HX (0.3604 - 0.4859, n=37) | |
| Medion Erazer Beast X40 2024 | |
| Medion Erazer Beast X40 2024 (Gaming Mode) | |
* ... im mniej tym lepiej
AIDA64: FP32 Ray-Trace | FPU Julia | CPU SHA3 | CPU Queen | FPU SinJulia | FPU Mandel | CPU AES | CPU ZLib | FP64 Ray-Trace | CPU PhotoWorxx
| Performance rating | |
| Asus ROG Strix Scar 17 G733PYV-LL053X | |
| Medion Erazer Beast X40 2024 | |
| MSI Titan 18 HX A14VIG | |
| Medion Erazer Beast X40 | |
| Asus ROG Strix Scar 18 G834JYR (2024) | |
| Schenker Key 17 Pro (Early 23) | |
| Przeciętny Intel Core i9-14900HX | |
| Średnia w klasie Gaming | |
| Medion Erazer Beast X40 2024 | |
| AIDA64 / FP32 Ray-Trace | |
| Asus ROG Strix Scar 17 G733PYV-LL053X (v6.88.6413 Beta) | |
| MSI Titan 18 HX A14VIG (v6.92.6600) | |
| Średnia w klasie Gaming (7192 - 85542, n=133, ostatnie 2 lata) | |
| Medion Erazer Beast X40 2024 (v6.92.6600, Gaming Mode) | |
| Medion Erazer Beast X40 (v6.75.6100) | |
| Asus ROG Strix Scar 18 G834JYR (2024) (v6.92.6600) | |
| Przeciętny Intel Core i9-14900HX (13098 - 33474, n=36) | |
| Schenker Key 17 Pro (Early 23) (v6.75.6100) | |
| Medion Erazer Beast X40 2024 (v6.92.6600) | |
| AIDA64 / FPU Julia | |
| Asus ROG Strix Scar 17 G733PYV-LL053X (v6.88.6413 Beta) | |
| MSI Titan 18 HX A14VIG (v6.92.6600) | |
| Medion Erazer Beast X40 2024 (v6.92.6600, Gaming Mode) | |
| Medion Erazer Beast X40 (v6.75.6100) | |
| Średnia w klasie Gaming (35040 - 238426, n=133, ostatnie 2 lata) | |
| Asus ROG Strix Scar 18 G834JYR (2024) (v6.92.6600) | |
| Przeciętny Intel Core i9-14900HX (67573 - 166040, n=36) | |
| Schenker Key 17 Pro (Early 23) (v6.75.6100) | |
| Medion Erazer Beast X40 2024 (v6.92.6600) | |
| AIDA64 / CPU SHA3 | |
| Asus ROG Strix Scar 17 G733PYV-LL053X (v6.88.6413 Beta) | |
| MSI Titan 18 HX A14VIG (v6.92.6600) | |
| Medion Erazer Beast X40 2024 (v6.92.6600, Gaming Mode) | |
| Medion Erazer Beast X40 (v6.75.6100) | |
| Asus ROG Strix Scar 18 G834JYR (2024) (v6.92.6600) | |
| Przeciętny Intel Core i9-14900HX (3589 - 7979, n=36) | |
| Schenker Key 17 Pro (Early 23) (v6.75.6100) | |
| Średnia w klasie Gaming (1728 - 9817, n=133, ostatnie 2 lata) | |
| Medion Erazer Beast X40 2024 (v6.92.6600) | |
| AIDA64 / CPU Queen | |
| Asus ROG Strix Scar 17 G733PYV-LL053X (v6.88.6413 Beta) | |
| MSI Titan 18 HX A14VIG (v6.92.6600) | |
| Medion Erazer Beast X40 2024 (v6.92.6600, Gaming Mode) | |
| Asus ROG Strix Scar 18 G834JYR (2024) (v6.92.6600) | |
| Przeciętny Intel Core i9-14900HX (118405 - 148966, n=36) | |
| Schenker Key 17 Pro (Early 23) (v6.75.6100) | |
| Medion Erazer Beast X40 (v6.75.6100) | |
| Medion Erazer Beast X40 2024 (v6.92.6600) | |
| Średnia w klasie Gaming (49785 - 173351, n=133, ostatnie 2 lata) | |
| AIDA64 / FPU SinJulia | |
| Asus ROG Strix Scar 17 G733PYV-LL053X (v6.88.6413 Beta) | |
| MSI Titan 18 HX A14VIG (v6.92.6600) | |
| Medion Erazer Beast X40 2024 (v6.92.6600, Gaming Mode) | |
| Asus ROG Strix Scar 18 G834JYR (2024) (v6.92.6600) | |
| Medion Erazer Beast X40 (v6.75.6100) | |
| Przeciętny Intel Core i9-14900HX (10475 - 18517, n=36) | |
| Schenker Key 17 Pro (Early 23) (v6.75.6100) | |
| Średnia w klasie Gaming (4424 - 33636, n=133, ostatnie 2 lata) | |
| Medion Erazer Beast X40 2024 (v6.92.6600) | |
| AIDA64 / FPU Mandel | |
| Asus ROG Strix Scar 17 G733PYV-LL053X (v6.88.6413 Beta) | |
| MSI Titan 18 HX A14VIG (v6.92.6600) | |
| Medion Erazer Beast X40 2024 (v6.92.6600, Gaming Mode) | |
| Medion Erazer Beast X40 (v6.75.6100) | |
| Średnia w klasie Gaming (17585 - 128721, n=133, ostatnie 2 lata) | |
| Asus ROG Strix Scar 18 G834JYR (2024) (v6.92.6600) | |
| Przeciętny Intel Core i9-14900HX (32543 - 83662, n=36) | |
| Schenker Key 17 Pro (Early 23) (v6.75.6100) | |
| Medion Erazer Beast X40 2024 | |
| AIDA64 / CPU AES | |
| Asus ROG Strix Scar 17 G733PYV-LL053X (v6.88.6413 Beta) | |
| Schenker Key 17 Pro (Early 23) (v6.75.6100) | |
| Przeciętny Intel Core i9-14900HX (86964 - 241777, n=36) | |
| MSI Titan 18 HX A14VIG (v6.92.6600) | |
| Medion Erazer Beast X40 2024 (v6.92.6600, Gaming Mode) | |
| Medion Erazer Beast X40 (v6.75.6100) | |
| Asus ROG Strix Scar 18 G834JYR (2024) (v6.92.6600) | |
| Średnia w klasie Gaming (19065 - 247074, n=133, ostatnie 2 lata) | |
| Medion Erazer Beast X40 2024 (v6.92.6600) | |
| AIDA64 / CPU ZLib | |
| MSI Titan 18 HX A14VIG (v6.92.6600) | |
| Medion Erazer Beast X40 2024 (v6.92.6600, Gaming Mode) | |
| Asus ROG Strix Scar 17 G733PYV-LL053X (v6.88.6413 Beta) | |
| Medion Erazer Beast X40 (v6.75.6100) | |
| Przeciętny Intel Core i9-14900HX (1054 - 2292, n=36) | |
| Asus ROG Strix Scar 18 G834JYR (2024) | |
| Schenker Key 17 Pro (Early 23) (v6.75.6100) | |
| Średnia w klasie Gaming (373 - 2531, n=133, ostatnie 2 lata) | |
| Medion Erazer Beast X40 2024 (v6.92.6600) | |
| AIDA64 / FP64 Ray-Trace | |
| Asus ROG Strix Scar 17 G733PYV-LL053X (v6.88.6413 Beta) | |
| MSI Titan 18 HX A14VIG (v6.92.6600) | |
| Medion Erazer Beast X40 2024 (v6.92.6600, Gaming Mode) | |
| Średnia w klasie Gaming (3856 - 45446, n=133, ostatnie 2 lata) | |
| Medion Erazer Beast X40 (v6.75.6100) | |
| Asus ROG Strix Scar 18 G834JYR (2024) (v6.92.6600) | |
| Przeciętny Intel Core i9-14900HX (6809 - 18349, n=36) | |
| Schenker Key 17 Pro (Early 23) (v6.75.6100) | |
| Medion Erazer Beast X40 2024 (v6.92.6600) | |
| AIDA64 / CPU PhotoWorxx | |
| Schenker Key 17 Pro (Early 23) (v6.75.6100) | |
| Asus ROG Strix Scar 18 G834JYR (2024) (v6.92.6600) | |
| Medion Erazer Beast X40 2024 (v6.92.6600) | |
| Medion Erazer Beast X40 2024 (v6.92.6600, Gaming Mode) | |
| Przeciętny Intel Core i9-14900HX (23903 - 54702, n=36) | |
| Medion Erazer Beast X40 (v6.75.6100) | |
| Średnia w klasie Gaming (10805 - 62916, n=133, ostatnie 2 lata) | |
| Asus ROG Strix Scar 17 G733PYV-LL053X (v6.88.6413 Beta) | |
| MSI Titan 18 HX A14VIG (v6.92.6600) | |
Wydajność systemu
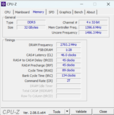
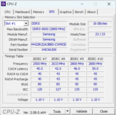
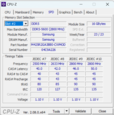
Wystarczy pobieżny rzut oka na specyfikację, aby potwierdzić, że system oferuje wystarczającą moc do płynnego uruchamiania wymagających aplikacji, takich jak gry, renderowanie i strumieniowanie. Prędkości transferu pamięci RAM są na normalnym poziomie dla pamięci DDR5-5600 RAM.
CrossMark: Overall | Productivity | Creativity | Responsiveness
WebXPRT 3: Overall
WebXPRT 4: Overall
Mozilla Kraken 1.1: Total
| PCMark 10 / Score | |
| Asus ROG Strix Scar 17 G733PYV-LL053X | |
| MSI Titan 18 HX A14VIG | |
| Medion Erazer Beast X40 2024 | |
| Schenker Key 17 Pro (Early 23) | |
| Asus ROG Strix Scar 18 G834JYR (2024) | |
| Przeciętny Intel Core i9-14900HX, NVIDIA GeForce RTX 4090 Laptop GPU (8230 - 9234, n=13) | |
| Średnia w klasie Gaming (5776 - 10060, n=113, ostatnie 2 lata) | |
| Medion Erazer Beast X40 | |
| PCMark 10 / Essentials | |
| MSI Titan 18 HX A14VIG | |
| Asus ROG Strix Scar 17 G733PYV-LL053X | |
| Asus ROG Strix Scar 18 G834JYR (2024) | |
| Schenker Key 17 Pro (Early 23) | |
| Medion Erazer Beast X40 | |
| Przeciętny Intel Core i9-14900HX, NVIDIA GeForce RTX 4090 Laptop GPU (10778 - 11628, n=13) | |
| Medion Erazer Beast X40 2024 | |
| Średnia w klasie Gaming (8810 - 12600, n=117, ostatnie 2 lata) | |
| PCMark 10 / Productivity | |
| Medion Erazer Beast X40 2024 | |
| Medion Erazer Beast X40 | |
| Schenker Key 17 Pro (Early 23) | |
| Asus ROG Strix Scar 17 G733PYV-LL053X | |
| Przeciętny Intel Core i9-14900HX, NVIDIA GeForce RTX 4090 Laptop GPU (9458 - 11759, n=13) | |
| Asus ROG Strix Scar 18 G834JYR (2024) | |
| MSI Titan 18 HX A14VIG | |
| Średnia w klasie Gaming (6662 - 16716, n=115, ostatnie 2 lata) | |
| PCMark 10 / Digital Content Creation | |
| MSI Titan 18 HX A14VIG | |
| Asus ROG Strix Scar 17 G733PYV-LL053X | |
| Asus ROG Strix Scar 18 G834JYR (2024) | |
| Medion Erazer Beast X40 2024 | |
| Przeciętny Intel Core i9-14900HX, NVIDIA GeForce RTX 4090 Laptop GPU (13219 - 16462, n=13) | |
| Schenker Key 17 Pro (Early 23) | |
| Średnia w klasie Gaming (7440 - 19351, n=115, ostatnie 2 lata) | |
| Medion Erazer Beast X40 | |
| CrossMark / Overall | |
| Schenker Key 17 Pro (Early 23) | |
| Asus ROG Strix Scar 18 G834JYR (2024) | |
| Medion Erazer Beast X40 2024 | |
| Medion Erazer Beast X40 | |
| Przeciętny Intel Core i9-14900HX, NVIDIA GeForce RTX 4090 Laptop GPU (1877 - 2344, n=10) | |
| Asus ROG Strix Scar 17 G733PYV-LL053X | |
| Średnia w klasie Gaming (1247 - 2344, n=113, ostatnie 2 lata) | |
| MSI Titan 18 HX A14VIG | |
| CrossMark / Productivity | |
| Schenker Key 17 Pro (Early 23) | |
| Medion Erazer Beast X40 2024 | |
| Asus ROG Strix Scar 18 G834JYR (2024) | |
| Medion Erazer Beast X40 | |
| Przeciętny Intel Core i9-14900HX, NVIDIA GeForce RTX 4090 Laptop GPU (1738 - 2162, n=10) | |
| Asus ROG Strix Scar 17 G733PYV-LL053X | |
| Średnia w klasie Gaming (1299 - 2211, n=113, ostatnie 2 lata) | |
| MSI Titan 18 HX A14VIG | |
| CrossMark / Creativity | |
| Asus ROG Strix Scar 18 G834JYR (2024) | |
| Schenker Key 17 Pro (Early 23) | |
| Asus ROG Strix Scar 17 G733PYV-LL053X | |
| Medion Erazer Beast X40 | |
| Przeciętny Intel Core i9-14900HX, NVIDIA GeForce RTX 4090 Laptop GPU (2195 - 2660, n=10) | |
| Medion Erazer Beast X40 2024 | |
| Średnia w klasie Gaming (1275 - 2729, n=113, ostatnie 2 lata) | |
| MSI Titan 18 HX A14VIG | |
| CrossMark / Responsiveness | |
| Schenker Key 17 Pro (Early 23) | |
| Asus ROG Strix Scar 18 G834JYR (2024) | |
| Medion Erazer Beast X40 2024 | |
| Przeciętny Intel Core i9-14900HX, NVIDIA GeForce RTX 4090 Laptop GPU (1478 - 2327, n=10) | |
| Medion Erazer Beast X40 | |
| Średnia w klasie Gaming (1030 - 2330, n=113, ostatnie 2 lata) | |
| Asus ROG Strix Scar 17 G733PYV-LL053X | |
| MSI Titan 18 HX A14VIG | |
| WebXPRT 3 / Overall | |
| Asus ROG Strix Scar 17 G733PYV-LL053X | |
| MSI Titan 18 HX A14VIG | |
| Medion Erazer Beast X40 2024 | |
| Przeciętny Intel Core i9-14900HX, NVIDIA GeForce RTX 4090 Laptop GPU (279 - 339, n=10) | |
| Medion Erazer Beast X40 | |
| Asus ROG Strix Scar 18 G834JYR (2024) | |
| Średnia w klasie Gaming (237 - 532, n=115, ostatnie 2 lata) | |
| Schenker Key 17 Pro (Early 23) | |
| WebXPRT 4 / Overall | |
| Asus ROG Strix Scar 17 G733PYV-LL053X | |
| Asus ROG Strix Scar 18 G834JYR (2024) | |
| Medion Erazer Beast X40 2024 | |
| Schenker Key 17 Pro (Early 23) | |
| Przeciętny Intel Core i9-14900HX, NVIDIA GeForce RTX 4090 Laptop GPU (246 - 309, n=8) | |
| MSI Titan 18 HX A14VIG | |
| Średnia w klasie Gaming (176.4 - 345, n=114, ostatnie 2 lata) | |
| Mozilla Kraken 1.1 / Total | |
| Średnia w klasie Gaming (397 - 674, n=124, ostatnie 2 lata) | |
| Schenker Key 17 Pro (Early 23) | |
| Medion Erazer Beast X40 | |
| Przeciętny Intel Core i9-14900HX, NVIDIA GeForce RTX 4090 Laptop GPU (428 - 535, n=11) | |
| MSI Titan 18 HX A14VIG | |
| Asus ROG Strix Scar 18 G834JYR (2024) | |
| Medion Erazer Beast X40 2024 | |
| Asus ROG Strix Scar 17 G733PYV-LL053X | |
* ... im mniej tym lepiej
| PCMark 10 Score | 8963 pkt. | |
Pomoc | ||
| AIDA64 / Memory Copy | |
| Asus ROG Strix Scar 18 G834JYR (2024) | |
| Schenker Key 17 Pro (Early 23) | |
| Medion Erazer Beast X40 2024 | |
| Przeciętny Intel Core i9-14900HX (38028 - 83392, n=36) | |
| Średnia w klasie Gaming (21750 - 108104, n=133, ostatnie 2 lata) | |
| Medion Erazer Beast X40 | |
| MSI Titan 18 HX A14VIG | |
| Asus ROG Strix Scar 17 G733PYV-LL053X | |
| AIDA64 / Memory Read | |
| Asus ROG Strix Scar 18 G834JYR (2024) | |
| Medion Erazer Beast X40 2024 | |
| Schenker Key 17 Pro (Early 23) | |
| Przeciętny Intel Core i9-14900HX (43306 - 87568, n=36) | |
| Medion Erazer Beast X40 | |
| Średnia w klasie Gaming (22956 - 104349, n=133, ostatnie 2 lata) | |
| Asus ROG Strix Scar 17 G733PYV-LL053X | |
| MSI Titan 18 HX A14VIG | |
| AIDA64 / Memory Write | |
| Asus ROG Strix Scar 18 G834JYR (2024) | |
| Medion Erazer Beast X40 2024 | |
| Schenker Key 17 Pro (Early 23) | |
| Średnia w klasie Gaming (22297 - 133486, n=133, ostatnie 2 lata) | |
| Przeciętny Intel Core i9-14900HX (37146 - 80589, n=36) | |
| Medion Erazer Beast X40 | |
| Asus ROG Strix Scar 17 G733PYV-LL053X | |
| MSI Titan 18 HX A14VIG | |
| AIDA64 / Memory Latency | |
| MSI Titan 18 HX A14VIG | |
| Średnia w klasie Gaming (59.5 - 259, n=133, ostatnie 2 lata) | |
| Schenker Key 17 Pro (Early 23) | |
| Medion Erazer Beast X40 | |
| Asus ROG Strix Scar 17 G733PYV-LL053X | |
| Przeciętny Intel Core i9-14900HX (76.1 - 105, n=36) | |
| Asus ROG Strix Scar 18 G834JYR (2024) | |
| Medion Erazer Beast X40 2024 | |
* ... im mniej tym lepiej
Opóźnienie DPC
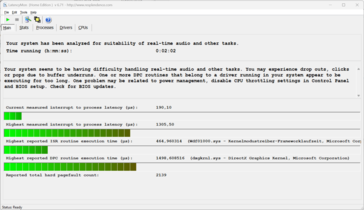
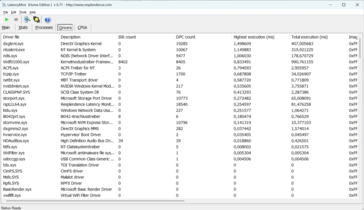
Latency Monitor ujawnia anomalie podczas testu opóźnień (surfowanie po Internecie, odtwarzanie wideo 4k i wysokie obciążenie Prime95). System nie wydaje się być odpowiedni do edycji wideo i audio w czasie rzeczywistym. Przyszłe aktualizacje oprogramowania i sterowników mogą doprowadzić do potencjalnej poprawy lub nawet pogorszenia wydajności.
| DPC Latencies / LatencyMon - interrupt to process latency (max), Web, Youtube, Prime95 | |
| Schenker Key 17 Pro (Early 23) | |
| MSI Titan 18 HX A14VIG | |
| Medion Erazer Beast X40 | |
| Medion Erazer Beast X40 2024 | |
| Asus ROG Strix Scar 18 G834JYR (2024) | |
| Asus ROG Strix Scar 17 G733PYV-LL053X | |
* ... im mniej tym lepiej
Pamięć masowa
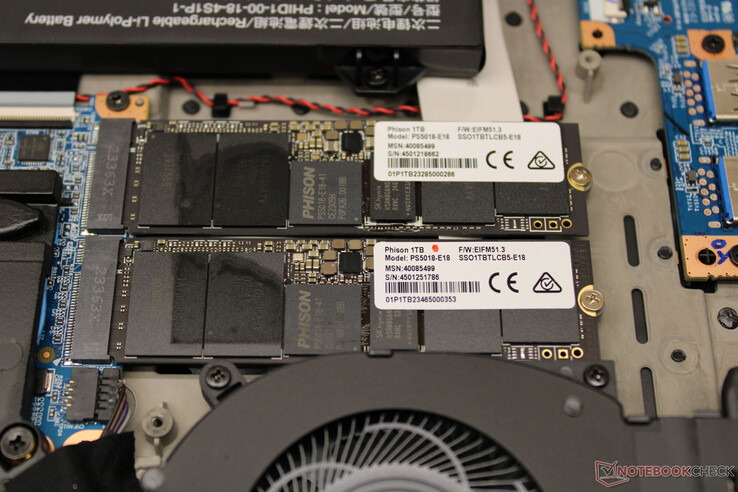
X40 ma na pokładzie dwa dyski SSD PCIe Gen 4 M.2 2280 o pojemności 1 TB każdy, ale nie są one skonfigurowane w macierzy RAID. Jeden dysk SSD służy jako dysk systemowy, a drugi jako magazyn danych. Osiągnięto bardzo dobre prędkości przesyłu danych. Nie występują spadki wydajności spowodowane dławieniem termicznym.
X40 generalnie obsługuje RAID-0/1, ale odpowiednia opcja musi być najpierw aktywowana w BIOS-ie, po czym należy ponownie zainstalować system Windows. Procedura ta nie jest zalecana dla osób niewtajemniczonych.
* ... im mniej tym lepiej
Disk throttling: DiskSpd Read Loop, Queue Depth 8
Karta graficzna
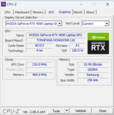
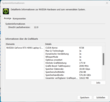
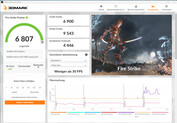
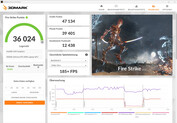
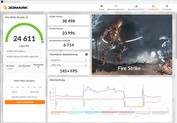
Medion Erazer Beast X40 opiera się na GeForce RTX 4090 - obecnie najpotężniejszym mobilnym GPU Nvidii. Posiada on 9 728 jednostek cieniujących, magistralę pamięci o szerokości 256 bitów oraz szybką pamięć GDDR6 o pojemności 16 GB. RTX 4090 ma maksymalne TGP wynoszące 175 W (150 W + 25 W Dynamic Boost) - nie ma możliwości przekroczenia tego limitu.
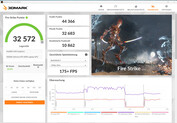
Wyniki benchmarków są na tym samym poziomie (Tryb Równowagi) lub powyżej (Tryb Gaming) poprzedniej średniej RTX 4090. Sytuacja wygląda jednak inaczej w grach.
Liczba klatek na sekundę powyżej średniej GPU jest osiągana w obu przypadkach. Zaawansowany Optimus jest obsługiwany, więc przełączanie między dGPU a Optimusem nie wymaga restartu.
| 3DMark Performance rating - Percent | |
| Medion Erazer Beast X40 2024 | |
| MSI Titan 18 HX A14VIG | |
| Asus ROG Strix Scar 17 G733PYV-LL053X | |
| Medion Erazer Beast X40 | |
| Schenker Key 17 Pro (Early 23) | |
| Przeciętny NVIDIA GeForce RTX 4090 Laptop GPU | |
| Medion Erazer Beast X40 2024 | |
| Asus ROG Strix Scar 18 G834JYR (2024) | |
| Średnia w klasie Gaming | |
| 3DMark 11 - 1280x720 Performance GPU | |
| Medion Erazer Beast X40 2024 (Gaming Mode) | |
| Schenker Key 17 Pro (Early 23) | |
| Medion Erazer Beast X40 | |
| Przeciętny NVIDIA GeForce RTX 4090 Laptop GPU (54073 - 73027, n=42) | |
| Medion Erazer Beast X40 2024 | |
| Asus ROG Strix Scar 17 G733PYV-LL053X | |
| MSI Titan 18 HX A14VIG | |
| Asus ROG Strix Scar 18 G834JYR (2024) | |
| Średnia w klasie Gaming (16033 - 80022, n=129, ostatnie 2 lata) | |
| 3DMark | |
| 1920x1080 Fire Strike Graphics | |
| MSI Titan 18 HX A14VIG | |
| Asus ROG Strix Scar 17 G733PYV-LL053X | |
| Medion Erazer Beast X40 2024 (Gaming Mode) | |
| Przeciętny NVIDIA GeForce RTX 4090 Laptop GPU (40259 - 53059, n=41) | |
| Medion Erazer Beast X40 | |
| Medion Erazer Beast X40 2024 | |
| Asus ROG Strix Scar 18 G834JYR (2024) | |
| Schenker Key 17 Pro (Early 23) | |
| Średnia w klasie Gaming (12242 - 62849, n=143, ostatnie 2 lata) | |
| 2560x1440 Time Spy Graphics | |
| Medion Erazer Beast X40 2024 (Gaming Mode) | |
| MSI Titan 18 HX A14VIG | |
| Schenker Key 17 Pro (Early 23) | |
| Asus ROG Strix Scar 17 G733PYV-LL053X | |
| Medion Erazer Beast X40 | |
| Przeciętny NVIDIA GeForce RTX 4090 Laptop GPU (16950 - 23292, n=43) | |
| Medion Erazer Beast X40 2024 | |
| Asus ROG Strix Scar 18 G834JYR (2024) | |
| Średnia w klasie Gaming (4310 - 25984, n=140, ostatnie 2 lata) | |
| 3DMark 11 Performance | 41974 pkt. | |
| 3DMark Fire Strike Score | 32572 pkt. | |
| 3DMark Time Spy Score | 19655 pkt. | |
Pomoc | ||
| Geekbench 5.5 | |
| OpenCL Score | |
| Medion Erazer Beast X40 2024 (Gaming Mode) | |
| Asus ROG Strix Scar 18 G834JYR (2024) | |
| Schenker Key 17 Pro (Early 23) | |
| Asus ROG Strix Scar 17 G733PYV-LL053X | |
| Medion Erazer Beast X40 2024 | |
| Przeciętny NVIDIA GeForce RTX 4090 Laptop GPU (6841 - 237138, n=39) | |
| MSI Titan 18 HX A14VIG | |
| Medion Erazer Beast X40 | |
| Średnia w klasie Gaming (45715 - 277970, n=130, ostatnie 2 lata) | |
| Vulkan Score 5.5 | |
| Medion Erazer Beast X40 2024 (Gaming Mode) | |
| Medion Erazer Beast X40 2024 | |
| MSI Titan 18 HX A14VIG | |
| Asus ROG Strix Scar 18 G834JYR (2024) | |
| Asus ROG Strix Scar 17 G733PYV-LL053X | |
| Przeciętny NVIDIA GeForce RTX 4090 Laptop GPU (49663 - 163089, n=28) | |
| Średnia w klasie Gaming (9296 - 203514, n=105, ostatnie 2 lata) | |
| Geekbench 6.5 | |
| GPU Vulkan | |
| Medion Erazer Beast X40 2024 (6.2.1, Gaming Mode) | |
| Medion Erazer Beast X40 2024 (6.2.1) | |
| Asus ROG Strix Scar 18 G834JYR (2024) (6.2.1) | |
| Asus ROG Strix Scar 17 G733PYV-LL053X | |
| MSI Titan 18 HX A14VIG (6.2.1) | |
| Przeciętny NVIDIA GeForce RTX 4090 Laptop GPU (128748 - 196201, n=16) | |
| Średnia w klasie Gaming (28528 - 231659, n=80, ostatnie 2 lata) | |
| GPU OpenCL | |
| Medion Erazer Beast X40 2024 (6.2.1) | |
| Medion Erazer Beast X40 2024 (6.2.1, Gaming Mode) | |
| Asus ROG Strix Scar 17 G733PYV-LL053X | |
| Asus ROG Strix Scar 18 G834JYR (2024) (6.2.1) | |
| Przeciętny NVIDIA GeForce RTX 4090 Laptop GPU (159127 - 209521, n=20) | |
| MSI Titan 18 HX A14VIG (6.2.1) | |
| Średnia w klasie Gaming (42333 - 253130, n=130, ostatnie 2 lata) | |
| V-Ray Benchmark Next 4.10 | |
| GPU | |
| Medion Erazer Beast X40 2024 (v4.10.07, Gaming Mode) | |
| Asus ROG Strix Scar 17 G733PYV-LL053X (v4.10.07 ) | |
| Schenker Key 17 Pro (Early 23) (v4.10.07 ) | |
| Medion Erazer Beast X40 (v4.10.07 ) | |
| Przeciętny NVIDIA GeForce RTX 4090 Laptop GPU (873 - 1334, n=30) | |
| Asus ROG Strix Scar 18 G834JYR (2024) (v4.10.07 ) | |
| Medion Erazer Beast X40 2024 (v4.10.07 ) | |
| Średnia w klasie Gaming (54 - 1333, n=125, ostatnie 2 lata) | |
| CPU | |
| Asus ROG Strix Scar 17 G733PYV-LL053X (v4.10.07 ) | |
| Medion Erazer Beast X40 2024 (v4.10.07, Gaming Mode) | |
| Medion Erazer Beast X40 (v4.10.07 ) | |
| Przeciętny NVIDIA GeForce RTX 4090 Laptop GPU (18206 - 37629, n=30) | |
| Asus ROG Strix Scar 18 G834JYR (2024) (v4.10.07 ) | |
| Schenker Key 17 Pro (Early 23) (v4.10.07 ) | |
| Średnia w klasie Gaming (6122 - 45327, n=125, ostatnie 2 lata) | |
| Medion Erazer Beast X40 2024 (v4.10.07 ) | |
* ... im mniej tym lepiej
| The Witcher 3 - 1920x1080 Ultra Graphics & Postprocessing (HBAO+) | |
| Medion Erazer Beast X40 2024 (Gaming Mode) | |
| MSI Titan 18 HX A14VIG | |
| Asus ROG Strix Scar 17 G733PYV-LL053X | |
| Schenker Key 17 Pro (Early 23) | |
| Medion Erazer Beast X40 2024 | |
| Przeciętny NVIDIA GeForce RTX 4090 Laptop GPU (139.2 - 216, n=35) | |
| Medion Erazer Beast X40 | |
| Asus ROG Strix Scar 18 G834JYR (2024) | |
| Średnia w klasie Gaming (80.2 - 240, n=35, ostatnie 2 lata) | |
| GTA V - 1920x1080 Highest AA:4xMSAA + FX AF:16x | |
| Asus ROG Strix Scar 17 G733PYV-LL053X | |
| Medion Erazer Beast X40 2024 (Gaming Mode) | |
| Medion Erazer Beast X40 | |
| Schenker Key 17 Pro (Early 23) | |
| Medion Erazer Beast X40 2024 | |
| MSI Titan 18 HX A14VIG | |
| Przeciętny NVIDIA GeForce RTX 4090 Laptop GPU (91.1 - 167.7, n=40) | |
| Asus ROG Strix Scar 18 G834JYR (2024) | |
| Średnia w klasie Gaming (47.9 - 186.9, n=120, ostatnie 2 lata) | |
| Final Fantasy XV Benchmark - 1920x1080 High Quality | |
| Medion Erazer Beast X40 2024 (1.3, Gaming Mode) | |
| MSI Titan 18 HX A14VIG (1.3) | |
| Schenker Key 17 Pro (Early 23) (1.3) | |
| Medion Erazer Beast X40 2024 (1.3) | |
| Asus ROG Strix Scar 17 G733PYV-LL053X (1.3) | |
| Medion Erazer Beast X40 (1.3) | |
| Przeciętny NVIDIA GeForce RTX 4090 Laptop GPU (122.2 - 201, n=40) | |
| Asus ROG Strix Scar 18 G834JYR (2024) (1.3) | |
| Średnia w klasie Gaming (37.9 - 215, n=125, ostatnie 2 lata) | |
| Strange Brigade - 1920x1080 ultra AA:ultra AF:16 | |
| Asus ROG Strix Scar 17 G733PYV-LL053X (1.47.22.14 D3D12) | |
| MSI Titan 18 HX A14VIG (1.47.22.14 D3D12) | |
| Schenker Key 17 Pro (Early 23) (1.47.22.14 D3D12) | |
| Medion Erazer Beast X40 2024 (1.47.22.14 D3D12, Gaming Mode) | |
| Medion Erazer Beast X40 2024 (1.47.22.14 D3D12) | |
| Medion Erazer Beast X40 (1.47.22.14 D3D12) | |
| Przeciętny NVIDIA GeForce RTX 4090 Laptop GPU (233 - 421, n=39) | |
| Asus ROG Strix Scar 18 G834JYR (2024) (1.47.22.14 D3D12) | |
| Średnia w klasie Gaming (76.3 - 456, n=115, ostatnie 2 lata) | |
| Dota 2 Reborn - 1920x1080 ultra (3/3) best looking | |
| Asus ROG Strix Scar 17 G733PYV-LL053X | |
| Medion Erazer Beast X40 2024 | |
| Medion Erazer Beast X40 2024 (Gaming Mode) | |
| Schenker Key 17 Pro (Early 23) | |
| Przeciętny NVIDIA GeForce RTX 4090 Laptop GPU (115.7 - 220, n=42) | |
| MSI Titan 18 HX A14VIG | |
| Medion Erazer Beast X40 | |
| Asus ROG Strix Scar 18 G834JYR (2024) | |
| Średnia w klasie Gaming (65.1 - 248, n=133, ostatnie 2 lata) | |
| X-Plane 11.11 - 1920x1080 high (fps_test=3) | |
| Asus ROG Strix Scar 17 G733PYV-LL053X | |
| Medion Erazer Beast X40 2024 | |
| Medion Erazer Beast X40 2024 (Gaming Mode) | |
| Asus ROG Strix Scar 18 G834JYR (2024) | |
| Schenker Key 17 Pro (Early 23) | |
| Przeciętny NVIDIA GeForce RTX 4090 Laptop GPU (77.8 - 166.2, n=46) | |
| Medion Erazer Beast X40 | |
| MSI Titan 18 HX A14VIG | |
| Średnia w klasie Gaming (33.4 - 150.2, n=136, ostatnie 2 lata) | |
| Helldivers 2 | |
| 1920x1080 Ultra Preset | |
| Medion Erazer Beast X40 2024 | |
| Przeciętny NVIDIA GeForce RTX 4090 Laptop GPU (130.2 - 141.2, n=2) | |
| Asus ROG Zephyrus M16 | |
| Średnia w klasie Gaming (12.1 - 153.8, n=9, ostatnie 2 lata) | |
| 2560x1440 Ultra Preset | |
| Medion Erazer Beast X40 2024 | |
| Przeciętny NVIDIA GeForce RTX 4090 Laptop GPU (105.5 - 122.6, n=2) | |
| Asus ROG Zephyrus M16 | |
| Średnia w klasie Gaming (32.4 - 140.1, n=5, ostatnie 2 lata) | |
| Enshrouded | |
| 1920x1080 Max. Quality AA:FX | |
| Medion Erazer Beast X40 2024 | |
| Przeciętny NVIDIA GeForce RTX 4090 Laptop GPU (79 - 101.5, n=3) | |
| Asus ROG Strix Scar 18 G834JYR (2024) | |
| Asus ROG Zephyrus M16 | |
| Średnia w klasie Gaming (9.48 - 51.1, n=6, ostatnie 2 lata) | |
| 2560x1440 Max. Quality AA:FX | |
| Medion Erazer Beast X40 2024 | |
| Asus ROG Strix Scar 18 G834JYR (2024) | |
| Przeciętny NVIDIA GeForce RTX 4090 Laptop GPU (61.8 - 76, n=3) | |
| Asus ROG Zephyrus M16 | |
| Średnia w klasie Gaming (n=1ostatnie 2 lata) | |
| Ready or Not | |
| 1920x1080 Epic Preset | |
| Asus ROG Zephyrus M16 | |
| Przeciętny NVIDIA GeForce RTX 4090 Laptop GPU (155.1 - 203, n=2) | |
| Medion Erazer Beast X40 2024 | |
| Średnia w klasie Gaming (64 - 131.5, n=4, ostatnie 2 lata) | |
| 2560x1440 Epic Preset | |
| Medion Erazer Beast X40 2024 | |
| Przeciętny NVIDIA GeForce RTX 4090 Laptop GPU (141.1 - 144.3, n=2) | |
| Asus ROG Zephyrus M16 | |
| Średnia w klasie Gaming (n=1ostatnie 2 lata) | |
| Immortals of Aveum | |
| 1920x1080 Ultra AF:16x | |
| Medion Erazer Beast X40 2024 | |
| Przeciętny NVIDIA GeForce RTX 4090 Laptop GPU (90.6 - 106.3, n=2) | |
| Średnia w klasie Gaming (26.5 - 37.8, n=2, ostatnie 2 lata) | |
| 2560x1440 Ultra AF:16x | |
| Medion Erazer Beast X40 2024 | |
| Przeciętny NVIDIA GeForce RTX 4090 Laptop GPU (62.9 - 76.5, n=2) | |
The Witcher 3 FPS chart
| low | med. | high | ultra | QHD | |
|---|---|---|---|---|---|
| GTA V (2015) | 187.3 | 186.7 | 183 | 141.5 | 139.8 |
| The Witcher 3 (2015) | 555 | 518 | 394 | 204 | 157.6 |
| Dota 2 Reborn (2015) | 241 | 214 | 205 | 189.9 | |
| Final Fantasy XV Benchmark (2018) | 225 | 210 | 181.1 | 147.7 | |
| X-Plane 11.11 (2018) | 207 | 182.2 | 143.9 | ||
| Strange Brigade (2018) | 484 | 401 | 387 | 371 | 289 |
| Immortals of Aveum (2023) | 119.3 | 109.6 | 106.3 | 76.5 | |
| Cyberpunk 2077 (2023) | 133.2 | 131 | 120.9 | 118.9 | 87.5 |
| Ready or Not (2023) | 289 | 166.6 | 158 | 155.1 | 144.3 |
| Enshrouded (2024) | 150.5 | 134.5 | 116.2 | 101.5 | 76 |
| Helldivers 2 (2024) | 146.8 | 143.8 | 143.3 | 141.2 | 122.6 |
Emisje i energia: Beast X40 może pracować cicho
Emisja hałasu
Obciążenie przy pełnym obciążeniu ujawnia, że poziomy ciśnienia akustycznego do 52 dB(A) są możliwe w przypadku Beast X40. Laptop jest tylko nieznacznie cichszy w trybie Gaming.
"Tryb cichy" zapewnia bardzo niski poziom hałasu, ale nadal zapewnia więcej niż wystarczającą moc do codziennych zadań, takich jak praca biurowa i korzystanie z Internetu. W tym trybie możliwe jest również granie. Jednak w naszym teście Witcher 3 system zablokował liczbę klatek na sekundę do 30 fps.
W pewnych okolicznościach, elektroniczny warkot może być słyszalny z wnętrza laptopa podczas testu The Witcher 3, na przykład, lub podczas uruchamiania benchmarku Specviewperf.
Hałas
| luz |
| 28 / 29 / 32 dB |
| obciążenie |
| 48 / 52 dB |
 | ||
30 dB cichy 40 dB(A) słyszalny 50 dB(A) irytujący |
||
min: | ||
| Medion Erazer Beast X40 2024 i9-14900HX, GeForce RTX 4090 Laptop GPU | Asus ROG Strix Scar 17 G733PYV-LL053X R9 7945HX3D, GeForce RTX 4090 Laptop GPU | Schenker Key 17 Pro (Early 23) i9-13900HX, GeForce RTX 4090 Laptop GPU | Asus ROG Strix Scar 18 G834JYR (2024) i9-14900HX, GeForce RTX 4090 Laptop GPU | MSI Titan 18 HX A14VIG i9-14900HX, GeForce RTX 4090 Laptop GPU | Medion Erazer Beast X40 i9-13900HX, GeForce RTX 4090 Laptop GPU | |
|---|---|---|---|---|---|---|
| Noise | 0% | -17% | 1% | 6% | -1% | |
| wyłączone / środowisko * (dB) | 25 | 23 8% | 26 -4% | 24 4% | 22.8 9% | 24 4% |
| Idle Minimum * (dB) | 28 | 23 18% | 26 7% | 27 4% | 23.8 15% | 25 11% |
| Idle Average * (dB) | 29 | 27.7 4% | 33 -14% | 28 3% | 23.8 18% | 29 -0% |
| Idle Maximum * (dB) | 32 | 34.7 -8% | 46 -44% | 32 -0% | 28 12% | 35 -9% |
| Load Average * (dB) | 48 | 53.4 -11% | 56 -17% | 50 -4% | 38 21% | 51 -6% |
| Witcher 3 ultra * (dB) | 50 | 53.4 -7% | 62 -24% | 50 -0% | 57.3 -15% | 51 -2% |
| Load Maximum * (dB) | 52 | 53.4 -3% | 64 -23% | 52 -0% | 62.8 -21% | 53 -2% |
* ... im mniej tym lepiej
Temperatura
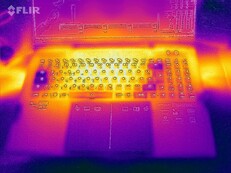
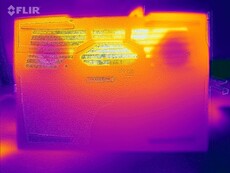
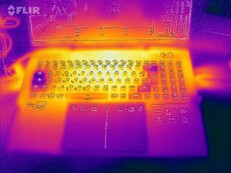
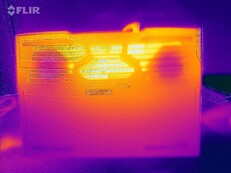
Test warunków skrajnych i test Witcher 3 powodują, że notebook nagrzewa się zauważalnie, ale nie nadmiernie. Wartości powyżej 50 stopni Celsjusza są osiągane w niektórych momentach. W codziennym użytkowaniu (Office, Internet) wartości pozostają w zielonym zakresie.
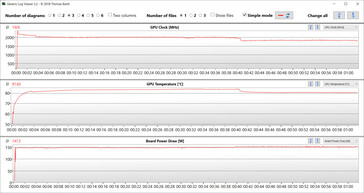
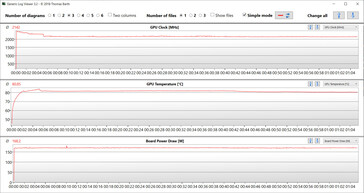
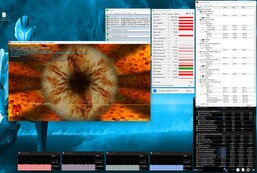
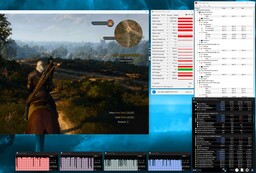
Test obciążeniowy (Prime95 i Furmark w trybie ciągłym) to ekstremalny scenariusz testujący stabilność systemu pod pełnym obciążeniem. Częstotliwość taktowania CPU spada do 1,9 do 2 GHz (rdzenie P) lub 1,7 GHz (rdzenie E) w ciągu pierwszych kilku minut i pozostaje na tym poziomie. GPU działa z prędkością od 2 do 2,1 GHz.
(-) Maksymalna temperatura w górnej części wynosi 47 °C / 117 F, w porównaniu do średniej 40.4 °C / 105 F , począwszy od 21.2 do 68.8 °C dla klasy Gaming.
(-) Dno nagrzewa się maksymalnie do 54 °C / 129 F, w porównaniu do średniej 43.3 °C / 110 F
(+) W stanie bezczynności średnia temperatura górnej części wynosi 28.1 °C / 83 F, w porównaniu ze średnią temperaturą urządzenia wynoszącą 33.9 °C / ### class_avg_f### F.
(-) Podczas gry w Wiedźmina 3 średnia temperatura górnej części wynosi 39.1 °C / 102 F, w porównaniu do średniej temperatury urządzenia wynoszącej 33.9 °C / ## #class_avg_f### F.
(+) Podparcia dłoni i touchpad osiągają maksymalną temperaturę skóry (34 °C / 93.2 F) i dlatego nie są gorące.
(-) Średnia temperatura obszaru podparcia dłoni w podobnych urządzeniach wynosiła 28.8 °C / 83.8 F (-5.2 °C / -9.4 F).
| Medion Erazer Beast X40 2024 Intel Core i9-14900HX, NVIDIA GeForce RTX 4090 Laptop GPU | Asus ROG Strix Scar 17 G733PYV-LL053X AMD Ryzen 9 7945HX3D, NVIDIA GeForce RTX 4090 Laptop GPU | Schenker Key 17 Pro (Early 23) Intel Core i9-13900HX, NVIDIA GeForce RTX 4090 Laptop GPU | Asus ROG Strix Scar 18 G834JYR (2024) Intel Core i9-14900HX, NVIDIA GeForce RTX 4090 Laptop GPU | MSI Titan 18 HX A14VIG Intel Core i9-14900HX, NVIDIA GeForce RTX 4090 Laptop GPU | Medion Erazer Beast X40 Intel Core i9-13900HX, NVIDIA GeForce RTX 4090 Laptop GPU | |
|---|---|---|---|---|---|---|
| Heat | 14% | -11% | 4% | 5% | 1% | |
| Maximum Upper Side * (°C) | 47 | 40.1 15% | 57 -21% | 49 -4% | 37.8 20% | 48 -2% |
| Maximum Bottom * (°C) | 54 | 46.7 14% | 60 -11% | 47 13% | 37.6 30% | 52 4% |
| Idle Upper Side * (°C) | 30 | 26.5 12% | 32 -7% | 29 3% | 34.8 -16% | 30 -0% |
| Idle Bottom * (°C) | 32 | 27.7 13% | 34 -6% | 31 3% | 36 -13% | 31 3% |
* ... im mniej tym lepiej
Głośnik
Głośniki stereo generują ogólnie bardzo przyzwoity dźwięk.
Medion Erazer Beast X40 2024 analiza dźwięku
(+) | głośniki mogą odtwarzać stosunkowo głośno (88 dB)
Bas 100 - 315 Hz
(±) | zredukowany bas - średnio 14.7% niższy od mediany
(±) | liniowość basu jest średnia (7.2% delta do poprzedniej częstotliwości)
Średnie 400 - 2000 Hz
(+) | zbalansowane środki średnie - tylko 3.7% od mediany
(+) | średnie są liniowe (5.8% delta do poprzedniej częstotliwości)
Wysokie 2–16 kHz
(+) | zrównoważone maksima - tylko 2.8% od mediany
(+) | wzloty są liniowe (6.4% delta do poprzedniej częstotliwości)
Ogólnie 100 - 16.000 Hz
(+) | ogólny dźwięk jest liniowy (12.1% różnicy w stosunku do mediany)
W porównaniu do tej samej klasy
» 12% wszystkich testowanych urządzeń w tej klasie było lepszych, 4% podobnych, 84% gorszych
» Najlepszy miał deltę 6%, średnia wynosiła ###średnia###%, najgorsza wynosiła 132%
W porównaniu do wszystkich testowanych urządzeń
» 9% wszystkich testowanych urządzeń było lepszych, 2% podobnych, 89% gorszych
» Najlepszy miał deltę 4%, średnia wynosiła ###średnia###%, najgorsza wynosiła 134%
Zużycie energii
Beast X40 nie zaskakuje pod względem zużycia energii. Wartości są na normalnym poziomie dla zainstalowanego sprzętu.
Test Witcher 3 i test obciążeniowy są uruchamiane przy nieco niższym zużyciu energii. Zasilacz o mocy 330 W okazuje się wystarczający podczas stresu.
| wyłączony / stan wstrzymania | |
| luz | |
| obciążenie |
|
Legenda:
min: | |
Power consumption: The Witcher 3 / Stress test
Power consumption: External monitor
Żywotność baterii
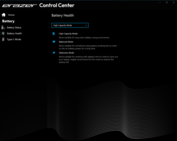
Beast X40 osiąga czas pracy 6:14 h w praktycznym teście WLAN (ilustracja obciążenia podczas uzyskiwania dostępu do stron internetowych za pomocą skryptu), co jest przyzwoitą wartością.
Stawia to X40 na tym samym poziomie, co jego poprzednik.
Za
Przeciw
Werdykt: Potęga z najwyższej półki
Medion Erazer Beast X40 pochodzi z górnego końca skali wydajności: RTX 4090 GeForce RTX 4090 i Core i9-14900HX zapewniają moc niezbędną do grania, streamowania, renderowania i edycji wideo. Kompromis między wydajnością a hałasem jest możliwy. Dzięki opcjonalnemu systemowi chłodzenia wodnego (ok. 200 euro) można uzyskać niewielki wzrost wydajności i ogólnie niższy poziom emisji.
Medion dostarcza niezwykle wydajny notebook do gier Erazer Beast X40.
Na plus należy zaliczyć wysokiej jakości 17-calowy wyświetlacz (2560 x 1600 pikseli, 240 Hz, G-Sync, sRGB) w formacie 16:10, dotykową klawiaturę mechaniczną oraz port Thunderbolt 4. Ten ostatni otwiera opcje rozbudowy (zewnętrzne GPU, rozwiązanie dokujące), obsługuje Power Delivery i może wyprowadzać sygnał DisplayPort. Ma również przyzwoitą żywotność baterii.
Różnice między obecnym a zeszłorocznym modelem zeszłorocznym X40 nie są znaczące. Dzięki nieco wyższemu taktowaniu, Core i9-14900HX zapewnia nieco wyższą wydajność przy tej samej liczbie rdzeni i wątków niż Core i9-13900HX z poprzedniego roku. Ten ostatni byłby (tańszą) alternatywą: Medion sprzedaje go obecnie za niecałe 3500 euro.
Inną alternatywą może być Asus ROG Strix Scar 17 X3D. Oferuje on porównywalny poziom wydajności i ekran z pokryciem DCI-P3. Laptop Asusa nie oferuje jednak Thunderbolt 4. Jest również gorszy pod względem żywotności baterii.
Cena i dostępność
Medion Erazer Beast X40 (2024) jest dostępny w sklepie Medion i Cyberport. de w cenie poniżej 4000 euro.
Medion Erazer Beast X40 2024
- 21/02/2024 v7 (old)
Sascha Mölck
Przezroczystość
Wyboru urządzeń do recenzji dokonuje nasza redakcja. Próbka testowa została udostępniona autorowi jako pożyczka od producenta lub sprzedawcy detalicznego na potrzeby tej recenzji. Pożyczkodawca nie miał wpływu na tę recenzję, producent nie otrzymał też kopii tej recenzji przed publikacją. Nie było obowiązku publikowania tej recenzji. Jako niezależna firma medialna, Notebookcheck nie podlega władzy producentów, sprzedawców detalicznych ani wydawców.
Tak testuje Notebookcheck
Każdego roku Notebookcheck niezależnie sprawdza setki laptopów i smartfonów, stosując standardowe procedury, aby zapewnić porównywalność wszystkich wyników. Od około 20 lat stale rozwijamy nasze metody badawcze, ustanawiając przy tym standardy branżowe. W naszych laboratoriach testowych doświadczeni technicy i redaktorzy korzystają z wysokiej jakości sprzętu pomiarowego. Testy te obejmują wieloetapowy proces walidacji. Nasz kompleksowy system ocen opiera się na setkach uzasadnionych pomiarów i benchmarków, co pozwala zachować obiektywizm.

