Recenzja laptopa MSI Titan 18 HX A14VIG: Rok smoka

Na targach CES 2023 pytaliśmy MSI o to, dlaczego nie mają w przygotowaniu 18-calowego laptopa do gier, skoro Asus, Alienware i Razer wprowadzają na rynek swoje własne 18-calowe oferty. Dopiero na targach CES 2024 w końcu zobaczyliśmy odpowiedni 18-calowy model MSI w postaci Titan 18 HX. Być może jest on nieco spóźniony na imprezę, ale jego specyfikacje i sprzęt są równie konkurencyjne.
Recenzowana przez nas konfiguracja została wyposażona w nowy procesor Intel Raptor Lake Core i9-14900HX 14. generacji, kartę graficzną GeForce RTX 4090 o mocy 175 W i wyświetlacz Mini-LED 4K (2400p) 120 Hz za około 4999 USD. W chwili pisania tego tekstu nie są dostępne mniejsze konfiguracje z innymi procesorami, kartami graficznymi lub wyświetlaczami.
Alternatywy dla Titan 18 HX obejmują inne 18-calowe laptopy do gier, takie jak Asus ROG Strix G18, Alienware m18, Razer Blade 18lub Acer Predator Helios 18.
Więcej recenzji MSI:
Potencjalni konkurenci w porównaniu
Ocena | Data | Model | Waga | Wysokość | Rozmiar | Rezolucja | Cena |
|---|---|---|---|---|---|---|---|
| 88.8 % v7 (old) | 01/2024 | MSI Titan 18 HX A14VIG i9-14900HX, GeForce RTX 4090 Laptop GPU | 3.6 kg | 32.1 mm | 18.00" | 3840x2400 | |
| 89 % v7 (old) | 02/2023 | MSI Titan GT77 HX 13VI i9-13950HX, GeForce RTX 4090 Laptop GPU | 3.5 kg | 23 mm | 17.30" | 3840x2160 | |
| 90.7 % v7 (old) | 04/2023 | Alienware m18 R1 i9-13980HX, GeForce RTX 4090 Laptop GPU | 3.9 kg | 26.7 mm | 18.00" | 1920x1200 | |
| 87.4 % v7 (old) | 03/2023 | Asus ROG Strix G18 G814JI i7-13650HX, GeForce RTX 4070 Laptop GPU | 3 kg | 31 mm | 18.00" | 2560x1600 | |
| 88.3 % v7 (old) | 10/2023 | Acer Predator Helios 18 N23Q2 i9-13900HX, GeForce RTX 4080 Laptop GPU | 3.2 kg | 29.15 mm | 18.00" | 2560x1600 | |
| 91.4 % v7 (old) | 02/2023 | Razer Blade 18 RTX 4070 i9-13950HX, GeForce RTX 4070 Laptop GPU | 3 kg | 21.9 mm | 18.00" | 2560x1600 |
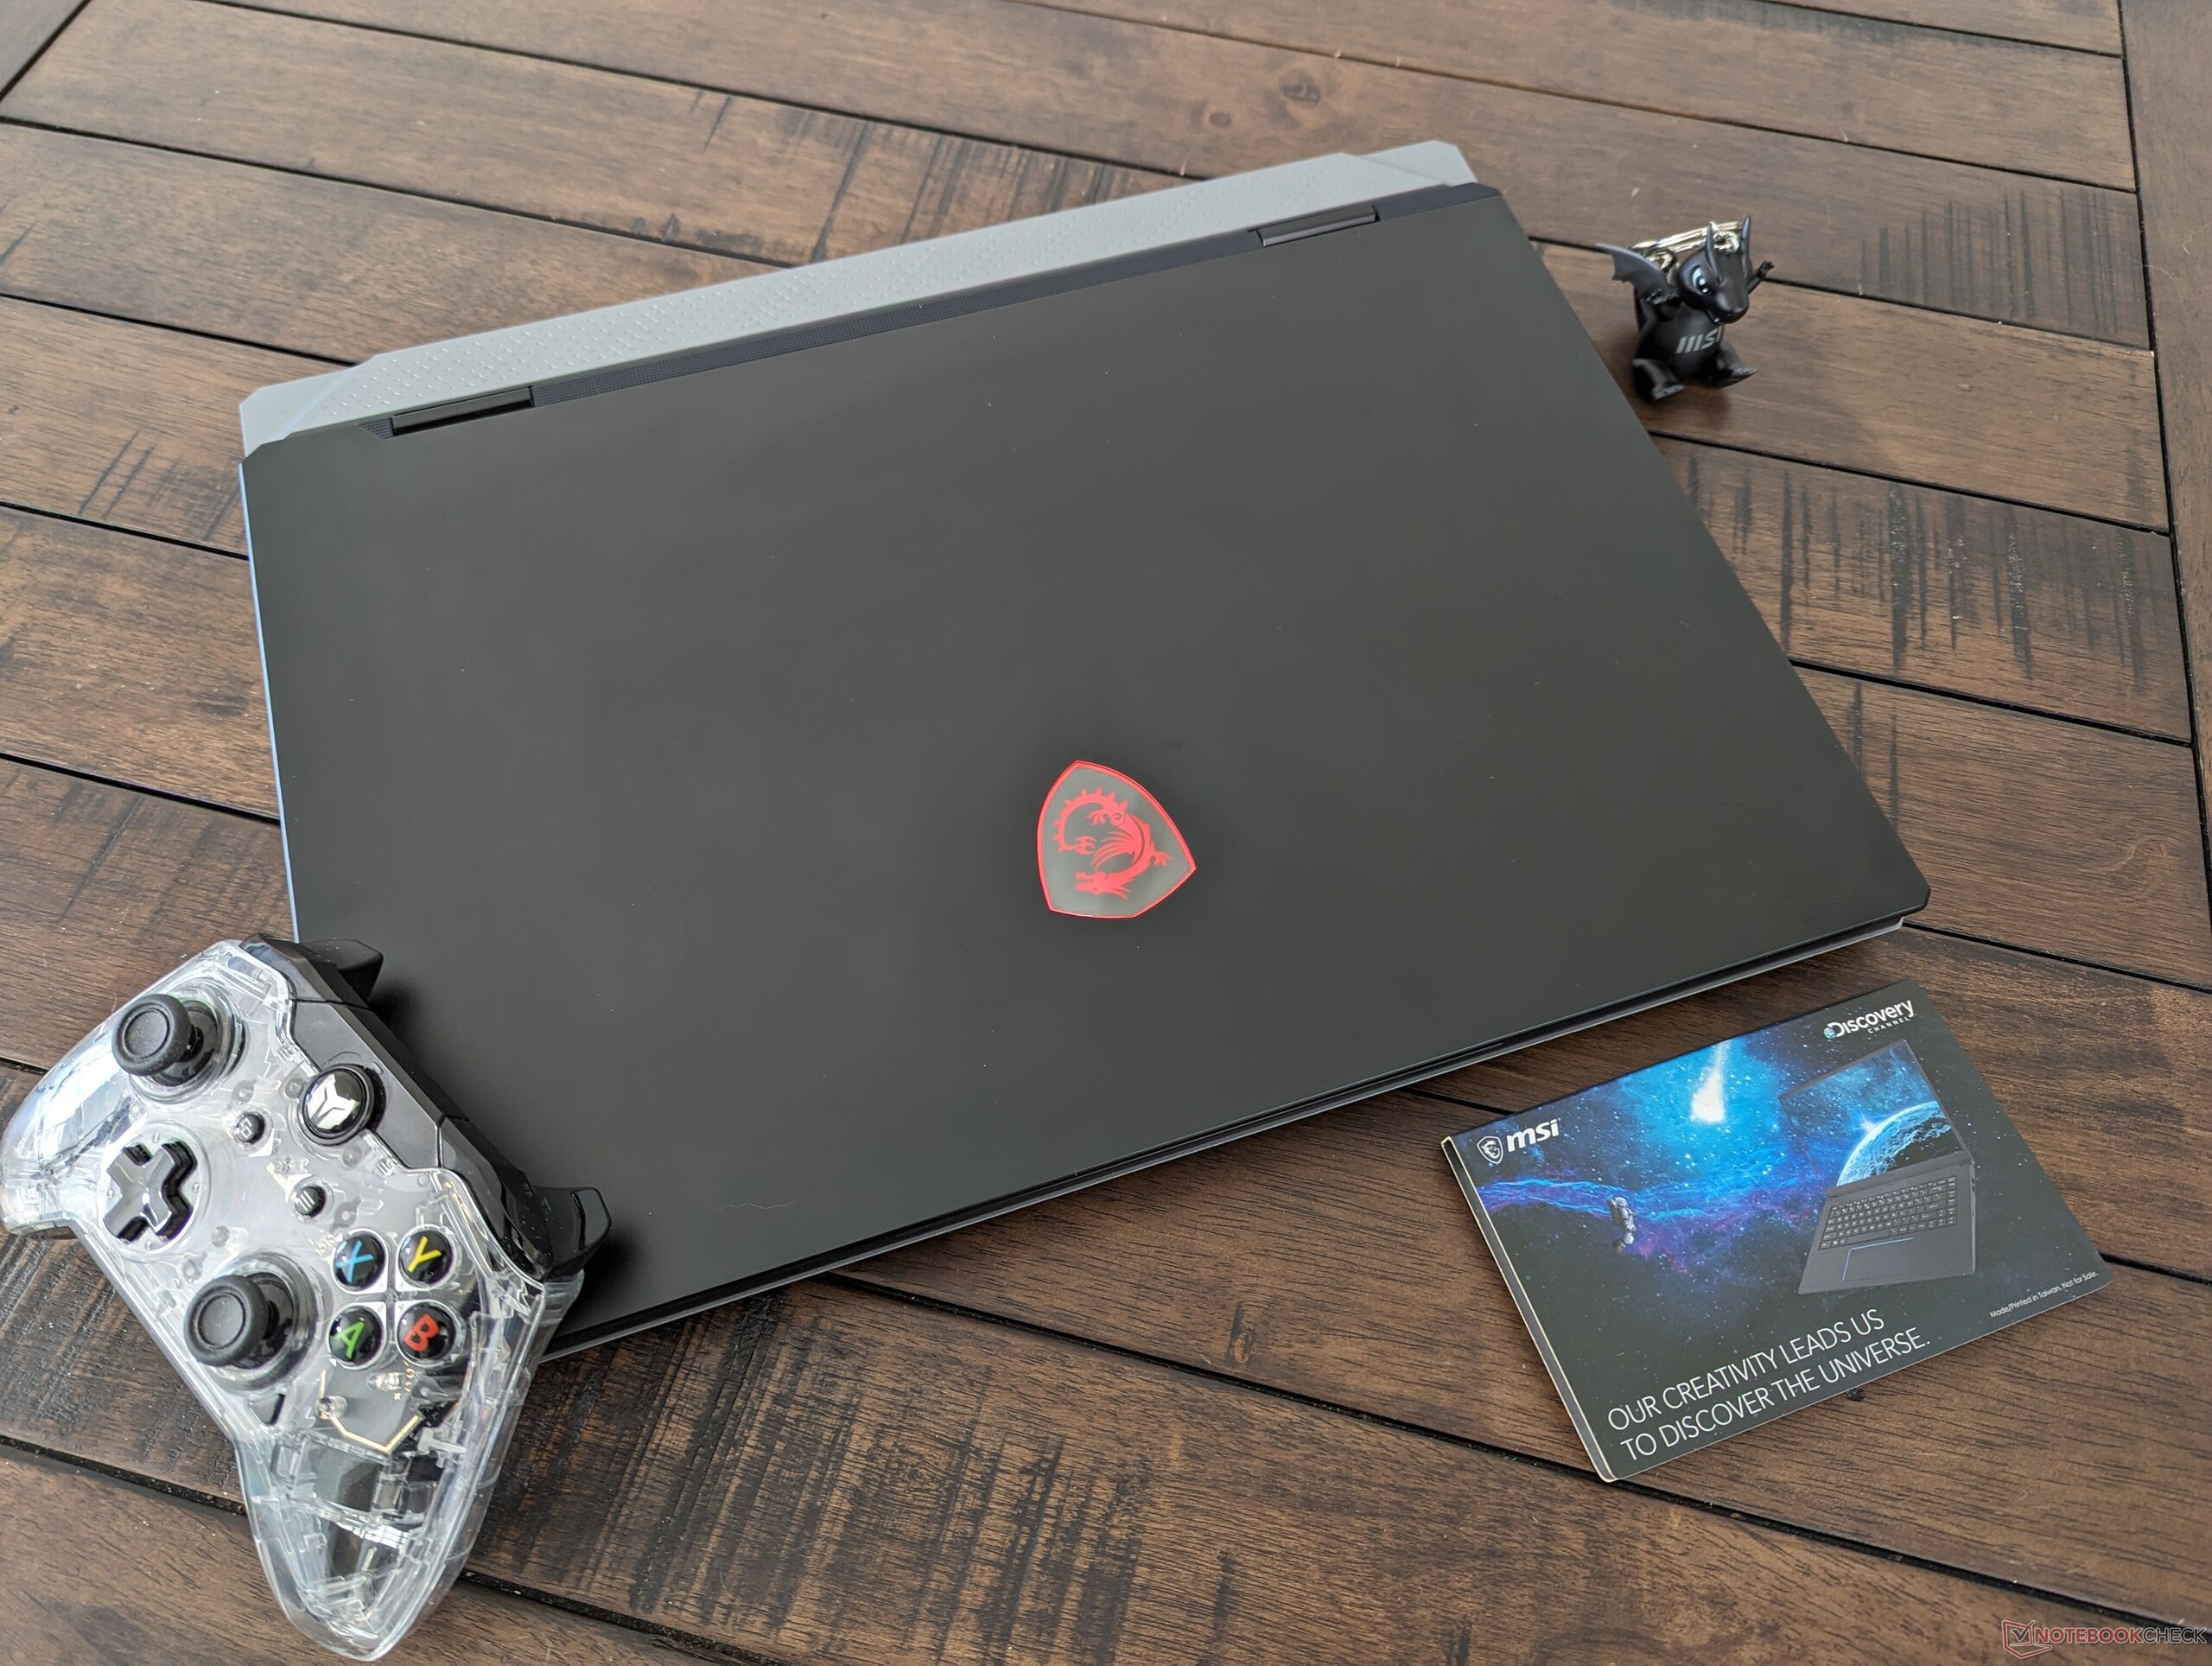
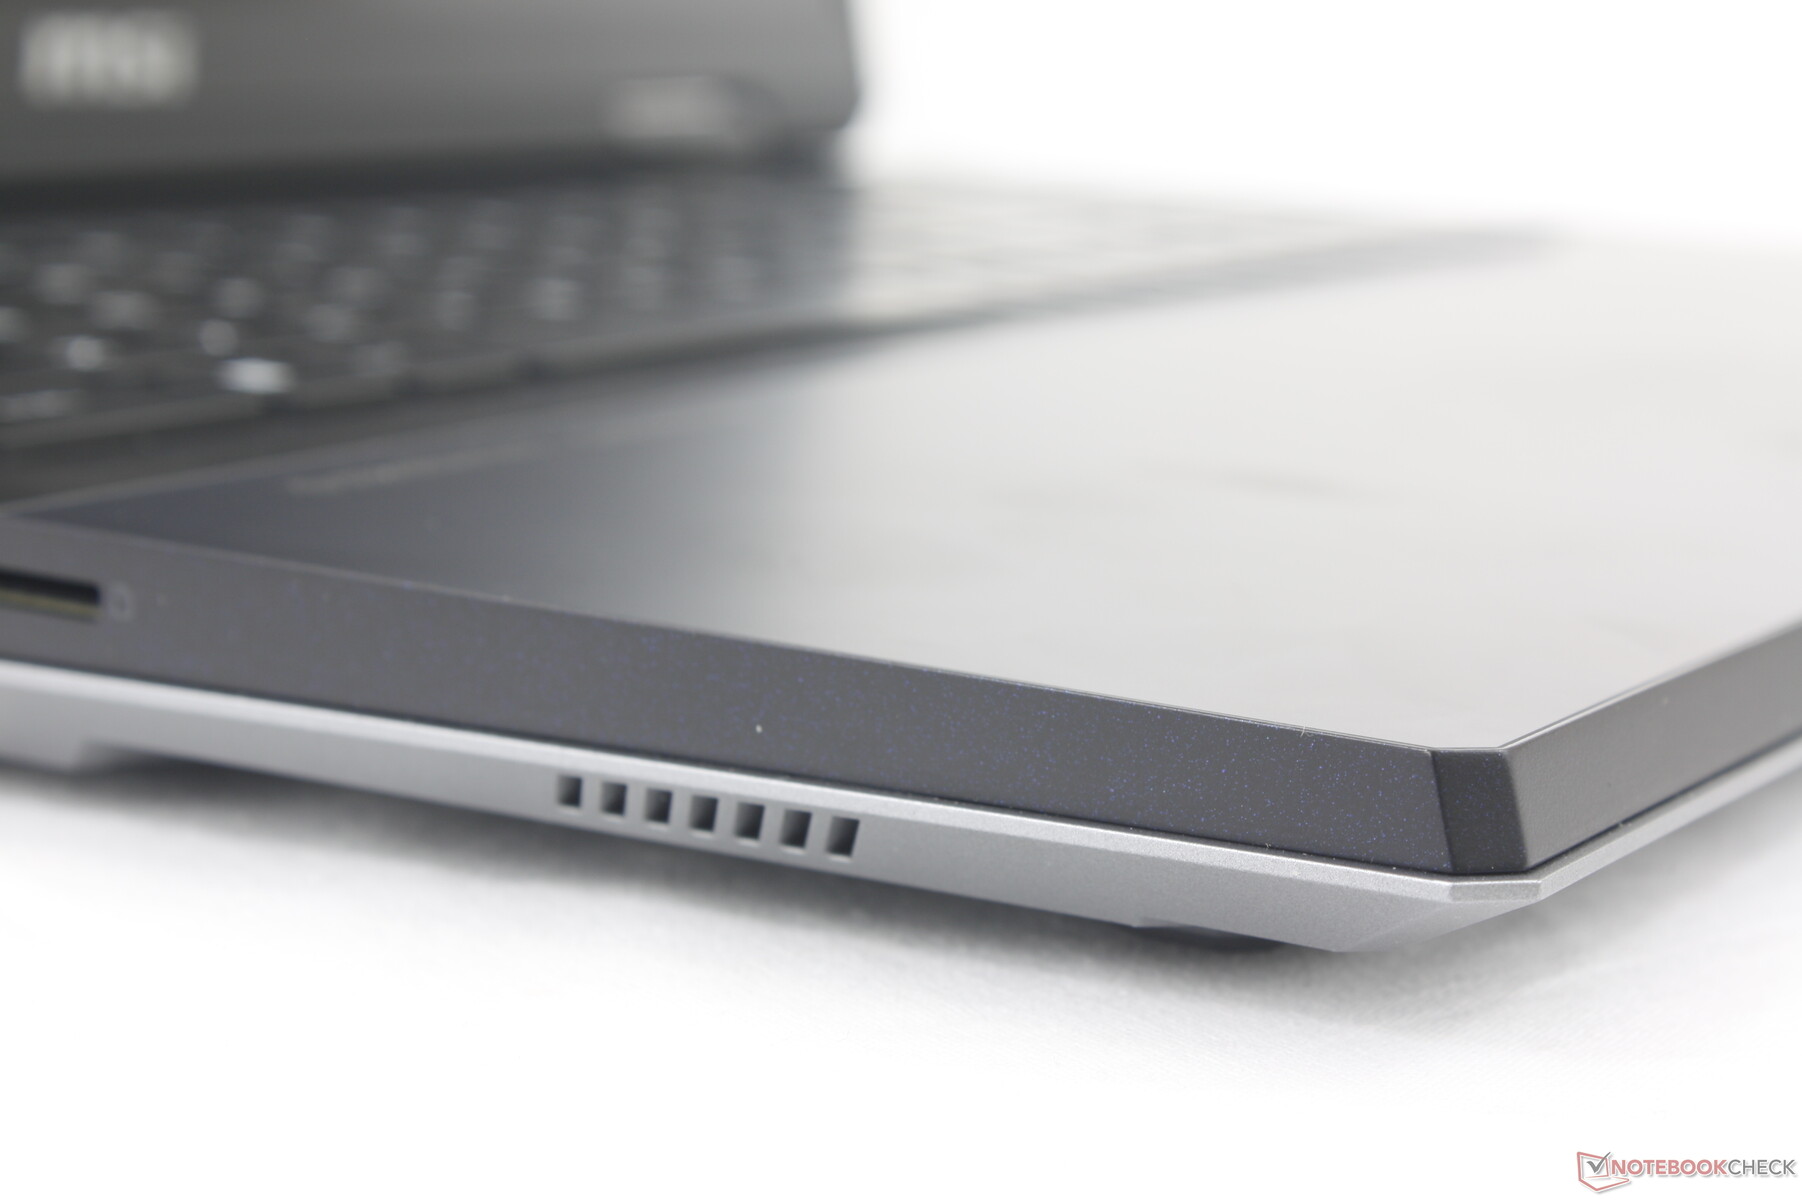
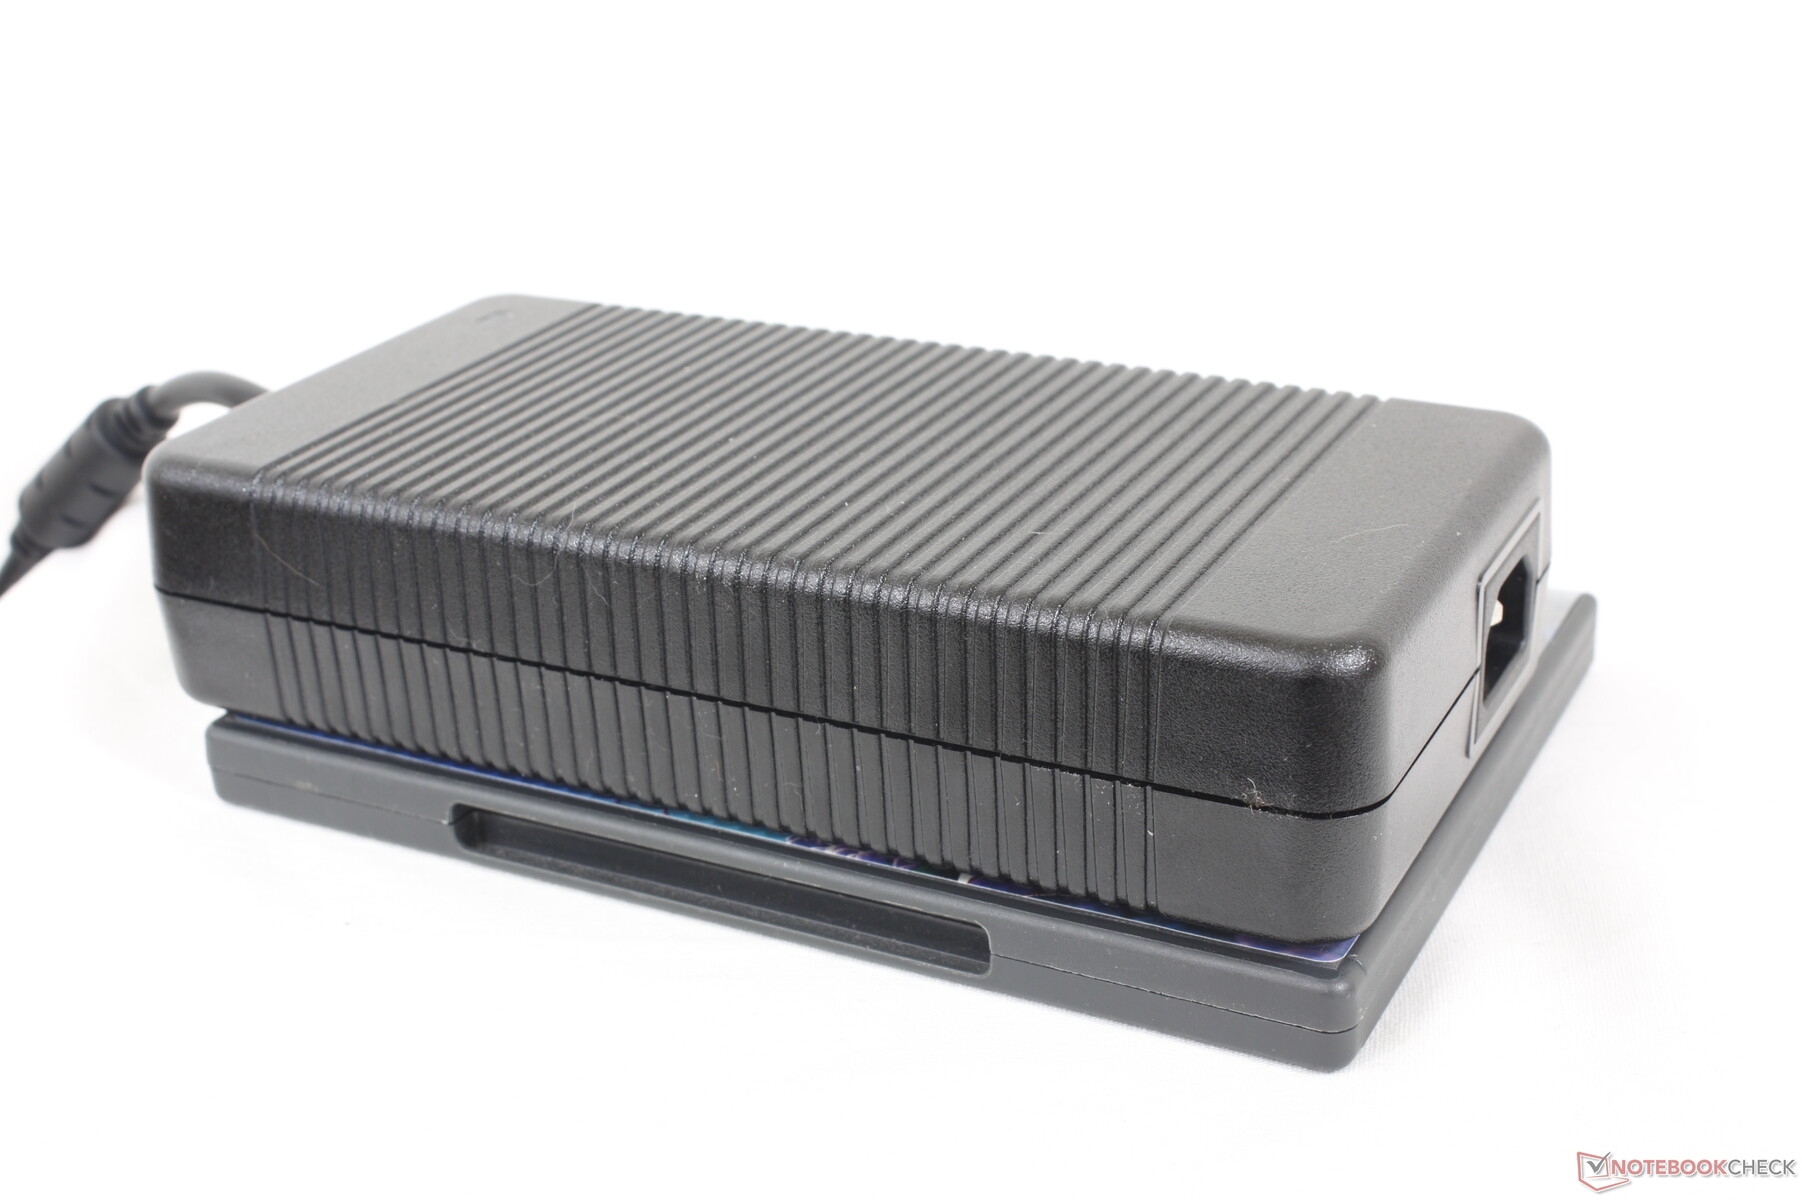
Obudowa - Mniej diod LED RGB
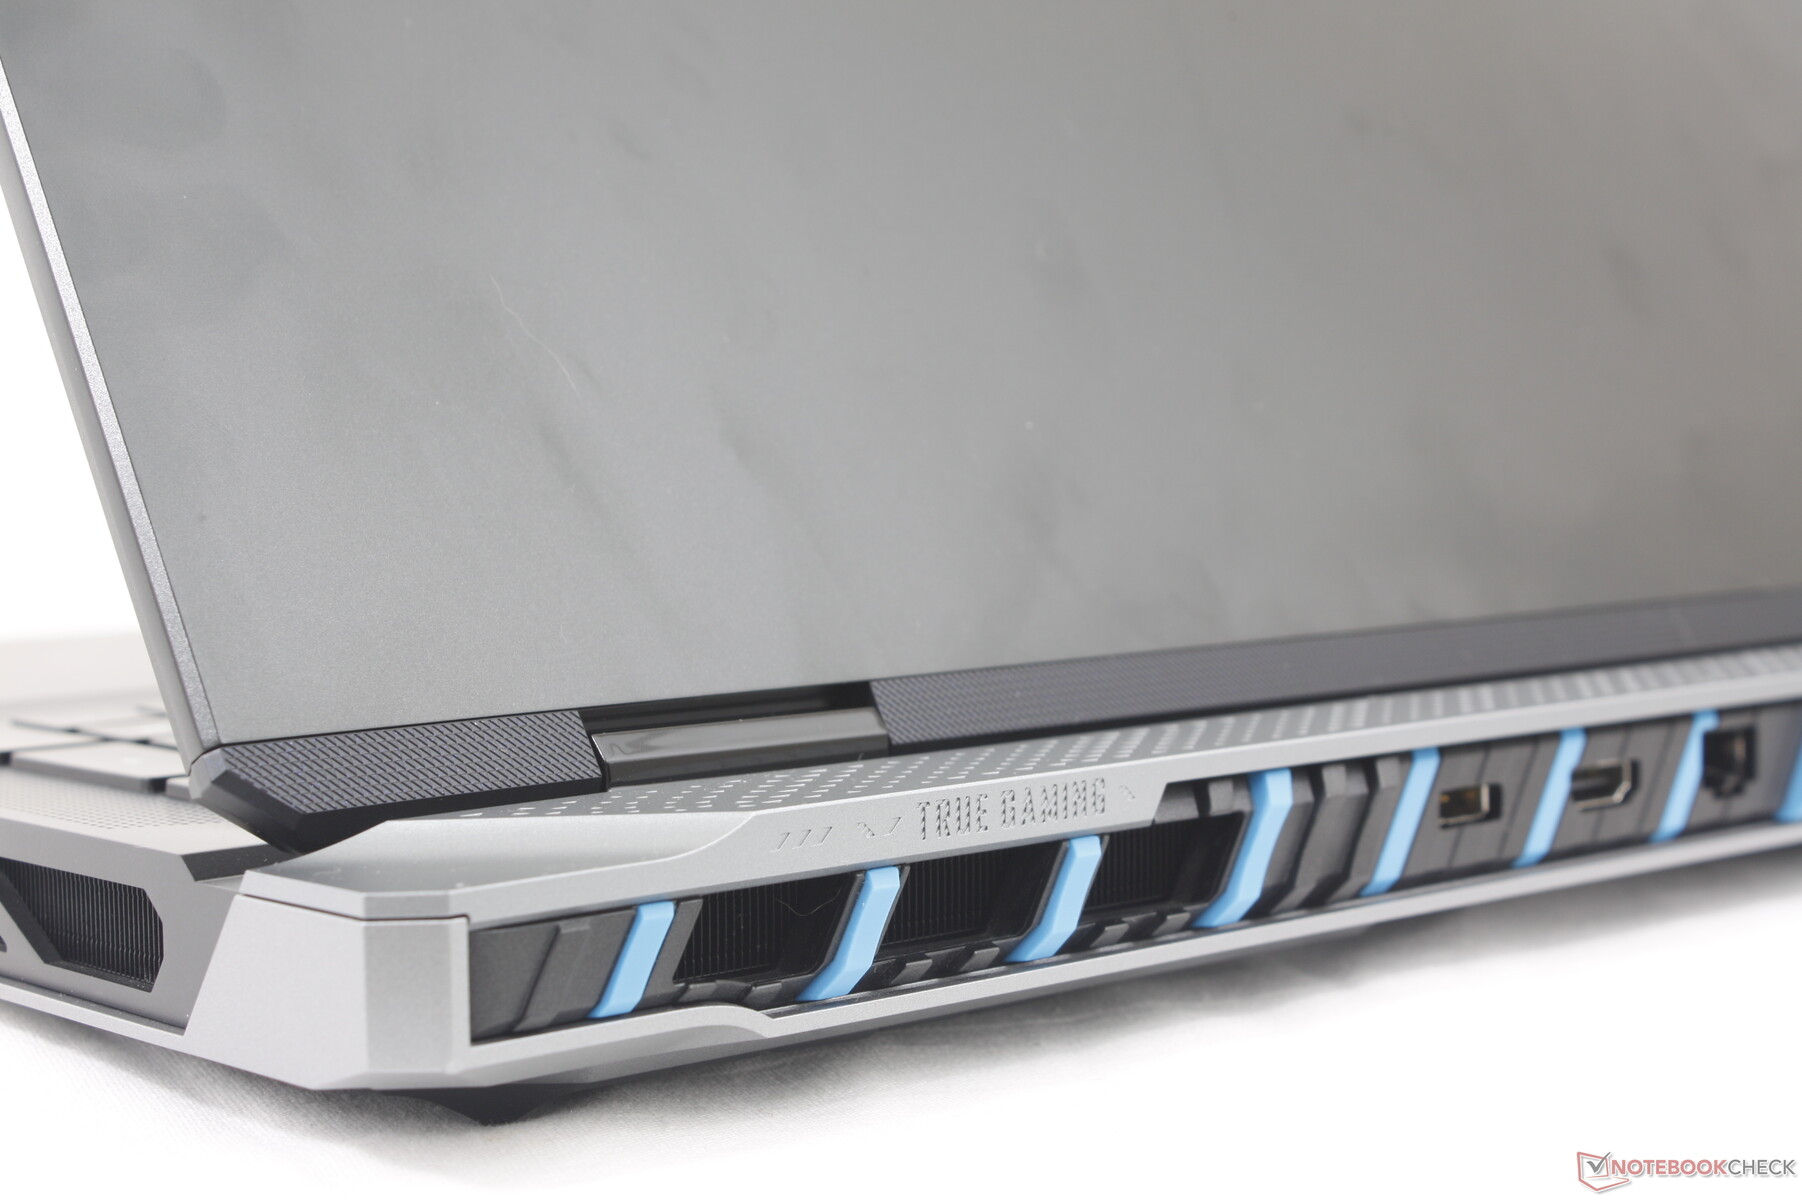
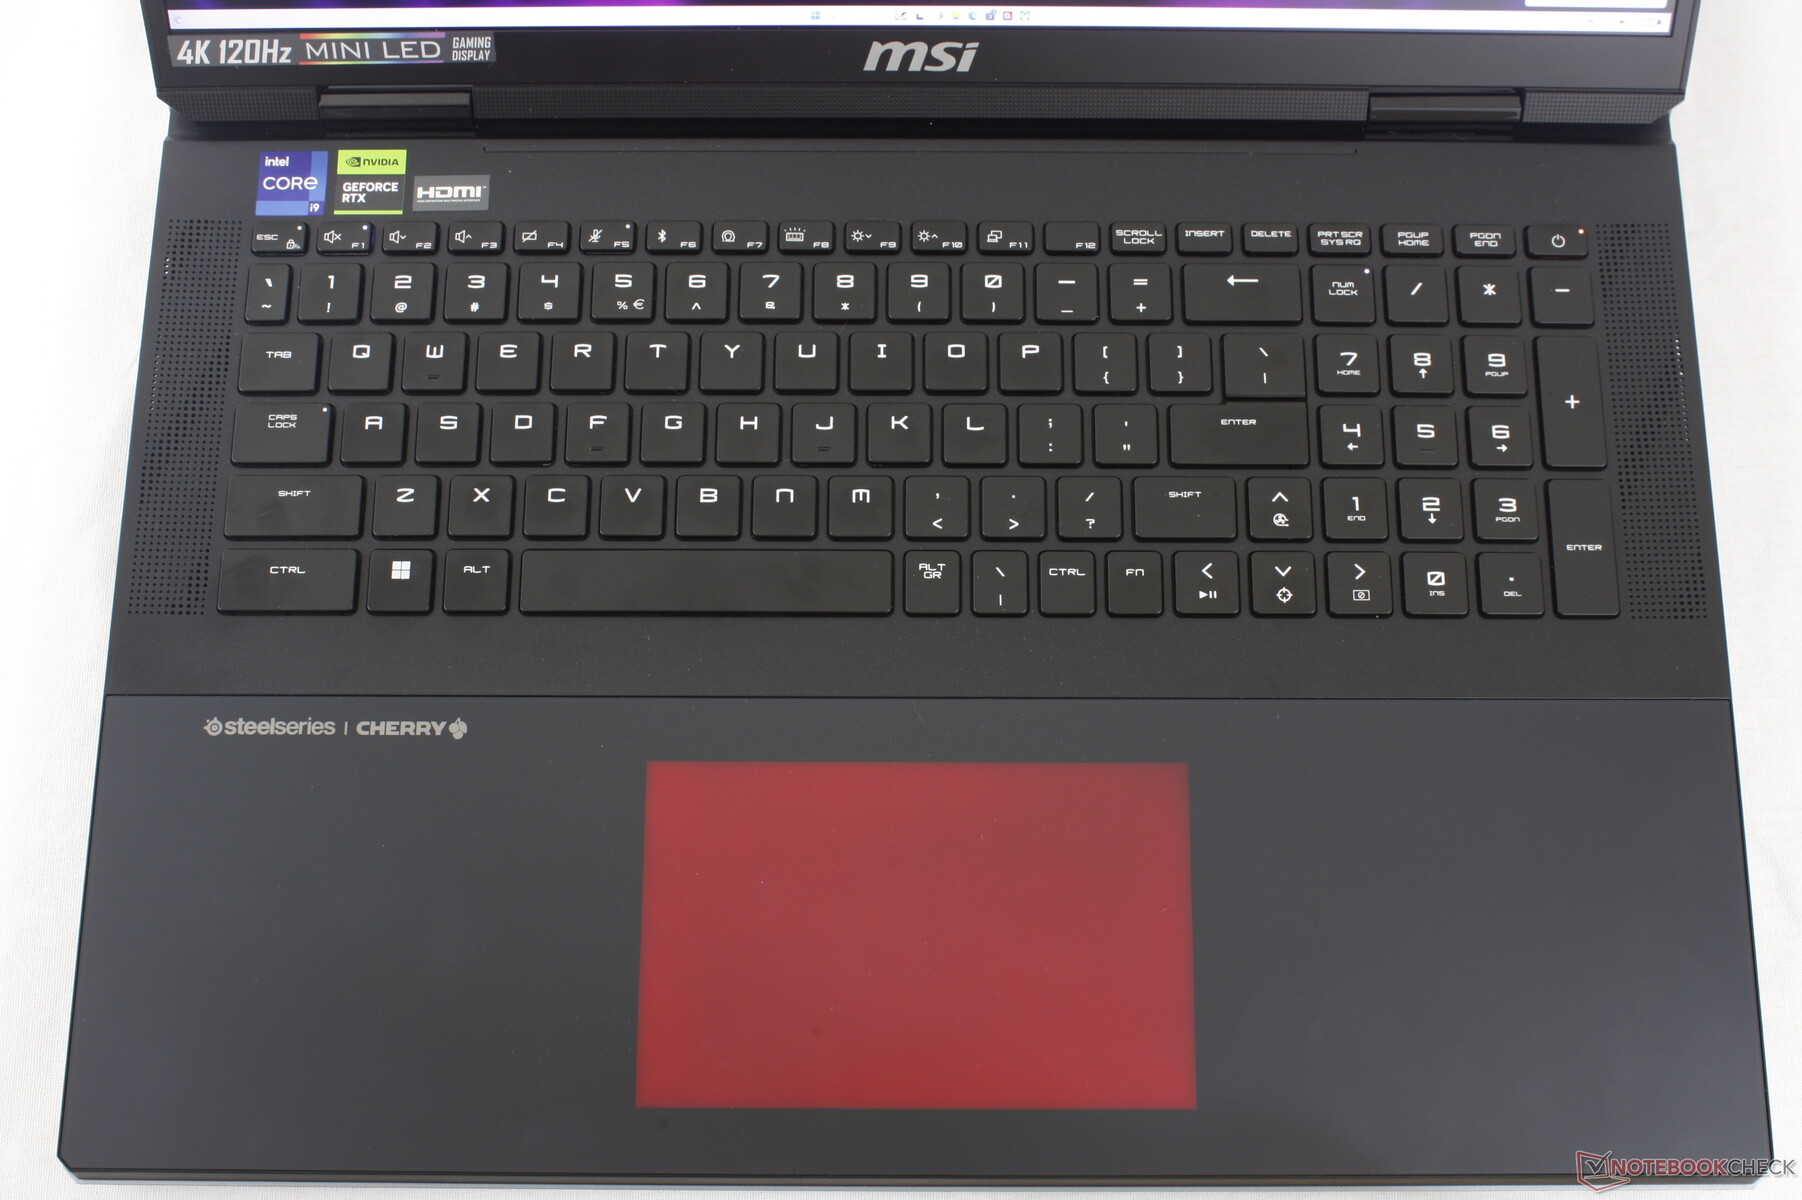
Nowe podwozie jest ewolucją modelu Titan GT77, a nie bardziej efektownego i inspirowanego stylem retro modelu GE78. W porównaniu do GT77, Titan 18 dodaje dwukolorowe srebrne i niebieskie kolory, które uzupełniają czarną obudowę. MSI unika również "niepotrzebnego" oświetlenia RGB, usuwając pasek LED z tyłu obudowy.
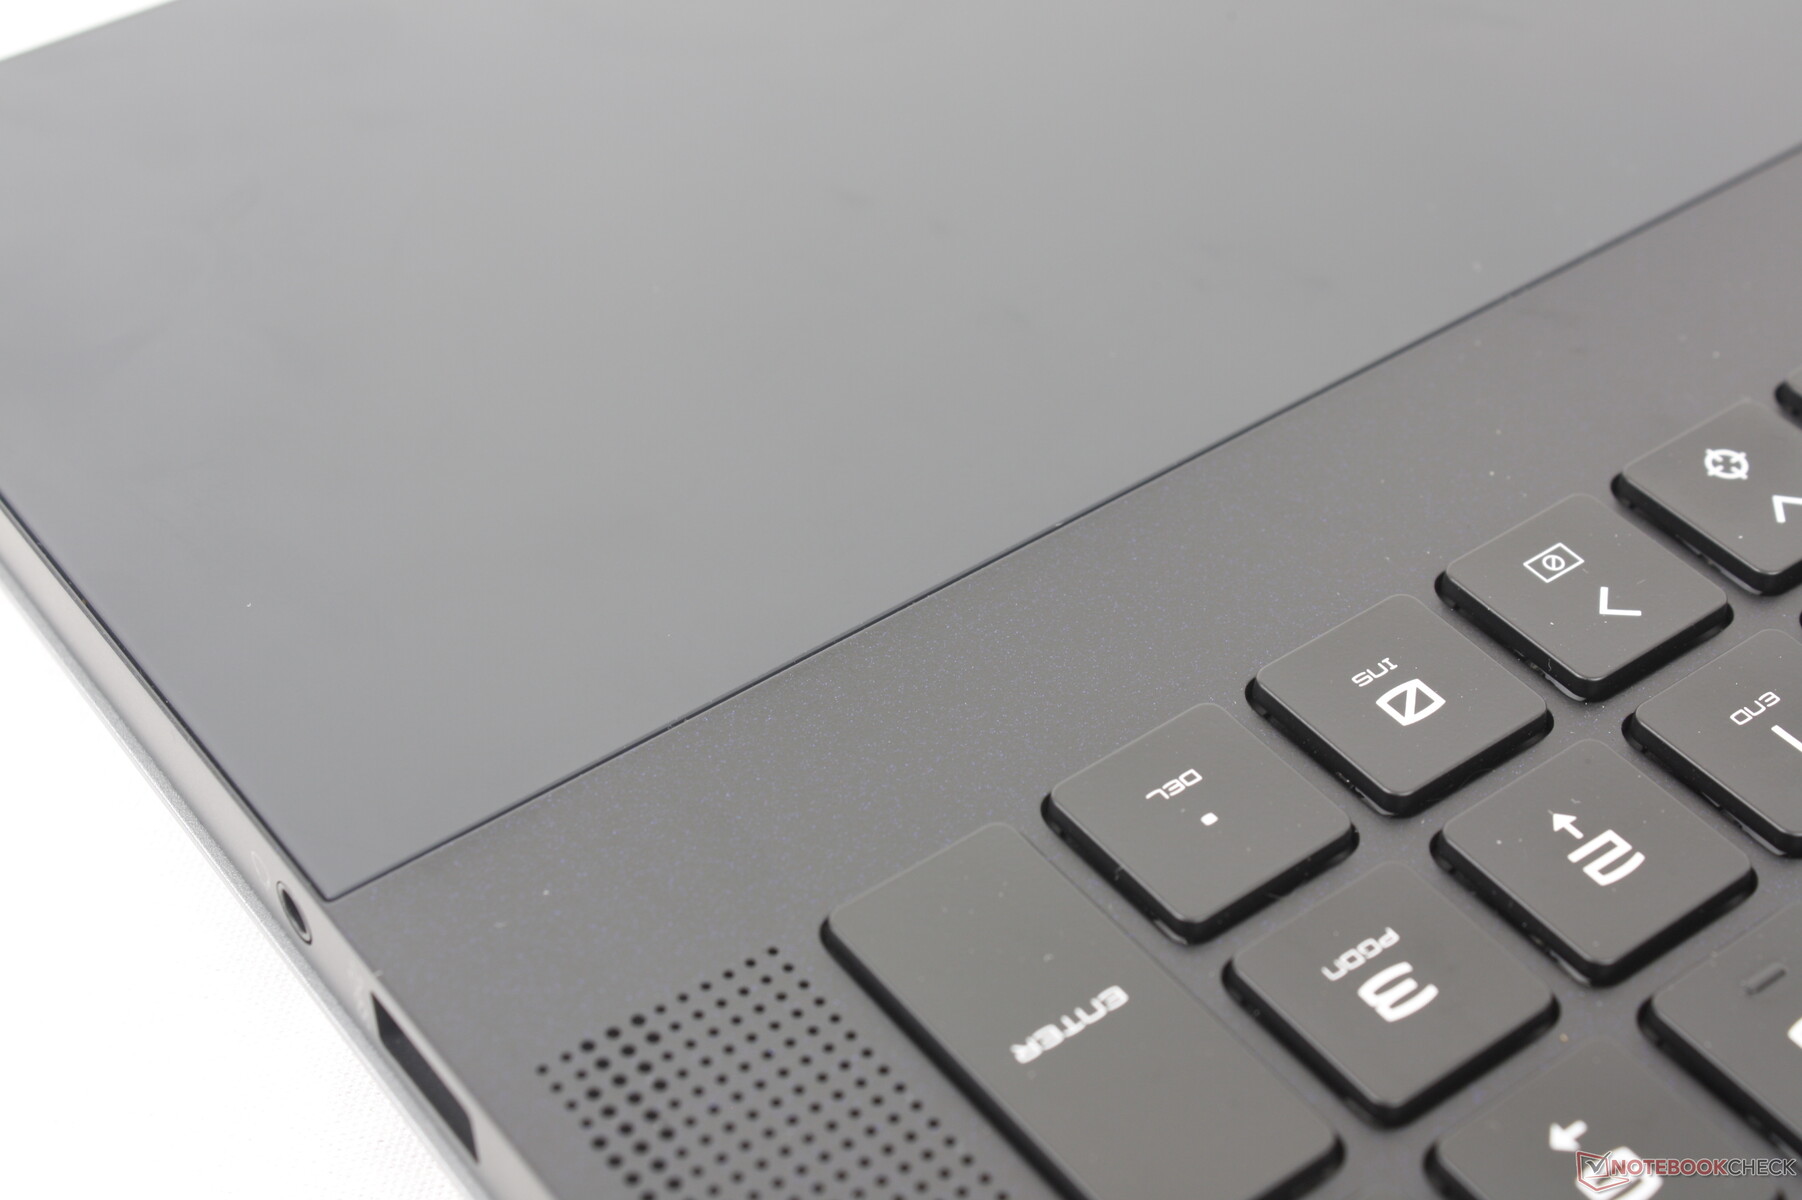
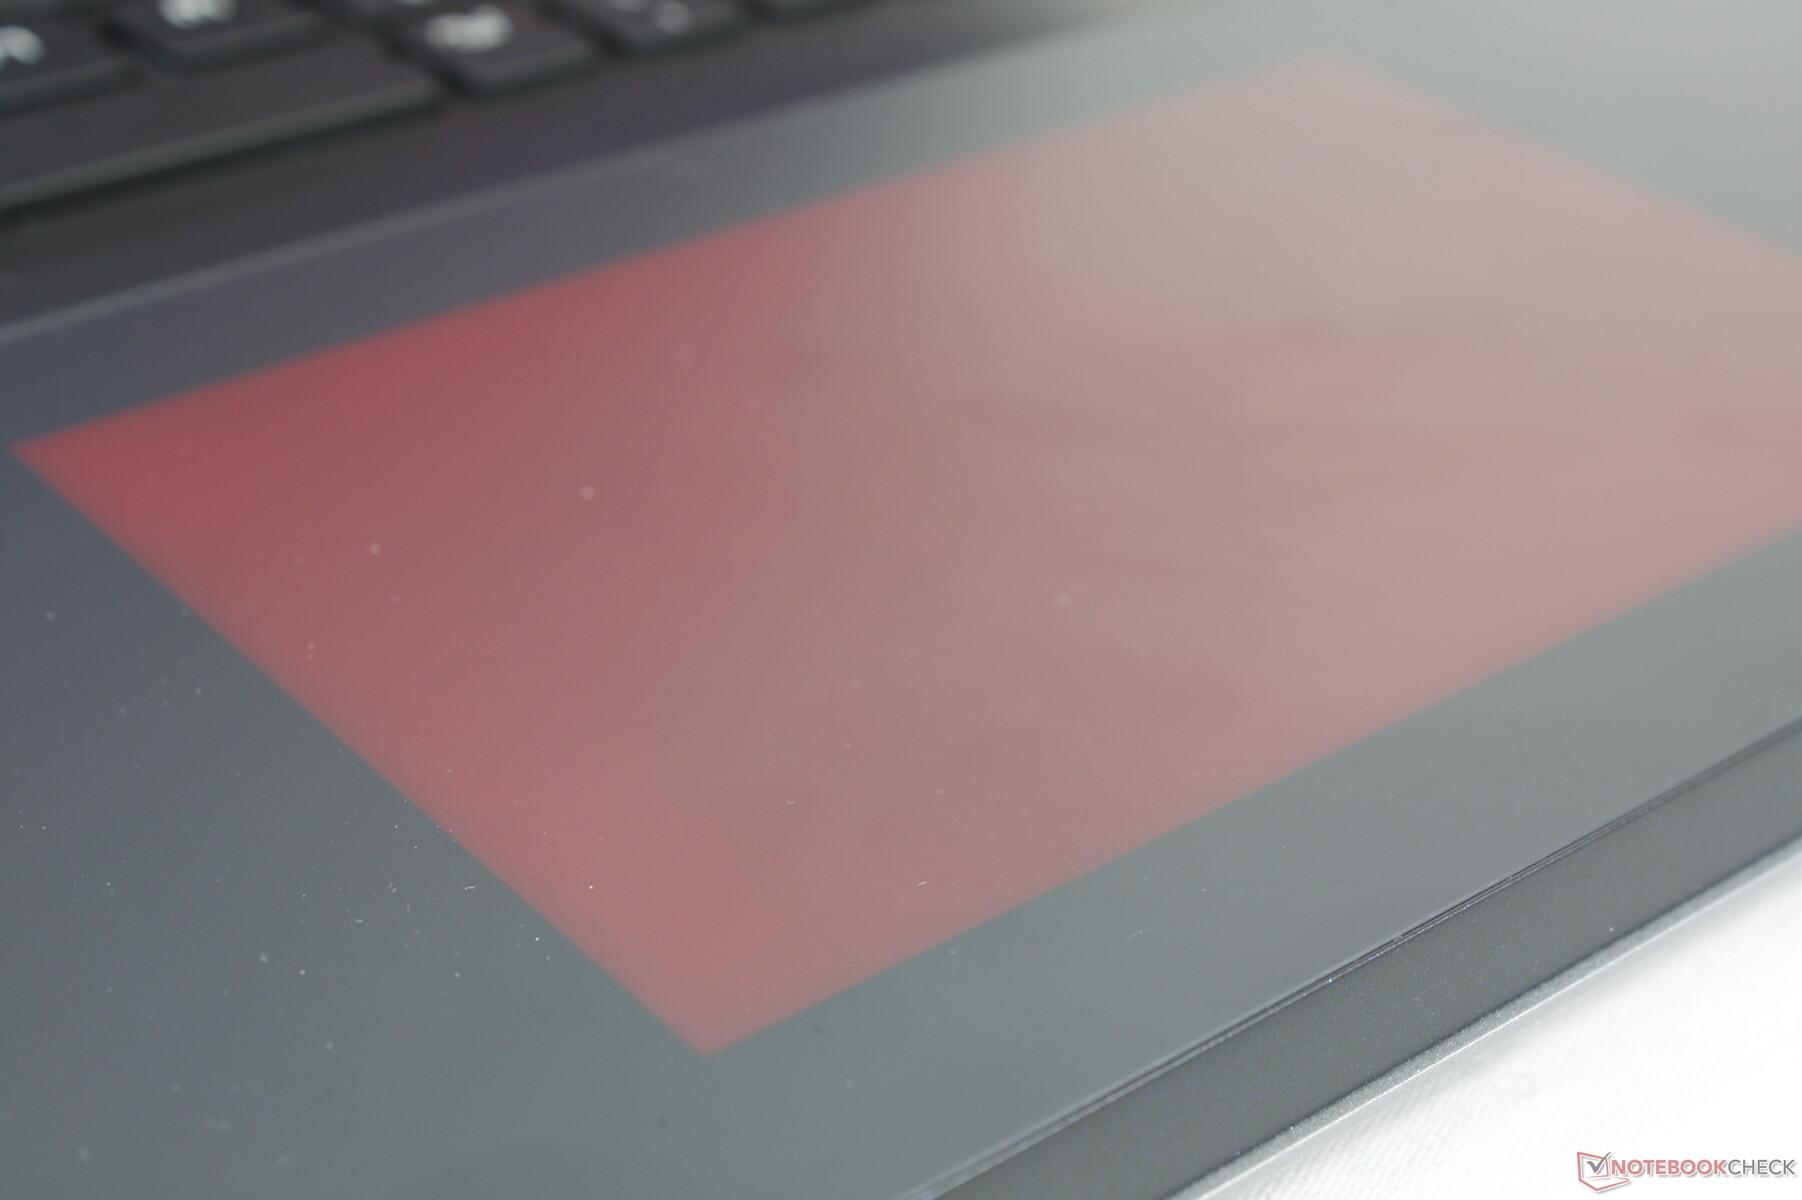
Być może najbardziej rozpoznawalnym aspektem Titan 18 jest płaskie szkło rozciągające się w poprzek podpórek pod nadgarstki i klawiatury. Dzięki temu clickpad jest zlicowany z podpórkami pod nadgarstki i jest podświetlany efektami RGB. Efektem końcowym jest bardziej elegancki i gładki design, przy jednoczesnym zachowaniu wysokiej klasy estetyki dla graczy.
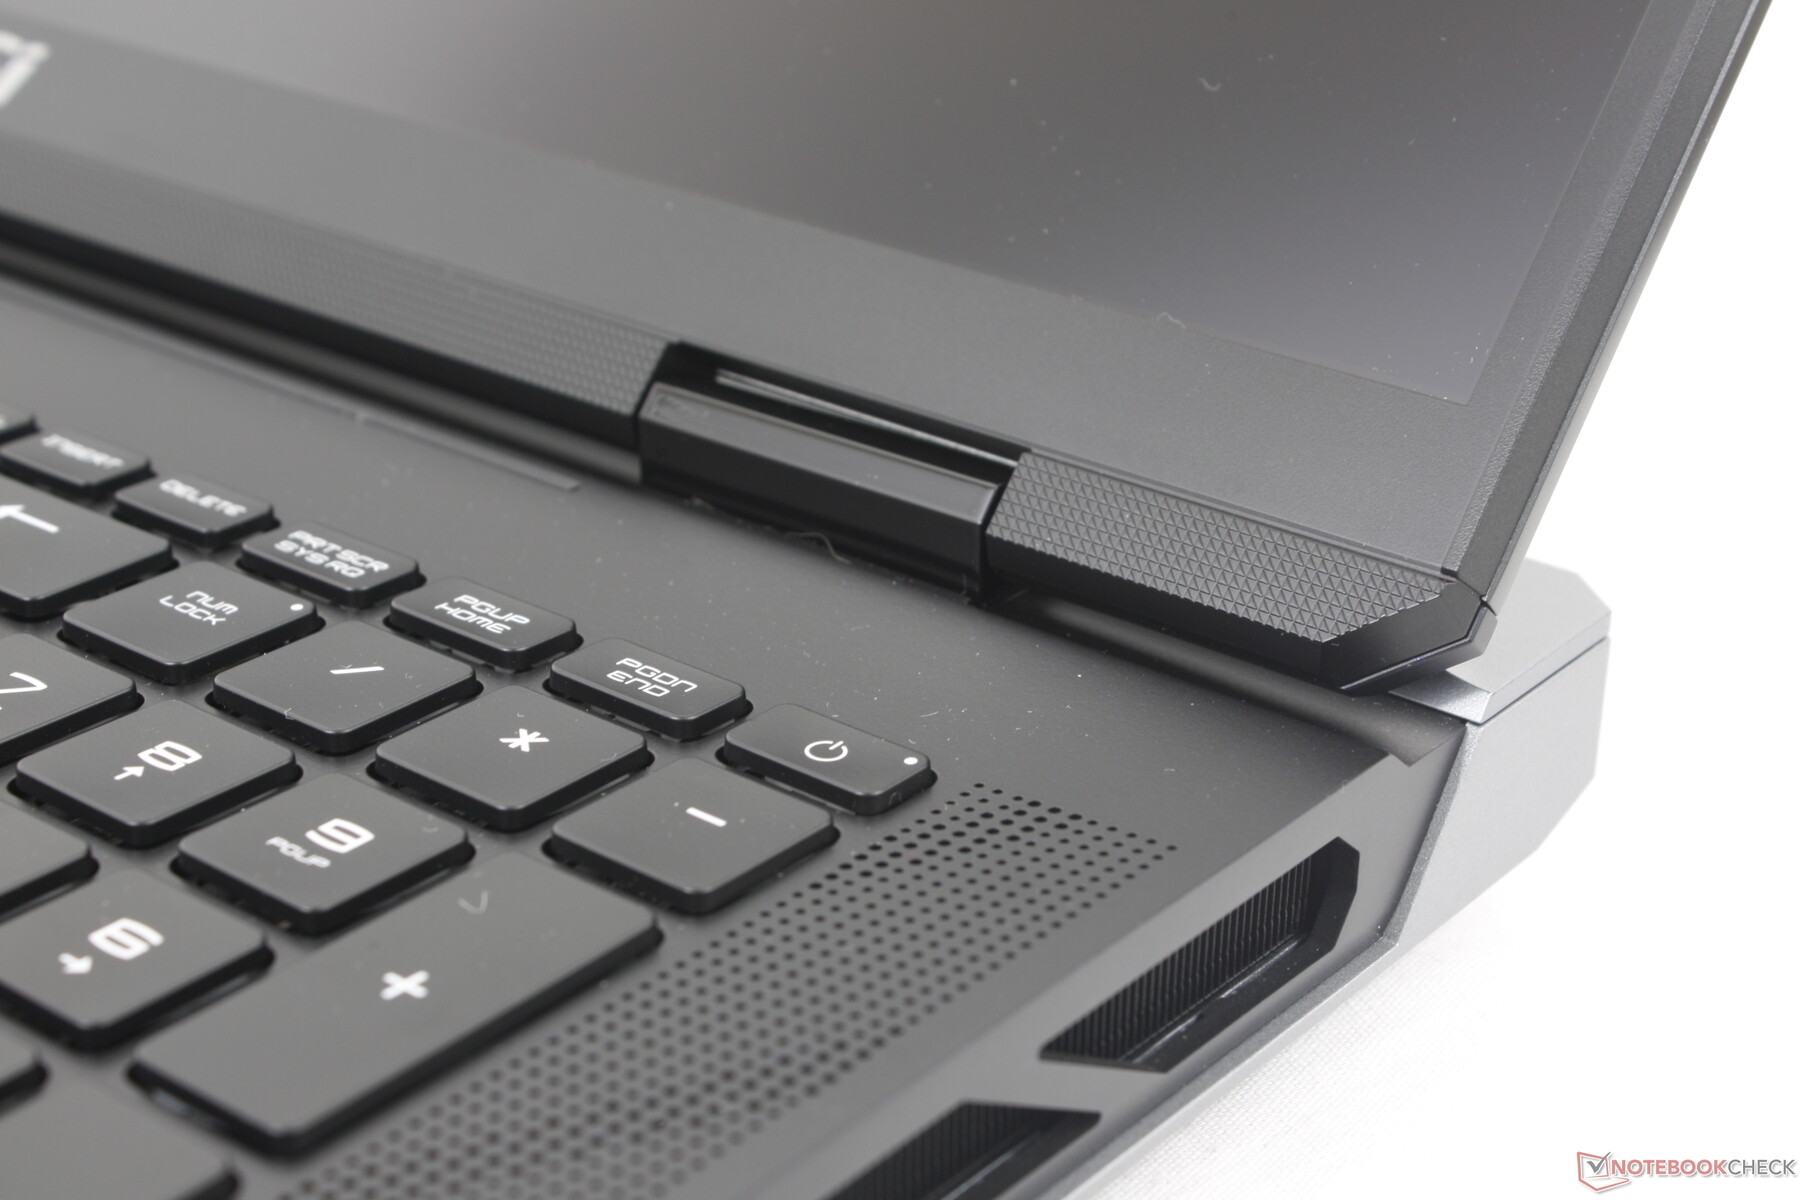
Sztywność obudowy wykonanej ze stopu magnezu i aluminium jest doskonała, z niewielkimi wypaczeniami podczas naciskania na środek klawiatury. Z pewnością jest ona bardziej luksusowa niż zwykłe plastikowe powierzchnie tańszych modeli MSI, takich jak Cyborg lub Katana. Jednak zawiasy mogłyby być mocniejsze, aby zapewnić lepsze poczucie trwałości, a cały system jest jednym wielkim magnesem na odciski palców.
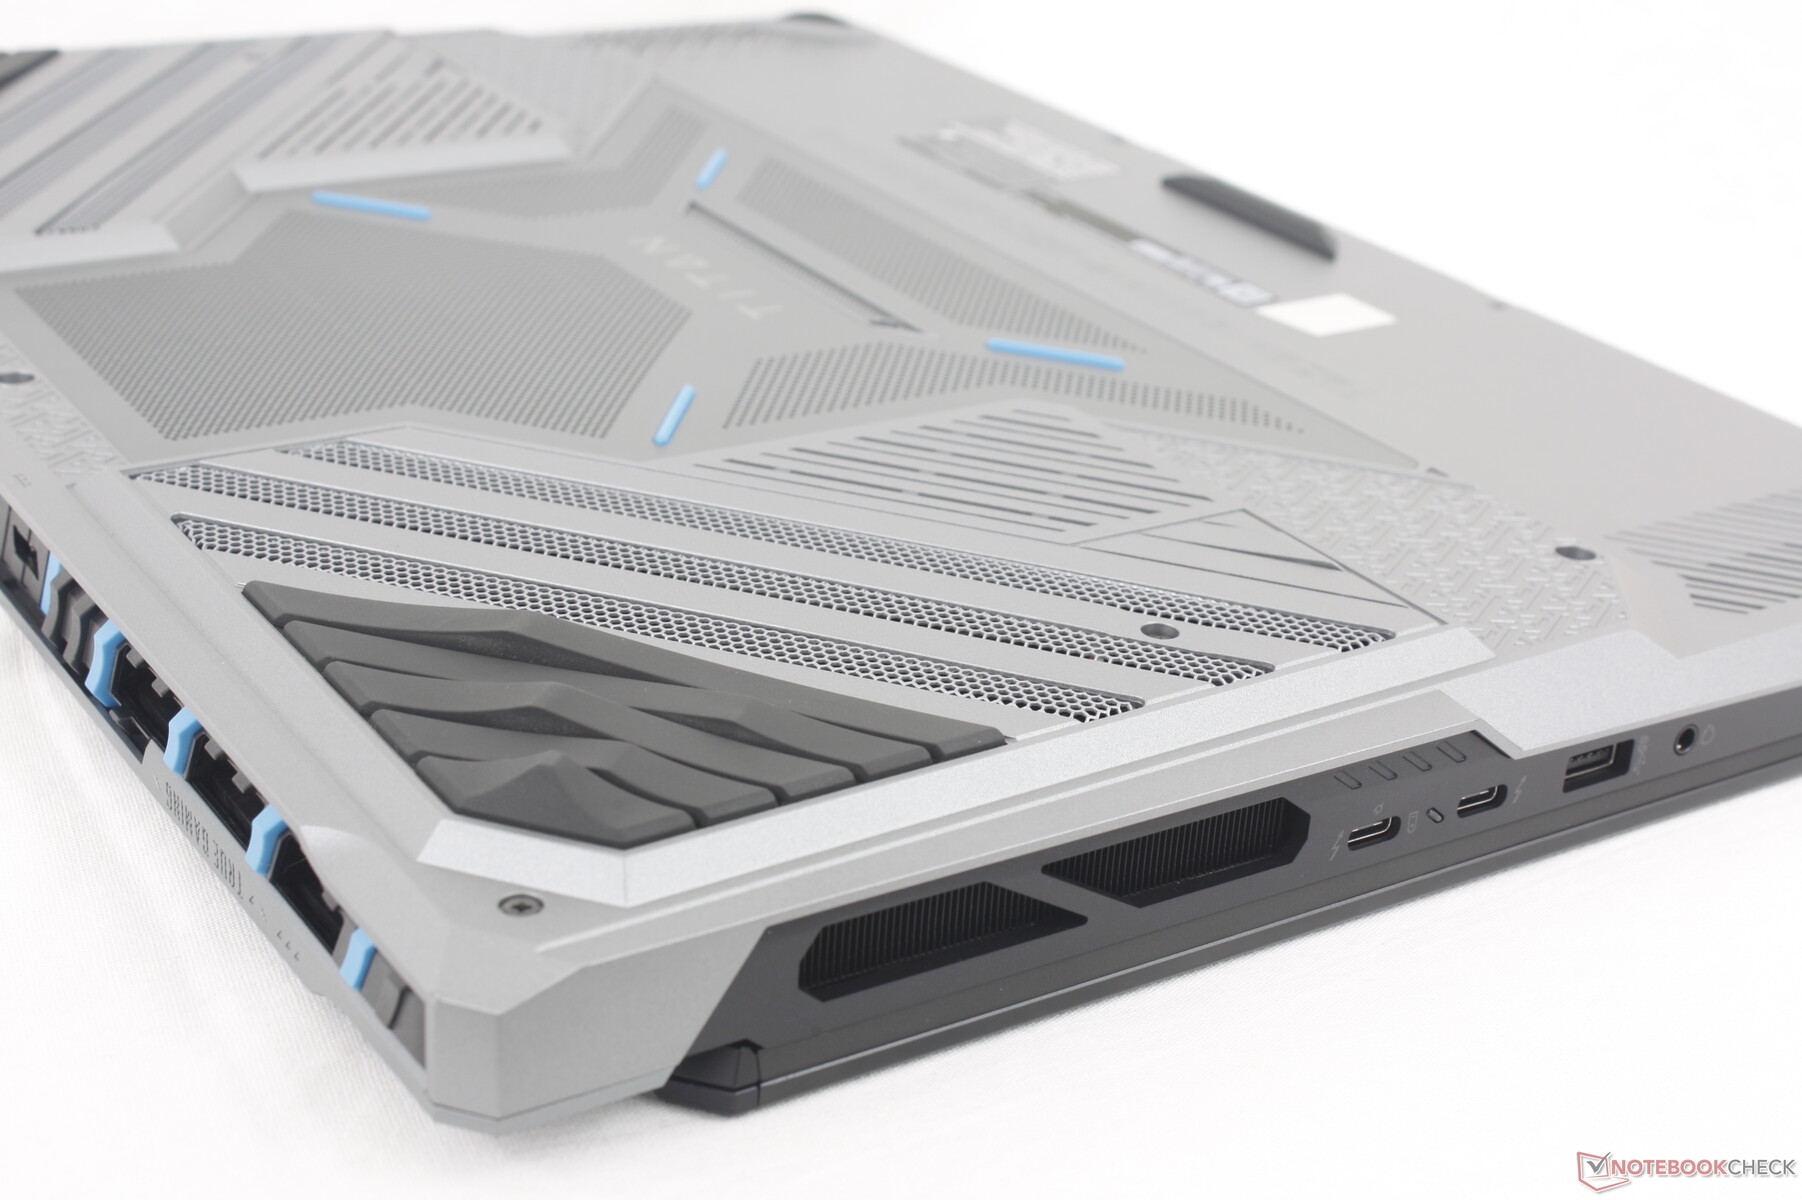
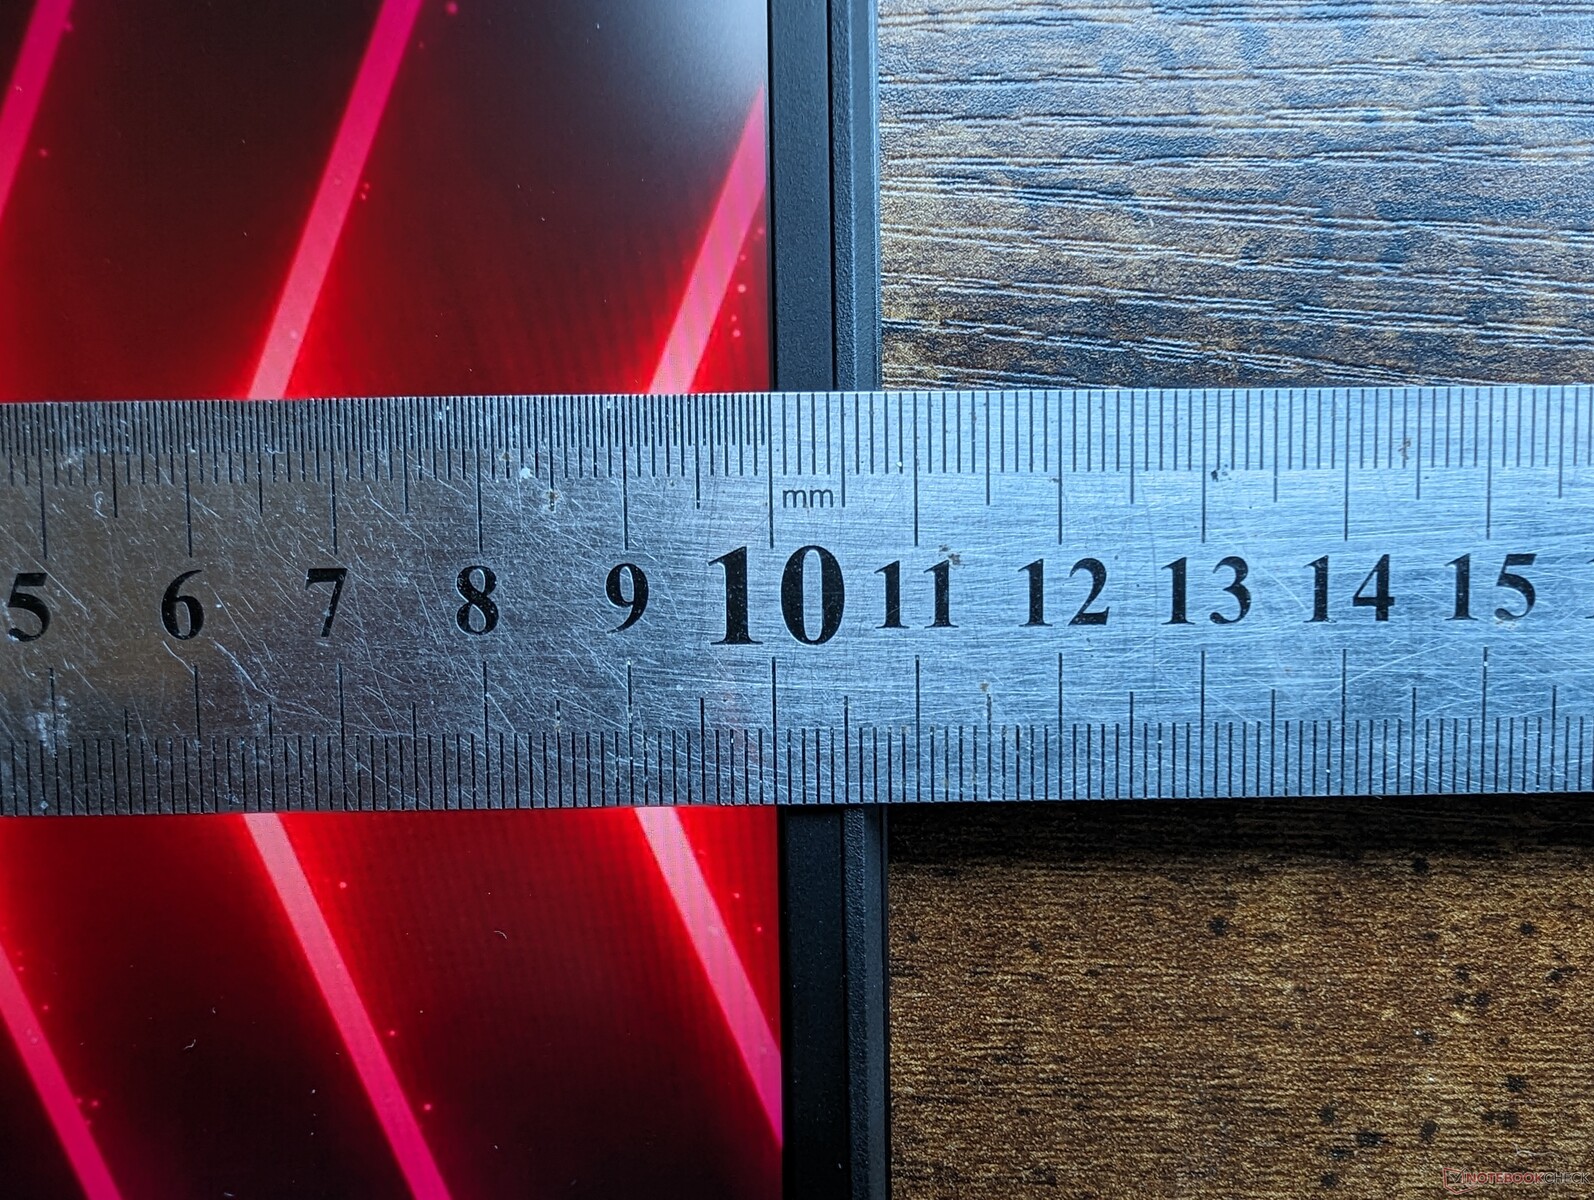
Warto zauważyć, że 18-calowy Titan 18 HX 16:10 ma mniejszą powierzchnię niż 17,3-calowy Titan 18 HX 16:9 Titan GT77 ze względu na krótszy tył. Z kolei nowszy model jest zauważalnie grubszy o prawie 10 mm, dzięki czemu jest jednym z najgrubszych 18-calowych laptopów do gier dostępnych na rynku. Niekoniecznie jest najcięższy, ponieważ ta korona przypada Alienware m18 R1, ale nadal jest zauważalnie cięższy niż Asus ROG Strix G18 lub Razer Blade 18 o ponad 500 g każdy.
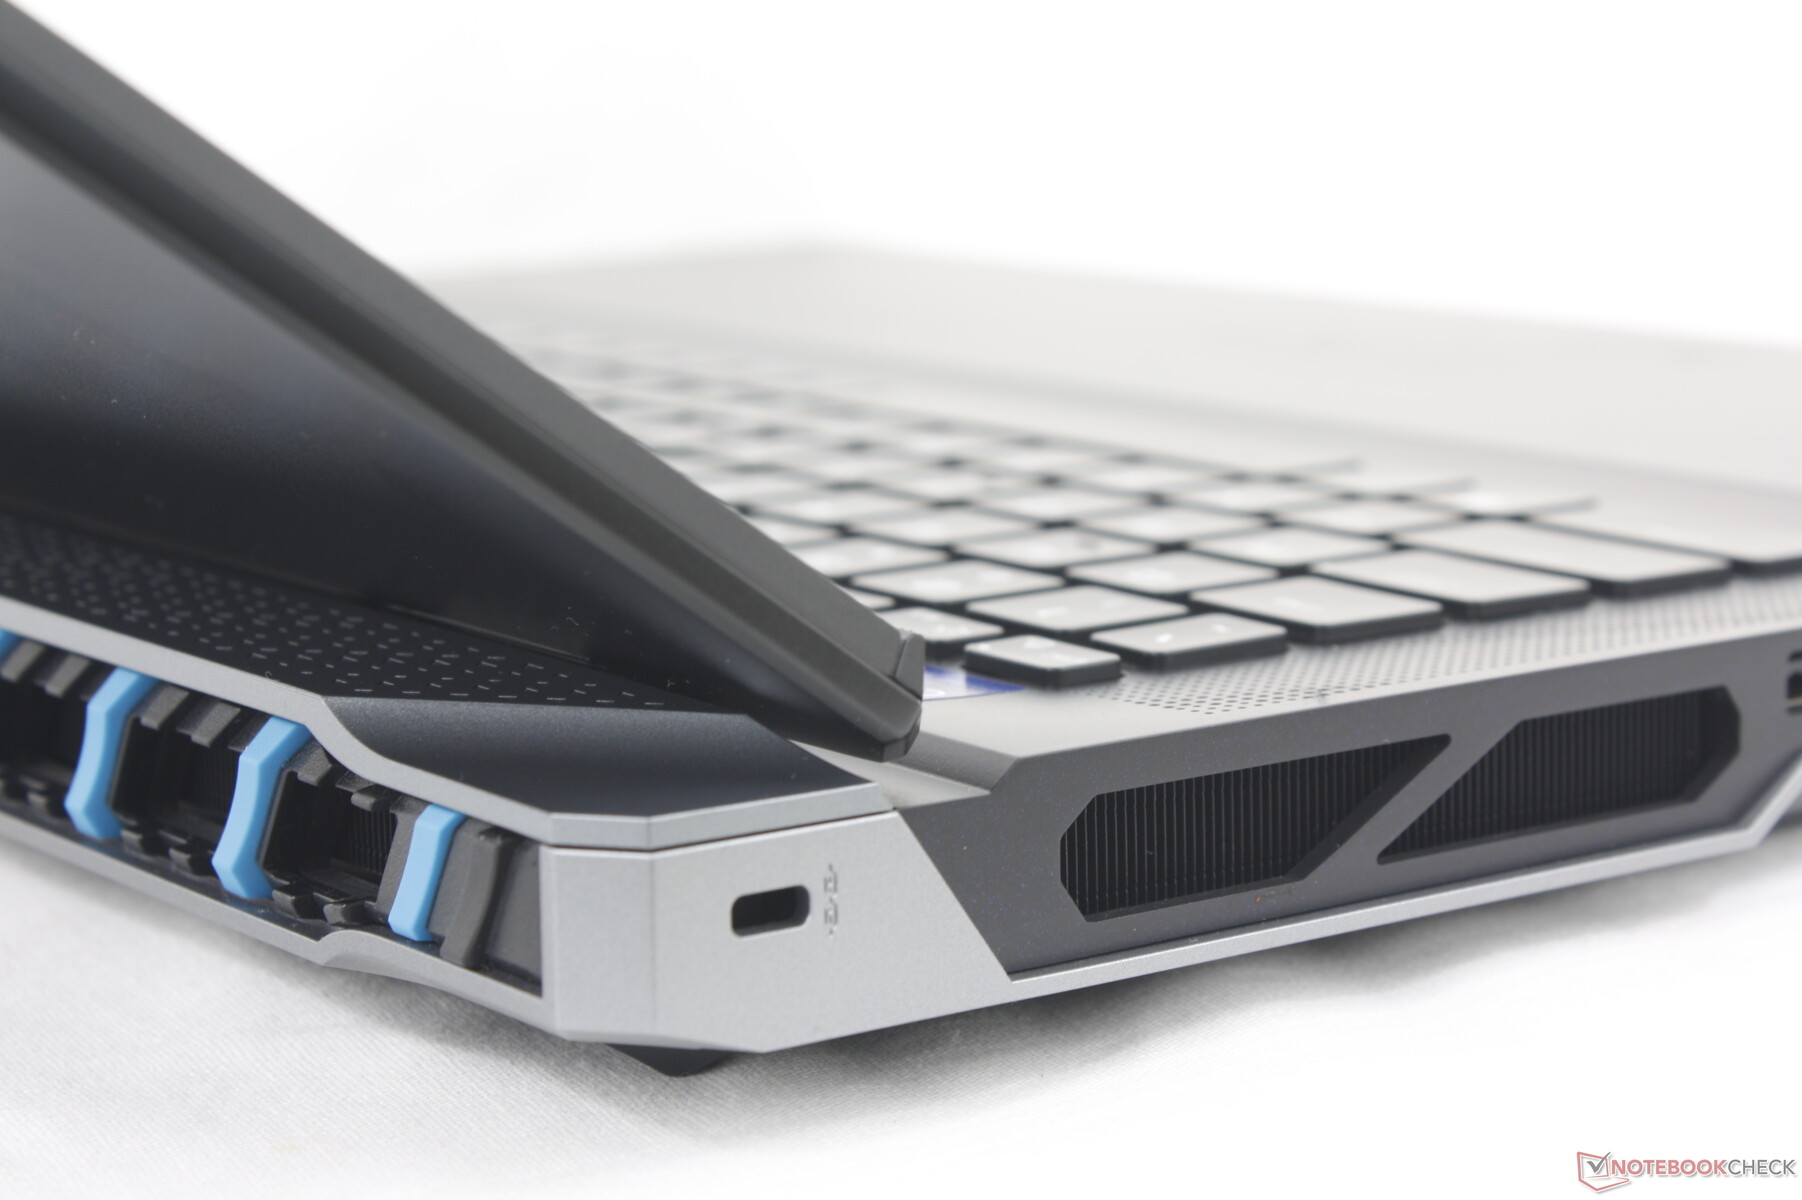
Łączność
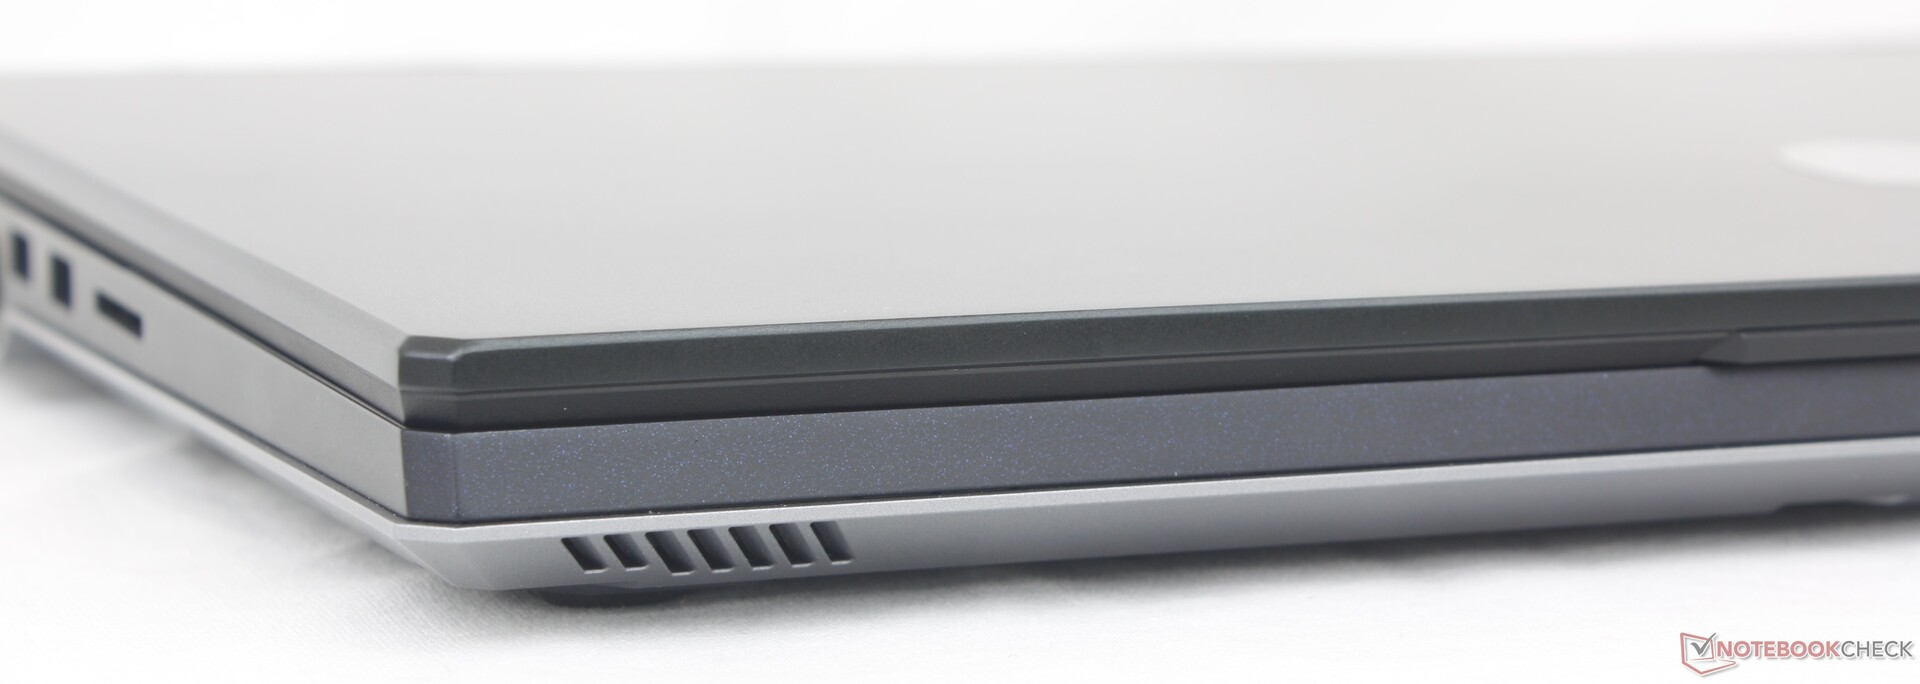
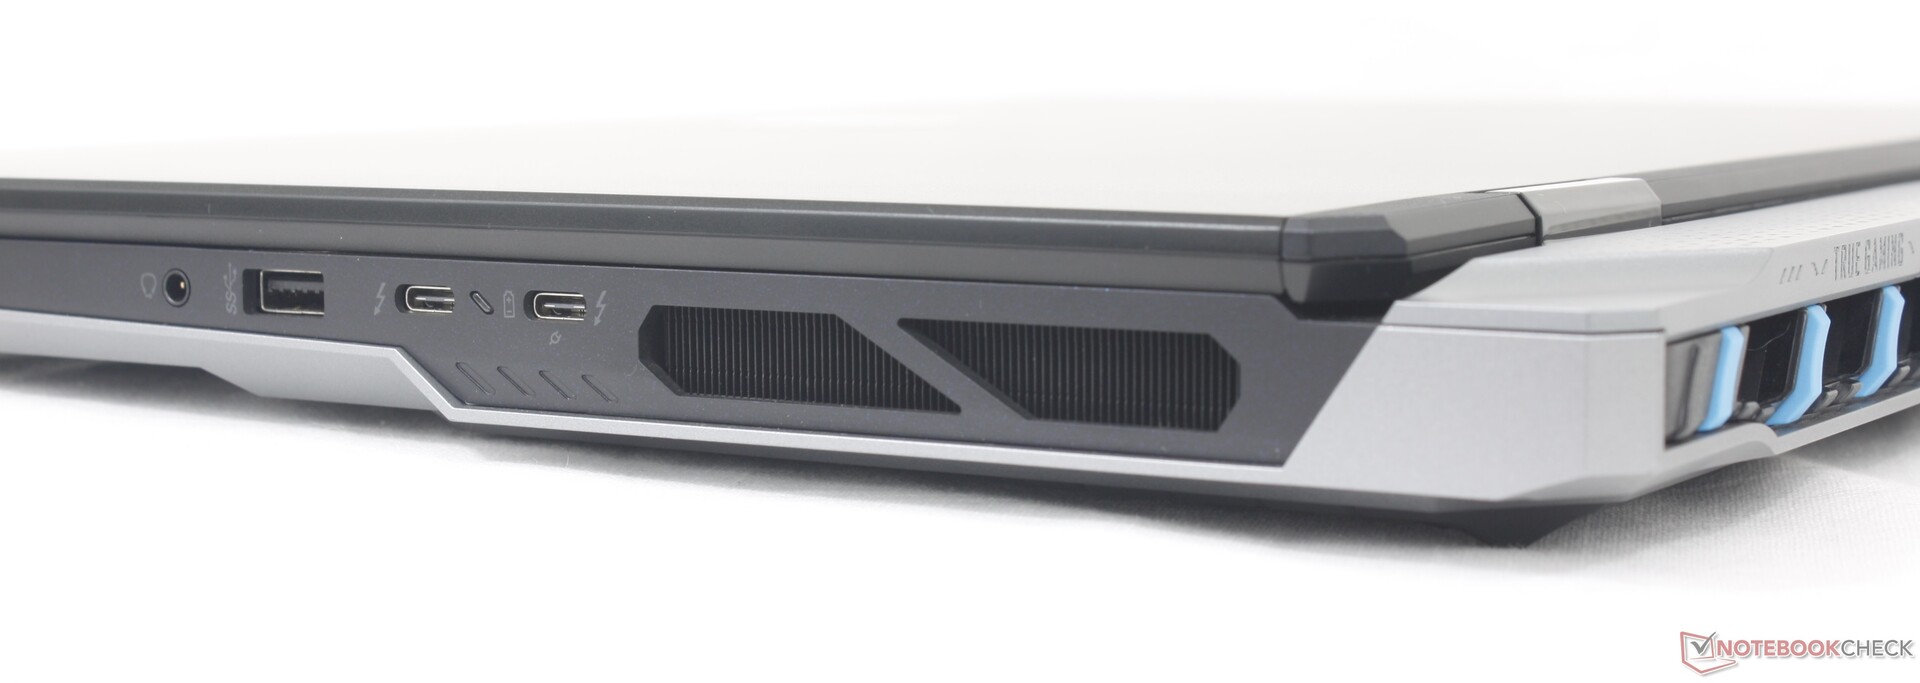
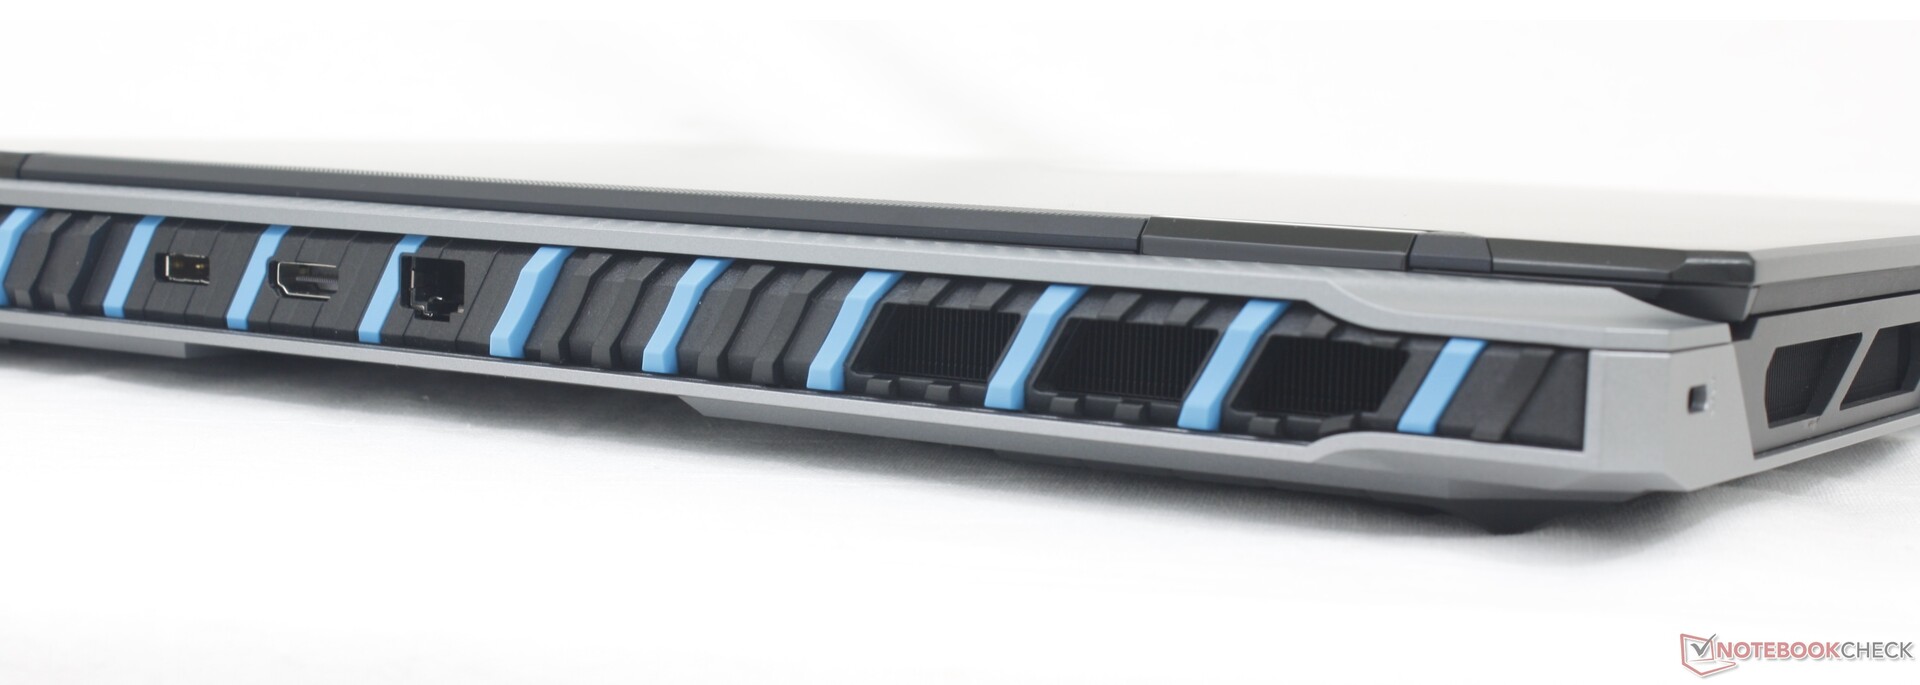
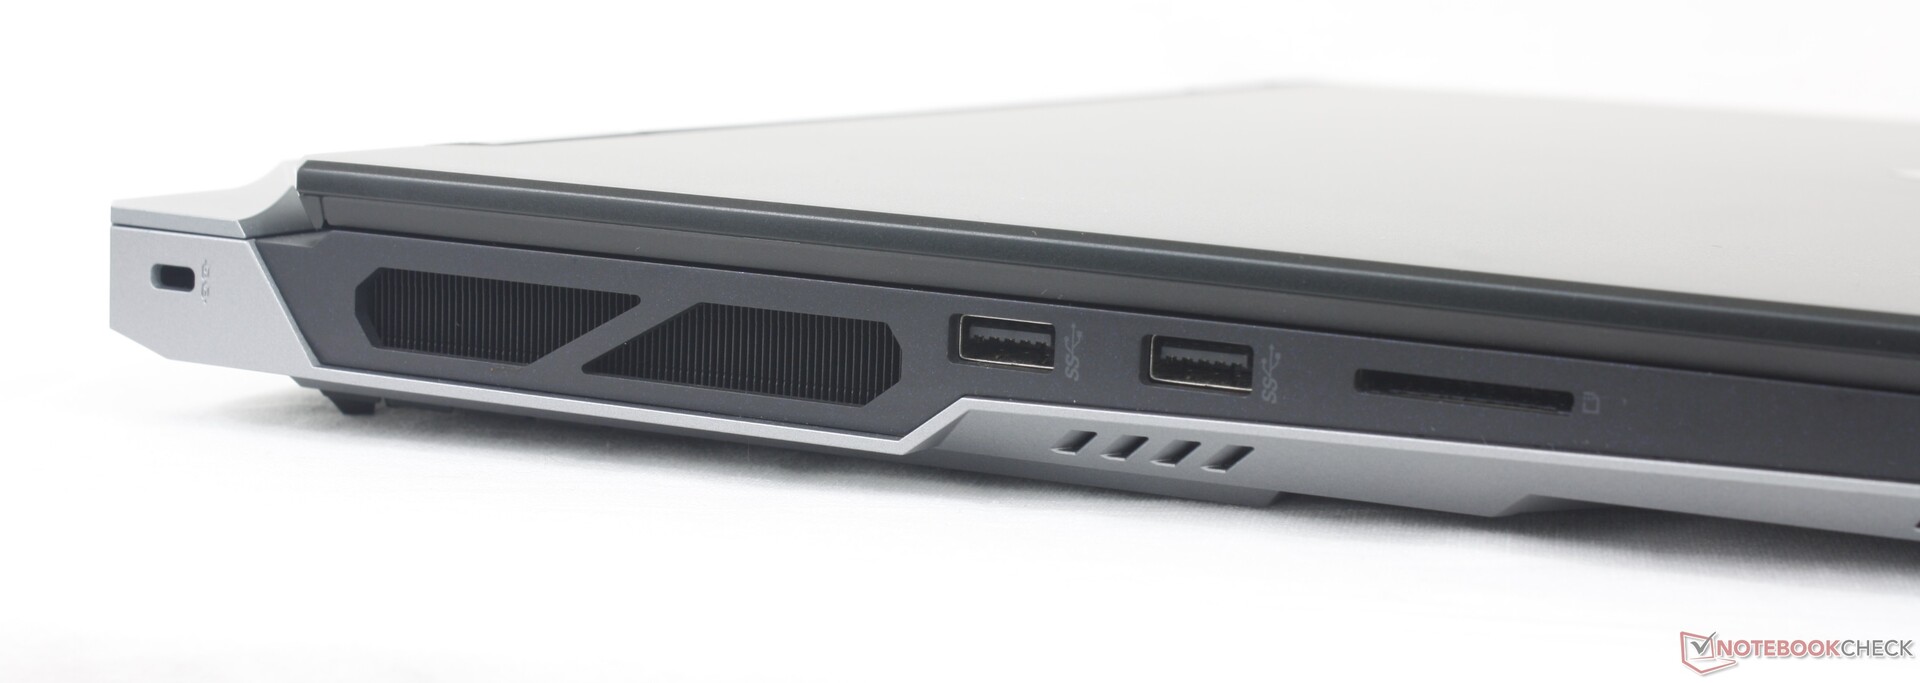
MSI przywróciło wszystkie porty z zeszłorocznego GT77, z wyjątkiem dedykowanego mini-DisplayPort. Porty zostały również rozmieszczone w najbardziej zauważalny sposób z tyłu, aby zmniejszyć bałagan. Dla porównania, porty w GT77 były ciasno upakowane wzdłuż lewej i prawej krawędzi.
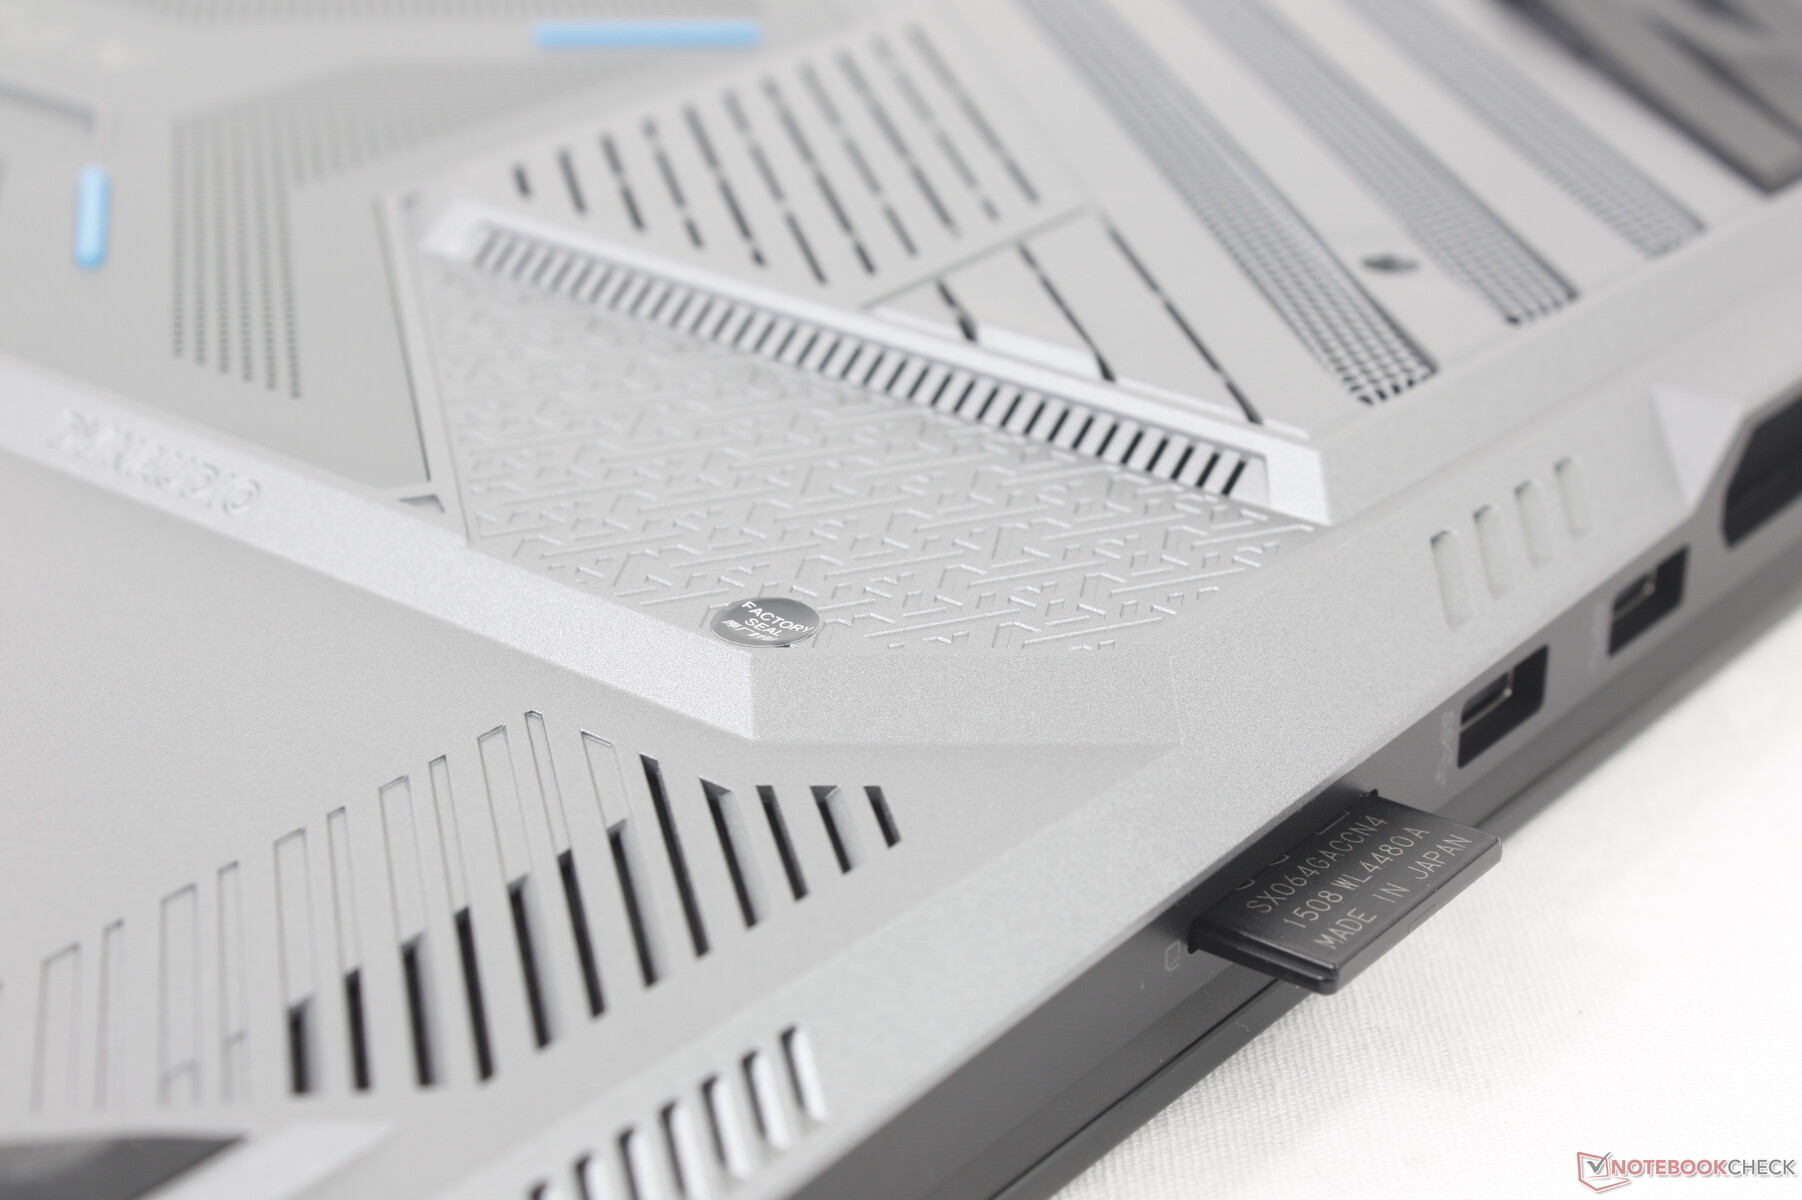
Czytnik kart SD
Podczas gdy obudowa została odnowiona, powolny czytnik kart nie. Przeniesienie 1 GB obrazów z naszej karty testowej UHS-II na pulpit zajmuje około 12 sekund, co jest 2x wolniejsze niż w przypadku czytników kart w Razer Blade 18 Razer Blade 18 lub Alienware m18 R1.
| SD Card Reader | |
| average JPG Copy Test (av. of 3 runs) | |
| Razer Blade 18 RTX 4070 (Angelibird AV Pro V60) | |
| Alienware m18 R1 (Angelibird AV Pro V60) | |
| MSI Titan 18 HX A14VIG (Toshiba Exceria Pro SDXC 64 GB UHS-II) | |
| MSI Titan GT77 HX 13VI (Angelibird AV Pro V60) | |
| Acer Predator Helios 18 N23Q2 | |
| maximum AS SSD Seq Read Test (1GB) | |
| Alienware m18 R1 (Angelibird AV Pro V60) | |
| Razer Blade 18 RTX 4070 (Angelibird AV Pro V60) | |
| MSI Titan 18 HX A14VIG (Toshiba Exceria Pro SDXC 64 GB UHS-II) | |
| MSI Titan GT77 HX 13VI (Angelibird AV Pro V60) | |
| Acer Predator Helios 18 N23Q2 | |
Komunikacja
WLAN zapewnia Killer BE1750x, który jest gamingowym wariantem BE1750W. Moduł obsługuje Wi-Fi 7, mimo że routery Wi-Fi 7 nie są jeszcze popularne. Nie doświadczyliśmy żadnych problemów z łącznością po sparowaniu z naszym routerem testowym Wi-Fi 6E.
| Networking | |
| iperf3 transmit AXE11000 | |
| Asus ROG Strix G18 G814JI | |
| MSI Titan GT77 HX 13VI | |
| Alienware m18 R1 | |
| Razer Blade 18 RTX 4070 | |
| MSI Titan 18 HX A14VIG | |
| Acer Predator Helios 18 N23Q2 | |
| iperf3 receive AXE11000 | |
| Asus ROG Strix G18 G814JI | |
| MSI Titan GT77 HX 13VI | |
| Razer Blade 18 RTX 4070 | |
| Alienware m18 R1 | |
| MSI Titan 18 HX A14VIG | |
| Acer Predator Helios 18 N23Q2 | |
| iperf3 transmit AXE11000 6GHz | |
| Acer Predator Helios 18 N23Q2 | |
| Alienware m18 R1 | |
| Razer Blade 18 RTX 4070 | |
| MSI Titan 18 HX A14VIG | |
| iperf3 receive AXE11000 6GHz | |
| Razer Blade 18 RTX 4070 | |
| Acer Predator Helios 18 N23Q2 | |
| MSI Titan 18 HX A14VIG | |
| Alienware m18 R1 | |
Kamera internetowa
Kamera internetowa 2 MP z fizyczną migawką prywatności i czujnikiem podczerwieni jest standardem. Kamera może mieć problemy z jasnością, jak pokazano na poniższym zdjęciu.

")
")
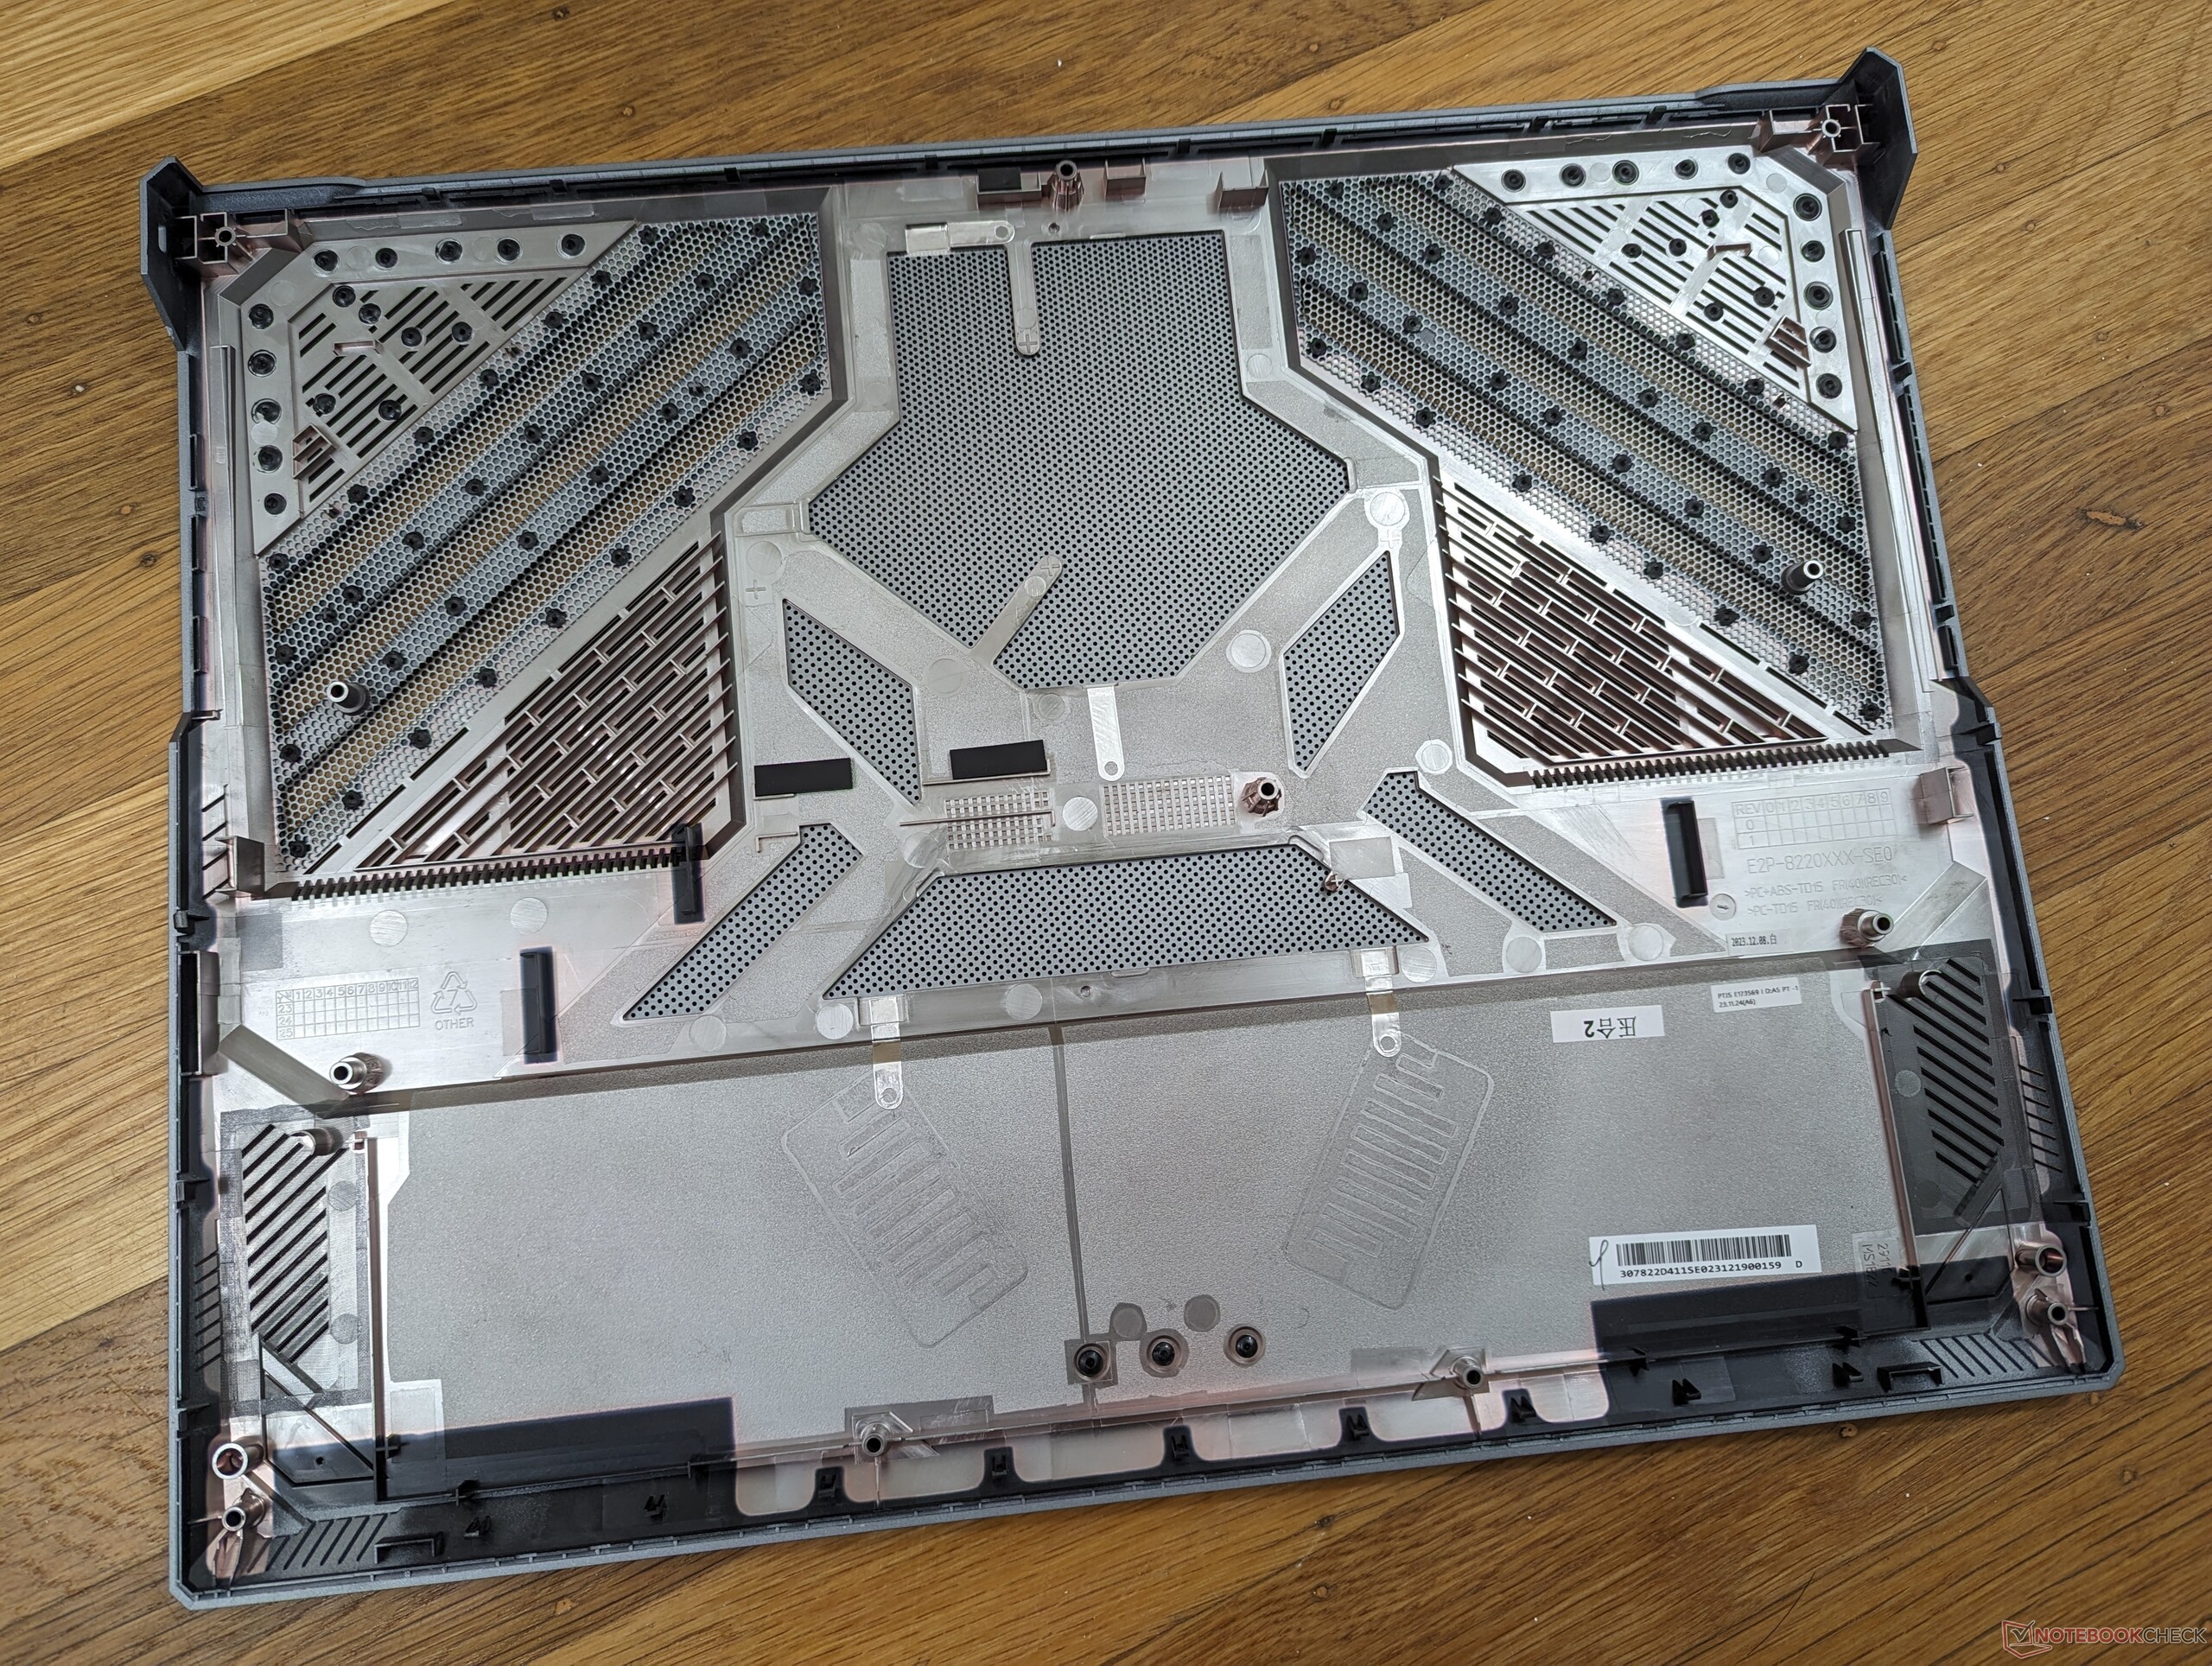
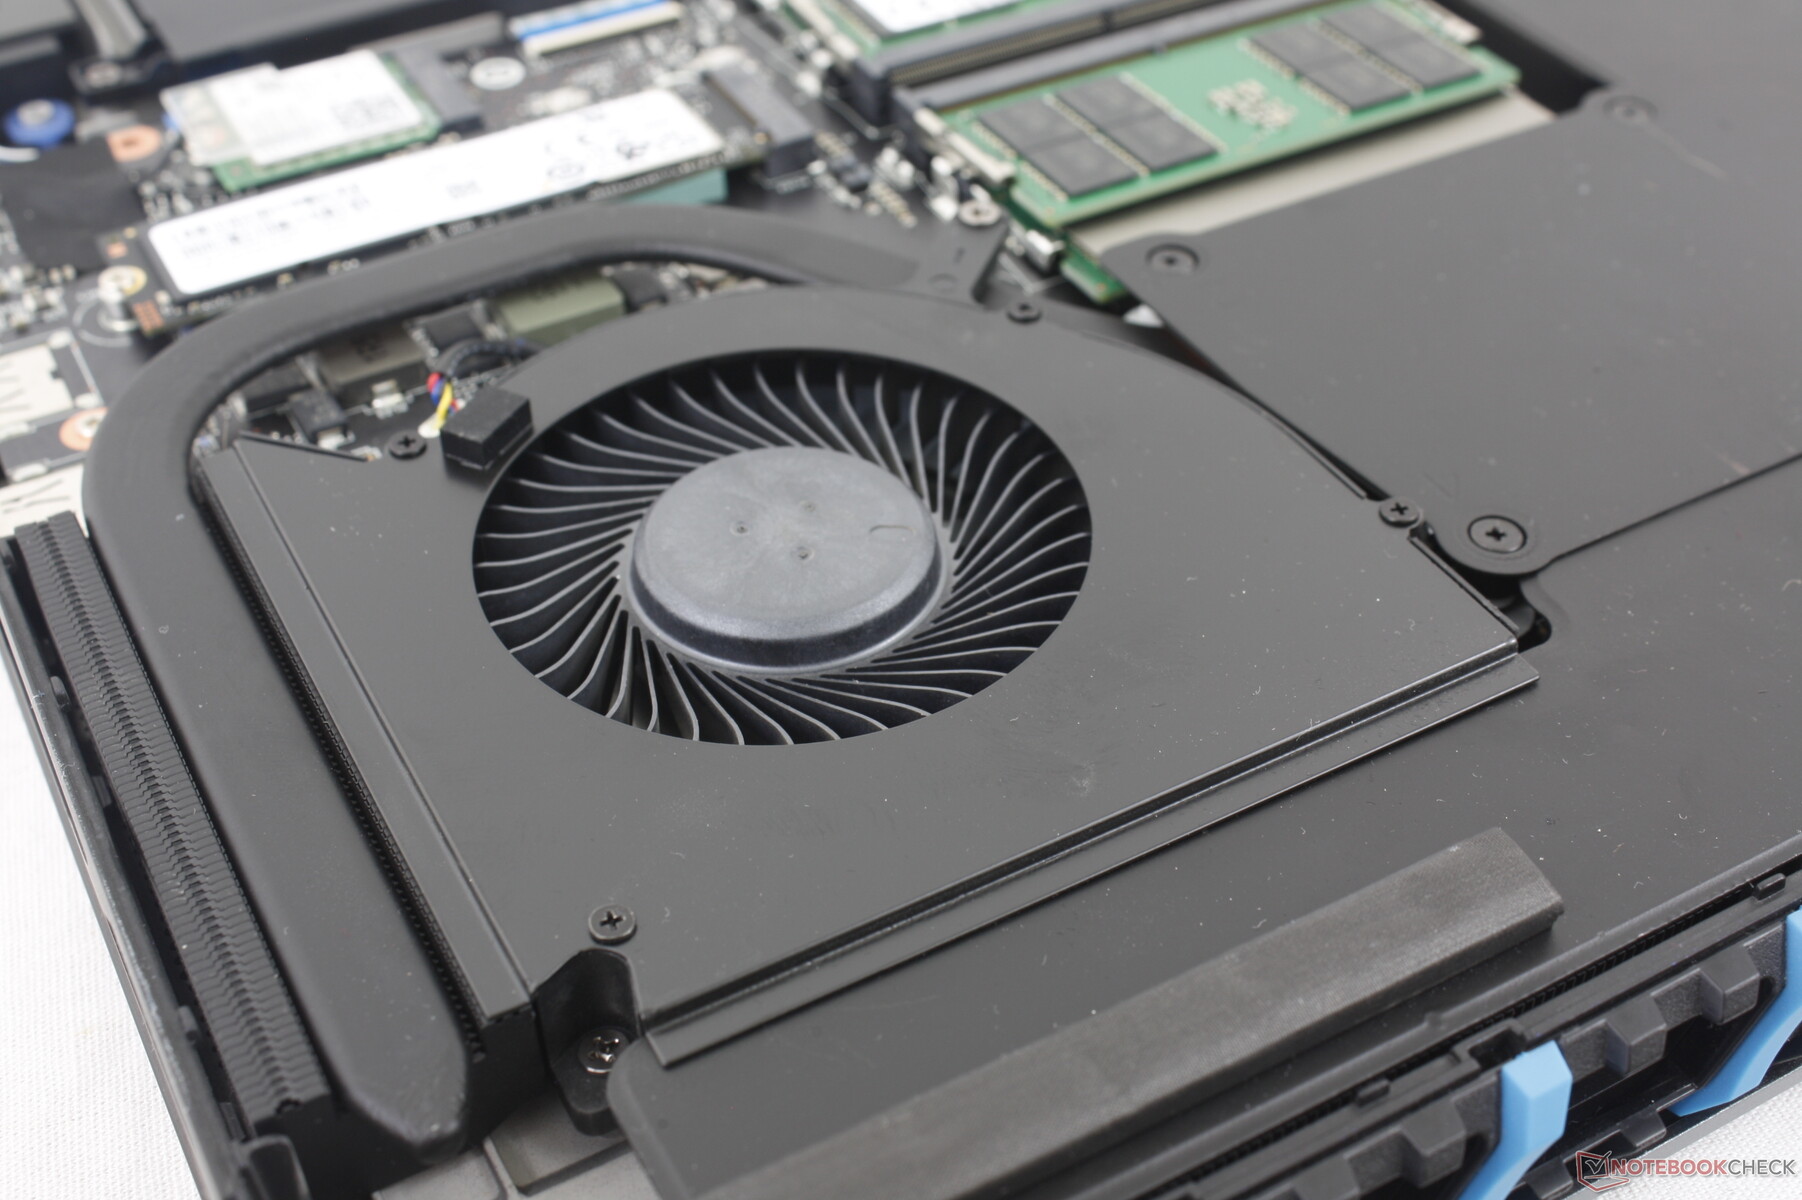
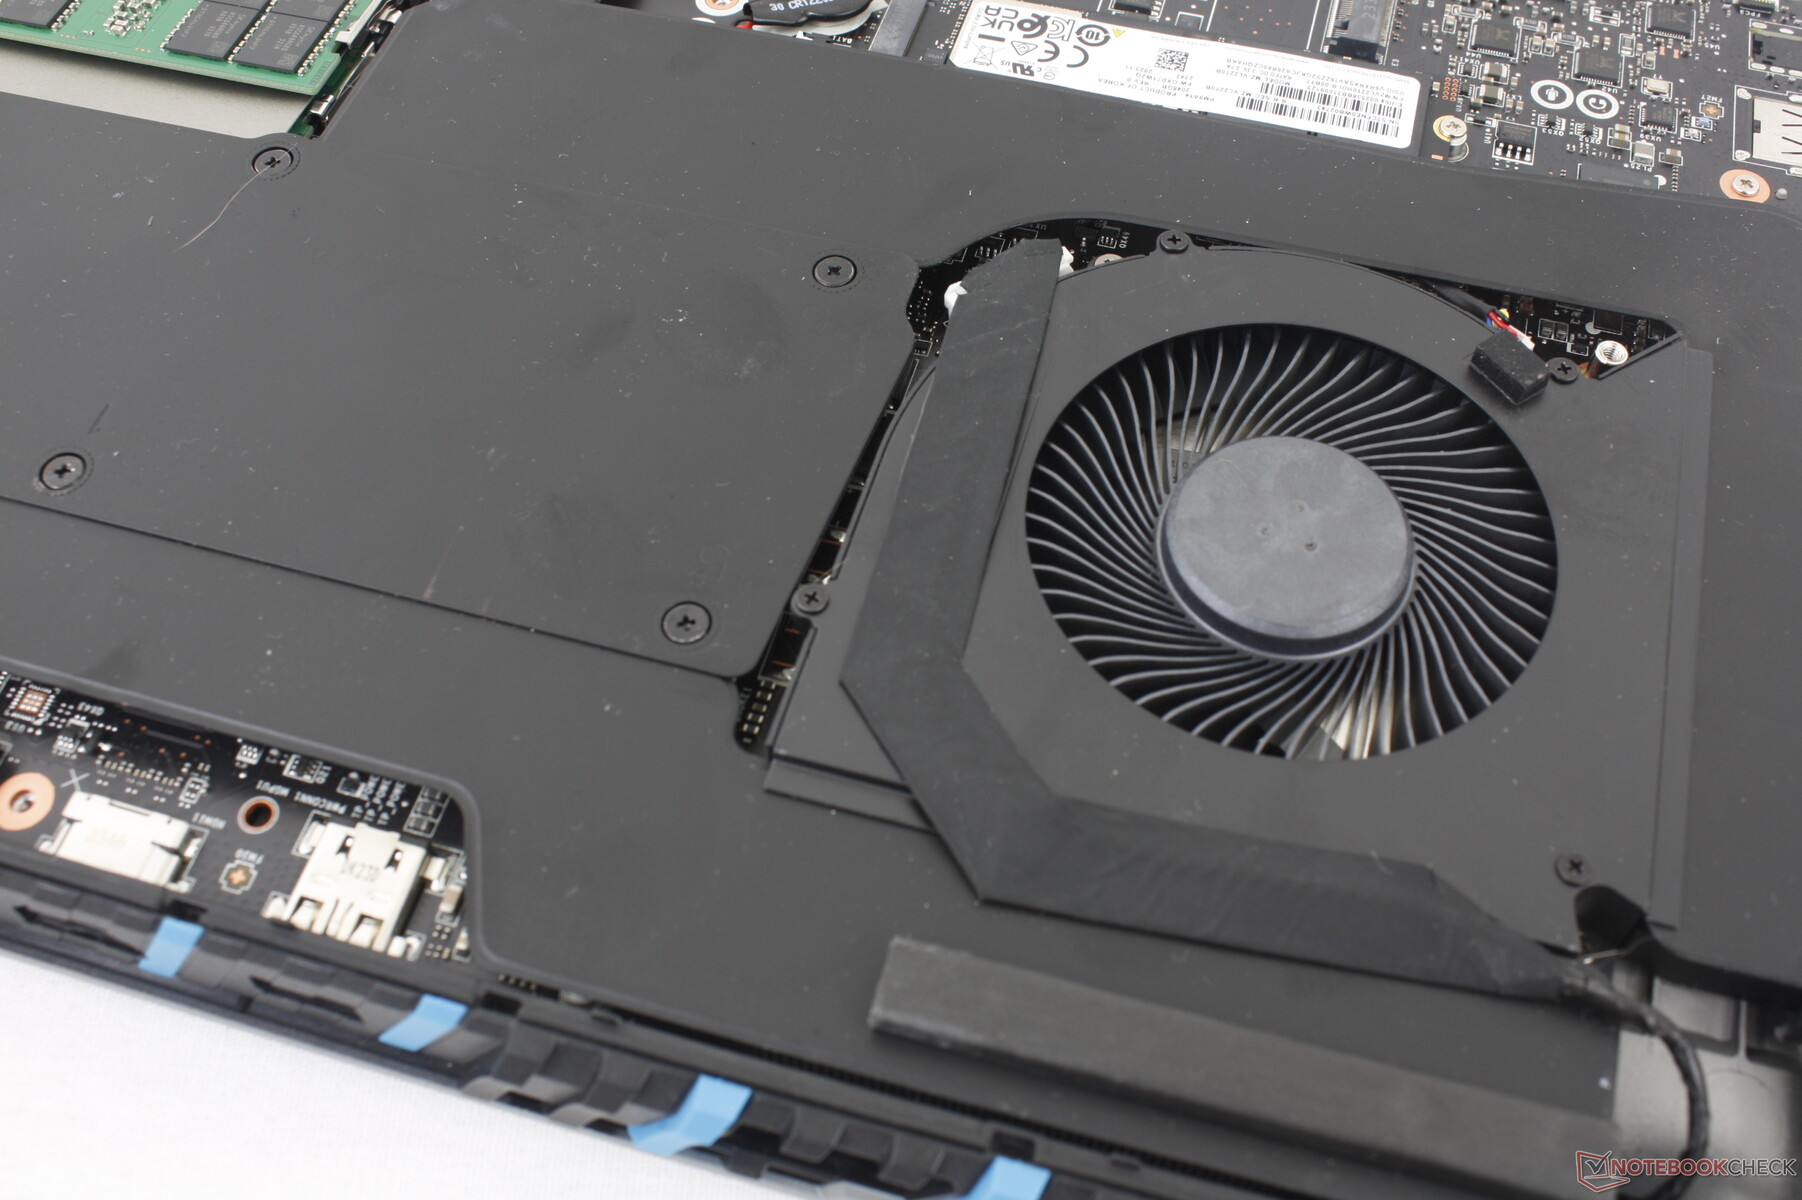
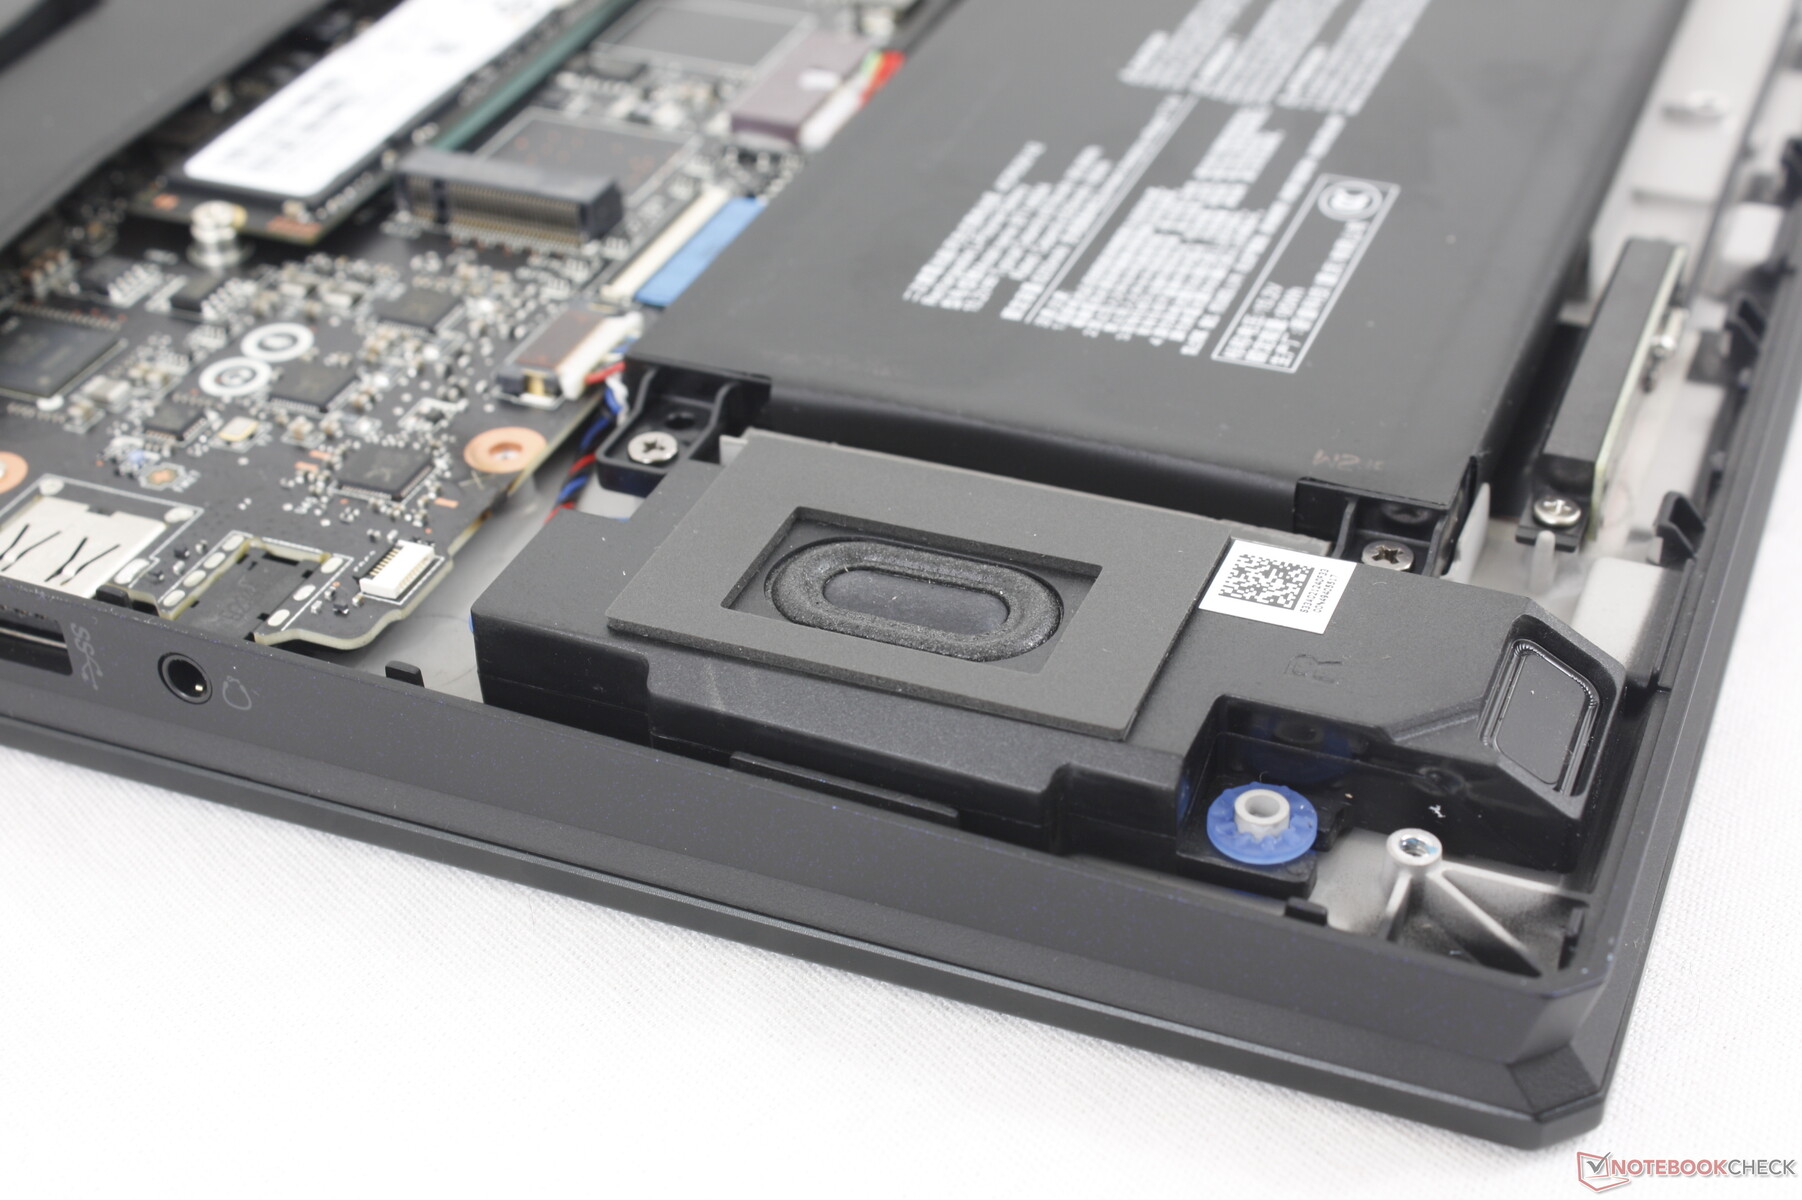
Konserwacja
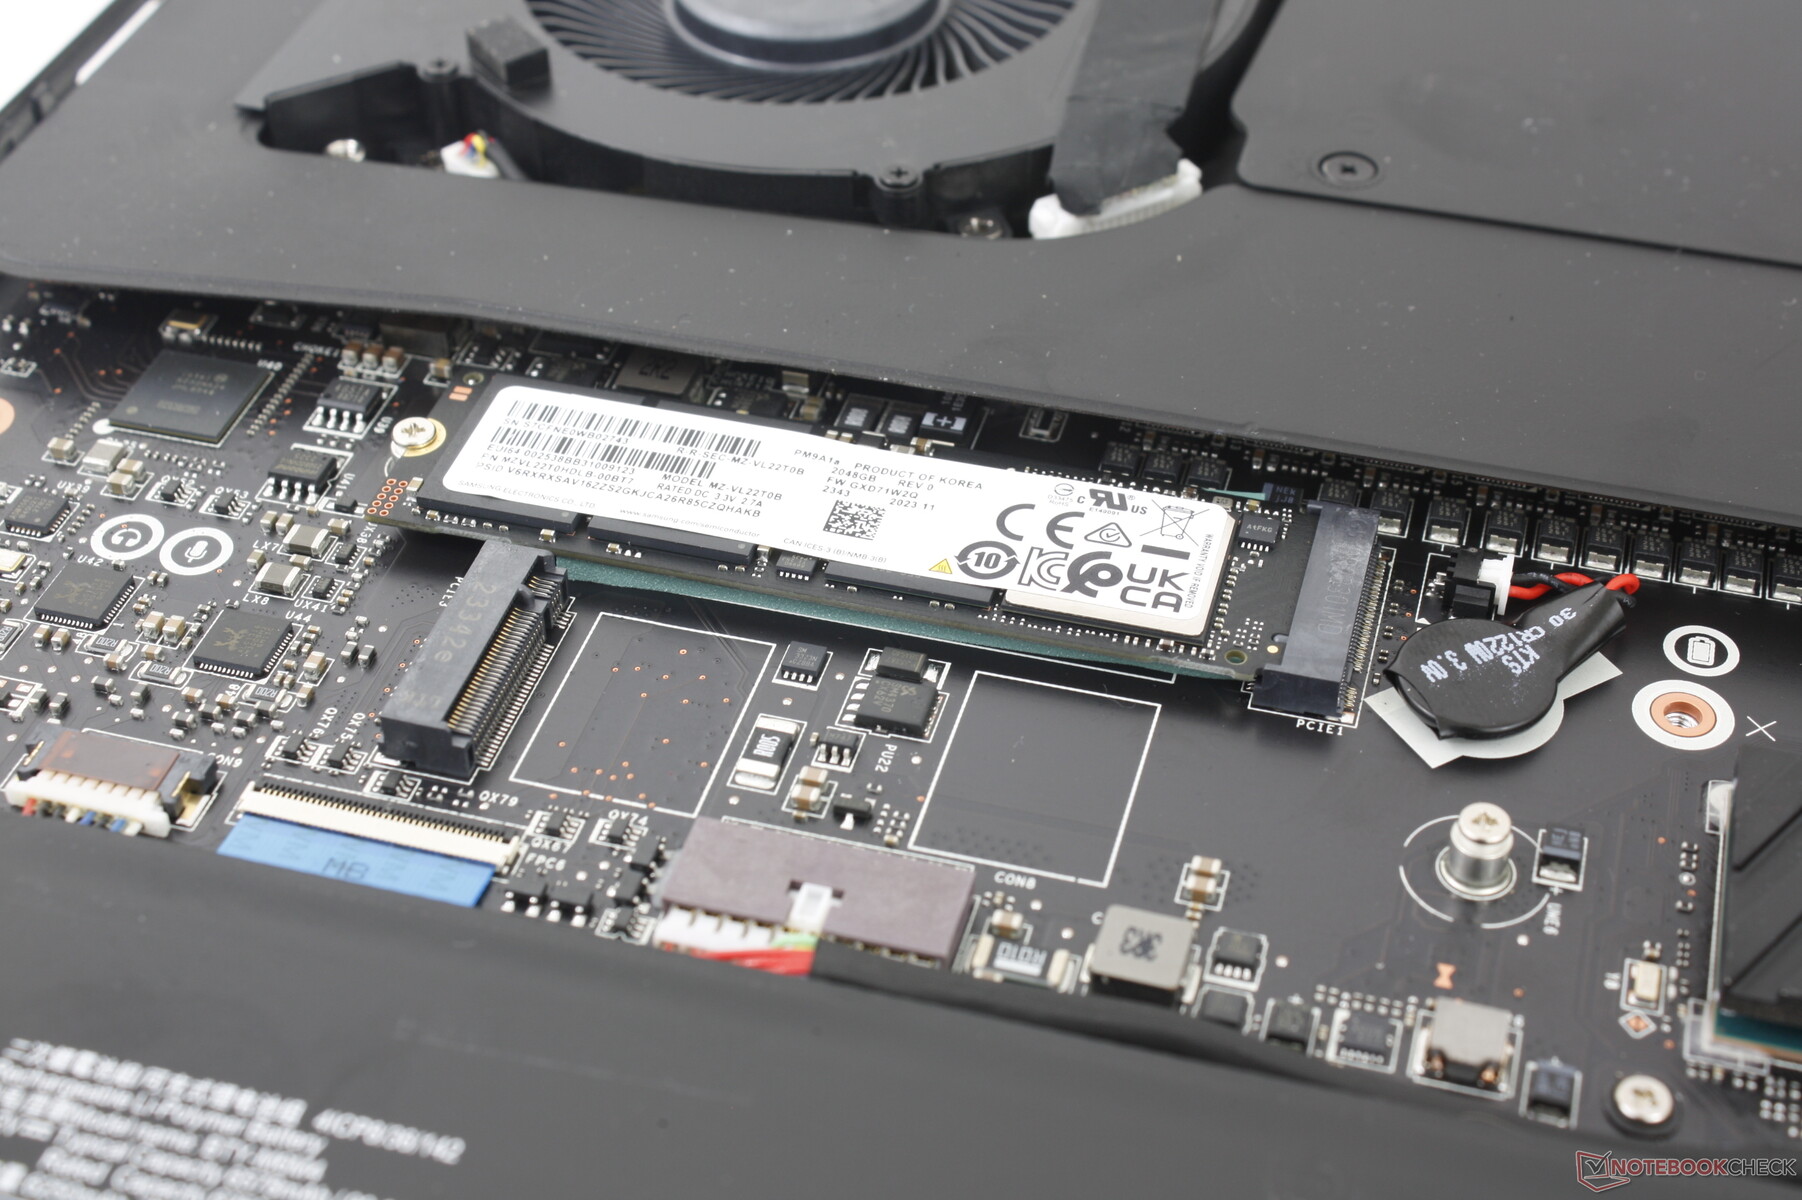
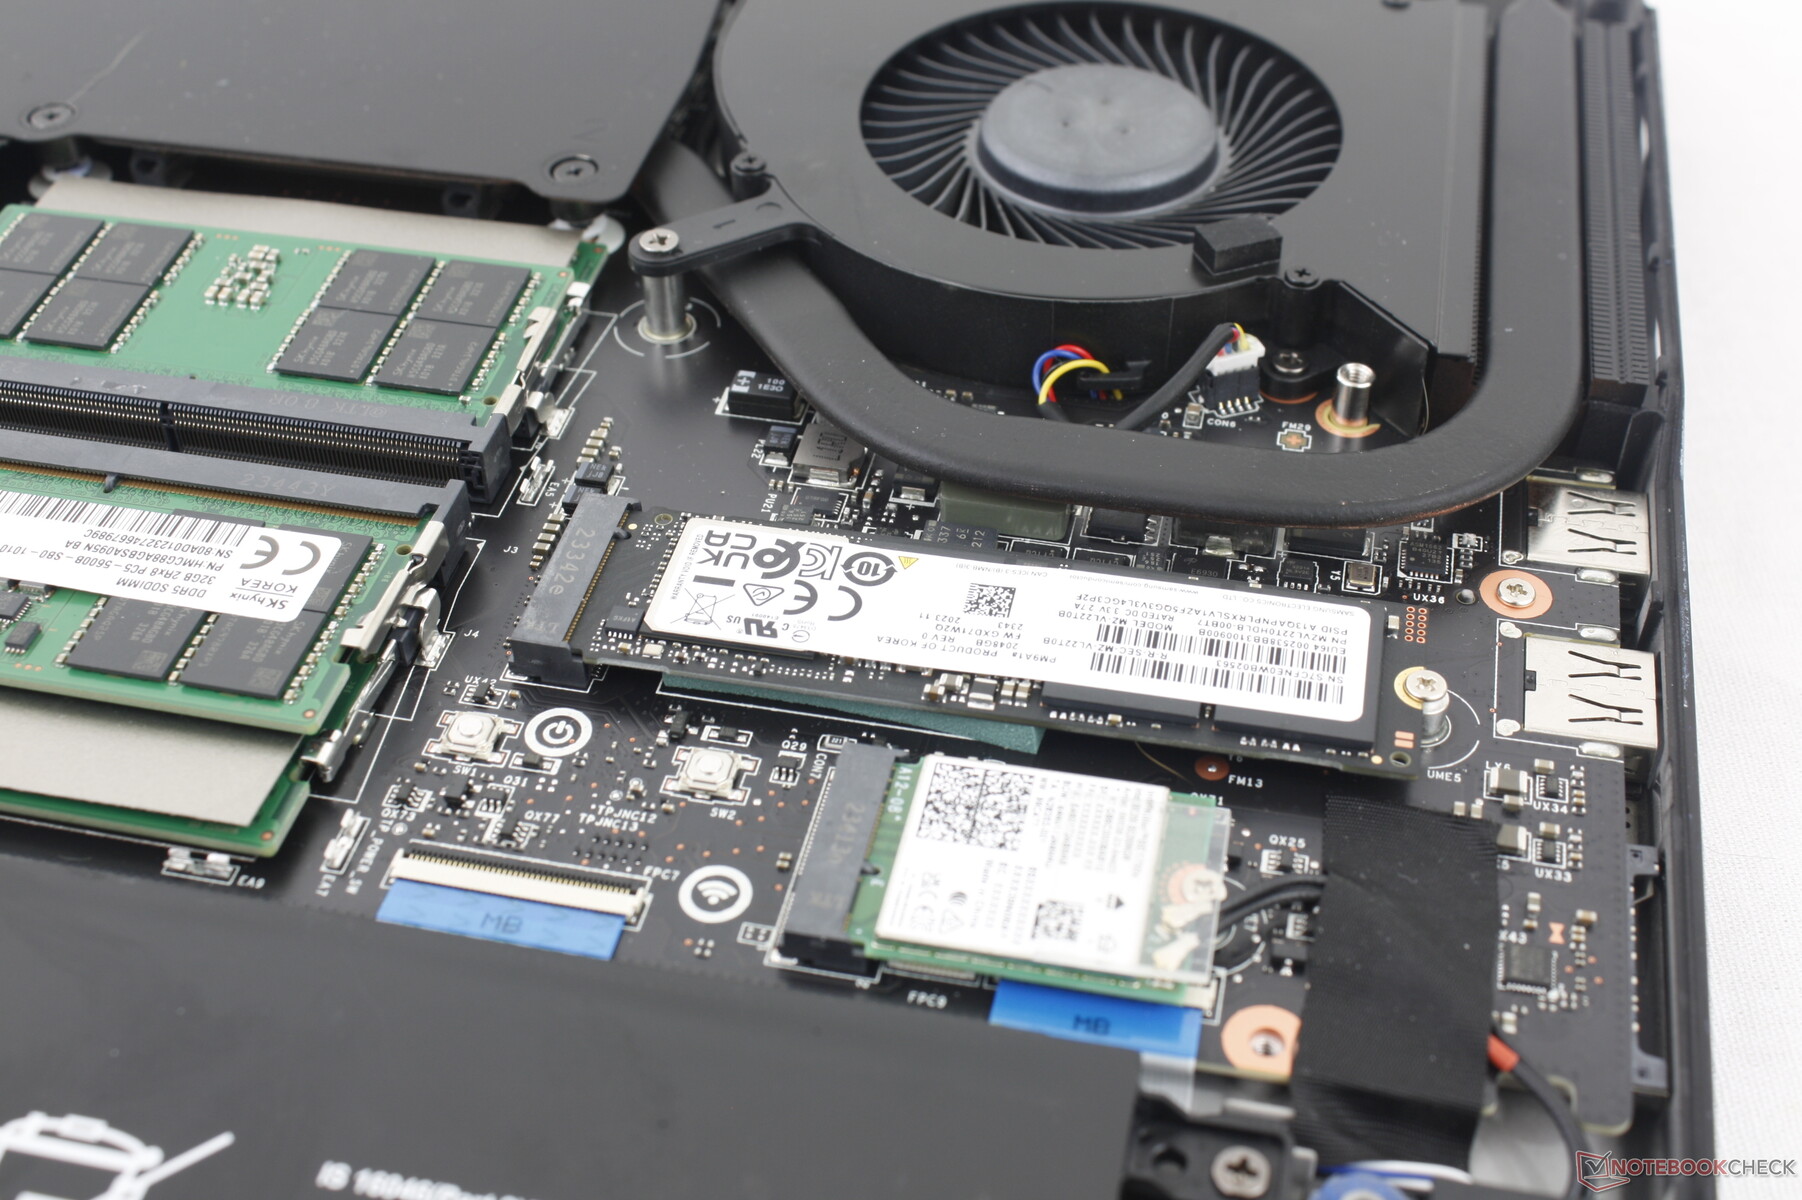
Dolny panel jest zabezpieczony 12 śrubami krzyżakowymi, co ułatwia serwisowanie. Proszę jednak pamiętać, że w tym celu należy zerwać naklejkę z fabryczną plombą.
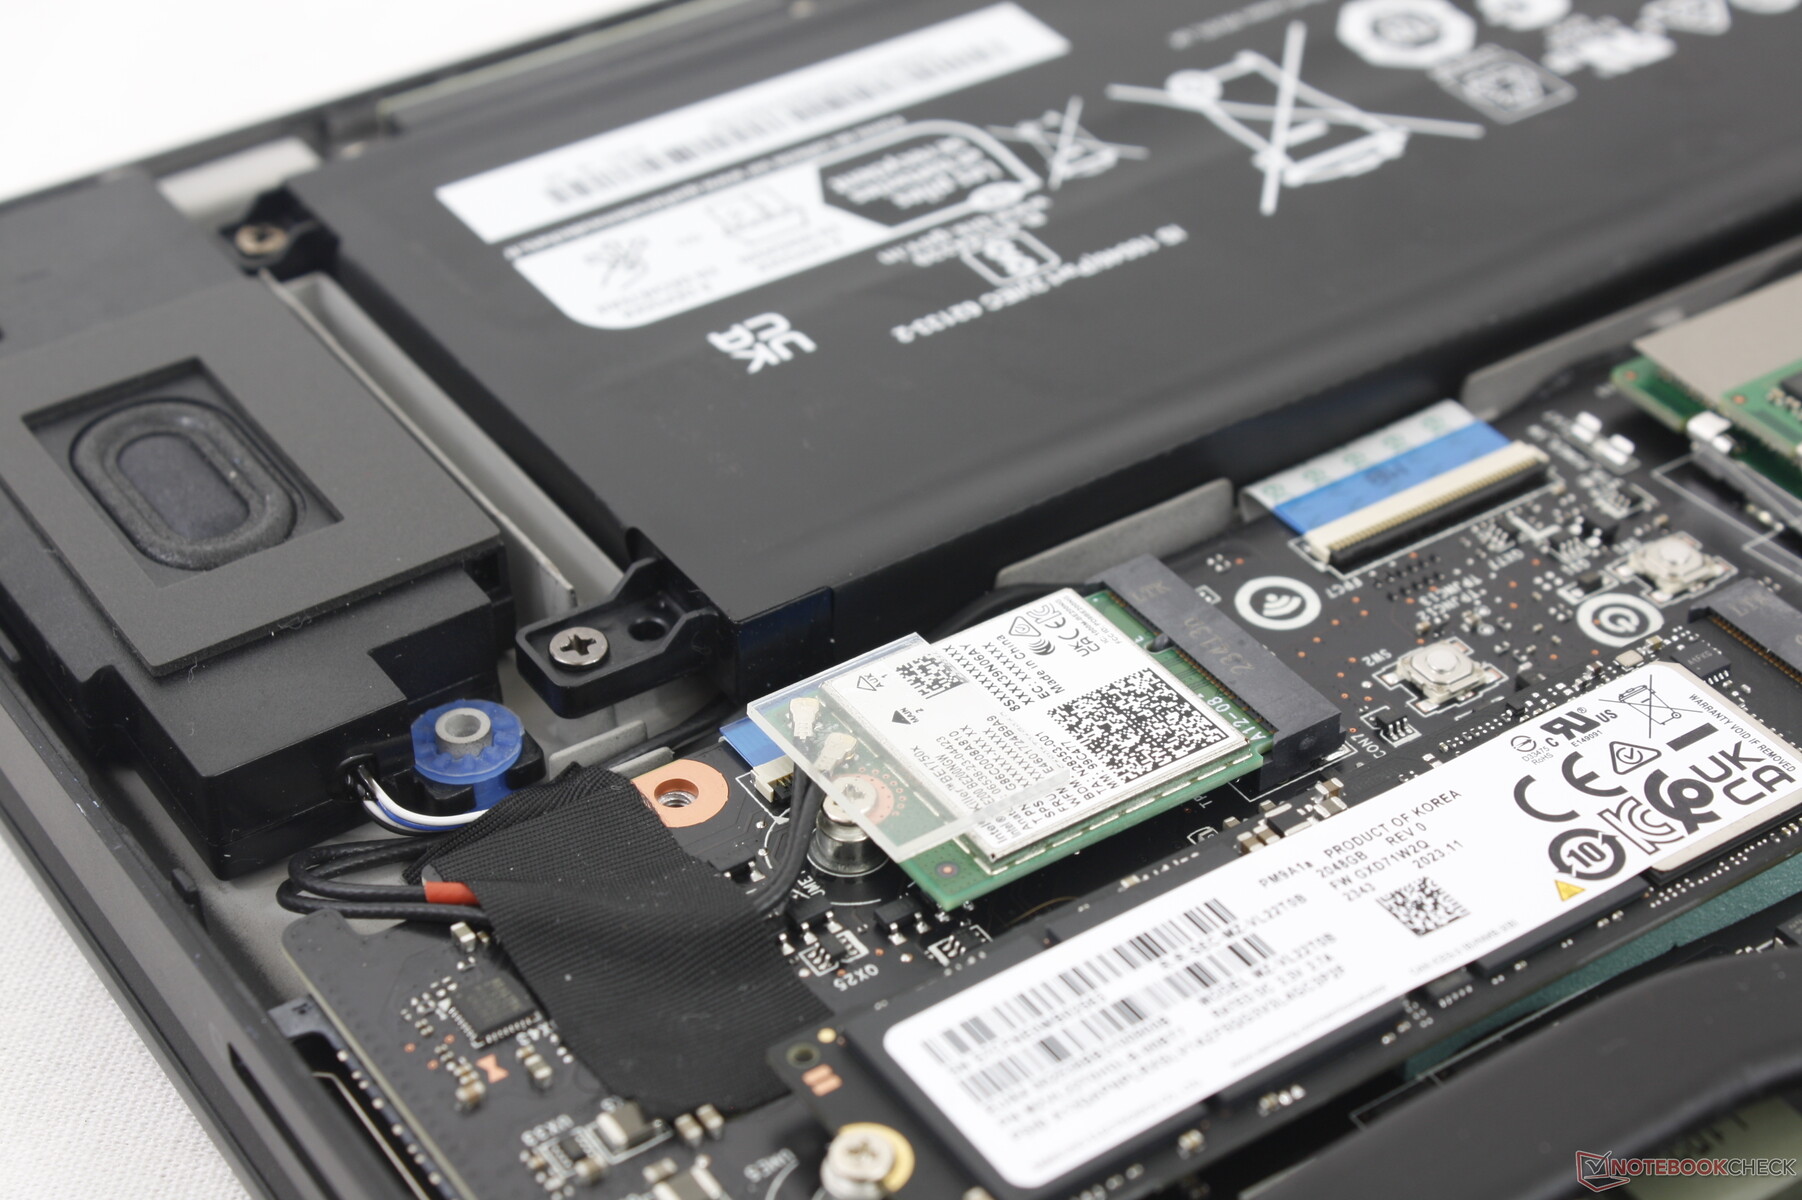
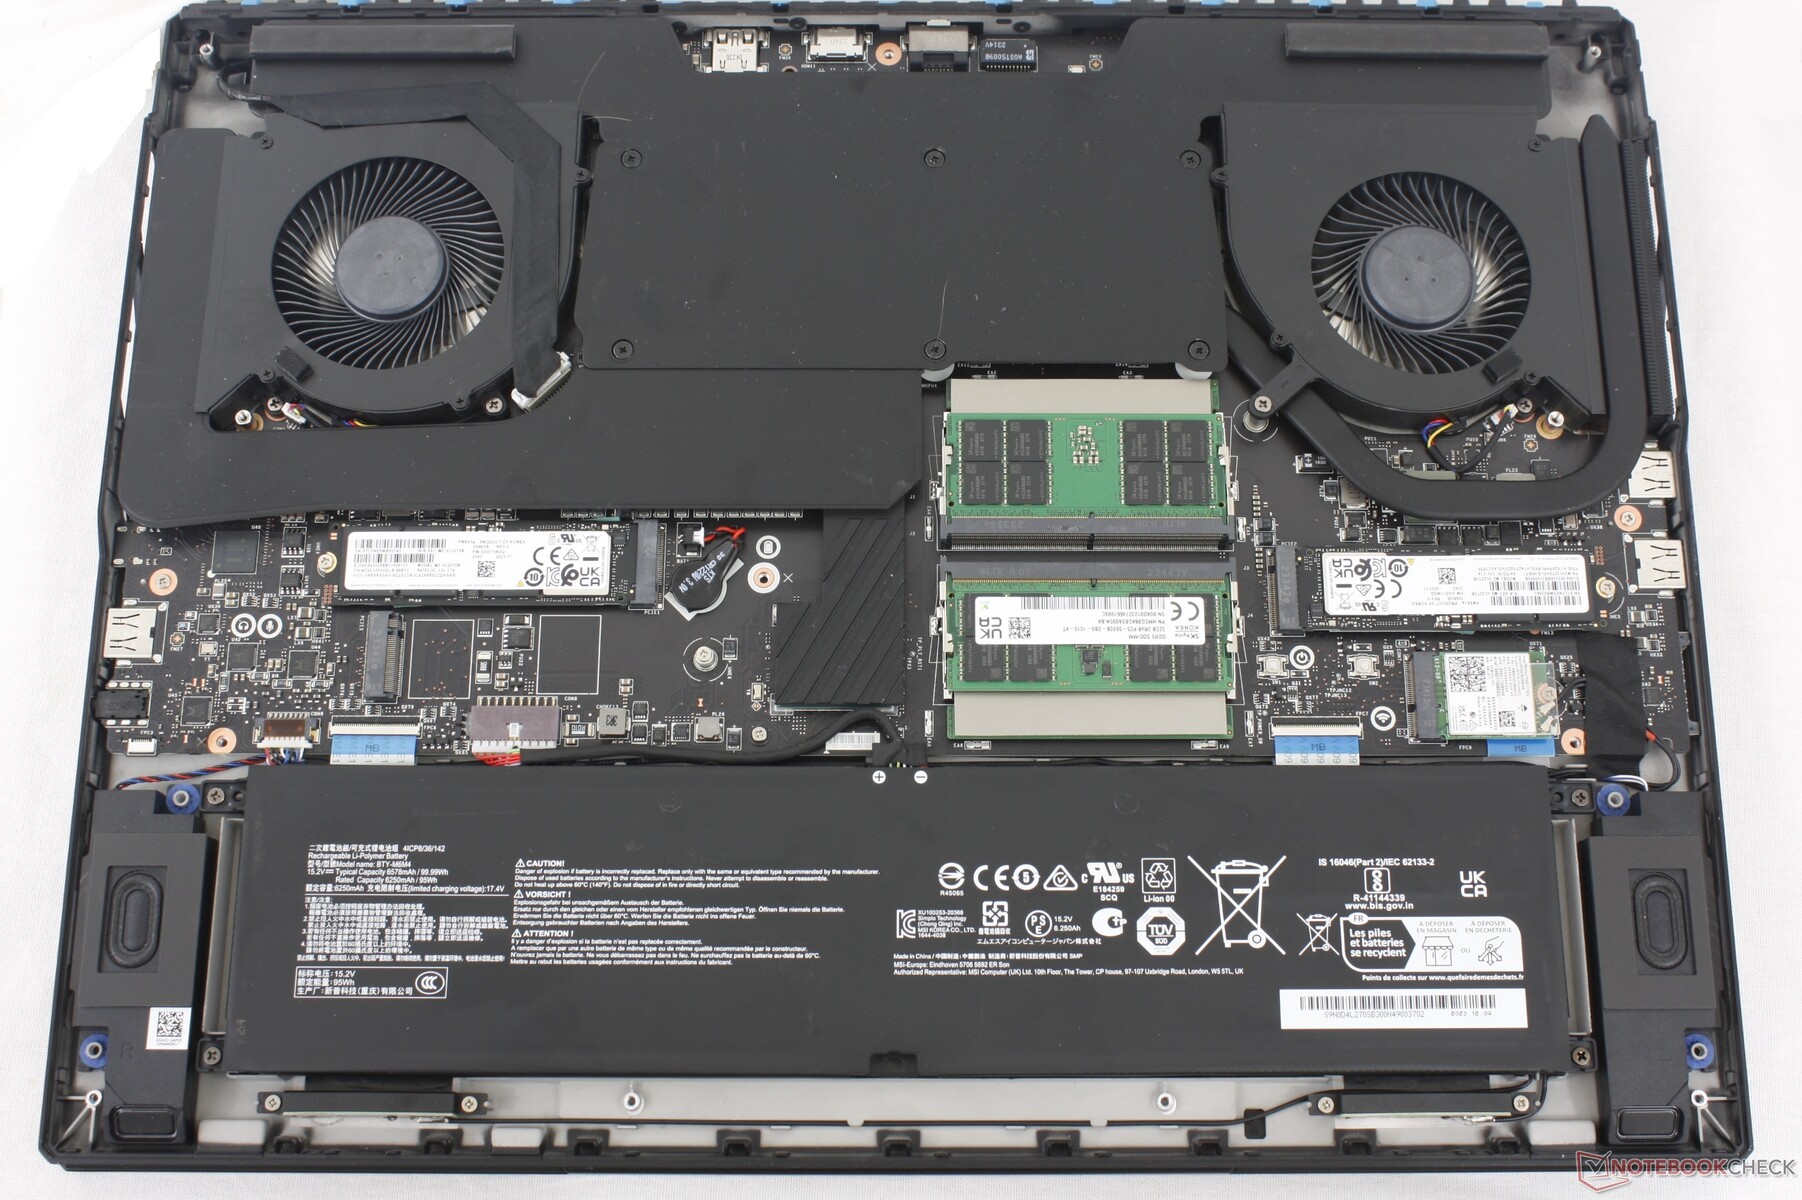
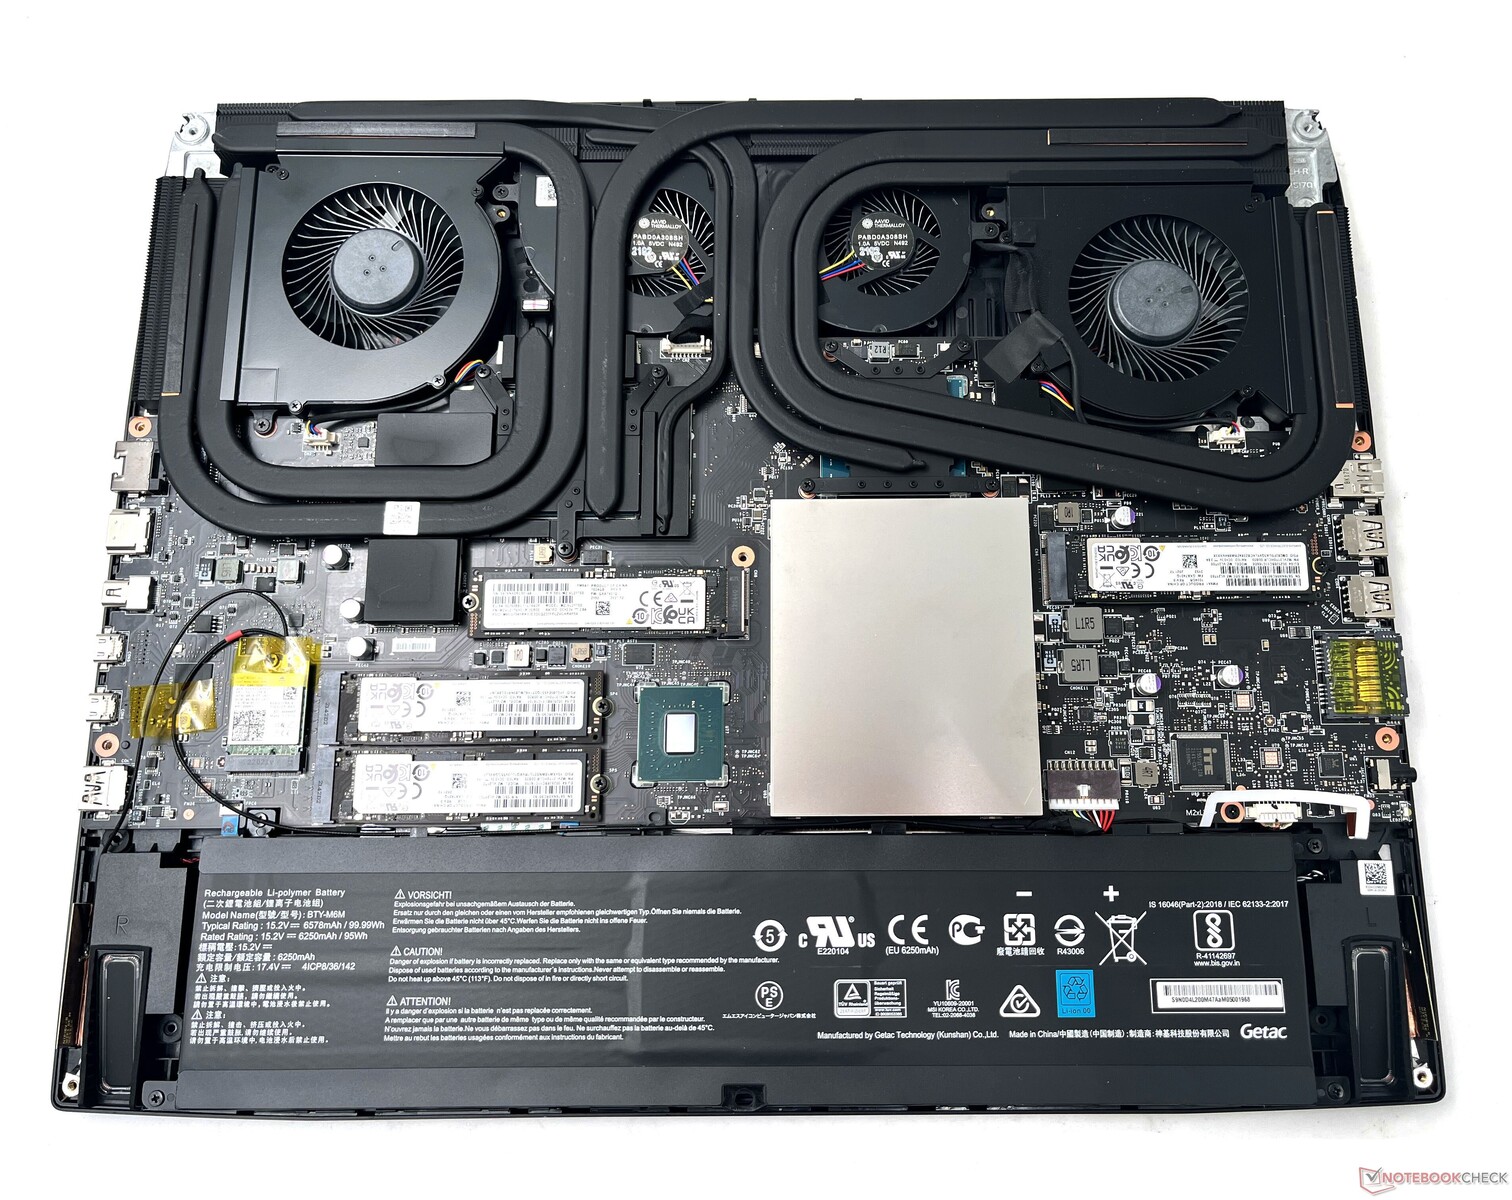
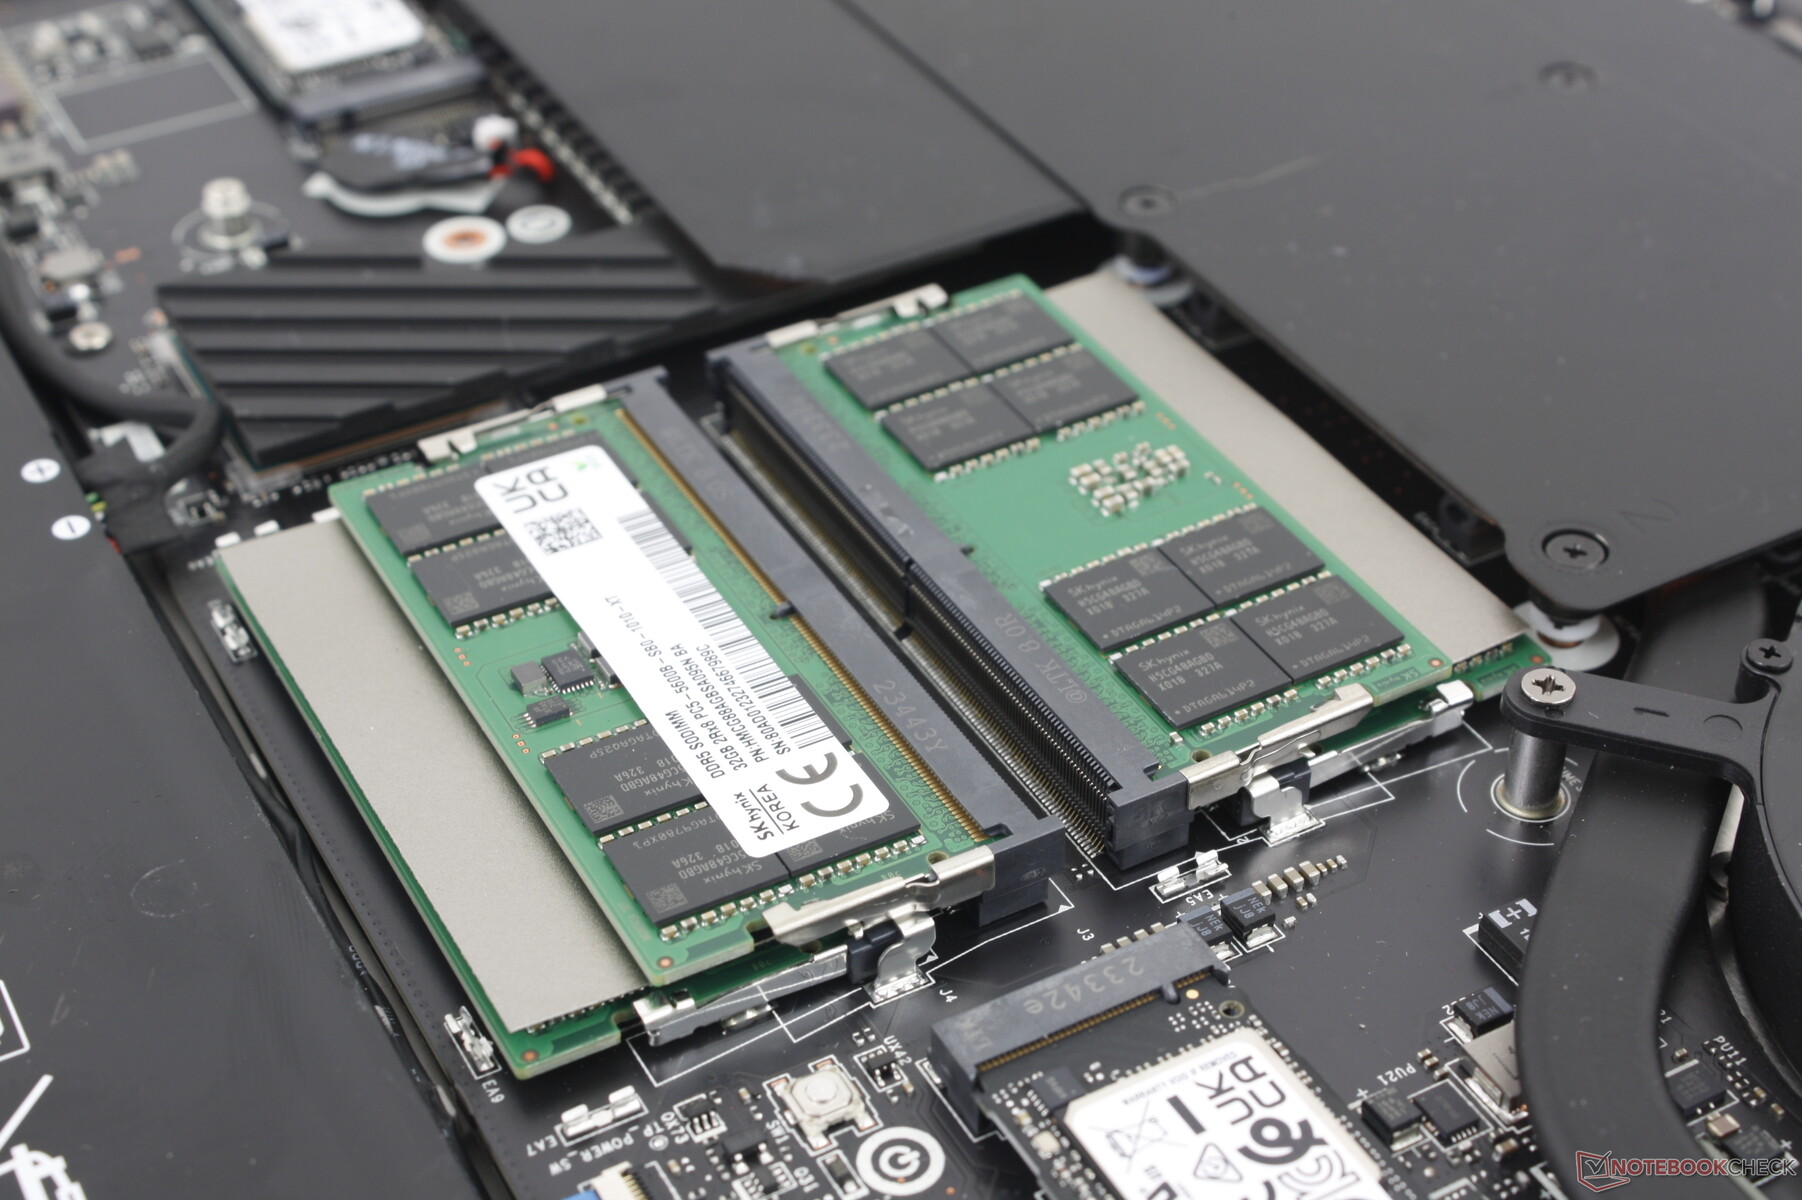
Po wejściu do środka, użytkownicy mają bezpośredni dostęp do 4x slotów SODIMM, 3x slotów M.2 2280 SSD (2x PCIe4 x4, 1x PCIe5 x4) oraz wyjmowanego modułu WLAN. Dla porównania, zeszłoroczny GT77 mógł obsługiwać do czterech dysków SSD, więc tym razem opcje pamięci masowej są nieco bardziej ograniczone.
Akcesoria i gwarancja
Pudełko detaliczne zawiera mysz USB (M99 Pro), aksamitną ściereczkę do czyszczenia, pamięć flash USB 256 GB i brelok Lucky the Dragon. Co dziwne, breloczek jest czarny, a nie czerwony, jak zazwyczaj przedstawiana jest maskotka.
Roczna ograniczona gwarancja producenta jest standardem w przypadku zakupu w USA.
Urządzenia wejściowe - wygodne i klikające klawisze
Klawiatura
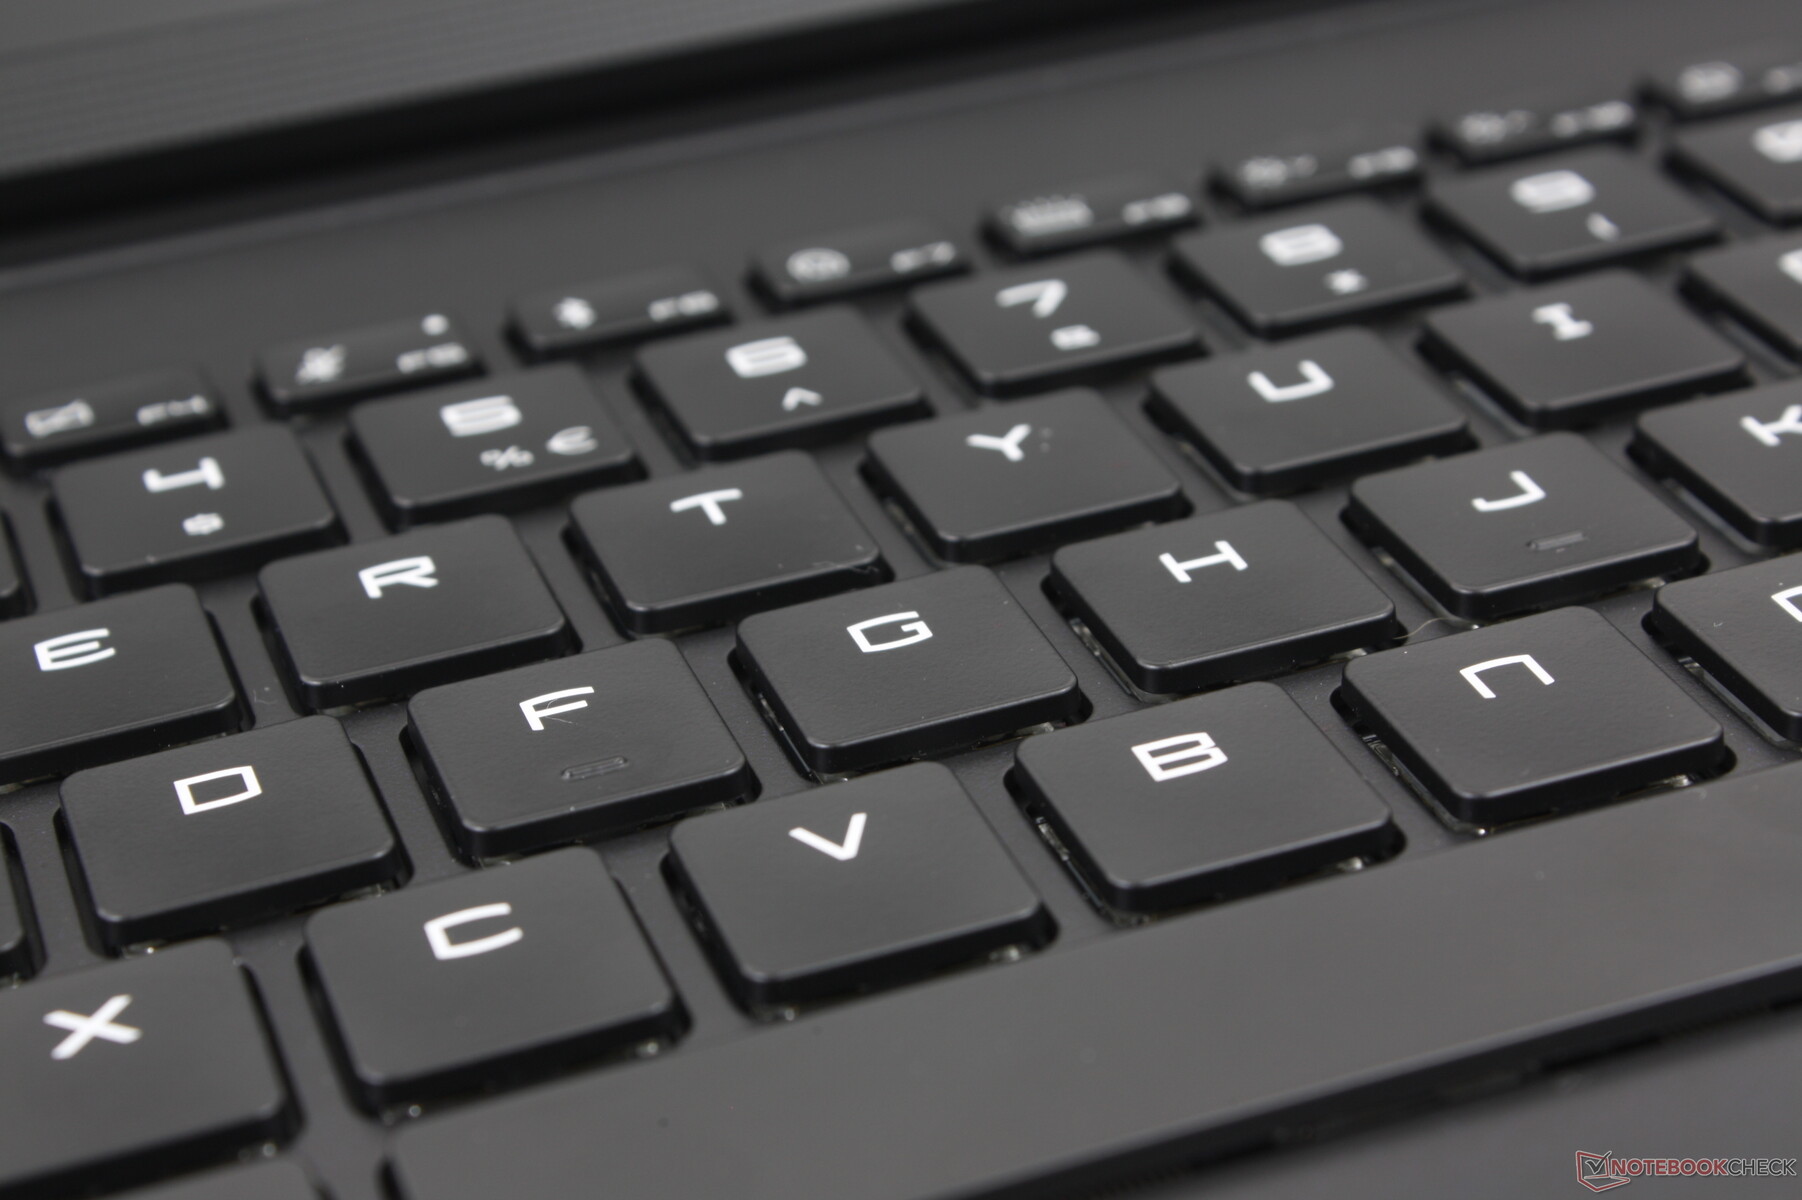
Niskoprofilowa klawiatura mechaniczna RGB Cherry jest standardem we wszystkich konfiguracjach, podobnie jak w niektórych modelach Alienware niektórych modelach Alienware. Wrażenia z pisania są jednymi z najlepszych, jakie mieliśmy na jakimkolwiek laptopie pod względem skoku i sprzężenia zwrotnego, ponieważ różnice są natychmiast zauważalne w porównaniu do standardowych klawiszy membranowych. Główną wadą jest oczywiście głośniejszy i wysoki stukot, szczególnie podczas naciskania klawiszy Enter i Spacja. Zdecydowanie nie jest to klawiatura, której chcieliby Państwo używać w salach lekcyjnych lub bibliotekach.
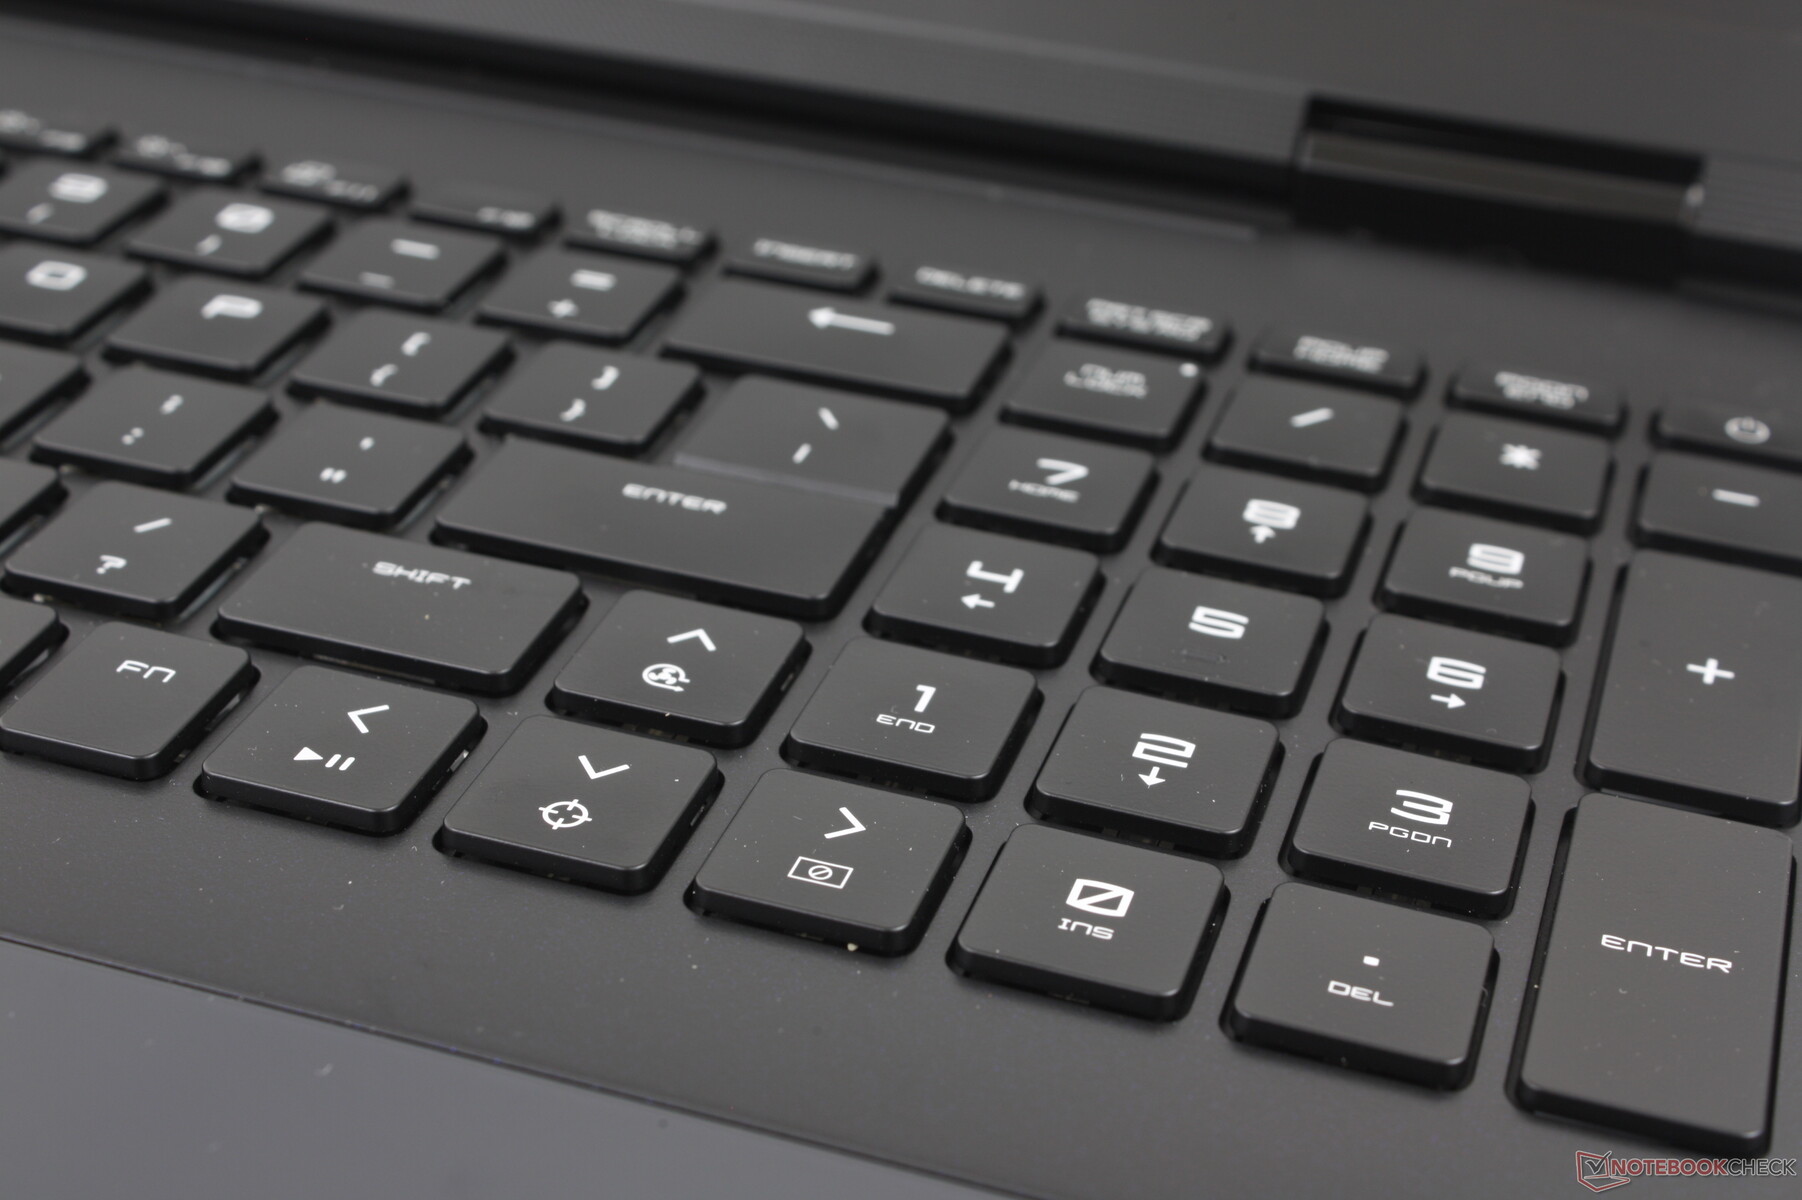
Niestety, nie wszystkie klawisze w Titan 18 HX są mechaniczne. Klawiatura numeryczna i klawisze strzałek są oparte na membranach, dzięki czemu są bardziej miękkie i ciche po naciśnięciu.
Panel dotykowy
Clickpad o wymiarach 13 x 8,2 cm jest podświetlany RGB, podobnie jak w niektórych modelach Alienware. Różnica polega jednak na tym, że clickpad MSI jest całkowicie zlicowany z otaczającymi go podpórkami pod nadgarstki, co zapewnia gładką i pozbawioną przejść powierzchnię od krawędzi do krawędzi. Takie podejście jest eleganckie i seksowne, ale mniej praktyczne niż tradycyjny clickpad z wyczuwalnymi krawędziami i narożnikami. Naciskanie w celu wprowadzania kliknięć myszy jest również trudniejsze i bardziej zawodne, zwłaszcza w przypadku wprowadzania wielodotykowego, takiego jak przeciąganie i upuszczanie. Standardowe opakowanie zawiera bezpłatną mysz USB, więc jasne jest, że MSI skłaniało się ku formie, a nie funkcji podczas projektowania clickpada.
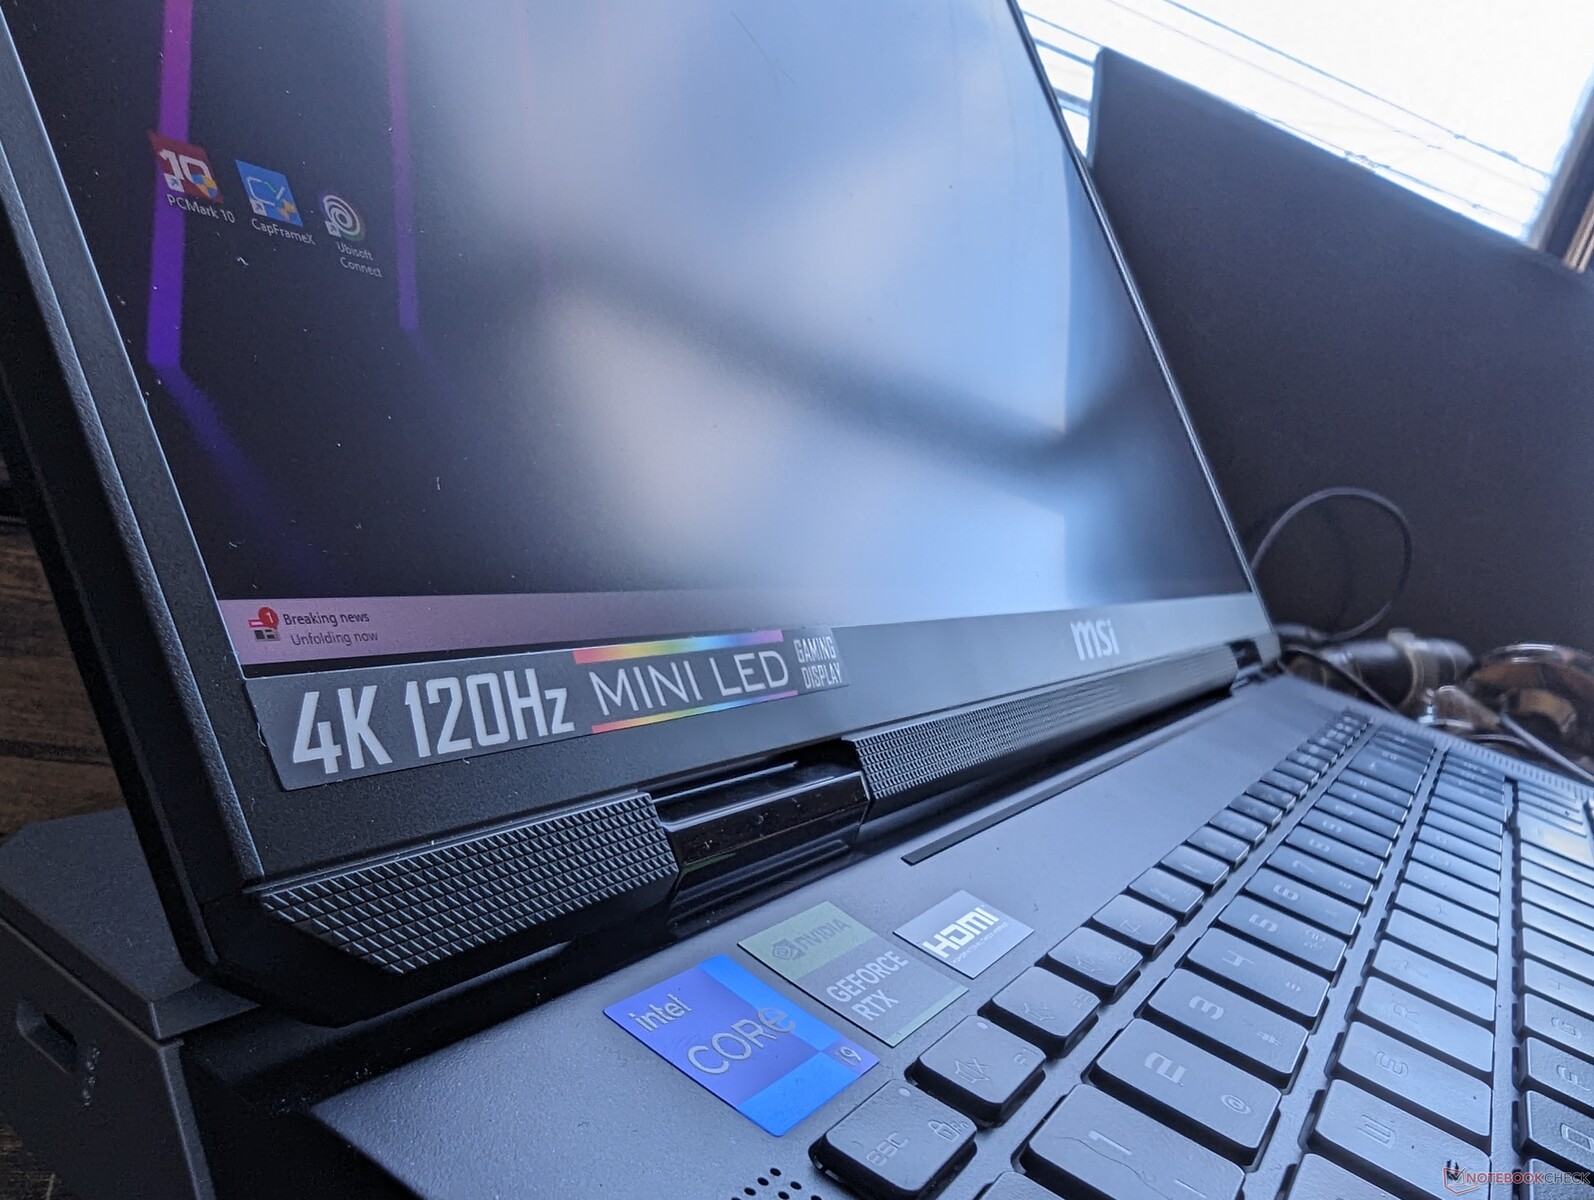
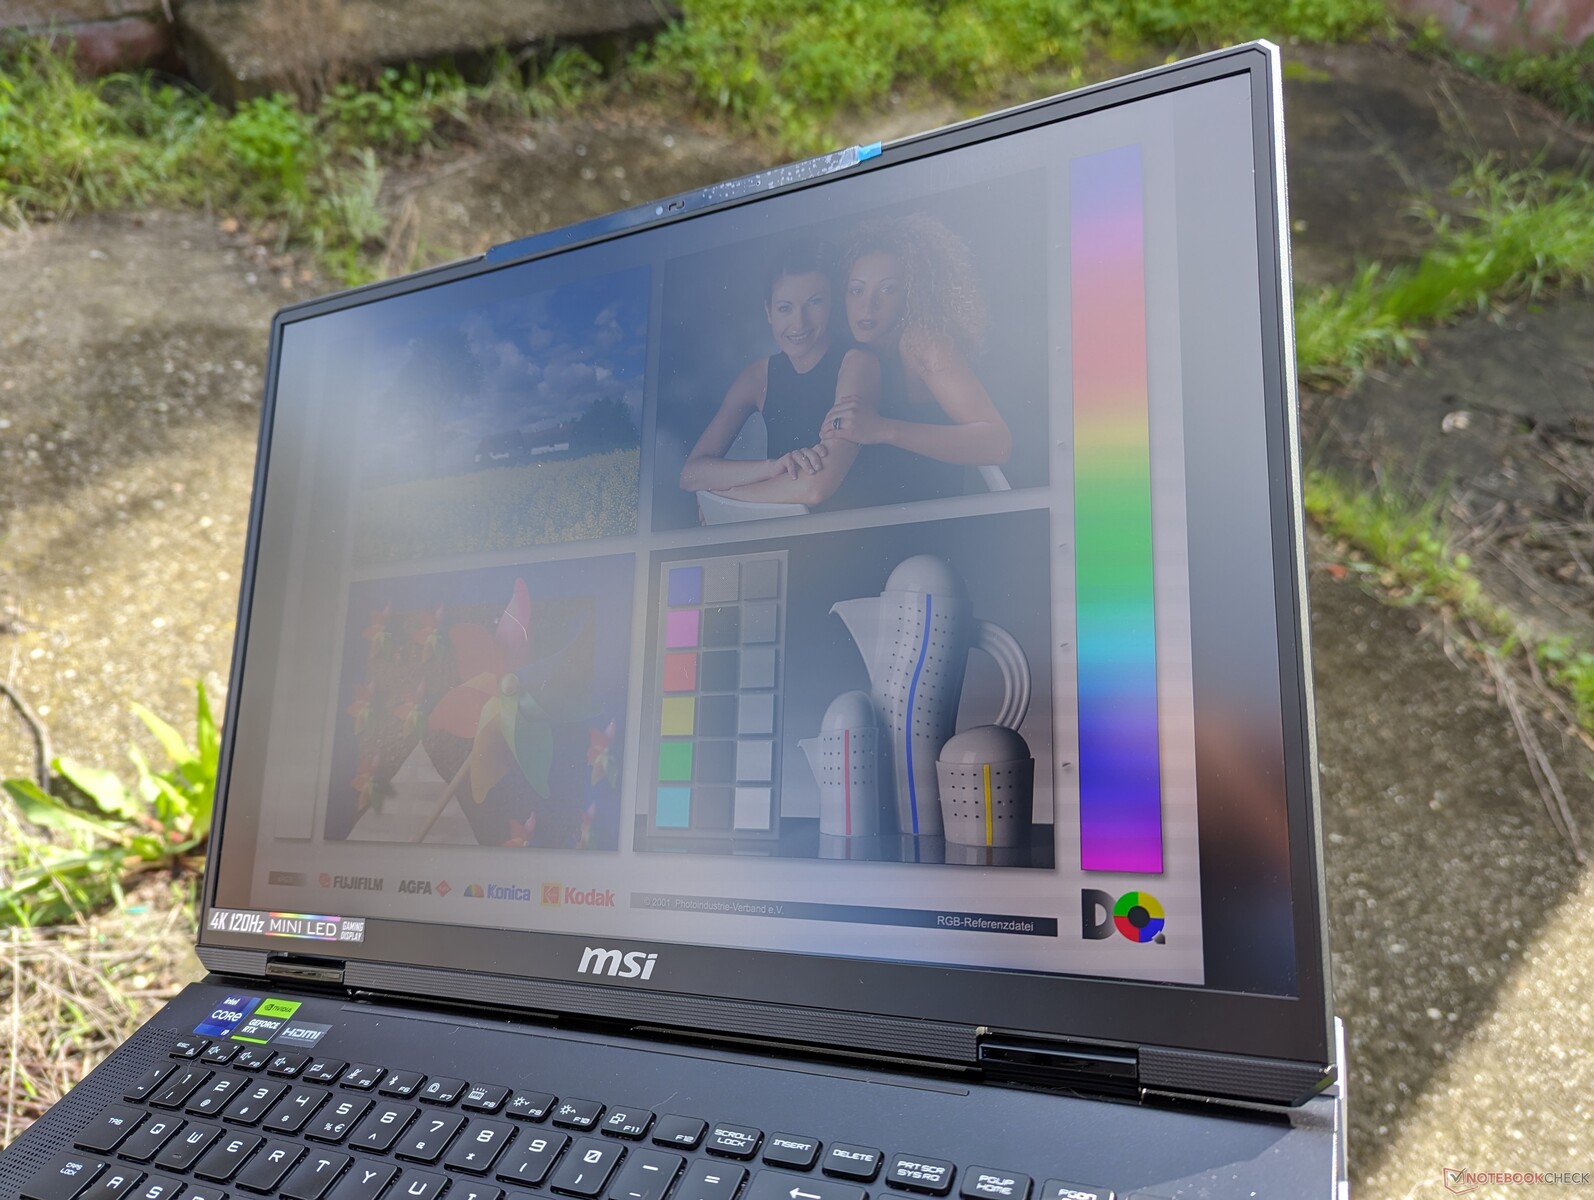
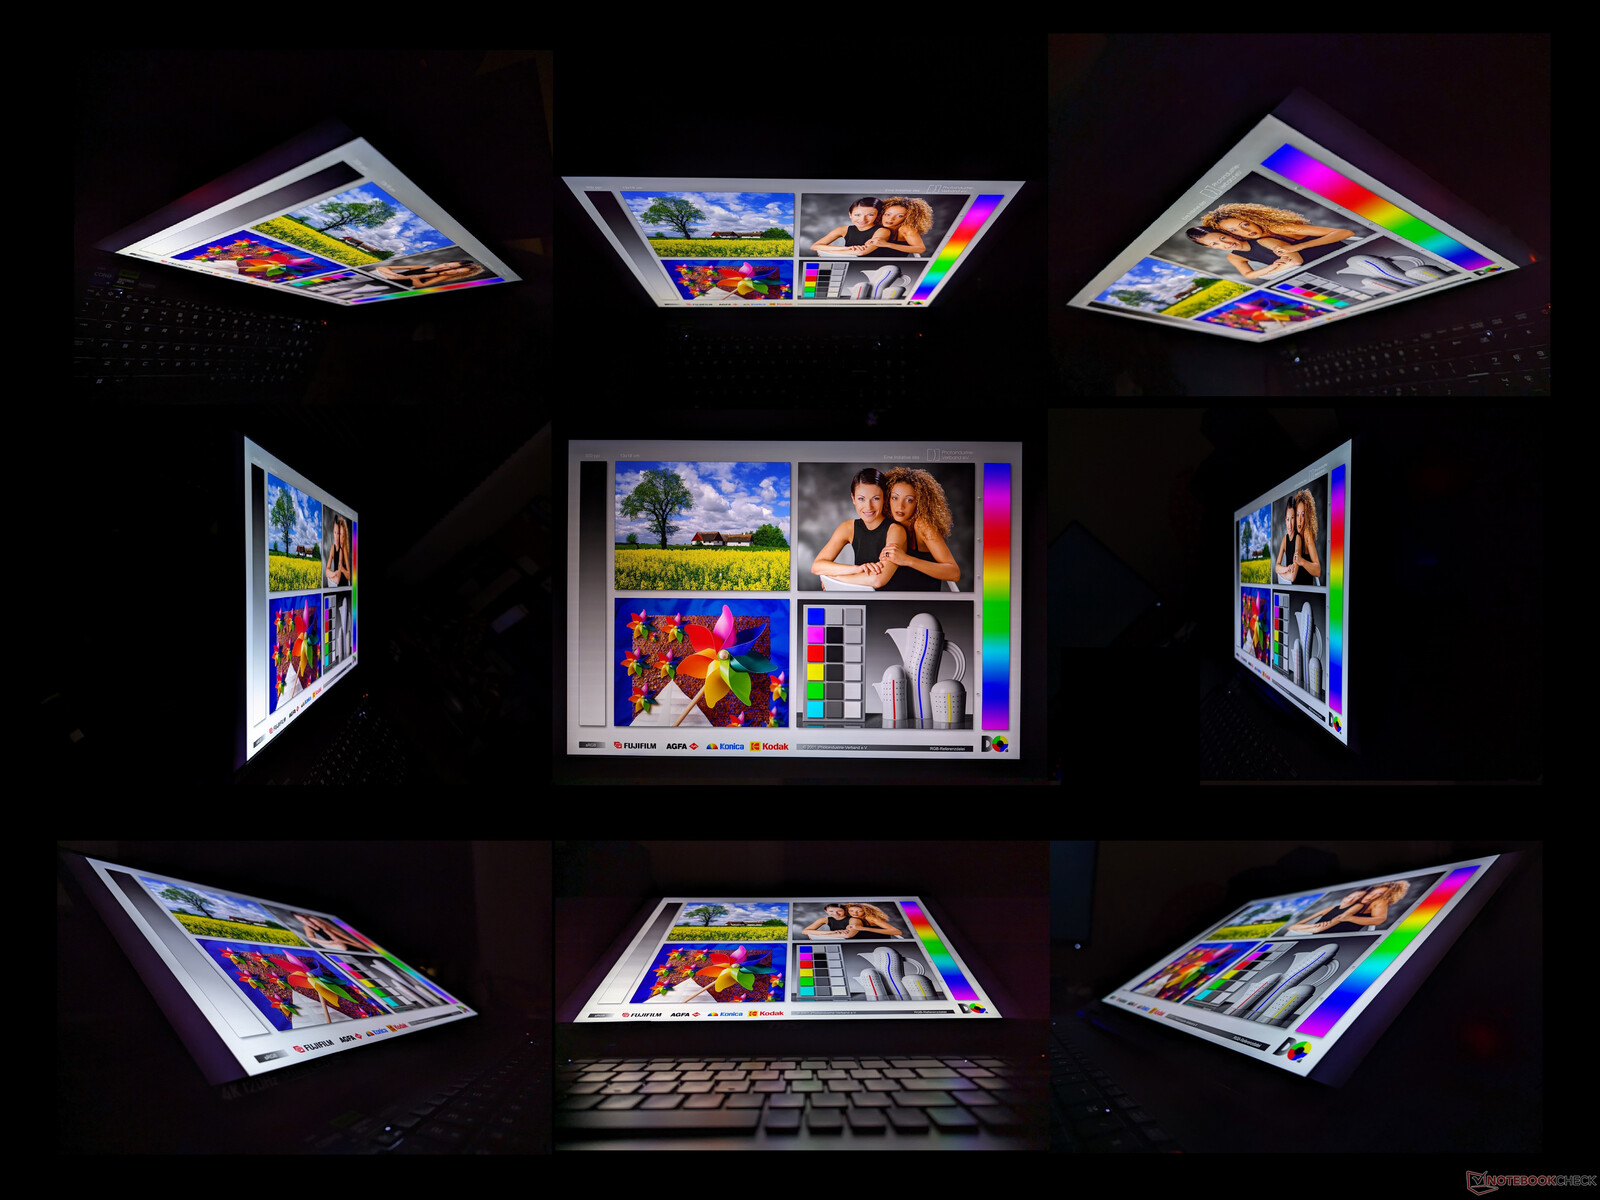
Wyświetlacz - bez wątpienia najbardziej charakterystyczna cecha Titan 18 HX
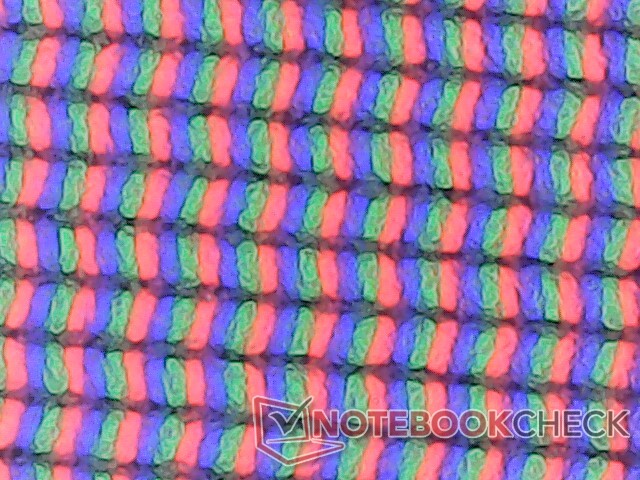
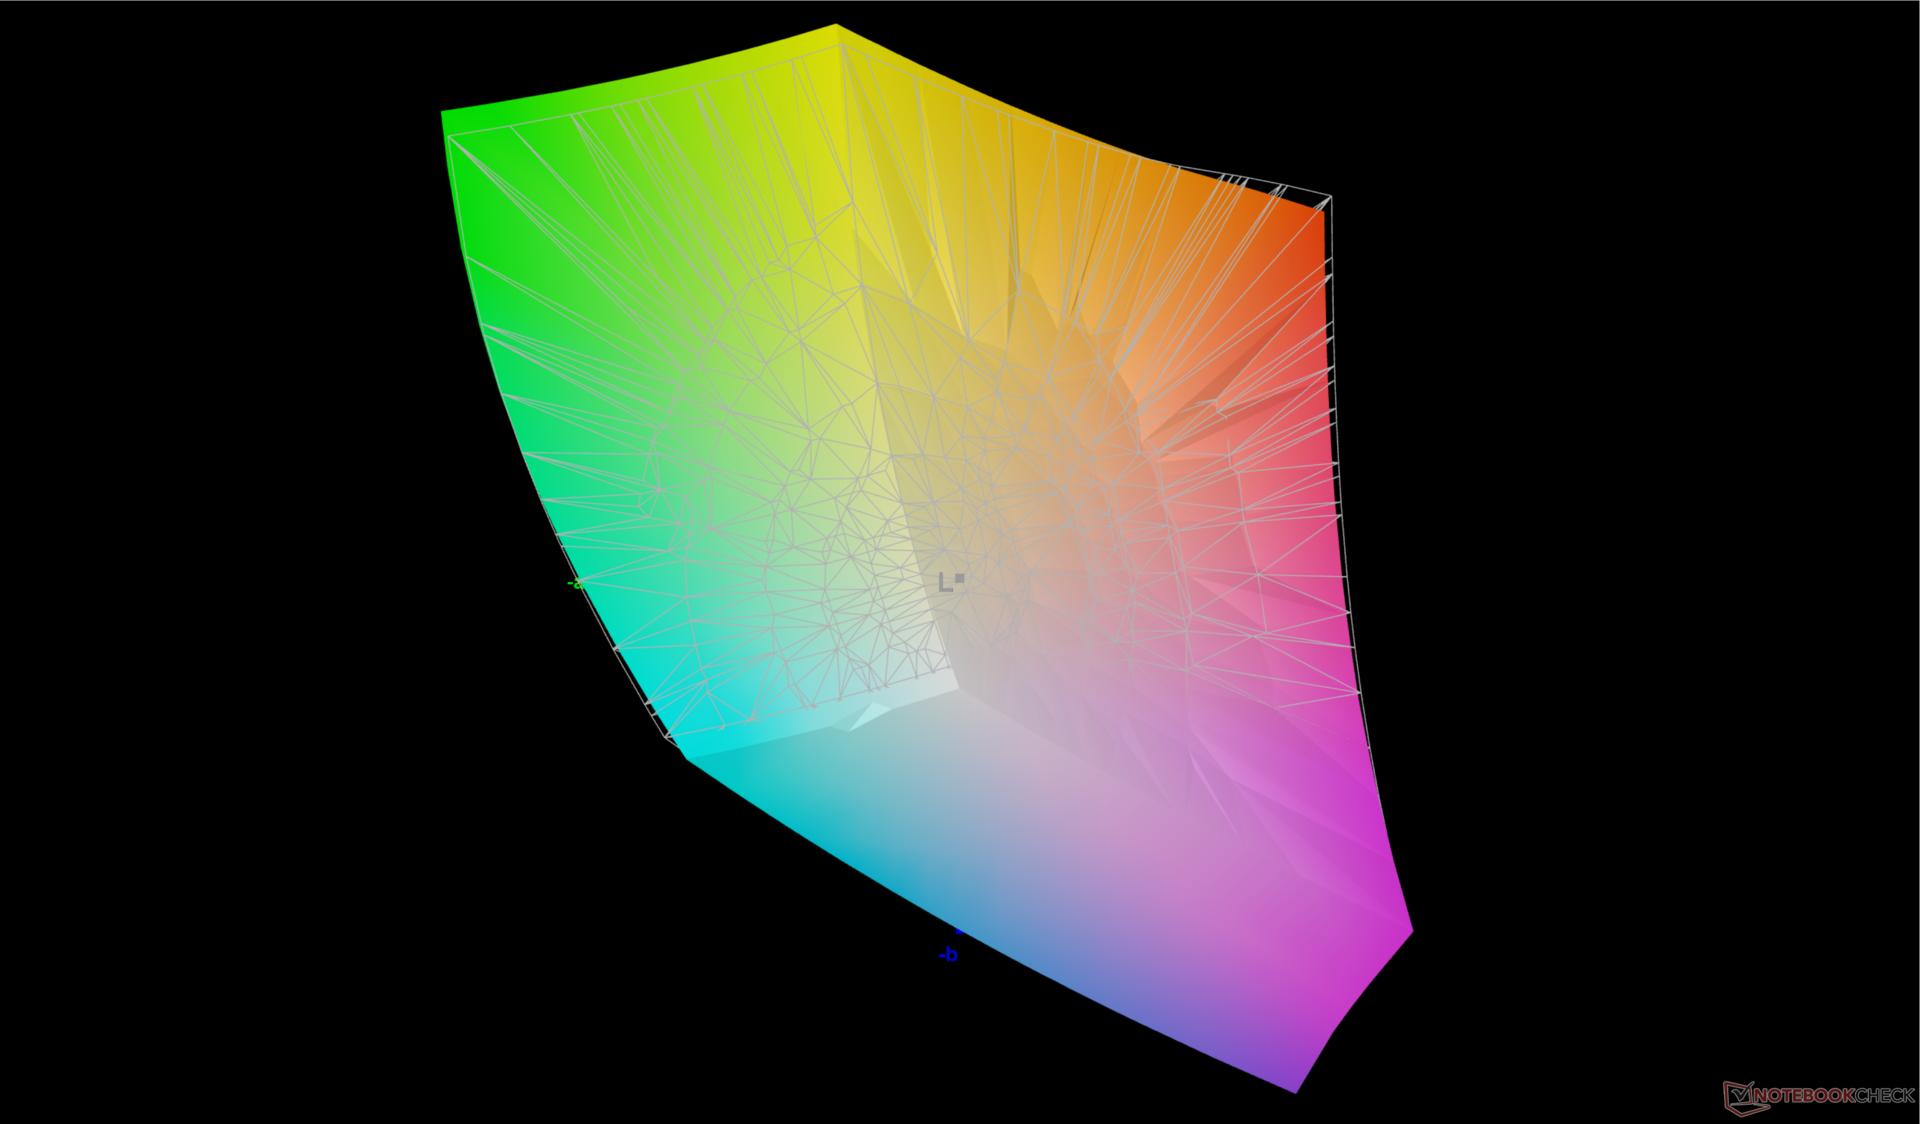
Titan 18 HX to jeden z pierwszych 18-calowych laptopów z wyświetlaczem mini-LED 4K o częstotliwości odświeżania 120 Hz. W porównaniu do IPS i OLED, panele mini-LED mogą być znacznie jaśniejsze, oferując jednocześnie podobne kolory DCI-P3 i poziomy czerni jak OLED, co zapewnia lepszą obsługę HDR. W tym przypadku wyświetlacz Titan 18 HX może osiągnąć do 1155 nitów w trybie HDR, zgodnie z naszym kolorymetrem, aby obsługiwać odtwarzanie HDR1000. W trybie SDR wyświetlacz jest ograniczony do około 470 nitów, co jest podobne do wielu paneli IPS.
Proszę pamiętać, że tryb HDR nie jest dostępny przy zasilaniu bateryjnym. Maksymalna jasność spada do zaledwie 323 nitów podczas pracy na baterii, nawet jeśli funkcja oszczędzania energii wyświetlacza jest wyłączona. Nie jesteśmy pewni, czy jest to błąd, ale spadek jasności jest z pewnością zauważalny pomiędzy zasilaniem bateryjnym i sieciowym.
Niestety, główną wadą wyświetlacza jest to, że nie obsługuje G-Sync ani zmiennej częstotliwości odświeżania (VRR). Może być również bardzo energochłonny ze względu na wysoki pułap jasności, jak pokazano w naszej sekcji Zużycie energii poniżej. Niemniej jednak wyświetlacz jest jednym z najlepszych, jakie widzieliśmy w jakimkolwiek laptopie zarówno do gier, jak i multimediów.
| |||||||||||||||||||||||||
rozświetlenie: 90 %
na akumulatorze: 323 cd/m²
kontrast: ∞:1 (czerń: 0 cd/m²)
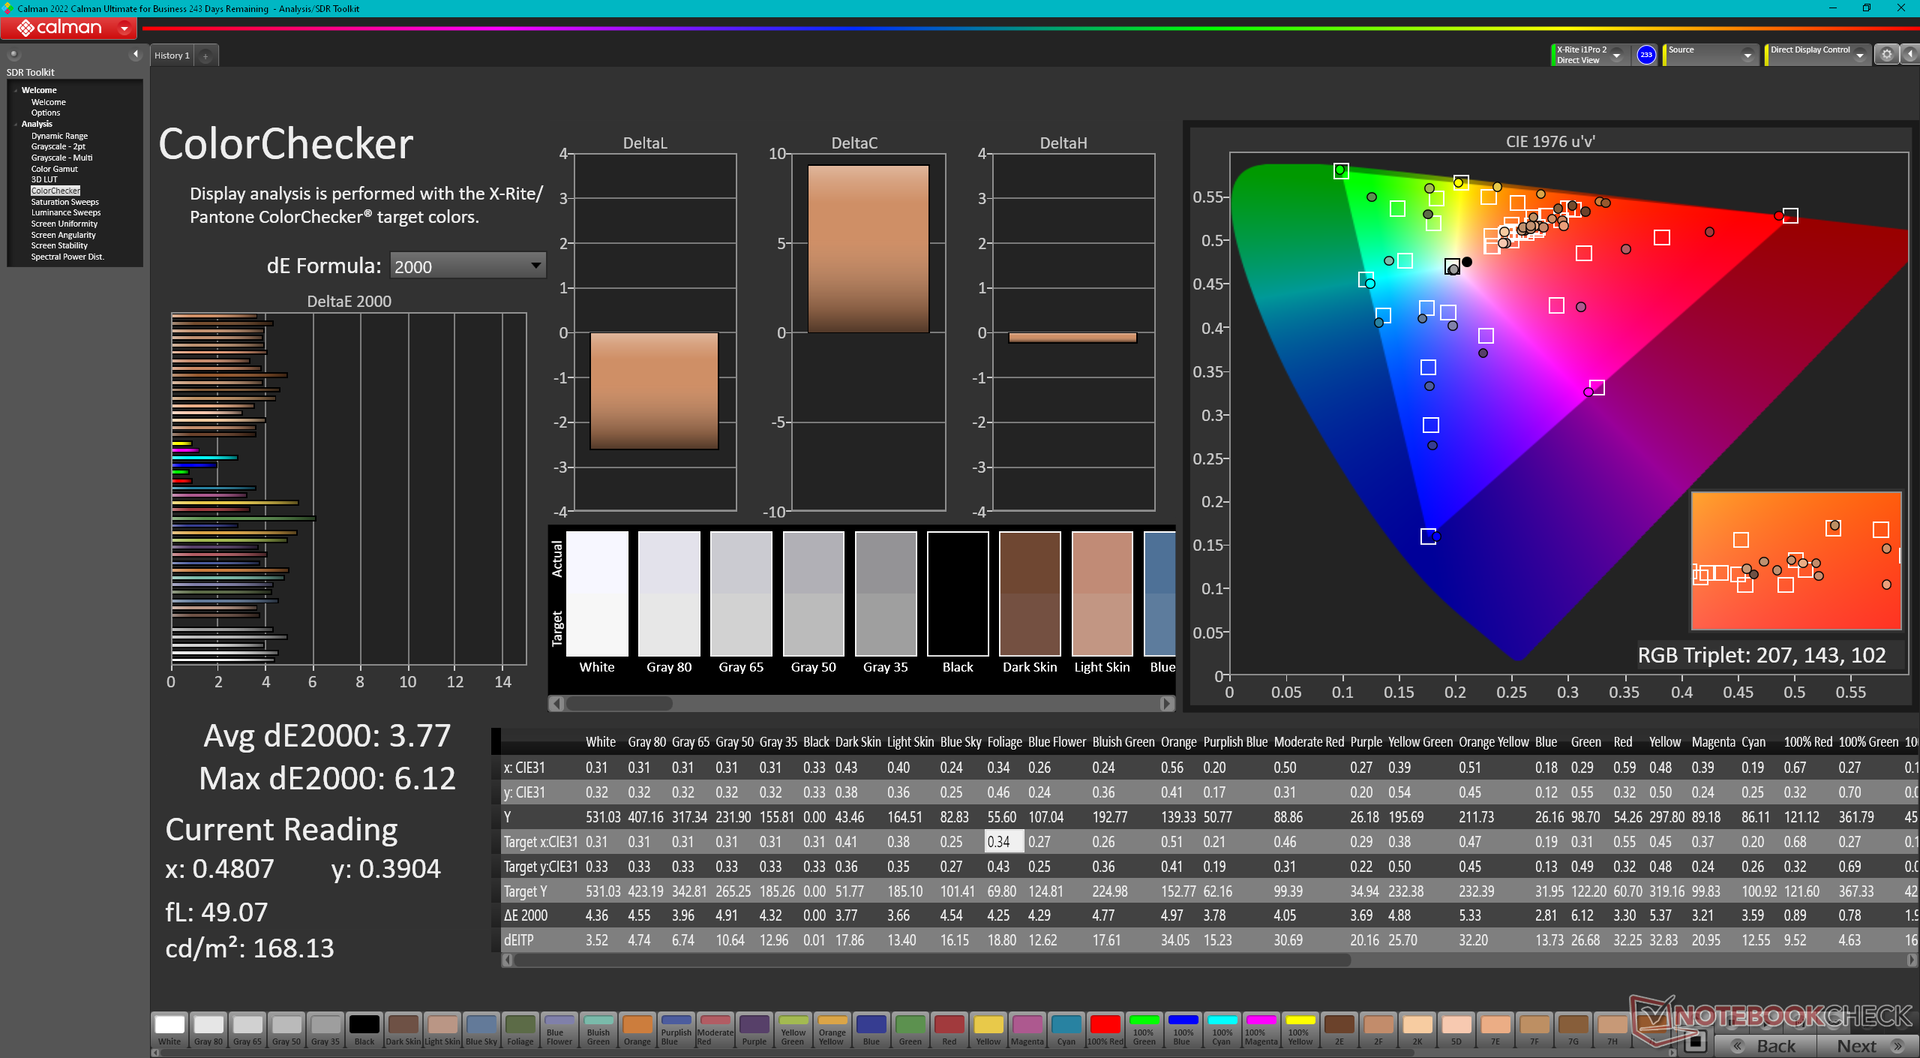
ΔE ColorChecker Calman: 3.77 | ∀{0.5-29.43 Ø4.73}
calibrated: 2.94
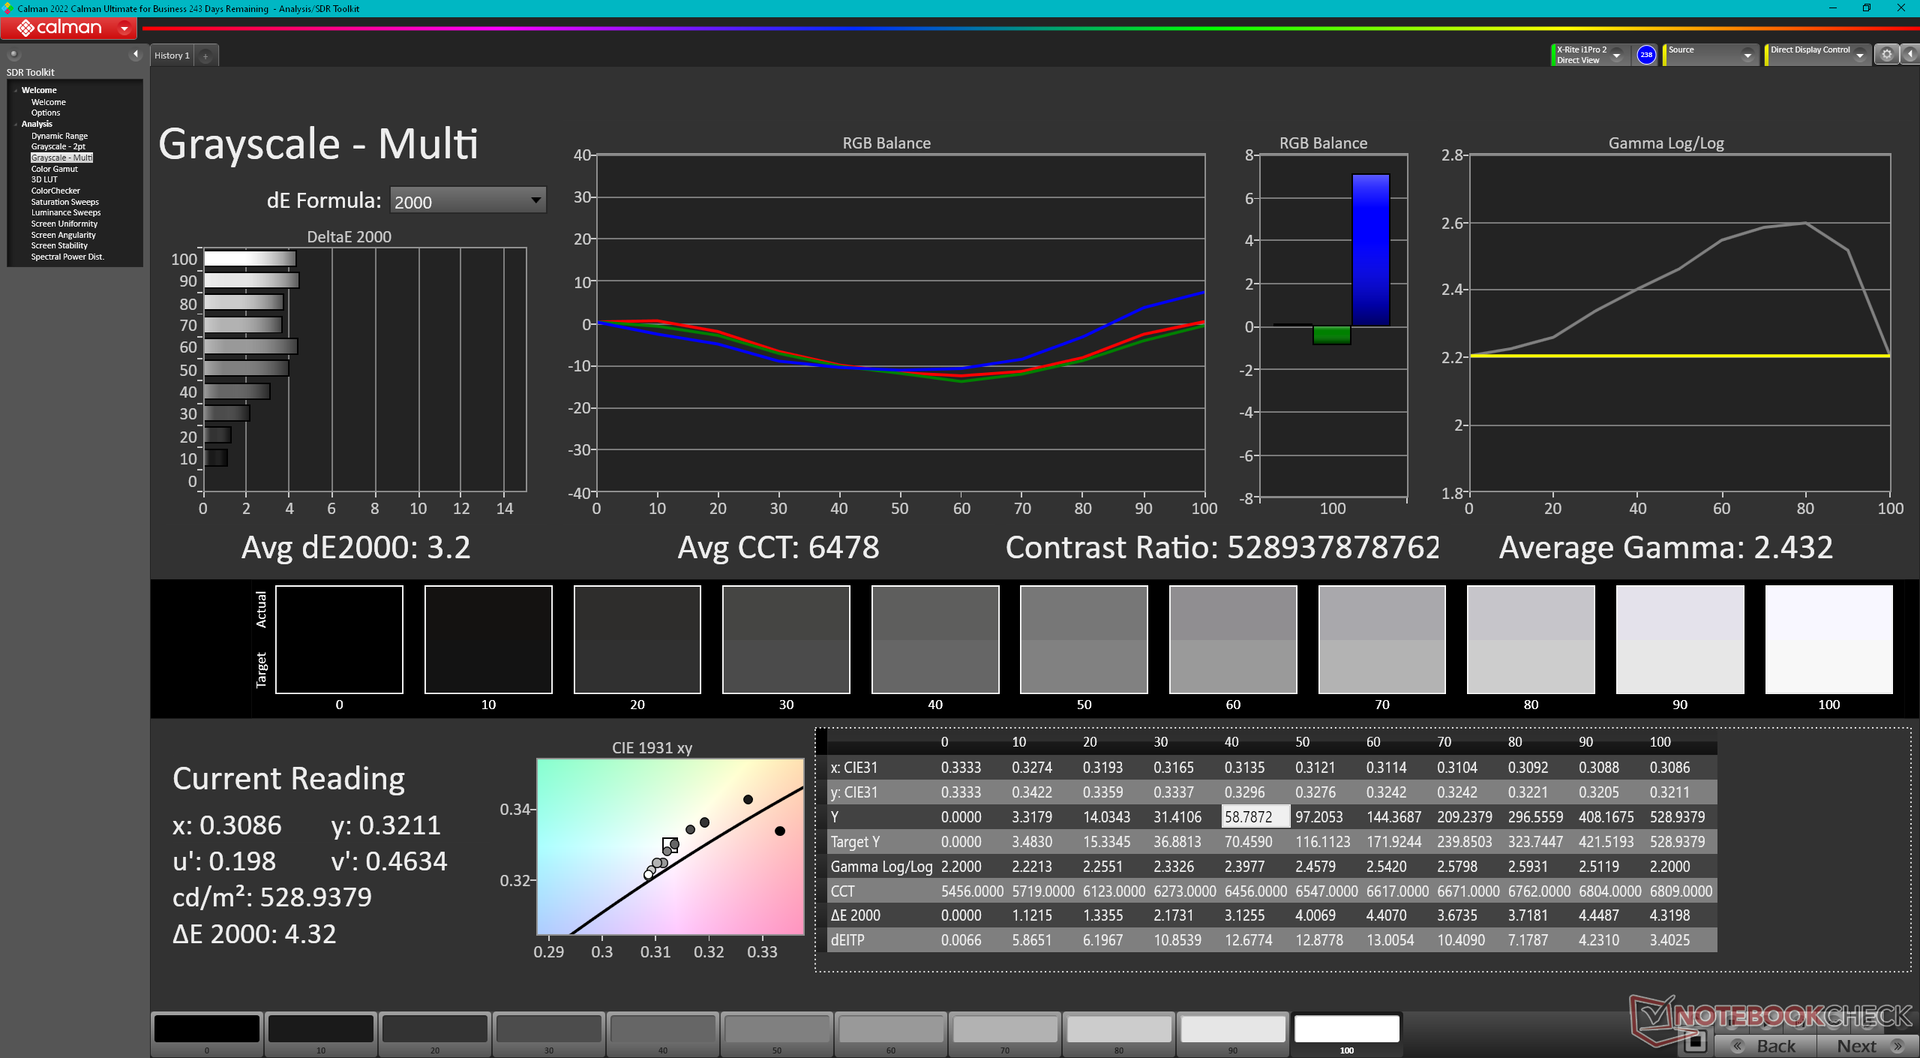
ΔE Greyscale Calman: 3.2 | ∀{0.09-98 Ø4.97}
86.2% AdobeRGB 1998 (Argyll 3D)
99.8% sRGB (Argyll 3D)
98.1% Display P3 (Argyll 3D)
Gamma: 2.43
CCT: 6478 K
| MSI Titan 18 HX A14VIG AU Optronics B180ZAN01.0, Mini-LED, 3840x2400, 18" | MSI Titan GT77 HX 13VI B173ZAN06.C, Mini-LED, 3840x2160, 17.3" | Alienware m18 R1 Chi Mei 180JME, IPS, 1920x1200, 18" | Asus ROG Strix G18 G814JI NE180QDM-NZ2 (BOE0B35), IPS, 2560x1600, 18" | Acer Predator Helios 18 N23Q2 AUO45A8 (B180QAN01.2), IPS, 2560x1600, 18" | Razer Blade 18 RTX 4070 AU Optronics B180QAN01.0, IPS, 2560x1600, 18" | |
|---|---|---|---|---|---|---|
| Display | 1% | 1% | -0% | 3% | -1% | |
| Display P3 Coverage (%) | 98.1 | 94.9 -3% | 97.7 0% | 98.1 0% | 99.8 2% | 96.9 -1% |
| sRGB Coverage (%) | 99.8 | 99.9 0% | 100 0% | 99.9 0% | 100 0% | 99.8 0% |
| AdobeRGB 1998 Coverage (%) | 86.2 | 92.4 7% | 89.8 4% | 85.6 -1% | 91.8 6% | 85.3 -1% |
| Response Times | -140% | 77% | 62% | 45% | 71% | |
| Response Time Grey 50% / Grey 80% * (ms) | 8.6 ? | 38.4 ? -347% | 3 ? 65% | 5.6 ? 35% | 7.6 ? 12% | 4.2 ? 51% |
| Response Time Black / White * (ms) | 81.8 ? | 26.6 ? 67% | 9.9 ? 88% | 9 ? 89% | 17.8 ? 78% | 8 ? 90% |
| PWM Frequency (Hz) | 2592 ? | 2380 ? | 2509 | |||
| Screen | -9% | 28% | 21% | -14% | 11% | |
| Brightness middle (cd/m²) | 467.5 | 606 30% | 372.8 -20% | 471 1% | 360 -23% | 549.6 18% |
| Brightness (cd/m²) | 459 | 602 31% | 367 -20% | 422 -8% | 355 -23% | 524 14% |
| Brightness Distribution (%) | 90 | 93 3% | 97 8% | 83 -8% | 92 2% | 89 -1% |
| Black Level * (cd/m²) | 0.0001 | 0.32 | 0.47 | 0.21 | 0.53 | |
| Colorchecker dE 2000 * | 3.77 | 4.8 -27% | 1.92 49% | 2.05 46% | 3.82 -1% | 3.32 12% |
| Colorchecker dE 2000 max. * | 6.12 | 8.2 -34% | 3.65 40% | 4.15 32% | 7.38 -21% | 6.63 -8% |
| Colorchecker dE 2000 calibrated * | 2.94 | 1.8 39% | 0.51 83% | 0.8 73% | 2.24 24% | 2.7 8% |
| Greyscale dE 2000 * | 3.2 | 6.5 -103% | 1.5 53% | 2.8 13% | 5.06 -58% | 2 37% |
| Gamma | 2.43 91% | 2.63 84% | 2.34 94% | 2.204 100% | 2.52 87% | 2.29 96% |
| CCT | 6478 100% | 6596 99% | 6607 98% | 7122 91% | 5657 115% | 6319 103% |
| Contrast (:1) | 6060000 | 1165 | 1002 | 1714 | 1037 | |
| Całkowita średnia (program / ustawienia) | -49% /
-28% | 35% /
29% | 28% /
23% | 11% /
-0% | 27% /
18% |
* ... im mniej tym lepiej
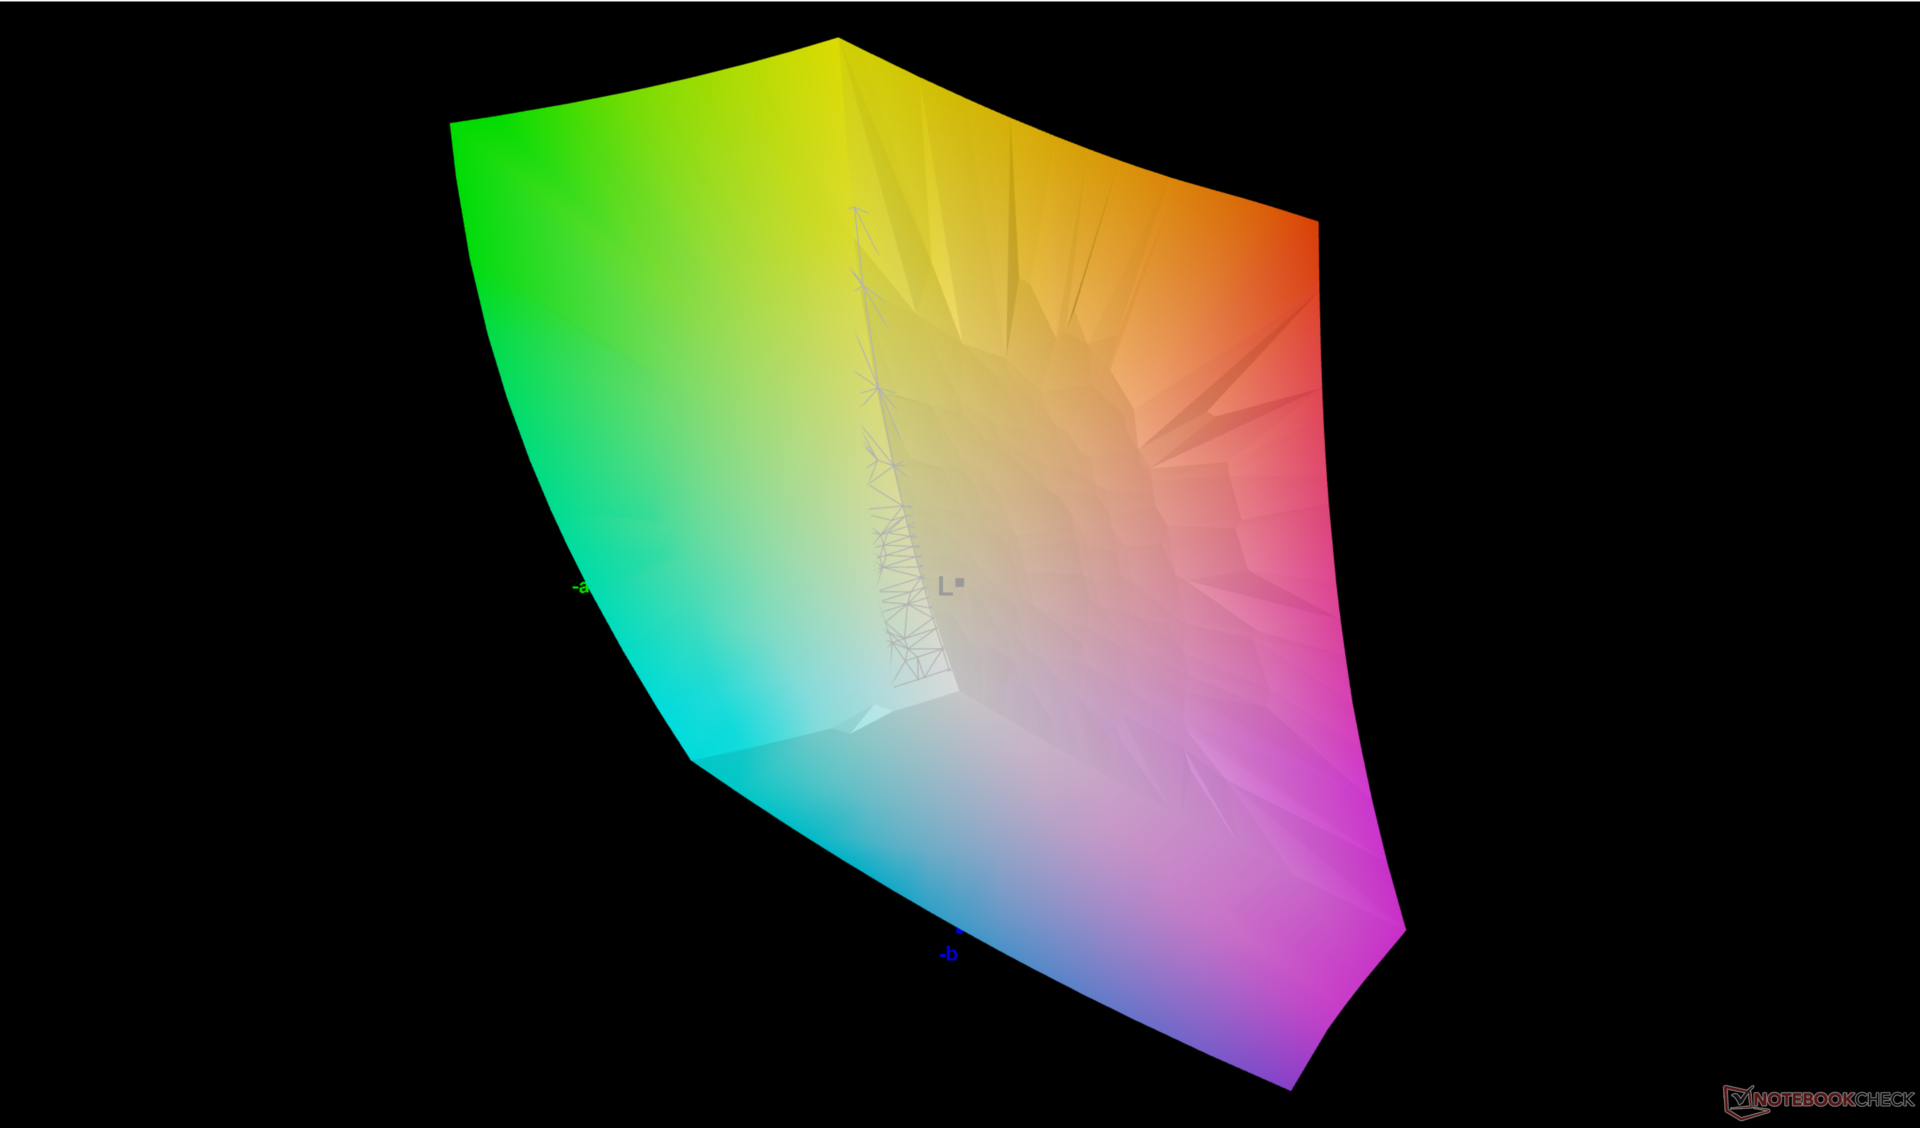
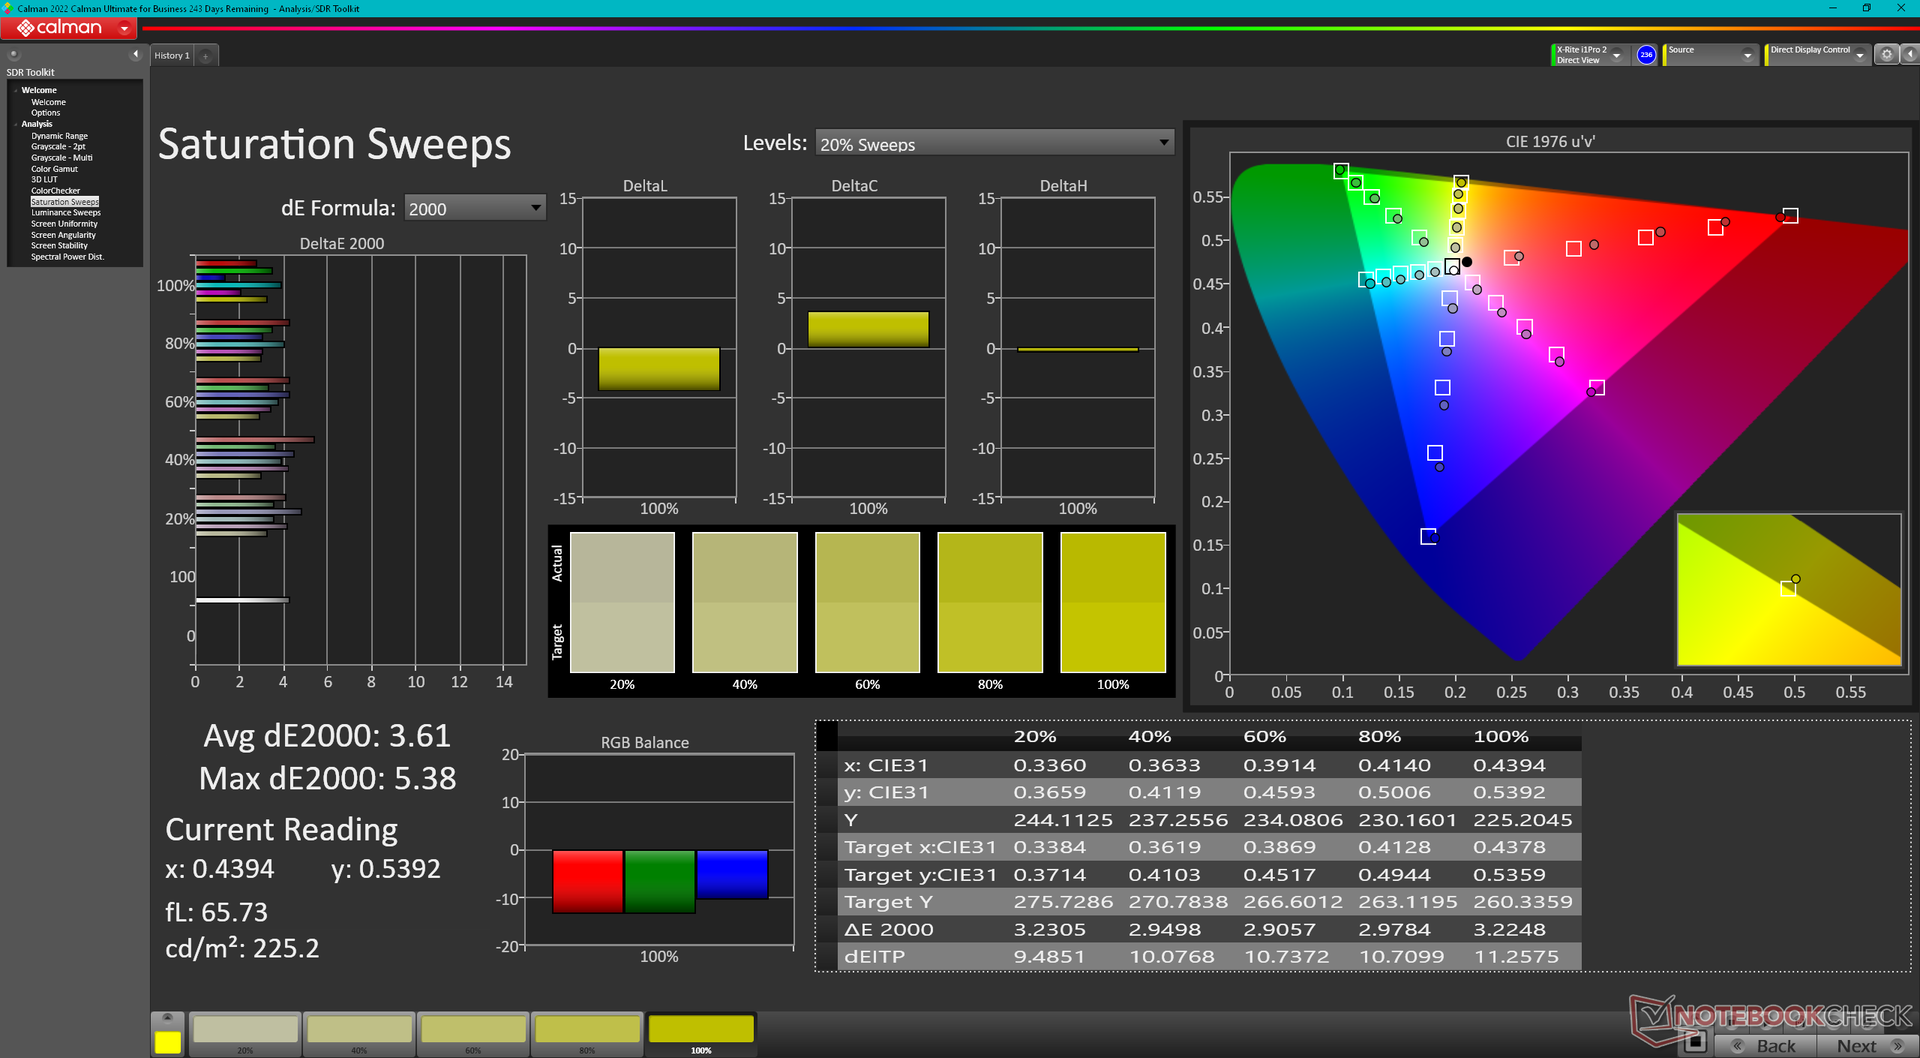
MSI nie reklamuje żadnych wysiłków związanych z kalibracją Pantone, pomimo wysokiej ceny wywoławczej Titan. Średnie wartości deltaE dla skali szarości i kolorów są jednak nadal bardzo dobre i wynoszą odpowiednio 3,2 i 3,77.
Wyświetl czasy reakcji
| ↔ Czas reakcji od czerni do bieli | ||
|---|---|---|
| 81.8 ms ... wzrost ↗ i spadek ↘ łącznie | ↗ 76 ms wzrost | 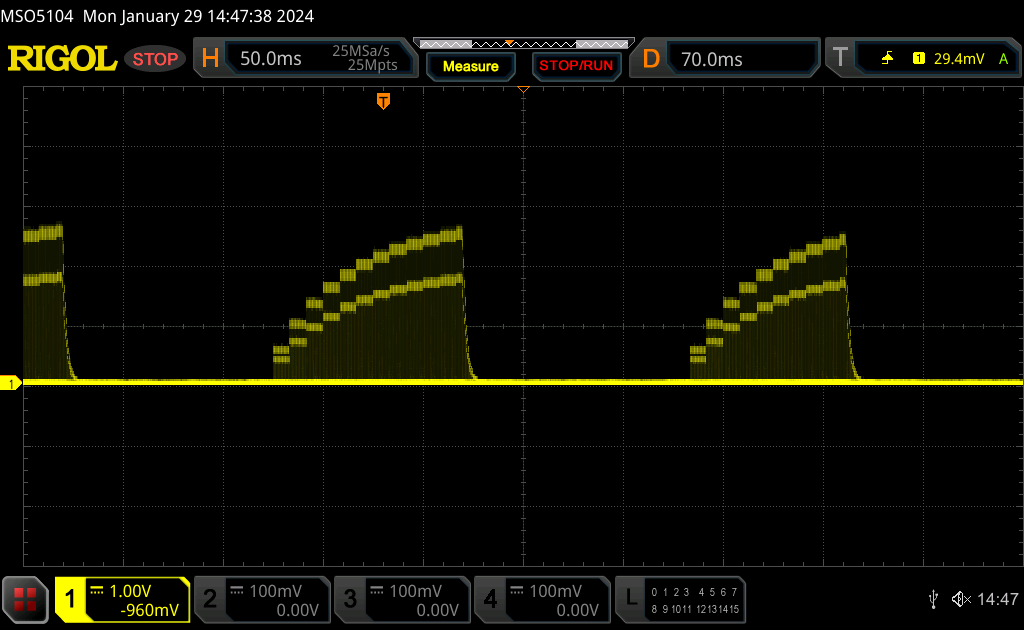 |
| ↘ 5.8 ms upadek | ||
| W naszych testach ekran wykazuje powolne tempo reakcji, co będzie niezadowalające dla graczy. Dla porównania, wszystkie testowane urządzenia wahają się od 0.1 (minimum) do 240 (maksimum) ms. » 100 % wszystkich urządzeń jest lepszych. Oznacza to, że zmierzony czas reakcji jest gorszy od średniej wszystkich testowanych urządzeń (19.9 ms). | ||
| ↔ Czas reakcji 50% szarości do 80% szarości | ||
| 8.6 ms ... wzrost ↗ i spadek ↘ łącznie | ↗ 4.2 ms wzrost | 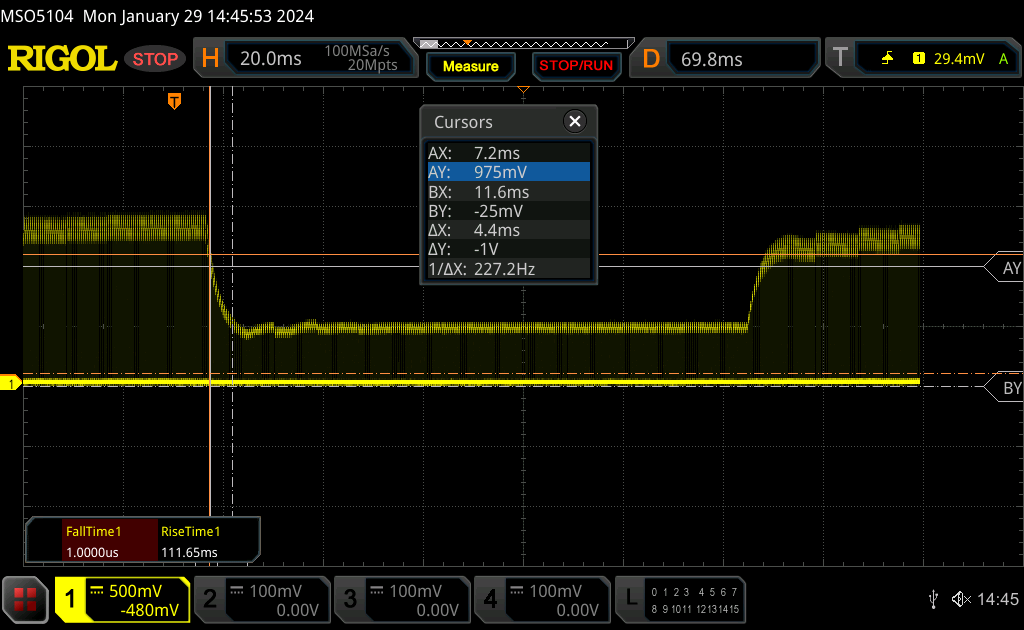 |
| ↘ 4.4 ms upadek | ||
| W naszych testach ekran wykazuje szybki czas reakcji i powinien nadawać się do gier. Dla porównania, wszystkie testowane urządzenia wahają się od 0.165 (minimum) do 636 (maksimum) ms. » 22 % wszystkich urządzeń jest lepszych. Oznacza to, że zmierzony czas reakcji jest lepszy od średniej wszystkich testowanych urządzeń (31.1 ms). | ||
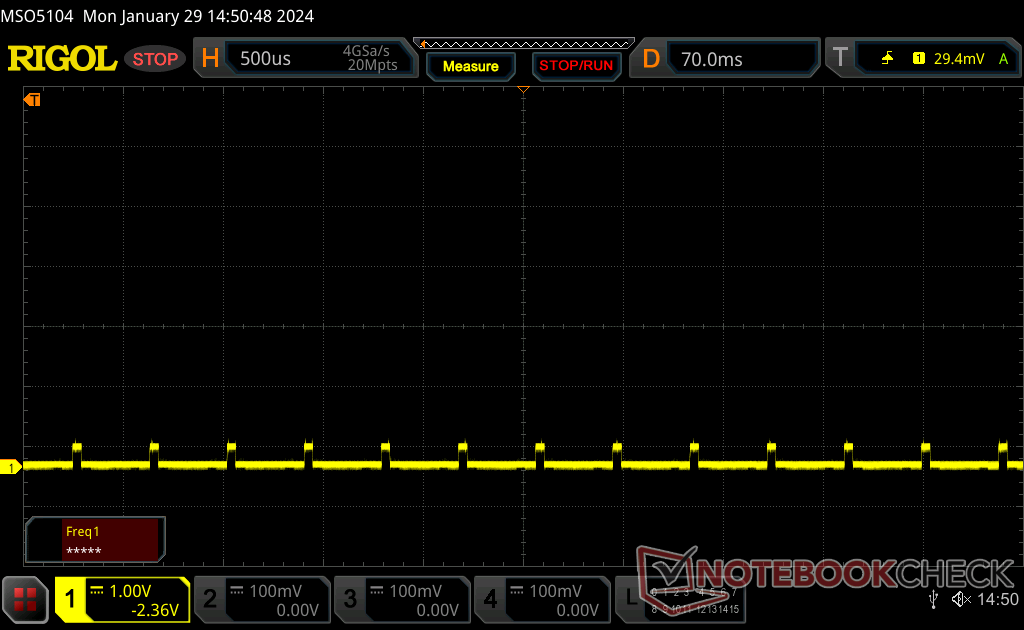
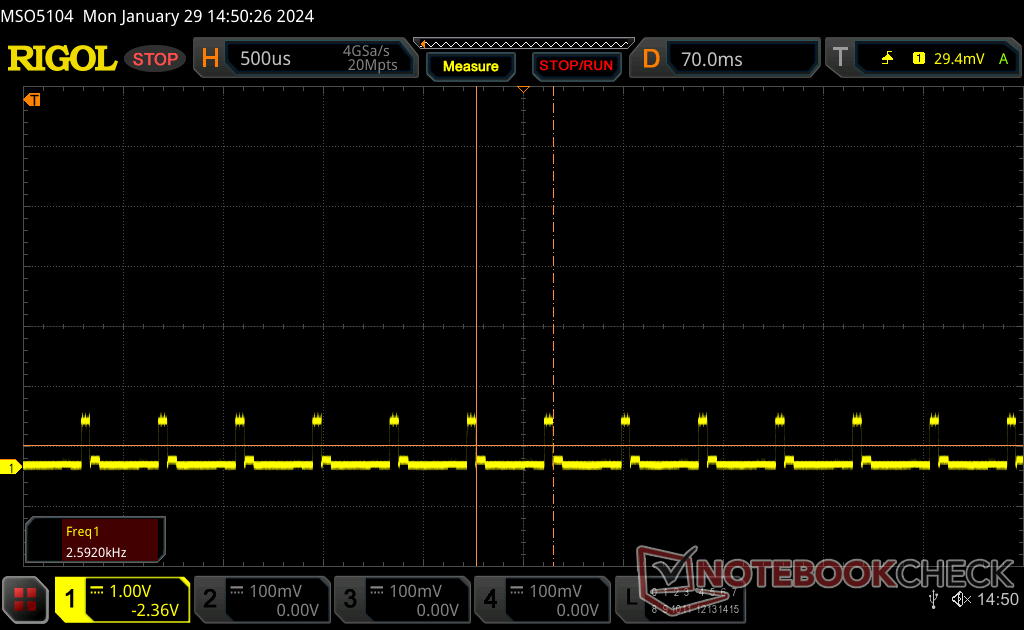
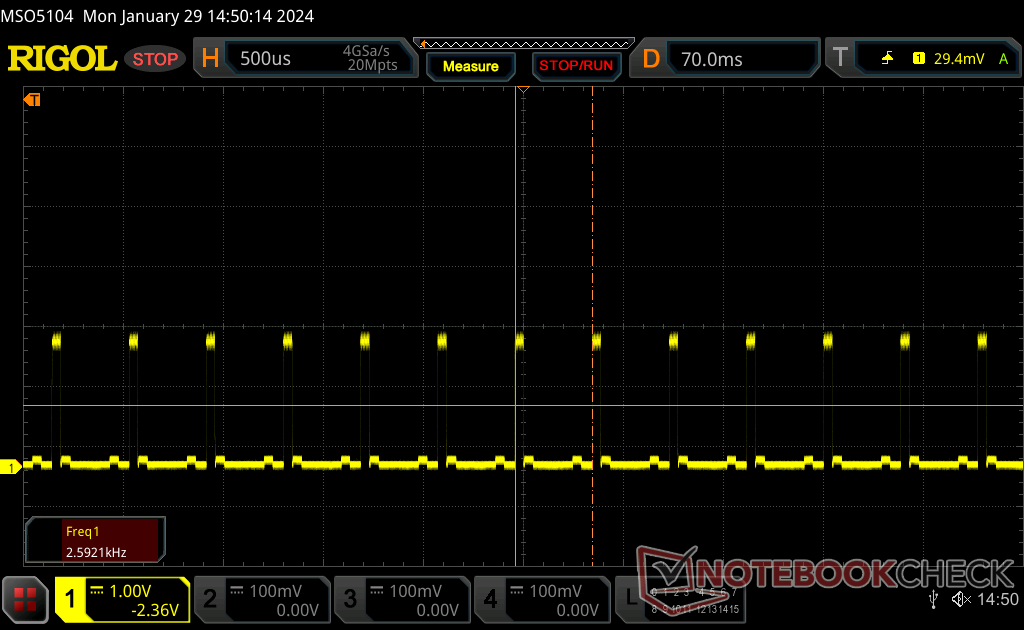
Migotanie ekranu / PWM (modulacja szerokości impulsu)
| Wykryto migotanie ekranu/wykryto PWM | 2592 Hz | ≤ 100 % ustawienia jasności | 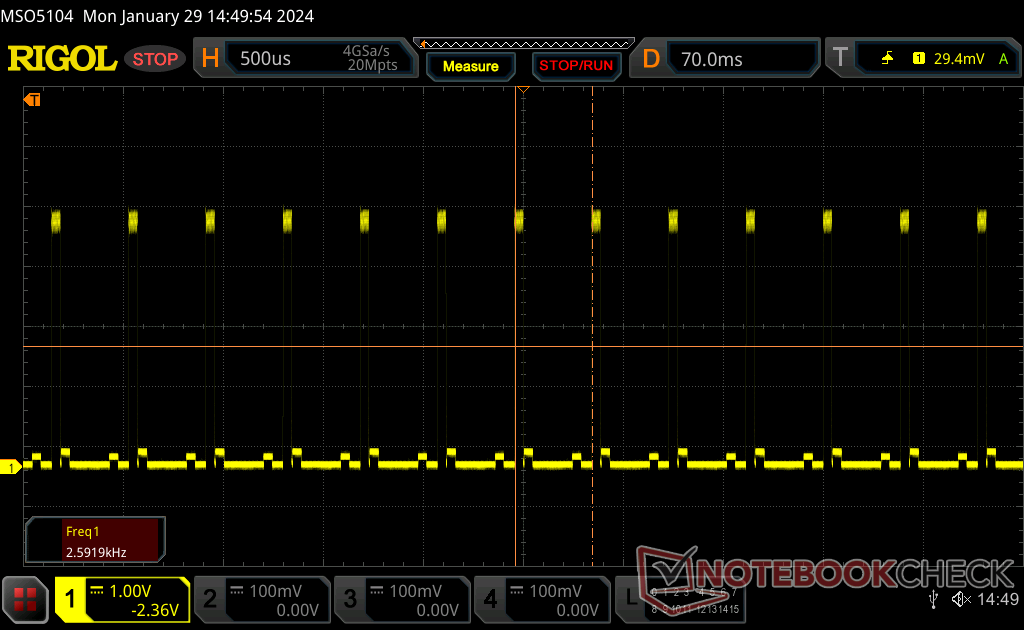 |
Podświetlenie wyświetlacza miga z częstotliwością 2592 Hz (najgorszy przypadek, np. przy użyciu PWM) Wykryto migotanie przy ustawieniu jasności 100 % i poniżej. Powyżej tego ustawienia jasności nie powinno być żadnego migotania ani PWM. Częstotliwość 2592 Hz jest dość wysoka, więc większość użytkowników wrażliwych na PWM nie powinna zauważyć żadnego migotania. Dla porównania: 52 % wszystkich testowanych urządzeń nie używa PWM do przyciemniania wyświetlacza. Jeśli wykryto PWM, zmierzono średnio 7798 (minimum: 5 - maksimum: 343500) Hz. | |||
Czasy reakcji w czerni i bieli oraz szarości dla mini-LED są trudne do zmierzenia tradycyjnymi metodami. Możemy jednak subiektywnie stwierdzić, że ghosting nie jest problemem podczas grania. Szybkie ruchy są płynne i nie rozmazują się, zapewniając wrażenia bliższe OLED lub wyświetlaczowi IPS z bardzo krótkim czasem reakcji.
Migotanie występuje ze stałą częstotliwością na wszystkich poziomach jasności, w tym na maksymalnym.

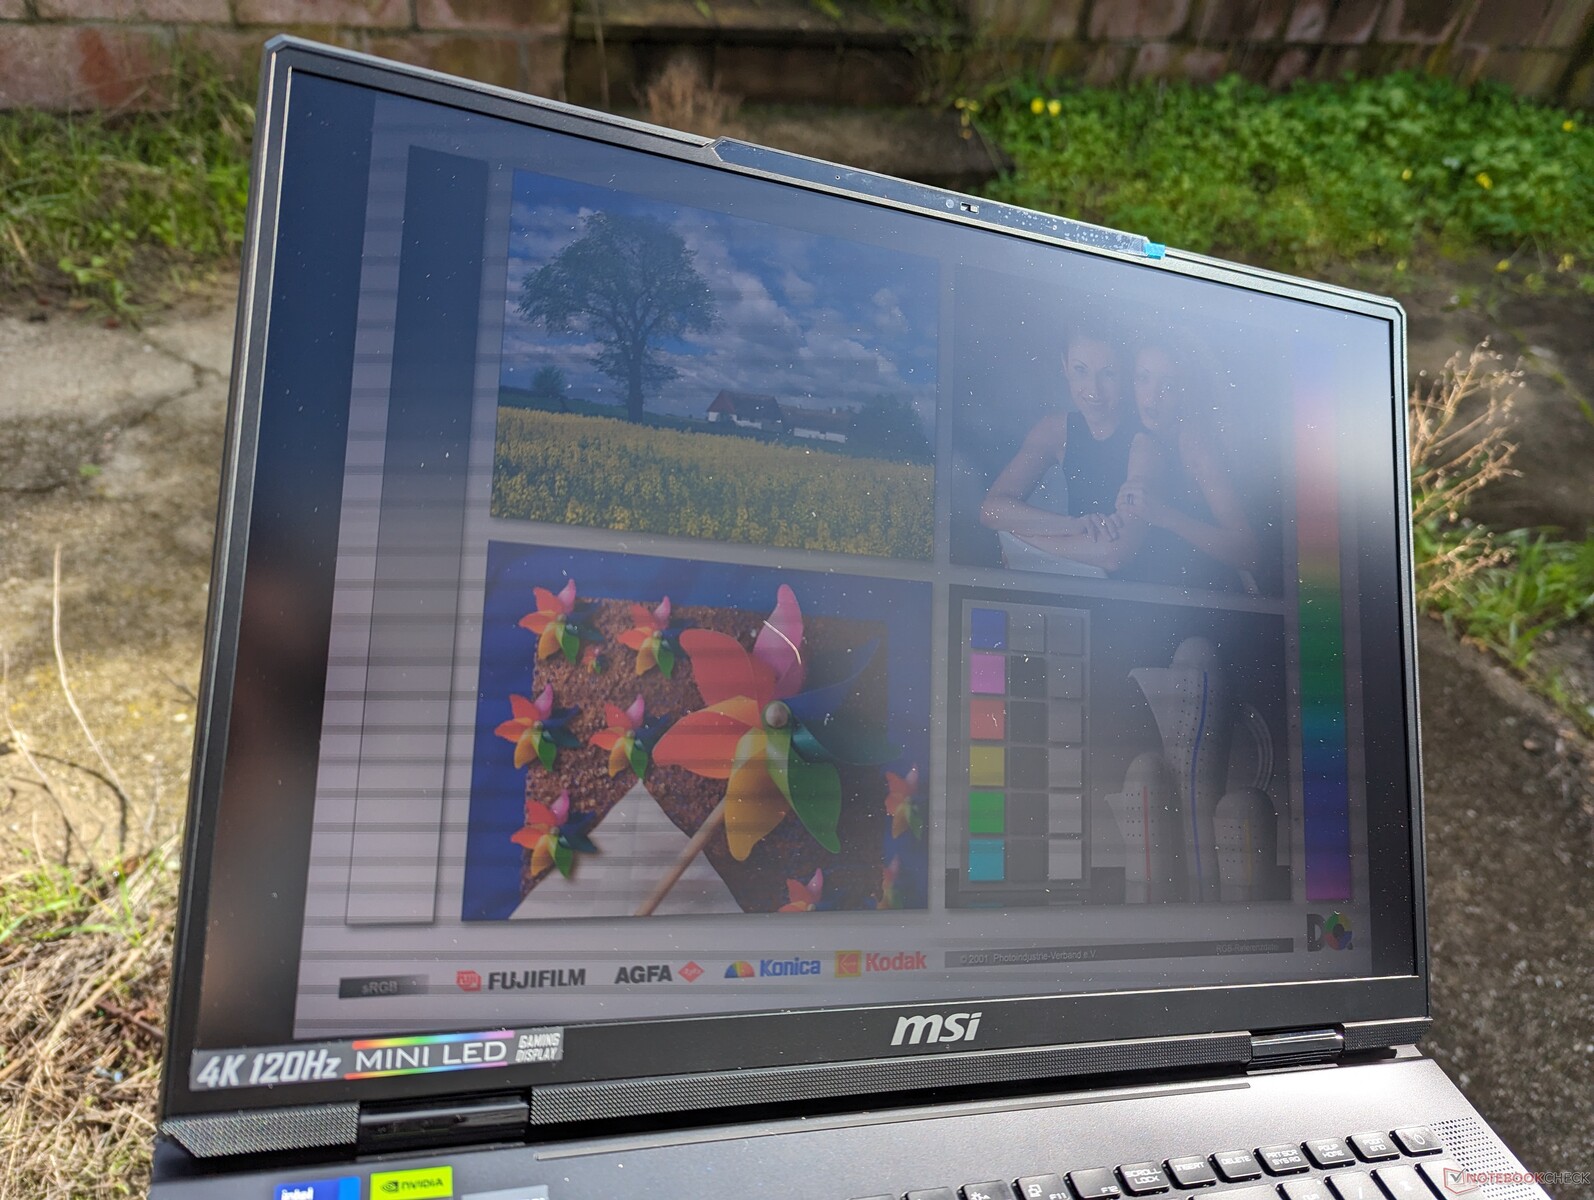
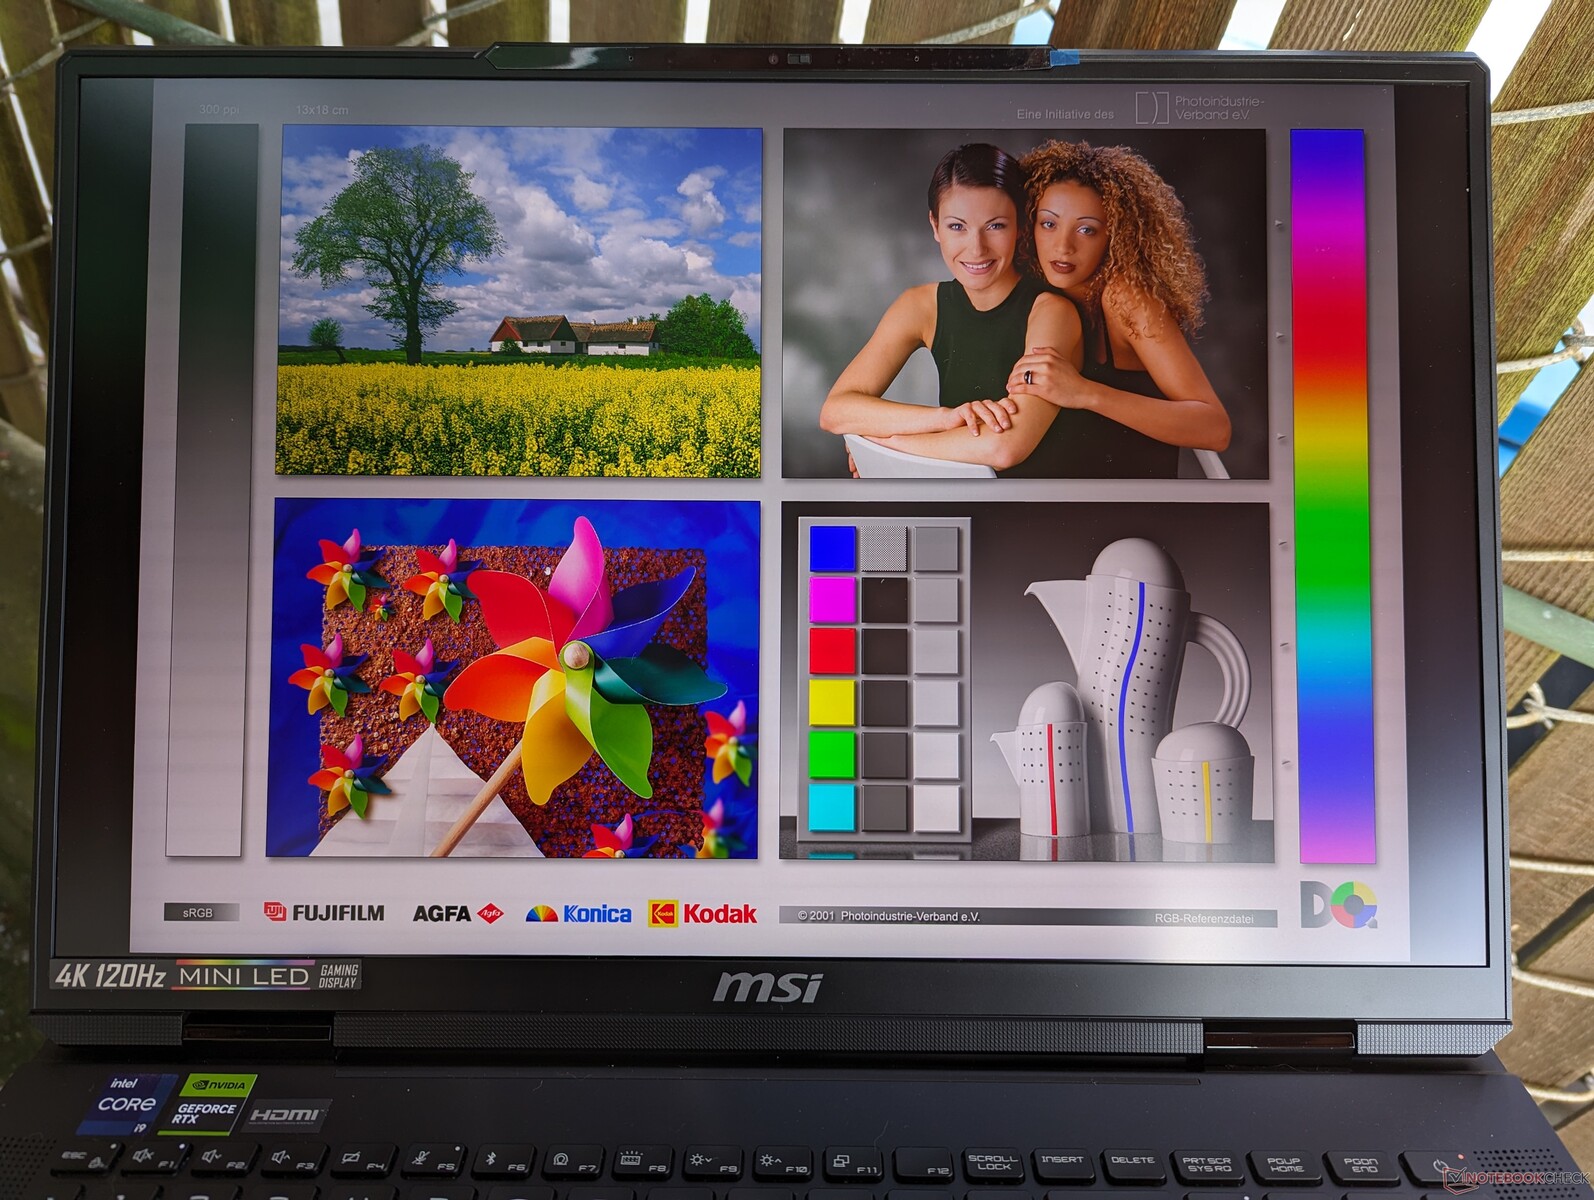
Widoczność na zewnątrz jest akceptowalna, jeśli znajduje się w cieniu, ale jeśli jest jaśniej, ekran staje się wyblakły. Ultra-jasne podświetlenie jest nieosiągalne, jeśli działa na zasilaniu bateryjnym, jak wspomniano powyżej.
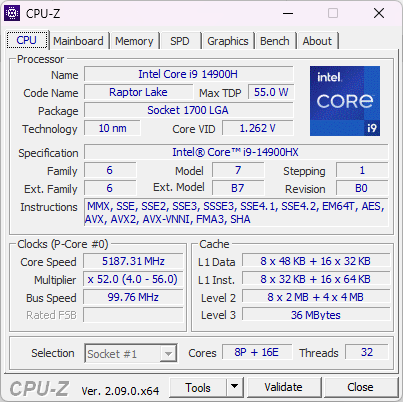
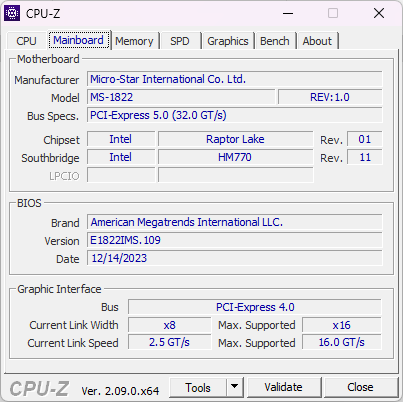
Wydajność - Raptor Lake-HX 14. generacji
Warunki testowania
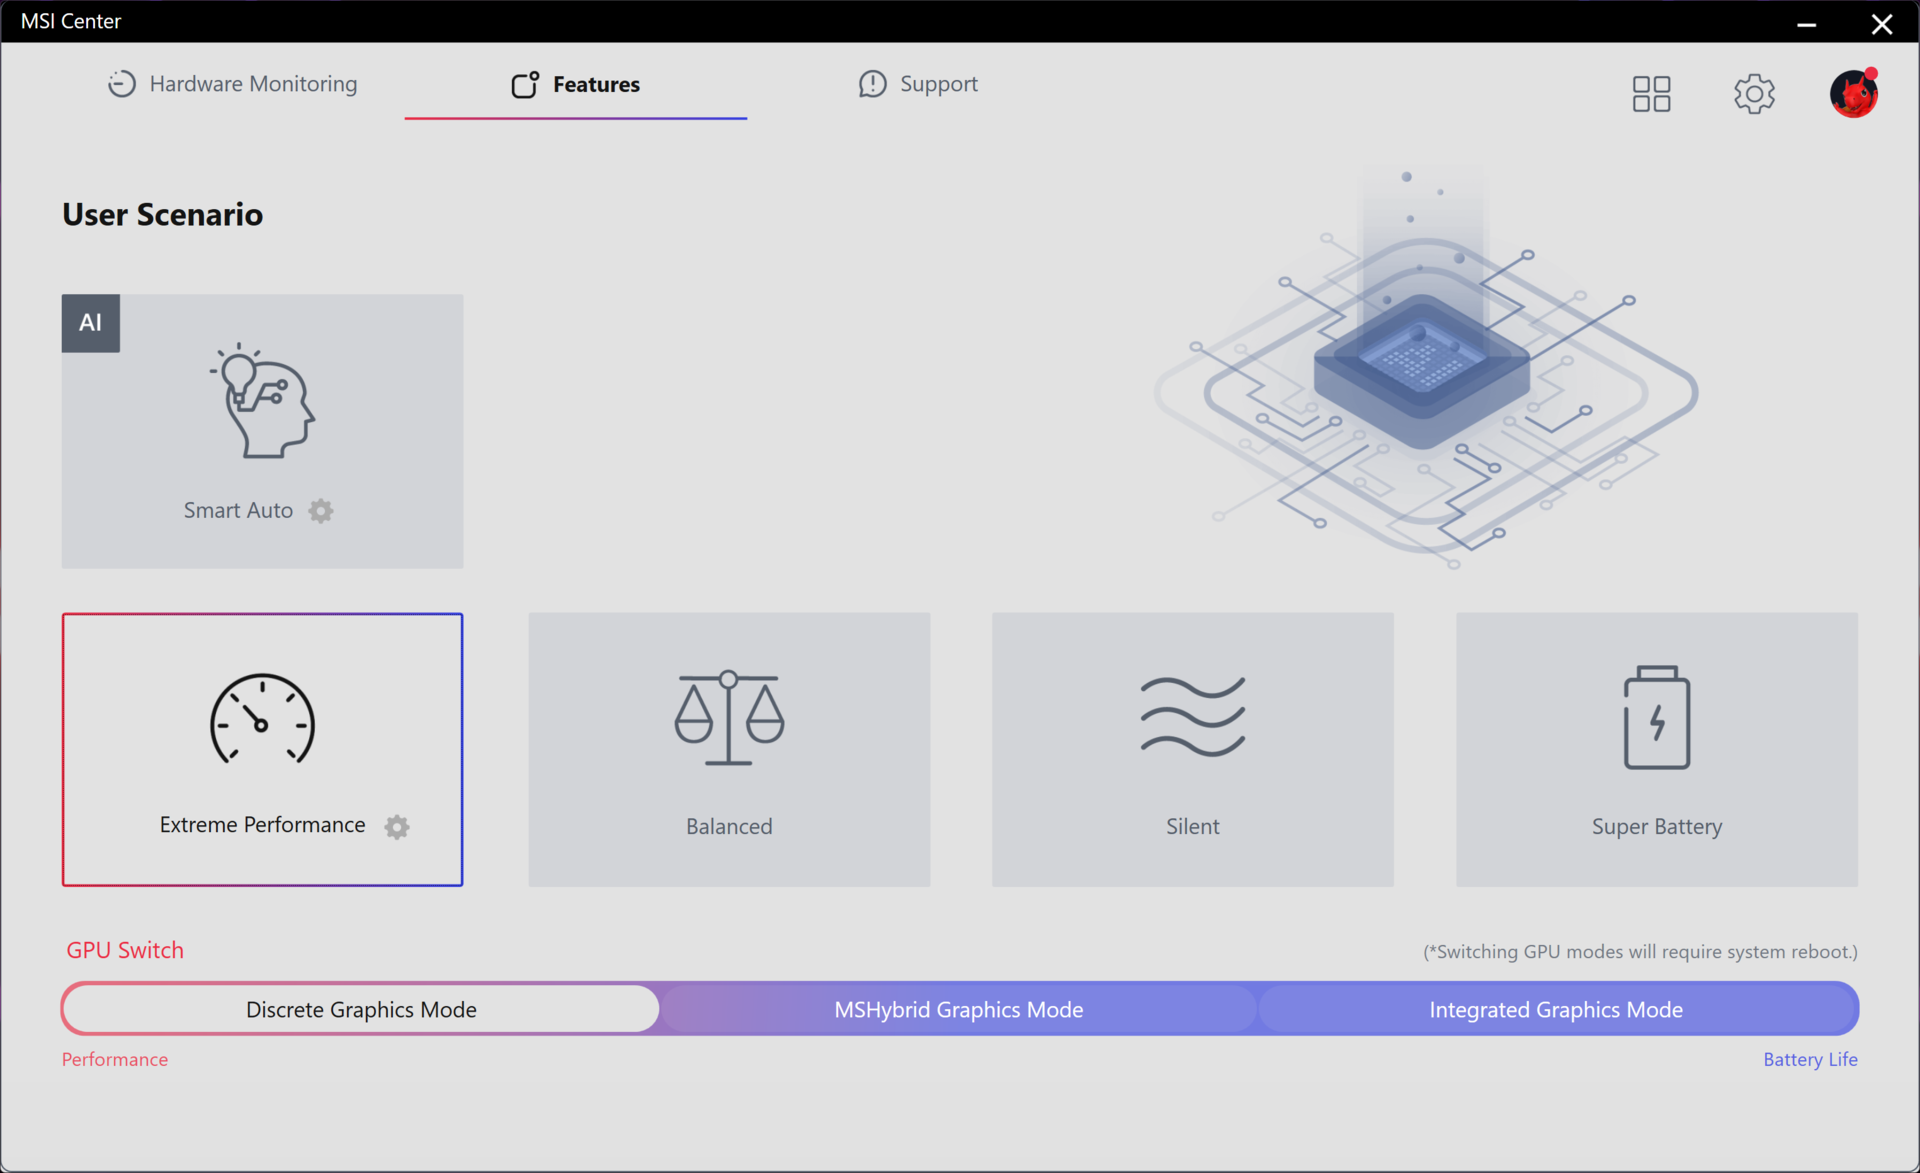
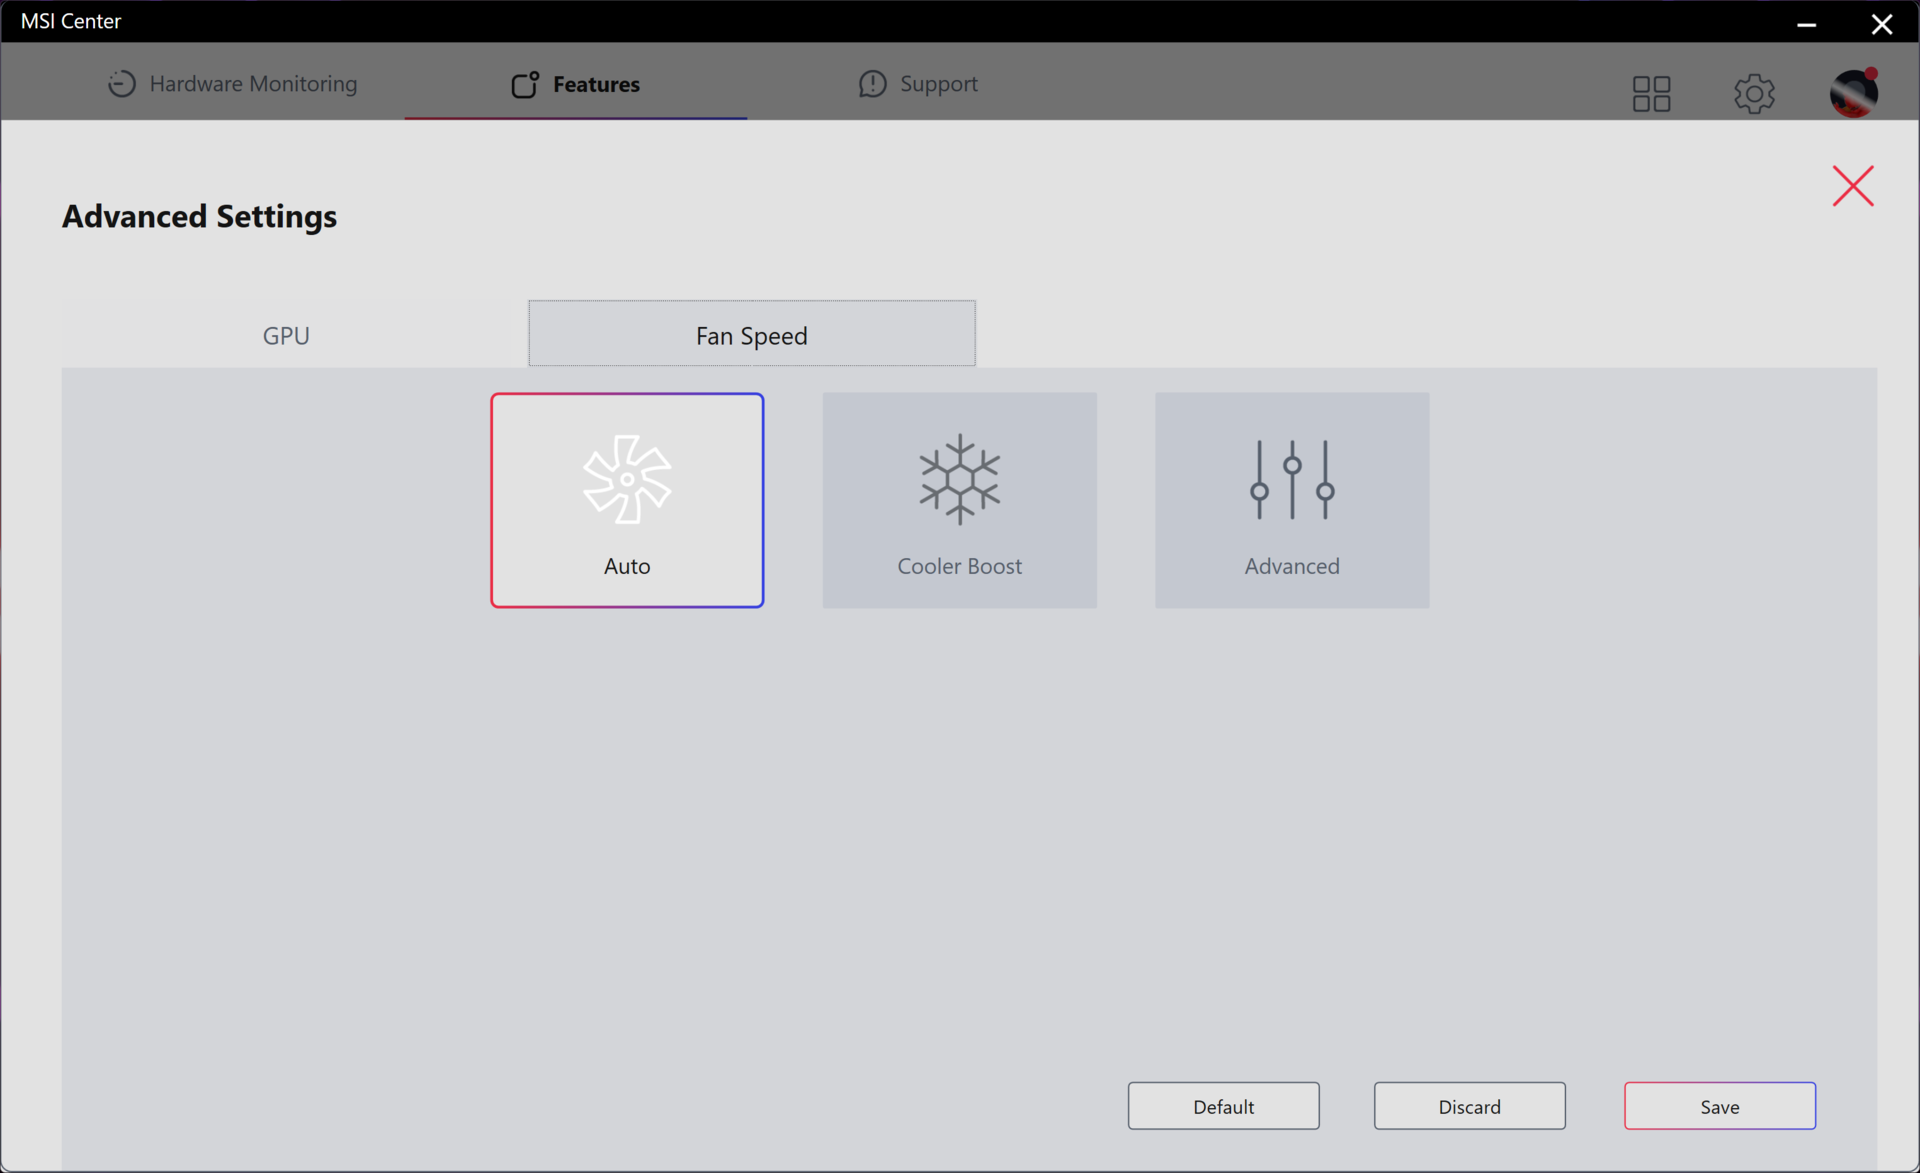
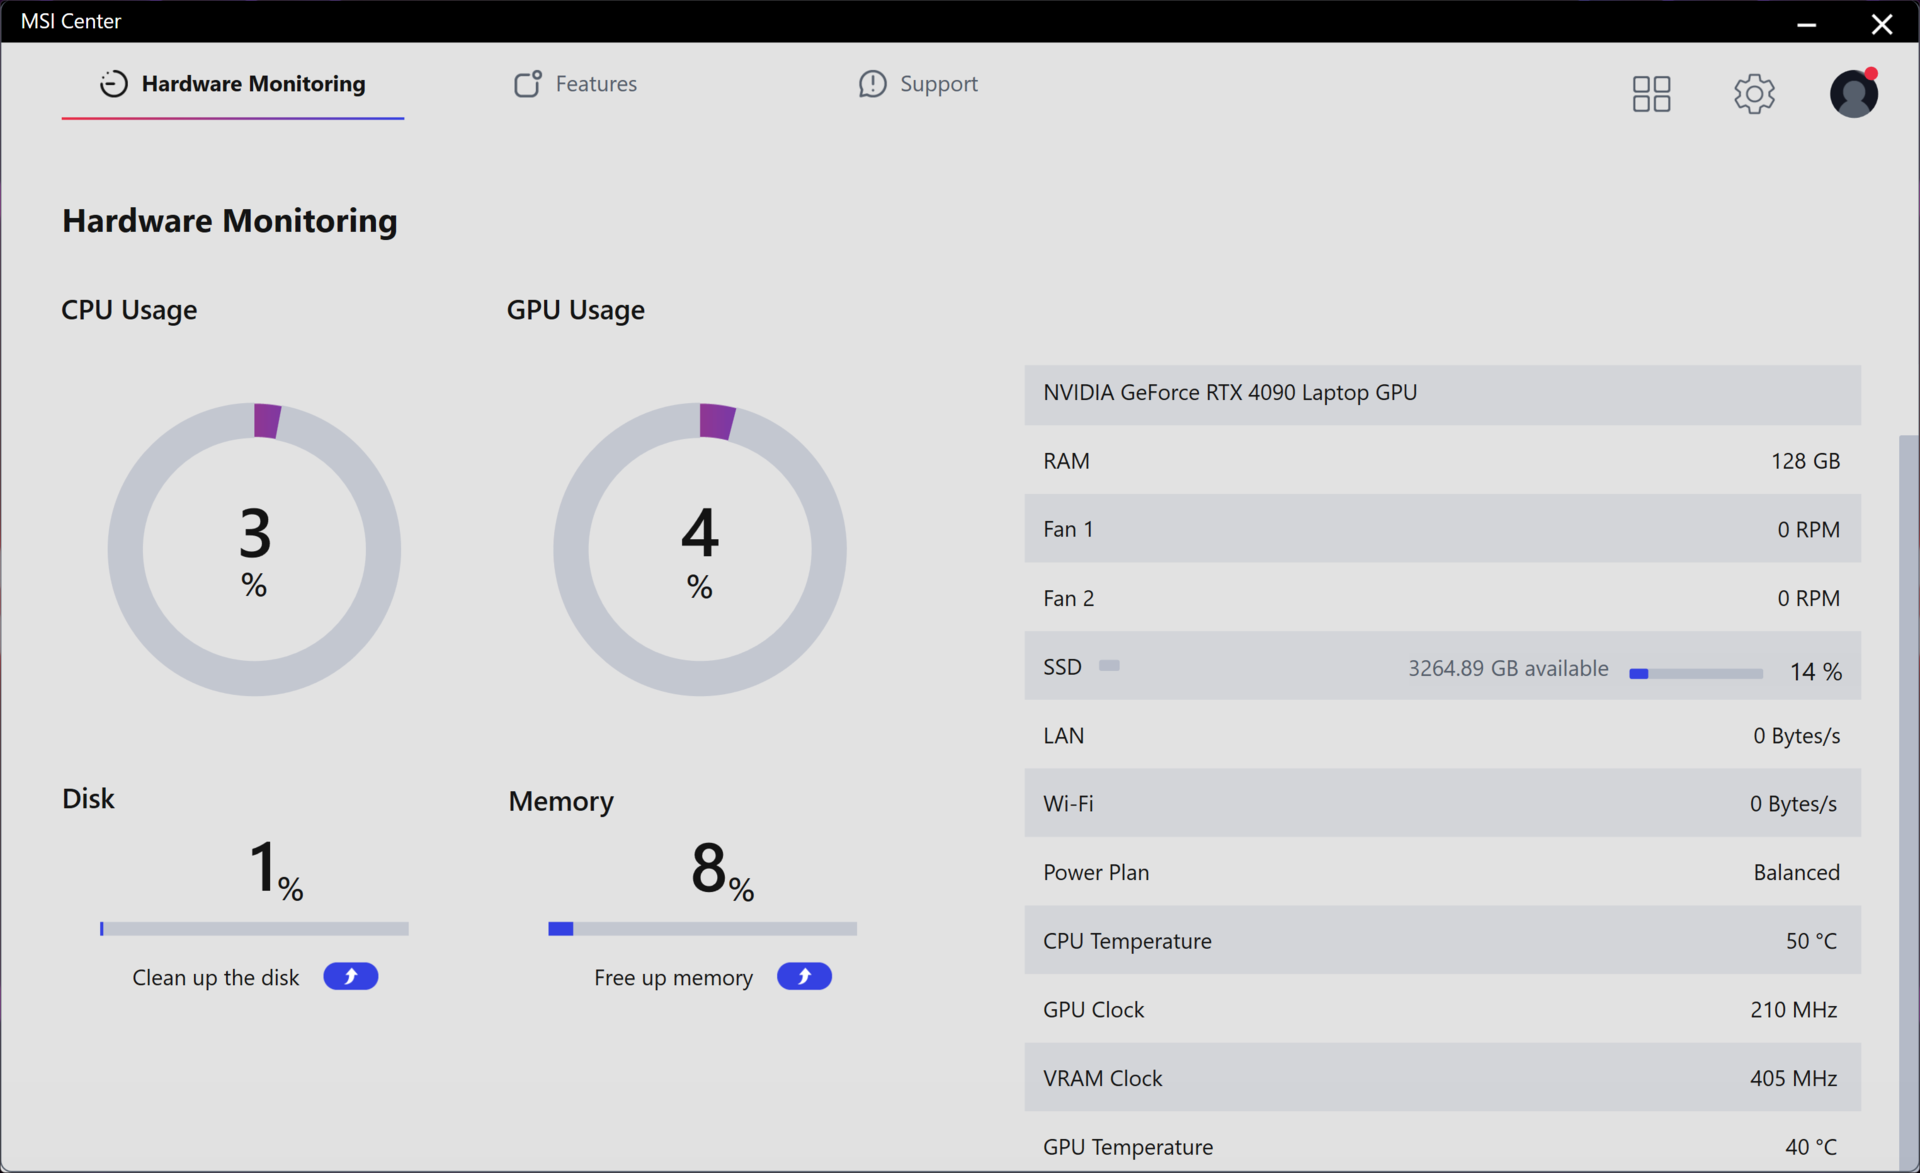
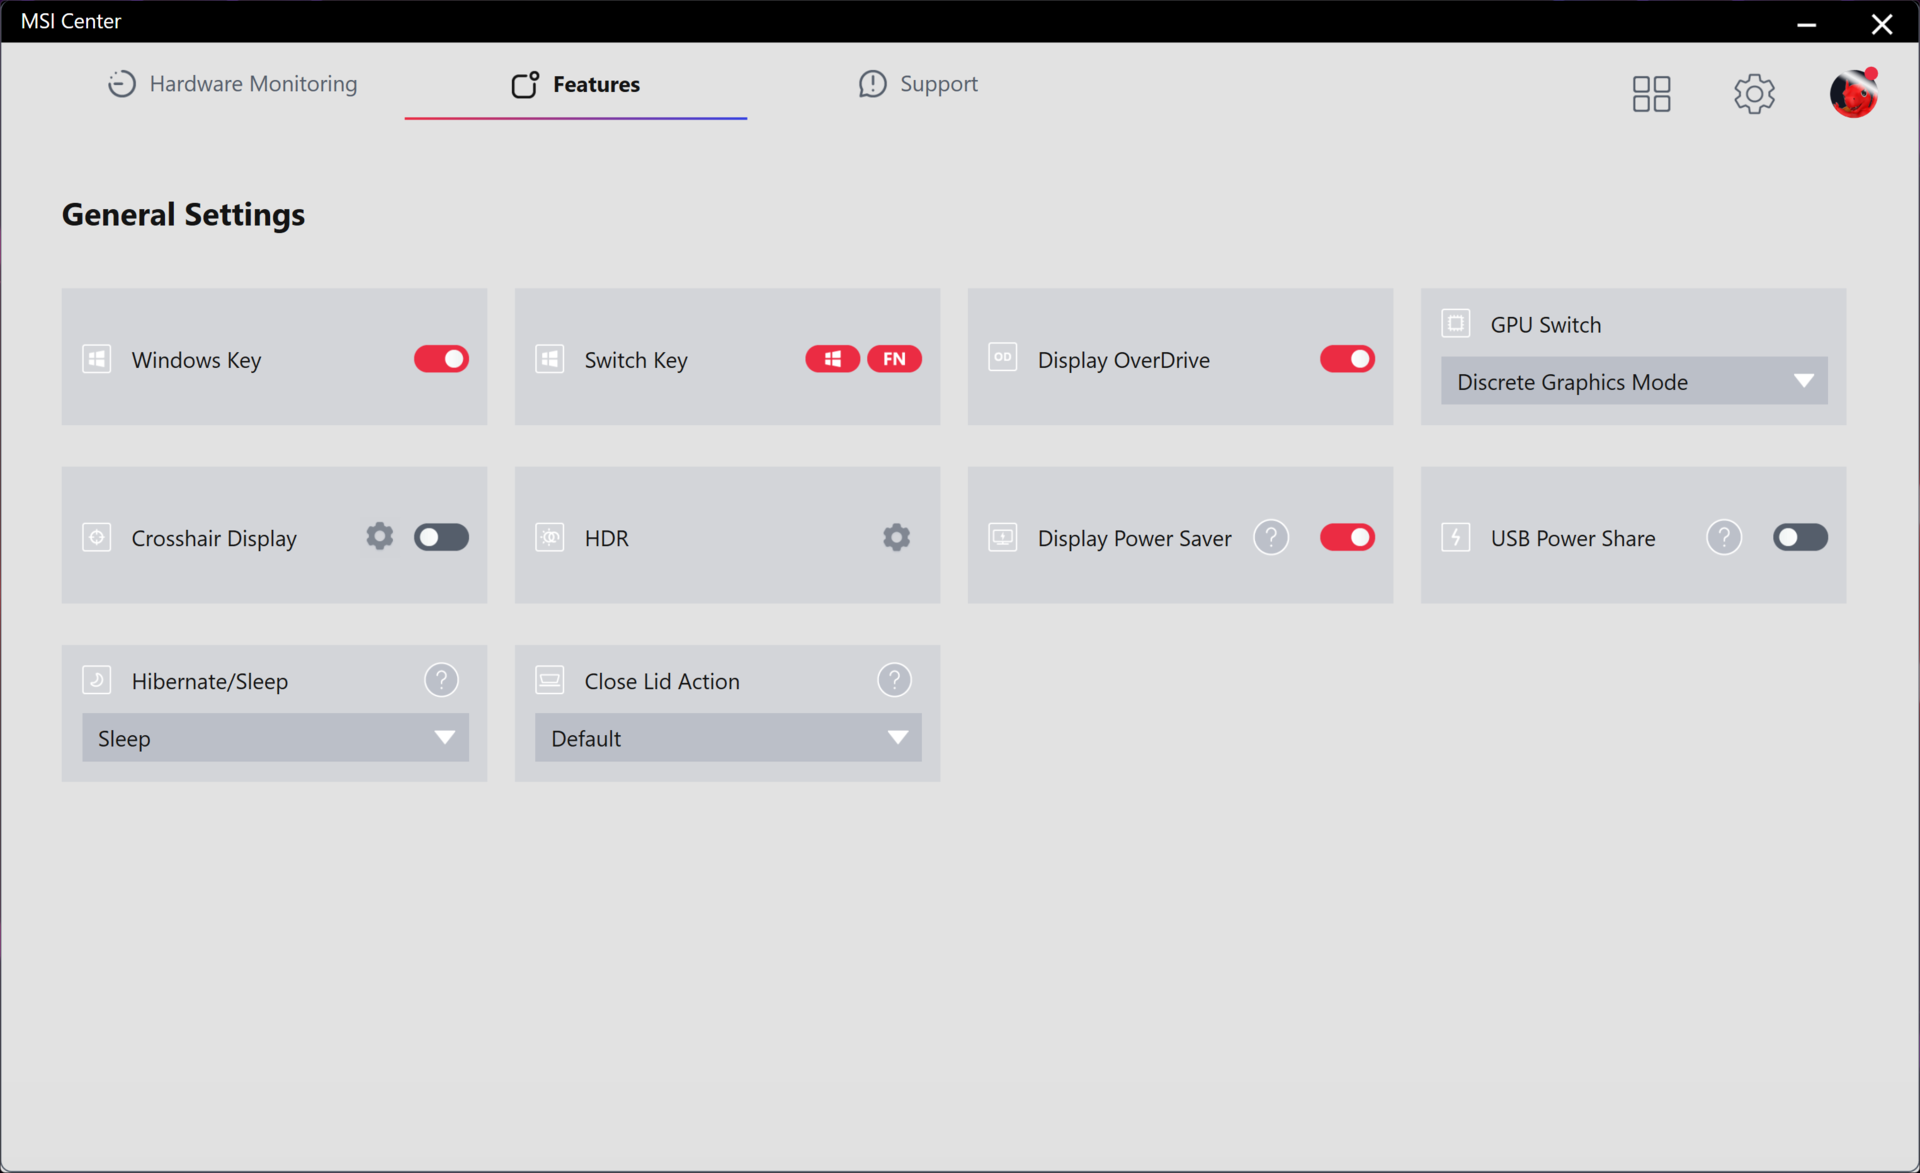
Przed wykonaniem poniższych testów ustawiliśmy MSI Center na tryb dyskretnego GPU i tryb ekstremalnej wydajności z aktywnym Cooler Boost. Cooler Boost to opracowana przez MSI nazwa trybu maksymalnej prędkości wentylatora. Właściciele powinni zapoznać się z MSI Center, ponieważ jest to centrum sterowania do monitorowania parametrów systemu, instalowania aktualizacji specyficznych dla MSI i przełączania większości funkcji.
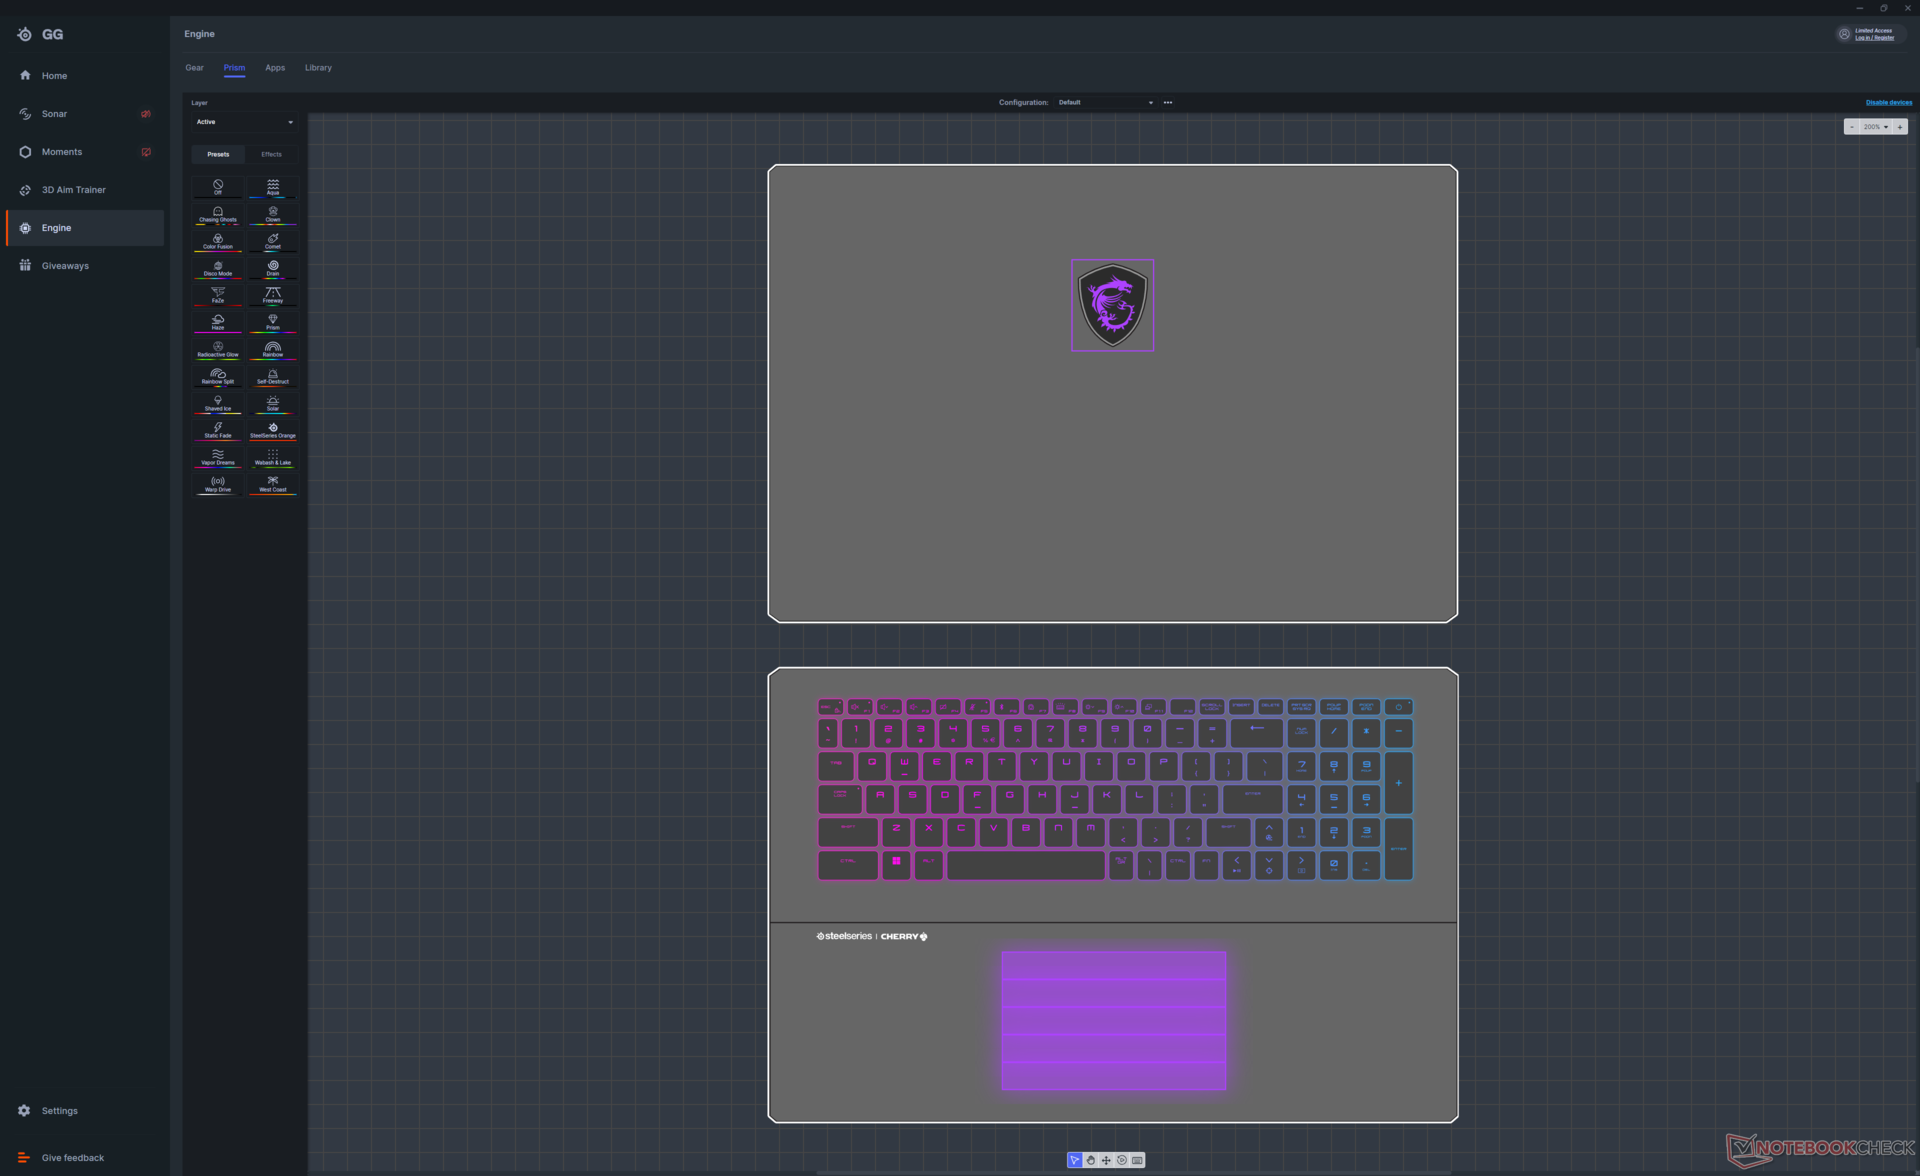
Podświetlenie klawiatury jest kontrolowane przez oddzielną preinstalowaną aplikację o nazwie SteelSeries GG.
Procesor
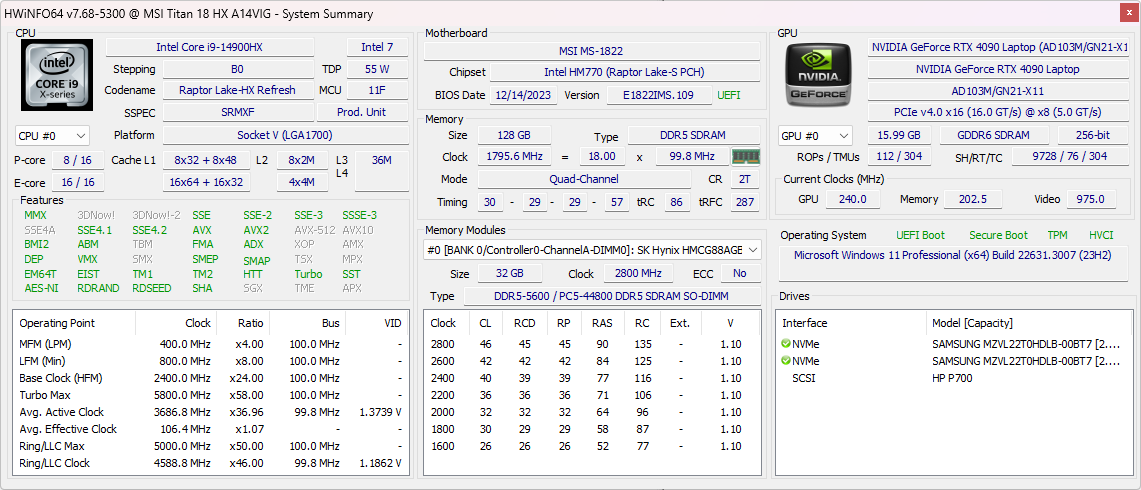
Surowa wydajność naszego Core i9-14900HX jest zasadniczo zbliżona do wydajności Core i9-13950HX w zeszłorocznym GT77. W związku z tym, proszę nie oczekiwać zauważalnego wzrostu wydajności podczas uruchamiania tradycyjnych aplikacji obciążających procesor. Procesor Raptor Lake-HX 14. generacji nie ma również nowych możliwości AI, w przeciwieństwie do serii Meteor Lake, która integruje NPU.
MSI przygotowuje się do uruchomienia w lutym aplikacji AI Artist dla laptopów wyposażonych w procesory Intel 14. generacji. Program wykorzystuje akcelerację sztucznej inteligencji Intela do generowania grafiki na podstawie podpowiedzi na poziomie lokalnym, zamiast polegać na usługach w chmurze, aby zapewnić szybsze wrażenia użytkownika. Jeśli nie są Państwo zainteresowani aplikacjami wykorzystującymi sztuczną inteligencję, to starszy procesor Intel 13. generacji może służyć równie dobrze.
Cinebench R15 Multi Loop
Cinebench R23: Multi Core | Single Core
Cinebench R20: CPU (Multi Core) | CPU (Single Core)
Cinebench R15: CPU Multi 64Bit | CPU Single 64Bit
Blender: v2.79 BMW27 CPU
7-Zip 18.03: 7z b 4 | 7z b 4 -mmt1
Geekbench 6.7: Multi-Core | Single-Core
Geekbench 5.5: Multi-Core | Single-Core
HWBOT x265 Benchmark v2.2: 4k Preset
LibreOffice : 20 Documents To PDF
R Benchmark 2.5: Overall mean
| CPU Performance rating | |
| Asus ROG Strix Scar 17 G733PYV-LL053X | |
| Asus ROG Strix Scar 17 G733PY-XS96 -2! | |
| Alienware m18 R1 -2! | |
| MSI Titan GT77 HX 13VI -2! | |
| MSI Titan 18 HX A14VIG | |
| Acer Predator Helios 18 N23Q2 | |
| Przeciętny Intel Core i9-14900HX | |
| Razer Blade 18 RTX 4070 -2! | |
| Alienware m16 R1 AMD | |
| MSI Raider GE68 HX 13VG, i7-13700HX | |
| NVIDIA GeForce RTX 4070 Super Founders Edition -15! | |
| Asus TUF Gaming A17 FA707XI-NS94 | |
| Asus ROG Strix G18 G814JI -2! | |
| MSI Stealth 16 Studio A13VG -2! | |
| Dell G16 7620 -2! | |
| Alienware m17 R5 (R9 6900HX, RX 6850M XT) -2! | |
| Cinebench R23 / Multi Core | |
| Asus ROG Strix Scar 17 G733PY-XS96 | |
| MSI Titan GT77 HX 13VI | |
| Asus ROG Strix Scar 17 G733PYV-LL053X | |
| Alienware m18 R1 | |
| MSI Titan 18 HX A14VIG | |
| Acer Predator Helios 18 N23Q2 | |
| Przeciętny Intel Core i9-14900HX (17078 - 36249, n=37) | |
| Razer Blade 18 RTX 4070 | |
| Alienware m16 R1 AMD | |
| MSI Raider GE68 HX 13VG, i7-13700HX | |
| Asus ROG Strix G18 G814JI | |
| MSI Stealth 16 Studio A13VG | |
| Asus TUF Gaming A17 FA707XI-NS94 | |
| Dell G16 7620 | |
| Alienware m17 R5 (R9 6900HX, RX 6850M XT) | |
| Cinebench R23 / Single Core | |
| Przeciętny Intel Core i9-14900HX (1720 - 2245, n=37) | |
| MSI Titan 18 HX A14VIG | |
| Alienware m18 R1 | |
| MSI Titan GT77 HX 13VI | |
| Acer Predator Helios 18 N23Q2 | |
| Razer Blade 18 RTX 4070 | |
| Asus ROG Strix Scar 17 G733PYV-LL053X | |
| Asus ROG Strix G18 G814JI | |
| MSI Raider GE68 HX 13VG, i7-13700HX | |
| Asus ROG Strix Scar 17 G733PY-XS96 | |
| MSI Stealth 16 Studio A13VG | |
| Alienware m16 R1 AMD | |
| Asus TUF Gaming A17 FA707XI-NS94 | |
| Dell G16 7620 | |
| Alienware m17 R5 (R9 6900HX, RX 6850M XT) | |
| Cinebench R20 / CPU (Multi Core) | |
| Asus ROG Strix Scar 17 G733PY-XS96 | |
| Asus ROG Strix Scar 17 G733PYV-LL053X | |
| MSI Titan GT77 HX 13VI | |
| Alienware m18 R1 | |
| MSI Titan 18 HX A14VIG | |
| Acer Predator Helios 18 N23Q2 | |
| Przeciętny Intel Core i9-14900HX (6579 - 13832, n=37) | |
| Razer Blade 18 RTX 4070 | |
| Alienware m16 R1 AMD | |
| MSI Raider GE68 HX 13VG, i7-13700HX | |
| Asus ROG Strix G18 G814JI | |
| MSI Stealth 16 Studio A13VG | |
| Asus TUF Gaming A17 FA707XI-NS94 | |
| Dell G16 7620 | |
| Alienware m17 R5 (R9 6900HX, RX 6850M XT) | |
| Cinebench R20 / CPU (Single Core) | |
| Przeciętny Intel Core i9-14900HX (657 - 859, n=37) | |
| MSI Titan 18 HX A14VIG | |
| Alienware m18 R1 | |
| Acer Predator Helios 18 N23Q2 | |
| MSI Titan GT77 HX 13VI | |
| Razer Blade 18 RTX 4070 | |
| Asus ROG Strix Scar 17 G733PYV-LL053X | |
| Asus ROG Strix G18 G814JI | |
| MSI Raider GE68 HX 13VG, i7-13700HX | |
| Asus ROG Strix Scar 17 G733PY-XS96 | |
| MSI Stealth 16 Studio A13VG | |
| Alienware m16 R1 AMD | |
| Asus TUF Gaming A17 FA707XI-NS94 | |
| Dell G16 7620 | |
| Alienware m17 R5 (R9 6900HX, RX 6850M XT) | |
| Cinebench R15 / CPU Multi 64Bit | |
| Asus ROG Strix Scar 17 G733PYV-LL053X | |
| Asus ROG Strix Scar 17 G733PY-XS96 | |
| MSI Titan GT77 HX 13VI | |
| Alienware m18 R1 | |
| MSI Titan 18 HX A14VIG | |
| Acer Predator Helios 18 N23Q2 | |
| Razer Blade 18 RTX 4070 | |
| Przeciętny Intel Core i9-14900HX (3263 - 5589, n=38) | |
| Alienware m16 R1 AMD | |
| MSI Raider GE68 HX 13VG, i7-13700HX | |
| Asus ROG Strix G18 G814JI | |
| MSI Stealth 16 Studio A13VG | |
| Asus TUF Gaming A17 FA707XI-NS94 | |
| Dell G16 7620 | |
| Alienware m17 R5 (R9 6900HX, RX 6850M XT) | |
| Cinebench R15 / CPU Single 64Bit | |
| Asus ROG Strix Scar 17 G733PYV-LL053X | |
| Asus ROG Strix Scar 17 G733PY-XS96 | |
| Przeciętny Intel Core i9-14900HX (247 - 323, n=37) | |
| Alienware m18 R1 | |
| MSI Titan GT77 HX 13VI | |
| MSI Titan 18 HX A14VIG | |
| Razer Blade 18 RTX 4070 | |
| Alienware m16 R1 AMD | |
| Acer Predator Helios 18 N23Q2 | |
| Asus TUF Gaming A17 FA707XI-NS94 | |
| Asus ROG Strix G18 G814JI | |
| MSI Stealth 16 Studio A13VG | |
| MSI Raider GE68 HX 13VG, i7-13700HX | |
| Alienware m17 R5 (R9 6900HX, RX 6850M XT) | |
| Dell G16 7620 | |
| 7-Zip 18.03 / 7z b 4 | |
| Asus ROG Strix Scar 17 G733PY-XS96 | |
| Asus ROG Strix Scar 17 G733PYV-LL053X | |
| Alienware m18 R1 | |
| MSI Titan GT77 HX 13VI | |
| MSI Titan 18 HX A14VIG | |
| Acer Predator Helios 18 N23Q2 | |
| Razer Blade 18 RTX 4070 | |
| Przeciętny Intel Core i9-14900HX (66769 - 136645, n=37) | |
| Alienware m16 R1 AMD | |
| MSI Raider GE68 HX 13VG, i7-13700HX | |
| Asus ROG Strix G18 G814JI | |
| MSI Stealth 16 Studio A13VG | |
| Asus TUF Gaming A17 FA707XI-NS94 | |
| Dell G16 7620 | |
| Alienware m17 R5 (R9 6900HX, RX 6850M XT) | |
| 7-Zip 18.03 / 7z b 4 -mmt1 | |
| Asus ROG Strix Scar 17 G733PY-XS96 | |
| Asus ROG Strix Scar 17 G733PYV-LL053X | |
| Przeciętny Intel Core i9-14900HX (5452 - 7545, n=37) | |
| Alienware m16 R1 AMD | |
| Acer Predator Helios 18 N23Q2 | |
| MSI Titan GT77 HX 13VI | |
| Alienware m18 R1 | |
| Razer Blade 18 RTX 4070 | |
| Asus TUF Gaming A17 FA707XI-NS94 | |
| MSI Titan 18 HX A14VIG | |
| MSI Raider GE68 HX 13VG, i7-13700HX | |
| Asus ROG Strix G18 G814JI | |
| MSI Stealth 16 Studio A13VG | |
| Alienware m17 R5 (R9 6900HX, RX 6850M XT) | |
| Dell G16 7620 | |
| Geekbench 6.7 / Multi-Core | |
| Acer Predator Helios 18 N23Q2 | |
| Przeciętny Intel Core i9-14900HX (13158 - 19665, n=37) | |
| Asus ROG Strix Scar 17 G733PYV-LL053X | |
| MSI Titan 18 HX A14VIG | |
| MSI Raider GE68 HX 13VG, i7-13700HX | |
| Alienware m16 R1 AMD | |
| Asus TUF Gaming A17 FA707XI-NS94 | |
| Geekbench 6.7 / Single-Core | |
| Przeciętny Intel Core i9-14900HX (2419 - 3129, n=37) | |
| Asus ROG Strix Scar 17 G733PYV-LL053X | |
| Acer Predator Helios 18 N23Q2 | |
| MSI Titan 18 HX A14VIG | |
| Asus TUF Gaming A17 FA707XI-NS94 | |
| Alienware m16 R1 AMD | |
| MSI Raider GE68 HX 13VG, i7-13700HX | |
| Geekbench 5.5 / Multi-Core | |
| Alienware m18 R1 | |
| MSI Titan GT77 HX 13VI | |
| Acer Predator Helios 18 N23Q2 | |
| Razer Blade 18 RTX 4070 | |
| Asus ROG Strix Scar 17 G733PYV-LL053X | |
| Przeciętny Intel Core i9-14900HX (8618 - 23194, n=37) | |
| Asus ROG Strix Scar 17 G733PY-XS96 | |
| MSI Titan 18 HX A14VIG | |
| MSI Raider GE68 HX 13VG, i7-13700HX | |
| Alienware m16 R1 AMD | |
| Asus ROG Strix G18 G814JI | |
| MSI Stealth 16 Studio A13VG | |
| Dell G16 7620 | |
| Asus TUF Gaming A17 FA707XI-NS94 | |
| Alienware m17 R5 (R9 6900HX, RX 6850M XT) | |
| Geekbench 5.5 / Single-Core | |
| Asus ROG Strix Scar 17 G733PYV-LL053X | |
| MSI Titan 18 HX A14VIG | |
| Przeciętny Intel Core i9-14900HX (1669 - 2210, n=37) | |
| Alienware m18 R1 | |
| Acer Predator Helios 18 N23Q2 | |
| Asus ROG Strix Scar 17 G733PY-XS96 | |
| MSI Titan GT77 HX 13VI | |
| Razer Blade 18 RTX 4070 | |
| Asus TUF Gaming A17 FA707XI-NS94 | |
| Alienware m16 R1 AMD | |
| MSI Raider GE68 HX 13VG, i7-13700HX | |
| Asus ROG Strix G18 G814JI | |
| MSI Stealth 16 Studio A13VG | |
| Dell G16 7620 | |
| Alienware m17 R5 (R9 6900HX, RX 6850M XT) | |
| HWBOT x265 Benchmark v2.2 / 4k Preset | |
| Asus ROG Strix Scar 17 G733PY-XS96 | |
| Asus ROG Strix Scar 17 G733PYV-LL053X | |
| Alienware m18 R1 | |
| MSI Titan GT77 HX 13VI | |
| Razer Blade 18 RTX 4070 | |
| MSI Titan 18 HX A14VIG | |
| Acer Predator Helios 18 N23Q2 | |
| Alienware m16 R1 AMD | |
| Przeciętny Intel Core i9-14900HX (16.8 - 38.9, n=37) | |
| MSI Raider GE68 HX 13VG, i7-13700HX | |
| Asus ROG Strix G18 G814JI | |
| Asus TUF Gaming A17 FA707XI-NS94 | |
| MSI Stealth 16 Studio A13VG | |
| Dell G16 7620 | |
| Alienware m17 R5 (R9 6900HX, RX 6850M XT) | |
| LibreOffice / 20 Documents To PDF | |
| Asus ROG Strix G18 G814JI | |
| Alienware m17 R5 (R9 6900HX, RX 6850M XT) | |
| MSI Stealth 16 Studio A13VG | |
| Dell G16 7620 | |
| MSI Raider GE68 HX 13VG, i7-13700HX | |
| Acer Predator Helios 18 N23Q2 | |
| Asus TUF Gaming A17 FA707XI-NS94 | |
| Alienware m18 R1 | |
| MSI Titan GT77 HX 13VI | |
| MSI Titan 18 HX A14VIG | |
| Razer Blade 18 RTX 4070 | |
| Przeciętny Intel Core i9-14900HX (19 - 85.1, n=37) | |
| Alienware m16 R1 AMD | |
| Asus ROG Strix Scar 17 G733PYV-LL053X | |
| Asus ROG Strix Scar 17 G733PY-XS96 | |
| R Benchmark 2.5 / Overall mean | |
| Dell G16 7620 | |
| Alienware m17 R5 (R9 6900HX, RX 6850M XT) | |
| MSI Stealth 16 Studio A13VG | |
| Asus ROG Strix G18 G814JI | |
| MSI Raider GE68 HX 13VG, i7-13700HX | |
| Asus TUF Gaming A17 FA707XI-NS94 | |
| Alienware m16 R1 AMD | |
| Asus ROG Strix Scar 17 G733PYV-LL053X | |
| Asus ROG Strix Scar 17 G733PY-XS96 | |
| MSI Titan GT77 HX 13VI | |
| Acer Predator Helios 18 N23Q2 | |
| Razer Blade 18 RTX 4070 | |
| Alienware m18 R1 | |
| MSI Titan 18 HX A14VIG | |
| Przeciętny Intel Core i9-14900HX (0.3604 - 0.4859, n=37) | |
Cinebench R23: Multi Core | Single Core
Cinebench R20: CPU (Multi Core) | CPU (Single Core)
Cinebench R15: CPU Multi 64Bit | CPU Single 64Bit
Blender: v2.79 BMW27 CPU
7-Zip 18.03: 7z b 4 | 7z b 4 -mmt1
Geekbench 6.7: Multi-Core | Single-Core
Geekbench 5.5: Multi-Core | Single-Core
HWBOT x265 Benchmark v2.2: 4k Preset
LibreOffice : 20 Documents To PDF
R Benchmark 2.5: Overall mean
* ... im mniej tym lepiej
AIDA64: FP32 Ray-Trace | FPU Julia | CPU SHA3 | CPU Queen | FPU SinJulia | FPU Mandel | CPU AES | CPU ZLib | FP64 Ray-Trace | CPU PhotoWorxx
| Performance rating | |
| Alienware m18 R1 | |
| Acer Predator Helios 18 N23Q2 | |
| MSI Titan 18 HX A14VIG | |
| MSI Titan GT77 HX 13VI | |
| Razer Blade 18 RTX 4070 | |
| Przeciętny Intel Core i9-14900HX | |
| Asus ROG Strix G18 G814JI | |
| AIDA64 / FP32 Ray-Trace | |
| Alienware m18 R1 | |
| MSI Titan 18 HX A14VIG | |
| MSI Titan GT77 HX 13VI | |
| Acer Predator Helios 18 N23Q2 | |
| Razer Blade 18 RTX 4070 | |
| Przeciętny Intel Core i9-14900HX (13098 - 33474, n=36) | |
| Asus ROG Strix G18 G814JI | |
| AIDA64 / FPU Julia | |
| MSI Titan 18 HX A14VIG | |
| Alienware m18 R1 | |
| MSI Titan GT77 HX 13VI | |
| Acer Predator Helios 18 N23Q2 | |
| Razer Blade 18 RTX 4070 | |
| Przeciętny Intel Core i9-14900HX (67573 - 166040, n=36) | |
| Asus ROG Strix G18 G814JI | |
| AIDA64 / CPU SHA3 | |
| MSI Titan 18 HX A14VIG | |
| Alienware m18 R1 | |
| MSI Titan GT77 HX 13VI | |
| Acer Predator Helios 18 N23Q2 | |
| Razer Blade 18 RTX 4070 | |
| Przeciętny Intel Core i9-14900HX (3589 - 7979, n=36) | |
| Asus ROG Strix G18 G814JI | |
| AIDA64 / CPU Queen | |
| MSI Titan 18 HX A14VIG | |
| Alienware m18 R1 | |
| MSI Titan GT77 HX 13VI | |
| Przeciętny Intel Core i9-14900HX (118405 - 148966, n=36) | |
| Razer Blade 18 RTX 4070 | |
| Acer Predator Helios 18 N23Q2 | |
| Asus ROG Strix G18 G814JI | |
| AIDA64 / FPU SinJulia | |
| MSI Titan 18 HX A14VIG | |
| MSI Titan GT77 HX 13VI | |
| Alienware m18 R1 | |
| Razer Blade 18 RTX 4070 | |
| Acer Predator Helios 18 N23Q2 | |
| Przeciętny Intel Core i9-14900HX (10475 - 18517, n=36) | |
| Asus ROG Strix G18 G814JI | |
| AIDA64 / FPU Mandel | |
| Alienware m18 R1 | |
| MSI Titan 18 HX A14VIG | |
| MSI Titan GT77 HX 13VI | |
| Acer Predator Helios 18 N23Q2 | |
| Razer Blade 18 RTX 4070 | |
| Przeciętny Intel Core i9-14900HX (32543 - 83662, n=36) | |
| Asus ROG Strix G18 G814JI | |
| AIDA64 / CPU AES | |
| Acer Predator Helios 18 N23Q2 | |
| Przeciętny Intel Core i9-14900HX (86964 - 241777, n=36) | |
| MSI Titan 18 HX A14VIG | |
| MSI Titan GT77 HX 13VI | |
| Alienware m18 R1 | |
| Razer Blade 18 RTX 4070 | |
| Asus ROG Strix G18 G814JI | |
| AIDA64 / CPU ZLib | |
| MSI Titan 18 HX A14VIG | |
| MSI Titan GT77 HX 13VI | |
| Alienware m18 R1 | |
| Acer Predator Helios 18 N23Q2 | |
| Razer Blade 18 RTX 4070 | |
| Przeciętny Intel Core i9-14900HX (1054 - 2292, n=36) | |
| Asus ROG Strix G18 G814JI | |
| AIDA64 / FP64 Ray-Trace | |
| Alienware m18 R1 | |
| MSI Titan 18 HX A14VIG | |
| MSI Titan GT77 HX 13VI | |
| Acer Predator Helios 18 N23Q2 | |
| Razer Blade 18 RTX 4070 | |
| Przeciętny Intel Core i9-14900HX (6809 - 18349, n=36) | |
| Asus ROG Strix G18 G814JI | |
| AIDA64 / CPU PhotoWorxx | |
| Alienware m18 R1 | |
| Acer Predator Helios 18 N23Q2 | |
| Razer Blade 18 RTX 4070 | |
| Przeciętny Intel Core i9-14900HX (23903 - 54702, n=36) | |
| Asus ROG Strix G18 G814JI | |
| MSI Titan GT77 HX 13VI | |
| MSI Titan 18 HX A14VIG | |
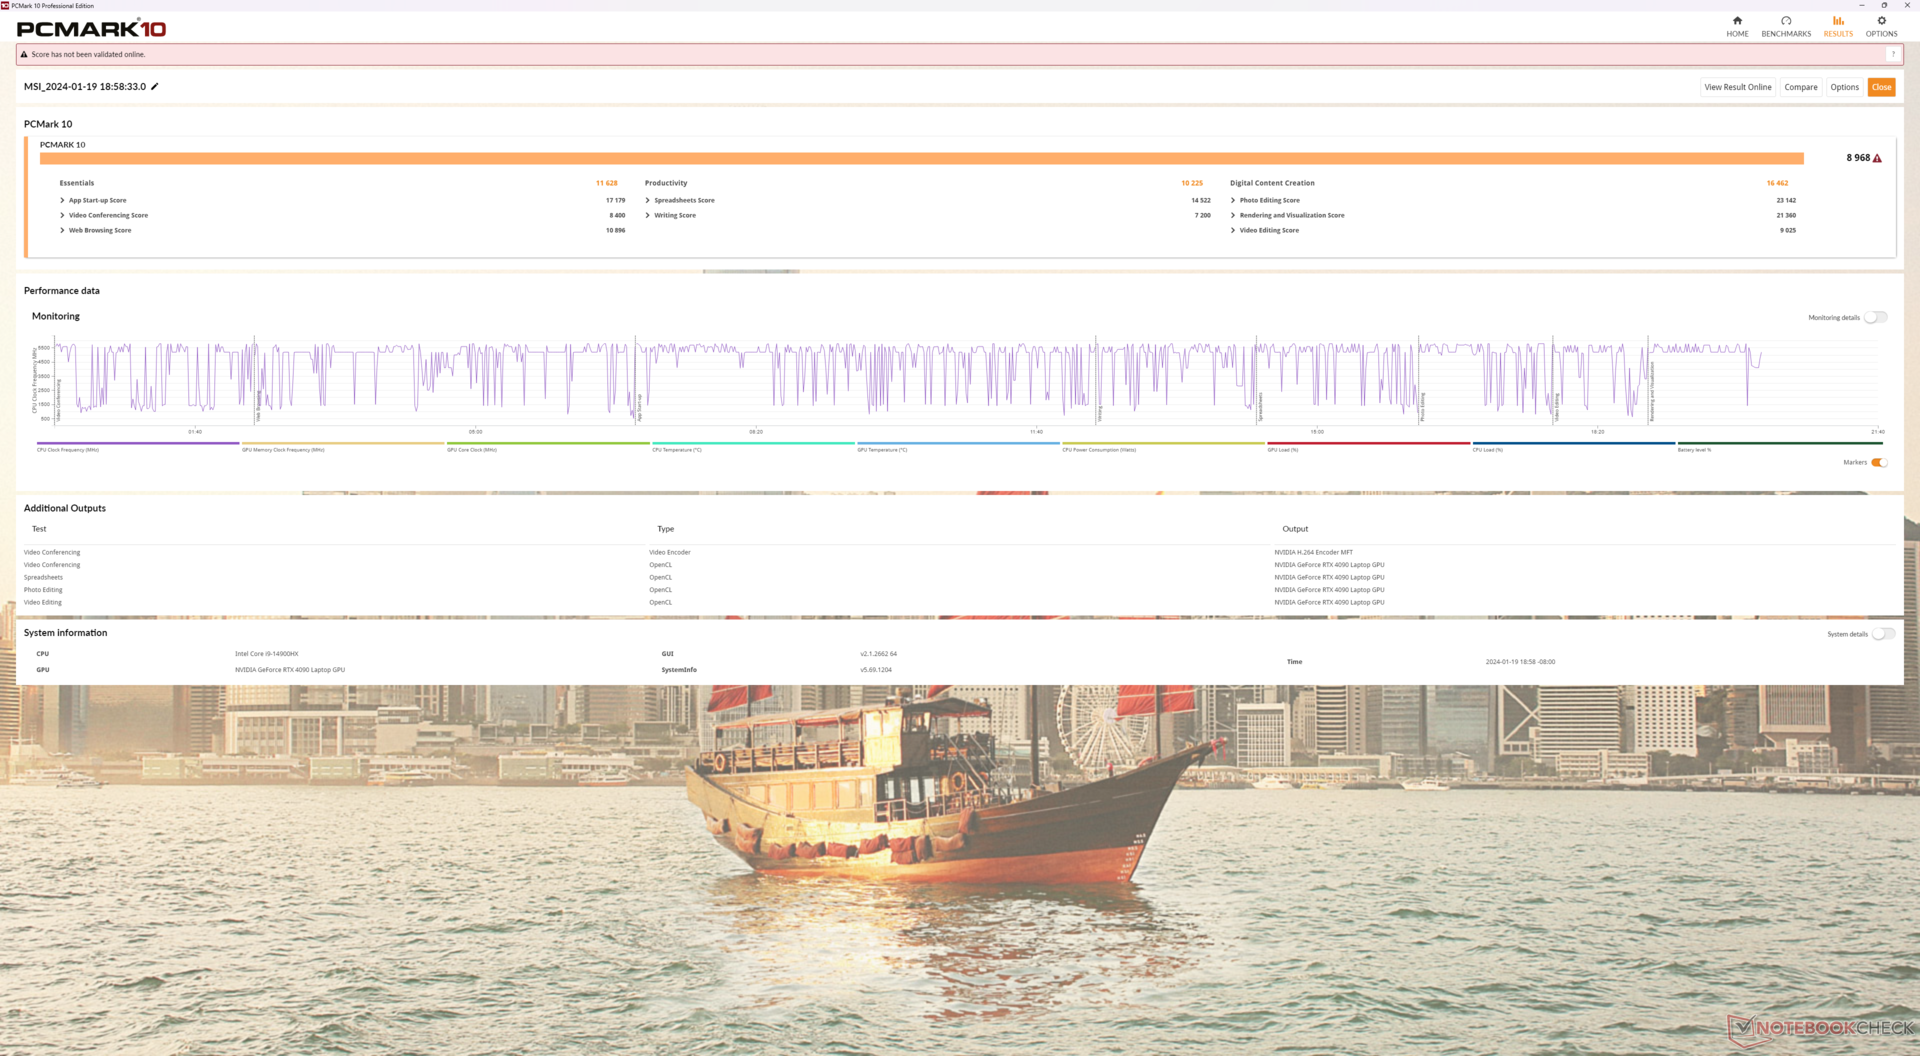
Wydajność systemu
Wyniki PCMark mieszczą się w zaledwie kilku punktach procentowych zeszłorocznego GT77, co sugeruje brak większych różnic w wydajności pomiędzy ich CPU i GPU podczas wykonywania codziennych zadań.
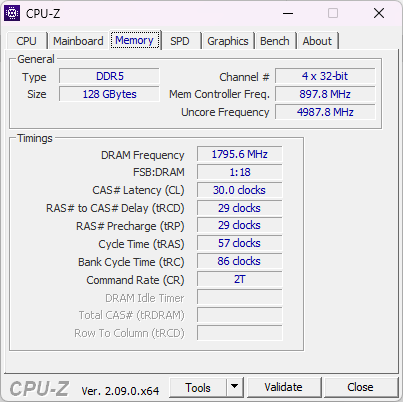
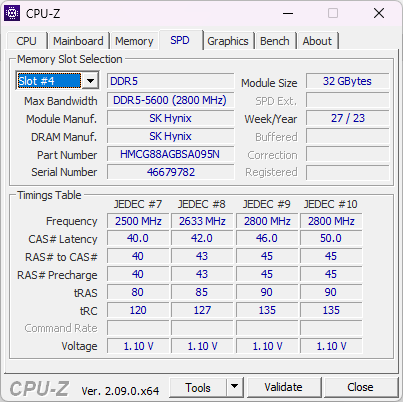
Proszę zauważyć, że wydajność pamięci RAM jest wolniejsza od naszej konfiguracji 128 GB nawet o 30 do 40 procent w porównaniu do konfiguracji 32 GB w Alienware m18 R1 Alienware m18 R1. Należy się tego spodziewać, ponieważ wydajność pamięci RAM przy wyższych pojemnościach jest ograniczona przez starzejący się interfejs SODIMM.
CrossMark: Overall | Productivity | Creativity | Responsiveness
WebXPRT 3: Overall
WebXPRT 4: Overall
Mozilla Kraken 1.1: Total
| PCMark 10 / Score | |
| MSI Titan 18 HX A14VIG | |
| MSI Titan GT77 HX 13VI | |
| Alienware m18 R1 | |
| Przeciętny Intel Core i9-14900HX, NVIDIA GeForce RTX 4090 Laptop GPU (8230 - 9234, n=13) | |
| Acer Predator Helios 18 N23Q2 | |
| Razer Blade 18 RTX 4070 | |
| Asus ROG Strix G18 G814JI | |
| PCMark 10 / Essentials | |
| MSI Titan GT77 HX 13VI | |
| Razer Blade 18 RTX 4070 | |
| MSI Titan 18 HX A14VIG | |
| Alienware m18 R1 | |
| Przeciętny Intel Core i9-14900HX, NVIDIA GeForce RTX 4090 Laptop GPU (10778 - 11628, n=13) | |
| Acer Predator Helios 18 N23Q2 | |
| Asus ROG Strix G18 G814JI | |
| PCMark 10 / Productivity | |
| Przeciętny Intel Core i9-14900HX, NVIDIA GeForce RTX 4090 Laptop GPU (9458 - 11759, n=13) | |
| Acer Predator Helios 18 N23Q2 | |
| MSI Titan 18 HX A14VIG | |
| Alienware m18 R1 | |
| MSI Titan GT77 HX 13VI | |
| Razer Blade 18 RTX 4070 | |
| Asus ROG Strix G18 G814JI | |
| PCMark 10 / Digital Content Creation | |
| MSI Titan 18 HX A14VIG | |
| MSI Titan GT77 HX 13VI | |
| Alienware m18 R1 | |
| Przeciętny Intel Core i9-14900HX, NVIDIA GeForce RTX 4090 Laptop GPU (13219 - 16462, n=13) | |
| Acer Predator Helios 18 N23Q2 | |
| Razer Blade 18 RTX 4070 | |
| Asus ROG Strix G18 G814JI | |
| CrossMark / Overall | |
| Acer Predator Helios 18 N23Q2 | |
| Alienware m18 R1 | |
| MSI Titan GT77 HX 13VI | |
| Razer Blade 18 RTX 4070 | |
| Przeciętny Intel Core i9-14900HX, NVIDIA GeForce RTX 4090 Laptop GPU (1877 - 2344, n=10) | |
| MSI Titan 18 HX A14VIG | |
| CrossMark / Productivity | |
| Acer Predator Helios 18 N23Q2 | |
| Alienware m18 R1 | |
| MSI Titan GT77 HX 13VI | |
| Razer Blade 18 RTX 4070 | |
| Przeciętny Intel Core i9-14900HX, NVIDIA GeForce RTX 4090 Laptop GPU (1738 - 2162, n=10) | |
| MSI Titan 18 HX A14VIG | |
| CrossMark / Creativity | |
| Alienware m18 R1 | |
| MSI Titan GT77 HX 13VI | |
| Acer Predator Helios 18 N23Q2 | |
| Razer Blade 18 RTX 4070 | |
| Przeciętny Intel Core i9-14900HX, NVIDIA GeForce RTX 4090 Laptop GPU (2195 - 2660, n=10) | |
| MSI Titan 18 HX A14VIG | |
| CrossMark / Responsiveness | |
| Acer Predator Helios 18 N23Q2 | |
| Alienware m18 R1 | |
| Razer Blade 18 RTX 4070 | |
| Przeciętny Intel Core i9-14900HX, NVIDIA GeForce RTX 4090 Laptop GPU (1478 - 2327, n=10) | |
| MSI Titan GT77 HX 13VI | |
| MSI Titan 18 HX A14VIG | |
| WebXPRT 3 / Overall | |
| Razer Blade 18 RTX 4070 | |
| Alienware m18 R1 | |
| MSI Titan 18 HX A14VIG | |
| Przeciętny Intel Core i9-14900HX, NVIDIA GeForce RTX 4090 Laptop GPU (279 - 339, n=10) | |
| MSI Titan GT77 HX 13VI | |
| Acer Predator Helios 18 N23Q2 | |
| Asus ROG Strix G18 G814JI | |
| Asus ROG Strix G18 G814JI | |
| WebXPRT 4 / Overall | |
| Alienware m18 R1 | |
| Razer Blade 18 RTX 4070 | |
| MSI Titan GT77 HX 13VI | |
| Przeciętny Intel Core i9-14900HX, NVIDIA GeForce RTX 4090 Laptop GPU (246 - 309, n=8) | |
| MSI Titan 18 HX A14VIG | |
| Asus ROG Strix G18 G814JI | |
| Asus ROG Strix G18 G814JI | |
| Mozilla Kraken 1.1 / Total | |
| Asus ROG Strix G18 G814JI | |
| Asus ROG Strix G18 G814JI | |
| MSI Titan GT77 HX 13VI | |
| Razer Blade 18 RTX 4070 | |
| Alienware m18 R1 | |
| Acer Predator Helios 18 N23Q2 | |
| Przeciętny Intel Core i9-14900HX, NVIDIA GeForce RTX 4090 Laptop GPU (428 - 535, n=11) | |
| MSI Titan 18 HX A14VIG | |
* ... im mniej tym lepiej
| PCMark 10 Score | 8968 pkt. | |
Pomoc | ||
| AIDA64 / Memory Copy | |
| Alienware m18 R1 | |
| Acer Predator Helios 18 N23Q2 | |
| Razer Blade 18 RTX 4070 | |
| Przeciętny Intel Core i9-14900HX (38028 - 83392, n=36) | |
| Asus ROG Strix G18 G814JI | |
| MSI Titan GT77 HX 13VI | |
| MSI Titan 18 HX A14VIG | |
| AIDA64 / Memory Read | |
| Alienware m18 R1 | |
| Acer Predator Helios 18 N23Q2 | |
| Razer Blade 18 RTX 4070 | |
| Przeciętny Intel Core i9-14900HX (43306 - 87568, n=36) | |
| Asus ROG Strix G18 G814JI | |
| MSI Titan GT77 HX 13VI | |
| MSI Titan 18 HX A14VIG | |
| AIDA64 / Memory Write | |
| Alienware m18 R1 | |
| Razer Blade 18 RTX 4070 | |
| Acer Predator Helios 18 N23Q2 | |
| Przeciętny Intel Core i9-14900HX (37146 - 80589, n=36) | |
| MSI Titan GT77 HX 13VI | |
| Asus ROG Strix G18 G814JI | |
| MSI Titan 18 HX A14VIG | |
| AIDA64 / Memory Latency | |
| MSI Titan 18 HX A14VIG | |
| MSI Titan GT77 HX 13VI | |
| Przeciętny Intel Core i9-14900HX (76.1 - 105, n=36) | |
| Razer Blade 18 RTX 4070 | |
| Asus ROG Strix G18 G814JI | |
| Acer Predator Helios 18 N23Q2 | |
| Alienware m18 R1 | |
* ... im mniej tym lepiej
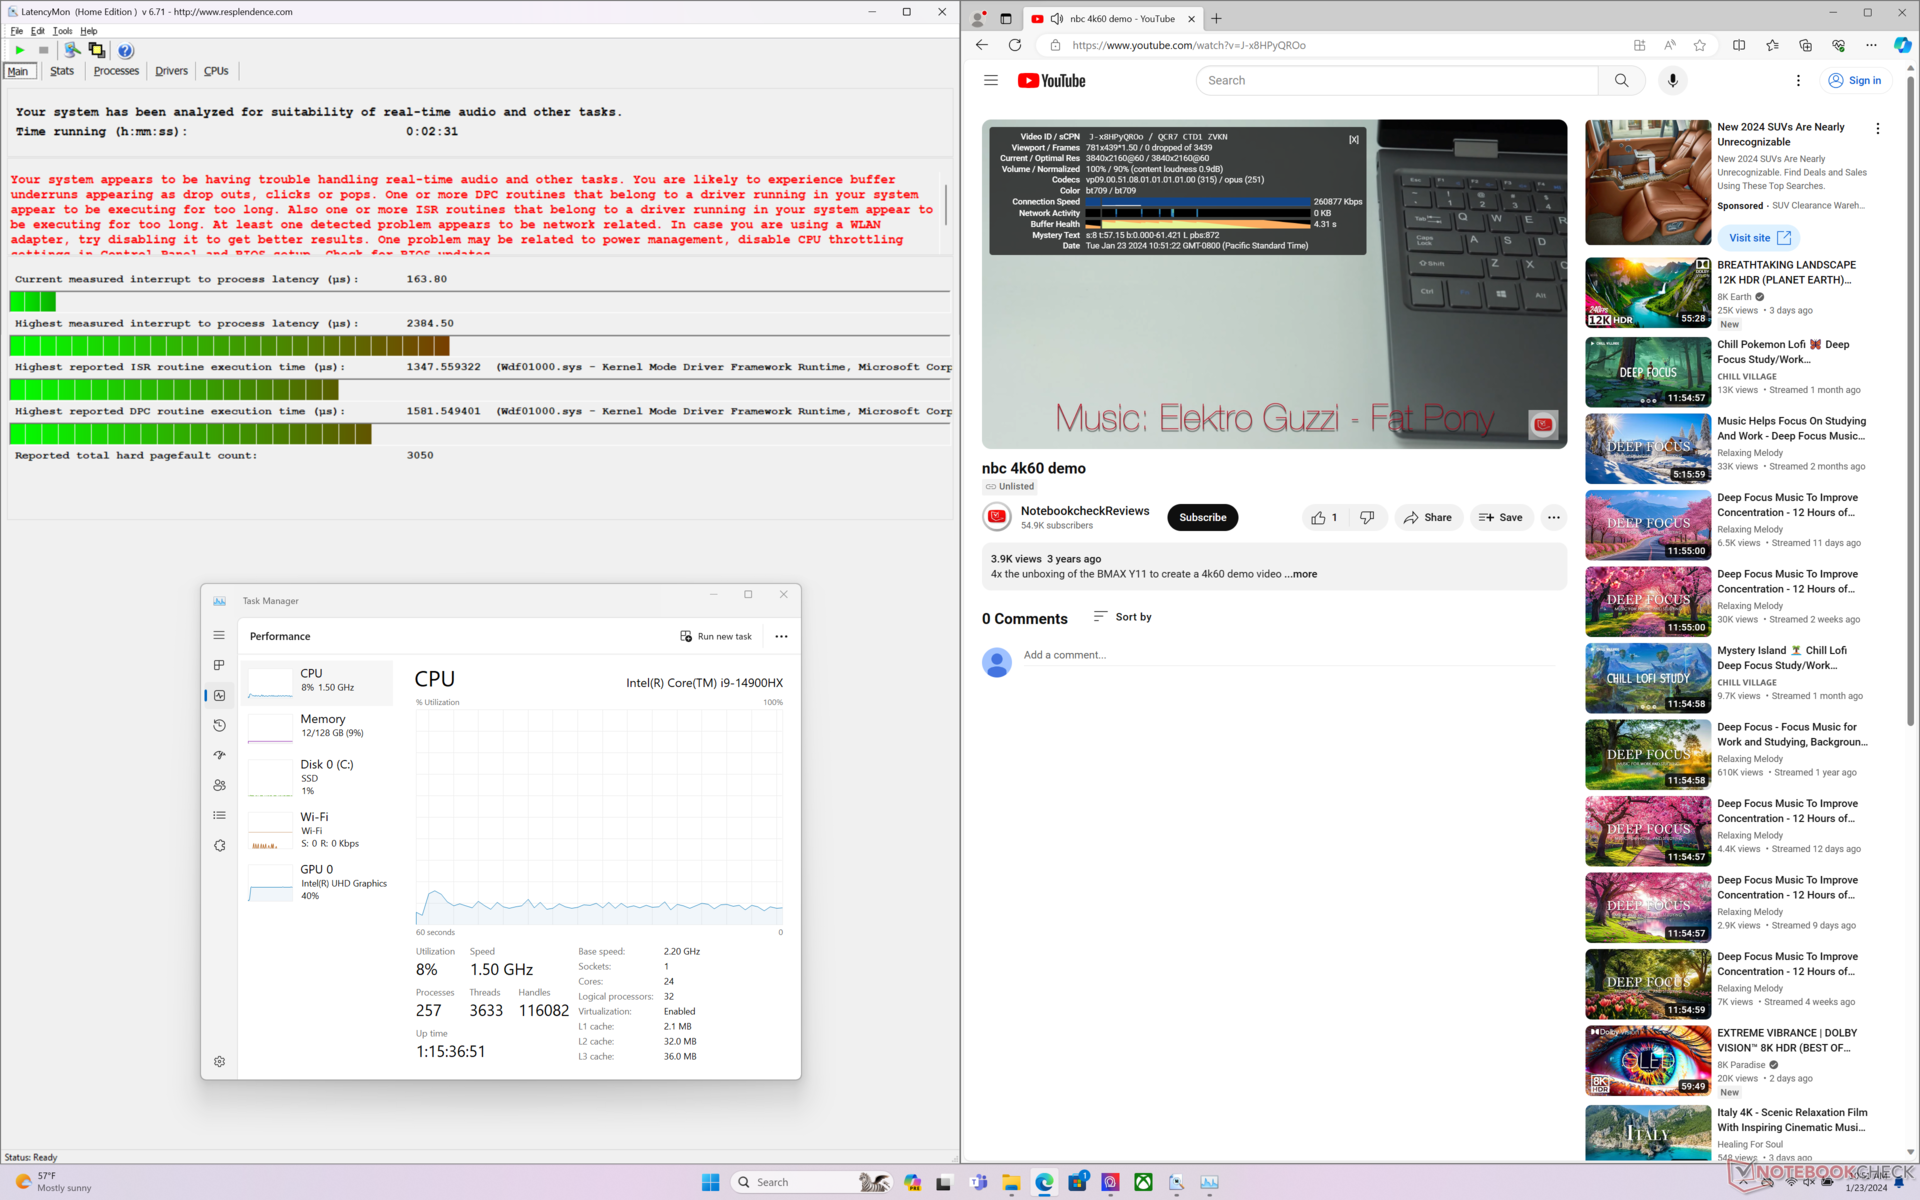
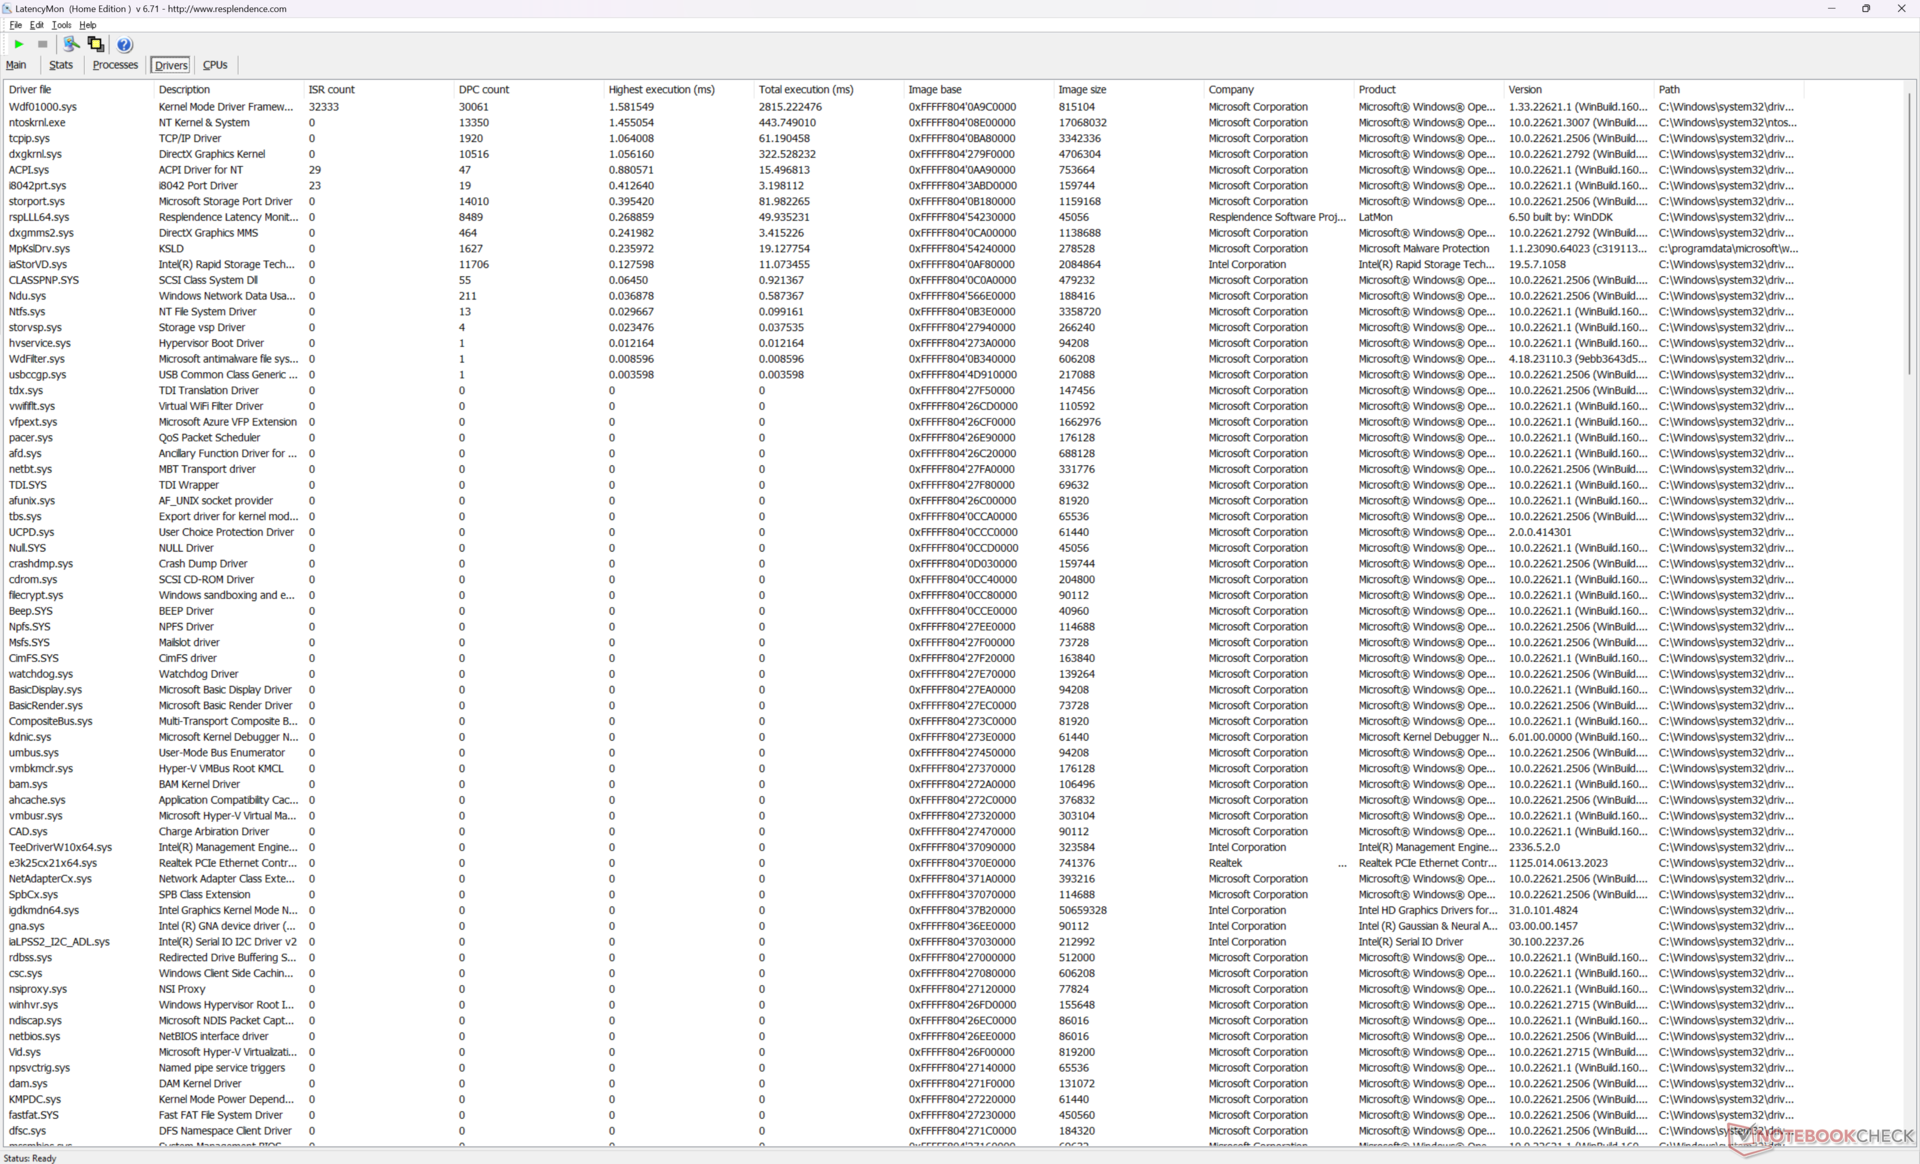
Opóźnienie DPC
LatencyMon pokazuje problemy z DPC podczas otwierania wielu kart przeglądarki na naszej stronie głównej. odtwarzanie wideo 4K przy 60 FPS w trybie iGPU jest poza tym idealne i nie odnotowano żadnych spadków klatek.
| DPC Latencies / LatencyMon - interrupt to process latency (max), Web, Youtube, Prime95 | |
| Acer Predator Helios 18 N23Q2 | |
| MSI Titan GT77 HX 13VI | |
| Alienware m18 R1 | |
| MSI Titan 18 HX A14VIG | |
| Razer Blade 18 RTX 4070 | |
| Asus ROG Strix G18 G814JI | |
* ... im mniej tym lepiej
Urządzenia pamięci masowej
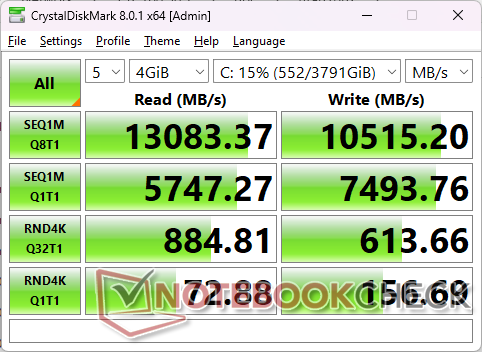
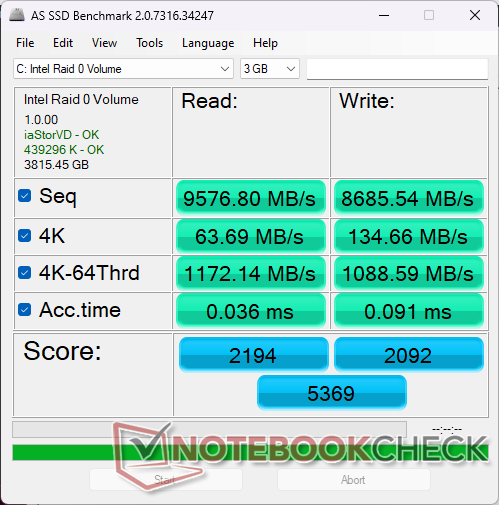
Nasze urządzenie jest dostarczane z dwoma Samsung MZVL22T0HDLB PM9A1a PCIe4 x4 NVMe SSD w konfiguracji RAID 0 dla prędkości transferu zbliżającej się do 13000 MB/s zamiast zwykłej ~7000 MB/s dla większości pojedynczych dysków SSD PCIe4 x4. Dyski nie wykazywały żadnych problemów z dławieniem przy kilkuminutowym obciążeniu w programie DiskSpd.
Titan 18 HX może również obsługiwać pojedynczy dysk PCIe5 M.2 SSD, ale dostępność takich dysków jest ograniczona, więc większość konfiguracji jest obecnie dostarczana z dyskami PCIe4 x4.

| Drive Performance rating - Percent | |
| Alienware m18 R1 | |
| Acer Predator Helios 18 N23Q2 | |
| Razer Blade 18 RTX 4070 | |
| MSI Titan GT77 HX 13VI | |
| MSI Titan 18 HX A14VIG | |
| Asus ROG Strix G18 G814JI | |
* ... im mniej tym lepiej
Disk Throttling: DiskSpd Read Loop, Queue Depth 8
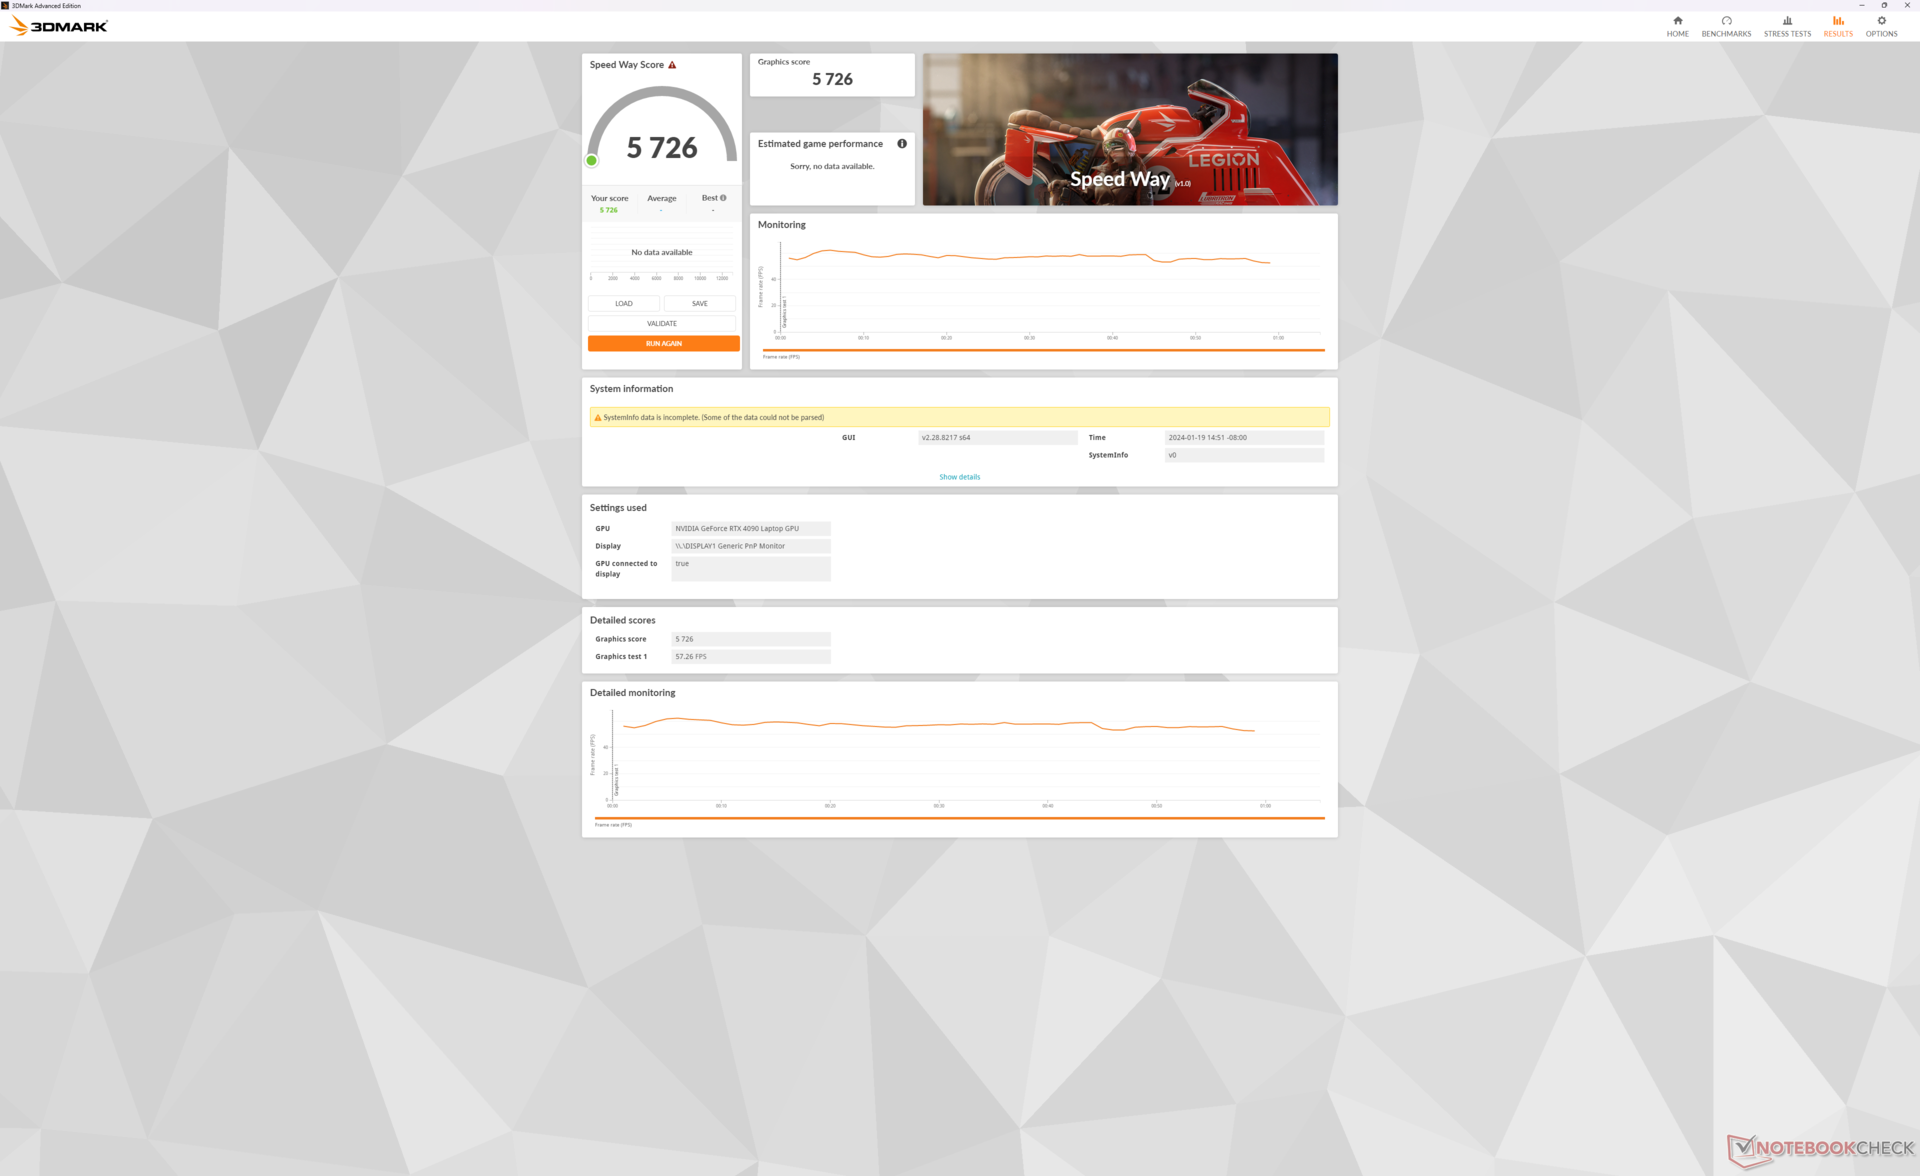
Wydajność GPU - Układ graficzny 175 W + procesor 95 W
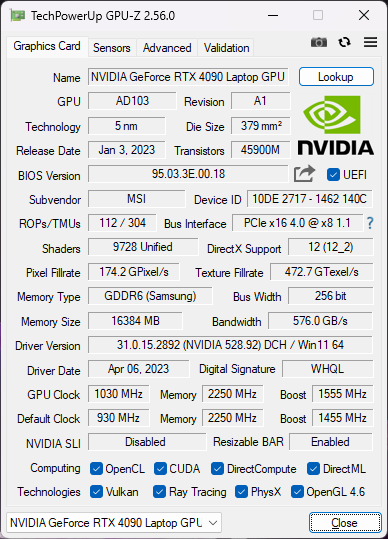
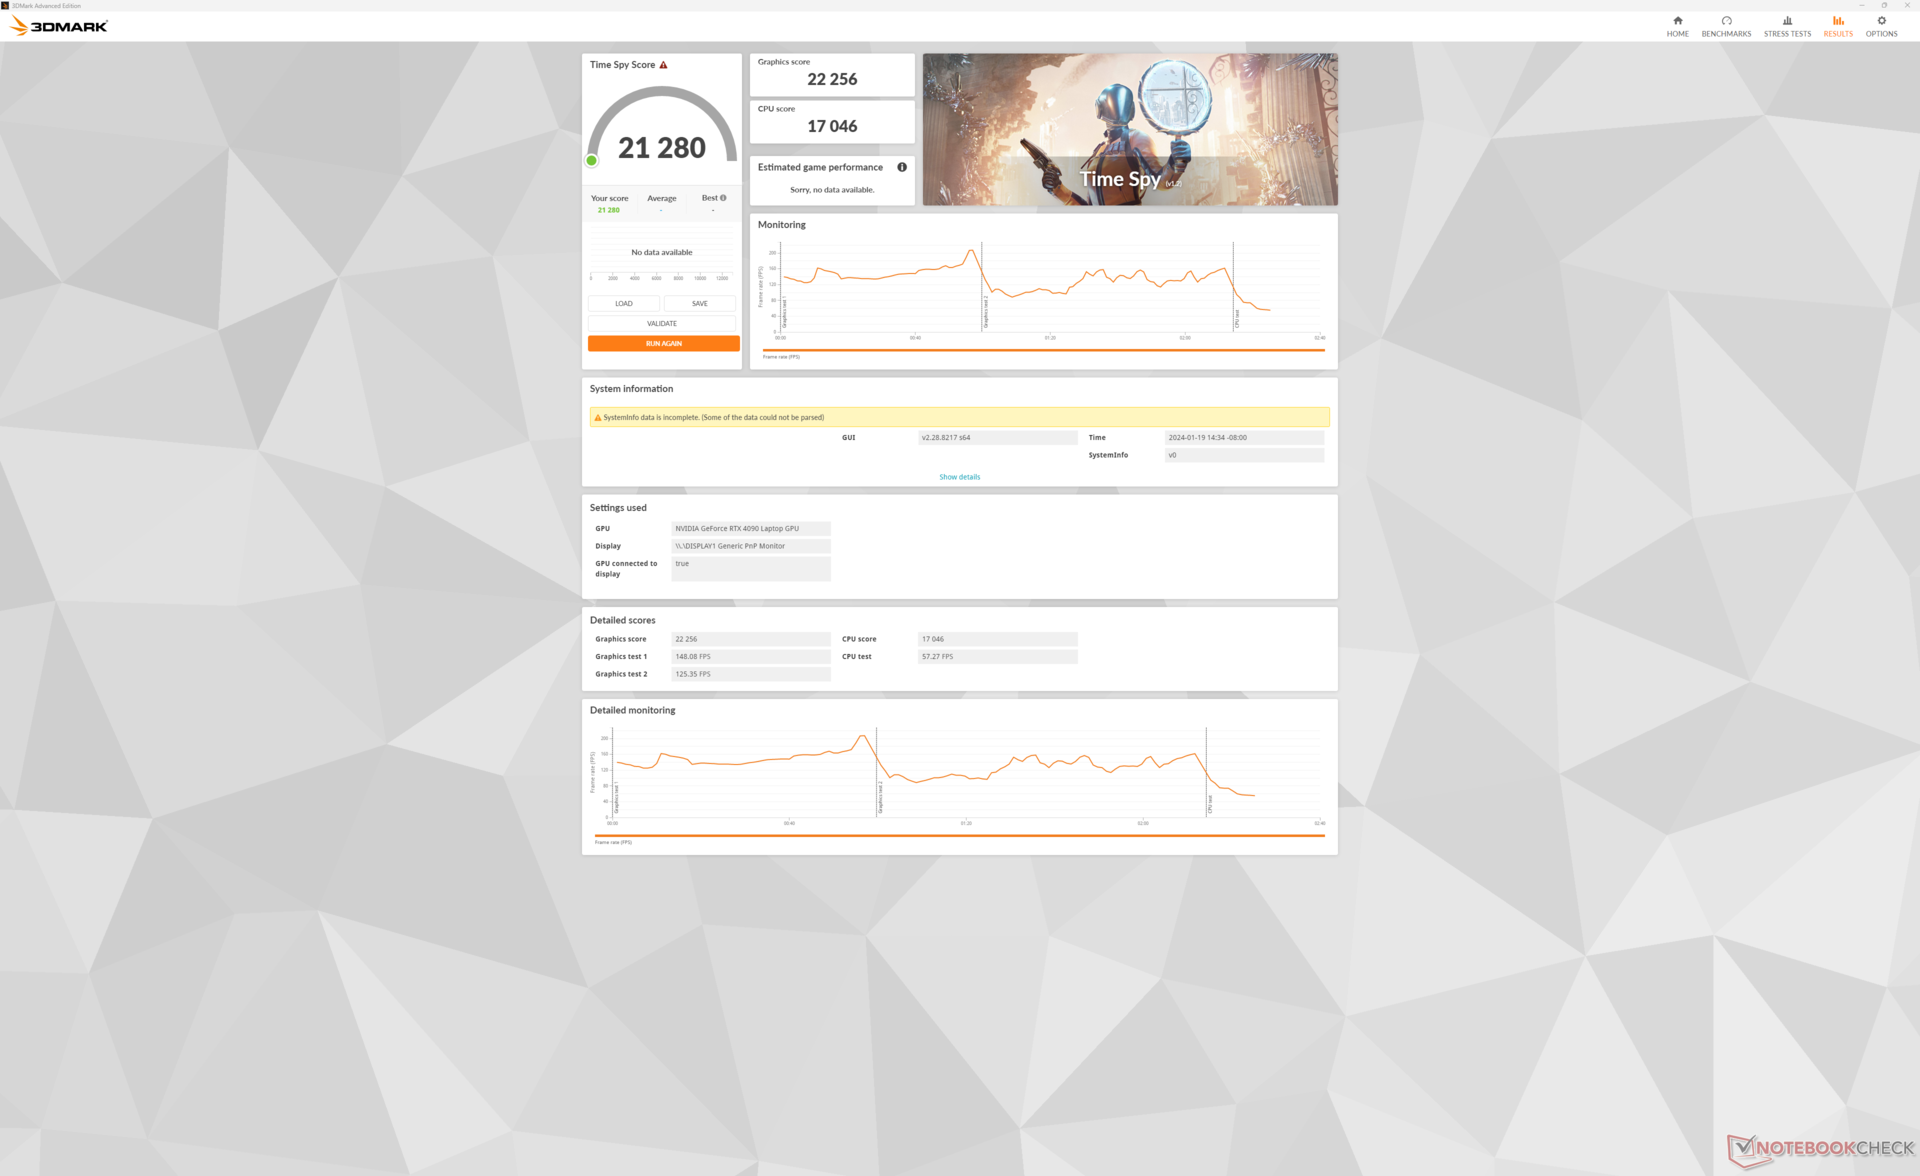
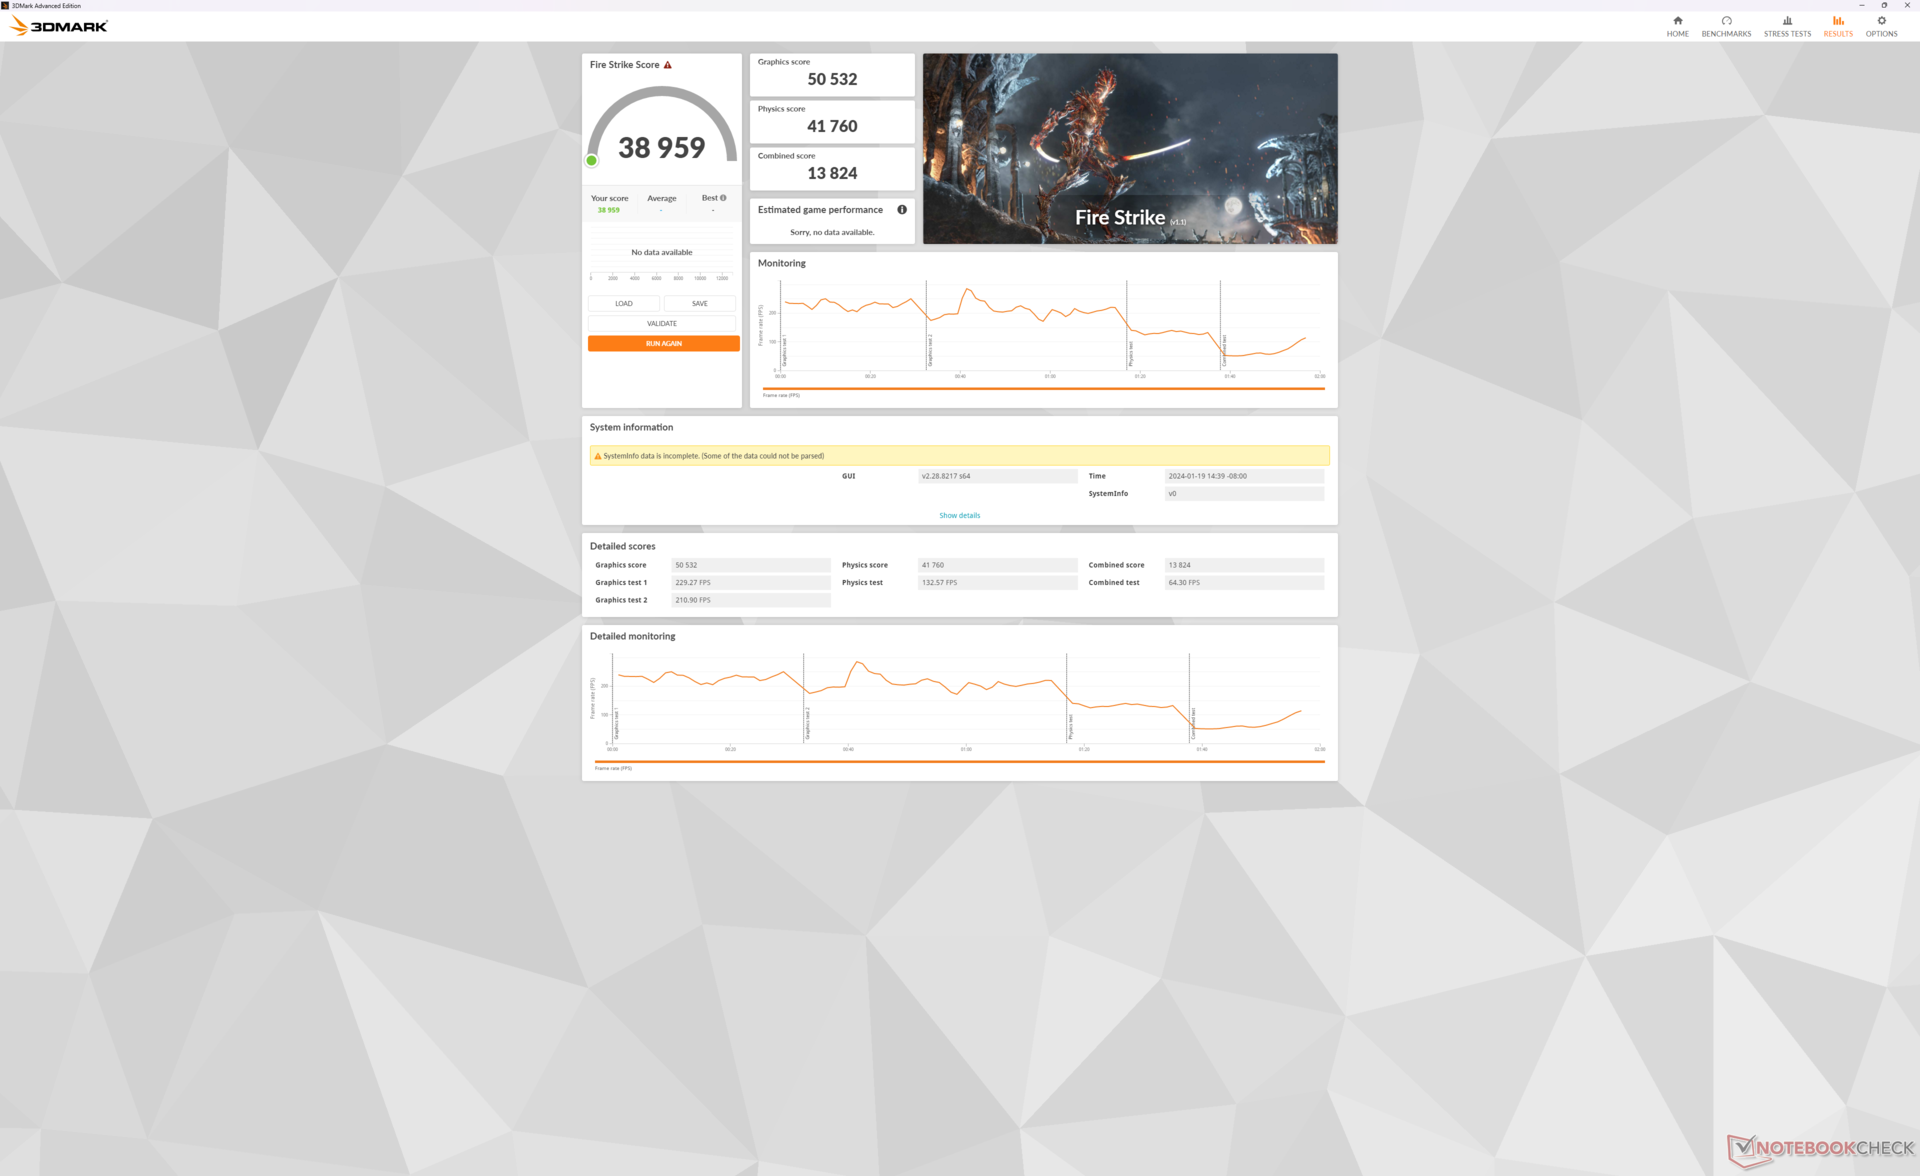
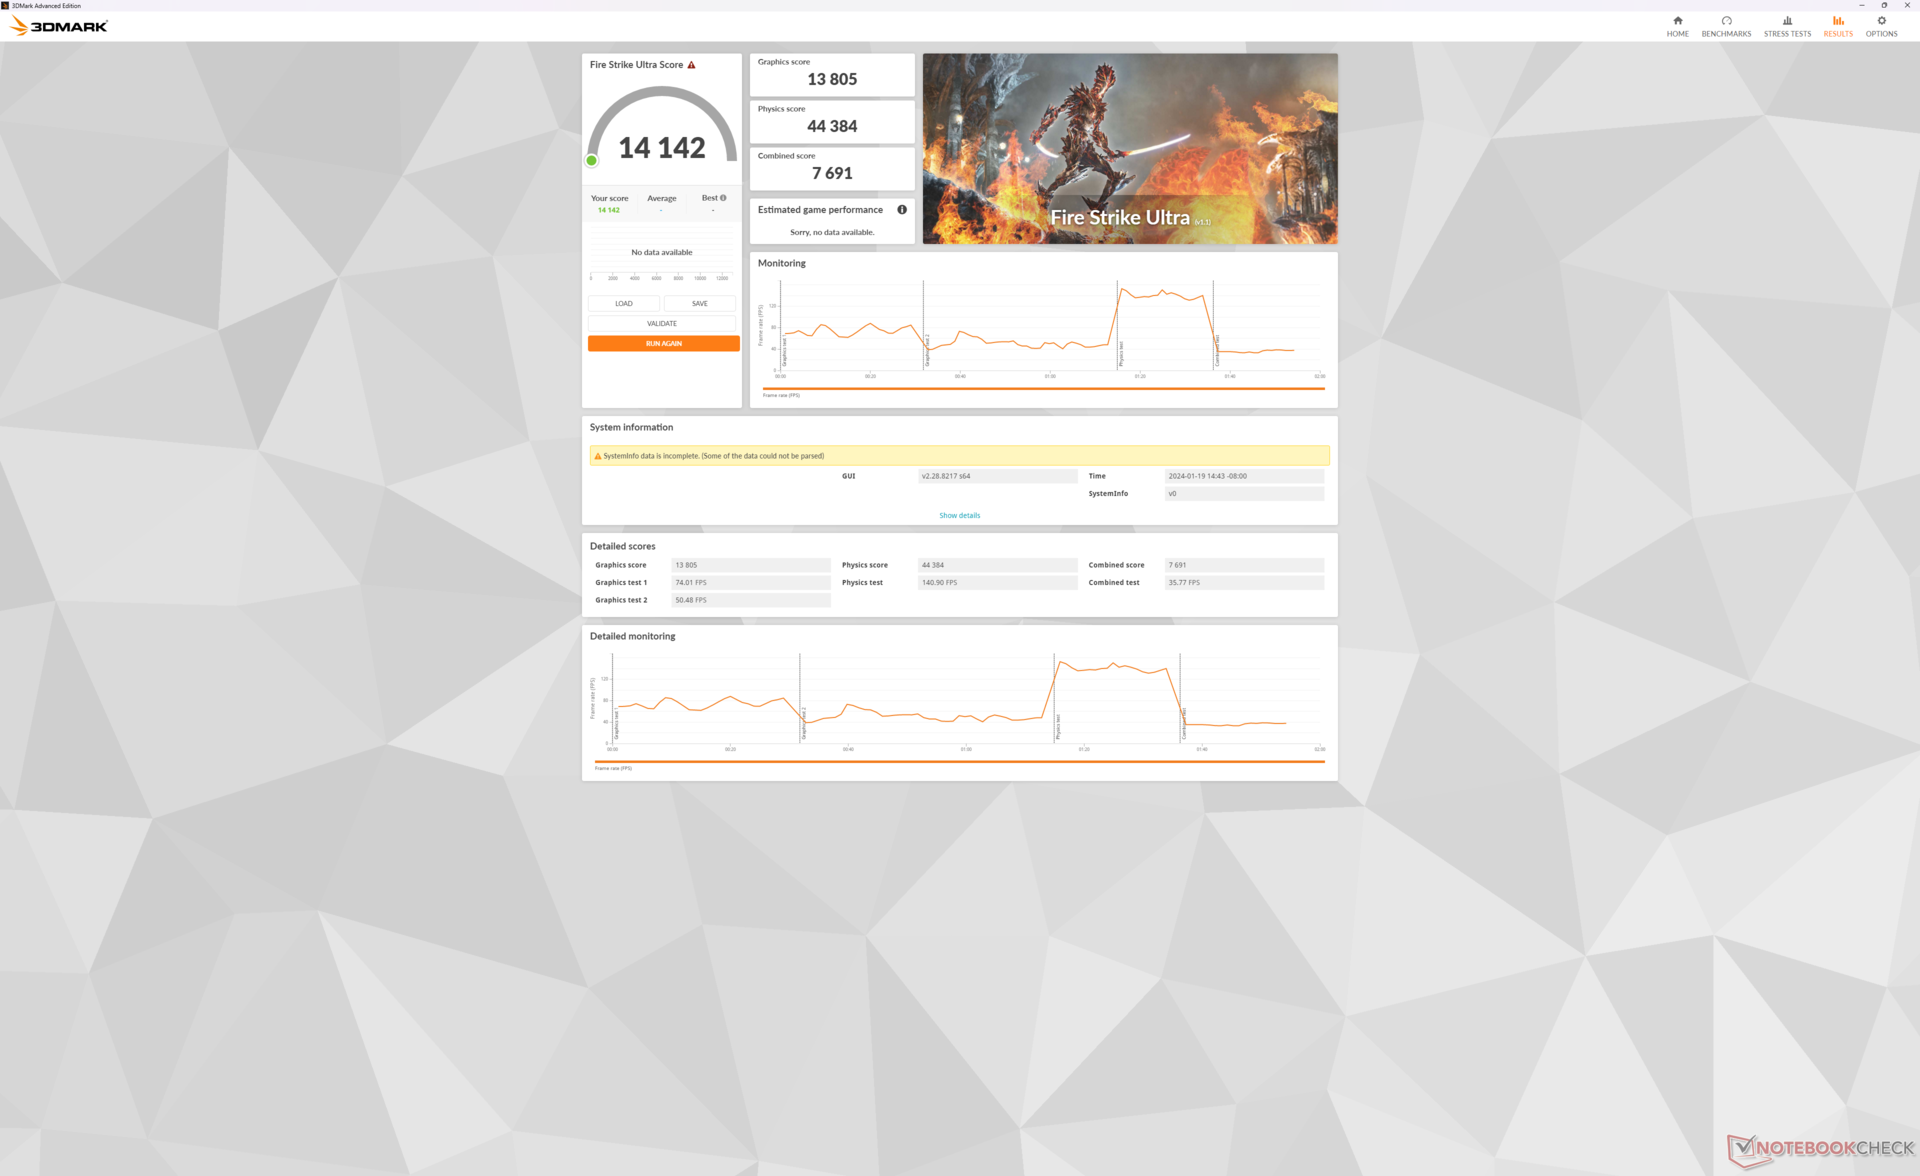
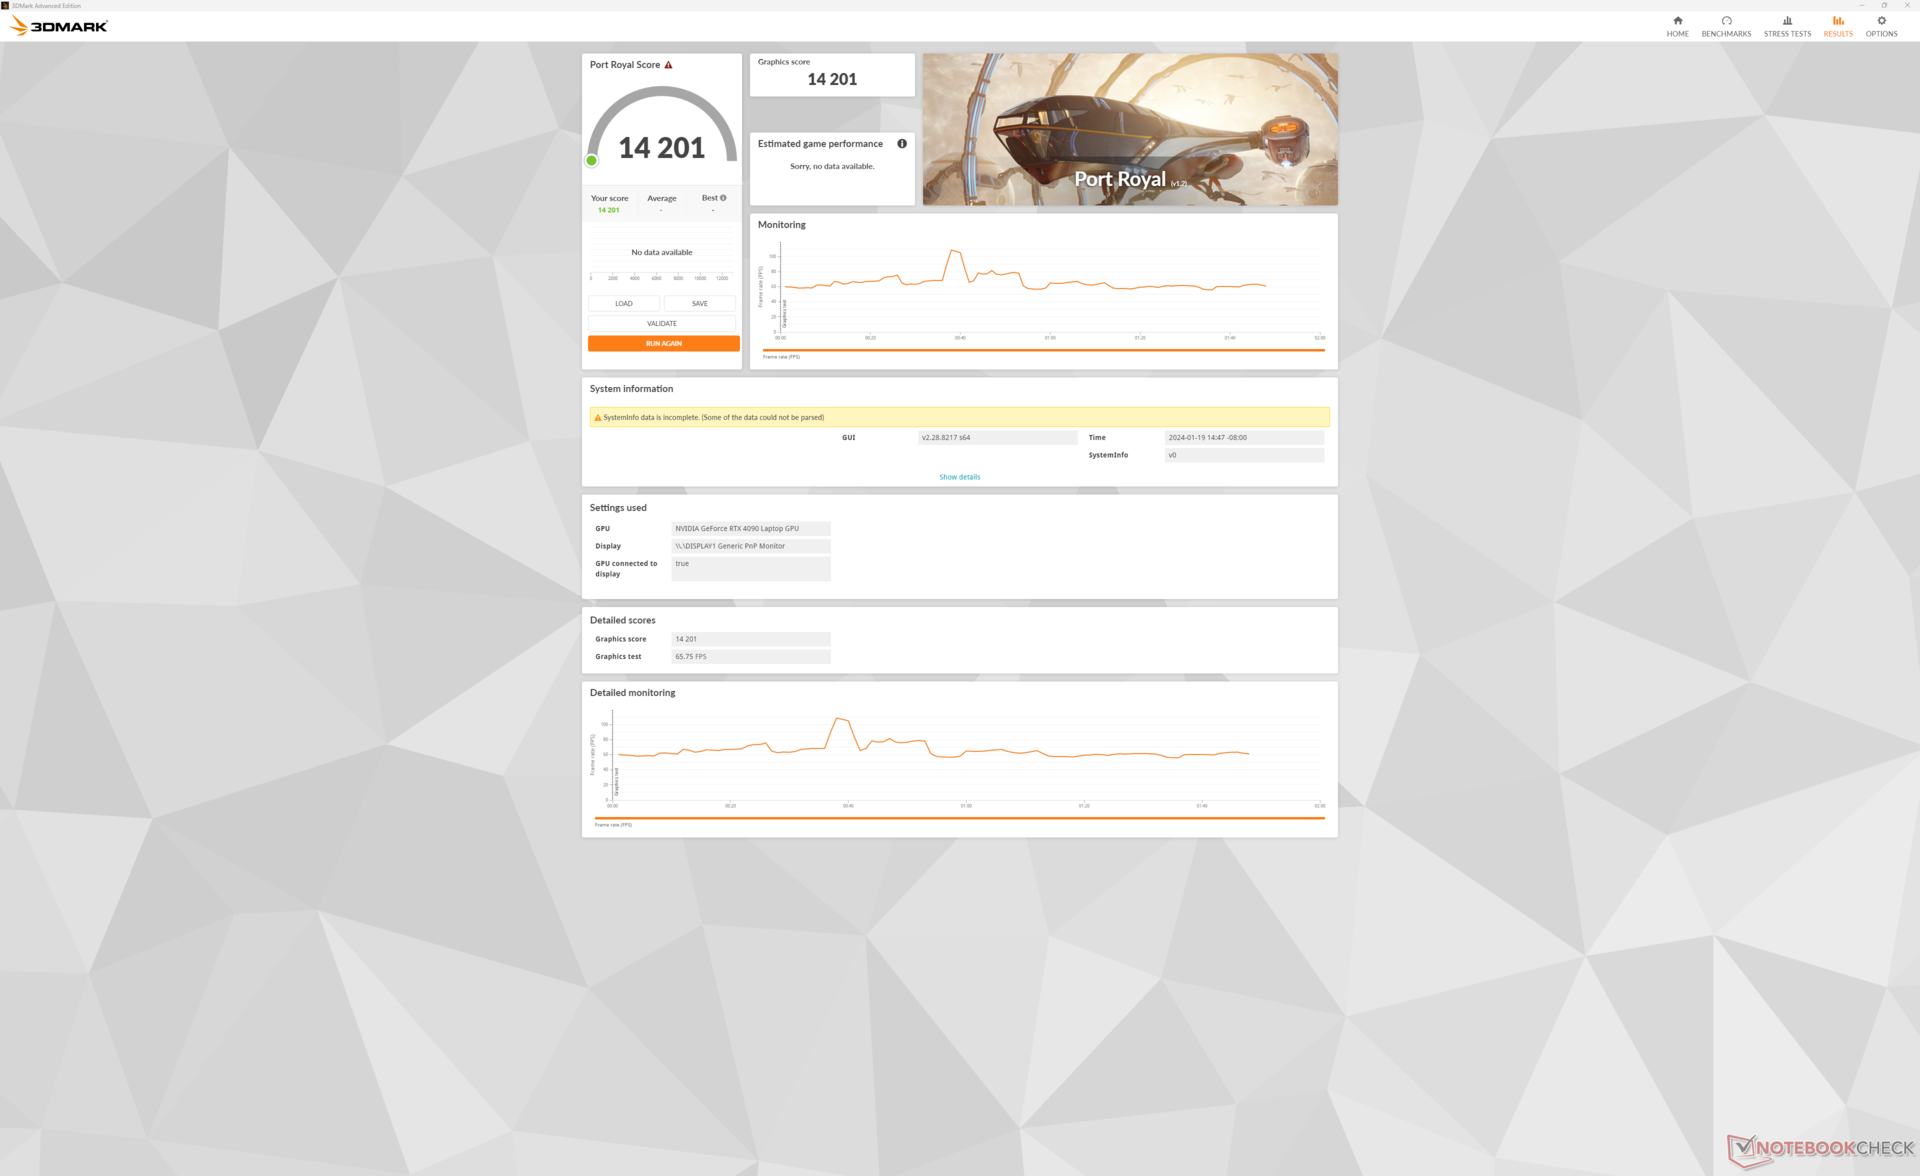
Mobilna karta graficzna 175 W GeForce RTX 4090 GPU w naszym Titan 18 HX zwróciłby niemal identyczne wyniki 3DMark jak zeszłoroczny GT77 wyposażony w ten sam GPU. Innymi słowy, proszę nie oczekiwać, że nowy system MSI będzie działał szybciej niż wcześniej, pomimo nowego, fantazyjnego wyglądu zewnętrznego. Niemniej jednak jest to jeden z najszybszych laptopów do gier na rynku z poziomem wydajności najbardziej zbliżonym do komputerów stacjonarnych GeForce RTX 4070 Super.
Włączenie lub wyłączenie Cooler Boost nie wydaje się znacząco wpływać na wydajność, jak pokazuje nasza tabela wyników Time Spy poniżej, mimo że istnieją znaczne różnice w hałasie wentylatora między tymi dwoma trybami. Tak więc, Cooler Boost jest zalecany tylko wtedy, gdy temperatury rdzenia są powodem do niepokoju lub podczas podkręcania. Uruchomienie trybu zrównoważonego zamiast trybu ekstremalnej wydajności zmniejszyłoby jednak wydajność grafiki o około 10 procent.
| Profil zasilania | Wynik grafiki | Wynik procesora | Całkowity wynik |
| Ekstremalna wydajność (Cooler Boost włączony) | 22256 | 17046 | 21280 |
| Ekstremalna wydajność (Cooler Boost wyłączony) | 22097 (-1%) | 16608 (-3%) | 21053 (-1%) |
| Tryb zrównoważony | 20121 (-10%) | 16532 (-3%) | 19486 (-8%) |
| Zasilanie bateryjne | 6480 (-71%) | 6999 (-59%) | 6552 (-69%) |
| 3DMark Performance rating - Percent | |
| AMD Ryzen 9 7900 -2! | |
| MSI Titan GT77 HX 13VI | |
| MSI Titan 18 HX A14VIG | |
| NVIDIA GeForce RTX 4070 Super Founders Edition | |
| Przeciętny NVIDIA GeForce RTX 4090 Laptop GPU | |
| Alienware m18 R1 AMD -1! | |
| Acer Predator Helios 18 N23Q2 -1! | |
| Asus ROG Strix Scar 17 SE G733CX-LL014W | |
| Alienware m17 R5 (R9 6900HX, RX 6850M XT) -1! | |
| Razer Blade 18 RTX 4070 | |
| MSI Raider GE68 HX 13VG, i7-13700HX -1! | |
| Asus ROG Strix G18 G814JI -1! | |
| Asus ROG Zephyrus M16 GU603Z -1! | |
| Dell G16 7620 -1! | |
| Lenovo ThinkPad Z16 Gen 2 -1! | |
| 3DMark 11 Performance | 46238 pkt. | |
| 3DMark Fire Strike Score | 38959 pkt. | |
| 3DMark Time Spy Score | 21280 pkt. | |
Pomoc | ||
* ... im mniej tym lepiej
Wydajność w grach
Wszystkie obecne tytuły działają płynnie na mobilnym RTX 4090 nawet przy większości ustawień na maksimum. GPU zaczyna jednak nieco walczyć w rozdzielczości 4K, a F1 22 i Cyberpunk 2077 osiągają średnio tylko 44 FPS. W takich scenariuszach zaleca się włączenie DLSS, zwłaszcza że wyświetlacz nie obsługuje G-Sync. Dla przykładu, uruchomienie Cyberpunk 2077 w natywnej rozdzielczości 4K i ustawieniach Ultra RT pozwoliłoby uzyskać średnio zaledwie 21,6 FPS, podczas gdy włączenie DLSS Auto i Frame Generation zwiększyłoby średnią do 89 FPS.
| Performance rating - Percent | |
| Alienware m18 R1 | |
| MSI Titan GT77 HX 13VI | |
| MSI Titan 18 HX A14VIG | |
| Acer Predator Helios 18 N23Q2 | |
| Razer Blade 18 RTX 4070 | |
| Asus ROG Strix G18 G814JI | |
| The Witcher 3 - 1920x1080 Ultra Graphics & Postprocessing (HBAO+) | |
| Alienware m18 R1 | |
| MSI Titan 18 HX A14VIG | |
| MSI Titan GT77 HX 13VI | |
| Acer Predator Helios 18 N23Q2 | |
| Asus ROG Strix G18 G814JI | |
| Razer Blade 18 RTX 4070 | |
| GTA V - 1920x1080 Highest AA:4xMSAA + FX AF:16x | |
| Acer Predator Helios 18 N23Q2 | |
| Alienware m18 R1 | |
| MSI Titan GT77 HX 13VI | |
| MSI Titan 18 HX A14VIG | |
| Razer Blade 18 RTX 4070 | |
| Asus ROG Strix G18 G814JI | |
| Final Fantasy XV Benchmark - 1920x1080 High Quality | |
| Alienware m18 R1 | |
| MSI Titan GT77 HX 13VI | |
| MSI Titan 18 HX A14VIG | |
| Acer Predator Helios 18 N23Q2 | |
| Asus ROG Strix G18 G814JI | |
| Razer Blade 18 RTX 4070 | |
| Strange Brigade - 1920x1080 ultra AA:ultra AF:16 | |
| MSI Titan 18 HX A14VIG | |
| MSI Titan GT77 HX 13VI | |
| Alienware m18 R1 | |
| Acer Predator Helios 18 N23Q2 | |
| Asus ROG Strix G18 G814JI | |
| Razer Blade 18 RTX 4070 | |
| Dota 2 Reborn - 1920x1080 ultra (3/3) best looking | |
| Alienware m18 R1 | |
| Acer Predator Helios 18 N23Q2 | |
| MSI Titan GT77 HX 13VI | |
| Razer Blade 18 RTX 4070 | |
| MSI Titan 18 HX A14VIG | |
| Asus ROG Strix G18 G814JI | |
| X-Plane 11.11 - 1920x1080 high (fps_test=3) | |
| Alienware m18 R1 | |
| Acer Predator Helios 18 N23Q2 | |
| Razer Blade 18 RTX 4070 | |
| MSI Titan GT77 HX 13VI | |
| MSI Titan GT77 HX 13VI | |
| MSI Titan 18 HX A14VIG | |
| Asus ROG Strix G18 G814JI | |
| The Witcher 3 | |
| 1920x1080 Ultra Graphics & Postprocessing (HBAO+) | |
| AMD Ryzen 9 7900 | |
| MSI Titan 18 HX A14VIG | |
| MSI Titan GT77 HX 13VI | |
| Przeciętny NVIDIA GeForce RTX 4090 Laptop GPU (139.2 - 216, n=35) | |
| NVIDIA GeForce RTX 4070 Super Founders Edition | |
| Acer Predator Helios 18 N23Q2 | |
| Alienware m18 R1 AMD | |
| Alienware m17 R5 (R9 6900HX, RX 6850M XT) | |
| MSI Raider GE68 HX 13VG, i7-13700HX | |
| Asus ROG Strix G18 G814JI | |
| Asus ROG Strix Scar 17 SE G733CX-LL014W | |
| Razer Blade 18 RTX 4070 | |
| Asus ROG Zephyrus M16 GU603Z | |
| Dell G16 7620 | |
| Lenovo ThinkPad Z16 Gen 2 | |
| 3840x2160 High Graphics & Postprocessing (Nvidia HairWorks Off) | |
| AMD Ryzen 9 7900 | |
| MSI Titan 18 HX A14VIG | |
| MSI Titan GT77 HX 13VI | |
| Przeciętny NVIDIA GeForce RTX 4090 Laptop GPU (96.3 - 167.6, n=19) | |
| NVIDIA GeForce RTX 4070 Super Founders Edition | |
| Alienware m18 R1 AMD | |
| Razer Blade 18 RTX 4070 | |
| Alienware m17 R5 (R9 6900HX, RX 6850M XT) | |
| Tiny Tina's Wonderlands | |
| 1920x1080 Badass Preset (DX12) | |
| MSI Titan GT77 HX 13VI | |
| MSI Titan 18 HX A14VIG | |
| Przeciętny NVIDIA GeForce RTX 4090 Laptop GPU (141.1 - 189.4, n=14) | |
| Alienware m18 R1 AMD | |
| Lenovo ThinkPad Z16 Gen 2 | |
| 2560x1440 Badass Preset (DX12) | |
| MSI Titan GT77 HX 13VI | |
| MSI Titan 18 HX A14VIG | |
| Przeciętny NVIDIA GeForce RTX 4090 Laptop GPU (103.4 - 137.8, n=14) | |
| Alienware m18 R1 AMD | |
| Lenovo ThinkPad Z16 Gen 2 | |
| 3840x2160 Badass Preset (DX12) | |
| MSI Titan 18 HX A14VIG | |
| MSI Titan GT77 HX 13VI | |
| Przeciętny NVIDIA GeForce RTX 4090 Laptop GPU (53.3 - 73.7, n=12) | |
| Alienware m18 R1 AMD | |
| Cyberpunk 2077 | |
| 1920x1080 Ultra Preset (FSR off) | |
| NVIDIA GeForce RTX 4070 Super Founders Edition | |
| MSI Titan 18 HX A14VIG | |
| Alienware m18 R1 AMD | |
| Acer Predator Helios 18 N23Q2 | |
| Przeciętny NVIDIA GeForce RTX 4090 Laptop GPU (93.1 - 158, n=21) | |
| Lenovo ThinkPad Z16 Gen 2 | |
| 2560x1440 Ultra Preset (FSR off) | |
| MSI Titan 18 HX A14VIG | |
| Przeciętny NVIDIA GeForce RTX 4090 Laptop GPU (68.1 - 103.9, n=21) | |
| Alienware m18 R1 AMD | |
| NVIDIA GeForce RTX 4070 Super Founders Edition | |
| Acer Predator Helios 18 N23Q2 | |
| Lenovo ThinkPad Z16 Gen 2 | |
| 3840x2160 Ultra Preset (FSR off) | |
| MSI Titan 18 HX A14VIG | |
| Przeciętny NVIDIA GeForce RTX 4090 Laptop GPU (31.6 - 50.6, n=11) | |
| NVIDIA GeForce RTX 4070 Super Founders Edition | |
| Alienware m18 R1 AMD | |
| 3840x2160 Ray Tracing Ultra Preset (DLSS off, no Path Tracing) | |
| Przeciętny NVIDIA GeForce RTX 4090 Laptop GPU (20.2 - 22.3, n=4) | |
| NVIDIA GeForce RTX 4070 Super Founders Edition | |
| F1 22 | |
| 1920x1080 Ultra High Preset AA:T AF:16x | |
| AMD Ryzen 9 7900 | |
| MSI Titan GT77 HX 13VI | |
| MSI Titan 18 HX A14VIG | |
| NVIDIA GeForce RTX 4070 Super Founders Edition | |
| Przeciętny NVIDIA GeForce RTX 4090 Laptop GPU (70.3 - 144.7, n=25) | |
| Alienware m18 R1 AMD | |
| MSI Raider GE68 HX 13VG, i7-13700HX | |
| Asus ROG Strix Scar 17 SE G733CX-LL014W | |
| Lenovo ThinkPad Z16 Gen 2 | |
| 2560x1440 Ultra High Preset AA:T AF:16x | |
| AMD Ryzen 9 7900 | |
| MSI Titan 18 HX A14VIG | |
| MSI Titan GT77 HX 13VI | |
| Przeciętny NVIDIA GeForce RTX 4090 Laptop GPU (65.9 - 92.2, n=25) | |
| NVIDIA GeForce RTX 4070 Super Founders Edition | |
| Alienware m18 R1 AMD | |
| Asus ROG Strix Scar 17 SE G733CX-LL014W | |
| MSI Raider GE68 HX 13VG, i7-13700HX | |
| Lenovo ThinkPad Z16 Gen 2 | |
| 3840x2160 Ultra High Preset AA:T AF:16x | |
| AMD Ryzen 9 7900 | |
| MSI Titan GT77 HX 13VI | |
| MSI Titan 18 HX A14VIG | |
| Przeciętny NVIDIA GeForce RTX 4090 Laptop GPU (36.8 - 46.1, n=18) | |
| NVIDIA GeForce RTX 4070 Super Founders Edition | |
| Alienware m18 R1 AMD | |
| MSI Raider GE68 HX 13VG, i7-13700HX | |
Witcher 3 FPS Chart
| low | med. | high | ultra | QHD | 4K | |
|---|---|---|---|---|---|---|
| GTA V (2015) | 139.2 | |||||
| The Witcher 3 (2015) | 595.3 | 506.6 | 412.2 | 211.2 | 160.7 | |
| Dota 2 Reborn (2015) | 218 | 196.3 | 186.5 | 174.5 | 168.3 | |
| Final Fantasy XV Benchmark (2018) | 229 | 216 | 184 | 158 | 93.6 | |
| X-Plane 11.11 (2018) | 184.9 | 161.8 | 126.1 | 106.5 | ||
| Far Cry 5 (2018) | 191 | 164 | 158 | 155 | 152 | 112 |
| Strange Brigade (2018) | 511 | 423 | 406 | 385 | 307 | 156.1 |
| Tiny Tina's Wonderlands (2022) | 324.7 | 279.8 | 223.7 | 182 | 130.8 | 71 |
| F1 22 (2022) | 307 | 297 | 280 | 132.7 | 90.5 | 44.6 |
| Baldur's Gate 3 (2023) | 246.7 | 226.9 | 208.6 | 207.7 | 155.2 | 80.8 |
| Cyberpunk 2077 (2023) | 155.7 | 145.4 | 135.9 | 129.8 | 94.5 | 43.9 |
| Avatar Frontiers of Pandora (2023) | 103 | 69 | 35 |
Emisje
Hałas systemowy
Hałas i zachowanie wentylatorów są bezpośrednio powiązane z profilami zasilania MSI Center: Ekstremalna wydajność z włączonym Cooler Boost, Ekstremalna wydajność z wyłączonym Cooler Boost, Zrównoważony i Cichy. Podczas grania z włączonym Cooler Boost może być głośno nawet do 63 dB(A) w porównaniu do 57,3 dB(A), gdy Cooler Boost jest wyłączony. Ponieważ jednak różnice w wydajności między tymi dwoma trybami są bardzo niewielkie, jak wspomniano powyżej, zaleca się granie z wyłączonym Cooler Boost, aby uniknąć dźwięku laptopa przypominającego suszarkę do włosów.
Hałas wentylatora podczas grania w trybie zrównoważonym osiąga szczyt na poziomie 53 dB(A), co jest zauważalnie cichsze niż którykolwiek z dwóch trybów ekstremalnej wydajności. Proszę jednak mieć na uwadze, że spadek wydajności jest większy w trybie zrównoważonym, jak wspomniano powyżej. Proszę być przygotowanym na bardzo głośny system podczas grania.
Hałas
| luz |
| 23.8 / 23.8 / 28 dB |
| obciążenie |
| 38 / 62.8 dB |
 | ||
30 dB cichy 40 dB(A) słyszalny 50 dB(A) irytujący |
||
min: | ||
| MSI Titan 18 HX A14VIG GeForce RTX 4090 Laptop GPU, i9-14900HX, 2x Samsung PM9A1a MZVL22T0HDLB (RAID 0) | MSI Titan GT77 HX 13VI GeForce RTX 4090 Laptop GPU, i9-13950HX, Samsung PM9A1 MZVL22T0HBLB | Alienware m18 R1 GeForce RTX 4090 Laptop GPU, i9-13980HX, SK hynix PC801 HFS001TEJ9X101N | Asus ROG Strix G18 G814JI GeForce RTX 4070 Laptop GPU, i7-13650HX, Micron 2400 MTFDKBA1T0QFM | Acer Predator Helios 18 N23Q2 GeForce RTX 4080 Laptop GPU, i9-13900HX, Samsung PM9A1 MZVL22T0HBLB | Razer Blade 18 RTX 4070 GeForce RTX 4070 Laptop GPU, i9-13950HX, SSSTC CA6-8D1024 | |
|---|---|---|---|---|---|---|
| Noise | -12% | 7% | 0% | 1% | 5% | |
| wyłączone / środowisko * (dB) | 22.8 | 24.6 -8% | 22.8 -0% | 25 -10% | 23 -1% | 23.5 -3% |
| Idle Minimum * (dB) | 23.8 | 29.2 -23% | 23 3% | 26 -9% | 23 3% | 23.8 -0% |
| Idle Average * (dB) | 23.8 | 29.2 -23% | 23 3% | 28 -18% | 23 3% | 23.8 -0% |
| Idle Maximum * (dB) | 28 | 29.2 -4% | 23 18% | 29 -4% | 23 18% | 26.8 4% |
| Load Average * (dB) | 38 | 50.7 -33% | 35.6 6% | 41 -8% | 45.26 -19% | 37.3 2% |
| Witcher 3 ultra * (dB) | 57.3 | 53.3 7% | 51.3 10% | 44 23% | 59.82 -4% | 48 16% |
| Load Maximum * (dB) | 62.8 | 61 3% | 56.7 10% | 46 27% | 59.94 5% | 53.5 15% |
* ... im mniej tym lepiej
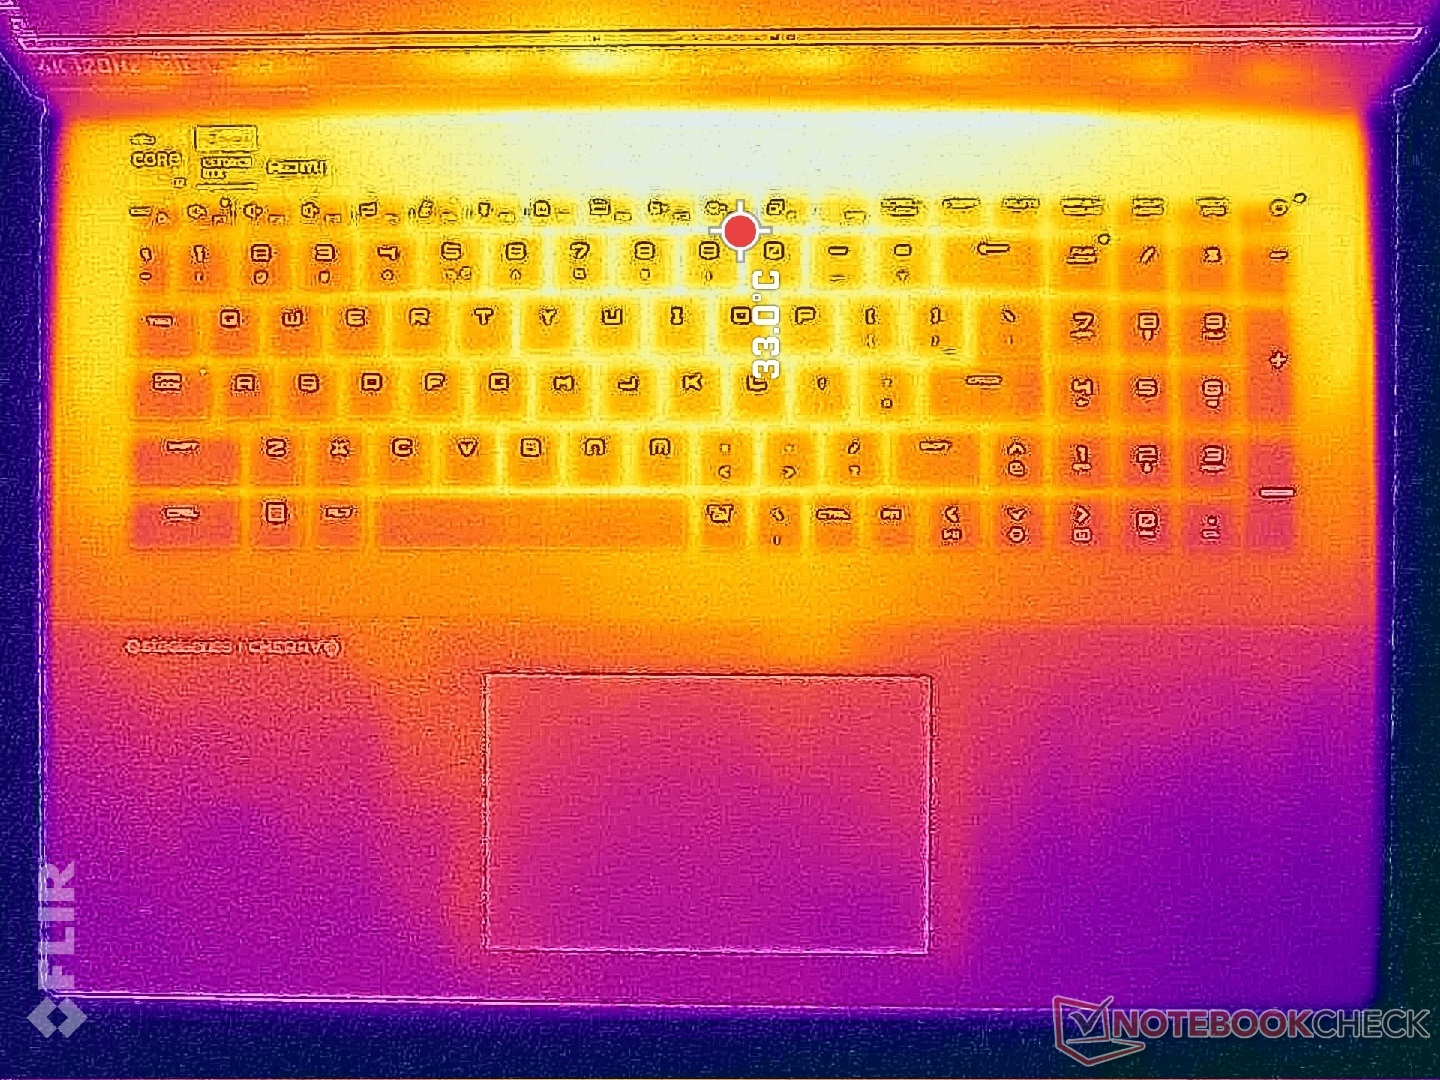
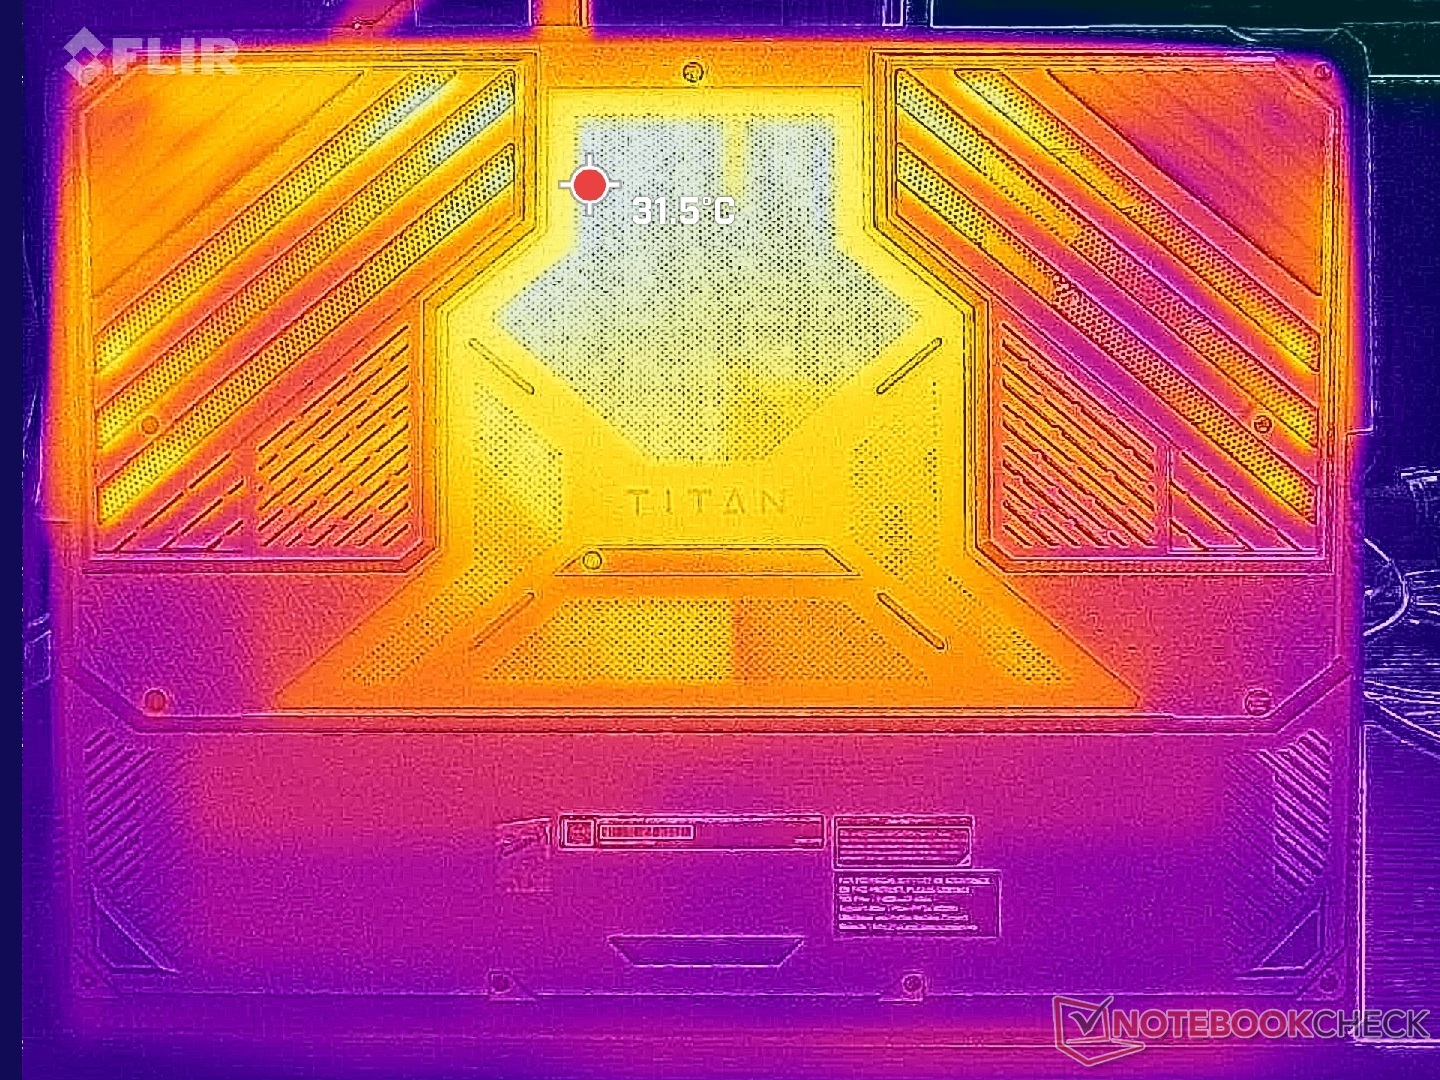
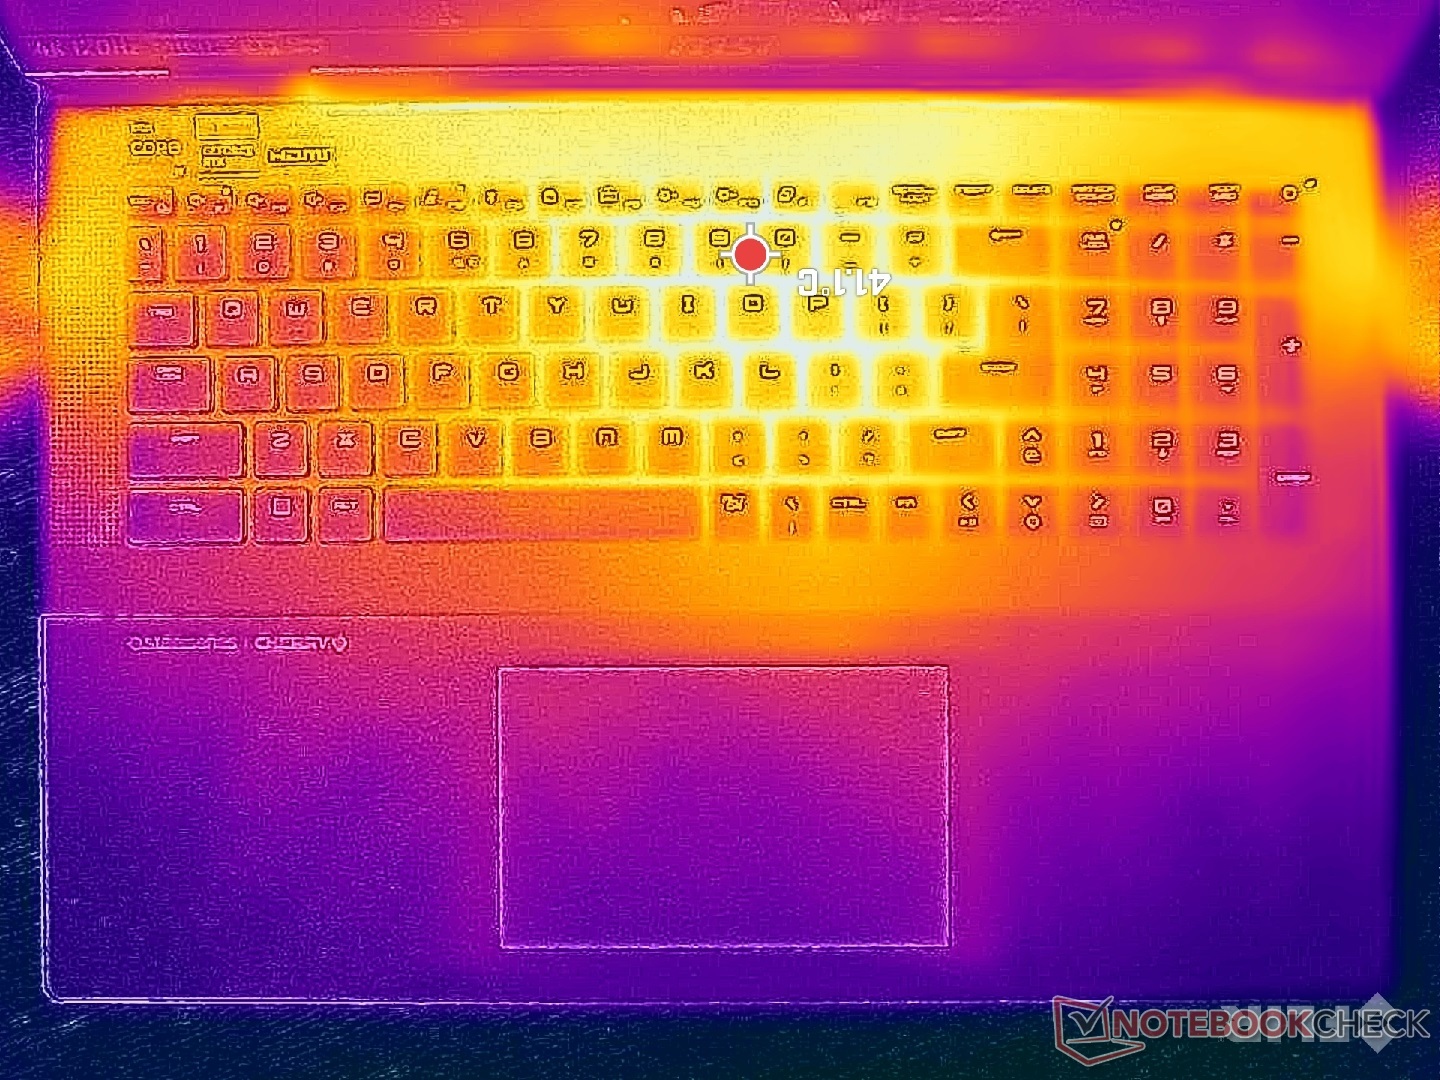
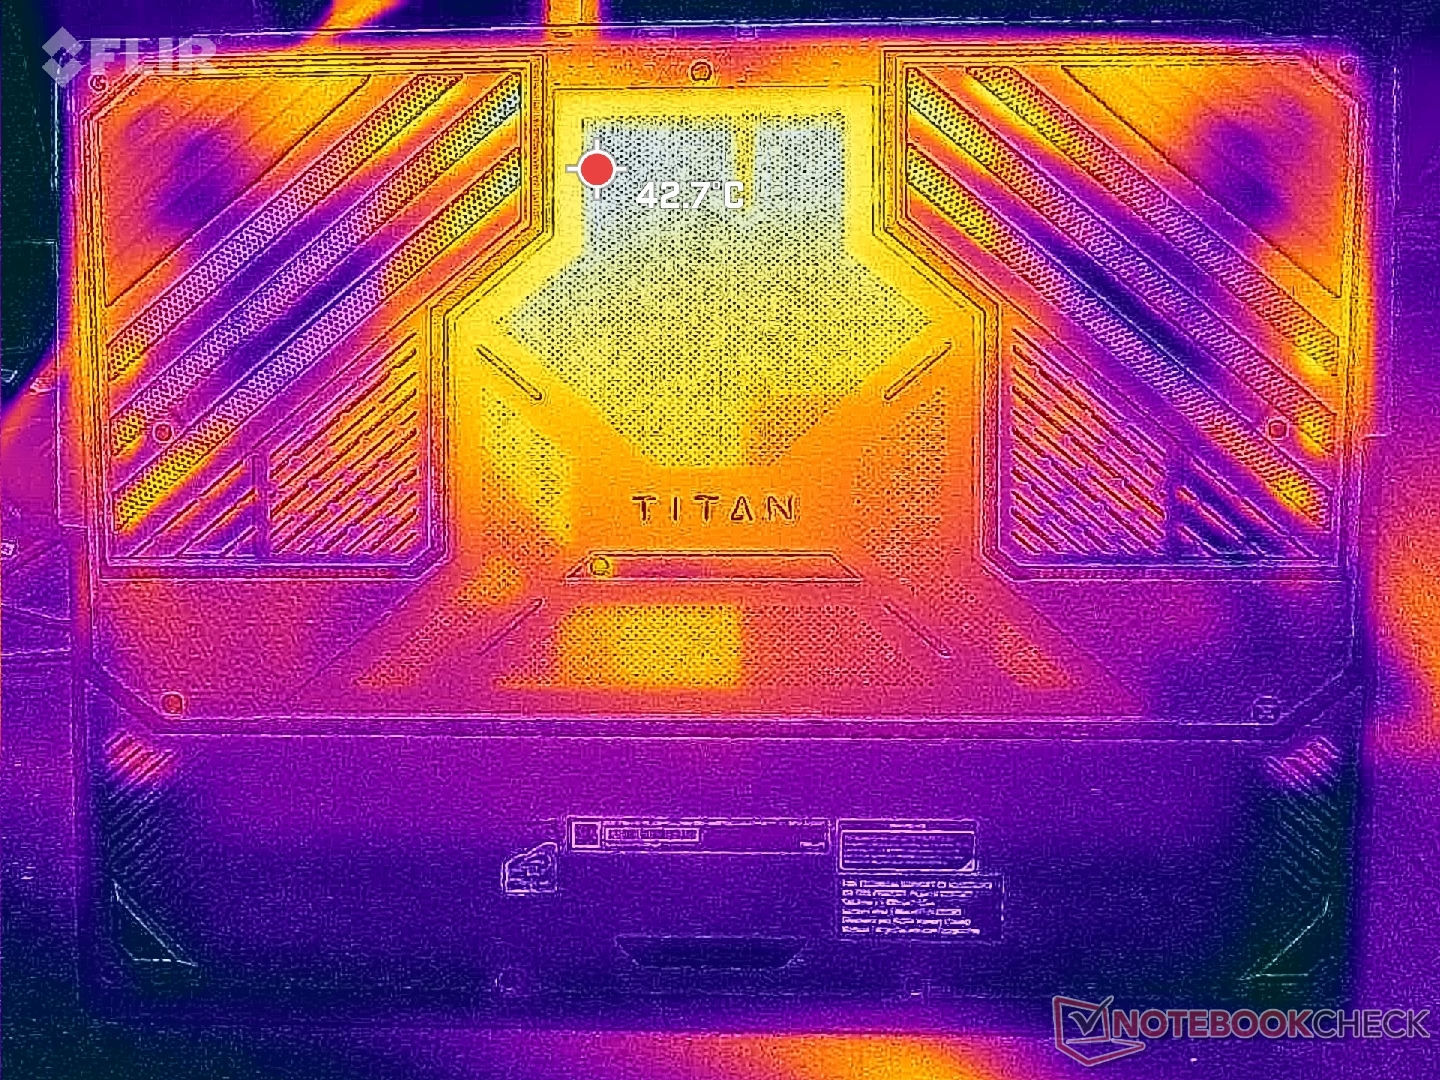
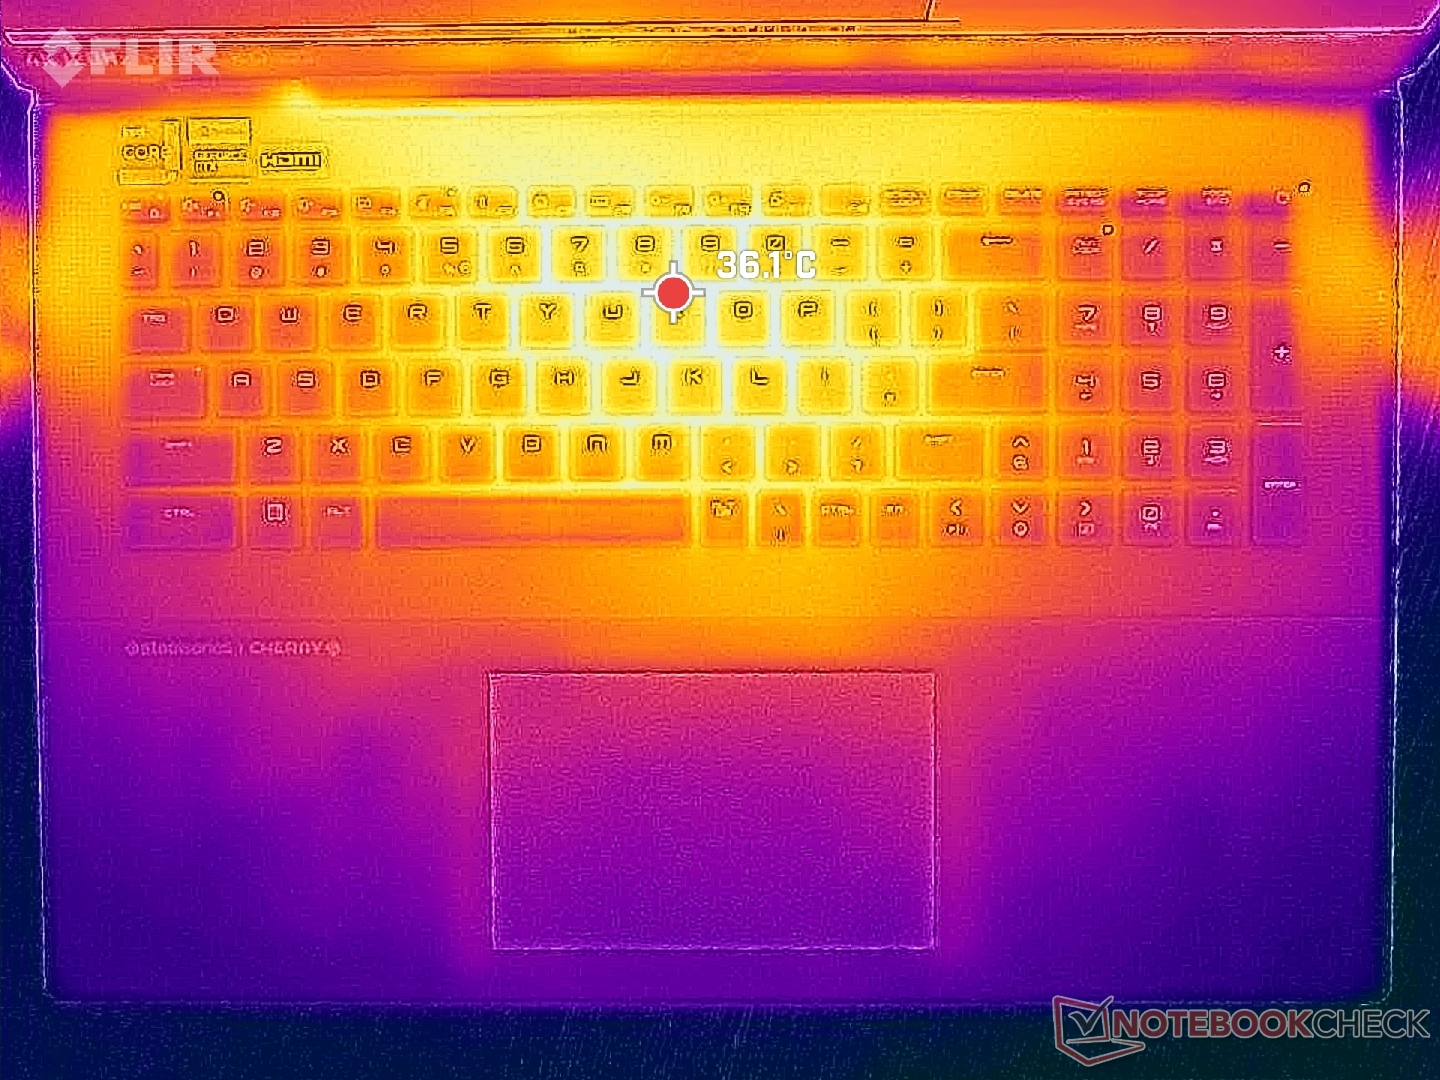
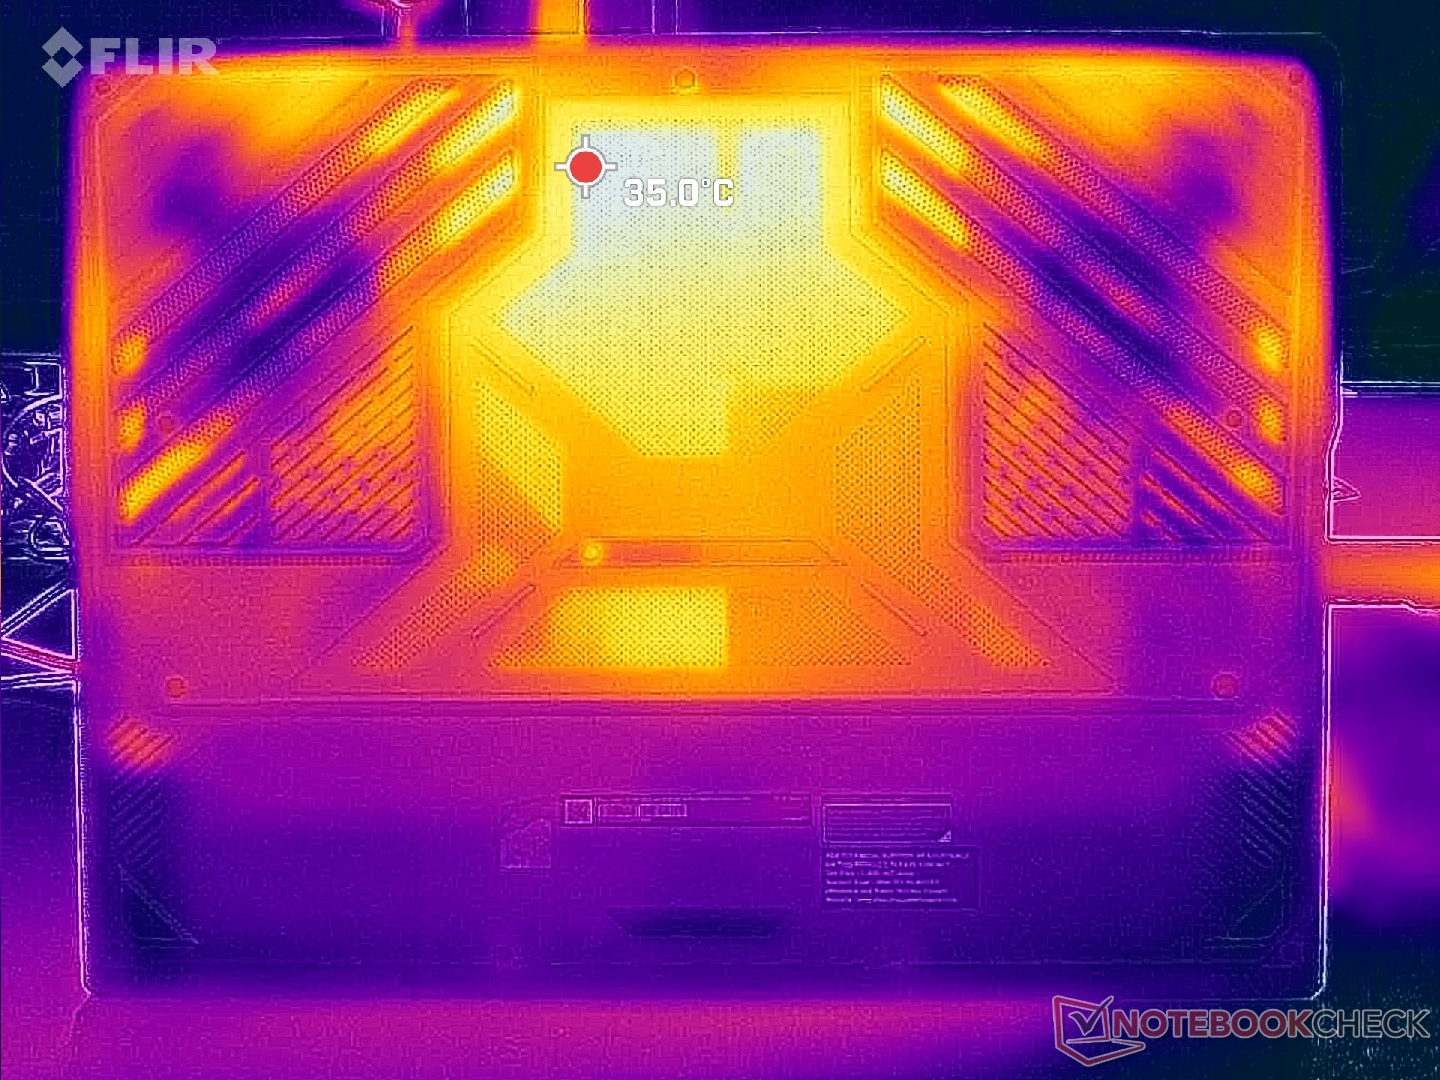
Temperatura
Co zaskakujące, temperatury powierzchni są tutaj nieco wyższe niż te, które odnotowaliśmy na unibody Razer Blade 18 pomimo grubszej konstrukcji MSI. Gorące punkty osiągnęłyby nieco ponad 41 C i 37 C z aktywnym i nieaktywnym Cooler Boost, w porównaniu do 35 C do 40 C na Razerze. Na szczęście gorące punkty znajdują się z tyłu systemu, gdzie dłonie i palce raczej się nie dotykają. Nigdy nie stwierdziliśmy, aby podpórki pod nadgarstki lub klawisze były niekomfortowo ciepłe podczas grania.
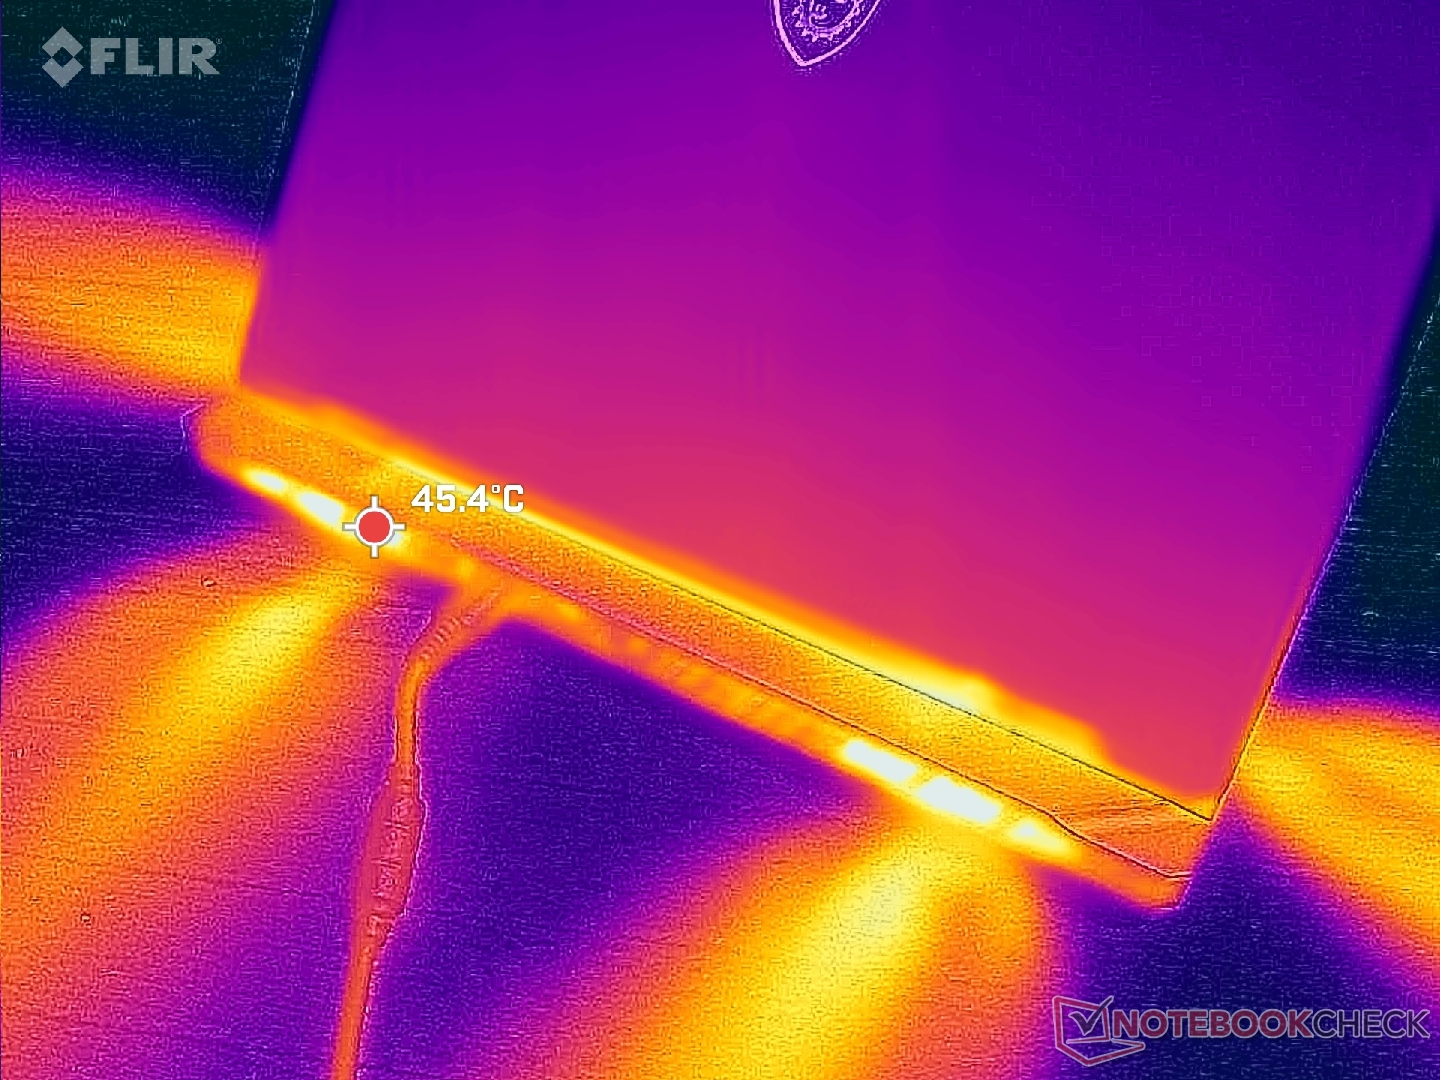
(+) Maksymalna temperatura w górnej części wynosi 37.8 °C / 100 F, w porównaniu do średniej 40.4 °C / 105 F , począwszy od 21.2 do 68.8 °C dla klasy Gaming.
(+) Dno nagrzewa się maksymalnie do 37.6 °C / 100 F, w porównaniu do średniej 43.2 °C / 110 F
(+) W stanie bezczynności średnia temperatura górnej części wynosi 29.8 °C / 86 F, w porównaniu ze średnią temperaturą urządzenia wynoszącą 33.9 °C / ### class_avg_f### F.
(±) Podczas gry w Wiedźmina 3 średnia temperatura górnej części wynosi 32.3 °C / 90 F, w porównaniu do średniej temperatury urządzenia wynoszącej 33.9 °C / ## #class_avg_f### F.
(+) Podpórki pod nadgarstki i touchpad są chłodniejsze niż temperatura skóry i maksymalnie 25.6 °C / 78.1 F i dlatego są chłodne w dotyku.
(+) Średnia temperatura obszaru podparcia dłoni w podobnych urządzeniach wynosiła 28.8 °C / 83.8 F (+3.2 °C / 5.7 F).
| MSI Titan 18 HX A14VIG Intel Core i9-14900HX, NVIDIA GeForce RTX 4090 Laptop GPU | MSI Titan GT77 HX 13VI Intel Core i9-13950HX, NVIDIA GeForce RTX 4090 Laptop GPU | Alienware m18 R1 Intel Core i9-13980HX, NVIDIA GeForce RTX 4090 Laptop GPU | Asus ROG Strix G18 G814JI Intel Core i7-13650HX, NVIDIA GeForce RTX 4070 Laptop GPU | Acer Predator Helios 18 N23Q2 Intel Core i9-13900HX, NVIDIA GeForce RTX 4080 Laptop GPU | Razer Blade 18 RTX 4070 Intel Core i9-13950HX, NVIDIA GeForce RTX 4070 Laptop GPU | |
|---|---|---|---|---|---|---|
| Heat | 6% | 10% | -3% | -12% | 5% | |
| Maximum Upper Side * (°C) | 37.8 | 40.6 -7% | 39 -3% | 45 -19% | 35 7% | 39.2 -4% |
| Maximum Bottom * (°C) | 37.6 | 41.1 -9% | 36.4 3% | 47 -25% | 56 -49% | 35.6 5% |
| Idle Upper Side * (°C) | 34.8 | 26.2 25% | 29.2 16% | 28 20% | 34 2% | 31.8 9% |
| Idle Bottom * (°C) | 36 | 30.3 16% | 27.8 23% | 31 14% | 39 -8% | 33.2 8% |
* ... im mniej tym lepiej
Test warunków skrajnych
Temperatura procesora pod obciążeniem może być wyższa niż oczekiwano, nawet jeśli funkcja Cooler Boost jest włączona. Przykładowo, uruchomienie strony Witcher 3 w celu odwzorowania typowych obciążeń w grach, spowodowałoby ustabilizowanie się temperatury procesora na poziomie 97 C i 90 C, odpowiednio przy wyłączonym i włączonym Cooler Boost. Tymczasem GPU ustabilizowałoby się w bardziej rozsądnym zakresie 60 C. Powtórzenie tego testu na Razer Blade 18 lub Alienware m18 R1 zaowocowałoby podobnymi temperaturami GPU, ale niższymi temperaturami procesora w niskim zakresie 80 C.
Proszę zauważyć, że nie ma większych różnic w wydajności pomiędzy włączonym i wyłączonym Cooler Boost, podobnie jak to zaobserwowaliśmy w sekcji Wydajność GPU powyżej. Zarówno częstotliwość taktowania GPU, jak i pobór mocy przez płytę główną przy uruchomionym Witcher 3 pozostałyby na względnie stałym poziomie, odpowiednio 2370 MHz i 169 W.
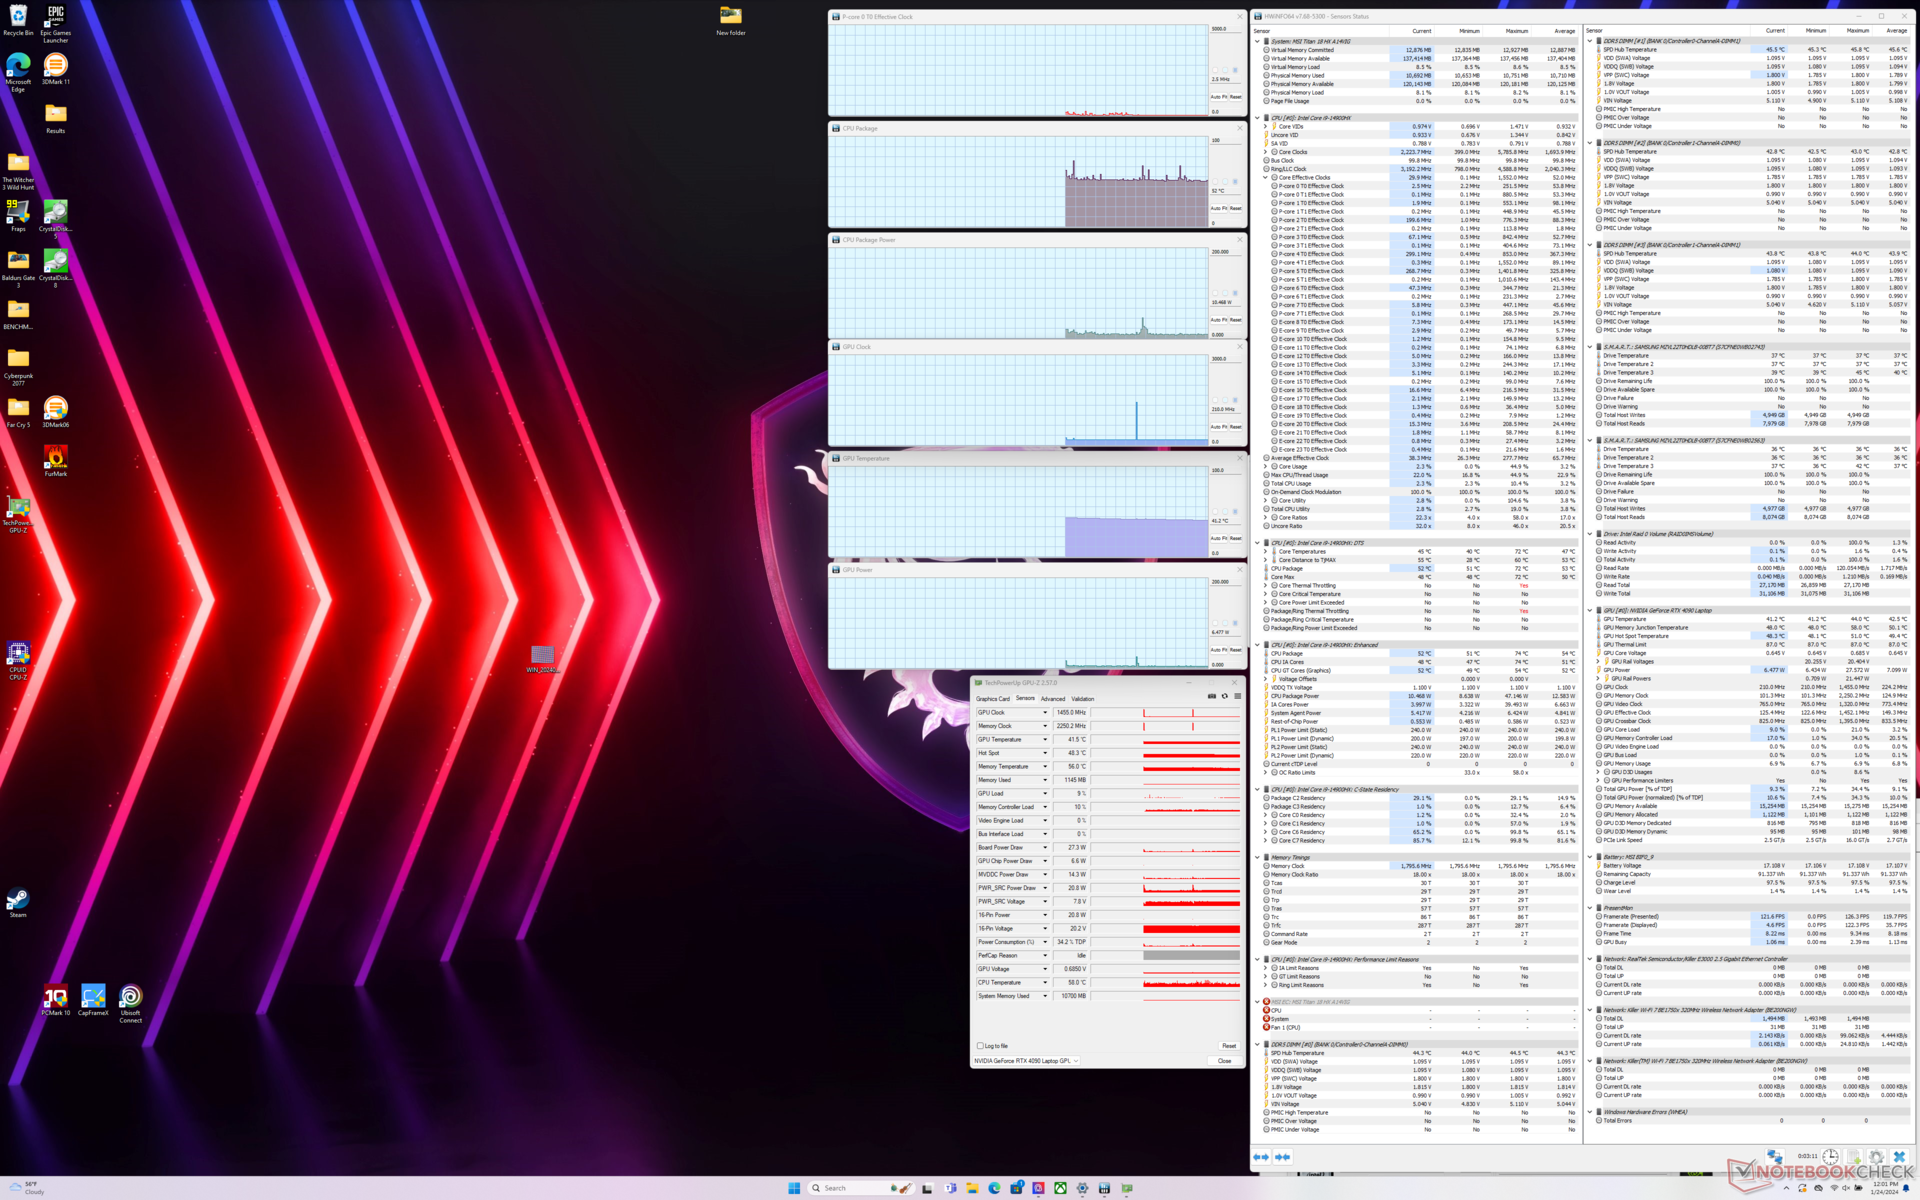
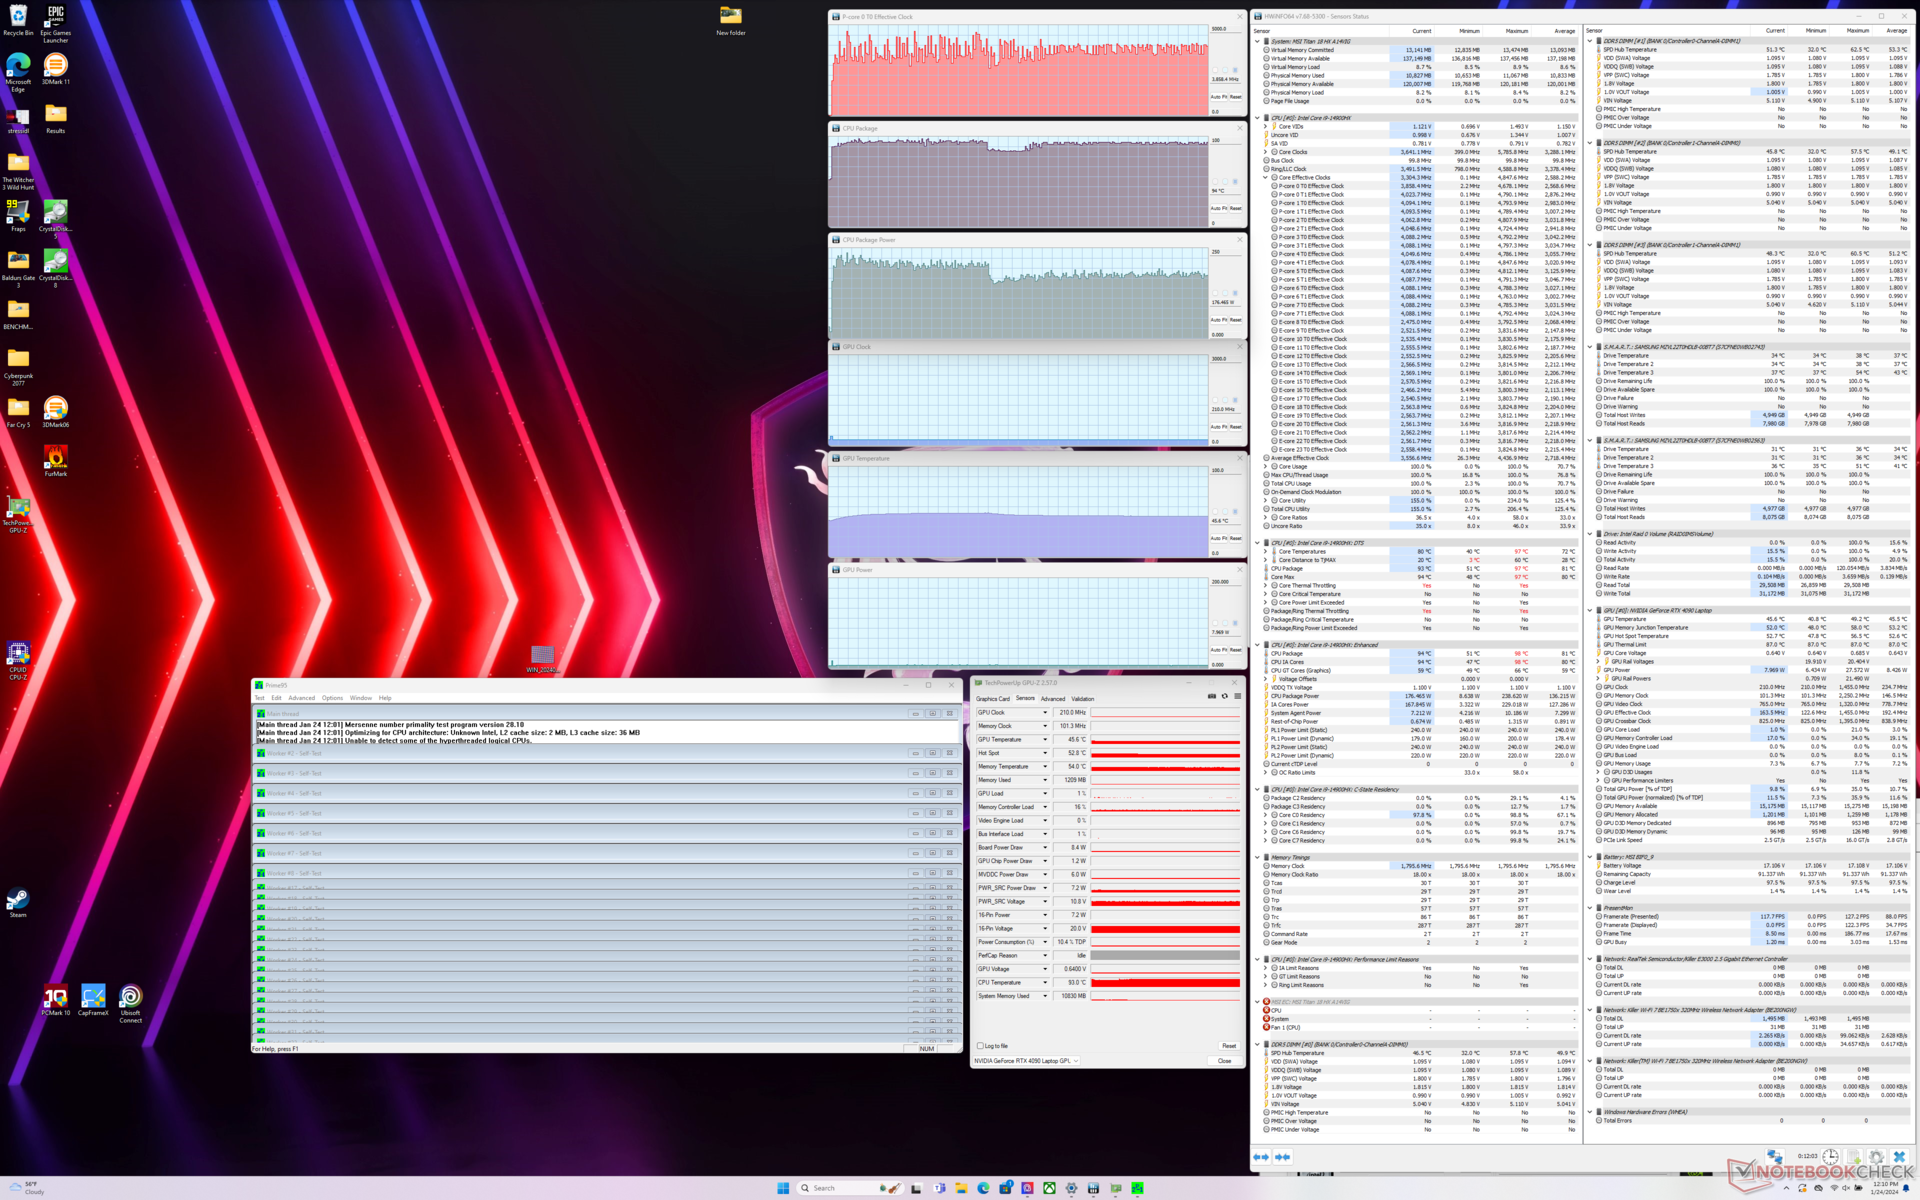
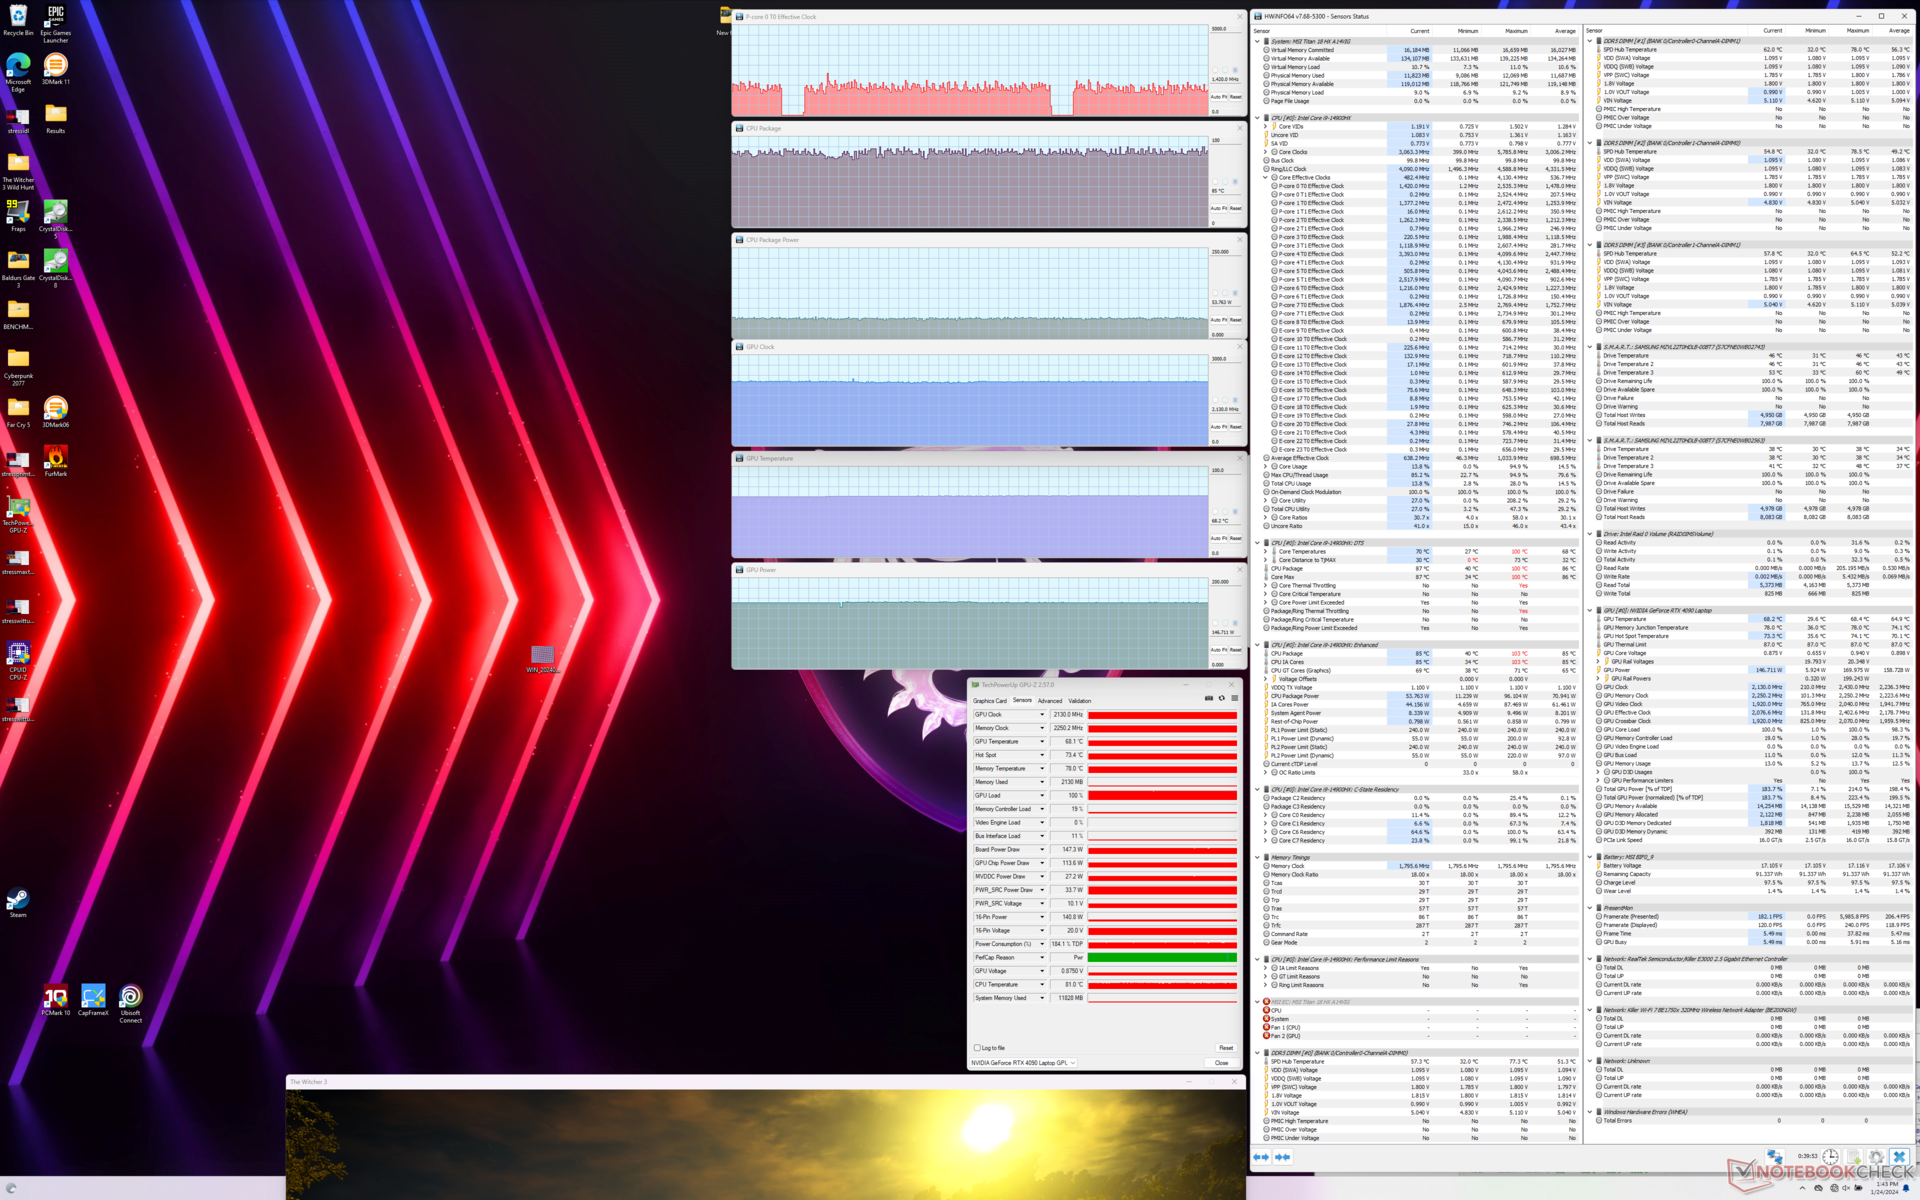
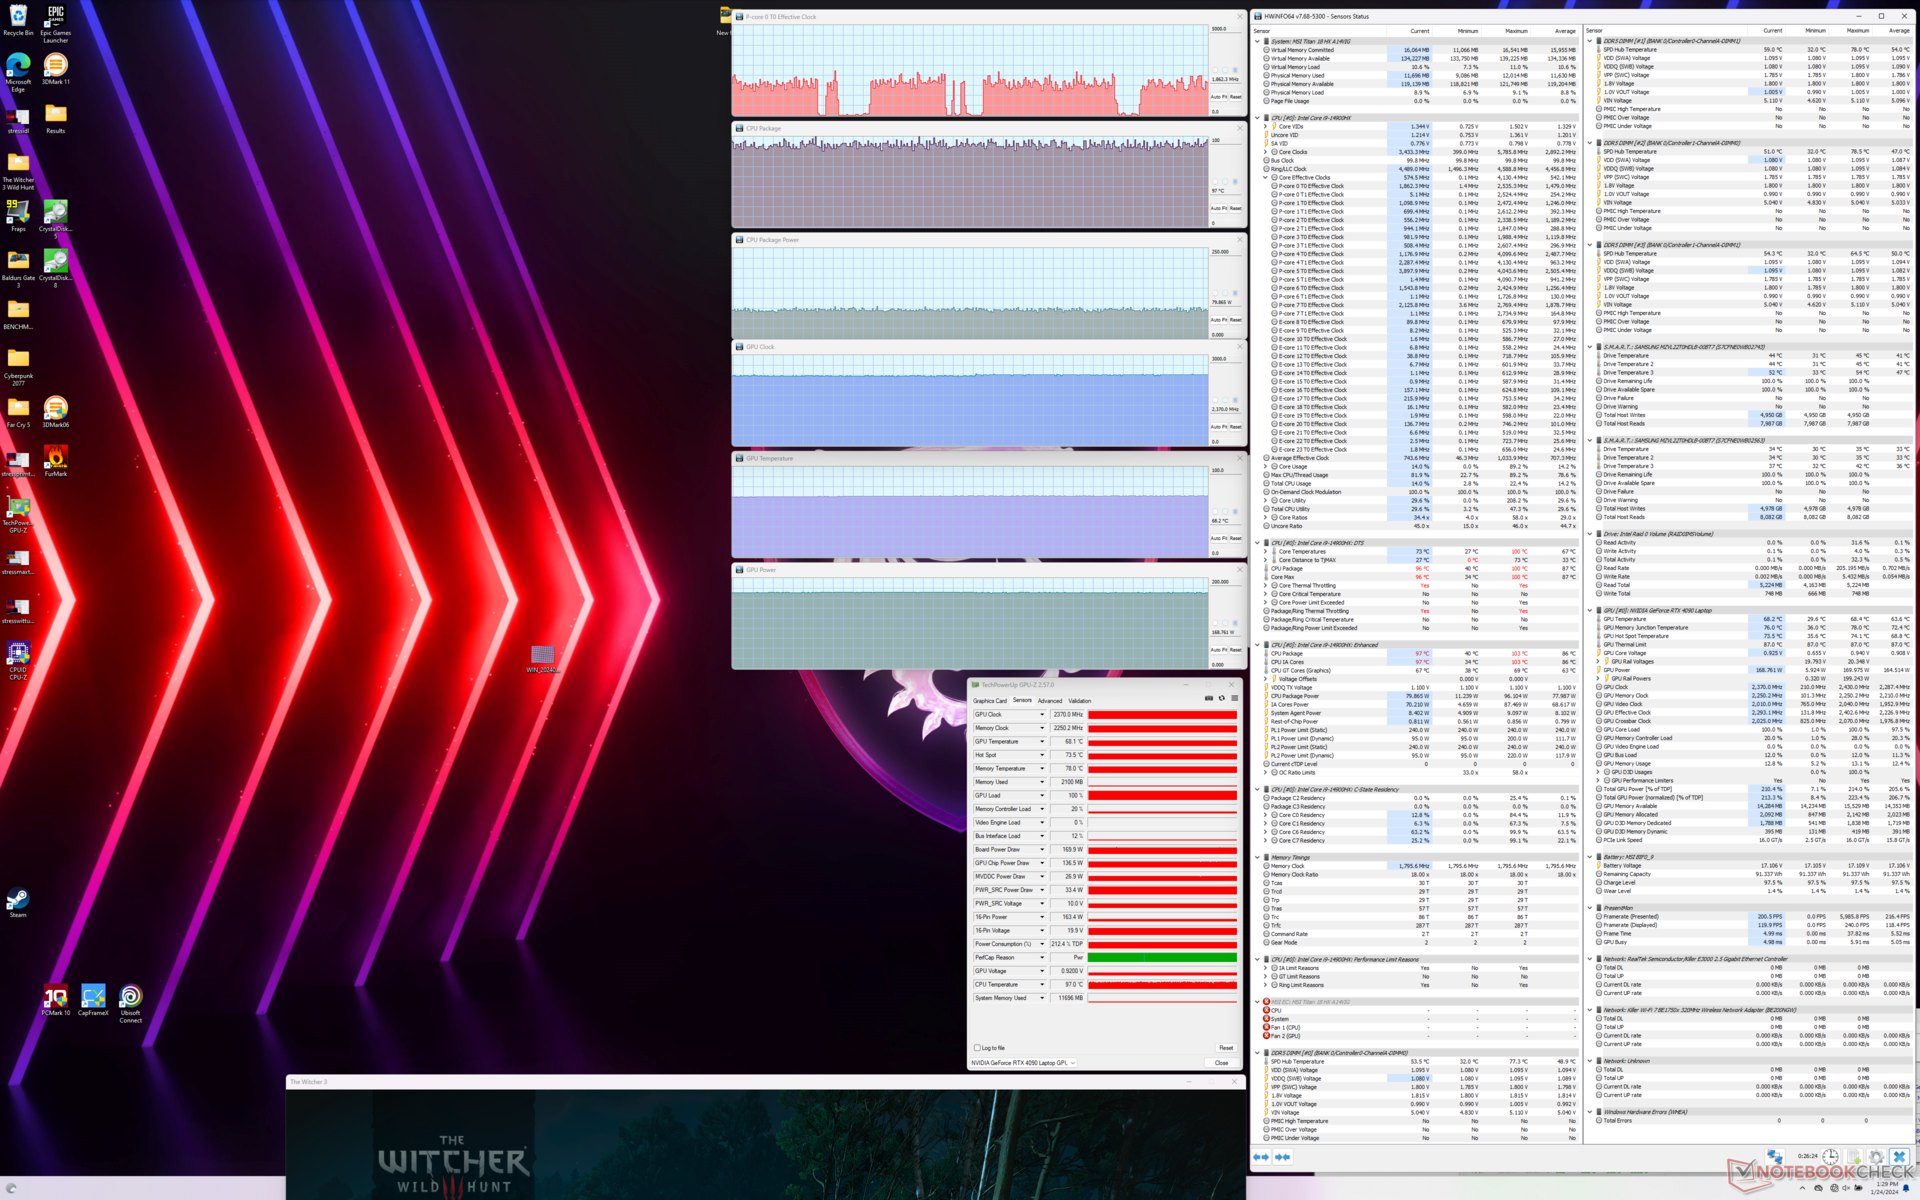
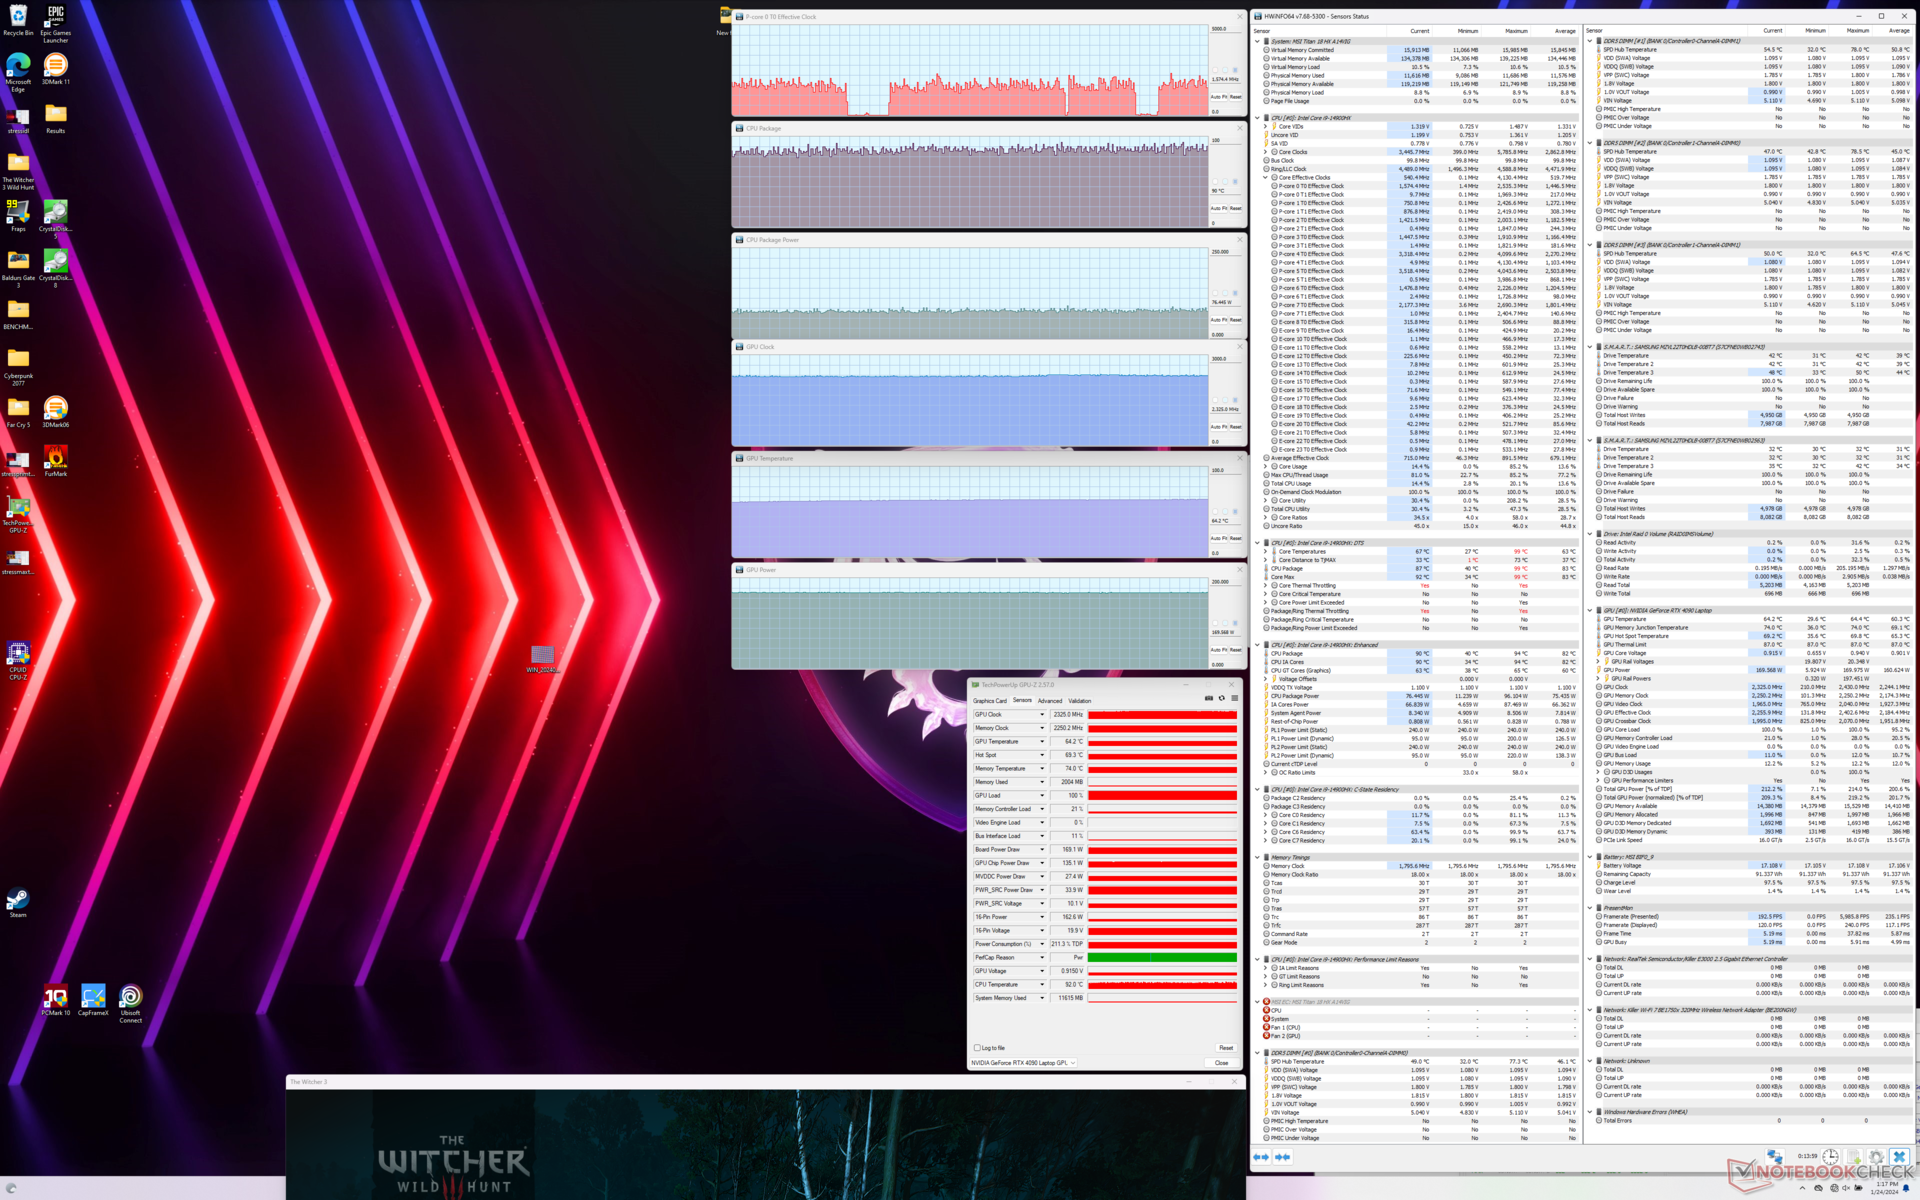
| Taktowanie CPU (GHz) | Taktowanie GPU (MHz) | Średnia temperatura CPU (°C) | Średnia temperatura GPU (°C) | |
| System w stanie spoczynku | -- | -- | 52 | 41 |
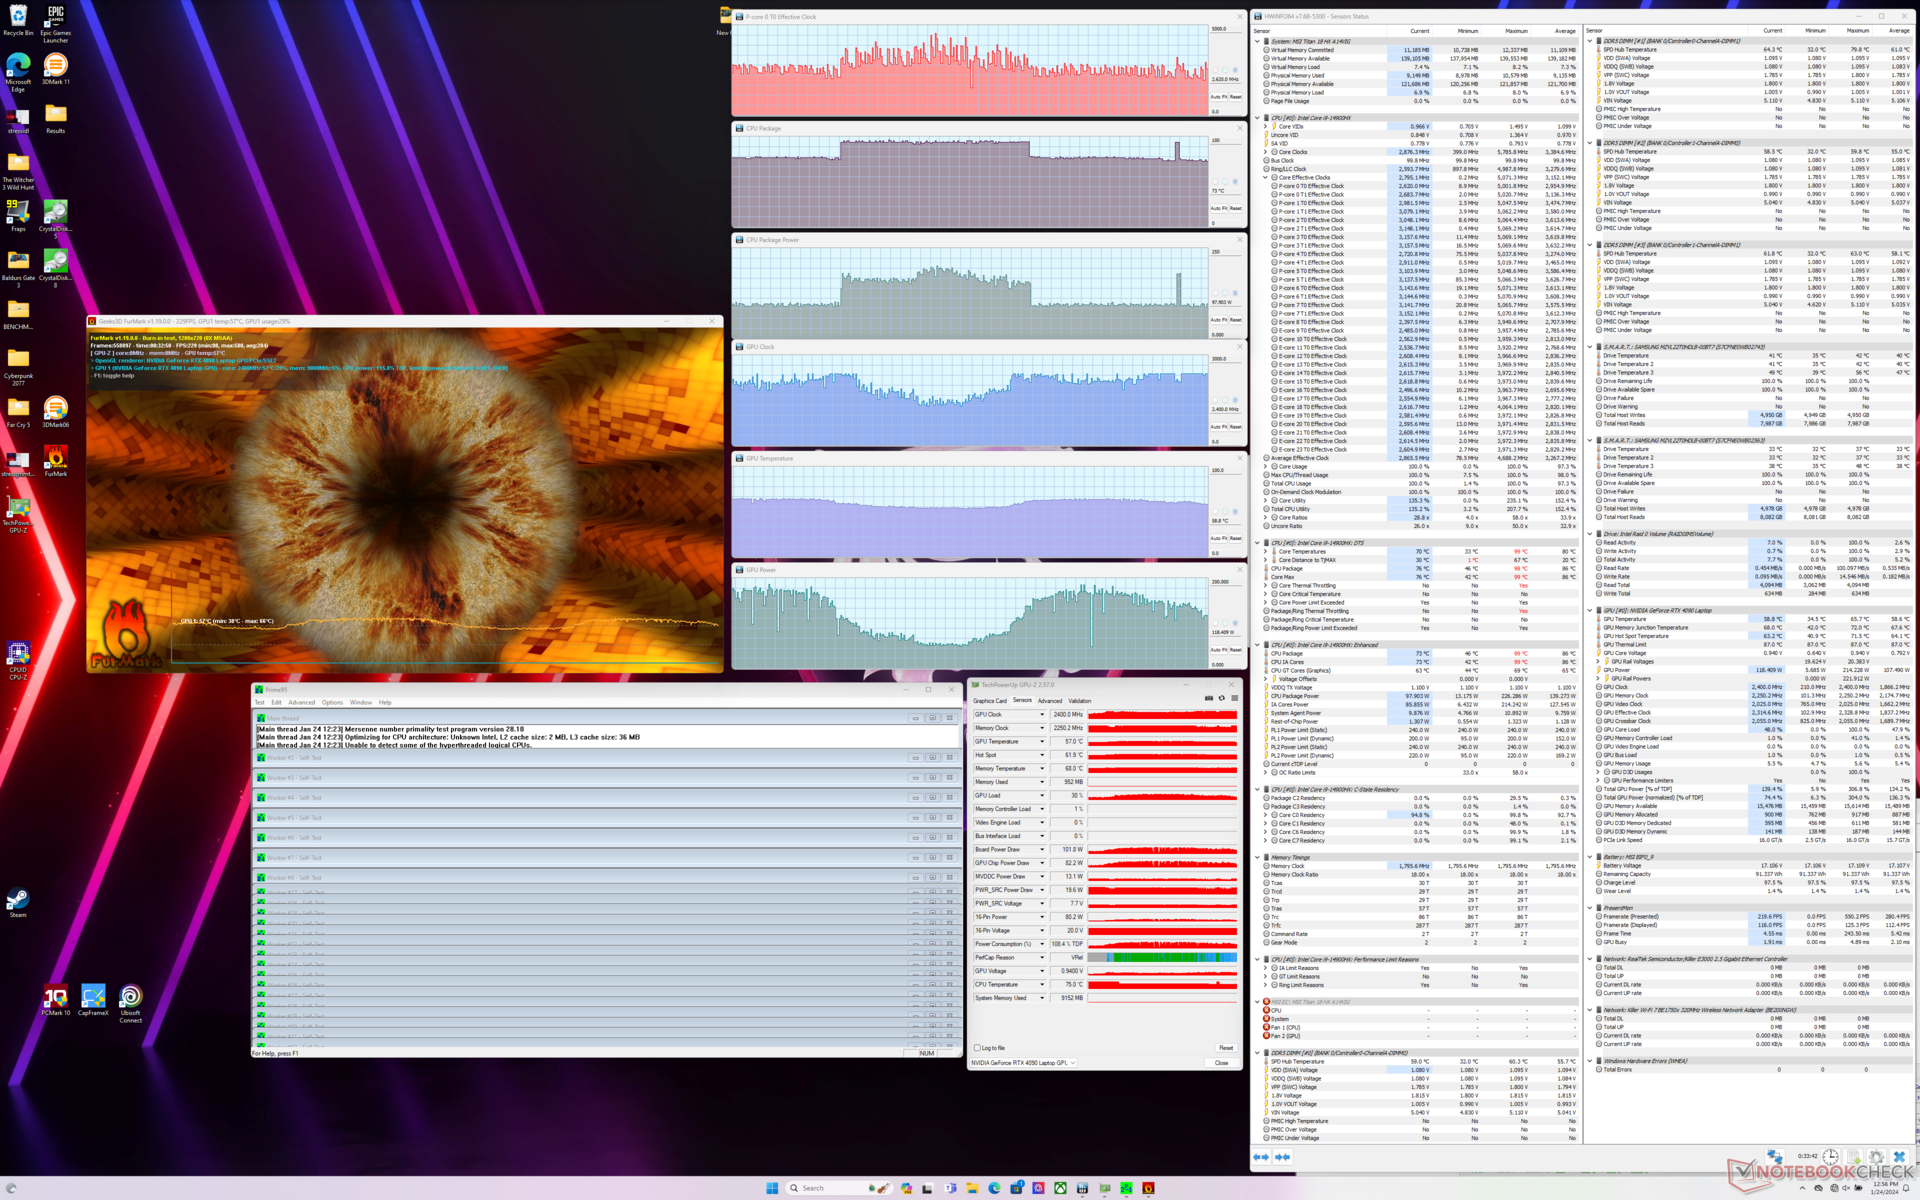
| Prime95Stress | ~3.8 | -- | 94 | 46 |
| Prime95+ FurMark Stress | ~2,6 - ~4,3 | 1300 - 2400 | 73 - 95 | 55 - 65 |
| Witcher 3 Obciążenie(tryb zrównoważony) | ~1,4 | 2130 | 85 | 68 |
| Witcher 3 Stres (Extreme Performance Cooler Boostwyłączony) | ~1.8 | 2370 | 97 | 68 |
| Witcher 3 Stres (Extreme Performance Cooler Boost włączony) | ~1.8 | 2325 | 90 | 64 |
Głośniki
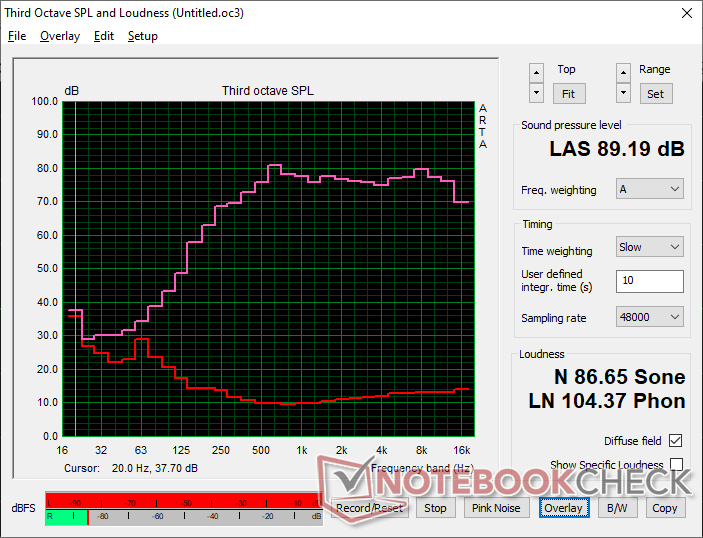
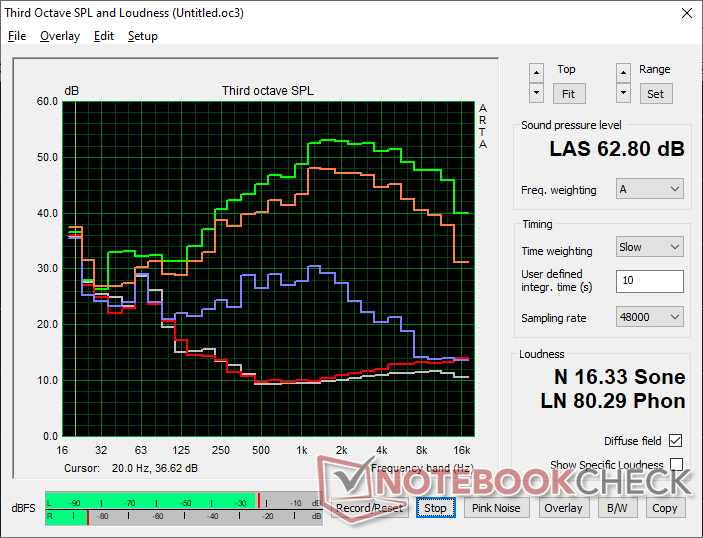
MSI Titan 18 HX A14VIG analiza dźwięku
(+) | głośniki mogą odtwarzać stosunkowo głośno (89.2 dB)
Bas 100 - 315 Hz
(-) | prawie brak basu - średnio 17.6% niższa od mediany
(±) | liniowość basu jest średnia (8% delta do poprzedniej częstotliwości)
Średnie 400 - 2000 Hz
(+) | zbalansowane środki średnie - tylko 1.8% od mediany
(+) | średnie są liniowe (3.7% delta do poprzedniej częstotliwości)
Wysokie 2–16 kHz
(+) | zrównoważone maksima - tylko 1.2% od mediany
(+) | wzloty są liniowe (2% delta do poprzedniej częstotliwości)
Ogólnie 100 - 16.000 Hz
(+) | ogólny dźwięk jest liniowy (9.9% różnicy w stosunku do mediany)
W porównaniu do tej samej klasy
» 5% wszystkich testowanych urządzeń w tej klasie było lepszych, 2% podobnych, 94% gorszych
» Najlepszy miał deltę 6%, średnia wynosiła ###średnia###%, najgorsza wynosiła 132%
W porównaniu do wszystkich testowanych urządzeń
» 4% wszystkich testowanych urządzeń było lepszych, 1% podobnych, 95% gorszych
» Najlepszy miał deltę 4%, średnia wynosiła ###średnia###%, najgorsza wynosiła 134%
Apple MacBook Pro 16 2021 M1 Pro analiza dźwięku
(+) | głośniki mogą odtwarzać stosunkowo głośno (84.7 dB)
Bas 100 - 315 Hz
(+) | dobry bas - tylko 3.8% od mediany
(+) | bas jest liniowy (5.2% delta do poprzedniej częstotliwości)
Średnie 400 - 2000 Hz
(+) | zbalansowane środki średnie - tylko 1.3% od mediany
(+) | średnie są liniowe (2.1% delta do poprzedniej częstotliwości)
Wysokie 2–16 kHz
(+) | zrównoważone maksima - tylko 1.9% od mediany
(+) | wzloty są liniowe (2.7% delta do poprzedniej częstotliwości)
Ogólnie 100 - 16.000 Hz
(+) | ogólny dźwięk jest liniowy (4.6% różnicy w stosunku do mediany)
W porównaniu do tej samej klasy
» 0% wszystkich testowanych urządzeń w tej klasie było lepszych, 0% podobnych, 100% gorszych
» Najlepszy miał deltę 5%, średnia wynosiła ###średnia###%, najgorsza wynosiła 45%
W porównaniu do wszystkich testowanych urządzeń
» 0% wszystkich testowanych urządzeń było lepszych, 0% podobnych, 100% gorszych
» Najlepszy miał deltę 4%, średnia wynosiła ###średnia###%, najgorsza wynosiła 134%
Zarządzanie energią
Zużycie energii
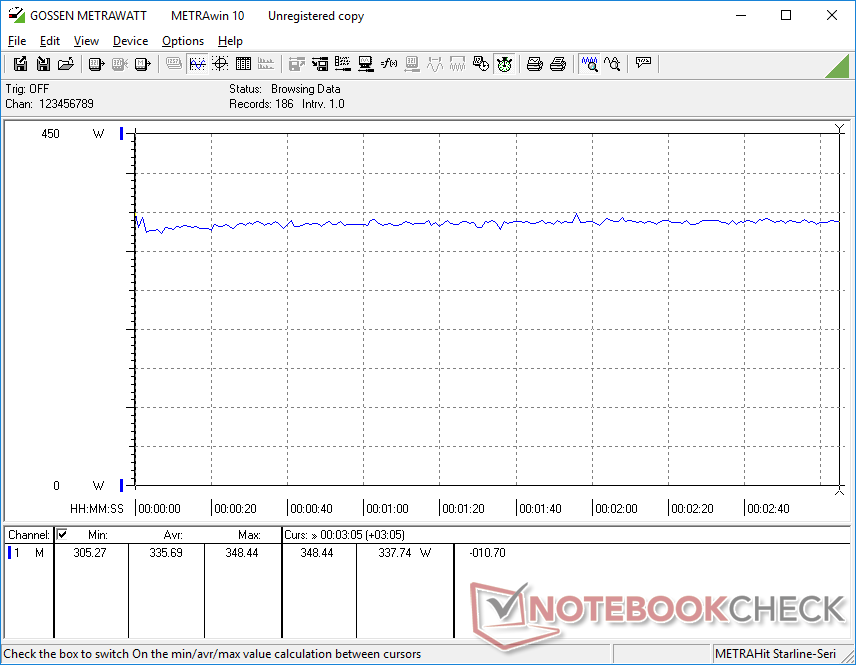
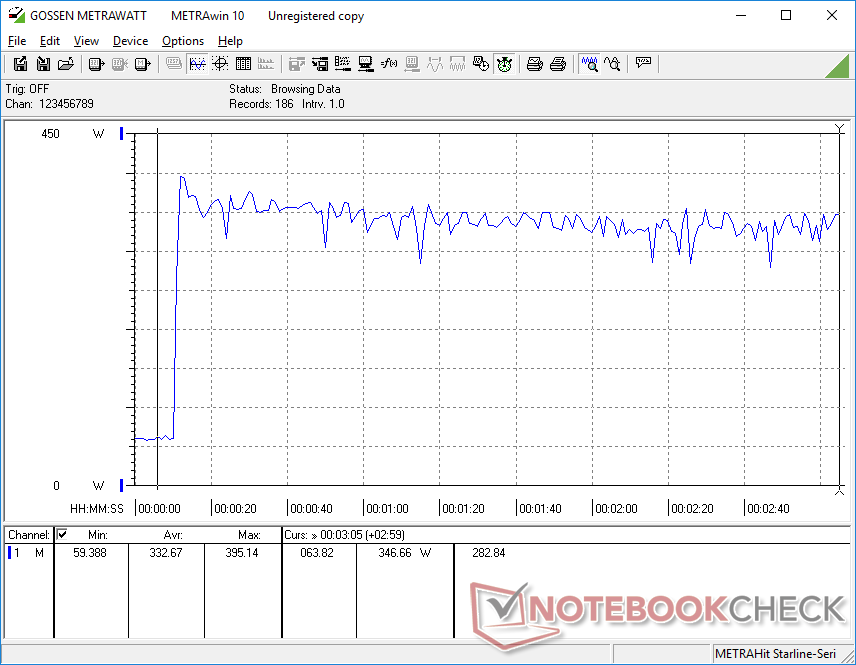
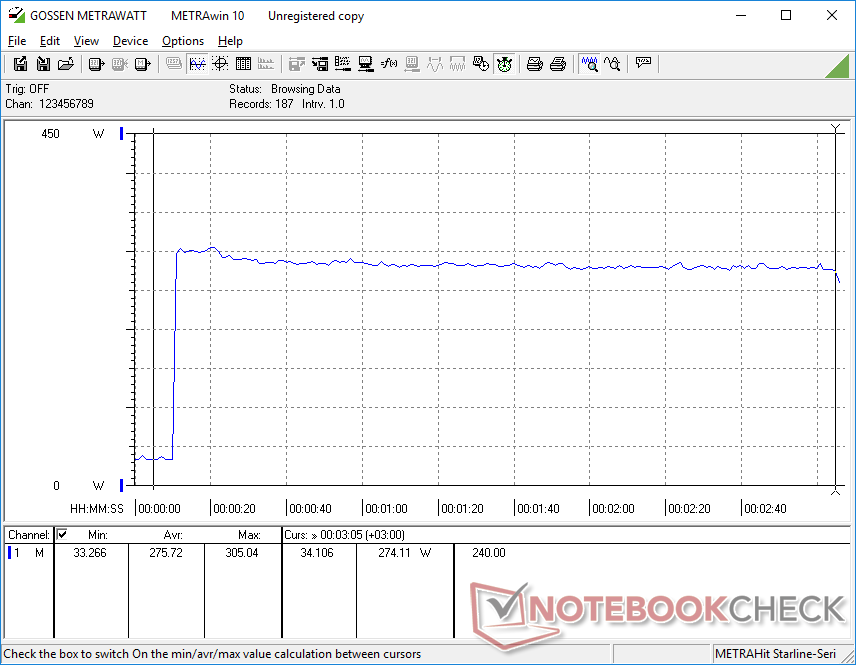
Ogólne zużycie energii jest ogólnie wyższe niż w przypadku innych 18-calowych laptopów do gier ze względu na wymagający 95 W procesor, 175 W GPU i ultra jasny wyświetlacz mini-LED 4K 120 Hz. Zwykła bezczynność na pulpicie pobierałaby od 13 W do 54 W w zależności od ustawienia jasności i ustawienia dGPU/iGPU, co jest znacznie szerszym zakresem niż w przypadku Asus ROG Strix G18 lub Acer Predator Helios 18, każdy ze standardowymi panelami IPS.
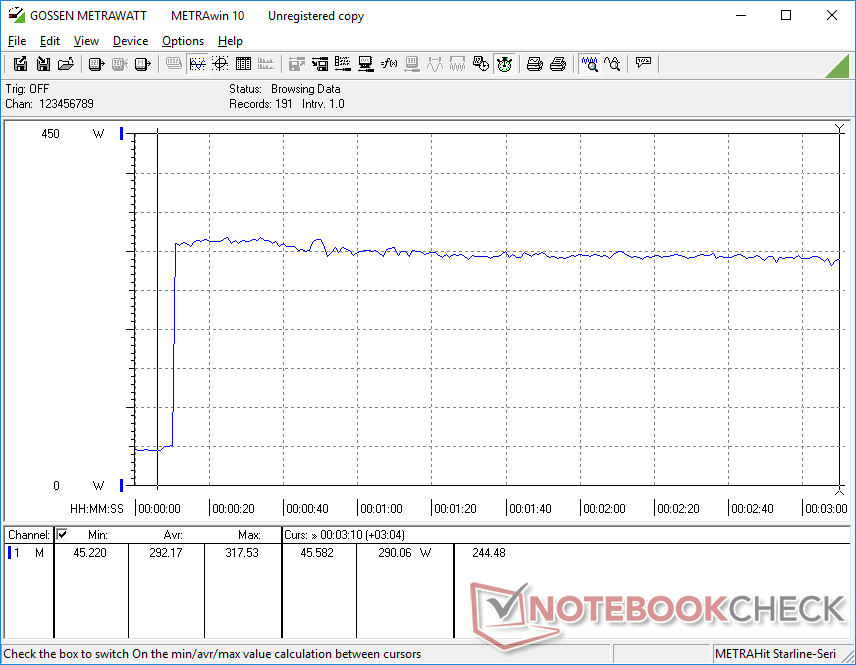
Jeśli chodzi o gry, system MSI nadal jest jednym z najbardziej wymagających laptopów. Uruchomienie Witcher 3 pobrałoby prawie 340 W w porównaniu do zaledwie 265 W i 311 W z zeszłorocznego GT77 lub Alienware m18 R1odpowiednio, wszystkie z tym samym GPU RTX 4090.
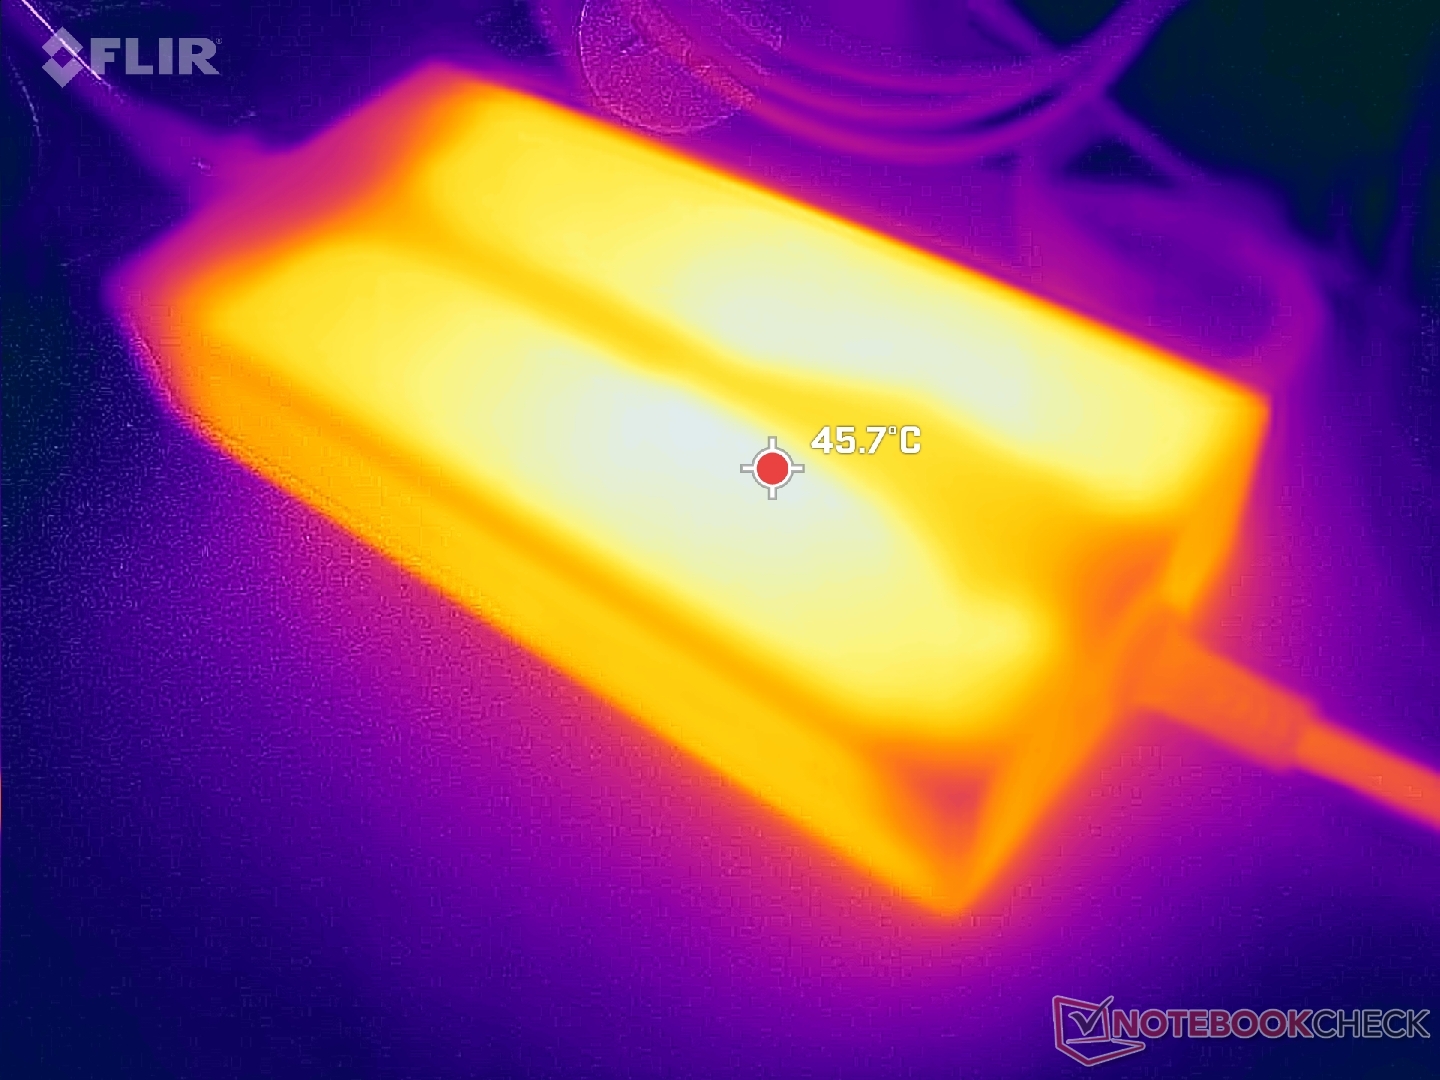
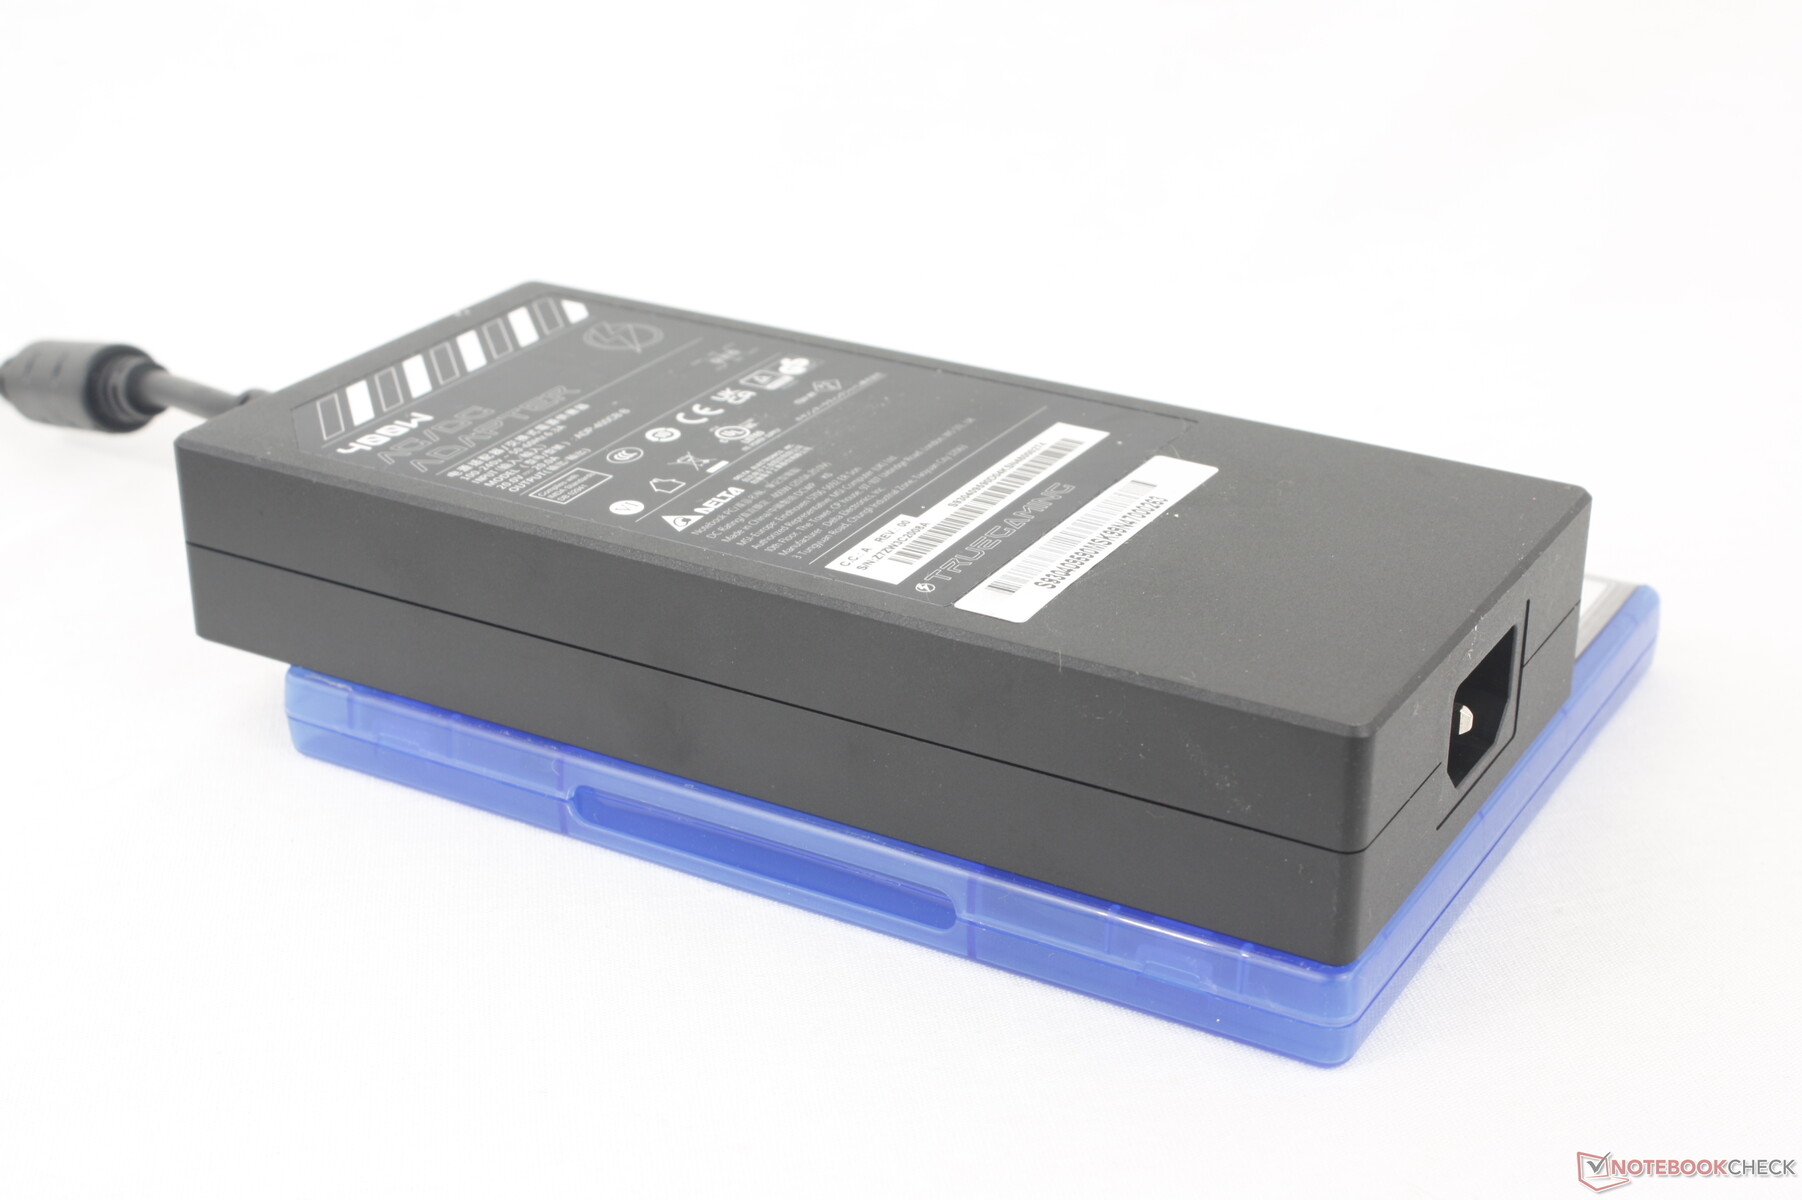
Nowością w tegorocznych laptopach MSI jest przeprojektowany zasilacz sieciowy, który jest teraz zarówno smuklejszy, jak i mocniejszy niż wcześniej. Wcześniejsze zasilacze były dość duże, zwłaszcza wersja 330 W, która była dostarczana z potężnymi laptopami, takimi jak Raider GE78. Titan 16 HX wykorzystuje zasilacz AC o mocy 400 W (~18,8 x 8,8 x 3,2 cm), który jest o około 35 procent mniejszy, zapewniając wyższą moc na objętość. Zasilacz o większej pojemności pozwala na uzyskanie bardziej spójnej wydajności i szybkości ładowania podczas pracy z wymagającymi obciążeniami. Dla porównania, większość innych wysokowydajnych laptopów do gier nadal jest dostarczana z zasilaczami o mocy 330 W lub mniejszej.
| wyłączony / stan wstrzymania | |
| luz | |
| obciążenie |
|
Legenda:
min: | |
| MSI Titan 18 HX A14VIG i9-14900HX, GeForce RTX 4090 Laptop GPU, 2x Samsung PM9A1a MZVL22T0HDLB (RAID 0), Mini-LED, 3840x2400, 18" | MSI Titan GT77 HX 13VI i9-13950HX, GeForce RTX 4090 Laptop GPU, Samsung PM9A1 MZVL22T0HBLB, Mini-LED, 3840x2160, 17.3" | Alienware m18 R1 i9-13980HX, GeForce RTX 4090 Laptop GPU, SK hynix PC801 HFS001TEJ9X101N, IPS, 1920x1200, 18" | Asus ROG Strix G18 G814JI i7-13650HX, GeForce RTX 4070 Laptop GPU, Micron 2400 MTFDKBA1T0QFM, IPS, 2560x1600, 18" | Acer Predator Helios 18 N23Q2 i9-13900HX, GeForce RTX 4080 Laptop GPU, Samsung PM9A1 MZVL22T0HBLB, IPS, 2560x1600, 18" | Razer Blade 18 RTX 4070 i9-13950HX, GeForce RTX 4070 Laptop GPU, SSSTC CA6-8D1024, IPS, 2560x1600, 18" | |
|---|---|---|---|---|---|---|
| Power Consumption | 16% | -9% | 41% | 19% | -5% | |
| Idle Minimum * (Watt) | 13.2 | 14 -6% | 21.6 -64% | 8 39% | 16 -21% | 24.5 -86% |
| Idle Average * (Watt) | 25.4 | 21.6 15% | 25.2 1% | 15 41% | 19 25% | 34.1 -34% |
| Idle Maximum * (Watt) | 53.5 | 24.8 54% | 56.7 -6% | 26 51% | 21.3 60% | 47.7 11% |
| Load Average * (Watt) | 151.4 | 122.5 19% | 164.1 -8% | 102 33% | 124 18% | 140 8% |
| Witcher 3 ultra * (Watt) | 336 | 265 21% | 311 7% | 178.6 47% | 289 14% | 202 40% |
| Load Maximum * (Watt) | 395.2 | 418 -6% | 338.9 14% | 267 32% | 319 19% | 261 34% |
* ... im mniej tym lepiej
Power Consumption Witcher 3 / Stresstest
Power Consumption external Monitor
Żywotność baterii
Udało nam się zarejestrować nieco ponad 4 godziny rzeczywistego przeglądania Internetu w trybie zrównoważonym z nieaktywną kartą graficzną dGPU. Nie jest to zbyt długi czas, ale należy się tego spodziewać po 18-calowym mocarzu z wyświetlaczem mini-LED 120 Hz. Nawet praca na biegu jałowym w trybie oszczędzania baterii MSI przy najniższym ustawieniu jasności w najlepszym scenariuszu trwałaby nieco poniżej 6 godzin. Wyniki Alienware m18 R1 lub Razer Blade 18 są podobne.
Ładowanie od stanu pustego do pełnej pojemności za pomocą dołączonego zasilacza sieciowego zajmuje około 2 do 2,5 godziny. System można również ładować za pomocą adapterów USB-C innych firm, aczkolwiek znacznie wolniej. Proszę pamiętać, że tylko jeden z dwóch portów USB-C obsługuje funkcję USB-C Power Delivery.
| MSI Titan 18 HX A14VIG i9-14900HX, GeForce RTX 4090 Laptop GPU, 99.9 Wh | MSI Titan GT77 HX 13VI i9-13950HX, GeForce RTX 4090 Laptop GPU, 99.9 Wh | Alienware m18 R1 i9-13980HX, GeForce RTX 4090 Laptop GPU, 97 Wh | Asus ROG Strix G18 G814JI i7-13650HX, GeForce RTX 4070 Laptop GPU, 90 Wh | Acer Predator Helios 18 N23Q2 i9-13900HX, GeForce RTX 4080 Laptop GPU, 90 Wh | Razer Blade 18 RTX 4070 i9-13950HX, GeForce RTX 4070 Laptop GPU, 91.7 Wh | |
|---|---|---|---|---|---|---|
| Czasy pracy | 22% | -15% | 64% | 24% | 7% | |
| Reader / Idle (h) | 5.9 | 5.6 -5% | 11.7 98% | 7 19% | ||
| WiFi v1.3 (h) | 4.2 | 5.3 26% | 4.3 2% | 8.1 93% | 4.4 5% | 4 -5% |
| Load (h) | 1.2 | 1.4 17% | 0.7 -42% | 1.2 0% | 1.7 42% | 1.3 8% |
| H.264 (h) | 6 | 4.8 |
Za
Przeciw
Werdykt - nowy wygląd zewnętrzny, ta sama wydajność wewnętrzna
Ze względu na brak nowego GPU Nvidii w tym roku dla laptopów, MSI musiało odświeżyć wszystko wokół karty graficznej, aby to nadrobić. Użytkownicy otrzymują nową 18-calową obudowę, nowy procesor Intel HX 14. generacji, nowy zasilacz sieciowy, większe klawisze i nowy wyświetlacz mini-LED 4K HDR1000 120 Hz, który towarzyszy wysokiej cenie. Większość z tych zmian stanowi krok naprzód w stosunku do zeszłorocznego modelu GT77ale ostatecznie użytkownicy otrzymują taką samą wydajność w grach z obu modeli.
Najważniejsze cechy Titan 18 to wyświetlacz mini-LED i procesor Core i9-14900HX. Ten pierwszy jest niewątpliwie imponujący i jest jednym z najlepszych sposobów na oglądanie treści HDR na dowolnym laptopie, ale brak obsługi G-Sync jest trudny do zignorowania, zwłaszcza we flagowym modelu do gier. W międzyczasie nowy procesor działa niemal identycznie jak Core i9-13950HX 13. generacji, który można znaleźć w GT77, co sprawia, że wydaje się być niczym więcej niż rebrandingiem. Titan 18 można zatem uznać za duży skok naprzód w stosunku do GT77 ze względu na wszystkie zmiany zewnętrzne, ale w porównaniu z nimi układy wewnętrzne Intela i Nvidii odczuwają stagnację.
MSI Titan 18 HX to jeden z najszybszych laptopów gamingowych tego roku z równie imponującym wyświetlaczem mini-LED 4K. Jego wydajność jest jednak niemal identyczna z zeszłorocznym GT77.
Jeśli pociąga Państwa duży i bardzo jasny 18-calowy wyświetlacz mini-LED, to Titan 18 HX jest jednym z niewielu miejsc, w których można go znaleźć w chwili pisania tego tekstu. Jeśli nie, to alternatywy takie jak Alienware m18 R1, Asus ROG Strix G18lub Razer Blade 18 wszystkie oferują G-Sync, szybsze częstotliwości odświeżania i tę samą opcję GeForce RTX 4090 w cieńszych i często lżejszych obudowach.
Cena i dostępność
Recenzowany model Titan 18 HX jest już dostępny na Amazon w cenie 5800 dolarów. MSI oferuje również model bezpośrednio na swojej oficjalnej stronie internetowej w niższych cenach początkowych.
MSI Titan 18 HX A14VIG
- 30/01/2024 v7 (old)
Allen Ngo
Przezroczystość
Wyboru urządzeń do recenzji dokonuje nasza redakcja. Próbka testowa została udostępniona autorowi jako pożyczka od producenta lub sprzedawcy detalicznego na potrzeby tej recenzji. Pożyczkodawca nie miał wpływu na tę recenzję, producent nie otrzymał też kopii tej recenzji przed publikacją. Nie było obowiązku publikowania tej recenzji. Jako niezależna firma medialna, Notebookcheck nie podlega władzy producentów, sprzedawców detalicznych ani wydawców.
Tak testuje Notebookcheck
Każdego roku Notebookcheck niezależnie sprawdza setki laptopów i smartfonów, stosując standardowe procedury, aby zapewnić porównywalność wszystkich wyników. Od około 20 lat stale rozwijamy nasze metody badawcze, ustanawiając przy tym standardy branżowe. W naszych laboratoriach testowych doświadczeni technicy i redaktorzy korzystają z wysokiej jakości sprzętu pomiarowego. Testy te obejmują wieloetapowy proces walidacji. Nasz kompleksowy system ocen opiera się na setkach uzasadnionych pomiarów i benchmarków, co pozwala zachować obiektywizm.Price comparison

