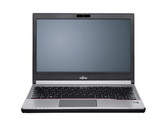
Intel Core i7-6600U
-
Seria Intel Core i7 Nazwa robocza Skylake Rodzina: Core i7 Skylake Taktowanie 2600 - 3400 MHz Pamięć 1. poziomu 128 KB Pamięć 2. poziomu 512 KB Pamięć 3. poziomu 4 MB Liczba rdzeni / wątków 2 / 4 TDP (Thermal Design Power) 15 W Technologia wytwarzania 14 nm Rozmiar procesora 99 mm2 Maks. temperatura 100 °C Gniazdo BGA Cechy Dual-Channel DDR3L-1600/DDR4-2133, HyperThreading, AVX, AVX2, Quick Sync, Virtualization, AES-NI, vPro, TXT GPU Intel HD Graphics 520 (300 - 1050 MHz)64-bity obsługa 64-bitów Architecture x86 Najniższa cena $393 U.S. Data premiery 01/09/2015 Odnośnik do produktu (zewn.) Intel Core i7 6600U
Testy Cinebench R15 - Cinebench R15 CPU Multi 64 Bit
min: 306 avg: 324 median: 321 (3%) max: 348 Points
...
AMD Ryzen Embedded R1606G
Intel Core i3-1000NG4
...
AMD Ryzen 9 7945HX
0 20 40 60 80 100 120 140 160 180 200 220 240 260 280 300 320 Tooltip Fujitsu Lifebook E756 : Ø213 (199.29-243.3)
Microsoft Surface Book with Performance Base: Ø310 (307.42-316.73)
Fujitsu Lifebook S936 6600U 512GB PalmSecure: Ø314 (311.9-321)
Microsoft Surface Book with Performance Base: Ø319 (316.27-324.66)
Cinebench R15 - Cinebench R15 CPU Single 64 Bit
min: 118 avg: 136.6 median: 141 (43%) max: 144 Points
...
AMD Ryzen 5 3450U
AMD Ryzen 5 3580U
AMD Ryzen Embedded R1606G
Intel Core i5-1030NG7
...
Intel Core i9-13980HX
Cinebench R11.5 - Cinebench R11.5 CPU Multi 64 Bit
min: 3.25 avg: 3.6 median: 3.6 (5%) max: 3.84 Points
...
Intel Pentium Silver N6000
...
AMD Ryzen 9 7945HX
Cinebench R11.5 - Cinebench R11.5 CPU Single 64 Bit
min: 1.19 avg: 1.6 median: 1.6 (5%) max: 1.63 Points
...
...
Intel Core i9-13980HX
Cinebench R10 - Cinebench R10 Rend. Single (32bit)
min: 3260 avg: 5259 median: 5298 (32%) max: 7045 pkt.
...
AMD Ryzen 5 PRO 4650U
Intel Core i3-10100Y
AMD Ryzen 5 4680U
AMD Ryzen 5 5500U
AMD Ryzen 5 4500U
AMD Ryzen 5 4600H
...
Intel Core i9-13980HX
Cinebench R10 - Cinebench R10 Rend. Multi (32bit)
min: 9140 avg: 11541 median: 11320 (8%) max: 14948 pkt.
...
Intel Celeron N5095
...
Intel Core i9-13980HX
Cinebench R10 - Cinebench R10 Rend. Multi (64bit)
min: 14391 avg: 14724 median: 14412 (10%) max: 15369 Points
...
Intel Celeron N5095
Intel Pentium Silver N6005
...
Intel Core i9-13980HX
Cinebench R10 - Cinebench R10 Rend. Single (64bit)
min: 6863 avg: 7593 median: 6890 (38%) max: 9027 Points
...
Intel Core i5-1035G7
Intel Core i5-1340P
...
Intel Core i9-13980HX
wPrime 2.10 - wPrime 2.0 1024m *
min: 447.3 avg: 503 median: 509 (6%) max: 526 s
...
Intel Core i3-1110G4
...
wPrime 2.10 - wPrime 2.0 32m *
min: 14.08 avg: 15.3 median: 14.7 (3%) max: 19.26 s
...
Intel Core i7-1360P
Intel Core i5-1030NG7
...
Transmeta Crusoe TM-5800
min: 2264 avg: 2450 median: 2449.5 (14%) max: 2635 pkt.
...
Intel Core i3-1000NG4
...
Intel Core i5-1240P
X264 HD Benchmark 4.0 - x264 Pass 2
min: 19.52 avg: 20.8 median: 20 (7%) max: 22.62 fps
...
AMD Ryzen 3 3250U
Intel Core i3-1110G4
...
Intel Core i9-13900HX
X264 HD Benchmark 4.0 - x264 Pass 1
min: 103.7 avg: 111 median: 109 (26%) max: 120.4 fps
...
AMD Athlon Gold 3150U
Intel Core i3-1110G4
Intel Celeron N5095
...
Intel Core i9-13900HX
TrueCrypt - TrueCrypt Serpent
min: 0.193 avg: 0.2 median: 0.2 (7%) max: 0.201 GB/s
...
Intel Celeron N5095
Intel Core i3-10100Y
Intel Pentium Gold 7505
Intel Core i3-1110G4
...
AMD Ryzen 9 7945HX
TrueCrypt - TrueCrypt Twofish
min: 0.317 avg: 0.3 median: 0.3 (6%) max: 0.343 GB/s
...
AMD Ryzen 3 3250U
Intel Core i3-10100Y
Intel Pentium Gold 7505
AMD Athlon Gold 3150U
...
Intel Core i9-13980HX
TrueCrypt - TrueCrypt AES
min: 1.9 avg: 1.9 median: 1.9 (6%) max: 2 GB/s
...
AMD Ryzen 3 3250U
...
AMD Ryzen 9 7945HX
3DMark 06 - CPU - 3DMark 06 - CPU
min: 4107 avg: 4334 median: 4333.5 (9%) max: 4560 Points
...
AMD Athlon Gold 3150U
...
Intel Core i9-13980HX
Super Pi mod 1.5 XS 1M - Super Pi mod 1.5 XS 1M *
min: 10.9 avg: 11.1 median: 11.1 (2%) max: 11.35 s
...
...
Super Pi mod 1.5 XS 2M - Super Pi mod 1.5 XS 2M *
min: 24.75 avg: 25.2 median: 25.1 (1%) max: 26.03 s
...
AMD Ryzen 7 4980U
Intel Core i5-1030NG7
Intel Core i5-L16G7
...
Super Pi Mod 1.5 XS 32M - Super Pi mod 1.5 XS 32M *
min: 558 avg: 578 median: 572 (3%) max: 610 s
...
AMD Ryzen 5 5500U
AMD Ryzen 9 6900HX
AMD Ryzen 5 4680U
AMD Ryzen 7 4800U
...
3DMark Vantage - 3DM Vant. Perf. CPU no Physx
12712 Points (12%)
Model CPU GPU RAM Wartość Lenovo ThinkPad T460s-20FA003GGE 6600U HD Graphics 520 1050 / 1066 MHz12 GB 12712
...
Intel Pentium Silver N6005
Intel Processor N95
Intel Core i3-1115G4
...
AMD Ryzen 9 7945HX
3DMark 11 - 3DM11 Performance Physics
min: 4034 avg: 4479 median: 4606.5 (12%) max: 4780 Points
...
AMD Athlon Gold 3150U
Intel Celeron N5095
Intel Pentium Silver N6005
...
AMD Ryzen 9 7945HX
3DMark - 3DMark Ice Storm Physics
min: 31340 avg: 38138 median: 37127 (31%) max: 42543 Points
...
...
Intel Core i9-13900H
3DMark - 3DMark Ice Storm Extreme Physics
min: 26121 avg: 37420 median: 39364 (33%) max: 42164 Points
...
Intel Core i5-1035G7
Intel Pentium Silver N6005
...
Intel Core i9-12900HX
3DMark - 3DMark Ice Storm Unlimited Physics
min: 42770 avg: 43159 median: 43159 (36%) max: 43548 Points
Model CPU GPU RAM Wartość Lenovo ThinkPad P40 Yoga 20GQ-000EUS 6600U Quadro M500M 1029 / 1800 MHz 2 GB 16 GB 42770 Lenovo ThinkPad T560-20FH002RGE 6600U GeForce 940MX 1242 / 1000 MHz 2 GB 8 GB 43548
...
Intel Pentium Silver N6000
AMD Ryzen 3 3250U
...
Intel Core i9-12900HX
3DMark - 3DMark Cloud Gate Physics
min: 3073 avg: 3543 median: 3569 (9%) max: 3745 Points
...
AMD Ryzen 3 3250U
...
AMD Ryzen 9 7945HX
3DMark - 3DMark Fire Strike Standard Physics
min: 4279 avg: 5086 median: 5134.5 (9%) max: 5344 Points
...
Intel Pentium Silver N6005
...
Intel Core i9-13980HX
Geekbench 3 - Geekbench 3 32 Bit Multi-Core
min: 6303 avg: 6693 median: 6692.5 (12%) max: 7082 pkt.
...
...
Geekbench 3 - Geekbench 3 32 Bit Single-Core
min: 3060 avg: 3222 median: 3222 (63%) max: 3384 pkt.
...
...
Intel Core i5-1230U
Geekbench 3 - Geekbench 3 64 Bit Multi-Core
min: 6618 avg: 7032 median: 7031.5 (11%) max: 7445 pkt.
...
AMD Ryzen 5 6600U
...
Intel Core i5-1230U
Geekbench 3 - Geekbench 3 64 Bit Single-Core
min: 3191 avg: 3369 median: 3369 (50%) max: 3547 pkt.
...
...
Intel Core i5-1230U
Mozilla Kraken 1.1 - Kraken 1.1 Total Score *
min: 1030 avg: 1601 median: 1048 (1%) max: 3827 ms
...
AMD 3020e
AMD Ryzen Embedded R1505G
Intel Celeron N5095
Intel Celeron 6305
Intel Celeron N4505
AMD Athlon Silver 3050e
...
Sunspider - Sunspider 1.0 Total Score *
min: 77.3 avg: 137.8 median: 134.4 (1%) max: 205 ms
...
Intel Core i5-1030NG7
AMD Ryzen 7 5800H
Intel Core i7-11800H
Intel Core i7-1165G7
Intel Core i3-1115G4
...
Octane V2 - Octane V2 Total Score
min: 8244 avg: 28548 median: 32986 (31%) max: 35045 Points
...
AMD Ryzen 5 3580U
...
Intel Core i9-13950HX
Power Consumption - Prime95 Power Consumption - external Monitor *
28.9 Watt (5%)
Model CPU GPU RAM Wartość Microsoft Surface Book with Performance Base 6600U GeForce GTX 965M 1150 / 1253 MHz 2 GB 16 GB 28.9
Qualcomm Snapdragon 7c Gen 2
...
Intel Celeron N5095
AMD Ryzen 7 PRO 5850U
Intel Core i5-1035G4
Intel Core i3-1110G4
AMD Ryzen 5 PRO 5650U
Intel Core i5-1140G7
Intel Core i7-1180G7
Intel Core i5-1035G1
AMD Ryzen 7 5800U
Intel Core i7-1065G7
Intel Core i5-1230U
...
Intel Core i7-12800HX
Power Consumption - Cinebench R15 Multi Power Consumption - external Monitor *
26.2 Watt (5%)
Model CPU GPU RAM Wartość Microsoft Surface Book with Performance Base 6600U GeForce GTX 965M 1150 / 1253 MHz 2 GB 16 GB 26.2
...
Intel Pentium Silver N6005
Intel Celeron N5095
Intel Pentium Gold 7505
Intel Core i3-1110G4
AMD Ryzen 7 PRO 5850U
AMD Ryzen 3 3250U
Apple M1
Intel Core i5-1140G7
AMD Ryzen 5 PRO 5650U
Intel Core i5-1035G1
Apple M2
...
Intel Core i7-12800HX
Power Consumption - Cinebench R15 Multi Power Efficiency - external Monitor
11.8 Points per Watt (14%)
Model CPU GPU RAM Wartość Microsoft Surface Book with Performance Base 6600U GeForce GTX 965M 1150 / 1253 MHz 2 GB 16 GB 11.8
...
Intel Xeon W-10885M
Intel Core i7-10610U
Intel Core i5-10500H
Intel Core i9-10885H
Intel Celeron N6211
Intel Core i7-10750H
...
Intel Core i5-10200H
- Zakres wyników testów referencyjnych dla tej karty graficznej
- Średnia wartość wyników testów referencyjnych dla tej karty graficzne
* Smaller numbers mean a higher performance
v1.22
log 30. 07:41:07
#0 no ids found in url (should be separated by "_") +0s ... 0s
#1 not redirecting to Ajax server +0s ... 0s
#2 did not recreate cache, as it is less than 5 days old! Created at Sun, 28 May 2023 13:55:04 +0200 +0.001s ... 0.001s
#3 no comparison url found in template nbc.compare_page_2 needed +0.006s ... 0.007s
#4 no comparison url found in template nbc.compare_page_2 needed +0s ... 0.007s
#5 no comparison url found in template nbc.compare_page_2 needed +0s ... 0.008s
#6 no comparison url found in template nbc.compare_page_2 needed +0s ... 0.008s
#7 no comparison url found in template nbc.compare_page_2 needed +0s ... 0.008s
#8 no comparison url found in template nbc.compare_page_2 needed +0s ... 0.008s
#9 no comparison url found in template nbc.compare_page_2 needed +0s ... 0.009s
#10 no comparison url found in template nbc.compare_page_2 needed +0s ... 0.009s
#11 no comparison url found in template nbc.compare_page_2 needed +0s ... 0.009s
#12 no comparison url found in template nbc.compare_page_2 needed +0s ... 0.009s
#13 no comparison url found in template nbc.compare_page_2 needed +0s ... 0.01s
#14 composed specs +0s ... 0.01s
#15 did output specs +0s ... 0.01s
#16 getting avg benchmarks for device 6969 +0.002s ... 0.012s
#17 got single benchmarks 6969 +0.048s ... 0.06s
#18 got avg benchmarks for devices +0s ... 0.06s
#19 min, max, avg, median took s +0.761s ... 0.82s
#20 no comparison url found in template nbc.compare_page_2 needed +0s ... 0.82s
#21 return log +0s ... 0.82s
Please share our article, every link counts!
.170
Inne procesory tej serii Core i7 Porównywalne CPU
Klaus Hinum (Update: 2015-09- 1)