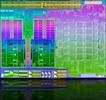
AMD A10-4600M
Test AMD Trinity A10-4600M
Seria AMD A-Series Nazwa robocza Trinity Rodzina: A-Series Trinity Taktowanie 2300 - 3200 MHz Pamięć 2. poziomu 4 MB Liczba rdzeni / wątków 4 / 4 TDP (Thermal Design Power) 35 W Liczba tranzystorów 1303 mln Technologia wytwarzania 32 nm Rozmiar procesora 246 mm2 Cechy SSE (1, 2, 3, 3S, 4.1, 4.2, 4A), x86-64, AES, AVX, FMA GPU AMD Radeon HD 7660G (497 - 686 MHz)64-bity obsługa 64-bitów Architecture x86 Data premiery 15/05/2012
Testy Performance Rating - CB R15 + R20 + 7-Zip + X265 + Blender + 3DM11 CPU
15.8 pt (22%)
Intel Celeron N6211
Intel Celeron N4500
Intel Celeron J4115
Intel Celeron 6305
...
AMD Ryzen 9 7945HX3D
max:
AMD Ryzen Threadripper PRO 7995WX
Cinebench R20 - Cinebench R20 CPU (Single Core)
62.6 Points (7%)
AMD A6-9220e
Intel Celeron J3355
...
AMD Ryzen 9 7945HX3D
max:
Intel Core i9-14900K
Cinebench R20 - Cinebench R20 CPU (Multi Core)
148 Points (0%)
AMD A6-9220e
Intel Celeron 3867U
Intel Celeron J3355
...
AMD Ryzen 9 7945HX3D
max:
AMD Ryzen Threadripper PRO 7995WX
Cinebench R15 - Cinebench R15 CPU Multi 64 Bit
min: 185 avg: 187 median: 187 (1%) max: 189 Points
...
Intel Celeron N4500
...
AMD Ryzen 9 7945HX3D
max:
AMD Ryzen Threadripper PRO 7995WX
0 10 20 30 40 50 60 70 80 90 100 110 120 130 140 150 160 170 180 Tooltip AMD Pumori Platform A10-4600M: Ø180.6 (173.86-187.26)
Cinebench R15 - Cinebench R15 CPU Single 64 Bit
min: 62 avg: 65.1 median: 63 (19%) max: 70.4 Points
...
...
AMD Ryzen 9 7945HX3D
max:
Intel Core i9-14900K
Cinebench R11.5 - Cinebench R11.5 CPU Multi 64 Bit
min: 1.98 avg: 2 median: 2 (3%) max: 2.07 Points
...
Intel Celeron N4500
...
AMD Ryzen 9 7945HX
max:
AMD Ryzen Threadripper PRO 7995WX
Cinebench R11.5 - Cinebench R11.5 CPU Single 64 Bit
min: 0.61 avg: 0.7 median: 0.7 (17%) max: 0.74 Points
...
Qualcomm Snapdragon 7c
...
Intel Core i9-13980HX
max:
Intel Core i9-14900K
Cinebench R10 - Cinebench R10 Rend. Single (32bit)
min: 2034 avg: 2098 median: 2078 (13%) max: 2231 pkt.
...
Intel Celeron J4115
...
Intel Core i9-13980HX
max:
AMD Ryzen 9 7950X3D
Cinebench R10 - Cinebench R10 Rend. Multi (32bit)
min: 5371 avg: 5649 median: 5696 (4%) max: 5812 pkt.
...
...
Intel Core i9-13980HX
max:
AMD Ryzen 9 7950X3D
Cinebench R10 - Cinebench R10 Rend. Multi (64bit)
min: 8017 avg: 8067 median: 8051 (6%) max: 8183 Points
...
...
Intel Core i9-13980HX
max:
Intel Core i9-14900K
Cinebench R10 - Cinebench R10 Rend. Single (64bit)
min: 2801 avg: 2856 median: 2821 (15%) max: 3066 Points
...
...
Intel Core i9-13980HX
max:
Intel Core i9-14900K
wPrime 2.10 - wPrime 2.0 1024m *
min: 786 avg: 850 median: 852 (10%) max: 901 s
...
...
wPrime 2.10 - wPrime 2.0 32m *
min: 24.1 avg: 26.1 median: 26.5 (5%) max: 26.92 s
...
Intel Core i7-13705H
...
Transmeta Crusoe TM-5800
min: 1844 avg: 1884 median: 1891.5 (3%) max: 1910 pkt.
...
...
AMD Ryzen 9 7945HX3D
max:
AMD Ryzen Threadripper PRO 7995WX
7-Zip 18.03 - 7-Zip 18.03 Multli Thread 4 runs
6898 MIPS (4%)
...
AMD Athlon Silver 3050e
AMD Ryzen Embedded R1505G
Intel Celeron J4125
Qualcomm Snapdragon 7c
Intel Core i5-L16G7
...
AMD Ryzen 9 7945HX3D
max:
AMD Ryzen Threadripper PRO 7995WX
7-Zip 18.03 - 7-Zip 18.03 Single Thread 4 runs
2699 MIPS (32%)
...
AMD Ryzen Embedded R1505G
AMD Athlon Silver 3050e
Intel Celeron N6211
AMD 3020e
Intel Celeron N4500
Intel Pentium Silver N6000
Intel Celeron N4505
AMD Athlon Gold 3150U
Intel Celeron N5095
...
AMD Ryzen 9 7945HX3D
max:
AMD Ryzen 9 7950X3D
X264 HD Benchmark 4.0 - x264 Pass 2
min: 4.47 avg: 11 median: 13.1 (5%) max: 13.44 fps
...
Intel Celeron 6305
...
Intel Core i9-13900HX
max:
AMD Ryzen Threadripper PRO 7995WX
X264 HD Benchmark 4.0 - x264 Pass 1
min: 21.54 avg: 52.8 median: 57.5 (13%) max: 74.6 fps
...
...
Intel Core i9-13900HX
max:
HWBOT x265 Benchmark v2.2 - HWBOT x265 4k Preset
1.2 fps (2%)
...
Intel Celeron N6211
AMD 3020e
Intel Celeron N4505
AMD Athlon Silver 3050e
Intel Celeron J4125
Intel Celeron J4115
Intel Core i5-L16G7
...
AMD Ryzen 9 7945HX3D
max:
AMD Ryzen Threadripper PRO 7995WX
0 0.1 0.2 0.4 0.5 0.6 0.7 0.9 1 1.1 1.2 1.3 1.5 1.6 1.7 1.8 2 2.1 2.2 2.3 Tooltip AMD Pumori Platform A10-4600M: Ø1.313 (0.24-2.45)
TrueCrypt - TrueCrypt Serpent
min: 0.138 avg: 0.1 median: 0.1 (4%) max: 0.143 GB/s
...
...
AMD Ryzen 9 7945HX
max:
AMD Ryzen Threadripper PRO 7995WX
TrueCrypt - TrueCrypt Twofish
min: 0.248 avg: 0.3 median: 0.3 (4%) max: 0.266 GB/s
...
...
Intel Core i9-13980HX
max:
Intel Core i9-14900K
TrueCrypt - TrueCrypt AES
1.2 GB/s (3%)
...
Intel Celeron N4500
...
AMD Ryzen 9 7945HX
max:
AMD Ryzen Threadripper PRO 7995WX
Blender - Blender 2.79 BMW27 CPU *
3004 Seconds (21%)
...
AMD Athlon Silver 3050e
Intel Celeron J4115
Intel Celeron J4125
Intel Celeron 6305
Intel Celeron N4505
AMD 3020e
Qualcomm Snapdragon 7c Gen 2
Intel Celeron N6211
Qualcomm Snapdragon 7c
...
R Benchmark 2.5 - R Benchmark 2.5 *
1.6 sec (35%)
...
Intel Celeron N6211
Intel Celeron 6305
Intel Celeron J4125
AMD 3020e
Intel Celeron J4115
Qualcomm Snapdragon 7c Gen 2
Qualcomm Snapdragon 7c
Intel Celeron N4500
...
3DMark 06 - CPU - 3DMark 06 - CPU
min: 2493 avg: 2820 median: 2865.5 (6%) max: 2917 Points
...
...
Intel Core i9-13980HX
max:
AMD Ryzen Threadripper PRO 7995WX
Super Pi mod 1.5 XS 1M - Super Pi mod 1.5 XS 1M *
min: 34.3 avg: 35 median: 35.1 (8%) max: 35.38 s
...
...
Super Pi mod 1.5 XS 2M - Super Pi mod 1.5 XS 2M *
min: 78.1 avg: 79.9 median: 80.1 (3%) max: 81 s
...
...
Super Pi Mod 1.5 XS 32M - Super Pi mod 1.5 XS 32M *
min: 1928 avg: 2067 median: 2090 (9%) max: 2133 s
...
...
SiSoft Sandra Dhrystone (MIPS) - SiSoft Sandra Dhrystone (MIPS)
min: 32000 avg: 33543 median: 34100 (16%) max: 34530 MIPS
...
...
SiSoft Sandra Whetstone (MFLOPS) - SiSoft Sandra Whetstone (MFLOPS)
min: 21760 avg: 22243 median: 22340 (17%) max: 22630 MFLOPS
...
...
max:
Intel Core i7-3960X
Windows 7 Experience Index - Win7 CPU
6.9 Points (88%)
...
...
max:
Intel Core i7-3960X
3DMark Vantage - 3DM Vant. Perf. CPU no Physx
min: 5998 avg: 6303 median: 6302.5 (6%) max: 6677 Points
...
Intel Celeron N4505
...
AMD Ryzen 9 7945HX
max:
3DMark 11 - 3DM11 Performance Physics
min: 2480 avg: 2577 median: 2596.5 (7%) max: 2633 Points
...
AMD 3020e
...
AMD Ryzen 9 7945HX3D
max:
AMD Ryzen 9 7950X3D
3DMark - 3DMark Ice Storm Physics
min: 22271 avg: 22725 median: 22756 (18%) max: 23147 Points
...
...
Intel Core i5-13500HX
max:
Intel Core i5-14600K
3DMark - 3DMark Ice Storm Extreme Physics
22897 Points (19%)
...
Intel Celeron J4125
Intel Celeron N4505
...
Intel Core i7-13620H
max:
Intel Core i5-14600K
3DMark - 3DMark Ice Storm Unlimited Physics
25218 Points (21%)
...
Intel Core i5-1030NG7
Intel Celeron N4505
AMD 3020e
Intel Celeron J4125
...
Intel Core i7-13620H
max:
Intel Core i5-14600K
3DMark - 3DMark Cloud Gate Physics
min: 1841 avg: 1877 median: 1882 (5%) max: 1909 Points
...
...
AMD Ryzen 9 7945HX
max:
Intel Core i9-14900K
3DMark - 3DMark Fire Strike Standard Physics
2569 Points (5%)
...
...
AMD Ryzen 9 7945HX3D
max:
Intel Core i9-14900K
Geekbench 5.5 - Geekbench 5.1 - 5.4 64 Bit Single-Core
446 pkt. (19%)
...
Intel Celeron J4115
Intel Celeron 3867U
Intel Celeron J4125
AMD 3015e
Intel Celeron 5205U
...
Apple M3
Geekbench 5.5 - Geekbench 5.1 - 5.4 64 Bit Multi-Core
1162 pkt. (2%)
...
AMD 3015e
Intel Celeron 3867U
Intel Celeron 5205U
Intel Celeron N4500
Intel Celeron J3455
AMD 3015Ce
AMD Athlon Silver 3050e
AMD 3020e
Intel Celeron 6305
Intel Celeron N4505
Intel Pentium Gold 6405U
...
Apple M3 Max 16-Core
max:
AMD Ryzen Threadripper PRO 7995WX
Geekbench 5.0 - Geekbench 5.0 64 Bit Single-Core
378 pkt. (2%)
AMD A6-9220e
Qualcomm Snapdragon 7c
Intel Celeron J4125
Intel Core i5-8260U
Intel Celeron N6211
...
Intel Core i9-13980HX
max:
Intel Core i9-14900K
Geekbench 5.0 - Geekbench 5.0 64 Bit Multi-Core
1089 pkt. (3%)
AMD A6-9220e
Qualcomm Snapdragon 7c
Intel Celeron N6211
Intel Celeron 6305
AMD 3020e
Intel Celeron N4505
AMD Athlon Silver 3050e
...
Intel Core i9-13980HX
max:
AMD Ryzen Threadripper PRO 3995WX
Geekbench 4.4 - Geekbench 4.1 - 4.4 64 Bit Single-Core
min: 1749 avg: 1906 median: 1906 (19%) max: 2063 pkt.
...
Intel Celeron J3355
Qualcomm Snapdragon 7c
Qualcomm Snapdragon 7c Gen 2
Intel Celeron J4125
...
Intel Core i9-13900HX
max:
Intel Core i9-14900K
Geekbench 4.4 - Geekbench 4.1 - 4.4 64 Bit Multi-Core
min: 4061 avg: 4372 median: 4371.5 (5%) max: 4682 pkt.
...
Intel Celeron N6211
Qualcomm Snapdragon 7c Gen 2
Intel Celeron 3867U
AMD 3020e
Intel Celeron 6305
AMD Athlon Silver 3050e
...
Intel Core i9-13900HX
max:
Intel Core i9-14900K
Geekbench 3 - Geekbench 3 64 Bit Multi-Core
4221 pkt. (7%)
...
...
Intel Core i5-1230U
max:
Intel Core i9-10980XE
Geekbench 3 - Geekbench 3 64 Bit Single-Core
1762 pkt. (26%)
...
AMD A6-9220e
AMD Ryzen 5 6600U
...
Intel Core i5-1230U
max:
Qualcomm Snapdragon 8 Gen 2 for Galaxy
Geekbench 2 - 32 Bit - Geekbench Stream
3377 Points (27%)
...
AMD A6-9220e
...
max:
Intel Core i7-7740X
Geekbench 2 - 32 Bit - Geekbench Memory
3109 Points (28%)
...
...
max:
Intel Core i7-7740X
Geekbench 2 - 32 Bit - Geekbench Floating Point
6169 Points (12%)
...
...
AMD Ryzen 7 4700U
max:
Intel Core i9-10980XE
Geekbench 2 - 32 Bit - Geekbench Integer
4603 Points (9%)
...
...
AMD Ryzen 7 4700U
max:
Intel Core i9-10980XE
Geekbench 2 - 32 Bit - Geekbench Total Score
4729 Points (12%)
...
...
AMD Ryzen 7 4700U
max:
Intel Core i9-10980XE
Mozilla Kraken 1.1 - Kraken 1.1 Total Score *
4242 ms (5%)
...
AMD A6-9220e
...
max:
Apple S7
Sunspider - Sunspider 1.0 Total Score *
196.2 ms (2%)
...
Intel Core i3-1005G1
Intel Celeron N4500
Intel Core i5-10310U
...
max:
Octane V2 - Octane V2 Total Score
7477 Points (7%)
...
...
Intel Core i9-13950HX
- Zakres wyników testów referencyjnych dla tej karty graficznej
- Średnia wartość wyników testów referencyjnych dla tej karty graficzne
* Smaller numbers mean a higher performance
v1.26
log 21. 07:17:05
#0 no ids found in url (should be separated by "_") +0s ... 0s
#1 not redirecting to Ajax server +0s ... 0s
#2 did not recreate cache, as it is less than 5 days old! Created at Thu, 16 Nov 2023 08:27:32 +0100 +0.001s ... 0.001s
#3 no comparison url found in template nbc.compare_page_2 needed +0.007s ... 0.008s
#4 no comparison url found in template nbc.compare_page_2 needed +0s ... 0.008s
#5 no comparison url found in template nbc.compare_page_2 needed +0s ... 0.008s
#6 no comparison url found in template nbc.compare_page_2 needed +0s ... 0.009s
#7 no comparison url found in template nbc.compare_page_2 needed +0s ... 0.009s
#8 no comparison url found in template nbc.compare_page_2 needed +0s ... 0.009s
#9 no comparison url found in template nbc.compare_page_2 needed +0s ... 0.009s
#10 no comparison url found in template nbc.compare_page_2 needed +0s ... 0.01s
#11 no comparison url found in template nbc.compare_page_2 needed +0s ... 0.01s
#12 composed specs +0s ... 0.01s
#13 did output specs +0s ... 0.01s
#14 getting avg benchmarks for device 3112 +0.017s ... 0.027s
#15 got single benchmarks 3112 +0.039s ... 0.066s
#16 got avg benchmarks for devices +0s ... 0.066s
#17 min, max, avg, median took s +1.001s ... 1.067s
#18 no comparison url found in template nbc.compare_page_2 needed +0s ... 1.067s
#19 return log +0s ... 1.067s
Please share our article, every link counts!
Inne procesory tej serii A-Series Porównywalne CPU
Klaus Hinum (Update: 2012-07-17)