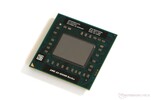
AMD A6-5350M

-
| Nazwa robocza | Richland | ||||||||||||||||||||||||||||||||||||||||||||
| Seria | AMD AMD A-Series | ||||||||||||||||||||||||||||||||||||||||||||
Rodzina: AMD A-Series Richland
| |||||||||||||||||||||||||||||||||||||||||||||
| Taktowanie | 2900 - 3500 MHz | ||||||||||||||||||||||||||||||||||||||||||||
| Pamięć 2. poziomu | 1 MB | ||||||||||||||||||||||||||||||||||||||||||||
| Liczba rdzeni / wątków | 2 / 2 | ||||||||||||||||||||||||||||||||||||||||||||
| TDP (Thermal Design Power) | 35 W | ||||||||||||||||||||||||||||||||||||||||||||
| Technologia wytwarzania | 32 nm | ||||||||||||||||||||||||||||||||||||||||||||
| Cechy | SSE (1, 2, 3, 3S, 4.1, 4.2, 4A), x86-64, AES, AVX, FMA, kontroler pamięci DDR3-1600 | ||||||||||||||||||||||||||||||||||||||||||||
| GPU | AMD Radeon HD 8450G (533 - 720 MHz) | ||||||||||||||||||||||||||||||||||||||||||||
| 64-bity | obsługa 64-bitów | ||||||||||||||||||||||||||||||||||||||||||||
| Architecture | x86 | ||||||||||||||||||||||||||||||||||||||||||||
| Data premiery | 12/03/2013 | ||||||||||||||||||||||||||||||||||||||||||||
Testy
Cinebench R15 - Cinebench R15 CPU Multi 64 Bit
min: 117 przeciętny: 117.5 mediana: 117.5 (1%) maks: 118 Points
...
AMD A6-5350M
...
AMD Ryzen 9 9955HX3D
max:
0%
100%
Cinebench R15 - Cinebench R15 CPU Single 64 Bit
min: 54 przeciętny: 63.5 mediana: 63.5 (18%) maks: 73 Points
...
AMD A6-5350M
...
max:
Intel Core Ultra 9 285K
0%
100%
Cinebench R11.5 - Cinebench R11.5 CPU Multi 64 Bit
min: 1 przeciętny: 1.2 mediana: 1.2 (2%) maks: 1.34 Points
Cinebench R11.5 - Cinebench R11.5 CPU Single 64 Bit
min: 0.64 przeciętny: 0.8 mediana: 0.7 (18%) maks: 0.87 Points
Cinebench R10 - Cinebench R10 Rend. Single (32bit)
min: 2389 przeciętny: 2490 mediana: 2480.5 (15%) maks: 2610 pkt.
Cinebench R10 - Cinebench R10 Rend. Multi (32bit)
min: 2990 przeciętny: 3740 mediana: 3956 (3%) maks: 4057 pkt.
Cinebench R10 - Cinebench R10 Rend. Multi (64bit)
min: 3558 przeciętny: 4653 mediana: 4823 (3%) maks: 5407 Points
Cinebench R10 - Cinebench R10 Rend. Single (64bit)
min: 2838 przeciętny: 3259 mediana: 3377 (4%) maks: 3444 Points
wPrime 2.10 - wPrime 2.0 32m *
min: 39.8 przeciętny: 40.9 mediana: 40.9 (8%) maks: 41.92 s
WinRAR - WinRAR 4.0
min: 1120 przeciętny: 1169 mediana: 1169 (2%) maks: 1218 pkt.
X264 HD Benchmark 4.0 - x264 Pass 2
min: 7.46 przeciętny: 8.2 mediana: 8.2 (0%) maks: 9 fps
X264 HD Benchmark 4.0 - x264 Pass 1
min: 40.25 przeciętny: 43.4 mediana: 43.4 (1%) maks: 46.5 fps
TrueCrypt - TrueCrypt Serpent
min: 0.0868 przeciętny: 0.1 mediana: 0.1 (3%) maks: 0.09 GB/s
TrueCrypt - TrueCrypt Twofish
min: 0.163 przeciętny: 0.2 mediana: 0.2 (3%) maks: 0.164 GB/s
TrueCrypt - TrueCrypt AES
min: 0.808 przeciętny: 0.8 mediana: 0.8 (2%) maks: 0.814 GB/s
3DMark 06 - CPU - 3DMark 06 - CPU
min: 1581 przeciętny: 1793 mediana: 1649 (4%) maks: 2148 Points
Super Pi mod 1.5 XS 1M - Super Pi mod 1.5 XS 1M *
min: 28.9 przeciętny: 29 mediana: 29 (6%) maks: 29.17 s
Super Pi mod 1.5 XS 2M - Super Pi mod 1.5 XS 2M *
69 s (3%)
Super Pi Mod 1.5 XS 32M - Super Pi mod 1.5 XS 32M *
1657 s (7%)
SiSoft Sandra Dhrystone (MIPS) - SiSoft Sandra Dhrystone (MIPS)
17160 MIPS (8%)
SiSoft Sandra Whetstone (MFLOPS) - SiSoft Sandra Whetstone (MFLOPS)
12710 MFLOPS (10%)
3DMark Vantage - 3DM Vant. Perf. CPU no Physx
min: 2764 przeciętny: 3371 mediana: 3404 (3%) maks: 3946 Points
3DMark 11 - 3DM11 Performance Physics
min: 942 przeciętny: 1357 mediana: 1414.5 (3%) maks: 1656 Points
3DMark - 3DMark Ice Storm Physics
min: 11808 przeciętny: 14488 mediana: 15493 (13%) maks: 15980 Points
3DMark - 3DMark Ice Storm Extreme Physics
16269 Points (13%)
3DMark - 3DMark Ice Storm Unlimited Physics
17364 Points (14%)
3DMark - 3DMark Cloud Gate Physics
min: 907 przeciętny: 1117 mediana: 1220 (3%) maks: 1294 Points
3DMark - 3DMark Fire Strike Standard Physics
min: 1185 przeciętny: 1539 mediana: 1713 (3%) maks: 1804 Points
Geekbench 2 - 32 Bit - Geekbench Stream
3509 Points (19%)
Geekbench 2 - 32 Bit - Geekbench Memory
3223 Points (22%)
Geekbench 2 - 32 Bit - Geekbench Floating Point
3891 Points (8%)
Geekbench 2 - 32 Bit - Geekbench Integer
3103 Points (6%)
Geekbench 2 - 32 Bit - Geekbench Total Score
3443 Points (9%)
Sunspider - Sunspider 1.0 Total Score *
min: 164 przeciętny: 223 mediana: 247 (3%) maks: 258 ms
Octane V2 - Octane V2 Total Score
min: 8944 przeciętny: 11205 mediana: 10252 (7%) maks: 14419 Points
- Zakres wyników testów referencyjnych dla tej karty graficznej
 - Średnia wartość wyników testów referencyjnych dla tej karty graficzne
* Mniejsze liczby oznaczają wyższą wydajność
* Mniejsze liczby oznaczają wyższą wydajność
v1.35


