Recenzja BMAX B7 Power: Oszczędny mini PC z procesorem Intel Core i7 za 400 USD
(MaxMini) B7 Power nie jest pierwszym testowanym przez nas urządzeniem od BMAX. Model BMAX MaxBook Y11 H1M6 Convertibleuzyskał w naszym teście 75 punktów procentowych. Przetestowaliśmy również poprzednika B7 Power, BMAX B5 Proale bez przyznawania mu oceny. Pod koniec 2022 roku B5 z procesorem Intel Gen8 był nadal modelem z najwyższej półki, ale teraz B7 Power jest wyposażony w procesor Intel Gen11. Może nie czyni go to najnowocześniejszym, ale z kolei utrzymuje przyjemną i niską cenę. Obecnie można go kupić za niecałe 400 USD. BMAX oferuje również B7 Pro, który jest wyposażony wIntel Core i5-1145G7zamiastIntel Core i7-11390H.
B7 Power musi konkurować z innymi mini PC. TheGeekom Mini IT11jest jednym z kandydatów z tym samym GPU - ale będziemy również analizować różnicę w wydajności w porównaniu z bardziej nowoczesnymi generacjami GPU, takimi jakIntel NUC 13 Pro Kit. Pomiędzy nimi można znaleźćIntel NUC 12 Pro Kitz procesorem Intel Gen12. Kolejne urządzenia porównawcze obejmująBeelink SEi11i swego rodzaju poprzednik B7 Power, modelB5 Pro.
Potencjalni konkurenci w porównaniu
Ocena | Data | Model | Waga | Wysokość | Rozmiar | Rezolucja | Cena |
|---|---|---|---|---|---|---|---|
| 78.4 % v7 (old) | 09/2023 | BMAX B7 Power G7A2 i7-11390H, Iris Xe G7 96EUs | 363 g | 44 mm | x | ||
| 80.6 % v7 (old) | 07/2023 | Geekom Mini IT11, i7-11390H i7-11390H, Iris Xe G7 96EUs | 536 g | 48 mm | x | ||
| 80.8 % v7 (old) | 04/2023 | Intel NUC 13 Pro Kit NUC13ANK i7-1360P, Iris Xe G7 96EUs | 538 g | 37 mm | x | ||
v (old) | 03/2023 | Intel NUC 12 Pro Kit NUC12WSBi5 i5-1240P, Iris Xe G7 80EUs | 549 g | 45.6 mm | x | ||
v (old) | 10/2022 | Beelink SEi11 Pro i5-11320H, Iris Xe G7 96EUs | 440 g | 40 mm | x | ||
v (old) | 11/2022 | BMAX B5 Pro G7H8 i5-8260U, UHD Graphics 620 | 369 g | 43.2 mm | x |
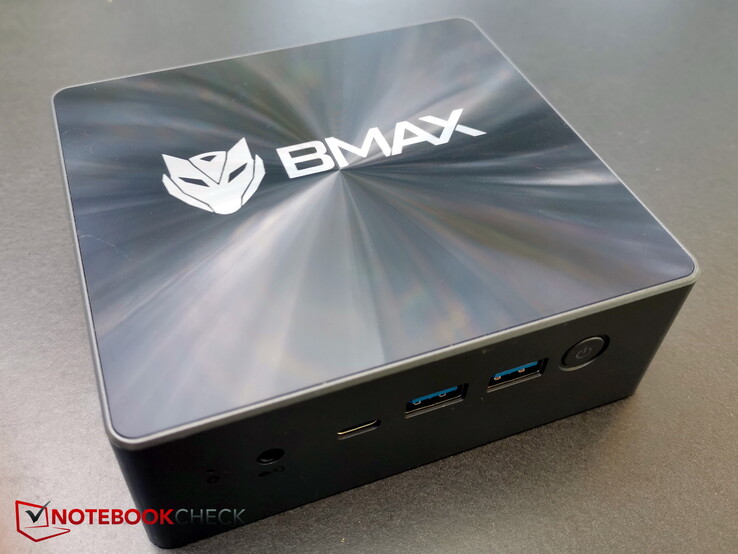
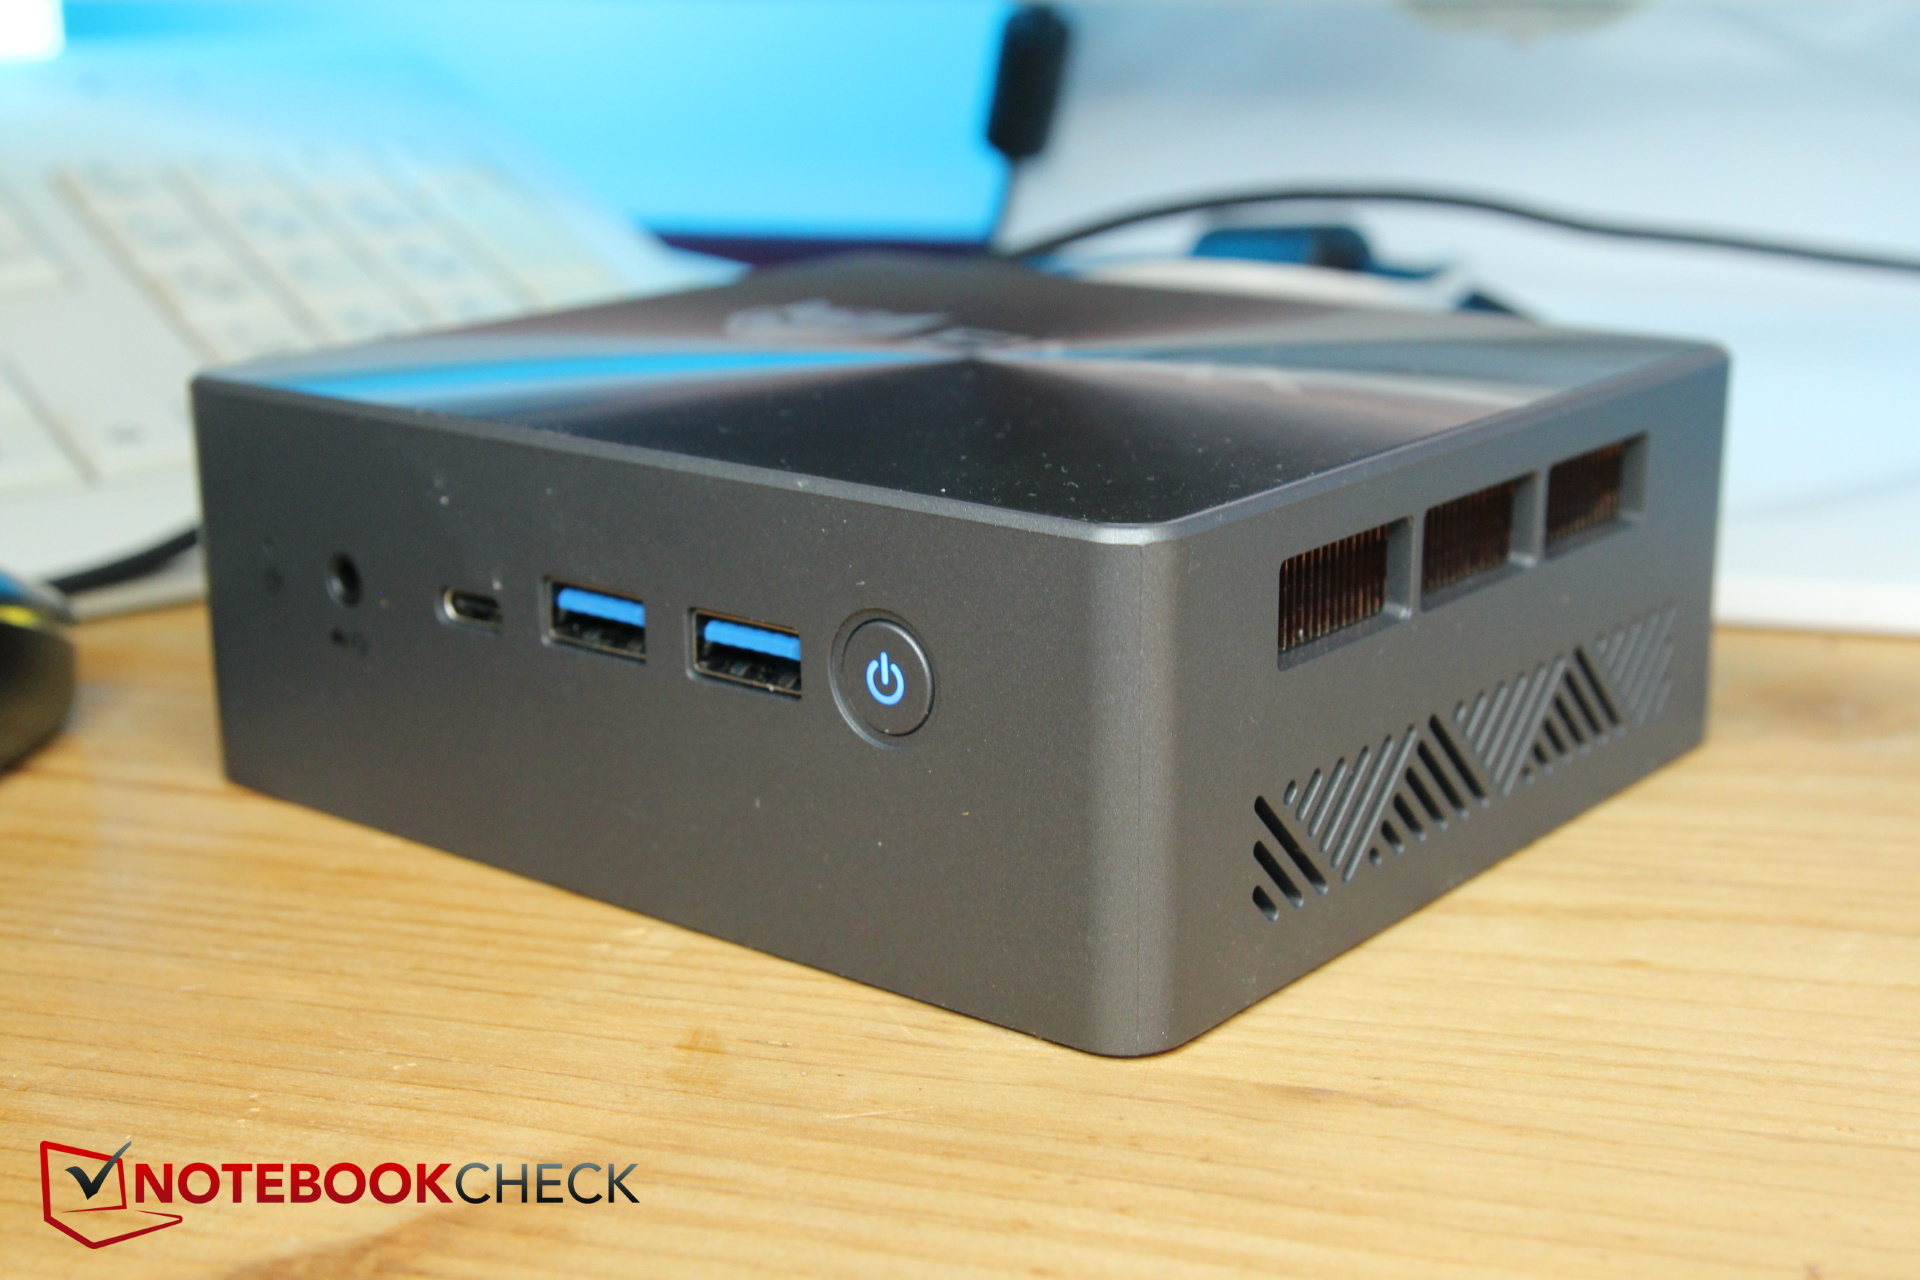
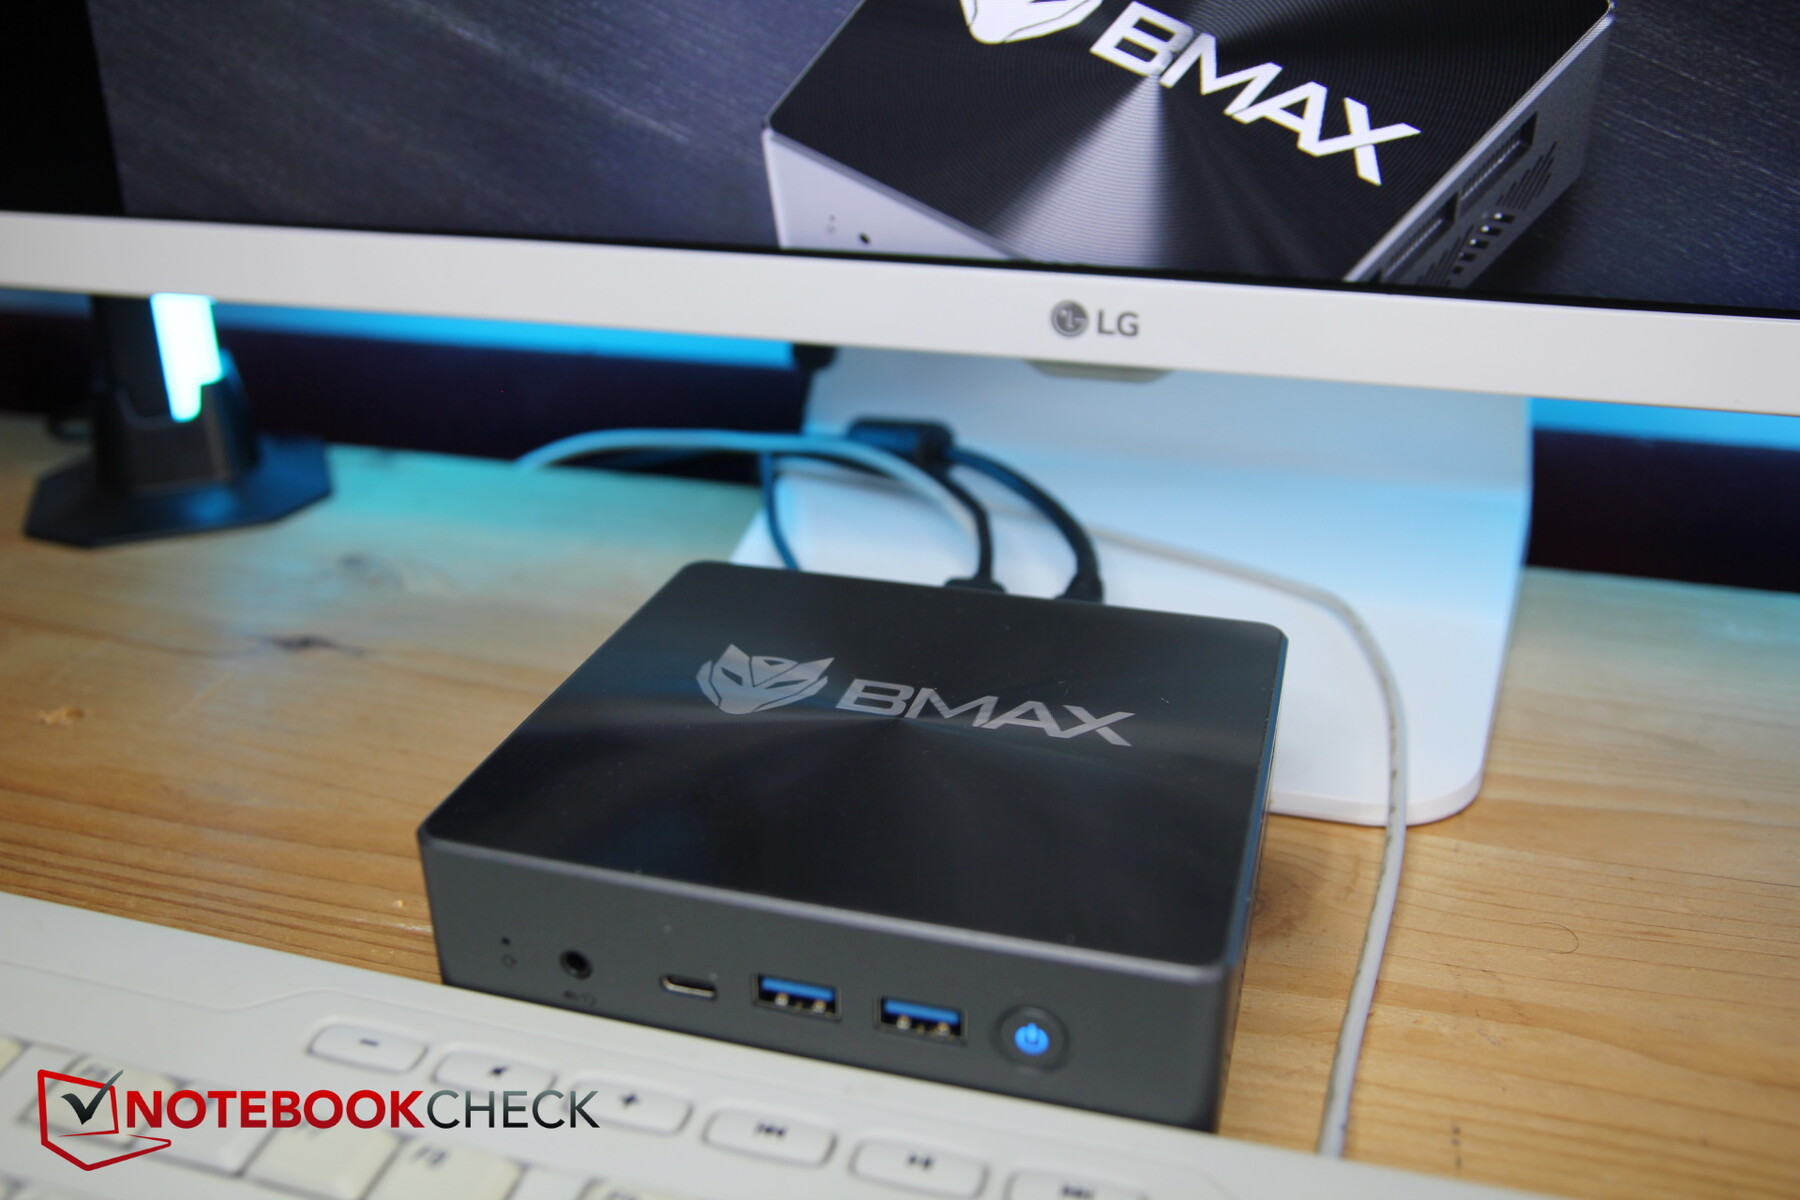
Obudowa - B7 Power jest wykonana z tworzywa sztucznego
Obudowa komputera jest w zasadzie w całości wykonana z ciemnoszarego lub czarnego plastiku. Ze względu na swój kompaktowy, prostokątny kształt, jest ona nadal dość solidna. Nie należy jednak próbować jej zbyt mocno wyginać, gdyż szybko można usłyszeć skrzypienie plastiku. Jednocześnie plastik nadaje urządzeniu przyjemnie niską wagę wynoszącą zaledwie 363 gramy.
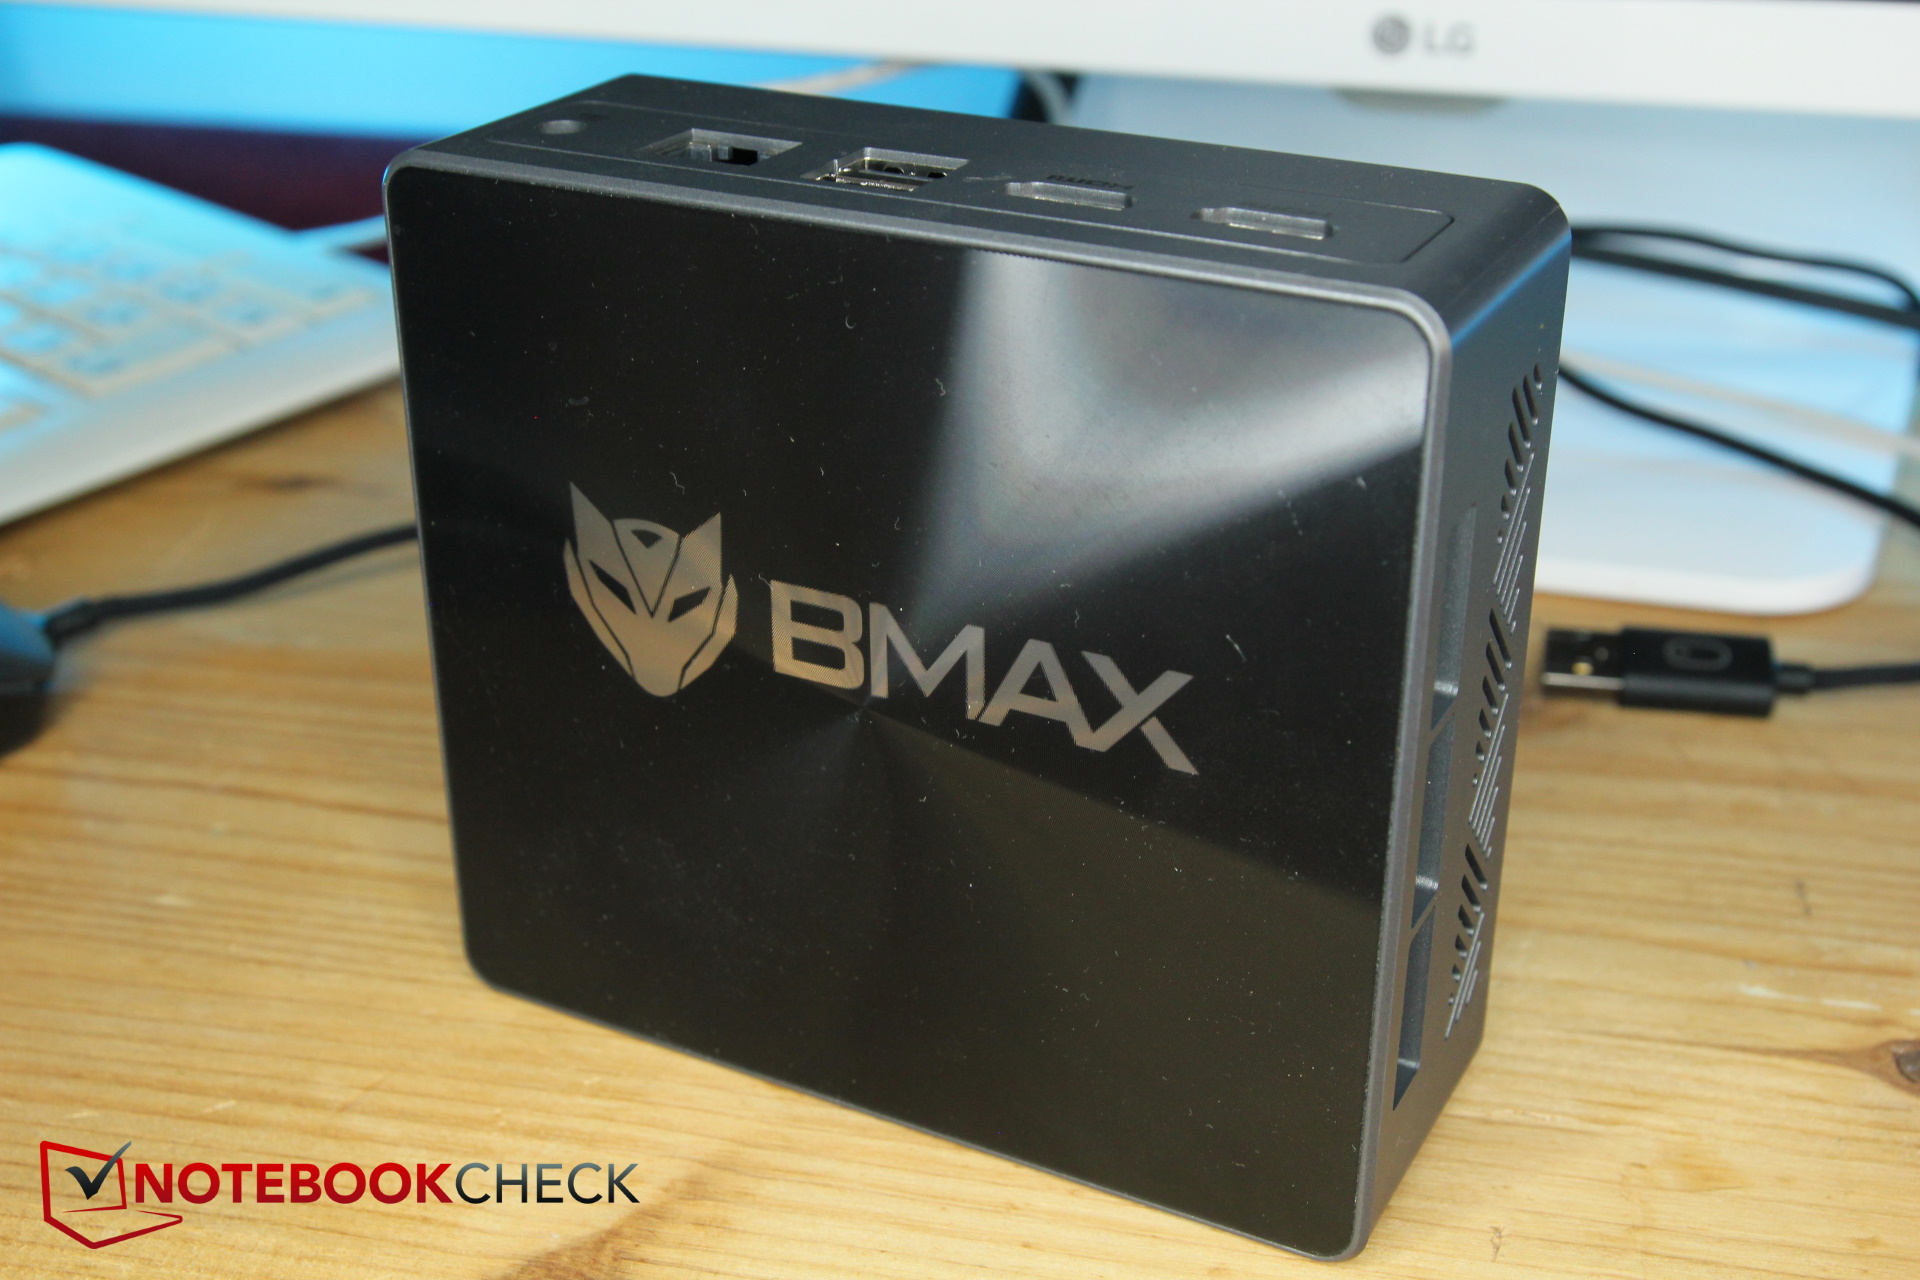
Górna część B7 Power przyciąga wzrok, ponieważ nad logo BMAX znajduje się nadruk o strukturze soczewki Fresnela, który sprawia, że górna strona mieni się inaczej w zależności od kąta patrzenia.

B7 Power jest również najlżejszym z mini PC w tym porównaniu. Przy wadze 363 gramów waży znacznie mniej niż modele Intel NUC (co najmniej 538 gramów). Kolejnym najlżejszym konkurentem jest mini PC od Beelinkale przy wadze 440 gramów jest już sporo cięższy.
Z drugiej strony, niektórzy konkurenci, tacy jak Intel NUC, są nieco mniejsi - ich przód jest o około 8 mm krótszy. Beelink ma podobne wymiary.
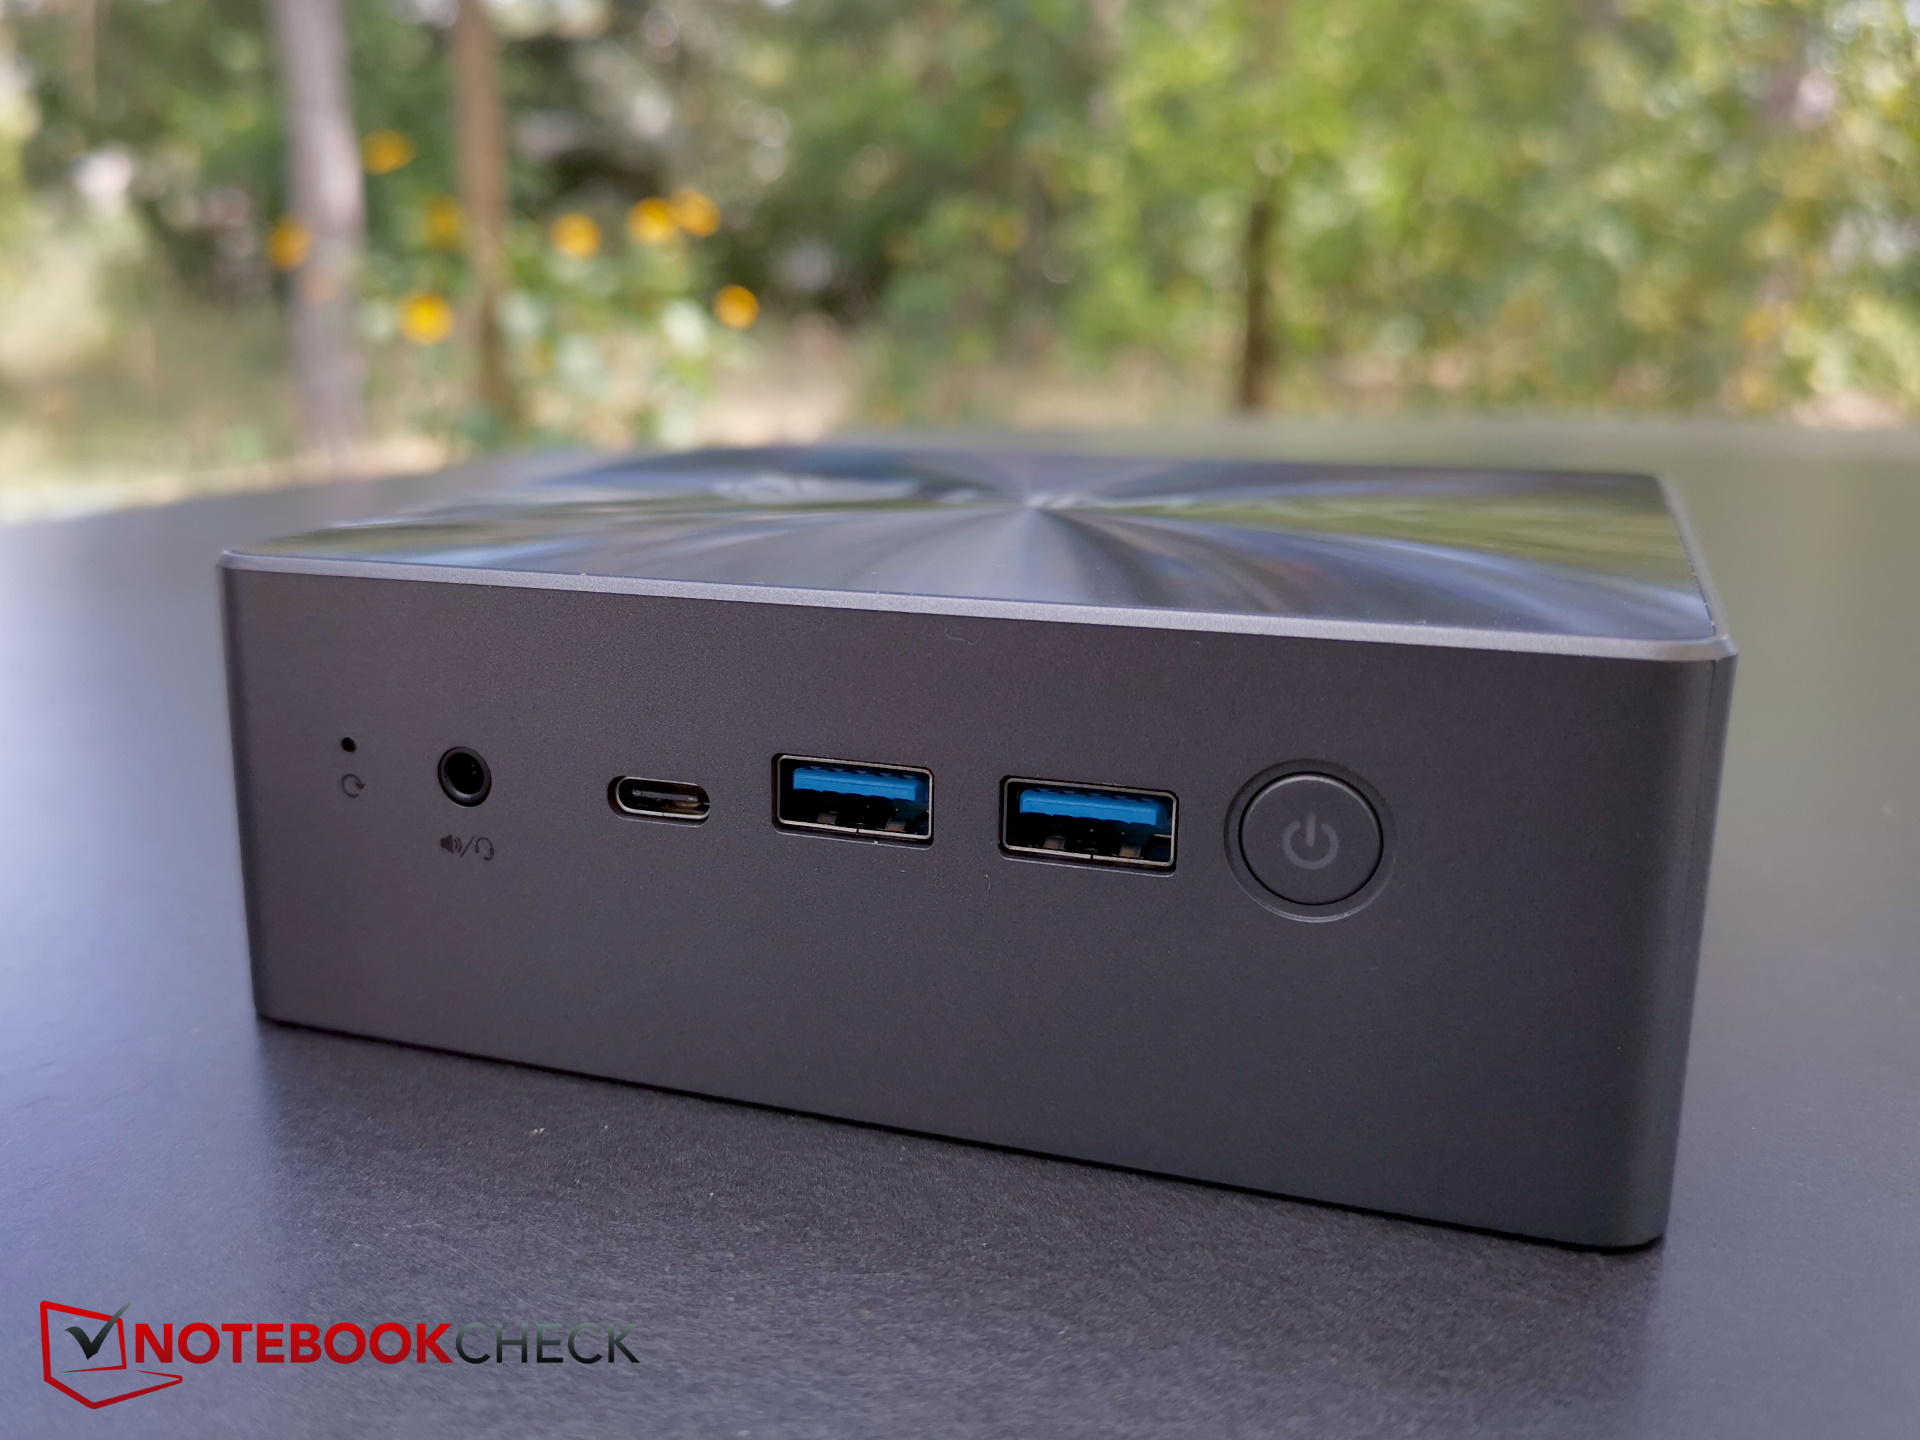
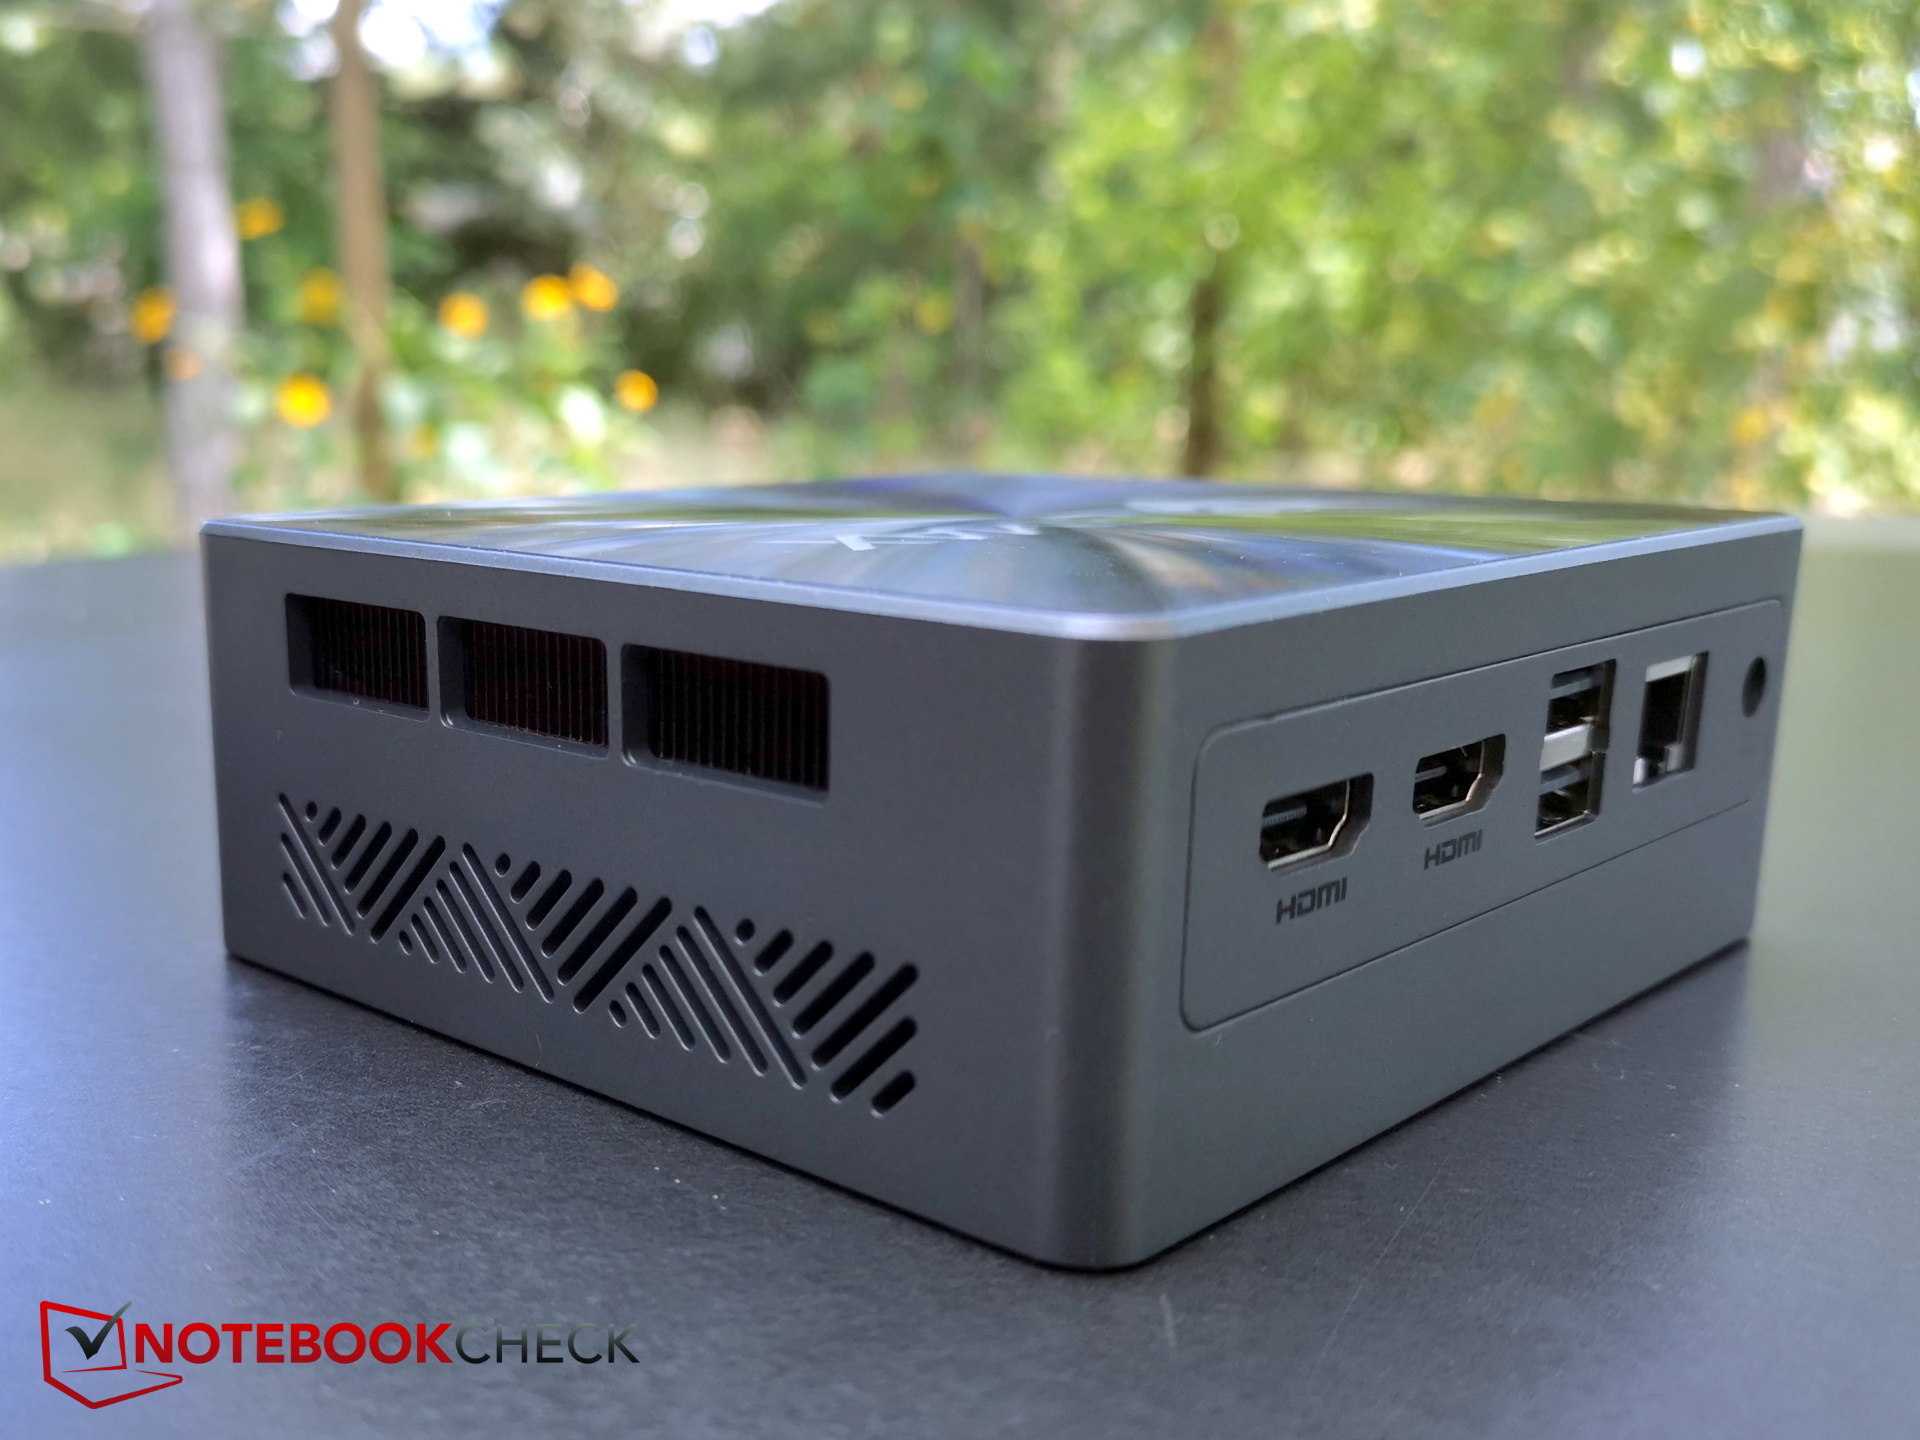
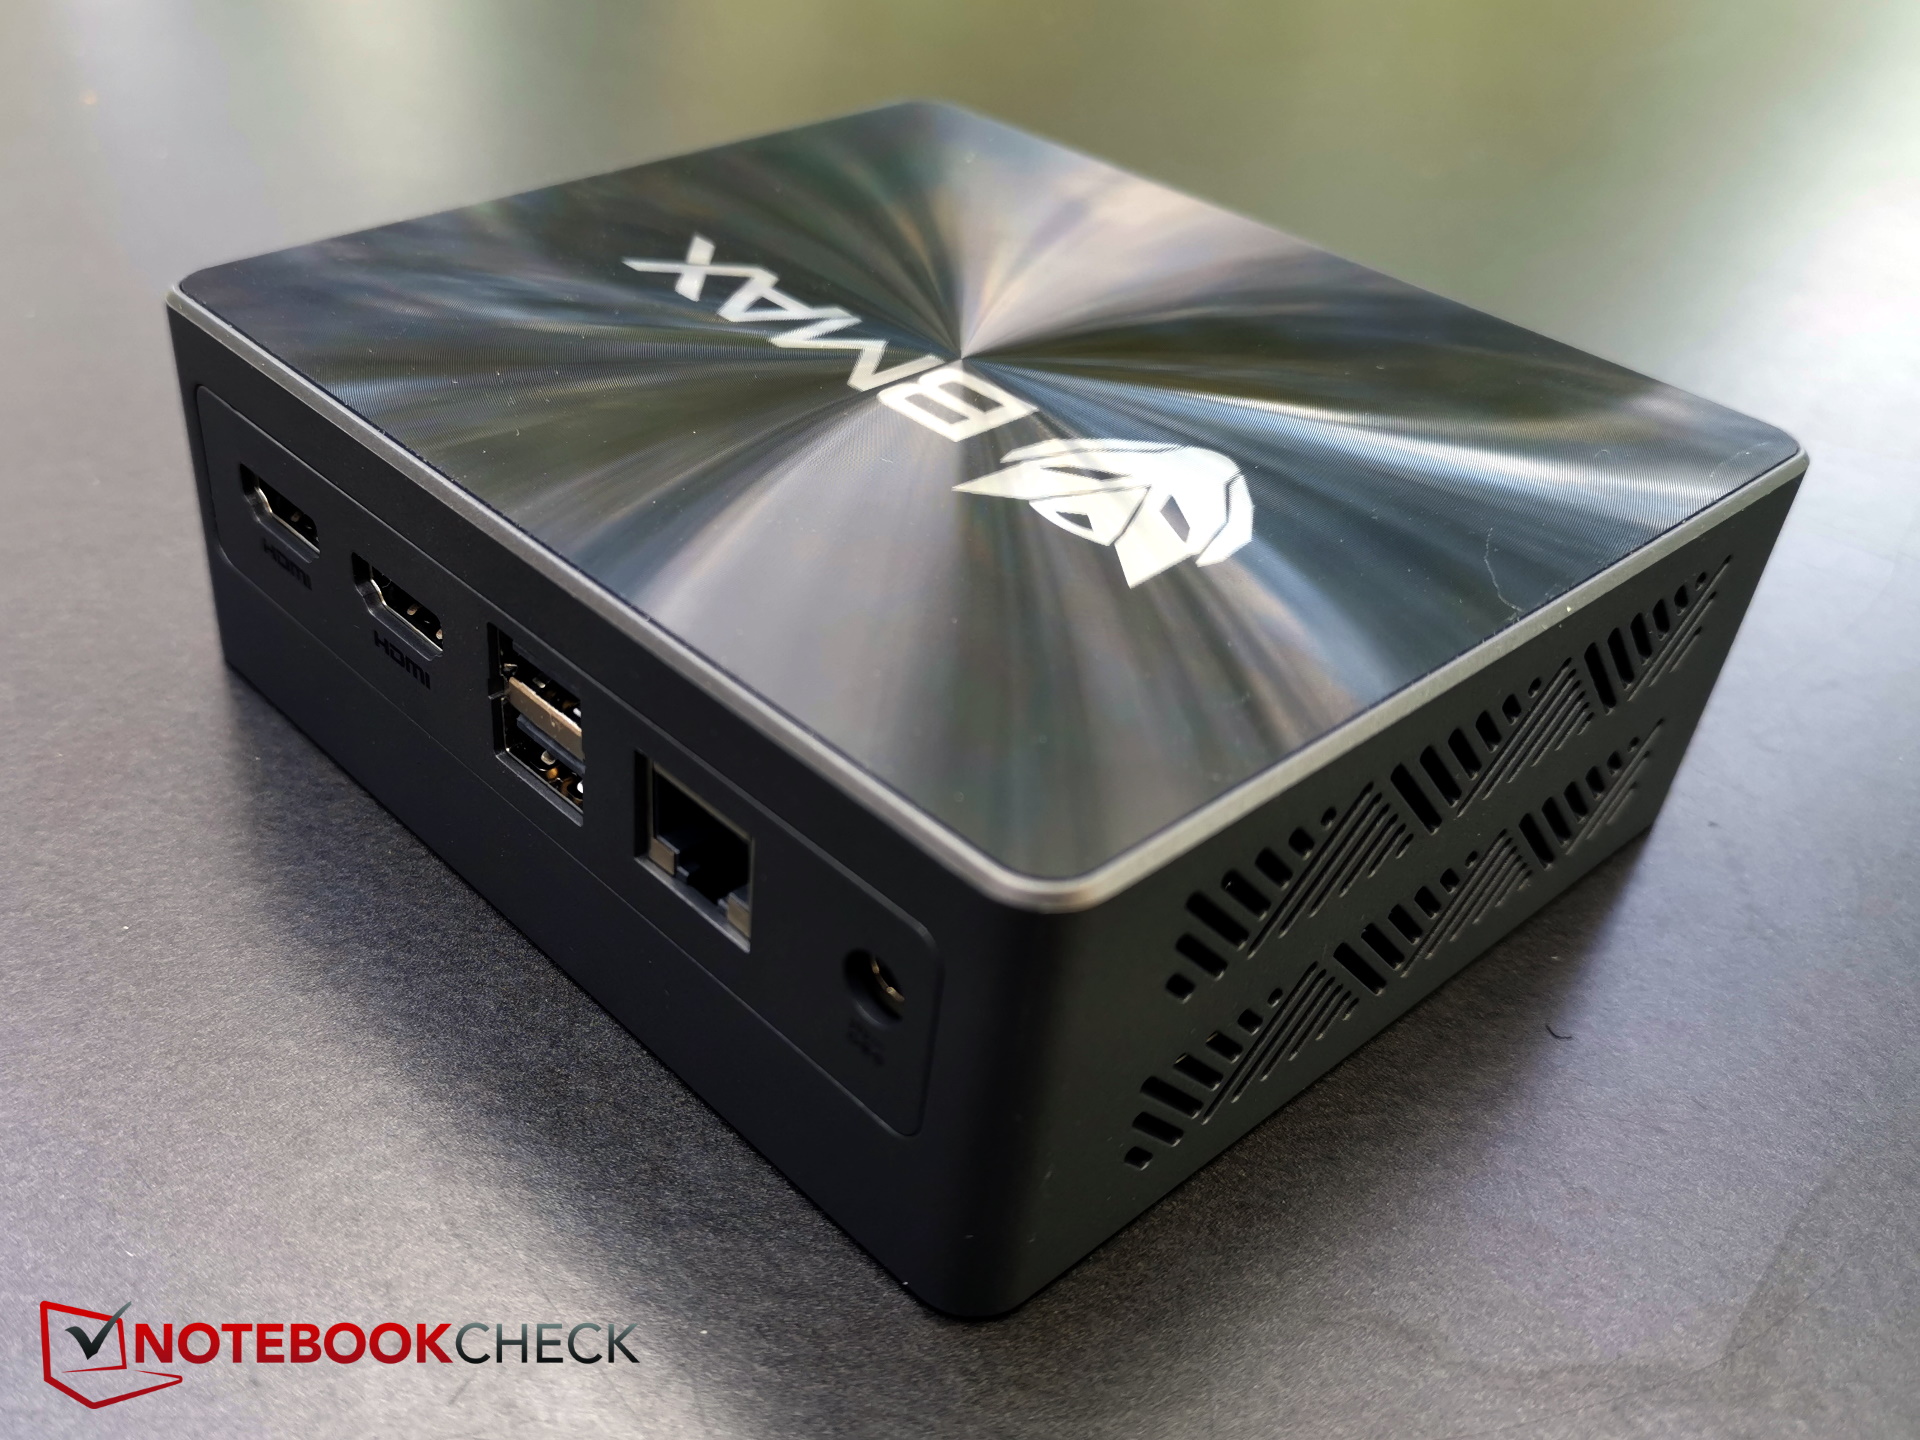
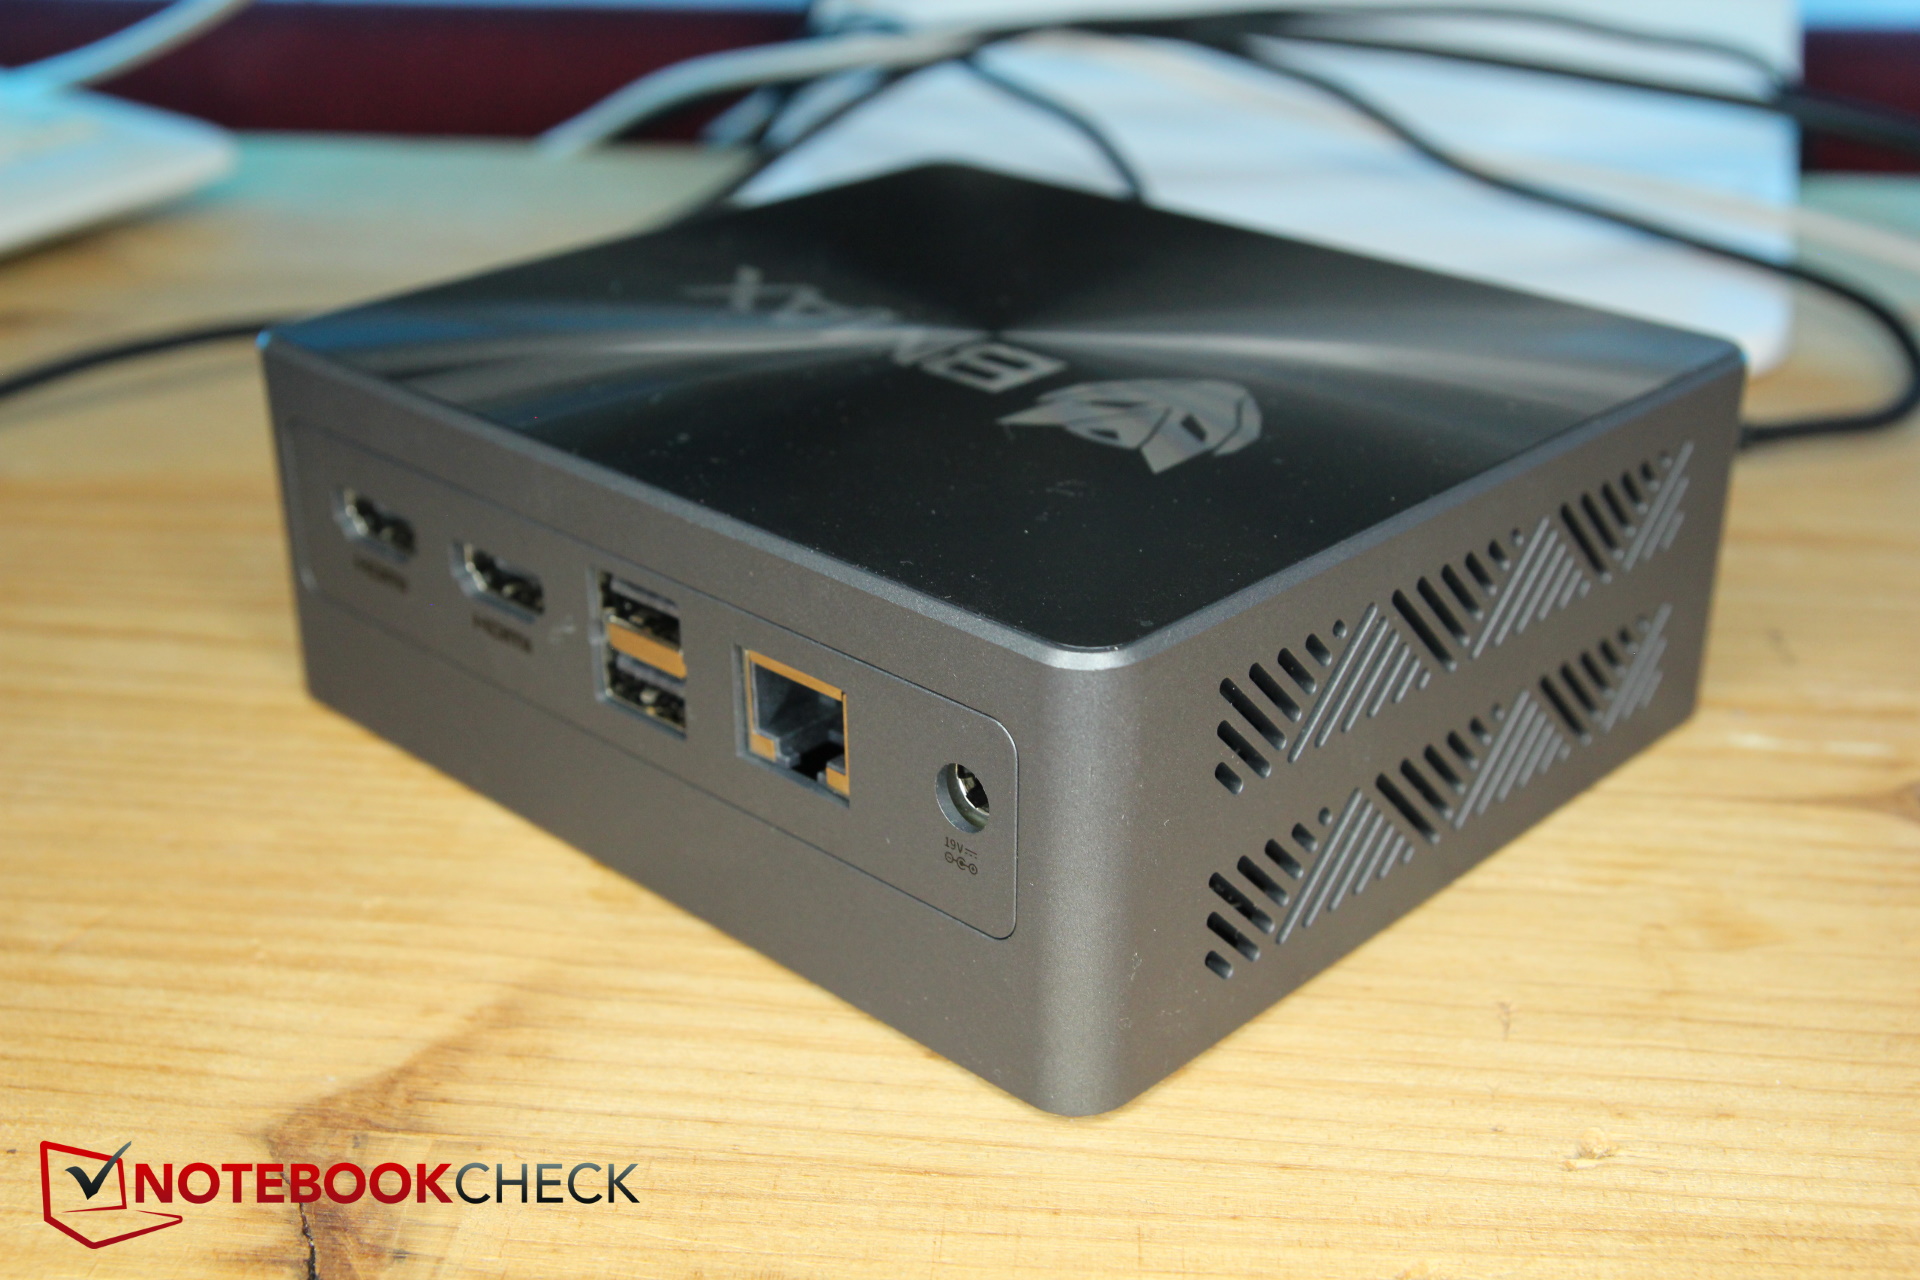
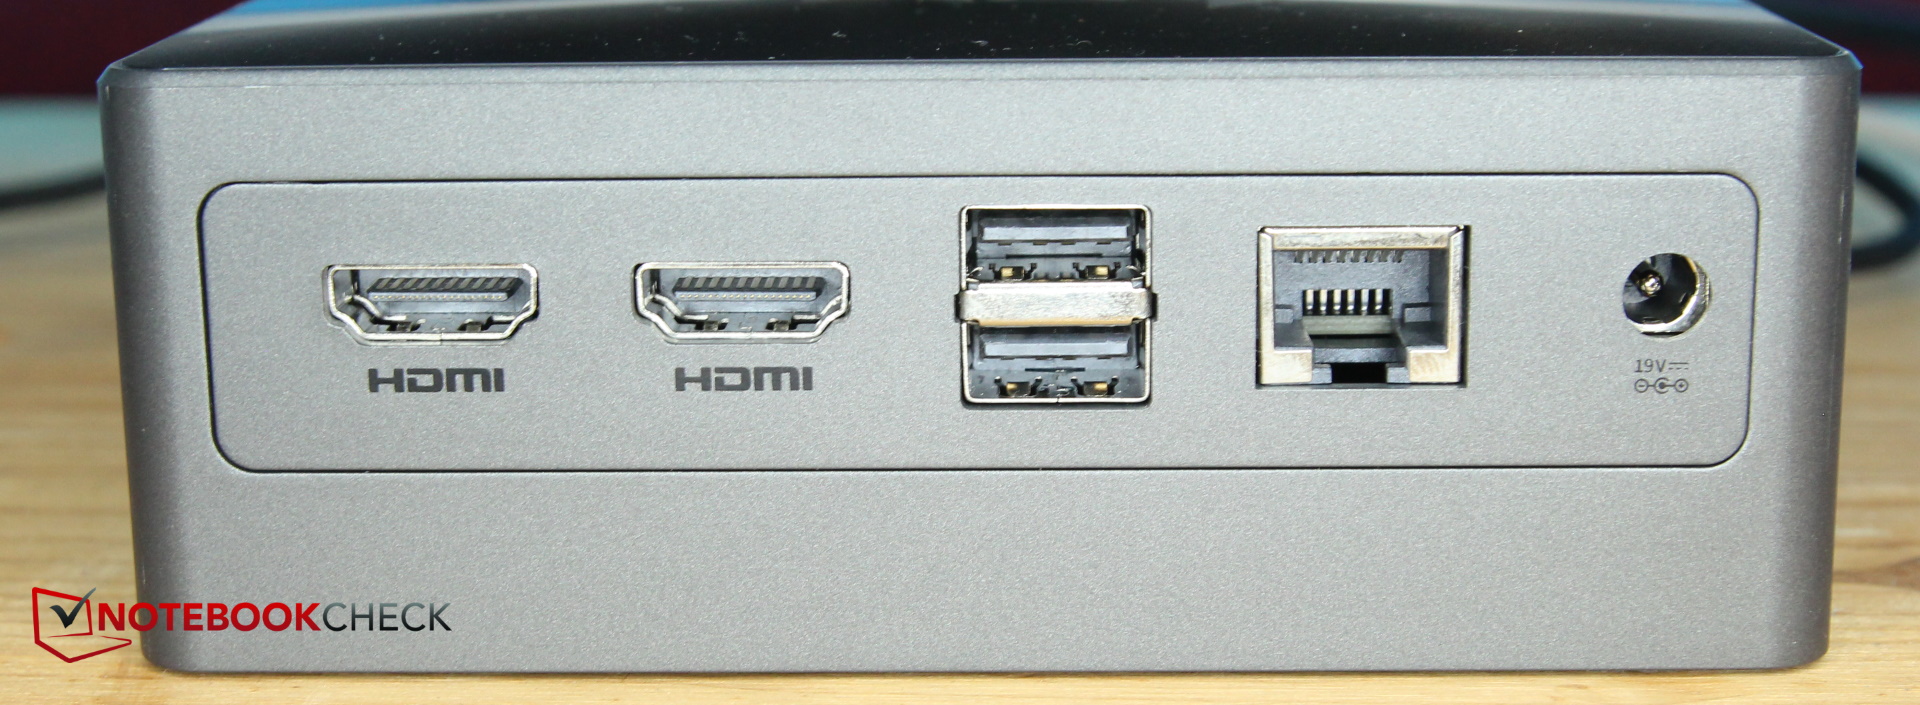
Łączność - USB-C bez Thunderbolt, ale z PD
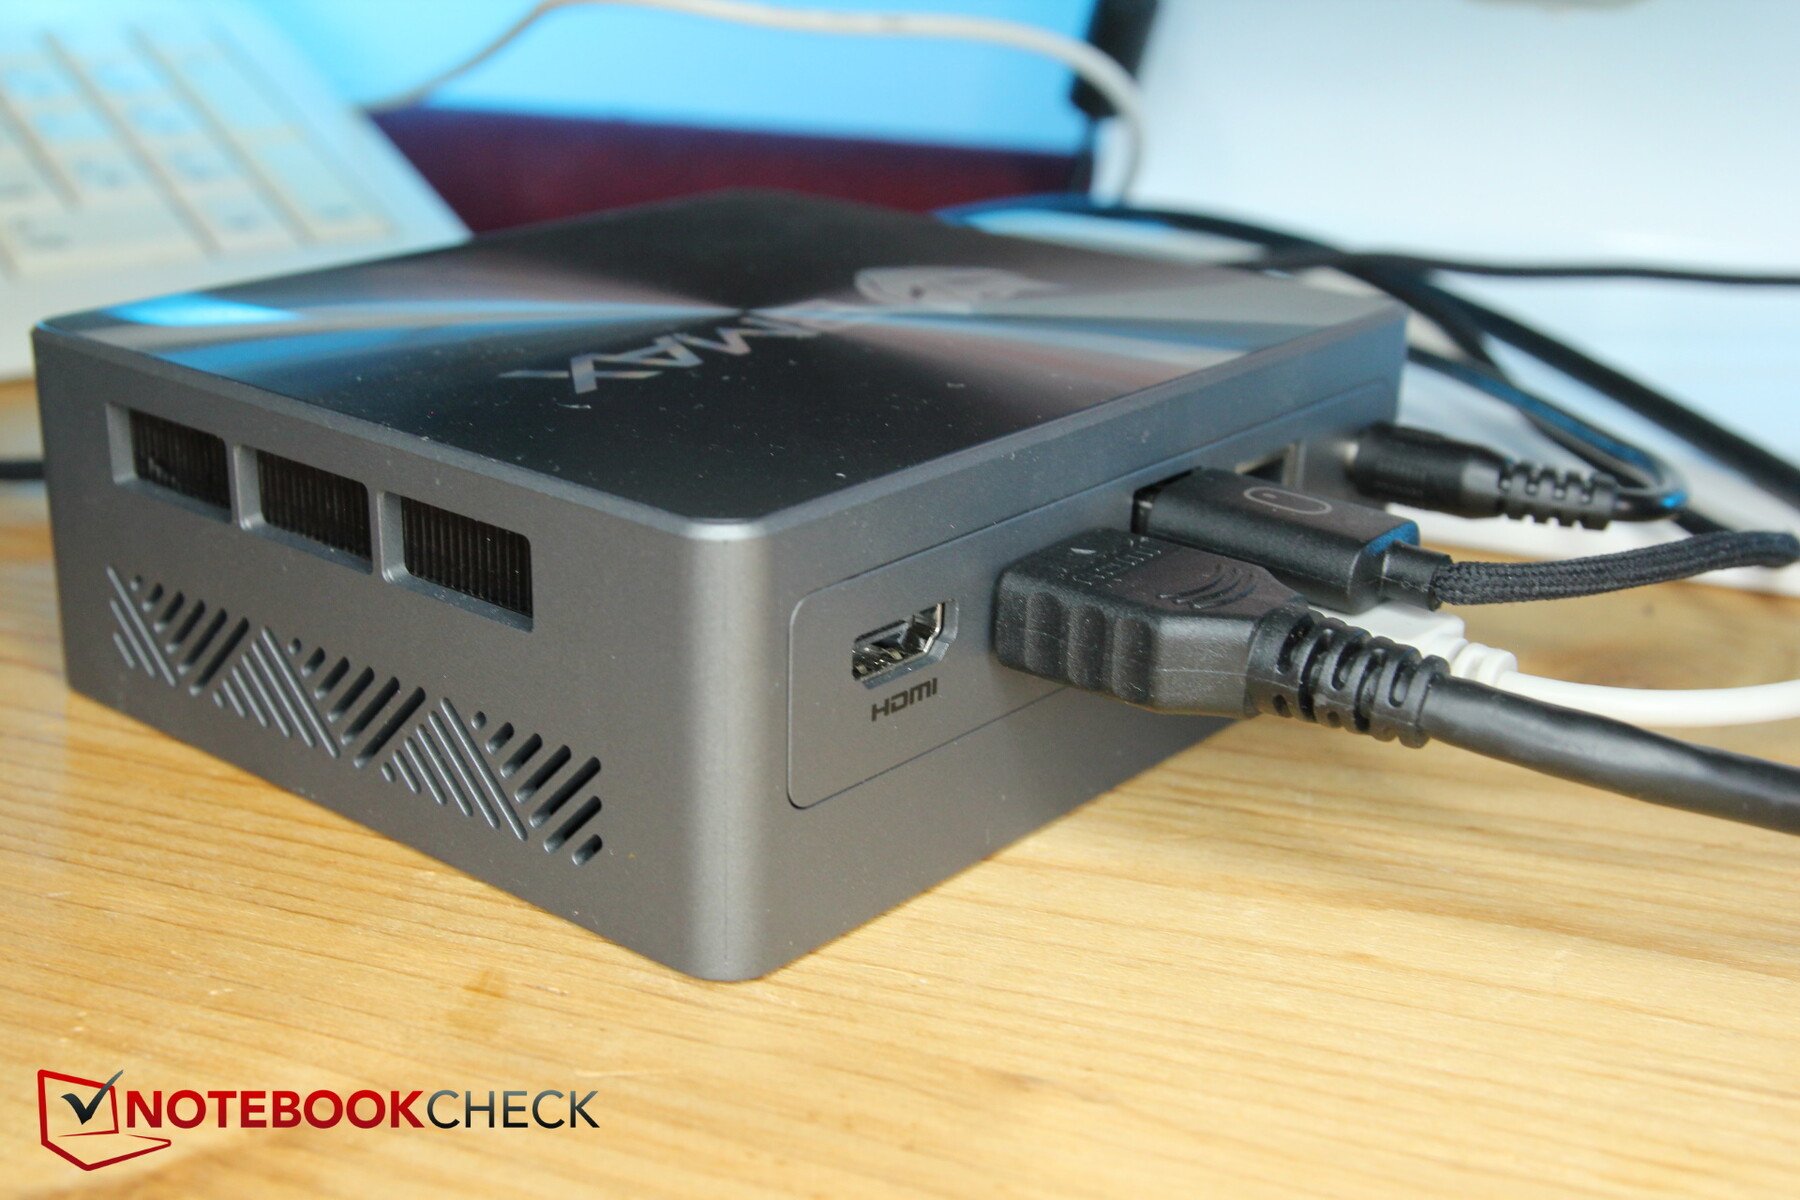
Z tyłu komputera znajdują się wszystkie niezbędne porty do stałych połączeń, w tym dwa porty USB-A do podłączenia myszy i klawiatury, dwa porty HDMI 2.0 do podłączenia maksymalnie dwóch monitorów, a także port LAN i złącze zasilania.
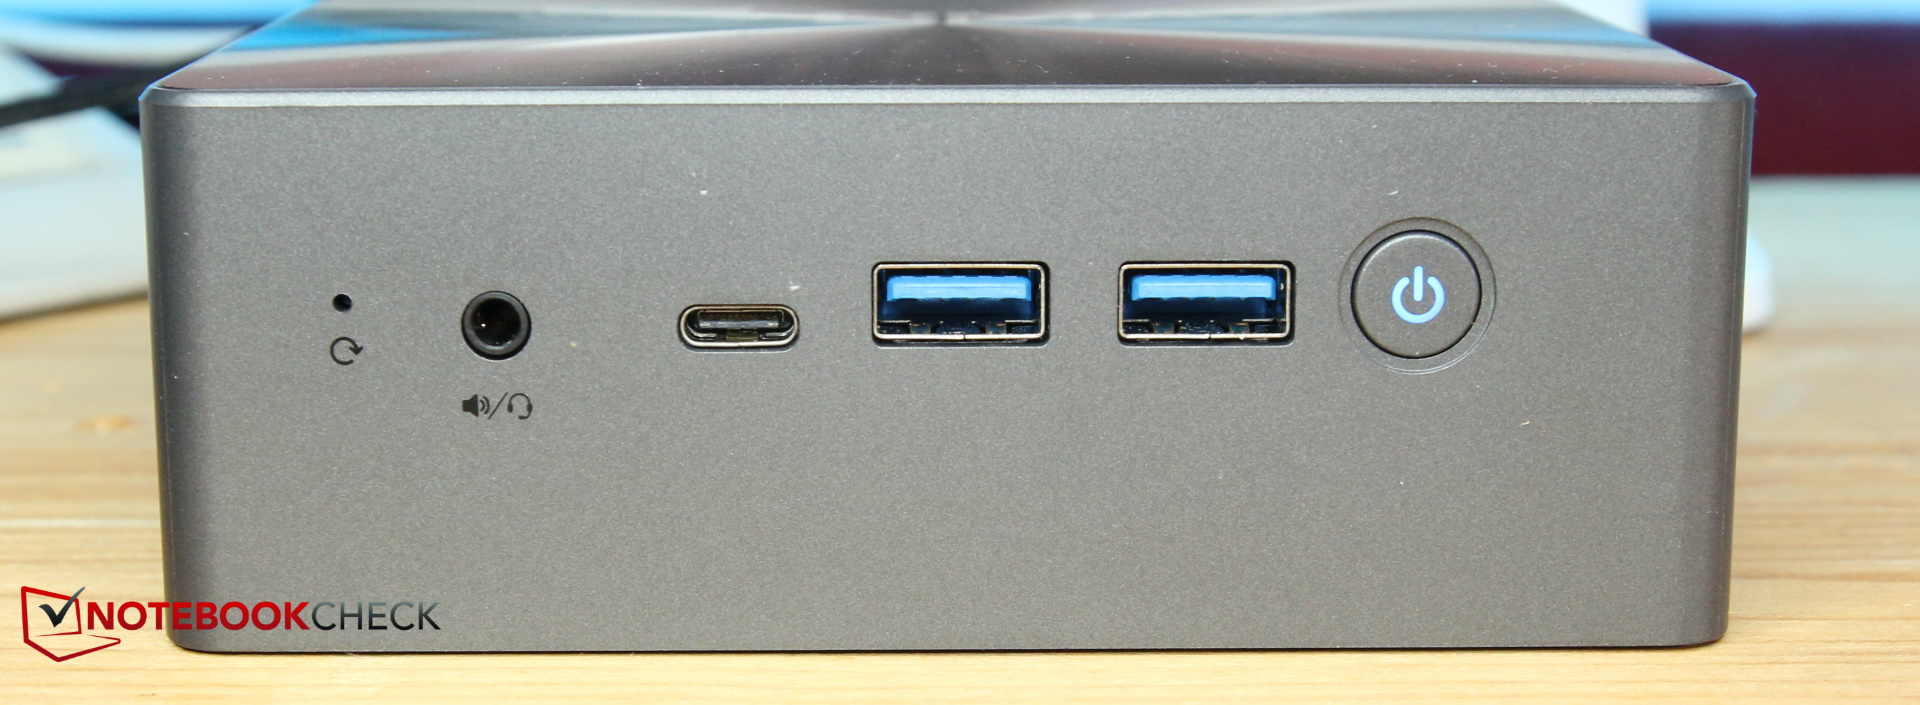
Z przodu znajdują się dodatkowe porty do podłączenia zewnętrznych urządzeń USB lub słuchawek. Tutaj można również znaleźć port USB-C. BMAX określił go jako "w pełni funkcjonalny". Oczywiste jest, że nie obsługuje on Thunderbolt - ale obsługuje DisplayPort, co oznacza, że do B7 Power można podłączyć trzy monitory jednocześnie.
Port ten obsługuje również Power Delivery, co potwierdził nasz test z dwiema ładowarkami USB-C. 30-watowa ładowarka MacBooka Air nie działała, ale 45-watowa już tak. Oficjalnie B7 wymaga 19 V i 2,5 A (47,5 W).
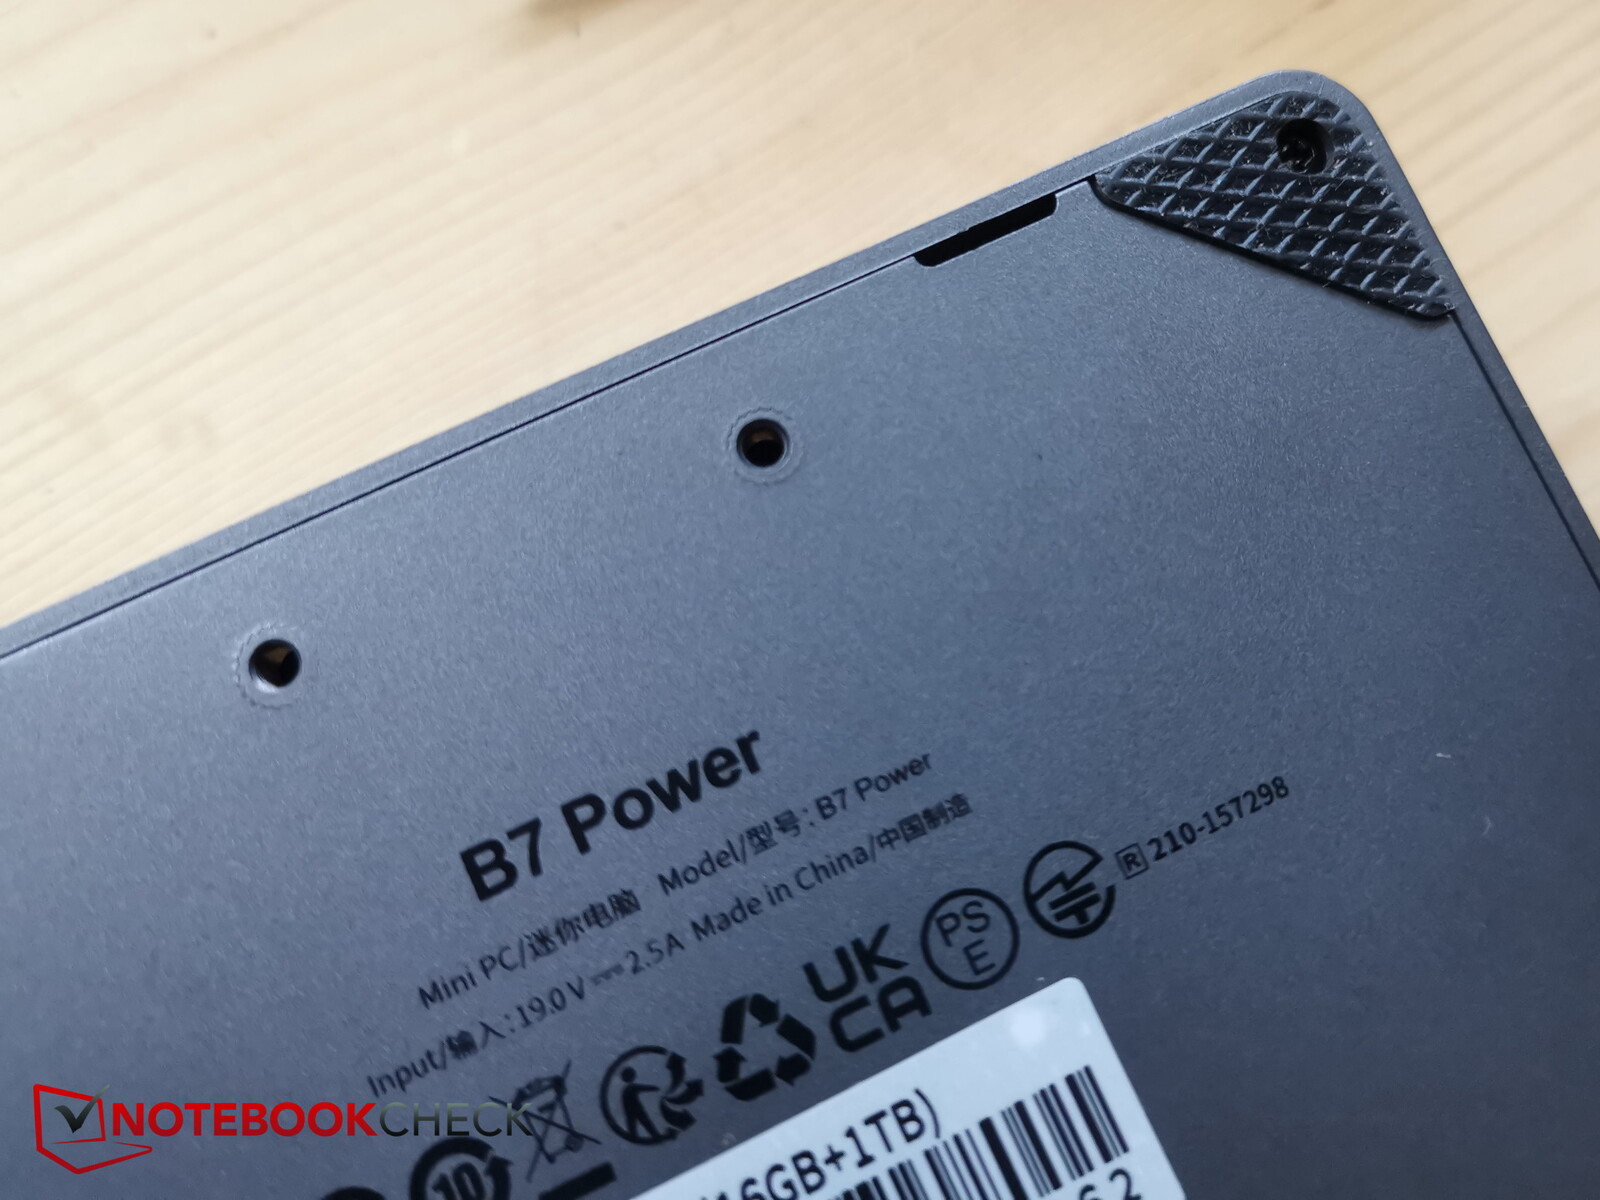
B7 nie posiada czytnika kart SD. Na spodzie urządzenia znajdują się otwory na śruby, które można wykorzystać do podłączenia mini PC z tyłu monitora za pomocą dołączonego uchwytu VESA.
Komunikacja
Oprócz gigabitowego połączenia LAN, B7 Power może również łączyć się przez WiFi. W tym celu producent zainstalował układ firmy Realtek, który rzekomo obsługuje również WiFi 6. Oznacza to, że można połączyć się z siecią 5 GHz - ale nie 6 GHz.
Mini PC jest dość szybki, jeśli chodzi o 5 GHz. Jednak korzystanie ze "zwykłego" 2,4 GHz daje nam zupełnie inne wrażenie. Tutaj prędkości transferu komputera w naszym otoczeniu testowym (wynajmowana nieruchomość, wiele nakładających się sieci w pobliżu) były obrzydliwe - zmierzyliśmy tylko od 100 do 150 MB / s.
Bezpieczeństwo
TPM jest oczywiście również obsługiwany dzięki układowi Intela, ale poza tym B7 Power nie oferuje nawet blokady Kensington. Jest jednak prawdopodobne, że niewiele osób będzie tęsknić za tym w mini PC.
Zakres dostawy i gwarancja
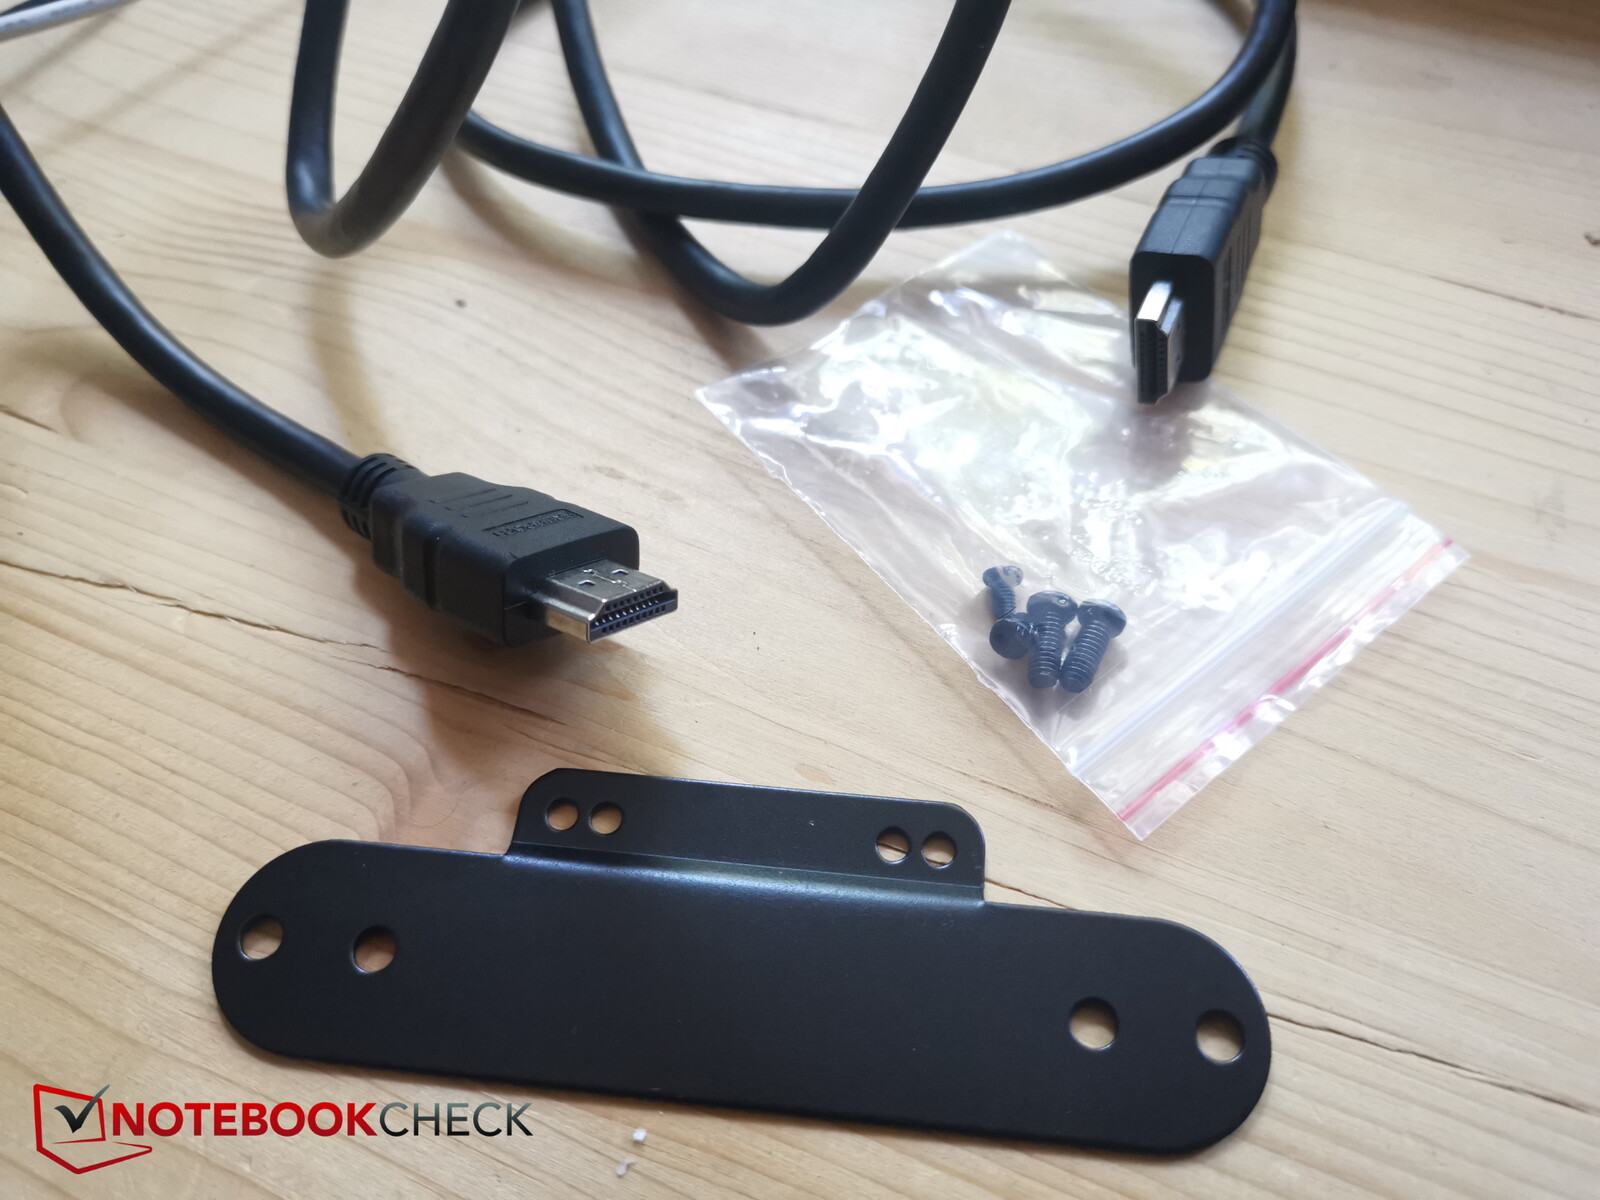
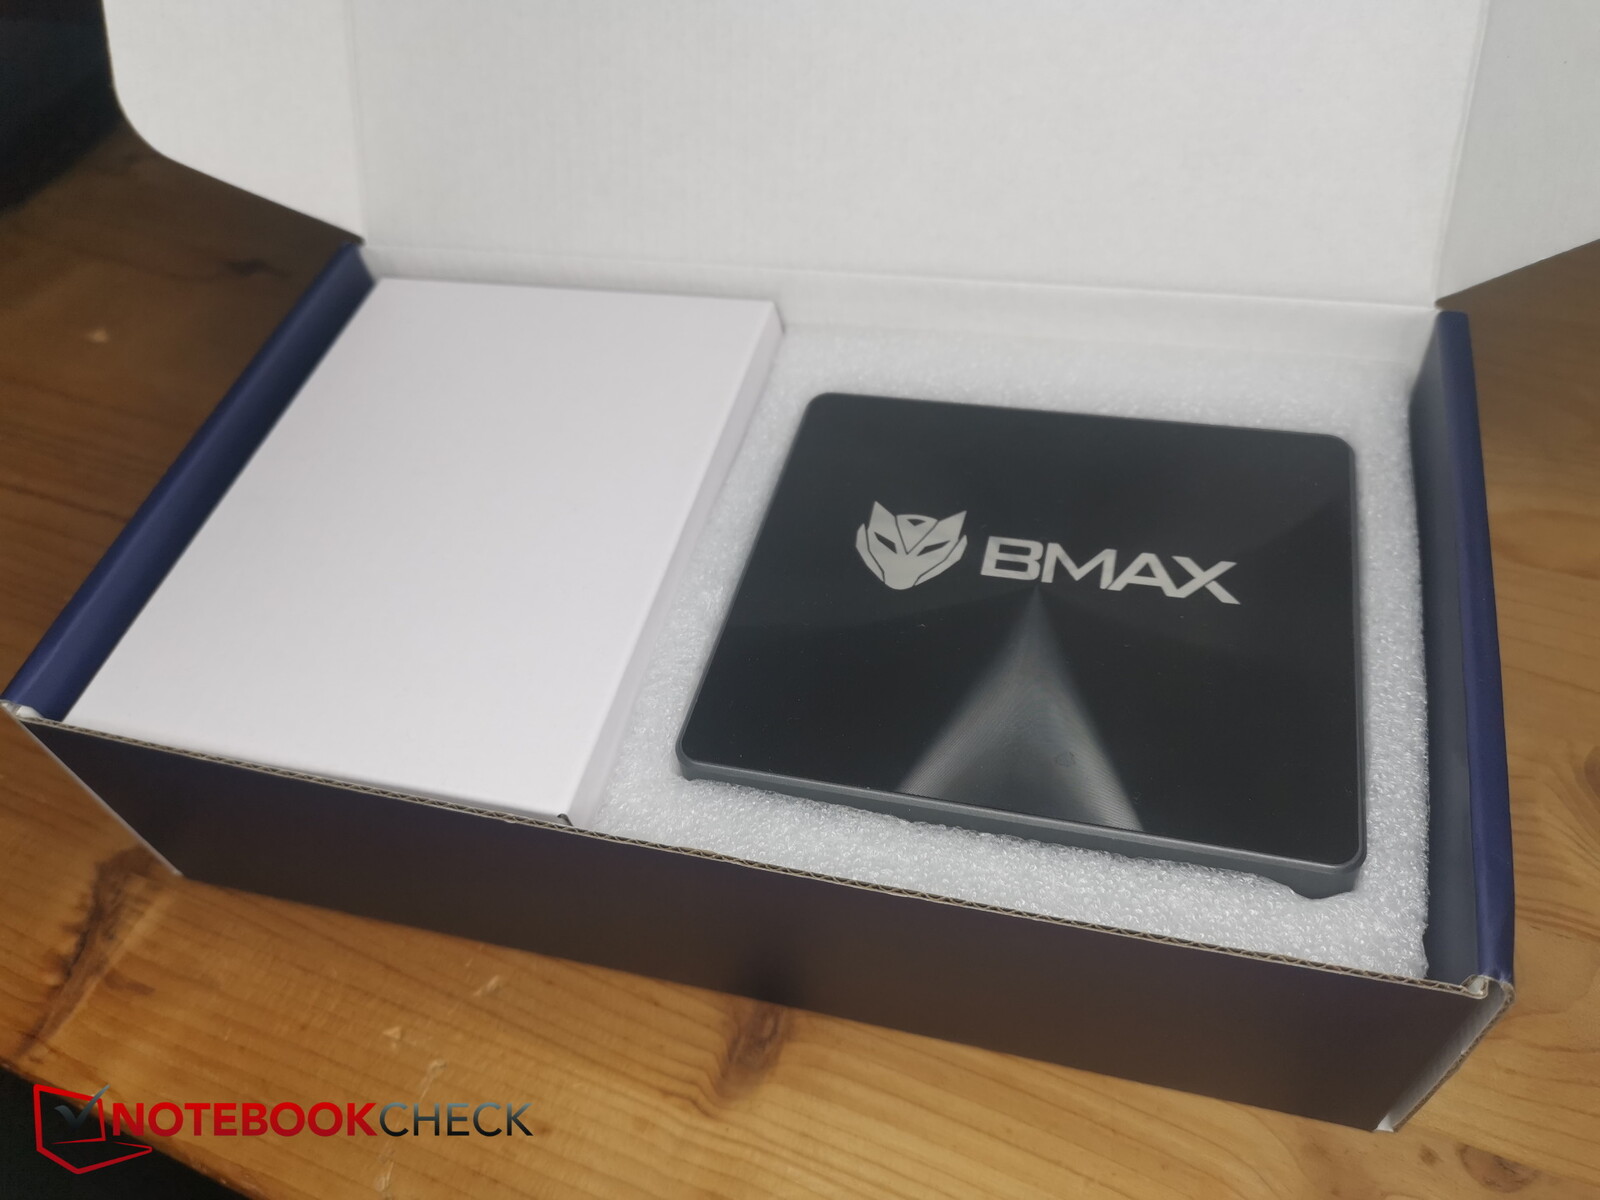
Oprócz samego mini PC, producent dołączył również własny zasilacz, kabel HDMI i uchwyt VESA wraz z wymaganymi śrubami.
Producent nie skomentował obecnie, czy komputer jest objęty gwarancją. Odpowiednie lokalne przepisy gwarancyjne powinny obejmować tę kwestię.
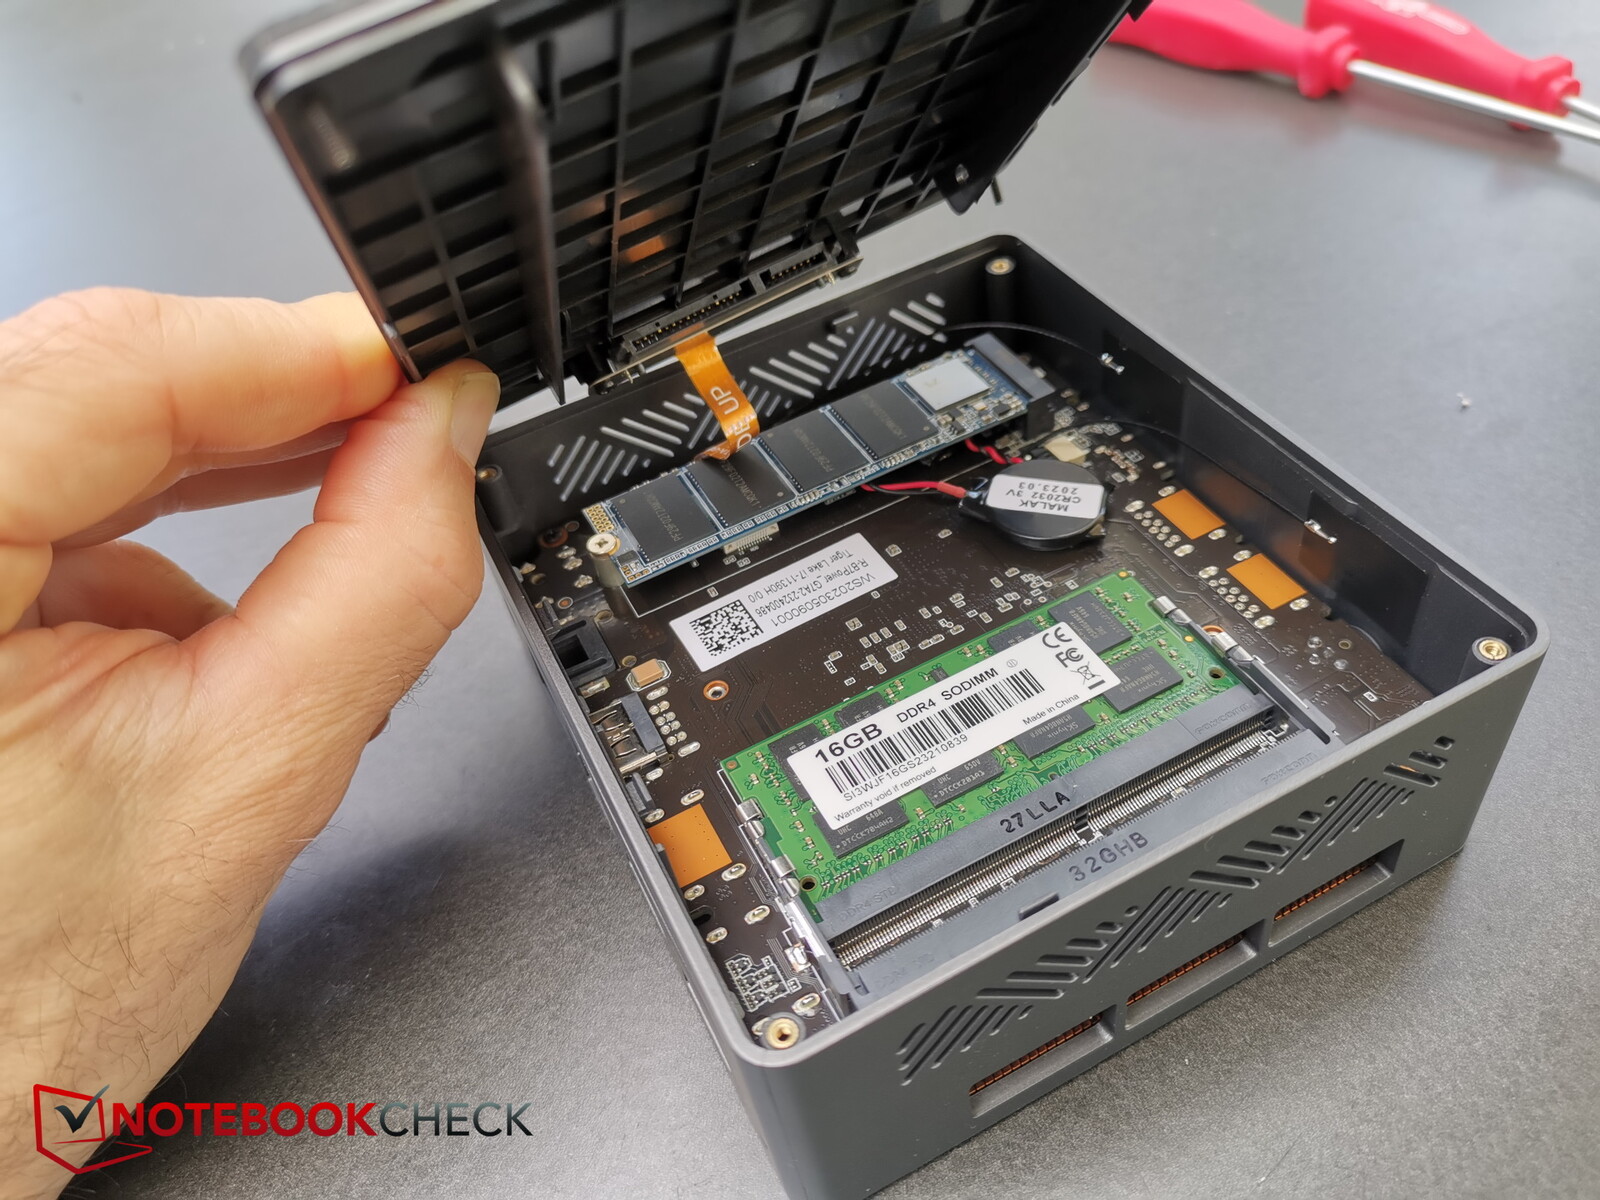
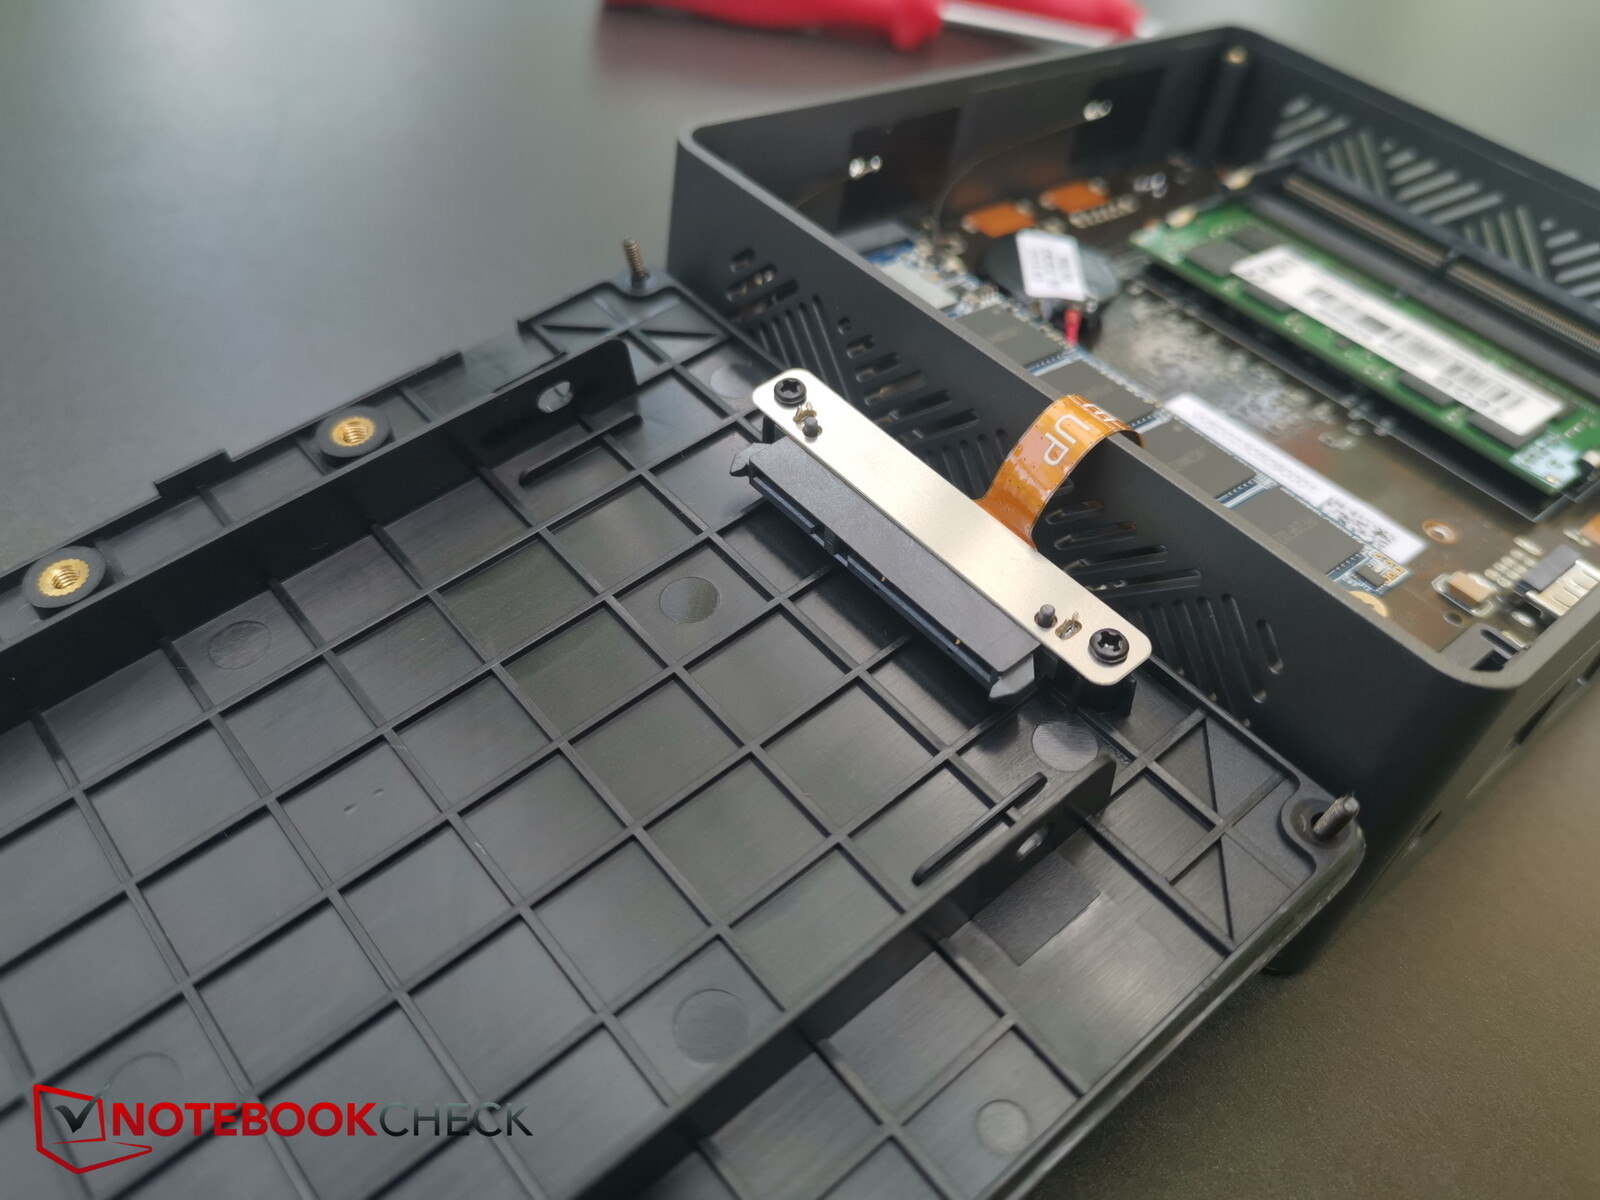
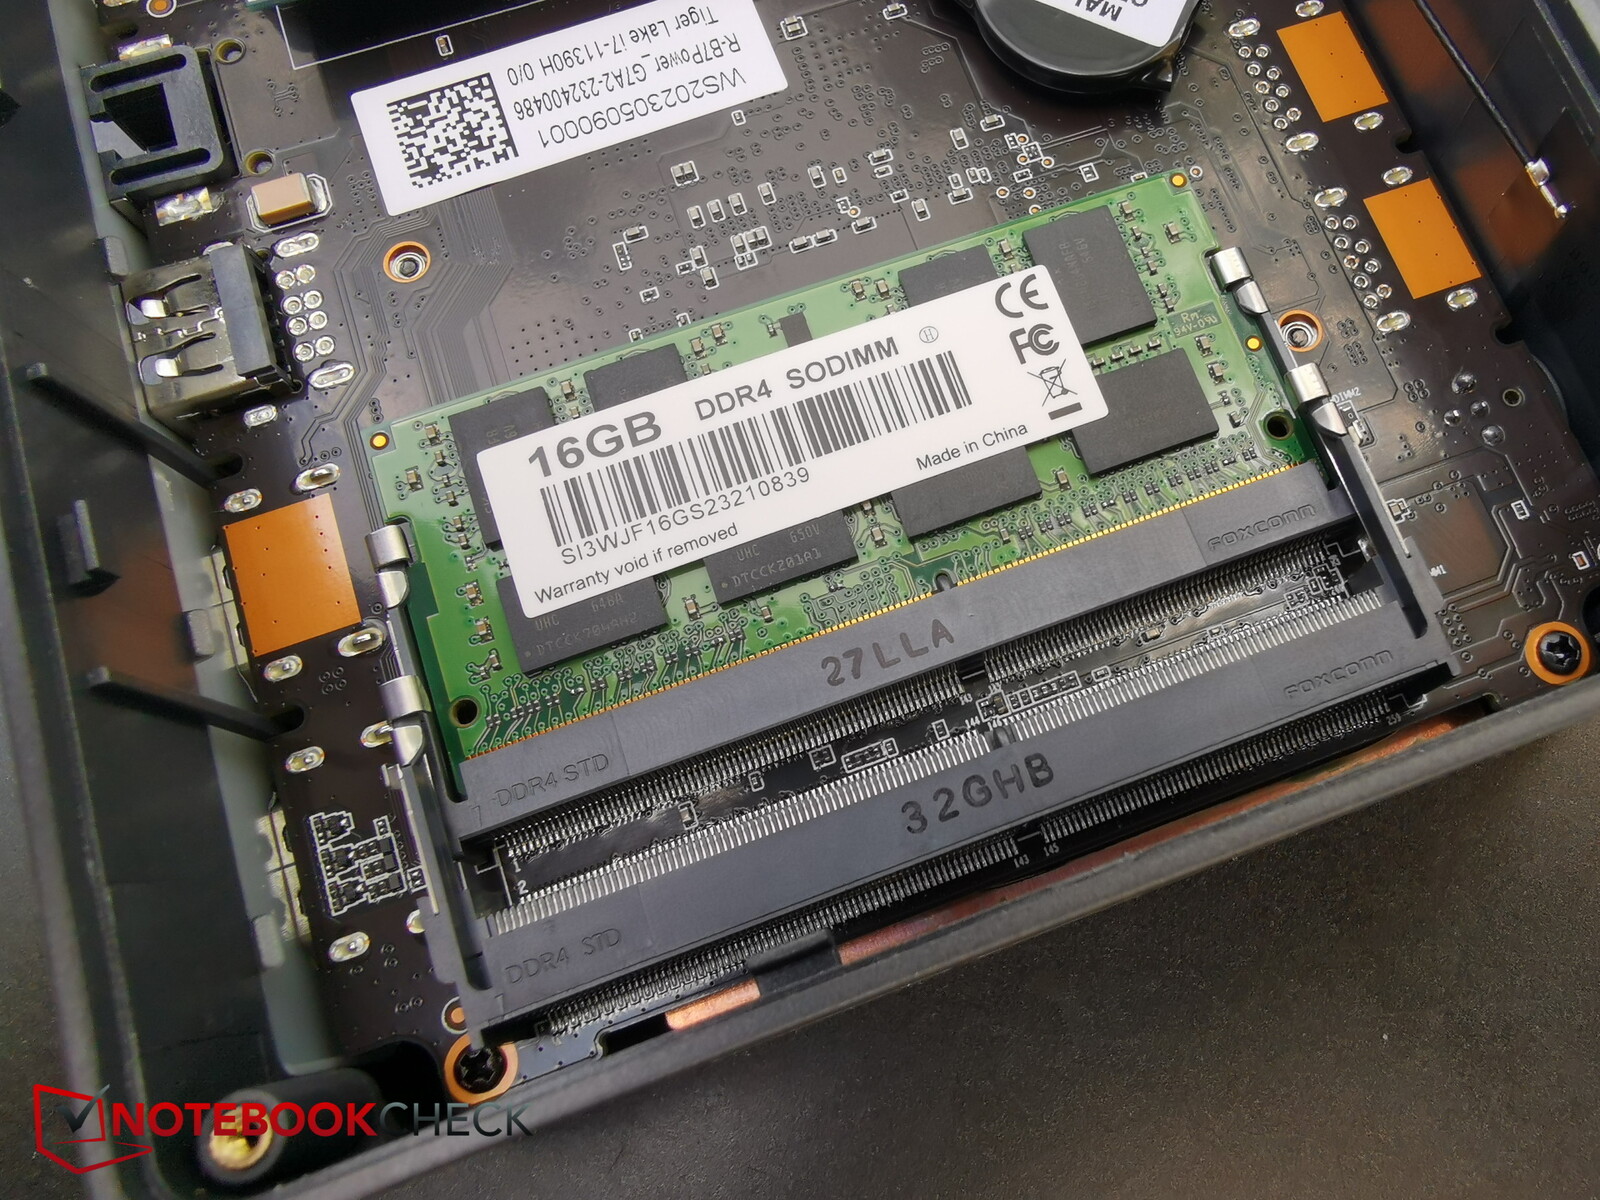
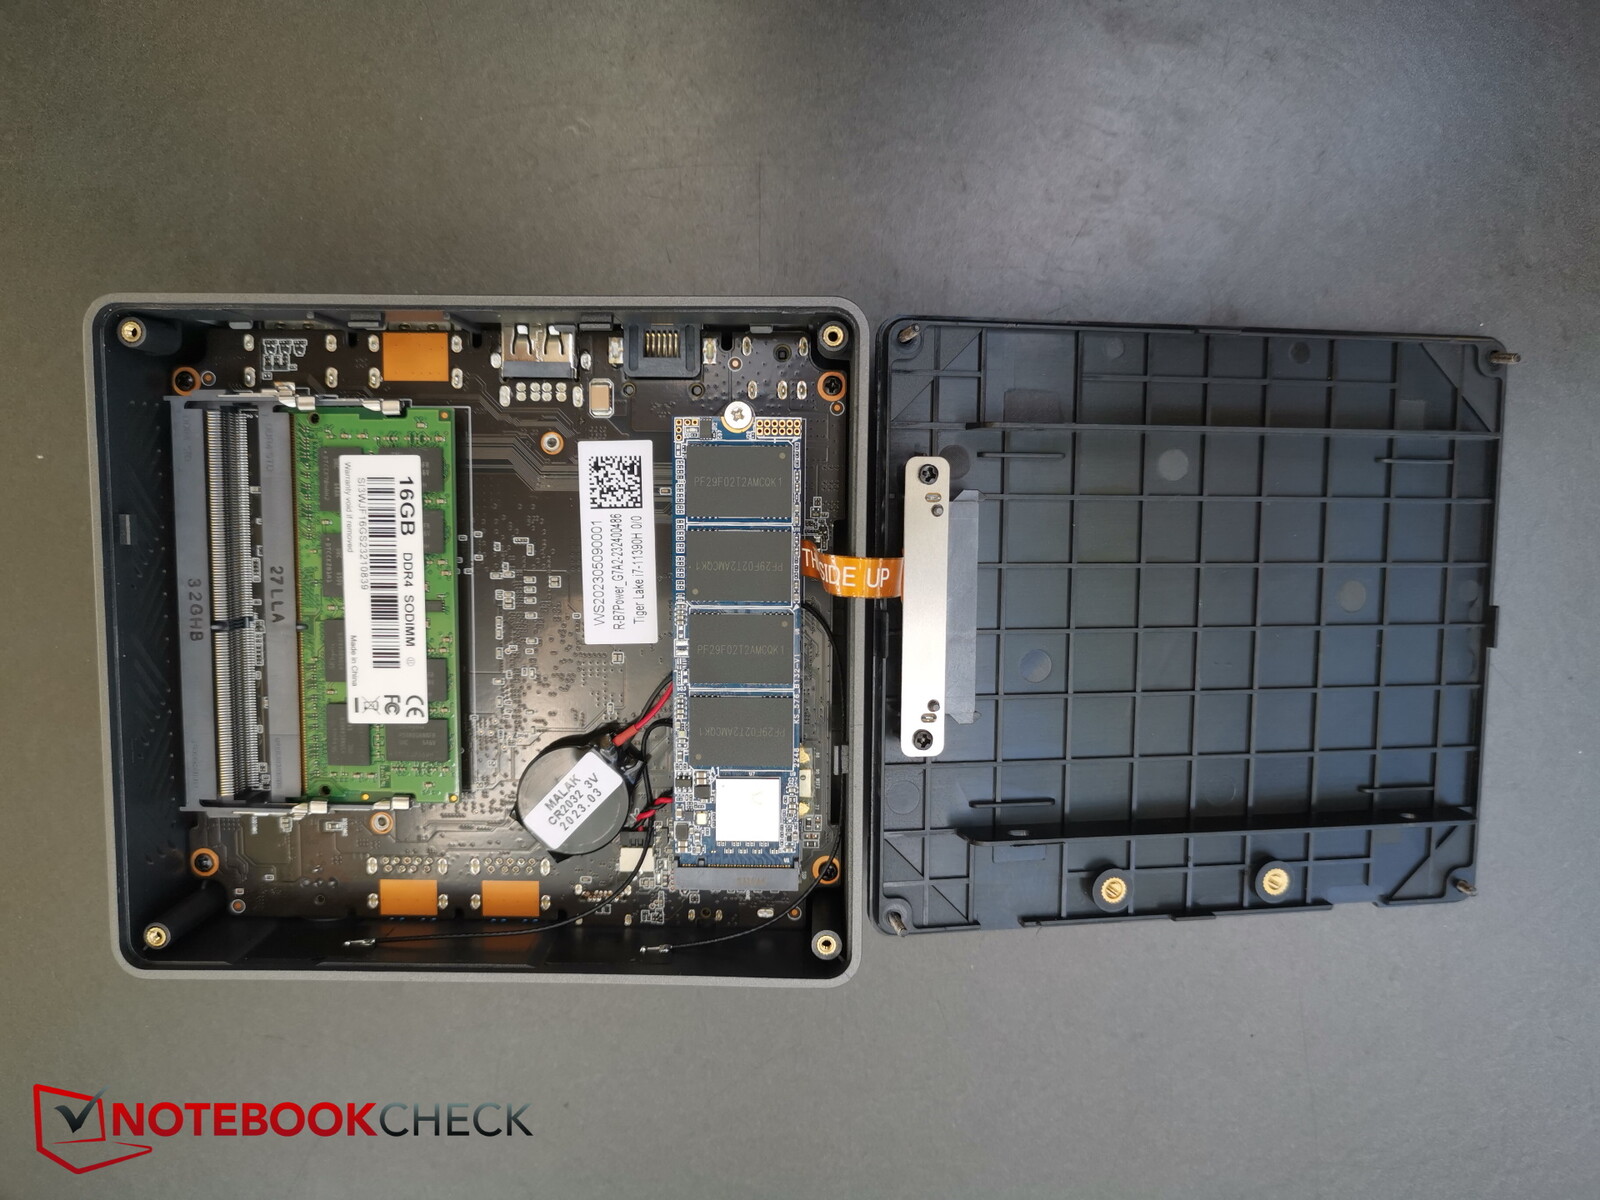
Konserwacja
Konserwacja urządzenia jest łatwa i przyjemna. Tylko 4 śruby krzyżowe utrzymują dolną płytę w miejscu. Po ich usunięciu można ostrożnie odwrócić spód na bok (w lewo, patrząc z przodu i z góry). Istnieje kabel łączący obie części, który łączy port SATA na wewnętrznej dolnej płycie z płytą główną.
Następnie można uzyskać dostęp do obu gniazd pamięci RAM, dysku SSD NVMe, a także wspomnianego wcześniej portu SATA dla 2,5-calowych dysków twardych lub SSD. Aby uzyskać dostęp do wentylatorów, należy dodatkowo rozebrać urządzenie.
Wydajność - niska nawet jak na Gen11
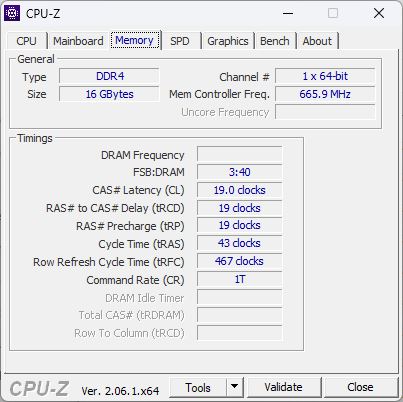
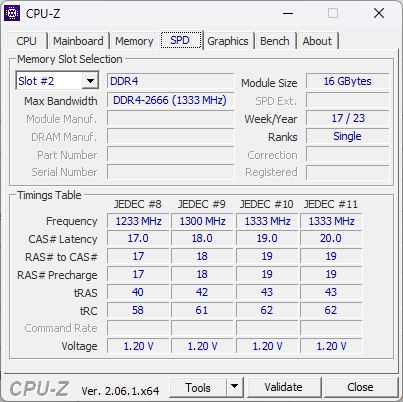
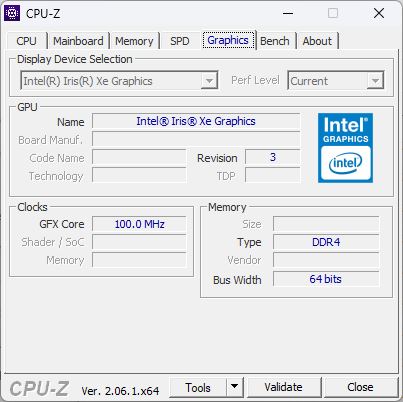
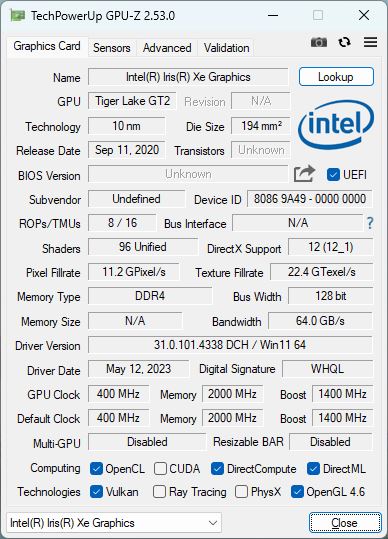
Intel Gen 11, w szczególnościIntel Core i7-11390Hjest ogólnie przyzwoitym procesorem - ale jest kilka lat za obecną technologią otaczającą Intel Gen13, którą można znaleźć wIntel NUC 13 Pro Kit. Uzupełnieniem konfiguracji jest 16 GB pamięci RAM z opcją aktualizacji i dysk SSD o pojemności 1 TB. Komputer nie jest wyposażony w dedykowaną kartę graficzną, ale zintegrowany z procesorem układ XE Graphics działa z pełną wydajnością 96 EU. Komputer nadaje się przede wszystkim do codziennych zastosowań biurowych, a być może także jako konsola retro.
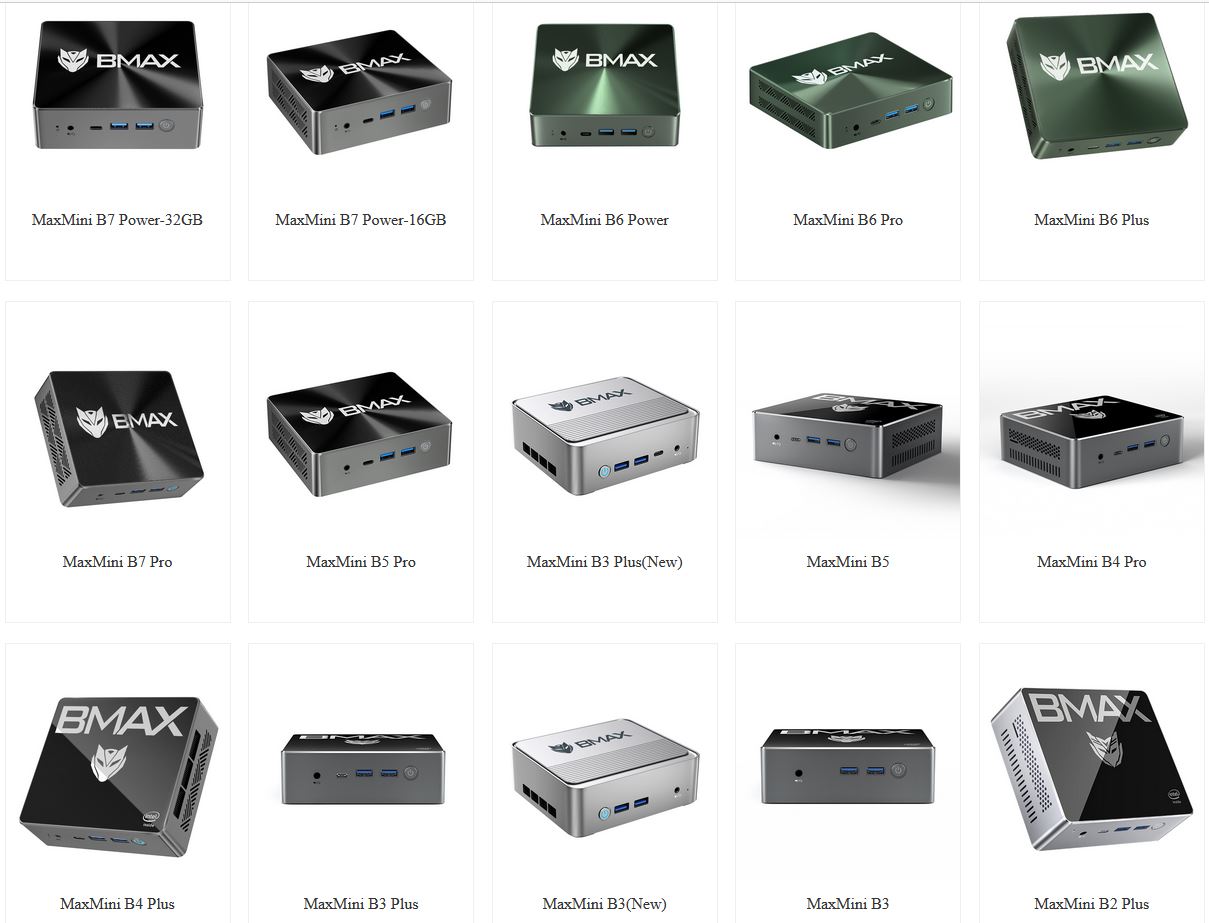
Na stronie BMAX dostępna jest cała gama innych mini PC, w tym B7 Pro z procesoremi5-1145G7. Jednak B7 Power jest już obecnie topowym modelem producenta.
Warunki testowania
B7 Power jest przyjemnie przestronny, ponieważ nie znajdziesz na nim żadnego oprogramowania typu bloatware ani własnego oprogramowania producenta, takiego jak Control Center. Aby uzyskać najlepsze wyniki testów porównawczych, przetestowaliśmy najlepszą wydajność w trybie Windows.
Nasz ekran pozostawał czarny podczas pierwszego uruchomienia. Zostało to rozwiązane przez naciśnięcie kombinacji klawiszy Windows + P.
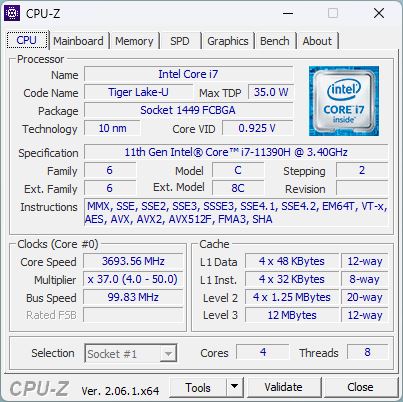
Procesor
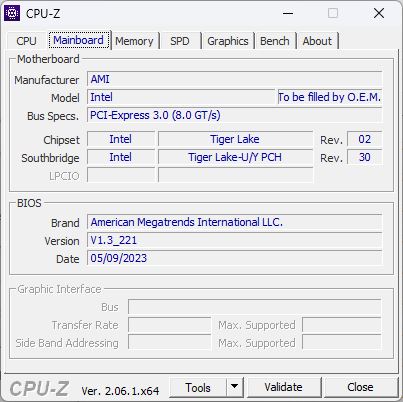
ProcesorIntel Core i7-11390Hjest nadal częścią serii Tiger Lake - dwa z jego 4 rdzeni mogą indywidualnie taktować z częstotliwością do 5 GHz. Wszystkie 4 rdzenie obsługują hiperwątkowość, co oznacza, że 8 wątków może być przetwarzanych jednocześnie.
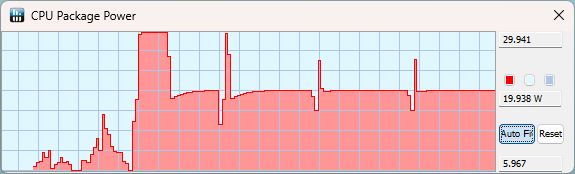
Układ można skonfigurować w zakresie od 28 do 35 watów (TDP), w zależności od gwarantowanego zegara bazowego, który może wynosić od 2,9 (28 W) do 3,4 GHz (35 W). Niższy koniec TDP wydaje się być skonfigurowany nieco bardziej dla B7 Power. W naszej pętli Cinebench R15 zużycie energii przez komputer wynosiło około 30 watów podczas pierwszego uruchomienia. Począwszy od drugiego uruchomienia, B7 osiągnął tylko 25 watów i to bardzo krótko; przez większość pozostałej części każdego uruchomienia mini-PC osiągał tylko nieco poniżej 20 watów.
Po pierwszym uruchomieniu Cinebench R15 wydajność urządzenia spadła o około 10 procent, a następnie pozostała stabilna. Jednak ogólnie wydajność ta jest raczej rozczarowująca. Oczywiście NUC 12 i 13 są wyraźnie przed nami, ale nawet Geekom Mini z tym samym procesorem był o całe 17 procent szybszy we wszystkich testach CPU. W porównaniu do średnich wyników i7-11390H w naszej bazie danych, wydajność procesora B7 Power jest o około 13 procent słabsza. Oznacza to, że potencjał procesora w żadnym wypadku nie został wyczerpany. Nawet B5 Power z Intel Gen8 ledwo dał się prześcignąć w teście Cinebench. Oba urządzenia dzieli ogromna różnica 87 procent w ogólnym wyniku CPU, ale jest między nimi tylko około 18 procent, jeśli chodzi o pętlę Cinebench.
Cinebench R15 Multi continuous test
Cinebench R23: Multi Core | Single Core
Cinebench R20: CPU (Multi Core) | CPU (Single Core)
Cinebench R15: CPU Multi 64Bit | CPU Single 64Bit
Blender: v2.79 BMW27 CPU
7-Zip 18.03: 7z b 4 | 7z b 4 -mmt1
Geekbench 5.5: Multi-Core | Single-Core
HWBOT x265 Benchmark v2.2: 4k Preset
LibreOffice : 20 Documents To PDF
R Benchmark 2.5: Overall mean
| CPU Performance rating | |
| Średnia w klasie Mini PC | |
| Intel NUC 13 Pro Kit NUC13ANK | |
| Intel NUC 12 Pro Kit NUC12WSBi5 -2! | |
| Geekom Mini IT11, i7-11390H | |
| Przeciętny Intel Core i7-11390H | |
| Beelink SEi11 Pro | |
| BMAX B7 Power G7A2 | |
| BMAX B5 Pro G7H8 | |
| Cinebench R23 / Multi Core | |
| Średnia w klasie Mini PC (1571 - 39416, n=96, ostatnie 2 lata) | |
| Intel NUC 13 Pro Kit NUC13ANK | |
| Intel NUC 12 Pro Kit NUC12WSBi5 | |
| Intel NUC 12 Pro Kit NUC12WSBi5 | |
| Intel NUC 12 Pro Kit NUC12WSBi5 | |
| Geekom Mini IT11, i7-11390H | |
| Beelink SEi11 Pro | |
| Przeciętny Intel Core i7-11390H (4570 - 6379, n=3) | |
| BMAX B7 Power G7A2 | |
| BMAX B5 Pro G7H8 | |
| Cinebench R23 / Single Core | |
| Intel NUC 13 Pro Kit NUC13ANK | |
| Średnia w klasie Mini PC (455 - 2303, n=96, ostatnie 2 lata) | |
| Intel NUC 12 Pro Kit NUC12WSBi5 | |
| Geekom Mini IT11, i7-11390H | |
| Przeciętny Intel Core i7-11390H (1407 - 1602, n=3) | |
| Beelink SEi11 Pro | |
| BMAX B7 Power G7A2 | |
| BMAX B5 Pro G7H8 | |
| Cinebench R20 / CPU (Multi Core) | |
| Średnia w klasie Mini PC (555 - 15041, n=96, ostatnie 2 lata) | |
| Intel NUC 13 Pro Kit NUC13ANK | |
| Intel NUC 12 Pro Kit NUC12WSBi5 | |
| Geekom Mini IT11, i7-11390H | |
| Beelink SEi11 Pro | |
| Przeciętny Intel Core i7-11390H (1767 - 2362, n=3) | |
| BMAX B7 Power G7A2 | |
| BMAX B5 Pro G7H8 | |
| Cinebench R20 / CPU (Single Core) | |
| Intel NUC 13 Pro Kit NUC13ANK | |
| Średnia w klasie Mini PC (173.6 - 884, n=96, ostatnie 2 lata) | |
| Intel NUC 12 Pro Kit NUC12WSBi5 | |
| Geekom Mini IT11, i7-11390H | |
| Przeciętny Intel Core i7-11390H (550 - 620, n=3) | |
| Beelink SEi11 Pro | |
| BMAX B7 Power G7A2 | |
| BMAX B5 Pro G7H8 | |
| Cinebench R15 / CPU Multi 64Bit | |
| Średnia w klasie Mini PC (254 - 5881, n=96, ostatnie 2 lata) | |
| Intel NUC 13 Pro Kit NUC13ANK | |
| Intel NUC 12 Pro Kit NUC12WSBi5 | |
| Intel NUC 12 Pro Kit NUC12WSBi5 | |
| Geekom Mini IT11, i7-11390H | |
| Przeciętny Intel Core i7-11390H (775 - 1041, n=3) | |
| Beelink SEi11 Pro | |
| BMAX B7 Power G7A2 | |
| BMAX B5 Pro G7H8 | |
| Cinebench R15 / CPU Single 64Bit | |
| Intel NUC 13 Pro Kit NUC13ANK | |
| Średnia w klasie Mini PC (78.3 - 340, n=96, ostatnie 2 lata) | |
| Intel NUC 12 Pro Kit NUC12WSBi5 | |
| Intel NUC 12 Pro Kit NUC12WSBi5 | |
| Geekom Mini IT11, i7-11390H | |
| Przeciętny Intel Core i7-11390H (209 - 239, n=3) | |
| Beelink SEi11 Pro | |
| BMAX B7 Power G7A2 | |
| BMAX B5 Pro G7H8 | |
| Blender / v2.79 BMW27 CPU | |
| BMAX B5 Pro G7H8 | |
| BMAX B7 Power G7A2 | |
| Przeciętny Intel Core i7-11390H (495 - 665, n=3) | |
| Beelink SEi11 Pro | |
| Geekom Mini IT11, i7-11390H | |
| Intel NUC 12 Pro Kit NUC12WSBi5 | |
| Średnia w klasie Mini PC (86 - 2330, n=92, ostatnie 2 lata) | |
| Intel NUC 13 Pro Kit NUC13ANK | |
| 7-Zip 18.03 / 7z b 4 | |
| Średnia w klasie Mini PC (8146 - 136872, n=91, ostatnie 2 lata) | |
| Intel NUC 13 Pro Kit NUC13ANK | |
| Intel NUC 12 Pro Kit NUC12WSBi5 | |
| Geekom Mini IT11, i7-11390H | |
| Przeciętny Intel Core i7-11390H (20822 - 28173, n=3) | |
| Beelink SEi11 Pro | |
| BMAX B7 Power G7A2 | |
| BMAX B5 Pro G7H8 | |
| 7-Zip 18.03 / 7z b 4 -mmt1 | |
| Intel NUC 13 Pro Kit NUC13ANK | |
| Geekom Mini IT11, i7-11390H | |
| Średnia w klasie Mini PC (2454 - 7462, n=92, ostatnie 2 lata) | |
| Przeciętny Intel Core i7-11390H (5539 - 5895, n=3) | |
| BMAX B7 Power G7A2 | |
| Intel NUC 12 Pro Kit NUC12WSBi5 | |
| Beelink SEi11 Pro | |
| BMAX B5 Pro G7H8 | |
| Geekbench 5.5 / Multi-Core | |
| Średnia w klasie Mini PC (1638 - 24593, n=95, ostatnie 2 lata) | |
| Intel NUC 13 Pro Kit NUC13ANK | |
| Przeciętny Intel Core i7-11390H (4457 - 6297, n=4) | |
| Geekom Mini IT11, i7-11390H | |
| Beelink SEi11 Pro | |
| BMAX B7 Power G7A2 | |
| BMAX B5 Pro G7H8 | |
| Geekbench 5.5 / Single-Core | |
| Intel NUC 13 Pro Kit NUC13ANK | |
| Średnia w klasie Mini PC (466 - 2395, n=95, ostatnie 2 lata) | |
| Geekom Mini IT11, i7-11390H | |
| Przeciętny Intel Core i7-11390H (1486 - 1677, n=4) | |
| Beelink SEi11 Pro | |
| BMAX B7 Power G7A2 | |
| BMAX B5 Pro G7H8 | |
| HWBOT x265 Benchmark v2.2 / 4k Preset | |
| Średnia w klasie Mini PC (1.5 - 40.3, n=92, ostatnie 2 lata) | |
| Intel NUC 13 Pro Kit NUC13ANK | |
| Intel NUC 12 Pro Kit NUC12WSBi5 | |
| Geekom Mini IT11, i7-11390H | |
| Beelink SEi11 Pro | |
| Przeciętny Intel Core i7-11390H (5.84 - 7.86, n=3) | |
| BMAX B7 Power G7A2 | |
| BMAX B5 Pro G7H8 | |
| LibreOffice / 20 Documents To PDF | |
| BMAX B5 Pro G7H8 | |
| Średnia w klasie Mini PC (33.1 - 132.6, n=92, ostatnie 2 lata) | |
| BMAX B7 Power G7A2 | |
| Beelink SEi11 Pro | |
| Intel NUC 12 Pro Kit NUC12WSBi5 | |
| Przeciętny Intel Core i7-11390H (43.2 - 52.6, n=3) | |
| Geekom Mini IT11, i7-11390H | |
| Intel NUC 13 Pro Kit NUC13ANK | |
| R Benchmark 2.5 / Overall mean | |
| BMAX B5 Pro G7H8 | |
| Beelink SEi11 Pro | |
| BMAX B7 Power G7A2 | |
| Przeciętny Intel Core i7-11390H (0.537 - 0.571, n=3) | |
| Geekom Mini IT11, i7-11390H | |
| Intel NUC 12 Pro Kit NUC12WSBi5 | |
| Średnia w klasie Mini PC (0.3517 - 1.56, n=93, ostatnie 2 lata) | |
| Intel NUC 13 Pro Kit NUC13ANK | |
* ... im mniej tym lepiej
AIDA64: FP32 Ray-Trace | FPU Julia | CPU SHA3 | CPU Queen | FPU SinJulia | FPU Mandel | CPU AES | CPU ZLib | FP64 Ray-Trace | CPU PhotoWorxx
| Performance rating | |
| Średnia w klasie Mini PC | |
| Intel NUC 13 Pro Kit NUC13ANK | |
| Intel NUC 12 Pro Kit NUC12WSBi5 | |
| Beelink SEi11 Pro | |
| Przeciętny Intel Core i7-11390H | |
| Geekom Mini IT11, i7-11390H | |
| BMAX B7 Power G7A2 | |
| BMAX B5 Pro G7H8 | |
| AIDA64 / FP32 Ray-Trace | |
| Średnia w klasie Mini PC (974 - 82725, n=103, ostatnie 2 lata) | |
| Intel NUC 13 Pro Kit NUC13ANK | |
| Beelink SEi11 Pro | |
| Przeciętny Intel Core i7-11390H (5904 - 7741, n=4) | |
| Geekom Mini IT11, i7-11390H | |
| Intel NUC 12 Pro Kit NUC12WSBi5 | |
| BMAX B7 Power G7A2 | |
| BMAX B5 Pro G7H8 | |
| AIDA64 / FPU Julia | |
| Średnia w klasie Mini PC (6115 - 363782, n=103, ostatnie 2 lata) | |
| Intel NUC 13 Pro Kit NUC13ANK | |
| Beelink SEi11 Pro | |
| Przeciętny Intel Core i7-11390H (25054 - 32624, n=4) | |
| Intel NUC 12 Pro Kit NUC12WSBi5 | |
| Geekom Mini IT11, i7-11390H | |
| BMAX B7 Power G7A2 | |
| BMAX B5 Pro G7H8 | |
| AIDA64 / CPU SHA3 | |
| Średnia w klasie Mini PC (385 - 9475, n=103, ostatnie 2 lata) | |
| Intel NUC 13 Pro Kit NUC13ANK | |
| Intel NUC 12 Pro Kit NUC12WSBi5 | |
| Beelink SEi11 Pro | |
| Przeciętny Intel Core i7-11390H (1747 - 2168, n=4) | |
| Geekom Mini IT11, i7-11390H | |
| BMAX B7 Power G7A2 | |
| BMAX B5 Pro G7H8 | |
| AIDA64 / CPU Queen | |
| Średnia w klasie Mini PC (20501 - 162855, n=87, ostatnie 2 lata) | |
| Intel NUC 13 Pro Kit NUC13ANK | |
| Intel NUC 12 Pro Kit NUC12WSBi5 | |
| Przeciętny Intel Core i7-11390H (47355 - 58761, n=4) | |
| Geekom Mini IT11, i7-11390H | |
| BMAX B7 Power G7A2 | |
| Beelink SEi11 Pro | |
| BMAX B5 Pro G7H8 | |
| AIDA64 / FPU SinJulia | |
| Średnia w klasie Mini PC (1116 - 31931, n=103, ostatnie 2 lata) | |
| Intel NUC 13 Pro Kit NUC13ANK | |
| Intel NUC 12 Pro Kit NUC12WSBi5 | |
| Beelink SEi11 Pro | |
| Przeciętny Intel Core i7-11390H (4106 - 5412, n=4) | |
| Geekom Mini IT11, i7-11390H | |
| BMAX B5 Pro G7H8 | |
| BMAX B7 Power G7A2 | |
| AIDA64 / FPU Mandel | |
| Średnia w klasie Mini PC (3322 - 192994, n=103, ostatnie 2 lata) | |
| Intel NUC 13 Pro Kit NUC13ANK | |
| Beelink SEi11 Pro | |
| Przeciętny Intel Core i7-11390H (15441 - 19348, n=4) | |
| Geekom Mini IT11, i7-11390H | |
| Intel NUC 12 Pro Kit NUC12WSBi5 | |
| BMAX B7 Power G7A2 | |
| BMAX B5 Pro G7H8 | |
| AIDA64 / CPU AES | |
| Intel NUC 13 Pro Kit NUC13ANK | |
| Średnia w klasie Mini PC (9915 - 204742, n=102, ostatnie 2 lata) | |
| Beelink SEi11 Pro | |
| Intel NUC 12 Pro Kit NUC12WSBi5 | |
| Przeciętny Intel Core i7-11390H (57644 - 77817, n=4) | |
| BMAX B7 Power G7A2 | |
| Geekom Mini IT11, i7-11390H | |
| BMAX B5 Pro G7H8 | |
| AIDA64 / CPU ZLib | |
| Średnia w klasie Mini PC (127.2 - 2431, n=103, ostatnie 2 lata) | |
| Intel NUC 12 Pro Kit NUC12WSBi5 | |
| Intel NUC 13 Pro Kit NUC13ANK | |
| Przeciętny Intel Core i7-11390H (362 - 424, n=4) | |
| Geekom Mini IT11, i7-11390H | |
| Beelink SEi11 Pro | |
| BMAX B7 Power G7A2 | |
| BMAX B5 Pro G7H8 | |
| AIDA64 / FP64 Ray-Trace | |
| Średnia w klasie Mini PC (537 - 43587, n=103, ostatnie 2 lata) | |
| Intel NUC 13 Pro Kit NUC13ANK | |
| Beelink SEi11 Pro | |
| Geekom Mini IT11, i7-11390H | |
| Przeciętny Intel Core i7-11390H (3138 - 4197, n=4) | |
| Intel NUC 12 Pro Kit NUC12WSBi5 | |
| BMAX B7 Power G7A2 | |
| BMAX B5 Pro G7H8 | |
| AIDA64 / CPU PhotoWorxx | |
| Średnia w klasie Mini PC (8069 - 96843, n=103, ostatnie 2 lata) | |
| Intel NUC 13 Pro Kit NUC13ANK | |
| Intel NUC 12 Pro Kit NUC12WSBi5 | |
| Beelink SEi11 Pro | |
| Geekom Mini IT11, i7-11390H | |
| Przeciętny Intel Core i7-11390H (11409 - 39871, n=4) | |
| BMAX B5 Pro G7H8 | |
| BMAX B7 Power G7A2 | |
Wydajność systemu
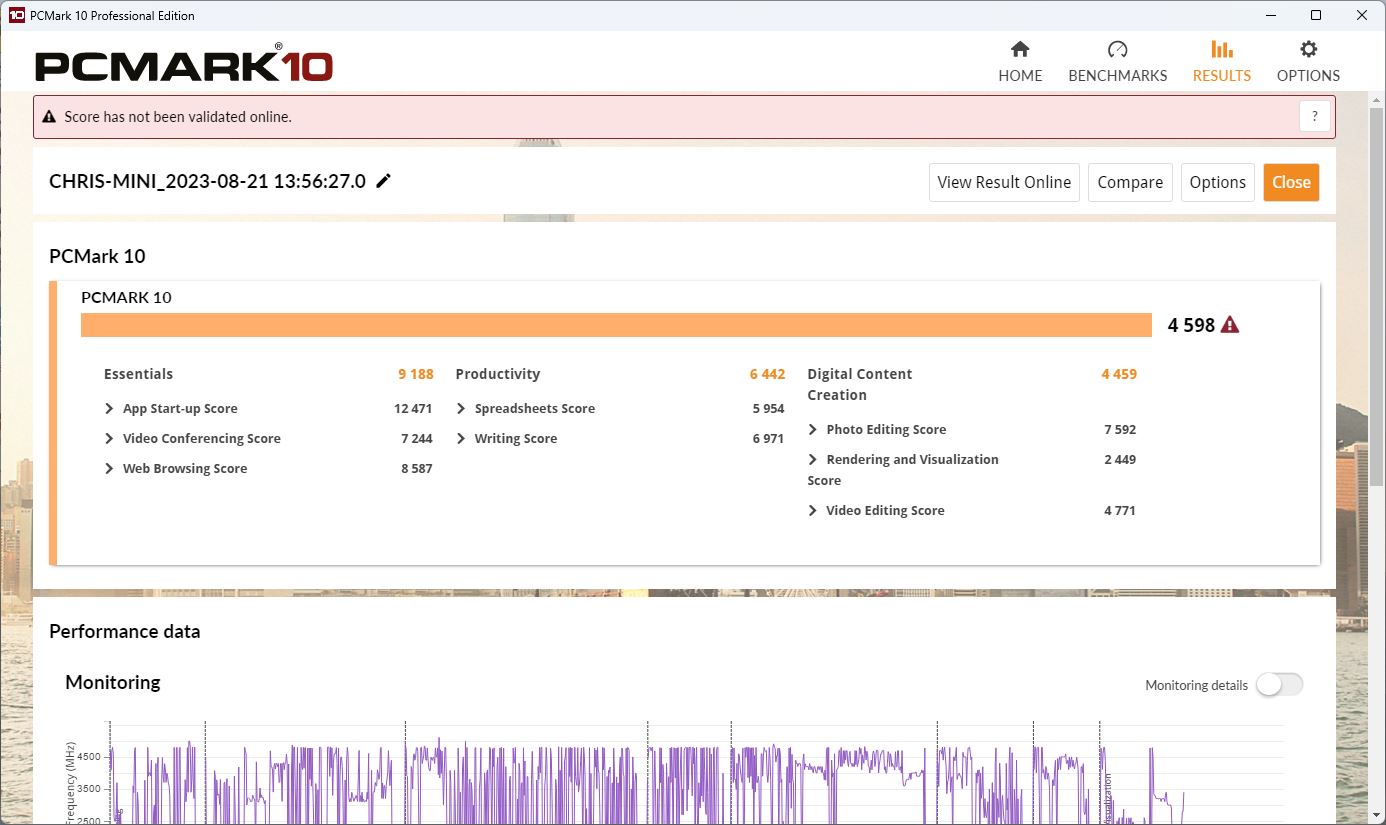
Jego wydajność również pozostawała w tyle za typowym i7-11390Ho 9 procent w PCMark. W CrossMark był tylko 6 procent w tyle.
Subiektywnie rzecz biorąc, komputer nadal radzi sobie dobrze w codziennym użytkowaniu, jeśli chodzi o przeglądanie stron internetowych i wykonywanie zadań biurowych.
CrossMark: Overall | Productivity | Creativity | Responsiveness
| PCMark 10 / Score | |
| Średnia w klasie Mini PC (2191 - 9326, n=102, ostatnie 2 lata) | |
| Intel NUC 13 Pro Kit NUC13ANK | |
| Intel NUC 12 Pro Kit NUC12WSBi5 | |
| Beelink SEi11 Pro | |
| Przeciętny Intel Core i7-11390H, Intel Iris Xe Graphics G7 96EUs (4598 - 5475, n=3) | |
| Geekom Mini IT11, i7-11390H | |
| BMAX B7 Power G7A2 | |
| BMAX B5 Pro G7H8 | |
| PCMark 10 / Essentials | |
| Intel NUC 13 Pro Kit NUC13ANK | |
| Intel NUC 12 Pro Kit NUC12WSBi5 | |
| Beelink SEi11 Pro | |
| Średnia w klasie Mini PC (5031 - 11997, n=101, ostatnie 2 lata) | |
| Przeciętny Intel Core i7-11390H, Intel Iris Xe Graphics G7 96EUs (9188 - 10451, n=3) | |
| Geekom Mini IT11, i7-11390H | |
| BMAX B7 Power G7A2 | |
| BMAX B5 Pro G7H8 | |
| PCMark 10 / Productivity | |
| Średnia w klasie Mini PC (3646 - 17739, n=101, ostatnie 2 lata) | |
| Intel NUC 13 Pro Kit NUC13ANK | |
| Intel NUC 12 Pro Kit NUC12WSBi5 | |
| Beelink SEi11 Pro | |
| Przeciętny Intel Core i7-11390H, Intel Iris Xe Graphics G7 96EUs (6442 - 7197, n=3) | |
| Geekom Mini IT11, i7-11390H | |
| BMAX B7 Power G7A2 | |
| BMAX B5 Pro G7H8 | |
| PCMark 10 / Digital Content Creation | |
| Średnia w klasie Mini PC (1558 - 17556, n=101, ostatnie 2 lata) | |
| Intel NUC 13 Pro Kit NUC13ANK | |
| Intel NUC 12 Pro Kit NUC12WSBi5 | |
| Przeciętny Intel Core i7-11390H, Intel Iris Xe Graphics G7 96EUs (4459 - 5920, n=3) | |
| Beelink SEi11 Pro | |
| Geekom Mini IT11, i7-11390H | |
| BMAX B7 Power G7A2 | |
| BMAX B5 Pro G7H8 | |
| CrossMark / Overall | |
| Intel NUC 13 Pro Kit NUC13ANK | |
| Średnia w klasie Mini PC (385 - 2244, n=94, ostatnie 2 lata) | |
| Geekom Mini IT11, i7-11390H | |
| Przeciętny Intel Core i7-11390H, Intel Iris Xe Graphics G7 96EUs (1274 - 1438, n=2) | |
| Beelink SEi11 Pro | |
| BMAX B7 Power G7A2 | |
| BMAX B5 Pro G7H8 | |
| CrossMark / Productivity | |
| Intel NUC 13 Pro Kit NUC13ANK | |
| Średnia w klasie Mini PC (446 - 2790, n=94, ostatnie 2 lata) | |
| Geekom Mini IT11, i7-11390H | |
| Przeciętny Intel Core i7-11390H, Intel Iris Xe Graphics G7 96EUs (1399 - 1523, n=2) | |
| Beelink SEi11 Pro | |
| BMAX B7 Power G7A2 | |
| BMAX B5 Pro G7H8 | |
| CrossMark / Creativity | |
| Intel NUC 13 Pro Kit NUC13ANK | |
| Średnia w klasie Mini PC (340 - 2879, n=94, ostatnie 2 lata) | |
| Geekom Mini IT11, i7-11390H | |
| Przeciętny Intel Core i7-11390H, Intel Iris Xe Graphics G7 96EUs (1198 - 1359, n=2) | |
| Beelink SEi11 Pro | |
| BMAX B7 Power G7A2 | |
| BMAX B5 Pro G7H8 | |
| CrossMark / Responsiveness | |
| Intel NUC 13 Pro Kit NUC13ANK | |
| Średnia w klasie Mini PC (363 - 2191, n=94, ostatnie 2 lata) | |
| Geekom Mini IT11, i7-11390H | |
| Beelink SEi11 Pro | |
| Przeciętny Intel Core i7-11390H, Intel Iris Xe Graphics G7 96EUs (1159 - 1434, n=2) | |
| BMAX B7 Power G7A2 | |
| BMAX B5 Pro G7H8 | |
| PCMark 10 Score | 4598 pkt. | |
Pomoc | ||
| AIDA64 / Memory Copy | |
| Średnia w klasie Mini PC (15933 - 163031, n=103, ostatnie 2 lata) | |
| Intel NUC 13 Pro Kit NUC13ANK | |
| Intel NUC 12 Pro Kit NUC12WSBi5 | |
| Geekom Mini IT11, i7-11390H | |
| Przeciętny Intel Core i7-11390H (19409 - 64750, n=4) | |
| Beelink SEi11 Pro | |
| BMAX B5 Pro G7H8 | |
| BMAX B7 Power G7A2 | |
| AIDA64 / Memory Read | |
| Średnia w klasie Mini PC (14143 - 123769, n=103, ostatnie 2 lata) | |
| Intel NUC 12 Pro Kit NUC12WSBi5 | |
| Geekom Mini IT11, i7-11390H | |
| Beelink SEi11 Pro | |
| Intel NUC 13 Pro Kit NUC13ANK | |
| Przeciętny Intel Core i7-11390H (21253 - 59793, n=4) | |
| BMAX B5 Pro G7H8 | |
| BMAX B7 Power G7A2 | |
| AIDA64 / Memory Write | |
| Średnia w klasie Mini PC (10630 - 216693, n=103, ostatnie 2 lata) | |
| Geekom Mini IT11, i7-11390H | |
| Intel NUC 12 Pro Kit NUC12WSBi5 | |
| Beelink SEi11 Pro | |
| Intel NUC 13 Pro Kit NUC13ANK | |
| Przeciętny Intel Core i7-11390H (19684 - 66881, n=4) | |
| BMAX B5 Pro G7H8 | |
| BMAX B7 Power G7A2 | |
| AIDA64 / Memory Latency | |
| Średnia w klasie Mini PC (88.1 - 184.8, n=104, ostatnie 2 lata) | |
| Intel NUC 13 Pro Kit NUC13ANK | |
| BMAX B5 Pro G7H8 | |
| Intel NUC 12 Pro Kit NUC12WSBi5 | |
| Beelink SEi11 Pro | |
| Przeciętny Intel Core i7-11390H (66.3 - 95.3, n=4) | |
| Geekom Mini IT11, i7-11390H | |
| BMAX B7 Power G7A2 | |
* ... im mniej tym lepiej
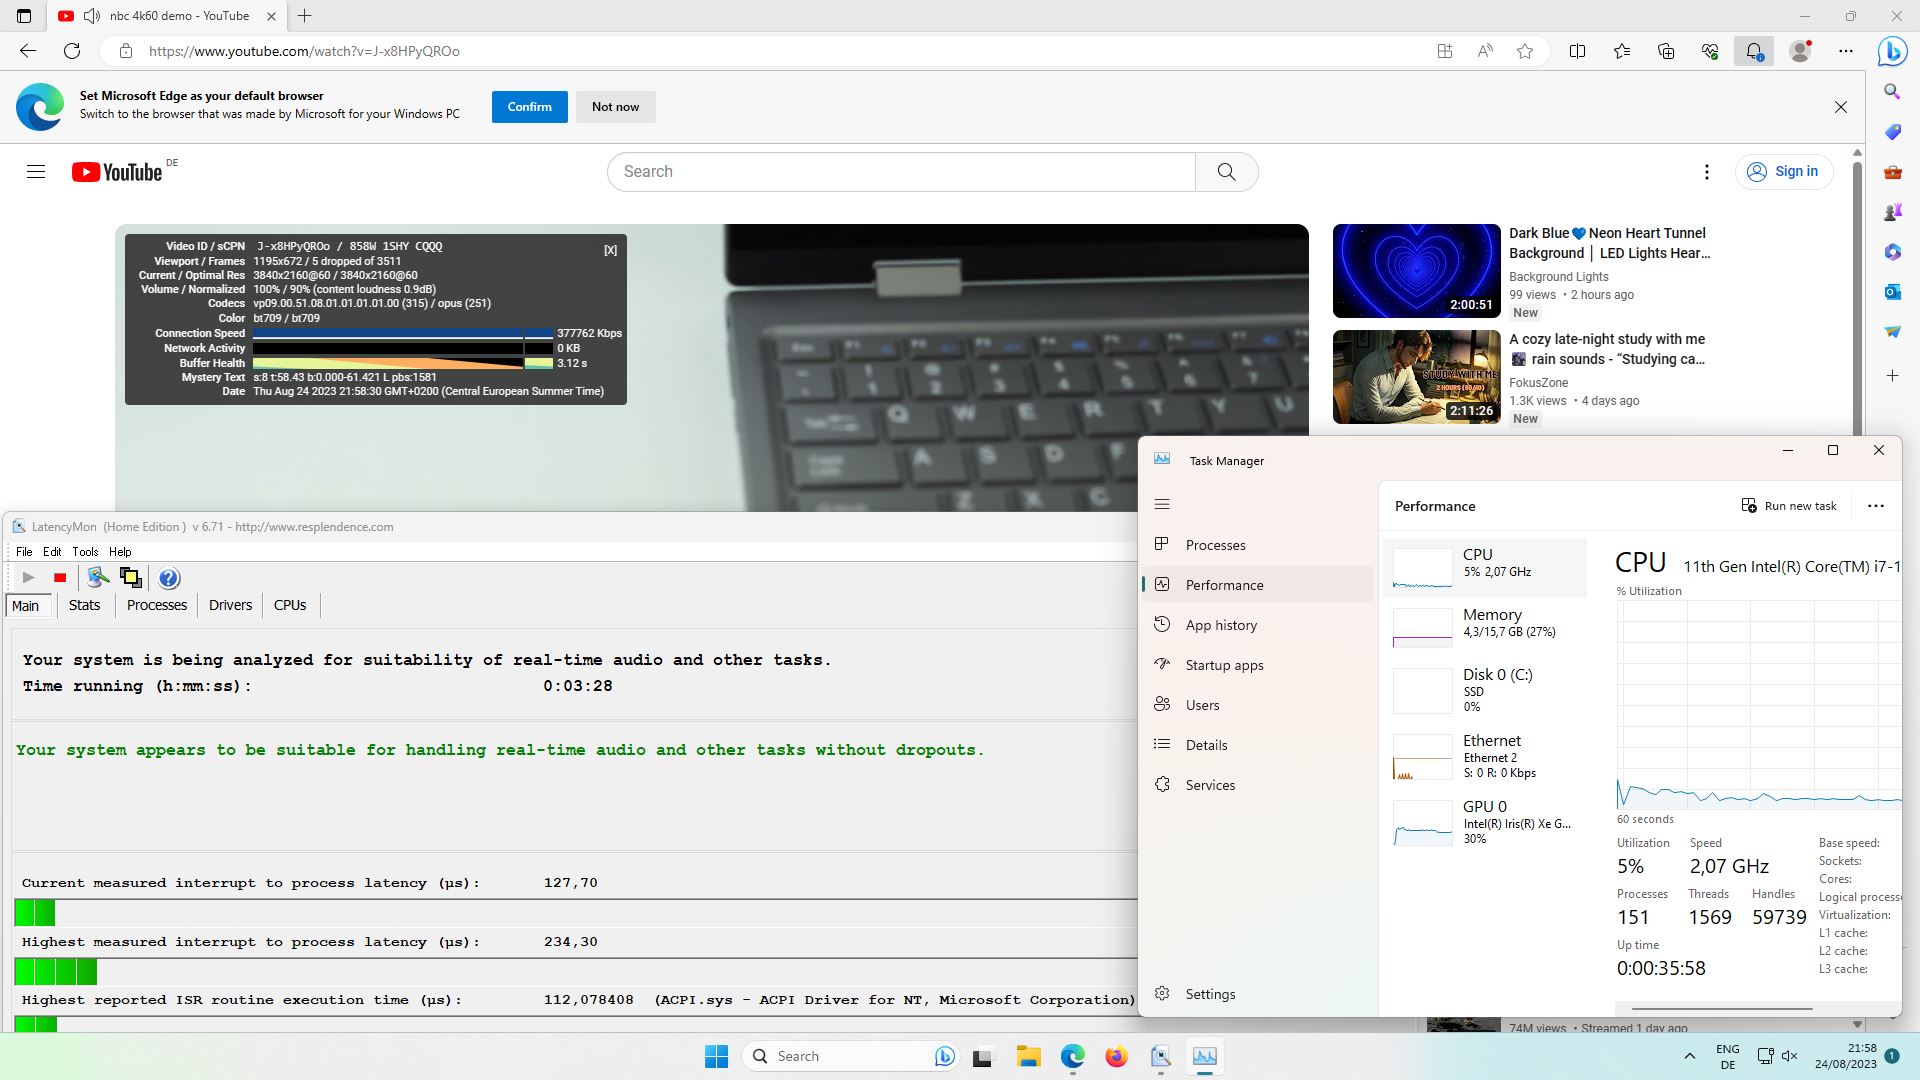
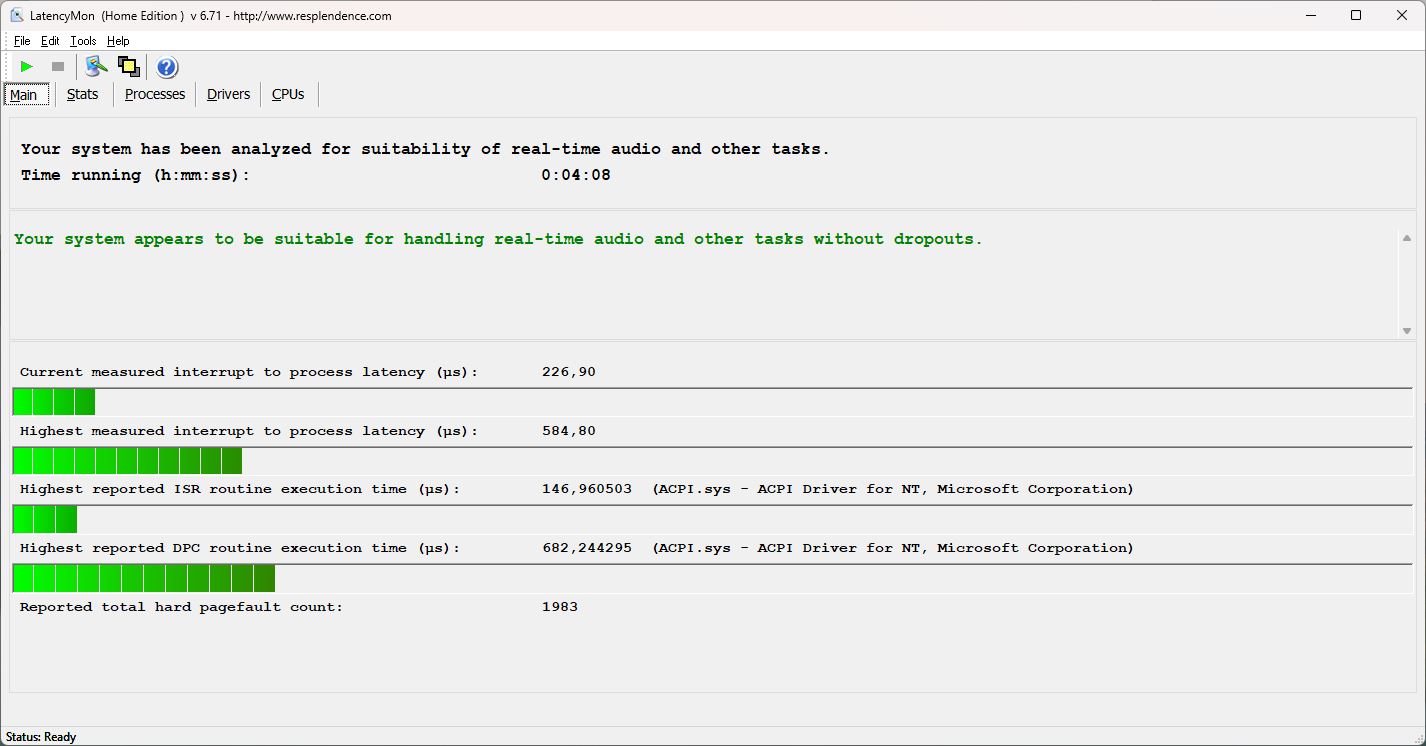
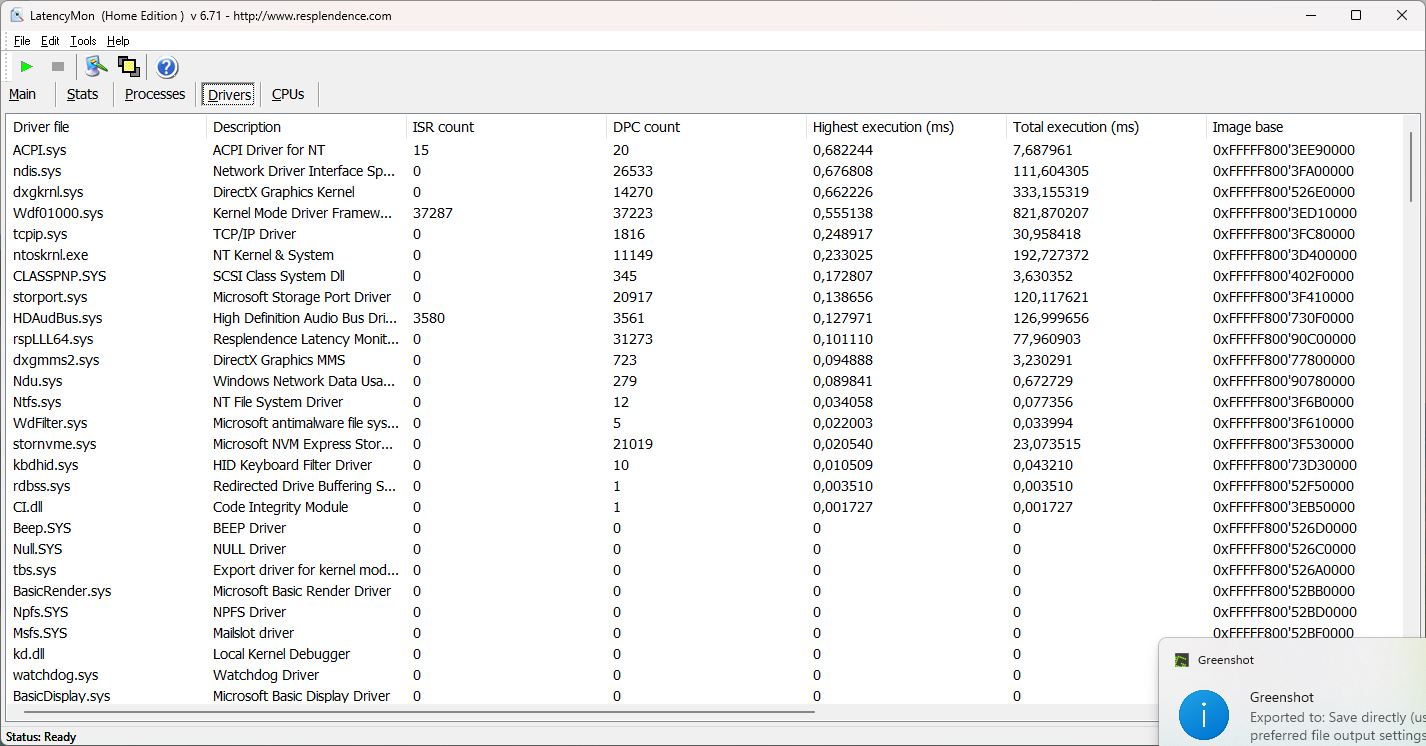
Opóźnienie DPC
Wczytywanie stron internetowych nie stanowi dla tego komputera żadnego problemu. Z łatwością udało mu się nawet otworzyć wiele zakładek na naszej stronie internetowej - co stanowi wyraźny kontrast z większością obecnych laptopów do gier.
Z kolei nie udało mu się idealnie odtworzyć naszego wideo 4K/60 fps - odnotowaliśmy trzy spadki klatek - ale poza tym działał całkiem płynnie. To sprawia, że B7 nadaje się do odtwarzania dźwięku w czasie rzeczywistym.
Dla porównania, opóźnienia Intel NUC były wyższe, ale mini PC ostatniej generacji od Geekom i Beelink radziły sobie nieco lepiej.
| DPC Latencies / LatencyMon - interrupt to process latency (max), Web, Youtube, Prime95 | |
| Intel NUC 13 Pro Kit NUC13ANK | |
| Intel NUC 12 Pro Kit NUC12WSBi5 | |
| BMAX B7 Power G7A2 | |
| Geekom Mini IT11, i7-11390H | |
| BMAX B5 Pro G7H8 | |
| Beelink SEi11 Pro | |
* ... im mniej tym lepiej
Urządzenia pamięci masowej
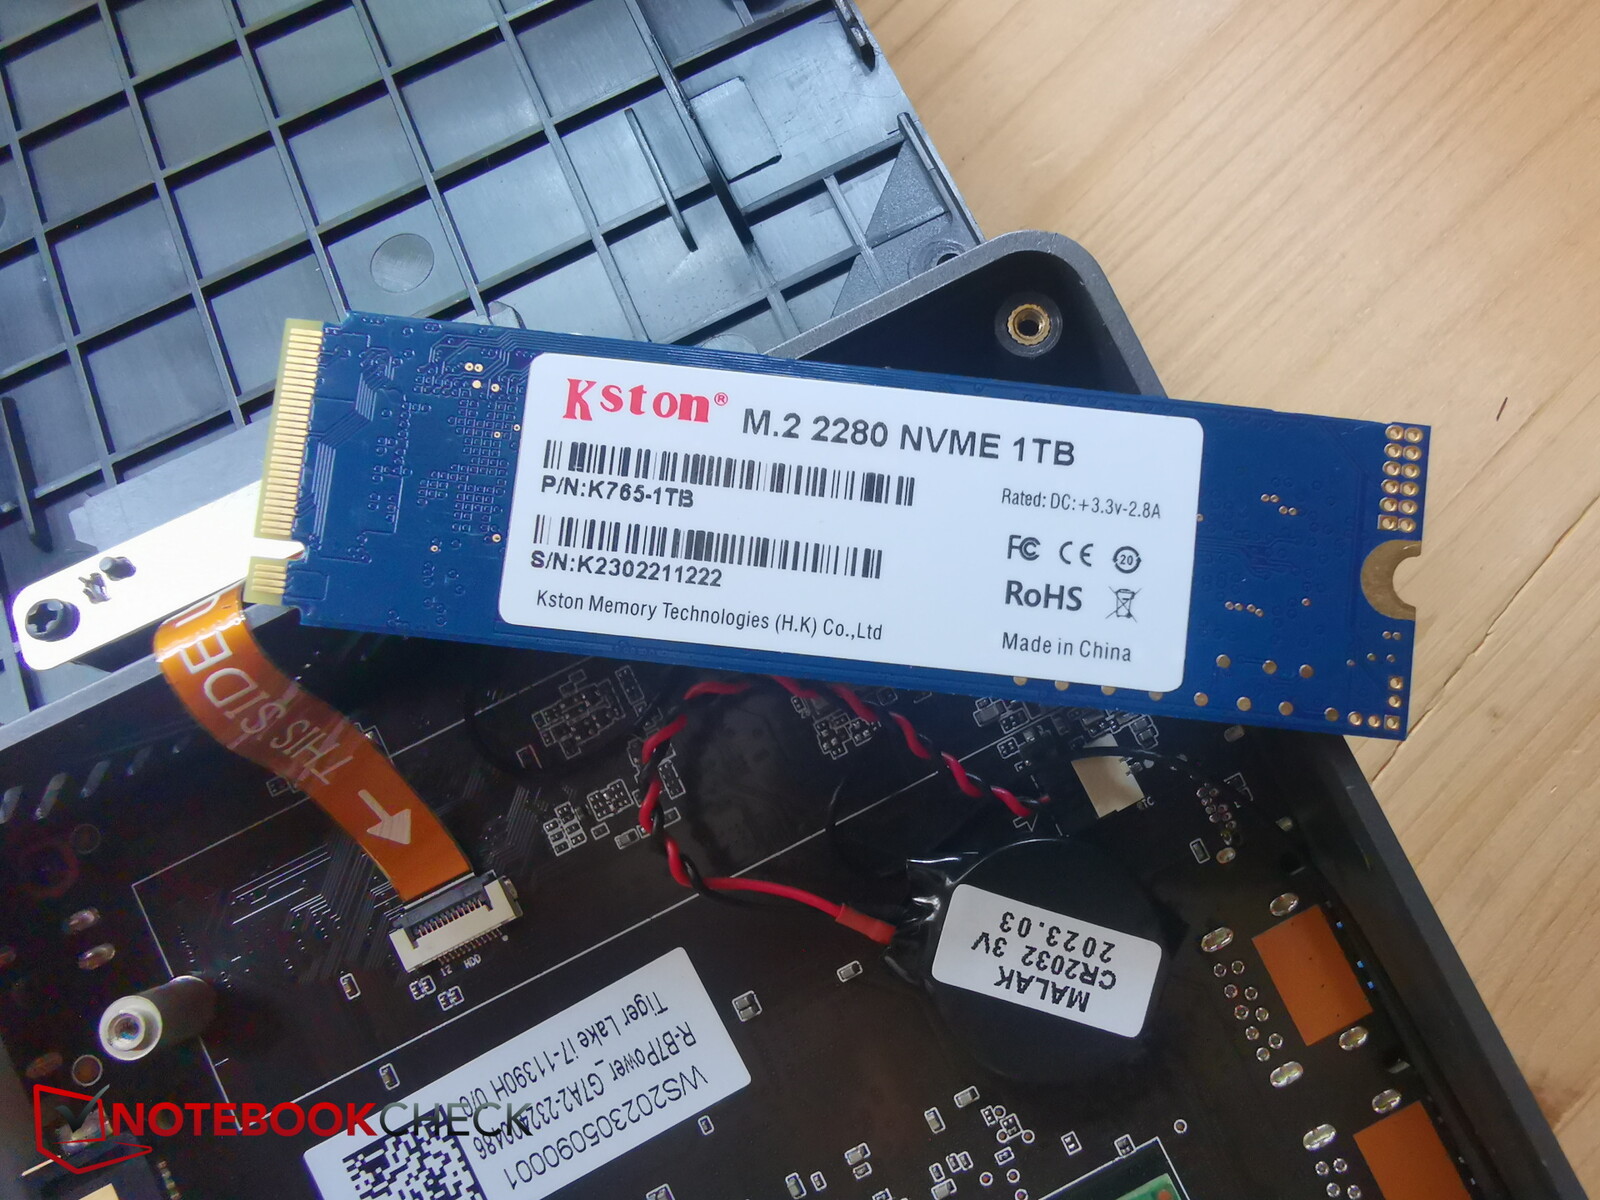
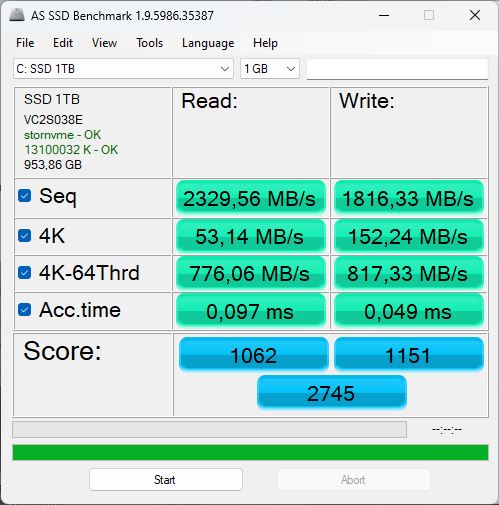
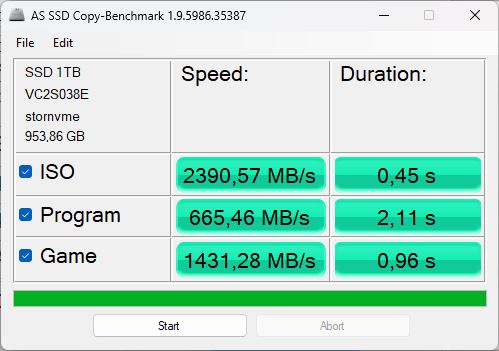
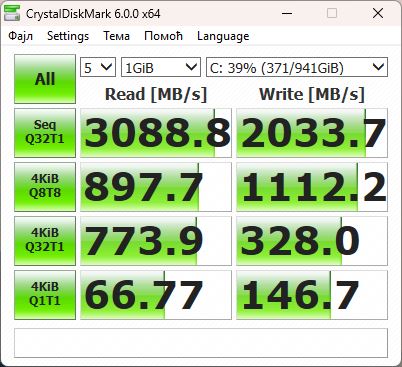
BMAX zainstalował w urządzeniu dysk SSD o pojemności 1 TB - tak jest również oznaczony wszędzie w systemie Windows, a nawet w BIOS-ie. Wszędzie jest po prostu napisane "SSD 1 TB". Aby określić zainstalowany model i jego producenta, należy otworzyć B7 Power i wyjąć dysk SSD. Z tyłu znajduje się etykieta. "Kston K765-1TB" nie jest tutaj zbyt dobrze znany. Tak naprawdę nie ma co ukrywać - w porównaniu ten model i tak osiągał przyzwoite prędkości przesyłu danych. Jedynie dysk SSD Samsunga wNUC 13wypadł znacznie lepiej we wszystkich testach.
Niestety, jego wydajność była nieco dławiona w okresach dłuższego obciążenia z powodu ograniczeń termicznych. Jednostka chłodząca nie jest zainstalowana, ale byłoby to zalecane.

* ... im mniej tym lepiej
Reading continuous performance: DiskSpd Read Loop, Queue Depth 8
Karta graficzna
Karta graficzna Intel Iris Xe Graphics G7 96EUszintegrowany z procesorem działa jako karta graficzna komputera. W zależności od procesora i poboru mocy, jej wydajność jest dość zróżnicowana.
Nawet w benchmarkach 3D jej wydajność była znacznie poniżej średniej. Średnio, Xe Graphics G7 z 96 EU w naszej bazie danych wypadł o 51 procent lepiej! Mimo to B7 Power poradził sobie o 118 procent lepiej niż B5 z procesorem Intel UHD Graphics 620. Jego wydajność jest wciąż zbyt słaba, a zainstalowany sprzęt jest mocno dławiony. Jego konkurenci z tym samym iGPU pozostali znacznie bliżej średnich wartości i w rezultacie znacznie wyprzedzili B7. Nic dziwnego, żeNUC 13 Probył panującym mistrzem w tej dziedzinie.
| 3DMark 11 Performance | 4743 pkt. | |
| 3DMark Cloud Gate Standard Score | 13442 pkt. | |
| 3DMark Fire Strike Score | 2546 pkt. | |
| 3DMark Time Spy Score | 1103 pkt. | |
Pomoc | ||
* ... im mniej tym lepiej
Wydajność w grach
Pomimo nazwy zawierającej termin "moc", B7 naprawdę nie jest przeznaczony do gier. O wiele bardziej nadaje się do codziennych zastosowań jako urządzenie biurowe.
Podczas uruchamiania gry The Witcher 3 Ultra, komputer osiągał średnio tylko od 8 do 9 klatek na sekundę. Komputer Geekom Mini IT11z tym samym CPU/iGPU był o 30 procent szybszy. Komputer Beelink SEi11 Pro- pomimo nieco słabszego procesora - wyprzedził oba pozostałe modele.
W najniższej rozdzielczości i przy najniższych ustawieniach detali można było osiągnąć średnio 48 klatek na sekundę podczas grania w The Witcher 3. W 720p i przy średnich detalach można osiągnąć 30 klatek na sekundę.
WFar Cry 5 również ledwo dało się grać w najniższych ustawieniach (1280 x 720, Low, ~ 29 fps). Będziesz musiał zadowolić się starszymi lub mniej wymagającymi grami i często tylko podczas grania w nie przy obniżonych ustawieniach. Z drugiej strony, zalecamy używanie tego komputera jako konsoli retro, np. w połączeniu z RetroArch.
| Performance rating - Percent | |
| Średnia w klasie Mini PC | |
| Intel NUC 13 Pro Kit NUC13ANK -3! | |
| Beelink SEi11 Pro -1! | |
| Intel NUC 12 Pro Kit NUC12WSBi5 -5! | |
| Geekom Mini IT11, i7-11390H -2! | |
| BMAX B7 Power G7A2 | |
| BMAX B5 Pro G7H8 -5! | |
| The Witcher 3 - 1920x1080 Ultra Graphics & Postprocessing (HBAO+) | |
| Średnia w klasie Mini PC (11.9 - 271, n=53, ostatnie 2 lata) | |
| Intel NUC 13 Pro Kit NUC13ANK | |
| Beelink SEi11 Pro | |
| Geekom Mini IT11, i7-11390H | |
| BMAX B7 Power G7A2 | |
| GTA V - 1920x1080 Highest AA:4xMSAA + FX AF:16x | |
| Średnia w klasie Mini PC (2.71 - 124.7, n=77, ostatnie 2 lata) | |
| Geekom Mini IT11, i7-11390H | |
| Geekom Mini IT11, i7-11390H | |
| BMAX B7 Power G7A2 | |
| Final Fantasy XV Benchmark - 1920x1080 High Quality | |
| Średnia w klasie Mini PC (5.3 - 209, n=94, ostatnie 2 lata) | |
| Beelink SEi11 Pro | |
| BMAX B7 Power G7A2 | |
| Strange Brigade - 1920x1080 ultra AA:ultra AF:16 | |
| Średnia w klasie Mini PC (17 - 245, n=47, ostatnie 2 lata) | |
| Intel NUC 13 Pro Kit NUC13ANK | |
| Beelink SEi11 Pro | |
| Geekom Mini IT11, i7-11390H | |
| BMAX B7 Power G7A2 | |
| Dota 2 Reborn - 1920x1080 ultra (3/3) best looking | |
| Średnia w klasie Mini PC (8.2 - 213, n=102, ostatnie 2 lata) | |
| Intel NUC 13 Pro Kit NUC13ANK | |
| Beelink SEi11 Pro | |
| Geekom Mini IT11, i7-11390H | |
| Intel NUC 12 Pro Kit NUC12WSBi5 | |
| BMAX B7 Power G7A2 | |
| BMAX B5 Pro G7H8 | |
| X-Plane 11.11 - 1920x1080 high (fps_test=3) | |
| Średnia w klasie Mini PC (4.77 - 147.9, n=86, ostatnie 2 lata) | |
| Beelink SEi11 Pro | |
| BMAX B7 Power G7A2 | |
W ciągu godziny jego wydajność ulegała znacznym wahaniom podczas grania w The Witcher 3, co sugeruje dławienie termiczne. Przynajmniej narzędzie CapframeX zmierzyło wahające się wartości między 7 a około 20 fps. Ta ostatnia wartość została osiągnięta tylko w krótkich seriach - średnia liczba klatek na sekundę wyniosła 8,8.
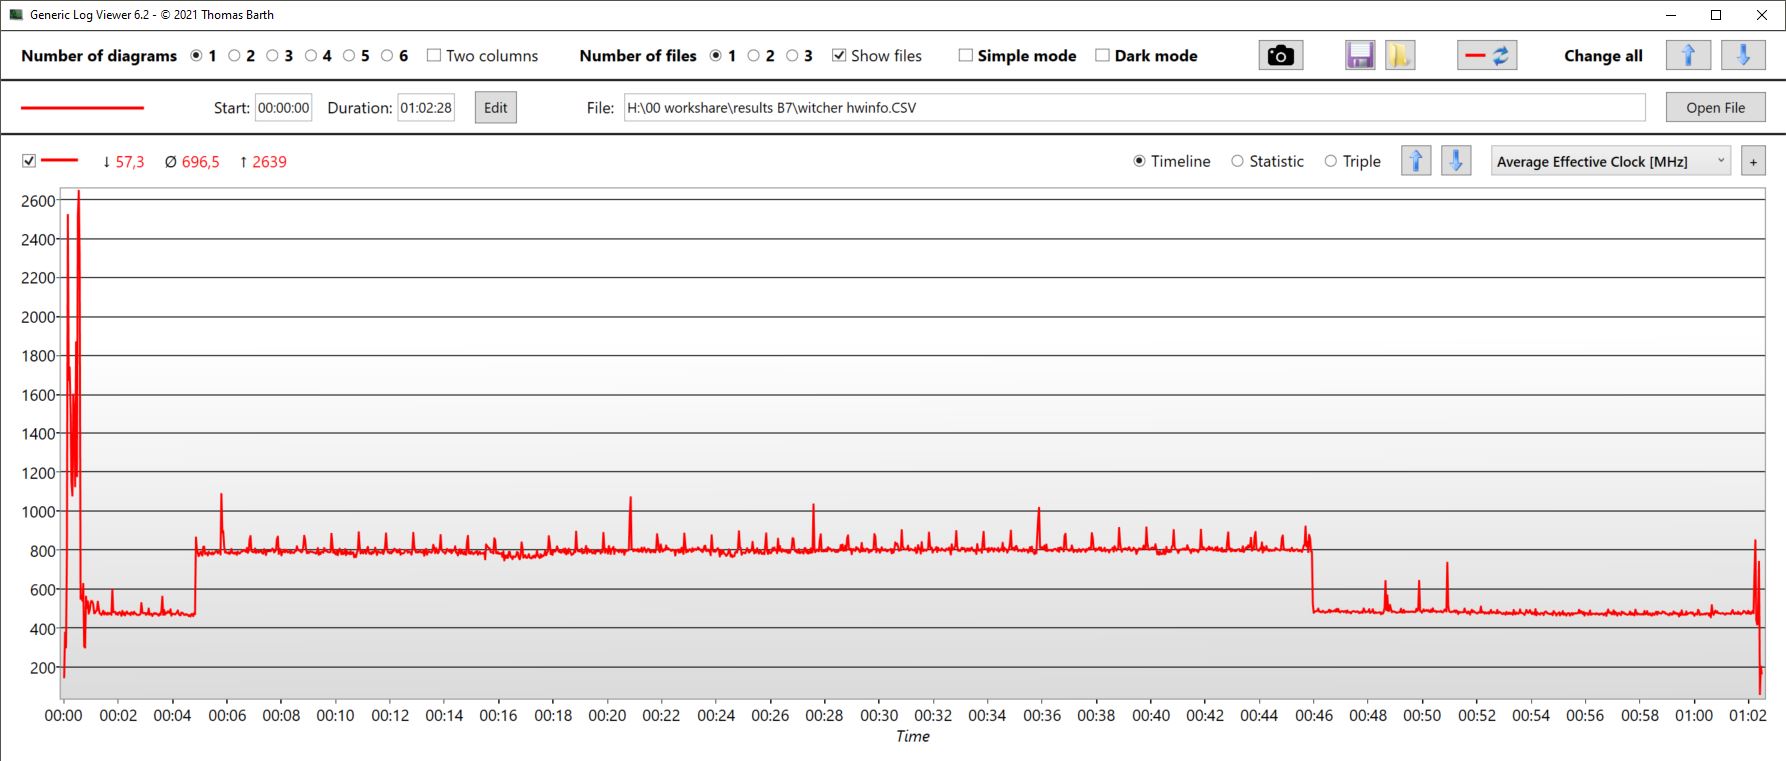
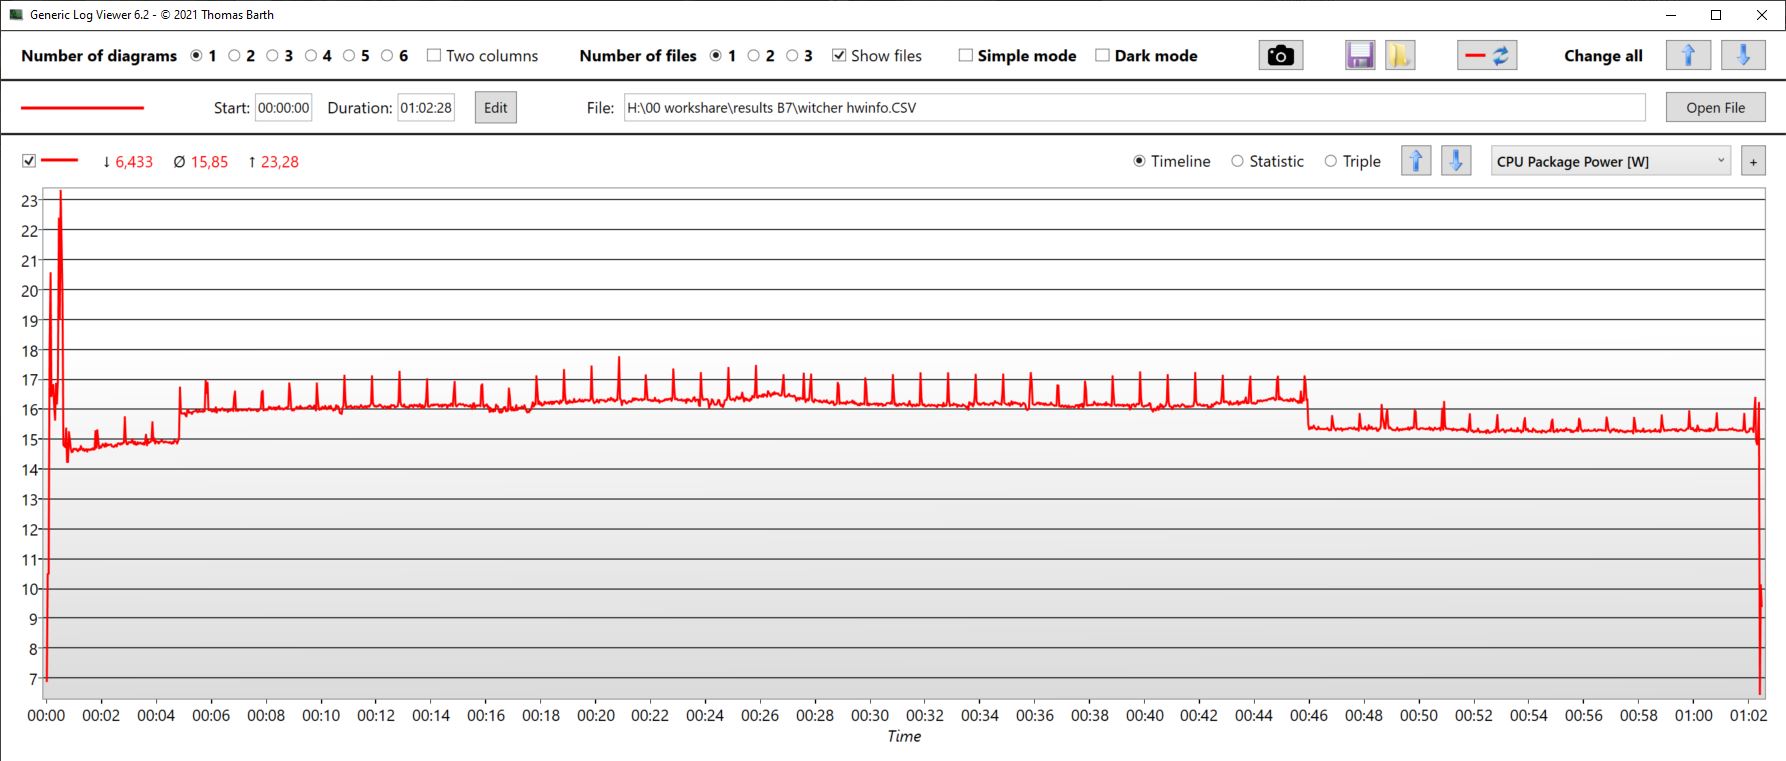
Witcher 3 FPS diagram
| low | med. | high | ultra | |
|---|---|---|---|---|
| GTA V (2015) | 56.4 | 44.8 | 4.13 | |
| The Witcher 3 (2015) | 48.4 | 31.3 | 8.8 | |
| Dota 2 Reborn (2015) | 92.3 | 64.9 | 32.9 | 29.6 |
| Final Fantasy XV Benchmark (2018) | 22.1 | 10.5 | 8.15 | |
| X-Plane 11.11 (2018) | 38 | 30 | 27.9 | |
| Far Cry 5 (2018) | 29 | |||
| Strange Brigade (2018) | 49 | 18.2 | 15.4 | 13.2 |
| Diablo 4 (2023) | 16.3 |
Emisje - ciche B7 Power
Emisja hałasu
Okej - jego wydajność jest niższa od przeciętnej, ale czy B7 Power może przynajmniej zrehabilitować się pod względem emisji i pokazać się jako cichy, oszczędny mini PC?
B7 Power ma tylko jeden wentylator. Nawet w trybie bezczynności jest on aktywowany po krótkim czasie. Trzeba jednak zbliżyć ucho do obudowy, aby usłyszeć te 25 dB. Nawet pod maksymalnym obciążeniem wentylator nie hałasuje zbytnio - zmierzyliśmy 27 dB.
Mocniejszy NUC13 jest znacznie głośniejszy z emisją hałasu przekraczającą 40 dB. B7 Power jest zdecydowanie najcichszym mini PC w tym porównaniu.
Hałas
| luz |
| 23 / 25.12 / 25.12 dB |
| obciążenie |
| 27.15 / 27.15 dB |
 | ||
30 dB cichy 40 dB(A) słyszalny 50 dB(A) irytujący |
||
min: | ||
| BMAX B7 Power G7A2 Iris Xe G7 96EUs, i7-11390H, Kston K765-1TB | Geekom Mini IT11, i7-11390H Iris Xe G7 96EUs, i7-11390H, Lexar 1024GB LNM6A1X001T-HNNNG | Intel NUC 13 Pro Kit NUC13ANK Iris Xe G7 96EUs, i7-1360P, Samsung PM9A1 MZVL2512HCJQ | Beelink SEi11 Pro Iris Xe G7 96EUs, i5-11320H, Kingston NV1 SNVS/500GCN | BMAX B5 Pro G7H8 UHD Graphics 620, i5-8260U | |
|---|---|---|---|---|---|
| Noise | -23% | -35% | -13% | -7% | |
| wyłączone / środowisko * (dB) | 23 | 29.7 -29% | 29.8 -30% | 22.8 1% | 23 -0% |
| Idle Minimum * (dB) | 23 | 30.2 -31% | 30.2 -31% | 24.7 -7% | 25.1 -9% |
| Idle Average * (dB) | 25.12 | 30.2 -20% | 31.1 -24% | 24.7 2% | 25.1 -0% |
| Idle Maximum * (dB) | 25.12 | 30.2 -20% | 31.9 -27% | 25.3 -1% | 25.1 -0% |
| Load Average * (dB) | 27.15 | 30.6 -13% | 40 -47% | 33.2 -22% | 28.6 -5% |
| Witcher 3 ultra * (dB) | 27.15 | 30.5 -12% | 34.5 -27% | 30.1 -11% | |
| Load Maximum * (dB) | 27.15 | 36.4 -34% | 40.5 -49% | 37.8 -39% | 34 -25% |
* ... im mniej tym lepiej
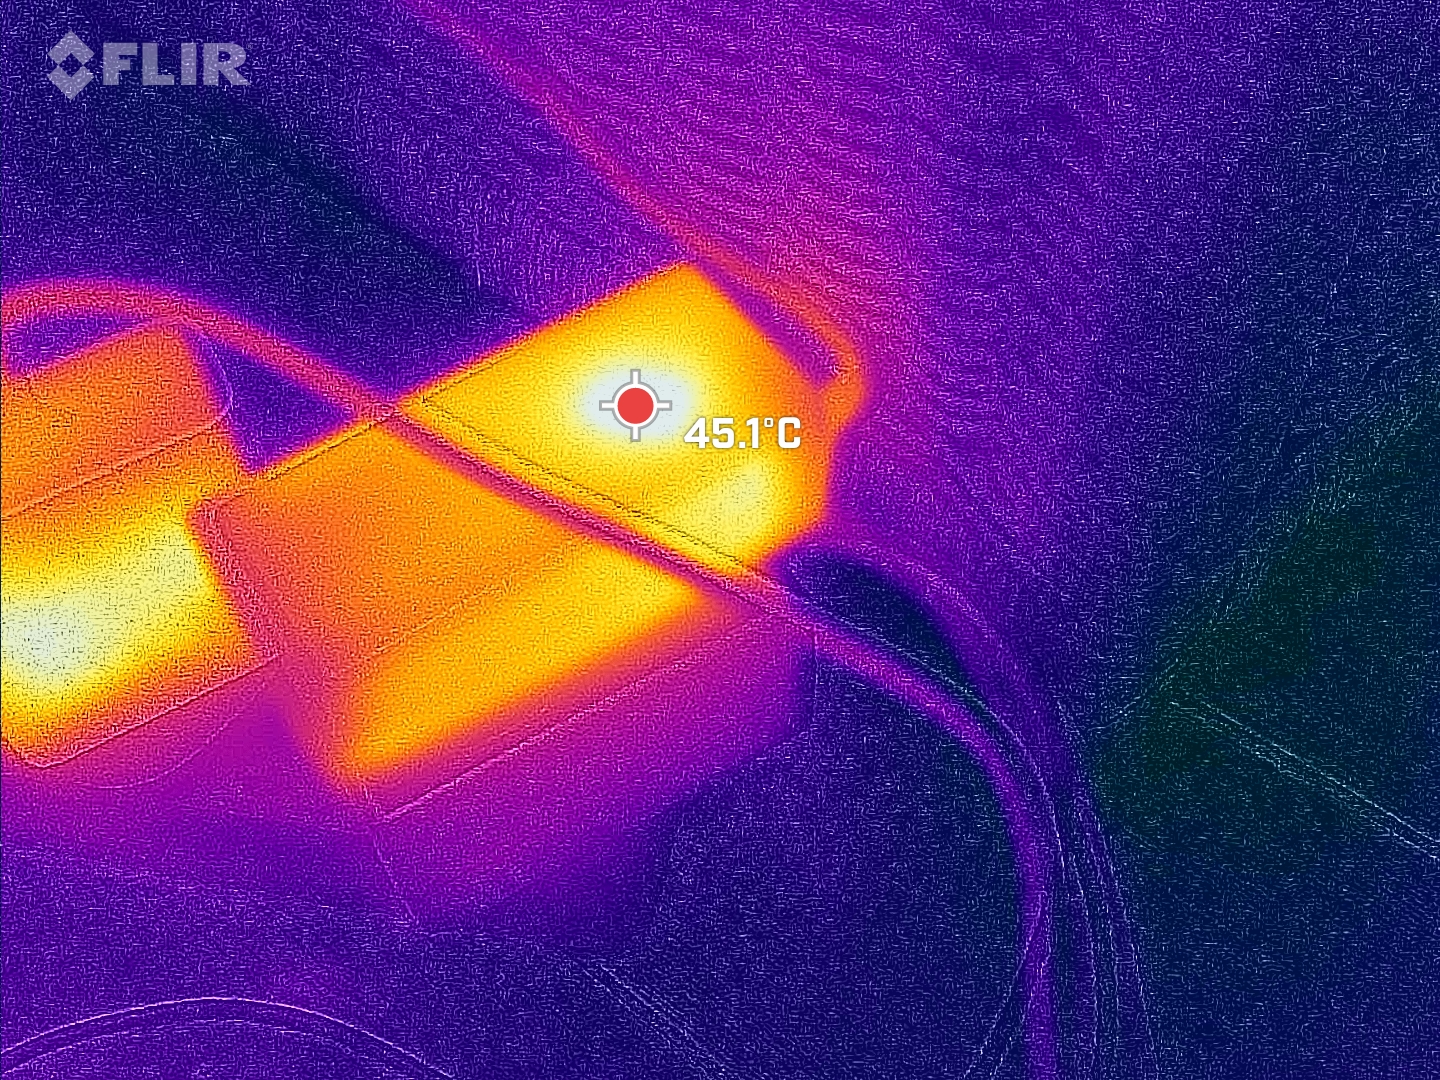
Temperatura
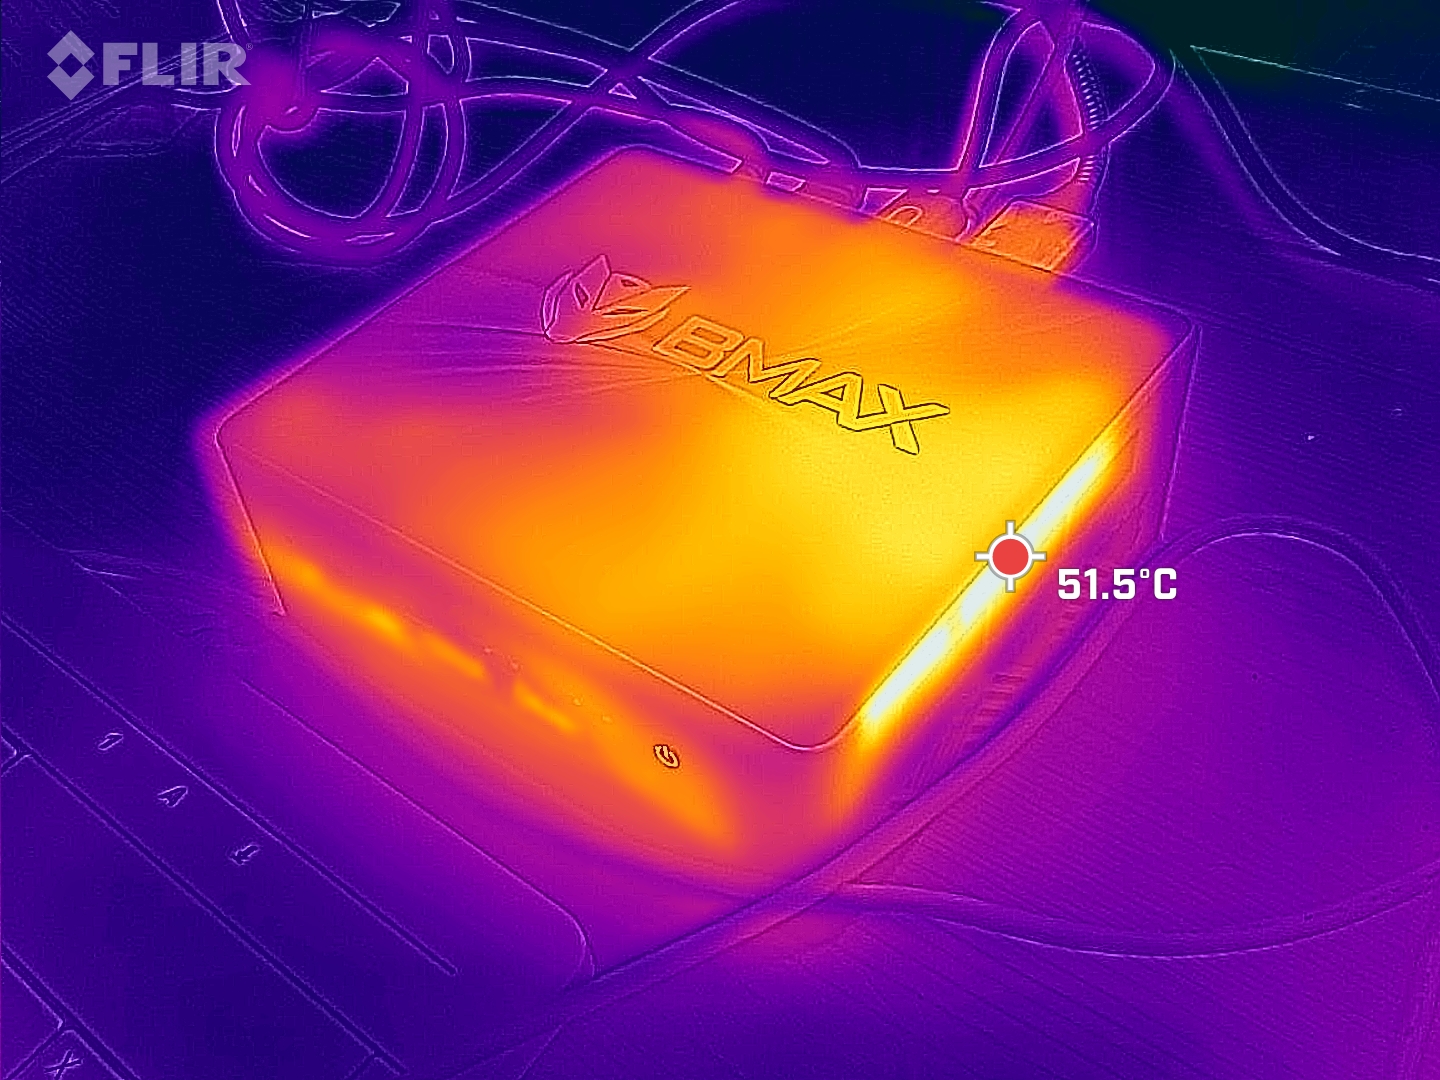
Z drugiej strony, cichy wentylator prowadzi również do dość wysokich temperatur - ale na szczęście tylko tam, gdzie znajduje się kratka wentylacyjna. Górna i dolna część obudowy osiągnęła średnią temperaturę 43 °C podczas testów gamingowych i obciążeniowych. Tam, gdzie powietrze jest wydmuchiwane z obudowy po prawej stronie, zmierzyliśmy do 54 °C.
(±) Maksymalna temperatura w górnej części wynosi 43 °C / 109 F, w porównaniu do średniej 35.4 °C / 96 F , począwszy od 20.6 do 69.5 °C dla klasy Mini PC.
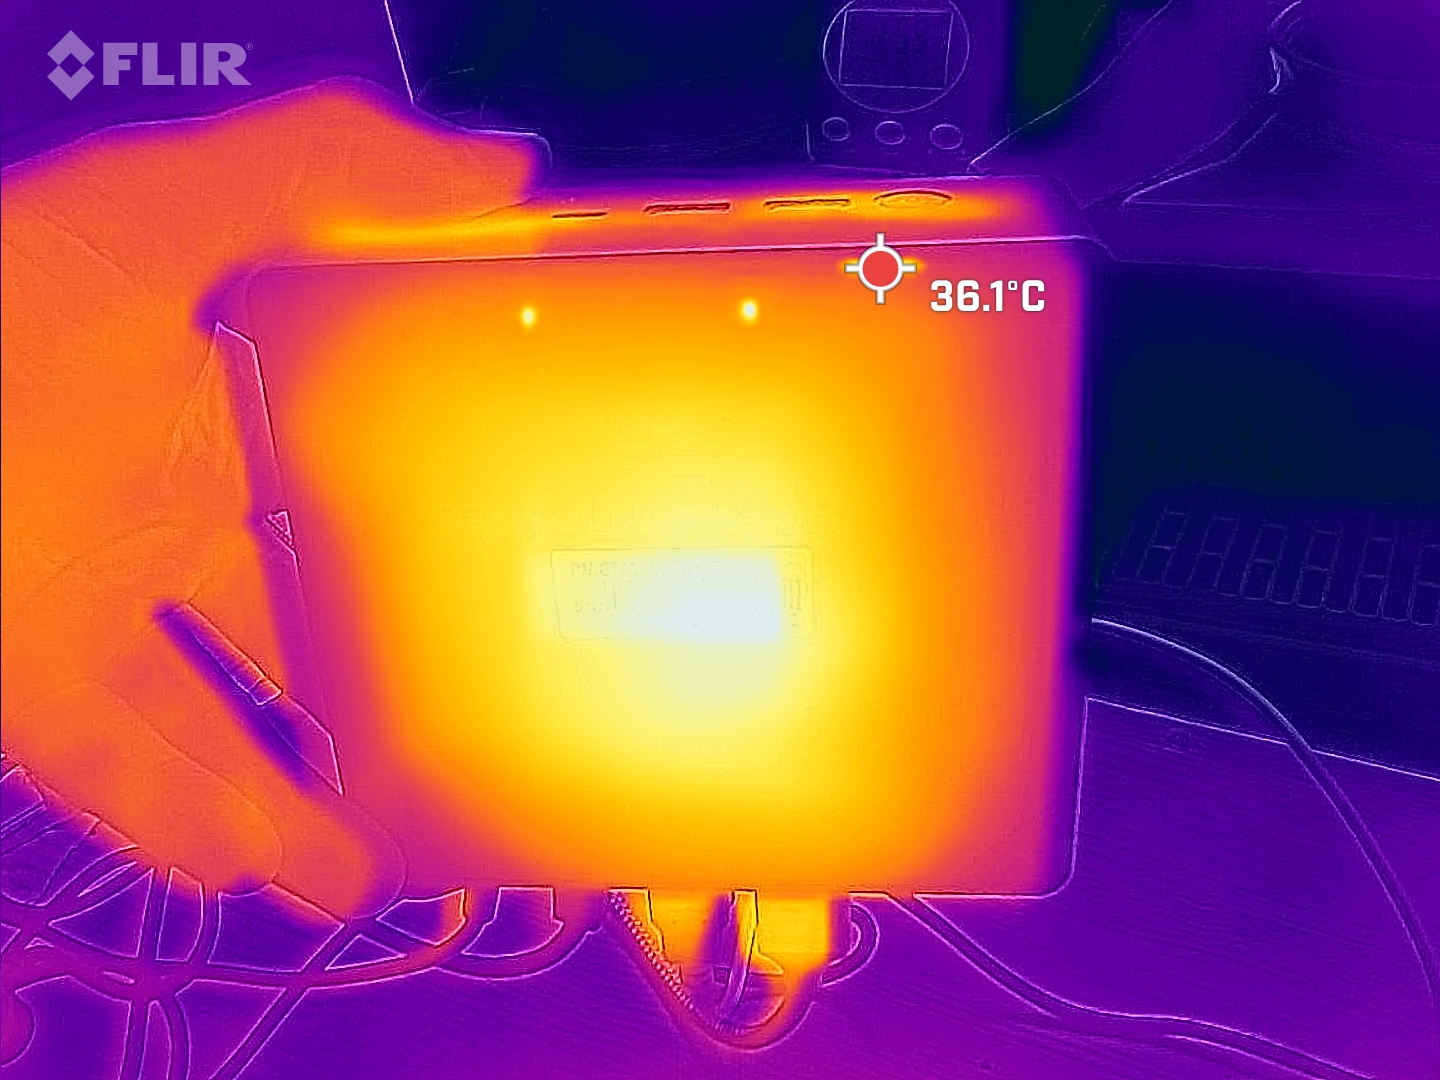
(±) Dno nagrzewa się maksymalnie do 42 °C / 108 F, w porównaniu do średniej 36.1 °C / 97 F
(±) W stanie bezczynności średnia temperatura górnej części wynosi 35.2 °C / 95 F, w porównaniu ze średnią temperaturą urządzenia wynoszącą 32.1 °C / ### class_avg_f### F.
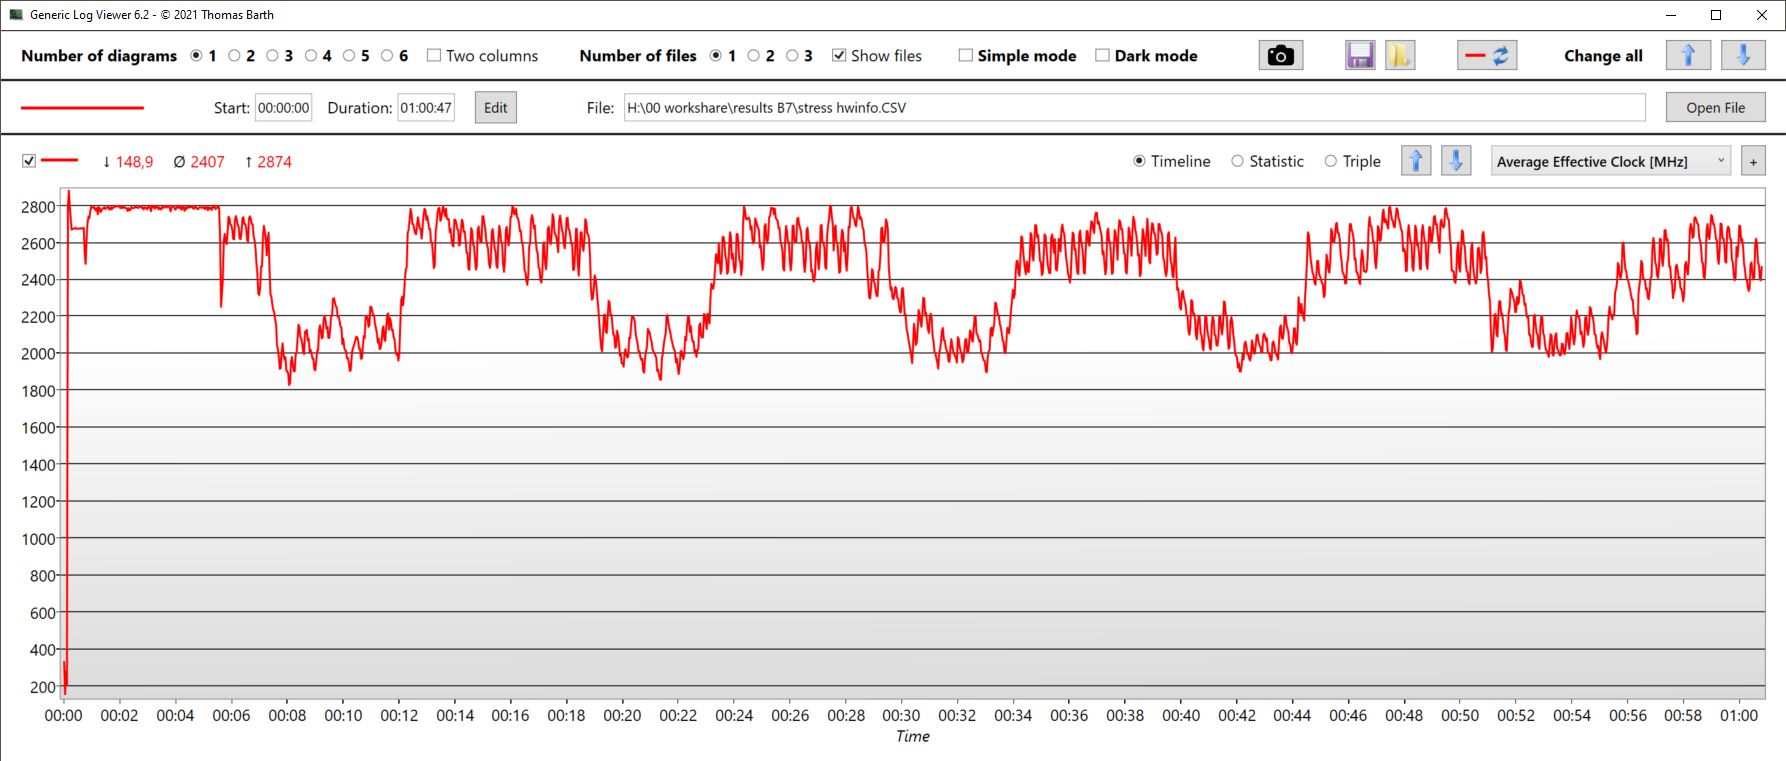
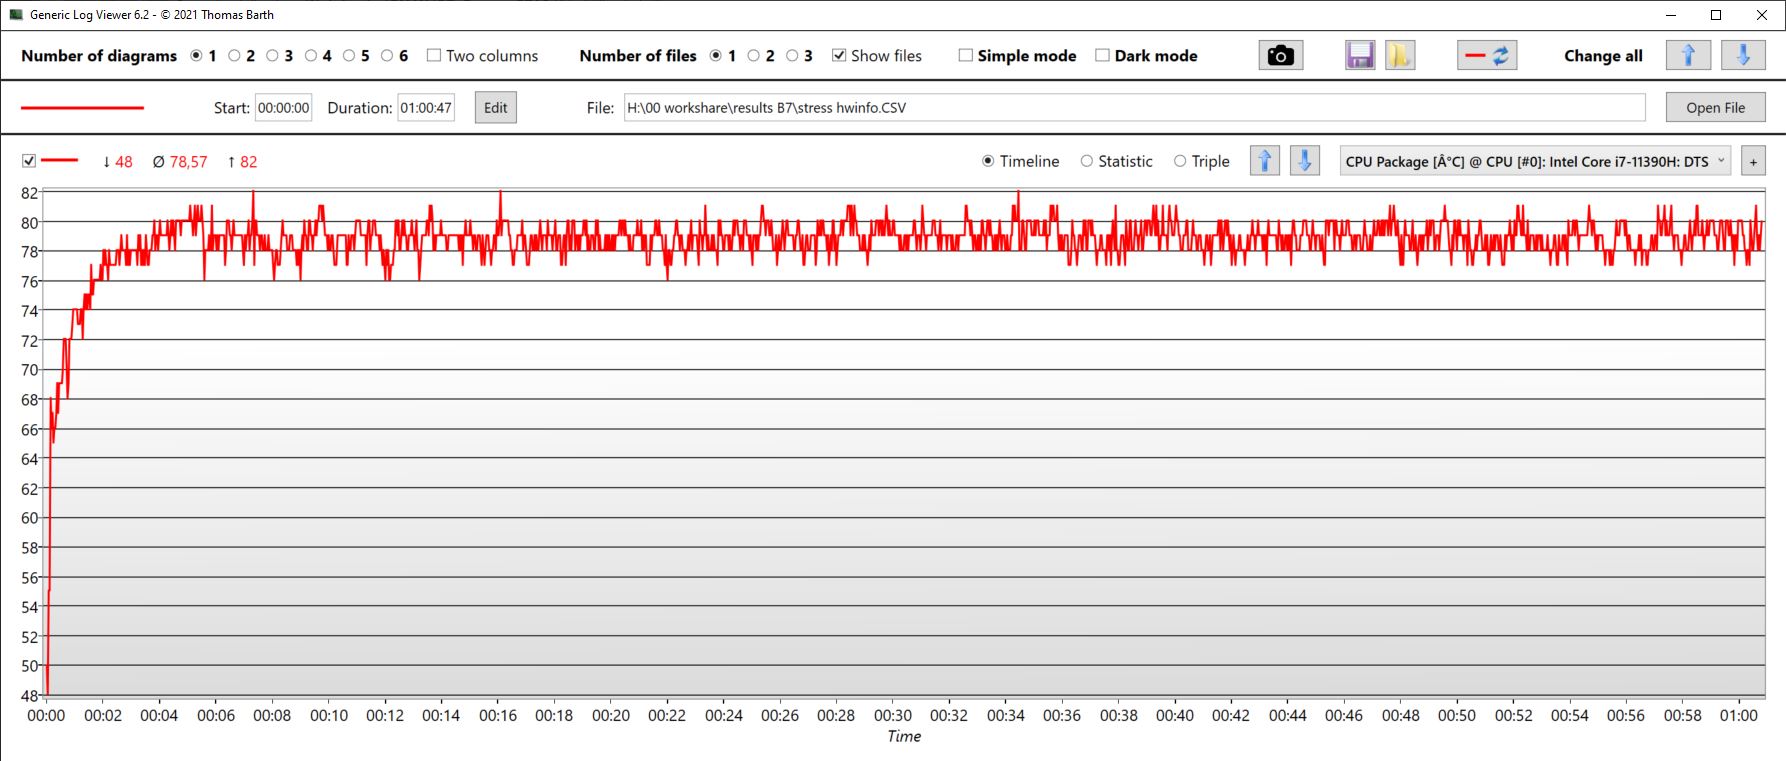
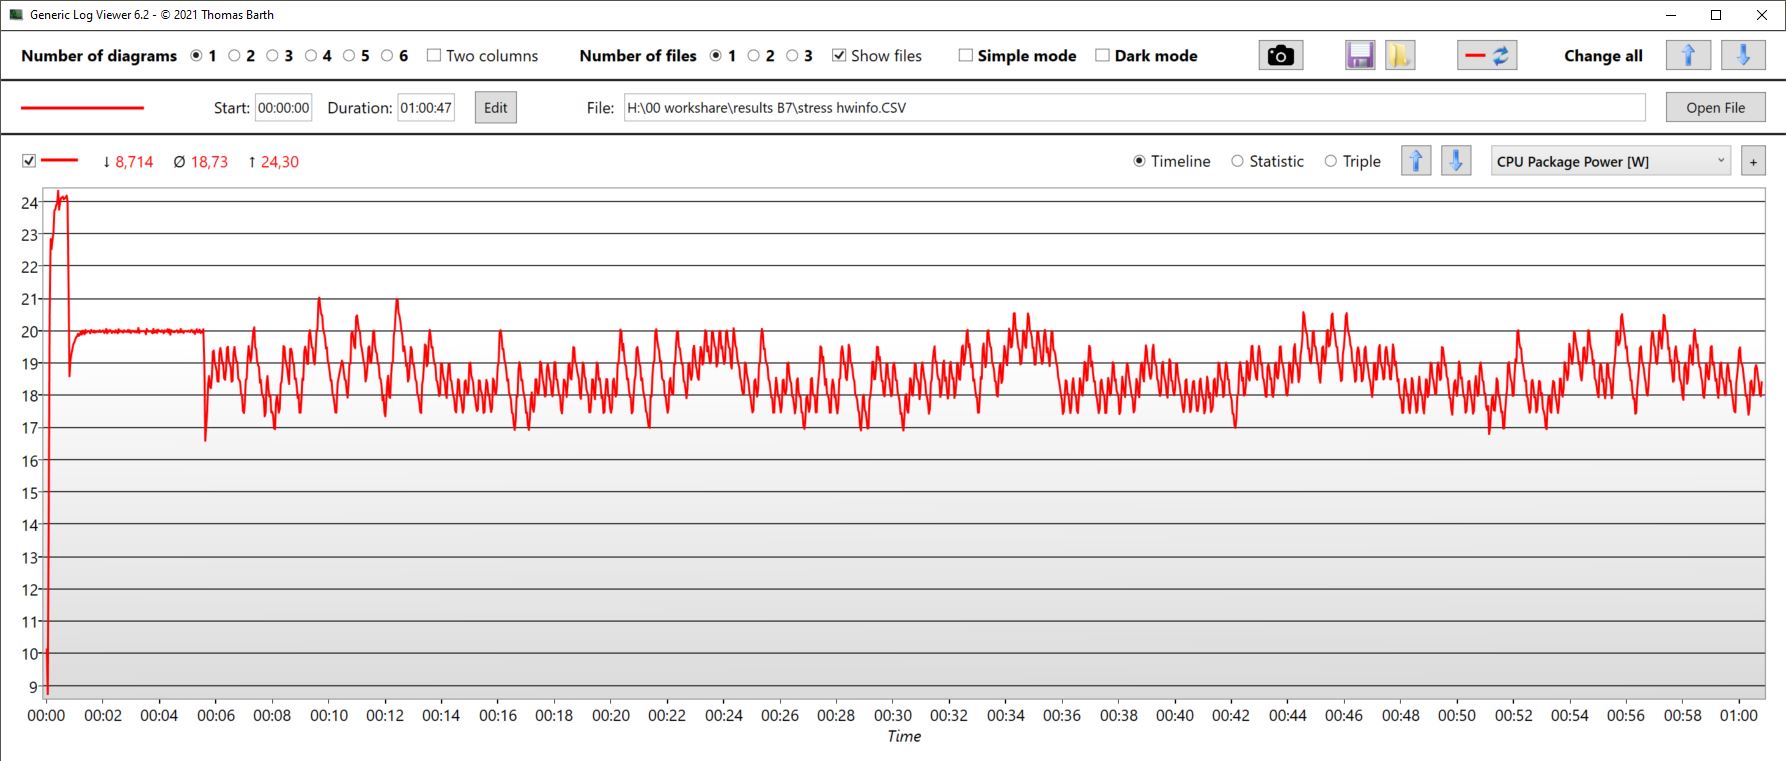
Test warunków skrajnych
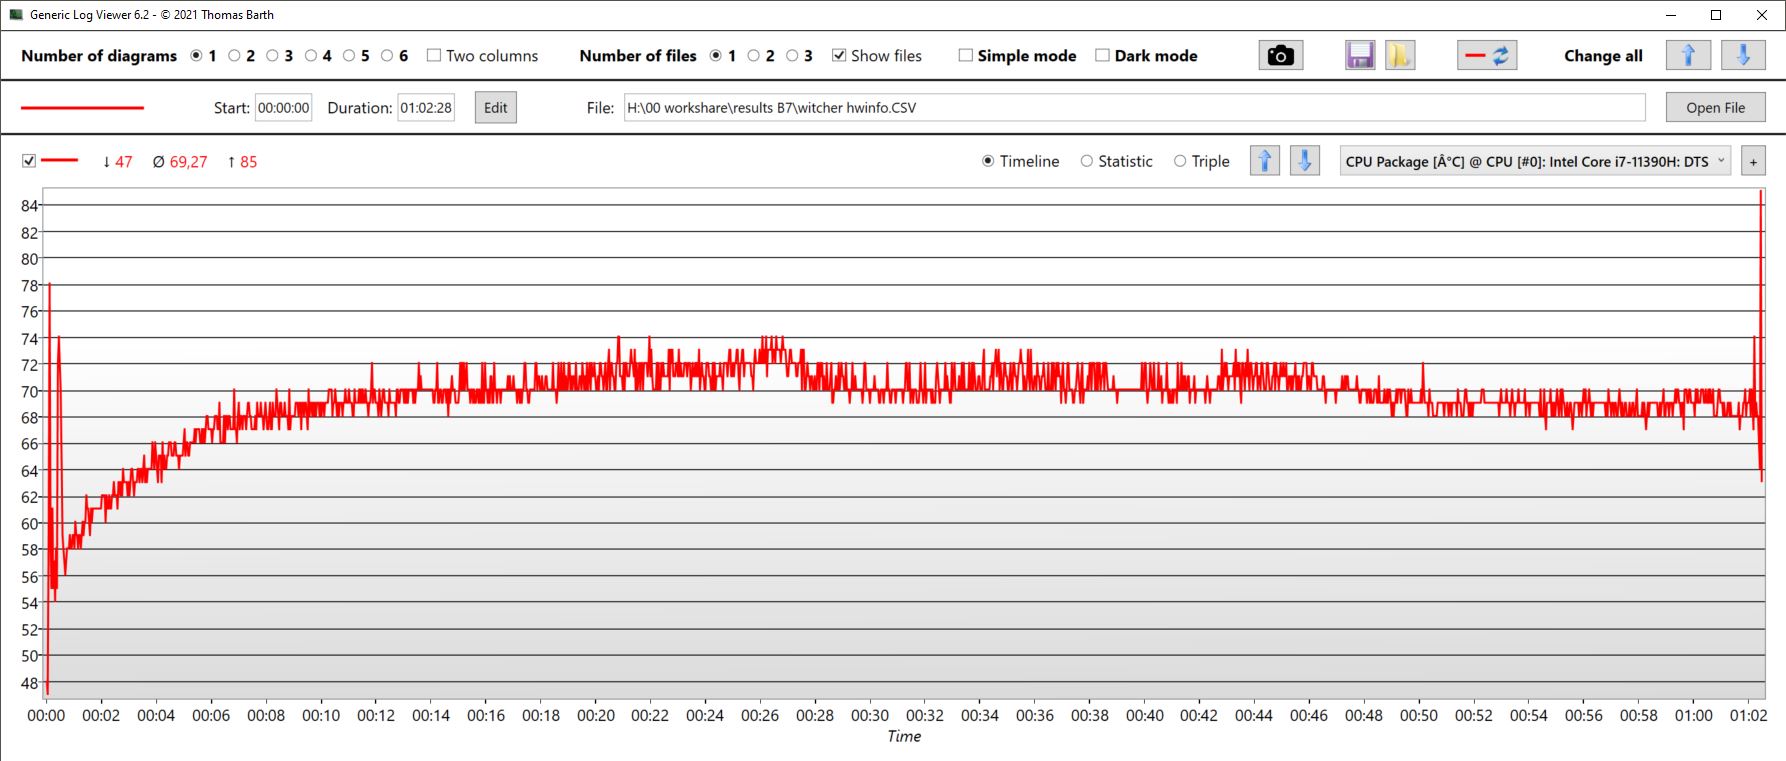
Prime95 i Furmark działały jednocześnie w teście warunków skrajnych. Taktowanie procesora wzrosło na krótko do ponad 2,8 GHz. Po krótkim spadku taktowanie procesora utrzymywało się na poziomie 2,8 GHz przez kolejne pięć minut, po czym cyklicznie spadało do wartości od 1,8 do 2,3 GHz. Temperatura poszczególnych rdzeni nigdy nie przekroczyła 78°C. Procesor jako całość rozgrzewał się jednak do 82°C, ale średnio utrzymywało się 78°C.
Pobór mocy CPU wynosił 24 W na początku, ale średnio tylko około 19 W.
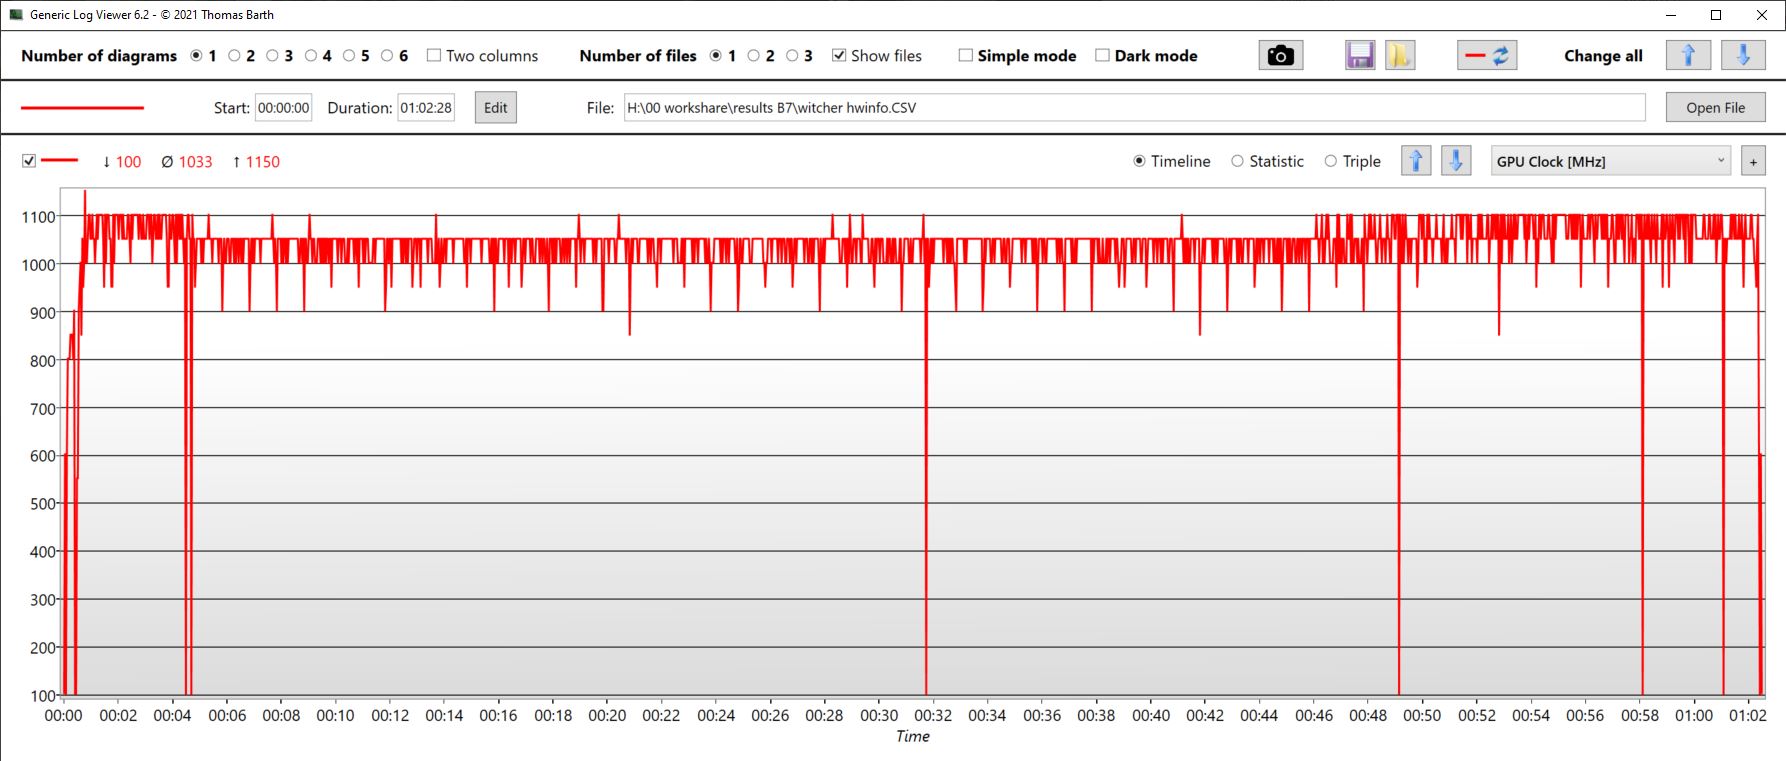
Zintegrowany procesor graficzny taktowany był zegarem 1,4 GHz przez bardzo krótki czas, po czym nastąpił ten sam okresowy spadek taktowania z około 600 MHz do 100 do 350 MHz. Średnio jednostka graficzna taktowała z częstotliwością 400 MHz.
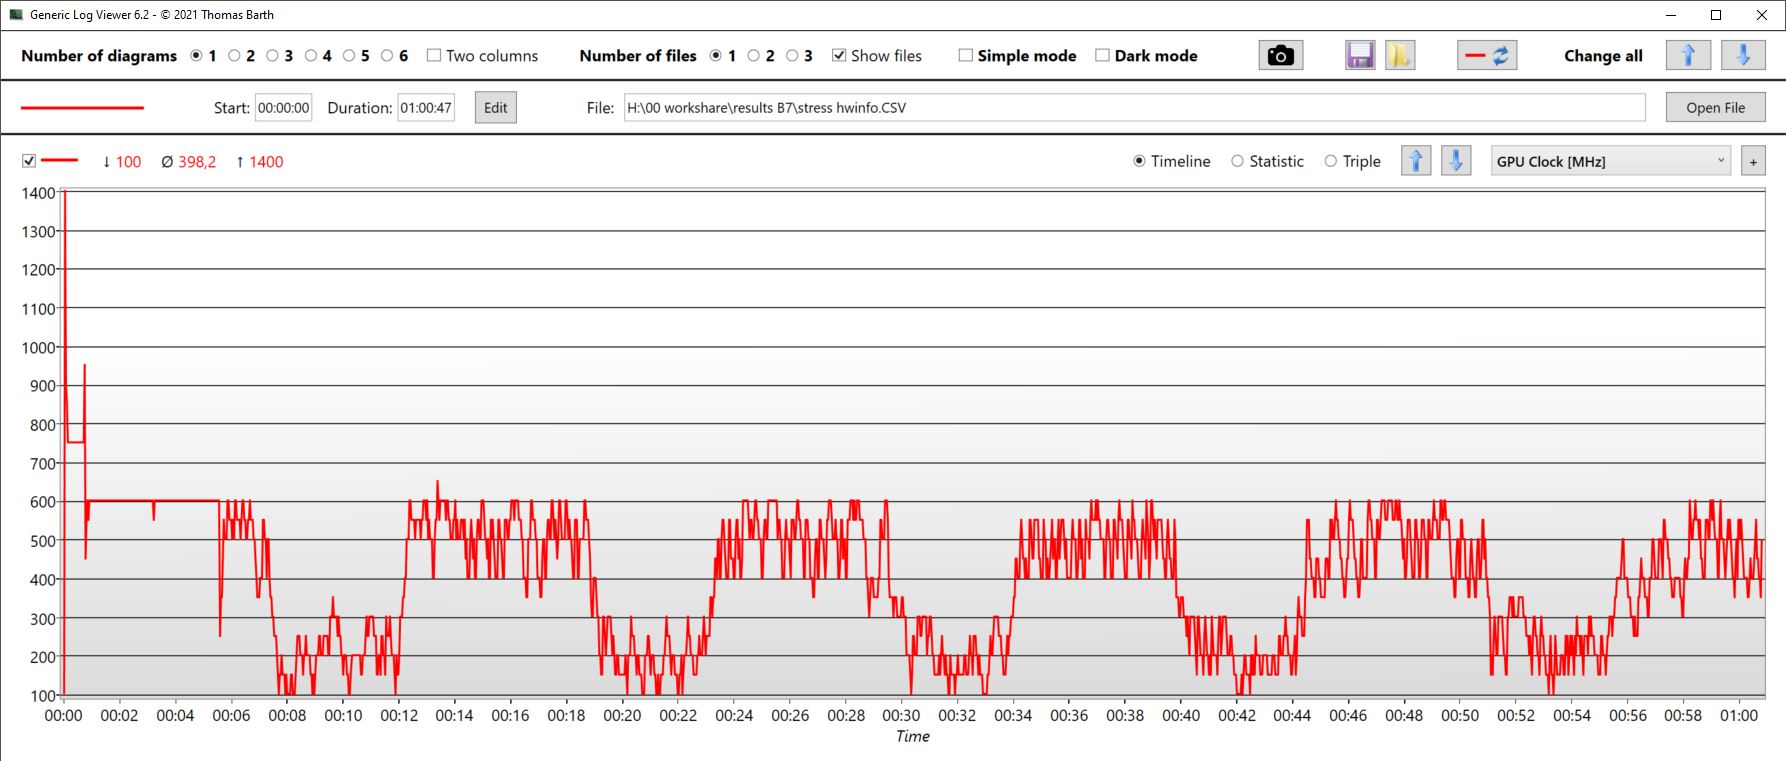
| Taktowanie CPU (GHz) | Taktowanie GPU (MHz) | Średnia temperatura CPU (°C) | Średnia temperatura GPU (°C) | |
| Prime95 + FurMark stress | 2.4 | 400 | 79 | 79 |
| Witcher 3 stres | 0.7 | 1033 | 69 | 69 |
Zarządzanie energią - bardzo oszczędny BMAX B7
Zużycie energii
Ogólnie rzecz biorąc, B7 Power jest bardzo oszczędny. W zależności od trybu zasilania, zmierzyliśmy od 9 do 10 watów w trybie bezczynności. B7 naprawdę pokazuje, jak oszczędny jest pod obciążeniem.
Jego bezwzględne maksymalne zużycie wyniosło tymczasowo nieco poniżej 44 watów - jednak średnio B7 Power nie zużywa stale więcej niż 35 watów. Jego niewielki zasilacz ma moc znamionową 47,5 W (19 V i 2,5 A). Alternatywnie, możesz zasilać B7 przez złącze USB-C, o ile ładowarka spełnia minimalne specyfikacje.
Uwaga: jeśli B7 jest wyłączony, nadal zużywa prawie 1 W. Ponadto porty USB pobierają przez nie energię. W rezultacie nasza mysz RGB nadal świeci, nawet gdy jest wyłączona. Bez klawiatury i myszy, B7 zużywa 830 mW po wyłączeniu. Z myszą i klawiaturą, jego zużycie wynosi częściowo ponad 1 wat. W zależności od zastosowania, zalecamy przełączalne gniazdo zasilania dla B7 Power.
| wyłączony / stan wstrzymania | |
| luz | |
| obciążenie |
|
Legenda:
min: | |
| BMAX B7 Power G7A2 i7-11390H, Iris Xe G7 96EUs, Kston K765-1TB, , x, | Geekom Mini IT11, i7-11390H i7-11390H, Iris Xe G7 96EUs, Lexar 1024GB LNM6A1X001T-HNNNG, , x, | Intel NUC 13 Pro Kit NUC13ANK i7-1360P, Iris Xe G7 96EUs, Samsung PM9A1 MZVL2512HCJQ, , x, | Beelink SEi11 Pro i5-11320H, Iris Xe G7 96EUs, Kingston NV1 SNVS/500GCN, , x, | BMAX B5 Pro G7H8 i5-8260U, UHD Graphics 620, , , x, | Przeciętny Intel Iris Xe Graphics G7 96EUs | Średnia w klasie Mini PC | |
|---|---|---|---|---|---|---|---|
| Power Consumption | -8% | -61% | -48% | -8% | -28% | -86% | |
| Idle Minimum * (Watt) | 9.1 | 7.3 20% | 5.1 44% | 9.8 -8% | 6 34% | 5.51 ? 39% | 8.67 ? 5% |
| Idle Average * (Watt) | 9.5 | 7.8 18% | 5.8 39% | 10.3 -8% | 6.2 35% | 8.66 ? 9% | 10.8 ? -14% |
| Idle Maximum * (Watt) | 10 | 8.4 16% | 10.2 -2% | 10.5 -5% | 6.3 37% | 10.9 ? -9% | 13.6 ? -36% |
| Load Average * (Watt) | 27.1 | 28.7 -6% | 68.1 -151% | 54.2 -100% | 42.8 -58% | 45.6 ? -68% | 64.8 ? -139% |
| Witcher 3 ultra * (Watt) | 29.1 | 53.1 -82% | 35 -20% | ||||
| Load Maximum * (Watt) | 32.3 | 61.1 -89% | 108.3 -235% | 59 -83% | 55.8 -73% | 67.8 ? -110% | 112.3 ? -248% |
* ... im mniej tym lepiej
Power consumption with external monitor
Za
Przeciw
Werdykt - bardziej jak "B7 Ekonomiczny"
BMAX B7 Power niepotrzebnie stwarza fałszywe wrażenie. Zainstalowany procesor pochodzi sprzed dwóch generacji i jest bardzo powolny nawet jak na swoje standardy, ponieważ jest dławiony. Jednocześnie B7 nie musi się wstydzić, ponieważ jego mocne strony - takie jak cicha praca i oszczędność - przemawiają za tym, że komputer jest wykorzystywany do zupełnie innych celów.
Mini PC X86 nadaje się do wszystkich zastosowań wymagających określonego poziomu wydajności przy jednoczesnym utrzymaniu niskiego zużycia energii i emisji hałasu. Obejmuje to wiele scenariuszy, takich jak używanie go jako domowego serwera, konsoli retro i tak dalej. B7 Power jest po prostu źle sprzedawany. Jeśli nadal kupujesz Intel Gen11 w dzisiejszych czasach, to prawdopodobnie i tak nie będziesz mieć oczu na najwyższą wydajność - w rezultacie prawdziwe mocne strony B7 powinny być bardziej sprzedawane. O wiele bardziej odpowiednie byłoby nadanie mu nazwy takiej jak B7 Power Server, B7 Home Server lub B7 Efficient.
Jeśli szukasz maksymalnej "mocy", to BMAX B7 Power z dławionym GPU Gen11 jest w złym miejscu. Z drugiej strony, jeśli polujesz na serwer domowy lub podobny, to urządzenie jest dla Ciebie idealne.
Cena i dostępność
BMAX B7 Power G7A2
- 12/09/2023 v7 (old)
Christian Hintze
Przezroczystość
Wyboru urządzeń do recenzji dokonuje nasza redakcja. Próbka testowa została udostępniona autorowi jako pożyczka od producenta lub sprzedawcy detalicznego na potrzeby tej recenzji. Pożyczkodawca nie miał wpływu na tę recenzję, producent nie otrzymał też kopii tej recenzji przed publikacją. Nie było obowiązku publikowania tej recenzji. Jako niezależna firma medialna, Notebookcheck nie podlega władzy producentów, sprzedawców detalicznych ani wydawców.
Tak testuje Notebookcheck
Każdego roku Notebookcheck niezależnie sprawdza setki laptopów i smartfonów, stosując standardowe procedury, aby zapewnić porównywalność wszystkich wyników. Od około 20 lat stale rozwijamy nasze metody badawcze, ustanawiając przy tym standardy branżowe. W naszych laboratoriach testowych doświadczeni technicy i redaktorzy korzystają z wysokiej jakości sprzętu pomiarowego. Testy te obejmują wieloetapowy proces walidacji. Nasz kompleksowy system ocen opiera się na setkach uzasadnionych pomiarów i benchmarków, co pozwala zachować obiektywizm.Price comparison

