Recenzja mini PC Beelink SER5 Pro 5600H: NUC 11 przyspiesza z AMD Ryzen
")
Podobnie jak Zotac i jego notorycznie duży wybór mini komputerów ZBox, Beelink chce zrobić to samo, wypuszczając co kilka miesięcy nowe modele wyposażone w coraz szybsze procesory. Beelink SER4 pojawił się na początku tego roku z procesorem Zen 2 Ryzen 7 4800U, ale teraz SER5 trafił na rynek z jeszcze szybszym Zen 3 Ryzen 5 5600H wszystko przy zachowaniu cen znacznie poniżej 500 USD
Konkurenci w tej przestrzeni to inne mini PC lub HTPC bez dyskretnej grafiki, jak np Ace Magician TK11, Geekom MiniAir 11, Zotac ZBox PI336oraz większość Modeli Intel NUC
Więcej recenzji Beelink:
Potencjalni konkurenci w porównaniu
Ocena | Data | Model | Waga | Wysokość | Rozmiar | Rezolucja | Cena |
|---|---|---|---|---|---|---|---|
v (old) | 10/2022 | Beelink SER Pro Ryzen 5 5600H R5 5600H, Vega 7 | 498 g | 42 mm | x | ||
v (old) | 10/2022 | Beelink SEi11 Pro i5-11320H, Iris Xe G7 96EUs | 440 g | 40 mm | x | ||
v (old) | Beelink GTR5 R9 5900HX, Vega 8 | 686 g | 39 mm | x | |||
v (old) | Intel NUC11TNKi5 i5-1135G7, Iris Xe G7 80EUs | 504 g | 37 mm | x | |||
v (old) | Intel NUC10i7FNH i7-10710U, UHD Graphics 620 | 697 g | 51 mm | 0.00" | 0x0 | ||
v (old) | Zotac ZBOX PI336 pico Celeron N6211, UHD Graphics (Elkhart Lake 16 EU) | 293 g | 20.7 mm | x |
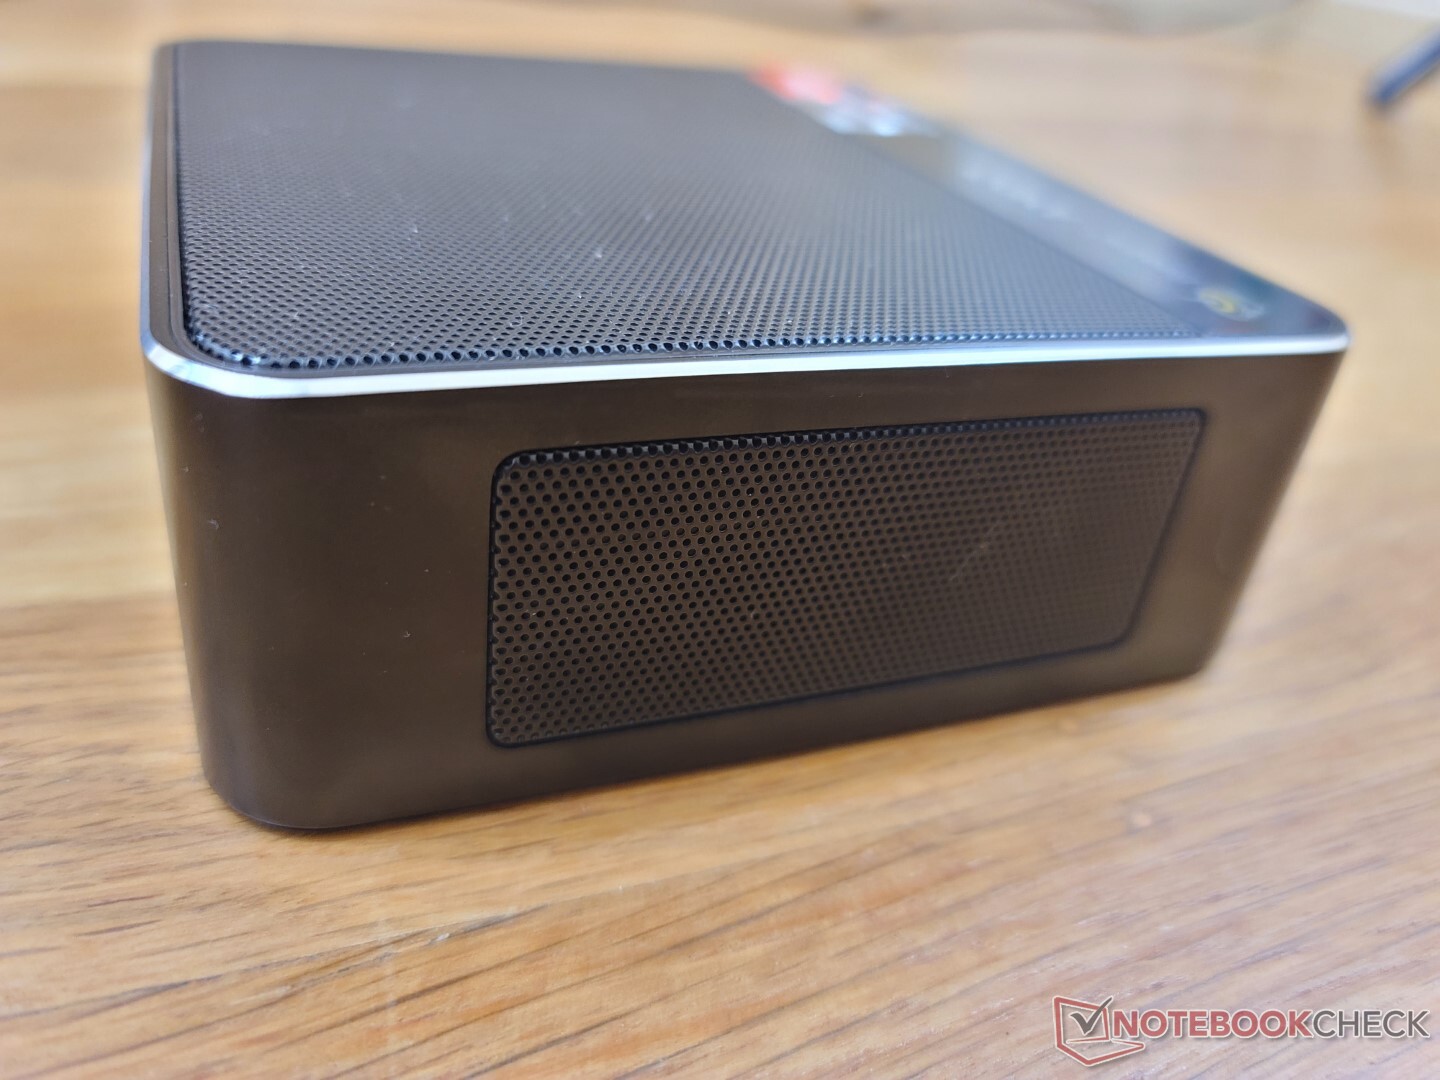
Sprawa
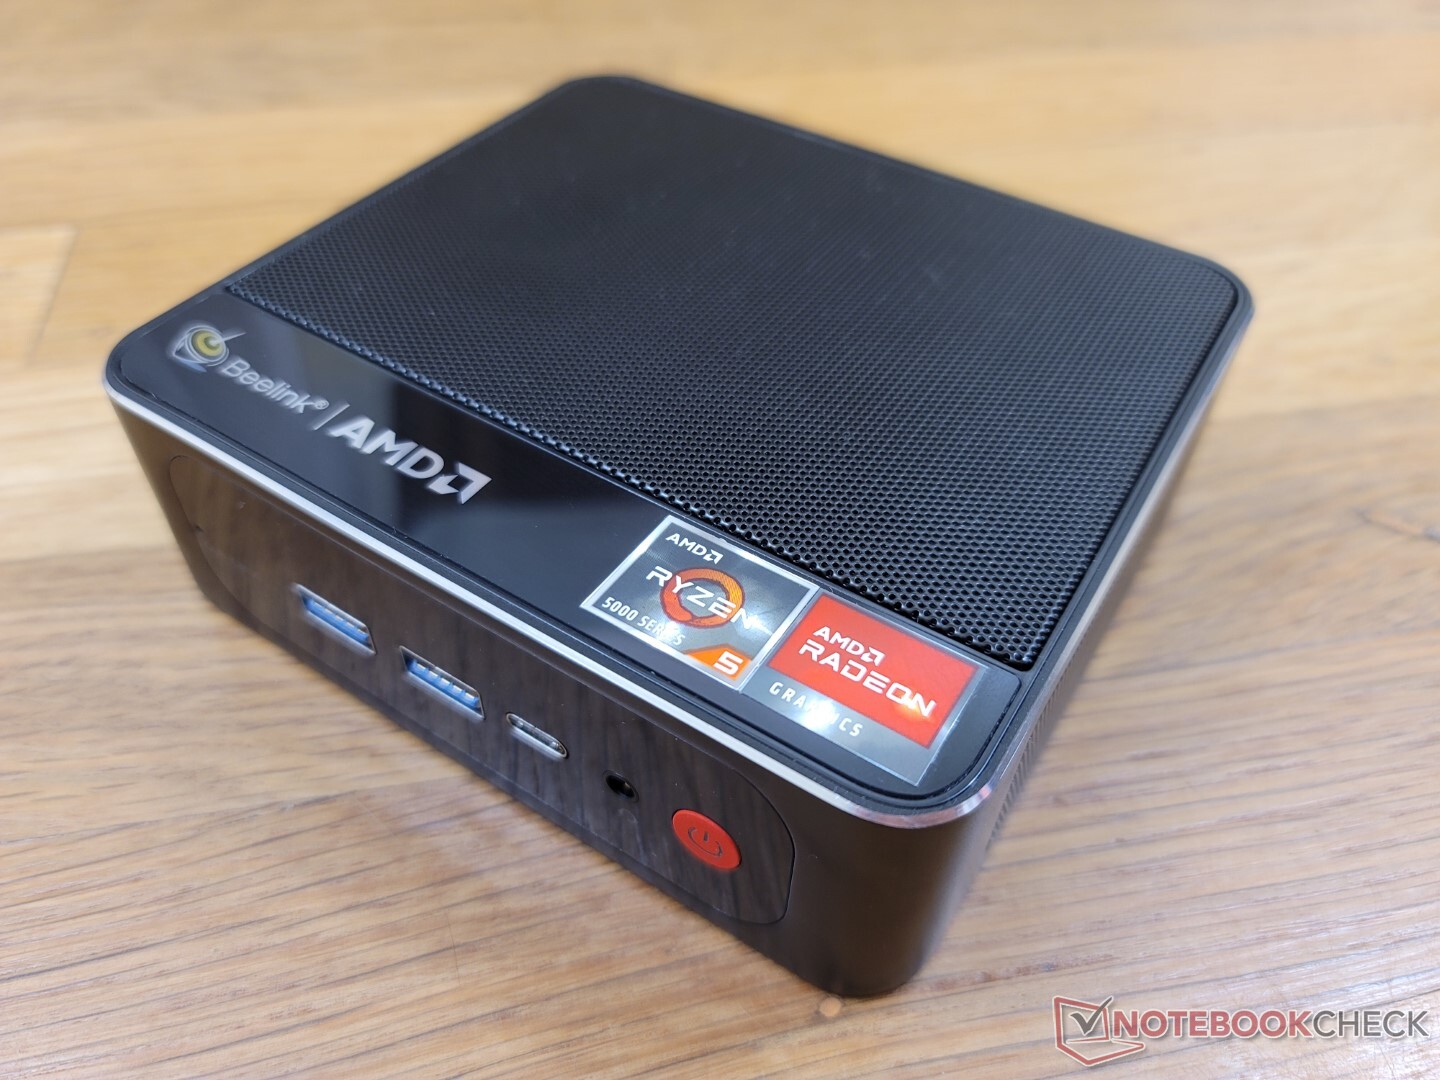
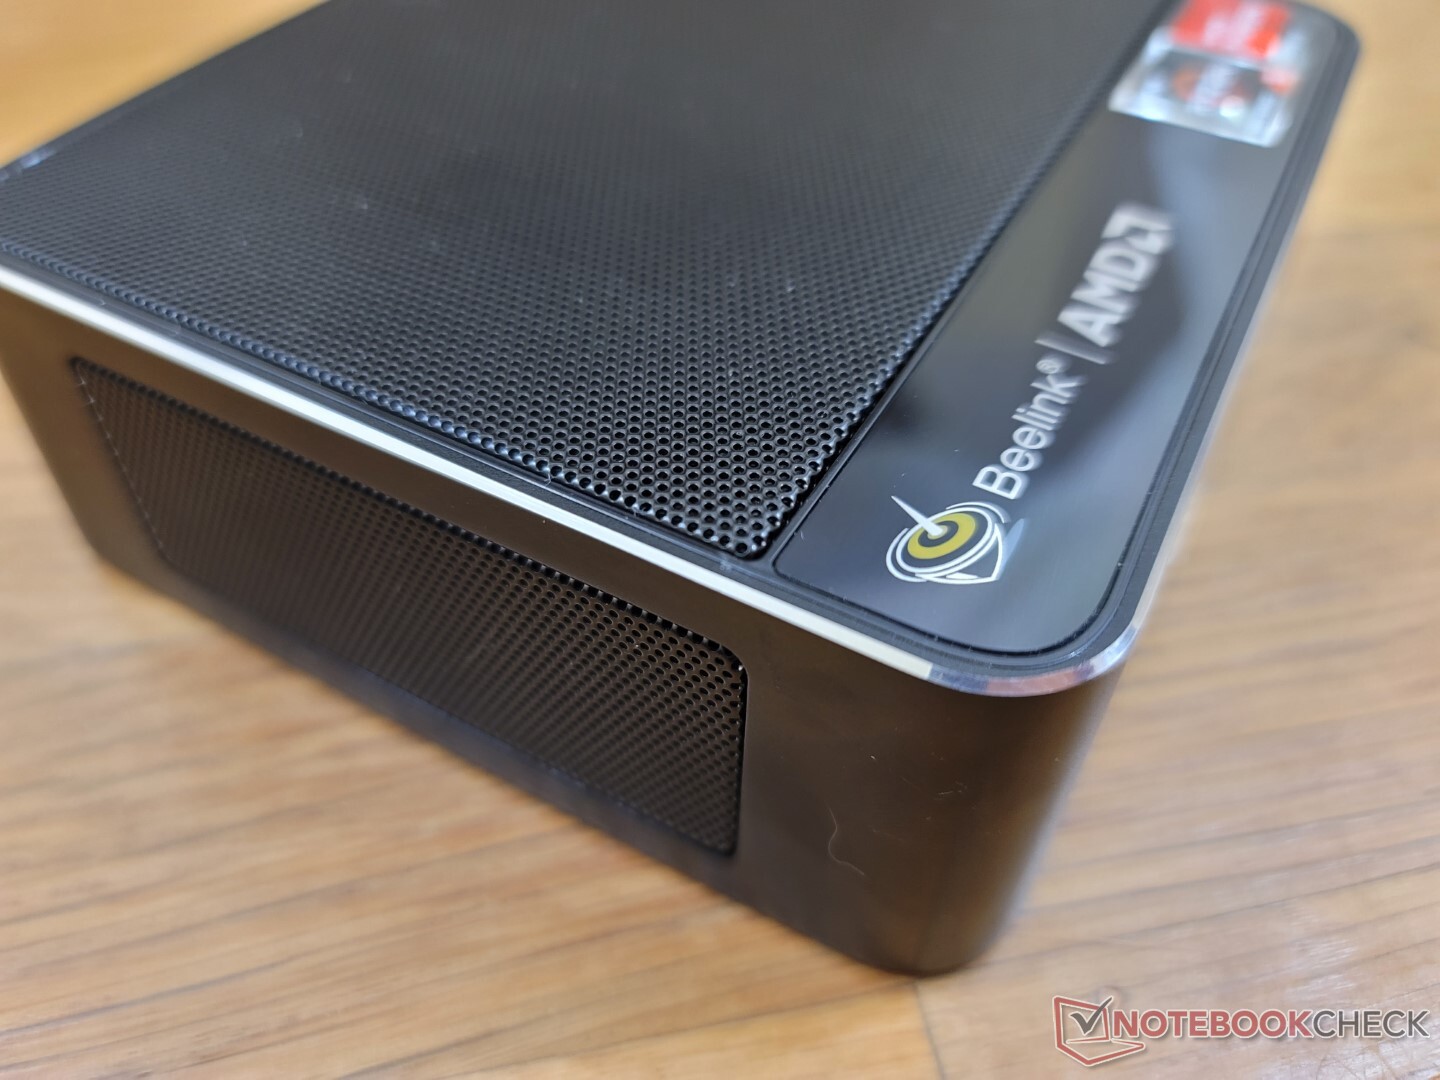
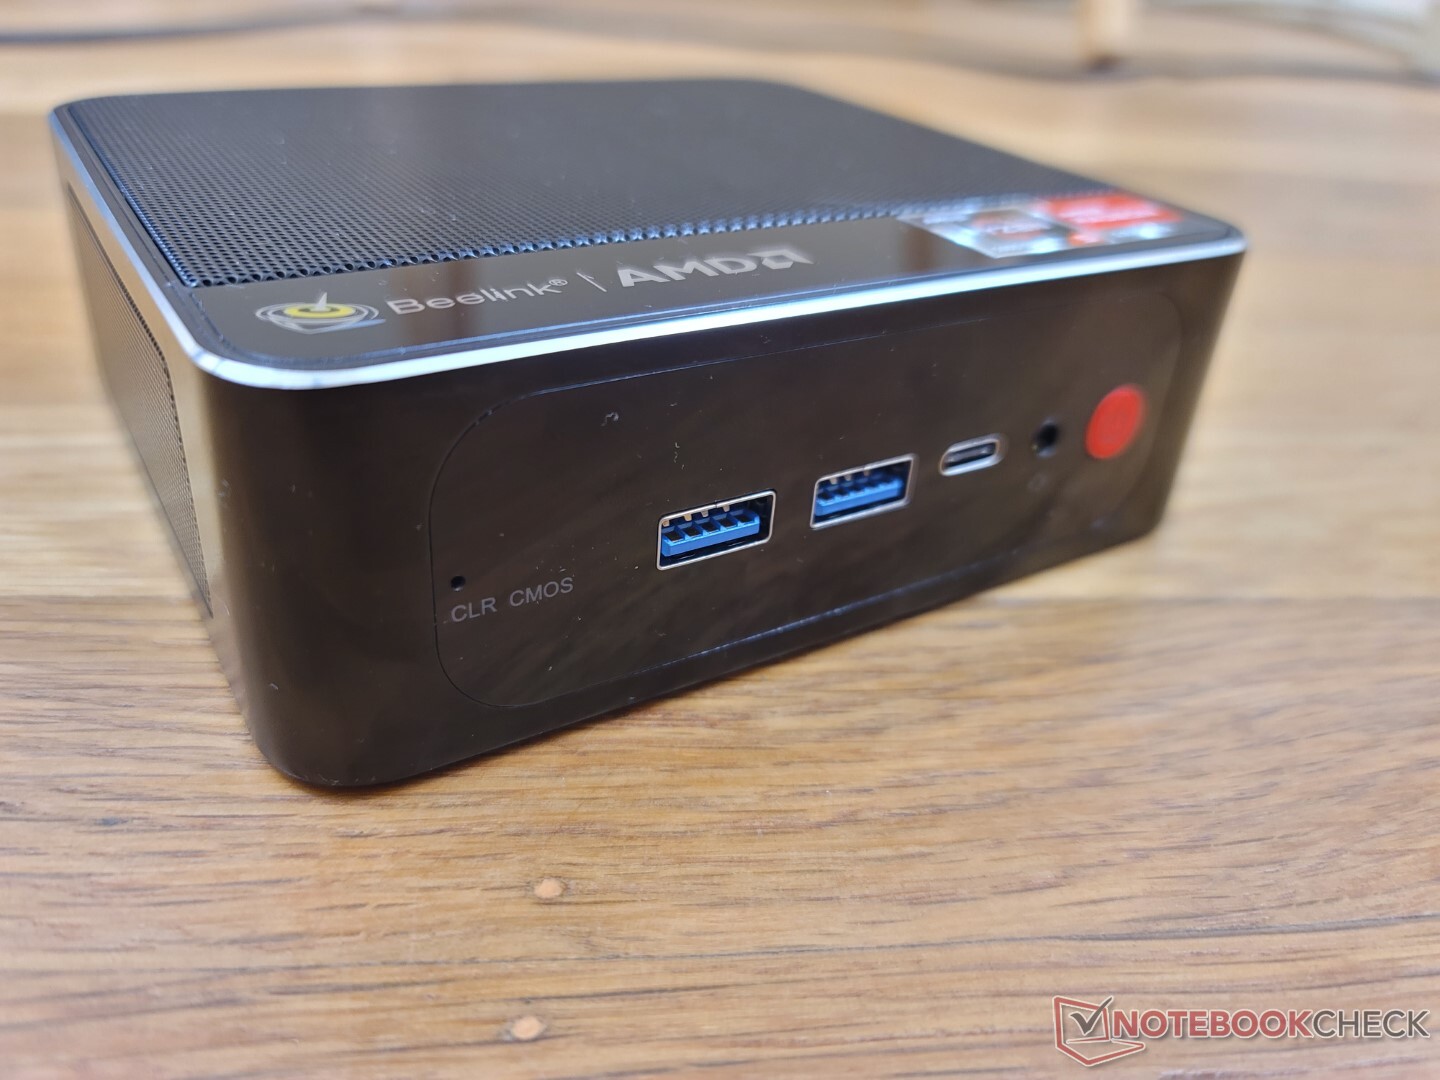
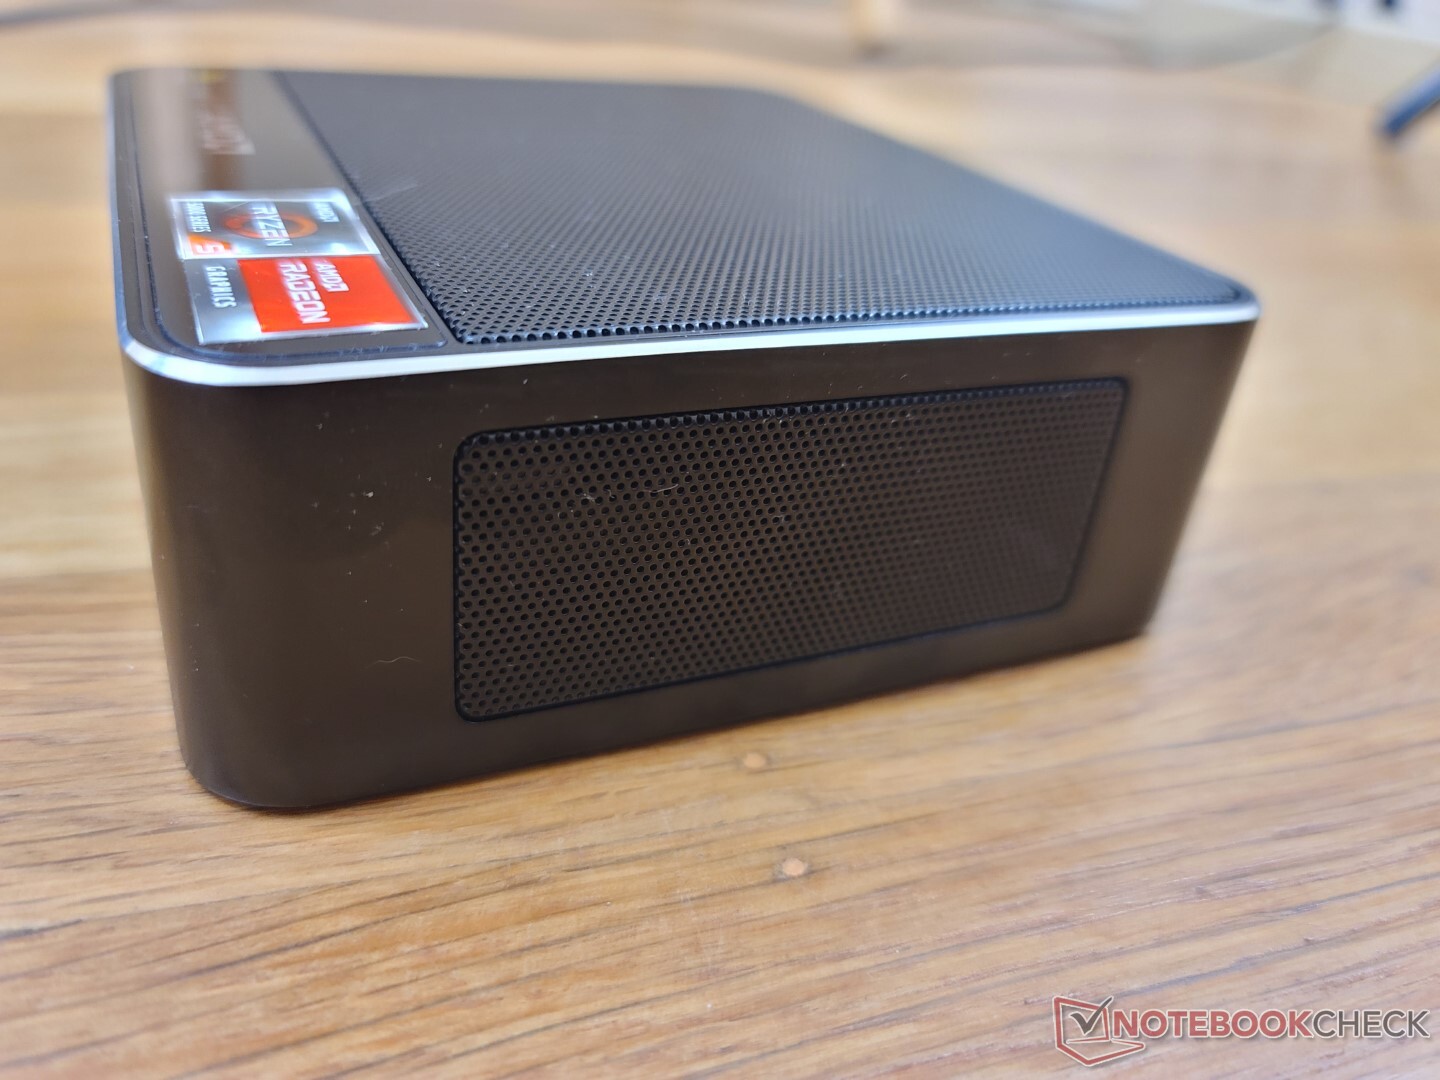
Zarówno SER4 jak i SER5 wykorzystują ten sam szkielet obudowy, aczkolwiek mają nieco inne oznaczenia powierzchniowe i kolory. W SER5 kratki wentylacyjne z boku są czarne, a nie czerwone
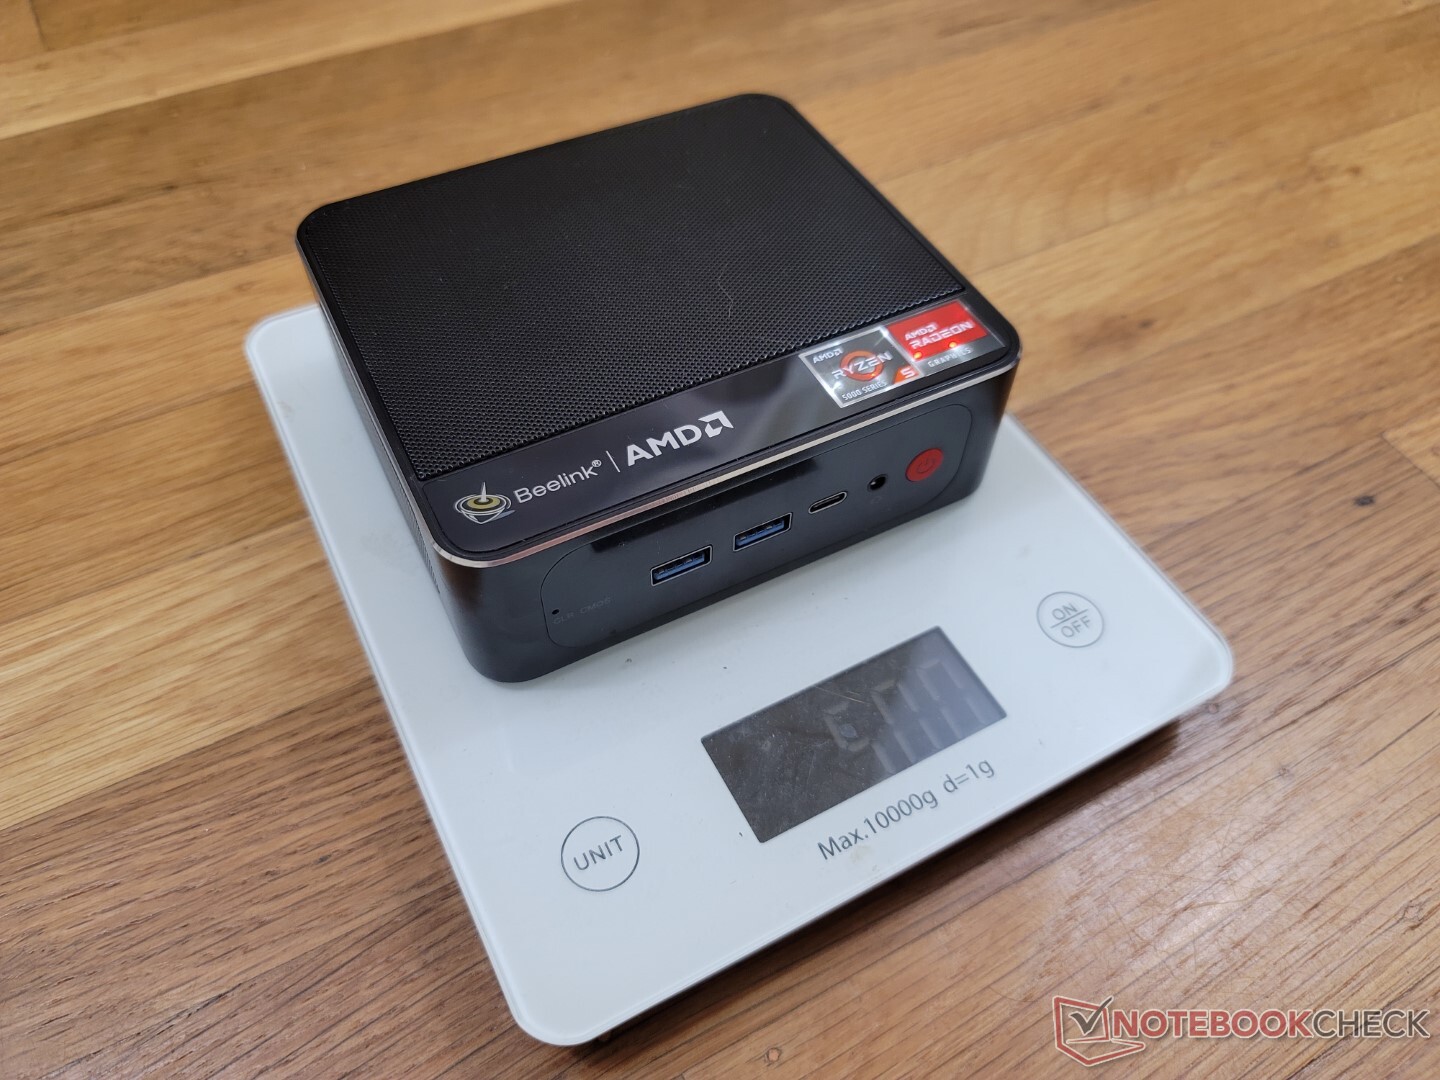
Pod względem rozmiarów SER5 jest tylko nieznacznie grubszy od Intel NUC 11TNK. Jest jednak tak samo ciężki przy wadze około pół kilograma.
Łączność
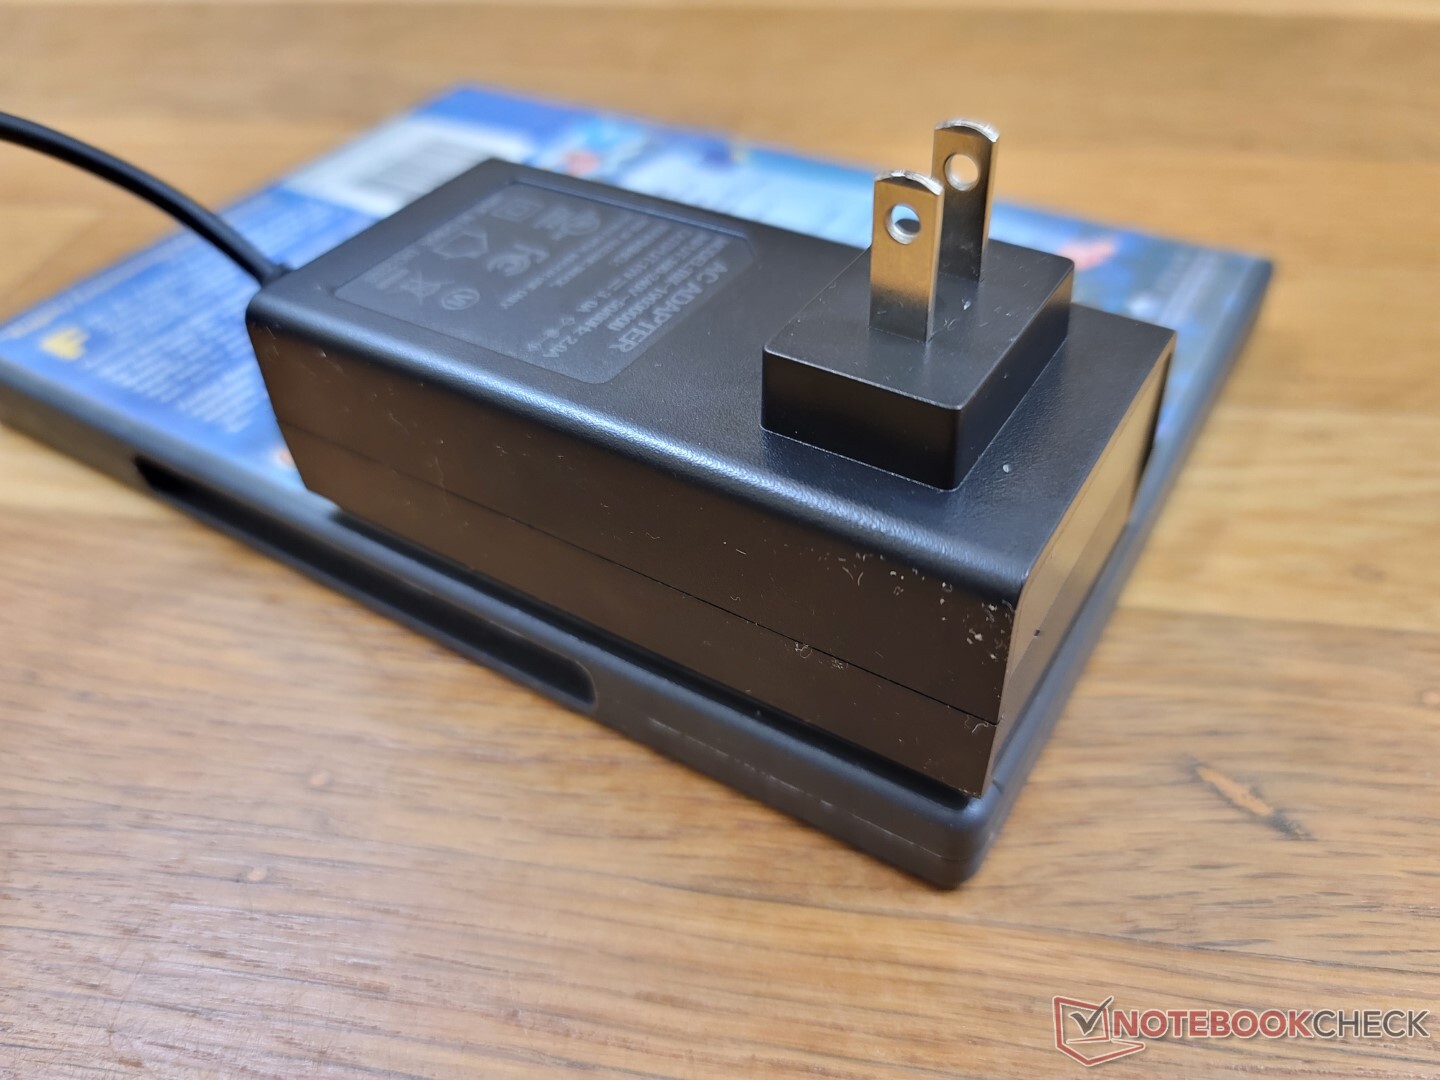
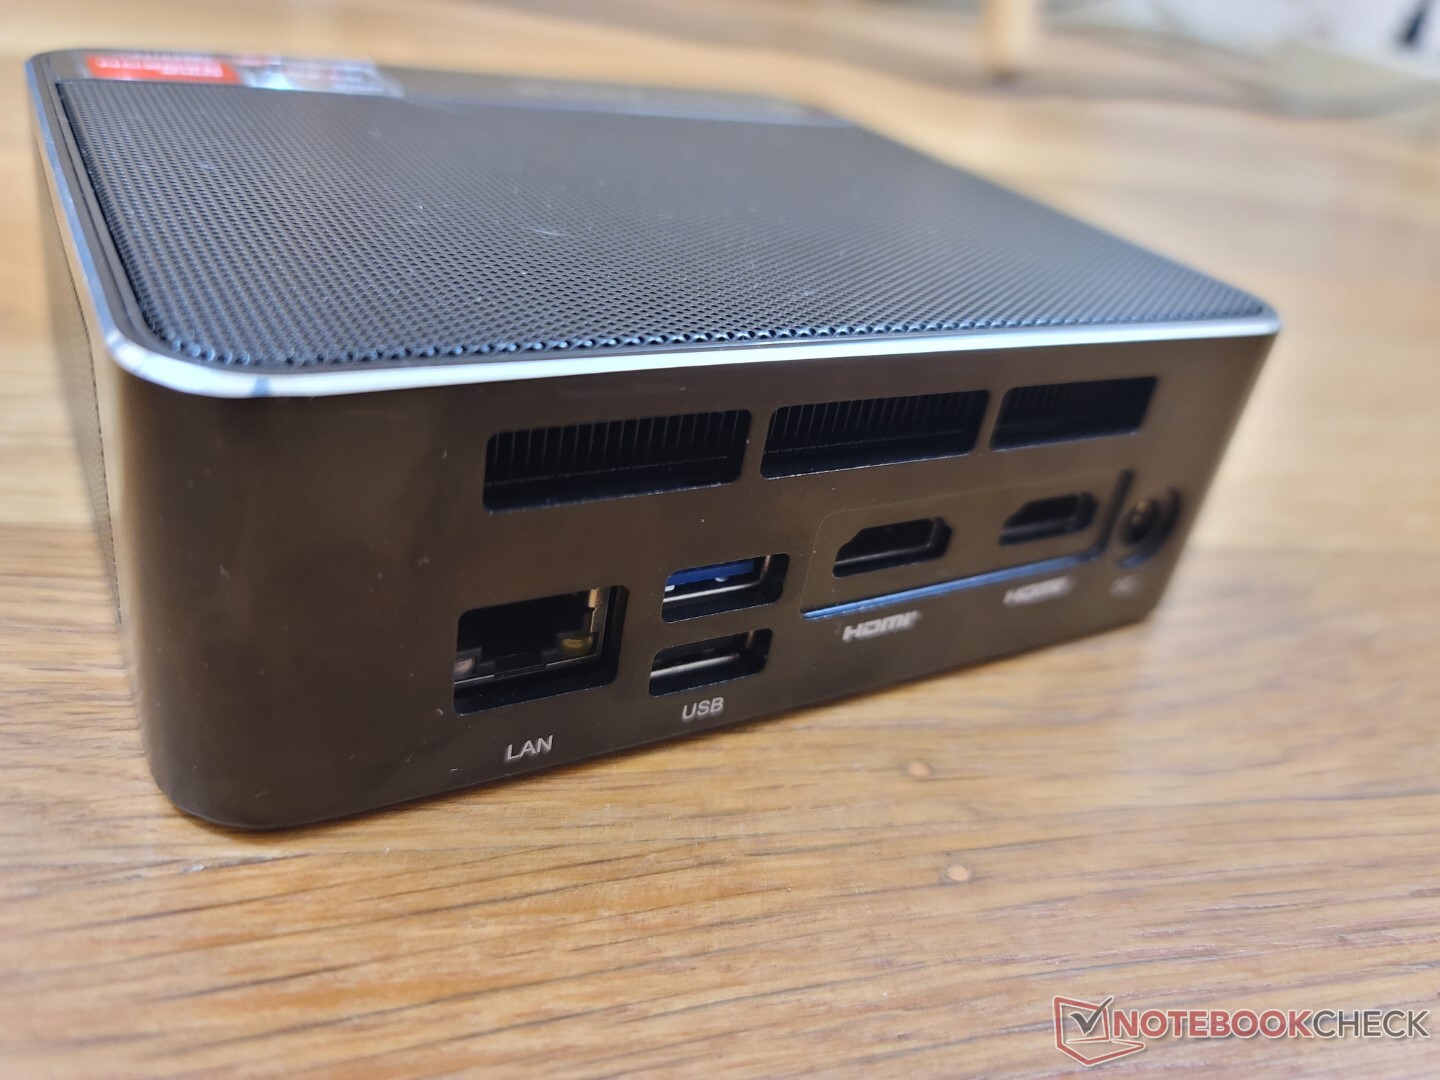
Opcje portów są takie same jak w SER4. Rozczarowujące jest to, że Beelink nadal nie przeszedł na adaptery AC USB-C, ponieważ SER5 polega na zastrzeżonym adapterze AC z beczką. Pojedynczy port USB-C z przodu obsługuje DisplayPort 1.4, ale nie PD-in.
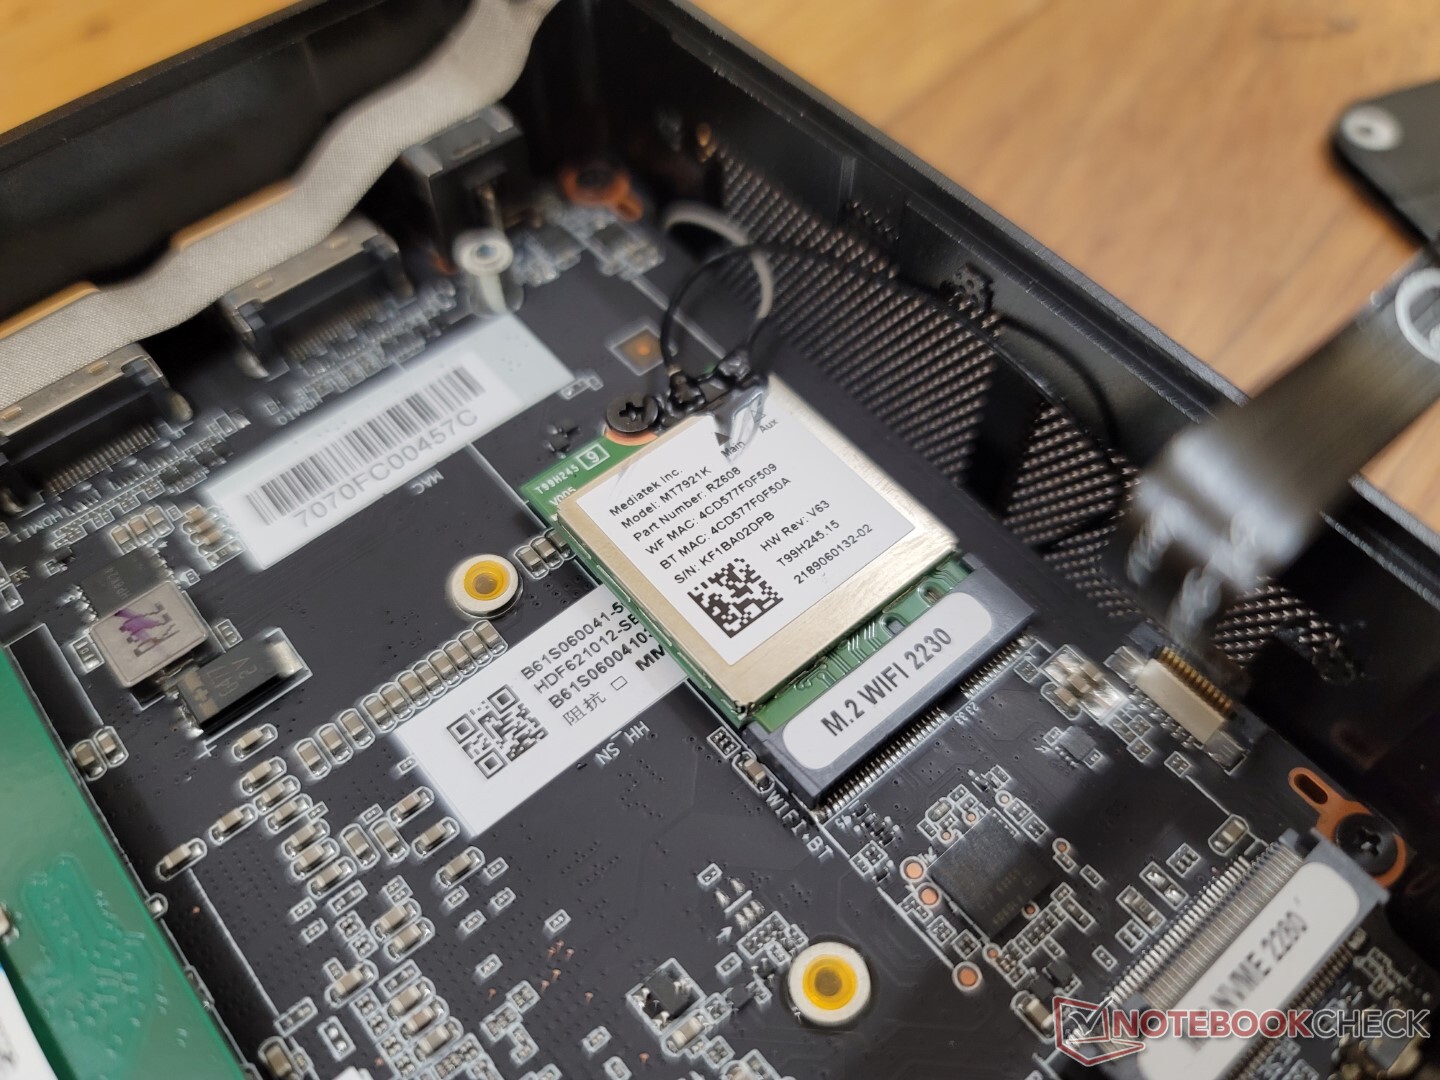
Komunikacja
MediaTek RZ608 jest standardem dla obsługi Wi-Fi 6E, podobnie jak w przypadku Beelink SEi11 Pro. Jednak wydajności wciąż brakuje w porównaniu do popularnej serii Intel AX200/210, co pokazują poniższe wykresy.
| Networking | |
| iperf3 transmit AX12 | |
| Intel NUC11TNKi5 | |
| Beelink GTR5 | |
| iperf3 receive AX12 | |
| Intel NUC11TNKi5 | |
| Beelink GTR5 | |
| iperf3 receive AXE11000 6GHz | |
| Zotac ZBOX PI336 pico | |
| Beelink SER Pro Ryzen 5 5600H | |
| Beelink SEi11 Pro | |
| iperf3 transmit AXE11000 6GHz | |
| Zotac ZBOX PI336 pico | |
| Beelink SER Pro Ryzen 5 5600H | |
| Beelink SEi11 Pro | |
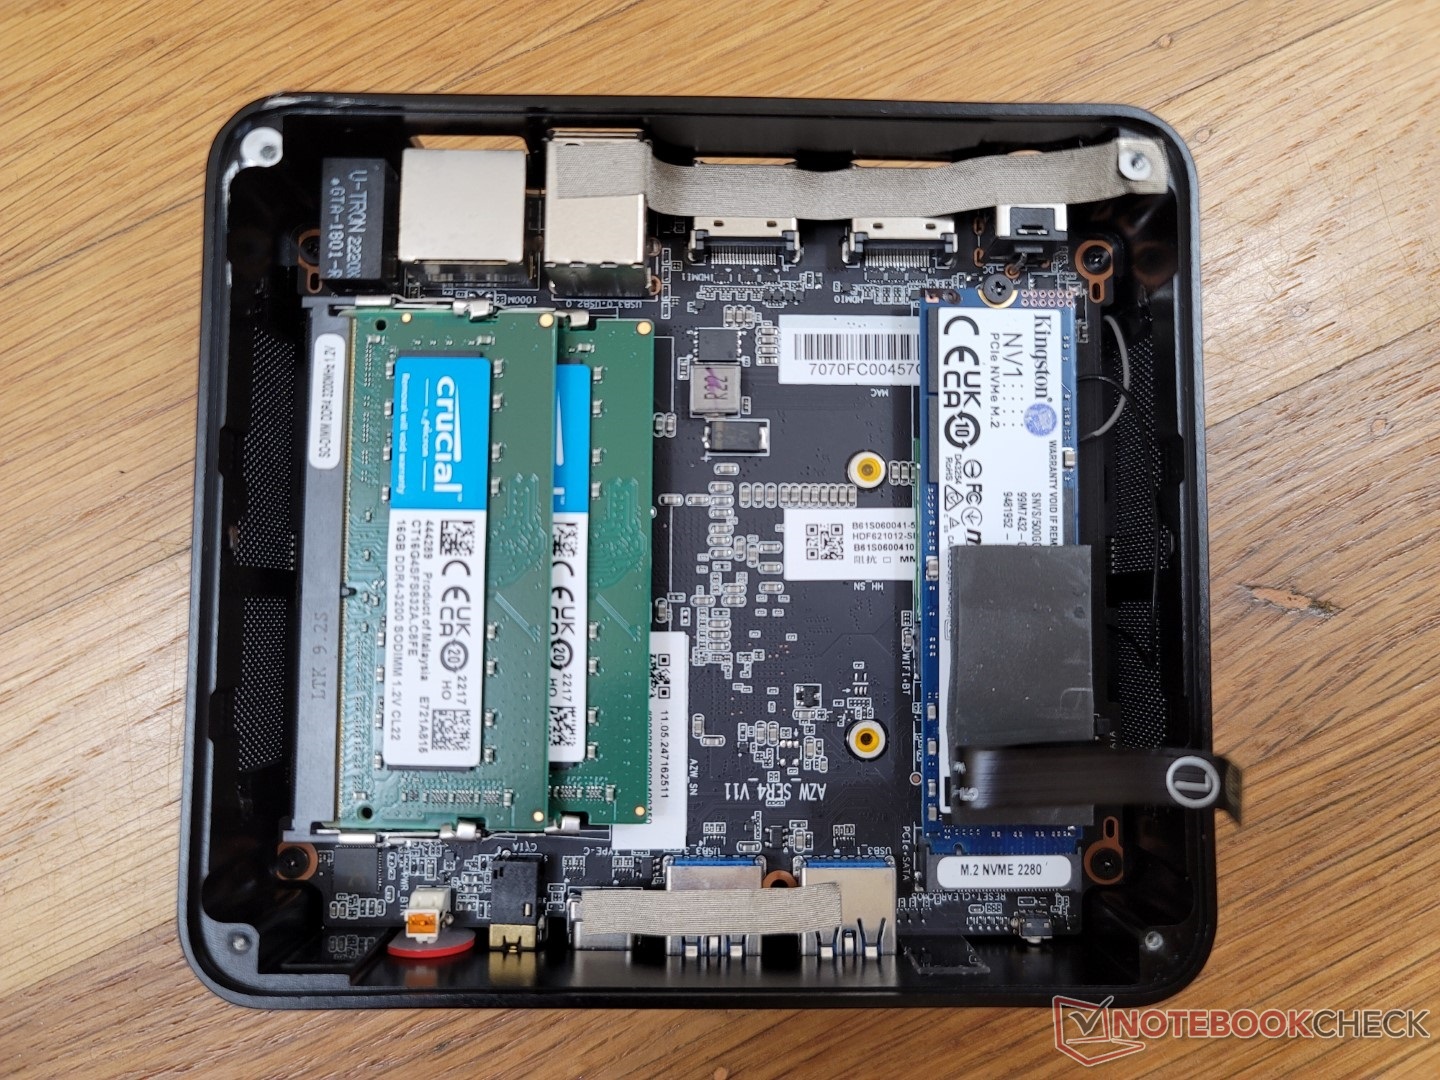
Konserwacja
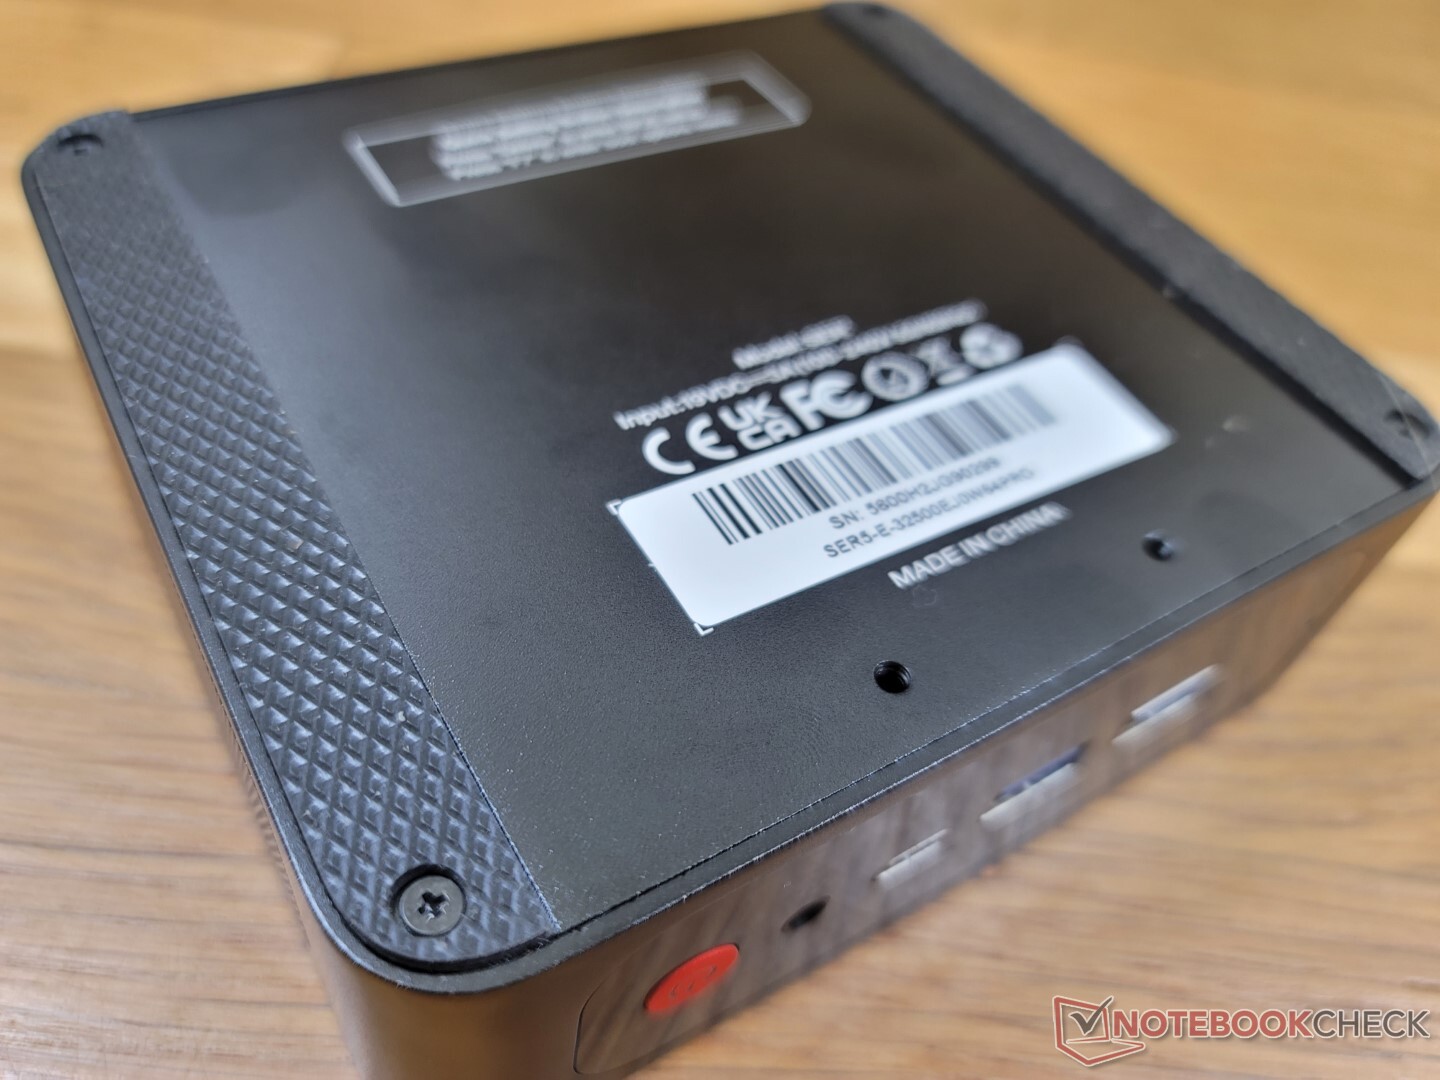
Dolny panel jest zabezpieczony czterema śrubami Philipsa. Śruby te są znacznie mniejsze niż śruby ręcznie skręcane w Intel NUC i będą wymagały śrubokręta do ich odkręcenia. Należy pamiętać, że te śruby są dość miękkie i mogą być łatwo usunięte, jeśli nie są ostrożne.
Akcesoria i gwarancja
W pudełku detalicznym znajduje się zdejmowany uchwyt montażowy VESA, dodatkowe śruby, instrukcja obsługi, dwa kable HDMI oraz zasilacz sieciowy.
W przypadku zakupu w USA obowiązuje standardowa roczna ograniczona gwarancja producenta.
Wydajność
Warunki badania
Przed przeprowadzeniem poniższych benchmarków ustawiliśmy nasze urządzenie w trybie Performance za pośrednictwem systemu Windows.
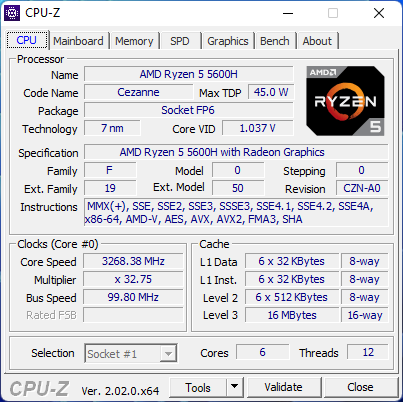
Procesor
Wydajność wielowątkowa jest o około 15 procent wolniejsza od przeciętnego komputera z naszej bazy danych wyposażonego w ten sam Ryzen 5 5600H CPU. Mimo to ogólna wydajność jest wciąż znacznie szybsza niż w przypadku popularnego Core i7-1165G7 jaki można znaleźć w wielu Ultrabookach i komputerach Intel NUC.
Cinebench R15 Multi Loop
Cinebench R23: Multi Core | Single Core
Cinebench R15: CPU Multi 64Bit | CPU Single 64Bit
Blender: v2.79 BMW27 CPU
7-Zip 18.03: 7z b 4 | 7z b 4 -mmt1
Geekbench 5.5: Multi-Core | Single-Core
HWBOT x265 Benchmark v2.2: 4k Preset
LibreOffice : 20 Documents To PDF
R Benchmark 2.5: Overall mean
| Cinebench R20 / CPU (Multi Core) | |
| HP Envy 16 h0112nr | |
| Schenker XMG Apex 15 NH57E PS | |
| Honor MagicBook 14 2022 | |
| Beelink GTR5 | |
| Przeciętny AMD Ryzen 5 5600H (3074 - 4059, n=16) | |
| Beelink SER4 | |
| Beelink SER Pro Ryzen 5 5600H | |
| Intel NUC10i7FNH | |
| Beelink SEi11 Pro | |
| Framework Laptop 13.5 | |
| Intel NUC11TNKi5 | |
| Zotac ZBOX PI336 pico | |
| Cinebench R20 / CPU (Single Core) | |
| HP Envy 16 h0112nr | |
| Honor MagicBook 14 2022 | |
| Framework Laptop 13.5 | |
| Beelink GTR5 | |
| Beelink SEi11 Pro | |
| Schenker XMG Apex 15 NH57E PS | |
| Przeciętny AMD Ryzen 5 5600H (527 - 538, n=15) | |
| Beelink SER Pro Ryzen 5 5600H | |
| Intel NUC11TNKi5 | |
| Beelink SER4 | |
| Intel NUC10i7FNH | |
| Zotac ZBOX PI336 pico | |
| Cinebench R23 / Multi Core | |
| HP Envy 16 h0112nr | |
| Schenker XMG Apex 15 NH57E PS | |
| Honor MagicBook 14 2022 | |
| Beelink GTR5 | |
| Przeciętny AMD Ryzen 5 5600H (7945 - 10416, n=13) | |
| Beelink SER4 | |
| Beelink SER Pro Ryzen 5 5600H | |
| Beelink SEi11 Pro | |
| Framework Laptop 13.5 | |
| Intel NUC11TNKi5 | |
| Zotac ZBOX PI336 pico | |
| Cinebench R23 / Single Core | |
| HP Envy 16 h0112nr | |
| Honor MagicBook 14 2022 | |
| Framework Laptop 13.5 | |
| Beelink GTR5 | |
| Beelink SEi11 Pro | |
| Schenker XMG Apex 15 NH57E PS | |
| Intel NUC11TNKi5 | |
| Beelink SER Pro Ryzen 5 5600H | |
| Przeciętny AMD Ryzen 5 5600H (1316 - 1381, n=13) | |
| Beelink SER4 | |
| Zotac ZBOX PI336 pico | |
| Cinebench R15 / CPU Multi 64Bit | |
| HP Envy 16 h0112nr | |
| Honor MagicBook 14 2022 | |
| Honor MagicBook 14 2022 | |
| Schenker XMG Apex 15 NH57E PS | |
| Beelink GTR5 | |
| Przeciętny AMD Ryzen 5 5600H (1319 - 1723, n=16) | |
| Beelink SER4 | |
| Beelink SER Pro Ryzen 5 5600H | |
| Intel NUC10i7FNH | |
| Beelink SEi11 Pro | |
| Framework Laptop 13.5 | |
| Intel NUC11TNKi5 | |
| Zotac ZBOX PI336 pico | |
| Cinebench R15 / CPU Single 64Bit | |
| HP Envy 16 h0112nr | |
| Beelink GTR5 | |
| Honor MagicBook 14 2022 | |
| Schenker XMG Apex 15 NH57E PS | |
| Framework Laptop 13.5 | |
| Przeciętny AMD Ryzen 5 5600H (218 - 225, n=14) | |
| Beelink SER Pro Ryzen 5 5600H | |
| Beelink SEi11 Pro | |
| Intel NUC11TNKi5 | |
| Intel NUC10i7FNH | |
| Beelink SER4 | |
| Zotac ZBOX PI336 pico | |
| Blender / v2.79 BMW27 CPU | |
| Zotac ZBOX PI336 pico | |
| Intel NUC11TNKi5 | |
| Framework Laptop 13.5 | |
| Beelink SEi11 Pro | |
| Intel NUC10i7FNH | |
| Beelink SER Pro Ryzen 5 5600H | |
| Beelink SER4 | |
| Przeciętny AMD Ryzen 5 5600H (300 - 384, n=14) | |
| Honor MagicBook 14 2022 | |
| Beelink GTR5 | |
| HP Envy 16 h0112nr | |
| Schenker XMG Apex 15 NH57E PS | |
| 7-Zip 18.03 / 7z b 4 | |
| Schenker XMG Apex 15 NH57E PS | |
| Beelink GTR5 | |
| HP Envy 16 h0112nr | |
| Honor MagicBook 14 2022 | |
| Przeciętny AMD Ryzen 5 5600H (36315 - 46562, n=14) | |
| Beelink SER4 | |
| Beelink SER Pro Ryzen 5 5600H | |
| Intel NUC10i7FNH | |
| Beelink SEi11 Pro | |
| Framework Laptop 13.5 | |
| Intel NUC11TNKi5 | |
| Zotac ZBOX PI336 pico | |
| 7-Zip 18.03 / 7z b 4 -mmt1 | |
| Beelink GTR5 | |
| HP Envy 16 h0112nr | |
| Schenker XMG Apex 15 NH57E PS | |
| Framework Laptop 13.5 | |
| Beelink SER Pro Ryzen 5 5600H | |
| Przeciętny AMD Ryzen 5 5600H (5213 - 5446, n=14) | |
| Honor MagicBook 14 2022 | |
| Beelink SEi11 Pro | |
| Intel NUC11TNKi5 | |
| Intel NUC10i7FNH | |
| Beelink SER4 | |
| Zotac ZBOX PI336 pico | |
| Geekbench 5.5 / Multi-Core | |
| HP Envy 16 h0112nr | |
| Honor MagicBook 14 2022 | |
| Schenker XMG Apex 15 NH57E PS | |
| Beelink GTR5 | |
| Przeciętny AMD Ryzen 5 5600H (4990 - 7253, n=14) | |
| Beelink SER4 | |
| Beelink SER Pro Ryzen 5 5600H | |
| Intel NUC10i7FNH | |
| Beelink SEi11 Pro | |
| Intel NUC11TNKi5 | |
| Zotac ZBOX PI336 pico | |
| Geekbench 5.5 / Single-Core | |
| HP Envy 16 h0112nr | |
| Honor MagicBook 14 2022 | |
| Beelink GTR5 | |
| Beelink SEi11 Pro | |
| Schenker XMG Apex 15 NH57E PS | |
| Beelink SER Pro Ryzen 5 5600H | |
| Przeciętny AMD Ryzen 5 5600H (1365 - 1445, n=14) | |
| Intel NUC11TNKi5 | |
| Intel NUC10i7FNH | |
| Beelink SER4 | |
| Zotac ZBOX PI336 pico | |
| HWBOT x265 Benchmark v2.2 / 4k Preset | |
| Schenker XMG Apex 15 NH57E PS | |
| HP Envy 16 h0112nr | |
| Beelink GTR5 | |
| Honor MagicBook 14 2022 | |
| Przeciętny AMD Ryzen 5 5600H (9.92 - 13.3, n=14) | |
| Beelink SER Pro Ryzen 5 5600H | |
| Beelink SER4 | |
| Intel NUC10i7FNH | |
| Beelink SEi11 Pro | |
| Framework Laptop 13.5 | |
| Intel NUC11TNKi5 | |
| Zotac ZBOX PI336 pico | |
| LibreOffice / 20 Documents To PDF | |
| Zotac ZBOX PI336 pico | |
| Beelink SER4 | |
| Przeciętny AMD Ryzen 5 5600H (52.2 - 81.5, n=14) | |
| Schenker XMG Apex 15 NH57E PS | |
| Beelink SER Pro Ryzen 5 5600H | |
| Intel NUC11TNKi5 | |
| Beelink GTR5 | |
| Beelink SEi11 Pro | |
| HP Envy 16 h0112nr | |
| Framework Laptop 13.5 | |
| Honor MagicBook 14 2022 | |
| R Benchmark 2.5 / Overall mean | |
| Zotac ZBOX PI336 pico | |
| Intel NUC10i7FNH | |
| Intel NUC11TNKi5 | |
| Beelink SEi11 Pro | |
| Beelink SER4 | |
| Framework Laptop 13.5 | |
| Przeciętny AMD Ryzen 5 5600H (0.526 - 0.596, n=14) | |
| Beelink SER Pro Ryzen 5 5600H | |
| Schenker XMG Apex 15 NH57E PS | |
| Honor MagicBook 14 2022 | |
| Beelink GTR5 | |
| HP Envy 16 h0112nr | |
* ... im mniej tym lepiej
AIDA64: FP32 Ray-Trace | FPU Julia | CPU SHA3 | CPU Queen | FPU SinJulia | FPU Mandel | CPU AES | CPU ZLib | FP64 Ray-Trace | CPU PhotoWorxx
| Performance rating | |
| Beelink GTR5 | |
| Beelink SER Pro Ryzen 5 5600H | |
| Beelink SEi11 Pro | |
| Intel NUC11TNKi5 | |
| Zotac ZBOX PI336 pico | |
| AIDA64 / FP32 Ray-Trace | |
| Beelink GTR5 | |
| Beelink SER Pro Ryzen 5 5600H | |
| Beelink SEi11 Pro | |
| Intel NUC11TNKi5 | |
| Zotac ZBOX PI336 pico | |
| AIDA64 / FPU Julia | |
| Beelink GTR5 | |
| Beelink SER Pro Ryzen 5 5600H | |
| Beelink SEi11 Pro | |
| Intel NUC11TNKi5 | |
| Zotac ZBOX PI336 pico | |
| AIDA64 / CPU SHA3 | |
| Beelink GTR5 | |
| Beelink SER Pro Ryzen 5 5600H | |
| Beelink SEi11 Pro | |
| Intel NUC11TNKi5 | |
| Zotac ZBOX PI336 pico | |
| AIDA64 / CPU Queen | |
| Beelink GTR5 | |
| Beelink SER Pro Ryzen 5 5600H | |
| Beelink SEi11 Pro | |
| Intel NUC11TNKi5 | |
| Zotac ZBOX PI336 pico | |
| AIDA64 / FPU SinJulia | |
| Beelink GTR5 | |
| Beelink SER Pro Ryzen 5 5600H | |
| Beelink SEi11 Pro | |
| Intel NUC11TNKi5 | |
| Zotac ZBOX PI336 pico | |
| AIDA64 / FPU Mandel | |
| Beelink GTR5 | |
| Beelink SER Pro Ryzen 5 5600H | |
| Beelink SEi11 Pro | |
| Intel NUC11TNKi5 | |
| Zotac ZBOX PI336 pico | |
| AIDA64 / CPU AES | |
| Beelink GTR5 | |
| Beelink SER Pro Ryzen 5 5600H | |
| Beelink SEi11 Pro | |
| Intel NUC11TNKi5 | |
| Zotac ZBOX PI336 pico | |
| AIDA64 / CPU ZLib | |
| Beelink GTR5 | |
| Beelink SER Pro Ryzen 5 5600H | |
| Intel NUC11TNKi5 | |
| Beelink SEi11 Pro | |
| Zotac ZBOX PI336 pico | |
| AIDA64 / FP64 Ray-Trace | |
| Beelink GTR5 | |
| Beelink SER Pro Ryzen 5 5600H | |
| Beelink SEi11 Pro | |
| Intel NUC11TNKi5 | |
| Zotac ZBOX PI336 pico | |
| AIDA64 / CPU PhotoWorxx | |
| Beelink SEi11 Pro | |
| Beelink GTR5 | |
| Beelink SER Pro Ryzen 5 5600H | |
| Intel NUC11TNKi5 | |
| Zotac ZBOX PI336 pico | |
Wydajność systemu
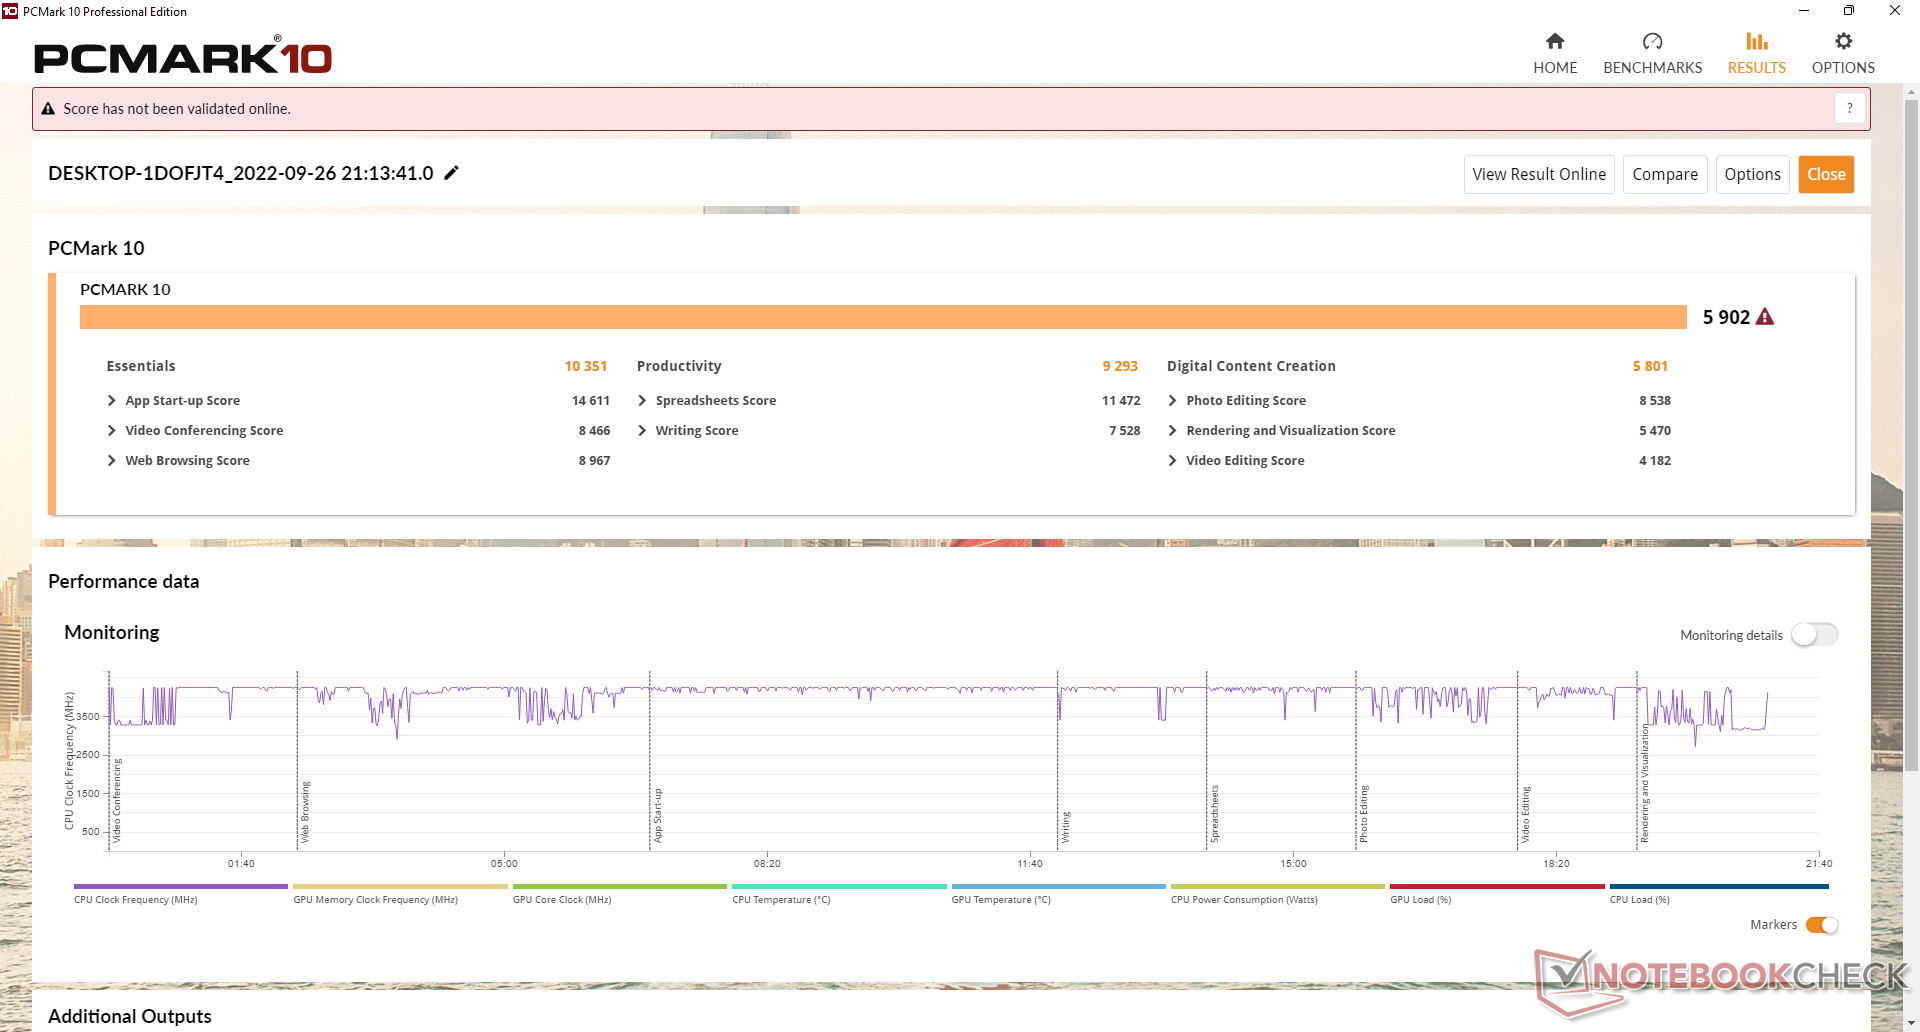
Wyniki PCMark 10 są takie, jakich się spodziewamy w porównaniu z innymi laptopami czy mini PC z procesorem Ryzen 5 5600H, z wyjątkiem podtestu Digital Content Creation, gdzie wydajność GPU ma największe znaczenie. Dzieje się tak dlatego, że wiele laptopów z tym samym procesorem jest zazwyczaj wyposażonych w szybszą grafikę dyskretną.
CrossMark: Overall | Productivity | Creativity | Responsiveness
| PCMark 10 / Score | |
| Beelink GTR5 | |
| Przeciętny AMD Ryzen 5 5600H (5309 - 7091, n=14) | |
| Beelink SER Pro Ryzen 5 5600H | |
| Beelink SEi11 Pro | |
| Intel NUC11TNKi5 | |
| Intel NUC10i7FNH | |
| PCMark 10 / Essentials | |
| Beelink GTR5 | |
| Beelink SER Pro Ryzen 5 5600H | |
| Beelink SEi11 Pro | |
| Przeciętny AMD Ryzen 5 5600H (9326 - 10506, n=14) | |
| Intel NUC10i7FNH | |
| Intel NUC11TNKi5 | |
| PCMark 10 / Productivity | |
| Beelink GTR5 | |
| Beelink SER Pro Ryzen 5 5600H | |
| Przeciętny AMD Ryzen 5 5600H (7975 - 9642, n=14) | |
| Beelink SEi11 Pro | |
| Intel NUC10i7FNH | |
| Intel NUC11TNKi5 | |
| PCMark 10 / Digital Content Creation | |
| Przeciętny AMD Ryzen 5 5600H (4921 - 9907, n=14) | |
| Beelink GTR5 | |
| Beelink SER Pro Ryzen 5 5600H | |
| Beelink SEi11 Pro | |
| Intel NUC11TNKi5 | |
| Intel NUC10i7FNH | |
| CrossMark / Overall | |
| Beelink GTR5 | |
| Beelink SEi11 Pro | |
| Beelink SER Pro Ryzen 5 5600H | |
| Przeciętny AMD Ryzen 5 5600H (1157 - 1353, n=7) | |
| CrossMark / Productivity | |
| Beelink GTR5 | |
| Beelink SEi11 Pro | |
| Beelink SER Pro Ryzen 5 5600H | |
| Przeciętny AMD Ryzen 5 5600H (1217 - 1384, n=7) | |
| CrossMark / Creativity | |
| Beelink GTR5 | |
| Przeciętny AMD Ryzen 5 5600H (1184 - 1377, n=7) | |
| Beelink SER Pro Ryzen 5 5600H | |
| Beelink SEi11 Pro | |
| CrossMark / Responsiveness | |
| Beelink SEi11 Pro | |
| Beelink GTR5 | |
| Beelink SER Pro Ryzen 5 5600H | |
| Przeciętny AMD Ryzen 5 5600H (926 - 1225, n=7) | |
| PCMark 10 Score | 5902 pkt. | |
Pomoc | ||
| AIDA64 / Memory Copy | |
| Beelink GTR5 | |
| Beelink SER Pro Ryzen 5 5600H | |
| Beelink SEi11 Pro | |
| Przeciętny AMD Ryzen 5 5600H (20549 - 42141, n=14) | |
| Intel NUC11TNKi5 | |
| Zotac ZBOX PI336 pico | |
| AIDA64 / Memory Read | |
| Beelink SER Pro Ryzen 5 5600H | |
| Beelink GTR5 | |
| Beelink SEi11 Pro | |
| Przeciętny AMD Ryzen 5 5600H (22917 - 47595, n=14) | |
| Intel NUC11TNKi5 | |
| Zotac ZBOX PI336 pico | |
| AIDA64 / Memory Write | |
| Beelink SEi11 Pro | |
| Beelink SER Pro Ryzen 5 5600H | |
| Beelink GTR5 | |
| Przeciętny AMD Ryzen 5 5600H (20226 - 44872, n=14) | |
| Intel NUC11TNKi5 | |
| Zotac ZBOX PI336 pico | |
| AIDA64 / Memory Latency | |
| Intel NUC11TNKi5 | |
| Beelink SEi11 Pro | |
| Beelink SER Pro Ryzen 5 5600H | |
| Beelink GTR5 | |
| Przeciętny AMD Ryzen 5 5600H (75 - 89.1, n=14) | |
| Zotac ZBOX PI336 pico | |
* ... im mniej tym lepiej
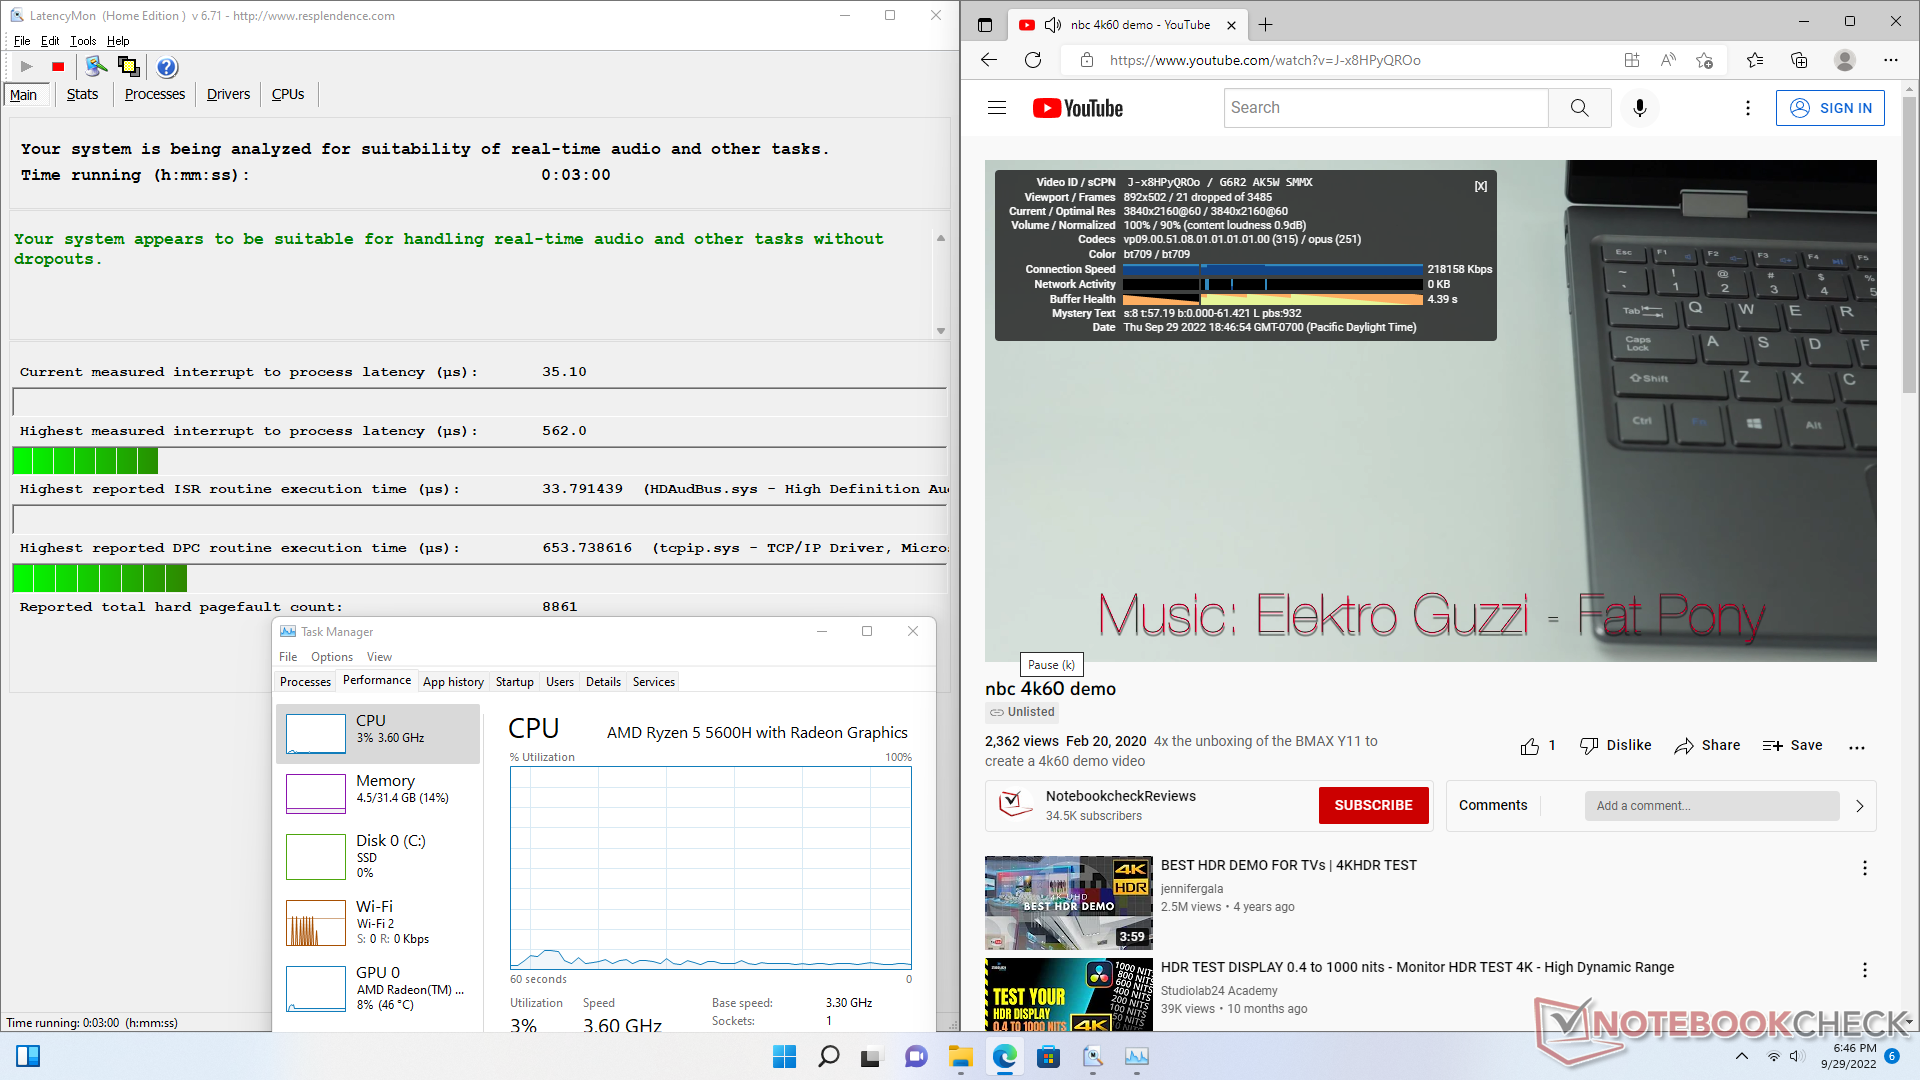
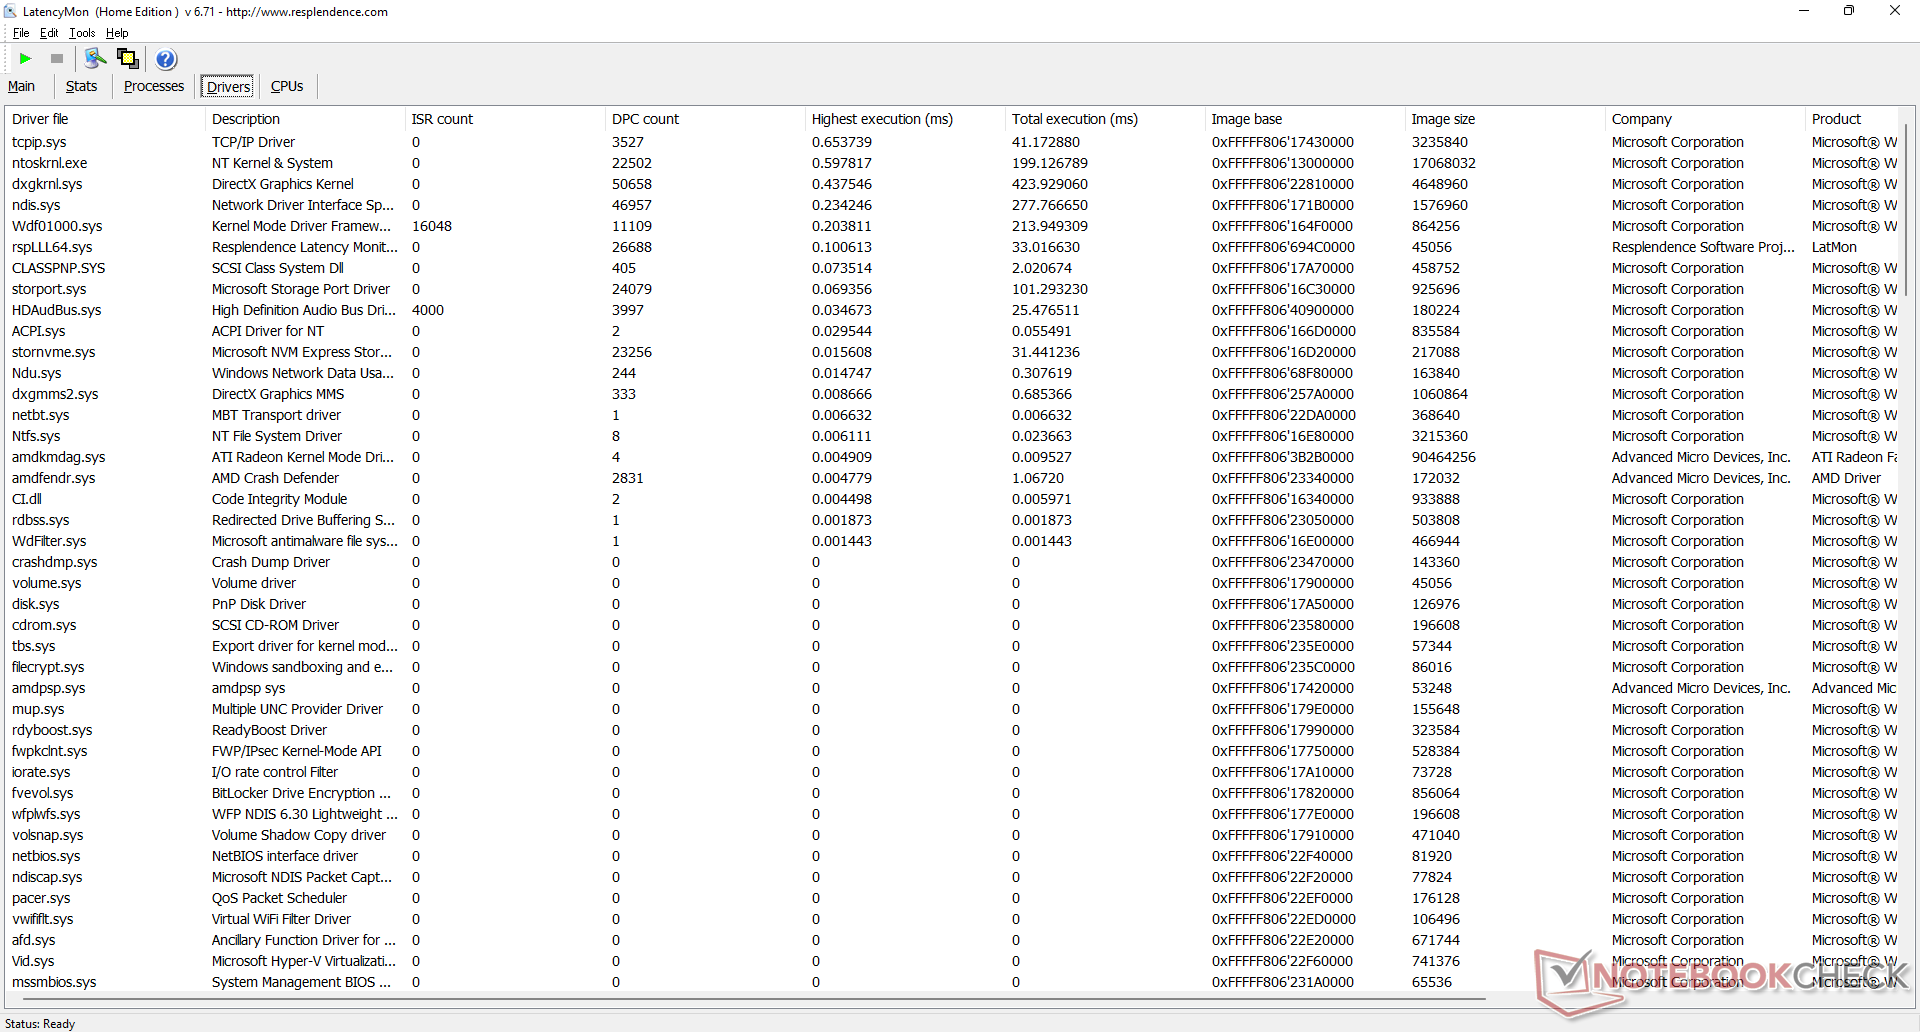
Opóźnienie DPC
LatencyMon nie wykazuje większych problemów z DPC podczas otwierania wielu kart przeglądarki na naszej stronie głównej. Niestety, odtwarzanie wideo w rozdzielczości 4K przy 60 FPS jest niedoskonałe - w trakcie naszego minutowego filmiku spadło 21 klatek.
| DPC Latencies / LatencyMon - interrupt to process latency (max), Web, Youtube, Prime95 | |
| Zotac ZBOX PI336 pico | |
| Beelink SER Pro Ryzen 5 5600H | |
| Intel NUC11TNKi5 | |
| Beelink SEi11 Pro | |
| Beelink GTR5 | |
* ... im mniej tym lepiej
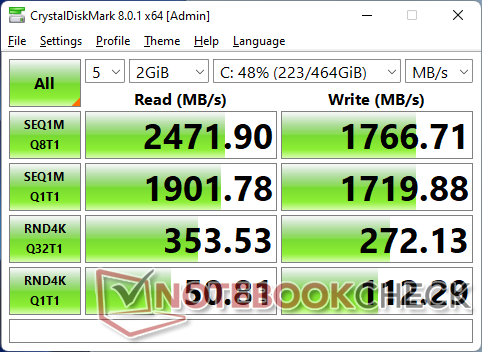
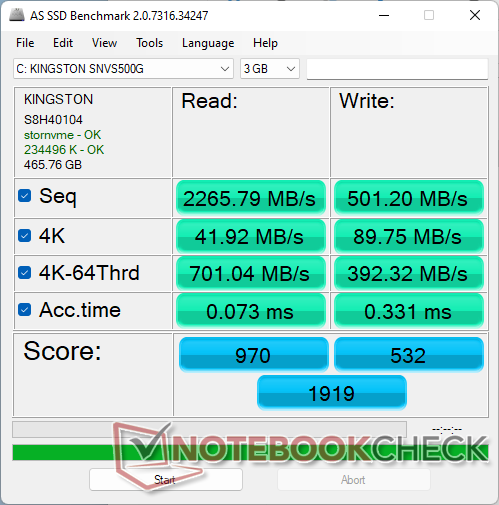
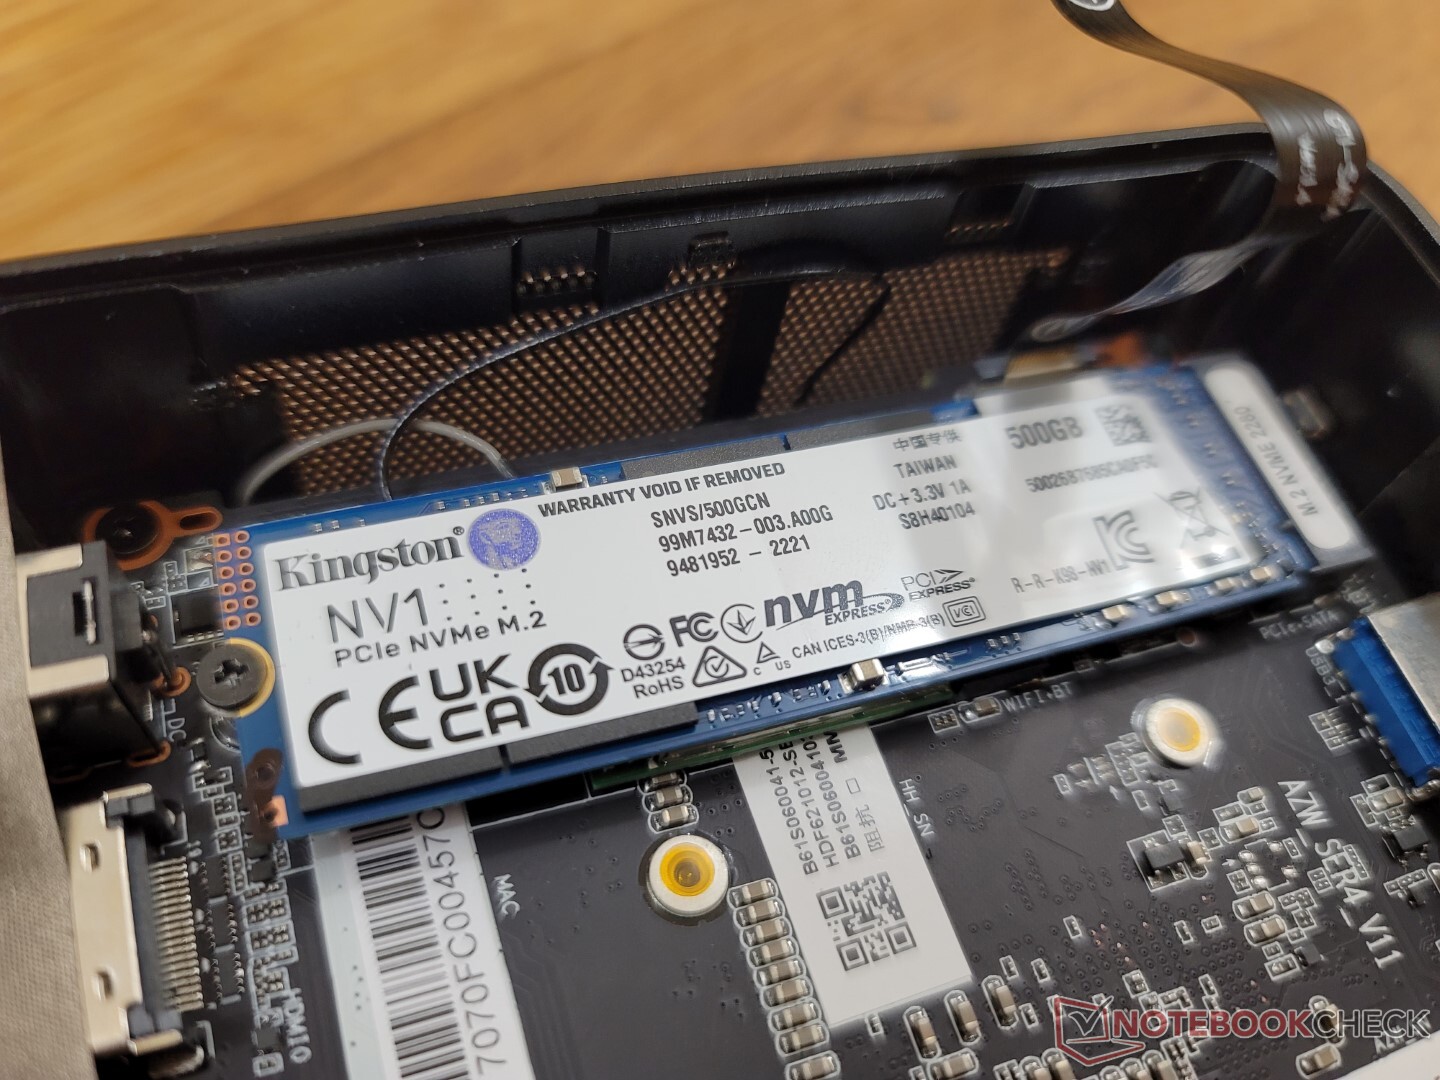
Urządzenia do przechowywania danych
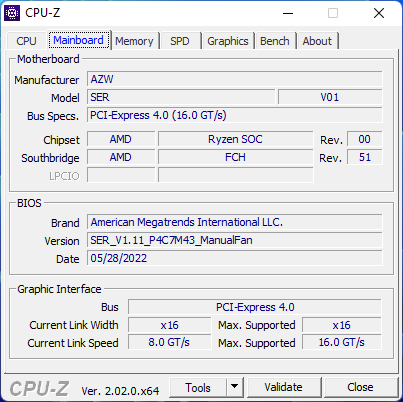
Prędkości NVMe są ograniczone do PCIe3 x4, podczas gdy większość nowszych modeli Intel NUC w pełni obsługuje PCIe4 x4. PCIe3 jest jednak więcej niż wystarczające dla większości użytkowników, więc obcięcie rogu nie jest tutaj znaczące. Nasz średniej klasy dysk SSD 500 GB Kingston NV1 SSD jest w stanie utrzymać maksymalną prędkość odczytu ~2500 MB/s bez żadnych problemów termicznych.

| Drive Performance rating - Percent | |
| Beelink SER Pro Ryzen 5 5600H -11! | |
| Beelink GTR5 | |
| Beelink SEi11 Pro | |
| Intel NUC10i7FNH | |
| Intel NUC11TNKi5 | |
| Zotac ZBOX PI336 pico | |
| DiskSpd | |
| seq read | |
| Beelink GTR5 | |
| Beelink SER Pro Ryzen 5 5600H | |
| Beelink SEi11 Pro | |
| Intel NUC10i7FNH | |
| Intel NUC11TNKi5 | |
| Zotac ZBOX PI336 pico | |
| seq write | |
| Beelink GTR5 | |
| Beelink SER Pro Ryzen 5 5600H | |
| Beelink SEi11 Pro | |
| Intel NUC10i7FNH | |
| Intel NUC11TNKi5 | |
| Zotac ZBOX PI336 pico | |
| seq q8 t1 read | |
| Beelink GTR5 | |
| Beelink SER Pro Ryzen 5 5600H | |
| Beelink SEi11 Pro | |
| Intel NUC10i7FNH | |
| Intel NUC11TNKi5 | |
| Zotac ZBOX PI336 pico | |
| seq q8 t1 write | |
| Beelink GTR5 | |
| Beelink SER Pro Ryzen 5 5600H | |
| Beelink SEi11 Pro | |
| Intel NUC10i7FNH | |
| Intel NUC11TNKi5 | |
| Zotac ZBOX PI336 pico | |
| 4k q1 t1 read | |
| Beelink GTR5 | |
| Beelink SEi11 Pro | |
| Beelink SER Pro Ryzen 5 5600H | |
| Intel NUC10i7FNH | |
| Intel NUC11TNKi5 | |
| Zotac ZBOX PI336 pico | |
| 4k q1 t1 write | |
| Beelink GTR5 | |
| Beelink SEi11 Pro | |
| Beelink SER Pro Ryzen 5 5600H | |
| Intel NUC10i7FNH | |
| Intel NUC11TNKi5 | |
| Zotac ZBOX PI336 pico | |
| 4k q32 t16 read | |
| Beelink GTR5 | |
| Beelink SER Pro Ryzen 5 5600H | |
| Beelink SEi11 Pro | |
| Intel NUC11TNKi5 | |
| Intel NUC10i7FNH | |
| Zotac ZBOX PI336 pico | |
| 4k q32 t16 write | |
| Beelink SER Pro Ryzen 5 5600H | |
| Beelink GTR5 | |
| Beelink SEi11 Pro | |
| Intel NUC11TNKi5 | |
| Intel NUC10i7FNH | |
| Zotac ZBOX PI336 pico | |
| AS SSD | |
| Score Total | |
| Beelink SEi11 Pro | |
| Beelink GTR5 | |
| Intel NUC10i7FNH | |
| Intel NUC11TNKi5 | |
| Zotac ZBOX PI336 pico | |
| Score Read | |
| Beelink SEi11 Pro | |
| Beelink GTR5 | |
| Intel NUC10i7FNH | |
| Intel NUC11TNKi5 | |
| Zotac ZBOX PI336 pico | |
| Score Write | |
| Beelink SEi11 Pro | |
| Beelink GTR5 | |
| Intel NUC10i7FNH | |
| Intel NUC11TNKi5 | |
| Zotac ZBOX PI336 pico | |
| Seq Read | |
| Beelink GTR5 | |
| Beelink SEi11 Pro | |
| Intel NUC10i7FNH | |
| Intel NUC11TNKi5 | |
| Zotac ZBOX PI336 pico | |
| Seq Write | |
| Beelink SEi11 Pro | |
| Beelink GTR5 | |
| Intel NUC10i7FNH | |
| Intel NUC11TNKi5 | |
| Zotac ZBOX PI336 pico | |
| 4K Read | |
| Beelink SEi11 Pro | |
| Beelink GTR5 | |
| Intel NUC10i7FNH | |
| Intel NUC11TNKi5 | |
| Zotac ZBOX PI336 pico | |
| 4K Write | |
| Beelink SEi11 Pro | |
| Beelink GTR5 | |
| Intel NUC10i7FNH | |
| Intel NUC11TNKi5 | |
| Zotac ZBOX PI336 pico | |
| 4K-64 Read | |
| Beelink SEi11 Pro | |
| Beelink GTR5 | |
| Intel NUC10i7FNH | |
| Intel NUC11TNKi5 | |
| Zotac ZBOX PI336 pico | |
| 4K-64 Write | |
| Beelink SEi11 Pro | |
| Beelink GTR5 | |
| Intel NUC10i7FNH | |
| Intel NUC11TNKi5 | |
| Zotac ZBOX PI336 pico | |
| Access Time Read | |
| Zotac ZBOX PI336 pico | |
| Intel NUC11TNKi5 | |
| Intel NUC10i7FNH | |
| Beelink GTR5 | |
| Beelink SEi11 Pro | |
| Access Time Write | |
| Zotac ZBOX PI336 pico | |
| Beelink SEi11 Pro | |
| Beelink GTR5 | |
| Intel NUC11TNKi5 | |
| Intel NUC10i7FNH | |
* ... im mniej tym lepiej
Disk Throttling: DiskSpd Read Loop, Queue Depth 8
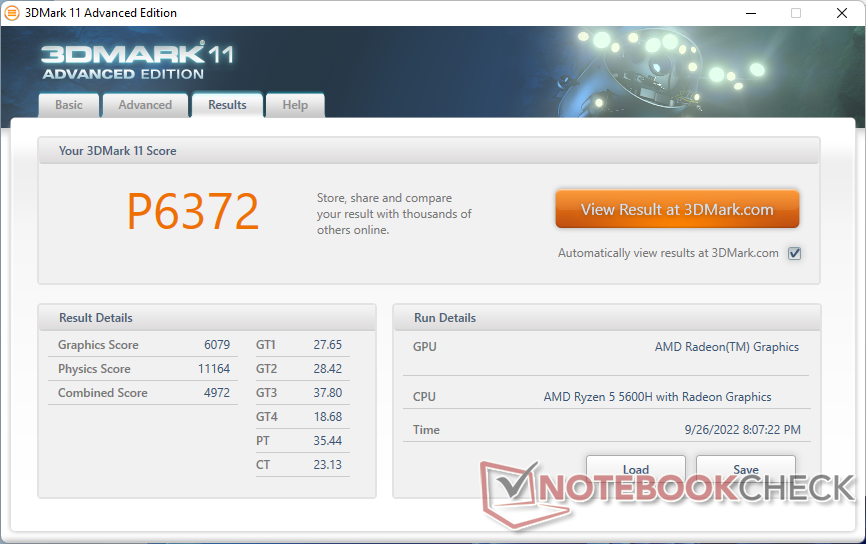
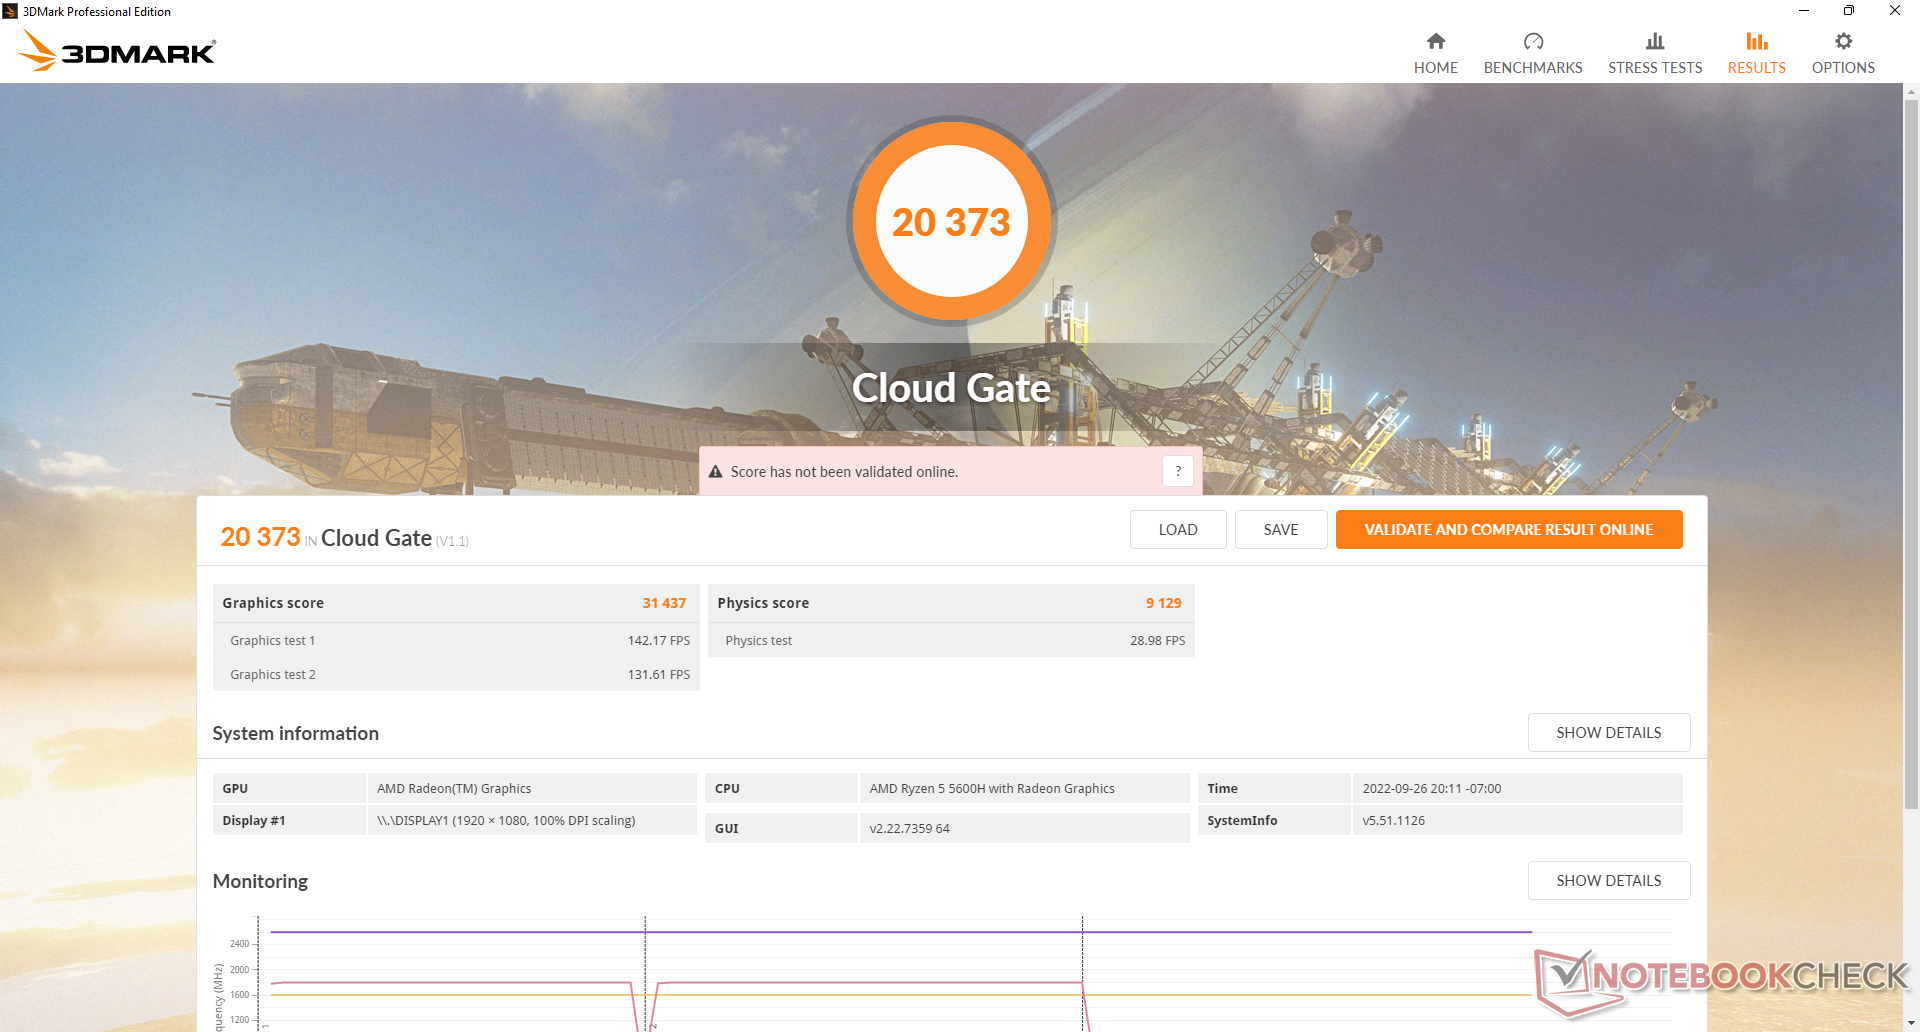
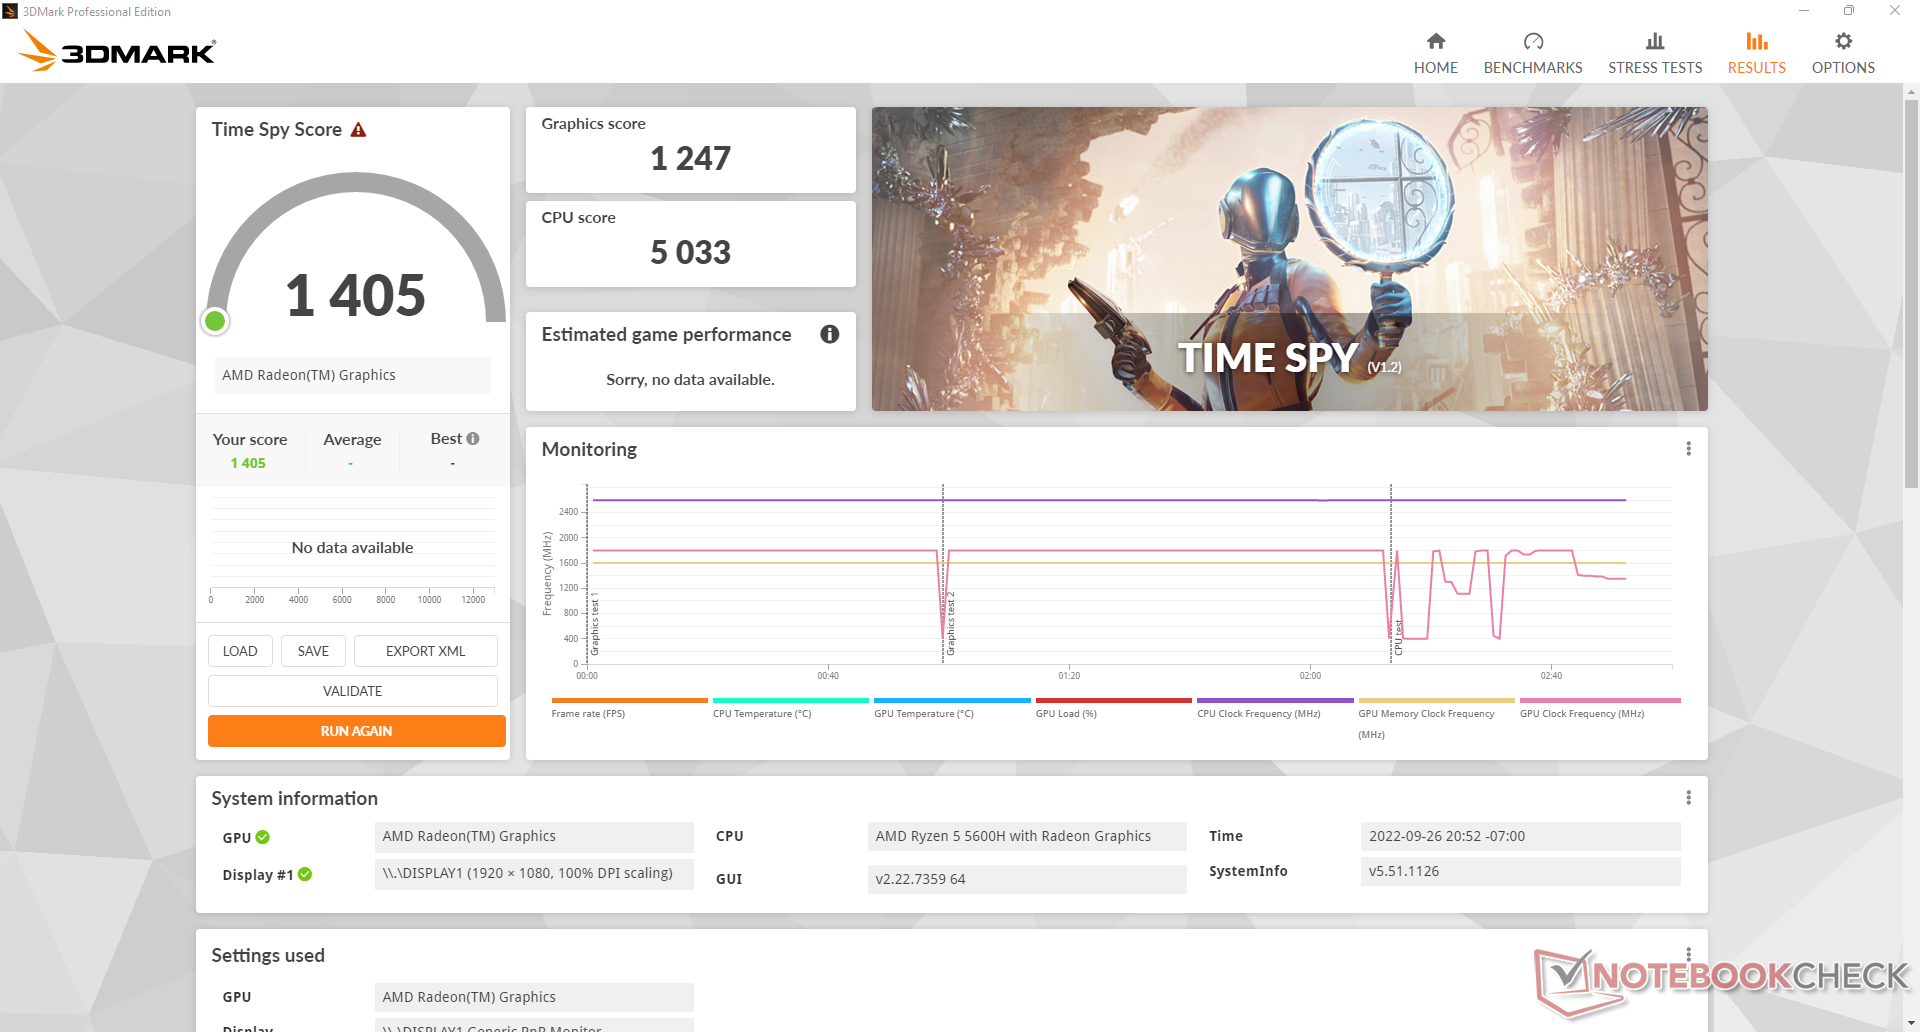
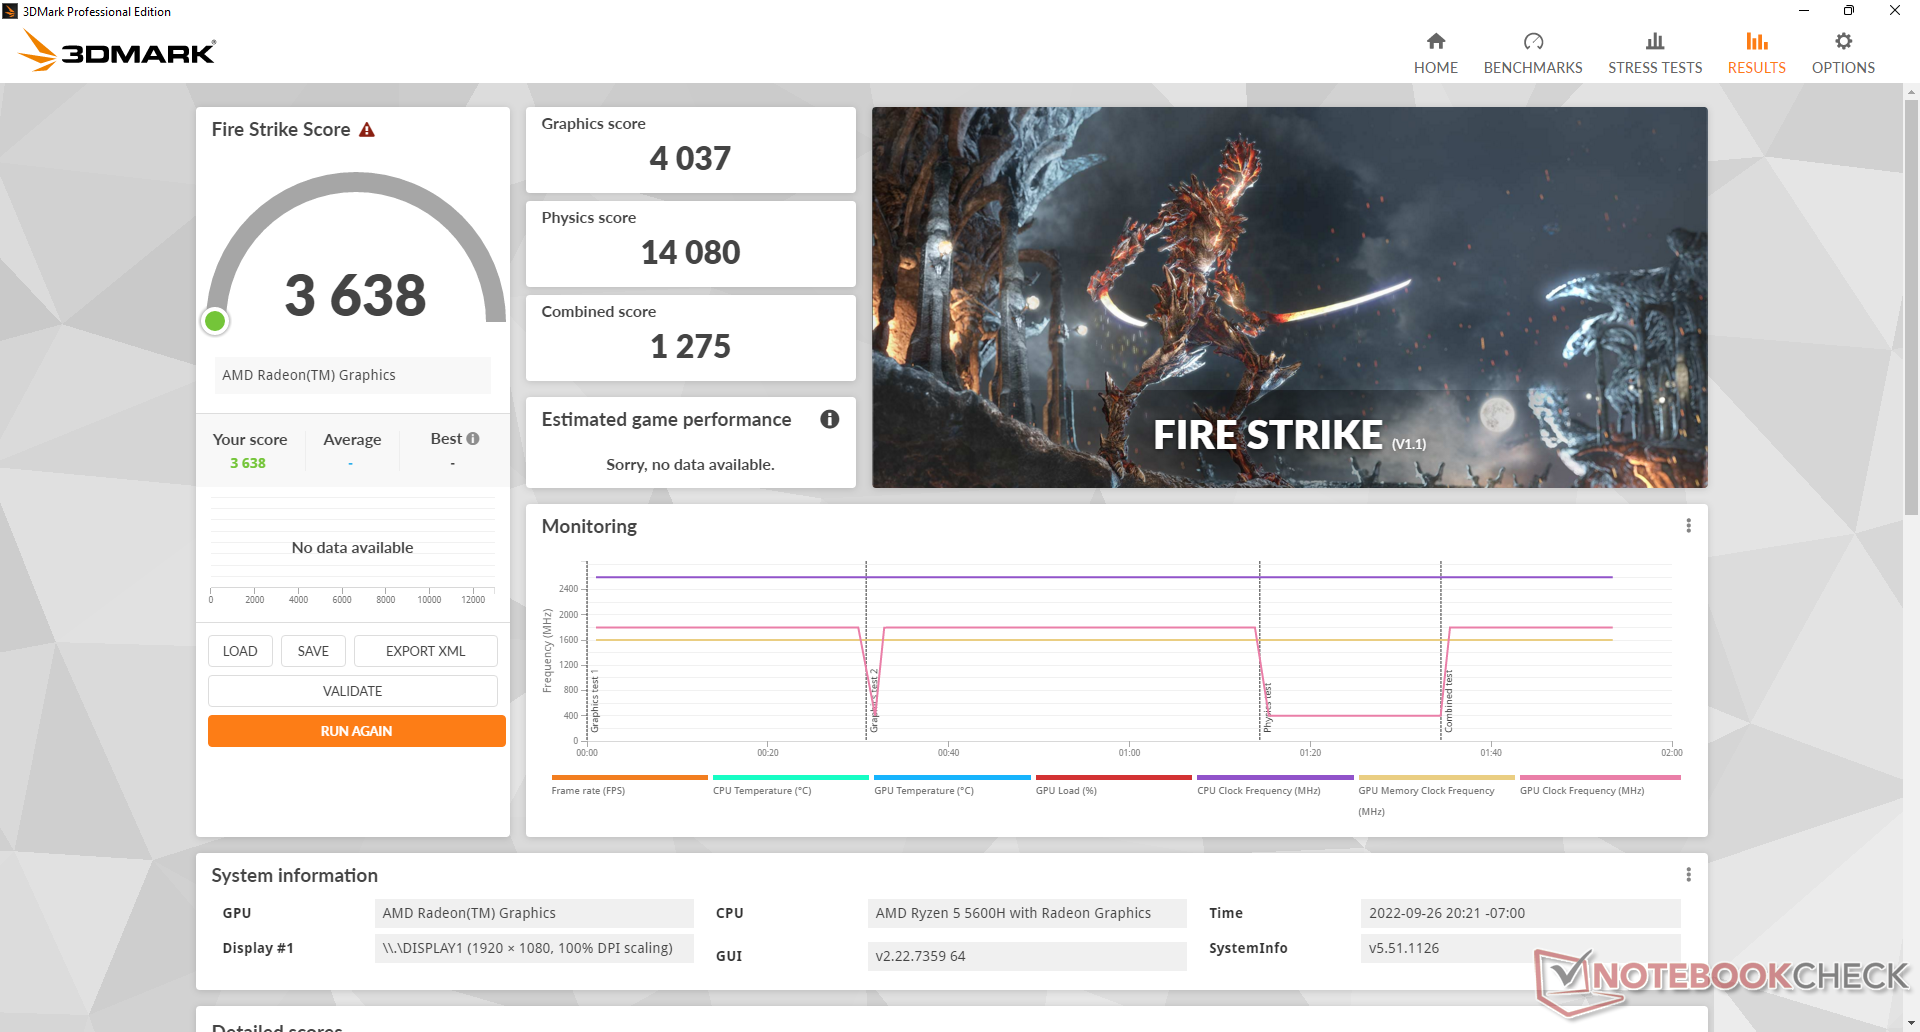
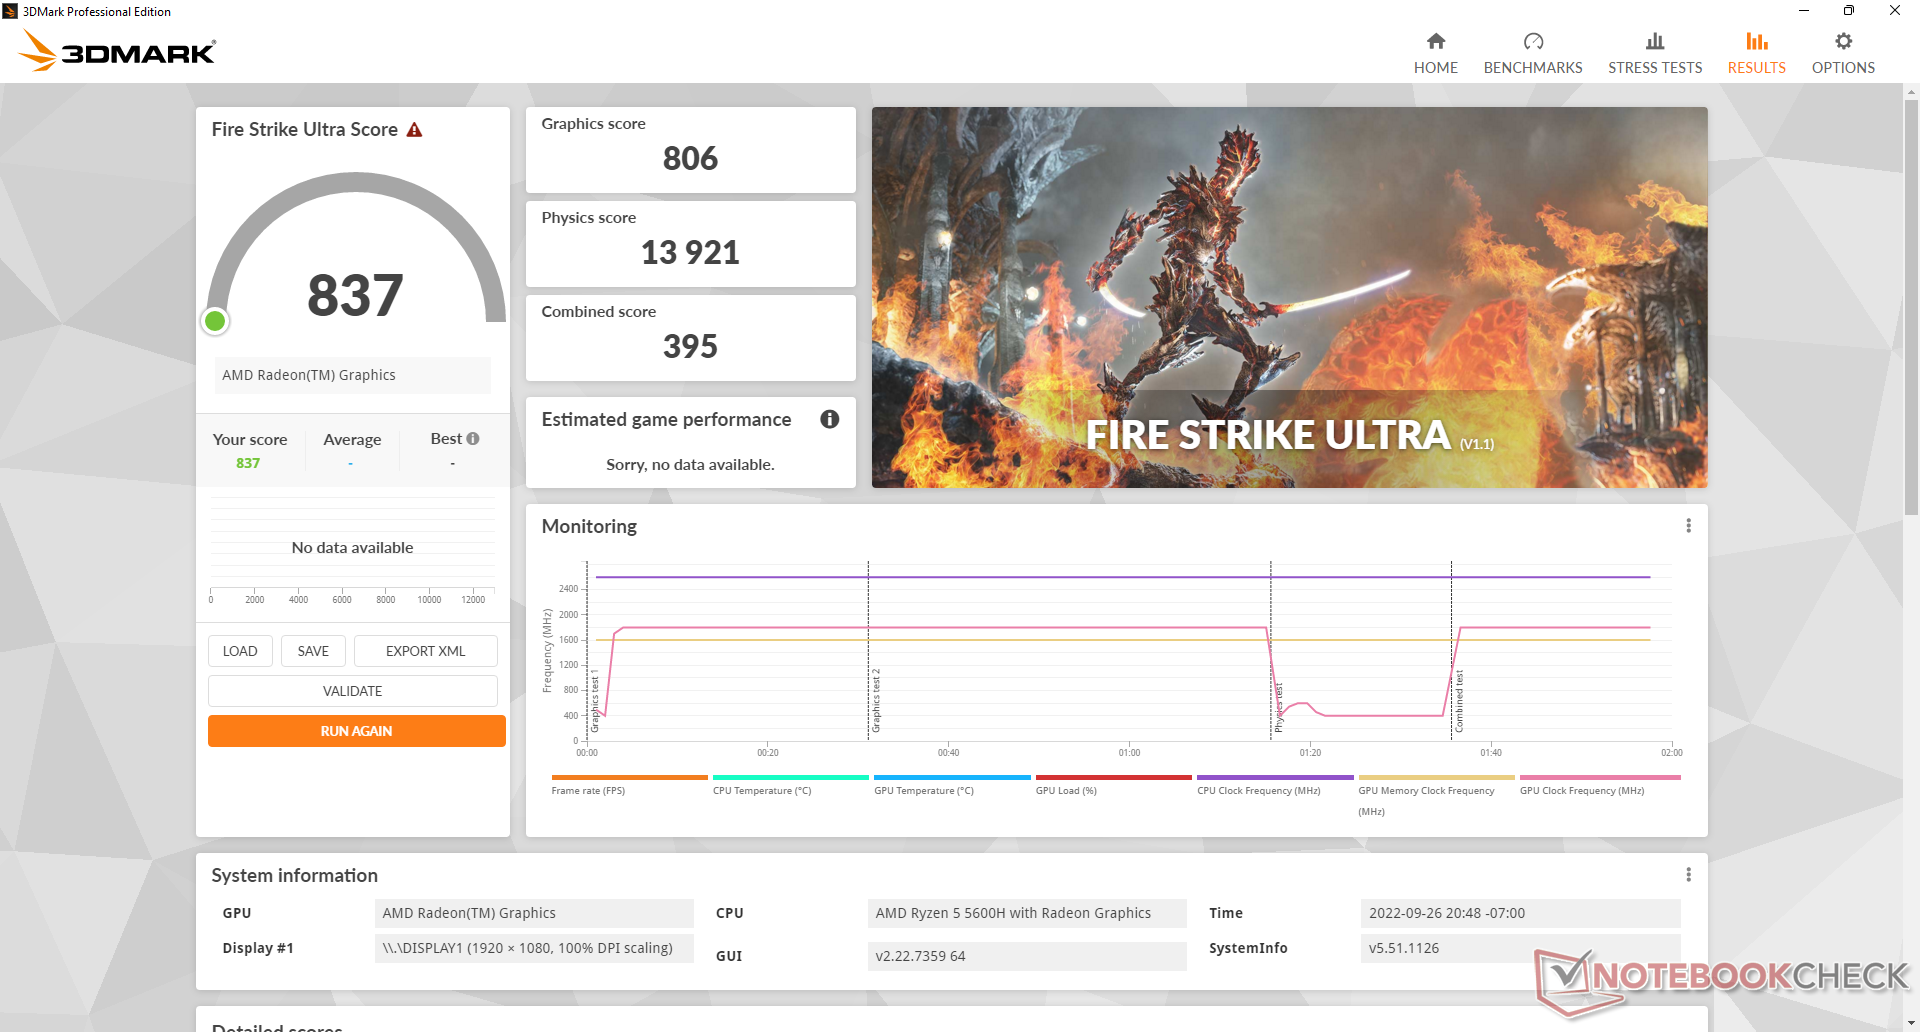
Wydajność GPU
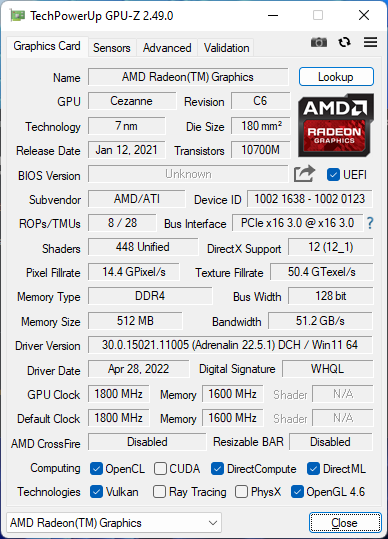
Wydajność graficzna jest znacznie szybsza niż w większości innych laptopów lub mini PC z tym samym zintegrowanym Radeon RX Vega 7 O 30 do 35 procent, ponieważ takie produkty zazwyczaj łączą GPU z wolniejszymi procesorami z serii Ryzen U lub tylko jednokanałową pamięcią RAM. Ryzen 5 5600H jest mniejszym wąskim gardłem dla układu GPU i w rezultacie zyskuje na częstotliwości generowania klatek. Nadal jednak nie jest to maszyna do gier.
Na stronie Iris Xe 96 EUs powszechnie spotykany w większości laptopów z 11. gen. Core i7 Intela lub mini PC jest nadal o około 10 do 15 procent szybszy.
| 3DMark | |
| 1920x1080 Fire Strike Graphics | |
| Intel NUC11PHKi7C | |
| Honor MagicBook 14 2022 | |
| Lenovo Yoga 7-14ARB G7 | |
| Beelink SEi11 Pro | |
| Beelink GTR5 | |
| Beelink SER Pro Ryzen 5 5600H | |
| Beelink SER4 | |
| Przeciętny AMD Radeon RX Vega 7 (1772 - 4037, n=66) | |
| Intel NUC11TNKi5 | |
| Intel NUC10i7FNH | |
| Zotac ZBOX PI336 pico | |
| 2560x1440 Time Spy Graphics | |
| Intel NUC11PHKi7C | |
| Honor MagicBook 14 2022 | |
| Lenovo Yoga 7-14ARB G7 | |
| Beelink SEi11 Pro | |
| Beelink GTR5 | |
| Beelink SER Pro Ryzen 5 5600H | |
| Beelink SER4 | |
| Intel NUC11TNKi5 | |
| Przeciętny AMD Radeon RX Vega 7 (496 - 1249, n=61) | |
| Intel NUC10i7FNH | |
| 2560x1440 Time Spy Score | |
| Intel NUC11PHKi7C | |
| Honor MagicBook 14 2022 | |
| Lenovo Yoga 7-14ARB G7 | |
| Beelink GTR5 | |
| Beelink SEi11 Pro | |
| Beelink SER4 | |
| Beelink SER Pro Ryzen 5 5600H | |
| Intel NUC11TNKi5 | |
| Przeciętny AMD Radeon RX Vega 7 (570 - 1420, n=62) | |
| Intel NUC10i7FNH | |
| 3DMark 11 - 1280x720 Performance GPU | |
| Intel NUC11PHKi7C | |
| Honor MagicBook 14 2022 | |
| Lenovo Yoga 7-14ARB G7 | |
| Beelink GTR5 | |
| Beelink SEi11 Pro | |
| Beelink SER Pro Ryzen 5 5600H | |
| Beelink SER4 | |
| Intel NUC11TNKi5 | |
| Przeciętny AMD Radeon RX Vega 7 (3353 - 6249, n=62) | |
| Intel NUC10i7FNH | |
| Zotac ZBOX PI336 pico | |
| 3DMark 11 Performance | 6372 pkt. | |
| 3DMark Cloud Gate Standard Score | 20373 pkt. | |
| 3DMark Fire Strike Score | 3638 pkt. | |
| 3DMark Time Spy Score | 1405 pkt. | |
Pomoc | ||
| Blender - v3.3 Classroom CPU | |
| Beelink SER Pro Ryzen 5 5600H | |
| Średnia w klasie Mini PC (132 - 4571, n=84, ostatnie 2 lata) | |
* ... im mniej tym lepiej
| The Witcher 3 | |
| 1024x768 Low Graphics & Postprocessing | |
| Intel NUC11PHKi7C | |
| Honor MagicBook 14 2022 | |
| Lenovo Yoga 7-14ARB G7 | |
| Beelink SEi11 Pro | |
| Beelink GTR5 | |
| Beelink SER Pro Ryzen 5 5600H | |
| Beelink SER4 | |
| Intel NUC11TNKi5 | |
| Przeciętny AMD Radeon RX Vega 7 (25.5 - 105.8, n=53) | |
| 1366x768 Medium Graphics & Postprocessing | |
| Intel NUC11PHKi7C | |
| Honor MagicBook 14 2022 | |
| Lenovo Yoga 7-14ARB G7 | |
| Beelink GTR5 | |
| Beelink SEi11 Pro | |
| Beelink SER Pro Ryzen 5 5600H | |
| Beelink SER4 | |
| Przeciętny AMD Radeon RX Vega 7 (9.74 - 81.3, n=39) | |
| 1920x1080 High Graphics & Postprocessing (Nvidia HairWorks Off) | |
| Intel NUC11PHKi7C | |
| Honor MagicBook 14 2022 | |
| Lenovo Yoga 7-14ARB G7 | |
| Beelink SEi11 Pro | |
| Beelink GTR5 | |
| Beelink SER Pro Ryzen 5 5600H | |
| Beelink SER4 | |
| Przeciętny AMD Radeon RX Vega 7 (8.96 - 26.2, n=52) | |
| 1920x1080 Ultra Graphics & Postprocessing (HBAO+) | |
| Intel NUC11PHKi7C | |
| Honor MagicBook 14 2022 | |
| Lenovo Yoga 7-14ARB G7 | |
| Beelink GTR5 | |
| Beelink SER Pro Ryzen 5 5600H | |
| Beelink SER4 | |
| Beelink SEi11 Pro | |
| Przeciętny AMD Radeon RX Vega 7 (6.5 - 15.8, n=44) | |
| X-Plane 11.11 | |
| 1280x720 low (fps_test=1) | |
| Honor MagicBook 14 2022 | |
| Intel NUC11PHKi7C | |
| Beelink GTR5 | |
| Beelink SEi11 Pro | |
| Lenovo Yoga 7-14ARB G7 | |
| Beelink SER Pro Ryzen 5 5600H | |
| Beelink SER4 | |
| Przeciętny AMD Radeon RX Vega 7 (24.7 - 53.4, n=60) | |
| Intel NUC11TNKi5 | |
| Intel NUC10i7FNH | |
| Zotac ZBOX PI336 pico | |
| 1920x1080 med (fps_test=2) | |
| Honor MagicBook 14 2022 | |
| Intel NUC11PHKi7C | |
| Beelink GTR5 | |
| Lenovo Yoga 7-14ARB G7 | |
| Beelink SEi11 Pro | |
| Beelink SER Pro Ryzen 5 5600H | |
| Beelink SER4 | |
| Przeciętny AMD Radeon RX Vega 7 (19.3 - 40.3, n=60) | |
| Intel NUC11TNKi5 | |
| Intel NUC10i7FNH | |
| Zotac ZBOX PI336 pico | |
| 1920x1080 high (fps_test=3) | |
| Honor MagicBook 14 2022 | |
| Intel NUC11PHKi7C | |
| Beelink GTR5 | |
| Beelink SEi11 Pro | |
| Lenovo Yoga 7-14ARB G7 | |
| Beelink SER Pro Ryzen 5 5600H | |
| Beelink SER4 | |
| Intel NUC11TNKi5 | |
| Przeciętny AMD Radeon RX Vega 7 (17.4 - 35.7, n=60) | |
| Intel NUC10i7FNH | |
| Zotac ZBOX PI336 pico | |
| Final Fantasy XV Benchmark | |
| 1280x720 Lite Quality | |
| Intel NUC11PHKi7C | |
| Honor MagicBook 14 2022 | |
| Lenovo Yoga 7-14ARB G7 | |
| Beelink GTR5 | |
| Beelink SER Pro Ryzen 5 5600H | |
| Beelink SEi11 Pro | |
| Beelink SER4 | |
| Przeciętny AMD Radeon RX Vega 7 (17.1 - 41.1, n=44) | |
| Intel NUC11TNKi5 | |
| Zotac ZBOX PI336 pico | |
| 1920x1080 Standard Quality | |
| Intel NUC11PHKi7C | |
| Honor MagicBook 14 2022 | |
| Lenovo Yoga 7-14ARB G7 | |
| Beelink GTR5 | |
| Beelink SEi11 Pro | |
| Beelink SER Pro Ryzen 5 5600H | |
| Beelink SER4 | |
| Przeciętny AMD Radeon RX Vega 7 (8.9 - 20.3, n=44) | |
| Intel NUC11TNKi5 | |
| Zotac ZBOX PI336 pico | |
| 1920x1080 High Quality | |
| Intel NUC11PHKi7C | |
| Honor MagicBook 14 2022 | |
| Lenovo Yoga 7-14ARB G7 | |
| Beelink GTR5 | |
| Beelink SEi11 Pro | |
| Beelink SER Pro Ryzen 5 5600H | |
| Beelink SER4 | |
| Intel NUC11TNKi5 | |
| Przeciętny AMD Radeon RX Vega 7 (5.85 - 14.3, n=41) | |
| Strange Brigade | |
| 1280x720 lowest AF:1 | |
| Intel NUC11PHKi7C | |
| Honor MagicBook 14 2022 | |
| Lenovo Yoga 7-14ARB G7 | |
| Beelink GTR5 | |
| Beelink SER Pro Ryzen 5 5600H | |
| Beelink SER4 | |
| Beelink SEi11 Pro | |
| Przeciętny AMD Radeon RX Vega 7 (19.4 - 95.3, n=43) | |
| Zotac ZBOX PI336 pico | |
| 1920x1080 medium AA:medium AF:4 | |
| Intel NUC11PHKi7C | |
| Honor MagicBook 14 2022 | |
| Lenovo Yoga 7-14ARB G7 | |
| Beelink GTR5 | |
| Beelink SER Pro Ryzen 5 5600H | |
| Beelink SEi11 Pro | |
| Beelink SER4 | |
| Przeciętny AMD Radeon RX Vega 7 (13.4 - 36.1, n=43) | |
| 1920x1080 high AA:high AF:8 | |
| Intel NUC11PHKi7C | |
| Honor MagicBook 14 2022 | |
| Lenovo Yoga 7-14ARB G7 | |
| Beelink GTR5 | |
| Beelink SER Pro Ryzen 5 5600H | |
| Beelink SER4 | |
| Beelink SEi11 Pro | |
| Przeciętny AMD Radeon RX Vega 7 (11.5 - 30.1, n=43) | |
| 1920x1080 ultra AA:ultra AF:16 | |
| Intel NUC11PHKi7C | |
| Honor MagicBook 14 2022 | |
| Lenovo Yoga 7-14ARB G7 | |
| Beelink GTR5 | |
| Beelink SER Pro Ryzen 5 5600H | |
| Beelink SER4 | |
| Beelink SEi11 Pro | |
| Przeciętny AMD Radeon RX Vega 7 (9.9 - 25.5, n=41) | |
Liczba klatek na sekundę nie jest niestety tak stabilna, jak się spodziewaliśmy. Podczas biegu jałowego na Witcher 3 na niskich ustawieniach 720p, liczba klatek na sekundę spadała czasem do 60 FPS lub nawet 19 FPS, pozornie bez powodu, jak pokazuje poniższy wykres. Za przerwy w wyświetlaniu klatek odpowiada prawdopodobnie słaba obsługa aktywności w tle.
Witcher 3 FPS Chart
| low | med. | high | ultra | |
|---|---|---|---|---|
| GTA V (2015) | 132.9 | 117.6 | 32.2 | 14.5 |
| The Witcher 3 (2015) | 79.2 | 48.7 | 25.1 | 15.8 |
| Dota 2 Reborn (2015) | 137.5 | 103.1 | 59.3 | 56.3 |
| Final Fantasy XV Benchmark (2018) | 41.1 | 20.3 | 14.3 | |
| X-Plane 11.11 (2018) | 53.4 | 40.3 | 35.7 | |
| Strange Brigade (2018) | 95.3 | 36 | 30.1 | 25.5 |
| Cyberpunk 2077 1.6 (2022) | 20.9 | 16.2 | 11.4 |
Emisje
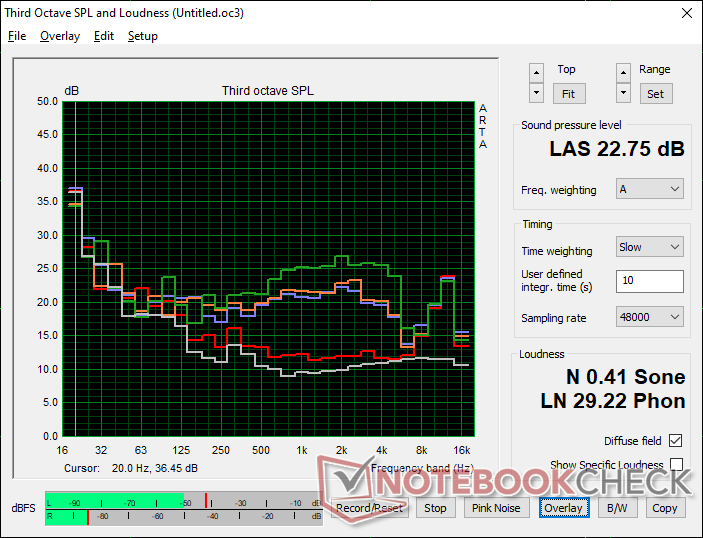
Szum systemu
Nasz testowy egzemplarz cierpi na brak szumu elektronicznego lub wycie cewki. Dzięki temu udało nam się zarejestrować hałas na poziomie 26,1 dB(A) na tle ciszy 22,8 dB(A) nawet podczas pracy na biegu jałowym bez uruchomionych aplikacji. Podczas typowych obciążeń, takich jak przeglądanie stron internetowych czy strumieniowanie wideo, szum wentylatora oscyluje w granicach 28,7 dB(A), czyli ciszej niż w przypadku NUC11TNK.
Podczas bardziej wymagających obciążeń, takich jak gry, hałas wentylatora wynosi od 32 do 37 dB(A), czyli ponownie ciszej niż w przypadku NUC11TNK i szybszego Beelink GTR5. Jest to cichy mini PC w stosunku do wydajności, którą otrzymujemy.
Hałas
| luz |
| 26.1 / 26.1 / 28.7 dB |
| obciążenie |
| 32.3 / 36.4 dB |
 | ||
30 dB cichy 40 dB(A) słyszalny 50 dB(A) irytujący |
||
min: | ||
| Beelink SER Pro Ryzen 5 5600H Vega 7, R5 5600H, Kingston NV1 SNVS/500GCN | Beelink SEi11 Pro Iris Xe G7 96EUs, i5-11320H, Kingston NV1 SNVS/500GCN | Beelink GTR5 Vega 8, R9 5900HX, Kingston NV1 SNVS/500GCN | Intel NUC11TNKi5 Iris Xe G7 80EUs, i5-1135G7, Transcend M.2 SSD 430S TS512GMTS430S | Beelink SEi8 Iris Plus Graphics 655, i3-8109U, Intel SSD 660p SSDPEKNW512G8 | Beelink SER4 Vega 8, R7 4800U, Intel SSD 660p SSDPEKNW512G8 | |
|---|---|---|---|---|---|---|
| Noise | 1% | -24% | -23% | -7% | -18% | |
| wyłączone / środowisko * (dB) | 22.8 | 22.8 -0% | 23.1 -1% | 24.8 -9% | 24.5 -7% | 23.4 -3% |
| Idle Minimum * (dB) | 26.1 | 24.7 5% | 34.2 -31% | 35.6 -36% | 26.5 -2% | 33.2 -27% |
| Idle Average * (dB) | 26.1 | 24.7 5% | 34.2 -31% | 35.6 -36% | 26.5 -2% | 33.2 -27% |
| Idle Maximum * (dB) | 28.7 | 25.3 12% | 34.2 -19% | 35.6 -24% | 31.1 -8% | 33.2 -16% |
| Load Average * (dB) | 32.3 | 33.2 -3% | 44.6 -38% | 36.2 -12% | 37.7 -17% | 38.6 -20% |
| Witcher 3 ultra * (dB) | 32.8 | 34.5 -5% | 41.4 -26% | 38 -16% | 39.2 -20% | |
| Load Maximum * (dB) | 36.4 | 37.8 -4% | 45.1 -24% | 47.6 -31% | 37.5 -3% | 40.8 -12% |
* ... im mniej tym lepiej
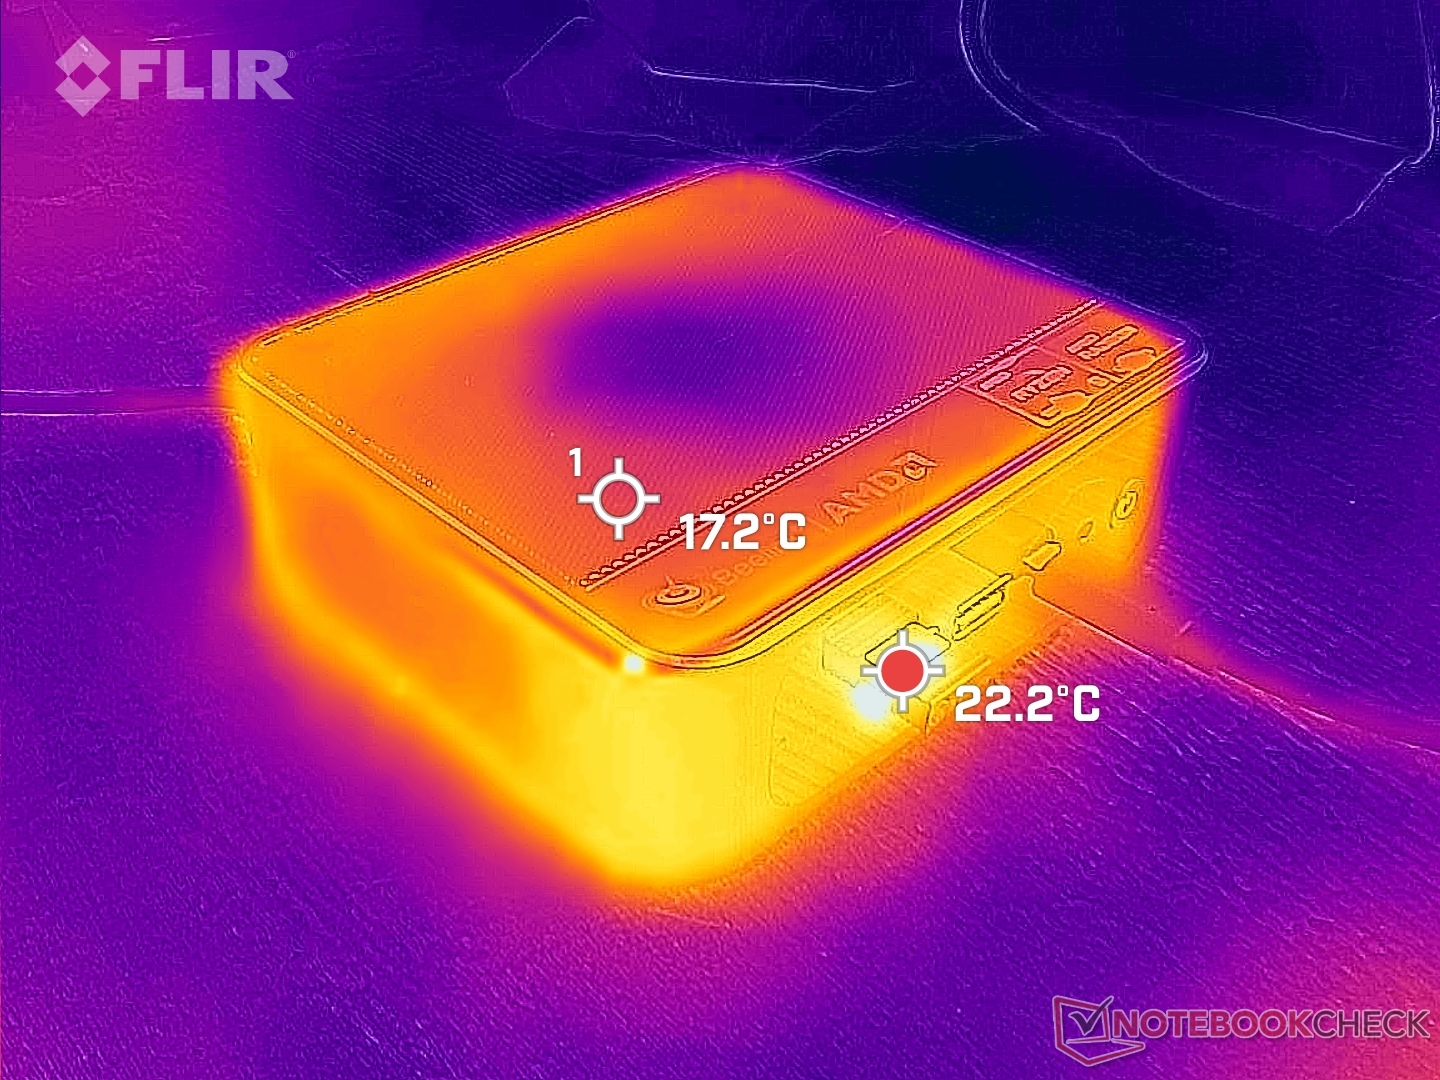
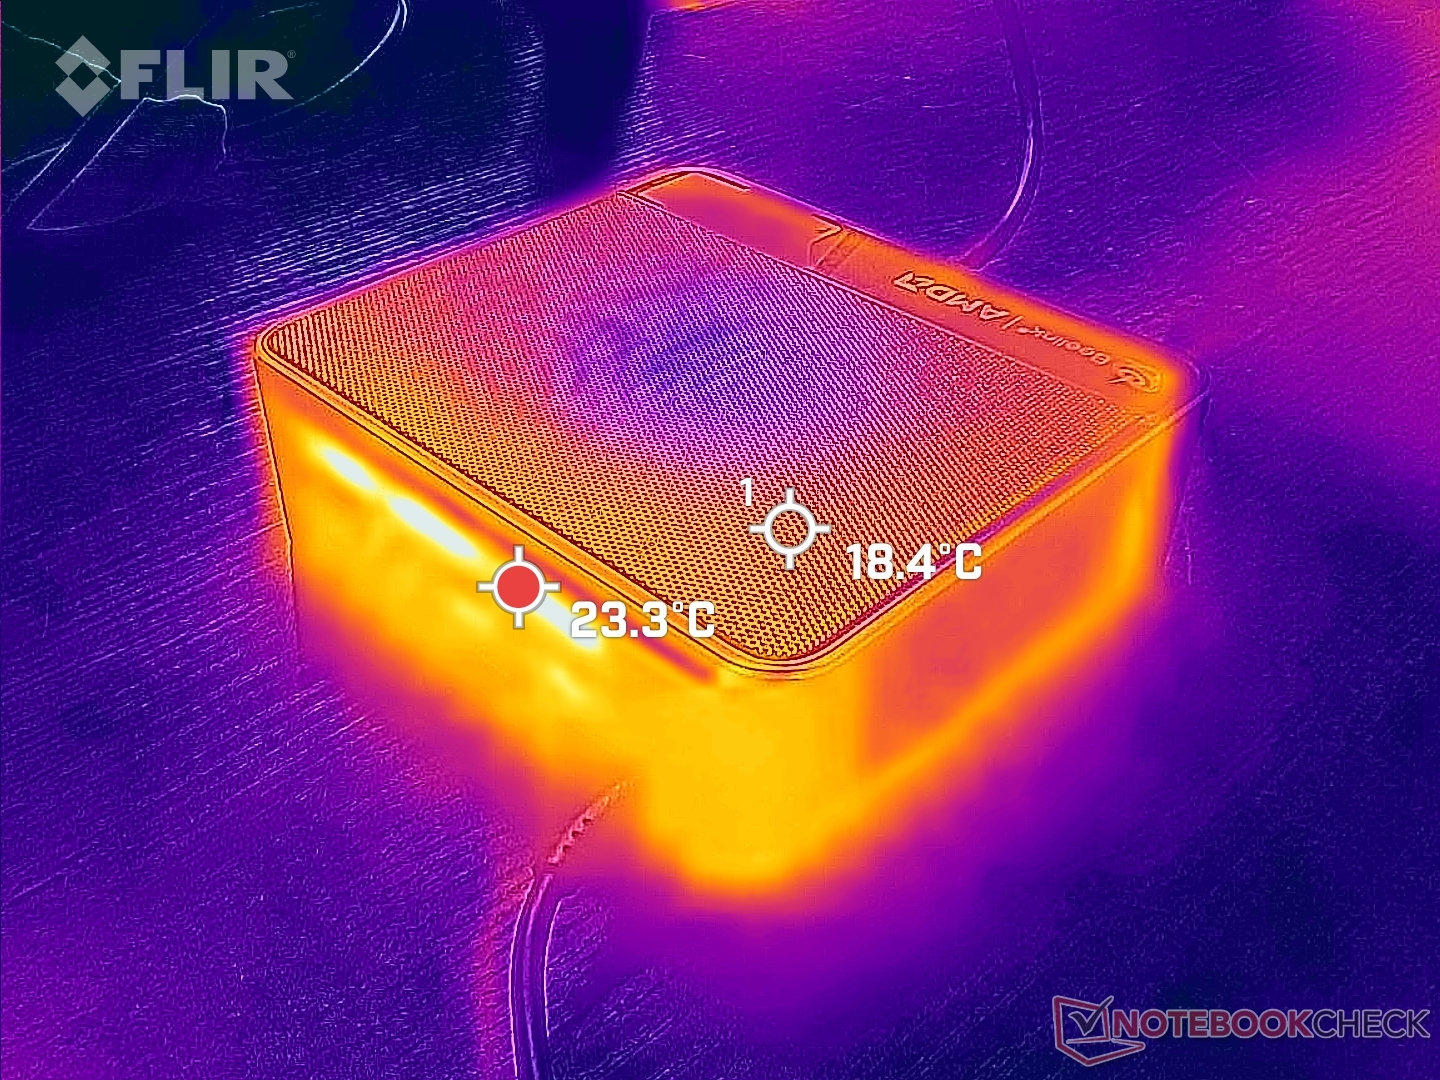
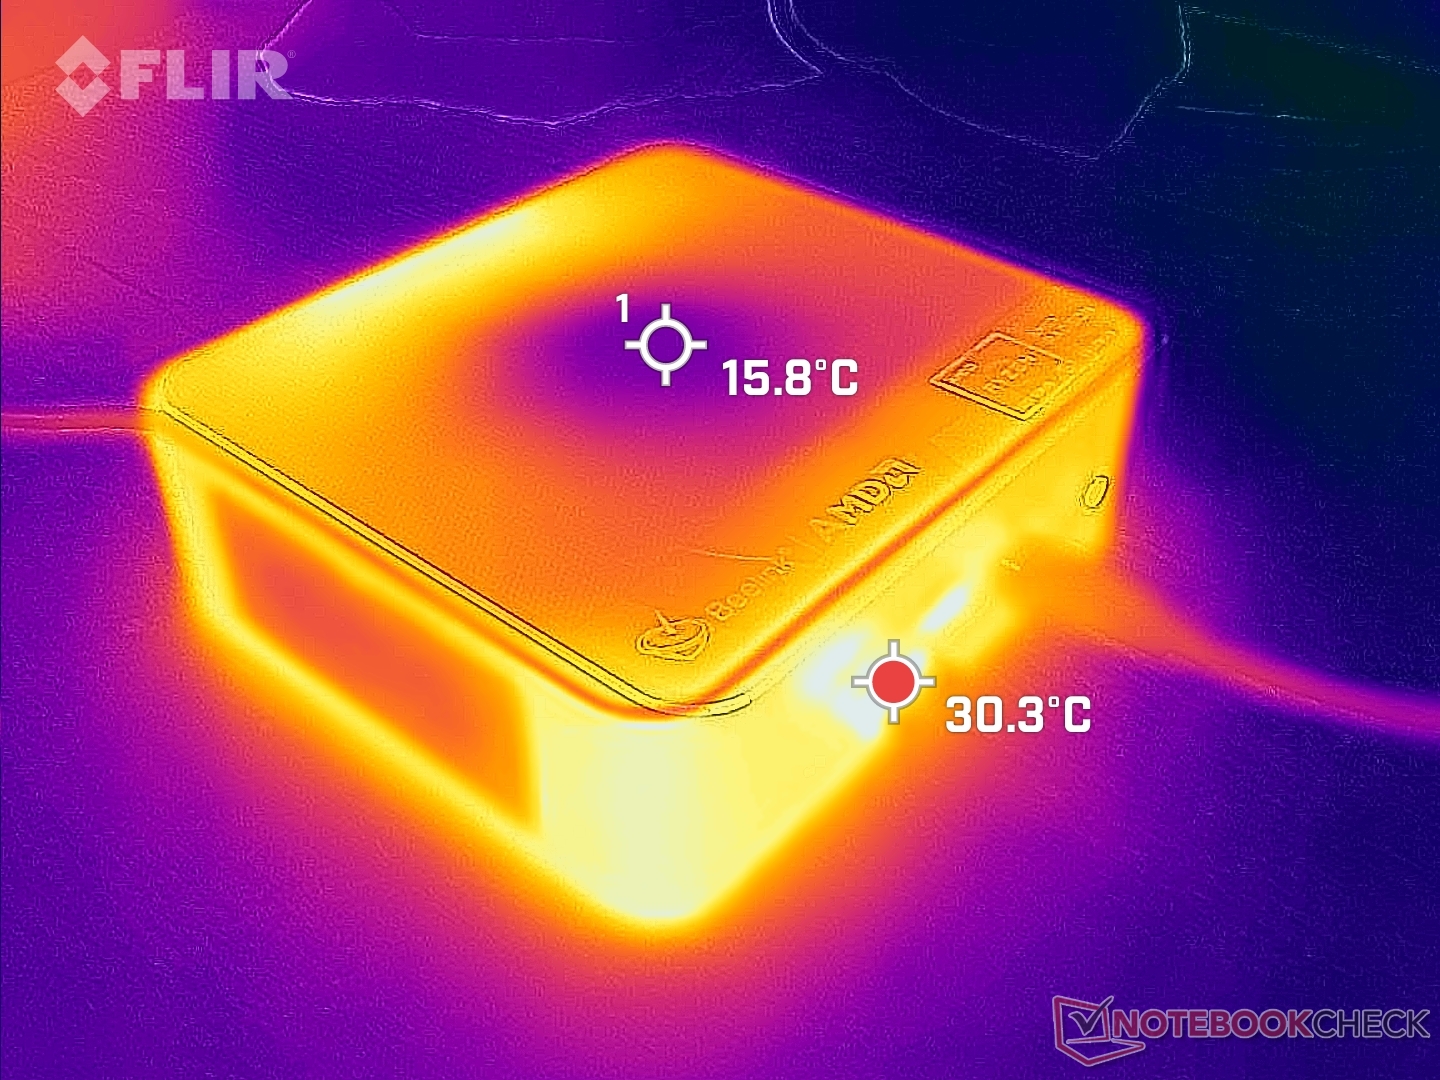
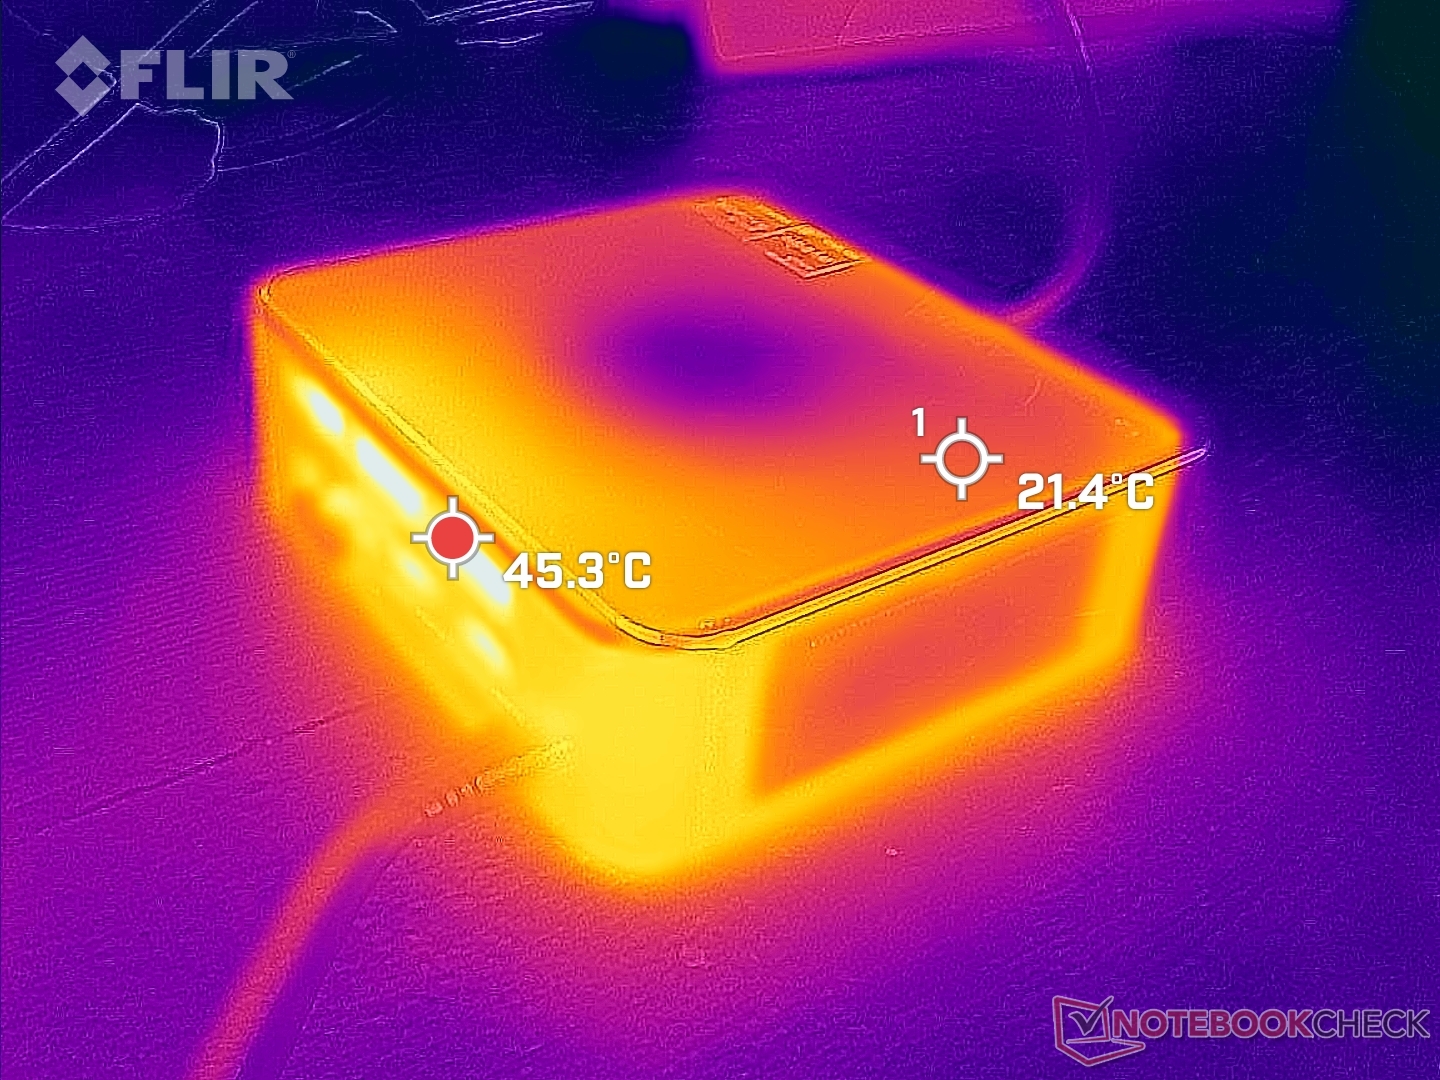
Temperatura
Chłodne powietrze dostaje się od góry, a zużyte ciepło wydostaje się z tyłu. Aby zapewnić optymalne chłodzenie, należy usunąć z góry wszelkie książki, papiery i inne przeszkody.
Stress Test
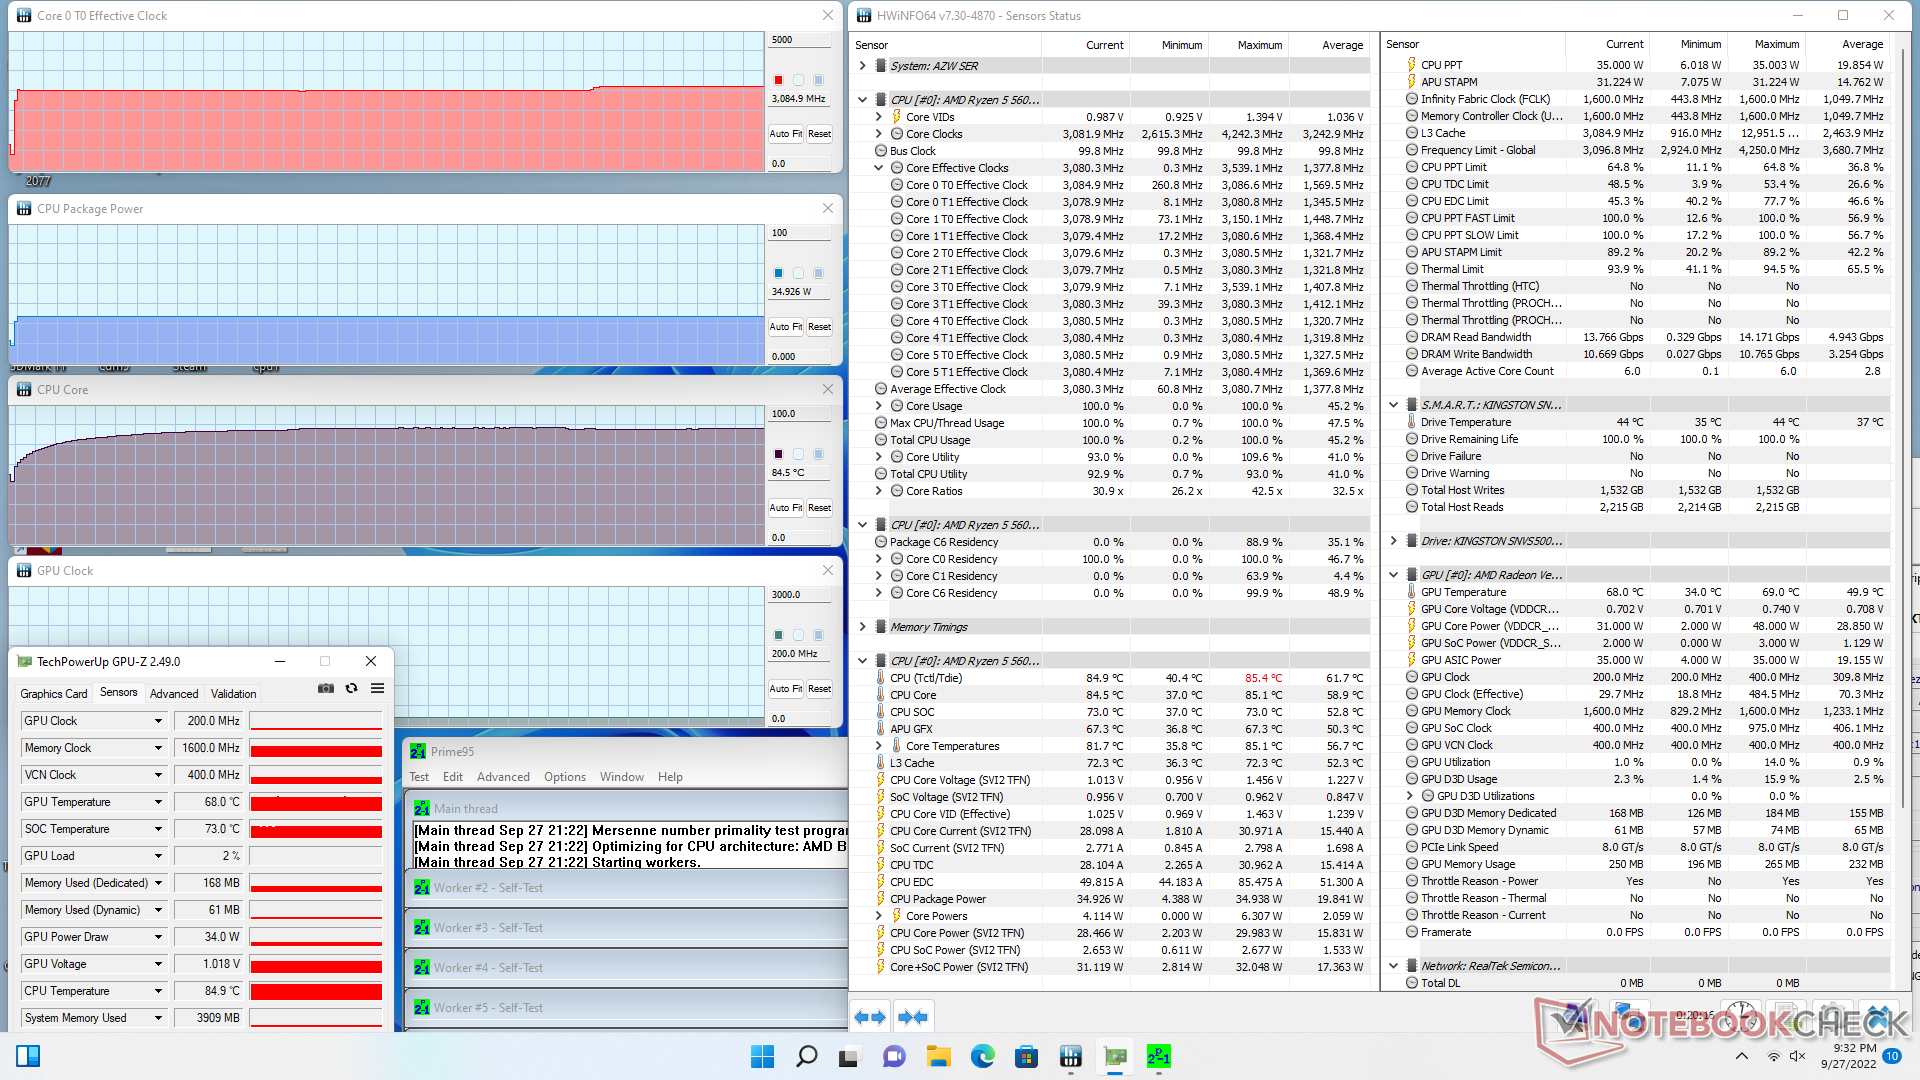
Częstotliwość taktowania procesora i pobór mocy na płycie ustabilizowały się odpowiednio na poziomie 3,0 GHz i 35 W po uruchomieniu Prime95. 35 W to dolna granica spektrum dla Ryzena 5 5600H, więc trochę rozczarowuje brak wyższych docelowych wartości TDP w SER5. Temperatura rdzenia jest już dość wysoka i wynosi 85 C, co może tłumaczyć niskie 35 W.
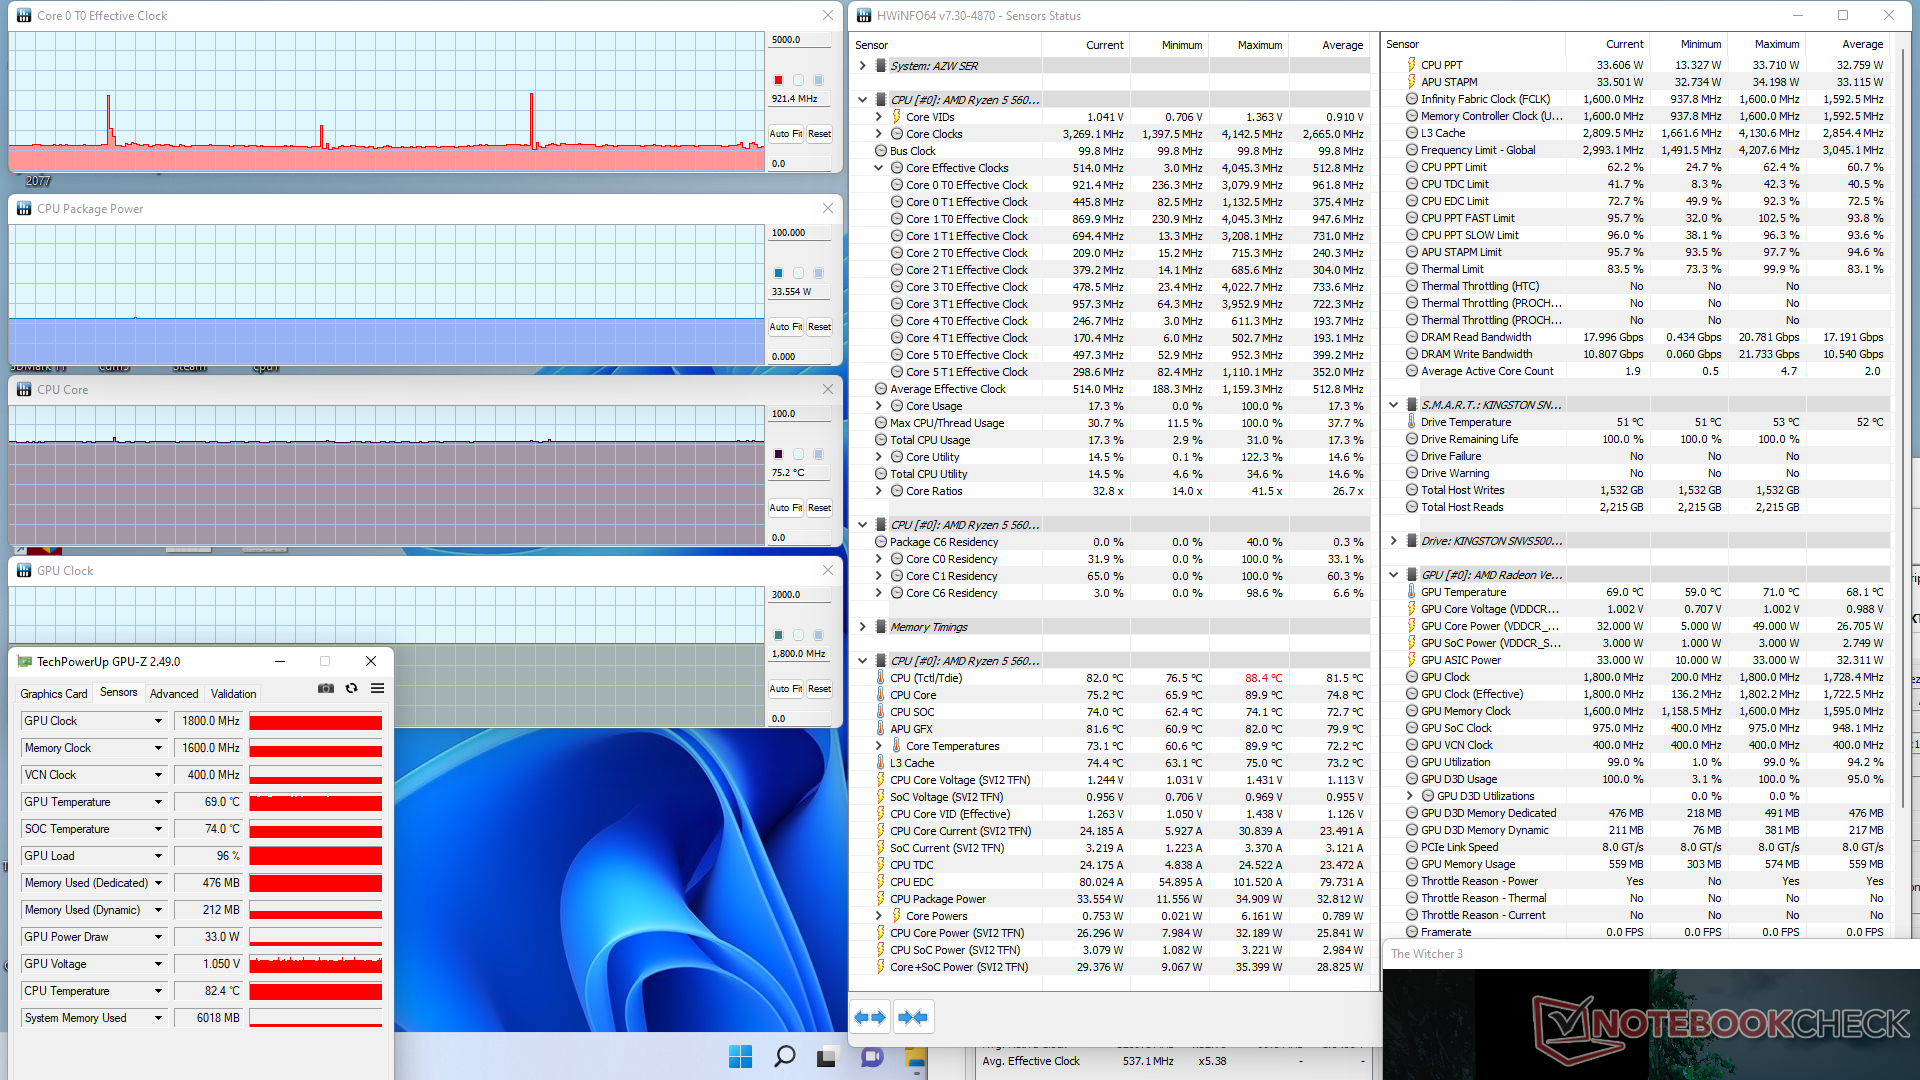
Uruchomienie Witcher 3 spowodowałoby temperaturę rdzenia 75 C w porównaniu do 57 C na Intel NUC11PAQ. W większości warunków system Beelink działa nieco cieplej niż Intel.
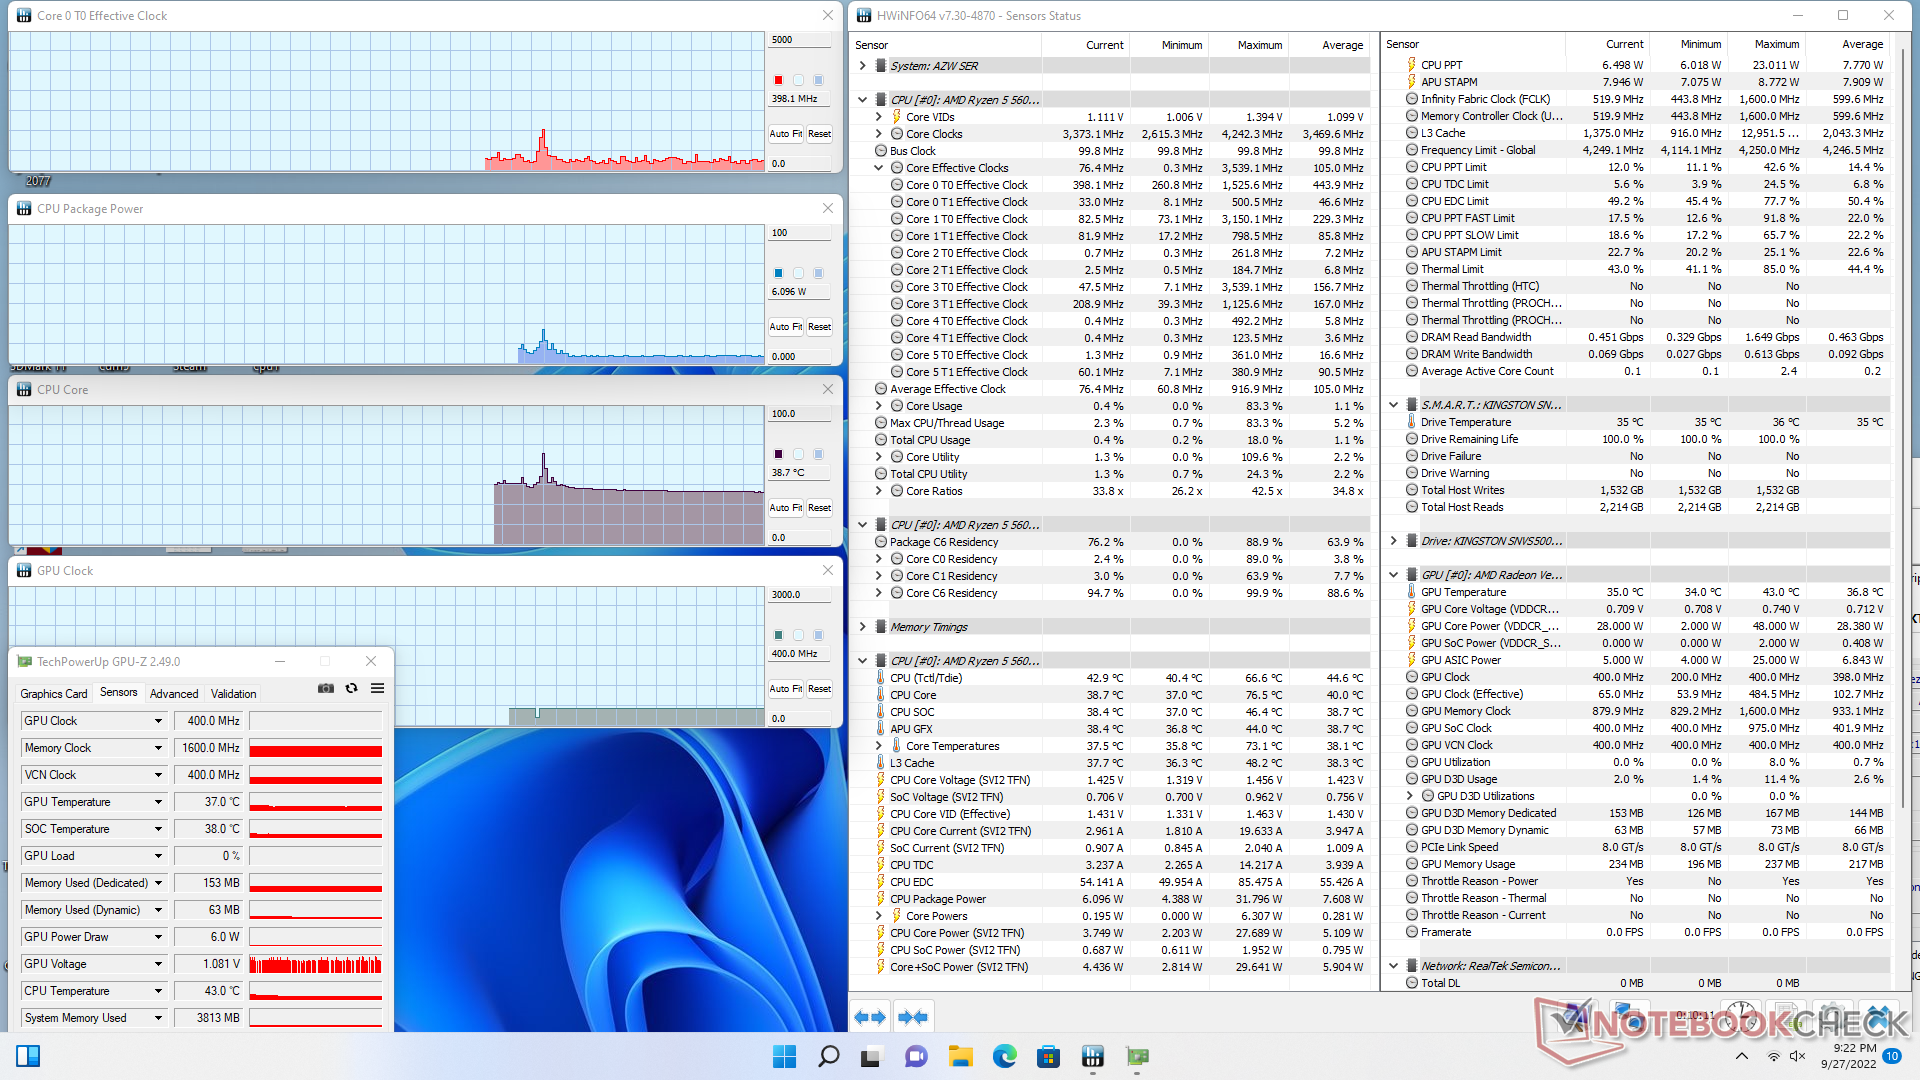
| ZegarCPU (GHz) | Zegar GPU (MHz) | Średnia temperatura CPU (°C) | |
| System Idle | -- | -- | 39 |
| Prime95 Stress | 3.0 | -- | 85 |
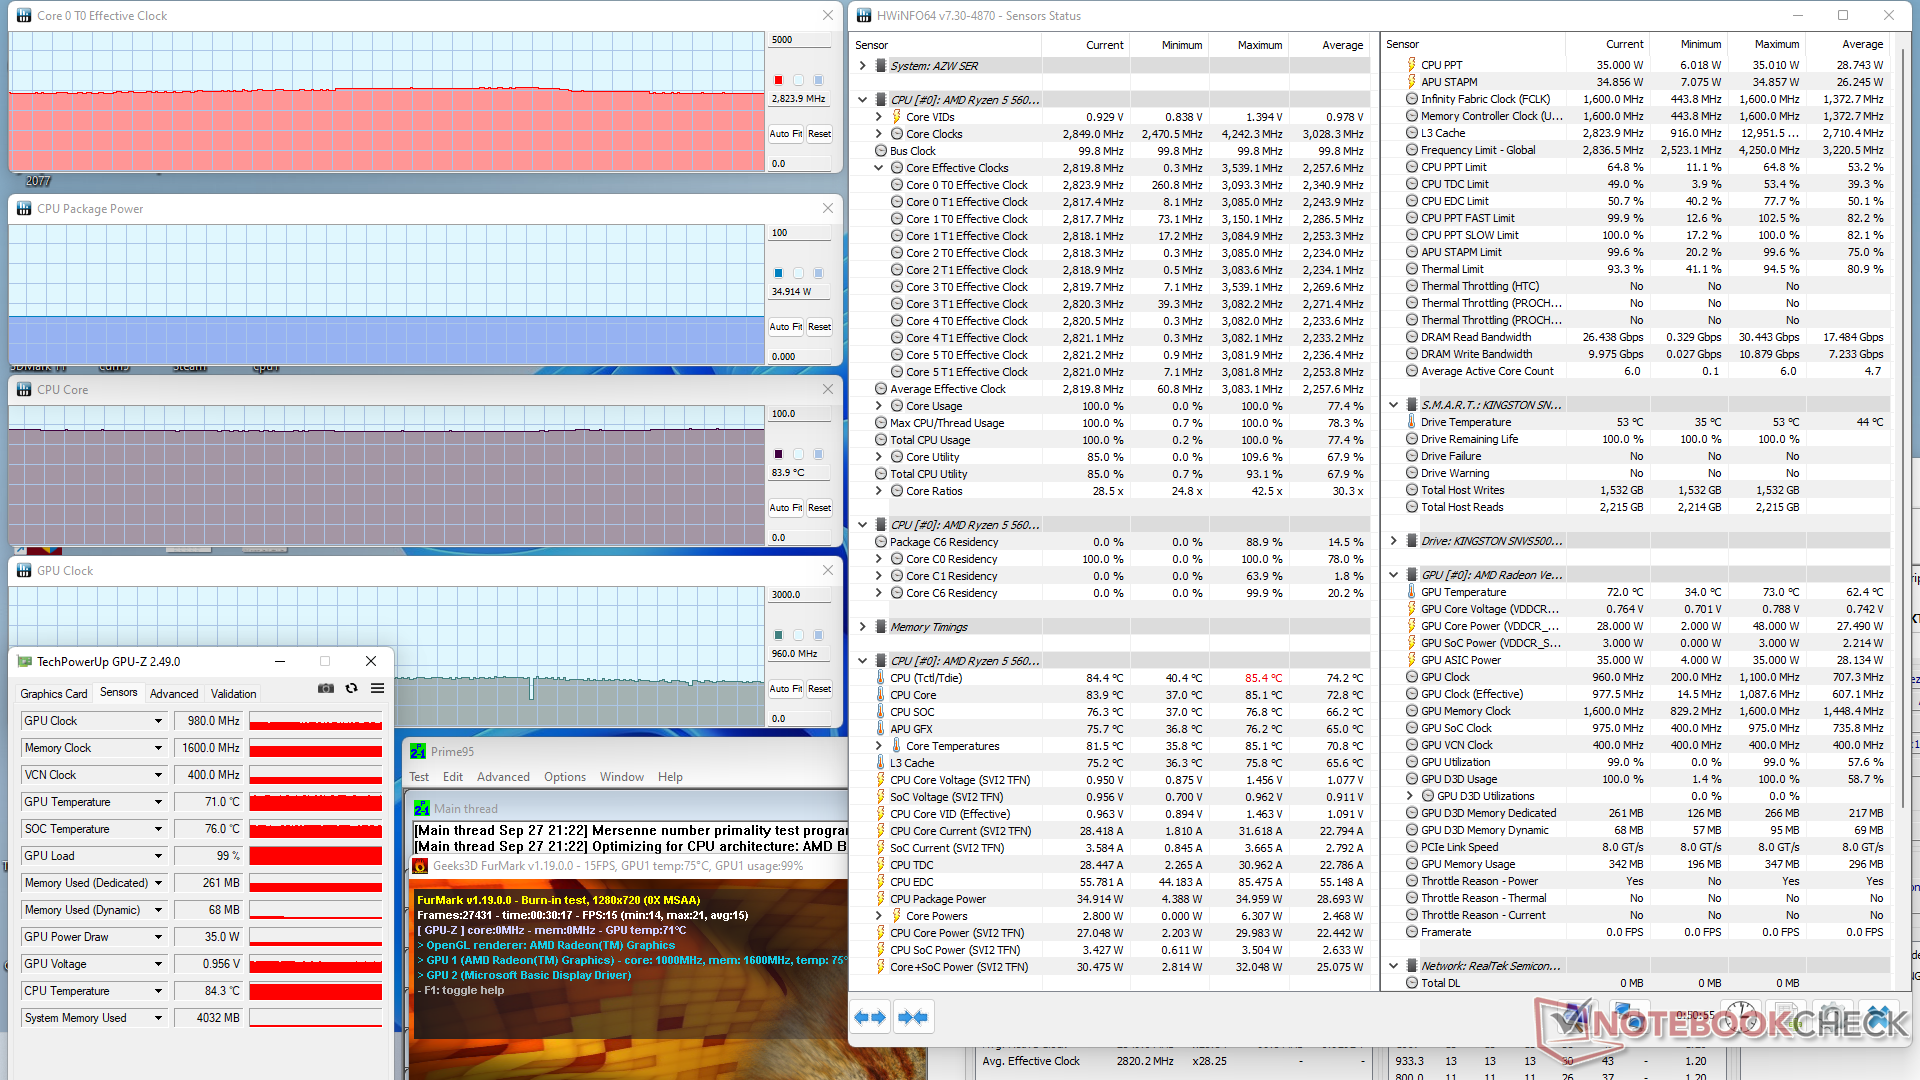
| Prime95 + FurMark Stress | 2.8 | 980 | 84 |
| Witcher 3 Stress | ~0,9 | 1800 | 75 |
Zarządzanie energią
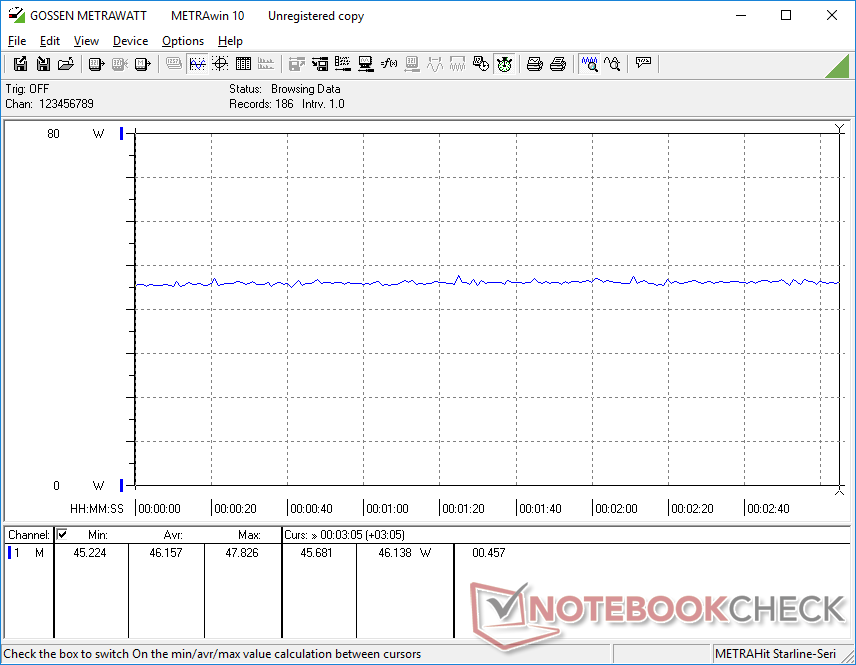
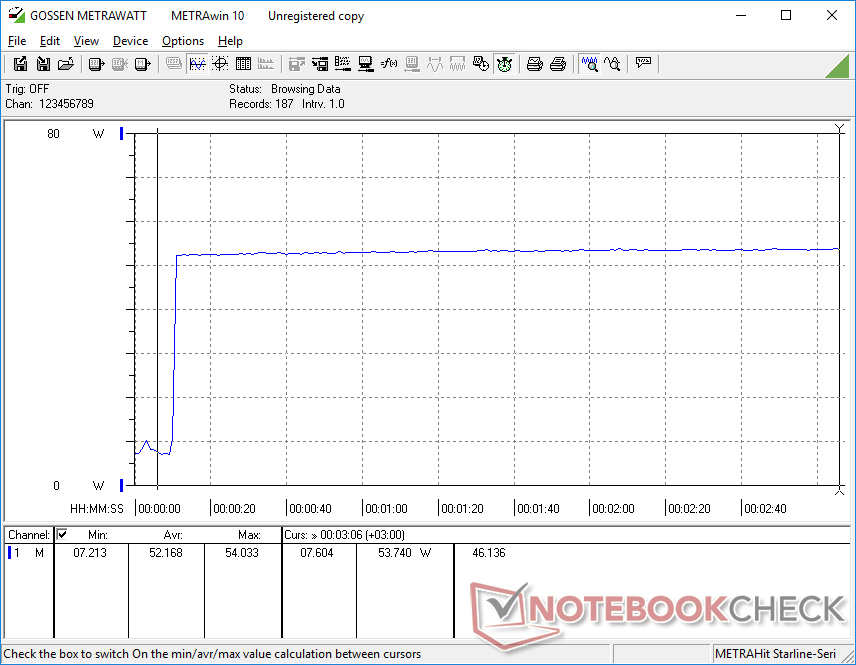
Pobór mocy
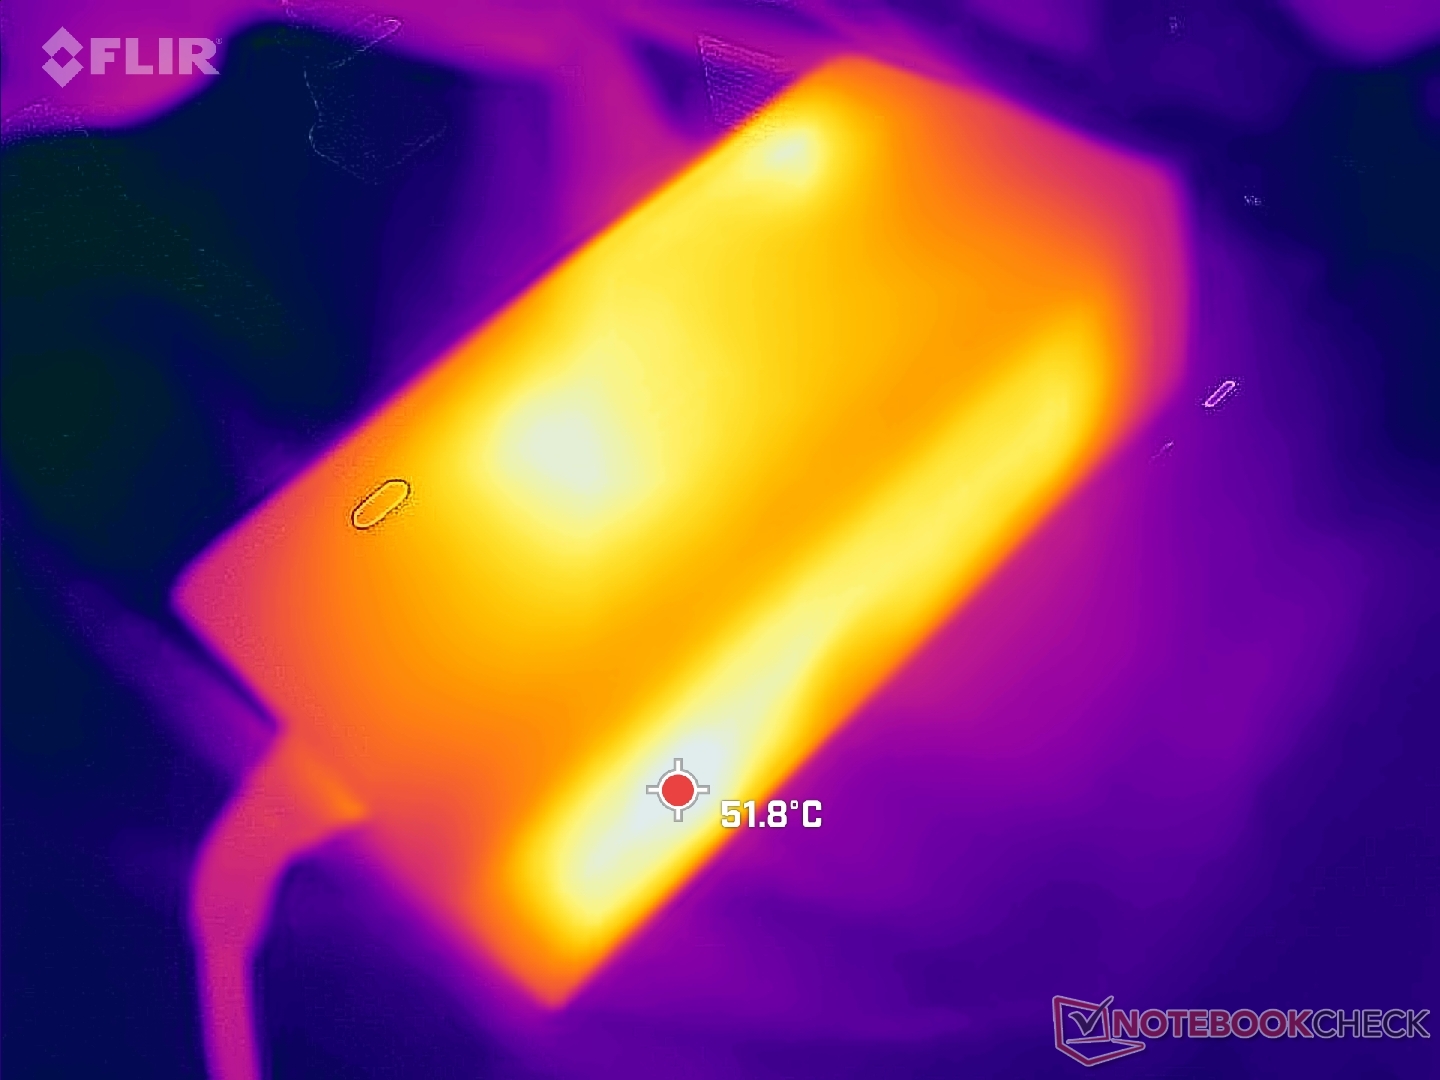
Pobór mocy jest ogólnie wyższy niż w przypadku modeli z procesorami z serii Ryzen U lub Core U, ponieważ nasz procesor z serii Ryzen H celuje w stosunkowo wyższe poziomy TDP. Intel NUC11 z Core i5-1135G7będzie potrzebował od 40 do 44 W w grach, w porównaniu do 46-50 W w Beelink. Wydajność w przeliczeniu na wat jest wciąż lepsza w przypadku Ryzena 5 5600H, szczególnie pod względem wydajności wielowątkowej procesora
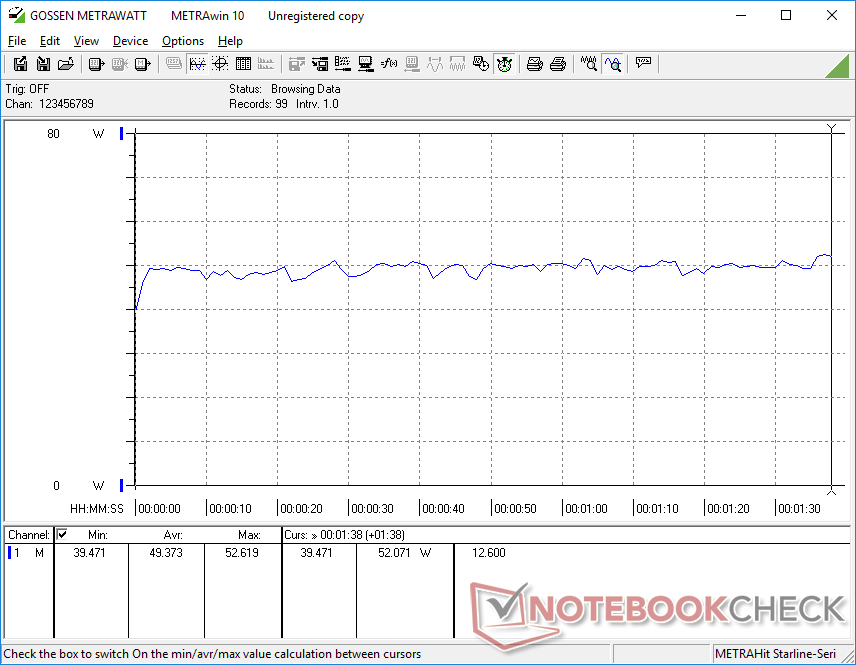
Na małym i średnim (~10 x 4,9 x 3,3 cm) zasilaczu ściennym o mocy 57 W udało nam się zarejestrować maksymalny pobór 50,2 W, gdy procesor jest wykorzystywany w 100 procentach. Podejrzewamy, że może to pójść jeszcze wyżej, jeśli podłączonych jest wiele urządzeń USB lub zewnętrznych monitorów USB-C.

| wyłączony / stan wstrzymania | |
| luz | |
| obciążenie |
|
Legenda:
min: | |
| Beelink SER Pro Ryzen 5 5600H R5 5600H, Vega 7, Kingston NV1 SNVS/500GCN, , x, | Beelink SEi11 Pro i5-11320H, Iris Xe G7 96EUs, Kingston NV1 SNVS/500GCN, , x, | Beelink GTR5 R9 5900HX, Vega 8, Kingston NV1 SNVS/500GCN, , x, | Intel NUC11TNKi5 i5-1135G7, Iris Xe G7 80EUs, Transcend M.2 SSD 430S TS512GMTS430S, , x, | Beelink SEi8 i3-8109U, Iris Plus Graphics 655, Intel SSD 660p SSDPEKNW512G8, , x, | Beelink SER4 R7 4800U, Vega 8, Intel SSD 660p SSDPEKNW512G8, , x, | |
|---|---|---|---|---|---|---|
| Power Consumption | -30% | -28% | -41% | -2% | 32% | |
| Idle Minimum * (Watt) | 5.4 | 9.8 -81% | 6.2 -15% | 11.5 -113% | 7.5 -39% | 4.1 24% |
| Idle Average * (Watt) | 8.2 | 10.3 -26% | 8.9 -9% | 12.4 -51% | 7.6 7% | 4.1 50% |
| Idle Maximum * (Watt) | 8.3 | 10.5 -27% | 9 -8% | 12.9 -55% | 9.2 -11% | 4.6 45% |
| Load Average * (Watt) | 49.3 | 54.2 -10% | 66.8 -35% | 40.7 17% | 41.1 17% | 35.6 28% |
| Witcher 3 ultra * (Watt) | 46.1 | 53.1 -15% | 62.6 -36% | 43.9 5% | 35.6 23% | |
| Load Maximum * (Watt) | 50.2 | 59 -18% | 81.6 -63% | 73.5 -46% | 41.4 18% | 39.9 21% |
* ... im mniej tym lepiej
Power Consumption Witcher 3 / Stresstest
Power Consumption external Monitor
Za
Przeciw
Werdykt - Kolejna doskonała alternatywa dla Intel NUC11
Za około 450 USD Beelink SER5 Pro jest w pełni wyposażony w 16 GB RAM, 500 GB pamięci masowej oraz licencjonowaną kopię systemu Windows 11 Pro. Dla porównania, Intel NUC11PAHi7 wyposażony w taką samą pojemność pamięci masowej i RAM kosztuje obecnie prawie 900 USD. SER5 jest nawet w stanie zaoferować szybszy procesor niż Intel i wiele z tych samych opcji rozbudowy, w tym SODIMM i podwójną pamięć masową. Jeśli szukasz oszczędności kilkuset dolarów, to Beelink powinien być wysoko na liście rozważań.
Beelink SER5 Pro jest o setki dolarów tańszy niż Intel NUC o podobnej wydajności. Firmy mogą nadal preferować niezawodność NUC, ale większość użytkowników domowych będzie chciała rozważyć bardziej przystępny Beelink.
Jest tu kilka cięć na rogach, ale żadne z nich nie wpływają tak bardzo na podstawowe wrażenia użytkownika. W porównaniu z Intel NUC, SER5 Pro brakuje Thunderbolt, blokady antykradzieżowej, obsługi dysków SSD PCIe4, trzyletniej gwarancji producenta i mocniejszego szkieletu obudowy. NUC nadal może być lepszą inwestycją, jeśli takie cechy są dla Ciebie ważne, ale oszczędności cenowe są w innych przypadkach znaczne.
Cena i dostępność
Beelink SER5 jest teraz dostępny na Amazon za nieco poniżej 400 USD.
Price comparison

