Notebookcheck Logo

Intel Core i5-13400F

Intel i5-13400F

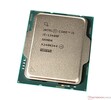
Intel Core i5-13400F to średniej klasy procesor do komputerów stacjonarnych z serii Raptor Lake. Obejmuje on hybrydową architekturę rdzeni CPU z połączonymi 10 rdzeniami. Sześć szybkich rdzeni wydajnościowych Golden Cove / Raptor Cove (rdzenie P) z HyperThreading i taktowaniem 3,5 - 5,1 GHz oraz cztery rdzenie wydajnościowe Gracemont bez HyperThreading i taktowaniem 2,6 - 3,9 GHz. 13400F może bazować na starszych układach Alder Lake (przynajmniej w przypadku wczesnych modeli) lub nowszych układach Raptor Lake. Procesory z serii F nie posiadają zintegrowanego iGPU.

Wydajność jest wyraźnie wyższa niż w przypadku starego Core i5-12400F dzięki dodatkowym czterem rdzeniom E. Pomagają one w obciążeniach wielowątkowych, a wyższe taktowanie rdzeni p pomaga w obciążeniach jednowątkowych.

Pobór mocy 13400F jest oceniany na 65 W przy długotrwałych obciążeniach (PL1) i 148 W przy krótkich seriach (PL2).

SeriaIntel Raptor Lake-S
Nazwa roboczaRaptor Lake-S

Rodzina: Raptor Lake-S Raptor Lake-S

Intel Core i7-137002.1 - 5.2 GHz16 / 24 cores30 MB L3
Intel Core i5-13400F « 2.5 - 4.6 GHz10 / 16 cores20 MB L3
Intel Core i5-134002.5 - 4.6 GHz10 / 16 cores20 MB L3
Taktowanie2500 - 4600 MHz
Pamięć 1. poziomu0.1 MB
Pamięć 2. poziomu9.5 MB
Pamięć 3. poziomu20 MB
Liczba rdzeni / wątków10 / 16
TDP (Thermal Design Power)65 W
Technologia wytwarzania10 nm
Rozmiar procesora257 mm2
Maks. temperatura100 °C
GniazdoLGA 1700
CechyIntel SSE4.1, Intel SSE4.2, Intel AVX2
64-bityobsługa 64-bitów
Architecturex86
Najniższa cena$196 U.S.
Data premiery04/01/2023
Odnośnik do produktu (zewn.)ark.intel.com

Testy

Performance Rating - CB R15 + R20 + 7-Zip + X265 + Blender + 3DM11 CPU
42.5 pt (59%)
2.47 -94%
...
41.2 -3%
41.3 -3%
41.5 -2%
41.6 -2%
AMD Ryzen 5 5600X
41.9 -1%
42.1 -1%
42.1 -1%
Intel Core i9-10980XE
42.1 -1%
42.3 0%
Intel Core i5-13400F
42.5
42.6 0%
42.7 0%
42.7 0%
42.7 0%
42.8 1%
42.9 1%
42.9 1%
43.1 1%
AMD Ryzen 9 3950X
43.2 2%
...
72.1 70%
0%
100%
Cinebench R23 - Cinebench R23 Multi Core
15911 Points (15%)
202 -99%
...
15337 -4%
AMD Ryzen 9 5900X
15441 -3%
AMD Ryzen 7 5800X
15476 -3%
Intel Core i9-10850K
15538 -2%
15603 -2%
15743 -1%
Intel Core i9-10900K
15821 -1%
15889 0%
15902 0%
Intel Core i5-13400F
15911
15953 0%
16302 2%
16411 3%
16514 4%
16575 4%
16952 7%
17178 8%
17182 8%
17387 9%
...
107681 577%
0%
100%
Cinebench R20 - Cinebench R20 CPU (Multi Core)
6091 Points (15%)
Cinebench R15 - Cinebench R15 CPU Multi 64 Bit
2364 Points (15%)
012024036048060072084096010801200132014401560168018001920204021602280Tooltip
Cinebench R15 - Cinebench R15 CPU Single 64 Bit
252 Points (76%)
Cinebench R11.5 - Cinebench R11.5 CPU Multi 64 Bit
27.5 Points (36%)
Cinebench R11.5 - Cinebench R11.5 CPU Single 64 Bit
3.1 Points (76%)
Cinebench R10 - Cinebench R10 Rend. Single (32bit)
8689 pkt. (52%)
Cinebench R10 - Cinebench R10 Rend. Multi (32bit)
51113 pkt. (37%)
Cinebench R10 - Cinebench R10 Rend. Multi (64bit)
82988 Points (58%)
Cinebench R10 - Cinebench R10 Rend. Single (64bit)
13947 Points (17%)
wPrime 2.10 - wPrime 2.0 1024m *
367.9 s (4%)
wPrime 2.10 - wPrime 2.0 32m *
3.3 s (1%)
WinRAR - WinRAR 4.0
8602 pkt. (14%)
7-Zip 18.03 - 7-Zip 18.03 Multli Thread 4 runs
60048 MIPS (34%)
7-Zip 18.03 - 7-Zip 18.03 Single Thread 4 runs
5743 MIPS (69%)
X264 HD Benchmark 4.0 - x264 Pass 2
136.9 fps (48%)
X264 HD Benchmark 4.0 - x264 Pass 1
314.5 fps (73%)
HWBOT x265 Benchmark v2.2 - HWBOT x265 4k Preset
19.2 fps (34%)
051015202530Tooltip
TrueCrypt - TrueCrypt Serpent
1.1 GB/s (0%)
TrueCrypt - TrueCrypt Twofish
2 GB/s (34%)
TrueCrypt - TrueCrypt AES
12.2 GB/s (32%)
Blender - Blender 3.3 Classroom CPU *
336 Seconds (4%)
Blender - Blender 2.79 BMW27 CPU *
206 Seconds (1%)
R Benchmark 2.5 - R Benchmark 2.5 *
0.5 sec (10%)
3DMark 06 - CPU - 3DMark 06 - CPU
13989 Points (30%)
Super Pi mod 1.5 XS 1M - Super Pi mod 1.5 XS 1M *
8 s (2%)
Super Pi mod 1.5 XS 2M - Super Pi mod 1.5 XS 2M *
17.9 s (1%)
Super Pi Mod 1.5 XS 32M - Super Pi mod 1.5 XS 32M *
420.5 s (2%)
3DMark Vantage - 3DM Vant. Perf. CPU no Physx
77937 Points (68%)
3DMark 11 - 3DM11 Performance Physics
23820 Points (64%)
3DMark - 3DMark Ice Storm Physics
77765 Points (63%)
3DMark - 3DMark Ice Storm Extreme Physics
76636 Points (62%)
3DMark - 3DMark Ice Storm Unlimited Physics
80273 Points (68%)
3DMark - 3DMark Cloud Gate Physics
19846 Points (50%)
3DMark - 3DMark Fire Strike Standard Physics
28087 Points (50%)
3DMark - 3DMark Time Spy CPU
12669 Points (53%)
Geekbench 5.5 - Geekbench 5.1 - 5.4 64 Bit Single-Core
1792 pkt. (76%)
Geekbench 5.5 - Geekbench 5.1 - 5.4 64 Bit Multi-Core
12095 pkt. (22%)
Geekbench 5.0 - Geekbench 5.0 64 Bit Multi-Core
12009 pkt. (38%)
Geekbench 4.4 - Geekbench 4.1 - 4.4 64 Bit Single-Core
7684 pkt. (77%)
Geekbench 4.4 - Geekbench 4.1 - 4.4 64 Bit Multi-Core
43856 pkt. (49%)
WebXPRT 3 - WebXPRT 3 Score
294 Points (61%)
CrossMark - CrossMark Overall
1941 Points (74%)
Power Consumption - Prime95 Power Consumption - external Monitor *
214 Watt (37%)
0153045607590105120135150165180195210225Tooltip
Power Consumption - Cinebench R15 Multi Power Consumption - external Monitor *
184.2 Watt (34%)
0153045607590105120135150165180195210225Tooltip
Power Consumption - Idle Power Consumption - external Monitor *
76.3 Watt (50%)
05101520253035404550556065707580Tooltip
- Zakres wyników testów referencyjnych dla tej karty graficznej
- Średnia wartość wyników testów referencyjnych dla tej karty graficzne
* Smaller numbers mean a higher performance

v1.26
log 25. 16:47:59

#0 no ids found in url (should be separated by "_") +0s ... 0s

#1 not redirecting to Ajax server +0s ... 0s

#2 did not recreate cache, as it is less than 5 days old! Created at Thu, 25 Apr 2024 05:38:32 +0200 +0.001s ... 0.001s

#3 no comparison url found in template nbc.compare_page_2 needed +0.006s ... 0.007s

#4 no comparison url found in template nbc.compare_page_2 needed +0s ... 0.007s

#5 composed specs +0s ... 0.007s

#6 did output specs +0s ... 0.007s

#7 getting avg benchmarks for device 14966 +0.017s ... 0.025s

#8 got single benchmarks 14966 +0.011s ... 0.036s

#9 got avg benchmarks for devices +0s ... 0.036s

#10 min, max, avg, median took s +1.038s ... 1.073s

#11 no comparison url found in template nbc.compare_page_2 needed +0s ... 1.074s

#12 return log +0s ... 1.074s

Please share our article, every link counts!

Inne procesory tej serii Raptor Lake-S

» Intel Core i9-13900K
   24x 3 GHz - 5.8 GHz
» Intel Core i7-13700K
   16x 3.4 GHz - 5.4 GHz
» Intel Core i5-13600K
   14x 3.5 GHz - 5.1 GHz
» Intel Core i7-13700
   16x 2.1 GHz - 5.2 GHz
» Intel Core i5-13400F
   10x 2.5 GHz - 4.6 GHz
» Intel Core i5-13400
   10x 2.5 GHz - 4.6 GHz

Porównywalne CPU

+ AMD Ryzen Threadripper 2970WX
   24x 3 GHz - 4.2 GHz
+ Intel Core i7-12700K
   12x 2.7 GHz - 5 GHz
+ AMD Ryzen 9 5900X
   12x 3.7 GHz - 4.8 GHz
+ Intel Core i9-10980XE
   18x 3 GHz - 4.6 GHz
+ Intel Core i9-9980XE
   18x 3 GHz - 4.4 GHz
» Intel Core i5-13400F
   10x 2.5 GHz - 4.6 GHz
- Intel Core i5-13400
   10x 2.5 GHz - 4.6 GHz
- Intel Core i7-12700F
   12x 3.3 GHz - 4.9 GHz
- Intel Core i7-12700
   12x 3.3 GHz - 4.9 GHz
- AMD Ryzen Threadripper 2950X
   16x 3.5 GHz - 4.4 GHz
- Intel Core i5-12600K
   10x 2.8 GHz - 4.9 GHz
> laptopy testy i recenzje notebooki > Rankingi > Zestawienie mobilnych procesorów > Intel Raptor Lake-S i5-13400F
Klaus Hinum (Update: 2023-11-26)