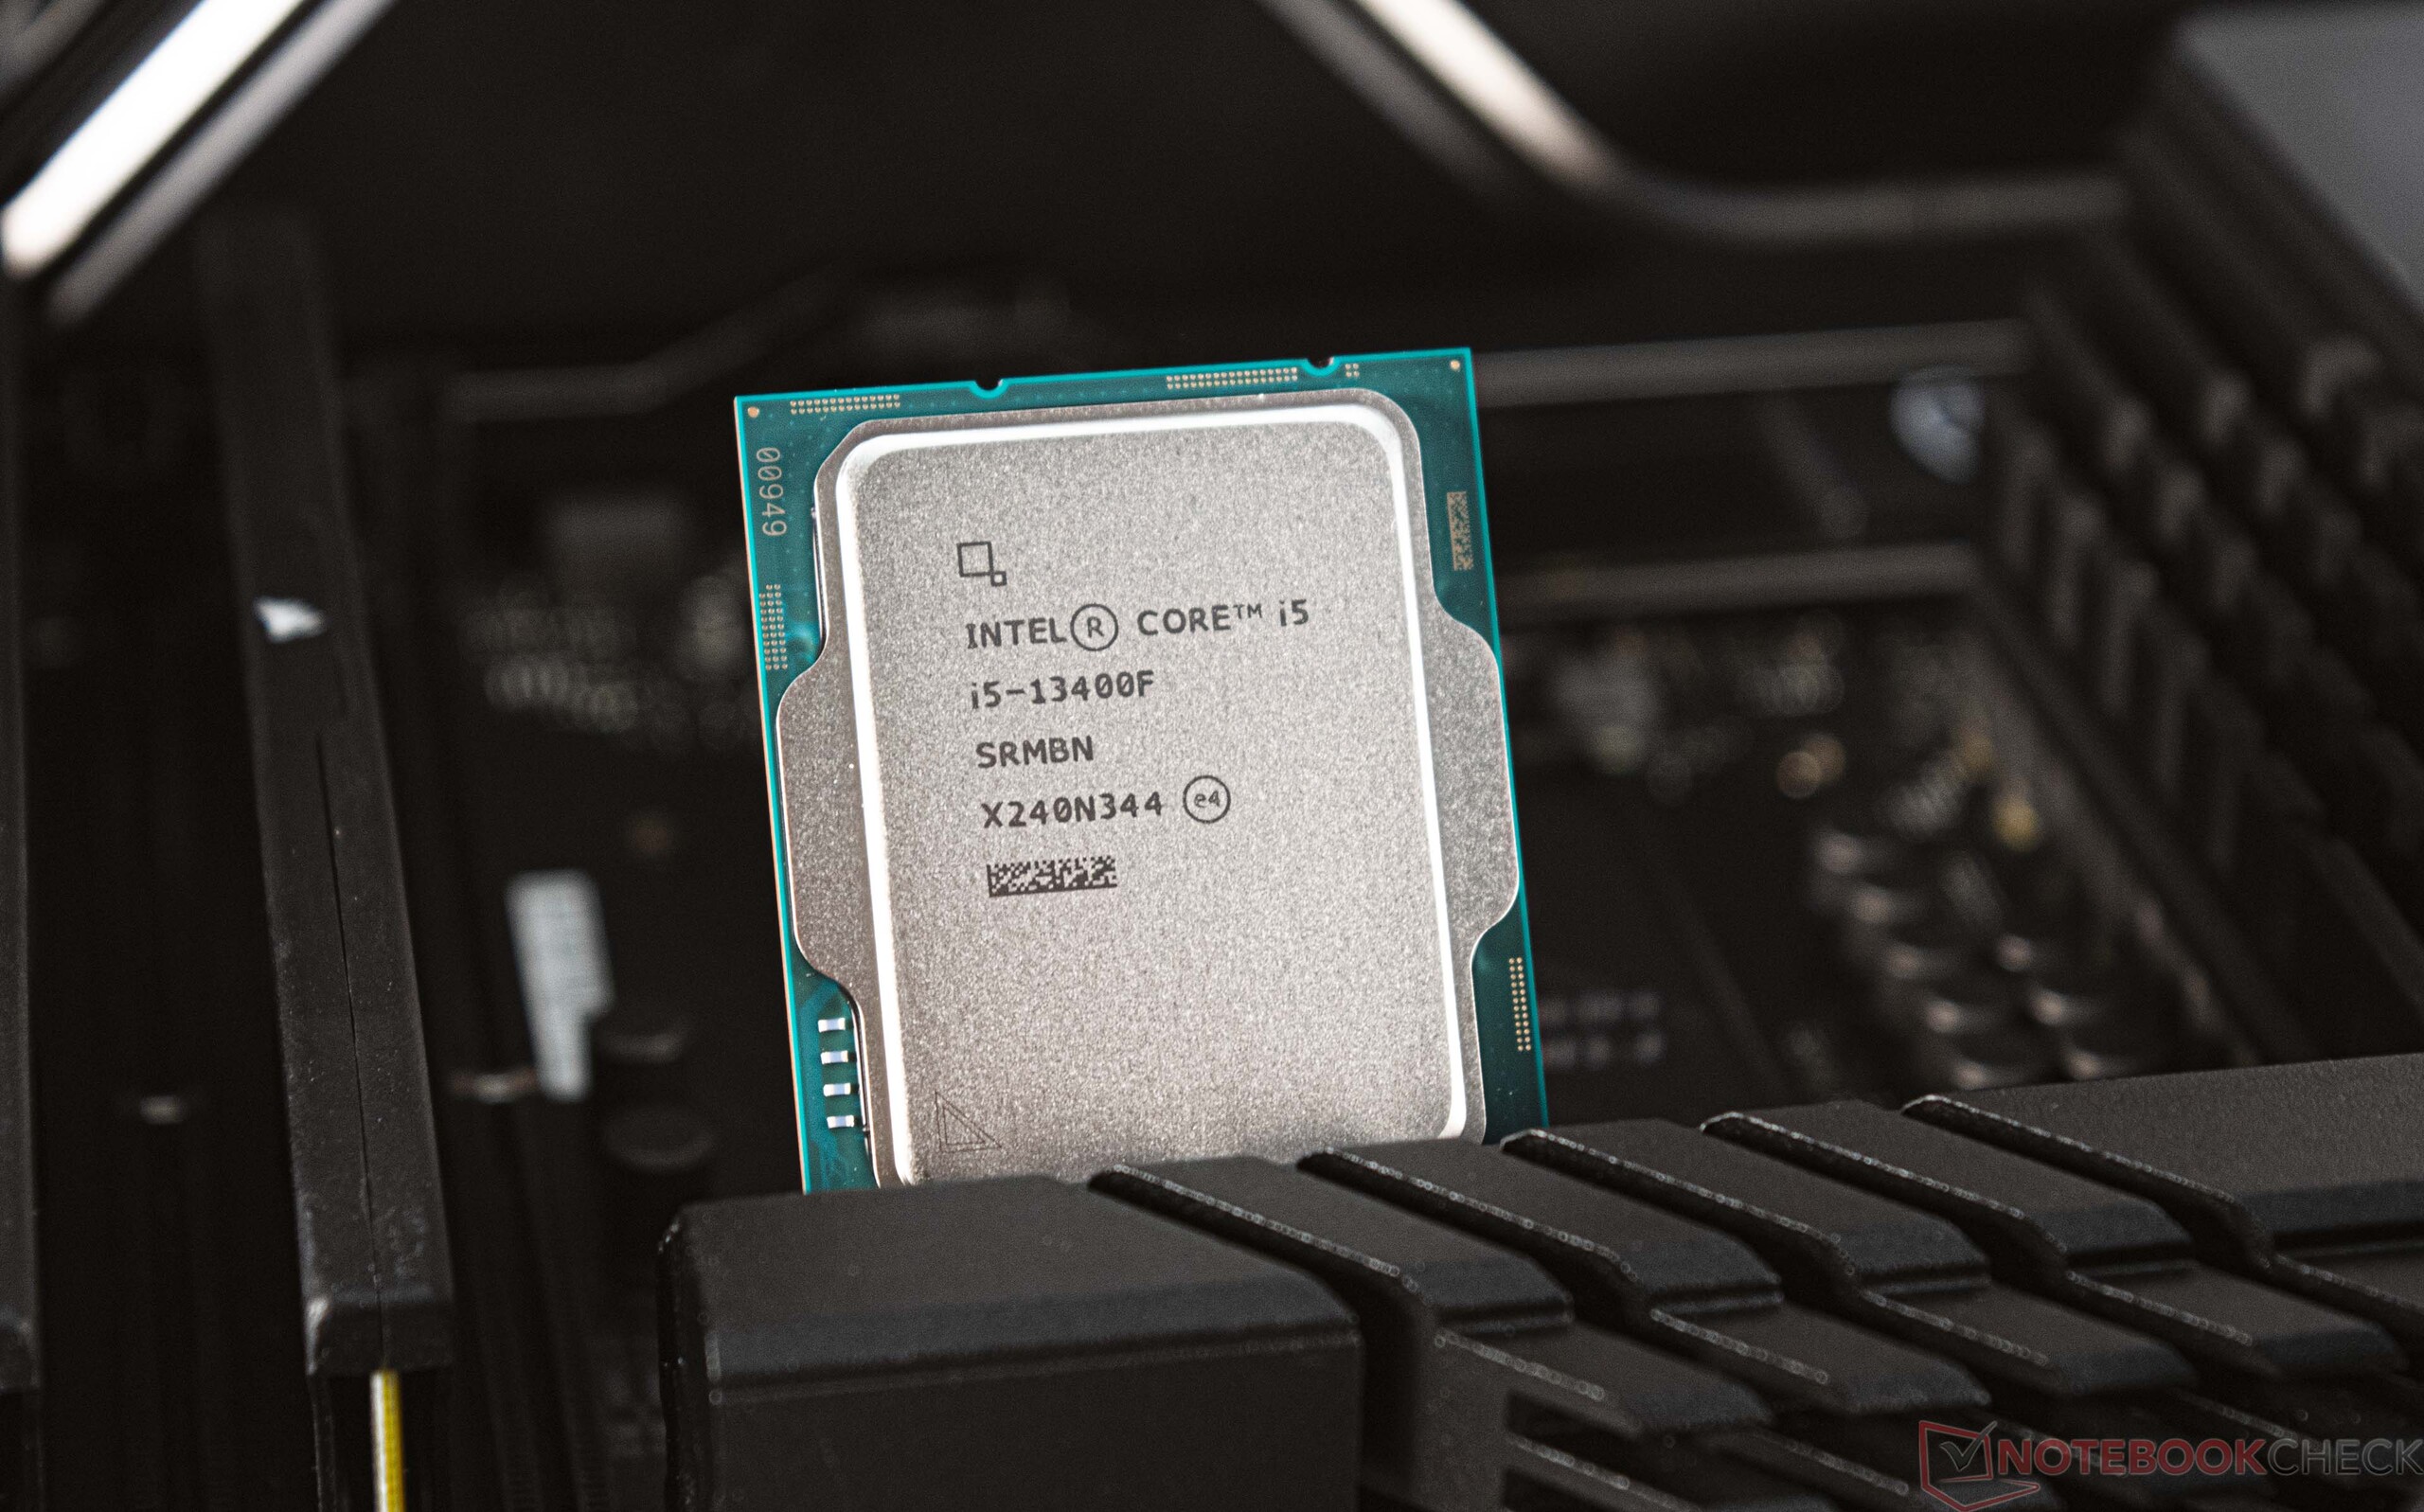
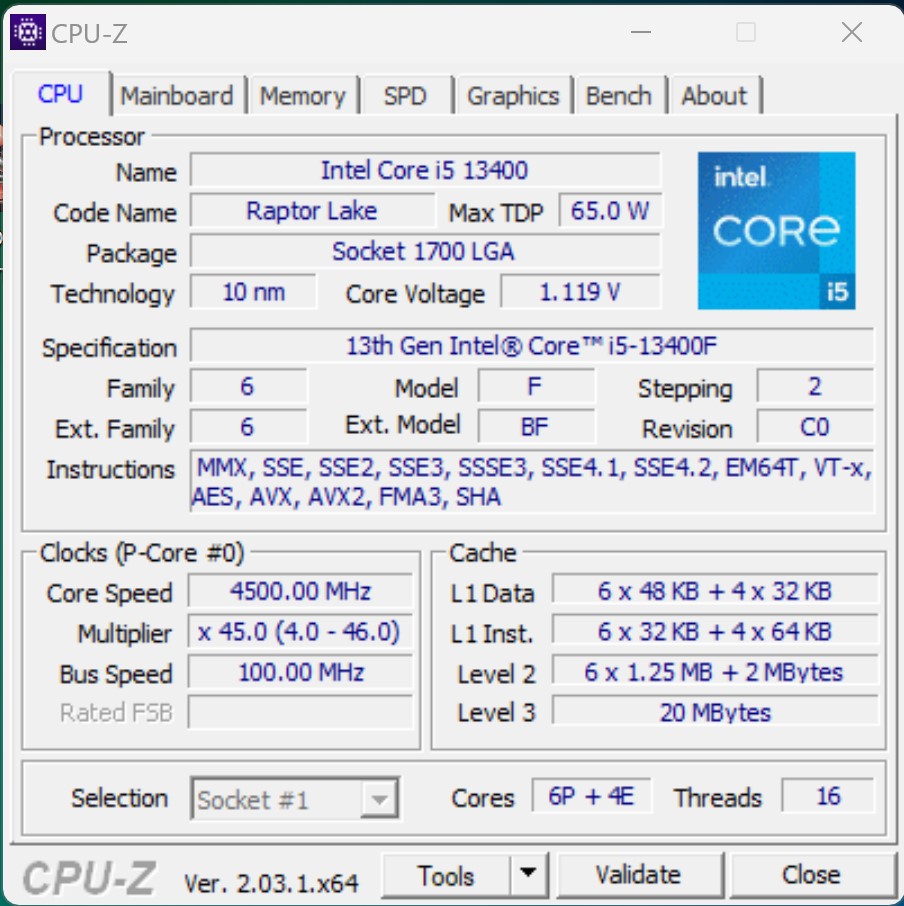
Procesor Intel Core i5-13400F do komputerów stacjonarnych w recenzji: Ekonomiczny i niedrogi 10-rdzeniowy procesor do gier i pracy

Intel wraz z serią Alder Lake wprowadził hybrydową architekturę procesorów, która łączy tzw. rdzenie P i E pod jednym rozpraszaczem ciepła. Rdzenie E były do tej pory pomijane w procesorach klasy podstawowej, co wpływało głównie na wydajność wielowątkową. Wraz z 13. generacją Core, Intel wreszcie dał Core i5-13400F 4 dodatkowe rdzenie E oprócz 6 rdzeni P. Tym samym jest on teraz na równi z m.in Intel Core i5-12600K z serii Alder Lake. Mimo to te dwa modele mocno różnią się poborem mocy. Natomiast tylko kilka punktów procentowych dzieli oba modele pod względem wydajności, którą możemy w tym momencie ujawnić.
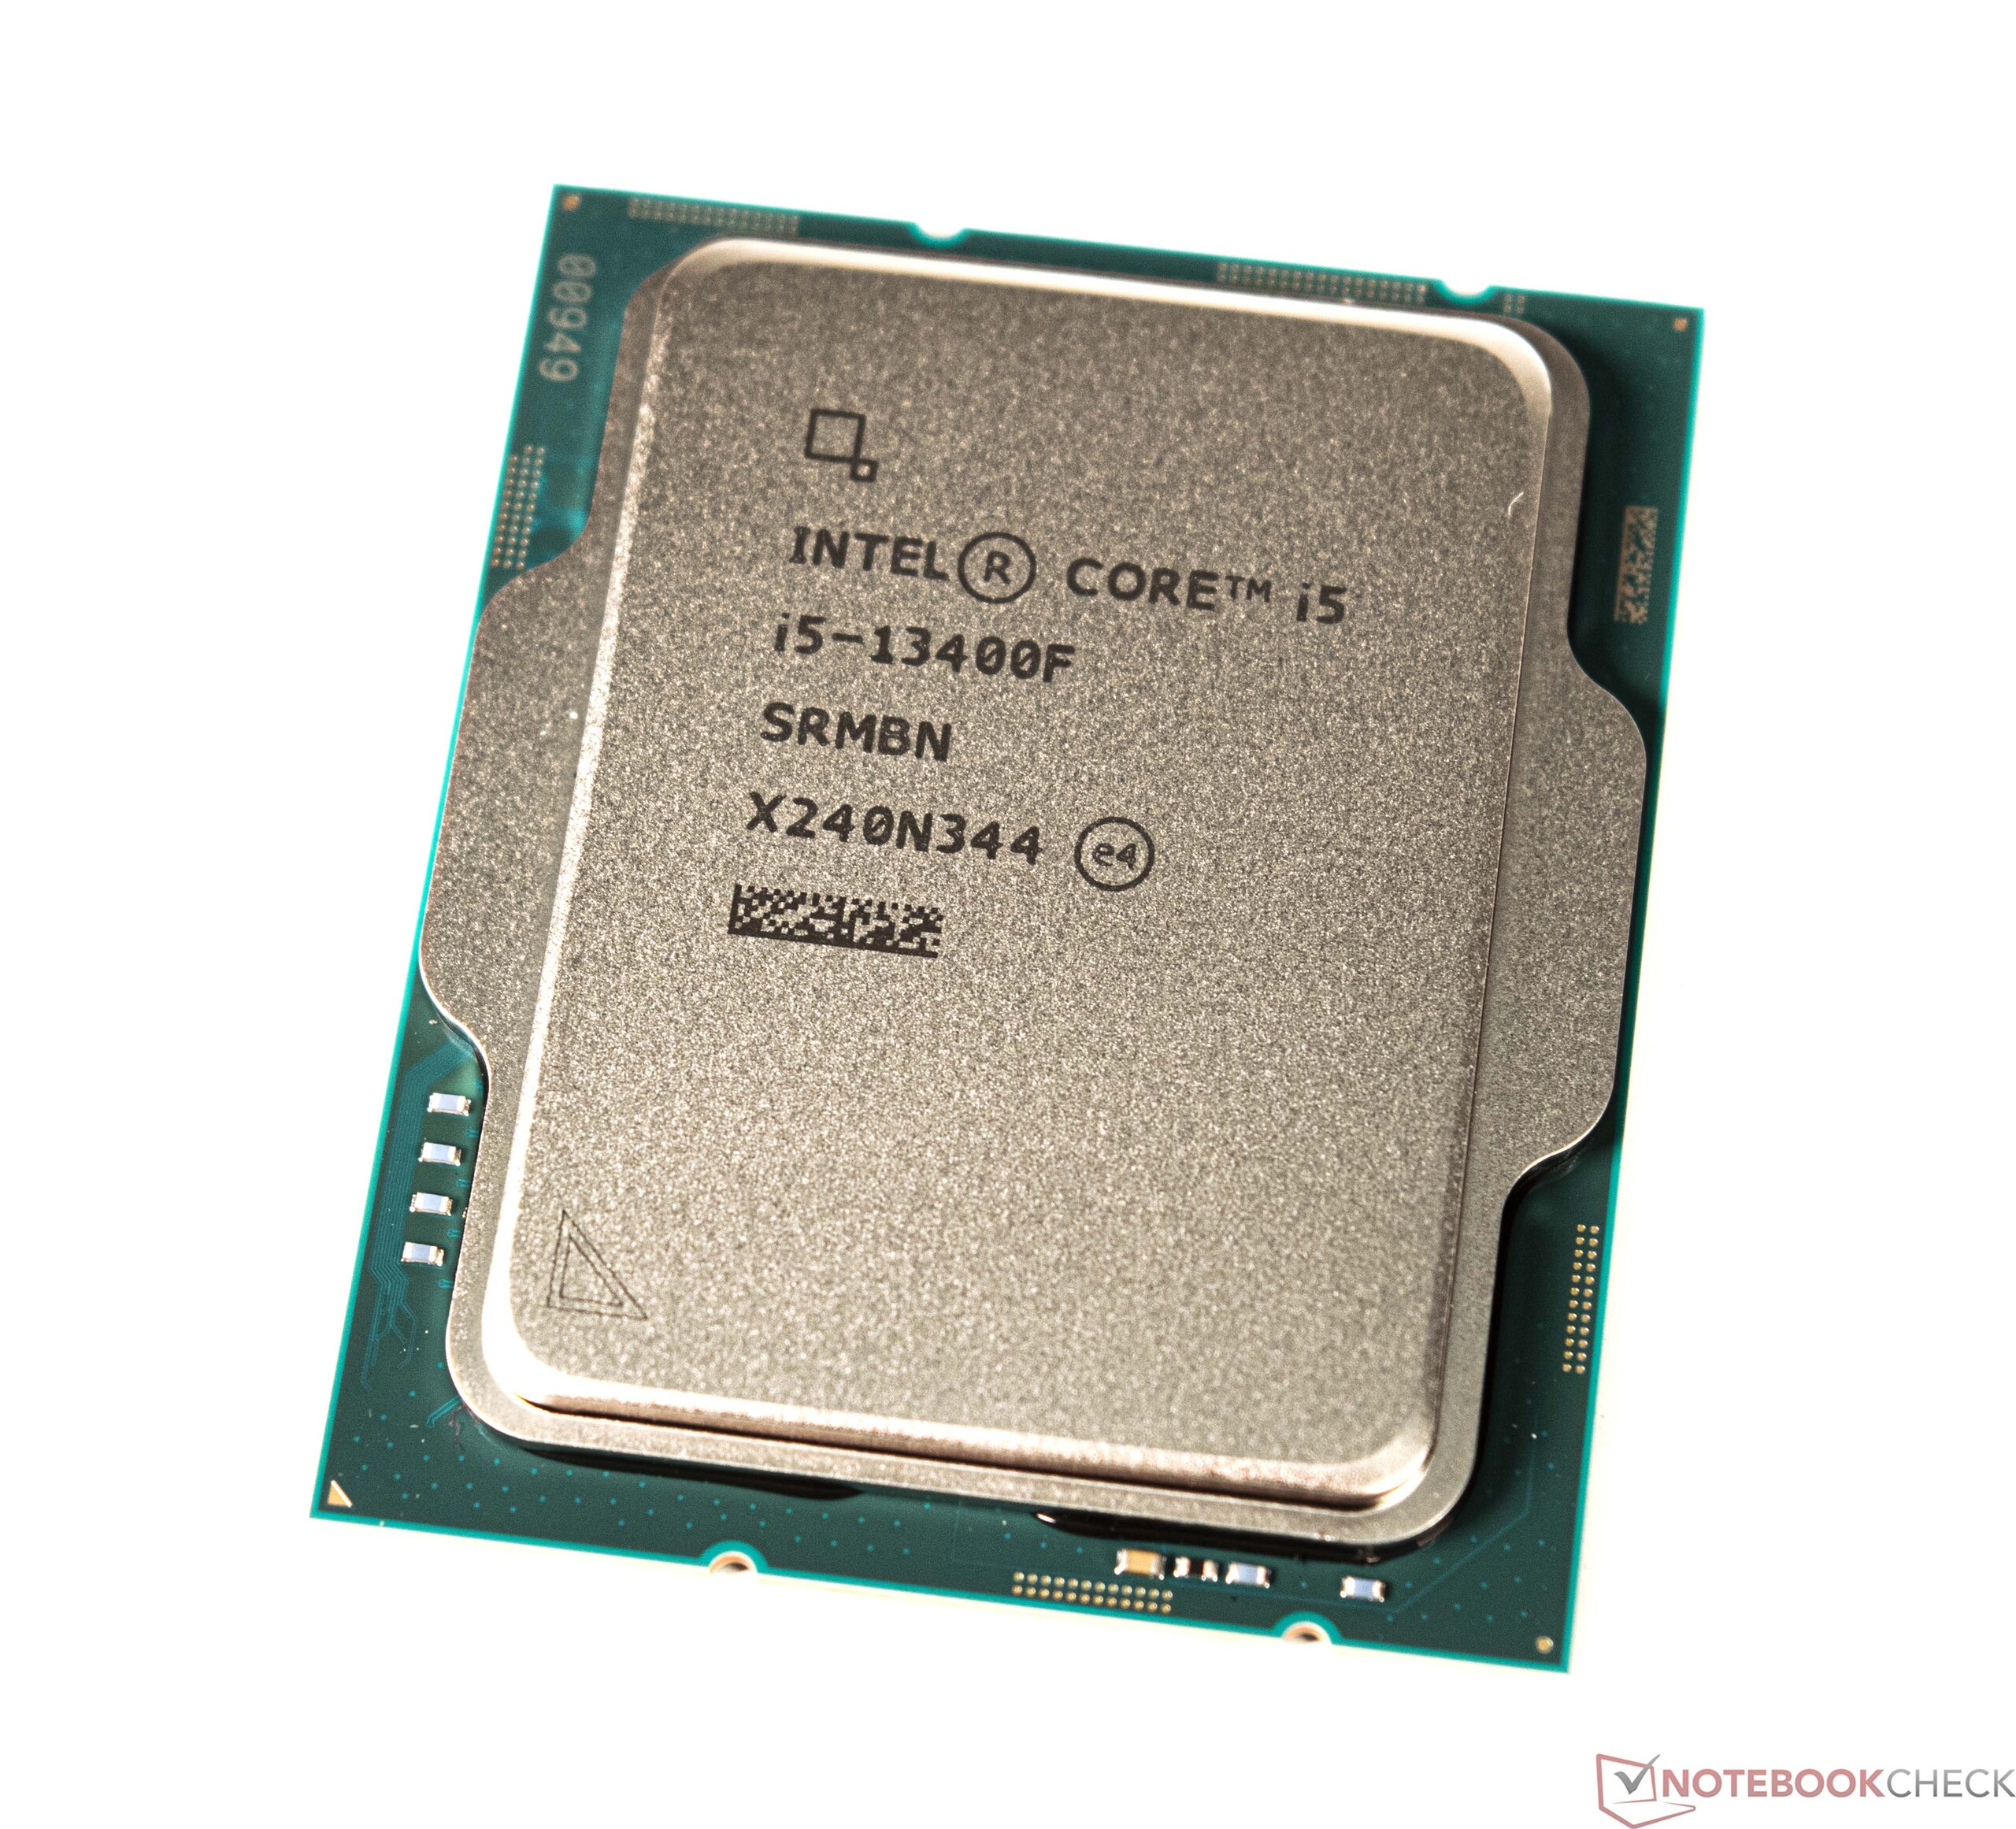
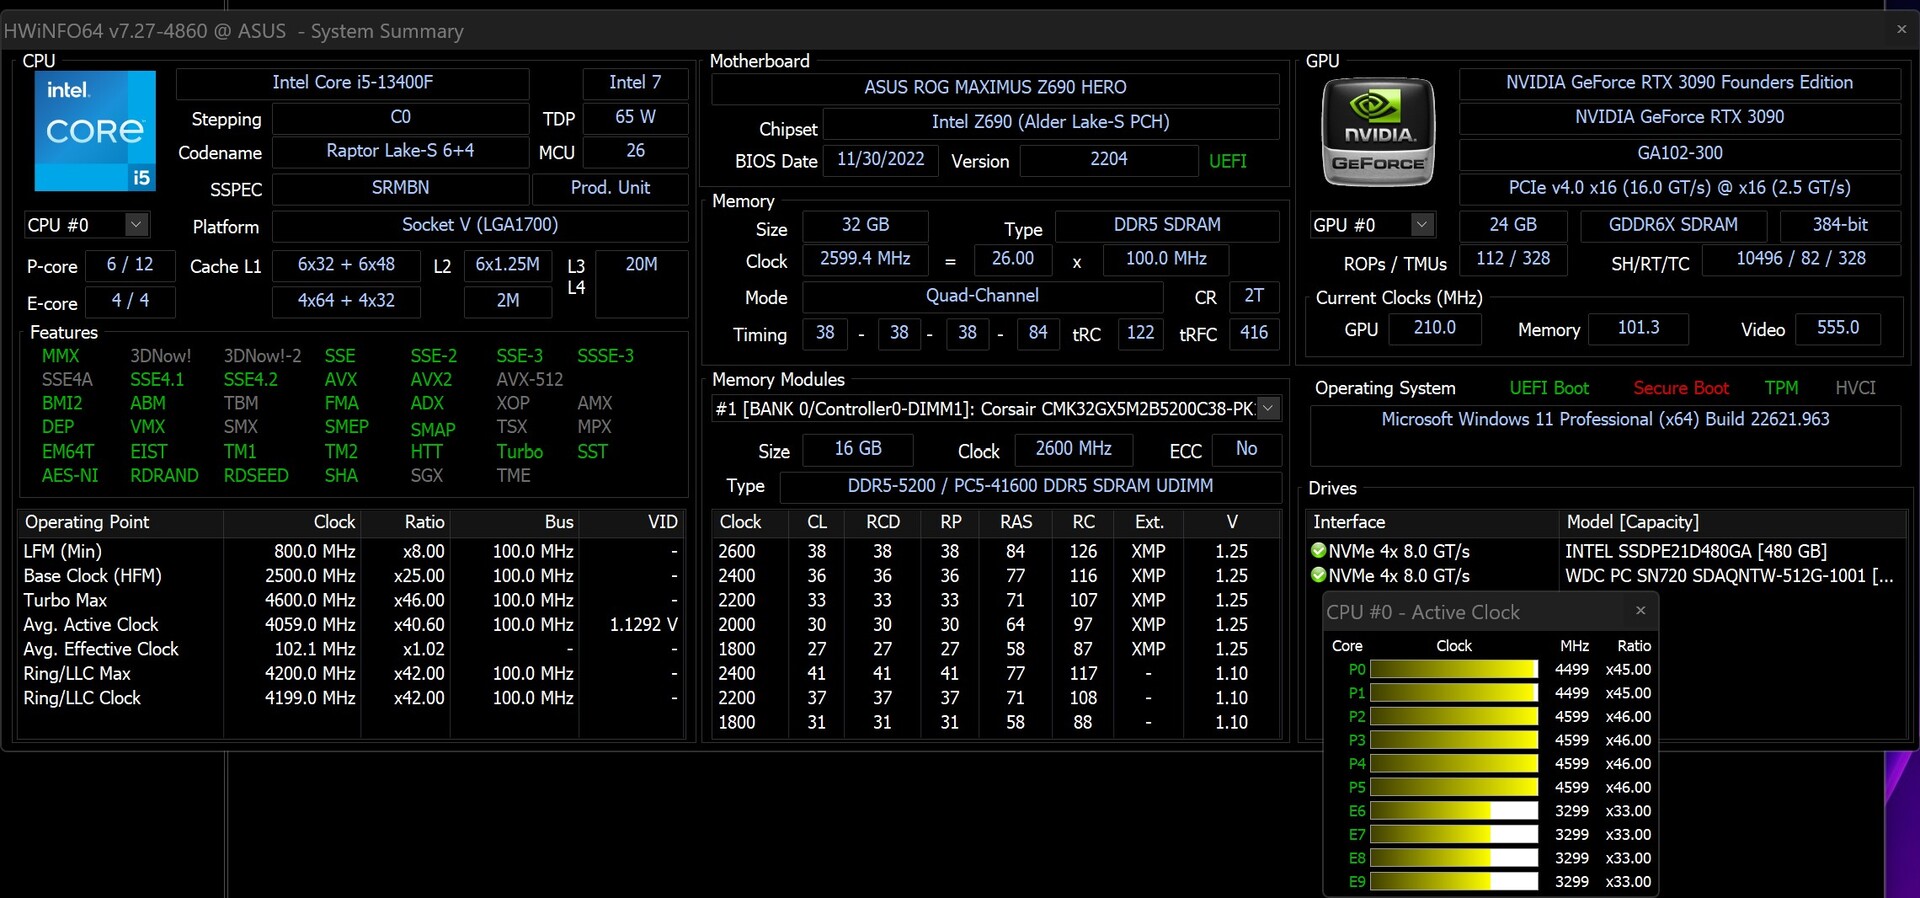
Zarówno Intel Alder-Lake, jak i Intel Raptor-Lake mają jako podbudowę socket 1700. Tym samym wszystkie nowe procesory mogą być uruchamiane również na starszych układach 600. Niemniej jednak należy wcześniej przeprowadzić aktualizację BIOS-u, aby najnowsze procesory były rozpoznawane i odpowiednio obsługiwane. Mówiąc o Alder-Lake i Raptor-Lake: Intel Core i5-13400F może być opcjonalnie dostępny w steppingu B0 lub C0. Stepping B0 odnosi się do Raptor-Lake DIE, natomiast Alder-Lake DIE znajduje się pod rozpraszaczem ciepła w steppingu C0.
W poniższej tabeli zebraliśmy dla Was najważniejszych przedstawicieli nowej rodziny Raptor Lake S. Więcej szczegółów nt Intel Core i5-13400F można znaleźć tutaj.
Procesory Core firmy Intel w porównaniu
| Model | Rdzenie / Wątki |
Zegar P-Core / Turbo | Zegar E-Core / Turbo | Pamięć podręczna L2 + L3 | Grafika | PBP | MTB | Cena (MSRP) |
| Core i9-13900K | 24 (8P + 16E) /32 | 3,0 GHz / 5,8 GHz | 2,2 GHz / 4,3 GHz | 32 + 36 MB | UHD 770 | 125 Watt | 253 Watt | $ 589 |
| Core i9-13900KF | 16 (8P + 16E) /32 | 3,0 GHz / 5,8 GHz | 2,2 GHz / 4,3 GHz | 32 + 36 MB | - | 125 Watt | 253 Watt | $ 564 |
| Core i9-12900K | 16 (8P + 8E) /24 | 3,2 GHz / 5,1 GHz | 2,4 GHz / 3,9 GHz | 14 + 30 MB | UHD 770 | 125 Watt | 241 Watt | $ 589 |
| Core i9-12900KF | 16 (8P + 8E) /24 | 3,2 GHz / 5,1 GHz | 2,4 GHz / 3,9 GHz | 14 + 30 MB | - | 125 Watt | 241 Watt | $ 564 |
| Core i7-13700K | 16 (8P + 8E) /24 | 3,4 GHz / 5,4 GHz | 2,5 GHz / 4,2 GHz | 24 + 30 MB | UHD 770 | 125 Watt | 253 Watt | $ 409 |
| Core i7-13700KF | 16 (8P + 8E) /24 | 3,4 GHz / 5,4 GHz | 2,5 GHz / 4,2 GHz | 24 + 30 MB | - | 125 Watt | 253 Watt | $ 384 |
| Core i7-12700K | 12 (8P + 4E) /20 | 3,6 GHz / 4,9 GHz | 2,7 GHz / 3,8 GHz | 12 + 25 MB | UHD 770 | 125 Watt | 190 Watt | $ 409 |
| Core i7-12700KF | 12 (8P + 4E) /20 | 3,6 GHz / 4,9 GHz | 2,7 GHz / 3,8 GHz | 12 + 25 MB | - | 125 Watt | 190 Watt | $ 384 |
| Core i5-13600K | 14 (6P + 8E) /20 | 3,5 GHz / 5,1 GHz | 2,6 GHz / 3,9 GHz | 20 + 24 MB | UHD 770 | 125 Watt | 181 Watt | $ 319 |
| Core i5-13600KF | 14 (6P + 8E) /20 | 3,5 GHz / 5,1 GHz | 2,6 GHz / 3,9 GHz | 20 + 24 MB | - | 125 Wat | 181 Watt | $ 294 |
| Core i5-12600K | 10 (6P + 4E) /16 | 3,7 GHz / 4,9 GHz | 2,8 GHz / 3,6 GHz | 9,5 + 20 MB | UHD 770 | 125 Wat | 150 Wat | $ 289 |
| Core i5-12600KF | 10 (6P + 4E) /16 | 3,7 GHz / 4,9 GHz | 2,8 GHz / 3,6 GHz | 9,5 + 20 MB | - | 125 Watt | 150 Watt | $ 264 |
| Core i5-13400F | 10 (6P + 4E) /16 | 2,5 GHz / 4,6 GHz | 1,8 GHz / 3,3 GHz | 9,5 + 20 MB | - | 65 Watt | 148Watt | $ 196 |
| Core i5-12400F | 6 (6P + 0E) /12 | 2,5 GHz / 4,4 GHz | - | 7,5 + 18 MB | - | 65 Watt | 117 Watt | $ 194 |
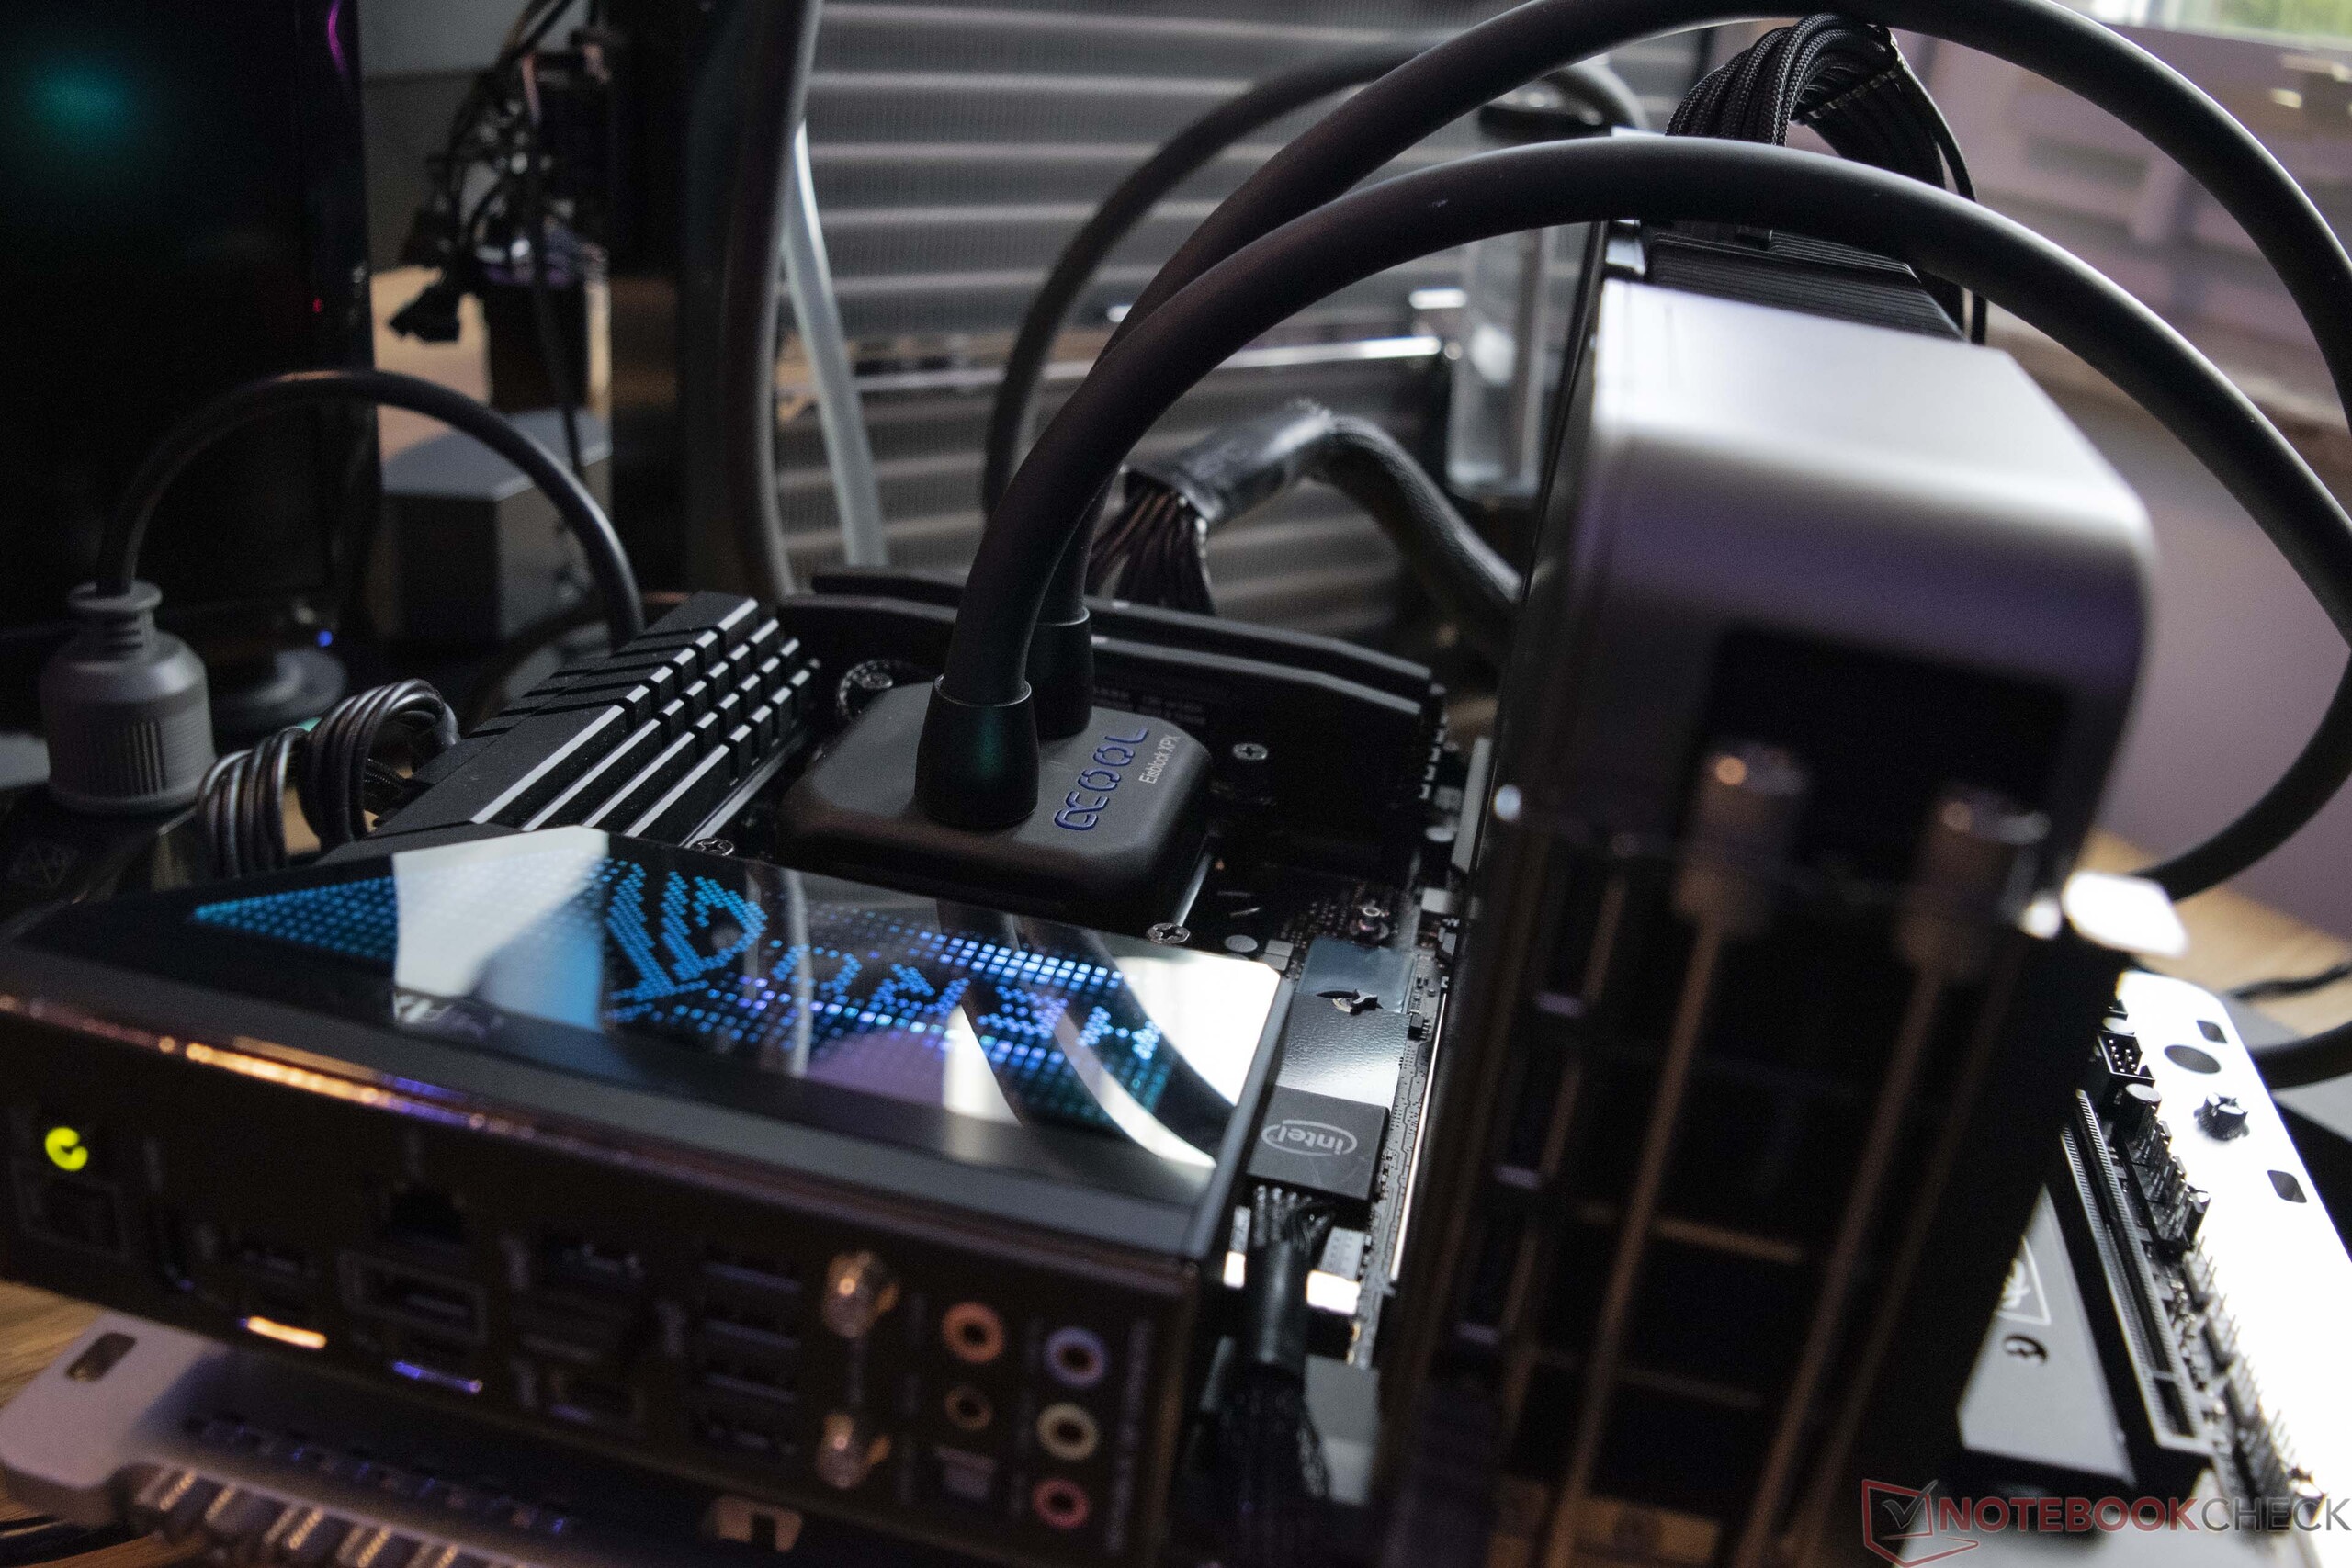
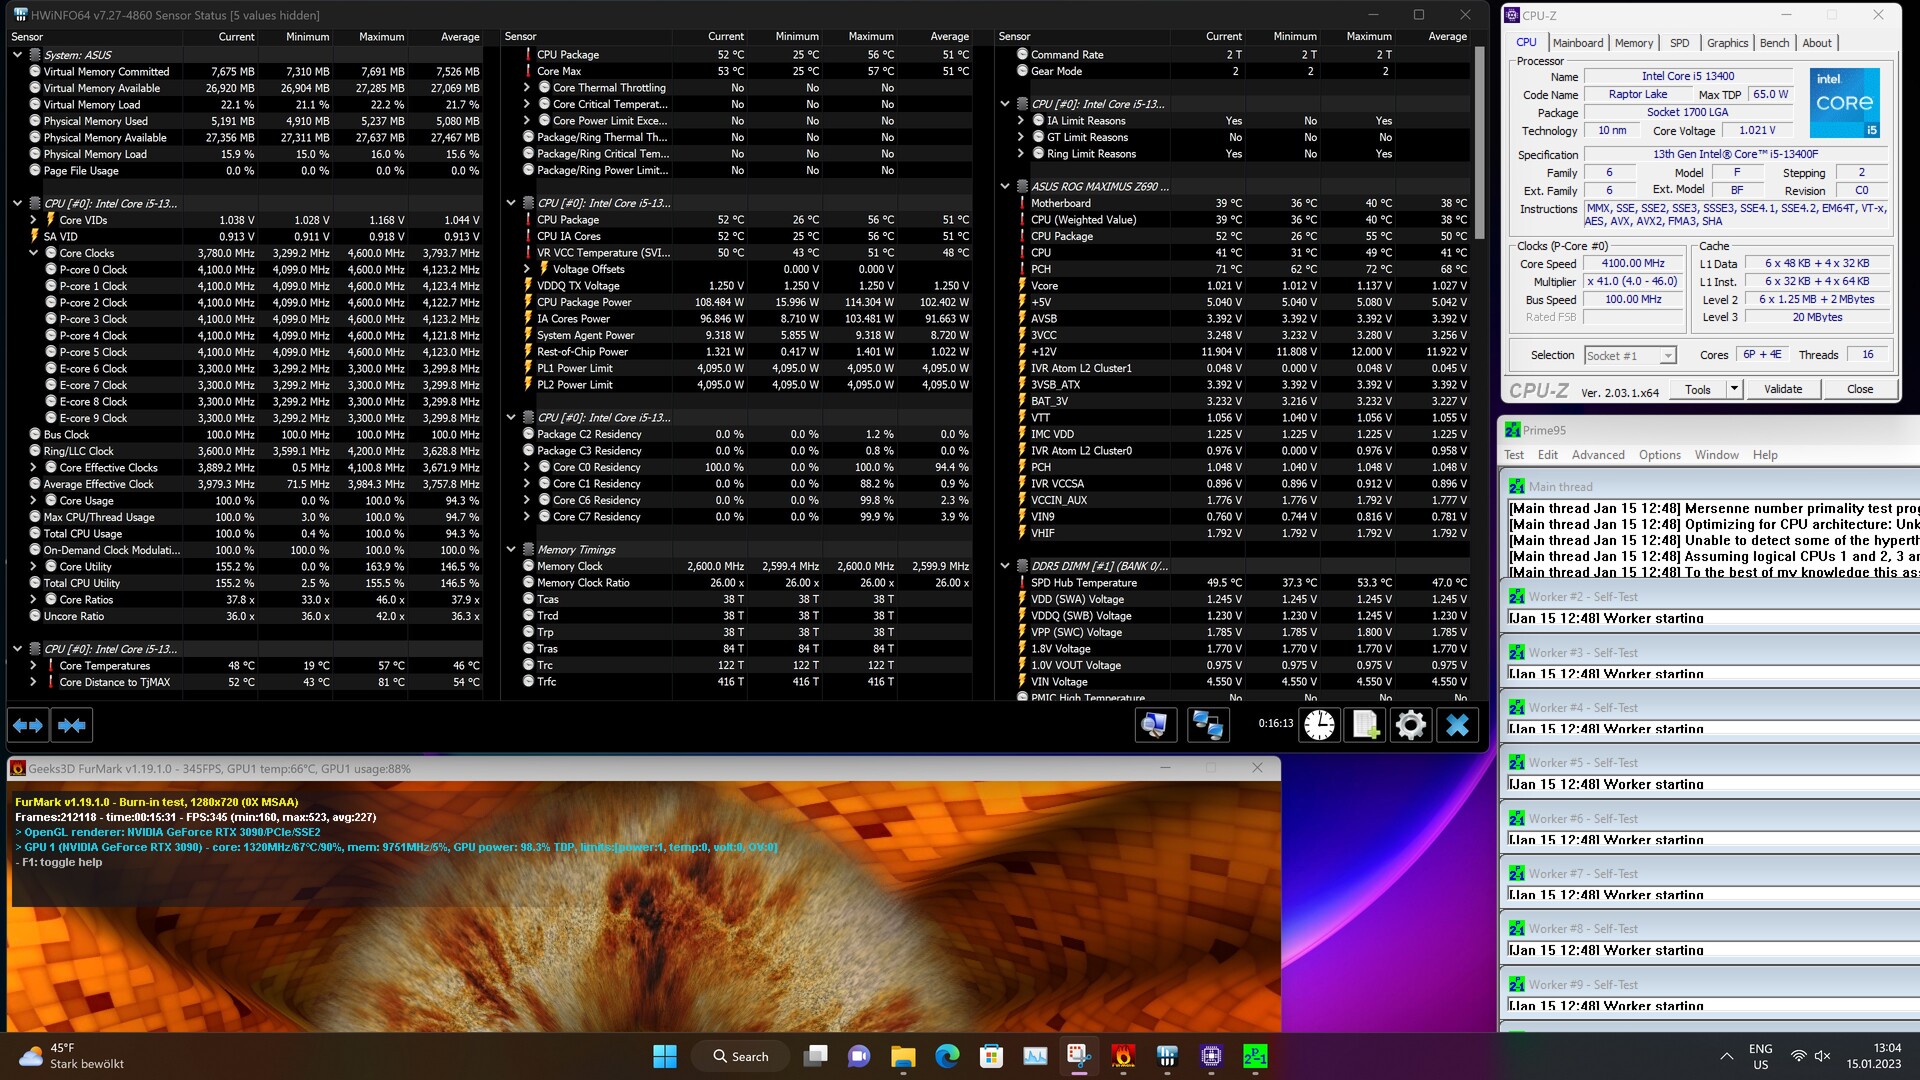
Szczegóły dotyczące naszego systemu testowego
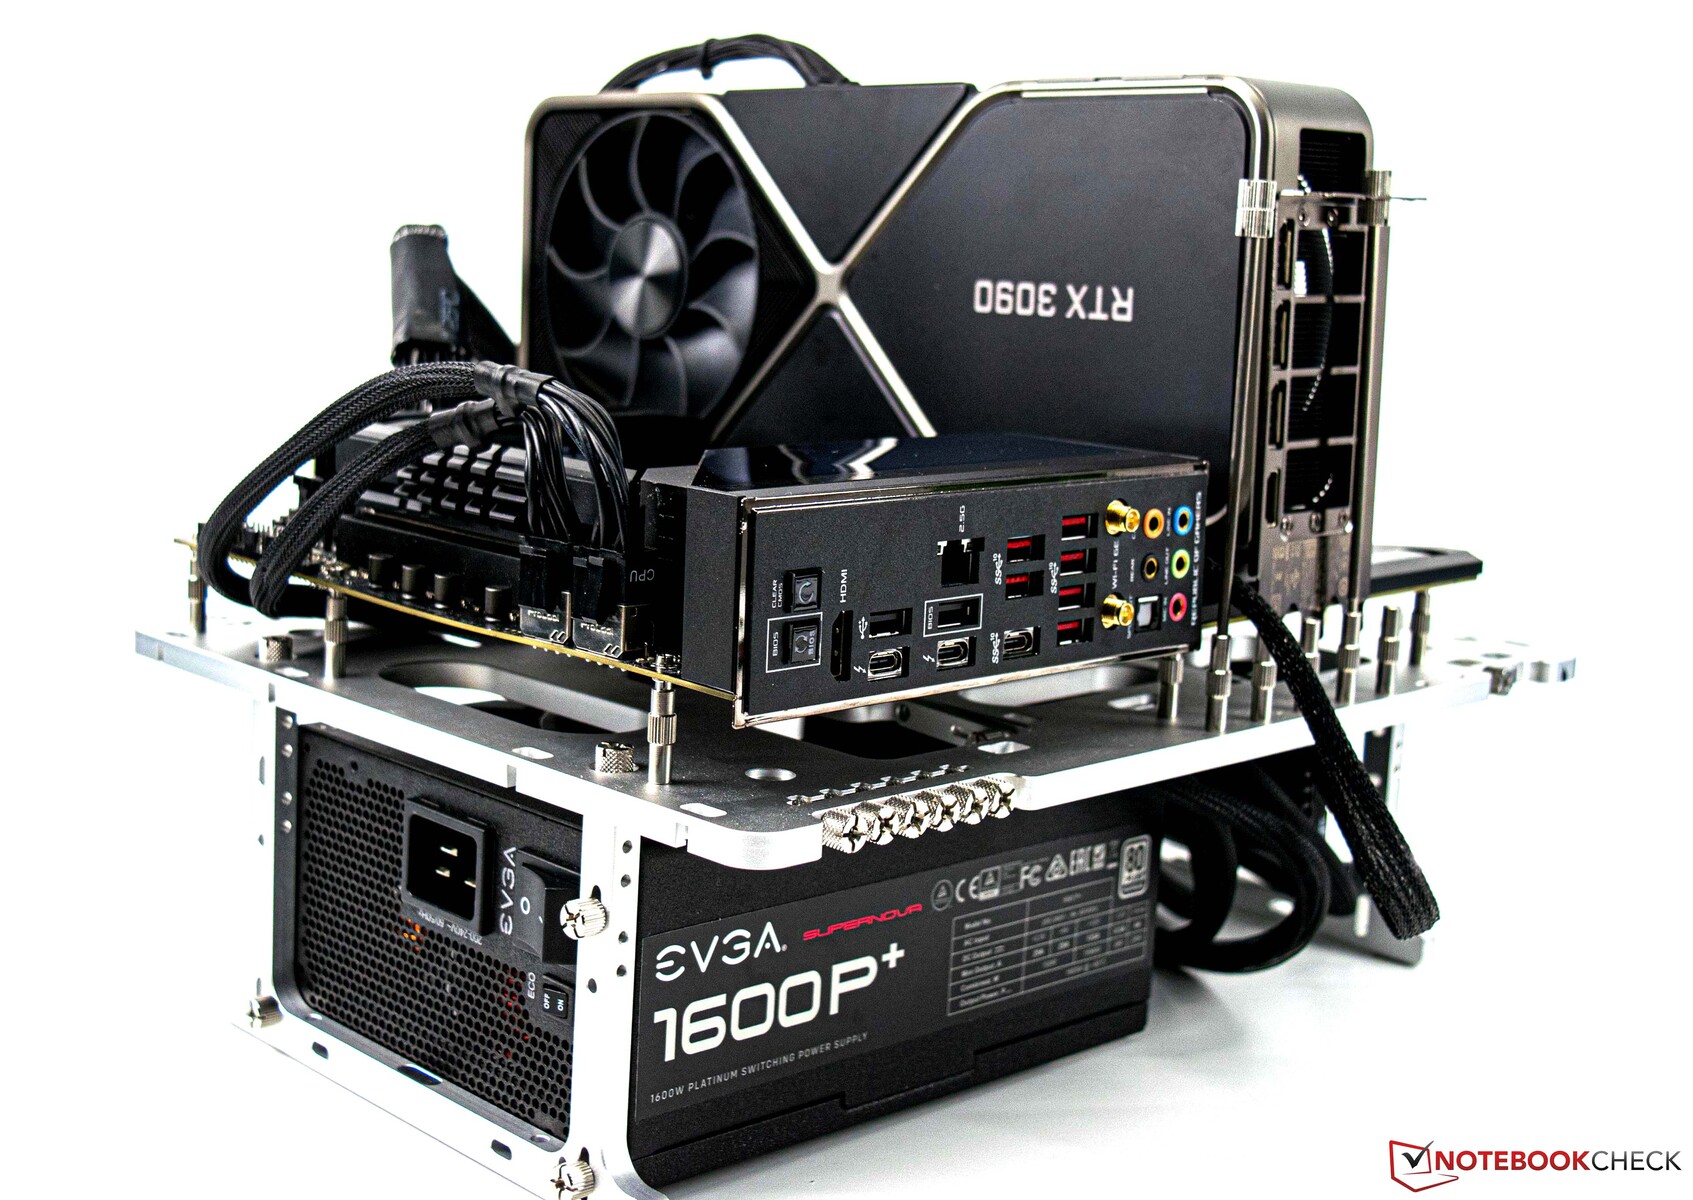
- Streacom BC1 V2 Open Benchtable
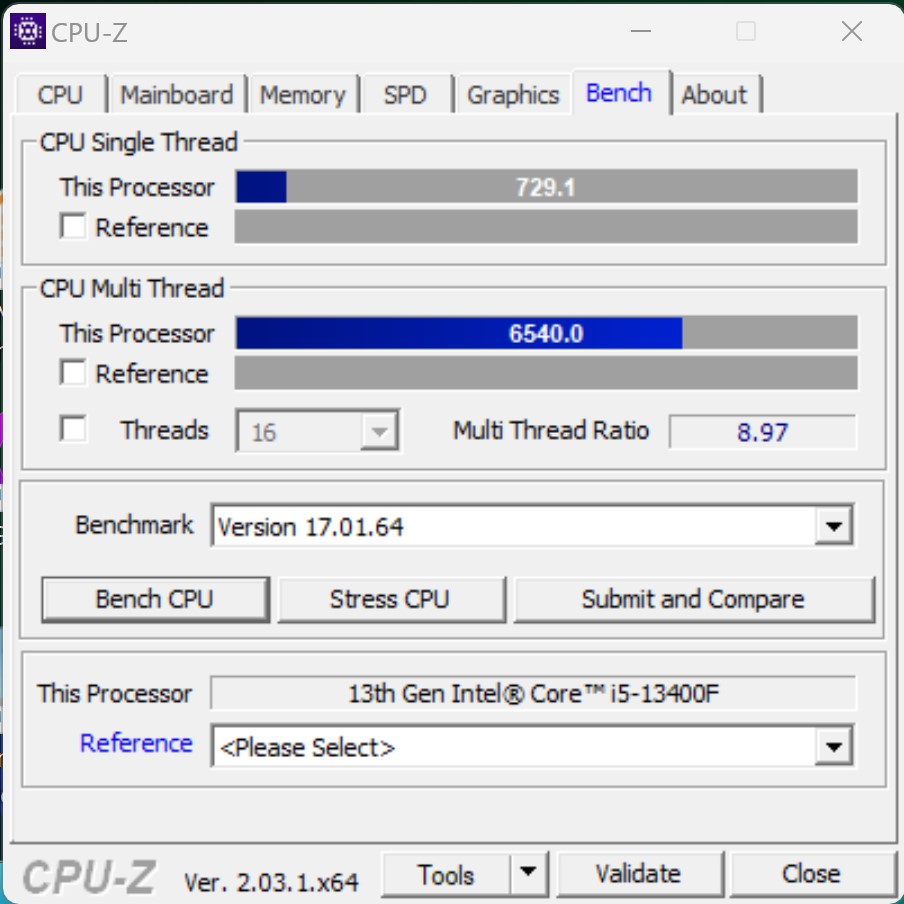
- Intel Core i5-13400F
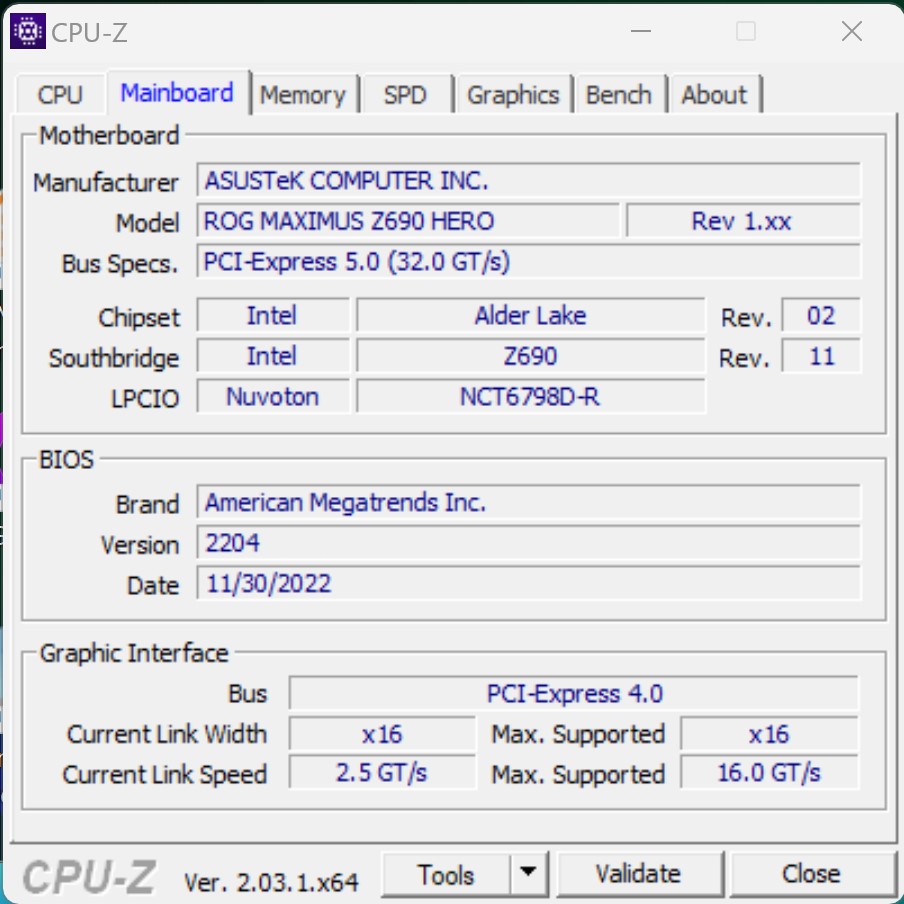
- Asus ROG Maximus Z690 Hero (BIOS v2204)
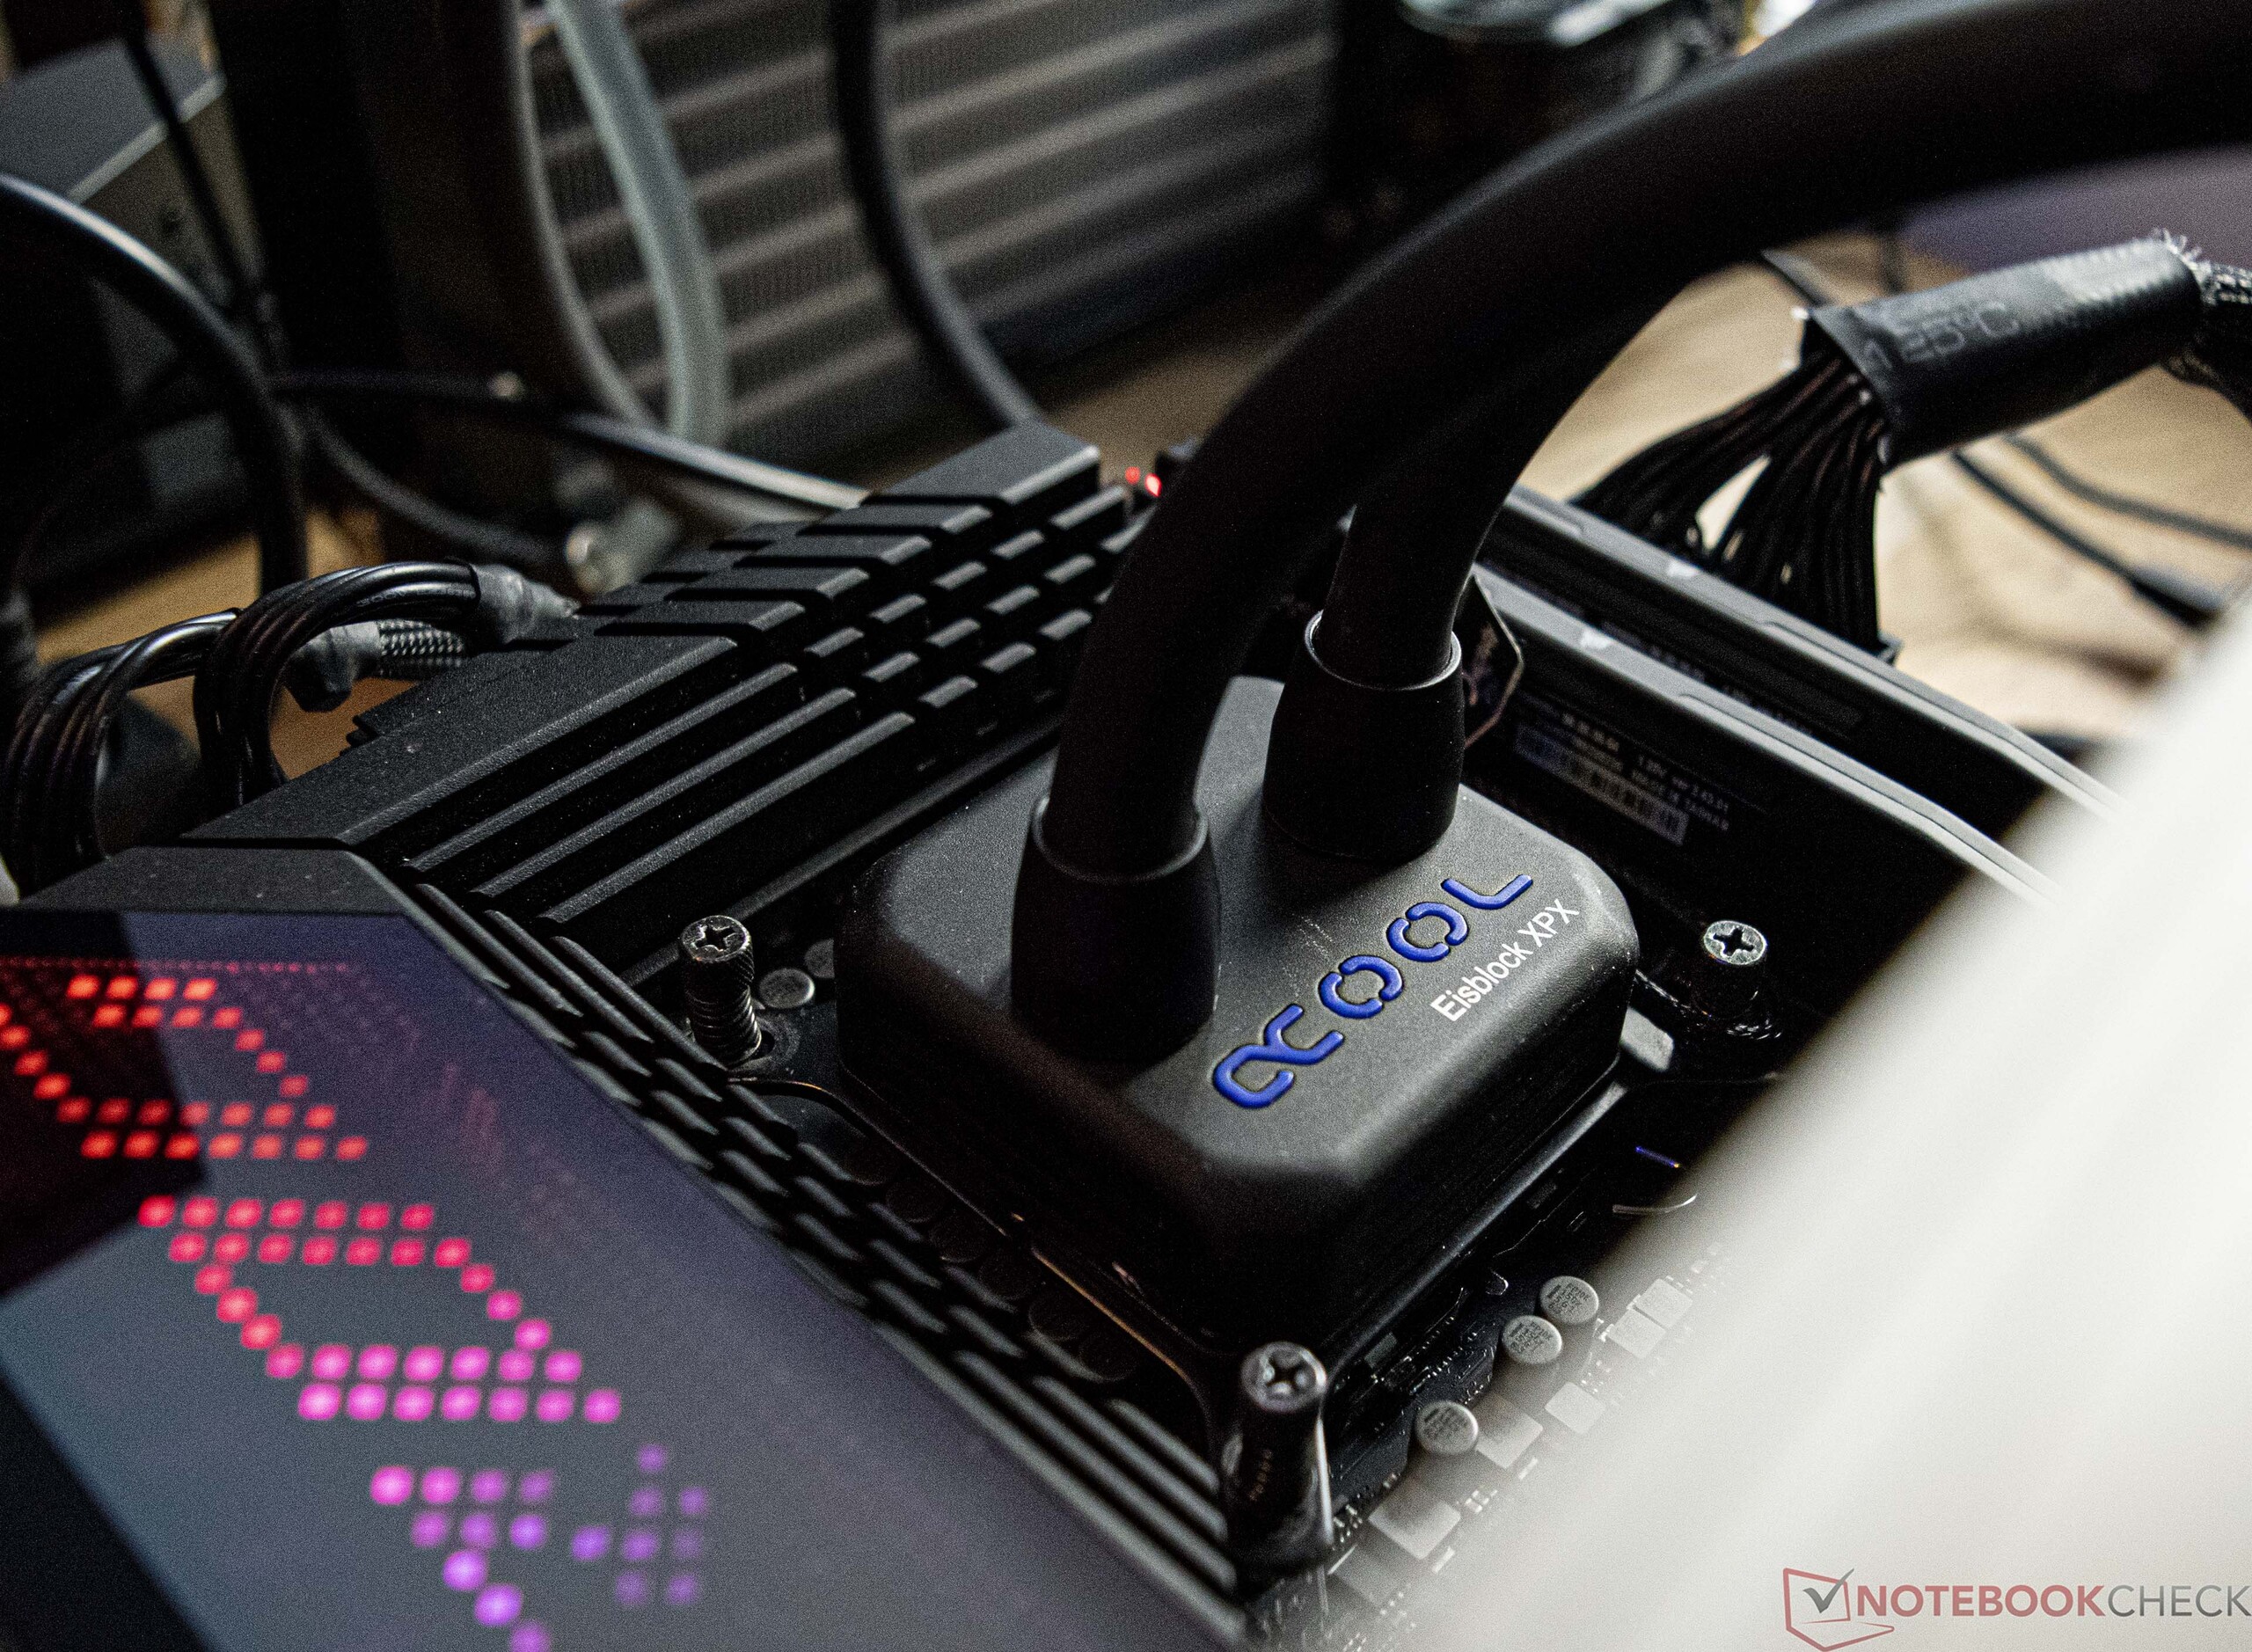
- Chłodzenie wodne Custom-Loop (Pompa: Alphacool Aquastream XT Ultra, Radiator: EK MO-RA3 420 LT BLACK)
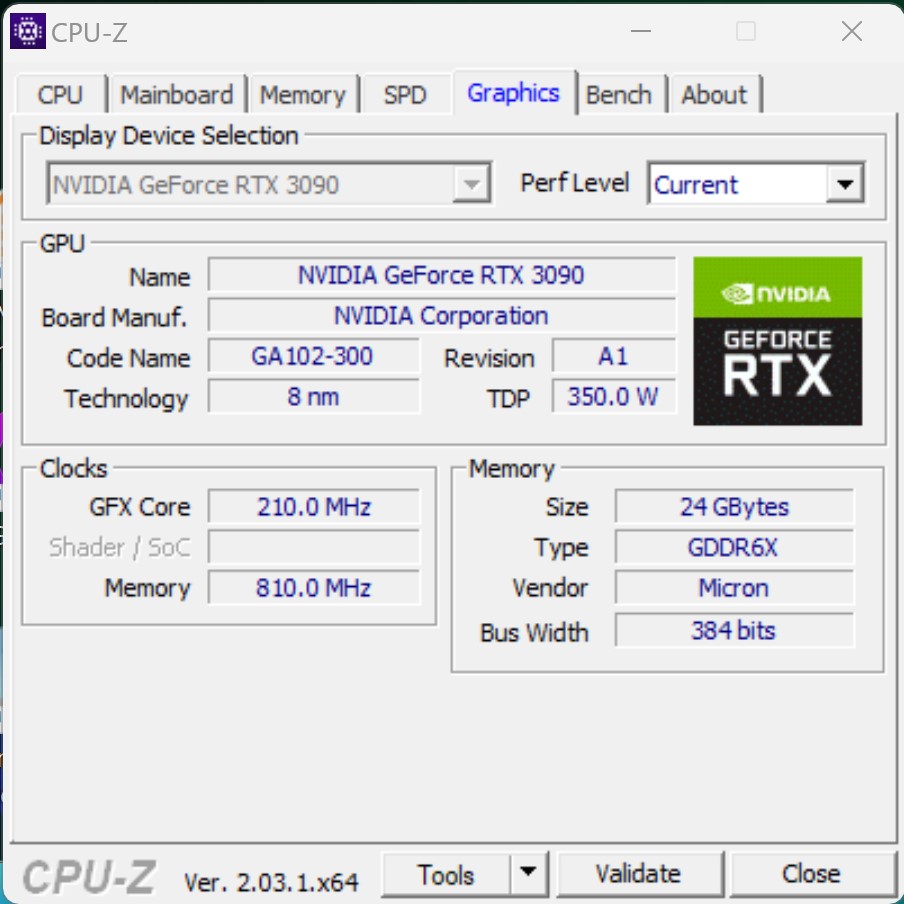
- Nvidia GeForce RTX 3090 Founders Edition (sterownik: 528.02)
- EVGA SuperNOVA P+ 1600W
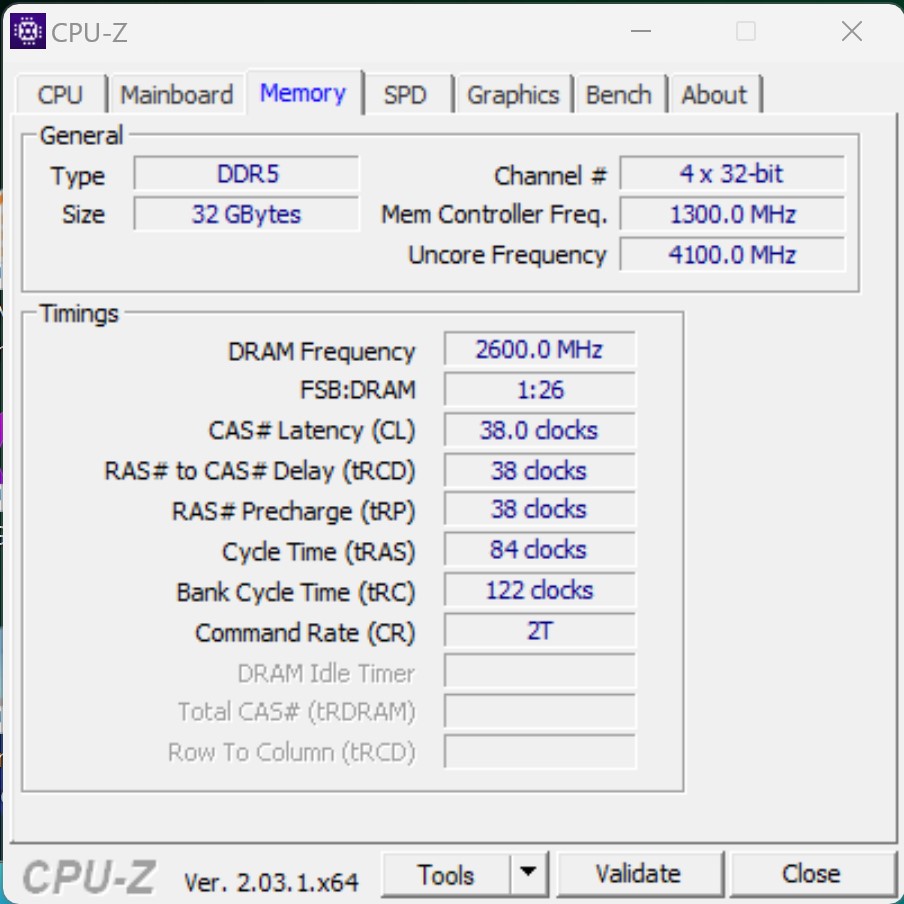
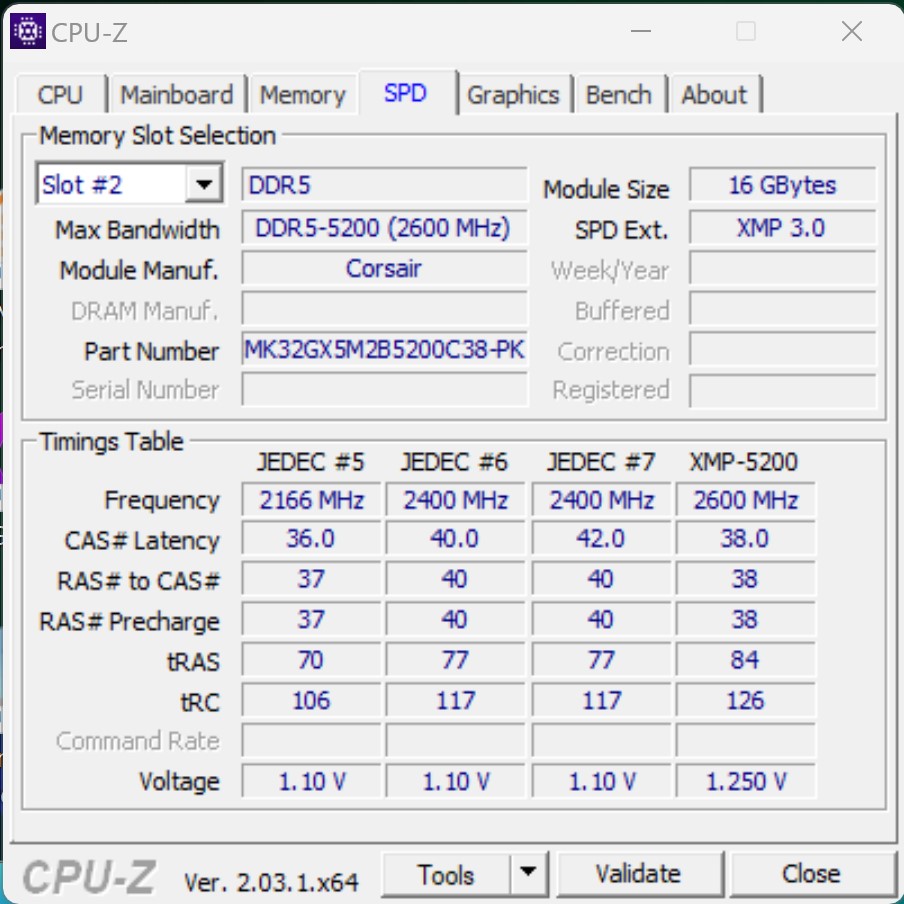
- G.Skill Ripjaws S5 (2x 16 GB - DDR5-5200 MT/s)
- Intel Optane 905p (480 GB system + benchmarki)
- Western Digital SN720 (gry)
- Microsoft Windows 11 Professional 64-bit (wersja 22H2)

Warunki testowe - Z690 po aktualizacji BIOS-u wciąż nadaje się do użytku
Jako bazę do tego testu nadal wykorzystujemy Asus ROG Maximus Z690 Hero, który był już naszym wyborem od momentu wprowadzenia m.in Procesorów Alder-Lake. Po pewnych problemach, których doświadczyliśmy podczas naszego testu z m.in Intel Core i9-13900K, nie było żadnych komplikacji zIntel Core i5-13400F. W celu uruchomienia Intel Core i5-13400F zainstalowany został najnowszy BIOS v2204. Na szczęście Asus ROG Maximus Z690 Hero oferuje możliwość aktualizacji BIOS-u bez procesora i pamięci RAM.
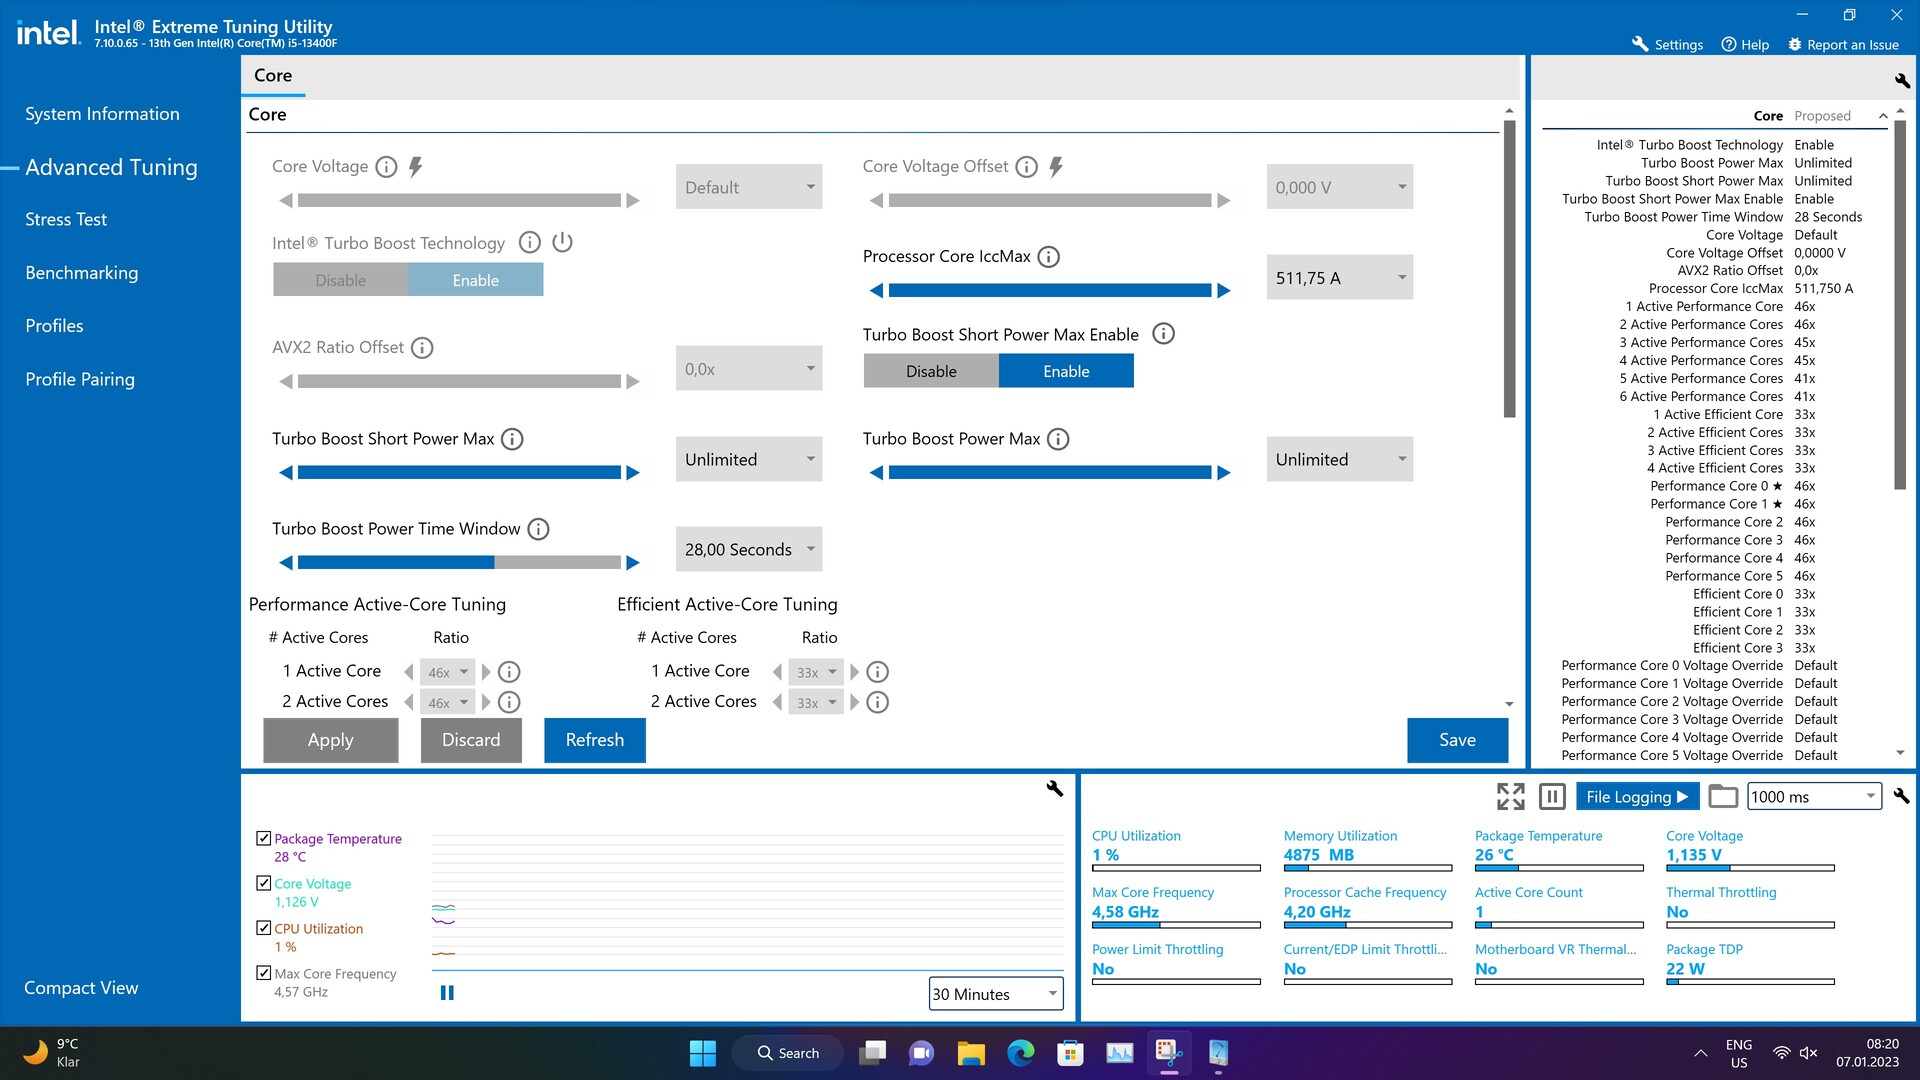
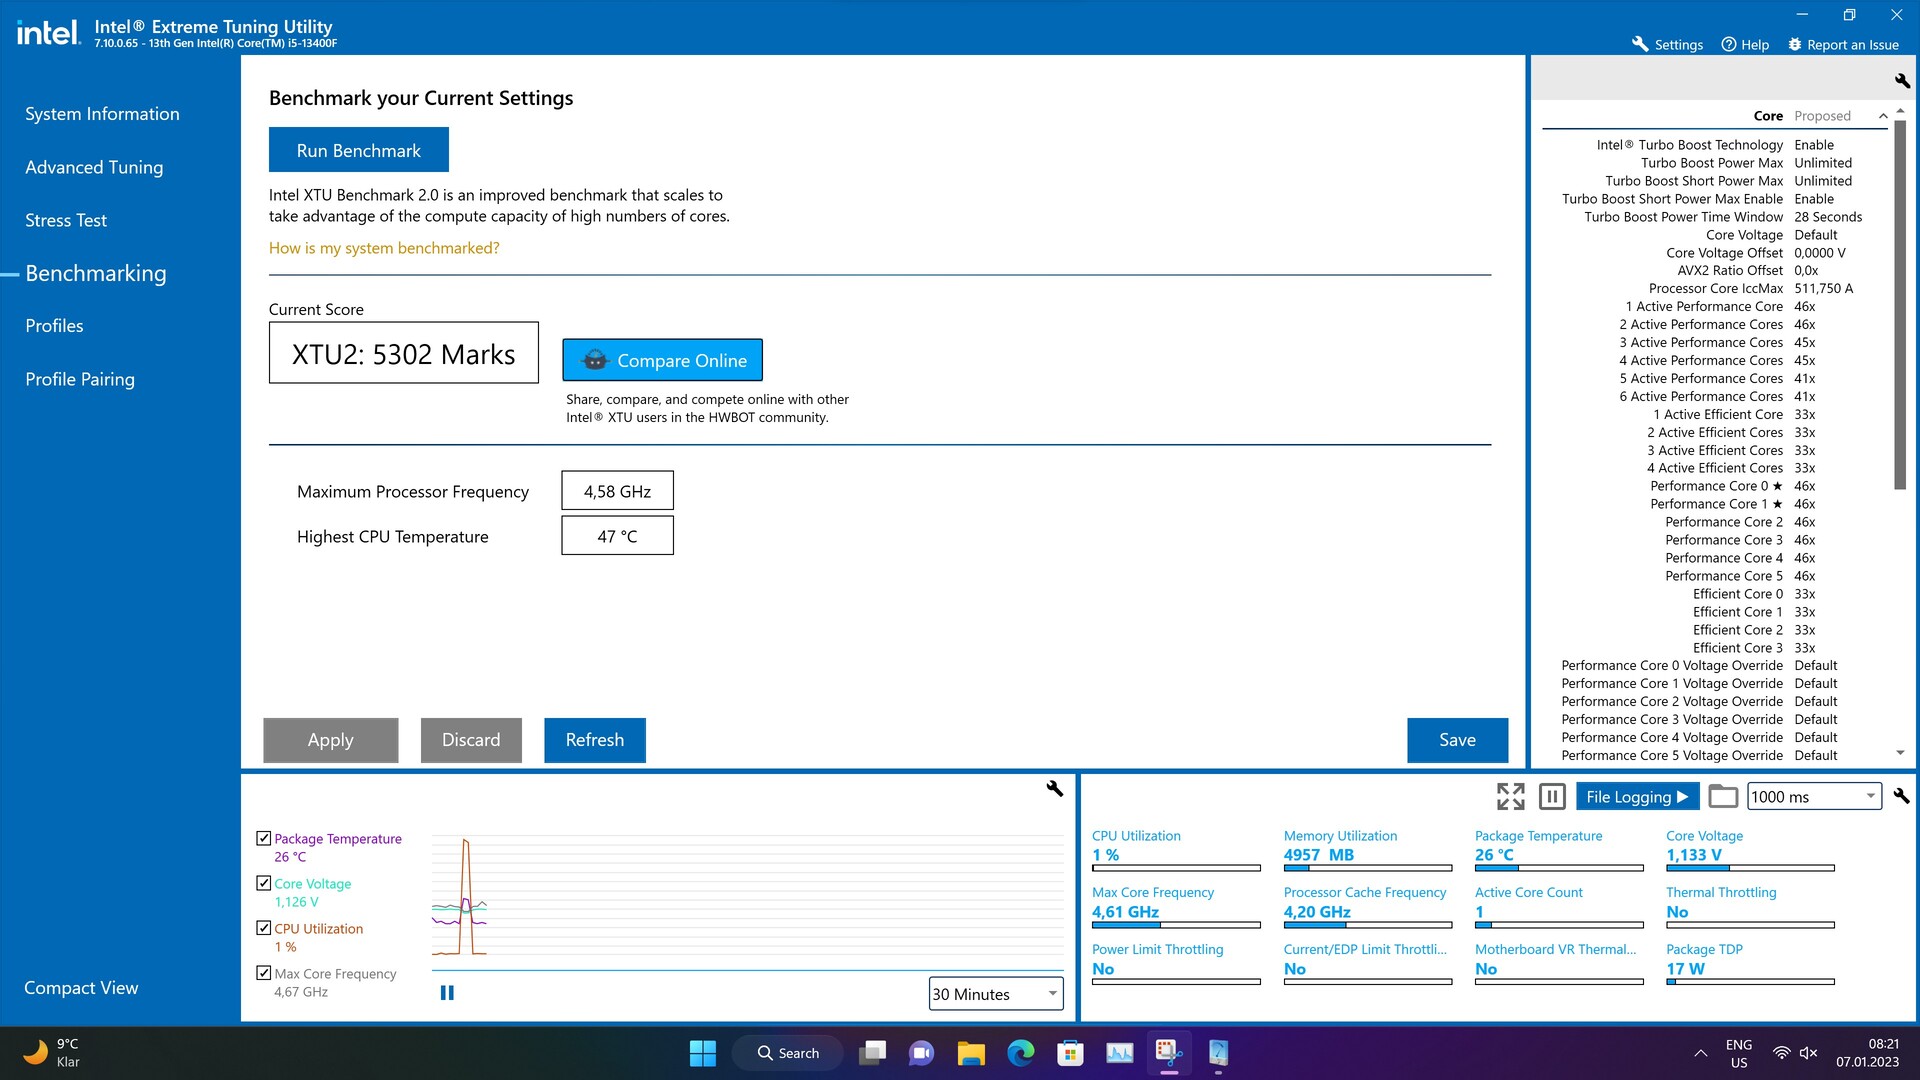
Wszystkie testy zostały przeprowadzone z najnowszym BIOS-em i włączonym profilem XMP1. Dodatkowo wyłączone zostały wszystkie ograniczenia limitu mocy, aby uzyskać dostęp do pełnej wydajności procesorów.
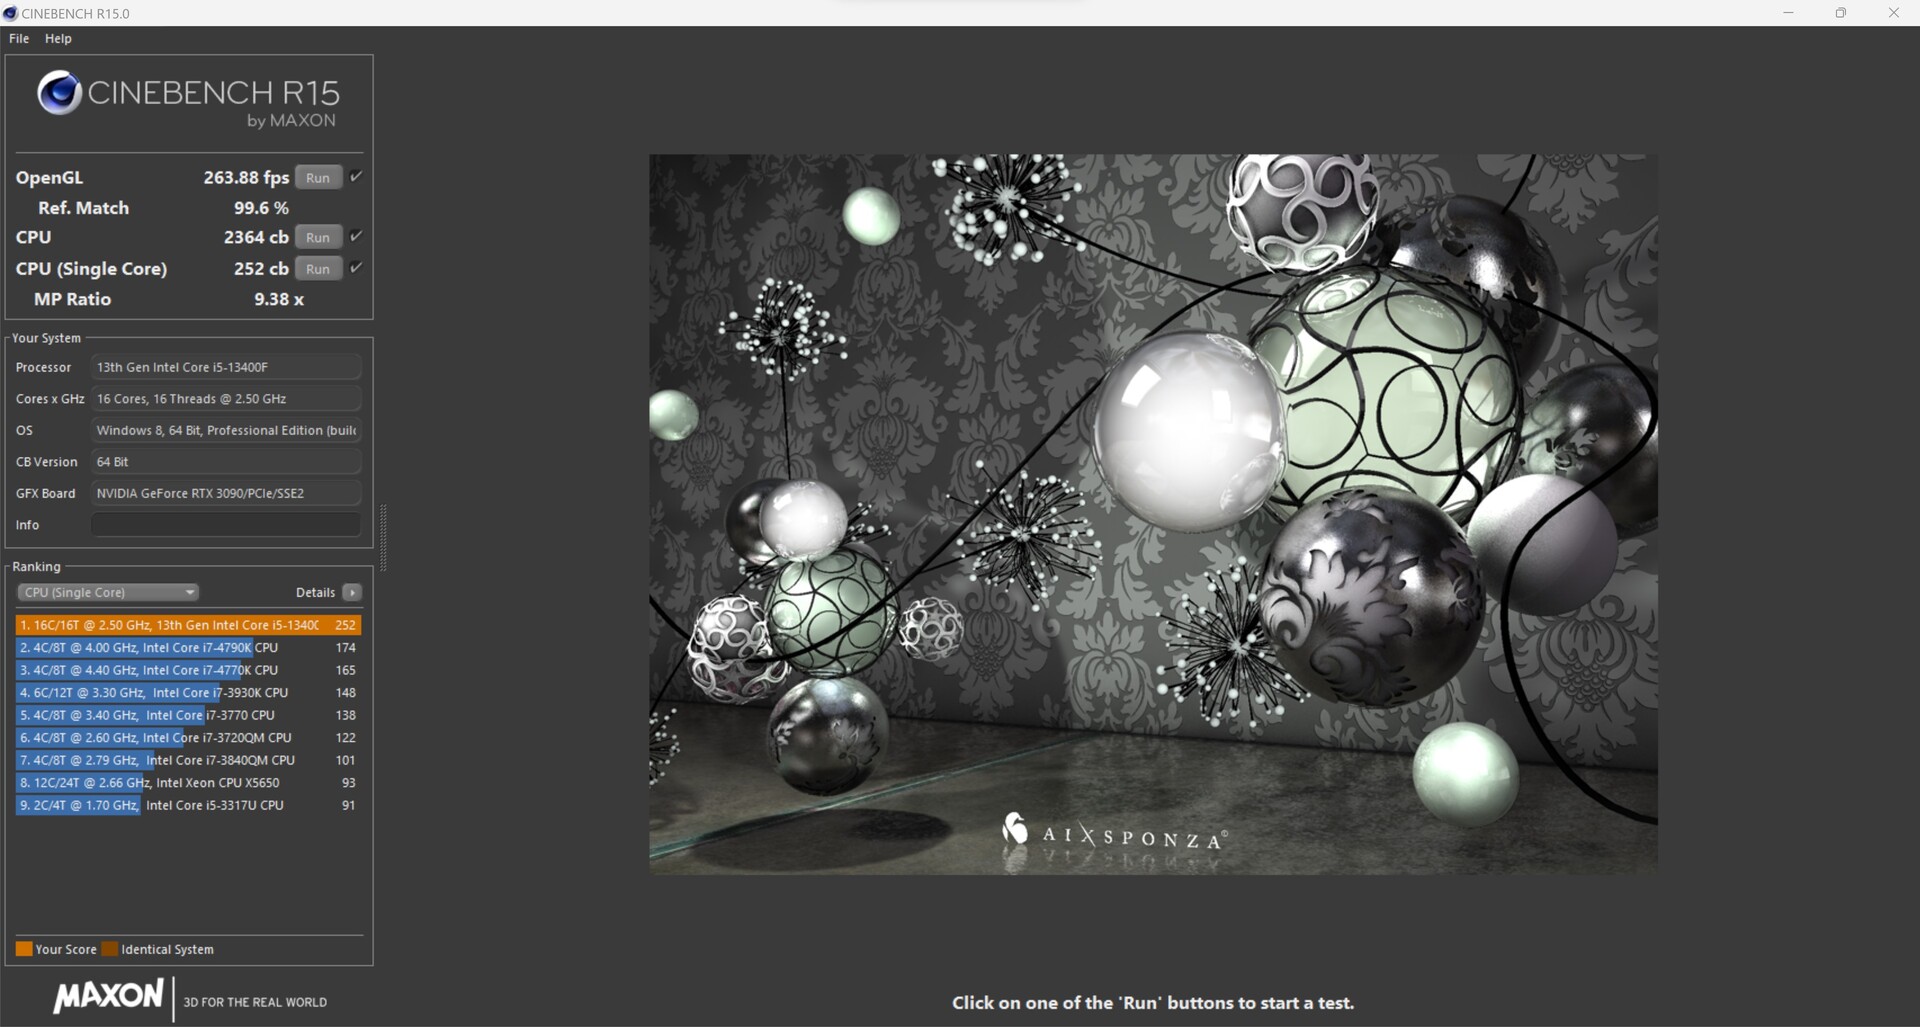
Benchmarki procesora
Niestety nie możemy w tym momencie dokonać bezpośredniego porównania wydajności z Intel Core i5-12400F. Mamy jednak w naszej bazie danych wiele innych procesorów, które mogą posłużyć jako punkt odniesienia. Widzimy więc minimalną przewagę Intel Core i5-13400F w porównaniu do Intel Core i7-12700F. Średnio Intel Core i5-13400F może osiągnąć lepszy wynik, choć brakujące wątki zdecydowanie prowadzą do gorszego wyniku w poszczególnych testach. Niemal identyczny obraz widzimy w bezpośrednim porównaniu z m.in AMD Ryzen 7 5800X. Podobnie jak Intel Core i5-13400F, ten ostatni oferuje 16 wątków, ale może uzyskać lepszy wynik w czystych benchmarkach wielowątkowych.
Jeśli ktoś potrzebuje większej wydajności, może zdecydować się na Intel Core i5-13600K. Tutaj jest około 20 procent więcej wydajności. Taki sam wzrost wydajności można uzyskać również w przypadku AMD Ryzen 7 7700X.
Więcej benchmarków na temat procesorów można znaleźć m.in.tutaj.
| Performance rating - Percent | |
| Intel Core i9-13900K | |
| Intel Core i5-13600K | |
| AMD Ryzen 7 7700X | |
| Intel Core i5-12600K | |
| AMD Ryzen 7 5800X | |
| Intel Core i7-12700F | |
| Intel Core i5-13400F | |
| AMD Ryzen 5 5600X | |
| Intel Core i5-11400F | |
| Cinebench R15 | |
| CPU Single 64Bit | |
| Intel Core i9-13900K | |
| AMD Ryzen 7 7700X | |
| Intel Core i5-13600K | |
| Intel Core i5-12600K | |
| Intel Core i7-12700F | |
| AMD Ryzen 7 5800X | |
| AMD Ryzen 5 5600X | |
| Intel Core i5-13400F | |
| Intel Core i5-11400F | |
| CPU Multi 64Bit | |
| Intel Core i9-13900K | |
| Intel Core i5-13600K | |
| AMD Ryzen 7 7700X | |
| AMD Ryzen 7 5800X | |
| Intel Core i7-12700F | |
| Intel Core i5-12600K | |
| Intel Core i5-13400F | |
| AMD Ryzen 5 5600X | |
| Intel Core i5-11400F | |
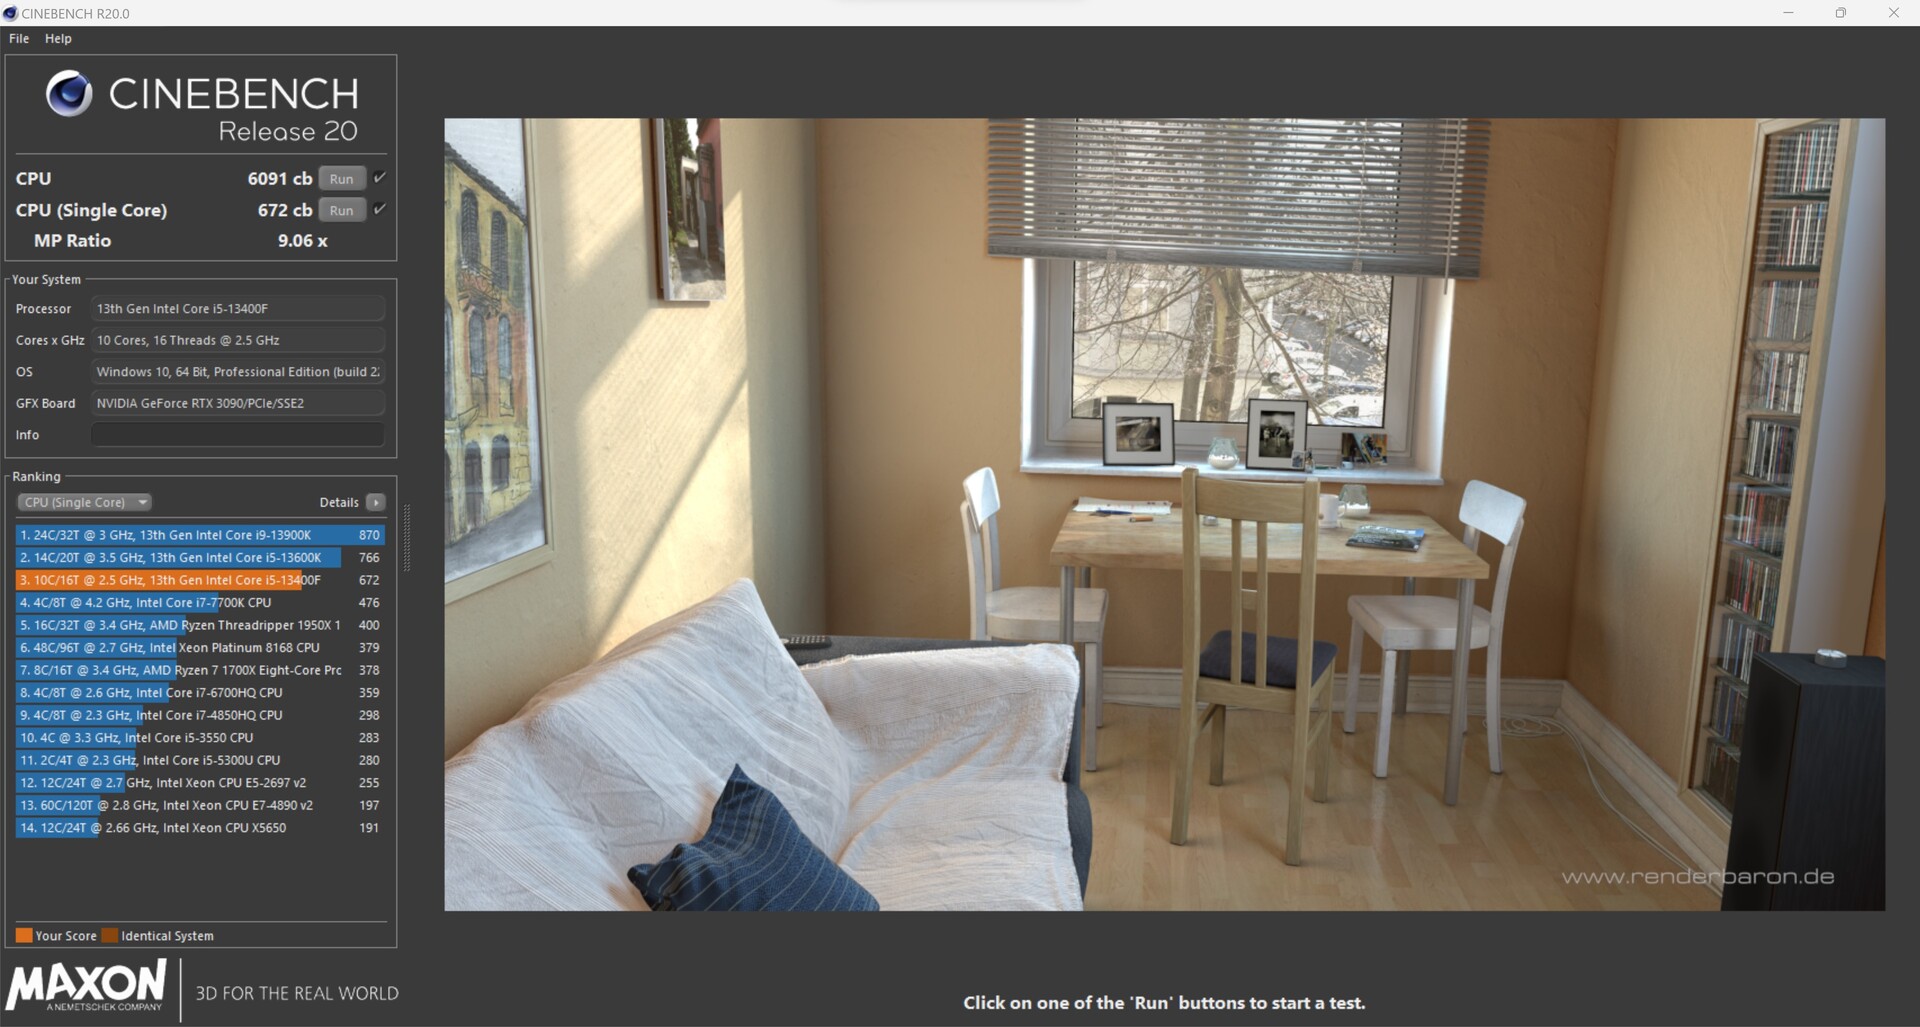
| Cinebench R20 | |
| CPU (Single Core) | |
| Intel Core i9-13900K | |
| Intel Core i5-13600K | |
| AMD Ryzen 7 7700X | |
| Intel Core i5-12600K | |
| Intel Core i7-12700F | |
| Intel Core i5-13400F | |
| AMD Ryzen 7 5800X | |
| AMD Ryzen 5 5600X | |
| Intel Core i5-11400F | |
| CPU (Multi Core) | |
| Intel Core i9-13900K | |
| Intel Core i5-13600K | |
| AMD Ryzen 7 7700X | |
| Intel Core i5-12600K | |
| Intel Core i5-13400F | |
| AMD Ryzen 7 5800X | |
| Intel Core i7-12700F | |
| AMD Ryzen 5 5600X | |
| Intel Core i5-11400F | |
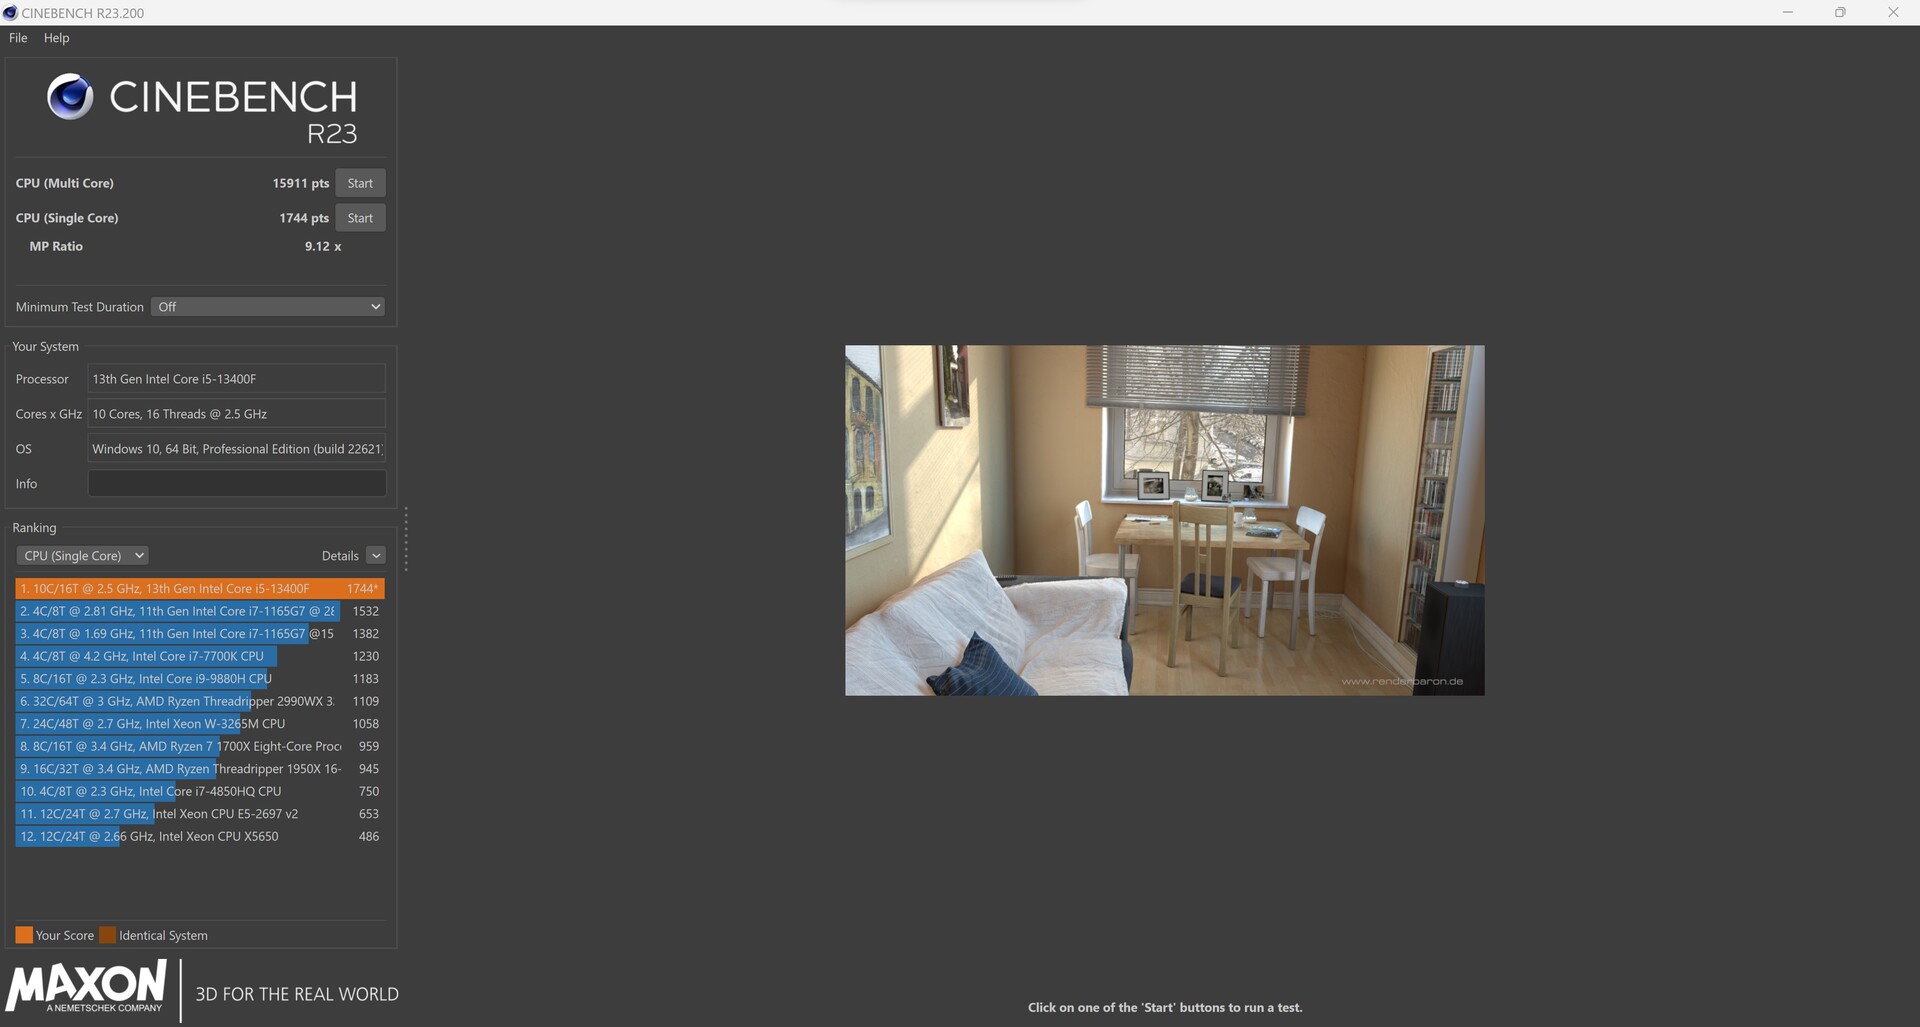
| Cinebench R23 | |
| Single Core | |
| Intel Core i9-13900K | |
| Intel Core i5-13600K | |
| AMD Ryzen 7 7700X | |
| Intel Core i5-12600K | |
| Intel Core i7-12700F | |
| Intel Core i5-13400F | |
| AMD Ryzen 7 5800X | |
| AMD Ryzen 5 5600X | |
| Intel Core i5-11400F | |
| Multi Core | |
| Intel Core i9-13900K | |
| Intel Core i5-13600K | |
| AMD Ryzen 7 7700X | |
| Intel Core i5-12600K | |
| Intel Core i5-13400F | |
| Intel Core i7-12700F | |
| AMD Ryzen 7 5800X | |
| AMD Ryzen 5 5600X | |
| Intel Core i5-11400F | |
| Cinebench R11.5 | |
| CPU Single 64Bit | |
| Intel Core i9-13900K | |
| AMD Ryzen 7 7700X | |
| Intel Core i5-13600K | |
| Intel Core i5-12600K | |
| Intel Core i7-12700F | |
| AMD Ryzen 7 5800X | |
| Intel Core i5-13400F | |
| AMD Ryzen 5 5600X | |
| Intel Core i5-11400F | |
| CPU Multi 64Bit | |
| Intel Core i9-13900K | |
| Intel Core i5-13600K | |
| AMD Ryzen 7 7700X | |
| Intel Core i7-12700F | |
| Intel Core i5-12600K | |
| AMD Ryzen 7 5800X | |
| Intel Core i5-13400F | |
| AMD Ryzen 5 5600X | |
| Intel Core i5-11400F | |
| Blender - v2.79 BMW27 CPU | |
| Intel Core i5-11400F | |
| AMD Ryzen 5 5600X | |
| Intel Core i7-12700F | |
| Intel Core i5-13400F | |
| AMD Ryzen 7 5800X | |
| Intel Core i5-12600K | |
| AMD Ryzen 7 7700X | |
| Intel Core i5-13600K | |
| Intel Core i9-13900K | |
| wPrime 2.10 | |
| 32m | |
| Intel Core i5-12600K | |
| Intel Core i5-11400F | |
| AMD Ryzen 5 5600X | |
| Intel Core i5-13400F | |
| AMD Ryzen 7 5800X | |
| Intel Core i7-12700F | |
| Intel Core i5-13600K | |
| AMD Ryzen 7 7700X | |
| Intel Core i9-13900K | |
| 1024m | |
| Intel Core i5-13400F | |
| Intel Core i5-12600K | |
| Intel Core i5-13600K | |
| Intel Core i7-12700F | |
| Intel Core i5-11400F | |
| AMD Ryzen 5 5600X | |
| AMD Ryzen 7 5800X | |
| Intel Core i9-13900K | |
| AMD Ryzen 7 7700X | |
| X264 HD Benchmark 4.0 | |
| Pass 1 | |
| Intel Core i9-13900K | |
| Intel Core i5-13600K | |
| AMD Ryzen 7 7700X | |
| AMD Ryzen 7 5800X | |
| Intel Core i5-12600K | |
| AMD Ryzen 5 5600X | |
| Intel Core i5-13400F | |
| Intel Core i7-12700F | |
| Intel Core i5-11400F | |
| Pass 2 | |
| Intel Core i9-13900K | |
| Intel Core i5-13600K | |
| AMD Ryzen 7 7700X | |
| AMD Ryzen 7 5800X | |
| Intel Core i5-12600K | |
| Intel Core i5-13400F | |
| Intel Core i7-12700F | |
| AMD Ryzen 5 5600X | |
| Intel Core i5-11400F | |
| WinRAR - Result | |
| AMD Ryzen 7 5800X | |
| AMD Ryzen 7 7700X | |
| Intel Core i9-13900K | |
| AMD Ryzen 5 5600X | |
| Intel Core i5-13600K | |
| Intel Core i7-12700F | |
| Intel Core i5-13400F | |
| Intel Core i5-11400F | |
| Intel Core i5-12600K | |
| TrueCrypt | |
| AES Mean 100MB | |
| Intel Core i9-13900K | |
| Intel Core i5-13600K | |
| AMD Ryzen 7 7700X | |
| AMD Ryzen 7 5800X | |
| Intel Core i5-12600K | |
| Intel Core i5-13400F | |
| AMD Ryzen 5 5600X | |
| Intel Core i5-11400F | |
| Intel Core i7-12700F | |
| Twofish Mean 100MB | |
| Intel Core i9-13900K | |
| Intel Core i5-13600K | |
| Intel Core i7-12700F | |
| AMD Ryzen 7 7700X | |
| Intel Core i5-12600K | |
| AMD Ryzen 7 5800X | |
| Intel Core i5-13400F | |
| AMD Ryzen 5 5600X | |
| Intel Core i5-11400F | |
| Serpent Mean 100MB | |
| Intel Core i9-13900K | |
| Intel Core i5-13600K | |
| Intel Core i7-12700F | |
| AMD Ryzen 7 7700X | |
| AMD Ryzen 7 5800X | |
| Intel Core i5-12600K | |
| Intel Core i5-13400F | |
| AMD Ryzen 5 5600X | |
| Intel Core i5-11400F | |
| Geekbench 5.5 | |
| Multi-Core | |
| Intel Core i9-13900K | |
| Intel Core i5-13600K | |
| AMD Ryzen 7 7700X | |
| Intel Core i5-12600K | |
| Intel Core i5-13400F | |
| AMD Ryzen 7 5800X | |
| Intel Core i7-12700F | |
| AMD Ryzen 5 5600X | |
| Intel Core i5-11400F | |
| Single-Core | |
| Intel Core i9-13900K | |
| AMD Ryzen 7 7700X | |
| Intel Core i5-13600K | |
| Intel Core i5-12600K | |
| Intel Core i5-13400F | |
| AMD Ryzen 7 5800X | |
| AMD Ryzen 5 5600X | |
| Intel Core i7-12700F | |
| Intel Core i5-11400F | |
| Geekbench 5.0 | |
| 5.0 Multi-Core | |
| Intel Core i9-13900K | |
| Intel Core i5-13600K | |
| AMD Ryzen 7 7700X | |
| Intel Core i5-12600K | |
| Intel Core i5-13400F | |
| AMD Ryzen 7 5800X | |
| Intel Core i7-12700F | |
| AMD Ryzen 5 5600X | |
| Intel Core i5-11400F | |
| 5.0 Single-Core | |
| Intel Core i9-13900K | |
| AMD Ryzen 7 7700X | |
| Intel Core i5-13600K | |
| Intel Core i5-12600K | |
| Intel Core i5-13400F | |
| AMD Ryzen 7 5800X | |
| AMD Ryzen 5 5600X | |
| Intel Core i7-12700F | |
| Intel Core i5-11400F | |
| Geekbench 4.4 | |
| 64 Bit Single-Core Score | |
| Intel Core i9-13900K | |
| AMD Ryzen 7 7700X | |
| Intel Core i5-13600K | |
| Intel Core i5-12600K | |
| Intel Core i5-13400F | |
| AMD Ryzen 7 5800X | |
| AMD Ryzen 5 5600X | |
| Intel Core i5-11400F | |
| Intel Core i7-12700F | |
| 64 Bit Multi-Core Score | |
| Intel Core i9-13900K | |
| Intel Core i5-13600K | |
| AMD Ryzen 7 7700X | |
| Intel Core i5-12600K | |
| AMD Ryzen 7 5800X | |
| Intel Core i5-13400F | |
| Intel Core i7-12700F | |
| AMD Ryzen 5 5600X | |
| Intel Core i5-11400F | |
| 3DMark 11 - 1280x720 Performance Physics | |
| Intel Core i9-13900K | |
| AMD Ryzen 7 7700X | |
| Intel Core i5-13600K | |
| Intel Core i5-12600K | |
| Intel Core i5-13400F | |
| Intel Core i7-12700F | |
| AMD Ryzen 7 5800X | |
| AMD Ryzen 5 5600X | |
| Intel Core i5-11400F | |
| 7-Zip 18.03 | |
| 7z b 4 | |
| Intel Core i9-13900K | |
| Intel Core i5-13600K | |
| AMD Ryzen 7 7700X | |
| AMD Ryzen 7 5800X | |
| Intel Core i5-12600K | |
| Intel Core i7-12700F | |
| Intel Core i5-13400F | |
| AMD Ryzen 5 5600X | |
| Intel Core i5-11400F | |
| 7z b 4 -mmt1 | |
| AMD Ryzen 7 7700X | |
| Intel Core i9-13900K | |
| AMD Ryzen 7 5800X | |
| AMD Ryzen 5 5600X | |
| Intel Core i5-13600K | |
| Intel Core i7-12700F | |
| Intel Core i5-12600K | |
| Intel Core i5-13400F | |
| Intel Core i5-11400F | |
| HWBOT x265 Benchmark v2.2 - 4k Preset | |
| Intel Core i9-13900K | |
| Intel Core i5-12600K | |
| Intel Core i5-13600K | |
| AMD Ryzen 7 7700X | |
| AMD Ryzen 7 5800X | |
| Intel Core i5-13400F | |
| Intel Core i7-12700F | |
| AMD Ryzen 5 5600X | |
| Intel Core i5-11400F | |
| R Benchmark 2.5 - Overall mean | |
| Intel Core i5-11400F | |
| AMD Ryzen 5 5600X | |
| Intel Core i5-13400F | |
| AMD Ryzen 7 5800X | |
| Intel Core i5-12600K | |
| Intel Core i7-12700F | |
| Intel Core i5-13600K | |
| AMD Ryzen 7 7700X | |
| Intel Core i9-13900K | |
| LibreOffice - 20 Documents To PDF | |
| Intel Core i5-12600K | |
| Intel Core i7-12700F | |
| Intel Core i5-11400F | |
| AMD Ryzen 5 5600X | |
| AMD Ryzen 7 5800X | |
| Intel Core i5-13400F | |
| Intel Core i9-13900K | |
| Intel Core i5-13600K | |
| AMD Ryzen 7 7700X | |
| WebXPRT 3 - Overall | |
| Intel Core i9-13900K | |
| AMD Ryzen 7 7700X | |
| Intel Core i5-13600K | |
| AMD Ryzen 7 5800X | |
| Intel Core i5-13400F | |
| Intel Core i5-12600K | |
| AMD Ryzen 5 5600X | |
| Intel Core i7-12700F | |
| Intel Core i5-11400F | |
| Mozilla Kraken 1.1 - Total | |
| Intel Core i5-11400F | |
| AMD Ryzen 5 5600X | |
| AMD Ryzen 7 5800X | |
| Intel Core i5-13400F | |
| Intel Core i7-12700F | |
| Intel Core i5-12600K | |
| Intel Core i5-13600K | |
| AMD Ryzen 7 7700X | |
| Intel Core i9-13900K | |
| 3DMark | |
| 1920x1080 Fire Strike Physics | |
| Intel Core i9-13900K | |
| Intel Core i5-13600K | |
| AMD Ryzen 7 7700X | |
| Intel Core i7-12700F | |
| AMD Ryzen 7 5800X | |
| Intel Core i5-12600K | |
| Intel Core i5-13400F | |
| AMD Ryzen 5 5600X | |
| Intel Core i5-11400F | |
| 2560x1440 Time Spy CPU | |
| Intel Core i9-13900K | |
| Intel Core i5-13600K | |
| AMD Ryzen 7 7700X | |
| Intel Core i5-12600K | |
| Intel Core i5-13400F | |
| AMD Ryzen 7 5800X | |
| Intel Core i7-12700F | |
| AMD Ryzen 5 5600X | |
| Intel Core i5-11400F | |
* ... im mniej tym lepiej
Intel Core i5-13400F vs. Cinebench R15 multi loop
Podczas stress testu, który przeprowadzamy z wykorzystaniem ciągłej pętli Cinebench R15, nie ma problemów ze stabilnym rozwijaniem mocy. Przy maksymalnej mocy 148 W, na którą Intel pozwala Core i5-13400F, układ chłodzenia nie jest szczególnie obciążony. Intel Core i5-13400F jest tylko minimalnie wolniejszy od Intel Core i5-12600K, uzyskując średnio 2338 punktów w ciągu wszystkich 50 przebiegów Intel Core i5-12600K (2 545 pkt.).
Syntetyczne benchmarki i wydajność aplikacji
Intel Core i5-13400F może również uzyskać dobre wyniki w benchmarkach aplikacji i jest równy Intel Core i5-12600K pod względem wydajności. W porównaniu z modelami K wymienionych tu procesorów Raptor-Lake nasza próbka recenzencka musi jednak pogodzić się z wyraźnym deficytem. Niemniej jednak Intel Core i5-13400F oferuje solidną wydajność w codziennym użytkowaniu, która w zupełności wystarczy do większości zastosowań.
| PCMark 10 - Score | |
| Intel Core i9-13900K | |
| AMD Ryzen 5 7600X | |
| Intel Core i5-13600K | |
| AMD Ryzen 9 5950X | |
| Intel Core i9-12900K | |
| Intel Core i5-13400F | |
| AMD Ryzen 5 5600X | |
| Intel Core i5-12600K | |
| Intel Core i7-12700F | |
| Intel Core i5-11400F | |
| AMD Ryzen 9 5900X | |
| 3DMark | |
| 1920x1080 Fire Strike Physics | |
| Intel Core i9-13900K | |
| AMD Ryzen 9 5950X | |
| Intel Core i9-12900K | |
| Intel Core i5-13600K | |
| AMD Ryzen 9 5900X | |
| Intel Core i7-12700F | |
| AMD Ryzen 5 7600X | |
| Intel Core i5-12600K | |
| Intel Core i5-13400F | |
| AMD Ryzen 5 5600X | |
| Intel Core i5-11400F | |
| 2560x1440 Time Spy CPU | |
| Intel Core i9-13900K | |
| Intel Core i9-12900K | |
| Intel Core i5-13600K | |
| Intel Core i5-12600K | |
| AMD Ryzen 9 5950X | |
| Intel Core i5-13400F | |
| AMD Ryzen 9 5900X | |
| Intel Core i7-12700F | |
| AMD Ryzen 5 7600X | |
| AMD Ryzen 5 5600X | |
| Intel Core i5-11400F | |
| 3DMark 11 - 1280x720 Performance Physics | |
| Intel Core i9-13900K | |
| Intel Core i5-13600K | |
| Intel Core i9-12900K | |
| AMD Ryzen 5 7600X | |
| AMD Ryzen 9 5950X | |
| Intel Core i5-12600K | |
| Intel Core i5-13400F | |
| Intel Core i7-12700F | |
| Intel Core i9-12900K | |
| AMD Ryzen 9 5900X | |
| AMD Ryzen 5 5600X | |
| Intel Core i5-11400F | |
| CrossMark - Overall | |
| Intel Core i9-13900K | |
| Intel Core i5-13600K | |
| AMD Ryzen 5 7600X | |
| Intel Core i5-13400F | |
| Intel Core i7-12700F | |
| Intel Core i5-12600K | |
| AMD Ryzen 9 5900X | |
| AMD Ryzen 9 5950X | |
| AMD Ryzen 5 5600X | |
| AIDA64 / Memory Copy | |
| Intel Core i9-13900K | |
| Intel Core i5-13600K | |
| Intel Core i5-13400F | |
| Intel Core i5-12600K | |
| AMD Ryzen 9 5900X | |
| AMD Ryzen 5 7600X | |
| AMD Ryzen 9 5950X | |
| AMD Ryzen 5 5600X | |
| Średnia w klasie (4514 - 234662, n=2203) | |
| AIDA64 / Memory Read | |
| Intel Core i9-13900K | |
| Intel Core i5-13400F | |
| Intel Core i5-12600K | |
| Intel Core i5-13600K | |
| AMD Ryzen 9 5900X | |
| AMD Ryzen 9 5950X | |
| AMD Ryzen 5 5600X | |
| AMD Ryzen 5 7600X | |
| Średnia w klasie (4031 - 271066, n=2165) | |
| AIDA64 / Memory Write | |
| AMD Ryzen 5 7600X | |
| Intel Core i9-13900K | |
| Intel Core i5-12600K | |
| Intel Core i5-13600K | |
| Intel Core i5-13400F | |
| Średnia w klasie (3506 - 242868, n=2170) | |
| AMD Ryzen 9 5900X | |
| AMD Ryzen 9 5950X | |
| AMD Ryzen 5 5600X | |
| AIDA64 / Memory Latency | |
| Średnia w klasie (6.1 - 536, n=2232) | |
| Intel Core i5-12600K | |
| Intel Core i5-13600K | |
| Intel Core i5-13400F | |
| Intel Core i9-13900K | |
| AMD Ryzen 9 5950X | |
| AMD Ryzen 5 5600X | |
| AMD Ryzen 5 7600X | |
| AMD Ryzen 9 5900X | |
* ... im mniej tym lepiej
Testy gier
Tak jak poprzednio, nasz egzemplarz recenzencki przede wszystkim pojedynkuje się z Intel Core i5-12600K w testach gamingowych. W wysokich rozdzielczościach i wysokiej presecie rywale zbliżają się do siebie. Jeśli chodzi wyłącznie o gry, z pewnością nie pomylisz się z Intel Core i5-13400F. Dzięki 16 wątkom wszystkie gry są obecnie grywalne dobrze z odpowiednią kartą graficzną. W naszym teście użyliśmy m.in Nvidia GeForce RTX 3090 Founder Edition aby porównać wydajność naszej próbki testowej z wydajnością urządzeń porównawczych. Jeśli chcesz również streamować w tym samym czasie, co gra, obecnie polecamy Intel Core i9-13900K lub złapać AMD Ryzen 9 7950X.
Gaming Performance
| Performance rating - Percent | |
| Intel Core i9-13900K | |
| AMD Ryzen 9 7900X | |
| AMD Ryzen 5 7600X | |
| Intel Core i9-12900K | |
| Intel Core i5-13600K | |
| Intel Core i5-13400F | |
| Intel Core i5-12600K | |
| F1 22 | |
| 1920x1080 Low Preset AA:T AF:16x | |
| AMD Ryzen 9 7900X | |
| AMD Ryzen 5 7600X | |
| Intel Core i5-13600K | |
| Intel Core i9-13900K | |
| Intel Core i9-12900K | |
| Intel Core i5-13400F | |
| Intel Core i5-12600K | |
| 1920x1080 Ultra High Preset AA:T AF:16x | |
| Intel Core i9-12900K | |
| Intel Core i5-12600K | |
| Intel Core i5-13600K | |
| Intel Core i5-13400F | |
| AMD Ryzen 5 7600X | |
| AMD Ryzen 9 7900X | |
| Intel Core i9-13900K | |
| Far Cry 5 | |
| 1920x1080 Ultra Preset AA:T | |
| Intel Core i9-13900K | |
| Intel Core i5-13600K | |
| Intel Core i9-12900K | |
| AMD Ryzen 9 7900X | |
| AMD Ryzen 5 7600X | |
| Intel Core i5-12600K | |
| Intel Core i5-13400F | |
| 1280x720 Low Preset AA:T | |
| Intel Core i9-13900K | |
| AMD Ryzen 9 7900X | |
| Intel Core i5-13600K | |
| AMD Ryzen 5 7600X | |
| Intel Core i9-12900K | |
| Intel Core i5-12600K | |
| Intel Core i5-13400F | |
| X-Plane 11.11 | |
| 1920x1080 high (fps_test=3) | |
| AMD Ryzen 9 7900X | |
| AMD Ryzen 5 7600X | |
| Intel Core i9-13900K | |
| Intel Core i9-12900K | |
| Intel Core i5-13600K | |
| Intel Core i5-13400F | |
| Intel Core i5-12600K | |
| 1280x720 low (fps_test=1) | |
| Intel Core i9-13900K | |
| AMD Ryzen 5 7600X | |
| AMD Ryzen 9 7900X | |
| Intel Core i9-12900K | |
| Intel Core i5-13600K | |
| Intel Core i5-13400F | |
| Intel Core i5-12600K | |
| Final Fantasy XV Benchmark | |
| 1920x1080 High Quality | |
| AMD Ryzen 9 7900X | |
| Intel Core i5-13600K | |
| Intel Core i9-13900K | |
| AMD Ryzen 5 7600X | |
| Intel Core i9-12900K | |
| Intel Core i5-13400F | |
| Intel Core i5-12600K | |
| 1280x720 Lite Quality | |
| AMD Ryzen 9 7900X | |
| Intel Core i5-13600K | |
| Intel Core i9-13900K | |
| Intel Core i9-12900K | |
| AMD Ryzen 5 7600X | |
| Intel Core i5-13400F | |
| Intel Core i5-12600K | |
| Dota 2 Reborn | |
| 1920x1080 ultra (3/3) best looking | |
| AMD Ryzen 9 7900X | |
| Intel Core i9-13900K | |
| AMD Ryzen 5 7600X | |
| Intel Core i5-13600K | |
| Intel Core i9-12900K | |
| Intel Core i5-12600K | |
| Intel Core i5-13400F | |
| 1280x720 min (0/3) fastest | |
| AMD Ryzen 5 7600X | |
| AMD Ryzen 9 7900X | |
| Intel Core i9-13900K | |
| Intel Core i5-13600K | |
| Intel Core i9-12900K | |
| Intel Core i5-12600K | |
| Intel Core i5-13400F | |
| GTA V | |
| 1920x1080 Highest AA:4xMSAA + FX AF:16x | |
| Intel Core i9-13900K | |
| AMD Ryzen 9 7900X | |
| AMD Ryzen 5 7600X | |
| Intel Core i5-13600K | |
| Intel Core i9-12900K | |
| Intel Core i5-12600K | |
| Intel Core i5-13400F | |
| 1024x768 Lowest Settings possible | |
| Intel Core i9-13900K | |
| AMD Ryzen 9 7900X | |
| AMD Ryzen 5 7600X | |
| Intel Core i5-13600K | |
| Intel Core i9-12900K | |
| Intel Core i5-13400F | |
| Intel Core i5-12600K | |
| low | med. | high | ultra | QHD | 4K | |
|---|---|---|---|---|---|---|
| GTA V (2015) | 187.5 | 187.5 | 187.1 | 161.4 | 151.8 | 182.2 |
| The Witcher 3 (2015) | 773 | 586 | 384 | 188.1 | 156.9 | |
| Dota 2 Reborn (2015) | 293.1 | 257 | 250.4 | 231.65 | 216.7 | |
| Final Fantasy XV Benchmark (2018) | 236 | 231 | 190.8 | 146.6 | 88.8 | |
| X-Plane 11.11 (2018) | 225 | 199.2 | 160.9 | 133.5 | ||
| Far Cry 5 (2018) | 244 | 211 | 203 | 186 | 176 | 110 |
| Strange Brigade (2018) | 741 | 479 | 380 | 329 | 249 | 153.1 |
| Shadow of the Tomb Raider (2018) | 314 | 261 | 251 | 234 | 172.2 | 99.6 |
| Far Cry New Dawn (2019) | 200 | 176 | 169 | 151 | 143 | 109 |
| Metro Exodus (2019) | 311 | 223 | 175.2 | 140.1 | 115.8 | 76.6 |
| Borderlands 3 (2019) | 244 | 213 | 190.8 | 164.1 | 131.6 | 75.3 |
| F1 2020 (2020) | 487 | 403 | 374 | 270 | 218 | 138.8 |
| F1 2021 (2021) | 648 | 548 | 441 | 224 | 175.4 | 105.3 |
| Cyberpunk 2077 1.6 (2022) | 214 | 213 | 174 | 173 | 88 | 46 |
| Tiny Tina's Wonderlands (2022) | 364 | 294 | 212 | 168.5 | 124 | 70.8 |
| F1 22 (2022) | 344 | 361 | 321 | 125.1 | 83.8 | 42.4 |
| The Quarry (2022) | 282 | 216 | 177.7 | 144.4 | 103.6 | 58.9 |
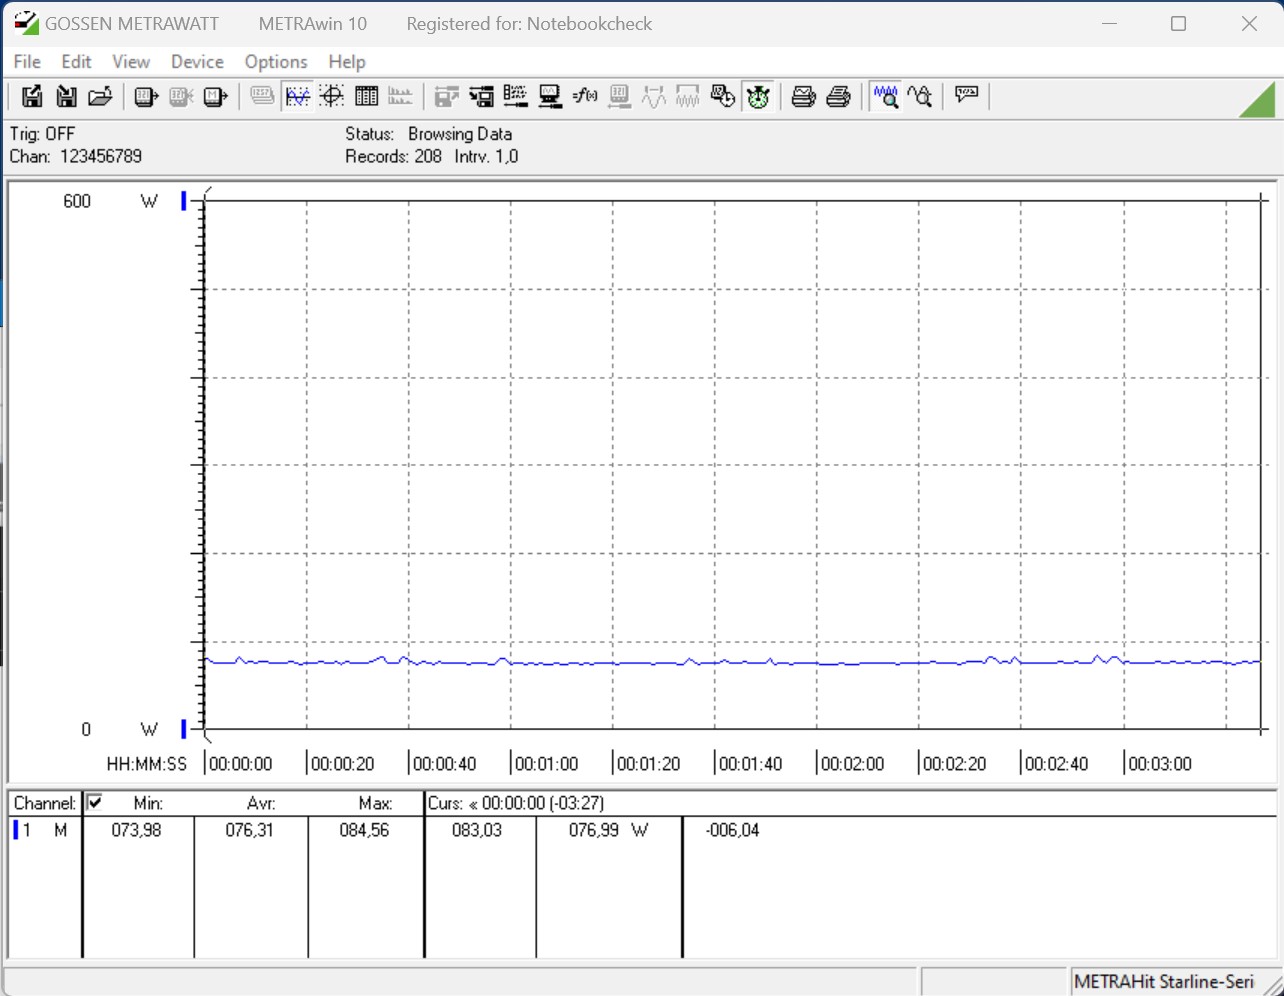
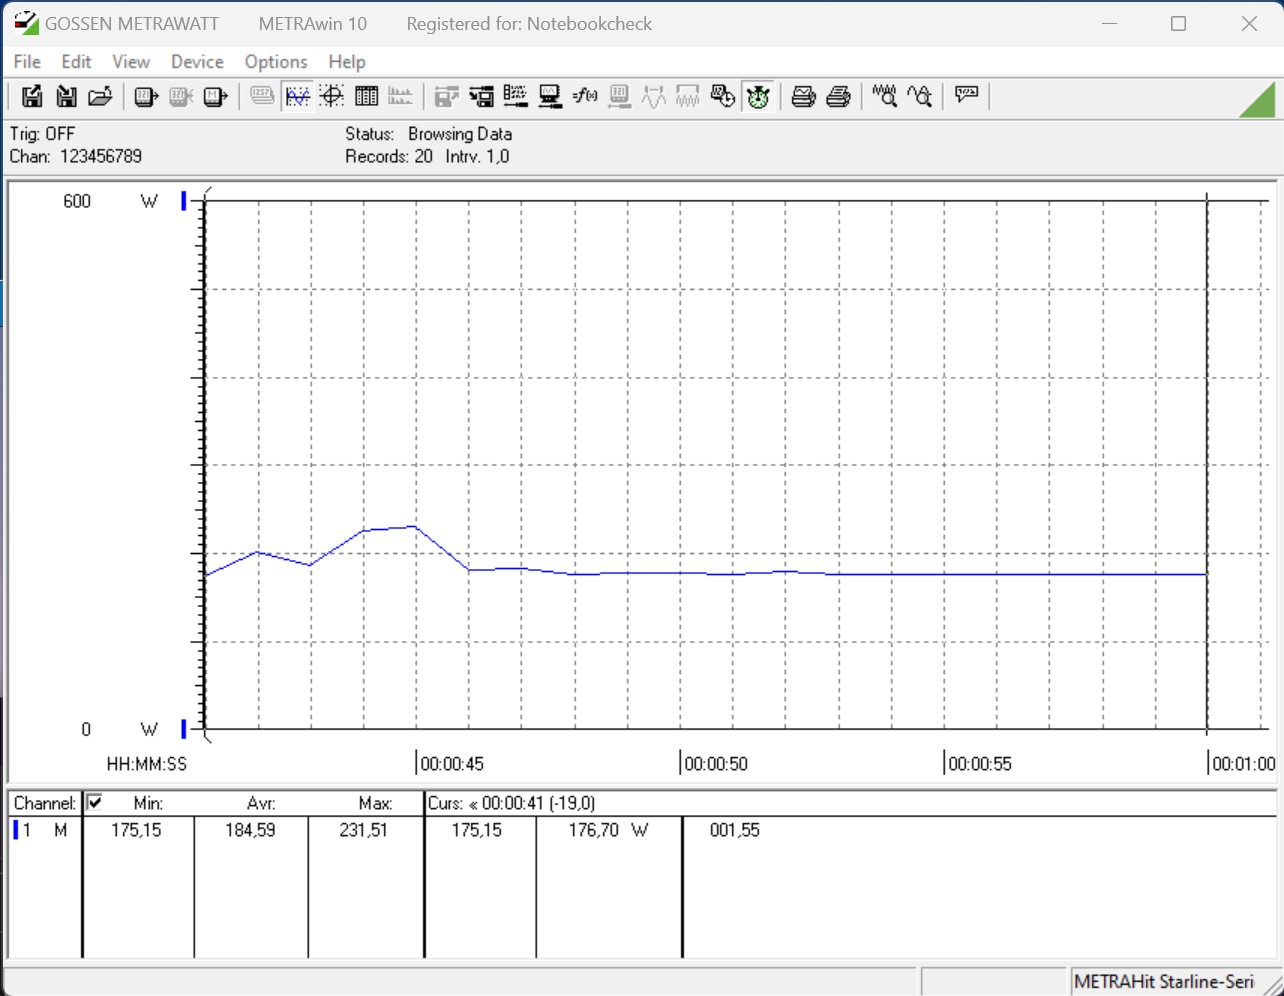
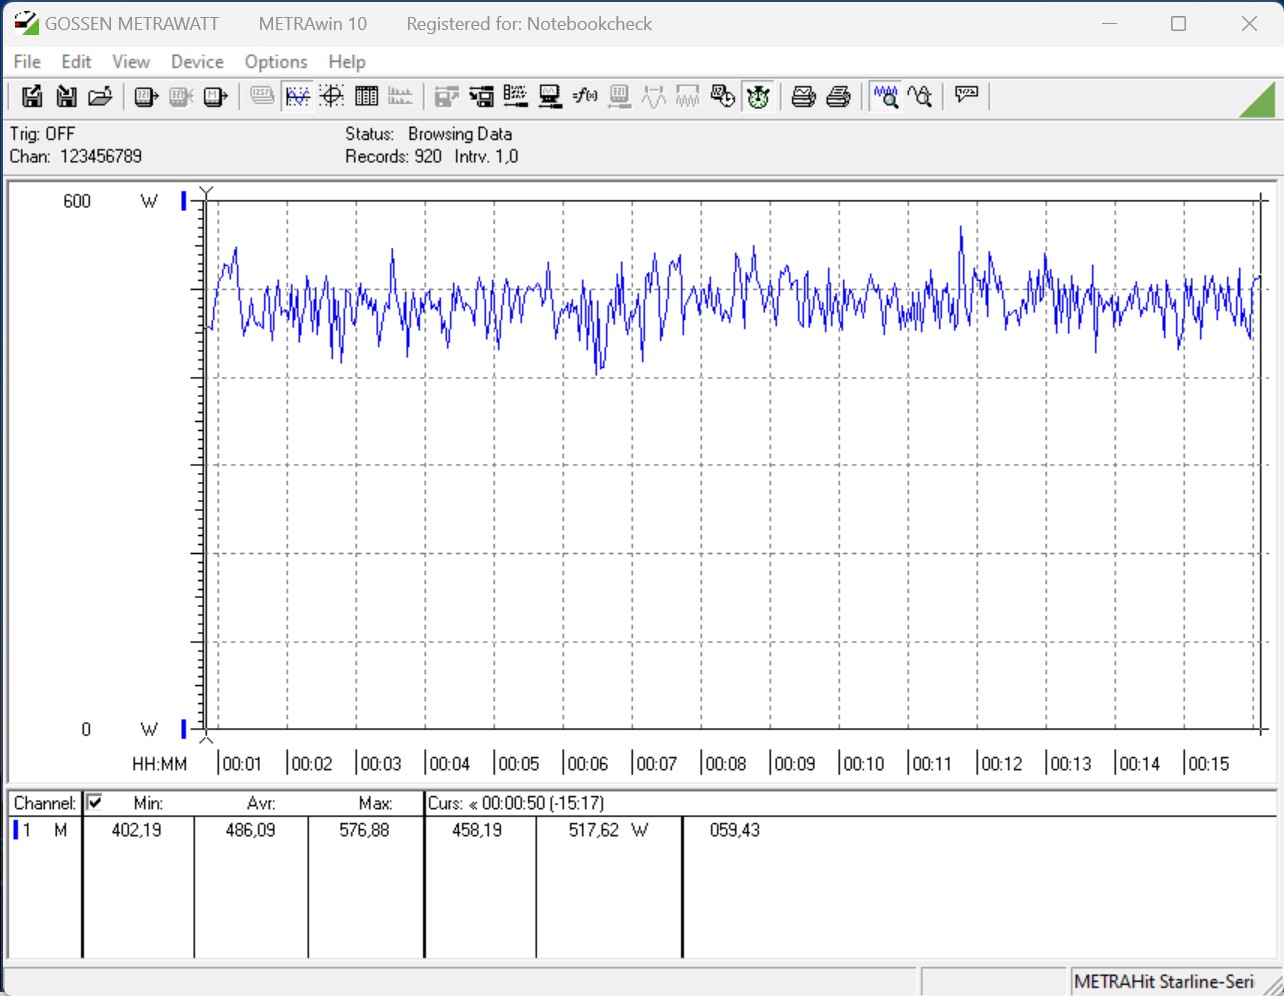
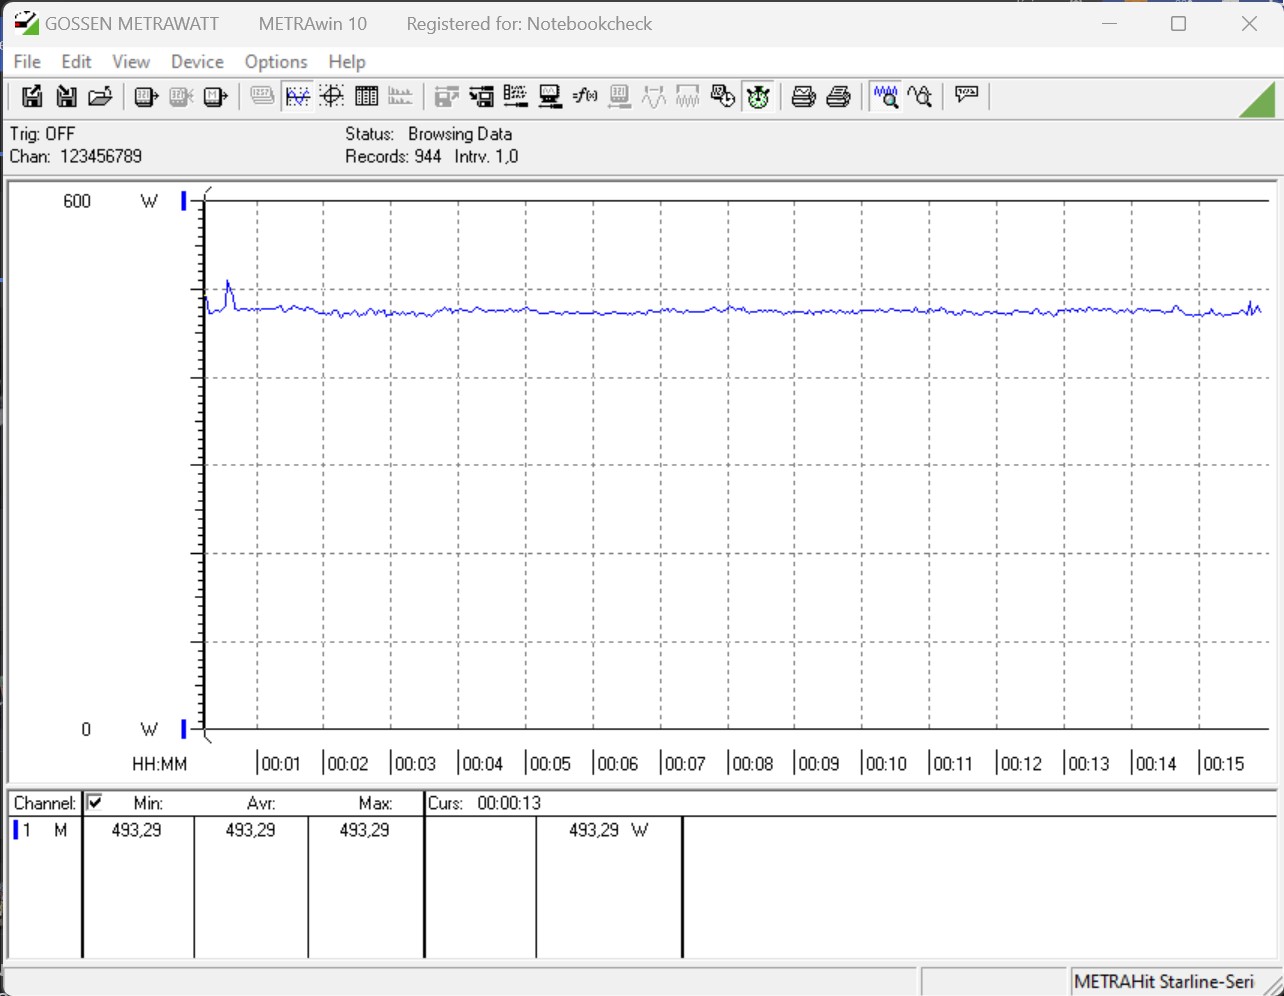
Zużycie energii
Według specyfikacji technicznej procesora Intel Core i5-13400F pobór mocy wynosi 65 watów, a pod obciążeniem może osiągnąć nawet 148 watów. Jeśli ograniczenia poboru mocy dla procesora nie są ograniczone w BIOS-ie, te 148 watów jest włączone na stałe i nie jest czasowo ograniczone wartością rosy. Wszystkie testy, które przeprowadziliśmy z procesorem, były wykonywane bez żadnych ograniczeń. W teście wielotematycznym Cinebench R15 notujemy pobór mocy systemu testowego na poziomie zaledwie 184 W. Tym samym Intel Core i5-13400F jest znacznie oszczędniejszy od Intel Core i5-12600K, który w naszym teście wymaga niespełna 206 W. W teście stresowym notujemy nieco więcej, bo 214 W. Niemniej jednak zużycie energii jest przyjemnie niskie.
Ze względu na niski pobór mocy Intel Core i5-13400F nie potrzebuje dużego chłodzenia. Można więc spokojnie obejść się bez AiO, a wysokiej jakości cooler powietrzny jest dla tego procesora całkowicie wystarczający.
| Power Consumption / Cinebench R15 Multi (external Monitor) | |
| Intel Core i9-13900K | |
| Intel Core i9-12900K (Idle: 70.5 W) | |
| AMD Ryzen 9 7900X | |
| Intel Core i5-13600K | |
| AMD Ryzen 9 5900X (Idle: 78.1 W) | |
| AMD Ryzen 9 5950X (Idle: 78 W) | |
| AMD Ryzen 5 7600X | |
| Intel Core i5-12600K (Idle: 70.45 W) | |
| Intel Core i5-13400F | |
| AMD Ryzen 5 5600X (Idle: 79.23 W) | |
| Power Consumption / Prime95 V2810 Stress (external Monitor) | |
| Intel Core i9-13900K | |
| Intel Core i5-13600K | |
| AMD Ryzen 9 7900X | |
| Intel Core i9-12900K (Idle: 70.5 W) | |
| Intel Core i5-12600K (Idle: 70.45 W) | |
| AMD Ryzen 9 5950X (Idle: 78 W) | |
| AMD Ryzen 9 5900X (Idle: 78.1 W) | |
| AMD Ryzen 5 7600X | |
| Intel Core i5-13400F | |
| AMD Ryzen 5 5600X (Idle: 79.23 W) | |
| Power Consumption / The Witcher 3 ultra (external Monitor) | |
| AMD Ryzen 9 7900X | |
| Intel Core i9-13900K | |
| AMD Ryzen 5 7600X | |
| Intel Core i5-13600K | |
| Intel Core i5-13400F | |
| Nvidia GeForce RTX 3090 Founders Edition (Idle: 91.1 W) | |
| Intel Core i9-12900K (Idle: 70.5 W) | |
| AMD Ryzen 9 5950X (Idle: 78 W) | |
| AMD Ryzen 9 5900X (Idle: 78.1 W) | |
| AMD Ryzen 5 5600X (Idle: 79.23 W) | |
| Intel Core i5-12600K (Idle: 70.45 W) | |
* ... im mniej tym lepiej
Power Consumption With External Monitor
Za
Przeciw
Wniosek - Ekonomiczny, szybki i łatwy do schłodzenia
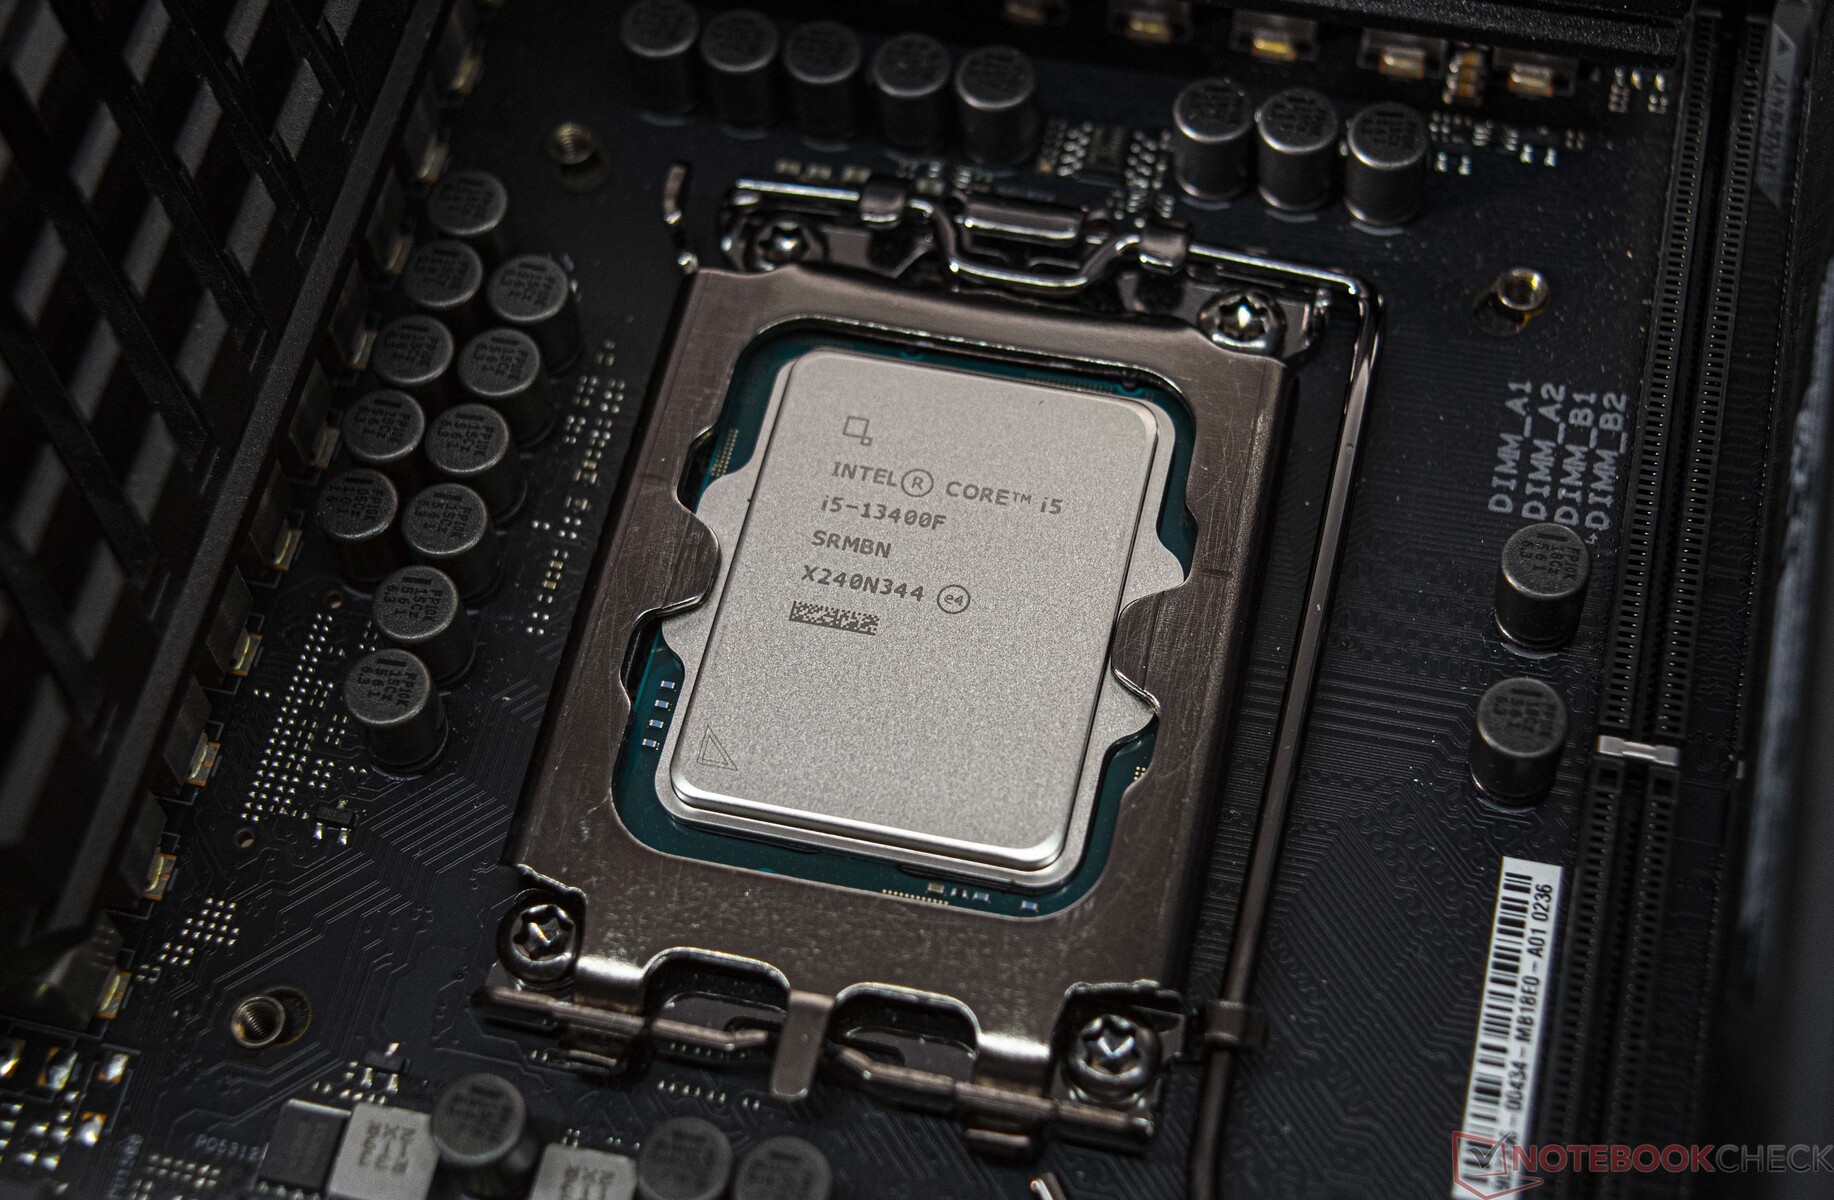

Intel wysłał już do wyścigu z Raptor Lake czcigodnego następcę generacji Alder Lake. Modeli ze średniej i podstawowej półki na tej samej bazie teraz stopniowo przybywa. Niemniej jednak trzeba się bliżej przyjrzeć i zwrócić uwagę na stepping procesora, bo nie zawsze jest to procesor Raptor Lake. W naszym przypadku mamy Intel Core i5-13400F w steppingu C0, co wskazuje, że jest to procesor Alder Lake w rdzeniu. Dopiero oznaczenie B0 wskazuje na natywny procesor Raptor-Lake. Obie wersje mają być dostępne i zakładamy, że radzą sobie równie dobrze.
Tymczasem Intel oferuje oszczędny 10-rdzeniowy model Intel Core i5-13400F, który oprócz rdzeni P posiada także 4 rdzenie E. Przy mocy do 148 W model ten jest stosunkowo oszczędny pod pełnym obciążeniem. Ponadto temperatury są łatwe do zniesienia i nie wymagają skomplikowanego i drogiego chłodzenia. W teście Intel Core i5-13400F może bardzo dobrze dotrzymać kroku Intel Core i5-12600K, mecz pod względem efektywności energetycznej jest wyraźnie na korzyść bardziej oszczędnego modelu. Za procesorami Zen 4 firmy AMD nie da się nadążyć. Tutaj natywny 10-rdzeniowiec z naszego testu raczej plasuje się z AMD Ryzen 7 5800X, który również posiada łącznie 16 wątków.
Intel Core i5-13400F oferuje solidną wydajność w codziennych zastosowaniach, a także opanowuje najnowsze gry. Ze względu na niskie TDP, oszczędny procesor można bez problemu schłodzić także w małych obudowach.
Do jednostki bazowej można jeszcze zastosować płytę główną z chipsetem z serii 600. Nie obciąża to zbytnio portfela przy modernizacji. Niemniej jednak trzeba wziąć pod uwagę, że nie będzie już nowej generacji Intela dla socket 1700. Obecny młyn plotek mówi, że socket 1851 zostanie wprowadzony wraz z Meteor Lake. Oznacza to, że nowa płyta główna znów będzie obowiązkowa.
Ceny i dostępność
Intel Core i5-13400F jest obecnie dostępny w Notebooksbilliger.de za 227 euro (~$247). Za 260 Euros (~$283) można kupić go ze zintegrowaną jednostką graficzną, również na Notebooksbilliger.de.
