Recenzja laptopa Lenovo Legion Pro 5i: Super wydajny i7-14700HX i wydajność RTX 4060
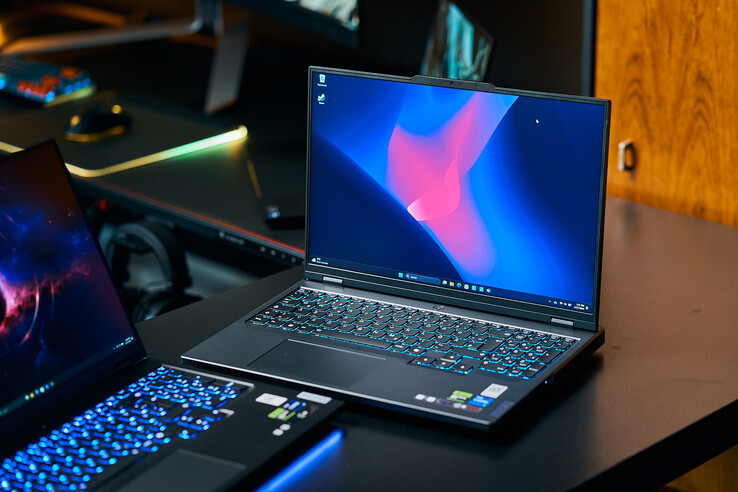
Przetestowaliśmy już jedną z lepszych konfiguracji wyposażonych w Procesor Core i9 14900HX i 140-watową GeForce RTX 4070. Jednak wielu graczy prawdopodobnie wybierze bardziej przystępną cenowo konfigurację z procesorem i7 14700HX i RTX 4060 której przyglądamy się dzisiaj. Model ten może również zepchnąć na dalszy plan niektóre słabe punkty "dużego" modelu, takie jak wysokie temperatury powierzchni i hałaśliwy system chłodzenia.
Pomijając jego większego brata i niepro Legion 5będziemy porównywać Legion Pro 5 z innymi kartami RTX 4060 dla graczy, takimi jak Dell G16, HP Victus 16 i XMG Core 15.
Potencjalni konkurenci w porównaniu
Wersja | Ocena | Data | Model | Waga | Wysokość | Rozmiar | Rezolucja | Cena |
|---|---|---|---|---|---|---|---|---|
| v8 | 82.3 % | 07/2024 | Lenovo Legion Pro 5 16IRX9 G9 i7-14700HX, GeForce RTX 4060 Laptop GPU | 2.5 kg | 26.55 mm | 16.00" | 2560x1600 | |
| v7 (old) | 84.3 % v7 (old) | 05/2024 | HP Victus 16 (2024) i7-14700HX, GeForce RTX 4060 Laptop GPU | 2.4 kg | 23.9 mm | 16.10" | 1920x1080 | |
| v7 (old) | 85.5 % v7 (old) | 02/2024 | Dell G16, i7-13650HX, RTX 4060 i7-13650HX, GeForce RTX 4060 Laptop GPU | 2.8 kg | 25.65 mm | 16.00" | 2560x1600 | |
| v8 | 83.7 % | 06/2024 | Schenker XMG Core 15 (M24) R7 8845HS, GeForce RTX 4060 Laptop GPU | 2.1 kg | 21.9 mm | 15.30" | 2560x1600 | |
| v7 (old) | 89.3 % v7 (old) | 04/2024 | Lenovo Legion Pro 5 16IRX9 i9-14900HX, GeForce RTX 4070 Laptop GPU | 2.5 kg | 26.95 mm | 16.00" | 2560x1600 | |
| v7 (old) | 89.1 % v7 (old) | 02/2024 | Lenovo Legion 5 16IRX G9 i7-14650HX, GeForce RTX 4060 Laptop GPU | 2.4 kg | 25.2 mm | 16.00" | 2560x1600 |
Prosimy pamiętać: Zaktualizowaliśmy nasz system oceny i wyniki wersji 8 nie są porównywalne z wynikami wersji 7. Więcej informacji znajdą Państwo tutaj.
Obudowa i łączność: Legion Pro bez czytnika kart SD
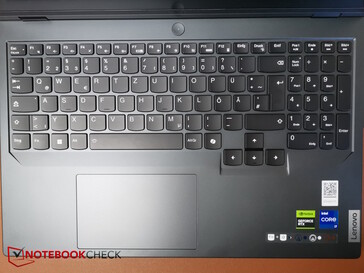
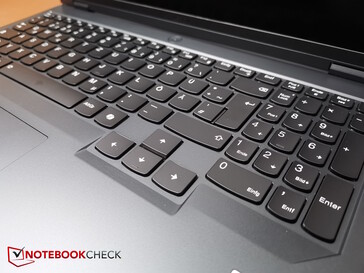
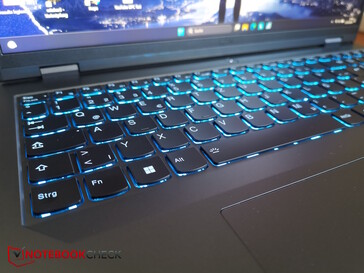
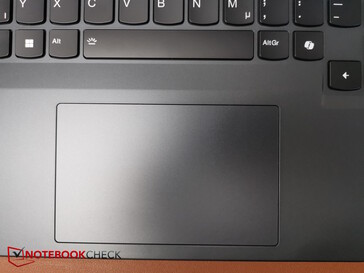
Ponieważ jego cechy fizyczne pozostały niezmienione, zalecamy przeczytanie naszego oryginalną recenzję Lenovo Legion Pro 5 16IRX9 aby uzyskać informacje na temat obudowy, opcji konserwacji i urządzeń wejściowych.
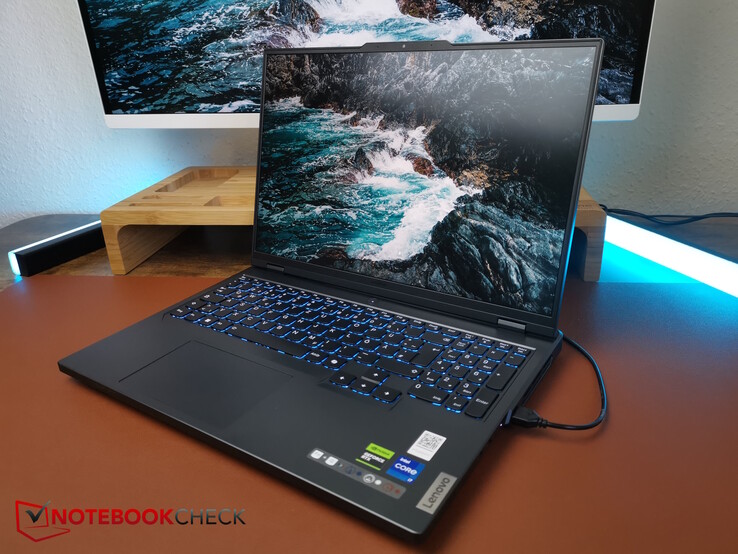
Urządzenia wejściowe - Renomowana jakość Legion
Nie wspomniano o tym w naszym pierwszym test Legion Pro 5i: Częstotliwość odświeżania można zmieniać w trzech krokach (240, 165 i 60 Hz) za pomocą kombinacji klawiszy Fn + R.
Display - Legion Pro również dla twórców treści
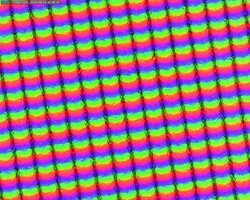
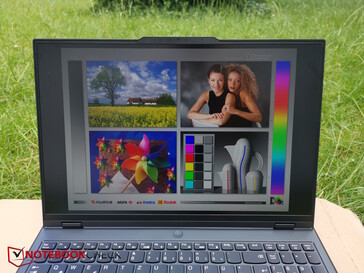
Lenovo zainstalowało w tym laptopie matowy wyświetlacz IPS o rozdzielczości 2560 x 1600 pikseli. W ofercie są jednak trzy warianty wyświetlacza, wszystkie o tej samej rozdzielczości. Podstawowy model ma pokrywać sRGB, ma częstotliwość odświeżania 165 Hz i jasność 300 nitów. Pozostałe dwa modele mają jasność 500 nitów i częstotliwość odświeżania 240 Hz, z których jeden obsługuje również DCI-P3. Nasz model testowy posiada jeden z wyświetlaczy o jasności 500 nitów i częstotliwości odświeżania 240 Hz.
Zmierzyliśmy średnią jasność 491 nitów, a jego podświetlenie na poziomie 90 procent jest dobre. Jednak poziom czerni mógłby być nieco lepszy, ale kontrast jest w porządku.
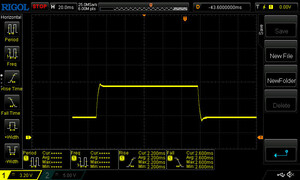
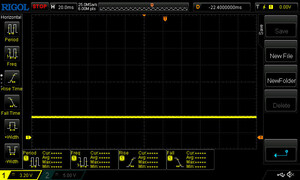
Odnotowaliśmy 150 nitów przy jasności około 58 procent. Nie wykorzystuje PWM, więc krwawienie ekranu nie jest problemem, a jego czas reakcji jest dość szybki jak na panel IPS.
| |||||||||||||||||||||||||
rozświetlenie: 90 %
na akumulatorze: 518 cd/m²
kontrast: 1439:1 (czerń: 0.36 cd/m²)
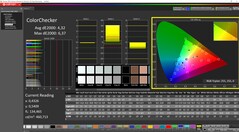
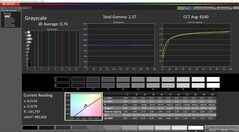
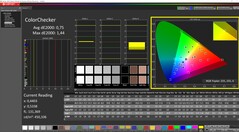
ΔE ColorChecker Calman: 4.32 | ∀{0.5-29.43 Ø4.76}
calibrated: 0.75
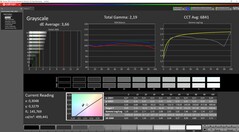
ΔE Greyscale Calman: 3.66 | ∀{0.09-98 Ø5}
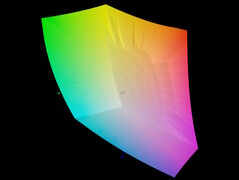
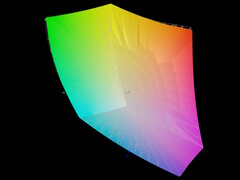
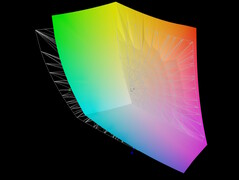
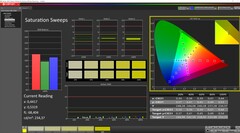
87.81% AdobeRGB 1998 (Argyll 3D)
99.93% sRGB (Argyll 3D)
99.22% Display P3 (Argyll 3D)
Gamma: 2.19
CCT: 6841 K
| Lenovo Legion Pro 5 16IRX9 G9 BOE NE160QDM-NZB, IPS, 2560x1600, 16" | HP Victus 16 (2024) Chi Mei CMN163E, IPS, 1920x1080, 16.1" | Dell G16, i7-13650HX, RTX 4060 Chi Mei CMN161D (160GME), IPS, 2560x1600, 16" | Schenker XMG Core 15 (M24) BOE NJ NE153QDM-NZ1 (BOE0C8E), IPS, 2560x1600, 15.3" | Lenovo Legion Pro 5 16IRX9 BOE NE160QDM-NYC, IPS, 2560x1600, 16" | Lenovo Legion 5 16IRX G9 NE160QDM-NZ3, IPS, 2560x1600, 16" | |
|---|---|---|---|---|---|---|
| Display | -49% | -18% | -14% | -17% | -14% | |
| Display P3 Coverage (%) | 99.22 | 41.3 -58% | 67.5 -32% | 73.2 -26% | 69.3 -30% | 72.4 -27% |
| sRGB Coverage (%) | 99.93 | 61.7 -38% | 98.5 -1% | 100 0% | 99.4 -1% | 100 0% |
| AdobeRGB 1998 Coverage (%) | 87.81 | 42.7 -51% | 69.3 -21% | 74.6 -15% | 70.1 -20% | 74.1 -16% |
| Response Times | -300% | -36% | -50% | -73% | -78% | |
| Response Time Grey 50% / Grey 80% * (ms) | 4.8 ? | 28.6 ? -496% | 7.6 ? -58% | 9.6 ? -100% | 11.9 ? -148% | 12.5 ? -160% |
| Response Time Black / White * (ms) | 9.2 ? | 18.7 ? -103% | 10.4 ? -13% | 9.2 ? -0% | 8.9 ? 3% | 8.7 ? 5% |
| PWM Frequency (Hz) | ||||||
| Screen | -76% | -22% | 3% | 12% | 21% | |
| Brightness middle (cd/m²) | 518 | 287 -45% | 369 -29% | 635 23% | 384 -26% | 526 2% |
| Brightness (cd/m²) | 491 | 288 -41% | 344 -30% | 604 23% | 366 -25% | 500 2% |
| Brightness Distribution (%) | 90 | 86 -4% | 89 -1% | 91 1% | 91 1% | 87 -3% |
| Black Level * (cd/m²) | 0.36 | 0.19 47% | 0.26 28% | 0.64 -78% | 0.35 3% | 0.33 8% |
| Contrast (:1) | 1439 | 1511 5% | 1419 -1% | 992 -31% | 1097 -24% | 1594 11% |
| Colorchecker dE 2000 * | 4.32 | 5.46 -26% | 3.04 30% | 1.89 56% | 0.97 78% | 1.2 72% |
| Colorchecker dE 2000 max. * | 6.37 | 20.36 -220% | 5.56 13% | 3.14 51% | 3.57 44% | 2.1 67% |
| Colorchecker dE 2000 calibrated * | 0.75 | 3.52 -369% | 2.35 -213% | 1.14 -52% | 0.77 -3% | 1 -33% |
| Greyscale dE 2000 * | 3.66 | 4.8 -31% | 3.38 8% | 2.53 31% | 1.5 59% | 1.3 64% |
| Gamma | 2.19 100% | 2.108 104% | 2.47 89% | 2.36 93% | 2.24 98% | 2.23 99% |
| CCT | 6841 95% | 6442 101% | 6040 108% | 6434 101% | 6709 97% | 6391 102% |
| Całkowita średnia (program / ustawienia) | -142% /
-102% | -25% /
-23% | -20% /
-8% | -26% /
-6% | -24% /
-1% |
* ... im mniej tym lepiej
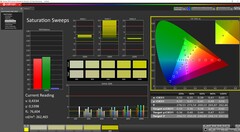
Prosto po wyjęciu z pudełka, ekran nie jest skalibrowany całkowicie optymalnie. Nasza własna kalibracja przy użyciu urządzenia do pomiaru kolorów X-Rite i1Pro i oprogramowania Calman spowodowała, że wartości DeltaE w skali szarości i kolorów spadły poniżej 1.
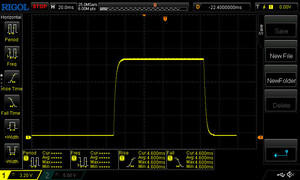
Wyświetl czasy reakcji
| ↔ Czas reakcji od czerni do bieli | ||
|---|---|---|
| 9.2 ms ... wzrost ↗ i spadek ↘ łącznie | ↗ 4.6 ms wzrost | |
| ↘ 4.6 ms upadek | ||
| W naszych testach ekran wykazuje szybki czas reakcji i powinien nadawać się do gier. Dla porównania, wszystkie testowane urządzenia wahają się od 0.1 (minimum) do 240 (maksimum) ms. » 25 % wszystkich urządzeń jest lepszych. Oznacza to, że zmierzony czas reakcji jest lepszy od średniej wszystkich testowanych urządzeń (20.1 ms). | ||
| ↔ Czas reakcji 50% szarości do 80% szarości | ||
| 4.8 ms ... wzrost ↗ i spadek ↘ łącznie | ↗ 2.2 ms wzrost | |
| ↘ 2.6 ms upadek | ||
| W naszych testach ekran wykazuje bardzo szybką reakcję i powinien bardzo dobrze nadawać się do szybkich gier. Dla porównania, wszystkie testowane urządzenia wahają się od 0.165 (minimum) do 636 (maksimum) ms. » 16 % wszystkich urządzeń jest lepszych. Oznacza to, że zmierzony czas reakcji jest lepszy od średniej wszystkich testowanych urządzeń (31.5 ms). | ||
Migotanie ekranu / PWM (modulacja szerokości impulsu)
| Migotanie ekranu/nie wykryto PWM | |||
Dla porównania: 53 % wszystkich testowanych urządzeń nie używa PWM do przyciemniania wyświetlacza. Jeśli wykryto PWM, zmierzono średnio 8036 (minimum: 5 - maksimum: 343500) Hz. | |||
Wydajność - świetna wydajność procesora i gier w Pro 5i
W przeciwieństwie do Legion Pro 5i z wysokiej klasy komponentami i9 14900HX i RTX 4070 które już testowaliśmy, obecne urządzenie testowe jest wyposażone w i7 14700HX i RTX 4060. Oznacza to, że laptop jest klasyfikowany jako gracz średniej klasy.
Dzięki stosunkowo dokładnemu odwzorowaniu kolorów i jasnemu wyświetlaczowi, Legion prawdopodobnie zainteresuje również wielu twórców - choć jego konstrukcja mogłaby być nieco bardziej subtelna.
Warunki testowania
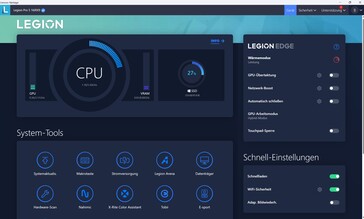
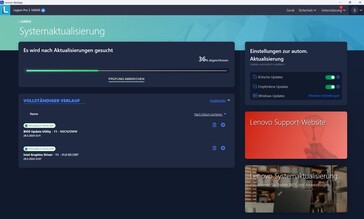
Oprogramowanie Lenovo Vantage działa jako centrum sterowania wewnątrz Legion Pro 5i. Oprócz profili wydajności można tu znaleźć różne inne ustawienia - od podświetlenia klawiatury i zasilania po przełącznik MUX i aktualizacje systemu.
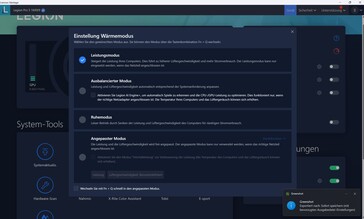
Do wyboru są trzy wstępnie ustawione profile wydajności(wydajność, zrównoważony, cichy) - silnik AI można również dodać w trybie zrównoważonym, a istnieje jeszcze jeden tryb niestandardowy, w którym różne parametry można ustawić ręcznie.
W naszych testach wykorzystaliśmy tryb wydajności bez podkręcania GPU. Tryb cichy został wykorzystany do naszych testów baterii. Od czasu do czasu podawaliśmy dodatkowo zmierzone wartości dla innych trybów wydajności.
Procesor
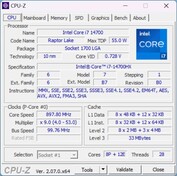
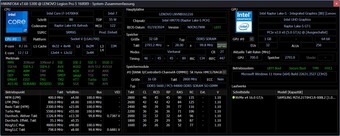
Procesor Intel Core i7-14700HX to wysokiej klasy procesor oparty na nowej serii Raptor Lake HX Refresh. Procesor zawiera 8 rdzeni P i 12 rdzeni E i może przetwarzać łącznie 28 wątków jednocześnie dzięki hiperwątkowości.
W naszym teście pętli procesor działał bardzo konsekwentnie i tylko z minimalnym spadkiem wydajności w ciągu 30 minut. Osiągnął on lepsze wyniki niż większość konkurentów - jedynie Legion Pro 5i z procesorem i9-14900HX
Jednak we wszystkich testach porównawczych stało się jasne, że procesor naszego Legion Pro 5i działa imponująco dobrze. Osiągnął on wynik o 9 procent lepszy od przeciętnego i7-14700HX z naszej bazy danych i tylko o 5 procent gorszy od i9-14900HX.
Po odłączeniu od zasilania, około 44 procent wydajności procesora zostało utracone podczas uruchamiania Cinebench R15 Multi. Poniższa tabela przedstawia wyniki Cinebench R15 Multi i TDP w zależności od profilu wydajności, z odpowiednimi krzywymi TDP w odpowiednim trybie po prawej stronie.
| Tryb wydajności/wartość pomiaru | Cinebench R 15 Multi score | TDP |
|---|---|---|
| Wydajność | 4137 | 190 - 130 |
| Zrównoważony z AI | 3650 | 125 - 70 |
| Zrównoważony bez AI | 3367 | 125 - 65 |
| Cichy | 2640 | 70 - 65 |
| Bateria | 2302 | 56 - 45 |
Cinebench R15 Multi continuous test
Cinebench R23: Multi Core | Single Core
Cinebench R20: CPU (Multi Core) | CPU (Single Core)
Cinebench R15: CPU Multi 64Bit | CPU Single 64Bit
Blender: v2.79 BMW27 CPU
7-Zip 18.03: 7z b 4 | 7z b 4 -mmt1
Geekbench 6.5: Multi-Core | Single-Core
Geekbench 5.5: Multi-Core | Single-Core
HWBOT x265 Benchmark v2.2: 4k Preset
LibreOffice : 20 Documents To PDF
R Benchmark 2.5: Overall mean
| CPU Performance rating | |
| Lenovo Legion Pro 5 16IRX9 | |
| Lenovo Legion Pro 5 16IRX9 G9 | |
| Lenovo Legion 5 16IRX G9 | |
| Średnia w klasie Gaming | |
| Przeciętny Intel Core i7-14700HX | |
| HP Victus 16 (2024) | |
| Schenker XMG Core 15 (M24) | |
| Dell G16, i7-13650HX, RTX 4060 | |
| Cinebench R23 / Multi Core | |
| Lenovo Legion Pro 5 16IRX9 | |
| Lenovo Legion Pro 5 16IRX9 G9 | |
| Średnia w klasie Gaming (5668 - 40970, n=136, ostatnie 2 lata) | |
| Lenovo Legion 5 16IRX G9 | |
| Przeciętny Intel Core i7-14700HX (19365 - 28122, n=9) | |
| HP Victus 16 (2024) | |
| Dell G16, i7-13650HX, RTX 4060 | |
| Schenker XMG Core 15 (M24) | |
| Cinebench R23 / Single Core | |
| Lenovo Legion Pro 5 16IRX9 G9 | |
| Lenovo Legion Pro 5 16IRX9 | |
| Przeciętny Intel Core i7-14700HX (1702 - 2144, n=9) | |
| Średnia w klasie Gaming (1136 - 2267, n=136, ostatnie 2 lata) | |
| Lenovo Legion 5 16IRX G9 | |
| Dell G16, i7-13650HX, RTX 4060 | |
| Schenker XMG Core 15 (M24) | |
| HP Victus 16 (2024) | |
| Cinebench R20 / CPU (Multi Core) | |
| Lenovo Legion Pro 5 16IRX9 | |
| Lenovo Legion Pro 5 16IRX9 G9 | |
| Średnia w klasie Gaming (2179 - 16108, n=135, ostatnie 2 lata) | |
| Lenovo Legion 5 16IRX G9 | |
| HP Victus 16 (2024) | |
| Przeciętny Intel Core i7-14700HX (7988 - 10540, n=9) | |
| Dell G16, i7-13650HX, RTX 4060 | |
| Schenker XMG Core 15 (M24) | |
| Cinebench R20 / CPU (Single Core) | |
| Lenovo Legion Pro 5 16IRX9 G9 | |
| Lenovo Legion Pro 5 16IRX9 | |
| Przeciętny Intel Core i7-14700HX (651 - 821, n=9) | |
| Średnia w klasie Gaming (439 - 870, n=135, ostatnie 2 lata) | |
| Lenovo Legion 5 16IRX G9 | |
| Dell G16, i7-13650HX, RTX 4060 | |
| Schenker XMG Core 15 (M24) | |
| HP Victus 16 (2024) | |
| Cinebench R15 / CPU Multi 64Bit | |
| Lenovo Legion Pro 5 16IRX9 | |
| Lenovo Legion Pro 5 16IRX9 G9 | |
| Średnia w klasie Gaming (1537 - 6271, n=135, ostatnie 2 lata) | |
| HP Victus 16 (2024) | |
| Przeciętny Intel Core i7-14700HX (3328 - 4248, n=9) | |
| Lenovo Legion 5 16IRX G9 | |
| Dell G16, i7-13650HX, RTX 4060 | |
| Schenker XMG Core 15 (M24) | |
| Cinebench R15 / CPU Single 64Bit | |
| Lenovo Legion Pro 5 16IRX9 G9 | |
| Lenovo Legion Pro 5 16IRX9 | |
| Średnia w klasie Gaming (188.8 - 343, n=134, ostatnie 2 lata) | |
| Lenovo Legion 5 16IRX G9 | |
| Przeciętny Intel Core i7-14700HX (238 - 304, n=9) | |
| Schenker XMG Core 15 (M24) | |
| Dell G16, i7-13650HX, RTX 4060 | |
| HP Victus 16 (2024) | |
| Blender / v2.79 BMW27 CPU | |
| Schenker XMG Core 15 (M24) | |
| HP Victus 16 (2024) | |
| Dell G16, i7-13650HX, RTX 4060 | |
| Średnia w klasie Gaming (80 - 517, n=131, ostatnie 2 lata) | |
| Przeciętny Intel Core i7-14700HX (126 - 212, n=9) | |
| Lenovo Legion 5 16IRX G9 | |
| Lenovo Legion Pro 5 16IRX9 G9 | |
| Lenovo Legion Pro 5 16IRX9 | |
| 7-Zip 18.03 / 7z b 4 | |
| Lenovo Legion Pro 5 16IRX9 | |
| Lenovo Legion Pro 5 16IRX9 G9 | |
| Lenovo Legion 5 16IRX G9 | |
| Przeciętny Intel Core i7-14700HX (68734 - 104730, n=9) | |
| Średnia w klasie Gaming (23795 - 148086, n=133, ostatnie 2 lata) | |
| HP Victus 16 (2024) | |
| Dell G16, i7-13650HX, RTX 4060 | |
| Schenker XMG Core 15 (M24) | |
| 7-Zip 18.03 / 7z b 4 -mmt1 | |
| Lenovo Legion Pro 5 16IRX9 G9 | |
| Lenovo Legion Pro 5 16IRX9 | |
| Lenovo Legion 5 16IRX G9 | |
| Przeciętny Intel Core i7-14700HX (5641 - 7041, n=9) | |
| Schenker XMG Core 15 (M24) | |
| Średnia w klasie Gaming (4199 - 7508, n=133, ostatnie 2 lata) | |
| Dell G16, i7-13650HX, RTX 4060 | |
| HP Victus 16 (2024) | |
| Geekbench 6.5 / Multi-Core | |
| Lenovo Legion Pro 5 16IRX9 | |
| Lenovo Legion Pro 5 16IRX9 G9 | |
| Lenovo Legion 5 16IRX G9 | |
| Przeciętny Intel Core i7-14700HX (14163 - 17562, n=9) | |
| Średnia w klasie Gaming (5340 - 22104, n=134, ostatnie 2 lata) | |
| HP Victus 16 (2024) | |
| Schenker XMG Core 15 (M24) | |
| Dell G16, i7-13650HX, RTX 4060 | |
| Geekbench 6.5 / Single-Core | |
| Lenovo Legion Pro 5 16IRX9 | |
| Lenovo Legion Pro 5 16IRX9 G9 | |
| Przeciętny Intel Core i7-14700HX (2378 - 2975, n=9) | |
| Średnia w klasie Gaming (1490 - 3259, n=134, ostatnie 2 lata) | |
| Lenovo Legion 5 16IRX G9 | |
| Schenker XMG Core 15 (M24) | |
| Dell G16, i7-13650HX, RTX 4060 | |
| HP Victus 16 (2024) | |
| Geekbench 5.5 / Multi-Core | |
| Lenovo Legion Pro 5 16IRX9 | |
| Lenovo Legion Pro 5 16IRX9 G9 | |
| Przeciętny Intel Core i7-14700HX (15705 - 19597, n=9) | |
| Lenovo Legion 5 16IRX G9 | |
| Średnia w klasie Gaming (4557 - 27010, n=133, ostatnie 2 lata) | |
| HP Victus 16 (2024) | |
| Schenker XMG Core 15 (M24) | |
| Dell G16, i7-13650HX, RTX 4060 | |
| Geekbench 5.5 / Single-Core | |
| Lenovo Legion Pro 5 16IRX9 G9 | |
| Lenovo Legion Pro 5 16IRX9 | |
| Średnia w klasie Gaming (986 - 2474, n=133, ostatnie 2 lata) | |
| Przeciętny Intel Core i7-14700HX (1700 - 2133, n=9) | |
| Schenker XMG Core 15 (M24) | |
| Lenovo Legion 5 16IRX G9 | |
| Dell G16, i7-13650HX, RTX 4060 | |
| HP Victus 16 (2024) | |
| HWBOT x265 Benchmark v2.2 / 4k Preset | |
| Lenovo Legion Pro 5 16IRX9 | |
| Średnia w klasie Gaming (7.7 - 44.3, n=133, ostatnie 2 lata) | |
| Lenovo Legion Pro 5 16IRX9 G9 | |
| Lenovo Legion 5 16IRX G9 | |
| Przeciętny Intel Core i7-14700HX (19.5 - 27.4, n=9) | |
| Schenker XMG Core 15 (M24) | |
| HP Victus 16 (2024) | |
| Dell G16, i7-13650HX, RTX 4060 | |
| LibreOffice / 20 Documents To PDF | |
| HP Victus 16 (2024) | |
| Dell G16, i7-13650HX, RTX 4060 | |
| Lenovo Legion Pro 5 16IRX9 G9 | |
| Schenker XMG Core 15 (M24) | |
| Średnia w klasie Gaming (19 - 88.8, n=133, ostatnie 2 lata) | |
| Przeciętny Intel Core i7-14700HX (41.9 - 55.3, n=9) | |
| Lenovo Legion 5 16IRX G9 | |
| Lenovo Legion Pro 5 16IRX9 | |
| R Benchmark 2.5 / Overall mean | |
| HP Victus 16 (2024) | |
| Schenker XMG Core 15 (M24) | |
| Średnia w klasie Gaming (0.3439 - 0.759, n=134, ostatnie 2 lata) | |
| Dell G16, i7-13650HX, RTX 4060 | |
| Dell G16, i7-13650HX, RTX 4060 | |
| Lenovo Legion 5 16IRX G9 | |
| Przeciętny Intel Core i7-14700HX (0.3821 - 0.4896, n=9) | |
| Lenovo Legion Pro 5 16IRX9 G9 | |
| Lenovo Legion Pro 5 16IRX9 | |
* ... im mniej tym lepiej
AIDA64: FP32 Ray-Trace | FPU Julia | CPU SHA3 | CPU Queen | FPU SinJulia | FPU Mandel | CPU AES | CPU ZLib | FP64 Ray-Trace | CPU PhotoWorxx
| Performance rating | |
| Lenovo Legion Pro 5 16IRX9 | |
| Średnia w klasie Gaming | |
| Lenovo Legion Pro 5 16IRX9 G9 | |
| Schenker XMG Core 15 (M24) | |
| Przeciętny Intel Core i7-14700HX | |
| Lenovo Legion 5 16IRX G9 | |
| Dell G16, i7-13650HX, RTX 4060 | |
| HP Victus 16 (2024) | |
| AIDA64 / FP32 Ray-Trace | |
| Schenker XMG Core 15 (M24) | |
| Średnia w klasie Gaming (7192 - 85542, n=133, ostatnie 2 lata) | |
| Lenovo Legion Pro 5 16IRX9 | |
| Lenovo Legion Pro 5 16IRX9 G9 | |
| Przeciętny Intel Core i7-14700HX (14147 - 23676, n=9) | |
| Lenovo Legion 5 16IRX G9 | |
| Dell G16, i7-13650HX, RTX 4060 | |
| HP Victus 16 (2024) | |
| AIDA64 / FPU Julia | |
| Średnia w klasie Gaming (35040 - 238426, n=133, ostatnie 2 lata) | |
| Lenovo Legion Pro 5 16IRX9 | |
| Schenker XMG Core 15 (M24) | |
| Lenovo Legion Pro 5 16IRX9 G9 | |
| Przeciętny Intel Core i7-14700HX (71875 - 116556, n=9) | |
| Lenovo Legion 5 16IRX G9 | |
| Dell G16, i7-13650HX, RTX 4060 | |
| HP Victus 16 (2024) | |
| AIDA64 / CPU SHA3 | |
| Lenovo Legion Pro 5 16IRX9 | |
| Średnia w klasie Gaming (1728 - 9817, n=133, ostatnie 2 lata) | |
| Lenovo Legion Pro 5 16IRX9 G9 | |
| Schenker XMG Core 15 (M24) | |
| Przeciętny Intel Core i7-14700HX (3388 - 5567, n=9) | |
| Dell G16, i7-13650HX, RTX 4060 | |
| Lenovo Legion 5 16IRX G9 | |
| HP Victus 16 (2024) | |
| AIDA64 / CPU Queen | |
| Lenovo Legion Pro 5 16IRX9 G9 | |
| Lenovo Legion Pro 5 16IRX9 | |
| Przeciętny Intel Core i7-14700HX (129134 - 152200, n=9) | |
| HP Victus 16 (2024) | |
| Schenker XMG Core 15 (M24) | |
| Średnia w klasie Gaming (49785 - 173351, n=133, ostatnie 2 lata) | |
| Dell G16, i7-13650HX, RTX 4060 | |
| Lenovo Legion 5 16IRX G9 | |
| AIDA64 / FPU SinJulia | |
| Schenker XMG Core 15 (M24) | |
| Lenovo Legion Pro 5 16IRX9 | |
| Średnia w klasie Gaming (4424 - 33636, n=133, ostatnie 2 lata) | |
| Lenovo Legion Pro 5 16IRX9 G9 | |
| Przeciętny Intel Core i7-14700HX (10266 - 14434, n=9) | |
| Lenovo Legion 5 16IRX G9 | |
| HP Victus 16 (2024) | |
| Dell G16, i7-13650HX, RTX 4060 | |
| AIDA64 / FPU Mandel | |
| Schenker XMG Core 15 (M24) | |
| Średnia w klasie Gaming (17585 - 128721, n=133, ostatnie 2 lata) | |
| Lenovo Legion Pro 5 16IRX9 | |
| Lenovo Legion Pro 5 16IRX9 G9 | |
| Przeciętny Intel Core i7-14700HX (35155 - 58380, n=9) | |
| Lenovo Legion 5 16IRX G9 | |
| Dell G16, i7-13650HX, RTX 4060 | |
| HP Victus 16 (2024) | |
| AIDA64 / CPU AES | |
| Lenovo Legion Pro 5 16IRX9 | |
| Lenovo Legion Pro 5 16IRX9 G9 | |
| Średnia w klasie Gaming (19065 - 247074, n=133, ostatnie 2 lata) | |
| Przeciętny Intel Core i7-14700HX (68616 - 113157, n=9) | |
| Schenker XMG Core 15 (M24) | |
| Lenovo Legion 5 16IRX G9 | |
| Dell G16, i7-13650HX, RTX 4060 | |
| HP Victus 16 (2024) | |
| AIDA64 / CPU ZLib | |
| Lenovo Legion Pro 5 16IRX9 | |
| Lenovo Legion Pro 5 16IRX9 G9 | |
| Średnia w klasie Gaming (373 - 2531, n=133, ostatnie 2 lata) | |
| Przeciętny Intel Core i7-14700HX (1003 - 1682, n=9) | |
| Lenovo Legion 5 16IRX G9 | |
| Dell G16, i7-13650HX, RTX 4060 | |
| HP Victus 16 (2024) | |
| Schenker XMG Core 15 (M24) | |
| AIDA64 / FP64 Ray-Trace | |
| Schenker XMG Core 15 (M24) | |
| Średnia w klasie Gaming (3856 - 45446, n=133, ostatnie 2 lata) | |
| Lenovo Legion Pro 5 16IRX9 | |
| Lenovo Legion Pro 5 16IRX9 G9 | |
| Przeciętny Intel Core i7-14700HX (7585 - 12928, n=9) | |
| Dell G16, i7-13650HX, RTX 4060 | |
| Lenovo Legion 5 16IRX G9 | |
| HP Victus 16 (2024) | |
| AIDA64 / CPU PhotoWorxx | |
| Lenovo Legion Pro 5 16IRX9 | |
| Lenovo Legion Pro 5 16IRX9 G9 | |
| Średnia w klasie Gaming (10805 - 62916, n=133, ostatnie 2 lata) | |
| Przeciętny Intel Core i7-14700HX (24276 - 49671, n=9) | |
| Schenker XMG Core 15 (M24) | |
| HP Victus 16 (2024) | |
| Dell G16, i7-13650HX, RTX 4060 | |
| Lenovo Legion 5 16IRX G9 | |
Wydajność systemu
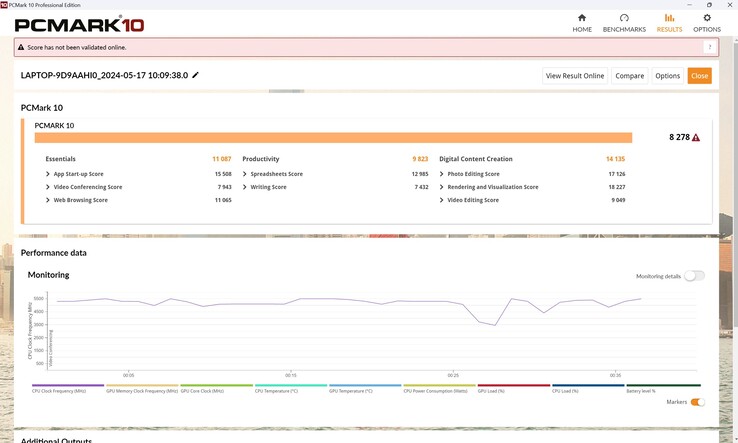
W PCMark 10 nasz Legion Pro był tylko nieznacznie słabszy, jeśli chodzi o wydajność, ale poza tym zawsze zajmował drugie miejsce bezpośrednio za lepiej wyposażonym Legion Pro.
W CrossMark jego wyniki ponownie były szczególnie dobre, a nasz model testowy zdołał nawet pokonać "lepszą" wersję samego siebie.
CrossMark: Overall | Productivity | Creativity | Responsiveness
WebXPRT 3: Overall
WebXPRT 4: Overall
Mozilla Kraken 1.1: Total
| PCMark 10 / Score | |
| Schenker XMG Core 15 (M24) | |
| Lenovo Legion Pro 5 16IRX9 | |
| Lenovo Legion Pro 5 16IRX9 G9 | |
| Średnia w klasie Gaming (5776 - 10060, n=112, ostatnie 2 lata) | |
| Przeciętny Intel Core i7-14700HX, NVIDIA GeForce RTX 4060 Laptop GPU (7528 - 8278, n=2) | |
| Lenovo Legion 5 16IRX G9 | |
| HP Victus 16 (2024) | |
| Dell G16, i7-13650HX, RTX 4060 | |
| PCMark 10 / Essentials | |
| Lenovo Legion Pro 5 16IRX9 | |
| Lenovo Legion Pro 5 16IRX9 G9 | |
| Przeciętny Intel Core i7-14700HX, NVIDIA GeForce RTX 4060 Laptop GPU (10778 - 11087, n=2) | |
| Lenovo Legion 5 16IRX G9 | |
| HP Victus 16 (2024) | |
| Średnia w klasie Gaming (8810 - 12600, n=116, ostatnie 2 lata) | |
| Schenker XMG Core 15 (M24) | |
| Dell G16, i7-13650HX, RTX 4060 | |
| PCMark 10 / Productivity | |
| Schenker XMG Core 15 (M24) | |
| Lenovo Legion Pro 5 16IRX9 | |
| Dell G16, i7-13650HX, RTX 4060 | |
| Średnia w klasie Gaming (6662 - 16716, n=114, ostatnie 2 lata) | |
| HP Victus 16 (2024) | |
| Przeciętny Intel Core i7-14700HX, NVIDIA GeForce RTX 4060 Laptop GPU (9823 - 9910, n=2) | |
| Lenovo Legion Pro 5 16IRX9 G9 | |
| Lenovo Legion 5 16IRX G9 | |
| PCMark 10 / Digital Content Creation | |
| Lenovo Legion Pro 5 16IRX9 | |
| Lenovo Legion Pro 5 16IRX9 G9 | |
| Średnia w klasie Gaming (7440 - 19351, n=114, ostatnie 2 lata) | |
| Schenker XMG Core 15 (M24) | |
| Przeciętny Intel Core i7-14700HX, NVIDIA GeForce RTX 4060 Laptop GPU (10841 - 14135, n=2) | |
| Lenovo Legion 5 16IRX G9 | |
| Dell G16, i7-13650HX, RTX 4060 | |
| HP Victus 16 (2024) | |
| CrossMark / Overall | |
| Lenovo Legion Pro 5 16IRX9 G9 | |
| Lenovo Legion 5 16IRX G9 | |
| Przeciętny Intel Core i7-14700HX, NVIDIA GeForce RTX 4060 Laptop GPU (1923 - 2132, n=2) | |
| Lenovo Legion Pro 5 16IRX9 | |
| Średnia w klasie Gaming (1247 - 2344, n=112, ostatnie 2 lata) | |
| HP Victus 16 (2024) | |
| Schenker XMG Core 15 (M24) | |
| Dell G16, i7-13650HX, RTX 4060 | |
| CrossMark / Productivity | |
| Lenovo Legion Pro 5 16IRX9 G9 | |
| Lenovo Legion 5 16IRX G9 | |
| Przeciętny Intel Core i7-14700HX, NVIDIA GeForce RTX 4060 Laptop GPU (1782 - 1973, n=2) | |
| Średnia w klasie Gaming (1299 - 2211, n=112, ostatnie 2 lata) | |
| Lenovo Legion Pro 5 16IRX9 | |
| Schenker XMG Core 15 (M24) | |
| HP Victus 16 (2024) | |
| Dell G16, i7-13650HX, RTX 4060 | |
| CrossMark / Creativity | |
| Lenovo Legion Pro 5 16IRX9 G9 | |
| Lenovo Legion 5 16IRX G9 | |
| Lenovo Legion Pro 5 16IRX9 | |
| Przeciętny Intel Core i7-14700HX, NVIDIA GeForce RTX 4060 Laptop GPU (2107 - 2399, n=2) | |
| Średnia w klasie Gaming (1275 - 2729, n=112, ostatnie 2 lata) | |
| HP Victus 16 (2024) | |
| Schenker XMG Core 15 (M24) | |
| Dell G16, i7-13650HX, RTX 4060 | |
| CrossMark / Responsiveness | |
| Lenovo Legion 5 16IRX G9 | |
| Lenovo Legion Pro 5 16IRX9 G9 | |
| Przeciętny Intel Core i7-14700HX, NVIDIA GeForce RTX 4060 Laptop GPU (1835 - 1885, n=2) | |
| HP Victus 16 (2024) | |
| Lenovo Legion Pro 5 16IRX9 | |
| Średnia w klasie Gaming (1030 - 2330, n=112, ostatnie 2 lata) | |
| Dell G16, i7-13650HX, RTX 4060 | |
| Schenker XMG Core 15 (M24) | |
| WebXPRT 3 / Overall | |
| Lenovo Legion Pro 5 16IRX9 | |
| Średnia w klasie Gaming (237 - 532, n=115, ostatnie 2 lata) | |
| Lenovo Legion 5 16IRX G9 | |
| Schenker XMG Core 15 (M24) | |
| Lenovo Legion Pro 5 16IRX9 G9 | |
| Przeciętny Intel Core i7-14700HX, NVIDIA GeForce RTX 4060 Laptop GPU (276 - 301, n=2) | |
| HP Victus 16 (2024) | |
| Dell G16, i7-13650HX, RTX 4060 | |
| WebXPRT 4 / Overall | |
| Lenovo Legion Pro 5 16IRX9 | |
| Lenovo Legion 5 16IRX G9 | |
| Średnia w klasie Gaming (176.4 - 345, n=112, ostatnie 2 lata) | |
| Lenovo Legion Pro 5 16IRX9 G9 | |
| Schenker XMG Core 15 (M24) | |
| Przeciętny Intel Core i7-14700HX, NVIDIA GeForce RTX 4060 Laptop GPU (251 - 273, n=2) | |
| HP Victus 16 (2024) | |
| Mozilla Kraken 1.1 / Total | |
| HP Victus 16 (2024) | |
| Dell G16, i7-13650HX, RTX 4060 | |
| Przeciętny Intel Core i7-14700HX, NVIDIA GeForce RTX 4060 Laptop GPU (467 - 542, n=2) | |
| Schenker XMG Core 15 (M24) | |
| Lenovo Legion 5 16IRX G9 | |
| Średnia w klasie Gaming (397 - 674, n=124, ostatnie 2 lata) | |
| Lenovo Legion Pro 5 16IRX9 G9 | |
| Lenovo Legion Pro 5 16IRX9 | |
* ... im mniej tym lepiej
| PCMark 10 Score | 8278 pkt. | |
Pomoc | ||
| AIDA64 / Memory Copy | |
| Lenovo Legion Pro 5 16IRX9 | |
| Lenovo Legion Pro 5 16IRX9 G9 | |
| Średnia w klasie Gaming (21750 - 108104, n=133, ostatnie 2 lata) | |
| Schenker XMG Core 15 (M24) | |
| Przeciętny Intel Core i7-14700HX (41617 - 78742, n=9) | |
| HP Victus 16 (2024) | |
| Lenovo Legion 5 16IRX G9 | |
| Dell G16, i7-13650HX, RTX 4060 | |
| AIDA64 / Memory Read | |
| Lenovo Legion Pro 5 16IRX9 | |
| Lenovo Legion Pro 5 16IRX9 G9 | |
| HP Victus 16 (2024) | |
| Przeciętny Intel Core i7-14700HX (46627 - 86175, n=9) | |
| Średnia w klasie Gaming (22956 - 104349, n=133, ostatnie 2 lata) | |
| Lenovo Legion 5 16IRX G9 | |
| Dell G16, i7-13650HX, RTX 4060 | |
| Schenker XMG Core 15 (M24) | |
| AIDA64 / Memory Write | |
| Schenker XMG Core 15 (M24) | |
| Lenovo Legion Pro 5 16IRX9 | |
| Lenovo Legion Pro 5 16IRX9 G9 | |
| Średnia w klasie Gaming (22297 - 133486, n=133, ostatnie 2 lata) | |
| Przeciętny Intel Core i7-14700HX (39155 - 76976, n=9) | |
| HP Victus 16 (2024) | |
| Dell G16, i7-13650HX, RTX 4060 | |
| Lenovo Legion 5 16IRX G9 | |
| AIDA64 / Memory Latency | |
| Średnia w klasie Gaming (59.5 - 259, n=133, ostatnie 2 lata) | |
| HP Victus 16 (2024) | |
| Dell G16, i7-13650HX, RTX 4060 | |
| Lenovo Legion 5 16IRX G9 | |
| Przeciętny Intel Core i7-14700HX (82.7 - 96.4, n=9) | |
| Schenker XMG Core 15 (M24) | |
| Lenovo Legion Pro 5 16IRX9 | |
| Lenovo Legion Pro 5 16IRX9 G9 | |
* ... im mniej tym lepiej
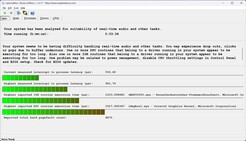
Opóźnienia DPC
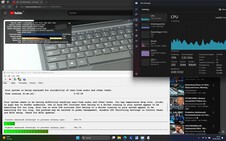
Pierwsze, mniejsze opóźnienia wystąpiły już podczas otwierania przeglądarki. Wartość opóźnienia ponownie nieznacznie wzrosła podczas otwierania kilku kart na naszej stronie internetowej. Nasz film 4K/60fps z YouTube był jednak odtwarzany bez żadnych problemów i spadków klatek. Wewnętrzne obciążenie GPU było bardzo wysokie i wynosiło 78 procent.
| DPC Latencies / LatencyMon - interrupt to process latency (max), Web, Youtube, Prime95 | |
| Lenovo Legion 5 16IRX G9 | |
| Schenker XMG Core 15 (M24) | |
| Dell G16, i7-13650HX, RTX 4060 | |
| Lenovo Legion Pro 5 16IRX9 | |
| Lenovo Legion Pro 5 16IRX9 G9 | |
| HP Victus 16 (2024) | |
* ... im mniej tym lepiej
Urządzenie pamięci masowej
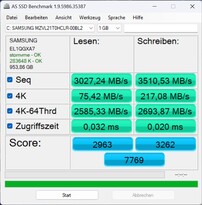
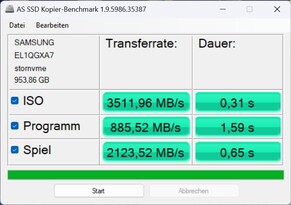
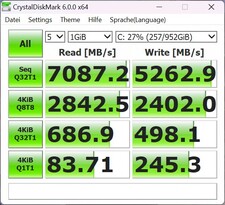
Lenovo zainstalowało szybki dysk SSD PCIe 4 NVMe od Samsunga z 1 TB pamięci masowej w naszym modelu - a dokładniej w wersji OEM dobrze znanego 980 Pro. Model ten zajmuje 14. miejsce w naszym zestawieniu Liście najlepszych dysków SSD a zatem jest jednym z najszybszych urządzeń pamięci masowej w polu porównawczym.
W naszych testach porównawczych osiągnął ogólnie dobre wartości, ale podobnie jak dyski SSD w innych modelach Legion (Pro) 5, nie był w stanie utrzymać swojej wydajności przez dłuższy czas i był dławiony termicznie. Szkoda, że Lenovo nie wyposażyło laptopa w lepszy system chłodzenia i że cała seria wydaje się być dotknięta tym problemem.
* ... im mniej tym lepiej
Reading continuous performance: DiskSpd Read Loop, Queue Depth 8
Karta graficzna
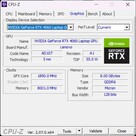
Nasza konfiguracja jest wyposażona w Nvidia Geforce RTX 4060 o mocy 140 W.
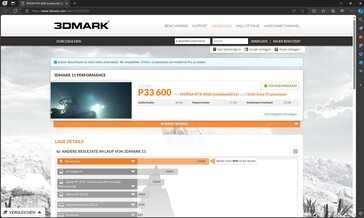
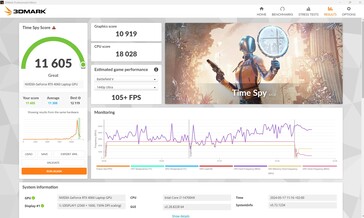
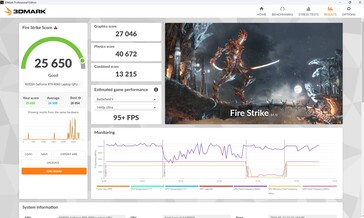
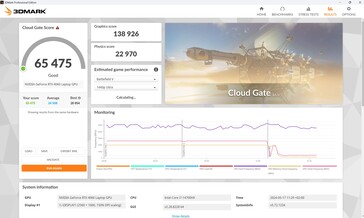
W syntetycznych testach 3DMark GPU wypadł nieco powyżej średniej, ale ten sam RTX 4060 był nieco szybszy w testach 3DMark 5 bez przyrostka Pro Legion 5 bez przyrostka Pro. Legion Pro 5 z kartą RTX 4070 i i9-14900HX był o około 20 procent szybszy w tych testach.
W trybie bateryjnym wydajność 3D spadła o 23 procent, gdy ponownie uruchomiono Fire Strike.
| 3DMark 11 Performance | 33600 pkt. | |
| 3DMark Cloud Gate Standard Score | 65475 pkt. | |
| 3DMark Fire Strike Score | 25650 pkt. | |
| 3DMark Time Spy Score | 11605 pkt. | |
Pomoc | ||
* ... im mniej tym lepiej
Jeśli chodzi o gry, Legion Pro 5 przewyższa całą konkurencję wyposażoną w RTX 4060 - w szczególności Victusa z tym samym CPU i GPU, który zajął ostatnie miejsce, zdobywając 15 punktów mniej. RTX-4070 Legion Pro wyprzedził tylko o 10 punktów.
Ostatecznie we wszystkie testowane przez nas gry można grać w rozdzielczości Full HD przy maksymalnych detalach; w rozdzielczości QHD liczba klatek na sekundę może czasami spaść poniżej 60 fps podczas uruchamiania wymagających gier, ale nawet wtedy nadal działają one płynnie.
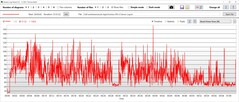
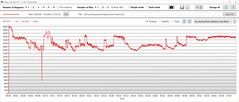
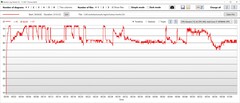
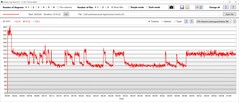
Nasz ciągły test w grze Cyberpunk 2077 wykazał bardzo stałą liczbę klatek na sekundę bez większych spadków. Taktowanie GPU wynosiło stale 2610 MHz, a jego temperatura dochodziła do 75-79 °C. Pobór mocy wynosił około 100 watów.
| The Witcher 3 - 1920x1080 Ultra Graphics & Postprocessing (HBAO+) | |
| Średnia w klasie Gaming (80.2 - 240, n=37, ostatnie 2 lata) | |
| Lenovo Legion Pro 5 16IRX9 | |
| Lenovo Legion Pro 5 16IRX9 G9 | |
| Schenker XMG Core 15 (M24) | |
| Dell G16, i7-13650HX, RTX 4060 | |
| HP Victus 16 (2024) | |
| Lenovo Legion 5 16IRX G9 | |
| Final Fantasy XV Benchmark - 1920x1080 High Quality | |
| Średnia w klasie Gaming (37.9 - 215, n=127, ostatnie 2 lata) | |
| Lenovo Legion Pro 5 16IRX9 | |
| Schenker XMG Core 15 (M24) | |
| Lenovo Legion 5 16IRX G9 | |
| Lenovo Legion Pro 5 16IRX9 G9 | |
| Dell G16, i7-13650HX, RTX 4060 | |
| HP Victus 16 (2024) | |
| Dota 2 Reborn - 1920x1080 ultra (3/3) best looking | |
| Lenovo Legion Pro 5 16IRX9 | |
| Lenovo Legion Pro 5 16IRX9 G9 | |
| Lenovo Legion 5 16IRX G9 | |
| Średnia w klasie Gaming (65.1 - 248, n=133, ostatnie 2 lata) | |
| HP Victus 16 (2024) | |
| Dell G16, i7-13650HX, RTX 4060 | |
| Schenker XMG Core 15 (M24) | |
| The Witcher 3 | |
| 1920x1080 High Graphics & Postprocessing (Nvidia HairWorks Off) | |
| Lenovo Legion Pro 5 16IRX9 | |
| Średnia w klasie Gaming (138 - 424, n=24, ostatnie 2 lata) | |
| Lenovo Legion 5 16IRX G9 | |
| Lenovo Legion Pro 5 16IRX9 G9 | |
| Schenker XMG Core 15 (M24) | |
| Przeciętny NVIDIA GeForce RTX 4060 Laptop GPU (110 - 229, n=36) | |
| HP Victus 16 (2024) | |
| Dell G16, i7-13650HX, RTX 4060 | |
| 1920x1080 Ultra Graphics & Postprocessing (HBAO+) | |
| Średnia w klasie Gaming (80.2 - 240, n=37, ostatnie 2 lata) | |
| Lenovo Legion Pro 5 16IRX9 | |
| Lenovo Legion Pro 5 16IRX9 G9 | |
| Schenker XMG Core 15 (M24) | |
| Dell G16, i7-13650HX, RTX 4060 | |
| Przeciętny NVIDIA GeForce RTX 4060 Laptop GPU (77 - 159.7, n=42) | |
| HP Victus 16 (2024) | |
| Lenovo Legion 5 16IRX G9 | |
| Skull & Bones | |
| 1920x1080 Ultra High Preset AA:T | |
| Średnia w klasie Gaming (31 - 118, n=12, ostatnie 2 lata) | |
| Schenker XMG Core 15 (M24) | |
| Przeciętny NVIDIA GeForce RTX 4060 Laptop GPU (65 - 73, n=5) | |
| Lenovo Legion Pro 5 16IRX9 G9 | |
| 2560x1440 Ultra High Preset AA:T | |
| Średnia w klasie Gaming (37 - 98, n=8, ostatnie 2 lata) | |
| Schenker XMG Core 15 (M24) | |
| Przeciętny NVIDIA GeForce RTX 4060 Laptop GPU (51 - 57, n=3) | |
| Lenovo Legion Pro 5 16IRX9 G9 | |
| F1 24 - 1920x1080 Ultra High Preset AA:T AF:16x | |
| Średnia w klasie Gaming (46.1 - 157.8, n=59, ostatnie 2 lata) | |
| Lenovo Legion Pro 5 16IRX9 G9 | |
| Przeciętny NVIDIA GeForce RTX 4060 Laptop GPU (47.5 - 61.6, n=10) | |
Cyberpunk 2077 FPS diagram
| low | med. | high | ultra | QHD | 4K | |
|---|---|---|---|---|---|---|
| GTA V (2015) | 187.2 | 185.9 | 185.2 | 124.9 | 87.3 | |
| The Witcher 3 (2015) | 531 | 364 | 217 | 112 | 83 | |
| Dota 2 Reborn (2015) | 228 | 203 | 191.7 | 183.8 | 129.4 | |
| Final Fantasy XV Benchmark (2018) | 226 | 155.5 | 106.1 | 78.1 | ||
| X-Plane 11.11 (2018) | 201 | 172.9 | 135.1 | 124.7 | ||
| Far Cry 5 (2018) | 192 | 165 | 158 | 148 | 106 | |
| Strange Brigade (2018) | 526 | 295 | 231 | 199.9 | ||
| Baldur's Gate 3 (2023) | 138.6 | 85.7 | 71.1 | 66.5 | 49.1 | |
| Cyberpunk 2077 (2023) | 135.3 | 100.8 | 88.7 | 79.5 | 47.5 | |
| Skull & Bones (2024) | 137 | 124 | 98 | 69 | 53 | |
| F1 24 (2024) | 286 | 247 | 185.3 | 60.6 |
Emisja i moc: Lewa gamingowa strona Lenovo nagrzewa się bardziej niż prawa
Emisja hałasu
W trybie wydajności wentylatory są przeważnie aktywne i tak jest też często w trybie bezczynności - kręcą się wtedy cicho na poziomie 25-26 dB. W naszym scenariuszu średniego obciążenia za pośrednictwem 3DMark06 osiągnęły one już nawet 45 dB, ale konkurencja jest podobnie głośna.
Przy wyższych obciążeniach emisja hałasu wentylatora waha się i nie pozostaje na stałym poziomie. Dane w tabeli przedstawiają jego maksymalne wartości. Przykładowo podczas grania w Cyberpunka jego emisja wahała się między 47,5 dB a 52,69 dB.
Hałas
| luz |
| 23 / 23 / 25 dB |
| obciążenie |
| 45.18 / 53.13 dB |
 | ||
30 dB cichy 40 dB(A) słyszalny 50 dB(A) irytujący |
||
min: | ||
| Lenovo Legion Pro 5 16IRX9 G9 GeForce RTX 4060 Laptop GPU, i7-14700HX, Samsung PM9A1 MZVL21T0HCLR | HP Victus 16 (2024) GeForce RTX 4060 Laptop GPU, i7-14700HX, Kioxia XG8 KXG80ZNV512G | Dell G16, i7-13650HX, RTX 4060 GeForce RTX 4060 Laptop GPU, i7-13650HX, WD PC SN740 SDDPNQD-1T00 | Schenker XMG Core 15 (M24) GeForce RTX 4060 Laptop GPU, R7 8845HS, Samsung 990 Pro 1 TB | Lenovo Legion Pro 5 16IRX9 GeForce RTX 4070 Laptop GPU, i9-14900HX, Samsung PM9A1 MZVL21T0HCLR | Lenovo Legion 5 16IRX G9 GeForce RTX 4060 Laptop GPU, i7-14650HX, Samsung PM9A1 MZVL21T0HCLR | |
|---|---|---|---|---|---|---|
| Noise | -13% | 6% | 4% | -7% | -11% | |
| wyłączone / środowisko * (dB) | 23 | 25 -9% | 23 -0% | 23 -0% | 23.9 -4% | 24 -4% |
| Idle Minimum * (dB) | 23 | 28 -22% | 23 -0% | 23 -0% | 24.3 -6% | 24 -4% |
| Idle Average * (dB) | 23 | 29 -26% | 23 -0% | 23 -0% | 24.3 -6% | 28.8 -25% |
| Idle Maximum * (dB) | 25 | 33 -32% | 27.96 -12% | 23 8% | 28.9 -16% | 32 -28% |
| Load Average * (dB) | 45.18 | 45 -0% | 27.96 38% | 38.92 14% | 45.8 -1% | 45.5 -1% |
| Cyberpunk 2077 ultra * (dB) | 52.69 | 52.06 1% | ||||
| Load Maximum * (dB) | 53.13 | 48 10% | 47.89 10% | 52.09 2% | 56.6 -7% | 55.7 -5% |
| Witcher 3 ultra * (dB) | 43 | 47.89 | 50.96 | 51 | 53.1 |
* ... im mniej tym lepiej
Temperatura
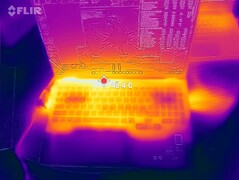
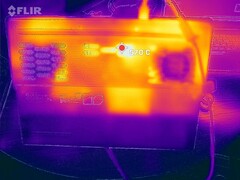
Klawiatura Legion nagrzewa się już podczas pracy na biegu jałowym - zmierzyliśmy do 39 °C na spodzie urządzenia. Ogólnie rzecz biorąc, lewa strona z klawiszami WASD (które są ważne dla graczy) wydaje się nagrzewać bardziej niż prawa.
Pod dużym obciążeniem zmierzyliśmy temperaturę 57 °C na spodzie. Dell G16 i Core 15 nagrzewały się podobnie, podczas gdy pozostali konkurenci byli chłodniejsi.
(-) Maksymalna temperatura w górnej części wynosi 50 °C / 122 F, w porównaniu do średniej 40.4 °C / 105 F , począwszy od 21.2 do 68.8 °C dla klasy Gaming.
(-) Dno nagrzewa się maksymalnie do 57 °C / 135 F, w porównaniu do średniej 43.3 °C / 110 F
(±) W stanie bezczynności średnia temperatura górnej części wynosi 32.9 °C / 91 F, w porównaniu ze średnią temperaturą urządzenia wynoszącą 33.9 °C / ### class_avg_f### F.
(-) 3: The average temperature for the upper side is 38.4 °C / 101 F, compared to the average of 33.9 °C / 93 F for the class Gaming.
(±) Podpórki pod nadgarstki i touchpad mogą się bardzo nagrzać w dotyku, maksymalnie do 36 °C / 96.8 F.
(-) Średnia temperatura obszaru podparcia dłoni w podobnych urządzeniach wynosiła 28.8 °C / 83.8 F (-7.2 °C / -13 F).
| Lenovo Legion Pro 5 16IRX9 G9 Intel Core i7-14700HX, NVIDIA GeForce RTX 4060 Laptop GPU | HP Victus 16 (2024) Intel Core i7-14700HX, NVIDIA GeForce RTX 4060 Laptop GPU | Dell G16, i7-13650HX, RTX 4060 Intel Core i7-13650HX, NVIDIA GeForce RTX 4060 Laptop GPU | Schenker XMG Core 15 (M24) AMD Ryzen 7 8845HS, NVIDIA GeForce RTX 4060 Laptop GPU | Lenovo Legion Pro 5 16IRX9 Intel Core i9-14900HX, NVIDIA GeForce RTX 4070 Laptop GPU | Lenovo Legion 5 16IRX G9 Intel Core i7-14650HX, NVIDIA GeForce RTX 4060 Laptop GPU | |
|---|---|---|---|---|---|---|
| Heat | 19% | 3% | -2% | 8% | 17% | |
| Maximum Upper Side * (°C) | 50 | 50 -0% | 49 2% | 52 -4% | 43.8 12% | 40.4 19% |
| Maximum Bottom * (°C) | 57 | 50 12% | 58 -2% | 61 -7% | 55.4 3% | 43.8 23% |
| Idle Upper Side * (°C) | 36 | 25 31% | 35 3% | 35 3% | 32.8 9% | 30.3 16% |
| Idle Bottom * (°C) | 39 | 26 33% | 35 10% | 39 -0% | 36 8% | 35.3 9% |
* ... im mniej tym lepiej
Głośniki
Głośniki nie wyróżniają się pozytywnie na tle konkurencji: są tylko umiarkowanie głośne i prawie w ogóle nie odnotowaliśmy basów. Do podłączenia urządzeń analogowych służy standardowe gniazdo słuchawkowe.
Lenovo Legion Pro 5 16IRX9 G9 analiza dźwięku
(±) | głośność głośnika jest średnia, ale dobra (77.13 dB)
Bas 100 - 315 Hz
(-) | prawie brak basu - średnio 18.3% niższa od mediany
(±) | liniowość basu jest średnia (12% delta do poprzedniej częstotliwości)
Średnie 400 - 2000 Hz
(±) | wyższe średnie - średnio 6.9% wyższe niż mediana
(+) | średnie są liniowe (4.9% delta do poprzedniej częstotliwości)
Wysokie 2–16 kHz
(+) | zrównoważone maksima - tylko 4.5% od mediany
(±) | liniowość wysokich wartości jest średnia (9.5% delta do poprzedniej częstotliwości)
Ogólnie 100 - 16.000 Hz
(±) | liniowość ogólnego dźwięku jest średnia (21.6% różnicy w stosunku do mediany)
W porównaniu do tej samej klasy
» 77% wszystkich testowanych urządzeń w tej klasie było lepszych, 5% podobnych, 18% gorszych
» Najlepszy miał deltę 6%, średnia wynosiła ###średnia###%, najgorsza wynosiła 132%
W porównaniu do wszystkich testowanych urządzeń
» 61% wszystkich testowanych urządzeń było lepszych, 7% podobnych, 32% gorszych
» Najlepszy miał deltę 4%, średnia wynosiła ###średnia###%, najgorsza wynosiła 134%
Dell G16, i7-13650HX, RTX 4060 analiza dźwięku
(±) | głośność głośnika jest średnia, ale dobra (80.55 dB)
Bas 100 - 315 Hz
(-) | prawie brak basu - średnio 25.1% niższa od mediany
(-) | bas nie jest liniowy (18.9% delta do poprzedniej częstotliwości)
Średnie 400 - 2000 Hz
(±) | wyższe średnie - średnio 8% wyższe niż mediana
(+) | średnie są liniowe (5.9% delta do poprzedniej częstotliwości)
Wysokie 2–16 kHz
(+) | zrównoważone maksima - tylko 3.5% od mediany
(±) | liniowość wysokich wartości jest średnia (8.6% delta do poprzedniej częstotliwości)
Ogólnie 100 - 16.000 Hz
(±) | liniowość ogólnego dźwięku jest średnia (23.4% różnicy w stosunku do mediany)
W porównaniu do tej samej klasy
» 85% wszystkich testowanych urządzeń w tej klasie było lepszych, 5% podobnych, 11% gorszych
» Najlepszy miał deltę 6%, średnia wynosiła ###średnia###%, najgorsza wynosiła 132%
W porównaniu do wszystkich testowanych urządzeń
» 69% wszystkich testowanych urządzeń było lepszych, 6% podobnych, 24% gorszych
» Najlepszy miał deltę 4%, średnia wynosiła ###średnia###%, najgorsza wynosiła 134%
Zużycie energii
Zmierzenie rzeczywistego zużycia energii przez Legion Pro 5 w stanie bezczynności nie jest najłatwiejsze, ponieważ laptop pobiera około 50 watów z gniazdka niemal bez przerwy - nawet w stanie bezczynności! Jeśli poczekają Państwo bardzo długo, pobór mocy w stanie spoczynku w końcu wyrówna się do stosunkowo normalnych wartości (15 do 20 watów), ale gdy tylko zmienią Państwo jasność laptopa za pomocą klawisza F, jego pobór mocy wzrasta do 50 watów i utrzymuje się na tym poziomie przez niezwykle długi czas. Wartości bezczynności podane w tabeli są więc raczej optymistycznie niskie.
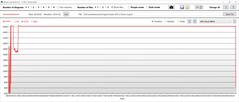
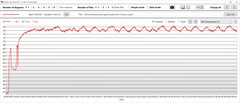
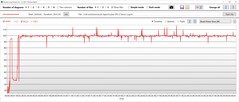
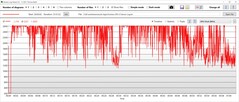
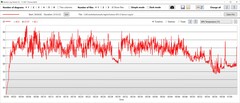
Pod dużym obciążeniem, zużycie energii i wydajność GPU dość mocno się wahają, co widać na naszych wykresach zużycia energii - zwłaszcza gdy CPU i GPU są w równym stopniu obciążone, jak w naszym teście obciążeniowym.
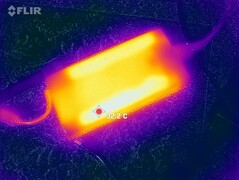
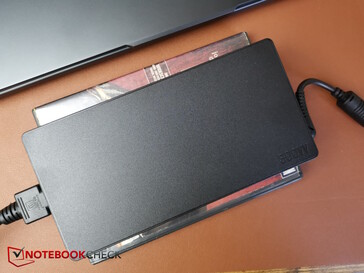
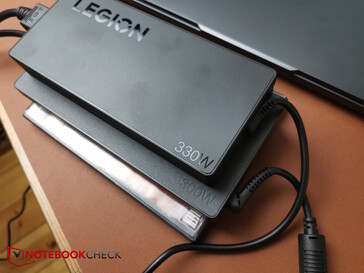
Podczas gry w Cyberpunk 2077 zmierzyliśmy średnie zużycie energii na poziomie 229 watów. W teście obciążeniowym nasze urządzenie pomiarowe zarejestrowało maksymalne i tylko krótkotrwałe zużycie do 297 watów, z czym powinien poradzić sobie płaski, ale dość duży 300-watowy zasilacz.
A propos zasilaczy: 300-watowy zasilacz dostarczony z naszym Legion Pro 5i jest znacznie większy niż 330-watowy zasilacz droższego Legion 9i.
| wyłączony / stan wstrzymania | |
| luz | |
| obciążenie |
|
Legenda:
min: | |
| Lenovo Legion Pro 5 16IRX9 G9 GeForce RTX 4060 Laptop GPU, i7-14700HX, Samsung PM9A1 MZVL21T0HCLR | HP Victus 16 (2024) GeForce RTX 4060 Laptop GPU, i7-14700HX, Kioxia XG8 KXG80ZNV512G | Dell G16, i7-13650HX, RTX 4060 GeForce RTX 4060 Laptop GPU, i7-13650HX, WD PC SN740 SDDPNQD-1T00 | Schenker XMG Core 15 (M24) GeForce RTX 4060 Laptop GPU, R7 8845HS, Samsung 990 Pro 1 TB | Lenovo Legion Pro 5 16IRX9 GeForce RTX 4070 Laptop GPU, i9-14900HX, Samsung PM9A1 MZVL21T0HCLR | Lenovo Legion 5 16IRX G9 GeForce RTX 4060 Laptop GPU, i7-14650HX, Samsung PM9A1 MZVL21T0HCLR | |
|---|---|---|---|---|---|---|
| Power Consumption | 11% | 14% | 23% | -22% | -8% | |
| Idle 150cd/m2 * (Watt) | 16.4 | 15.4 6% | 14 15% | 11.8 28% | 21 -28% | 17.6 -7% |
| 3DMark06 Return To Proxycon * (Watt) | 124 | 104 16% | 77.5 37% | |||
| Cyberpunk 2077 FHD ultra no FSR 150cd * (Watt) | 229 | |||||
| 1280x720 Prime95 28.10 and Furmark 1.25 * (Watt) | 211 | 176.9 16% | 190 10% | 200.6 5% | 245 -16% | 227 -8% |
* ... im mniej tym lepiej
Power consumption Witcher 3 / stress test
Power consumption with external monitor
Czas trwania
Lenovo zainstalowało w laptopie baterię o pojemności 80 Wh; poza Core 15 z większą baterią, konkurencja stosuje modele o podobnej pojemności.
Nasze urządzenie testowe wytrzymało nieco ponad 5 godzin w testach Wi-Fi i wideo z jasnością zredukowaną do 150 nitów - jest to wartość średnia do nieco poniżej średniej, którą często przewyższała konkurencja.
| Lenovo Legion Pro 5 16IRX9 G9 i7-14700HX, GeForce RTX 4060 Laptop GPU, 80 Wh | HP Victus 16 (2024) i7-14700HX, GeForce RTX 4060 Laptop GPU, 83 Wh | Dell G16, i7-13650HX, RTX 4060 i7-13650HX, GeForce RTX 4060 Laptop GPU, 86 Wh | Schenker XMG Core 15 (M24) R7 8845HS, GeForce RTX 4060 Laptop GPU, 99.8 Wh | Lenovo Legion Pro 5 16IRX9 i9-14900HX, GeForce RTX 4070 Laptop GPU, 80 Wh | Lenovo Legion 5 16IRX G9 i7-14650HX, GeForce RTX 4060 Laptop GPU, 80 Wh | Średnia w klasie Gaming | |
|---|---|---|---|---|---|---|---|
| Czasy pracy | 67% | 6% | 108% | -23% | 25% | 22% | |
| H.264 (h) | 5.2 | 6.4 23% | 10.1 94% | 9.6 85% | 7.93 ? 53% | ||
| WiFi v1.3 (h) | 5.1 | 8.5 67% | 6.3 24% | 14.8 190% | 4.8 -6% | 7.4 45% | 6.71 ? 32% |
| Load (h) | 1.8 | 1.3 -28% | 2.5 39% | 1.1 -39% | 0.8 -56% | 1.472 ? -18% | |
| Reader / Idle (h) | 6.7 | 9.23 ? |
Za
Przeciw
Werdykt - Pełna koncentracja na wydajności
Legion Pro 5 skupia się wyłącznie na wydajności. Jego już potężny i7-14700HX i RTX 4060 działają szybciej niż przeciętnie, a pod względem wydajności zbliżają się nawet do konfiguracji z i9-14900HX i RTX 4070. Dzięki potencjalnie niezwykle wiernie odwzorowującemu kolory wyświetlaczowi laptop Legion Pro może być również interesujący dla twórców treści.
Z kolei szkoda, że ekran nie jest skalibrowany bardzo dokładnie zaraz po wyjęciu z pudełka. Biorąc pod uwagę skupienie się na wydajności w grach, producent powinien był zauważyć, że system chłodzenia działa nieco lepiej po prawej stronie niż po stronie WASD, co jest ważne dla graczy. Inne negatywne punkty obejmują dławienie termiczne dysku SSD, a także częściowo wysoką wydajność urządzenia w trybie bezczynności, która zajmuje sporo czasu, aby ponownie się uspokoić. Pozytywy przeważają jednak nad negatywami.
Jeśli szukają Państwo super wydajnego laptopa do gier, to proszę zwrócić uwagę na Lenovo Legion Pro 5i. Twórcy treści również mogą być zadowoleni, jednak kilka mniejszych szczegółów pozostawia więcej miejsca na potencjalną optymalizację.
Cena i dostępność
Lenovo Legion Pro 5i można zamówić bezpośrednio u producenta. MRSP dla naszego urządzenia testowego wynosi 1395 USD.
Prosimy pamiętać: Zaktualizowaliśmy nasz system oceny i wyniki wersji 8 nie są porównywalne z wynikami wersji 7. Więcej informacji znajdą Państwo tutaj.
Lenovo Legion Pro 5 16IRX9 G9
- 03/07/2024 v8
Christian Hintze
Przezroczystość
Wyboru urządzeń do recenzji dokonuje nasza redakcja. Próbka testowa została udostępniona autorowi jako pożyczka od producenta lub sprzedawcy detalicznego na potrzeby tej recenzji. Pożyczkodawca nie miał wpływu na tę recenzję, producent nie otrzymał też kopii tej recenzji przed publikacją. Nie było obowiązku publikowania tej recenzji. Jako niezależna firma medialna, Notebookcheck nie podlega władzy producentów, sprzedawców detalicznych ani wydawców.
Tak testuje Notebookcheck
Każdego roku Notebookcheck niezależnie sprawdza setki laptopów i smartfonów, stosując standardowe procedury, aby zapewnić porównywalność wszystkich wyników. Od około 20 lat stale rozwijamy nasze metody badawcze, ustanawiając przy tym standardy branżowe. W naszych laboratoriach testowych doświadczeni technicy i redaktorzy korzystają z wysokiej jakości sprzętu pomiarowego. Testy te obejmują wieloetapowy proces walidacji. Nasz kompleksowy system ocen opiera się na setkach uzasadnionych pomiarów i benchmarków, co pozwala zachować obiektywizm.













 Total Sustainability Score:
