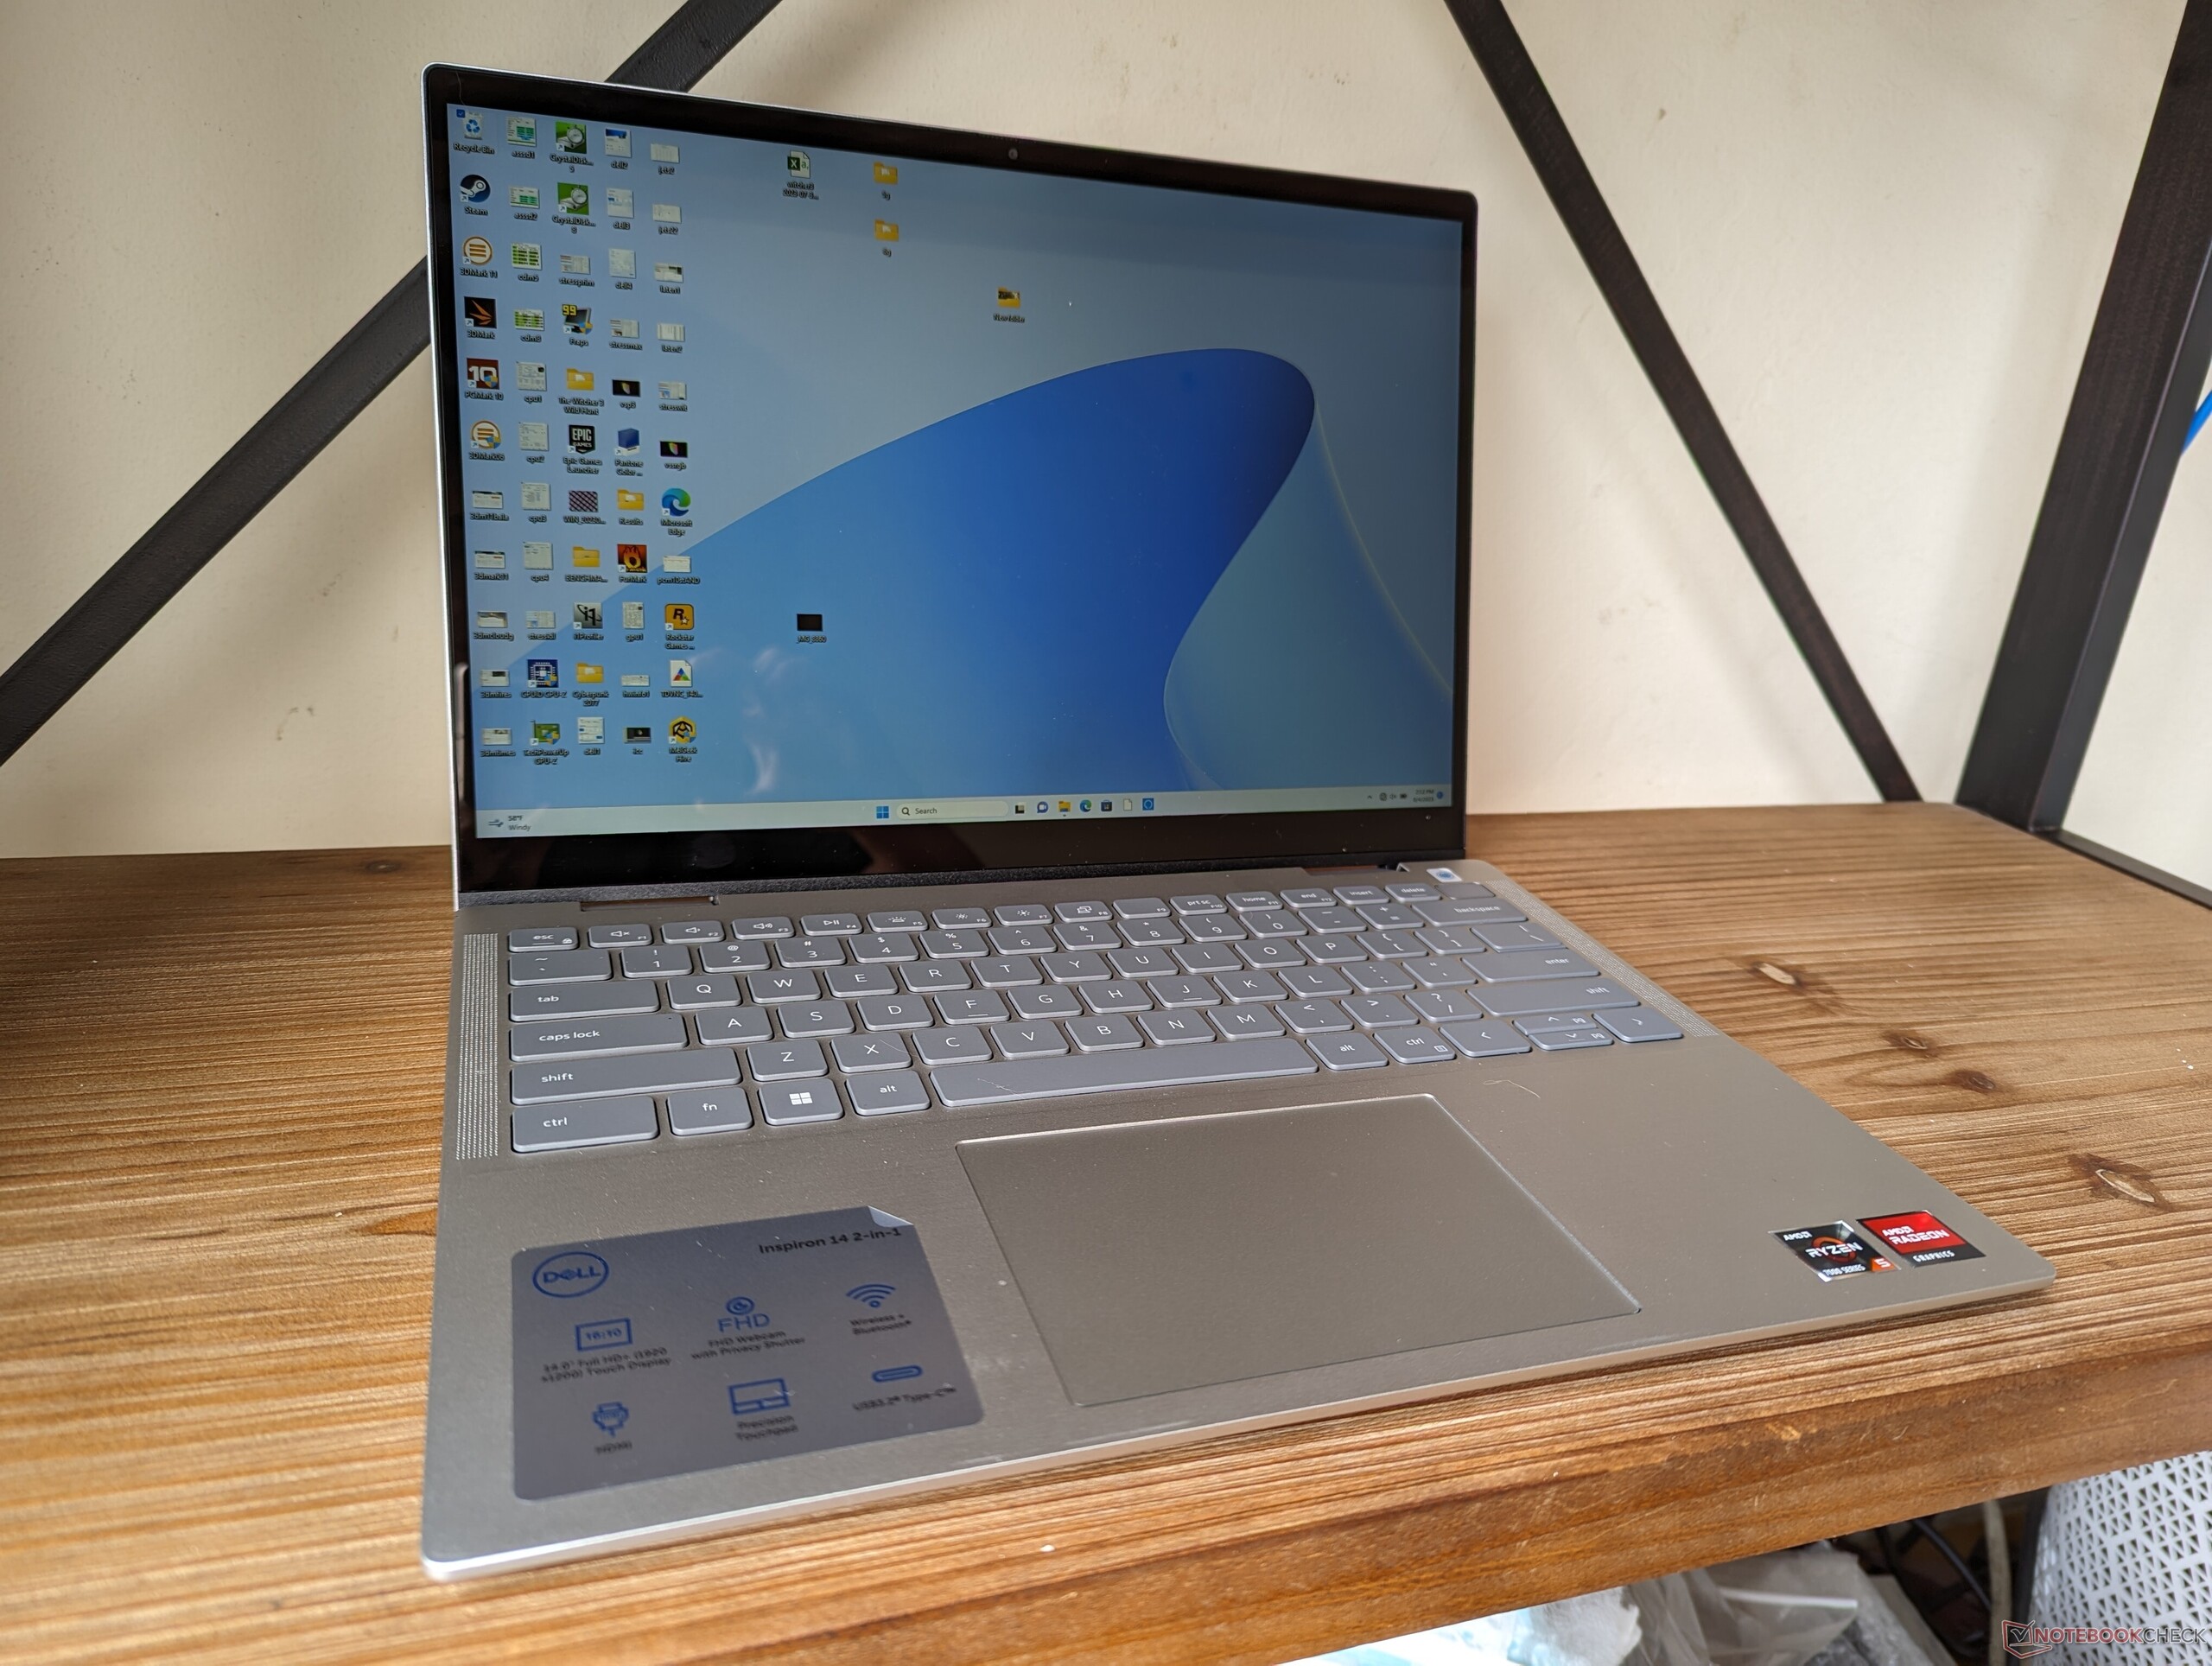
Recenzja konwertowalnego laptopa Dell Inspiron 14 7435 2 w 1: Ryzen 5 7530U dla oszczędnych użytkowników

Inspiron 14 7435 2-in-1 to wersja Inspiron 14 7430 2-in-1 z procesorem AMD. Bezpośrednio zastępuje zeszłoroczny model Inspiron 14 7420 2-w-1 z ulepszonymi elementami wewnętrznymi i zewnętrznymi.
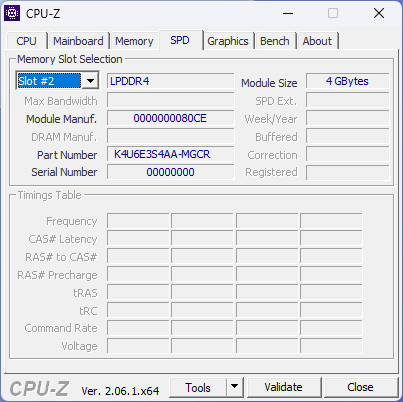
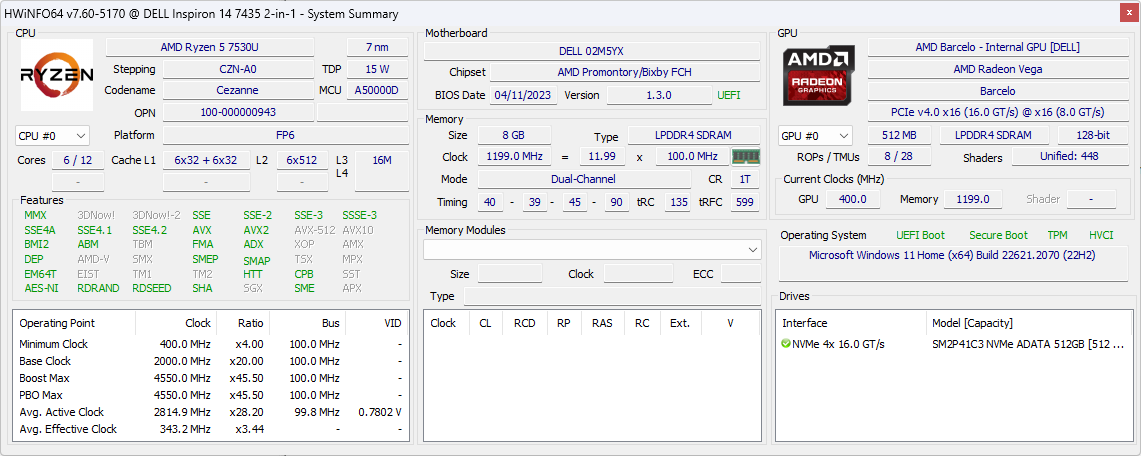
Nasza konkretna konfiguracja testowa to niższej klasy SKU z procesorem Ryzen 5 7530U i 8 GB wlutowanej pamięci RAM LPDDR4x-4266 za jedyne 550 USD. Dostępna jest również wersja z wyższej półki z dwukrotnie większą pamięcią RAM i procesorem Ryzen 7 7730U, ale wszystkie konfiguracje są wyposażone w ten sam ekran dotykowy IPS 1200p i zintegrowaną grafikę Radeon Vega.
Konkurenci obejmują inne budżetowe konwertowalne komputery, takie jak Acer Aspire 5 Spin 14,Lenovo IdeaPad Flex 7ilub HP Pavilion x360 14. Istnieje 16-calowa wersja tego modelu o nazwie Inspiron 16 7635 2-w-1.
Więcej recenzji Dell:
Potencjalni konkurenci w porównaniu
Ocena | Data | Model | Waga | Wysokość | Rozmiar | Rezolucja | Cena |
|---|---|---|---|---|---|---|---|
| 84.5 % v7 (old) | 08/2023 | Dell Inspiron 14 7435 2-in-1 R5 7530U, Vega 7 | 1.6 kg | 18.6 mm | 14.00" | 1920x1200 | |
| 83.7 % v7 (old) | Dell Inspiron 14 7420 2-in-1 i7-1255U, Iris Xe G7 96EUs | 1.6 kg | 17.86 mm | 14.00" | 1920x1200 | ||
| 83.2 % v7 (old) | 12/2022 | Lenovo IdeaPad Flex 7i 14IAU7 i7-1255U, Iris Xe G7 96EUs | 1.5 kg | 18.9 mm | 14.00" | 2240x1400 | |
| 82.2 % v7 (old) | 06/2023 | Acer Aspire 5 Spin 14 i5-1335U, Iris Xe G7 80EUs | 1.6 kg | 17.99 mm | 14.00" | 1920x1200 | |
| 87.5 % v7 (old) | LG Gram 14T90P i5-1135G7, Iris Xe G7 80EUs | 1.2 kg | 17 mm | 14.00" | 1900x1200 | ||
| 81.8 % v7 (old) | 07/2024 | HP Pavilion x360 14-dy0157ng i5-1135G7, Iris Xe G7 80EUs | 1.5 kg | 19.9 mm | 14.00" | 1920x1080 |
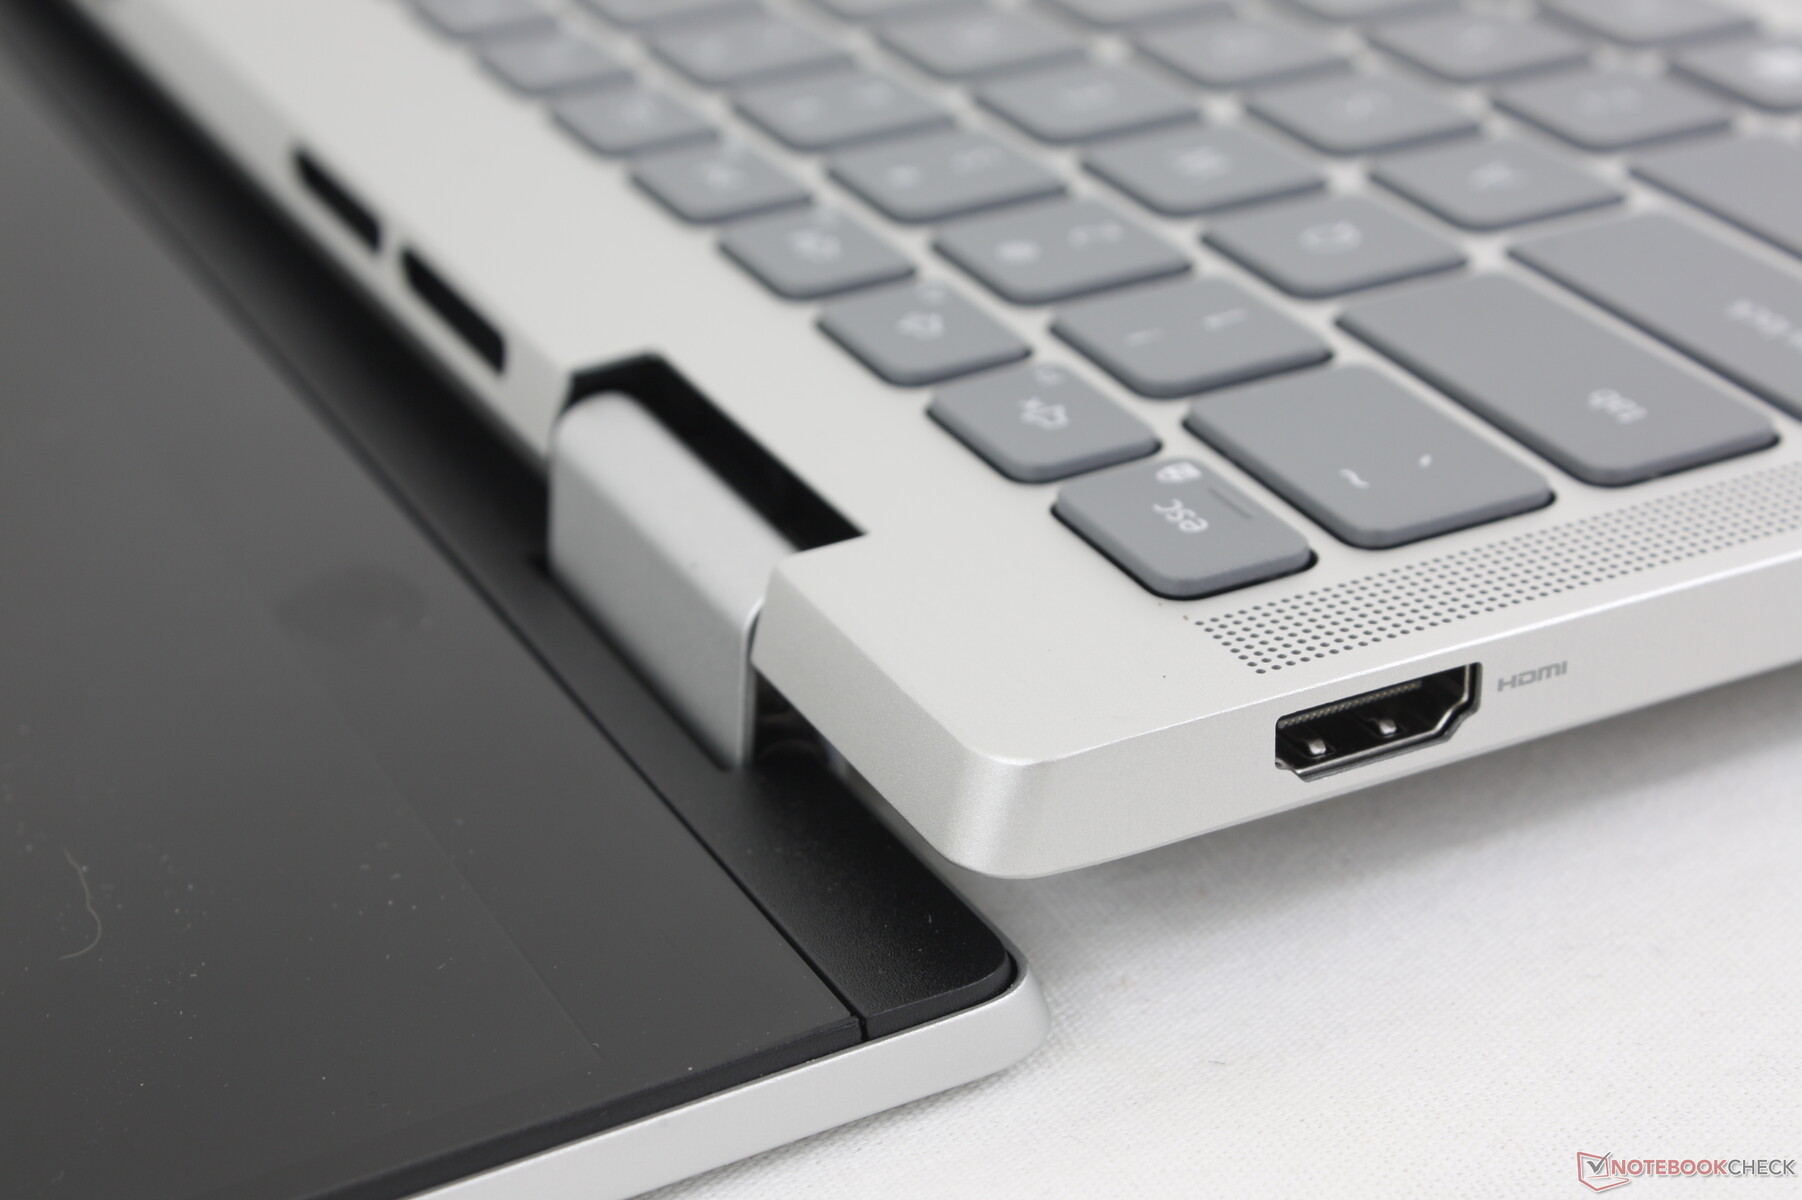
Obudowa - poprawione głośniki i zawiasy
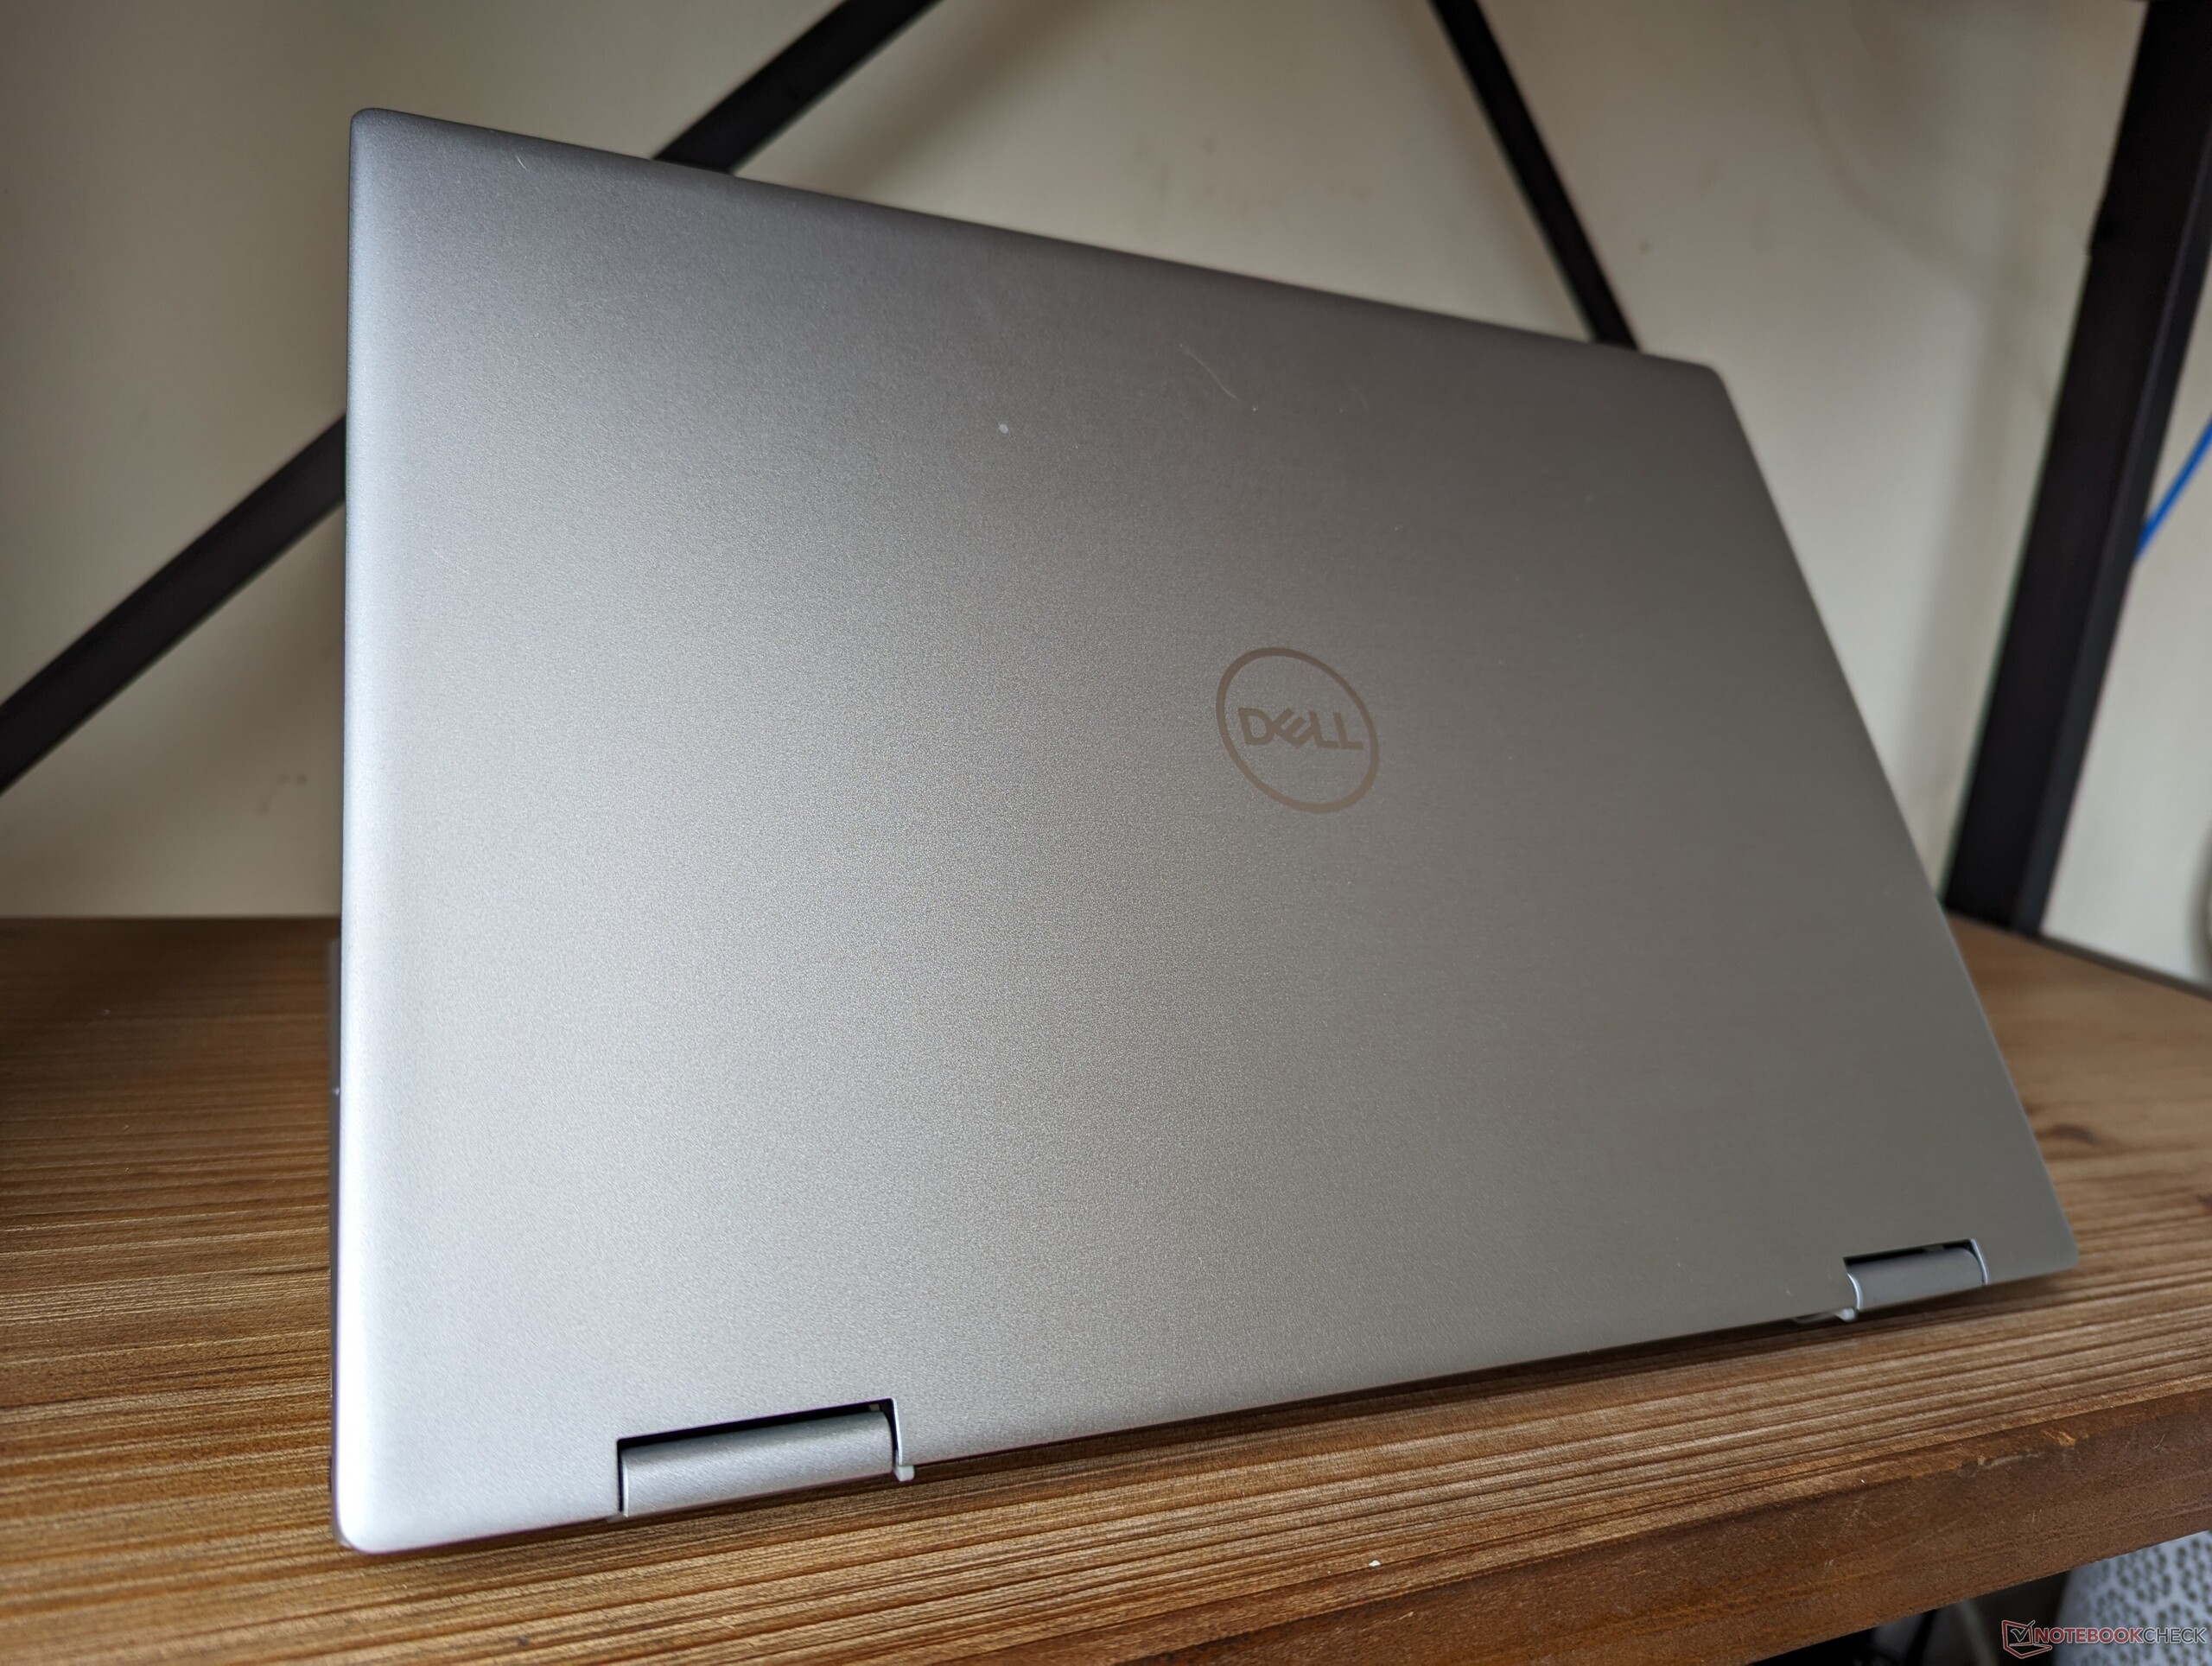
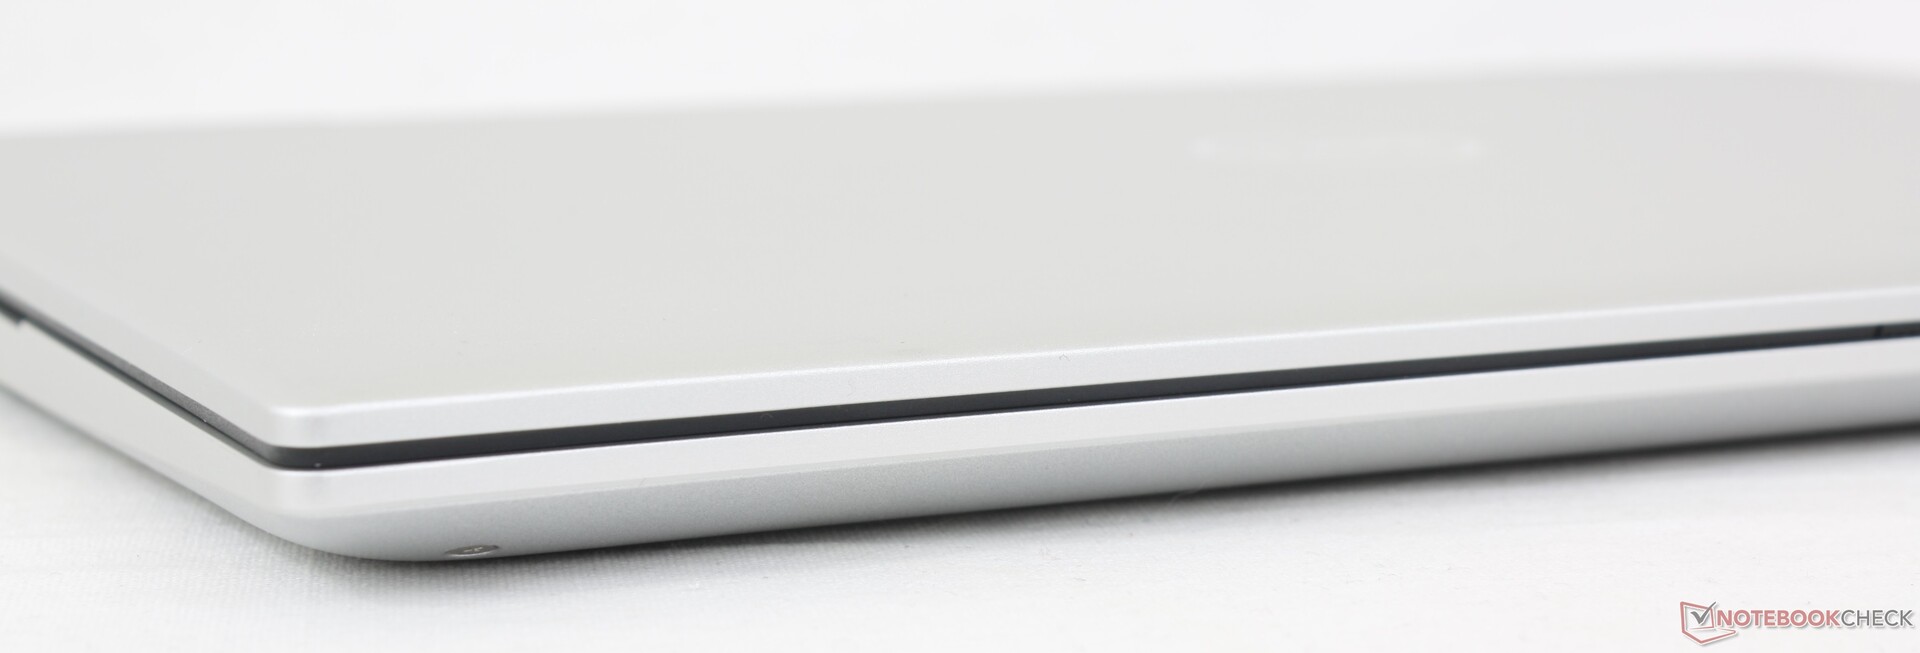
Choć wygląda identycznie jak inspiron 14 7620 2-w-1 z 2022 r na pierwszy rzut oka, kilka różnic jest zauważalnych po bliższym przyjrzeniu się. Po pierwsze, szeroko reklamowane podpórki pod nadgarstki z Mylaru zostały usunięte na rzecz większej ilości plastiku ABS. Specjalny materiał miał chronić podpórki pod nadgarstki i klawiaturę przed gromadzeniem się tłuszczu, ale ostatecznie okazał się zbędny w budżetowym laptopie takim jak ten. Po drugie, zawiasy zostały przeprojektowane, aby były nieco większe i bardziej płaskie, co powinno poprawić trwałość. Wreszcie, głośniki zostały przeniesione z przednich rogów obudowy na krawędzie klawiatury, dzięki czemu są teraz skierowane bezpośrednio w stronę użytkownika.
Sztywność obudowy pozostaje mniej więcej taka sama jak poprzednio ze względu na podobny szkielet i wybór tworzyw sztucznych.
Wymiary i waga są niemal identyczne jak w zeszłorocznym modelu, pomimo wszystkich zmian zewnętrznych i wewnętrznych. Niekoniecznie jest to zła rzecz, ponieważ model ten jest nadal porównywalny z alternatywami, takimi jak Pavilion x360 14 lub IdeaPad Flex 14 7i, ale Dell mógł pójść o krok dalej, aby uczynić Inspirona jeszcze bardziej przenośnym i lukratywnym dla potencjalnych nabywców.
Porównanie rozmiarów
Łączność
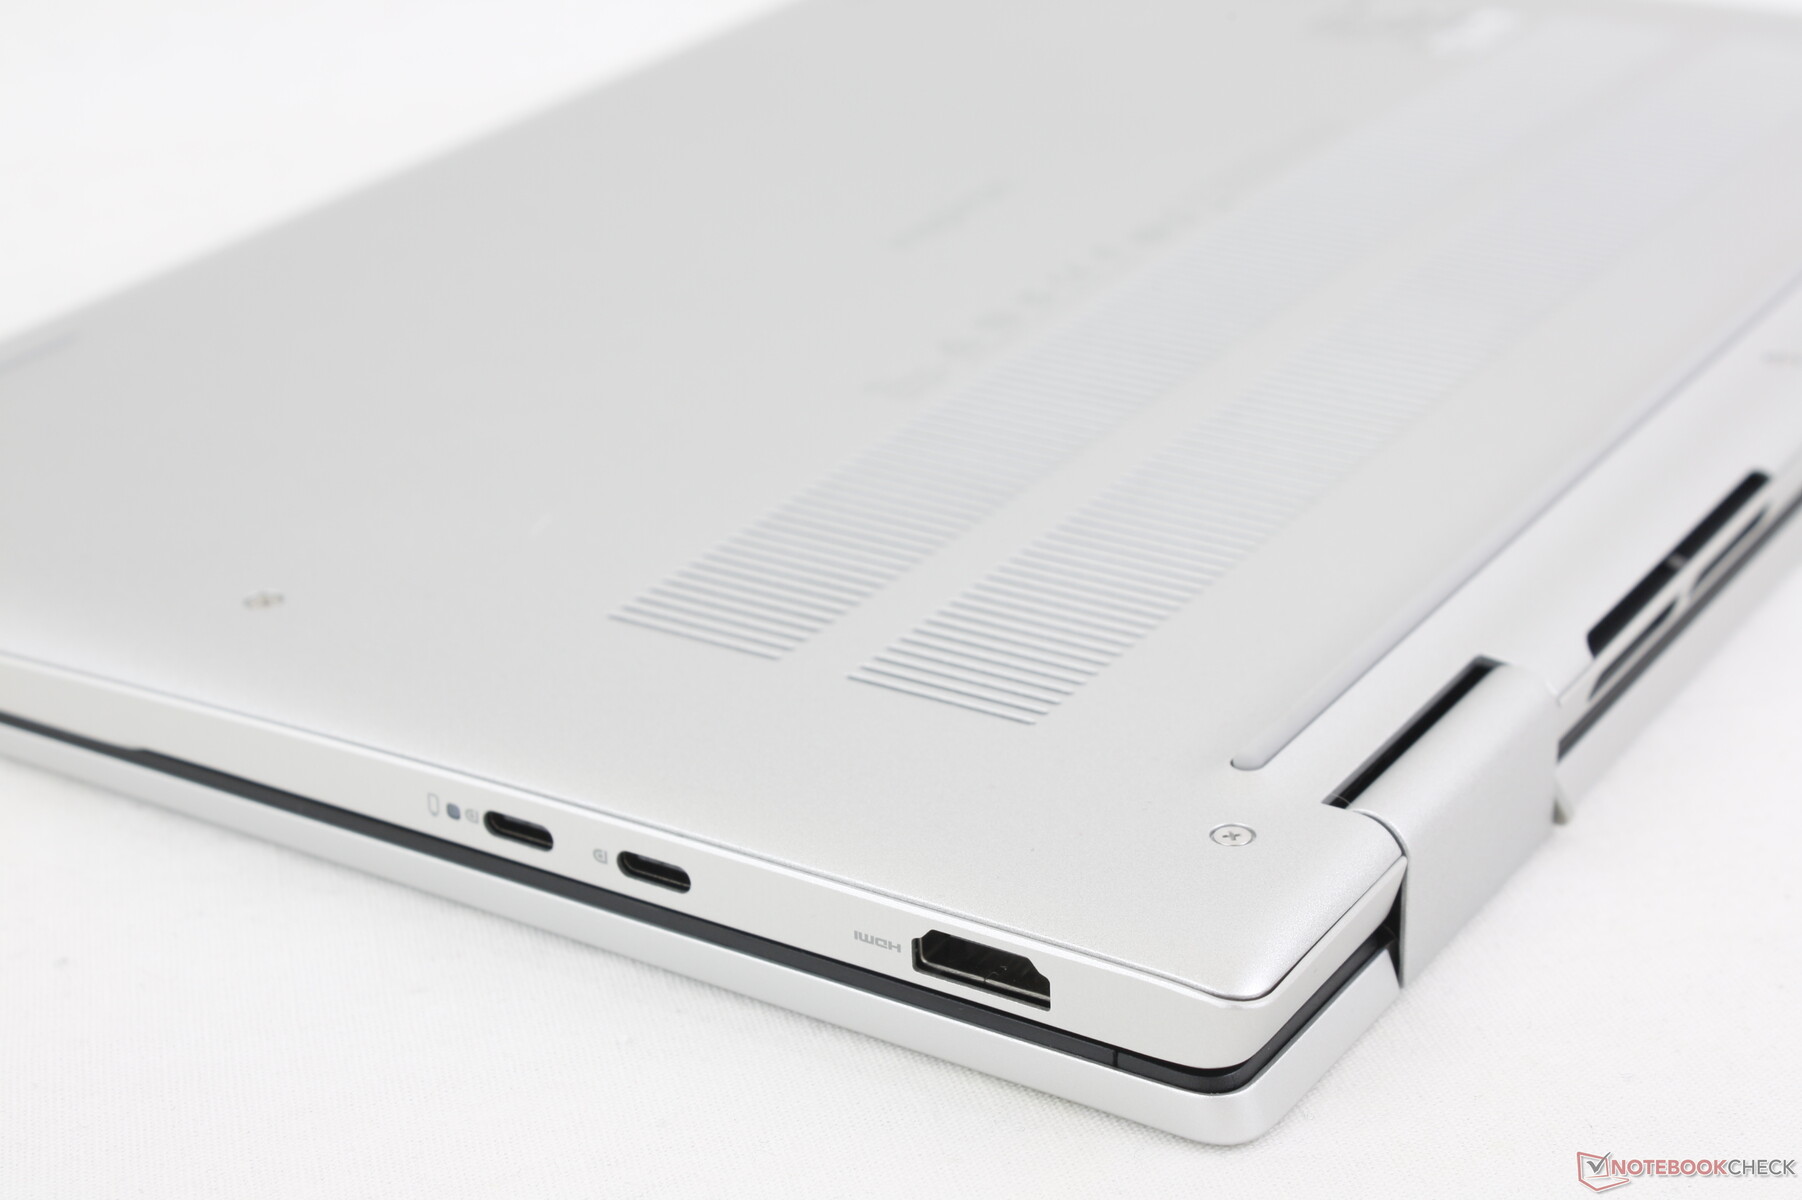
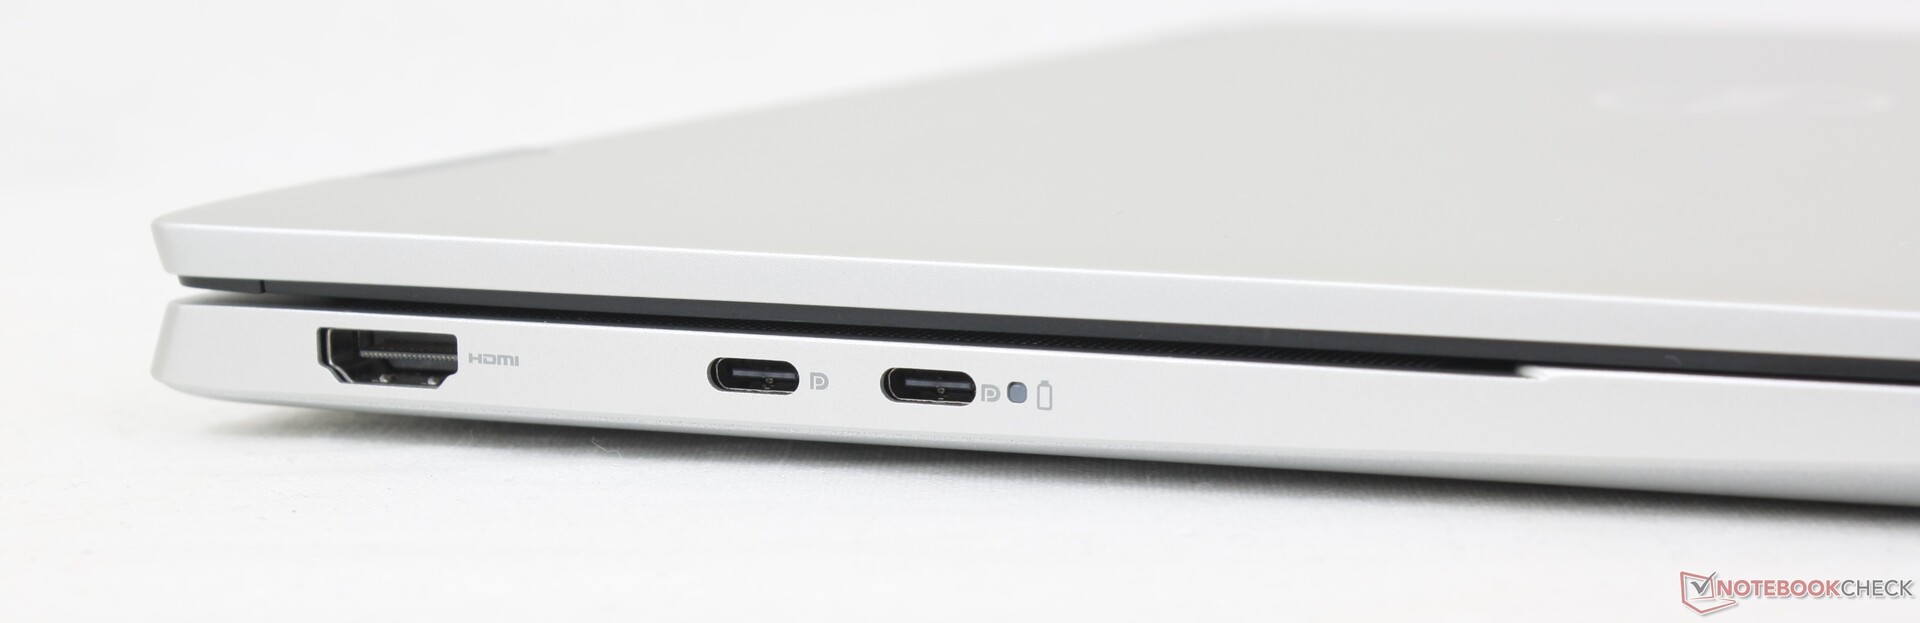
Opcje portów są porównywalne do IdeaPad Flex 5i 14 i Pavilion x360 14 z niewielkimi różnicami w liczbie portów USB. Należy pamiętać, że porty USB-C w naszej konfiguracji AMD nie obsługują Thunderbolt, w przeciwieństwie do Inspiron 7430 2-w-1 z procesorem Intel.
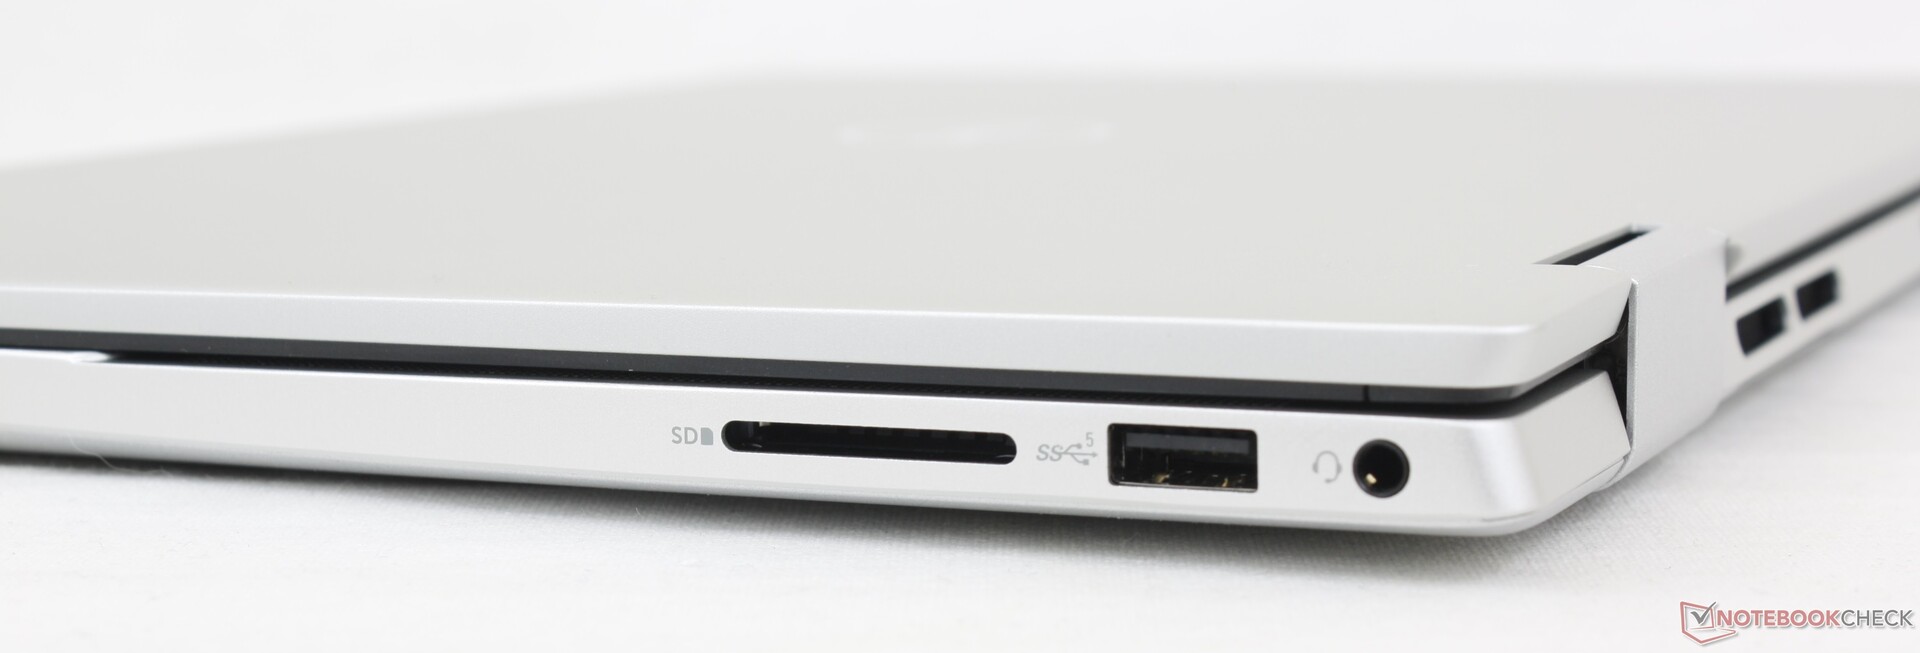
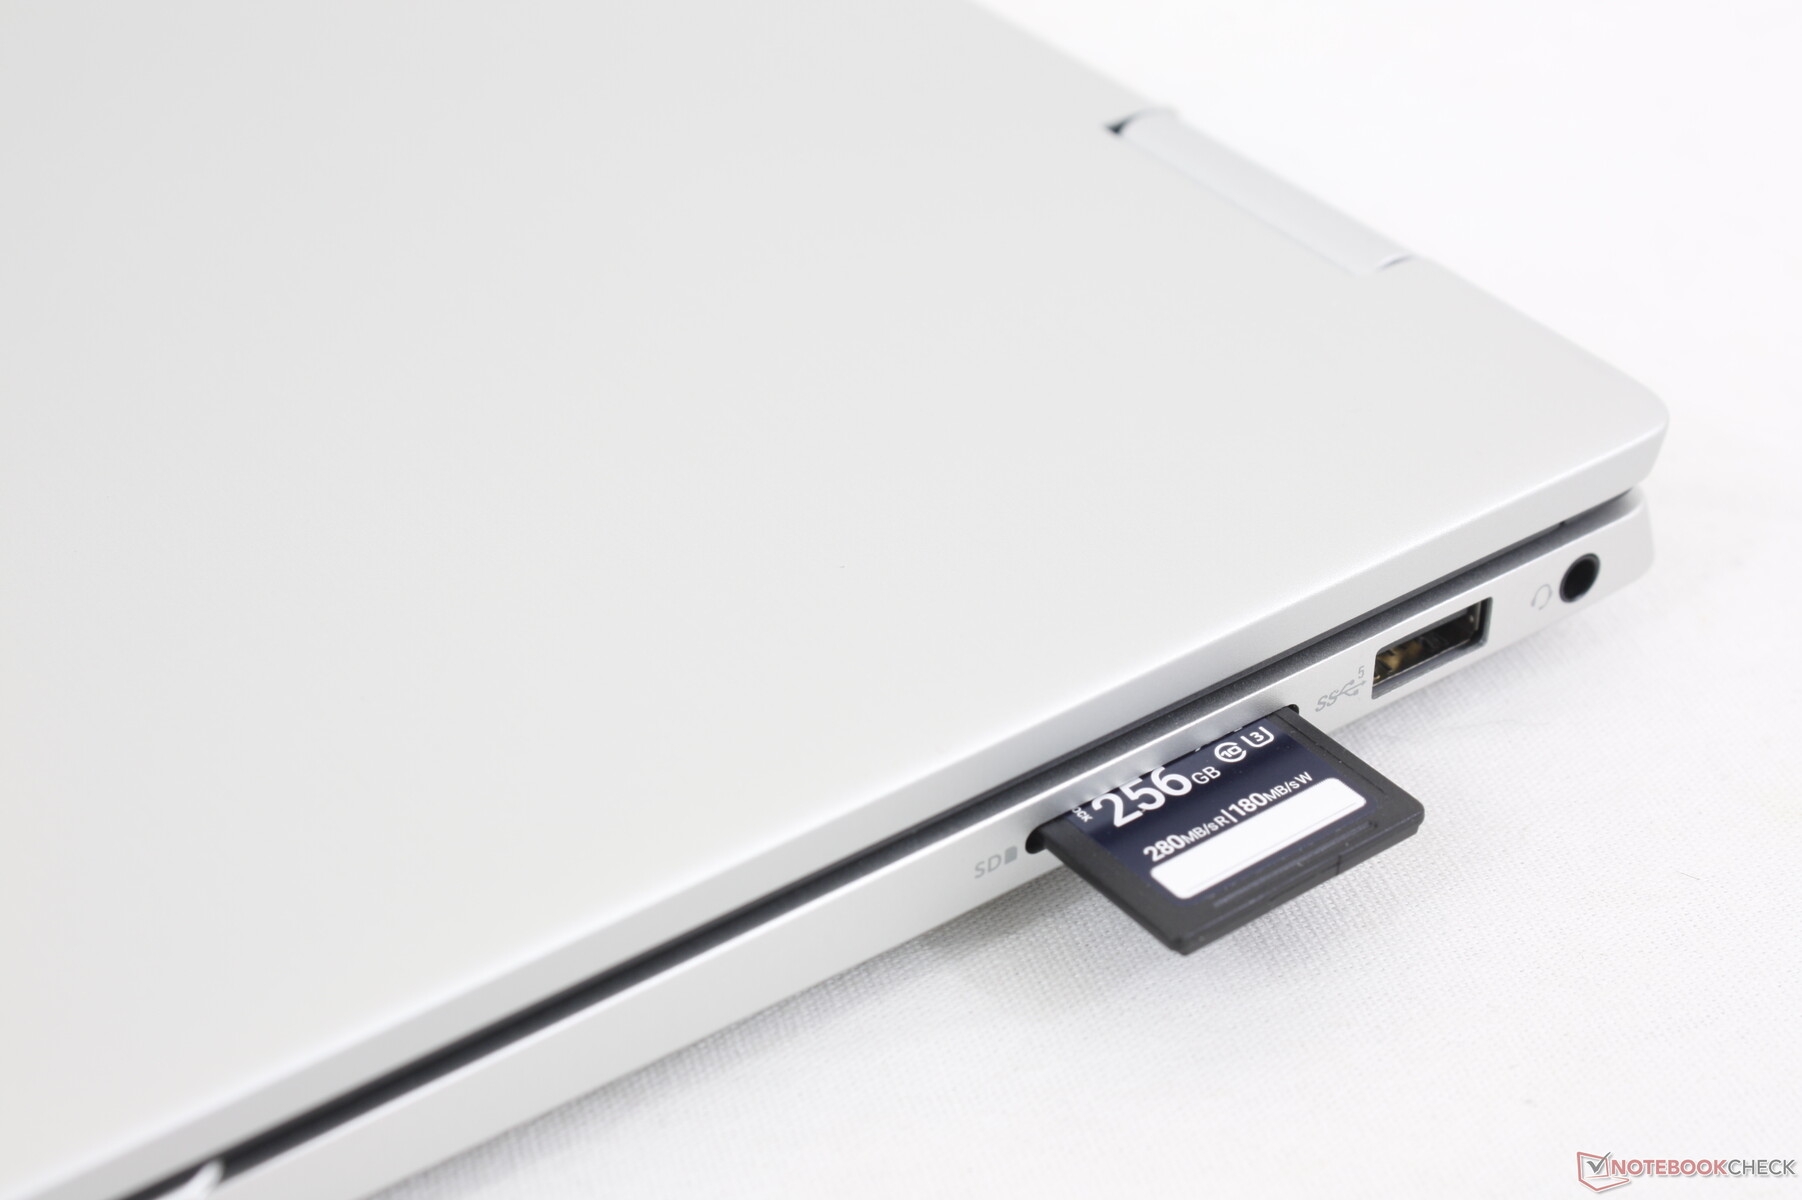
Czytnik kart SD
Szybkość transferu ze zintegrowanego czytnika kart SD poprawiła się nieznacznie z ~20 MB/s w zeszłorocznym Inspironie 7420 do ~35 MB/s w naszym najnowszym modelu. Mimo to, czytniki SD w konkurencyjnych modelach, takich jak IdeaPad Flex 7i lub Pavilion x360 14 są znacznie szybsze o ponad 2x.
| SD Card Reader | |
| average JPG Copy Test (av. of 3 runs) | |
| Lenovo IdeaPad Flex 7i 14IAU7 (Toshiba Exceria Pro SDXC 64 GB UHS-II) | |
| HP Pavilion x360 14-dy0157ng (Toshiba Exceria Pro M501 microSDXC 64GB) | |
| LG Gram 14T90P (AV Pro V60) | |
| Dell Inspiron 14 7435 2-in-1 (PNY EliteX-Pro60 V60 256 GB) | |
| Dell Inspiron 14 7420 2-in-1 (Toshiba Exceria Pro SDXC 64 GB UHS-II) | |
| maximum AS SSD Seq Read Test (1GB) | |
| Lenovo IdeaPad Flex 7i 14IAU7 (Toshiba Exceria Pro SDXC 64 GB UHS-II) | |
| LG Gram 14T90P (AV Pro V60) | |
| HP Pavilion x360 14-dy0157ng (Toshiba Exceria Pro M501 microSDXC 64GB) | |
| Dell Inspiron 14 7435 2-in-1 (PNY EliteX-Pro60 V60 256 GB) | |
| Dell Inspiron 14 7420 2-in-1 (Toshiba Exceria Pro SDXC 64 GB UHS-II) | |
Komunikacja
Jesteśmy zaskoczeni obsługą Wi-Fi6E w naszej podstawowej konfiguracji. Szybkość transferu jest stabilna po sparowaniu z naszą siecią Asus AXE11000 6 GHz, ale szybkość odbioru jest zdecydowanie wolniejsza niż oczekiwano o prawie połowę w porównaniu do laptopów z Intel AX211.
| Networking | |
| iperf3 transmit AX12 | |
| HP Pavilion x360 14-dy0157ng | |
| iperf3 receive AX12 | |
| HP Pavilion x360 14-dy0157ng | |
| iperf3 transmit AXE11000 | |
| Acer Aspire 5 Spin 14 | |
| Dell Inspiron 14 7435 2-in-1 | |
| Lenovo IdeaPad Flex 7i 14IAU7 | |
| LG Gram 14T90P | |
| iperf3 receive AXE11000 | |
| Acer Aspire 5 Spin 14 | |
| LG Gram 14T90P | |
| Lenovo IdeaPad Flex 7i 14IAU7 | |
| Dell Inspiron 14 7435 2-in-1 | |
| iperf3 transmit AXE11000 6GHz | |
| Dell Inspiron 14 7435 2-in-1 | |
| Acer Aspire 5 Spin 14 | |
| Lenovo IdeaPad Flex 7i 14IAU7 | |
| Dell Inspiron 14 7420 2-in-1 | |
| iperf3 receive AXE11000 6GHz | |
| Acer Aspire 5 Spin 14 | |
| Dell Inspiron 14 7420 2-in-1 | |
| Lenovo IdeaPad Flex 7i 14IAU7 | |
| Dell Inspiron 14 7435 2-in-1 | |
Kamera internetowa
Dell nie wprowadził żadnych zmian w kamerze internetowej 2 MP lub 1080p. W zestawie znajduje się migawka prywatności, podczas gdy podczerwień jest nadal pomijana, aby zaoszczędzić na kosztach.


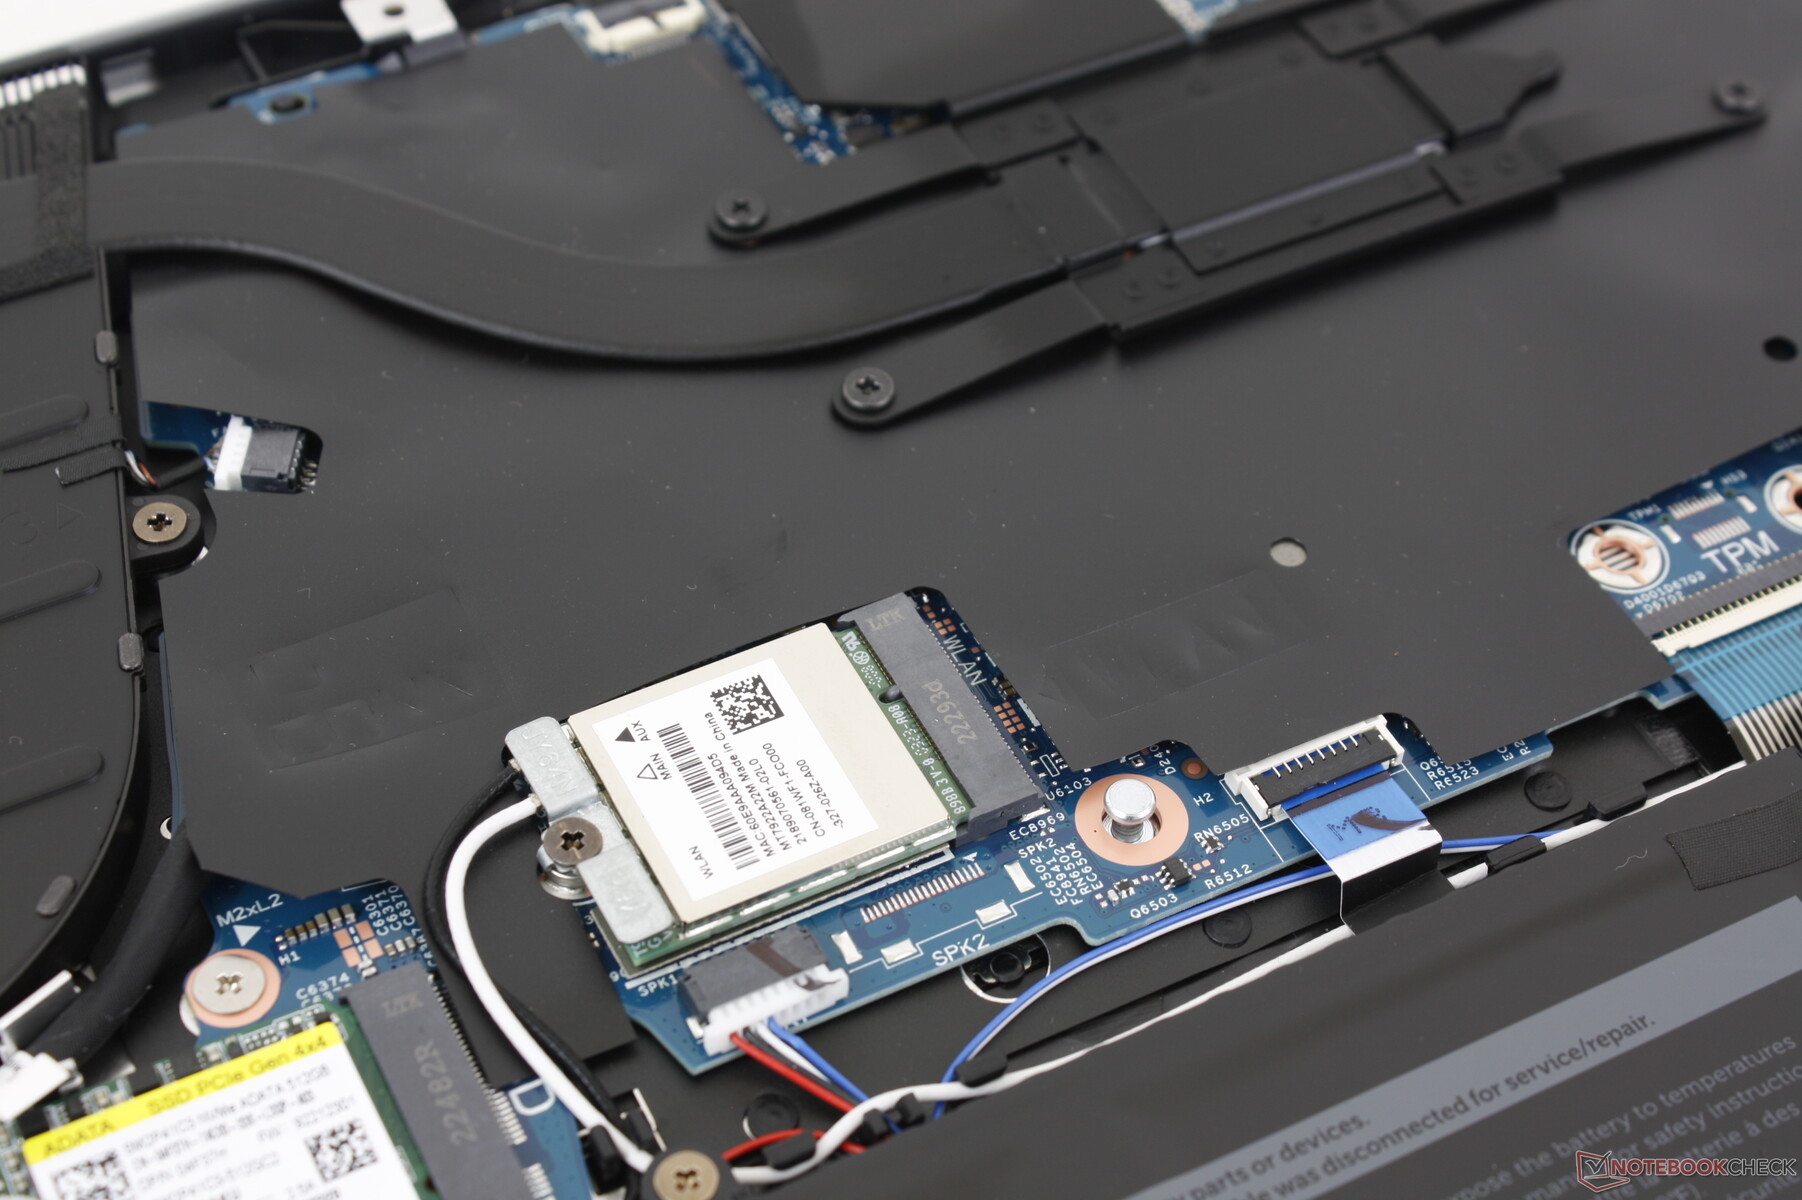
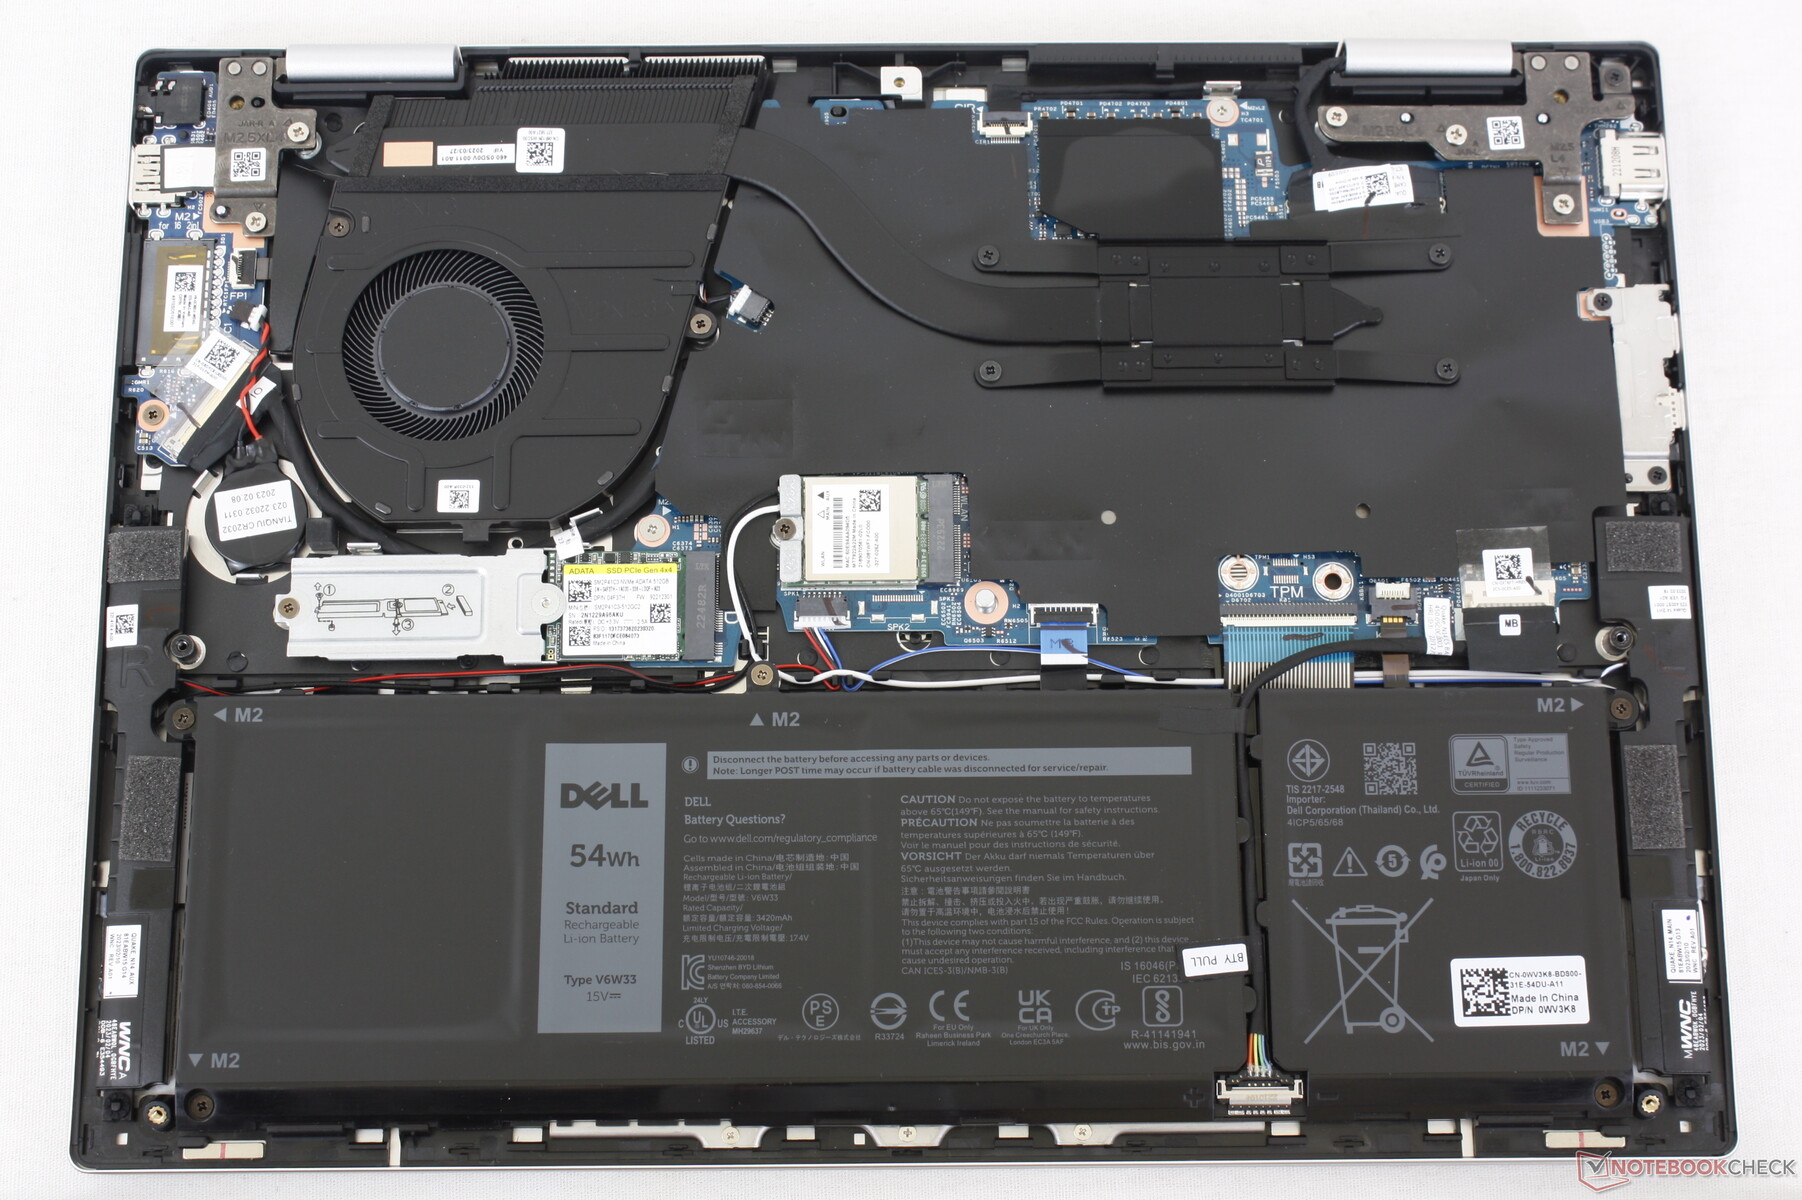
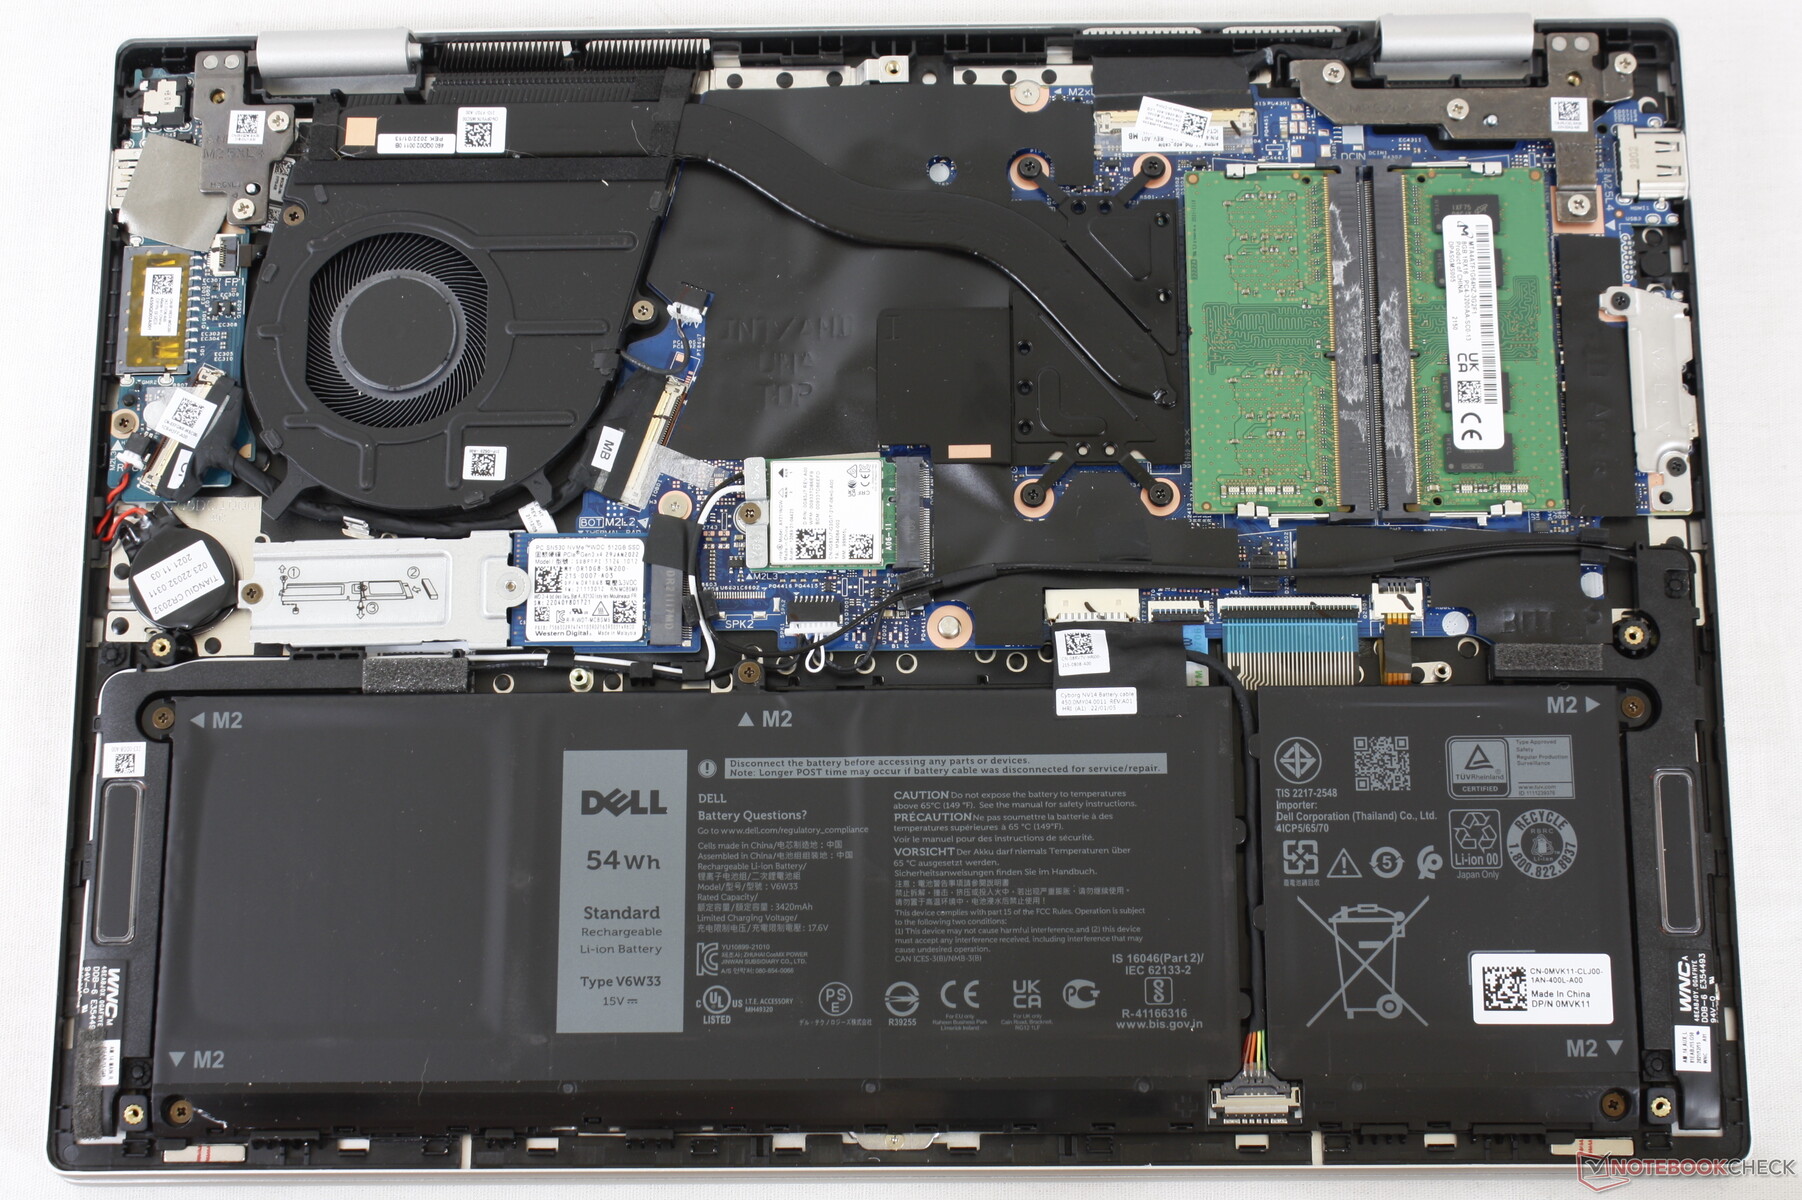
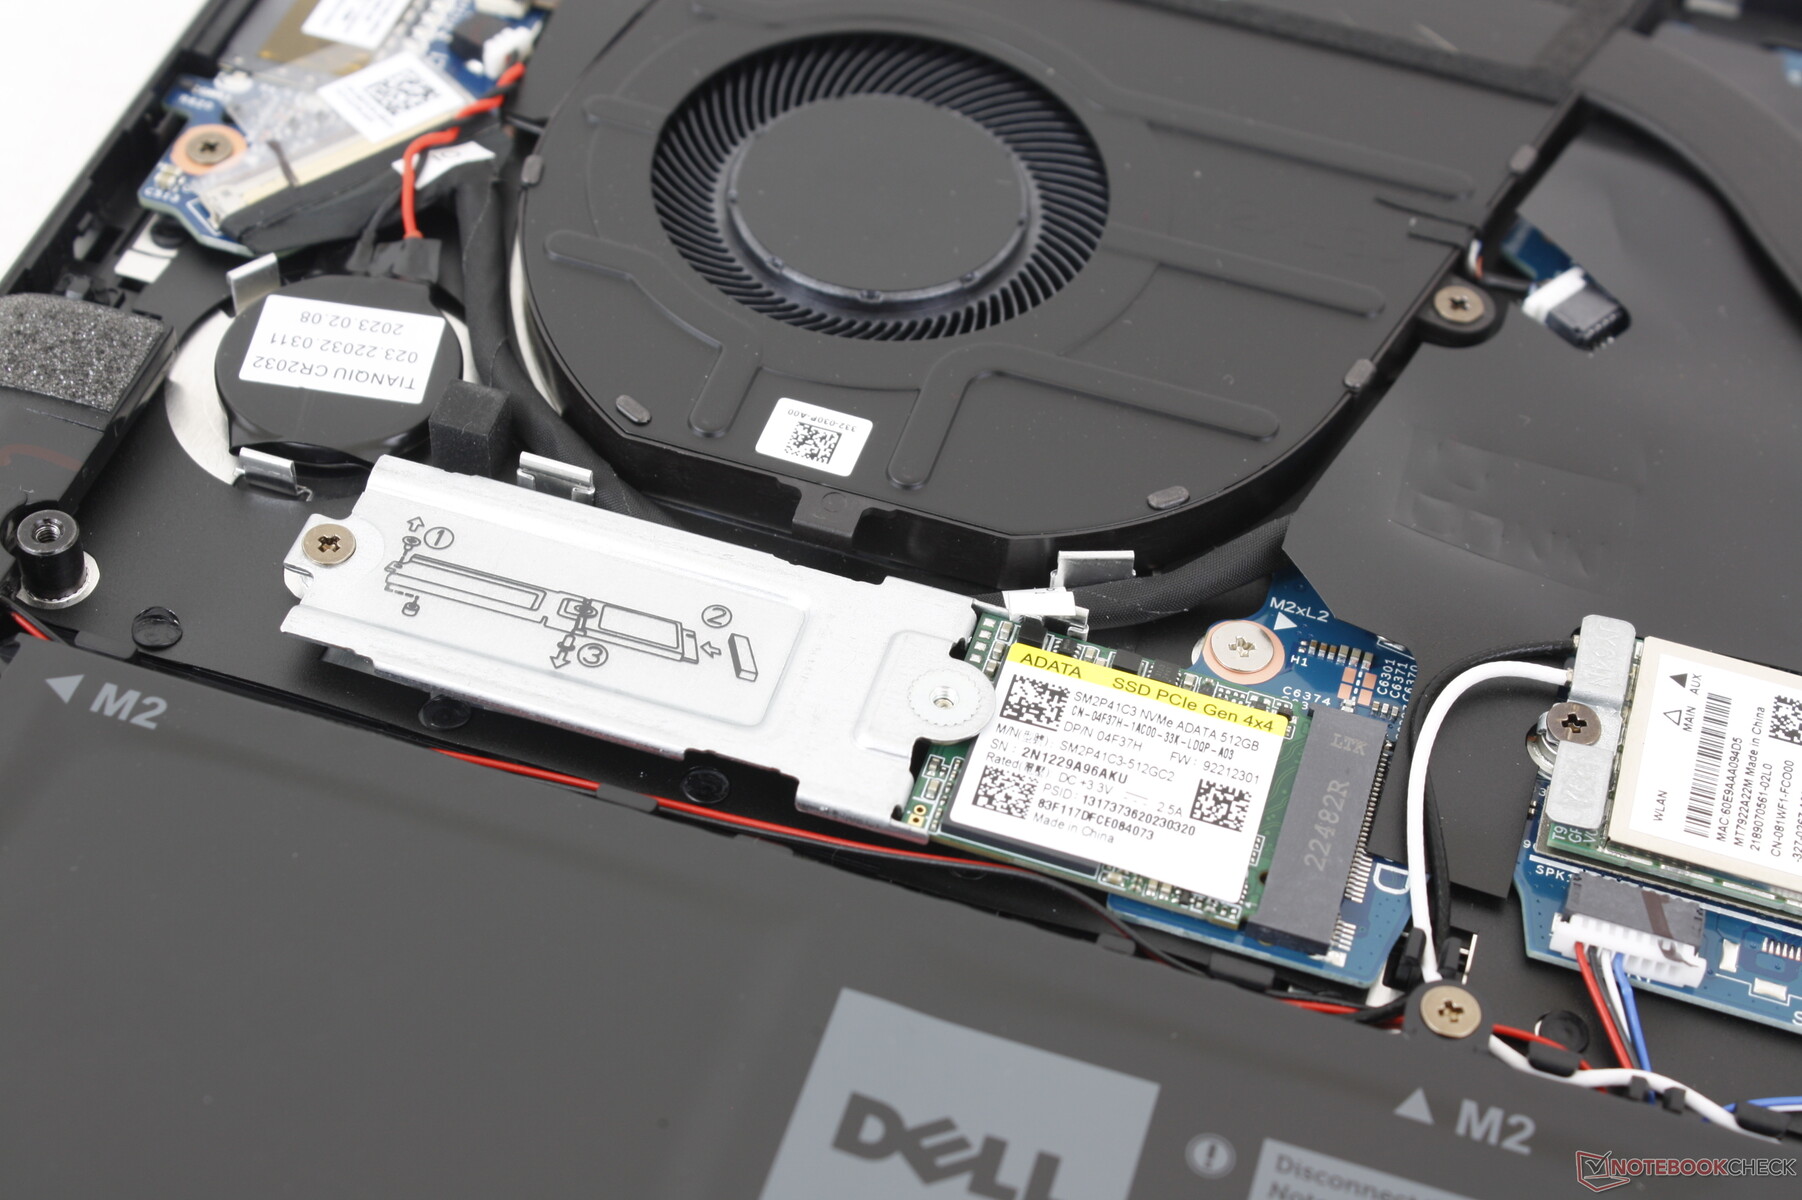
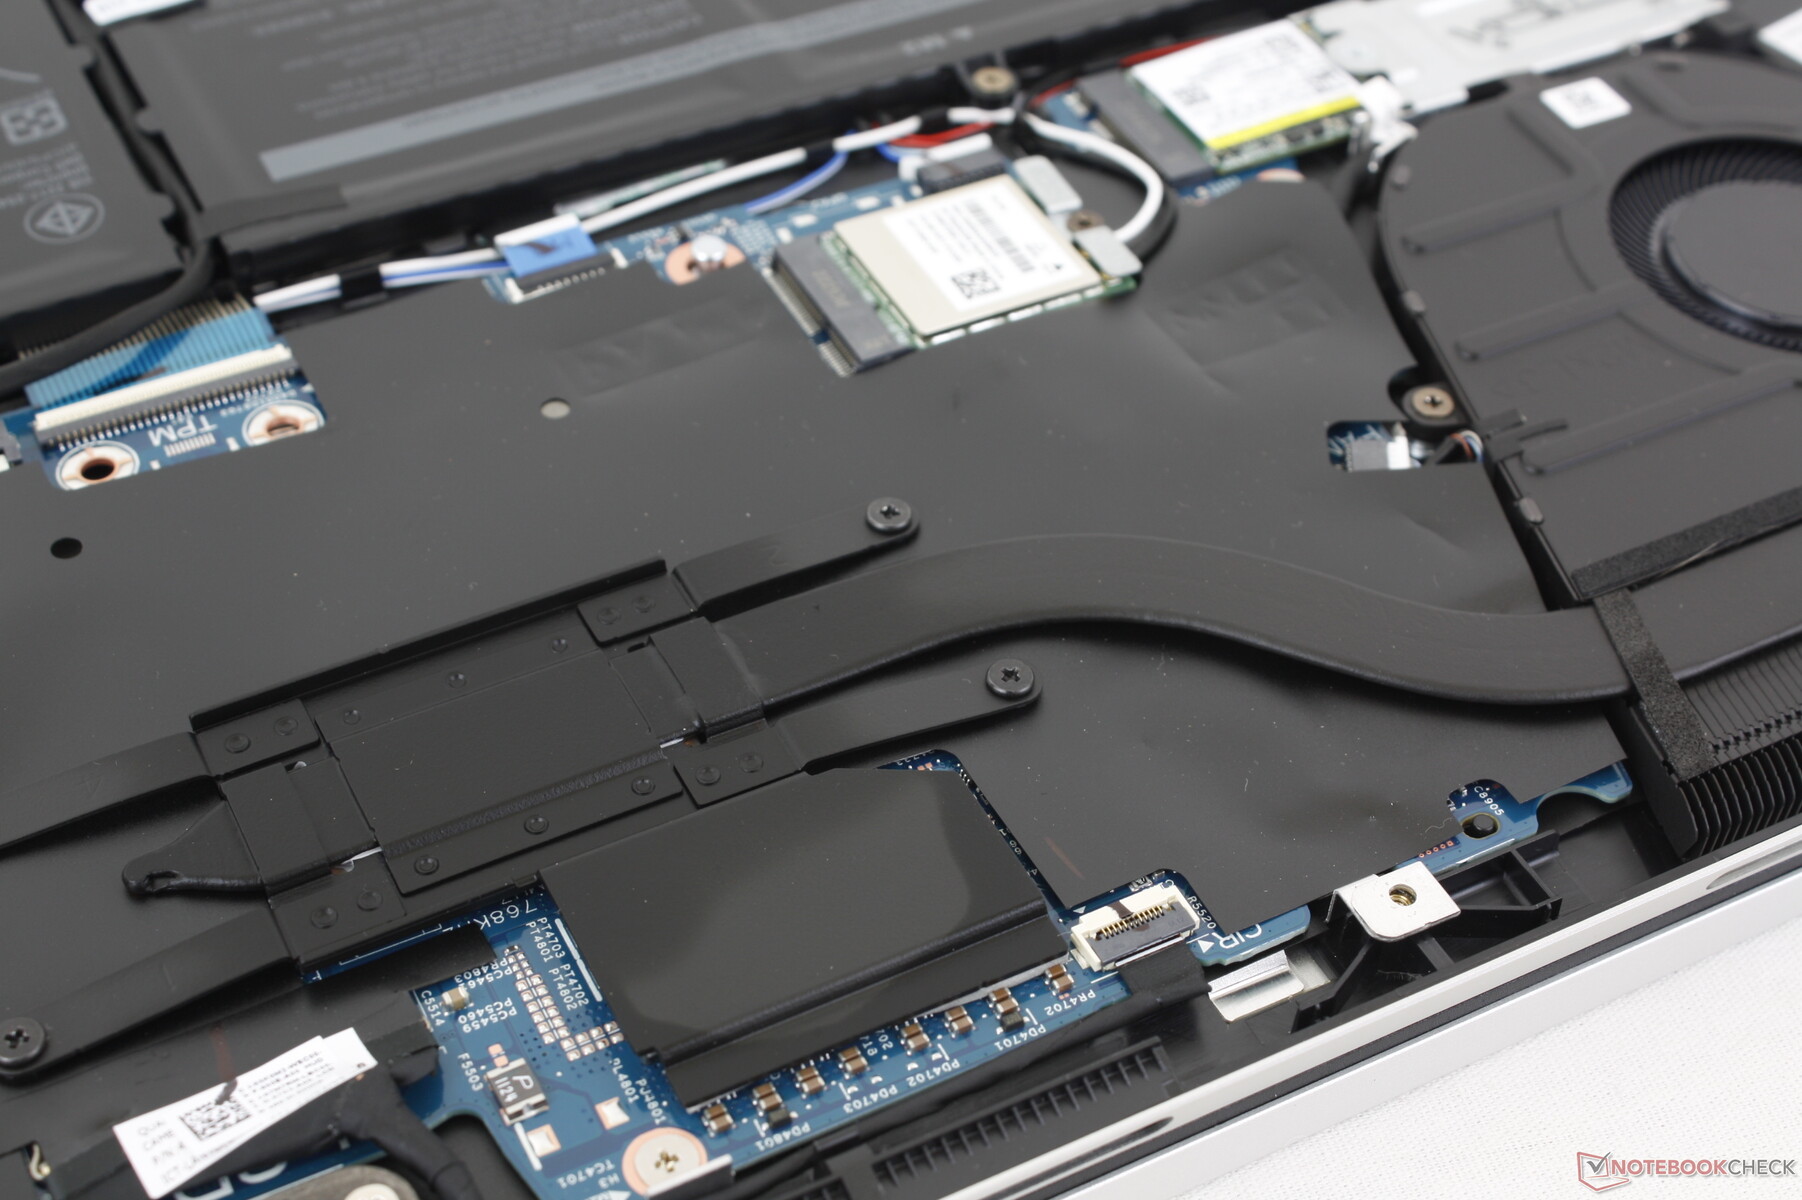
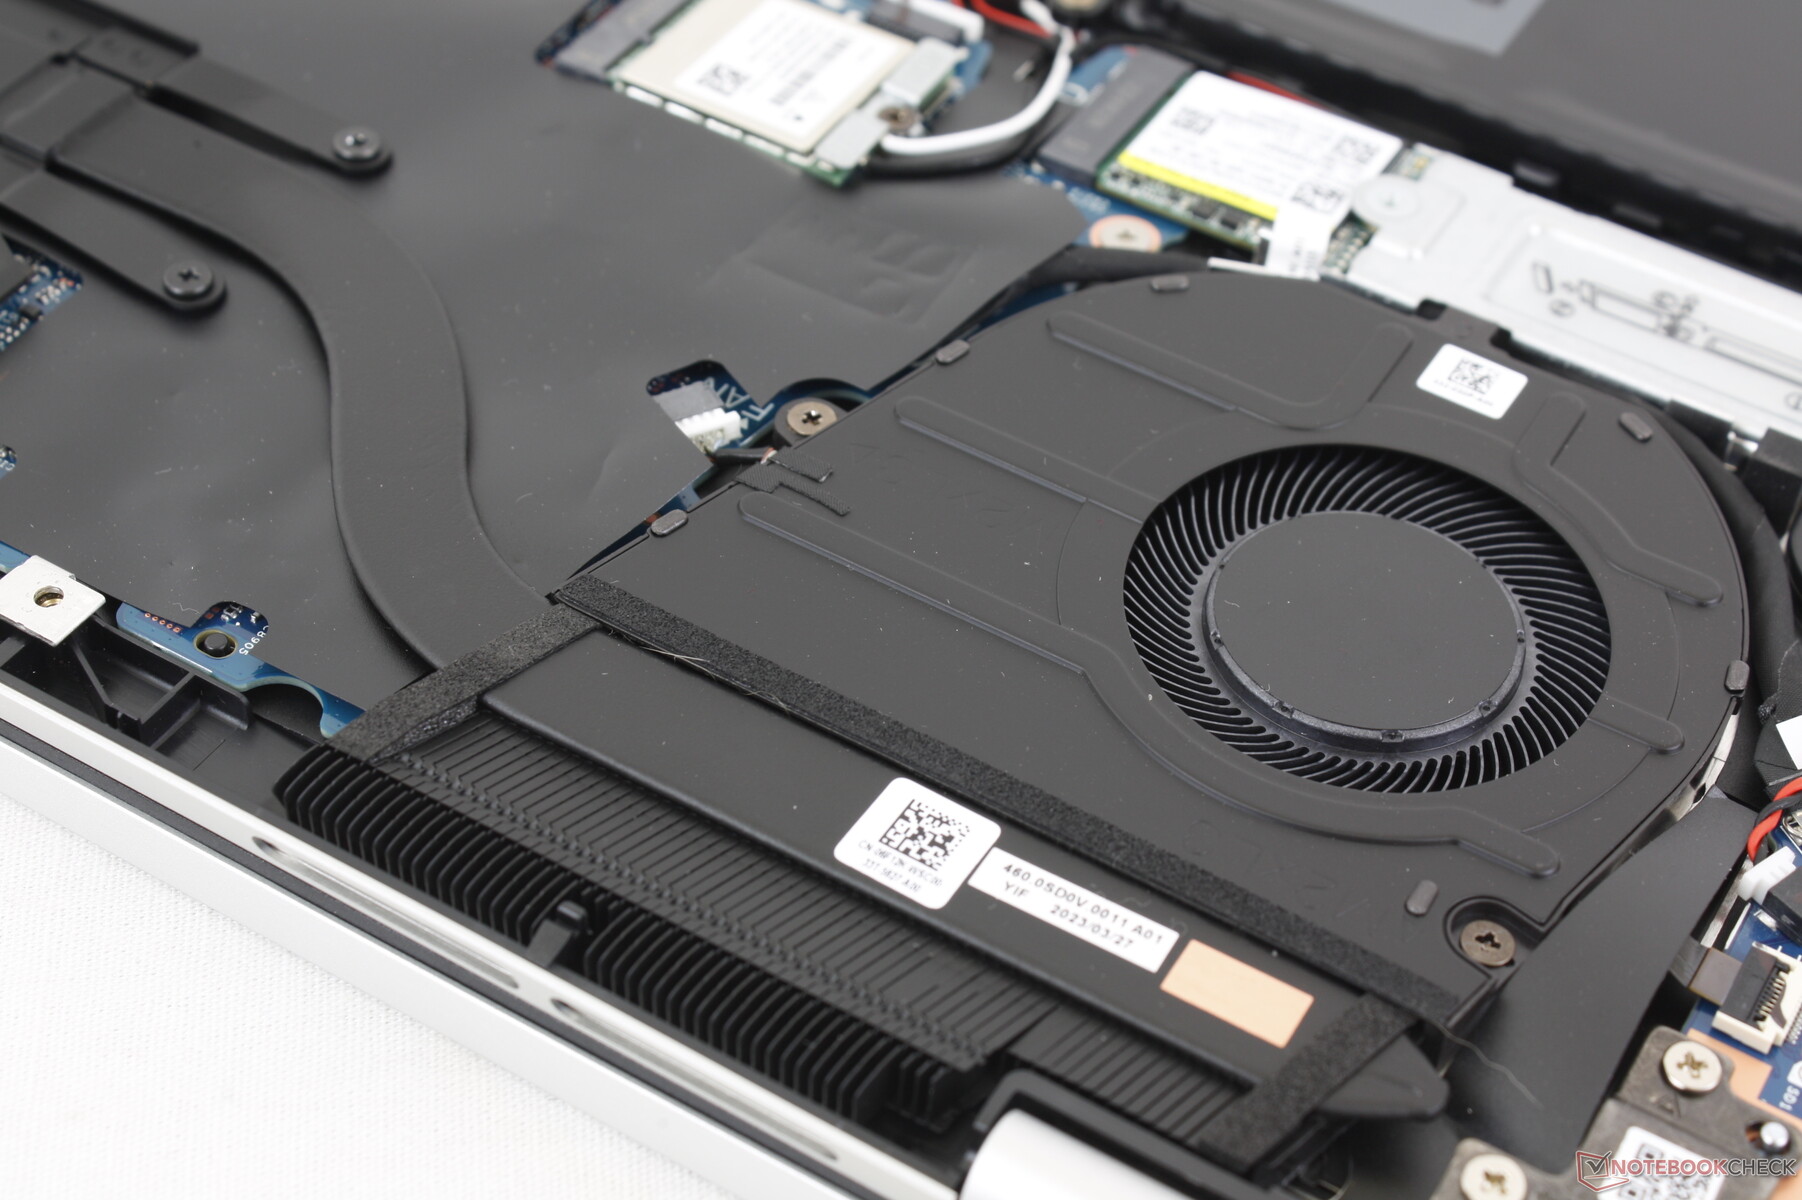
Konserwacja
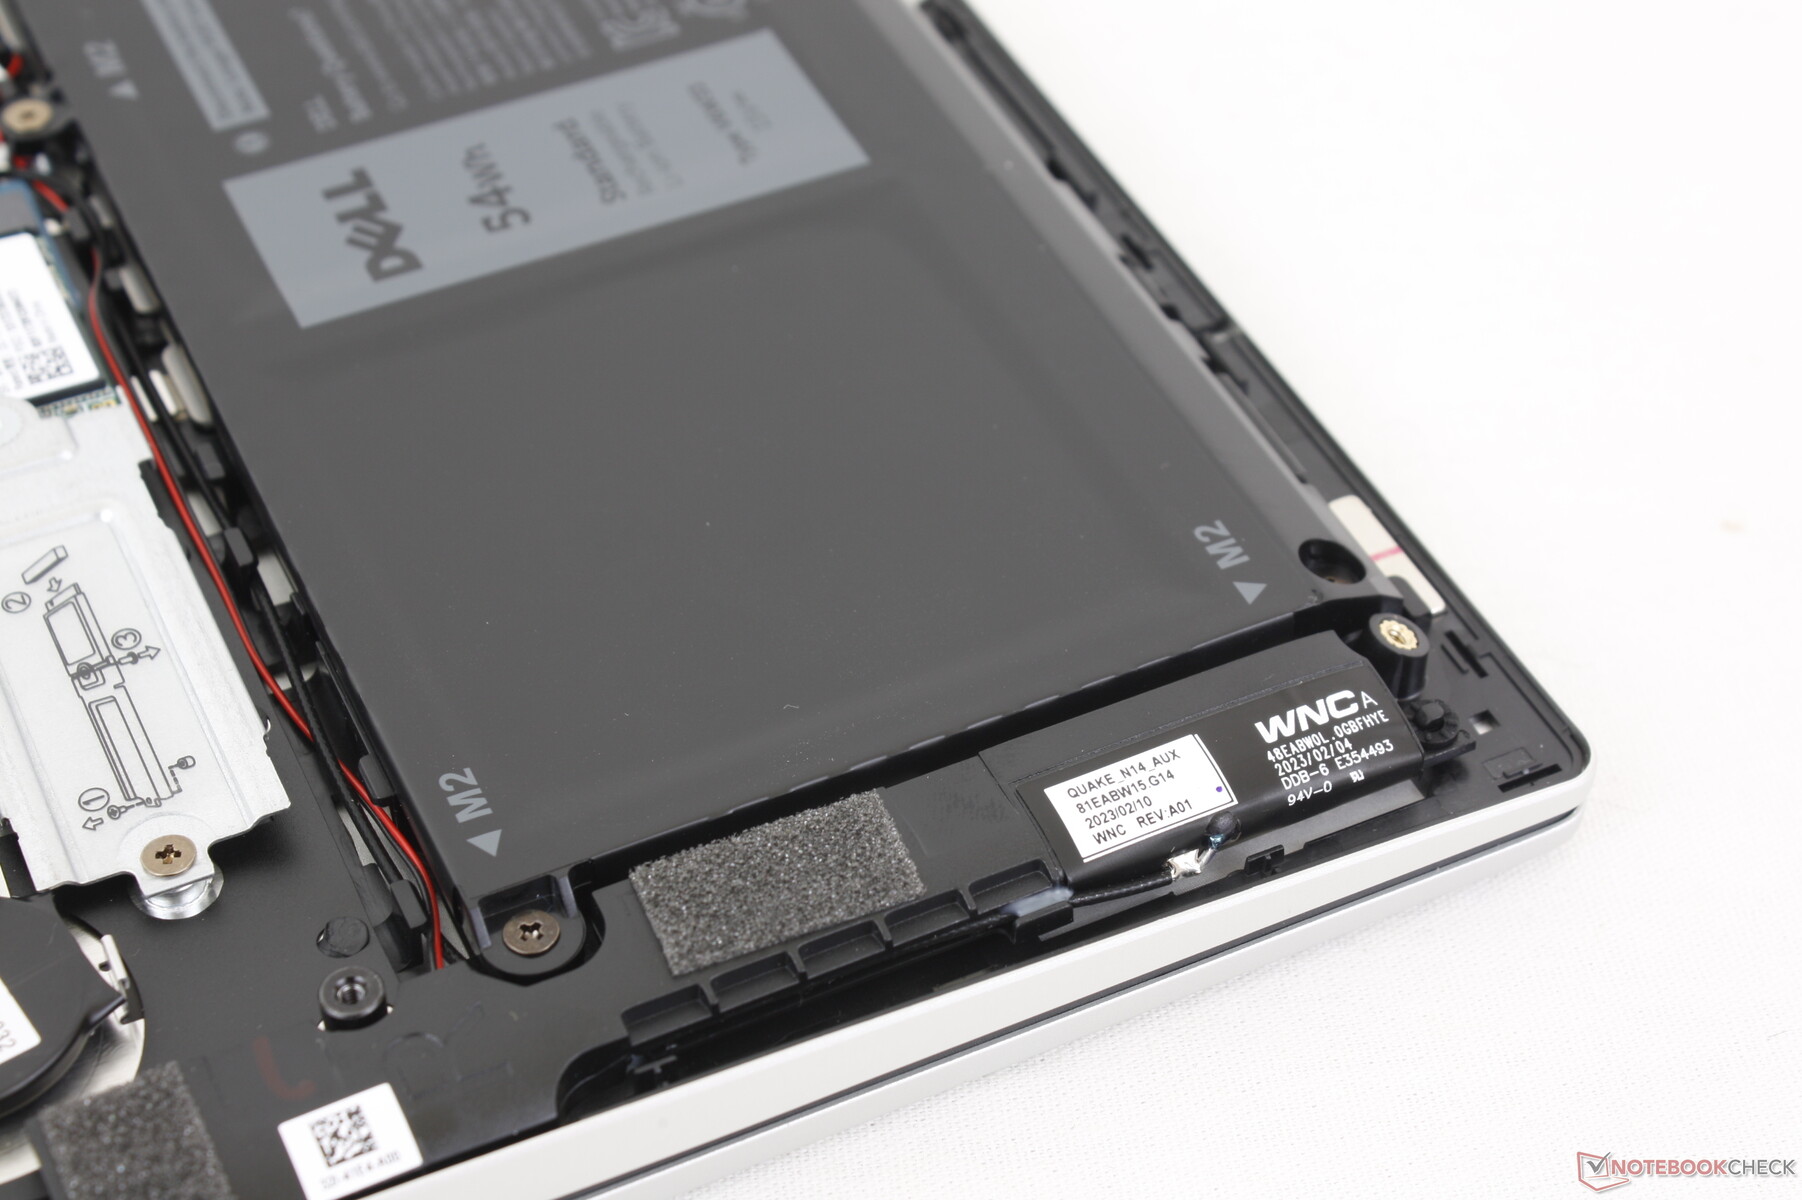
Dell wprowadził jedną istotną zmianę na płycie głównej w porównaniu do zeszłorocznego projektu: Pamięć RAM jest teraz przylutowana zamiast gniazda, jak pokazano na poniższych zdjęciach. Choć jest to niefortunny widok, lutowana pamięć RAM jest powszechna w innych budżetowych komputerach konwertowalnych, takich jak IdeaPad Flex 7 lubAcer Aspire 5 Spin 14.
Akcesoria i gwarancja
W pudełku nie ma żadnych dodatków poza zasilaczem sieciowym i dokumentacją. Obowiązuje zwykła roczna ograniczona gwarancja producenta.
Urządzenia wejściowe - koniec z folią
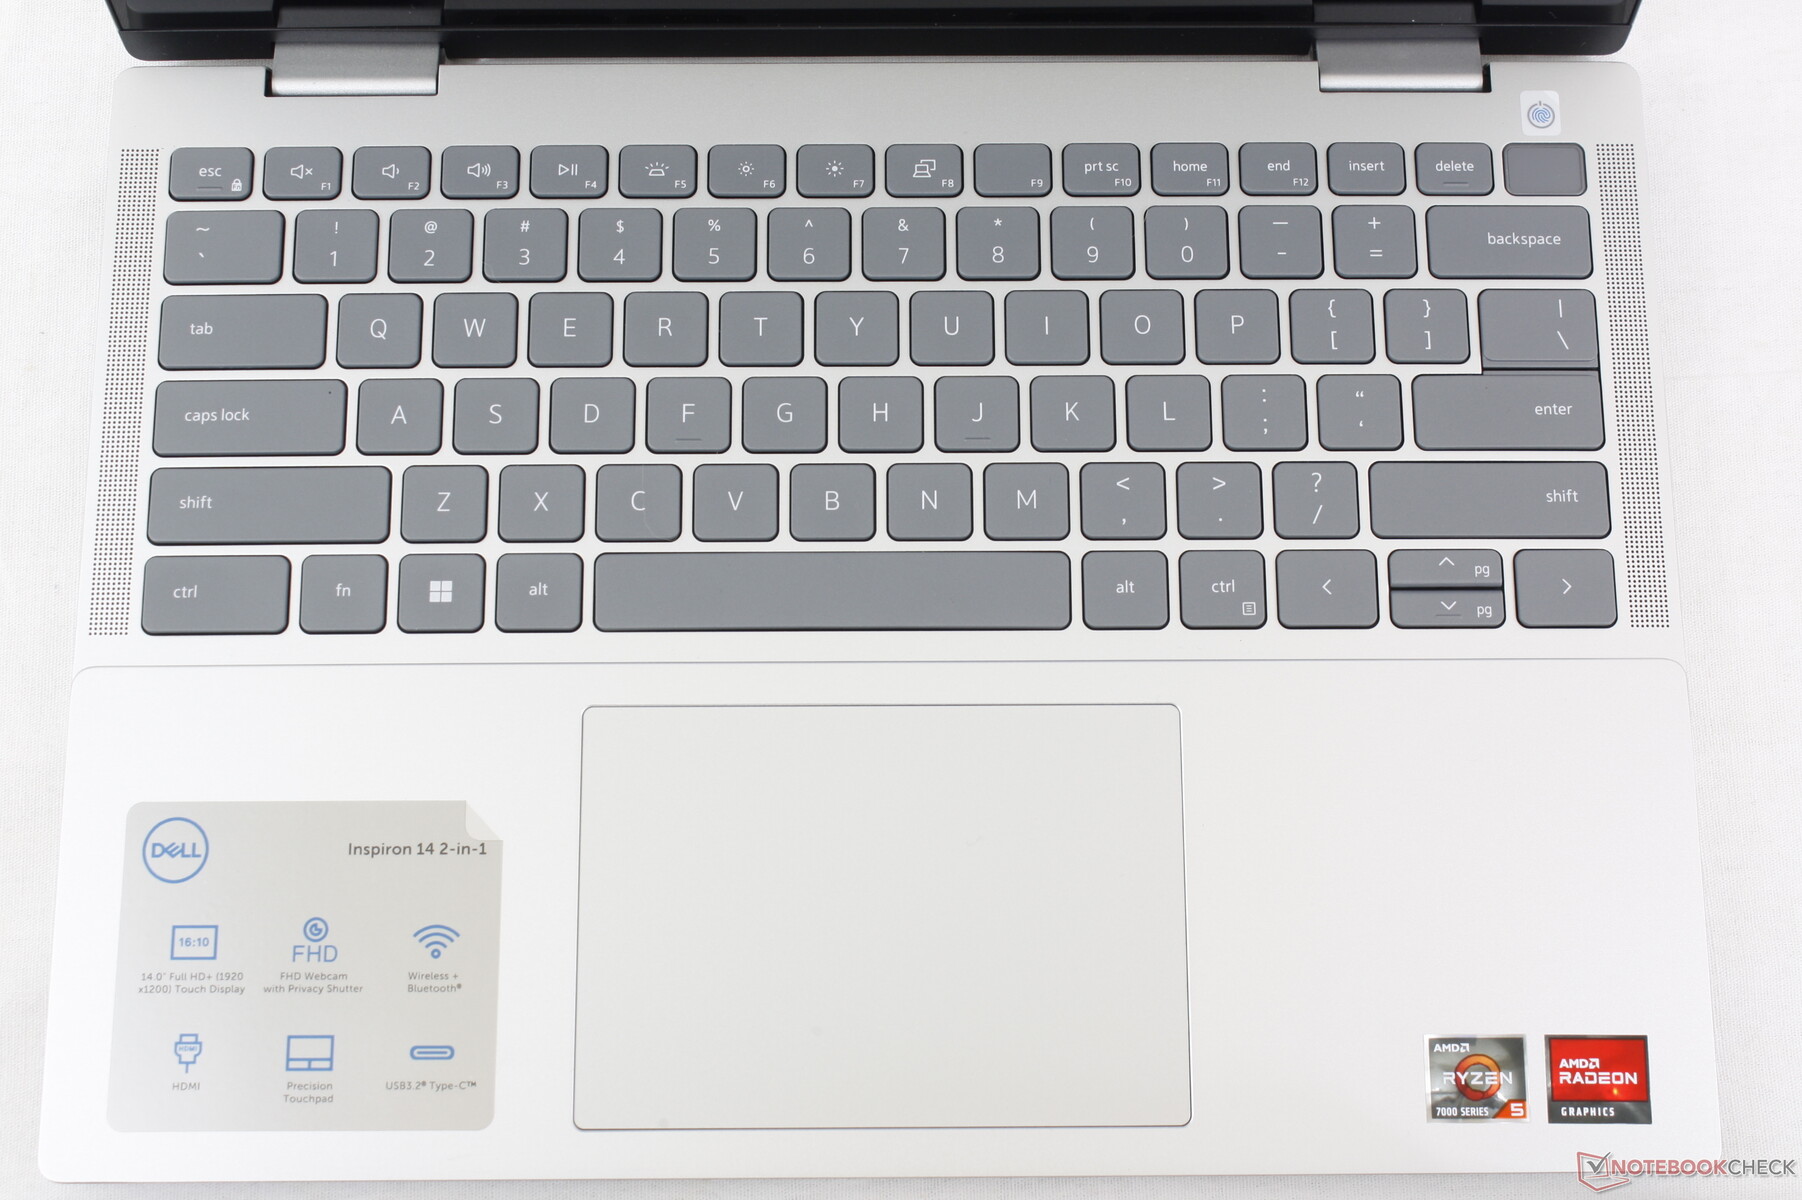
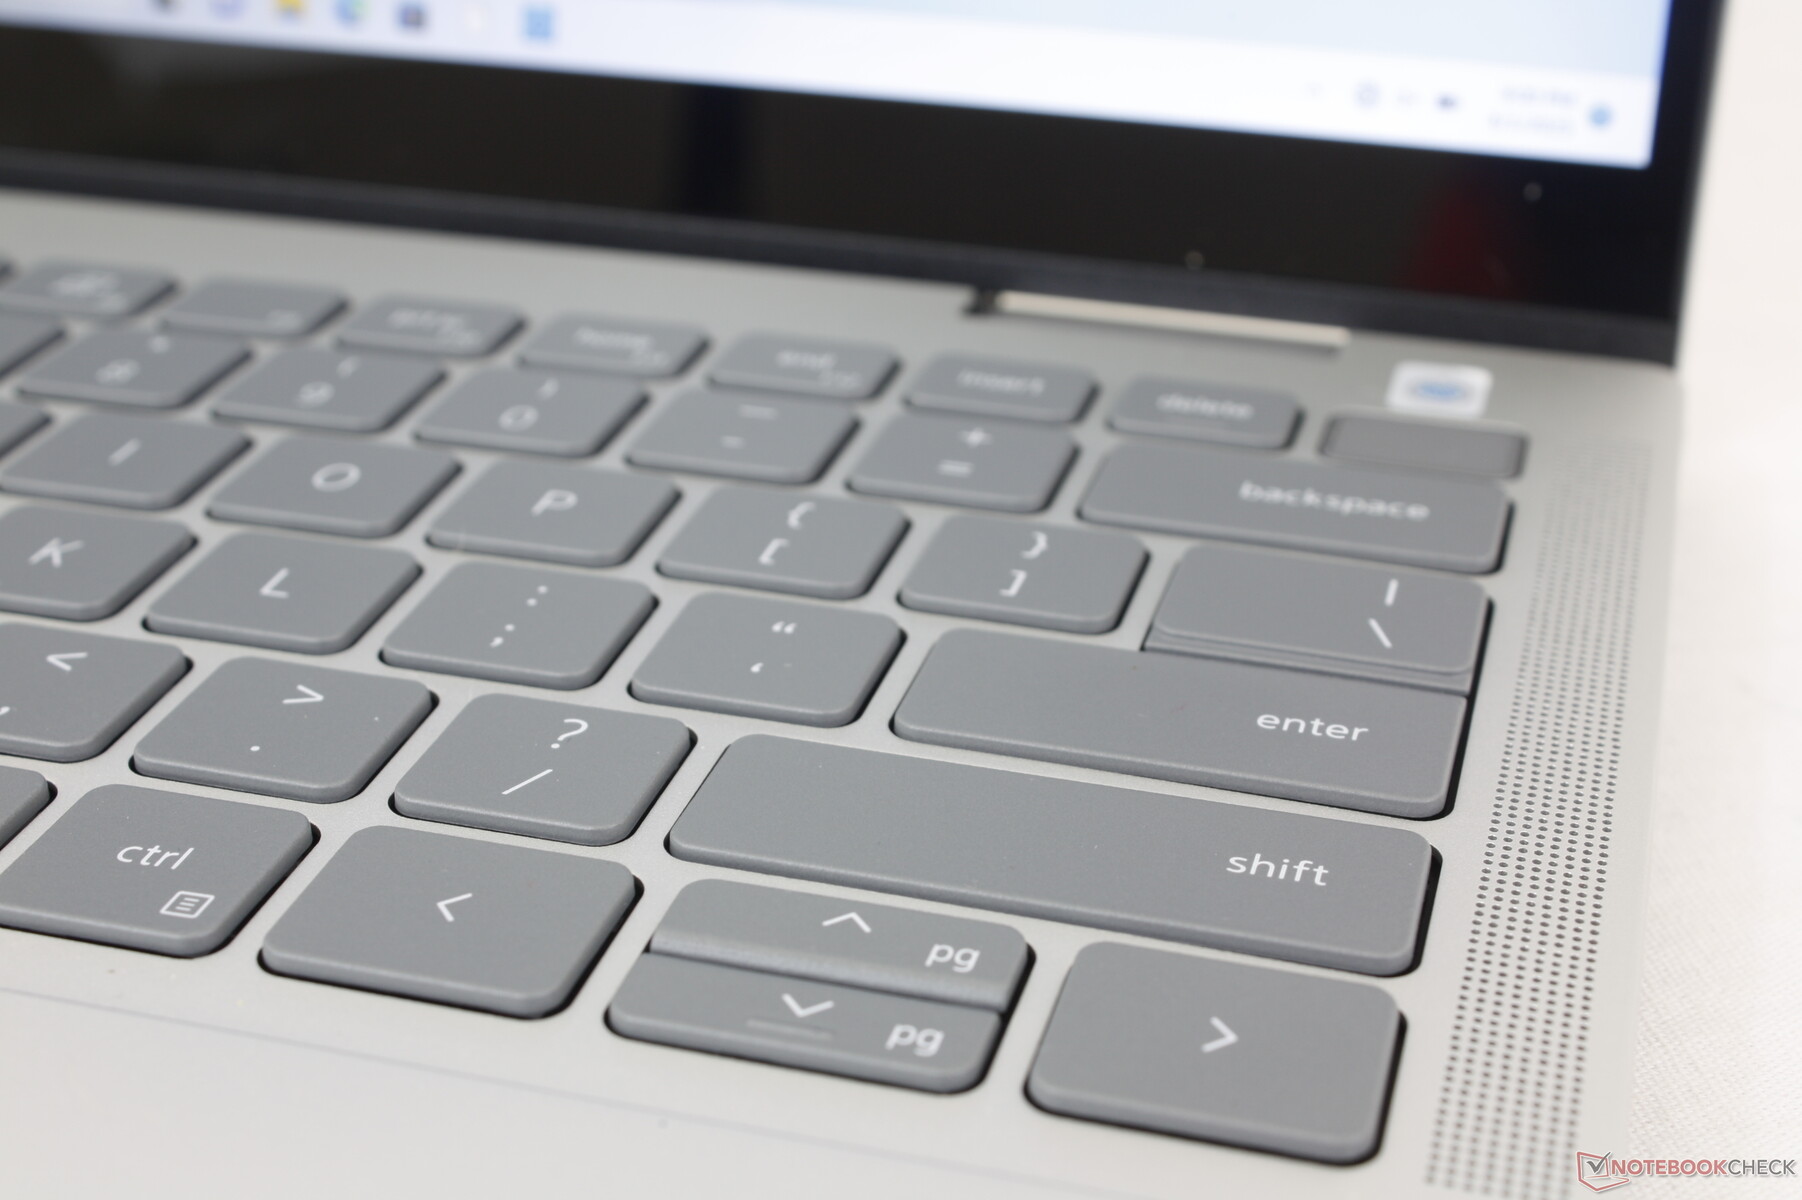
Klawiatura i panel dotykowy
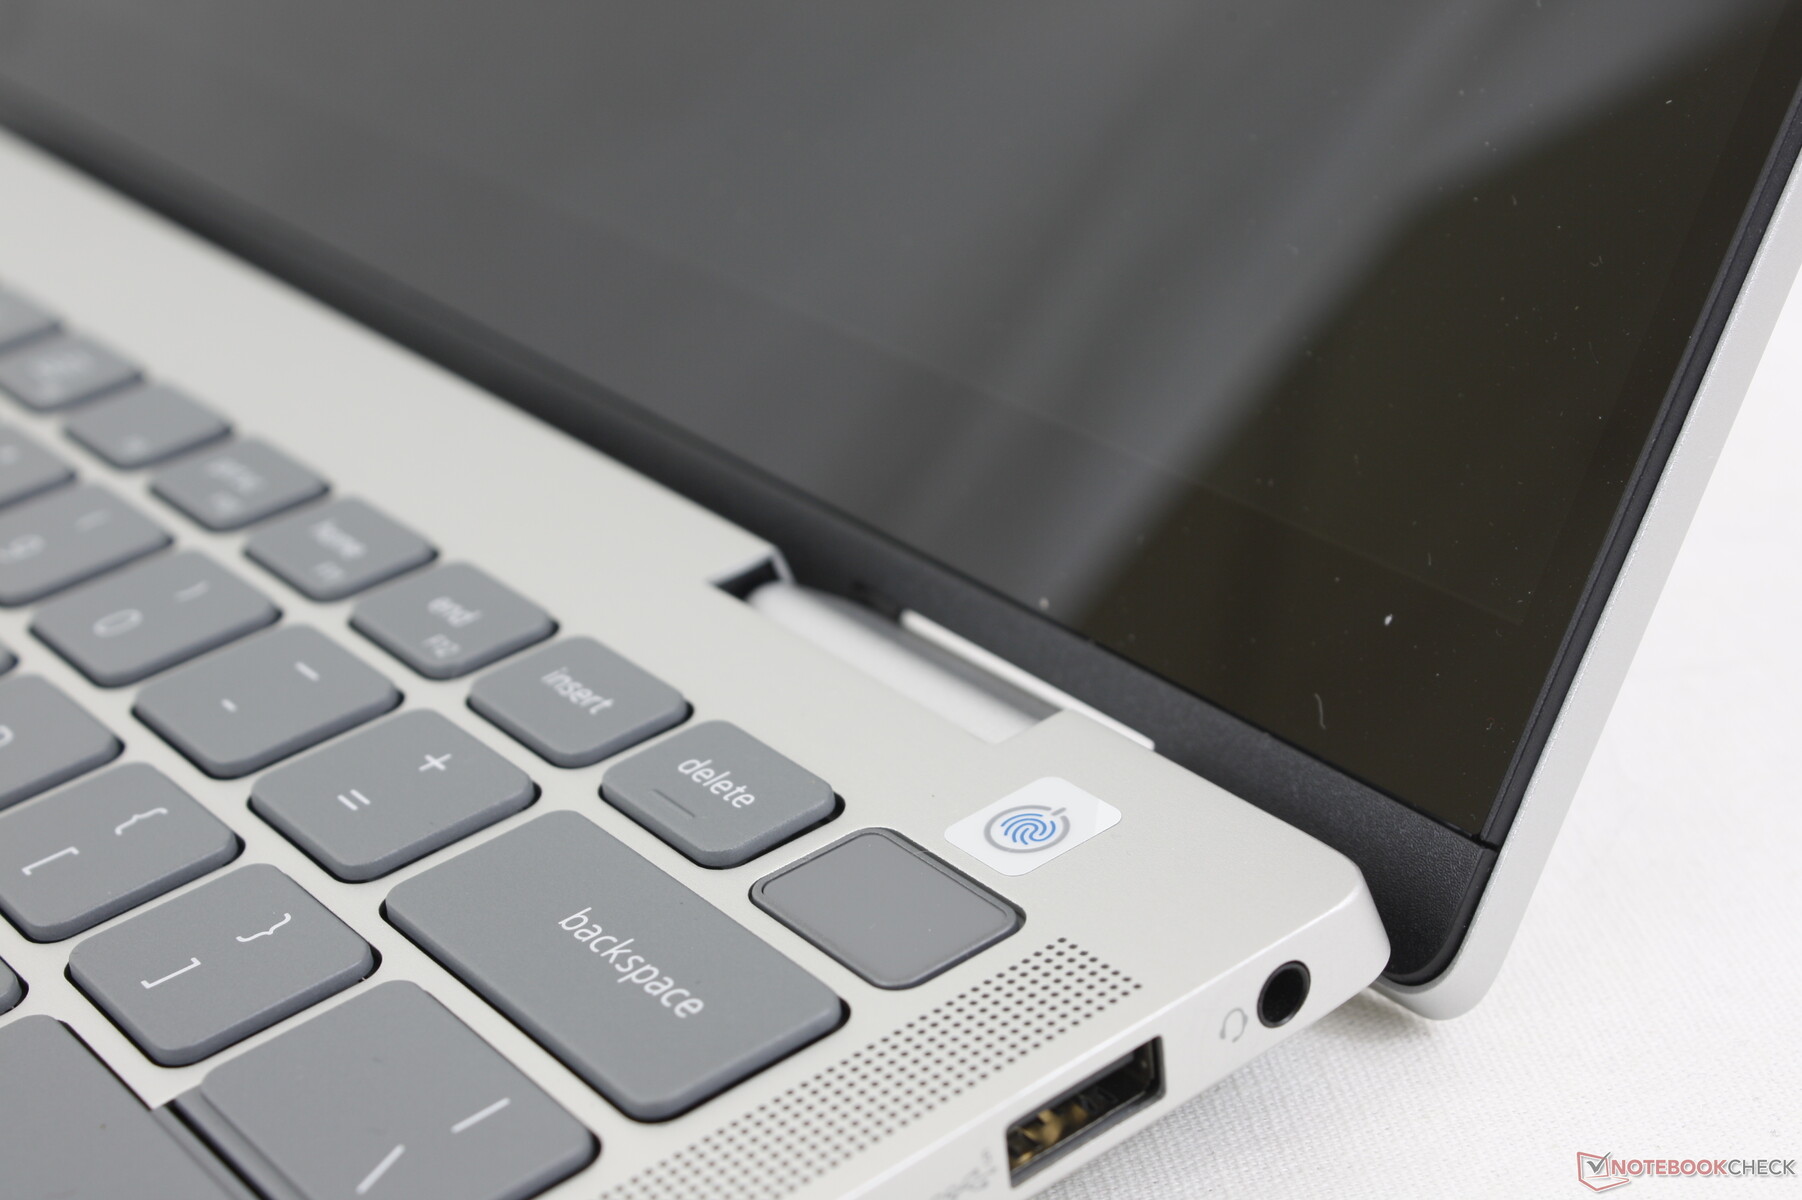
Podczas gdy wrażenia z pisania na klawiaturze pozostają takie same jak w zeszłorocznym modelu Inspiron 14 7420, konstrukcja klawiatury uległa zmianie ze względu na usunięcie warstwy Mylar. Ma teraz bardziej tradycyjny wygląd, zachowując oryginalną powierzchnię 11,5 x 8 cm. Niestety, sprzężenie zwrotne podczas klikania nie uległo poprawie, ponieważ nadal wydaje się gąbczaste i nieco zbyt płytkie.


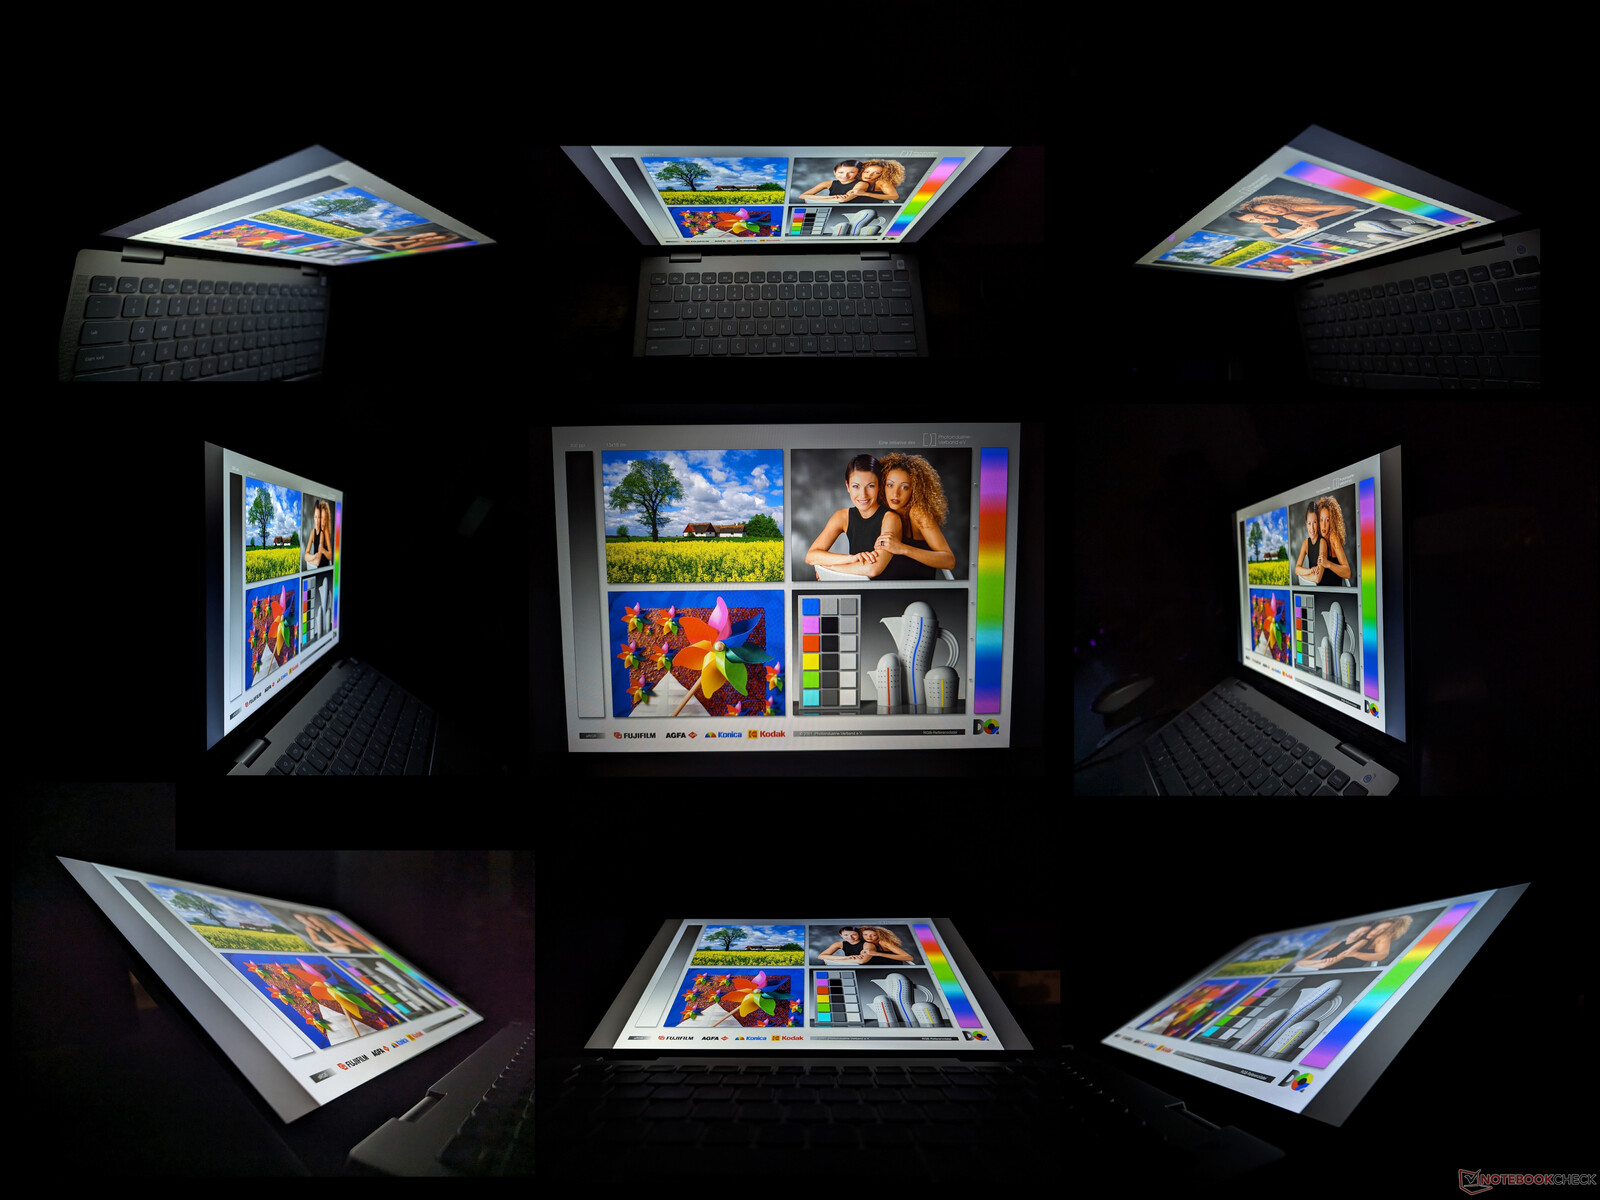
Wyświetlacz - 60 Hz, 45% NTSC, 1200p, 16:10
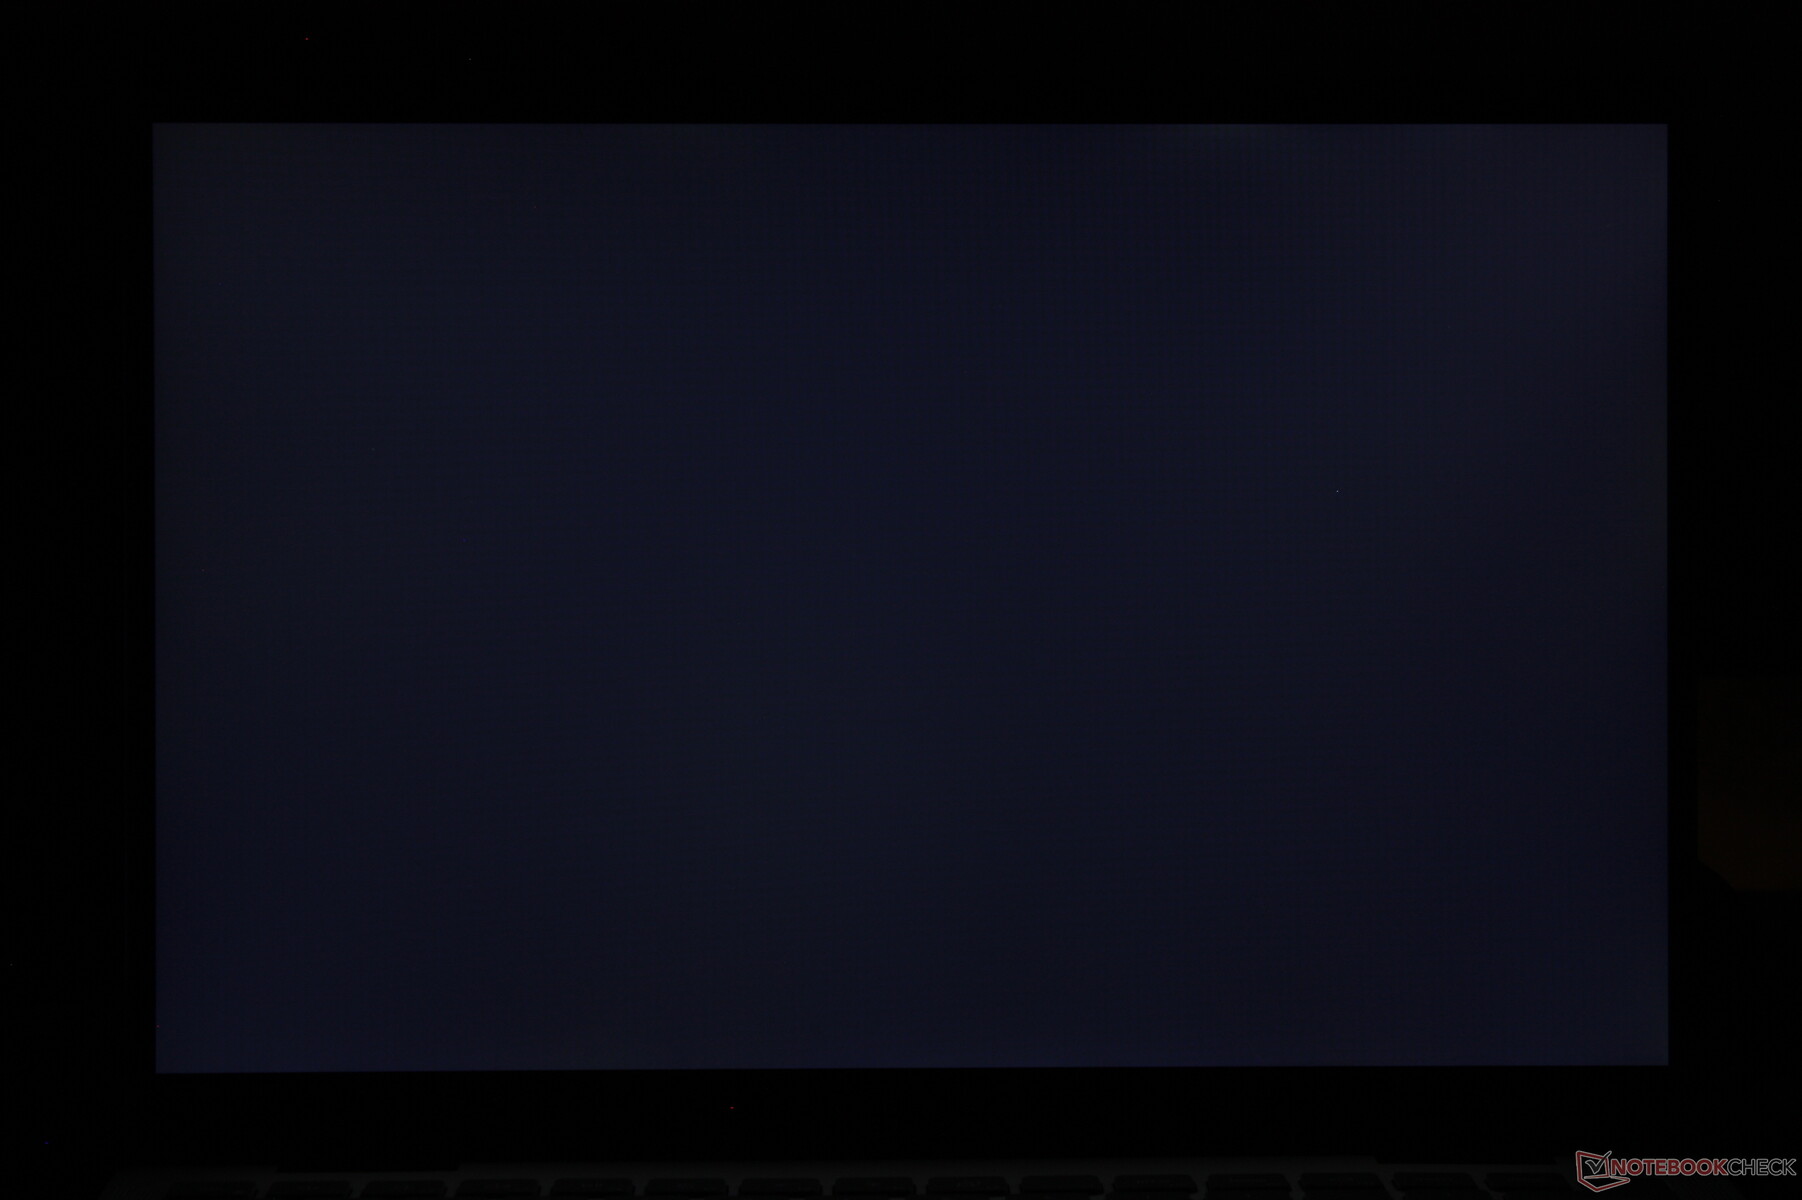
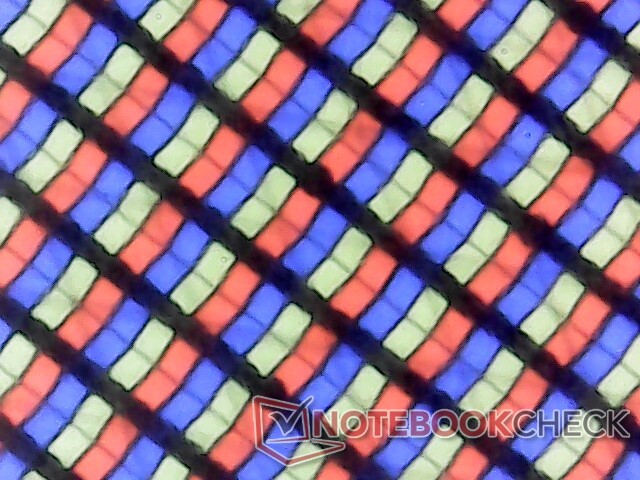
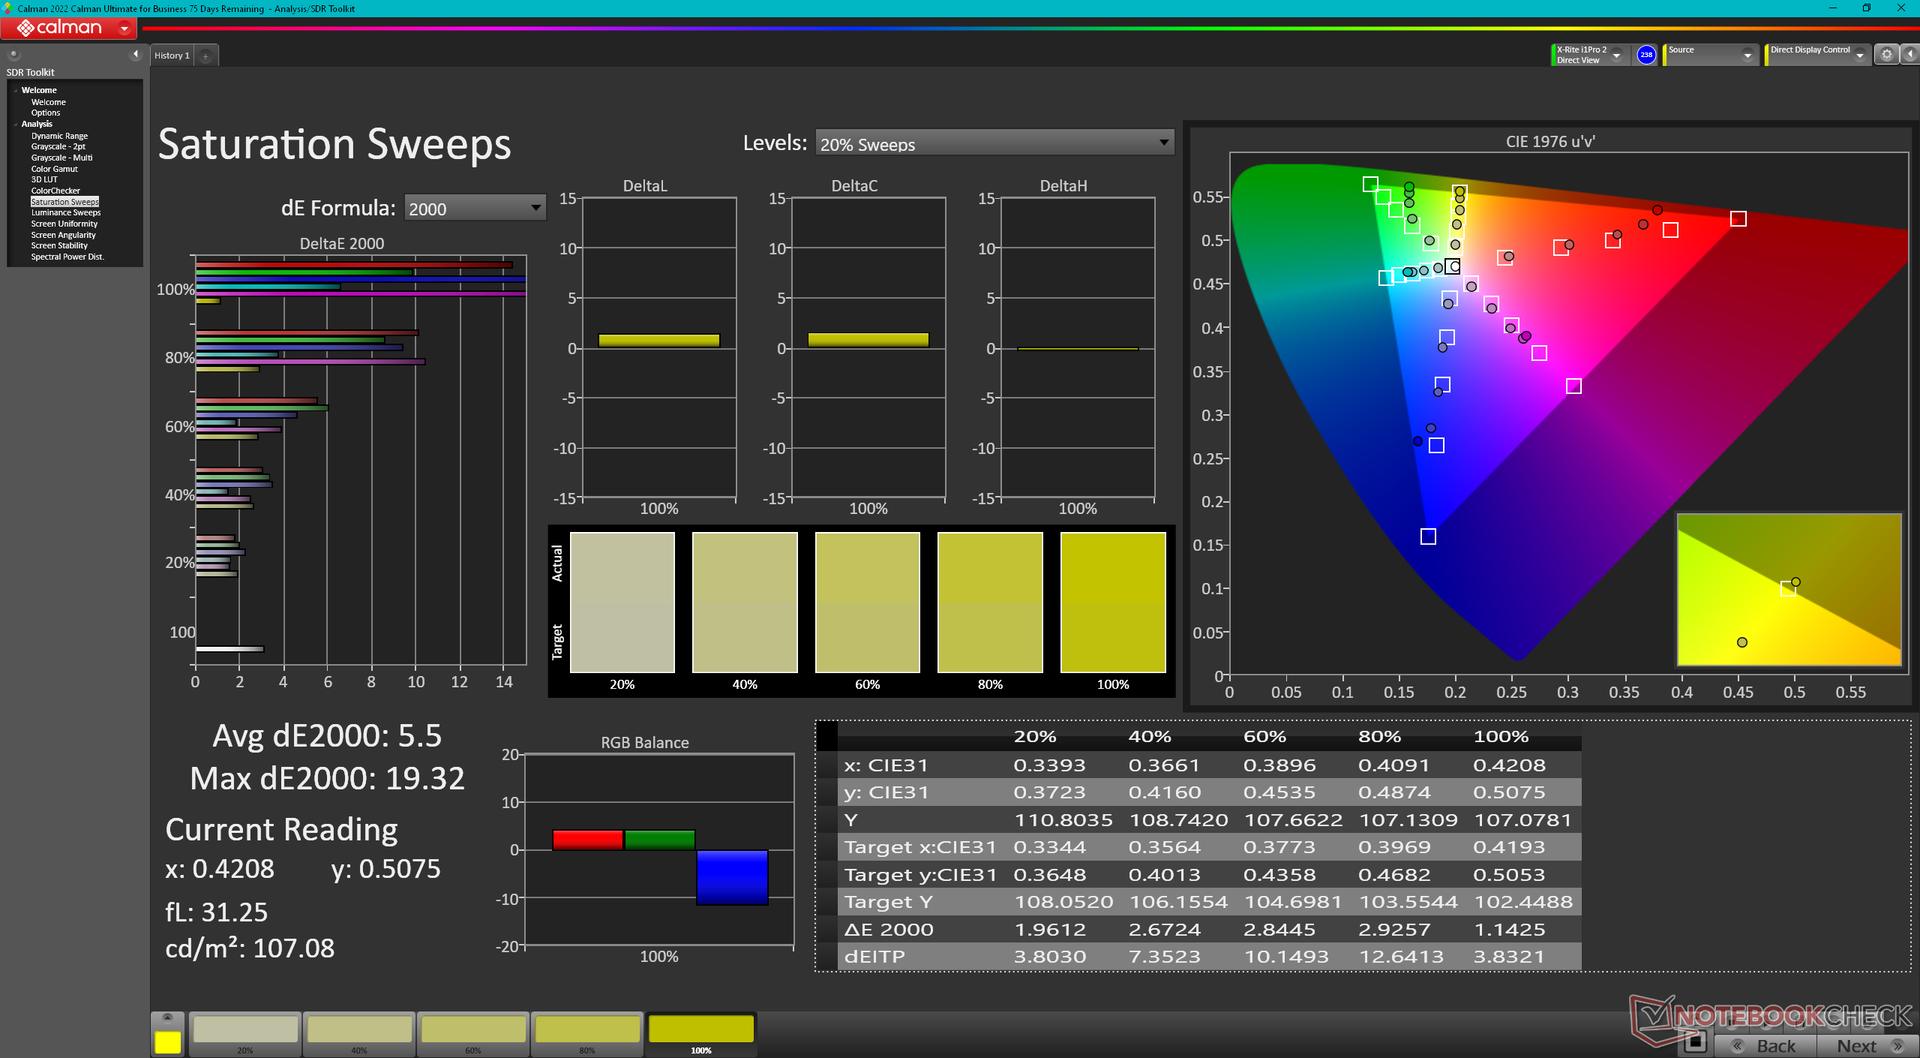
Tegoroczny model wyposażony jest w panel LG Philips 140WU2 IPS, który zastąpił panel BOE NV14N42 w zeszłorocznym Inspironie 14 9420 2-w-1. Podstawowe atrybuty są prawie identyczne, co zapewnia podobne wrażenia wizualne między nimi. Wąski zakres kolorów, przeciętny czas reakcji i mierny współczynnik kontrastu są standardowe w tym przedziale cenowym.
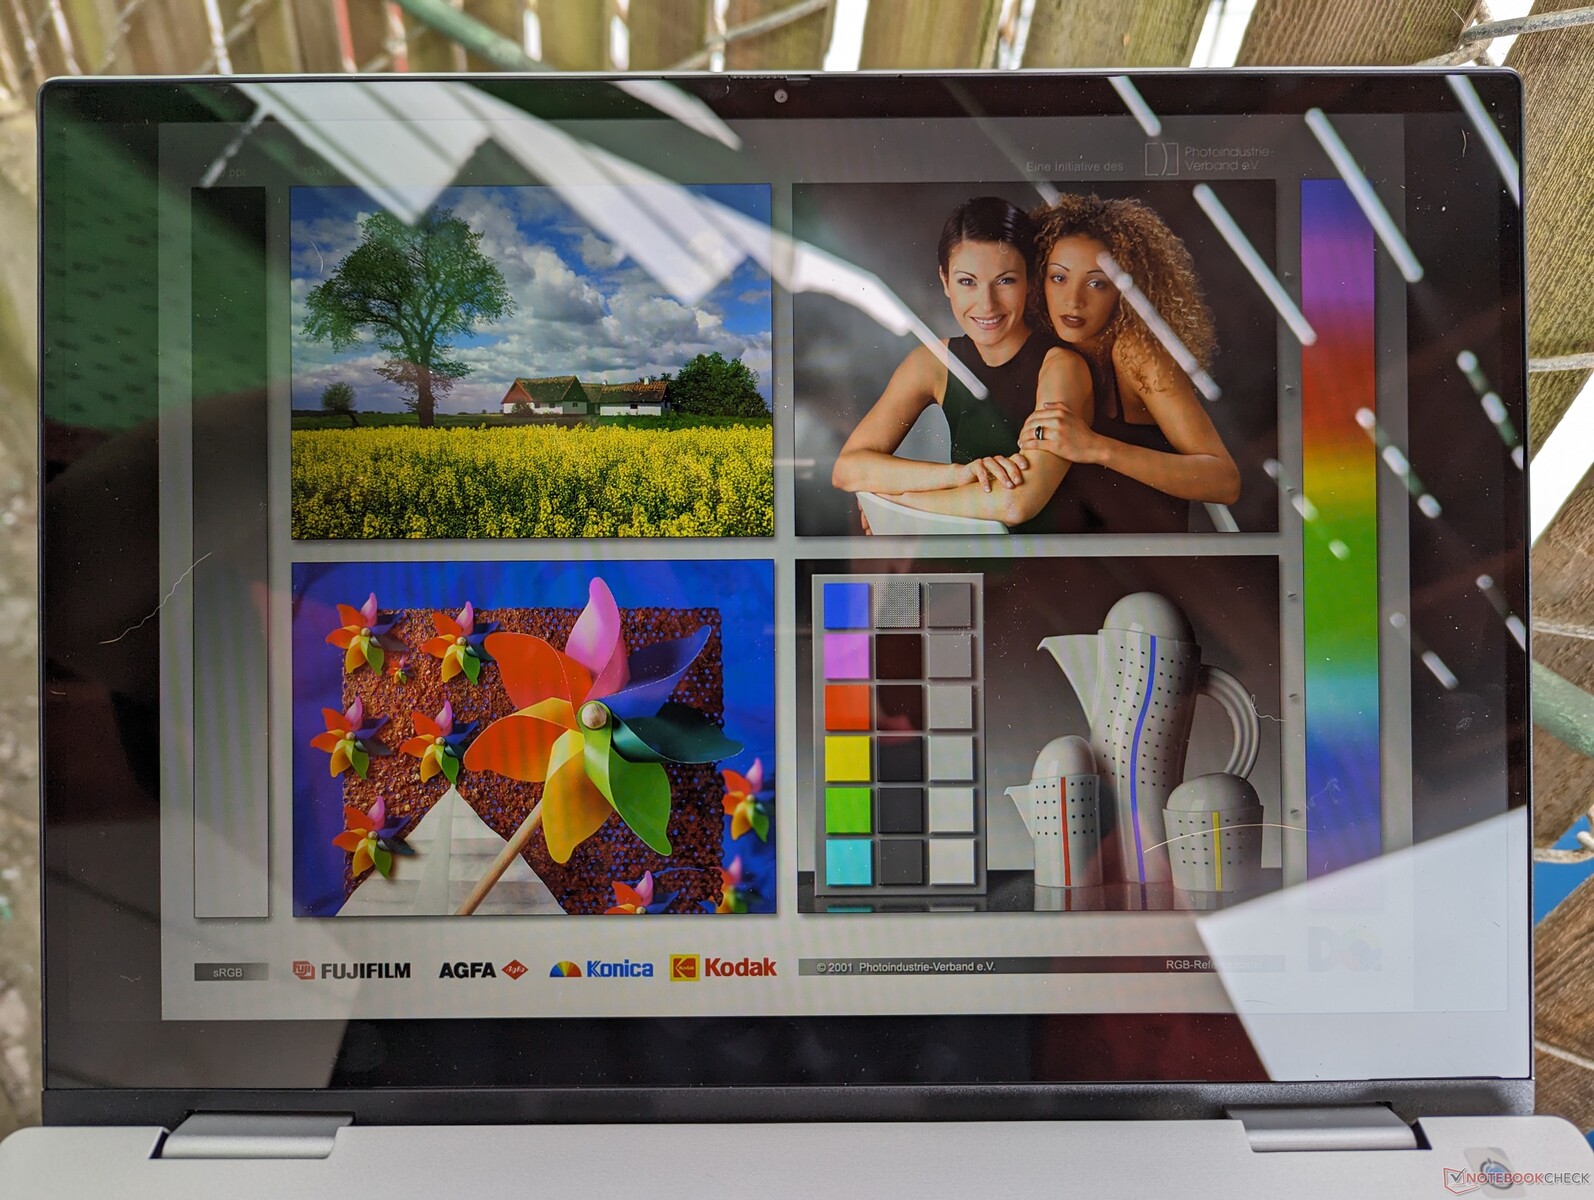
Aspekt, który zasługuje na większą uwagę, dotyczy słabej jasności ekranu dotykowego. Niski zakres 200 nitów jest wystarczający dla środowisk wewnętrznych, ale nasze oczekiwania są wyższe w przypadku kabrioletów, ponieważ właściciele częściej używają ich podczas podróży lub w jaśniejszych warunkach zewnętrznych. Jeśli widoczność na zewnątrz ma znaczenie, potencjalni nabywcy powinni rozważyć droższy model XPS 13 9315 2-w-1 który jest 2x jaśniejszy od naszego Inspirona.
| |||||||||||||||||||||||||
rozświetlenie: 87 %
na akumulatorze: 231.8 cd/m²
kontrast: 859:1 (czerń: 0.27 cd/m²)
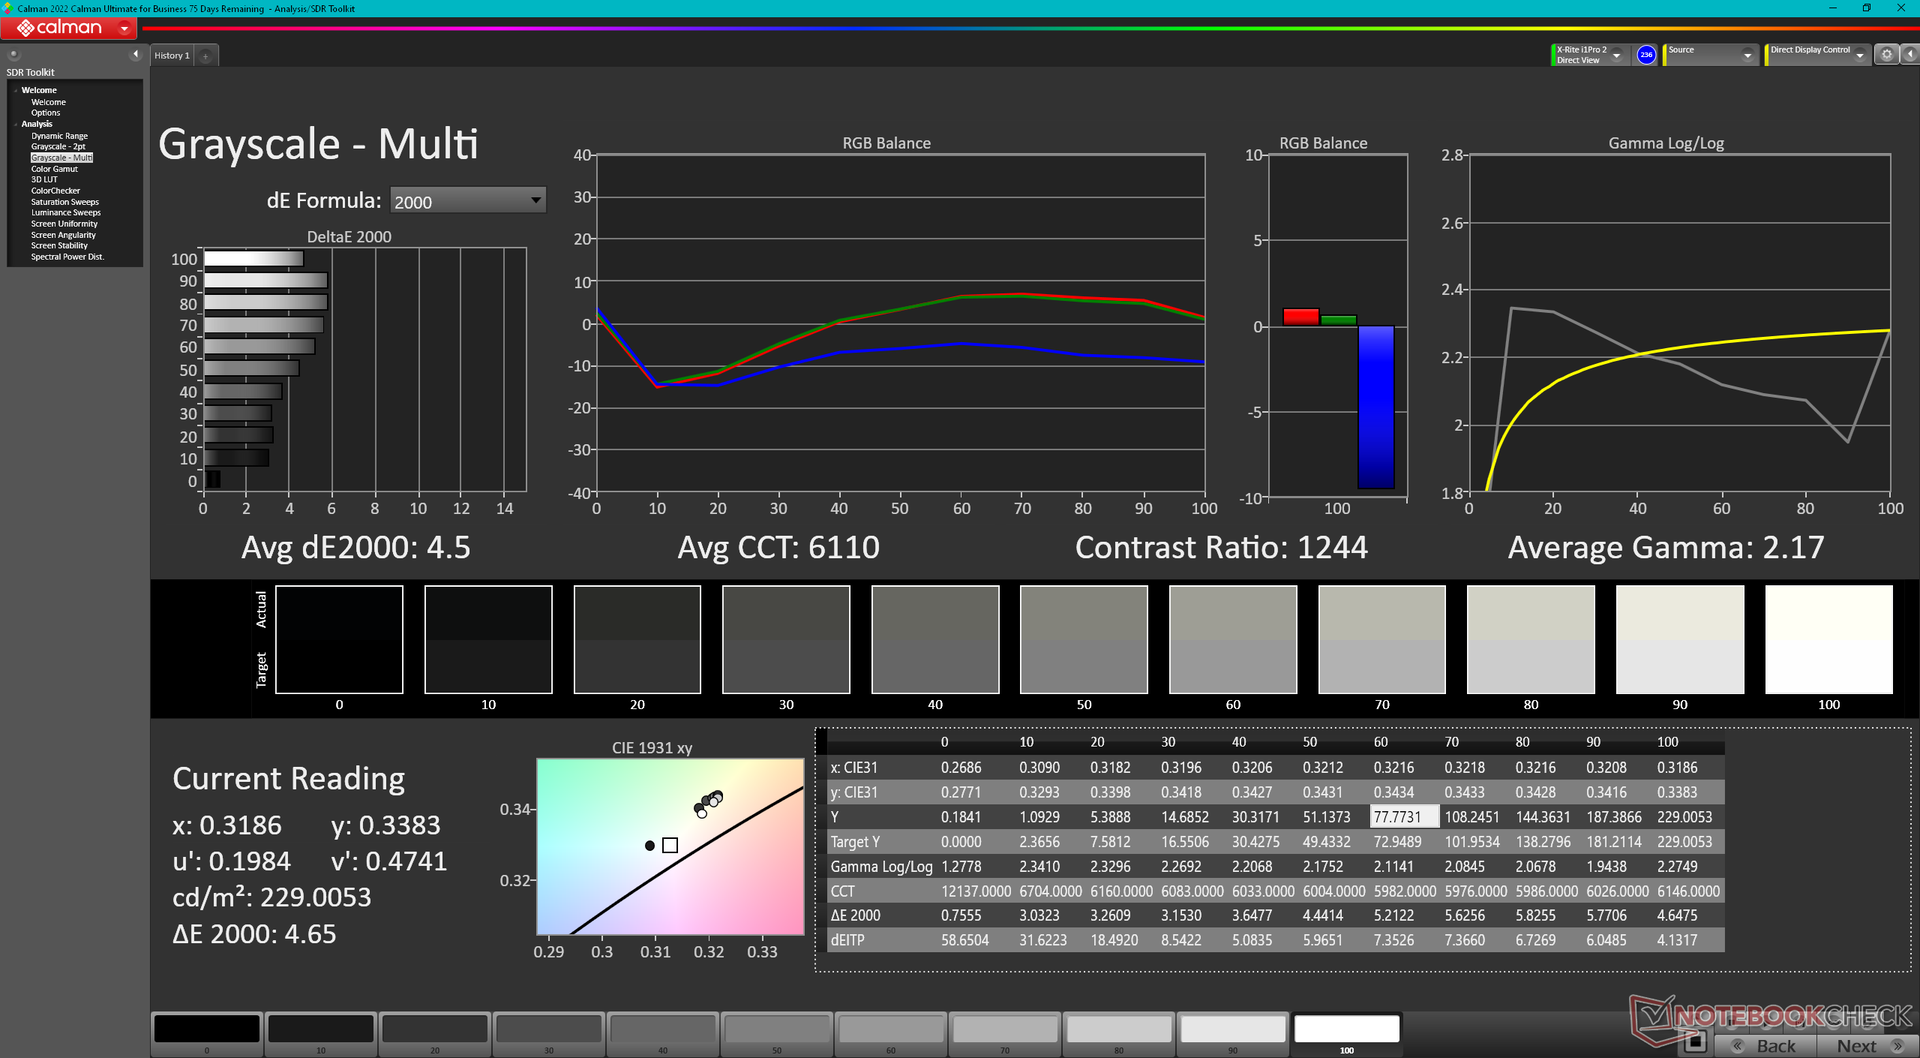
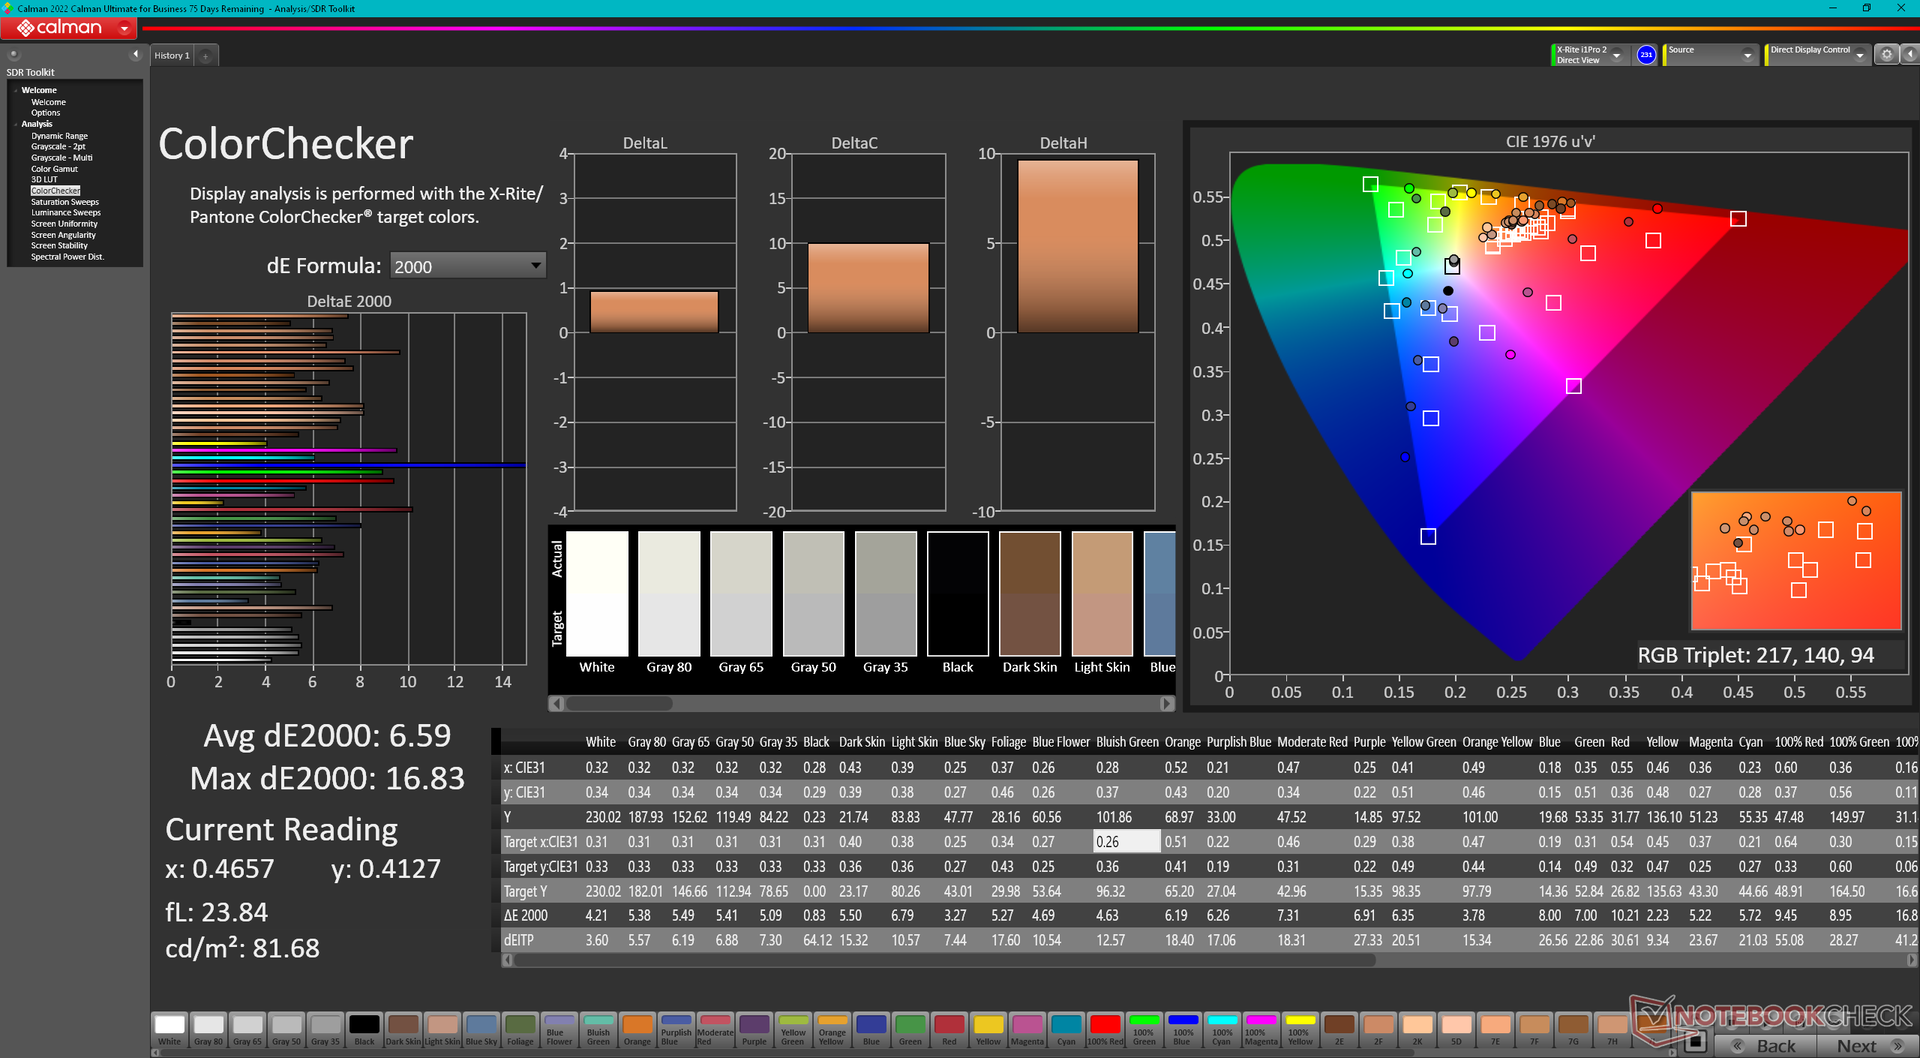
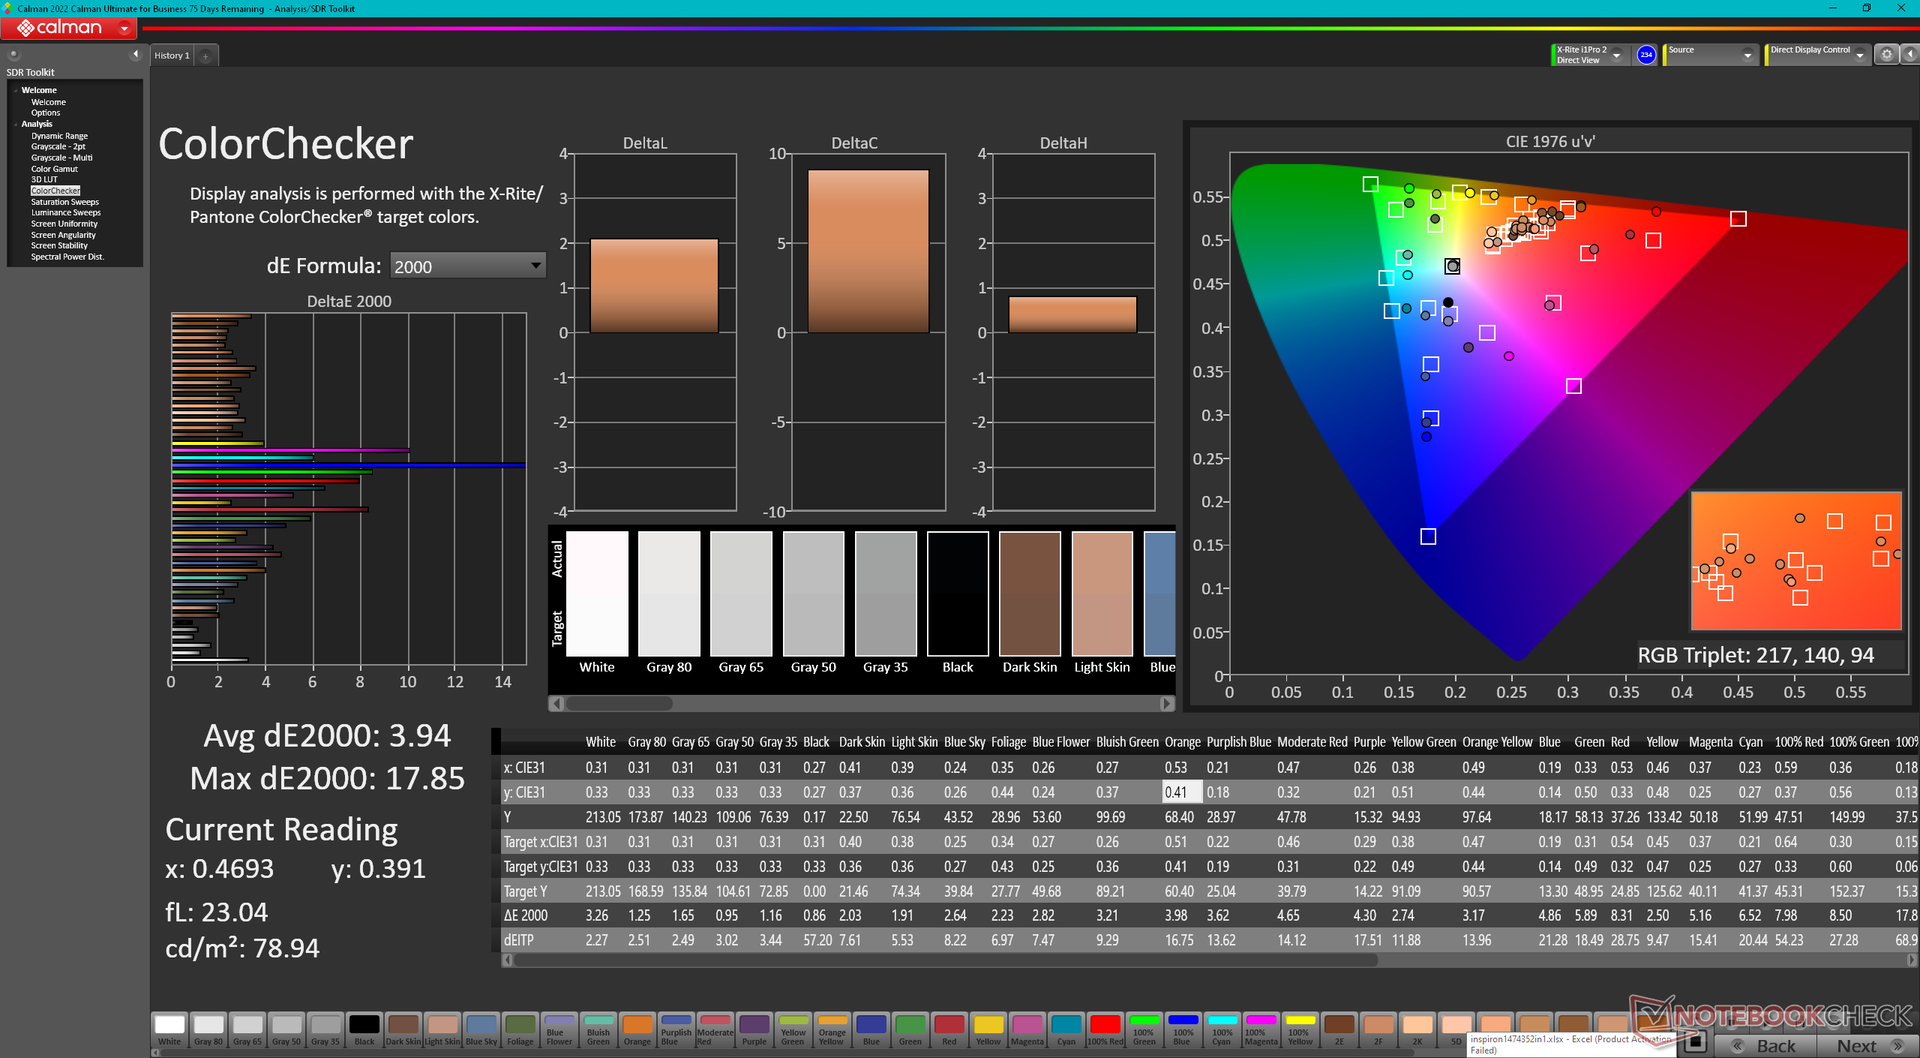
ΔE ColorChecker Calman: 6.59 | ∀{0.5-29.43 Ø4.71}
calibrated: 3.94
ΔE Greyscale Calman: 4.5 | ∀{0.09-98 Ø4.96}
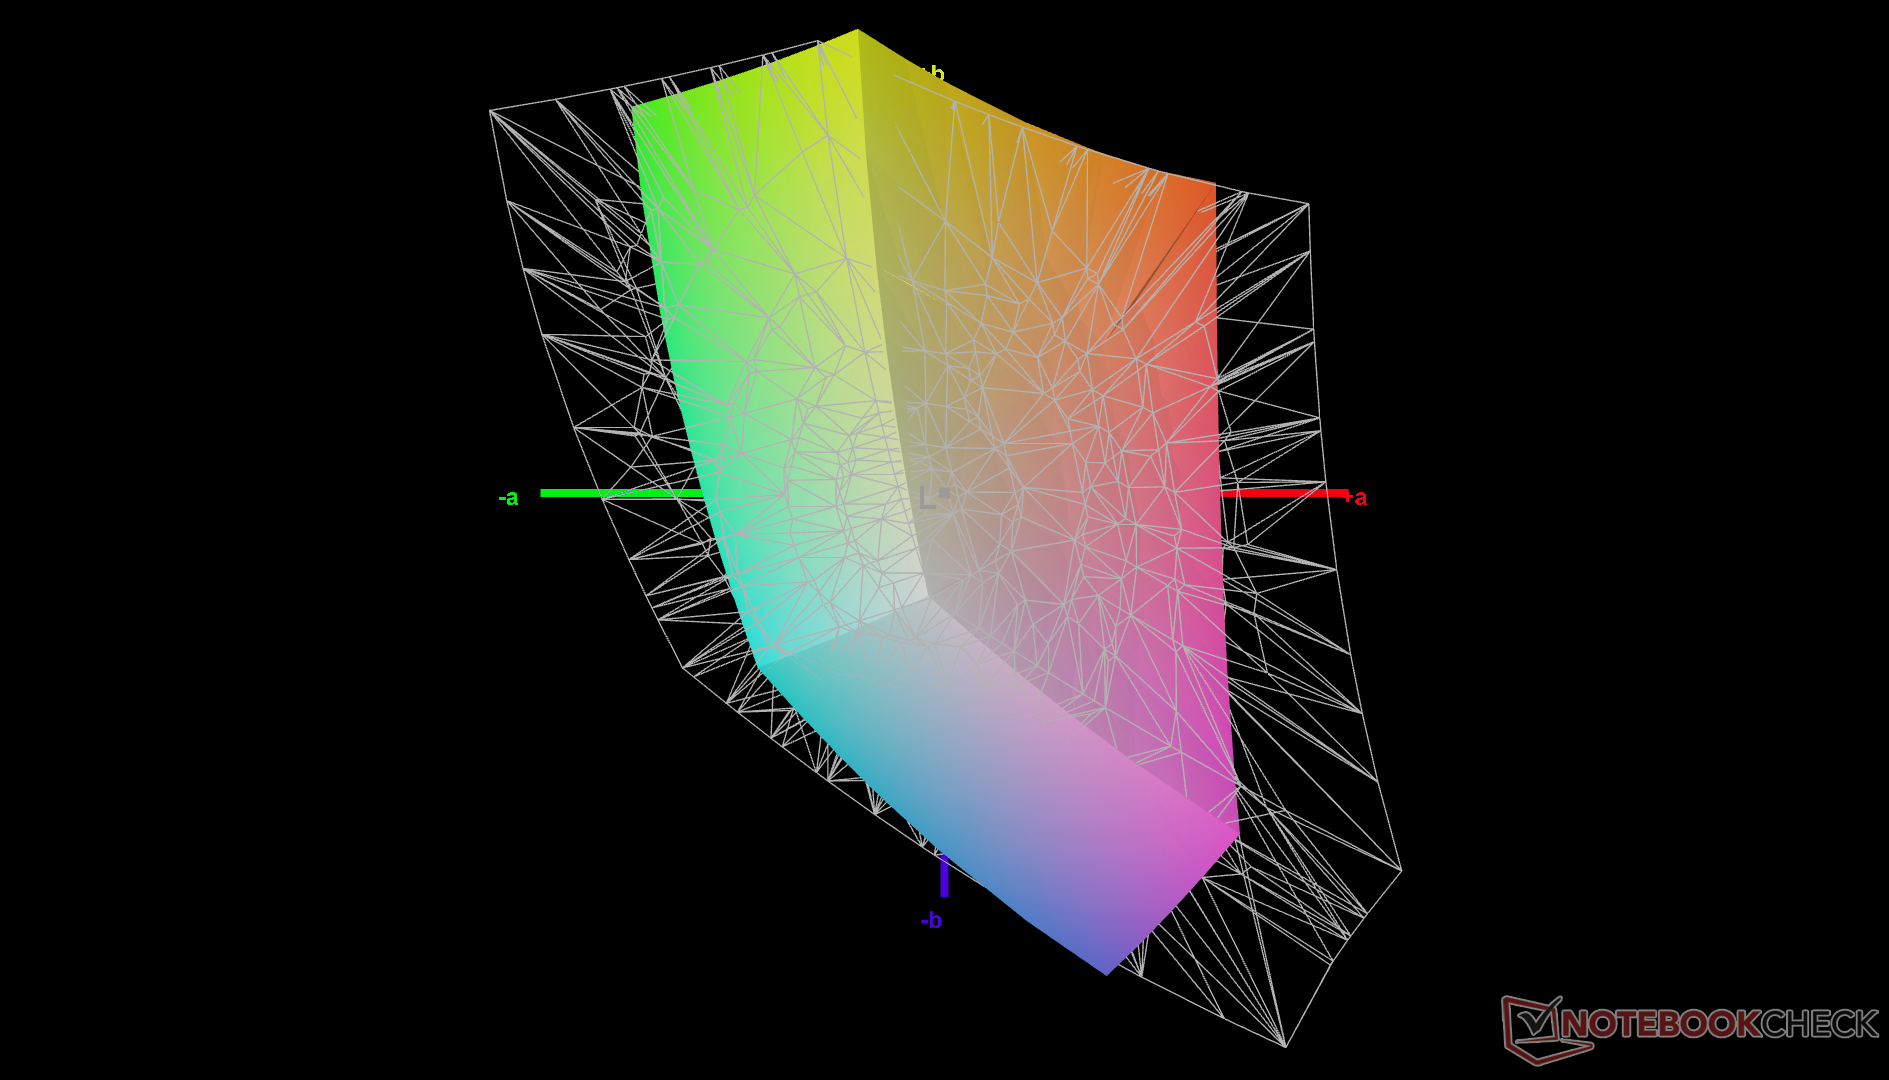
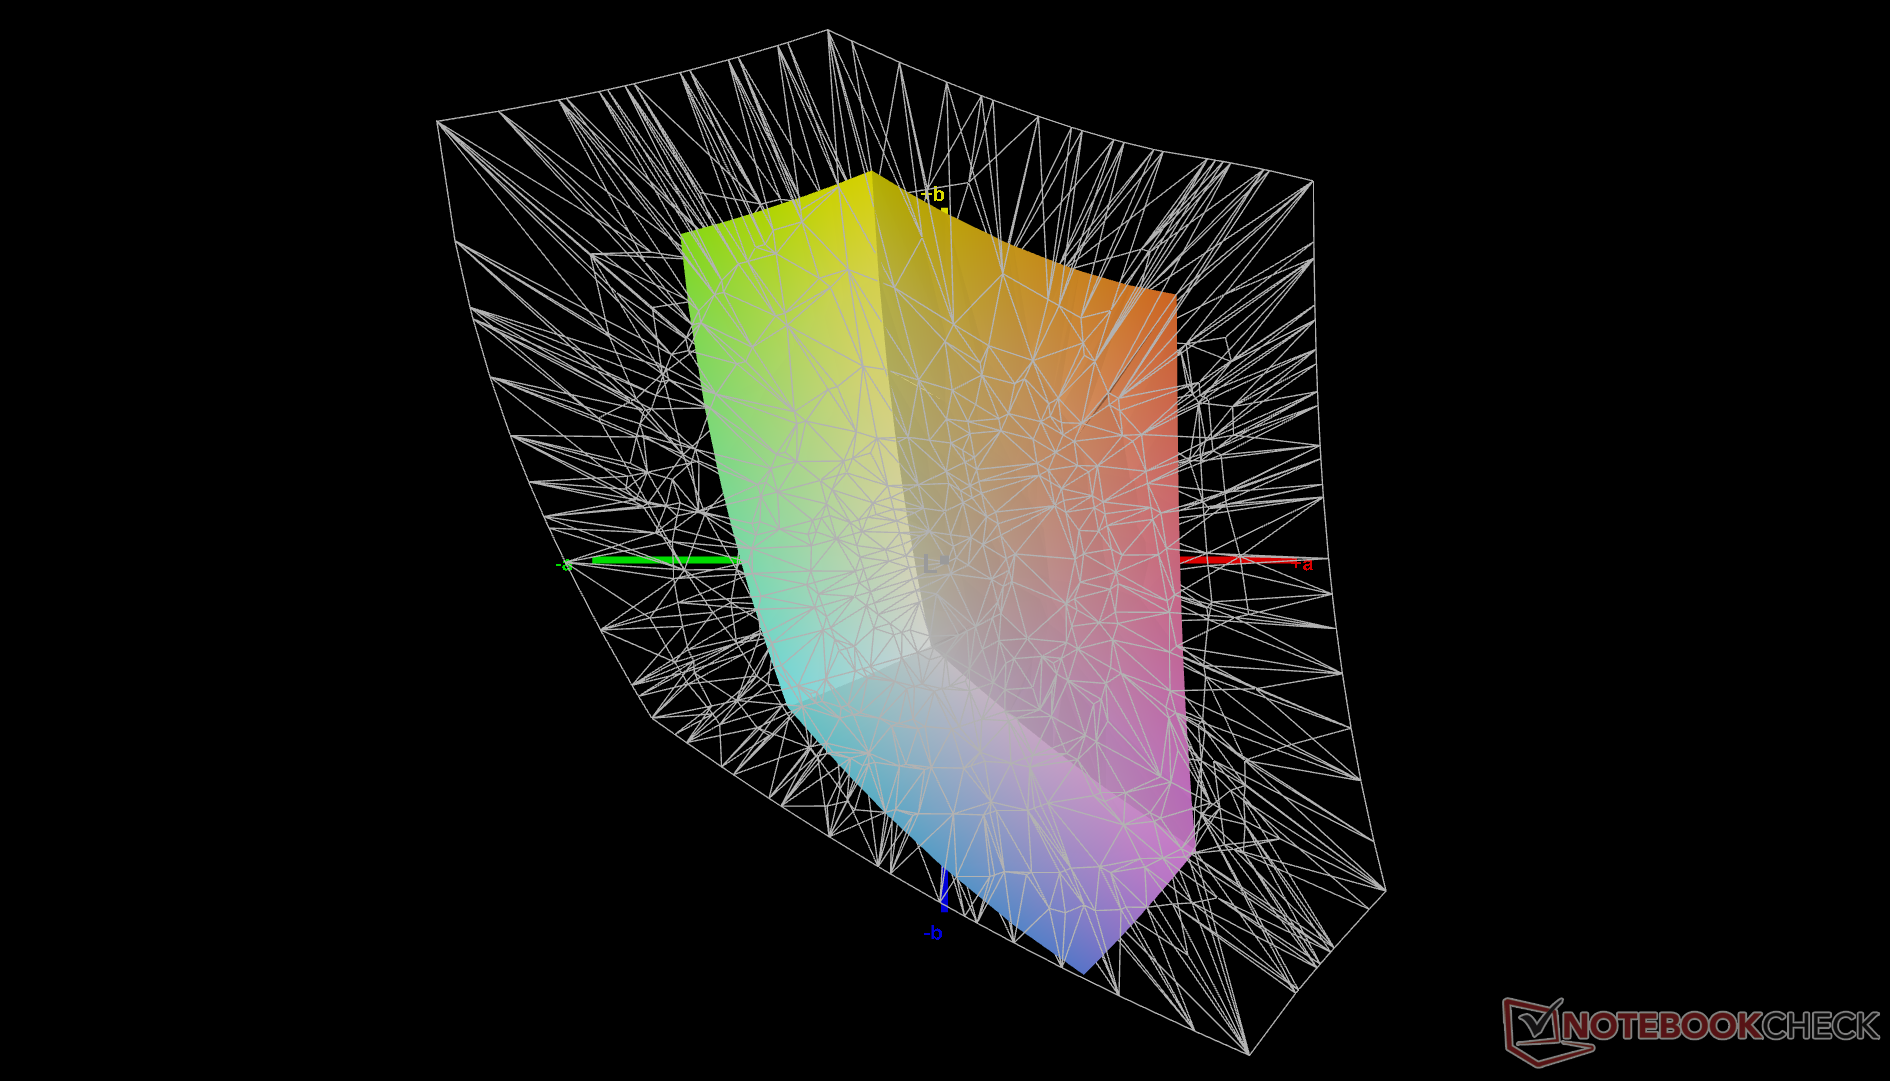
45.8% AdobeRGB 1998 (Argyll 3D)
64.4% sRGB (Argyll 3D)
44.4% Display P3 (Argyll 3D)
Gamma: 2.17
CCT: 6110 K
| Dell Inspiron 14 7435 2-in-1 LG Philips 140WU2, IPS, 1920x1200, 14" | Dell Inspiron 14 7420 2-in-1 BOE NV14N42, IPS, 1920x1200, 14" | Lenovo IdeaPad Flex 7i 14IAU7 BOE CQ NV140DRM-162, IPS, 2240x1400, 14" | Acer Aspire 5 Spin 14 BOE CQ NV140WUM-N41, IPS, 1920x1200, 14" | LG Gram 14T90P LG Philips LP140WU1-SPA1, IPS, 1900x1200, 14" | HP Pavilion x360 14-dy0157ng Chi Mei N140HCA-E5B, IPS, 1920x1080, 14" | |
|---|---|---|---|---|---|---|
| Display | -13% | 56% | -12% | 89% | -3% | |
| Display P3 Coverage (%) | 44.4 | 38.6 -13% | 69.8 57% | 38.5 -13% | 98.8 123% | 42.7 -4% |
| sRGB Coverage (%) | 64.4 | 56.2 -13% | 98 52% | 57.3 -11% | 100 55% | 63.7 -1% |
| AdobeRGB 1998 Coverage (%) | 45.8 | 39.9 -13% | 72.2 58% | 39.8 -13% | 44.2 -3% | |
| Response Times | -24% | -101% | -23% | -90% | -39% | |
| Response Time Grey 50% / Grey 80% * (ms) | 19.6 ? | 27.2 ? -39% | 44.4 ? -127% | 29 ? -48% | 44 ? -124% | 32 ? -63% |
| Response Time Black / White * (ms) | 19.3 ? | 20.8 ? -8% | 33.6 ? -74% | 19 ? 2% | 30 ? -55% | 22 ? -14% |
| PWM Frequency (Hz) | ||||||
| Screen | -6% | 31% | 12% | 34% | 39% | |
| Brightness middle (cd/m²) | 231.8 | 269.4 16% | 317.3 37% | 249 7% | 305.5 32% | 269 16% |
| Brightness (cd/m²) | 216 | 260 20% | 301 39% | 235 9% | 289 34% | 241 12% |
| Brightness Distribution (%) | 87 | 89 2% | 90 3% | 85 -2% | 87 0% | 82 -6% |
| Black Level * (cd/m²) | 0.27 | 0.41 -52% | 0.22 19% | 0.27 -0% | 0.27 -0% | 0.11 59% |
| Contrast (:1) | 859 | 657 -24% | 1442 68% | 922 7% | 1131 32% | 2445 185% |
| Colorchecker dE 2000 * | 6.59 | 6.53 1% | 3.99 39% | 5 24% | 3.31 50% | 5.68 14% |
| Colorchecker dE 2000 max. * | 16.83 | 19.76 -17% | 9.34 45% | 8.32 51% | 6.12 64% | 9.61 43% |
| Colorchecker dE 2000 calibrated * | 3.94 | 3.13 21% | 0.6 85% | 5.06 -28% | ||
| Greyscale dE 2000 * | 4.5 | 5.4 -20% | 6.9 -53% | 2.86 36% | 1.9 58% | 4.95 -10% |
| Gamma | 2.17 101% | 2.05 107% | 2.19 100% | 2.19 100% | 2.04 108% | 2.17 101% |
| CCT | 6110 106% | 6007 108% | 6161 106% | 6419 101% | 6706 97% | 6628 98% |
| Color Space (Percent of AdobeRGB 1998) (%) | 44.2 | |||||
| Color Space (Percent of sRGB) (%) | 63.7 | |||||
| Całkowita średnia (program / ustawienia) | -14% /
-10% | -5% /
18% | -8% /
2% | 11% /
22% | -1% /
18% |
* ... im mniej tym lepiej
Temperatura kolorów jest nieco zbyt ciepła po wyjęciu z pudełka. Kalibracja za pomocą naszego kolorymetru X-Rite rozwiązuje ten problem, zapewniając ogólnie dokładniejsze kolory. Należy jednak pamiętać, że kolory nadal będą niedokładne przy wyższych poziomach nasycenia ze względu na ograniczone pokrycie sRGB wspomniane powyżej.
Wyświetl czasy reakcji
| ↔ Czas reakcji od czerni do bieli | ||
|---|---|---|
| 19.3 ms ... wzrost ↗ i spadek ↘ łącznie | ↗ 10.6 ms wzrost | 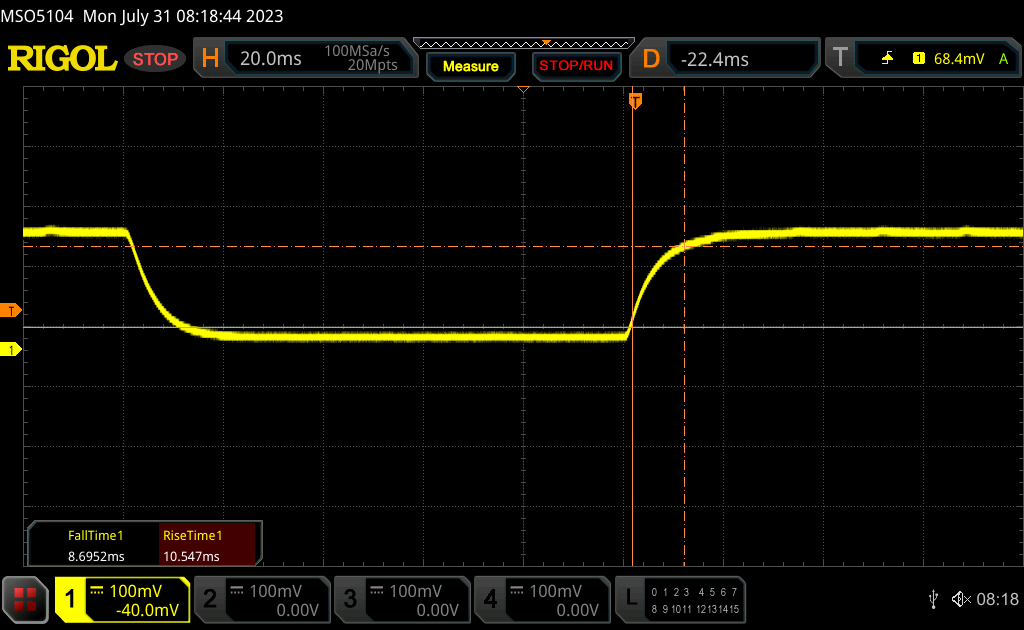 |
| ↘ 8.7 ms upadek | ||
| W naszych testach ekran wykazuje dobry współczynnik reakcji, ale może być zbyt wolny dla graczy rywalizujących ze sobą. Dla porównania, wszystkie testowane urządzenia wahają się od 0.1 (minimum) do 240 (maksimum) ms. » 43 % wszystkich urządzeń jest lepszych. Oznacza to, że zmierzony czas reakcji jest zbliżony do średniej wszystkich testowanych urządzeń (19.8 ms). | ||
| ↔ Czas reakcji 50% szarości do 80% szarości | ||
| 19.6 ms ... wzrost ↗ i spadek ↘ łącznie | ↗ 13.6 ms wzrost | 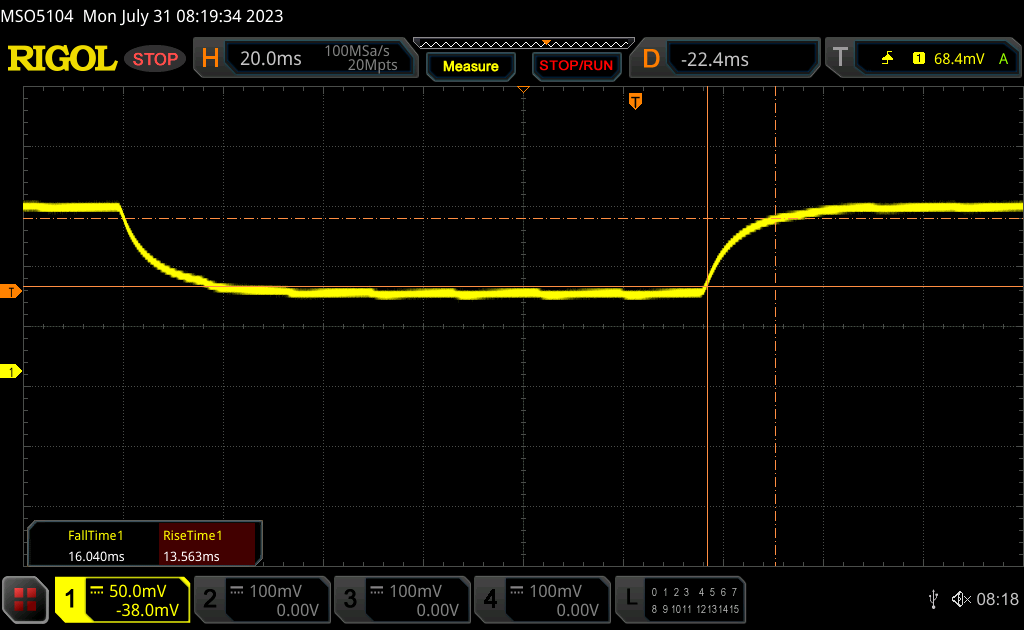 |
| ↘ 16 ms upadek | ||
| W naszych testach ekran wykazuje dobry współczynnik reakcji, ale może być zbyt wolny dla graczy rywalizujących ze sobą. Dla porównania, wszystkie testowane urządzenia wahają się od 0.165 (minimum) do 636 (maksimum) ms. » 33 % wszystkich urządzeń jest lepszych. Oznacza to, że zmierzony czas reakcji jest lepszy od średniej wszystkich testowanych urządzeń (30.9 ms). | ||
Migotanie ekranu / PWM (modulacja szerokości impulsu)
| Migotanie ekranu/nie wykryto PWM | 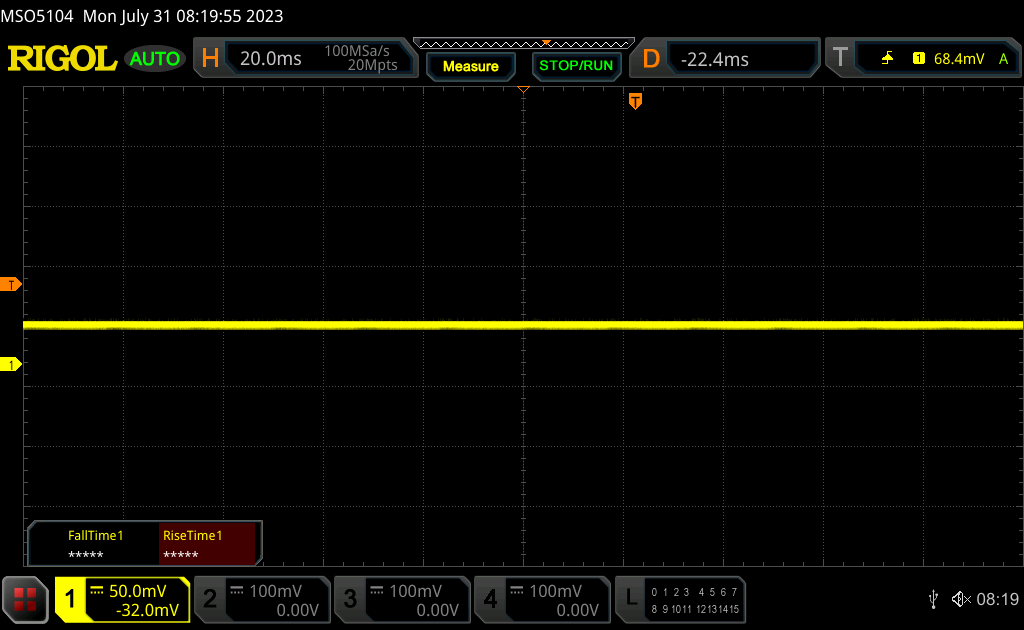 | ||
Dla porównania: 52 % wszystkich testowanych urządzeń nie używa PWM do przyciemniania wyświetlacza. Jeśli wykryto PWM, zmierzono średnio 7741 (minimum: 5 - maksimum: 343500) Hz. | |||
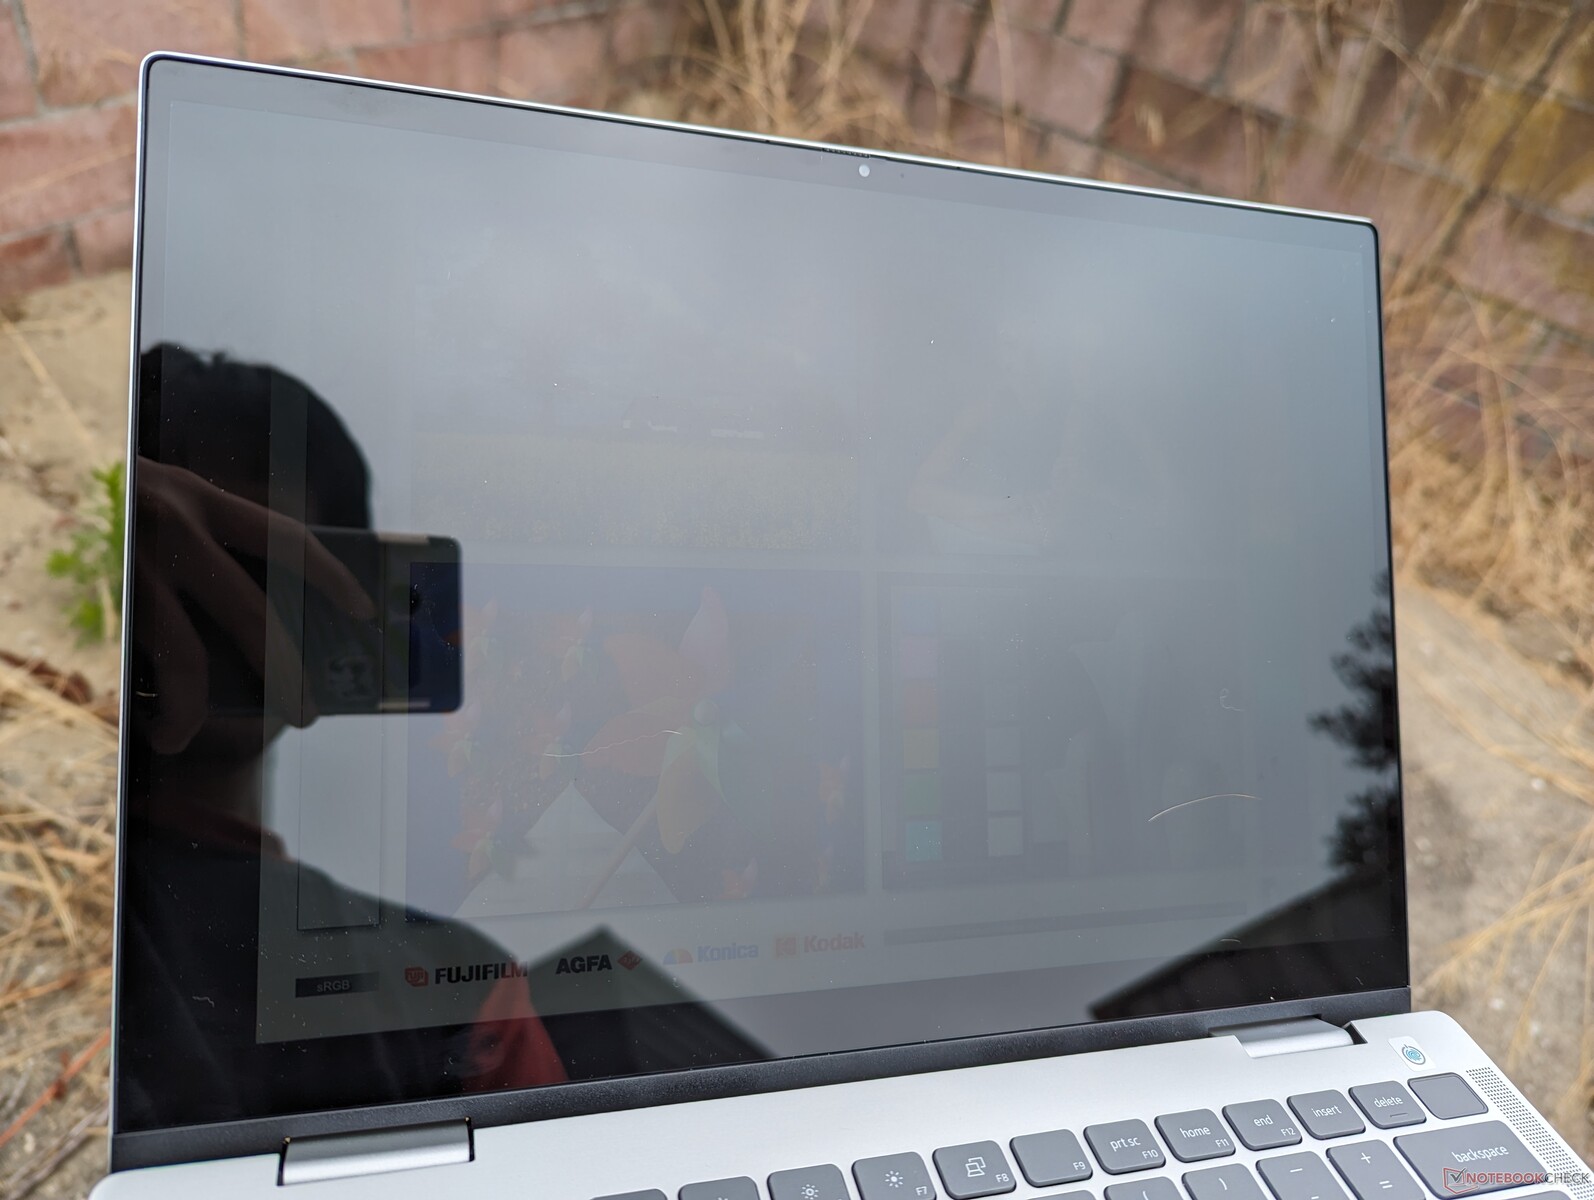
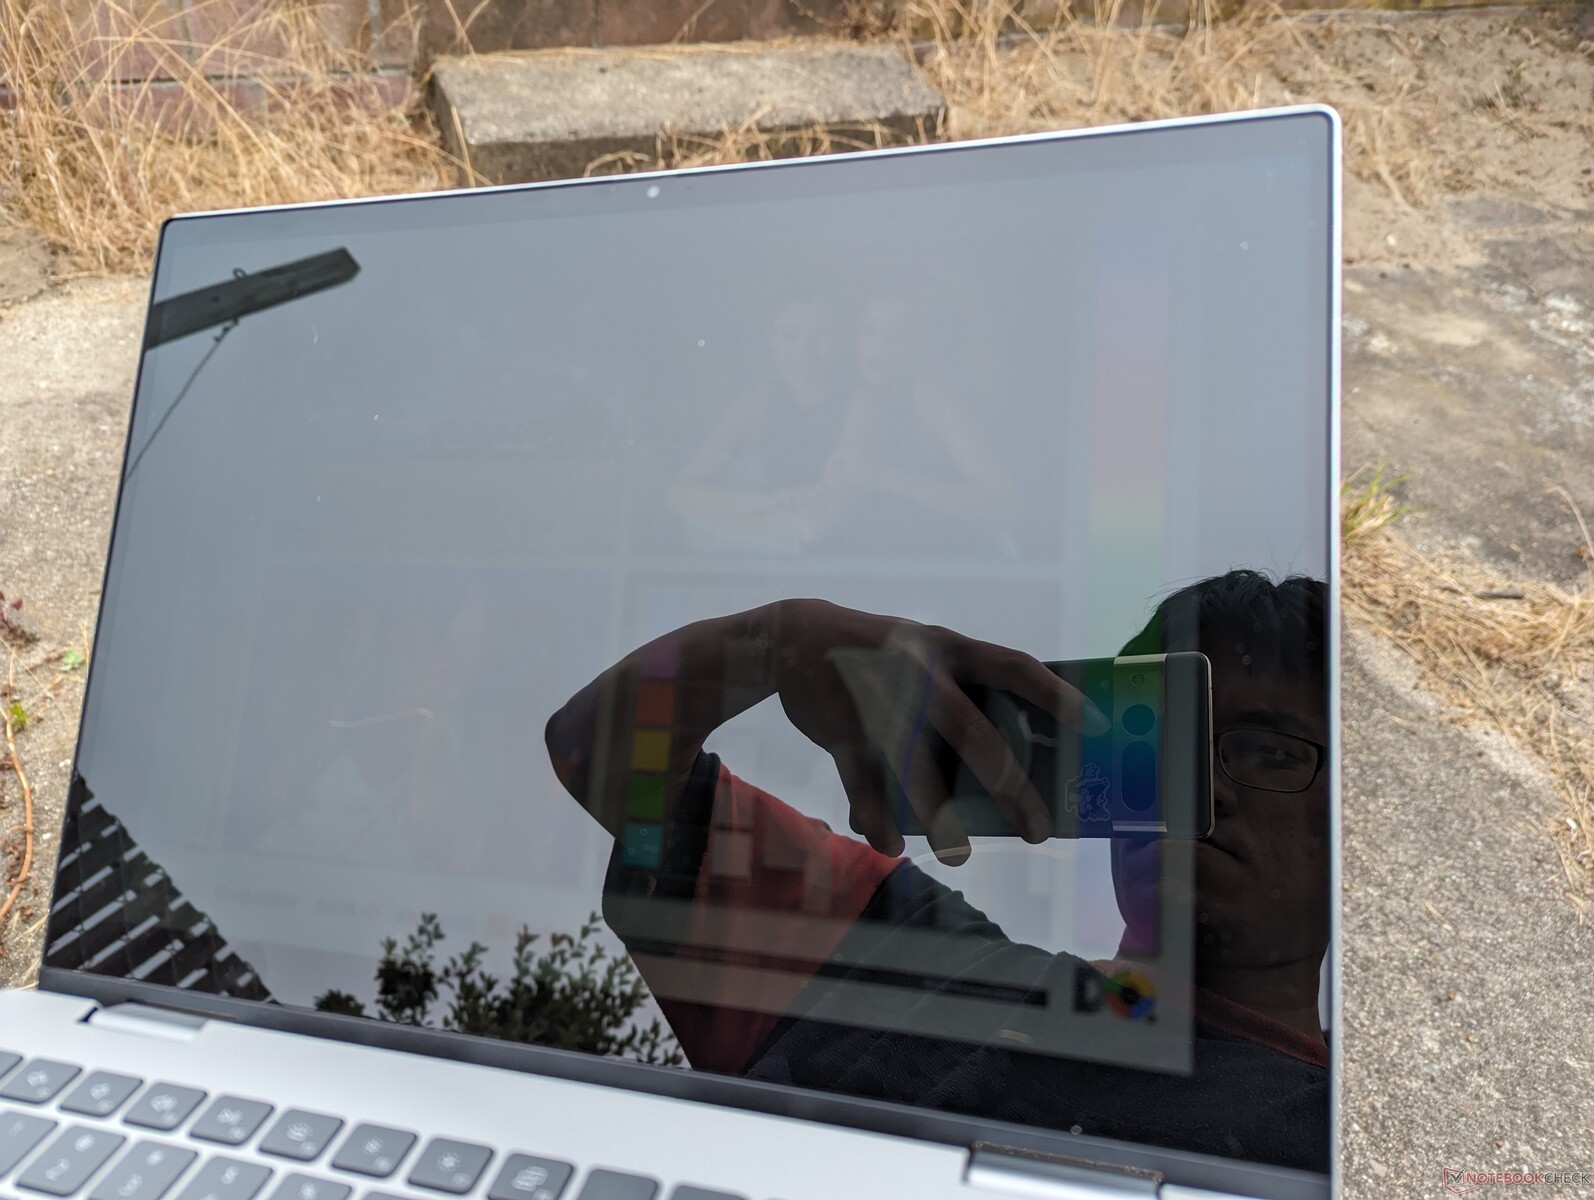
Odblaski są zauważalne nawet podczas korzystania z laptopa w pomieszczeniach lub w cieniu. Słabe podświetlenie nie jest w stanie zniwelować znacznej części odblasków z błyszczącej nakładki, co poważnie wpływa na widoczność w warunkach zewnętrznych.
Wydajność - AMD Zen 3 At Heart
Warunki testowania
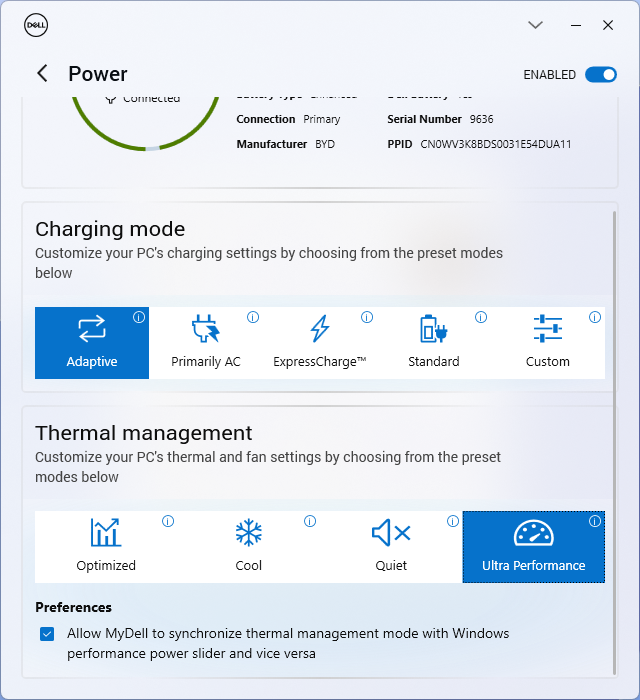
Przed uruchomieniem poniższych testów ustawiliśmy nasze urządzenie w tryb wydajności za pomocą oprogramowania MyDell. Co wygodne, profile zasilania MyDell są zsynchronizowane z profilami zasilania systemu Windows, w przeciwieństwie do większości innych modeli konkurencyjnych producentów.
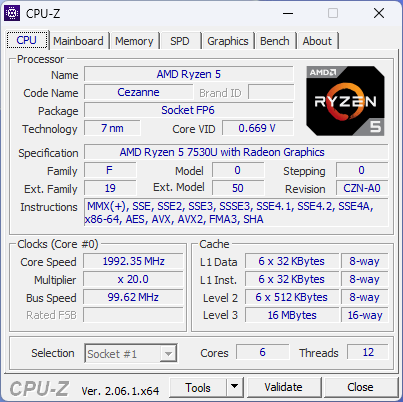
Procesor
6-rdzeniowy Ryzen 5 7530U działa niemal identycznie jakRyzen 5 6600U ponieważ oba oparte są na architekturze Zen 3. Ogólna wydajność jest porównywalna do średniej klasy Core i5-1335U jaki można znaleźć w modelach takich jakAcer Aspire 5 Spin 14 jednocześnie znacznie przewyższając mobilne rozwiązania Core i3. AMD dostosowało ten procesor tak, aby był konkurencyjny w stosunku do serii Core i5 zarówno pod względem wydajności, jak i ceny.
Aktualizacja do 8-rdzeniowego Ryzen 7 7730U oczekuje się, że zwiększy wydajność wielowątkową o około 30 do 40 procent w oparciu o nasz czas z Asus Zenbook 14.
Cinebench R15 Multi Loop
Cinebench R23: Multi Core | Single Core
Cinebench R20: CPU (Multi Core) | CPU (Single Core)
Cinebench R15: CPU Multi 64Bit | CPU Single 64Bit
Blender: v2.79 BMW27 CPU
7-Zip 18.03: 7z b 4 | 7z b 4 -mmt1
Geekbench 5.5: Multi-Core | Single-Core
HWBOT x265 Benchmark v2.2: 4k Preset
LibreOffice : 20 Documents To PDF
R Benchmark 2.5: Overall mean
| CPU Performance rating | |
| Lenovo Yoga 9 14IRP G8 | |
| Lenovo Yoga 7-14ARB G7 | |
| Lenovo ThinkPad X1 Yoga G8 i7-1355U -1! | |
| Dell Latitude 9440 2-in-1 -1! | |
| MSI Summit E14 Flip Evo A12MT | |
| Morefine M600, 6600U | |
| Dell Inspiron 14 7420 2-in-1 | |
| Acer Aspire 5 Spin 14 | |
| Dell Inspiron 14 7435 2-in-1 | |
| Przeciętny AMD Ryzen 5 7530U | |
| Lenovo IdeaPad Flex 5 14IAU7-82R7007TGE | |
| Lenovo ThinkBook 14s Yoga ITL 20WE0023GE | |
| HP Pavilion x360 14-dy0157ng | |
| Cinebench R23 / Multi Core | |
| Lenovo Yoga 9 14IRP G8 | |
| Lenovo Yoga 7-14ARB G7 | |
| Lenovo ThinkPad X1 Yoga G8 i7-1355U | |
| Dell Latitude 9440 2-in-1 | |
| MSI Summit E14 Flip Evo A12MT | |
| Morefine M600, 6600U | |
| Dell Inspiron 14 7435 2-in-1 | |
| Przeciętny AMD Ryzen 5 7530U (6931 - 9347, n=9) | |
| Acer Aspire 5 Spin 14 | |
| Dell Inspiron 14 7420 2-in-1 | |
| Lenovo IdeaPad Flex 5 14IAU7-82R7007TGE | |
| Lenovo ThinkBook 14s Yoga ITL 20WE0023GE | |
| HP Pavilion x360 14-dy0157ng | |
| Cinebench R23 / Single Core | |
| Dell Latitude 9440 2-in-1 | |
| Lenovo Yoga 9 14IRP G8 | |
| Lenovo ThinkPad X1 Yoga G8 i7-1355U | |
| Dell Inspiron 14 7420 2-in-1 | |
| MSI Summit E14 Flip Evo A12MT | |
| Lenovo IdeaPad Flex 5 14IAU7-82R7007TGE | |
| Acer Aspire 5 Spin 14 | |
| Lenovo Yoga 7-14ARB G7 | |
| Lenovo ThinkBook 14s Yoga ITL 20WE0023GE | |
| Przeciętny AMD Ryzen 5 7530U (1371 - 1470, n=9) | |
| Dell Inspiron 14 7435 2-in-1 | |
| Morefine M600, 6600U | |
| HP Pavilion x360 14-dy0157ng | |
| Cinebench R20 / CPU (Multi Core) | |
| Lenovo Yoga 7-14ARB G7 | |
| Lenovo Yoga 9 14IRP G8 | |
| Lenovo ThinkPad X1 Yoga G8 i7-1355U | |
| Dell Latitude 9440 2-in-1 | |
| MSI Summit E14 Flip Evo A12MT | |
| Morefine M600, 6600U | |
| Przeciętny AMD Ryzen 5 7530U (2780 - 3655, n=9) | |
| Dell Inspiron 14 7435 2-in-1 | |
| Acer Aspire 5 Spin 14 | |
| Dell Inspiron 14 7420 2-in-1 | |
| Lenovo IdeaPad Flex 5 14IAU7-82R7007TGE | |
| Lenovo ThinkBook 14s Yoga ITL 20WE0023GE | |
| HP Pavilion x360 14-dy0157ng | |
| Cinebench R20 / CPU (Single Core) | |
| Lenovo Yoga 9 14IRP G8 | |
| Dell Latitude 9440 2-in-1 | |
| Lenovo ThinkPad X1 Yoga G8 i7-1355U | |
| Dell Inspiron 14 7420 2-in-1 | |
| MSI Summit E14 Flip Evo A12MT | |
| Lenovo IdeaPad Flex 5 14IAU7-82R7007TGE | |
| Lenovo Yoga 7-14ARB G7 | |
| Acer Aspire 5 Spin 14 | |
| Lenovo ThinkBook 14s Yoga ITL 20WE0023GE | |
| Przeciętny AMD Ryzen 5 7530U (528 - 574, n=9) | |
| Dell Inspiron 14 7435 2-in-1 | |
| Morefine M600, 6600U | |
| HP Pavilion x360 14-dy0157ng | |
| Cinebench R15 / CPU Multi 64Bit | |
| Lenovo Yoga 9 14IRP G8 | |
| Lenovo Yoga 7-14ARB G7 | |
| Lenovo ThinkPad X1 Yoga G8 i7-1355U | |
| Dell Latitude 9440 2-in-1 | |
| Acer Aspire 5 Spin 14 | |
| Przeciętny AMD Ryzen 5 7530U (1101 - 1599, n=9) | |
| MSI Summit E14 Flip Evo A12MT | |
| Morefine M600, 6600U | |
| Dell Inspiron 14 7435 2-in-1 | |
| Dell Inspiron 14 7420 2-in-1 | |
| Lenovo IdeaPad Flex 5 14IAU7-82R7007TGE | |
| Lenovo ThinkBook 14s Yoga ITL 20WE0023GE | |
| HP Pavilion x360 14-dy0157ng | |
| Cinebench R15 / CPU Single 64Bit | |
| Lenovo Yoga 9 14IRP G8 | |
| Dell Latitude 9440 2-in-1 | |
| Lenovo ThinkPad X1 Yoga G8 i7-1355U | |
| Dell Inspiron 14 7420 2-in-1 | |
| MSI Summit E14 Flip Evo A12MT | |
| Lenovo Yoga 7-14ARB G7 | |
| Przeciętny AMD Ryzen 5 7530U (213 - 237, n=9) | |
| Dell Inspiron 14 7435 2-in-1 | |
| Lenovo IdeaPad Flex 5 14IAU7-82R7007TGE | |
| Morefine M600, 6600U | |
| Acer Aspire 5 Spin 14 | |
| Lenovo ThinkBook 14s Yoga ITL 20WE0023GE | |
| HP Pavilion x360 14-dy0157ng | |
| Blender / v2.79 BMW27 CPU | |
| HP Pavilion x360 14-dy0157ng | |
| Lenovo ThinkBook 14s Yoga ITL 20WE0023GE | |
| Lenovo IdeaPad Flex 5 14IAU7-82R7007TGE | |
| Dell Inspiron 14 7420 2-in-1 | |
| Morefine M600, 6600U | |
| Acer Aspire 5 Spin 14 | |
| Przeciętny AMD Ryzen 5 7530U (330 - 469, n=8) | |
| Dell Inspiron 14 7435 2-in-1 | |
| MSI Summit E14 Flip Evo A12MT | |
| Lenovo Yoga 9 14IRP G8 | |
| Lenovo Yoga 7-14ARB G7 | |
| 7-Zip 18.03 / 7z b 4 | |
| Lenovo Yoga 7-14ARB G7 | |
| Lenovo Yoga 9 14IRP G8 | |
| MSI Summit E14 Flip Evo A12MT | |
| Morefine M600, 6600U | |
| Lenovo ThinkPad X1 Yoga G8 i7-1355U | |
| Dell Latitude 9440 2-in-1 | |
| Przeciętny AMD Ryzen 5 7530U (32204 - 42364, n=8) | |
| Dell Inspiron 14 7435 2-in-1 | |
| Acer Aspire 5 Spin 14 | |
| Dell Inspiron 14 7420 2-in-1 | |
| Lenovo IdeaPad Flex 5 14IAU7-82R7007TGE | |
| Lenovo ThinkBook 14s Yoga ITL 20WE0023GE | |
| HP Pavilion x360 14-dy0157ng | |
| 7-Zip 18.03 / 7z b 4 -mmt1 | |
| Dell Latitude 9440 2-in-1 | |
| Lenovo Yoga 9 14IRP G8 | |
| Lenovo ThinkPad X1 Yoga G8 i7-1355U | |
| Dell Inspiron 14 7420 2-in-1 | |
| Lenovo Yoga 7-14ARB G7 | |
| Morefine M600, 6600U | |
| MSI Summit E14 Flip Evo A12MT | |
| Lenovo ThinkBook 14s Yoga ITL 20WE0023GE | |
| Przeciętny AMD Ryzen 5 7530U (5113 - 5544, n=8) | |
| Dell Inspiron 14 7435 2-in-1 | |
| Acer Aspire 5 Spin 14 | |
| Lenovo IdeaPad Flex 5 14IAU7-82R7007TGE | |
| HP Pavilion x360 14-dy0157ng | |
| Geekbench 5.5 / Multi-Core | |
| Lenovo Yoga 9 14IRP G8 | |
| MSI Summit E14 Flip Evo A12MT | |
| Lenovo ThinkPad X1 Yoga G8 i7-1355U | |
| Lenovo Yoga 7-14ARB G7 | |
| Dell Latitude 9440 2-in-1 | |
| Acer Aspire 5 Spin 14 | |
| Morefine M600, 6600U | |
| Dell Inspiron 14 7420 2-in-1 | |
| Dell Inspiron 14 7435 2-in-1 | |
| Przeciętny AMD Ryzen 5 7530U (5475 - 6648, n=8) | |
| Lenovo IdeaPad Flex 5 14IAU7-82R7007TGE | |
| Lenovo ThinkBook 14s Yoga ITL 20WE0023GE | |
| HP Pavilion x360 14-dy0157ng | |
| Geekbench 5.5 / Single-Core | |
| Dell Latitude 9440 2-in-1 | |
| Lenovo Yoga 9 14IRP G8 | |
| Lenovo ThinkPad X1 Yoga G8 i7-1355U | |
| MSI Summit E14 Flip Evo A12MT | |
| Acer Aspire 5 Spin 14 | |
| Dell Inspiron 14 7420 2-in-1 | |
| Lenovo IdeaPad Flex 5 14IAU7-82R7007TGE | |
| Lenovo Yoga 7-14ARB G7 | |
| Lenovo ThinkBook 14s Yoga ITL 20WE0023GE | |
| Morefine M600, 6600U | |
| Dell Inspiron 14 7435 2-in-1 | |
| Przeciętny AMD Ryzen 5 7530U (1393 - 1512, n=8) | |
| HP Pavilion x360 14-dy0157ng | |
| HWBOT x265 Benchmark v2.2 / 4k Preset | |
| Lenovo Yoga 7-14ARB G7 | |
| Lenovo Yoga 9 14IRP G8 | |
| MSI Summit E14 Flip Evo A12MT | |
| Morefine M600, 6600U | |
| Dell Inspiron 14 7435 2-in-1 | |
| Dell Latitude 9440 2-in-1 | |
| Lenovo ThinkPad X1 Yoga G8 i7-1355U | |
| Przeciętny AMD Ryzen 5 7530U (8.17 - 11.6, n=8) | |
| Acer Aspire 5 Spin 14 | |
| Dell Inspiron 14 7420 2-in-1 | |
| Lenovo ThinkBook 14s Yoga ITL 20WE0023GE | |
| Lenovo IdeaPad Flex 5 14IAU7-82R7007TGE | |
| HP Pavilion x360 14-dy0157ng | |
| LibreOffice / 20 Documents To PDF | |
| Lenovo Yoga 7-14ARB G7 | |
| Lenovo IdeaPad Flex 5 14IAU7-82R7007TGE | |
| Morefine M600, 6600U | |
| Przeciętny AMD Ryzen 5 7530U (44.6 - 58.9, n=8) | |
| HP Pavilion x360 14-dy0157ng | |
| Dell Inspiron 14 7435 2-in-1 | |
| Dell Inspiron 14 7420 2-in-1 | |
| MSI Summit E14 Flip Evo A12MT | |
| Acer Aspire 5 Spin 14 | |
| Lenovo ThinkPad X1 Yoga G8 i7-1355U | |
| Lenovo ThinkBook 14s Yoga ITL 20WE0023GE | |
| Lenovo Yoga 9 14IRP G8 | |
| Dell Latitude 9440 2-in-1 | |
| R Benchmark 2.5 / Overall mean | |
| HP Pavilion x360 14-dy0157ng | |
| Lenovo ThinkBook 14s Yoga ITL 20WE0023GE | |
| Lenovo IdeaPad Flex 5 14IAU7-82R7007TGE | |
| Przeciętny AMD Ryzen 5 7530U (0.515 - 0.567, n=8) | |
| Dell Inspiron 14 7435 2-in-1 | |
| Acer Aspire 5 Spin 14 | |
| Morefine M600, 6600U | |
| Lenovo Yoga 7-14ARB G7 | |
| MSI Summit E14 Flip Evo A12MT | |
| Dell Inspiron 14 7420 2-in-1 | |
| Lenovo ThinkPad X1 Yoga G8 i7-1355U | |
| Lenovo Yoga 9 14IRP G8 | |
| Dell Latitude 9440 2-in-1 | |
Cinebench R23: Multi Core | Single Core
Cinebench R20: CPU (Multi Core) | CPU (Single Core)
Cinebench R15: CPU Multi 64Bit | CPU Single 64Bit
Blender: v2.79 BMW27 CPU
7-Zip 18.03: 7z b 4 | 7z b 4 -mmt1
Geekbench 5.5: Multi-Core | Single-Core
HWBOT x265 Benchmark v2.2: 4k Preset
LibreOffice : 20 Documents To PDF
R Benchmark 2.5: Overall mean
* ... im mniej tym lepiej
* ... im mniej tym lepiej
AIDA64: FP32 Ray-Trace | FPU Julia | CPU SHA3 | CPU Queen | FPU SinJulia | FPU Mandel | CPU AES | CPU ZLib | FP64 Ray-Trace | CPU PhotoWorxx
| Performance rating | |
| Przeciętny AMD Ryzen 5 7530U | |
| Dell Inspiron 14 7435 2-in-1 | |
| Lenovo IdeaPad Flex 7i 14IAU7 | |
| Acer Aspire 5 Spin 14 | |
| LG Gram 14T90P | |
| HP Pavilion x360 14-dy0157ng | |
| Dell Inspiron 14 7420 2-in-1 | |
| AIDA64 / FP32 Ray-Trace | |
| Dell Inspiron 14 7435 2-in-1 | |
| Przeciętny AMD Ryzen 5 7530U (7609 - 10970, n=9) | |
| Lenovo IdeaPad Flex 7i 14IAU7 | |
| Acer Aspire 5 Spin 14 | |
| LG Gram 14T90P | |
| HP Pavilion x360 14-dy0157ng | |
| Dell Inspiron 14 7420 2-in-1 | |
| AIDA64 / FPU Julia | |
| Dell Inspiron 14 7435 2-in-1 | |
| Przeciętny AMD Ryzen 5 7530U (48473 - 68384, n=9) | |
| Lenovo IdeaPad Flex 7i 14IAU7 | |
| Acer Aspire 5 Spin 14 | |
| LG Gram 14T90P | |
| HP Pavilion x360 14-dy0157ng | |
| Dell Inspiron 14 7420 2-in-1 | |
| AIDA64 / CPU SHA3 | |
| Przeciętny AMD Ryzen 5 7530U (1591 - 2323, n=9) | |
| Lenovo IdeaPad Flex 7i 14IAU7 | |
| Dell Inspiron 14 7435 2-in-1 | |
| LG Gram 14T90P | |
| Acer Aspire 5 Spin 14 | |
| HP Pavilion x360 14-dy0157ng | |
| Dell Inspiron 14 7420 2-in-1 | |
| AIDA64 / CPU Queen | |
| Dell Inspiron 14 7435 2-in-1 | |
| Przeciętny AMD Ryzen 5 7530U (66646 - 78105, n=8) | |
| Lenovo IdeaPad Flex 7i 14IAU7 | |
| Dell Inspiron 14 7420 2-in-1 | |
| Acer Aspire 5 Spin 14 | |
| LG Gram 14T90P | |
| HP Pavilion x360 14-dy0157ng | |
| AIDA64 / FPU SinJulia | |
| Dell Inspiron 14 7435 2-in-1 | |
| Przeciętny AMD Ryzen 5 7530U (7611 - 9248, n=9) | |
| Lenovo IdeaPad Flex 7i 14IAU7 | |
| Dell Inspiron 14 7420 2-in-1 | |
| LG Gram 14T90P | |
| Acer Aspire 5 Spin 14 | |
| HP Pavilion x360 14-dy0157ng | |
| AIDA64 / FPU Mandel | |
| Dell Inspiron 14 7435 2-in-1 | |
| Przeciętny AMD Ryzen 5 7530U (26912 - 37624, n=9) | |
| Lenovo IdeaPad Flex 7i 14IAU7 | |
| LG Gram 14T90P | |
| Acer Aspire 5 Spin 14 | |
| HP Pavilion x360 14-dy0157ng | |
| Dell Inspiron 14 7420 2-in-1 | |
| AIDA64 / CPU AES | |
| Acer Aspire 5 Spin 14 | |
| LG Gram 14T90P | |
| HP Pavilion x360 14-dy0157ng | |
| Przeciętny AMD Ryzen 5 7530U (33314 - 92360, n=9) | |
| Lenovo IdeaPad Flex 7i 14IAU7 | |
| Dell Inspiron 14 7435 2-in-1 | |
| Dell Inspiron 14 7420 2-in-1 | |
| AIDA64 / CPU ZLib | |
| Acer Aspire 5 Spin 14 | |
| Lenovo IdeaPad Flex 7i 14IAU7 | |
| Dell Inspiron 14 7420 2-in-1 | |
| Dell Inspiron 14 7435 2-in-1 | |
| Przeciętny AMD Ryzen 5 7530U (443 - 612, n=9) | |
| LG Gram 14T90P | |
| HP Pavilion x360 14-dy0157ng | |
| AIDA64 / FP64 Ray-Trace | |
| Dell Inspiron 14 7435 2-in-1 | |
| Przeciętny AMD Ryzen 5 7530U (4008 - 5738, n=9) | |
| Lenovo IdeaPad Flex 7i 14IAU7 | |
| LG Gram 14T90P | |
| Acer Aspire 5 Spin 14 | |
| HP Pavilion x360 14-dy0157ng | |
| Dell Inspiron 14 7420 2-in-1 | |
| AIDA64 / CPU PhotoWorxx | |
| Lenovo IdeaPad Flex 7i 14IAU7 | |
| LG Gram 14T90P | |
| Acer Aspire 5 Spin 14 | |
| HP Pavilion x360 14-dy0157ng | |
| Dell Inspiron 14 7420 2-in-1 | |
| Dell Inspiron 14 7435 2-in-1 | |
| Przeciętny AMD Ryzen 5 7530U (9832 - 19525, n=9) | |
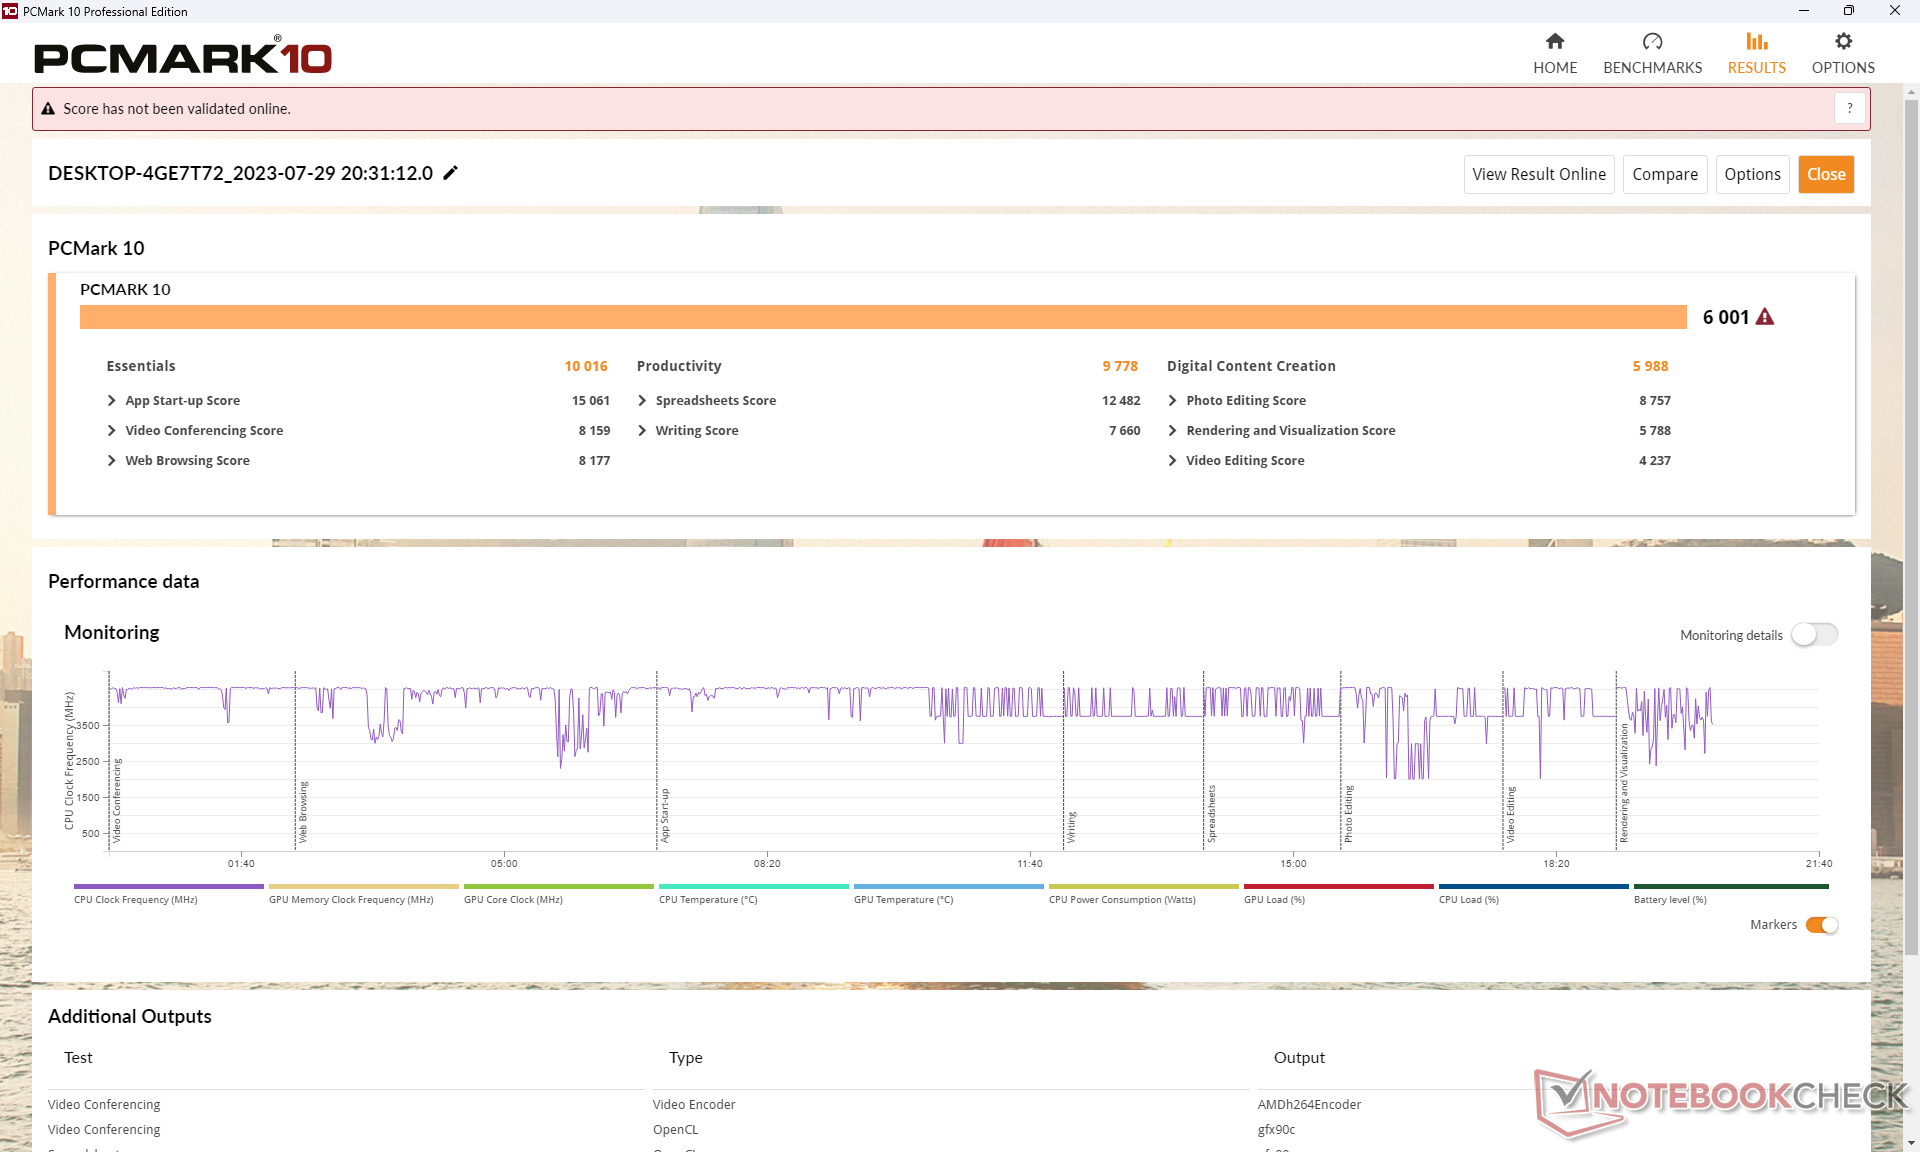
Wydajność systemu
Wyniki PCMark są wyższe niż w przypadku większości innych niedrogich subnotebooków, szczególnie w podteście Productivity. Podejrzewamy, że może to być spowodowane 6-rdzeniową/12-wątkową konfiguracją procesora, która może mieć większy wpływ na benchmark niż konfiguracje P-core i E-Core procesorów Intela.
CrossMark: Overall | Productivity | Creativity | Responsiveness
| PCMark 10 / Score | |
| Dell Inspiron 14 7435 2-in-1 | |
| Przeciętny AMD Ryzen 5 7530U, AMD Radeon RX Vega 7 (5686 - 6209, n=8) | |
| Lenovo IdeaPad Flex 7i 14IAU7 | |
| Dell Inspiron 14 7420 2-in-1 | |
| Acer Aspire 5 Spin 14 | |
| LG Gram 14T90P | |
| HP Pavilion x360 14-dy0157ng | |
| PCMark 10 / Essentials | |
| Lenovo IdeaPad Flex 7i 14IAU7 | |
| Przeciętny AMD Ryzen 5 7530U, AMD Radeon RX Vega 7 (9183 - 11242, n=8) | |
| Acer Aspire 5 Spin 14 | |
| Dell Inspiron 14 7420 2-in-1 | |
| Dell Inspiron 14 7435 2-in-1 | |
| LG Gram 14T90P | |
| HP Pavilion x360 14-dy0157ng | |
| PCMark 10 / Productivity | |
| Przeciętny AMD Ryzen 5 7530U, AMD Radeon RX Vega 7 (8983 - 14037, n=8) | |
| Dell Inspiron 14 7435 2-in-1 | |
| Lenovo IdeaPad Flex 7i 14IAU7 | |
| Acer Aspire 5 Spin 14 | |
| Dell Inspiron 14 7420 2-in-1 | |
| LG Gram 14T90P | |
| HP Pavilion x360 14-dy0157ng | |
| PCMark 10 / Digital Content Creation | |
| Dell Inspiron 14 7435 2-in-1 | |
| Dell Inspiron 14 7420 2-in-1 | |
| Lenovo IdeaPad Flex 7i 14IAU7 | |
| Acer Aspire 5 Spin 14 | |
| Przeciętny AMD Ryzen 5 7530U, AMD Radeon RX Vega 7 (4941 - 6093, n=8) | |
| HP Pavilion x360 14-dy0157ng | |
| LG Gram 14T90P | |
| CrossMark / Overall | |
| Acer Aspire 5 Spin 14 | |
| Lenovo IdeaPad Flex 7i 14IAU7 | |
| Dell Inspiron 14 7420 2-in-1 | |
| LG Gram 14T90P | |
| Przeciętny AMD Ryzen 5 7530U, AMD Radeon RX Vega 7 (1029 - 1336, n=7) | |
| Dell Inspiron 14 7435 2-in-1 | |
| CrossMark / Productivity | |
| Acer Aspire 5 Spin 14 | |
| Dell Inspiron 14 7420 2-in-1 | |
| Lenovo IdeaPad Flex 7i 14IAU7 | |
| LG Gram 14T90P | |
| Przeciętny AMD Ryzen 5 7530U, AMD Radeon RX Vega 7 (1115 - 1370, n=7) | |
| Dell Inspiron 14 7435 2-in-1 | |
| CrossMark / Creativity | |
| Lenovo IdeaPad Flex 7i 14IAU7 | |
| Dell Inspiron 14 7420 2-in-1 | |
| Acer Aspire 5 Spin 14 | |
| Przeciętny AMD Ryzen 5 7530U, AMD Radeon RX Vega 7 (992 - 1390, n=7) | |
| Dell Inspiron 14 7435 2-in-1 | |
| LG Gram 14T90P | |
| CrossMark / Responsiveness | |
| Acer Aspire 5 Spin 14 | |
| LG Gram 14T90P | |
| Dell Inspiron 14 7420 2-in-1 | |
| Lenovo IdeaPad Flex 7i 14IAU7 | |
| Dell Inspiron 14 7435 2-in-1 | |
| Przeciętny AMD Ryzen 5 7530U, AMD Radeon RX Vega 7 (900 - 1096, n=7) | |
| PCMark 10 Score | 6001 pkt. | |
Pomoc | ||
| AIDA64 / Memory Copy | |
| LG Gram 14T90P | |
| Lenovo IdeaPad Flex 7i 14IAU7 | |
| Acer Aspire 5 Spin 14 | |
| HP Pavilion x360 14-dy0157ng | |
| Dell Inspiron 14 7420 2-in-1 | |
| Dell Inspiron 14 7435 2-in-1 | |
| Przeciętny AMD Ryzen 5 7530U (20155 - 42853, n=9) | |
| AIDA64 / Memory Read | |
| LG Gram 14T90P | |
| Lenovo IdeaPad Flex 7i 14IAU7 | |
| HP Pavilion x360 14-dy0157ng | |
| Acer Aspire 5 Spin 14 | |
| Dell Inspiron 14 7420 2-in-1 | |
| Dell Inspiron 14 7435 2-in-1 | |
| Przeciętny AMD Ryzen 5 7530U (23068 - 40270, n=9) | |
| AIDA64 / Memory Write | |
| Acer Aspire 5 Spin 14 | |
| LG Gram 14T90P | |
| Lenovo IdeaPad Flex 7i 14IAU7 | |
| HP Pavilion x360 14-dy0157ng | |
| Dell Inspiron 14 7420 2-in-1 | |
| Dell Inspiron 14 7435 2-in-1 | |
| Przeciętny AMD Ryzen 5 7530U (22954 - 41838, n=9) | |
| AIDA64 / Memory Latency | |
| Dell Inspiron 14 7435 2-in-1 | |
| Acer Aspire 5 Spin 14 | |
| Przeciętny AMD Ryzen 5 7530U (88.1 - 110.8, n=9) | |
| Lenovo IdeaPad Flex 7i 14IAU7 | |
| LG Gram 14T90P | |
| HP Pavilion x360 14-dy0157ng | |
| Dell Inspiron 14 7420 2-in-1 | |
* ... im mniej tym lepiej
Opóźnienie DPC
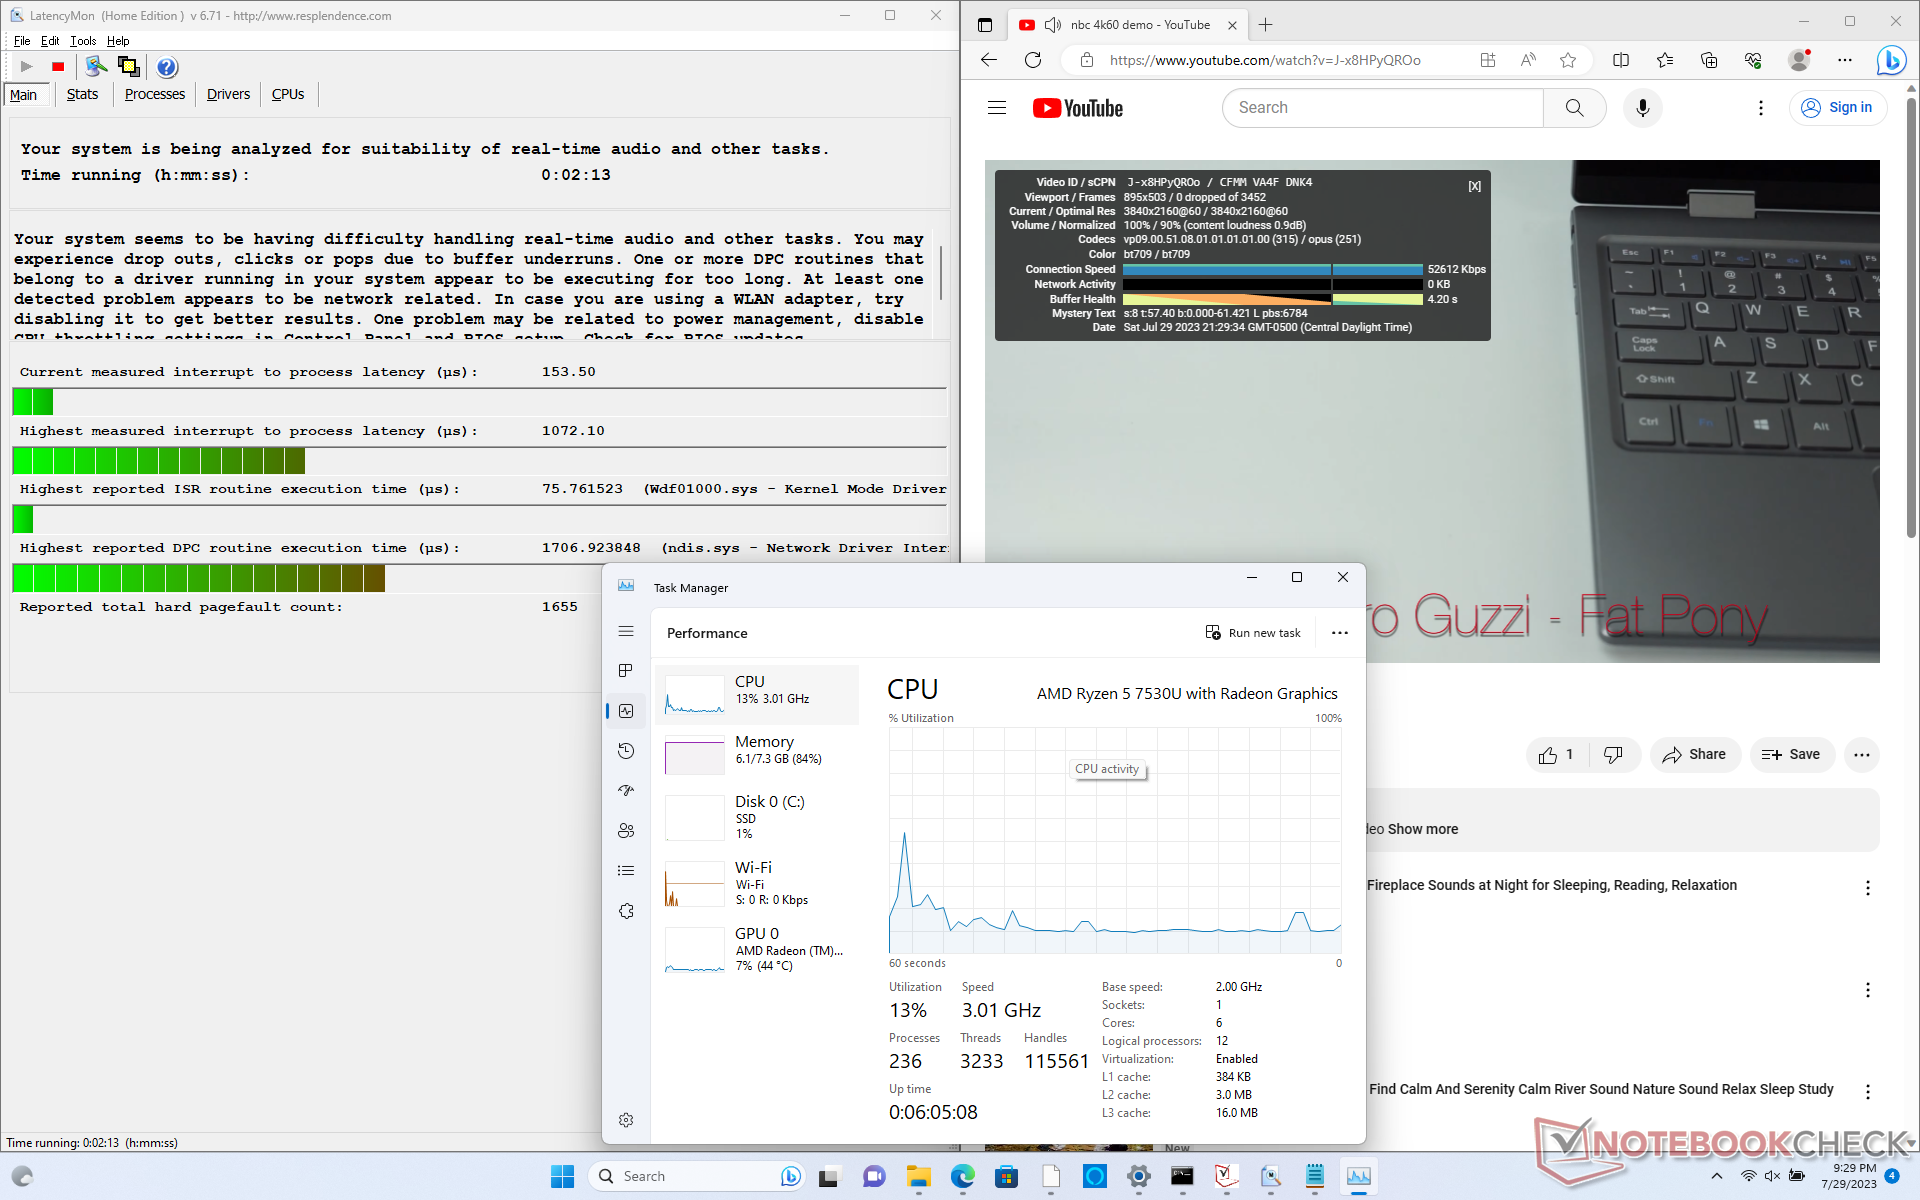
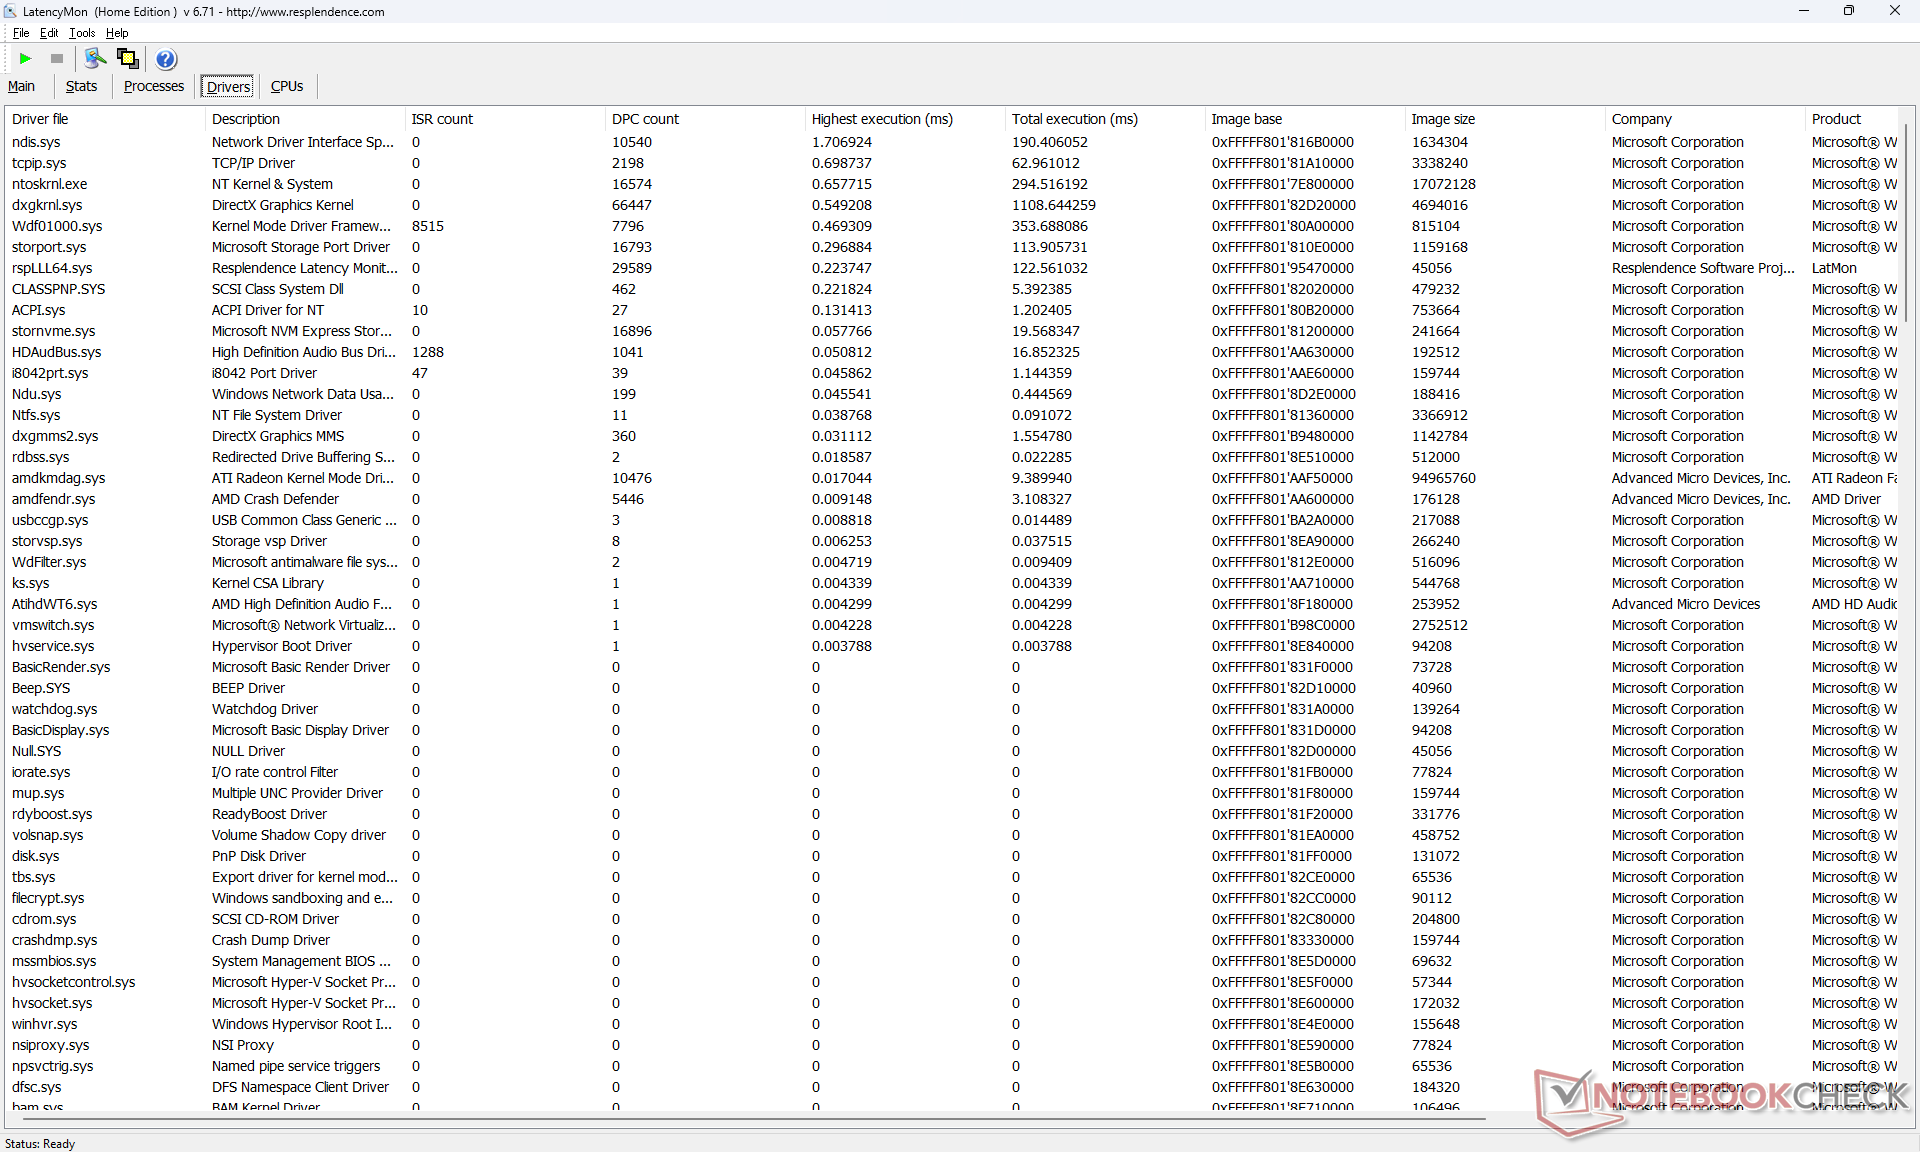
LatencyMon ujawnia drobne problemy z DPC podczas otwierania wielu kart przeglądarki na naszej stronie głównej. odtwarzanie wideo 4K przy 60 FPS jest poza tym idealne i nie odnotowano żadnych spadków klatek.
| DPC Latencies / LatencyMon - interrupt to process latency (max), Web, Youtube, Prime95 | |
| Acer Aspire 5 Spin 14 | |
| Dell Inspiron 14 7435 2-in-1 | |
| LG Gram 14T90P | |
| HP Pavilion x360 14-dy0157ng | |
| Lenovo IdeaPad Flex 7i 14IAU7 | |
| Dell Inspiron 14 7420 2-in-1 | |
* ... im mniej tym lepiej
Urządzenia pamięci masowej
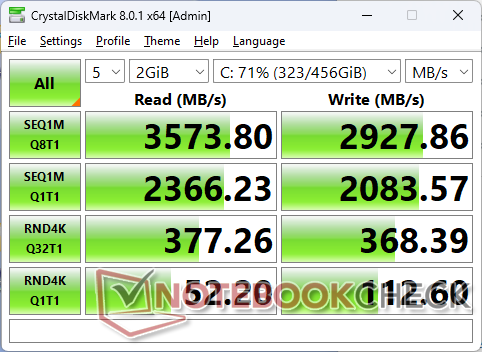
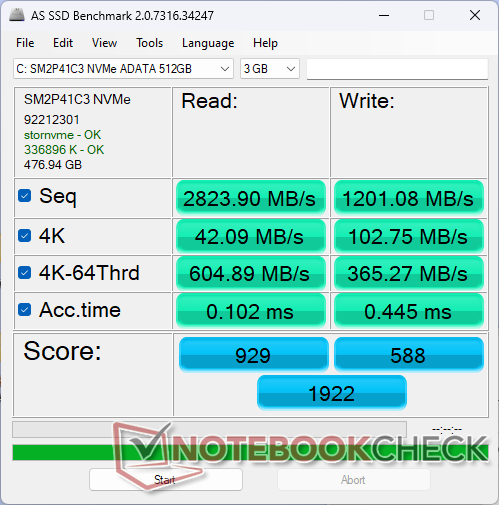
Nasza jednostka testowa jest dostarczana z budżetowym dyskiem 512 GB ADATA SM2P41C3 PCIe4 x4 NVMe SSD oferującym prędkości odczytu i zapisu do odpowiednio 3600 MB/s i 3000 MB/s. Dysk ten dobrze współgra z procesorem Ryzen 5, ponieważ superszybkie dyski SSD nie przynoszą większych korzyści docelowym użytkownikom domowym i studentom.
W przeciwieństwie do droższych modeli, LG Gram 14T90P nie ma opcji dodatkowego dysku SSD.LG Gram 14T90P konwertowalny.

| Drive Performance rating - Percent | |
| Acer Aspire 5 Spin 14 | |
| LG Gram 14T90P | |
| Lenovo IdeaPad Flex 7i 14IAU7 | |
| HP Pavilion x360 14-dy0157ng | |
| Dell Inspiron 14 7420 2-in-1 | |
| Dell Inspiron 14 7435 2-in-1 | |
* ... im mniej tym lepiej
Disk Throttling: DiskSpd Read Loop, Queue Depth 8
Wydajność GPU - starszy Radeon RX Vega
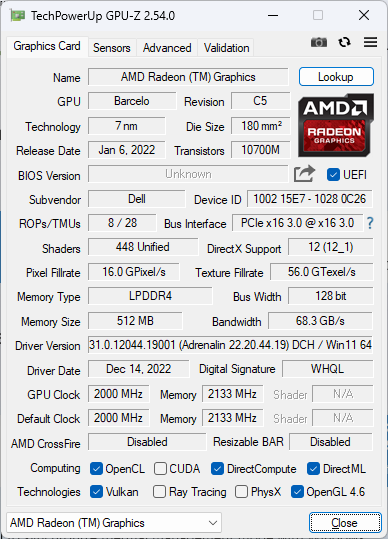
Modele Ryzen 5 7530U i Ryzen 7 7730U działają na starszych zintegrowanych układach graficznych Radeon RX Vega zamiast nowszych Radeon 680M lub 780M a szkoda, bo nowsze rozwiązania mogą być nawet 2x do 2,5x szybsze. Poza bardzo niewymagającymi grami, takimi jak Dota 2 Reborn, system nie radzi sobie z nowoczesnymi tytułami, zwłaszcza biorąc pod uwagę ograniczone 8 GB pamięci RAM. F1 22, na przykład, działał tylko na bardzo niskich ustawieniach, ponieważ cokolwiek wyższego powodowało awarię.
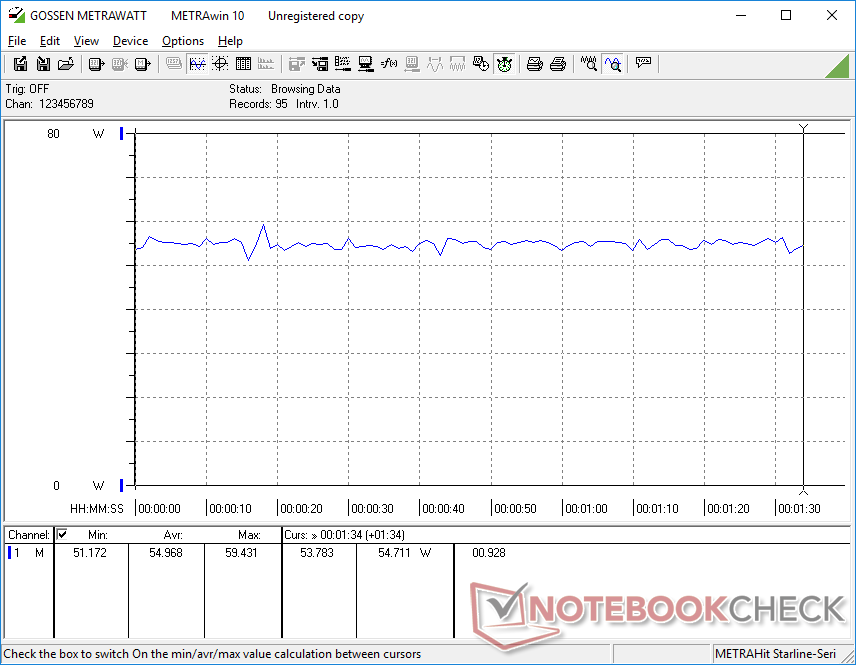
Liczba klatek na sekundę okresowo spadała do połowy lat 50-tych, po czym powracała do wysokich lat 60-tych na biegu jałowym Witcher 3. Spadki występowały w stałych odstępach czasu, jak pokazano na poniższym wykresie FPS, co sugeruje słabą obsługę aktywnych aplikacji działających w tle.
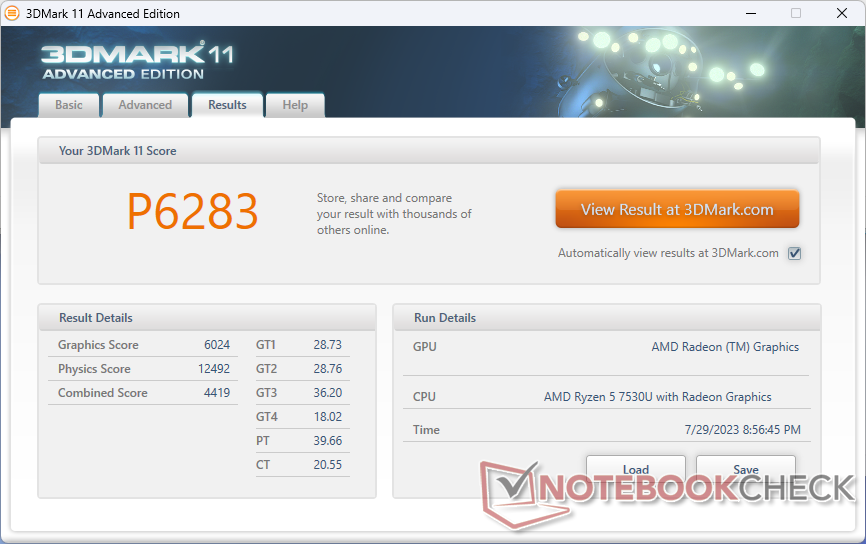
Ogólna wydajność spada o około 10 procent w trybie zrównoważonym, jak pokazuje poniższa tabela 3DMark 11.
| Profil zasilania | Wynik grafiki | Wynik fizyki | Wynik łączny |
| Bateria | 5798 (-4%) | 11906 (-5%) | 4161 (-6%) |
| Zrównoważony | 5472 (-9%) | 10908 (-13%) | 4195 (-5%) |
| Wydajność | 6024 | 12492 | 4419 |
| 3DMark Performance rating - Percent | |
| Lenovo Yoga 7-14ARB G7 | |
| Lenovo Yoga 9 14IRP G8 -1! | |
| Dell Latitude 9440 2-in-1 -1! | |
| MSI Summit E14 Flip Evo A12MT | |
| Lenovo ThinkPad X1 Yoga G8 i7-1355U -1! | |
| Acer Aspire 5 Spin 14 | |
| HP Pavilion x360 14-dy0157ng | |
| Dell Inspiron 14 7435 2-in-1 | |
| Dell Inspiron 14 7420 2-in-1 | |
| Lenovo ThinkBook 14s Yoga ITL 20WE0023GE | |
| Przeciętny AMD Radeon RX Vega 7 | |
| Lenovo IdeaPad Flex 5 14IAU7-82R7007TGE | |
| 3DMark 11 - 1280x720 Performance GPU | |
| Lenovo Yoga 7-14ARB G7 | |
| Lenovo Yoga 9 14IRP G8 | |
| Dell Latitude 9440 2-in-1 | |
| Lenovo ThinkPad X1 Yoga G8 i7-1355U | |
| MSI Summit E14 Flip Evo A12MT | |
| Lenovo ThinkBook 14s Yoga ITL 20WE0023GE | |
| Dell Inspiron 14 7435 2-in-1 | |
| HP Pavilion x360 14-dy0157ng | |
| Dell Inspiron 14 7420 2-in-1 | |
| Acer Aspire 5 Spin 14 | |
| Przeciętny AMD Radeon RX Vega 7 (3353 - 6249, n=62) | |
| Lenovo IdeaPad Flex 5 14IAU7-82R7007TGE | |
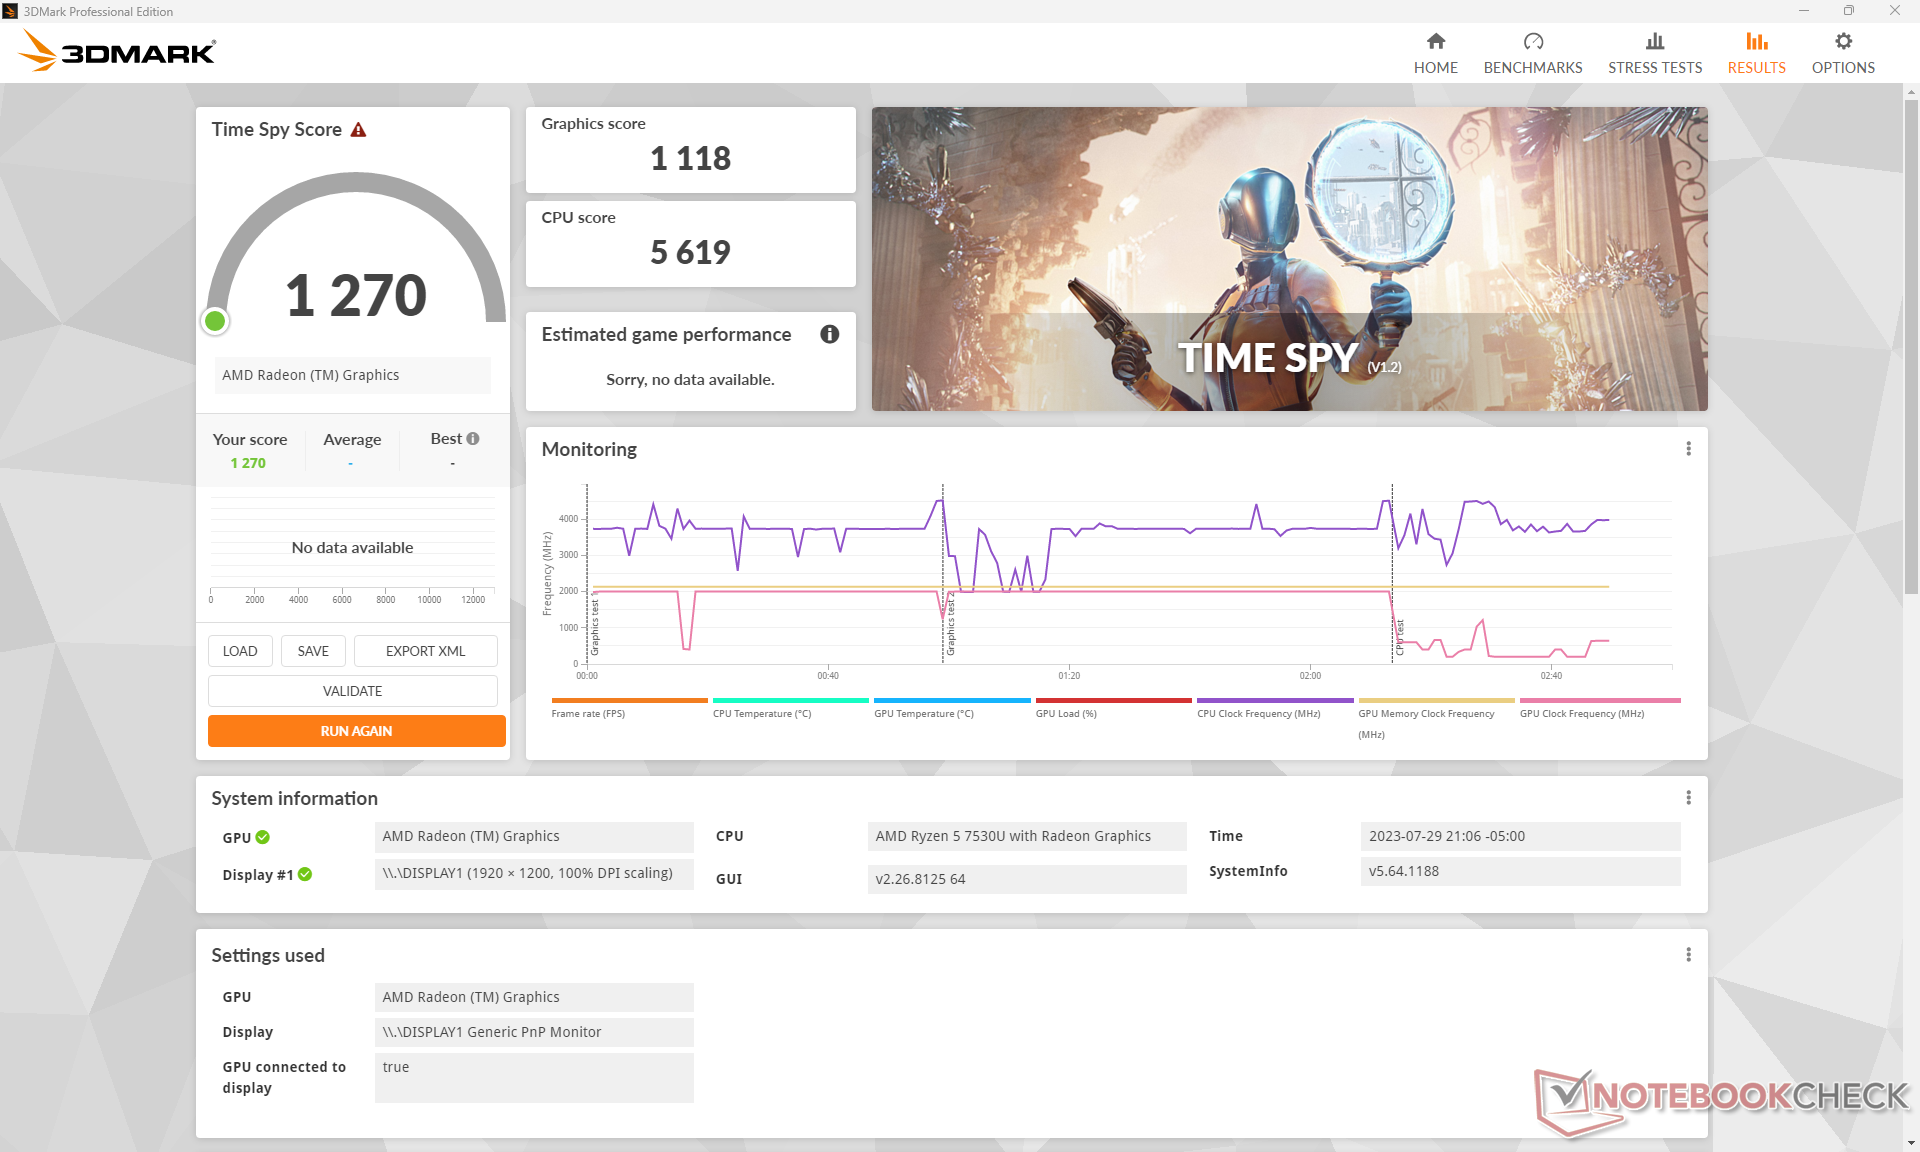
| 3DMark 11 Performance | 6283 pkt. | |
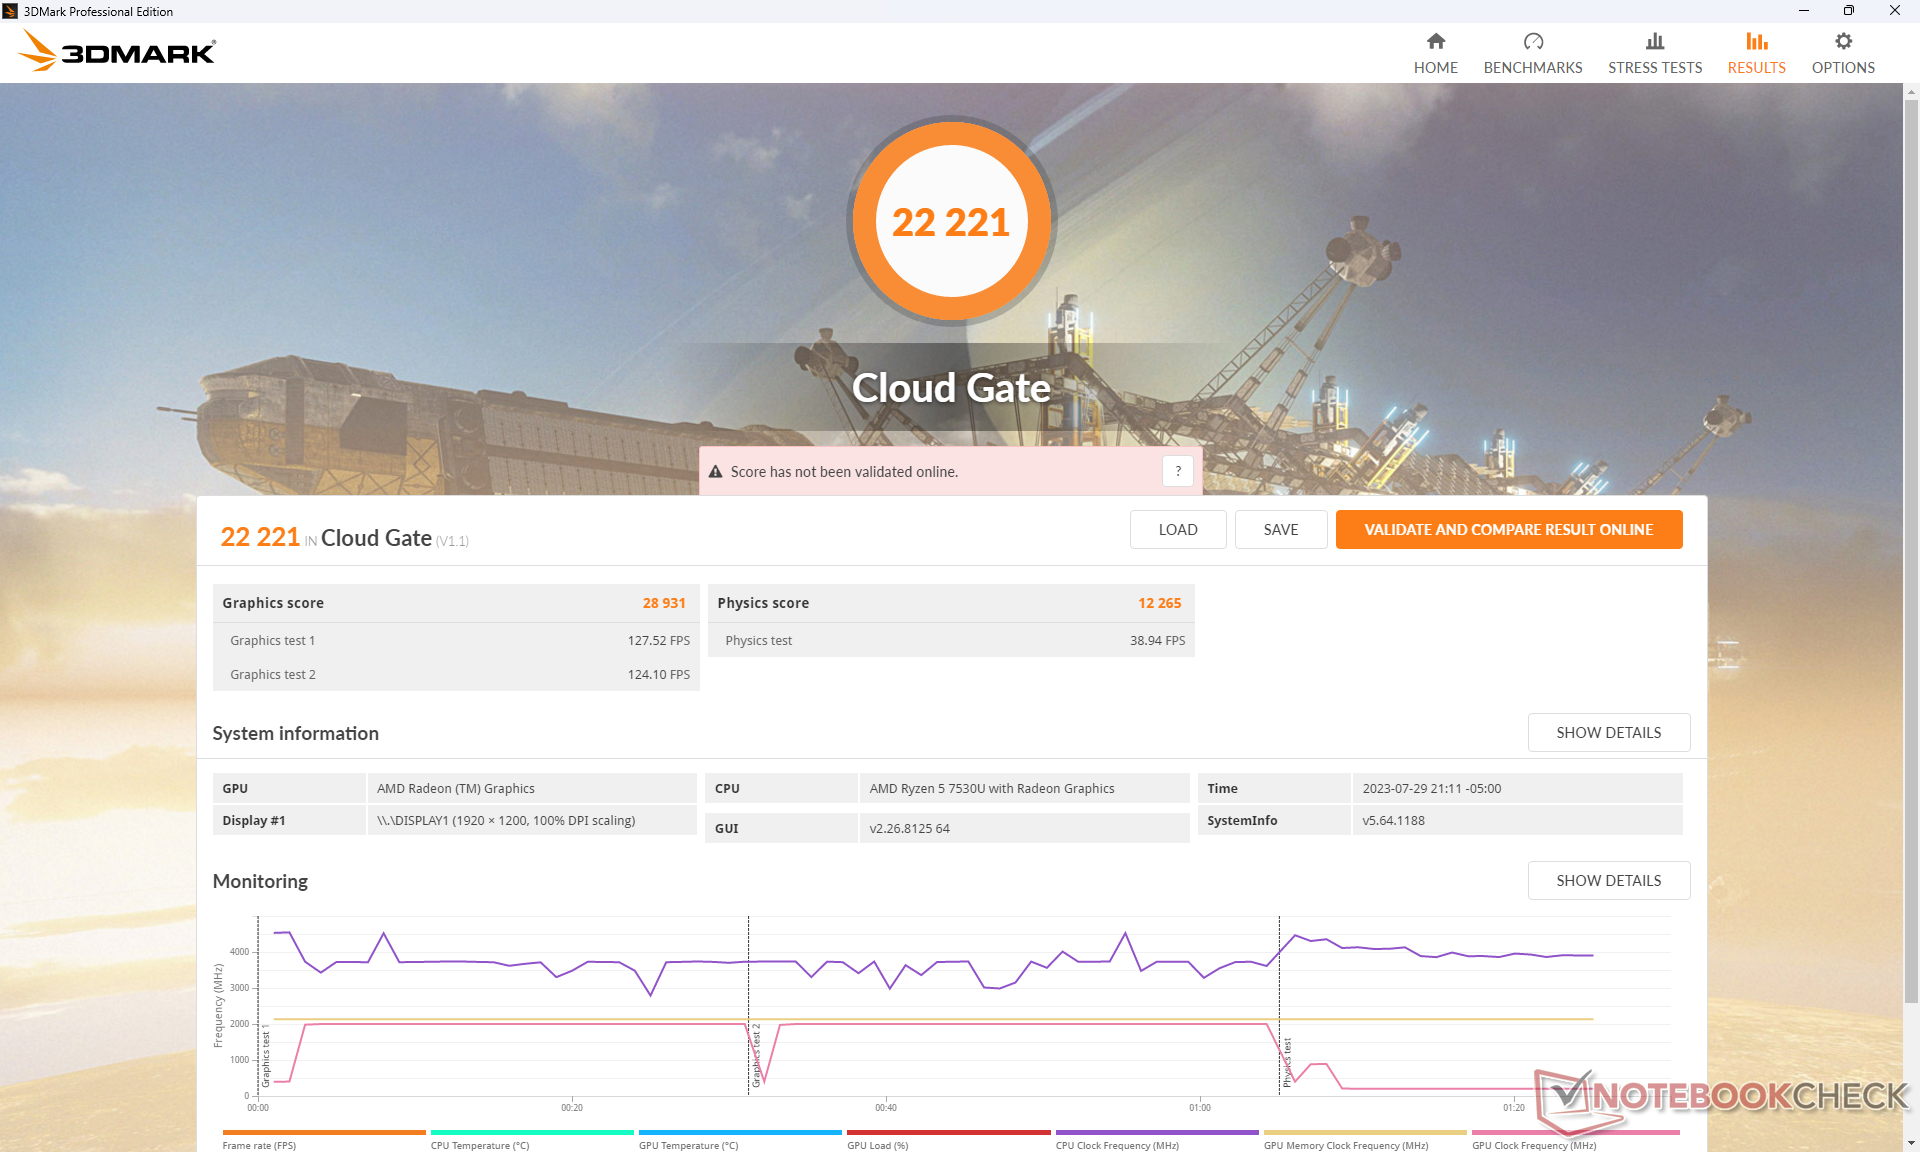
| 3DMark Cloud Gate Standard Score | 22221 pkt. | |
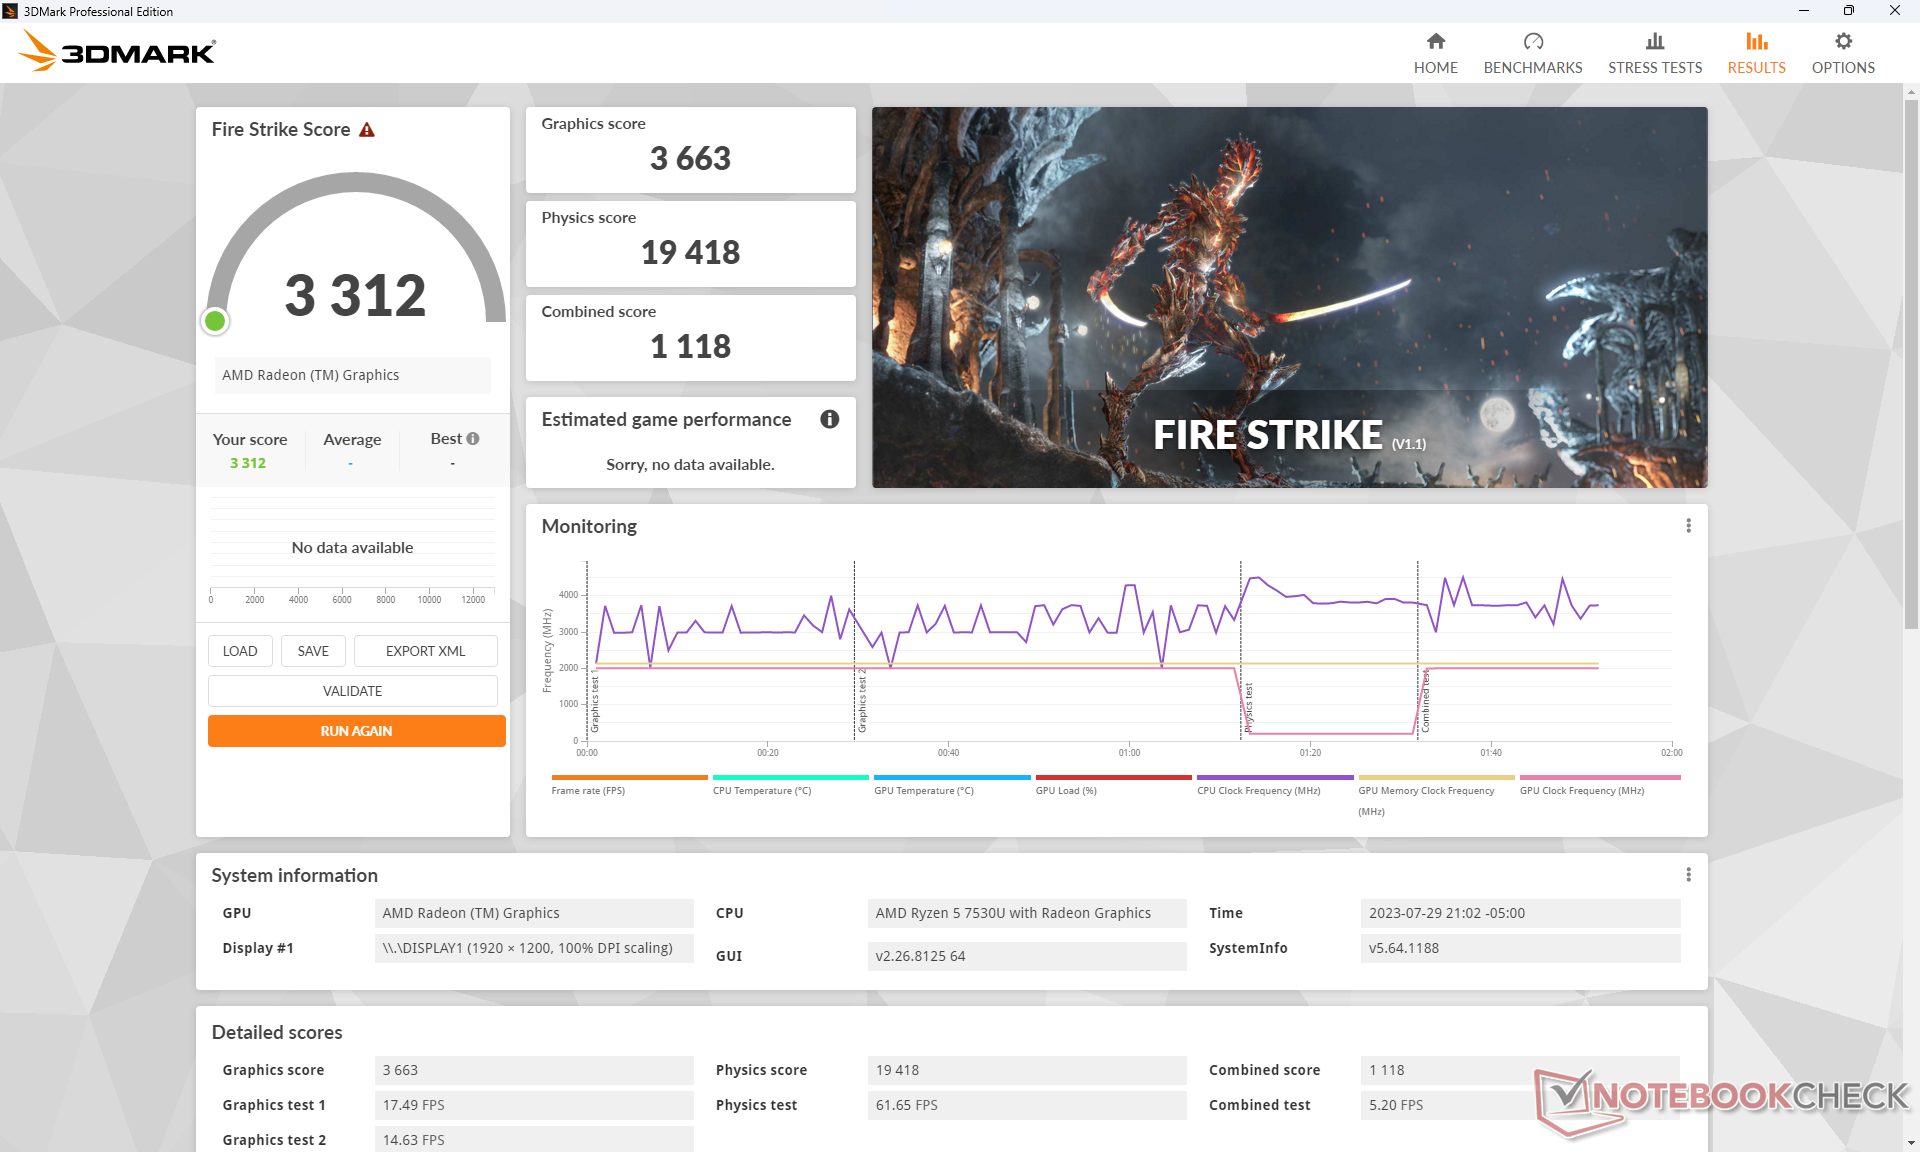
| 3DMark Fire Strike Score | 3312 pkt. | |
| 3DMark Time Spy Score | 1270 pkt. | |
Pomoc | ||
| F1 22 - 1280x720 Ultra Low Preset AA:T AF:16x | |
| Dell Latitude 9440 2-in-1 | |
| Lenovo ThinkPad X1 Yoga G8 i7-1355U | |
| Przeciętny AMD Radeon RX Vega 7 (43.6 - 80.8, n=11) | |
| Dell Inspiron 14 7435 2-in-1 | |
| Tiny Tina's Wonderlands - 1280x720 Lowest Preset (DX12) | |
| Przeciętny AMD Radeon RX Vega 7 (49.7 - 70.4, n=7) | |
| Dell Inspiron 14 7435 2-in-1 | |
| Dell Latitude 9440 2-in-1 | |
| Lenovo ThinkPad X1 Yoga G8 i7-1355U | |
Witcher 3 FPS Chart
| low | med. | high | ultra | |
|---|---|---|---|---|
| GTA V (2015) | 107.7 | 25.7 | 10.2 | |
| The Witcher 3 (2015) | 76 | 21.5 | 14.5 | |
| Dota 2 Reborn (2015) | 107.4 | 87.3 | 49.9 | 47.1 |
| Final Fantasy XV Benchmark (2018) | 35.1 | 17.5 | 12.1 | |
| X-Plane 11.11 (2018) | 37.4 | 29.5 | 26.4 | |
| Strange Brigade (2018) | 79.5 | 31.4 | 25.6 | 22.3 |
| Cyberpunk 2077 1.6 (2022) | 16.3 | 12.8 | 8.9 | 6.7 |
| Tiny Tina's Wonderlands (2022) | 26.5 | |||
| F1 22 (2022) |
Emisje
Hałas systemowy
Wewnętrzny wentylator ma tendencję do pulsowania w zakresie od bezczynności do 33,3 dB(A) podczas przeglądania stron internetowych lub strumieniowania wideo. Wzrost hałasu wentylatora ma tendencję do nagłego i ostrego, a nie stopniowego, co niestety sprawia, że hałas jest bardziej zauważalny.
Stałe wysokie obciążenia, takie jak gry, spowodowałyby hałas wentylatora o wartości prawie 41 dB(A) w trybie Performance. W trybie zrównoważonym hałas wentylatora spadłby nieznacznie do 39,8 dB(A).
Jesteśmy w stanie zauważyć lekkie wycie cewki lub szum elektroniczny z naszej jednostki testowej, więc nigdy nie jest naprawdę cicho, nawet gdy wentylator jest bezczynny. Niski zakres 40 dB(A) jest cichszy niż Acer Aspire 5 Spin 14, a jednocześnie głośniejszy niżLG Gram 14T90P.
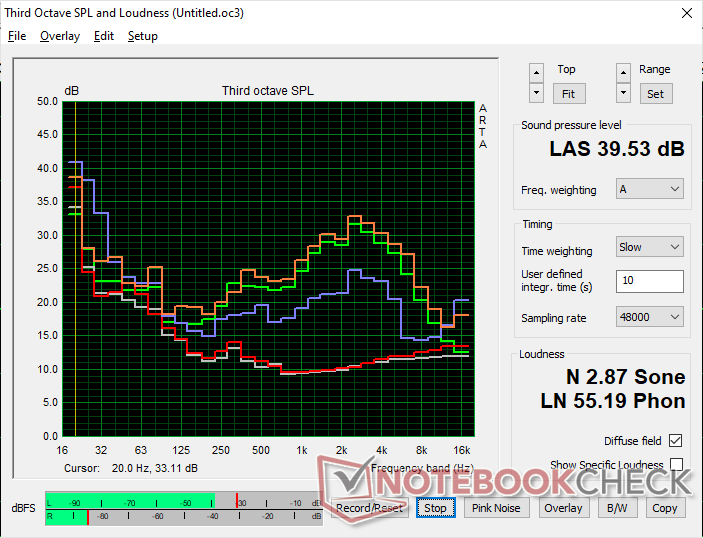
Hałas
| luz |
| 23.2 / 23.2 / 23.2 dB |
| obciążenie |
| 33 / 41.3 dB |
 | ||
30 dB cichy 40 dB(A) słyszalny 50 dB(A) irytujący |
||
min: | ||
| Dell Inspiron 14 7435 2-in-1 Vega 7, R5 7530U | Dell Inspiron 14 7420 2-in-1 Iris Xe G7 96EUs, i7-1255U, WDC PC SN530 SDBPMPZ-512G | Lenovo IdeaPad Flex 7i 14IAU7 Iris Xe G7 96EUs, i7-1255U, Samsung PM9B1 512GB MZAL4512HBLU | Acer Aspire 5 Spin 14 Iris Xe G7 80EUs, i5-1335U, Micron 2450 512GB MTFDKBA512TFK | LG Gram 14T90P Iris Xe G7 80EUs, i5-1135G7, Samsung SSD PM981a MZVLB512HBJQ | HP Pavilion x360 14-dy0157ng Iris Xe G7 80EUs, i5-1135G7, Toshiba KBG40ZNV512G | |
|---|---|---|---|---|---|---|
| Noise | -3% | 1% | -22% | 0% | -10% | |
| wyłączone / środowisko * (dB) | 22.8 | 23.1 -1% | 23.3 -2% | 26 -14% | 25.4 -11% | 27 -18% |
| Idle Minimum * (dB) | 23.2 | 24.7 -6% | 23.3 -0% | 27.7 -19% | 25.5 -10% | 27 -16% |
| Idle Average * (dB) | 23.2 | 24.7 -6% | 23.3 -0% | 27.7 -19% | 25.5 -10% | 27 -16% |
| Idle Maximum * (dB) | 23.2 | 24.7 -6% | 23.3 -0% | 29.7 -28% | 25.5 -10% | 27 -16% |
| Load Average * (dB) | 33 | 27.7 16% | 34.3 -4% | 46.3 -40% | 28.3 14% | 38.3 -16% |
| Witcher 3 ultra * (dB) | 40.9 | 45.1 -10% | 37.8 8% | 35 14% | ||
| Load Maximum * (dB) | 41.3 | 45.1 -9% | 37.8 8% | 45.4 -10% | 35 15% | 33.2 20% |
* ... im mniej tym lepiej
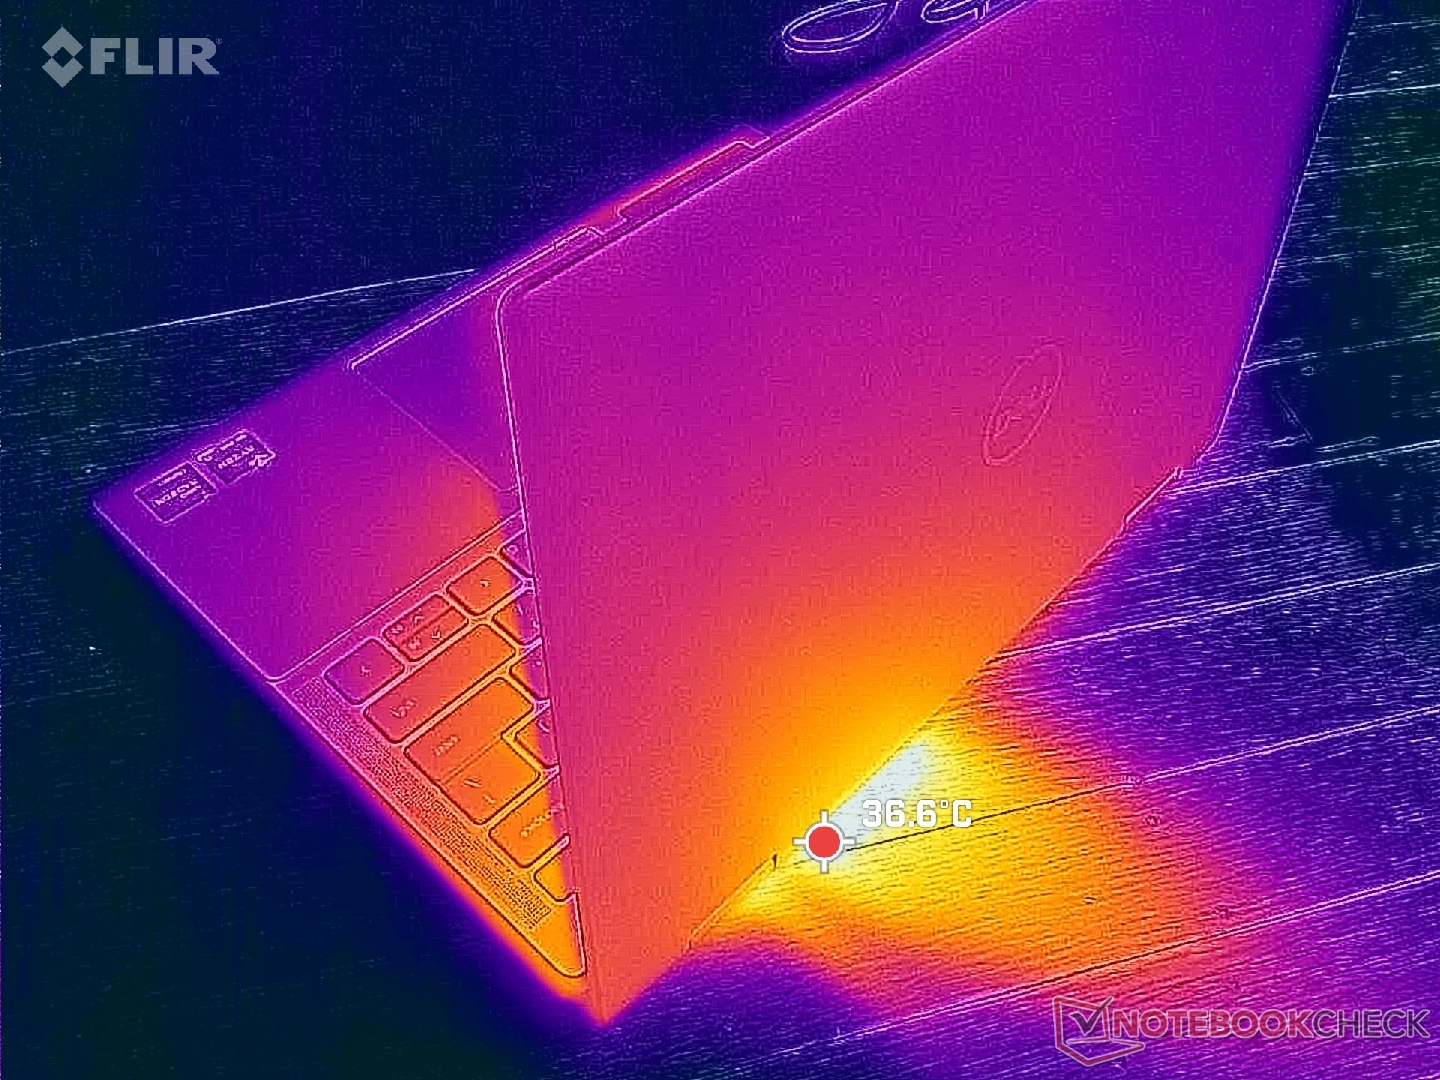
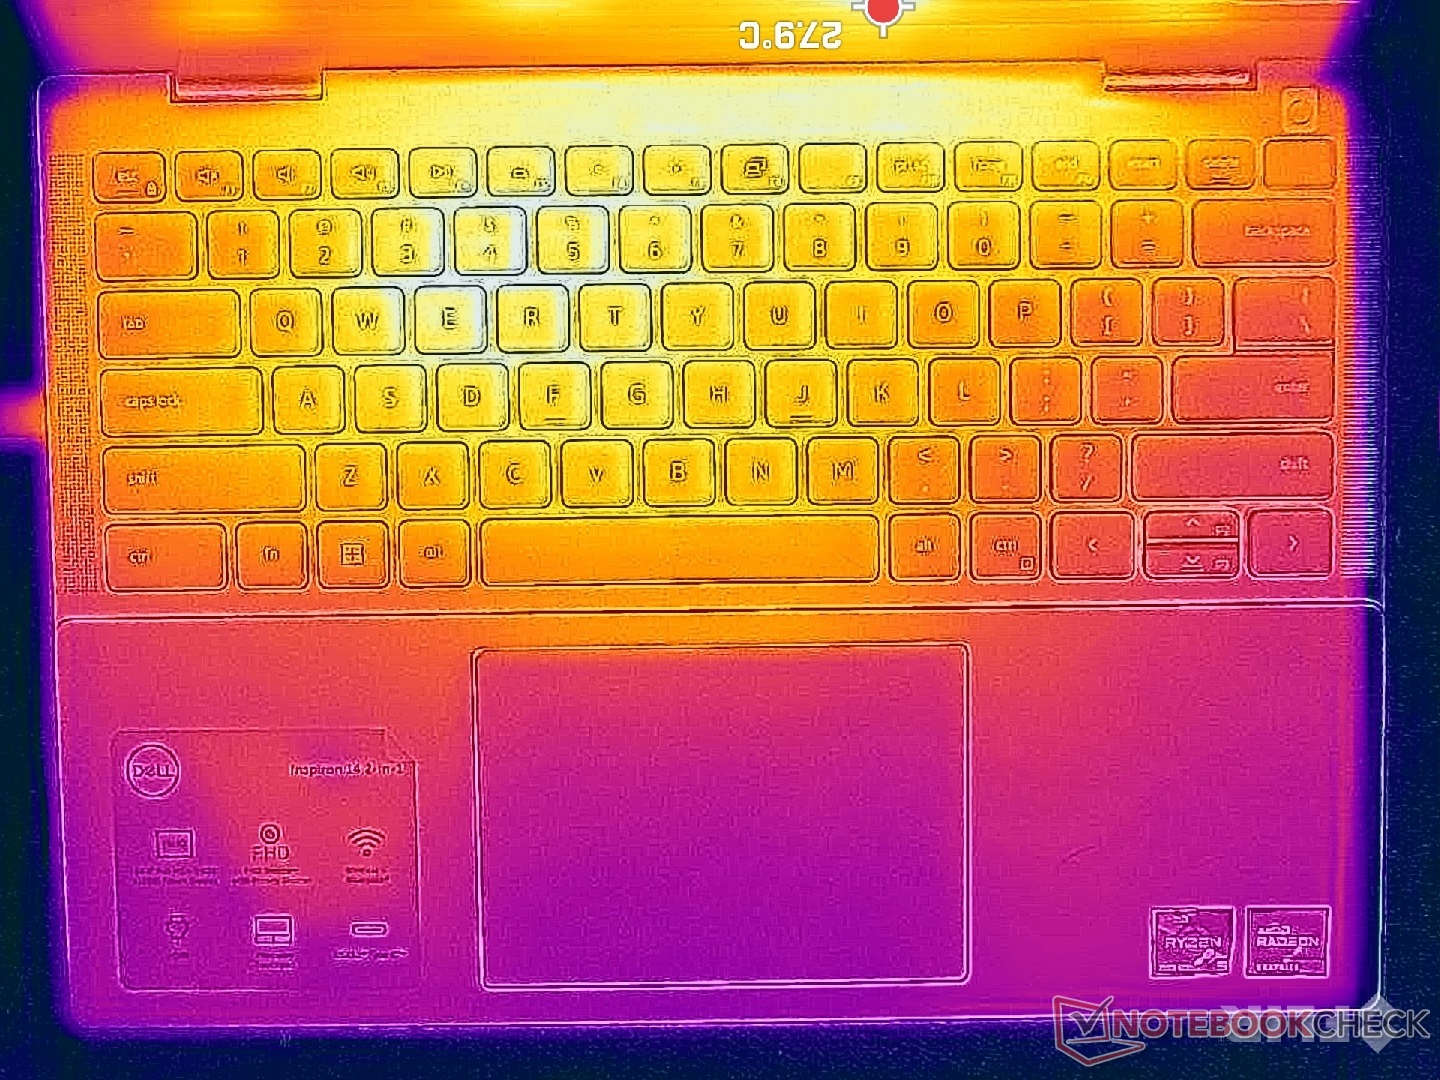
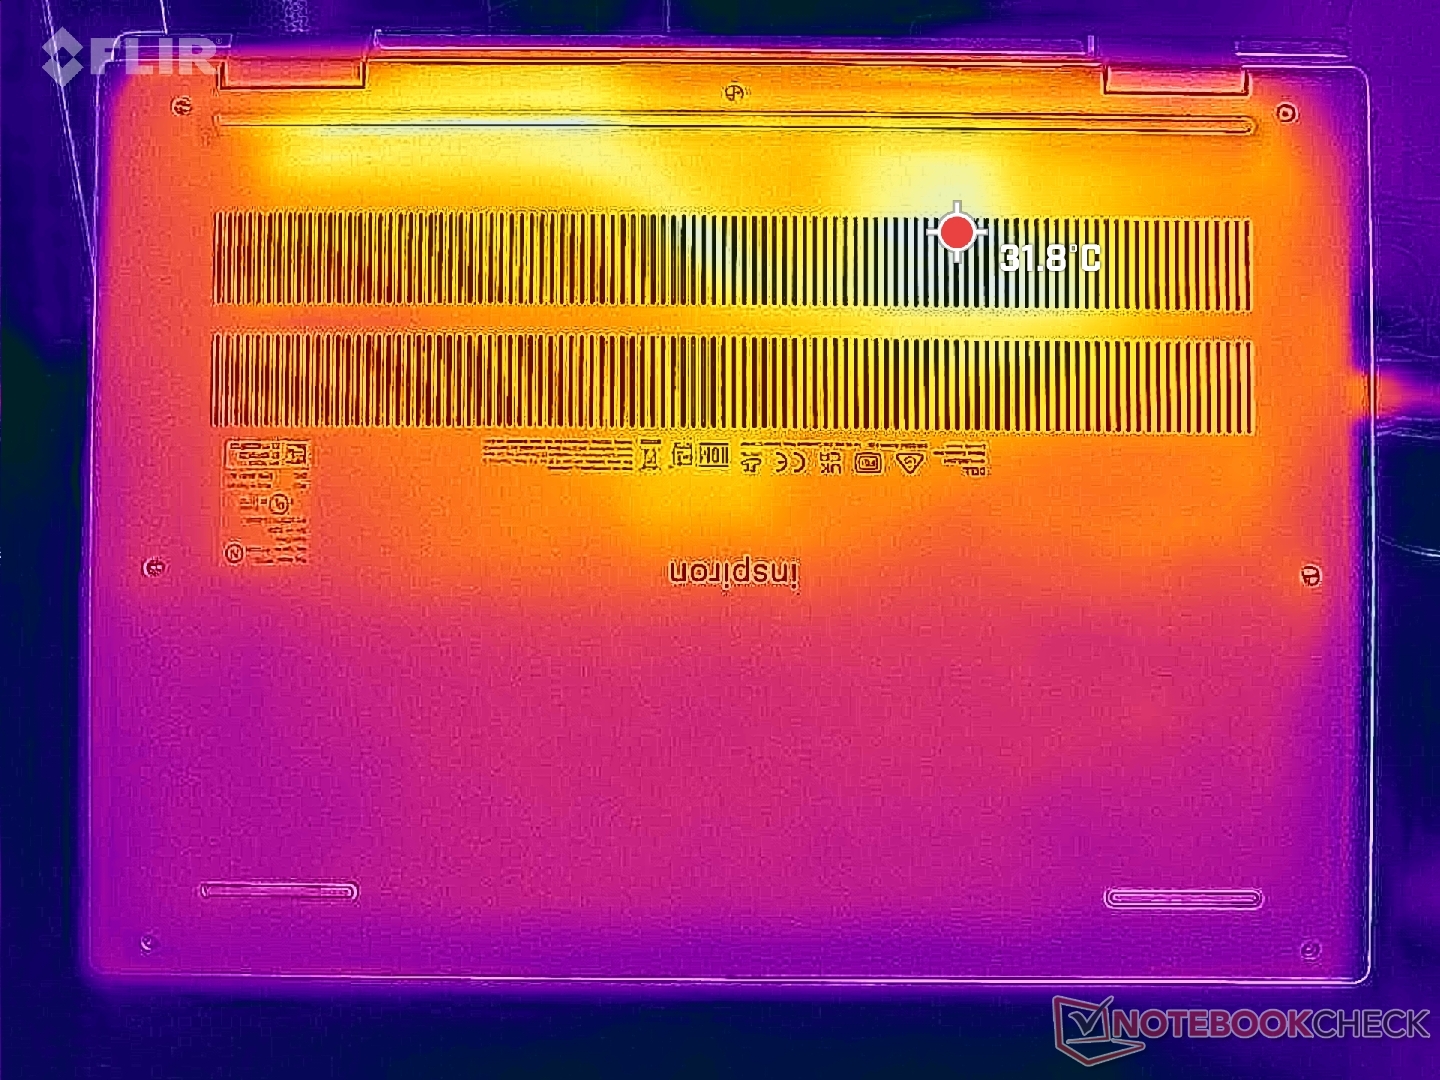
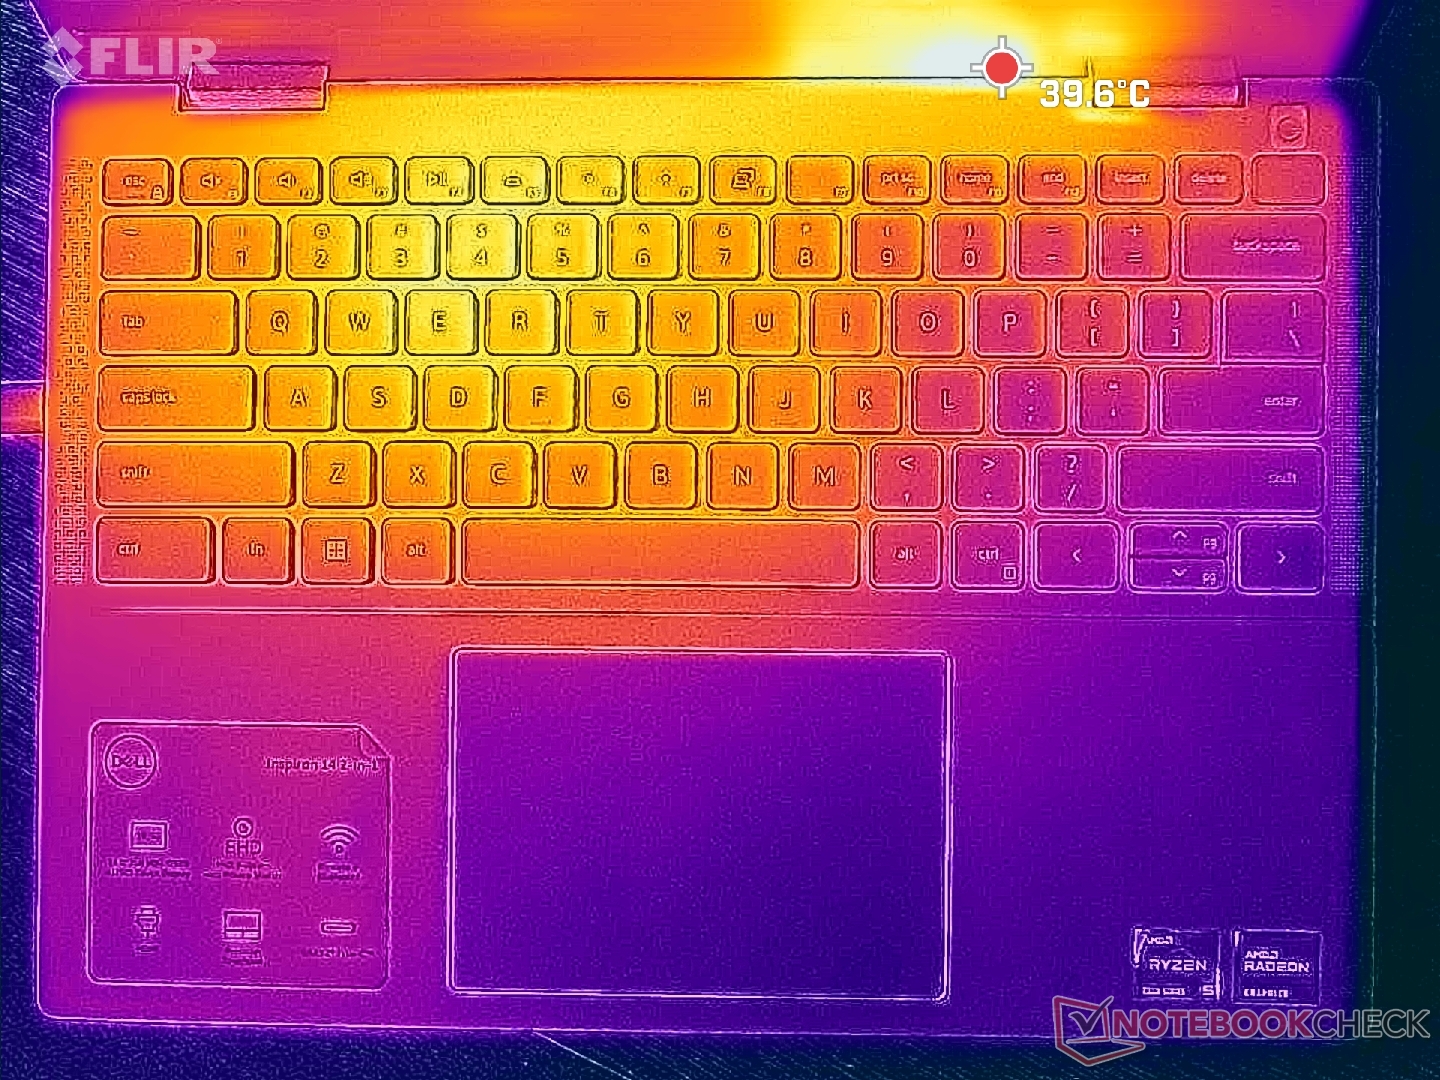
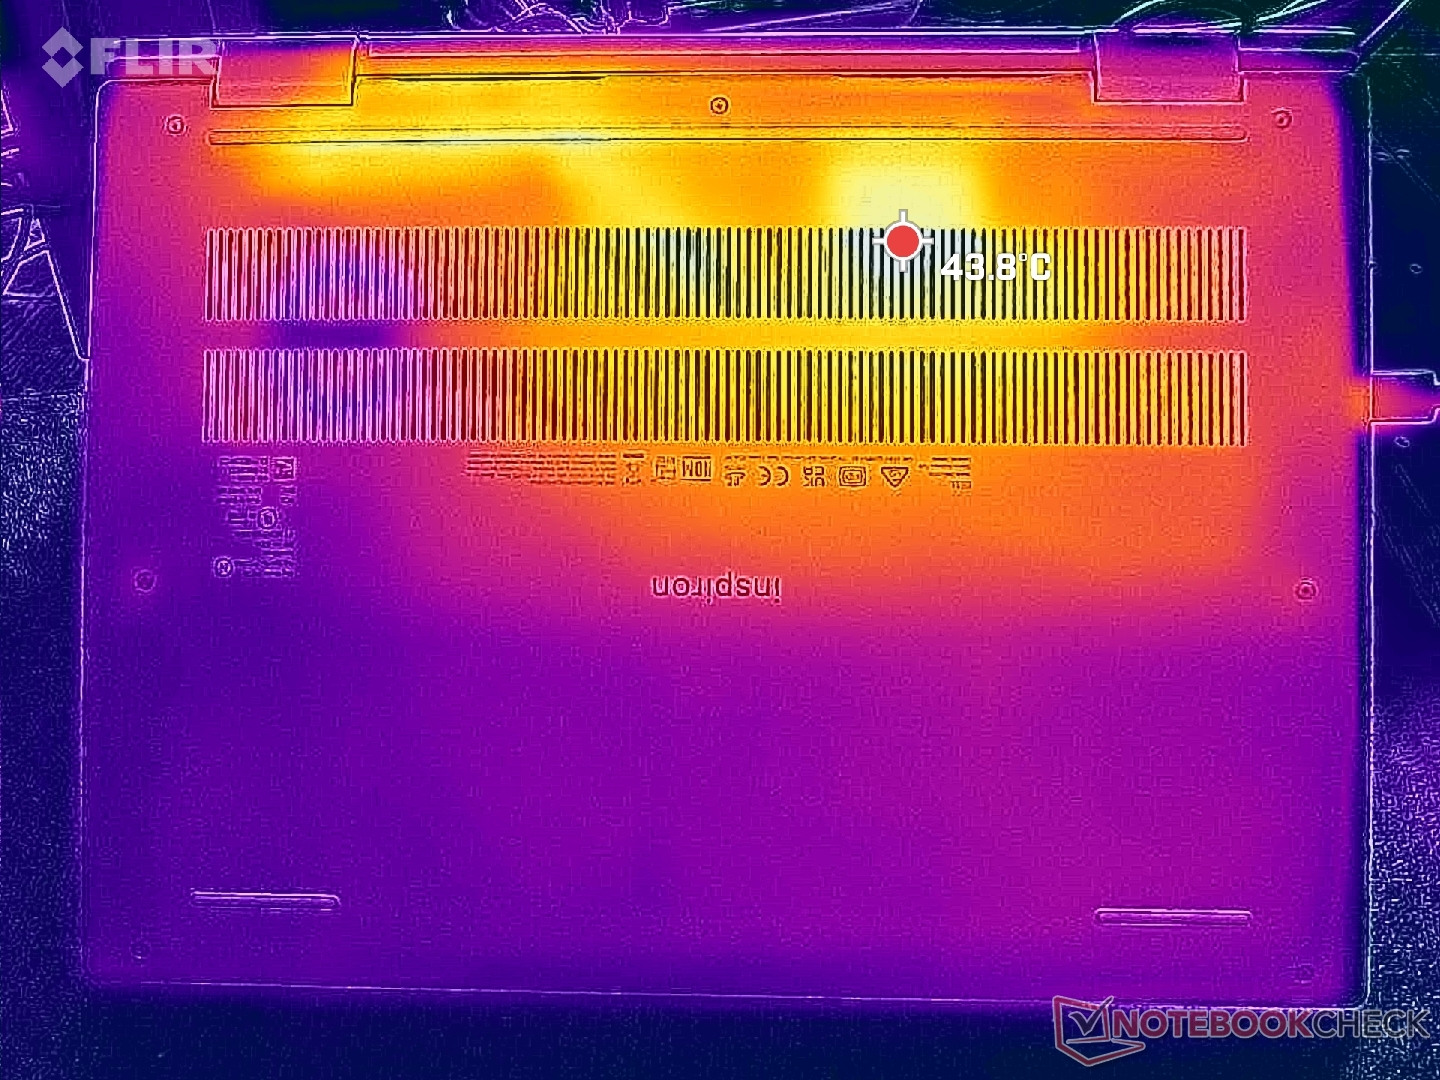
Temperatura
Temperatury powierzchni są niższe niż te, które odnotowaliśmy w zeszłorocznym Inspironie 14 7620 2-w-1. Na przykład pod obciążeniem gorące punkty na górze i na dole zbliżały się odpowiednio do 36 C i 39 C, w porównaniu do 46 C w zeszłorocznym modelu. Wysoki zakres 30 C jest porównywalny z modelami takimi jak IdeaPad Flex 7i 14.
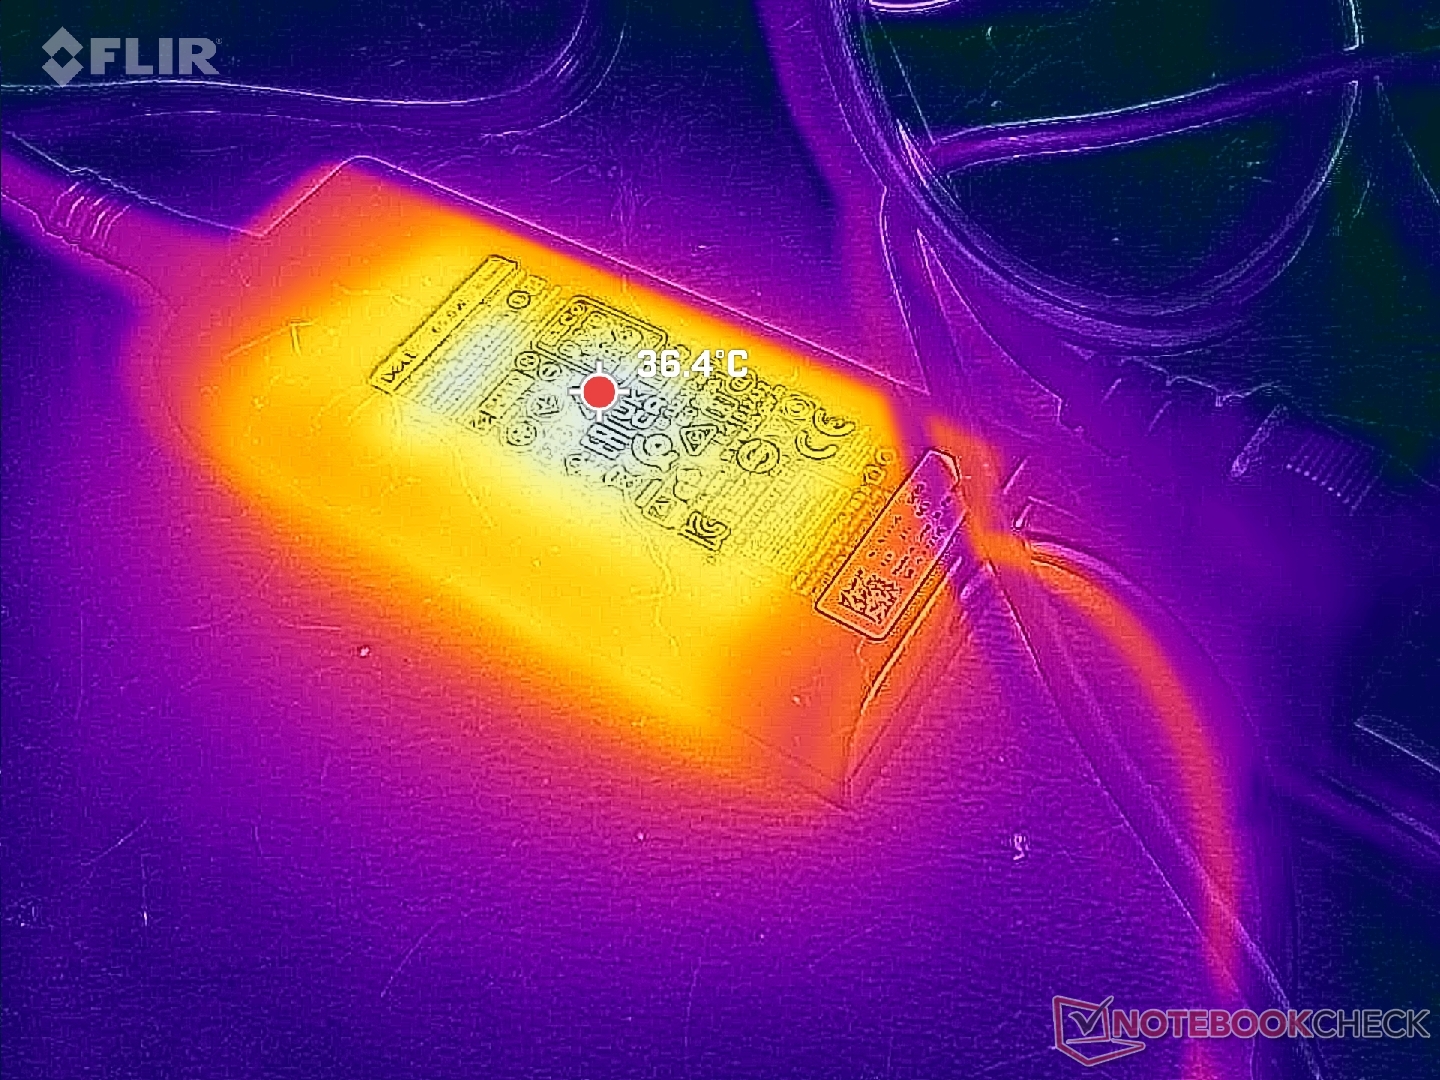
Zasilacz sieciowy również działałby chłodniej przy około 36 C zamiast 46 C.
(+) Maksymalna temperatura w górnej części wynosi 35.2 °C / 95 F, w porównaniu do średniej 35.4 °C / 96 F , począwszy od 19.6 do 60 °C dla klasy Convertible.
(+) Dno nagrzewa się maksymalnie do 38.2 °C / 101 F, w porównaniu do średniej 36.9 °C / 98 F
(+) W stanie bezczynności średnia temperatura górnej części wynosi 28.7 °C / 84 F, w porównaniu ze średnią temperaturą urządzenia wynoszącą 30.3 °C / ### class_avg_f### F.
(+) Podpórki pod nadgarstki i touchpad są chłodniejsze niż temperatura skóry i maksymalnie 26.6 °C / 79.9 F i dlatego są chłodne w dotyku.
(±) Średnia temperatura obszaru podparcia dłoni w podobnych urządzeniach wynosiła 28 °C / 82.4 F (+1.4 °C / 2.5 F).
| Dell Inspiron 14 7435 2-in-1 AMD Ryzen 5 7530U, AMD Radeon RX Vega 7 | Dell Inspiron 14 7420 2-in-1 Intel Core i7-1255U, Intel Iris Xe Graphics G7 96EUs | Lenovo IdeaPad Flex 7i 14IAU7 Intel Core i7-1255U, Intel Iris Xe Graphics G7 96EUs | Acer Aspire 5 Spin 14 Intel Core i5-1335U, Intel Iris Xe Graphics G7 80EUs | LG Gram 14T90P Intel Core i5-1135G7, Intel Iris Xe Graphics G7 80EUs | HP Pavilion x360 14-dy0157ng Intel Core i5-1135G7, Intel Iris Xe Graphics G7 80EUs | |
|---|---|---|---|---|---|---|
| Heat | -2% | 11% | -14% | 3% | -2% | |
| Maximum Upper Side * (°C) | 35.2 | 38.2 -9% | 35.4 -1% | 41.7 -18% | 41.6 -18% | 38.9 -11% |
| Maximum Bottom * (°C) | 38.2 | 45.6 -19% | 38.8 -2% | 54.4 -42% | 46.2 -21% | 40.3 -5% |
| Idle Upper Side * (°C) | 31.2 | 27.4 12% | 22.6 28% | 30.4 3% | 22.6 28% | 31.8 -2% |
| Idle Bottom * (°C) | 30.4 | 28.4 7% | 24.2 20% | 29.8 2% | 23.2 24% | 27.4 10% |
* ... im mniej tym lepiej
Test warunków skrajnych
Po uruchomieniu Prime95, procesor zwiększał taktowanie do 3,8 GHz i 34 W przez zaledwie kilka sekund, po czym spadał i stabilizował się na poziomie 2,7 GHz i 20 W. Temperatura rdzenia pozostawała względnie niska na poziomie 66 C, nawet pod obciążeniem, co jest porównywalne z Inspironem 14 7420 2-w-1 z procesorem Intela w podobnych warunkach. Podejrzewamy, że wyższe jednostki SKU Ryzen 7 lub Core i7 działałyby cieplej niż to, co zarejestrowaliśmy w naszej podstawowej konfiguracji Ryzen 5.
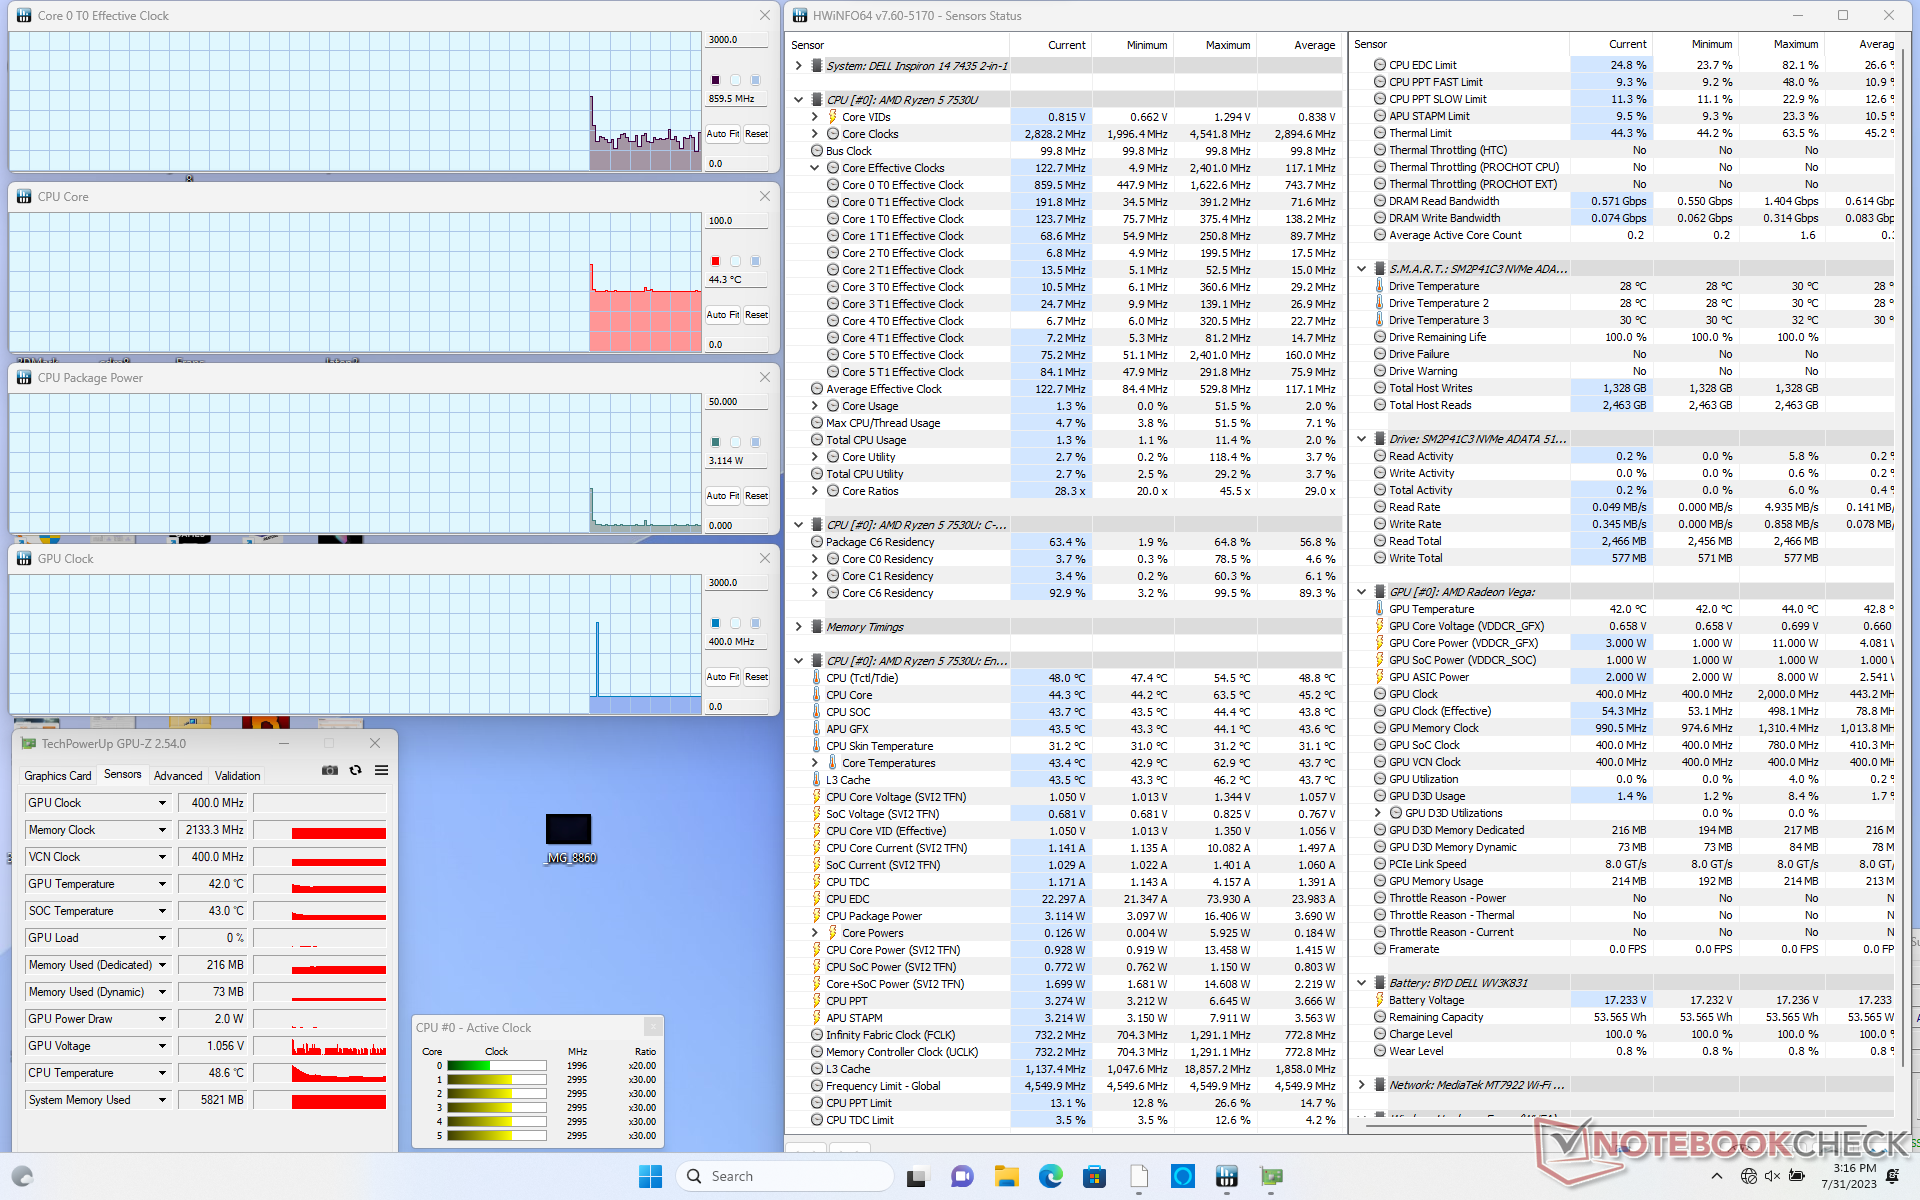
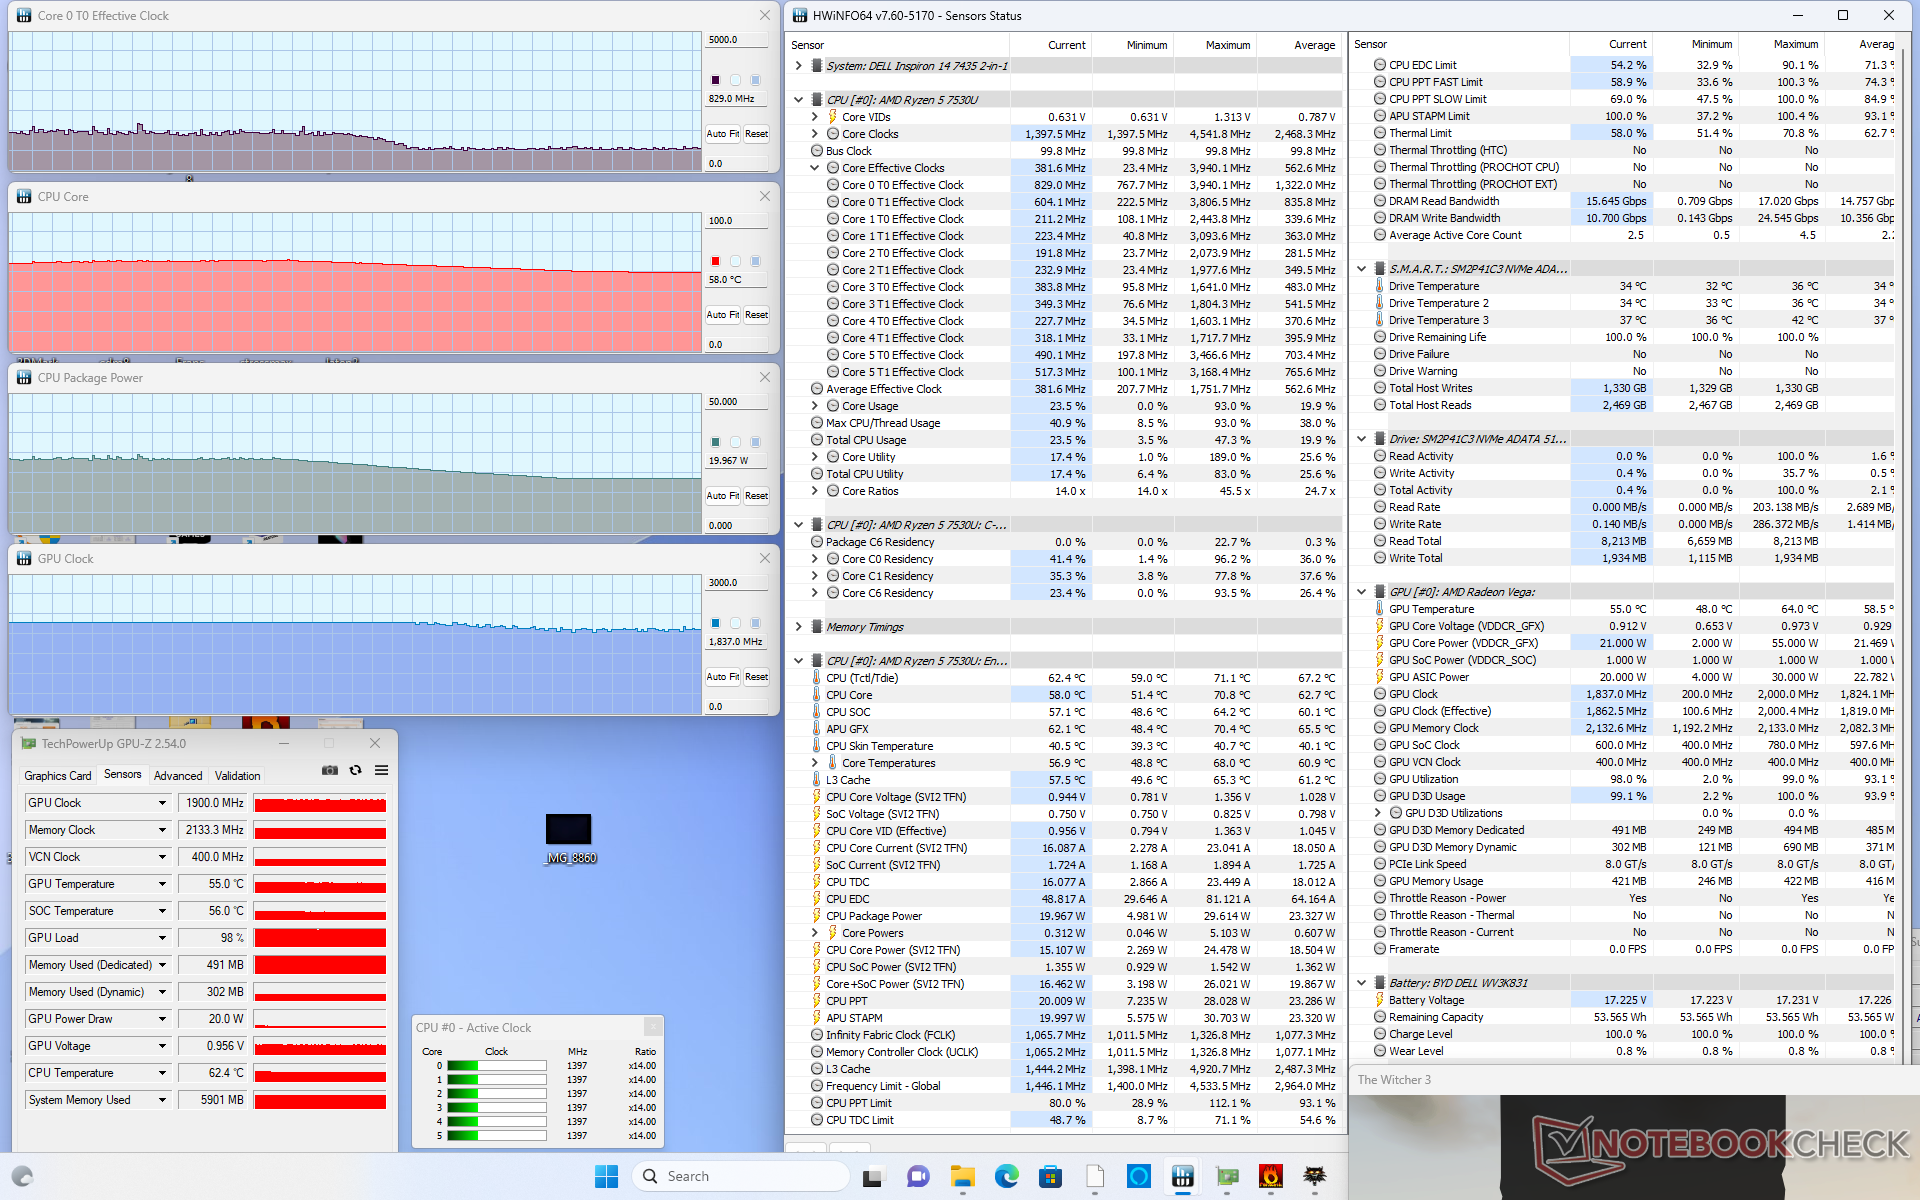
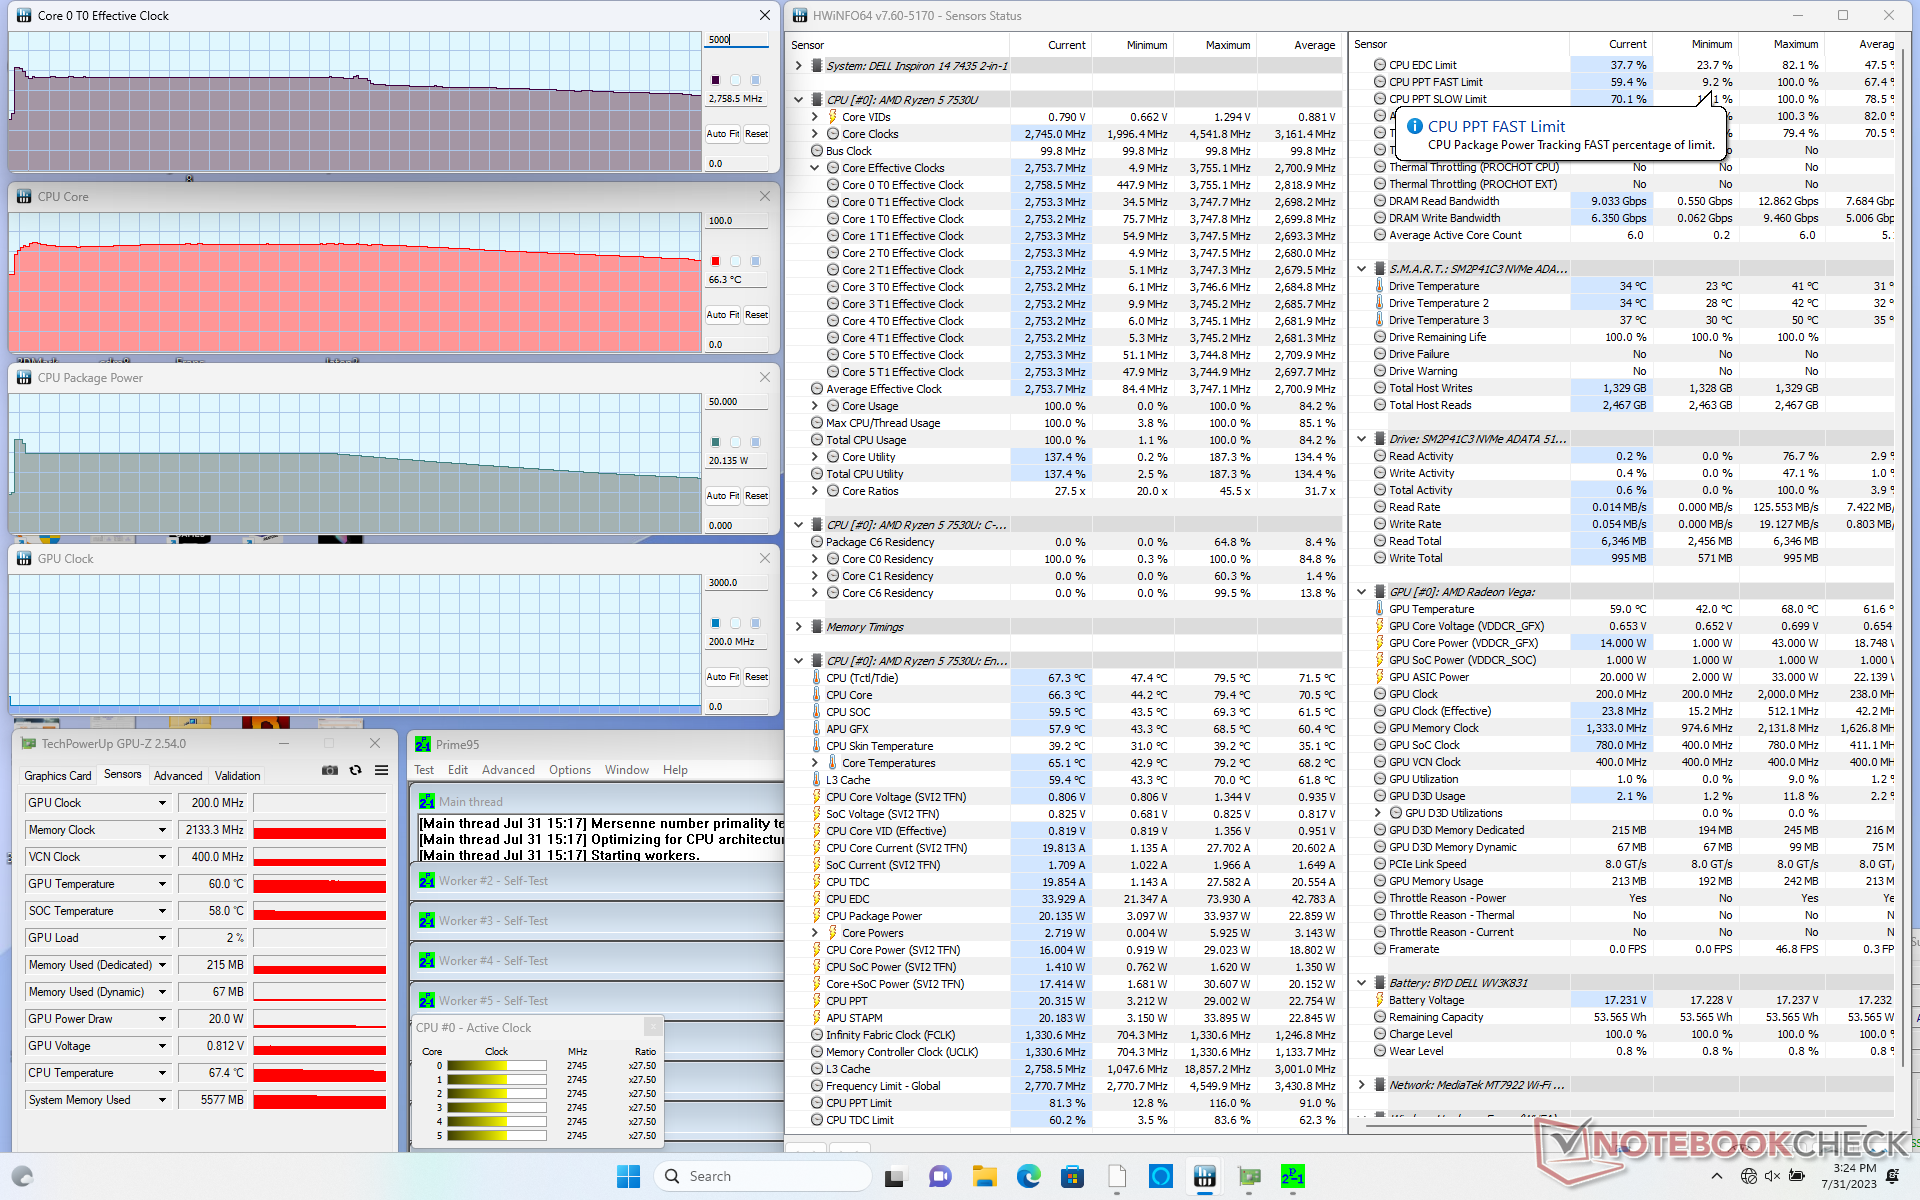
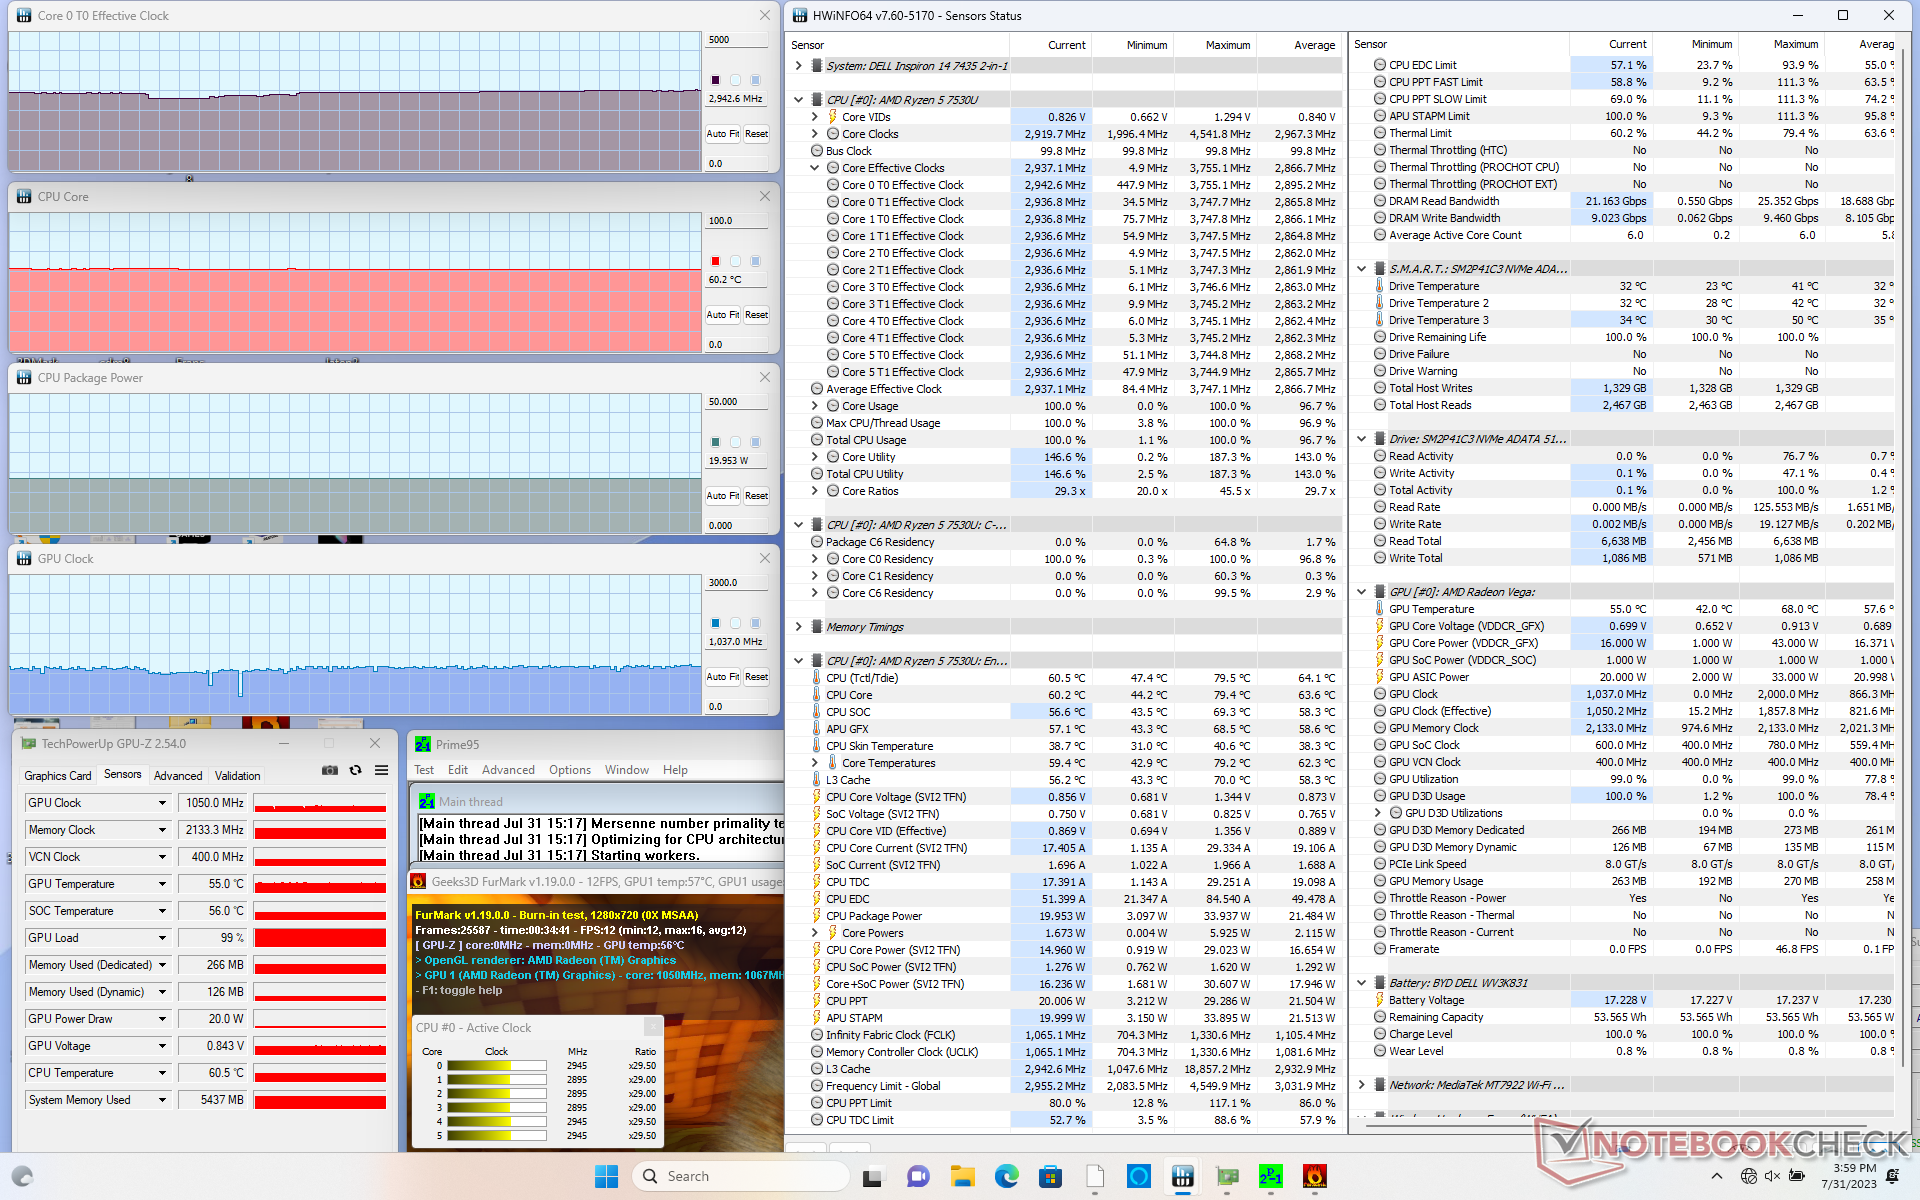
| Taktowanie CPU (GHz) | Taktowanie GPU (MHz) | Średnia temperatura CPU (°C) | |
| System bezczynności | -- | -- | 44 |
| Prime95Stress | 2.7 | -- | 66 |
| Prime95+ FurMark Stress | 2.9 | 1050 | 60 |
| Witcher 3 Obciążenie | 0.8 | 1900 | 58 |
Głośniki
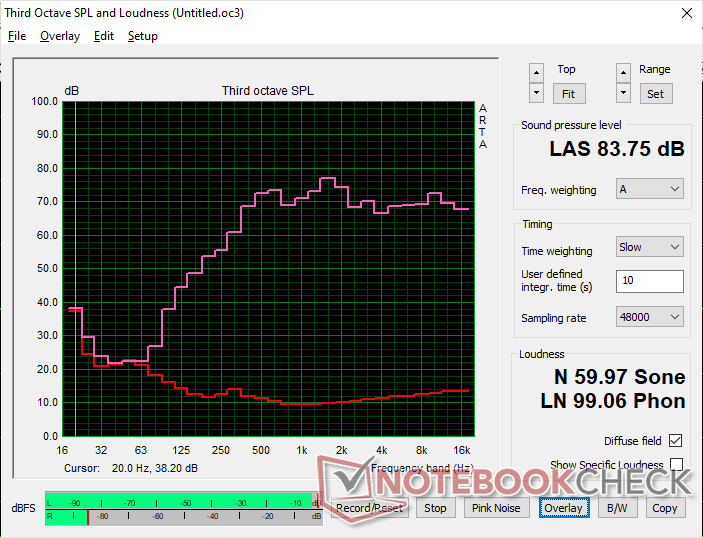
Dell Inspiron 14 7435 2-in-1 analiza dźwięku
(+) | głośniki mogą odtwarzać stosunkowo głośno (83.8 dB)
Bas 100 - 315 Hz
(-) | prawie brak basu - średnio 18.8% niższa od mediany
(±) | liniowość basu jest średnia (9.9% delta do poprzedniej częstotliwości)
Średnie 400 - 2000 Hz
(+) | zbalansowane środki średnie - tylko 3.5% od mediany
(+) | średnie są liniowe (6.1% delta do poprzedniej częstotliwości)
Wysokie 2–16 kHz
(+) | zrównoważone maksima - tylko 1.2% od mediany
(+) | wzloty są liniowe (4.4% delta do poprzedniej częstotliwości)
Ogólnie 100 - 16.000 Hz
(+) | ogólny dźwięk jest liniowy (12.3% różnicy w stosunku do mediany)
W porównaniu do tej samej klasy
» 14% wszystkich testowanych urządzeń w tej klasie było lepszych, 3% podobnych, 83% gorszych
» Najlepszy miał deltę 6%, średnia wynosiła ###średnia###%, najgorsza wynosiła 57%
W porównaniu do wszystkich testowanych urządzeń
» 10% wszystkich testowanych urządzeń było lepszych, 3% podobnych, 87% gorszych
» Najlepszy miał deltę 4%, średnia wynosiła ###średnia###%, najgorsza wynosiła 134%
Apple MacBook Pro 16 2021 M1 Pro analiza dźwięku
(+) | głośniki mogą odtwarzać stosunkowo głośno (84.7 dB)
Bas 100 - 315 Hz
(+) | dobry bas - tylko 3.8% od mediany
(+) | bas jest liniowy (5.2% delta do poprzedniej częstotliwości)
Średnie 400 - 2000 Hz
(+) | zbalansowane środki średnie - tylko 1.3% od mediany
(+) | średnie są liniowe (2.1% delta do poprzedniej częstotliwości)
Wysokie 2–16 kHz
(+) | zrównoważone maksima - tylko 1.9% od mediany
(+) | wzloty są liniowe (2.7% delta do poprzedniej częstotliwości)
Ogólnie 100 - 16.000 Hz
(+) | ogólny dźwięk jest liniowy (4.6% różnicy w stosunku do mediany)
W porównaniu do tej samej klasy
» 0% wszystkich testowanych urządzeń w tej klasie było lepszych, 0% podobnych, 100% gorszych
» Najlepszy miał deltę 5%, średnia wynosiła ###średnia###%, najgorsza wynosiła 45%
W porównaniu do wszystkich testowanych urządzeń
» 0% wszystkich testowanych urządzeń było lepszych, 0% podobnych, 100% gorszych
» Najlepszy miał deltę 4%, średnia wynosiła ###średnia###%, najgorsza wynosiła 134%
Zarządzanie energią
Zużycie energii
Zużycie energii jest porównywalne do Inspirona 14 7420 z procesorem Intela podczas niewymagających obciążeń, ale jest konsekwentnie wyższe podczas uruchamiania bardziej wymagających obciążeń, takich jak gry. Sugeruje to, że zintegrowany procesor graficzny AMD jest nieco mniej energooszczędny niż konkurencyjne układy Iris Xe 96 EU, podczas gdy wydajność procesora na wat jest bardziej zbliżona.
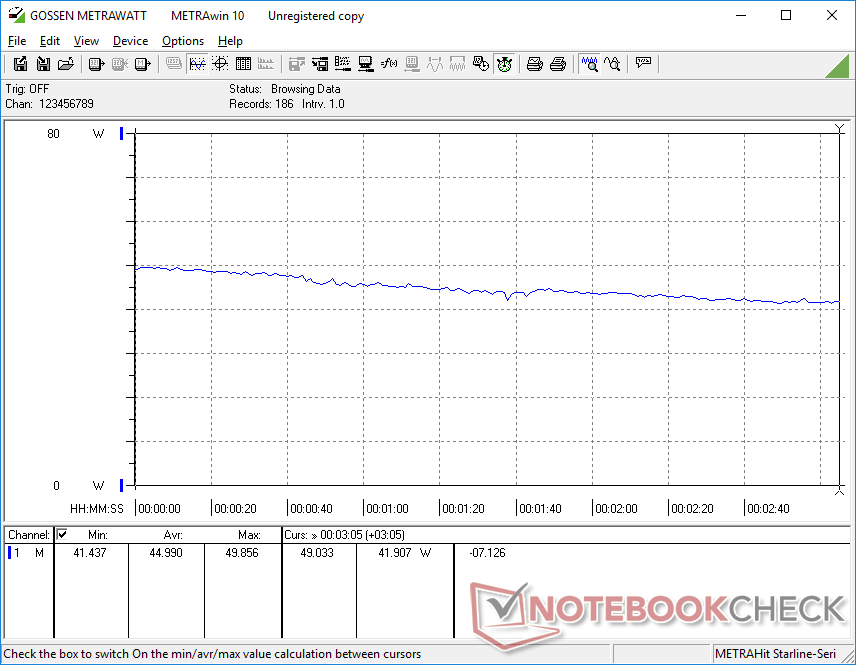
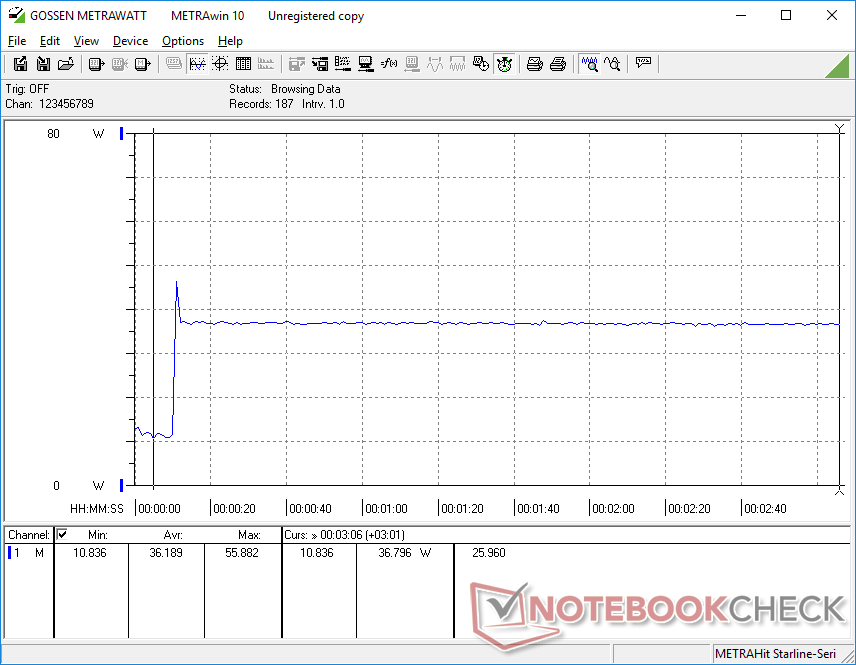
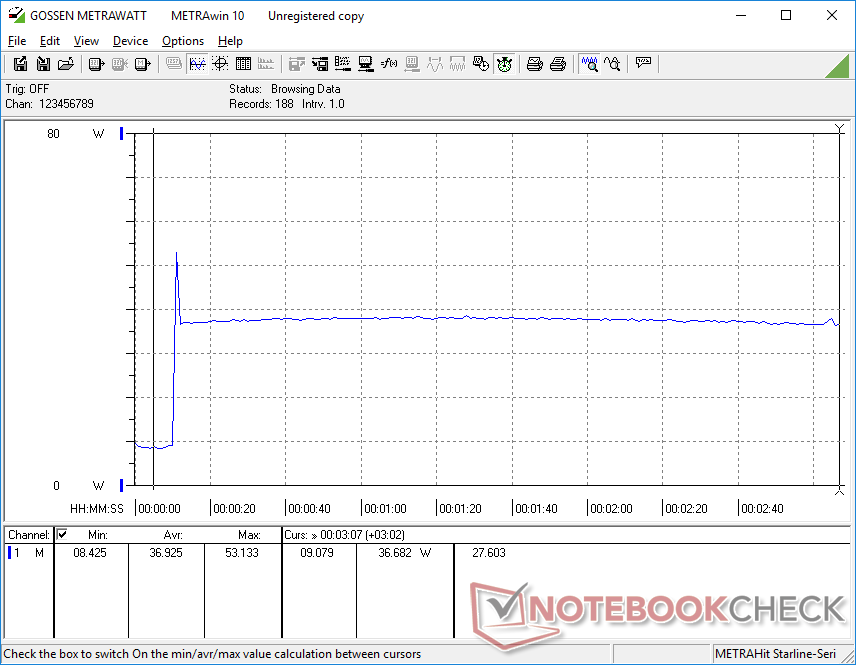
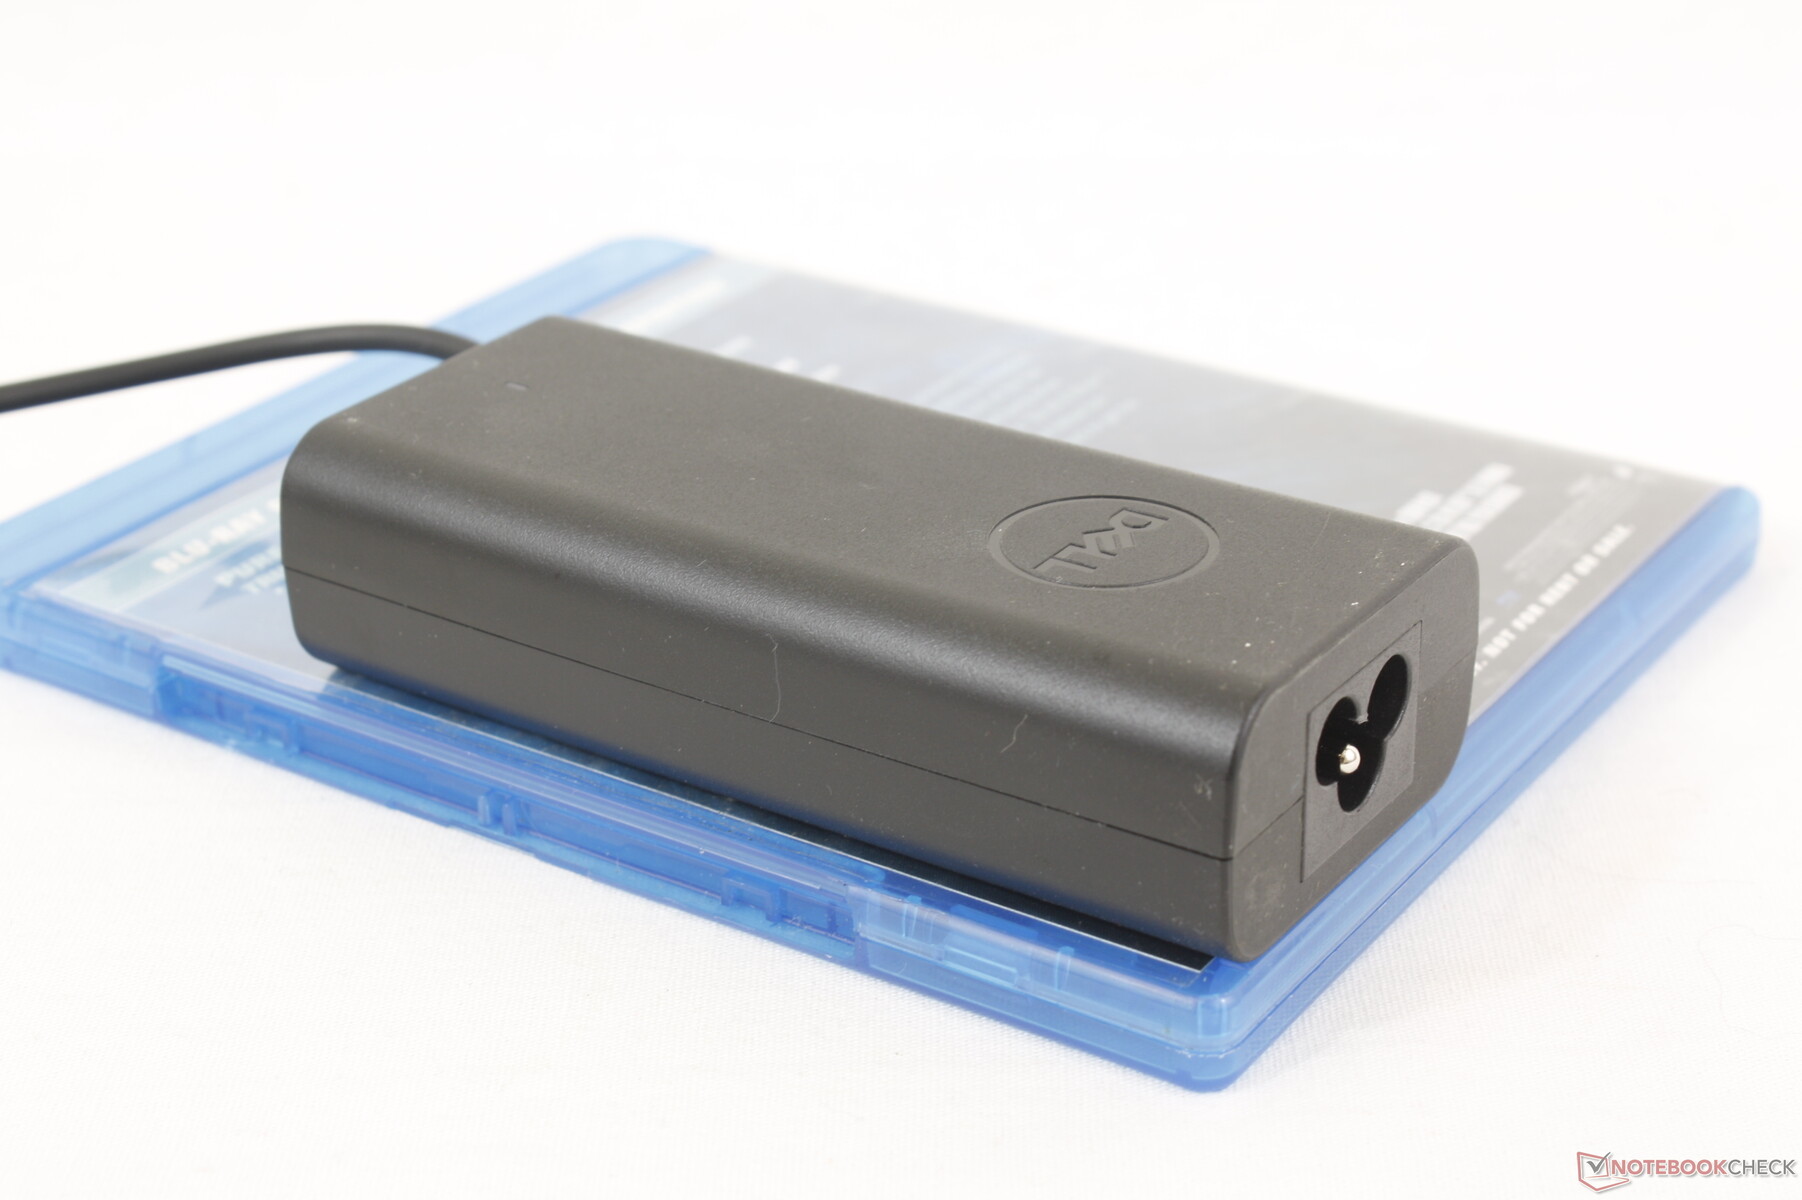
Jesteśmy w stanie zmierzyć maksymalny pobór mocy 56 W z małego (11,1 x 5,1 x 2,8 cm) adaptera USB-C o mocy 65 W, gdy procesor jest wykorzystywany w 100 procentach. Jednak wskaźnik ten jest bardzo krótkotrwały, jak pokazują poniższe zrzuty ekranu, ze względu na ograniczony potencjał Turbo Boost systemu.
| wyłączony / stan wstrzymania | |
| luz | |
| obciążenie |
|
Legenda:
min: | |
| Dell Inspiron 14 7435 2-in-1 R5 7530U, Vega 7, , IPS, 1920x1200, 14" | Dell Inspiron 14 7420 2-in-1 i7-1255U, Iris Xe G7 96EUs, WDC PC SN530 SDBPMPZ-512G, IPS, 1920x1200, 14" | Lenovo IdeaPad Flex 7i 14IAU7 i7-1255U, Iris Xe G7 96EUs, Samsung PM9B1 512GB MZAL4512HBLU, IPS, 2240x1400, 14" | Acer Aspire 5 Spin 14 i5-1335U, Iris Xe G7 80EUs, Micron 2450 512GB MTFDKBA512TFK, IPS, 1920x1200, 14" | LG Gram 14T90P i5-1135G7, Iris Xe G7 80EUs, Samsung SSD PM981a MZVLB512HBJQ, IPS, 1900x1200, 14" | HP Pavilion x360 14-dy0157ng i5-1135G7, Iris Xe G7 80EUs, Toshiba KBG40ZNV512G, IPS, 1920x1080, 14" | |
|---|---|---|---|---|---|---|
| Power Consumption | 6% | -10% | 12% | 24% | 33% | |
| Idle Minimum * (Watt) | 5.3 | 5.2 2% | 7.1 -34% | 4.3 19% | 2.8 47% | 4 25% |
| Idle Average * (Watt) | 9.1 | 8.2 10% | 11 -21% | 5.8 36% | 5.5 40% | 6.7 26% |
| Idle Maximum * (Watt) | 9.4 | 9.9 -5% | 11.4 -21% | 8.8 6% | 6.4 32% | 8.2 13% |
| Load Average * (Watt) | 54.9 | 44.4 19% | 43.7 20% | 44 20% | 45.4 17% | 29.6 46% |
| Witcher 3 ultra * (Watt) | 45 | 35 22% | 35.1 22% | 41.5 8% | 34 24% | 29.6 34% |
| Load Maximum * (Watt) | 55.8 | 62.5 -12% | 71 -27% | 67 -20% | 65.9 -18% | 26.7 52% |
* ... im mniej tym lepiej
Power Consumption Witcher 3 / Stresstest
Power Consumption external Monitor
Żywotność baterii
Czas pracy wyraźnie wzrósł z roku na rok, pomimo braku zmian w pojemności baterii. Jesteśmy w stanie taktować 11 godzin rzeczywistego przeglądania sieci WLAN na naszej jednostce zasilanej przez AMD w porównaniu do 7,5 godziny na zeszłorocznym modelu zasilanym przez Intela. Inspiron 14 7435 2-w-1 jest zatem trwalszy niż wiele innych subnotebooków w tym przedziale cenowym.
Ładowanie od stanu pustego do pełnej pojemności zajmuje około dwóch godzin.
| Dell Inspiron 14 7435 2-in-1 R5 7530U, Vega 7, 54 Wh | Dell Inspiron 14 7420 2-in-1 i7-1255U, Iris Xe G7 96EUs, 54 Wh | Lenovo IdeaPad Flex 7i 14IAU7 i7-1255U, Iris Xe G7 96EUs, 59 Wh | Acer Aspire 5 Spin 14 i5-1335U, Iris Xe G7 80EUs, 54.6 Wh | LG Gram 14T90P i5-1135G7, Iris Xe G7 80EUs, 72 Wh | HP Pavilion x360 14-dy0157ng i5-1135G7, Iris Xe G7 80EUs, 43 Wh | |
|---|---|---|---|---|---|---|
| Czasy pracy | -16% | -32% | 0% | 12% | -22% | |
| Reader / Idle (h) | 19.9 | 15.9 -20% | 17.7 -11% | |||
| WiFi v1.3 (h) | 11.1 | 7.6 -32% | 7.6 -32% | 11.1 0% | 12.1 9% | 7.1 -36% |
| Load (h) | 2 | 2.1 5% | 2.3 15% | 1.6 -20% | ||
| H.264 (h) | 8.9 |
Za
Przeciw
Werdykt - dobra wydajność w stosunku do ceny, ale wyświetlacz mógłby wymagać trochę pracy
Z punktu widzenia wydajności, nasz kosztujący 550 USD Ryzen 5 Inspiron 14 7435 2-w-1 działa równie dobrze jak kosztujący 800 USD Core i5 Inspiron 14 7430 2-w-1 bez żadnych kompromisów w zakresie żywotności baterii, jakości wyświetlania, głośników lub innych cech fizycznych. Jeśli obsługa Thunderbolt nie znajduje się wysoko na twojej liście, możesz zaoszczędzić prawie 200 USD, wybierając AMD zamiast Intela dla tego konkretnego modelu.
Konfiguracja Ryzen 5 jest doskonale dostrojona, aby działać równie dobrze jak konfiguracja Core i5 za setki dolarów mniej. Kosztowne aktualizacje pamięci RAM i słaby ekran dotykowy jednak nieco obniżają jakość tego modelu.
Przylutowana pamięć RAM jest główną wadą tego modelu w tym roku, ponieważ prosta aktualizacja z 8 GB do 16 GB to dodatkowe 150 USD. W przypadku tego, co ma być budżetowym kabrioletem, kosztowna aktualizacja może być zniechęcająca dla docelowych odbiorców. W przeciwnym razie zmiany w głośnikach, klawiaturze i zawiasach są mile widzianymi ulepszeniami.
Chcielibyśmy, aby przyszłe wersje zawierały jaśniejsze opcje ekranu dotykowego dla lepszej widoczności na zewnątrz. Obecny wyświetlacz o jasności 250 nitów ogranicza model do środowisk wewnętrznych, co jest niefortunne, ponieważ kupujący mogą chcieć korzystać z 14-calowego kabrioletu w podróży. Taka funkcja dałaby Inspironowi 14 7435 2-w-1 znaczącą przewagę nad konkurentami, takimi jak Acer Aspire 5 Spin 14, Lenovo IdeaPad Flex 7ilub HP Pavilion x360 14.
Cena i dostępność
Dell wysyła teraz swój Inspiron 14 7435 2-w-1 w cenie od 549 USD za naszą recenzowaną konfigurację Ryzen 5 do 699 USD za konfigurację Ryzen 7. Alternatywnie, Intel Inspiron 14 7430 2-w-1 zaczyna się od 799 USD za konfigurację Core i5.
Dell Inspiron 14 7435 2-in-1
- 08/08/2023 v7 (old)
Allen Ngo
Przezroczystość
Wyboru urządzeń do recenzji dokonuje nasza redakcja. Próbka testowa została udostępniona autorowi jako pożyczka od producenta lub sprzedawcy detalicznego na potrzeby tej recenzji. Pożyczkodawca nie miał wpływu na tę recenzję, producent nie otrzymał też kopii tej recenzji przed publikacją. Nie było obowiązku publikowania tej recenzji. Jako niezależna firma medialna, Notebookcheck nie podlega władzy producentów, sprzedawców detalicznych ani wydawców.
Tak testuje Notebookcheck
Każdego roku Notebookcheck niezależnie sprawdza setki laptopów i smartfonów, stosując standardowe procedury, aby zapewnić porównywalność wszystkich wyników. Od około 20 lat stale rozwijamy nasze metody badawcze, ustanawiając przy tym standardy branżowe. W naszych laboratoriach testowych doświadczeni technicy i redaktorzy korzystają z wysokiej jakości sprzętu pomiarowego. Testy te obejmują wieloetapowy proces walidacji. Nasz kompleksowy system ocen opiera się na setkach uzasadnionych pomiarów i benchmarków, co pozwala zachować obiektywizm.Price comparison

