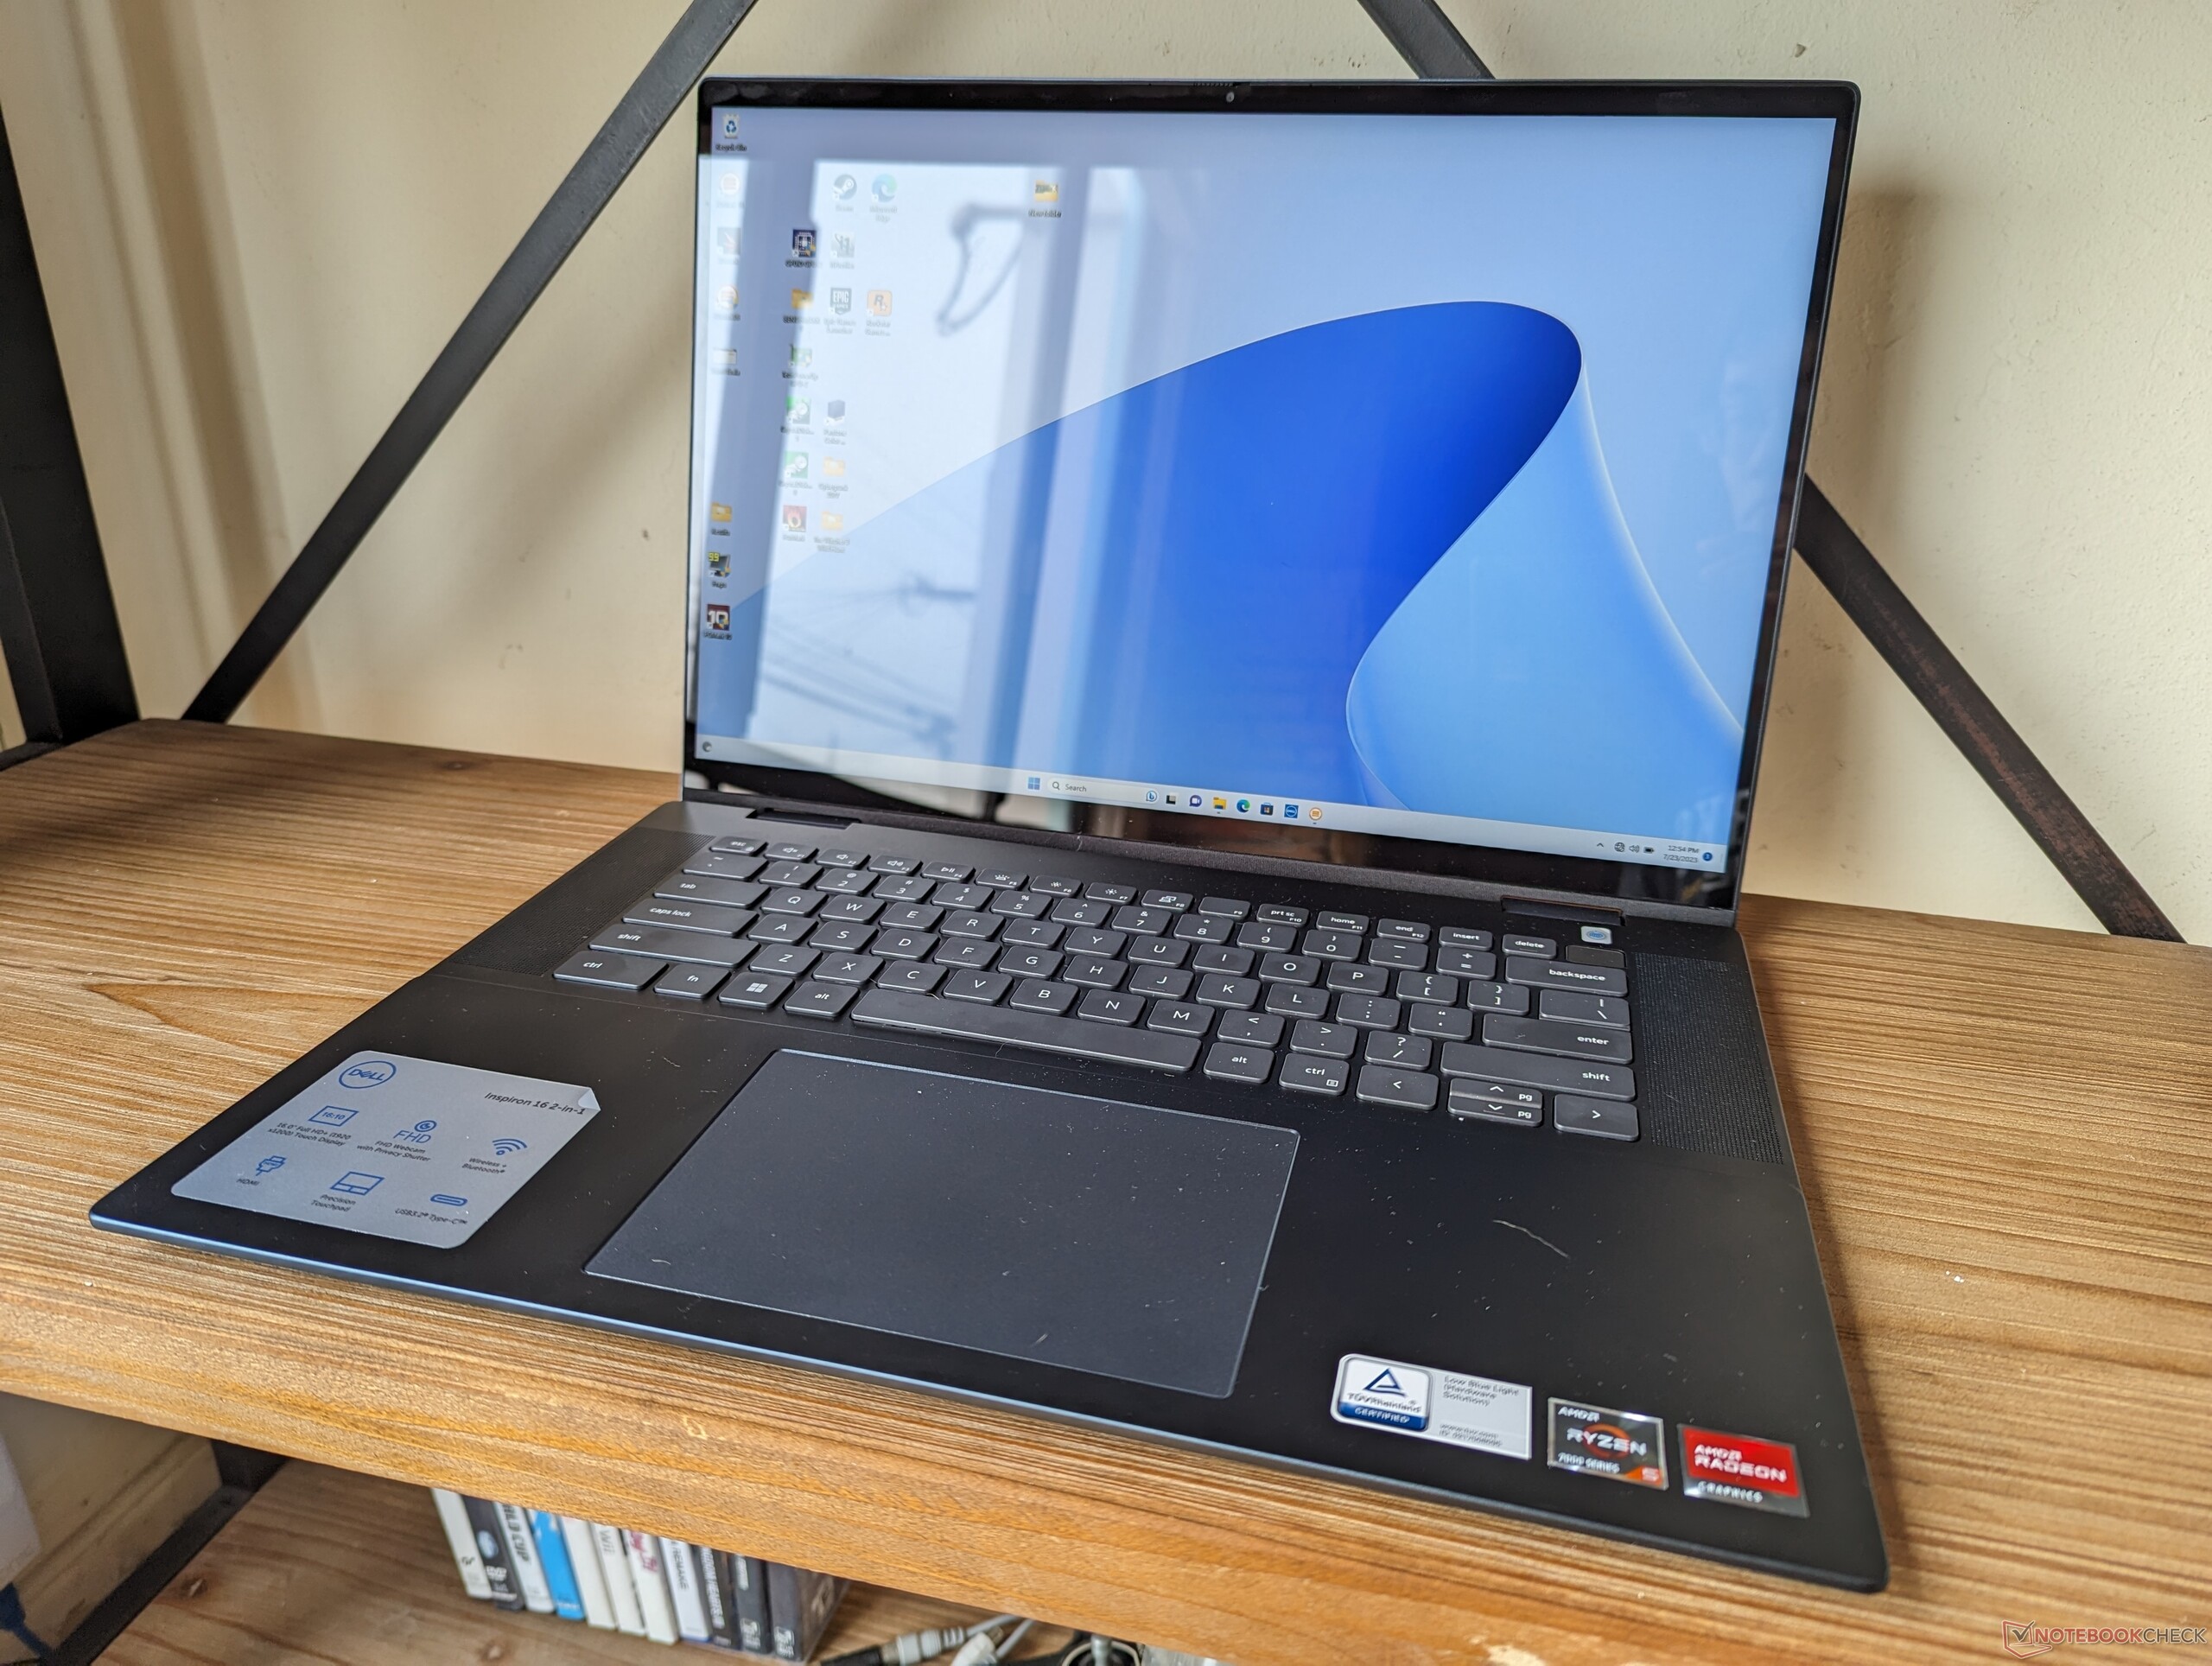
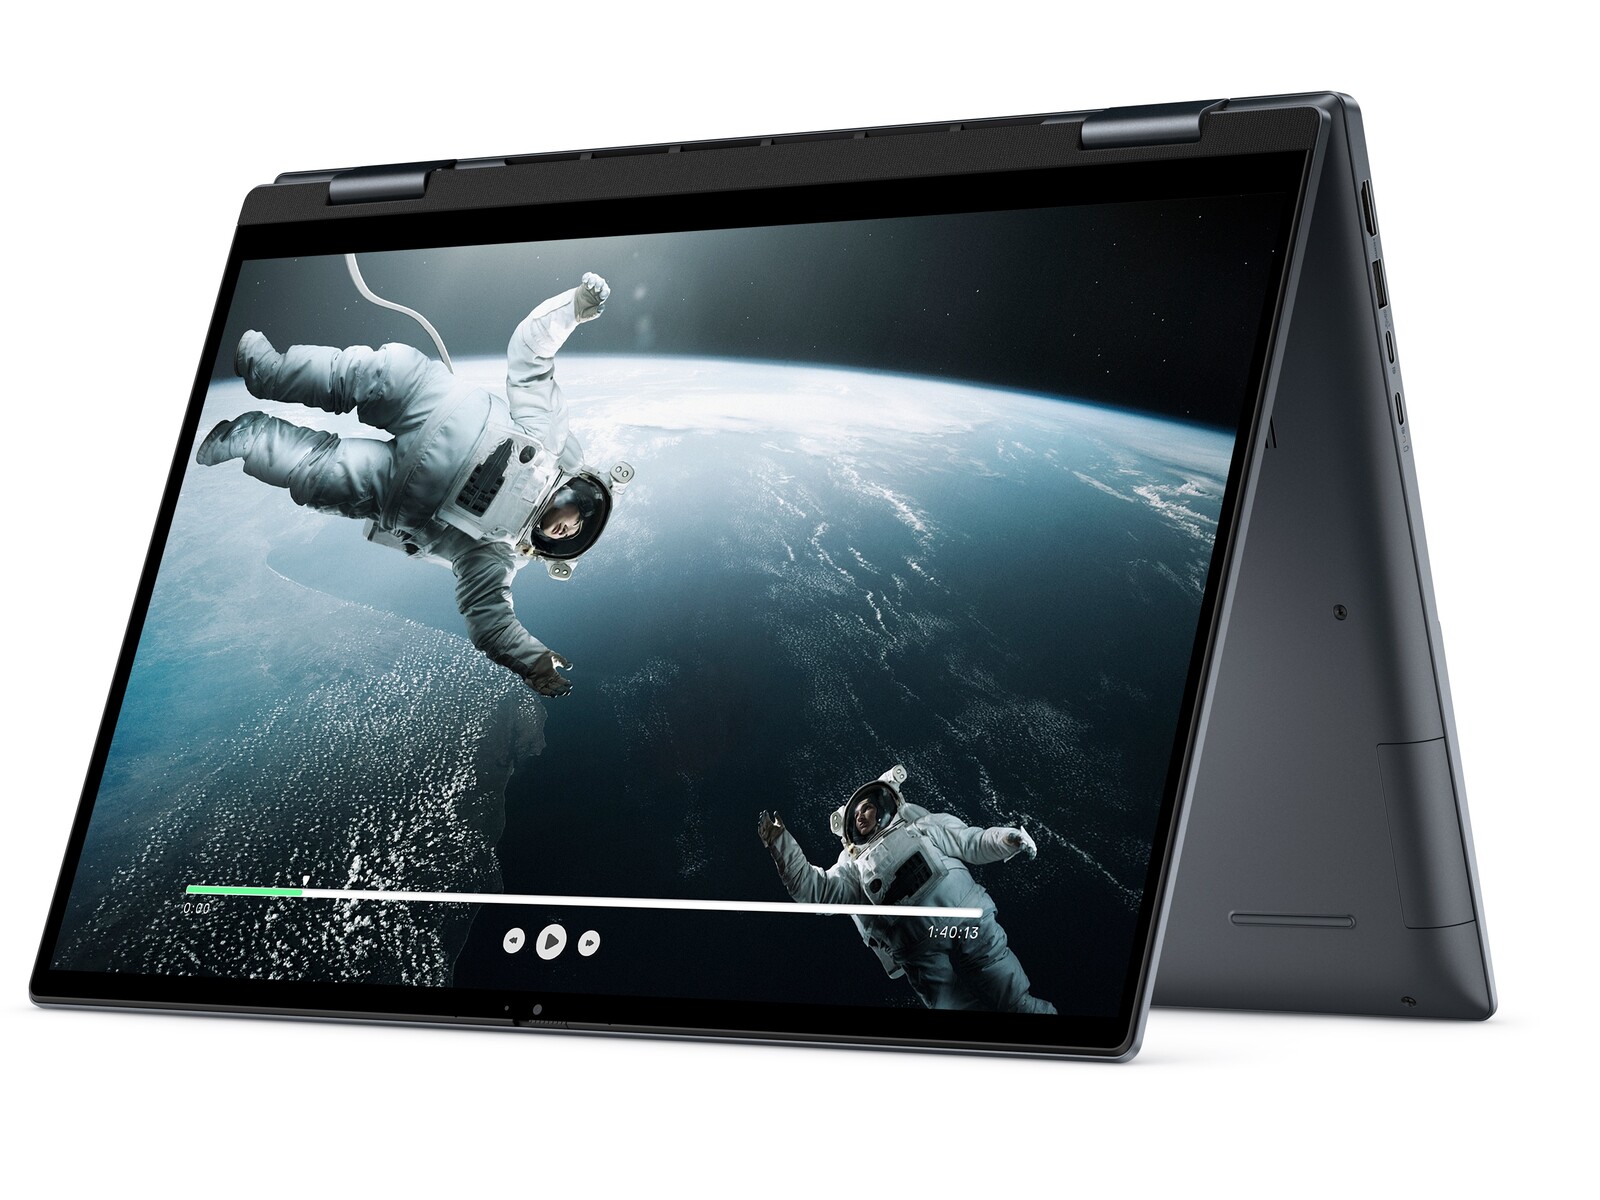
Recenzja laptopa 2 w 1 Dell Inspiron 16 7635: Rozcieńczony Inspiron 16 7630 z procesorem AMD Ryzen

Inspiron 16 7635 2-in-1 to wersja Inspiron 16 7630 2-in-1 z procesorem AMD. Podobnie jak inne modele Inspiron, jest on skierowany do budżetowej i średniej klasy kategorii konsumenckiej, w przeciwieństwie do wyższej klasy biznesowej Latitude lub prosumenckiej serii XPS. Jest to bezpośredni następca zeszłorocznego Inspiron 16 7620 2-w-1 z nowymi procesorami i zmienionym wyglądem zewnętrznym.
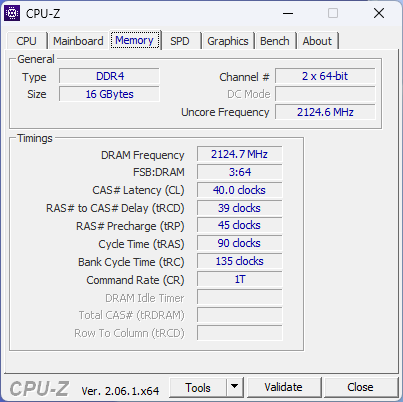
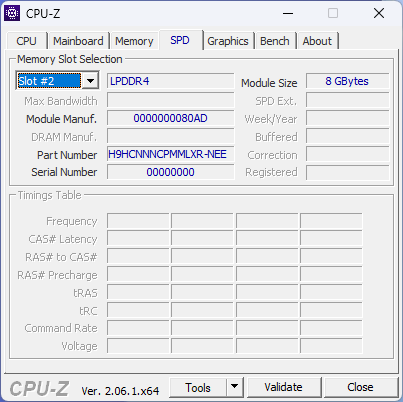
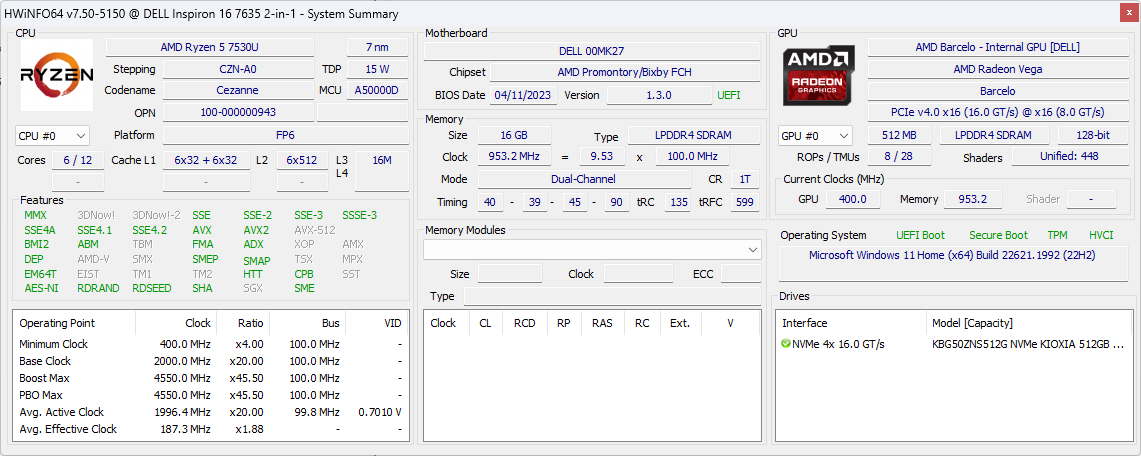
Nasza konkretna jednostka testowa to konfiguracja z niższej półki z procesorem Zen 3 Ryzen 5 7530U, 16 GB wlutowanej pamięci RAM LPDDR4x 4266 MHz i 512 GB NVMe SSD za około 900 USD w sprzedaży detalicznej. Dostępna jest również wyższa opcja Ryzen 7 7730U, ale wszystkie SKU AMD są obecnie dostarczane z tym samym panelem IPS 1200p, podczas gdy wersja Intela ma droższą opcję OLED 2400p.
Alternatywy dla Inspiron 16 7635 2-w-1 obejmują inne duże laptopy konwertowalne, takie jak Lenovo Flex 5 16 lub bardziej wydajny MSI Summit E16 Fliplub HP Spectre x360 16.
Więcej recenzji Dell:
Potencjalni konkurenci w porównaniu
Ocena | Data | Model | Waga | Wysokość | Rozmiar | Rezolucja | Cena |
|---|---|---|---|---|---|---|---|
| 84.6 % v7 (old) | 07/2023 | Dell Inspiron 16 7635 2-in-1 R5 7530U, Vega 7 | 2 kg | 18.99 mm | 16.00" | 1920x1200 | |
| 87.5 % v7 (old) | 06/2023 | Acer Swift Edge SFE16-42-R1GM R7 7735U, Radeon 680M | 1.2 kg | 13.95 mm | 16.00" | 3840x2400 | |
| 85.8 % v7 (old) | 05/2023 | Lenovo Yoga 7 16IRL8 i7-1355U, Iris Xe G7 96EUs | 2 kg | 16.99 mm | 16.00" | 1920x1200 | |
| 85.6 % v7 (old) | 05/2023 | Samsung Galaxy Book3 Pro 16 i5-1340P, Iris Xe G7 80EUs | 1.6 kg | 12.5 mm | 16.00" | 2880x1800 | |
| 80.7 % v7 (old) | 04/2023 | Lenovo IdeaPad Flex 5 16ABR G8 R7 7730U, Vega 8 | 2 kg | 18.7 mm | 16.00" | 1920x1200 | |
| 85.7 % v7 (old) | Dell Inspiron 16 7620 2-in-1 i7-1260P, Iris Xe G7 96EUs | 2.1 kg | 18.41 mm | 16.00" | 1920x1200 |
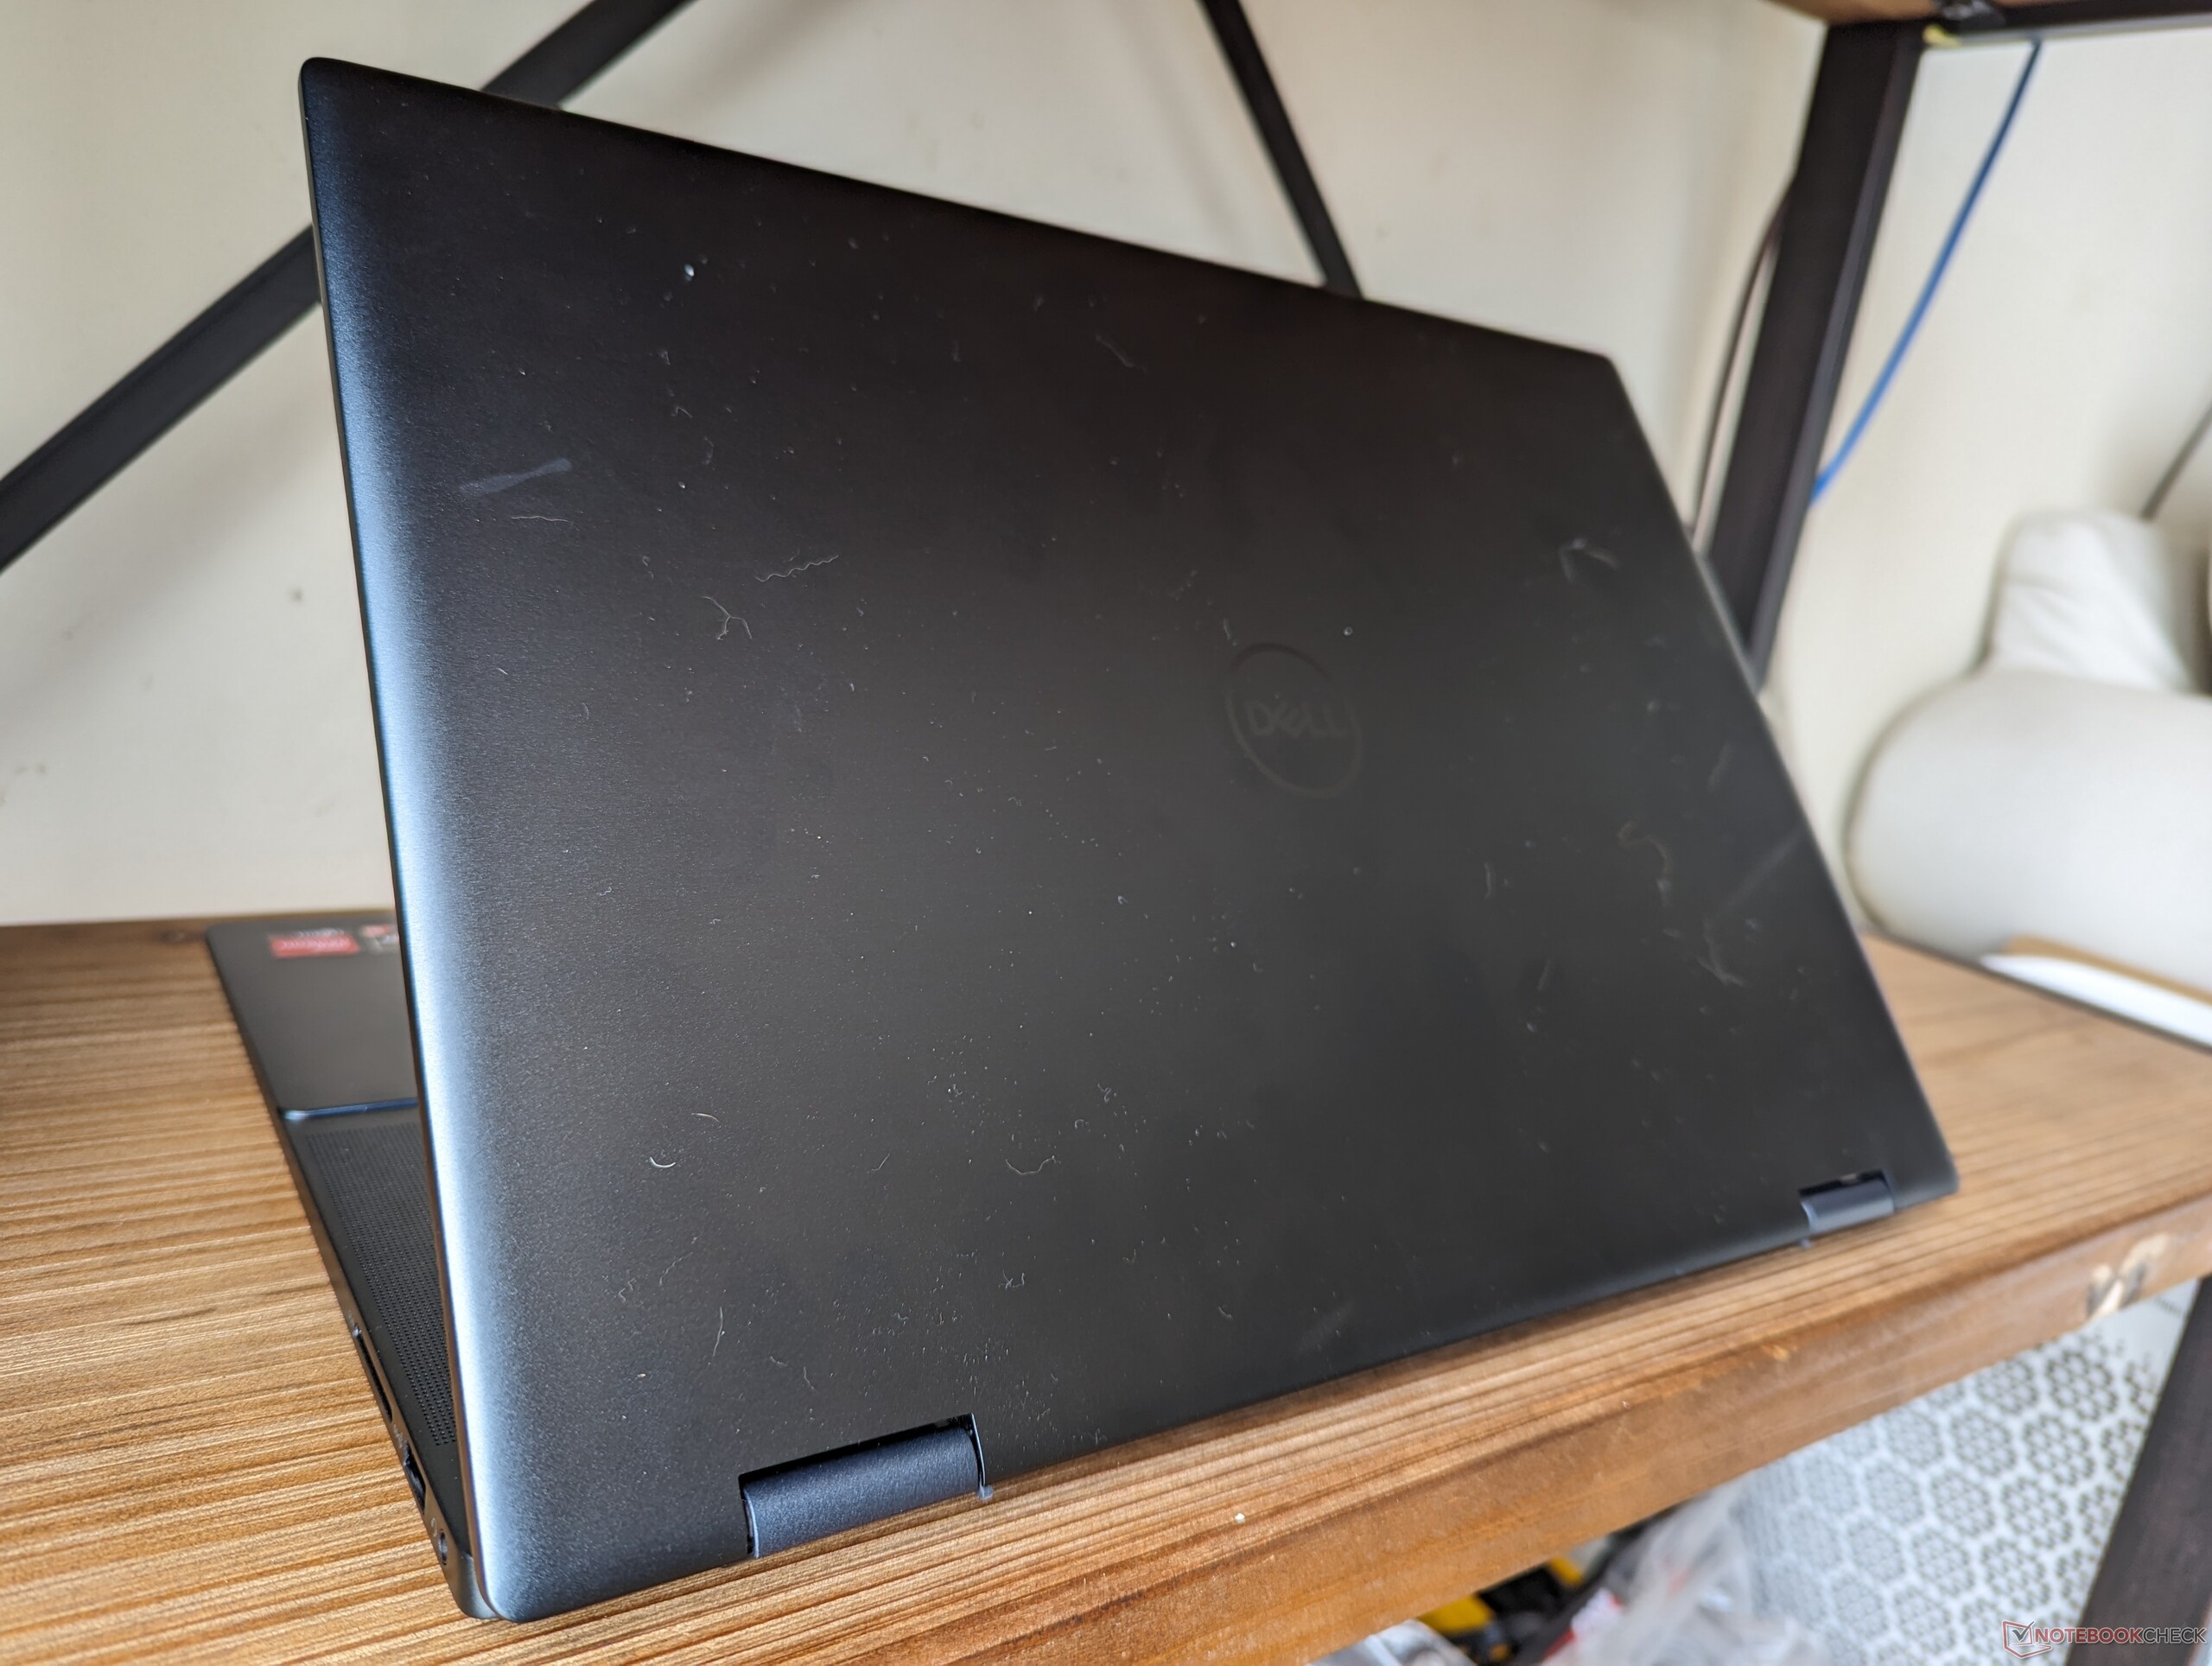
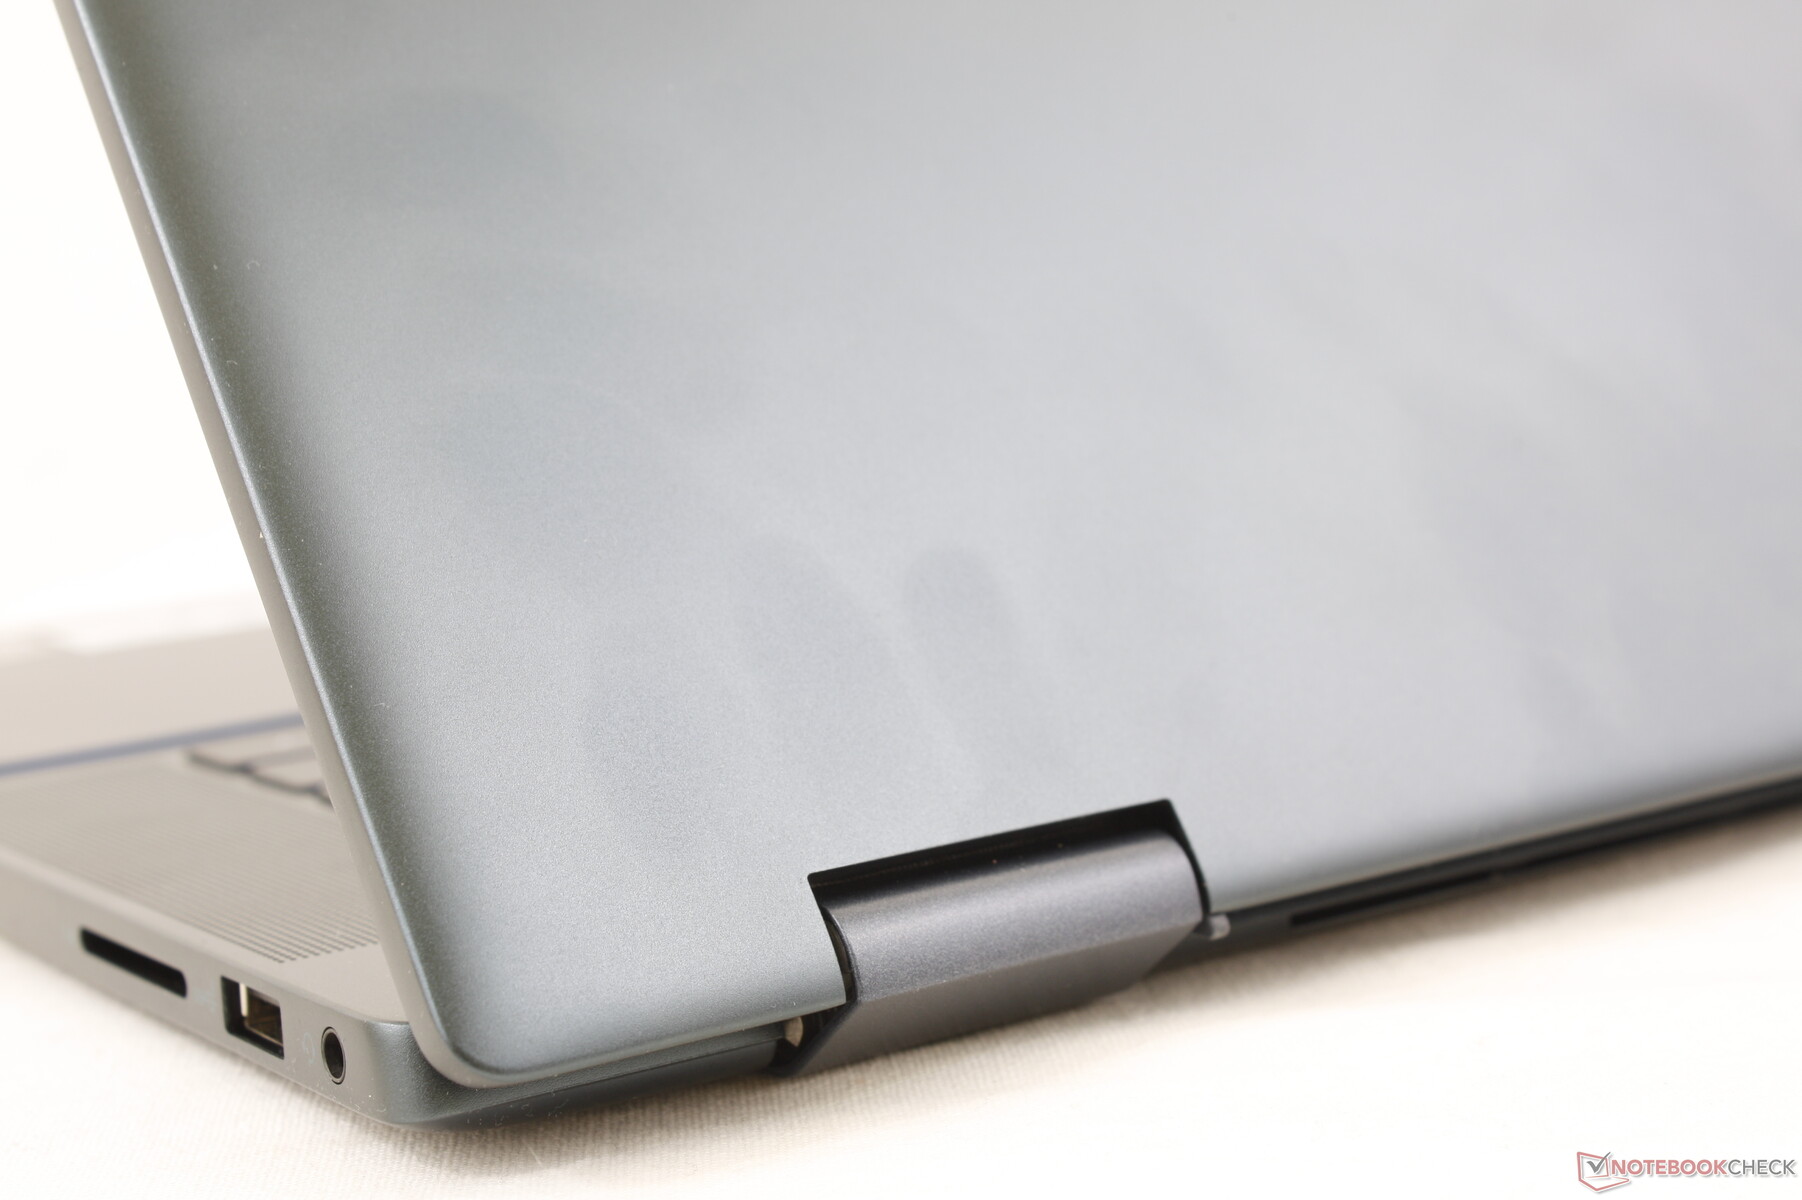
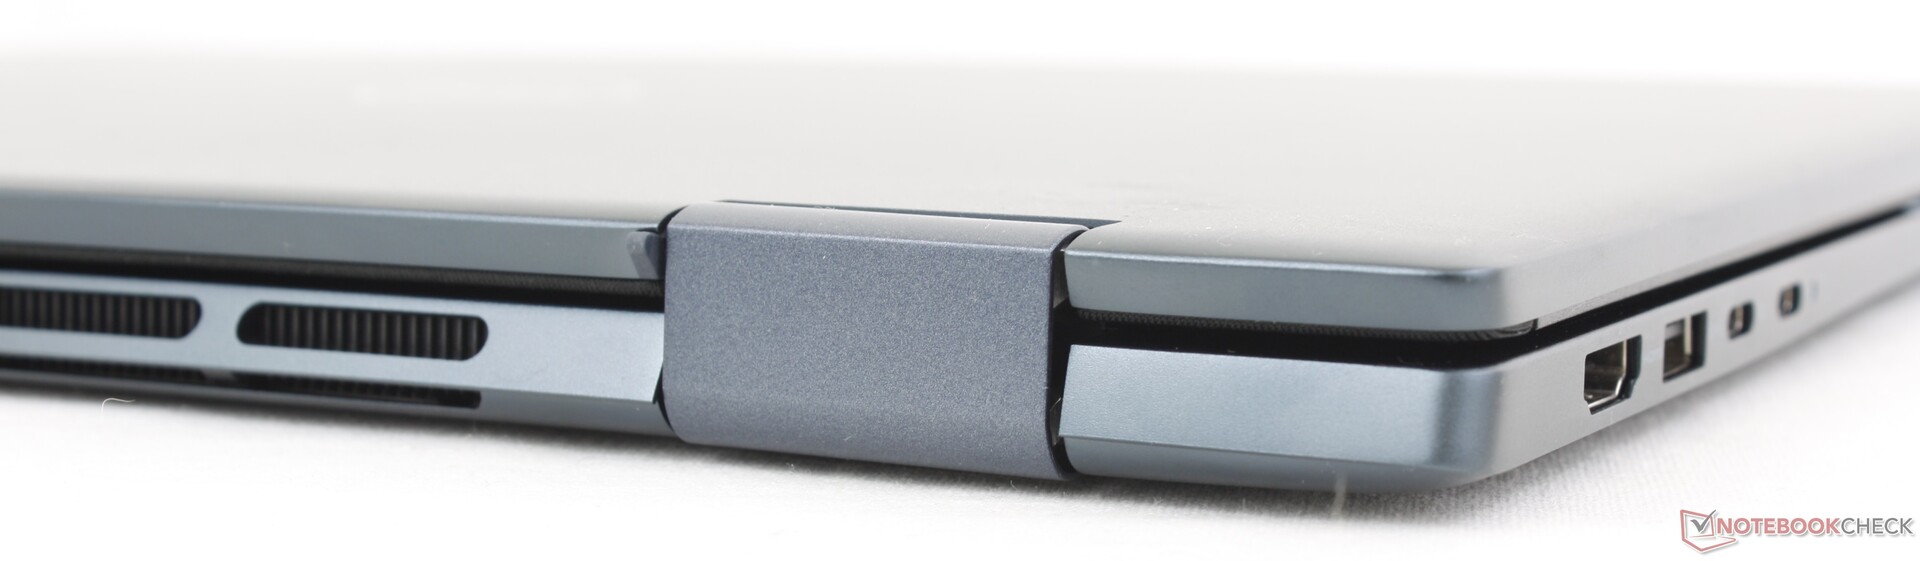
Przypadek - bezgłośne upuszczanie folii Mylar
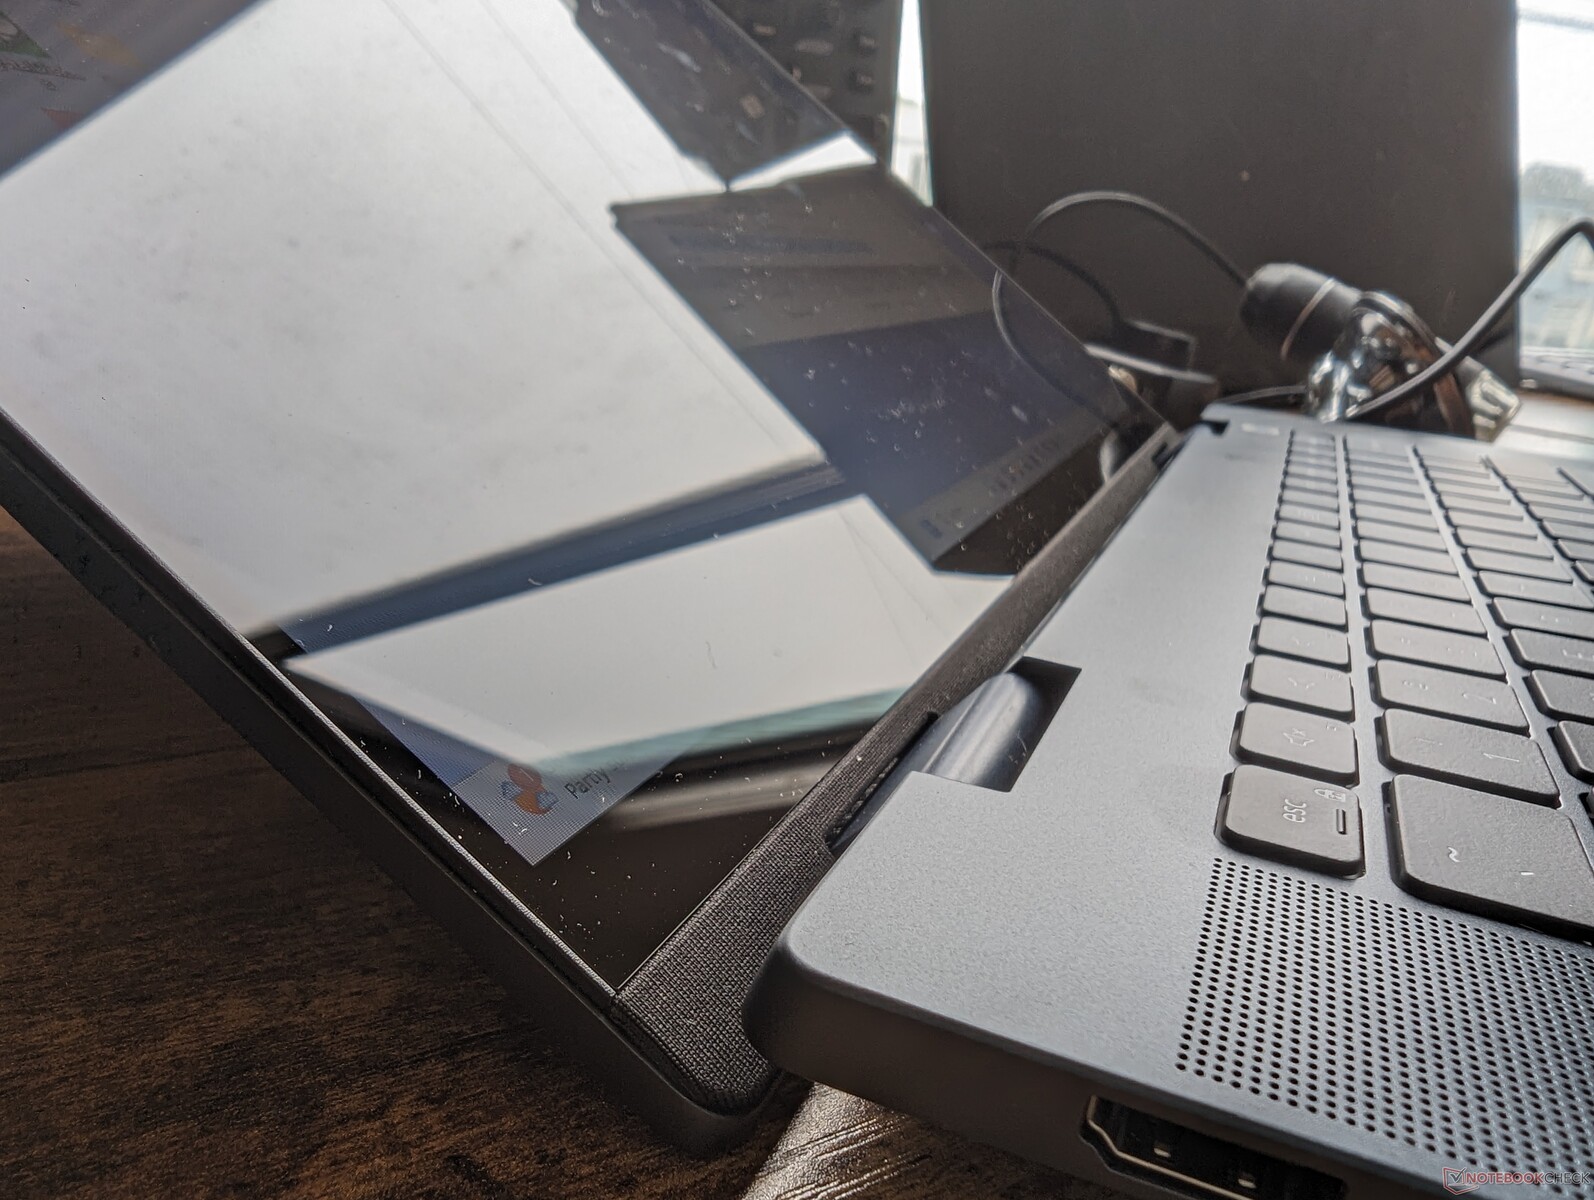
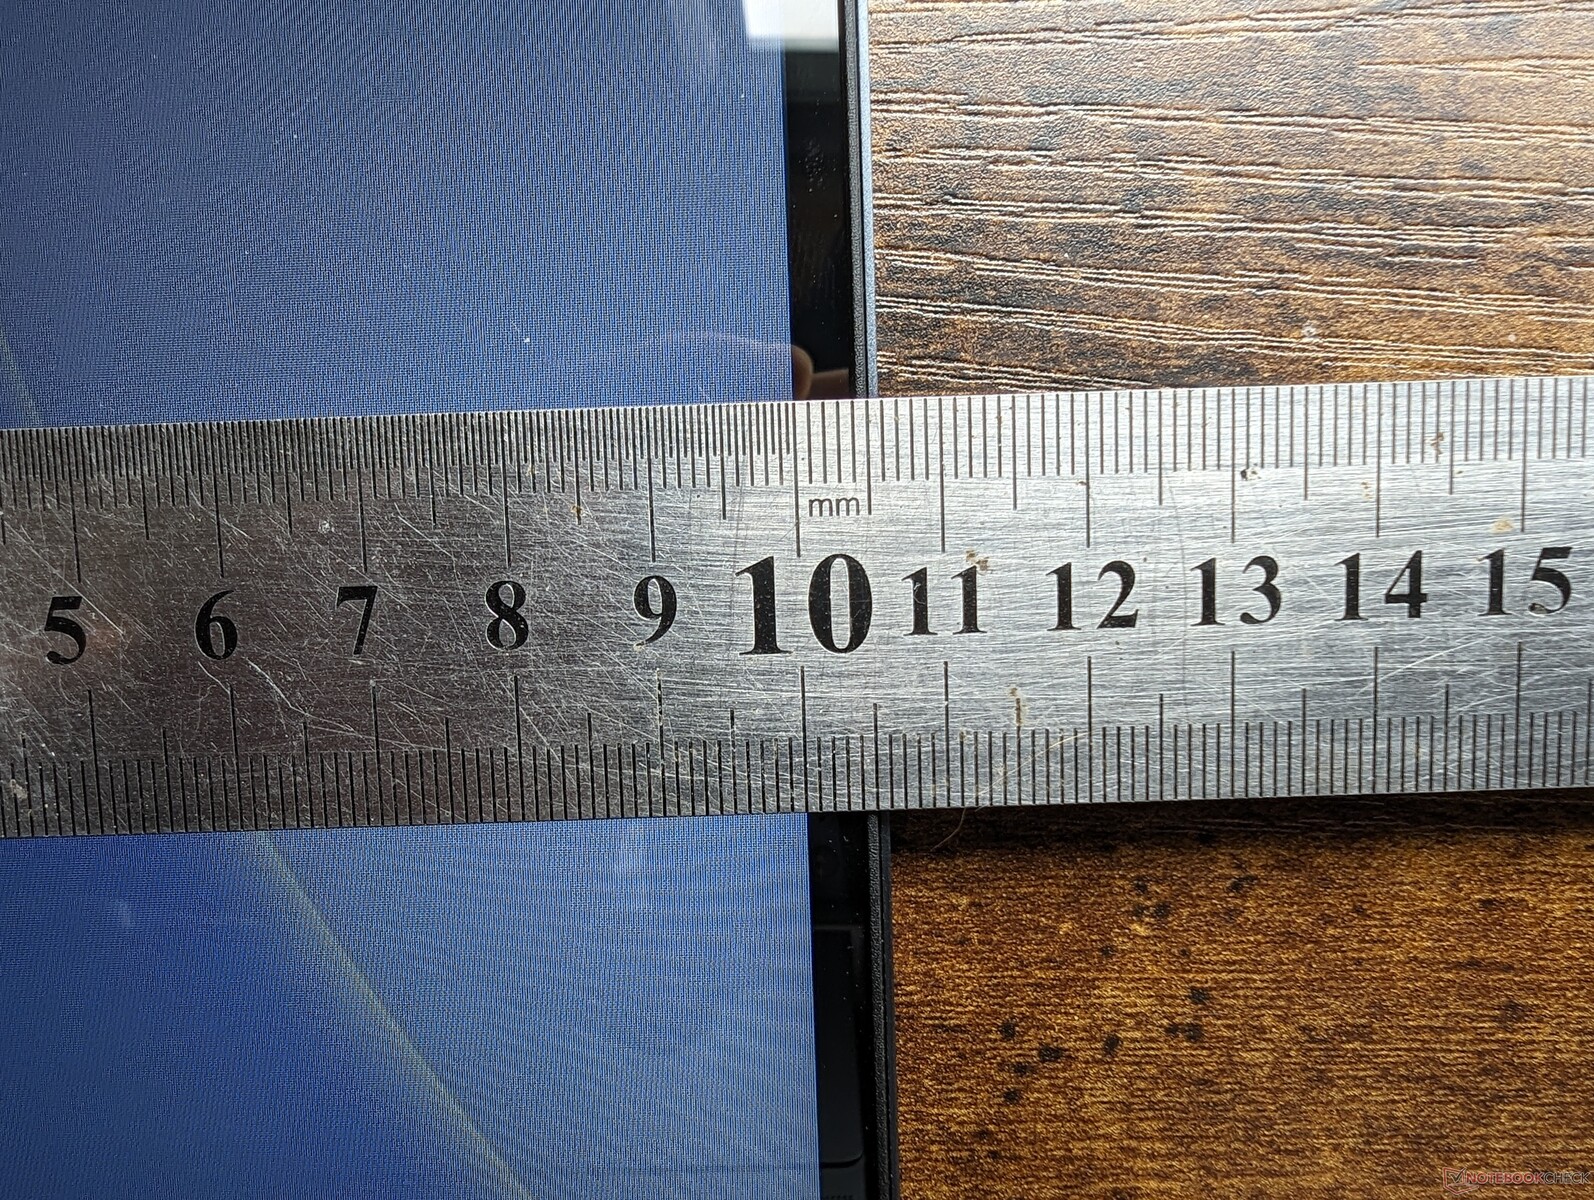
Dell zrobił wielką sprawę z wykorzystania Mylaru w zeszłorocznym Inspironie 16 7620 2-w-1, więc nieco kłopotliwe jest to, że nagle zniknął w tegorocznym odświeżeniu Inspiron 16 7630/7635. Zamiast tego obudowa składa się teraz z kombinacji aluminium i tworzyw sztucznych pochodzących z recyklingu, co zapewnia bardziej monotonną kolorystykę i wygląd. Zawiasy zostały również przeprojektowane, aby były bardziej płaskie, a z tyłu znajdują się teraz dodatkowe kratki wentylacyjne, które pomagają w chłodzeniu.
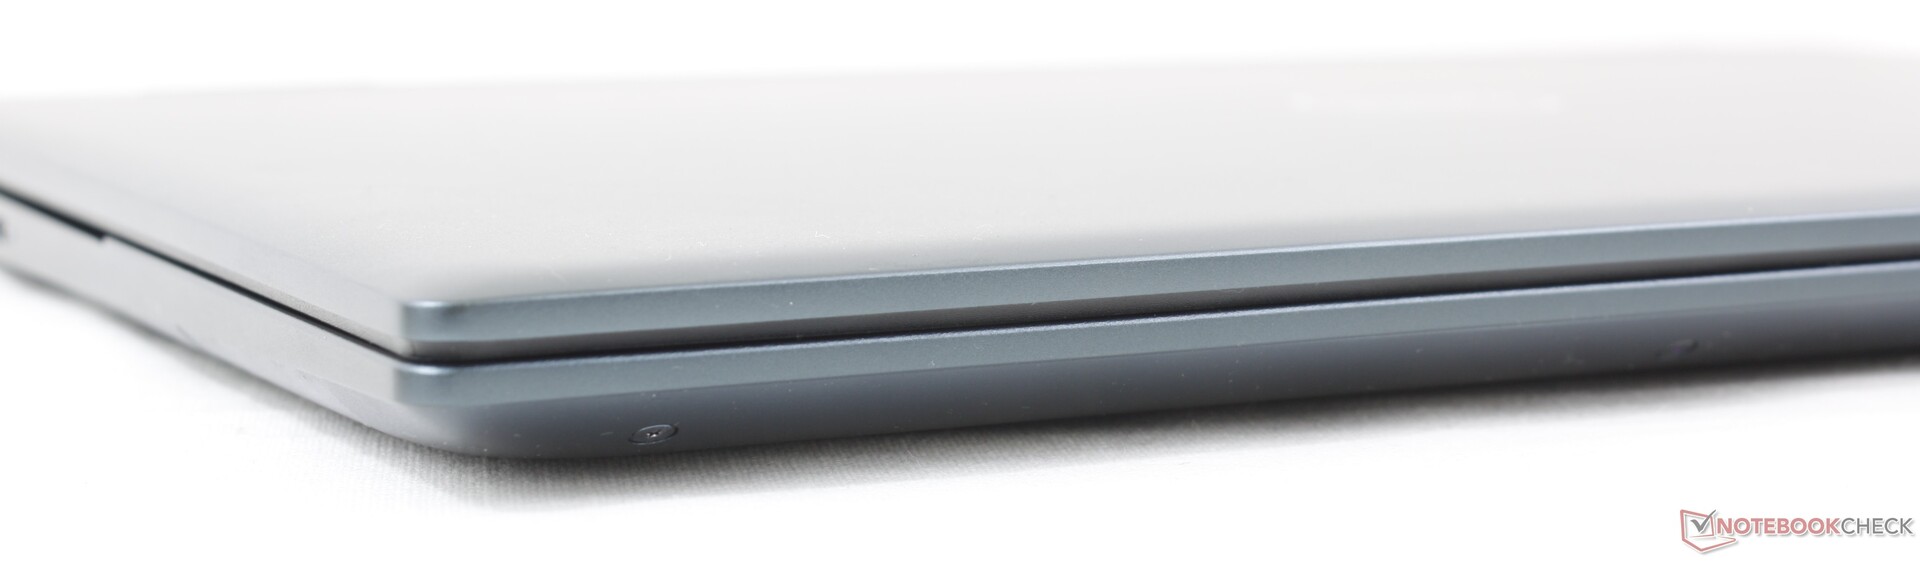
Jakość podwozia pozostaje mniej więcej taka sama rok do roku pomimo zmian zewnętrznych. Gęsta waga przyczynia się do nieugiętej podstawy dla mocnych pierwszych wrażeń, która jest tylko o krok lub dwa w dół od znacznie droższego i równie ciężkiegoHP Spectre x360 16.
Być może przez przypadek, wymiary i waga są niemal identyczne jak w konkurencyjnym modeluIdeaPad Flex 5 16. Nowy model nie jest niestety ani mniejszy, ani lżejszy od zeszłorocznego Inspirona 16 7620 2-w-1, przez co pozostaje stosunkowo ciężkim laptopem, nawet jak na 16-calową kategorię wielkości.

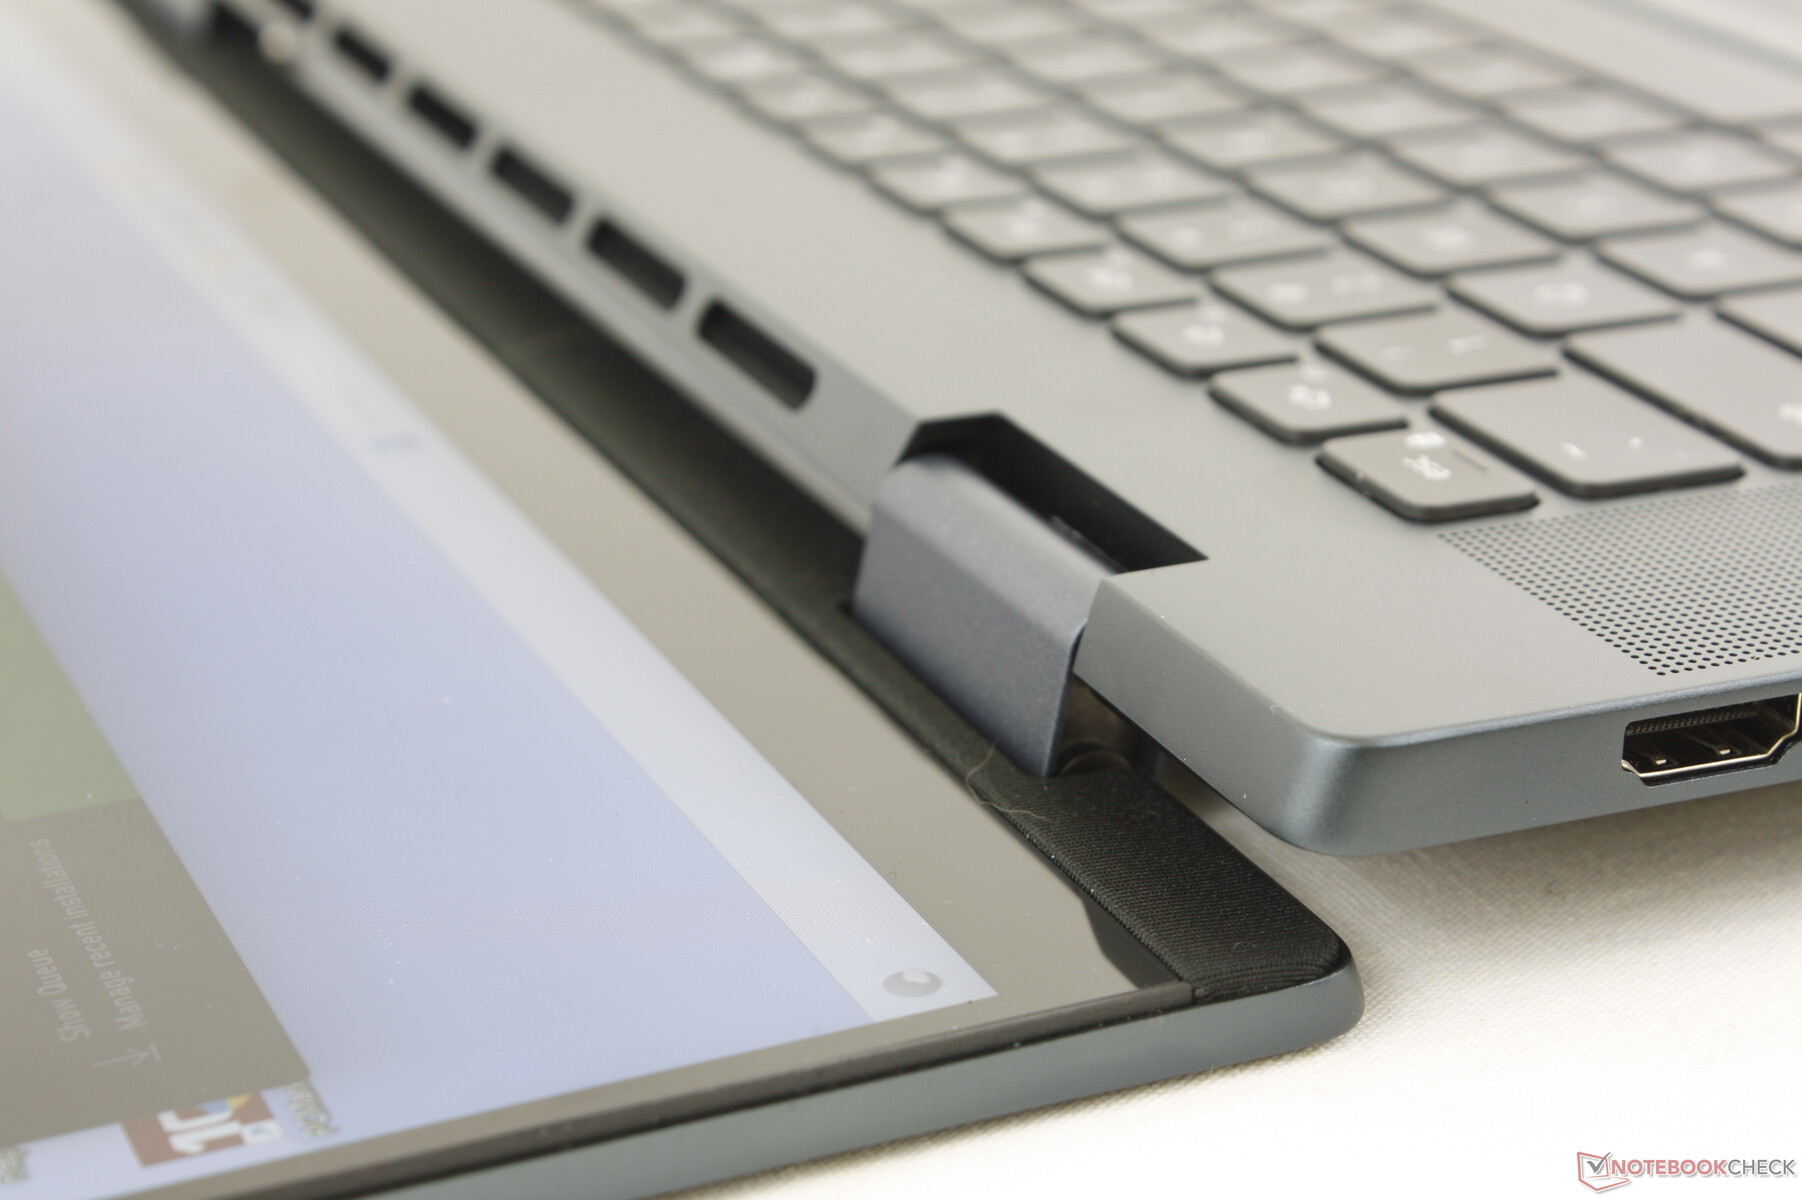
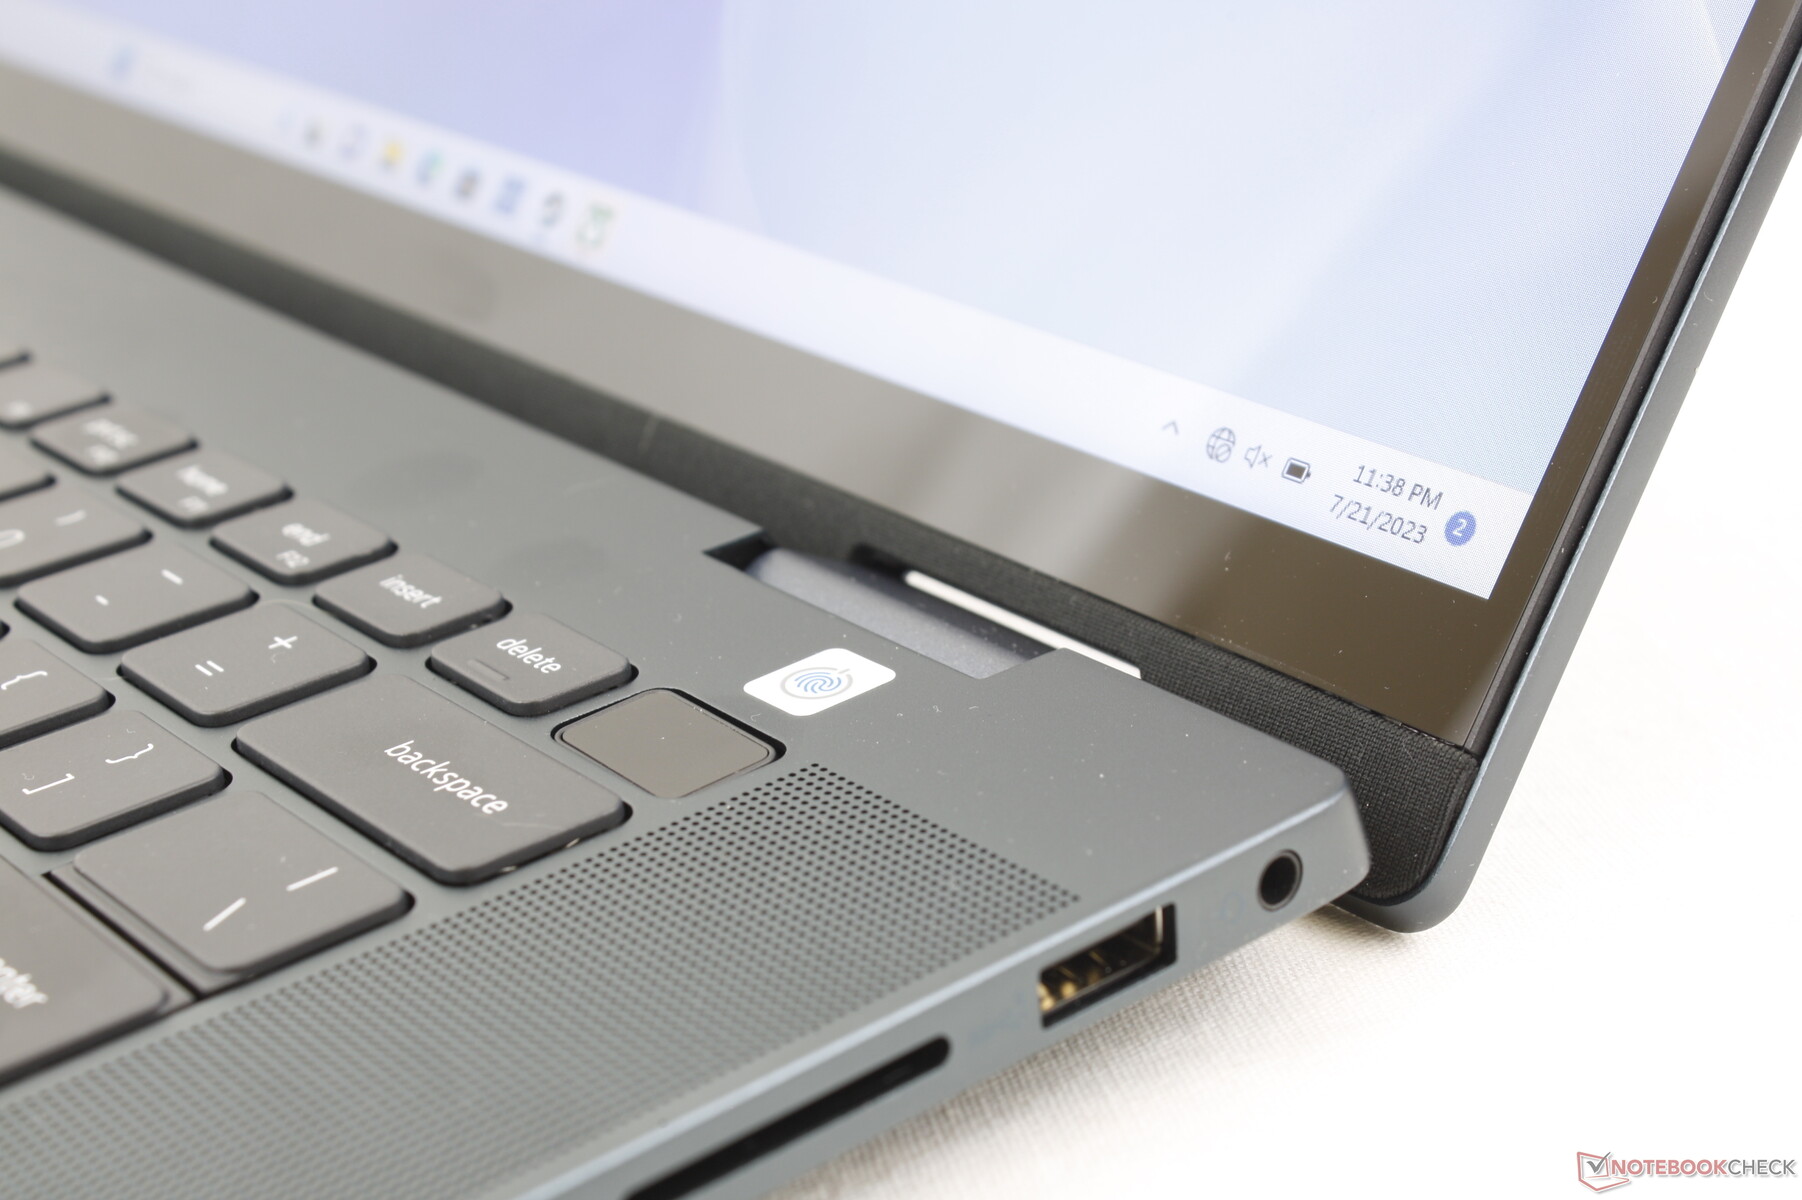
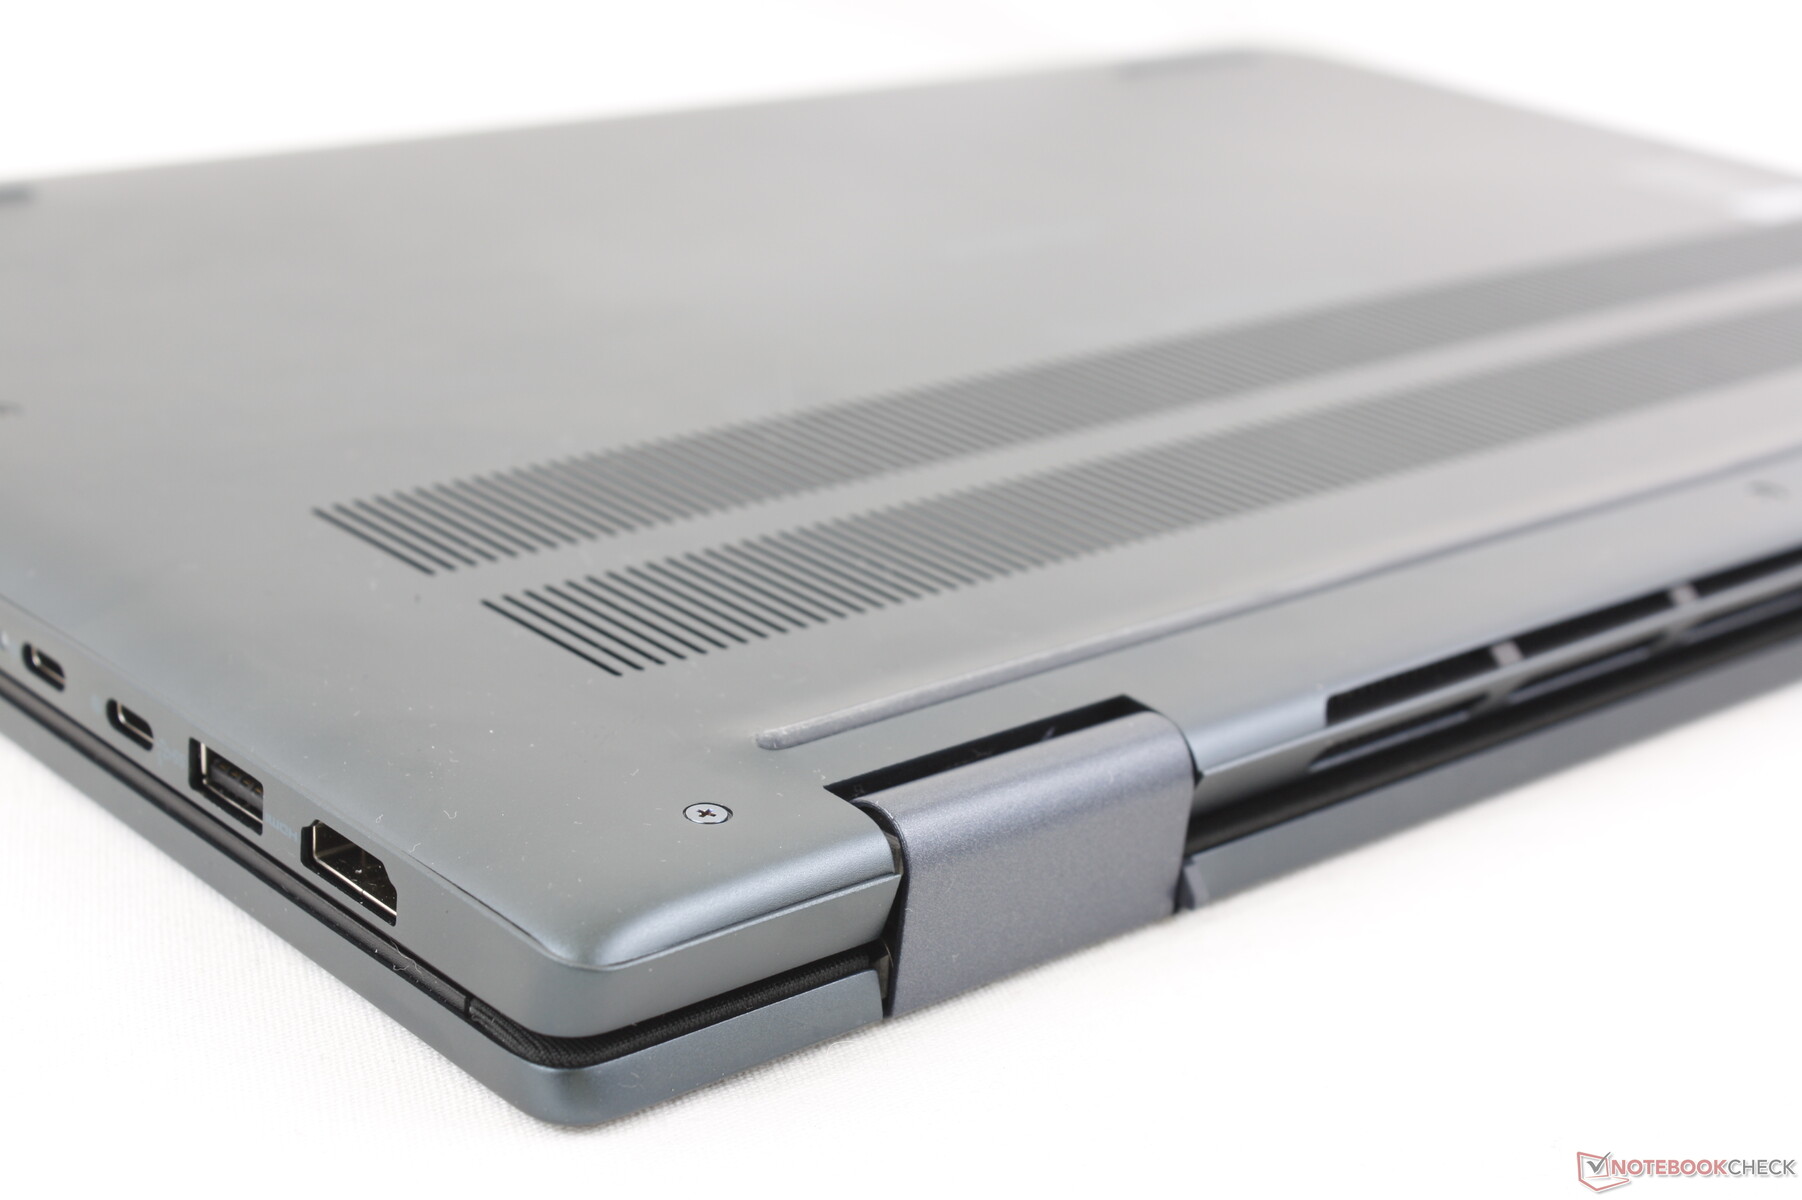
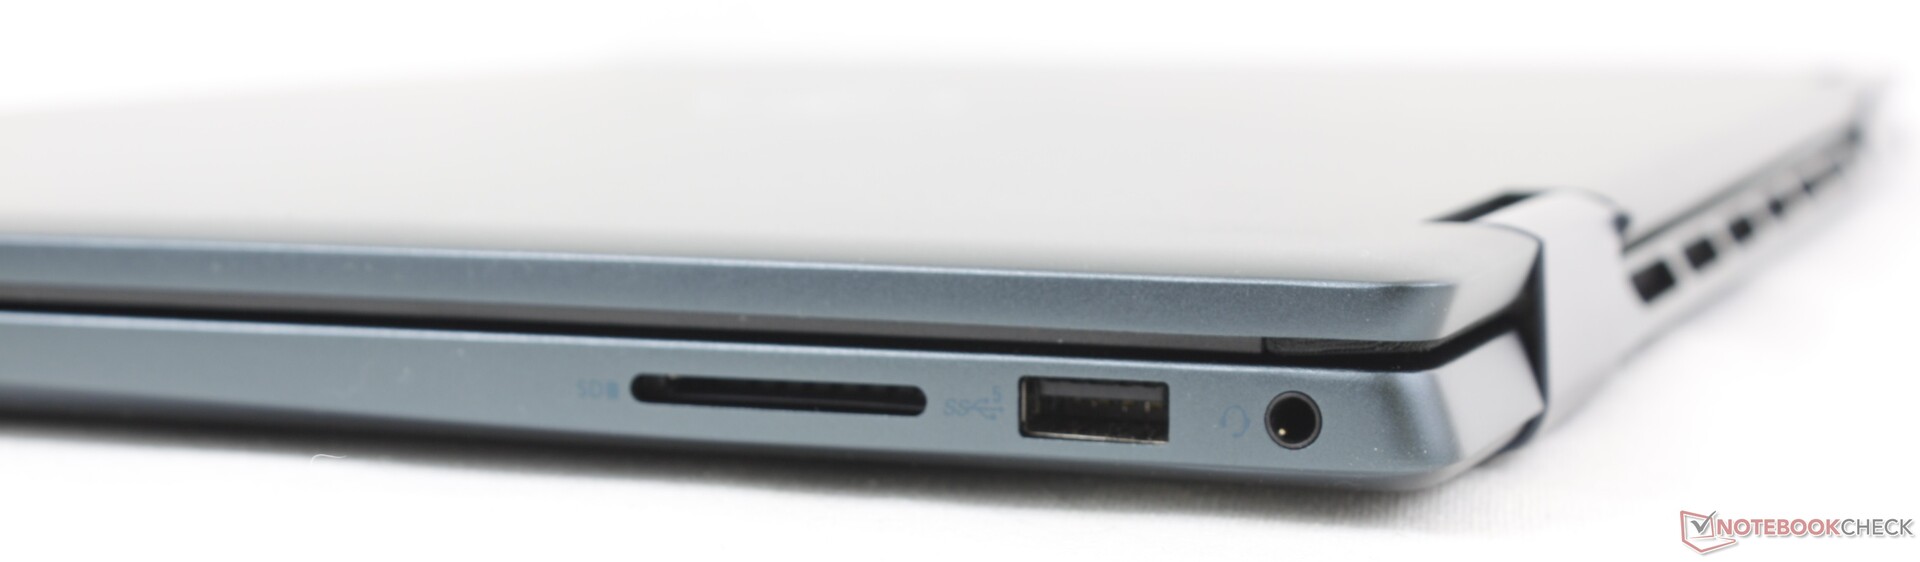
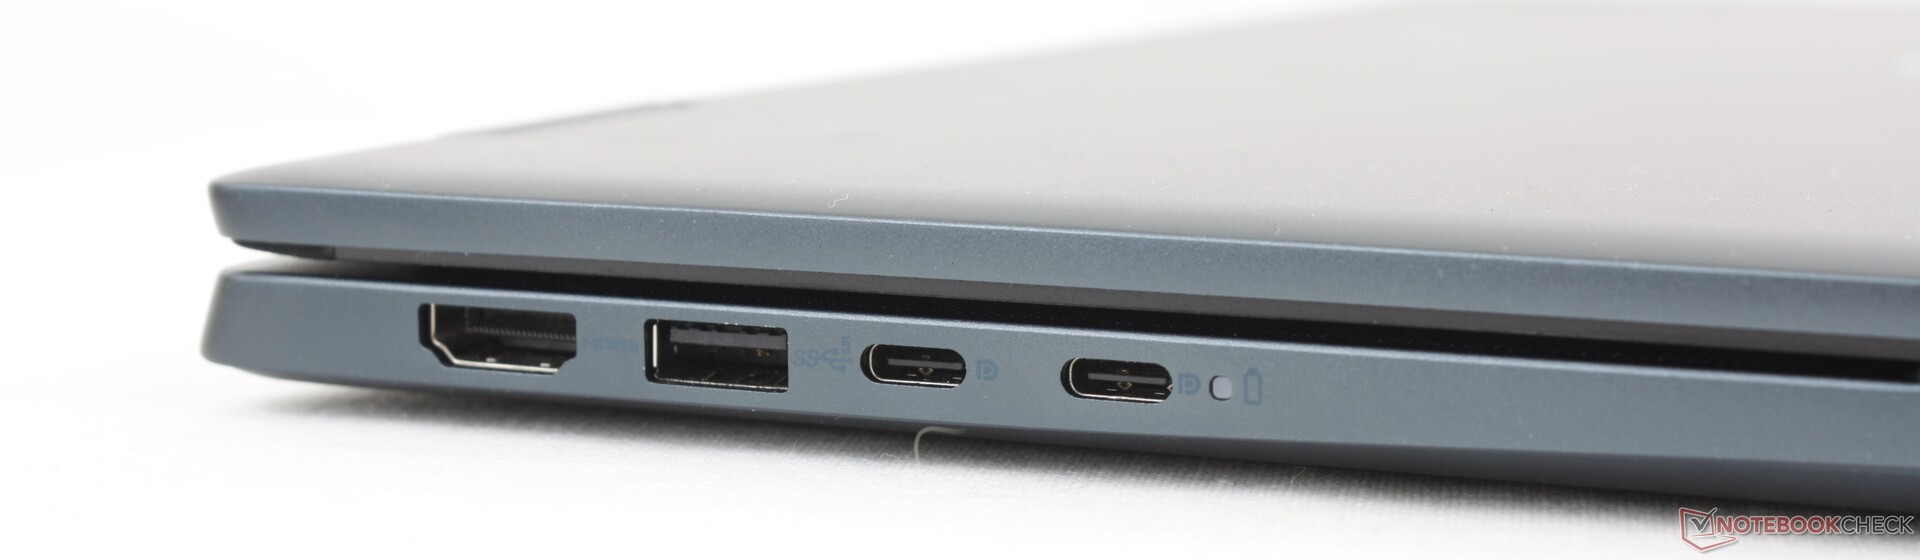
Łączność - brak obsługi Thunderbolt
Model ten zachowuje wszystkie porty, które można znaleźć w zeszłorocznym Inspironie 16 7620 2-w-1. Główną różnicą jest jednak to, że nasza konfiguracja AMD nie obsługuje Thunderbolt. Różnorodność portów jest jednak nadal porównywalna z innymi 16-calowymi laptopami, takimi jak IdeaPad Flex 5 16 lub Acer Swift Edge SFE16.
Należy pamiętać, że port HDMI to tylko 1.4 zamiast 2.0. Aby zapewnić prawidłową obsługę zewnętrznych monitorów 4K przy 60 Hz, należy zamiast tego korzystać z portów USB-C.
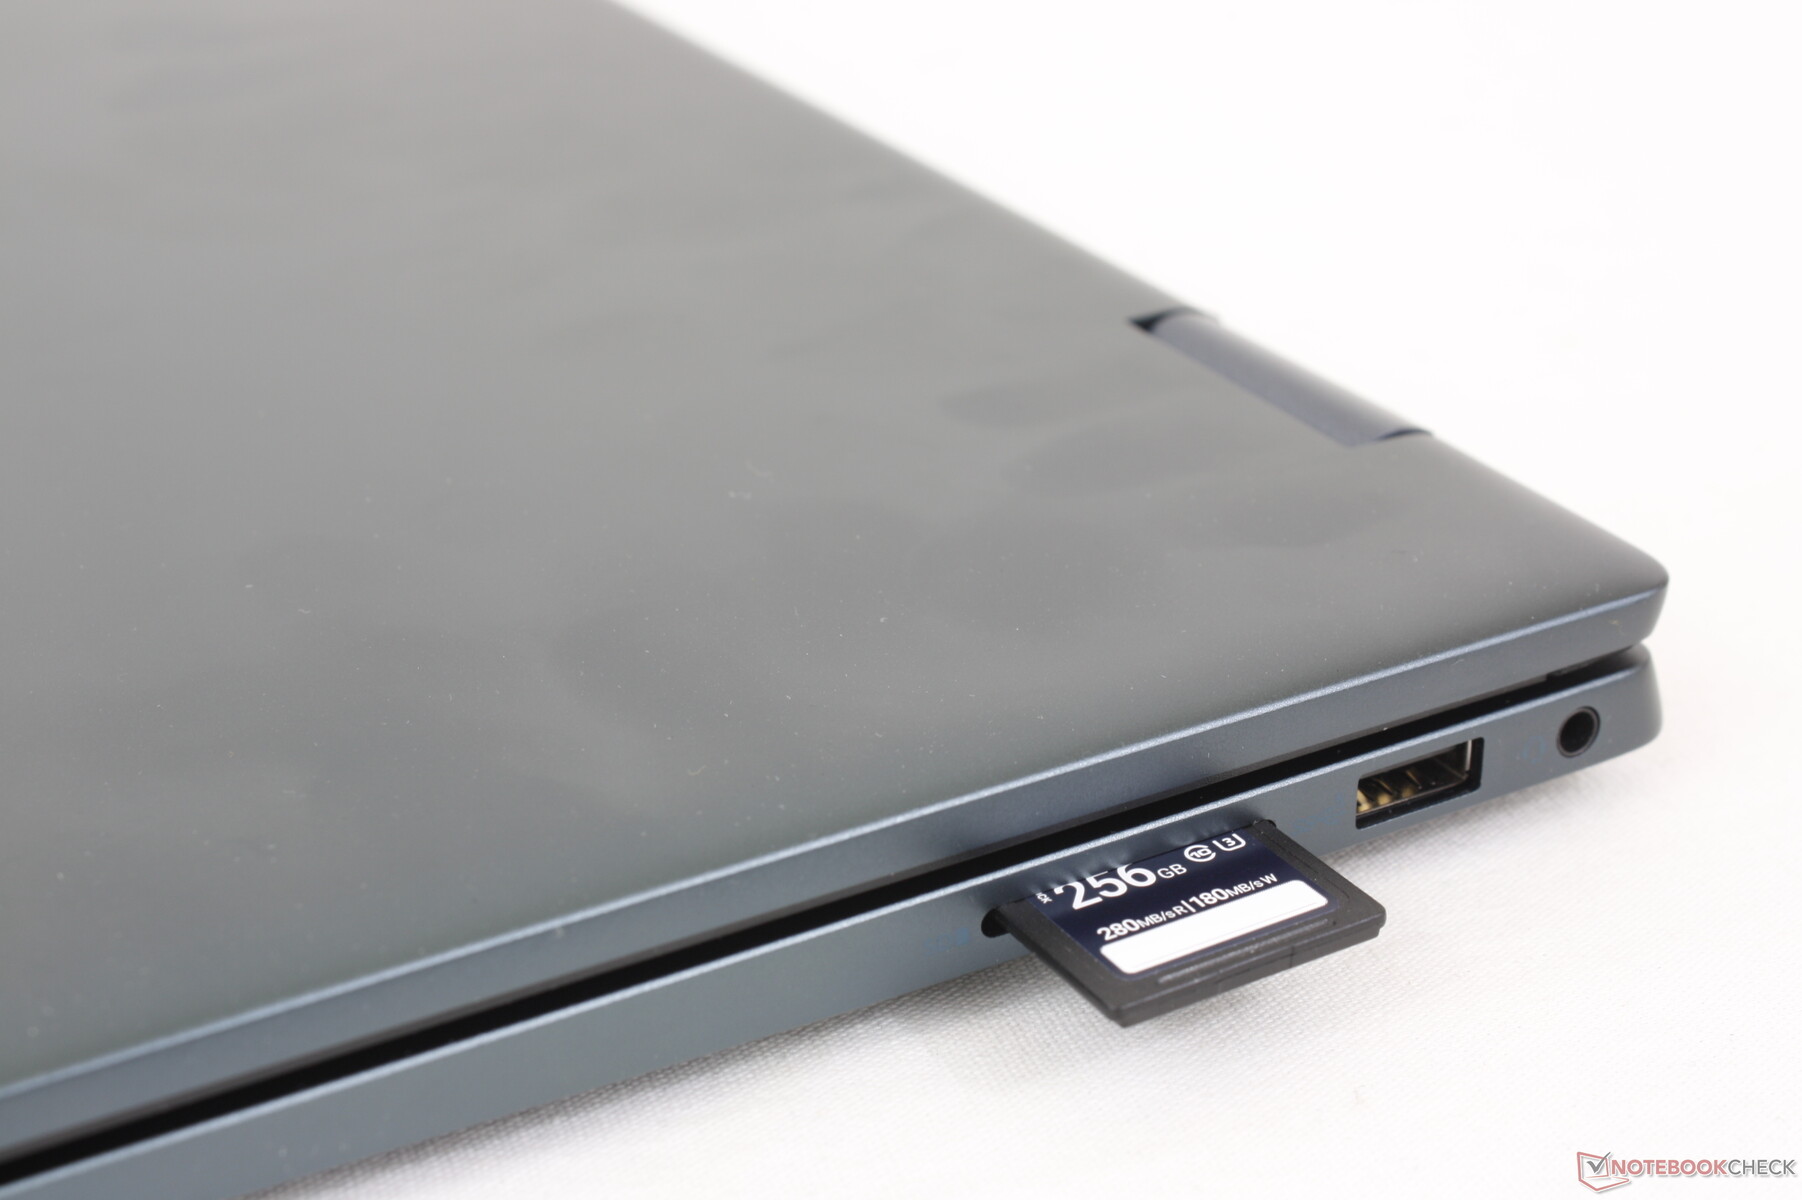
Czytnik kart SD
Zintegrowany czytnik kart działa nieco szybciej niż wcześniej, ale szybkość transferu jest nadal o połowę niższa niż w Lenovo IdeaPad Flex 5 16 lub Galaxy Book3 Pro 16. Przeniesienie 1 GB zdjęć z naszej karty testowej PNY UHS-II na pulpit zajmuje około 32 sekund w porównaniu do 17 sekund na wspomnianym Lenovo.
| SD Card Reader | |
| average JPG Copy Test (av. of 3 runs) | |
| Lenovo IdeaPad Flex 5 16ABR G8 (Angelibird AV Pro V60) | |
| Samsung Galaxy Book3 Pro 16 | |
| Lenovo Yoga 7 16IRL8 (AV Pro SD microSD 128 GB V60) | |
| Dell Inspiron 16 7635 2-in-1 (PNY EliteX-Pro60 V60 256 GB) | |
| Dell Inspiron 16 7620 2-in-1 (Toshiba Exceria Pro SDXC 64 GB UHS-II) | |
| maximum AS SSD Seq Read Test (1GB) | |
| Lenovo Yoga 7 16IRL8 (AV Pro SD microSD 128 GB V60) | |
| Lenovo IdeaPad Flex 5 16ABR G8 (Angelibird AV Pro V60) | |
| Samsung Galaxy Book3 Pro 16 | |
| Dell Inspiron 16 7635 2-in-1 (PNY EliteX-Pro60 V60 256 GB) | |
| Dell Inspiron 16 7620 2-in-1 (Toshiba Exceria Pro SDXC 64 GB UHS-II) | |
Komunikacja
AMD Inspiron jest dostarczany z modułem MediaTek Wi-Fi 6E MT7922, podczas gdy Intel Inspiron jest dostarczany z modułem AX211. Oba moduły są kompatybilne z routerami Wi-Fi 6E lub 6 GHz. Wydajność jest stabilna i bezproblemowa po sparowaniu z naszym Asus AXE11000.
| Networking | |
| iperf3 transmit AXE11000 | |
| Samsung Galaxy Book3 Pro 16 | |
| Dell Inspiron 16 7635 2-in-1 | |
| Lenovo Yoga 7 16IRL8 | |
| Lenovo IdeaPad Flex 5 16ABR G8 | |
| Acer Swift Edge SFE16-42-R1GM | |
| iperf3 receive AXE11000 | |
| Samsung Galaxy Book3 Pro 16 | |
| Dell Inspiron 16 7635 2-in-1 | |
| Lenovo Yoga 7 16IRL8 | |
| Acer Swift Edge SFE16-42-R1GM | |
| Lenovo IdeaPad Flex 5 16ABR G8 | |
| iperf3 transmit AXE11000 6GHz | |
| Samsung Galaxy Book3 Pro 16 | |
| Dell Inspiron 16 7620 2-in-1 | |
| Acer Swift Edge SFE16-42-R1GM | |
| Dell Inspiron 16 7635 2-in-1 | |
| Lenovo Yoga 7 16IRL8 | |
| iperf3 receive AXE11000 6GHz | |
| Acer Swift Edge SFE16-42-R1GM | |
| Samsung Galaxy Book3 Pro 16 | |
| Lenovo Yoga 7 16IRL8 | |
| Dell Inspiron 16 7620 2-in-1 | |
| Dell Inspiron 16 7635 2-in-1 | |
Kamera internetowa
Kamera internetowa 1080p i migawka prywatności są standardowo dostarczane we wszystkich konfiguracjach, aby nie było niespodzianek pod względem jakości obrazu. Jednak tylko model Intela jest wyposażony w opcjonalny czujnik podczerwieni.


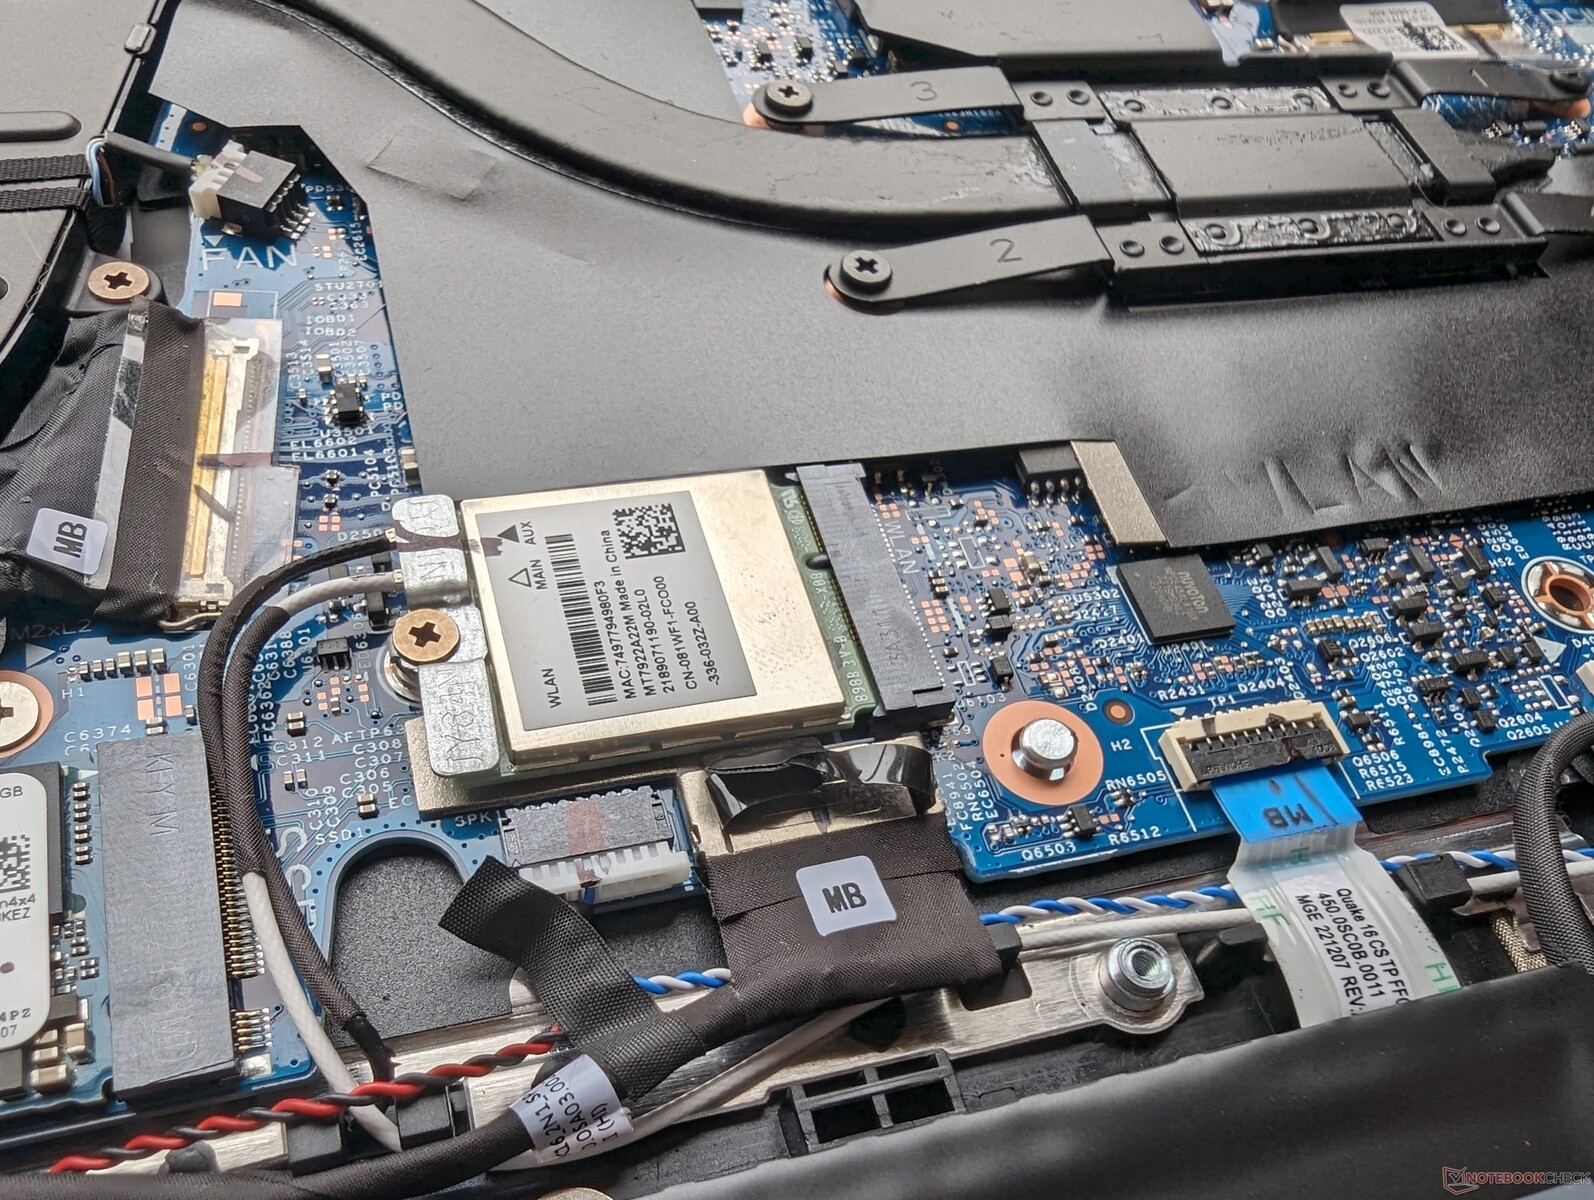
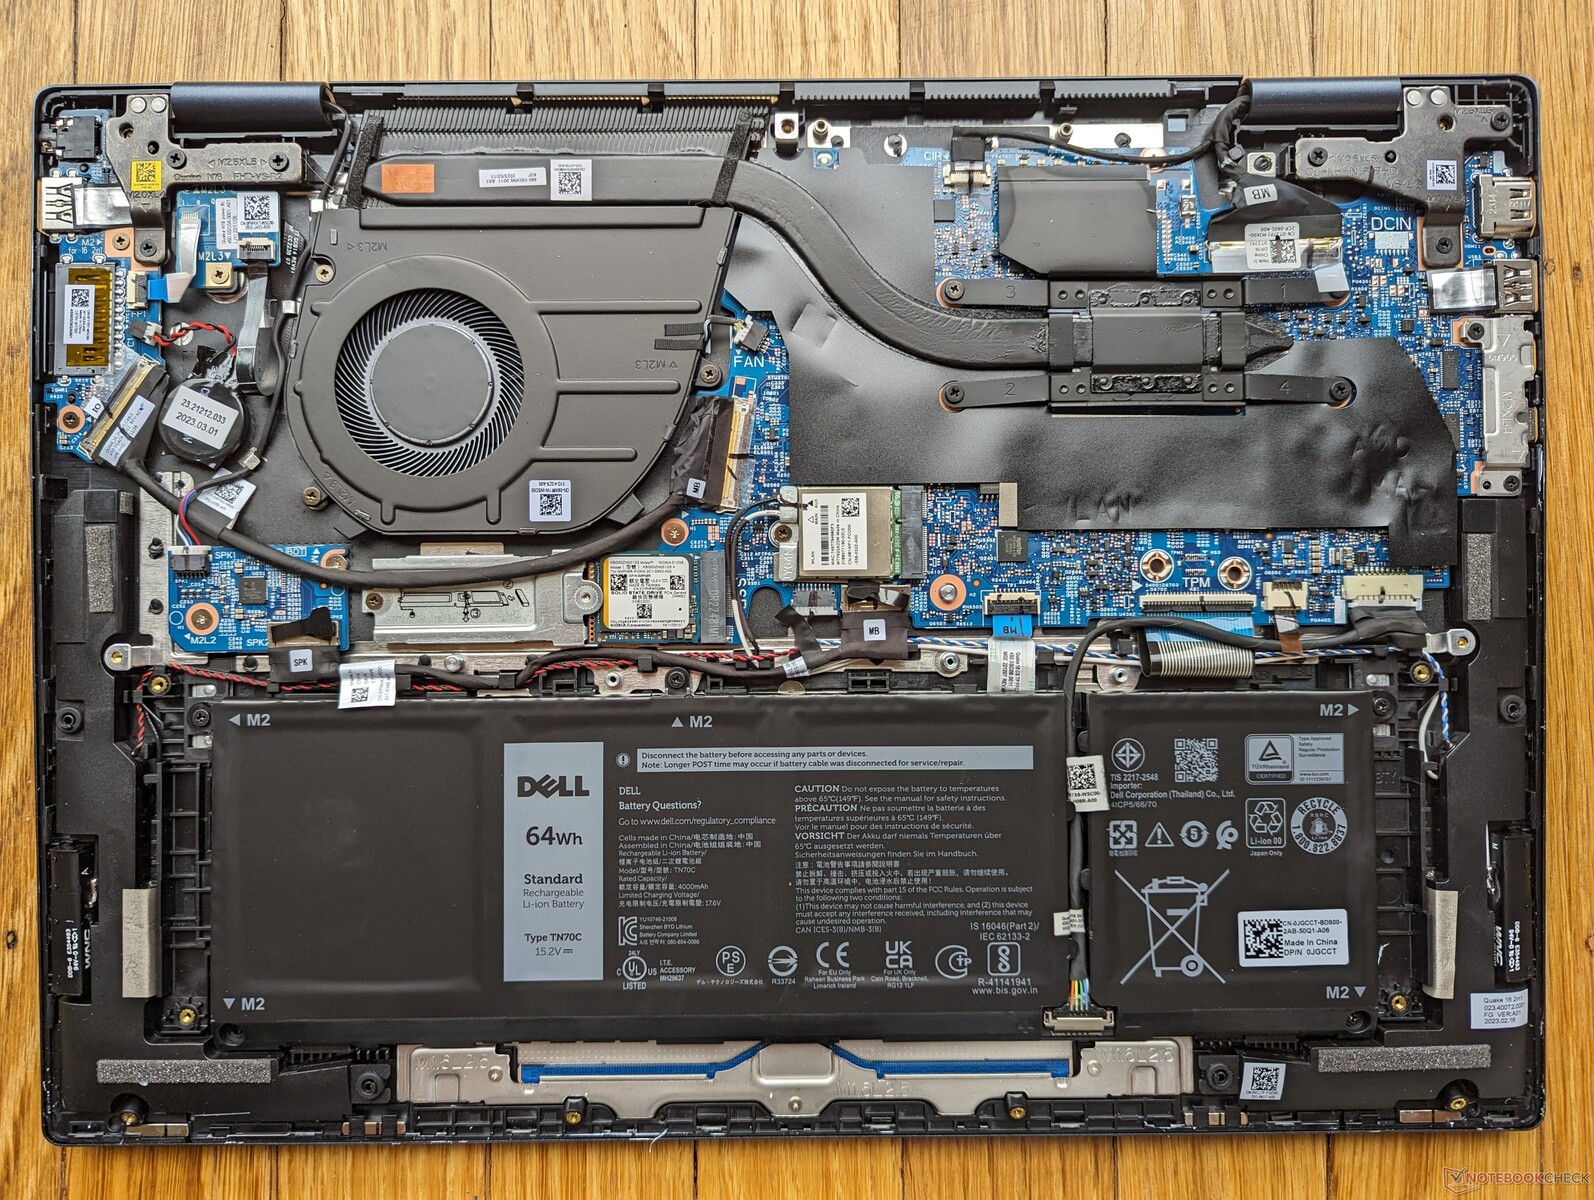
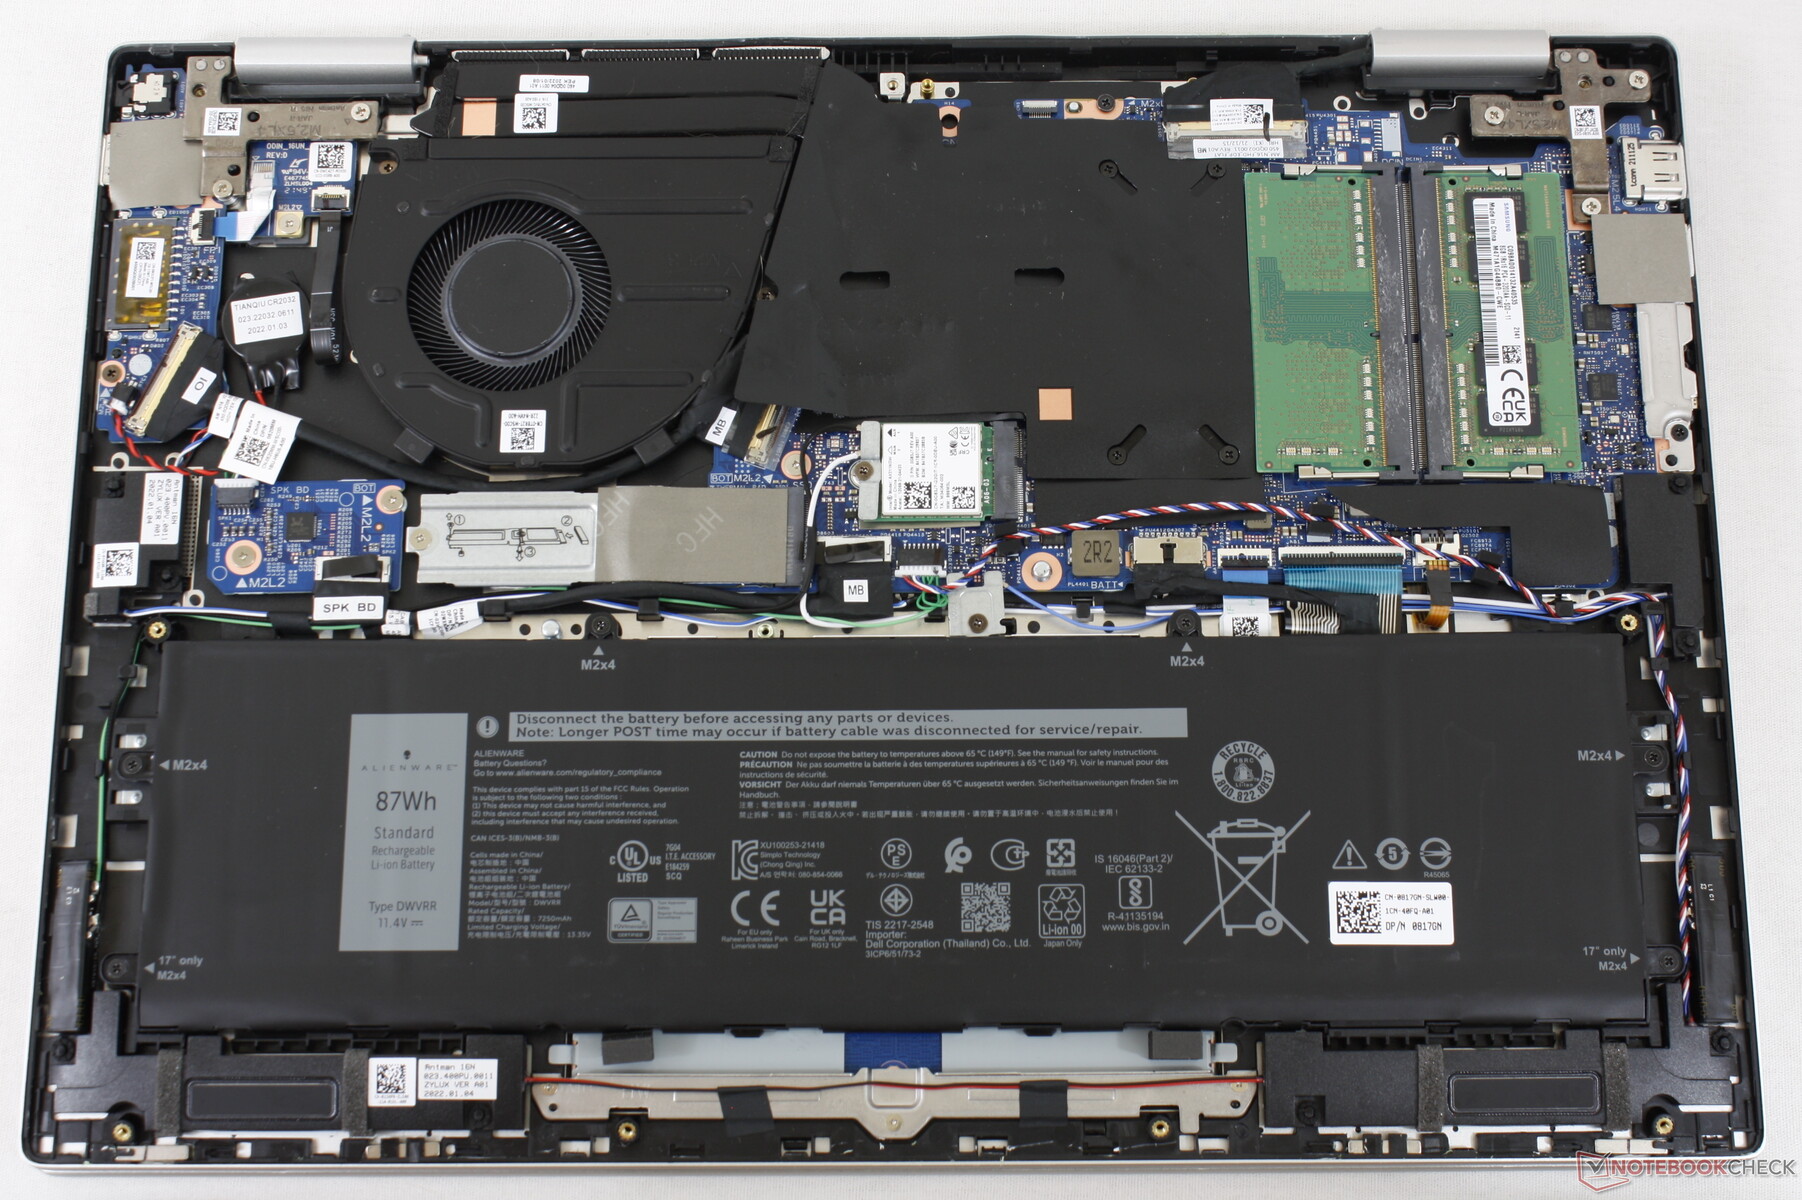
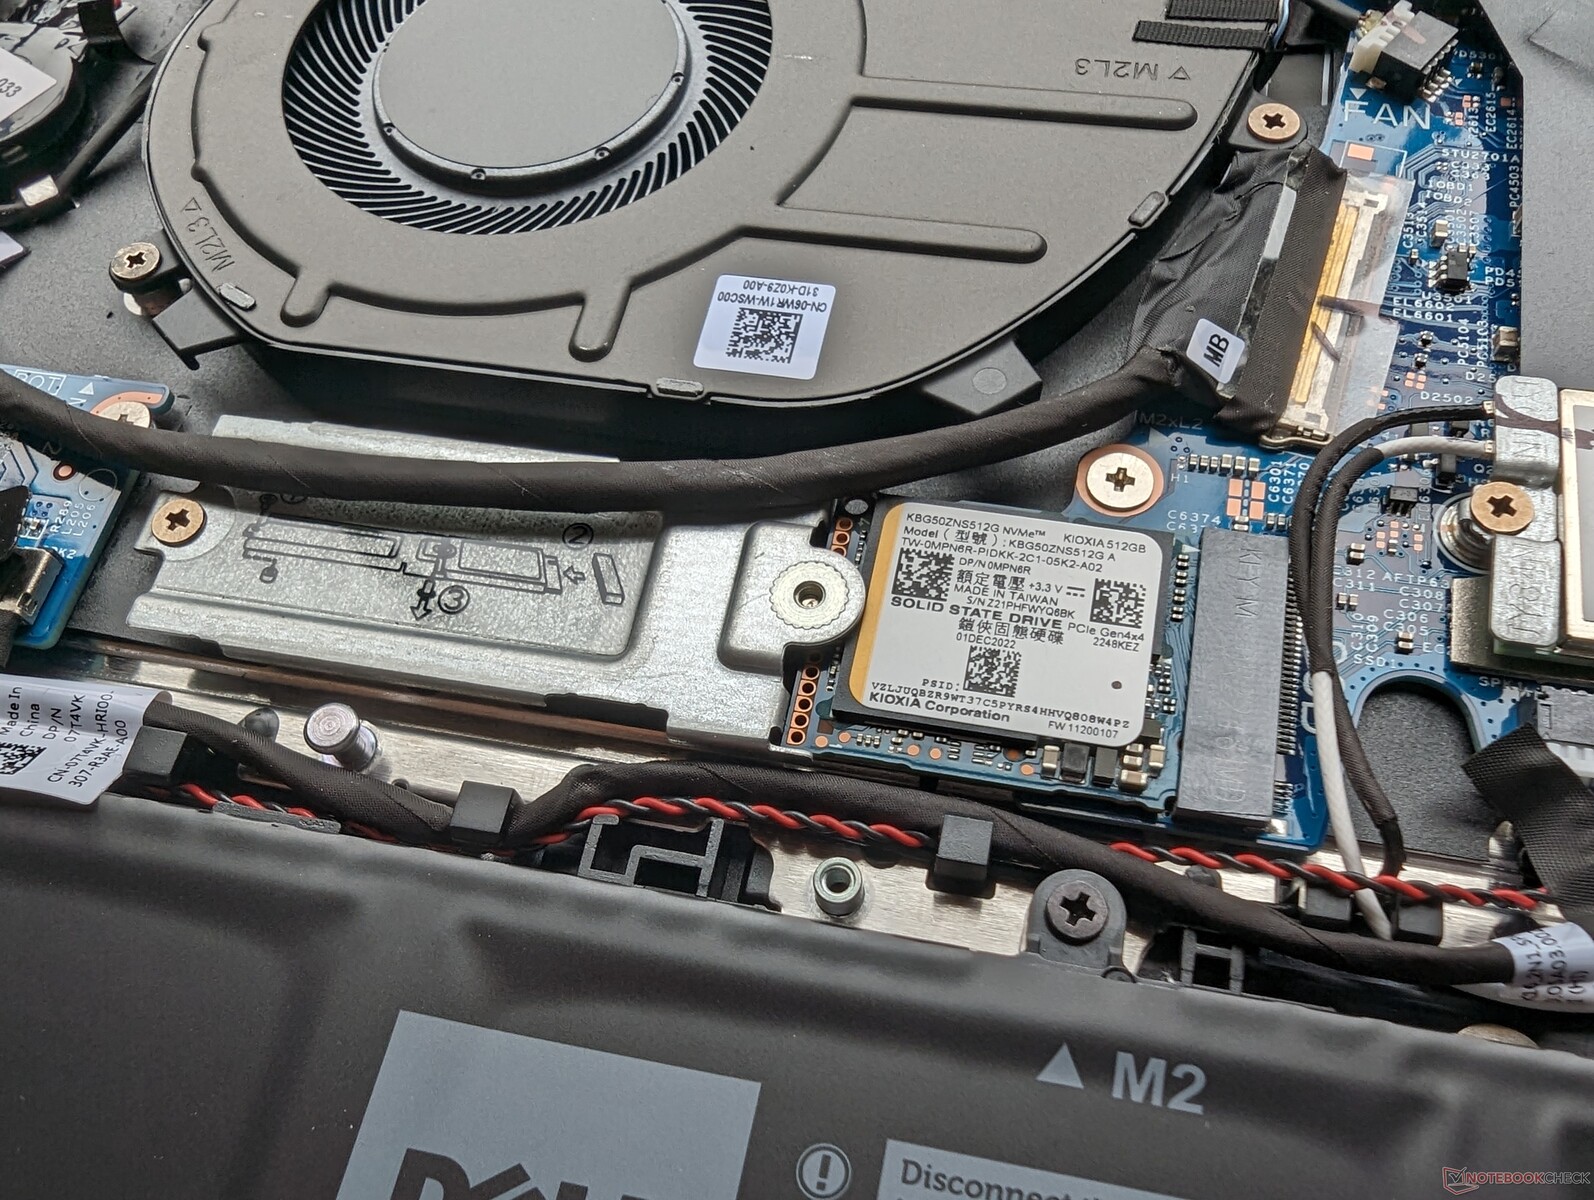
Konserwacja
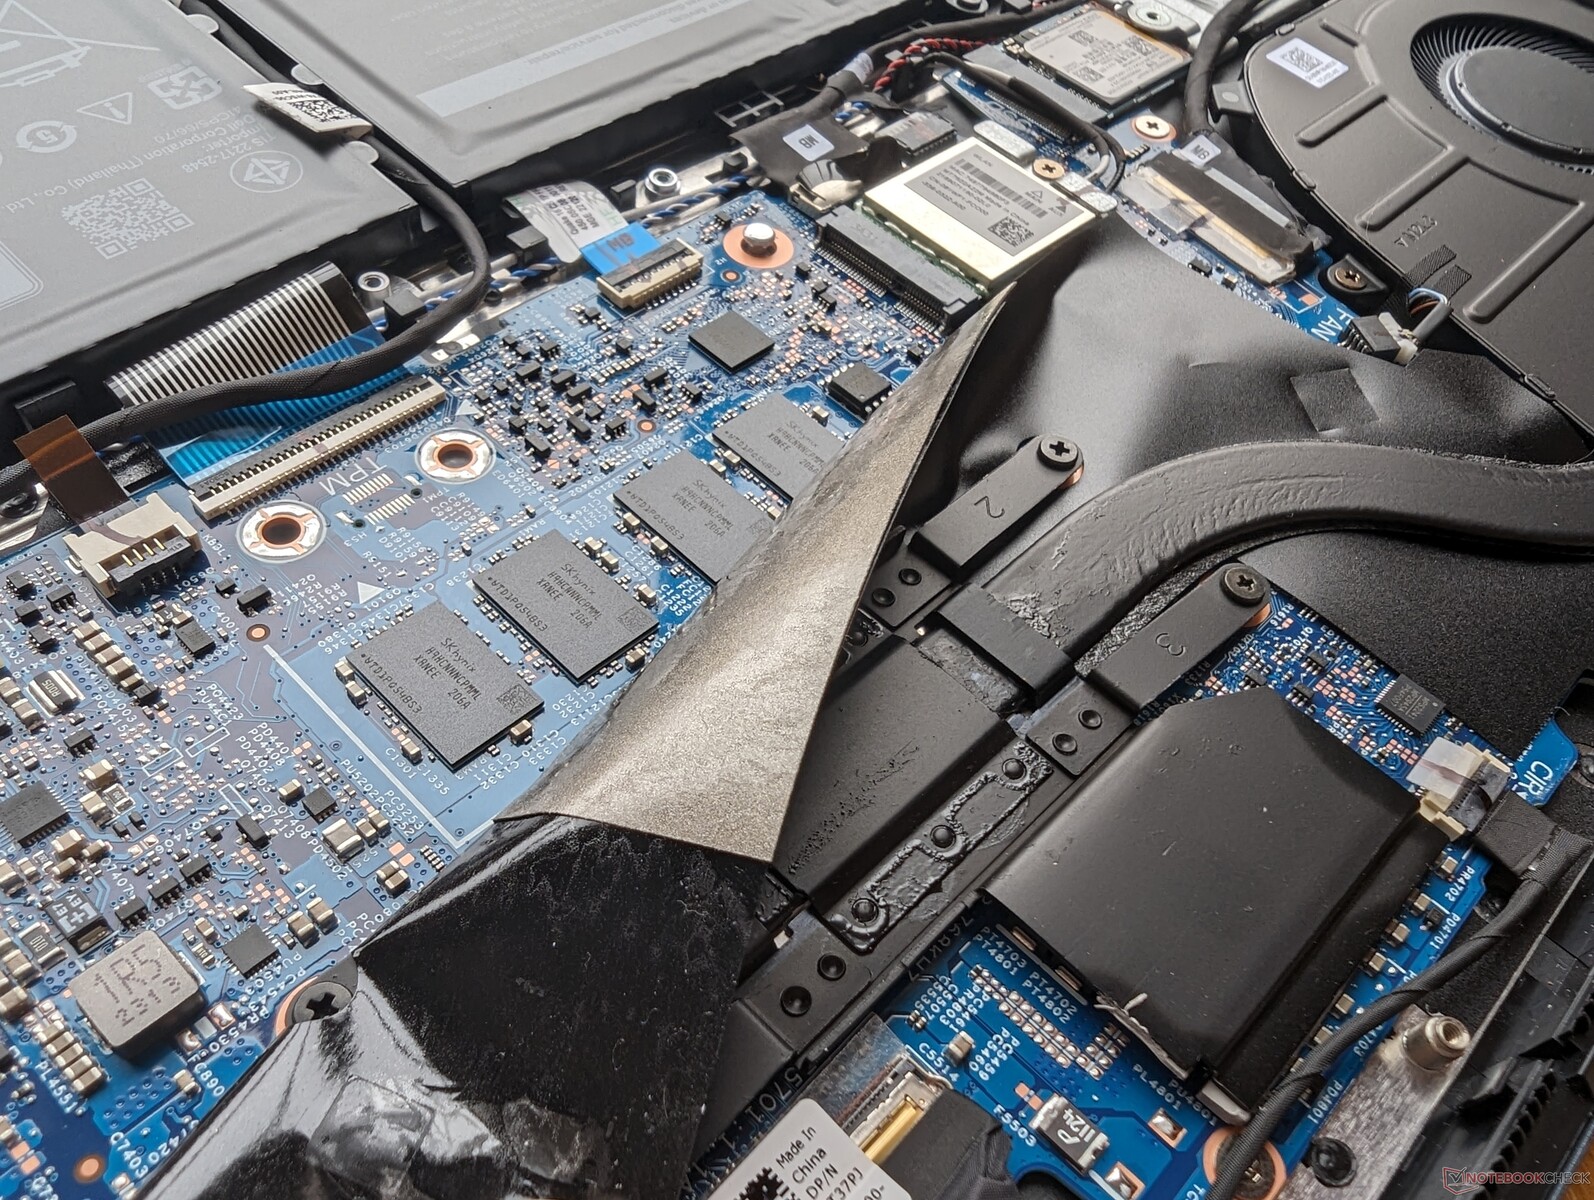
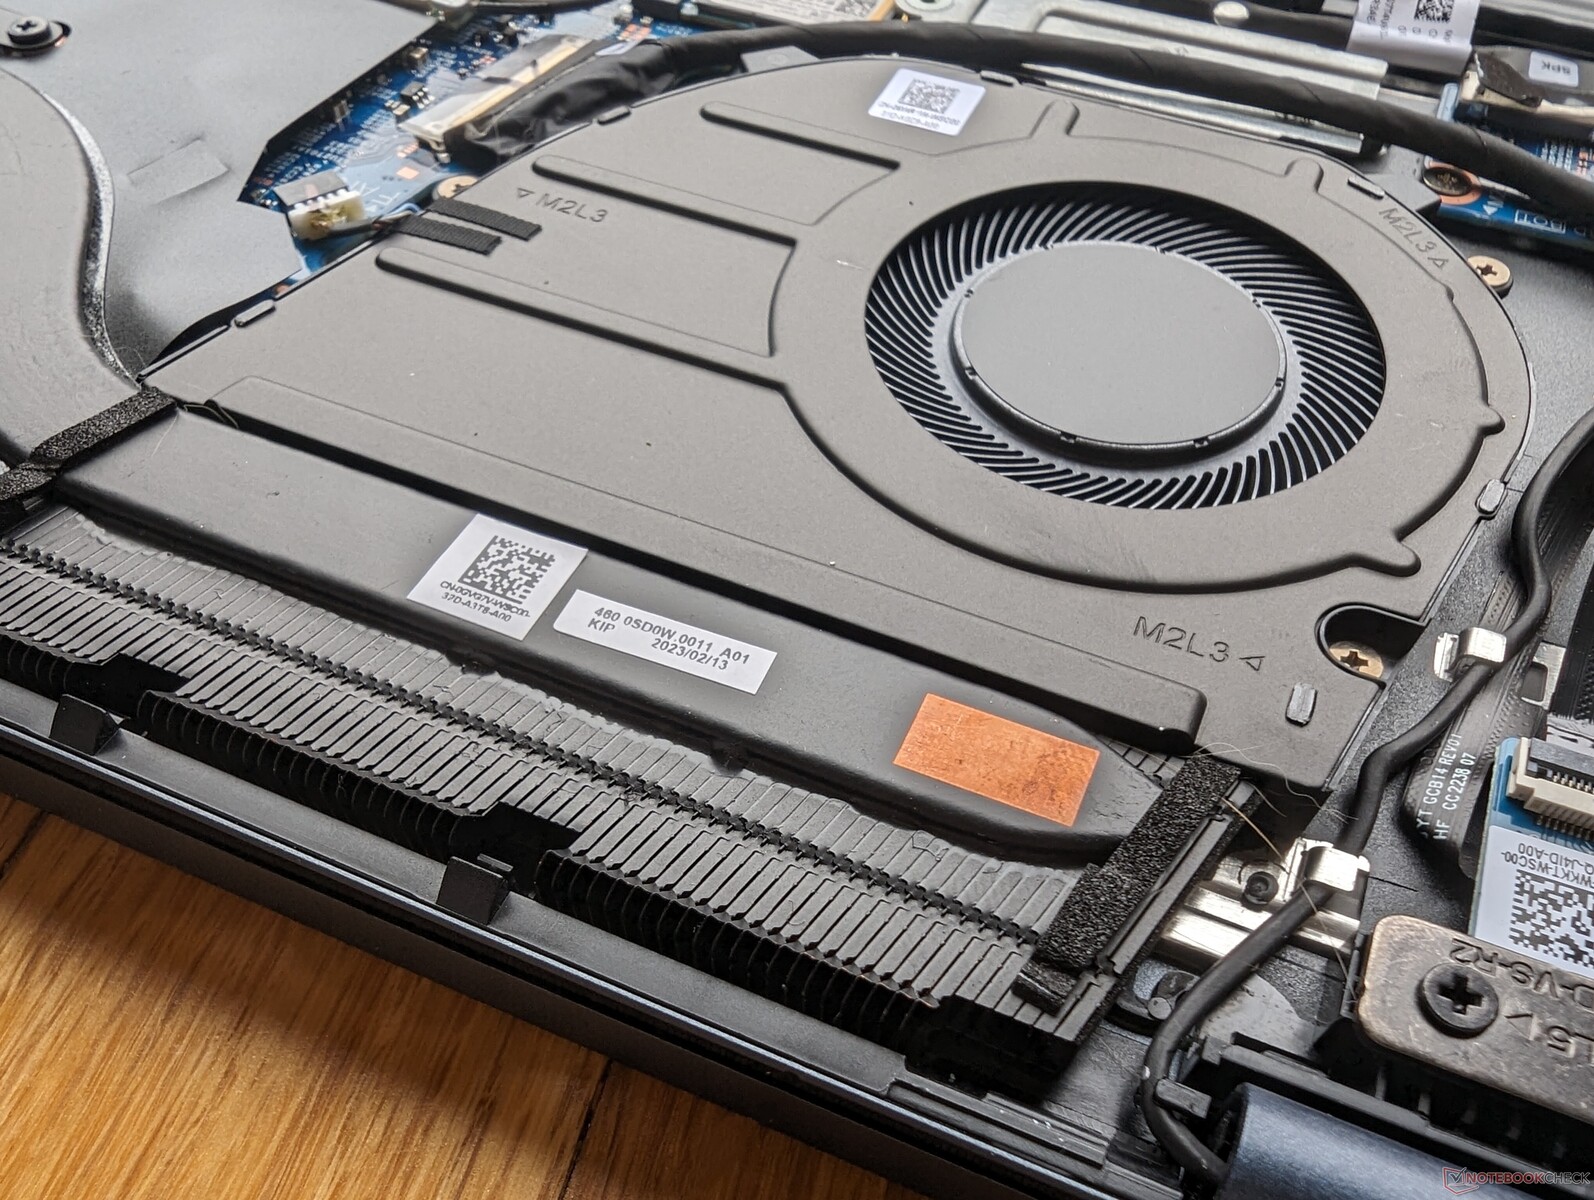
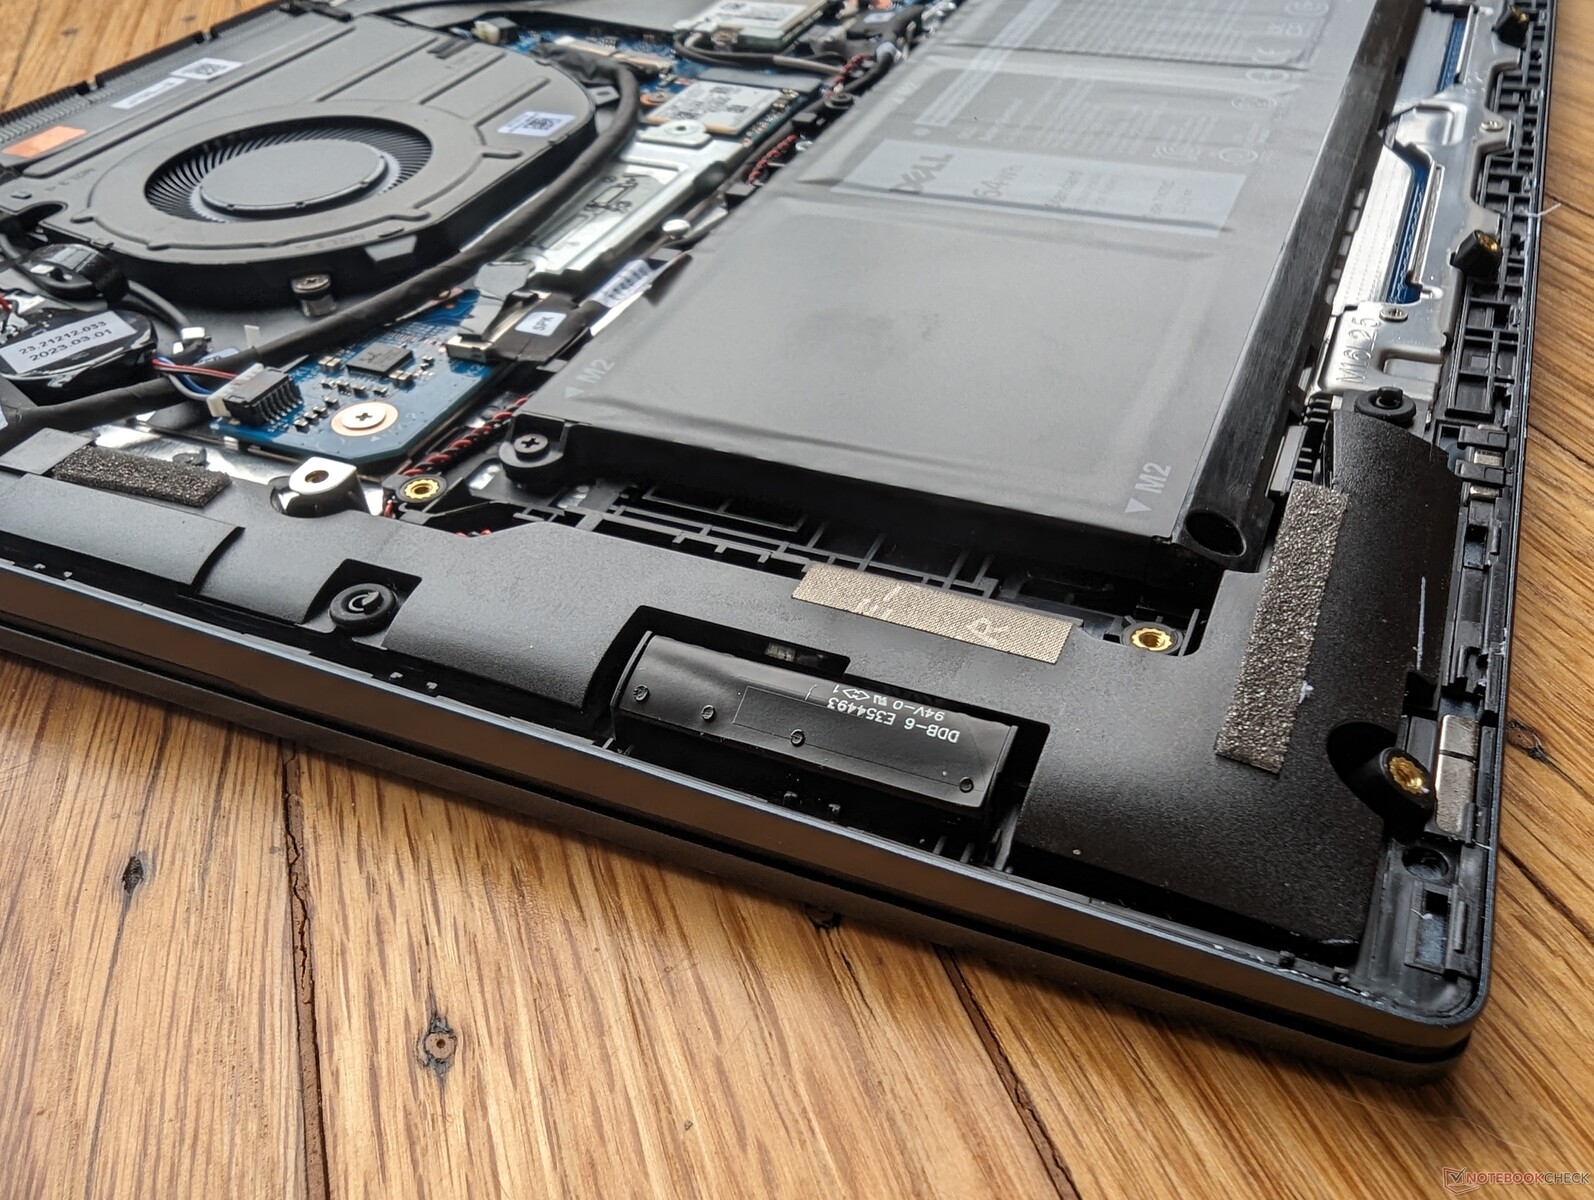
Dolny panel jest zabezpieczony dziewięcioma śrubami krzyżakowymi. Należy pamiętać, że zatrzaski wokół krawędzi są bardzo ciasne, dlatego zalecamy użycie ostrej plastikowej krawędzi, aby ostrożnie podważyć panel, zaczynając od tyłu.
Pamięć RAM jest teraz wlutowana w modelu 2023, podczas gdy w wersji 2022 była ona wymienialna przez użytkownika, jak pokazano na poniższych zdjęciach.
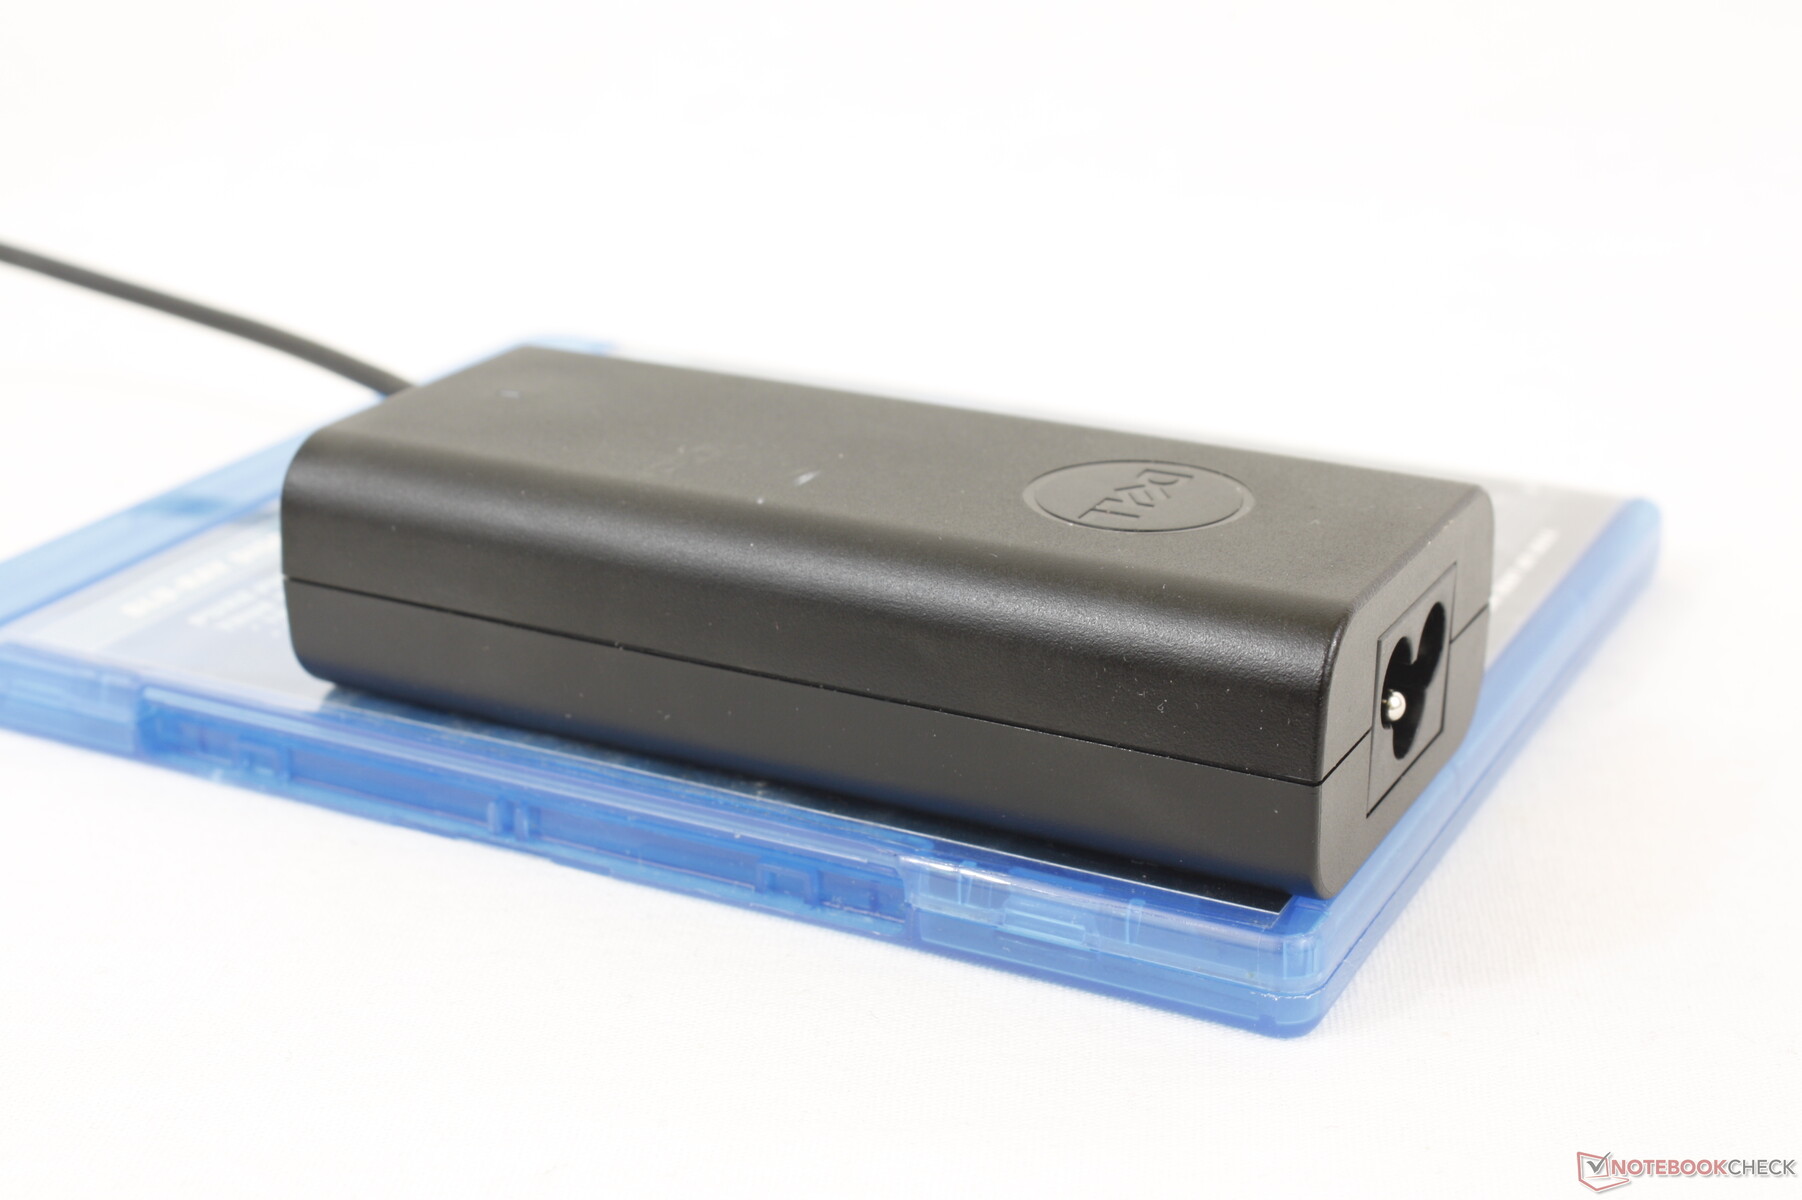
Akcesoria i gwarancja
W pudełku nie ma żadnych dodatków poza zasilaczem sieciowym i dokumentacją. Zwykła roczna ograniczona gwarancja producenta ma zastosowanie w przypadku zakupu w USA.
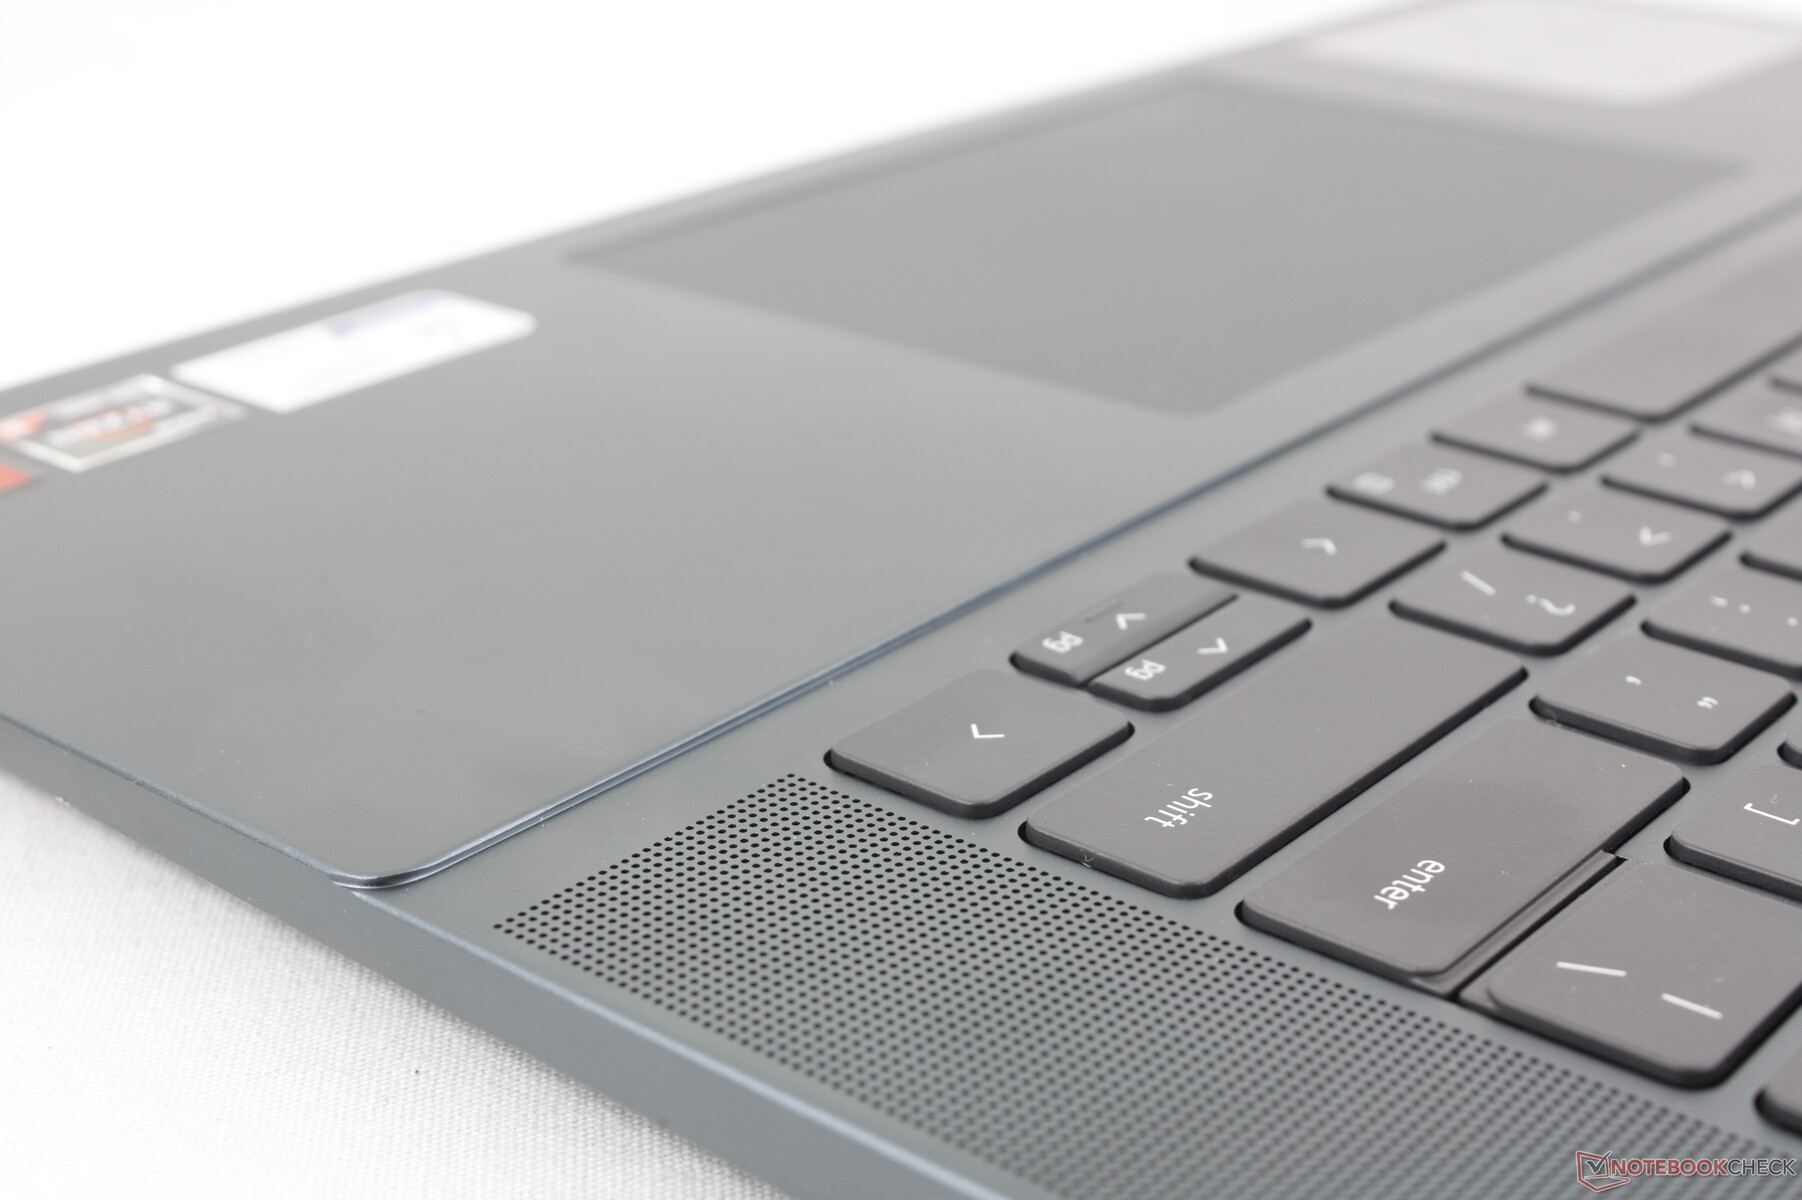
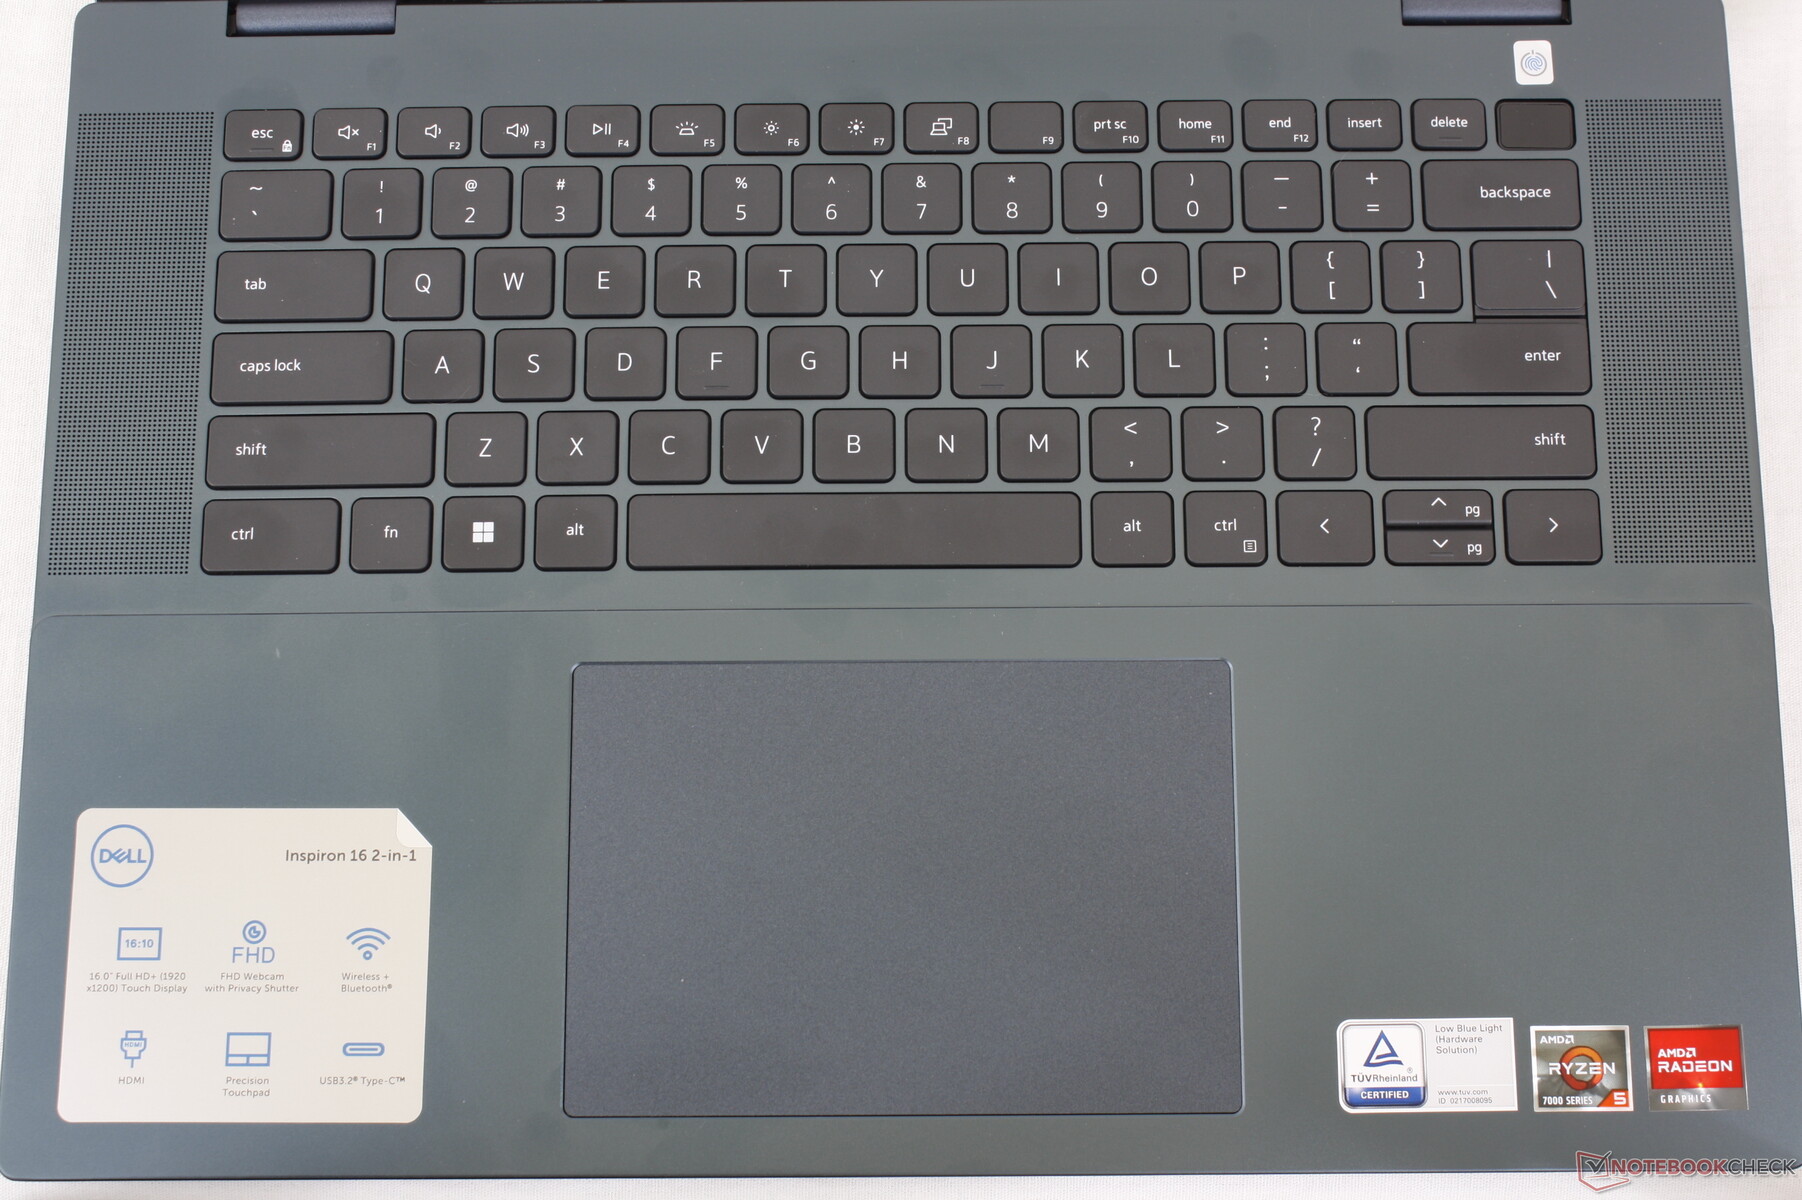
Urządzenia wejściowe
Klawiatura
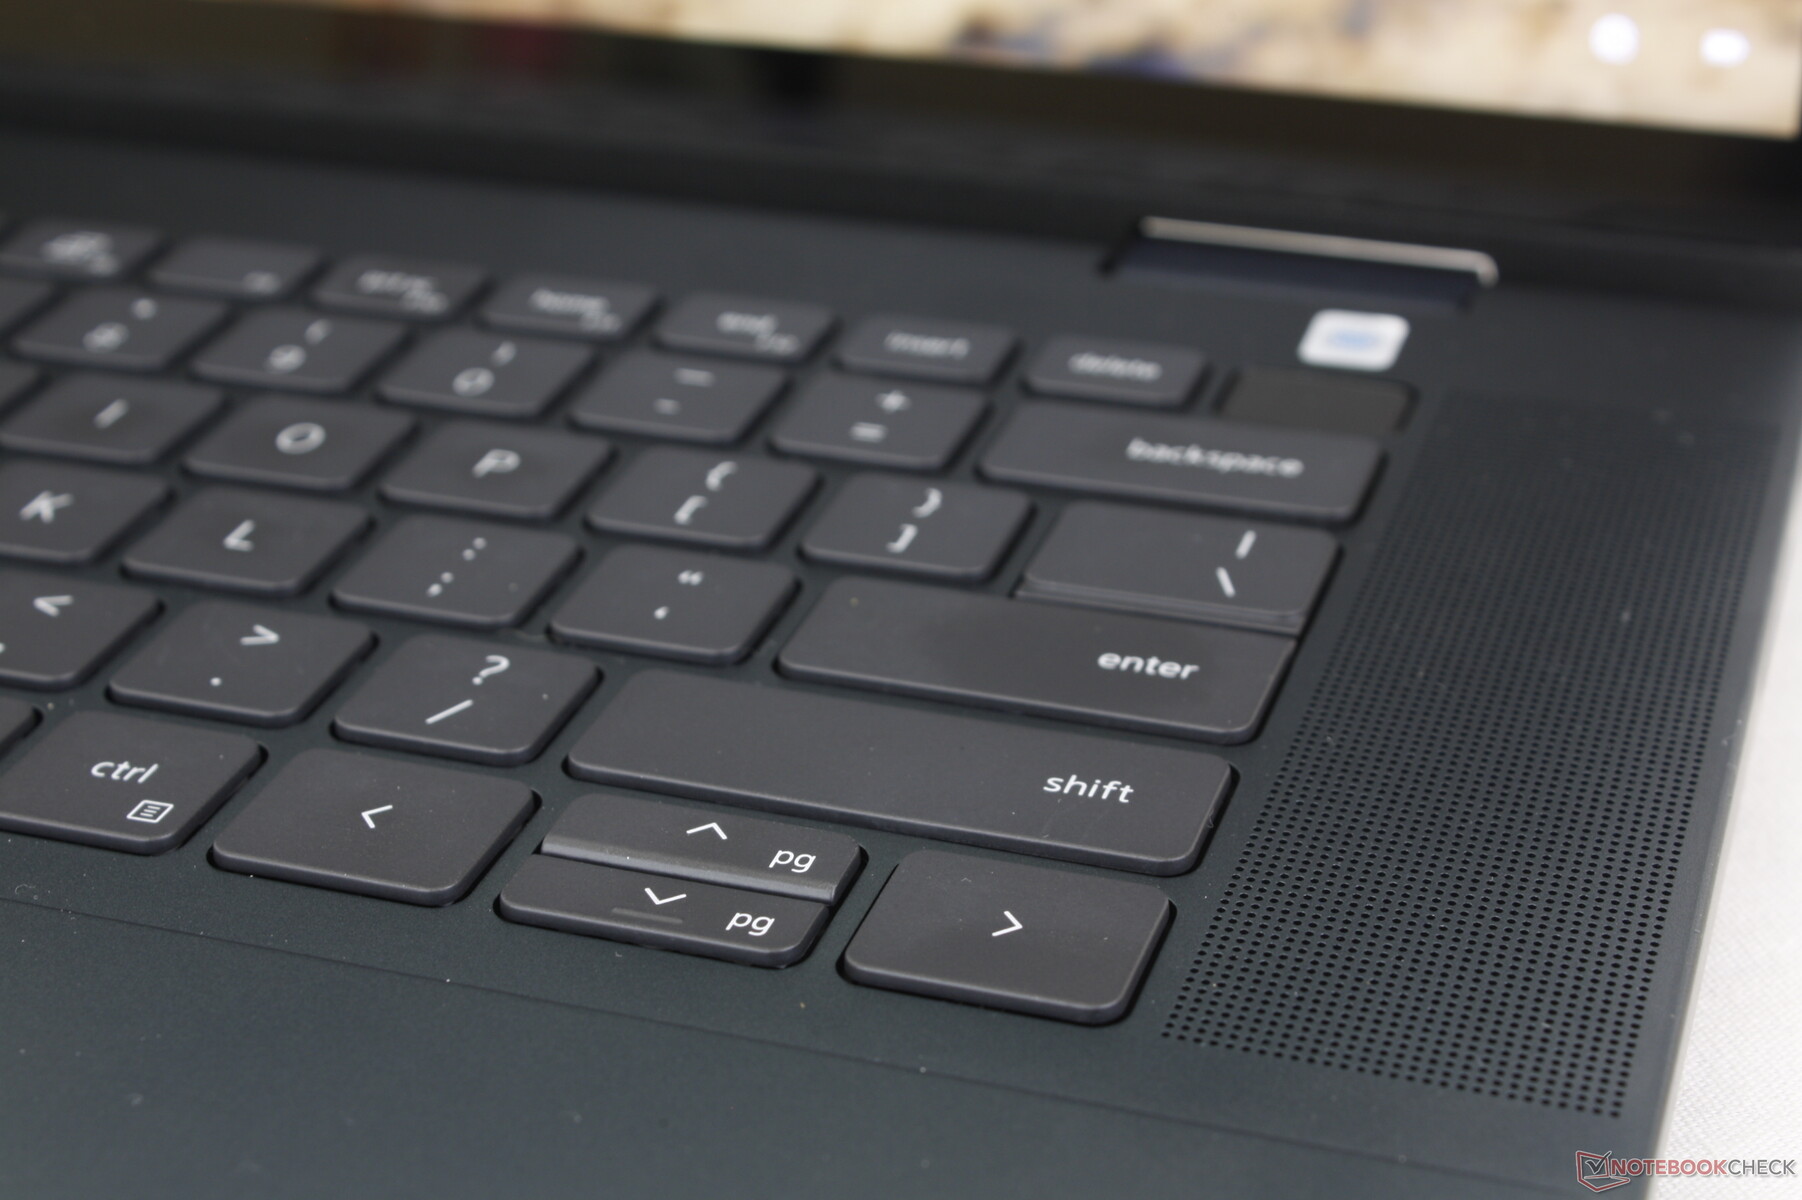
Doświadczenie pisania jest dość spójne we wszystkich laptopach Inspiron, więc klawisze QWERTY pozostają stosunkowo miękkie i mają płytki skok. Nawet 14-calowy Inspiron 14 wykorzystuje tę samą klawiaturę, co nasz większy 16-calowy Inspiron 16; jedyną różnicą jest to, że Inspiron 16 integruje dodatkowe głośniki skierowane w górę wzdłuż boków klawiatury. Dodane głośniki zamiast klawiatury numerycznej podkreślają fakt, że Inspiron 16 7635 2-w-1 to przede wszystkim komputer multimedialny.
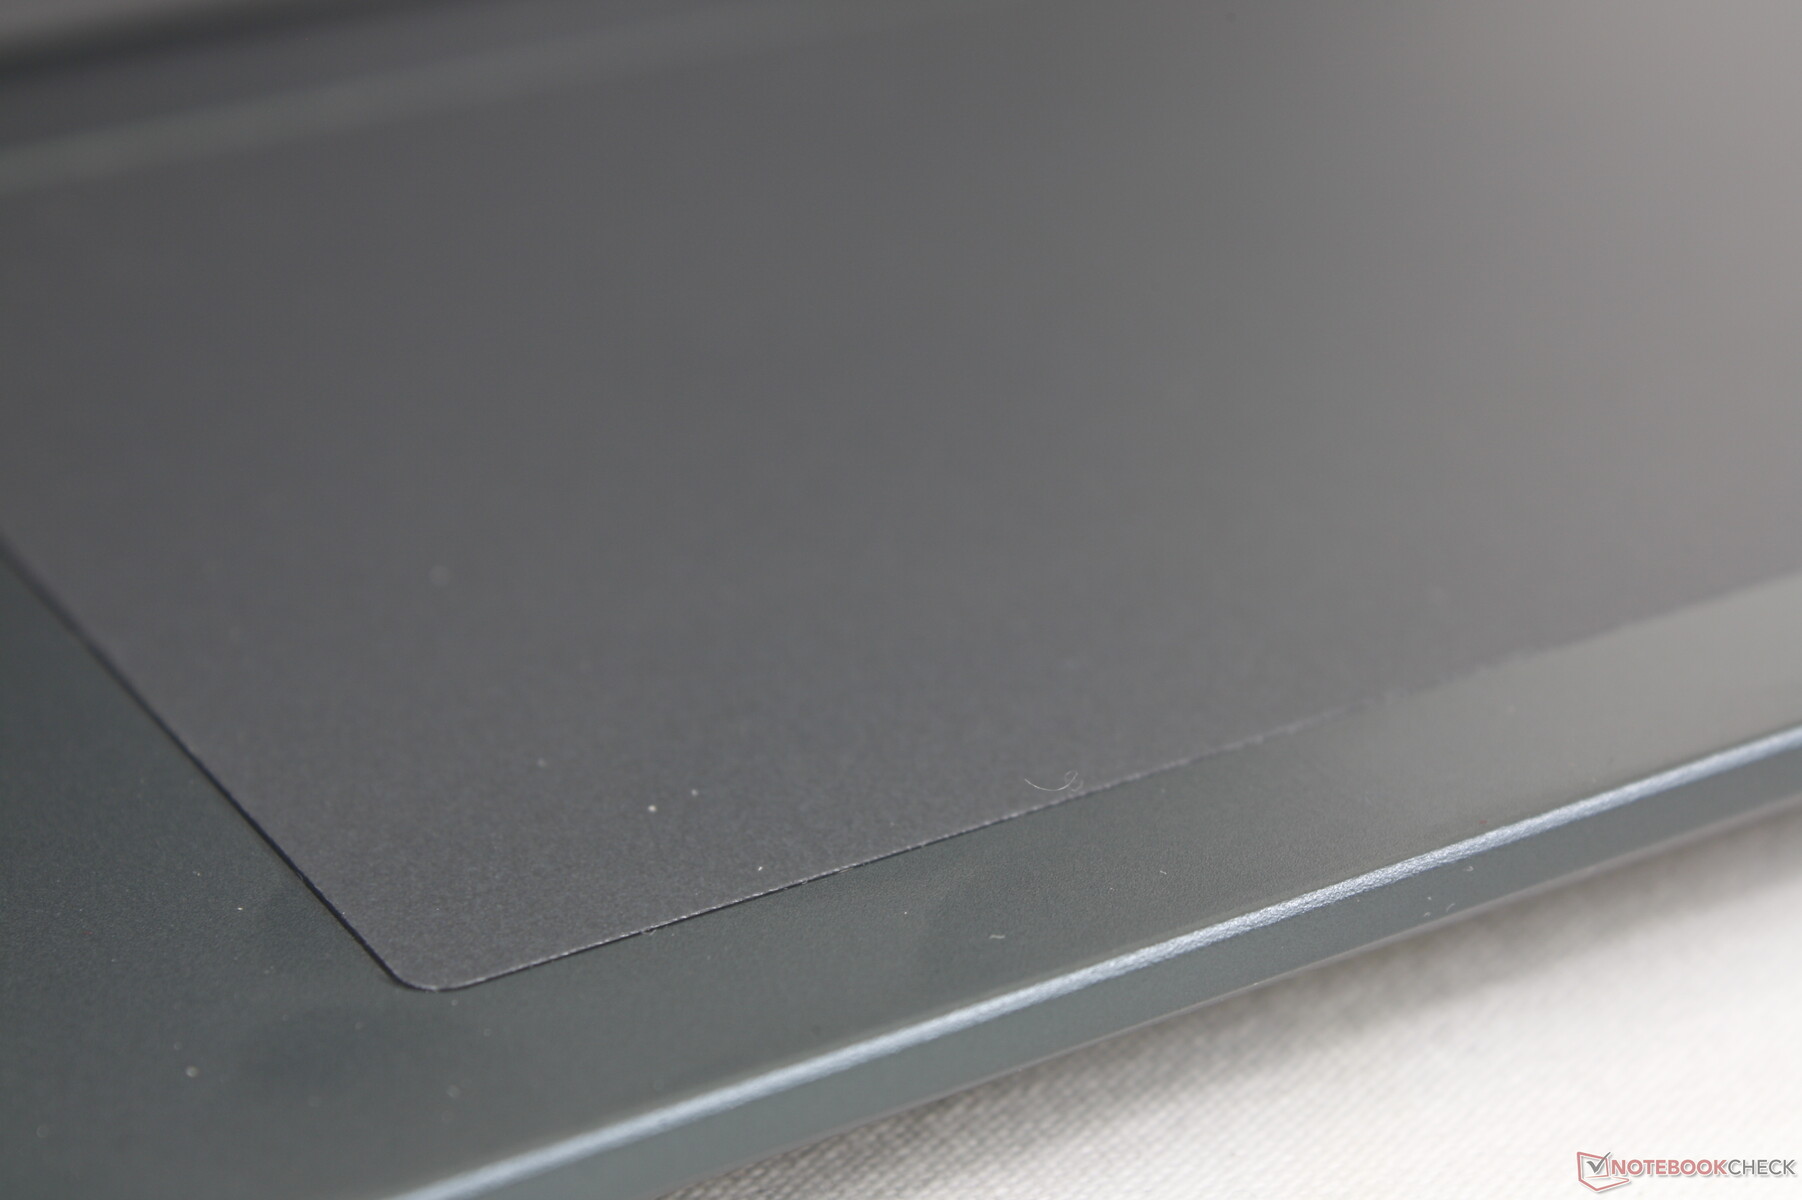
Touchpad
Rozmiar klawiatury (13,3 x 9 cm) pozostał niezmieniony w stosunku do zeszłorocznego modelu, mimo że wizualny projekt klawiatury powrócił do bardziej tradycyjnego wyglądu. Niestety, sprzężenie zwrotne podczas klikania na powierzchni nie uległo poprawie, więc pozostaje miękkie i płytkie w porównaniu do twardszego clickpada w HP Spectre HP Spectre clickpad.

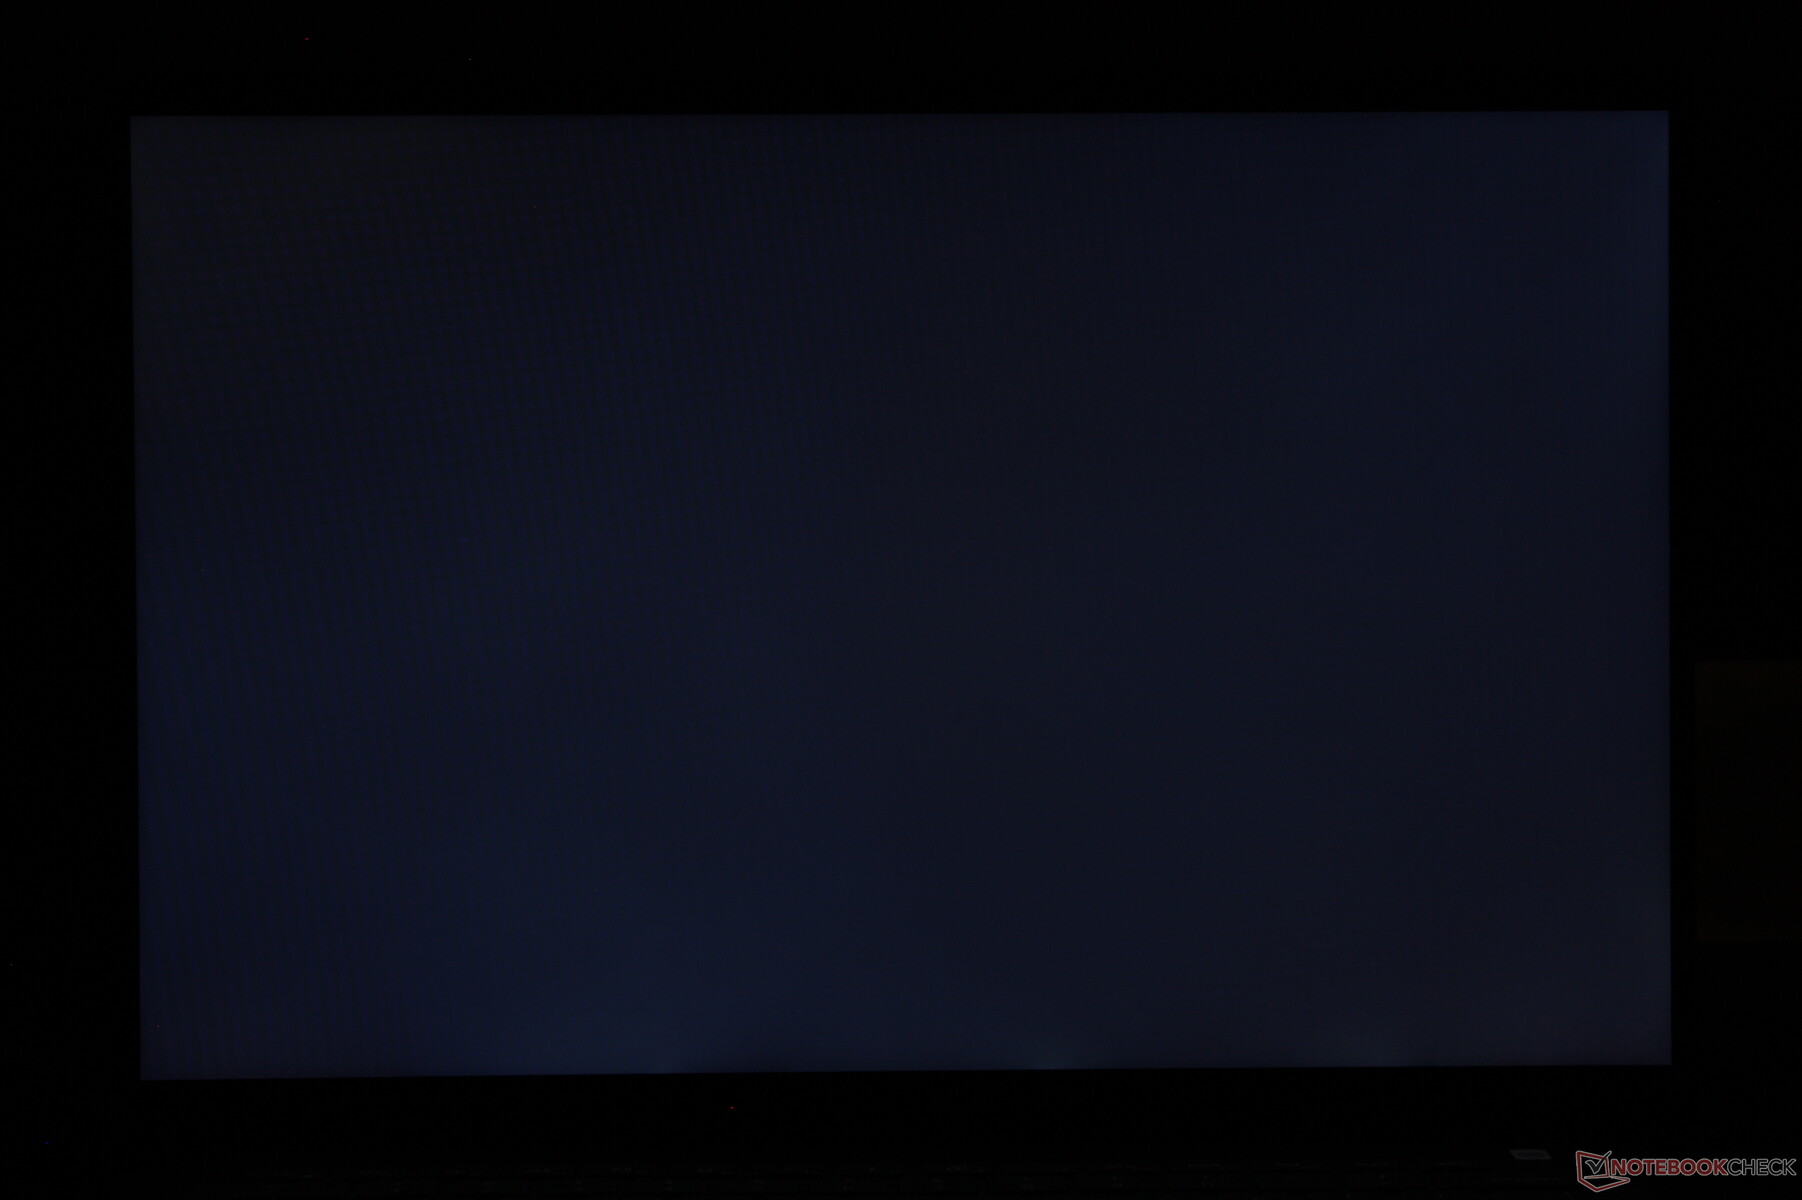
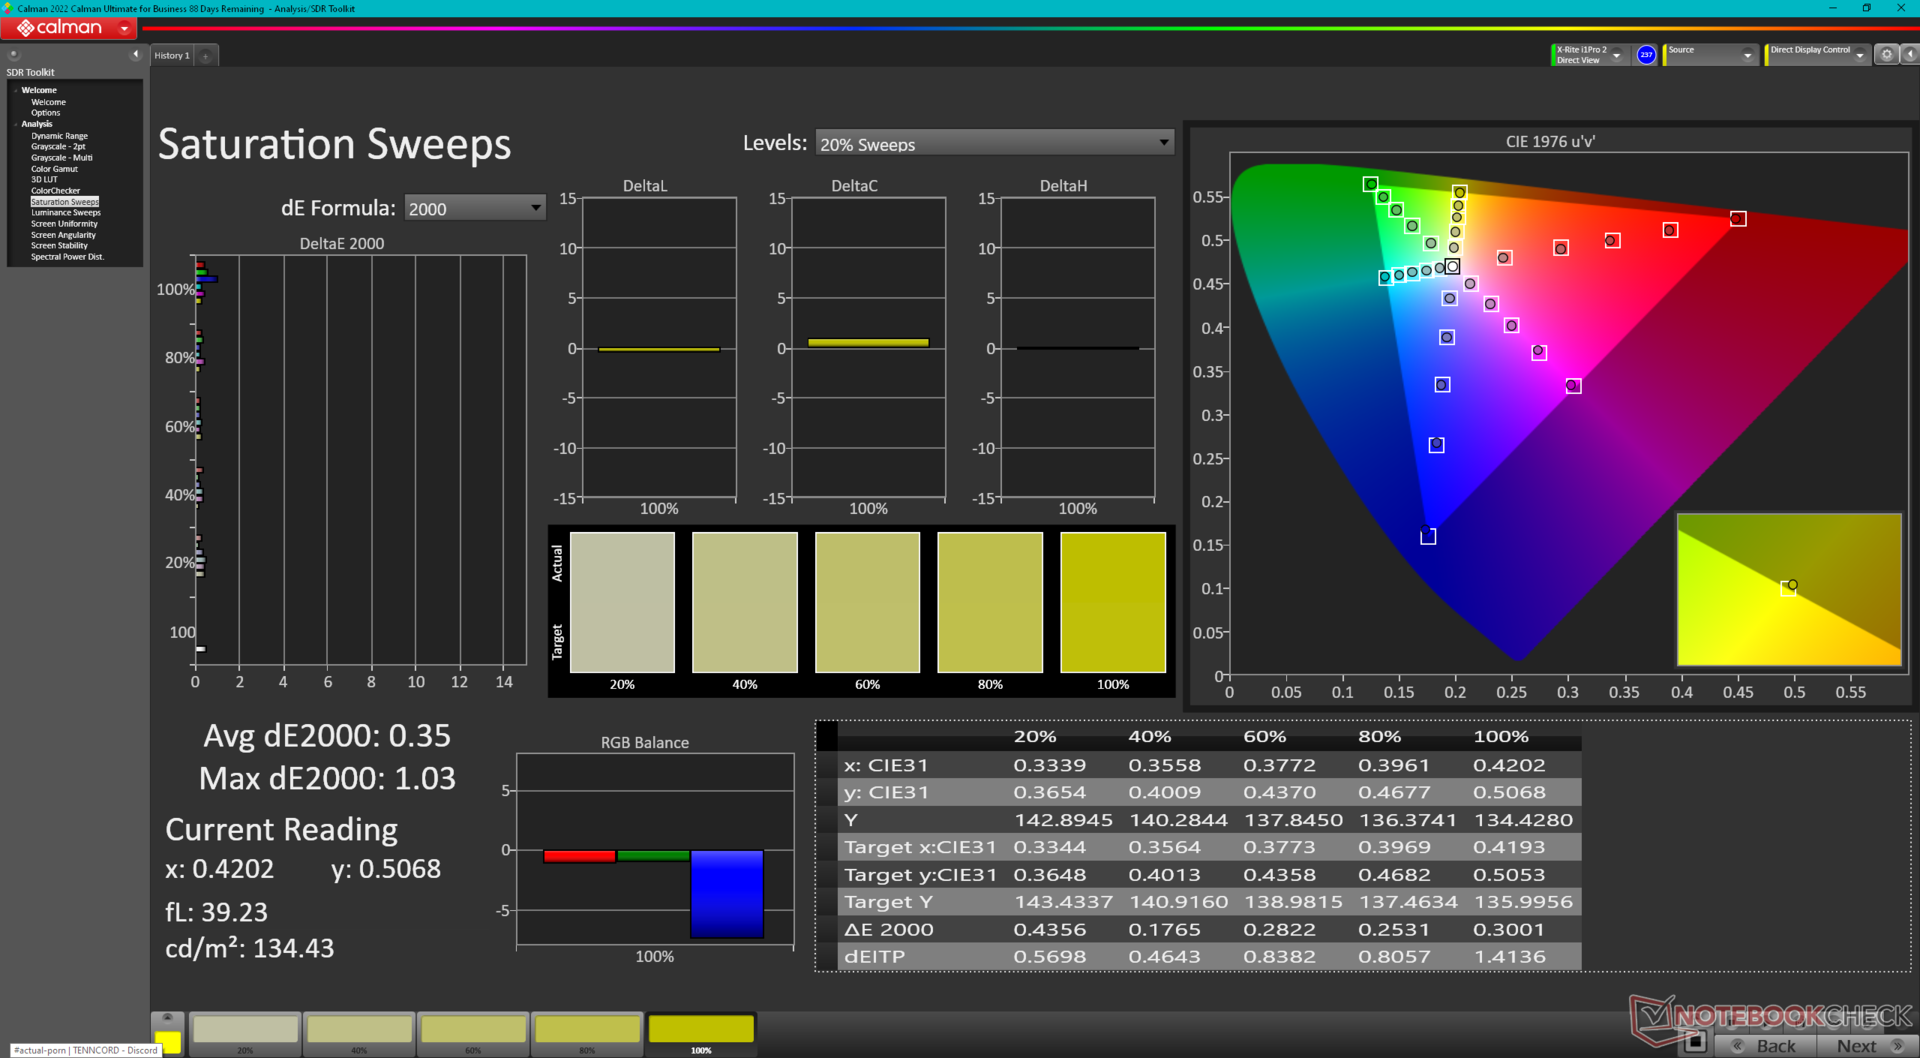
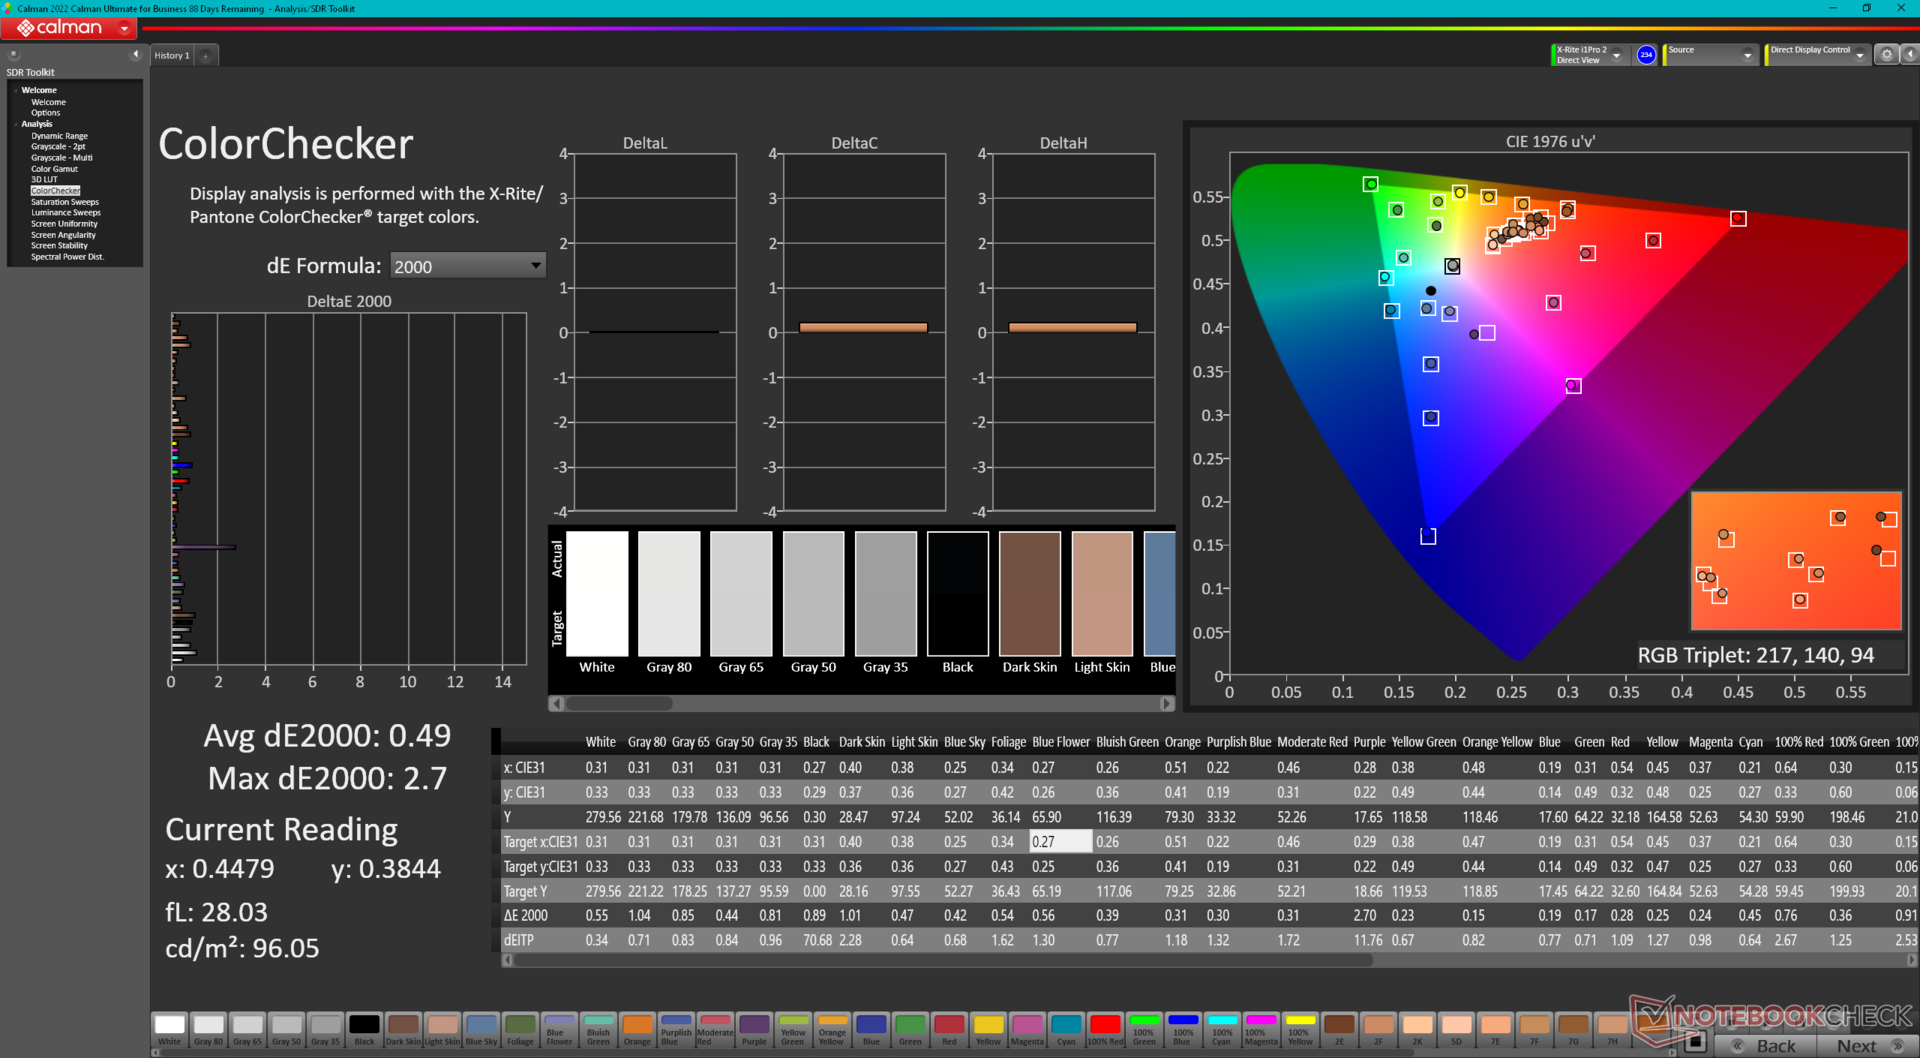
Wyświetlacz - pełne kolory sRGB
Model ten jest pierwszym w naszej bazie danych, który jest dostarczany z panelem Chi Mei 160JCA IPS, podczas gdy panelem w zeszłorocznym modelu był BOE NV16N45. Podstawowe atrybuty są poza tym niemal identyczne między tymi dwoma panelami, w tym ich współczynniki kontrastu ~ 1000:1, pełne pokrycie sRGB, częstotliwość odświeżania 60 Hz i średni czas reakcji. Wrażenia wizualne są zatem zasadniczo takie same między modelami 2022 i 2023, chyba że są skonfigurowane z opcją OLED 2400p w Inspironie 16 7630 2 w 1 z procesorem Intel.
Podczas gdy nasz panel Chi Mei jest wyższej jakości niż LEN160WUXGA w modeluIdeaPad Flex 5 16 pod względem kolorów, byłoby miło zobaczyć, jak Dell idzie o krok dalej w tym roku, włączając szybsze opcje częstotliwości odświeżania 90 Hz lub 120 Hz dla płynniejszego interfejsu użytkownika.
| |||||||||||||||||||||||||
rozświetlenie: 79 %
na akumulatorze: 301.3 cd/m²
kontrast: 1076:1 (czerń: 0.28 cd/m²)
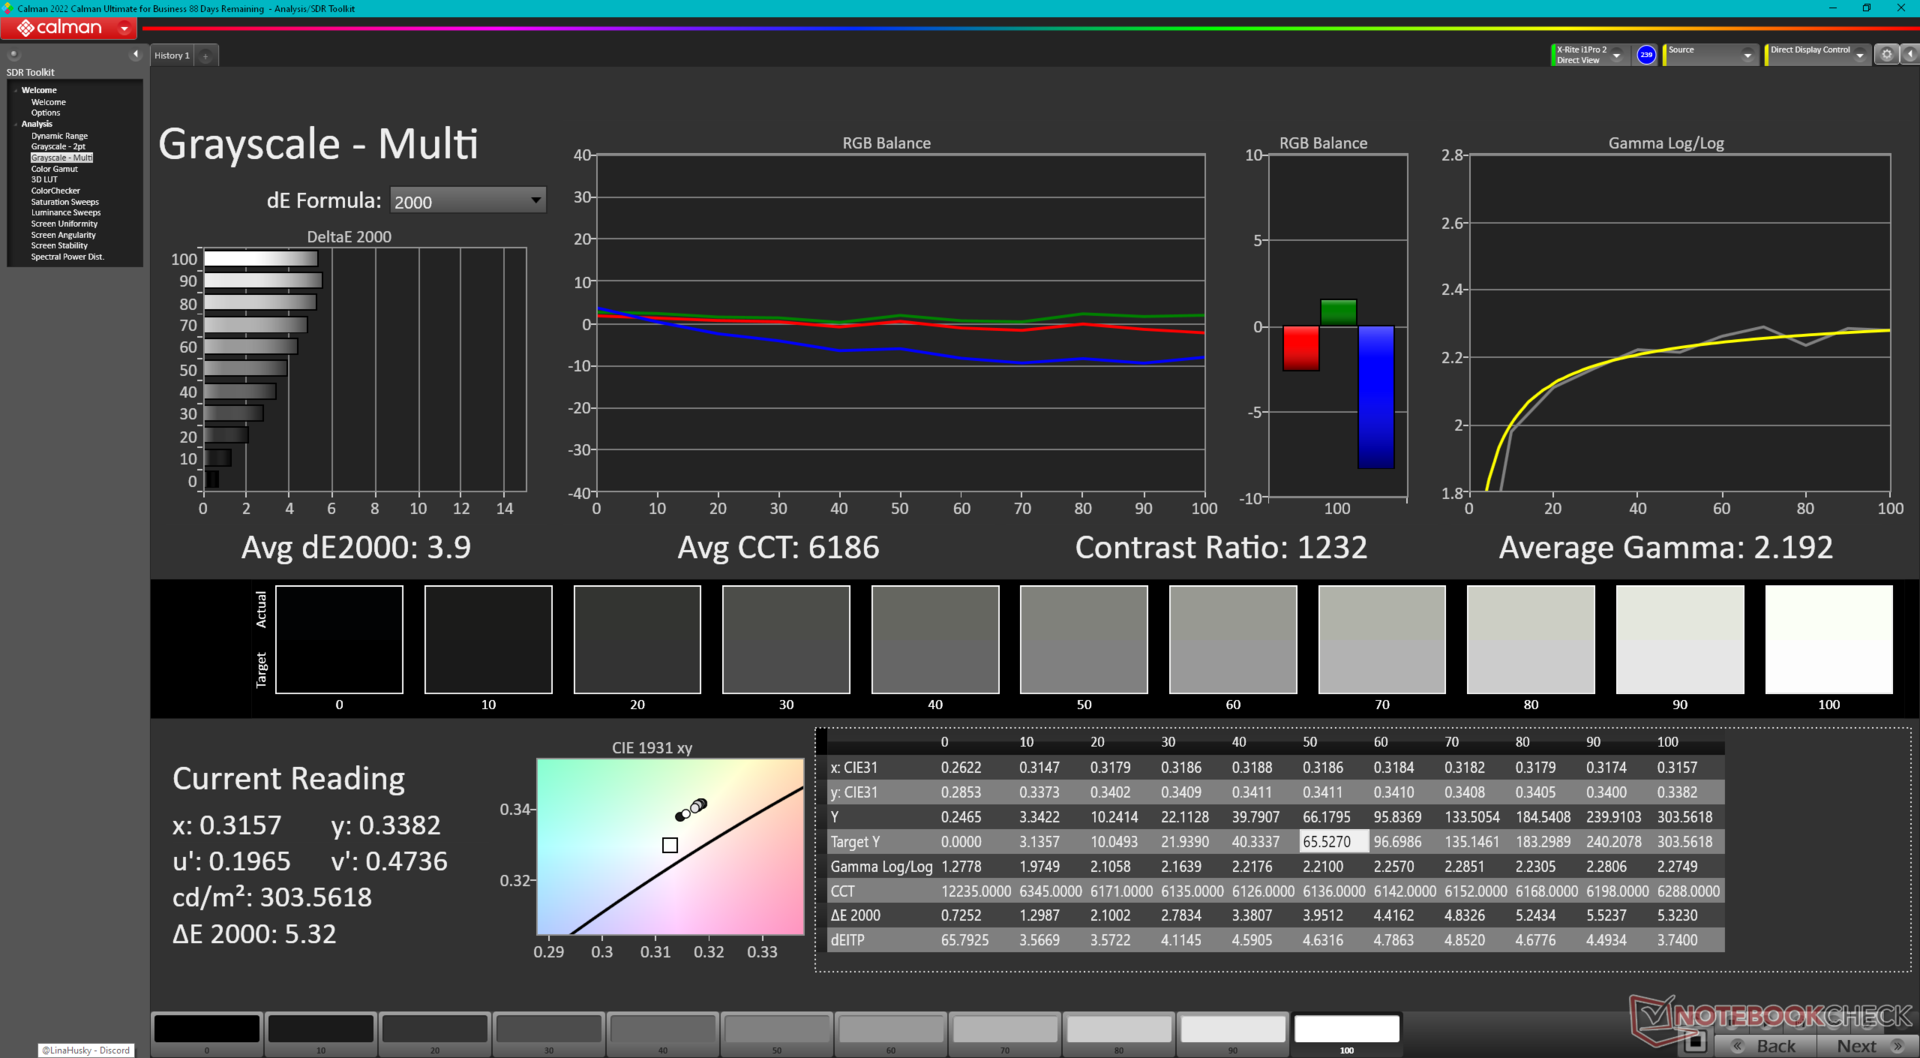
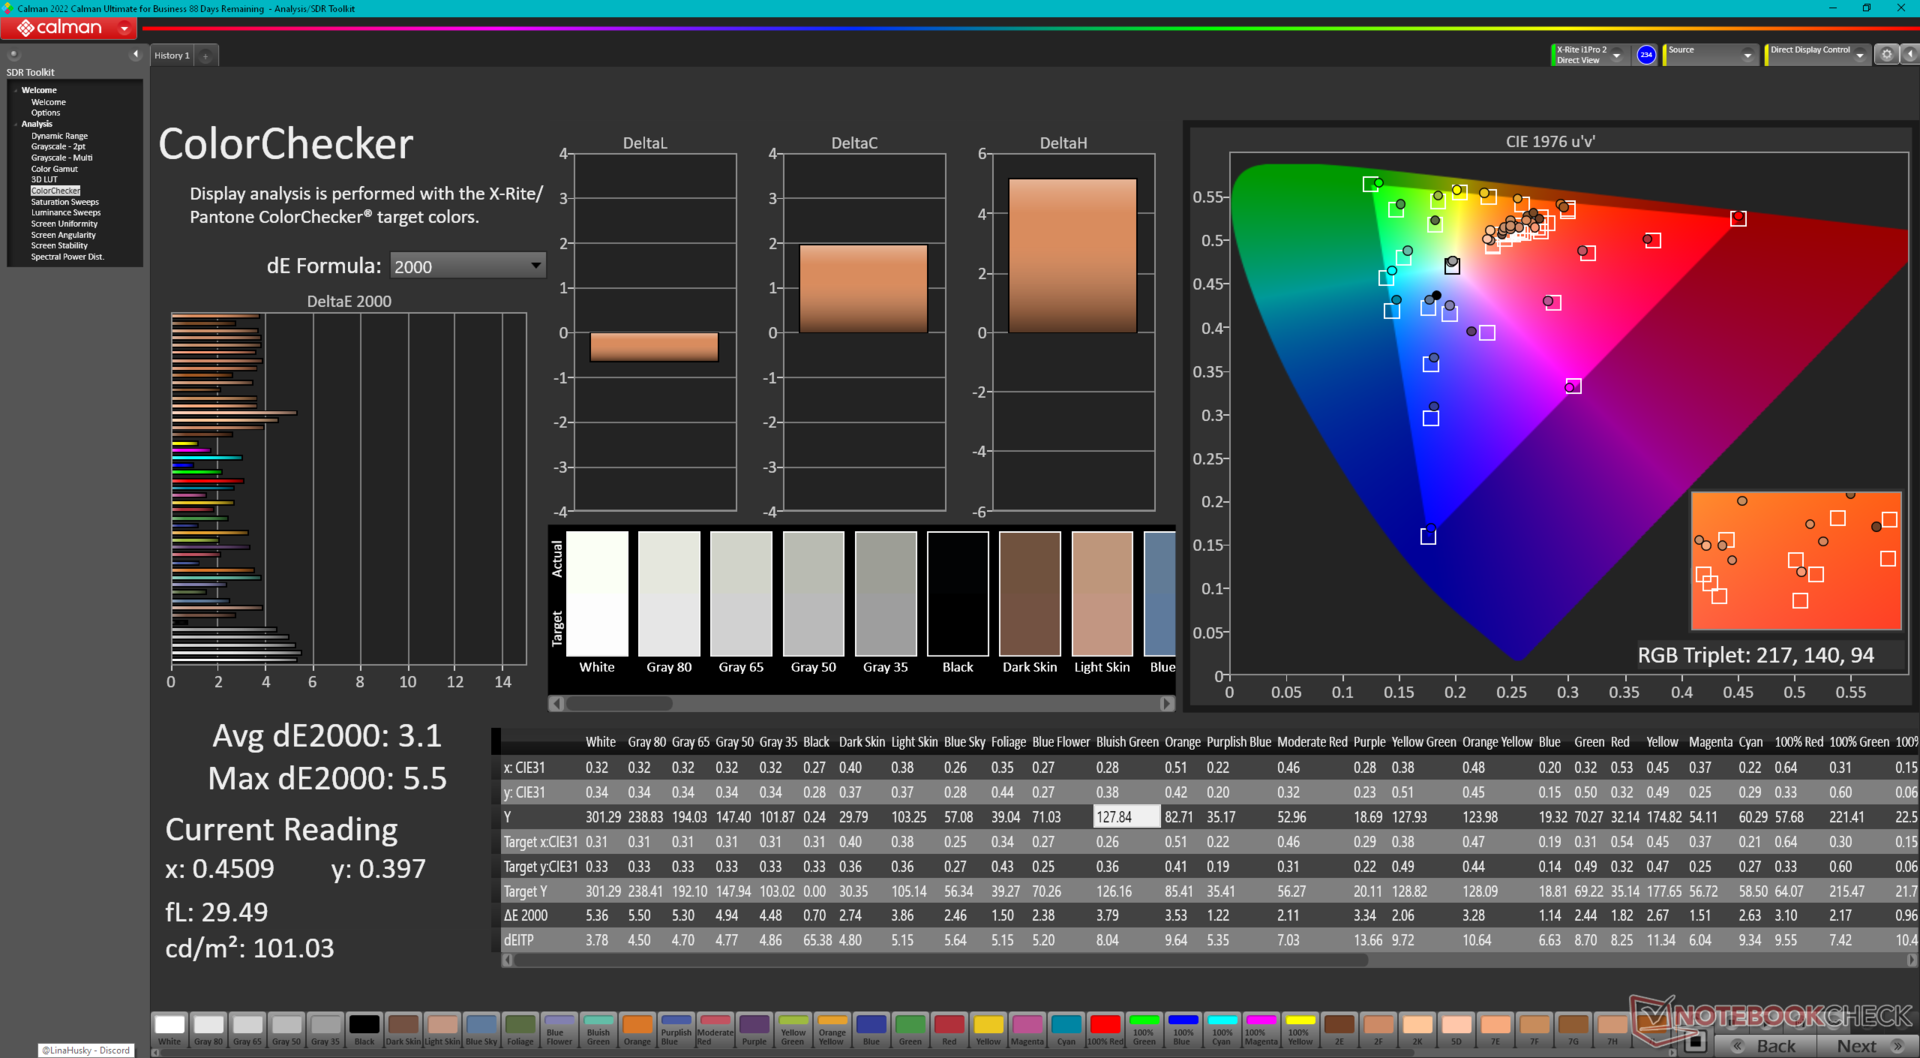
ΔE ColorChecker Calman: 3.1 | ∀{0.5-29.43 Ø4.71}
calibrated: 0.49
ΔE Greyscale Calman: 3.9 | ∀{0.09-98 Ø4.96}
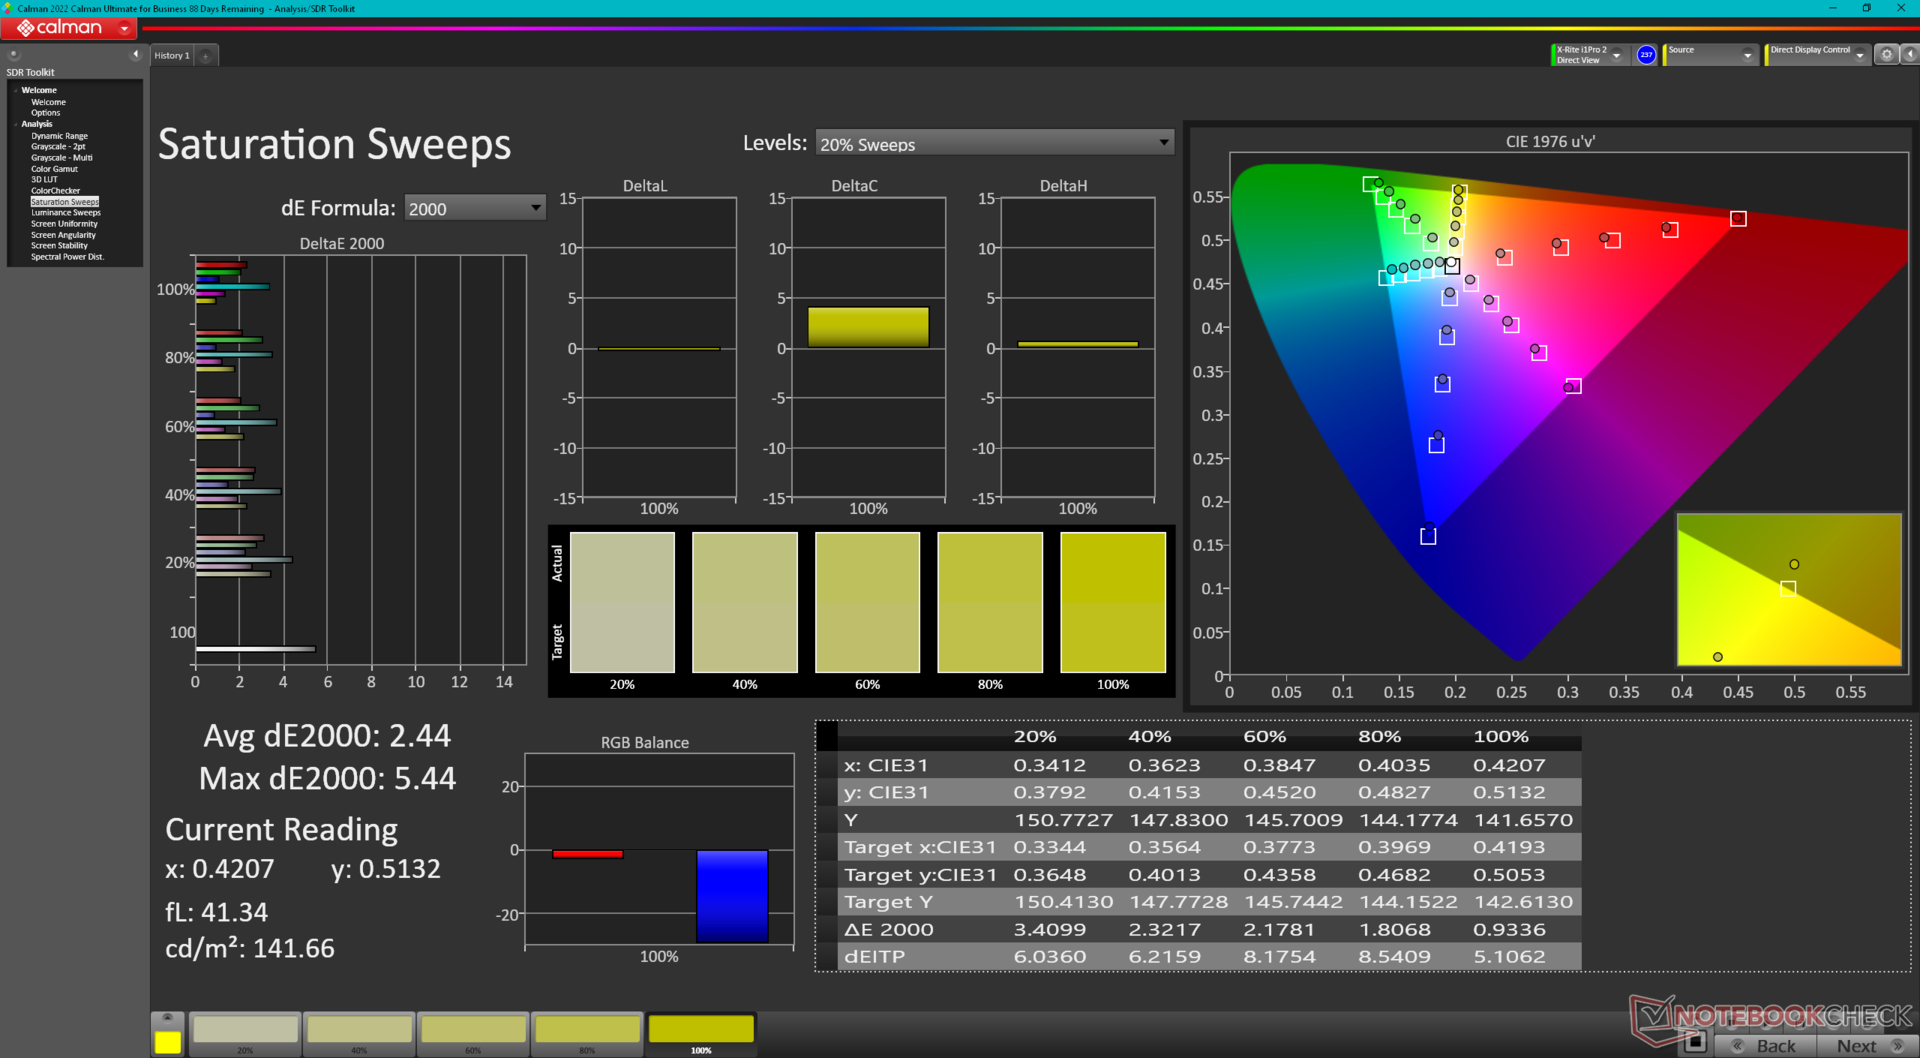
69.5% AdobeRGB 1998 (Argyll 3D)
98.2% sRGB (Argyll 3D)
67.4% Display P3 (Argyll 3D)
Gamma: 2.19
CCT: 6186 K
| Dell Inspiron 16 7635 2-in-1 Chi Mei 160JCA, IPS, 1920x1200, 16" | Acer Swift Edge SFE16-42-R1GM Samsung SDC4168, OLED, 3840x2400, 16" | Lenovo Yoga 7 16IRL8 LEN160FHD, IPS, 1920x1200, 16" | Samsung Galaxy Book3 Pro 16 Samsung ATNA60CL03-0, AMOLED, 2880x1800, 16" | Lenovo IdeaPad Flex 5 16ABR G8 LEN160WUXGA, IPS, 1920x1200, 16" | Dell Inspiron 16 7620 2-in-1 BOE NV16N45, IPS, 1920x1200, 16" | |
|---|---|---|---|---|---|---|
| Display | 30% | -37% | 30% | -41% | -1% | |
| Display P3 Coverage (%) | 67.4 | 99.7 48% | 42 -38% | 99.7 48% | 40 -41% | 67 -1% |
| sRGB Coverage (%) | 98.2 | 100 2% | 62.8 -36% | 100 2% | 57.6 -41% | 95.9 -2% |
| AdobeRGB 1998 Coverage (%) | 69.5 | 97.2 40% | 43.5 -37% | 97 40% | 41.3 -41% | 69.3 0% |
| Response Times | 89% | -15% | 91% | -16% | -15% | |
| Response Time Grey 50% / Grey 80% * (ms) | 27.6 ? | 2 ? 93% | 31.8 ? -15% | 2 ? 93% | 33 ? -20% | 32 ? -16% |
| Response Time Black / White * (ms) | 18.2 ? | 3 ? 84% | 20.9 ? -15% | 2 ? 89% | 20.2 ? -11% | 20.8 ? -14% |
| PWM Frequency (Hz) | 239 ? | |||||
| Screen | -43% | -63% | 250% | -149% | -24% | |
| Brightness middle (cd/m²) | 301.3 | 369 22% | 279.4 -7% | 412 37% | 392 30% | 320.7 6% |
| Brightness (cd/m²) | 269 | 371 38% | 257 -4% | 412 53% | 371 38% | 309 15% |
| Brightness Distribution (%) | 79 | 97 23% | 81 3% | 98 24% | 89 13% | 90 14% |
| Black Level * (cd/m²) | 0.28 | 0.18 36% | 0.015 95% | 0.25 11% | 0.36 -29% | |
| Contrast (:1) | 1076 | 1552 44% | 27467 2453% | 1568 46% | 891 -17% | |
| Colorchecker dE 2000 * | 3.1 | 2.3 26% | 5.12 -65% | 2.34 25% | 7.3 -135% | 4.18 -35% |
| Colorchecker dE 2000 max. * | 5.5 | 4.37 21% | 19.42 -253% | 3.34 39% | 20.8 -278% | 8.48 -54% |
| Colorchecker dE 2000 calibrated * | 0.49 | 2.87 -486% | 1.84 -276% | 2.95 -502% | 5.4 -1002% | 0.77 -57% |
| Greyscale dE 2000 * | 3.9 | 1.83 53% | 5.5 -41% | 2.78 29% | 6.5 -67% | 6.3 -62% |
| Gamma | 2.19 100% | 2.39 92% | 2.22 99% | 2.5 88% | 2.29 96% | 2.21 100% |
| CCT | 6186 105% | 6392 102% | 6407 101% | 6879 94% | 5993 108% | 6258 104% |
| Całkowita średnia (program / ustawienia) | 25% /
-3% | -38% /
-50% | 124% /
180% | -69% /
-107% | -13% /
-18% |
* ... im mniej tym lepiej
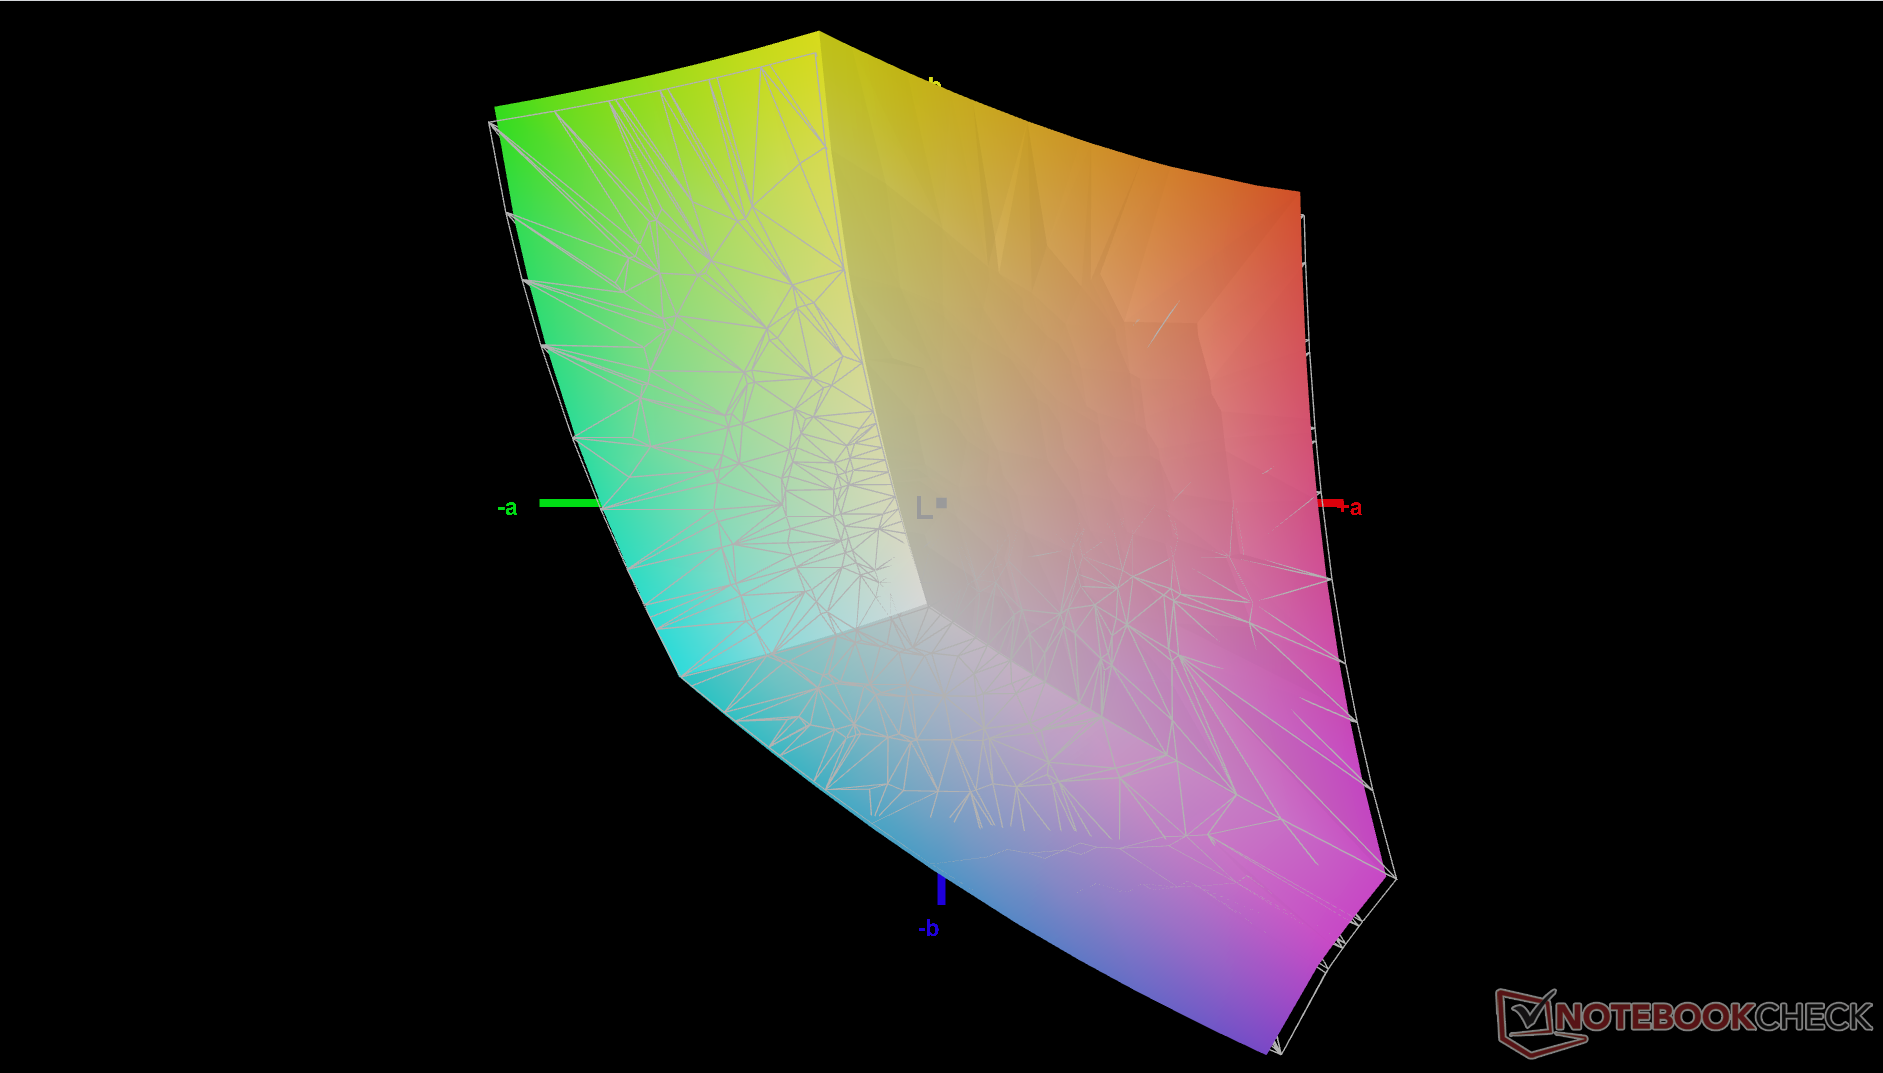
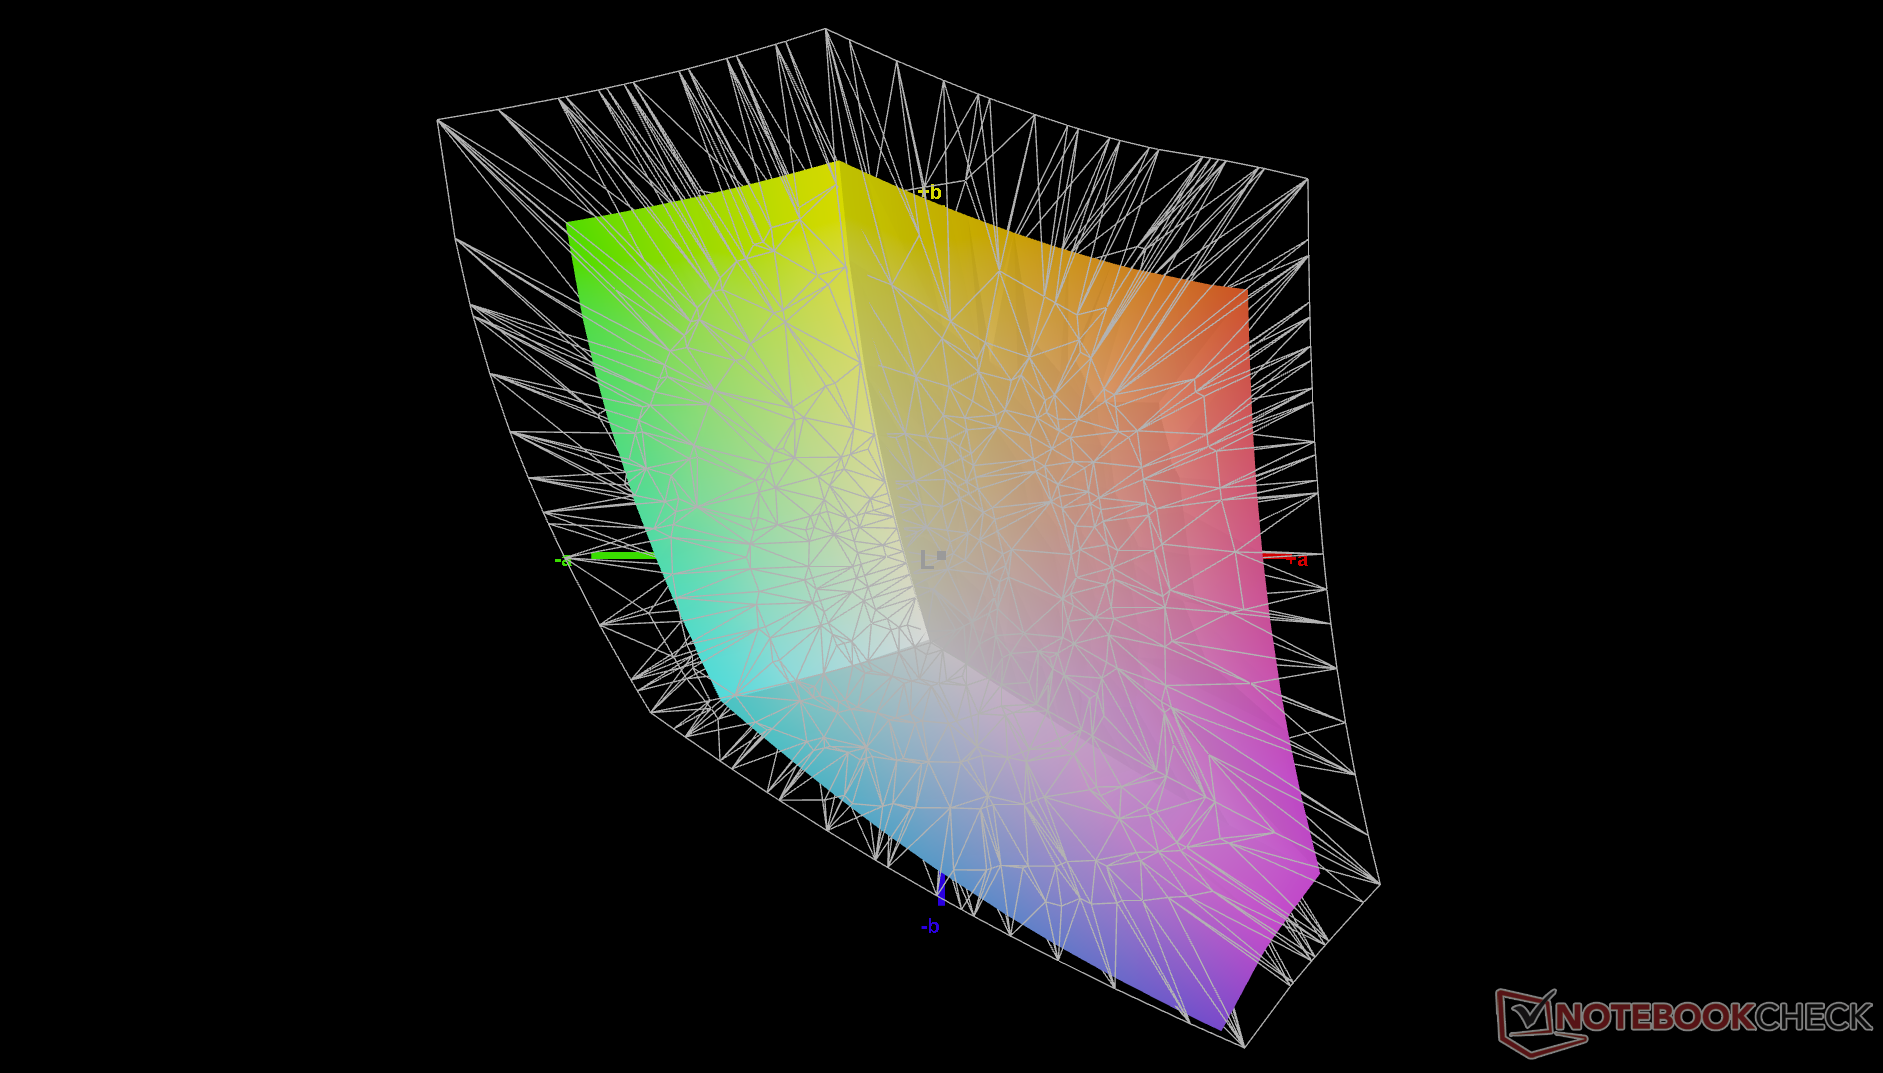
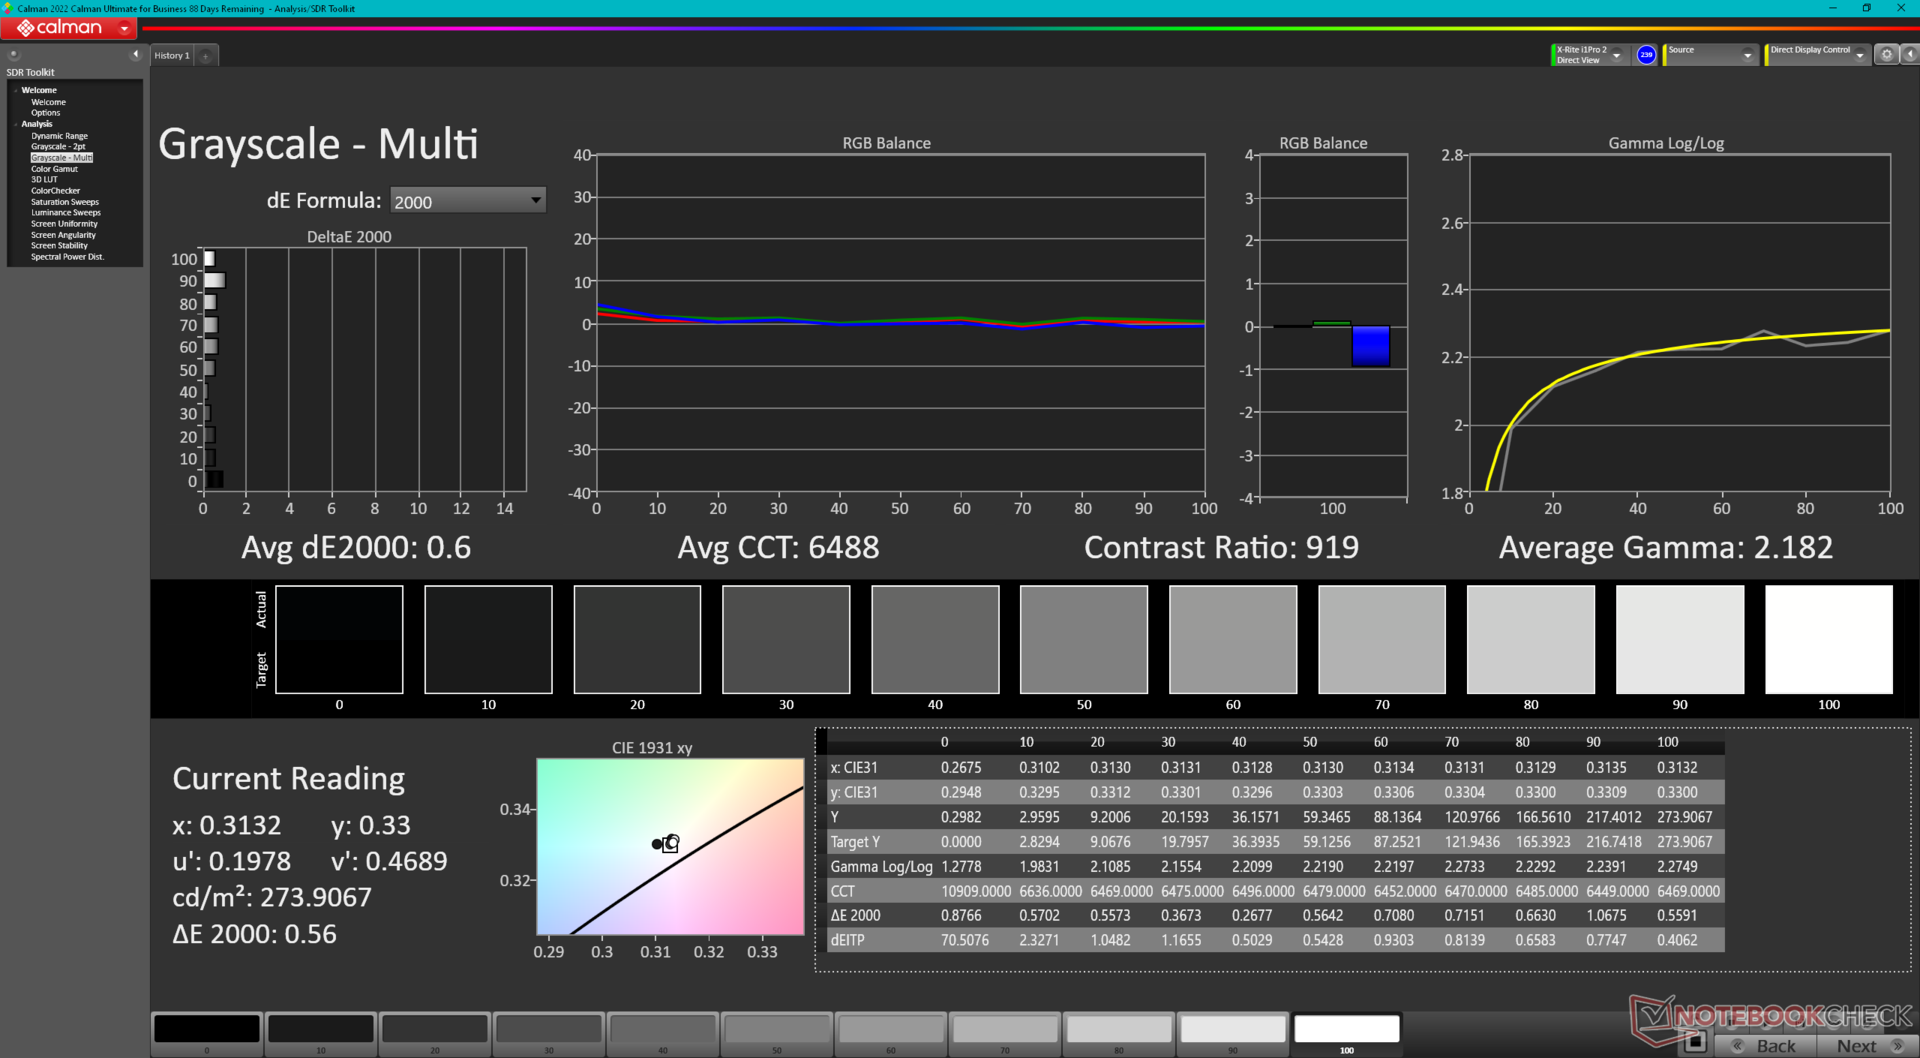
Wyświetlacz nie jest wstępnie skalibrowany, czego można się spodziewać po budżetowej maszynie. Niemniej jednak, średnie wartości deltaE dla skali szarości i kolorów nie są złe i wynoszą odpowiednio 3,9 i 3,1. Prawidłowa kalibracja poprawiłaby średnie wartości jeszcze bardziej, do zaledwie 0,6 i 0,49, dlatego zalecamy zastosowanie naszego skalibrowanego profilu ICM powyżej, aby lepiej wykorzystać pełne kolory sRGB panelu.
Wyświetl czasy reakcji
| ↔ Czas reakcji od czerni do bieli | ||
|---|---|---|
| 18.2 ms ... wzrost ↗ i spadek ↘ łącznie | ↗ 9.6 ms wzrost | 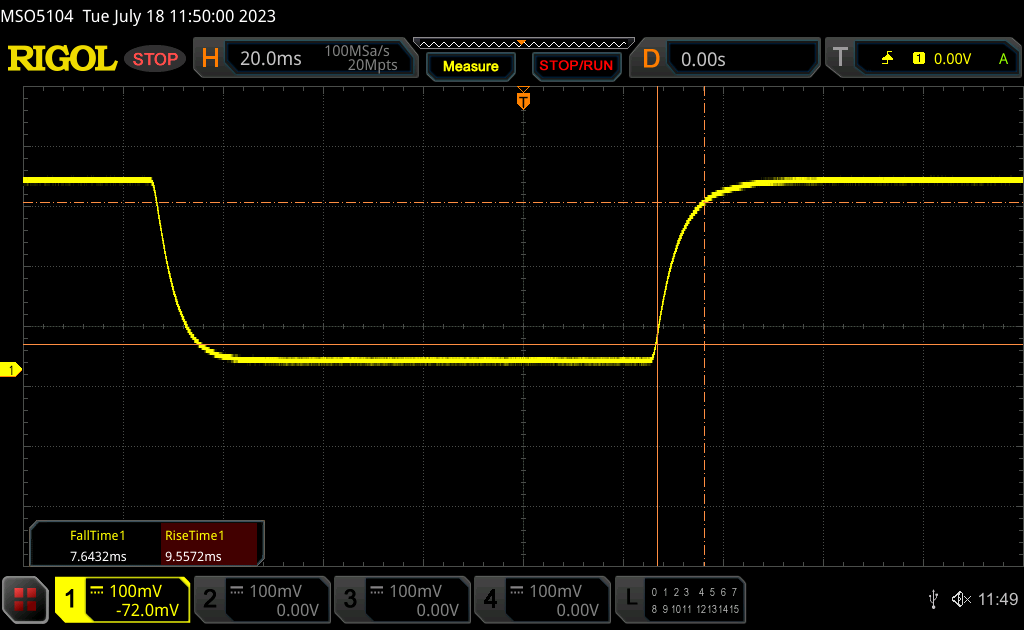 |
| ↘ 7.6 ms upadek | ||
| W naszych testach ekran wykazuje dobry współczynnik reakcji, ale może być zbyt wolny dla graczy rywalizujących ze sobą. Dla porównania, wszystkie testowane urządzenia wahają się od 0.1 (minimum) do 240 (maksimum) ms. » 41 % wszystkich urządzeń jest lepszych. Oznacza to, że zmierzony czas reakcji jest zbliżony do średniej wszystkich testowanych urządzeń (19.8 ms). | ||
| ↔ Czas reakcji 50% szarości do 80% szarości | ||
| 27.6 ms ... wzrost ↗ i spadek ↘ łącznie | ↗ 13.2 ms wzrost | 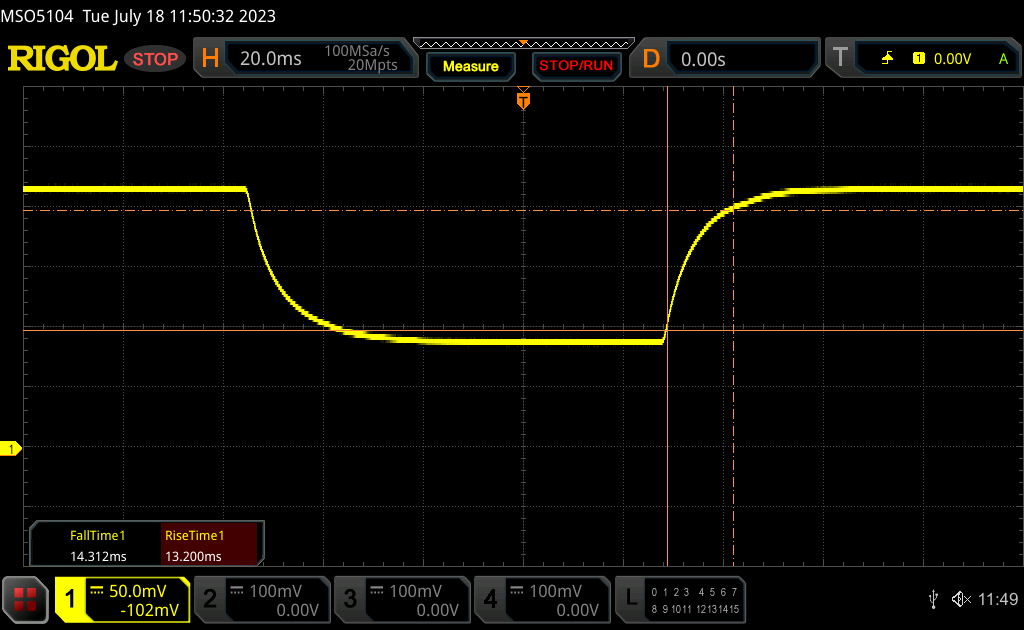 |
| ↘ 14.3 ms upadek | ||
| W naszych testach ekran wykazuje stosunkowo powolne tempo reakcji i może być zbyt wolny dla graczy. Dla porównania, wszystkie testowane urządzenia wahają się od 0.165 (minimum) do 636 (maksimum) ms. » 37 % wszystkich urządzeń jest lepszych. Oznacza to, że zmierzony czas reakcji jest lepszy od średniej wszystkich testowanych urządzeń (31 ms). | ||
Migotanie ekranu / PWM (modulacja szerokości impulsu)
| Migotanie ekranu/nie wykryto PWM | 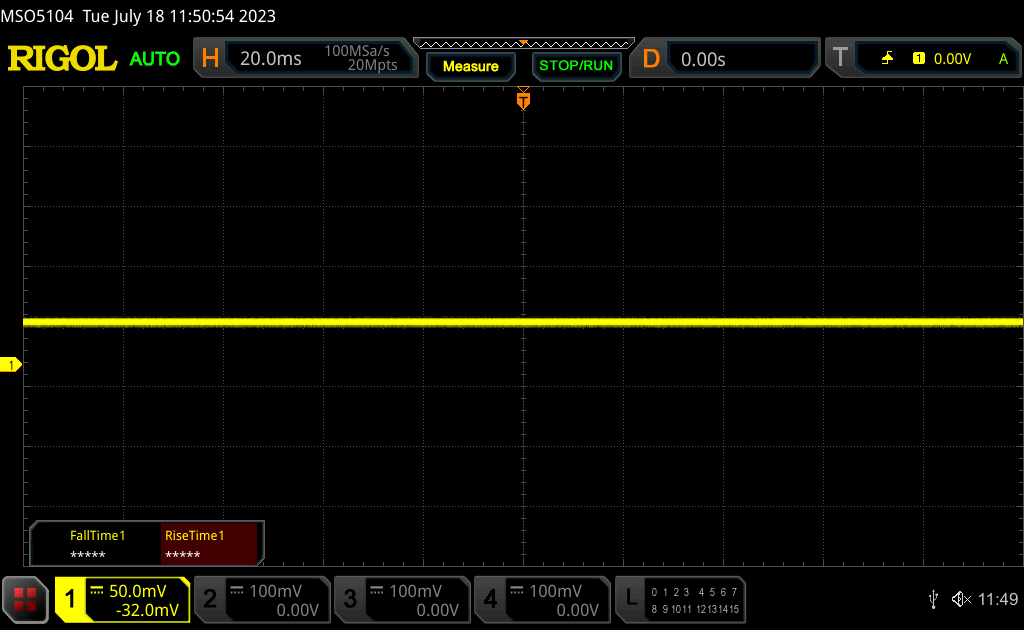 | ||
Dla porównania: 52 % wszystkich testowanych urządzeń nie używa PWM do przyciemniania wyświetlacza. Jeśli wykryto PWM, zmierzono średnio 7757 (minimum: 5 - maksimum: 343500) Hz. | |||
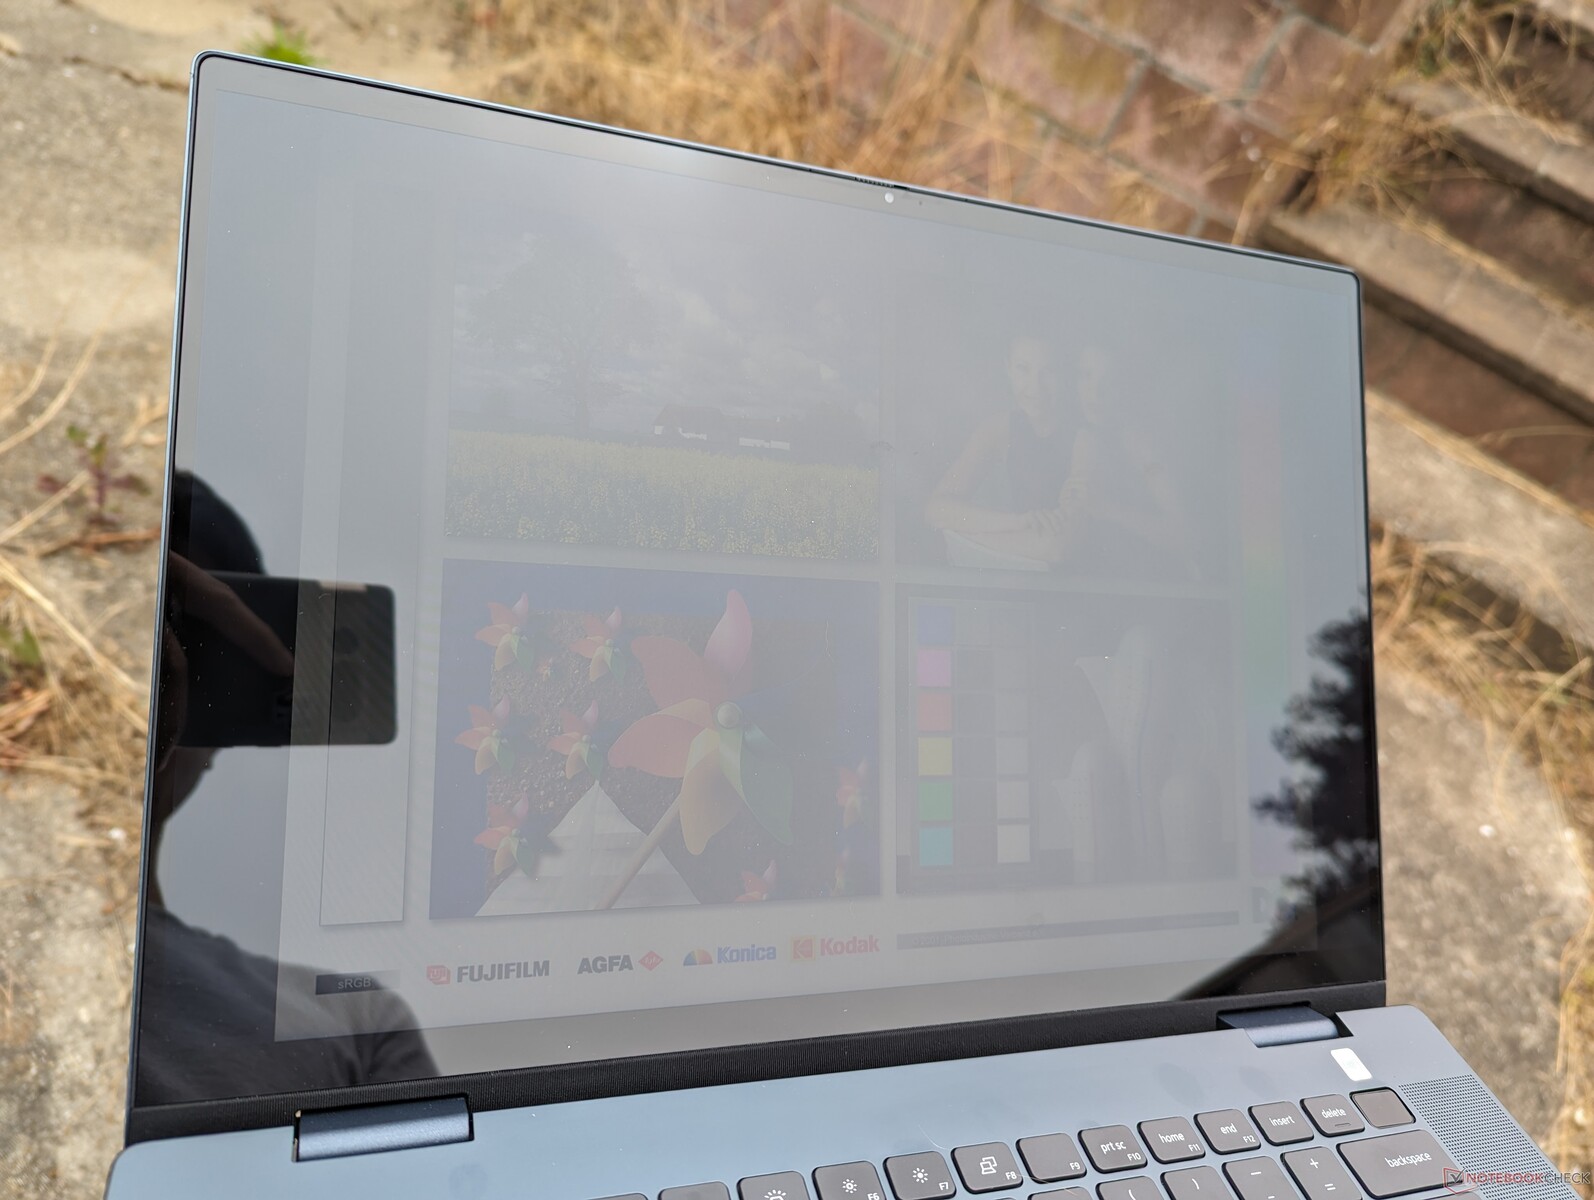
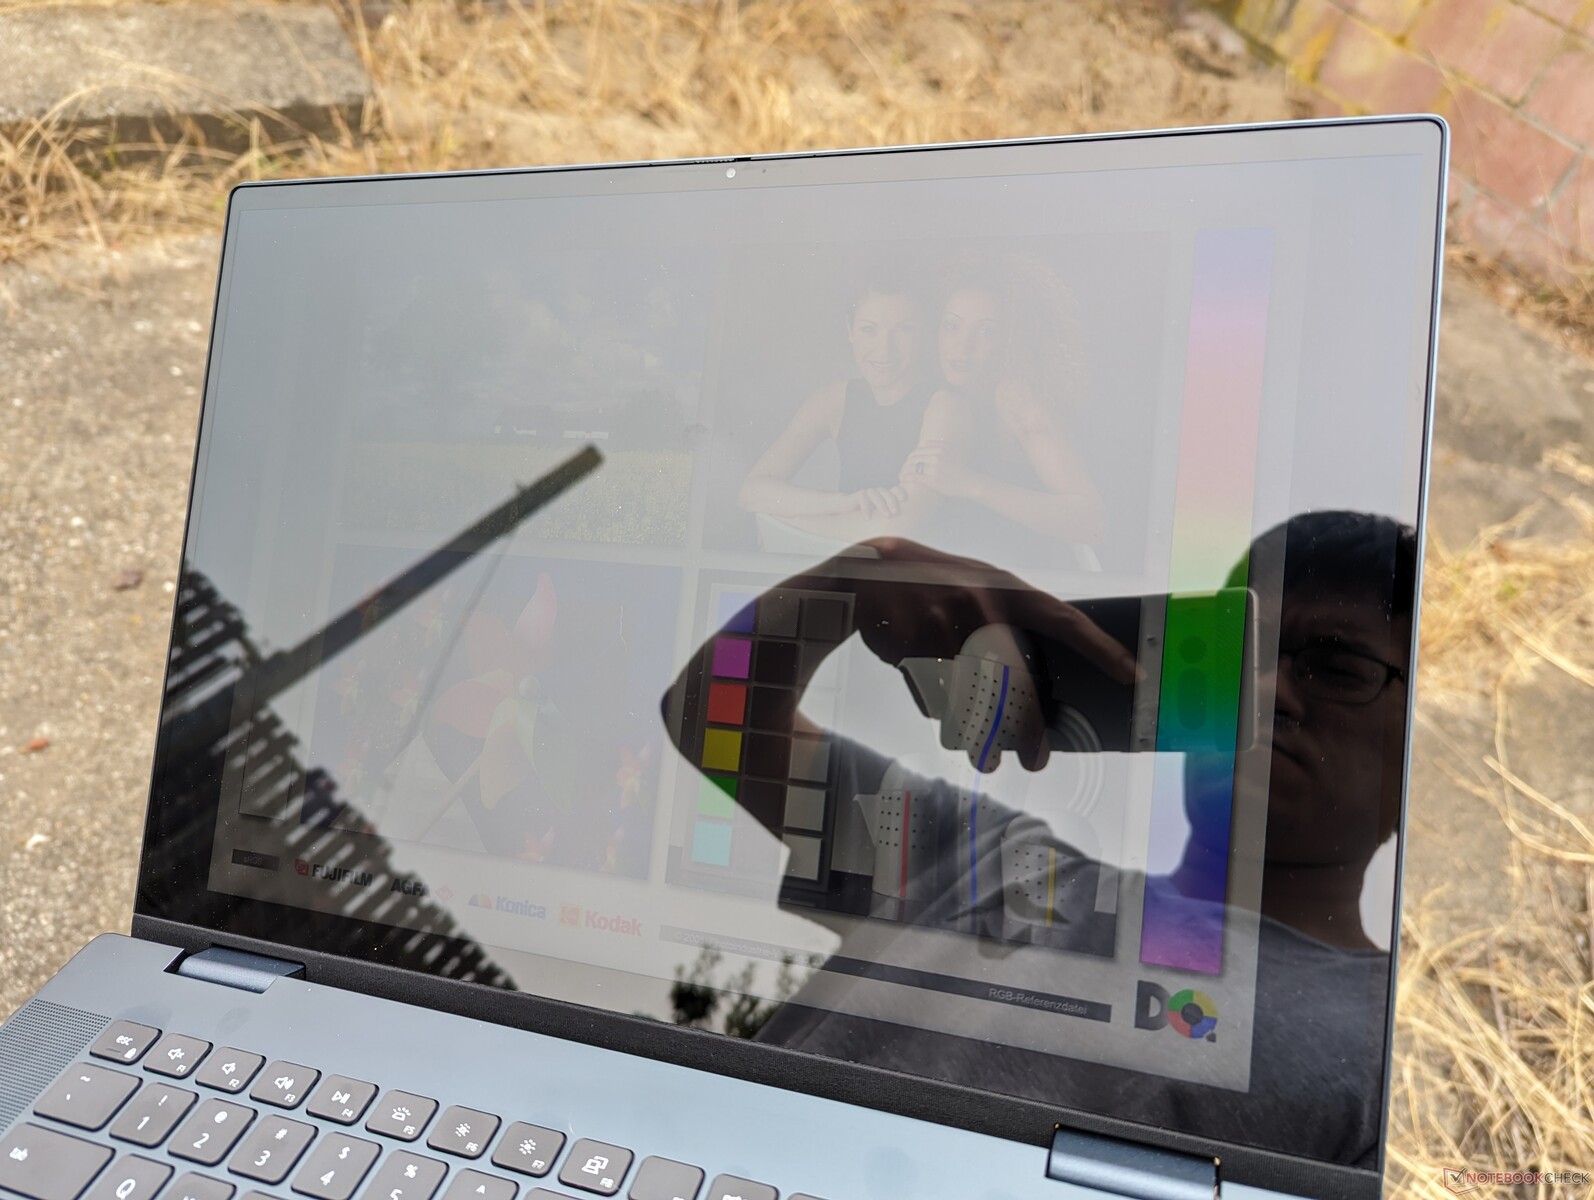
Widoczność na zewnątrz jest w najlepszym razie przeciętna, ponieważ ekran dotykowy o jasności 300 nitów nie jest wystarczająco jasny, aby znacząco zmniejszyć lub przezwyciężyć odblaski. Tablety takie jak iPad Pro 12.6 mogą być dwa lub więcej razy jaśniejsze. Dell jest przede wszystkim multimedialnym urządzeniem konwertowalnym do pracy w pomieszczeniach.
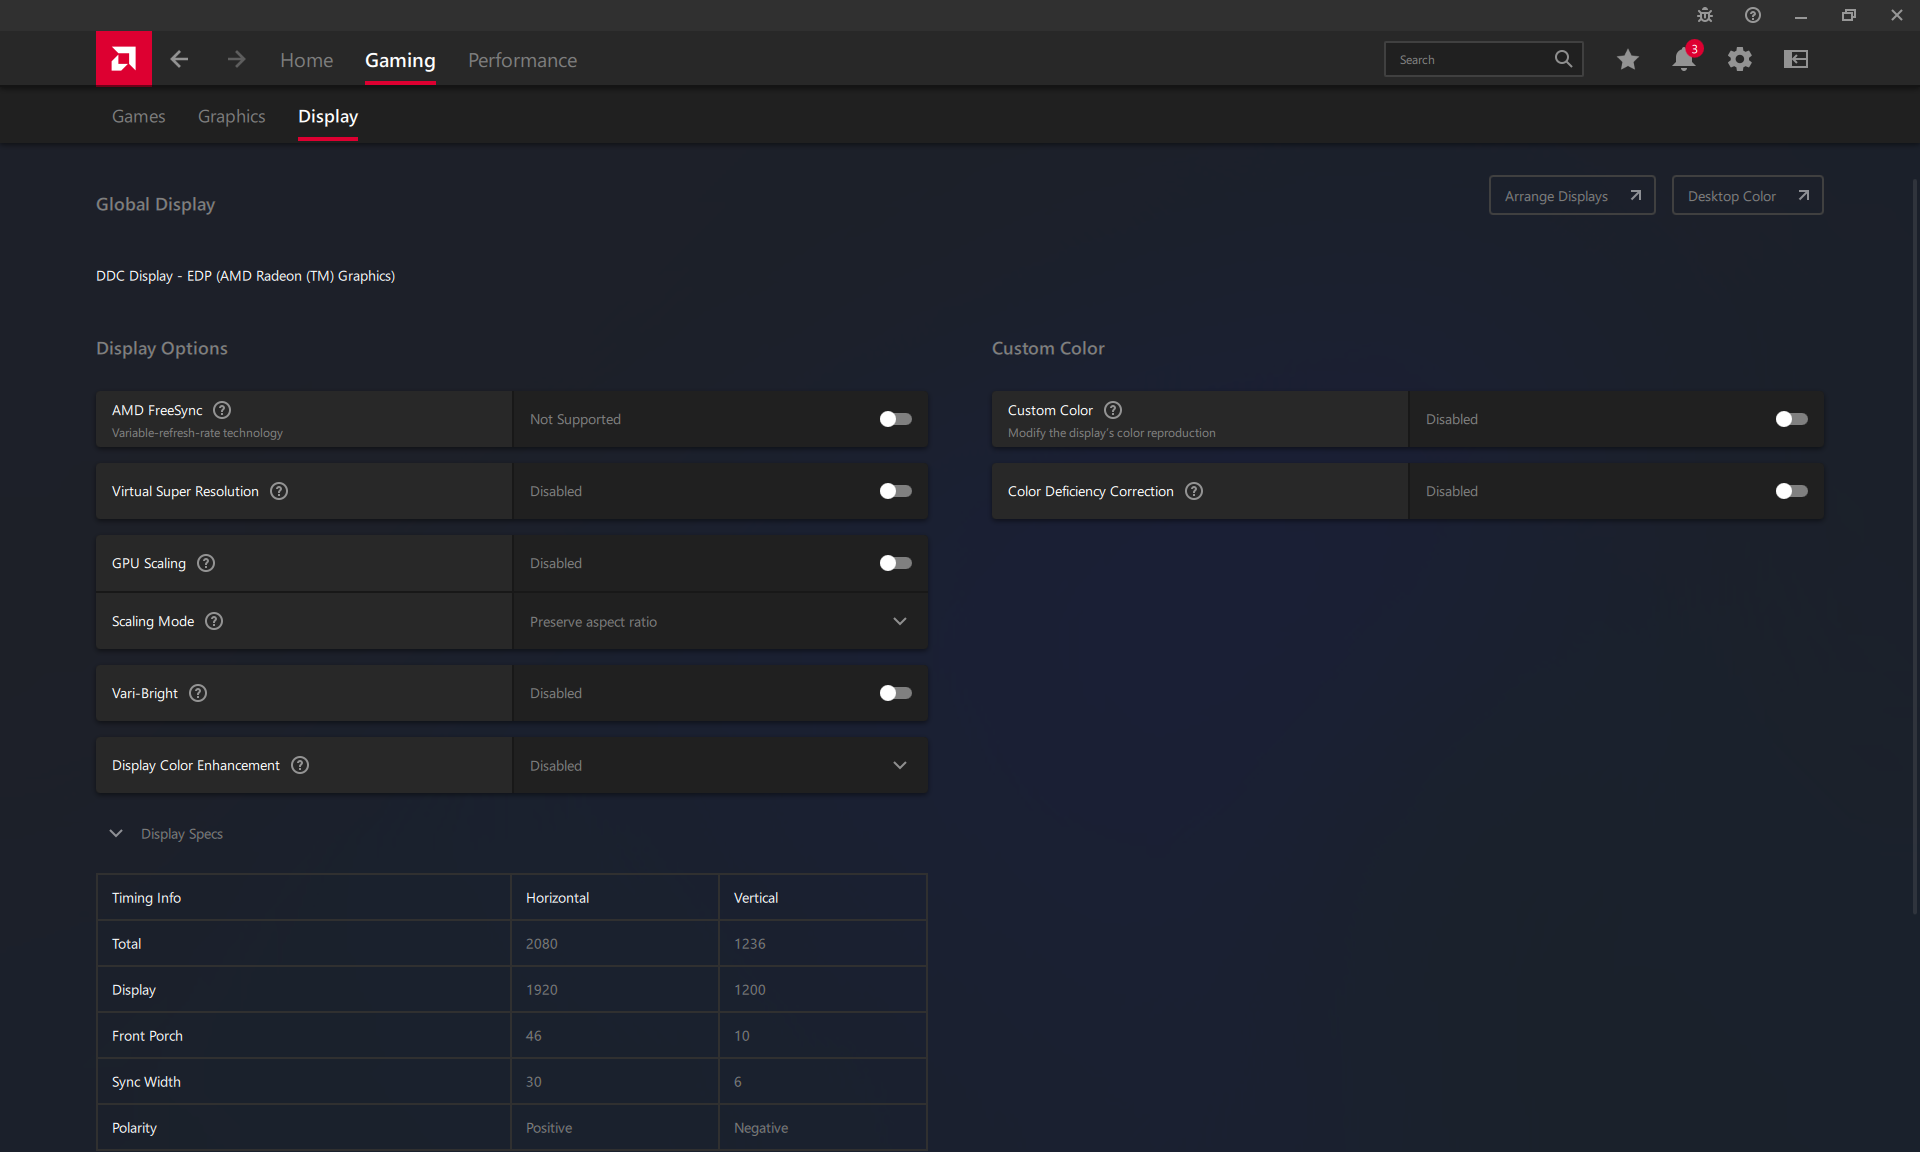
Pamiętaj, aby wyłączyć AMD Vari-Bright za pośrednictwem AMD Adrenalin, w przeciwnym razie maksymalna jasność zostanie zmniejszona podczas pracy na zasilaniu bateryjnym.


Wydajność - nie wszystkie procesory Ryzen 7000 to Zen 4
Warunki testowania
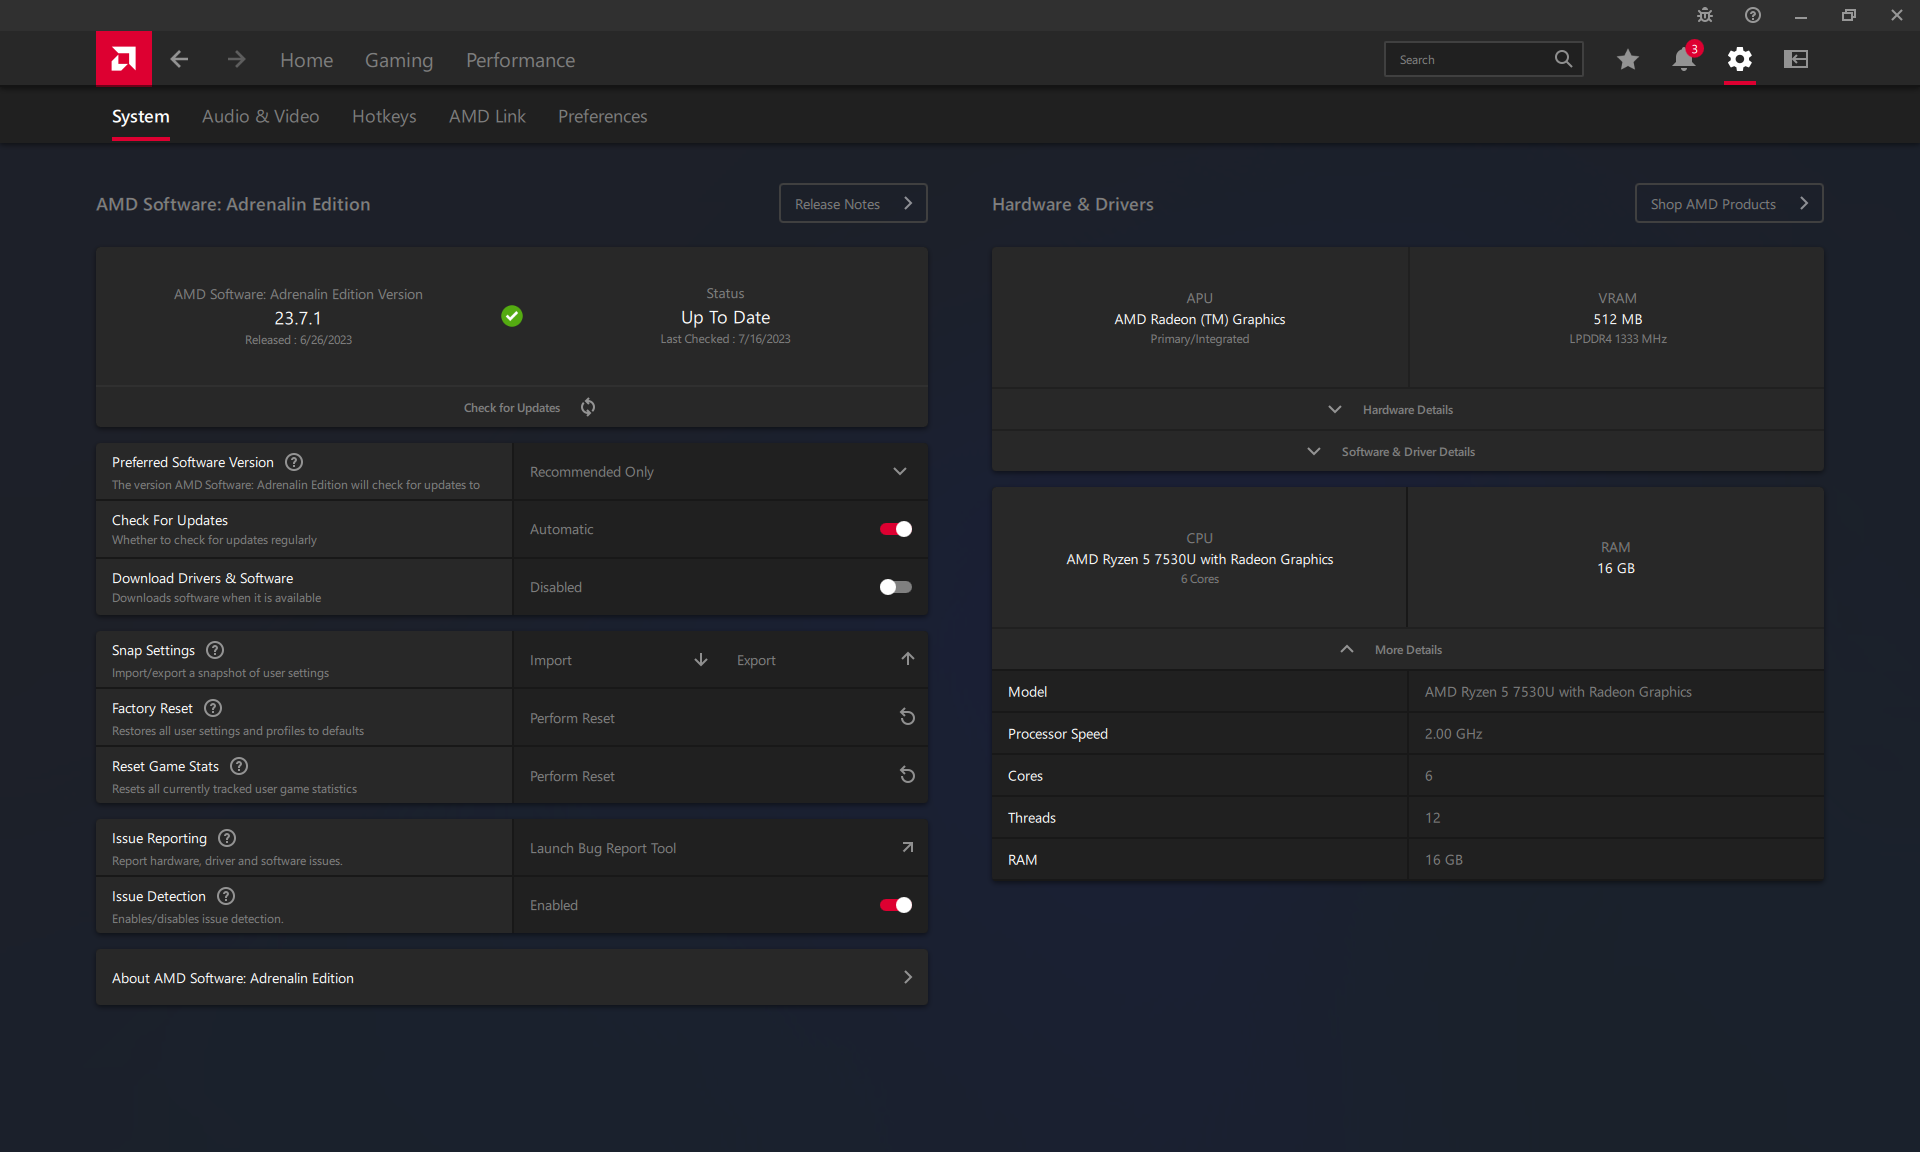
Przed uruchomieniem poniższych testów porównawczych ustawiliśmy naszą jednostkę w trybie wydajności za pośrednictwem systemu Windows. Dodatkowe ustawienia graficzne są dostępne w AMD Adrenalin, który nie był fabrycznie zainstalowany w naszym urządzeniu. Zalecamy zainstalowanie narzędzia AMD do automatycznego wykrywania Adrenalin i najnowszych sterowników graficznych.
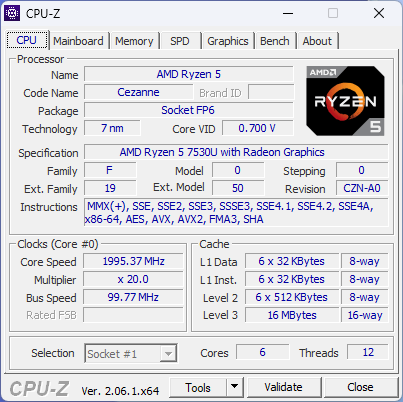
Procesor
ProcesorRyzen 5 7530U działa niemal identycznie jak zeszłoroczny Ryzen 5 6600H aczkolwiek przy niższym poborze mocy, co przekłada się na wyższą wydajność w przeliczeniu na wat. Jest to zatem procesor średniej klasy porównywalny do konkurencyjnego Core i5-1235U lub Core i7-1255U które można znaleźć w wielu ultrabookach, takich jakhP Spectre x360 13.5. W typowy dla AMD sposób, wydajność jednowątkowa jest jednak wolniejsza o około 15 do 20 procent od wyżej wymienionych procesorów Intela.
Aktualizacja do 8-rdzeniowego Ryzen 7 7730U z naszego 6-rdzeniowego Ryzen 5 7530U powinna zwiększyć wydajność wielowątkową o około 15 do 35 procent w oparciu o nasz czas spędzony z IdeaPad Flex 5 16. Procesor Core i7-1360P w Intel Inspiron działałby jeszcze szybciej.
Cinebench R15 Multi Loop
Cinebench R23: Multi Core | Single Core
Cinebench R20: CPU (Multi Core) | CPU (Single Core)
Cinebench R15: CPU Multi 64Bit | CPU Single 64Bit
Blender: v2.79 BMW27 CPU
7-Zip 18.03: 7z b 4 | 7z b 4 -mmt1
Geekbench 5.5: Multi-Core | Single-Core
HWBOT x265 Benchmark v2.2: 4k Preset
LibreOffice : 20 Documents To PDF
R Benchmark 2.5: Overall mean
| CPU Performance rating | |
| Lenovo Legion Pro 5 16ARX8 | |
| Framework Laptop 13.5 13th Gen Intel | |
| Acer Swift Go SFG16-71 | |
| Lenovo Legion 7 16ARHA7 | |
| HP Spectre x360 2-in-1 16-f1075ng | |
| Lenovo IdeaPad Gaming 3 15IAH7 | |
| HP Omen 16-n0033dx | |
| Samsung Galaxy Book3 Pro 16 | |
| Lenovo Yoga 7 16IRL8 | |
| Lenovo IdeaPad Flex 5 16ABR G8 | |
| Dell Inspiron 16 7620 2-in-1 | |
| Acer Swift Edge SFE16-42-R1GM | |
| Lenovo IdeaPad 5 Pro 16ARH7 | |
| Dell Inspiron 16 7635 2-in-1 | |
| Przeciętny AMD Ryzen 5 7530U | |
| Lenovo Ideapad Gaming 3 15IHU-82K1002RGE | |
| Acer Aspire Nitro 5 AN515-55-57GF | |
| Cinebench R23 / Multi Core | |
| Lenovo Legion Pro 5 16ARX8 | |
| Lenovo IdeaPad Gaming 3 15IAH7 | |
| Lenovo Legion 7 16ARHA7 | |
| Acer Swift Go SFG16-71 | |
| Framework Laptop 13.5 13th Gen Intel | |
| HP Omen 16-n0033dx | |
| HP Spectre x360 2-in-1 16-f1075ng | |
| Lenovo IdeaPad Flex 5 16ABR G8 | |
| Samsung Galaxy Book3 Pro 16 | |
| Lenovo Yoga 7 16IRL8 | |
| Acer Swift Edge SFE16-42-R1GM | |
| Dell Inspiron 16 7620 2-in-1 | |
| Lenovo IdeaPad 5 Pro 16ARH7 | |
| Dell Inspiron 16 7635 2-in-1 | |
| Przeciętny AMD Ryzen 5 7530U (6931 - 9347, n=9) | |
| Lenovo Ideapad Gaming 3 15IHU-82K1002RGE | |
| Acer Aspire Nitro 5 AN515-55-57GF | |
| Cinebench R23 / Single Core | |
| Framework Laptop 13.5 13th Gen Intel | |
| Acer Swift Go SFG16-71 | |
| Lenovo Legion Pro 5 16ARX8 | |
| Lenovo Yoga 7 16IRL8 | |
| HP Spectre x360 2-in-1 16-f1075ng | |
| Samsung Galaxy Book3 Pro 16 | |
| Lenovo IdeaPad Gaming 3 15IAH7 | |
| Dell Inspiron 16 7620 2-in-1 | |
| Lenovo Legion 7 16ARHA7 | |
| HP Omen 16-n0033dx | |
| Acer Swift Edge SFE16-42-R1GM | |
| Lenovo IdeaPad 5 Pro 16ARH7 | |
| Lenovo IdeaPad Flex 5 16ABR G8 | |
| Dell Inspiron 16 7635 2-in-1 | |
| Przeciętny AMD Ryzen 5 7530U (1371 - 1470, n=9) | |
| Lenovo Ideapad Gaming 3 15IHU-82K1002RGE | |
| Acer Aspire Nitro 5 AN515-55-57GF | |
| Cinebench R20 / CPU (Multi Core) | |
| Lenovo Legion Pro 5 16ARX8 | |
| Lenovo IdeaPad Gaming 3 15IAH7 | |
| Lenovo Legion 7 16ARHA7 | |
| Acer Swift Go SFG16-71 | |
| HP Omen 16-n0033dx | |
| Framework Laptop 13.5 13th Gen Intel | |
| HP Spectre x360 2-in-1 16-f1075ng | |
| Samsung Galaxy Book3 Pro 16 | |
| Lenovo IdeaPad 5 Pro 16ARH7 | |
| Lenovo Yoga 7 16IRL8 | |
| Acer Swift Edge SFE16-42-R1GM | |
| Lenovo IdeaPad Flex 5 16ABR G8 | |
| Dell Inspiron 16 7620 2-in-1 | |
| Dell Inspiron 16 7635 2-in-1 | |
| Przeciętny AMD Ryzen 5 7530U (2780 - 3655, n=9) | |
| Lenovo Ideapad Gaming 3 15IHU-82K1002RGE | |
| Acer Aspire Nitro 5 AN515-55-57GF | |
| Cinebench R20 / CPU (Single Core) | |
| Framework Laptop 13.5 13th Gen Intel | |
| Acer Swift Go SFG16-71 | |
| Lenovo Legion Pro 5 16ARX8 | |
| Lenovo Yoga 7 16IRL8 | |
| HP Spectre x360 2-in-1 16-f1075ng | |
| Lenovo IdeaPad Gaming 3 15IAH7 | |
| Samsung Galaxy Book3 Pro 16 | |
| Dell Inspiron 16 7620 2-in-1 | |
| Lenovo Legion 7 16ARHA7 | |
| HP Omen 16-n0033dx | |
| Lenovo IdeaPad 5 Pro 16ARH7 | |
| Dell Inspiron 16 7635 2-in-1 | |
| Przeciętny AMD Ryzen 5 7530U (528 - 574, n=9) | |
| Lenovo IdeaPad Flex 5 16ABR G8 | |
| Acer Swift Edge SFE16-42-R1GM | |
| Lenovo Ideapad Gaming 3 15IHU-82K1002RGE | |
| Acer Aspire Nitro 5 AN515-55-57GF | |
| Cinebench R15 / CPU Multi 64Bit | |
| Lenovo Legion Pro 5 16ARX8 | |
| Framework Laptop 13.5 13th Gen Intel | |
| Lenovo Legion 7 16ARHA7 | |
| Acer Swift Go SFG16-71 | |
| Lenovo IdeaPad Gaming 3 15IAH7 | |
| HP Omen 16-n0033dx | |
| HP Spectre x360 2-in-1 16-f1075ng | |
| Lenovo IdeaPad Flex 5 16ABR G8 | |
| Samsung Galaxy Book3 Pro 16 | |
| Lenovo Yoga 7 16IRL8 | |
| Acer Swift Edge SFE16-42-R1GM | |
| Dell Inspiron 16 7620 2-in-1 | |
| Lenovo IdeaPad 5 Pro 16ARH7 | |
| Dell Inspiron 16 7635 2-in-1 | |
| Przeciętny AMD Ryzen 5 7530U (1101 - 1599, n=9) | |
| Lenovo Ideapad Gaming 3 15IHU-82K1002RGE | |
| Acer Aspire Nitro 5 AN515-55-57GF | |
| Cinebench R15 / CPU Single 64Bit | |
| Lenovo Legion Pro 5 16ARX8 | |
| Framework Laptop 13.5 13th Gen Intel | |
| HP Spectre x360 2-in-1 16-f1075ng | |
| Acer Swift Go SFG16-71 | |
| Lenovo Yoga 7 16IRL8 | |
| Lenovo Legion 7 16ARHA7 | |
| Lenovo IdeaPad Gaming 3 15IAH7 | |
| HP Omen 16-n0033dx | |
| Dell Inspiron 16 7620 2-in-1 | |
| Samsung Galaxy Book3 Pro 16 | |
| Lenovo IdeaPad 5 Pro 16ARH7 | |
| Acer Swift Edge SFE16-42-R1GM | |
| Dell Inspiron 16 7635 2-in-1 | |
| Przeciętny AMD Ryzen 5 7530U (213 - 237, n=9) | |
| Lenovo IdeaPad Flex 5 16ABR G8 | |
| Lenovo Ideapad Gaming 3 15IHU-82K1002RGE | |
| Acer Aspire Nitro 5 AN515-55-57GF | |
| Blender / v2.79 BMW27 CPU | |
| Acer Aspire Nitro 5 AN515-55-57GF | |
| Lenovo Ideapad Gaming 3 15IHU-82K1002RGE | |
| Przeciętny AMD Ryzen 5 7530U (330 - 469, n=8) | |
| Dell Inspiron 16 7635 2-in-1 | |
| Lenovo Yoga 7 16IRL8 | |
| Dell Inspiron 16 7620 2-in-1 | |
| Lenovo IdeaPad 5 Pro 16ARH7 | |
| Acer Swift Edge SFE16-42-R1GM | |
| Samsung Galaxy Book3 Pro 16 | |
| Lenovo IdeaPad Flex 5 16ABR G8 | |
| HP Spectre x360 2-in-1 16-f1075ng | |
| Acer Swift Go SFG16-71 | |
| Framework Laptop 13.5 13th Gen Intel | |
| HP Omen 16-n0033dx | |
| Lenovo IdeaPad Gaming 3 15IAH7 | |
| Lenovo Legion 7 16ARHA7 | |
| Lenovo Legion Pro 5 16ARX8 | |
| 7-Zip 18.03 / 7z b 4 | |
| Lenovo Legion Pro 5 16ARX8 | |
| Lenovo Legion 7 16ARHA7 | |
| HP Omen 16-n0033dx | |
| Framework Laptop 13.5 13th Gen Intel | |
| Acer Swift Go SFG16-71 | |
| Lenovo IdeaPad Flex 5 16ABR G8 | |
| Acer Swift Edge SFE16-42-R1GM | |
| HP Spectre x360 2-in-1 16-f1075ng | |
| Samsung Galaxy Book3 Pro 16 | |
| Lenovo IdeaPad 5 Pro 16ARH7 | |
| Lenovo IdeaPad Gaming 3 15IAH7 | |
| Lenovo Yoga 7 16IRL8 | |
| Dell Inspiron 16 7635 2-in-1 | |
| Przeciętny AMD Ryzen 5 7530U (32204 - 42364, n=8) | |
| Dell Inspiron 16 7620 2-in-1 | |
| Acer Aspire Nitro 5 AN515-55-57GF | |
| Lenovo Ideapad Gaming 3 15IHU-82K1002RGE | |
| 7-Zip 18.03 / 7z b 4 -mmt1 | |
| Lenovo Legion Pro 5 16ARX8 | |
| Framework Laptop 13.5 13th Gen Intel | |
| Acer Swift Go SFG16-71 | |
| HP Spectre x360 2-in-1 16-f1075ng | |
| Lenovo Legion 7 16ARHA7 | |
| HP Omen 16-n0033dx | |
| Lenovo Yoga 7 16IRL8 | |
| Acer Swift Edge SFE16-42-R1GM | |
| Lenovo IdeaPad Gaming 3 15IAH7 | |
| Dell Inspiron 16 7620 2-in-1 | |
| Przeciętny AMD Ryzen 5 7530U (5113 - 5544, n=8) | |
| Lenovo IdeaPad Flex 5 16ABR G8 | |
| Lenovo IdeaPad 5 Pro 16ARH7 | |
| Samsung Galaxy Book3 Pro 16 | |
| Dell Inspiron 16 7635 2-in-1 | |
| Acer Aspire Nitro 5 AN515-55-57GF | |
| Lenovo Ideapad Gaming 3 15IHU-82K1002RGE | |
| Geekbench 5.5 / Multi-Core | |
| Lenovo Legion Pro 5 16ARX8 | |
| Acer Swift Go SFG16-71 | |
| Framework Laptop 13.5 13th Gen Intel | |
| Samsung Galaxy Book3 Pro 16 | |
| Lenovo Legion 7 16ARHA7 | |
| HP Omen 16-n0033dx | |
| Lenovo Yoga 7 16IRL8 | |
| HP Spectre x360 2-in-1 16-f1075ng | |
| Acer Swift Edge SFE16-42-R1GM | |
| Lenovo IdeaPad Gaming 3 15IAH7 | |
| Lenovo IdeaPad Flex 5 16ABR G8 | |
| Dell Inspiron 16 7620 2-in-1 | |
| Lenovo IdeaPad 5 Pro 16ARH7 | |
| Dell Inspiron 16 7635 2-in-1 | |
| Przeciętny AMD Ryzen 5 7530U (5475 - 6648, n=8) | |
| Acer Aspire Nitro 5 AN515-55-57GF | |
| Lenovo Ideapad Gaming 3 15IHU-82K1002RGE | |
| Geekbench 5.5 / Single-Core | |
| Lenovo Legion Pro 5 16ARX8 | |
| Framework Laptop 13.5 13th Gen Intel | |
| Acer Swift Go SFG16-71 | |
| HP Spectre x360 2-in-1 16-f1075ng | |
| Lenovo Yoga 7 16IRL8 | |
| Samsung Galaxy Book3 Pro 16 | |
| Dell Inspiron 16 7620 2-in-1 | |
| Lenovo IdeaPad Gaming 3 15IAH7 | |
| Lenovo Legion 7 16ARHA7 | |
| HP Omen 16-n0033dx | |
| Acer Swift Edge SFE16-42-R1GM | |
| Lenovo IdeaPad 5 Pro 16ARH7 | |
| Dell Inspiron 16 7635 2-in-1 | |
| Przeciętny AMD Ryzen 5 7530U (1393 - 1512, n=8) | |
| Lenovo IdeaPad Flex 5 16ABR G8 | |
| Lenovo Ideapad Gaming 3 15IHU-82K1002RGE | |
| Acer Aspire Nitro 5 AN515-55-57GF | |
| HWBOT x265 Benchmark v2.2 / 4k Preset | |
| Lenovo Legion Pro 5 16ARX8 | |
| Lenovo Legion 7 16ARHA7 | |
| HP Omen 16-n0033dx | |
| Acer Swift Go SFG16-71 | |
| Lenovo IdeaPad Gaming 3 15IAH7 | |
| Framework Laptop 13.5 13th Gen Intel | |
| HP Spectre x360 2-in-1 16-f1075ng | |
| Samsung Galaxy Book3 Pro 16 | |
| Acer Swift Edge SFE16-42-R1GM | |
| Lenovo IdeaPad Flex 5 16ABR G8 | |
| Lenovo IdeaPad 5 Pro 16ARH7 | |
| Dell Inspiron 16 7620 2-in-1 | |
| Dell Inspiron 16 7635 2-in-1 | |
| Lenovo Yoga 7 16IRL8 | |
| Przeciętny AMD Ryzen 5 7530U (8.17 - 11.6, n=8) | |
| Lenovo Ideapad Gaming 3 15IHU-82K1002RGE | |
| Acer Aspire Nitro 5 AN515-55-57GF | |
| LibreOffice / 20 Documents To PDF | |
| Lenovo IdeaPad 5 Pro 16ARH7 | |
| Acer Aspire Nitro 5 AN515-55-57GF | |
| Acer Swift Edge SFE16-42-R1GM | |
| HP Omen 16-n0033dx | |
| Lenovo Legion 7 16ARHA7 | |
| Lenovo Ideapad Gaming 3 15IHU-82K1002RGE | |
| Przeciętny AMD Ryzen 5 7530U (44.6 - 58.9, n=8) | |
| Lenovo IdeaPad Flex 5 16ABR G8 | |
| Dell Inspiron 16 7635 2-in-1 | |
| Dell Inspiron 16 7620 2-in-1 | |
| Lenovo IdeaPad Gaming 3 15IAH7 | |
| Lenovo Yoga 7 16IRL8 | |
| HP Spectre x360 2-in-1 16-f1075ng | |
| Samsung Galaxy Book3 Pro 16 | |
| Acer Swift Go SFG16-71 | |
| Framework Laptop 13.5 13th Gen Intel | |
| Lenovo Legion Pro 5 16ARX8 | |
| R Benchmark 2.5 / Overall mean | |
| Acer Aspire Nitro 5 AN515-55-57GF | |
| Lenovo Ideapad Gaming 3 15IHU-82K1002RGE | |
| Lenovo IdeaPad Flex 5 16ABR G8 | |
| Przeciętny AMD Ryzen 5 7530U (0.515 - 0.567, n=8) | |
| Lenovo IdeaPad 5 Pro 16ARH7 | |
| Dell Inspiron 16 7635 2-in-1 | |
| Acer Swift Edge SFE16-42-R1GM | |
| Lenovo IdeaPad Gaming 3 15IAH7 | |
| Samsung Galaxy Book3 Pro 16 | |
| Dell Inspiron 16 7620 2-in-1 | |
| HP Omen 16-n0033dx | |
| Lenovo Legion 7 16ARHA7 | |
| HP Spectre x360 2-in-1 16-f1075ng | |
| Lenovo Yoga 7 16IRL8 | |
| Acer Swift Go SFG16-71 | |
| Framework Laptop 13.5 13th Gen Intel | |
| Lenovo Legion Pro 5 16ARX8 | |
Cinebench R23: Multi Core | Single Core
Cinebench R20: CPU (Multi Core) | CPU (Single Core)
Cinebench R15: CPU Multi 64Bit | CPU Single 64Bit
Blender: v2.79 BMW27 CPU
7-Zip 18.03: 7z b 4 | 7z b 4 -mmt1
Geekbench 5.5: Multi-Core | Single-Core
HWBOT x265 Benchmark v2.2: 4k Preset
LibreOffice : 20 Documents To PDF
R Benchmark 2.5: Overall mean
* ... im mniej tym lepiej
AIDA64: FP32 Ray-Trace | FPU Julia | CPU SHA3 | CPU Queen | FPU SinJulia | FPU Mandel | CPU AES | CPU ZLib | FP64 Ray-Trace | CPU PhotoWorxx
| Performance rating | |
| Acer Swift Edge SFE16-42-R1GM | |
| Lenovo IdeaPad Flex 5 16ABR G8 | |
| Samsung Galaxy Book3 Pro 16 | |
| Dell Inspiron 16 7635 2-in-1 | |
| Przeciętny AMD Ryzen 5 7530U | |
| Lenovo Yoga 7 16IRL8 | |
| Dell Inspiron 16 7620 2-in-1 | |
| AIDA64 / FP32 Ray-Trace | |
| Lenovo IdeaPad Flex 5 16ABR G8 | |
| Acer Swift Edge SFE16-42-R1GM | |
| Dell Inspiron 16 7635 2-in-1 | |
| Przeciętny AMD Ryzen 5 7530U (7609 - 10970, n=9) | |
| Samsung Galaxy Book3 Pro 16 | |
| Lenovo Yoga 7 16IRL8 | |
| Dell Inspiron 16 7620 2-in-1 | |
| AIDA64 / FPU Julia | |
| Lenovo IdeaPad Flex 5 16ABR G8 | |
| Acer Swift Edge SFE16-42-R1GM | |
| Dell Inspiron 16 7635 2-in-1 | |
| Przeciętny AMD Ryzen 5 7530U (48473 - 68384, n=9) | |
| Samsung Galaxy Book3 Pro 16 | |
| Lenovo Yoga 7 16IRL8 | |
| Dell Inspiron 16 7620 2-in-1 | |
| AIDA64 / CPU SHA3 | |
| Samsung Galaxy Book3 Pro 16 | |
| Lenovo IdeaPad Flex 5 16ABR G8 | |
| Acer Swift Edge SFE16-42-R1GM | |
| Lenovo Yoga 7 16IRL8 | |
| Dell Inspiron 16 7635 2-in-1 | |
| Przeciętny AMD Ryzen 5 7530U (1591 - 2323, n=9) | |
| Dell Inspiron 16 7620 2-in-1 | |
| AIDA64 / CPU Queen | |
| Lenovo IdeaPad Flex 5 16ABR G8 | |
| Acer Swift Edge SFE16-42-R1GM | |
| Samsung Galaxy Book3 Pro 16 | |
| Dell Inspiron 16 7620 2-in-1 | |
| Dell Inspiron 16 7635 2-in-1 | |
| Przeciętny AMD Ryzen 5 7530U (66646 - 78105, n=8) | |
| Lenovo Yoga 7 16IRL8 | |
| AIDA64 / FPU SinJulia | |
| Acer Swift Edge SFE16-42-R1GM | |
| Lenovo IdeaPad Flex 5 16ABR G8 | |
| Dell Inspiron 16 7635 2-in-1 | |
| Przeciętny AMD Ryzen 5 7530U (7611 - 9248, n=9) | |
| Samsung Galaxy Book3 Pro 16 | |
| Dell Inspiron 16 7620 2-in-1 | |
| Lenovo Yoga 7 16IRL8 | |
| AIDA64 / FPU Mandel | |
| Lenovo IdeaPad Flex 5 16ABR G8 | |
| Acer Swift Edge SFE16-42-R1GM | |
| Dell Inspiron 16 7635 2-in-1 | |
| Przeciętny AMD Ryzen 5 7530U (26912 - 37624, n=9) | |
| Samsung Galaxy Book3 Pro 16 | |
| Lenovo Yoga 7 16IRL8 | |
| Dell Inspiron 16 7620 2-in-1 | |
| AIDA64 / CPU AES | |
| Samsung Galaxy Book3 Pro 16 | |
| Przeciętny AMD Ryzen 5 7530U (33314 - 92360, n=9) | |
| Lenovo Yoga 7 16IRL8 | |
| Lenovo IdeaPad Flex 5 16ABR G8 | |
| Acer Swift Edge SFE16-42-R1GM | |
| Dell Inspiron 16 7620 2-in-1 | |
| Dell Inspiron 16 7635 2-in-1 | |
| AIDA64 / CPU ZLib | |
| Samsung Galaxy Book3 Pro 16 | |
| Lenovo Yoga 7 16IRL8 | |
| Acer Swift Edge SFE16-42-R1GM | |
| Lenovo IdeaPad Flex 5 16ABR G8 | |
| Dell Inspiron 16 7620 2-in-1 | |
| Dell Inspiron 16 7635 2-in-1 | |
| Przeciętny AMD Ryzen 5 7530U (443 - 612, n=9) | |
| AIDA64 / FP64 Ray-Trace | |
| Lenovo IdeaPad Flex 5 16ABR G8 | |
| Acer Swift Edge SFE16-42-R1GM | |
| Dell Inspiron 16 7635 2-in-1 | |
| Przeciętny AMD Ryzen 5 7530U (4008 - 5738, n=9) | |
| Samsung Galaxy Book3 Pro 16 | |
| Lenovo Yoga 7 16IRL8 | |
| Dell Inspiron 16 7620 2-in-1 | |
| AIDA64 / CPU PhotoWorxx | |
| Samsung Galaxy Book3 Pro 16 | |
| Lenovo Yoga 7 16IRL8 | |
| Acer Swift Edge SFE16-42-R1GM | |
| Dell Inspiron 16 7635 2-in-1 | |
| Lenovo IdeaPad Flex 5 16ABR G8 | |
| Dell Inspiron 16 7620 2-in-1 | |
| Przeciętny AMD Ryzen 5 7530U (9832 - 19525, n=9) | |
Wydajność systemu
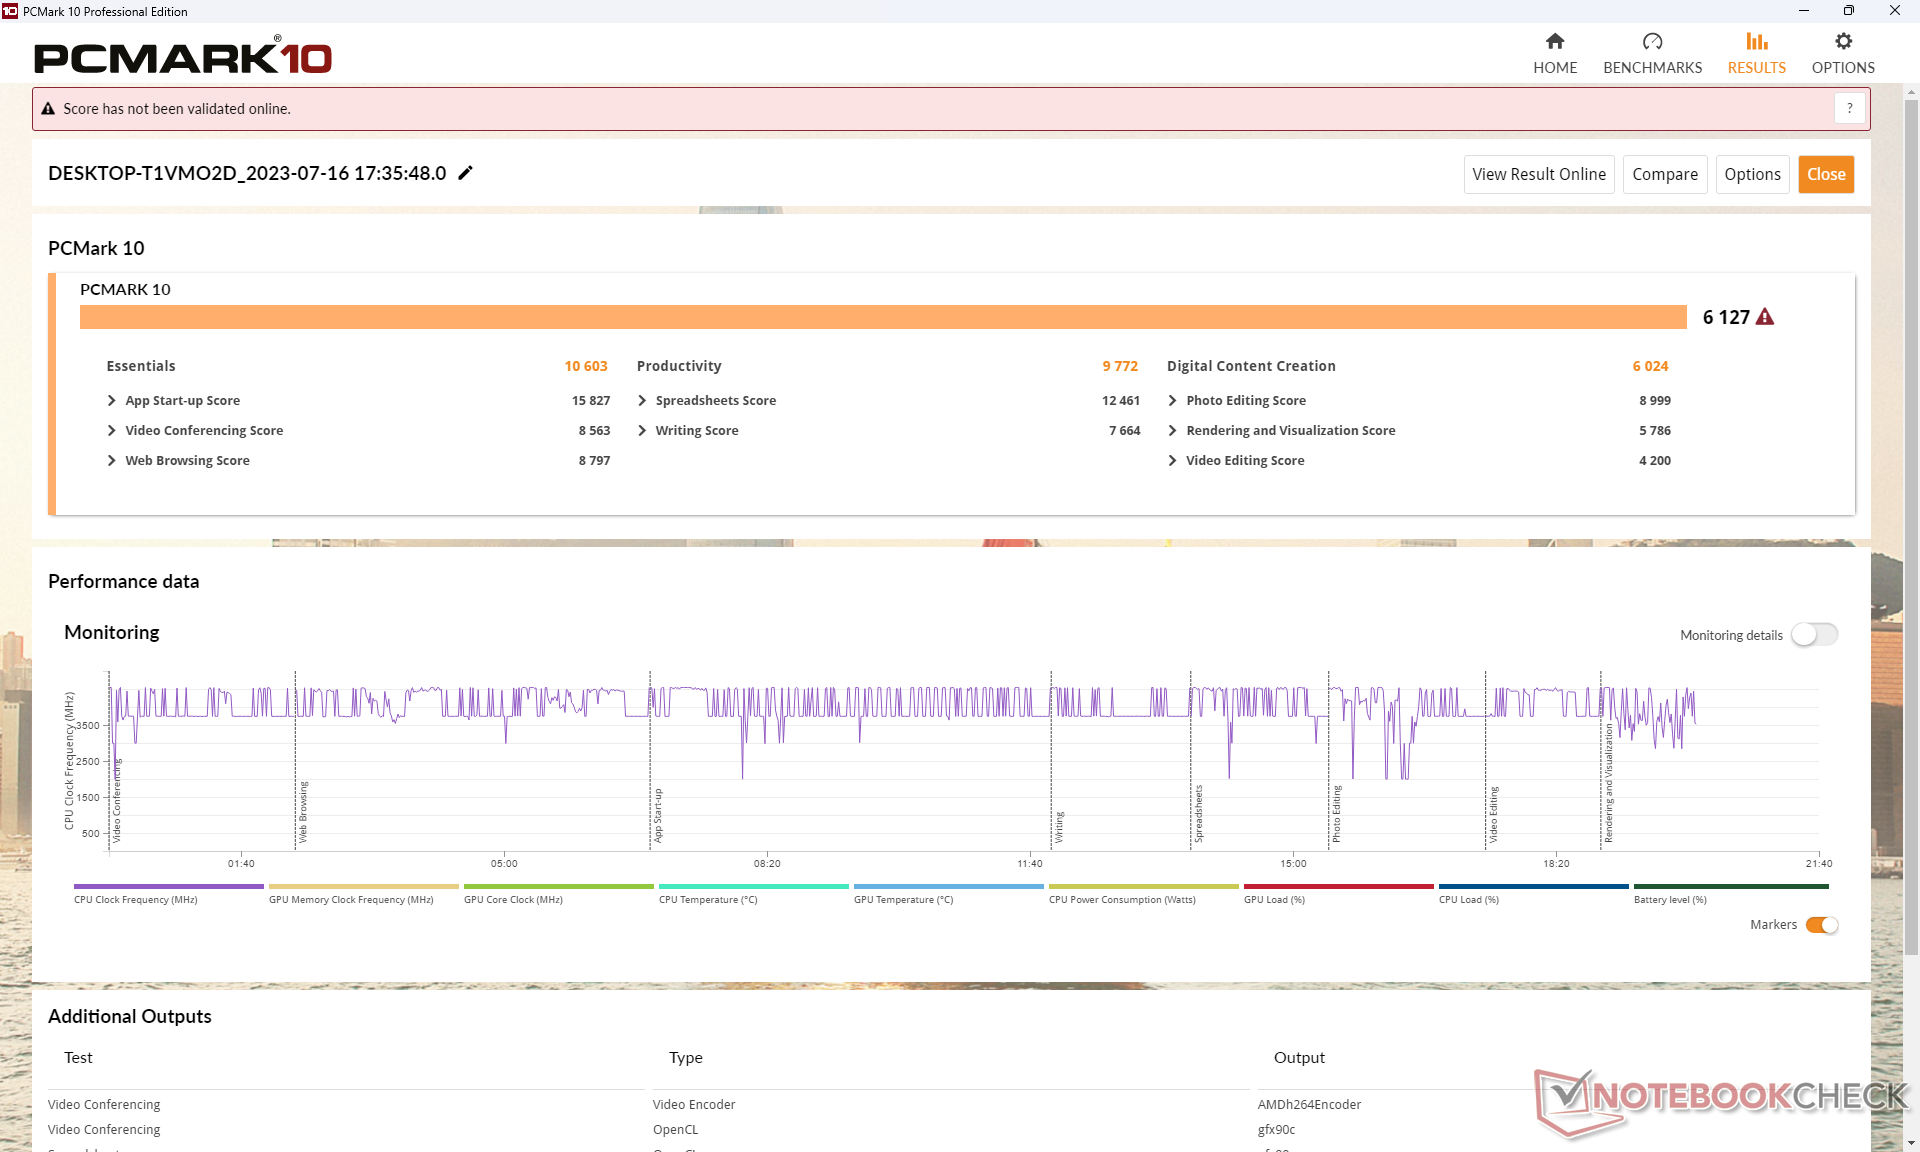
Wyniki PCMark są porównywalne z alternatywami działającymi na procesorach Core-U, a nawet Core-P, takimi jak Samsung Galaxy Book3 Pro 16 lub zeszłoroczny Dell Inspiron 16 7620 2-w-1. Co ciekawe, podtest produktywności faworyzuje nasz system Dell z większym marginesem.
CrossMark: Overall | Productivity | Creativity | Responsiveness
| PCMark 10 / Score | |
| Lenovo IdeaPad Flex 5 16ABR G8 | |
| Acer Swift Edge SFE16-42-R1GM | |
| Dell Inspiron 16 7635 2-in-1 | |
| Przeciętny AMD Ryzen 5 7530U, AMD Radeon RX Vega 7 (5686 - 6209, n=8) | |
| Lenovo Yoga 7 16IRL8 | |
| Samsung Galaxy Book3 Pro 16 | |
| Dell Inspiron 16 7620 2-in-1 | |
| PCMark 10 / Essentials | |
| Lenovo Yoga 7 16IRL8 | |
| Lenovo IdeaPad Flex 5 16ABR G8 | |
| Dell Inspiron 16 7635 2-in-1 | |
| Samsung Galaxy Book3 Pro 16 | |
| Przeciętny AMD Ryzen 5 7530U, AMD Radeon RX Vega 7 (9183 - 11242, n=8) | |
| Dell Inspiron 16 7620 2-in-1 | |
| Acer Swift Edge SFE16-42-R1GM | |
| PCMark 10 / Productivity | |
| Przeciętny AMD Ryzen 5 7530U, AMD Radeon RX Vega 7 (8983 - 14037, n=8) | |
| Dell Inspiron 16 7635 2-in-1 | |
| Lenovo IdeaPad Flex 5 16ABR G8 | |
| Acer Swift Edge SFE16-42-R1GM | |
| Lenovo Yoga 7 16IRL8 | |
| Samsung Galaxy Book3 Pro 16 | |
| Dell Inspiron 16 7620 2-in-1 | |
| PCMark 10 / Digital Content Creation | |
| Acer Swift Edge SFE16-42-R1GM | |
| Lenovo Yoga 7 16IRL8 | |
| Samsung Galaxy Book3 Pro 16 | |
| Lenovo IdeaPad Flex 5 16ABR G8 | |
| Dell Inspiron 16 7635 2-in-1 | |
| Dell Inspiron 16 7620 2-in-1 | |
| Przeciętny AMD Ryzen 5 7530U, AMD Radeon RX Vega 7 (4941 - 6093, n=8) | |
| CrossMark / Overall | |
| Lenovo Yoga 7 16IRL8 | |
| Samsung Galaxy Book3 Pro 16 | |
| Dell Inspiron 16 7620 2-in-1 | |
| Acer Swift Edge SFE16-42-R1GM | |
| Lenovo IdeaPad Flex 5 16ABR G8 | |
| Przeciętny AMD Ryzen 5 7530U, AMD Radeon RX Vega 7 (1029 - 1336, n=7) | |
| Dell Inspiron 16 7635 2-in-1 | |
| CrossMark / Productivity | |
| Lenovo Yoga 7 16IRL8 | |
| Samsung Galaxy Book3 Pro 16 | |
| Dell Inspiron 16 7620 2-in-1 | |
| Acer Swift Edge SFE16-42-R1GM | |
| Lenovo IdeaPad Flex 5 16ABR G8 | |
| Przeciętny AMD Ryzen 5 7530U, AMD Radeon RX Vega 7 (1115 - 1370, n=7) | |
| Dell Inspiron 16 7635 2-in-1 | |
| CrossMark / Creativity | |
| Lenovo Yoga 7 16IRL8 | |
| Samsung Galaxy Book3 Pro 16 | |
| Dell Inspiron 16 7620 2-in-1 | |
| Lenovo IdeaPad Flex 5 16ABR G8 | |
| Acer Swift Edge SFE16-42-R1GM | |
| Dell Inspiron 16 7635 2-in-1 | |
| Przeciętny AMD Ryzen 5 7530U, AMD Radeon RX Vega 7 (992 - 1390, n=7) | |
| CrossMark / Responsiveness | |
| Samsung Galaxy Book3 Pro 16 | |
| Lenovo Yoga 7 16IRL8 | |
| Dell Inspiron 16 7620 2-in-1 | |
| Acer Swift Edge SFE16-42-R1GM | |
| Przeciętny AMD Ryzen 5 7530U, AMD Radeon RX Vega 7 (900 - 1096, n=7) | |
| Lenovo IdeaPad Flex 5 16ABR G8 | |
| Dell Inspiron 16 7635 2-in-1 | |
| PCMark 10 Score | 6127 pkt. | |
Pomoc | ||
| AIDA64 / Memory Copy | |
| Samsung Galaxy Book3 Pro 16 | |
| Lenovo Yoga 7 16IRL8 | |
| Acer Swift Edge SFE16-42-R1GM | |
| Dell Inspiron 16 7635 2-in-1 | |
| Lenovo IdeaPad Flex 5 16ABR G8 | |
| Dell Inspiron 16 7620 2-in-1 | |
| Przeciętny AMD Ryzen 5 7530U (20155 - 42853, n=9) | |
| AIDA64 / Memory Read | |
| Samsung Galaxy Book3 Pro 16 | |
| Lenovo Yoga 7 16IRL8 | |
| Acer Swift Edge SFE16-42-R1GM | |
| Dell Inspiron 16 7620 2-in-1 | |
| Dell Inspiron 16 7635 2-in-1 | |
| Lenovo IdeaPad Flex 5 16ABR G8 | |
| Przeciętny AMD Ryzen 5 7530U (23068 - 40270, n=9) | |
| AIDA64 / Memory Write | |
| Samsung Galaxy Book3 Pro 16 | |
| Lenovo Yoga 7 16IRL8 | |
| Acer Swift Edge SFE16-42-R1GM | |
| Dell Inspiron 16 7620 2-in-1 | |
| Dell Inspiron 16 7635 2-in-1 | |
| Lenovo IdeaPad Flex 5 16ABR G8 | |
| Przeciętny AMD Ryzen 5 7530U (22954 - 41838, n=9) | |
| AIDA64 / Memory Latency | |
| Lenovo IdeaPad Flex 5 16ABR G8 | |
| Dell Inspiron 16 7635 2-in-1 | |
| Acer Swift Edge SFE16-42-R1GM | |
| Przeciętny AMD Ryzen 5 7530U (88.1 - 110.8, n=9) | |
| Lenovo Yoga 7 16IRL8 | |
| Samsung Galaxy Book3 Pro 16 | |
* ... im mniej tym lepiej
Opóźnienie DPC
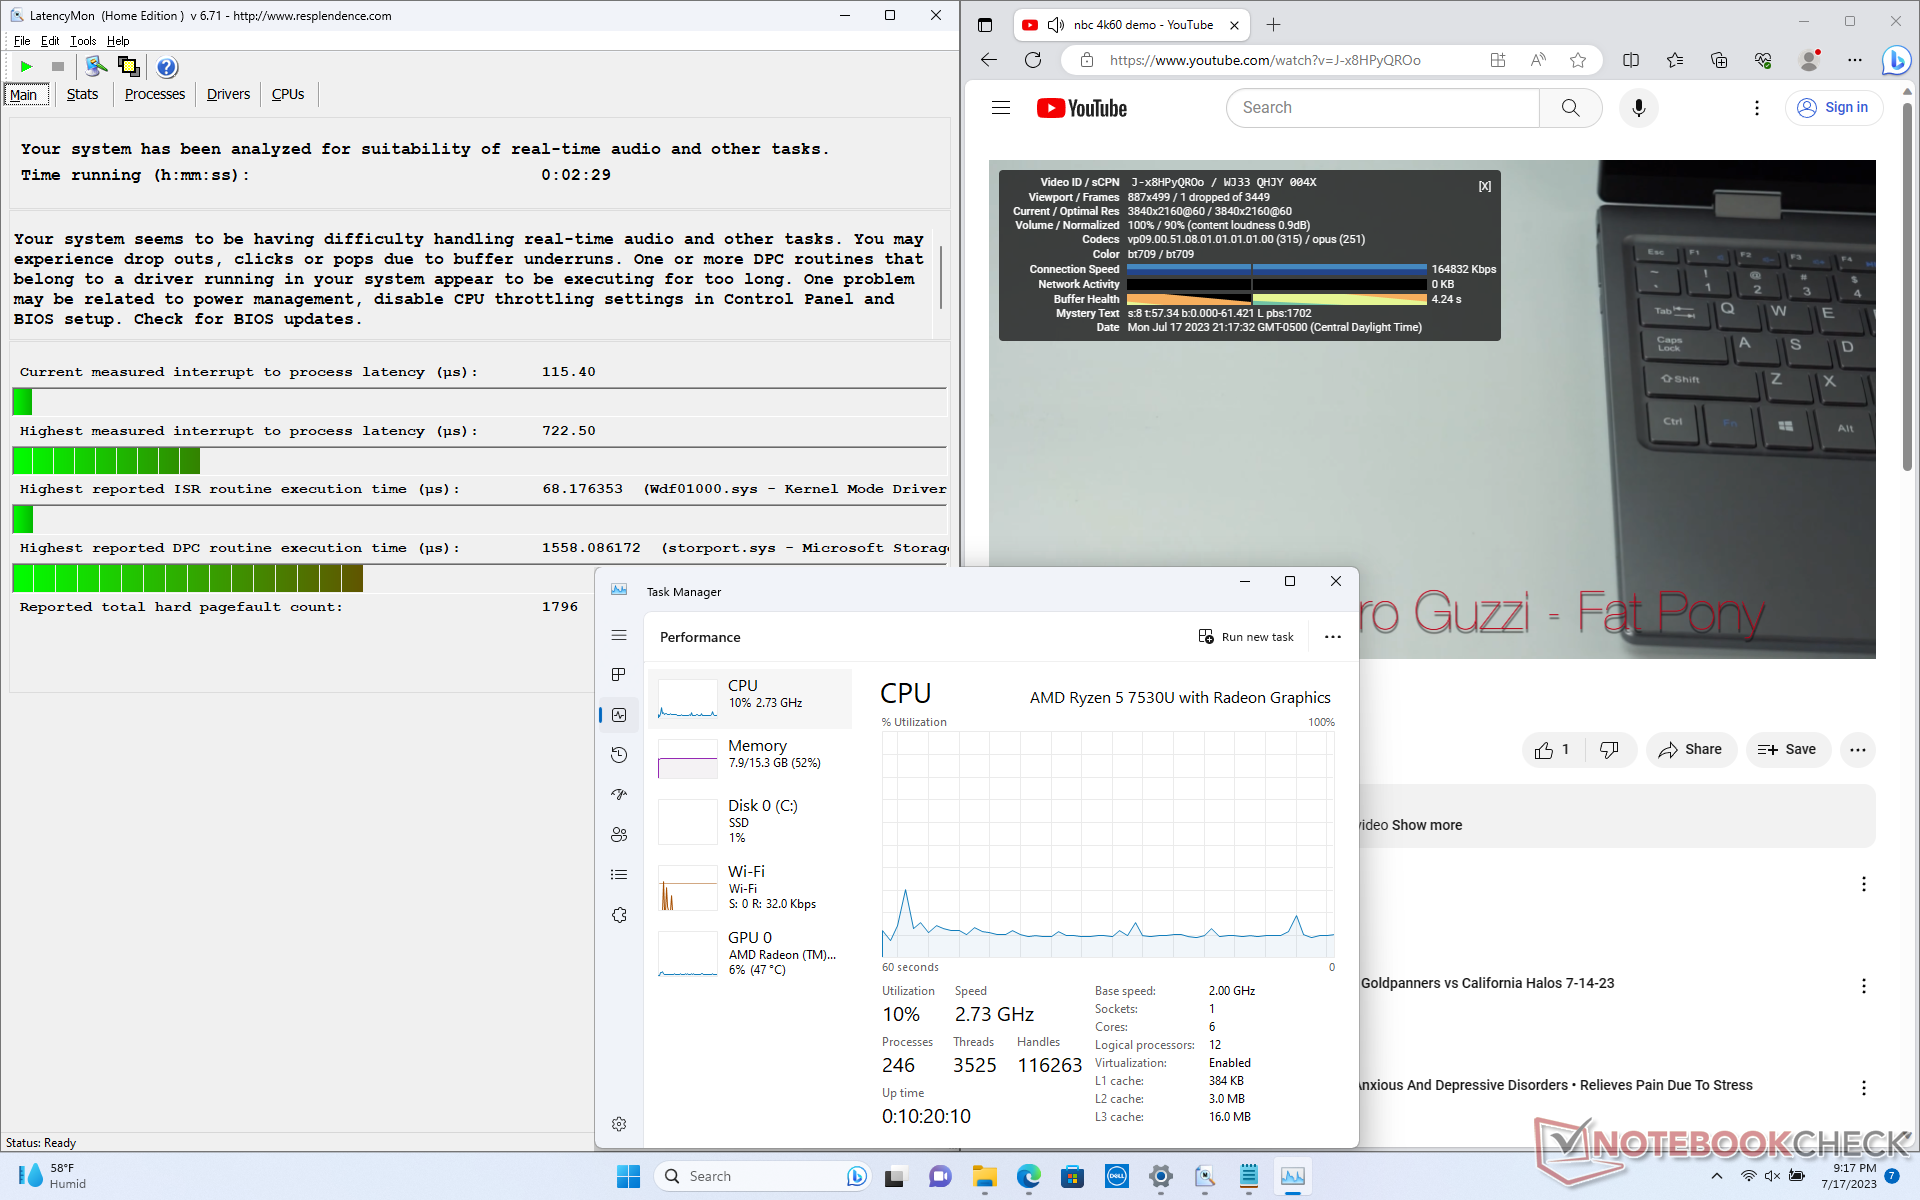
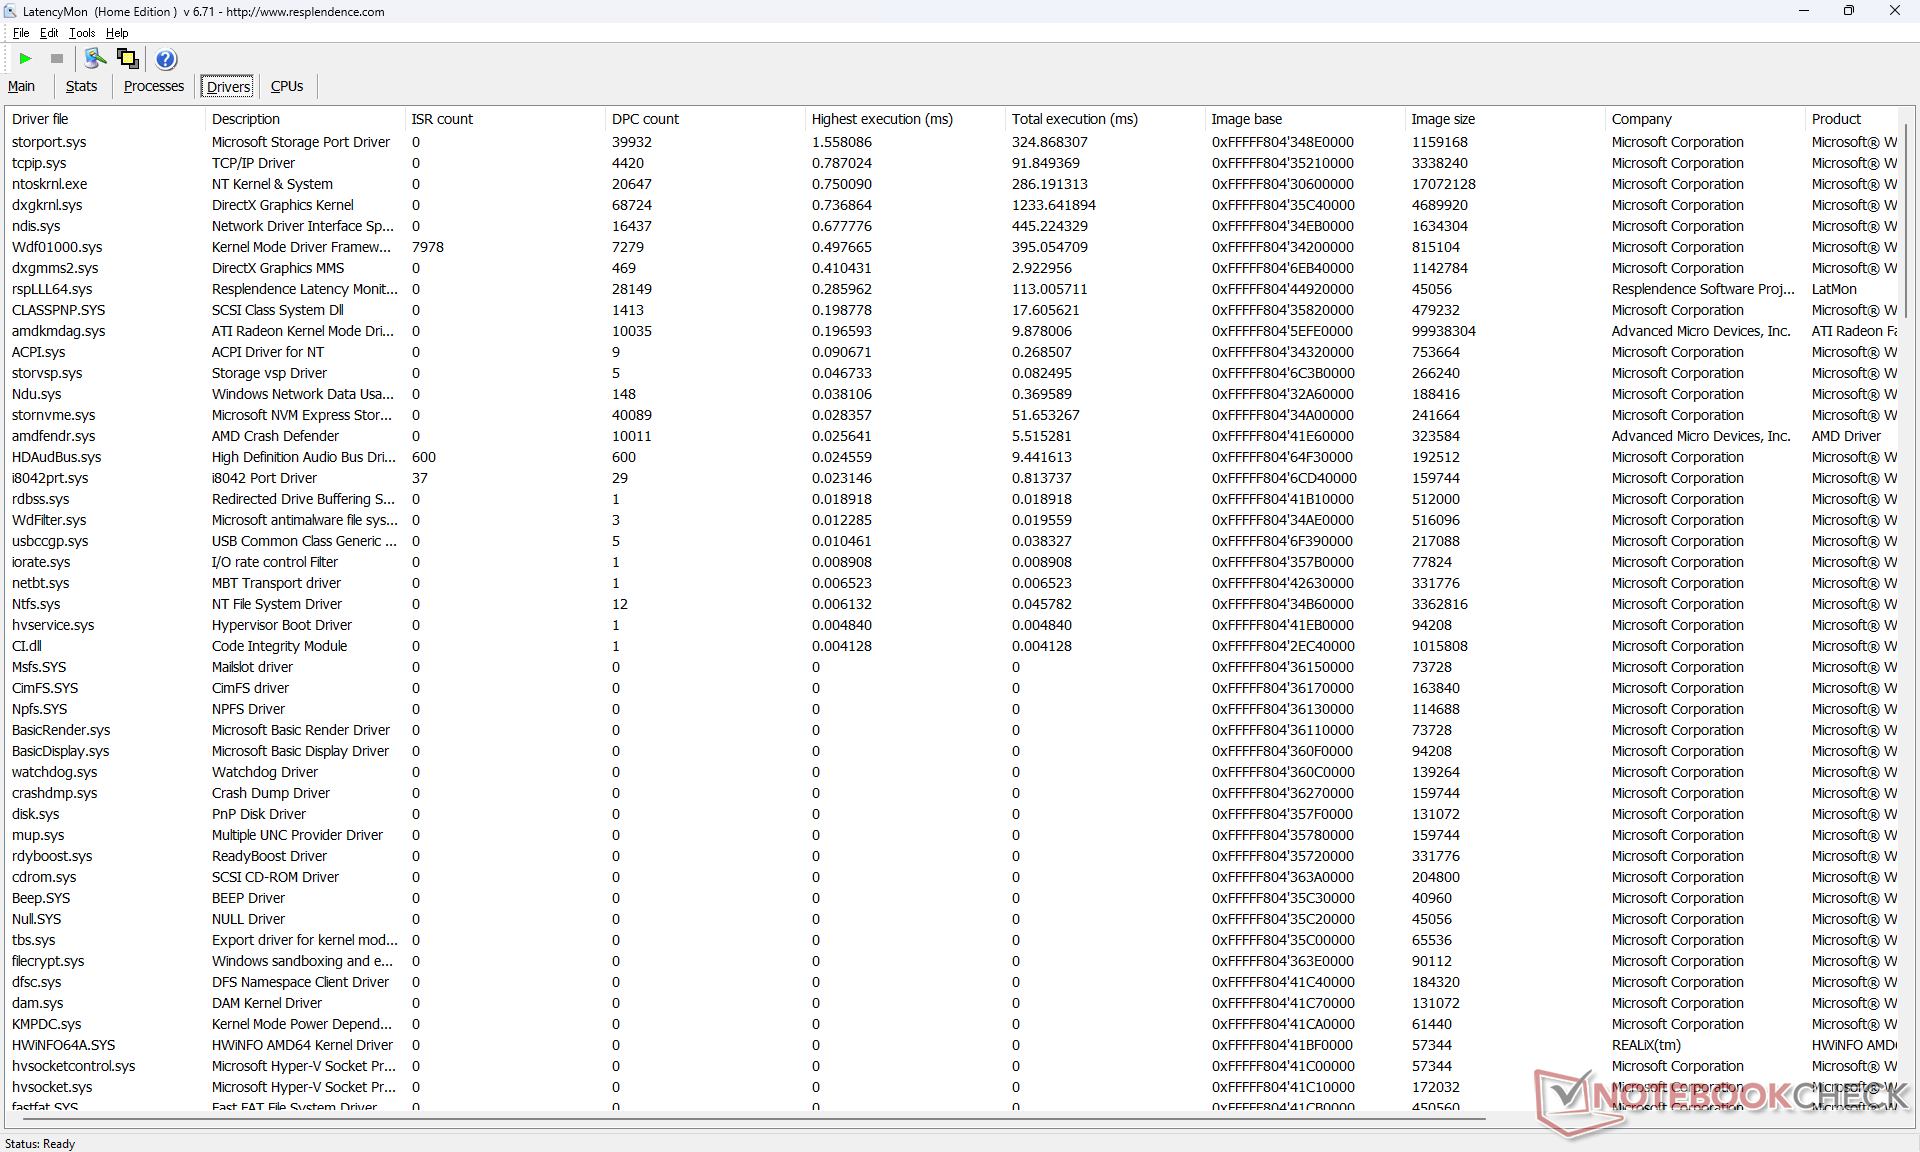
LatencyMon zgłasza tylko niewielkie problemy z DPC podczas otwierania wielu kart na naszej stronie głównej. odtwarzanie wideo 4K przy 60 FPS jest poza tym doskonałe, z tylko jedną spadającą klatką zarejestrowaną podczas naszego minutowego filmu testowego.
| DPC Latencies / LatencyMon - interrupt to process latency (max), Web, Youtube, Prime95 | |
| Acer Swift Edge SFE16-42-R1GM | |
| Lenovo IdeaPad Flex 5 16ABR G8 | |
| Lenovo Yoga 7 16IRL8 | |
| Dell Inspiron 16 7635 2-in-1 | |
| Dell Inspiron 16 7620 2-in-1 | |
| Samsung Galaxy Book3 Pro 16 | |
* ... im mniej tym lepiej
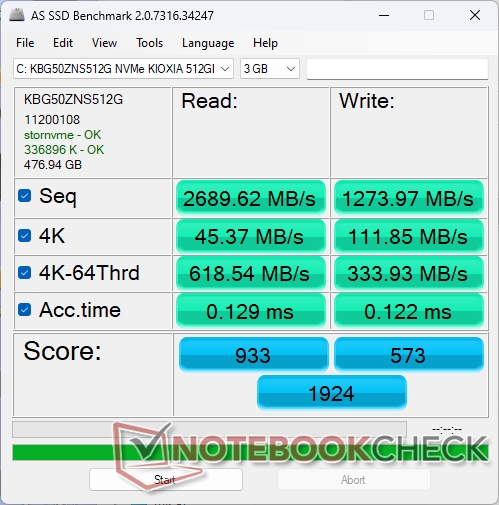
Urządzenia pamięci masowej
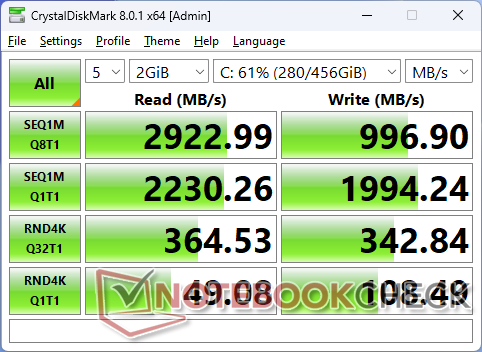
Nasza jednostka testowa jest dostarczana z budżetowym Kioxia KBG50ZNS512G PCIe4 x4 NVMe SSD, który według producenta oferuje maksymalne prędkości sekwencyjnego odczytu i zapisu na poziomie odpowiednio 3500 MB/s i 2700 MB/s. W naszych testach obciążeniowych byliśmy jednak w stanie osiągnąć tylko nieco ponad 2200 MB/s, nawet po wielu ponownych testach, co sugeruje, że dysk może mieć problemy z utrzymaniem maksymalnych prędkości transferu przez dłuższy czas. Niemniej jednak, nie stanowi to problemu w przypadku większości scenariuszy multimedialnych i codziennych obciążeń przeglądarki.

| Drive Performance rating - Percent | |
| Acer Swift Edge SFE16-42-R1GM | |
| Lenovo Yoga 7 16IRL8 | |
| Samsung Galaxy Book3 Pro 16 | |
| Lenovo IdeaPad Flex 5 16ABR G8 | |
| Dell Inspiron 16 7635 2-in-1 | |
| Dell Inspiron 16 7620 2-in-1 | |
* ... im mniej tym lepiej
Disk Throttling: DiskSpd Read Loop, Queue Depth 8
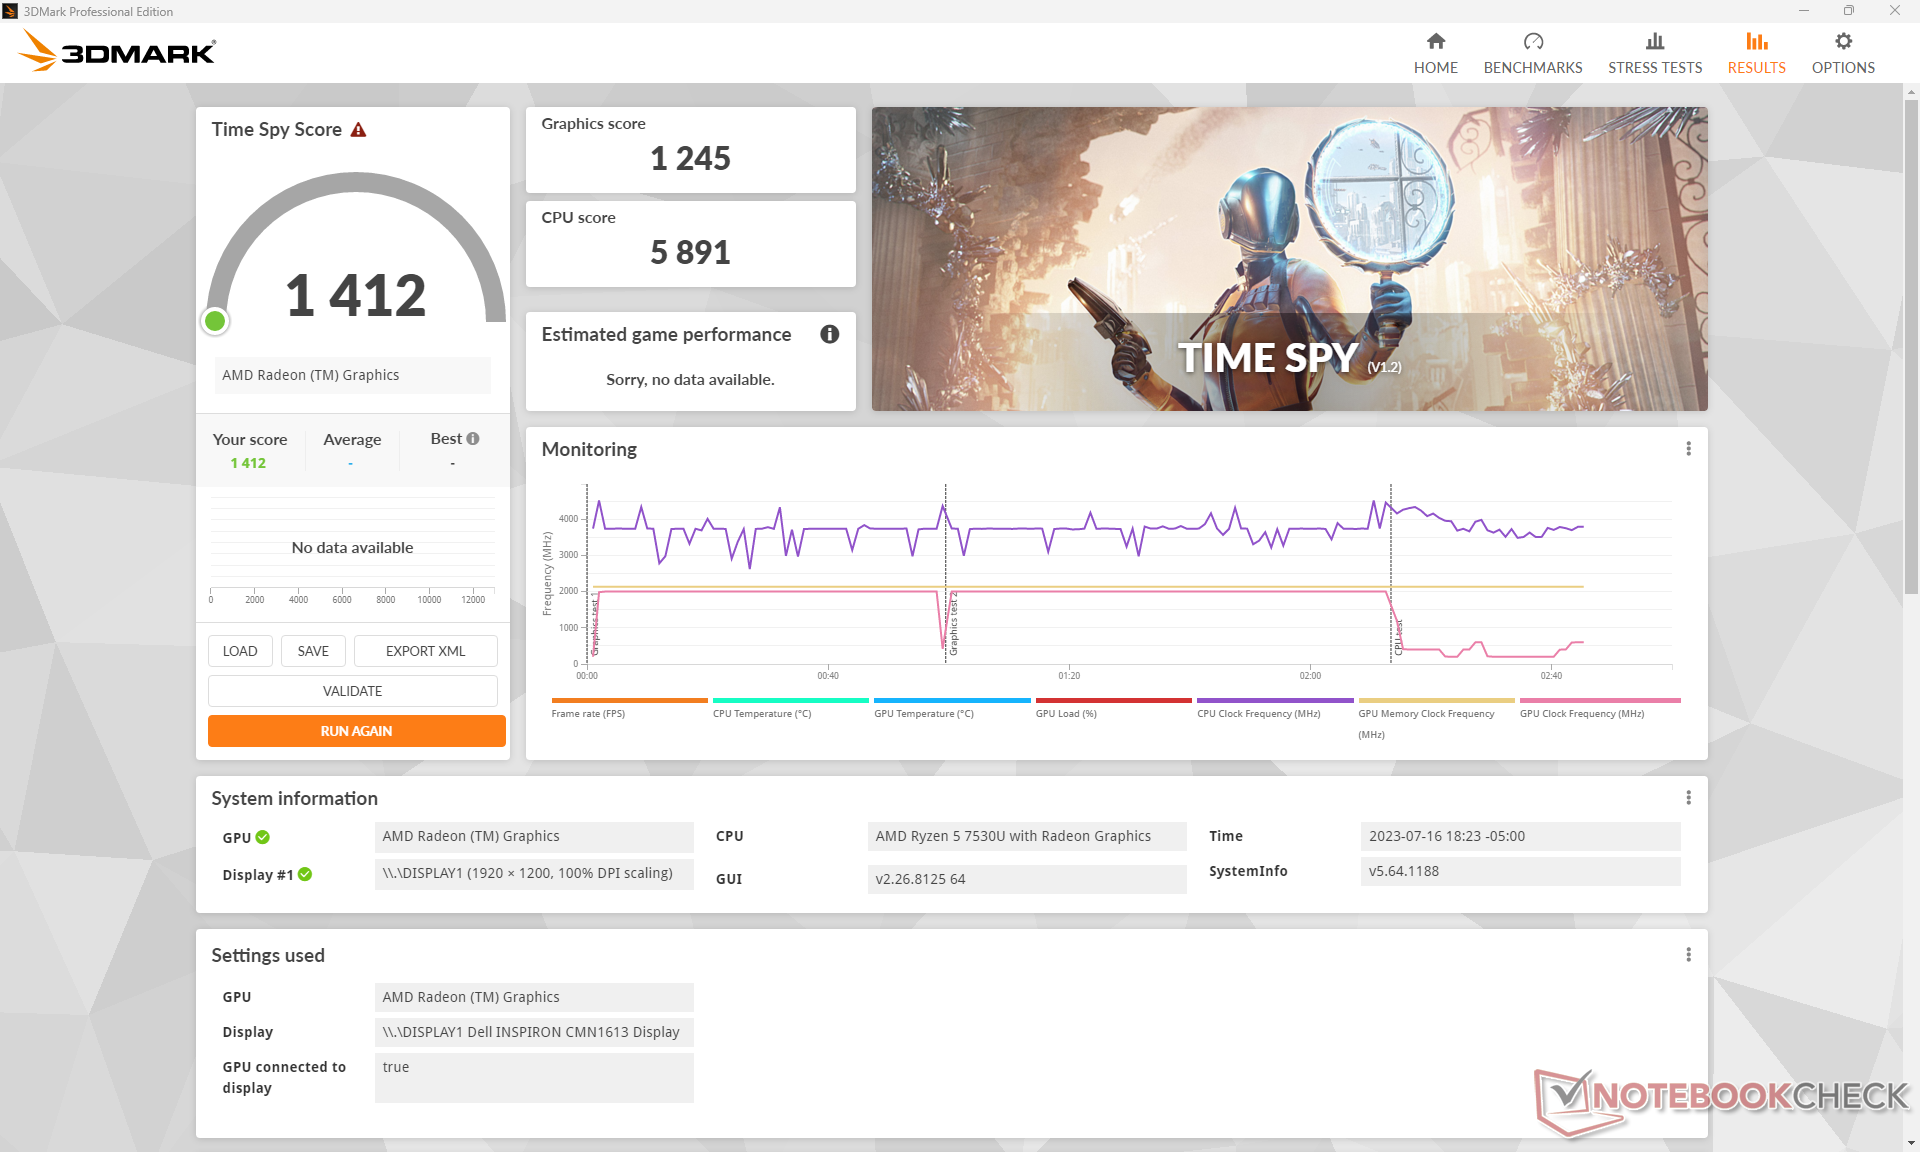
Wydajność GPU
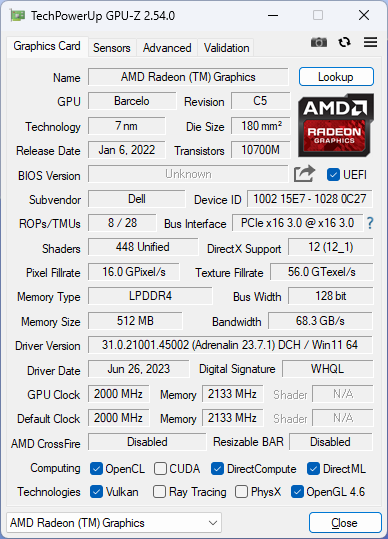
Jako procesor Zen 3, Ryzen 5 7530U wykorzystuje starszą kartę graficzną Radeon RX Vega 7 zamiast nowszego Radeon 680M lub 780M które można znaleźć odpowiednio w procesorach Zen 3+ i Zen 4. Jest to o tyle niefortunne, że Radeon 680M znacznie zwiększyłby wydajność graficzną o 70 do 80 procent, dzięki czemu byłby szybszy niż jakiekolwiek obecne rozwiązanie Intel Iris Xe. Zamiast tego, ogólna wydajność graficzna jest o około 25 procent niższa od starzejących się układów Iris Xe 96 EUs. Spodziewamy się, że wydajność będzie jeszcze niższa, jeśli zostanie skonfigurowana z zaledwie 8 GB wlutowanej systemowej pamięci RAM.
Aktualizacja do Radeon RX Vega 8 w wyższej konfiguracji Ryzen 7 7730U powinna nieznacznie zwiększyć wydajność graficzną o 5 procent.
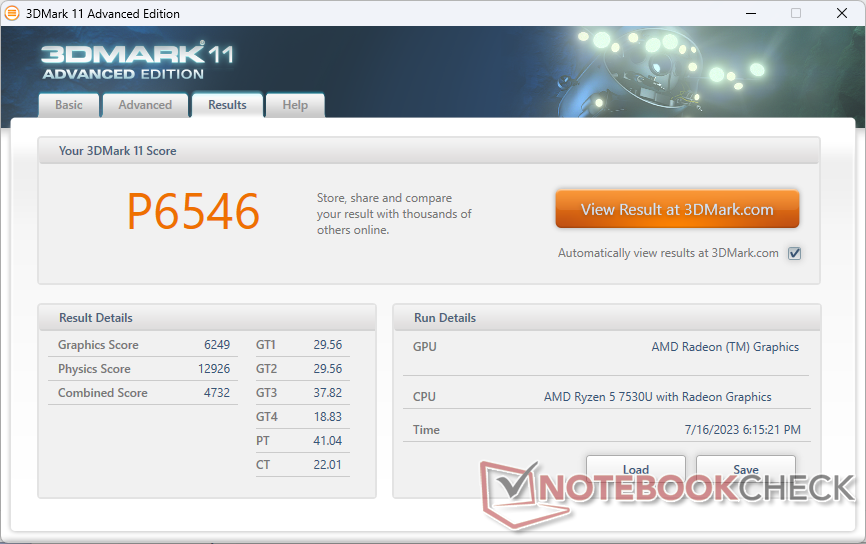
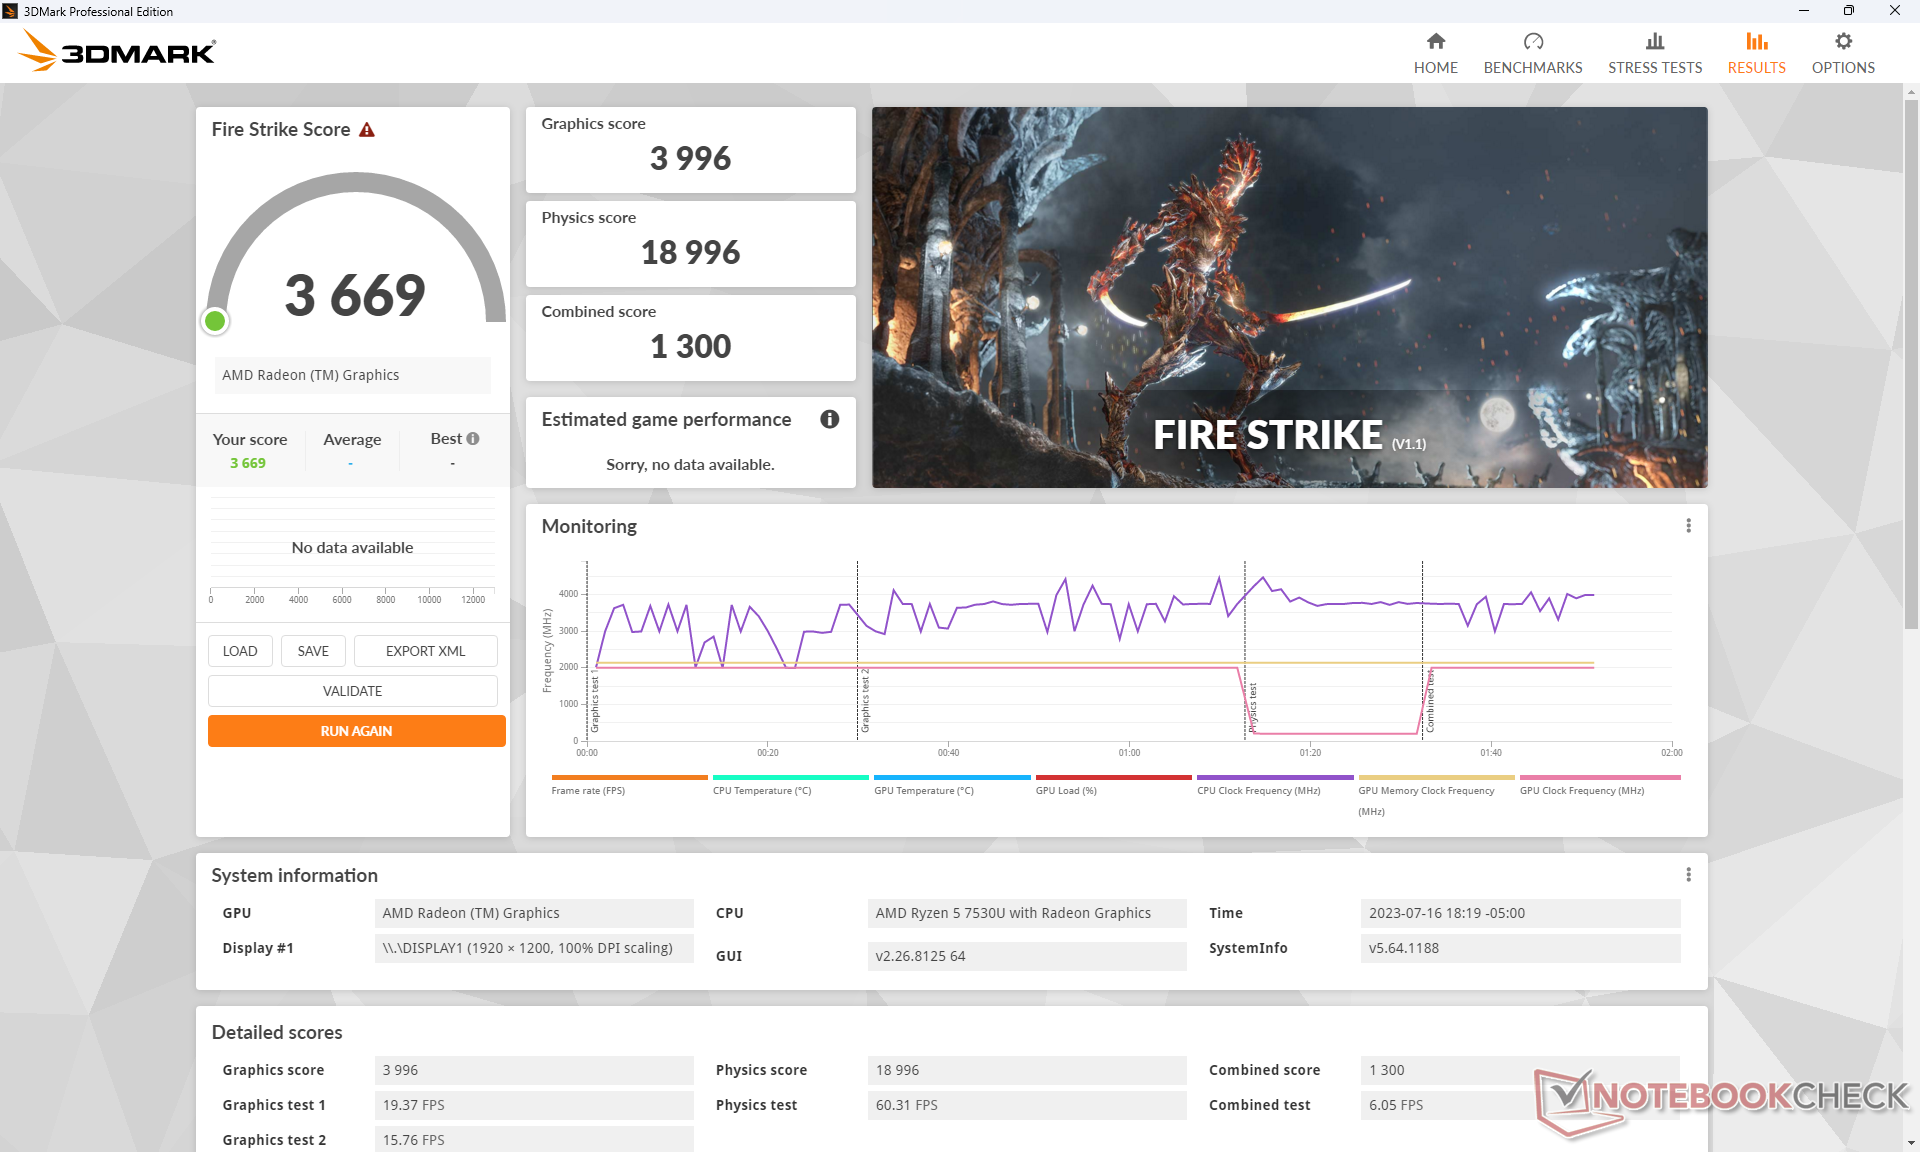
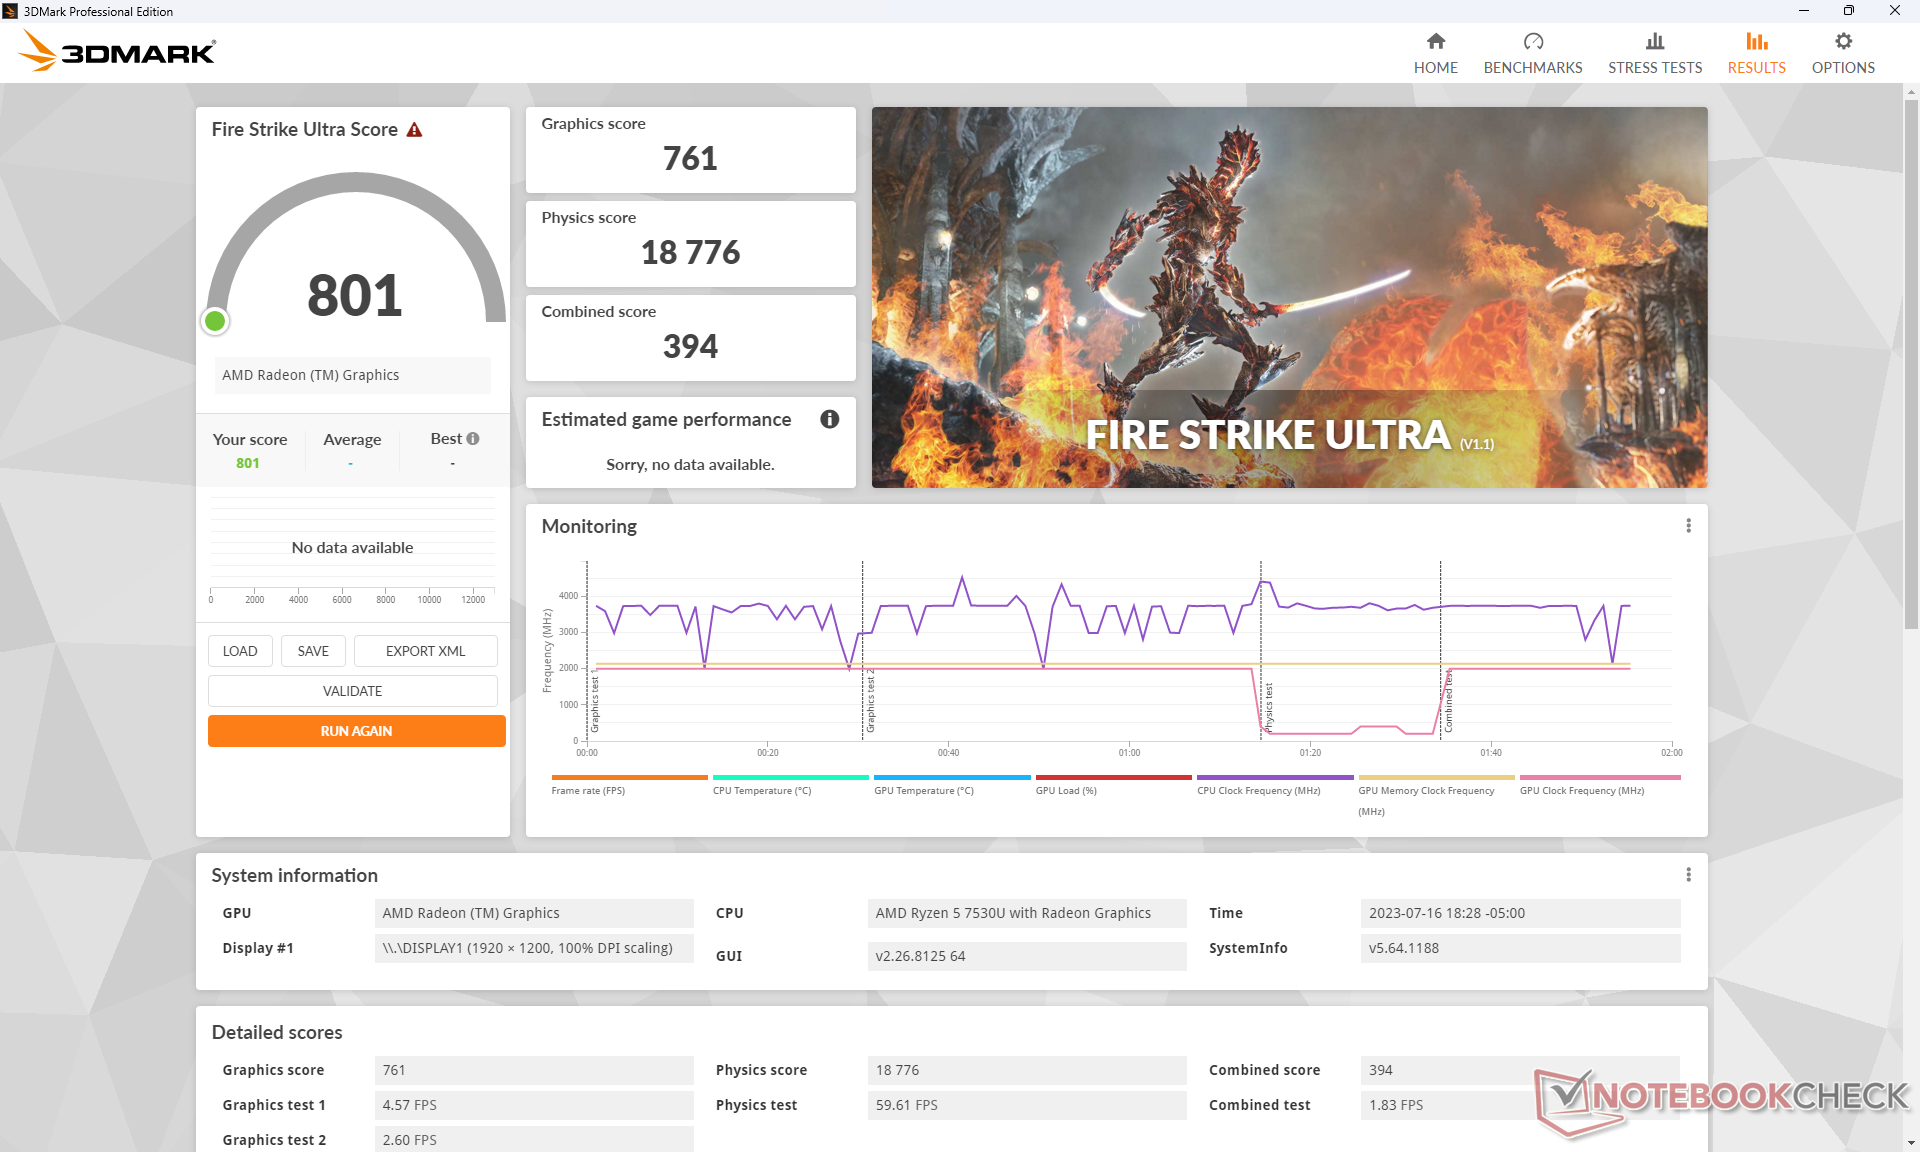
| 3DMark 11 Performance | 6546 pkt. | |
| 3DMark Fire Strike Score | 3669 pkt. | |
| 3DMark Time Spy Score | 1412 pkt. | |
Pomoc | ||
* ... im mniej tym lepiej
| Returnal | |
| 1280x720 Low Preset | |
| Beelink GTR7 7840HS | |
| Dell Inspiron 16 7635 2-in-1 | |
| Przeciętny AMD Radeon RX Vega 7 (18 - 18, n=2) | |
| 1920x1080 Low Preset | |
| Beelink GTR7 7840HS | |
| Dell Inspiron 16 7635 2-in-1 | |
| Przeciętny AMD Radeon RX Vega 7 (12 - 13, n=2) | |
| 1920x1080 Medium Preset | |
| Beelink GTR7 7840HS | |
| Dell Inspiron 16 7635 2-in-1 | |
| Przeciętny AMD Radeon RX Vega 7 (11 - 12, n=2) | |
| Cyberpunk 2077 1.6 | |
| 1280x720 Low Preset | |
| Beelink GTR7 7840HS | |
| Dell Inspiron 16 7635 2-in-1 | |
| Dell Inspiron 16 7635 2-in-1 | |
| Przeciętny AMD Radeon RX Vega 7 (18.1 - 35.8, n=5) | |
| 1920x1080 Low Preset | |
| Beelink GTR7 7840HS | |
| Lenovo Yoga 7 16IRL8 | |
| Dell Inspiron 16 7635 2-in-1 | |
| Dell Inspiron 16 7620 2-in-1 | |
| Przeciętny AMD Radeon RX Vega 7 (10 - 20.9, n=4) | |
| 1920x1080 Medium Preset | |
| Beelink GTR7 7840HS | |
| Lenovo Yoga 7 16IRL8 | |
| Dell Inspiron 16 7635 2-in-1 | |
| Dell Inspiron 16 7620 2-in-1 | |
| Przeciętny AMD Radeon RX Vega 7 (11.6 - 16.2, n=4) | |
| 1920x1080 High Preset | |
| Beelink GTR7 7840HS | |
| Lenovo Yoga 7 16IRL8 | |
| Dell Inspiron 16 7620 2-in-1 | |
| Dell Inspiron 16 7635 2-in-1 | |
| Przeciętny AMD Radeon RX Vega 7 (8.5 - 11.4, n=4) | |
| 1920x1080 Ultra Preset | |
| Beelink GTR7 7840HS | |
| Lenovo Yoga 7 16IRL8 | |
| Dell Inspiron 16 7620 2-in-1 | |
| Dell Inspiron 16 7635 2-in-1 | |
| Przeciętny AMD Radeon RX Vega 7 (6.7 - 8.5, n=3) | |
Liczba klatek na sekundę na biegu jałowym Witcher 3 sporadycznie, ale konsekwentnie spadała o prawie 15 FPS na krótkie okresy, po czym wracała do normy. Takie zachowanie jest niekorzystne, ponieważ sugeruje problemy ze sterownikiem graficznym lub przerywanie aktywności w tle na poziomie systemu operacyjnego.
Witcher 3 FPS Chart
| low | med. | high | ultra | |
|---|---|---|---|---|
| GTA V (2015) | 24.1 | 9.55 | ||
| The Witcher 3 (2015) | 79.6 | 24.5 | 15.7 | |
| Dota 2 Reborn (2015) | 109 | 90.7 | 55.4 | 52.4 |
| Final Fantasy XV Benchmark (2018) | 37.5 | 18.8 | 12.9 | |
| X-Plane 11.11 (2018) | 38.4 | 30.4 | 26.3 | |
| Strange Brigade (2018) | 86.8 | 33.8 | 28.1 | 23.2 |
| Cyberpunk 2077 1.6 (2022) | 20.3 | 15.3 | 10.5 | 8.5 |
| Tiny Tina's Wonderlands (2022) | 28.8 | 21.2 | 12.9 | 9.2 |
| F1 22 (2022) | 36.2 | 32.3 | 23.9 | 17.1 |
| Returnal (2023) | 13 | 12 |
Emisje
Hałas systemowy
Wentylator jest generalnie cichy podczas niskich obciążeń, takich jak przeglądanie stron internetowych lub strumieniowanie wideo, gdzie ma tendencję do wahania się w zakresie 27 dB(A) na cichym tle 23,6 dB(A). Jednak przy większych obciążeniach, takich jak 3DMark 06, hałas wentylatora szybko podskoczyłby do nieco ponad 40 dB(A), nawet przy zrównoważonym profilu zasilania. Maksymalny hałas wentylatora wynosił nieco ponad 44 dB(A) przy dużych obciążeniach, takich jak gry, i był nawet głośniejszy niż ten, który zarejestrowaliśmy na starszym Inspironie 16 7620.Inspiron 16 7620 2-w-1.
Hałas
| luz |
| 23.6 / 23.6 / 23.6 dB |
| obciążenie |
| 40.3 / 44.2 dB |
 | ||
30 dB cichy 40 dB(A) słyszalny 50 dB(A) irytujący |
||
min: | ||
| Dell Inspiron 16 7635 2-in-1 Vega 7, R5 7530U, Kioxia BG5 KBG50ZNS512G | Acer Swift Edge SFE16-42-R1GM Radeon 680M, R7 7735U, Micron 3400 1TB MTFDKBA1T0TFH | Lenovo Yoga 7 16IRL8 Iris Xe G7 96EUs, i7-1355U, WD PC SN740 512GB SDDPMQD-512G-1101 | Samsung Galaxy Book3 Pro 16 Iris Xe G7 80EUs, i5-1340P, WD PC SN740 256GB SDDPNQD-256G | Lenovo IdeaPad Flex 5 16ABR G8 Vega 8, R7 7730U, Samsung PM9B1 1024GB MZAL41T0HBLB | Dell Inspiron 16 7620 2-in-1 Iris Xe G7 96EUs, i7-1260P, Toshiba KBG40ZNS512G NVMe | |
|---|---|---|---|---|---|---|
| Noise | -10% | -0% | -11% | -0% | 8% | |
| wyłączone / środowisko * (dB) | 23.6 | 25.7 -9% | 22.8 3% | 25.2 -7% | 24.2 -3% | 23.2 2% |
| Idle Minimum * (dB) | 23.6 | 25.7 -9% | 22.9 3% | 25.2 -7% | 24.2 -3% | 23.5 -0% |
| Idle Average * (dB) | 23.6 | 27 -14% | 22.9 3% | 25.2 -7% | 24.2 -3% | 23.5 -0% |
| Idle Maximum * (dB) | 23.6 | 29.3 -24% | 26.9 -14% | 29.3 -24% | 28.7 -22% | 23.5 -0% |
| Load Average * (dB) | 40.3 | 42.3 -5% | 41.7 -3% | 46.4 -15% | 33.1 18% | 29.4 27% |
| Witcher 3 ultra * (dB) | 44.2 | 41.5 6% | 41.8 5% | 35.6 19% | ||
| Load Maximum * (dB) | 44.2 | 42.7 3% | 43.6 1% | 46.4 -5% | 41.8 5% | 39.7 10% |
* ... im mniej tym lepiej
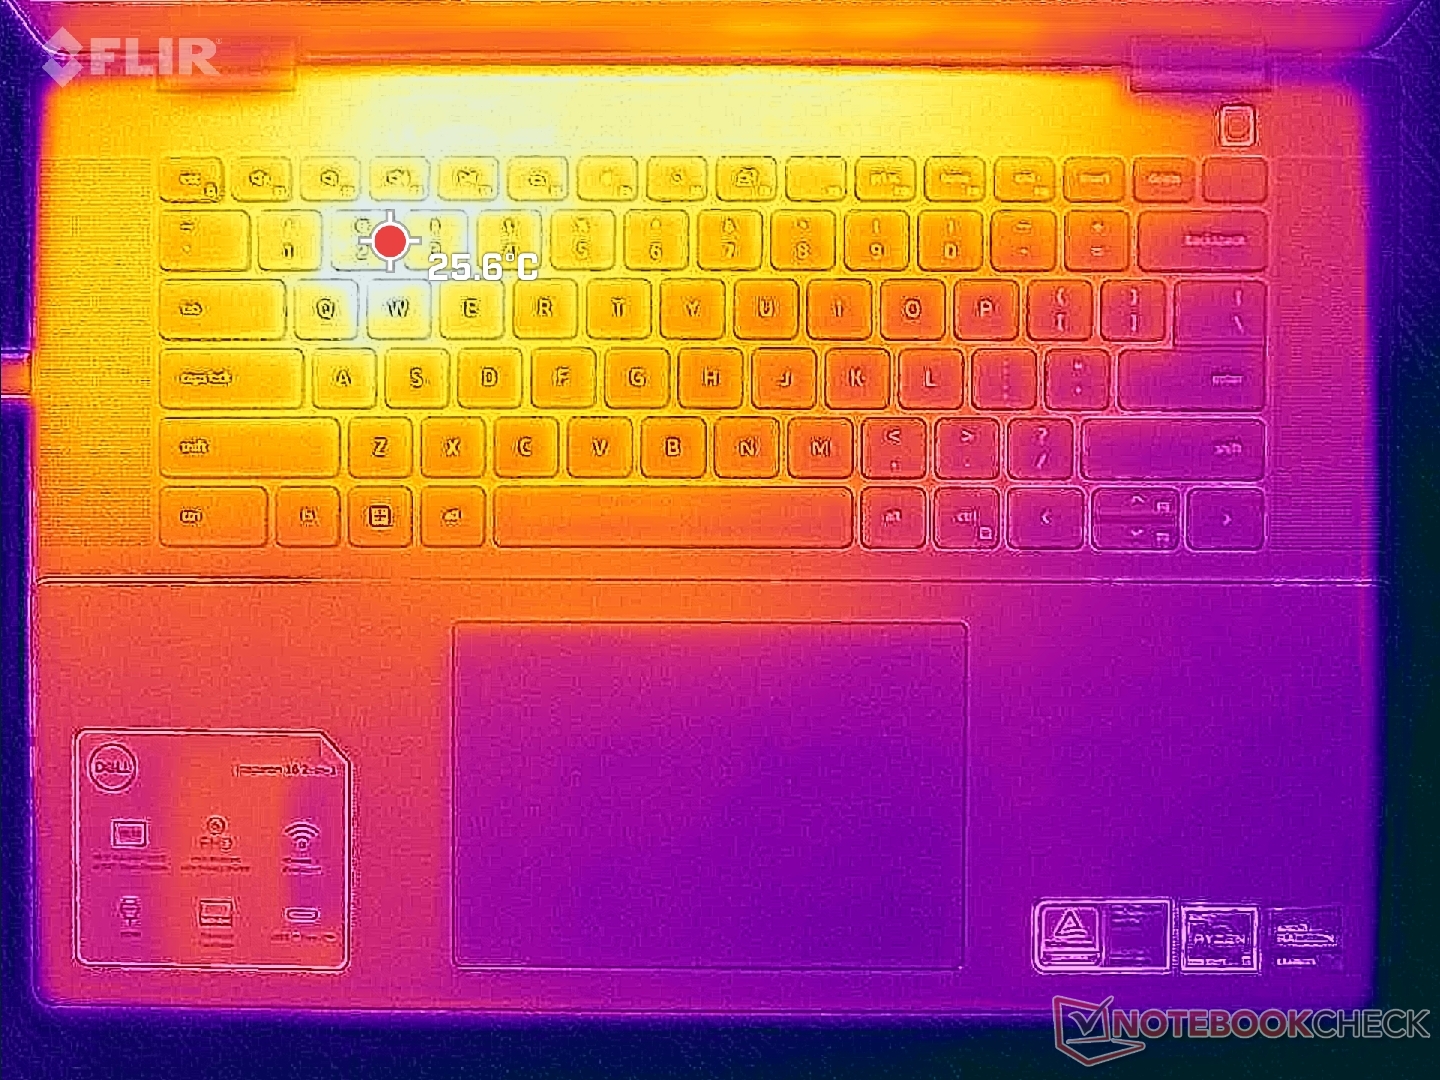
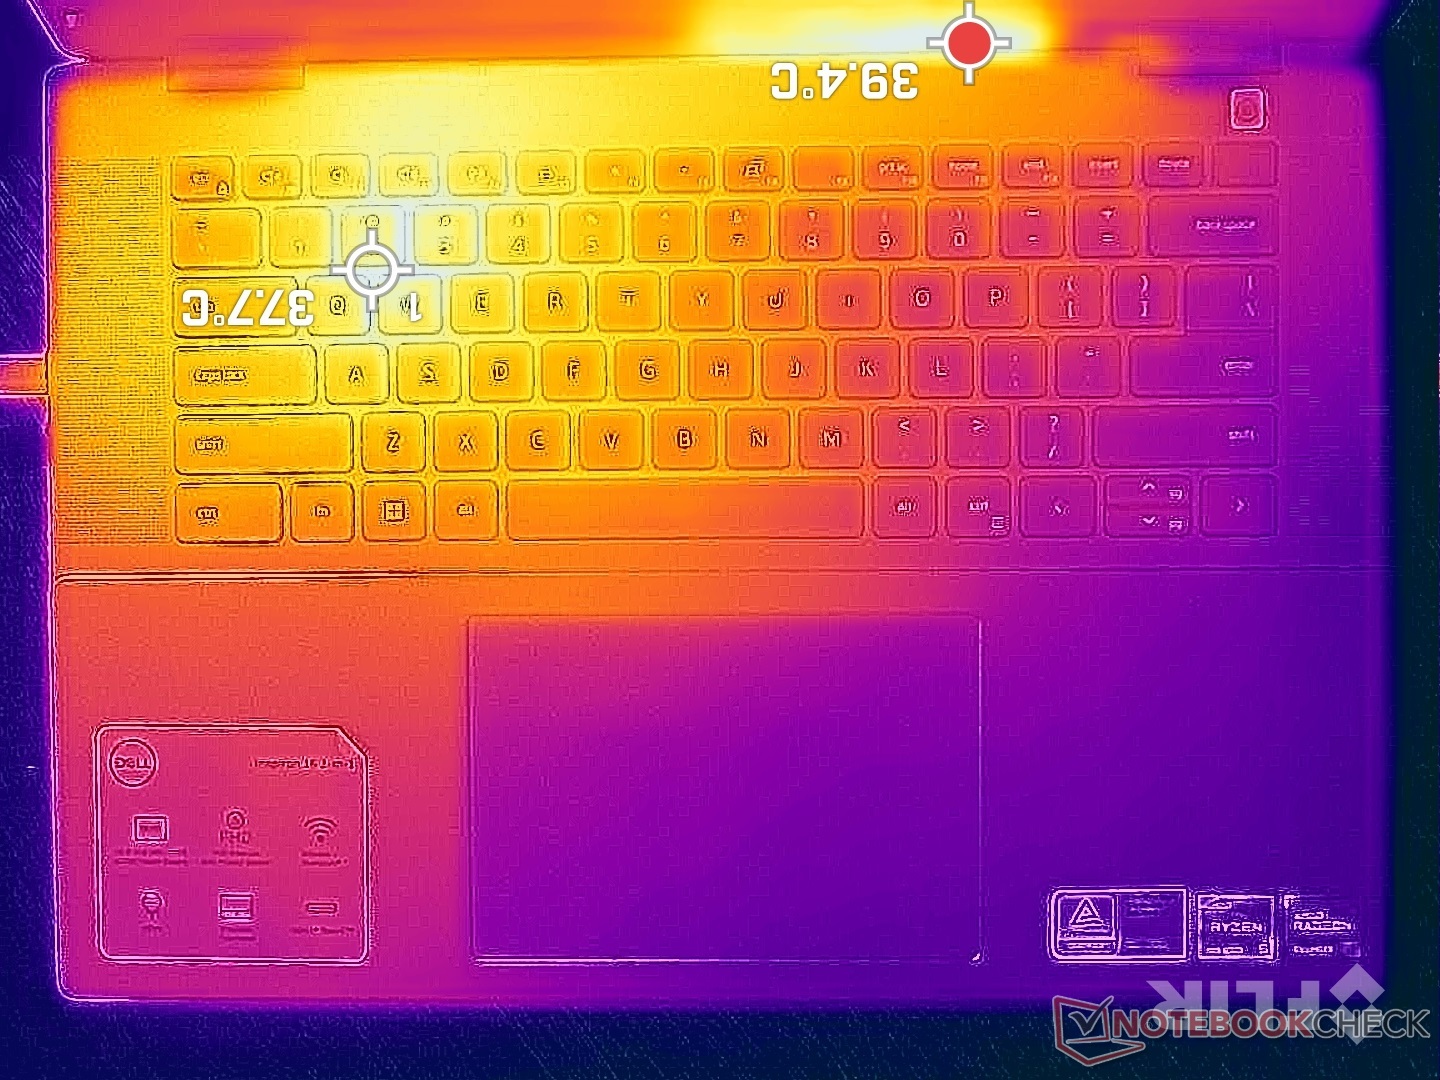
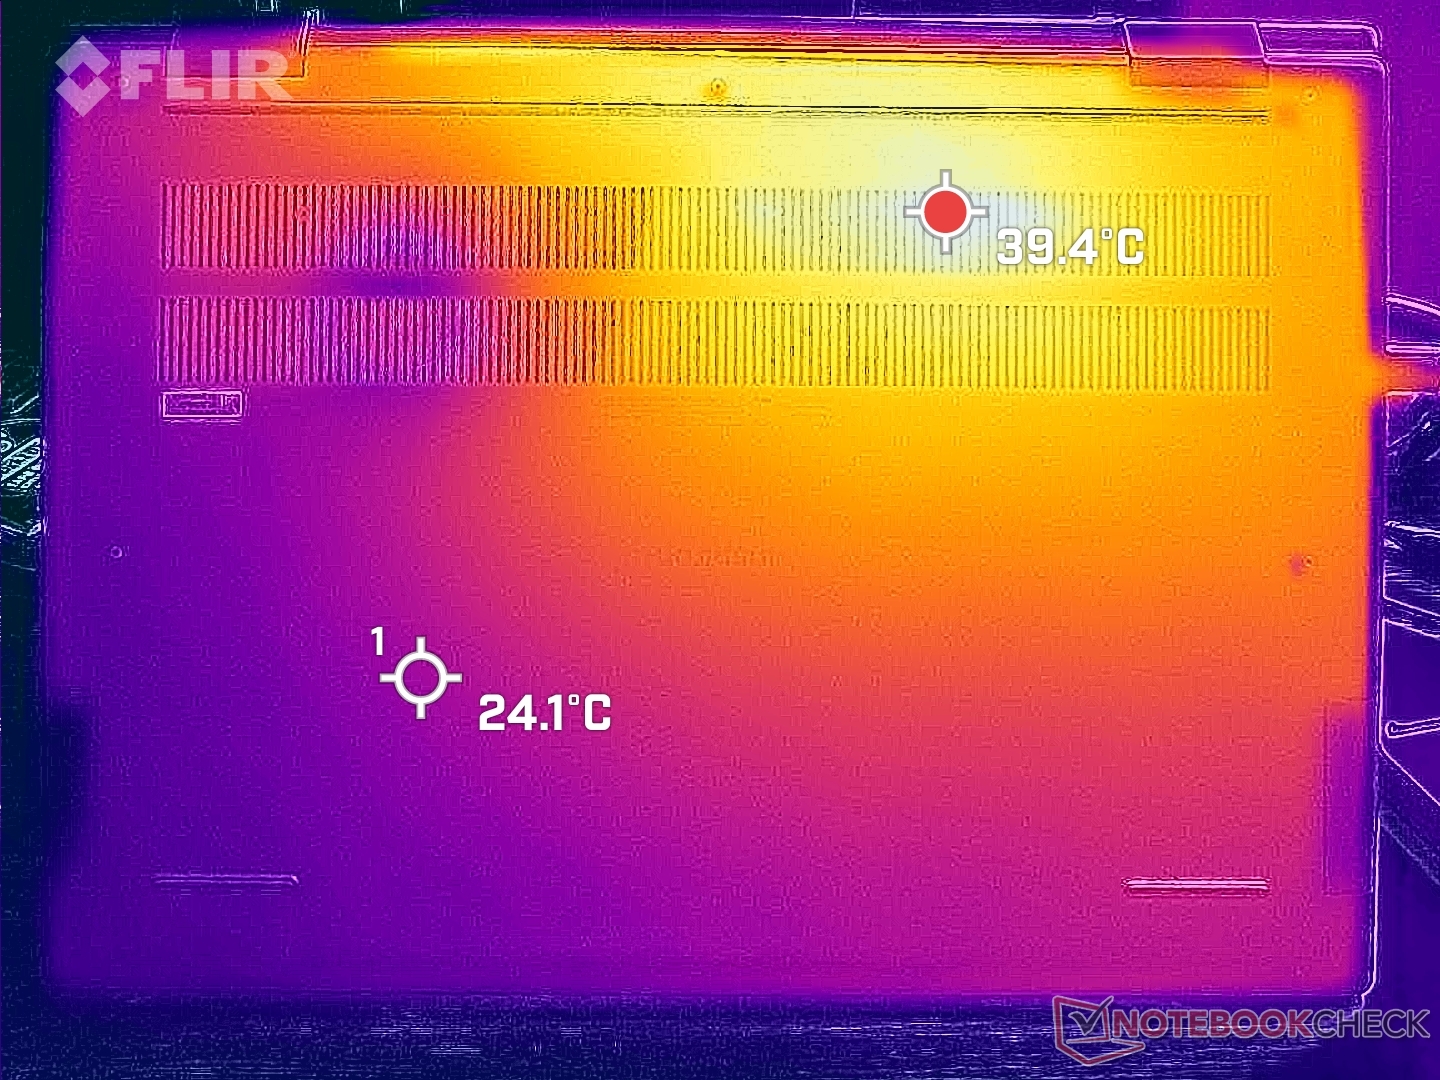
Temperatura
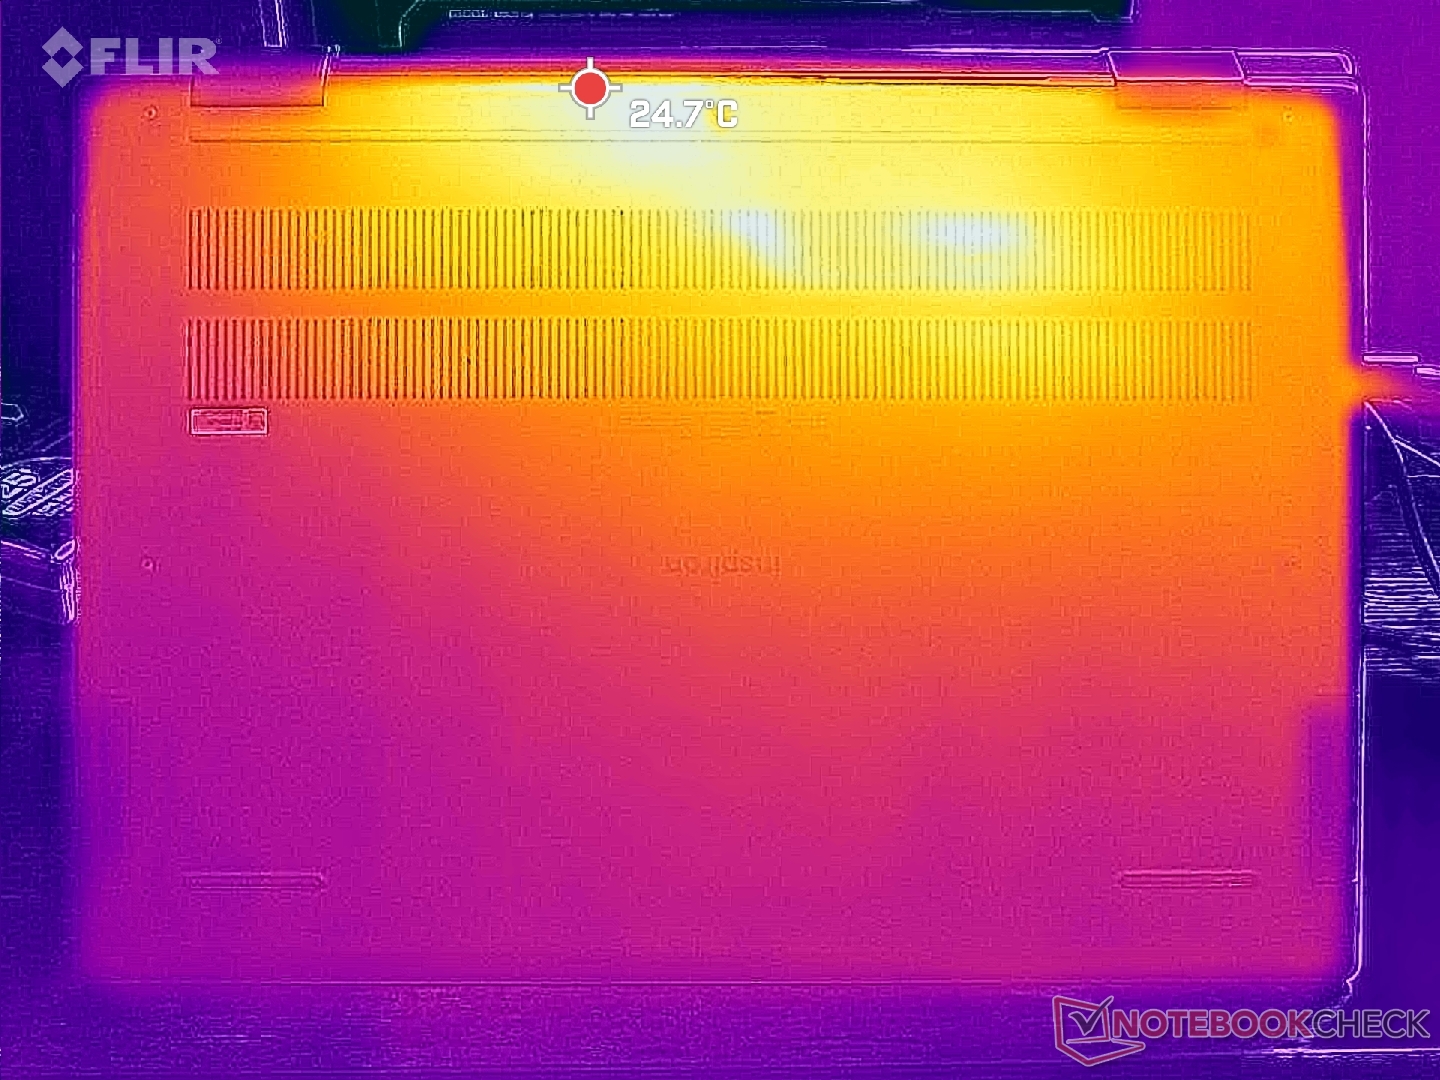
Temperatury powierzchni są najcieplejsze na lewej połowie klawiatury zamiast na środku, ponieważ położenie procesora zmieniło się w stosunku do zeszłorocznego projektu. Gorące punkty mogą osiągnąć nieco ponad 40 ° C na górnej i dolnej powierzchni, co jest nadal zauważalnie chłodniejsze niż naIdeaPad Flex 5 16 lub starszym Inspiron 16 7620 2-w-1 gdzie temperatury powierzchni mogą osiągnąć blisko 50 C pod obciążeniem. Ogólnie głośniejszy hałas wentylatora Inspiron 16 7635 2-w-1 może być częściowo odpowiedzialny za niższe temperatury powierzchni.
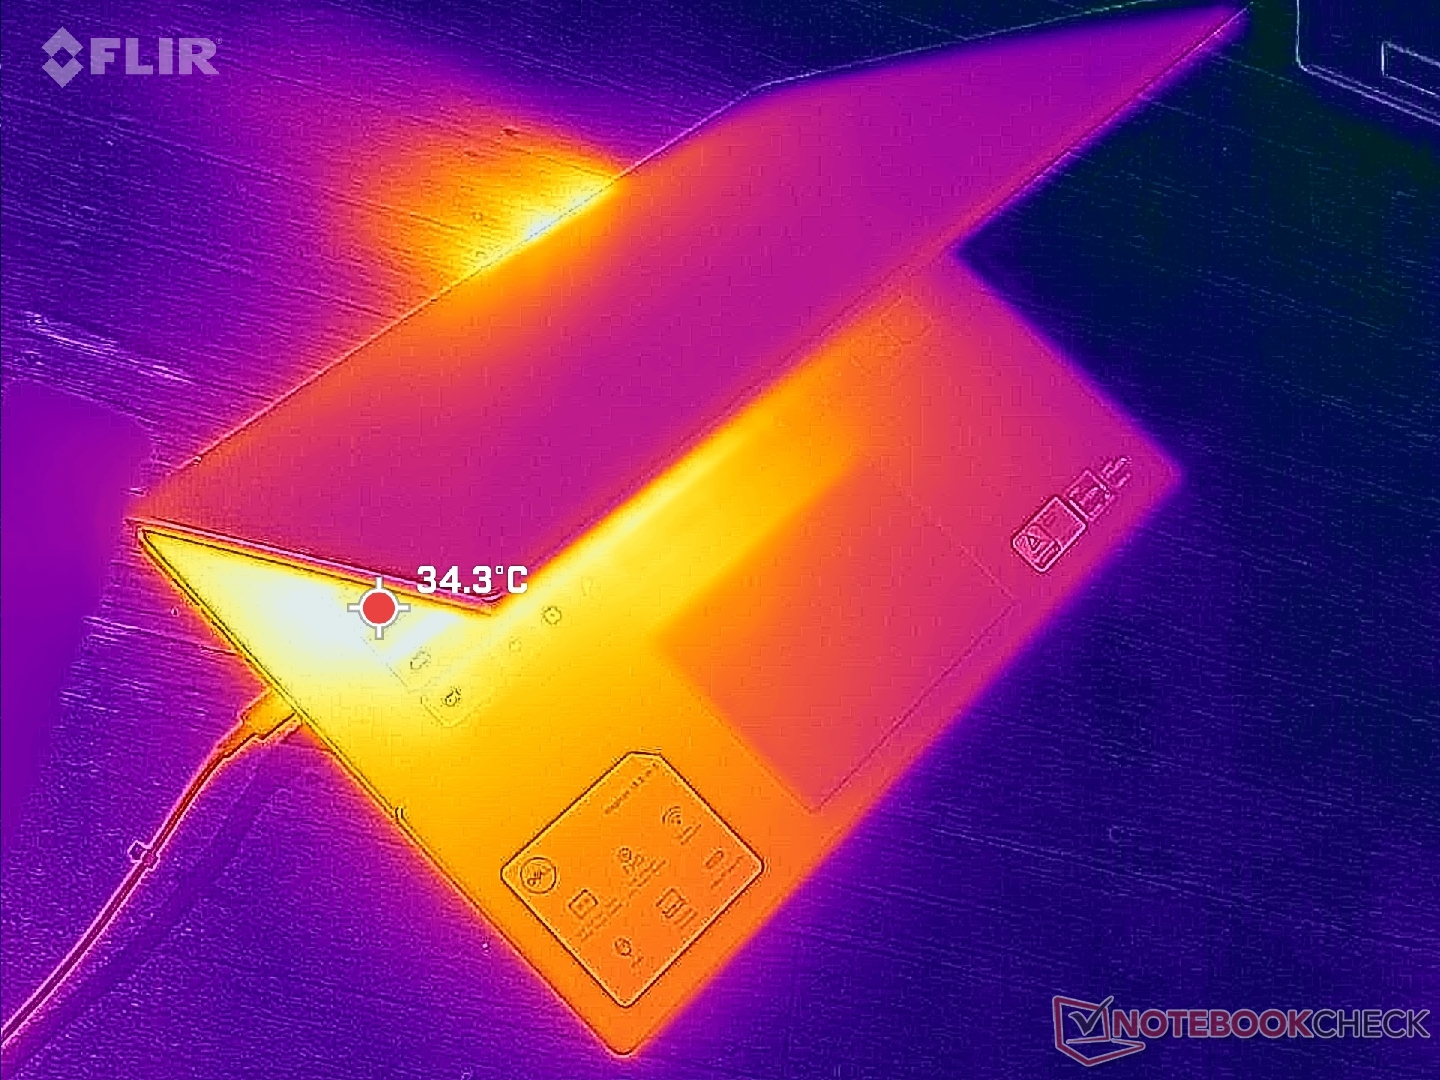
(±) Maksymalna temperatura w górnej części wynosi 41.6 °C / 107 F, w porównaniu do średniej 35.4 °C / 96 F , począwszy od 19.6 do 60 °C dla klasy Convertible.
(+) Dno nagrzewa się maksymalnie do 39 °C / 102 F, w porównaniu do średniej 36.9 °C / 98 F
(+) W stanie bezczynności średnia temperatura górnej części wynosi 25.8 °C / 78 F, w porównaniu ze średnią temperaturą urządzenia wynoszącą 30.3 °C / ### class_avg_f### F.
(+) Podpórki pod nadgarstki i touchpad są chłodniejsze niż temperatura skóry i maksymalnie 31.4 °C / 88.5 F i dlatego są chłodne w dotyku.
(-) Średnia temperatura obszaru podparcia dłoni w podobnych urządzeniach wynosiła 28 °C / 82.4 F (-3.4 °C / -6.1 F).
| Dell Inspiron 16 7635 2-in-1 AMD Ryzen 5 7530U, AMD Radeon RX Vega 7 | Acer Swift Edge SFE16-42-R1GM AMD Ryzen 7 7735U, AMD Radeon 680M | Lenovo Yoga 7 16IRL8 Intel Core i7-1355U, Intel Iris Xe Graphics G7 96EUs | Samsung Galaxy Book3 Pro 16 Intel Core i5-1340P, Intel Iris Xe Graphics G7 80EUs | Lenovo IdeaPad Flex 5 16ABR G8 AMD Ryzen 7 7730U, AMD Radeon RX Vega 8 (Ryzen 4000/5000) | Dell Inspiron 16 7620 2-in-1 Intel Core i7-1260P, Intel Iris Xe Graphics G7 96EUs | |
|---|---|---|---|---|---|---|
| Heat | -15% | -1% | -9% | -5% | -13% | |
| Maximum Upper Side * (°C) | 41.6 | 49.4 -19% | 37.6 10% | 41.6 -0% | 51.4 -24% | 42.2 -1% |
| Maximum Bottom * (°C) | 39 | 44.7 -15% | 40 -3% | 45 -15% | 47.8 -23% | 47.4 -22% |
| Idle Upper Side * (°C) | 29.4 | 34 -16% | 30.4 -3% | 31 -5% | 24.8 16% | 32.2 -10% |
| Idle Bottom * (°C) | 28.6 | 31.6 -10% | 30.6 -7% | 33.6 -17% | 24.9 13% | 33.6 -17% |
* ... im mniej tym lepiej
Test warunków skrajnych
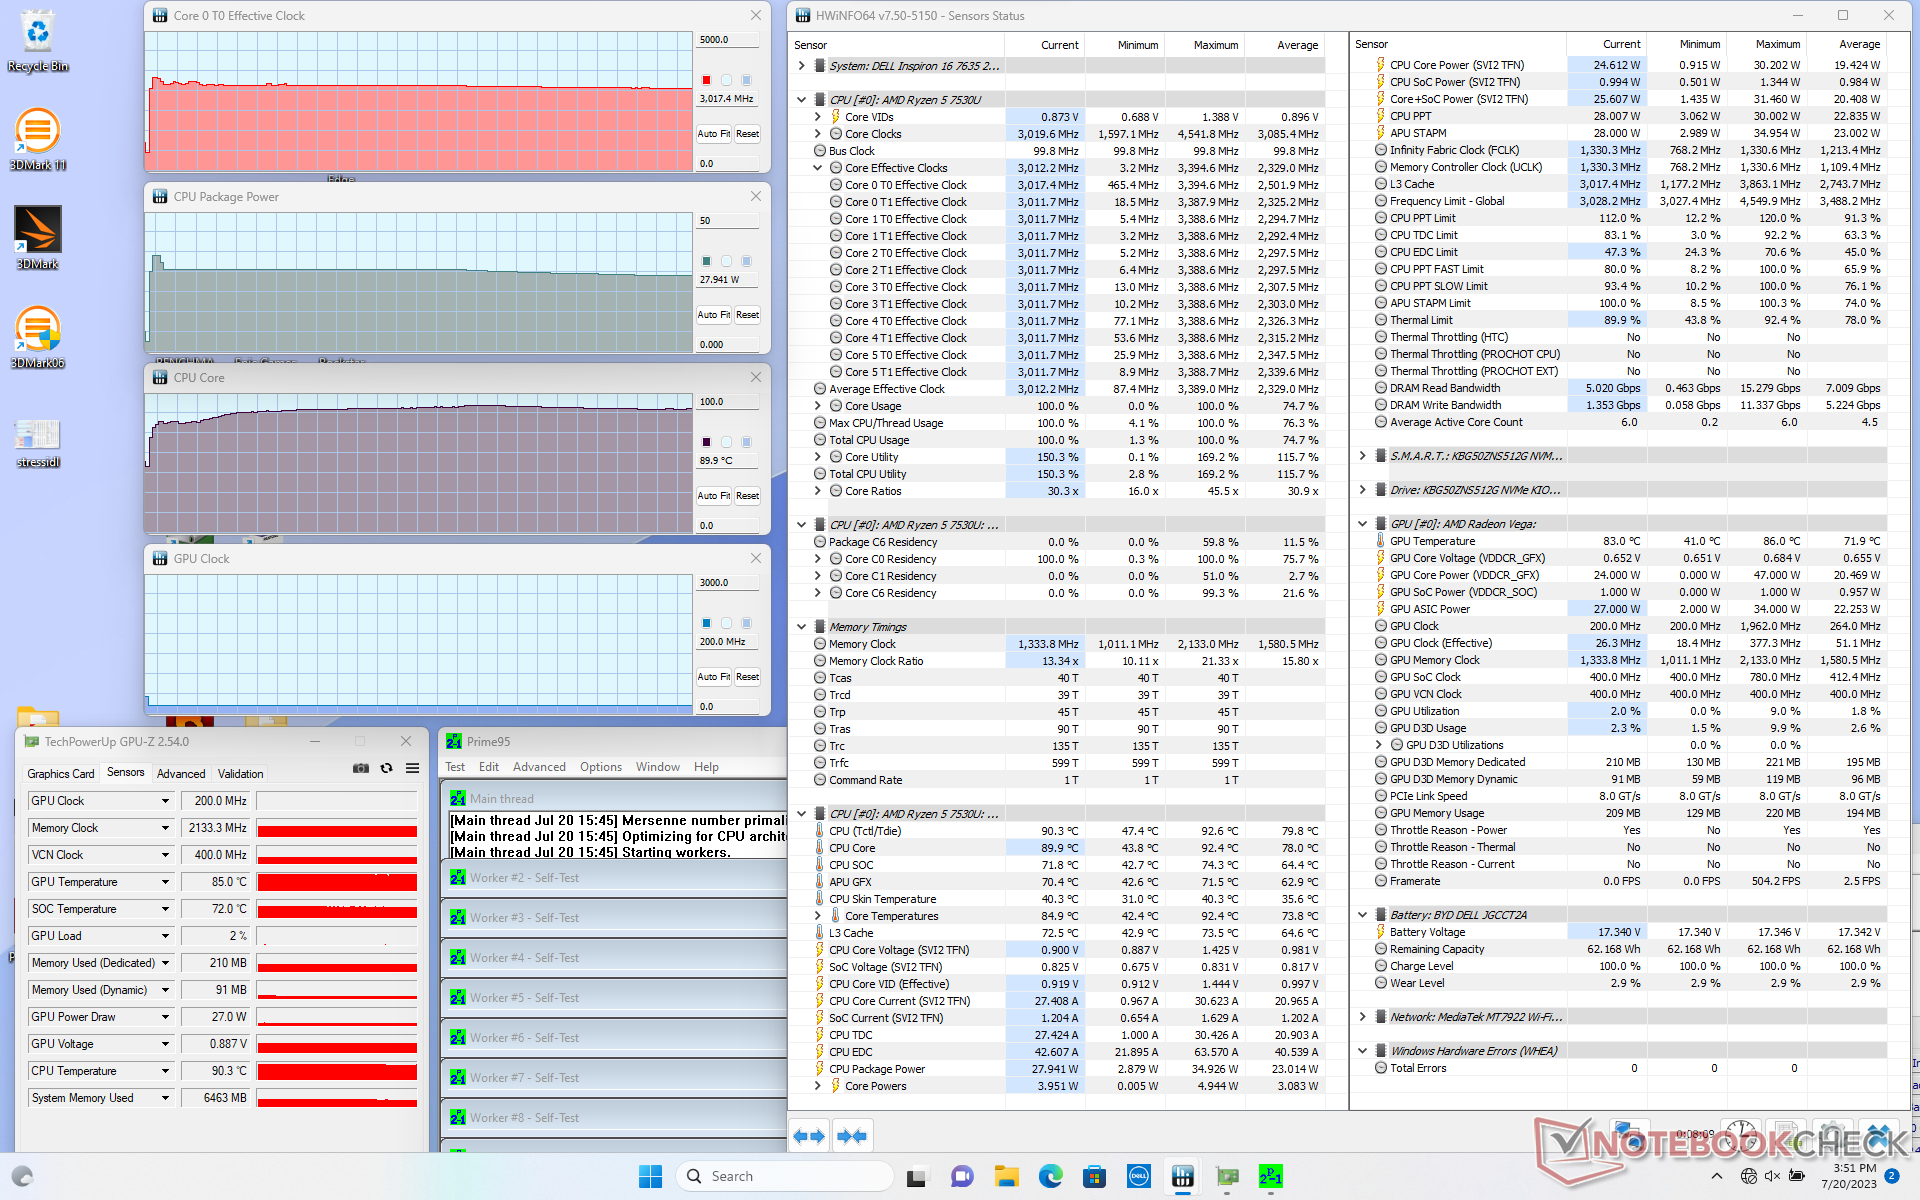
Częstotliwość taktowania procesora, pobór mocy płyty i temperatura podczas uruchamiania Prime95 wzrosły odpowiednio do 3,4 GHz, 35 W i 81 C. Procesor ostatecznie ustabilizował się na poziomie 3 GHz, 28 W i 90 C po około minucie, w porównaniu do 81 C w zeszłorocznym Inspironie 16 7620 2-w-1 z procesorem Intel.
Praca na zasilaniu bateryjnym nieznacznie obniża wydajność. Test 3DMark 11 na baterii zwróciłby wyniki fizyki i grafiki odpowiednio 12497 i 5935 punktów, w porównaniu do 12926 i 6249 punktów przy zasilaniu sieciowym.
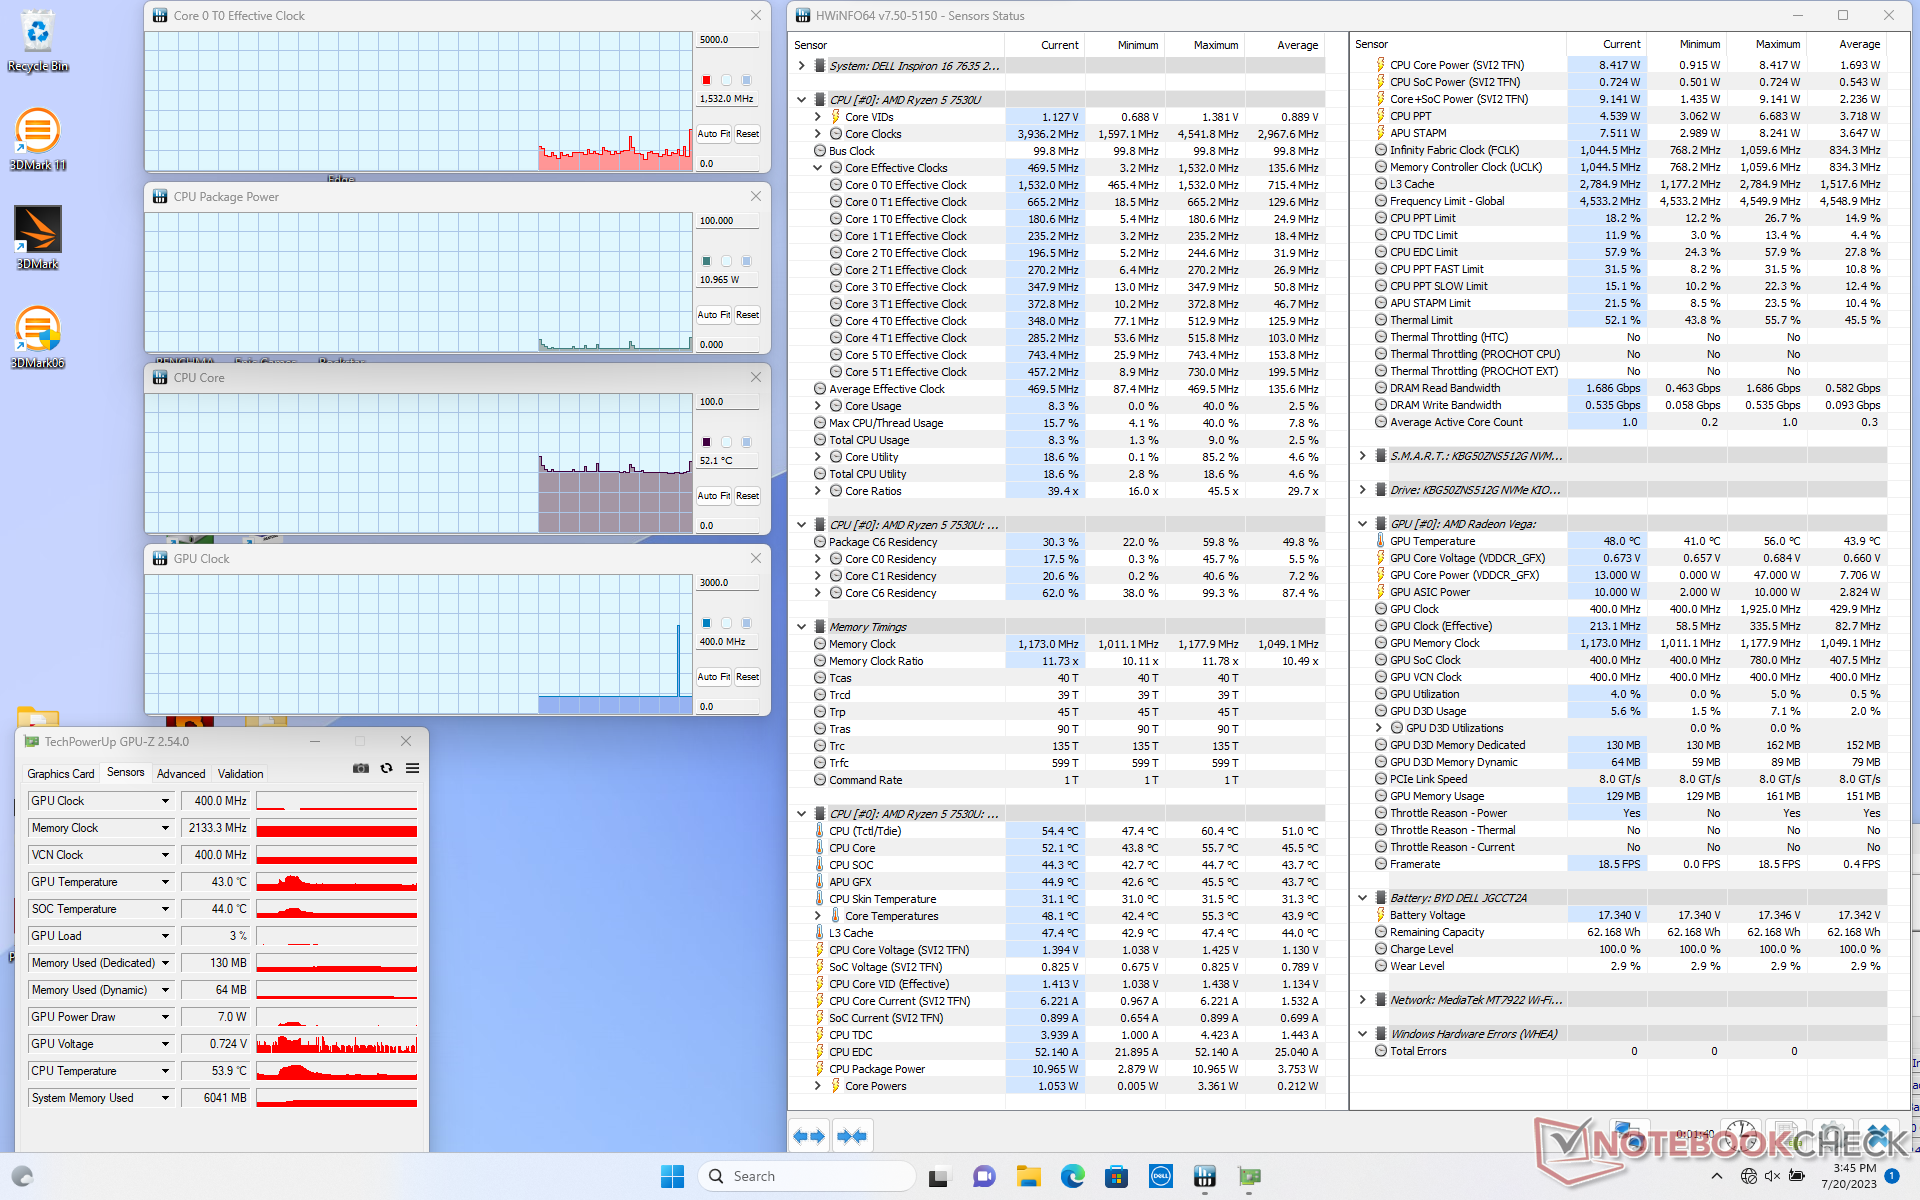
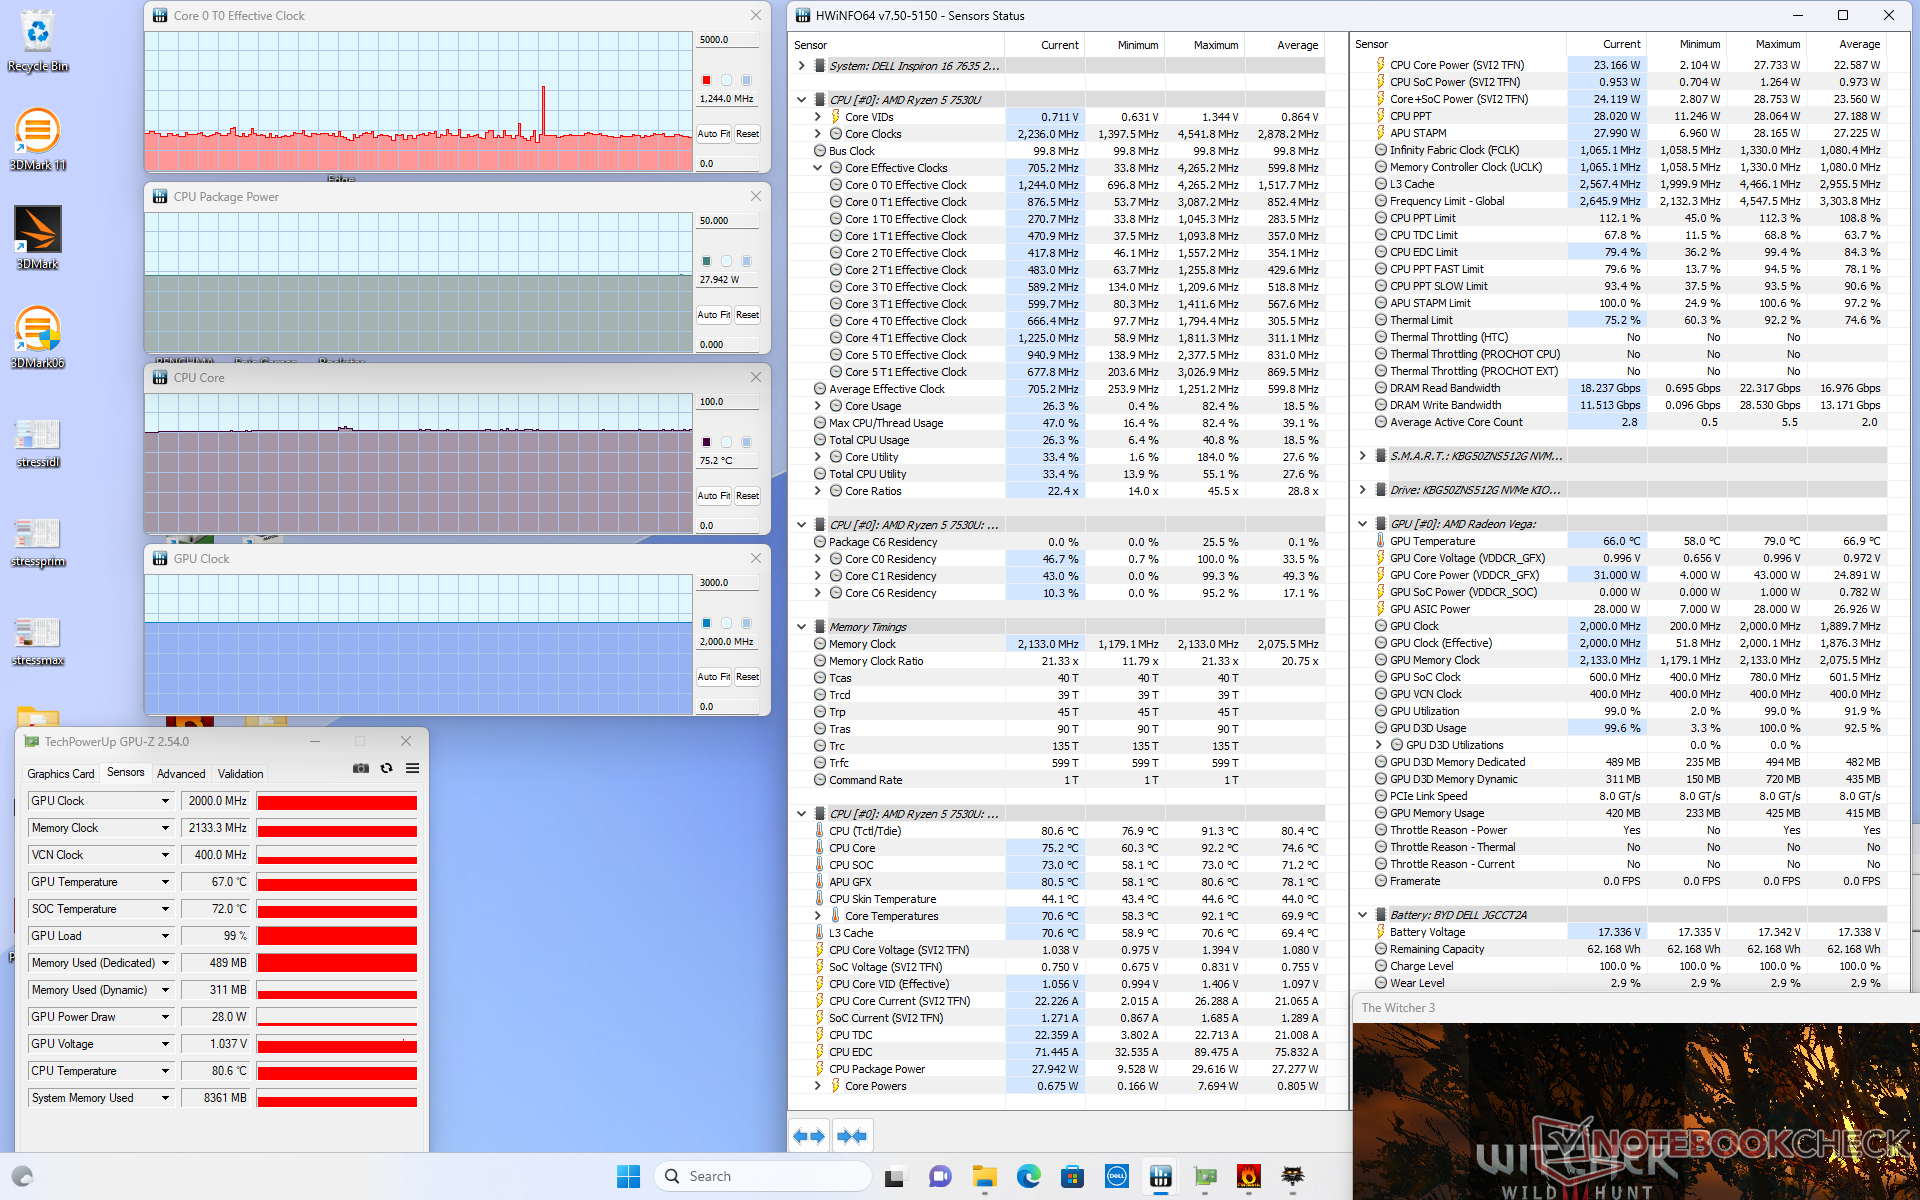
| Taktowanie CPU (GHz) | Taktowanie GPU (MHz) | Średnia temperatura CPU (°C) | |
| System bezczynności | -- | -- | 52 |
| Prime95Stress | 3.0 | -- | 90 |
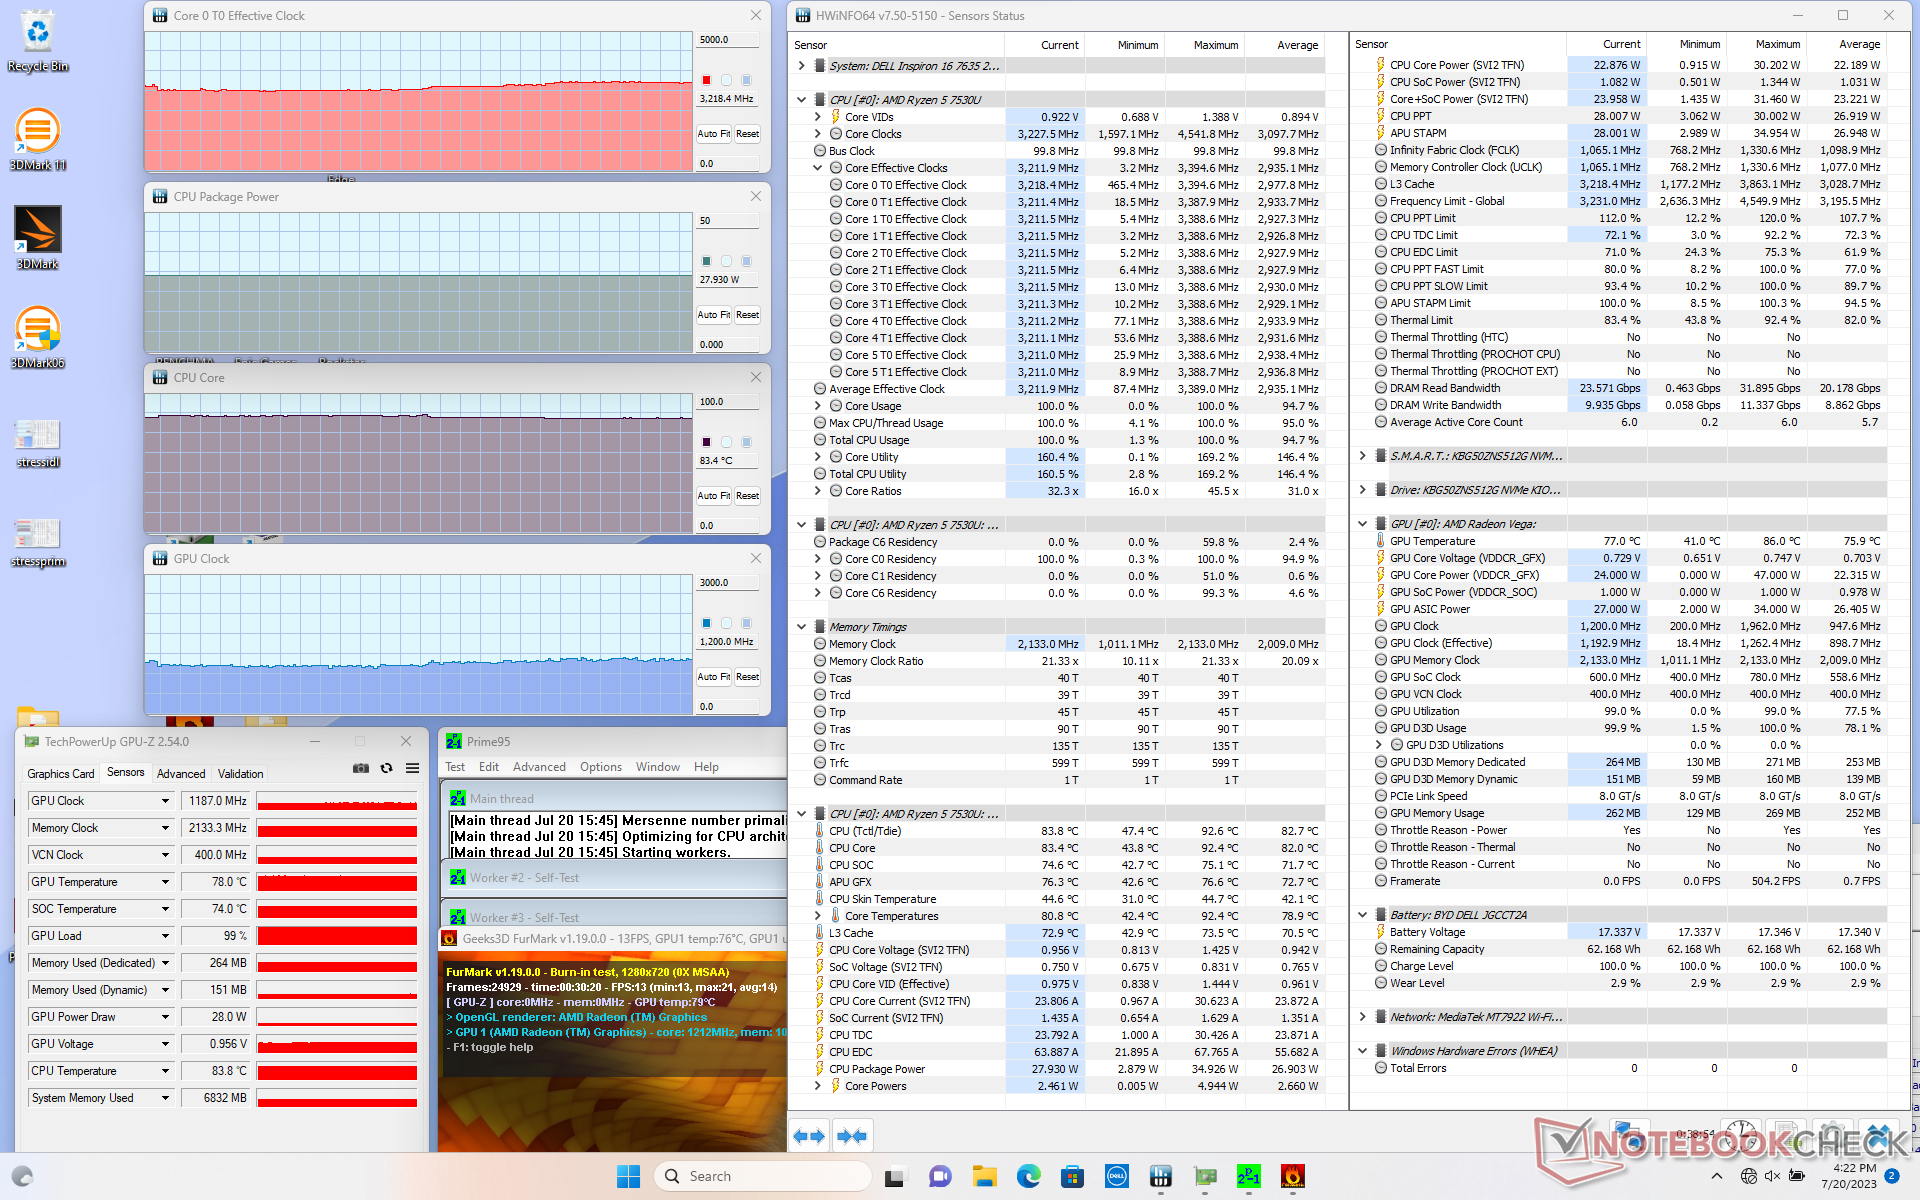
| Prime95+ FurMark Stress | 3.1 - 3.2 | 1187 | 83 |
| Witcher 3 Stres | 1.2 | 2000 | 75 |
Głośniki
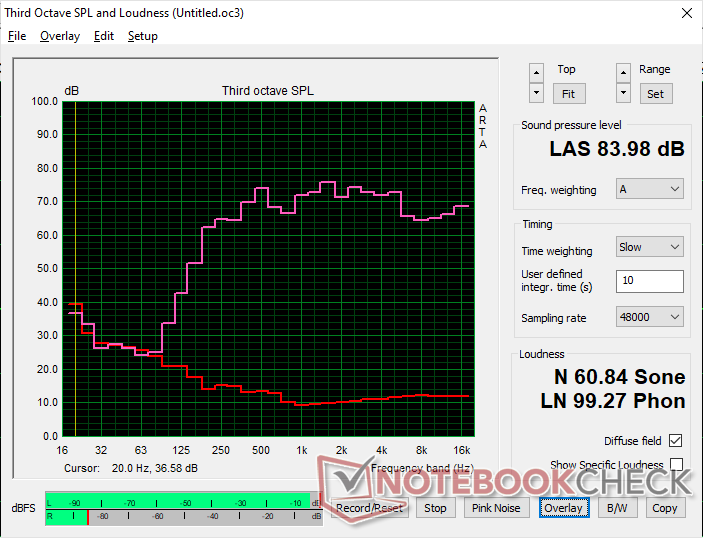
Dell Inspiron 16 7635 2-in-1 analiza dźwięku
(+) | głośniki mogą odtwarzać stosunkowo głośno (84 dB)
Bas 100 - 315 Hz
(±) | zredukowany bas - średnio 14.9% niższy od mediany
(±) | liniowość basu jest średnia (11.9% delta do poprzedniej częstotliwości)
Średnie 400 - 2000 Hz
(+) | zbalansowane środki średnie - tylko 3.5% od mediany
(+) | średnie są liniowe (6.9% delta do poprzedniej częstotliwości)
Wysokie 2–16 kHz
(+) | zrównoważone maksima - tylko 4.1% od mediany
(+) | wzloty są liniowe (3.7% delta do poprzedniej częstotliwości)
Ogólnie 100 - 16.000 Hz
(+) | ogólny dźwięk jest liniowy (12.2% różnicy w stosunku do mediany)
W porównaniu do tej samej klasy
» 12% wszystkich testowanych urządzeń w tej klasie było lepszych, 4% podobnych, 84% gorszych
» Najlepszy miał deltę 6%, średnia wynosiła ###średnia###%, najgorsza wynosiła 57%
W porównaniu do wszystkich testowanych urządzeń
» 10% wszystkich testowanych urządzeń było lepszych, 2% podobnych, 88% gorszych
» Najlepszy miał deltę 4%, średnia wynosiła ###średnia###%, najgorsza wynosiła 134%
Apple MacBook Pro 16 2021 M1 Pro analiza dźwięku
(+) | głośniki mogą odtwarzać stosunkowo głośno (84.7 dB)
Bas 100 - 315 Hz
(+) | dobry bas - tylko 3.8% od mediany
(+) | bas jest liniowy (5.2% delta do poprzedniej częstotliwości)
Średnie 400 - 2000 Hz
(+) | zbalansowane środki średnie - tylko 1.3% od mediany
(+) | średnie są liniowe (2.1% delta do poprzedniej częstotliwości)
Wysokie 2–16 kHz
(+) | zrównoważone maksima - tylko 1.9% od mediany
(+) | wzloty są liniowe (2.7% delta do poprzedniej częstotliwości)
Ogólnie 100 - 16.000 Hz
(+) | ogólny dźwięk jest liniowy (4.6% różnicy w stosunku do mediany)
W porównaniu do tej samej klasy
» 0% wszystkich testowanych urządzeń w tej klasie było lepszych, 0% podobnych, 100% gorszych
» Najlepszy miał deltę 5%, średnia wynosiła ###średnia###%, najgorsza wynosiła 45%
W porównaniu do wszystkich testowanych urządzeń
» 0% wszystkich testowanych urządzeń było lepszych, 0% podobnych, 100% gorszych
» Najlepszy miał deltę 4%, średnia wynosiła ###średnia###%, najgorsza wynosiła 134%
Zarządzanie energią
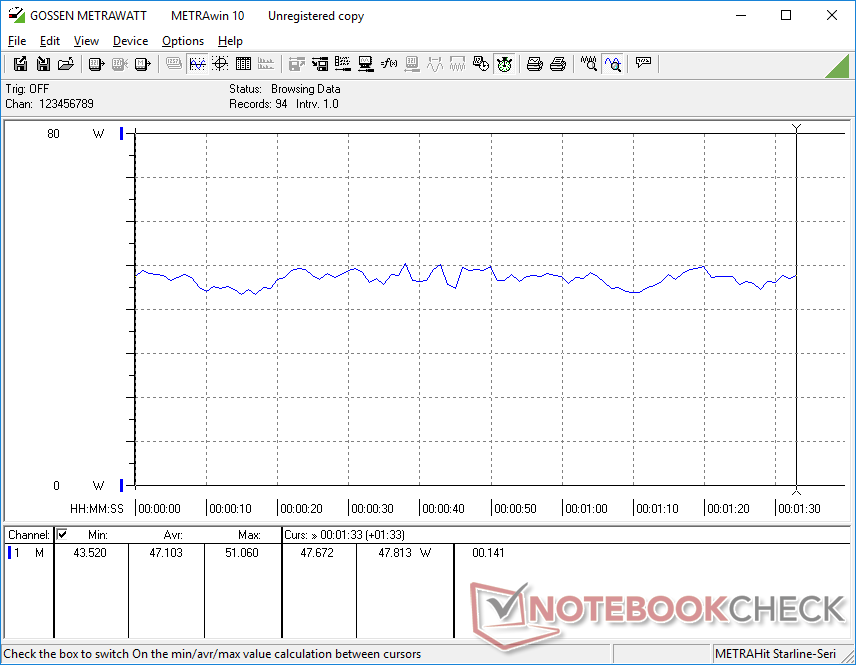
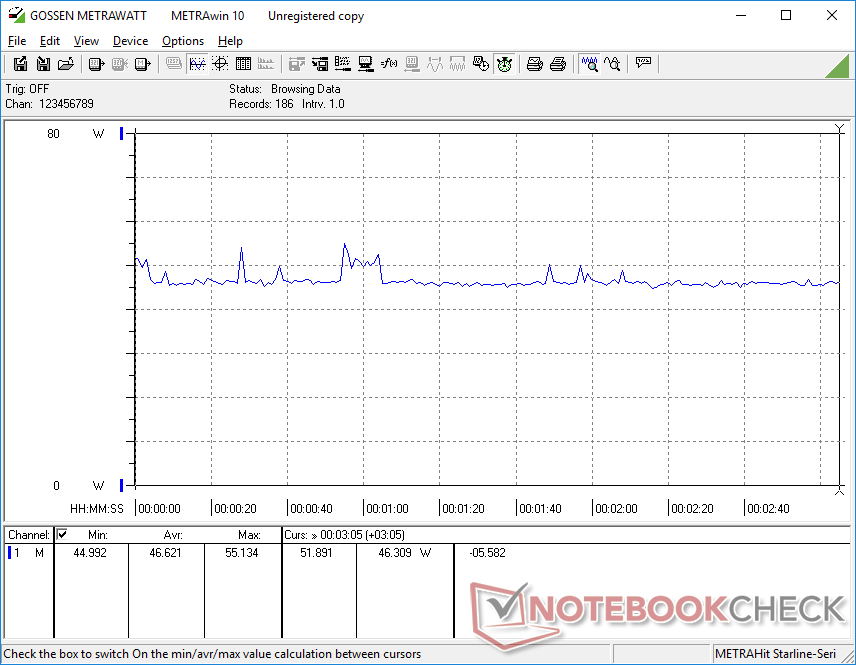
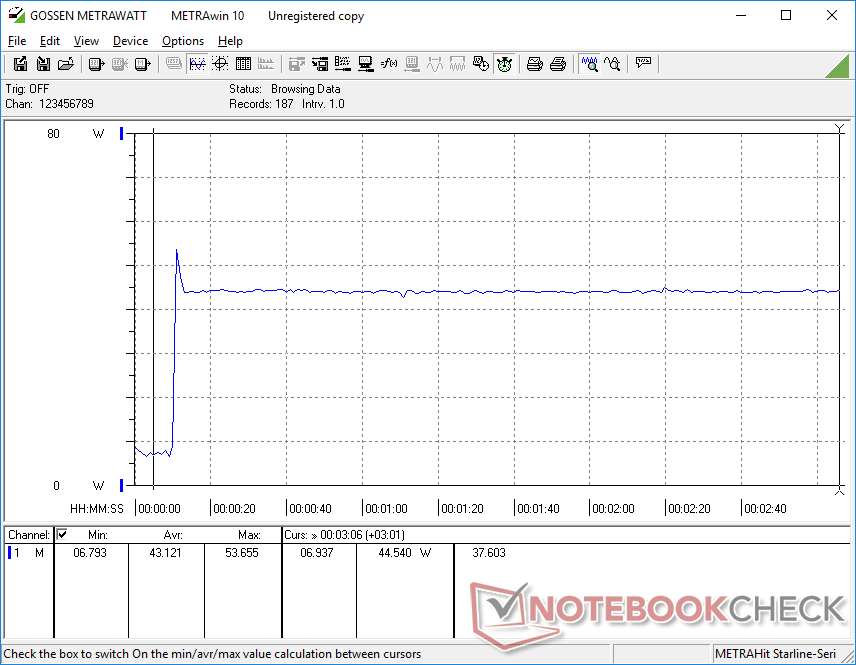
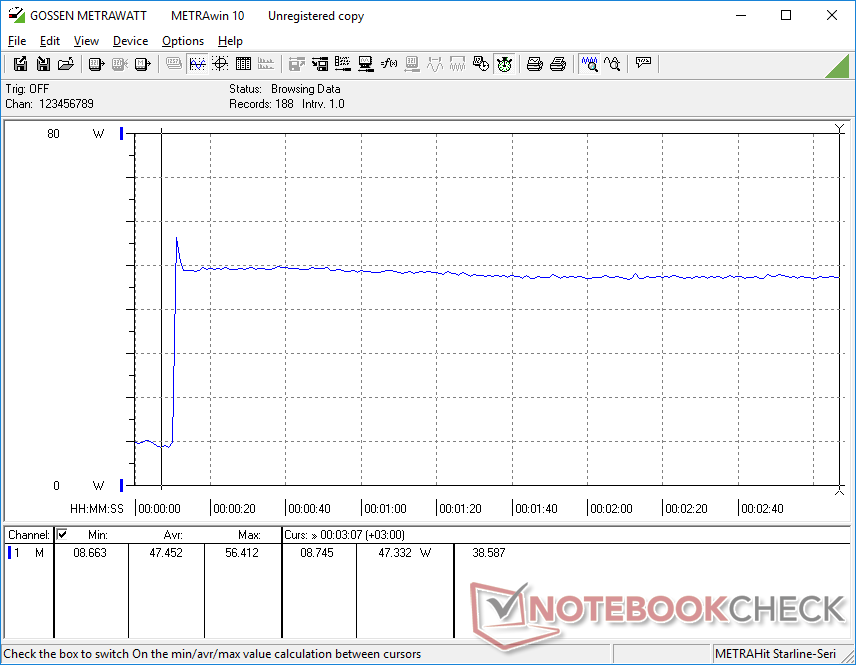
Zużycie energii
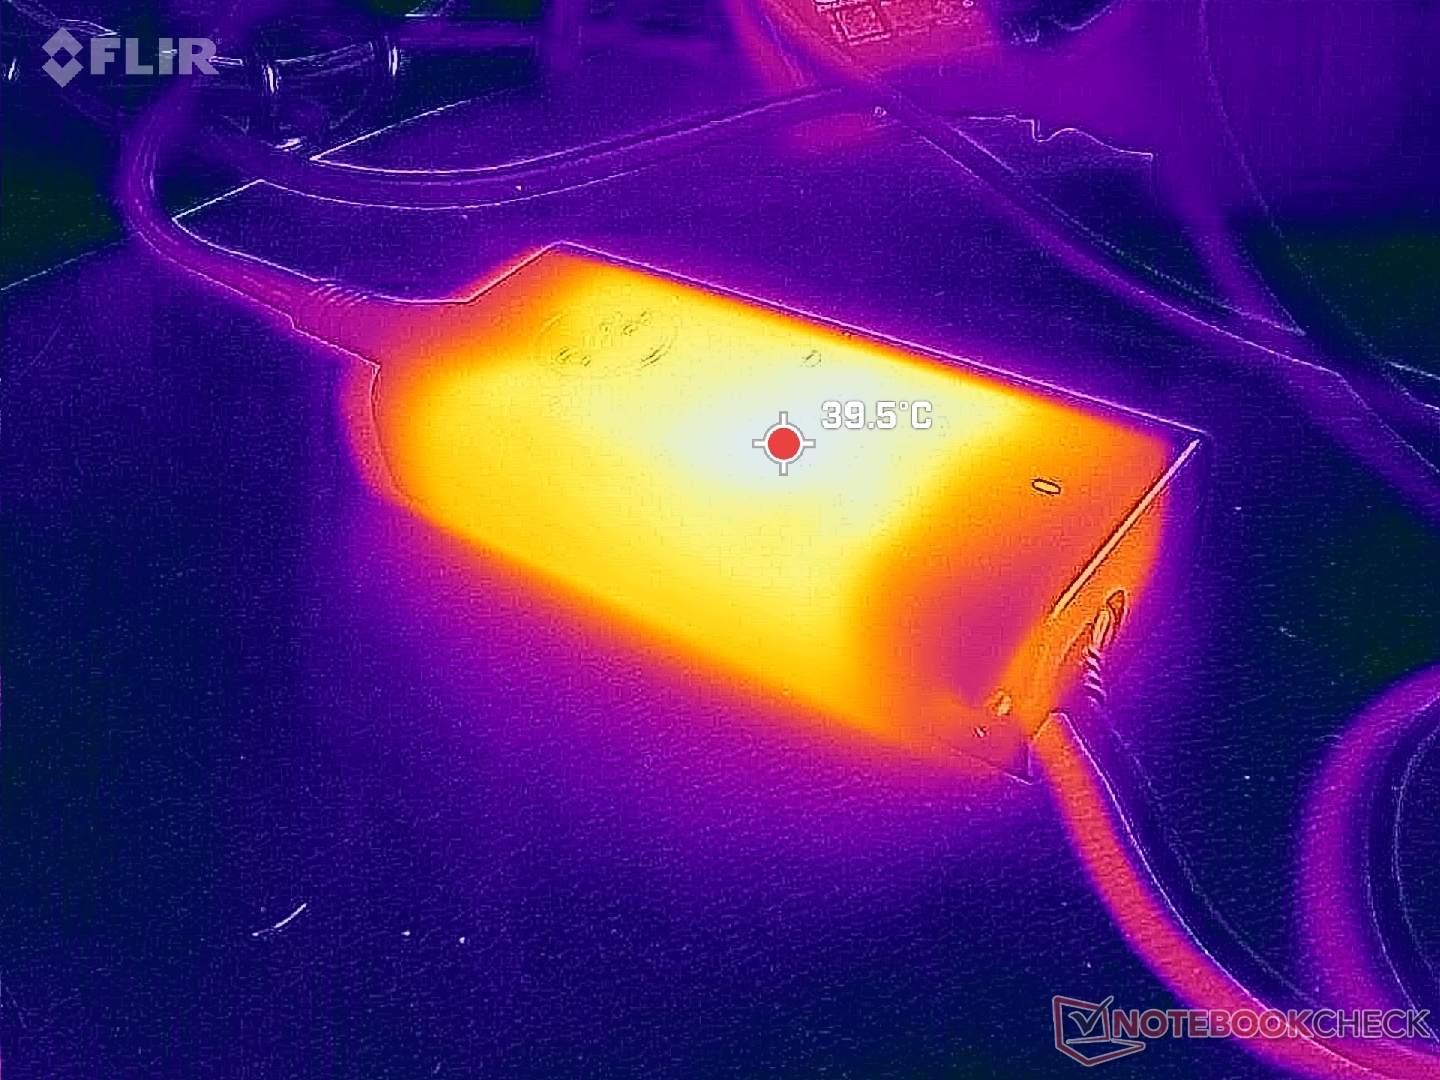
Zużycie energii w większości warunków jest konsekwentnie niższe niż w zeszłorocznym Inspironie 16 7620 2 w 1 z procesorem Core-P, co może być odpowiedzialne za dobre wyniki żywotności baterii w następnej sekcji. Jest on również niższy niż w zasilanym przez Core-U Yoga 7 16IRL8 aby pokazać doskonałą wydajność na wat w porównaniu z konkurencją.
Jesteśmy w stanie zmierzyć maksymalny pobór mocy 57 W z małego i średniego (~ 11,2 x 5 x 2,8 cm) zasilacza sieciowego 65 W, gdy procesor jest wykorzystywany w 100 procentach. Duży narzut zapewnia, że system może nadal ładować się podczas uruchamiania wymagających obciążeń, nawet jeśli w wolniejszym tempie, a procesor nie jest wąskim gardłem z powodu niewystarczającego rozmiaru zasilacza AC.
| wyłączony / stan wstrzymania | |
| luz | |
| obciążenie |
|
Legenda:
min: | |
| Dell Inspiron 16 7635 2-in-1 R5 7530U, Vega 7, Kioxia BG5 KBG50ZNS512G, IPS, 1920x1200, 16" | Acer Swift Edge SFE16-42-R1GM R7 7735U, Radeon 680M, Micron 3400 1TB MTFDKBA1T0TFH, OLED, 3840x2400, 16" | Lenovo Yoga 7 16IRL8 i7-1355U, Iris Xe G7 96EUs, WD PC SN740 512GB SDDPMQD-512G-1101, IPS, 1920x1200, 16" | Samsung Galaxy Book3 Pro 16 i5-1340P, Iris Xe G7 80EUs, WD PC SN740 256GB SDDPNQD-256G, AMOLED, 2880x1800, 16" | Lenovo IdeaPad Flex 5 16ABR G8 R7 7730U, Vega 8, Samsung PM9B1 1024GB MZAL41T0HBLB, IPS, 1920x1200, 16" | Dell Inspiron 16 7620 2-in-1 i7-1260P, Iris Xe G7 96EUs, Toshiba KBG40ZNS512G NVMe, IPS, 1920x1200, 16" | |
|---|---|---|---|---|---|---|
| Power Consumption | -15% | -8% | 8% | -21% | -10% | |
| Idle Minimum * (Watt) | 4.8 | 8.6 -79% | 3.3 31% | 3.9 19% | 5.4 -13% | 5.3 -10% |
| Idle Average * (Watt) | 7.6 | 7.7 -1% | 10.2 -34% | 4.8 37% | 11.1 -46% | 8.3 -9% |
| Idle Maximum * (Watt) | 8.7 | 9.3 -7% | 10.3 -18% | 10 -15% | 11.6 -33% | 9.6 -10% |
| Load Average * (Watt) | 47.1 | 47.9 -2% | 55.2 -17% | 44 7% | 52.7 -12% | 54.3 -15% |
| Witcher 3 ultra * (Watt) | 46.6 | 46.3 1% | 43.8 6% | 42.3 9% | 47.6 -2% | 43.9 6% |
| Load Maximum * (Watt) | 56.4 | 56 1% | 65.7 -16% | 63 -12% | 67 -19% | 70 -24% |
* ... im mniej tym lepiej
Power Consumption Witcher 3 / Stresstest
Power Consumption external Monitor
Żywotność baterii
Inspiron 16 7635 2-w-1 jest wyposażony w akumulator o pojemności 64 Wh w porównaniu do większego akumulatora 86 Wh w Inspiron 16 7630 2-w-1 lub 7620 2-w-1. Użytkownicy AMD otrzymują zatem krótszy koniec kija, ponieważ większa bateria jest obecnie dostępna wyłącznie w konfiguracjach Intela.
Czas pracy na baterii jest jednak nadal bardzo dobry pomimo mniejszego zestawu baterii w naszej jednostce AMD. Jesteśmy w stanie zarejestrować 14,5 godziny rzeczywistego przeglądania sieci WLAN, co jest prawie takie samo, jak to, co zarejestrowaliśmy na zeszłorocznym Inspironie 16 7620 2-w-1 z procesorem Intela. To dłużej niż podobnie wyposażony IdeaPad Flex 5 16 również o kilka godzin.
Ładowanie od pustego do pełnego naładowania za pomocą dołączonego zasilacza sieciowego zajmuje około 2 godzin.
| Dell Inspiron 16 7635 2-in-1 R5 7530U, Vega 7, 64 Wh | Acer Swift Edge SFE16-42-R1GM R7 7735U, Radeon 680M, 54 Wh | Lenovo Yoga 7 16IRL8 i7-1355U, Iris Xe G7 96EUs, 71 Wh | Samsung Galaxy Book3 Pro 16 i5-1340P, Iris Xe G7 80EUs, 76 Wh | Lenovo IdeaPad Flex 5 16ABR G8 R7 7730U, Vega 8, 52.5 Wh | Dell Inspiron 16 7620 2-in-1 i7-1260P, Iris Xe G7 96EUs, 87 Wh | |
|---|---|---|---|---|---|---|
| Czasy pracy | -43% | -17% | -3% | -37% | 11% | |
| Reader / Idle (h) | 26 | 10.9 -58% | 19 -27% | 30.4 17% | 17 -35% | |
| WiFi v1.3 (h) | 14.5 | 7.3 -50% | 9.4 -35% | 10.2 -30% | 9.8 -32% | 14.6 1% |
| Load (h) | 1.9 | 1.5 -21% | 2.1 11% | 2 5% | 1.1 -42% | 3.2 68% |
| H.264 (h) | 8.6 | 14.4 | 13.1 |
Za
Przeciw
Werdykt - wiele ściętych narożników w porównaniu do Inspiron 16 7630 2-w-1
Inspiron 16 7635 2-w-1 z procesorem AMD to coś więcej niż tylko wymiana procesora w porównaniu do Inspirona 16 7630 2-w-1 z procesorem Intela. Brakuje mu opcji ekranu dotykowego OLED o wyższej rozdzielczości, czujnika podczerwieni, oddzielnych opcji graficznych, większego akumulatora i obsługi Thunderbolt, a wszystko to w imię bycia nieco tańszym. Jeśli chcesz zapłacić tylko 100 USD więcej, zalecamy rozważenie modelu Inspiron 16 7630 2 w 1 z procesorem Core i7-1360P zamiast naszej konfiguracji Ryzen 5, ponieważ zapewni on zarówno szybszą wydajność procesora i karty graficznej, jak i podwoi pojemność pamięci masowej. Jest nieco cięższy o 100 g, ale obie wersje modelu są już dość ciężkie, zaczynając od 2 kg każda.
Głębsze kolory sRGB Inspirona 16 7635 2-w-1 dają Dellowi przewagę nad konkurencyjnym Lenovo Flex 5 16.
W przyszłych wersjach zdecydowanie chcielibyśmy zobaczyć opcje procesorów Zen 4 lub przynajmniej Zen 3+, aby zwiększyć mierną wydajność graficzną. Opcja Ryzen 7 7730U nie jest zalecana, ponieważ jest droższa, wolniejsza i ma mniej funkcji niż konfiguracja Core i7-1360P. Zeszłoroczny Inspiron 16 7620 2-w-1 nadal byłby wart rozważenia, zwłaszcza że najnowsza wersja nie jest lżejsza ani bardziej przenośna.
Cena i dostępność
Modele Inspiron 16 7635 2-w-1 i Inspiron 16 7630 2-w-1 są już dostępne w sprzedaży bezpośrednio od firmy Dell, a ich ceny zaczynają się odpowiednio od 650 USD i 800 USD. Recenzowana przez nas konfiguracja kosztuje 900 USD.
Dell Inspiron 16 7635 2-in-1
- 23/07/2023 v7 (old)
Allen Ngo
Przezroczystość
Wyboru urządzeń do recenzji dokonuje nasza redakcja. Próbka testowa została udostępniona autorowi jako pożyczka od producenta lub sprzedawcy detalicznego na potrzeby tej recenzji. Pożyczkodawca nie miał wpływu na tę recenzję, producent nie otrzymał też kopii tej recenzji przed publikacją. Nie było obowiązku publikowania tej recenzji. Jako niezależna firma medialna, Notebookcheck nie podlega władzy producentów, sprzedawców detalicznych ani wydawców.
Tak testuje Notebookcheck
Każdego roku Notebookcheck niezależnie sprawdza setki laptopów i smartfonów, stosując standardowe procedury, aby zapewnić porównywalność wszystkich wyników. Od około 20 lat stale rozwijamy nasze metody badawcze, ustanawiając przy tym standardy branżowe. W naszych laboratoriach testowych doświadczeni technicy i redaktorzy korzystają z wysokiej jakości sprzętu pomiarowego. Testy te obejmują wieloetapowy proces walidacji. Nasz kompleksowy system ocen opiera się na setkach uzasadnionych pomiarów i benchmarków, co pozwala zachować obiektywizm.Price comparison

