Werdykt - XPS odrodzony
Podobnie jak nowy XPS 14, XPS 16 2026 rozwiązuje niektóre z głównych obaw związanych z modelem 2025, zapewniając ogólnie lepsze wrażenia użytkownika. System jest teraz znacznie lżejszy i bardziej przyjazny w podróży, z czystszą estetyką wizualną i bez frustrujących klawiszy dotykowych. Przejście na Panther Lake znacznie poprawiło również wydajność w przeliczeniu na wat, aby wydłużyć czas pracy o co najmniej kilka godzin.
Kluczowy powód odchudzonej, cichszej i bardziej kompaktowej konstrukcji w tym roku można przypisać jednej ważnej zmianie: brak dodatkowych opcji graficznych. Brak dGPU oznacza, że system może obejść się bez mniejszej płytki PCB, mniejszego rozwiązania chłodzącego i cieńszego profilu dla ogólnie lżejszego modelu. Użytkownicy będą musieli poświęcić wydajność graficzną, ponieważ zintegrowany procesor graficzny Panther Lake - jakkolwiek wydajny - nie może równać się z surową mocą GeForce RTX 5070 w odchodzącym Dell 16 Premium. Zewnętrzne GPU mogą obejść to ograniczenie, ale twórcy treści lub gracze wymagający większej wydajności graficznej w podróży mogą znaleźć lepszą wartość w modelu 2025.
Smuklejsza i bardziej skoncentrowana konstrukcja nowego XPS 16 może czasami wydawać się ogołocona w porównaniu do niektórych konkurentów. Alternatywy takie jak Samsung Galaxy Book6 Ultra lub Asus Zenbook S16 oferują więcej zintegrowanych portów, a nawet obsługę dodatkowych dysków SSD M.2, aby zmniejszyć zależność od adapterów lub stacji dokujących.
Za
Przeciw
Cena i dostępność
Dell dostarcza obecnie XPS 16 w cenie od 1750 USD za konfigurację z Core Ultra 5 325, jak w recenzji, do 2160 USD za konfigurację z Core Ultra X7 358H OLED z ekranem dotykowym.
Spis treści
- Werdykt - XPS odrodzony
- Specyfikacje
- Obudowa - o wiele lżejsza niż wcześniej
- Łączność
- Urządzenia wejściowe - pożegnanie z klawiszami dotykowymi
- Wyświetlacz - jeden z najlepszych paneli FHD+ IPS
- Wydajność - stawianie wszystkiego na Panther Lake
- Emisje - ciszej, ale wciąż dość ciepło
- Zarządzanie energią - Panther Lake jest królem wydajności
- Ocena Notebookcheck
- Potencjalni konkurenci w porównaniu
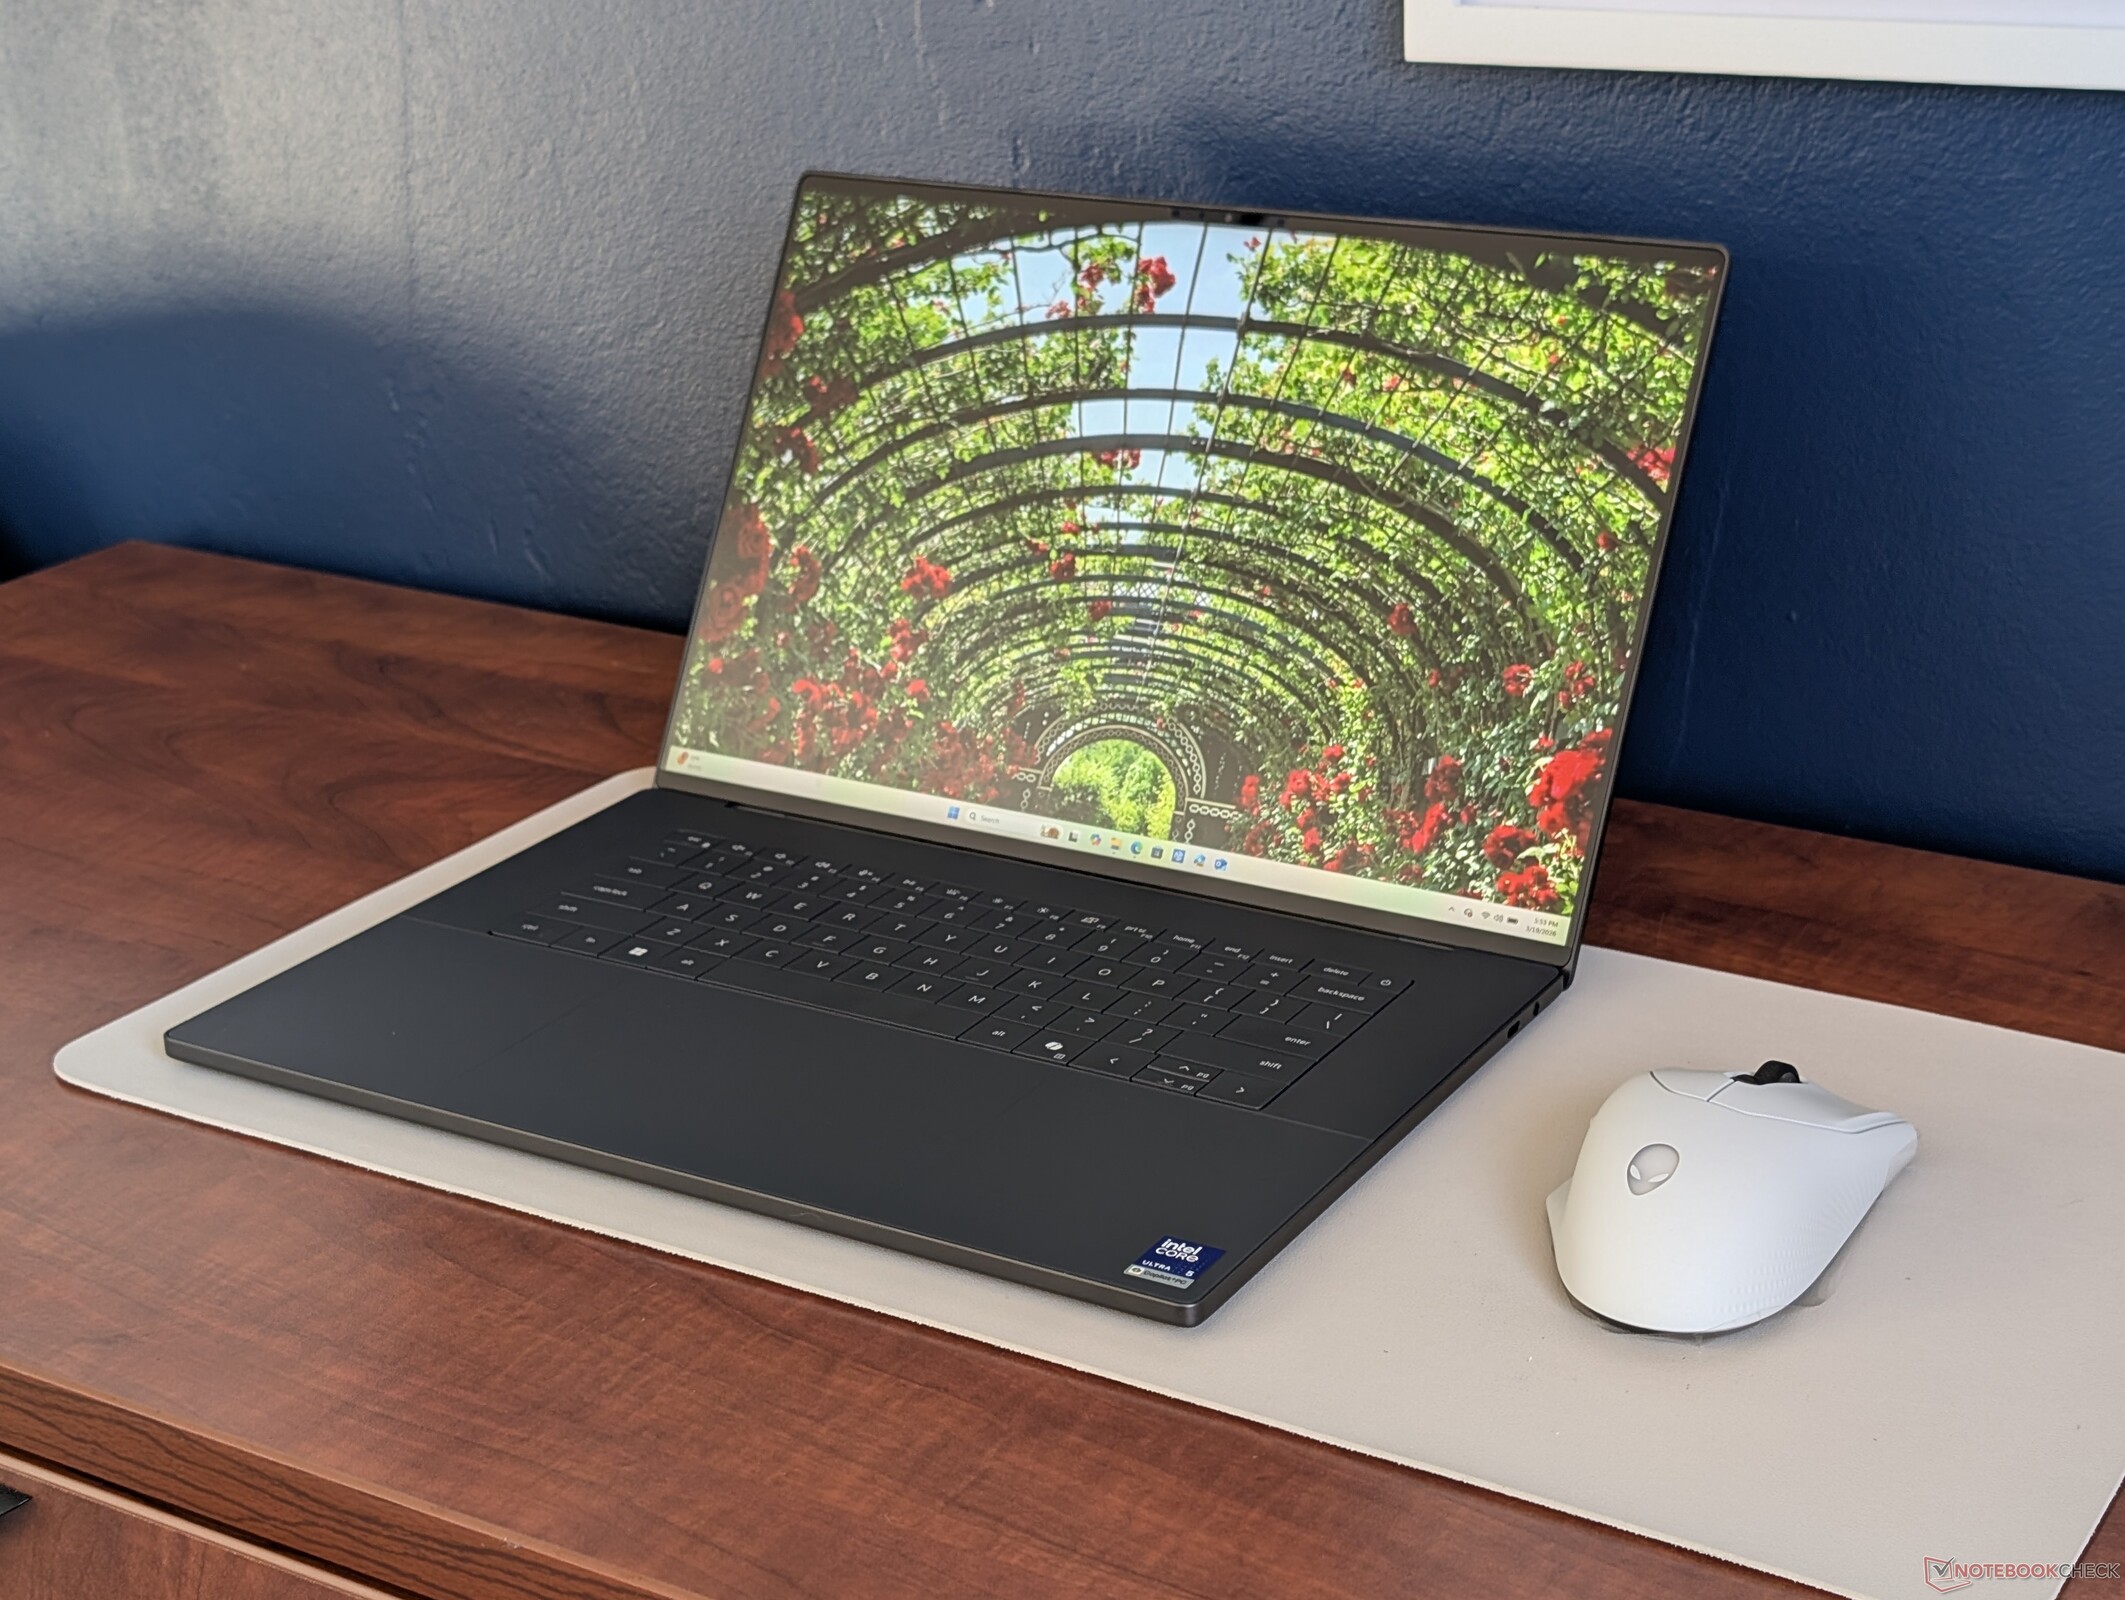
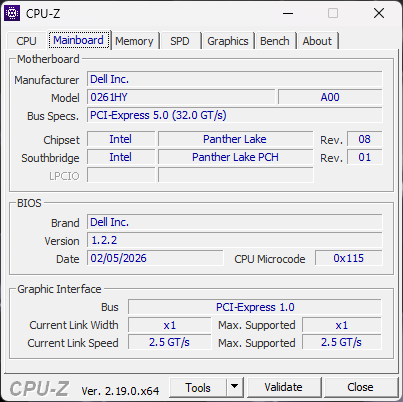
Zaprezentowany na targach CES 2026 wraz z nowym XPS 14, 2026 XPS 16 jest odrodzeniem serii po tym, jak w zeszłym roku pominął markę "XPS" na rzecz "Dell 16 Premium". Nowy model oferuje nie tylko najnowsze opcje procesorów Intel Panther Lake, ale także zaktualizowaną konstrukcję obudowy, która zapewnia ulepszone wrażenia użytkownika w porównaniu z poprzednimi latami.
Nasza jednostka testowa to podstawowa konfiguracja z procesorem Core Ultra 5 325 i wyświetlaczem FHD + 120 Hz IPS za około 1700 USD. Wyższe konfiguracje obejmują Core Ultra 7 355, Core Ultra X7 358H i ekran dotykowy OLED 120 Hz za prawie 2200 USD. Wszystkie opcje w momencie publikacji są dostarczane tylko ze zintegrowaną grafiką.
Alternatywy dla Dell XPS 16 obejmują inne wysokiej klasy 16-calowe urządzenia multimedialne, takie jak Samsung Galaxy Book6 Ultra, Asus Zenbook S16lub Lenovo Yoga Pro 9 16.
Więcej recenzji Dell:
Specyfikacje
Obudowa - o wiele lżejsza niż wcześniej
Przeprojektowana obudowa jest mało podobna do poprzedniej wersji Dell 16 Premium lub 2024 XPS 16. Niemniej jednak składa się z tych samych materiałów, co 2026 XPS 14, a więc nasze wrażenia z XPS 14 przekładają się na nowy XPS 16. Sztywność jest tak samo dobra jak wcześniej, ale z bardziej pudełkowymi krawędziami i narożnikami, które dokładniej naśladują wizualny styl MacBook Pro 16.
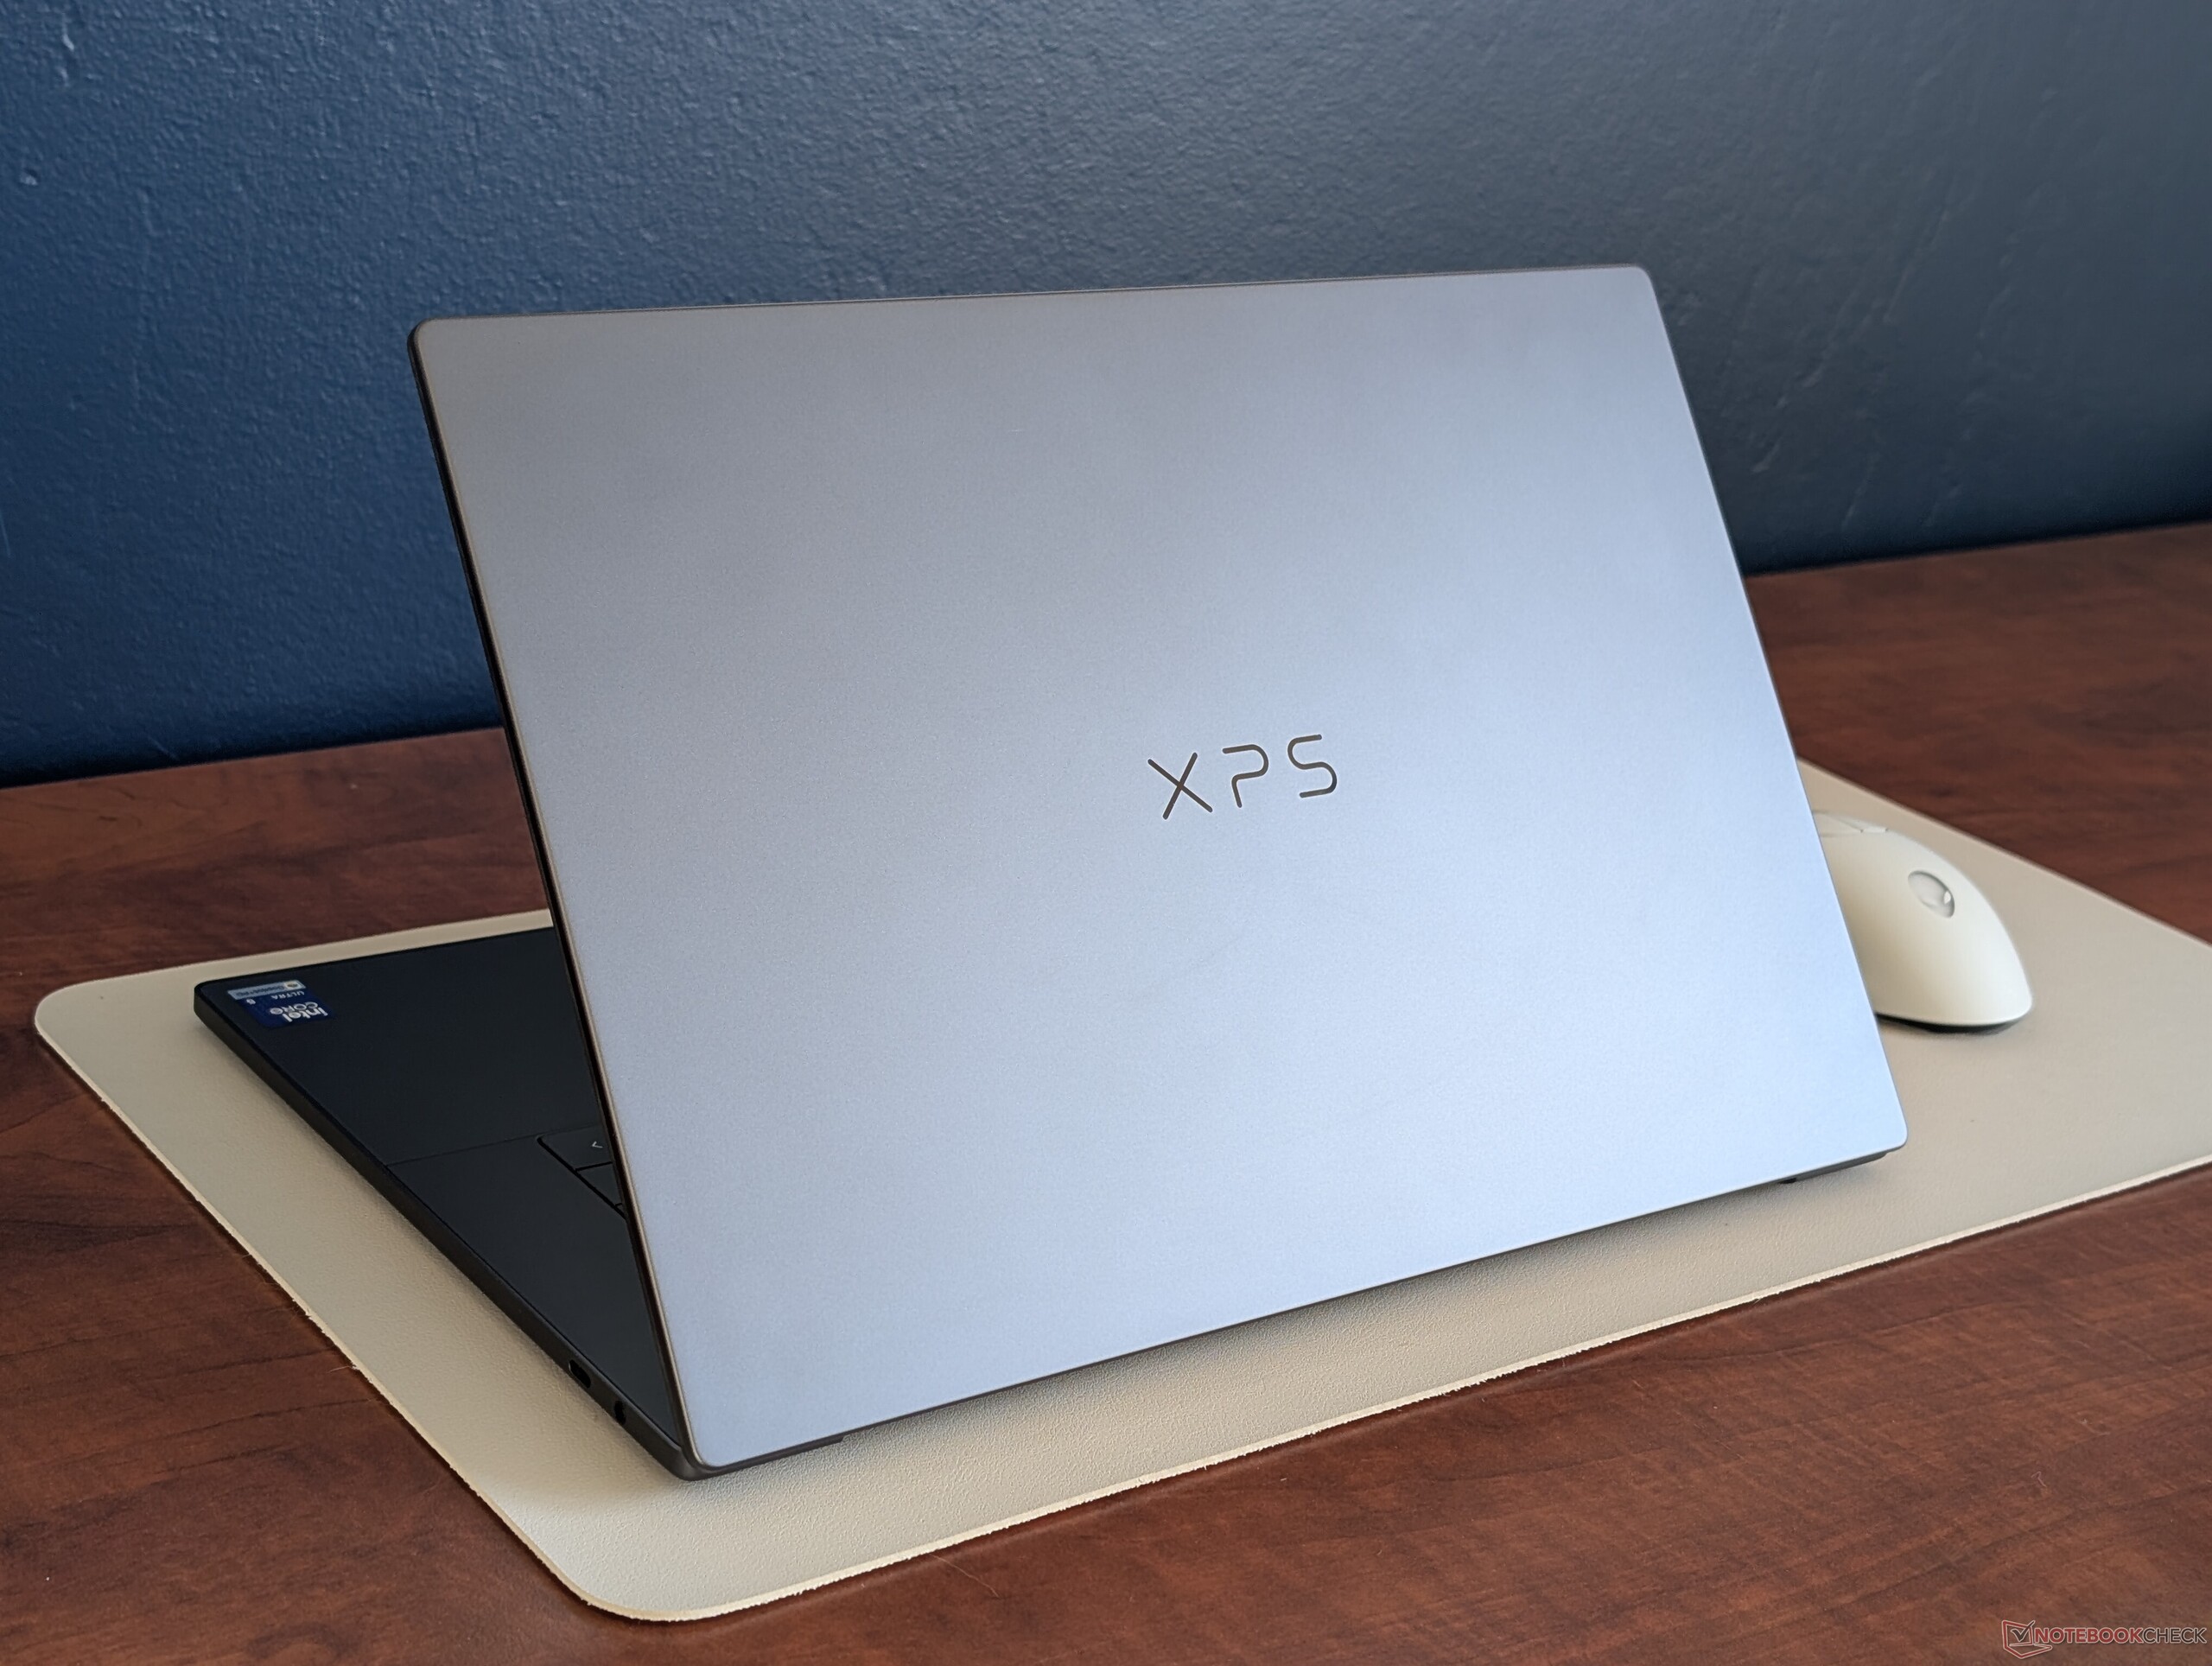
Różnice w rozmiarze i wadze pomiędzy nowym XPS 16 a starszym XPS 16 (lub Dell 16 Premium) są znaczące. Zaktualizowany model jest zauważalnie mniejszy pod względem długości, szerokości i wysokości, a jednocześnie jest znacznie lżejszy o około 600 gramów. Zmiany te były możliwe głównie dzięki rezygnacji z oddzielnych opcji graficznych i chłodzenia komorą parową podczas przechodzenia na nową konstrukcję XPS 16. Rozmiar ekranu został również nieznacznie zmniejszony z 16,3 cala do 16,0 cala.


Łączność
Wszystkie trzy porty USB-C obsługują teraz Thunderbolt 4, podczas gdy nie było to prawdą w zeszłorocznym modelu. Niestety, Dell zrezygnował z gniazda kart MicroSD, ku rozczarowaniu właścicieli lustrzanek cyfrowych.
Konkurencyjne modele, takie jak Asus Zenbook S16 lub Lenovo Yoga Pro 9 16IAH10 mają zwykle więcej zintegrowanych portów i opcji niż Dell.


Komunikacja

Kamera internetowa
Kamera została ulepszona z 2 MP w Dell 16 Premium do 8 MP w nowym XPS 16. Chociaż obsługiwana jest podczerwień, nadal nie ma fizycznej migawki aparatu.


Konserwacja
Procedury serwisowe są zupełnie inne niż w przypadku zeszłorocznego modelu XPS 16, ale poza tym niemal identyczne jak w przypadku nowego XPS 14 szczegółowo tutaj. Zamiast zdejmować dolny panel, użytkownicy muszą ostrożnie zdjąć klawiaturę, aby uzyskać dostęp do płyty głównej, więc proces jest nieco bardziej skomplikowany.
Opcje aktualizacji są niestety bardzo ograniczone. Model ten obsługuje tylko jeden dysk SSD M.2 i nie ma innych komponentów, które można by rozbudować, pomimo dużej 16-calowej obudowy.

Zrównoważony rozwój
Dell twierdzi, że 75% aluminium pochodzącego z recyklingu w górnej i dolnej pokrywie, 50% kobaltu pochodzącego z recyklingu dla baterii, 90% stali pochodzącej z recyklingu dla klawiszy, 100% miedzi pochodzącej z recyklingu dla PCB baterii i 10% szkła pochodzącego z recyklingu dla konfiguracji OLED. Opakowanie w pełni nadaje się do recyklingu i nie zawiera plastiku.
Akcesoria i gwarancja
W pudełku nie ma żadnych dodatków poza zasilaczem sieciowym i dokumentacją. Standardowa roczna ograniczona gwarancja producenta ma zastosowanie w przypadku zakupu w USA z opcją przedłużenia do czterech lat.
Urządzenia wejściowe - pożegnanie z klawiszami dotykowymi
Klawiatura
Dell (na szczęście) porzucił kontrowersyjne klawisze dotykowe z zeszłorocznego modelu na rzecz bardziej tradycyjnego podejścia. W rzeczywistości rozmiar klawiszy i informacje zwrotne są identyczne jak w nowy XPS 14 zapewniając takie same wrażenia z pisania między nimi, pomimo większej obudowy naszego XPS 16.
Panel dotykowy
W przeciwieństwie do klawiatury, clickpad korzysta z większej 16-calowej obudowy, ponieważ jego powierzchnia jest nieco większa niż clickpada w XPS 14 (~15,2 x 9 cm vs ~15,2 x 7,5 cm). Trakcja jest bardzo płynna, ale działania wielodotykowe lub przeciąganie i upuszczanie są nadal trudne ze względu na płytkie i słabe sprzężenie zwrotne. "Niewidzialny" clickpad prawdopodobnie nadal faworyzuje formę nad funkcją.


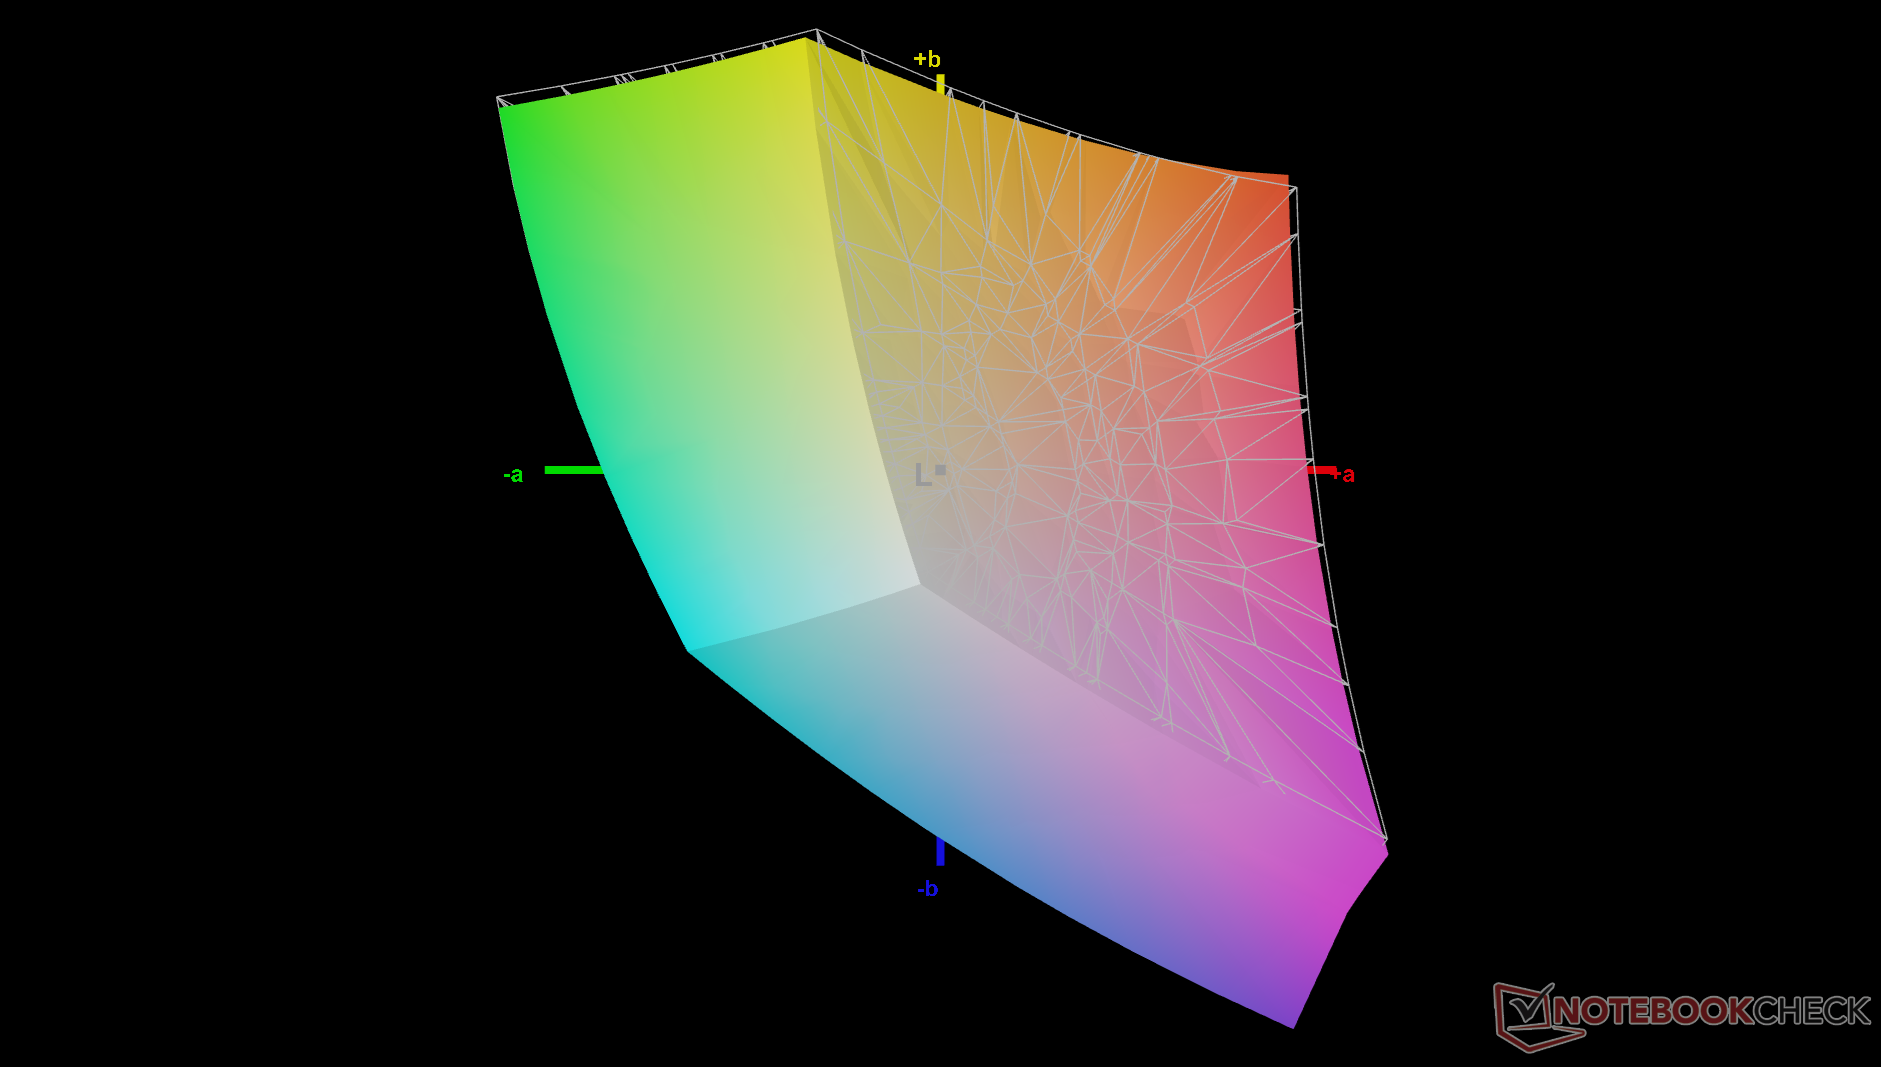
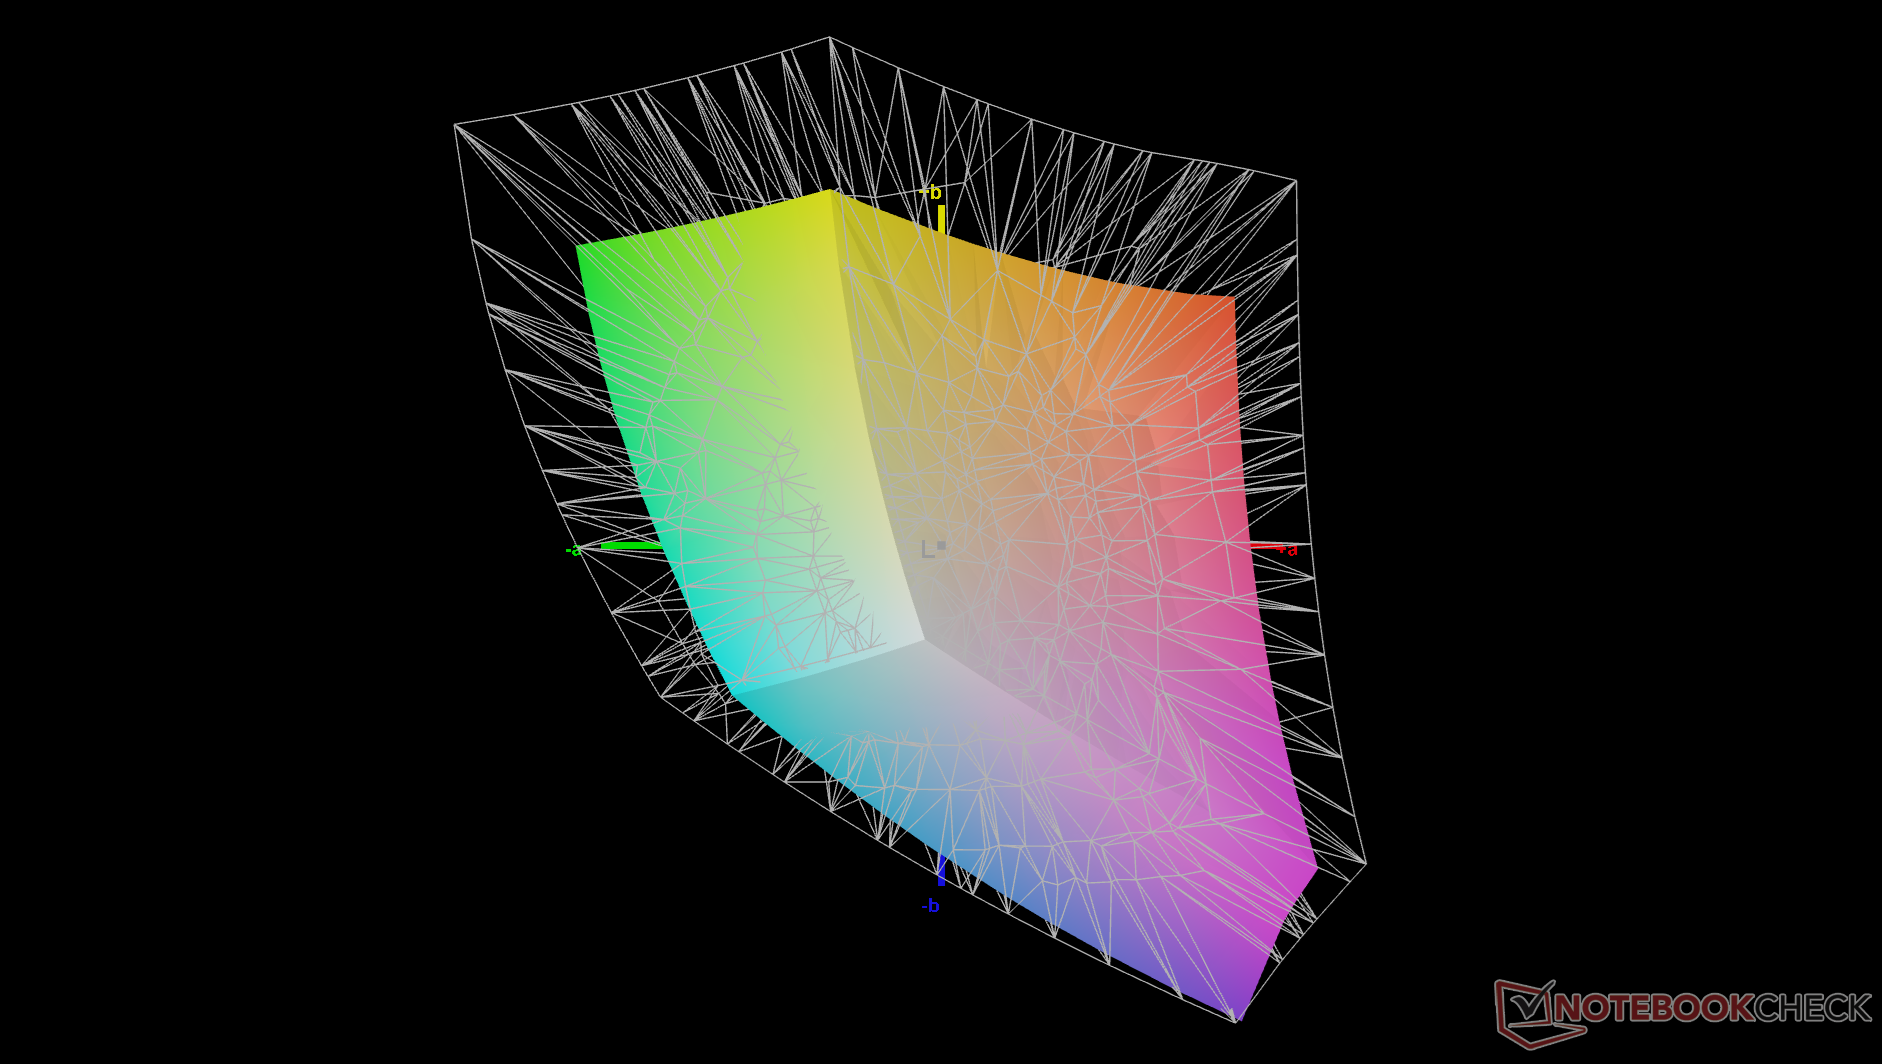
Wyświetlacz - jeden z najlepszych paneli FHD+ IPS
Dostępne są dwie opcje wyświetlania:
- 1920 x 1200, 100% sRGB, IPS, bezdotykowy, 1 - 120 Hz, matowy
- 3200 x 2000, 100% DCI-P3, OLED, ekran dotykowy, 20 - 120 Hz, DisplayHDR 500, błyszczący
Podstawowy wyświetlacz oferuje bardzo wysoki współczynnik kontrastu ~2000:1, szczególnie jak na panel IPS. Jakość obrazu jest zaskakująco ostra jak na matową nakładkę, a pełne kolory sRGB powinny zadowolić większość ogólnych użytkowników lub zwykłych twórców treści. Głębsze kolory P3, obsługa HDR lub funkcje ekranu dotykowego są dostępne tylko w droższych konfiguracjach OLED.
Proszę zauważyć, że funkcja VRR jest domyślnie wyłączona. Użytkownicy mogą włączyć VRR za pomocą zaawansowanych opcji wyświetlania systemu Windows. Minimalna częstotliwość odświeżania 1 Hz to unikalna cecha panelu bazowego, której nie znajdziemy w większości innych laptopów.


| |||||||||||||||||||||||||
rozświetlenie: 92 %
na akumulatorze: 534.6 cd/m²
kontrast: 2056:1 (czerń: 0.26 cd/m²)
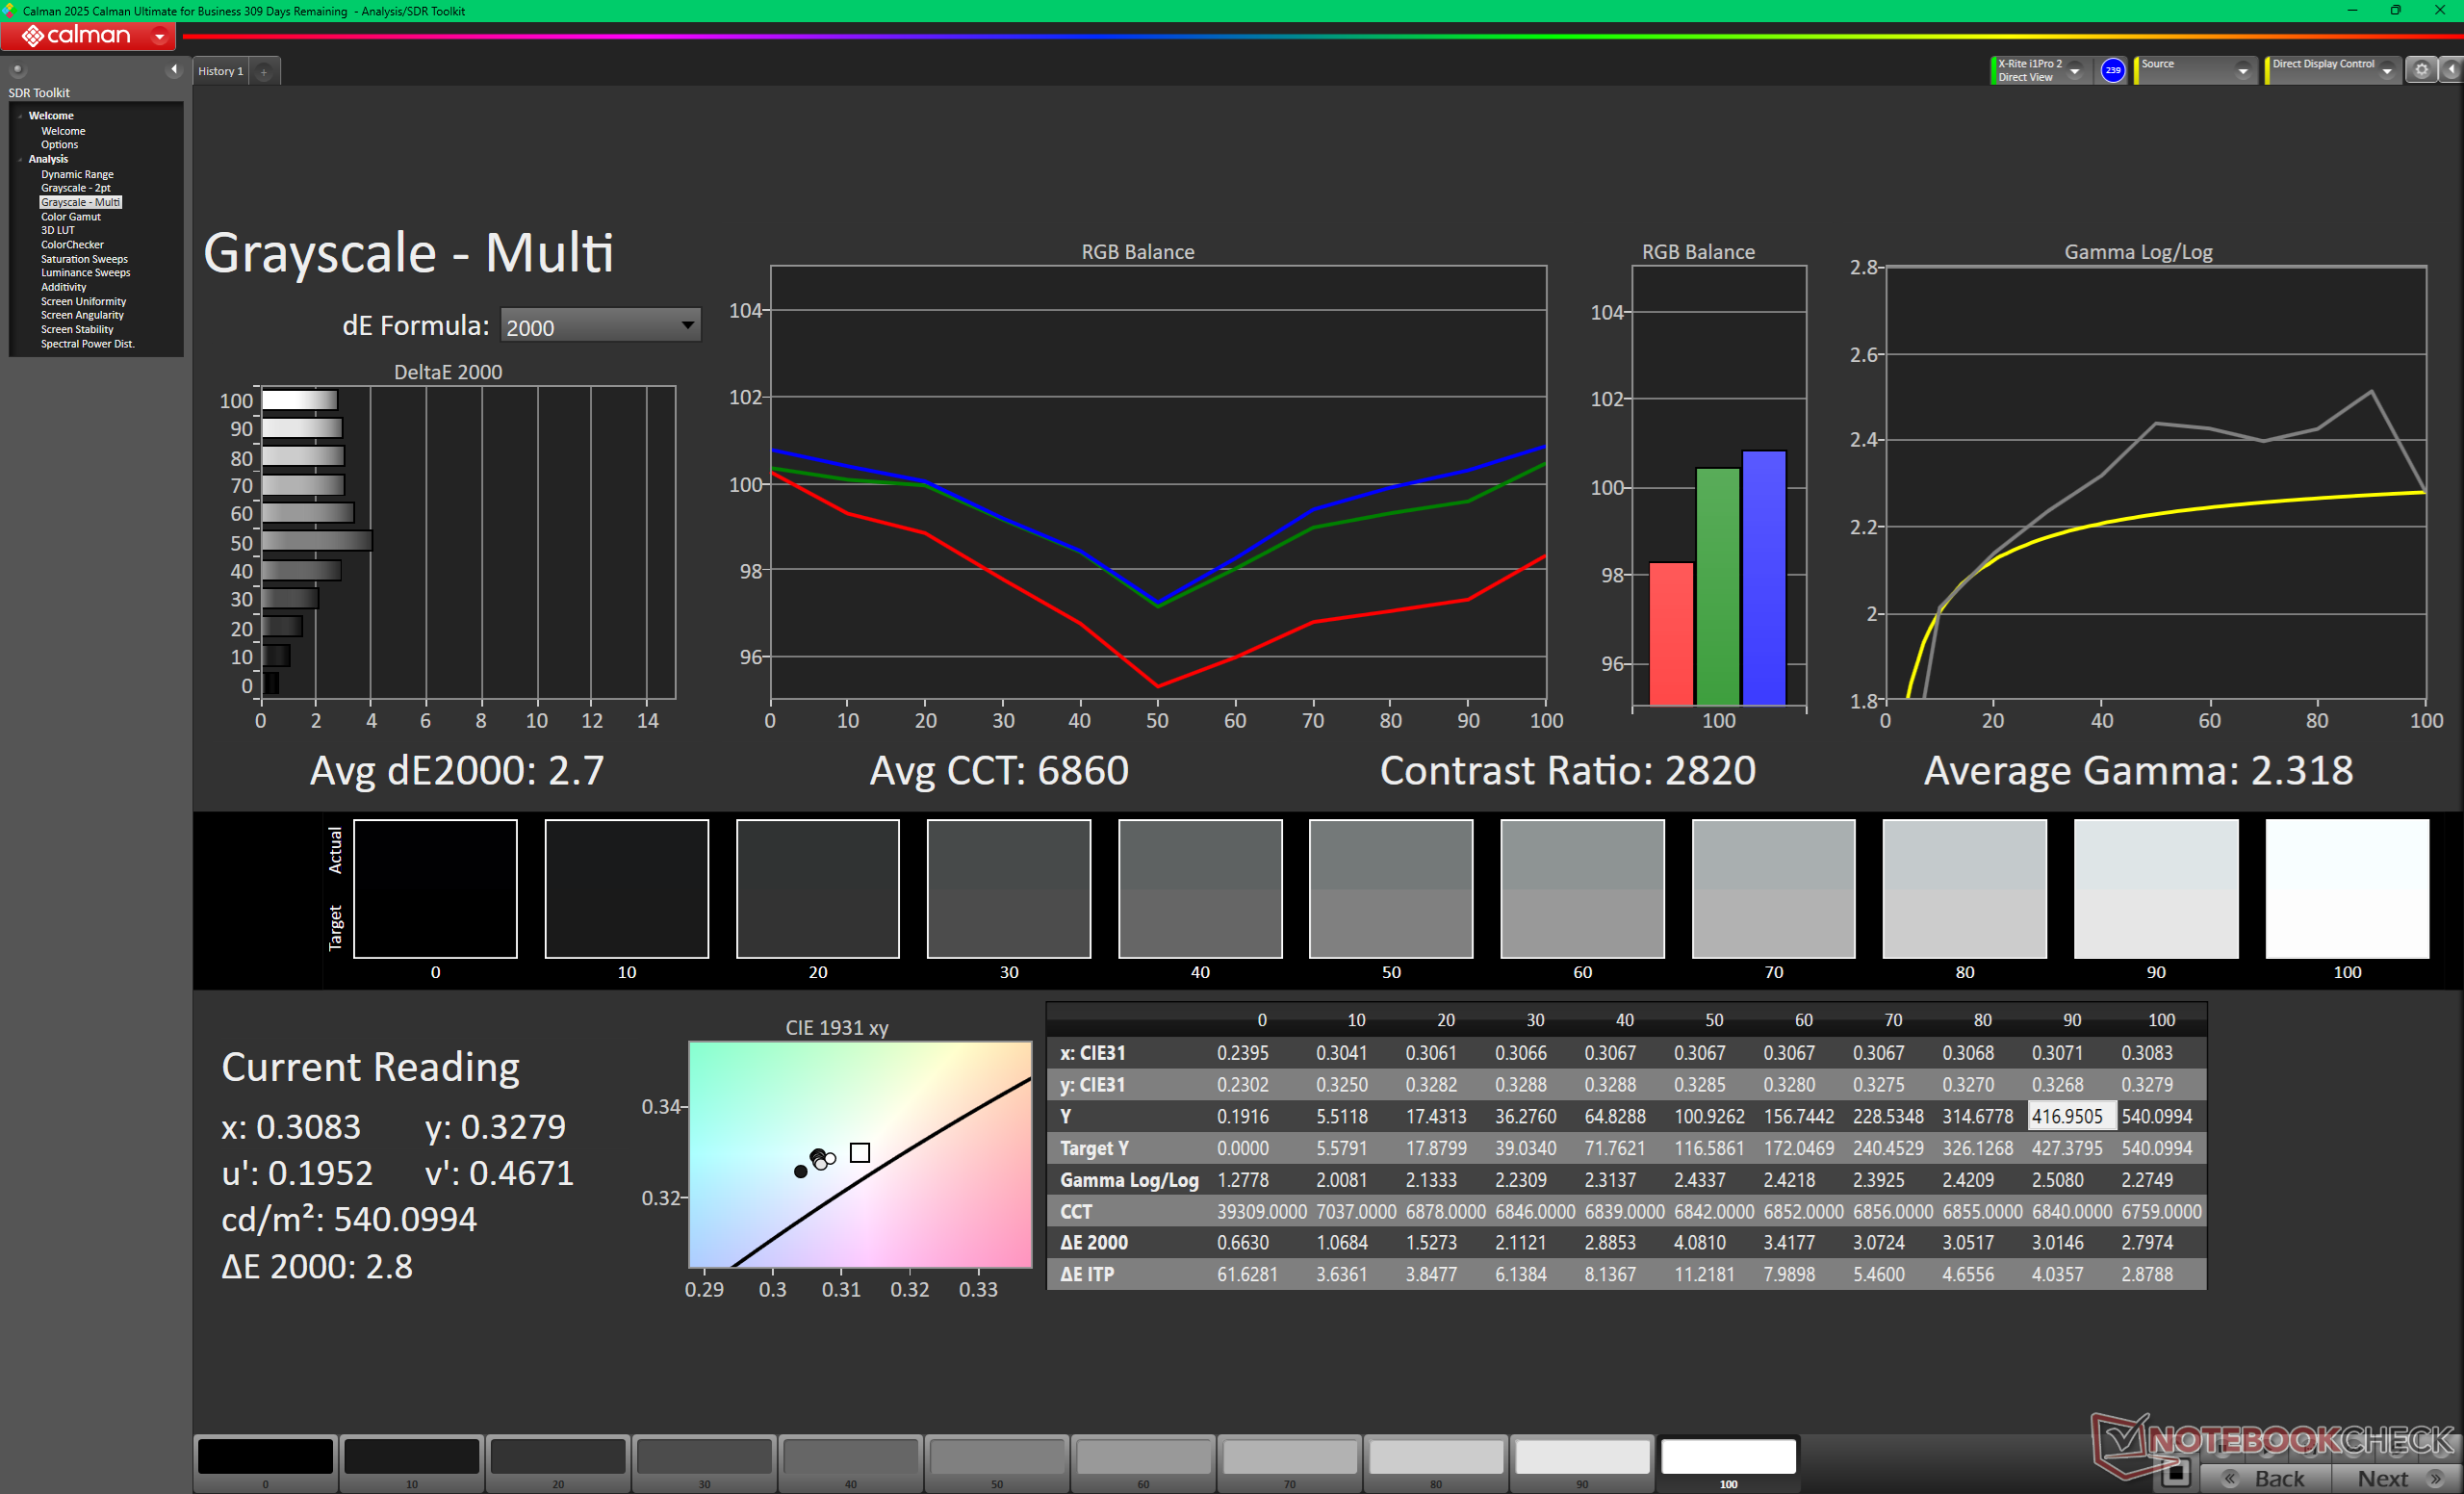
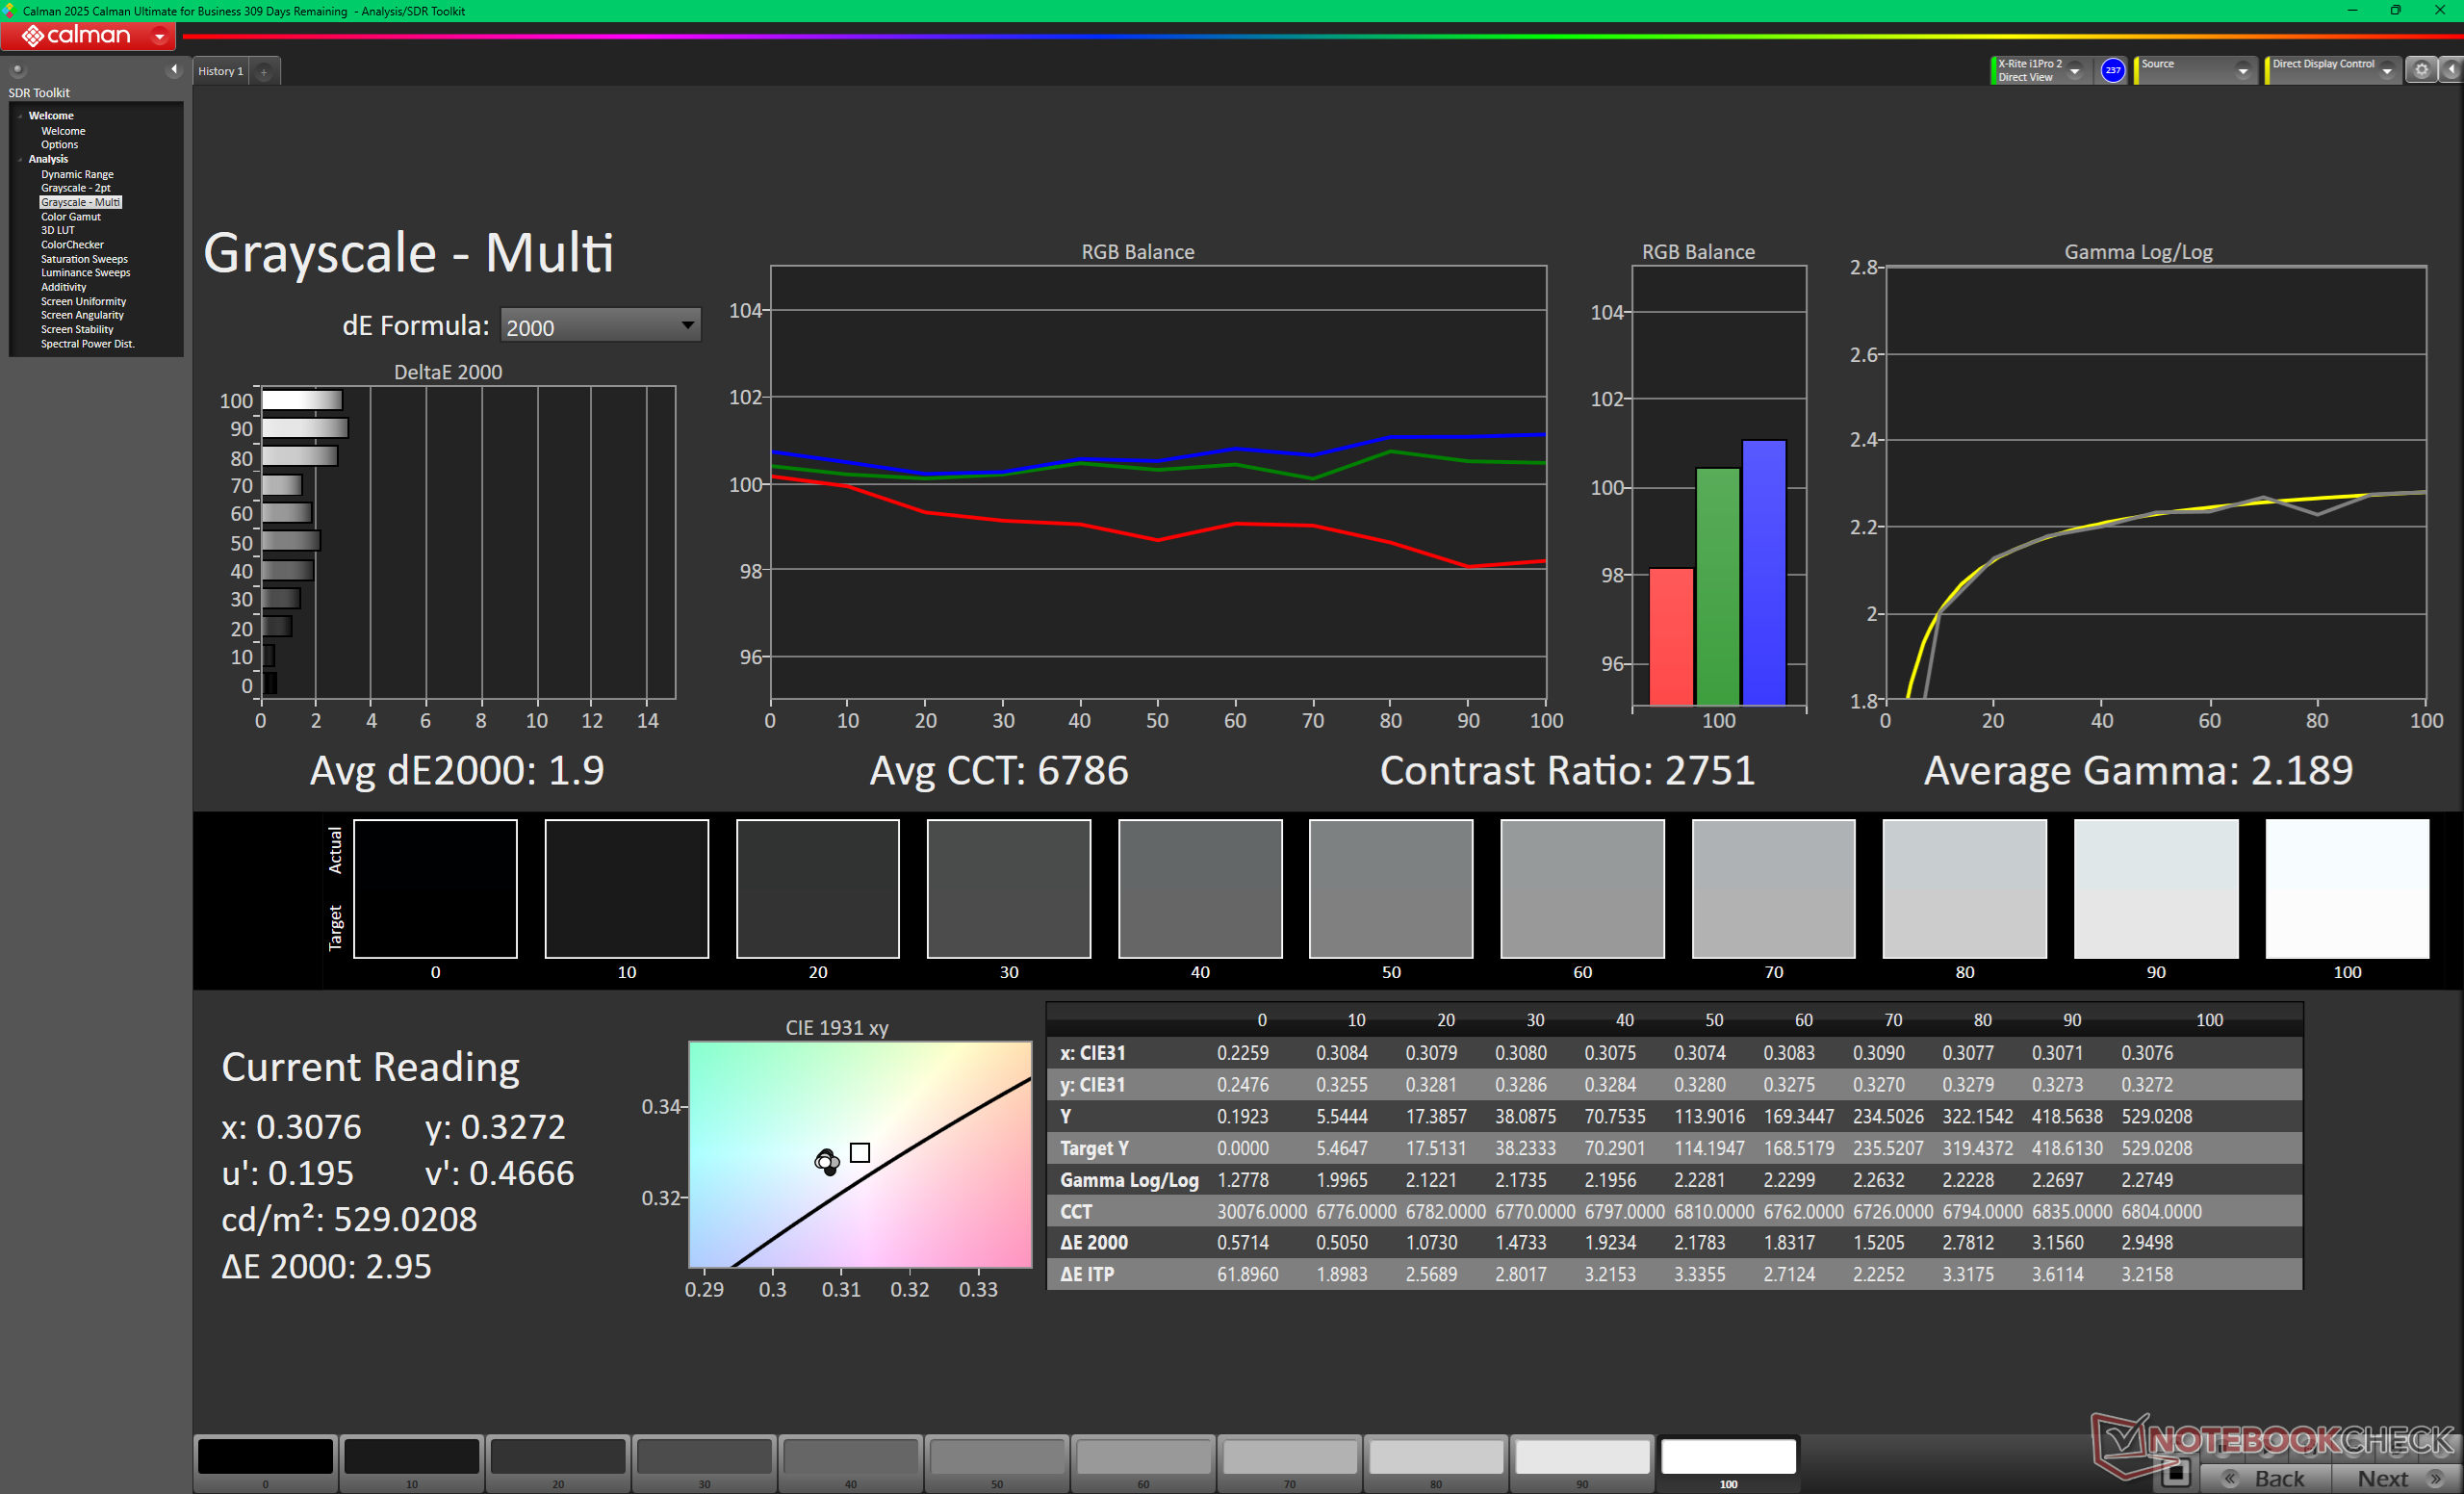
ΔE ColorChecker Calman: 2.53 | ∀{0.5-29.43 Ø4.73}
calibrated: 1.26
ΔE Greyscale Calman: 2.7 | ∀{0.09-98 Ø4.97}
67.7% AdobeRGB 1998 (Argyll 3D)
97.4% sRGB (Argyll 3D)
66.2% Display P3 (Argyll 3D)
Gamma: 2.32
CCT: 6860 K
| Dell XPS 16 Core Ultra 5 325 LG Philips 160WUX, IPS, 1920x1200, 16", 120 Hz | Dell XPS 16 9640 SDC4196, OLED, 3840x2400, 16.3", 90 Hz | Lenovo Yoga Pro 9 16IAH10 RTX 5050 ATNA60HR04-0, OLED, 2880x1800, 16", 120 Hz | Samsung Galaxy Book6 Ultra ATNA60HR05-0, OLED, 2880x1800, 16", 120 Hz | Asus ZenBook S16 UM5606GA ATNA60HR07-0, OLED, 2880x1800, 16", 120 Hz | MSI Prestige 16 AI Evo B2HMG B160QAN03_R, IPS, 2560x1600, 16", 60 Hz | |
|---|---|---|---|---|---|---|
| Display | 27% | 25% | 31% | 24% | ||
| Display P3 Coverage (%) | 66.2 | 98.3 48% | 97 47% | 99.8 51% | 96.4 46% | |
| sRGB Coverage (%) | 97.4 | 100 3% | 99.9 3% | 100 3% | 99.7 2% | |
| AdobeRGB 1998 Coverage (%) | 67.7 | 87.8 30% | 85.3 26% | 94 39% | 84.3 25% | |
| Response Times | 98% | 99% | 98% | -12% | ||
| Response Time Grey 50% / Grey 80% * (ms) | 39.3 ? | 0.82 ? 98% | 0.5 ? 99% | 1.27 ? 97% | 51.5 ? -31% | |
| Response Time Black / White * (ms) | 26 ? | 0.85 ? 97% | 0.4 ? 98% | 0.43 ? 98% | 24.3 ? 7% | |
| PWM Frequency (Hz) | 360 ? | 1200 | 240 ? | 960 ? | ||
| PWM Amplitude * (%) | 37 | 100 | 56 | |||
| Screen | 8% | -15% | 26% | 18% | -55% | |
| Brightness middle (cd/m²) | 534.6 | 366 -32% | 471.7 -12% | 499 -7% | 465 -13% | 471 -12% |
| Brightness (cd/m²) | 515 | 367 -29% | 474 -8% | 505 -2% | 466 -10% | 455 -12% |
| Brightness Distribution (%) | 92 | 96 4% | 98 7% | 97 5% | 99 8% | 92 0% |
| Black Level * (cd/m²) | 0.26 | 0.2 23% | ||||
| Contrast (:1) | 2056 | 2355 15% | ||||
| Colorchecker dE 2000 * | 2.53 | 1.3 49% | 3.53 -40% | 0.9 64% | 1 60% | 5.8 -129% |
| Colorchecker dE 2000 max. * | 4.57 | 3.6 21% | 6.31 -38% | 2.1 54% | 3 34% | 10.8 -136% |
| Colorchecker dE 2000 calibrated * | 1.26 | 1 21% | 1.9 -51% | |||
| Greyscale dE 2000 * | 2.7 | 2.2 19% | 2.6 4% | 1.6 41% | 1.9 30% | 7.8 -189% |
| Gamma | 2.32 95% | 2.14 103% | 2.24 98% | 2.22 99% | 2.19 100% | 2.07 106% |
| CCT | 6860 95% | 6680 97% | 6292 103% | 6445 101% | 6458 101% | 7262 90% |
| Całkowita średnia (program / ustawienia) | 44% /
27% | -15% /
-15% | 50% /
39% | 49% /
36% | -14% /
-32% |
* ... im mniej tym lepiej
Wyświetlacz jest przyzwoicie skalibrowany po wyjęciu z pudełka, z pewnym polem do poprawy. Kalibracja za pomocą naszego własnego kolorymetru X-Rite, na przykład, poprawiłaby i tak już niskie średnie wartości deltaE skali szarości i kolorów z 2,7 i 2,53 do zaledwie 1,9 i 1,26, odpowiednio. Nasz powyższy skalibrowany profil ICM jest dostępny do pobrania powyżej za darmo.


Wyświetl czasy reakcji
| ↔ Czas reakcji od czerni do bieli | ||
|---|---|---|
| 26 ms ... wzrost ↗ i spadek ↘ łącznie | ↗ 11.7 ms wzrost | 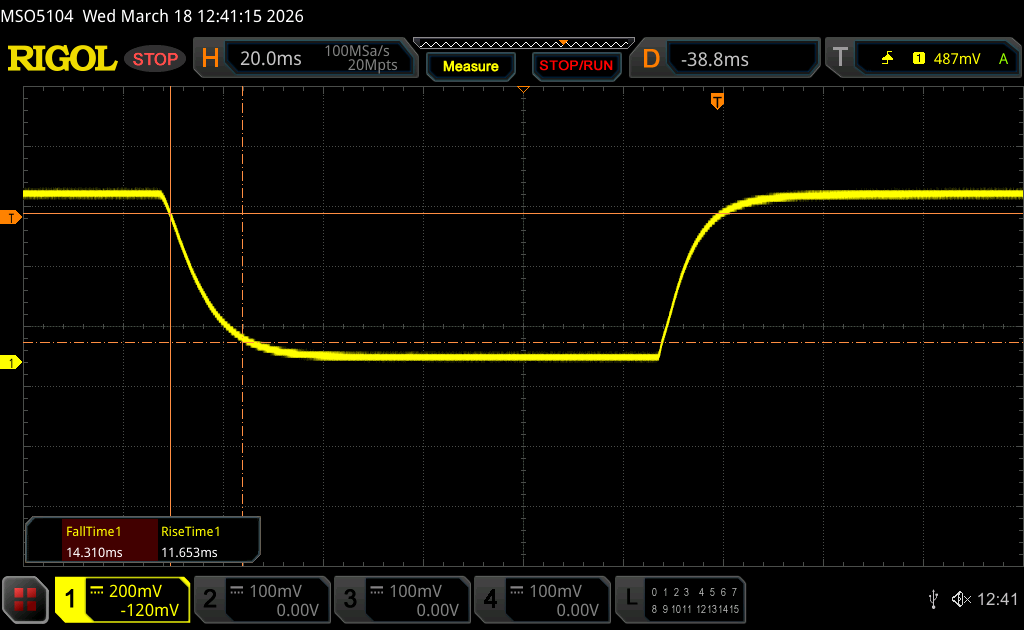 |
| ↘ 14.3 ms upadek | ||
| W naszych testach ekran wykazuje stosunkowo powolne tempo reakcji i może być zbyt wolny dla graczy. Dla porównania, wszystkie testowane urządzenia wahają się od 0.1 (minimum) do 240 (maksimum) ms. » 62 % wszystkich urządzeń jest lepszych. Oznacza to, że zmierzony czas reakcji jest gorszy od średniej wszystkich testowanych urządzeń (19.9 ms). | ||
| ↔ Czas reakcji 50% szarości do 80% szarości | ||
| 39.3 ms ... wzrost ↗ i spadek ↘ łącznie | ↗ 18.1 ms wzrost | 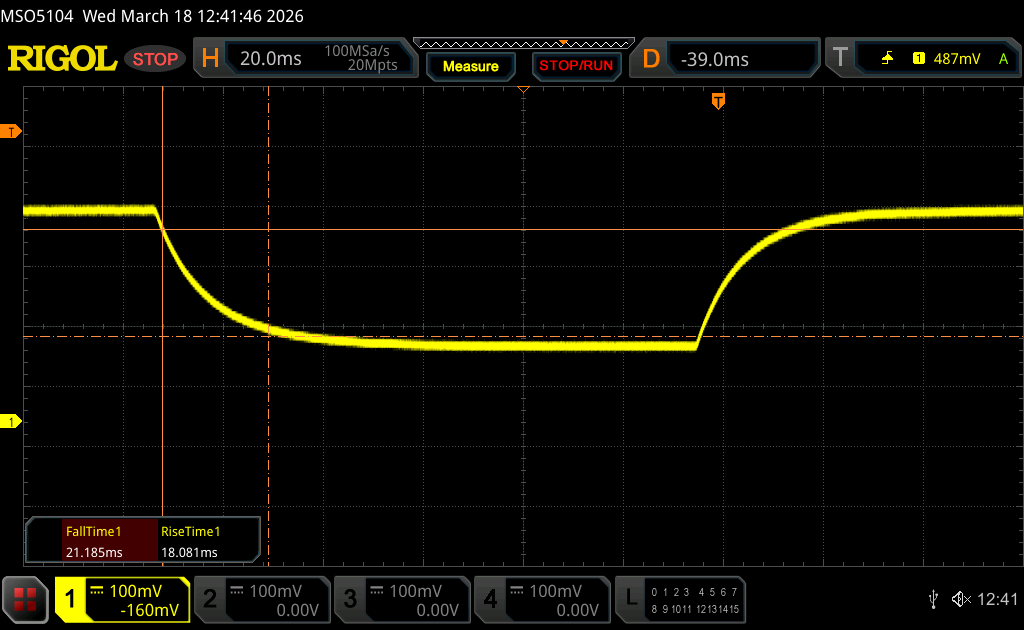 |
| ↘ 21.2 ms upadek | ||
| W naszych testach ekran wykazuje powolne tempo reakcji, co będzie niezadowalające dla graczy. Dla porównania, wszystkie testowane urządzenia wahają się od 0.165 (minimum) do 636 (maksimum) ms. » 60 % wszystkich urządzeń jest lepszych. Oznacza to, że zmierzony czas reakcji jest gorszy od średniej wszystkich testowanych urządzeń (31.1 ms). | ||
Migotanie ekranu / PWM (modulacja szerokości impulsu)
| Migotanie ekranu/nie wykryto PWM |  | ||
Dla porównania: 52 % wszystkich testowanych urządzeń nie używa PWM do przyciemniania wyświetlacza. Jeśli wykryto PWM, zmierzono średnio 7810 (minimum: 5 - maksimum: 343500) Hz. | |||
Widoczność na zewnątrz jest przyzwoita, gdy znajduje się w cieniu, dzięki stosunkowo jasnemu podświetleniu 500 nitów i matowej nakładce. W przeciwnym razie kolory stają się zbyt wyblakłe, jeśli są wystawione na bezpośrednie działanie promieni słonecznych.


Wydajność - stawianie wszystkiego na Panther Lake
Warunki testowania
Przed przeprowadzeniem poniższych testów porównawczych ustawiliśmy system Windows i Dell Optimizer na tryb wydajności.
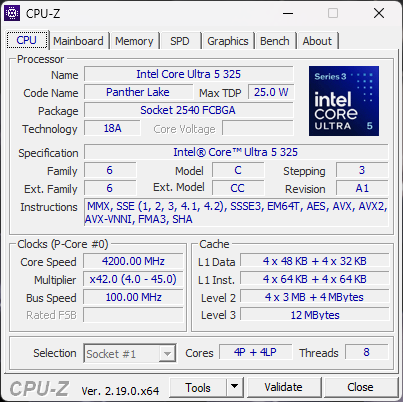
Procesor
Podstawa Core Ultra 5 325 jest nieco powolny jak na procesor z serii H, ponieważ jest tylko o 10 procent szybszy niż ULV Core Ultra 7 258V jeśli chodzi o wydajność wielowątkową. W rzeczywistości aktualizacja z Core Ultra 5 325 do Core Ultra 7 355 oczekuje się, że poprawi wydajność tylko o około 5 procent, ponieważ oba mają identyczną liczbę rdzeni i rozmiar pamięci podręcznej. Użytkownicy musieliby dokonać aktualizacji do wyższej klasy Core Ultra X7 358H aby uzyskać znacznie bardziej znaczący, 70-procentowy wzrost wydajności procesora.
Cinebench R15 Multi Loop
Cinebench R23: Multi Core | Single Core
Cinebench R20: CPU (Multi Core) | CPU (Single Core)
Cinebench R15: CPU Multi 64Bit | CPU Single 64Bit
Blender: v2.79 BMW27 CPU
7-Zip 18.03: 7z b 4 | 7z b 4 -mmt1
Geekbench 6.6: Multi-Core | Single-Core
Geekbench 5.5: Multi-Core | Single-Core
HWBOT x265 Benchmark v2.2: 4k Preset
LibreOffice : 20 Documents To PDF
R Benchmark 2.5: Overall mean
* ... im mniej tym lepiej
AIDA64: FP32 Ray-Trace | FPU Julia | CPU SHA3 | CPU Queen | FPU SinJulia | FPU Mandel | CPU AES | CPU ZLib | FP64 Ray-Trace | CPU PhotoWorxx | CPU CheckMate
| Performance rating | |
| Asus ZenBook S16 UM5606GA -1! | |
| Lenovo Yoga Pro 9 16IAH10 RTX 5050 -1! | |
| Samsung Galaxy Book6 Ultra -1! | |
| Dell XPS 16 9640 -1! | |
| MSI Prestige 16 AI Evo B2HMG -1! | |
| Dell XPS 16 Core Ultra 5 325 -1! | |
| Przeciętny Intel Core Ultra 5 325 -1! | |
| AIDA64 / FP32 Ray-Trace | |
| Asus ZenBook S16 UM5606GA (v6.92.6600) | |
| Lenovo Yoga Pro 9 16IAH10 RTX 5050 (v6.92.6600) | |
| Samsung Galaxy Book6 Ultra (v8.20.8100) | |
| MSI Prestige 16 AI Evo B2HMG (v6.92.6600) | |
| Dell XPS 16 9640 (v6.92.6600) | |
| Dell XPS 16 Core Ultra 5 325 (v8.20.8100) | |
| Przeciętny Intel Core Ultra 5 325 (11016 - 11977, n=2) | |
| AIDA64 / FPU Julia | |
| Lenovo Yoga Pro 9 16IAH10 RTX 5050 (v6.92.6600) | |
| Samsung Galaxy Book6 Ultra (v8.20.8100) | |
| Asus ZenBook S16 UM5606GA (v6.92.6600) | |
| MSI Prestige 16 AI Evo B2HMG (v6.92.6600) | |
| Dell XPS 16 9640 (v6.92.6600) | |
| Dell XPS 16 Core Ultra 5 325 (v8.20.8100) | |
| Przeciętny Intel Core Ultra 5 325 (57164 - 62102, n=2) | |
| AIDA64 / CPU SHA3 | |
| Samsung Galaxy Book6 Ultra (v8.20.8100) | |
| Lenovo Yoga Pro 9 16IAH10 RTX 5050 (v6.92.6600) | |
| Asus ZenBook S16 UM5606GA (v6.92.6600) | |
| MSI Prestige 16 AI Evo B2HMG (v6.92.6600) | |
| Dell XPS 16 9640 (v6.92.6600) | |
| Dell XPS 16 Core Ultra 5 325 (v8.20.8100) | |
| Przeciętny Intel Core Ultra 5 325 (2508 - 2718, n=2) | |
| AIDA64 / CPU Queen | |
| Asus ZenBook S16 UM5606GA (v6.92.6600) | |
| Dell XPS 16 9640 (v6.92.6600) | |
| MSI Prestige 16 AI Evo B2HMG (v6.92.6600) | |
| Lenovo Yoga Pro 9 16IAH10 RTX 5050 (v6.92.6600) | |
| AIDA64 / FPU SinJulia | |
| Asus ZenBook S16 UM5606GA (v6.92.6600) | |
| Dell XPS 16 9640 (v6.92.6600) | |
| Lenovo Yoga Pro 9 16IAH10 RTX 5050 (v6.92.6600) | |
| MSI Prestige 16 AI Evo B2HMG (v6.92.6600) | |
| Samsung Galaxy Book6 Ultra (v8.20.8100) | |
| Dell XPS 16 Core Ultra 5 325 (v8.20.8100) | |
| Przeciętny Intel Core Ultra 5 325 (4409 - 4414, n=2) | |
| AIDA64 / FPU Mandel | |
| Lenovo Yoga Pro 9 16IAH10 RTX 5050 (v6.92.6600) | |
| Samsung Galaxy Book6 Ultra (v8.20.8100) | |
| Asus ZenBook S16 UM5606GA (v6.92.6600) | |
| MSI Prestige 16 AI Evo B2HMG (v6.92.6600) | |
| Dell XPS 16 9640 (v6.92.6600) | |
| Dell XPS 16 Core Ultra 5 325 (v8.20.8100) | |
| Przeciętny Intel Core Ultra 5 325 (30237 - 33224, n=2) | |
| AIDA64 / CPU AES | |
| Asus ZenBook S16 UM5606GA (v6.92.6600) | |
| Dell XPS 16 9640 (v6.92.6600) | |
| Lenovo Yoga Pro 9 16IAH10 RTX 5050 (v6.92.6600) | |
| MSI Prestige 16 AI Evo B2HMG (v6.92.6600) | |
| Samsung Galaxy Book6 Ultra (v8.20.8100) | |
| Dell XPS 16 Core Ultra 5 325 (v8.20.8100) | |
| Przeciętny Intel Core Ultra 5 325 (37348 - 37641, n=2) | |
| AIDA64 / CPU ZLib | |
| Lenovo Yoga Pro 9 16IAH10 RTX 5050 (v6.92.6600) | |
| Dell XPS 16 9640 (v6.92.6600) | |
| Samsung Galaxy Book6 Ultra (v8.20.8100) | |
| Asus ZenBook S16 UM5606GA (v6.92.6600) | |
| MSI Prestige 16 AI Evo B2HMG (v6.92.6600) | |
| Dell XPS 16 Core Ultra 5 325 (v8.20.8100) | |
| Przeciętny Intel Core Ultra 5 325 (596 - 627, n=2) | |
| AIDA64 / FP64 Ray-Trace | |
| Asus ZenBook S16 UM5606GA (v6.92.6600) | |
| Lenovo Yoga Pro 9 16IAH10 RTX 5050 (v6.92.6600) | |
| Samsung Galaxy Book6 Ultra (v8.20.8100) | |
| MSI Prestige 16 AI Evo B2HMG (v6.92.6600) | |
| Dell XPS 16 9640 (v6.92.6600) | |
| Dell XPS 16 Core Ultra 5 325 (v8.20.8100) | |
| Przeciętny Intel Core Ultra 5 325 (5761 - 6324, n=2) | |
| AIDA64 / CPU PhotoWorxx | |
| Samsung Galaxy Book6 Ultra (v8.20.8100) | |
| Lenovo Yoga Pro 9 16IAH10 RTX 5050 (v6.92.6600) | |
| MSI Prestige 16 AI Evo B2HMG (v6.92.6600) | |
| Dell XPS 16 Core Ultra 5 325 (v8.20.8100) | |
| Przeciętny Intel Core Ultra 5 325 (53916 - 58393, n=2) | |
| Asus ZenBook S16 UM5606GA (v6.92.6600) | |
| Dell XPS 16 9640 (v6.92.6600) | |
| AIDA64 / CPU CheckMate | |
| Samsung Galaxy Book6 Ultra (v8.20.8100) | |
| Dell XPS 16 Core Ultra 5 325 (v8.20.8100) | |
| Przeciętny Intel Core Ultra 5 325 (2643 - 2730, n=2) | |
Wydajność systemu
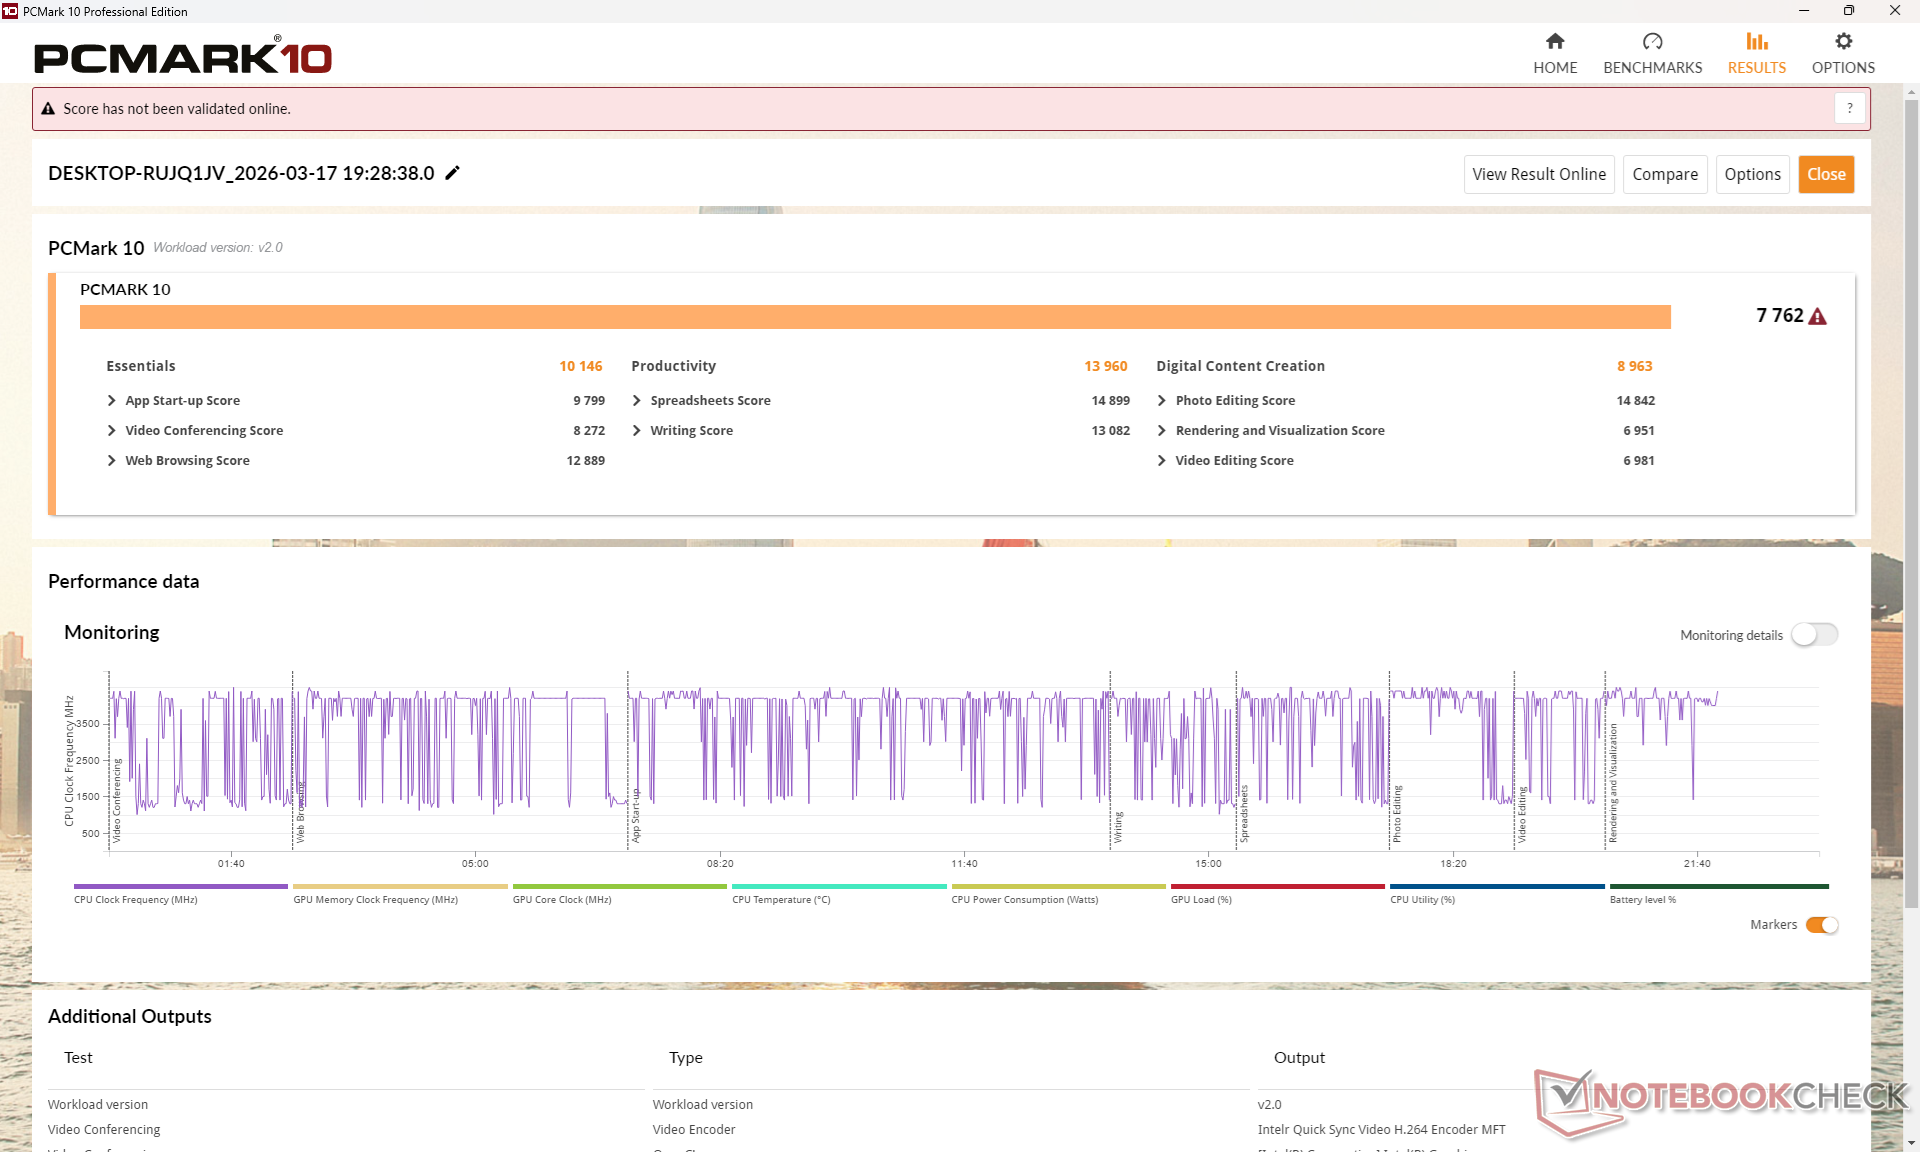
PCMark 10: Score | Essentials | Productivity | Digital Content Creation
CrossMark: Overall | Productivity | Creativity | Responsiveness
WebXPRT 3: Overall
WebXPRT 4: Overall
Mozilla Kraken 1.1: Total
Geekbench AI: Single Precision GPU 1.7 | Half Precision GPU 1.7 | Quantized GPU 1.7
| Performance rating | |
| Lenovo Yoga Pro 9 16IAH10 RTX 5050 | |
| Samsung Galaxy Book6 Ultra | |
| MSI Prestige 16 AI Evo B2HMG -3! | |
| Dell XPS 16 9640 -4! | |
| Asus ZenBook S16 UM5606GA -3! | |
| Przeciętny Intel Core Ultra 5 325, Intel Graphics 4 Xe3 Panther Lake iGPU | |
| Dell XPS 16 Core Ultra 5 325 | |
| PCMark 10 / Score | |
| Lenovo Yoga Pro 9 16IAH10 RTX 5050 | |
| Samsung Galaxy Book6 Ultra | |
| Asus ZenBook S16 UM5606GA | |
| MSI Prestige 16 AI Evo B2HMG | |
| Dell XPS 16 Core Ultra 5 325 | |
| Przeciętny Intel Core Ultra 5 325, Intel Graphics 4 Xe3 Panther Lake iGPU (7532 - 7762, n=2) | |
| Dell XPS 16 9640 | |
| PCMark 10 / Essentials | |
| MSI Prestige 16 AI Evo B2HMG | |
| Lenovo Yoga Pro 9 16IAH10 RTX 5050 | |
| Asus ZenBook S16 UM5606GA | |
| Dell XPS 16 9640 | |
| Przeciętny Intel Core Ultra 5 325, Intel Graphics 4 Xe3 Panther Lake iGPU (10146 - 10402, n=2) | |
| Dell XPS 16 Core Ultra 5 325 | |
| Samsung Galaxy Book6 Ultra | |
| PCMark 10 / Productivity | |
| Samsung Galaxy Book6 Ultra | |
| Lenovo Yoga Pro 9 16IAH10 RTX 5050 | |
| Asus ZenBook S16 UM5606GA | |
| Dell XPS 16 Core Ultra 5 325 | |
| Przeciętny Intel Core Ultra 5 325, Intel Graphics 4 Xe3 Panther Lake iGPU (12413 - 13960, n=2) | |
| MSI Prestige 16 AI Evo B2HMG | |
| Dell XPS 16 9640 | |
| PCMark 10 / Digital Content Creation | |
| Lenovo Yoga Pro 9 16IAH10 RTX 5050 | |
| Samsung Galaxy Book6 Ultra | |
| MSI Prestige 16 AI Evo B2HMG | |
| Dell XPS 16 9640 | |
| Asus ZenBook S16 UM5606GA | |
| Przeciętny Intel Core Ultra 5 325, Intel Graphics 4 Xe3 Panther Lake iGPU (8963 - 8979, n=2) | |
| Dell XPS 16 Core Ultra 5 325 | |
| CrossMark / Overall | |
| MSI Prestige 16 AI Evo B2HMG | |
| Lenovo Yoga Pro 9 16IAH10 RTX 5050 | |
| Samsung Galaxy Book6 Ultra | |
| Dell XPS 16 9640 | |
| Przeciętny Intel Core Ultra 5 325, Intel Graphics 4 Xe3 Panther Lake iGPU (1666 - 1772, n=2) | |
| Dell XPS 16 Core Ultra 5 325 | |
| Asus ZenBook S16 UM5606GA | |
| CrossMark / Productivity | |
| MSI Prestige 16 AI Evo B2HMG | |
| Lenovo Yoga Pro 9 16IAH10 RTX 5050 | |
| Dell XPS 16 9640 | |
| Samsung Galaxy Book6 Ultra | |
| Przeciętny Intel Core Ultra 5 325, Intel Graphics 4 Xe3 Panther Lake iGPU (1581 - 1715, n=2) | |
| Asus ZenBook S16 UM5606GA | |
| Dell XPS 16 Core Ultra 5 325 | |
| CrossMark / Creativity | |
| MSI Prestige 16 AI Evo B2HMG | |
| Lenovo Yoga Pro 9 16IAH10 RTX 5050 | |
| Samsung Galaxy Book6 Ultra | |
| Dell XPS 16 9640 | |
| Asus ZenBook S16 UM5606GA | |
| Przeciętny Intel Core Ultra 5 325, Intel Graphics 4 Xe3 Panther Lake iGPU (1889 - 1917, n=2) | |
| Dell XPS 16 Core Ultra 5 325 | |
| CrossMark / Responsiveness | |
| MSI Prestige 16 AI Evo B2HMG | |
| Dell XPS 16 9640 | |
| Samsung Galaxy Book6 Ultra | |
| Lenovo Yoga Pro 9 16IAH10 RTX 5050 | |
| Przeciętny Intel Core Ultra 5 325, Intel Graphics 4 Xe3 Panther Lake iGPU (1338 - 1544, n=2) | |
| Asus ZenBook S16 UM5606GA | |
| Dell XPS 16 Core Ultra 5 325 | |
| WebXPRT 3 / Overall | |
| MSI Prestige 16 AI Evo B2HMG | |
| Lenovo Yoga Pro 9 16IAH10 RTX 5050 | |
| Samsung Galaxy Book6 Ultra | |
| Asus ZenBook S16 UM5606GA | |
| Przeciętny Intel Core Ultra 5 325, Intel Graphics 4 Xe3 Panther Lake iGPU (282 - 308, n=2) | |
| Dell XPS 16 9640 | |
| Dell XPS 16 Core Ultra 5 325 | |
| WebXPRT 4 / Overall | |
| MSI Prestige 16 AI Evo B2HMG | |
| Lenovo Yoga Pro 9 16IAH10 RTX 5050 | |
| Samsung Galaxy Book6 Ultra | |
| Przeciętny Intel Core Ultra 5 325, Intel Graphics 4 Xe3 Panther Lake iGPU (267 - 276, n=2) | |
| Dell XPS 16 Core Ultra 5 325 | |
| Dell XPS 16 9640 | |
| Asus ZenBook S16 UM5606GA | |
| Mozilla Kraken 1.1 / Total | |
| Dell XPS 16 Core Ultra 5 325 | |
| Przeciętny Intel Core Ultra 5 325, Intel Graphics 4 Xe3 Panther Lake iGPU (492 - 497, n=2) | |
| Asus ZenBook S16 UM5606GA | |
| Samsung Galaxy Book6 Ultra | |
| Lenovo Yoga Pro 9 16IAH10 RTX 5050 | |
| MSI Prestige 16 AI Evo B2HMG | |
| Geekbench AI / Single Precision GPU 1.7 | |
| Samsung Galaxy Book6 Ultra | |
| Lenovo Yoga Pro 9 16IAH10 RTX 5050 | |
| Dell XPS 16 Core Ultra 5 325 | |
| Przeciętny Intel Core Ultra 5 325, Intel Graphics 4 Xe3 Panther Lake iGPU (n=1) | |
| Geekbench AI / Half Precision GPU 1.7 | |
| Lenovo Yoga Pro 9 16IAH10 RTX 5050 | |
| Samsung Galaxy Book6 Ultra | |
| Dell XPS 16 Core Ultra 5 325 | |
| Przeciętny Intel Core Ultra 5 325, Intel Graphics 4 Xe3 Panther Lake iGPU (n=1) | |
| Geekbench AI / Quantized GPU 1.7 | |
| Samsung Galaxy Book6 Ultra | |
| Lenovo Yoga Pro 9 16IAH10 RTX 5050 | |
| Dell XPS 16 Core Ultra 5 325 | |
| Przeciętny Intel Core Ultra 5 325, Intel Graphics 4 Xe3 Panther Lake iGPU (n=1) | |
* ... im mniej tym lepiej
| PCMark 10 Score | 7762 pkt. | |
Pomoc | ||
| AIDA64 / Memory Copy | |
| Samsung Galaxy Book6 Ultra | |
| Dell XPS 16 Core Ultra 5 325 | |
| Lenovo Yoga Pro 9 16IAH10 RTX 5050 | |
| MSI Prestige 16 AI Evo B2HMG | |
| Asus ZenBook S16 UM5606GA | |
| Przeciętny Intel Core Ultra 5 325 (89482 - 100226, n=2) | |
| Dell XPS 16 9640 | |
| AIDA64 / Memory Read | |
| Samsung Galaxy Book6 Ultra | |
| Asus ZenBook S16 UM5606GA | |
| Lenovo Yoga Pro 9 16IAH10 RTX 5050 | |
| Dell XPS 16 Core Ultra 5 325 | |
| Dell XPS 16 9640 | |
| Przeciętny Intel Core Ultra 5 325 (74747 - 86178, n=2) | |
| MSI Prestige 16 AI Evo B2HMG | |
| AIDA64 / Memory Write | |
| Samsung Galaxy Book6 Ultra | |
| Asus ZenBook S16 UM5606GA | |
| Dell XPS 16 Core Ultra 5 325 | |
| Lenovo Yoga Pro 9 16IAH10 RTX 5050 | |
| Przeciętny Intel Core Ultra 5 325 (92966 - 107858, n=2) | |
| Dell XPS 16 9640 | |
| MSI Prestige 16 AI Evo B2HMG | |
| AIDA64 / Memory Latency | |
| Dell XPS 16 9640 | |
| MSI Prestige 16 AI Evo B2HMG | |
| Lenovo Yoga Pro 9 16IAH10 RTX 5050 | |
| Przeciętny Intel Core Ultra 5 325 (102 - 108.4, n=2) | |
| Asus ZenBook S16 UM5606GA | |
| Dell XPS 16 Core Ultra 5 325 | |
| Samsung Galaxy Book6 Ultra | |
* ... im mniej tym lepiej
Opóźnienie DPC
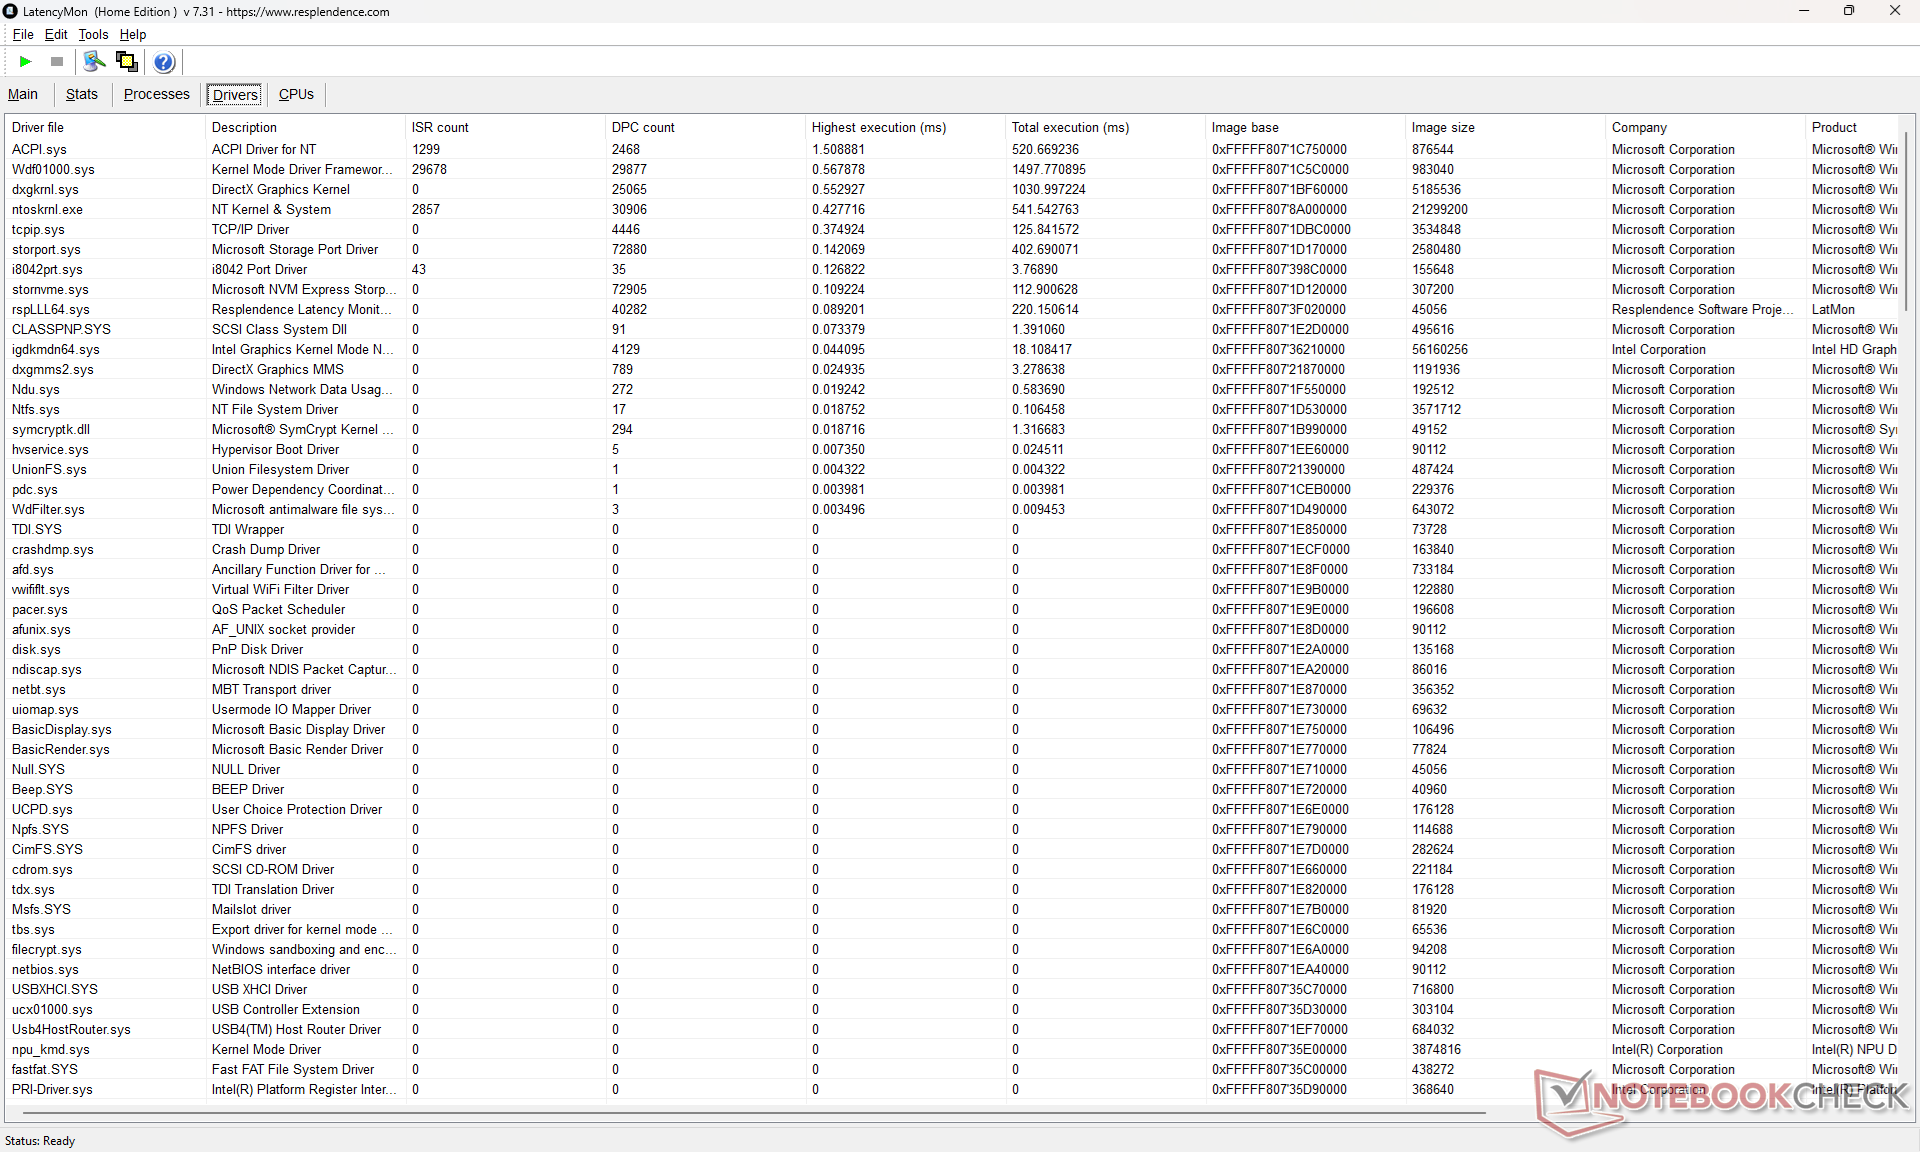
| DPC Latencies / LatencyMon - interrupt to process latency (max), Web, Youtube, Prime95 | |
| Lenovo Yoga Pro 9 16IAH10 RTX 5050 | |
| Dell XPS 16 Core Ultra 5 325 | |
| MSI Prestige 16 AI Evo B2HMG | |
| Dell XPS 16 9640 | |
| Samsung Galaxy Book6 Ultra | |
| Asus ZenBook S16 UM5606GA | |
* ... im mniej tym lepiej
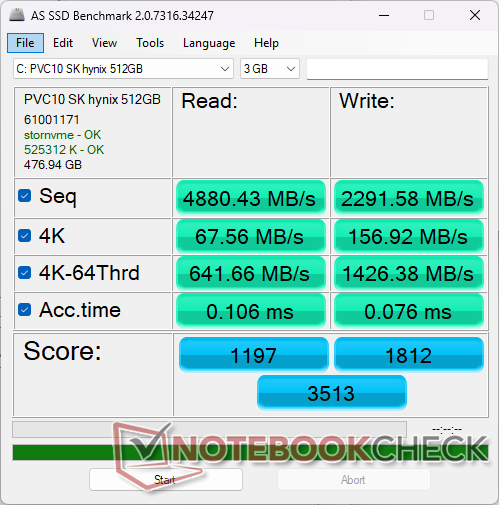
Urządzenia pamięci masowej
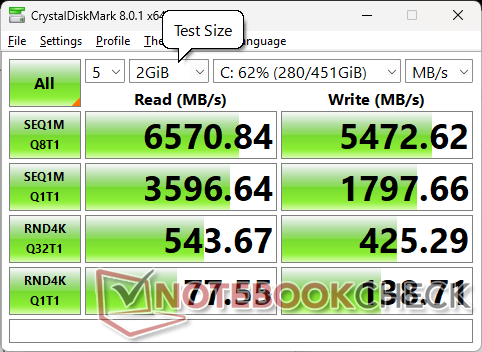
Proszę zwrócić uwagę na SK Hynix PVC10 PCIe4 x4 NVMe SSD może utrzymać prędkość transferu do 6600 MB/s bez żadnych problemów z dławieniem, jak pokazują poniższe wyniki testu pętli DiskSpd. Proszę zauważyć, że wyższe konfiguracje XPS 16 są wyposażone w opcjonalne dyski SSD PCIe5.


| Drive Performance rating - Percent | |
| MSI Prestige 16 AI Evo B2HMG | |
| Dell XPS 16 9640 | |
| Lenovo Yoga Pro 9 16IAH10 RTX 5050 | |
| Asus ZenBook S16 UM5606GA | |
| Samsung Galaxy Book6 Ultra | |
| Dell XPS 16 Core Ultra 5 325 | |
* ... im mniej tym lepiej
Dławienie dysku: Pętla odczytu DiskSpd, głębokość kolejki 8
Wydajność GPU
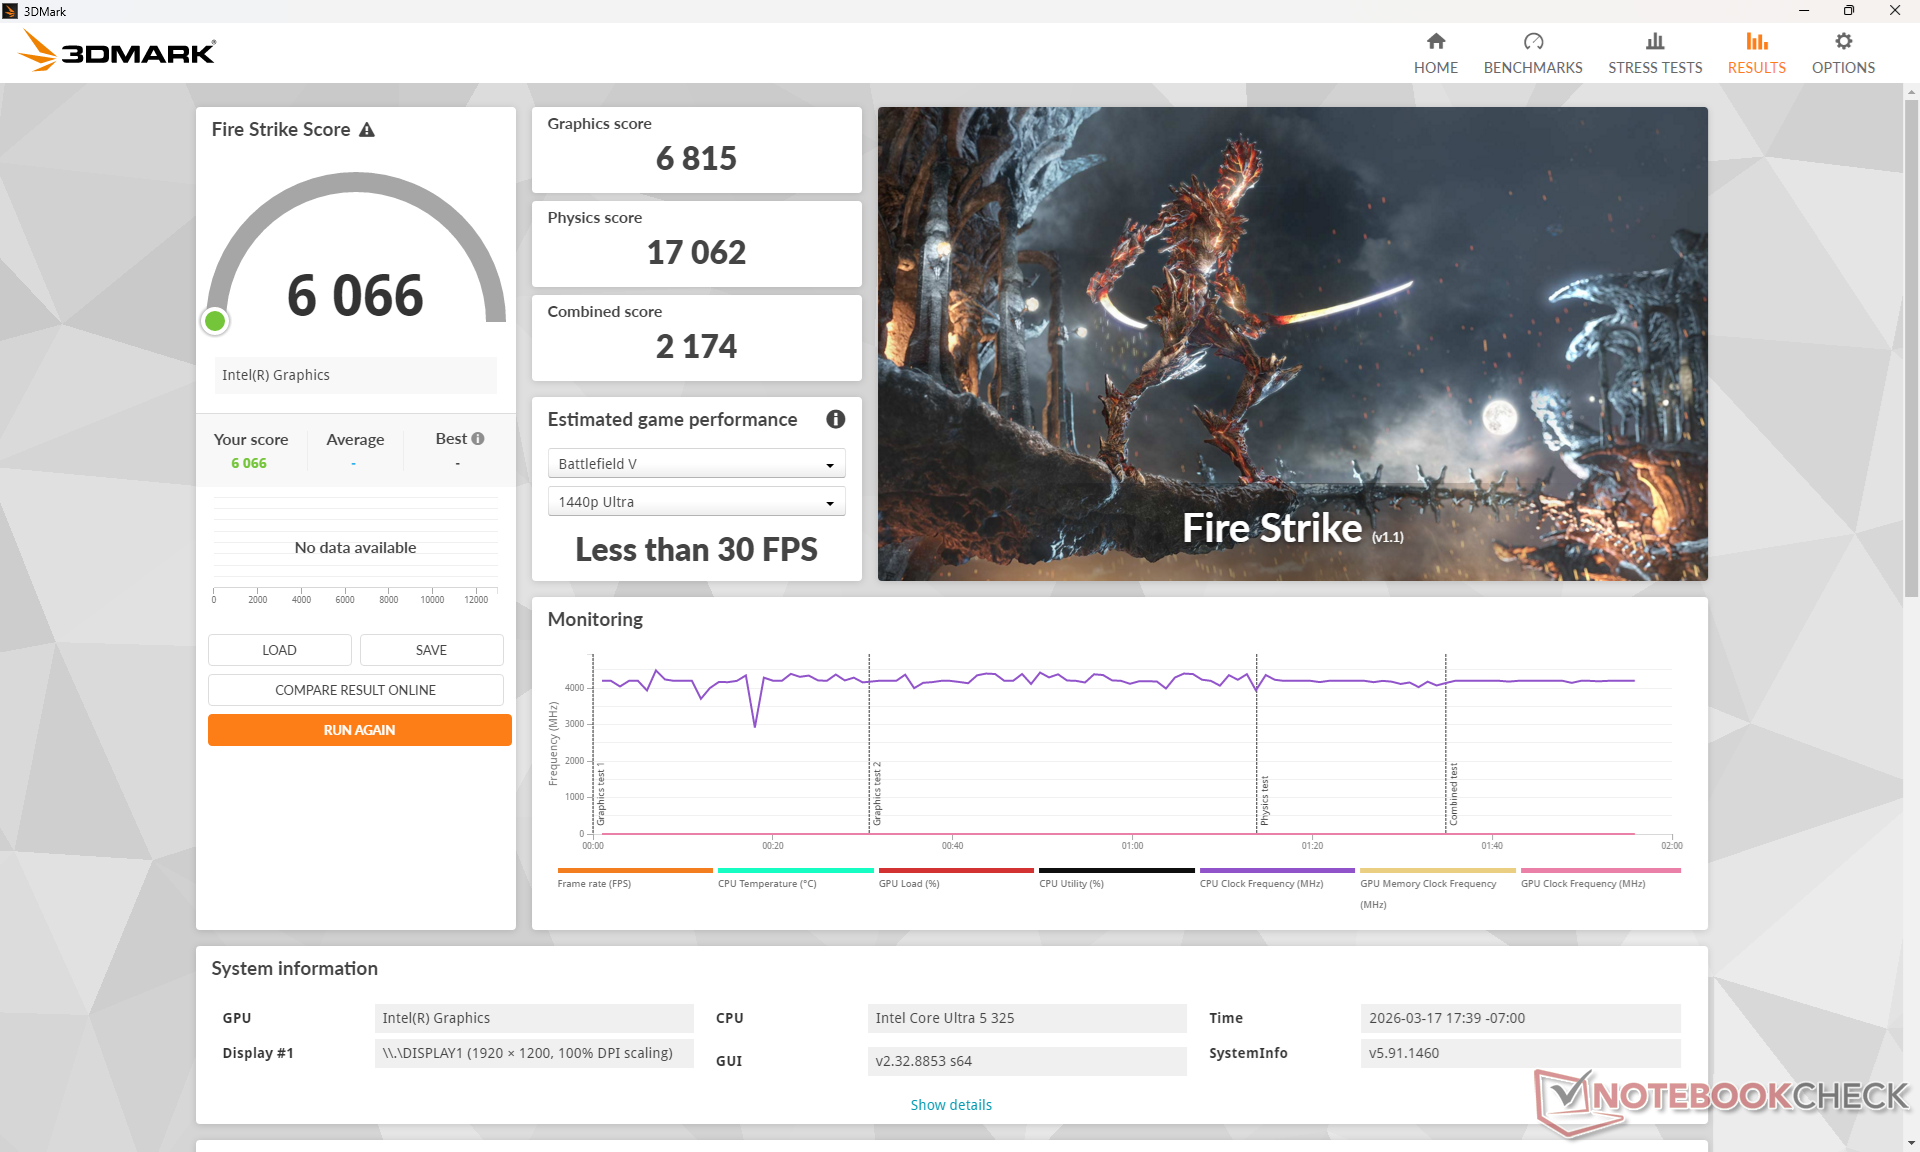
Panther Lake Xe3 Panther Lake Xe3 4 to jedno z najwolniejszych zintegrowanych rozwiązań z linii Panther Lake. Poziom wydajności jest najbardziej zbliżony do starej, dwugeneracyjnej serii Arc 8 lub AMD Radeon 680M. Aktualizacja do konfiguracji Core Ultra 7 355 nie poprawi wydajności graficznej o znaczące marginesy, ponieważ procesor wykorzystuje ten sam iGPU Xe3 4. Zamiast tego użytkownicy muszą dokonać aktualizacji do Core Ultra X7 358H ze zintegrowanym Arc B390 aby uzyskać 2,5-krotny wzrost wydajności, jak pokazują poniższe tabele.
| Profil mocy | Wynik grafiki | Wynik fizyki | Łączny wynik |
| Tryb wydajności | 6815 | 17062 | 2174 |
| Tryb zrównoważony | 6633 (-3%) | 16820 (-1%) | 2039 (-6%) |
| Zasilanie bateryjne | 6480 (-5%) | 17601 (+3%) | 2140 (-2%) |
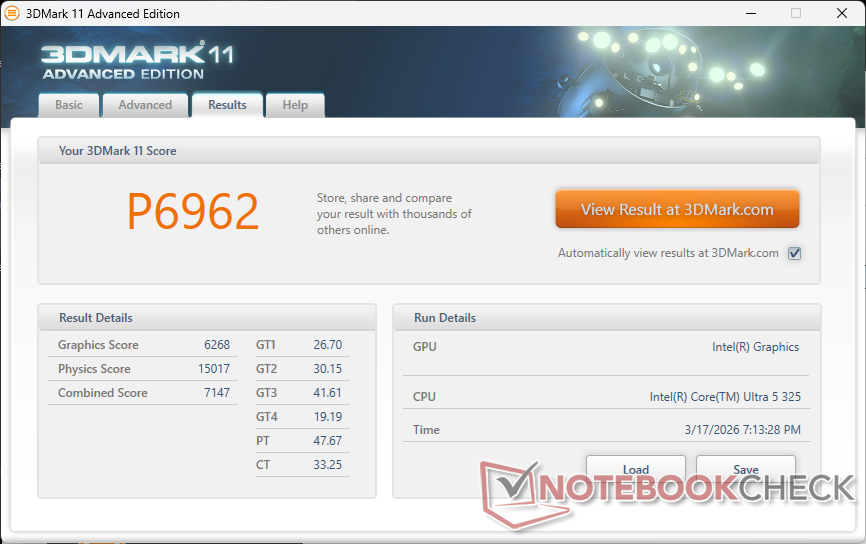
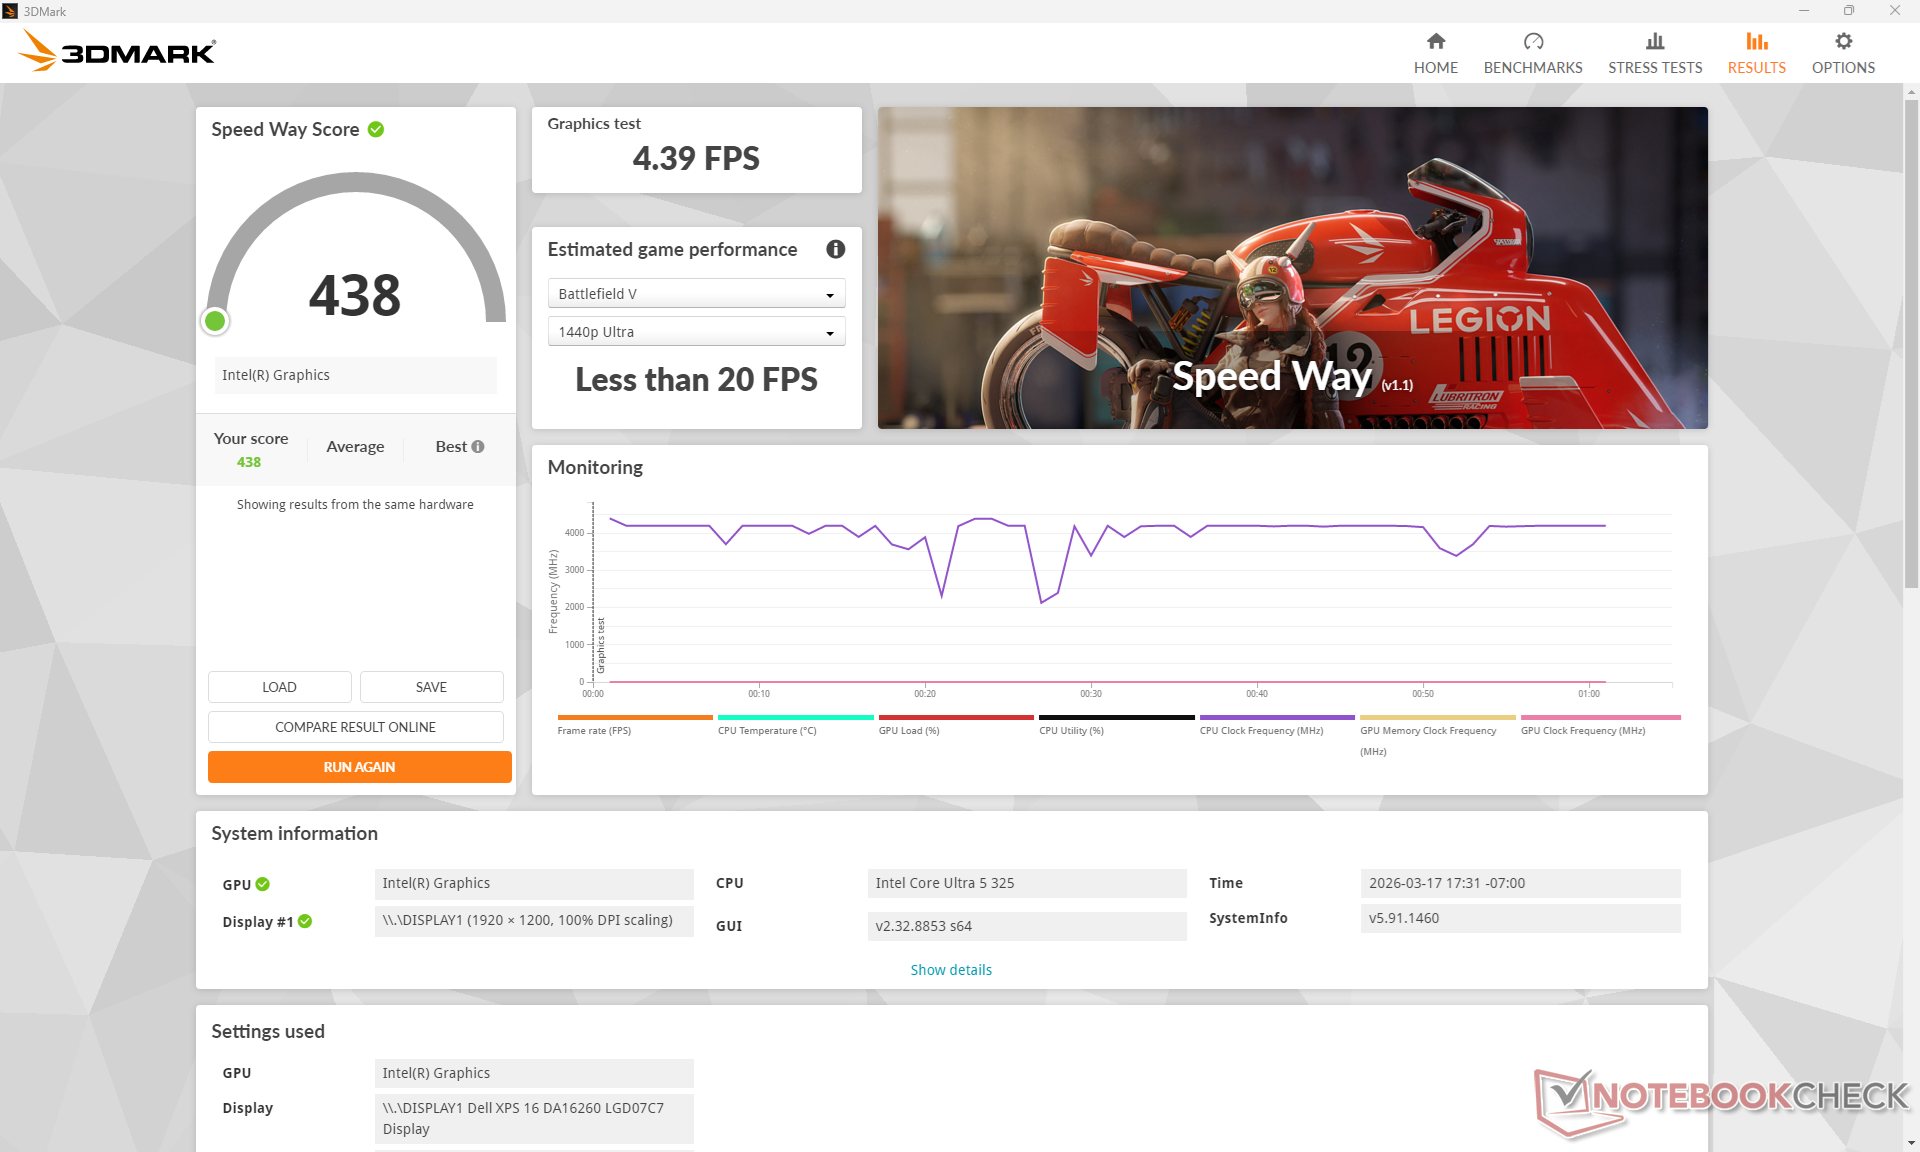
| 3DMark 11 Performance | 6962 pkt. | |
| 3DMark Cloud Gate Standard Score | 26419 pkt. | |
| 3DMark Fire Strike Score | 6066 pkt. | |
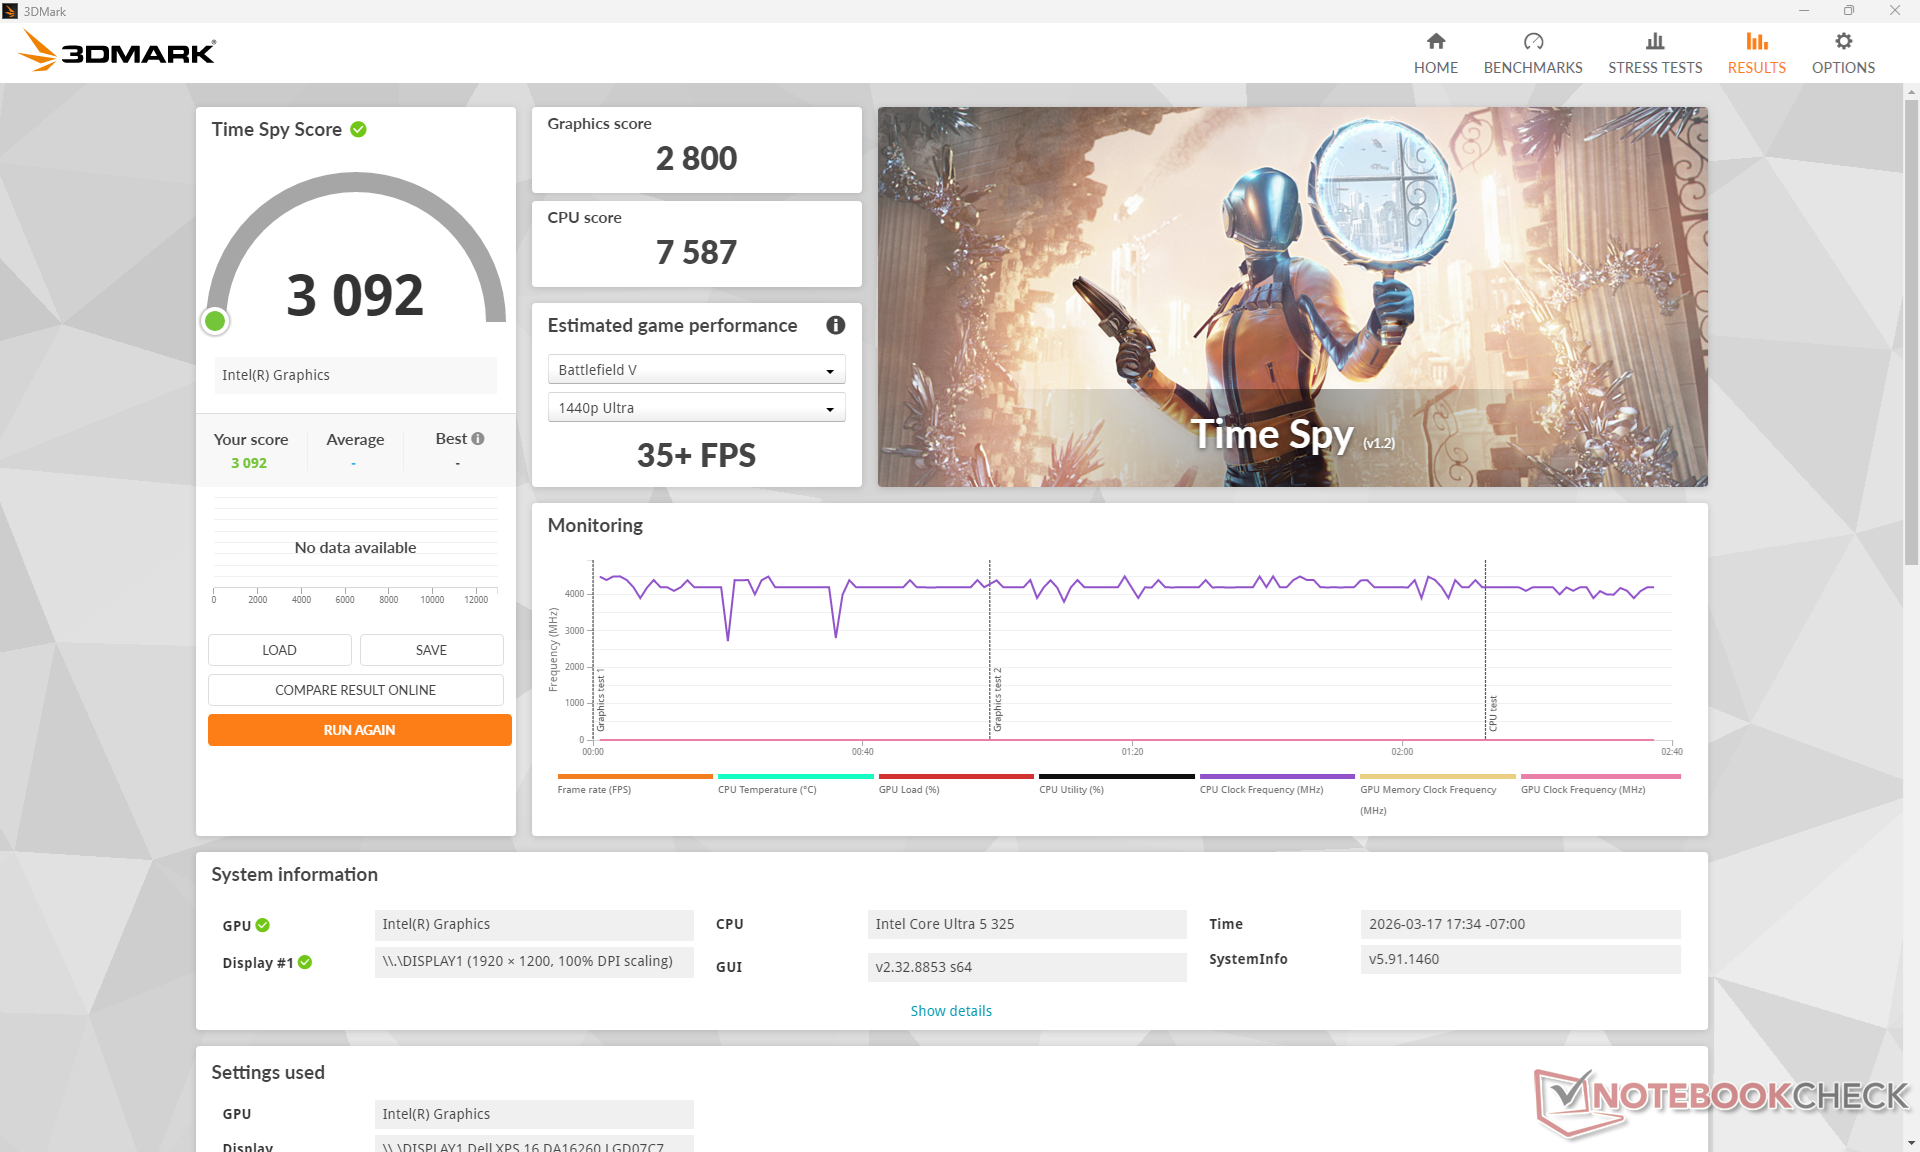
| 3DMark Time Spy Score | 3092 pkt. | |
Pomoc | ||
* ... im mniej tym lepiej
| Performance rating - Percent | |
| Samsung Galaxy Book6 Ultra | |
| Lenovo Yoga Pro 9 16IAH10 RTX 5050 | |
| Dell XPS 16 9640 | |
| Asus ZenBook S16 UM5606GA | |
| MSI Prestige 16 AI Evo B2HMG | |
| Dell XPS 16 Core Ultra 5 325 | |
| Cyberpunk 2077 - 1920x1080 Ultra Preset (FSR off) | |
| Samsung Galaxy Book6 Ultra | |
| Lenovo Yoga Pro 9 16IAH10 RTX 5050 | |
| Dell XPS 16 9640 | |
| MSI Prestige 16 AI Evo B2HMG | |
| Asus ZenBook S16 UM5606GA | |
| Dell XPS 16 Core Ultra 5 325 | |
| Baldur's Gate 3 - 1920x1080 Ultra Preset AA:T | |
| Samsung Galaxy Book6 Ultra | |
| Lenovo Yoga Pro 9 16IAH10 RTX 5050 | |
| Dell XPS 16 9640 | |
| Asus ZenBook S16 UM5606GA | |
| MSI Prestige 16 AI Evo B2HMG | |
| Dell XPS 16 Core Ultra 5 325 | |
| GTA V - 1920x1080 Highest AA:4xMSAA + FX AF:16x | |
| Samsung Galaxy Book6 Ultra | |
| Lenovo Yoga Pro 9 16IAH10 RTX 5050 | |
| Dell XPS 16 9640 | |
| Asus ZenBook S16 UM5606GA | |
| Dell XPS 16 Core Ultra 5 325 | |
| MSI Prestige 16 AI Evo B2HMG | |
| Final Fantasy XV Benchmark - 1920x1080 High Quality | |
| Samsung Galaxy Book6 Ultra | |
| Lenovo Yoga Pro 9 16IAH10 RTX 5050 | |
| Dell XPS 16 9640 | |
| MSI Prestige 16 AI Evo B2HMG | |
| Asus ZenBook S16 UM5606GA | |
| Dell XPS 16 Core Ultra 5 325 | |
| Strange Brigade - 1920x1080 ultra AA:ultra AF:16 | |
| Samsung Galaxy Book6 Ultra | |
| Lenovo Yoga Pro 9 16IAH10 RTX 5050 | |
| Dell XPS 16 9640 | |
| MSI Prestige 16 AI Evo B2HMG | |
| Asus ZenBook S16 UM5606GA | |
| Dell XPS 16 Core Ultra 5 325 | |
| Dota 2 Reborn - 1920x1080 ultra (3/3) best looking | |
| Lenovo Yoga Pro 9 16IAH10 RTX 5050 | |
| Samsung Galaxy Book6 Ultra | |
| Dell XPS 16 9640 | |
| Asus ZenBook S16 UM5606GA | |
| MSI Prestige 16 AI Evo B2HMG | |
| Dell XPS 16 Core Ultra 5 325 | |
| X-Plane 11.11 - 1920x1080 high (fps_test=3) | |
| Lenovo Yoga Pro 9 16IAH10 RTX 5050 | |
| Dell XPS 16 9640 | |
| Dell XPS 16 9640 | |
| Samsung Galaxy Book6 Ultra | |
| Asus ZenBook S16 UM5606GA | |
| MSI Prestige 16 AI Evo B2HMG | |
| Dell XPS 16 Core Ultra 5 325 | |
Cyberpunk 2077 ultra FPS Chart
| low | med. | high | ultra | |
|---|---|---|---|---|
| GTA V (2015) | 162.4 | 158.1 | 51.8 | 20.8 |
| Dota 2 Reborn (2015) | 102.9 | 89 | 72.6 | 68.4 |
| Final Fantasy XV Benchmark (2018) | 66.3 | 35.4 | 25.1 | |
| X-Plane 11.11 (2018) | 37.8 | 30.6 | 22.9 | |
| Strange Brigade (2018) | 107.3 | 38.2 | 35.9 | 43.3 |
| Baldur's Gate 3 (2023) | 27.4 | 22.2 | 19 | 18.7 |
| Cyberpunk 2077 (2023) | 35.2 | 27 | 23.8 | 19.9 |
| F1 24 (2024) | 55.6 | 52.7 | 40.8 | 13.2 |
Emisje - ciszej, ale wciąż dość ciepło
Hałas systemowy
Hałas wentylatora jest znacznie cichszy niż w poprzednim Dell 16 Premium w zasadzie we wszystkich scenariuszach. System jest w stanie pozostać cichy lub niesłyszalny przez dłuższy czas w porównaniu do większości innych laptopów. Przykładowo, hałas wentylatora nie jest słyszalny podczas uruchamiania 3DMark06 aż do ponad dwóch trzecich pierwszej sceny benchmarku, podczas gdy hałas pojawiłby się znacznie wcześniej i głośniej na ZenBook S16.
Hałas wentylatora podczas grania oscylował między 38 a 44 dB(A), co nadal jest cichsze niż w przypadku zeszłorocznego modelu lub wspomnianego wcześniej Asusa w podobnych warunkach.


Hałas
| luz |
| 22.9 / 22.9 / 23.9 dB |
| obciążenie |
| 34.8 / 43.3 dB |
 | ||
30 dB cichy 40 dB(A) słyszalny 50 dB(A) irytujący |
||
min: | ||
| Dell XPS 16 Core Ultra 5 325 Ultra 5 325, Intel Graphics 4 Xe3 PTL | Dell XPS 16 9640 Ultra 7 155H, GeForce RTX 4070 Laptop GPU | Lenovo Yoga Pro 9 16IAH10 RTX 5050 Ultra 9 285H, GeForce RTX 5050 Laptop | Samsung Galaxy Book6 Ultra Ultra 7 356H, GeForce RTX 5070 Laptop | Asus ZenBook S16 UM5606GA Ryzen AI 9 465, Radeon 880M | MSI Prestige 16 AI Evo B2HMG Ultra 9 285H, Arc 140T | |
|---|---|---|---|---|---|---|
| Noise | -11% | -12% | -12% | -15% | -5% | |
| wyłączone / środowisko * (dB) | 22.8 | 24.5 -7% | 24.6 -8% | 25.1 -10% | 24.9 -9% | 23.6 -4% |
| Idle Minimum * (dB) | 22.9 | 24.5 -7% | 24.6 -7% | 25.1 -10% | 24.9 -9% | 23.6 -3% |
| Idle Average * (dB) | 22.9 | 24.5 -7% | 24.6 -7% | 25.1 -10% | 24.9 -9% | 23.6 -3% |
| Idle Maximum * (dB) | 23.9 | 27.5 -15% | 26.8 -12% | 25.1 -5% | 24.9 -4% | 26.2 -10% |
| Load Average * (dB) | 34.8 | 39.6 -14% | 32.8 6% | 36.9 -6% | 45.7 -31% | 37.1 -7% |
| Cyberpunk 2077 ultra * (dB) | 38 | 51.8 -36% | 48.5 -28% | 49 -29% | 42.1 -11% | |
| Load Maximum * (dB) | 43.3 | 49.7 -15% | 51.8 -20% | 48.5 -12% | 50.4 -16% | 42.1 3% |
| Witcher 3 ultra * (dB) | 49.7 |
* ... im mniej tym lepiej
Temperatura
Temperatury powierzchni są wyższe niż oczekiwano, zwłaszcza że nowy XPS 16 nie posiada żadnej oddzielnej grafiki. Gorące punkty mogą osiągnąć ponad 43 C podczas uruchamiania wymagających obciążeń, takich jak gry, w porównaniu do zaledwie 37 C w zeszłorocznym cięższym modelu Dell 16 Premium z dyskretną grafiką GeForce RTX 5070.


(±) Maksymalna temperatura w górnej części wynosi 43.8 °C / 111 F, w porównaniu do średniej 36.8 °C / 98 F , począwszy od 21 do 71 °C dla klasy Multimedia.
(±) Dno nagrzewa się maksymalnie do 42 °C / 108 F, w porównaniu do średniej 39.1 °C / 102 F
(+) W stanie bezczynności średnia temperatura górnej części wynosi 22.4 °C / 72 F, w porównaniu ze średnią temperaturą urządzenia wynoszącą 31.3 °C / ### class_avg_f### F.
(±) 3: The average temperature for the upper side is 35.3 °C / 96 F, compared to the average of 31.3 °C / 88 F for the class Multimedia.
(+) Podpórki pod nadgarstki i touchpad są chłodniejsze niż temperatura skóry i maksymalnie 31.6 °C / 88.9 F i dlatego są chłodne w dotyku.
(-) Średnia temperatura obszaru podparcia dłoni w podobnych urządzeniach wynosiła 28.7 °C / 83.7 F (-2.9 °C / -5.2 F).


| Dell XPS 16 Core Ultra 5 325 Ultra 5 325, Intel Graphics 4 Xe3 PTL | Dell XPS 16 9640 Ultra 7 155H, GeForce RTX 4070 Laptop GPU | Lenovo Yoga Pro 9 16IAH10 RTX 5050 Ultra 9 285H, GeForce RTX 5050 Laptop | Samsung Galaxy Book6 Ultra Ultra 7 356H, GeForce RTX 5070 Laptop | Asus ZenBook S16 UM5606GA Ryzen AI 9 465, Radeon 880M | MSI Prestige 16 AI Evo B2HMG Ultra 9 285H, Arc 140T | |
|---|---|---|---|---|---|---|
| Heat | -4% | -9% | -8% | -9% | -13% | |
| Maximum Upper Side * (°C) | 43.8 | 39.4 10% | 34.4 21% | 42.7 3% | 43.4 1% | 48.1 -10% |
| Maximum Bottom * (°C) | 42 | 36.9 12% | 41.4 1% | 49.1 -17% | 46.2 -10% | 51.6 -23% |
| Idle Upper Side * (°C) | 23.2 | 28.2 -22% | 28.6 -23% | 25.4 -9% | 26.5 -14% | 25.9 -12% |
| Idle Bottom * (°C) | 23.6 | 27.4 -16% | 31.8 -35% | 25.5 -8% | 27 -14% | 25.2 -7% |
* ... im mniej tym lepiej
Test warunków skrajnych
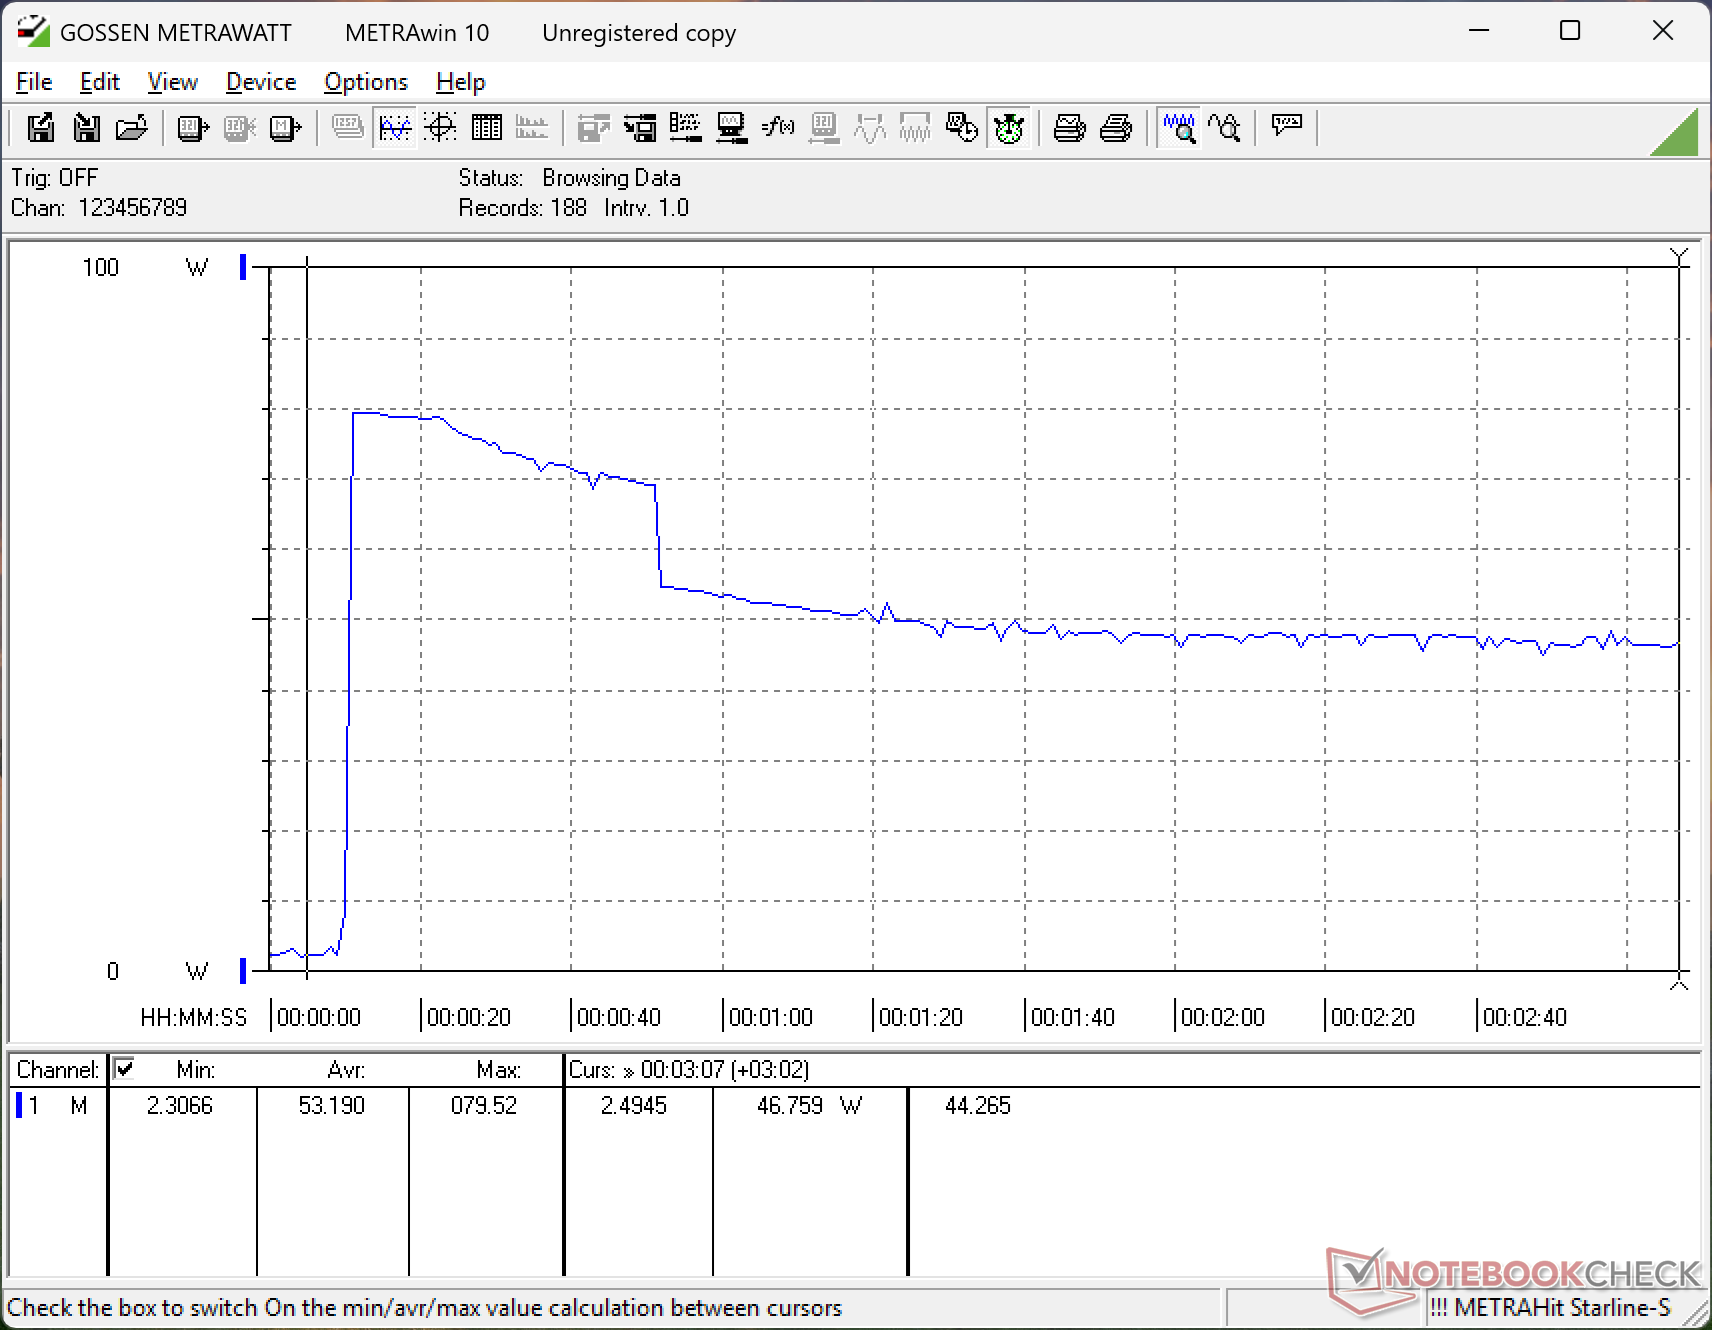
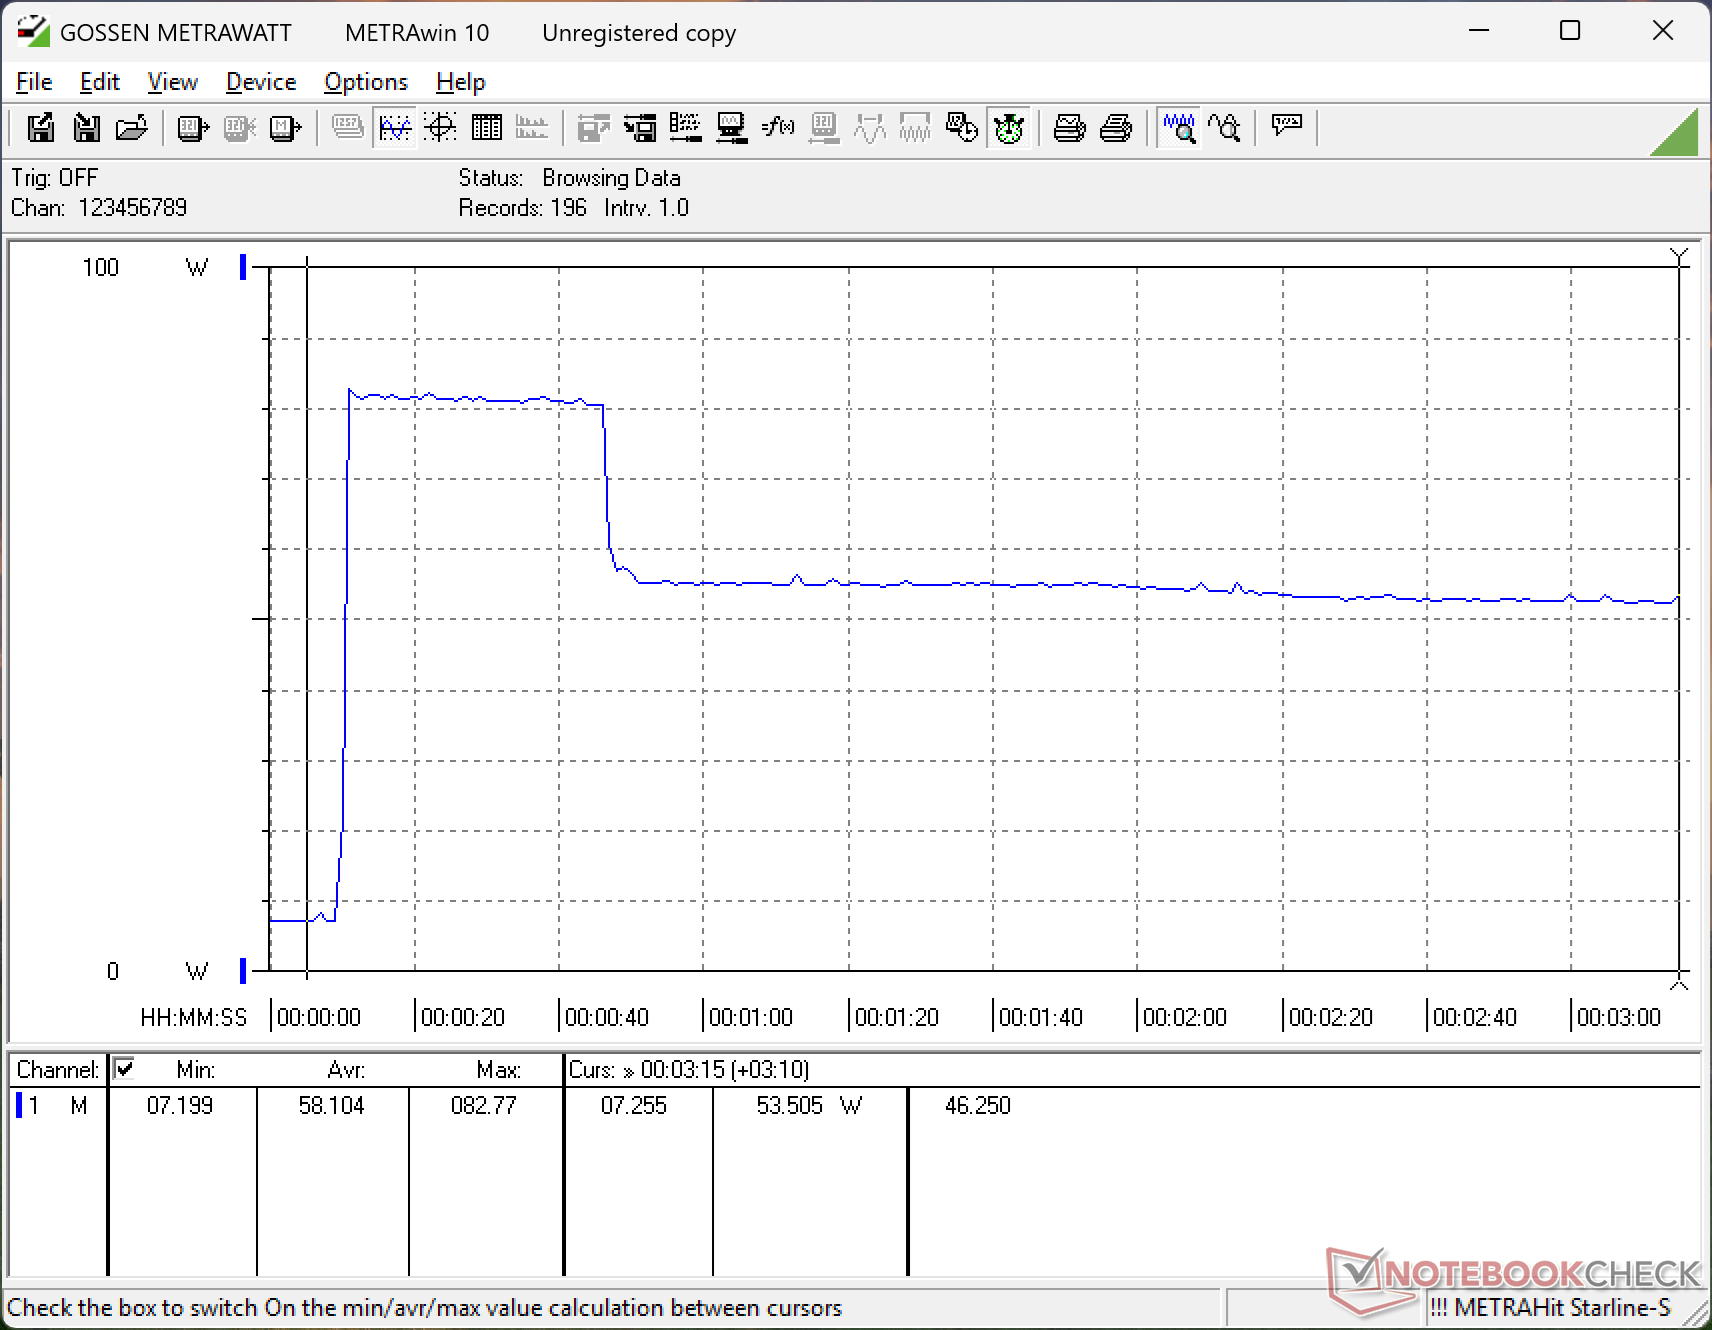
Procesor może stać się dość ciepły, gdy jest obciążony. Podczas uruchamiania Prime95, na przykład, procesor zwiększyłby taktowanie do 3,6 GHz, 54 W i 100 C, trwając zaledwie kilka sekund, zanim spadłby i ustabilizował się na poziomie 3,0 GHz i 32 W, aby utrzymać bardziej rozsądną temperaturę rdzenia na poziomie 86 C. Dla porównania, Core Ultra 7 w Dell 16 Premium z 2025 roku ustabilizowałby się w cieplejszej temperaturze 93 C w podobnych warunkach. Prawdopodobnie nowy XPS 16 również ustabilizowałby się przy temperaturach rdzenia powyżej 90 C, gdyby był skonfigurowany ze znacznie szybszym Core Ultra X7 zamiast naszego Core Ultra 5.
Po uruchomieniu gry Cyberpunk 2077, która reprezentuje bardziej zrównoważone obciążenie CPU-GPU, temperatura rdzenia ustabilizowałaby się na bardzo ciepłym poziomie 89 C w porównaniu do 75 C na XPS 16 z 2025 roku z szybszą grafiką GeForce RTX. Ogólnie wyższe temperatury rdzenia są prawdopodobnie odpowiedzialne za wyższe temperatury powierzchni wspomniane powyżej.
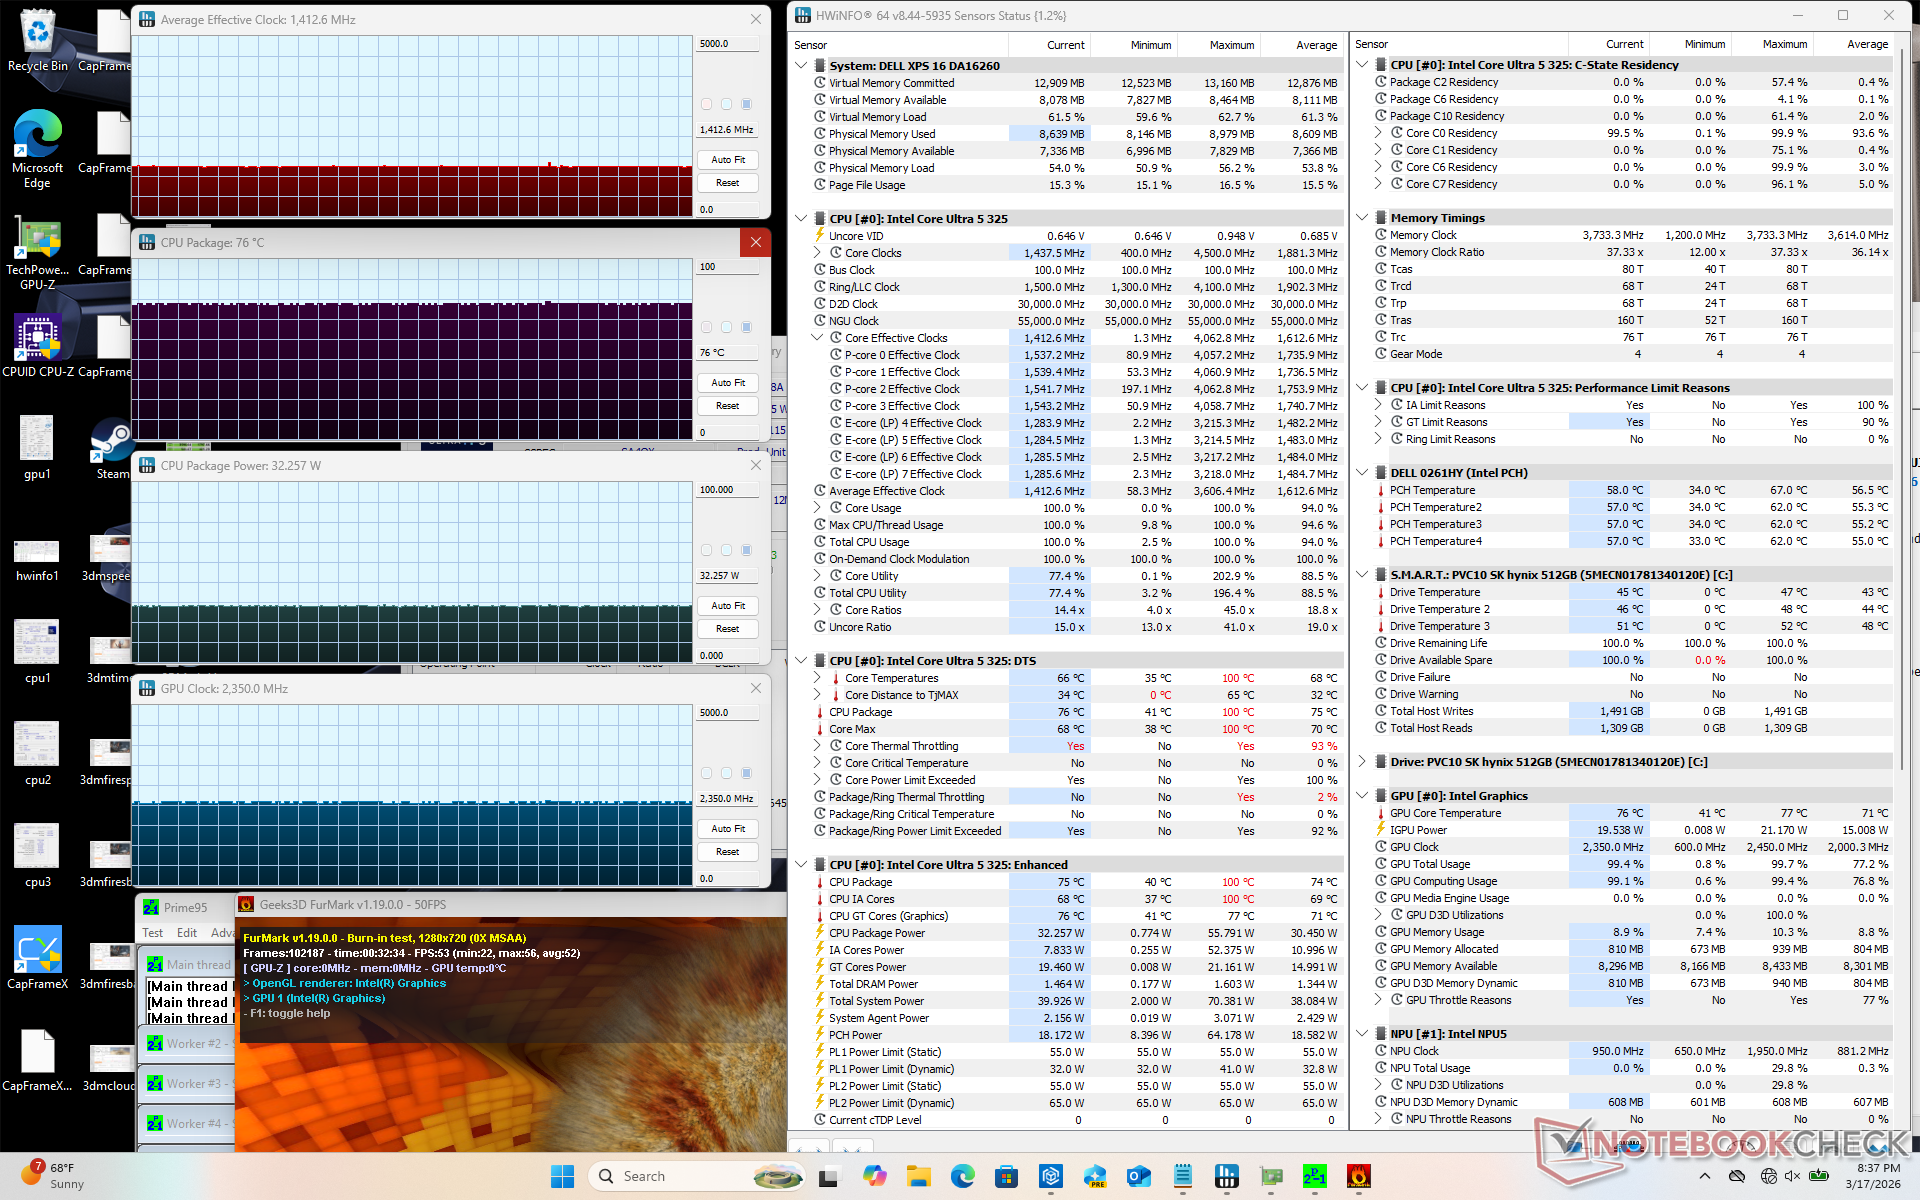
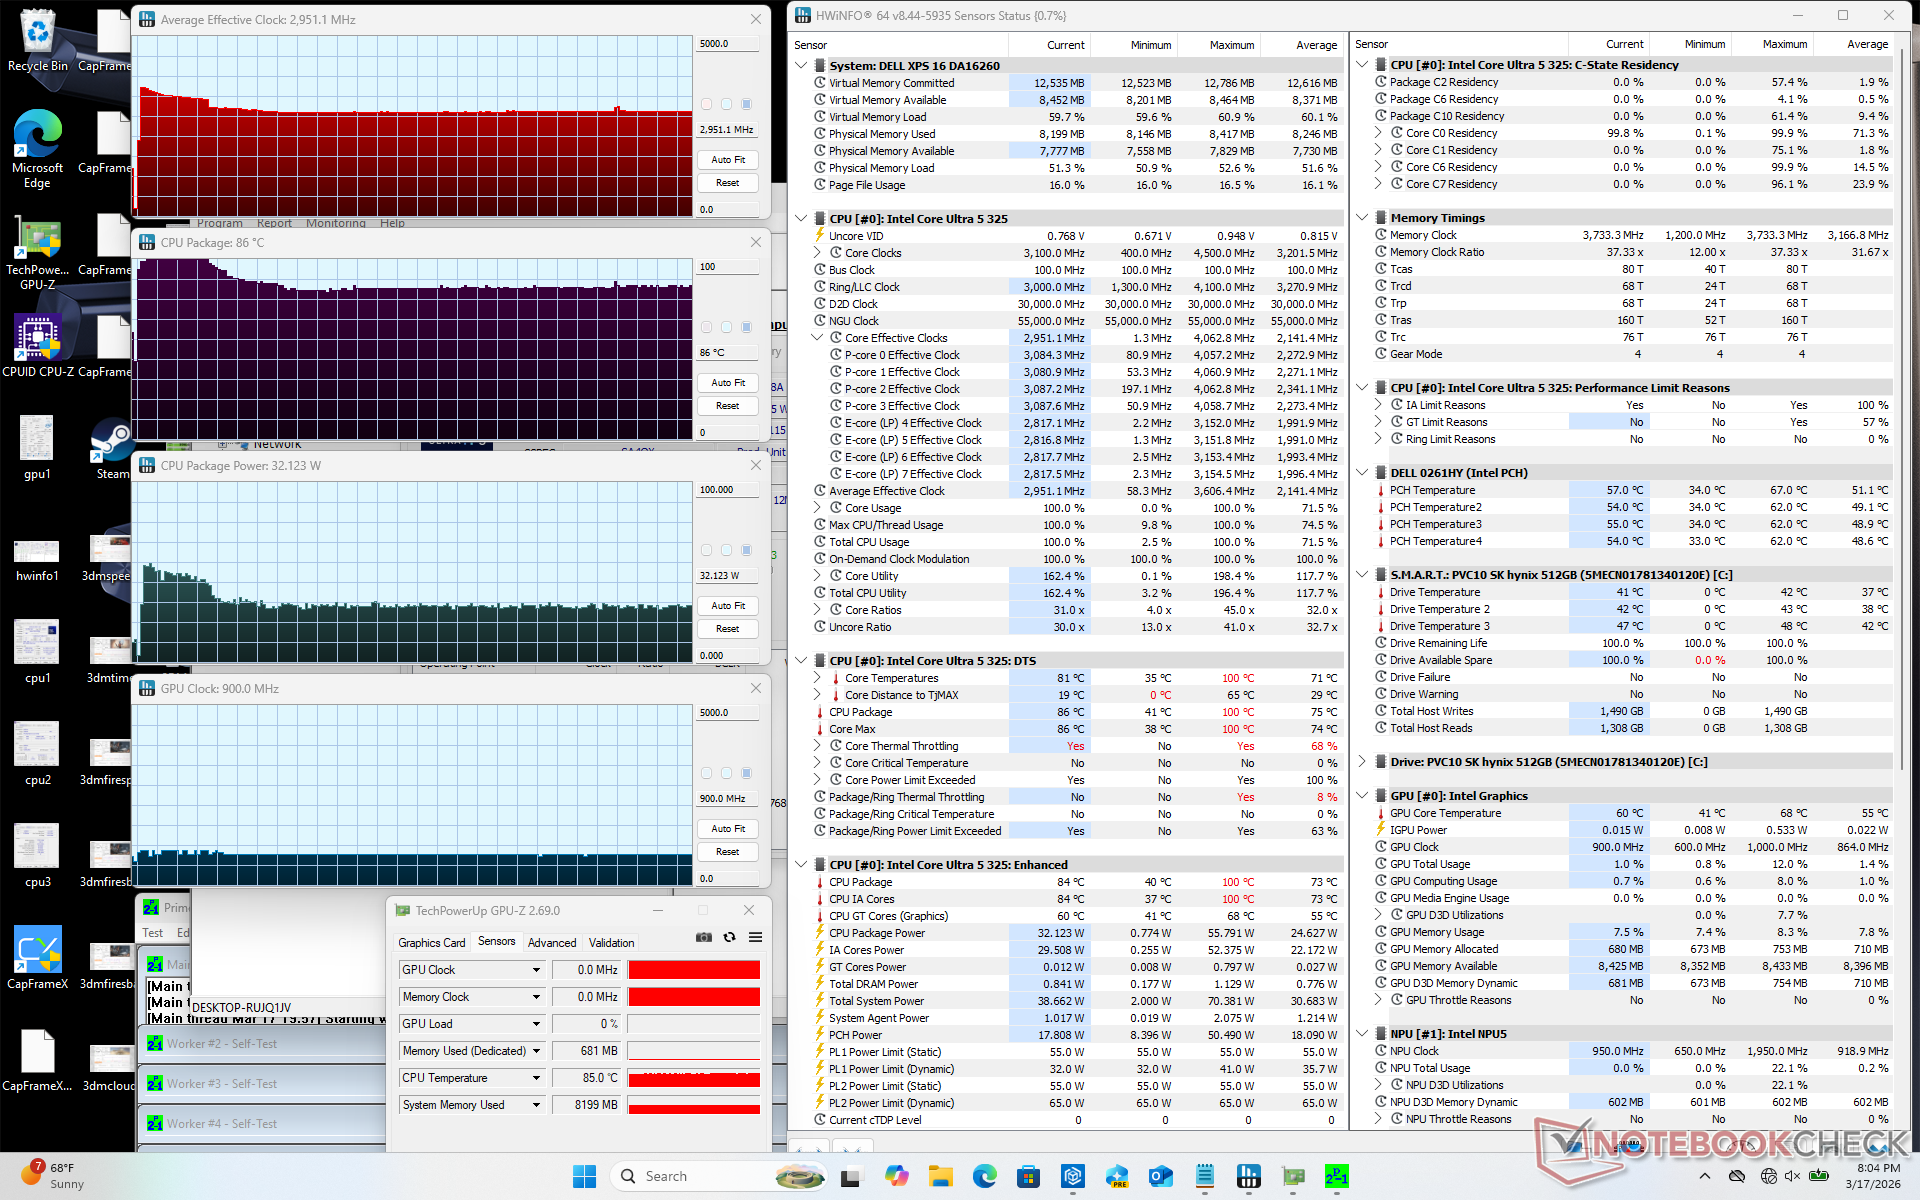
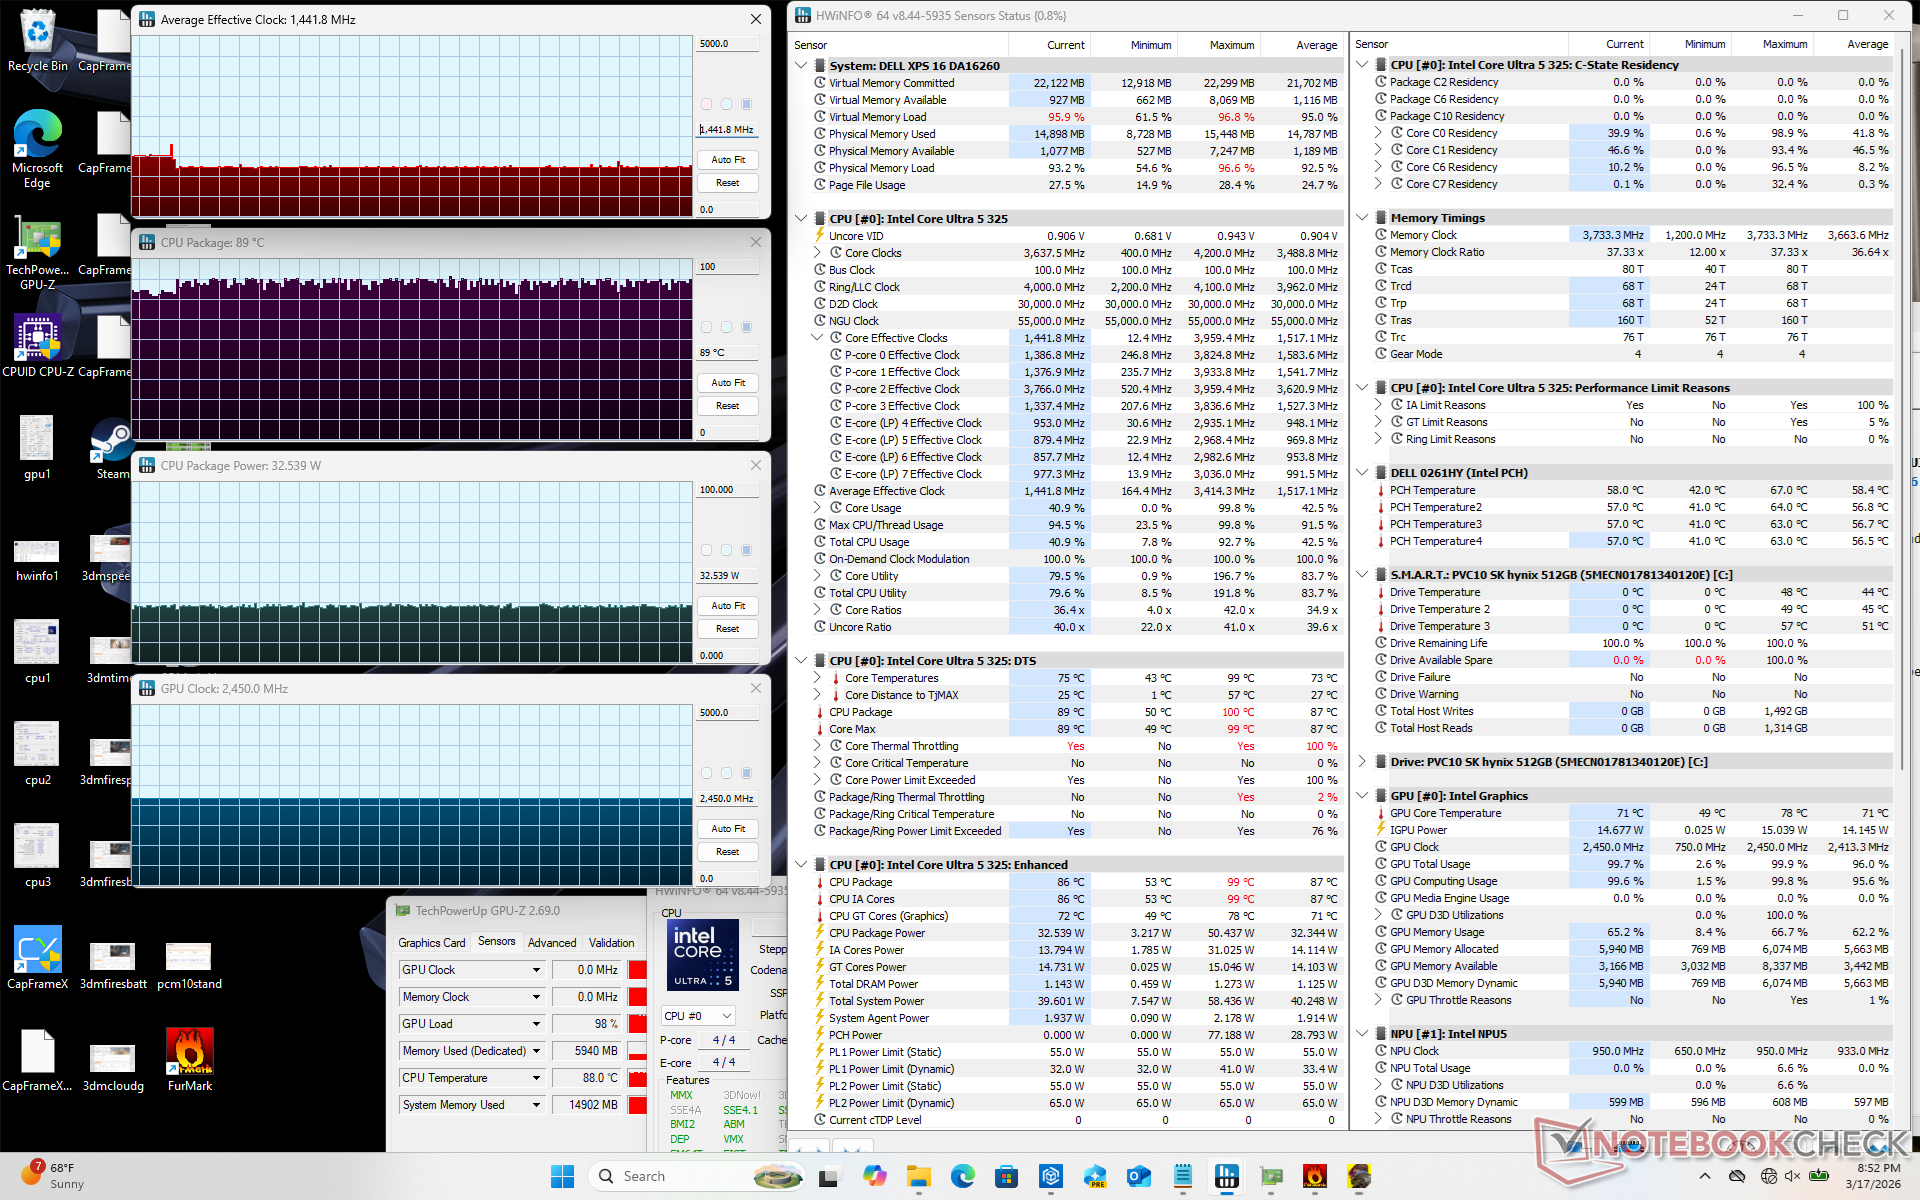
| Średnie taktowanie CPU (GHz) | Taktowanie GPU (MHz) | Średnia temperatura CPU (°C) | |
| System bezczynności | -- | -- | 47 |
| Prime95 Stress | 3.0 | -- | 86 |
| Prime95 + FurMark Stress | 1.4 | 2350 | 76 |
| Cyberpunk 2077 Stress | 1.4 | 2450 | 89 |
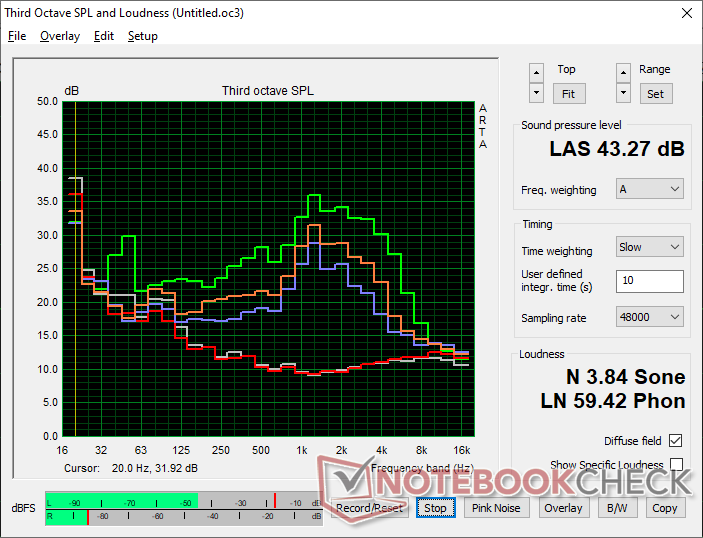
Głośniki

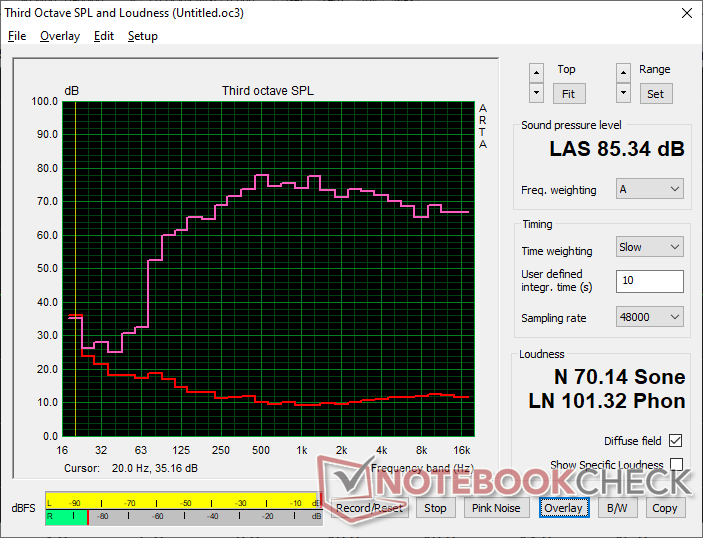
Dell XPS 16 Core Ultra 5 325 analiza dźwięku
(+) | głośniki mogą odtwarzać stosunkowo głośno (85.3 dB)
Bas 100 - 315 Hz
(±) | zredukowany bas - średnio 6.1% niższy od mediany
(+) | bas jest liniowy (5.6% delta do poprzedniej częstotliwości)
Średnie 400 - 2000 Hz
(+) | zbalansowane środki średnie - tylko 3.2% od mediany
(+) | średnie są liniowe (4.6% delta do poprzedniej częstotliwości)
Wysokie 2–16 kHz
(+) | zrównoważone maksima - tylko 2.4% od mediany
(+) | wzloty są liniowe (3.3% delta do poprzedniej częstotliwości)
Ogólnie 100 - 16.000 Hz
(+) | ogólny dźwięk jest liniowy (7% różnicy w stosunku do mediany)
W porównaniu do tej samej klasy
» 5% wszystkich testowanych urządzeń w tej klasie było lepszych, 1% podobnych, 94% gorszych
» Najlepszy miał deltę 5%, średnia wynosiła ###średnia###%, najgorsza wynosiła 45%
W porównaniu do wszystkich testowanych urządzeń
» 1% wszystkich testowanych urządzeń było lepszych, 0% podobnych, 99% gorszych
» Najlepszy miał deltę 4%, średnia wynosiła ###średnia###%, najgorsza wynosiła 134%
Apple MacBook Pro 16 2021 M1 Pro analiza dźwięku
(+) | głośniki mogą odtwarzać stosunkowo głośno (84.7 dB)
Bas 100 - 315 Hz
(+) | dobry bas - tylko 3.8% od mediany
(+) | bas jest liniowy (5.2% delta do poprzedniej częstotliwości)
Średnie 400 - 2000 Hz
(+) | zbalansowane środki średnie - tylko 1.3% od mediany
(+) | średnie są liniowe (2.1% delta do poprzedniej częstotliwości)
Wysokie 2–16 kHz
(+) | zrównoważone maksima - tylko 1.9% od mediany
(+) | wzloty są liniowe (2.7% delta do poprzedniej częstotliwości)
Ogólnie 100 - 16.000 Hz
(+) | ogólny dźwięk jest liniowy (4.6% różnicy w stosunku do mediany)
W porównaniu do tej samej klasy
» 0% wszystkich testowanych urządzeń w tej klasie było lepszych, 0% podobnych, 100% gorszych
» Najlepszy miał deltę 5%, średnia wynosiła ###średnia###%, najgorsza wynosiła 45%
W porównaniu do wszystkich testowanych urządzeń
» 0% wszystkich testowanych urządzeń było lepszych, 0% podobnych, 100% gorszych
» Najlepszy miał deltę 4%, średnia wynosiła ###średnia###%, najgorsza wynosiła 134%
Zarządzanie energią - Panther Lake jest królem wydajności
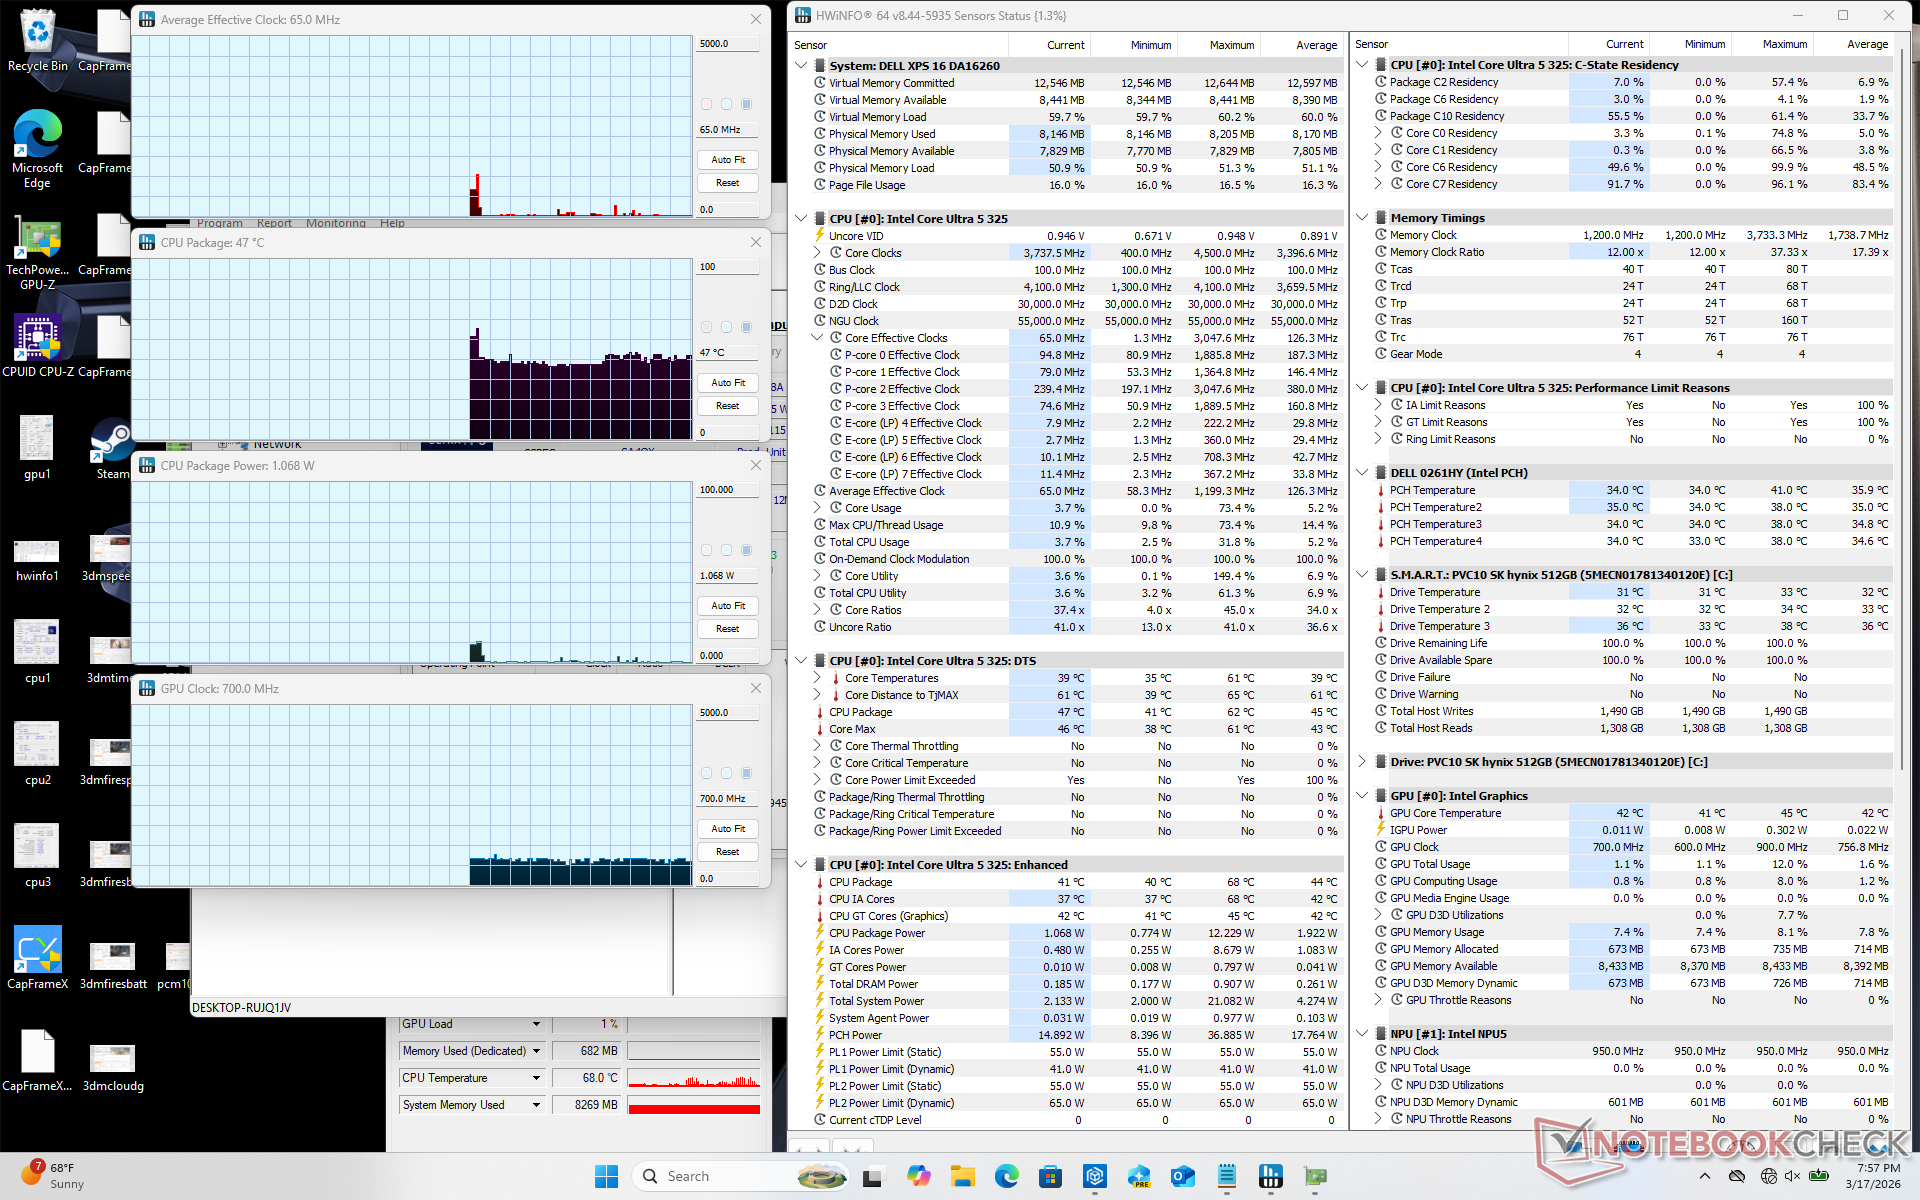
Zużycie energii
Panther Lake wykorzystuje wydajność Lunar Lake-V z surową wydajnością Arrow Lake-H, aby uzyskać to, co najlepsze z obu światów. Na biegu jałowym na pulpicie przy najniższym ustawieniu jasności zużywałby zaledwie 1,3 W, co jest niezwykle niskim zużyciem energii, szczególnie w przypadku 16-calowej obudowy. Zużycie energii pozostałoby na bardzo niskim poziomie nieco poniżej 50 W podczas uruchamiania gier ze względu na brak dyskretnego GPU. W przypadku konfiguracji z procesorem Core Ultra X7, zużycie energii podczas grania wyniosłoby zaledwie kilka watów więcej w oparciu o nasz czas spędzony z modelem XPS 14 uzyskując jedne z najwyższych wartości wydajności na wat spośród wszystkich laptopów z iGPU.
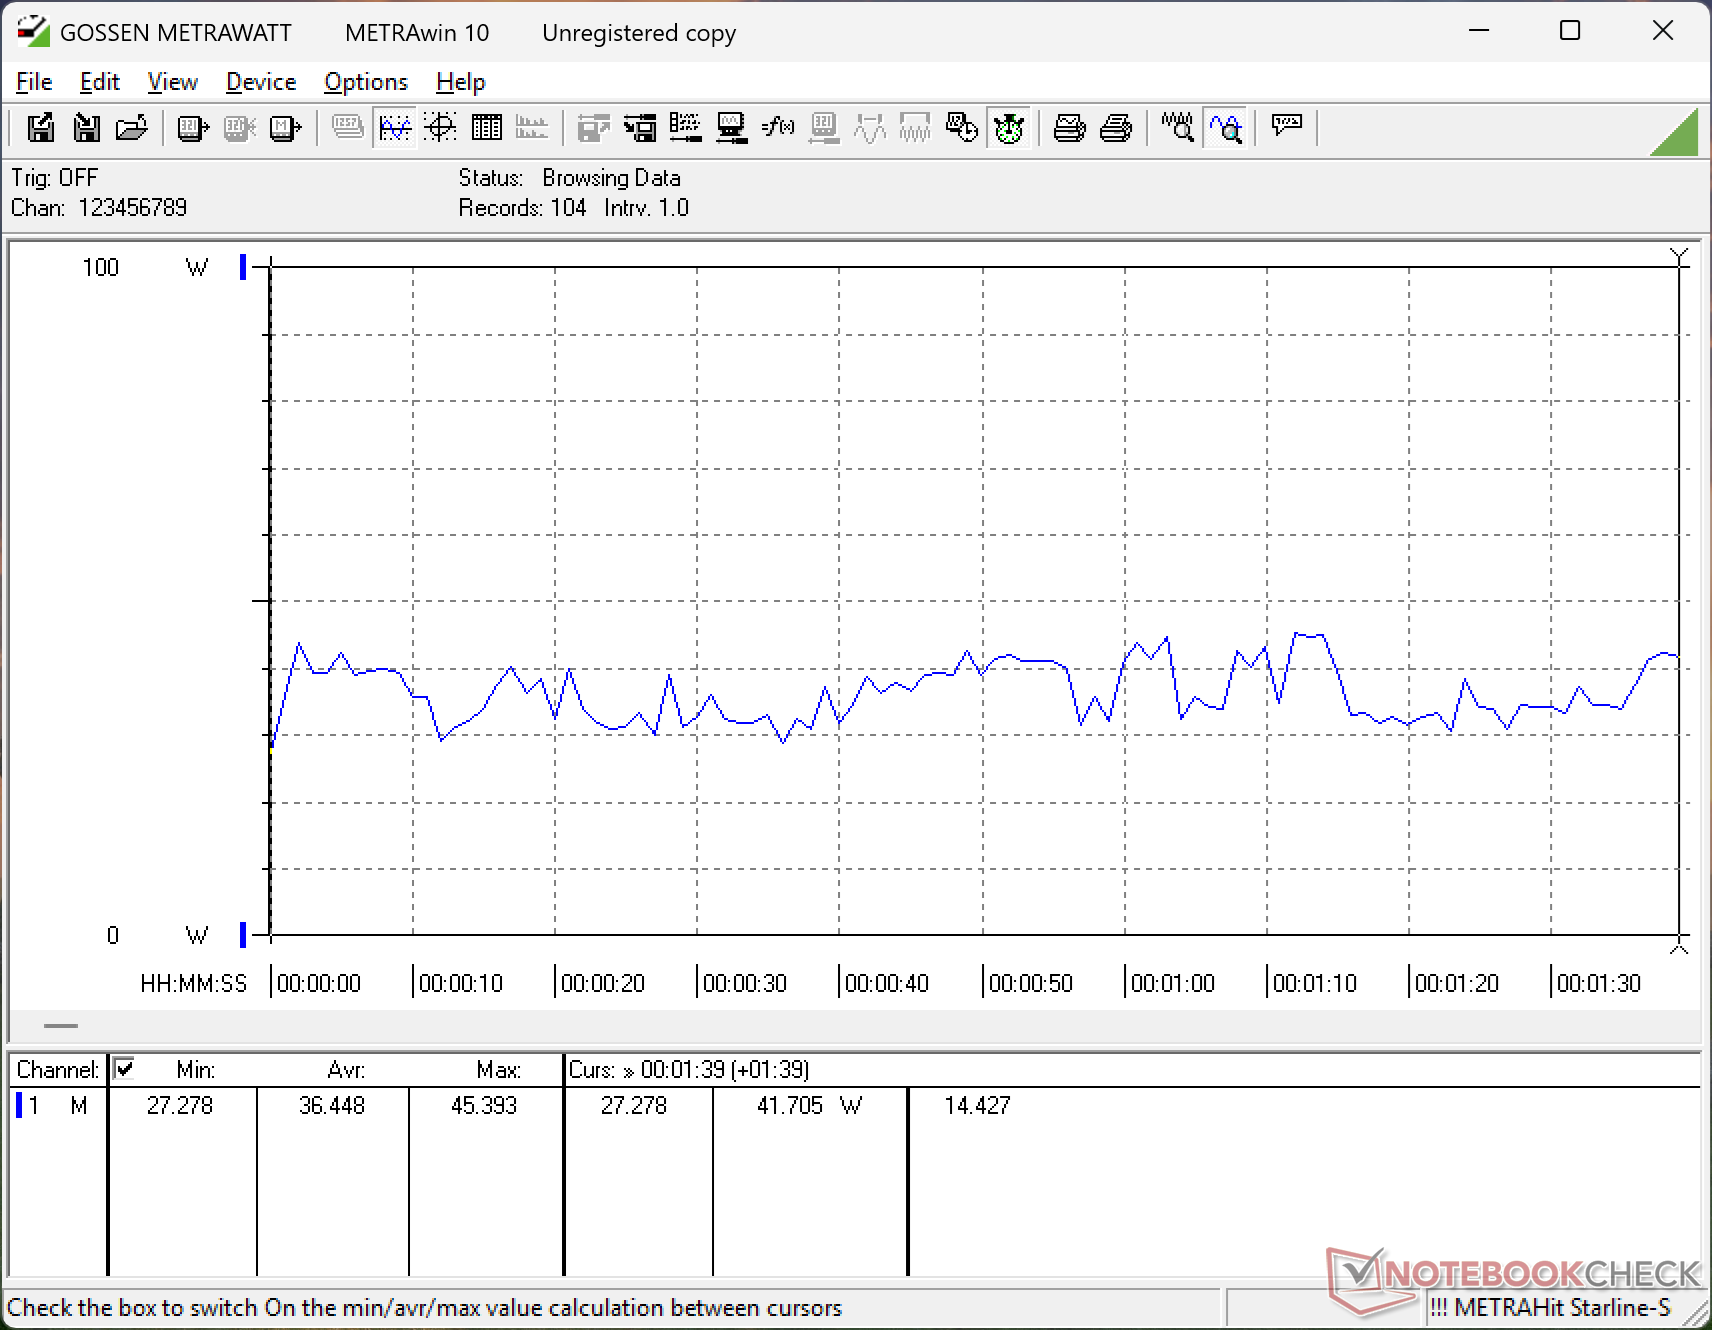
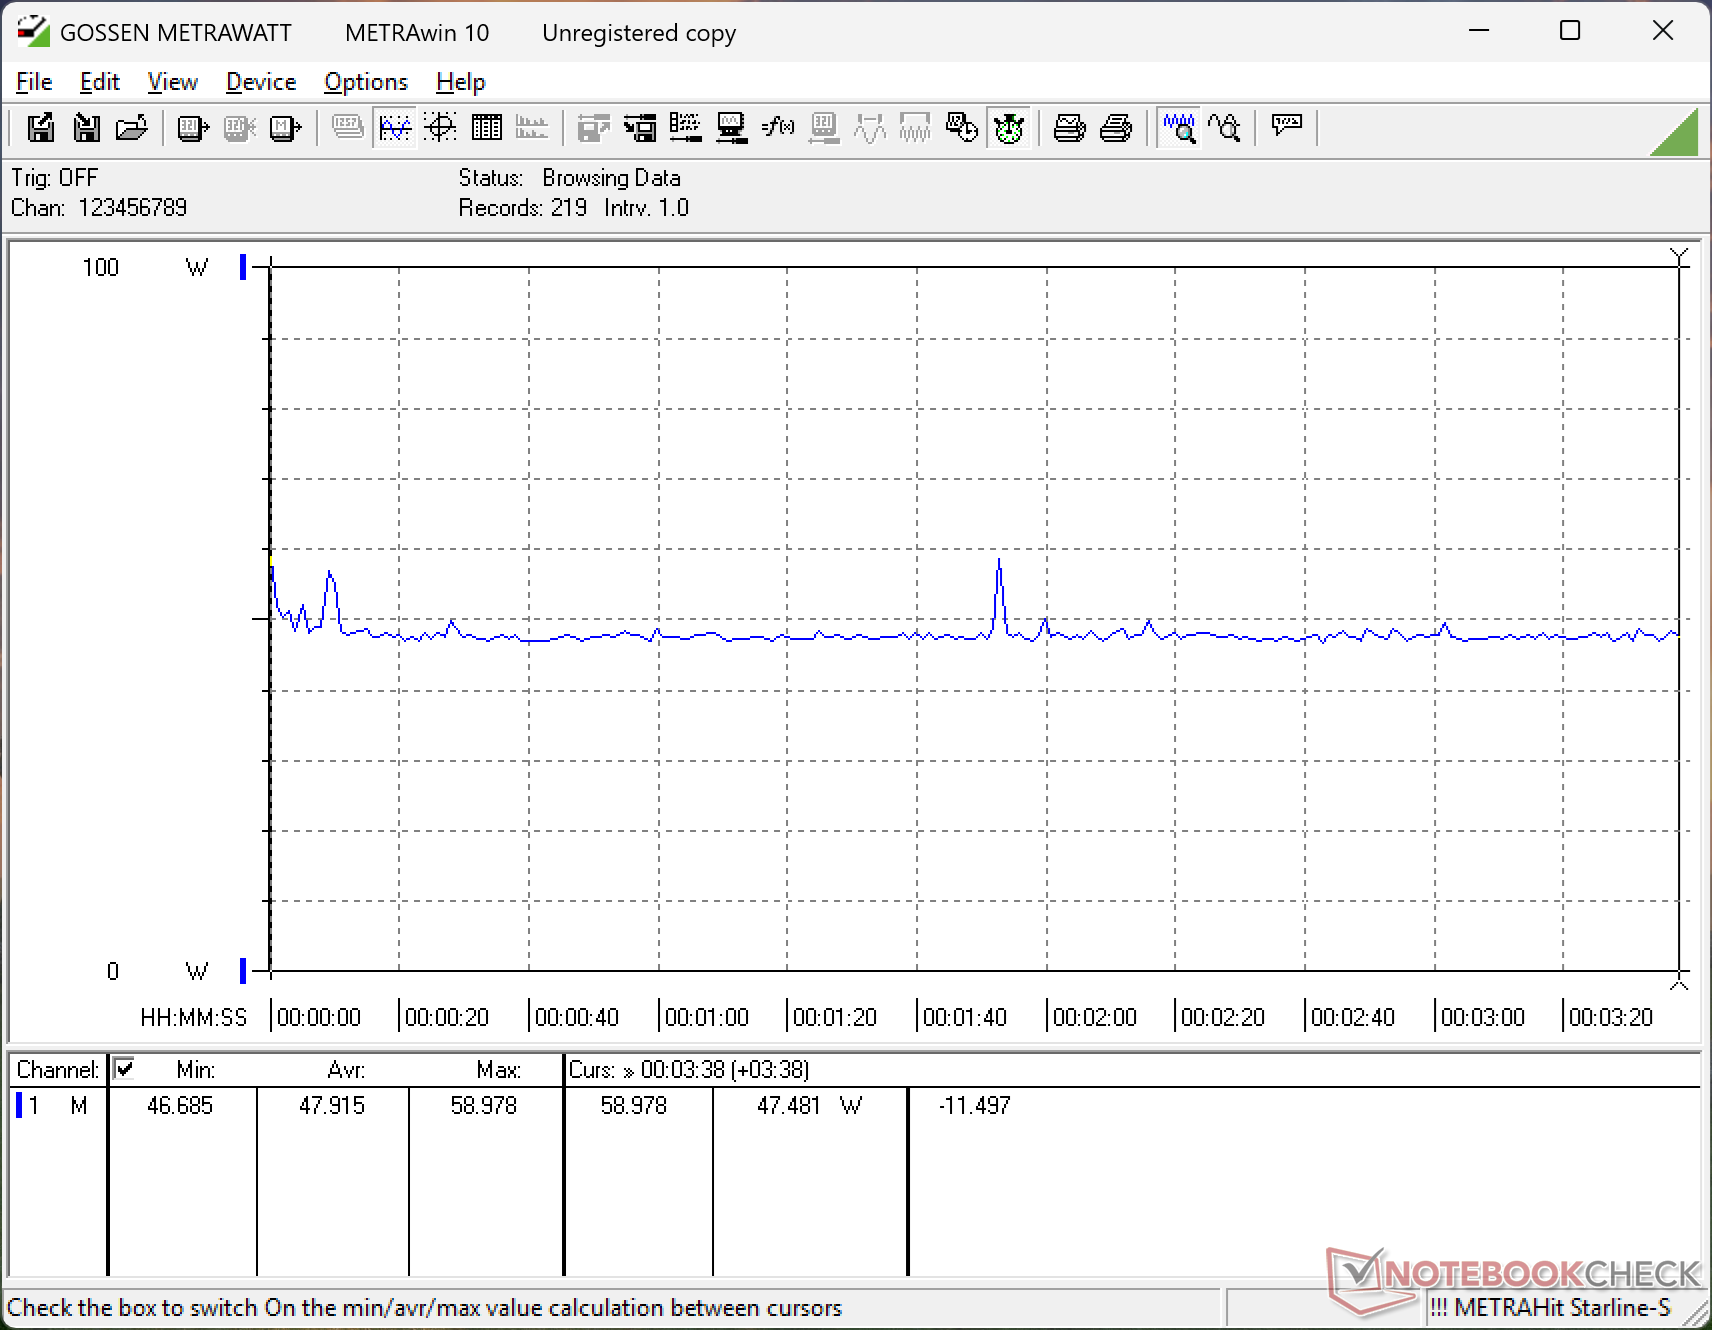
Jesteśmy w stanie zarejestrować tymczasowy maksymalny pobór mocy 83 W z małego (~ 10,2 x 5,5 x 2,2 cm) uniwersalnego zasilacza sieciowego USB-C o mocy 100 W, gdy procesor jest w pełni obciążony.
| wyłączony / stan wstrzymania | |
| luz | |
| obciążenie |
|
Legenda:
min: | |
| Dell XPS 16 Core Ultra 5 325 Ultra 5 325, Intel Graphics 4 Xe3 PTL, SK hynix PVC10 HFS512GEM4X182N, IPS, 1920x1200, 16" | Dell 16 Premium DA16250 Ultra 7 255H, GeForce RTX 5070 Laptop, Kioxia BG6 KBG6AZNV1T02, OLED, 3840x2400, 16.3" | Lenovo Yoga Pro 9 16IAH10 RTX 5050 Ultra 9 285H, GeForce RTX 5050 Laptop, WD PC SN7100S SDFPMSL-1T00-1101, OLED, 2880x1800, 16" | Samsung Galaxy Book6 Ultra Ultra 7 356H, GeForce RTX 5070 Laptop, Samsung PM9C1b MZVL81T0HFLB-00BH1, OLED, 2880x1800, 16" | Asus ZenBook S16 UM5606GA Ryzen AI 9 465, Radeon 880M, SanDisk PC SN5100S, OLED, 2880x1800, 16" | MSI Prestige 16 AI Evo B2HMG Ultra 9 285H, Arc 140T, Micron 2500 1TB MTFDKBA1T0QGN, IPS, 2560x1600, 16" | |
|---|---|---|---|---|---|---|
| Power Consumption | -225% | -261% | -119% | -65% | -93% | |
| Idle Minimum * (Watt) | 1.3 | 6.5 -400% | 6.8 -423% | 4.4 -238% | 3.7 -185% | 4.4 -238% |
| Idle Average * (Watt) | 4.5 | 8.1 -80% | 20.1 -347% | 6.4 -42% | 7.4 -64% | 9.2 -104% |
| Idle Maximum * (Watt) | 4.6 | 33 -617% | 21.6 -370% | 7.1 -54% | 9.5 -107% | 9.5 -107% |
| Load Average * (Watt) | 36.5 | 88.9 -144% | 87.6 -140% | 55.1 -51% | 57.9 -59% | 66.9 -83% |
| Cyberpunk 2077 ultra external monitor * (Watt) | 45.4 | 108.9 -140% | 147.9 -226% | 133 -193% | 57 -26% | 67.4 -48% |
| Cyberpunk 2077 ultra * (Watt) | 47.9 | 108.7 -127% | 148.2 -209% | 134.3 -180% | 58.5 -22% | 68.8 -44% |
| Load Maximum * (Watt) | 82.8 | 138.3 -67% | 173.5 -110% | 143.9 -74% | 76.9 7% | 102.9 -24% |
* ... im mniej tym lepiej
Pobór mocy Cyberpunk / Test warunków skrajnych
Zużycie energii przez monitor zewnętrzny
Żywotność baterii

Dell reklamuje żywotność baterii do 31 godzin w oparciu o wewnętrzne kryteria testowania WLAN. Podczas testów w naszych własnych warunkach WLAN udało nam się jednak zarejestrować czas pracy wynoszący prawie 27 godzin, co wciąż jest niesamowicie imponujące, biorąc pod uwagę, że pojemność baterii 70 Wh jest w rzeczywistości niewielka jak na 16-calową obudowę.
| Dell XPS 16 Core Ultra 5 325 Ultra 5 325, Intel Graphics 4 Xe3 PTL, 70 Wh | Dell XPS 16 9640 Ultra 7 155H, GeForce RTX 4070 Laptop GPU, 99.5 Wh | Lenovo Yoga Pro 9 16IAH10 RTX 5050 Ultra 9 285H, GeForce RTX 5050 Laptop, 84 Wh | Samsung Galaxy Book6 Ultra Ultra 7 356H, GeForce RTX 5070 Laptop, 80.2 Wh | Asus ZenBook S16 UM5606GA Ryzen AI 9 465, Radeon 880M, 83 Wh | MSI Prestige 16 AI Evo B2HMG Ultra 9 285H, Arc 140T, 99.9 Wh | |
|---|---|---|---|---|---|---|
| Czasy pracy | -61% | -60% | -37% | -51% | -38% | |
| WiFi v1.3 (h) | 26.6 | 10.5 -61% | 10.7 -60% | 16.8 -37% | 13.1 -51% | 16.5 -38% |
| H.264 (h) | 16.5 | 20.8 | ||||
| Load (h) | 1.5 | 2.4 |
Ocena Notebookcheck
W XPS 16 2026 zrezygnowano z dyskretnych opcji GPU na rzecz smuklejszej, lżejszej, cichszej, trwalszej i wydajniejszej konstrukcji.
Dell XPS 16 Core Ultra 5 325
- 20/03/2026 v8
Allen Ngo
 Total Sustainability Score:
 Potencjalni konkurenci w porównaniu
Obraz | Model / recenzja | Cena | Waga | Wysokość | Ekran |
|---|---|---|---|---|---|
1. 84.2%  | Dell XPS 16 Core Ultra 5 325 Intel Core Ultra 5 325 ⎘ Intel Graphics 4 Xe3 Panther Lake iGPU ⎘ 16 GB Pamięć, 512 GB SSD | Amazon: 1. $2,799.00 Dell Premium 16 (XPS 16 2025... 2. $2,499.99 Dell Premium 16 (XPS 16 2025... 3. $2,599.00 Dell Premium 16 (XPS 16 2025... Cena katalogowa: 1600 USD | 1.7 kg | 15.4 mm | 16.00" 1920x1200 142 PPI IPS |
2. 87.9%  | Dell 16 Premium DA16250 Intel Core Ultra 7 255H ⎘ NVIDIA GeForce RTX 5070 Laptop ⎘ 32 GB Pamięć, 1024 GB SSD | Amazon: Cena katalogowa: 3300 USD | 2.3 kg | 18.7 mm | 16.30" 3840x2400 278 PPI OLED |
3. 88.8%  | Lenovo Yoga Pro 9 16IAH10 RTX 5050 Intel Core Ultra 9 285H ⎘ NVIDIA GeForce RTX 5050 Laptop ⎘ 32 GB Pamięć, 1024 GB SSD | Amazon: Cena katalogowa: 1800 USD | 2 kg | 17.9 mm | 16.00" 2880x1800 212 PPI OLED |
4. 90.7%  | Samsung Galaxy Book6 Ultra Intel Core Ultra 7 356H ⎘ NVIDIA GeForce RTX 5070 Laptop ⎘ 32 GB Pamięć, 1000 GB SSD | Amazon: Cena katalogowa: 3599€ | 1.9 kg | 15.4 mm | 16.00" 2880x1800 212 PPI OLED |
5. 86.6%  | Asus ZenBook S16 UM5606GA AMD Ryzen AI 9 465 ⎘ AMD Radeon 880M ⎘ 32 GB Pamięć, 1024 GB SSD | Amazon: Cena katalogowa: 1799€ | 1.5 kg | 12.9 mm | 16.00" 2880x1800 212 PPI OLED |
6. 82.8%  | MSI Prestige 16 AI Evo B2HMG Intel Core Ultra 9 285H ⎘ Intel Arc Graphics 140T ⎘ 32 GB Pamięć, 1024 GB SSD | Amazon: 1. $1,479.00 MSI Prestige 16 AI+ Evo 16" ... 2. $1,099.49 msi Prestige 13 AI Evo Lapto... 3. $1,414.25 MSI Prestige 14 AI+ EVO PRE1... | 1.6 kg | 18.95 mm | 16.00" 2560x1600 189 PPI IPS |
Przezroczystość
Wyboru urządzeń do recenzji dokonuje nasza redakcja. Próbkę do badań autor zakupił bezpłatnie na własny koszt. Pożyczkodawca nie miał wpływu na tę recenzję, producent nie otrzymał też kopii tej recenzji przed publikacją. Nie było obowiązku publikowania tej recenzji. Jako niezależna firma medialna, Notebookcheck nie podlega władzy producentów, sprzedawców detalicznych ani wydawców.
Tak testuje Notebookcheck
Każdego roku Notebookcheck niezależnie sprawdza setki laptopów i smartfonów, stosując standardowe procedury, aby zapewnić porównywalność wszystkich wyników. Od około 20 lat stale rozwijamy nasze metody badawcze, ustanawiając przy tym standardy branżowe. W naszych laboratoriach testowych doświadczeni technicy i redaktorzy korzystają z wysokiej jakości sprzętu pomiarowego. Testy te obejmują wieloetapowy proces walidacji. Nasz kompleksowy system ocen opiera się na setkach uzasadnionych pomiarów i benchmarków, co pozwala zachować obiektywizm.
