

Notebookcheck Logo
Teaser

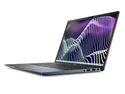
Recenzja Dell Pro 7 14 P714265: Biznes z klasą

64 GB pamięci RAM w 14-calowym subnotebooku.

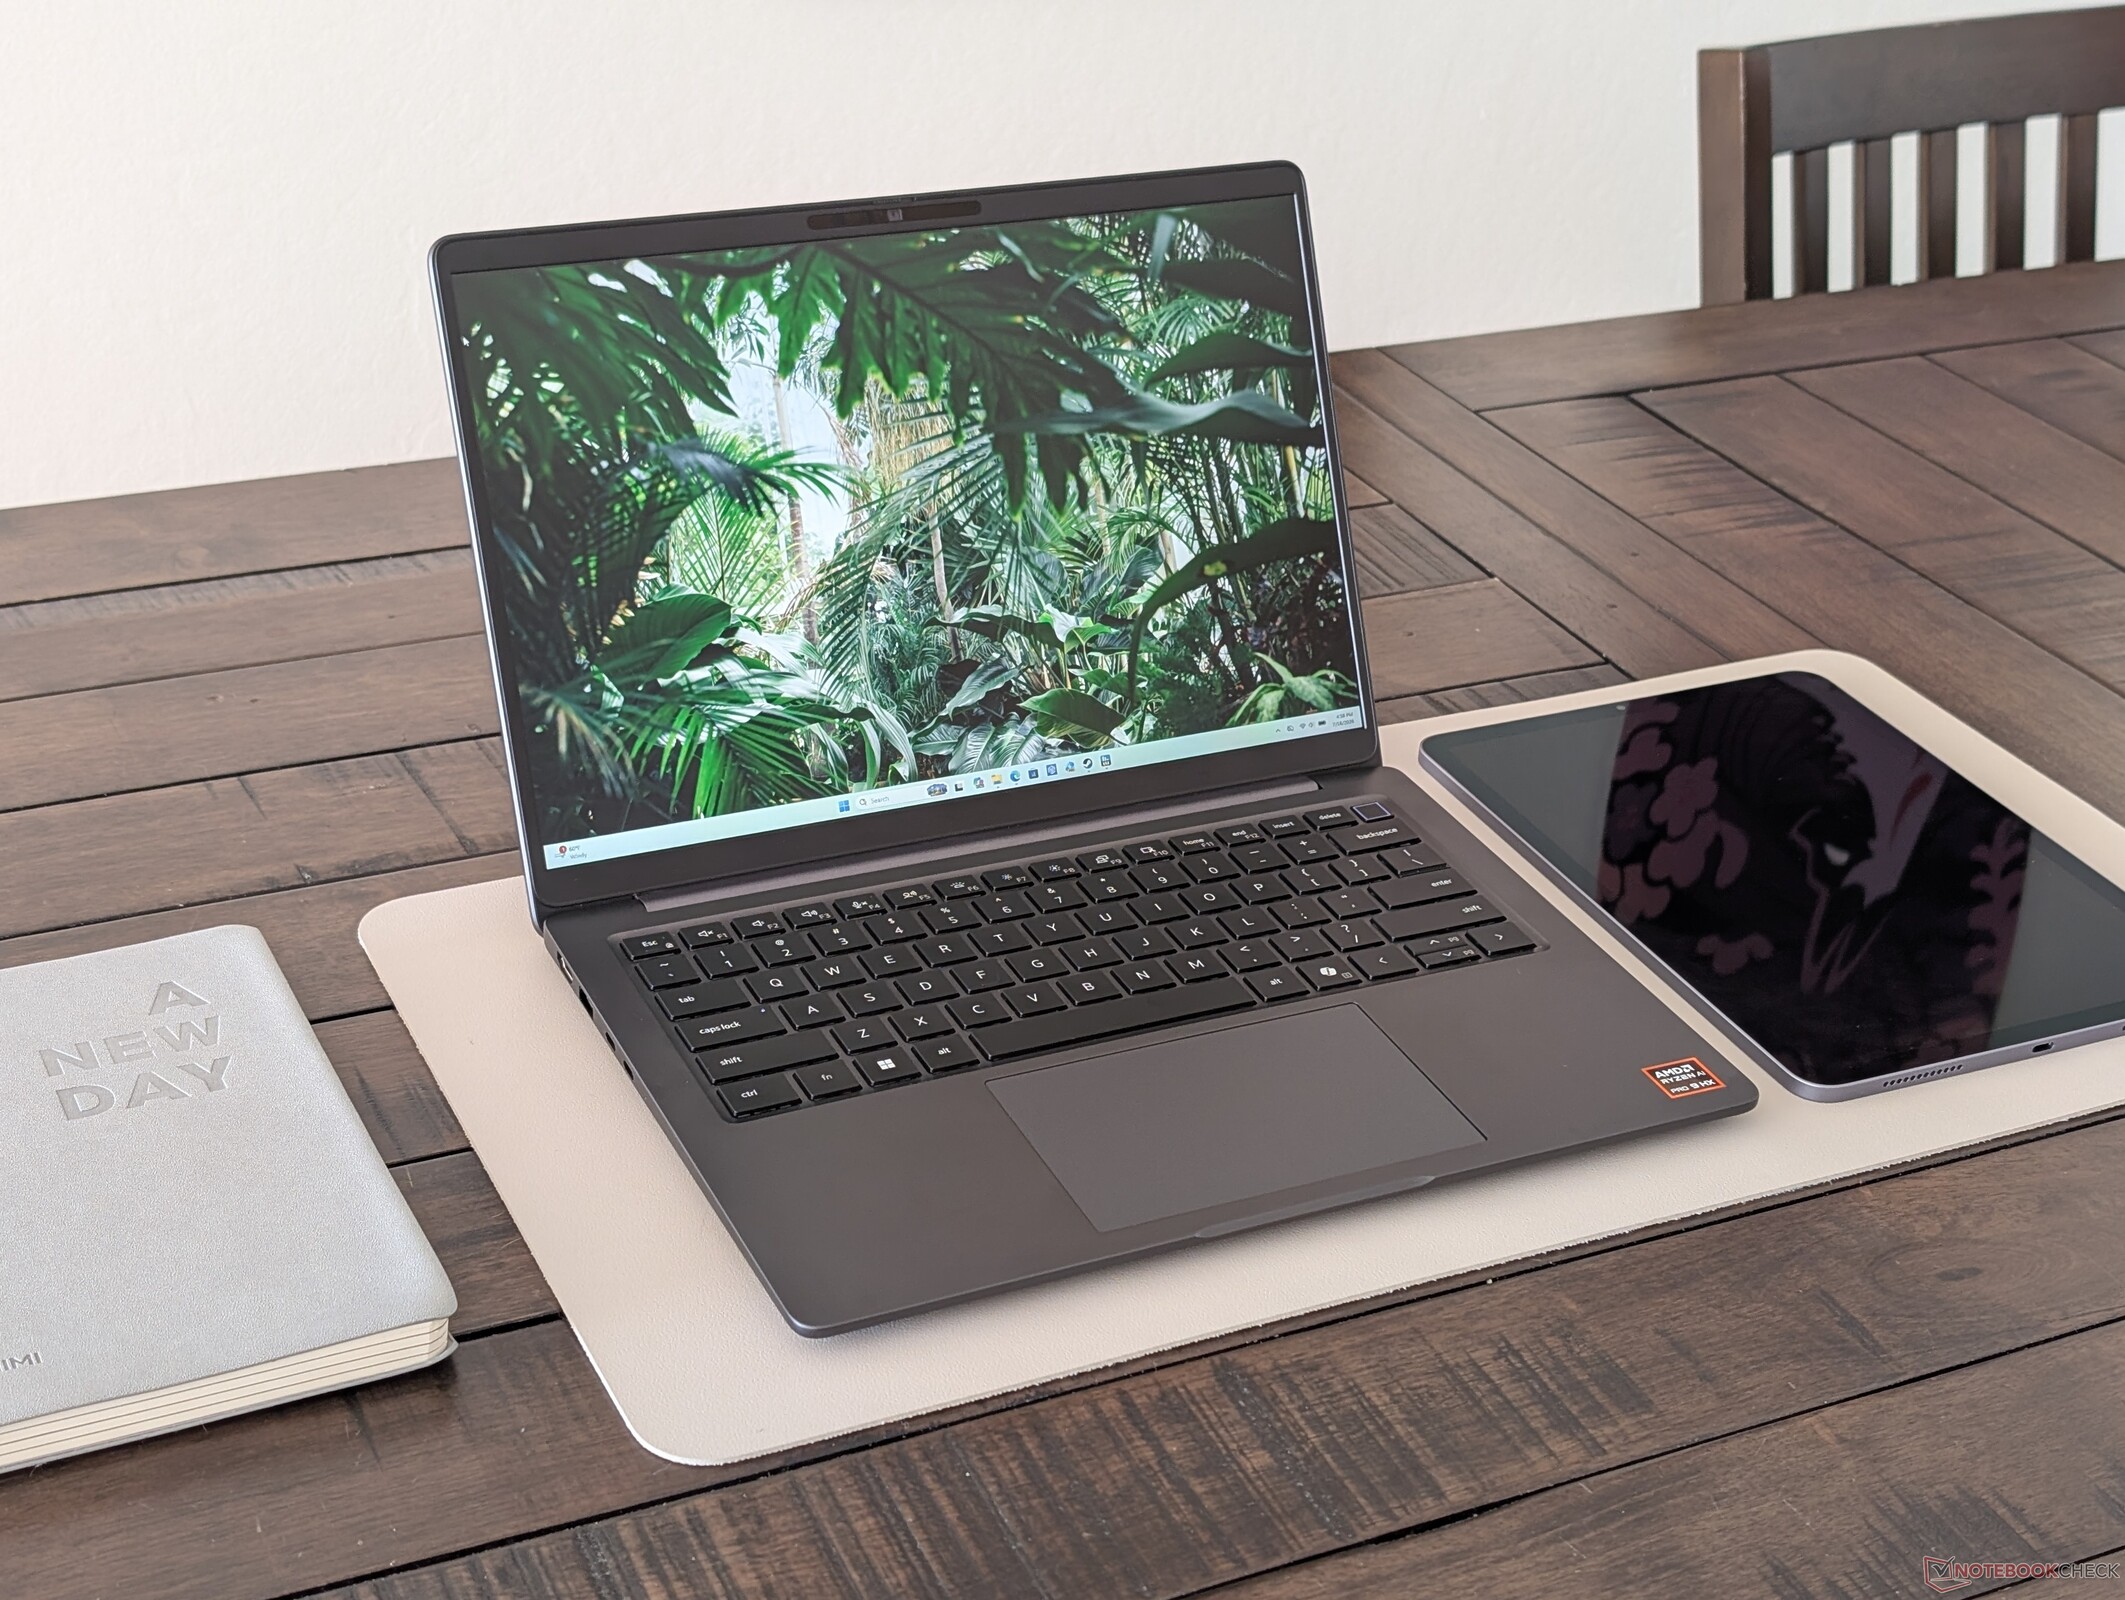
Model Dell Pro 7 14 kontynuuje tradycję serii Latitude, w której funkcjonalność i łatwość obsługi mają pierwszeństwo przed kontrowersyjnymi rozwiązaniami, takimi jak klawiatura bez kratki. Jest to również jeden z nielicznych laptopów wyposażonych w procesor Ryzen AI 9 HX Pro 470.
Allen Ngo, 👁 Allen Ngo (tłumaczenie DeepL / Ninh Duy) Opublikowany 🇺🇸 🇳🇱 ...
AMD Zen 5 Laptop / Notebook Business

Wniosek — niewielkie aktualizacje przynoszące znaczną poprawę

Chociaż ostatnie zmiany w nazewnictwie laptopów firmy Dell mogą sprawiać trudności w orientacji, to jednak kolejne wersje konstrukcyjne i coroczne aktualizacje zmierzają w kierunku większej spójności i pewności. Różnorodne zmiany zewnętrzne nadają urządzeniom bardziej przejrzysty wygląd, zachowując jednocześnie profesjonalną estetykę i łatwość naprawy, z których znane są laptopy biznesowe. Doceniamy różnorodność wbudowanych portów oraz ich optymalne rozmieszczenie, zamiast polegania wyłącznie na opcjach USB-C. Jeśli chodzi o podzespoły wewnętrzne, wydajność procesorów AMD uległa znacznemu zwiększeniu, zwłaszcza w porównaniu ze starszymi modelami z serii Lunar Lake-V.

Pozostałe zastrzeżenia mają charakter drugorzędny. Obudowa jest nieco większa niż w przypadku niektórych modeli HP Elite, a zarówno obsługa HDR, jak i wydajność w trybie Turbo Boost są ograniczone. Docenilibyśmy również bardziej precyzyjną regulację hałasu wentylatora, ponieważ zmiany prędkości obrotowej w modelu Dell Pro 7 14 mogą być nagłe i słyszalne. Zalecamy rezygnację z podstawowej opcji wyświetlacza ze względu na bardzo słabe pokrycie przestrzeni barwnej sRGB wynoszące około 60% oraz skonfigurowanie urządzenia z mniejszą i lżejszą baterią o pojemności 55 Wh, o ile nie jest wymagany wyjątkowo długi czas pracy. Najwyższej klasy konfiguracja Dell Pro 7 14 z procesorem AMD przewyższa obecne modele z serii Intel 3, stanowiąc lepszy wybór dla osób poszukujących wysokiej wydajności.

Za

+ wyposażony standardowo w technologię Intel vPro lub AMD Pro
+ stosunkowo niskie temperatury pracy
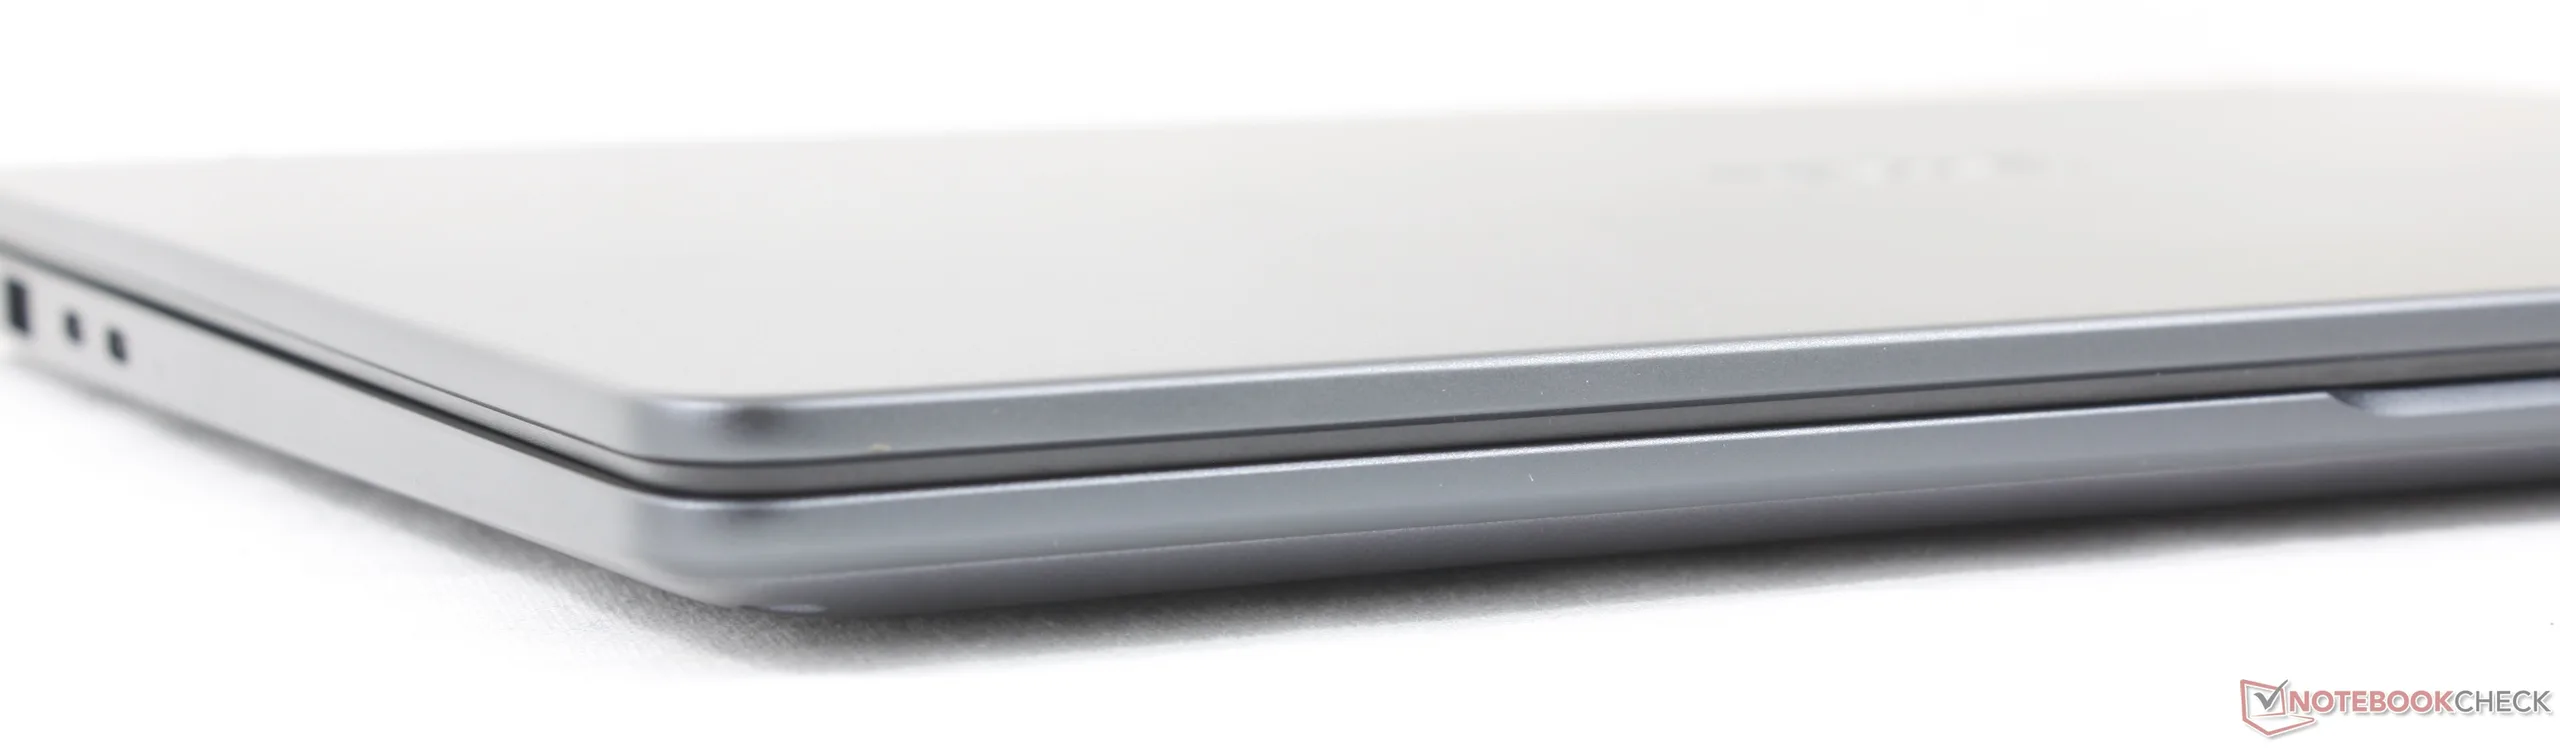
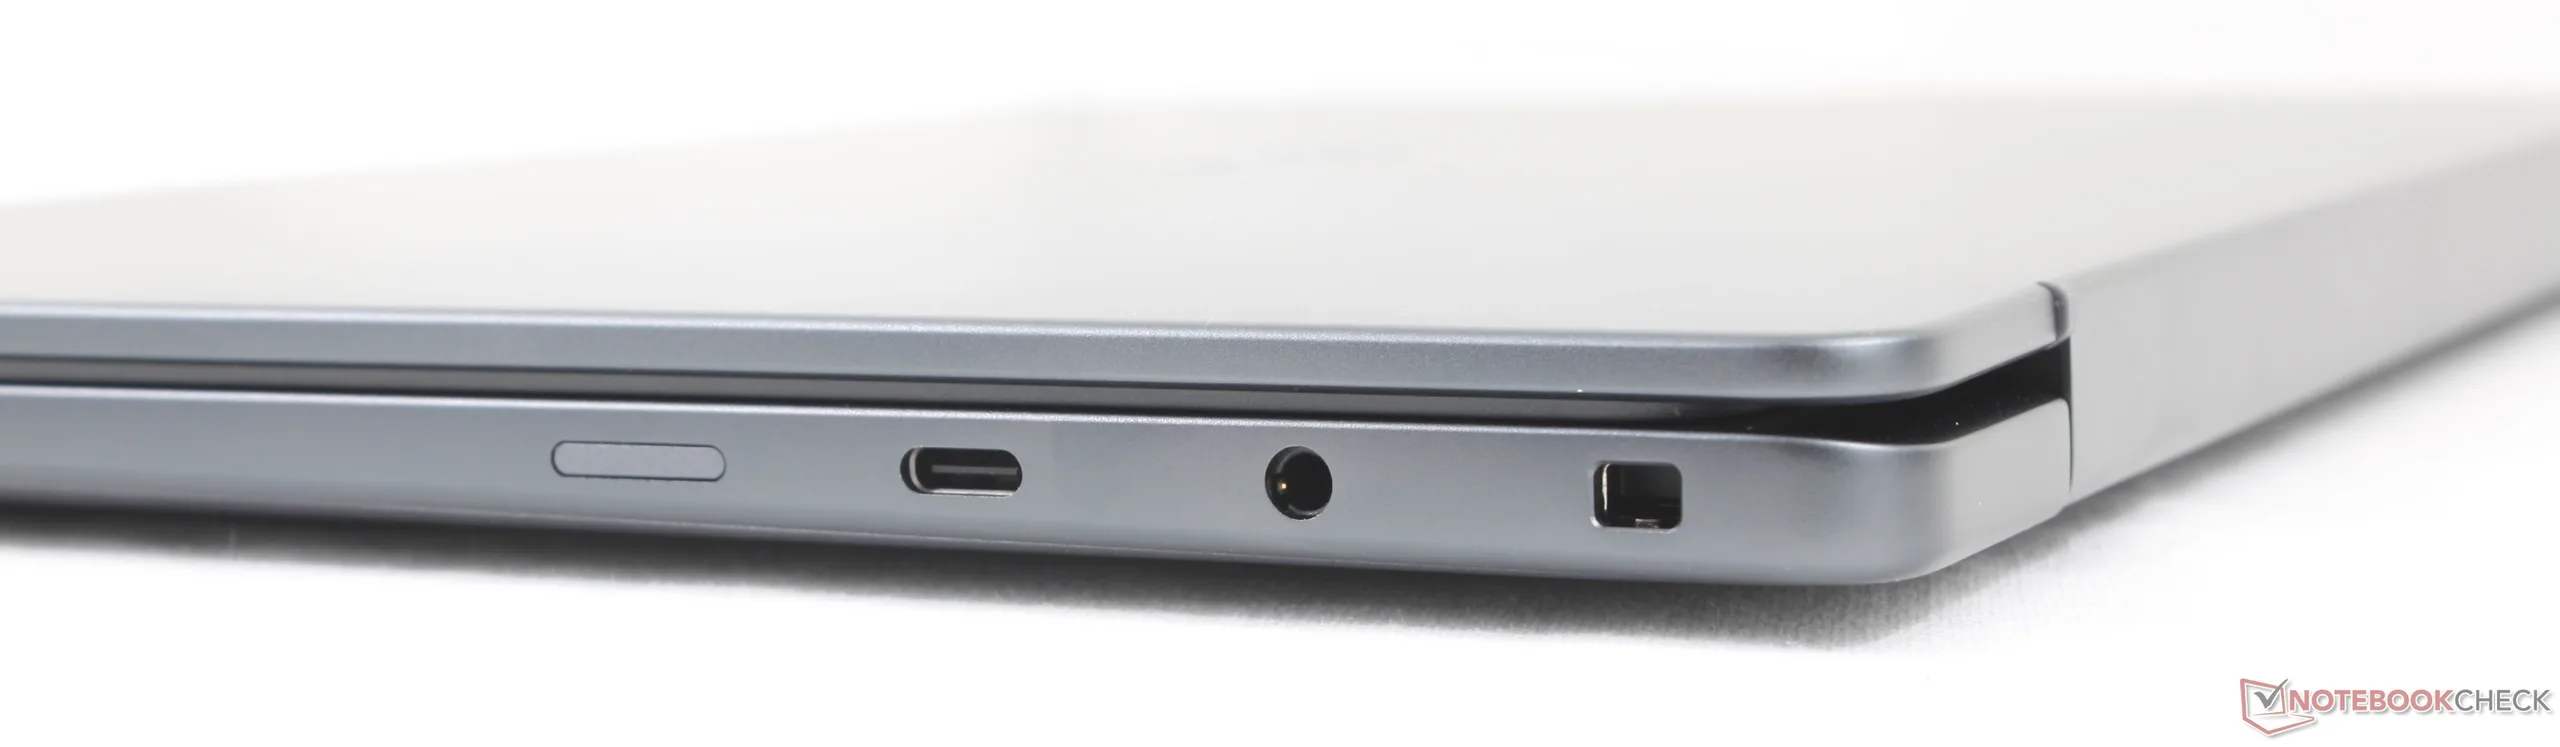
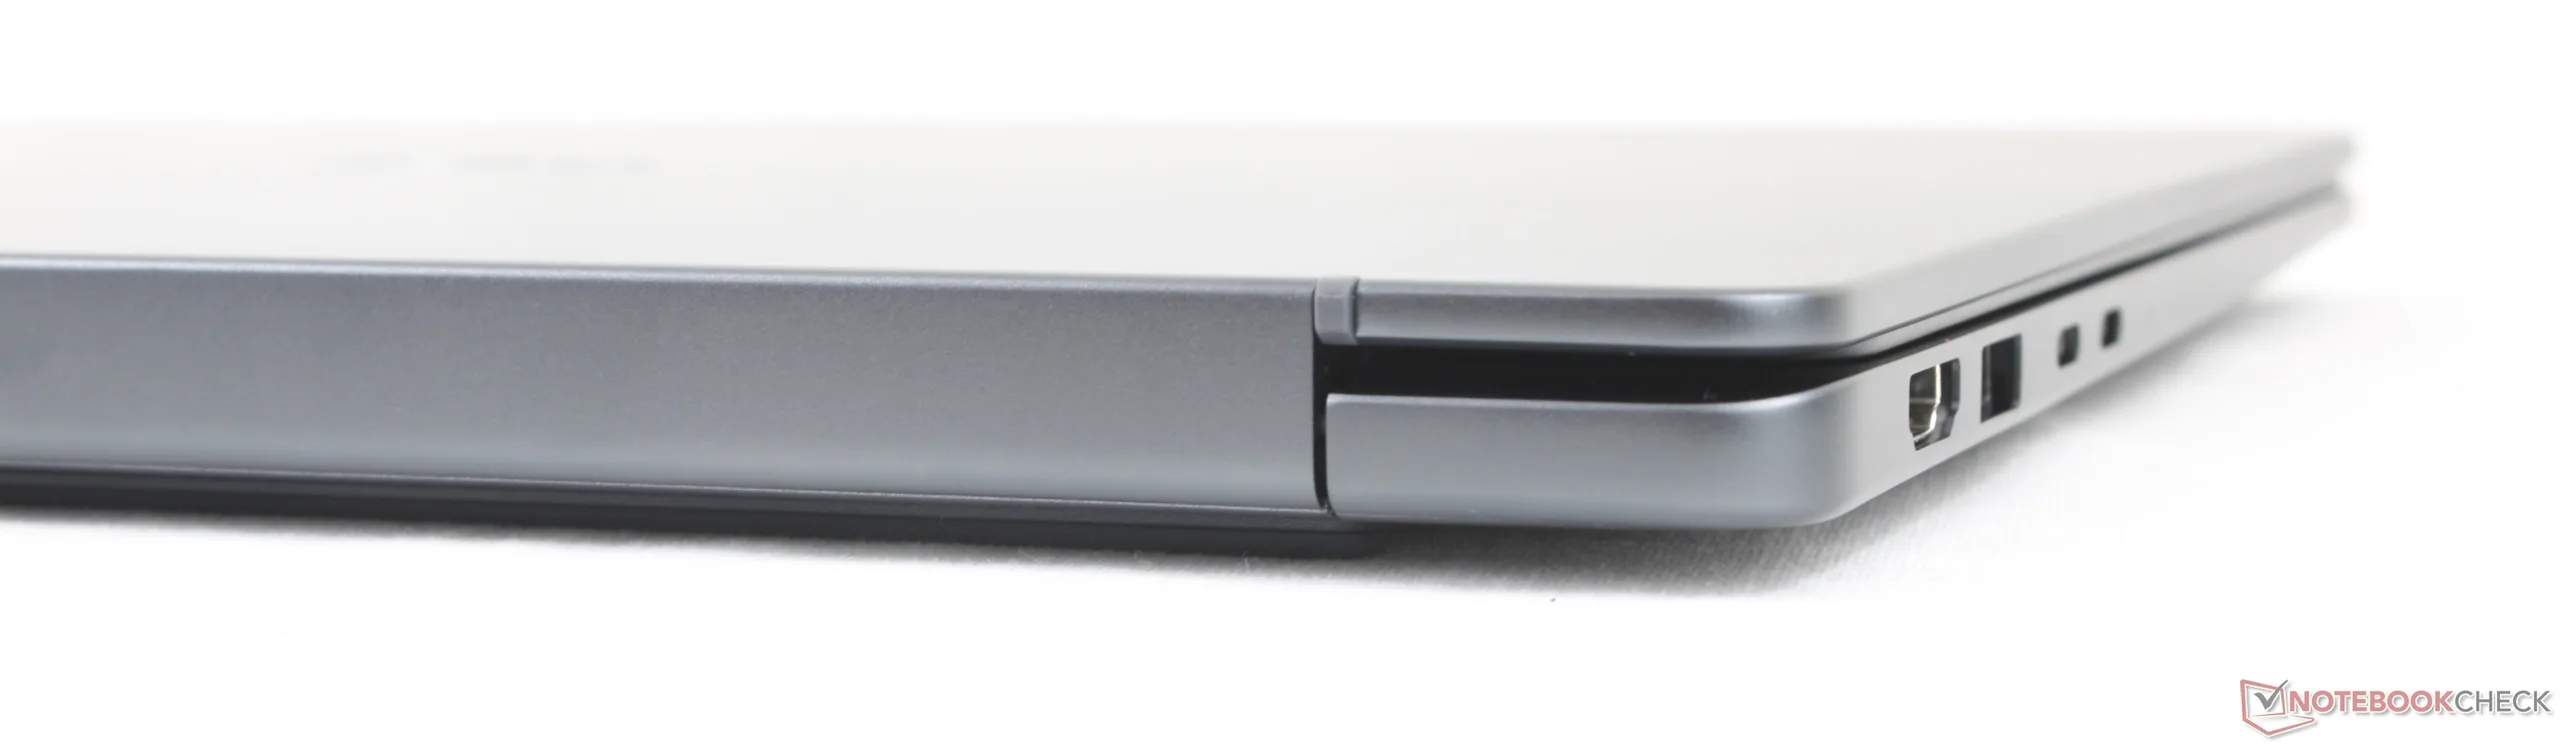
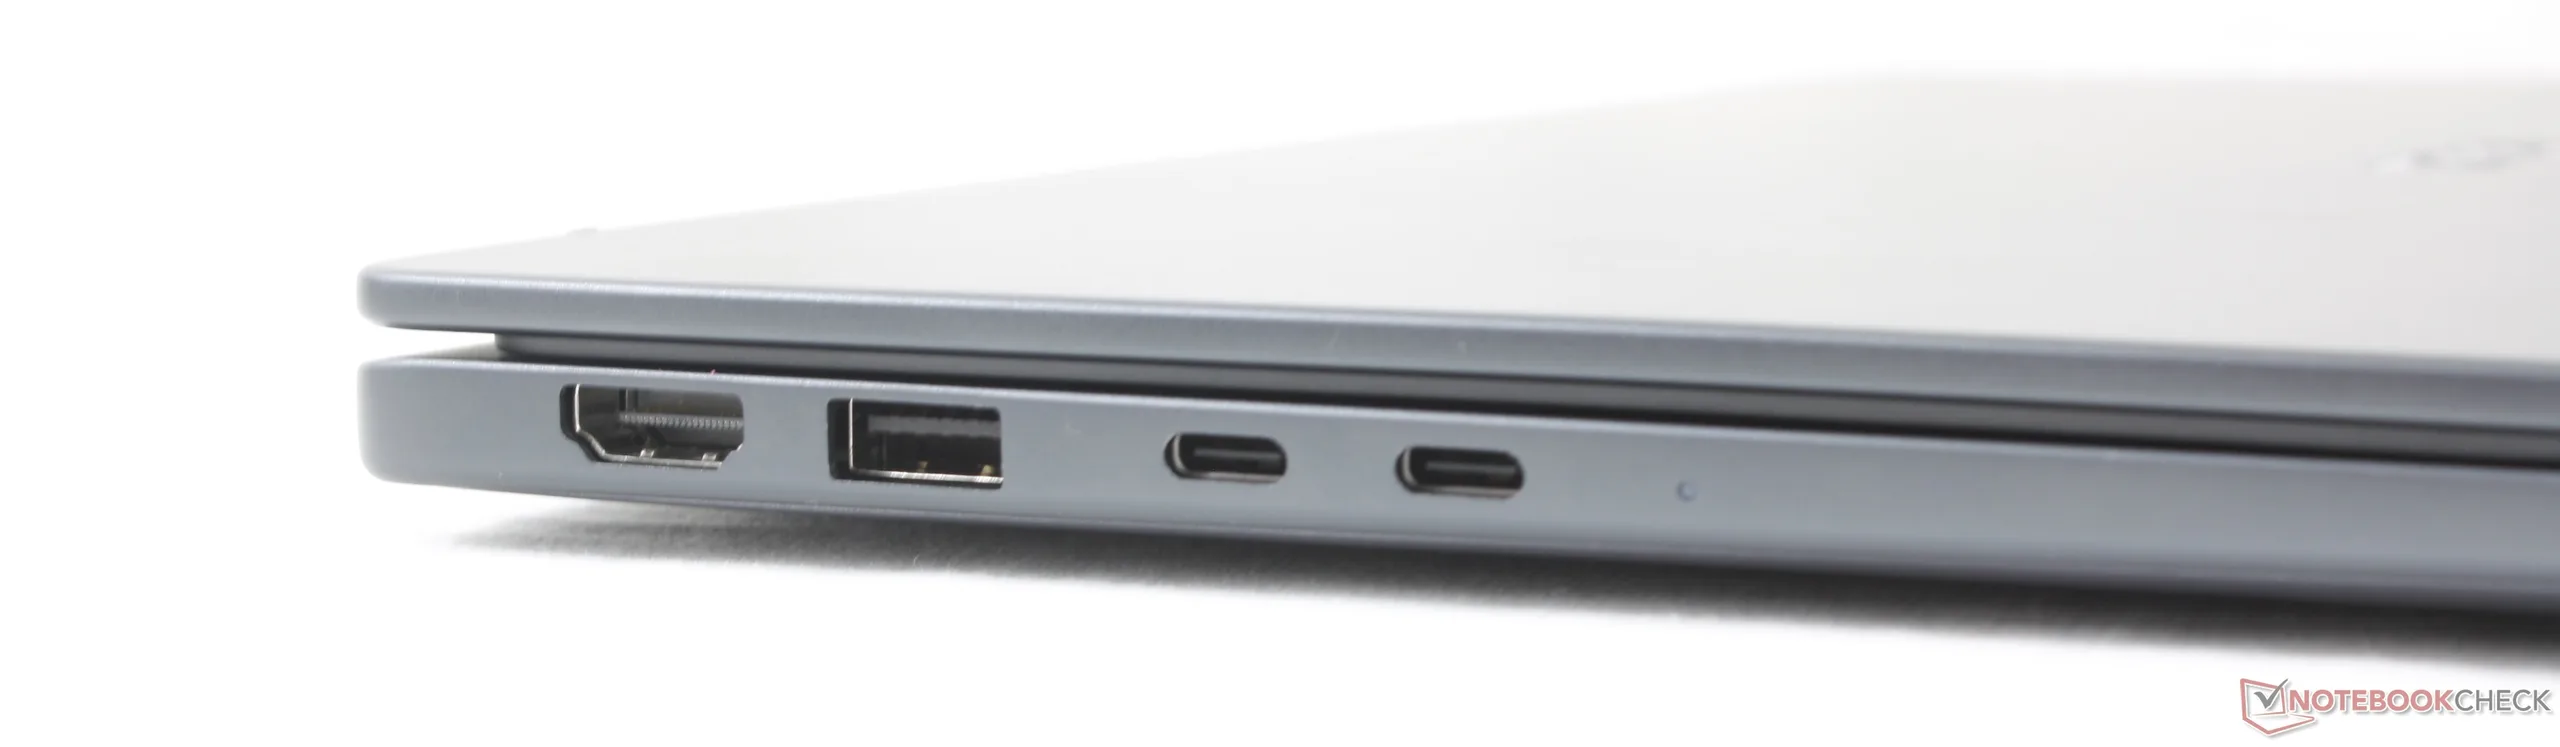
+ duży wybór wbudowanych portów
+ doskonała wydajność w stosunku do rozmiarów urządzenia
+ długa żywotność baterii

Przeciw

- Zrównoważony charakter technologii Turbo Boost mógłby być lepszy
- nieco większy ślad ekologiczny niż u konkurencji
- podstawowa opcja wyświetlacza charakteryzuje się bardzo słabą jakością odwzorowania kolorów
- stosunkowo głośna praca wentylatora pod obciążeniem

Cena i dostępność

Firma Dell rozpoczęła już dostawy modelu Dell Pro 7 14 w cenach od 2200 do 5000 USD, w konfiguracji wykorzystanej w niniejszej recenzji.

Amazon Logo
$939.99
Dell Pro 14 Plus Business Laptop (Next Gen Latitude 5450) 14.0" IPS FHD+

14-calowa seria Dell Pro 7 stanowi następcę starszej generacji serii Latitude 7000, przeznaczonej dla biur i przedsiębiorstw. Najnowszy model obsługuje zarówno procesory Intel serii 3 vPro, jak i AMD Zen 5 Pro, co zapewnia bardzo szeroki wybór modeli.

Nasz egzemplarz testowy to wysokiej klasy konfiguracja z procesorem AMD Ryzen AI 9 HX PRO 470 oraz wyświetlaczem IPS o rozdzielczości 1200p i częstotliwości odświeżania 120 Hz, którego cena wynosi prawie 5000 USD. Inne wersje wyposażenia obejmują modele z wolniejszym procesorem Ryzen AI 5 Pro 435 oraz wyświetlaczem o rozdzielczości do 1600p i częstotliwości odświeżania 120 Hz.

14-calowy Dell Pro konkuruje z innymi subnotebookami przeznaczonymi dla biznesu, takimi jak seria Asus ExpertBook, seria Lenovo ThinkPad T14 czy seria HP Elite.

Więcej recenzji produktów Dell:

Specyfikacje

Dell Pro 7 14 P714265
Procesor
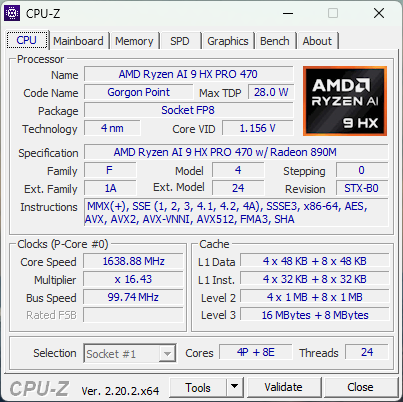
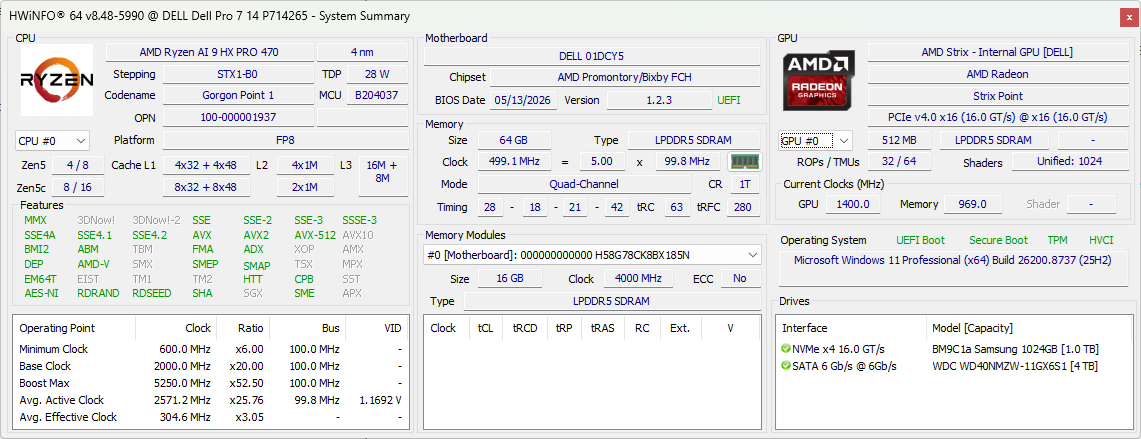
AMD Ryzen AI 9 HX PRO 470 12c/24t, 4 x 5.2 GHz AMD Zen 5, 8 x 3.3 GHz AMD Zen 5c, 44 W PL2 / Short Burst, 28 W PL1 / Sustained, Gorgon Point
Karta grafiki
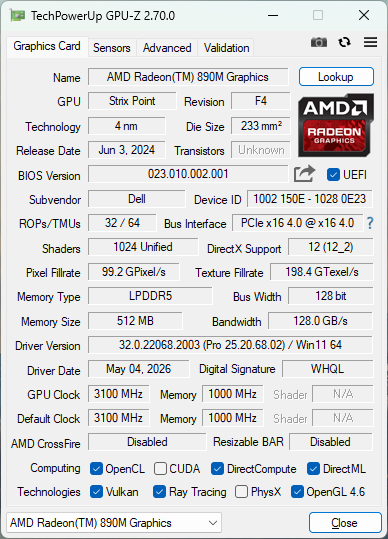
AMD Radeon 890M, rdzeń: 2340 MHz, pamięć: 1000 MHz, LPDDR5x, 32.0.22068.2003
Pamięć
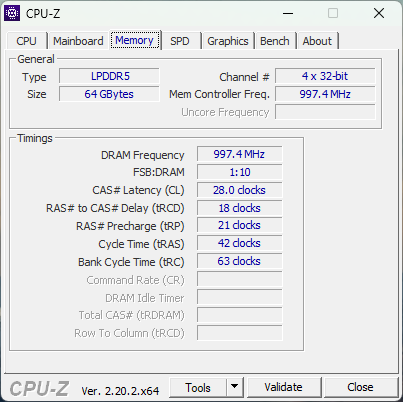
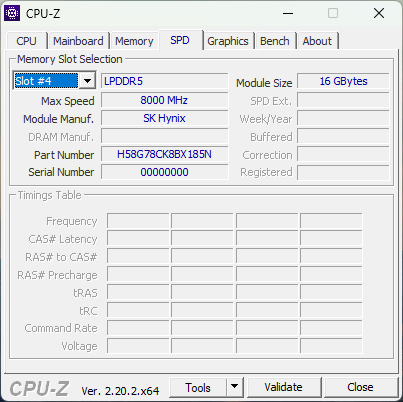
64 GB 
, LPDDR5x, 8533 MT/s, Dual-Channel
Matryca
14.00 cali 16:10, 1920 x 1200 pikseli 162 PPI, LG Philips LP140WU, IPS, Dell P/N: VK79W, refleksująca: nie, 120 Hz
Chipset
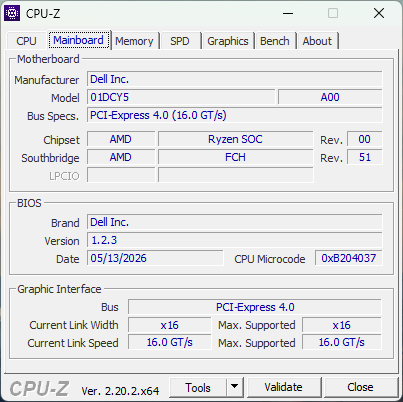
AMD Promontory/Bixby FCH
Karta dźwiękowa
AMD Zen - Audio Processor - HD Audio Controller
Złącza
1 USB 3.0, 1 USB 3.2 Gen 2x2 20Gbps, 2 USB4 40 Gbps, 2 Thunderbolt 4, USB-C Power Delivery (PD), 1 HDMI, 3 DisplayPort, 1 blokada Kensingtona, gniazda audio: 3.5 mm combo, 1 czytnik linii papilarnych
Łączność
Mediatek Wi-Fi 7 MT7925 Wireless LAN Card (a/b/g/ac = Wi-Fi 5/ax = Wi-Fi 6/ Wi-Fi 6E 6 GHz be = Wi-Fi 7), Bluetooth 5.4
Gabaryty
wysokość x szerokość x głębokość (mm): 16.45 x 315.5 x 226
Akumulator
70 Wh litowo-polimerowy
System operacyjny
Microsoft Windows 11 Pro
Kamera
kamerka: w/ privacy shutter and IR
Główny aparat: 8.3 MPix 1440p30
Inne
głośniki: 2x 2 W, klawiatura: Chiclet, podświetlanie klawiatury: tak, Dell Optimizer, 36 miesiące(y) gwarancji
Waga
1.349 kg, zasilacz: 252 g
Cena
4900 USD
Amazon
Uwaga: Producent może używać komponentów pochodzących od różnych dostawców, w tym paneli wyświetlaczy, napędów lub kart pamięci o podobnych specyfikacjach.


Przykład

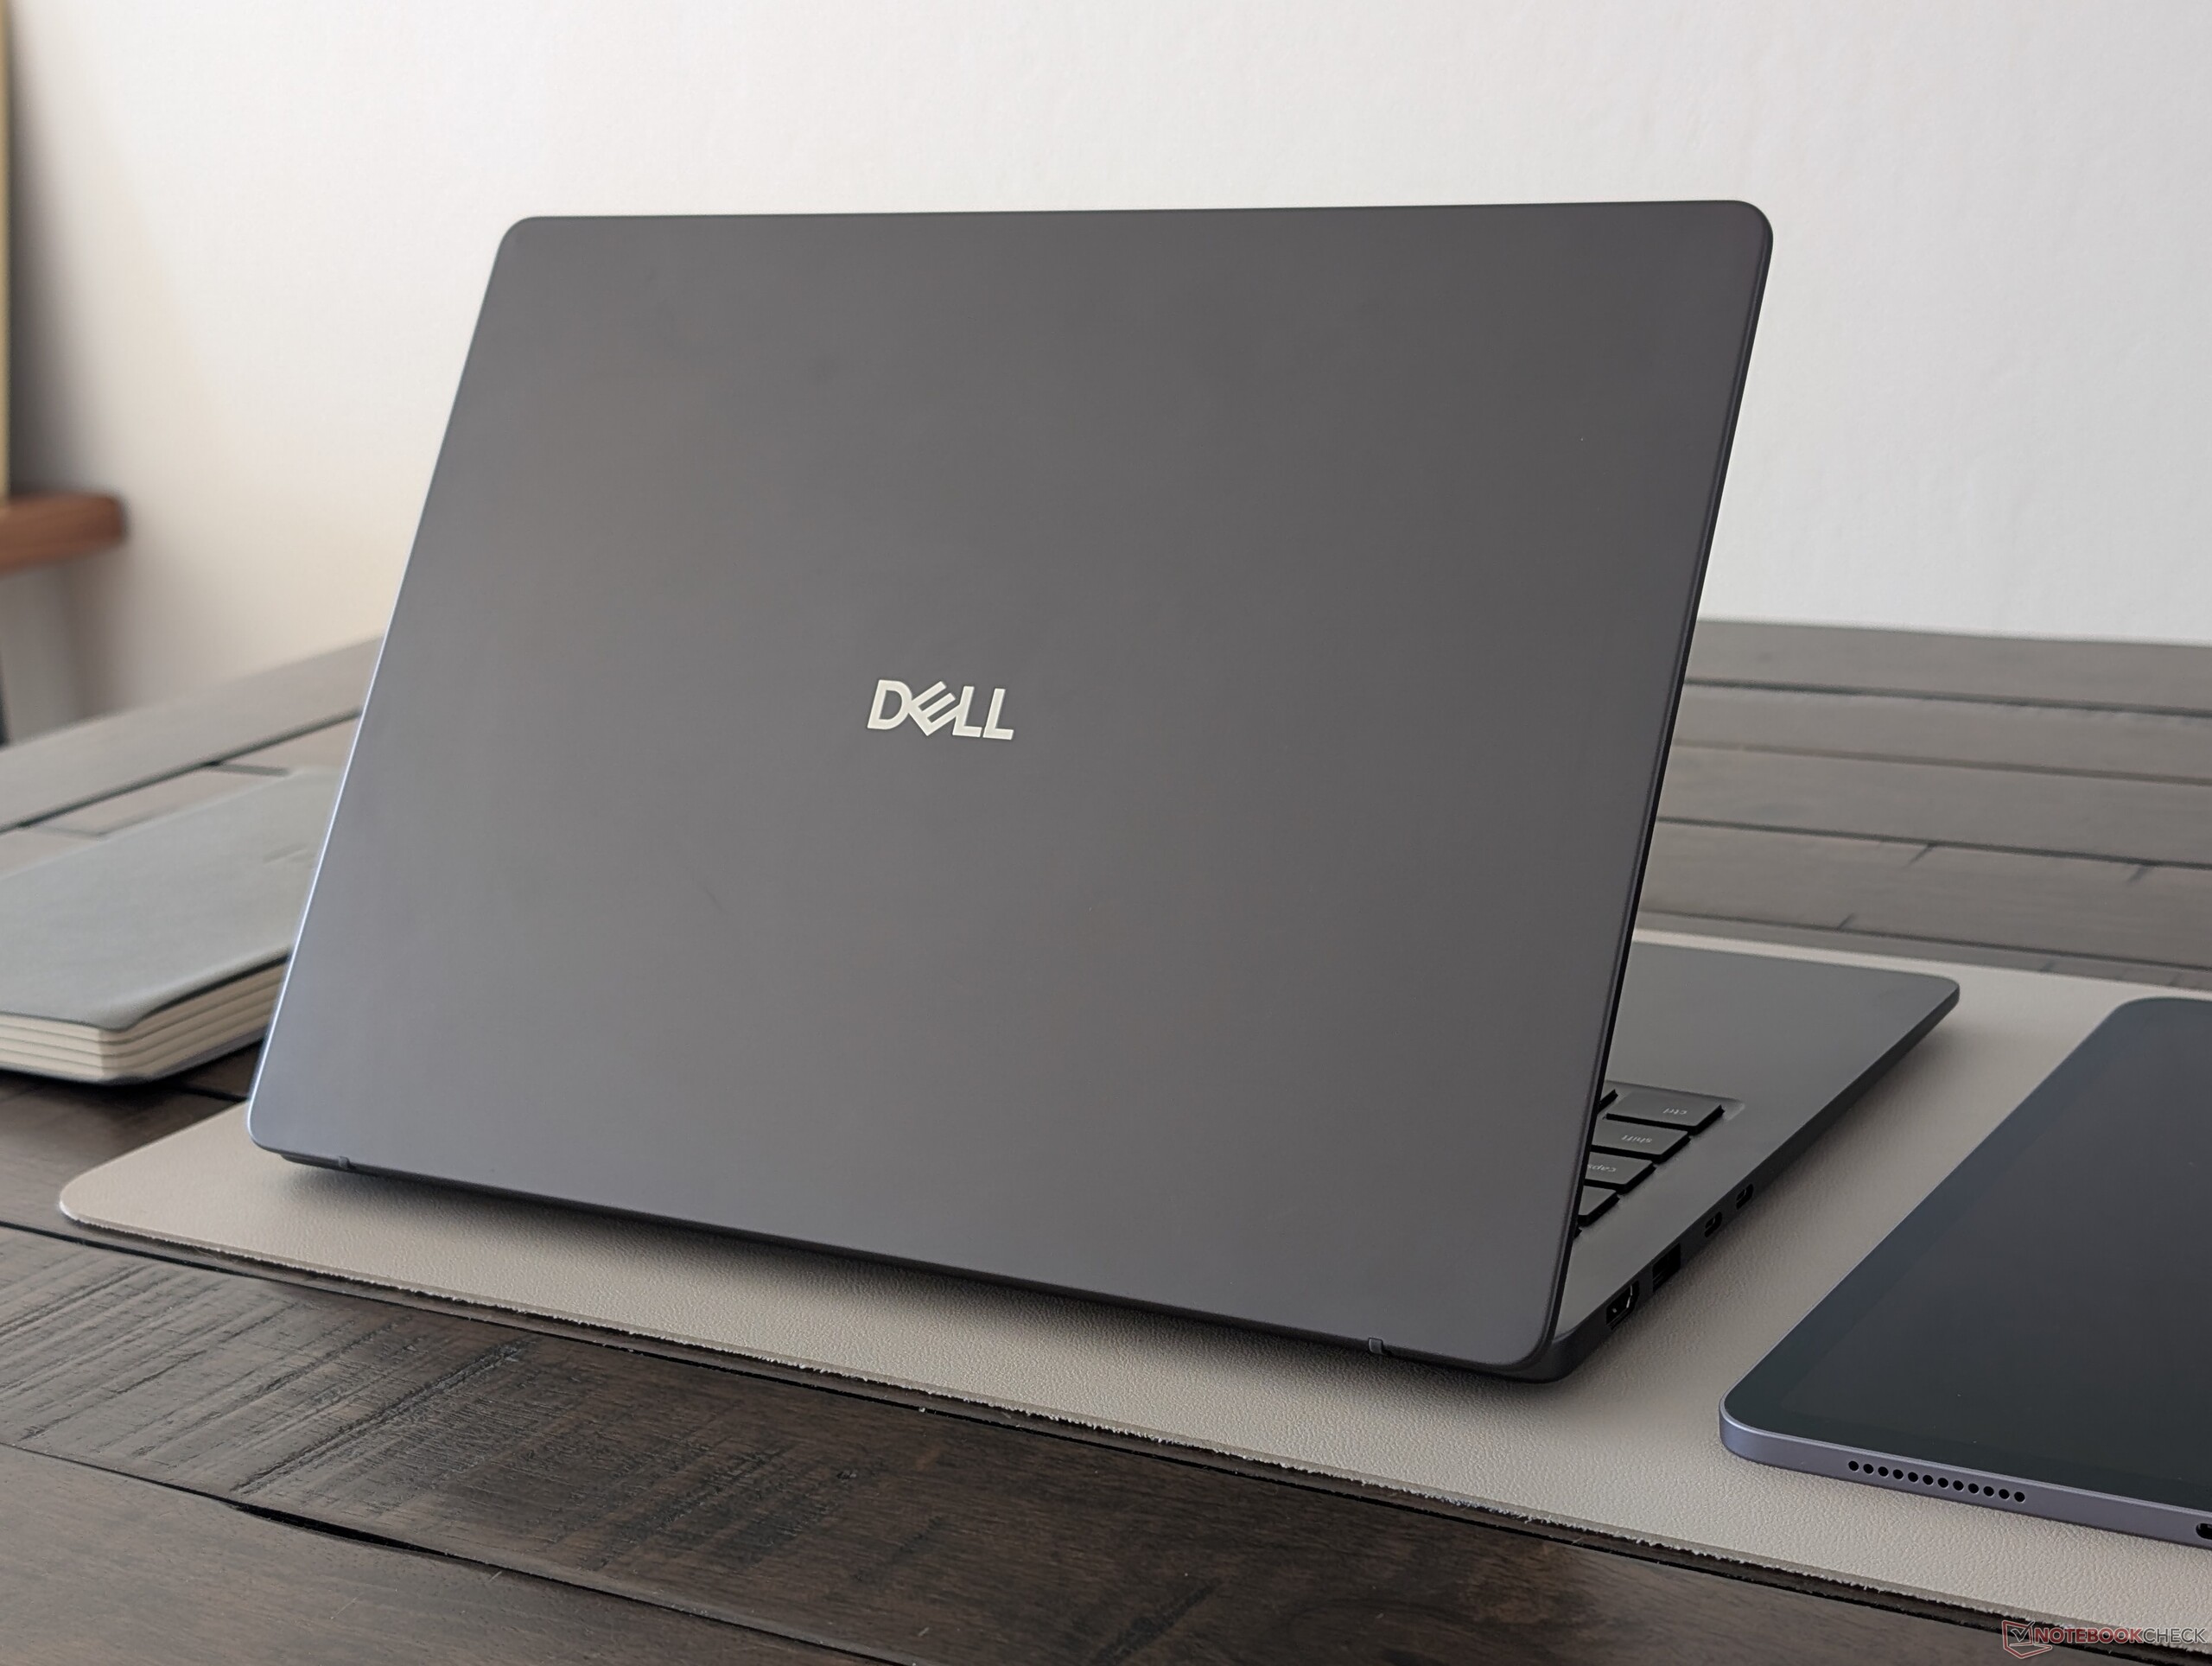
Obudowa łączy w sobie bardziej elegancki i opływowy wygląd modelu Dell Pro 14 Premium z funkcjonalnością i solidnością modelu Latitude 7440, zapewniając profesjonalny, a jednocześnie atrakcyjny wygląd. Innymi słowy, nowa konstrukcja jest bardziej stylowa niż starsze modele z serii Latitude, a jednocześnie nie wymaga poświęcenia sztywności ani jakości wykonania. Niemniej jednak pokrywa obudowy mogłaby być nieco sztywniejsza, ponieważ ugięta jest nieco łatwiej niż poprzednio.
Porównanie rozmiarów

315.5 mm 226 mm 16.45 mm 1.3 kg313 mm 220.2 mm 17.95 mm 1.2 kg311.2 mm 216.7 mm 17.95 mm 1.3 kg313 mm 219.4 mm 15.9 mm 1.2 kg310.9 mm 212.8 mm 15.9 mm 1.1 kg312.2 mm 215 mm 13.2 mm 1.5 kg297 mm 210 mm 1 mm 5.7 g

Łączność

Przednia część: Brak portów
Poprawnie: USB-A 4.0 z DisplayPort 2.1 + Power Delivery, zestaw słuchawkowy 3,5 mm, blokada Noble
Tył: Brak portów
Tył: Brak portów
Po lewej: HDMI 2.1, USB-A 3.2 Gen. 1 (5 Gb/s), 2x USB-A 4.0 z DisplayPort 2.1 + Power Delivery

Komunikacja

Networking
iperf3 transmit Wi-Fi6/7 RT-BE96U
Lenovo ThinkPad T14s Gen 7 21YW0022GE
Mediatek Wi-Fi 7 MT7925 Wireless LAN Card
1723 (1533min - 1812max) MBit/s
iperf3 receive Wi-Fi6/7 RT-BE96U
Lenovo ThinkPad T14s Gen 7 21YW0022GE
Mediatek Wi-Fi 7 MT7925 Wireless LAN Card
1957 (1880min - 2007max) MBit/s
iperf3 receive AXE11000 6GHz
HP EliteBook X G1a 14 AI
Mediatek Wi-Fi 7 MT7925 Wireless LAN Card
1735 (1680min - 1795max) MBit/s +4%
Dell Pro 7 14 P714265
Mediatek Wi-Fi 7 MT7925 Wireless LAN Card
1673 (1472min - 1801max) MBit/s
Asus ExpertBook Ultra B9406CAA
Intel Wi-Fi 7 BE211 320MHz
1621 (1600min - 1650max) MBit/s -3%
Dell Pro 14 Premium
Intel BE201 320MHz
1449 (1352min - 1523max) MBit/s -13%
Dell Latitude 7440
Intel Wi-Fi 6E AX211
1223 (1075min - 1257max) MBit/s -27%
iperf3 transmit AXE11000 6GHz
Asus ExpertBook Ultra B9406CAA
Intel Wi-Fi 7 BE211 320MHz
1625 (848min - 1675max) MBit/s +5%
Dell Pro 7 14 P714265
Mediatek Wi-Fi 7 MT7925 Wireless LAN Card
1555 (1268min - 1670max) MBit/s
Dell Pro 14 Premium
Intel BE201 320MHz
1279 (1138min - 1394max) MBit/s -18%
HP EliteBook X G1a 14 AI
Mediatek Wi-Fi 7 MT7925 Wireless LAN Card
1159 (1113min - 1214max) MBit/s -25%
Dell Latitude 7440
Intel Wi-Fi 6E AX211
1009 (740min - 1193max) MBit/s -35%
0100200300400500600700800900100011001200130014001500160017001800Tooltip
Dell Pro 7 14 P714265; iperf3 transmit AXE11000 6GHz; iperf 3.1.3: Ø1555 (1268-1670) MBit/s
Dell Pro 7 14 P714265; iperf3 receive AXE11000 6GHz; iperf 3.1.3: Ø1672 (1472-1801) MBit/s

Kamera internetowa

ColorChecker
6.3 ∆E
11.5 ∆E
16.4 ∆E
14.9 ∆E
16.1 ∆E
15.8 ∆E
10 ∆E
9.7 ∆E
13 ∆E
10.3 ∆E
12.7 ∆E
8.9 ∆E
7.7 ∆E
12.8 ∆E
13.7 ∆E
11.9 ∆E
11.7 ∆E
15.8 ∆E
7.2 ∆E
7.9 ∆E
10 ∆E
10.7 ∆E
9.1 ∆E
2.6 ∆E
ColorChecker Dell Pro 7 14 P714265: 11.12 ∆E min: 2.6 - max: 16.41 ∆E

Konserwacja

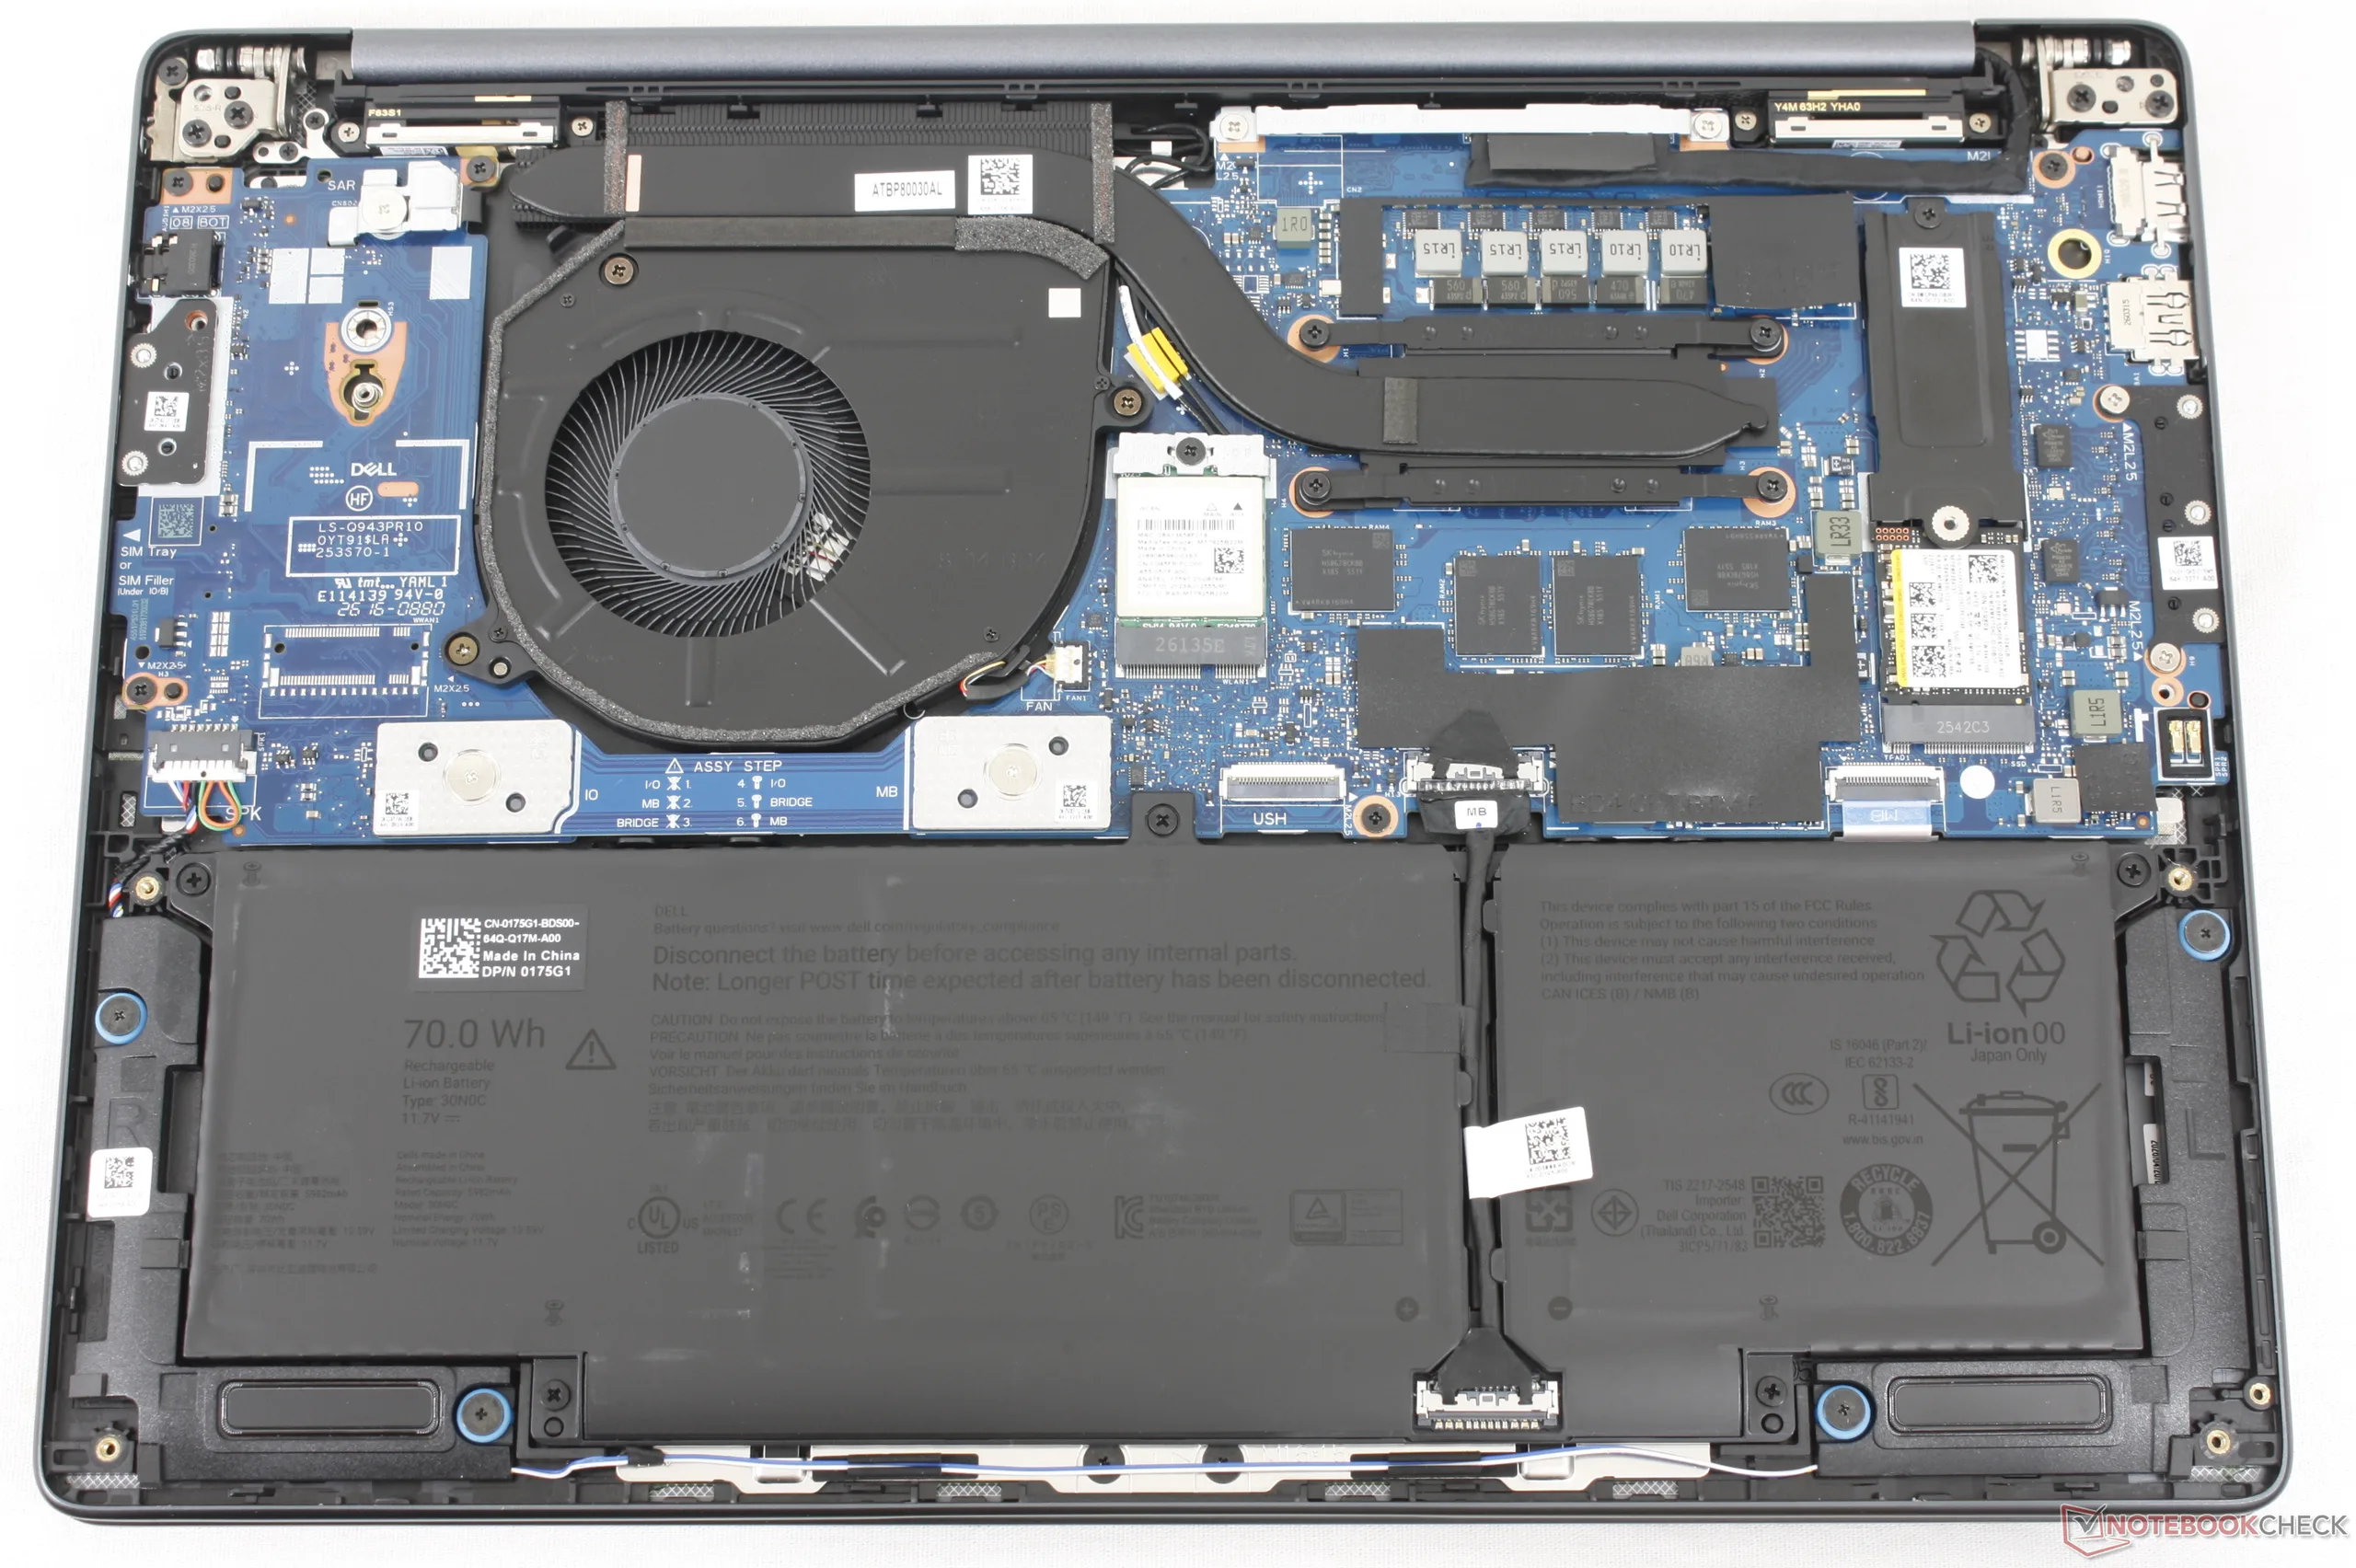
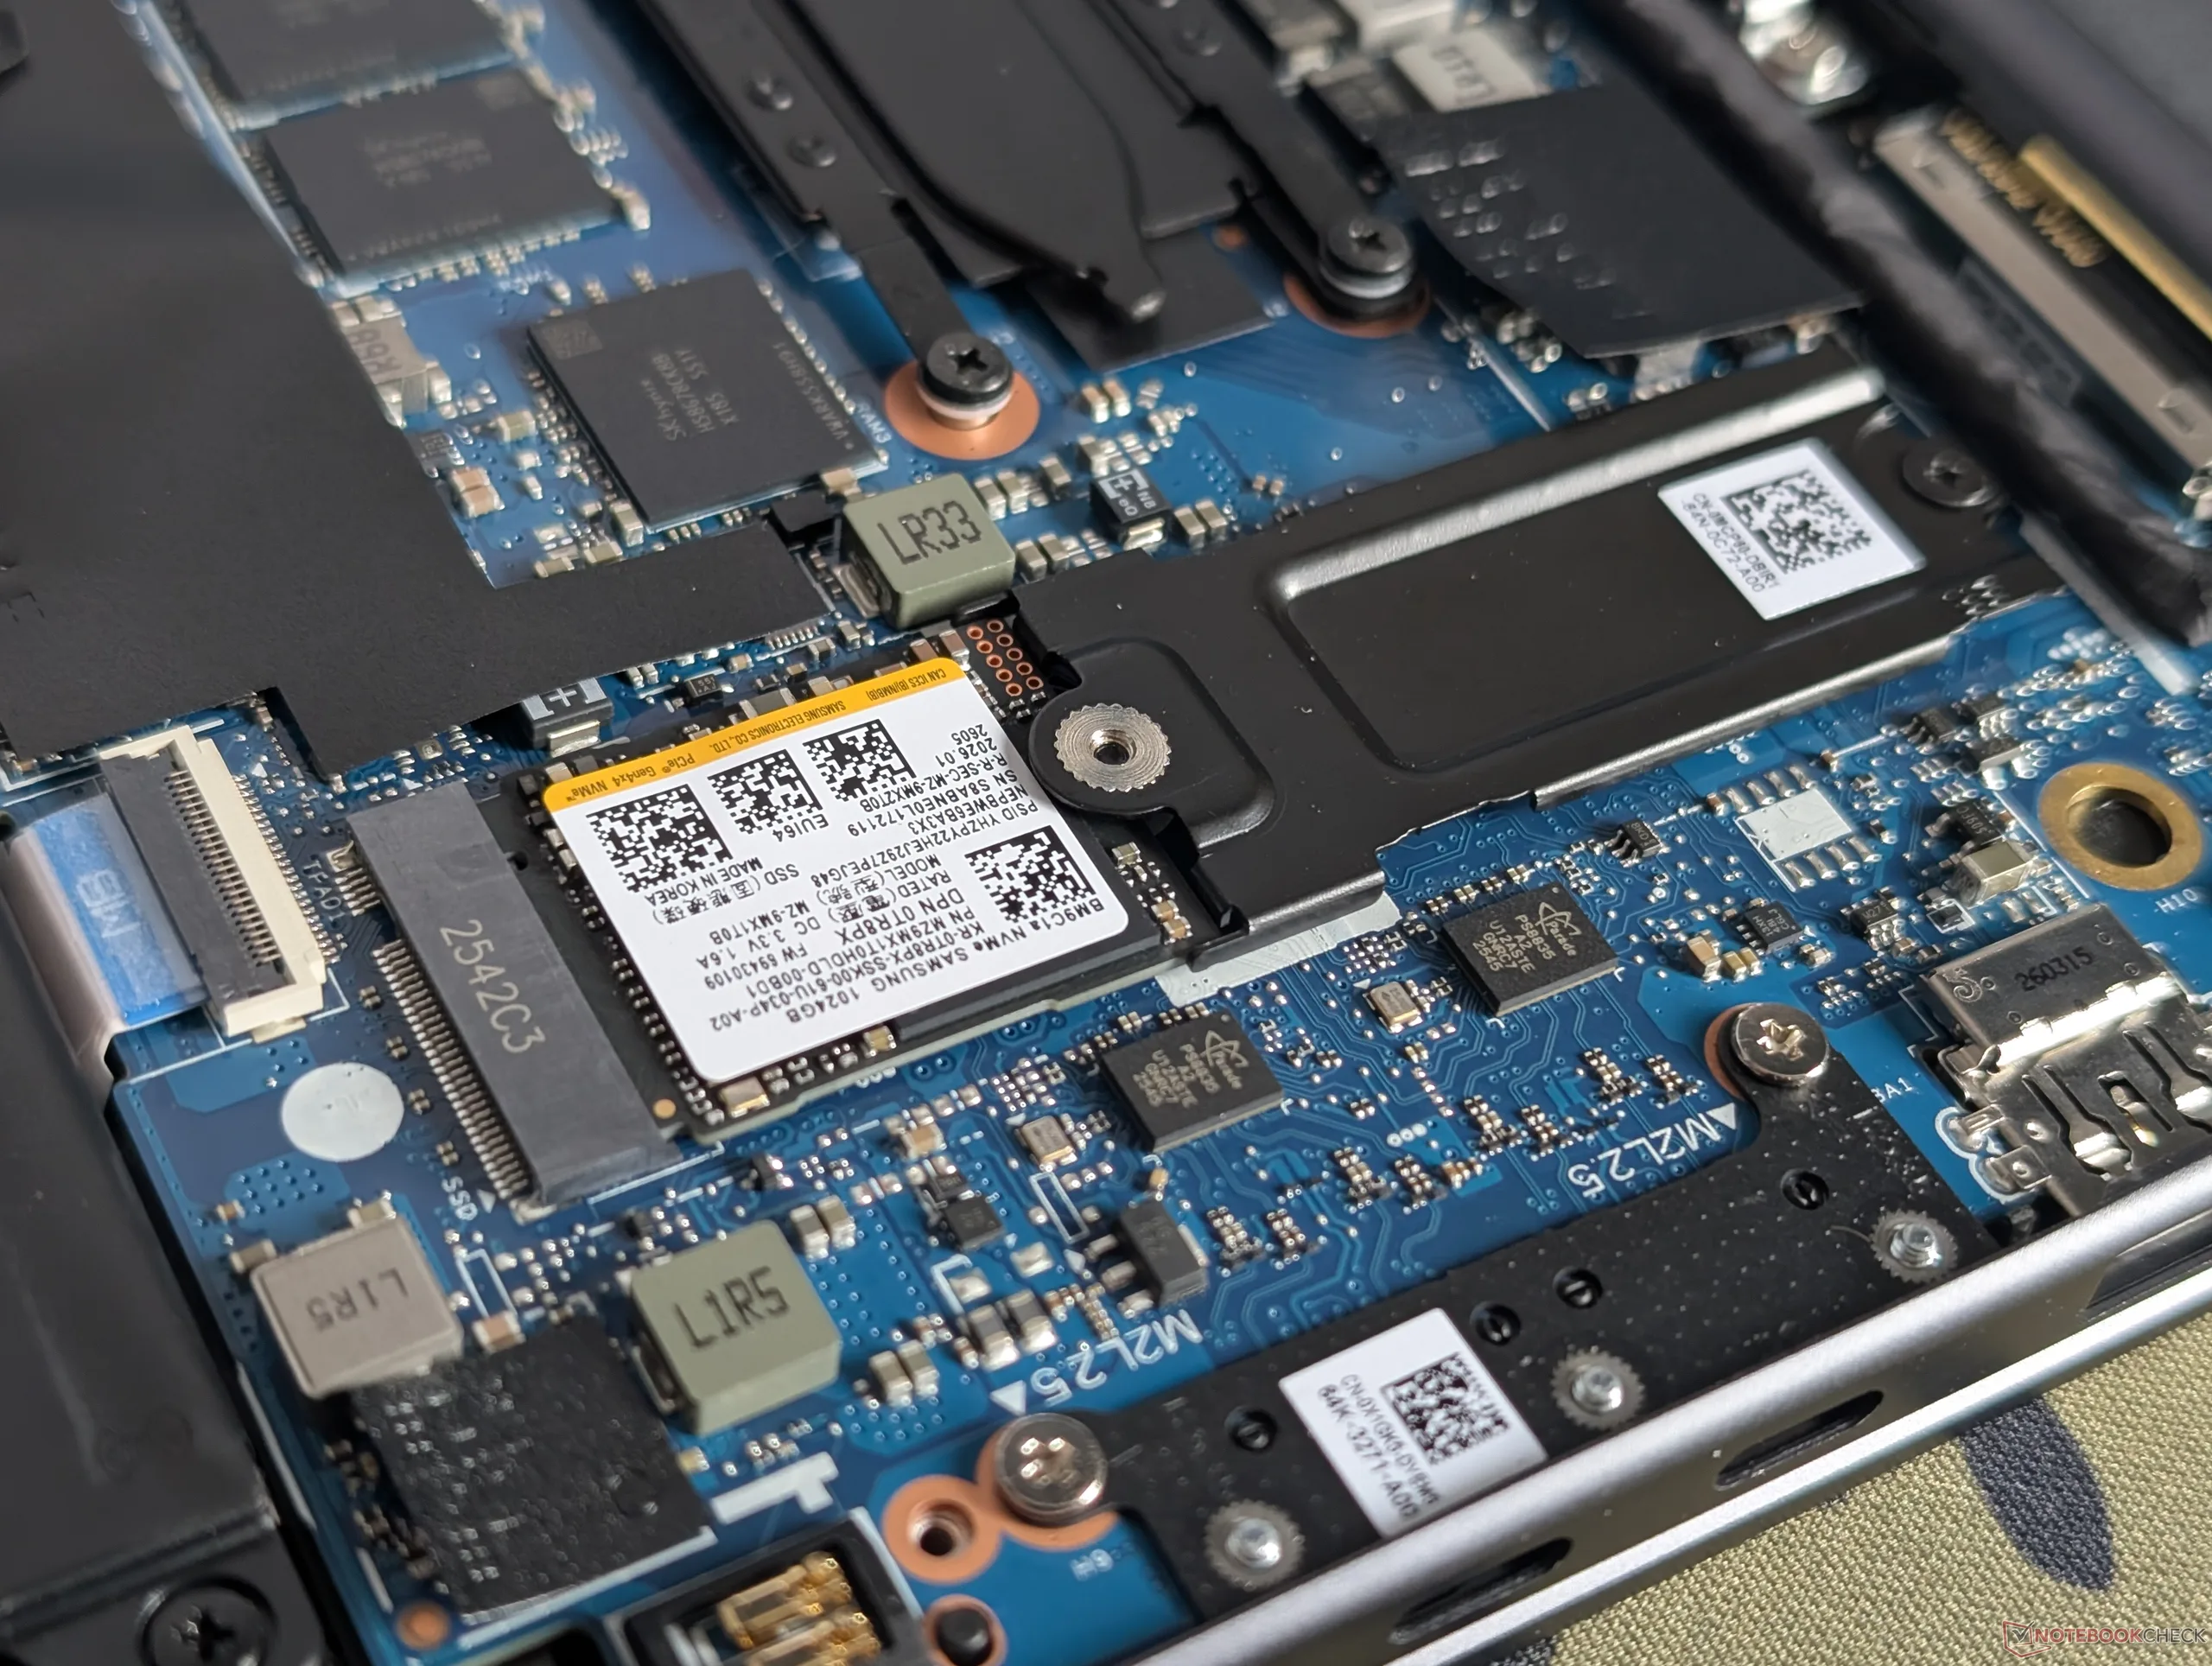
Moduły WLAN i dysk SSD M.2 2280 można rozbudować, natomiast pamięć RAM jest przylutowana. Moduł WAN można rozbudować wyłącznie w przypadku skonfigurowania tej funkcji.

Zrównoważony rozwój

W modelu tym wykorzystano znaczne ilości tworzyw sztucznych pochodzących z recyklingu, aluminium, stali, szkła i miedzi w wielu elementach, w tym w górnej i dolnej obudowie, obudowie głośnika, układzie chłodzenia, akumulatorze i innych. Samo opakowanie nadaje się w całości do recyklingu i nie zawiera tworzyw sztucznych.

Urządzenia wejściowe
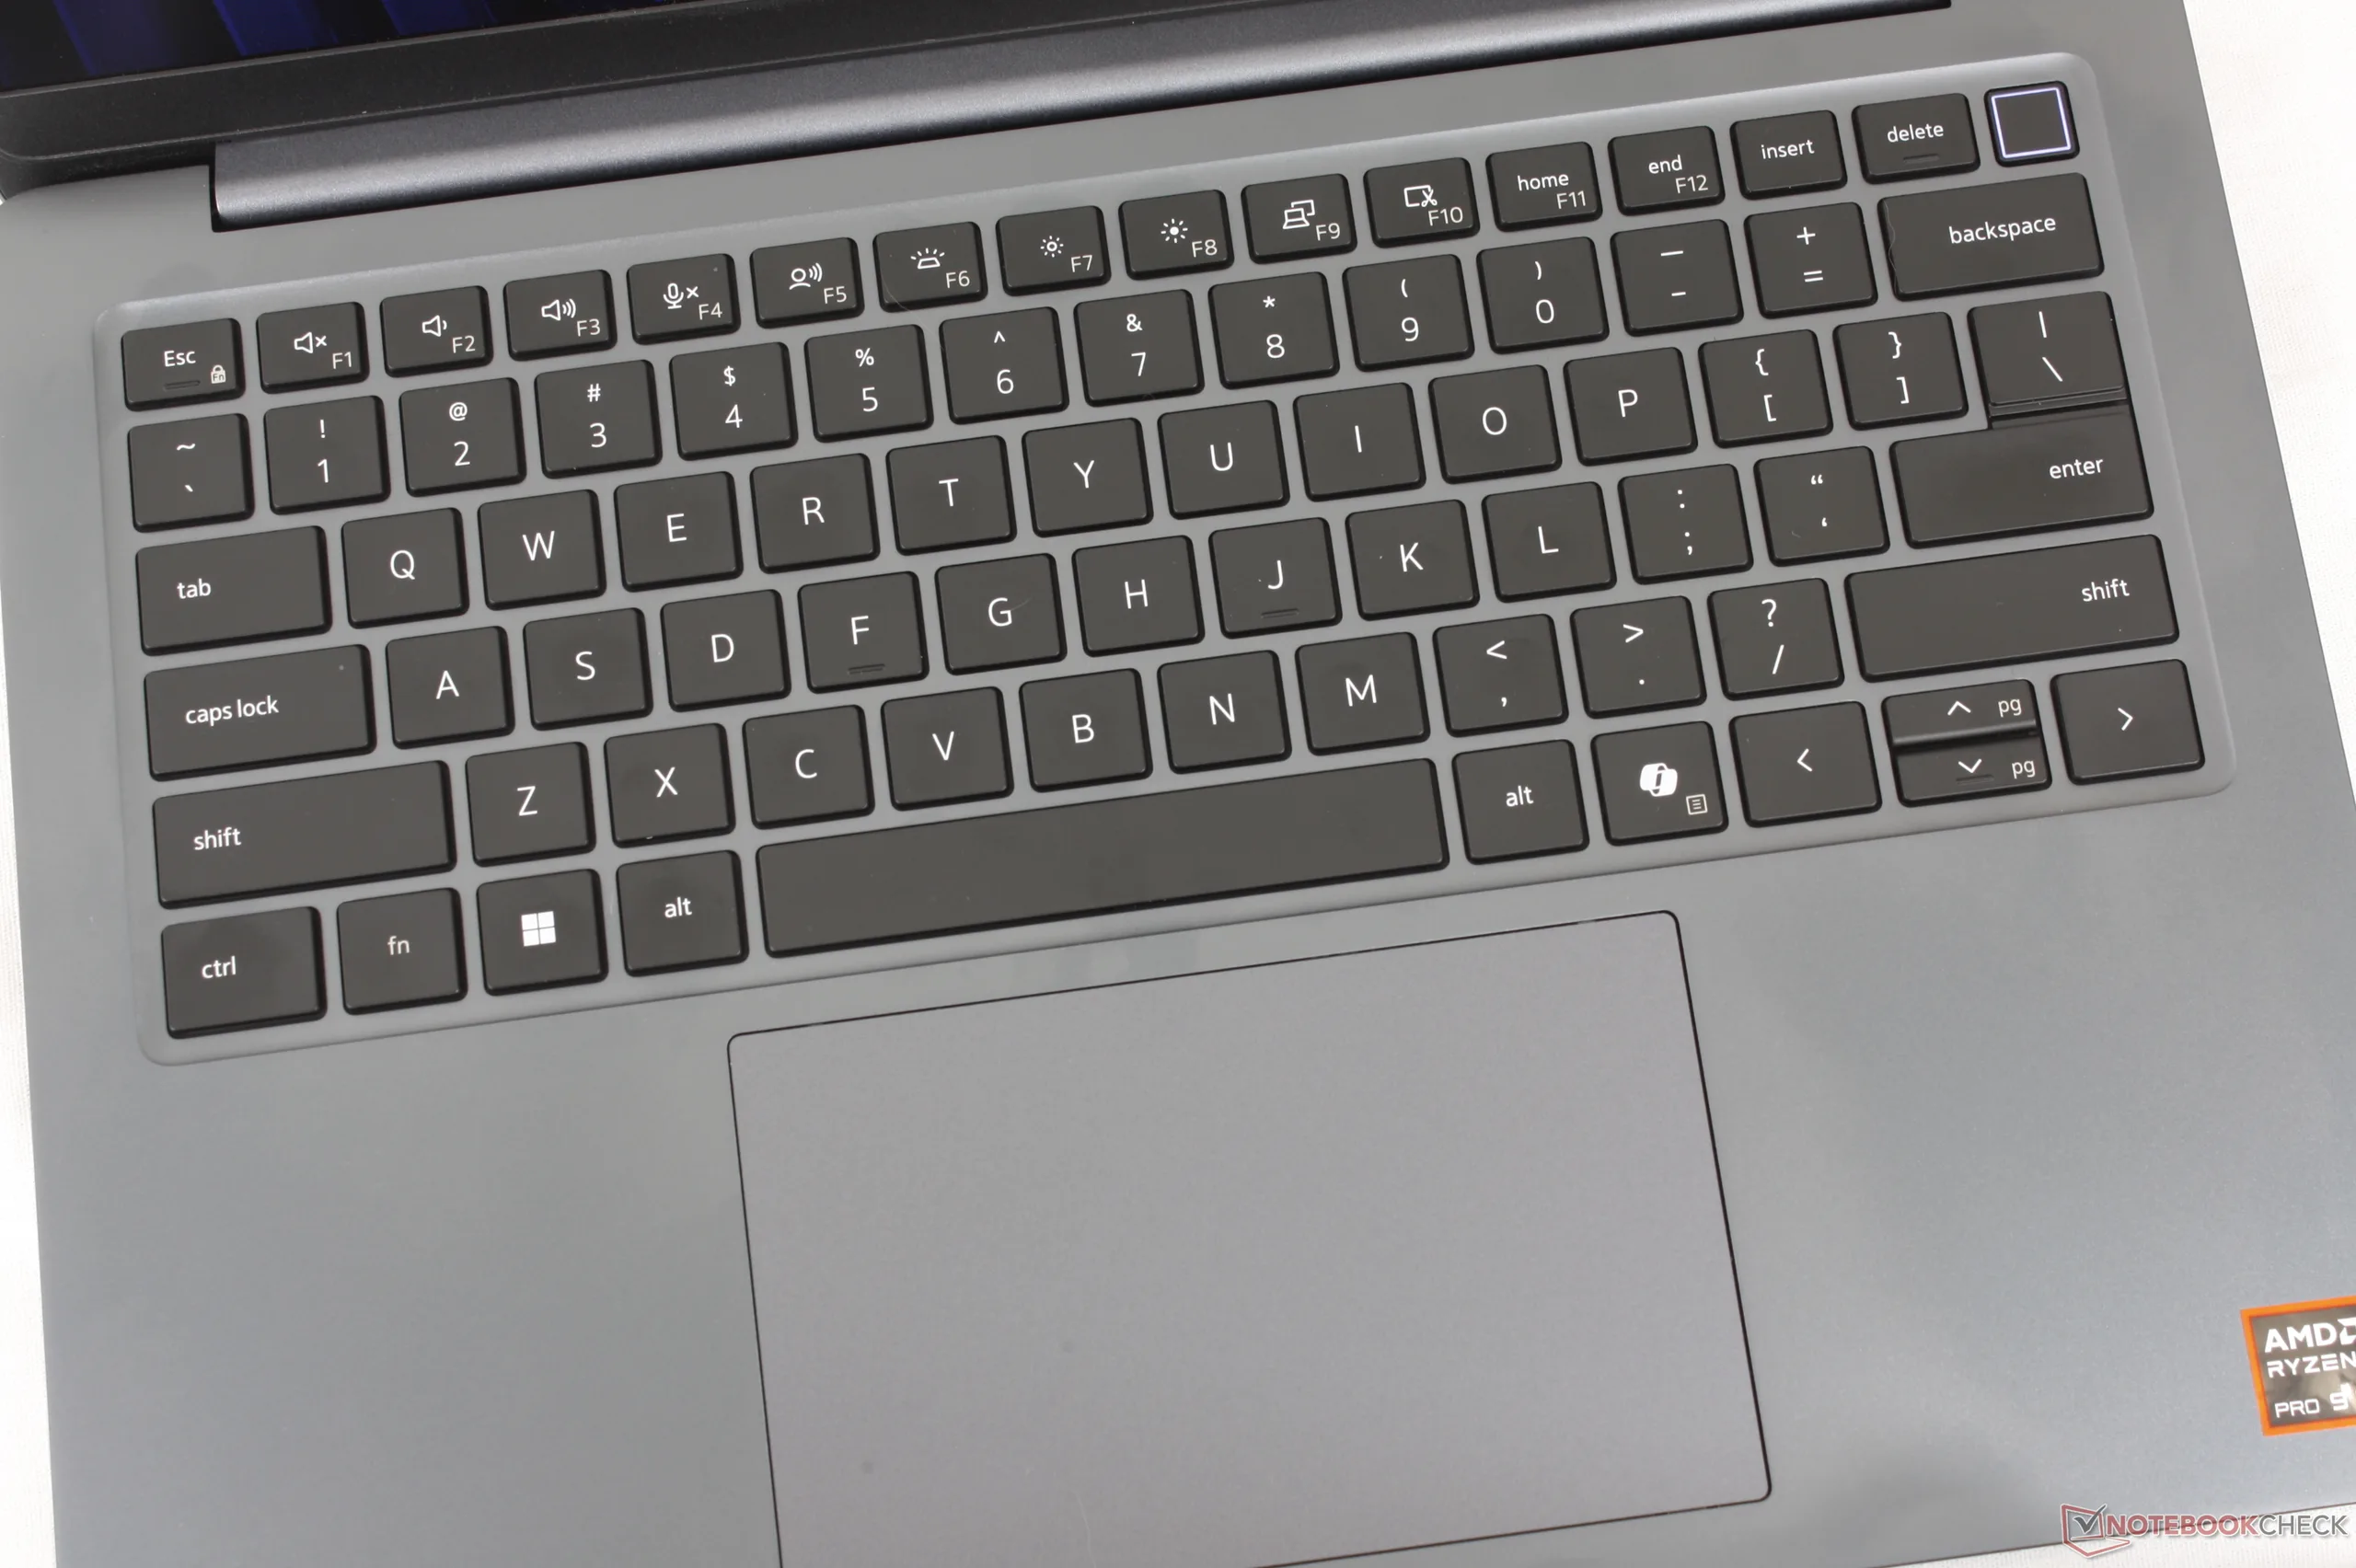
Doświadczenie związane z pisaniem na klawiaturze jest bardzo podobne do tego w starszym modelu Latitude 7440, wyposażonym w spory panel dotykowy o wymiarach 12 x 8 x 7,9 cm

Wyświetlanie

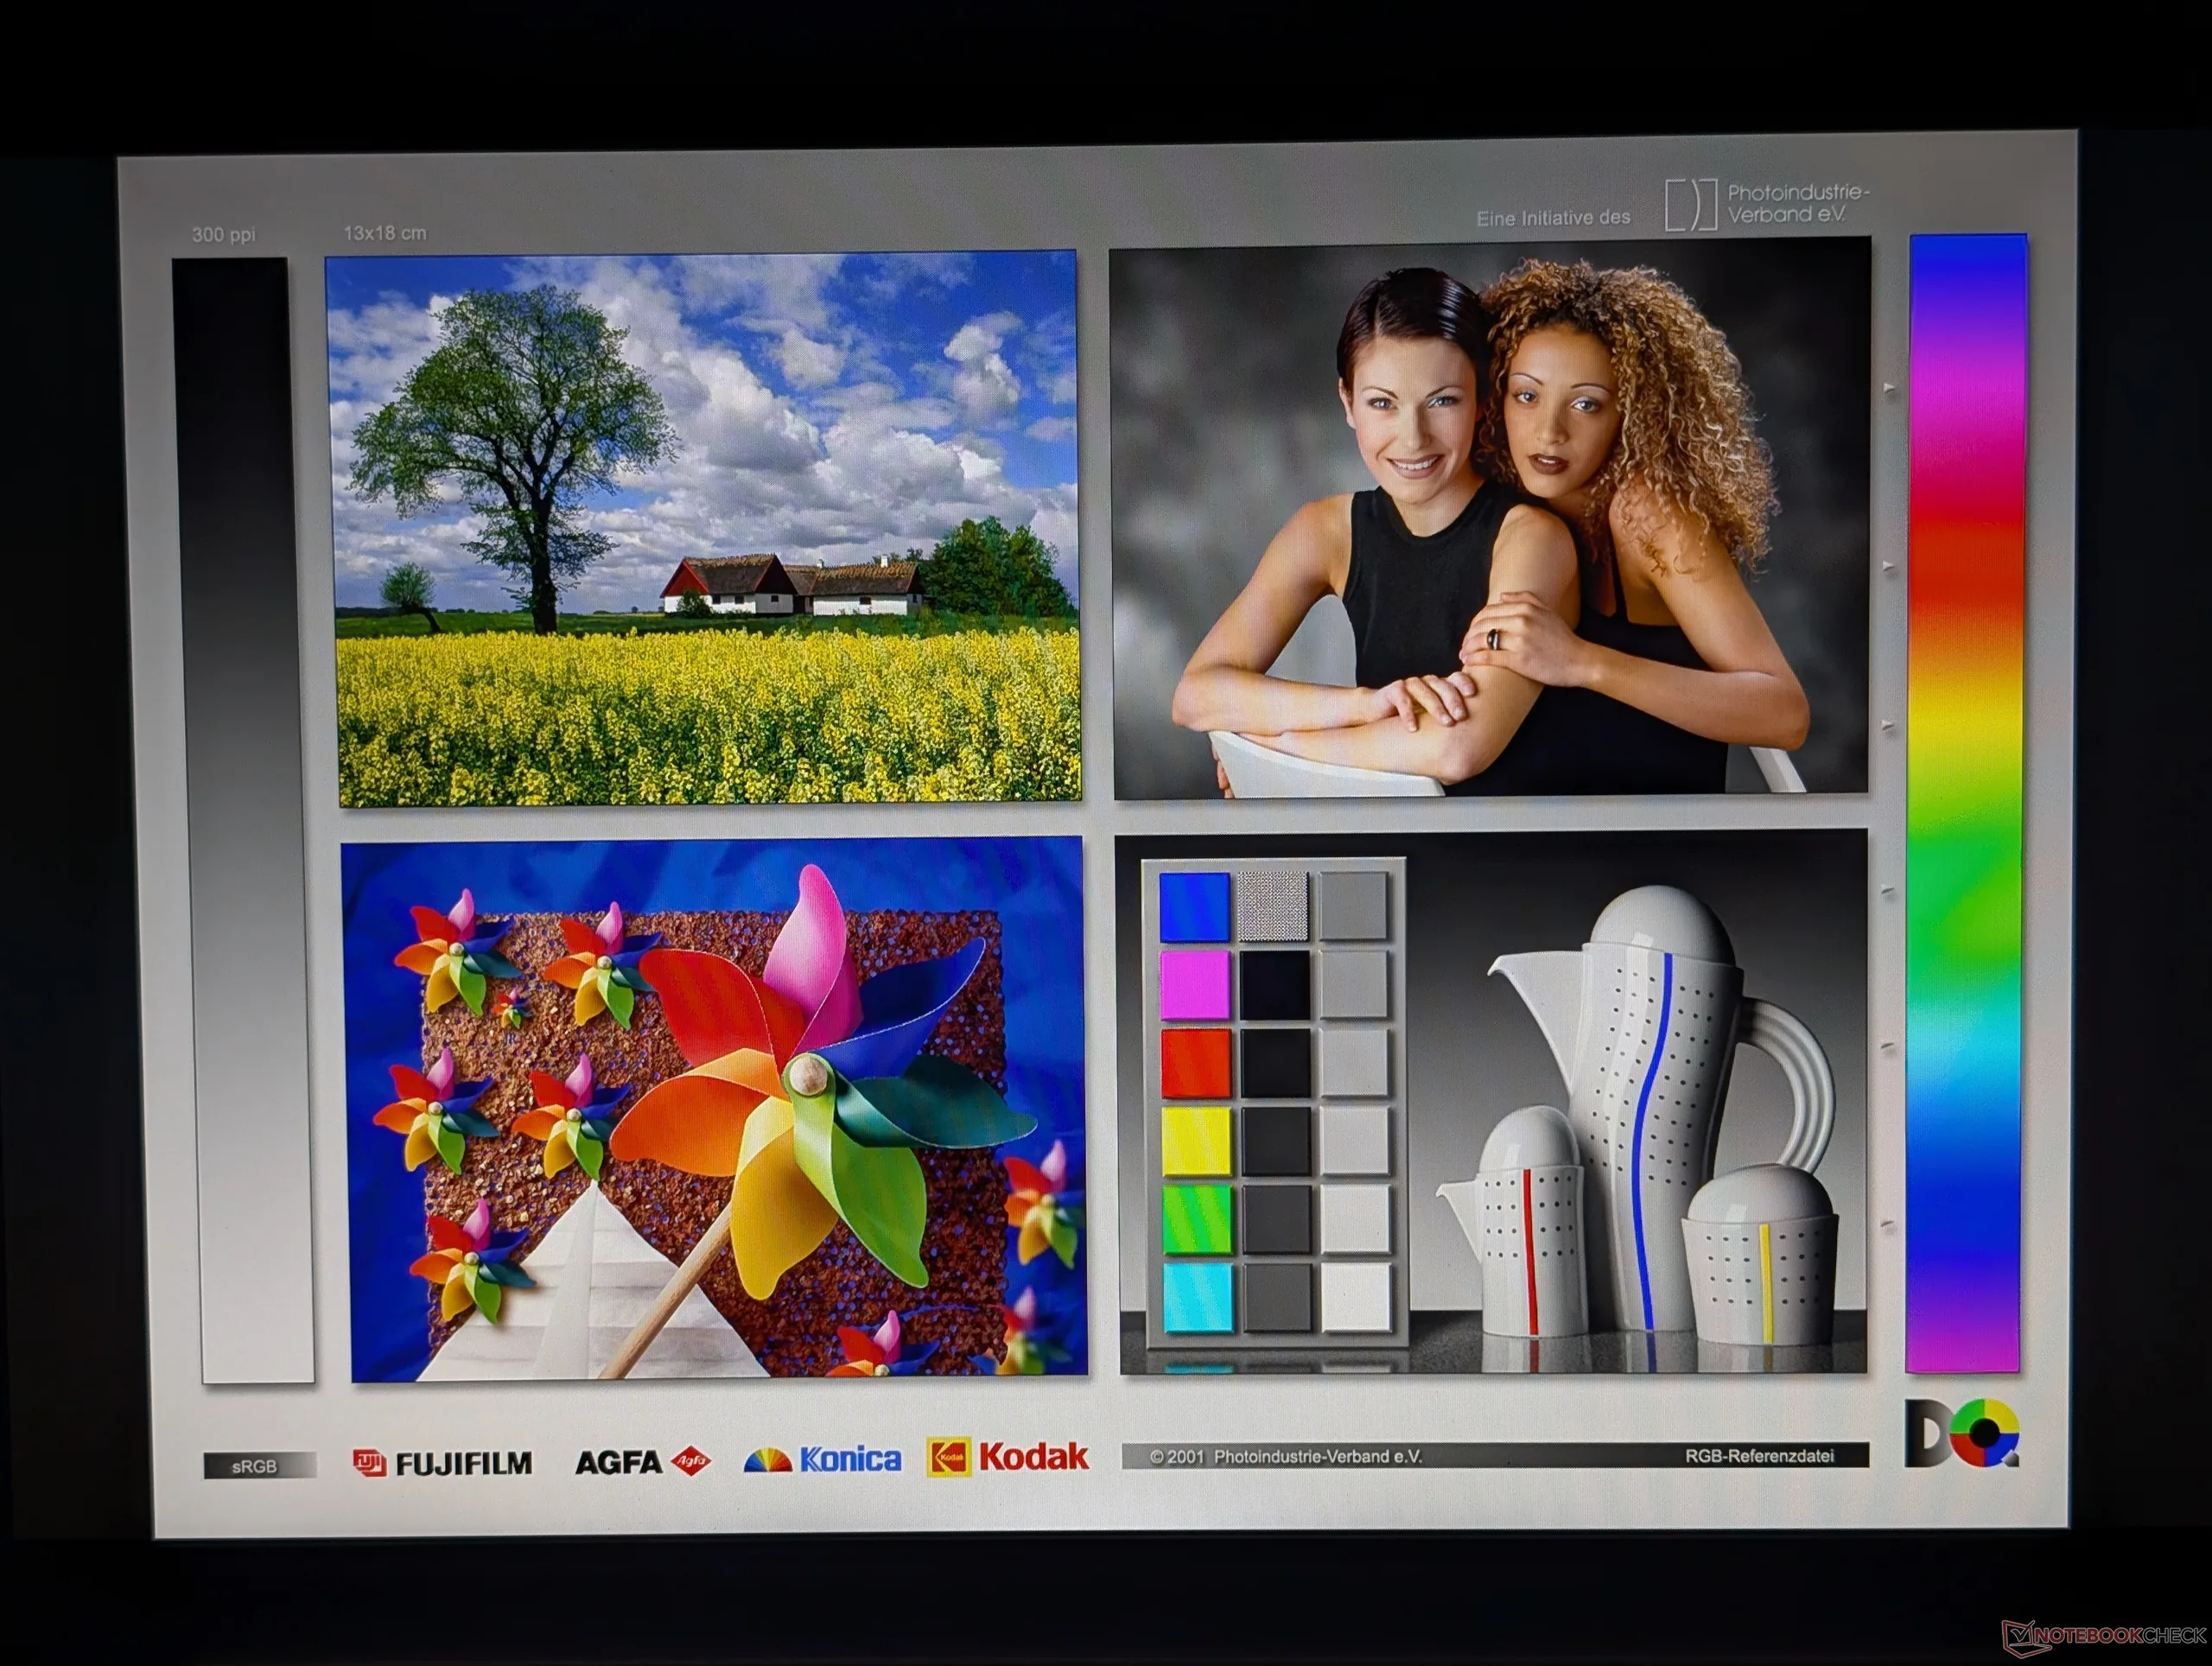
Panel matowy jest nieco bardziej ziarnisty niż jego błyszczący odpowiednik
Prawie całkowity brak nierównomiernego rozlewania się podświetlenia
500.7
cd/m²
473.2
cd/m²
520.3
cd/m²
513
cd/m²
571.5
cd/m²
485.2
cd/m²
542.8
cd/m²
522.2
cd/m²
490.2
cd/m²
podświetlenie ekranu
LG Philips LP140WU testowany z X-Rite i1Pro 3
maksimum: 571.5 cd/m² (Nits) średnia: 513.2 cd/m² Minimum: 28.3 cd/m²
rozświetlenie: 83 %
na akumulatorze: 571.5 cd/m²
kontrast: 1971:1 (czerń: 0.29 cd/m²)
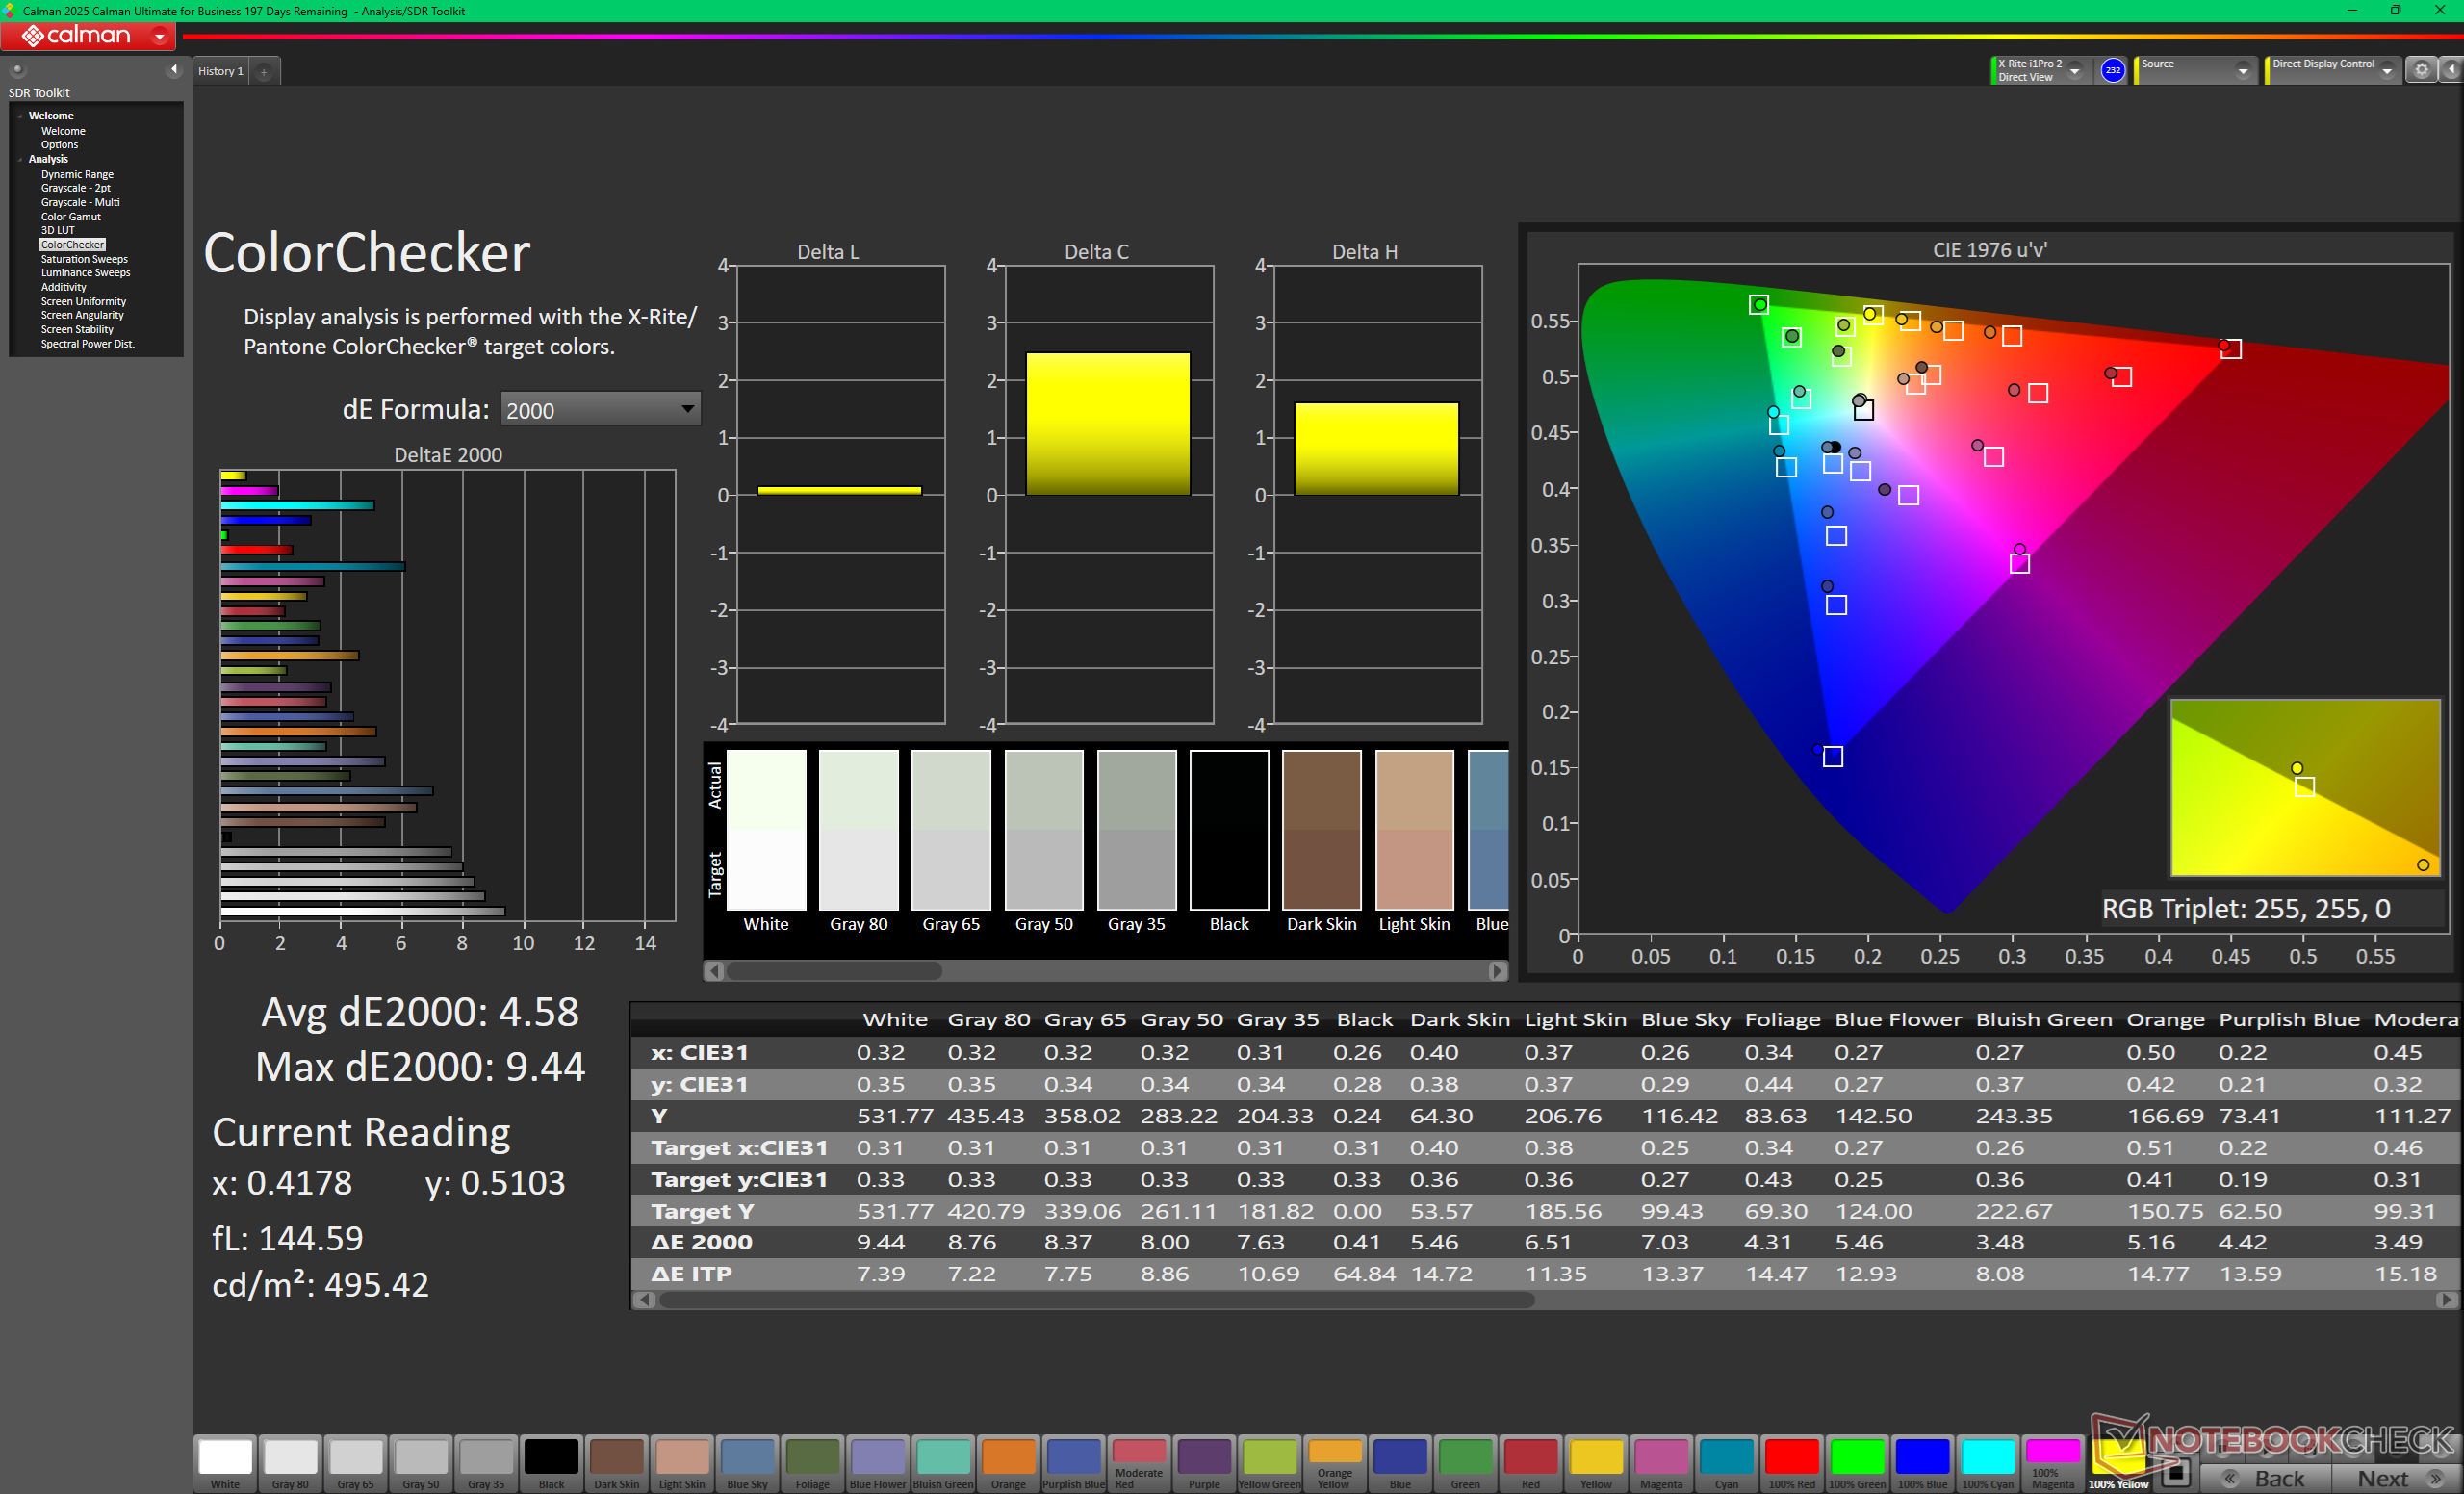
ΔE ColorChecker Calman: 4.58 | ∀{0.5-29.43 Ø4.71}
calibrated: 0.72
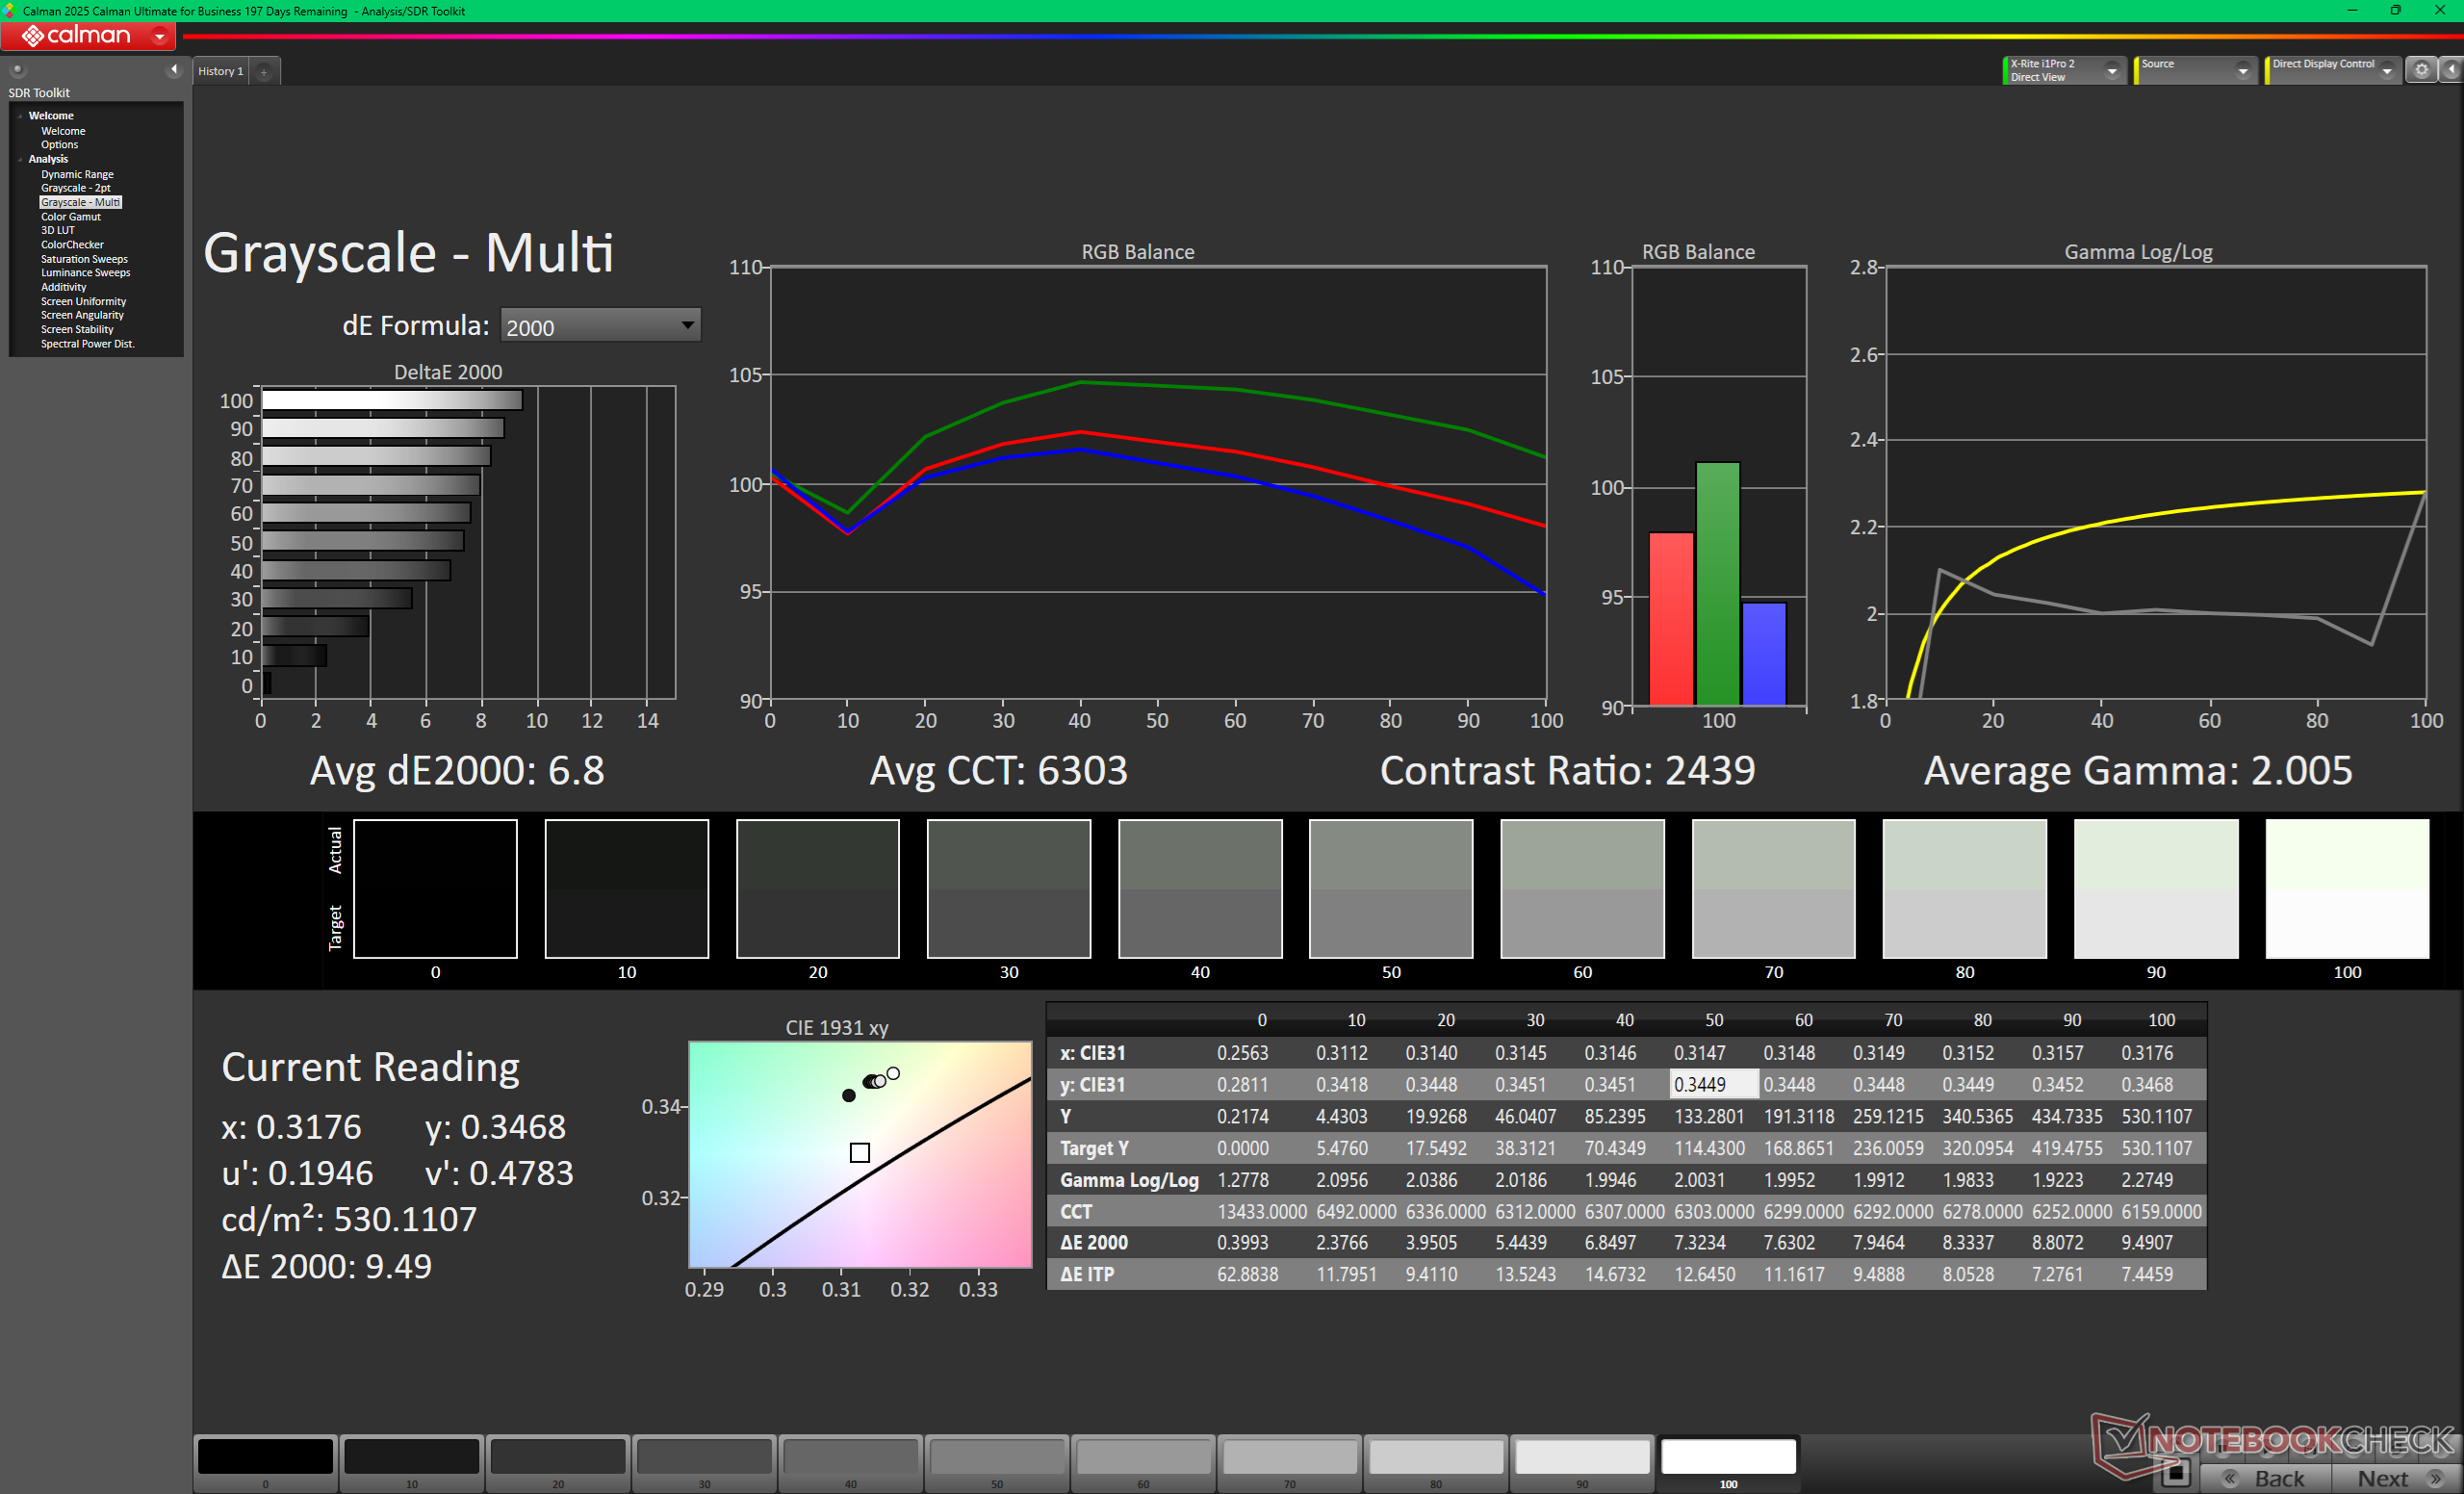
ΔE Greyscale Calman: 6.8 | ∀{0.09-98 Ø4.96}
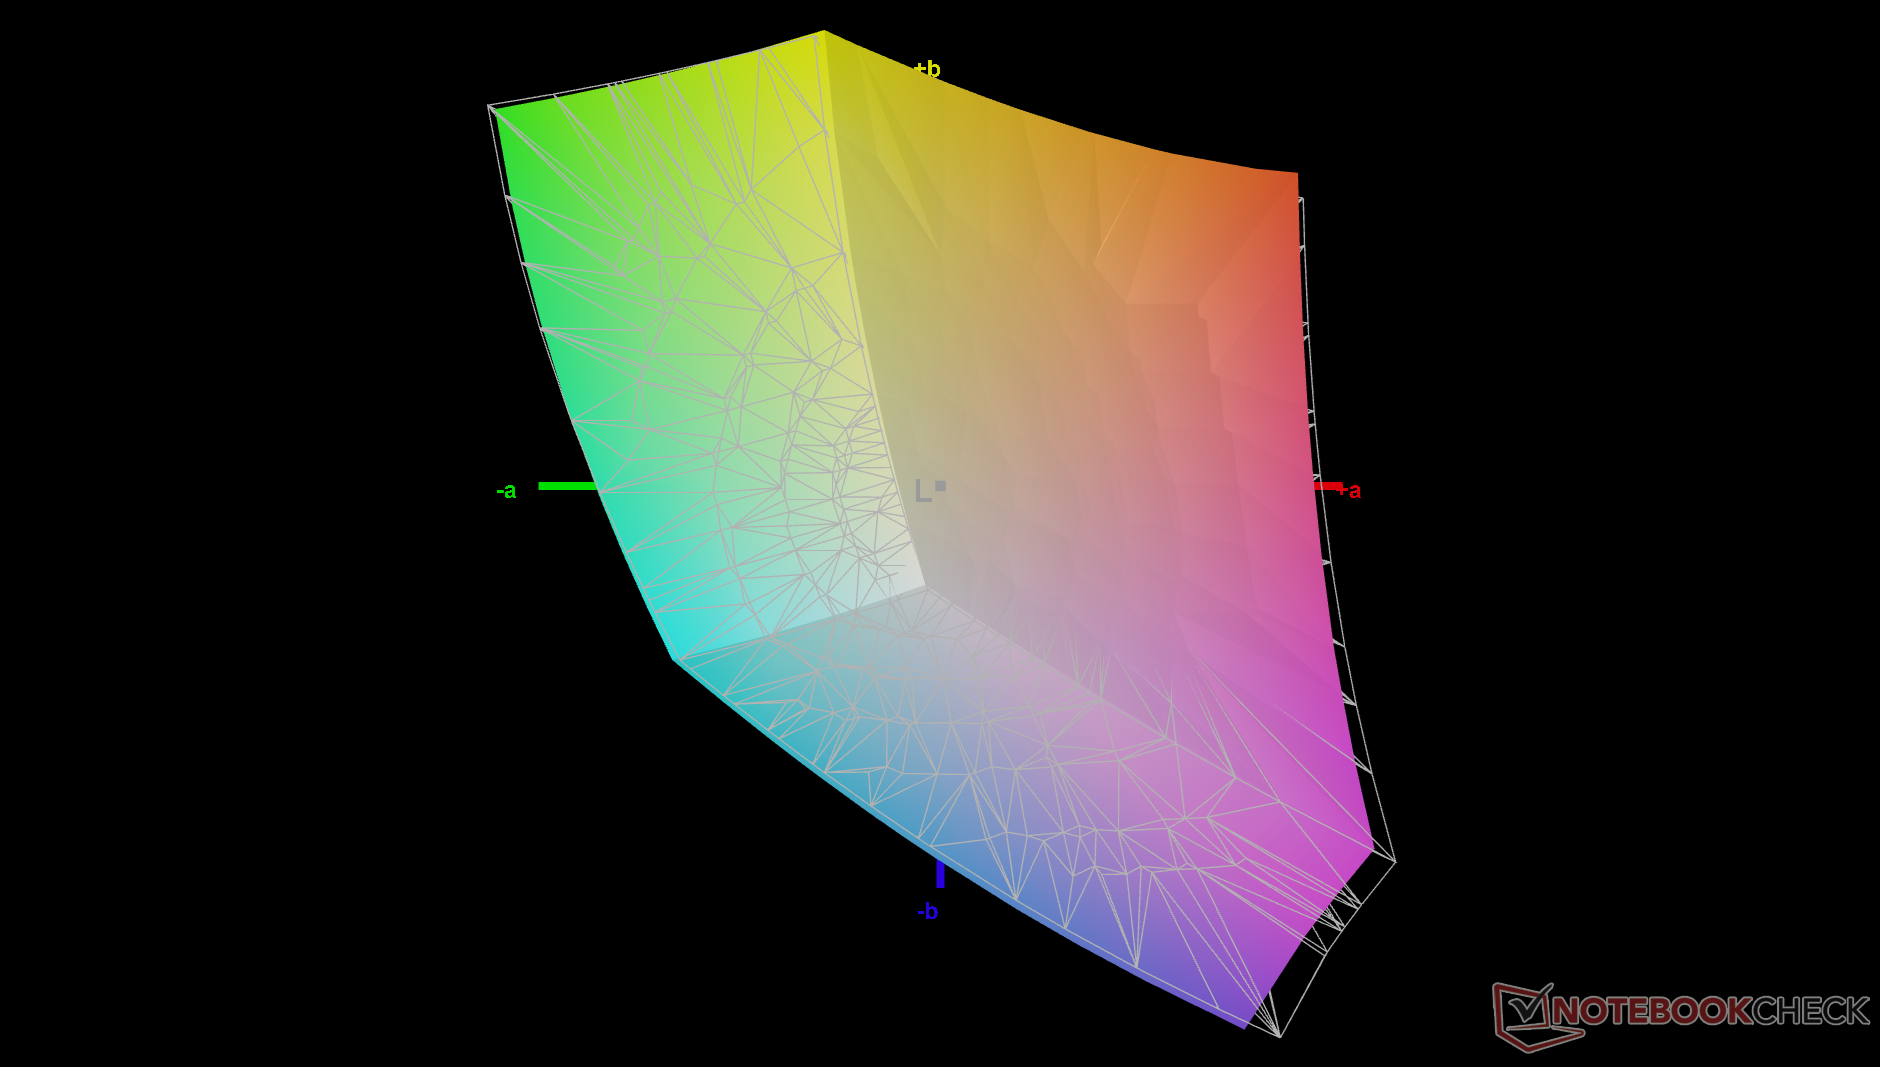
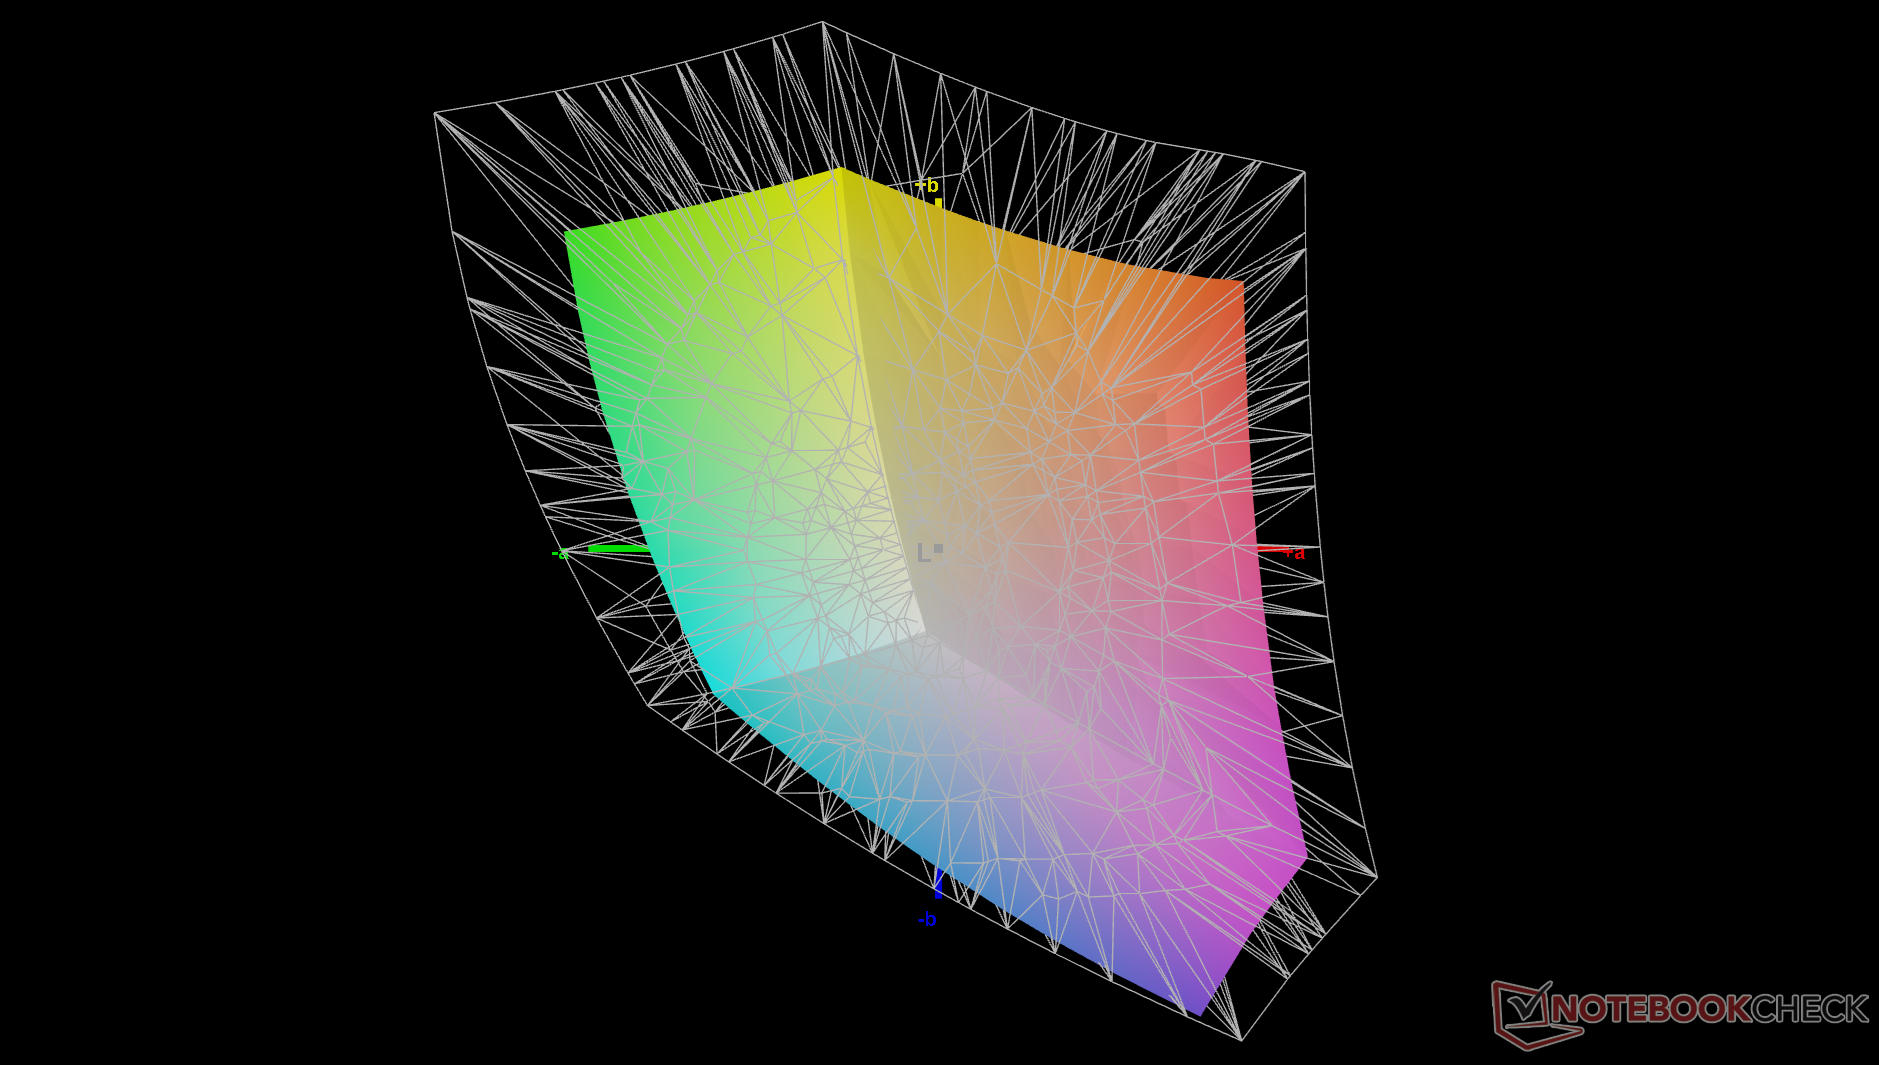
68.1% AdobeRGB 1998 (Argyll 3D)
96.4% sRGB (Argyll 3D)
65.9% Display P3 (Argyll 3D)
Gamma: 2
CCT: 6303 K
Dell Pro 7 14 P714265
LG Philips LP140WU, IPS, 1920x1200, 14", 120 Hz
Dell Pro 14 Premium
LG Phillips 140WT1, OLED, 2880x1800, 14", 60 Hz
Dell Latitude 7440
AU Optronics B140QAX, IPS, 2560x1600, 14", 60 Hz
Lenovo ThinkPad T14s Gen 7 21YW0022GE
MNE007QB1-1, IPS, 1920x1200, 14", 60 Hz
Asus ExpertBook Ultra B9406CAA
Samsung ATNA40LE01-0, OLED, 2880x1800, 14", 120 Hz
HP EliteBook X G1a 14 AI
LG Philips LGD07A1, IPS, 1920x1200, 14", 60 Hz
Display
32%
10%
4%
26%
-5%
Display P3 Coverage (%)
65.9
99
50%
75.4
14%
71.6
9%
96.2
46%
62.6
-5%
sRGB Coverage (%)
96.4
100
4%
99.9
4%
97.4
1%
100
4%
93.2
-3%
AdobeRGB 1998 Coverage (%)
68.1
95.8
41%
76.2
12%
70.4
3%
86.7
27%
64
-6%
Response Times
95%
1%
53%
98%
2%
Response Time Grey 50% / Grey 80% * (ms)
50.5 ?(23.1, 27.4)
1.4 ?(0.7, 0.7)
97%
56 ?(26.1, 29.9)
-11%
27.8 ?(10.2, 17.6)
45%
0.71 ?(0.38, 0.33)
99%
55.8 ?(25.3, 30.5)
-10%
Response Time Black / White * (ms)
35.2 ?(14.4, 20.8)
2.7 ?(1.6, 1.1)
92%
30.8 ?(14, 16.8)
12%
14 ?(4.3, 9.7)
60%
0.94 ?(0.49, 0.45)
97%
30.5 ?(15.3, 15.2)
13%
PWM Frequency (Hz)
241.1 ?(100)
968.8 ?(100)
PWM Amplitude * (%)
32
20
Screen
9%
-3%
13%
37%
-16%
Brightness middle (cd/m²)
571.5
392.3
-31%
517.3
-9%
574
0%
600.5
5%
442.8
-23%
Brightness (cd/m²)
513
392
-24%
488
-5%
530
3%
612
19%
412
-20%
Brightness Distribution (%)
83
95
14%
88
6%
87
5%
96
16%
87
5%
Black Level * (cd/m²)
0.29
0.34
-17%
0.32
-10%
0.22
24%
Contrast (:1)
1971
1521
-23%
1794
-9%
2013
2%
Colorchecker dE 2000 *
4.58
3.39
26%
3.3
28%
2
56%
1.18
74%
5.92
-29%
Colorchecker dE 2000 max. *
9.44
6.53
31%
7.81
17%
3.7
61%
3.4
64%
10.46
-11%
Colorchecker dE 2000 calibrated *
0.72
0.99
-38%
1.02
-42%
1.1
-53%
0.73
-1%
1.31
-82%
Greyscale dE 2000 *
6.8
1.1
84%
5.6
18%
2.6
62%
1
85%
7.6
-12%
Gamma
2 110%
2.23 99%
2.37 93%
2.27 97%
2.27 97%
2.22 99%
CCT
6303 103%
6502 100%
6804 96%
6910 94%
6567 99%
6728 97%
Całkowita średnia (program / ustawienia)
45% / 29%
3% / 0%
23% / 17%
54% / 45%
-6% / -11%

* ... im mniej tym lepiej

vs. sRGB
vs. sRGB
vs. P3
vs. P3
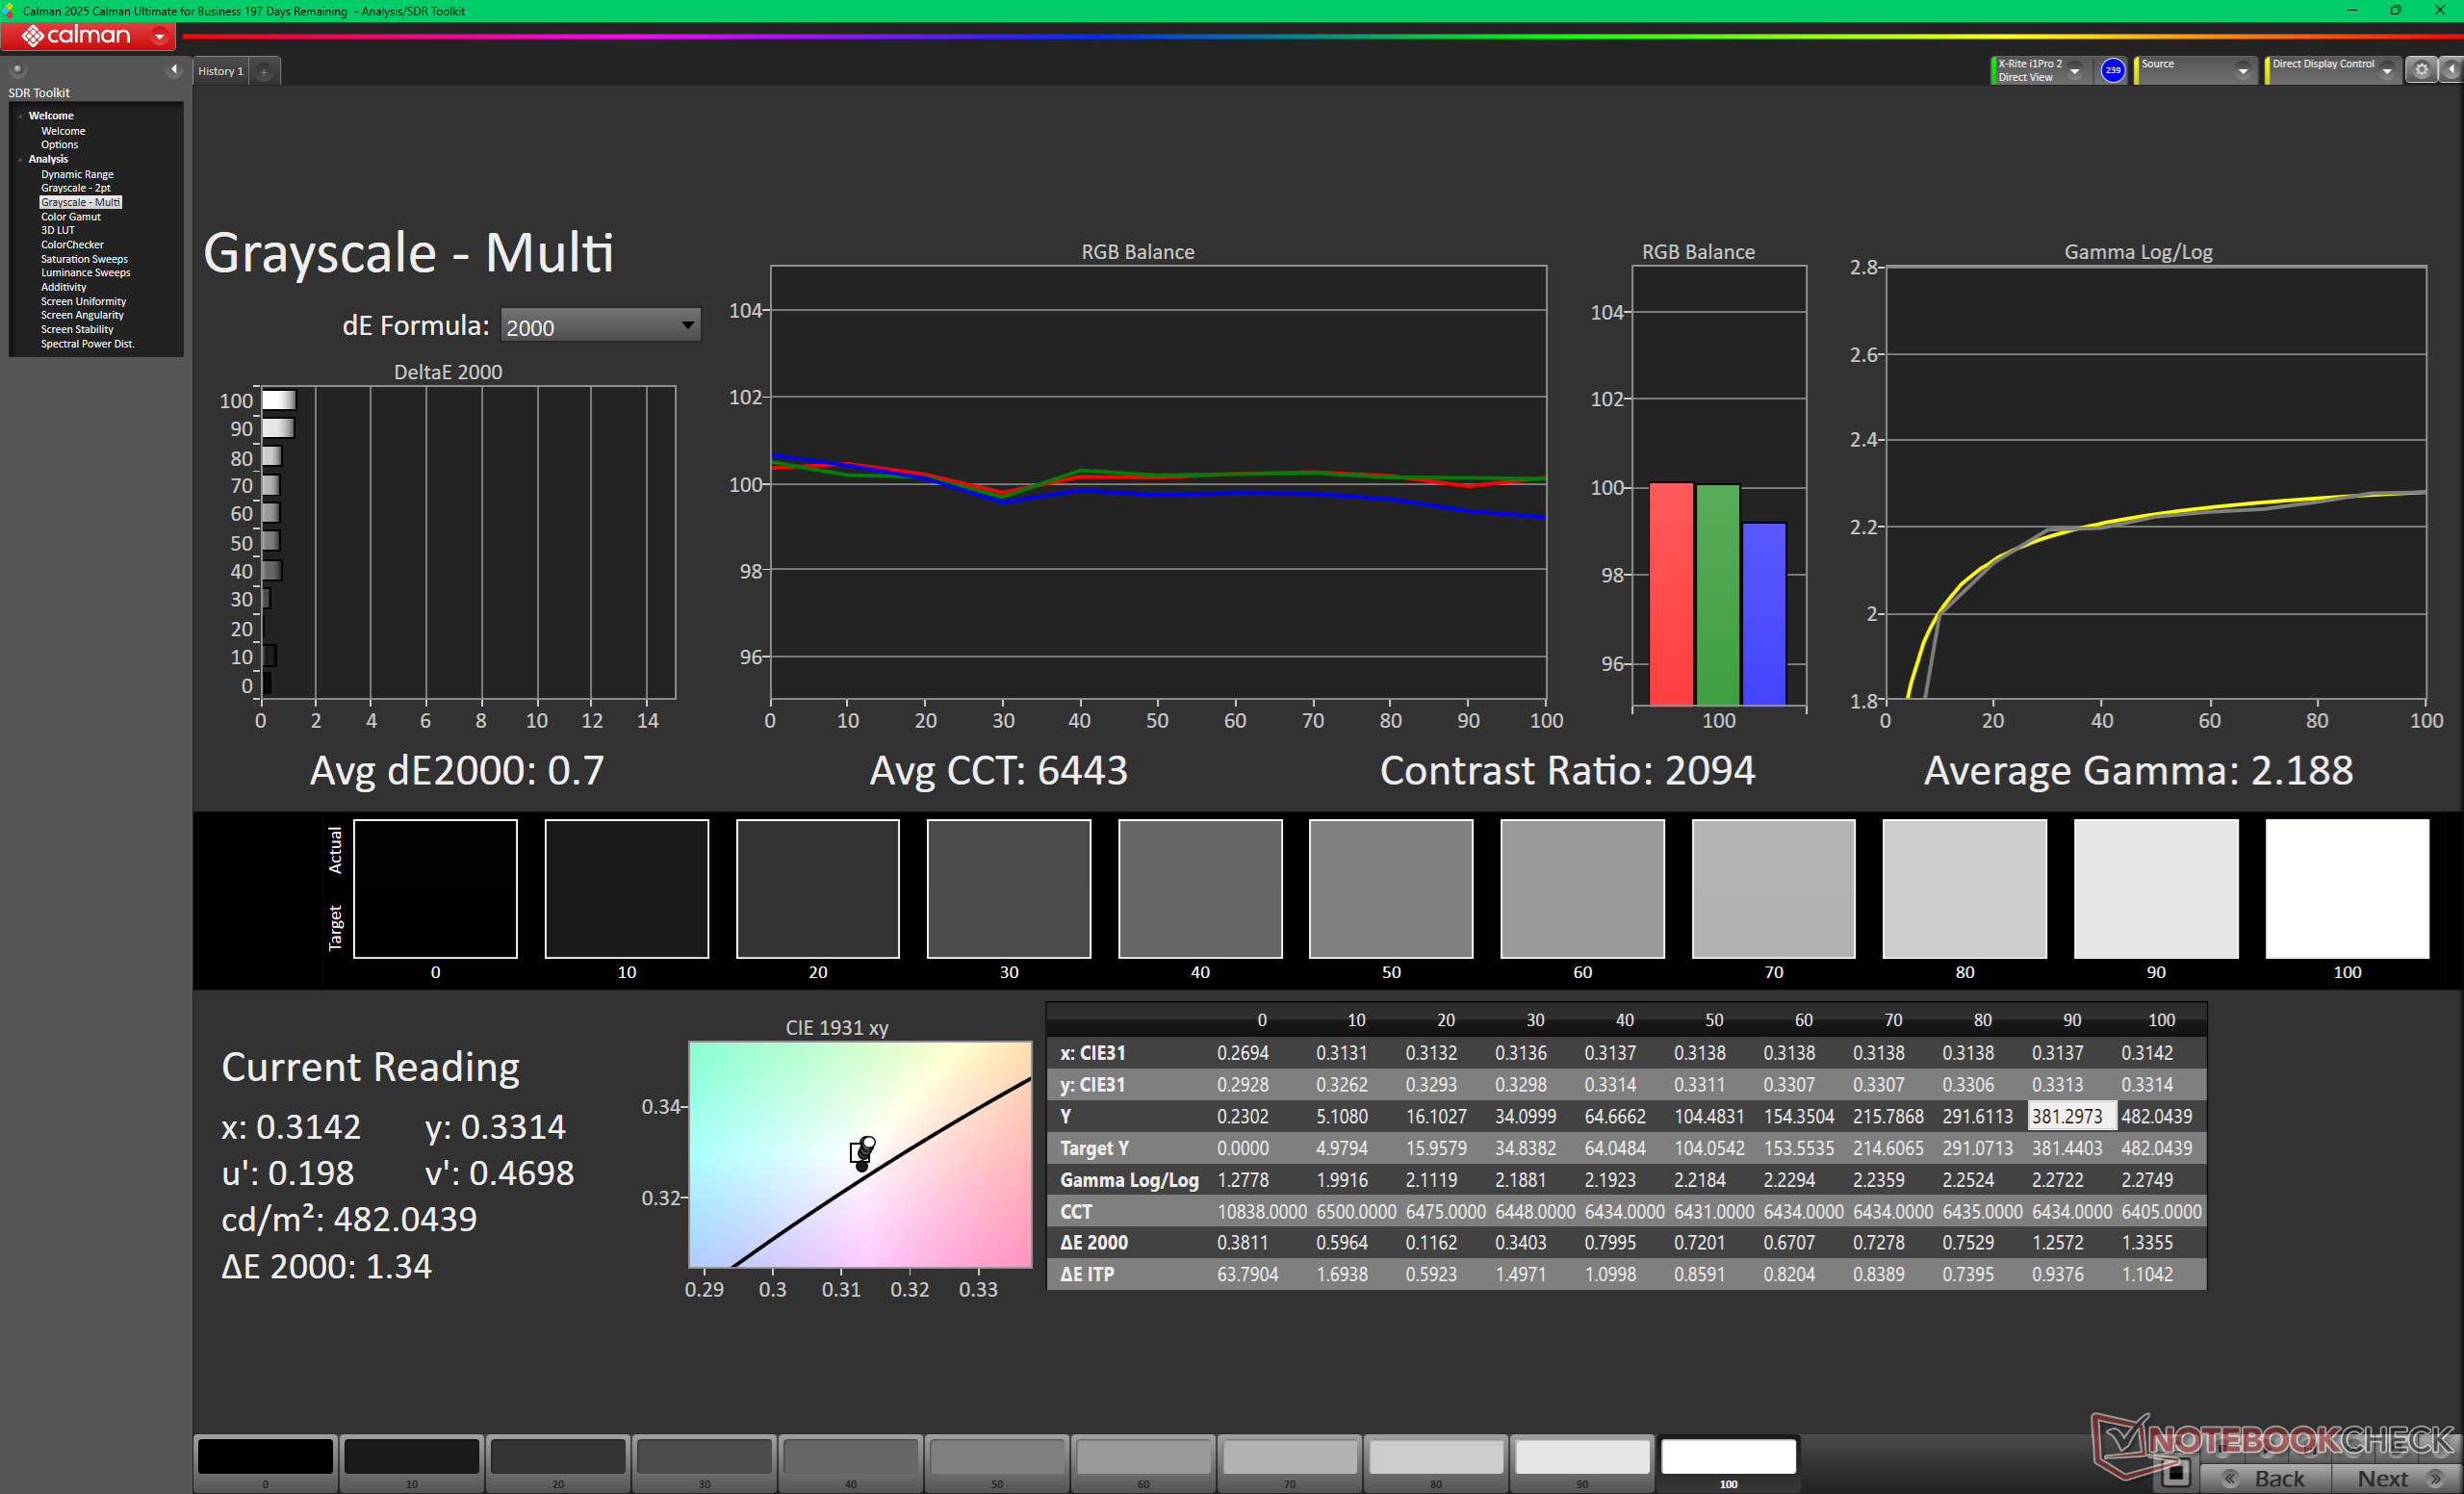
Skala szarości przed kalibracją (w porównaniu z sRGB)
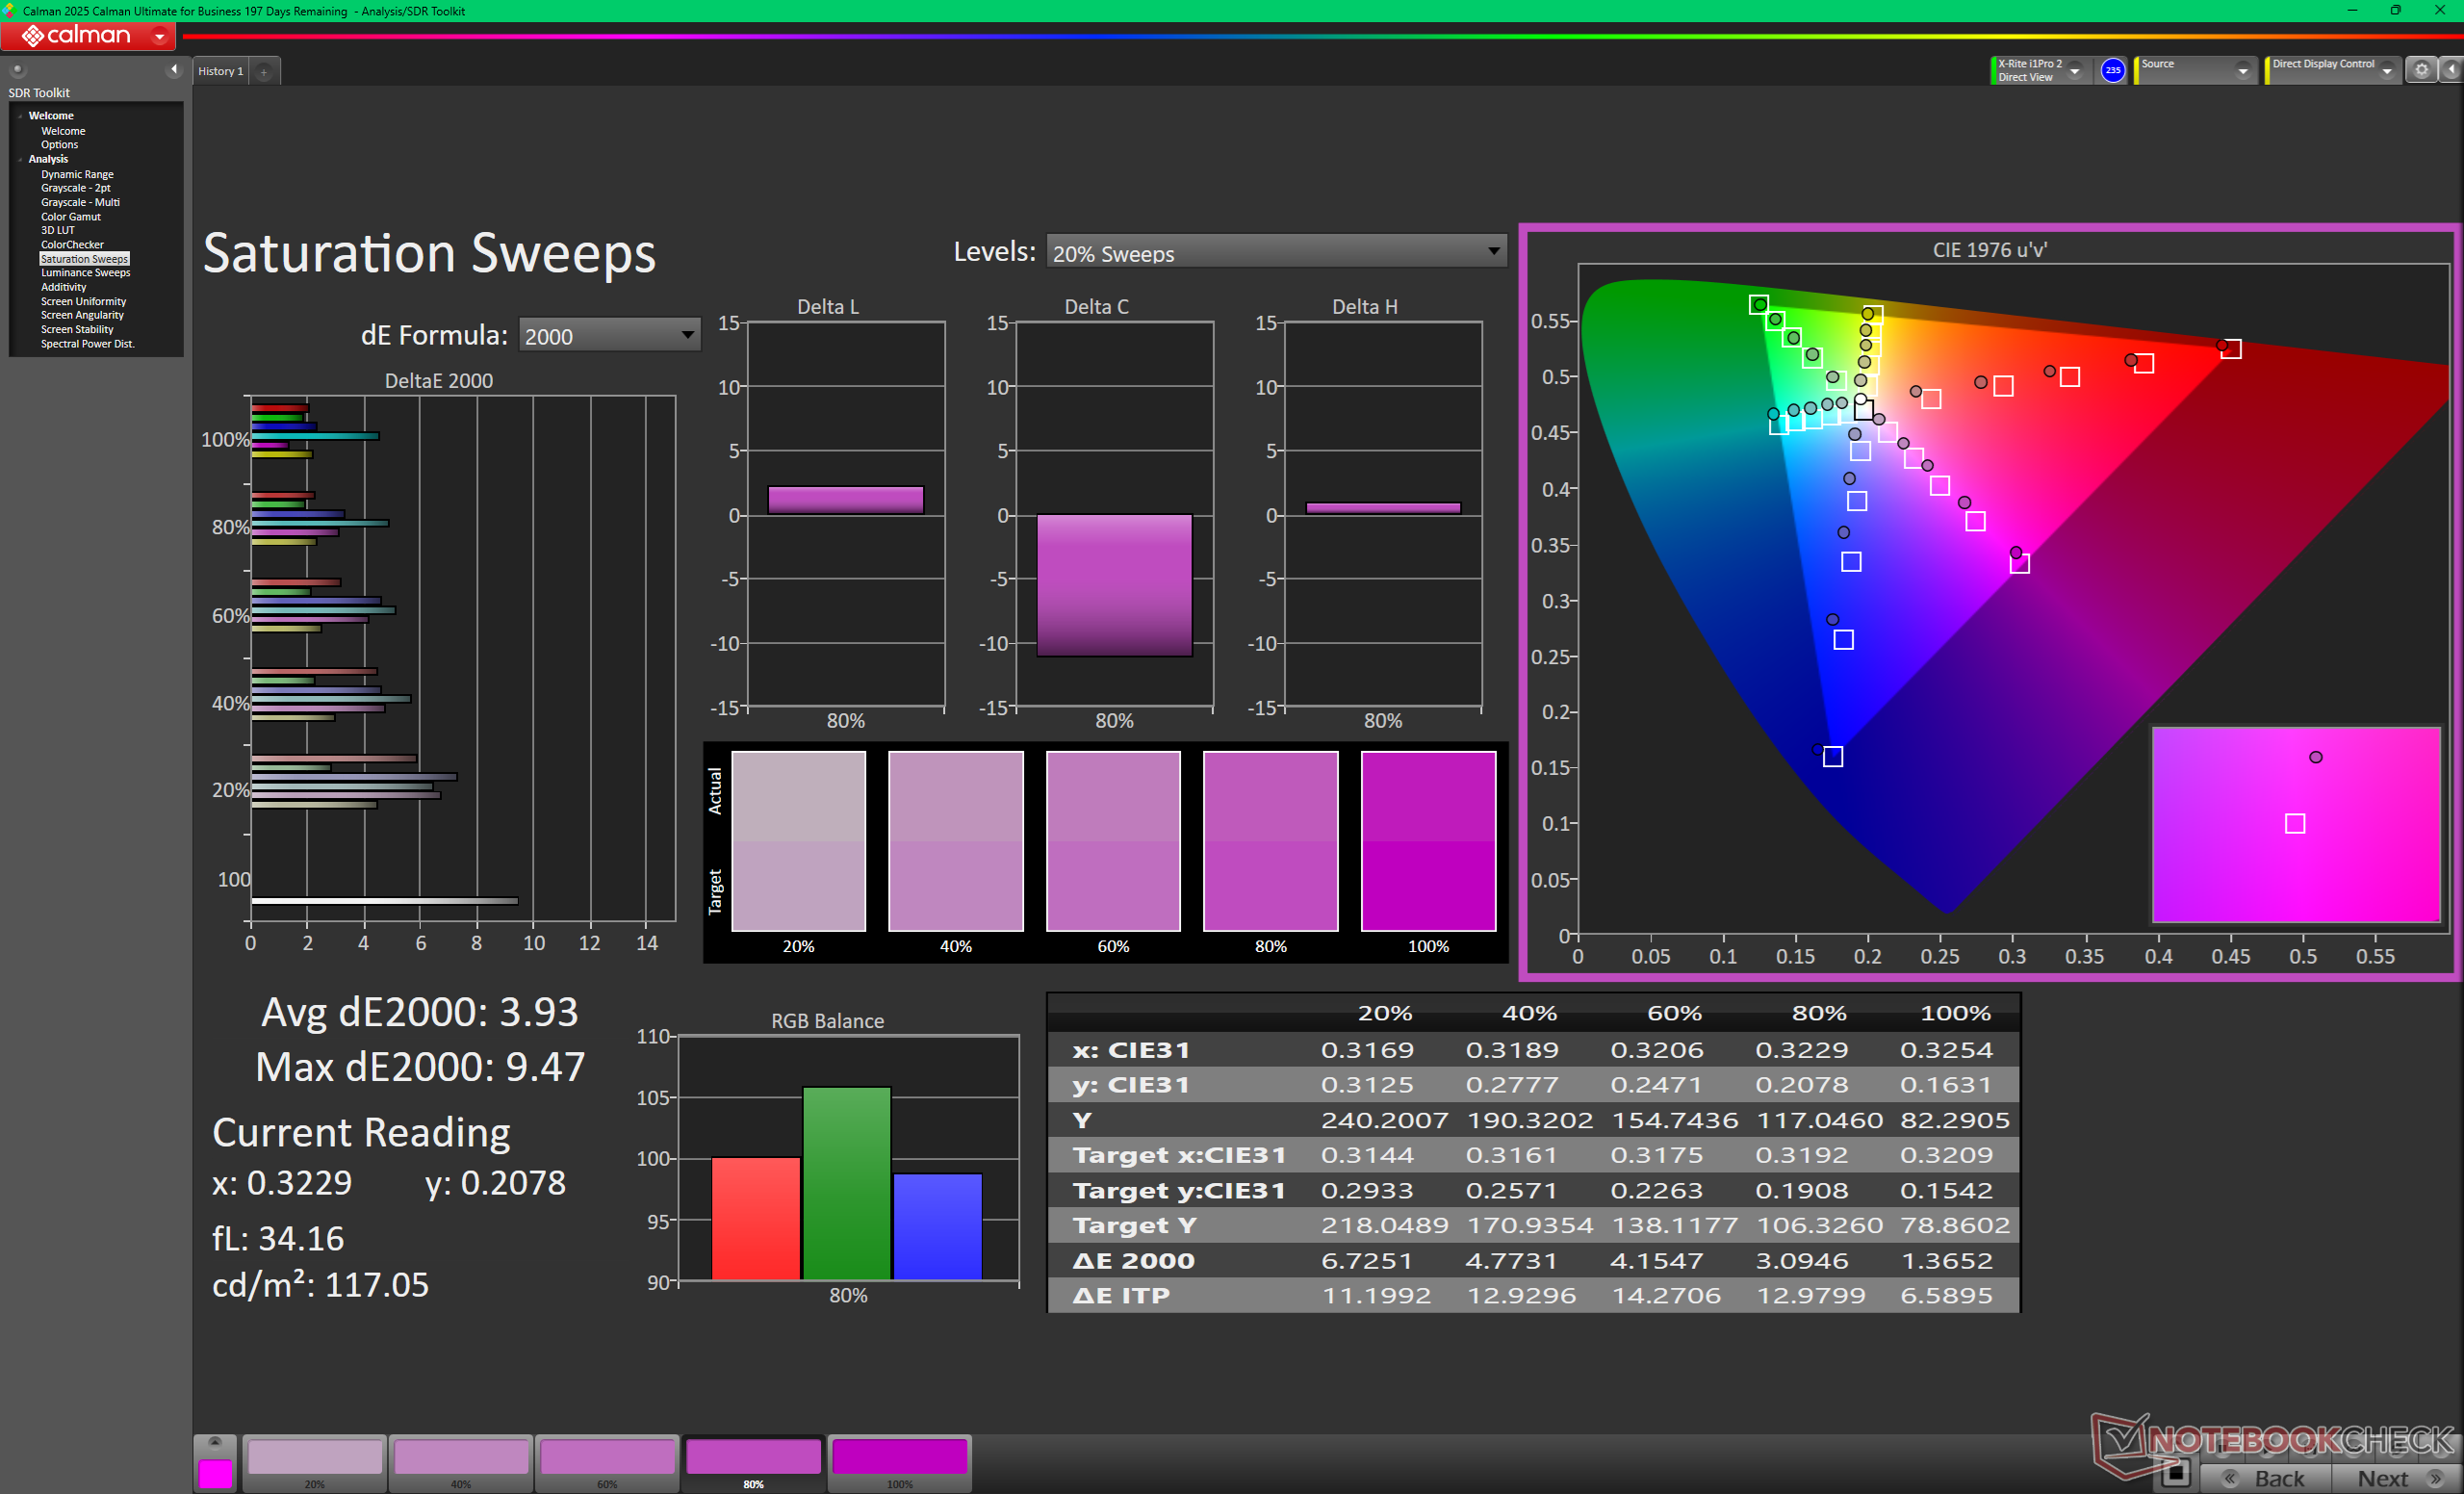
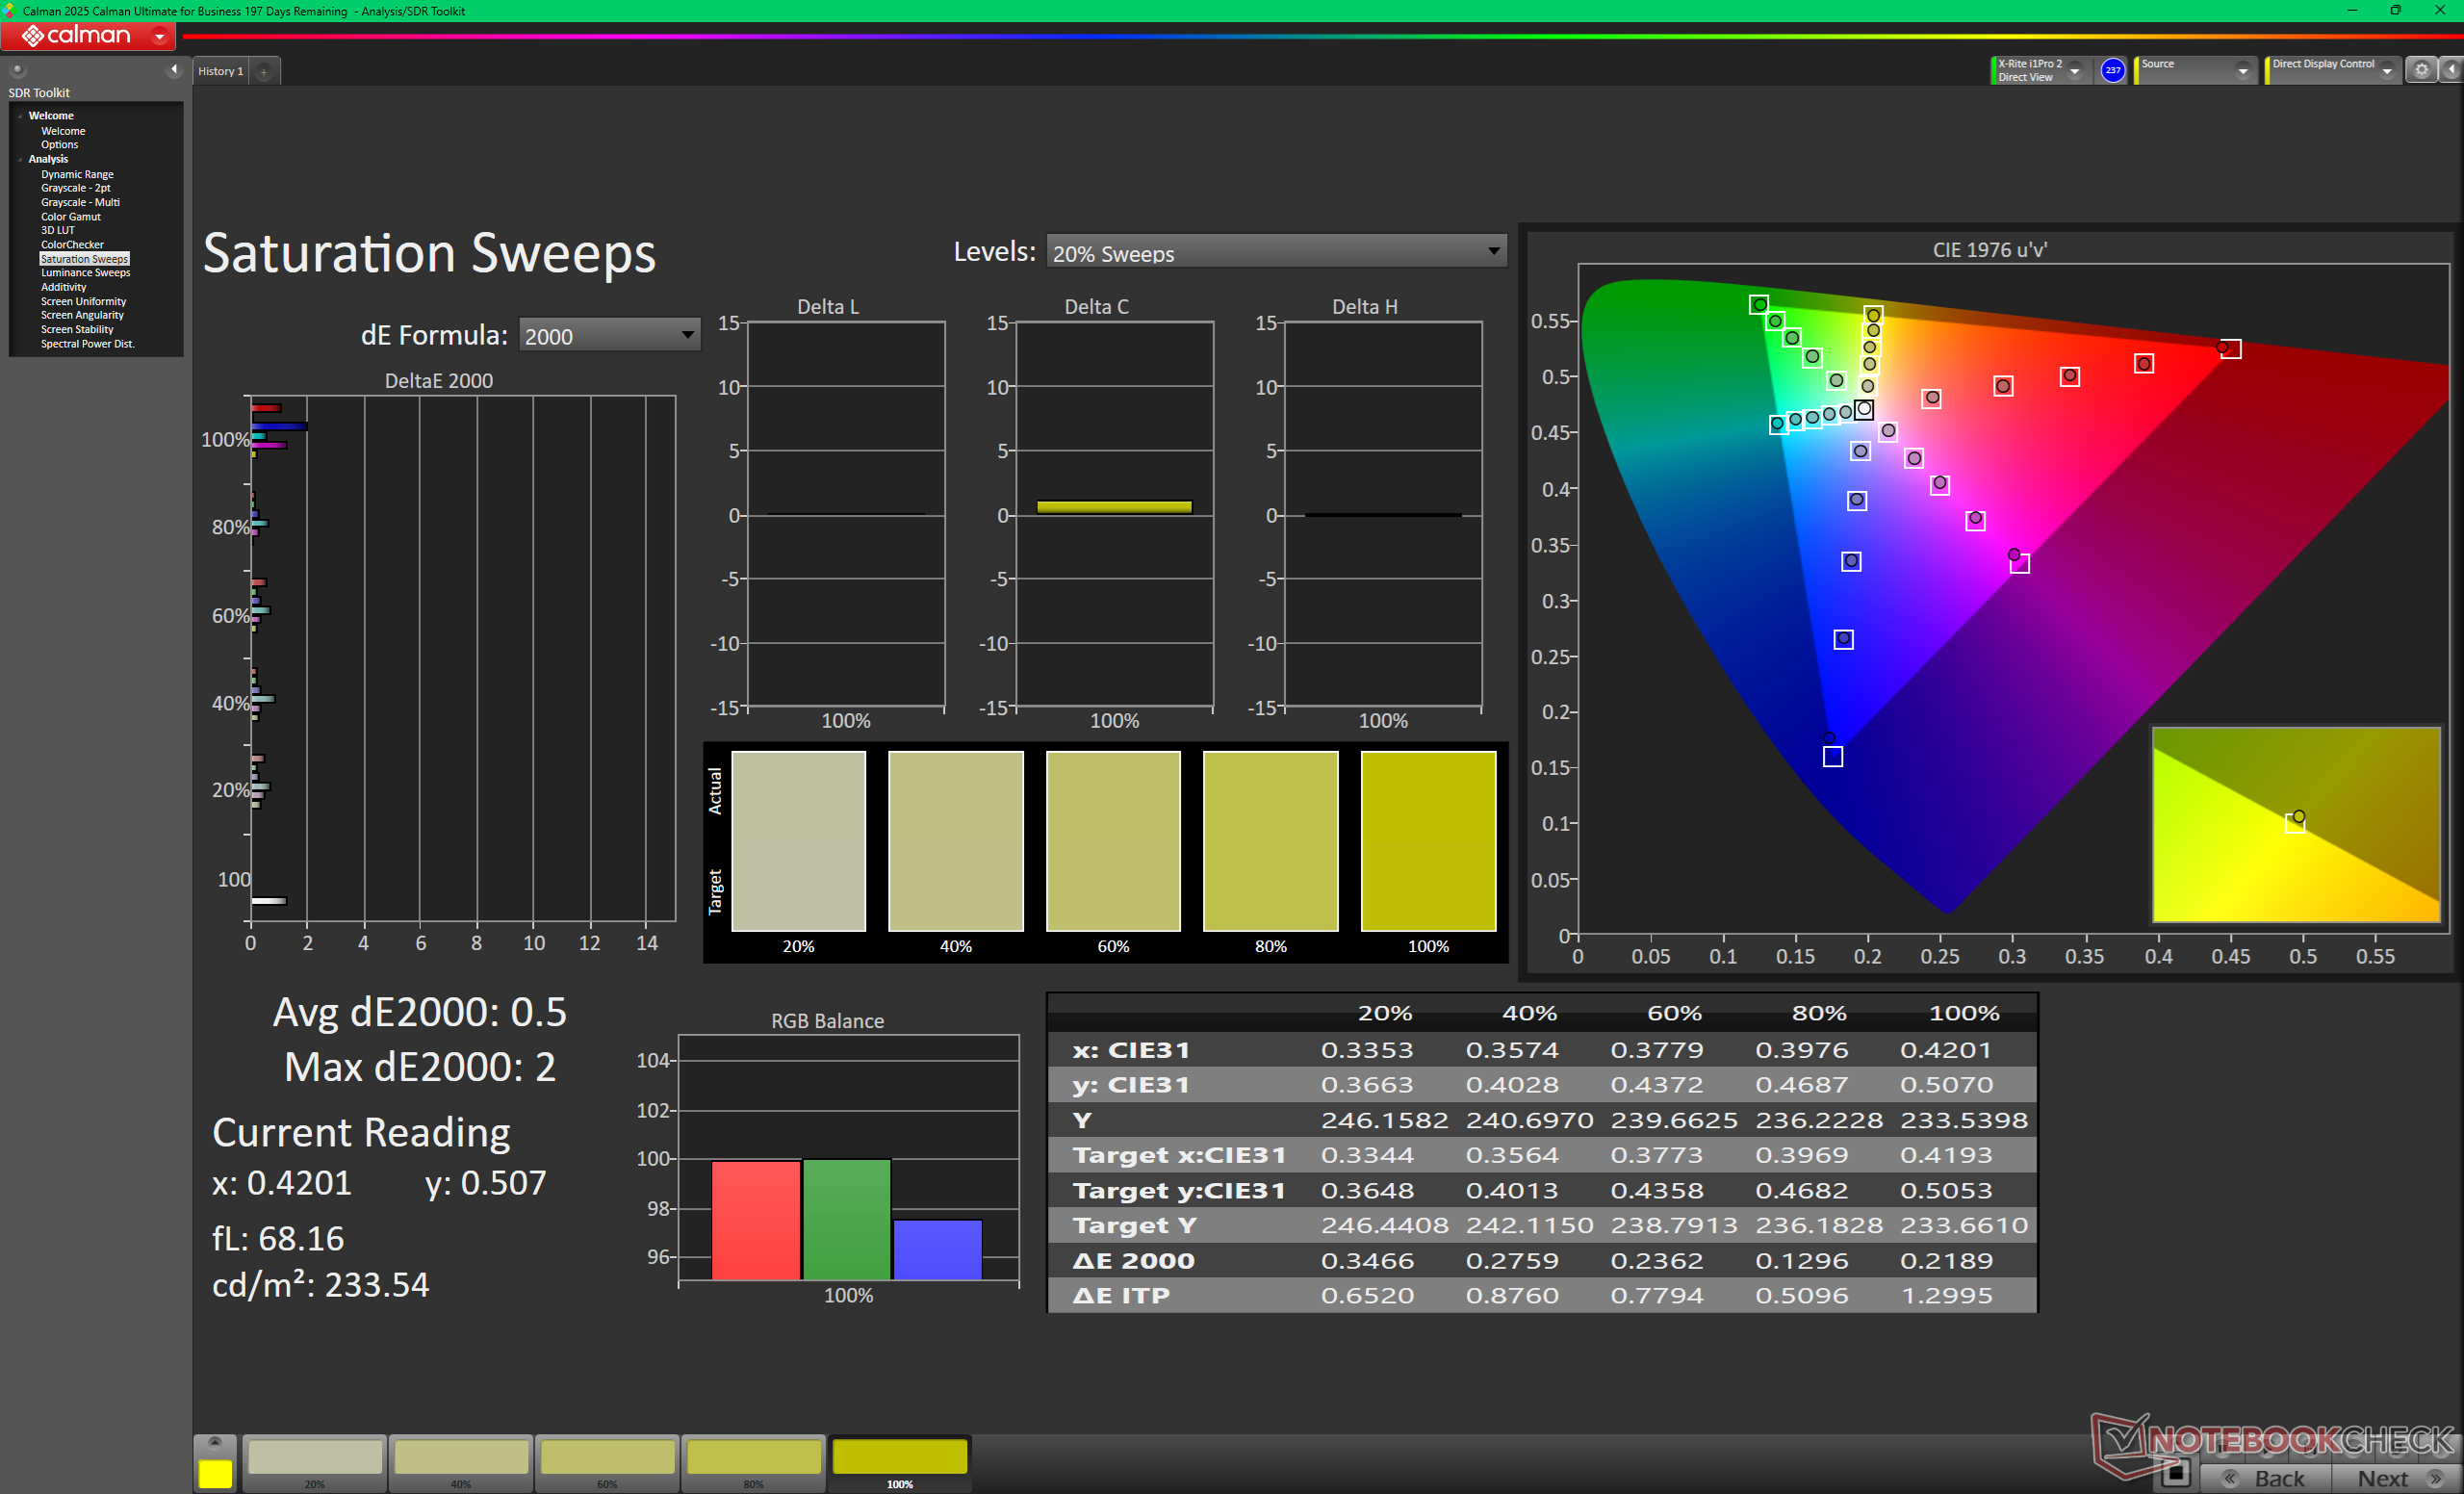
Przebiegi nasycenia przed kalibracją (w porównaniu z sRGB)
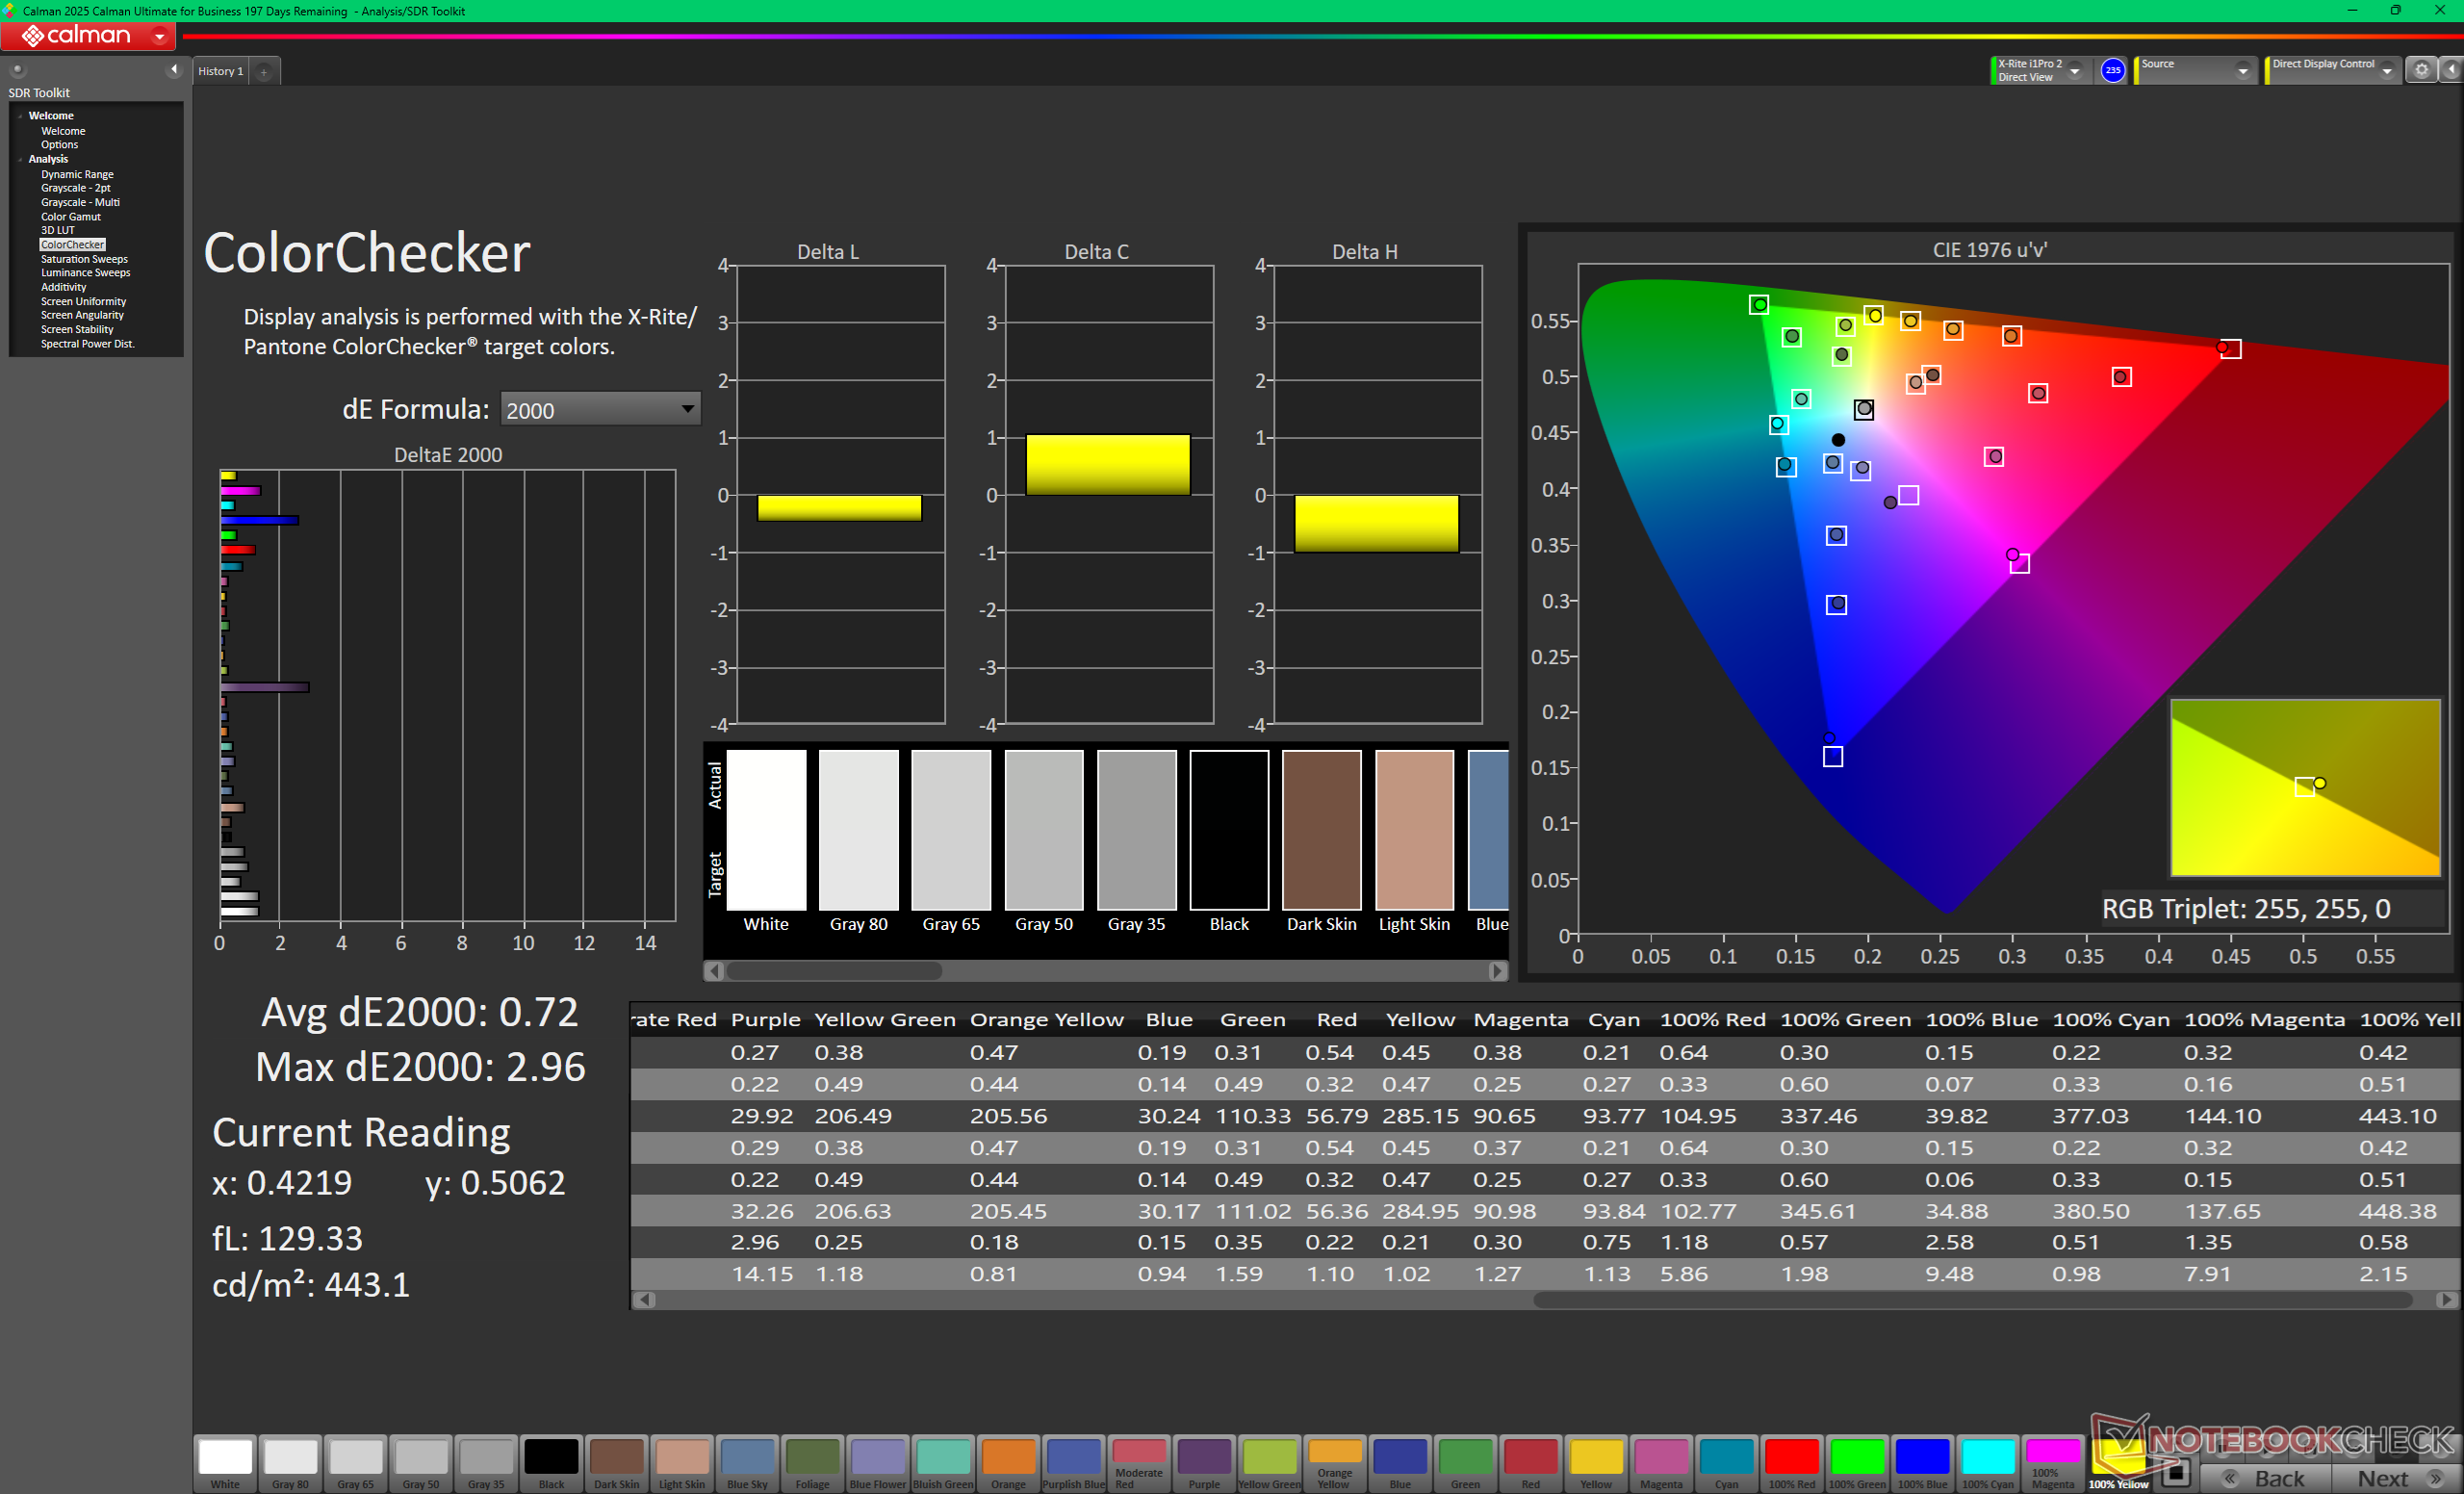
ColorChecker przed kalibracją (w porównaniu z sRGB)
Skala szarości po kalibracji
Przebiegi nasycenia po kalibracji
ColorChecker po kalibracji

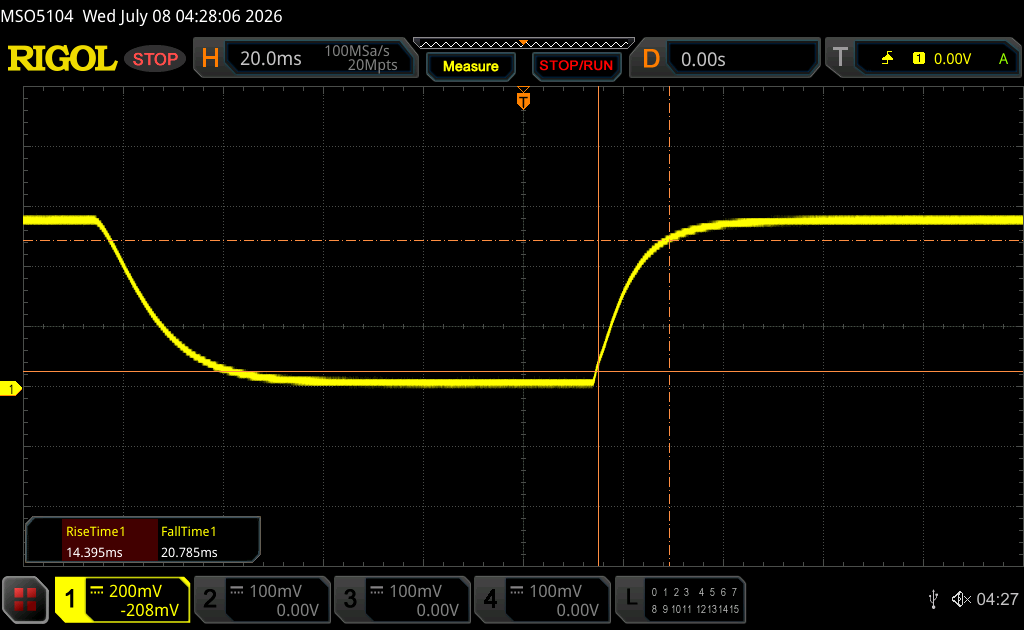
Wyświetl czasy reakcji

Czasy reakcji wyświetlacza pokazują, jak szybko ekran może zmieniać kolor z jednego koloru na drugi. Długi czas reakcji może powodować powstawanie powidoków i sprawiać, że poruszające się obiekty będą niewyraźne (duchy). Gracze szybkich tytułów 3D powinni zwrócić szczególną uwagę na szybki czas reakcji.
       Czas reakcji od czerni do bieli
35.2 ms ... wzrost ↗ i spadek ↘ łącznie↗ 14.4 ms wzrost
↘ 20.8 ms upadek
W naszych testach ekran wykazuje powolne tempo reakcji, co będzie niezadowalające dla graczy.
Dla porównania, wszystkie testowane urządzenia wahają się od 0.1 (minimum) do 240 (maksimum) ms. » 93 % wszystkich urządzeń jest lepszych.
Oznacza to, że zmierzony czas reakcji jest gorszy od średniej wszystkich testowanych urządzeń (19.8 ms).
       Czas reakcji 50% szarości do 80% szarości
50.5 ms ... wzrost ↗ i spadek ↘ łącznie↗ 23.1 ms wzrost
↘ 27.4 ms upadek
W naszych testach ekran wykazuje powolne tempo reakcji, co będzie niezadowalające dla graczy.
Dla porównania, wszystkie testowane urządzenia wahają się od 0.165 (minimum) do 636 (maksimum) ms. » 87 % wszystkich urządzeń jest lepszych.
Oznacza to, że zmierzony czas reakcji jest gorszy od średniej wszystkich testowanych urządzeń (31 ms).

Migotanie ekranu / PWM (modulacja szerokości impulsu)

Aby przyciemnić ekran, niektóre notebooki po prostu w krótkich odstępach czasu włączają i wyłączają podświetlenie — jest to metoda zwana modulacją szerokości impulsu (PWM). W idealnym przypadku ta częstotliwość cykli powinna być niewykrywalna dla ludzkiego oka. Jeśli wspomniana częstotliwość jest zbyt niska, użytkownicy o wrażliwych oczach mogą odczuwać zmęczenie lub bóle głowy, a nawet całkowicie zauważyć migotanie.
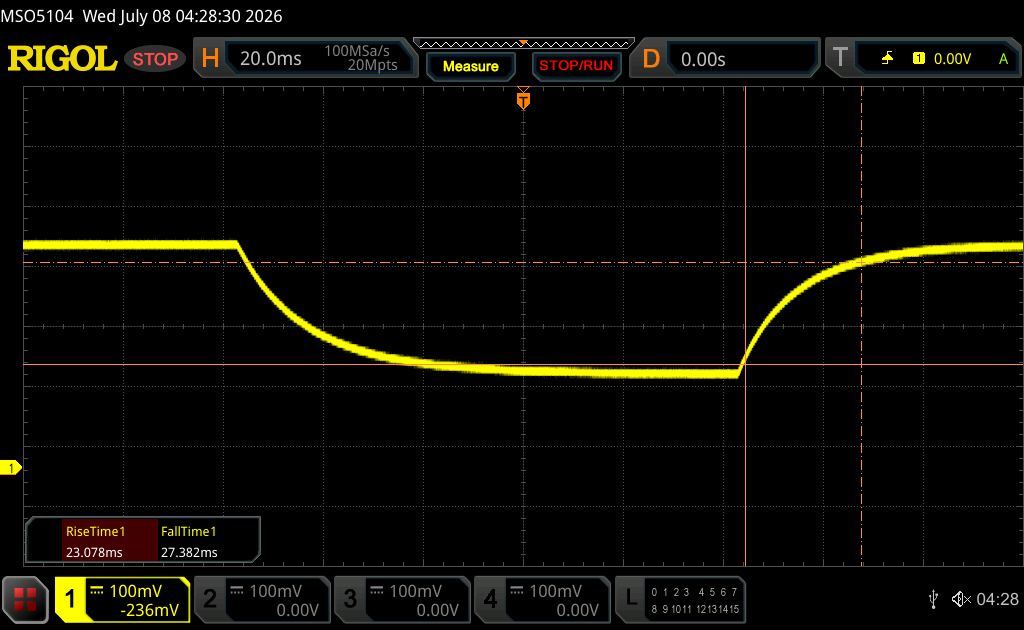
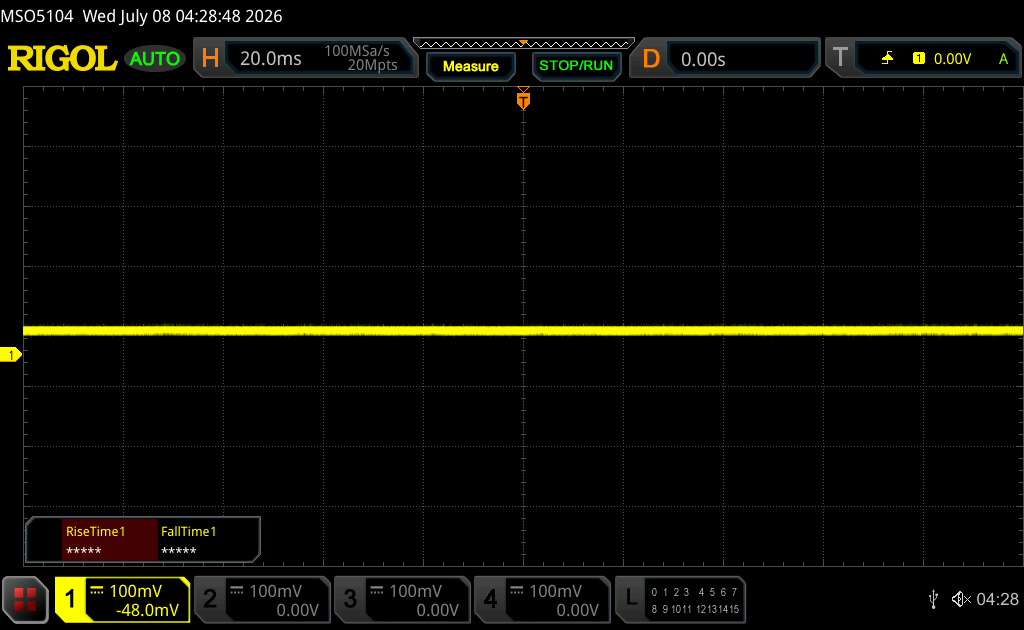
Migotanie ekranu/nie wykryto PWM

Dla porównania: 52 % wszystkich testowanych urządzeń nie używa PWM do przyciemniania wyświetlacza. Jeśli wykryto PWM, zmierzono średnio 7747 (minimum: 5 - maksimum: 343500) Hz.

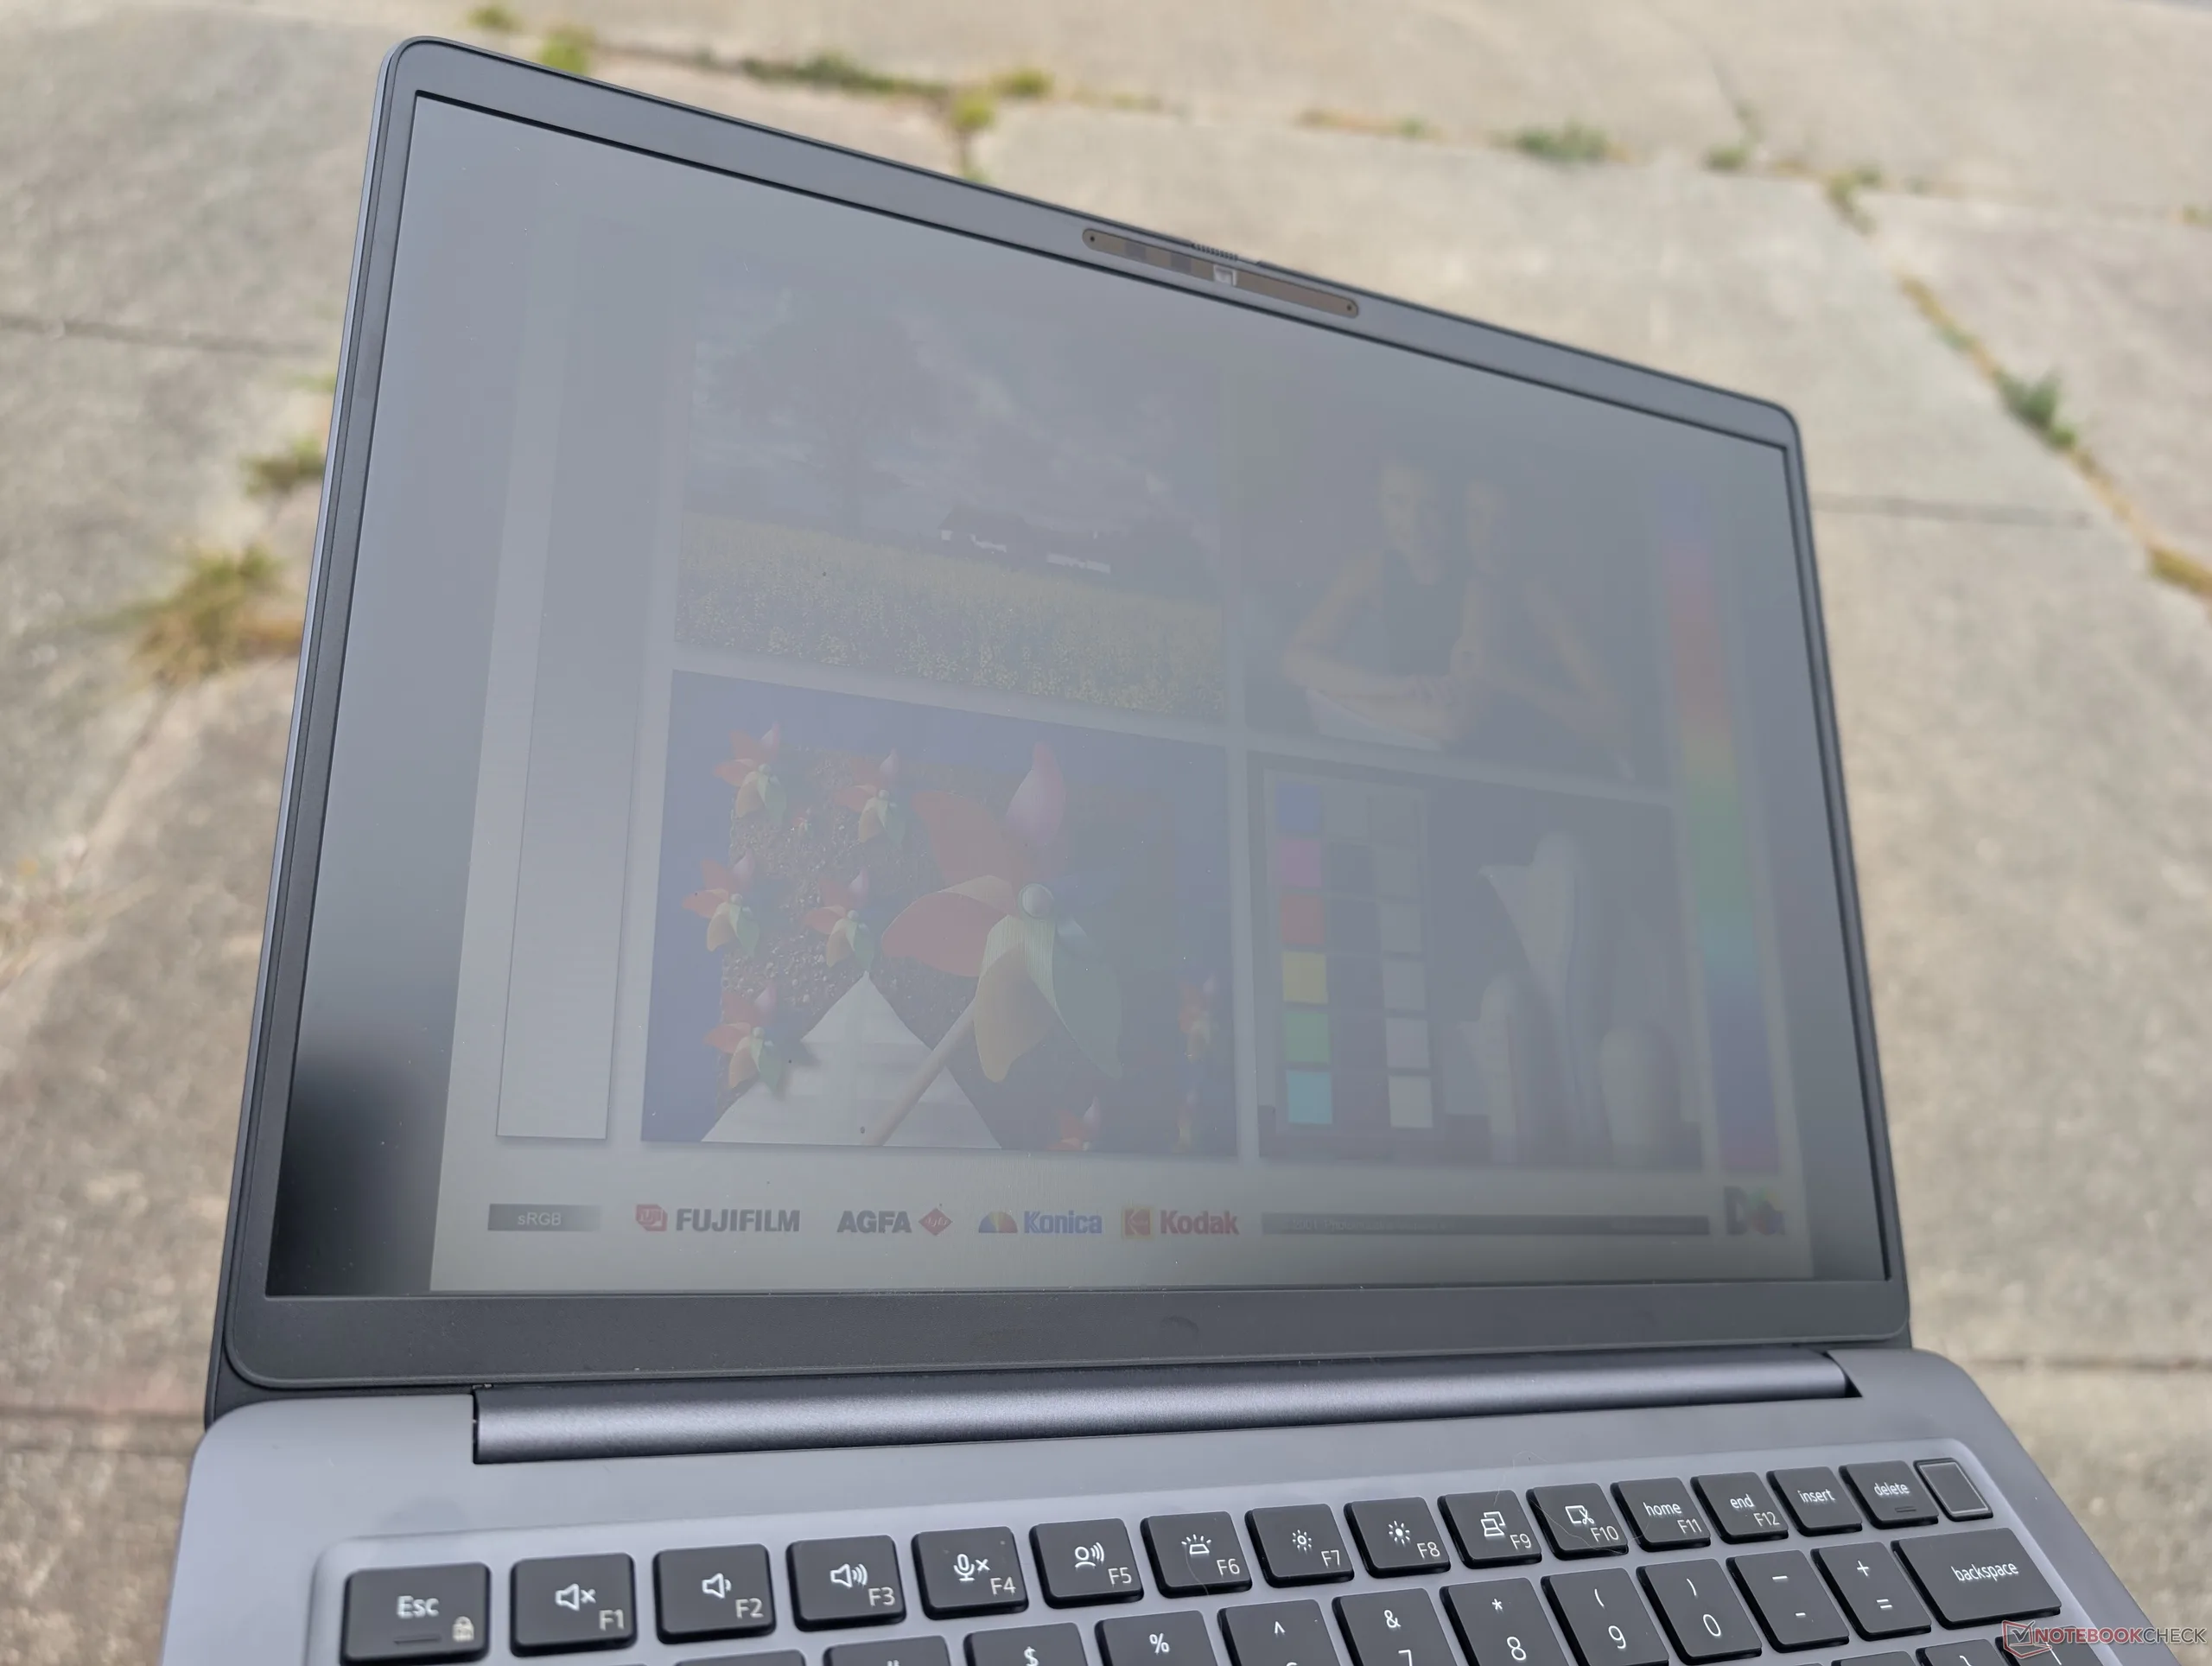
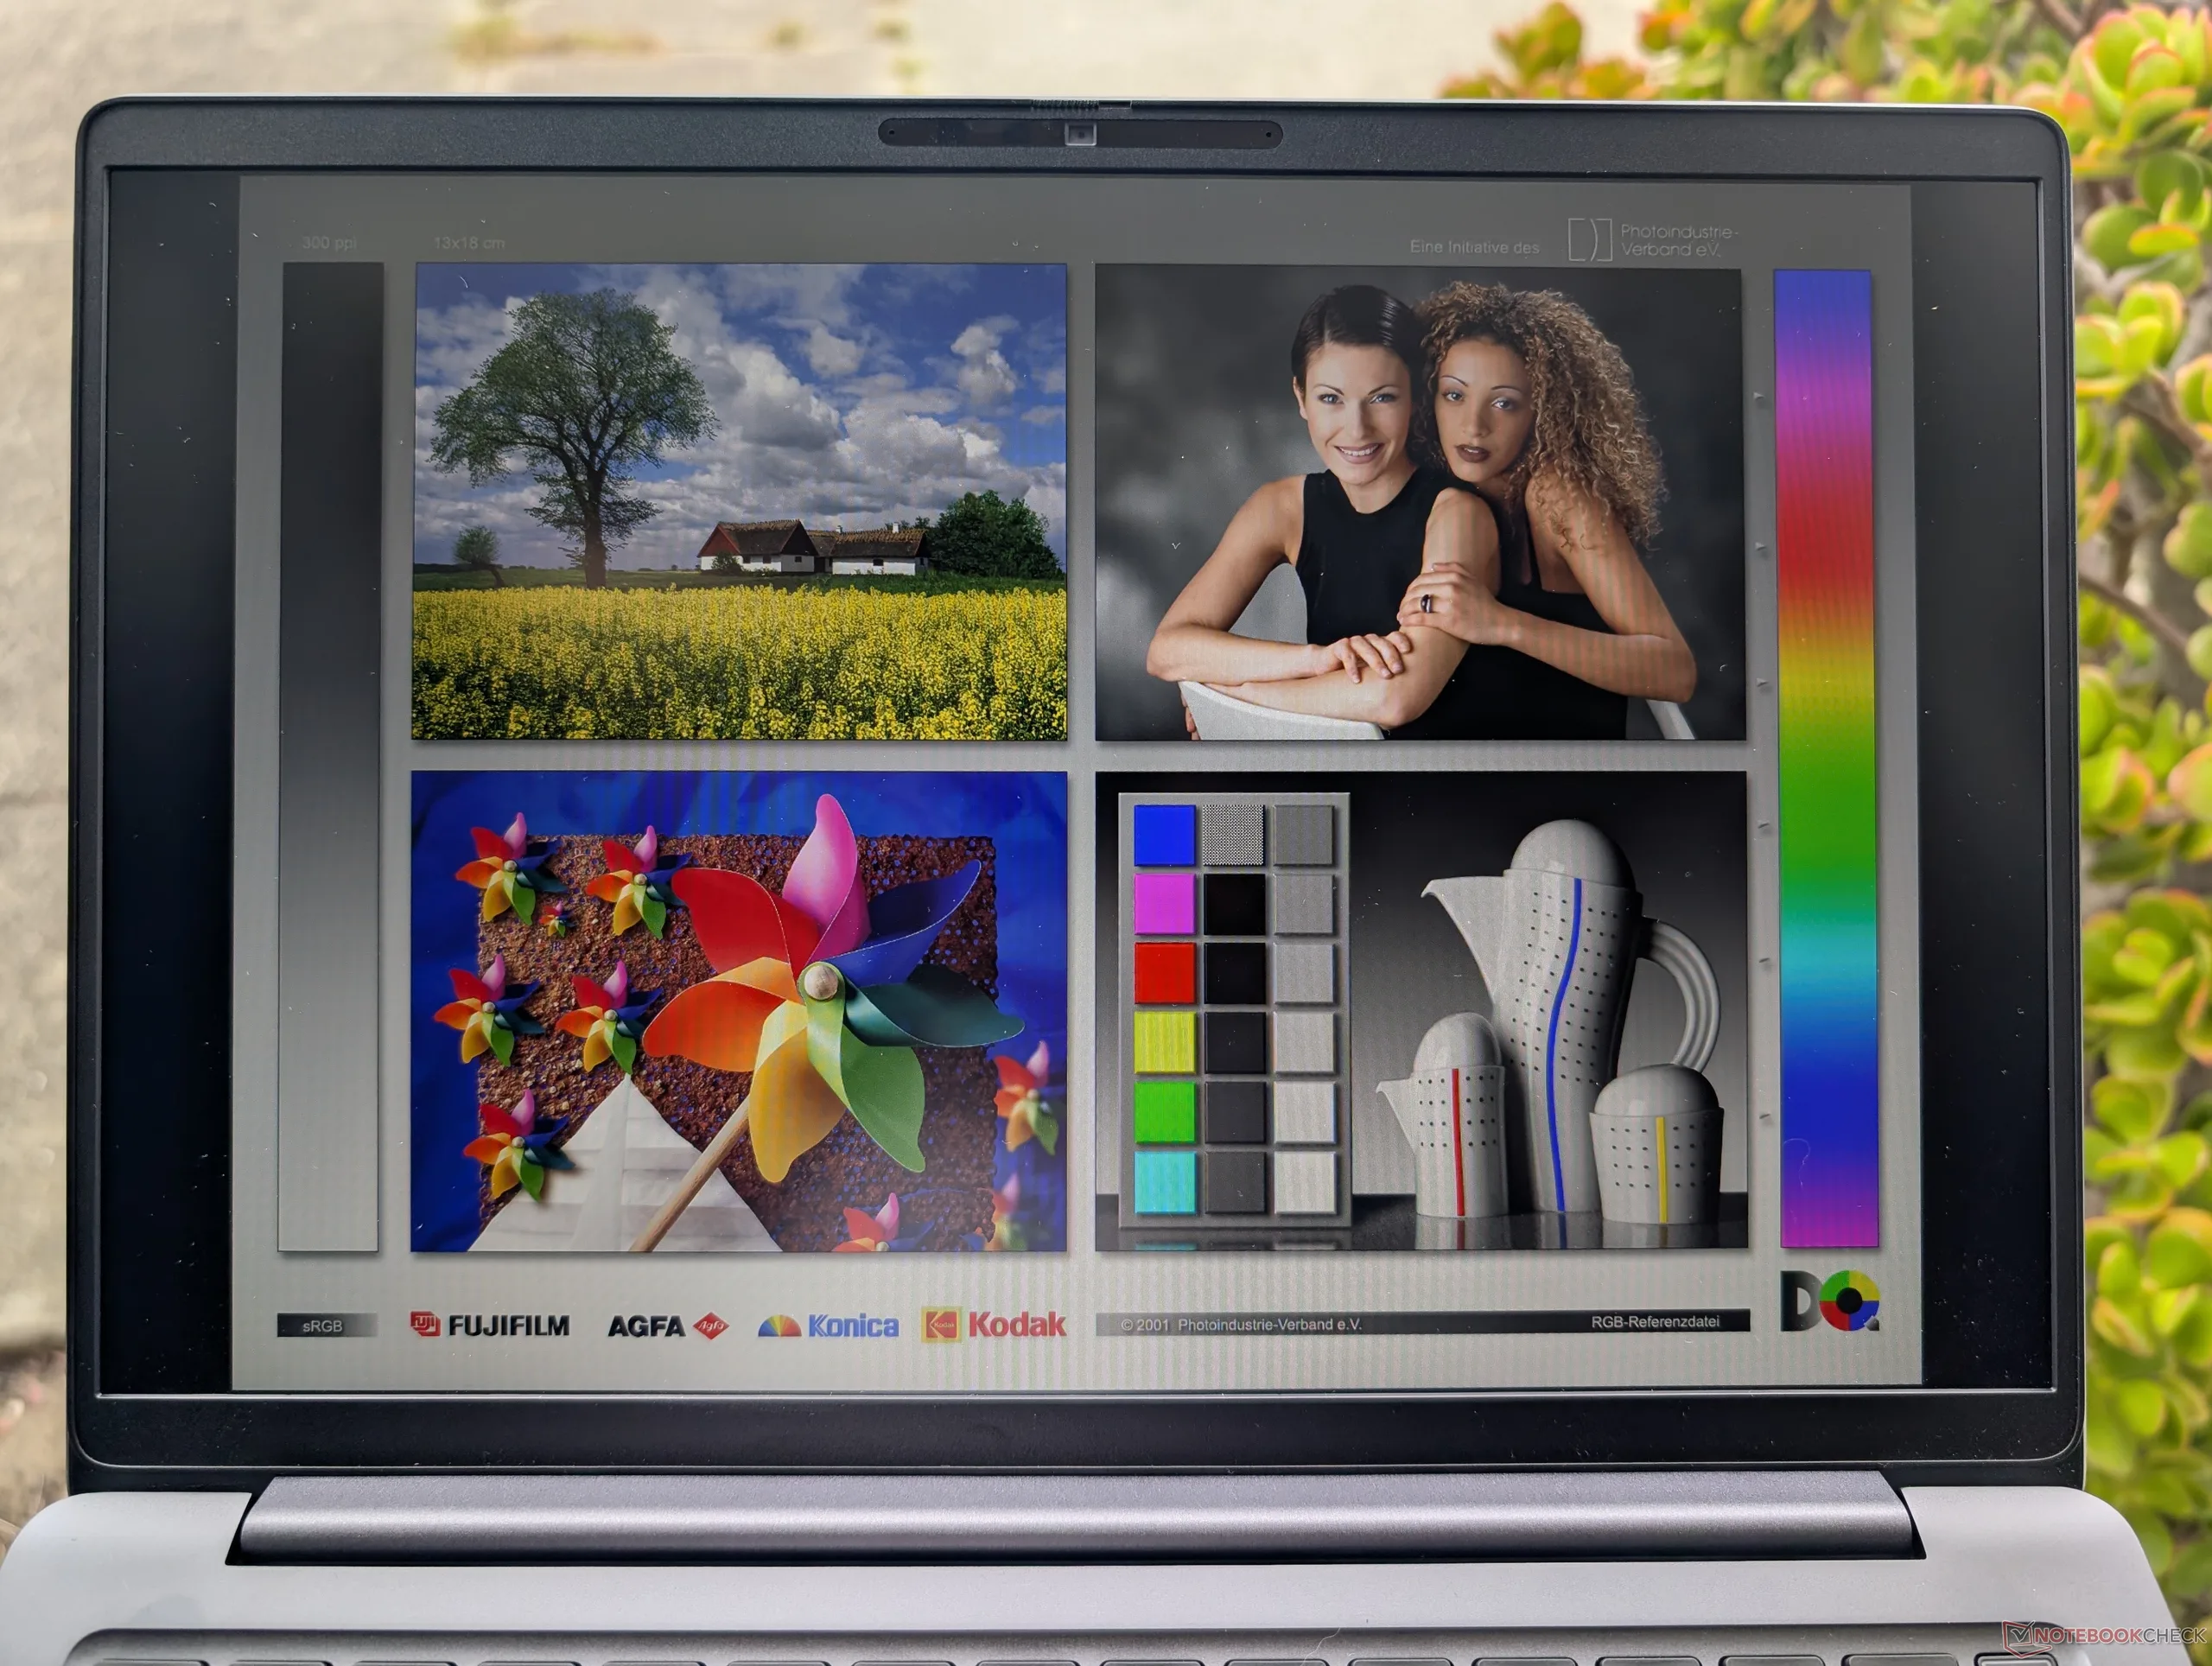
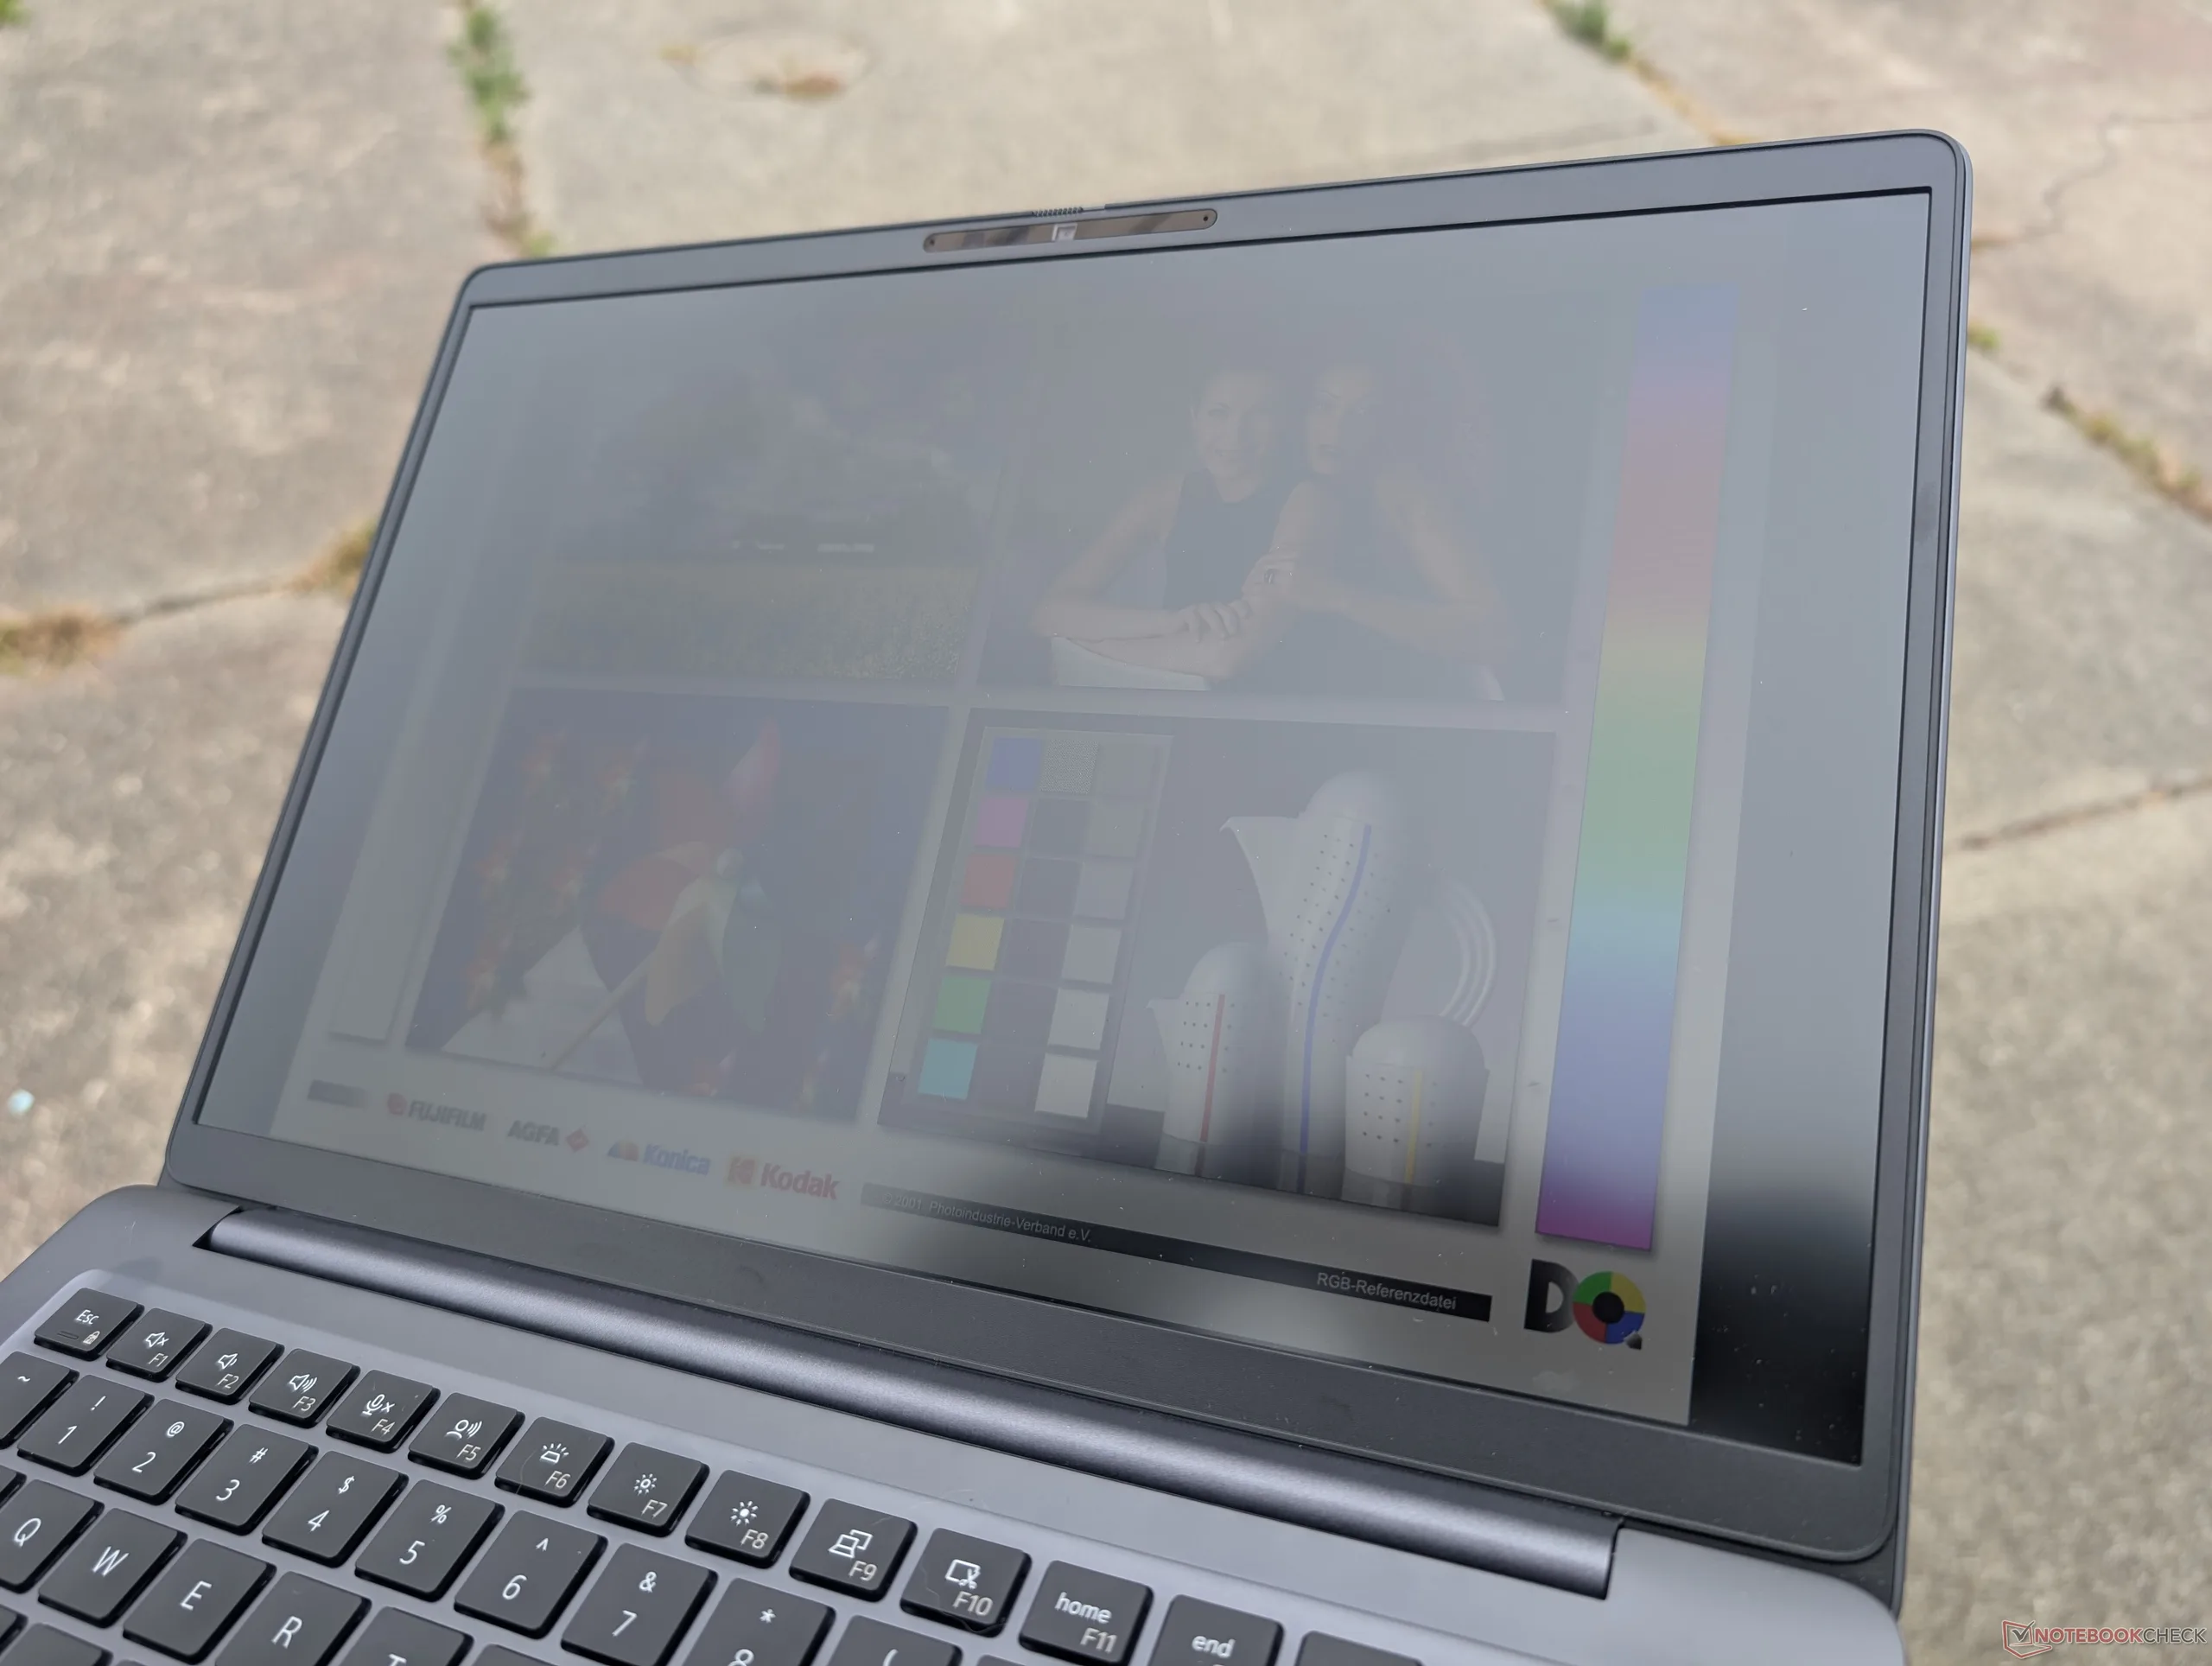
Na świeżym powietrzu w słońcu
Na świeżym powietrzu, w cieniu
Na świeżym powietrzu w słońcu
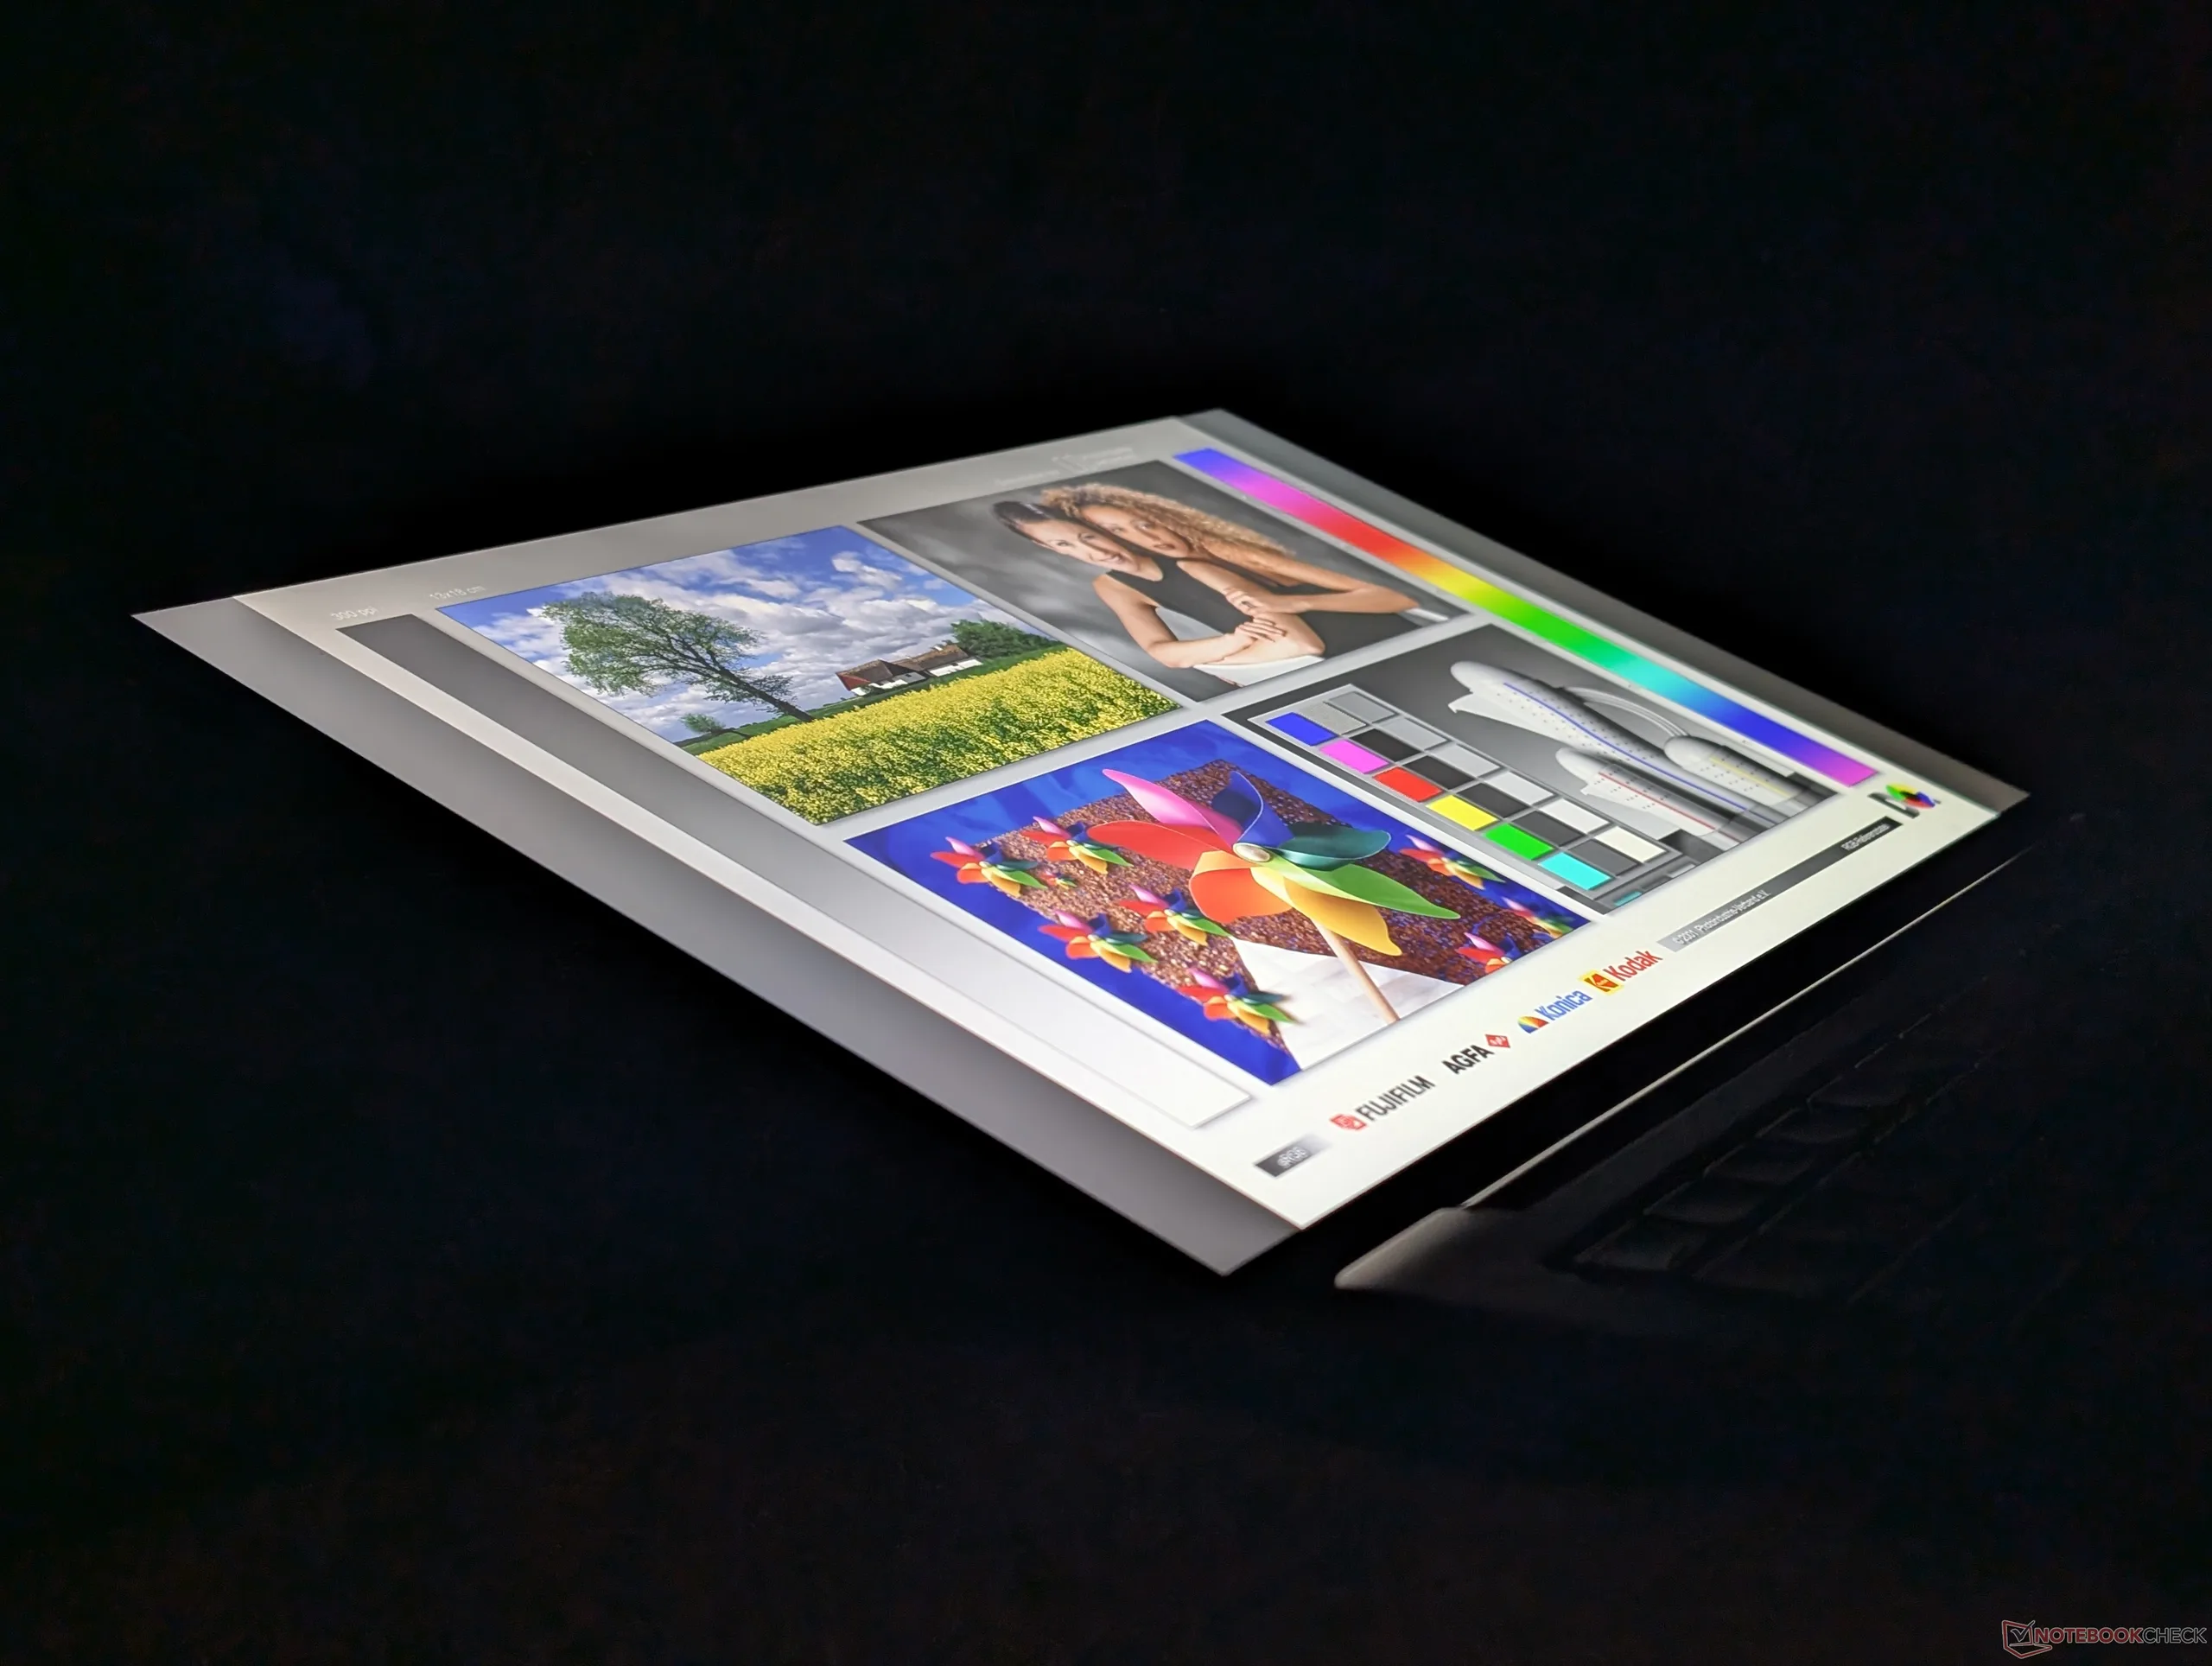
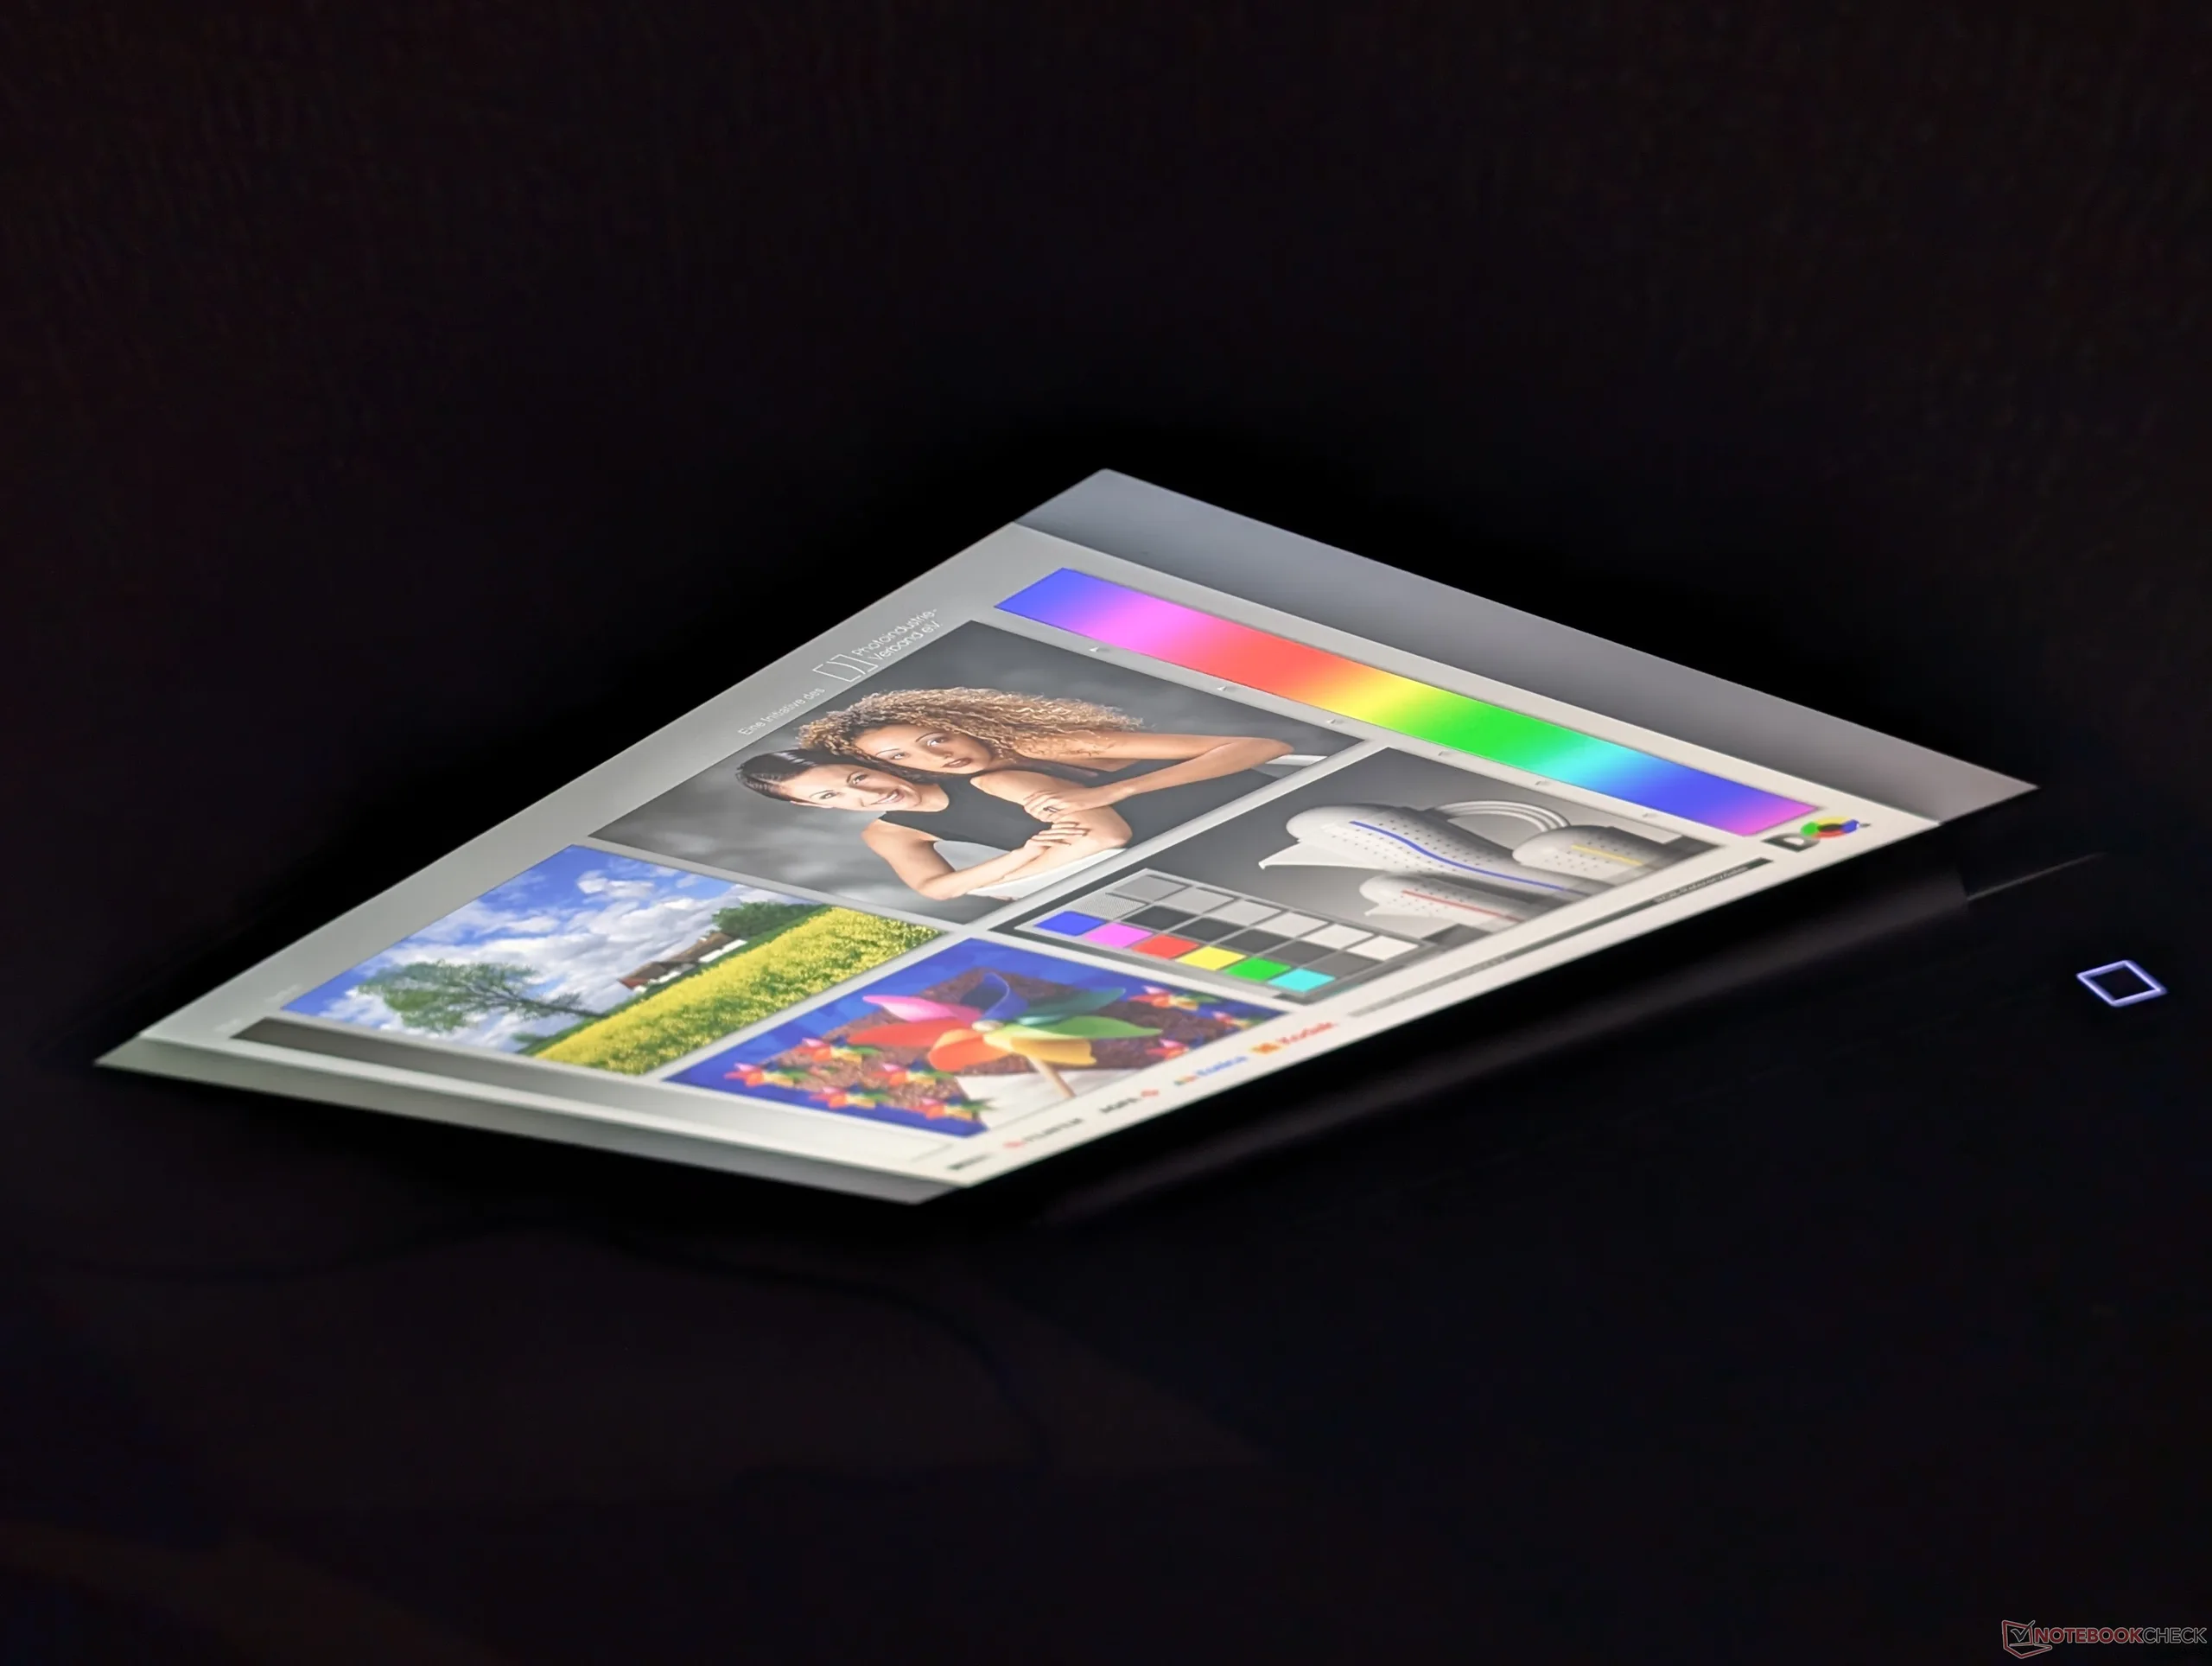
Szerokie kąty widzenia wyświetlacza IPS

Wydajność

Warunki testowania

Przed uruchomieniem poniższych testów porównawczych ustawiliśmy program Dell Optimizer w trybie wydajnościowym.

Wydajność procesora

Cinebench R15 Multi Loop

07014021028035042049056063070077084091098010501120119012601330140014701540161016801750182018901960203021002170224023102380245025202590266027302800287029403010308031503220Tooltip
Dell Pro 7 14 P714265 AMD Ryzen AI 9 HX PRO 470: Ø2690 (2661.34-3274.13) Points
Dell Pro 14 Premium Intel Core Ultra 7 268V: Ø1553 (1539.35-1573.81) Points
Dell Latitude 7440 Intel Core i5-1345U: Ø1310 (929.37-1541.9) Points
Lenovo ThinkPad T14s Gen 7 21YW0022GE AMD Ryzen AI 7 PRO 450: Ø2330 (2063.03-2456.7) Points
Asus ExpertBook Ultra B9406CAA Intel Core Ultra X7 358H: Ø2886 (2802.49-3038.82) Points
HP EliteBook X G1a 14 AI AMD Ryzen AI 9 HX PRO 375: Ø3077 (3043.45-3132.34) Points
CPU Performance rating: Percent
Cinebench R23: Multi Core | Single Core
Cinebench R20: CPU (Multi Core) | CPU (Single Core)
Cinebench R15: CPU Multi 64Bit | CPU Single 64Bit
Blender: v2.79 BMW27 CPU
7-Zip 18.03: 7z b 4 | 7z b 4 -mmt1
Geekbench 6.7: Multi-Core | Single-Core
Geekbench 5.5: Multi-Core | Single-Core
HWBOT x265 Benchmark v2.2: 4k Preset
LibreOffice : 20 Documents To PDF
R Benchmark 2.5: Overall mean
CPU Performance rating
Asus ExpertBook Ultra B9406CAA
Intel Core Ultra X7 358H
84.9 pt
Przeciętny AMD Ryzen AI 9 HX PRO 470
 
84 pt
Dell Pro 7 14 P714265
AMD Ryzen AI 9 HX PRO 470
83.4 pt
HP EliteBook X G1a 14 AI
AMD Ryzen AI 9 HX PRO 375
79.8 pt
HP OmniBook X Flip 14
AMD Ryzen AI 9 465
79.1 pt
Lenovo ThinkPad T14s Gen 7 21YW0022GE
AMD Ryzen AI 7 PRO 450
74.2 pt
Lenovo ThinkPad X1 2-in-1 Gen 11
Intel Core Ultra 7 355
64.3 pt
Dell Pro 14 Premium
Intel Core Ultra 7 268V
63.2 pt
Lenovo ThinkPad T14s 2in1 Gen1
Intel Core Ultra 7 255U
61.5 pt
Lenovo Yoga 7a 2-in-1 14AGP11
AMD Ryzen AI 5 435
58.8 pt
Lenovo ThinkPad E14 Gen 7 21U2002QGE
Intel Core Ultra 5 228V
55.3 pt
Dell Latitude 7440 -2!
Intel Core i5-1345U
53.6 pt
Lenovo IdeaPad 5i 2-in-1 14IPH11
Intel Core Ultra 5 322
50.6 pt
Cinebench R23 / Multi Core
HP EliteBook X G1a 14 AI
AMD Ryzen AI 9 HX PRO 375
20399 (20203.5min - 20398.7max) Points +8%
Asus ExpertBook Ultra B9406CAA
Intel Core Ultra X7 358H
19841 (17837.1min - 19840.9max) Points +5%
Przeciętny AMD Ryzen AI 9 HX PRO 470
  (18834 - 19095, n=2)
18965 Points +1%
Dell Pro 7 14 P714265
AMD Ryzen AI 9 HX PRO 470
18834 (17418.6min - 18834.3max) Points
HP OmniBook X Flip 14
AMD Ryzen AI 9 465
17345 (16926.8min - 17345.2max) Points -8%
Lenovo ThinkPad T14s Gen 7 21YW0022GE
AMD Ryzen AI 7 PRO 450
16054 Points -15%
Lenovo ThinkPad T14s 2in1 Gen1
Intel Core Ultra 7 255U
11581 Points -39%
Lenovo ThinkPad X1 2-in-1 Gen 11
Intel Core Ultra 7 355
11504 (11407.4min - 11503.8max) Points -39%
Lenovo Yoga 7a 2-in-1 14AGP11
AMD Ryzen AI 5 435
11333 Points -40%
Dell Pro 14 Premium
Intel Core Ultra 7 268V
10653 (10400min - 10653.5max) Points -43%
Lenovo ThinkPad E14 Gen 7 21U2002QGE
Intel Core Ultra 5 228V
10077 Points -46%
Dell Latitude 7440
Intel Core i5-1345U
9795 (7630.48min - 9794.71max) Points -48%
Lenovo IdeaPad 5i 2-in-1 14IPH11
Intel Core Ultra 5 322
7862 Points -58%
Cinebench R23 / Single Core
Asus ExpertBook Ultra B9406CAA
Intel Core Ultra X7 358H
2079 Points +1%
Przeciętny AMD Ryzen AI 9 HX PRO 470
  (2054 - 2063, n=2)
2059 Points 0%
Dell Pro 7 14 P714265
AMD Ryzen AI 9 HX PRO 470
2054 Points
Lenovo ThinkPad T14s Gen 7 21YW0022GE
AMD Ryzen AI 7 PRO 450
2010 Points -2%
HP OmniBook X Flip 14
AMD Ryzen AI 9 465
1996 Points -3%
Lenovo ThinkPad X1 2-in-1 Gen 11
Intel Core Ultra 7 355
1973 Points -4%
Dell Pro 14 Premium
Intel Core Ultra 7 268V
1952 Points -5%
HP EliteBook X G1a 14 AI
AMD Ryzen AI 9 HX PRO 375
1884 Points -8%
Lenovo ThinkPad T14s 2in1 Gen1
Intel Core Ultra 7 255U
1829 Points -11%
Lenovo Yoga 7a 2-in-1 14AGP11
AMD Ryzen AI 5 435
1816 Points -12%
Lenovo IdeaPad 5i 2-in-1 14IPH11
Intel Core Ultra 5 322
1782 Points -13%
Lenovo ThinkPad E14 Gen 7 21U2002QGE
Intel Core Ultra 5 228V
1761 Points -14%
Dell Latitude 7440
Intel Core i5-1345U
1757 Points -14%
Cinebench R20 / CPU (Multi Core)
HP EliteBook X G1a 14 AI
AMD Ryzen AI 9 HX PRO 375
8086 Points +10%
Asus ExpertBook Ultra B9406CAA
Intel Core Ultra X7 358H
7736 Points +5%
Przeciętny AMD Ryzen AI 9 HX PRO 470
  (7355 - 7433, n=2)
7394 Points +1%
Dell Pro 7 14 P714265
AMD Ryzen AI 9 HX PRO 470
7355 Points
HP OmniBook X Flip 14
AMD Ryzen AI 9 465
6801 Points -8%
Lenovo ThinkPad T14s Gen 7 21YW0022GE
AMD Ryzen AI 7 PRO 450
6274 Points -15%
Lenovo ThinkPad T14s 2in1 Gen1
Intel Core Ultra 7 255U
4459 Points -39%
Lenovo ThinkPad X1 2-in-1 Gen 11
Intel Core Ultra 7 355
4381 Points -40%
Lenovo Yoga 7a 2-in-1 14AGP11
AMD Ryzen AI 5 435
4380 Points -40%
Dell Pro 14 Premium
Intel Core Ultra 7 268V
4136 Points -44%
Lenovo ThinkPad E14 Gen 7 21U2002QGE
Intel Core Ultra 5 228V
3927 Points -47%
Dell Latitude 7440
Intel Core i5-1345U
3610 Points -51%
Lenovo IdeaPad 5i 2-in-1 14IPH11
Intel Core Ultra 5 322
3061 Points -58%
Cinebench R20 / CPU (Single Core)
Przeciętny AMD Ryzen AI 9 HX PRO 470
  (806 - 810, n=2)
808 Points 0%
Dell Pro 7 14 P714265
AMD Ryzen AI 9 HX PRO 470
806 Points
Lenovo ThinkPad T14s Gen 7 21YW0022GE
AMD Ryzen AI 7 PRO 450
793 Points -2%
Asus ExpertBook Ultra B9406CAA
Intel Core Ultra X7 358H
788 Points -2%
HP OmniBook X Flip 14
AMD Ryzen AI 9 465
780 Points -3%
Lenovo ThinkPad X1 2-in-1 Gen 11
Intel Core Ultra 7 355
742 Points -8%
HP EliteBook X G1a 14 AI
AMD Ryzen AI 9 HX PRO 375
738 Points -8%
Dell Pro 14 Premium
Intel Core Ultra 7 268V
737 Points -9%
Lenovo Yoga 7a 2-in-1 14AGP11
AMD Ryzen AI 5 435
704 Points -13%
Lenovo ThinkPad T14s 2in1 Gen1
Intel Core Ultra 7 255U
701 Points -13%
Lenovo ThinkPad E14 Gen 7 21U2002QGE
Intel Core Ultra 5 228V
678 Points -16%
Lenovo IdeaPad 5i 2-in-1 14IPH11
Intel Core Ultra 5 322
676 Points -16%
Dell Latitude 7440
Intel Core i5-1345U
656 Points -19%
Cinebench R15 / CPU Multi 64Bit
Dell Pro 7 14 P714265
AMD Ryzen AI 9 HX PRO 470
3274 (2661.34min - 3274.13max) Points
HP EliteBook X G1a 14 AI
AMD Ryzen AI 9 HX PRO 375
3132 (3043.45min - 3132.34max) Points -4%
Przeciętny AMD Ryzen AI 9 HX PRO 470
  (2983 - 3274, n=2)
3129 Points -4%
Asus ExpertBook Ultra B9406CAA
Intel Core Ultra X7 358H
3039 (2802.49min - 3038.82max) Points -7%
HP OmniBook X Flip 14
AMD Ryzen AI 9 465
2650 (2572.18min - 2650.24max) Points -19%
Lenovo ThinkPad T14s Gen 7 21YW0022GE
AMD Ryzen AI 7 PRO 450
2457 (2063.03min - 2456.7max) Points -25%
Lenovo ThinkPad T14s 2in1 Gen1
Intel Core Ultra 7 255U
1957 (1275.67min - 1957.23max) Points -40%
Lenovo ThinkPad X1 2-in-1 Gen 11
Intel Core Ultra 7 355
1706 (1656.45min - 1706.27max) Points -48%
Lenovo Yoga 7a 2-in-1 14AGP11
AMD Ryzen AI 5 435
1686 (1523.69min - 1686.48max) Points -49%
Dell Pro 14 Premium
Intel Core Ultra 7 268V
1574 (1539.35min - 1573.81max) Points -52%
Dell Latitude 7440
Intel Core i5-1345U
1542 (929.37min - 1541.9max) Points -53%
Lenovo ThinkPad E14 Gen 7 21U2002QGE
Intel Core Ultra 5 228V
1535 (1389.95min - 1535.1max) Points -53%
Lenovo IdeaPad 5i 2-in-1 14IPH11
Intel Core Ultra 5 322
1181 (1141.75min - 1181.06max) Points -64%
Cinebench R15 / CPU Single 64Bit
Przeciętny AMD Ryzen AI 9 HX PRO 470
  (313 - 316, n=2)
315 Points +1%
Dell Pro 7 14 P714265
AMD Ryzen AI 9 HX PRO 470
313 Points
Asus ExpertBook Ultra B9406CAA
Intel Core Ultra X7 358H
309 Points -1%
HP OmniBook X Flip 14
AMD Ryzen AI 9 465
306 Points -2%
Dell Pro 14 Premium
Intel Core Ultra 7 268V
293 Points -6%
Lenovo ThinkPad X1 2-in-1 Gen 11
Intel Core Ultra 7 355
289 Points -8%
HP EliteBook X G1a 14 AI
AMD Ryzen AI 9 HX PRO 375
280 Points -11%
Lenovo ThinkPad E14 Gen 7 21U2002QGE
Intel Core Ultra 5 228V
273 Points -13%
Lenovo IdeaPad 5i 2-in-1 14IPH11
Intel Core Ultra 5 322
271 Points -13%
Lenovo Yoga 7a 2-in-1 14AGP11
AMD Ryzen AI 5 435
260 Points -17%
Lenovo ThinkPad T14s 2in1 Gen1
Intel Core Ultra 7 255U
251 Points -20%
Dell Latitude 7440
Intel Core i5-1345U
244 Points -22%
Lenovo ThinkPad T14s Gen 7 21YW0022GE
AMD Ryzen AI 7 PRO 450
220 Points -30%
Blender / v2.79 BMW27 CPU
Lenovo IdeaPad 5i 2-in-1 14IPH11
Intel Core Ultra 5 322
437 Seconds * -146%
Lenovo ThinkPad E14 Gen 7 21U2002QGE
Intel Core Ultra 5 228V
416 Seconds * -134%
Dell Latitude 7440
Intel Core i5-1345U
332 Seconds * -87%
Dell Pro 14 Premium
Intel Core Ultra 7 268V
317 Seconds * -78%
Lenovo ThinkPad T14s 2in1 Gen1
Intel Core Ultra 7 255U
315 Seconds * -77%
Lenovo Yoga 7a 2-in-1 14AGP11
AMD Ryzen AI 5 435
310 Seconds * -74%
Lenovo ThinkPad X1 2-in-1 Gen 11
Intel Core Ultra 7 355
299 Seconds * -68%
Lenovo ThinkPad T14s Gen 7 21YW0022GE
AMD Ryzen AI 7 PRO 450
205 Seconds * -15%
HP OmniBook X Flip 14
AMD Ryzen AI 9 465
186 Seconds * -4%
Dell Pro 7 14 P714265
AMD Ryzen AI 9 HX PRO 470
178 Seconds *
Asus ExpertBook Ultra B9406CAA
Intel Core Ultra X7 358H
175 Seconds * +2%
Przeciętny AMD Ryzen AI 9 HX PRO 470
  (168 - 178, n=2)
173 Seconds * +3%
HP EliteBook X G1a 14 AI
AMD Ryzen AI 9 HX PRO 375
163 Seconds * +8%
7-Zip 18.03 / 7z b 4
HP EliteBook X G1a 14 AI
AMD Ryzen AI 9 HX PRO 375
76886 MIPS +7%
Przeciętny AMD Ryzen AI 9 HX PRO 470
  (71554 - 74523, n=2)
73039 MIPS +2%
Dell Pro 7 14 P714265
AMD Ryzen AI 9 HX PRO 470
71554 MIPS
Asus ExpertBook Ultra B9406CAA
Intel Core Ultra X7 358H
68533 MIPS -4%
HP OmniBook X Flip 14
AMD Ryzen AI 9 465
66496 MIPS -7%
Lenovo ThinkPad T14s Gen 7 21YW0022GE
AMD Ryzen AI 7 PRO 450
57988 MIPS -19%
Lenovo ThinkPad T14s 2in1 Gen1
Intel Core Ultra 7 255U
44657 MIPS -38%
Lenovo Yoga 7a 2-in-1 14AGP11
AMD Ryzen AI 5 435
40909 MIPS -43%
Dell Latitude 7440
Intel Core i5-1345U
40563 MIPS -43%
Lenovo ThinkPad X1 2-in-1 Gen 11
Intel Core Ultra 7 355
38421 MIPS -46%
Dell Pro 14 Premium
Intel Core Ultra 7 268V
36654 MIPS -49%
Lenovo ThinkPad E14 Gen 7 21U2002QGE
Intel Core Ultra 5 228V
28714 MIPS -60%
Lenovo IdeaPad 5i 2-in-1 14IPH11
Intel Core Ultra 5 322
24834 MIPS -65%
7-Zip 18.03 / 7z b 4 -mmt1
Przeciętny AMD Ryzen AI 9 HX PRO 470
  (6041 - 6353, n=2)
6197 MIPS +3%
Asus ExpertBook Ultra B9406CAA
Intel Core Ultra X7 358H
6170 MIPS +2%
HP OmniBook X Flip 14
AMD Ryzen AI 9 465
6076 MIPS +1%
Dell Pro 7 14 P714265
AMD Ryzen AI 9 HX PRO 470
6041 MIPS
Lenovo ThinkPad T14s Gen 7 21YW0022GE
AMD Ryzen AI 7 PRO 450
5945 MIPS -2%
Lenovo ThinkPad X1 2-in-1 Gen 11
Intel Core Ultra 7 355
5734 MIPS -5%
Dell Pro 14 Premium
Intel Core Ultra 7 268V
5688 MIPS -6%
HP EliteBook X G1a 14 AI
AMD Ryzen AI 9 HX PRO 375
5595 MIPS -7%
Lenovo ThinkPad E14 Gen 7 21U2002QGE
Intel Core Ultra 5 228V
5326 MIPS -12%
Lenovo IdeaPad 5i 2-in-1 14IPH11
Intel Core Ultra 5 322
5323 MIPS -12%
Lenovo Yoga 7a 2-in-1 14AGP11
AMD Ryzen AI 5 435
5300 MIPS -12%
Dell Latitude 7440
Intel Core i5-1345U
5296 MIPS -12%
Lenovo ThinkPad T14s 2in1 Gen1
Intel Core Ultra 7 255U
5227 MIPS -13%
Geekbench 6.7 / Multi-Core
Asus ExpertBook Ultra B9406CAA
Intel Core Ultra X7 358H
16674 Points +11%
Przeciętny AMD Ryzen AI 9 HX PRO 470
  (14979 - 15079, n=2)
15029 Points 0%
Dell Pro 7 14 P714265
AMD Ryzen AI 9 HX PRO 470
14979 Points
HP EliteBook X G1a 14 AI
AMD Ryzen AI 9 HX PRO 375
14341 Points -4%
HP OmniBook X Flip 14
AMD Ryzen AI 9 465
14069 Points -6%
Lenovo ThinkPad T14s Gen 7 21YW0022GE
AMD Ryzen AI 7 PRO 450
13439 Points -10%
Dell Pro 14 Premium
Intel Core Ultra 7 268V
11087 Points -26%
Lenovo ThinkPad T14s 2in1 Gen1
Intel Core Ultra 7 255U
11075 Points -26%
Lenovo ThinkPad X1 2-in-1 Gen 11
Intel Core Ultra 7 355
11036 Points -26%
Lenovo ThinkPad E14 Gen 7 21U2002QGE
Intel Core Ultra 5 228V
10353 Points -31%
Lenovo Yoga 7a 2-in-1 14AGP11
AMD Ryzen AI 5 435
10116 Points -32%
Lenovo IdeaPad 5i 2-in-1 14IPH11
Intel Core Ultra 5 322
8048 Points -46%
Geekbench 6.7 / Single-Core
Przeciętny AMD Ryzen AI 9 HX PRO 470
  (2918 - 2988, n=2)
2953 Points +1%
Dell Pro 7 14 P714265
AMD Ryzen AI 9 HX PRO 470
2918 Points
Lenovo ThinkPad T14s Gen 7 21YW0022GE
AMD Ryzen AI 7 PRO 450
2899 Points -1%
HP OmniBook X Flip 14
AMD Ryzen AI 9 465
2844 Points -3%
Asus ExpertBook Ultra B9406CAA
Intel Core Ultra X7 358H
2836 Points -3%
Dell Pro 14 Premium
Intel Core Ultra 7 268V
2822 Points -3%
Lenovo ThinkPad X1 2-in-1 Gen 11
Intel Core Ultra 7 355
2722 Points -7%
HP EliteBook X G1a 14 AI
AMD Ryzen AI 9 HX PRO 375
2647 Points -9%
Lenovo ThinkPad E14 Gen 7 21U2002QGE
Intel Core Ultra 5 228V
2605 Points -11%
Lenovo Yoga 7a 2-in-1 14AGP11
AMD Ryzen AI 5 435
2576 Points -12%
Lenovo IdeaPad 5i 2-in-1 14IPH11
Intel Core Ultra 5 322
2556 Points -12%
Lenovo ThinkPad T14s 2in1 Gen1
Intel Core Ultra 7 255U
2523 Points -14%
Geekbench 5.5 / Multi-Core
Asus ExpertBook Ultra B9406CAA
Intel Core Ultra X7 358H
16929 Points +13%
Dell Pro 7 14 P714265
AMD Ryzen AI 9 HX PRO 470
15013 Points
Przeciętny AMD Ryzen AI 9 HX PRO 470
  (14571 - 15013, n=2)
14792 Points -1%
HP EliteBook X G1a 14 AI
AMD Ryzen AI 9 HX PRO 375
13557 Points -10%
HP OmniBook X Flip 14
AMD Ryzen AI 9 465
13125 Points -13%
Lenovo ThinkPad T14s Gen 7 21YW0022GE
AMD Ryzen AI 7 PRO 450
12037 Points -20%
Lenovo ThinkPad T14s 2in1 Gen1
Intel Core Ultra 7 255U
10220 Points -32%
Lenovo ThinkPad X1 2-in-1 Gen 11
Intel Core Ultra 7 355
10152 Points -32%
Dell Pro 14 Premium
Intel Core Ultra 7 268V
9634 Points -36%
Lenovo ThinkPad E14 Gen 7 21U2002QGE
Intel Core Ultra 5 228V
9169 Points -39%
Lenovo Yoga 7a 2-in-1 14AGP11
AMD Ryzen AI 5 435
8532 Points -43%
Dell Latitude 7440
Intel Core i5-1345U
8263 Points -45%
Lenovo IdeaPad 5i 2-in-1 14IPH11
Intel Core Ultra 5 322
6615 Points -56%
Geekbench 5.5 / Single-Core
Przeciętny AMD Ryzen AI 9 HX PRO 470
  (2129 - 2175, n=2)
2152 Points +1%
Lenovo ThinkPad T14s Gen 7 21YW0022GE
AMD Ryzen AI 7 PRO 450
2148 Points +1%
Dell Pro 7 14 P714265
AMD Ryzen AI 9 HX PRO 470
2129 Points
Asus ExpertBook Ultra B9406CAA
Intel Core Ultra X7 358H
2116 Points -1%
HP OmniBook X Flip 14
AMD Ryzen AI 9 465
2075 Points -3%
Dell Pro 14 Premium
Intel Core Ultra 7 268V
2023 Points -5%
Lenovo ThinkPad X1 2-in-1 Gen 11
Intel Core Ultra 7 355
2020 Points -5%
HP EliteBook X G1a 14 AI
AMD Ryzen AI 9 HX PRO 375
1919 Points -10%
Lenovo ThinkPad E14 Gen 7 21U2002QGE
Intel Core Ultra 5 228V
1905 Points -11%
Lenovo IdeaPad 5i 2-in-1 14IPH11
Intel Core Ultra 5 322
1877 Points -12%
Lenovo Yoga 7a 2-in-1 14AGP11
AMD Ryzen AI 5 435
1867 Points -12%
Lenovo ThinkPad T14s 2in1 Gen1
Intel Core Ultra 7 255U
1859 Points -13%
Dell Latitude 7440
Intel Core i5-1345U
1710 Points -20%
HWBOT x265 Benchmark v2.2 / 4k Preset
Asus ExpertBook Ultra B9406CAA
Intel Core Ultra X7 358H
23.1 fps +5%
Przeciętny AMD Ryzen AI 9 HX PRO 470
  (21.9 - 23.2, n=2)
22.5 fps +3%
Dell Pro 7 14 P714265
AMD Ryzen AI 9 HX PRO 470
21.9 fps
HP OmniBook X Flip 14
AMD Ryzen AI 9 465
21.6 fps -1%
HP EliteBook X G1a 14 AI
AMD Ryzen AI 9 HX PRO 375
20.8 fps -5%
Lenovo ThinkPad T14s Gen 7 21YW0022GE
AMD Ryzen AI 7 PRO 450
20.1 fps -8%
Lenovo ThinkPad X1 2-in-1 Gen 11
Intel Core Ultra 7 355
14.8 fps -32%
Lenovo Yoga 7a 2-in-1 14AGP11
AMD Ryzen AI 5 435
14.1 fps -36%
Dell Pro 14 Premium
Intel Core Ultra 7 268V
13.5 fps -38%
Lenovo ThinkPad T14s 2in1 Gen1
Intel Core Ultra 7 255U
13.1 fps -40%
Dell Latitude 7440
Intel Core i5-1345U
10.8 fps -51%
Lenovo ThinkPad E14 Gen 7 21U2002QGE
Intel Core Ultra 5 228V
10.6 fps -52%
Lenovo IdeaPad 5i 2-in-1 14IPH11
Intel Core Ultra 5 322
9.67 fps -56%
LibreOffice / 20 Documents To PDF
Lenovo Yoga 7a 2-in-1 14AGP11
AMD Ryzen AI 5 435
64.9 s * -17%
HP EliteBook X G1a 14 AI
AMD Ryzen AI 9 HX PRO 375
56.4 s * -2%
Dell Pro 7 14 P714265
AMD Ryzen AI 9 HX PRO 470
55.4 s *
Lenovo IdeaPad 5i 2-in-1 14IPH11
Intel Core Ultra 5 322
55.2 s * -0%
Przeciętny AMD Ryzen AI 9 HX PRO 470
  (54.7 - 55.4, n=2)
55.1 s * +1%
Lenovo ThinkPad E14 Gen 7 21U2002QGE
Intel Core Ultra 5 228V
54 s * +3%
Lenovo ThinkPad T14s Gen 7 21YW0022GE
AMD Ryzen AI 7 PRO 450
53.1 s * +4%
HP OmniBook X Flip 14
AMD Ryzen AI 9 465
52.5 s * +5%
Asus ExpertBook Ultra B9406CAA
Intel Core Ultra X7 358H
51.9 s * +6%
Lenovo ThinkPad T14s 2in1 Gen1
Intel Core Ultra 7 255U
47.3 s * +15%
Lenovo ThinkPad X1 2-in-1 Gen 11
Intel Core Ultra 7 355
47.3 s * +15%
Dell Latitude 7440
Intel Core i5-1345U
45.5 s * +18%
Dell Pro 14 Premium
Intel Core Ultra 7 268V
44.9 s * +19%
R Benchmark 2.5 / Overall mean
Dell Latitude 7440
Intel Core i5-1345U
0.4948 sec * -22%
Lenovo ThinkPad E14 Gen 7 21U2002QGE
Intel Core Ultra 5 228V
0.492 sec * -22%
Lenovo IdeaPad 5i 2-in-1 14IPH11
Intel Core Ultra 5 322
0.4697 sec * -16%
Lenovo ThinkPad T14s 2in1 Gen1
Intel Core Ultra 7 255U
0.4672 sec * -15%
HP EliteBook X G1a 14 AI
AMD Ryzen AI 9 HX PRO 375
0.45 sec * -11%
Lenovo Yoga 7a 2-in-1 14AGP11
AMD Ryzen AI 5 435
0.4497 sec * -11%
Lenovo ThinkPad X1 2-in-1 Gen 11
Intel Core Ultra 7 355
0.4438 sec * -10%
Dell Pro 14 Premium
Intel Core Ultra 7 268V
0.4349 sec * -7%
Lenovo ThinkPad T14s Gen 7 21YW0022GE
AMD Ryzen AI 7 PRO 450
0.4332 sec * -7%
Asus ExpertBook Ultra B9406CAA
Intel Core Ultra X7 358H
0.4247 sec * -5%
HP OmniBook X Flip 14
AMD Ryzen AI 9 465
0.4162 sec * -3%
Dell Pro 7 14 P714265
AMD Ryzen AI 9 HX PRO 470
0.4047 sec *
Przeciętny AMD Ryzen AI 9 HX PRO 470
  (0.393 - 0.4047, n=2)
0.3989 sec * +1%
CPU Performance rating: Percent
Cinebench R23: Multi Core | Single Core
Cinebench R20: CPU (Multi Core) | CPU (Single Core)
Cinebench R15: CPU Multi 64Bit | CPU Single 64Bit
Blender: v2.79 BMW27 CPU
7-Zip 18.03: 7z b 4 | 7z b 4 -mmt1
Geekbench 6.7: Multi-Core | Single-Core
Geekbench 5.5: Multi-Core | Single-Core
HWBOT x265 Benchmark v2.2: 4k Preset
LibreOffice : 20 Documents To PDF
R Benchmark 2.5: Overall mean

* ... im mniej tym lepiej

Cinebench R15 CPU Multi 64Bit
3274 Points
Cinebench R15 OpenGL 64Bit
105.5 fps
Cinebench R15 Ref. Match 64Bit
97.9 %
Cinebench R15 CPU Single 64Bit
313 Points
Cinebench R20 CPU (Multi Core)
7355 Points
Cinebench R20 CPU (Single Core)
806 Points
Cinebench R23 Single Core
2054 Points
Cinebench R23 Multi Core
18834 Points
Cinebench 2024 CPU Single Core
114.4 Points
Cinebench 2024 CPU Multi Core
987 Points
Cinebench 2026 CPU Single Thread
471 Points
Cinebench 2026 CPU Multi
4142 Points
Pomoc
Performance rating
HP EliteBook X G1a 14 AI -1!
AMD Ryzen AI 9 HX PRO 375, Radeon 890M
97.2 pt
Przeciętny AMD Ryzen AI 9 HX PRO 470 -1!
 
94.3 pt
Dell Pro 7 14 P714265 -1!
AMD Ryzen AI 9 HX PRO 470, Radeon 890M
92.1 pt
Lenovo ThinkPad T14s Gen 7 21YW0022GE -1!
AMD Ryzen AI 7 PRO 450, Radeon 860M
77.6 pt
Dell Pro 14 Premium -1!
Intel Core Ultra 7 268V, Arc 140V
48.9 pt
Asus ExpertBook Ultra B9406CAA -1!
Intel Core Ultra X7 358H, Arc B390 Panther Lake iGPU
44.5 pt
Dell Latitude 7440 -1!
Intel Core i5-1345U, Iris Xe G7 80EUs
41.8 pt
AIDA64 / FP32 Ray-Trace
HP EliteBook X G1a 14 AI
AMD Ryzen AI 9 HX PRO 375, Radeon 890M (v6.92.6600)
31245 KRay/s +10%
Przeciętny AMD Ryzen AI 9 HX PRO 470
  (28416 - 30478, n=2)
29447 KRay/s +4%
Dell Pro 7 14 P714265
AMD Ryzen AI 9 HX PRO 470, Radeon 890M (v8.20.8100)
28416 KRay/s
Lenovo ThinkPad T14s Gen 7 21YW0022GE
AMD Ryzen AI 7 PRO 450, Radeon 860M (v8.20.8100)
24488 KRay/s -14%
Dell Pro 14 Premium
Intel Core Ultra 7 268V, Arc 140V (v6.92.6600)
12549 KRay/s -56%
Asus ExpertBook Ultra B9406CAA
Intel Core Ultra X7 358H, Arc B390 Panther Lake iGPU (v6.92.6600)
12221 KRay/s -57%
Dell Latitude 7440
Intel Core i5-1345U, Iris Xe G7 80EUs (v6.85.6300)
8830 KRay/s -69%
AIDA64 / FPU Julia
HP EliteBook X G1a 14 AI
AMD Ryzen AI 9 HX PRO 375, Radeon 890M (v6.92.6600)
125394 Points +7%
Przeciętny AMD Ryzen AI 9 HX PRO 470
  (117109 - 124643, n=2)
120876 Points +3%
Dell Pro 7 14 P714265
AMD Ryzen AI 9 HX PRO 470, Radeon 890M (v8.20.8100)
117109 Points
Lenovo ThinkPad T14s Gen 7 21YW0022GE
AMD Ryzen AI 7 PRO 450, Radeon 860M (v8.20.8100)
100434 Points -14%
Dell Pro 14 Premium
Intel Core Ultra 7 268V, Arc 140V (v6.92.6600)
61769 Points -47%
Dell Latitude 7440
Intel Core i5-1345U, Iris Xe G7 80EUs (v6.85.6300)
43149 Points -63%
Asus ExpertBook Ultra B9406CAA
Intel Core Ultra X7 358H, Arc B390 Panther Lake iGPU (v6.92.6600)
29930 Points -74%
AIDA64 / CPU SHA3
HP EliteBook X G1a 14 AI
AMD Ryzen AI 9 HX PRO 375, Radeon 890M (v6.92.6600)
5398 MB/s +12%
Przeciętny AMD Ryzen AI 9 HX PRO 470
  (4824 - 5065, n=2)
4945 MB/s +3%
Dell Pro 7 14 P714265
AMD Ryzen AI 9 HX PRO 470, Radeon 890M (v8.20.8100)
4824 MB/s
Asus ExpertBook Ultra B9406CAA
Intel Core Ultra X7 358H, Arc B390 Panther Lake iGPU (v6.92.6600)
4549 MB/s -6%
Lenovo ThinkPad T14s Gen 7 21YW0022GE
AMD Ryzen AI 7 PRO 450, Radeon 860M (v8.20.8100)
3934 MB/s -18%
Dell Pro 14 Premium
Intel Core Ultra 7 268V, Arc 140V (v6.92.6600)
2737 MB/s -43%
Dell Latitude 7440
Intel Core i5-1345U, Iris Xe G7 80EUs (v6.85.6300)
2265 MB/s -53%
AIDA64 / CPU Queen
HP EliteBook X G1a 14 AI
AMD Ryzen AI 9 HX PRO 375, Radeon 890M (v6.92.6600)
95224 Points
Asus ExpertBook Ultra B9406CAA
Intel Core Ultra X7 358H, Arc B390 Panther Lake iGPU (v6.92.6600)
63425 Points
Dell Latitude 7440
Intel Core i5-1345U, Iris Xe G7 80EUs (v6.85.6300)
62953 Points
Dell Pro 14 Premium
Intel Core Ultra 7 268V, Arc 140V (v6.92.6600)
49702 Points
AIDA64 / FPU SinJulia
HP EliteBook X G1a 14 AI
AMD Ryzen AI 9 HX PRO 375, Radeon 890M (v6.92.6600)
18321 Points +4%
Przeciętny AMD Ryzen AI 9 HX PRO 470
  (17621 - 18076, n=2)
17849 Points +1%
Dell Pro 7 14 P714265
AMD Ryzen AI 9 HX PRO 470, Radeon 890M (v8.20.8100)
17621 Points
Lenovo ThinkPad T14s Gen 7 21YW0022GE
AMD Ryzen AI 7 PRO 450, Radeon 860M (v8.20.8100)
13684 Points -22%
Dell Latitude 7440
Intel Core i5-1345U, Iris Xe G7 80EUs (v6.85.6300)
5206 Points -70%
Asus ExpertBook Ultra B9406CAA
Intel Core Ultra X7 358H, Arc B390 Panther Lake iGPU (v6.92.6600)
4735 Points -73%
Dell Pro 14 Premium
Intel Core Ultra 7 268V, Arc 140V (v6.92.6600)
4419 Points -75%
AIDA64 / FPU Mandel
HP EliteBook X G1a 14 AI
AMD Ryzen AI 9 HX PRO 375, Radeon 890M (v6.92.6600)
66922 Points +8%
Przeciętny AMD Ryzen AI 9 HX PRO 470
  (62125 - 65789, n=2)
63957 Points +3%
Dell Pro 7 14 P714265
AMD Ryzen AI 9 HX PRO 470, Radeon 890M (v8.20.8100)
62125 Points
Lenovo ThinkPad T14s Gen 7 21YW0022GE
AMD Ryzen AI 7 PRO 450, Radeon 860M (v8.20.8100)
51669 Points -17%
Dell Pro 14 Premium
Intel Core Ultra 7 268V, Arc 140V (v6.92.6600)
32800 Points -47%
Dell Latitude 7440
Intel Core i5-1345U, Iris Xe G7 80EUs (v6.85.6300)
21556 Points -65%
Asus ExpertBook Ultra B9406CAA
Intel Core Ultra X7 358H, Arc B390 Panther Lake iGPU (v6.92.6600)
14716 Points -76%
AIDA64 / CPU AES
Przeciętny AMD Ryzen AI 9 HX PRO 470
  (98035 - 103177, n=2)
100606 MB/s +3%
Dell Pro 7 14 P714265
AMD Ryzen AI 9 HX PRO 470, Radeon 890M (v8.20.8100)
98035 MB/s
Lenovo ThinkPad T14s Gen 7 21YW0022GE
AMD Ryzen AI 7 PRO 450, Radeon 860M (v8.20.8100)
81704 MB/s -17%
HP EliteBook X G1a 14 AI
AMD Ryzen AI 9 HX PRO 375, Radeon 890M (v6.92.6600)
78226 MB/s -20%
Dell Latitude 7440
Intel Core i5-1345U, Iris Xe G7 80EUs (v6.85.6300)
41994 MB/s -57%
Dell Pro 14 Premium
Intel Core Ultra 7 268V, Arc 140V (v6.92.6600)
39140 MB/s -60%
Asus ExpertBook Ultra B9406CAA
Intel Core Ultra X7 358H, Arc B390 Panther Lake iGPU (v6.92.6600)
5127 MB/s -95%
AIDA64 / CPU ZLib
HP EliteBook X G1a 14 AI
AMD Ryzen AI 9 HX PRO 375, Radeon 890M (v6.92.6600)
1366 MB/s +16%
Przeciętny AMD Ryzen AI 9 HX PRO 470
  (1174 - 1262, n=2)
1218 MB/s +4%
Dell Pro 7 14 P714265
AMD Ryzen AI 9 HX PRO 470, Radeon 890M (v8.20.8100)
1174 MB/s
Asus ExpertBook Ultra B9406CAA
Intel Core Ultra X7 358H, Arc B390 Panther Lake iGPU (v6.92.6600)
1168 MB/s -1%
Lenovo ThinkPad T14s Gen 7 21YW0022GE
AMD Ryzen AI 7 PRO 450, Radeon 860M (v8.20.8100)
1014 MB/s -14%
Dell Latitude 7440
Intel Core i5-1345U, Iris Xe G7 80EUs (v6.85.6300)
640 MB/s -45%
Dell Pro 14 Premium
Intel Core Ultra 7 268V, Arc 140V (v6.92.6600)
630 MB/s -46%
AIDA64 / FP64 Ray-Trace
HP EliteBook X G1a 14 AI
AMD Ryzen AI 9 HX PRO 375, Radeon 890M (v6.92.6600)
17834 KRay/s +21%
Przeciętny AMD Ryzen AI 9 HX PRO 470
  (14799 - 15857, n=2)
15328 KRay/s +4%
Dell Pro 7 14 P714265
AMD Ryzen AI 9 HX PRO 470, Radeon 890M (v8.20.8100)
14799 KRay/s
Lenovo ThinkPad T14s Gen 7 21YW0022GE
AMD Ryzen AI 7 PRO 450, Radeon 860M (v8.20.8100)
13274 KRay/s -10%
Dell Pro 14 Premium
Intel Core Ultra 7 268V, Arc 140V (v6.92.6600)
6824 KRay/s -54%
Asus ExpertBook Ultra B9406CAA
Intel Core Ultra X7 358H, Arc B390 Panther Lake iGPU (v6.92.6600)
6506 KRay/s -56%
Dell Latitude 7440
Intel Core i5-1345U, Iris Xe G7 80EUs (v6.85.6300)
4640 KRay/s -69%
AIDA64 / CPU PhotoWorxx
Dell Pro 14 Premium
Intel Core Ultra 7 268V, Arc 140V (v6.92.6600)
54608 MPixel/s +9%
Przeciętny AMD Ryzen AI 9 HX PRO 470
  (50296 - 52444, n=2)
51370 MPixel/s +2%
HP EliteBook X G1a 14 AI
AMD Ryzen AI 9 HX PRO 375, Radeon 890M (v6.92.6600)
51197 MPixel/s +2%
Dell Pro 7 14 P714265
AMD Ryzen AI 9 HX PRO 470, Radeon 890M (v8.20.8100)
50296 MPixel/s
Lenovo ThinkPad T14s Gen 7 21YW0022GE
AMD Ryzen AI 7 PRO 450, Radeon 860M (v8.20.8100)
46202 MPixel/s -8%
Dell Latitude 7440
Intel Core i5-1345U, Iris Xe G7 80EUs (v6.85.6300)
39231 MPixel/s -22%
Asus ExpertBook Ultra B9406CAA
Intel Core Ultra X7 358H, Arc B390 Panther Lake iGPU (v6.92.6600)
30538 MPixel/s -39%
AIDA64 / CPU CheckMate
Dell Pro 7 14 P714265
AMD Ryzen AI 9 HX PRO 470, Radeon 890M (v8.20.8100)
7017 MP/s
Przeciętny AMD Ryzen AI 9 HX PRO 470
  (6848 - 7017, n=2)
6933 MP/s -1%
Lenovo ThinkPad T14s Gen 7 21YW0022GE
AMD Ryzen AI 7 PRO 450, Radeon 860M (v8.20.8100)
5484 MP/s -22%

Wydajność systemu

PCMark 10 Standard
PCMark 10 Standard
Performance rating
Asus ExpertBook Ultra B9406CAA
Arc B390 Panther Lake iGPU, Ultra X7 358H, Samsung PM9E1 MZVLC2T0HBLD
90.8 pt
Przeciętny AMD Ryzen AI 9 HX PRO 470, AMD Radeon 890M
 
80.8 pt
Dell Pro 7 14 P714265
Radeon 890M, Ryzen AI 9 HX PRO 470
79.8 pt
HP EliteBook X G1a 14 AI -3!
Radeon 890M, Ryzen AI 9 HX PRO 375, Kioxia XG8 KXG80ZNV1T02
78.3 pt
Lenovo ThinkPad T14s Gen 7 21YW0022GE
Radeon 860M, Ryzen AI 7 PRO 450, Micron 2650 MTFDKBA512TGW
78 pt
Dell Pro 14 Premium
Arc 140V, Core Ultra 7 268V, Kioxia BG6 KBG6AZNV1T02
76.4 pt
Dell Latitude 7440 -7!
Iris Xe G7 80EUs, i5-1345U, Samsung MZ9L4512HBLU-00BMV
58.1 pt
PCMark 10 / Score
Asus ExpertBook Ultra B9406CAA
Arc B390 Panther Lake iGPU, Ultra X7 358H, Samsung PM9E1 MZVLC2T0HBLD
9298 Points +10%
Przeciętny AMD Ryzen AI 9 HX PRO 470, AMD Radeon 890M
  (8465 - 8665, n=2)
8565 Points +1%
Dell Pro 7 14 P714265
Radeon 890M, Ryzen AI 9 HX PRO 470
8465 Points
Lenovo ThinkPad T14s Gen 7 21YW0022GE
Radeon 860M, Ryzen AI 7 PRO 450, Micron 2650 MTFDKBA512TGW
8180 Points -3%
HP EliteBook X G1a 14 AI
Radeon 890M, Ryzen AI 9 HX PRO 375, Kioxia XG8 KXG80ZNV1T02
7578 Points -10%
Dell Pro 14 Premium
Arc 140V, Core Ultra 7 268V, Kioxia BG6 KBG6AZNV1T02
7166 Points -15%
Dell Latitude 7440
Iris Xe G7 80EUs, i5-1345U, Samsung MZ9L4512HBLU-00BMV
5554 Points -34%
PCMark 10 / Essentials
Lenovo ThinkPad T14s Gen 7 21YW0022GE
Radeon 860M, Ryzen AI 7 PRO 450, Micron 2650 MTFDKBA512TGW
11208 Points +7%
HP EliteBook X G1a 14 AI
Radeon 890M, Ryzen AI 9 HX PRO 375, Kioxia XG8 KXG80ZNV1T02
10962 Points +5%
Asus ExpertBook Ultra B9406CAA
Arc B390 Panther Lake iGPU, Ultra X7 358H, Samsung PM9E1 MZVLC2T0HBLD
10811 Points +3%
Dell Latitude 7440
Iris Xe G7 80EUs, i5-1345U, Samsung MZ9L4512HBLU-00BMV
10758 Points +3%
Przeciętny AMD Ryzen AI 9 HX PRO 470, AMD Radeon 890M
  (10475 - 11009, n=2)
10742 Points +3%
Dell Pro 7 14 P714265
Radeon 890M, Ryzen AI 9 HX PRO 470
10475 Points
Dell Pro 14 Premium
Arc 140V, Core Ultra 7 268V, Kioxia BG6 KBG6AZNV1T02
10465 Points 0%
PCMark 10 / Productivity
Przeciętny AMD Ryzen AI 9 HX PRO 470, AMD Radeon 890M
  (15768 - 16430, n=2)
16099 Points +2%
Dell Pro 7 14 P714265
Radeon 890M, Ryzen AI 9 HX PRO 470
15768 Points
Asus ExpertBook Ultra B9406CAA
Arc B390 Panther Lake iGPU, Ultra X7 358H, Samsung PM9E1 MZVLC2T0HBLD
14899 Points -6%
Lenovo ThinkPad T14s Gen 7 21YW0022GE
Radeon 860M, Ryzen AI 7 PRO 450, Micron 2650 MTFDKBA512TGW
14067 Points -11%
HP EliteBook X G1a 14 AI
Radeon 890M, Ryzen AI 9 HX PRO 375, Kioxia XG8 KXG80ZNV1T02
9701 Points -38%
Dell Pro 14 Premium
Arc 140V, Core Ultra 7 268V, Kioxia BG6 KBG6AZNV1T02
9206 Points -42%
Dell Latitude 7440
Iris Xe G7 80EUs, i5-1345U, Samsung MZ9L4512HBLU-00BMV
7189 Points -54%
PCMark 10 / Digital Content Creation
Asus ExpertBook Ultra B9406CAA
Arc B390 Panther Lake iGPU, Ultra X7 358H, Samsung PM9E1 MZVLC2T0HBLD
13541 Points +36%
HP EliteBook X G1a 14 AI
Radeon 890M, Ryzen AI 9 HX PRO 375, Kioxia XG8 KXG80ZNV1T02
11108 Points +11%
Dell Pro 14 Premium
Arc 140V, Core Ultra 7 268V, Kioxia BG6 KBG6AZNV1T02
10366 Points +4%
Dell Pro 7 14 P714265
Radeon 890M, Ryzen AI 9 HX PRO 470
9967 Points
Przeciętny AMD Ryzen AI 9 HX PRO 470, AMD Radeon 890M
  (9762 - 9967, n=2)
9865 Points -1%
Lenovo ThinkPad T14s Gen 7 21YW0022GE
Radeon 860M, Ryzen AI 7 PRO 450, Micron 2650 MTFDKBA512TGW
9424 Points -5%
Dell Latitude 7440
Iris Xe G7 80EUs, i5-1345U, Samsung MZ9L4512HBLU-00BMV
6012 Points -40%
CrossMark / Overall
Asus ExpertBook Ultra B9406CAA
Arc B390 Panther Lake iGPU, Ultra X7 358H, Samsung PM9E1 MZVLC2T0HBLD
1884 Points +6%
Przeciętny AMD Ryzen AI 9 HX PRO 470, AMD Radeon 890M
  (1783 - 1903, n=2)
1843 Points +3%
Lenovo ThinkPad T14s Gen 7 21YW0022GE
Radeon 860M, Ryzen AI 7 PRO 450, Micron 2650 MTFDKBA512TGW
1803 Points +1%
Dell Pro 7 14 P714265
Radeon 890M, Ryzen AI 9 HX PRO 470
1783 Points
Dell Pro 14 Premium
Arc 140V, Core Ultra 7 268V, Kioxia BG6 KBG6AZNV1T02
1746 Points -2%
HP EliteBook X G1a 14 AI
Radeon 890M, Ryzen AI 9 HX PRO 375, Kioxia XG8 KXG80ZNV1T02
1685 Points -5%
CrossMark / Productivity
Lenovo ThinkPad T14s Gen 7 21YW0022GE
Radeon 860M, Ryzen AI 7 PRO 450, Micron 2650 MTFDKBA512TGW
1760 Points +7%
Przeciętny AMD Ryzen AI 9 HX PRO 470, AMD Radeon 890M
  (1651 - 1729, n=2)
1690 Points +2%
Dell Pro 14 Premium
Arc 140V, Core Ultra 7 268V, Kioxia BG6 KBG6AZNV1T02
1684 Points +2%
Asus ExpertBook Ultra B9406CAA
Arc B390 Panther Lake iGPU, Ultra X7 358H, Samsung PM9E1 MZVLC2T0HBLD
1678 Points +2%
Dell Pro 7 14 P714265
Radeon 890M, Ryzen AI 9 HX PRO 470
1651 Points
HP EliteBook X G1a 14 AI
Radeon 890M, Ryzen AI 9 HX PRO 375, Kioxia XG8 KXG80ZNV1T02
1554 Points -6%
CrossMark / Creativity
Asus ExpertBook Ultra B9406CAA
Arc B390 Panther Lake iGPU, Ultra X7 358H, Samsung PM9E1 MZVLC2T0HBLD
2241 Points +10%
Przeciętny AMD Ryzen AI 9 HX PRO 470, AMD Radeon 890M
  (2034 - 2254, n=2)
2144 Points +5%
Dell Pro 7 14 P714265
Radeon 890M, Ryzen AI 9 HX PRO 470
2034 Points
Dell Pro 14 Premium
Arc 140V, Core Ultra 7 268V, Kioxia BG6 KBG6AZNV1T02
1992 Points -2%
HP EliteBook X G1a 14 AI
Radeon 890M, Ryzen AI 9 HX PRO 375, Kioxia XG8 KXG80ZNV1T02
1957 Points -4%
Lenovo ThinkPad T14s Gen 7 21YW0022GE
Radeon 860M, Ryzen AI 7 PRO 450, Micron 2650 MTFDKBA512TGW
1841 Points -9%
CrossMark / Responsiveness
Lenovo ThinkPad T14s Gen 7 21YW0022GE
Radeon 860M, Ryzen AI 7 PRO 450, Micron 2650 MTFDKBA512TGW
1820 Points +21%
Asus ExpertBook Ultra B9406CAA
Arc B390 Panther Lake iGPU, Ultra X7 358H, Samsung PM9E1 MZVLC2T0HBLD
1585 Points +5%
Przeciętny AMD Ryzen AI 9 HX PRO 470, AMD Radeon 890M
  (1510 - 1526, n=2)
1518 Points +1%
Dell Pro 7 14 P714265
Radeon 890M, Ryzen AI 9 HX PRO 470
1510 Points
HP EliteBook X G1a 14 AI
Radeon 890M, Ryzen AI 9 HX PRO 375, Kioxia XG8 KXG80ZNV1T02
1371 Points -9%
Dell Pro 14 Premium
Arc 140V, Core Ultra 7 268V, Kioxia BG6 KBG6AZNV1T02
1309 Points -13%
WebXPRT 3 / Overall
Przeciętny AMD Ryzen AI 9 HX PRO 470, AMD Radeon 890M
  (342 - 349, n=2)
346 Points +1%
Dell Pro 7 14 P714265
Radeon 890M, Ryzen AI 9 HX PRO 470
342 Points
Lenovo ThinkPad T14s Gen 7 21YW0022GE
Radeon 860M, Ryzen AI 7 PRO 450, Micron 2650 MTFDKBA512TGW
331 Points -3%
HP EliteBook X G1a 14 AI
Radeon 890M, Ryzen AI 9 HX PRO 375, Kioxia XG8 KXG80ZNV1T02
328 Points -4%
Dell Pro 14 Premium
Arc 140V, Core Ultra 7 268V, Kioxia BG6 KBG6AZNV1T02
317 Points -7%
Asus ExpertBook Ultra B9406CAA
Arc B390 Panther Lake iGPU, Ultra X7 358H, Samsung PM9E1 MZVLC2T0HBLD
304 Points -11%
Dell Latitude 7440
Iris Xe G7 80EUs, i5-1345U, Samsung MZ9L4512HBLU-00BMV
274 Points -20%
WebXPRT 4 / Overall
Dell Pro 14 Premium
Arc 140V, Core Ultra 7 268V, Kioxia BG6 KBG6AZNV1T02
292 Points +5%
Przeciętny AMD Ryzen AI 9 HX PRO 470, AMD Radeon 890M
  (278 - 284, n=2)
281 Points +1%
Asus ExpertBook Ultra B9406CAA
Arc B390 Panther Lake iGPU, Ultra X7 358H, Samsung PM9E1 MZVLC2T0HBLD
279 Points 0%
Dell Pro 7 14 P714265
Radeon 890M, Ryzen AI 9 HX PRO 470
278 Points
Lenovo ThinkPad T14s Gen 7 21YW0022GE
Radeon 860M, Ryzen AI 7 PRO 450, Micron 2650 MTFDKBA512TGW
270 Points -3%
HP EliteBook X G1a 14 AI
Radeon 890M, Ryzen AI 9 HX PRO 375, Kioxia XG8 KXG80ZNV1T02
262 Points -6%
Dell Latitude 7440
Iris Xe G7 80EUs, i5-1345U, Samsung MZ9L4512HBLU-00BMV
242 Points -13%
Mozilla Kraken 1.1 / Total
Dell Latitude 7440
Iris Xe G7 80EUs, i5-1345U, Samsung MZ9L4512HBLU-00BMV
538 ms * -26%
HP EliteBook X G1a 14 AI
Radeon 890M, Ryzen AI 9 HX PRO 375, Kioxia XG8 KXG80ZNV1T02
460 ms * -8%
Dell Pro 14 Premium
Arc 140V, Core Ultra 7 268V, Kioxia BG6 KBG6AZNV1T02
460 ms * -8%
Asus ExpertBook Ultra B9406CAA
Arc B390 Panther Lake iGPU, Ultra X7 358H, Samsung PM9E1 MZVLC2T0HBLD
449 ms * -5%
Lenovo ThinkPad T14s Gen 7 21YW0022GE
Radeon 860M, Ryzen AI 7 PRO 450, Micron 2650 MTFDKBA512TGW
446 ms * -5%
Dell Pro 7 14 P714265
Radeon 890M, Ryzen AI 9 HX PRO 470
426 ms *
Przeciętny AMD Ryzen AI 9 HX PRO 470, AMD Radeon 890M
  (426 - 426, n=2)
426 ms * -0%
Geekbench AI / Single Precision GPU 1.7
Asus ExpertBook Ultra B9406CAA
Arc B390 Panther Lake iGPU, Ultra X7 358H, Samsung PM9E1 MZVLC2T0HBLD
12255 Points +70%
Dell Pro 14 Premium
Arc 140V, Core Ultra 7 268V, Kioxia BG6 KBG6AZNV1T02
8376 Points +16%
Dell Pro 7 14 P714265
Radeon 890M, Ryzen AI 9 HX PRO 470
7225 Points
Przeciętny AMD Ryzen AI 9 HX PRO 470, AMD Radeon 890M
  (6931 - 7225, n=2)
7078 Points -2%
Lenovo ThinkPad T14s Gen 7 21YW0022GE
Radeon 860M, Ryzen AI 7 PRO 450, Micron 2650 MTFDKBA512TGW
6638 Points -8%
Geekbench AI / Half Precision GPU 1.7
Asus ExpertBook Ultra B9406CAA
Arc B390 Panther Lake iGPU, Ultra X7 358H, Samsung PM9E1 MZVLC2T0HBLD
21796 Points +84%
Dell Pro 14 Premium
Arc 140V, Core Ultra 7 268V, Kioxia BG6 KBG6AZNV1T02
15626 Points +32%
Dell Pro 7 14 P714265
Radeon 890M, Ryzen AI 9 HX PRO 470
11832 Points
Przeciętny AMD Ryzen AI 9 HX PRO 470, AMD Radeon 890M
  (11589 - 11832, n=2)
11711 Points -1%
Lenovo ThinkPad T14s Gen 7 21YW0022GE
Radeon 860M, Ryzen AI 7 PRO 450, Micron 2650 MTFDKBA512TGW
10131 Points -14%
Geekbench AI / Quantized GPU 1.7
Asus ExpertBook Ultra B9406CAA
Arc B390 Panther Lake iGPU, Ultra X7 358H, Samsung PM9E1 MZVLC2T0HBLD
8011 Points +42%
Dell Pro 7 14 P714265
Radeon 890M, Ryzen AI 9 HX PRO 470
5656 Points
Dell Pro 14 Premium
Arc 140V, Core Ultra 7 268V, Kioxia BG6 KBG6AZNV1T02
5570 Points -2%
Przeciętny AMD Ryzen AI 9 HX PRO 470, AMD Radeon 890M
  (5297 - 5656, n=2)
5477 Points -3%
Lenovo ThinkPad T14s Gen 7 21YW0022GE
Radeon 860M, Ryzen AI 7 PRO 450, Micron 2650 MTFDKBA512TGW
5124 Points -9%

* ... im mniej tym lepiej

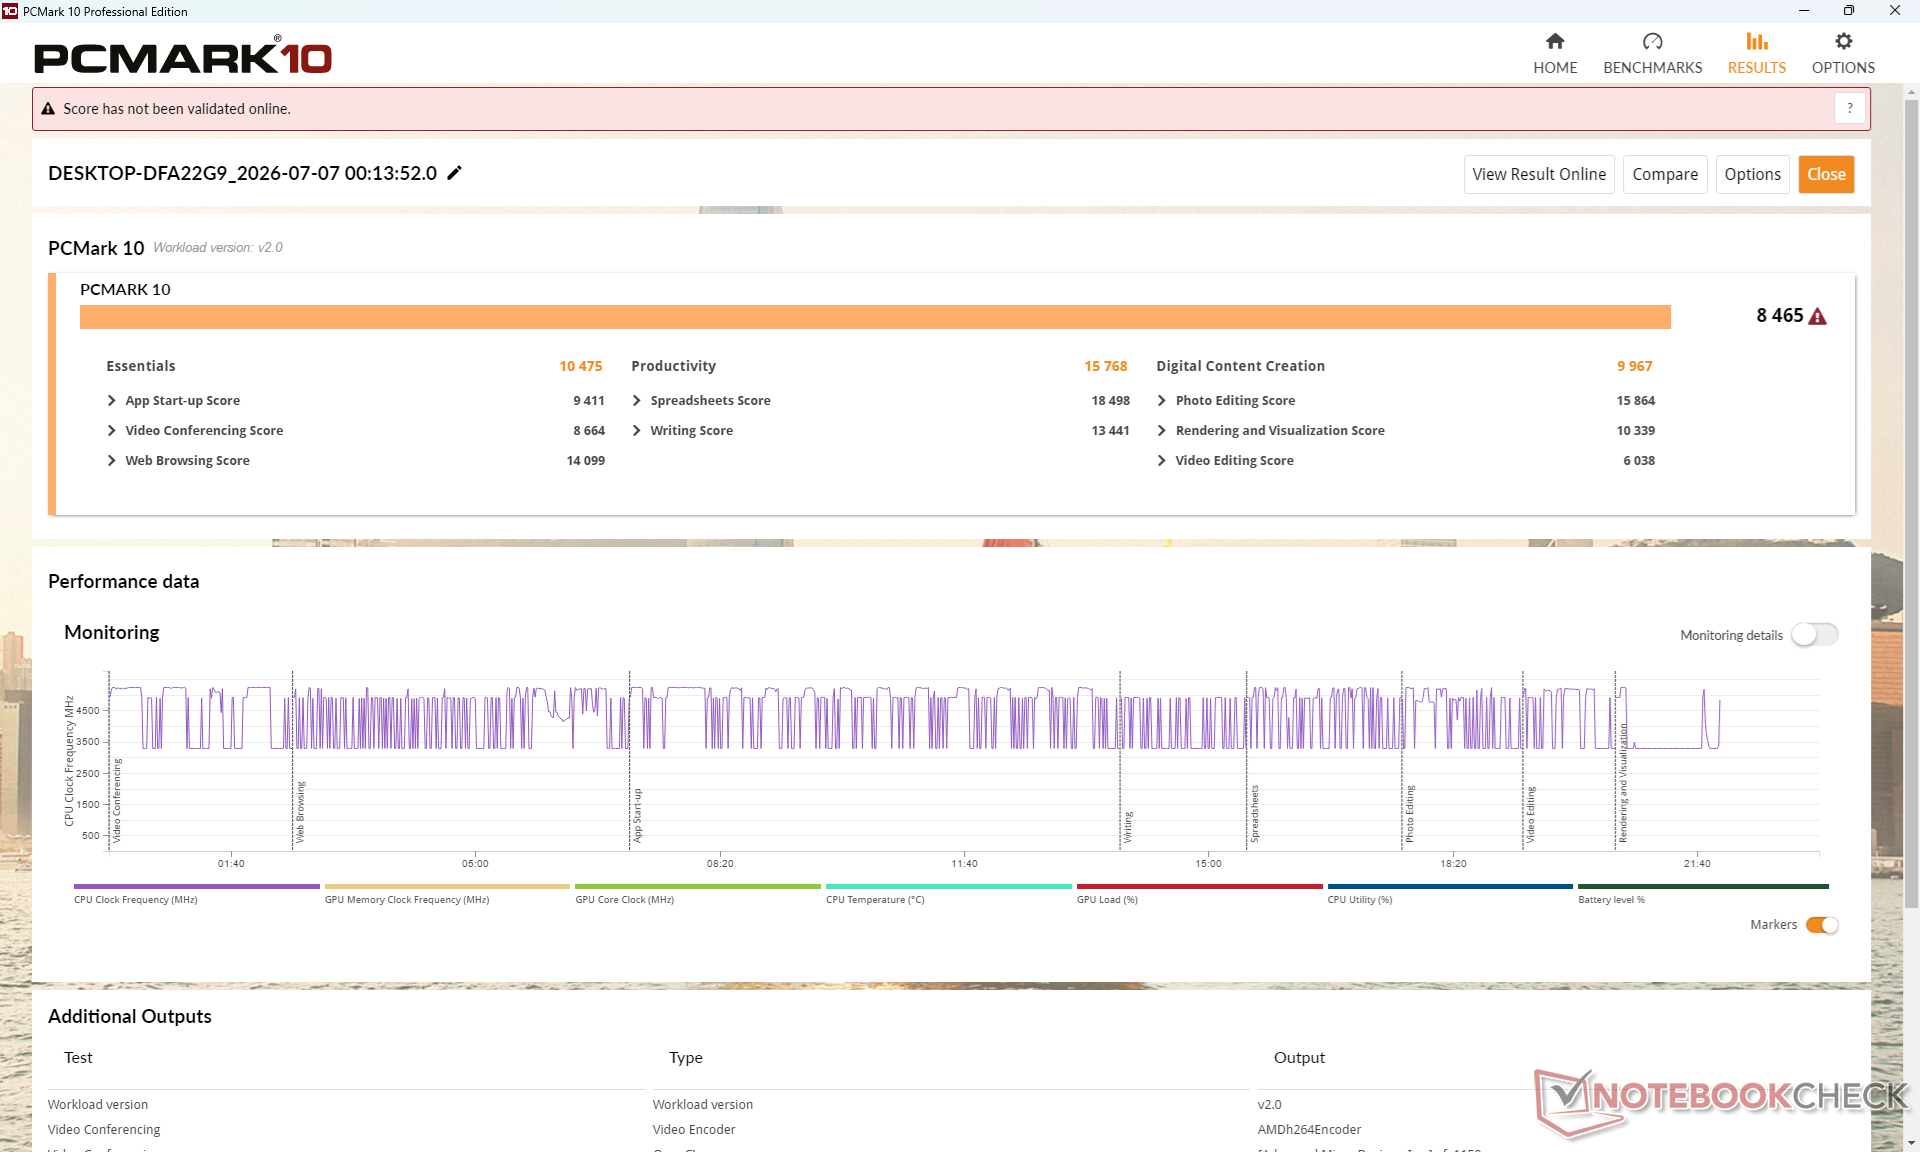
PCMark 10 Score
8465 pkt.
Pomoc
AIDA64 / Memory Copy
Dell Pro 14 Premium
Intel Core Ultra 7 268V, Arc 140V
108195 MB/s +30%
HP EliteBook X G1a 14 AI
AMD Ryzen AI 9 HX PRO 375, Radeon 890M
90972 MB/s +10%
Lenovo ThinkPad T14s Gen 7 21YW0022GE
AMD Ryzen AI 7 PRO 450, Radeon 860M
87261 MB/s +5%
Dell Pro 7 14 P714265
AMD Ryzen AI 9 HX PRO 470, Radeon 890M
82931 MB/s
Przeciętny AMD Ryzen AI 9 HX PRO 470
  (77066 - 82931, n=2)
79999 MB/s -4%
Dell Latitude 7440
Intel Core i5-1345U, Iris Xe G7 80EUs
57716 MB/s -30%
AIDA64 / Memory Read
Asus ExpertBook Ultra B9406CAA
Intel Core Ultra X7 358H, Arc B390 Panther Lake iGPU
117245 MB/s +35%
HP EliteBook X G1a 14 AI
AMD Ryzen AI 9 HX PRO 375, Radeon 890M
99980 MB/s +15%
Dell Pro 14 Premium
Intel Core Ultra 7 268V, Arc 140V
87731 MB/s +1%
Dell Pro 7 14 P714265
AMD Ryzen AI 9 HX PRO 470, Radeon 890M
86838 MB/s
Przeciętny AMD Ryzen AI 9 HX PRO 470
  (81001 - 86838, n=2)
83920 MB/s -3%
Lenovo ThinkPad T14s Gen 7 21YW0022GE
AMD Ryzen AI 7 PRO 450, Radeon 860M
66186 MB/s -24%
Dell Latitude 7440
Intel Core i5-1345U, Iris Xe G7 80EUs
50185 MB/s -42%
AIDA64 / Memory Write
Asus ExpertBook Ultra B9406CAA
Intel Core Ultra X7 358H, Arc B390 Panther Lake iGPU
119858 MB/s +10%
Dell Pro 14 Premium
Intel Core Ultra 7 268V, Arc 140V
117867 MB/s +8%
Lenovo ThinkPad T14s Gen 7 21YW0022GE
AMD Ryzen AI 7 PRO 450, Radeon 860M
109442 MB/s 0%
Dell Pro 7 14 P714265
AMD Ryzen AI 9 HX PRO 470, Radeon 890M
109384 MB/s
HP EliteBook X G1a 14 AI
AMD Ryzen AI 9 HX PRO 375, Radeon 890M
101681 MB/s -7%
Przeciętny AMD Ryzen AI 9 HX PRO 470
  (85194 - 109384, n=2)
97289 MB/s -11%
Dell Latitude 7440
Intel Core i5-1345U, Iris Xe G7 80EUs
72373 MB/s -34%
AIDA64 / Memory Latency
HP EliteBook X G1a 14 AI
AMD Ryzen AI 9 HX PRO 375, Radeon 890M
128.7 ns * -9%
Lenovo ThinkPad T14s Gen 7 21YW0022GE
AMD Ryzen AI 7 PRO 450, Radeon 860M
123.8 ns * -4%
Dell Pro 7 14 P714265
AMD Ryzen AI 9 HX PRO 470, Radeon 890M
118.5 ns *
Przeciętny AMD Ryzen AI 9 HX PRO 470
  (100.1 - 118.5, n=2)
109.3 ns * +8%
Dell Latitude 7440
Intel Core i5-1345U, Iris Xe G7 80EUs
102.1 ns * +14%
Dell Pro 14 Premium
Intel Core Ultra 7 268V, Arc 140V
101.5 ns * +14%

* ... im mniej tym lepiej

Opóźnienie DPC
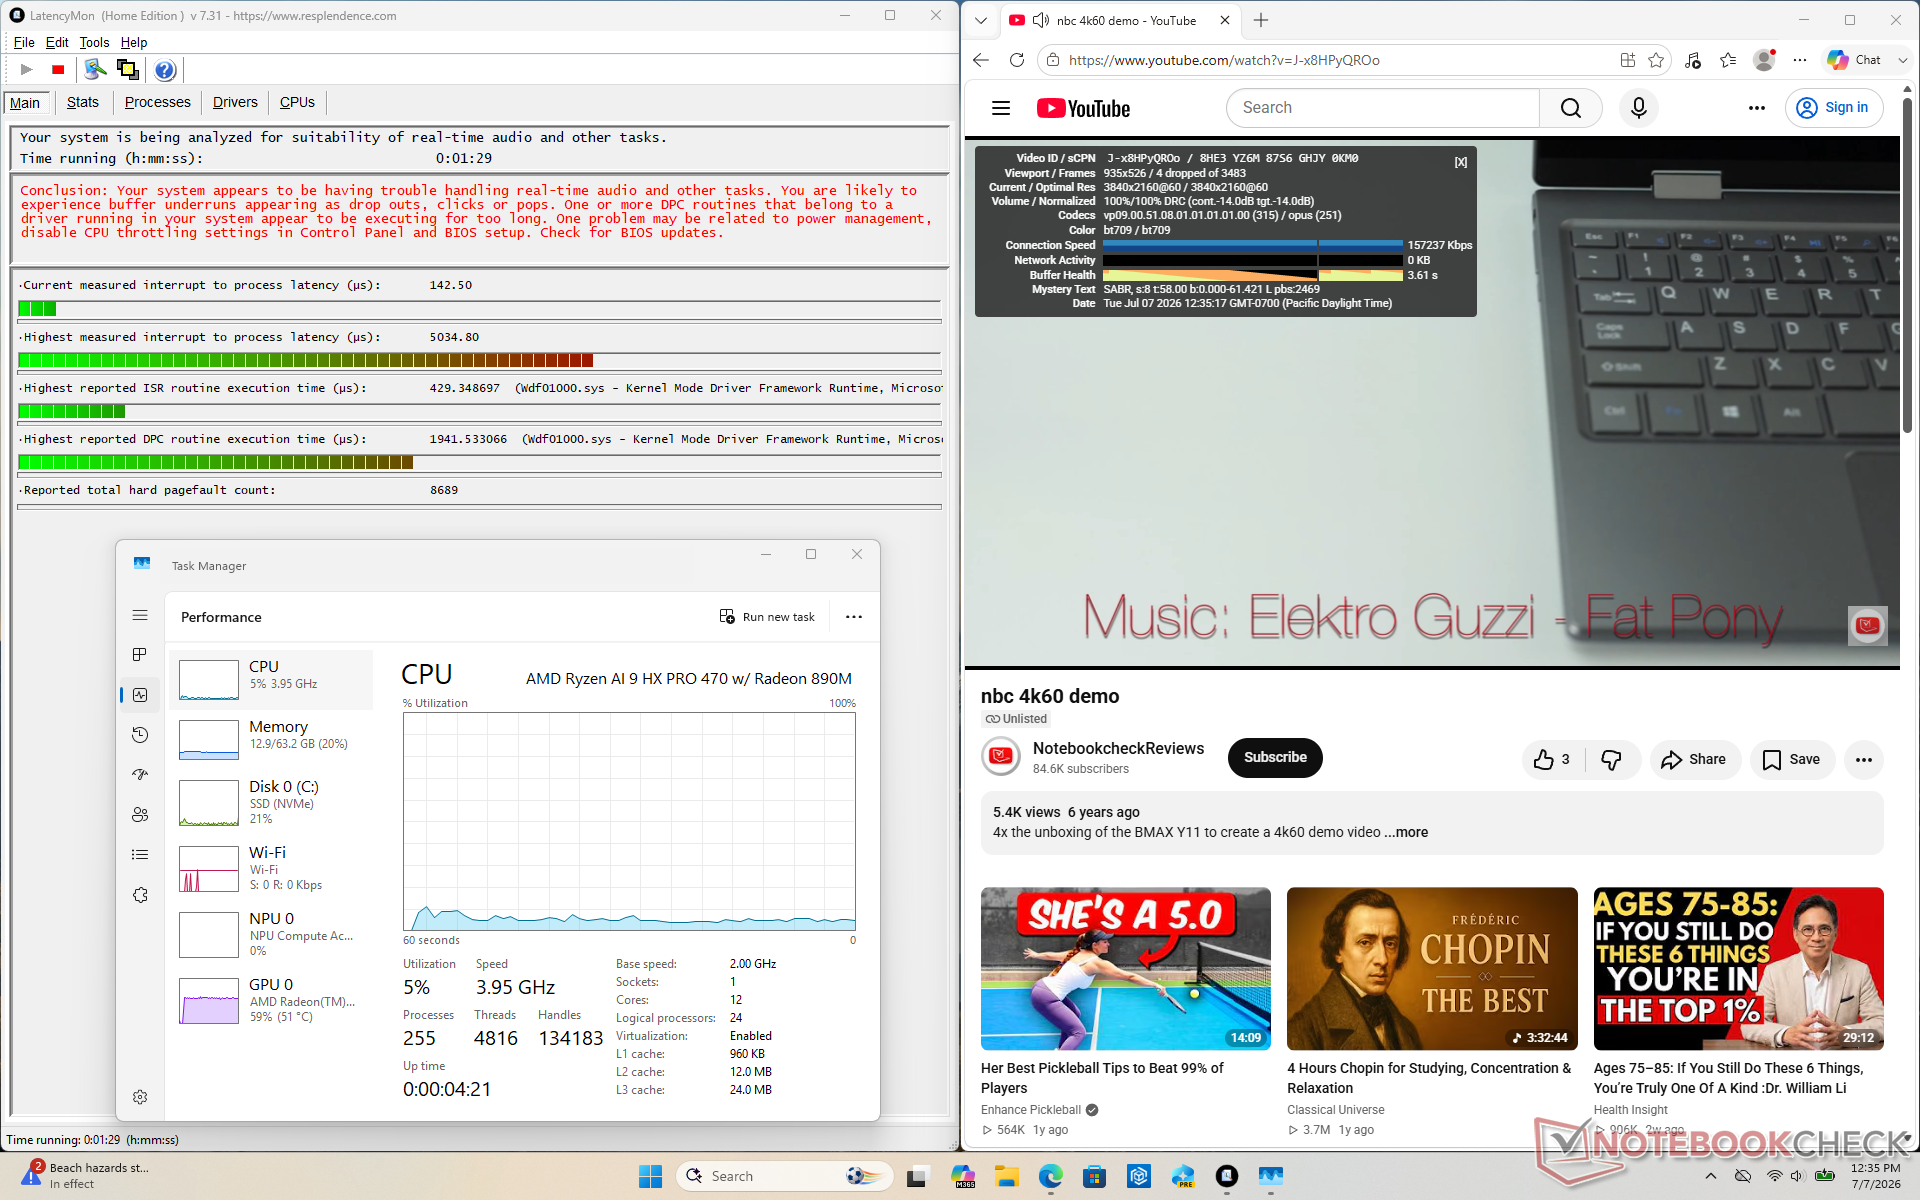
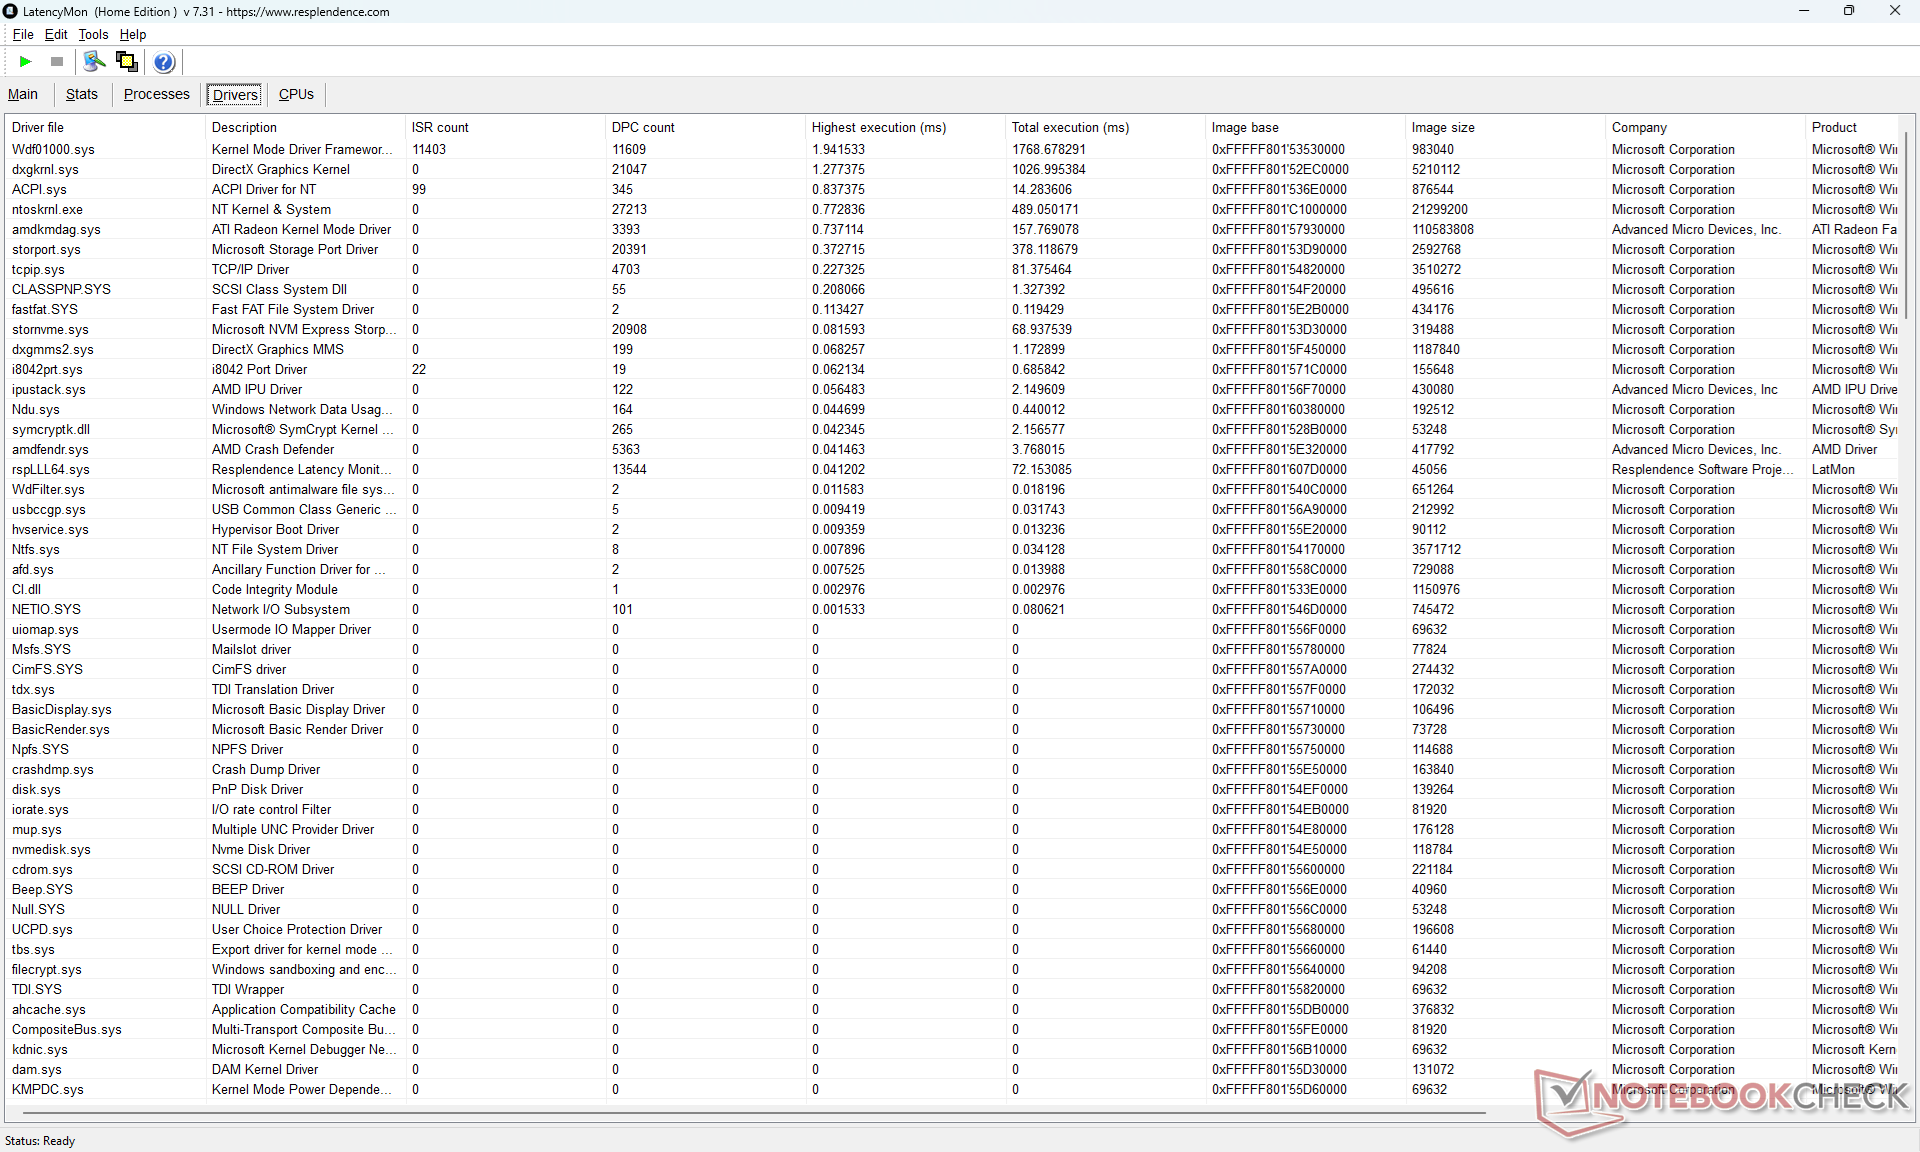
Program LatencyMon wykrywa problemy związane z DPC oraz kilka utraconych klatek podczas naszego testu odtwarzania wideo w rozdzielczości 4K60
Lista sterowników
Lista sterowników
DPC Latencies / LatencyMon - interrupt to process latency (max), Web, Youtube, Prime95
Dell Pro 14 Premium
Arc 140V, Core Ultra 7 268V, Kioxia BG6 KBG6AZNV1T02
5706.7 μs * -13%
Dell Pro 7 14 P714265
Radeon 890M, Ryzen AI 9 HX PRO 470
5034.8 μs *
Lenovo ThinkPad T14s Gen 7 21YW0022GE
Radeon 860M, Ryzen AI 7 PRO 450, Micron 2650 MTFDKBA512TGW
2926.1 μs * +42%
Dell Latitude 7440
Iris Xe G7 80EUs, i5-1345U, Samsung MZ9L4512HBLU-00BMV
1203.08 μs * +76%
HP EliteBook X G1a 14 AI
Radeon 890M, Ryzen AI 9 HX PRO 375, Kioxia XG8 KXG80ZNV1T02
526.3 μs * +90%
Asus ExpertBook Ultra B9406CAA
Arc B390 Panther Lake iGPU, Ultra X7 358H, Samsung PM9E1 MZVLC2T0HBLD
398 μs * +92%

* ... im mniej tym lepiej

Urządzenia pamięci masowej
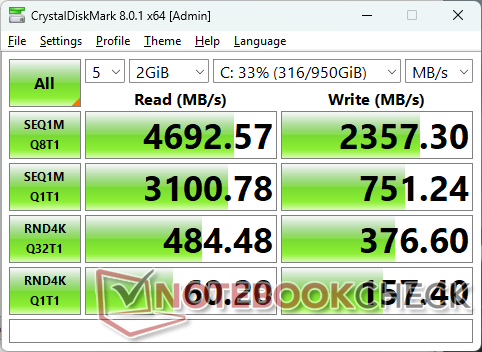
CDM 8
CDM 8
AS SSD
AS SSD
Brak opcji dodatkowej pamięci
CDM 5/6 Read Seq Q32T1: 4666 MB/s
CDM 5/6 Write Seq Q32T1: 5135 MB/s
CDM 5/6 Read 4K Q32T1: 482.9 MB/s
CDM 5/6 Write 4K Q32T1: 458.4 MB/s
CDM 5 Read Seq: 3051 MB/s
CDM 5 Write Seq: 169.3 MB/s
CDM 5/6 Read 4K: 59.6 MB/s
CDM 5/6 Write 4K: 138.7 MB/s
Drive Performance rating - Percent
Lenovo ThinkPad T14s Gen 7 21YW0022GE
Micron 2650 MTFDKBA512TGW
83.3 pt
Asus ExpertBook Ultra B9406CAA
Samsung PM9E1 MZVLC2T0HBLD
71.6 pt
HP EliteBook X G1a 14 AI
Kioxia XG8 KXG80ZNV1T02
52.7 pt
Dell Pro 7 14 P714265
 
50.1 pt
Dell Latitude 7440
Samsung MZ9L4512HBLU-00BMV
42.1 pt
Dell Pro 14 Premium
Kioxia BG6 KBG6AZNV1T02
40 pt
DiskSpd
seq read
Asus ExpertBook Ultra B9406CAA
Samsung PM9E1 MZVLC2T0HBLD
5202 (5000.31min - 5202.2max) MB/s +68%
Lenovo ThinkPad T14s Gen 7 21YW0022GE
Micron 2650 MTFDKBA512TGW
4665 (4580.04min - 4665.32max) MB/s +51%
HP EliteBook X G1a 14 AI
Kioxia XG8 KXG80ZNV1T02
3522 (3482.28min - 3522.04max) MB/s +14%
Dell Pro 7 14 P714265
 
3090 (3051.36min - 3089.52max) MB/s
Dell Pro 14 Premium
Kioxia BG6 KBG6AZNV1T02
2842 (2812.74min - 2841.62max) MB/s -8%
Dell Latitude 7440
Samsung MZ9L4512HBLU-00BMV
2443 (2427.84min - 2443.39max) MB/s -21%
seq write
Lenovo ThinkPad T14s Gen 7 21YW0022GE
Micron 2650 MTFDKBA512TGW
5223 (5088.01min - 5223.21max) MB/s +484%
HP EliteBook X G1a 14 AI
Kioxia XG8 KXG80ZNV1T02
3675 (3599.13min - 3675.04max) MB/s +311%
Asus ExpertBook Ultra B9406CAA
Samsung PM9E1 MZVLC2T0HBLD
2975 (2363.07min - 2974.81max) MB/s +232%
Dell Pro 14 Premium
Kioxia BG6 KBG6AZNV1T02
2313 (2192.36min - 2312.74max) MB/s +158%
Dell Latitude 7440
Samsung MZ9L4512HBLU-00BMV
1776 (1737.28min - 1776.3max) MB/s +98%
Dell Pro 7 14 P714265
 
895 (42.36min - 895.27max) MB/s
seq q8 t1 read
Asus ExpertBook Ultra B9406CAA
Samsung PM9E1 MZVLC2T0HBLD
14067 (11621.3min - 14067.1max) MB/s +98%
Dell Pro 7 14 P714265
 
7090 (5662.1min - 7090.34max) MB/s
Lenovo ThinkPad T14s Gen 7 21YW0022GE
Micron 2650 MTFDKBA512TGW
6991 (6471.18min - 6991.07max) MB/s -1%
HP EliteBook X G1a 14 AI
Kioxia XG8 KXG80ZNV1T02
6964 (6466.85min - 6963.72max) MB/s -2%
Dell Pro 14 Premium
Kioxia BG6 KBG6AZNV1T02
6110 (5320.32min - 6110.05max) MB/s -14%
Dell Latitude 7440
Samsung MZ9L4512HBLU-00BMV
3519 (2577.61min - 3518.81max) MB/s -50%
seq q8 t1 write
Asus ExpertBook Ultra B9406CAA
Samsung PM9E1 MZVLC2T0HBLD
9127 (8641.19min - 9127.43max) MB/s +77%
HP EliteBook X G1a 14 AI
Kioxia XG8 KXG80ZNV1T02
5530 (5479.23min - 5530.4max) MB/s +7%
Lenovo ThinkPad T14s Gen 7 21YW0022GE
Micron 2650 MTFDKBA512TGW
5333 (5268.41min - 5333.48max) MB/s +3%
Dell Pro 14 Premium
Kioxia BG6 KBG6AZNV1T02
5279 (5231.58min - 5279.37max) MB/s +2%
Dell Pro 7 14 P714265
 
5154 (51.38min - 5154.41max) MB/s
Dell Latitude 7440
Samsung MZ9L4512HBLU-00BMV
2210 (2175.38min - 2210.17max) MB/s -57%
4k q1 t1 read
Lenovo ThinkPad T14s Gen 7 21YW0022GE
Micron 2650 MTFDKBA512TGW
87.5 (85.01min - 87.46max) MB/s +55%
Dell Latitude 7440
Samsung MZ9L4512HBLU-00BMV
78.8 (76.59min - 78.83max) MB/s +39%
Asus ExpertBook Ultra B9406CAA
Samsung PM9E1 MZVLC2T0HBLD
69.7 (68.02min - 69.67max) MB/s +23%
Dell Pro 7 14 P714265
 
56.5 (55.7min - 56.49max) MB/s
HP EliteBook X G1a 14 AI
Kioxia XG8 KXG80ZNV1T02
51.2 (49.86min - 51.22max) MB/s -9%
Dell Pro 14 Premium
Kioxia BG6 KBG6AZNV1T02
44.1 (43.53min - 44.13max) MB/s -22%
4k q1 t1 write
Lenovo ThinkPad T14s Gen 7 21YW0022GE
Micron 2650 MTFDKBA512TGW
273 (265.84min - 273.13max) MB/s +84%
Dell Pro 7 14 P714265
 
148.5 (50.42min - 148.46max) MB/s
Dell Latitude 7440
Samsung MZ9L4512HBLU-00BMV
131.4 (129.27min - 131.42max) MB/s -12%
HP EliteBook X G1a 14 AI
Kioxia XG8 KXG80ZNV1T02
127.4 (124.41min - 127.43max) MB/s -14%
Asus ExpertBook Ultra B9406CAA
Samsung PM9E1 MZVLC2T0HBLD
125.3 (122.16min - 125.28max) MB/s -16%
Dell Pro 14 Premium
Kioxia BG6 KBG6AZNV1T02
121.8 (119.08min - 121.81max) MB/s -18%
4k q32 t16 read
Lenovo ThinkPad T14s Gen 7 21YW0022GE
Micron 2650 MTFDKBA512TGW
3783 (3766.41min - 3783.27max) MB/s +425%
Dell Pro 7 14 P714265
 
721 (666.51min - 720.75max) MB/s
Asus ExpertBook Ultra B9406CAA
Samsung PM9E1 MZVLC2T0HBLD
690 (639.86min - 689.58max) MB/s -4%
Dell Pro 14 Premium
Kioxia BG6 KBG6AZNV1T02
639 (624.64min - 639.07max) MB/s -11%
HP EliteBook X G1a 14 AI
Kioxia XG8 KXG80ZNV1T02
535 (525.83min - 535.33max) MB/s -26%
Dell Latitude 7440
Samsung MZ9L4512HBLU-00BMV
476 (466.05min - 475.52max) MB/s -34%
4k q32 t16 write
Lenovo ThinkPad T14s Gen 7 21YW0022GE
Micron 2650 MTFDKBA512TGW
3889 (3629.66min - 3889.46max) MB/s +1527%
Dell Pro 14 Premium
Kioxia BG6 KBG6AZNV1T02
403 (313.61min - 402.71max) MB/s +69%
Asus ExpertBook Ultra B9406CAA
Samsung PM9E1 MZVLC2T0HBLD
390 (355.81min - 389.58max) MB/s +63%
Dell Latitude 7440
Samsung MZ9L4512HBLU-00BMV
360 (355.44min - 360.36max) MB/s +51%
HP EliteBook X G1a 14 AI
Kioxia XG8 KXG80ZNV1T02
292 (284.01min - 291.89max) MB/s +22%
Dell Pro 7 14 P714265
 
239 (39.03min - 238.53max) MB/s
AS SSD
Score Total
Lenovo ThinkPad T14s Gen 7 21YW0022GE
Micron 2650 MTFDKBA512TGW
6690 Points +45%
Asus ExpertBook Ultra B9406CAA
Samsung PM9E1 MZVLC2T0HBLD
6239 Points +35%
Dell Pro 7 14 P714265
 
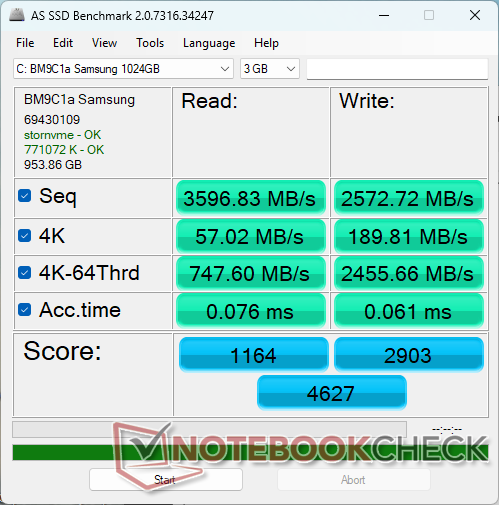
4627 Points
HP EliteBook X G1a 14 AI
Kioxia XG8 KXG80ZNV1T02
4344 Points -6%
Dell Latitude 7440
Samsung MZ9L4512HBLU-00BMV
3533 Points -24%
Dell Pro 14 Premium
Kioxia BG6 KBG6AZNV1T02
3357 Points -27%
Score Read
Lenovo ThinkPad T14s Gen 7 21YW0022GE
Micron 2650 MTFDKBA512TGW
3406 Points +193%
Asus ExpertBook Ultra B9406CAA
Samsung PM9E1 MZVLC2T0HBLD
1804 Points +55%
Dell Pro 7 14 P714265
 
1164 Points
Dell Pro 14 Premium
Kioxia BG6 KBG6AZNV1T02
1156 Points -1%
HP EliteBook X G1a 14 AI
Kioxia XG8 KXG80ZNV1T02
1089 Points -6%
Dell Latitude 7440
Samsung MZ9L4512HBLU-00BMV
1028 Points -12%
Score Write
Asus ExpertBook Ultra B9406CAA
Samsung PM9E1 MZVLC2T0HBLD
3672 Points +26%
Dell Pro 7 14 P714265
 
2903 Points
HP EliteBook X G1a 14 AI
Kioxia XG8 KXG80ZNV1T02
2774 Points -4%
Dell Latitude 7440
Samsung MZ9L4512HBLU-00BMV
2029 Points -30%
Dell Pro 14 Premium
Kioxia BG6 KBG6AZNV1T02
1669 Points -43%
Lenovo ThinkPad T14s Gen 7 21YW0022GE
Micron 2650 MTFDKBA512TGW
1575 Points -46%
Seq Read
Asus ExpertBook Ultra B9406CAA
Samsung PM9E1 MZVLC2T0HBLD
8710.83 MB/s +142%
Lenovo ThinkPad T14s Gen 7 21YW0022GE
Micron 2650 MTFDKBA512TGW
5374 MB/s +49%
HP EliteBook X G1a 14 AI
Kioxia XG8 KXG80ZNV1T02
5219.38 MB/s +45%
Dell Pro 14 Premium
Kioxia BG6 KBG6AZNV1T02
4681.73 MB/s +30%
Dell Pro 7 14 P714265
 
3596.83 MB/s
Dell Latitude 7440
Samsung MZ9L4512HBLU-00BMV
3017.95 MB/s -16%
Seq Write
Asus ExpertBook Ultra B9406CAA
Samsung PM9E1 MZVLC2T0HBLD
5359.95 MB/s +108%
Lenovo ThinkPad T14s Gen 7 21YW0022GE
Micron 2650 MTFDKBA512TGW
4540 MB/s +76%
HP EliteBook X G1a 14 AI
Kioxia XG8 KXG80ZNV1T02
3440.17 MB/s +34%
Dell Pro 14 Premium
Kioxia BG6 KBG6AZNV1T02
3344.41 MB/s +30%
Dell Pro 7 14 P714265
 
2572.72 MB/s
Dell Latitude 7440
Samsung MZ9L4512HBLU-00BMV
1520.78 MB/s -41%
4K Read
Lenovo ThinkPad T14s Gen 7 21YW0022GE
Micron 2650 MTFDKBA512TGW
96.3 MB/s +69%
Dell Latitude 7440
Samsung MZ9L4512HBLU-00BMV
72.35 MB/s +27%
Asus ExpertBook Ultra B9406CAA
Samsung PM9E1 MZVLC2T0HBLD
57.24 MB/s 0%
Dell Pro 7 14 P714265
 
57.02 MB/s
HP EliteBook X G1a 14 AI
Kioxia XG8 KXG80ZNV1T02
52.04 MB/s -9%
Dell Pro 14 Premium
Kioxia BG6 KBG6AZNV1T02
41.94 MB/s -26%
4K Write
Lenovo ThinkPad T14s Gen 7 21YW0022GE
Micron 2650 MTFDKBA512TGW
228 MB/s +20%
Dell Latitude 7440
Samsung MZ9L4512HBLU-00BMV
197.6 MB/s +4%
Dell Pro 7 14 P714265
 
189.81 MB/s
HP EliteBook X G1a 14 AI
Kioxia XG8 KXG80ZNV1T02
167.51 MB/s -12%
Asus ExpertBook Ultra B9406CAA
Samsung PM9E1 MZVLC2T0HBLD
161.08 MB/s -15%
Dell Pro 14 Premium
Kioxia BG6 KBG6AZNV1T02
123.27 MB/s -35%
4K-64 Read
Lenovo ThinkPad T14s Gen 7 21YW0022GE
Micron 2650 MTFDKBA512TGW
2772 MB/s +271%
Asus ExpertBook Ultra B9406CAA
Samsung PM9E1 MZVLC2T0HBLD
875.94 MB/s +17%
Dell Pro 7 14 P714265
 
747.6 MB/s
Dell Latitude 7440
Samsung MZ9L4512HBLU-00BMV
654.24 MB/s -12%
Dell Pro 14 Premium
Kioxia BG6 KBG6AZNV1T02
645.47 MB/s -14%
HP EliteBook X G1a 14 AI
Kioxia XG8 KXG80ZNV1T02
514.65 MB/s -31%
4K-64 Write
Asus ExpertBook Ultra B9406CAA
Samsung PM9E1 MZVLC2T0HBLD
2974.88 MB/s +21%
Dell Pro 7 14 P714265
 
2455.66 MB/s
HP EliteBook X G1a 14 AI
Kioxia XG8 KXG80ZNV1T02
2262.06 MB/s -8%
Dell Latitude 7440
Samsung MZ9L4512HBLU-00BMV
1678.93 MB/s -32%
Dell Pro 14 Premium
Kioxia BG6 KBG6AZNV1T02
1211.62 MB/s -51%
Lenovo ThinkPad T14s Gen 7 21YW0022GE
Micron 2650 MTFDKBA512TGW
893 MB/s -64%
Access Time Read
Dell Latitude 7440
Samsung MZ9L4512HBLU-00BMV
0.098 ms * -29%
Dell Pro 7 14 P714265
 
0.076 ms *
Dell Pro 14 Premium
Kioxia BG6 KBG6AZNV1T02
0.068 ms * +11%
HP EliteBook X G1a 14 AI
Kioxia XG8 KXG80ZNV1T02
0.066 ms * +13%
Asus ExpertBook Ultra B9406CAA
Samsung PM9E1 MZVLC2T0HBLD
0.033 ms * +57%
Lenovo ThinkPad T14s Gen 7 21YW0022GE
Micron 2650 MTFDKBA512TGW
0.028 ms * +63%
Access Time Write
Dell Pro 14 Premium
Kioxia BG6 KBG6AZNV1T02
0.276 ms * -352%
Dell Latitude 7440
Samsung MZ9L4512HBLU-00BMV
0.091 ms * -49%
HP EliteBook X G1a 14 AI
Kioxia XG8 KXG80ZNV1T02
0.071 ms * -16%
Asus ExpertBook Ultra B9406CAA
Samsung PM9E1 MZVLC2T0HBLD
0.07 ms * -15%
Dell Pro 7 14 P714265
 
0.061 ms *
Lenovo ThinkPad T14s Gen 7 21YW0022GE
Micron 2650 MTFDKBA512TGW
0.017 ms * +72%

* ... im mniej tym lepiej

Ograniczanie przepustowości dysku: pętla odczytu DiskSpd, głębokość kolejki 8

0145290435580725870101511601305145015951740188520302175232024652610275529003045319033353480362537703915406042054350449546404785493050755220536555105655580059456090623563806525667068156960Tooltip
Dell Pro 7 14 P714265  ; diskspd 2.0.17 f: Ø7038 (5312.37-7084.39) MB/s
Dell Pro 14 Premium Kioxia BG6 KBG6AZNV1T02; diskspd 2.0.17 f: Ø6009 (5149.35-6061.61) MB/s

Wydajność procesora graficznego

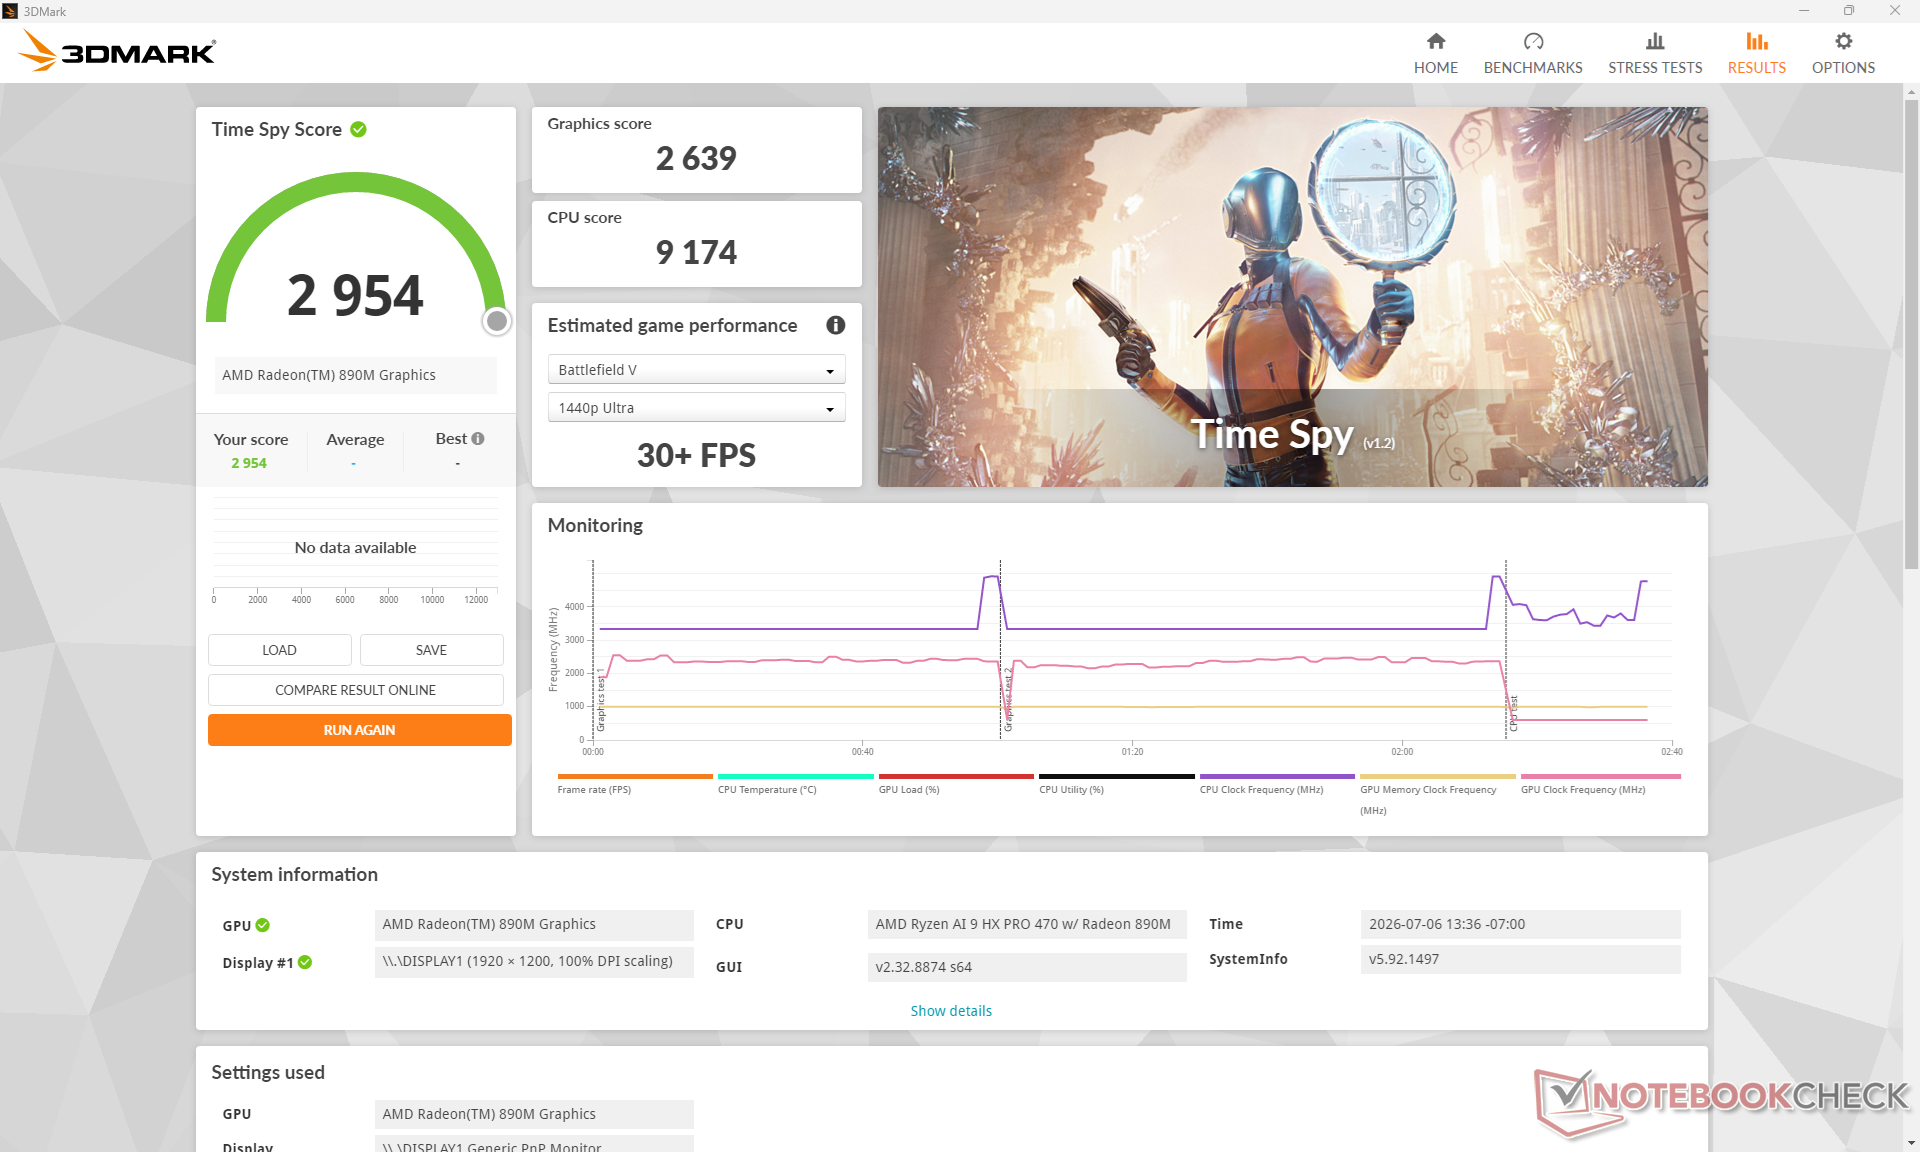
Profil mocyWynik graficznyWynik w testach fizykiWynik łączny
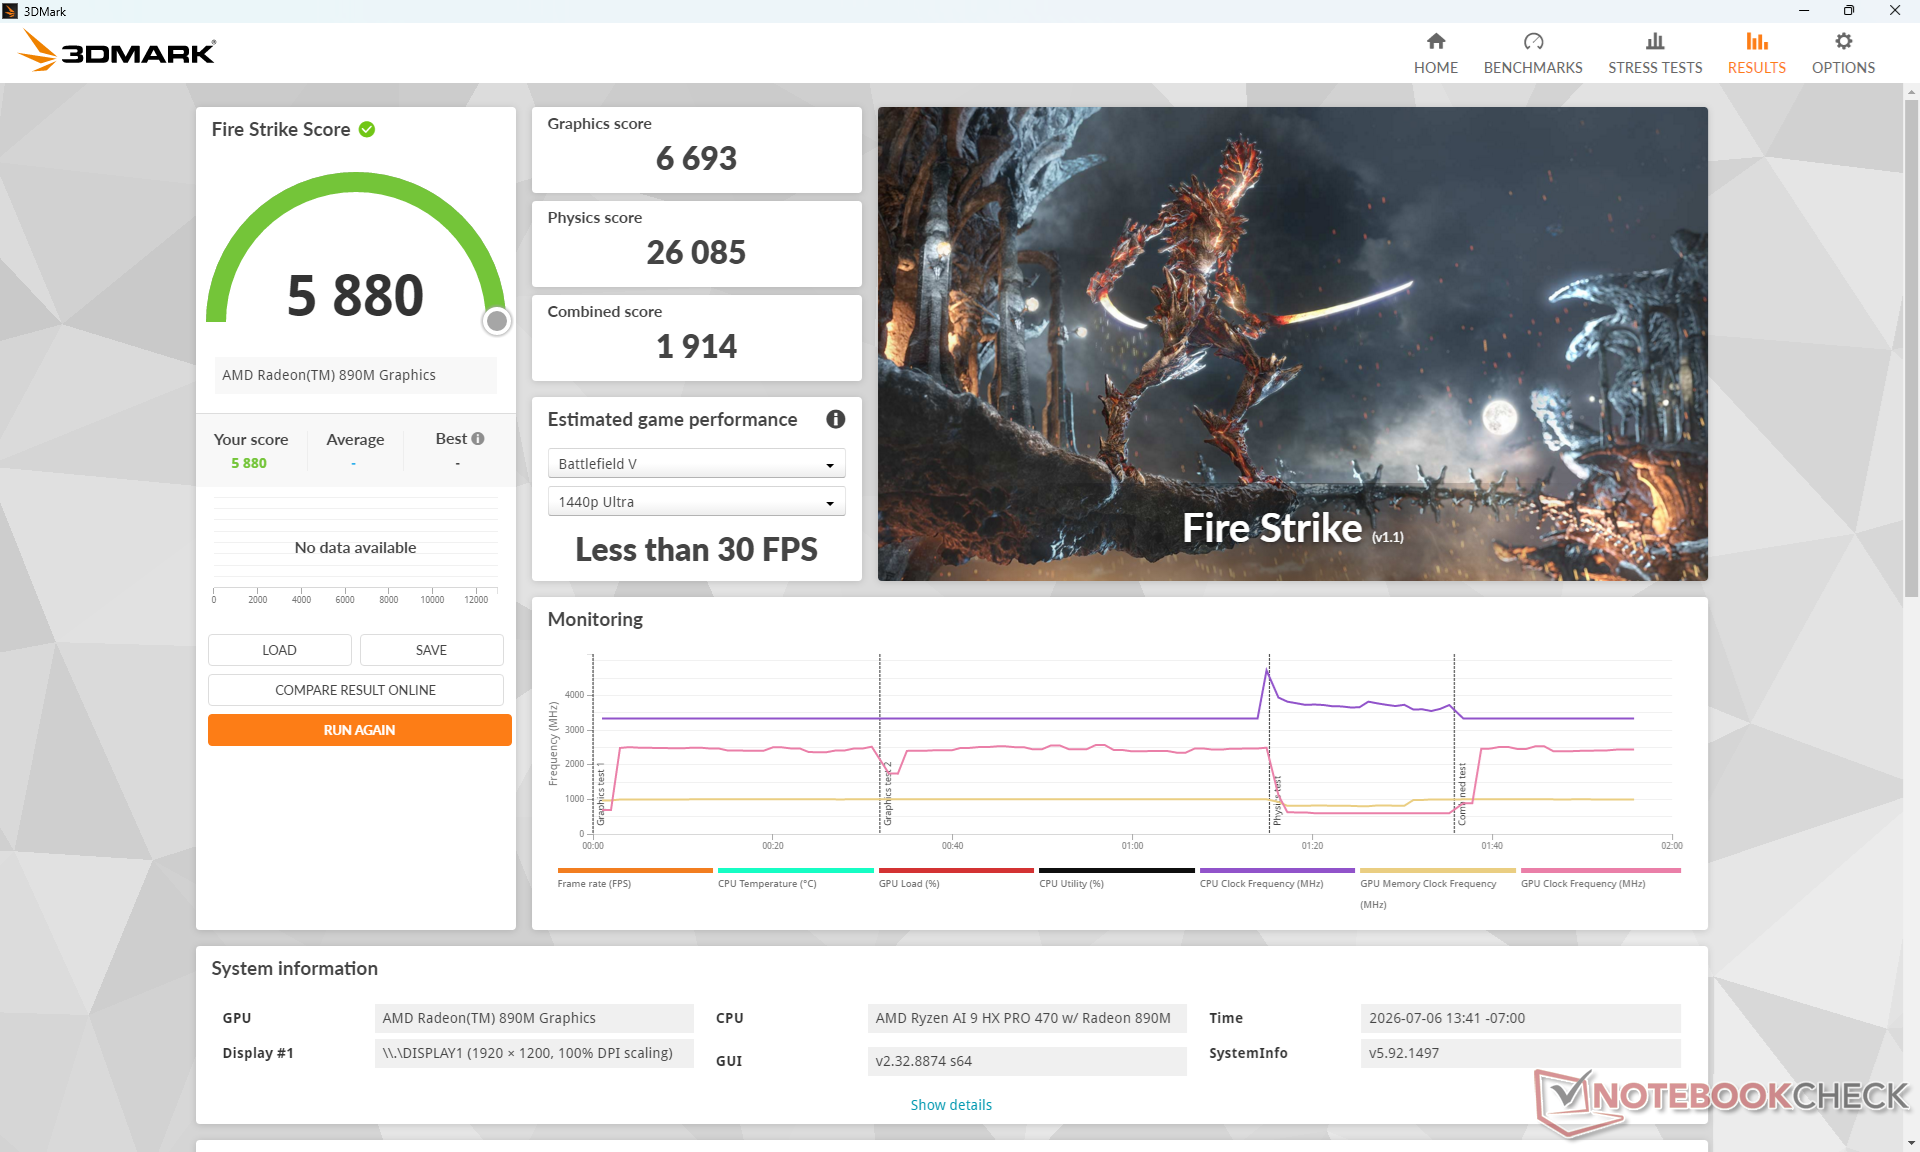
Tryb wydajności669326 0851914
Tryb zrównoważony6109 (-9%)22 507 (-14 %)1858 (-3%)
Zasilanie akumulatorowe6545 (-2%)22 785 (-13 %)1887 (-1%)
3DMark 11
3DMark 11
Fire Strike
Fire Strike
Time Spy
Time Spy
Speed Way
Speed Way
3DMark Performance rating - Percent
Asus ExpertBook Ultra B9406CAA
Intel Arc B390 12 Xe3 Panther Lake iGPU, Intel Core Ultra X7 358H
100 pt
HP EliteBook X G1a 14 AI
AMD Radeon 890M, AMD Ryzen AI 9 HX PRO 375
64.1 pt
HP OmniBook X Flip 14
AMD Radeon 880M, AMD Ryzen AI 9 465
58.2 pt
Dell Pro 14 Premium
Intel Arc Graphics 140V, Intel Core Ultra 7 268V
57.9 pt
Przeciętny AMD Radeon 890M
 
57.5 pt
Lenovo ThinkPad E14 Gen 7 21U2002QGE
Intel Arc Graphics 130V, Intel Core Ultra 5 228V
53.1 pt
Dell Pro 7 14 P714265
AMD Radeon 890M, AMD Ryzen AI 9 HX PRO 470
48.6 pt
Lenovo ThinkPad T14s Gen 7 21YW0022GE
AMD Radeon 860M, AMD Ryzen AI 7 PRO 450
48.4 pt
Lenovo ThinkPad X1 2-in-1 Gen 11
Intel Graphics 4 Xe3 Panther Lake iGPU, Intel Core Ultra 7 355
43.6 pt
Lenovo ThinkPad T14s 2in1 Gen1
Intel Graphics 4-Core iGPU (Meteor / Arrow Lake), Intel Core Ultra 7 255U
32.3 pt
Lenovo Yoga 7a 2-in-1 14AGP11
AMD Radeon 840M, AMD Ryzen AI 5 435
25.7 pt
Dell Latitude 7440
Intel Iris Xe Graphics G7 80EUs, Intel Core i5-1345U
24.1 pt
Lenovo IdeaPad 5i 2-in-1 14IPH11 -1!
Intel Graphics 2 Xe3 Panther Lake iGPU, Intel Core Ultra 5 322
19.5 pt
3DMark 11 - 1280x720 Performance GPU
Asus ExpertBook Ultra B9406CAA
Intel Arc B390 12 Xe3 Panther Lake iGPU, Intel Core Ultra X7 358H
18313 Points +33%
HP EliteBook X G1a 14 AI
AMD Radeon 890M, AMD Ryzen AI 9 HX PRO 375
16418 Points +19%
Przeciętny AMD Radeon 890M
  (8947 - 17483, n=29)
14692 Points +7%
HP OmniBook X Flip 14
AMD Radeon 880M, AMD Ryzen AI 9 465
14479 Points +5%
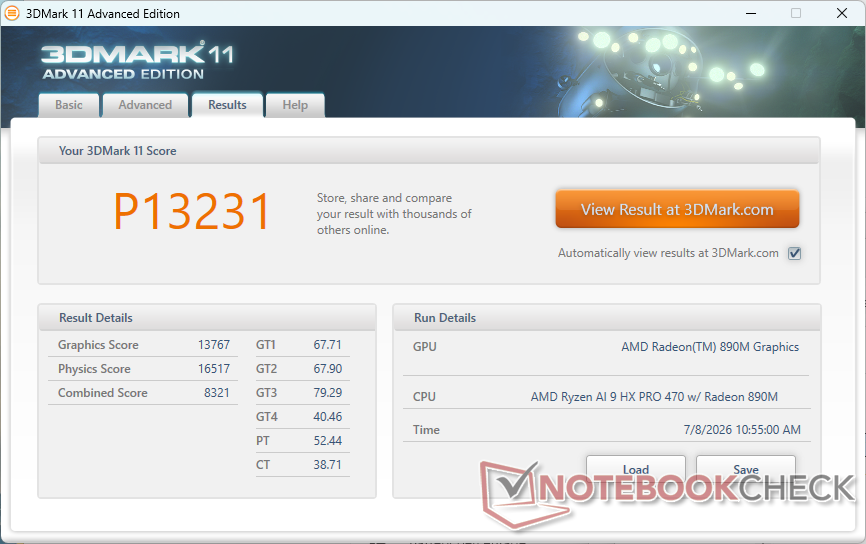
Dell Pro 7 14 P714265
AMD Radeon 890M, AMD Ryzen AI 9 HX PRO 470
13767 Points
Dell Pro 14 Premium
Intel Arc Graphics 140V, Intel Core Ultra 7 268V
12580 Points -9%
Lenovo ThinkPad T14s Gen 7 21YW0022GE
AMD Radeon 860M, AMD Ryzen AI 7 PRO 450
11833 Points -14%
Lenovo ThinkPad E14 Gen 7 21U2002QGE
Intel Arc Graphics 130V, Intel Core Ultra 5 228V
10079 Points -27%
Lenovo ThinkPad X1 2-in-1 Gen 11
Intel Graphics 4 Xe3 Panther Lake iGPU, Intel Core Ultra 7 355
7678 Points -44%
Lenovo Yoga 7a 2-in-1 14AGP11
AMD Radeon 840M, AMD Ryzen AI 5 435
7367 Points -46%
Lenovo ThinkPad T14s 2in1 Gen1
Intel Graphics 4-Core iGPU (Meteor / Arrow Lake), Intel Core Ultra 7 255U
6214 Points -55%
Dell Latitude 7440
Intel Iris Xe Graphics G7 80EUs, Intel Core i5-1345U
5485 Points -60%
Lenovo IdeaPad 5i 2-in-1 14IPH11
Intel Graphics 2 Xe3 Panther Lake iGPU, Intel Core Ultra 5 322
3683 Points -73%
3DMark
1920x1080 Fire Strike Graphics
Asus ExpertBook Ultra B9406CAA
Intel Arc B390 12 Xe3 Panther Lake iGPU, Intel Core Ultra X7 358H
17054 Points +155%
HP EliteBook X G1a 14 AI
AMD Radeon 890M, AMD Ryzen AI 9 HX PRO 375
9810 Points +47%
HP OmniBook X Flip 14
AMD Radeon 880M, AMD Ryzen AI 9 465
9462 Points +41%
Dell Pro 14 Premium
Intel Arc Graphics 140V, Intel Core Ultra 7 268V
8941 Points +34%
Lenovo ThinkPad E14 Gen 7 21U2002QGE
Intel Arc Graphics 130V, Intel Core Ultra 5 228V
8755 Points +31%
Przeciętny AMD Radeon 890M
  (5173 - 10037, n=29)
8744 Points +31%
Lenovo ThinkPad T14s Gen 7 21YW0022GE
AMD Radeon 860M, AMD Ryzen AI 7 PRO 450
7459 Points +11%
Lenovo ThinkPad X1 2-in-1 Gen 11
Intel Graphics 4 Xe3 Panther Lake iGPU, Intel Core Ultra 7 355
7227 Points +8%
Dell Pro 7 14 P714265
AMD Radeon 890M, AMD Ryzen AI 9 HX PRO 470
6693 Points
Lenovo ThinkPad T14s 2in1 Gen1
Intel Graphics 4-Core iGPU (Meteor / Arrow Lake), Intel Core Ultra 7 255U
5118 Points -24%
Dell Latitude 7440
Intel Iris Xe Graphics G7 80EUs, Intel Core i5-1345U
4442 Points -34%
Lenovo Yoga 7a 2-in-1 14AGP11
AMD Radeon 840M, AMD Ryzen AI 5 435
3706 Points -45%
Lenovo IdeaPad 5i 2-in-1 14IPH11
Intel Graphics 2 Xe3 Panther Lake iGPU, Intel Core Ultra 5 322
3085 Points -54%
2560x1440 Time Spy Graphics
Asus ExpertBook Ultra B9406CAA
Intel Arc B390 12 Xe3 Panther Lake iGPU, Intel Core Ultra X7 358H
6679 Points +153%
Dell Pro 14 Premium
Intel Arc Graphics 140V, Intel Core Ultra 7 268V
3730 Points +41%
HP EliteBook X G1a 14 AI
AMD Radeon 890M, AMD Ryzen AI 9 HX PRO 375
3614 Points +37%
Lenovo ThinkPad E14 Gen 7 21U2002QGE
Intel Arc Graphics 130V, Intel Core Ultra 5 228V
3538 Points +34%
Przeciętny AMD Radeon 890M
  (1918 - 3750, n=30)
3255 Points +23%
HP OmniBook X Flip 14
AMD Radeon 880M, AMD Ryzen AI 9 465
3247 Points +23%
Lenovo ThinkPad X1 2-in-1 Gen 11
Intel Graphics 4 Xe3 Panther Lake iGPU, Intel Core Ultra 7 355
2989 Points +13%
Lenovo ThinkPad T14s Gen 7 21YW0022GE
AMD Radeon 860M, AMD Ryzen AI 7 PRO 450
2812 Points +7%
Dell Pro 7 14 P714265
AMD Radeon 890M, AMD Ryzen AI 9 HX PRO 470
2639 Points
Lenovo ThinkPad T14s 2in1 Gen1
Intel Graphics 4-Core iGPU (Meteor / Arrow Lake), Intel Core Ultra 7 255U
2144 Points -19%
Lenovo IdeaPad 5i 2-in-1 14IPH11
Intel Graphics 2 Xe3 Panther Lake iGPU, Intel Core Ultra 5 322
1362 Points -48%
Lenovo Yoga 7a 2-in-1 14AGP11
AMD Radeon 840M, AMD Ryzen AI 5 435
1335 Points -49%
Dell Latitude 7440
Intel Iris Xe Graphics G7 80EUs, Intel Core i5-1345U
1318 Points -50%
2560x1440 Time Spy Score
Asus ExpertBook Ultra B9406CAA
Intel Arc B390 12 Xe3 Panther Lake iGPU, Intel Core Ultra X7 358H
7270 Points +146%
HP EliteBook X G1a 14 AI
AMD Radeon 890M, AMD Ryzen AI 9 HX PRO 375
3997 Points +35%
Dell Pro 14 Premium
Intel Arc Graphics 140V, Intel Core Ultra 7 268V
3985 Points +35%
Lenovo ThinkPad E14 Gen 7 21U2002QGE
Intel Arc Graphics 130V, Intel Core Ultra 5 228V
3850 Points +30%
HP OmniBook X Flip 14
AMD Radeon 880M, AMD Ryzen AI 9 465
3606 Points +22%
Przeciętny AMD Radeon 890M
  (2168 - 4163, n=29)
3605 Points +22%
Lenovo ThinkPad X1 2-in-1 Gen 11
Intel Graphics 4 Xe3 Panther Lake iGPU, Intel Core Ultra 7 355
3303 Points +12%
Lenovo ThinkPad T14s Gen 7 21YW0022GE
AMD Radeon 860M, AMD Ryzen AI 7 PRO 450
3148 Points +7%
Dell Pro 7 14 P714265
AMD Radeon 890M, AMD Ryzen AI 9 HX PRO 470
2954 Points
Lenovo ThinkPad T14s 2in1 Gen1
Intel Graphics 4-Core iGPU (Meteor / Arrow Lake), Intel Core Ultra 7 255U
2397 Points -19%
Lenovo Yoga 7a 2-in-1 14AGP11
AMD Radeon 840M, AMD Ryzen AI 5 435
1517 Points -49%
Dell Latitude 7440
Intel Iris Xe Graphics G7 80EUs, Intel Core i5-1345U
1501 Points -49%
3DMark 11 Performance
13231 pkt.
3DMark Cloud Gate Standard Score
32754 pkt.
3DMark Fire Strike Score
5880 pkt.
3DMark Time Spy Score
2954 pkt.
Pomoc
Blender
v3.3 Classroom CPU
Lenovo IdeaPad 5i 2-in-1 14IPH11
Intel Graphics 2 Xe3 Panther Lake iGPU, Intel Core Ultra 5 322
715 Seconds * -156%
Lenovo ThinkPad E14 Gen 7 21U2002QGE
Intel Arc Graphics 130V, Intel Core Ultra 5 228V
676 Seconds * -142%
Dell Latitude 7440
Intel Iris Xe Graphics G7 80EUs, Intel Core i5-1345U
632 Seconds * -127%
Lenovo ThinkPad T14s 2in1 Gen1
Intel Graphics 4-Core iGPU (Meteor / Arrow Lake), Intel Core Ultra 7 255U
613 Seconds * -120%
Dell Pro 14 Premium
Intel Arc Graphics 140V, Intel Core Ultra 7 268V
520 Seconds * -86%
Lenovo Yoga 7a 2-in-1 14AGP11
AMD Radeon 840M, AMD Ryzen AI 5 435
495 Seconds * -77%
Lenovo ThinkPad X1 2-in-1 Gen 11
Intel Graphics 4 Xe3 Panther Lake iGPU, Intel Core Ultra 7 355
479 Seconds * -72%
Lenovo ThinkPad T14s Gen 7 21YW0022GE
AMD Radeon 860M, AMD Ryzen AI 7 PRO 450
337 Seconds * -21%
HP OmniBook X Flip 14
AMD Radeon 880M, AMD Ryzen AI 9 465
290 Seconds * -4%
Asus ExpertBook Ultra B9406CAA
Intel Arc B390 12 Xe3 Panther Lake iGPU, Intel Core Ultra X7 358H
288 Seconds * -3%
Dell Pro 7 14 P714265
AMD Radeon 890M, AMD Ryzen AI 9 HX PRO 470
279 Seconds *
Przeciętny AMD Radeon 890M
  (211 - 475, n=28)
267 Seconds * +4%
HP EliteBook X G1a 14 AI
AMD Radeon 890M, AMD Ryzen AI 9 HX PRO 375
245 Seconds * +12%
v3.3 Classroom oneAPI/Intel
Lenovo ThinkPad X1 2-in-1 Gen 11
Intel Graphics 4 Xe3 Panther Lake iGPU, Intel Core Ultra 7 355
235 Seconds *
Dell Pro 14 Premium
Intel Arc Graphics 140V, Intel Core Ultra 7 268V
204 Seconds *
Asus ExpertBook Ultra B9406CAA
Intel Arc B390 12 Xe3 Panther Lake iGPU, Intel Core Ultra X7 358H
110 Seconds *
v4.3 Barbershop CPU
Dell Pro 14 Premium
Intel Arc Graphics 140V, Intel Core Ultra 7 268V
2723 Seconds * -89%
Lenovo ThinkPad X1 2-in-1 Gen 11
Intel Graphics 4 Xe3 Panther Lake iGPU, Intel Core Ultra 7 355
2466 Seconds * -71%
HP OmniBook X Flip 14
AMD Radeon 880M, AMD Ryzen AI 9 465
1486 Seconds * -3%
Dell Pro 7 14 P714265
AMD Radeon 890M, AMD Ryzen AI 9 HX PRO 470
1444 Seconds *
Asus ExpertBook Ultra B9406CAA
Intel Arc B390 12 Xe3 Panther Lake iGPU, Intel Core Ultra X7 358H
1439 Seconds * -0%
HP EliteBook X G1a 14 AI
AMD Radeon 890M, AMD Ryzen AI 9 HX PRO 375
1281 Seconds * +11%
Przeciętny AMD Radeon 890M
  (1101 - 1532, n=15)
1258 Seconds * +13%

* ... im mniej tym lepiej

Performance rating - Percent
Asus ExpertBook Ultra B9406CAA
Intel Core Ultra X7 358H, Intel Arc B390 12 Xe3 Panther Lake iGPU
99.2 pt
Dell Pro 14 Premium -1!
Intel Core Ultra 7 268V, Intel Arc Graphics 140V
68.7 pt
Dell Pro 7 14 P714265
AMD Ryzen AI 9 HX PRO 470, AMD Radeon 890M
65.3 pt
HP EliteBook X G1a 14 AI
AMD Ryzen AI 9 HX PRO 375, AMD Radeon 890M
63.2 pt
Lenovo ThinkPad T14s Gen 7 21YW0022GE
AMD Ryzen AI 7 PRO 450, AMD Radeon 860M
56.6 pt
Dell Latitude 7440 -2!
Intel Core i5-1345U, Intel Iris Xe Graphics G7 80EUs
35.4 pt
Cyberpunk 2077 - 1920x1080 Ultra Preset (FSR off)
Asus ExpertBook Ultra B9406CAA
Intel Core Ultra X7 358H, Intel Arc B390 12 Xe3 Panther Lake iGPU
47.2 (39.1min, 36.3P1) fps +84%
Dell Pro 14 Premium
Intel Core Ultra 7 268V, Intel Arc Graphics 140V
29 (24.3min, 23.4P1) fps +13%
HP EliteBook X G1a 14 AI
AMD Ryzen AI 9 HX PRO 375, AMD Radeon 890M
26.8 (22.8min, 19.6P1) fps +4%
Dell Pro 7 14 P714265
AMD Ryzen AI 9 HX PRO 470, AMD Radeon 890M
25.7 (21.4min, 20.2P1) fps
Lenovo ThinkPad T14s Gen 7 21YW0022GE
AMD Ryzen AI 7 PRO 450, AMD Radeon 860M
17.7 (14.1min) fps -31%
Baldur's Gate 3 - 1920x1080 Ultra Preset AA:T
Asus ExpertBook Ultra B9406CAA
Intel Core Ultra X7 358H, Intel Arc B390 12 Xe3 Panther Lake iGPU
53.4 (45.4min, 46.4P0.1, 49.5P1) fps +98%
Dell Pro 14 Premium
Intel Core Ultra 7 268V, Intel Arc Graphics 140V
31.6 fps +17%
HP EliteBook X G1a 14 AI
AMD Ryzen AI 9 HX PRO 375, AMD Radeon 890M
27.9 fps +3%
Dell Pro 7 14 P714265
AMD Ryzen AI 9 HX PRO 470, AMD Radeon 890M
27 (20.4min, 20.6P0.1, 24.1P1) fps
Lenovo ThinkPad T14s Gen 7 21YW0022GE
AMD Ryzen AI 7 PRO 450, AMD Radeon 860M
17.9 (14.8min, 15.2P0.1, 16.1P1) fps -34%
GTA V - 1920x1080 Highest AA:4xMSAA + FX AF:16x
Asus ExpertBook Ultra B9406CAA
Intel Core Ultra X7 358H, Intel Arc B390 12 Xe3 Panther Lake iGPU
45.3 (11.1min, 34.5P1) fps +38%
HP EliteBook X G1a 14 AI
AMD Ryzen AI 9 HX PRO 375, AMD Radeon 890M
33.3 (3.55min, 23.8P1) fps +2%
Dell Pro 7 14 P714265
AMD Ryzen AI 9 HX PRO 470, AMD Radeon 890M
32.8 (4.62min, 23.8P1) fps
Lenovo ThinkPad T14s Gen 7 21YW0022GE
AMD Ryzen AI 7 PRO 450, AMD Radeon 860M
25.4 (4.78min, 18.2P1) fps -23%
Dell Latitude 7440
Intel Core i5-1345U, Intel Iris Xe Graphics G7 80EUs
8.81 (4.42min, 5.46P1) fps -73%
Final Fantasy XV Benchmark - 1920x1080 High Quality
Asus ExpertBook Ultra B9406CAA
Intel Core Ultra X7 358H, Intel Arc B390 12 Xe3 Panther Lake iGPU
55.4 fps +82%
Dell Pro 14 Premium
Intel Core Ultra 7 268V, Intel Arc Graphics 140V
36.5 fps +20%
HP EliteBook X G1a 14 AI
AMD Ryzen AI 9 HX PRO 375, AMD Radeon 890M
32.9 fps +8%
Dell Pro 7 14 P714265
AMD Ryzen AI 9 HX PRO 470, AMD Radeon 890M
30.4 fps
Lenovo ThinkPad T14s Gen 7 21YW0022GE
AMD Ryzen AI 7 PRO 450, AMD Radeon 860M
26.8 fps -12%
Dell Latitude 7440
Intel Core i5-1345U, Intel Iris Xe Graphics G7 80EUs
16.8 fps -45%
Strange Brigade - 1920x1080 ultra AA:ultra AF:16
Asus ExpertBook Ultra B9406CAA
Intel Core Ultra X7 358H, Intel Arc B390 12 Xe3 Panther Lake iGPU
99.5 (24.8min, 76.1P1) fps +92%
Dell Pro 14 Premium
Intel Core Ultra 7 268V, Intel Arc Graphics 140V
57.6 (15.1min, 29.8P1) fps +11%
HP EliteBook X G1a 14 AI
AMD Ryzen AI 9 HX PRO 375, AMD Radeon 890M
56.5 (17.6min, 30.5P1) fps +9%
Dell Pro 7 14 P714265
AMD Ryzen AI 9 HX PRO 470, AMD Radeon 890M
51.7 (33min, 38.9P1) fps
Lenovo ThinkPad T14s Gen 7 21YW0022GE
AMD Ryzen AI 7 PRO 450, AMD Radeon 860M
44.4 (33min, 34.8P1) fps -14%
Dell Latitude 7440
Intel Core i5-1345U, Intel Iris Xe Graphics G7 80EUs
21.9 (5min, 6.24P1) fps -58%
Dota 2 Reborn - 1920x1080 ultra (3/3) best looking
Asus ExpertBook Ultra B9406CAA
Intel Core Ultra X7 358H, Intel Arc B390 12 Xe3 Panther Lake iGPU
102.5 (67.7min) fps +29%
Dell Pro 14 Premium
Intel Core Ultra 7 268V, Intel Arc Graphics 140V
87.4 (56.9min) fps +10%
Lenovo ThinkPad T14s Gen 7 21YW0022GE
AMD Ryzen AI 7 PRO 450, AMD Radeon 860M
81.3 (71.8min) fps +3%
Dell Pro 7 14 P714265
AMD Ryzen AI 9 HX PRO 470, AMD Radeon 890M
79.2 (63.3min) fps
Dell Latitude 7440
Intel Core i5-1345U, Intel Iris Xe Graphics G7 80EUs
56.3 (41.5min) fps -29%
HP EliteBook X G1a 14 AI
AMD Ryzen AI 9 HX PRO 375, AMD Radeon 890M
44.8 (33.2min) fps -43%
X-Plane 11.11 - 1920x1080 high (fps_test=3)
HP EliteBook X G1a 14 AI
AMD Ryzen AI 9 HX PRO 375, AMD Radeon 890M
42.2 fps +5%
Lenovo ThinkPad T14s Gen 7 21YW0022GE
AMD Ryzen AI 7 PRO 450, AMD Radeon 860M
40.7 fps +1%
Dell Pro 7 14 P714265
AMD Ryzen AI 9 HX PRO 470, AMD Radeon 890M
40.2 fps
Asus ExpertBook Ultra B9406CAA
Intel Core Ultra X7 358H, Intel Arc B390 12 Xe3 Panther Lake iGPU
39.7 fps -1%
Dell Pro 14 Premium
Intel Core Ultra 7 268V, Intel Arc Graphics 140V
34.9 fps -13%
Dell Latitude 7440
Intel Core i5-1345U, Intel Iris Xe Graphics G7 80EUs
21.3 fps -47%
Baldur's Gate 3
1920x1080 High Preset AA:T
Asus ExpertBook Ultra B9406CAA
Intel Core Ultra X7 358H, Intel Arc B390 12 Xe3 Panther Lake iGPU
54.3 (45.6min, 47.8P0.1, 50P1) fps +94%
Dell Pro 14 Premium
Intel Core Ultra 7 268V, Intel Arc Graphics 140V
32.2 fps +15%
HP OmniBook X Flip 14
AMD Ryzen AI 9 465, AMD Radeon 880M
31.7 (25.1min, 26.2P0.1, 29.1P1) fps +13%
Przeciętny AMD Radeon 890M
  (16.9 - 33.2, n=34)
28.6 fps +2%
HP EliteBook X G1a 14 AI
AMD Ryzen AI 9 HX PRO 375, AMD Radeon 890M
28.5 fps +2%
Dell Pro 7 14 P714265
AMD Ryzen AI 9 HX PRO 470, AMD Radeon 890M
28 (19.9min, 20.6P0.1, 25.7P1) fps
Lenovo ThinkPad E14 Gen 7 21U2002QGE
Intel Core Ultra 5 228V, Intel Arc Graphics 130V
25.9 (21.9min, 22.2P0.1, 23P1) fps -7%
Lenovo ThinkPad X1 2-in-1 Gen 11
Intel Core Ultra 7 355, Intel Graphics 4 Xe3 Panther Lake iGPU
23.7 (21.1min, 21.3P0.1, 21.9P1) fps -15%
Lenovo ThinkPad T14s Gen 7 21YW0022GE
AMD Ryzen AI 7 PRO 450, AMD Radeon 860M
18.2 (14.8min, 15P0.1, 16.7P1) fps -35%
Lenovo ThinkPad T14s 2in1 Gen1
Intel Core Ultra 7 255U, Intel Graphics 4-Core iGPU (Meteor / Arrow Lake)
14 fps -50%
Lenovo Yoga 7a 2-in-1 14AGP11
AMD Ryzen AI 5 435, AMD Radeon 840M
13.5 (12min) fps -52%
1920x1080 Ultra Preset AA:T
Asus ExpertBook Ultra B9406CAA
Intel Core Ultra X7 358H, Intel Arc B390 12 Xe3 Panther Lake iGPU
53.4 (45.4min, 46.4P0.1, 49.5P1) fps +98%
Dell Pro 14 Premium
Intel Core Ultra 7 268V, Intel Arc Graphics 140V
31.6 fps +17%
HP OmniBook X Flip 14
AMD Ryzen AI 9 465, AMD Radeon 880M
31.4 (24.3min, 25P0.1, 28.6P1) fps +16%
HP EliteBook X G1a 14 AI
AMD Ryzen AI 9 HX PRO 375, AMD Radeon 890M
27.9 fps +3%
Przeciętny AMD Radeon 890M
  (16.8 - 32.7, n=33)
27.8 fps +3%
Dell Pro 7 14 P714265
AMD Ryzen AI 9 HX PRO 470, AMD Radeon 890M
27 (20.4min, 20.6P0.1, 24.1P1) fps
Lenovo ThinkPad E14 Gen 7 21U2002QGE
Intel Core Ultra 5 228V, Intel Arc Graphics 130V
24.9 (21.2min, 21.3P0.1, 21.7P1) fps -8%
Lenovo ThinkPad X1 2-in-1 Gen 11
Intel Core Ultra 7 355, Intel Graphics 4 Xe3 Panther Lake iGPU
23.1 (20.9min, 21P0.1, 21.5P1) fps -14%
Lenovo ThinkPad T14s Gen 7 21YW0022GE
AMD Ryzen AI 7 PRO 450, AMD Radeon 860M
17.9 (14.8min, 15.2P0.1, 16.1P1) fps -34%
Lenovo ThinkPad T14s 2in1 Gen1
Intel Core Ultra 7 255U, Intel Graphics 4-Core iGPU (Meteor / Arrow Lake)
13.6 fps -50%
Lenovo Yoga 7a 2-in-1 14AGP11
AMD Ryzen AI 5 435, AMD Radeon 840M
11.7 (8min) fps -57%
Cyberpunk 2077
1920x1080 Low Preset (FSR off)
Asus ExpertBook Ultra B9406CAA
Intel Core Ultra X7 358H, Intel Arc B390 12 Xe3 Panther Lake iGPU
77.7 (67min, 64.3P1) fps +58%
HP EliteBook X G1a 14 AI
AMD Ryzen AI 9 HX PRO 375, AMD Radeon 890M
50.5 (42.4min, 37.5P1) fps +3%
Dell Pro 7 14 P714265
AMD Ryzen AI 9 HX PRO 470, AMD Radeon 890M
49.2 (41.8min, 37.3P1) fps
Dell Pro 14 Premium
Intel Core Ultra 7 268V, Intel Arc Graphics 140V
47.8 (40.1min, 37.9P1) fps -3%
Przeciętny AMD Radeon 890M
  (27.1 - 52.6, n=34)
45.8 fps -7%
Lenovo ThinkPad E14 Gen 7 21U2002QGE
Intel Core Ultra 5 228V, Intel Arc Graphics 130V
43 (35.7min) fps -13%
HP OmniBook X Flip 14
AMD Ryzen AI 9 465, AMD Radeon 880M
40.7 (32.4min, 29P1) fps -17%
Lenovo ThinkPad X1 2-in-1 Gen 11
Intel Core Ultra 7 355, Intel Graphics 4 Xe3 Panther Lake iGPU
39.4 (33.3min, 32P1) fps -20%
Lenovo ThinkPad T14s Gen 7 21YW0022GE
AMD Ryzen AI 7 PRO 450, AMD Radeon 860M
35.5 (28.4min) fps -28%
Lenovo Yoga 7a 2-in-1 14AGP11
AMD Ryzen AI 5 435, AMD Radeon 840M
23.7 (20min) fps -52%
Lenovo ThinkPad T14s 2in1 Gen1
Intel Core Ultra 7 255U, Intel Graphics 4-Core iGPU (Meteor / Arrow Lake)
22.5 (19.2min) fps -54%
Lenovo IdeaPad 5i 2-in-1 14IPH11
Intel Core Ultra 5 322, Intel Graphics 2 Xe3 Panther Lake iGPU
18.8 (16min) fps -62%
1920x1080 Medium Preset (FSR off)
Asus ExpertBook Ultra B9406CAA
Intel Core Ultra X7 358H, Intel Arc B390 12 Xe3 Panther Lake iGPU
63.1 (54.6min, 52.4P1) fps +63%
HP EliteBook X G1a 14 AI
AMD Ryzen AI 9 HX PRO 375, AMD Radeon 890M
39.6 (33.7min, 31.1P1) fps +3%
Dell Pro 7 14 P714265
AMD Ryzen AI 9 HX PRO 470, AMD Radeon 890M
38.6 (33.4min, 31.9P1) fps
Dell Pro 14 Premium
Intel Core Ultra 7 268V, Intel Arc Graphics 140V
38.5 (32.6min, 31P1) fps 0%
Przeciętny AMD Radeon 890M
  (16.9 - 41.9, n=33)
36.1 fps -6%
Lenovo ThinkPad E14 Gen 7 21U2002QGE
Intel Core Ultra 5 228V, Intel Arc Graphics 130V
33 (28.5min) fps -15%
HP OmniBook X Flip 14
AMD Ryzen AI 9 465, AMD Radeon 880M
32.6 (27.1min, 24.8P1) fps -16%
Lenovo ThinkPad X1 2-in-1 Gen 11
Intel Core Ultra 7 355, Intel Graphics 4 Xe3 Panther Lake iGPU
29.8 (25.8min, 24.8P1) fps -23%
Lenovo ThinkPad T14s Gen 7 21YW0022GE
AMD Ryzen AI 7 PRO 450, AMD Radeon 860M
27.7 (22.9min) fps -28%
Lenovo ThinkPad T14s 2in1 Gen1
Intel Core Ultra 7 255U, Intel Graphics 4-Core iGPU (Meteor / Arrow Lake)
18.3 (15.9min) fps -53%
Lenovo Yoga 7a 2-in-1 14AGP11
AMD Ryzen AI 5 435, AMD Radeon 840M
17.8 (15min) fps -54%
Lenovo IdeaPad 5i 2-in-1 14IPH11
Intel Core Ultra 5 322, Intel Graphics 2 Xe3 Panther Lake iGPU
14 (12min) fps -64%
1920x1080 High Preset (FSR off)
Asus ExpertBook Ultra B9406CAA
Intel Core Ultra X7 358H, Intel Arc B390 12 Xe3 Panther Lake iGPU
53.8 (46.6min, 44.7P1) fps +81%
Dell Pro 14 Premium
Intel Core Ultra 7 268V, Intel Arc Graphics 140V
33.4 (27.8min, 26.4P1) fps +12%
HP EliteBook X G1a 14 AI
AMD Ryzen AI 9 HX PRO 375, AMD Radeon 890M
30.9 (26.5min, 24P1) fps +4%
Dell Pro 7 14 P714265
AMD Ryzen AI 9 HX PRO 470, AMD Radeon 890M
29.7 (25min, 23.6P1) fps
Lenovo ThinkPad E14 Gen 7 21U2002QGE
Intel Core Ultra 5 228V, Intel Arc Graphics 130V
29.2 (24.5min) fps -2%
Przeciętny AMD Radeon 890M
  (13 - 32.3, n=33)
28.1 fps -5%
Lenovo ThinkPad X1 2-in-1 Gen 11
Intel Core Ultra 7 355, Intel Graphics 4 Xe3 Panther Lake iGPU
26.1 (22.5min, 21.6P1) fps -12%
HP OmniBook X Flip 14
AMD Ryzen AI 9 465, AMD Radeon 880M
25.4 (20.4min, 18.1P1) fps -14%
Lenovo ThinkPad T14s Gen 7 21YW0022GE
AMD Ryzen AI 7 PRO 450, AMD Radeon 860M
21.6 (17.5min) fps -27%
Lenovo ThinkPad T14s 2in1 Gen1
Intel Core Ultra 7 255U, Intel Graphics 4-Core iGPU (Meteor / Arrow Lake)
15.5 (13.2min) fps -48%
Lenovo Yoga 7a 2-in-1 14AGP11
AMD Ryzen AI 5 435, AMD Radeon 840M
14.8 (12min) fps -50%
Lenovo IdeaPad 5i 2-in-1 14IPH11
Intel Core Ultra 5 322, Intel Graphics 2 Xe3 Panther Lake iGPU
12.2 (11min) fps -59%
1920x1080 Ultra Preset (FSR off)
Asus ExpertBook Ultra B9406CAA
Intel Core Ultra X7 358H, Intel Arc B390 12 Xe3 Panther Lake iGPU
47.2 (39.1min, 36.3P1) fps +84%
Dell Pro 14 Premium
Intel Core Ultra 7 268V, Intel Arc Graphics 140V
29 (24.3min, 23.4P1) fps +13%
HP EliteBook X G1a 14 AI
AMD Ryzen AI 9 HX PRO 375, AMD Radeon 890M
26.8 (22.8min, 19.6P1) fps +4%
Dell Pro 7 14 P714265
AMD Ryzen AI 9 HX PRO 470, AMD Radeon 890M
25.7 (21.4min, 20.2P1) fps
Lenovo ThinkPad E14 Gen 7 21U2002QGE
Intel Core Ultra 5 228V, Intel Arc Graphics 130V
25.4 (21.1min) fps -1%
Przeciętny AMD Radeon 890M
  (15.5 - 28.4, n=34)
24.8 fps -4%
Lenovo ThinkPad X1 2-in-1 Gen 11
Intel Core Ultra 7 355, Intel Graphics 4 Xe3 Panther Lake iGPU
21.8 (18.6min, 17.7P1) fps -15%
HP OmniBook X Flip 14
AMD Ryzen AI 9 465, AMD Radeon 880M
20.5 (15.8min, 14.1P1) fps -20%
Lenovo ThinkPad T14s Gen 7 21YW0022GE
AMD Ryzen AI 7 PRO 450, AMD Radeon 860M
17.7 (14.1min) fps -31%
Lenovo ThinkPad T14s 2in1 Gen1
Intel Core Ultra 7 255U, Intel Graphics 4-Core iGPU (Meteor / Arrow Lake)
13.7 (11.8min) fps -47%
Lenovo Yoga 7a 2-in-1 14AGP11
AMD Ryzen AI 5 435, AMD Radeon 840M
9.9 (8min) fps -61%
Lenovo IdeaPad 5i 2-in-1 14IPH11
Intel Core Ultra 5 322, Intel Graphics 2 Xe3 Panther Lake iGPU
8.9 (8min) fps -65%
Final Fantasy XV Benchmark
1280x720 Lite Quality
Asus ExpertBook Ultra B9406CAA
Intel Core Ultra X7 358H, Intel Arc B390 12 Xe3 Panther Lake iGPU
134.5 fps +66%
Dell Pro 14 Premium
Intel Core Ultra 7 268V, Intel Arc Graphics 140V
88.5 fps +9%
HP OmniBook X Flip 14
AMD Ryzen AI 9 465, AMD Radeon 880M
85.9 fps +6%
Lenovo ThinkPad E14 Gen 7 21U2002QGE
Intel Core Ultra 5 228V, Intel Arc Graphics 130V
85.6 fps +5%
HP EliteBook X G1a 14 AI
AMD Ryzen AI 9 HX PRO 375, AMD Radeon 890M
85.5 fps +5%
Dell Pro 7 14 P714265
AMD Ryzen AI 9 HX PRO 470, AMD Radeon 890M
81.2 fps
Przeciętny AMD Radeon 890M
  (40.9 - 94.6, n=31)
80.2 fps -1%
Lenovo ThinkPad T14s Gen 7 21YW0022GE
AMD Ryzen AI 7 PRO 450, AMD Radeon 860M
78.8 fps -3%
Lenovo ThinkPad X1 2-in-1 Gen 11
Intel Core Ultra 7 355, Intel Graphics 4 Xe3 Panther Lake iGPU
69 fps -15%
Lenovo ThinkPad T14s 2in1 Gen1
Intel Core Ultra 7 255U, Intel Graphics 4-Core iGPU (Meteor / Arrow Lake)
51.5 fps -37%
Dell Latitude 7440
Intel Core i5-1345U, Intel Iris Xe Graphics G7 80EUs
37.9 fps -53%
1920x1080 Standard Quality
Asus ExpertBook Ultra B9406CAA
Intel Core Ultra X7 358H, Intel Arc B390 12 Xe3 Panther Lake iGPU
76.1 fps +84%
Dell Pro 14 Premium
Intel Core Ultra 7 268V, Intel Arc Graphics 140V
49.5 fps +20%
HP EliteBook X G1a 14 AI
AMD Ryzen AI 9 HX PRO 375, AMD Radeon 890M
45.2 fps +9%
Lenovo ThinkPad E14 Gen 7 21U2002QGE
Intel Core Ultra 5 228V, Intel Arc Graphics 130V
44 fps +7%
HP OmniBook X Flip 14
AMD Ryzen AI 9 465, AMD Radeon 880M
43.1 fps +4%
Przeciętny AMD Radeon 890M
  (23.7 - 48.4, n=31)
41.6 fps +1%
Dell Pro 7 14 P714265
AMD Ryzen AI 9 HX PRO 470, AMD Radeon 890M
41.3 fps
Lenovo ThinkPad T14s Gen 7 21YW0022GE
AMD Ryzen AI 7 PRO 450, AMD Radeon 860M
36.4 fps -12%
Lenovo ThinkPad X1 2-in-1 Gen 11
Intel Core Ultra 7 355, Intel Graphics 4 Xe3 Panther Lake iGPU
36.3 fps -12%
Lenovo ThinkPad T14s 2in1 Gen1
Intel Core Ultra 7 255U, Intel Graphics 4-Core iGPU (Meteor / Arrow Lake)
27.4 fps -34%
Dell Latitude 7440
Intel Core i5-1345U, Intel Iris Xe Graphics G7 80EUs
21 fps -49%
1920x1080 High Quality
Asus ExpertBook Ultra B9406CAA
Intel Core Ultra X7 358H, Intel Arc B390 12 Xe3 Panther Lake iGPU
55.4 fps +82%
Dell Pro 14 Premium
Intel Core Ultra 7 268V, Intel Arc Graphics 140V
36.5 fps +20%
HP EliteBook X G1a 14 AI
AMD Ryzen AI 9 HX PRO 375, AMD Radeon 890M
32.9 fps +8%
HP OmniBook X Flip 14
AMD Ryzen AI 9 465, AMD Radeon 880M
31.3 fps +3%
Lenovo ThinkPad E14 Gen 7 21U2002QGE
Intel Core Ultra 5 228V, Intel Arc Graphics 130V
31 fps +2%
Dell Pro 7 14 P714265
AMD Ryzen AI 9 HX PRO 470, AMD Radeon 890M
30.4 fps
Przeciętny AMD Radeon 890M
  (17.7 - 34.8, n=31)
29.9 fps -2%
Lenovo ThinkPad T14s Gen 7 21YW0022GE
AMD Ryzen AI 7 PRO 450, AMD Radeon 860M
26.8 fps -12%
Lenovo ThinkPad X1 2-in-1 Gen 11
Intel Core Ultra 7 355, Intel Graphics 4 Xe3 Panther Lake iGPU
25.9 fps -15%
Lenovo ThinkPad T14s 2in1 Gen1
Intel Core Ultra 7 255U, Intel Graphics 4-Core iGPU (Meteor / Arrow Lake)
18.8 fps -38%
Dell Latitude 7440
Intel Core i5-1345U, Intel Iris Xe Graphics G7 80EUs
16.8 fps -45%
Strange Brigade
1280x720 lowest AF:1
Asus ExpertBook Ultra B9406CAA
Intel Core Ultra X7 358H, Intel Arc B390 12 Xe3 Panther Lake iGPU
388 (83.8min, 276P1) fps +111%
Lenovo ThinkPad E14 Gen 7 21U2002QGE
Intel Core Ultra 5 228V, Intel Arc Graphics 130V
211 (96.3min, 153.8P1) fps +15%
HP EliteBook X G1a 14 AI
AMD Ryzen AI 9 HX PRO 375, AMD Radeon 890M
195.7 (97min, 164.4P1) fps +6%
Dell Pro 14 Premium
Intel Core Ultra 7 268V, Intel Arc Graphics 140V
194.3 (46.6min, 130.1P1) fps +6%
Lenovo ThinkPad X1 2-in-1 Gen 11
Intel Core Ultra 7 355, Intel Graphics 4 Xe3 Panther Lake iGPU
192.1 (106.5min, 158.6P1) fps +4%
HP OmniBook X Flip 14
AMD Ryzen AI 9 465, AMD Radeon 880M
188.9 (72.4min, 157.9P1) fps +3%
Dell Pro 7 14 P714265
AMD Ryzen AI 9 HX PRO 470, AMD Radeon 890M
184 (89.2min, 157.8P1) fps
Przeciętny AMD Radeon 890M
  (117.3 - 199.8, n=26)
175.4 fps -5%
Lenovo ThinkPad T14s Gen 7 21YW0022GE
AMD Ryzen AI 7 PRO 450, AMD Radeon 860M
167.8 (104.4min, 141.4P1) fps -9%
Lenovo ThinkPad T14s 2in1 Gen1
Intel Core Ultra 7 255U, Intel Graphics 4-Core iGPU (Meteor / Arrow Lake)
126.5 (56.7min, 98.7P1) fps -31%
Dell Latitude 7440
Intel Core i5-1345U, Intel Iris Xe Graphics G7 80EUs
78.5 (10.9min, 23.7P1) fps -57%
1920x1080 medium AA:medium AF:4
Asus ExpertBook Ultra B9406CAA
Intel Core Ultra X7 358H, Intel Arc B390 12 Xe3 Panther Lake iGPU
132.7 (49.3min, 107.1P1) fps +80%
Dell Pro 14 Premium
Intel Core Ultra 7 268V, Intel Arc Graphics 140V
80.2 (22.5min, 67.6P1) fps +9%
HP EliteBook X G1a 14 AI
AMD Ryzen AI 9 HX PRO 375, AMD Radeon 890M
79.5 (54.7min, 66.1P1) fps +8%
Lenovo ThinkPad X1 2-in-1 Gen 11
Intel Core Ultra 7 355, Intel Graphics 4 Xe3 Panther Lake iGPU
76.2 (58.3min, 64.2P1) fps +4%
HP OmniBook X Flip 14
AMD Ryzen AI 9 465, AMD Radeon 880M
75.6 (50.6min, 56.7P1) fps +3%
Przeciętny AMD Radeon 890M
  (60.4 - 82, n=26)
75 fps +2%
Dell Pro 7 14 P714265
AMD Ryzen AI 9 HX PRO 470, AMD Radeon 890M
73.6 (43.2min, 58.9P1) fps
Lenovo ThinkPad E14 Gen 7 21U2002QGE
Intel Core Ultra 5 228V, Intel Arc Graphics 130V
72.2 (47.8min, 60.2P1) fps -2%
Lenovo ThinkPad T14s Gen 7 21YW0022GE
AMD Ryzen AI 7 PRO 450, AMD Radeon 860M
64 (46.4min, 48.6P1) fps -13%
Lenovo ThinkPad T14s 2in1 Gen1
Intel Core Ultra 7 255U, Intel Graphics 4-Core iGPU (Meteor / Arrow Lake)
54.7 (34.4min, 43.9P1) fps -26%
Dell Latitude 7440
Intel Core i5-1345U, Intel Iris Xe Graphics G7 80EUs
33.8 (11.5min, 18.6P1) fps -54%
1920x1080 high AA:high AF:8
Asus ExpertBook Ultra B9406CAA
Intel Core Ultra X7 358H, Intel Arc B390 12 Xe3 Panther Lake iGPU
107.6 (64.5min, 89P1) fps +77%
HP EliteBook X G1a 14 AI
AMD Ryzen AI 9 HX PRO 375, AMD Radeon 890M
67.8 (42.6min, 51P1) fps +12%
Dell Pro 14 Premium
Intel Core Ultra 7 268V, Intel Arc Graphics 140V
67.4 (18.8min, 52.5P1) fps +11%
Przeciętny AMD Radeon 890M
  (51 - 69.8, n=26)
63.2 fps +4%
Lenovo ThinkPad X1 2-in-1 Gen 11
Intel Core Ultra 7 355, Intel Graphics 4 Xe3 Panther Lake iGPU
62.1 (42.8min, 48.3P1) fps +2%
HP OmniBook X Flip 14
AMD Ryzen AI 9 465, AMD Radeon 880M
60.8 (16.7min, 44P1) fps 0%
Dell Pro 7 14 P714265
AMD Ryzen AI 9 HX PRO 470, AMD Radeon 890M
60.8 (40.2min, 45.9P1) fps
Lenovo ThinkPad E14 Gen 7 21U2002QGE
Intel Core Ultra 5 228V, Intel Arc Graphics 130V
58.4 (37.5min, 45.9P1) fps -4%
Lenovo ThinkPad T14s Gen 7 21YW0022GE
AMD Ryzen AI 7 PRO 450, AMD Radeon 860M
52 (35.9min, 40.8P1) fps -14%
Lenovo ThinkPad T14s 2in1 Gen1
Intel Core Ultra 7 255U, Intel Graphics 4-Core iGPU (Meteor / Arrow Lake)
43.8 (16.8min, 31.9P1) fps -28%
Dell Latitude 7440
Intel Core i5-1345U, Intel Iris Xe Graphics G7 80EUs
26.9 (6.9min, 12.5P1) fps -56%
1920x1080 ultra AA:ultra AF:16
Asus ExpertBook Ultra B9406CAA
Intel Core Ultra X7 358H, Intel Arc B390 12 Xe3 Panther Lake iGPU
99.5 (24.8min, 76.1P1) fps +92%
Dell Pro 14 Premium
Intel Core Ultra 7 268V, Intel Arc Graphics 140V
57.6 (15.1min, 29.8P1) fps +11%
HP EliteBook X G1a 14 AI
AMD Ryzen AI 9 HX PRO 375, AMD Radeon 890M
56.5 (17.6min, 30.5P1) fps +9%
Przeciętny AMD Radeon 890M
  (44.8 - 59.7, n=26)
53.8 fps +4%
Lenovo ThinkPad X1 2-in-1 Gen 11
Intel Core Ultra 7 355, Intel Graphics 4 Xe3 Panther Lake iGPU
53 (34.5min, 41P1) fps +3%
Dell Pro 7 14 P714265
AMD Ryzen AI 9 HX PRO 470, AMD Radeon 890M
51.7 (33min, 38.9P1) fps
Lenovo ThinkPad E14 Gen 7 21U2002QGE
Intel Core Ultra 5 228V, Intel Arc Graphics 130V
51.4 (23min, 38P1) fps -1%
HP OmniBook X Flip 14
AMD Ryzen AI 9 465, AMD Radeon 880M
50.7 (30.9min, 37.2P1) fps -2%
Lenovo ThinkPad T14s Gen 7 21YW0022GE
AMD Ryzen AI 7 PRO 450, AMD Radeon 860M
44.4 (33min, 34.8P1) fps -14%
Lenovo ThinkPad T14s 2in1 Gen1
Intel Core Ultra 7 255U, Intel Graphics 4-Core iGPU (Meteor / Arrow Lake)
35.2 (23min, 26.3P1) fps -32%
Dell Latitude 7440
Intel Core i5-1345U, Intel Iris Xe Graphics G7 80EUs
21.9 (5min, 6.24P1) fps -58%
F1 24
1920x1080 Low Preset AA:T AF:16x
Asus ExpertBook Ultra B9406CAA
Intel Core Ultra X7 358H, Intel Arc B390 12 Xe3 Panther Lake iGPU
146.3 (125min, 106P1) fps +78%
Przeciętny AMD Radeon 890M
  (48.4 - 104.6, n=23)
83.1 fps +1%
Dell Pro 14 Premium
Intel Core Ultra 7 268V, Intel Arc Graphics 140V
82.4 (52min, 52P1) fps 0%
Dell Pro 7 14 P714265
AMD Ryzen AI 9 HX PRO 470, AMD Radeon 890M
82.1 (69min, 55P1) fps
Lenovo ThinkPad E14 Gen 7 21U2002QGE
Intel Core Ultra 5 228V, Intel Arc Graphics 130V
80.6 (66min, 61P1) fps -2%
HP OmniBook X Flip 14
AMD Ryzen AI 9 465, AMD Radeon 880M
77.7 (57min, 44P1) fps -5%
Lenovo ThinkPad T14s Gen 7 21YW0022GE
AMD Ryzen AI 7 PRO 450, AMD Radeon 860M
69 (54min, 48P1) fps -16%
Lenovo ThinkPad X1 2-in-1 Gen 11
Intel Core Ultra 7 355, Intel Graphics 4 Xe3 Panther Lake iGPU
68 (56min, 56P1) fps -17%
Lenovo ThinkPad T14s 2in1 Gen1
Intel Core Ultra 7 255U, Intel Graphics 4-Core iGPU (Meteor / Arrow Lake)
41.7 (34min, 32P1) fps -49%
1920x1080 Medium Preset AA:T AF:16x
Asus ExpertBook Ultra B9406CAA
Intel Core Ultra X7 358H, Intel Arc B390 12 Xe3 Panther Lake iGPU
135 (117min, 95P1) fps +84%
Dell Pro 14 Premium
Intel Core Ultra 7 268V, Intel Arc Graphics 140V
75.7 (58min, 48P1) fps +3%
Przeciętny AMD Radeon 890M
  (43.9 - 94, n=23)
75.3 fps +2%
Lenovo ThinkPad E14 Gen 7 21U2002QGE
Intel Core Ultra 5 228V, Intel Arc Graphics 130V
74.3 (62min, 58P1) fps +1%
Dell Pro 7 14 P714265
AMD Ryzen AI 9 HX PRO 470, AMD Radeon 890M
73.5 (62min, 55P1) fps
HP OmniBook X Flip 14
AMD Ryzen AI 9 465, AMD Radeon 880M
69.5 (46min, 39P1) fps -5%
Lenovo ThinkPad X1 2-in-1 Gen 11
Intel Core Ultra 7 355, Intel Graphics 4 Xe3 Panther Lake iGPU
63.8 (54min, 54P1) fps -13%
Lenovo ThinkPad T14s Gen 7 21YW0022GE
AMD Ryzen AI 7 PRO 450, AMD Radeon 860M
61.7 (52min, 44P1) fps -16%
Lenovo ThinkPad T14s 2in1 Gen1
Intel Core Ultra 7 255U, Intel Graphics 4-Core iGPU (Meteor / Arrow Lake)
39.6 (33min, 29P1) fps -46%
1920x1080 High Preset AA:T AF:16x
Asus ExpertBook Ultra B9406CAA
Intel Core Ultra X7 358H, Intel Arc B390 12 Xe3 Panther Lake iGPU
104.3 (91min, 76P1) fps +86%
Dell Pro 14 Premium
Intel Core Ultra 7 268V, Intel Arc Graphics 140V
59.9 (46min, 43P1) fps +7%
Dell Pro 7 14 P714265
AMD Ryzen AI 9 HX PRO 470, AMD Radeon 890M
56 (46min, 39P1) fps
Lenovo ThinkPad E14 Gen 7 21U2002QGE
Intel Core Ultra 5 228V, Intel Arc Graphics 130V
55.2 (46min, 46P1) fps -1%
Przeciętny AMD Radeon 890M
  (31.1 - 67, n=23)
54.9 fps -2%
HP OmniBook X Flip 14
AMD Ryzen AI 9 465, AMD Radeon 880M
50.2 (35min, 31P1) fps -10%
Lenovo ThinkPad X1 2-in-1 Gen 11
Intel Core Ultra 7 355, Intel Graphics 4 Xe3 Panther Lake iGPU
46.7 (39min, 39P1) fps -17%
Lenovo ThinkPad T14s Gen 7 21YW0022GE
AMD Ryzen AI 7 PRO 450, AMD Radeon 860M
45.8 (37min, 33P1) fps -18%
Lenovo ThinkPad T14s 2in1 Gen1
Intel Core Ultra 7 255U, Intel Graphics 4-Core iGPU (Meteor / Arrow Lake)
30 (25min, 22P1) fps -46%
1920x1080 Ultra High Preset AA:T AF:16x
Asus ExpertBook Ultra B9406CAA
Intel Core Ultra X7 358H, Intel Arc B390 12 Xe3 Panther Lake iGPU
38 (31min, 30P1) fps +153%
Dell Pro 14 Premium
Intel Core Ultra 7 268V, Intel Arc Graphics 140V
19.1 (7min, 14P1) fps +27%
Lenovo ThinkPad E14 Gen 7 21U2002QGE
Intel Core Ultra 5 228V, Intel Arc Graphics 130V
18.1 (15min, 15P1) fps +21%
Dell Pro 7 14 P714265
AMD Ryzen AI 9 HX PRO 470, AMD Radeon 890M
15 (9min, 8P1) fps
Lenovo ThinkPad X1 2-in-1 Gen 11
Intel Core Ultra 7 355, Intel Graphics 4 Xe3 Panther Lake iGPU
14.8 (12min, 11P1) fps -1%
Przeciętny AMD Radeon 890M
  (8.41 - 18.4, n=19)
14.1 fps -6%
HP OmniBook X Flip 14
AMD Ryzen AI 9 465, AMD Radeon 880M
13.1 (9min, 7P1) fps -13%
Lenovo ThinkPad T14s Gen 7 21YW0022GE
AMD Ryzen AI 7 PRO 450, AMD Radeon 860M
10.8 (8min, 8P1) fps -28%
Lenovo ThinkPad T14s 2in1 Gen1
Intel Core Ultra 7 255U, Intel Graphics 4-Core iGPU (Meteor / Arrow Lake)
8.51 (6min, 6P1) fps -43%
X-Plane 11.11
1280x720 low (fps_test=1)
Przeciętny AMD Radeon 890M
  (45.5 - 92.8, n=31)
75.1 fps +16%
HP OmniBook X Flip 14
AMD Ryzen AI 9 465, AMD Radeon 880M
70 fps +8%
Lenovo ThinkPad T14s Gen 7 21YW0022GE
AMD Ryzen AI 7 PRO 450, AMD Radeon 860M
69.9 fps +8%
HP EliteBook X G1a 14 AI
AMD Ryzen AI 9 HX PRO 375, AMD Radeon 890M
65.1 fps 0%
Dell Pro 7 14 P714265
AMD Ryzen AI 9 HX PRO 470, AMD Radeon 890M
65 fps
Asus ExpertBook Ultra B9406CAA
Intel Core Ultra X7 358H, Intel Arc B390 12 Xe3 Panther Lake iGPU
58.5 fps -10%
Lenovo Yoga 7a 2-in-1 14AGP11
AMD Ryzen AI 5 435, AMD Radeon 840M
53 fps -18%
Dell Pro 14 Premium
Intel Core Ultra 7 268V, Intel Arc Graphics 140V
46.2 fps -29%
Lenovo ThinkPad E14 Gen 7 21U2002QGE
Intel Core Ultra 5 228V, Intel Arc Graphics 130V
44.4 fps -32%
Lenovo ThinkPad T14s 2in1 Gen1
Intel Core Ultra 7 255U, Intel Graphics 4-Core iGPU (Meteor / Arrow Lake)
38.5 fps -41%
Dell Latitude 7440
Intel Core i5-1345U, Intel Iris Xe Graphics G7 80EUs
33.8 fps -48%
Lenovo ThinkPad X1 2-in-1 Gen 11
Intel Core Ultra 7 355, Intel Graphics 4 Xe3 Panther Lake iGPU
33 fps -49%
Lenovo IdeaPad 5i 2-in-1 14IPH11
Intel Core Ultra 5 322, Intel Graphics 2 Xe3 Panther Lake iGPU
22.9 fps -65%
1920x1080 med (fps_test=2)
Przeciętny AMD Radeon 890M
  (40.8 - 71.1, n=31)
59.3 fps +10%
HP OmniBook X Flip 14
AMD Ryzen AI 9 465, AMD Radeon 880M
55.7 fps +3%
HP EliteBook X G1a 14 AI
AMD Ryzen AI 9 HX PRO 375, AMD Radeon 890M
54.9 fps +2%
Dell Pro 7 14 P714265
AMD Ryzen AI 9 HX PRO 470, AMD Radeon 890M
53.9 fps
Lenovo ThinkPad T14s Gen 7 21YW0022GE
AMD Ryzen AI 7 PRO 450, AMD Radeon 860M
51.2 fps -5%
Asus ExpertBook Ultra B9406CAA
Intel Core Ultra X7 358H, Intel Arc B390 12 Xe3 Panther Lake iGPU
45.5 fps -16%
Dell Pro 14 Premium
Intel Core Ultra 7 268V, Intel Arc Graphics 140V
39.6 fps -27%
Lenovo Yoga 7a 2-in-1 14AGP11
AMD Ryzen AI 5 435, AMD Radeon 840M
38.7 fps -28%
Lenovo ThinkPad E14 Gen 7 21U2002QGE
Intel Core Ultra 5 228V, Intel Arc Graphics 130V
31.6 fps -41%
Lenovo ThinkPad T14s 2in1 Gen1
Intel Core Ultra 7 255U, Intel Graphics 4-Core iGPU (Meteor / Arrow Lake)
30 fps -44%
Dell Latitude 7440
Intel Core i5-1345U, Intel Iris Xe Graphics G7 80EUs
28.3 fps -47%
Lenovo ThinkPad X1 2-in-1 Gen 11
Intel Core Ultra 7 355, Intel Graphics 4 Xe3 Panther Lake iGPU
27.2 fps -50%
Lenovo IdeaPad 5i 2-in-1 14IPH11
Intel Core Ultra 5 322, Intel Graphics 2 Xe3 Panther Lake iGPU
22.9 fps -58%
1920x1080 high (fps_test=3)
Przeciętny AMD Radeon 890M
  (33.7 - 58.3, n=31)
46.3 fps +15%
HP OmniBook X Flip 14
AMD Ryzen AI 9 465, AMD Radeon 880M
43.6 fps +8%
HP EliteBook X G1a 14 AI
AMD Ryzen AI 9 HX PRO 375, AMD Radeon 890M
42.2 fps +5%
Lenovo ThinkPad T14s Gen 7 21YW0022GE
AMD Ryzen AI 7 PRO 450, AMD Radeon 860M
40.7 fps +1%
Dell Pro 7 14 P714265
AMD Ryzen AI 9 HX PRO 470, AMD Radeon 890M
40.2 fps
Asus ExpertBook Ultra B9406CAA
Intel Core Ultra X7 358H, Intel Arc B390 12 Xe3 Panther Lake iGPU
39.7 fps -1%
Dell Pro 14 Premium
Intel Core Ultra 7 268V, Intel Arc Graphics 140V
34.9 fps -13%
Lenovo Yoga 7a 2-in-1 14AGP11
AMD Ryzen AI 5 435, AMD Radeon 840M
34 fps -15%
Lenovo ThinkPad E14 Gen 7 21U2002QGE
Intel Core Ultra 5 228V, Intel Arc Graphics 130V
29.2 fps -27%
Lenovo ThinkPad X1 2-in-1 Gen 11
Intel Core Ultra 7 355, Intel Graphics 4 Xe3 Panther Lake iGPU
24.7 fps -39%
Lenovo ThinkPad T14s 2in1 Gen1
Intel Core Ultra 7 255U, Intel Graphics 4-Core iGPU (Meteor / Arrow Lake)
23.8 fps -41%
Lenovo IdeaPad 5i 2-in-1 14IPH11
Intel Core Ultra 5 322, Intel Graphics 2 Xe3 Panther Lake iGPU
22.9 fps -43%
Dell Latitude 7440
Intel Core i5-1345U, Intel Iris Xe Graphics G7 80EUs
21.3 fps -47%
Dota 2 Reborn - 1920x1080 ultra (3/3) best looking
Asus ExpertBook Ultra B9406CAA
Intel Core Ultra X7 358H, Intel Arc B390 12 Xe3 Panther Lake iGPU
102.5 (67.7min) fps +29%
Dell Pro 14 Premium
Intel Core Ultra 7 268V, Intel Arc Graphics 140V
87.4 (56.9min) fps +10%
HP OmniBook X Flip 14
AMD Ryzen AI 9 465, AMD Radeon 880M
86 (76.2min) fps +9%
Lenovo ThinkPad X1 2-in-1 Gen 11
Intel Core Ultra 7 355, Intel Graphics 4 Xe3 Panther Lake iGPU
84.9 (56.2min) fps +7%
Lenovo ThinkPad T14s Gen 7 21YW0022GE
AMD Ryzen AI 7 PRO 450, AMD Radeon 860M
81.3 (71.8min) fps +3%
Dell Pro 7 14 P714265
AMD Ryzen AI 9 HX PRO 470, AMD Radeon 890M
79.2 (63.3min) fps
Przeciętny AMD Radeon 890M
  (32.4 - 93, n=34)
68.2 fps -14%
Lenovo Yoga 7a 2-in-1 14AGP11
AMD Ryzen AI 5 435, AMD Radeon 840M
57.9 (52min) fps -27%
Dell Latitude 7440
Intel Core i5-1345U, Intel Iris Xe Graphics G7 80EUs
56.3 (41.5min) fps -29%
Lenovo ThinkPad E14 Gen 7 21U2002QGE
Intel Core Ultra 5 228V, Intel Arc Graphics 130V
52.2 (30.3min) fps -34%
Lenovo ThinkPad T14s 2in1 Gen1
Intel Core Ultra 7 255U, Intel Graphics 4-Core iGPU (Meteor / Arrow Lake)
51.8 (29.8min) fps -35%
HP EliteBook X G1a 14 AI
AMD Ryzen AI 9 HX PRO 375, AMD Radeon 890M
44.8 (33.2min) fps -43%
Lenovo IdeaPad 5i 2-in-1 14IPH11
Intel Core Ultra 5 322, Intel Graphics 2 Xe3 Panther Lake iGPU
34.6 fps -56%
GTA V
1920x1080 High/On (Advanced Graphics Off) AA:2xMSAA + FX AF:8x
Asus ExpertBook Ultra B9406CAA
Intel Core Ultra X7 358H, Intel Arc B390 12 Xe3 Panther Lake iGPU
111.9 (7.17min, 76.9P1) fps +42%
HP EliteBook X G1a 14 AI
AMD Ryzen AI 9 HX PRO 375, AMD Radeon 890M
79.5 (5.91min, 52.6P1) fps +1%
Dell Pro 7 14 P714265
AMD Ryzen AI 9 HX PRO 470, AMD Radeon 890M
78.9 (5.51min, 55.6P1) fps
HP OmniBook X Flip 14
AMD Ryzen AI 9 465, AMD Radeon 880M
74.6 (5.57min, 50P1) fps -5%
Przeciętny AMD Radeon 890M
  (36.6 - 81.5, n=30)
72.6 fps -8%
Lenovo ThinkPad T14s Gen 7 21YW0022GE
AMD Ryzen AI 7 PRO 450, AMD Radeon 860M
67.6 (6.64min, 47.6P1) fps -14%
Lenovo ThinkPad E14 Gen 7 21U2002QGE
Intel Core Ultra 5 228V, Intel Arc Graphics 130V
65.8 (7.58min, 50P1) fps -17%
Lenovo ThinkPad X1 2-in-1 Gen 11
Intel Core Ultra 7 355, Intel Graphics 4 Xe3 Panther Lake iGPU
54.8 (8.59min, 40P1) fps -31%
Lenovo Yoga 7a 2-in-1 14AGP11
AMD Ryzen AI 5 435, AMD Radeon 840M
47 (4.94min, 33.3P1) fps -40%
Lenovo ThinkPad T14s 2in1 Gen1
Intel Core Ultra 7 255U, Intel Graphics 4-Core iGPU (Meteor / Arrow Lake)
25.8 (3.56min, 17.2P1) fps -67%
Dell Latitude 7440
Intel Core i5-1345U, Intel Iris Xe Graphics G7 80EUs
20.7 (7.69min, 15.4P1) fps -74%
1920x1080 Highest AA:4xMSAA + FX AF:16x
Asus ExpertBook Ultra B9406CAA
Intel Core Ultra X7 358H, Intel Arc B390 12 Xe3 Panther Lake iGPU
45.3 (11.1min, 34.5P1) fps +38%
HP EliteBook X G1a 14 AI
AMD Ryzen AI 9 HX PRO 375, AMD Radeon 890M
33.3 (3.55min, 23.8P1) fps +2%
Dell Pro 7 14 P714265
AMD Ryzen AI 9 HX PRO 470, AMD Radeon 890M
32.8 (4.62min, 23.8P1) fps
Przeciętny AMD Radeon 890M
  (14.9 - 33.3, n=30)
30.4 fps -7%
HP OmniBook X Flip 14
AMD Ryzen AI 9 465, AMD Radeon 880M
29.7 (4.58min, 19.6P1) fps -9%
Lenovo ThinkPad E14 Gen 7 21U2002QGE
Intel Core Ultra 5 228V, Intel Arc Graphics 130V
25.6 (8.2min, 20.8P1) fps -22%
Lenovo ThinkPad T14s Gen 7 21YW0022GE
AMD Ryzen AI 7 PRO 450, AMD Radeon 860M
25.4 (4.78min, 18.2P1) fps -23%
Lenovo ThinkPad X1 2-in-1 Gen 11
Intel Core Ultra 7 355, Intel Graphics 4 Xe3 Panther Lake iGPU
21.8 (4.61min, 16.7P1) fps -34%
Lenovo Yoga 7a 2-in-1 14AGP11
AMD Ryzen AI 5 435, AMD Radeon 840M
14.3 (3.37min, 10.3P1) fps -56%
Lenovo ThinkPad T14s 2in1 Gen1
Intel Core Ultra 7 255U, Intel Graphics 4-Core iGPU (Meteor / Arrow Lake)
10.3 (4.91min, 8.26P1) fps -69%
Dell Latitude 7440
Intel Core i5-1345U, Intel Iris Xe Graphics G7 80EUs
8.81 (4.42min, 5.46P1) fps -73%

Wykres liczby klatek na sekundę w grze Cyberpunk 2077 w ustawieniach ultra

0510152025Tooltip
Dell Pro 7 14 P714265 Ryzen AI 9 HX PRO 470, Radeon 890M: Ø24.4 (21.6-26.7) fps
lowmed.highultra
GTA V (2015) 170.1 78.9 32.8
Dota 2 Reborn (2015) 153.9 125.8 88.9 79.2
Final Fantasy XV Benchmark (2018) 81.2 41.3 30.4
X-Plane 11.11 (2018) 65 53.9 40.2
Strange Brigade (2018) 184 73.6 60.8 51.7
Baldur's Gate 3 (2023) 44.1 35.3 28 27
Cyberpunk 2077 (2023) 49.2 38.6 29.7 25.7
F1 24 (2024) 82.1 73.5 56 15

Emisje

Hałas systemowy

Profil hałasu wentylatora (biały: tło, czerwony: system w stanie spoczynku, niebieski: 3DMark 06, pomarańczowy: Cyberpunk 2077, zielony: obciążenie Prime95)

Hałas

luz
23.2 / 23.2 / 23.2 dB
obciążenie
37.5 / 47.1 dB
  red to green bar
 
 
30 dB
cichy
40 dB(A)
słyszalny
50 dB(A)
irytujący
 
min: dark, med: mid, max: light   Earthworks M23R, Arta (odległość 15 cm)   hałas otoczenia: 23.2 dB(A)
dB(A) 0102030405060708090Deep BassMiddle BassHigh BassLower RangeMidsHigher MidsLower HighsMid HighsUpper HighsSuper Highs2034.427.336.832.133.12525.622.125.423.522.93121.920.721.522.621.44017.718.718.719.518.25023.52221.726.427.56322.722.122.724.625.78022.720.923.825.327.110021.318.719.923.122.212516.916.217.918.618.71601716.714.116.222.720019.218.514.114.124.425021.419.913.114.227.731520.41912.814.627.140020.320.210.511.928.950020.120.410.510.43063022.121.99.710.131.280022.422.51010.531.3100024.824.69.89.934.312502626.49.79.635.4160027.226.89.99.836.1200028.328.1101036.6250029.329.310.610.438.3315029.12910.910.738.3400025.22511.31135.2500023.222.811.911.335.4630017.217.112.111.632.7800015.115.212.411.930.11000013.213.312.412.325.61250012.312.412.31221.71600011.111.211.211.117.2SPL37.737.523.223.247.1N2.42.30.40.55.5median 21.3median 20.2median 11.3median 11.3median 30.1Delta4.14.31.51.96.4hearing rangehide median Fan NoiseDell Pro 7 14 P714265
Dell Pro 7 14 P714265
Ryzen AI 9 HX PRO 470, Radeon 890M
Dell Pro 14 Premium
Core Ultra 7 268V, Arc 140V
Dell Latitude 7440
i5-1345U, Iris Xe G7 80EUs
Lenovo ThinkPad T14s Gen 7 21YW0022GE
Ryzen AI 7 PRO 450, Radeon 860M
Asus ExpertBook Ultra B9406CAA
Ultra X7 358H, Arc B390 Panther Lake iGPU
HP EliteBook X G1a 14 AI
Ryzen AI 9 HX PRO 375, Radeon 890M
Noise
-2%
10%
-3%
2%
2%
wyłączone / środowisko * (dB)
23.2
23.1
-0%
22.8
2%
24.8
-7%
22.9
1%
24
-3%
Idle Minimum * (dB)
23.2
23.1
-0%
22.8
2%
24.8
-7%
23.4
-1%
24.4
-5%
Idle Average * (dB)
23.2
23.1
-0%
22.8
2%
24.8
-7%
23.4
-1%
24.4
-5%
Idle Maximum * (dB)
23.2
23.1
-0%
22.8
2%
24.8
-7%
23.4
-1%
24.5
-6%
Load Average * (dB)
37.5
38.2
-2%
26.3
30%
36.7
2%
28.6
24%
25.4
32%
Cyberpunk 2077 ultra * (dB)
37.7
44.2
-17%
41.6
-10%
42.8
-14%
39.3
-4%
Load Maximum * (dB)
47.1
44.2
6%
38.3
19%
41.6
12%
45.2
4%
43.1
8%
Witcher 3 ultra * (dB)
30

* ... im mniej tym lepiej

Temperatura
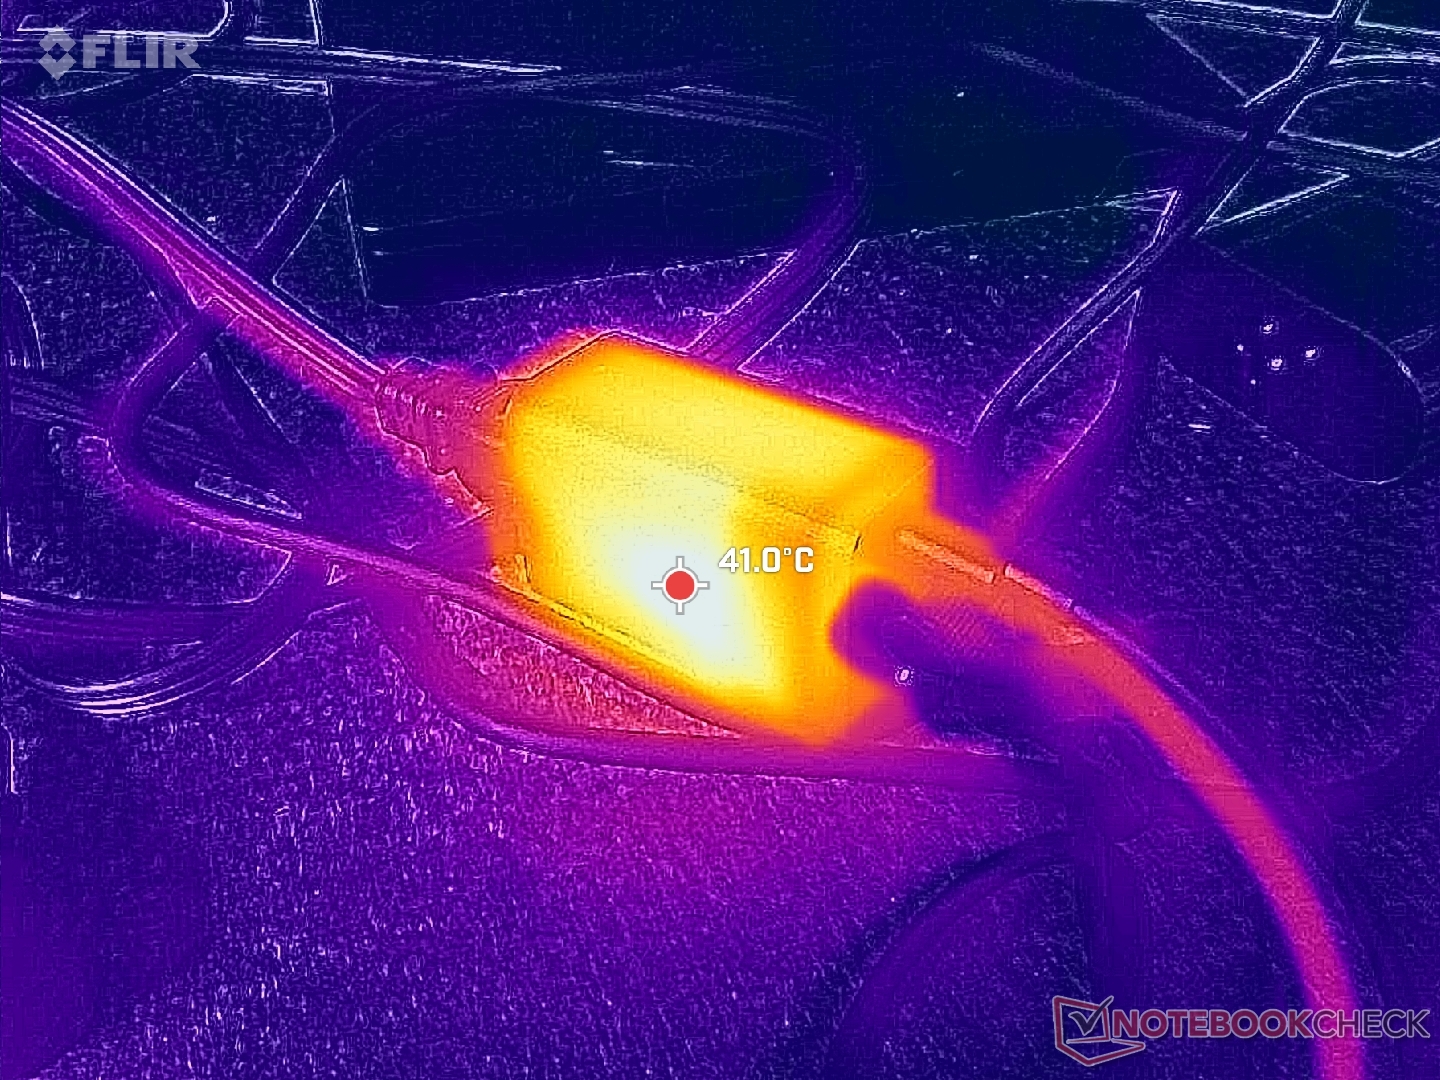
Tylny układ wydechowy
Mały zasilacz sieciowy o mocy 65 W (~4,2 x 3,2 x 6,4 cm) osiąga temperaturę ponad 41°C podczas pracy pod dużym obciążeniem
w stresie
 40.2 °C40.8 °C34.6 °C 
 39.6 °C39.2 °C29.8 °C 
 28.2 °C25.8 °C23.2 °C 
maks. w ogóle: 40.8 °C
średnia: 33.5 °C
27.6 °C40 °C42.6 °C
25.4 °C39.4 °C41.6 °C
24.2 °C28.6 °C32 °C
maks. w ogóle: 42.6 °C
średnia: 33.5 °C
zasilacz  42 °C | temperatura otoczenia 20 °C | Fluke 62 Mini IR Thermometer
(±) Średnia temperatura górnej części przy maksymalnym obciążeniu wynosi 33.5 °C / 92 F, w porównaniu do średniej 29.5 °C / ###class_avg_f# ## F dla urządzeń w klasie Office.
(±) Maksymalna temperatura w górnej części wynosi 40.8 °C / 105 F, w porównaniu do średniej 34.3 °C / 94 F , począwszy od 21.2 do 62.5 °C dla klasy Office.
(±) Dno nagrzewa się maksymalnie do 42.6 °C / 109 F, w porównaniu do średniej 36.8 °C / 98 F
(+) W stanie bezczynności średnia temperatura górnej części wynosi 24.4 °C / 76 F, w porównaniu ze średnią temperaturą urządzenia wynoszącą 29.5 °C / ### class_avg_f### F.
(+) Podpórki pod nadgarstki i touchpad są chłodniejsze niż temperatura skóry i maksymalnie 28.2 °C / 82.8 F i dlatego są chłodne w dotyku.
(±) Średnia temperatura obszaru podparcia dłoni w podobnych urządzeniach wynosiła 27.5 °C / 81.5 F (-0.7 °C / -1.3 F).
Stan bezczynności systemu (okładka C)
Stan bezczynności systemu (pokrywa D)
Test obciążeniowy Prime95+FurMark (poziom C)
Dell Pro 7 14 P714265
Ryzen AI 9 HX PRO 470, Radeon 890M
Dell Pro 14 Premium
Core Ultra 7 268V, Arc 140V
Dell Latitude 7440
i5-1345U, Iris Xe G7 80EUs
Lenovo ThinkPad T14s Gen 7 21YW0022GE
Ryzen AI 7 PRO 450, Radeon 860M
Asus ExpertBook Ultra B9406CAA
Ultra X7 358H, Arc B390 Panther Lake iGPU
HP EliteBook X G1a 14 AI
Ryzen AI 9 HX PRO 375, Radeon 890M
Heat
12%
1%
2%
8%
12%
Maximum Upper Side * (°C)
40.8
33
19%
39
4%
42.3
-4%
38.6
5%
36
12%
Maximum Bottom * (°C)
42.6
28
34%
40.6
5%
43.8
-3%
38.4
10%
34.2
20%
Idle Upper Side * (°C)
26
28
-8%
28
-8%
25.2
3%
24.6
5%
25
4%
Idle Bottom * (°C)
29.2
28.8
1%
28.8
1%
25.5
13%
26
11%
25.6
12%

* ... im mniej tym lepiej

Test obciążeniowy

Po uruchomieniu testu obciążeniowego Prime95 częstotliwość procesora wzrastała do 3,3 GHz, a pobór mocy do 44 W, utrzymując się na tym poziomie zaledwie przez kilka sekund, po czym ustabilizowała się na poziomie 2,4 GHz i 28 W.
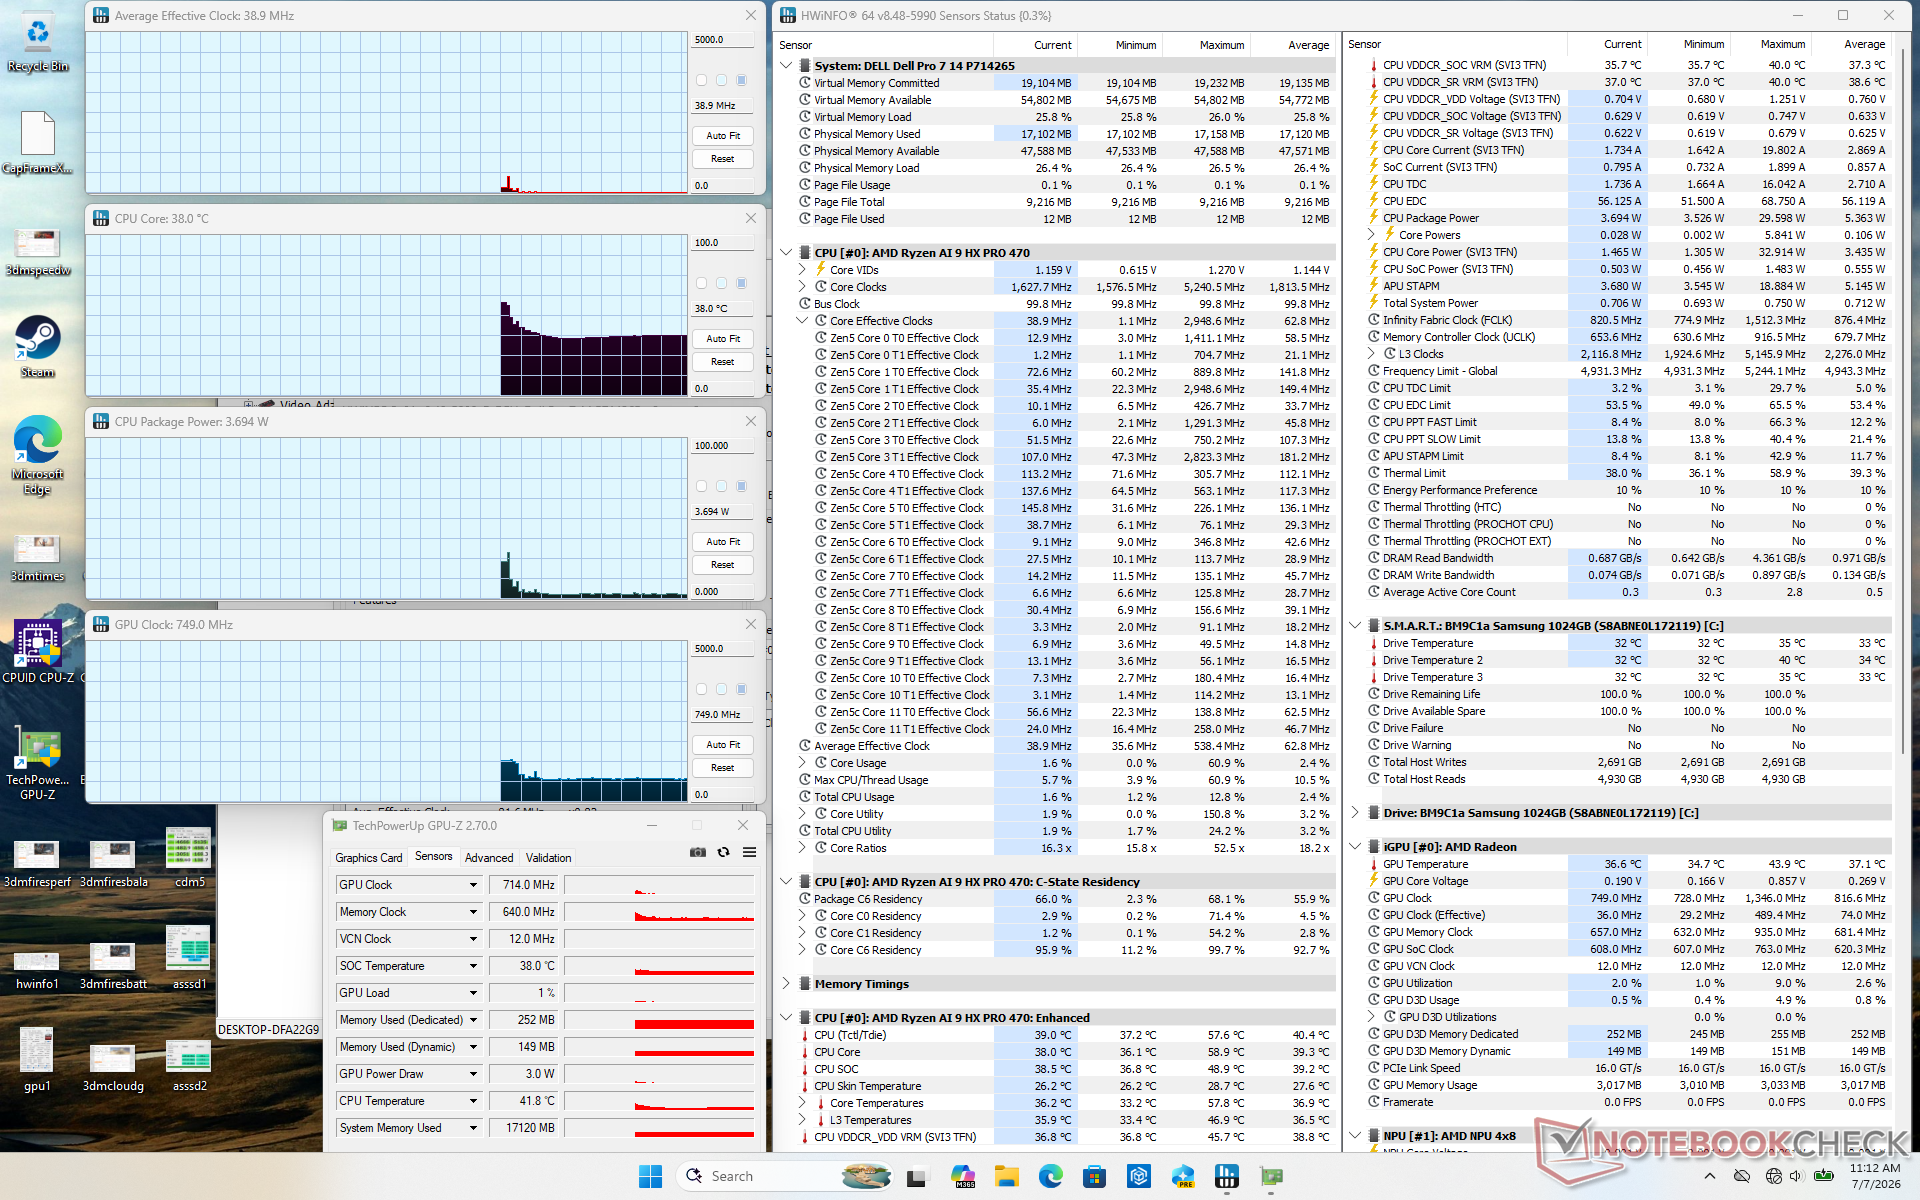
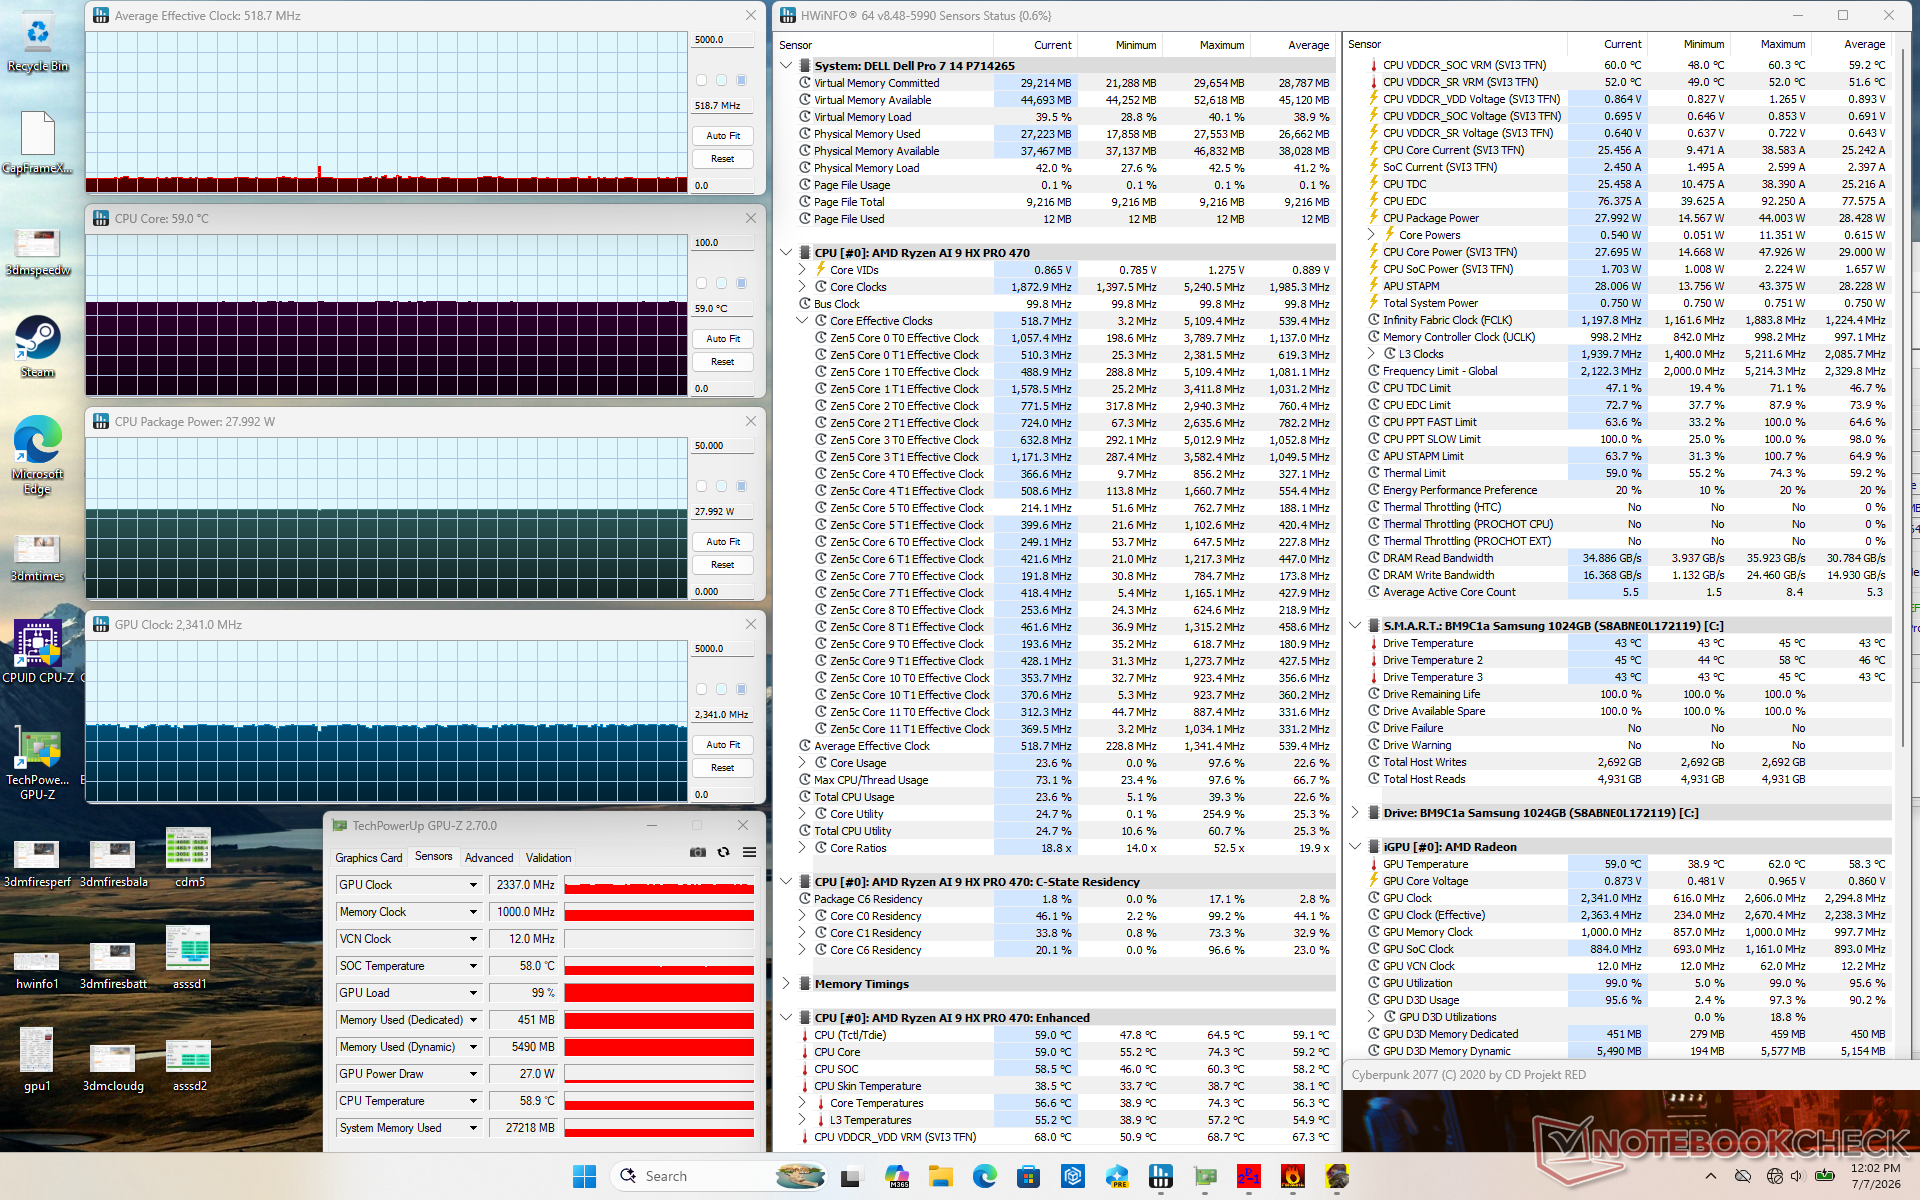
Bezczynność systemu
Bezczynność systemu
Obciążenie gry Cyberpunk 2077
Test obciążeniowy Prime95
Testy obciążeniowe Prime95 i FurMark
Średnia częstotliwość taktowania procesora (GHz) Częstotliwość taktowania karty graficznej (MHz) Średnia temperatura procesora (°C)
Tryb bezczynności systemu -- -- 38
Obciążenie programem Prime95 2,4 -- 62
ObciążenieprogramamiPrime95 i FurMark 2,2 754 63
Obciążenie grąCyberpunk 2077 0,5 2341 59

Prelegenci

Szum różowy charakteryzuje się wysoką maksymalną głośnością oraz szerszym niż zwykle zakresem dla danej klasy wielkości
dB(A) 0102030405060708090Deep BassMiddle BassHigh BassLower RangeMidsHigher MidsLower HighsMid HighsUpper HighsSuper Highs2036.8352525.4253121.524.74018.720.85021.724.16322.724.38023.839.610019.950.612517.955.716014.159.920014.161.825013.16531512.867.640010.570.250010.569.26309.7748001076.910009.87512509.774.116009.977.520001075.7250010.674.5315010.974.6400011.373.9500011.970.2630012.170.2800012.467.41000012.462.71250012.364.51600011.262.7SPL23.285.9N0.468.4median 11.3median 70.2Delta1.55.526.325.821.422.12624.925.127.622.532.523.448.72655.818.860.922.167.2267019.372.317.674.217.774.319.575.31571.711.871.311.27410.574.21072.710.17210.67210.97511.374.811.671.71269.71269.612.371.112.669.61270.111.269.824.784.70.666.6median 12median 71.73.42.2hearing rangehide median Pink NoiseDell Pro 7 14 P714265Apple MacBook Pro 16 2021 M1 Pro
Wykres częstotliwości (pola wyboru można zaznaczyć i odznaczyć, aby porównać urządzenia)
Dell Pro 7 14 P714265 analiza dźwięku

(+) | głośniki mogą odtwarzać stosunkowo głośno (85.9 dB)
Bas 100 - 315 Hz
(±) | zredukowany bas - średnio 10.1% niższy od mediany
(±) | liniowość basu jest średnia (7.9% delta do poprzedniej częstotliwości)
Średnie 400 - 2000 Hz
(+) | zbalansowane środki średnie - tylko 4.1% od mediany
(+) | średnie są liniowe (4.1% delta do poprzedniej częstotliwości)
Wysokie 2–16 kHz
(+) | zrównoważone maksima - tylko 3.2% od mediany
(+) | wzloty są liniowe (3.2% delta do poprzedniej częstotliwości)
Ogólnie 100 - 16.000 Hz
(+) | ogólny dźwięk jest liniowy (10% różnicy w stosunku do mediany)
W porównaniu do tej samej klasy
» 1% wszystkich testowanych urządzeń w tej klasie było lepszych, 1% podobnych, 98% gorszych
» Najlepszy miał deltę 7%, średnia wynosiła ###średnia###%, najgorsza wynosiła 53%
W porównaniu do wszystkich testowanych urządzeń
» 4% wszystkich testowanych urządzeń było lepszych, 1% podobnych, 94% gorszych
» Najlepszy miał deltę 4%, średnia wynosiła ###średnia###%, najgorsza wynosiła 134%

Apple MacBook Pro 16 2021 M1 Pro analiza dźwięku

(+) | głośniki mogą odtwarzać stosunkowo głośno (84.7 dB)
Bas 100 - 315 Hz
(+) | dobry bas - tylko 3.8% od mediany
(+) | bas jest liniowy (5.2% delta do poprzedniej częstotliwości)
Średnie 400 - 2000 Hz
(+) | zbalansowane środki średnie - tylko 1.3% od mediany
(+) | średnie są liniowe (2.1% delta do poprzedniej częstotliwości)
Wysokie 2–16 kHz
(+) | zrównoważone maksima - tylko 1.9% od mediany
(+) | wzloty są liniowe (2.7% delta do poprzedniej częstotliwości)
Ogólnie 100 - 16.000 Hz
(+) | ogólny dźwięk jest liniowy (4.6% różnicy w stosunku do mediany)
W porównaniu do tej samej klasy
» 0% wszystkich testowanych urządzeń w tej klasie było lepszych, 0% podobnych, 100% gorszych
» Najlepszy miał deltę 5%, średnia wynosiła ###średnia###%, najgorsza wynosiła 45%
W porównaniu do wszystkich testowanych urządzeń
» 0% wszystkich testowanych urządzeń było lepszych, 0% podobnych, 100% gorszych
» Najlepszy miał deltę 4%, średnia wynosiła ###średnia###%, najgorsza wynosiła 134%

Zarządzanie energią

Pobór mocy

Zużycie energii w teście 3DMark 06
Zużycie zasobów w grze Cyberpunk 2077 w rozdzielczości 1080p i ustawieniach Ultra
Zużycie energii wzrosło do 68 W po uruchomieniu testu obciążeniowego Prime95, po czym spadło i ustabilizowało się na poziomie 48 W zaledwie 15 sekund później
Test obciążeniowy Prime95+FurMark rozpoczęto po upływie 10 sekund
Pobór mocy
wyłączony / stan wstrzymaniadarklight 0.2 / 0.56 W
luzdarkmidlight 2.8 / 6 / 7.4 W
obciążenie midlight 47.9 / 67 W
 color bar
Legenda: min: dark, med: mid, max: light        Metrahit Energy
Dell Pro 7 14 P714265
Ryzen AI 9 HX PRO 470, Radeon 890M, , IPS, 1920x1200, 14"
Dell Pro 14 Premium
Core Ultra 7 268V, Arc 140V, Kioxia BG6 KBG6AZNV1T02, OLED, 2880x1800, 14"
Dell Latitude 7440
i5-1345U, Iris Xe G7 80EUs, Samsung MZ9L4512HBLU-00BMV, IPS, 2560x1600, 14"
Lenovo ThinkPad T14s Gen 7 21YW0022GE
Ryzen AI 7 PRO 450, Radeon 860M, Micron 2650 MTFDKBA512TGW, IPS, 1920x1200, 14"
Asus ExpertBook Ultra B9406CAA
Ultra X7 358H, Arc B390 Panther Lake iGPU, Samsung PM9E1 MZVLC2T0HBLD, OLED, 2880x1800, 14"
HP EliteBook X G1a 14 AI
Ryzen AI 9 HX PRO 375, Radeon 890M, Kioxia XG8 KXG80ZNV1T02, IPS, 1920x1200, 14"
Power Consumption
8%
-14%
-1%
-2%
-63%
Idle Minimum * (Watt)
2.8
3.5
-25%
4.5
-61%
2.7
4%
3.5
-25%
6.5
-132%
Idle Average * (Watt)
6
4.3
28%
6.5
-8%
5.5
8%
4
33%
8.7
-45%
Idle Maximum * (Watt)
7.4
7.9
-7%
7.3
1%
6.8
8%
5.3
28%
10.3
-39%
Load Average * (Watt)
47.9
38.9
19%
52.5
-10%
60.5
-26%
43.7
9%
75.7
-58%
Cyberpunk 2077 ultra * (Watt)
47.9
39
19%
49.7
-4%
61.3
-28%
76.2
-59%
Cyberpunk 2077 ultra external monitor * (Watt)
45.3
38.7
15%
44.1
3%
61.4
-36%
73.1
-61%
Load Maximum * (Watt)
67
60.7
9%
63
6%
64.8
3%
63.4
5%
100.7
-50%
Witcher 3 ultra * (Watt)
46.2

* ... im mniej tym lepiej

Zużycie energii w grze Cyberpunk / Test obciążeniowy

05101520253035404550556065Tooltip
Dell Pro 7 14 P714265 Ryzen AI 9 HX PRO 470, Radeon 890M; 1280x720 Prime95 28.10 and Furmark 1.25: Ø53.3 (51.6-67.2) Watt
Dell Pro 14 Premium Core Ultra 7 268V, Arc 140V; 1280x720 Prime95 28.10 and Furmark 1.25: Ø39.1 (30.1-60.6) Watt
Dell Pro 7 14 P714265 Ryzen AI 9 HX PRO 470, Radeon 890M; Idle 150cd/m2: Ø5.57 (4.86-9.11) Watt
Dell Pro 14 Premium Core Ultra 7 268V, Arc 140V; Idle 150cd/m2: Ø3.65 (3.26-6.12) Watt
Dell Pro 7 14 P714265 Ryzen AI 9 HX PRO 470, Radeon 890M; Cyberpunk 2077 FHD ultra no FSR 150cd: Ø47.9 (47.4-49.5) Watt
Dell Pro 14 Premium Core Ultra 7 268V, Arc 140V; Cyberpunk 2077 FHD ultra no FSR 150cd: Ø39 (37.9-50.3) Watt

Pobór mocy przez monitor zewnętrzny

05101520253035404550556065Tooltip
Dell Pro 7 14 P714265 Ryzen AI 9 HX PRO 470, Radeon 890M; Prime95 V2810 Stress (external Monitor): Ø49.6 (47.7-67.8) Watt
Dell Pro 14 Premium Core Ultra 7 268V, Arc 140V; Prime95 V2810 Stress (external Monitor): Ø39.4 (32-56) Watt
Dell Pro 7 14 P714265 Ryzen AI 9 HX PRO 470, Radeon 890M; Cinebench R15 Multi (external Monitor): Ø61.1 (44.2-64.3) Watt
Dell Pro 14 Premium Core Ultra 7 268V, Arc 140V; Cinebench R15 Multi (external Monitor): Ø53.3 (52.4-54.1) Watt
Dell Pro 7 14 P714265 Ryzen AI 9 HX PRO 470, Radeon 890M; Cinebench R23 Multi (external Monitor): Ø49.5 (42.2-63.7) Watt
Dell Pro 7 14 P714265 Ryzen AI 9 HX PRO 470, Radeon 890M; 1280x720 FurMark 1.19 GPU Stress Test (external Monitor): Ø47.7 (45.2-61.8) Watt
Dell Pro 14 Premium Core Ultra 7 268V, Arc 140V; 1280x720 FurMark 1.19 GPU Stress Test (external Monitor): Ø32.8 (27.3-40.8) Watt
Dell Pro 7 14 P714265 Ryzen AI 9 HX PRO 470, Radeon 890M; Idle 1min (external Monitor): Ø2.89 (2.38-6.56) Watt
Dell Pro 14 Premium Core Ultra 7 268V, Arc 140V; Idle 1min (external Monitor): Ø3.57 (3.14-6) Watt
Dell Pro 7 14 P714265 Ryzen AI 9 HX PRO 470, Radeon 890M; Cyberpunk 2077 FHD ultra no FSR (external Monitor): Ø45.3 (44.7-47.9) Watt
Dell Pro 14 Premium Core Ultra 7 268V, Arc 140V; Cyberpunk 2077 FHD ultra no FSR (external Monitor): Ø38.7 (37.7-41.1) Watt

Żywotność baterii

Wydajność akumulatora
WiFi Websurfing
15h 42min
Dell Pro 7 14 P714265
Ryzen AI 9 HX PRO 470, Radeon 890M, 70 Wh
Dell Pro 14 Premium
Core Ultra 7 268V, Arc 140V, 60 Wh
Dell Latitude 7440
i5-1345U, Iris Xe G7 80EUs, 57 Wh
Lenovo ThinkPad T14s Gen 7 21YW0022GE
Ryzen AI 7 PRO 450, Radeon 860M, 58 Wh
Asus ExpertBook Ultra B9406CAA
Ultra X7 358H, Arc B390 Panther Lake iGPU, 70 Wh
HP EliteBook X G1a 14 AI
Ryzen AI 9 HX PRO 375, Radeon 890M, 74.5 Wh
Czasy pracy
-3%
-17%
11%
3%
-10%
WiFi v1.3 (h)
15.7
15.2
-3%
13
-17%
17.4
11%
16.1
3%
14.2
-10%
Reader / Idle (h)
23.8
21.2
Load (h)
2.7

Ocena serwisu Notebookcheck

Bardziej elegancki, zmodernizowany wygląd oraz znacznie szybsze procesory AMD to zauważalne ulepszenia i najlepsze powody, dla których warto wybrać model Dell Pro 7 14 zamiast urządzeń poprzedniej generacji z procesorami Lunar Lake.

Dell Pro 7 14 P714265 - 21/07/2026 v8
Allen Ngo

Wykonanie
86 / 98 → 88%
Klawiatura
80%
Myszka
75%
Komunikacja
71 / 80 → 89%
Waga
71 / 20-75 → 92%
Akumulator
90%
Wyświetlacz
82%
Wydajność w grach
54 / 75 → 72%
Wydajność w programach użytkowych
85 / 92 → 92%
AI Performance
90%
Temperatura
92%
Hałas
86%
Głośniki
86%
Kamerka
43 / 75 → 57%
Średnio
69%
85%
Office - Ważona średnia
CO2 Emissions
No Data
Materials
50%
Packaging
100%
Power Use
87%
Repairability
50%
Software Updates
22.3%
Recycle Logo Total Sustainability Score: 51.6%

Porównanie potencjalnych konkurentów

Obraz
Model / recenzja
Cena
Waga
Wysokość
Ekran
1.
84.7%
Dell Pro 7 14 P714265
AMD Ryzen AI 9 HX PRO 470 ⎘
AMD Radeon 890M ⎘
64 GB Pamięć
Amazon: Cena katalogowa: 4900 USD1.3 kg16.45 mm14.00"
1920x1200
162 PPI
IPS
2.
86.4%
Dell Pro 14 Premium
Dell Pro 14 Premium
Intel Core Ultra 7 268V ⎘
Intel Arc Graphics 140V ⎘
32 GB Pamięć, 1024 GB SSD
Cena katalogowa: 2500 USD1.3 kg17.95 mm14.00"
2880x1800
243 PPI
OLED
3.
90.3% v7 (old)
Dell Latitude 7440
Dell Latitude 7440
Intel Core i5-1345U ⎘
Intel Iris Xe Graphics G7 80EUs ⎘
16 GB Pamięć, 512 GB SSD
Amazon:
1. $440.00
Dell Latitude 7440 14" i5-13...
2. $646.75
Dell Latitude 7440 14" Lapto...
3. $599.99
Dell Latitude 7440 14" Lapto...
Cena katalogowa: 1900 USD
1.2 kg17.95 mm14.00"
2560x1600
216 PPI
IPS
4.
89.7%
Lenovo ThinkPad T14s Gen 7 21YW0022GE
AMD Ryzen AI 7 PRO 450 ⎘
AMD Radeon 860M ⎘
64 GB Pamięć, 512 GB SSD
Amazon:
1. $1,399.99
Lenovo ThinkPad T14s Gen 6 2...
2. $849.99
Lenovo ThinkPad E14 Gen 7 Bu...
3. $1,039.99
Lenovo 2026 ThinkPad E14 Gen...
1.2 kg15.9 mm14.00"
1920x1200
162 PPI
IPS
5.
87.6%
Asus ExpertBook Ultra B9406CAA
Intel Core Ultra X7 358H ⎘
Intel Arc B390 12 Xe3 Panther Lake iGPU ⎘
32 GB Pamięć, 2048 GB SSD
Amazon: 1.1 kg15.9 mm14.00"
2880x1800
243 PPI
OLED
6.
88.7%
HP EliteBook X G1a 14 AI
AMD Ryzen AI 9 HX PRO 375 ⎘
AMD Radeon 890M ⎘
32 GB Pamięć, 1024 GB SSD
Amazon: Cena katalogowa: 2200 USD1.5 kg13.2 mm14.00"
1920x1200
162 PPI
IPS

Przezroczystość

Wyboru urządzeń do recenzji dokonuje nasza redakcja. Próbka testowa została udostępniona autorowi jako pożyczka od producenta lub sprzedawcy detalicznego na potrzeby tej recenzji. Pożyczkodawca nie miał wpływu na tę recenzję, producent nie otrzymał też kopii tej recenzji przed publikacją. Nie było obowiązku publikowania tej recenzji. Jako niezależna firma medialna, Notebookcheck nie podlega władzy producentów, sprzedawców detalicznych ani wydawców.

Tak testuje Notebookcheck

Każdego roku Notebookcheck niezależnie sprawdza setki laptopów i smartfonów, stosując standardowe procedury, aby zapewnić porównywalność wszystkich wyników. Od około 20 lat stale rozwijamy nasze metody badawcze, ustanawiając przy tym standardy branżowe. W naszych laboratoriach testowych doświadczeni technicy i redaktorzy korzystają z wysokiej jakości sprzętu pomiarowego. Testy te obejmują wieloetapowy proces walidacji. Nasz kompleksowy system ocen opiera się na setkach uzasadnionych pomiarów i benchmarków, co pozwala zachować obiektywizm.
Google LogoAdd as a preferred source on Google
Mail Logo
> laptopy testy i recenzje notebooki > Laptopy > Recenzja Dell Pro 7 14 P714265: Biznes z klasą
Allen Ngo, 2026-07-22 (Update: 2026-07-22)