Werdykt - Stosunkowo niewielkie odświeżenie
Dell 14 Premium to stosunkowo niewielka aktualizacja zeszłorocznego modelu XPS 14. Poza zastąpieniem Core Ultra 7 155H przez Core Ultra 7 255H, wrażenia użytkownika pozostają w dużej mierze takie same, ponieważ nie ma zewnętrznych różnic między tymi dwoma modelami, w tym nawet ich ekranami dotykowymi Samsung OLED. Kontrowersyjna klawiatura pozostaje, podobnie jak opcjonalna grafika GeForce RTX 4050.
Pod maską warto zauważyć, że Core Ultra 7 255H jest w stanie utrzymać szybsze taktowanie Turbo Boost dłużej niż procesor Meteor Lake-H w XPS 14. Wydajność graficzna z Arc 140T jest tylko nieznacznie szybsza niż Arc 8, więc zaawansowani użytkownicy mogą nadal chcieć rozważyć konfigurację RTX 4050. W przeciwnym razie zeszłoroczny XPS 14 jest zasadniczo identyczny pod względem podstawowych scenariuszy multimedialnych i wielozadaniowych, a jednocześnie kosztuje mniej.
Cena wywoławcza 2000 USD za naszą konfigurację testową zasługuje na pewną analizę, ponieważ alternatywy, takie jak Asus Zephyrus G14 lub Razer Blade 14 kosztują dokładnie tyle samo lub mniej, ale oferują znacznie wyższą wydajność graficzną i podobną 14-calową obudowę. Przypadkowi gracze lub łowcy wydajności mogą znaleźć większą wartość w niektórych alternatywach pod tym względem.
Za
Przeciw
Cena i dostępność
Dell wysyła teraz Dell 14 Premium w cenie od 1500 USD za konfigurację podstawową lub od 1940 USD za konfigurację przedstawioną w recenzji.
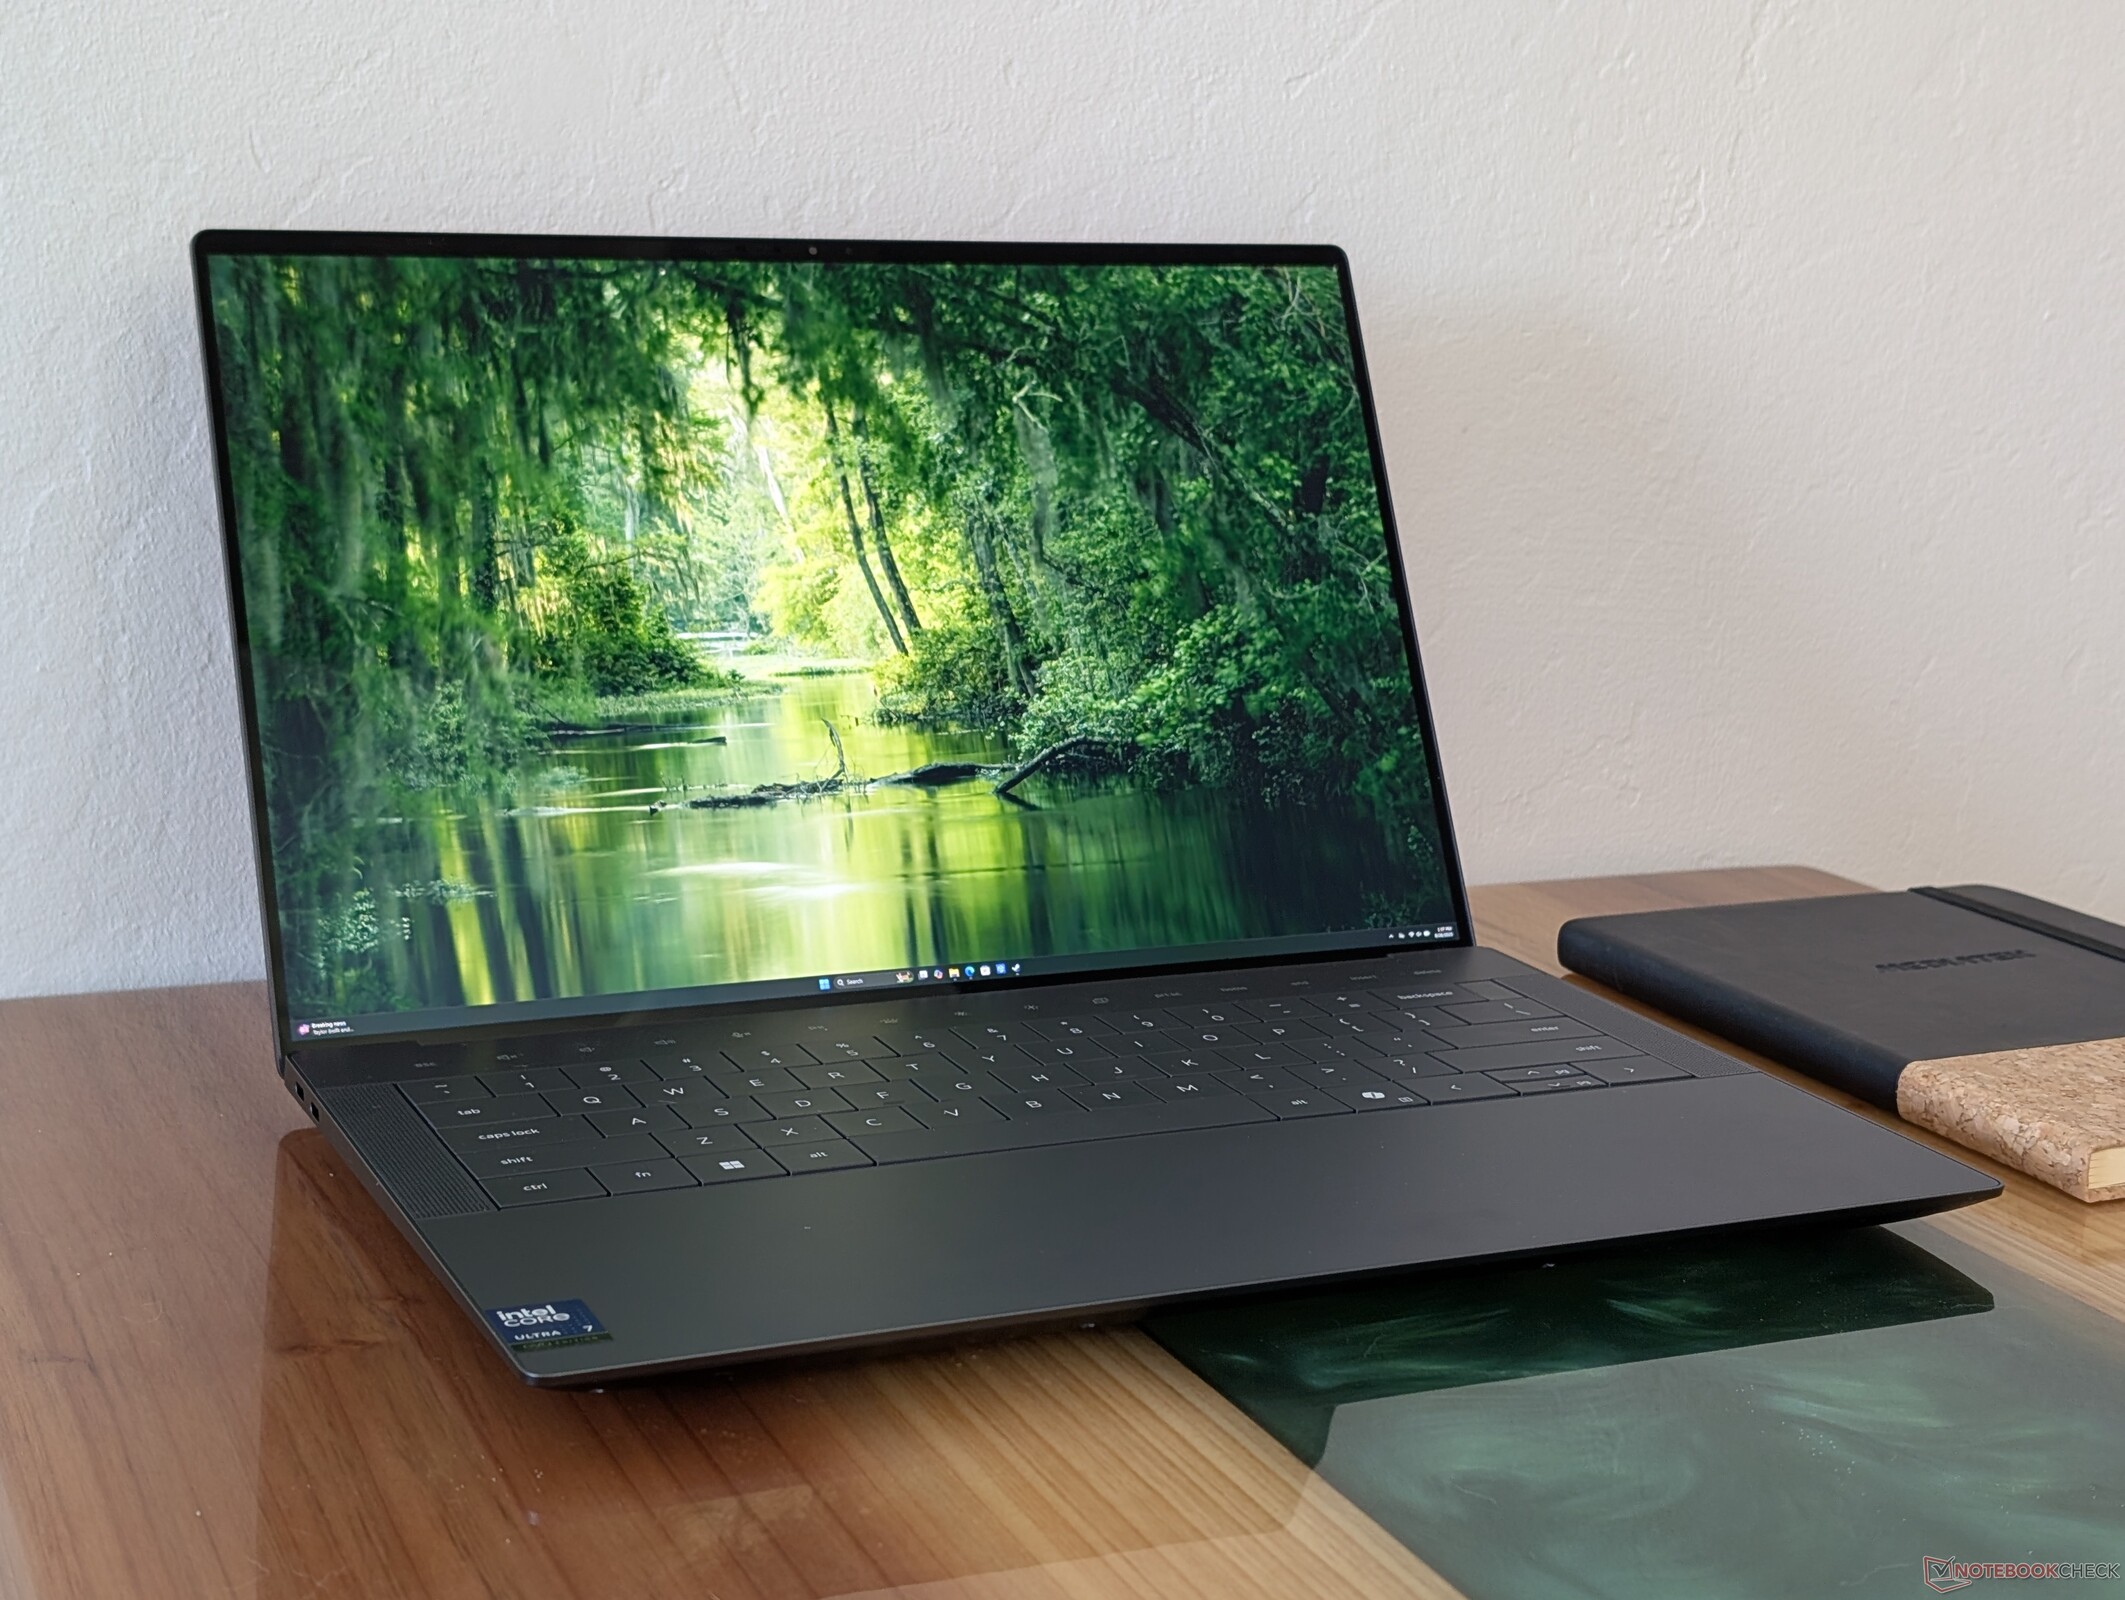
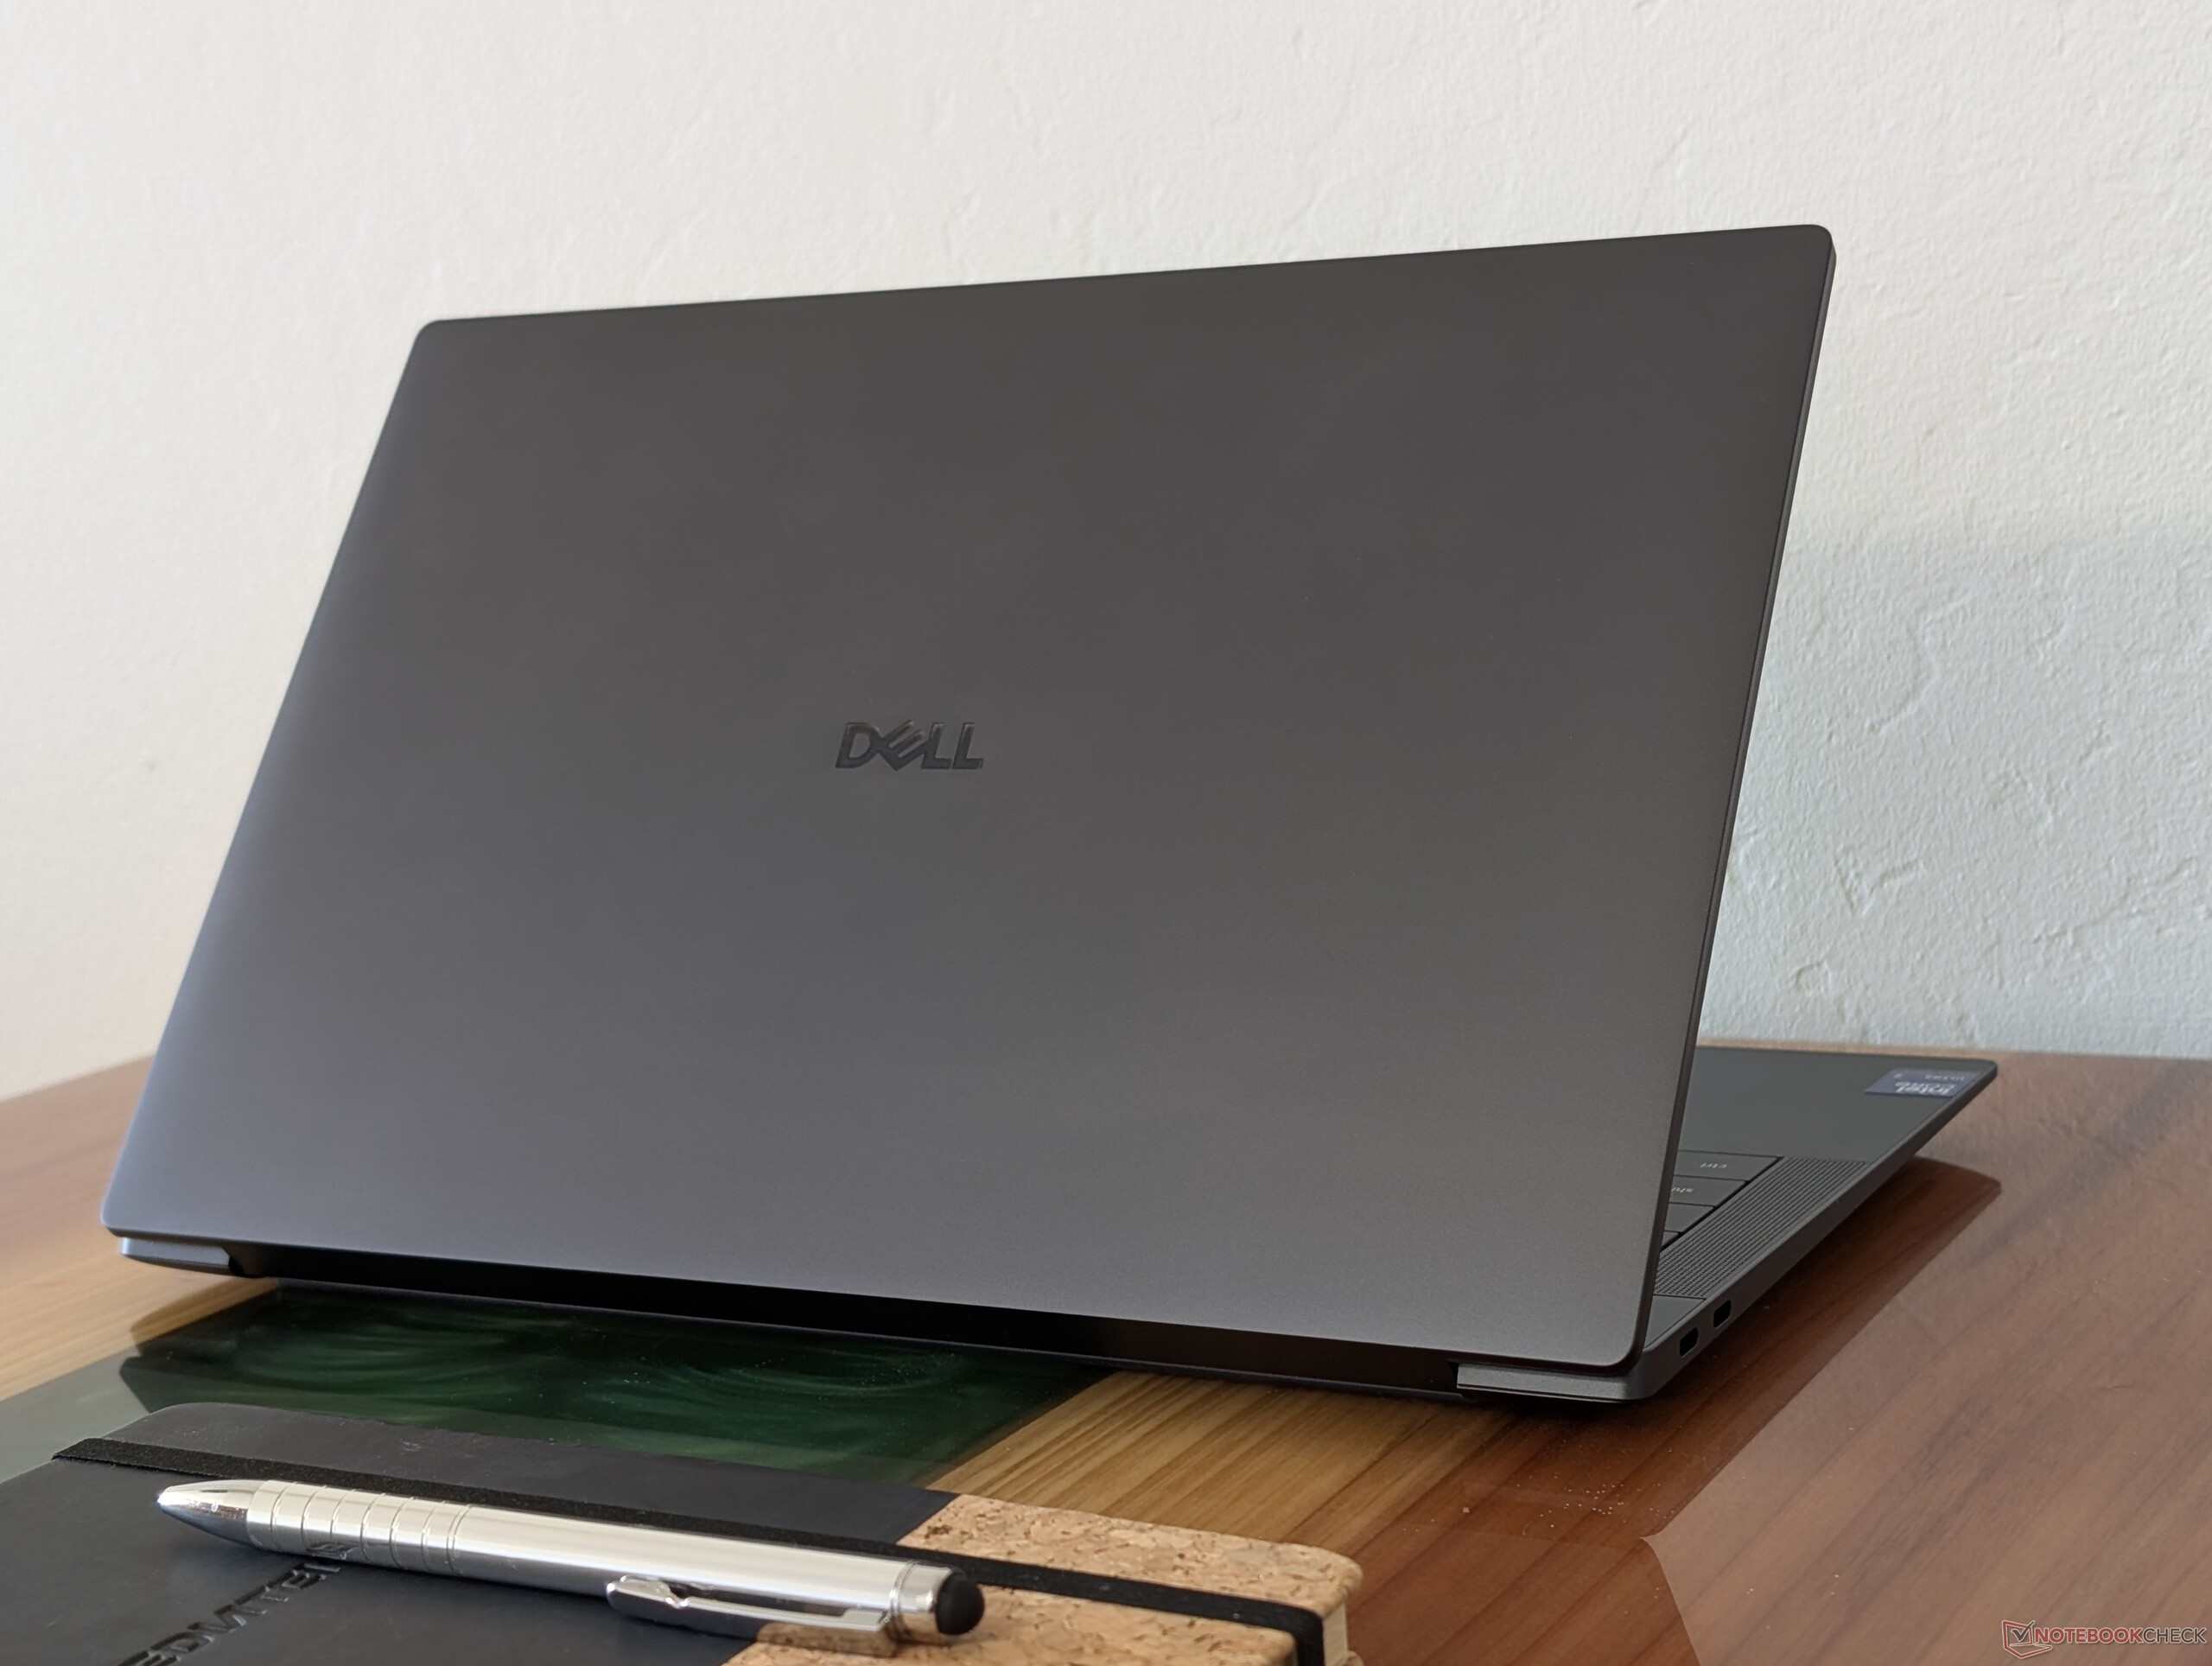
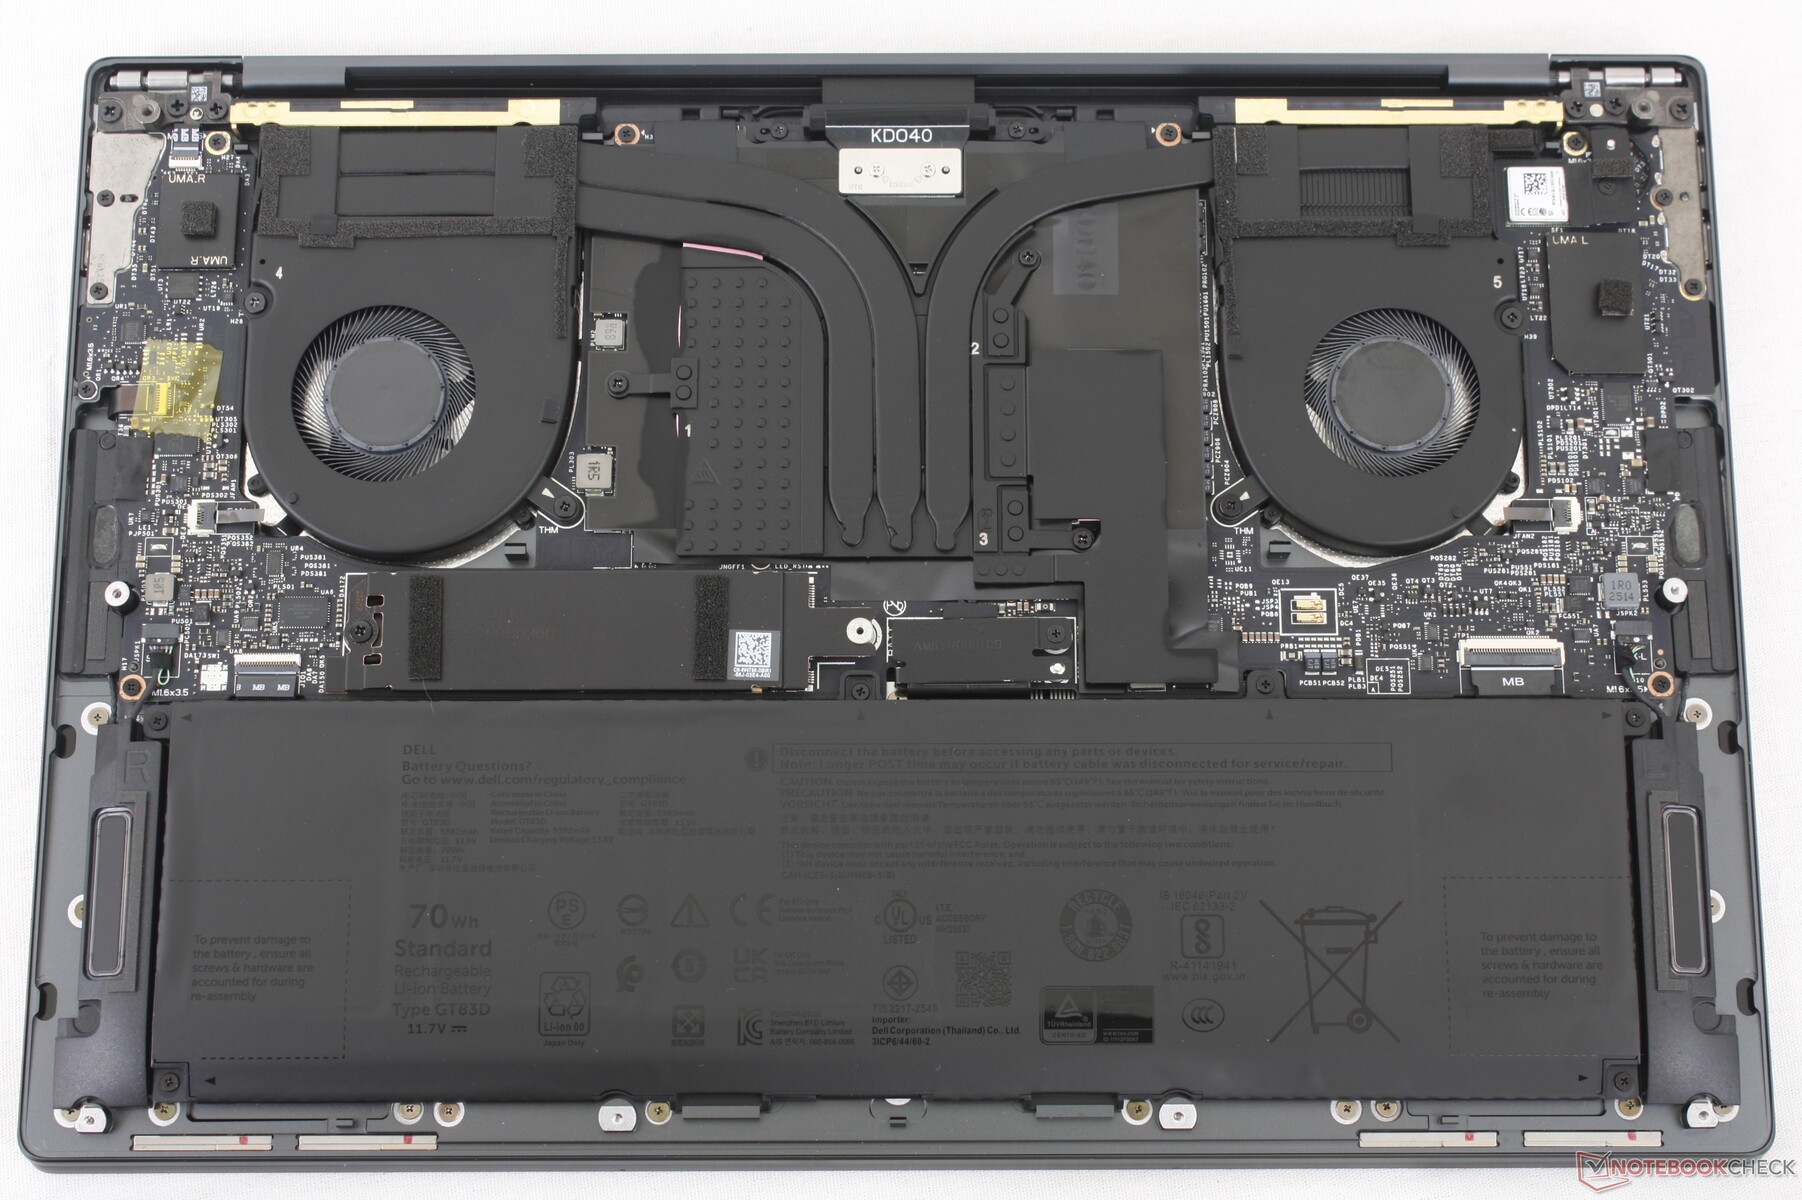
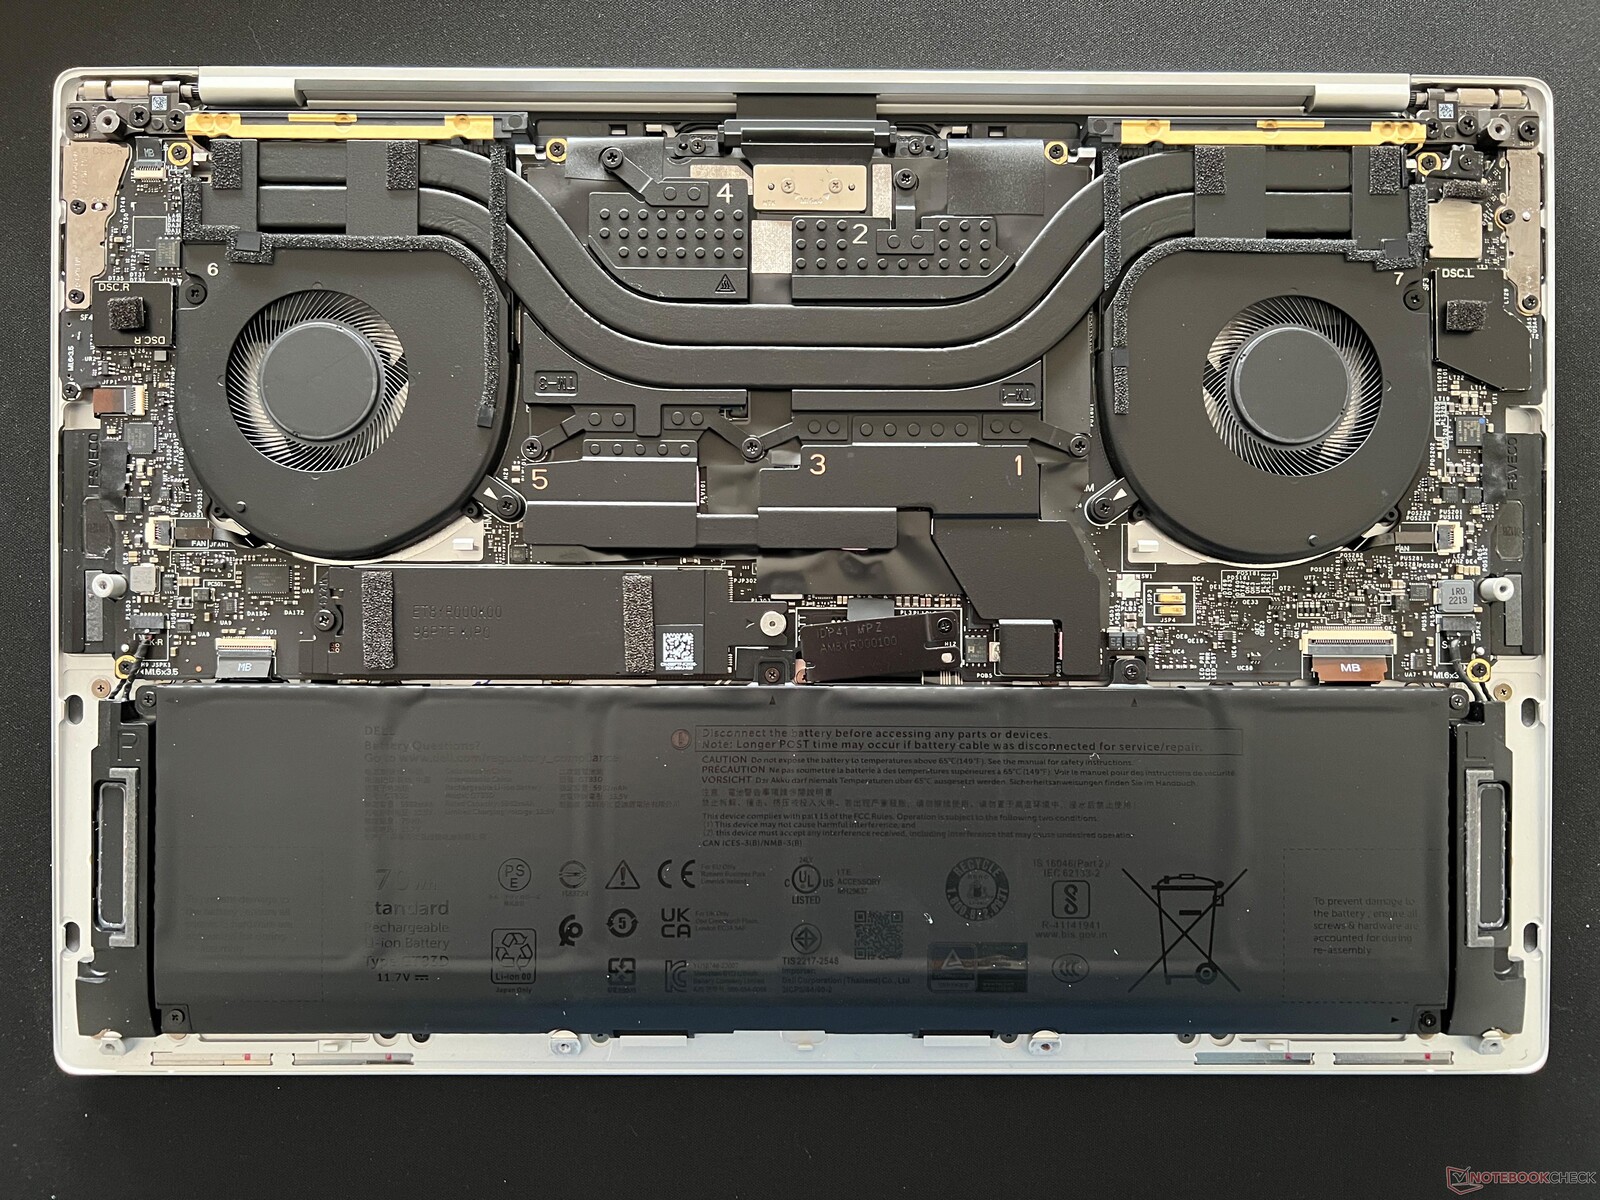
Dell 14 Premium jest bezpośrednim następcą zeszłorocznego XPS 14. Zmiana nazwy jest częścią większego planu firmy Dell, polegającego na wycofaniu z oferty rzeczowników własnych, takich jak "XPS", "Latitude" i "Precision", na rzecz bardziej zrozumiałych słów, takich jak "Premium", "Plus" lub "Pro". Poza tym nie ma żadnych znaczących zmian w obudowie, dlatego zalecamy sprawdzenie naszej recenzję XPS 14 aby dowiedzieć się więcej o fizycznych cechach Dell 14 Premium.
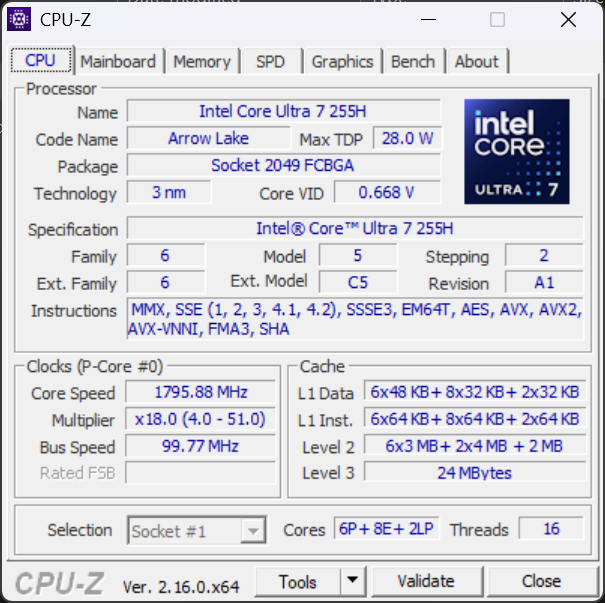
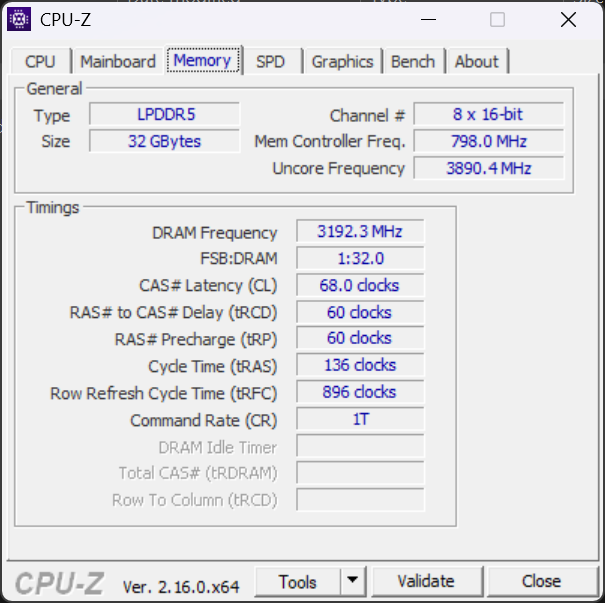
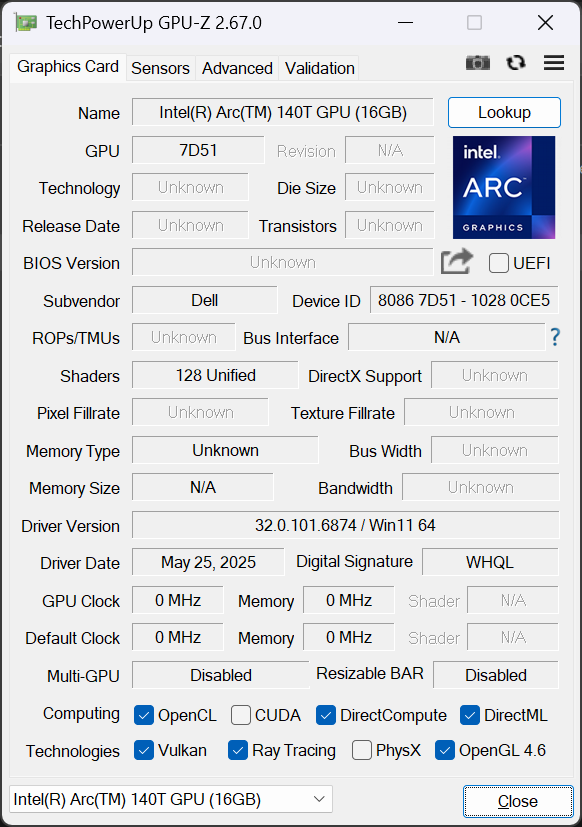
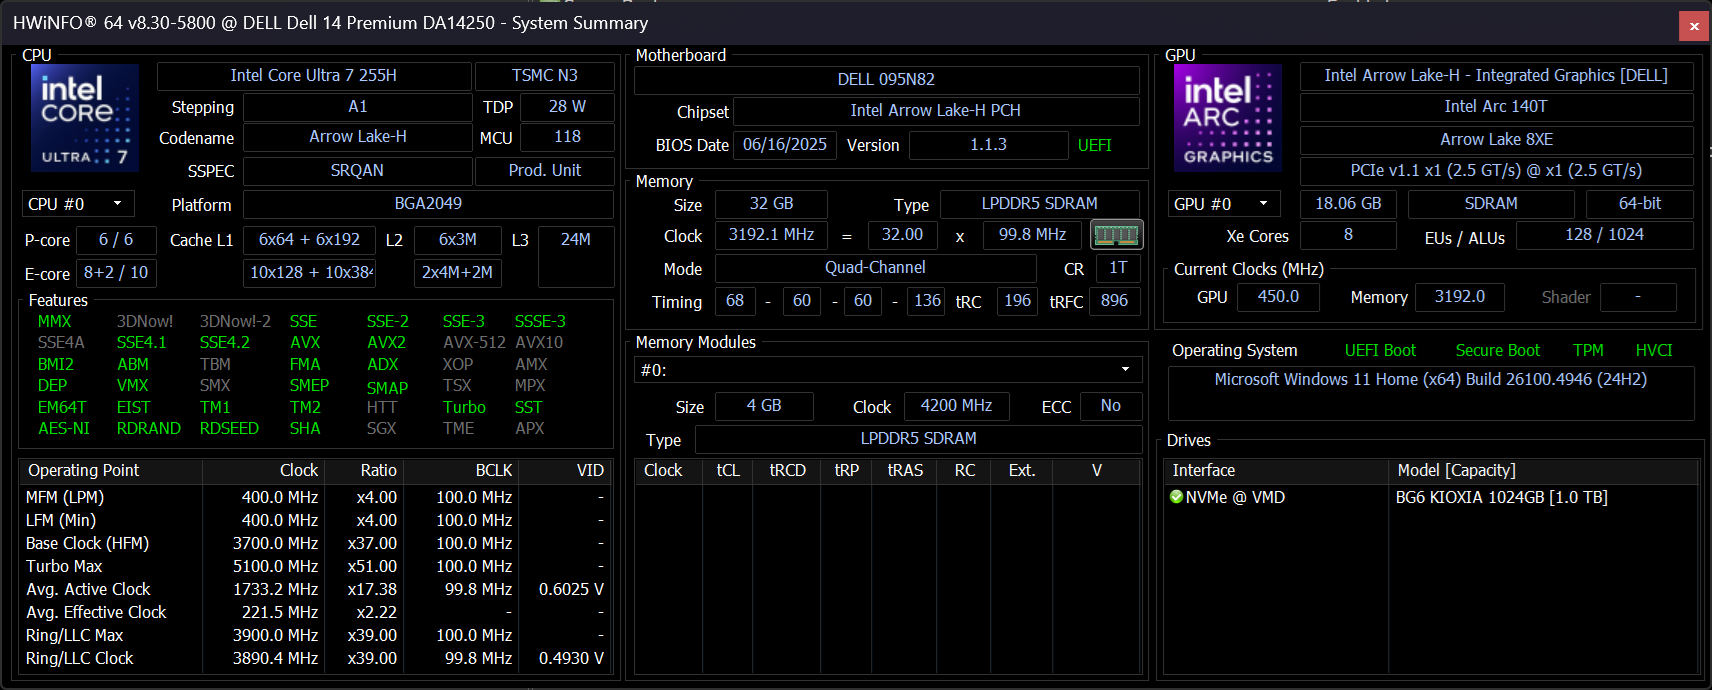
Nasza jednostka testowa to środkowa konfiguracja z 32 GB pamięci RAM i ekranem dotykowym OLED 3,2K 120 Hz za nieco poniżej 2000 USD. Mniejsze jednostki SKU są dostępne z połową pamięci RAM i pamięci masowej oraz wyświetlaczem IPS 2K, podczas gdy wyższe jednostki SKU są wyposażone w dyskretny procesor graficzny GeForce RTX 4050 o mocy 30 W. Procesor Core Ultra 7 255H pozostaje niezmienny.
Więcej recenzji Dell:
Specyfikacje
Sprawa
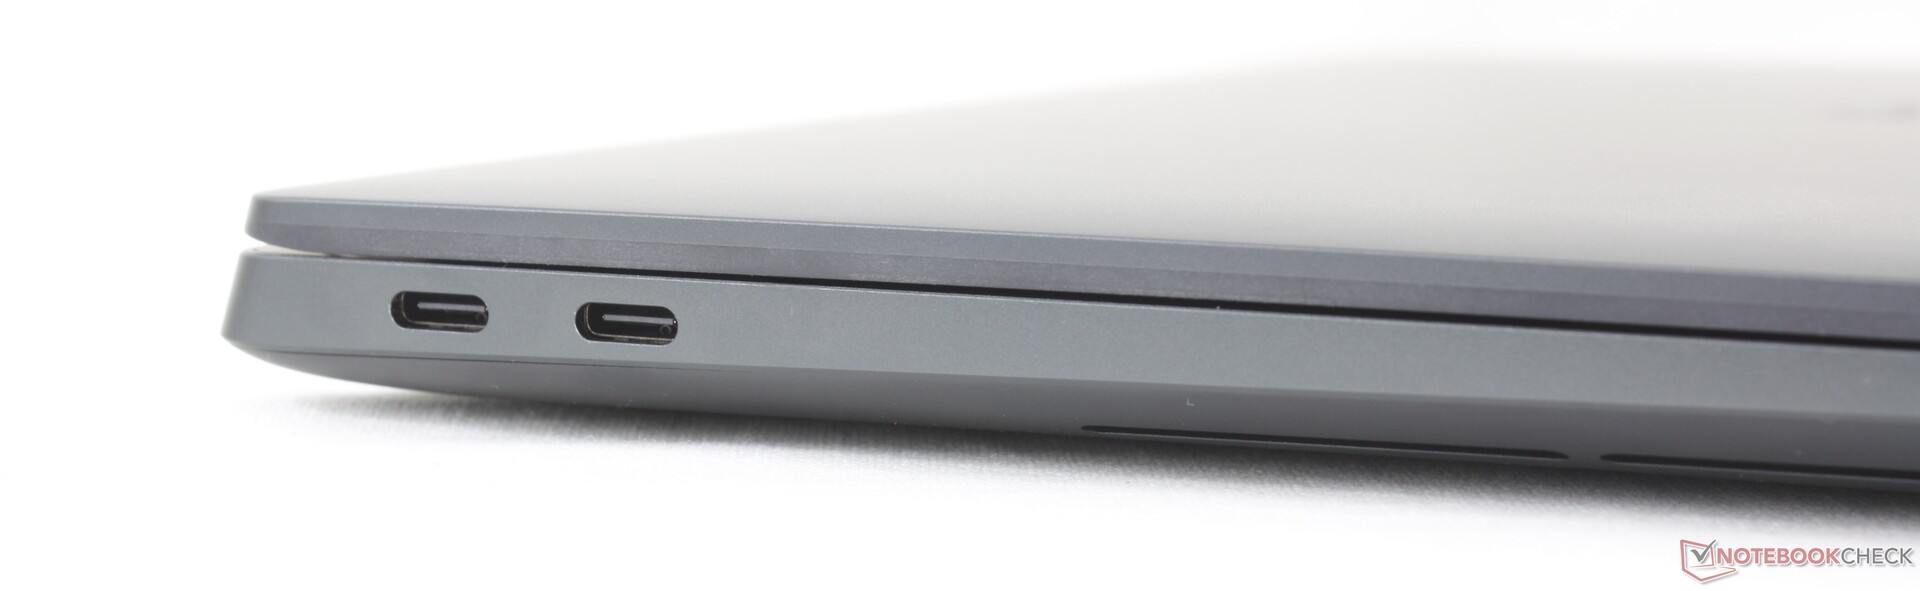
Cechy obudowy i szkielet pozostają identyczne jak w XPS 14, w tym potrójne porty Thunderbolt 4.
Łączność
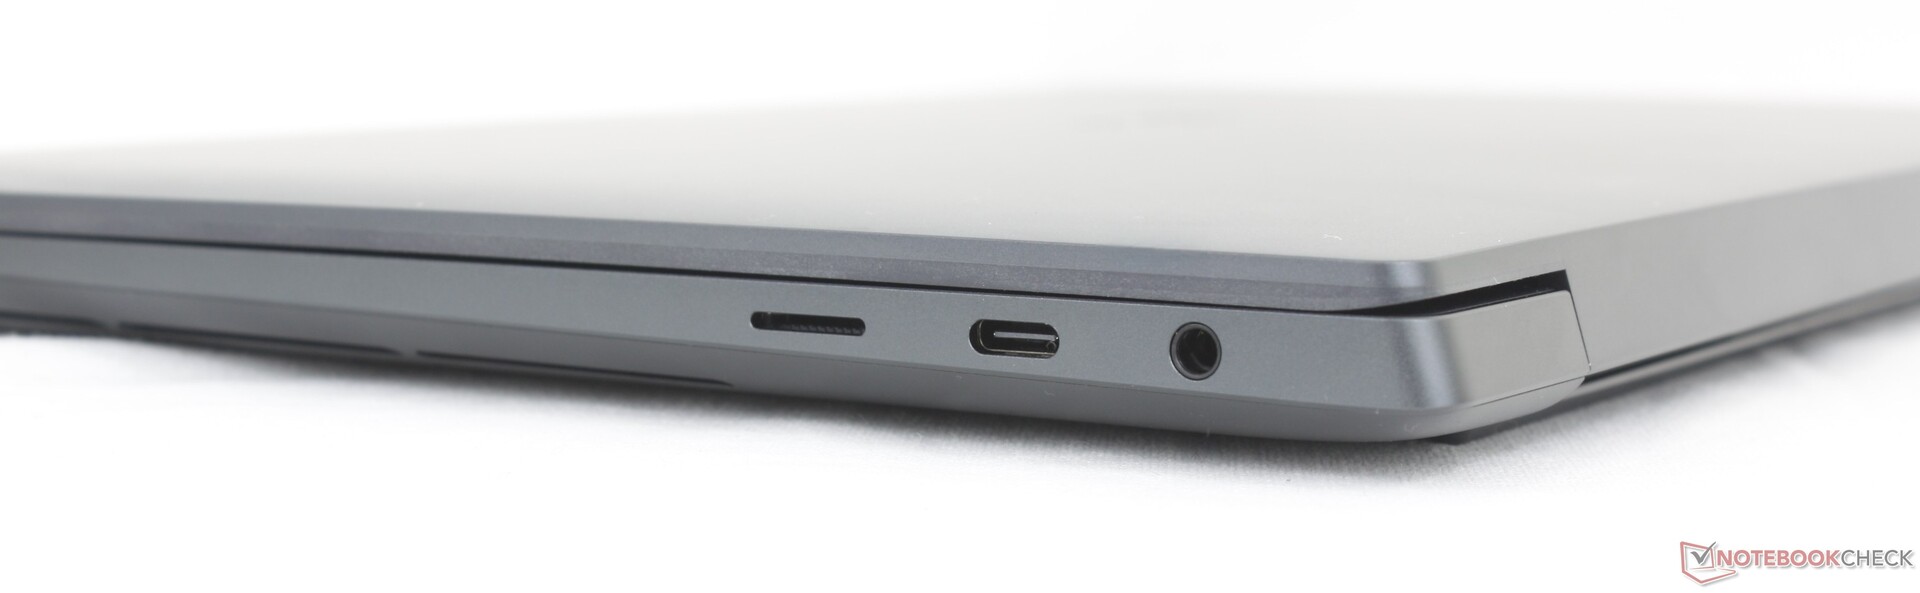
Czytnik kart SD
| SD Card Reader | |
| average JPG Copy Test (av. of 3 runs) | |
| Dell XPS 14 2024 OLED (Angelbird AV Pro V60) | |
| maximum AS SSD Seq Read Test (1GB) | |
| Dell XPS 14 2024 OLED (Angelbird AV Pro V60) | |
Komunikacja
| Networking | |
| iperf3 transmit AXE11000 | |
| Asus Zenbook S 14 UX5406 | |
| Dell XPS 14 2024 OLED | |
| Asus ZenBook Duo OLED UX8406CA | |
| HP OmniBook Ultra 14 | |
| Lenovo ThinkPad X9-14 Gen 1 Aura Edition | |
| Dell 14 Premium | |
| iperf3 receive AXE11000 | |
| Asus Zenbook S 14 UX5406 | |
| Dell XPS 14 2024 OLED | |
| Asus ZenBook Duo OLED UX8406CA | |
| Lenovo ThinkPad X9-14 Gen 1 Aura Edition | |
| HP OmniBook Ultra 14 | |
| Dell 14 Premium | |
| iperf3 transmit AXE11000 6GHz | |
| HP OmniBook Ultra 14 | |
| Dell 14 Premium | |
| Lenovo ThinkPad X9-14 Gen 1 Aura Edition | |
| iperf3 receive AXE11000 6GHz | |
| HP OmniBook Ultra 14 | |
| Lenovo ThinkPad X9-14 Gen 1 Aura Edition | |
| Dell 14 Premium | |
Kamera internetowa
Chociaż podczerwień jest standardem, nie ma wbudowanej migawki.


Konserwacja
Zrównoważony rozwój
System składa się w 75 procentach z aluminium pochodzącego z recyklingu w przypadku górnej pokrywy, w 25 procentach z aluminium o niskiej emisji w przypadku podpórek pod dłonie, do 21 procent szkła pochodzącego z recyklingu w przypadku wyświetlacza i do 30 procent plastiku pochodzącego z recyklingu. Opakowanie w pełni nadaje się do recyklingu.
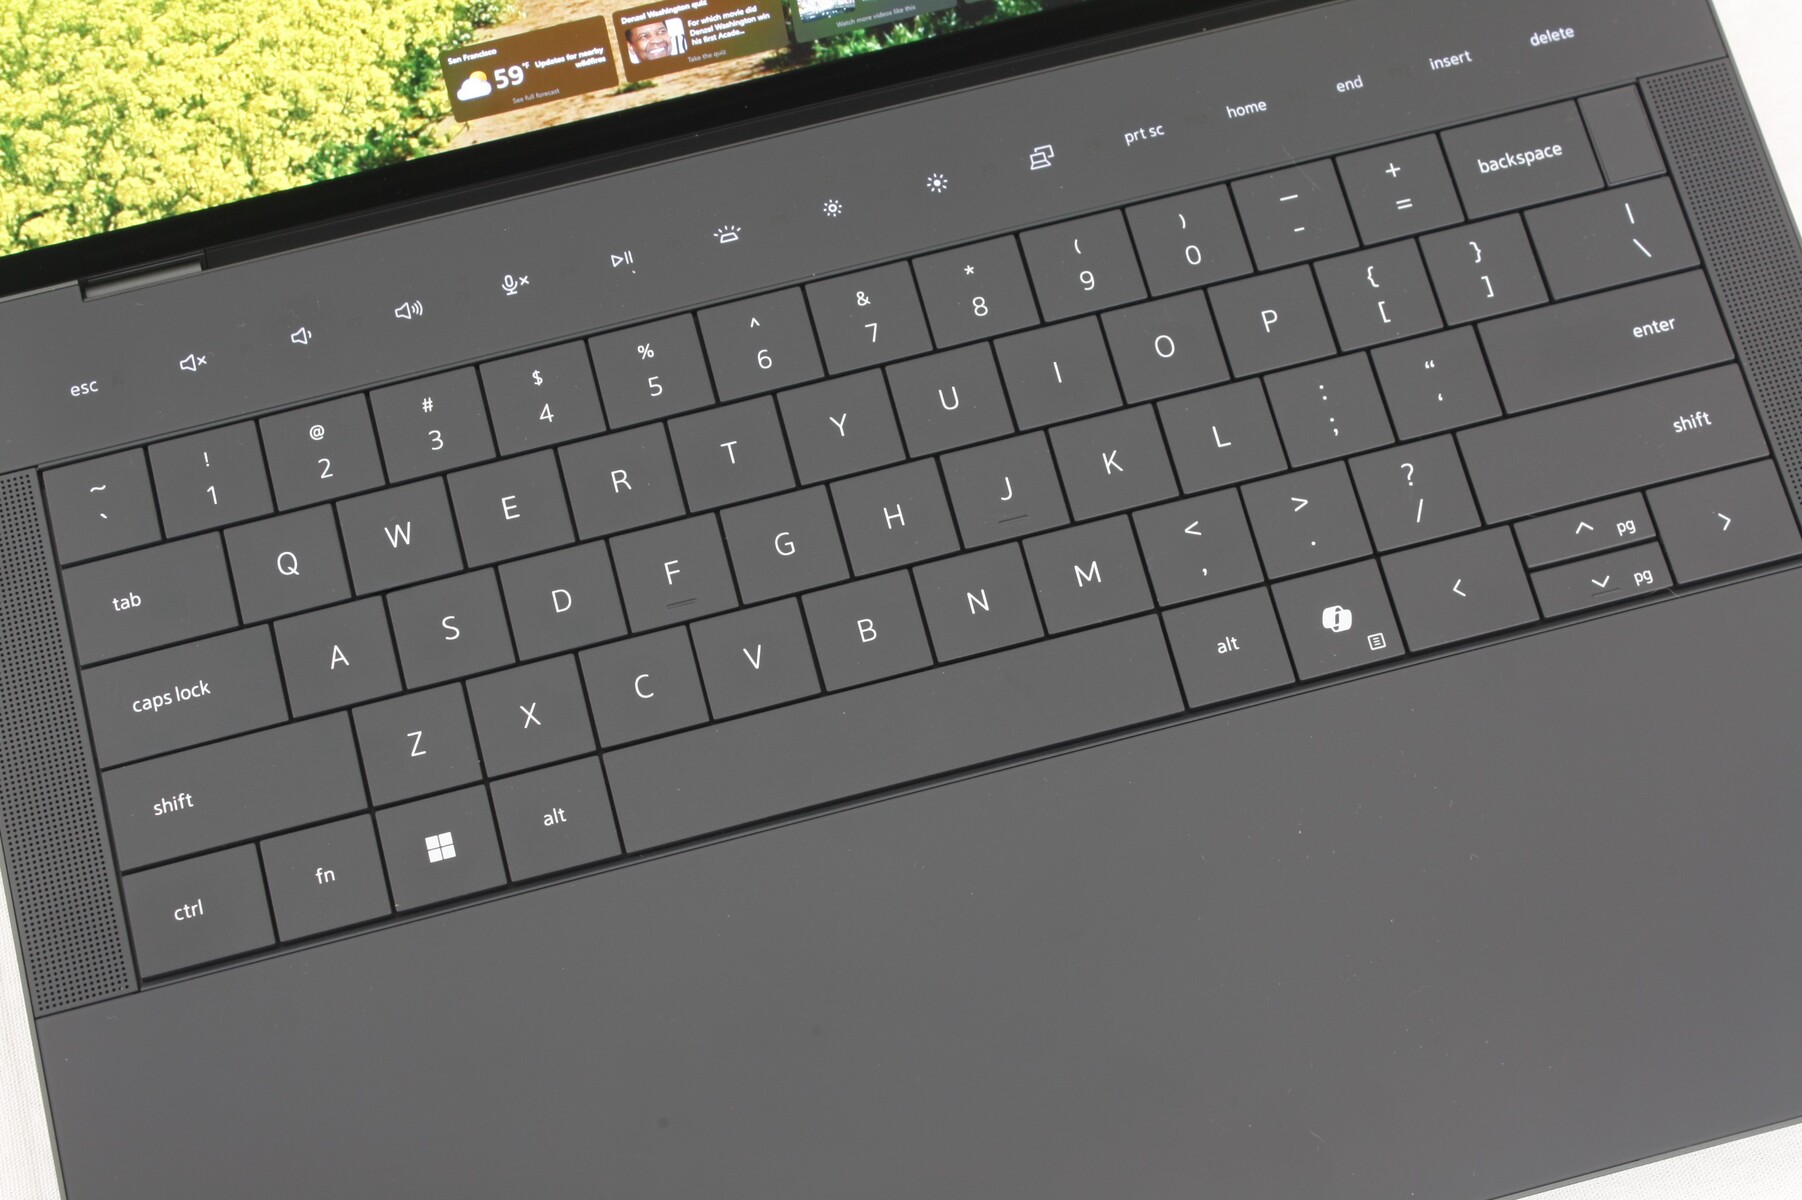
Urządzenia wejściowe
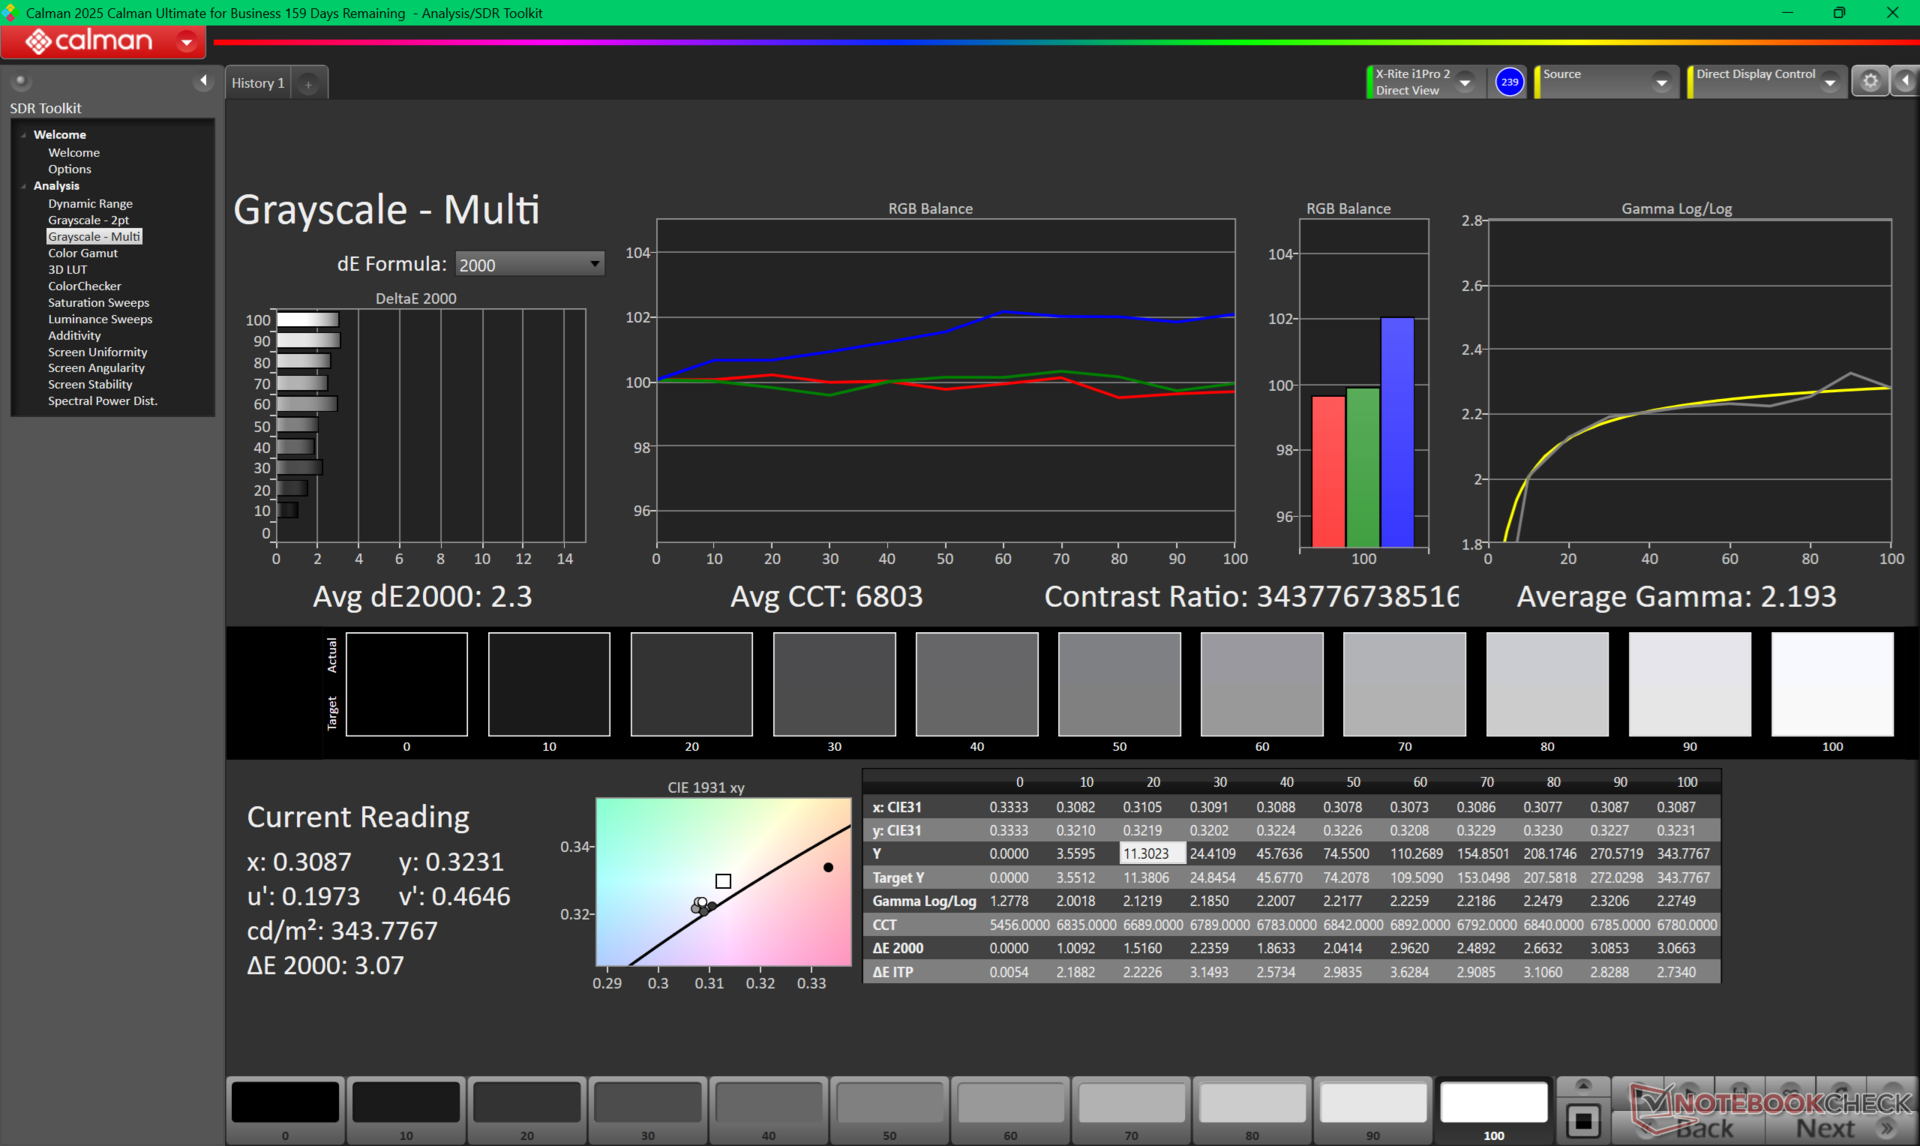
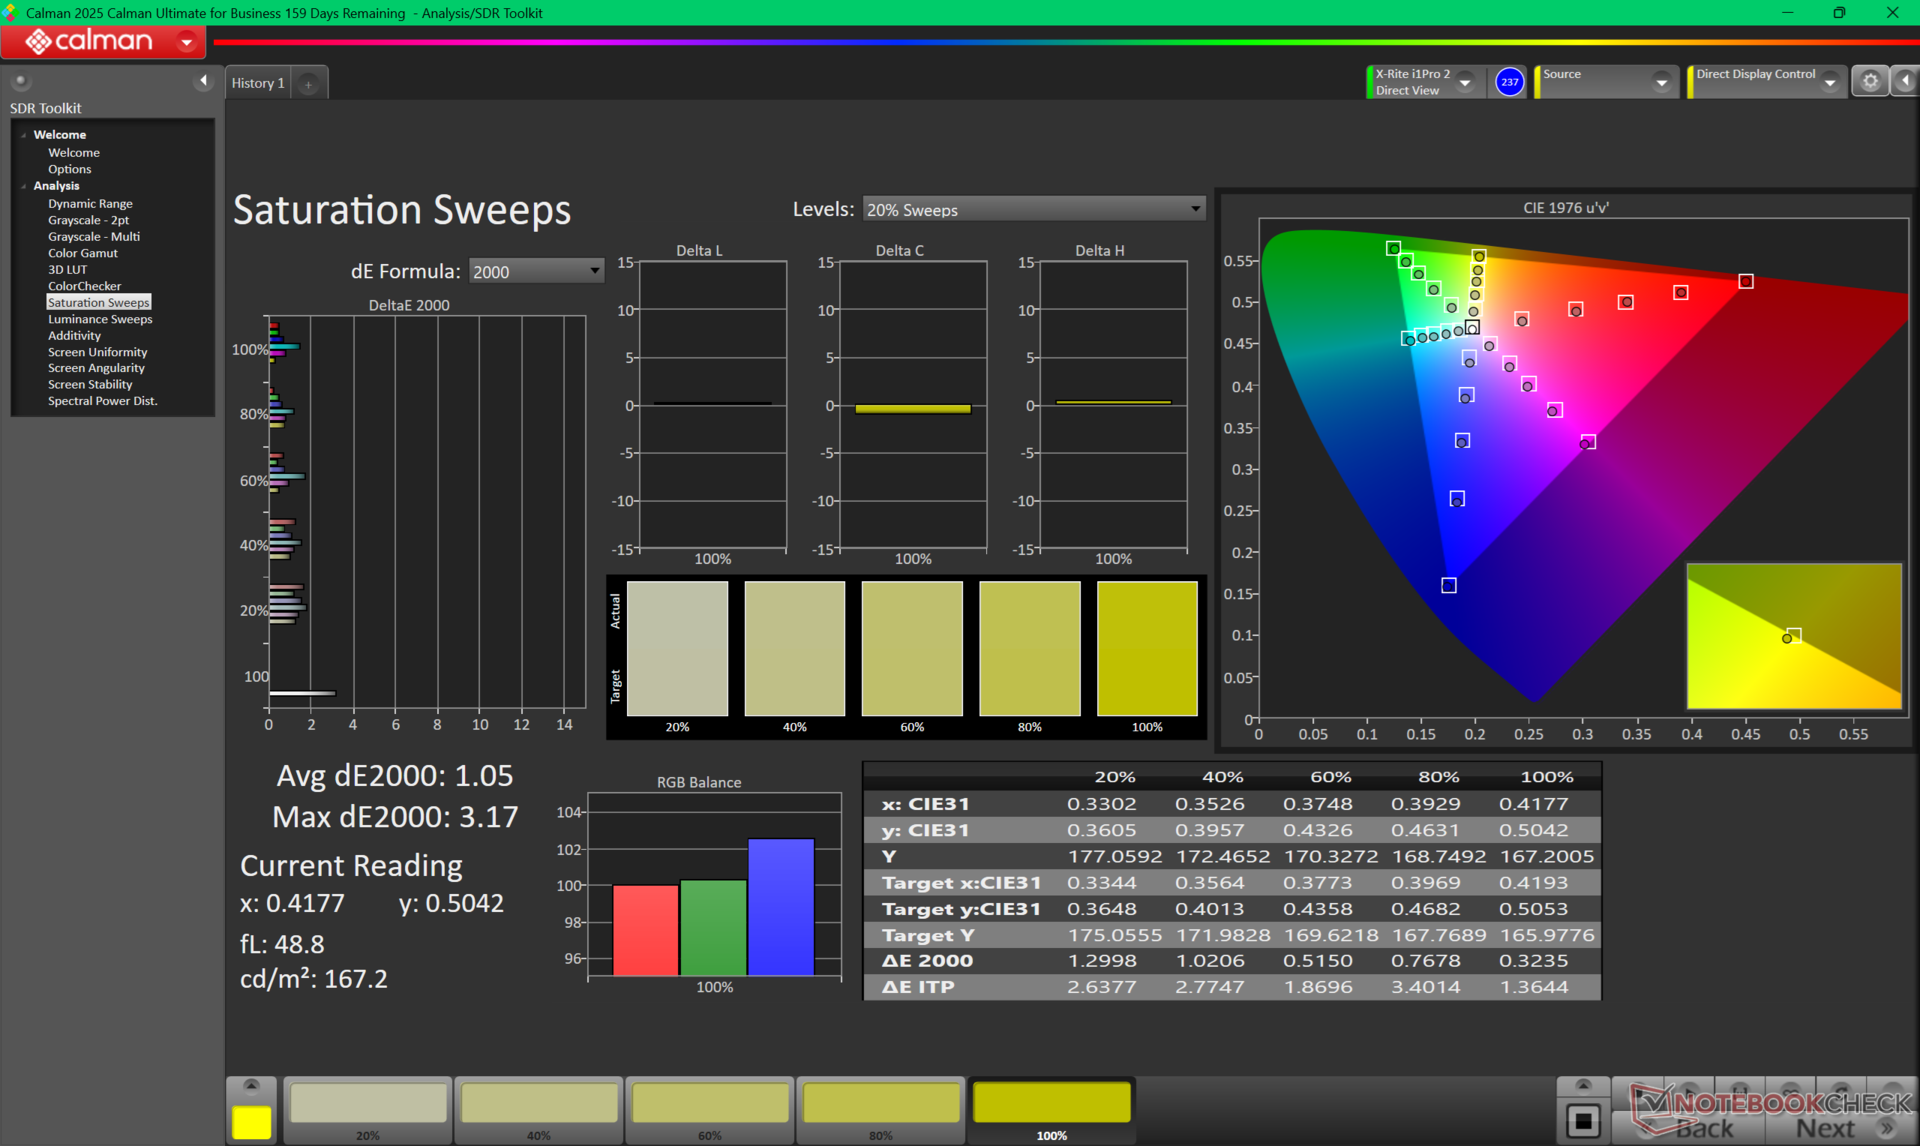
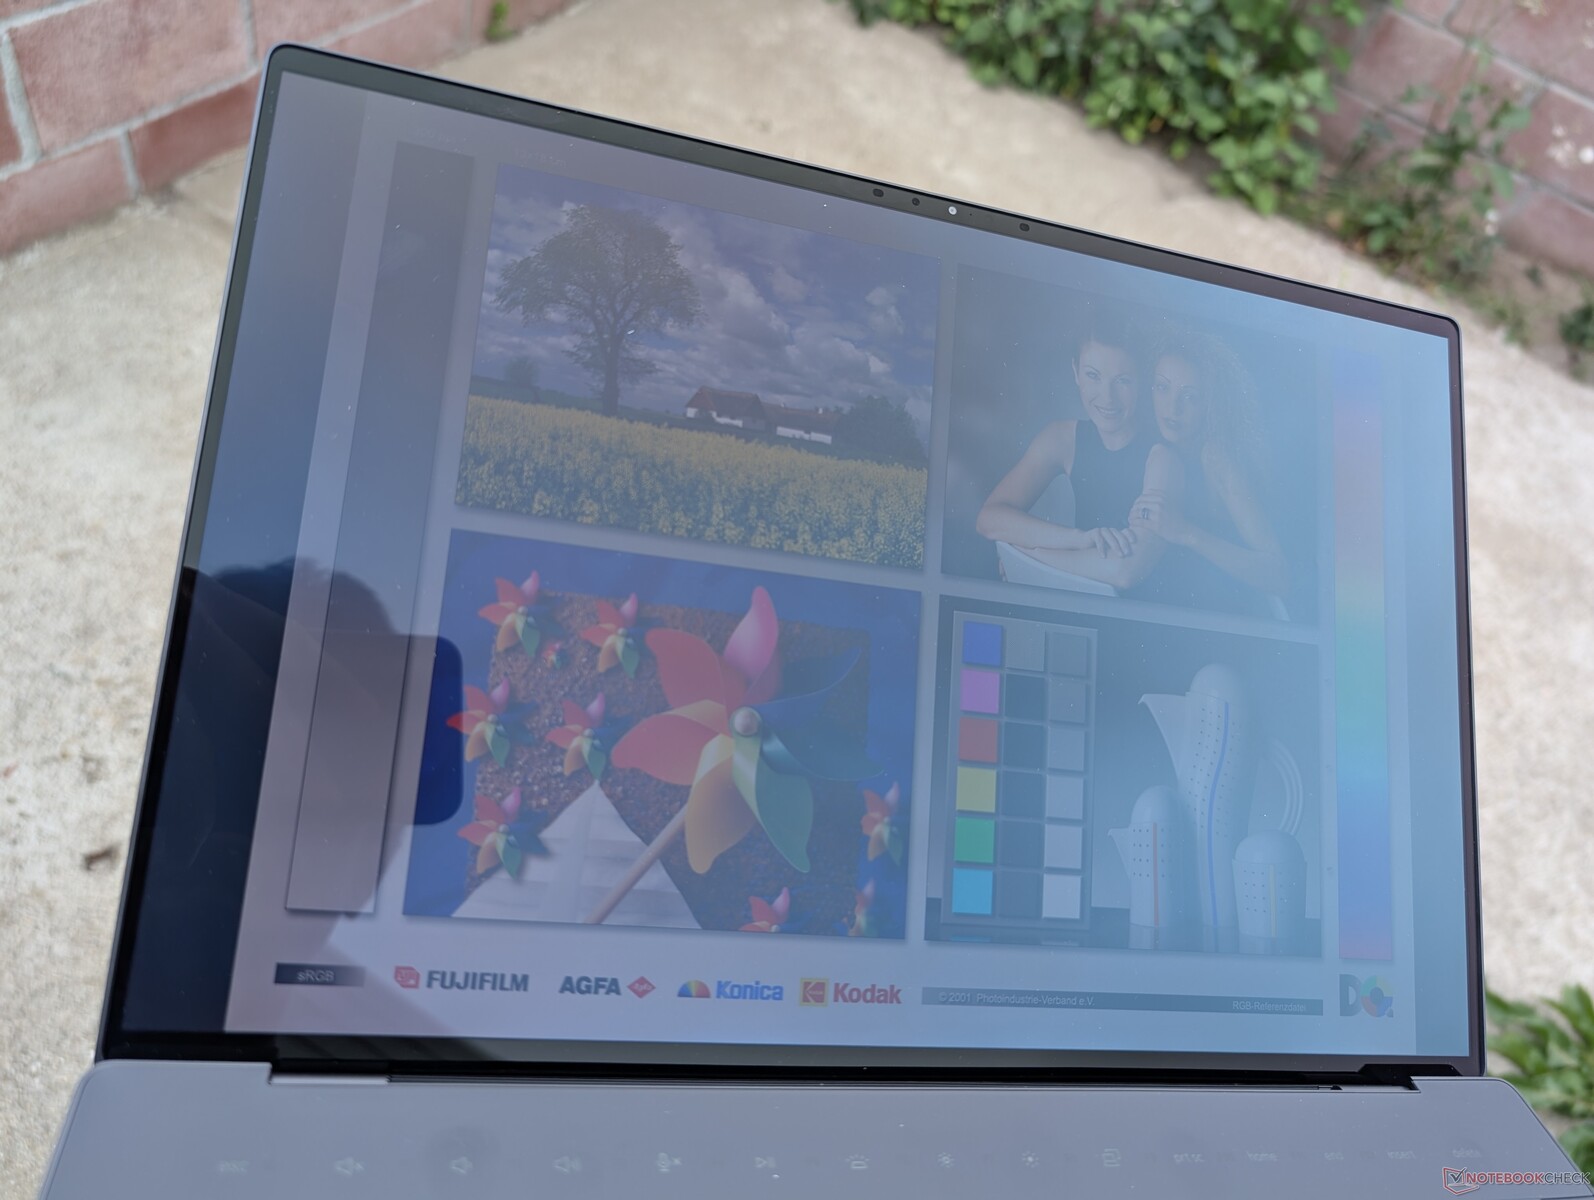
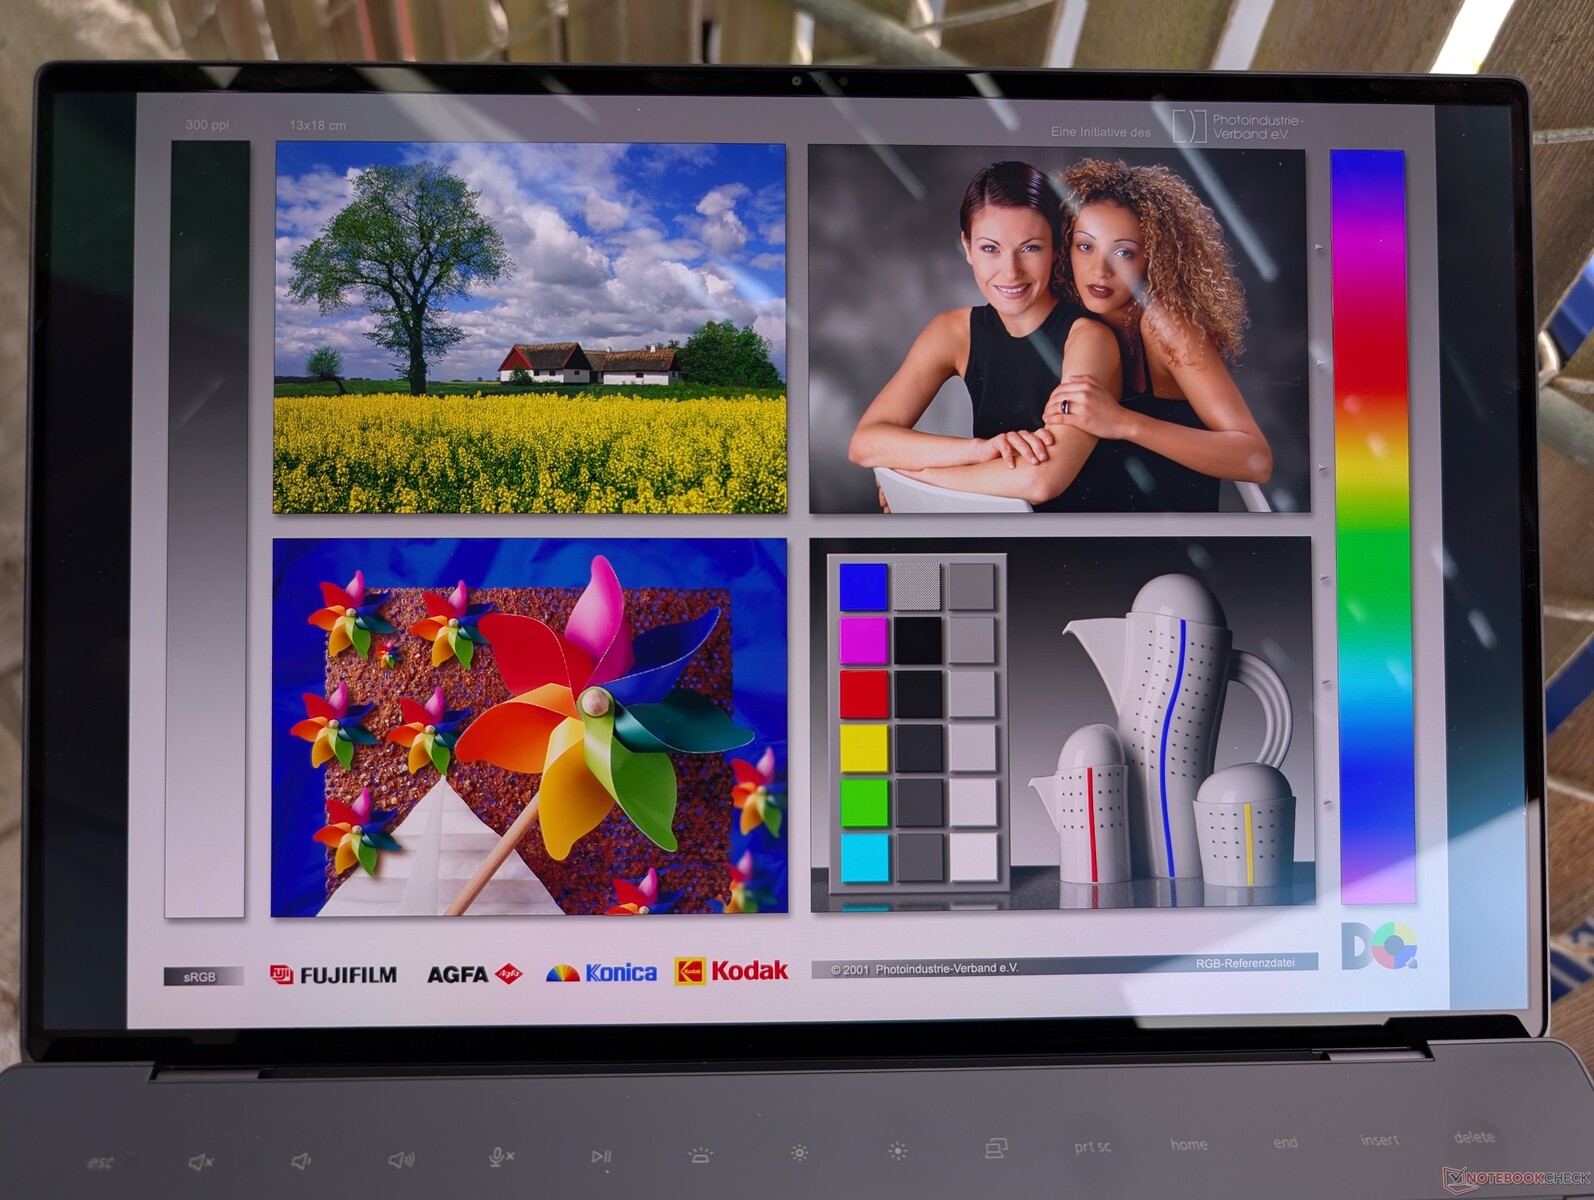
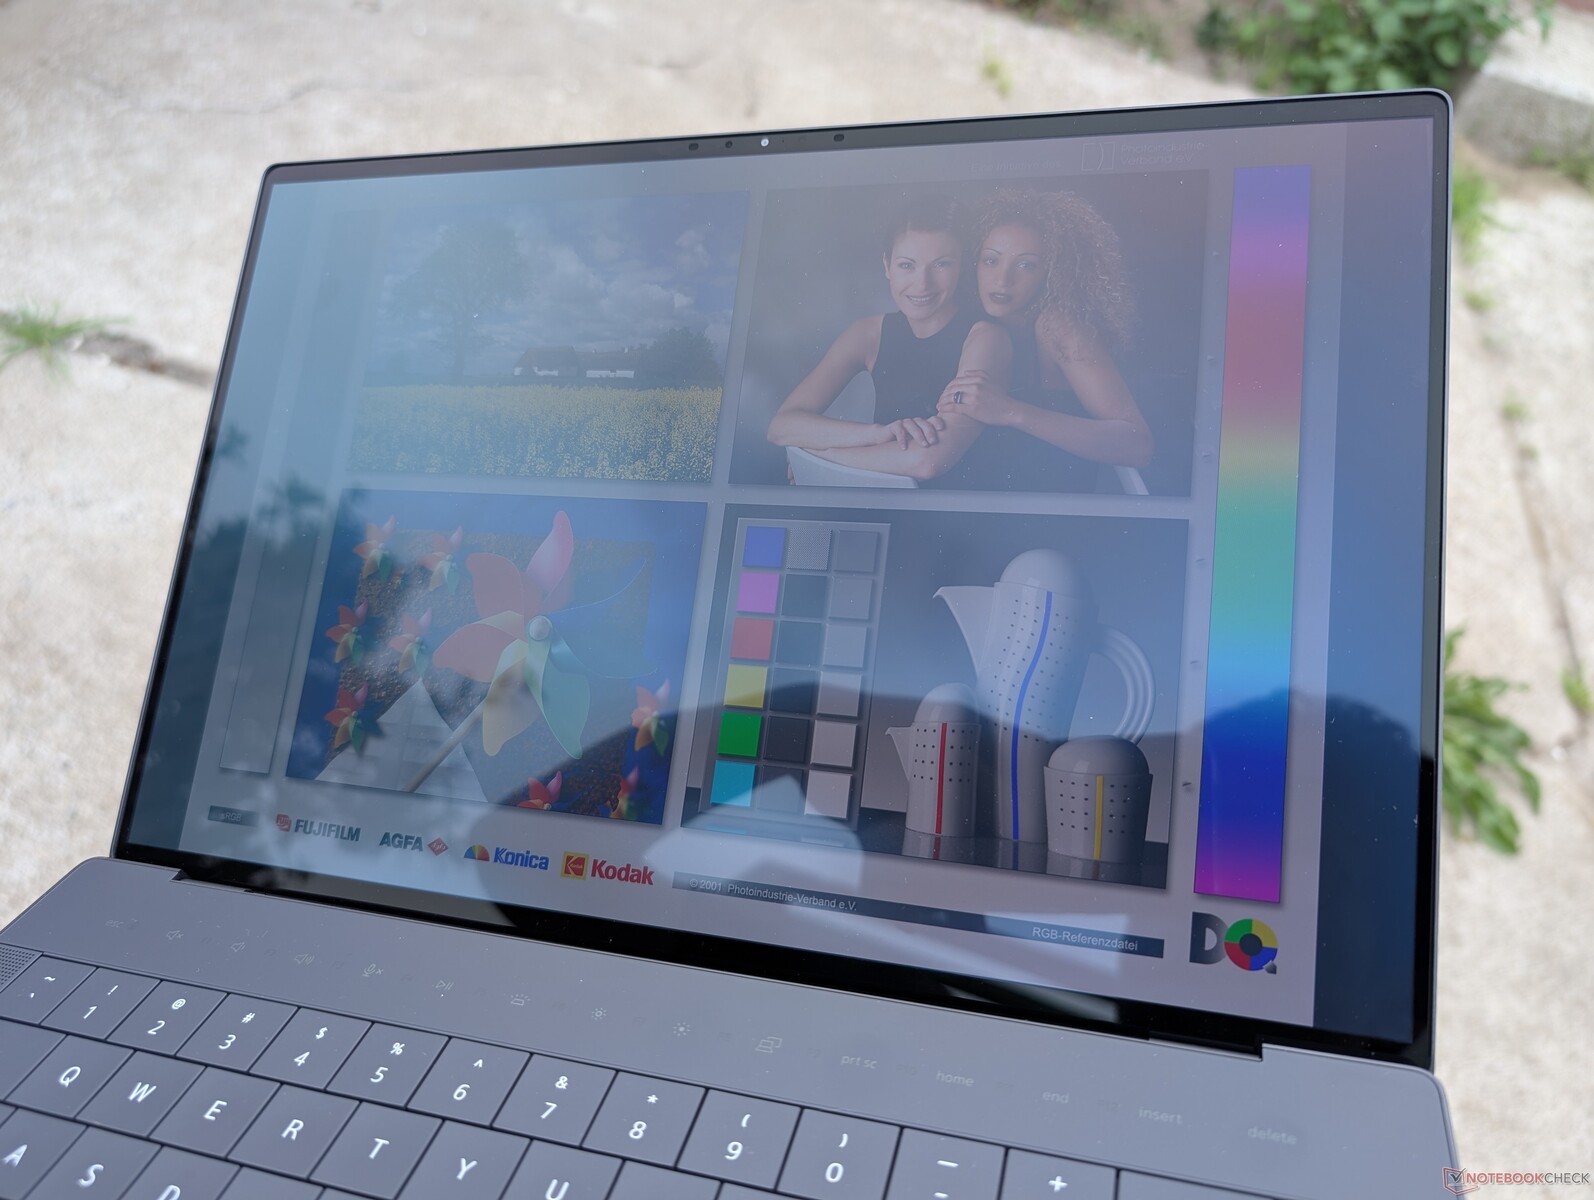
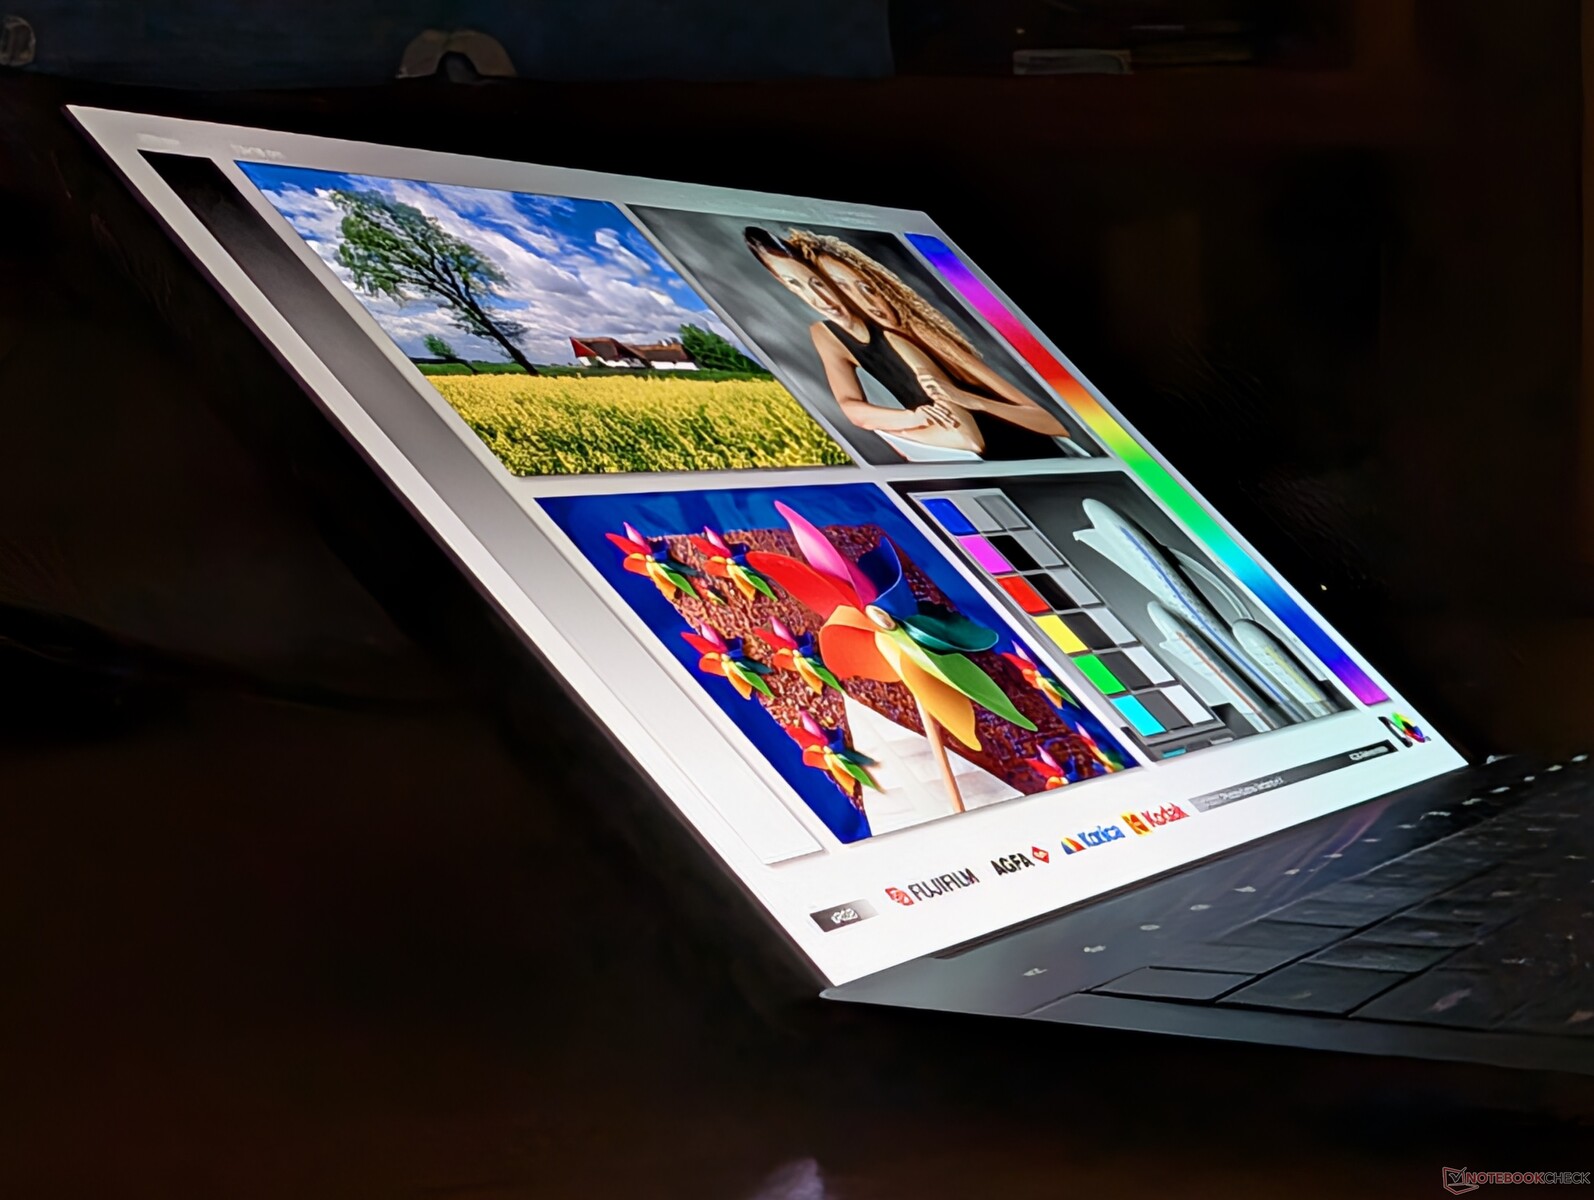
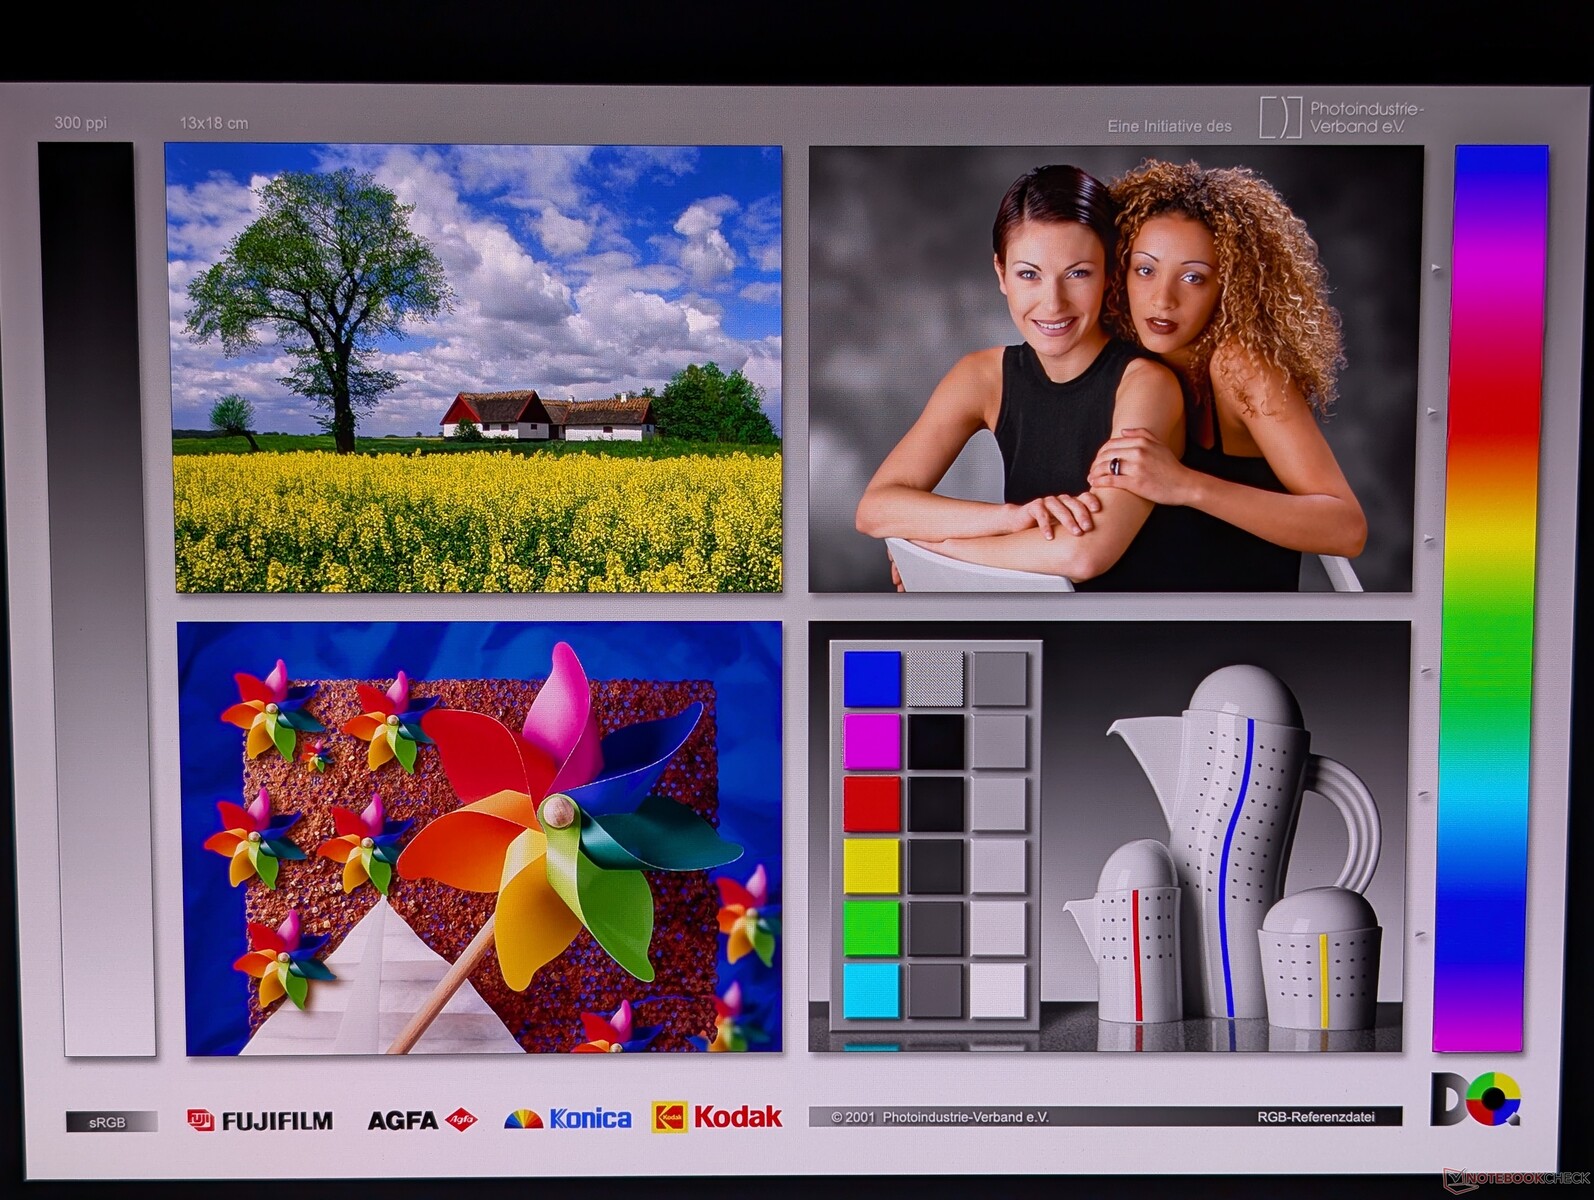
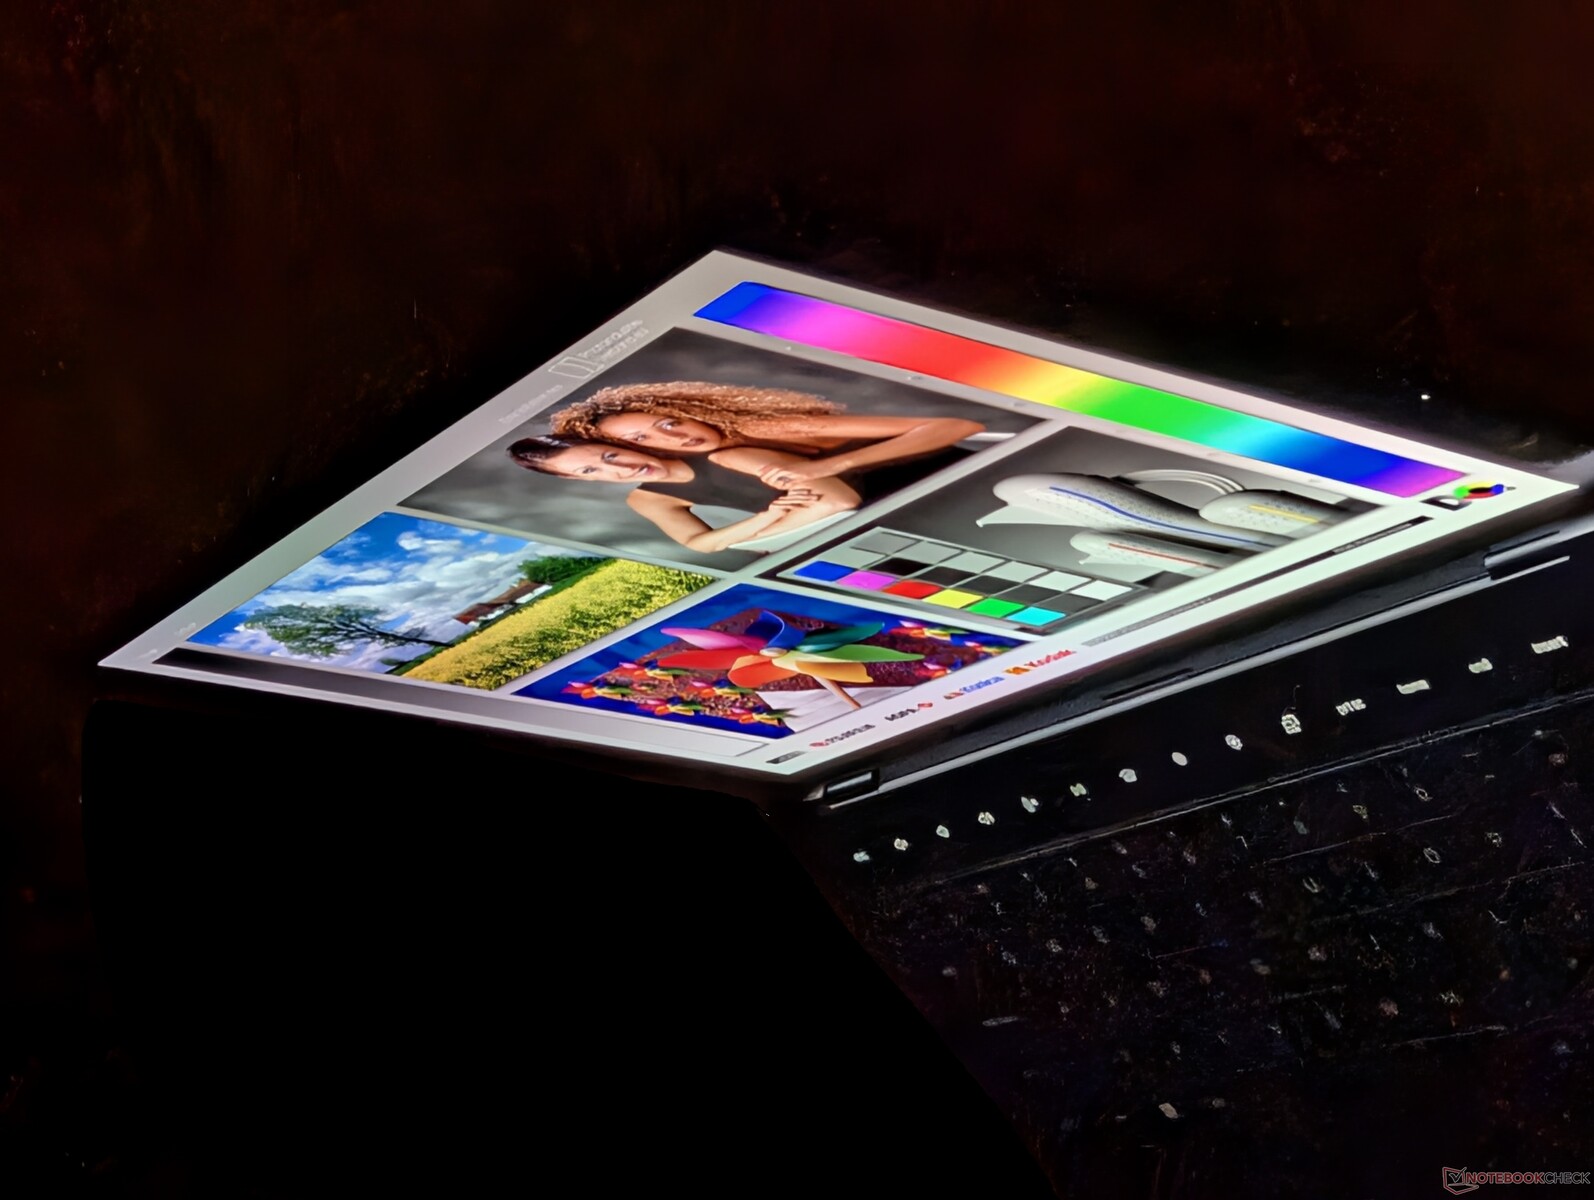
Wyświetlacz
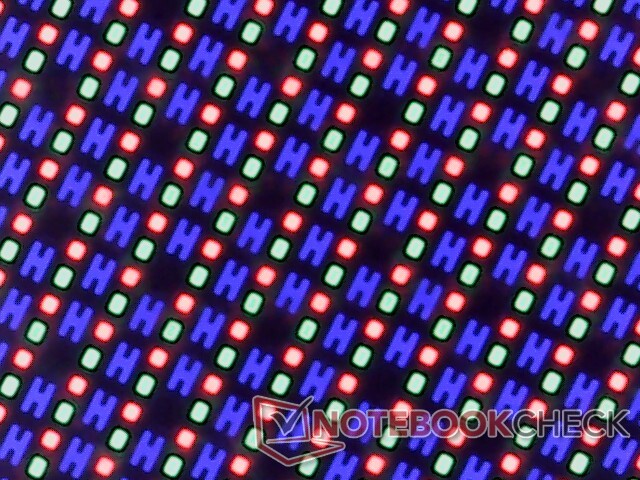
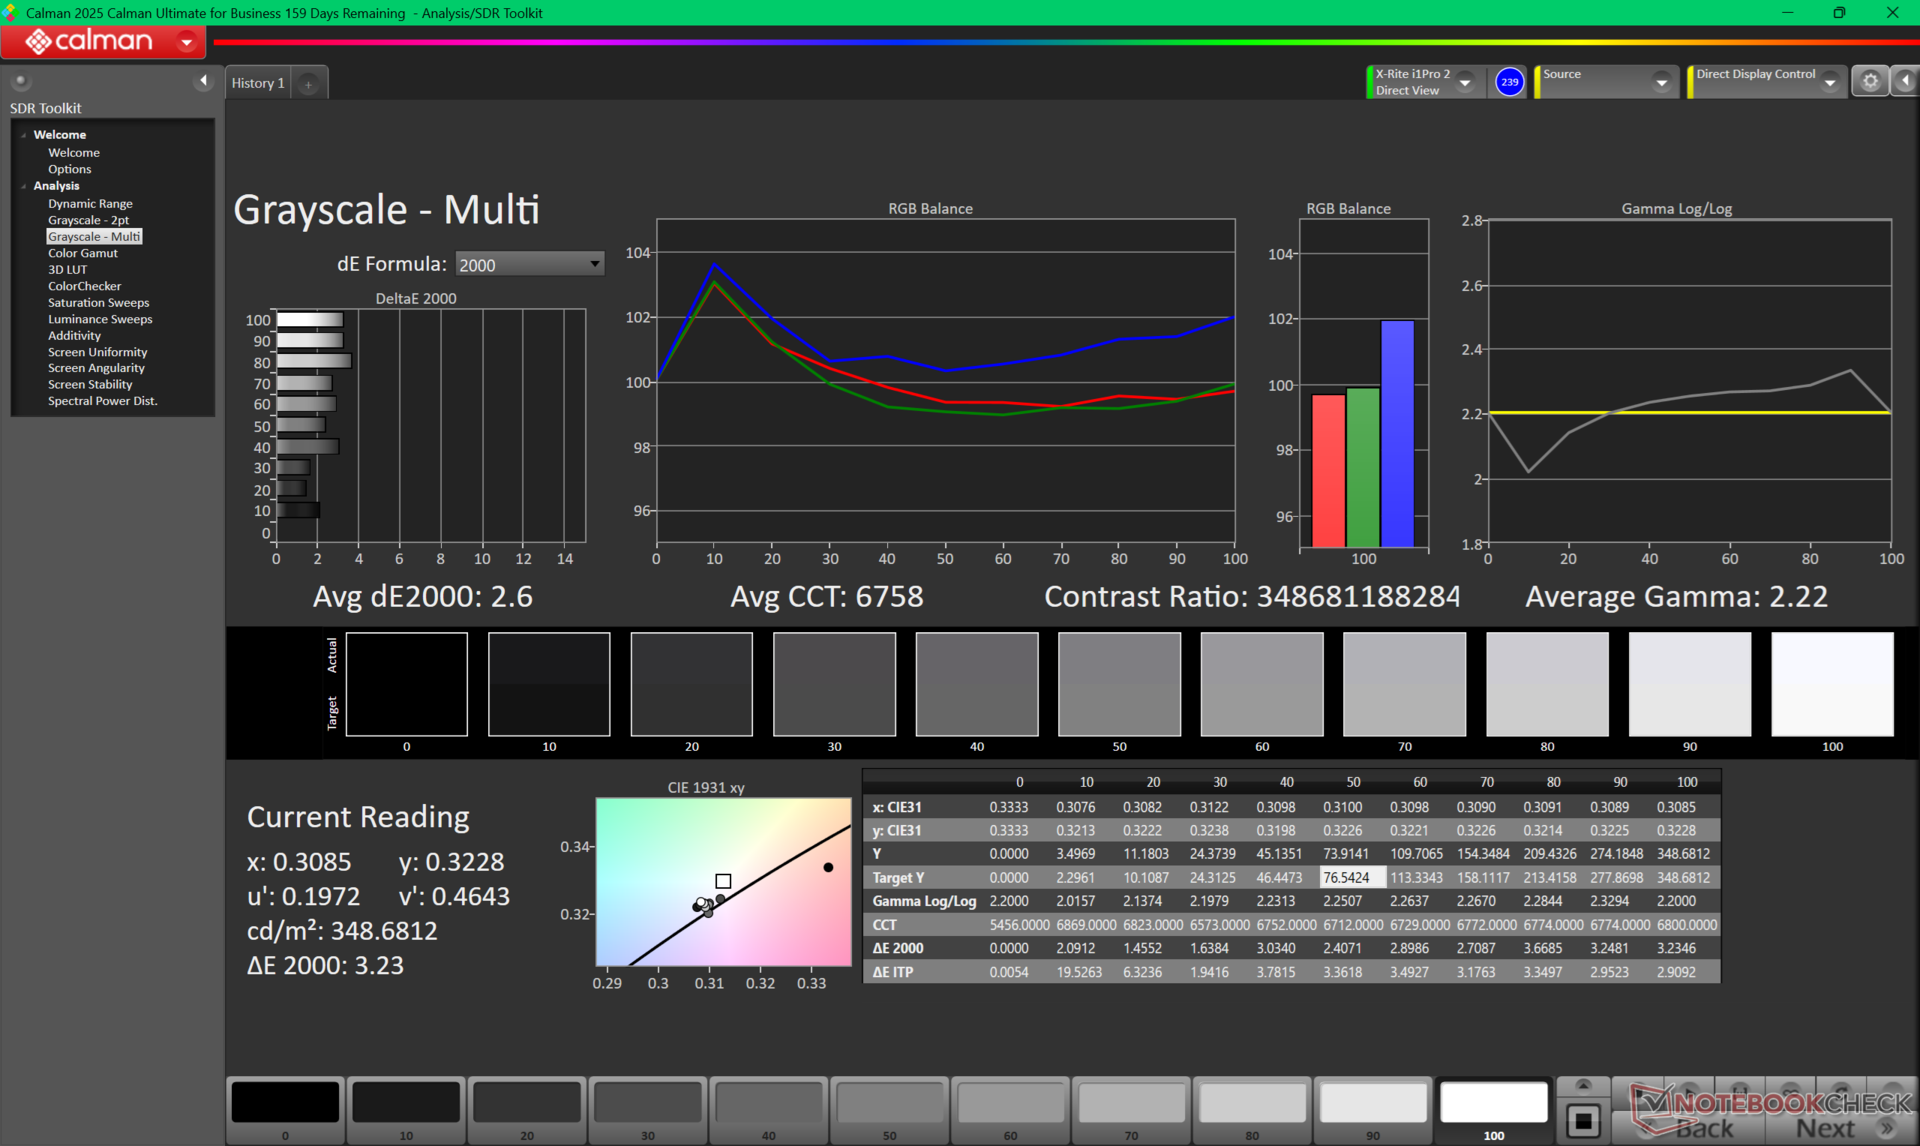
Ekran dotykowy Samsung OLED o rozdzielczości 3,2K z XPS 14 został przeniesiony do Dell 14 Premium bez szwanku.
Maksymalna jasność osiąga około 350 nitów w trybie SDR lub 595 nitów po włączeniu HDR.
| |||||||||||||||||||||||||
rozświetlenie: 98 %
na akumulatorze: 349.3 cd/m²
kontrast: ∞:1 (czerń: 0 cd/m²)
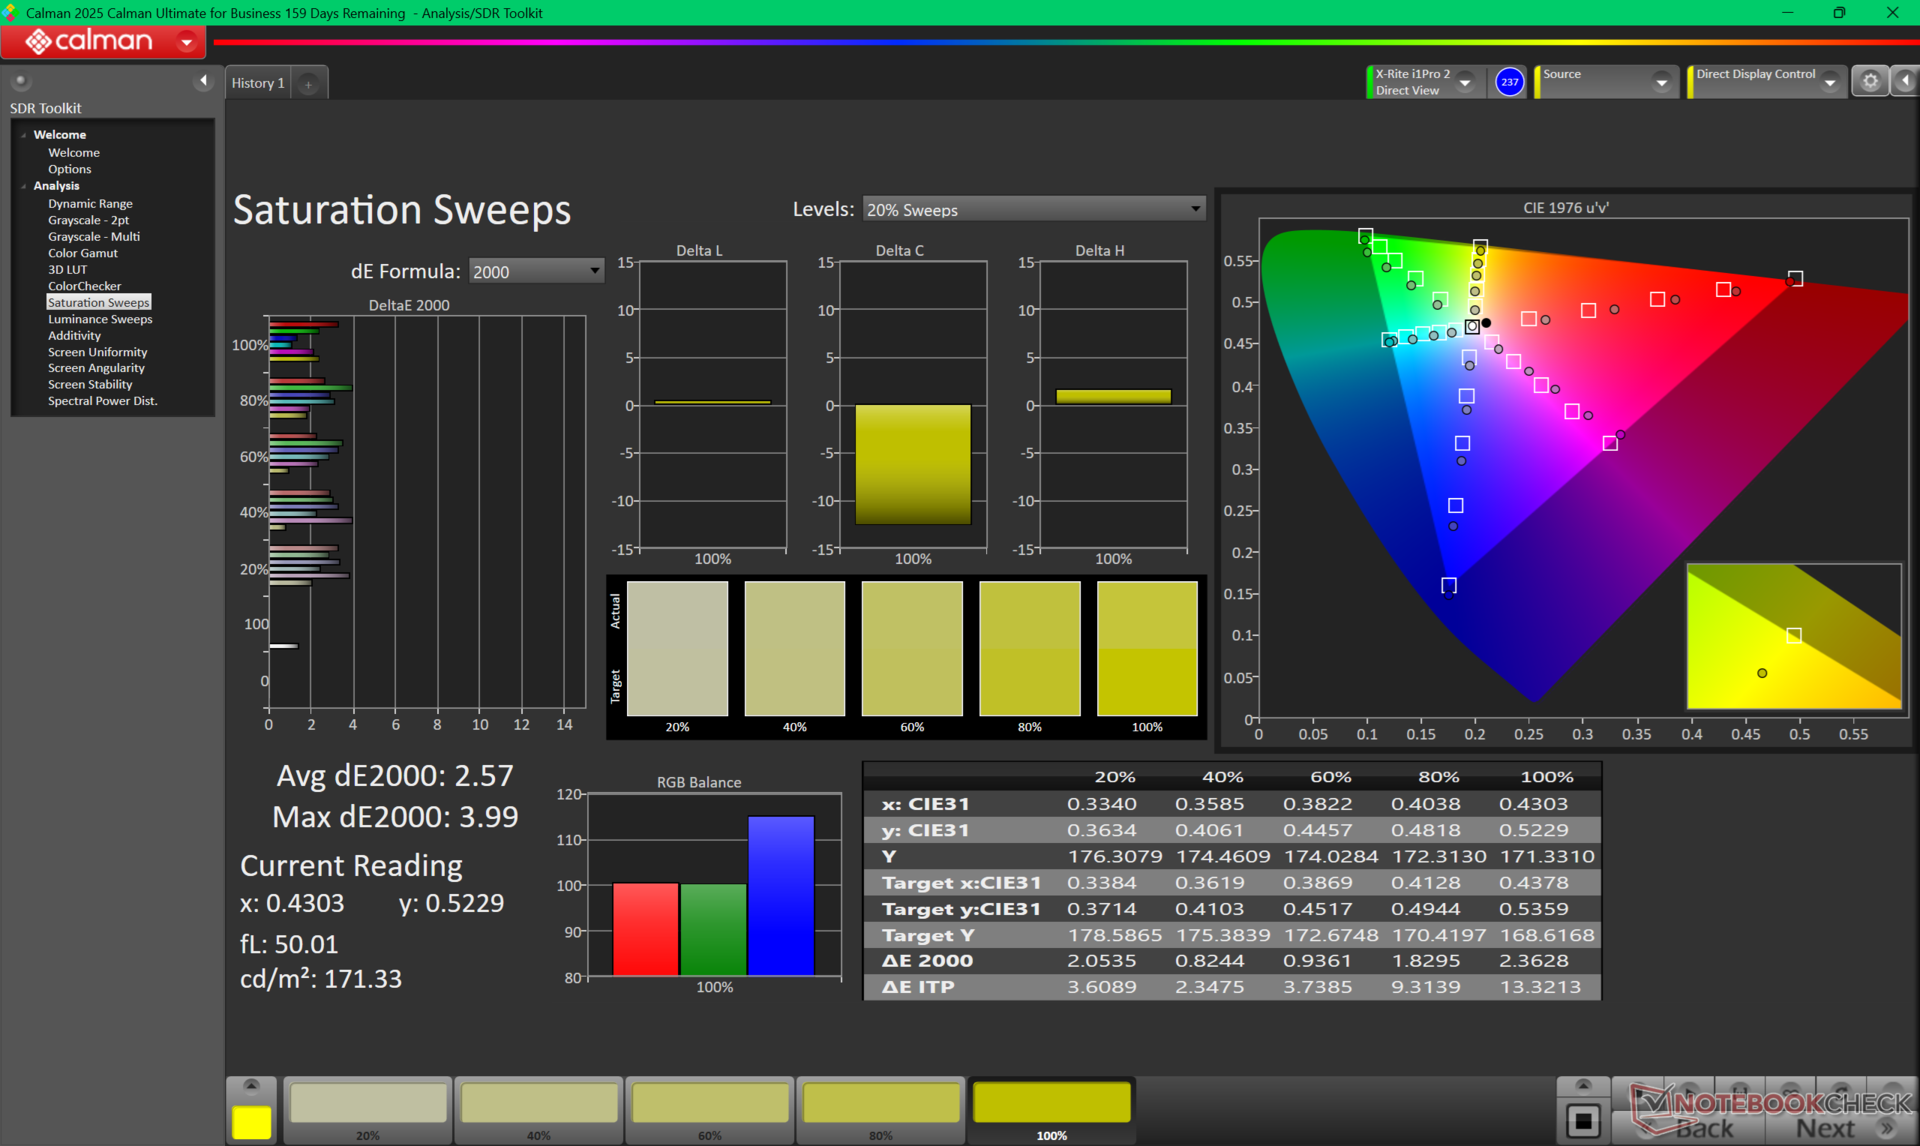
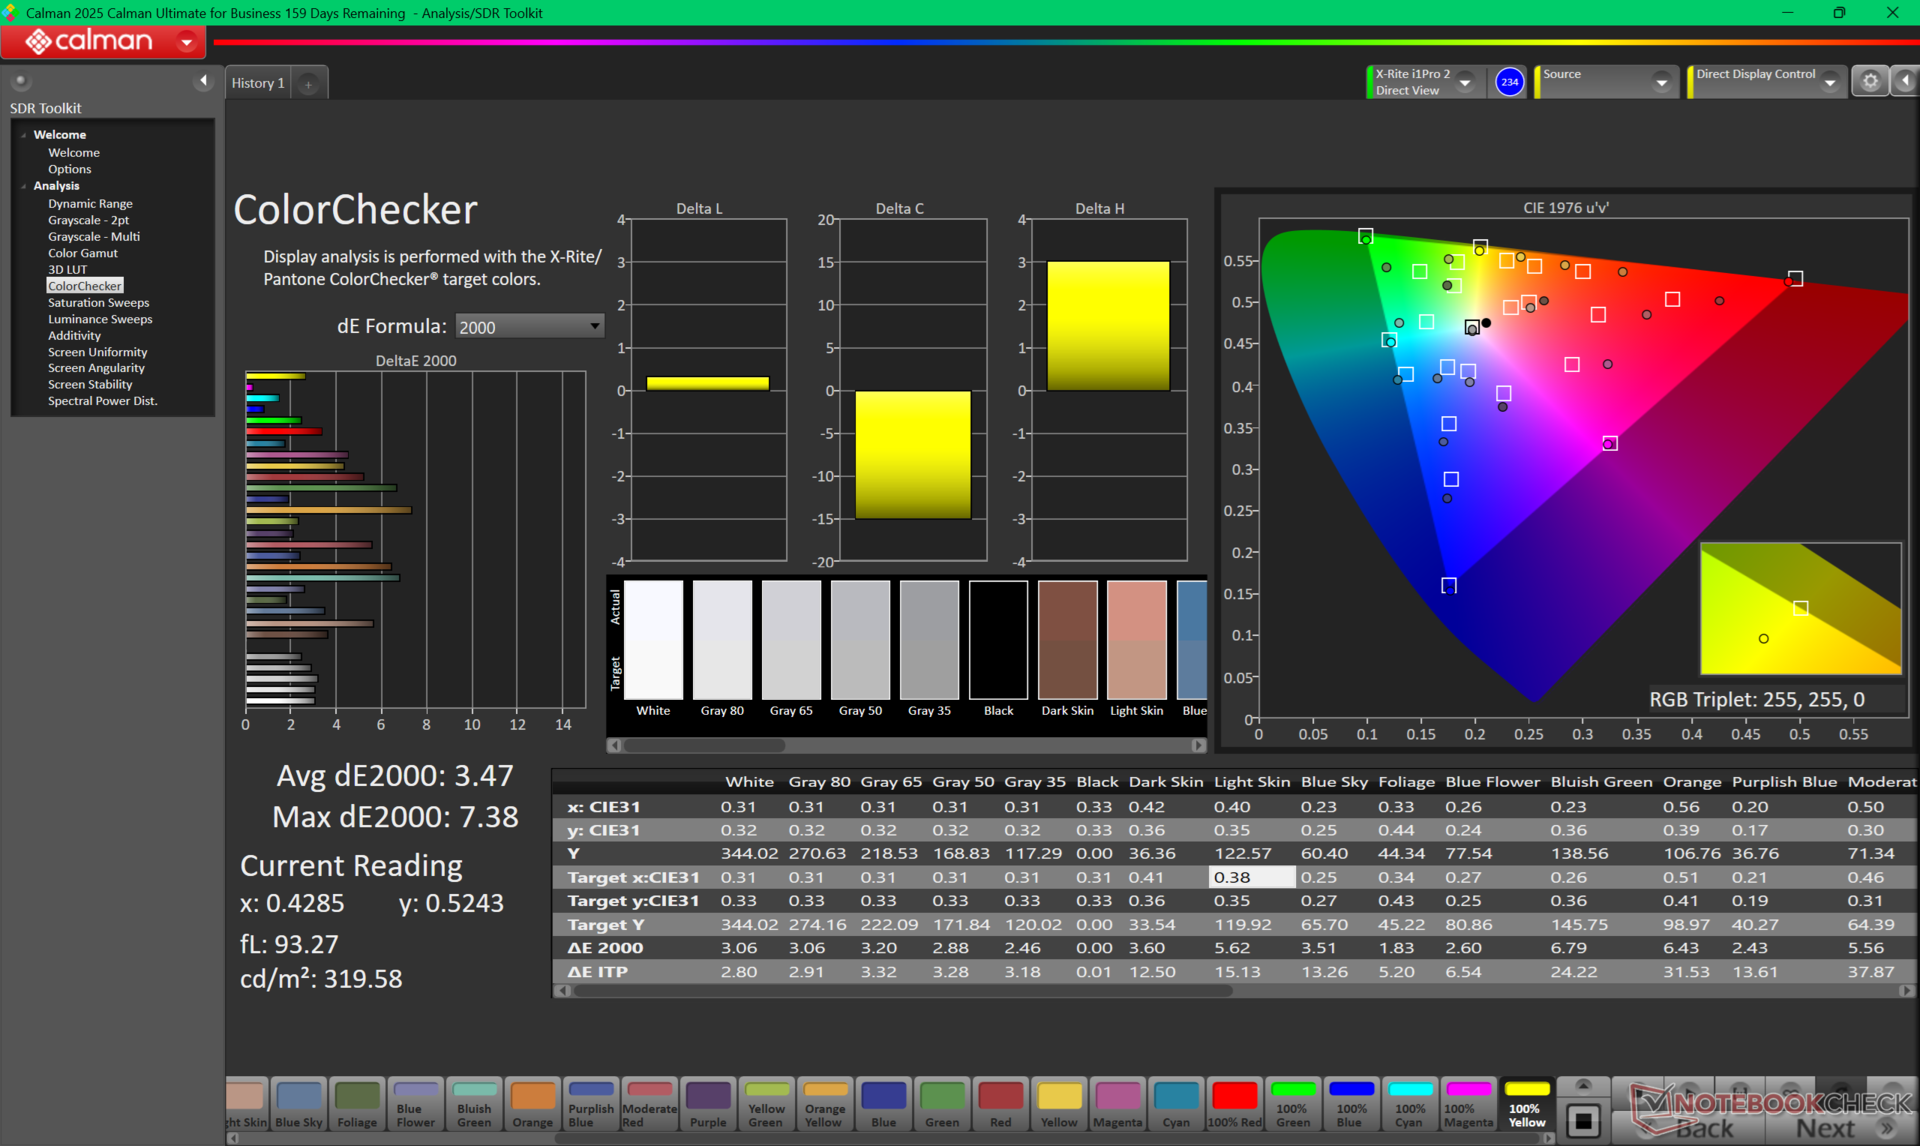
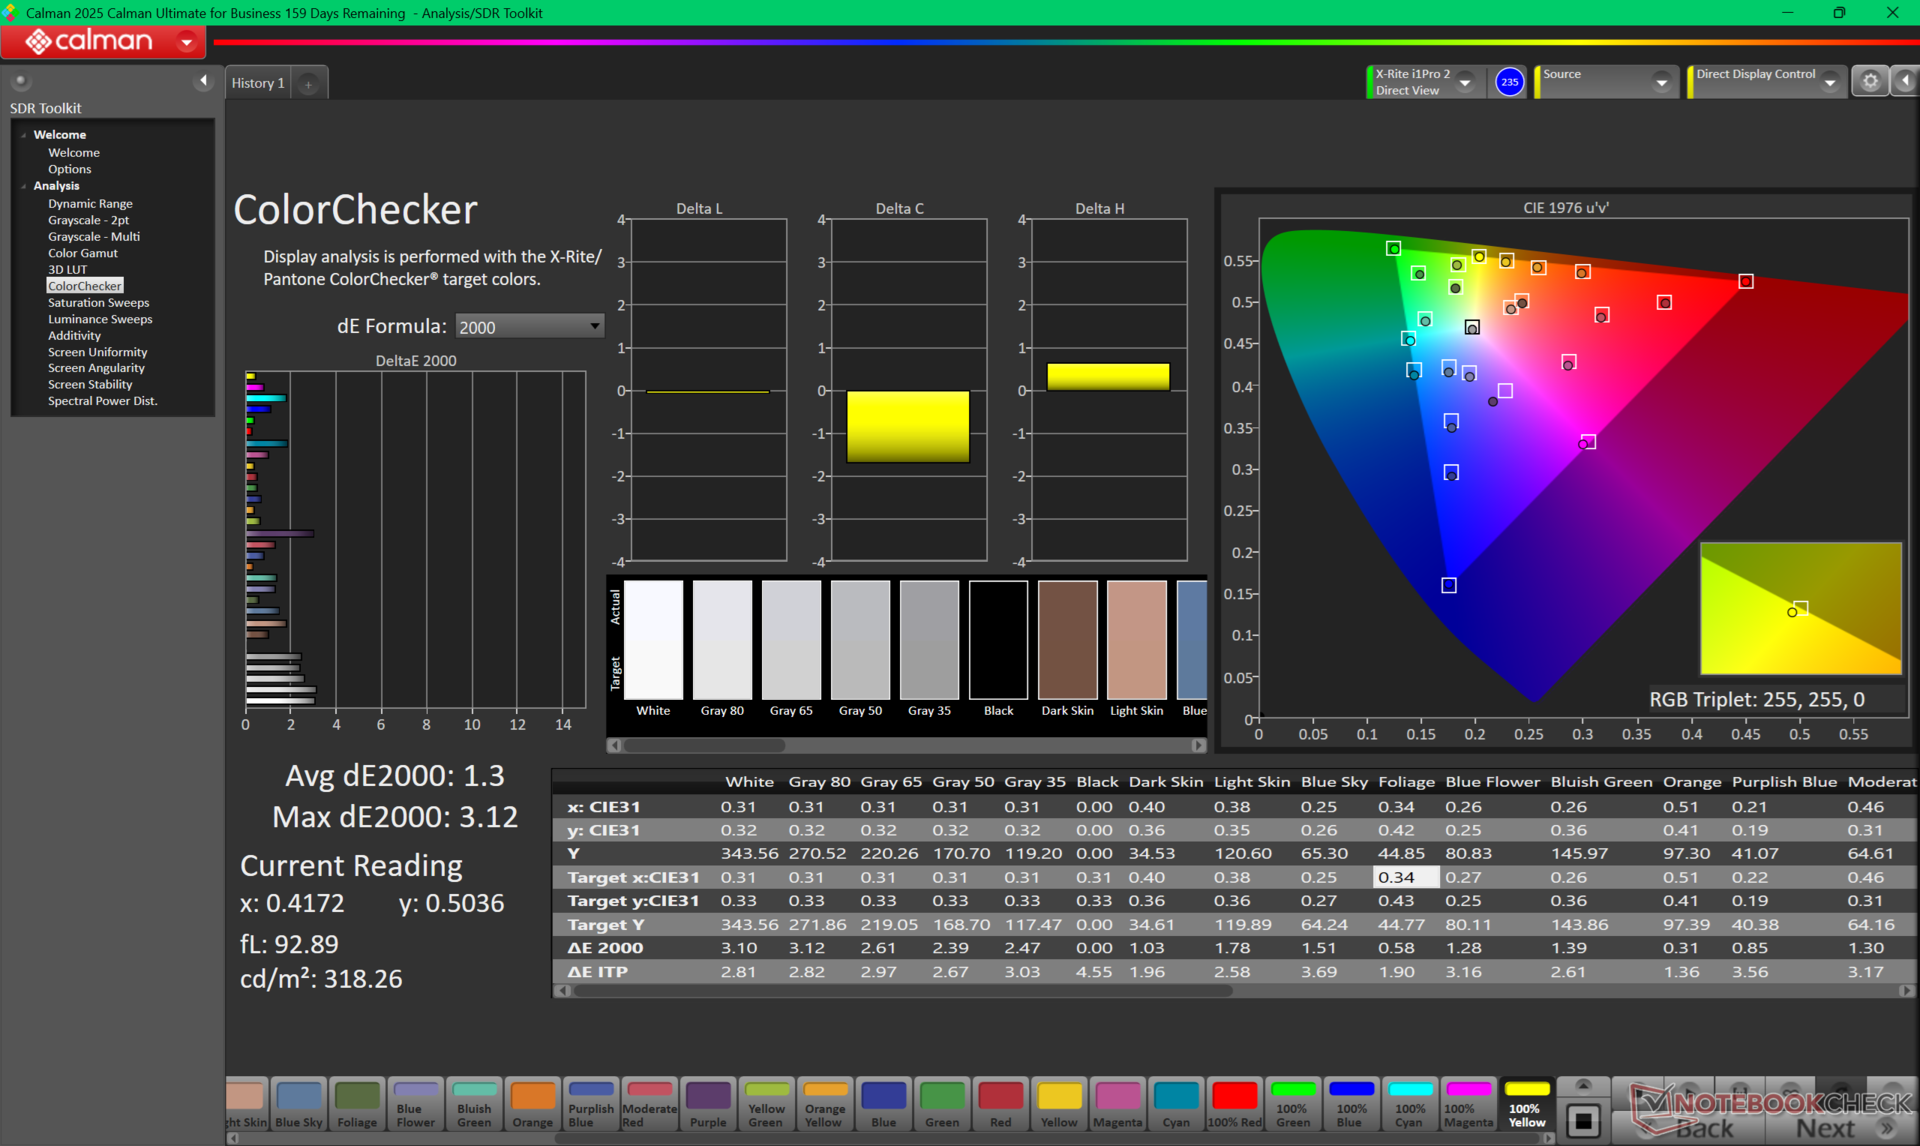
ΔE ColorChecker Calman: 3.47 | ∀{0.5-29.43 Ø4.72}
calibrated: 1.3
ΔE Greyscale Calman: 2.6 | ∀{0.09-98 Ø4.97}
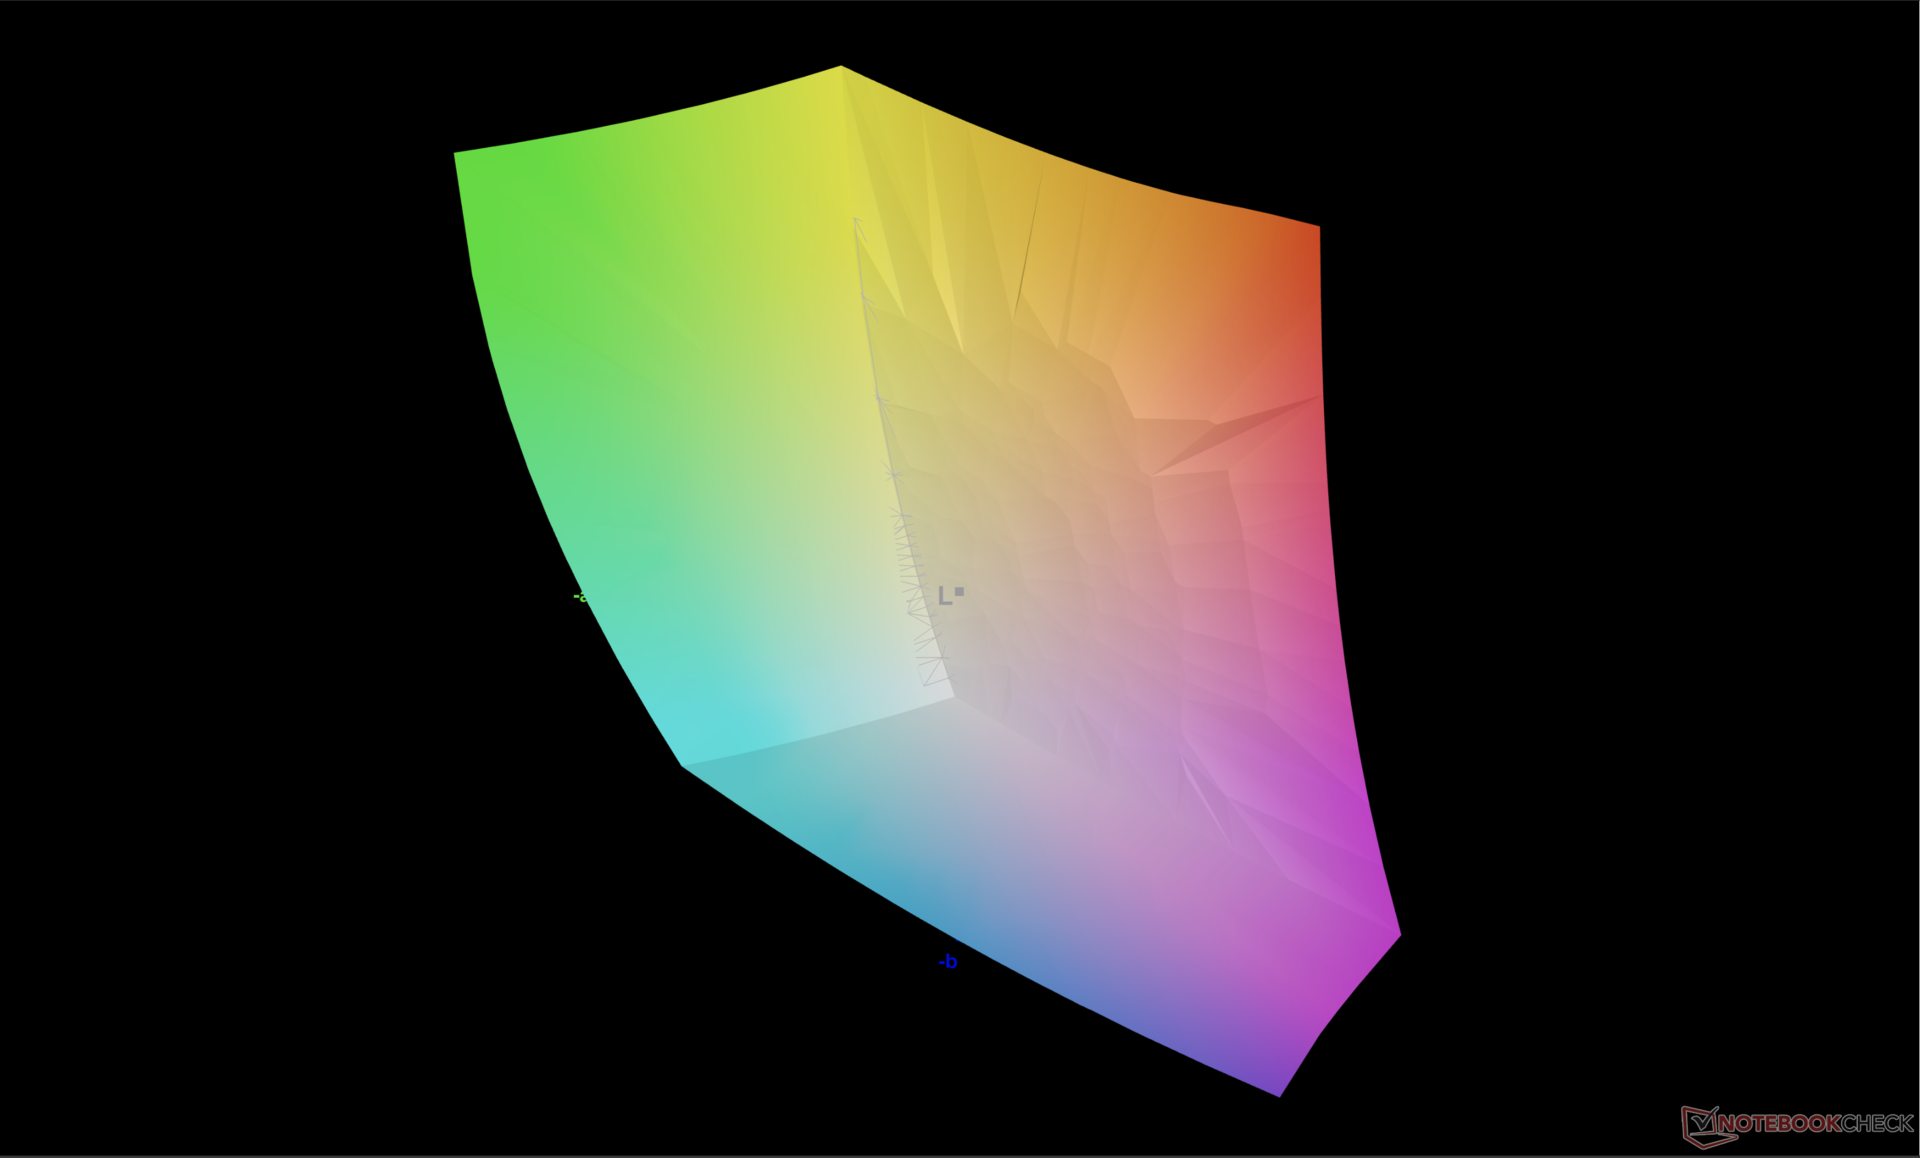
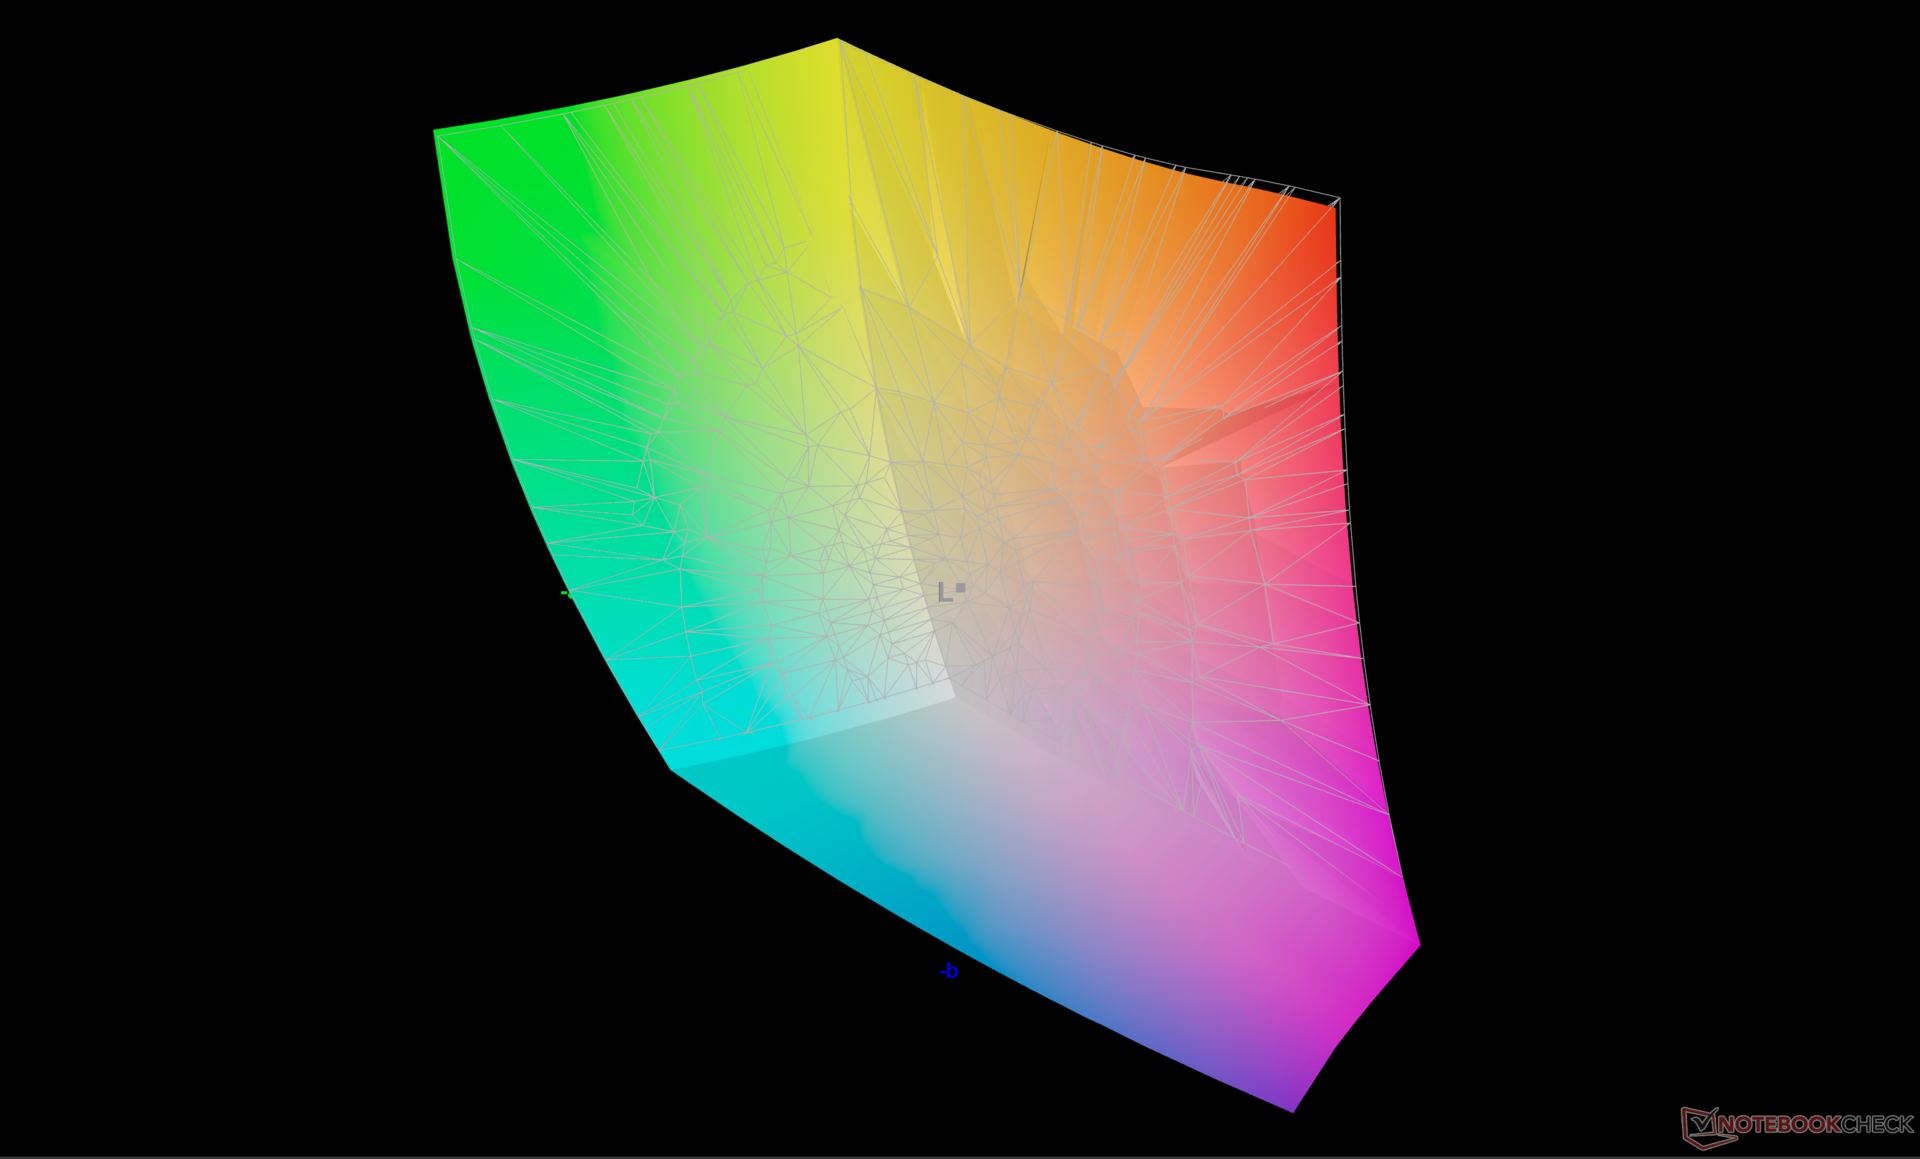
87.2% AdobeRGB 1998 (Argyll 3D)
100% sRGB (Argyll 3D)
99.3% Display P3 (Argyll 3D)
Gamma: 2.22
CCT: 6758 K
| Dell 14 Premium Samsung 145FB02, OLED, 3200x2000, 14.5", 120 Hz | HP OmniBook Ultra 14 BOE0C9E, IPS, 2240x1400, 14", 60 Hz | Asus Zenbook S 14 UX5406 ATNA40CU09-0, OLED, 2880x1800, 14", 120 Hz | Lenovo ThinkPad X9-14 Gen 1 Aura Edition ATNA40CT04-0 , OLED, 1920x1200, 14", 60 Hz | Asus ZenBook Duo OLED UX8406CA ATNA40CT02-0, OLED, 1920x1200, 14", 60 Hz | Dell XPS 14 2024 OLED SDC41A2, OLED, 3200x2000, 14.5", 120 Hz | |
|---|---|---|---|---|---|---|
| Display | -18% | 1% | 4% | -1% | -0% | |
| Display P3 Coverage (%) | 99.3 | 67.1 -32% | 99 0% | 99.2 0% | 98.4 -1% | 98.5 -1% |
| sRGB Coverage (%) | 100 | 99 -1% | 100 0% | 99.9 0% | 99.8 0% | 100 0% |
| AdobeRGB 1998 Coverage (%) | 87.2 | 68.9 -21% | 89.2 2% | 97.8 12% | 86.7 -1% | 87.2 0% |
| Response Times | -3852% | 5% | -217% | -38% | 12% | |
| Response Time Grey 50% / Grey 80% * (ms) | 0.72 ? | 35.9 ? -4886% | 0.7 ? 3% | 3 ? -317% | 1.51 ? -110% | 0.7 ? 3% |
| Response Time Black / White * (ms) | 0.96 ? | 28 ? -2817% | 0.71 ? 26% | 4.2 ? -338% | 1.36 ? -42% | 0.77 ? 20% |
| PWM Frequency (Hz) | 475 | 480 ? | 480 | 480 ? | 480 | |
| PWM Amplitude * (%) | 23 | 26 -13% | 22 4% | 14 39% | ||
| Screen | 16% | 36% | -41% | 25% | 20% | |
| Brightness middle (cd/m²) | 349.3 | 359.5 3% | 374 7% | 398 14% | 359 3% | 351 0% |
| Brightness (cd/m²) | 352 | 361 3% | 379 8% | 399 13% | 362 3% | 353 0% |
| Brightness Distribution (%) | 98 | 92 -6% | 98 0% | 98 0% | 98 0% | 97 -1% |
| Black Level * (cd/m²) | 0.27 | |||||
| Colorchecker dE 2000 * | 3.47 | 1.64 53% | 1 71% | 4.8 -38% | 1.2 65% | 1.7 51% |
| Colorchecker dE 2000 max. * | 7.38 | 4.68 37% | 2.2 70% | 9.1 -23% | 3.2 57% | 2.2 70% |
| Colorchecker dE 2000 calibrated * | 1.3 | 0.97 25% | 5 -285% | 0.8 38% | ||
| Greyscale dE 2000 * | 2.6 | 2.6 -0% | 1.1 58% | 1.7 35% | 2.1 19% | 3.1 -19% |
| Gamma | 2.22 99% | 2.22 99% | 2.15 102% | 2.2 100% | 2.24 98% | 2.12 104% |
| CCT | 6758 96% | 6388 102% | 6549 99% | 6485 100% | 6433 101% | 6616 98% |
| Contrast (:1) | 1331 | |||||
| Całkowita średnia (program / ustawienia) | -1285% /
-637% | 14% /
19% | -85% /
-71% | -5% /
3% | 11% /
13% |
* ... im mniej tym lepiej
Wyświetl czasy reakcji
| ↔ Czas reakcji od czerni do bieli | ||
|---|---|---|
| 0.96 ms ... wzrost ↗ i spadek ↘ łącznie | ↗ 0.45 ms wzrost | 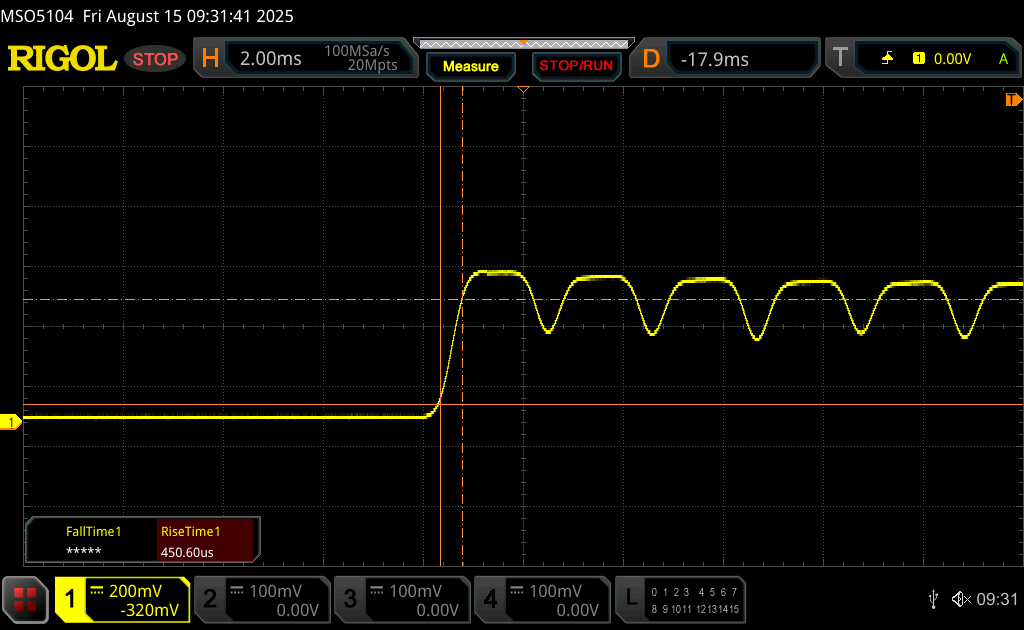 |
| ↘ 0.51 ms upadek | ||
| W naszych testach ekran wykazuje bardzo szybką reakcję i powinien bardzo dobrze nadawać się do szybkich gier. Dla porównania, wszystkie testowane urządzenia wahają się od 0.1 (minimum) do 240 (maksimum) ms. » 4 % wszystkich urządzeń jest lepszych. Oznacza to, że zmierzony czas reakcji jest lepszy od średniej wszystkich testowanych urządzeń (19.8 ms). | ||
| ↔ Czas reakcji 50% szarości do 80% szarości | ||
| 0.72 ms ... wzrost ↗ i spadek ↘ łącznie | ↗ 0.37 ms wzrost | 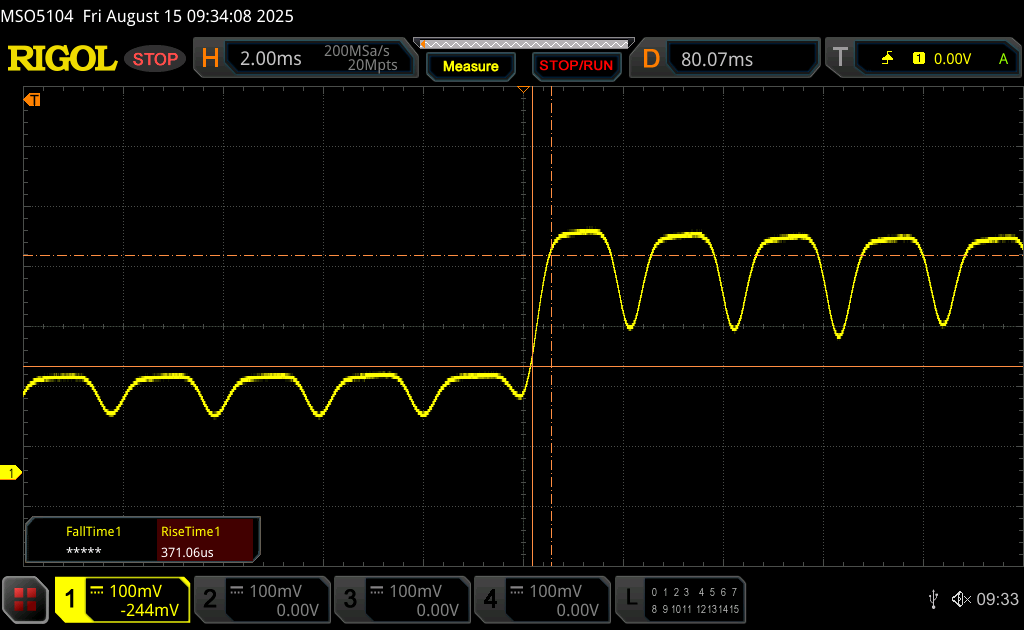 |
| ↘ 0.35 ms upadek | ||
| W naszych testach ekran wykazuje bardzo szybką reakcję i powinien bardzo dobrze nadawać się do szybkich gier. Dla porównania, wszystkie testowane urządzenia wahają się od 0.165 (minimum) do 636 (maksimum) ms. » 2 % wszystkich urządzeń jest lepszych. Oznacza to, że zmierzony czas reakcji jest lepszy od średniej wszystkich testowanych urządzeń (31 ms). | ||
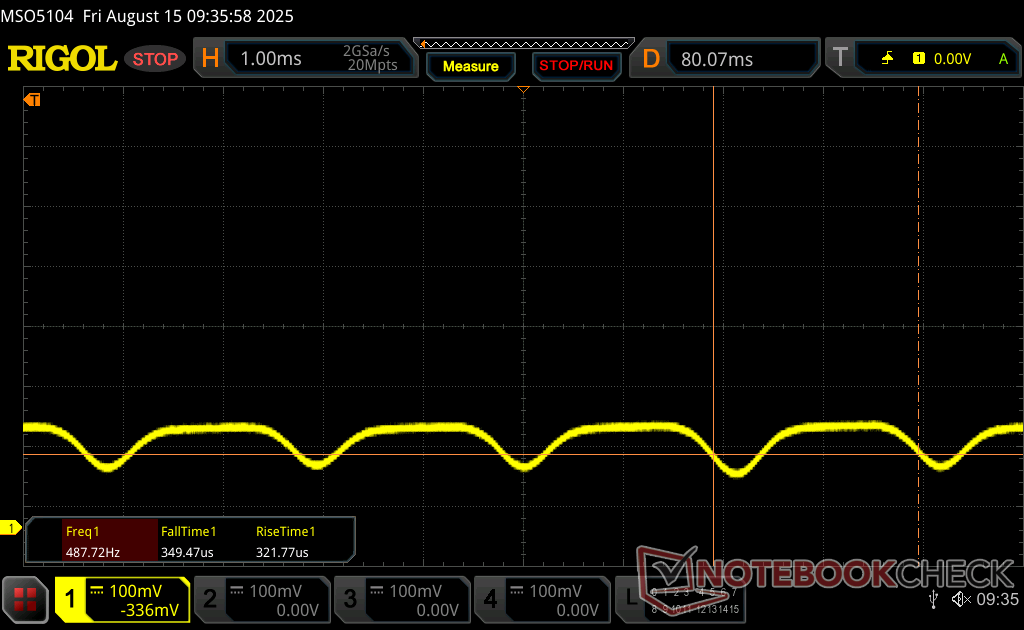
Migotanie ekranu / PWM (modulacja szerokości impulsu)
| Wykryto migotanie ekranu/wykryto PWM | 475 Hz Amplitude: 23 % | 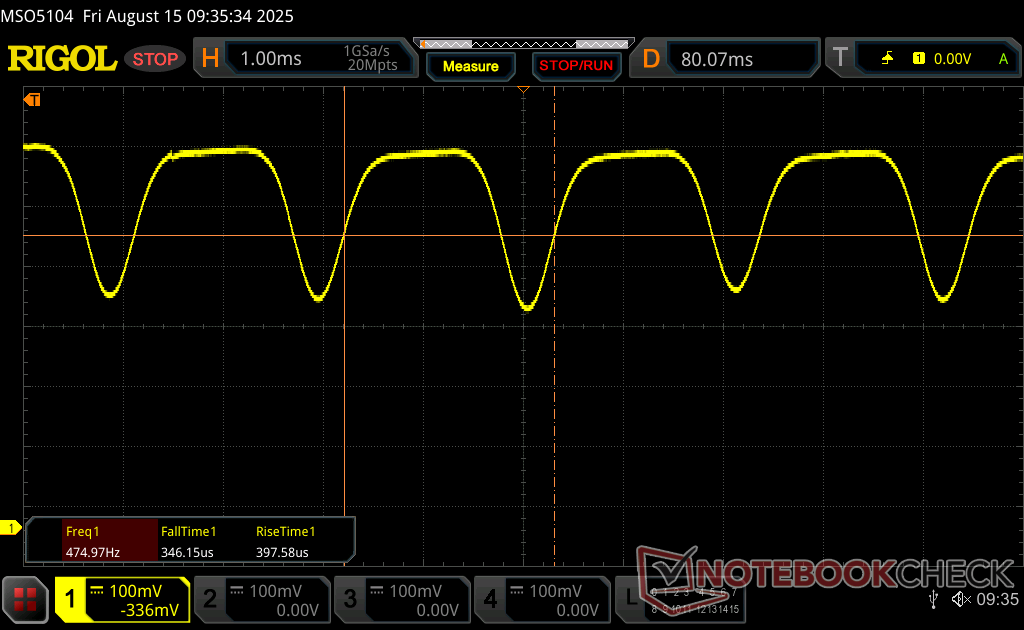 | |
Podświetlenie wyświetlacza miga z częstotliwością 475 Hz (najgorszy przypadek, np. przy użyciu PWM) . Częstotliwość 475 Hz jest stosunkowo wysoka, więc większość użytkowników wrażliwych na PWM nie powinna zauważyć żadnego migotania. Istnieją jednak doniesienia, że niektórzy użytkownicy są nadal wrażliwi na PWM przy częstotliwości 500 Hz i wyższej, więc należy zachować ostrożność. Dla porównania: 52 % wszystkich testowanych urządzeń nie używa PWM do przyciemniania wyświetlacza. Jeśli wykryto PWM, zmierzono średnio 7747 (minimum: 5 - maksimum: 343500) Hz. | |||
Wydajność
Warunki testowania
Przed przeprowadzeniem poniższych testów ustawiliśmy Dell Optimizer na tryb wydajności.
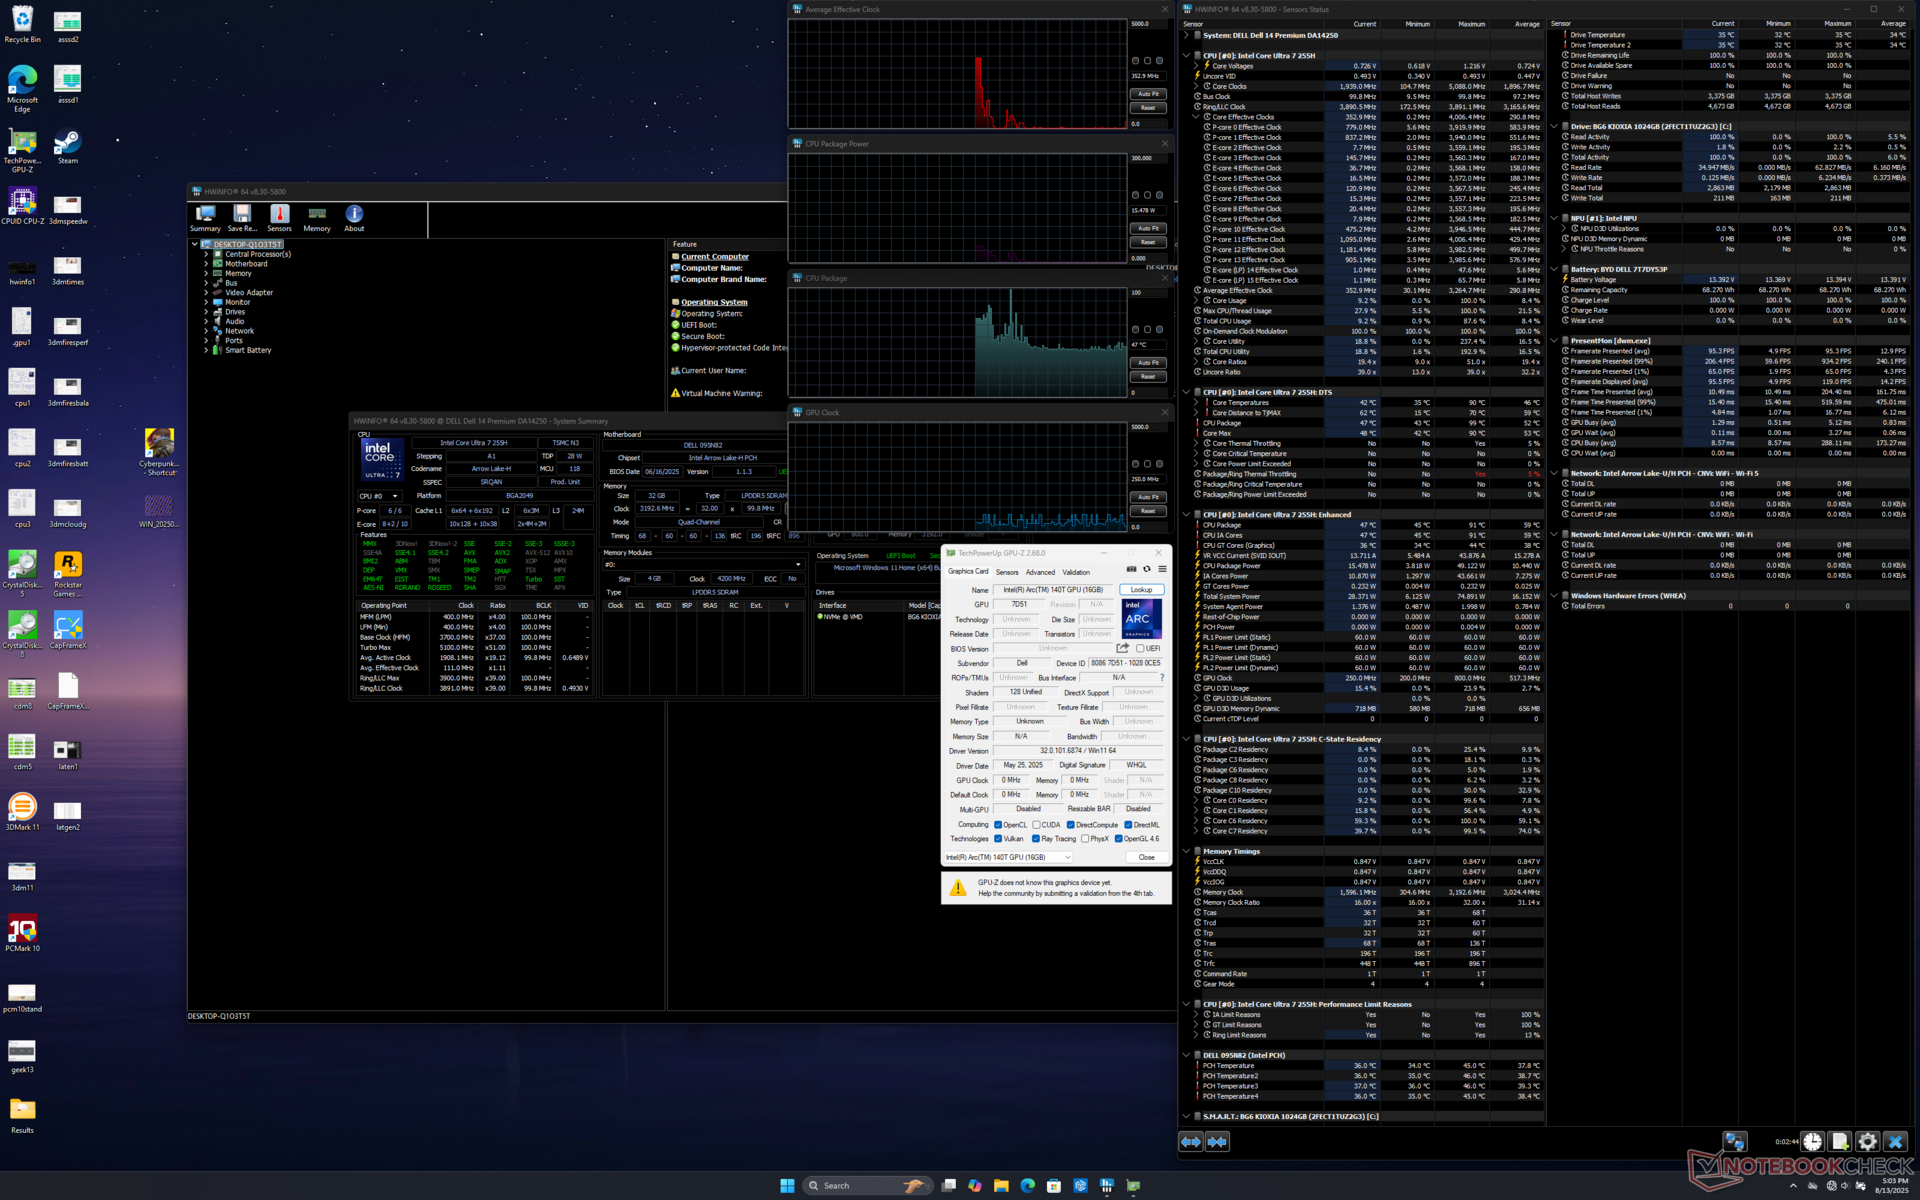
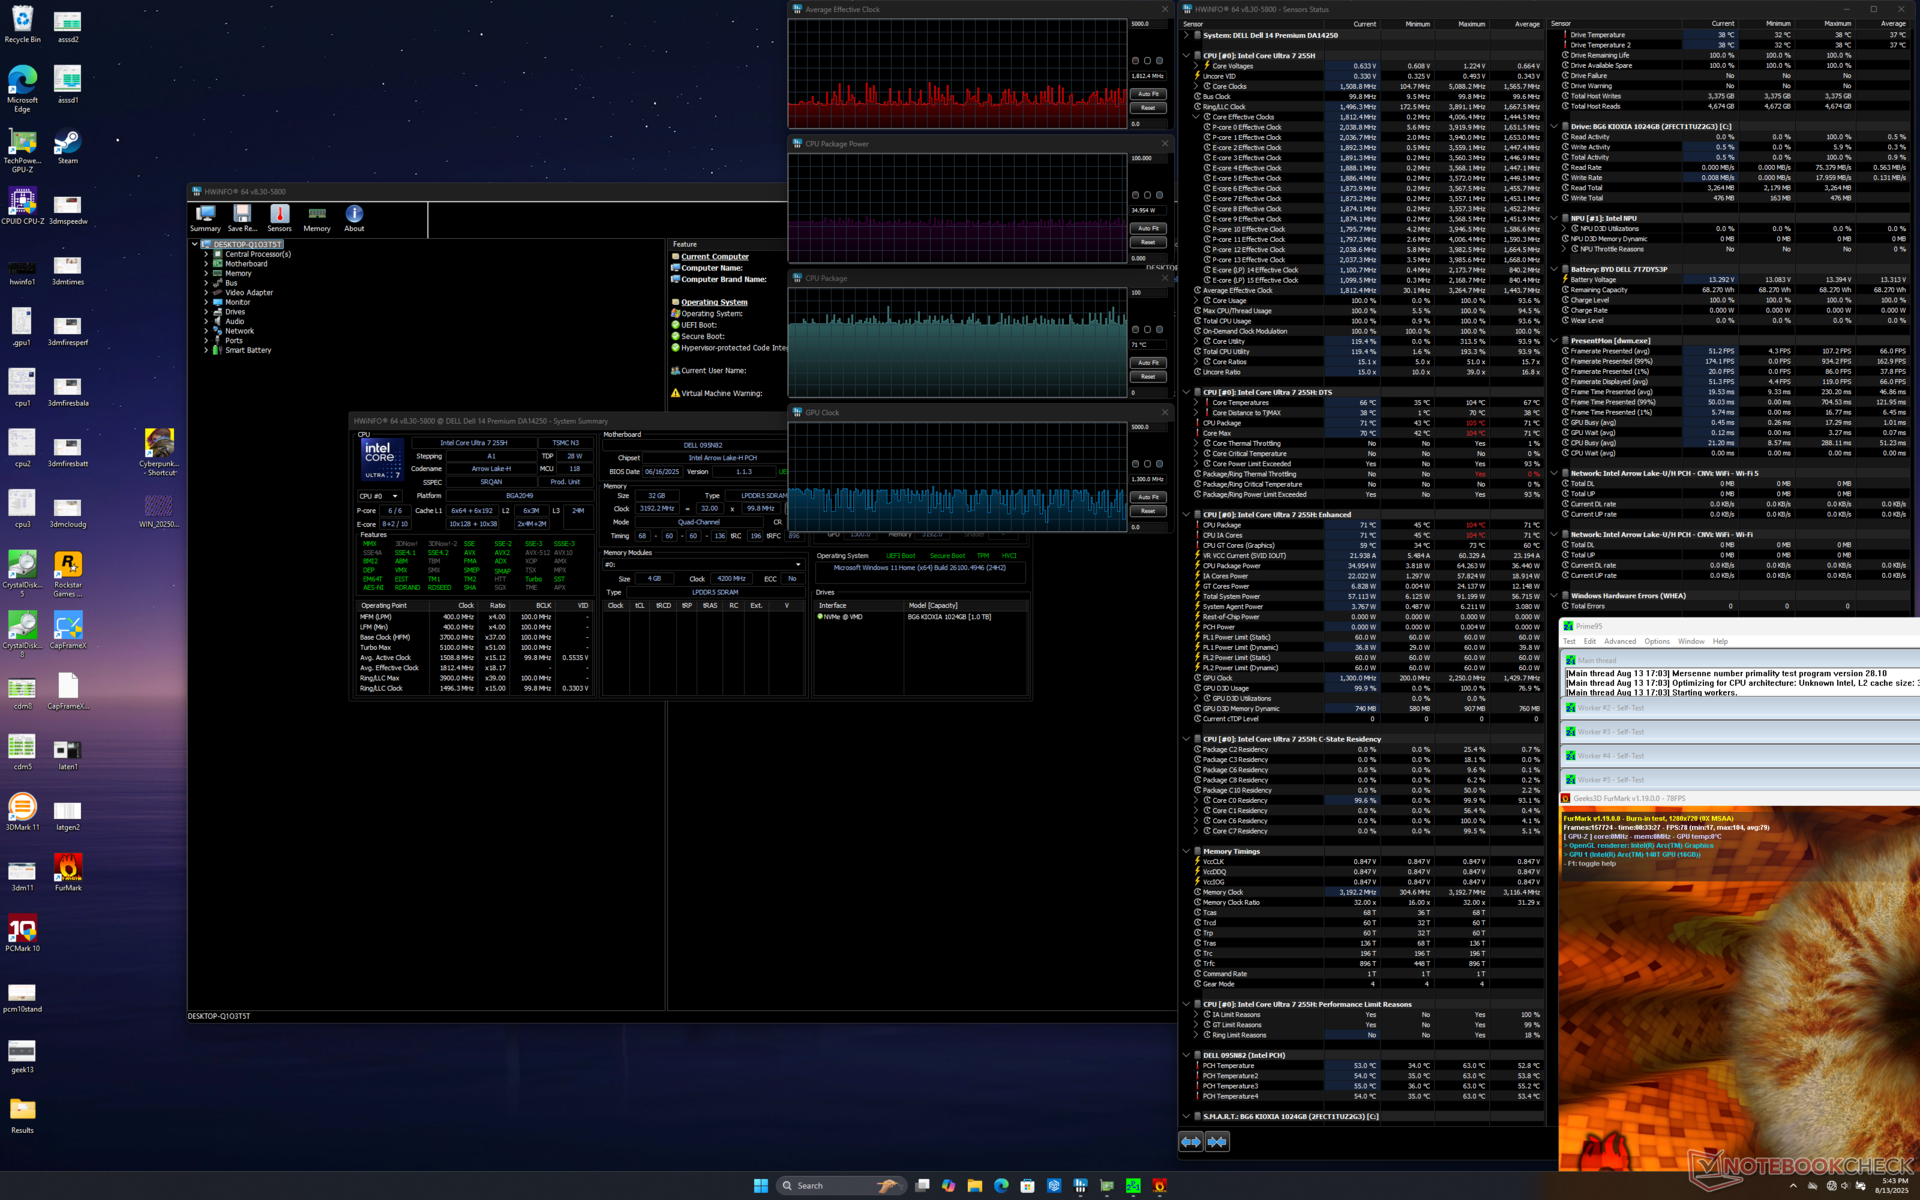
Procesor
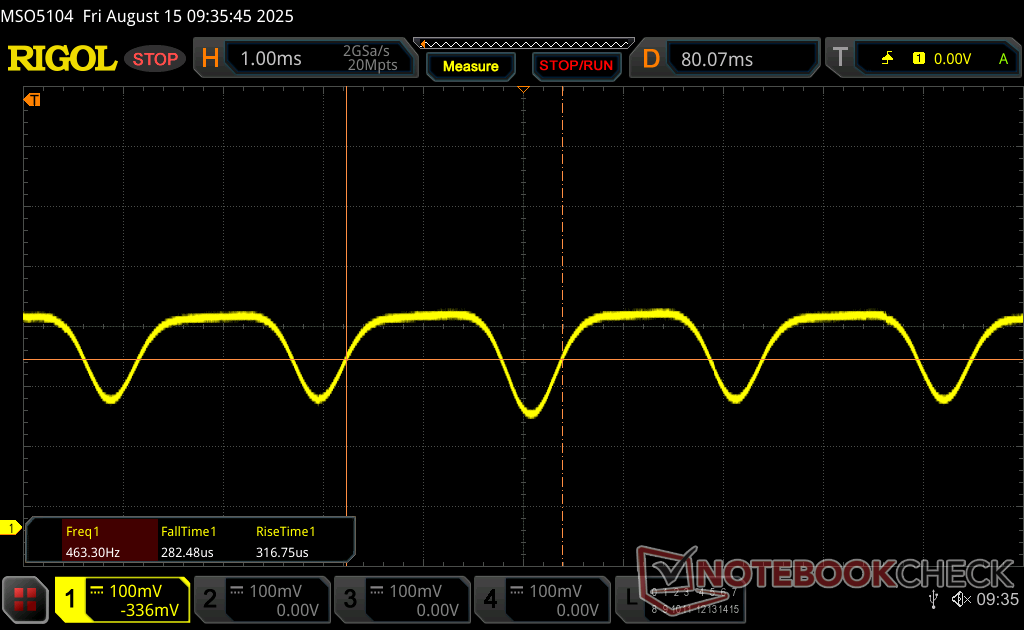
Procesor Core Ultra 7 255H sprawdza się dobrze na Dell 14 Premium - przynajmniej jak na mały, 14-calowy subnotebook. Większość laptopów z tym samym procesorem jest zwykle większa i/lub grubsza od naszego Della 14 Premium, więc ciaśniejsze wymiary Della naturalnie prowadzą do ściślejszej kontroli temperatury i bardziej ograniczonych korzyści Turbo Boost. Poniższy wykres pętli CineBench R15 xT pokazuje stałą wydajność przez pierwsze kilka pętli, a następnie spada nawet o 35%. Z drugiej strony, zrównoważona wydajność jest przynajmniej lepsza niż w XPS 14.
Cinebench R15 Multi Loop
Cinebench R23: Multi Core | Single Core
Cinebench R20: CPU (Multi Core) | CPU (Single Core)
Cinebench R15: CPU Multi 64Bit | CPU Single 64Bit
Blender: v2.79 BMW27 CPU
7-Zip 18.03: 7z b 4 | 7z b 4 -mmt1
Geekbench 6.7: Multi-Core | Single-Core
Geekbench 5.5: Multi-Core | Single-Core
HWBOT x265 Benchmark v2.2: 4k Preset
LibreOffice : 20 Documents To PDF
R Benchmark 2.5: Overall mean
| CPU Performance rating | |
| Asus ROG Zephyrus G14 2025 GA403WW | |
| Przeciętny Intel Core Ultra 7 255H | |
| Razer Blade 14 2025 | |
| Dell 14 Premium | |
| Asus ZenBook Duo OLED UX8406CA | |
| Dell XPS 14 2024 OLED | |
| HP EliteBook X G1i 14 AI | |
| Dell Pro 14 Premium | |
| Lenovo ThinkPad X9-14 Gen 1 Aura Edition | |
| Lenovo ThinkPad T14s Gen 6 Intel | |
| Asus Zenbook S 14 UX5406 | |
| Dell Latitude 7440 -2! | |
| Lenovo ThinkPad E14 Gen2-20TA000DGE -4! | |
| LG Gram 14Z90Q -2! | |
| Cinebench R20 / CPU (Multi Core) | |
| Asus ROG Zephyrus G14 2025 GA403WW | |
| Razer Blade 14 2025 | |
| Dell 14 Premium | |
| Przeciętny Intel Core Ultra 7 255H (6356 - 8860, n=19) | |
| Asus ZenBook Duo OLED UX8406CA | |
| Dell XPS 14 2024 OLED | |
| HP EliteBook X G1i 14 AI | |
| Dell Pro 14 Premium | |
| Lenovo ThinkPad X9-14 Gen 1 Aura Edition | |
| Lenovo ThinkPad T14s Gen 6 Intel | |
| Dell Latitude 7440 | |
| Asus Zenbook S 14 UX5406 | |
| Lenovo ThinkPad E14 Gen2-20TA000DGE | |
| LG Gram 14Z90Q | |
| Cinebench R20 / CPU (Single Core) | |
| Asus ZenBook Duo OLED UX8406CA | |
| Asus ROG Zephyrus G14 2025 GA403WW | |
| Przeciętny Intel Core Ultra 7 255H (743 - 826, n=19) | |
| Razer Blade 14 2025 | |
| Dell 14 Premium | |
| Dell Pro 14 Premium | |
| HP EliteBook X G1i 14 AI | |
| Lenovo ThinkPad X9-14 Gen 1 Aura Edition | |
| Lenovo ThinkPad T14s Gen 6 Intel | |
| Dell XPS 14 2024 OLED | |
| Dell Latitude 7440 | |
| Asus Zenbook S 14 UX5406 | |
| Lenovo ThinkPad E14 Gen2-20TA000DGE | |
| LG Gram 14Z90Q | |
| Cinebench R15 / CPU Multi 64Bit | |
| Asus ROG Zephyrus G14 2025 GA403WW | |
| Razer Blade 14 2025 | |
| Przeciętny Intel Core Ultra 7 255H (2414 - 3444, n=19) | |
| Asus ZenBook Duo OLED UX8406CA | |
| Dell 14 Premium | |
| Dell XPS 14 2024 OLED | |
| Lenovo ThinkPad X9-14 Gen 1 Aura Edition | |
| HP EliteBook X G1i 14 AI | |
| Dell Pro 14 Premium | |
| Asus Zenbook S 14 UX5406 | |
| Dell Latitude 7440 | |
| Lenovo ThinkPad T14s Gen 6 Intel | |
| Lenovo ThinkPad E14 Gen2-20TA000DGE | |
| LG Gram 14Z90Q | |
| Cinebench R15 / CPU Single 64Bit | |
| Asus ZenBook Duo OLED UX8406CA | |
| Asus ROG Zephyrus G14 2025 GA403WW | |
| Przeciętny Intel Core Ultra 7 255H (258 - 322, n=20) | |
| Lenovo ThinkPad X9-14 Gen 1 Aura Edition | |
| Dell Pro 14 Premium | |
| Dell 14 Premium | |
| HP EliteBook X G1i 14 AI | |
| Lenovo ThinkPad T14s Gen 6 Intel | |
| Asus Zenbook S 14 UX5406 | |
| Dell XPS 14 2024 OLED | |
| Dell Latitude 7440 | |
| Lenovo ThinkPad E14 Gen2-20TA000DGE | |
| LG Gram 14Z90Q | |
| Razer Blade 14 2025 | |
| Blender / v2.79 BMW27 CPU | |
| LG Gram 14Z90Q | |
| Lenovo ThinkPad E14 Gen2-20TA000DGE | |
| Asus Zenbook S 14 UX5406 | |
| Lenovo ThinkPad T14s Gen 6 Intel | |
| Lenovo ThinkPad X9-14 Gen 1 Aura Edition | |
| Dell Latitude 7440 | |
| Dell Pro 14 Premium | |
| HP EliteBook X G1i 14 AI | |
| Dell XPS 14 2024 OLED | |
| Asus ZenBook Duo OLED UX8406CA | |
| Przeciętny Intel Core Ultra 7 255H (156 - 293, n=19) | |
| Dell 14 Premium | |
| Razer Blade 14 2025 | |
| Asus ROG Zephyrus G14 2025 GA403WW | |
| 7-Zip 18.03 / 7z b 4 | |
| Asus ROG Zephyrus G14 2025 GA403WW | |
| Razer Blade 14 2025 | |
| Dell 14 Premium | |
| Przeciętny Intel Core Ultra 7 255H (42155 - 70397, n=20) | |
| Dell XPS 14 2024 OLED | |
| Asus ZenBook Duo OLED UX8406CA | |
| Dell Latitude 7440 | |
| Dell Pro 14 Premium | |
| HP EliteBook X G1i 14 AI | |
| Lenovo ThinkPad X9-14 Gen 1 Aura Edition | |
| Lenovo ThinkPad T14s Gen 6 Intel | |
| Asus Zenbook S 14 UX5406 | |
| LG Gram 14Z90Q | |
| Lenovo ThinkPad E14 Gen2-20TA000DGE | |
| 7-Zip 18.03 / 7z b 4 -mmt1 | |
| Asus ROG Zephyrus G14 2025 GA403WW | |
| Asus ZenBook Duo OLED UX8406CA | |
| Razer Blade 14 2025 | |
| Przeciętny Intel Core Ultra 7 255H (4589 - 6385, n=20) | |
| Dell 14 Premium | |
| Lenovo ThinkPad X9-14 Gen 1 Aura Edition | |
| HP EliteBook X G1i 14 AI | |
| Dell Pro 14 Premium | |
| Asus Zenbook S 14 UX5406 | |
| Dell XPS 14 2024 OLED | |
| Lenovo ThinkPad E14 Gen2-20TA000DGE | |
| Dell Latitude 7440 | |
| Lenovo ThinkPad T14s Gen 6 Intel | |
| LG Gram 14Z90Q | |
| Geekbench 5.5 / Multi-Core | |
| Asus ROG Zephyrus G14 2025 GA403WW | |
| Przeciętny Intel Core Ultra 7 255H (11348 - 17218, n=19) | |
| Asus ZenBook Duo OLED UX8406CA | |
| Dell 14 Premium | |
| Razer Blade 14 2025 | |
| Dell XPS 14 2024 OLED | |
| HP EliteBook X G1i 14 AI | |
| Dell Pro 14 Premium | |
| Lenovo ThinkPad X9-14 Gen 1 Aura Edition | |
| Asus Zenbook S 14 UX5406 | |
| Lenovo ThinkPad T14s Gen 6 Intel | |
| Dell Latitude 7440 | |
| LG Gram 14Z90Q | |
| Lenovo ThinkPad E14 Gen2-20TA000DGE | |
| Geekbench 5.5 / Single-Core | |
| Asus ROG Zephyrus G14 2025 GA403WW | |
| Razer Blade 14 2025 | |
| HP EliteBook X G1i 14 AI | |
| Przeciętny Intel Core Ultra 7 255H (1938 - 2121, n=19) | |
| Lenovo ThinkPad X9-14 Gen 1 Aura Edition | |
| Dell Pro 14 Premium | |
| Asus ZenBook Duo OLED UX8406CA | |
| Asus Zenbook S 14 UX5406 | |
| Dell 14 Premium | |
| Lenovo ThinkPad T14s Gen 6 Intel | |
| Dell XPS 14 2024 OLED | |
| Dell Latitude 7440 | |
| LG Gram 14Z90Q | |
| Lenovo ThinkPad E14 Gen2-20TA000DGE | |
| HWBOT x265 Benchmark v2.2 / 4k Preset | |
| Asus ROG Zephyrus G14 2025 GA403WW | |
| Razer Blade 14 2025 | |
| Dell 14 Premium | |
| Przeciętny Intel Core Ultra 7 255H (13.7 - 26.5, n=19) | |
| Asus ZenBook Duo OLED UX8406CA | |
| Dell XPS 14 2024 OLED | |
| HP EliteBook X G1i 14 AI | |
| Dell Pro 14 Premium | |
| Lenovo ThinkPad X9-14 Gen 1 Aura Edition | |
| Lenovo ThinkPad T14s Gen 6 Intel | |
| Dell Latitude 7440 | |
| Asus Zenbook S 14 UX5406 | |
| Lenovo ThinkPad E14 Gen2-20TA000DGE | |
| LG Gram 14Z90Q | |
| LibreOffice / 20 Documents To PDF | |
| Asus Zenbook S 14 UX5406 | |
| Razer Blade 14 2025 | |
| Dell 14 Premium | |
| LG Gram 14Z90Q | |
| Asus ZenBook Duo OLED UX8406CA | |
| Lenovo ThinkPad E14 Gen2-20TA000DGE | |
| Asus ROG Zephyrus G14 2025 GA403WW | |
| Lenovo ThinkPad T14s Gen 6 Intel | |
| Dell XPS 14 2024 OLED | |
| Przeciętny Intel Core Ultra 7 255H (41.1 - 61.6, n=19) | |
| HP EliteBook X G1i 14 AI | |
| Dell Latitude 7440 | |
| Dell Pro 14 Premium | |
| Lenovo ThinkPad X9-14 Gen 1 Aura Edition | |
| R Benchmark 2.5 / Overall mean | |
| Lenovo ThinkPad E14 Gen2-20TA000DGE | |
| LG Gram 14Z90Q | |
| Dell Latitude 7440 | |
| Lenovo ThinkPad T14s Gen 6 Intel | |
| Dell XPS 14 2024 OLED | |
| Dell 14 Premium | |
| Asus Zenbook S 14 UX5406 | |
| Lenovo ThinkPad X9-14 Gen 1 Aura Edition | |
| Przeciętny Intel Core Ultra 7 255H (0.4233 - 0.515, n=19) | |
| HP EliteBook X G1i 14 AI | |
| Dell Pro 14 Premium | |
| Asus ZenBook Duo OLED UX8406CA | |
| Razer Blade 14 2025 | |
| Asus ROG Zephyrus G14 2025 GA403WW | |
Cinebench R23: Multi Core | Single Core
Cinebench R20: CPU (Multi Core) | CPU (Single Core)
Cinebench R15: CPU Multi 64Bit | CPU Single 64Bit
Blender: v2.79 BMW27 CPU
7-Zip 18.03: 7z b 4 | 7z b 4 -mmt1
Geekbench 6.7: Multi-Core | Single-Core
Geekbench 5.5: Multi-Core | Single-Core
HWBOT x265 Benchmark v2.2: 4k Preset
LibreOffice : 20 Documents To PDF
R Benchmark 2.5: Overall mean
* ... im mniej tym lepiej
Wydajność systemu
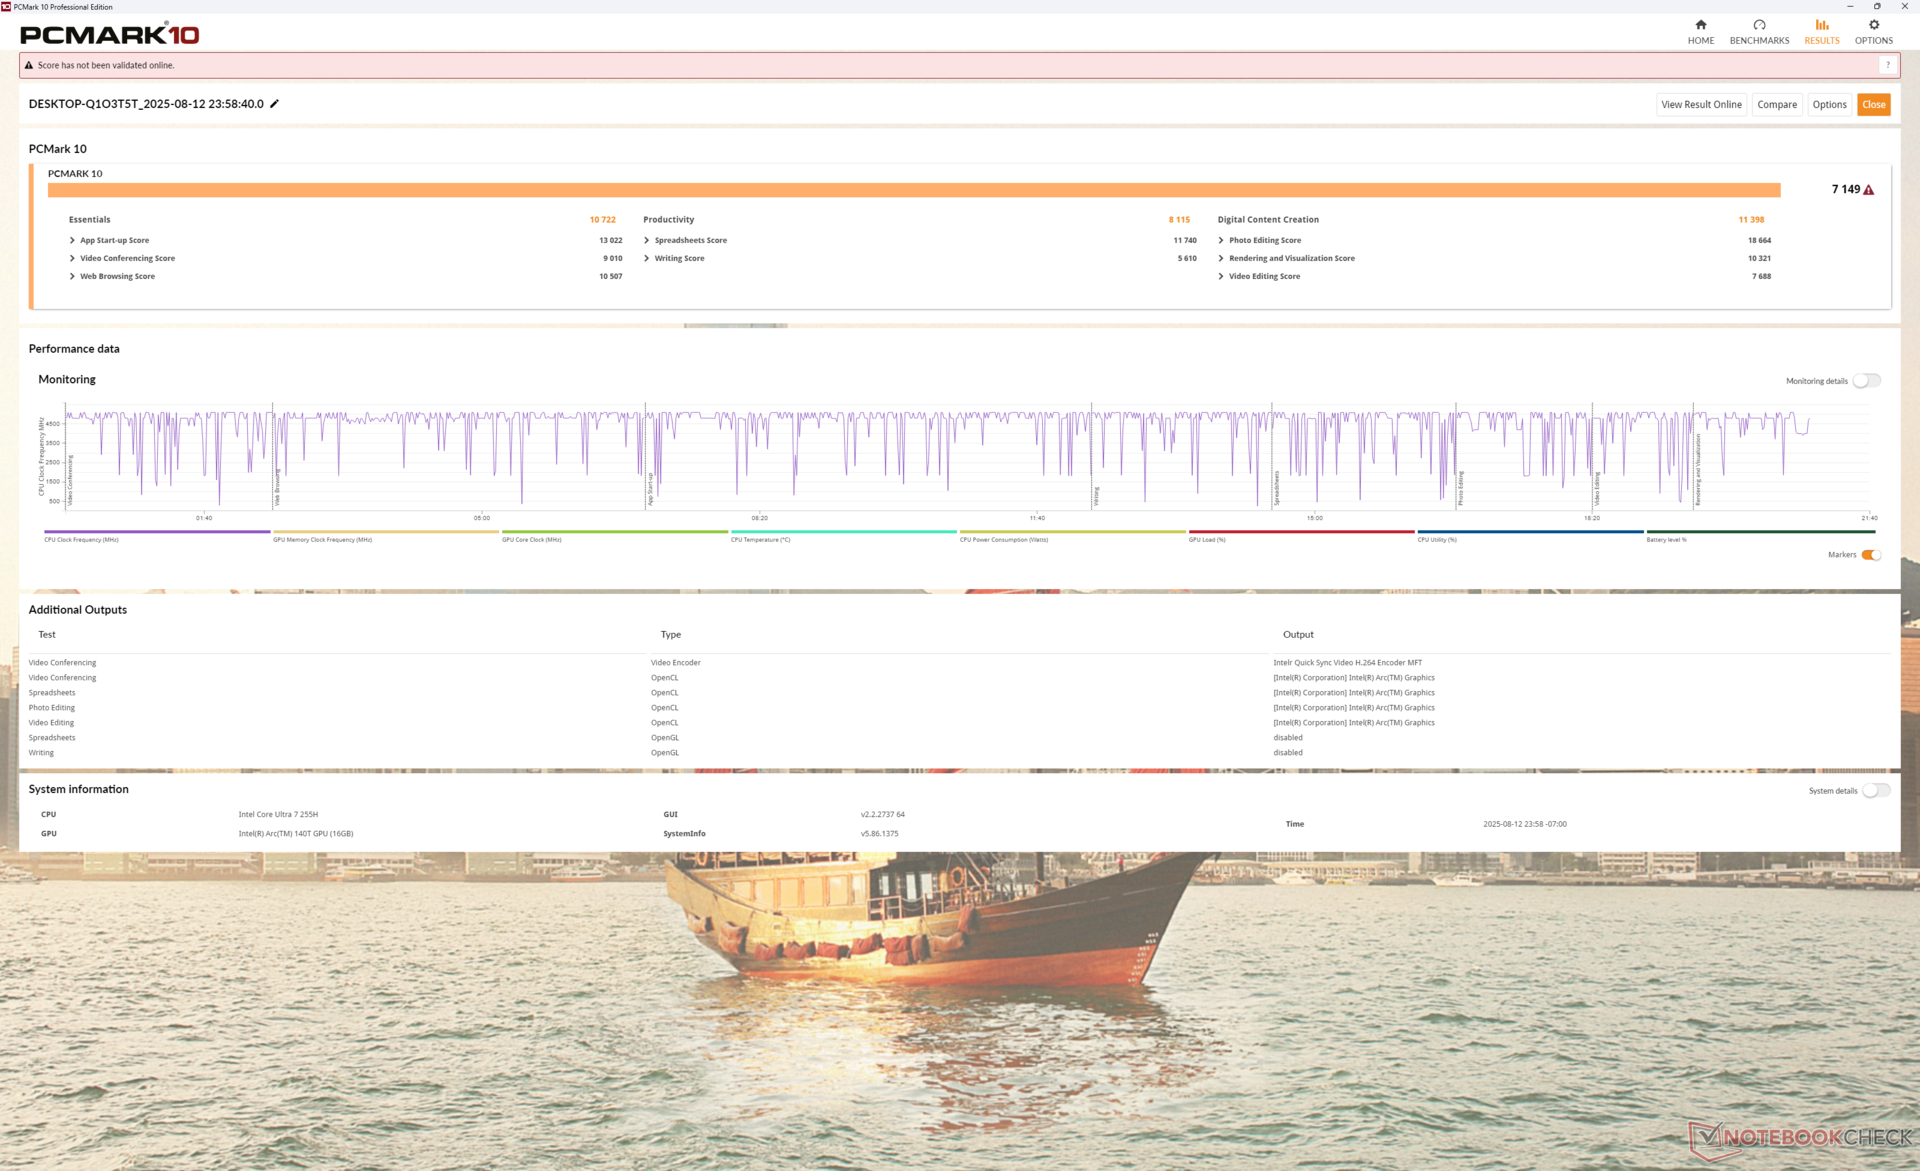
PCMark 10: Score | Essentials | Productivity | Digital Content Creation
CrossMark: Overall | Productivity | Creativity | Responsiveness
WebXPRT 3: Overall
WebXPRT 4: Overall
Mozilla Kraken 1.1: Total
| Performance rating | |
| Przeciętny Intel Core Ultra 7 255H, Intel Arc Graphics 140T | |
| Dell Pro 14 Premium | |
| HP EliteBook X G1i 14 AI | |
| Dell 14 Premium | |
| Asus Zenbook S 14 UX5406 | |
| Lenovo ThinkPad T14s Gen 6 Intel | |
| Dell Latitude 7440 -4! | |
| PCMark 10 / Score | |
| Przeciętny Intel Core Ultra 7 255H, Intel Arc Graphics 140T (6878 - 9156, n=13) | |
| Dell Pro 14 Premium | |
| HP EliteBook X G1i 14 AI | |
| Dell 14 Premium | |
| Asus Zenbook S 14 UX5406 | |
| Lenovo ThinkPad T14s Gen 6 Intel | |
| Dell Latitude 7440 | |
| PCMark 10 / Essentials | |
| Przeciętny Intel Core Ultra 7 255H, Intel Arc Graphics 140T (10637 - 11556, n=13) | |
| Dell Latitude 7440 | |
| Dell 14 Premium | |
| Dell Pro 14 Premium | |
| HP EliteBook X G1i 14 AI | |
| Lenovo ThinkPad T14s Gen 6 Intel | |
| Asus Zenbook S 14 UX5406 | |
| PCMark 10 / Productivity | |
| Przeciętny Intel Core Ultra 7 255H, Intel Arc Graphics 140T (7598 - 15694, n=13) | |
| Asus Zenbook S 14 UX5406 | |
| Dell Pro 14 Premium | |
| HP EliteBook X G1i 14 AI | |
| Lenovo ThinkPad T14s Gen 6 Intel | |
| Dell 14 Premium | |
| Dell Latitude 7440 | |
| PCMark 10 / Digital Content Creation | |
| Przeciętny Intel Core Ultra 7 255H, Intel Arc Graphics 140T (10461 - 12552, n=13) | |
| Dell 14 Premium | |
| HP EliteBook X G1i 14 AI | |
| Dell Pro 14 Premium | |
| Asus Zenbook S 14 UX5406 | |
| Lenovo ThinkPad T14s Gen 6 Intel | |
| Dell Latitude 7440 | |
| CrossMark / Overall | |
| Przeciętny Intel Core Ultra 7 255H, Intel Arc Graphics 140T (1610 - 2018, n=13) | |
| Dell Pro 14 Premium | |
| HP EliteBook X G1i 14 AI | |
| Asus Zenbook S 14 UX5406 | |
| Dell 14 Premium | |
| Lenovo ThinkPad T14s Gen 6 Intel | |
| CrossMark / Productivity | |
| Przeciętny Intel Core Ultra 7 255H, Intel Arc Graphics 140T (1566 - 1908, n=13) | |
| Dell Pro 14 Premium | |
| HP EliteBook X G1i 14 AI | |
| Asus Zenbook S 14 UX5406 | |
| Dell 14 Premium | |
| Lenovo ThinkPad T14s Gen 6 Intel | |
| CrossMark / Creativity | |
| Przeciętny Intel Core Ultra 7 255H, Intel Arc Graphics 140T (1827 - 2396, n=13) | |
| Dell Pro 14 Premium | |
| Asus Zenbook S 14 UX5406 | |
| HP EliteBook X G1i 14 AI | |
| Dell 14 Premium | |
| Lenovo ThinkPad T14s Gen 6 Intel | |
| CrossMark / Responsiveness | |
| Przeciętny Intel Core Ultra 7 255H, Intel Arc Graphics 140T (1194 - 1781, n=13) | |
| Dell Pro 14 Premium | |
| Asus Zenbook S 14 UX5406 | |
| HP EliteBook X G1i 14 AI | |
| Lenovo ThinkPad T14s Gen 6 Intel | |
| Dell 14 Premium | |
| WebXPRT 3 / Overall | |
| Dell Pro 14 Premium | |
| Przeciętny Intel Core Ultra 7 255H, Intel Arc Graphics 140T (273 - 327, n=13) | |
| HP EliteBook X G1i 14 AI | |
| Dell 14 Premium | |
| Lenovo ThinkPad T14s Gen 6 Intel | |
| Dell Latitude 7440 | |
| Asus Zenbook S 14 UX5406 | |
| WebXPRT 4 / Overall | |
| Przeciętny Intel Core Ultra 7 255H, Intel Arc Graphics 140T (247 - 317, n=13) | |
| Dell Pro 14 Premium | |
| HP EliteBook X G1i 14 AI | |
| Dell 14 Premium | |
| Lenovo ThinkPad T14s Gen 6 Intel | |
| Asus Zenbook S 14 UX5406 | |
| Dell Latitude 7440 | |
| Mozilla Kraken 1.1 / Total | |
| Asus Zenbook S 14 UX5406 | |
| Dell Latitude 7440 | |
| Dell 14 Premium | |
| Lenovo ThinkPad T14s Gen 6 Intel | |
| HP EliteBook X G1i 14 AI | |
| Dell Pro 14 Premium | |
| Przeciętny Intel Core Ultra 7 255H, Intel Arc Graphics 140T (427 - 510, n=13) | |
* ... im mniej tym lepiej
| PCMark 10 Score | 7149 pkt. | |
Pomoc | ||
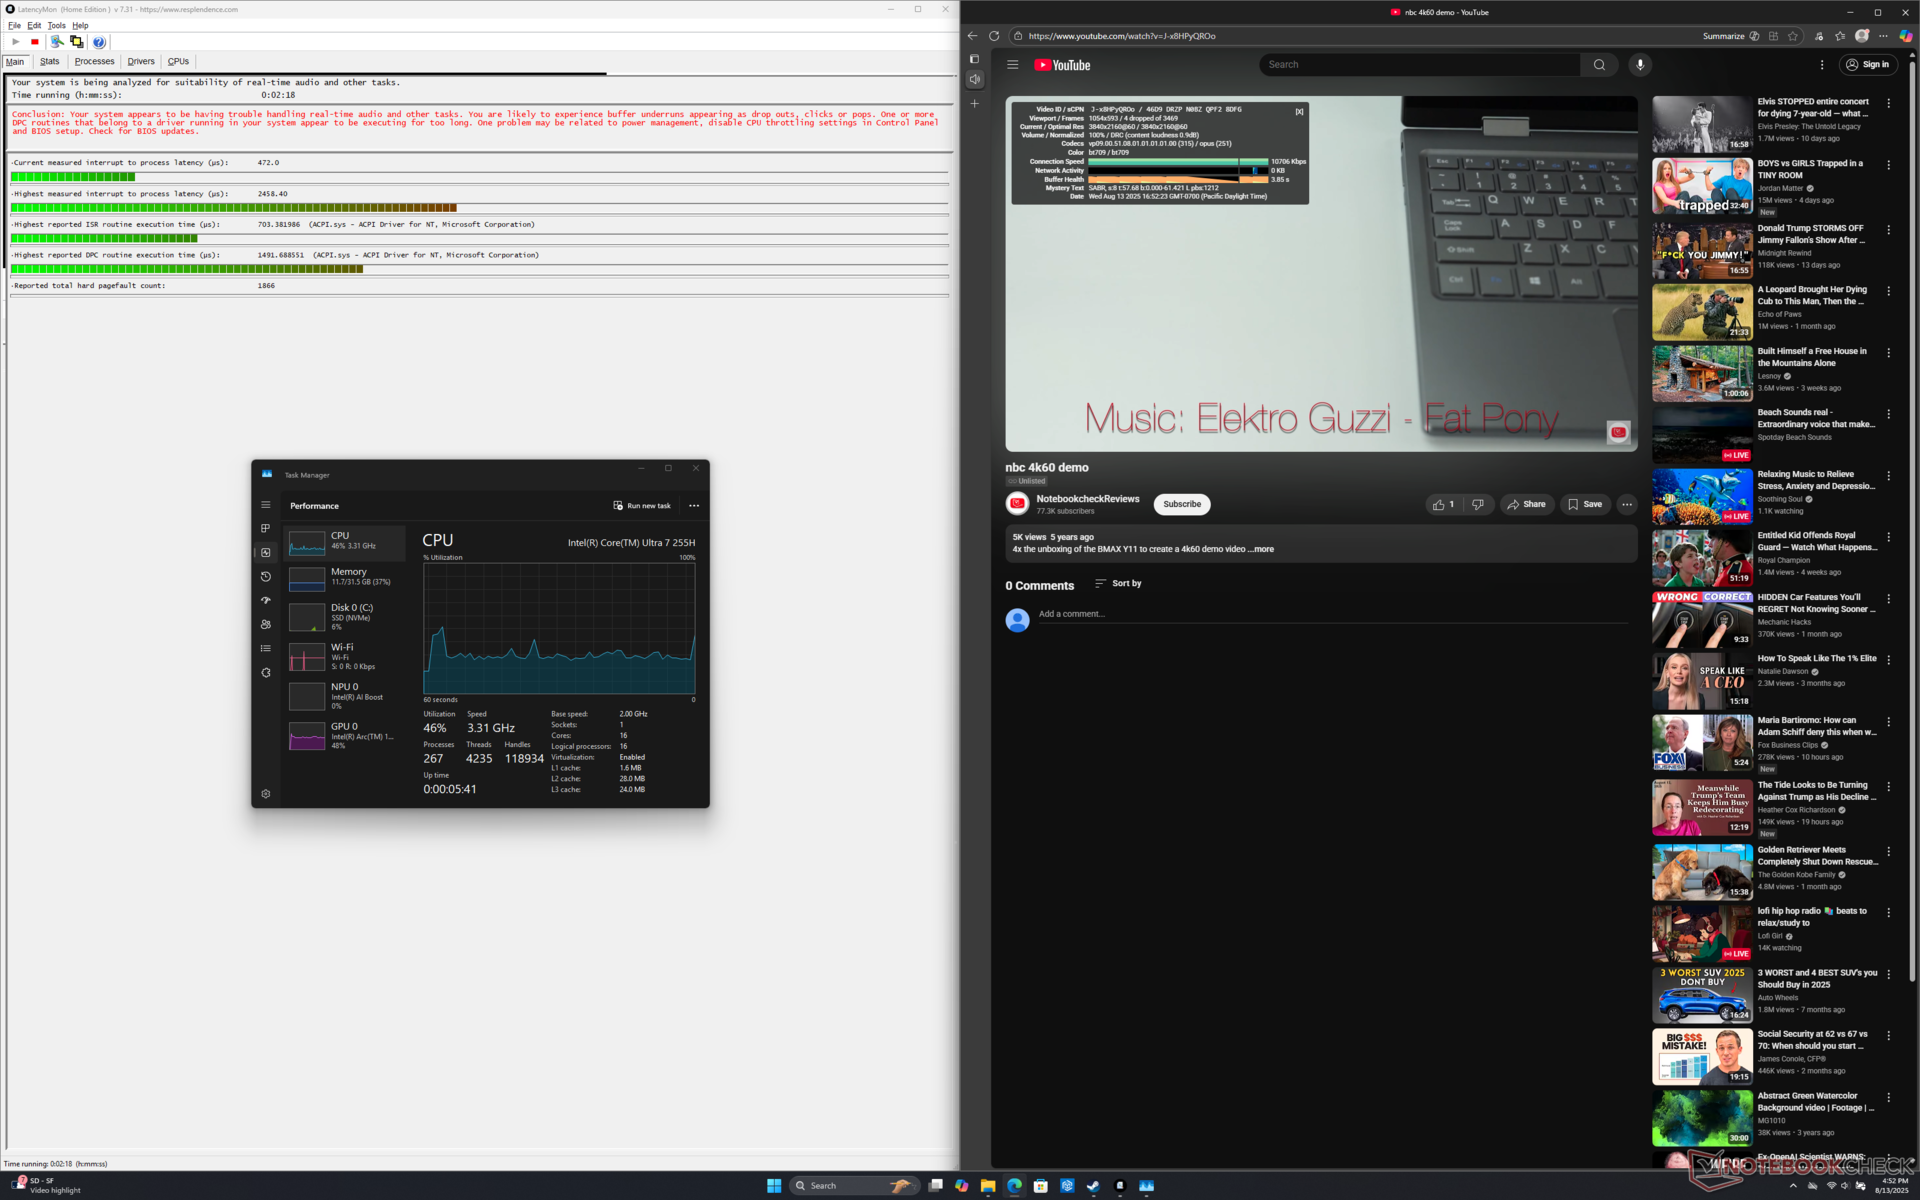
Opóźnienie DPC
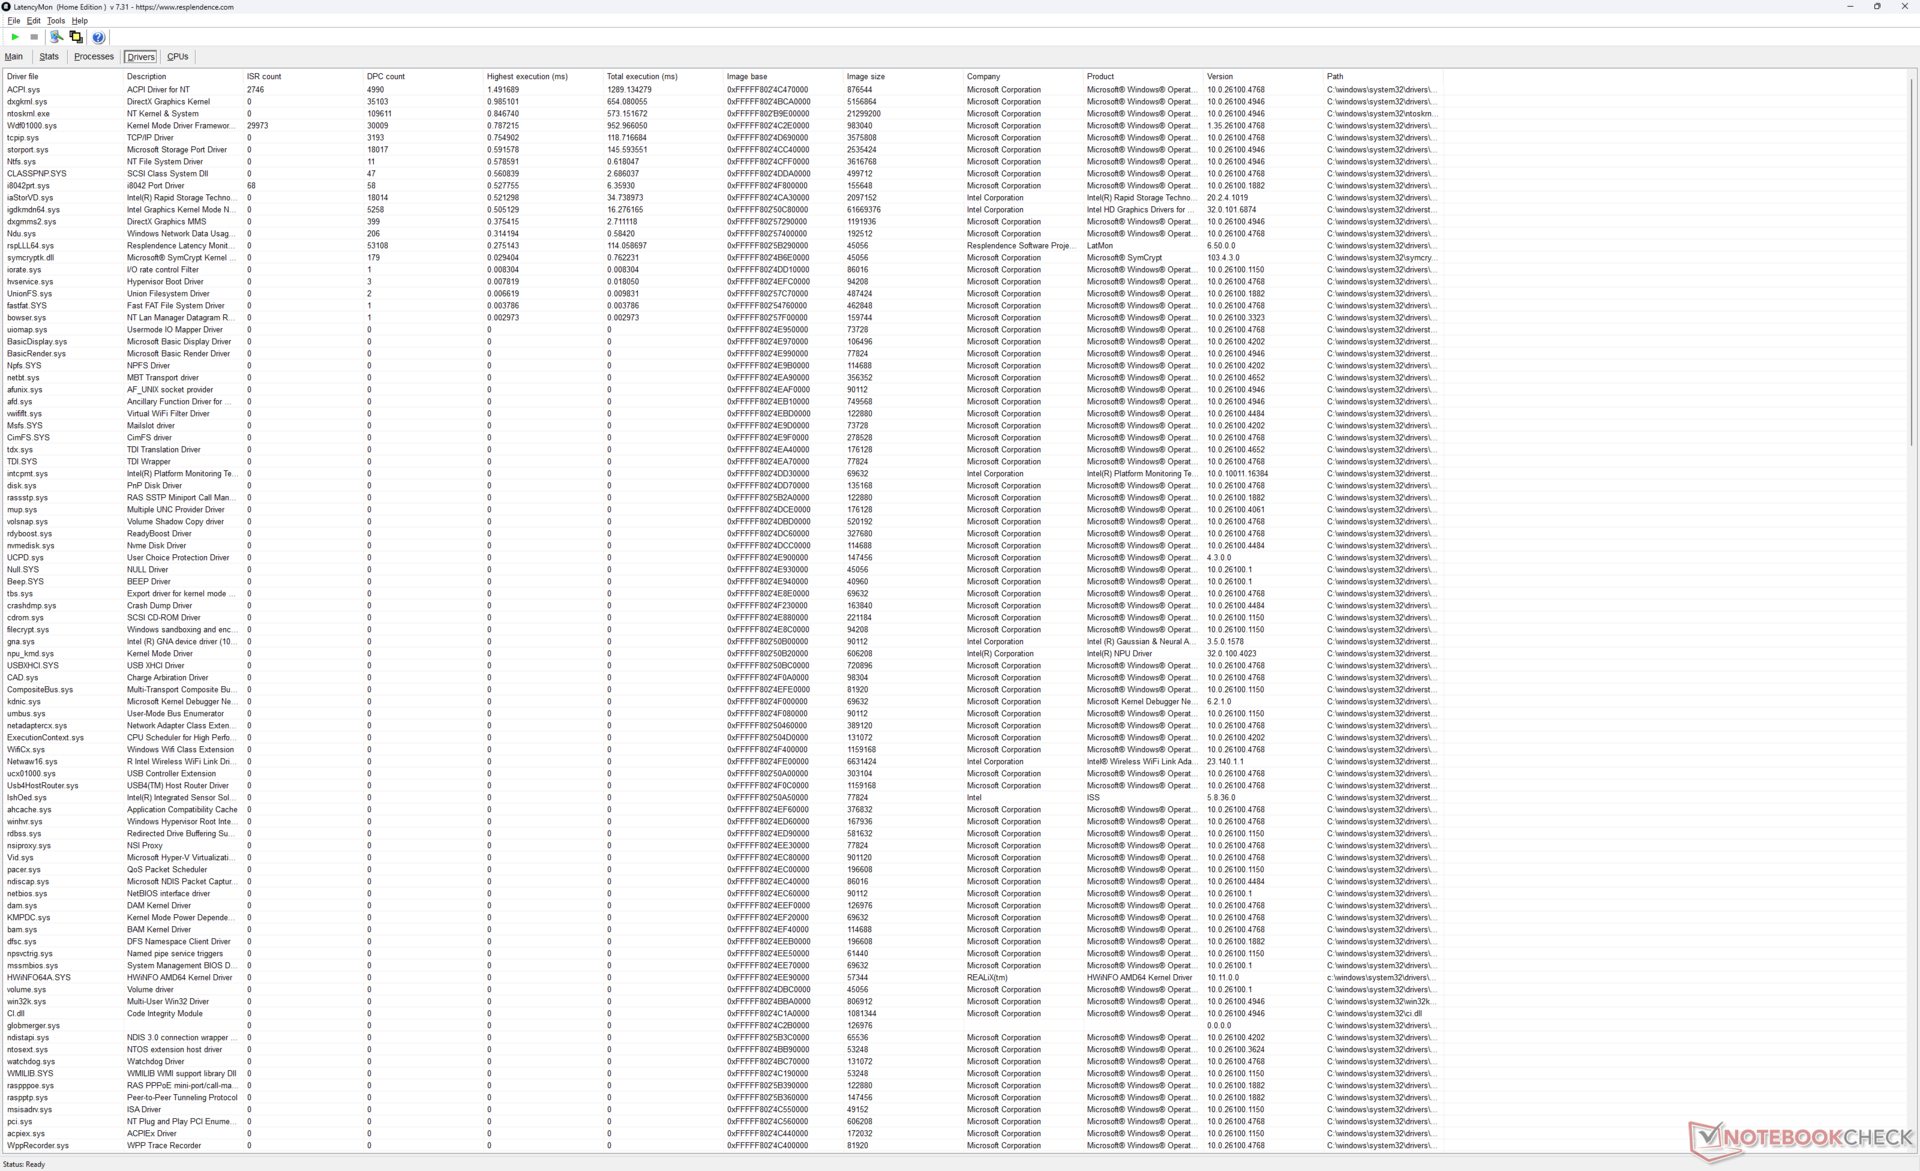
| DPC Latencies / LatencyMon - interrupt to process latency (max), Web, Youtube, Prime95 | |
| Dell Pro 14 Premium | |
| Dell 14 Premium | |
| Dell XPS 14 2024 OLED | |
| Asus Zenbook S 14 UX5406 | |
| Lenovo ThinkPad X9-14 Gen 1 Aura Edition | |
| Asus ZenBook Duo OLED UX8406CA | |
* ... im mniej tym lepiej
Urządzenia pamięci masowej
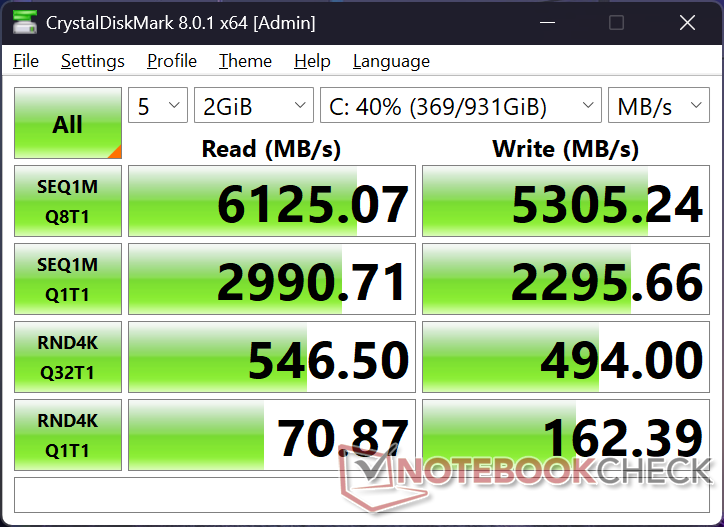
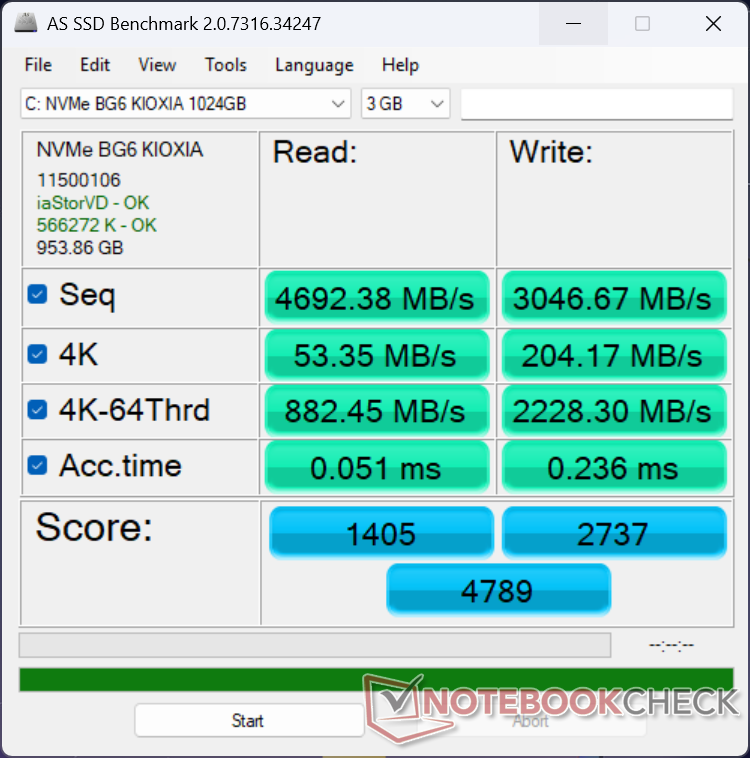

| Drive Performance rating - Percent | |
| Asus ZenBook Duo OLED UX8406CA | |
| Dell XPS 14 2024 OLED | |
| Dell 14 Premium | |
| Asus Zenbook S 14 UX5406 | |
| Lenovo ThinkPad X9-14 Gen 1 Aura Edition | |
| Dell Pro 14 Premium | |
* ... im mniej tym lepiej
Dławienie dysku: Pętla odczytu DiskSpd, głębokość kolejki 8
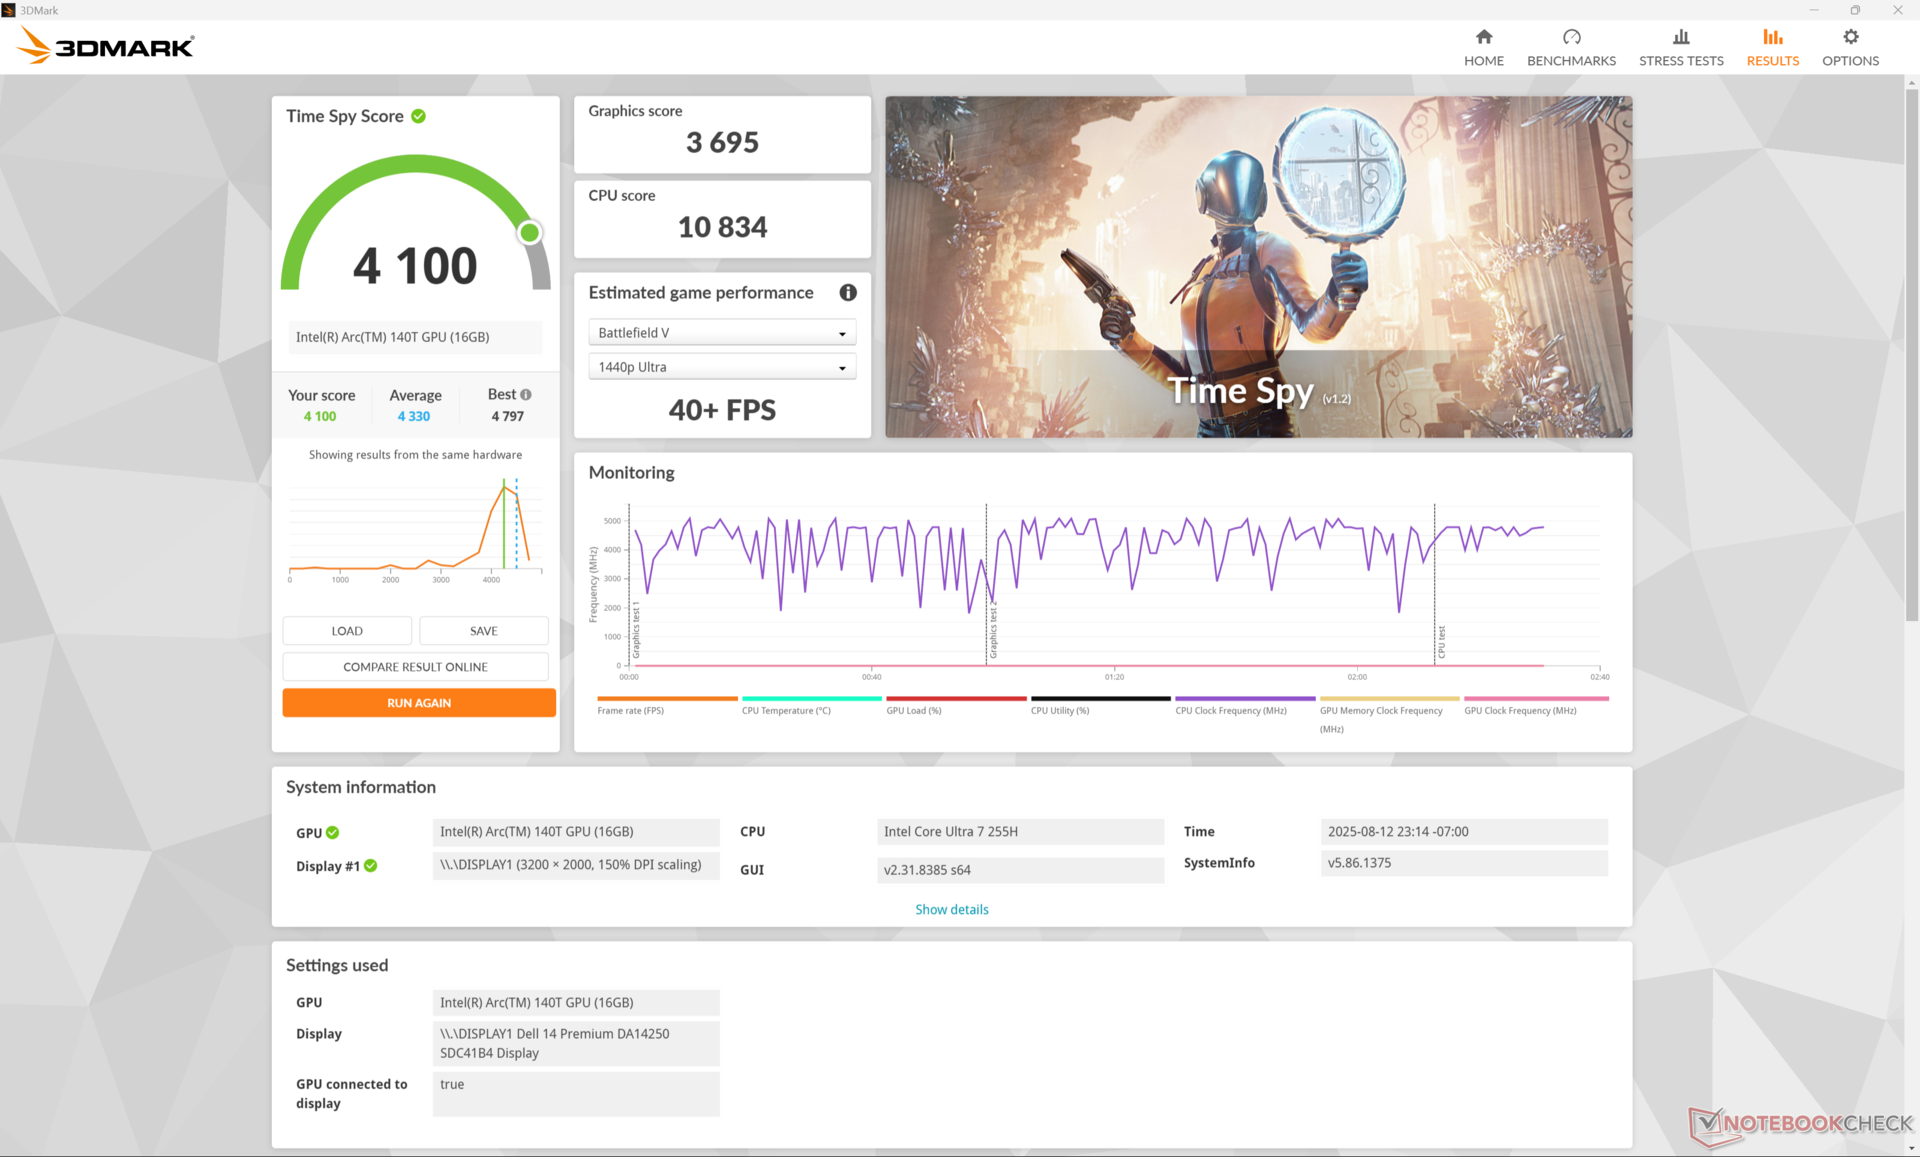
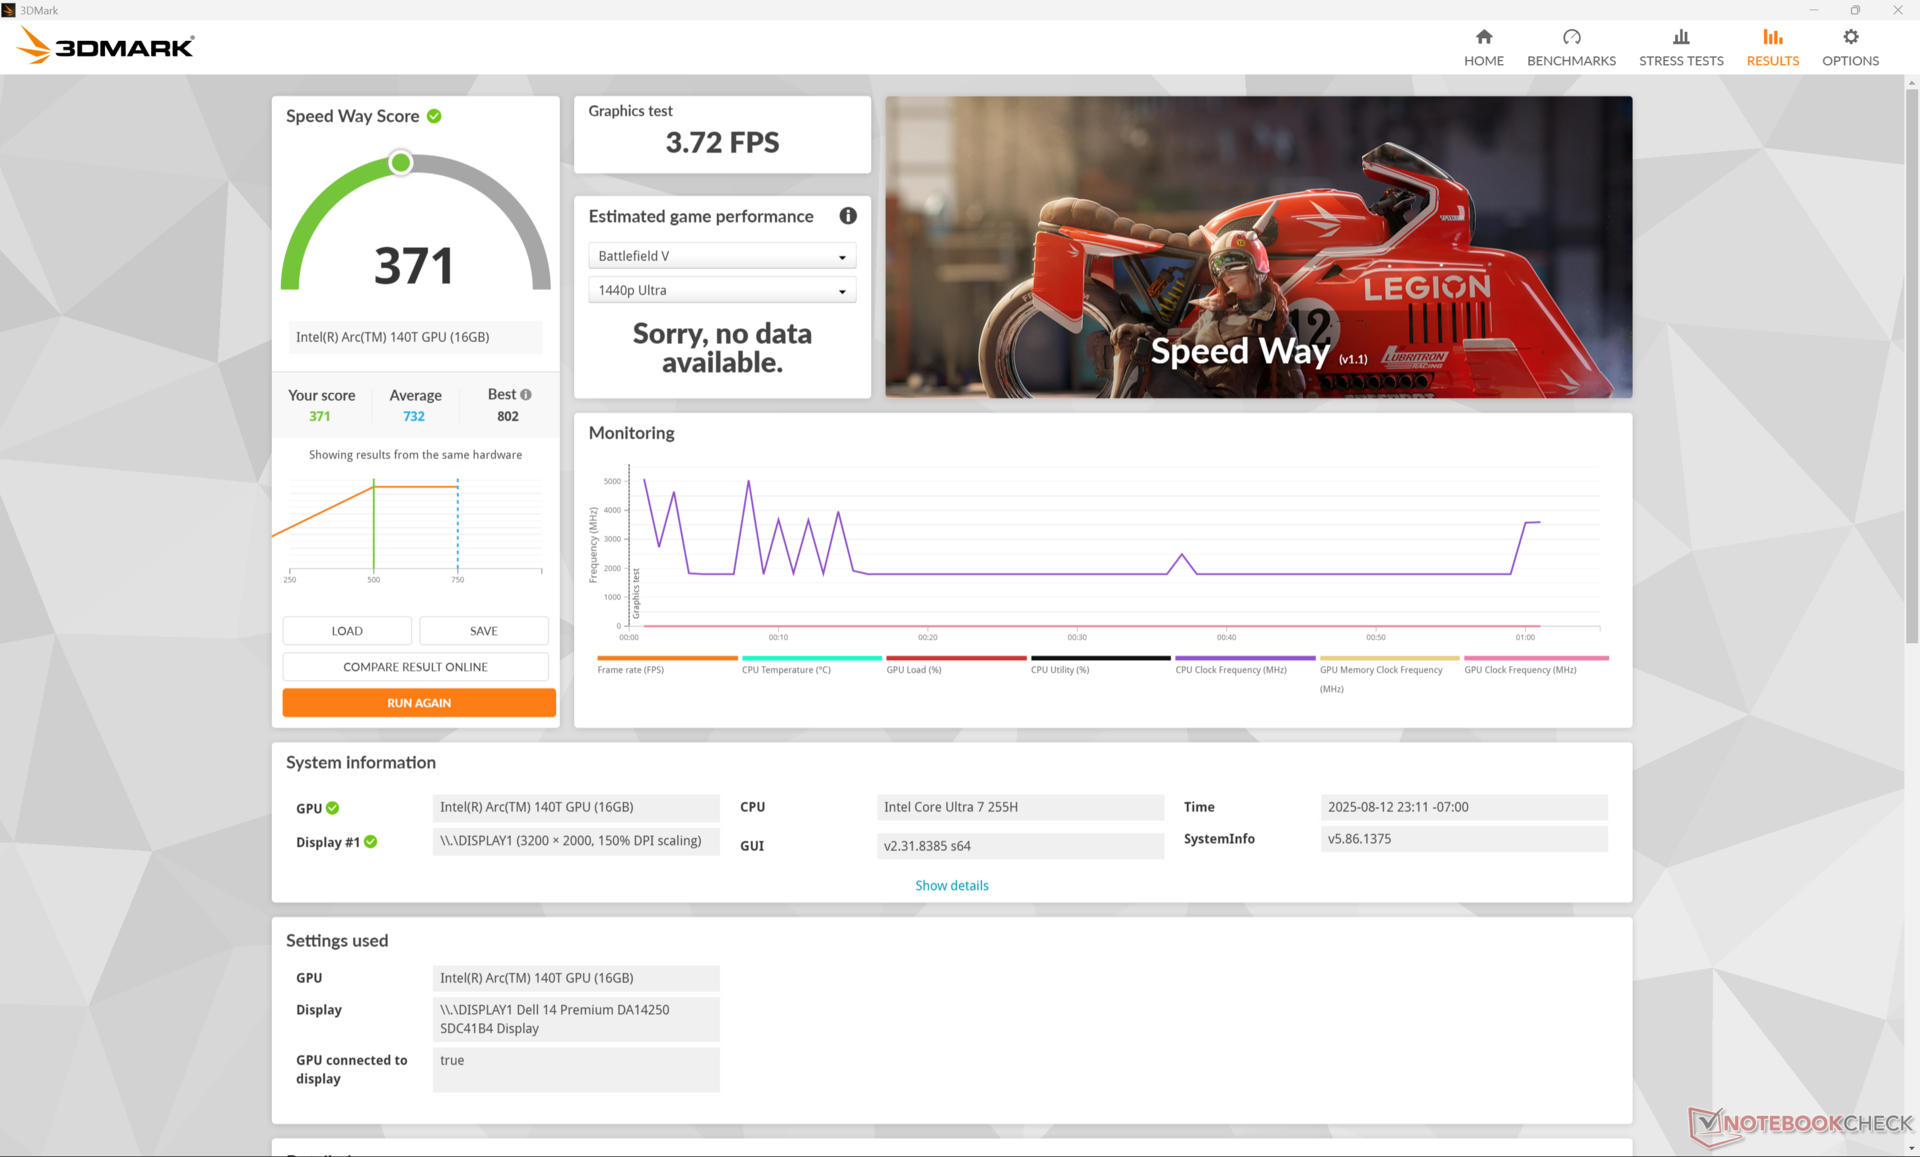
Wydajność GPU
System jest dostarczany z Arc 140T w standardzie w porównaniu do Arc 8 w XPS 14, co zapewnia średnio 15-procentowy wzrost wydajności.
| Profil zasilania | Wynik grafiki | Wynik fizyki | Wynik łączny |
| Tryb wydajności | 8762 | 30950 | 3166 |
| Tryb zrównoważony | 8743 | 31107 | 3165 |
| Zasilanie bateryjne | 8707 | 27949 | 3139 |

| 3DMark Performance rating - Percent | |
| Dell XPS 14 2024 OLED -1! | |
| Asus ZenBook Duo OLED UX8406CA -1! | |
| HP EliteBook X G1i 14 AI -1! | |
| Dell Pro 14 Premium | |
| Dell 14 Premium | |
| Przeciętny Intel Arc Graphics 140T | |
| Asus Zenbook S 14 UX5406 | |
| Lenovo ThinkPad X9-14 Gen 1 Aura Edition -1! | |
| Lenovo ThinkPad T14s Gen 6 Intel -1! | |
| Honor MagicBook Art 14 -1! | |
| LG Gram 14Z90Q | |
| Dell Latitude 7440 -1! | |
| Lenovo ThinkPad E14 Gen2-20TA000DGE -1! | |
| 3DMark 11 Performance | 12588 pkt. | |
| 3DMark Cloud Gate Standard Score | 38051 pkt. | |
| 3DMark Fire Strike Score | 8194 pkt. | |
| 3DMark Time Spy Score | 4100 pkt. | |
Pomoc | ||
* ... im mniej tym lepiej
| Performance rating - Percent | |
| Dell XPS 14 2024 OLED | |
| HP OmniBook Ultra 14 | |
| Lenovo ThinkPad X9-14 Gen 1 Aura Edition -1! | |
| Dell 14 Premium | |
| Asus ZenBook Duo OLED UX8406CA | |
| Asus Zenbook S 14 UX5406 | |
| Cyberpunk 2077 - 1920x1080 Ultra Preset (FSR off) | |
| Dell XPS 14 2024 OLED | |
| HP OmniBook Ultra 14 | |
| Asus Zenbook S 14 UX5406 | |
| Asus ZenBook Duo OLED UX8406CA | |
| Dell 14 Premium | |
| Lenovo ThinkPad X9-14 Gen 1 Aura Edition | |
| Baldur's Gate 3 - 1920x1080 Ultra Preset AA:T | |
| Dell XPS 14 2024 OLED | |
| HP OmniBook Ultra 14 | |
| Dell 14 Premium | |
| Asus ZenBook Duo OLED UX8406CA | |
| Lenovo ThinkPad X9-14 Gen 1 Aura Edition | |
| Asus Zenbook S 14 UX5406 | |
| GTA V - 1920x1080 Highest AA:4xMSAA + FX AF:16x | |
| Dell XPS 14 2024 OLED | |
| HP OmniBook Ultra 14 | |
| Lenovo ThinkPad X9-14 Gen 1 Aura Edition | |
| Asus Zenbook S 14 UX5406 | |
| Asus ZenBook Duo OLED UX8406CA | |
| Dell 14 Premium | |
| Final Fantasy XV Benchmark - 1920x1080 High Quality | |
| Dell XPS 14 2024 OLED | |
| HP OmniBook Ultra 14 | |
| Asus Zenbook S 14 UX5406 | |
| Lenovo ThinkPad X9-14 Gen 1 Aura Edition | |
| Dell 14 Premium | |
| Asus ZenBook Duo OLED UX8406CA | |
| Strange Brigade - 1920x1080 ultra AA:ultra AF:16 | |
| Dell XPS 14 2024 OLED | |
| Asus ZenBook Duo OLED UX8406CA | |
| Dell 14 Premium | |
| HP OmniBook Ultra 14 | |
| Asus Zenbook S 14 UX5406 | |
| Dota 2 Reborn - 1920x1080 ultra (3/3) best looking | |
| Dell XPS 14 2024 OLED | |
| Lenovo ThinkPad X9-14 Gen 1 Aura Edition | |
| Dell 14 Premium | |
| Asus ZenBook Duo OLED UX8406CA | |
| Asus Zenbook S 14 UX5406 | |
| HP OmniBook Ultra 14 | |
| X-Plane 11.11 - 1920x1080 high (fps_test=3) | |
| Dell XPS 14 2024 OLED | |
| HP OmniBook Ultra 14 | |
| Dell 14 Premium | |
| Asus ZenBook Duo OLED UX8406CA | |
| Lenovo ThinkPad X9-14 Gen 1 Aura Edition | |
| Asus Zenbook S 14 UX5406 | |
Cyberpunk 2077 ultra FPS Chart
| low | med. | high | ultra | |
|---|---|---|---|---|
| GTA V (2015) | 164.1 | 154 | 38.1 | 15.4 |
| Dota 2 Reborn (2015) | 100.1 | 94.9 | 59.7 | 77.5 |
| Final Fantasy XV Benchmark (2018) | 80.1 | 43.9 | 29.8 | |
| X-Plane 11.11 (2018) | 61.7 | 50.2 | 41 | |
| Strange Brigade (2018) | 187.7 | 81.9 | 68.2 | 56.3 |
| Baldur's Gate 3 (2023) | 35.8 | 28.8 | 25.8 | 25.5 |
| Cyberpunk 2077 (2023) | 38 | 30.5 | 26.4 | 23.9 |
| F1 24 (2024) | 77.7 | 69.6 | 54.5 | 18.2 |
Emisje
Hałas systemowy
Podwójne wentylatory są prawie zawsze aktywne, aczkolwiek przy wystarczająco niskich obrotach, aby były niezauważalne podczas zwykłego przeglądania stron internetowych lub strumieniowania wideo. Wentylatory pracują jednak szybciej niż w innych 14-calowych subnotebookach z serii U lub V, gdy wprowadzane są wyższe obciążenia w odpowiedzi na wyższe wymagania TDP procesora z serii H. Ogólny hałas wentylatora staje się zauważalnie głośniejszy, gdy system pracuje pod dużym obciążeniem.
Hałas
| luz |
| 23.2 / 24 / 24.7 dB |
| obciążenie |
| 39 / 44.9 dB |
 | ||
30 dB cichy 40 dB(A) słyszalny 50 dB(A) irytujący |
||
min: | ||
| Dell 14 Premium Arc 140T, Ultra 7 255H, Kioxia BG6 KBG6AZNV1T02 | Dell Pro 14 Premium Arc 140V, Core Ultra 7 268V, Kioxia BG6 KBG6AZNV1T02 | Dell Latitude 7440 Iris Xe G7 80EUs, i5-1345U, Samsung MZ9L4512HBLU-00BMV | HP EliteBook X G1i 14 AI Arc 140V, Core Ultra 7 268V, Kioxia XG8 KXG80ZNV512G | Lenovo ThinkPad T14s Gen 6 Intel Arc 130V, Core Ultra 5 228V, SK hynix PCB01 HFS001TFM9X179N GL | Asus Zenbook S 14 UX5406 Arc 140V, Core Ultra 7 258V, WD PC SN560 SDDPNQE-1T00 | |
|---|---|---|---|---|---|---|
| Noise | 2% | 11% | -7% | 5% | 11% | |
| wyłączone / środowisko * (dB) | 23 | 23.1 -0% | 22.8 1% | 28.2 -23% | 24.2 -5% | 23.7 -3% |
| Idle Minimum * (dB) | 23.2 | 23.1 -0% | 22.8 2% | 28.4 -22% | 24.2 -4% | 23.7 -2% |
| Idle Average * (dB) | 24 | 23.1 4% | 22.8 5% | 28.4 -18% | 24.2 -1% | 23.7 1% |
| Idle Maximum * (dB) | 24.7 | 23.1 6% | 22.8 8% | 28.8 -17% | 24.2 2% | 23.7 4% |
| Load Average * (dB) | 39 | 38.2 2% | 26.3 33% | 33.5 14% | 30.2 23% | 30.5 22% |
| Cyberpunk 2077 ultra * (dB) | 43 | 44.2 -3% | 39.1 9% | 39.3 9% | 31.1 28% | |
| Load Maximum * (dB) | 44.9 | 44.2 2% | 38.3 15% | 40.4 10% | 39.6 12% | 33.6 25% |
| Witcher 3 ultra * (dB) | 30 |
* ... im mniej tym lepiej
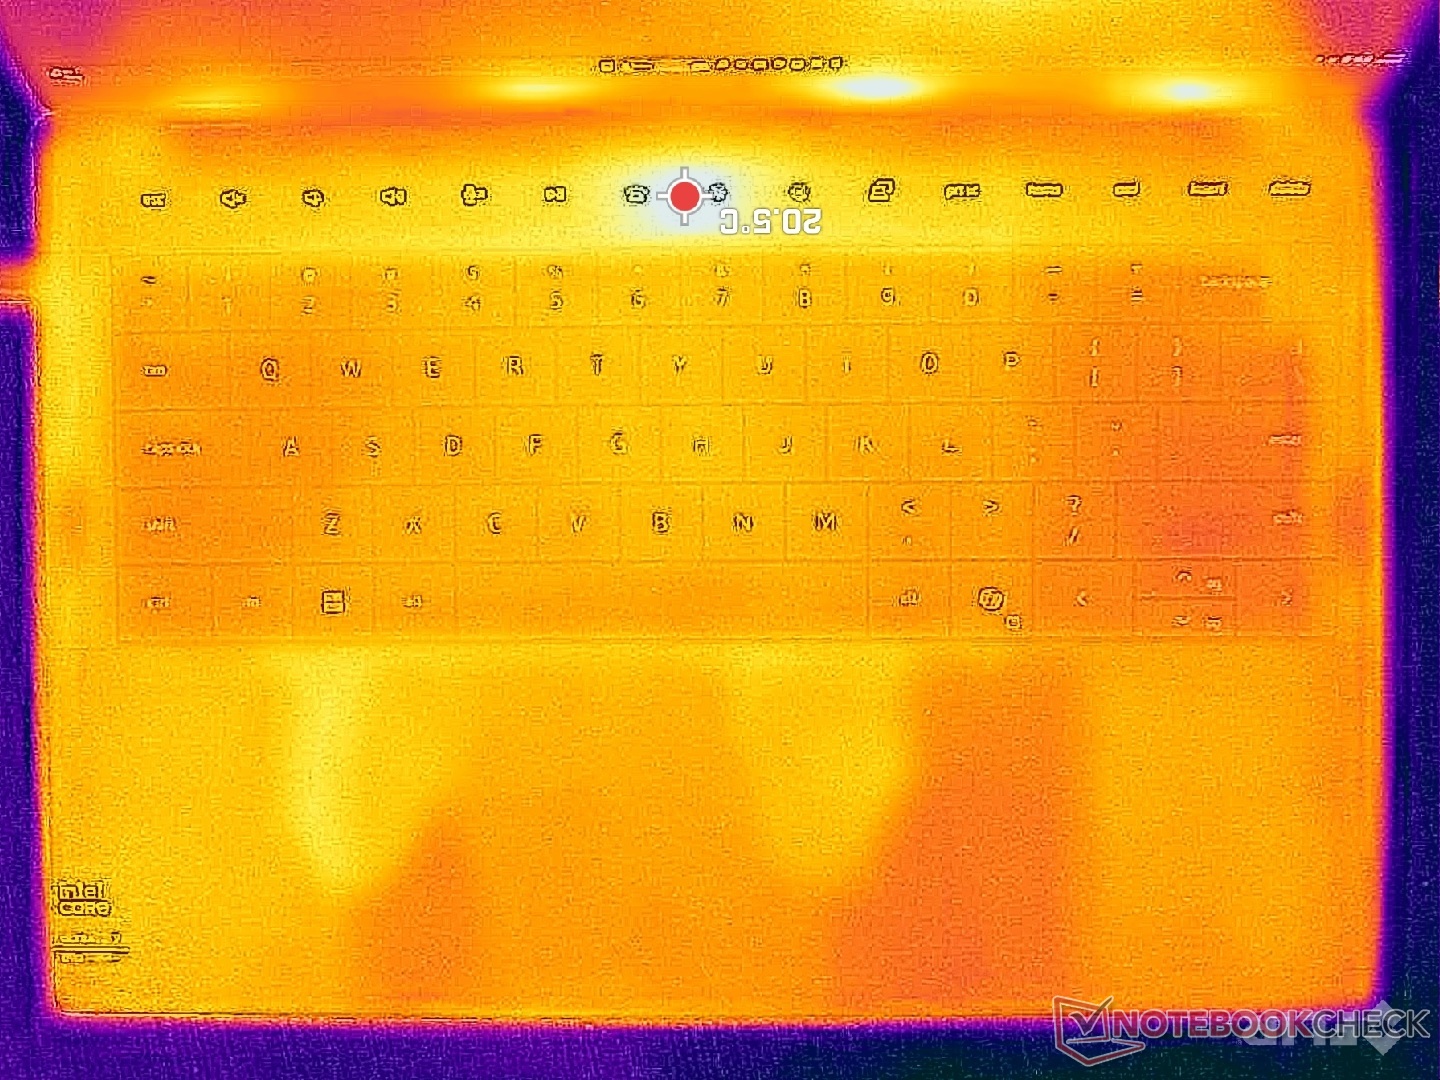
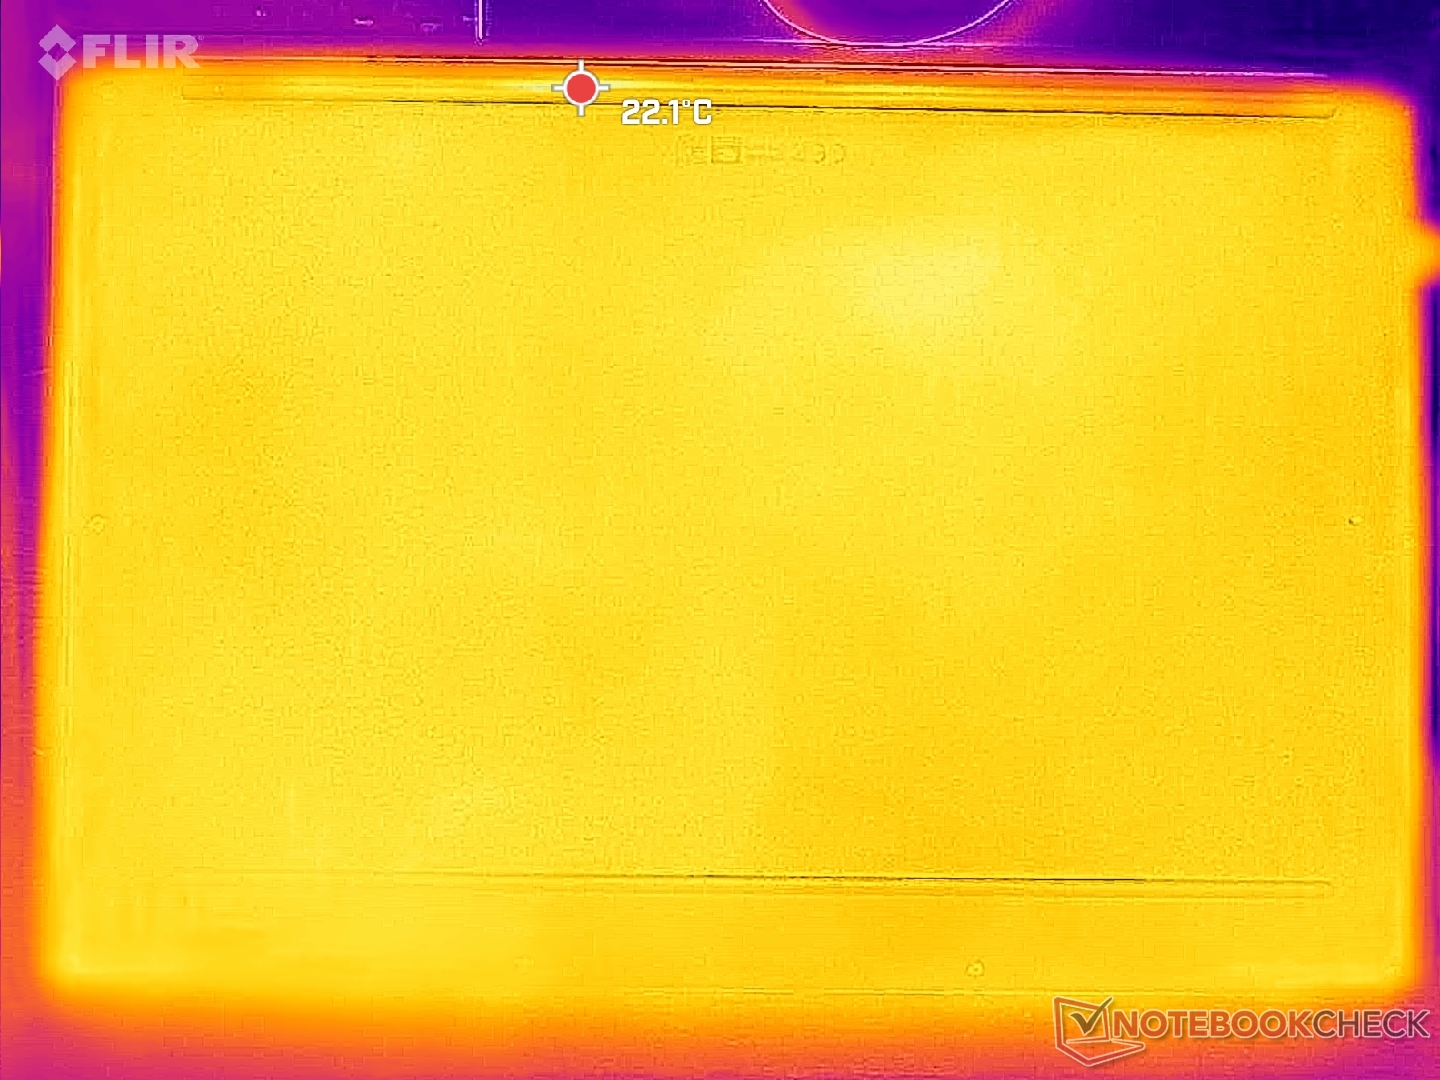
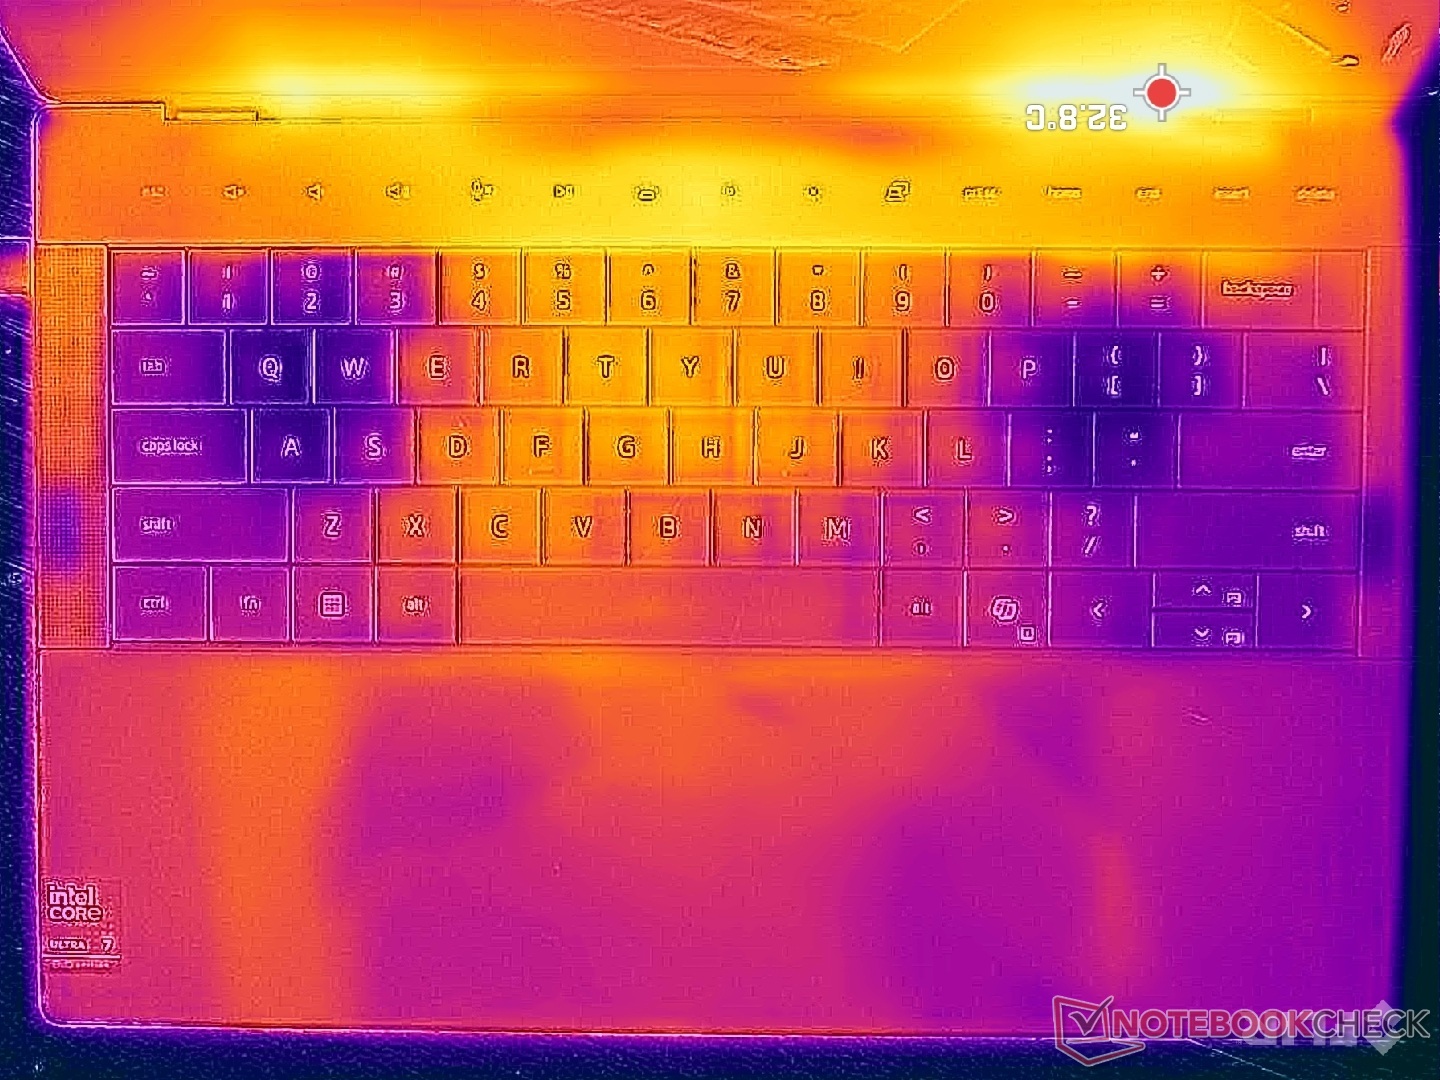
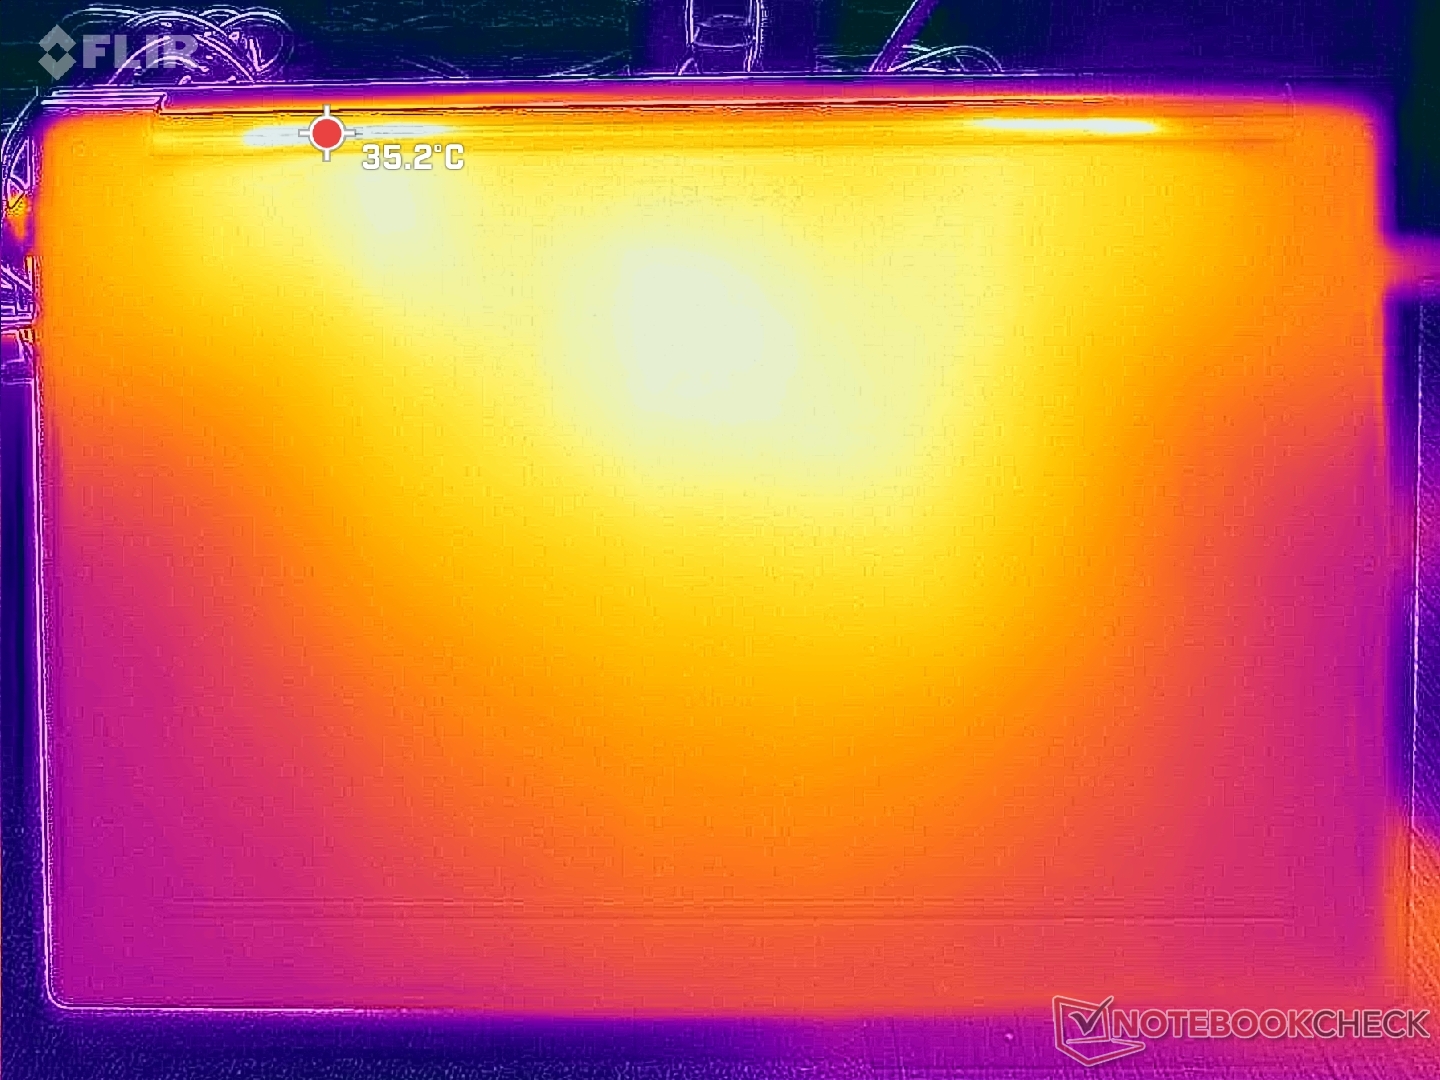
Temperatura
Gorące punkty są po chłodniejszej stronie i wynoszą nieco ponad 33 C przy długotrwałym obciążeniu, pomimo wysokiej wydajności procesora.
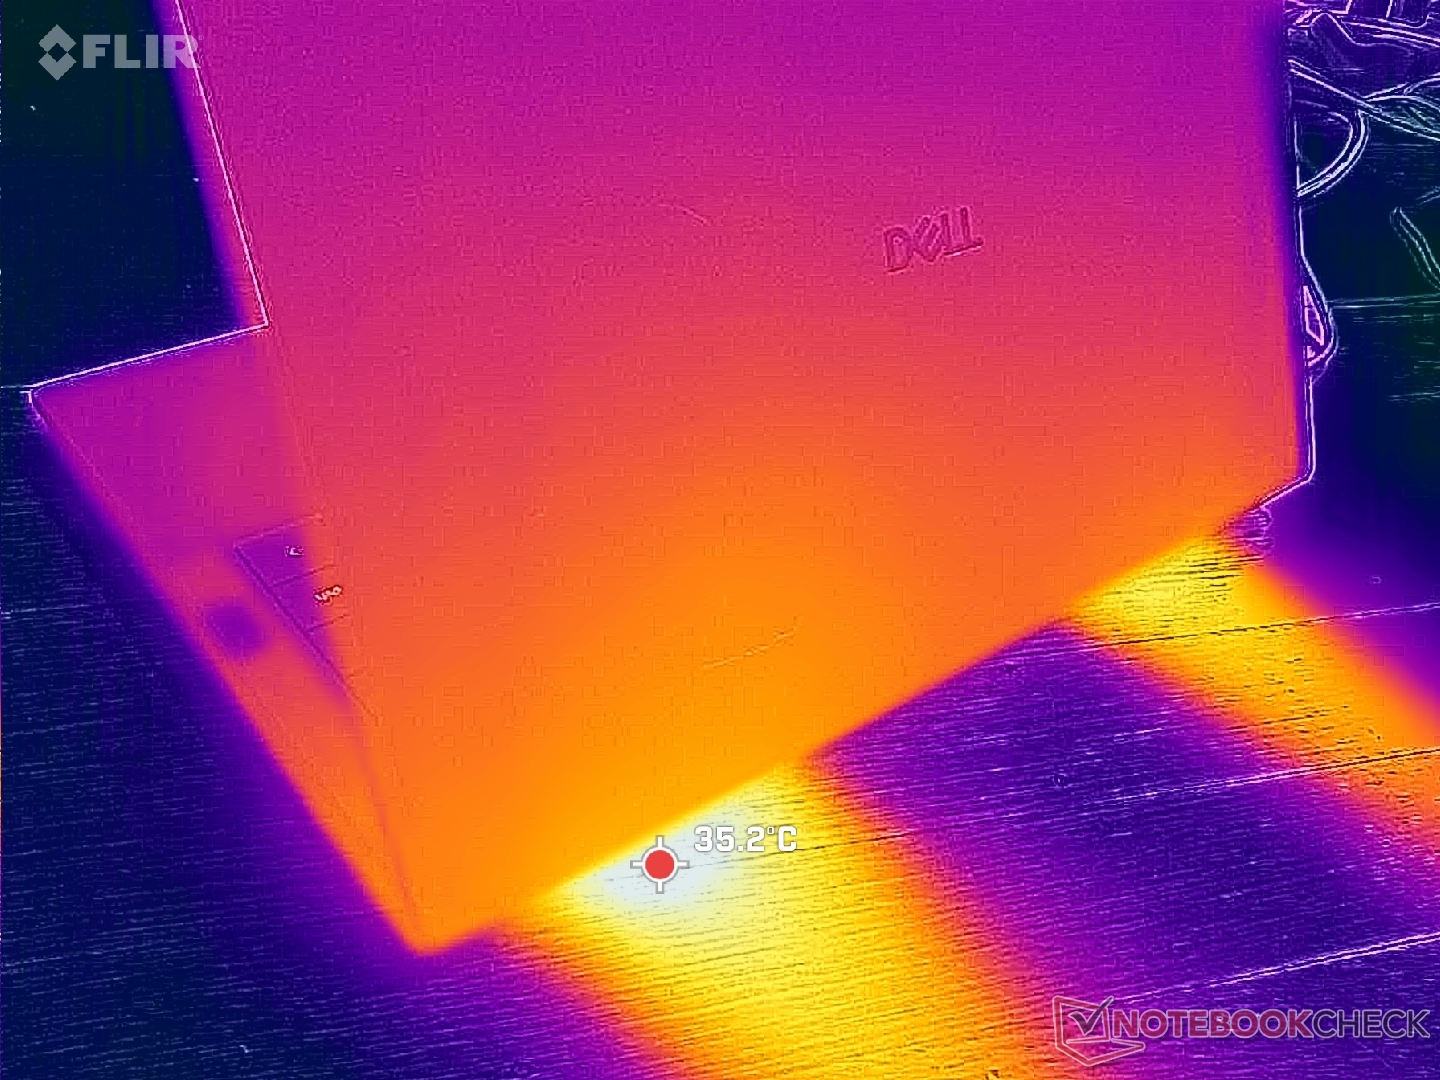
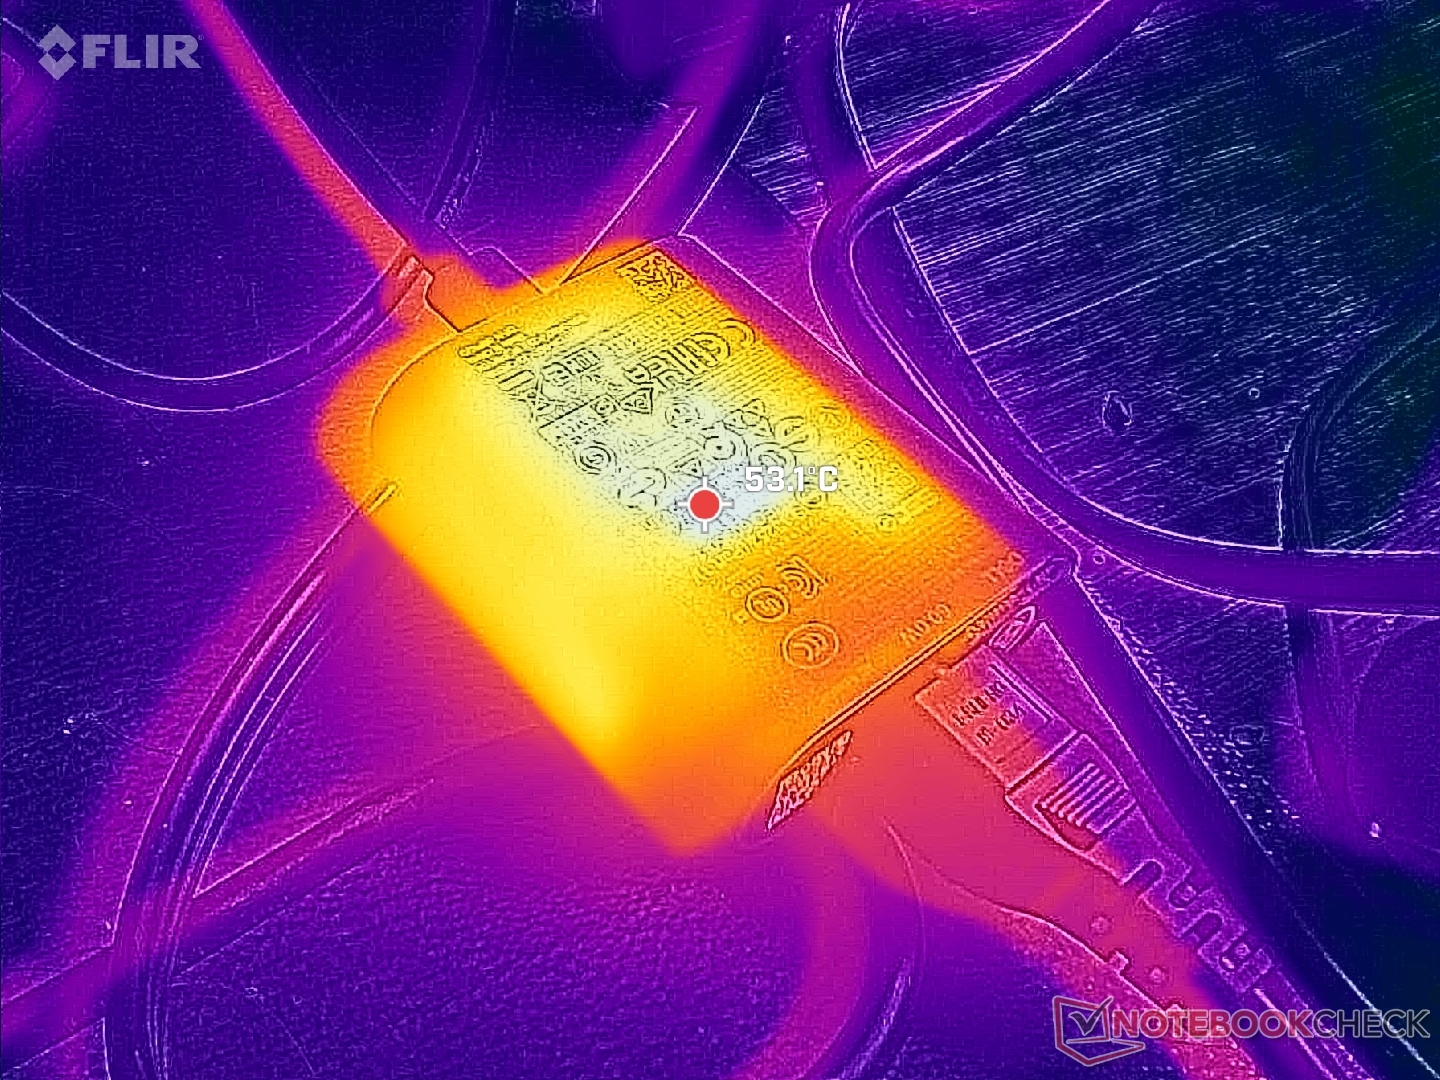
(+) Maksymalna temperatura w górnej części wynosi 33 °C / 91 F, w porównaniu do średniej 36.8 °C / 98 F , począwszy od 21 do 71 °C dla klasy Multimedia.
(+) Dno nagrzewa się maksymalnie do 33.6 °C / 92 F, w porównaniu do średniej 39.1 °C / 102 F
(+) W stanie bezczynności średnia temperatura górnej części wynosi 25 °C / 77 F, w porównaniu ze średnią temperaturą urządzenia wynoszącą 31.3 °C / ### class_avg_f### F.
(+) Podpórki pod nadgarstki i touchpad są chłodniejsze niż temperatura skóry i maksymalnie 29 °C / 84.2 F i dlatego są chłodne w dotyku.
(±) Średnia temperatura obszaru podparcia dłoni w podobnych urządzeniach wynosiła 28.7 °C / 83.7 F (-0.3 °C / -0.5 F).
| Dell 14 Premium Intel Core Ultra 7 255H, Intel Arc Graphics 140T | Dell Pro 14 Premium Intel Core Ultra 7 268V, Intel Arc Graphics 140V | Asus Zenbook S 14 UX5406 Intel Core Ultra 7 258V, Intel Arc Graphics 140V | Lenovo ThinkPad X9-14 Gen 1 Aura Edition Intel Core Ultra 7 258V, Intel Arc Graphics 140V | Asus ZenBook Duo OLED UX8406CA Intel Core Ultra 9 285H, Intel Arc Graphics 140T | Dell XPS 14 2024 OLED Intel Core Ultra 7 155H, NVIDIA GeForce RTX 4050 Laptop GPU | |
|---|---|---|---|---|---|---|
| Heat | -1% | -18% | -27% | -11% | -15% | |
| Maximum Upper Side * (°C) | 33 | 33 -0% | 43.7 -32% | 45.4 -38% | 35.3 -7% | 40.5 -23% |
| Maximum Bottom * (°C) | 33.6 | 28 17% | 46.9 -40% | 46.4 -38% | 47.2 -40% | 42.6 -27% |
| Idle Upper Side * (°C) | 26.4 | 28 -6% | 25.8 2% | 30.2 -14% | 24.8 6% | 26.9 -2% |
| Idle Bottom * (°C) | 25.6 | 28.8 -13% | 26.3 -3% | 29.9 -17% | 26.2 -2% | 27.8 -9% |
* ... im mniej tym lepiej
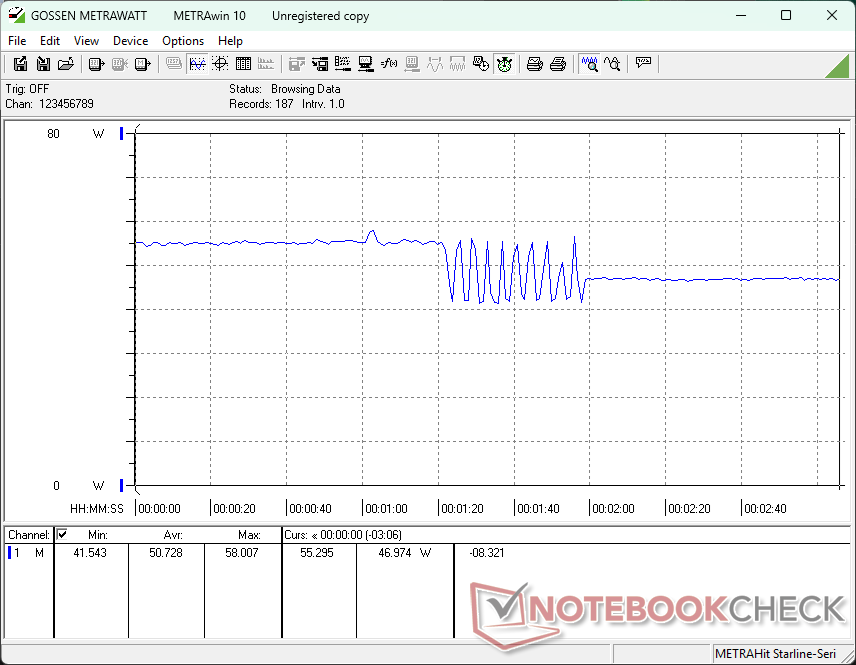
Test warunków skrajnych
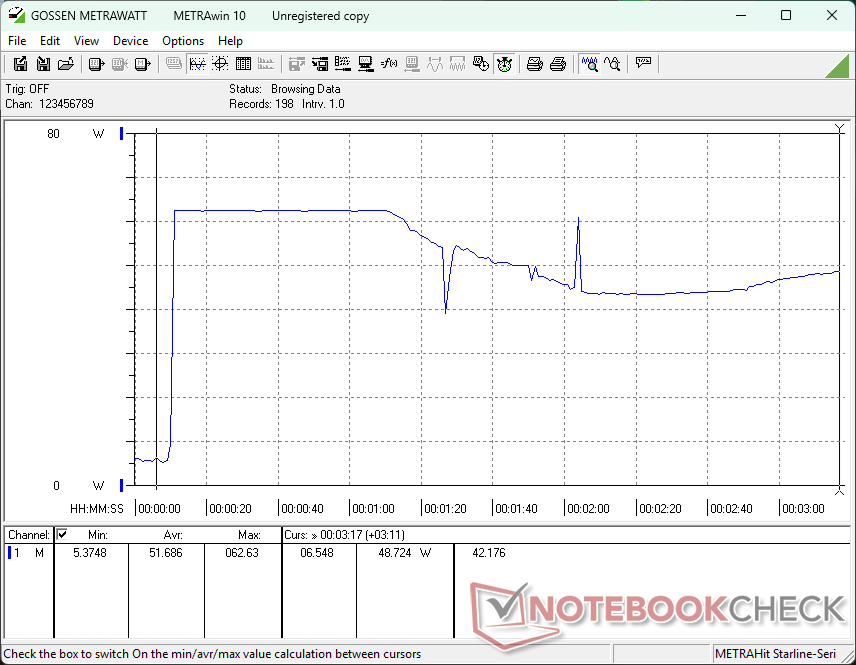
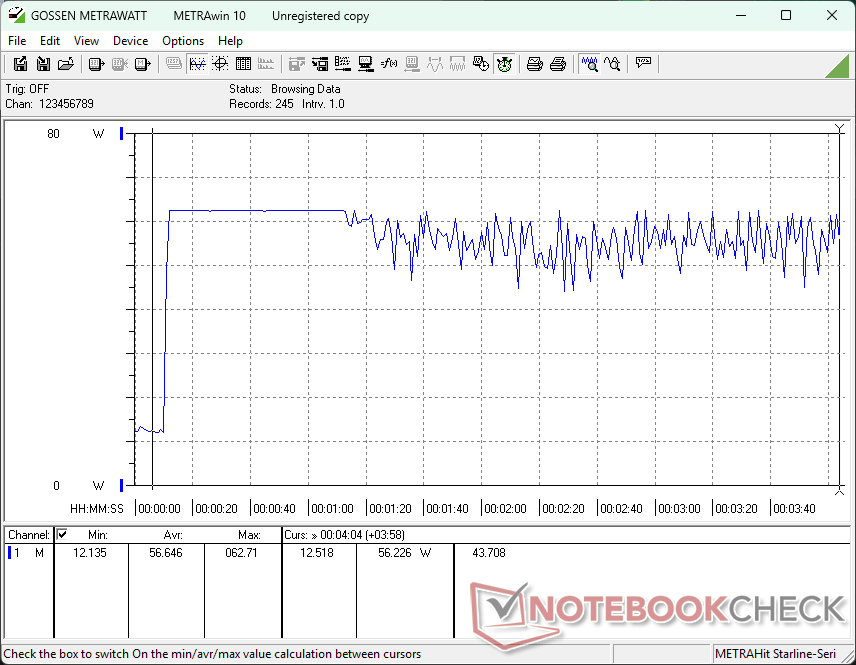
Po uruchomieniu Prime95 w celu obciążenia procesora, średnie częstotliwości taktowania wzrosłyby do 3 GHz przy 60 W i 104 C. Oczywiście taka temperatura jest niekomfortowa do utrzymania przez długi czas, więc procesor szybko spadłby do 2,5 GHz, 42 W i 85 C po zaledwie minucie testu.
Podobne dławienie częstotliwości taktowania wystąpiłoby podczas uruchamiania gry Cyberpunk 2077 w celu reprezentowania wymagających obciążeń, jak pokazano w poniższej tabeli i zrzucie ekranu. Wahania częstotliwości taktowania pokrywają się z naszymi wynikami wolniejszej niż oczekiwano liczby klatek na sekundę w sekcji Wydajność GPU.
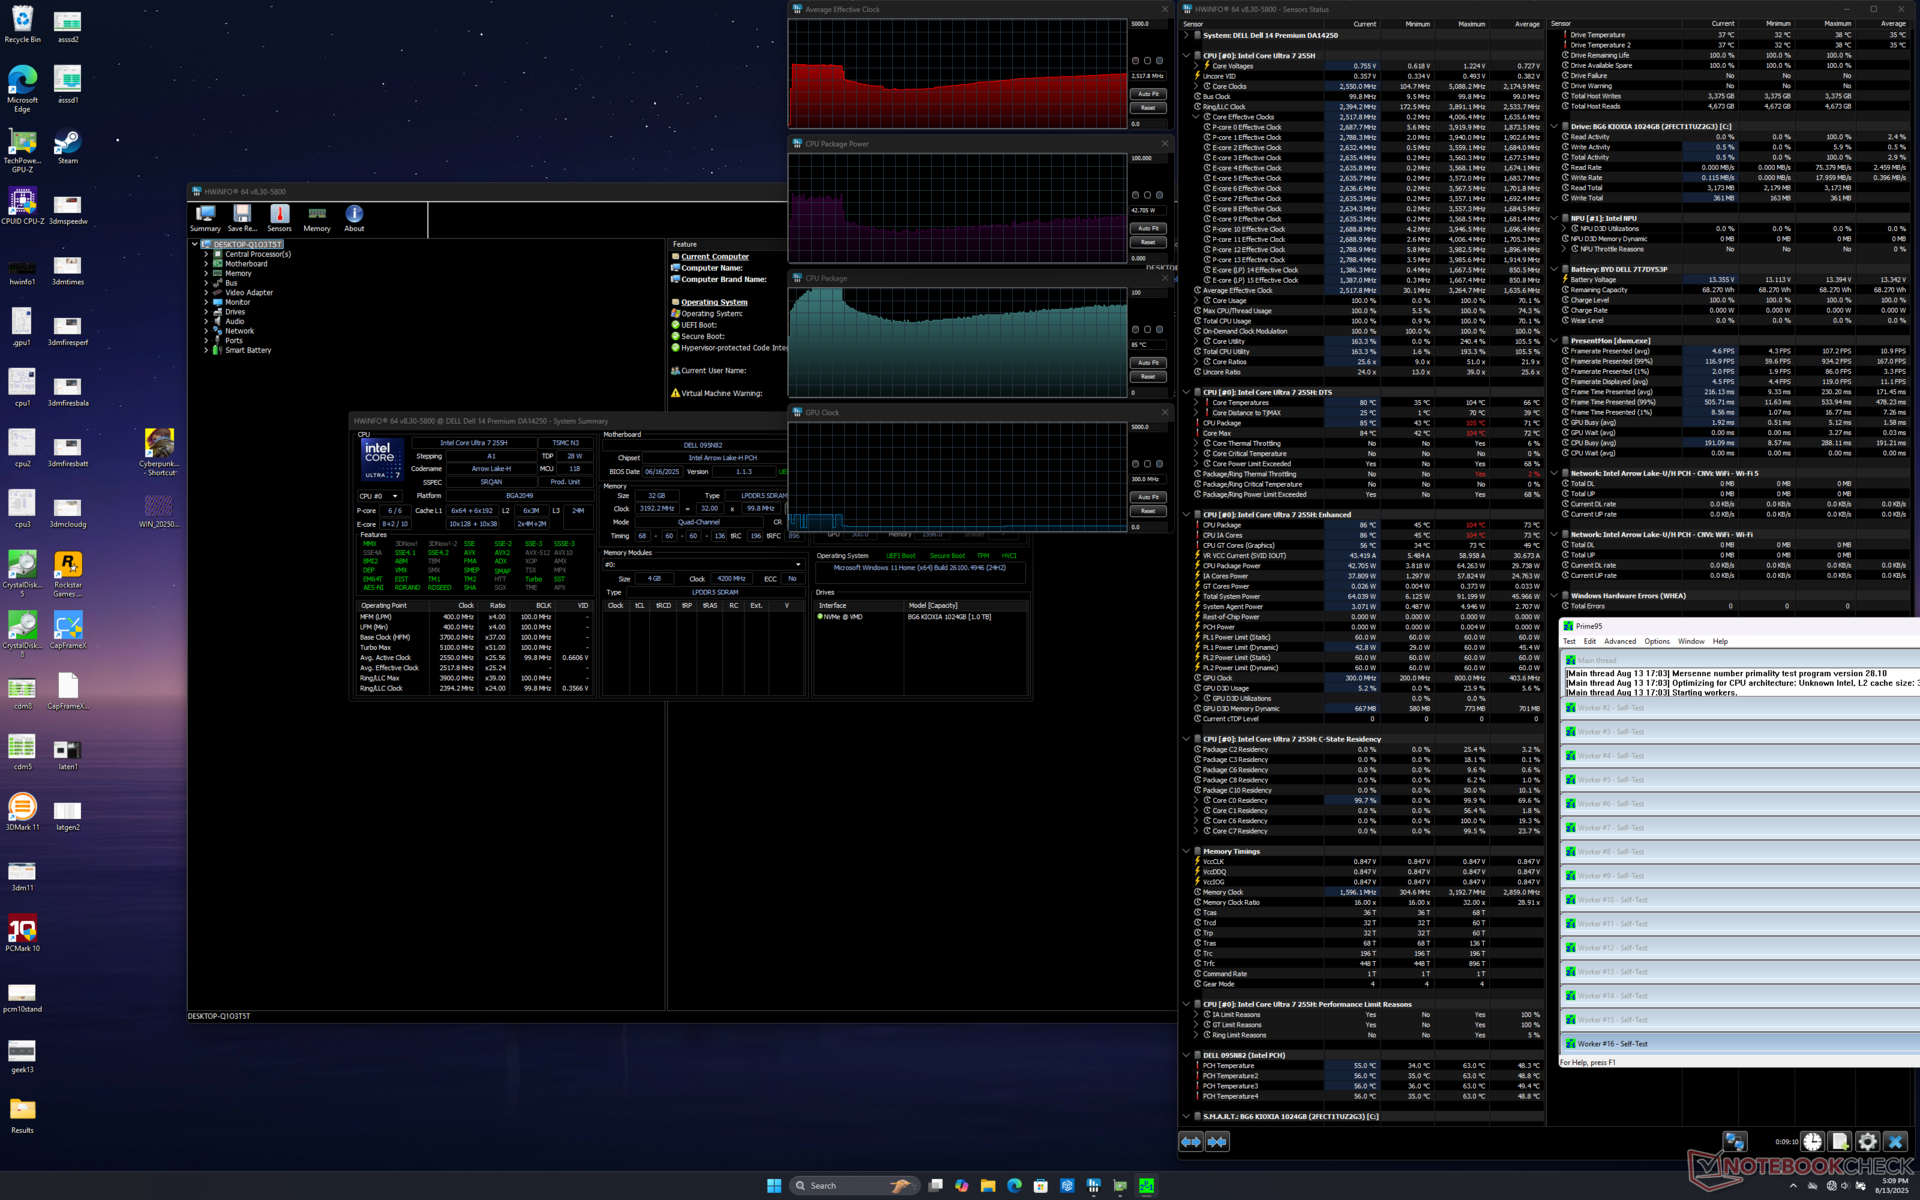
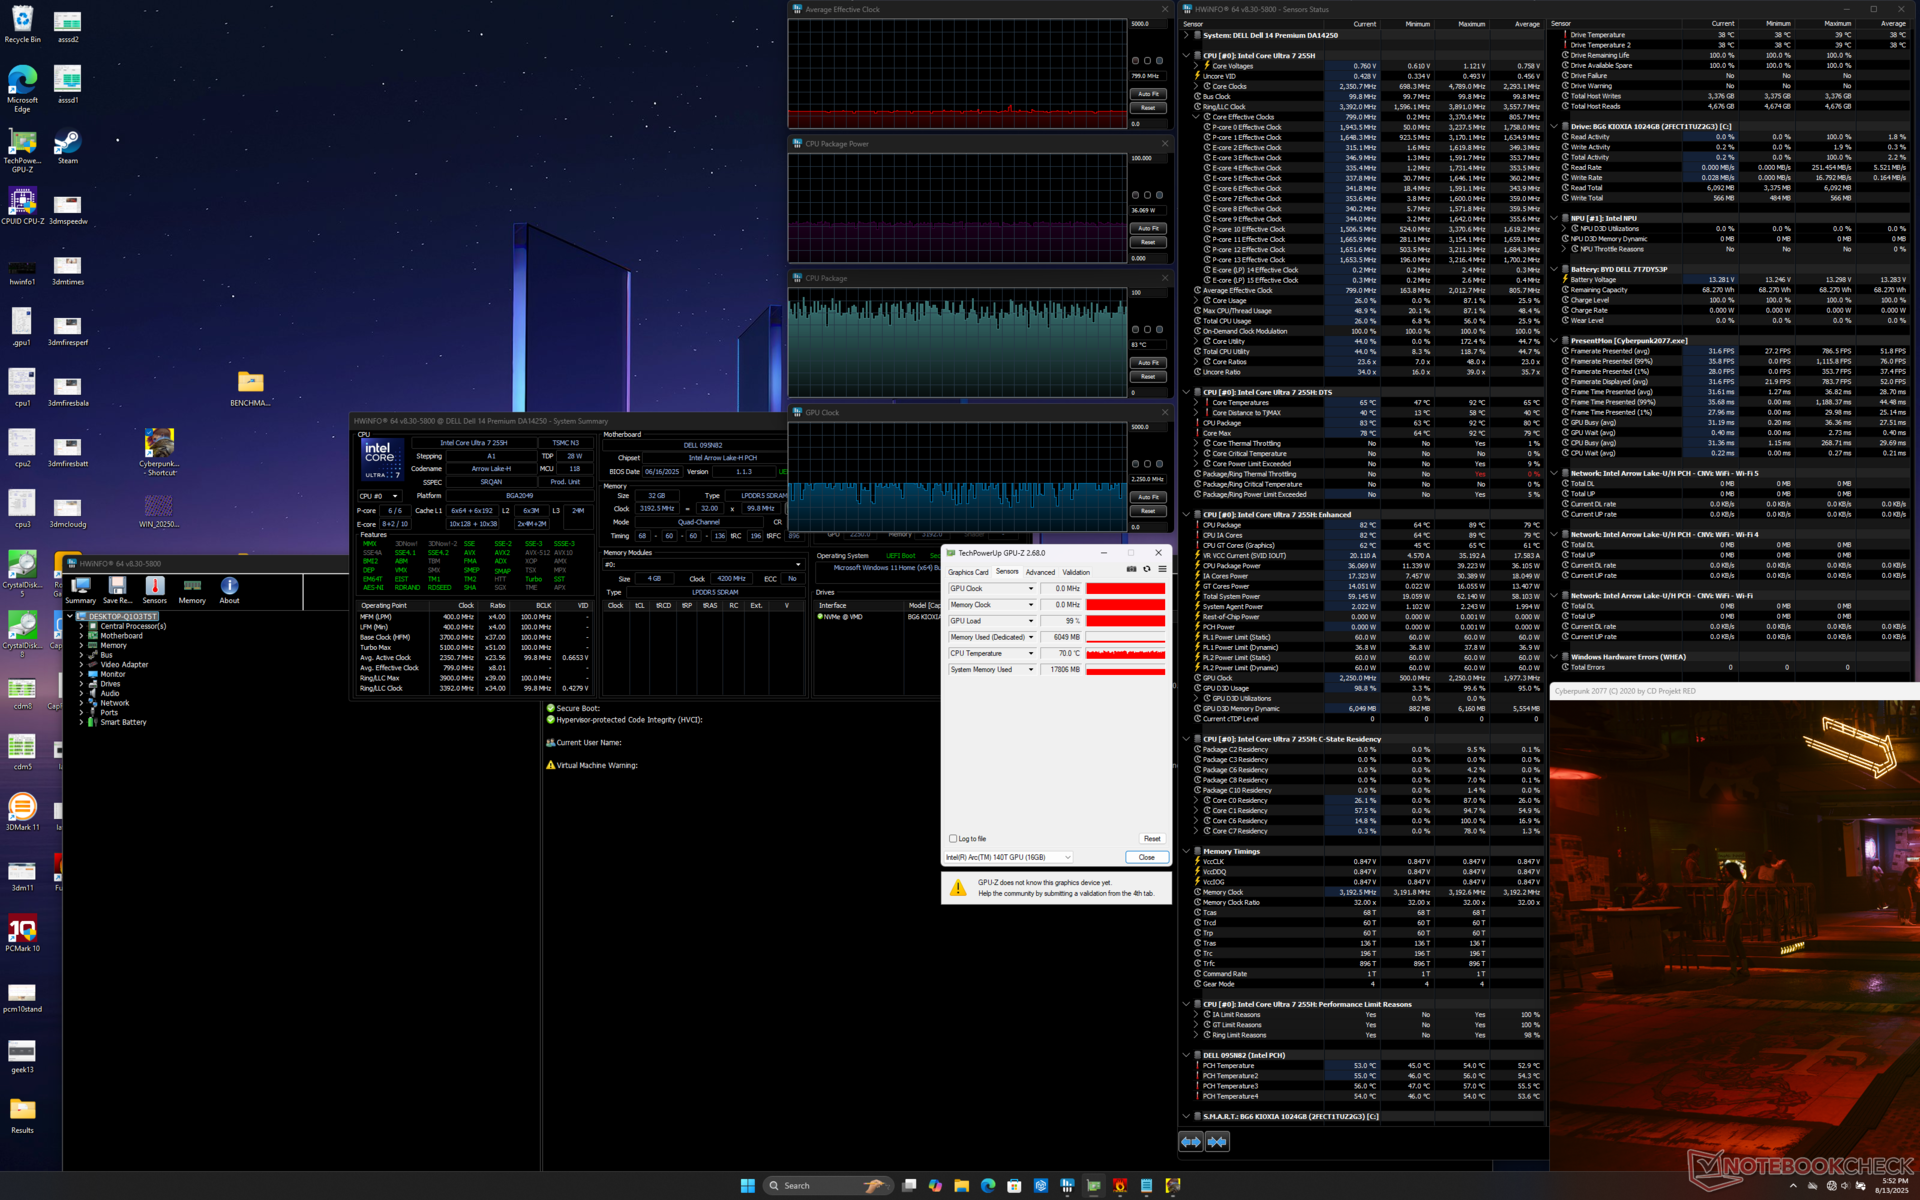
| Średnie taktowanie CPU (GHz) | Taktowanie GPU (MHz) | Średnia temperatura CPU (°C) | |
| System bezczynności | -- | -- | 47 |
| Prime95 Stress | 2.5 | -- | 85 |
| Prime95 + FurMark Stress | 1.1 - 1.8 | 550 - 1943 | ~71 |
| Cyberpunk 2077 Stress | 0.8 | 1110 - 2250 | ~83 |
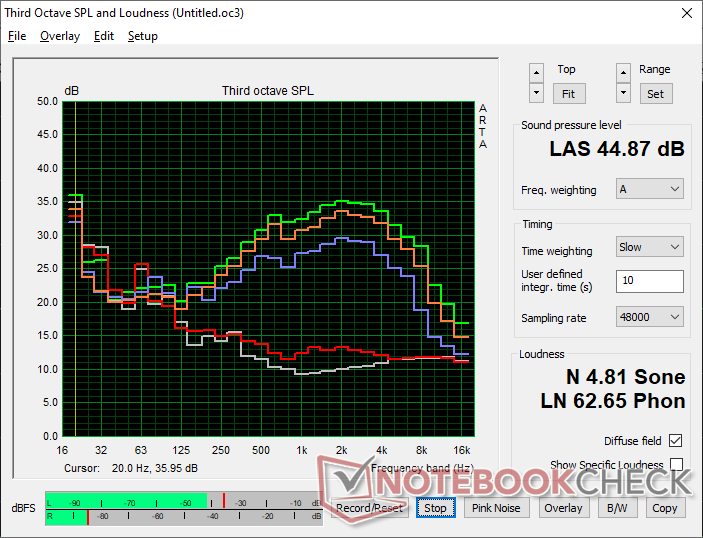
Głośniki
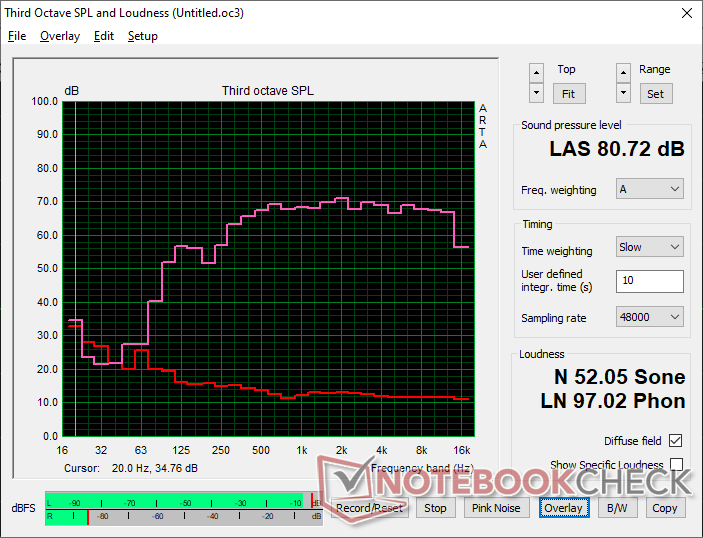
Dell 14 Premium analiza dźwięku
(±) | głośność głośnika jest średnia, ale dobra (80.7 dB)
Bas 100 - 315 Hz
(±) | zredukowany bas - średnio 11.4% niższy od mediany
(±) | liniowość basu jest średnia (10.1% delta do poprzedniej częstotliwości)
Średnie 400 - 2000 Hz
(+) | zbalansowane środki średnie - tylko 1.4% od mediany
(+) | średnie są liniowe (2.6% delta do poprzedniej częstotliwości)
Wysokie 2–16 kHz
(+) | zrównoważone maksima - tylko 1% od mediany
(+) | wzloty są liniowe (3.4% delta do poprzedniej częstotliwości)
Ogólnie 100 - 16.000 Hz
(+) | ogólny dźwięk jest liniowy (9.2% różnicy w stosunku do mediany)
W porównaniu do tej samej klasy
» 13% wszystkich testowanych urządzeń w tej klasie było lepszych, 0% podobnych, 87% gorszych
» Najlepszy miał deltę 5%, średnia wynosiła ###średnia###%, najgorsza wynosiła 45%
W porównaniu do wszystkich testowanych urządzeń
» 3% wszystkich testowanych urządzeń było lepszych, 1% podobnych, 96% gorszych
» Najlepszy miał deltę 4%, średnia wynosiła ###średnia###%, najgorsza wynosiła 134%
Apple MacBook Pro 16 2021 M1 Pro analiza dźwięku
(+) | głośniki mogą odtwarzać stosunkowo głośno (84.7 dB)
Bas 100 - 315 Hz
(+) | dobry bas - tylko 3.8% od mediany
(+) | bas jest liniowy (5.2% delta do poprzedniej częstotliwości)
Średnie 400 - 2000 Hz
(+) | zbalansowane środki średnie - tylko 1.3% od mediany
(+) | średnie są liniowe (2.1% delta do poprzedniej częstotliwości)
Wysokie 2–16 kHz
(+) | zrównoważone maksima - tylko 1.9% od mediany
(+) | wzloty są liniowe (2.7% delta do poprzedniej częstotliwości)
Ogólnie 100 - 16.000 Hz
(+) | ogólny dźwięk jest liniowy (4.6% różnicy w stosunku do mediany)
W porównaniu do tej samej klasy
» 0% wszystkich testowanych urządzeń w tej klasie było lepszych, 0% podobnych, 100% gorszych
» Najlepszy miał deltę 5%, średnia wynosiła ###średnia###%, najgorsza wynosiła 45%
W porównaniu do wszystkich testowanych urządzeń
» 0% wszystkich testowanych urządzeń było lepszych, 0% podobnych, 100% gorszych
» Najlepszy miał deltę 4%, średnia wynosiła ###średnia###%, najgorsza wynosiła 134%
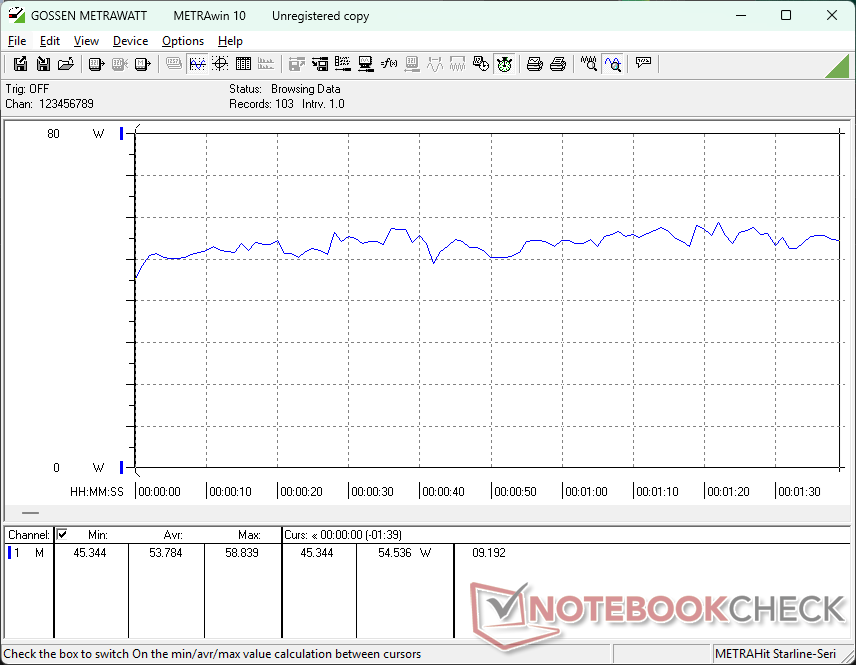
Zarządzanie energią
Zużycie energii
Średnie zużycie energii jest wyższe niż w przypadku większości 14-calowych subnotebooków, co w dużej mierze jest zasługą procesora z serii H. Niemniej jednak występują wahania poboru mocy, gdy system jest obciążony, co pokrywa się z wahaniami częstotliwości taktowania Turbo Boost, o których wspomniano powyżej.
| wyłączony / stan wstrzymania | |
| luz | |
| obciążenie |
|
Legenda:
min: | |
| Dell 14 Premium Ultra 7 255H, Arc 140T, Kioxia BG6 KBG6AZNV1T02, OLED, 3200x2000, 14.5" | HP OmniBook Ultra 14 Ryzen AI 9 HX 375, Radeon 890M, SK hynix PC801 HFS002TEJ9X101N, IPS, 2240x1400, 14" | Asus Zenbook S 14 UX5406 Core Ultra 7 258V, Arc 140V, WD PC SN560 SDDPNQE-1T00, OLED, 2880x1800, 14" | Lenovo ThinkPad X9-14 Gen 1 Aura Edition Core Ultra 7 258V, Arc 140V, WD PC SN740 SDDQMQD-1T00, OLED, 1920x1200, 14" | Asus ZenBook Duo OLED UX8406CA Ultra 9 285H, Arc 140T, Western Digital PC SN5000S SDEQNSJ-1T00, OLED, 1920x1200, 14" | Dell XPS 14 2024 OLED Ultra 7 155H, GeForce RTX 4050 Laptop GPU, Samsung PM9A1 MZVL21T0HCLR, OLED, 3200x2000, 14.5" | |
|---|---|---|---|---|---|---|
| Power Consumption | -1% | 20% | 22% | 0% | -47% | |
| Idle Minimum * (Watt) | 4.4 | 2.7 39% | 5.1 -16% | 3.6 18% | 4.1 7% | 8.1 -84% |
| Idle Average * (Watt) | 6.1 | 5.4 11% | 6.2 -2% | 4.6 25% | 8.2 -34% | 9.9 -62% |
| Idle Maximum * (Watt) | 13.7 | 5.5 60% | 6.9 50% | 5.2 62% | 8.7 36% | 10.4 24% |
| Load Average * (Watt) | 53.8 | 67.4 -25% | 38.7 28% | 31.2 42% | 56.7 -5% | 75.6 -41% |
| Cyberpunk 2077 ultra external monitor * (Watt) | 46.5 | 67.8 -46% | 28.6 38% | 48.4 -4% | 47 -1% | |
| Cyberpunk 2077 ultra * (Watt) | 50.7 | 67.9 -34% | 33.1 35% | 47.3 7% | 48.7 4% | |
| Load Maximum * (Watt) | 62.7 | 68.3 -9% | 60 4% | 61.8 1% | 65.1 -4% | 107.1 -71% |
| Witcher 3 ultra * (Watt) | 65.6 |
* ... im mniej tym lepiej
Pobór mocy Cyberpunk / Test warunków skrajnych
Zużycie energii przez monitor zewnętrzny
Żywotność baterii
Czas działania sieci WLAN jest o kilka godzin dłuższy niż w przypadku XPS 14 wyposażonego w oddzielną grafikę RTX 4050.
| Dell 14 Premium Ultra 7 255H, Arc 140T, 69.5 Wh | HP OmniBook Ultra 14 Ryzen AI 9 HX 375, Radeon 890M, 68 Wh | Asus Zenbook S 14 UX5406 Core Ultra 7 258V, Arc 140V, 72 Wh | Lenovo ThinkPad X9-14 Gen 1 Aura Edition Core Ultra 7 258V, Arc 140V, 55 Wh | Asus ZenBook Duo OLED UX8406CA Ultra 9 285H, Arc 140T, 75 Wh | Dell XPS 14 2024 OLED Ultra 7 155H, GeForce RTX 4050 Laptop GPU, 69.5 Wh | |
|---|---|---|---|---|---|---|
| Czasy pracy | 2% | 32% | 31% | 3% | -28% | |
| WiFi v1.3 (h) | 10.8 | 11 2% | 14.3 32% | 14.2 31% | 11.1 3% | 7.8 -28% |
| Reader / Idle (h) | 36.6 | |||||
| Load (h) | 1.5 | 2.6 | 1.3 | 1.3 | ||
| H.264 (h) | 20 | 16.9 | 10.6 |
Ocena Notebookcheck
Dell 14 Premium to mniej więcej niewielkie odświeżenie zeszłorocznego XPS 14 z nowymi opcjami procesora, ale bez nowego wyświetlacza lub oddzielnych opcji GPU.
Dell 14 Premium
- 29/08/2025 v8
Allen Ngo
 Total Sustainability Score:
 Potencjalni konkurenci w porównaniu
Obraz | Model / recenzja | Cena | Waga | Wysokość | Ekran |
|---|---|---|---|---|---|
1. 82.5%  | Dell 14 Premium Intel Core Ultra 7 255H ⎘ Intel Arc Graphics 140T ⎘ 32 GB Pamięć, 1024 GB SSD | Amazon: Cena katalogowa: 1950 USD | 1.7 kg | 18 mm | 14.50" 3200x2000 260 PPI OLED |
2. 86.4%  | Dell Pro 14 Premium Intel Core Ultra 7 268V ⎘ Intel Arc Graphics 140V ⎘ 32 GB Pamięć, 1024 GB SSD | Cena katalogowa: 2500 USD | 1.3 kg | 17.95 mm | 14.00" 2880x1800 243 PPI OLED |
3. 88.1%  | Asus Zenbook S 14 UX5406 Intel Core Ultra 7 258V ⎘ Intel Arc Graphics 140V ⎘ 32 GB Pamięć, 1024 GB SSD | Amazon: Cena katalogowa: 1999€ | 1.2 kg | 13 mm | 14.00" 2880x1800 243 PPI OLED |
4. 88.8%  | Lenovo ThinkPad X9-14 Gen 1 Aura Edition Intel Core Ultra 7 258V ⎘ Intel Arc Graphics 140V ⎘ 32 GB Pamięć, 1024 GB SSD | Amazon: Cena katalogowa: 1800 Euro | 1.2 kg | 17.8 mm | 14.00" 1920x1200 162 PPI OLED |
5. 86.5%  | Asus ZenBook Duo OLED UX8406CA Intel Core Ultra 9 285H ⎘ Intel Arc Graphics 140T ⎘ 32 GB Pamięć, 1024 GB SSD | Amazon: Cena katalogowa: 2099€ | 1.8 kg | 19.9 mm | 14.00" 1920x1200 162 PPI OLED |
6. 86.3% v7 (old) 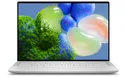 | Dell XPS 14 2024 OLED Intel Core Ultra 7 155H ⎘ NVIDIA GeForce RTX 4050 Laptop GPU ⎘ 32 GB Pamięć, 1024 GB SSD | Amazon: Cena katalogowa: 2949€ | 1.8 kg | 19 mm | 14.50" 3200x2000 260 PPI OLED |
Przezroczystość
Wyboru urządzeń do recenzji dokonuje nasza redakcja. Próbka testowa została udostępniona autorowi jako pożyczka od producenta lub sprzedawcy detalicznego na potrzeby tej recenzji. Pożyczkodawca nie miał wpływu na tę recenzję, producent nie otrzymał też kopii tej recenzji przed publikacją. Nie było obowiązku publikowania tej recenzji. Jako niezależna firma medialna, Notebookcheck nie podlega władzy producentów, sprzedawców detalicznych ani wydawców.
Tak testuje Notebookcheck
Każdego roku Notebookcheck niezależnie sprawdza setki laptopów i smartfonów, stosując standardowe procedury, aby zapewnić porównywalność wszystkich wyników. Od około 20 lat stale rozwijamy nasze metody badawcze, ustanawiając przy tym standardy branżowe. W naszych laboratoriach testowych doświadczeni technicy i redaktorzy korzystają z wysokiej jakości sprzętu pomiarowego. Testy te obejmują wieloetapowy proces walidacji. Nasz kompleksowy system ocen opiera się na setkach uzasadnionych pomiarów i benchmarków, co pozwala zachować obiektywizm.
