Recenzja Lenovo ThinkPad P1 G6: 80 W GeForce RTX 4080 dla ultracienkiej stacji roboczej

Niedawno recenzowaliśmy ThinkPad P1 G6 z procesorem Core i9-13900H, kartą graficzną RTX 2000 i wyświetlaczem IPS 1600p i stwierdziliśmy, że jest to bardzo konkurencyjna 16-calowa stacja robocza. Tym razem jesteśmy gotowi sprawdzić drugą konfigurację z procesorem Core i7-13800H, układem graficznym GeForce RTX 4080 i wyświetlaczem OLED 2400p, aby zobaczyć, jak różne specyfikacje mogą wpłynąć na wydajność, żywotność baterii, sprzęt wewnętrzny i nie tylko.
Proszę zauważyć, że serii ThinkPad P1 16 nie należy mylić z serią Serią ThinkPad P16 która składa się z większych i cięższych modeli z szybszymi opcjami z serii Core HX.
Więcej recenzji Lenovo:
Potencjalni konkurenci w porównaniu
Ocena | Data | Model | Waga | Wysokość | Rozmiar | Rezolucja | Cena |
|---|---|---|---|---|---|---|---|
| 90.1 % v7 (old) | 12/2023 | Lenovo ThinkPad P1 G6 21FV001KUS i7-13800H, GeForce RTX 4080 Laptop GPU | 1.9 kg | 17.5 mm | 16.00" | 3480x2400 | |
| 91.7 % v7 (old) | 10/2023 | Lenovo ThinkPad P1 G6-21FV000DGE i9-13900H, RTX 2000 Ada Generation Laptop | 1.9 kg | 17.5 mm | 16.00" | 2560x1600 | |
| 89.8 % v7 (old) | Lenovo ThinkPad P1 G4-20Y4S0KS00 i7-11850H, GeForce RTX 3070 Laptop GPU | 2 kg | 17.7 mm | 16.00" | 3840x2400 | ||
| 91 % v7 (old) | 02/2023 | Lenovo ThinkPad P16 G1 RTX A5500 i9-12950HX, RTX A5500 Laptop GPU | 3 kg | 30.23 mm | 16.00" | 3840x2400 | |
| 89 % v7 (old) | 08/2023 | Dell Precision 5000 5680 i9-13900H, RTX 5000 Ada Generation Laptop | 2.3 kg | 22.17 mm | 16.00" | 3840x2400 | |
| 92.3 % v7 (old) | 09/2023 | HP ZBook Fury 16 G10 i9-13950HX, RTX 5000 Ada Generation Laptop | 2.6 kg | 28.5 mm | 16.00" | 3840x2400 |
Czytnik kart SD
| SD Card Reader | |
| average JPG Copy Test (av. of 3 runs) | |
| Dell Precision 5000 5680 (Toshiba Exceria Pro SDXC 64 GB UHS-II) | |
| Lenovo ThinkPad P1 G6 21FV001KUS (Toshiba Exceria Pro SDXC 64 GB UHS-II) | |
| HP ZBook Fury 16 G10 (Toshiba Exceria Pro SDXC 64 GB UHS-II) | |
| Lenovo ThinkPad P1 G6-21FV000DGE (Angelbird AV Pro V60) | |
| Lenovo ThinkPad P16 G1 RTX A5500 (Toshiba Exceria Pro SDXC 64 GB UHS-II) | |
| maximum AS SSD Seq Read Test (1GB) | |
| Dell Precision 5000 5680 (Toshiba Exceria Pro SDXC 64 GB UHS-II) | |
| Lenovo ThinkPad P1 G6 21FV001KUS (Toshiba Exceria Pro SDXC 64 GB UHS-II) | |
| HP ZBook Fury 16 G10 (Toshiba Exceria Pro SDXC 64 GB UHS-II) | |
| Lenovo ThinkPad P1 G6-21FV000DGE (Angelbird AV Pro V60) | |
| Lenovo ThinkPad P16 G1 RTX A5500 (Toshiba Exceria Pro SDXC 64 GB UHS-II) | |
Komunikacja
Podczas gdy szybkość odbioru jest stała, szybkość nadawania jest zwykle wolniejsza i z większymi wahaniami niż oczekiwano, nawet po wielokrotnych testach.
Kamera internetowa
Urządzenie zostało skonfigurowane z kamerą internetową 5 MP 1440p w porównaniu do kamery internetowej 2 MP 1080p w naszej oryginalnej recenzji RTX 2000, aby uzyskać ostrzejszy obraz.
Podczerwień i fizyczna migawka są standardem.


Konserwacja
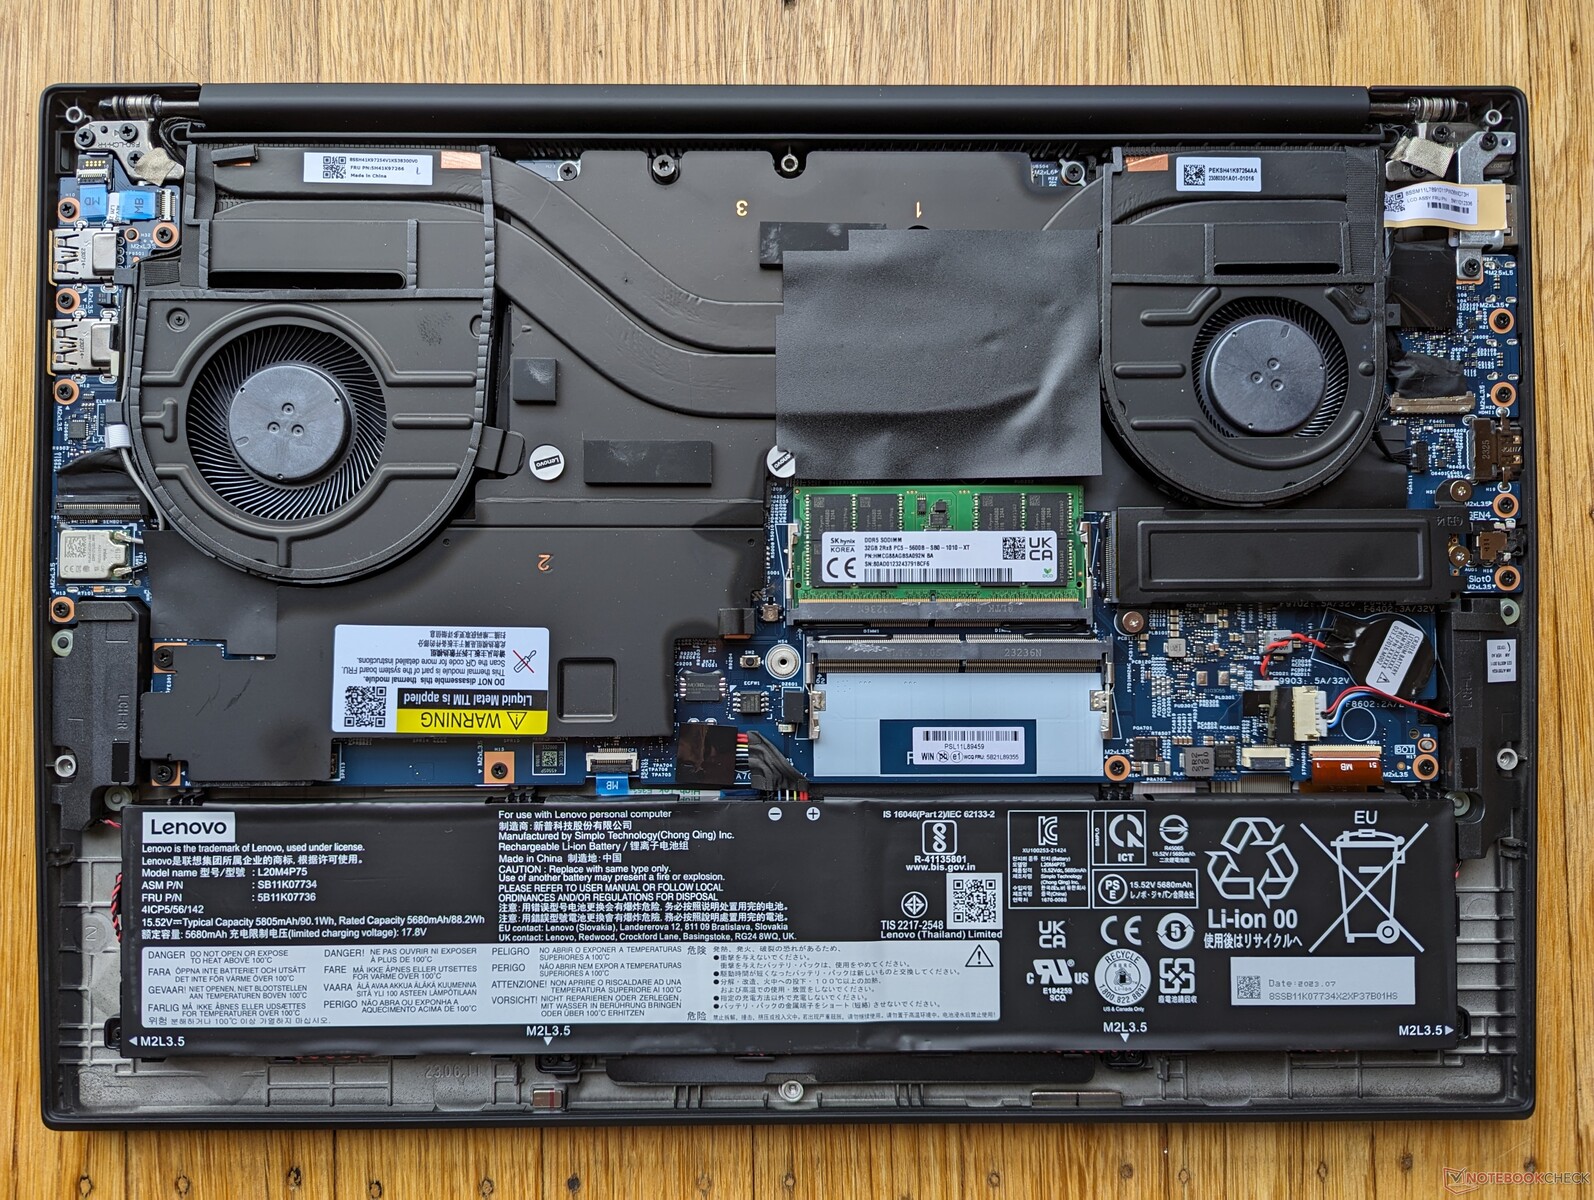
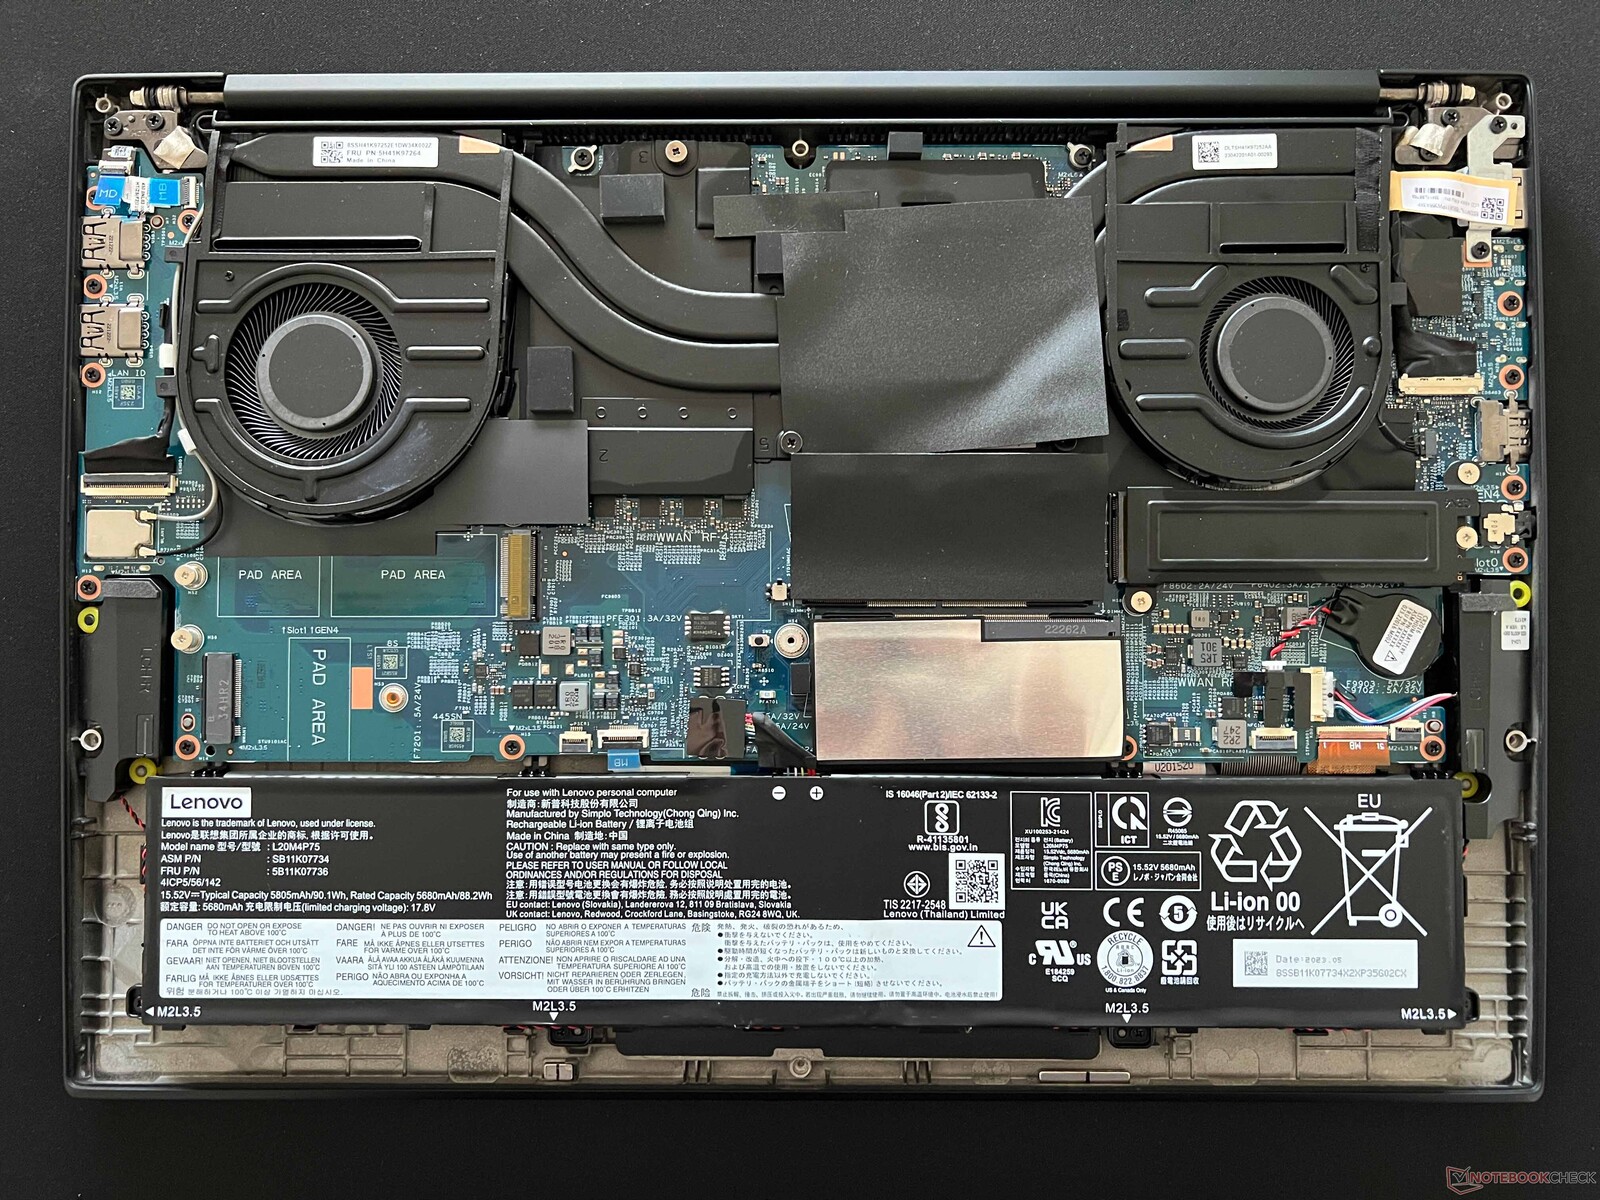
W porównaniu do konfiguracji ThinkPad P1 G6 RTX 2000, konfiguracja RTX 4080 integruje rozszerzone rozwiązanie chłodzące z większym wentylatorem, aby pomieścić bardziej wymagający procesor graficzny. Niestety odbywa się to kosztem dwóch gniazd rozszerzeń, co pokazują poniższe zdjęcia porównawcze.
Akcesoria i gwarancja
W pudełku nie ma żadnych dodatków poza zwykłym zasilaczem sieciowym i dokumentacją. Rozczarowujące jest to, że standardowa ograniczona gwarancja wynosi tylko 12 miesięcy w przypadku zakupu w USA, w porównaniu do 36 miesięcy dla wielu modeli Dell Precision.
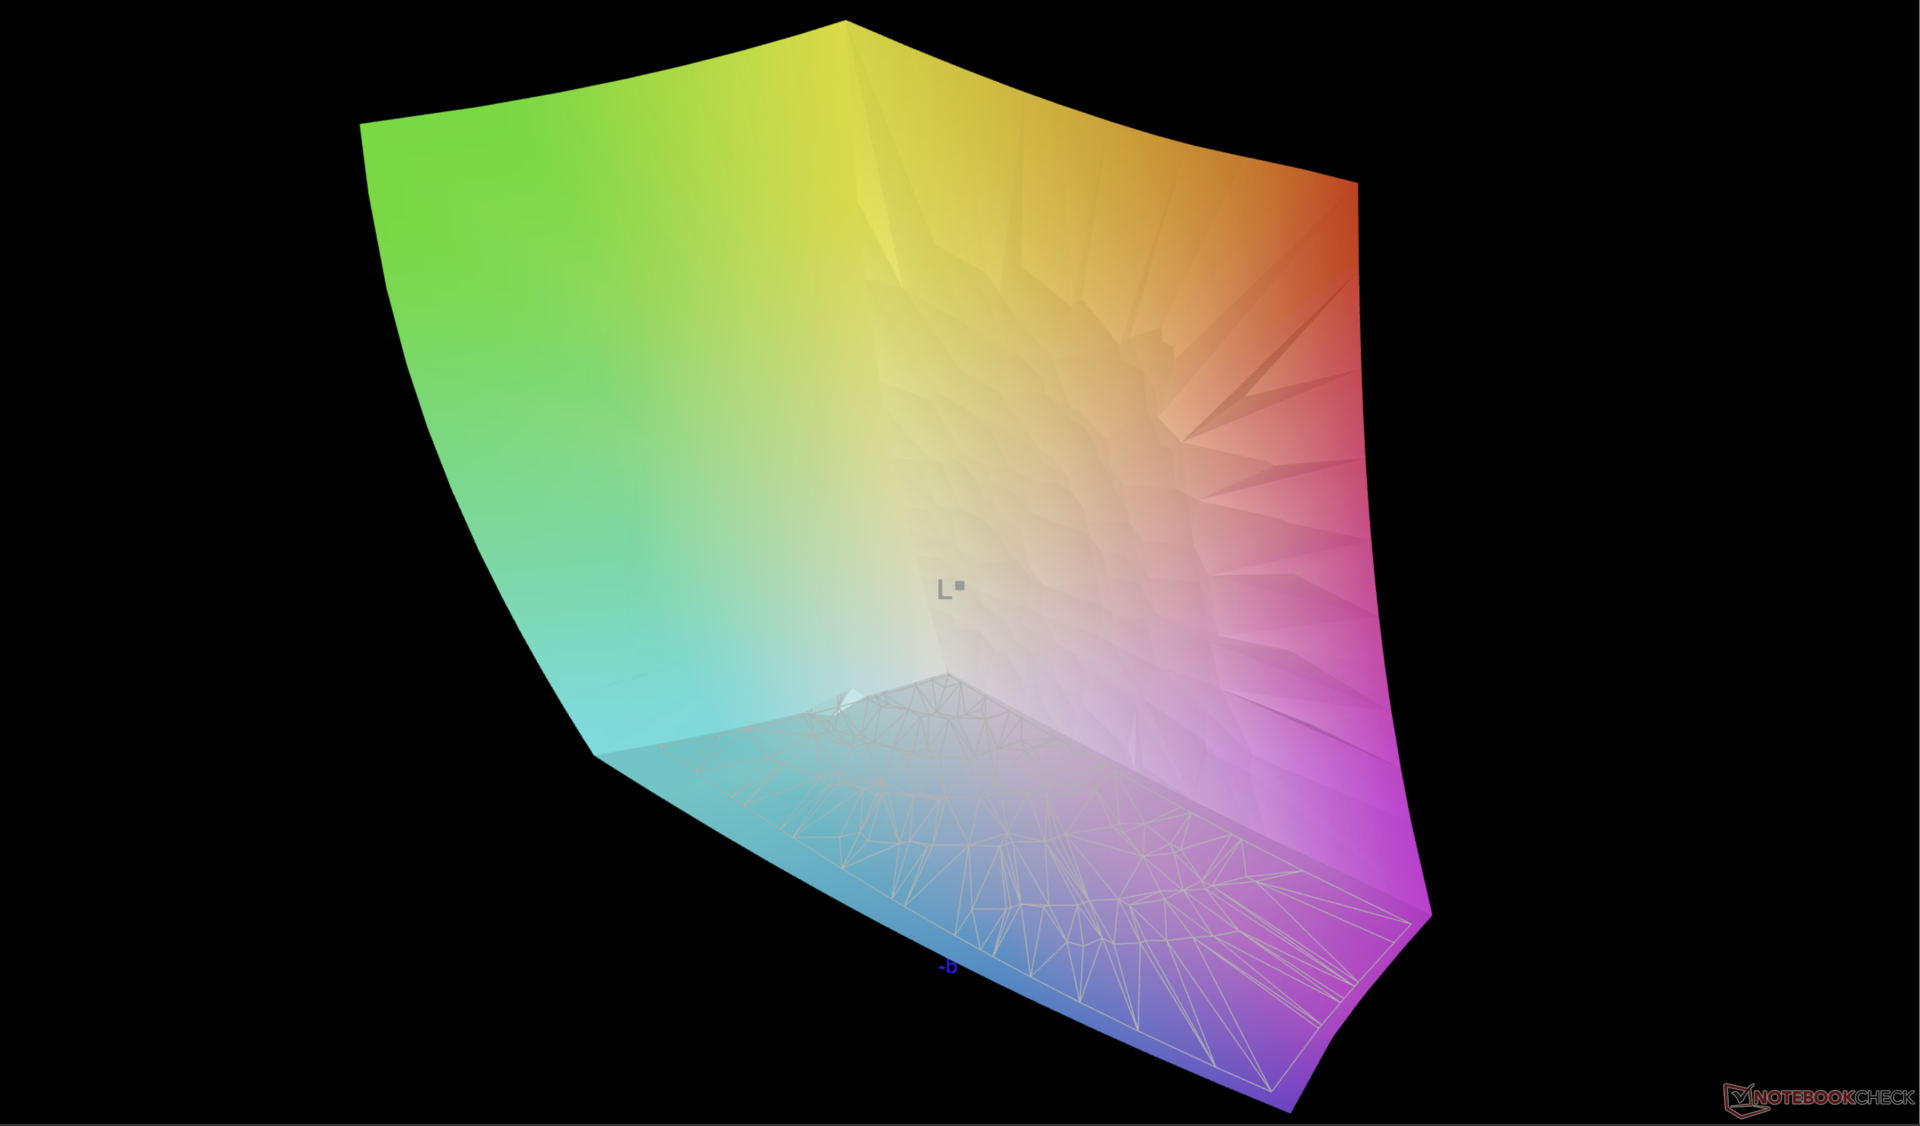
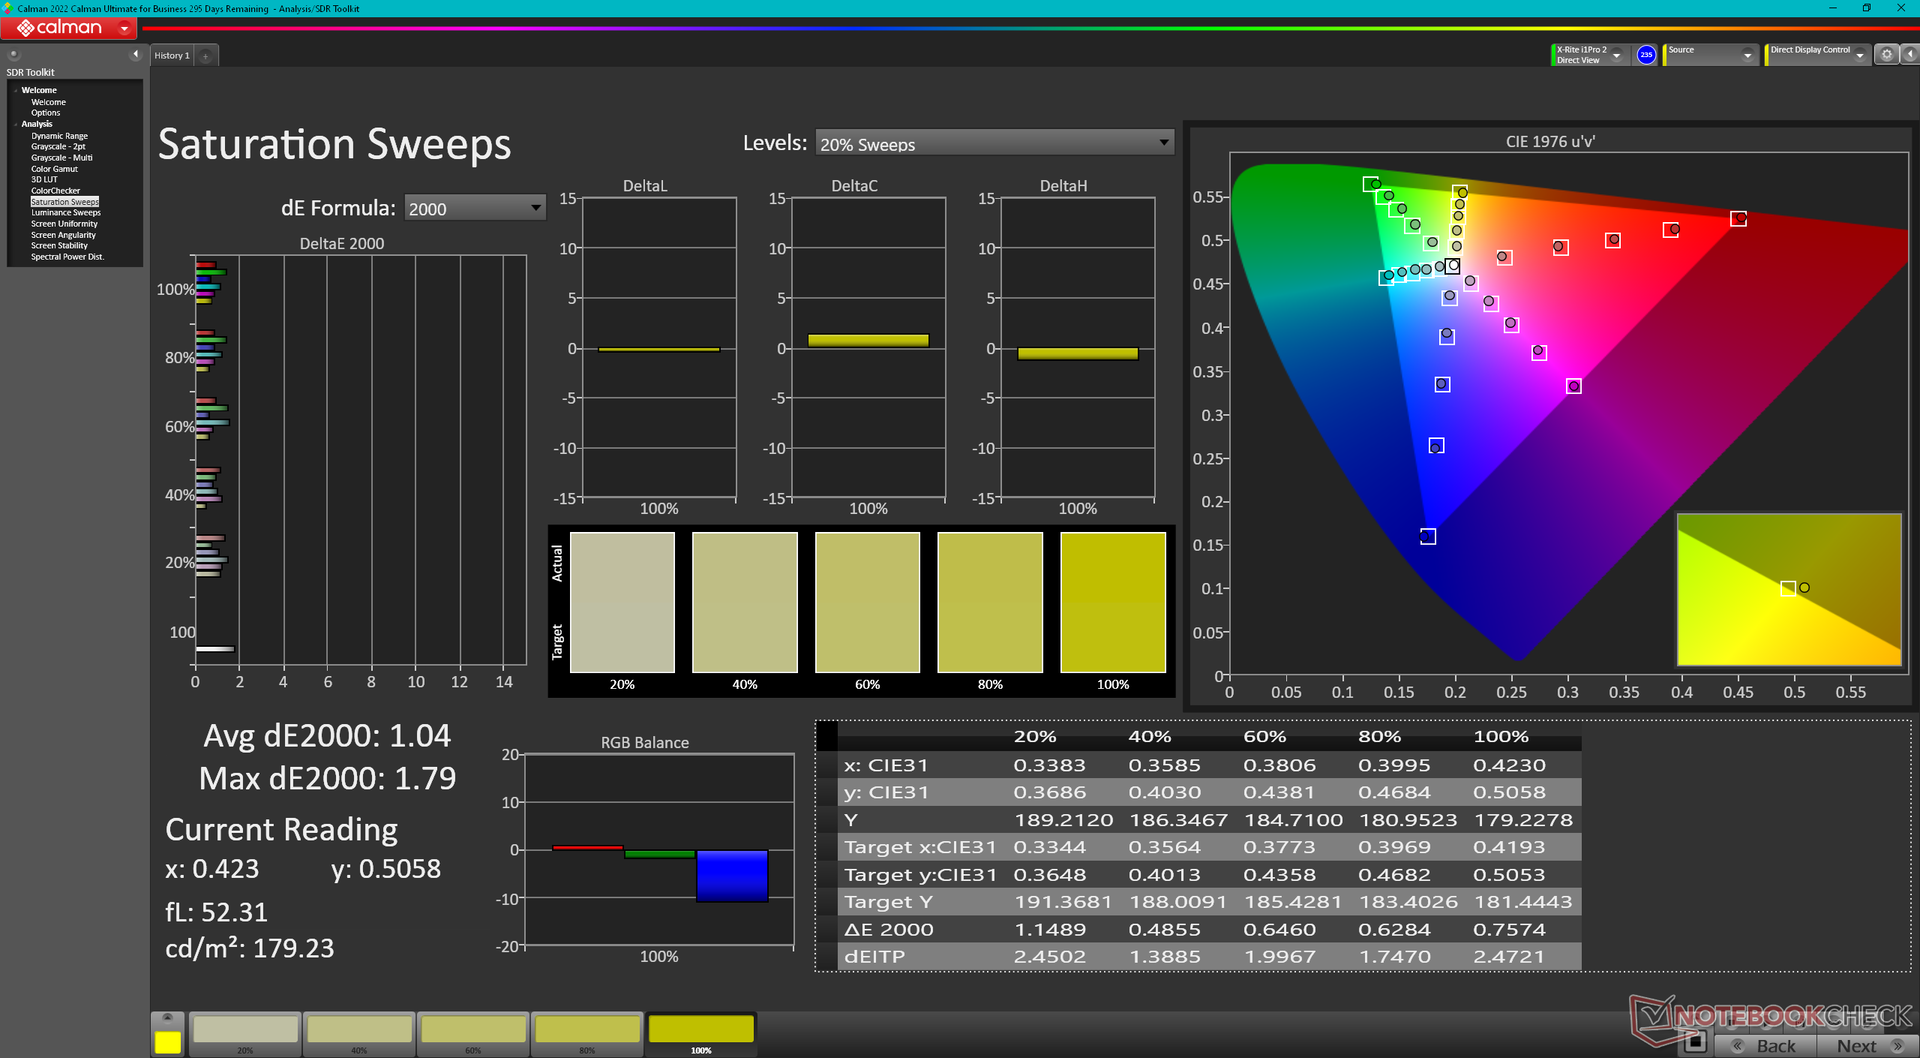
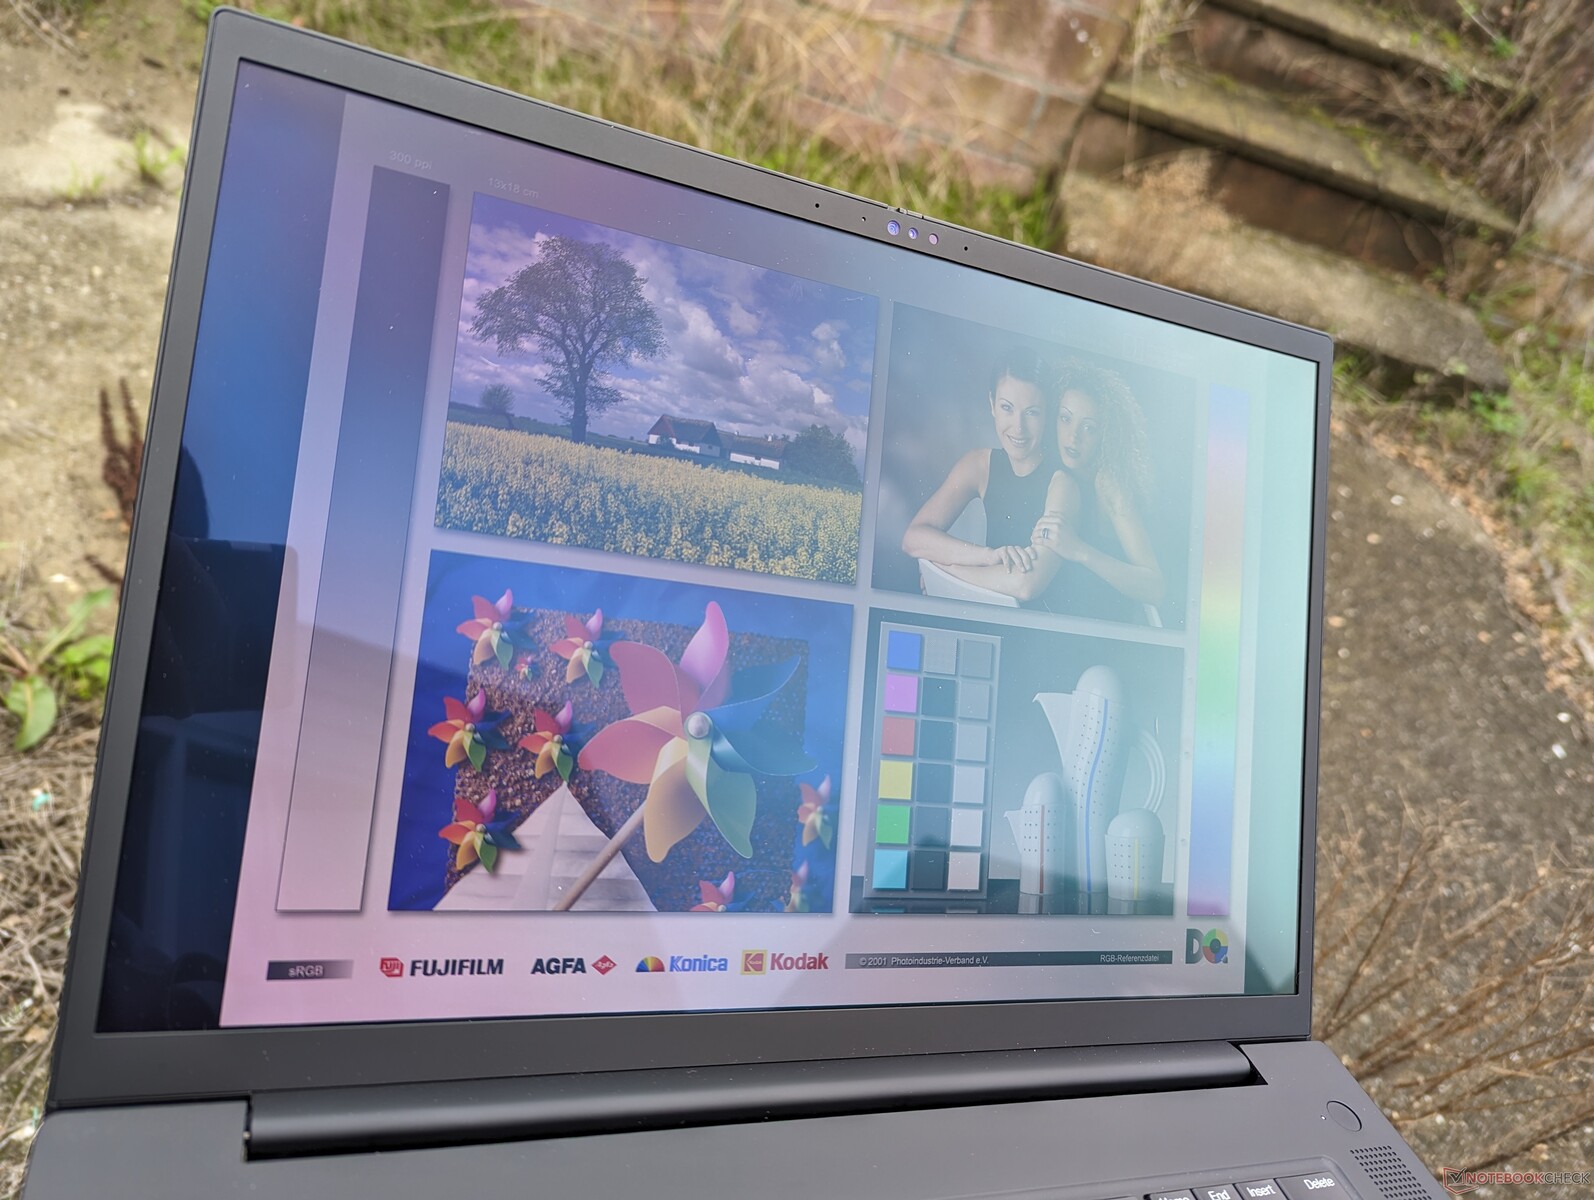
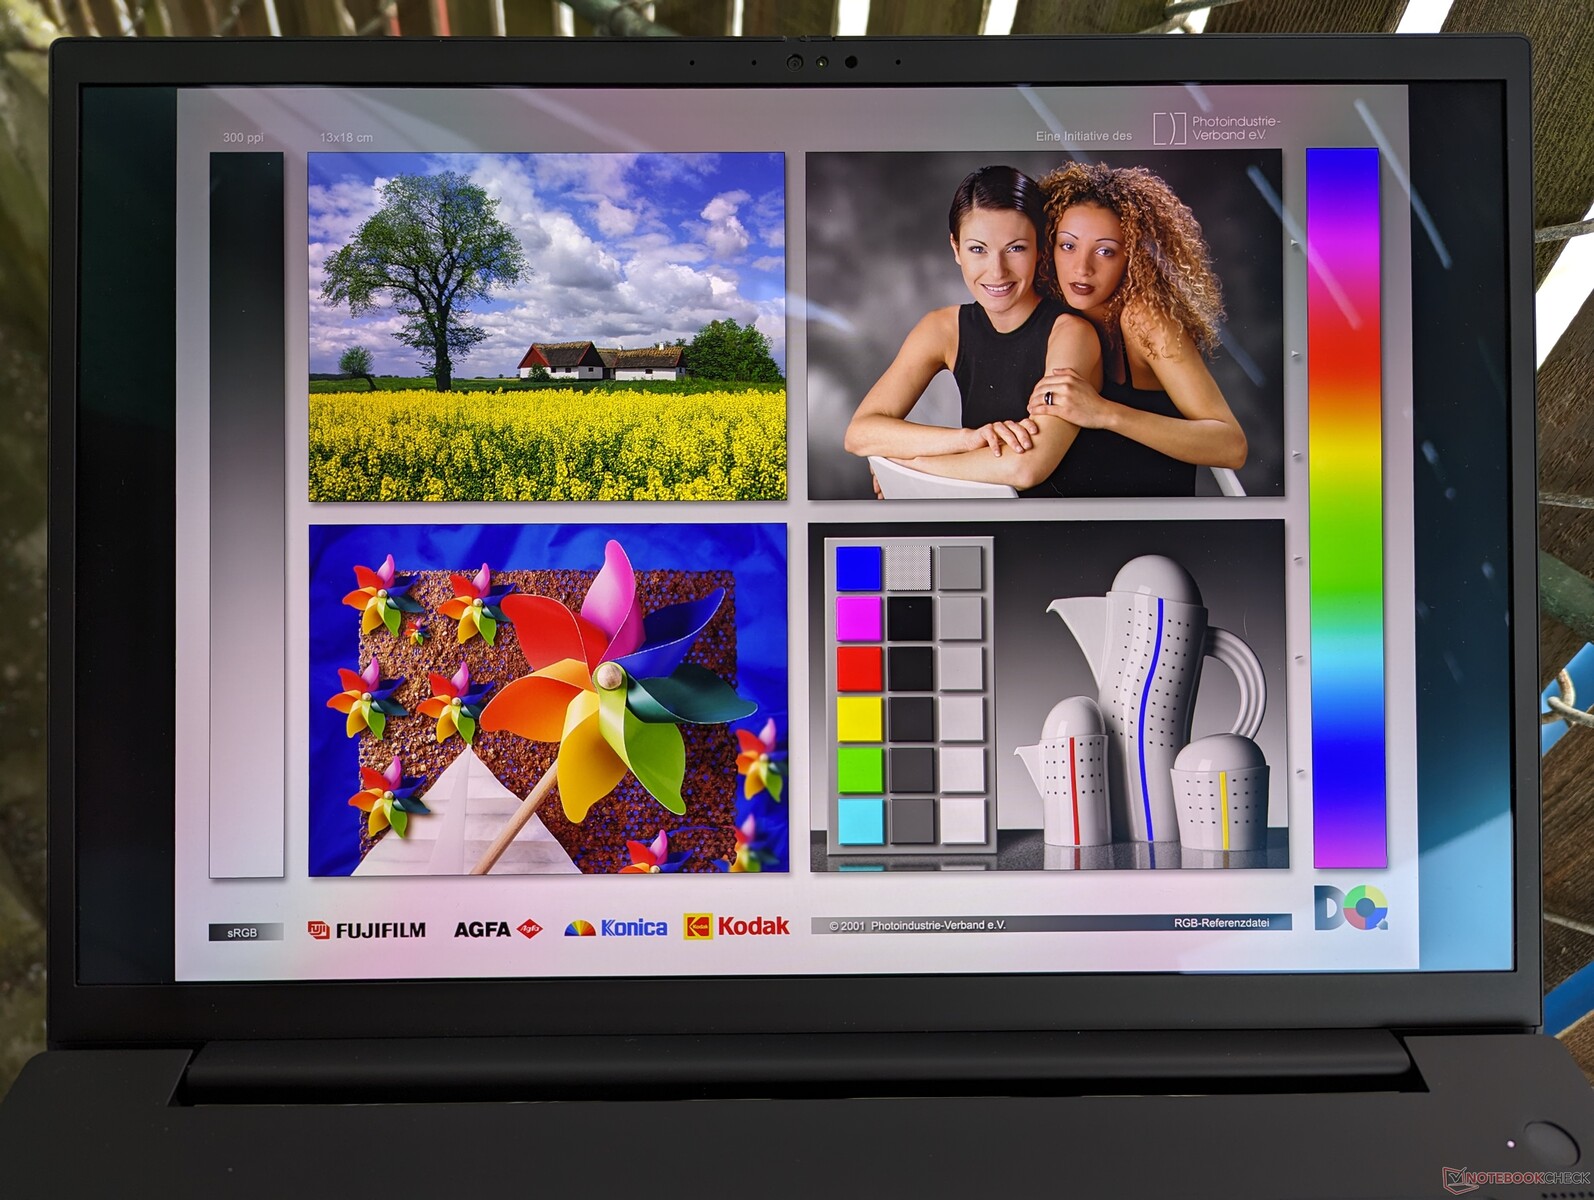
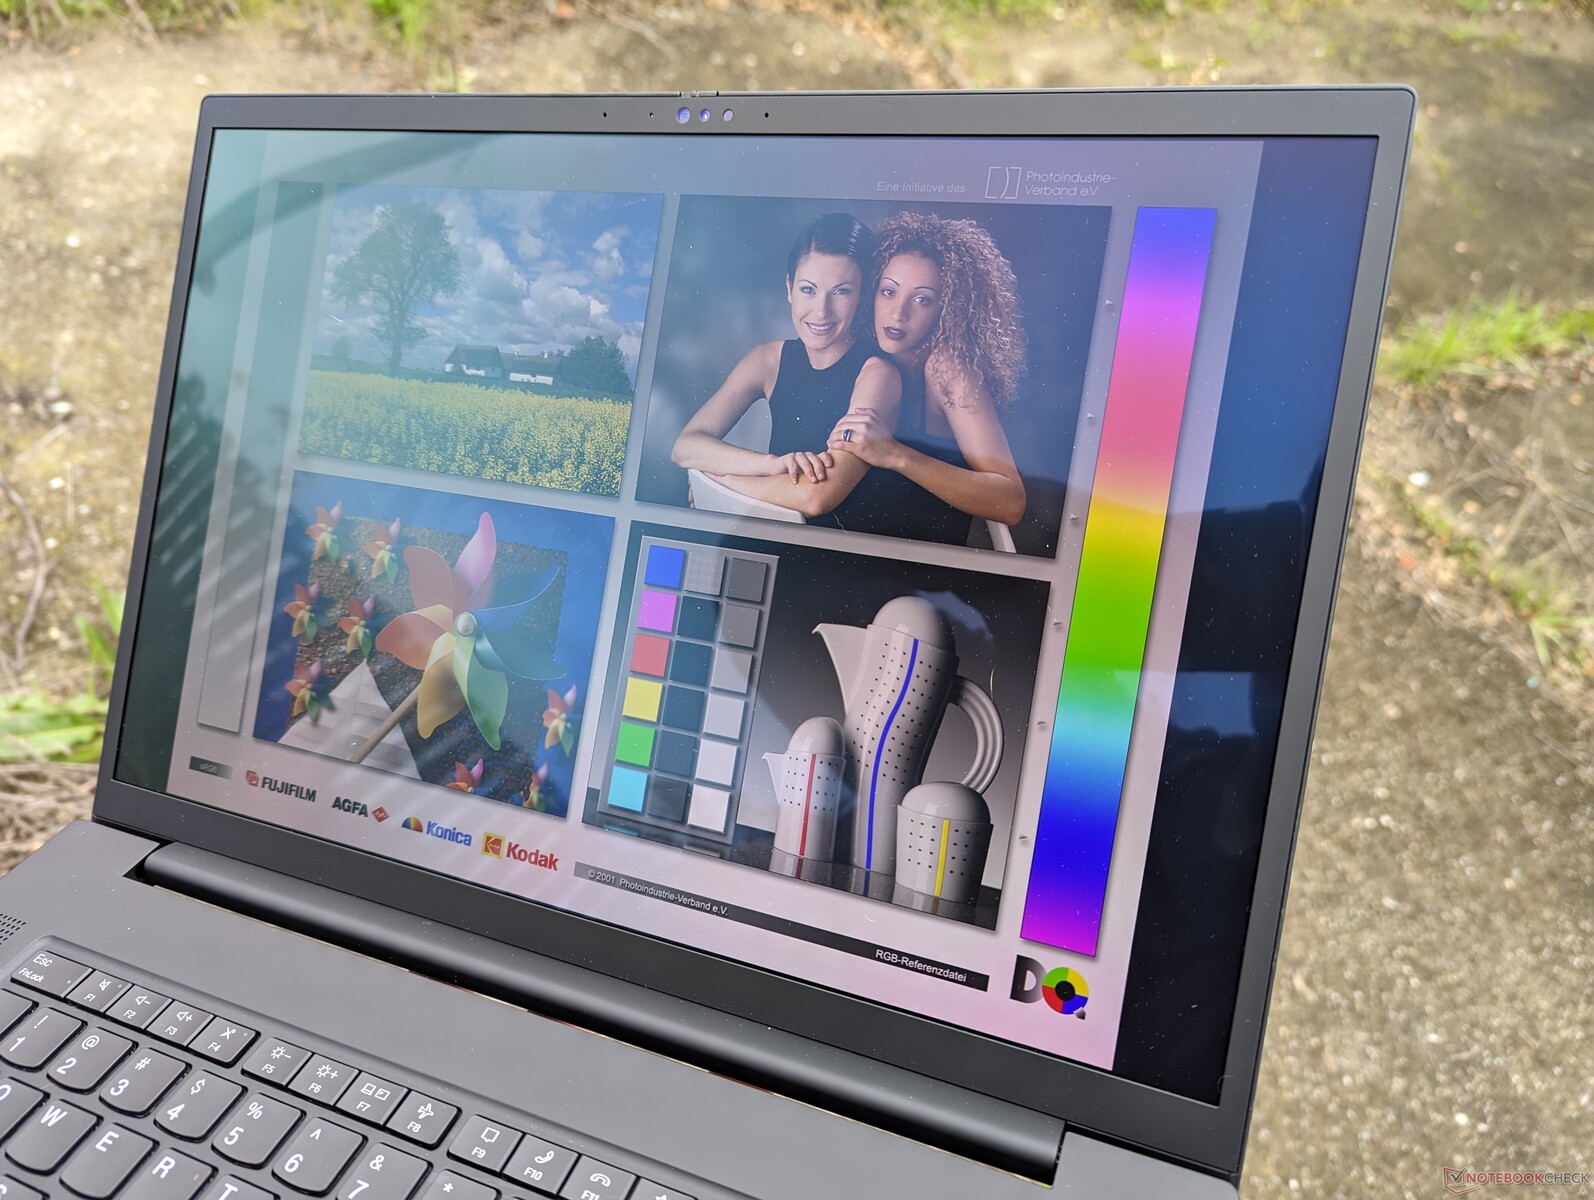
Wyświetlacz - HDR400 z kolorami DCI-P3
Panel OLED 4K oferuje lepsze kolory, szybszy czas reakcji, funkcjonalność ekranu dotykowego i gęstszą rozdzielczość natywną niż panel IPS 2K w naszej wcześniejszej konfiguracji z RTX 2000. Korzyści te wiążą się jednak z wolniejszą natywną częstotliwością odświeżania wynoszącą zaledwie 60 Hz i niższą maksymalną jasnością, jak pokazuje poniższa tabela. W związku z tym panel IPS może być preferowany w zależności od zastosowania. Szkoda, że Lenovo nie oferuje opcji OLED 120 Hz, takich jak Vivobook Pro 16X.

| |||||||||||||||||||||||||
rozświetlenie: 98 %
na akumulatorze: 375.1 cd/m²
kontrast: ∞:1 (czerń: 0 cd/m²)
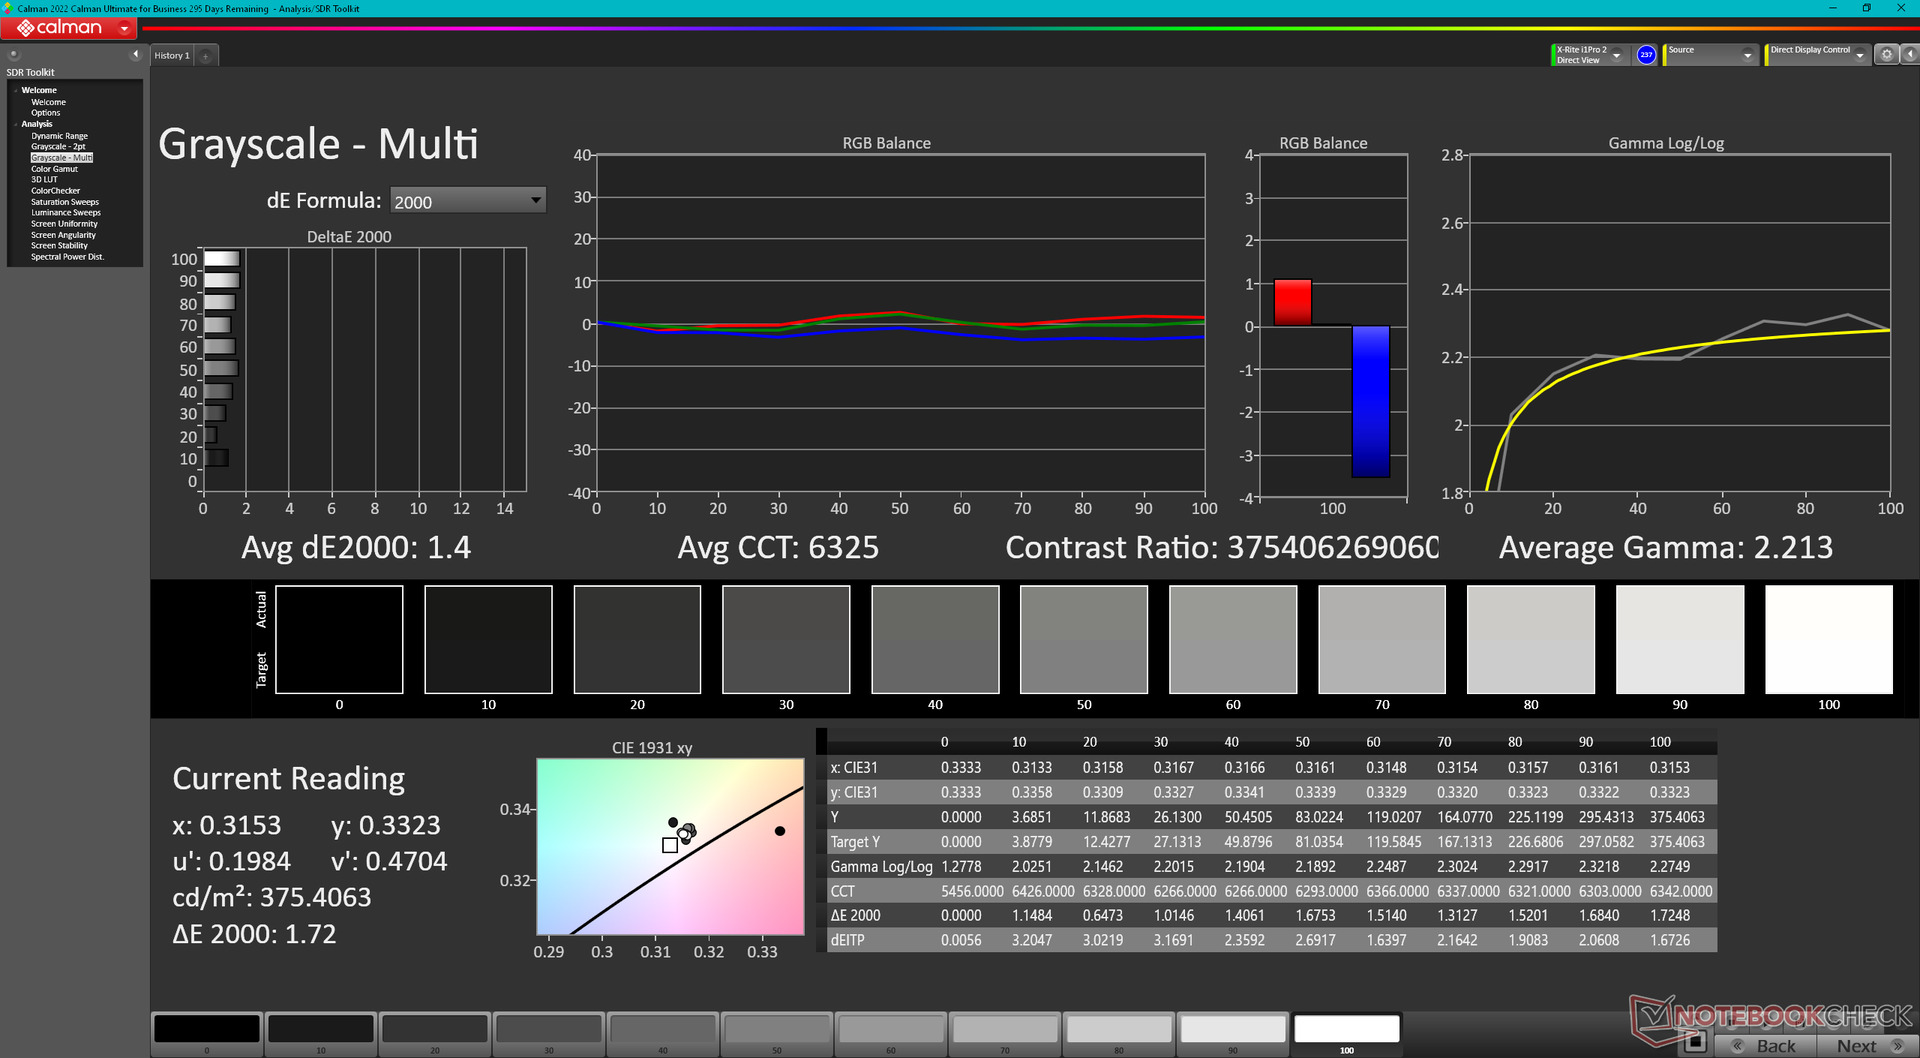
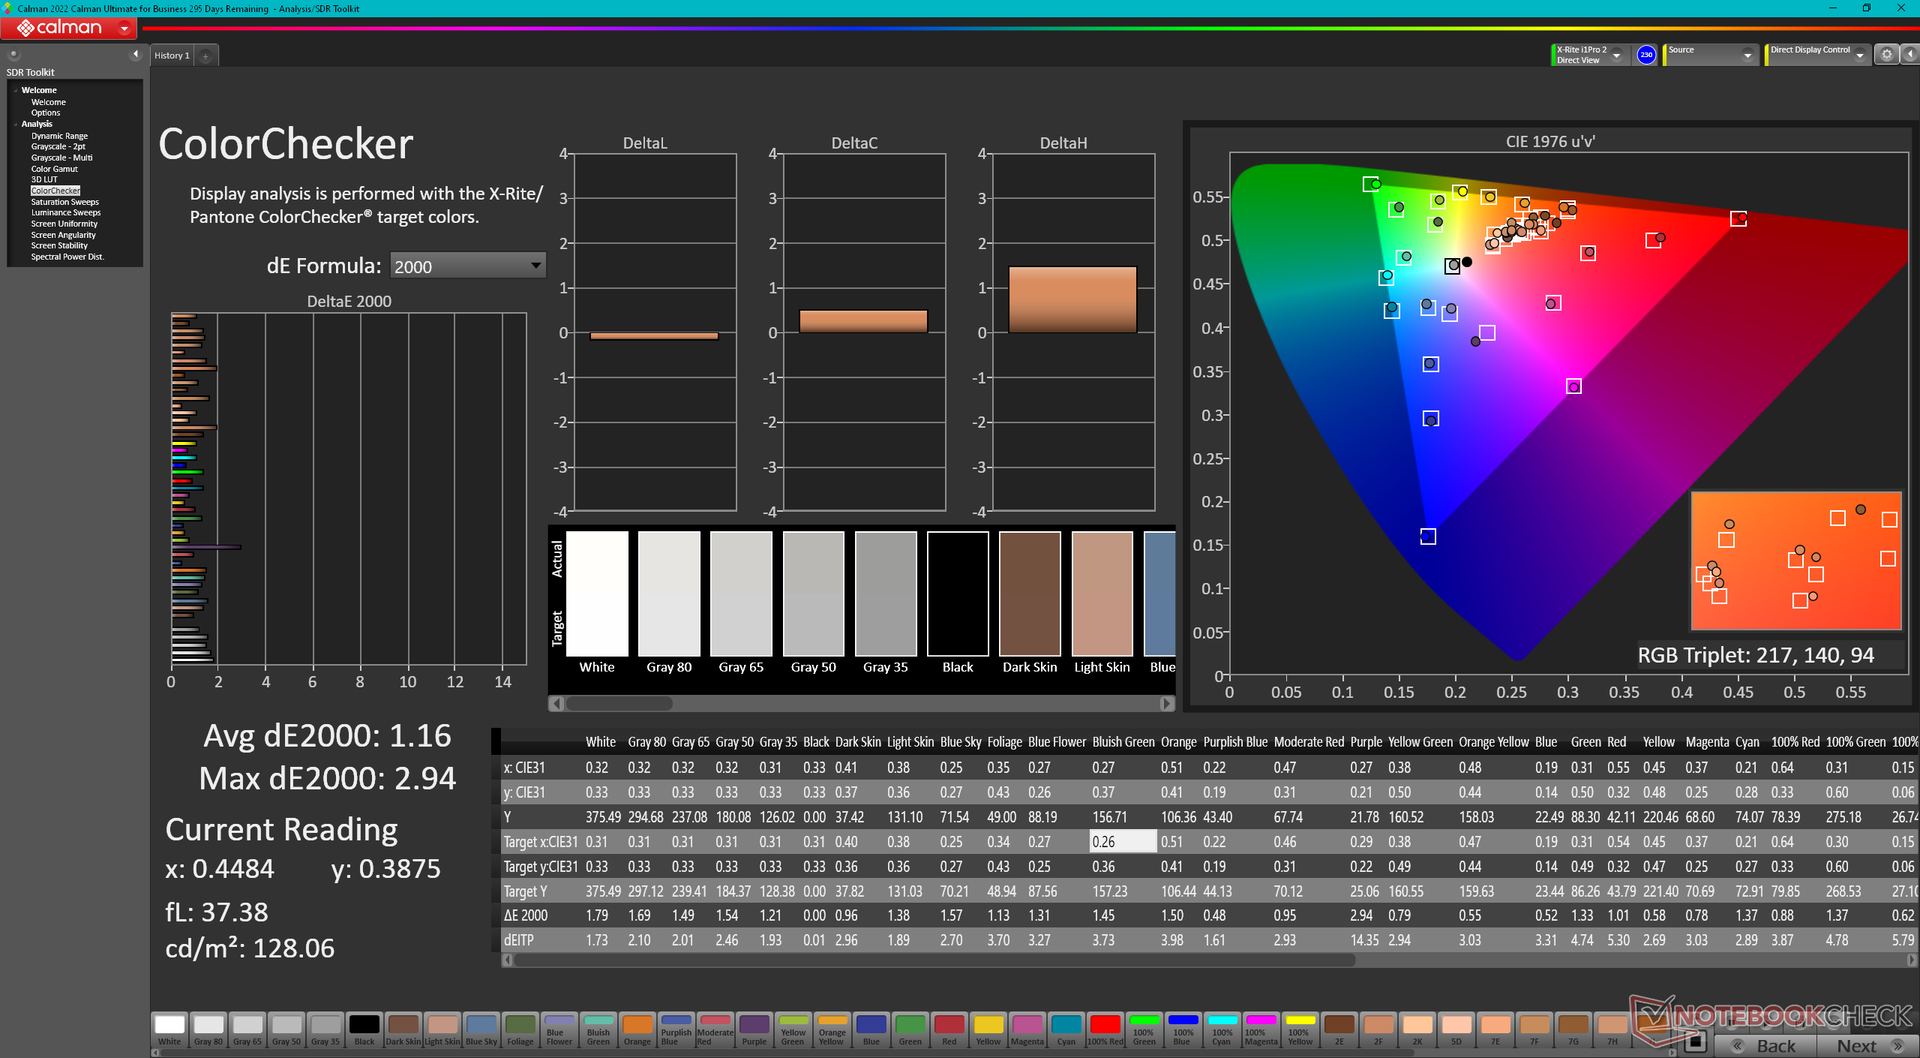
ΔE ColorChecker Calman: 1.16 | ∀{0.5-29.43 Ø4.71}
ΔE Greyscale Calman: 1.4 | ∀{0.09-98 Ø4.96}
97.9% AdobeRGB 1998 (Argyll 3D)
100% sRGB (Argyll 3D)
99.8% Display P3 (Argyll 3D)
Gamma: 2.2
CCT: 6325 K
| Lenovo ThinkPad P1 G6 21FV001KUS Samsung ATNA60YV04-0, OLED, 3480x2400, 16" | Lenovo ThinkPad P1 G6-21FV000DGE NE160QDM-NY1, IPS, 2560x1600, 16" | Lenovo ThinkPad P1 G4-20Y4S0KS00 LP160UQ1-SPB1, IPS LED, 3840x2400, 16" | Lenovo ThinkPad P16 G1 RTX A5500 LP160UQ1-SPB1, IPS, 3840x2400, 16" | Dell Precision 5000 5680 Samsung 160YV03, OLED, 3840x2400, 16" | HP ZBook Fury 16 G10 AUO87A8, IPS, 3840x2400, 16" | |
|---|---|---|---|---|---|---|
| Display | -21% | -5% | -7% | 0% | -5% | |
| Display P3 Coverage (%) | 99.8 | 68.1 -32% | 85.7 -14% | 82.9 -17% | 99.9 0% | 98 -2% |
| sRGB Coverage (%) | 100 | 97.5 -2% | 99.4 -1% | 98.9 -1% | 100 0% | 99.9 0% |
| AdobeRGB 1998 Coverage (%) | 97.9 | 70.2 -28% | 98.9 1% | 95.9 -2% | 97.5 0% | 86.2 -12% |
| Response Times | -583% | -2435% | -2313% | -1% | -530% | |
| Response Time Grey 50% / Grey 80% * (ms) | 1.69 ? | 13.7 ? -711% | 55.2 ? -3166% | 45.6 ? -2598% | 1.68 ? 1% | 11.9 ? -604% |
| Response Time Black / White * (ms) | 1.73 ? | 9.6 ? -455% | 31.2 ? -1703% | 36.8 ? -2027% | 1.77 ? -2% | 9.6 ? -455% |
| PWM Frequency (Hz) | 60 ? | 60 ? | ||||
| Screen | 12% | -22% | -27% | -81% | -14% | |
| Brightness middle (cd/m²) | 375.1 | 521 39% | 630 68% | 601.9 60% | 345.7 -8% | 514.6 37% |
| Brightness (cd/m²) | 379 | 484 28% | 622 64% | 569 50% | 349 -8% | 495 31% |
| Brightness Distribution (%) | 98 | 89 -9% | 90 -8% | 77 -21% | 98 0% | 90 -8% |
| Black Level * (cd/m²) | 0.36 | 0.41 | 0.47 | 0.46 | ||
| Colorchecker dE 2000 * | 1.16 | 1.2 -3% | 2.2 -90% | 2.45 -111% | 3.59 -209% | 2.4 -107% |
| Colorchecker dE 2000 max. * | 2.94 | 2.5 15% | 5 -70% | 4.46 -52% | 7.02 -139% | 4.86 -65% |
| Greyscale dE 2000 * | 1.4 | 1.4 -0% | 2.7 -93% | 2.6 -86% | 3.1 -121% | 1 29% |
| Gamma | 2.2 100% | 2.25 98% | 2.26 97% | 2.3 96% | 2.13 103% | 2.3 96% |
| CCT | 6325 103% | 6682 97% | 6886 94% | 6805 96% | 6448 101% | 6553 99% |
| Contrast (:1) | 1447 | 1537 | 1281 | 1119 | ||
| Colorchecker dE 2000 calibrated * | 1 | 1 | 0.99 | 0.4 | ||
| Całkowita średnia (program / ustawienia) | -197% /
-105% | -821% /
-456% | -782% /
-437% | -27% /
-44% | -183% /
-105% |
* ... im mniej tym lepiej
Wyświetlacz jest wstępnie skalibrowany ze średnimi wartościami deltaE skali szarości i koloru wynoszącymi odpowiednio 1,4 i 1,16. Dalsza kalibracja nie jest więc konieczna dla większości użytkowników.
Wyświetl czasy reakcji
| ↔ Czas reakcji od czerni do bieli | ||
|---|---|---|
| 1.73 ms ... wzrost ↗ i spadek ↘ łącznie | ↗ 0.77 ms wzrost |  |
| ↘ 0.96 ms upadek | ||
| W naszych testach ekran wykazuje bardzo szybką reakcję i powinien bardzo dobrze nadawać się do szybkich gier. Dla porównania, wszystkie testowane urządzenia wahają się od 0.1 (minimum) do 240 (maksimum) ms. » 10 % wszystkich urządzeń jest lepszych. Oznacza to, że zmierzony czas reakcji jest lepszy od średniej wszystkich testowanych urządzeń (19.8 ms). | ||
| ↔ Czas reakcji 50% szarości do 80% szarości | ||
| 1.69 ms ... wzrost ↗ i spadek ↘ łącznie | ↗ 0.89 ms wzrost | 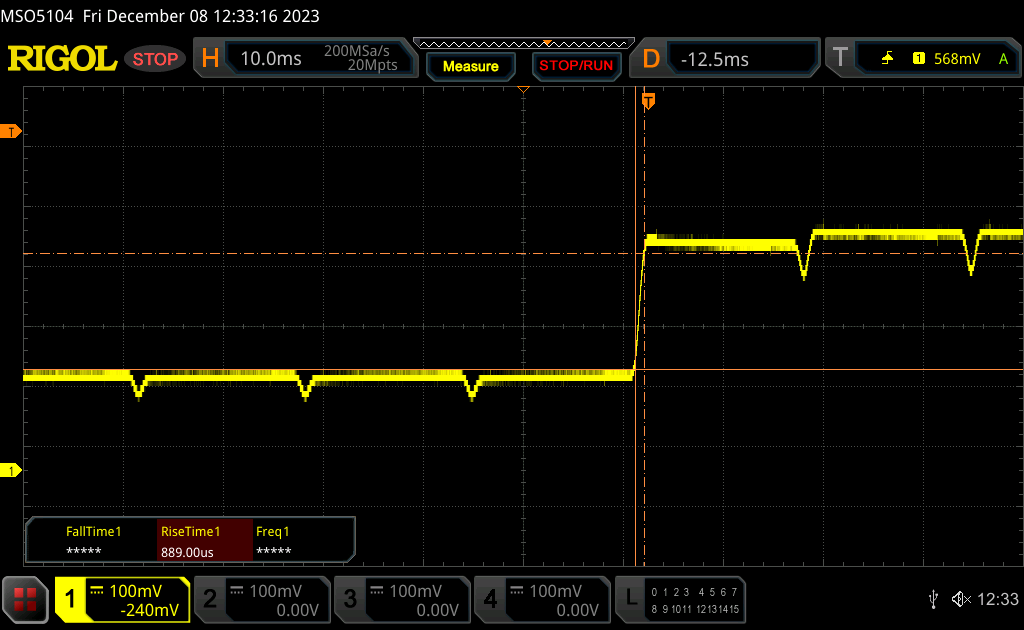 |
| ↘ 0.8 ms upadek | ||
| W naszych testach ekran wykazuje bardzo szybką reakcję i powinien bardzo dobrze nadawać się do szybkich gier. Dla porównania, wszystkie testowane urządzenia wahają się od 0.165 (minimum) do 636 (maksimum) ms. » 9 % wszystkich urządzeń jest lepszych. Oznacza to, że zmierzony czas reakcji jest lepszy od średniej wszystkich testowanych urządzeń (31 ms). | ||
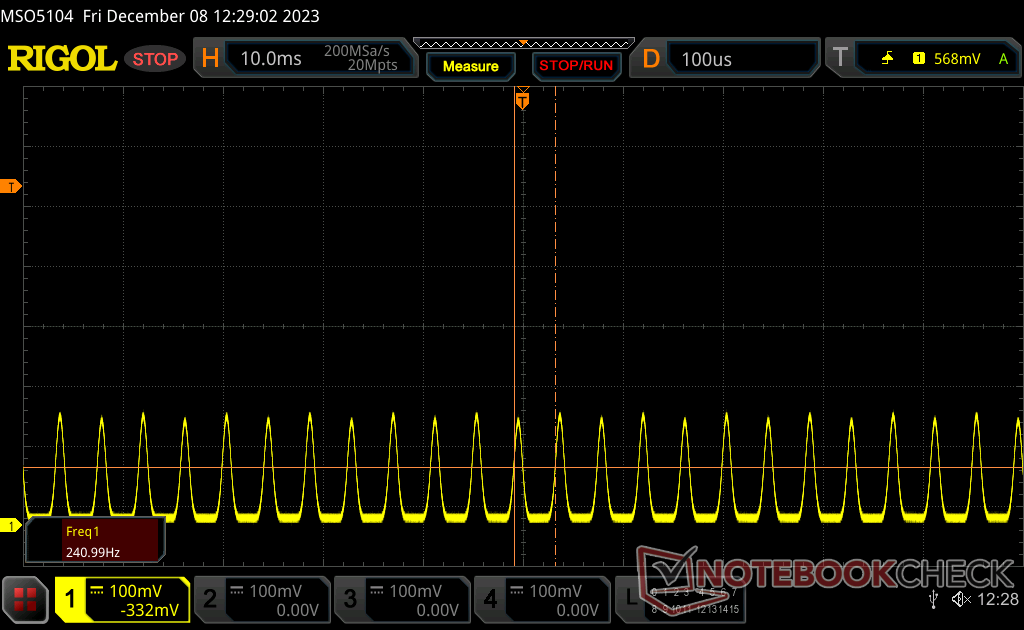
Migotanie ekranu / PWM (modulacja szerokości impulsu)
| Wykryto migotanie ekranu/wykryto PWM | 60 Hz | ≤ 100 % ustawienia jasności |  |
Podświetlenie wyświetlacza miga z częstotliwością 60 Hz (najgorszy przypadek, np. przy użyciu PWM) Wykryto migotanie przy ustawieniu jasności 100 % i poniżej. Powyżej tego ustawienia jasności nie powinno być żadnego migotania ani PWM. Częstotliwość 60 Hz jest bardzo niska, więc migotanie może powodować zmęczenie oczu i bóle głowy po dłuższym użytkowaniu. Dla porównania: 52 % wszystkich testowanych urządzeń nie używa PWM do przyciemniania wyświetlacza. Jeśli wykryto PWM, zmierzono średnio 7757 (minimum: 5 - maksimum: 343500) Hz. | |||
Modulacja szerokości impulsu jest obecna na wszystkich poziomach jasności, czego można oczekiwać od panelu OLED. Jesteśmy w stanie wykryć częstotliwość 239 Hz od 0 do 57 procent jasności i 60 Hz od 58 do 100 procent jasności.
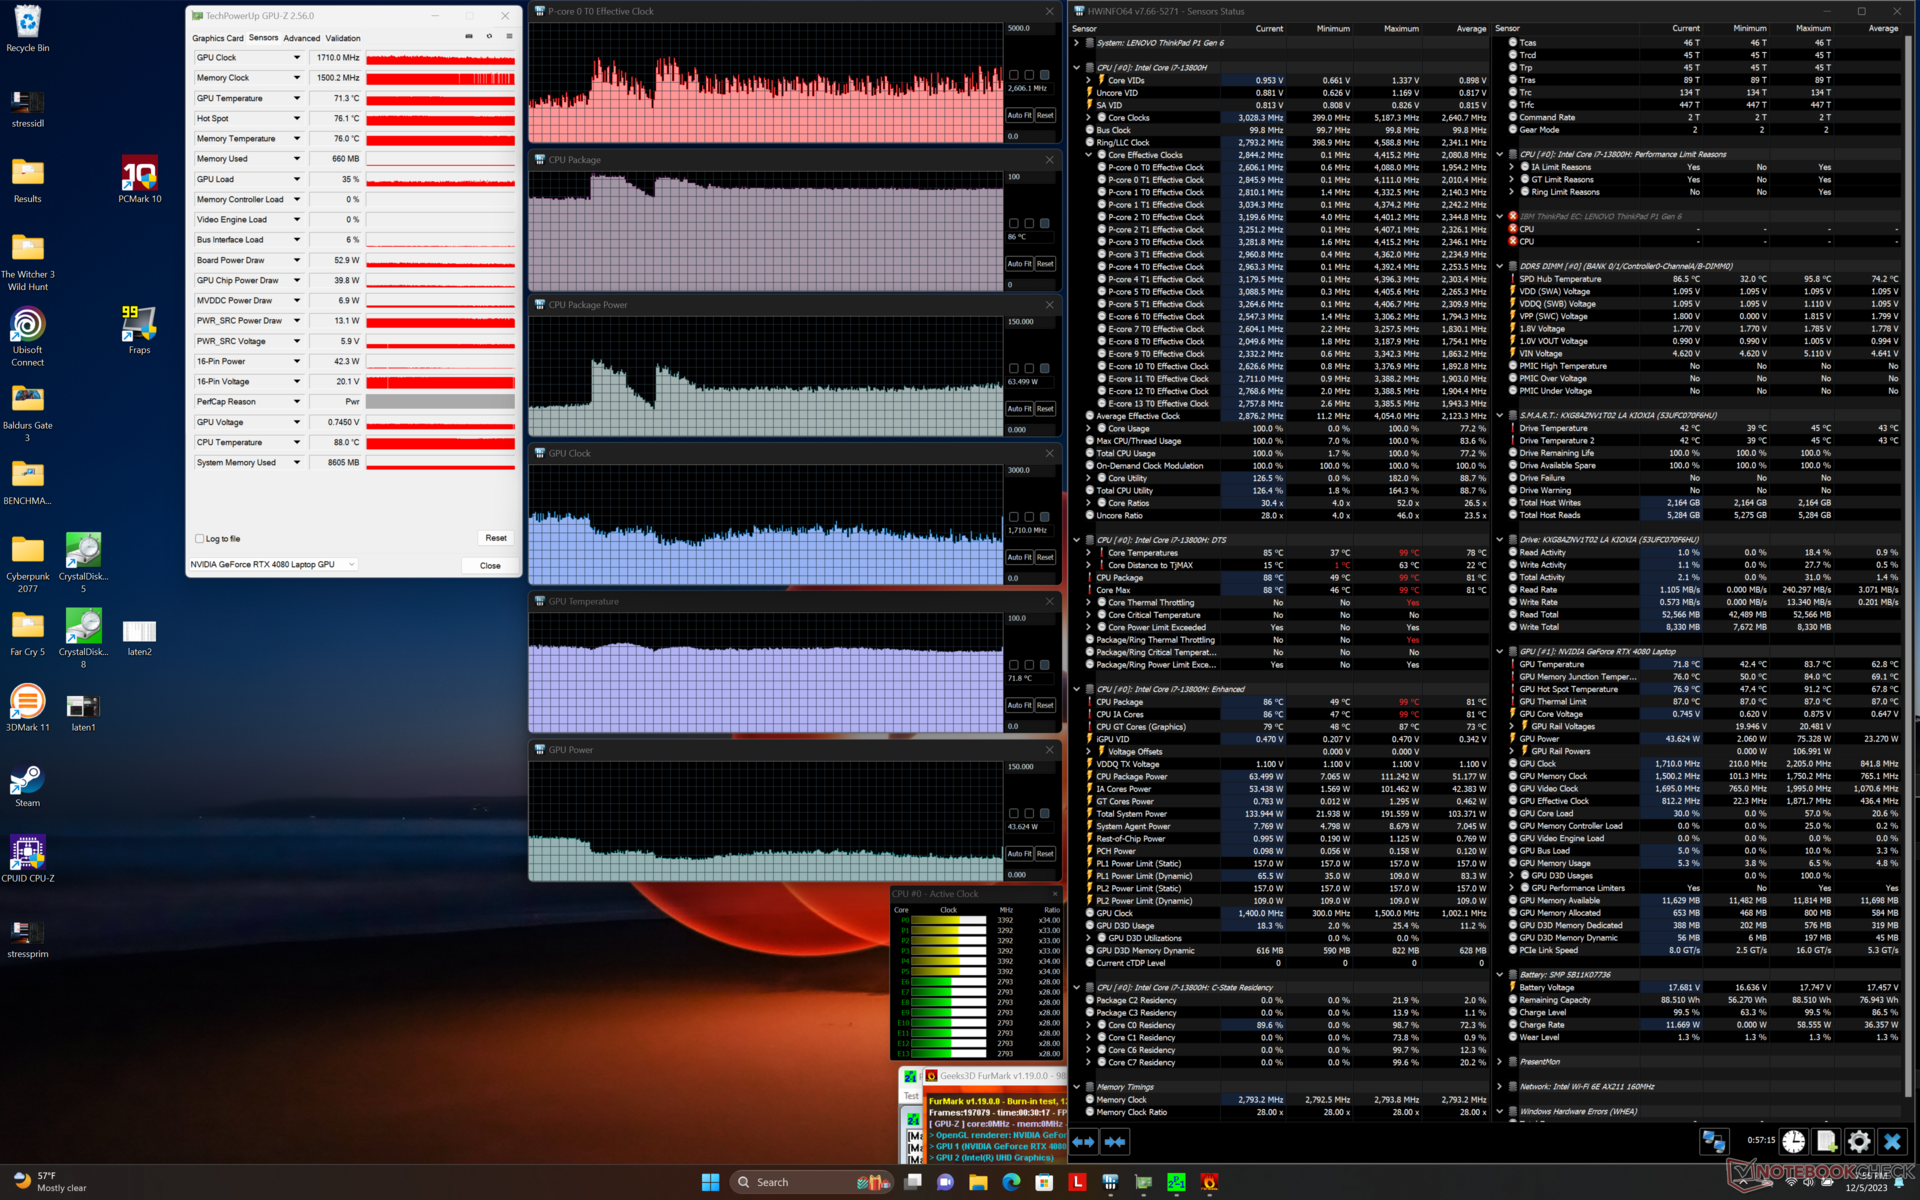
Wydajność
Warunki testowania
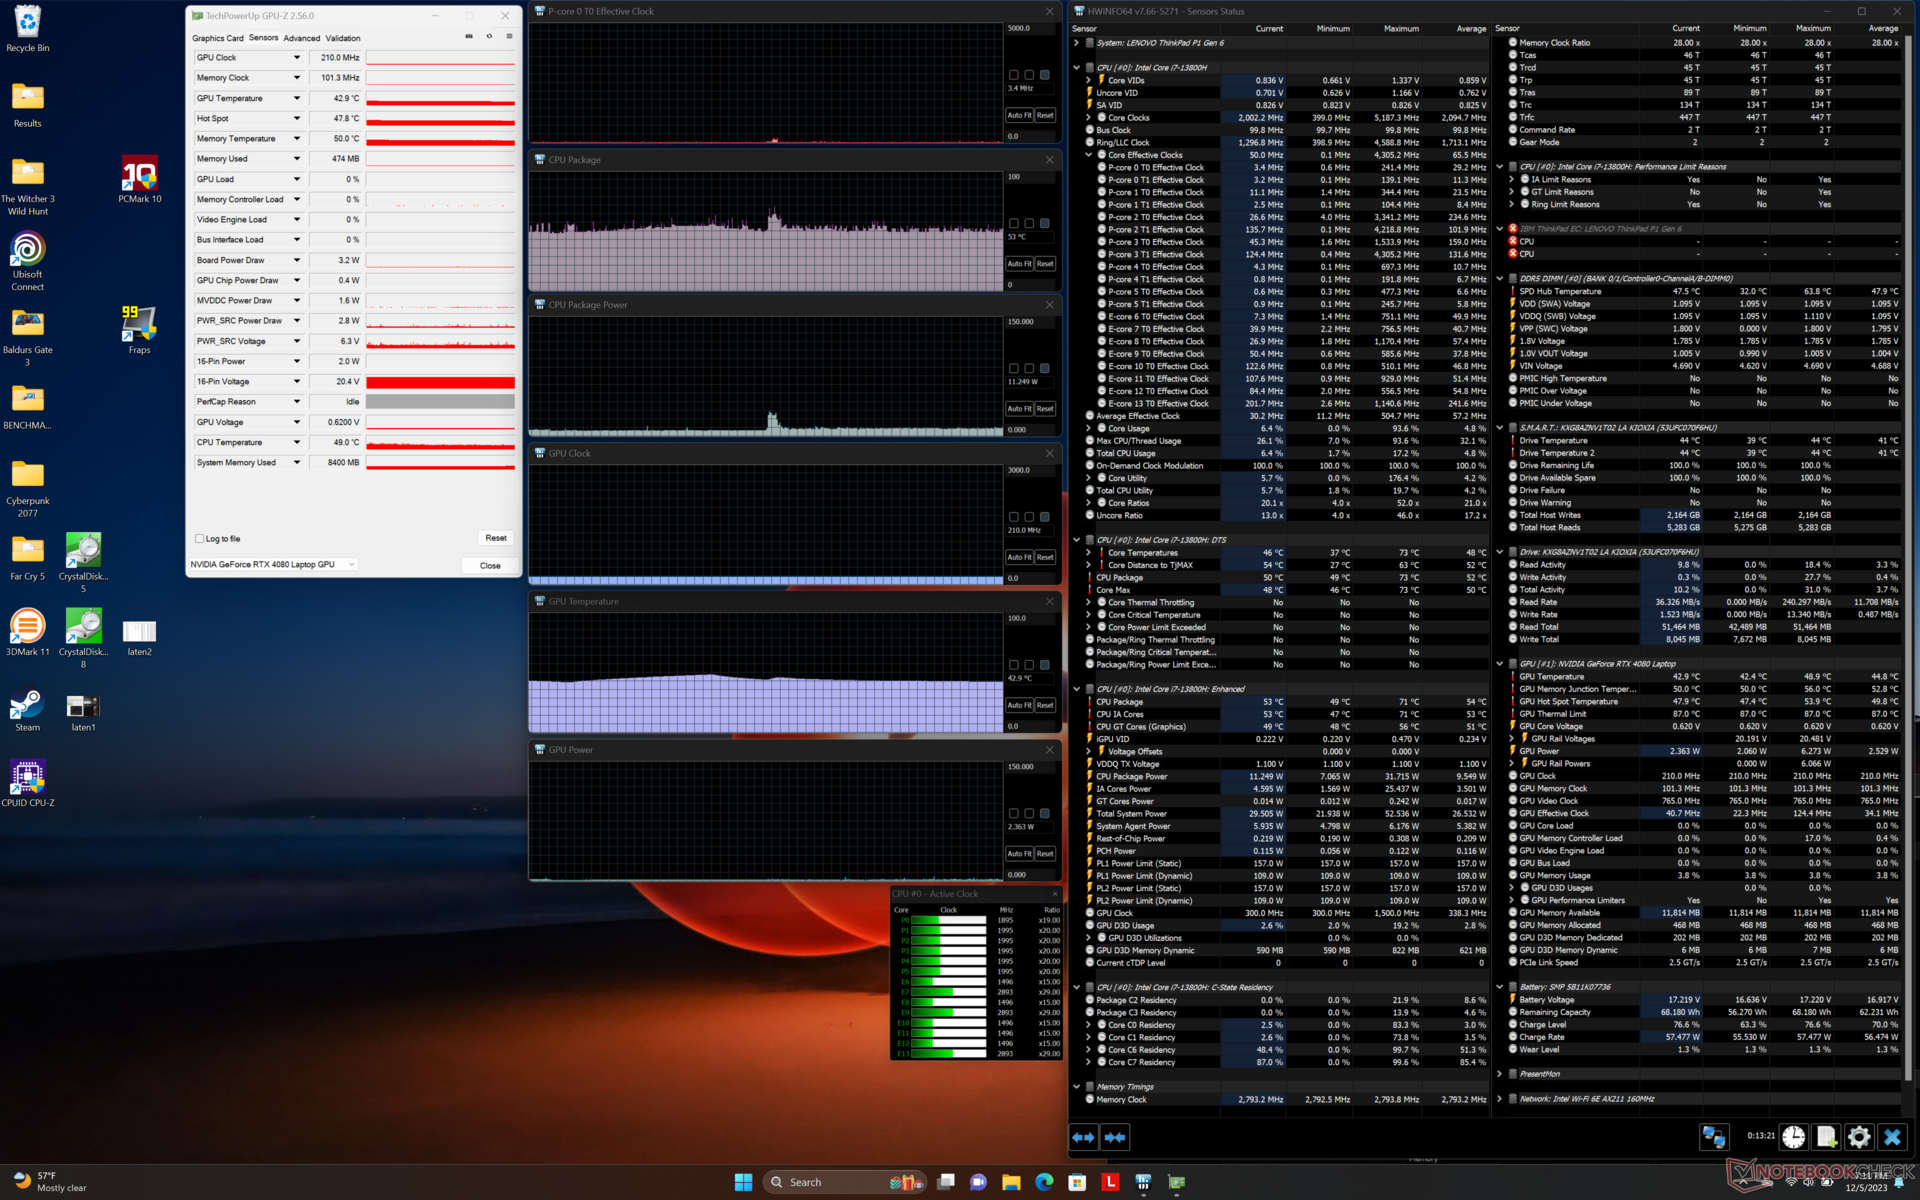
Przed uruchomieniem poniższych testów porównawczych ustawiliśmy system Windows na tryb wydajności. Lenovo Vantage nie zawiera żadnych specjalistycznych profili zasilania, aby zachować prostotę.
Obsługiwany jest tylko Optimus 1.0 bez opcji Advanced Optimus lub MUX, co jest nieco rozczarowujące, biorąc pod uwagę wysokiej klasy GPU RTX 4080.
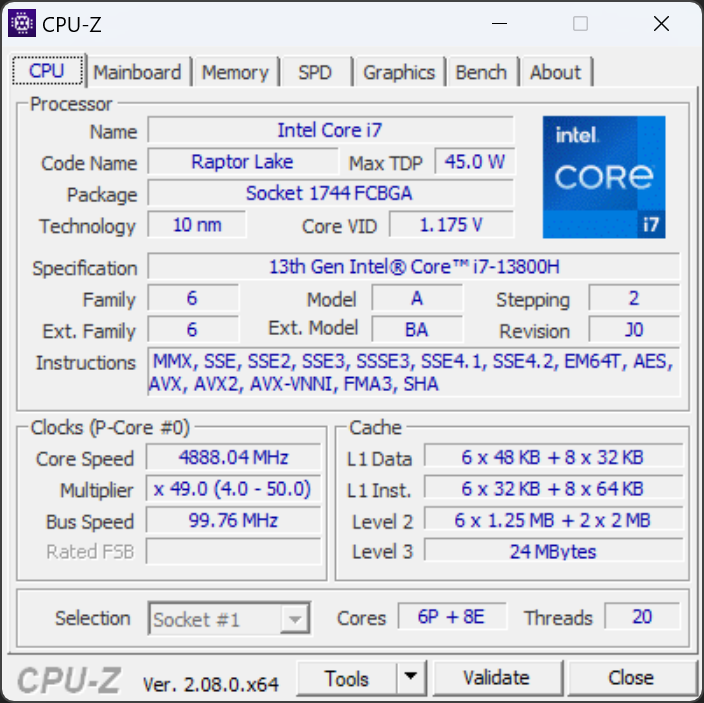
Procesor
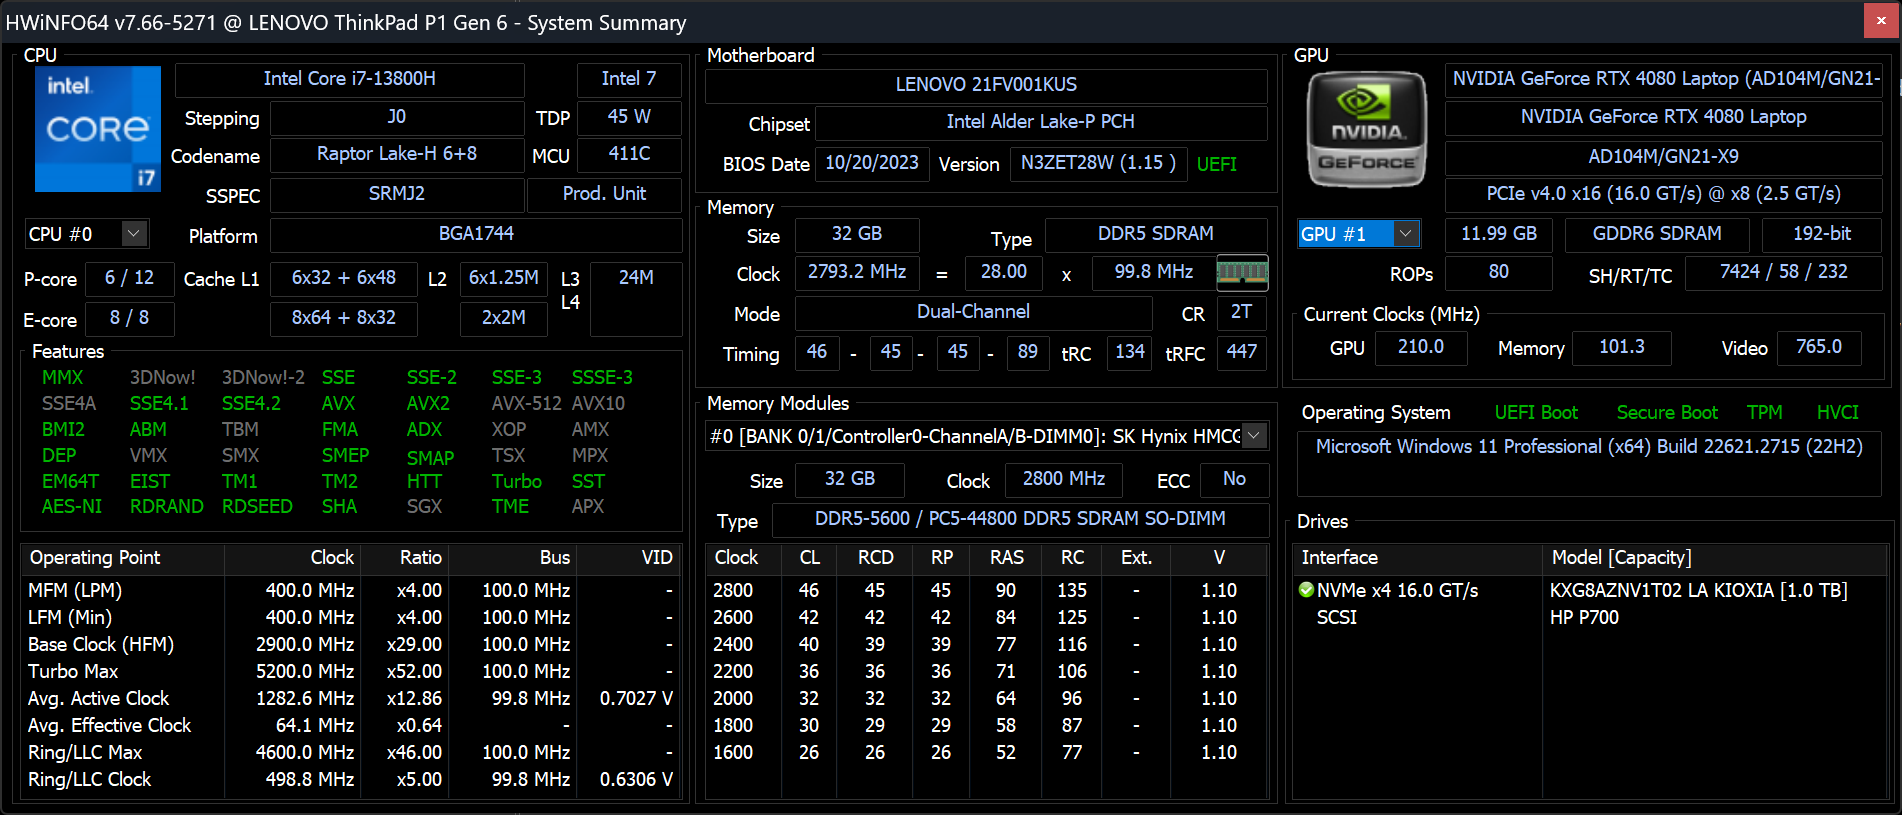
Procesor Core i7-13800H w naszej jednostce jest tylko 3 do 5 procent wolniejszy niż Core i9-13900H nawet po uwzględnieniu wszelkich zachowań związanych z dławieniem. Różnica ta jest zasadniczo nieistotna dla zdecydowanej większości użytkowników. Nabywcy poszukujący bardziej namacalnego wzrostu wydajności powinni zamiast tego rozważyć serię ThinkPad P16, która jest dostarczana z procesorami Core z serii HX.
Cinebench R15 Multi Loop
Cinebench R23: Multi Core | Single Core
Cinebench R20: CPU (Multi Core) | CPU (Single Core)
Cinebench R15: CPU Multi 64Bit | CPU Single 64Bit
Blender: v2.79 BMW27 CPU
7-Zip 18.03: 7z b 4 | 7z b 4 -mmt1
Geekbench 5.5: Multi-Core | Single-Core
HWBOT x265 Benchmark v2.2: 4k Preset
LibreOffice : 20 Documents To PDF
R Benchmark 2.5: Overall mean
| CPU Performance rating | |
| Asus ProArt Studiobook 16 OLED H7604 | |
| HP ZBook Fury 16 G10 | |
| MSI Raider GE68 HX 13VG, i7-13700HX | |
| Lenovo ThinkPad P16 G1 RTX A5500 | |
| Dell Precision 5000 5680 | |
| Lenovo ThinkPad P1 G6 21FV001KUS | |
| Przeciętny Intel Core i7-13800H | |
| Lenovo ThinkPad P1 G6-21FV000DGE | |
| Apple MacBook Pro 16 2023 M3 Pro -8! | |
| Gigabyte Aero 16 YE5 | |
| Lenovo ThinkPad P1 G4-20Y4S0KS00 | |
| Lenovo ThinkPad X1 Extreme G4-20Y5CTO1WW (3050 Ti) | |
| LG Gram 2in1 16 16T90R - G.AA78G | |
| Lenovo ThinkPad E16 G1 Core i5-1335U -1! | |
| Lenovo ThinkPad E16 G1-21JUS08X00 | |
| Cinebench R23 / Multi Core | |
| Asus ProArt Studiobook 16 OLED H7604 | |
| HP ZBook Fury 16 G10 | |
| MSI Raider GE68 HX 13VG, i7-13700HX | |
| Lenovo ThinkPad P16 G1 RTX A5500 | |
| Dell Precision 5000 5680 | |
| Lenovo ThinkPad P1 G6-21FV000DGE | |
| Gigabyte Aero 16 YE5 | |
| Lenovo ThinkPad P1 G6 21FV001KUS | |
| Przeciętny Intel Core i7-13800H (n=1) | |
| Apple MacBook Pro 16 2023 M3 Pro | |
| Lenovo ThinkPad X1 Extreme G4-20Y5CTO1WW (3050 Ti) | |
| Lenovo ThinkPad P1 G4-20Y4S0KS00 | |
| LG Gram 2in1 16 16T90R - G.AA78G | |
| Lenovo ThinkPad E16 G1-21JUS08X00 | |
| Lenovo ThinkPad E16 G1 Core i5-1335U | |
| Cinebench R23 / Single Core | |
| Asus ProArt Studiobook 16 OLED H7604 | |
| HP ZBook Fury 16 G10 | |
| Lenovo ThinkPad P1 G6-21FV000DGE | |
| Dell Precision 5000 5680 | |
| Lenovo ThinkPad P1 G6 21FV001KUS | |
| Przeciętny Intel Core i7-13800H (n=1) | |
| Apple MacBook Pro 16 2023 M3 Pro | |
| Gigabyte Aero 16 YE5 | |
| Lenovo ThinkPad P16 G1 RTX A5500 | |
| MSI Raider GE68 HX 13VG, i7-13700HX | |
| Lenovo ThinkPad E16 G1 Core i5-1335U | |
| LG Gram 2in1 16 16T90R - G.AA78G | |
| Lenovo ThinkPad P1 G4-20Y4S0KS00 | |
| Lenovo ThinkPad X1 Extreme G4-20Y5CTO1WW (3050 Ti) | |
| Lenovo ThinkPad E16 G1-21JUS08X00 | |
| Cinebench R20 / CPU (Multi Core) | |
| Asus ProArt Studiobook 16 OLED H7604 | |
| HP ZBook Fury 16 G10 | |
| MSI Raider GE68 HX 13VG, i7-13700HX | |
| Lenovo ThinkPad P16 G1 RTX A5500 | |
| Dell Precision 5000 5680 | |
| Lenovo ThinkPad P1 G6-21FV000DGE | |
| Gigabyte Aero 16 YE5 | |
| Lenovo ThinkPad P1 G6 21FV001KUS | |
| Przeciętny Intel Core i7-13800H (n=1) | |
| Lenovo ThinkPad X1 Extreme G4-20Y5CTO1WW (3050 Ti) | |
| Lenovo ThinkPad P1 G4-20Y4S0KS00 | |
| LG Gram 2in1 16 16T90R - G.AA78G | |
| Lenovo ThinkPad E16 G1-21JUS08X00 | |
| Lenovo ThinkPad E16 G1 Core i5-1335U | |
| Cinebench R20 / CPU (Single Core) | |
| HP ZBook Fury 16 G10 | |
| Asus ProArt Studiobook 16 OLED H7604 | |
| Lenovo ThinkPad P1 G6-21FV000DGE | |
| Dell Precision 5000 5680 | |
| Lenovo ThinkPad P1 G6 21FV001KUS | |
| Przeciętny Intel Core i7-13800H (n=1) | |
| Lenovo ThinkPad P16 G1 RTX A5500 | |
| MSI Raider GE68 HX 13VG, i7-13700HX | |
| Gigabyte Aero 16 YE5 | |
| Lenovo ThinkPad E16 G1 Core i5-1335U | |
| LG Gram 2in1 16 16T90R - G.AA78G | |
| Lenovo ThinkPad P1 G4-20Y4S0KS00 | |
| Lenovo ThinkPad X1 Extreme G4-20Y5CTO1WW (3050 Ti) | |
| Lenovo ThinkPad E16 G1-21JUS08X00 | |
| Cinebench R15 / CPU Multi 64Bit | |
| Asus ProArt Studiobook 16 OLED H7604 | |
| HP ZBook Fury 16 G10 | |
| MSI Raider GE68 HX 13VG, i7-13700HX | |
| Lenovo ThinkPad P16 G1 RTX A5500 | |
| Gigabyte Aero 16 YE5 | |
| Lenovo ThinkPad P1 G6 21FV001KUS | |
| Przeciętny Intel Core i7-13800H (n=1) | |
| Lenovo ThinkPad P1 G6-21FV000DGE | |
| Dell Precision 5000 5680 | |
| LG Gram 2in1 16 16T90R - G.AA78G | |
| Apple MacBook Pro 16 2023 M3 Pro | |
| Lenovo ThinkPad X1 Extreme G4-20Y5CTO1WW (3050 Ti) | |
| Lenovo ThinkPad P1 G4-20Y4S0KS00 | |
| Lenovo ThinkPad E16 G1-21JUS08X00 | |
| Lenovo ThinkPad E16 G1 Core i5-1335U | |
| Cinebench R15 / CPU Single 64Bit | |
| Asus ProArt Studiobook 16 OLED H7604 | |
| HP ZBook Fury 16 G10 | |
| Dell Precision 5000 5680 | |
| Lenovo ThinkPad P1 G6-21FV000DGE | |
| Lenovo ThinkPad P1 G6 21FV001KUS | |
| Przeciętny Intel Core i7-13800H (n=1) | |
| Gigabyte Aero 16 YE5 | |
| Lenovo ThinkPad P16 G1 RTX A5500 | |
| MSI Raider GE68 HX 13VG, i7-13700HX | |
| LG Gram 2in1 16 16T90R - G.AA78G | |
| Lenovo ThinkPad E16 G1 Core i5-1335U | |
| Lenovo ThinkPad P1 G4-20Y4S0KS00 | |
| Lenovo ThinkPad E16 G1-21JUS08X00 | |
| Lenovo ThinkPad X1 Extreme G4-20Y5CTO1WW (3050 Ti) | |
| Blender / v2.79 BMW27 CPU | |
| Lenovo ThinkPad E16 G1 Core i5-1335U | |
| Apple MacBook Pro 16 2023 M3 Pro | |
| LG Gram 2in1 16 16T90R - G.AA78G | |
| Lenovo ThinkPad E16 G1-21JUS08X00 | |
| Lenovo ThinkPad P1 G4-20Y4S0KS00 | |
| Lenovo ThinkPad X1 Extreme G4-20Y5CTO1WW (3050 Ti) | |
| Gigabyte Aero 16 YE5 | |
| Dell Precision 5000 5680 | |
| Lenovo ThinkPad P1 G6-21FV000DGE | |
| Lenovo ThinkPad P1 G6 21FV001KUS | |
| Przeciętny Intel Core i7-13800H (n=1) | |
| Lenovo ThinkPad P16 G1 RTX A5500 | |
| MSI Raider GE68 HX 13VG, i7-13700HX | |
| HP ZBook Fury 16 G10 | |
| Asus ProArt Studiobook 16 OLED H7604 | |
| 7-Zip 18.03 / 7z b 4 | |
| Asus ProArt Studiobook 16 OLED H7604 | |
| HP ZBook Fury 16 G10 | |
| MSI Raider GE68 HX 13VG, i7-13700HX | |
| Lenovo ThinkPad P16 G1 RTX A5500 | |
| Lenovo ThinkPad P1 G6-21FV000DGE | |
| Lenovo ThinkPad P1 G6 21FV001KUS | |
| Przeciętny Intel Core i7-13800H (n=1) | |
| Dell Precision 5000 5680 | |
| Gigabyte Aero 16 YE5 | |
| Lenovo ThinkPad P1 G4-20Y4S0KS00 | |
| Lenovo ThinkPad X1 Extreme G4-20Y5CTO1WW (3050 Ti) | |
| Lenovo ThinkPad E16 G1-21JUS08X00 | |
| LG Gram 2in1 16 16T90R - G.AA78G | |
| Lenovo ThinkPad E16 G1 Core i5-1335U | |
| 7-Zip 18.03 / 7z b 4 -mmt1 | |
| Asus ProArt Studiobook 16 OLED H7604 | |
| HP ZBook Fury 16 G10 | |
| Lenovo ThinkPad P1 G6-21FV000DGE | |
| Lenovo ThinkPad P1 G6 21FV001KUS | |
| Przeciętny Intel Core i7-13800H (n=1) | |
| Dell Precision 5000 5680 | |
| Gigabyte Aero 16 YE5 | |
| Lenovo ThinkPad P16 G1 RTX A5500 | |
| MSI Raider GE68 HX 13VG, i7-13700HX | |
| Lenovo ThinkPad P1 G4-20Y4S0KS00 | |
| Lenovo ThinkPad X1 Extreme G4-20Y5CTO1WW (3050 Ti) | |
| Lenovo ThinkPad E16 G1-21JUS08X00 | |
| Lenovo ThinkPad E16 G1 Core i5-1335U | |
| LG Gram 2in1 16 16T90R - G.AA78G | |
| Geekbench 5.5 / Multi-Core | |
| Asus ProArt Studiobook 16 OLED H7604 | |
| HP ZBook Fury 16 G10 | |
| MSI Raider GE68 HX 13VG, i7-13700HX | |
| Apple MacBook Pro 16 2023 M3 Pro | |
| Lenovo ThinkPad P16 G1 RTX A5500 | |
| Dell Precision 5000 5680 | |
| Gigabyte Aero 16 YE5 | |
| Lenovo ThinkPad P1 G6 21FV001KUS | |
| Przeciętny Intel Core i7-13800H (n=1) | |
| Lenovo ThinkPad P1 G6-21FV000DGE | |
| LG Gram 2in1 16 16T90R - G.AA78G | |
| Lenovo ThinkPad P1 G4-20Y4S0KS00 | |
| Lenovo ThinkPad X1 Extreme G4-20Y5CTO1WW (3050 Ti) | |
| Lenovo ThinkPad E16 G1 Core i5-1335U | |
| Lenovo ThinkPad E16 G1-21JUS08X00 | |
| Geekbench 5.5 / Single-Core | |
| Apple MacBook Pro 16 2023 M3 Pro | |
| Asus ProArt Studiobook 16 OLED H7604 | |
| HP ZBook Fury 16 G10 | |
| Dell Precision 5000 5680 | |
| Lenovo ThinkPad P1 G6 21FV001KUS | |
| Przeciętny Intel Core i7-13800H (n=1) | |
| Lenovo ThinkPad P1 G6-21FV000DGE | |
| Lenovo ThinkPad P16 G1 RTX A5500 | |
| MSI Raider GE68 HX 13VG, i7-13700HX | |
| Gigabyte Aero 16 YE5 | |
| Lenovo ThinkPad E16 G1 Core i5-1335U | |
| Lenovo ThinkPad P1 G4-20Y4S0KS00 | |
| LG Gram 2in1 16 16T90R - G.AA78G | |
| Lenovo ThinkPad X1 Extreme G4-20Y5CTO1WW (3050 Ti) | |
| Lenovo ThinkPad E16 G1-21JUS08X00 | |
| HWBOT x265 Benchmark v2.2 / 4k Preset | |
| Asus ProArt Studiobook 16 OLED H7604 | |
| HP ZBook Fury 16 G10 | |
| MSI Raider GE68 HX 13VG, i7-13700HX | |
| Lenovo ThinkPad P16 G1 RTX A5500 | |
| Dell Precision 5000 5680 | |
| Lenovo ThinkPad P1 G6 21FV001KUS | |
| Przeciętny Intel Core i7-13800H (n=1) | |
| Lenovo ThinkPad P1 G6-21FV000DGE | |
| Gigabyte Aero 16 YE5 | |
| Lenovo ThinkPad P1 G4-20Y4S0KS00 | |
| Lenovo ThinkPad X1 Extreme G4-20Y5CTO1WW (3050 Ti) | |
| Lenovo ThinkPad E16 G1-21JUS08X00 | |
| LG Gram 2in1 16 16T90R - G.AA78G | |
| Lenovo ThinkPad E16 G1 Core i5-1335U | |
| LibreOffice / 20 Documents To PDF | |
| LG Gram 2in1 16 16T90R - G.AA78G | |
| MSI Raider GE68 HX 13VG, i7-13700HX | |
| Lenovo ThinkPad E16 G1 Core i5-1335U | |
| Lenovo ThinkPad E16 G1-21JUS08X00 | |
| Lenovo ThinkPad P1 G6-21FV000DGE | |
| Lenovo ThinkPad P1 G4-20Y4S0KS00 | |
| Lenovo ThinkPad P1 G6 21FV001KUS | |
| Przeciętny Intel Core i7-13800H (n=1) | |
| Asus ProArt Studiobook 16 OLED H7604 | |
| HP ZBook Fury 16 G10 | |
| Lenovo ThinkPad X1 Extreme G4-20Y5CTO1WW (3050 Ti) | |
| Dell Precision 5000 5680 | |
| Lenovo ThinkPad P16 G1 RTX A5500 | |
| Gigabyte Aero 16 YE5 | |
| R Benchmark 2.5 / Overall mean | |
| LG Gram 2in1 16 16T90R - G.AA78G | |
| Lenovo ThinkPad X1 Extreme G4-20Y5CTO1WW (3050 Ti) | |
| Lenovo ThinkPad P1 G4-20Y4S0KS00 | |
| Lenovo ThinkPad E16 G1-21JUS08X00 | |
| Lenovo ThinkPad P16 G1 RTX A5500 | |
| MSI Raider GE68 HX 13VG, i7-13700HX | |
| Lenovo ThinkPad P1 G6-21FV000DGE | |
| Gigabyte Aero 16 YE5 | |
| Dell Precision 5000 5680 | |
| Lenovo ThinkPad P1 G6 21FV001KUS | |
| Przeciętny Intel Core i7-13800H (n=1) | |
| HP ZBook Fury 16 G10 | |
| Asus ProArt Studiobook 16 OLED H7604 | |
Cinebench R23: Multi Core | Single Core
Cinebench R20: CPU (Multi Core) | CPU (Single Core)
Cinebench R15: CPU Multi 64Bit | CPU Single 64Bit
Blender: v2.79 BMW27 CPU
7-Zip 18.03: 7z b 4 | 7z b 4 -mmt1
Geekbench 5.5: Multi-Core | Single-Core
HWBOT x265 Benchmark v2.2: 4k Preset
LibreOffice : 20 Documents To PDF
R Benchmark 2.5: Overall mean
* ... im mniej tym lepiej
AIDA64: FP32 Ray-Trace | FPU Julia | CPU SHA3 | CPU Queen | FPU SinJulia | FPU Mandel | CPU AES | CPU ZLib | FP64 Ray-Trace | CPU PhotoWorxx
| Performance rating | |
| HP ZBook Fury 16 G10 | |
| Lenovo ThinkPad P16 G1 RTX A5500 | |
| Lenovo ThinkPad P1 G6 21FV001KUS | |
| Przeciętny Intel Core i7-13800H | |
| Dell Precision 5000 5680 | |
| Lenovo ThinkPad P1 G6-21FV000DGE | |
| Lenovo ThinkPad P1 G4-20Y4S0KS00 -9! | |
| AIDA64 / FP32 Ray-Trace | |
| HP ZBook Fury 16 G10 | |
| Lenovo ThinkPad P16 G1 RTX A5500 | |
| Lenovo ThinkPad P1 G6 21FV001KUS | |
| Przeciętny Intel Core i7-13800H (n=1) | |
| Lenovo ThinkPad P1 G6-21FV000DGE | |
| Dell Precision 5000 5680 | |
| AIDA64 / FPU Julia | |
| HP ZBook Fury 16 G10 | |
| Lenovo ThinkPad P16 G1 RTX A5500 | |
| Lenovo ThinkPad P1 G6 21FV001KUS | |
| Przeciętny Intel Core i7-13800H (n=1) | |
| Lenovo ThinkPad P1 G6-21FV000DGE | |
| Dell Precision 5000 5680 | |
| AIDA64 / CPU SHA3 | |
| HP ZBook Fury 16 G10 | |
| Lenovo ThinkPad P16 G1 RTX A5500 | |
| Lenovo ThinkPad P1 G6 21FV001KUS | |
| Przeciętny Intel Core i7-13800H (n=1) | |
| Lenovo ThinkPad P1 G6-21FV000DGE | |
| Dell Precision 5000 5680 | |
| AIDA64 / CPU Queen | |
| HP ZBook Fury 16 G10 | |
| Dell Precision 5000 5680 | |
| Lenovo ThinkPad P1 G6-21FV000DGE | |
| Lenovo ThinkPad P1 G6 21FV001KUS | |
| Przeciętny Intel Core i7-13800H (n=1) | |
| Lenovo ThinkPad P16 G1 RTX A5500 | |
| AIDA64 / FPU SinJulia | |
| HP ZBook Fury 16 G10 | |
| Lenovo ThinkPad P16 G1 RTX A5500 | |
| Lenovo ThinkPad P1 G6 21FV001KUS | |
| Przeciętny Intel Core i7-13800H (n=1) | |
| Lenovo ThinkPad P1 G6-21FV000DGE | |
| Dell Precision 5000 5680 | |
| AIDA64 / FPU Mandel | |
| HP ZBook Fury 16 G10 | |
| Lenovo ThinkPad P16 G1 RTX A5500 | |
| Lenovo ThinkPad P1 G6 21FV001KUS | |
| Przeciętny Intel Core i7-13800H (n=1) | |
| Lenovo ThinkPad P1 G6-21FV000DGE | |
| Dell Precision 5000 5680 | |
| AIDA64 / CPU AES | |
| HP ZBook Fury 16 G10 | |
| Lenovo ThinkPad P16 G1 RTX A5500 | |
| Lenovo ThinkPad P1 G6 21FV001KUS | |
| Przeciętny Intel Core i7-13800H (n=1) | |
| Lenovo ThinkPad P1 G6-21FV000DGE | |
| Dell Precision 5000 5680 | |
| AIDA64 / CPU ZLib | |
| HP ZBook Fury 16 G10 | |
| Lenovo ThinkPad P16 G1 RTX A5500 | |
| Lenovo ThinkPad P1 G6 21FV001KUS | |
| Przeciętny Intel Core i7-13800H (n=1) | |
| Lenovo ThinkPad P1 G6-21FV000DGE | |
| Dell Precision 5000 5680 | |
| Lenovo ThinkPad P1 G4-20Y4S0KS00 | |
| AIDA64 / FP64 Ray-Trace | |
| HP ZBook Fury 16 G10 | |
| Lenovo ThinkPad P16 G1 RTX A5500 | |
| Lenovo ThinkPad P1 G6 21FV001KUS | |
| Przeciętny Intel Core i7-13800H (n=1) | |
| Lenovo ThinkPad P1 G6-21FV000DGE | |
| Dell Precision 5000 5680 | |
| AIDA64 / CPU PhotoWorxx | |
| Dell Precision 5000 5680 | |
| Lenovo ThinkPad P16 G1 RTX A5500 | |
| HP ZBook Fury 16 G10 | |
| Lenovo ThinkPad P1 G6-21FV000DGE | |
| Lenovo ThinkPad P1 G6 21FV001KUS | |
| Przeciętny Intel Core i7-13800H (n=1) | |
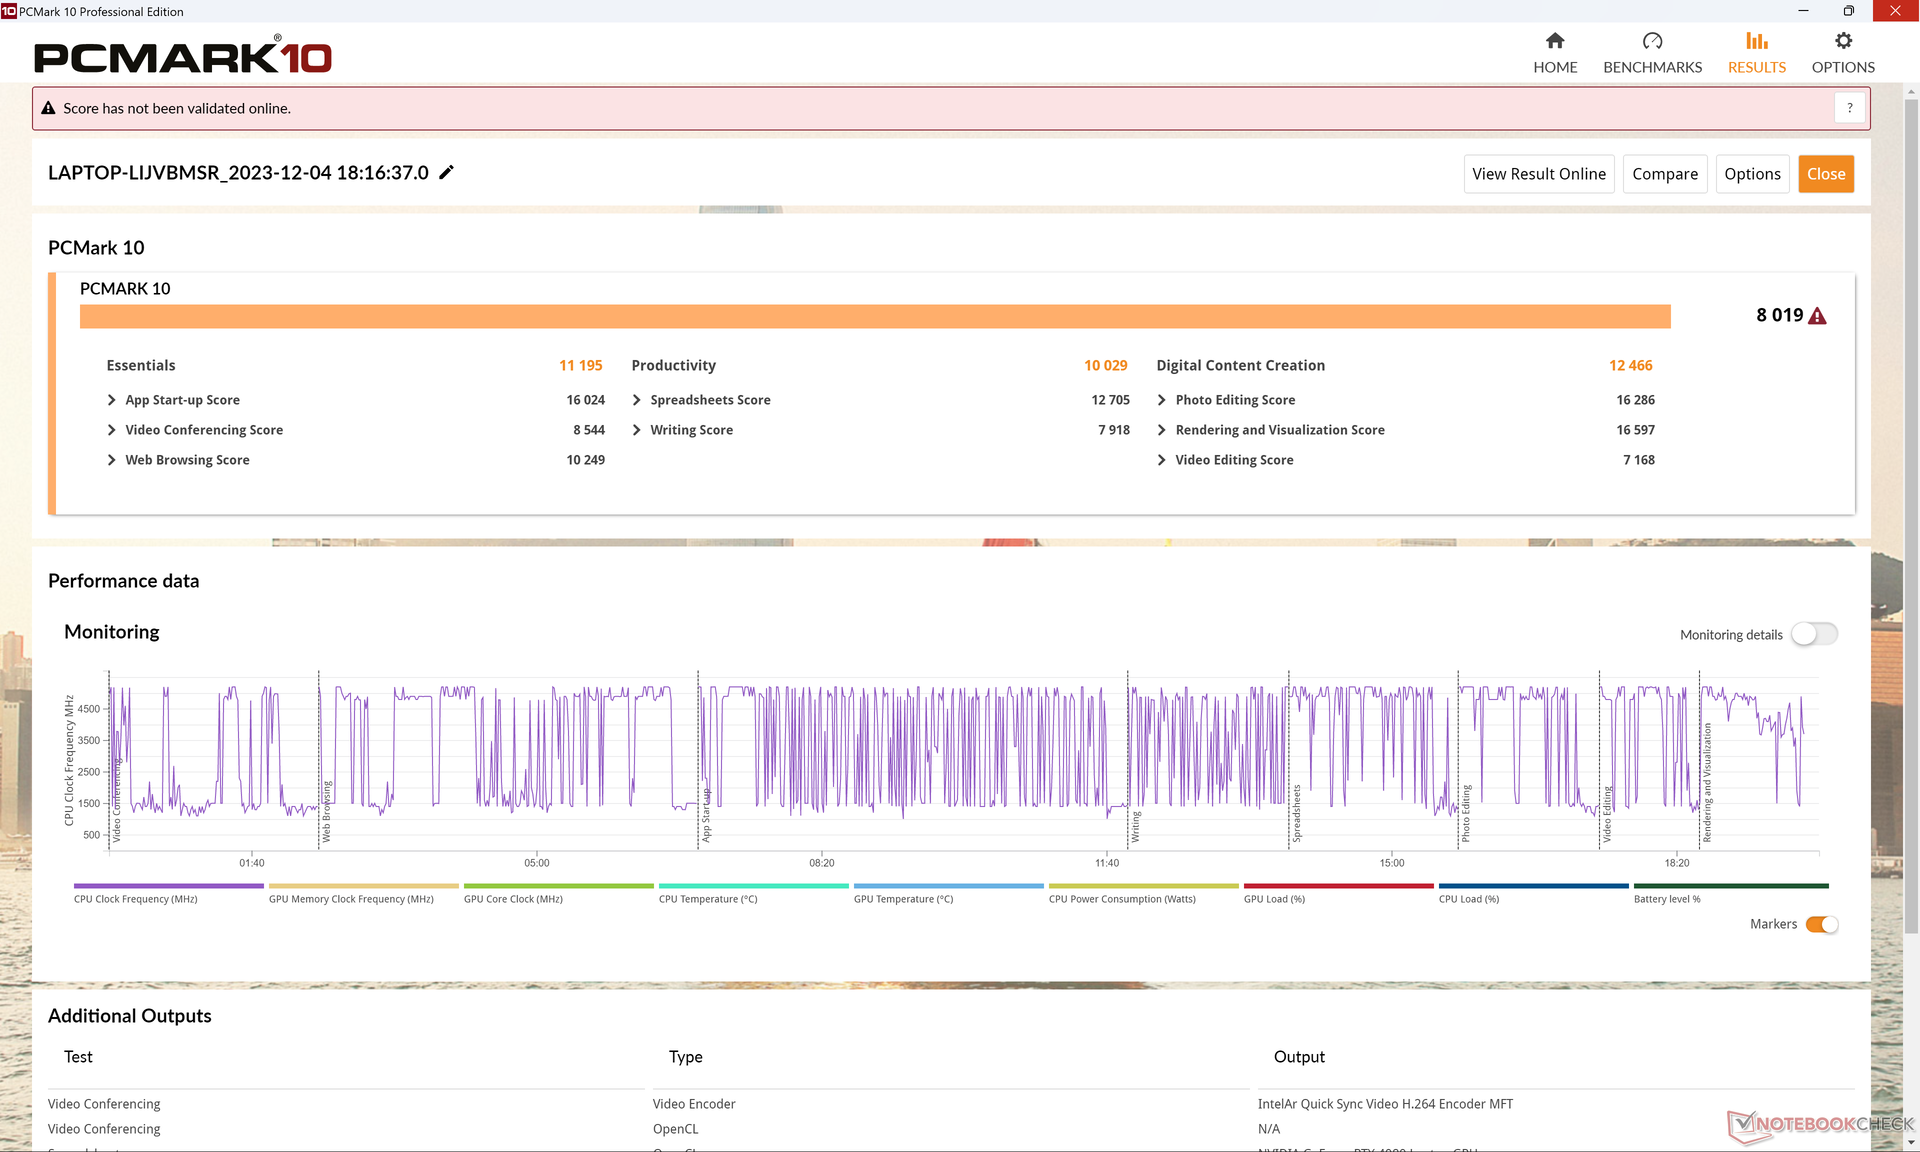
Wydajność systemu
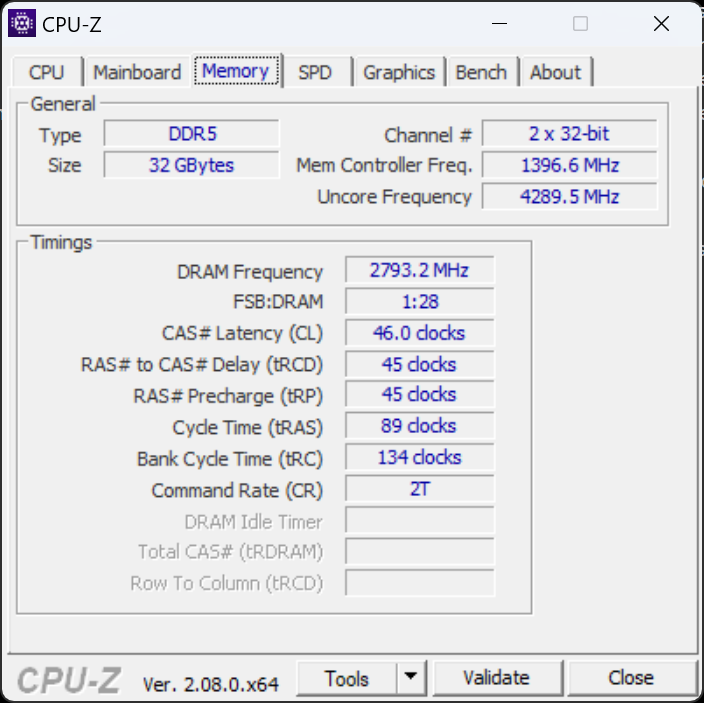
Wyniki PCMark są porównywalne, jeśli nie nieco szybsze niż w przypadku konfiguracji ThinkPad P1 G6 z RTX 2000, głównie dzięki szybszemu układowi GPU RTX 4080. Proszę zauważyć, że wydajność pamięci jest niska, ponieważ nasz egzemplarz został skonfigurowany z tylko jednym modułem RAM w trybie jednokanałowym zamiast dwóch.
CrossMark: Overall | Productivity | Creativity | Responsiveness
WebXPRT 3: Overall
WebXPRT 4: Overall
Mozilla Kraken 1.1: Total
| PCMark 10 / Score | |
| Dell Precision 5000 5680 | |
| HP ZBook Fury 16 G10 | |
| Lenovo ThinkPad P1 G6 21FV001KUS | |
| Przeciętny Intel Core i7-13800H, NVIDIA GeForce RTX 4080 Laptop GPU (n=1) | |
| Lenovo ThinkPad P1 G6-21FV000DGE | |
| Lenovo ThinkPad P16 G1 RTX A5500 | |
| Lenovo ThinkPad P1 G4-20Y4S0KS00 | |
| PCMark 10 / Essentials | |
| Dell Precision 5000 5680 | |
| Lenovo ThinkPad P1 G6 21FV001KUS | |
| Przeciętny Intel Core i7-13800H, NVIDIA GeForce RTX 4080 Laptop GPU (n=1) | |
| Lenovo ThinkPad P1 G6-21FV000DGE | |
| HP ZBook Fury 16 G10 | |
| Lenovo ThinkPad P16 G1 RTX A5500 | |
| Lenovo ThinkPad P1 G4-20Y4S0KS00 | |
| PCMark 10 / Productivity | |
| Dell Precision 5000 5680 | |
| Lenovo ThinkPad P1 G6 21FV001KUS | |
| Przeciętny Intel Core i7-13800H, NVIDIA GeForce RTX 4080 Laptop GPU (n=1) | |
| Lenovo ThinkPad P1 G6-21FV000DGE | |
| Lenovo ThinkPad P16 G1 RTX A5500 | |
| HP ZBook Fury 16 G10 | |
| Lenovo ThinkPad P1 G4-20Y4S0KS00 | |
| PCMark 10 / Digital Content Creation | |
| HP ZBook Fury 16 G10 | |
| Dell Precision 5000 5680 | |
| Lenovo ThinkPad P1 G6 21FV001KUS | |
| Przeciętny Intel Core i7-13800H, NVIDIA GeForce RTX 4080 Laptop GPU (n=1) | |
| Lenovo ThinkPad P1 G6-21FV000DGE | |
| Lenovo ThinkPad P1 G4-20Y4S0KS00 | |
| Lenovo ThinkPad P16 G1 RTX A5500 | |
| CrossMark / Overall | |
| Dell Precision 5000 5680 | |
| HP ZBook Fury 16 G10 | |
| Lenovo ThinkPad P16 G1 RTX A5500 | |
| Lenovo ThinkPad P1 G6-21FV000DGE | |
| Lenovo ThinkPad P1 G6 21FV001KUS | |
| Przeciętny Intel Core i7-13800H, NVIDIA GeForce RTX 4080 Laptop GPU (n=1) | |
| Lenovo ThinkPad P1 G4-20Y4S0KS00 | |
| CrossMark / Productivity | |
| HP ZBook Fury 16 G10 | |
| Dell Precision 5000 5680 | |
| Lenovo ThinkPad P1 G6-21FV000DGE | |
| Lenovo ThinkPad P16 G1 RTX A5500 | |
| Lenovo ThinkPad P1 G6 21FV001KUS | |
| Przeciętny Intel Core i7-13800H, NVIDIA GeForce RTX 4080 Laptop GPU (n=1) | |
| Lenovo ThinkPad P1 G4-20Y4S0KS00 | |
| CrossMark / Creativity | |
| Lenovo ThinkPad P16 G1 RTX A5500 | |
| Dell Precision 5000 5680 | |
| HP ZBook Fury 16 G10 | |
| Lenovo ThinkPad P1 G6 21FV001KUS | |
| Przeciętny Intel Core i7-13800H, NVIDIA GeForce RTX 4080 Laptop GPU (n=1) | |
| Lenovo ThinkPad P1 G6-21FV000DGE | |
| Lenovo ThinkPad P1 G4-20Y4S0KS00 | |
| CrossMark / Responsiveness | |
| HP ZBook Fury 16 G10 | |
| Lenovo ThinkPad P1 G6-21FV000DGE | |
| Dell Precision 5000 5680 | |
| Lenovo ThinkPad P1 G6 21FV001KUS | |
| Przeciętny Intel Core i7-13800H, NVIDIA GeForce RTX 4080 Laptop GPU (n=1) | |
| Lenovo ThinkPad P1 G4-20Y4S0KS00 | |
| Lenovo ThinkPad P16 G1 RTX A5500 | |
| WebXPRT 3 / Overall | |
| Dell Precision 5000 5680 | |
| HP ZBook Fury 16 G10 | |
| Lenovo ThinkPad P1 G6-21FV000DGE | |
| Lenovo ThinkPad P16 G1 RTX A5500 | |
| Lenovo ThinkPad P1 G6 21FV001KUS | |
| Przeciętny Intel Core i7-13800H, NVIDIA GeForce RTX 4080 Laptop GPU (n=1) | |
| Lenovo ThinkPad P1 G4-20Y4S0KS00 | |
| WebXPRT 4 / Overall | |
| Lenovo ThinkPad P1 G6-21FV000DGE | |
| HP ZBook Fury 16 G10 | |
| Dell Precision 5000 5680 | |
| Lenovo ThinkPad P1 G6 21FV001KUS | |
| Przeciętny Intel Core i7-13800H, NVIDIA GeForce RTX 4080 Laptop GPU (n=1) | |
| Lenovo ThinkPad P16 G1 RTX A5500 | |
| Mozilla Kraken 1.1 / Total | |
| Lenovo ThinkPad P1 G4-20Y4S0KS00 | |
| Lenovo ThinkPad P16 G1 RTX A5500 | |
| Lenovo ThinkPad P1 G6 21FV001KUS | |
| Przeciętny Intel Core i7-13800H, NVIDIA GeForce RTX 4080 Laptop GPU (n=1) | |
| Dell Precision 5000 5680 | |
| Lenovo ThinkPad P1 G6-21FV000DGE | |
| HP ZBook Fury 16 G10 | |
* ... im mniej tym lepiej
| PCMark 10 Score | 8019 pkt. | |
Pomoc | ||
| AIDA64 / Memory Copy | |
| Dell Precision 5000 5680 | |
| Lenovo ThinkPad P16 G1 RTX A5500 | |
| HP ZBook Fury 16 G10 | |
| Lenovo ThinkPad P1 G6-21FV000DGE | |
| Lenovo ThinkPad P1 G6 21FV001KUS | |
| Przeciętny Intel Core i7-13800H (n=1) | |
| AIDA64 / Memory Read | |
| Dell Precision 5000 5680 | |
| Lenovo ThinkPad P16 G1 RTX A5500 | |
| HP ZBook Fury 16 G10 | |
| Lenovo ThinkPad P1 G6 21FV001KUS | |
| Przeciętny Intel Core i7-13800H (n=1) | |
| Lenovo ThinkPad P1 G6-21FV000DGE | |
| AIDA64 / Memory Write | |
| Dell Precision 5000 5680 | |
| Lenovo ThinkPad P16 G1 RTX A5500 | |
| HP ZBook Fury 16 G10 | |
| Lenovo ThinkPad P1 G6 21FV001KUS | |
| Przeciętny Intel Core i7-13800H (n=1) | |
| Lenovo ThinkPad P1 G6-21FV000DGE | |
| AIDA64 / Memory Latency | |
| HP ZBook Fury 16 G10 | |
| Dell Precision 5000 5680 | |
| Lenovo ThinkPad P16 G1 RTX A5500 | |
| Lenovo ThinkPad P1 G6 21FV001KUS | |
| Przeciętny Intel Core i7-13800H (n=1) | |
| Lenovo ThinkPad P1 G6-21FV000DGE | |
| Lenovo ThinkPad P1 G4-20Y4S0KS00 | |
* ... im mniej tym lepiej
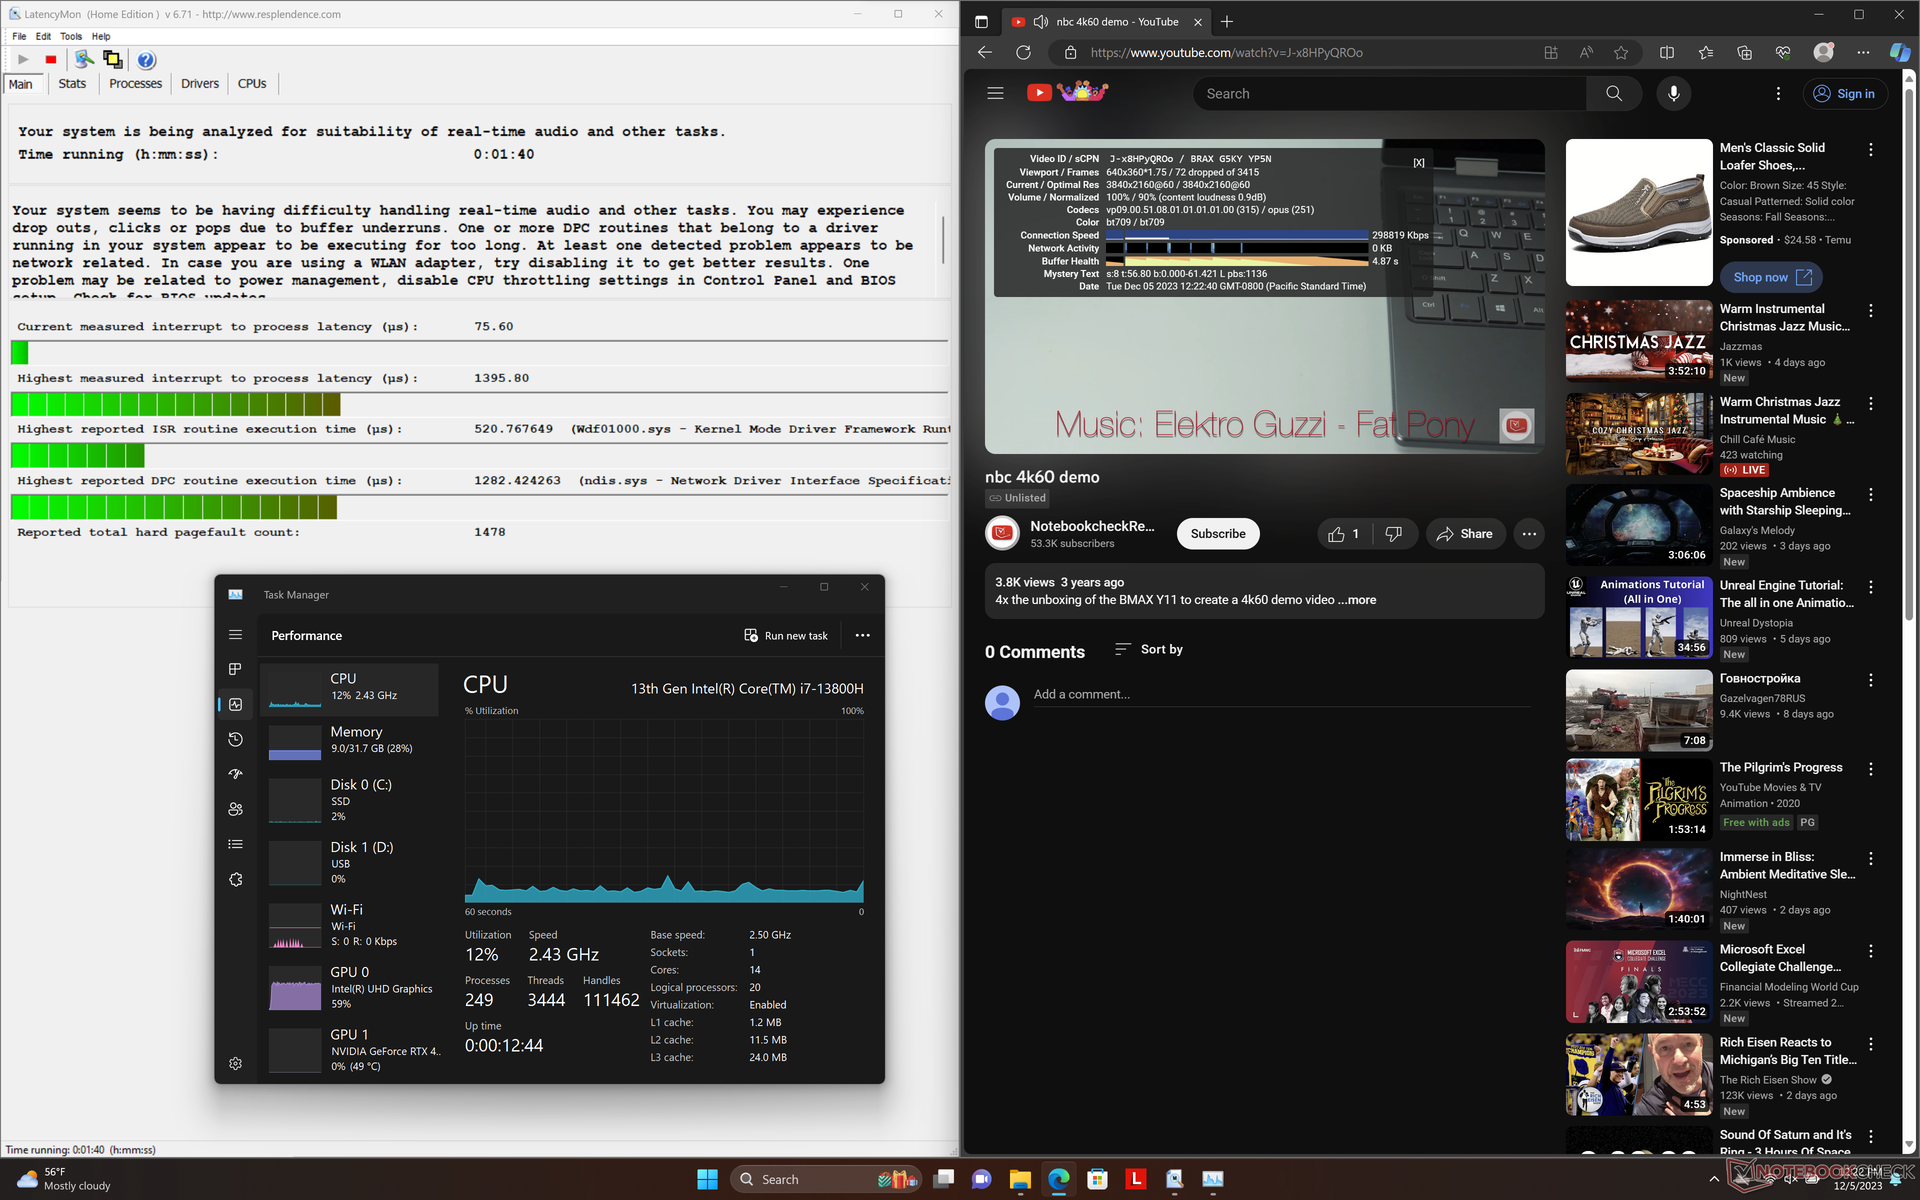
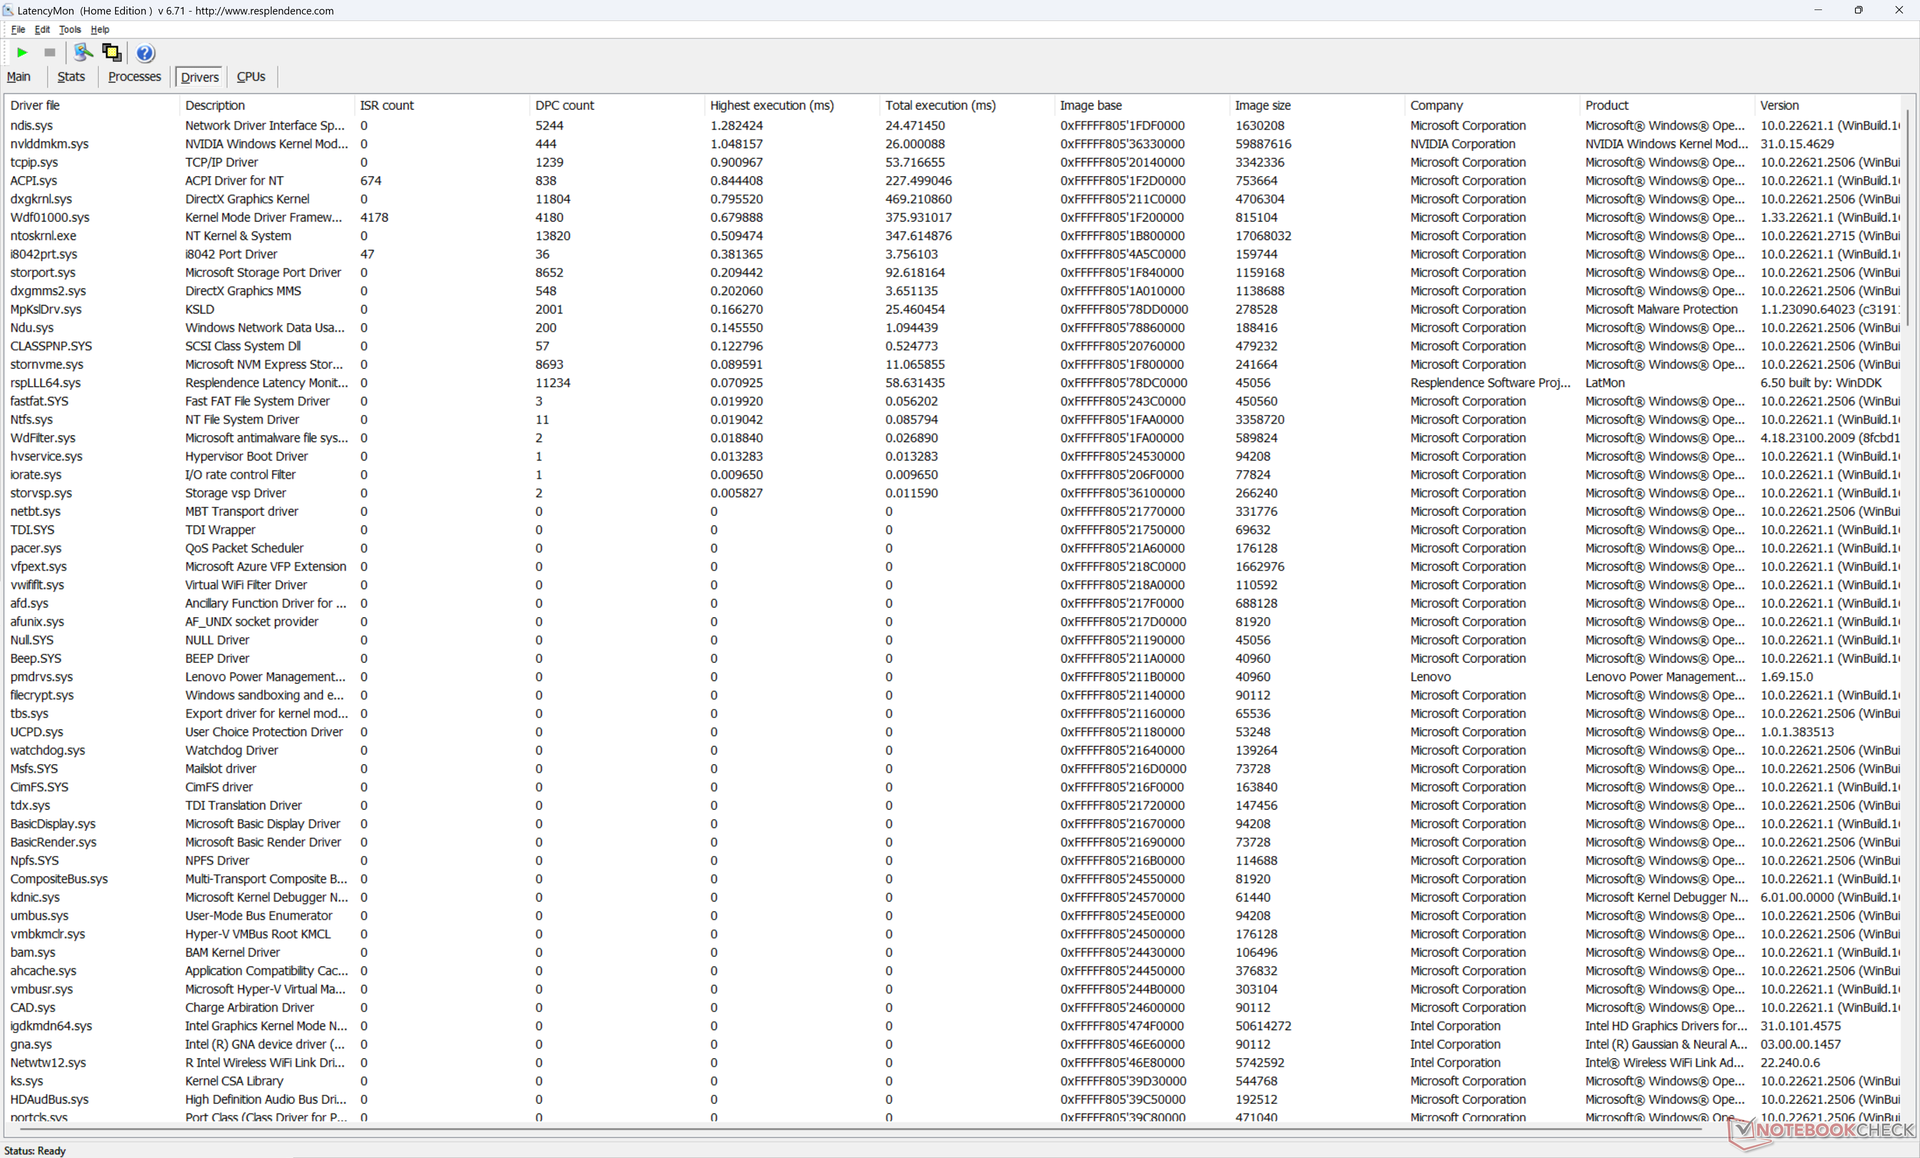
Opóźnienie DPC
LatencyMon ujawnia problemy z DPC podczas otwierania wielu kart przeglądarki na naszej stronie głównej i 75 upuszczonych klatek podczas odtwarzania jednominutowego wideo 4K60. To ostatnie jest szczególnie rozczarowujące, biorąc pod uwagę cenę i profesjonalny aspekt tego modelu. Sugeruje to również problemy ze sterownikami lub słabą obsługę aplikacji działających w tle, które mogą przerywać okno w centrum uwagi.
| DPC Latencies / LatencyMon - interrupt to process latency (max), Web, Youtube, Prime95 | |
| HP ZBook Fury 16 G10 | |
| Lenovo ThinkPad P1 G6-21FV000DGE | |
| Dell Precision 5000 5680 | |
| Lenovo ThinkPad P16 G1 RTX A5500 | |
| Lenovo ThinkPad P1 G6 21FV001KUS | |
| Lenovo ThinkPad P1 G4-20Y4S0KS00 | |
* ... im mniej tym lepiej
Urządzenia pamięci masowej
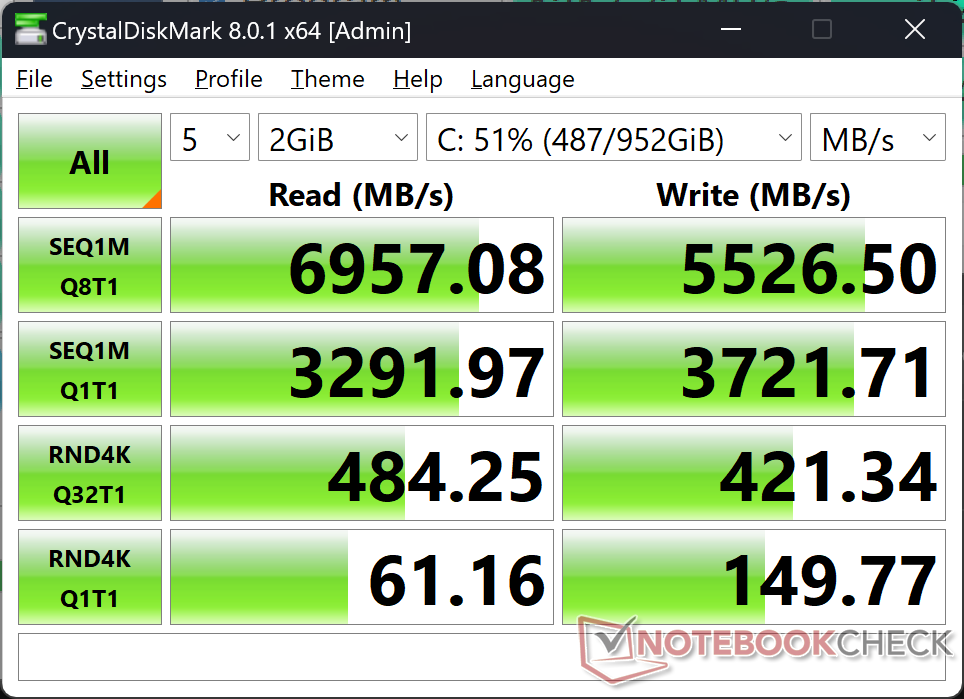
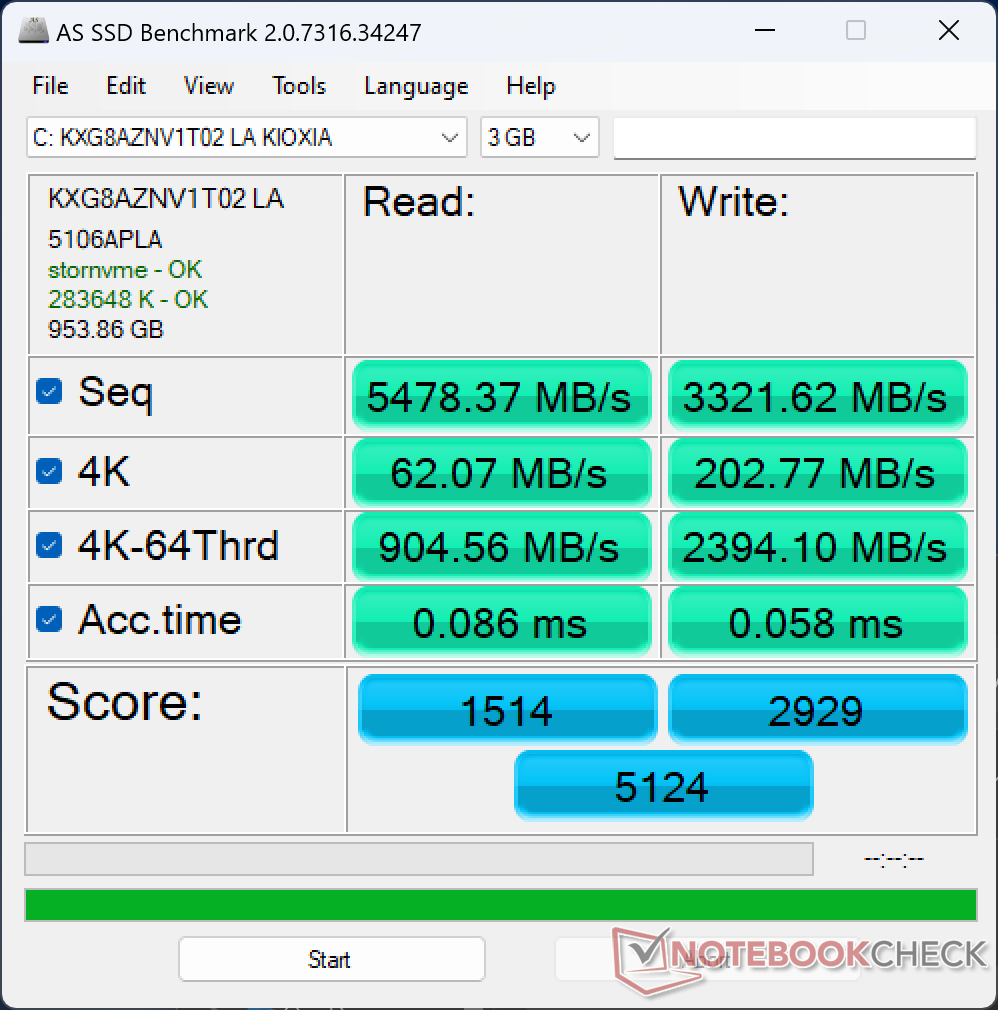
Nasza jednostka testowa jest dostarczana z Kioxia XG8 KXG8AZNV1T02 zamiast SK Hynix PC711 w naszym oryginalnym ThinkPadzie P1 G6. Ogólna wydajność jest ogólnie wolniejsza, szczególnie podczas zapisywania danych, ale szybkość odczytu jest mimo to doskonała, z niewielkim dławieniem po około 3 minutach stresu.
Proszę zauważyć, że niektóre konfiguracje ThinkPad P1 G6 mogą obsługiwać więcej niż jeden wewnętrzny dysk SSD M.2. Jednak ta konkretna recenzowana konfiguracja może obsługiwać tylko jeden dysk.

| Drive Performance rating - Percent | |
| Lenovo ThinkPad P1 G4-20Y4S0KS00 | |
| Lenovo ThinkPad P1 G6-21FV000DGE | |
| HP ZBook Fury 16 G10 | |
| Dell Precision 5000 5680 | |
| Lenovo ThinkPad P1 G6 21FV001KUS | |
| Lenovo ThinkPad P16 G1 RTX A5500 | |
* ... im mniej tym lepiej
Disk Throttling: DiskSpd Read Loop, Queue Depth 8
Wydajność GPU
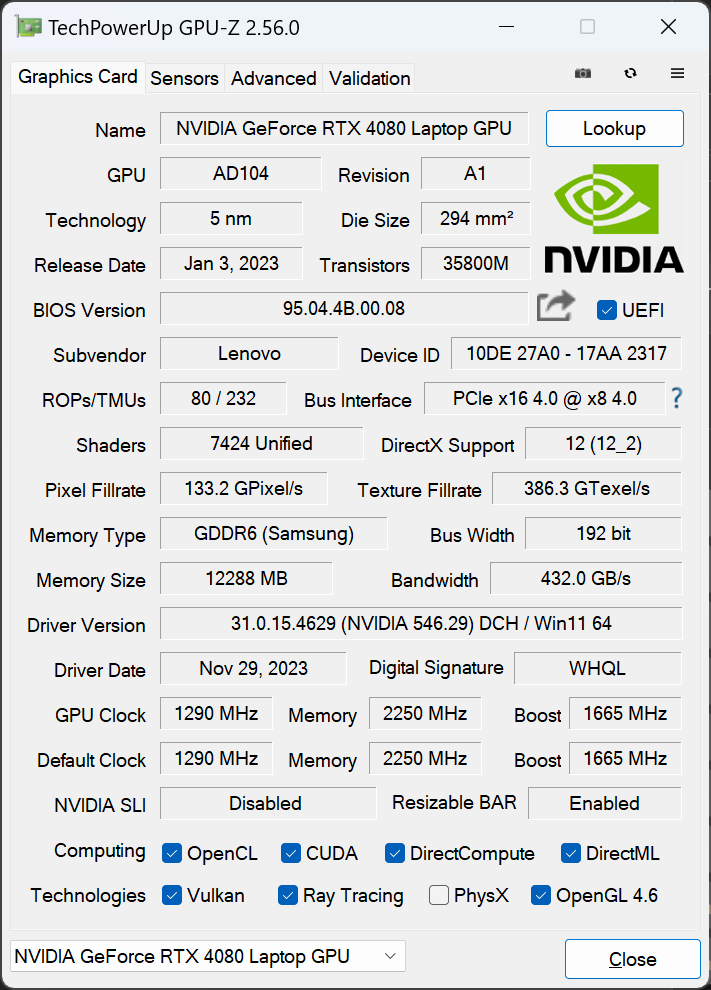
Panel sterowania Nvidia podaje maksymalną moc grafiki na poziomie 105 W. W rzeczywistości jednak, według GPU-Z, jesteśmy w stanie osiągnąć maksymalnie 80 W. Ogólna wydajność jest zatem od 15 do 20 procent wolniejsza niż w przypadku przeciętnego laptopa w naszej bazie danych z tym samym mobilnym procesorem graficznym GeForce RTX 4080, ponieważ ten konkretny procesor graficzny częściej działa przy wyższych pułapach mocy.
Niezależnie od tego, wydajność graficzna nadal znacznie wyprzedza RTX 2000 w większości testów porównawczych, z wyjątkiem testów Specviewperf Siemens NX i Medical. Aby uzyskać wyższą wydajność, Lenovo oferuje RTX 5000 w najwyższej konfiguracji.
Uruchomienie trybu zrównoważonego zamiast trybu wydajności wpływa na wydajność GPU, podczas gdy procesor pozostaje w dużej mierze bez zmian, jak pokazują nasze wyniki Fire Strike w poniższej tabeli.
| Profil zasilania | Wynik fizyki | Wynik grafiki | Wynik łączny |
| Tryb wydajności | 29543 | 33402 | 12423 |
| Tryb zrównoważony | 30978 (-0%) | 25806 (-23%) | 9616 (-23%) |
| Zasilanie bateryjne | 21163 (-28%) | 18870 (-44%) | 4960 (-60%) |
| 3DMark Performance rating - Percent | |
| Razer Blade 16 Early 2023 RTX 4090 -34! | |
| HP ZBook Fury 16 G10 -1! | |
| Lenovo ThinkPad P16 G1 RTX A5500 -1! | |
| Przeciętny NVIDIA GeForce RTX 4080 Laptop GPU -1! | |
| Lenovo ThinkPad P1 G6 21FV001KUS -1! | |
| Lenovo ThinkPad P1 G6-21FV000DGE -17! | |
| Asus ProArt Studiobook 16 OLED H7604 -17! | |
| Gigabyte Aero 16 YE5 -2! | |
| Lenovo ThinkPad P1 G4-20Y4S0KS00 -11! | |
| Lenovo ThinkPad X1 Extreme G4-20Y5CTO1WW (3050 Ti) -36! | |
| LG Gram 2in1 16 16T90R - G.AA78G -36! | |
| 3DMark 11 - 1280x720 Performance GPU | |
| Razer Blade 16 Early 2023 RTX 4090 | |
| Przeciętny NVIDIA GeForce RTX 4080 Laptop GPU (45199 - 63128, n=24) | |
| HP ZBook Fury 16 G10 | |
| Lenovo ThinkPad P1 G6 21FV001KUS | |
| Asus ProArt Studiobook 16 OLED H7604 | |
| Lenovo ThinkPad P16 G1 RTX A5500 | |
| Gigabyte Aero 16 YE5 | |
| Lenovo ThinkPad P1 G6-21FV000DGE | |
| Lenovo ThinkPad P1 G4-20Y4S0KS00 | |
| Lenovo ThinkPad X1 Extreme G4-20Y5CTO1WW (3050 Ti) | |
| LG Gram 2in1 16 16T90R - G.AA78G | |
| 3DMark 11 Performance | 38087 pkt. | |
| 3DMark Fire Strike Score | 28105 pkt. | |
| 3DMark Time Spy Score | 13863 pkt. | |
Pomoc | ||
* ... im mniej tym lepiej
| F1 22 | |
| 1920x1080 Ultra High Preset AA:T AF:16x | |
| Przeciętny NVIDIA GeForce RTX 4080 Laptop GPU (72.3 - 124.2, n=15) | |
| HP ZBook Fury 16 G10 | |
| Lenovo ThinkPad P1 G6 21FV001KUS | |
| Asus ProArt Studiobook 16 OLED H7604 | |
| Lenovo ThinkPad P1 G6-21FV000DGE | |
| 2560x1440 Ultra High Preset AA:T AF:16x | |
| Przeciętny NVIDIA GeForce RTX 4080 Laptop GPU (55.4 - 79, n=13) | |
| HP ZBook Fury 16 G10 | |
| Lenovo ThinkPad P1 G6 21FV001KUS | |
| Asus ProArt Studiobook 16 OLED H7604 | |
| Lenovo ThinkPad P1 G6-21FV000DGE | |
| 3840x2160 Ultra High Preset AA:T AF:16x | |
| Przeciętny NVIDIA GeForce RTX 4080 Laptop GPU (25.8 - 39.8, n=10) | |
| HP ZBook Fury 16 G10 | |
| Lenovo ThinkPad P1 G6 21FV001KUS | |
| Final Fantasy XV Benchmark | |
| 1920x1080 High Quality | |
| Przeciętny NVIDIA GeForce RTX 4080 Laptop GPU (129 - 182.1, n=23) | |
| HP ZBook Fury 16 G10 | |
| Lenovo ThinkPad P1 G6 21FV001KUS | |
| Asus ProArt Studiobook 16 OLED H7604 | |
| Lenovo ThinkPad P16 G1 RTX A5500 | |
| Gigabyte Aero 16 YE5 | |
| Lenovo ThinkPad P1 G6-21FV000DGE | |
| LG Gram 2in1 16 16T90R - G.AA78G | |
| 2560x1440 High Quality | |
| Przeciętny NVIDIA GeForce RTX 4080 Laptop GPU (98 - 142, n=22) | |
| HP ZBook Fury 16 G10 | |
| Lenovo ThinkPad P1 G6 21FV001KUS | |
| Asus ProArt Studiobook 16 OLED H7604 | |
| Lenovo ThinkPad P16 G1 RTX A5500 | |
| Gigabyte Aero 16 YE5 | |
| Lenovo ThinkPad P1 G6-21FV000DGE | |
| 3840x2160 High Quality | |
| Przeciętny NVIDIA GeForce RTX 4080 Laptop GPU (60.8 - 79.5, n=13) | |
| HP ZBook Fury 16 G10 | |
| Lenovo ThinkPad P1 G6 21FV001KUS | |
| Lenovo ThinkPad P16 G1 RTX A5500 | |
| Gigabyte Aero 16 YE5 | |
| The Witcher 3 | |
| 1920x1080 Ultra Graphics & Postprocessing (HBAO+) | |
| Przeciętny NVIDIA GeForce RTX 4080 Laptop GPU (130.4 - 186.1, n=20) | |
| HP ZBook Fury 16 G10 | |
| Lenovo ThinkPad P1 G6 21FV001KUS | |
| Lenovo ThinkPad P16 G1 RTX A5500 | |
| Asus ProArt Studiobook 16 OLED H7604 | |
| Gigabyte Aero 16 YE5 | |
| Lenovo ThinkPad P1 G4-20Y4S0KS00 | |
| Lenovo ThinkPad P1 G6-21FV000DGE | |
| Lenovo ThinkPad X1 Extreme G4-20Y5CTO1WW (3050 Ti) | |
| Apple MacBook Pro 16 2023 M3 Pro | |
| LG Gram 2in1 16 16T90R - G.AA78G | |
| 3840x2160 High Graphics & Postprocessing (Nvidia HairWorks Off) | |
| Przeciętny NVIDIA GeForce RTX 4080 Laptop GPU (66 - 129.4, n=10) | |
| HP ZBook Fury 16 G10 | |
| Lenovo ThinkPad P1 G6 21FV001KUS | |
| Gigabyte Aero 16 YE5 | |
| Lenovo ThinkPad P16 G1 RTX A5500 | |
| Lenovo ThinkPad P1 G4-20Y4S0KS00 | |
| Lenovo ThinkPad X1 Extreme G4-20Y5CTO1WW (3050 Ti) | |
| Dota 2 Reborn - 3840x2160 ultra (3/3) best looking | |
| HP ZBook Fury 16 G10 | |
| Przeciętny NVIDIA GeForce RTX 4080 Laptop GPU (116.7 - 182.6, n=14) | |
| Lenovo ThinkPad P1 G6 21FV001KUS | |
| Lenovo ThinkPad P16 G1 RTX A5500 | |
| Gigabyte Aero 16 YE5 | |
| Lenovo ThinkPad P1 G4-20Y4S0KS00 | |
| Lenovo ThinkPad X1 Extreme G4-20Y5CTO1WW (3050 Ti) | |
| X-Plane 11.11 - 3840x2160 high (fps_test=3) | |
| Przeciętny NVIDIA GeForce RTX 4080 Laptop GPU (78 - 143.7, n=13) | |
| Lenovo ThinkPad P1 G6 21FV001KUS | |
| HP ZBook Fury 16 G10 | |
| Lenovo ThinkPad P16 G1 RTX A5500 | |
| Gigabyte Aero 16 YE5 | |
| Lenovo ThinkPad P1 G4-20Y4S0KS00 | |
| Lenovo ThinkPad X1 Extreme G4-20Y5CTO1WW (3050 Ti) | |
| Far Cry 5 | |
| 1920x1080 Ultra Preset AA:T | |
| Lenovo ThinkPad P1 G6 21FV001KUS | |
| Przeciętny NVIDIA GeForce RTX 4080 Laptop GPU (114 - 162, n=11) | |
| Asus ProArt Studiobook 16 OLED H7604 | |
| HP ZBook Fury 16 G10 | |
| Gigabyte Aero 16 YE5 | |
| Lenovo ThinkPad P1 G6-21FV000DGE | |
| LG Gram 2in1 16 16T90R - G.AA78G | |
| 2560x1440 Ultra Preset AA:T | |
| Przeciętny NVIDIA GeForce RTX 4080 Laptop GPU (114 - 157, n=10) | |
| HP ZBook Fury 16 G10 | |
| Lenovo ThinkPad P1 G6 21FV001KUS | |
| Asus ProArt Studiobook 16 OLED H7604 | |
| Gigabyte Aero 16 YE5 | |
| Lenovo ThinkPad P1 G6-21FV000DGE | |
| 3840x2160 Ultra Preset AA:T | |
| Przeciętny NVIDIA GeForce RTX 4080 Laptop GPU (71 - 97, n=6) | |
| Lenovo ThinkPad P1 G6 21FV001KUS | |
| Gigabyte Aero 16 YE5 | |
| Tiny Tina's Wonderlands | |
| 1920x1080 Badass Preset (DX12) | |
| Przeciętny NVIDIA GeForce RTX 4080 Laptop GPU (112.9 - 167.1, n=9) | |
| HP ZBook Fury 16 G10 | |
| Lenovo ThinkPad P1 G6 21FV001KUS | |
| 2560x1440 Badass Preset (DX12) | |
| Przeciętny NVIDIA GeForce RTX 4080 Laptop GPU (85 - 114.8, n=9) | |
| HP ZBook Fury 16 G10 | |
| Lenovo ThinkPad P1 G6 21FV001KUS | |
| 3840x2160 Badass Preset (DX12) | |
| Przeciętny NVIDIA GeForce RTX 4080 Laptop GPU (46.4 - 60.9, n=9) | |
| HP ZBook Fury 16 G10 | |
| Lenovo ThinkPad P1 G6 21FV001KUS | |
| Baldur's Gate 3 | |
| 1920x1080 Ultra Preset AA:T | |
| Przeciętny NVIDIA GeForce RTX 4080 Laptop GPU (111.8 - 181.2, n=7) | |
| Lenovo ThinkPad P1 G6 21FV001KUS | |
| Apple MacBook Pro 16 2023 M3 Pro | |
| 2560x1440 Ultra Preset AA:T | |
| Przeciętny NVIDIA GeForce RTX 4080 Laptop GPU (88.3 - 129.3, n=7) | |
| Lenovo ThinkPad P1 G6 21FV001KUS | |
| 3840x2160 Ultra Preset AA:T | |
| Przeciętny NVIDIA GeForce RTX 4080 Laptop GPU (48.8 - 68.4, n=5) | |
| Lenovo ThinkPad P1 G6 21FV001KUS | |
| Cyberpunk 2077 | |
| 1920x1080 Ultra Preset (FSR off) | |
| Przeciętny NVIDIA GeForce RTX 4080 Laptop GPU (83.9 - 127.1, n=15) | |
| Lenovo ThinkPad P1 G6 21FV001KUS | |
| Apple MacBook Pro 16 2023 M3 Pro | |
| LG Gram 2in1 16 16T90R - G.AA78G | |
| 2560x1440 Ultra Preset (FSR off) | |
| Przeciętny NVIDIA GeForce RTX 4080 Laptop GPU (56.2 - 86.3, n=15) | |
| Lenovo ThinkPad P1 G6 21FV001KUS | |
| 3840x2160 Ultra Preset (FSR off) | |
| Przeciętny NVIDIA GeForce RTX 4080 Laptop GPU (25.8 - 39.8, n=8) | |
| Lenovo ThinkPad P1 G6 21FV001KUS | |
| 3840x2160 Ray Tracing Ultra Preset + DLSS3 Quality + FG | |
| Przeciętny NVIDIA GeForce RTX 4080 Laptop GPU (48.4 - 58.5, n=4) | |
| Lenovo ThinkPad P1 G6 21FV001KUS | |
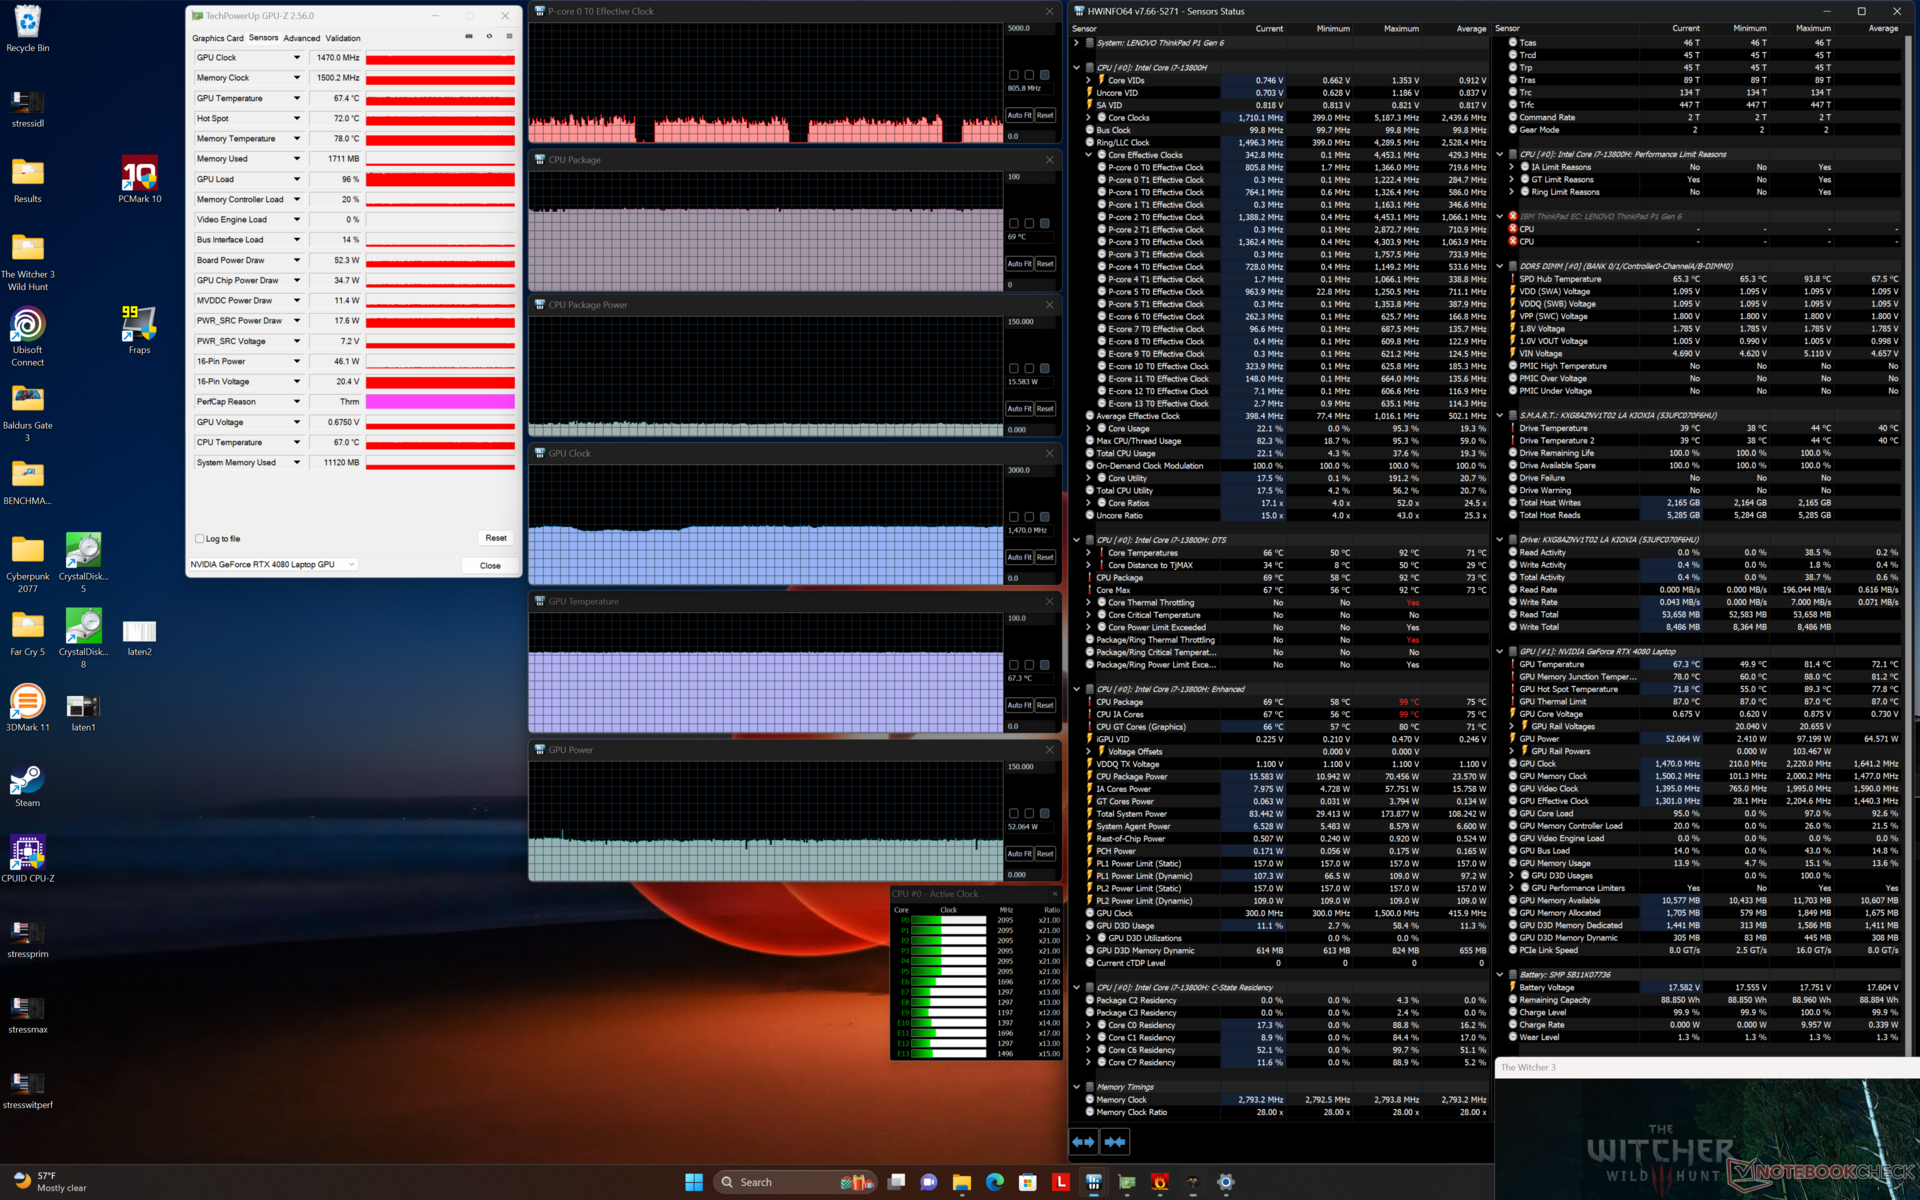
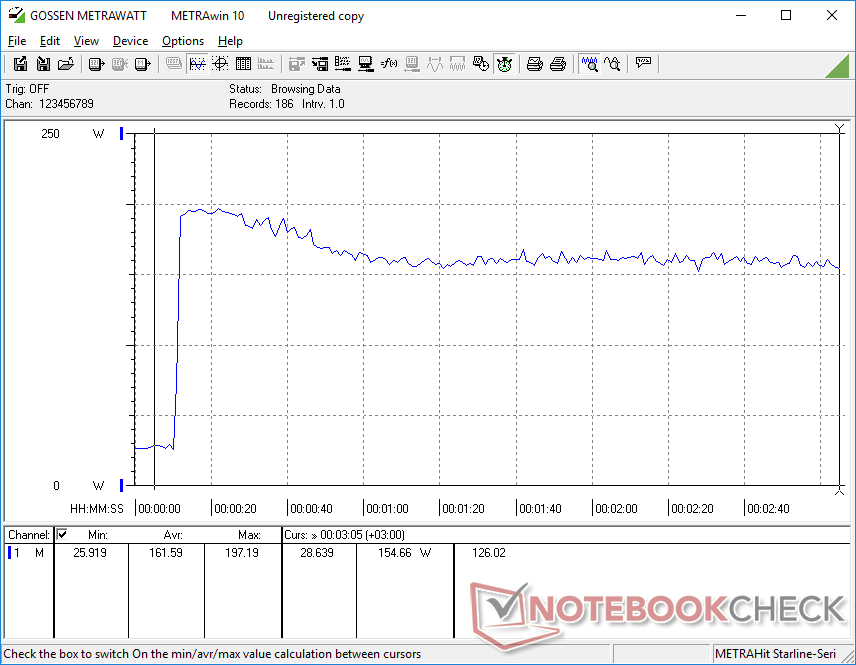
Liczba klatek na sekundę na biegu jałowym Witcher 3 była stała przez cały czas, z wyjątkiem jednego przypadku, w którym wydajność spadła do 90 FPS, jak pokazano na poniższym wykresie. Nagły spadek jest prawdopodobnie spowodowany słabą obsługą aplikacji działających w tle.
Witcher 3 FPS Chart
| low | med. | high | ultra | QHD | 4K | |
|---|---|---|---|---|---|---|
| GTA V (2015) | 120.3 | 106.4 | 120.3 | |||
| The Witcher 3 (2015) | 130.4 | 78.5 | ||||
| Dota 2 Reborn (2015) | 191.8 | 169 | 155.8 | 147.3 | 144.6 | |
| Final Fantasy XV Benchmark (2018) | 135.3 | 102.6 | 61.5 | |||
| X-Plane 11.11 (2018) | 171.1 | 150.8 | 118.6 | 103 | ||
| Far Cry 5 (2018) | 149 | 126 | 71 | |||
| Tiny Tina's Wonderlands (2022) | 118.6 | 85 | 46.4 | |||
| F1 22 (2022) | 202 | 81.5 | 55.4 | 29.7 | ||
| Baldur's Gate 3 (2023) | 124.8 | 88.7 | 48.8 | |||
| Cyberpunk 2077 (2023) | 103.8 | 90.9 | 59.9 | 25.8 |
Emisje
Hałas systemowy
Hałas wentylatorów jest głośniejszy niż w przypadku konfiguracji z RTX 2000 podczas pracy z wymagającymi obciążeniami. Na przykład podczas uruchamiania Witcher 3, hałas wentylatora wynosiłby od 47 do 55 dB(A) w porównaniu do zaledwie 41 do 48 dB(A) w słabszej konfiguracji. Poza tym, system doskonale radzi sobie z utrzymaniem ciszy przez długi czas podczas uruchamiania prostszych procesów, takich jak przeglądarki lub strumieniowanie wideo.
Hałas
| luz |
| 22.5 / 22.5 / 22.5 dB |
| obciążenie |
| 28.7 / 54.4 dB |
 | ||
30 dB cichy 40 dB(A) słyszalny 50 dB(A) irytujący |
||
min: | ||
| Lenovo ThinkPad P1 G6 21FV001KUS GeForce RTX 4080 Laptop GPU, i7-13800H, Kioxia XG8 KXG8AZNV1T02 | Lenovo ThinkPad P1 G6-21FV000DGE RTX 2000 Ada Generation Laptop, i9-13900H, SK Hynix PC711 1TB HFS001TDE9X084N | Lenovo ThinkPad P1 G4-20Y4S0KS00 GeForce RTX 3070 Laptop GPU, i7-11850H, Samsung PM9A1 MZVL21T0HCLR | Lenovo ThinkPad P16 G1 RTX A5500 RTX A5500 Laptop GPU, i9-12950HX, WDC PC SN810 2TB | Dell Precision 5000 5680 RTX 5000 Ada Generation Laptop, i9-13900H, 2x SK hynix PC801 HFS512GEJ9X101N RAID 0 | HP ZBook Fury 16 G10 RTX 5000 Ada Generation Laptop, i9-13950HX, SK hynix PC801 HFS001TEJ9X101N | |
|---|---|---|---|---|---|---|
| Noise | -11% | -9% | -2% | -5% | -7% | |
| wyłączone / środowisko * (dB) | 22.5 | 24.5 -9% | 23.8 -6% | 23.1 -3% | 22.8 -1% | 22.9 -2% |
| Idle Minimum * (dB) | 22.5 | 24.5 -9% | 23.8 -6% | 23.1 -3% | 23 -2% | 22.9 -2% |
| Idle Average * (dB) | 22.5 | 24.5 -9% | 23.8 -6% | 23.1 -3% | 23 -2% | 22.9 -2% |
| Idle Maximum * (dB) | 22.5 | 24.5 -9% | 28.3 -26% | 23.1 -3% | 23 -2% | 28.5 -27% |
| Load Average * (dB) | 28.7 | 48 -67% | 38.6 -34% | 28.9 -1% | 37.2 -30% | 40.6 -41% |
| Witcher 3 ultra * (dB) | 47.5 | 40.7 14% | 47.4 -0% | 51.6 -9% | 51 -7% | 44.1 7% |
| Load Maximum * (dB) | 54.4 | 48 12% | 47.4 13% | 51.4 6% | 51 6% | 45.8 16% |
* ... im mniej tym lepiej
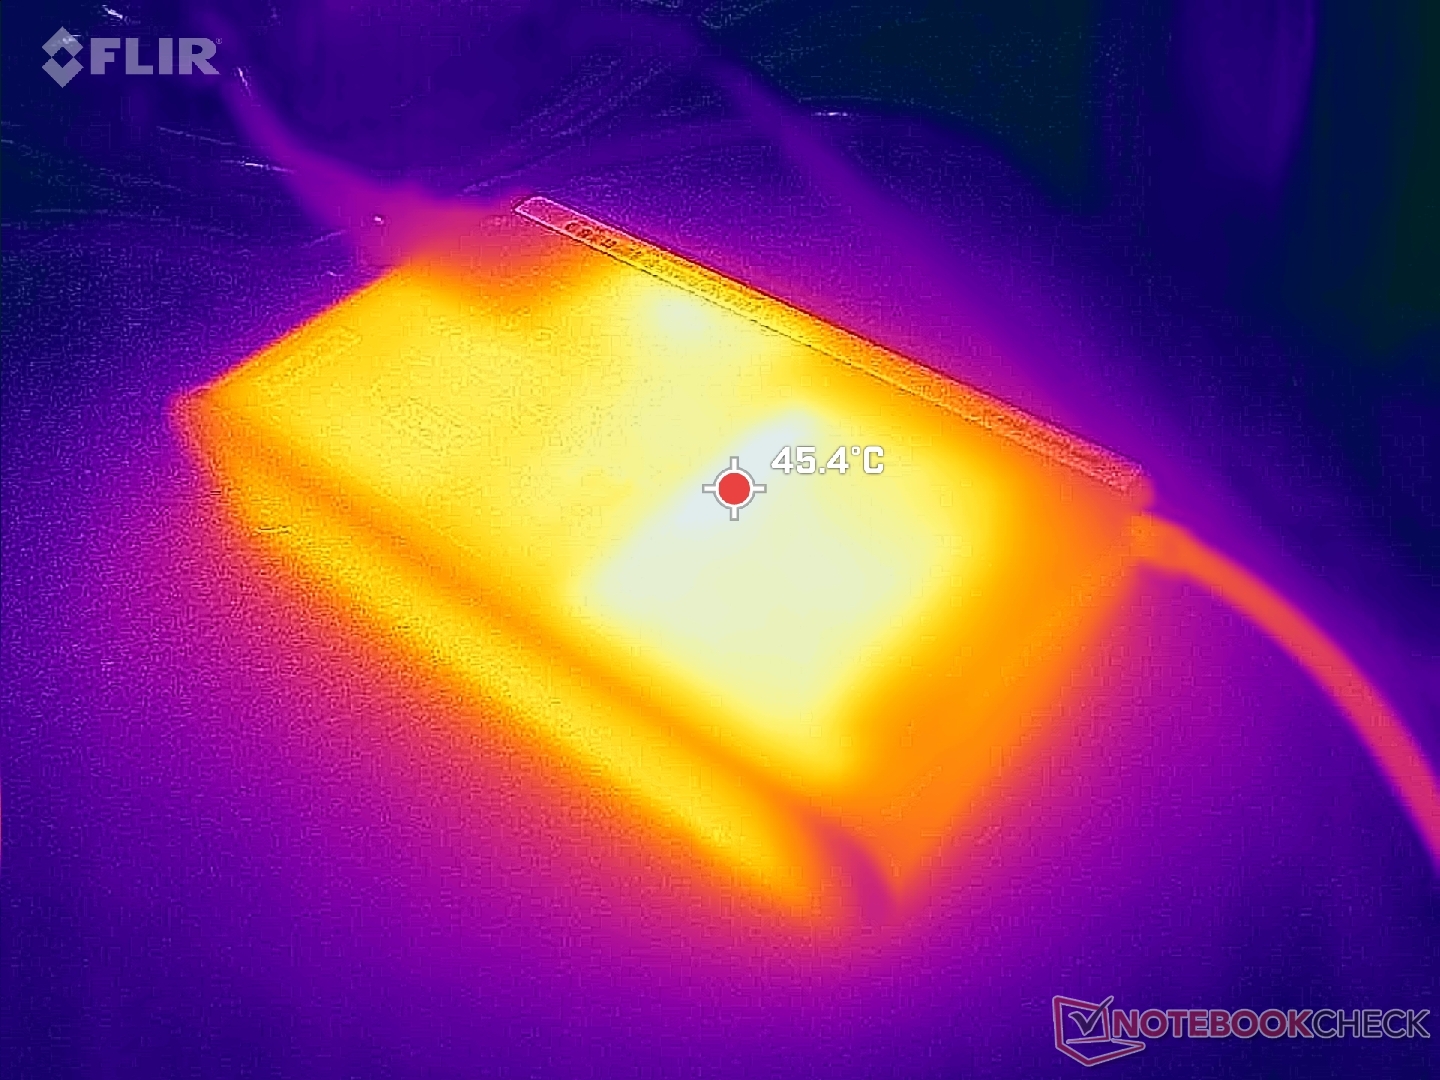
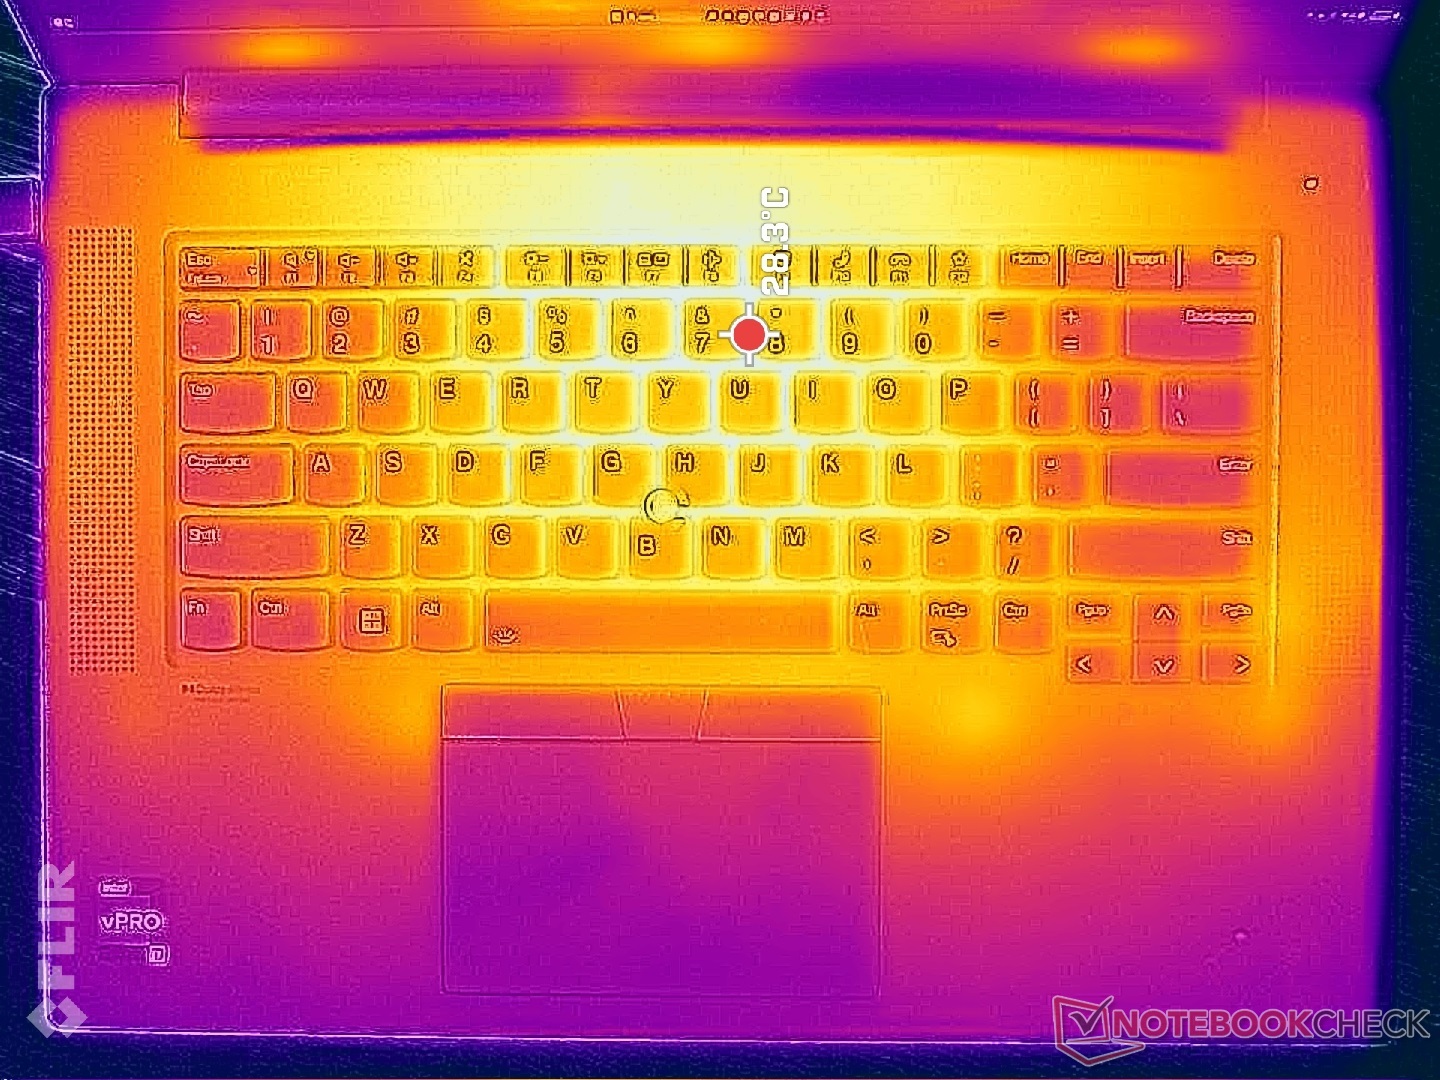
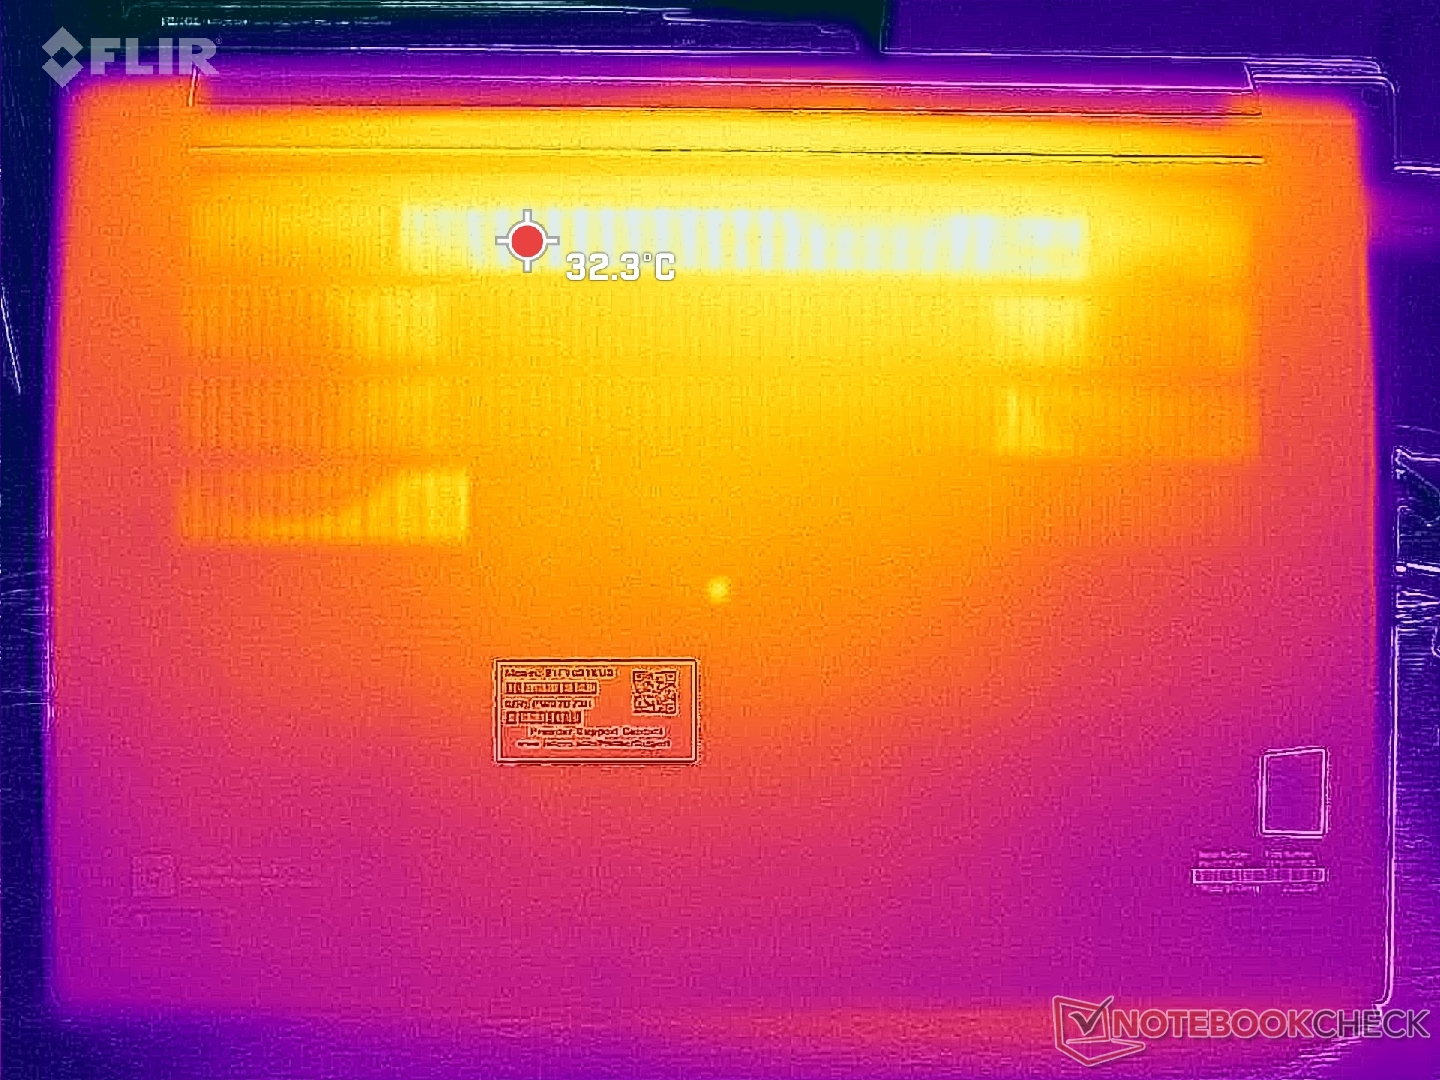
Temperatura
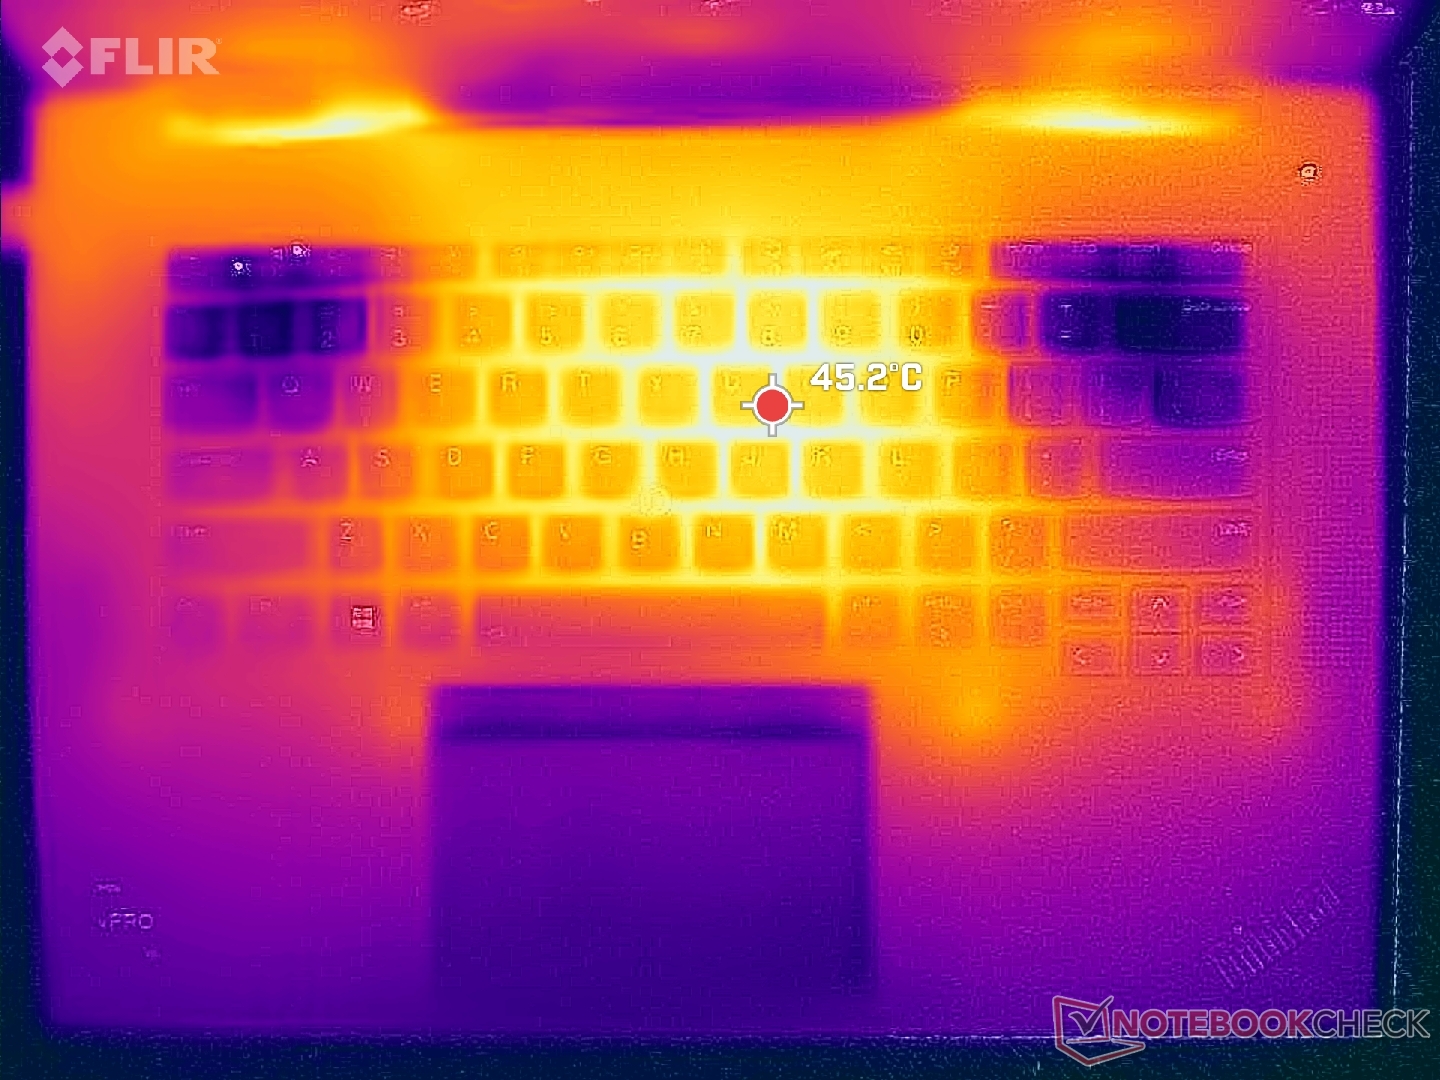
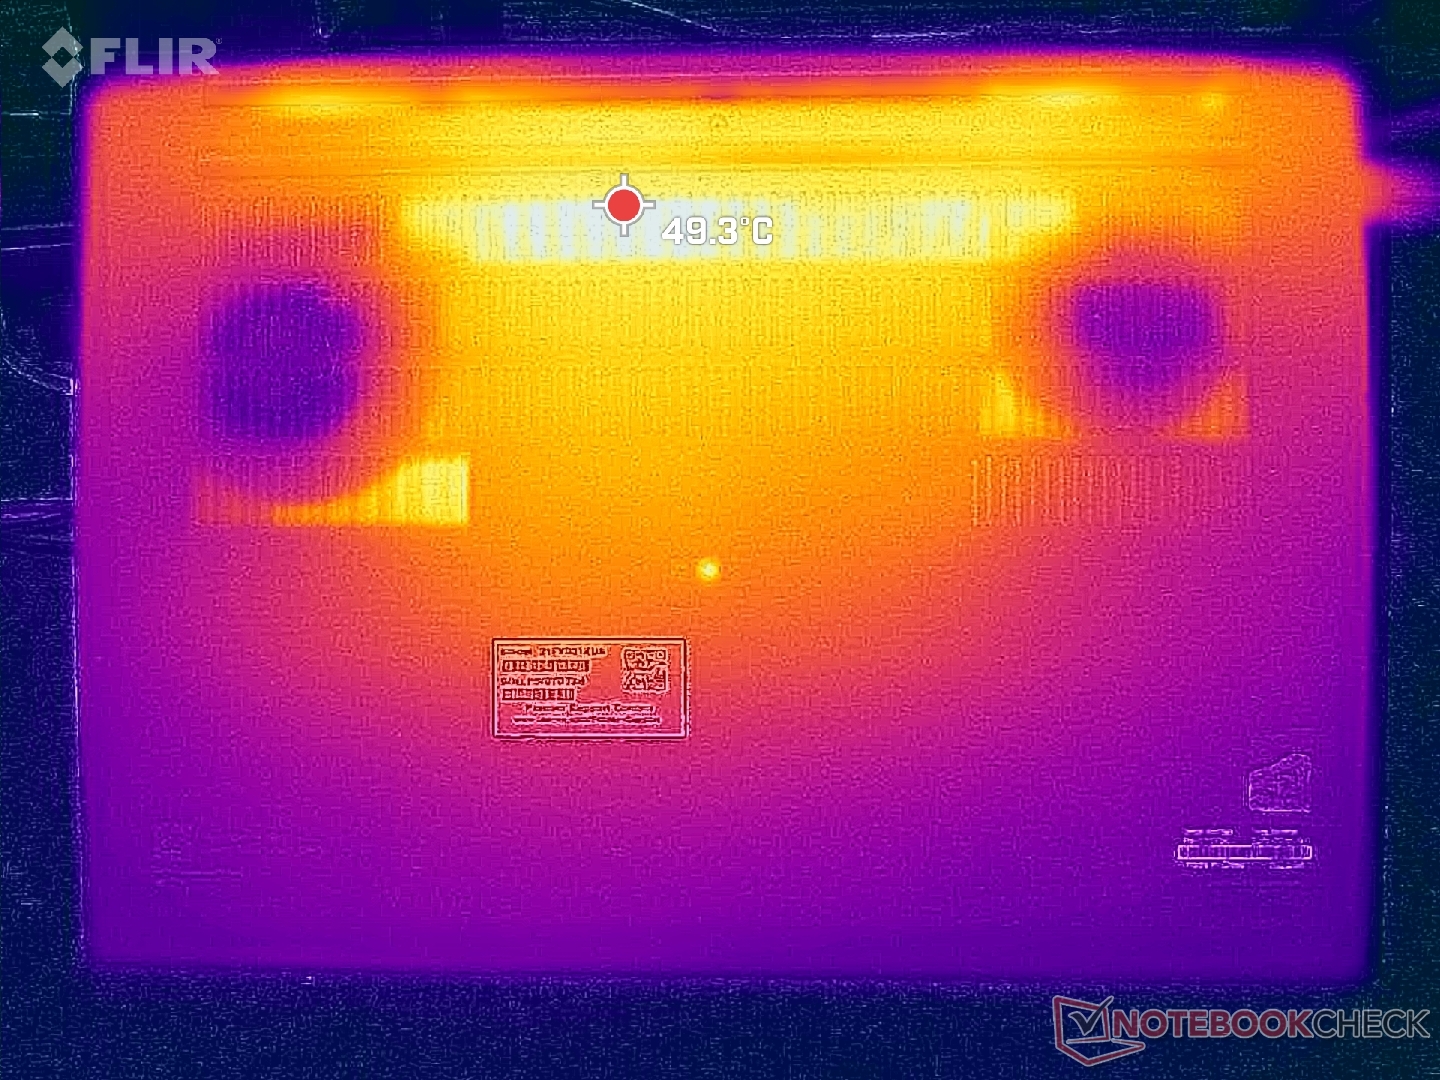
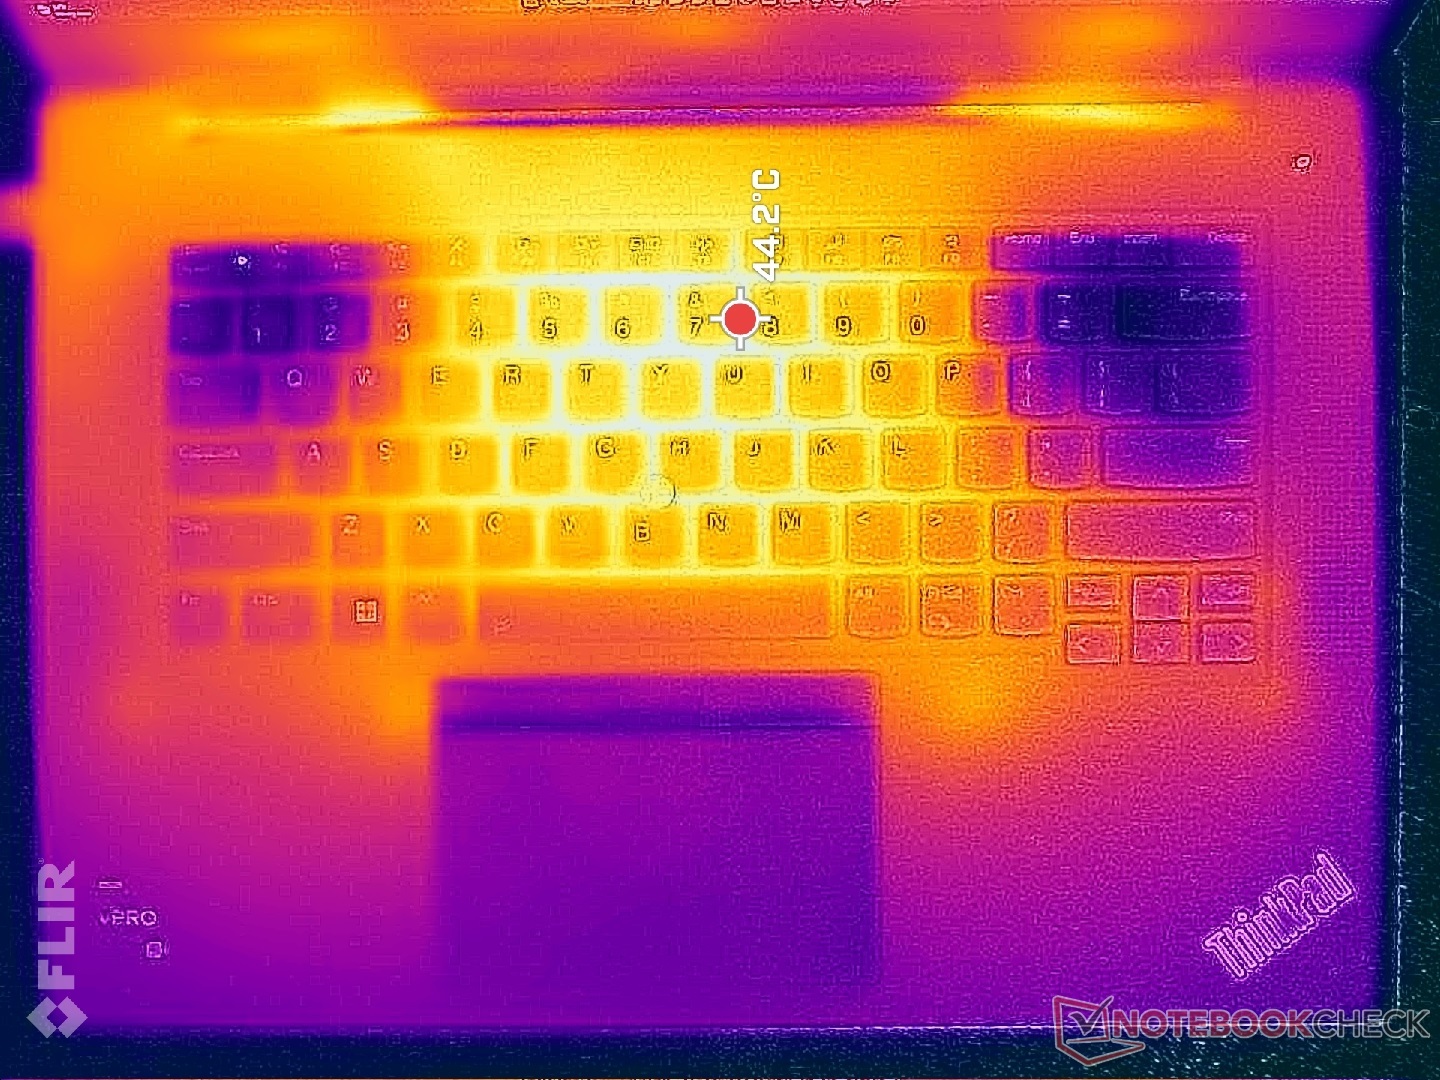
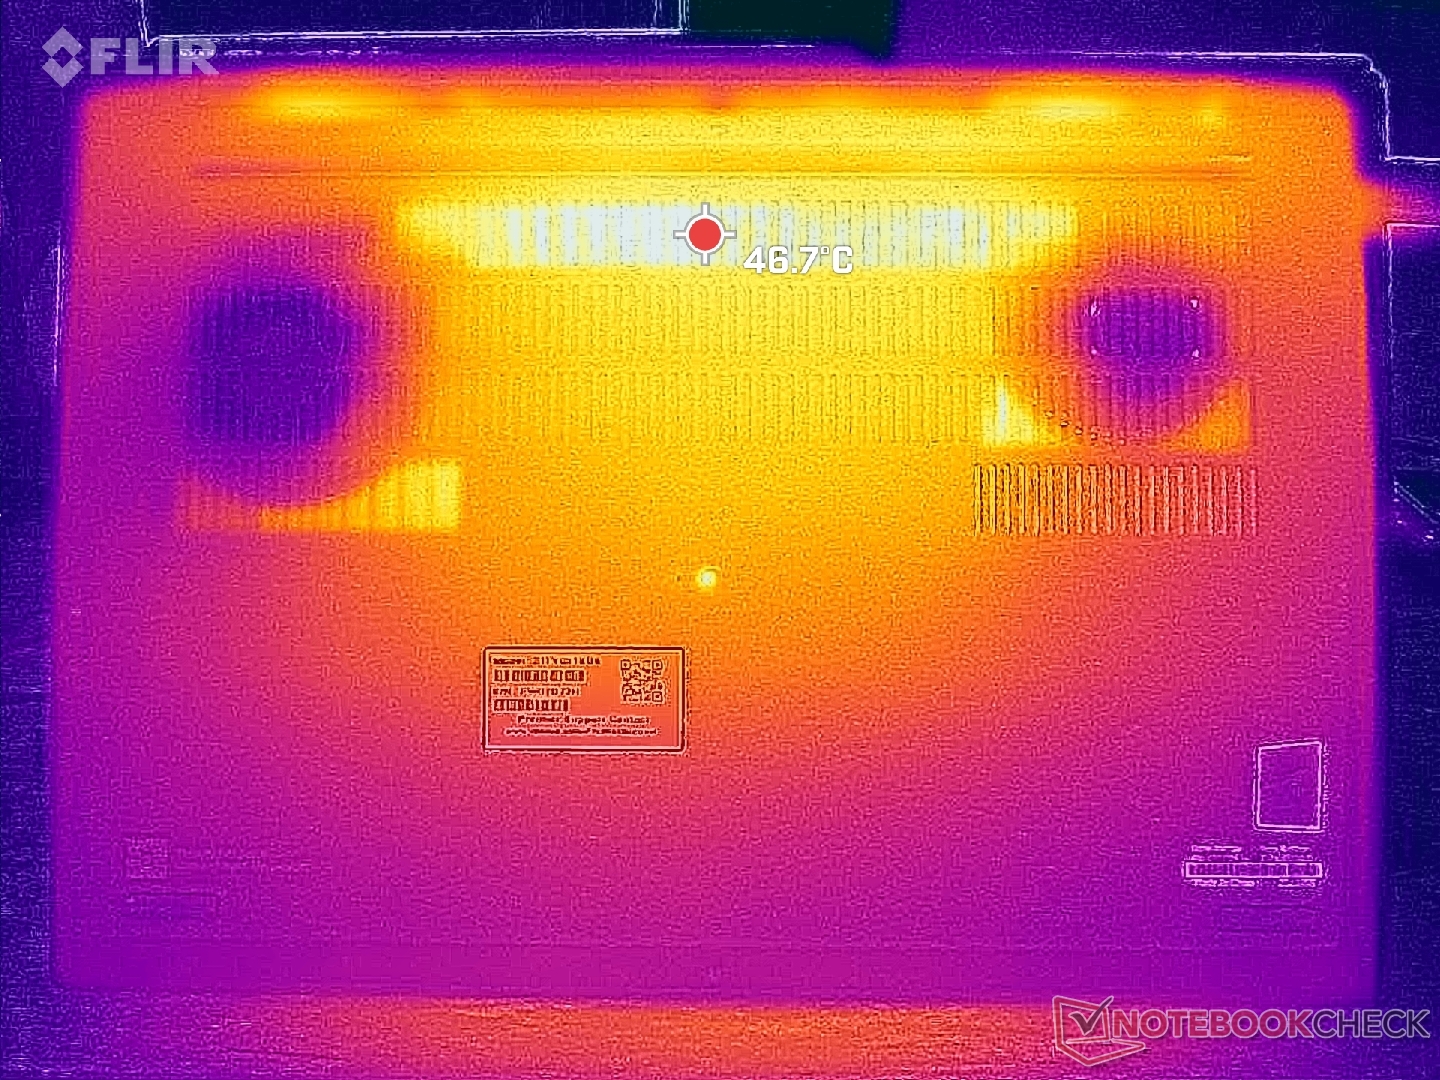
Temperatury powierzchni mogą być dość wysokie nawet podczas pracy na biegu jałowym na pulpicie, ponieważ wentylatory mają tendencję do letargu, dopóki nie zostaną wprowadzone znacznie wyższe obciążenia. Gorące punkty na klawiaturze i dolnej powierzchni mogą wynosić odpowiednio 45 C i 49 C, w porównaniu do 51 C i 32 C w konkurencyjnych laptopach Dell Precision 5680.
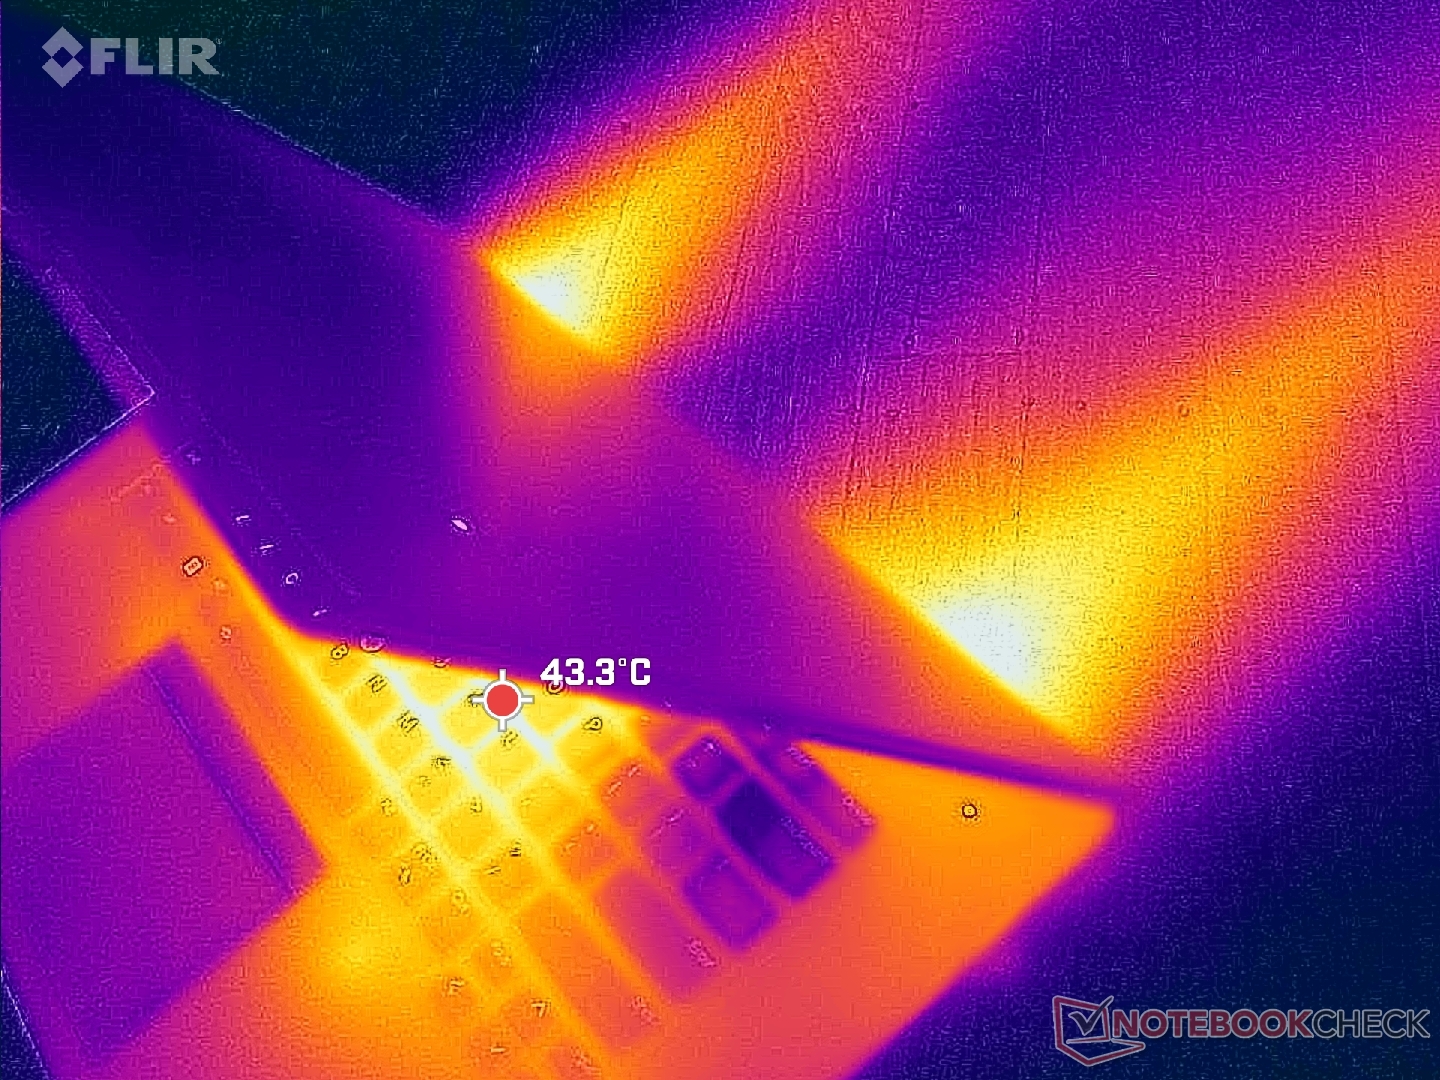
(±) Maksymalna temperatura w górnej części wynosi 42 °C / 108 F, w porównaniu do średniej 38.2 °C / 101 F , począwszy od 22.2 do 69.8 °C dla klasy Workstation.
(-) Dno nagrzewa się maksymalnie do 45.2 °C / 113 F, w porównaniu do średniej 41.1 °C / 106 F
(+) W stanie bezczynności średnia temperatura górnej części wynosi 29 °C / 84 F, w porównaniu ze średnią temperaturą urządzenia wynoszącą 32 °C / ### class_avg_f### F.
(±) Podczas gry w Wiedźmina 3 średnia temperatura górnej części wynosi 36.1 °C / 97 F, w porównaniu do średniej temperatury urządzenia wynoszącej 32 °C / ## #class_avg_f### F.
(+) Podpórki pod nadgarstki i touchpad są chłodniejsze niż temperatura skóry i maksymalnie 30.8 °C / 87.4 F i dlatego są chłodne w dotyku.
(-) Średnia temperatura obszaru podparcia dłoni w podobnych urządzeniach wynosiła 27.8 °C / 82 F (-3 °C / -5.4 F).
| Lenovo ThinkPad P1 G6 21FV001KUS Intel Core i7-13800H, NVIDIA GeForce RTX 4080 Laptop GPU | Lenovo ThinkPad P1 G6-21FV000DGE Intel Core i9-13900H, NVIDIA RTX 2000 Ada Generation Laptop | Lenovo ThinkPad P1 G4-20Y4S0KS00 Intel Core i7-11850H, NVIDIA GeForce RTX 3070 Laptop GPU | Lenovo ThinkPad P16 G1 RTX A5500 Intel Core i9-12950HX, NVIDIA RTX A5500 Laptop GPU | Dell Precision 5000 5680 Intel Core i9-13900H, NVIDIA RTX 5000 Ada Generation Laptop | HP ZBook Fury 16 G10 Intel Core i9-13950HX, NVIDIA RTX 5000 Ada Generation Laptop | |
|---|---|---|---|---|---|---|
| Heat | 1% | -1% | -4% | 3% | -2% | |
| Maximum Upper Side * (°C) | 42 | 47.1 -12% | 51 -21% | 44.8 -7% | 50.2 -20% | 44.8 -7% |
| Maximum Bottom * (°C) | 45.2 | 56.5 -25% | 53.5 -18% | 49.8 -10% | 32 29% | 50 -11% |
| Idle Upper Side * (°C) | 33 | 28.1 15% | 28.8 13% | 30.6 7% | 37.4 -13% | 34.4 -4% |
| Idle Bottom * (°C) | 37 | 27.6 25% | 29.3 21% | 38.6 -4% | 31.2 16% | 31.8 14% |
* ... im mniej tym lepiej
Test warunków skrajnych
Pod obciążeniem Prime95 procesor zwiększał taktowanie do 4,1 GHz i 111 W tylko przez kilka pierwszych sekund, po czym spadał i stabilizował się na poziomie 75 W i zakresie od 2,5 do 3,1 GHz. Co najważniejsze, temperatura rdzenia ustabilizowała się na bardzo ciepłym poziomie 97 C, co sugeruje, że procesor przesuwa rozwiązanie chłodzące do granic możliwości, aby zmaksymalizować potencjał Turbo Boost.
Wydajność układu graficznego spada, jeśli jest on uruchomiony w trybie zrównoważonym zamiast w trybie wydajności, jak wspomniano powyżej. Dla przykładu, GPU ustabilizowałoby się na poziomie 1890 MHz, 79 W i 77 C podczas pracy w trybie Witcher 3 w trybie wydajności w porównaniu do zaledwie 1470 MHz, 52 W i 67 C w trybie zrównoważonym.
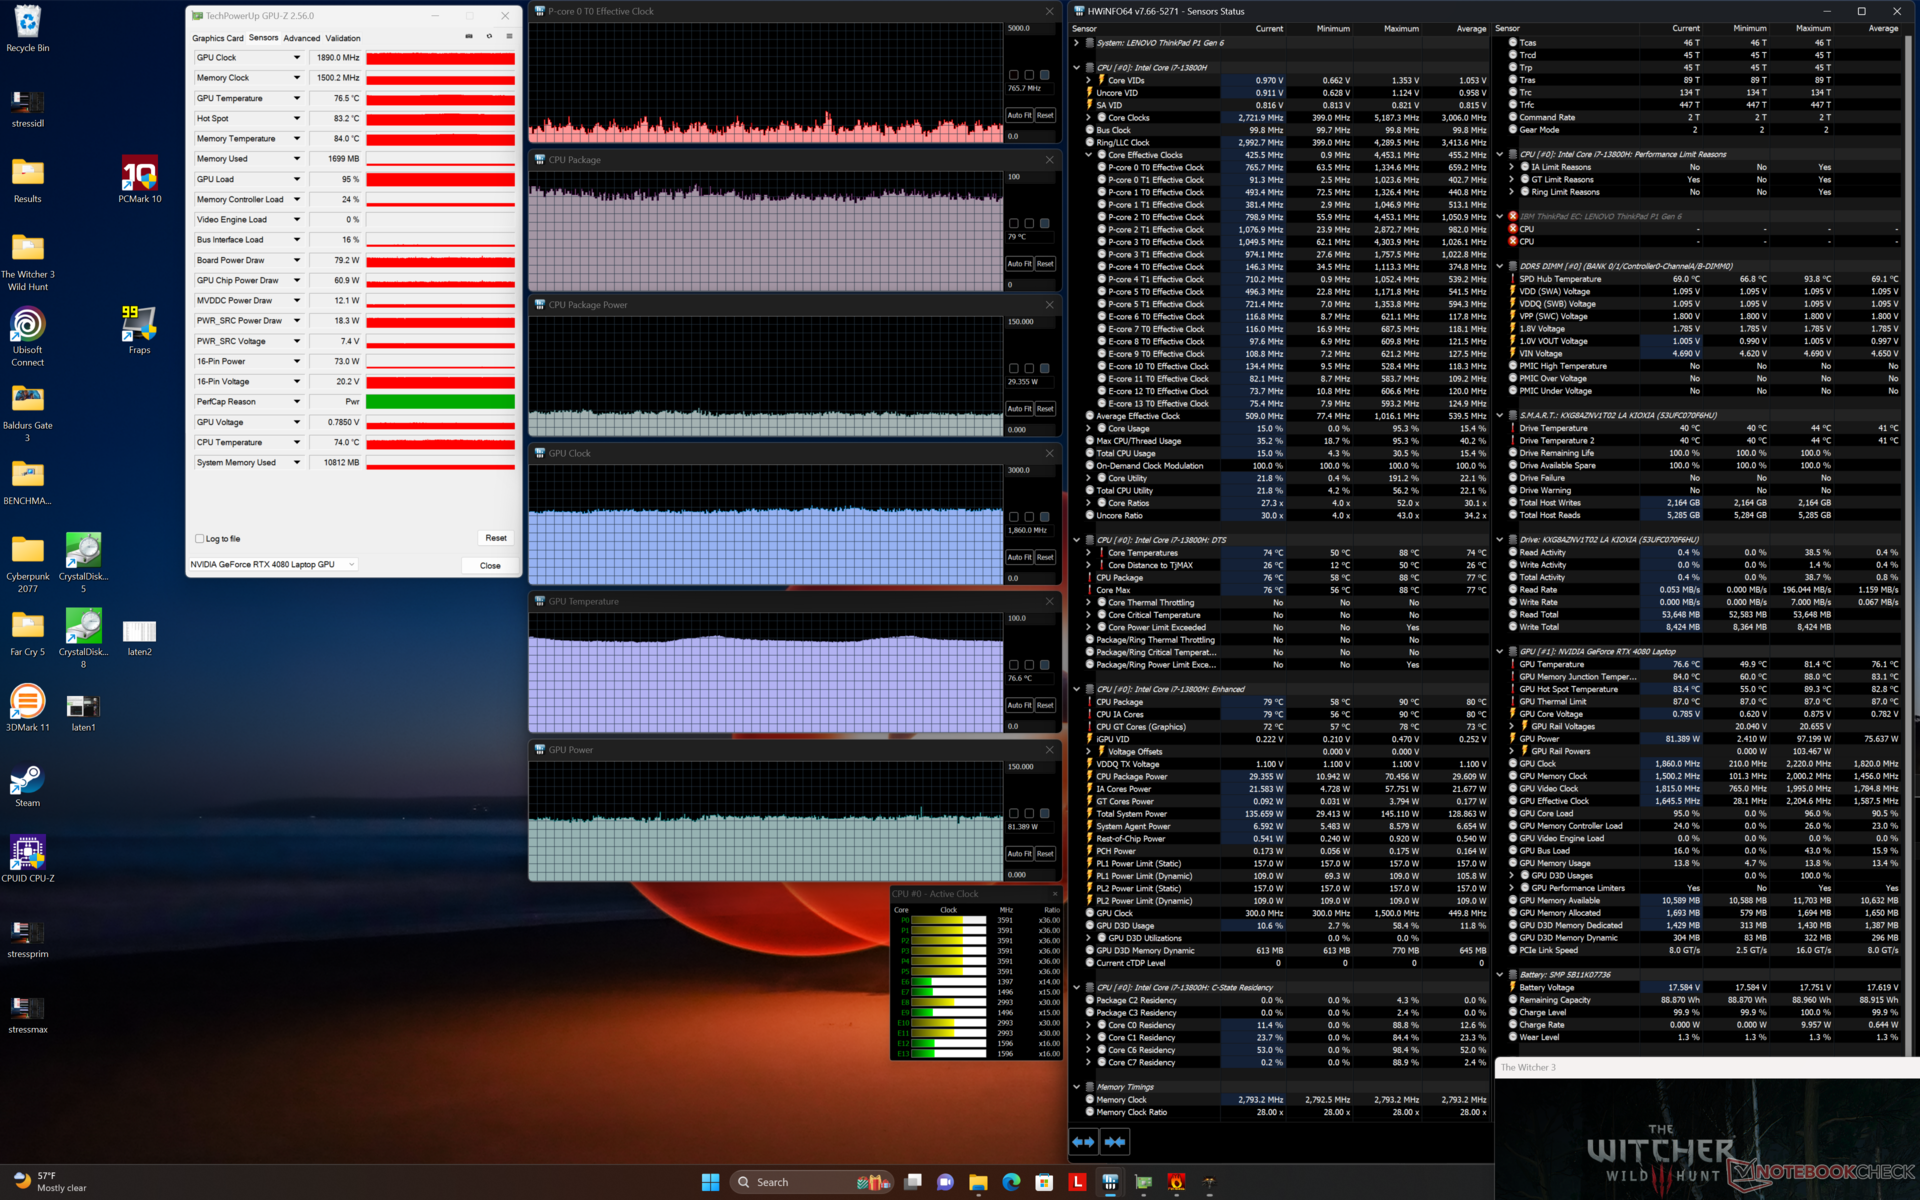
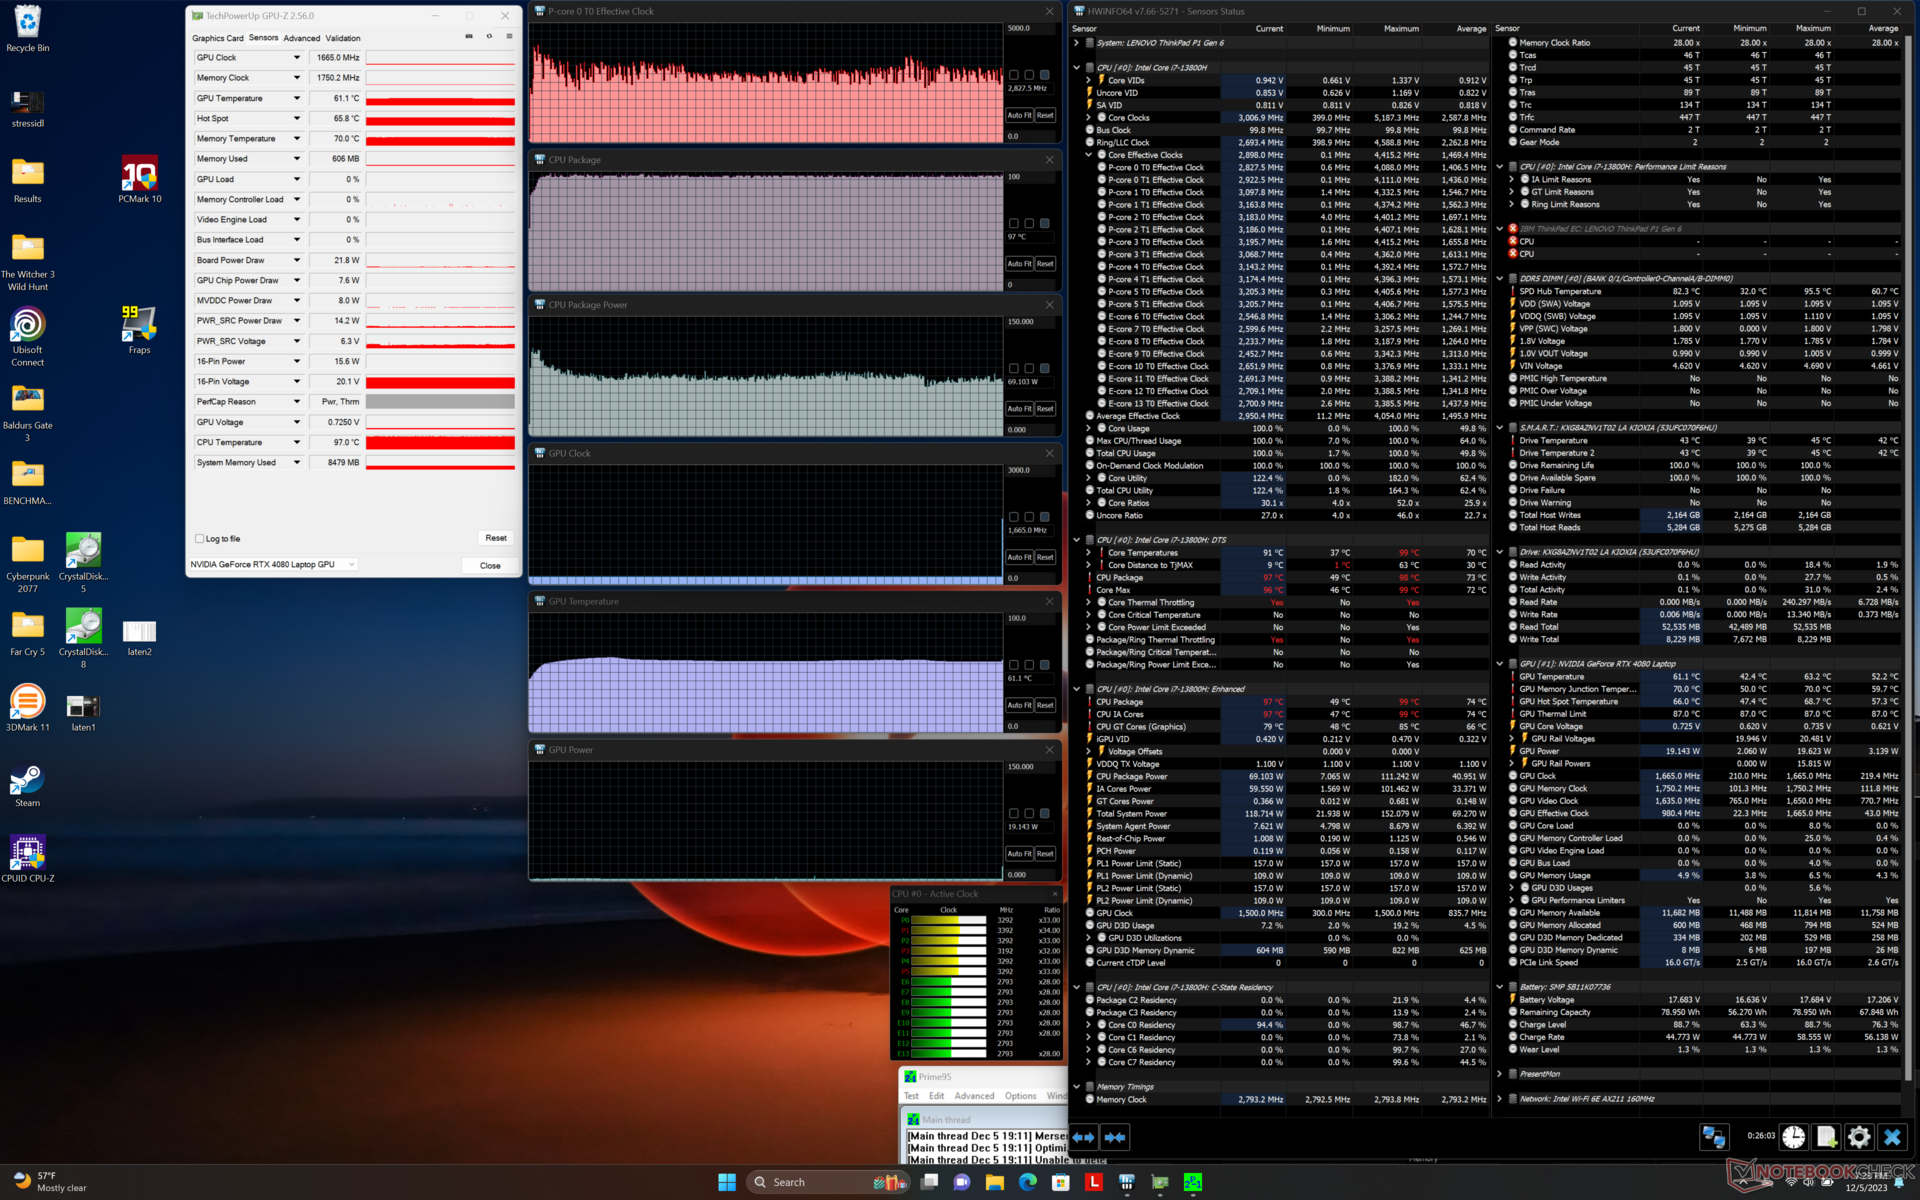
| Taktowanie CPU (GHz) | Taktowanie GPU (MHz) | Średnia temperatura CPU (°C) | Średnia temperatura GPU (°C) | |
| System w stanie spoczynku | -- | -- | 53 | 43 |
| Prime95Stress | -- | -- | 2.5 - 3.1 | 97 |
| Prime95+ FurMark Stress | ~2.1 - 3.1 | ~1071 | 86 | 72 |
| Witcher 3 Obciążenie (trybzrównoważony) | 0.8 | 1470 | 69 | 67 |
| Witcher 3 Obciążenie (trybwydajności) | ~0.8 | 1890 | 79 | 77 |
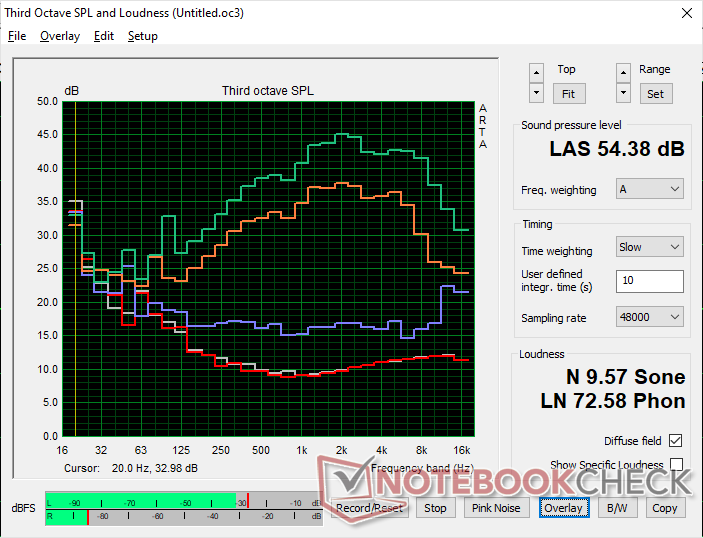
Głośniki
Lenovo ThinkPad P1 G6 21FV001KUS analiza dźwięku
(+) | głośniki mogą odtwarzać stosunkowo głośno (85.2 dB)
Bas 100 - 315 Hz
(±) | zredukowany bas - średnio 8% niższy od mediany
(±) | liniowość basu jest średnia (10.2% delta do poprzedniej częstotliwości)
Średnie 400 - 2000 Hz
(±) | wyższe średnie - średnio 7.7% wyższe niż mediana
(+) | średnie są liniowe (4.7% delta do poprzedniej częstotliwości)
Wysokie 2–16 kHz
(+) | zrównoważone maksima - tylko 4.2% od mediany
(+) | wzloty są liniowe (6.2% delta do poprzedniej częstotliwości)
Ogólnie 100 - 16.000 Hz
(+) | ogólny dźwięk jest liniowy (13.2% różnicy w stosunku do mediany)
W porównaniu do tej samej klasy
» 23% wszystkich testowanych urządzeń w tej klasie było lepszych, 6% podobnych, 71% gorszych
» Najlepszy miał deltę 7%, średnia wynosiła ###średnia###%, najgorsza wynosiła 35%
W porównaniu do wszystkich testowanych urządzeń
» 13% wszystkich testowanych urządzeń było lepszych, 3% podobnych, 84% gorszych
» Najlepszy miał deltę 4%, średnia wynosiła ###średnia###%, najgorsza wynosiła 134%
Apple MacBook Pro 16 2021 M1 Pro analiza dźwięku
(+) | głośniki mogą odtwarzać stosunkowo głośno (84.7 dB)
Bas 100 - 315 Hz
(+) | dobry bas - tylko 3.8% od mediany
(+) | bas jest liniowy (5.2% delta do poprzedniej częstotliwości)
Średnie 400 - 2000 Hz
(+) | zbalansowane środki średnie - tylko 1.3% od mediany
(+) | średnie są liniowe (2.1% delta do poprzedniej częstotliwości)
Wysokie 2–16 kHz
(+) | zrównoważone maksima - tylko 1.9% od mediany
(+) | wzloty są liniowe (2.7% delta do poprzedniej częstotliwości)
Ogólnie 100 - 16.000 Hz
(+) | ogólny dźwięk jest liniowy (4.6% różnicy w stosunku do mediany)
W porównaniu do tej samej klasy
» 0% wszystkich testowanych urządzeń w tej klasie było lepszych, 0% podobnych, 100% gorszych
» Najlepszy miał deltę 5%, średnia wynosiła ###średnia###%, najgorsza wynosiła 45%
W porównaniu do wszystkich testowanych urządzeń
» 0% wszystkich testowanych urządzeń było lepszych, 0% podobnych, 100% gorszych
» Najlepszy miał deltę 4%, średnia wynosiła ###średnia###%, najgorsza wynosiła 134%
Zarządzanie energią
Zużycie energii
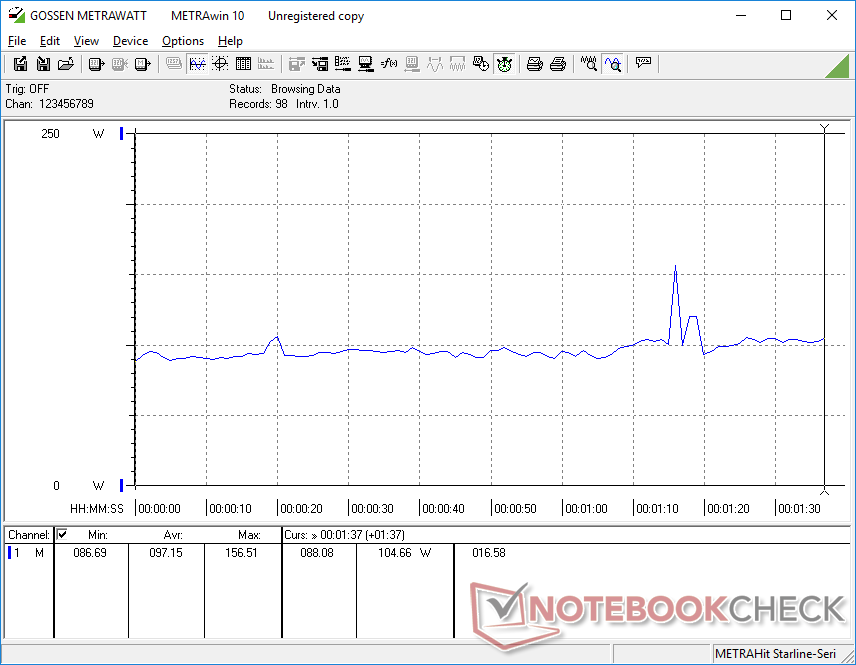
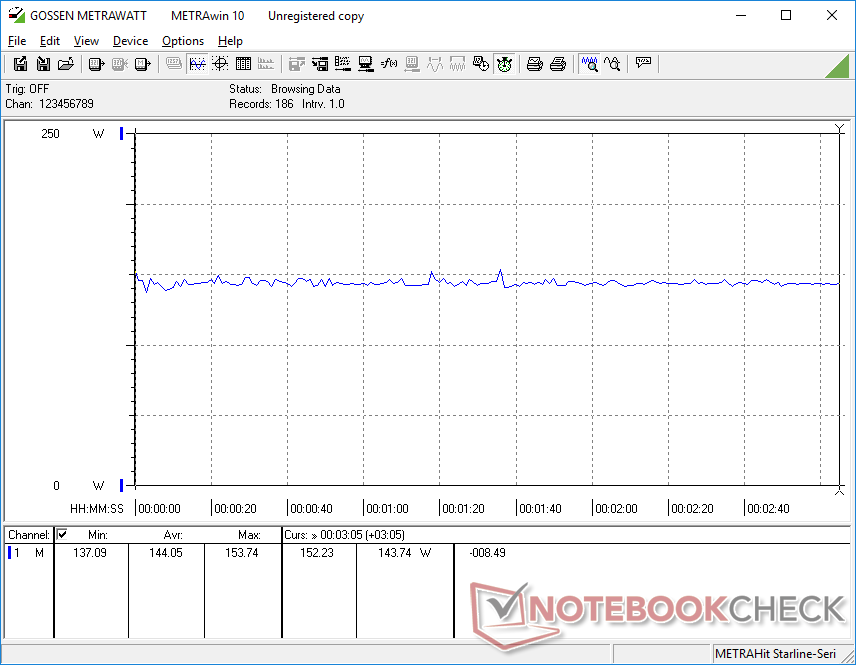
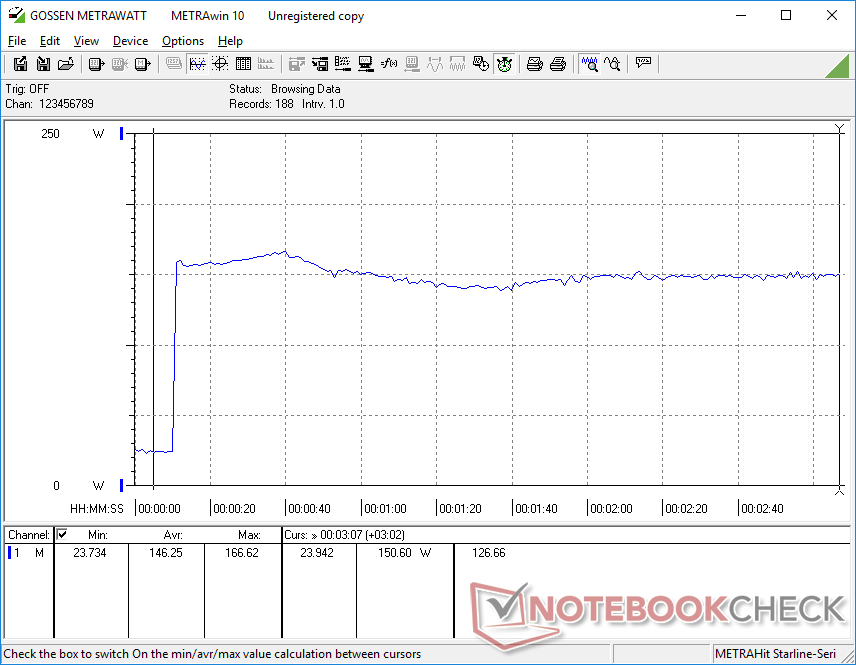
Nasza jednostka testowa jest generalnie bardziej wymagająca niż konfiguracja z mniejszą mocą RTX 2000, co wyjaśnia krótszy czas pracy na baterii w następnej sekcji. Uruchomienie Witcher 3 do reprezentowania wymagających obciążeń, na przykład, zużyłoby o 37 procent więcej energii.
Jesteśmy w stanie zarejestrować maksymalny pobór mocy na poziomie 197 W ze średniej wielkości (~17 x 8,8 x 2,5 cm) zasilacza 230 W, gdy CPU i GPU są wykorzystywane w 100 procentach.
| wyłączony / stan wstrzymania | |
| luz | |
| obciążenie |
|
Legenda:
min: | |
| Lenovo ThinkPad P1 G6 21FV001KUS i7-13800H, GeForce RTX 4080 Laptop GPU, Kioxia XG8 KXG8AZNV1T02, OLED, 3480x2400, 16" | Lenovo ThinkPad P1 G6-21FV000DGE i9-13900H, RTX 2000 Ada Generation Laptop, SK Hynix PC711 1TB HFS001TDE9X084N, IPS, 2560x1600, 16" | Lenovo ThinkPad P1 G4-20Y4S0KS00 i7-11850H, GeForce RTX 3070 Laptop GPU, Samsung PM9A1 MZVL21T0HCLR, IPS LED, 3840x2400, 16" | Lenovo ThinkPad P16 G1 RTX A5500 i9-12950HX, RTX A5500 Laptop GPU, WDC PC SN810 2TB, IPS, 3840x2400, 16" | Dell Precision 5000 5680 i9-13900H, RTX 5000 Ada Generation Laptop, 2x SK hynix PC801 HFS512GEJ9X101N RAID 0, OLED, 3840x2400, 16" | HP ZBook Fury 16 G10 i9-13950HX, RTX 5000 Ada Generation Laptop, SK hynix PC801 HFS001TEJ9X101N, IPS, 3840x2400, 16" | |
|---|---|---|---|---|---|---|
| Power Consumption | 5% | -15% | -51% | 0% | -46% | |
| Idle Minimum * (Watt) | 8 | 8.3 -4% | 8.1 -1% | 7.5 6% | 8 -0% | 15.3 -91% |
| Idle Average * (Watt) | 9.5 | 14.5 -53% | 20.2 -113% | 20.1 -112% | 10.4 -9% | 18.2 -92% |
| Idle Maximum * (Watt) | 23.7 | 15.3 35% | 21.9 8% | 40 -69% | 30.5 -29% | 28 -18% |
| Load Average * (Watt) | 97.2 | 91.8 6% | 88.2 9% | 137 -41% | 75.4 22% | 137.9 -42% |
| Witcher 3 ultra * (Watt) | 144 | 104.7 27% | 149 -3% | 208 -44% | 134 7% | 189.4 -32% |
| Load Maximum * (Watt) | 197.2 | 164.5 17% | 170.6 13% | 285.9 -45% | 175 11% | 202 -2% |
* ... im mniej tym lepiej
Power Consumption Witcher 3 / Stresstest
Power Consumption external Monitor
Żywotność baterii
Czasy pracy są znacznie krótsze niż w przypadku konfiguracji z RTX 2000 o ponad połowę ze względu na bardziej wymagający wyświetlacz OLED i szybszy procesor graficzny. Udało nam się uzyskać jedynie nieco ponad 4 godziny rzeczywistego przeglądania sieci WLAN, nawet przy zrównoważonym profilu zasilania.
| Lenovo ThinkPad P1 G6 21FV001KUS i7-13800H, GeForce RTX 4080 Laptop GPU, 90 Wh | Lenovo ThinkPad P1 G6-21FV000DGE i9-13900H, RTX 2000 Ada Generation Laptop, 90 Wh | Lenovo ThinkPad P1 G4-20Y4S0KS00 i7-11850H, GeForce RTX 3070 Laptop GPU, 90 Wh | Lenovo ThinkPad P16 G1 RTX A5500 i9-12950HX, RTX A5500 Laptop GPU, 94 Wh | Dell Precision 5000 5680 i9-13900H, RTX 5000 Ada Generation Laptop, 98 Wh | HP ZBook Fury 16 G10 i9-13950HX, RTX 5000 Ada Generation Laptop, 95 Wh | |
|---|---|---|---|---|---|---|
| Czasy pracy | 126% | 67% | 38% | 136% | 74% | |
| WiFi v1.3 (h) | 4.2 | 9.5 126% | 7 67% | 5.8 38% | 9.9 136% | 7.3 74% |
| H.264 (h) | 11.2 | 7.2 | ||||
| Load (h) | 1.1 | 1.2 | 1.7 | |||
| Reader / Idle (h) | 17.9 |
Za
Przeciw
Werdykt - większa wydajność kosztem czasu pracy na baterii
ThinkPad P1 G6 oferuje szeroką gamę poziomów konfiguracji, w tym IPS, OLED, Core i7, Core i9 oraz opcje GPU GeForce RTX lub RTX Ada. W oparciu o nasz czas spędzony z dwiema bardzo różnymi konfiguracjami, dwie opcje procesora (Core i7-13800H vs Core i9-13900H) mają minimalne różnice między nimi, co oznacza, że rozsądnie byłoby wybrać tańszy Core i7, a następnie wydać dodatkowe dolary gdzie indziej.
Jeśli chodzi o wyświetlacz, to mamy do wyboru IPS 1600p i OLED 2400p. Pierwszy z nich oferuje szybszą natywną częstotliwość odświeżania i wyższą maksymalną jasność, podczas gdy drugi oferuje ekran dotykowy, kolory DCI-P3, minimalny ghosting i obsługę HDR400. Przyszłe modele mogą zawierać panele OLED 120 Hz, które stają się coraz bardziej powszechne w modelach takich jak Asus VivoBook.
ThinkPad P1 G6 oferuje wysoką wydajność w przeliczeniu na objętość, aczkolwiek kosztem czasu pracy na baterii, głośniejszych wentylatorów i ograniczonych możliwości rozbudowy w porównaniu do mniejszych konfiguracji.
Konfiguracja szybszych opcji GPU, takich jak RTX 5000 lub nasz RTX 4080 zamiast RTX 2000, pociąga za sobą pewne wady. Ulepszenia pamięci wewnętrznej stają się bardziej ograniczone, hałas wentylatora staje się głośniejszy pod obciążeniem, a żywotność baterii zauważalnie spada. Musimy również wspomnieć o zacinaniu się liczby klatek na sekundę podczas strumieniowania wideo i stosunkowo niskim pułapie 80 W TGP. Mimo to ThinkPad P1 G6 jest jedną z najszybszych mobilnych stacji roboczych w swoim rozmiarze i wadze. Aby uzyskać coś rozsądnie szybszego, należy rozważyć bardziej masywną serię ThinkPad P16 zamiast tego.
Cena i dostępność
Lenovo dostarcza obecnie ThinkPada P1 G6 w wielu konfiguracjach, zaczynając od 1680 USD za podstawową konfigurację Core i7/RTX A1000/1200p IPS do 2700 USD i więcej w przypadku konfiguracji z RTX 4080.
Lenovo ThinkPad P1 G6 21FV001KUS
- 08/12/2023 v7 (old)
Allen Ngo
Przezroczystość
Wyboru urządzeń do recenzji dokonuje nasza redakcja. Próbka testowa została udostępniona autorowi jako pożyczka od producenta lub sprzedawcy detalicznego na potrzeby tej recenzji. Pożyczkodawca nie miał wpływu na tę recenzję, producent nie otrzymał też kopii tej recenzji przed publikacją. Nie było obowiązku publikowania tej recenzji. Jako niezależna firma medialna, Notebookcheck nie podlega władzy producentów, sprzedawców detalicznych ani wydawców.
Tak testuje Notebookcheck
Każdego roku Notebookcheck niezależnie sprawdza setki laptopów i smartfonów, stosując standardowe procedury, aby zapewnić porównywalność wszystkich wyników. Od około 20 lat stale rozwijamy nasze metody badawcze, ustanawiając przy tym standardy branżowe. W naszych laboratoriach testowych doświadczeni technicy i redaktorzy korzystają z wysokiej jakości sprzętu pomiarowego. Testy te obejmują wieloetapowy proces walidacji. Nasz kompleksowy system ocen opiera się na setkach uzasadnionych pomiarów i benchmarków, co pozwala zachować obiektywizm.Price comparison

