
Werdykt - szczuplejszy i lżejszy z pewnymi kompromisami
Dell 16 Plus 2 w 1 to zarówno ulepszenie, jak i obniżenie wersji w stosunku do zeszłorocznego Inspiron 16 7640 2-w-1. Jest nieco lżejszy i cieńszy, a jego wydajność graficzna jest znacznie wyższa niż wcześniej, co może być korzystne dla podróżników, zwykłych graczy lub zadań z akceleracją GPU.
Niektóre ze zmian w porównaniu rok do roku mogą nie być dla wszystkich. W szczególności przejście z procesorów Core Ultra-H na Core Ultra-V zmniejszyło surową moc obliczeniową o spory margines. W międzyczasie przestawione porty są prawdopodobnie gorsze, ponieważ oba porty USB-C są teraz upakowane blisko siebie, co wpływa na ergonomię dokowania. Pojemność baterii również została znacznie zmniejszona do tego stopnia, że czas pracy na baterii jest krótszy niż w Inspironie 16 7640 2-w-1, mimo że starszy system jest dostarczany z szybszym procesorem Core Ultra-H.
Zrównoważeni użytkownicy, którzy potrafią docenić zintegrowaną klawiaturę numeryczną i stosunkowo szybkie iGPU, mogą preferować nowszy Dell 16 Plus 2-w-1. W przeciwnym razie, zaawansowani użytkownicy, którzy polegają na surowej mocy procesora, mogą nadal chcieć starszego Inspirona 16 7640 2-w-1, zwłaszcza że oba modele mają dokładnie te same panele, co zapewnia identyczne wrażenia wizualne.
Za
Przeciw
Cena i dostępność
Dell dostarcza teraz Dell 16 Plus 2-w-1 w cenie od 950 USD z panelem IPS lub 1500 USD z mini-LED.
- $999.99Dell 16 Plus 2-in-1 Business Laptop, 16" FHD+ Touchscreen, Intel Core Ultra 7 256V(8 Cores, up to 4.8 GHz) Intel Arc Graphics, 16GB DDR5, 512GB SSD, Backlit, Windows 11 Home, with SVT Stylus Pen Hub
- $1,079.99Dell 16 Plus LDB06250 AI Business 2-in-1 Laptop 16'' Touch WQXGA Display
- $1,199.00Dell Plus 16" FHD 2-in-1 Touchscreen Laptop, Intel Core Ultra 7 256V, 16GB RAM, 2TB Storage(1TB SSD+1TB Docking Station Set), Backlit Keyboard, Webcam, Wi-Fi 7, Copilot, Win 11 Pro, Ice Blue
Dell 16 Plus 2-w-1 to konwertowalna wersja laptopa Dell 16 Plus clamshell i bezpośrednim następcą 2024 Inspiron 16 7640 2-w-1. Reprezentuje początek nowej generacji laptopów głównego nurtu zaprojektowanych w celu zastąpienia starej konwencji nazewnictwa Inspiron.
Nasza jednostka testowa to środkowa konfiguracja z procesorem Core Ultra 7 256V i ekranem dotykowym Mini-LED 2,5K 90 Hz za około 1400 USD. Niższe jednostki SKU mogą być wyposażone w bardziej tradycyjny ekran dotykowy FHD IPS, podczas gdy wyższe jednostki SKU są dostarczane z procesorem Core Ultra 9 288V.
Konkurentami Dell 16 Plus 2 w 1 są inne 16-calowe multimedialne komputery konwertowalne, takie jak HP Envy x360 2-w-1 16, Lenovo Yoga 7 2-w-1 16ILL10lub Samsung Galaxy Book5 Pro 360.
Więcej recenzji Dell:
Specyfikacje
Sprawa
Obudowa nawiązuje do modelu Inspiron 16 7640 2-w-1, wykorzystując podobne materiały aluminiowe i plastikowe, aby zapewnić znajomą "Inspironową" atmosferę i jakość. Wymiary i waga obu modeli są niemal identyczne, z wyjątkiem nieco cieńszego profilu nowszego modelu.

Łączność
Opcje portów są identyczne jak w zeszłorocznym Inspironie, aczkolwiek z jedną ważną różnicą: pominięciem zintegrowanego czytnika kart SD. Dwa porty USB-C również zostały zmienione, prawdopodobnie na gorsze, ponieważ nie można już ładować systemu wzdłuż jego prawej krawędzi.


Komunikacja
Kamera internetowa
Kamera internetowa 2 MP jest standardowo wyposażona w fizyczną migawkę i nie ma podczerwieni.


Konserwacja

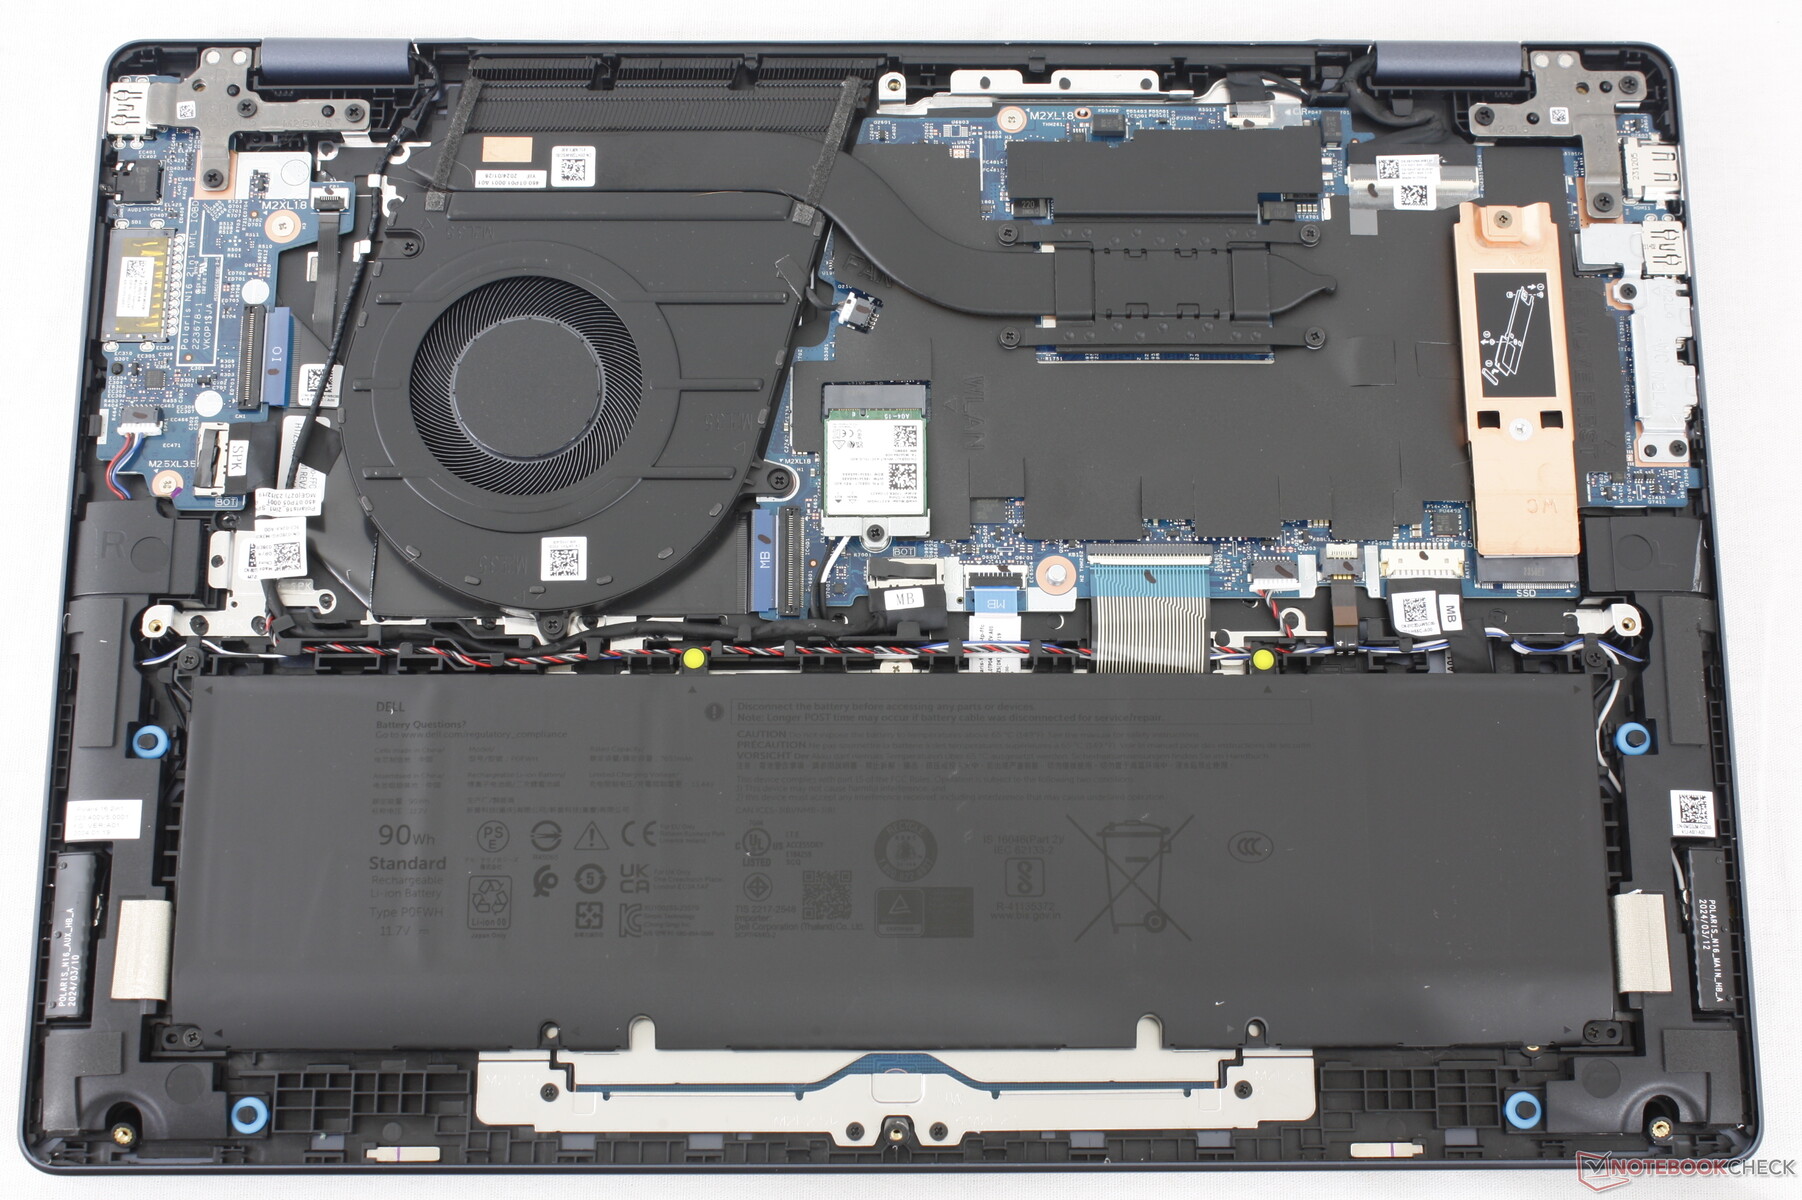
Zrównoważony rozwój
Dell nie oznaczył wyraźnie żadnych materiałów pochodzących z recyklingu użytych podczas produkcji Dell 16 Plus 2-w-1. Opakowanie nie wykorzystuje plastiku, co ułatwia recykling.
Akcesoria i gwarancja
Pudełko detaliczne zawiera zasilacz sieciowy i dokumentację. W przypadku zakupu w Stanach Zjednoczonych obowiązuje standardowa roczna gwarancja producenta.
Urządzenia wejściowe
Klawiatura i panel dotykowy
Klawiatura i clickpad są 1:1 z Dell 16 Plus clamshell zapewniając identyczne wrażenia. Jest to ulepszenie pod względem wydajności w stosunku do zeszłorocznego Inspirona 16 7640 2 w 1, który preferował duże kratki głośników nad zintegrowanym numpadem.
Wyświetlacz

System wykorzystuje dokładnie ten sam panel mini-LED AU Optronics B160QAT, który można znaleźć w zeszłorocznym Inspironie 16 7640 2-w-1, zapewniając takie same wrażenia wizualne między dwoma modelami. Panele mini-LED są zwykle jaśniejsze i mają głębsze kolory niż większość paneli IPS, co zapewnia lepszą obsługę HDR, ale mogą wykazywać efekty halo i słabsze poziomy czerni, które nie występują w przypadku paneli OLED.
Maksymalna jasność może osiągnąć 642 nitów po włączeniu HDR lub 432 nitów w domyślnym trybie SDR.


| |||||||||||||||||||||||||
rozświetlenie: 97 %
na akumulatorze: 432.1 cd/m²
kontrast: ∞:1 (czerń: 0 cd/m²)
ΔE ColorChecker Calman: 1.95 | ∀{0.5-29.43 Ø4.71}
calibrated: 1.16
ΔE Greyscale Calman: 2 | ∀{0.09-98 Ø4.96}
94.2% AdobeRGB 1998 (Argyll 3D)
100% sRGB (Argyll 3D)
99.5% Display P3 (Argyll 3D)
Gamma: 2.3
CCT: 6222 K
| Dell 16 Plus 2-in-1 AU Optronics B160QAT, Mini-LED, 2560x1600, 16", 90 Hz | Dell Inspiron 16 7640 2-in-1 AU Optronics B160QAT, Mini-LED, 2560x1600, 16", 90 Hz | Lenovo Yoga 7 2-in-1 16ILL10 LEN160WUM, IPS, 1920x1200, 16", 60 Hz | Samsung Galaxy Book5 Pro 360 ATNA60CL09-0, OLED, 2880x1800, 16", 120 Hz | MSI Summit A16 AI Plus A3HMTG AU Optronics B16QAN02.N, IPS, 2560x1600, 16", 165 Hz | HP Envy x360 2-in-1 16-ad0097nr Samsung SDC41A6, OLED, 2880x1800, 16", 120 Hz | |
|---|---|---|---|---|---|---|
| Display | -1% | -53% | 1% | -4% | 1% | |
| Display P3 Coverage (%) | 99.5 | 99.4 0% | 39.7 -60% | 99.9 0% | 96.8 -3% | 99.6 0% |
| sRGB Coverage (%) | 100 | 100 0% | 57.9 -42% | 100 0% | 99.8 0% | 100 0% |
| AdobeRGB 1998 Coverage (%) | 94.2 | 92.5 -2% | 41 -56% | 96.6 3% | 84.7 -10% | 96.5 2% |
| Response Times | 32% | 50% | 73% | 80% | 98% | |
| Response Time Grey 50% / Grey 80% * (ms) | 48.8 ? | 15.4 ? 68% | 30 ? 39% | 0.48 ? 99% | 12.9 ? 74% | 0.8 ? 98% |
| Response Time Black / White * (ms) | 57.6 ? | 60.6 ? -5% | 22.5 ? 61% | 0.64 ? 99% | 8.9 ? 85% | 0.89 ? 98% |
| PWM Frequency (Hz) | 2807 ? | 2753.7 ? | 240 ? | 491.8 ? | ||
| PWM Amplitude * (%) | 50 | 40 20% | ||||
| Screen | -49% | -169% | 16% | -22% | -19% | |
| Brightness middle (cd/m²) | 432.1 | 413 -4% | 317.9 -26% | 387 -10% | 475.4 10% | 399.4 -8% |
| Brightness (cd/m²) | 426 | 409 -4% | 304 -29% | 392 -8% | 440 3% | 405 -5% |
| Brightness Distribution (%) | 97 | 97 0% | 90 -7% | 98 1% | 89 -8% | 98 1% |
| Black Level * (cd/m²) | 0.14 | 0.25 | 0.36 | |||
| Colorchecker dE 2000 * | 1.95 | 3.48 -78% | 7.39 -279% | 1 49% | 2.99 -53% | 4.05 -108% |
| Colorchecker dE 2000 max. * | 3.87 | 6.97 -80% | 21.43 -454% | 1.9 51% | 7.64 -97% | 6.69 -73% |
| Colorchecker dE 2000 calibrated * | 1.16 | 3.06 -164% | 0.74 36% | 1.02 12% | ||
| Greyscale dE 2000 * | 2 | 4.5 -125% | 6.5 -225% | 1.7 15% | 2.9 -45% | 1.1 45% |
| Gamma | 2.3 96% | 2.15 102% | 2.22 99% | 2.25 98% | 2.31 95% | 2.27 97% |
| CCT | 6222 104% | 6446 101% | 6140 106% | 6325 103% | 6472 100% | 6419 101% |
| Contrast (:1) | 2950 | 1272 | 1321 | |||
| Całkowita średnia (program / ustawienia) | -6% /
-21% | -57% /
-104% | 30% /
27% | 18% /
-1% | 27% /
5% |
* ... im mniej tym lepiej


Wyświetl czasy reakcji
| ↔ Czas reakcji od czerni do bieli | ||
|---|---|---|
| 57.6 ms ... wzrost ↗ i spadek ↘ łącznie | ↗ 50.4 ms wzrost |  |
| ↘ 7.2 ms upadek | ||
| W naszych testach ekran wykazuje powolne tempo reakcji, co będzie niezadowalające dla graczy. Dla porównania, wszystkie testowane urządzenia wahają się od 0.1 (minimum) do 240 (maksimum) ms. » 99 % wszystkich urządzeń jest lepszych. Oznacza to, że zmierzony czas reakcji jest gorszy od średniej wszystkich testowanych urządzeń (19.8 ms). | ||
| ↔ Czas reakcji 50% szarości do 80% szarości | ||
| 48.8 ms ... wzrost ↗ i spadek ↘ łącznie | ↗ 33.6 ms wzrost |  |
| ↘ 15.2 ms upadek | ||
| W naszych testach ekran wykazuje powolne tempo reakcji, co będzie niezadowalające dla graczy. Dla porównania, wszystkie testowane urządzenia wahają się od 0.165 (minimum) do 636 (maksimum) ms. » 84 % wszystkich urządzeń jest lepszych. Oznacza to, że zmierzony czas reakcji jest gorszy od średniej wszystkich testowanych urządzeń (30.9 ms). | ||
Migotanie ekranu / PWM (modulacja szerokości impulsu)
| Wykryto migotanie ekranu/wykryto PWM | 2807 Hz Amplitude: 50 % | ≤ 100 % ustawienia jasności |  |
Podświetlenie wyświetlacza miga z częstotliwością 2807 Hz (najgorszy przypadek, np. przy użyciu PWM) Wykryto migotanie przy ustawieniu jasności 100 % i poniżej. Powyżej tego ustawienia jasności nie powinno być żadnego migotania ani PWM. Częstotliwość 2807 Hz jest dość wysoka, więc większość użytkowników wrażliwych na PWM nie powinna zauważyć żadnego migotania. Dla porównania: 52 % wszystkich testowanych urządzeń nie używa PWM do przyciemniania wyświetlacza. Jeśli wykryto PWM, zmierzono średnio 7748 (minimum: 5 - maksimum: 343500) Hz. | |||


Wydajność


Warunki testowania
Przed uruchomieniem poniższych testów porównawczych ustawiliśmy Dell Optimizer na tryb wydajności.
Procesor
The Core Ultra 7 256V kładzie nacisk na wydajność w przeliczeniu na wat, a nie na surową wydajność, więc oferuje bardzo niewiele w porównaniu z ostatnią generacją Core Ultra 7 155U lub nawet Core i7-1355U jeśli użytkownicy nie korzystają ze zintegrowanej jednostki NPU. Być może najbardziej znaczący jest upgrade do droższego modelu Core Ultra 9 288V w oparciu o nasz czas spędzony z Acer Swift 16 AI, oczekuje się, że zwiększy wydajność tylko o marne 5 procent. The Core Ultra 7 155H w zeszłorocznym Inspironie 16 7640 2-w-1 jest około 1,5x szybszy niż nasz Core Ultra 256V.
Cinebench R15 Multi Loop
Cinebench R23: Multi Core | Single Core
Cinebench R20: CPU (Multi Core) | CPU (Single Core)
Cinebench R15: CPU Multi 64Bit | CPU Single 64Bit
Blender: v2.79 BMW27 CPU
7-Zip 18.03: 7z b 4 | 7z b 4 -mmt1
Geekbench 6.7: Multi-Core | Single-Core
Geekbench 5.5: Multi-Core | Single-Core
HWBOT x265 Benchmark v2.2: 4k Preset
LibreOffice : 20 Documents To PDF
R Benchmark 2.5: Overall mean
* ... im mniej tym lepiej
AIDA64: FP32 Ray-Trace | FPU Julia | CPU SHA3 | CPU Queen | FPU SinJulia | FPU Mandel | CPU AES | CPU ZLib | FP64 Ray-Trace | CPU PhotoWorxx
| Performance rating | |
| MSI Summit A16 AI Plus A3HMTG | |
| HP Envy x360 2-in-1 16-ad0097nr | |
| Dell Inspiron 16 7640 2-in-1 | |
| Dell 16 Plus 2-in-1 | |
| Lenovo Yoga 7 2-in-1 16ILL10 | |
| Przeciętny Intel Core Ultra 7 258V | |
| Samsung Galaxy Book5 Pro 360 | |
| AIDA64 / FP32 Ray-Trace | |
| MSI Summit A16 AI Plus A3HMTG | |
| HP Envy x360 2-in-1 16-ad0097nr | |
| Dell Inspiron 16 7640 2-in-1 | |
| Dell 16 Plus 2-in-1 | |
| Samsung Galaxy Book5 Pro 360 | |
| Lenovo Yoga 7 2-in-1 16ILL10 | |
| Przeciętny Intel Core Ultra 7 258V (8454 - 12781, n=26) | |
| AIDA64 / FPU Julia | |
| MSI Summit A16 AI Plus A3HMTG | |
| HP Envy x360 2-in-1 16-ad0097nr | |
| Dell Inspiron 16 7640 2-in-1 | |
| Samsung Galaxy Book5 Pro 360 | |
| Lenovo Yoga 7 2-in-1 16ILL10 | |
| Dell 16 Plus 2-in-1 | |
| Przeciętny Intel Core Ultra 7 258V (40875 - 63401, n=26) | |
| AIDA64 / CPU SHA3 | |
| MSI Summit A16 AI Plus A3HMTG | |
| HP Envy x360 2-in-1 16-ad0097nr | |
| Dell Inspiron 16 7640 2-in-1 | |
| Lenovo Yoga 7 2-in-1 16ILL10 | |
| Przeciętny Intel Core Ultra 7 258V (1930 - 2817, n=26) | |
| Samsung Galaxy Book5 Pro 360 | |
| Dell 16 Plus 2-in-1 | |
| AIDA64 / CPU Queen | |
| HP Envy x360 2-in-1 16-ad0097nr | |
| MSI Summit A16 AI Plus A3HMTG | |
| Dell Inspiron 16 7640 2-in-1 | |
| Dell 16 Plus 2-in-1 | |
| Lenovo Yoga 7 2-in-1 16ILL10 | |
| Przeciętny Intel Core Ultra 7 258V (48816 - 49818, n=24) | |
| Samsung Galaxy Book5 Pro 360 | |
| AIDA64 / FPU SinJulia | |
| MSI Summit A16 AI Plus A3HMTG | |
| HP Envy x360 2-in-1 16-ad0097nr | |
| Dell Inspiron 16 7640 2-in-1 | |
| Lenovo Yoga 7 2-in-1 16ILL10 | |
| Dell 16 Plus 2-in-1 | |
| Przeciętny Intel Core Ultra 7 258V (3817 - 4440, n=26) | |
| Samsung Galaxy Book5 Pro 360 | |
| AIDA64 / FPU Mandel | |
| MSI Summit A16 AI Plus A3HMTG | |
| HP Envy x360 2-in-1 16-ad0097nr | |
| Dell Inspiron 16 7640 2-in-1 | |
| Samsung Galaxy Book5 Pro 360 | |
| Lenovo Yoga 7 2-in-1 16ILL10 | |
| Dell 16 Plus 2-in-1 | |
| Przeciętny Intel Core Ultra 7 258V (21670 - 33565, n=26) | |
| AIDA64 / CPU AES | |
| Dell Inspiron 16 7640 2-in-1 | |
| HP Envy x360 2-in-1 16-ad0097nr | |
| MSI Summit A16 AI Plus A3HMTG | |
| Dell 16 Plus 2-in-1 | |
| Lenovo Yoga 7 2-in-1 16ILL10 | |
| Przeciętny Intel Core Ultra 7 258V (30957 - 40753, n=26) | |
| Samsung Galaxy Book5 Pro 360 | |
| AIDA64 / CPU ZLib | |
| MSI Summit A16 AI Plus A3HMTG | |
| Dell Inspiron 16 7640 2-in-1 | |
| HP Envy x360 2-in-1 16-ad0097nr | |
| Lenovo Yoga 7 2-in-1 16ILL10 | |
| Dell 16 Plus 2-in-1 | |
| Przeciętny Intel Core Ultra 7 258V (422 - 632, n=26) | |
| Samsung Galaxy Book5 Pro 360 | |
| AIDA64 / FP64 Ray-Trace | |
| MSI Summit A16 AI Plus A3HMTG | |
| HP Envy x360 2-in-1 16-ad0097nr | |
| Dell Inspiron 16 7640 2-in-1 | |
| Samsung Galaxy Book5 Pro 360 | |
| Dell 16 Plus 2-in-1 | |
| Lenovo Yoga 7 2-in-1 16ILL10 | |
| Przeciętny Intel Core Ultra 7 258V (4258 - 6930, n=26) | |
| AIDA64 / CPU PhotoWorxx | |
| Dell 16 Plus 2-in-1 | |
| Przeciętny Intel Core Ultra 7 258V (44223 - 59245, n=26) | |
| Lenovo Yoga 7 2-in-1 16ILL10 | |
| MSI Summit A16 AI Plus A3HMTG | |
| Samsung Galaxy Book5 Pro 360 | |
| Dell Inspiron 16 7640 2-in-1 | |
| HP Envy x360 2-in-1 16-ad0097nr | |
Wydajność systemu
Wyniki PCMark 10 są nieznacznie, ale konsekwentnie niższe niż w przypadku Lenovo Yoga 7 2-w-1 16ILL10. Wydajność pamięci RAM jest poza tym bardzo szybka dzięki architekturze on-die Lunar Lake.

PCMark 10: Score | Essentials | Productivity | Digital Content Creation
CrossMark: Overall | Productivity | Creativity | Responsiveness
WebXPRT 3: Overall
WebXPRT 4: Overall
Mozilla Kraken 1.1: Total
| Performance rating | |
| MSI Summit A16 AI Plus A3HMTG | |
| Lenovo Yoga 7 2-in-1 16ILL10 | |
| Dell Inspiron 16 7640 2-in-1 | |
| Dell 16 Plus 2-in-1 | |
| Przeciętny Intel Core Ultra 7 258V, Intel Arc Graphics 140V | |
| HP Envy x360 2-in-1 16-ad0097nr | |
| Samsung Galaxy Book5 Pro 360 | |
| PCMark 10 / Score | |
| MSI Summit A16 AI Plus A3HMTG | |
| Lenovo Yoga 7 2-in-1 16ILL10 | |
| Dell Inspiron 16 7640 2-in-1 | |
| HP Envy x360 2-in-1 16-ad0097nr | |
| Przeciętny Intel Core Ultra 7 258V, Intel Arc Graphics 140V (6265 - 7420, n=23) | |
| Dell 16 Plus 2-in-1 | |
| Samsung Galaxy Book5 Pro 360 | |
| PCMark 10 / Essentials | |
| Lenovo Yoga 7 2-in-1 16ILL10 | |
| MSI Summit A16 AI Plus A3HMTG | |
| Dell Inspiron 16 7640 2-in-1 | |
| HP Envy x360 2-in-1 16-ad0097nr | |
| Przeciętny Intel Core Ultra 7 258V, Intel Arc Graphics 140V (9295 - 11467, n=23) | |
| Dell 16 Plus 2-in-1 | |
| Samsung Galaxy Book5 Pro 360 | |
| PCMark 10 / Productivity | |
| HP Envy x360 2-in-1 16-ad0097nr | |
| MSI Summit A16 AI Plus A3HMTG | |
| Lenovo Yoga 7 2-in-1 16ILL10 | |
| Przeciętny Intel Core Ultra 7 258V, Intel Arc Graphics 140V (7357 - 13600, n=23) | |
| Samsung Galaxy Book5 Pro 360 | |
| Dell Inspiron 16 7640 2-in-1 | |
| Dell 16 Plus 2-in-1 | |
| PCMark 10 / Digital Content Creation | |
| MSI Summit A16 AI Plus A3HMTG | |
| Lenovo Yoga 7 2-in-1 16ILL10 | |
| Dell Inspiron 16 7640 2-in-1 | |
| Przeciętny Intel Core Ultra 7 258V, Intel Arc Graphics 140V (8160 - 10308, n=23) | |
| Dell 16 Plus 2-in-1 | |
| Samsung Galaxy Book5 Pro 360 | |
| HP Envy x360 2-in-1 16-ad0097nr | |
| CrossMark / Overall | |
| MSI Summit A16 AI Plus A3HMTG | |
| Lenovo Yoga 7 2-in-1 16ILL10 | |
| Dell Inspiron 16 7640 2-in-1 | |
| Dell 16 Plus 2-in-1 | |
| Przeciętny Intel Core Ultra 7 258V, Intel Arc Graphics 140V (1275 - 1742, n=22) | |
| HP Envy x360 2-in-1 16-ad0097nr | |
| Samsung Galaxy Book5 Pro 360 | |
| CrossMark / Productivity | |
| Lenovo Yoga 7 2-in-1 16ILL10 | |
| Dell Inspiron 16 7640 2-in-1 | |
| Dell 16 Plus 2-in-1 | |
| HP Envy x360 2-in-1 16-ad0097nr | |
| Przeciętny Intel Core Ultra 7 258V, Intel Arc Graphics 140V (1267 - 1684, n=22) | |
| MSI Summit A16 AI Plus A3HMTG | |
| Samsung Galaxy Book5 Pro 360 | |
| CrossMark / Creativity | |
| MSI Summit A16 AI Plus A3HMTG | |
| Lenovo Yoga 7 2-in-1 16ILL10 | |
| Dell Inspiron 16 7640 2-in-1 | |
| Dell 16 Plus 2-in-1 | |
| Przeciętny Intel Core Ultra 7 258V, Intel Arc Graphics 140V (1393 - 1977, n=22) | |
| HP Envy x360 2-in-1 16-ad0097nr | |
| Samsung Galaxy Book5 Pro 360 | |
| CrossMark / Responsiveness | |
| Dell Inspiron 16 7640 2-in-1 | |
| MSI Summit A16 AI Plus A3HMTG | |
| HP Envy x360 2-in-1 16-ad0097nr | |
| Lenovo Yoga 7 2-in-1 16ILL10 | |
| Samsung Galaxy Book5 Pro 360 | |
| Przeciętny Intel Core Ultra 7 258V, Intel Arc Graphics 140V (999 - 1411, n=22) | |
| Dell 16 Plus 2-in-1 | |
| WebXPRT 3 / Overall | |
| MSI Summit A16 AI Plus A3HMTG | |
| Lenovo Yoga 7 2-in-1 16ILL10 | |
| HP Envy x360 2-in-1 16-ad0097nr | |
| Dell 16 Plus 2-in-1 | |
| Dell Inspiron 16 7640 2-in-1 | |
| Przeciętny Intel Core Ultra 7 258V, Intel Arc Graphics 140V (219 - 317, n=22) | |
| Samsung Galaxy Book5 Pro 360 | |
| WebXPRT 4 / Overall | |
| Lenovo Yoga 7 2-in-1 16ILL10 | |
| Dell 16 Plus 2-in-1 | |
| Przeciętny Intel Core Ultra 7 258V, Intel Arc Graphics 140V (199.5 - 291, n=22) | |
| MSI Summit A16 AI Plus A3HMTG | |
| Samsung Galaxy Book5 Pro 360 | |
| Dell Inspiron 16 7640 2-in-1 | |
| HP Envy x360 2-in-1 16-ad0097nr | |
| Mozilla Kraken 1.1 / Total | |
| HP Envy x360 2-in-1 16-ad0097nr | |
| Dell Inspiron 16 7640 2-in-1 | |
| Samsung Galaxy Book5 Pro 360 | |
| Przeciętny Intel Core Ultra 7 258V, Intel Arc Graphics 140V (468 - 559, n=24) | |
| Dell 16 Plus 2-in-1 | |
| Lenovo Yoga 7 2-in-1 16ILL10 | |
| MSI Summit A16 AI Plus A3HMTG | |
* ... im mniej tym lepiej
| PCMark 10 Score | 6766 pkt. | |
Pomoc | ||
| AIDA64 / Memory Copy | |
| Przeciętny Intel Core Ultra 7 258V (104408 - 114336, n=24) | |
| Dell 16 Plus 2-in-1 | |
| Samsung Galaxy Book5 Pro 360 | |
| Lenovo Yoga 7 2-in-1 16ILL10 | |
| MSI Summit A16 AI Plus A3HMTG | |
| Dell Inspiron 16 7640 2-in-1 | |
| HP Envy x360 2-in-1 16-ad0097nr | |
| AIDA64 / Memory Read | |
| MSI Summit A16 AI Plus A3HMTG | |
| Lenovo Yoga 7 2-in-1 16ILL10 | |
| Dell 16 Plus 2-in-1 | |
| Przeciętny Intel Core Ultra 7 258V (82846 - 89417, n=24) | |
| Samsung Galaxy Book5 Pro 360 | |
| Dell Inspiron 16 7640 2-in-1 | |
| HP Envy x360 2-in-1 16-ad0097nr | |
| AIDA64 / Memory Write | |
| Lenovo Yoga 7 2-in-1 16ILL10 | |
| Dell 16 Plus 2-in-1 | |
| Przeciętny Intel Core Ultra 7 258V (108824 - 117989, n=24) | |
| Samsung Galaxy Book5 Pro 360 | |
| MSI Summit A16 AI Plus A3HMTG | |
| HP Envy x360 2-in-1 16-ad0097nr | |
| Dell Inspiron 16 7640 2-in-1 | |
| AIDA64 / Memory Latency | |
| Dell Inspiron 16 7640 2-in-1 | |
| HP Envy x360 2-in-1 16-ad0097nr | |
| MSI Summit A16 AI Plus A3HMTG | |
| Dell 16 Plus 2-in-1 | |
| Lenovo Yoga 7 2-in-1 16ILL10 | |
| Przeciętny Intel Core Ultra 7 258V (95 - 101.7, n=24) | |
| Samsung Galaxy Book5 Pro 360 | |
* ... im mniej tym lepiej
Opóźnienie DPC
LatencyMon pokazuje niewielkie problemy z DPC podczas otwierania wielu kart przeglądarki na naszej stronie głównej. odtwarzanie wideo 4K przy 60 Hz jest poza tym idealne i nie odnotowano żadnych spadków klatek.


| DPC Latencies / LatencyMon - interrupt to process latency (max), Web, Youtube, Prime95 | |
| MSI Summit A16 AI Plus A3HMTG | |
| Dell 16 Plus 2-in-1 | |
| HP Envy x360 2-in-1 16-ad0097nr | |
| Dell Inspiron 16 7640 2-in-1 | |
| Samsung Galaxy Book5 Pro 360 | |
| Lenovo Yoga 7 2-in-1 16ILL10 | |
* ... im mniej tym lepiej
Urządzenia pamięci masowej
Nie tylko Samsung BM9C1 PCIe4 NVMe SSD jest wolniejszy niż Micron 2550 w zeszłorocznym modelu, ale ma też tendencję do dławienia. Szybkość transferu wahała się między 3400 MB/s a 4700 MB/s w porównaniu do stabilniejszych ~5000 MB/s na Inspiron 16 7640 2-w-1 podczas wykonywania naszego testu pętli DiskSpd, jak pokazano na poniższym wykresie.


| Drive Performance rating - Percent | |
| Samsung Galaxy Book5 Pro 360 | |
| Dell Inspiron 16 7640 2-in-1 | |
| Lenovo Yoga 7 2-in-1 16ILL10 | |
| MSI Summit A16 AI Plus A3HMTG | |
| Dell 16 Plus 2-in-1 | |
| HP Envy x360 2-in-1 16-ad0097nr | |
* ... im mniej tym lepiej
Disk Throttling: DiskSpd Read Loop, Queue Depth 8
Wydajność GPU
Podczas gdy Core Ultra 7 258V jest wolniejszy niż Core Ultra 7 255H w zeszłorocznym Inspironie, jeśli chodzi o wydajność procesora, odwrotnie jest w przypadku porównania Arc 140V do Arc 8. Dell 16 Plus 2-w-1 jest w stanie uruchomić wymagające gry, takie jak Final Fantasy XV lub Cyberpunk 2077, od 35 do 50 procent szybciej pomimo wolniejszej wydajności procesora.
| Profil zasilania | Wynik grafiki | Wynik fizyki | Łączny wynik |
| Tryb wydajności | 10163 | 19741 | 3139 |
| Tryb zrównoważony | 8556 (-16%) | 16859 (-15%) | 2576 (-18%) |
| Zasilanie bateryjne | 9568 (-6%) | 16911 (-14%) | 2651 (-16%) |
Wydajność spada o około 15 procent, jeśli działa w trybie zrównoważonym zamiast w trybie wydajności, jak pokazuje nasza tabela wyników Fire Strike powyżej.


| 3DMark 11 Performance | 10966 pkt. | |
| 3DMark Fire Strike Score | 8829 pkt. | |
| 3DMark Time Spy Score | 4322 pkt. | |
Pomoc | ||
* ... im mniej tym lepiej
| F1 24 | |
| 1920x1080 Low Preset AA:T AF:16x | |
| Lenovo Yoga 7 2-in-1 16ILL10 | |
| Dell 16 Plus 2-in-1 | |
| Przeciętny Intel Arc Graphics 140V (54 - 99, n=25) | |
| Lenovo ThinkPad T16 Gen 3 21MN005XGE | |
| 1920x1080 Medium Preset AA:T AF:16x | |
| Lenovo Yoga 7 2-in-1 16ILL10 | |
| Dell 16 Plus 2-in-1 | |
| Przeciętny Intel Arc Graphics 140V (49.2 - 88.2, n=24) | |
| Lenovo ThinkPad T16 Gen 3 21MN005XGE | |
| 1920x1080 High Preset AA:T AF:16x | |
| Dell 16 Plus 2-in-1 | |
| Lenovo Yoga 7 2-in-1 16ILL10 | |
| Przeciętny Intel Arc Graphics 140V (34.4 - 66.4, n=27) | |
| Lenovo ThinkPad T16 Gen 3 21MN005XGE | |
| 1920x1080 Ultra High Preset AA:T AF:16x | |
| Lenovo Yoga 7 2-in-1 16ILL10 | |
| Dell 16 Plus 2-in-1 | |
| Przeciętny Intel Arc Graphics 140V (14.6 - 22, n=25) | |
| Lenovo ThinkPad T16 Gen 3 21MN005XGE | |
Cyberpunk 2077 ultra FPS Chart
| low | med. | high | ultra | |
|---|---|---|---|---|
| Dota 2 Reborn (2015) | 105.1 | 88.2 | 87.7 | 86 |
| Final Fantasy XV Benchmark (2018) | 83.5 | 48.2 | 35.4 | |
| X-Plane 11.11 (2018) | 46.7 | 37.9 | 31.2 | |
| Strange Brigade (2018) | 228 | 70 | 61 | 54.7 |
| Baldur's Gate 3 (2023) | 42.4 | 35.4 | 31.4 | 31 |
| Cyberpunk 2077 (2023) | 47.7 | 38.8 | 32.9 | 29 |
| F1 24 (2024) | 84.4 | 77.4 | 60.4 | 19.7 |
Emisje
Hałas systemowy
Poziom i pułap hałasu wentylatora są zasadniczo niezmienione w stosunku do tego, co zaobserwowaliśmy w zeszłorocznym modelu, pomimo różnic w wydajności procesora i iGPU. Wentylator w Dell 16 Plus 2-w-1 reaguje jednak wolniej na obciążenie ekranu, dzięki czemu system może pozostać cichszy przez dłuższy czas, zanim konieczne będzie zwiększenie obrotów.

Hałas
| luz |
| 23 / 23 / 24.7 dB |
| obciążenie |
| 32.5 / 45.6 dB |
 | ||
30 dB cichy 40 dB(A) słyszalny 50 dB(A) irytujący |
||
min: | ||
| Dell 16 Plus 2-in-1 Arc 140V, Core Ultra 7 258V, Samsung BM9C1 1024GB | Dell Inspiron 16 7640 2-in-1 Arc 8-Core, Ultra 7 155H, Micron 2550 1TB | Lenovo Yoga 7 2-in-1 16ILL10 Arc 140V, Core Ultra 7 256V, WD PC SN7100S SDFPMSL-512G-1101 | Samsung Galaxy Book5 Pro 360 Arc 130V, Core Ultra 5 226V, Samsung PM9B1 512GB MZVL4512HBLU | MSI Summit A16 AI Plus A3HMTG Radeon 880M, Ryzen AI 9 365, Samsung PM9C1 MZVL81T0HELB-00BTW | HP Envy x360 2-in-1 16-ad0097nr Radeon 780M, R7 8840HS, KIOXIA BG5 KBG50ZNV1T02 | |
|---|---|---|---|---|---|---|
| Noise | -6% | -3% | 3% | -12% | 7% | |
| wyłączone / środowisko * (dB) | 23.2 | 22.9 1% | 23.3 -0% | 23.6 -2% | 23.8 -3% | 22.9 1% |
| Idle Minimum * (dB) | 23 | 22.9 -0% | 23.3 -1% | 23.6 -3% | 25 -9% | 23 -0% |
| Idle Average * (dB) | 23 | 22.9 -0% | 23.3 -1% | 23.6 -3% | 25 -9% | 23 -0% |
| Idle Maximum * (dB) | 24.7 | 25 -1% | 25.7 -4% | 23.6 4% | 29.5 -19% | 23 7% |
| Load Average * (dB) | 32.5 | 45.1 -39% | 40.2 -24% | 29.4 10% | 37.5 -15% | 23.8 27% |
| Cyberpunk 2077 ultra * (dB) | 42.6 | 44.9 -5% | 41.6 2% | 40.6 5% | 46.5 -9% | |
| Load Maximum * (dB) | 45.6 | 44.9 2% | 41.6 9% | 40.6 11% | 56.1 -23% | 43.8 4% |
| Witcher 3 ultra * (dB) | 43.8 |
* ... im mniej tym lepiej
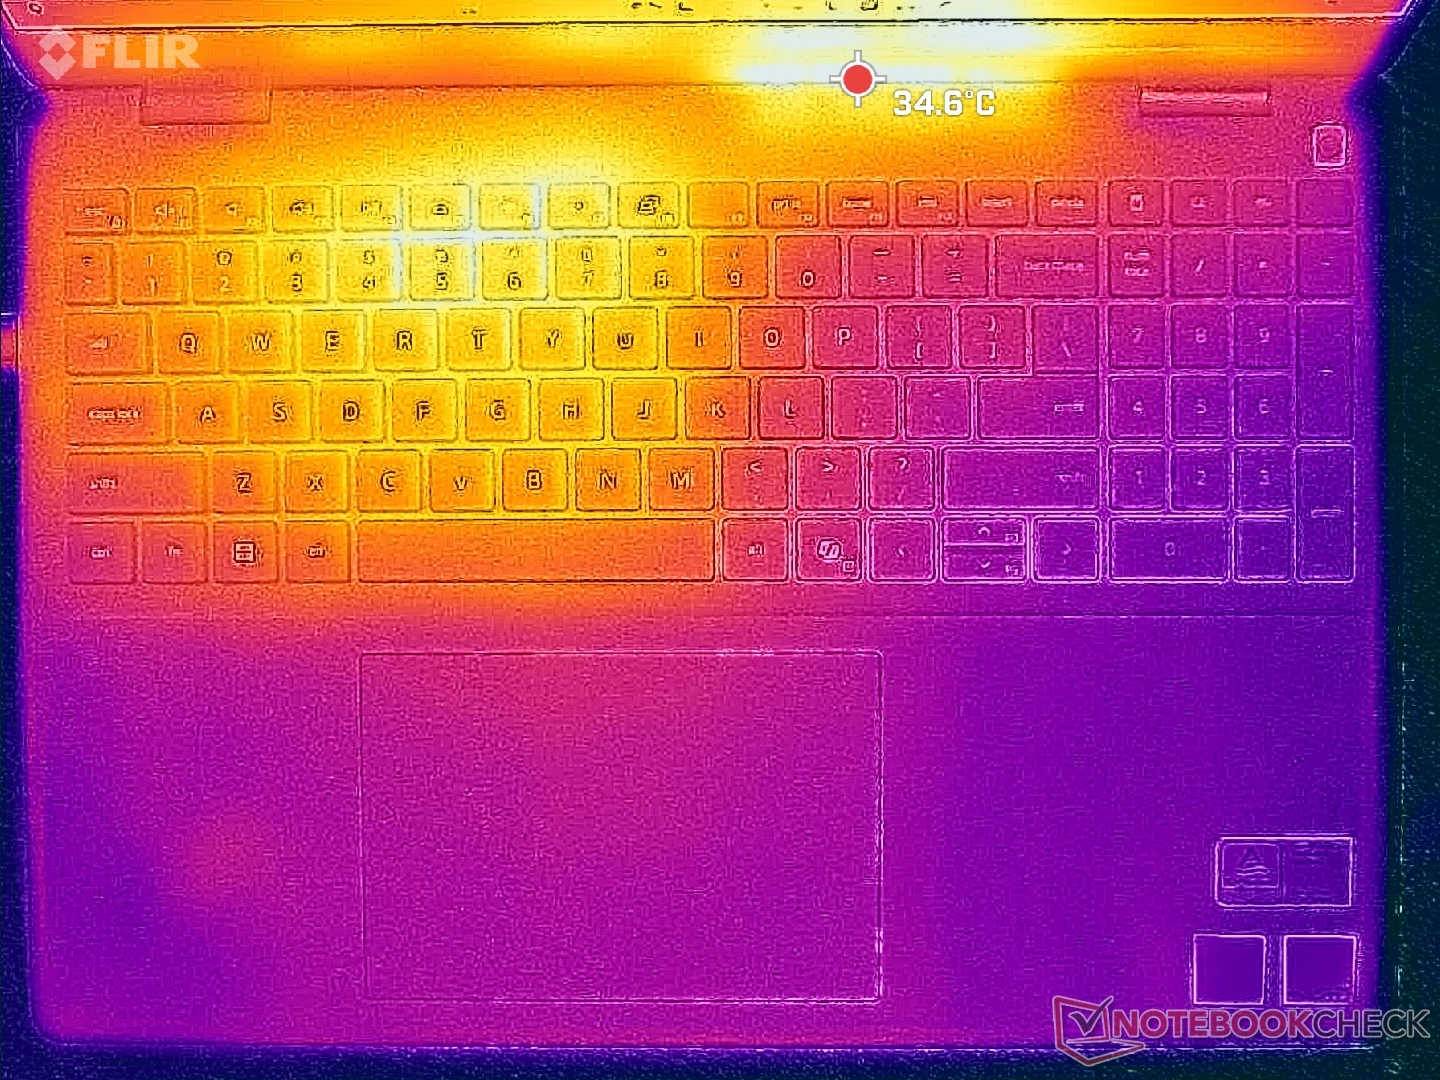
Temperatura
Temperatura powierzchni w gorących punktach może osiągnąć nieco ponad 44 C i 39 C odpowiednio na pokładzie klawiatury i dolnym panelu, co jest tylko nieznacznie cieplejsze niż to, co zarejestrowaliśmy na konkurencyjnych urządzeniach Lenovo Yoga 7 2-w-1 16ILL10.


(±) Maksymalna temperatura w górnej części wynosi 44 °C / 111 F, w porównaniu do średniej 35.4 °C / 96 F , począwszy od 19.6 do 60 °C dla klasy Convertible.
(+) Dno nagrzewa się maksymalnie do 39.4 °C / 103 F, w porównaniu do średniej 36.9 °C / 98 F
(+) W stanie bezczynności średnia temperatura górnej części wynosi 28.7 °C / 84 F, w porównaniu ze średnią temperaturą urządzenia wynoszącą 30.3 °C / ### class_avg_f### F.
(+) Podpórki pod nadgarstki i touchpad są chłodniejsze niż temperatura skóry i maksymalnie 26.8 °C / 80.2 F i dlatego są chłodne w dotyku.
(±) Średnia temperatura obszaru podparcia dłoni w podobnych urządzeniach wynosiła 28 °C / 82.4 F (+1.2 °C / 2.2 F).


| Dell 16 Plus 2-in-1 Intel Core Ultra 7 258V, Intel Arc Graphics 140V | Dell Inspiron 16 7640 2-in-1 Intel Core Ultra 7 155H, Intel Arc 8-Core iGPU | Lenovo Yoga 7 2-in-1 16ILL10 Intel Core Ultra 7 256V, Intel Arc Graphics 140V | Samsung Galaxy Book5 Pro 360 Intel Core Ultra 5 226V, Intel Arc Graphics 130V | MSI Summit A16 AI Plus A3HMTG AMD Ryzen AI 9 365, AMD Radeon 880M | HP Envy x360 2-in-1 16-ad0097nr AMD Ryzen 7 8840HS, AMD Radeon 780M | |
|---|---|---|---|---|---|---|
| Heat | -4% | 12% | 12% | -3% | 4% | |
| Maximum Upper Side * (°C) | 44 | 46.8 -6% | 42.6 3% | 40.9 7% | 52.8 -20% | 42.6 3% |
| Maximum Bottom * (°C) | 39.4 | 45.6 -16% | 36.8 7% | 45.1 -14% | 42 -7% | 47.8 -21% |
| Idle Upper Side * (°C) | 31.8 | 32.2 -1% | 26.4 17% | 23.8 25% | 30.6 4% | 27.4 14% |
| Idle Bottom * (°C) | 34.2 | 31.4 8% | 26.6 22% | 23.5 31% | 29.6 13% | 27.8 19% |
* ... im mniej tym lepiej
Test warunków skrajnych
Podczas inicjowania stresu Prime95, procesor zwiększał taktowanie do 3,4 GHz i 38 W, aż do osiągnięcia 93 C kilka sekund później. Następnie wydajność spadłaby do 2,5 GHz i 22 W, aby utrzymać niższą temperaturę rdzenia na poziomie 72 C. Jest to o prawie 15 C niższa temperatura w porównaniu do Inspirona 16 7640 2-w-1 w podobnych warunkach, ale proszę pamiętać, że Dell 16 Plus 2-w-1 jest również wyposażony w wolniejszy procesor.
Temperatura rdzenia podczas uruchamiania Cyberpunk 2077 w celu reprezentowania typowych obciążeń w grach byłaby również znacznie niższa niż na zeszłorocznym Inspironie, oferując jednocześnie lepszą wydajność w grach.


| Średnie taktowanie CPU (GHz) | Taktowanie GPU (MHz) | Średnia temperatura CPU (°C) | |
| System w stanie spoczynku | -- | -- | 32 |
| Prime95 Stress | 2.5 | 400 | 72 |
| Prime95 + FurMark Stress | 2.0 | 1150 | 73 |
| Cyberpunk 2077 Stress | 1.0 | 1950 | 72 |
Głośniki

Dell 16 Plus 2-in-1 analiza dźwięku
(+) | głośniki mogą odtwarzać stosunkowo głośno (82.5 dB)
Bas 100 - 315 Hz
(-) | prawie brak basu - średnio 16.2% niższa od mediany
(±) | liniowość basu jest średnia (12.1% delta do poprzedniej częstotliwości)
Średnie 400 - 2000 Hz
(+) | zbalansowane środki średnie - tylko 0.8% od mediany
(+) | średnie są liniowe (1.8% delta do poprzedniej częstotliwości)
Wysokie 2–16 kHz
(+) | zrównoważone maksima - tylko 2.4% od mediany
(+) | wzloty są liniowe (2.9% delta do poprzedniej częstotliwości)
Ogólnie 100 - 16.000 Hz
(+) | ogólny dźwięk jest liniowy (10.5% różnicy w stosunku do mediany)
W porównaniu do tej samej klasy
» 7% wszystkich testowanych urządzeń w tej klasie było lepszych, 2% podobnych, 91% gorszych
» Najlepszy miał deltę 6%, średnia wynosiła ###średnia###%, najgorsza wynosiła 57%
W porównaniu do wszystkich testowanych urządzeń
» 5% wszystkich testowanych urządzeń było lepszych, 1% podobnych, 93% gorszych
» Najlepszy miał deltę 4%, średnia wynosiła ###średnia###%, najgorsza wynosiła 134%
Apple MacBook Pro 16 2021 M1 Pro analiza dźwięku
(+) | głośniki mogą odtwarzać stosunkowo głośno (84.7 dB)
Bas 100 - 315 Hz
(+) | dobry bas - tylko 3.8% od mediany
(+) | bas jest liniowy (5.2% delta do poprzedniej częstotliwości)
Średnie 400 - 2000 Hz
(+) | zbalansowane środki średnie - tylko 1.3% od mediany
(+) | średnie są liniowe (2.1% delta do poprzedniej częstotliwości)
Wysokie 2–16 kHz
(+) | zrównoważone maksima - tylko 1.9% od mediany
(+) | wzloty są liniowe (2.7% delta do poprzedniej częstotliwości)
Ogólnie 100 - 16.000 Hz
(+) | ogólny dźwięk jest liniowy (4.6% różnicy w stosunku do mediany)
W porównaniu do tej samej klasy
» 0% wszystkich testowanych urządzeń w tej klasie było lepszych, 0% podobnych, 100% gorszych
» Najlepszy miał deltę 5%, średnia wynosiła ###średnia###%, najgorsza wynosiła 45%
W porównaniu do wszystkich testowanych urządzeń
» 0% wszystkich testowanych urządzeń było lepszych, 0% podobnych, 100% gorszych
» Najlepszy miał deltę 4%, średnia wynosiła ###średnia###%, najgorsza wynosiła 134%
Zarządzanie energią
Zużycie energii
Zużycie energii na biegu jałowym jest podobne do tego, które odnotowaliśmy w zeszłorocznym modelu Inspiron 16 7640 2-w-1 ponieważ mają one więcej niż kilka podobnych komponentów. Jednak przy bardziej wymagających obciążeniach Dell 16 Plus 2 w 1 wymaga znacznie mniej energii, ponieważ Core Ultra 7 258V jest wolniejszy i bardziej wydajny niż Core Ultra 7 155H.
Jesteśmy w stanie zmierzyć maksymalne zużycie energii na poziomie 67 W z małego (~ 11 x 5 x 2,8 cm) zasilacza sieciowego USB-C o mocy 65 W.


| wyłączony / stan wstrzymania | |
| luz | |
| obciążenie |
|
Legenda:
min: | |
| Dell 16 Plus 2-in-1 Core Ultra 7 258V, Arc 140V, Samsung BM9C1 1024GB, Mini-LED, 2560x1600, 16" | Dell Inspiron 16 7640 2-in-1 Ultra 7 155H, Arc 8-Core, Micron 2550 1TB, Mini-LED, 2560x1600, 16" | Lenovo Yoga 7 2-in-1 16ILL10 Core Ultra 7 256V, Arc 140V, WD PC SN7100S SDFPMSL-512G-1101, IPS, 1920x1200, 16" | Samsung Galaxy Book5 Pro 360 Core Ultra 5 226V, Arc 130V, Samsung PM9B1 512GB MZVL4512HBLU, OLED, 2880x1800, 16" | MSI Summit A16 AI Plus A3HMTG Ryzen AI 9 365, Radeon 880M, Samsung PM9C1 MZVL81T0HELB-00BTW, IPS, 2560x1600, 16" | HP Envy x360 2-in-1 16-ad0097nr R7 8840HS, Radeon 780M, KIOXIA BG5 KBG50ZNV1T02, OLED, 2880x1800, 16" | |
|---|---|---|---|---|---|---|
| Power Consumption | -30% | 17% | 19% | -16% | 12% | |
| Idle Minimum * (Watt) | 7 | 6.1 13% | 4.2 40% | 5.3 24% | 5.4 23% | 5 29% |
| Idle Average * (Watt) | 13.2 | 13.5 -2% | 8.3 37% | 6.7 49% | 11 17% | 6.2 53% |
| Idle Maximum * (Watt) | 13.4 | 13.8 -3% | 9.5 29% | 7.3 46% | 11.2 16% | 14.7 -10% |
| Load Average * (Watt) | 43.9 | 63.6 -45% | 40.3 8% | 37.6 14% | 76.6 -74% | 49.9 -14% |
| Cyberpunk 2077 ultra external monitor * (Watt) | 40.7 | 64.6 -59% | 40.8 -0% | 42.8 -5% | 49.2 -21% | |
| Cyberpunk 2077 ultra * (Watt) | 44.9 | 67 -49% | 47.4 -6% | 44.6 1% | 61.1 -36% | |
| Load Maximum * (Watt) | 67.8 | 109.7 -62% | 59 13% | 64.1 5% | 91.8 -35% | 65 4% |
| Witcher 3 ultra * (Watt) | 54.5 |
* ... im mniej tym lepiej
Power Consumption Cyberpunk / Stress Test
Power Consumption external Monitor
Żywotność baterii
Pojemność baterii jest mniejsza niż w zeszłorocznym Inspironie 16 7640 2-w-1, co negatywnie wpływa na czas pracy sieci WLAN, ale wynosi on nieco ponad dwie godziny.
| Dell 16 Plus 2-in-1 Core Ultra 7 258V, Arc 140V, 64 Wh | Dell Inspiron 16 7640 2-in-1 Ultra 7 155H, Arc 8-Core, 90 Wh | Lenovo Yoga 7 2-in-1 16ILL10 Core Ultra 7 256V, Arc 140V, 70 Wh | Samsung Galaxy Book5 Pro 360 Core Ultra 5 226V, Arc 130V, 76 Wh | MSI Summit A16 AI Plus A3HMTG Ryzen AI 9 365, Radeon 880M, 82 Wh | HP Envy x360 2-in-1 16-ad0097nr R7 8840HS, Radeon 780M, 68 Wh | |
|---|---|---|---|---|---|---|
| Czasy pracy | 28% | 125% | 21% | 2% | -13% | |
| WiFi v1.3 (h) | 8.9 | 11.4 28% | 20 125% | 10.8 21% | 9.1 2% | 7.7 -13% |
| Reader / Idle (h) | 21.8 | 15.6 | ||||
| Load (h) | 1.6 | 2.1 | 1.9 | |||
| H.264 (h) | 19.7 |
Ocena Notebookcheck
Dell 16 Plus 2-in-1
- 14/06/2025 v8
Allen Ngo
 Total Sustainability Score:
 Potential Competitors in Comparison
Obraz | Model / recenzja | Cena | Waga | Wysokość | Ekran |
|---|---|---|---|---|---|
1. 83.5%  | Dell 16 Plus 2-in-1 Intel Core Ultra 7 258V ⎘ Intel Arc Graphics 140V ⎘ 32 GB Pamięć, 1024 GB SSD | Amazon: $1,149.99 Cena katalogowa: 1500 USD | 2 kg | 16.99 mm | 16.00" 2560x1600 189 PPI Mini-LED |
2. 82.1%  | Dell Inspiron 16 7640 2-in-1 Intel Core Ultra 7 155H ⎘ Intel Arc 8-Core iGPU ⎘ 16 GB Pamięć, 1024 GB SSD | Amazon: Cena katalogowa: 1000 USD | 2.1 kg | 18.99 mm | 16.00" 2560x1600 189 PPI Mini-LED |
3. 84.3%  | Lenovo Yoga 7 2-in-1 16ILL10 Intel Core Ultra 7 256V ⎘ Intel Arc Graphics 140V ⎘ 16 GB Pamięć, 512 GB SSD | Amazon: Cena katalogowa: 1000 USD | 1.9 kg | 15.85 mm | 16.00" 1920x1200 142 PPI IPS |
4. 85.9%  | Samsung Galaxy Book5 Pro 360 Intel Core Ultra 5 226V ⎘ Intel Arc Graphics 130V ⎘ 16 GB Pamięć, 512 GB SSD | Amazon: Cena katalogowa: 1799€ | 1.7 kg | 12.8 mm | 16.00" 2880x1800 212 PPI OLED |
5. 81.9%  | MSI Summit A16 AI Plus A3HMTG AMD Ryzen AI 9 365 ⎘ AMD Radeon 880M ⎘ 32 GB Pamięć, 1024 GB SSD | Amazon: Cena katalogowa: 1600 USD | 2.1 kg | 16.85 mm | 16.00" 2560x1600 189 PPI IPS |
6. 87.2% v7 (old)  | HP Envy x360 2-in-1 16-ad0097nr AMD Ryzen 7 8840HS ⎘ AMD Radeon 780M ⎘ 16 GB Pamięć, 1024 GB SSD | Amazon: 1. $135.99 Replacement for HP Envy x360... 2. $159.88 HPDELGB for HP Envy x360 2-i... 3. $699.99 HP Envy 2-in-1 16" 2K Touch-... Cena katalogowa: 1300 USD | 1.8 kg | 18.3 mm | 16.00" 2880x1800 212 PPI OLED |
Przezroczystość
Wyboru urządzeń do recenzji dokonuje nasza redakcja. Próbka testowa została udostępniona autorowi jako pożyczka od producenta lub sprzedawcy detalicznego na potrzeby tej recenzji. Pożyczkodawca nie miał wpływu na tę recenzję, producent nie otrzymał też kopii tej recenzji przed publikacją. Nie było obowiązku publikowania tej recenzji. Jako niezależna firma medialna, Notebookcheck nie podlega władzy producentów, sprzedawców detalicznych ani wydawców.
Tak testuje Notebookcheck
Każdego roku Notebookcheck niezależnie sprawdza setki laptopów i smartfonów, stosując standardowe procedury, aby zapewnić porównywalność wszystkich wyników. Od około 20 lat stale rozwijamy nasze metody badawcze, ustanawiając przy tym standardy branżowe. W naszych laboratoriach testowych doświadczeni technicy i redaktorzy korzystają z wysokiej jakości sprzętu pomiarowego. Testy te obejmują wieloetapowy proces walidacji. Nasz kompleksowy system ocen opiera się na setkach uzasadnionych pomiarów i benchmarków, co pozwala zachować obiektywizm.
