Werdykt - proste, ale może zbyt proste?
Jako mini PC dla firm, Cubi NUC 2MG jest prostą i niezawodną opcją bez krzykliwej estetyki. Zintegrowany głośnik, mikrofony, obsługa Co-Pilot+ i funkcja Power Link mogą się przydać w określonych warunkach lub scenariuszach użytkowania, a procesor Lunar Lake-V jest ogólnie chłodniejszy i bardziej wydajny niż obecne alternatywy AMD. Szczególnie doceniamy szybki zintegrowany czytnik MicroSD, ponieważ wiele innych mini PC nie posiada czytników kart.
Naszym głównym zarzutem wobec Cubi 2MG jest jego stosunkowo wysoka cena wynosząca 900 USD, podczas gdy szybsze mini komputery AMD, takie jak Beelink SER9 Pro lub GMK NucBox K12 są łatwo dostępne za setki dolarów mniej. Takie alternatywy są również wyposażone w przydatne funkcje, takie jak wymienna pamięć RAM i obsługa większej liczby wewnętrznych dysków SSD. MSI twierdzi, że oferuje lepszą obsługę klienta i dłuższą trzyletnią gwarancję w standardzie, aby uzasadnić cenę wywoławczą, ale wydajność w przeliczeniu na dolara jest jednak stosunkowo słaba.
Zachowanie wentylatorów również mogłoby ulec poprawie. O ile nie korzystamy z trybu cichego, wentylator ma tendencję do pulsowania i jest bardziej zauważalny nawet podczas pracy z niewymagającym obciążeniem. Cyklicznie zmieniające się taktowanie GPU, choć nie jest problemem w większości profesjonalnych ustawień, to jednak jest dziwne, gdy większość innych mini PC nie wykazuje tego samego problemu.
Za
Przeciw
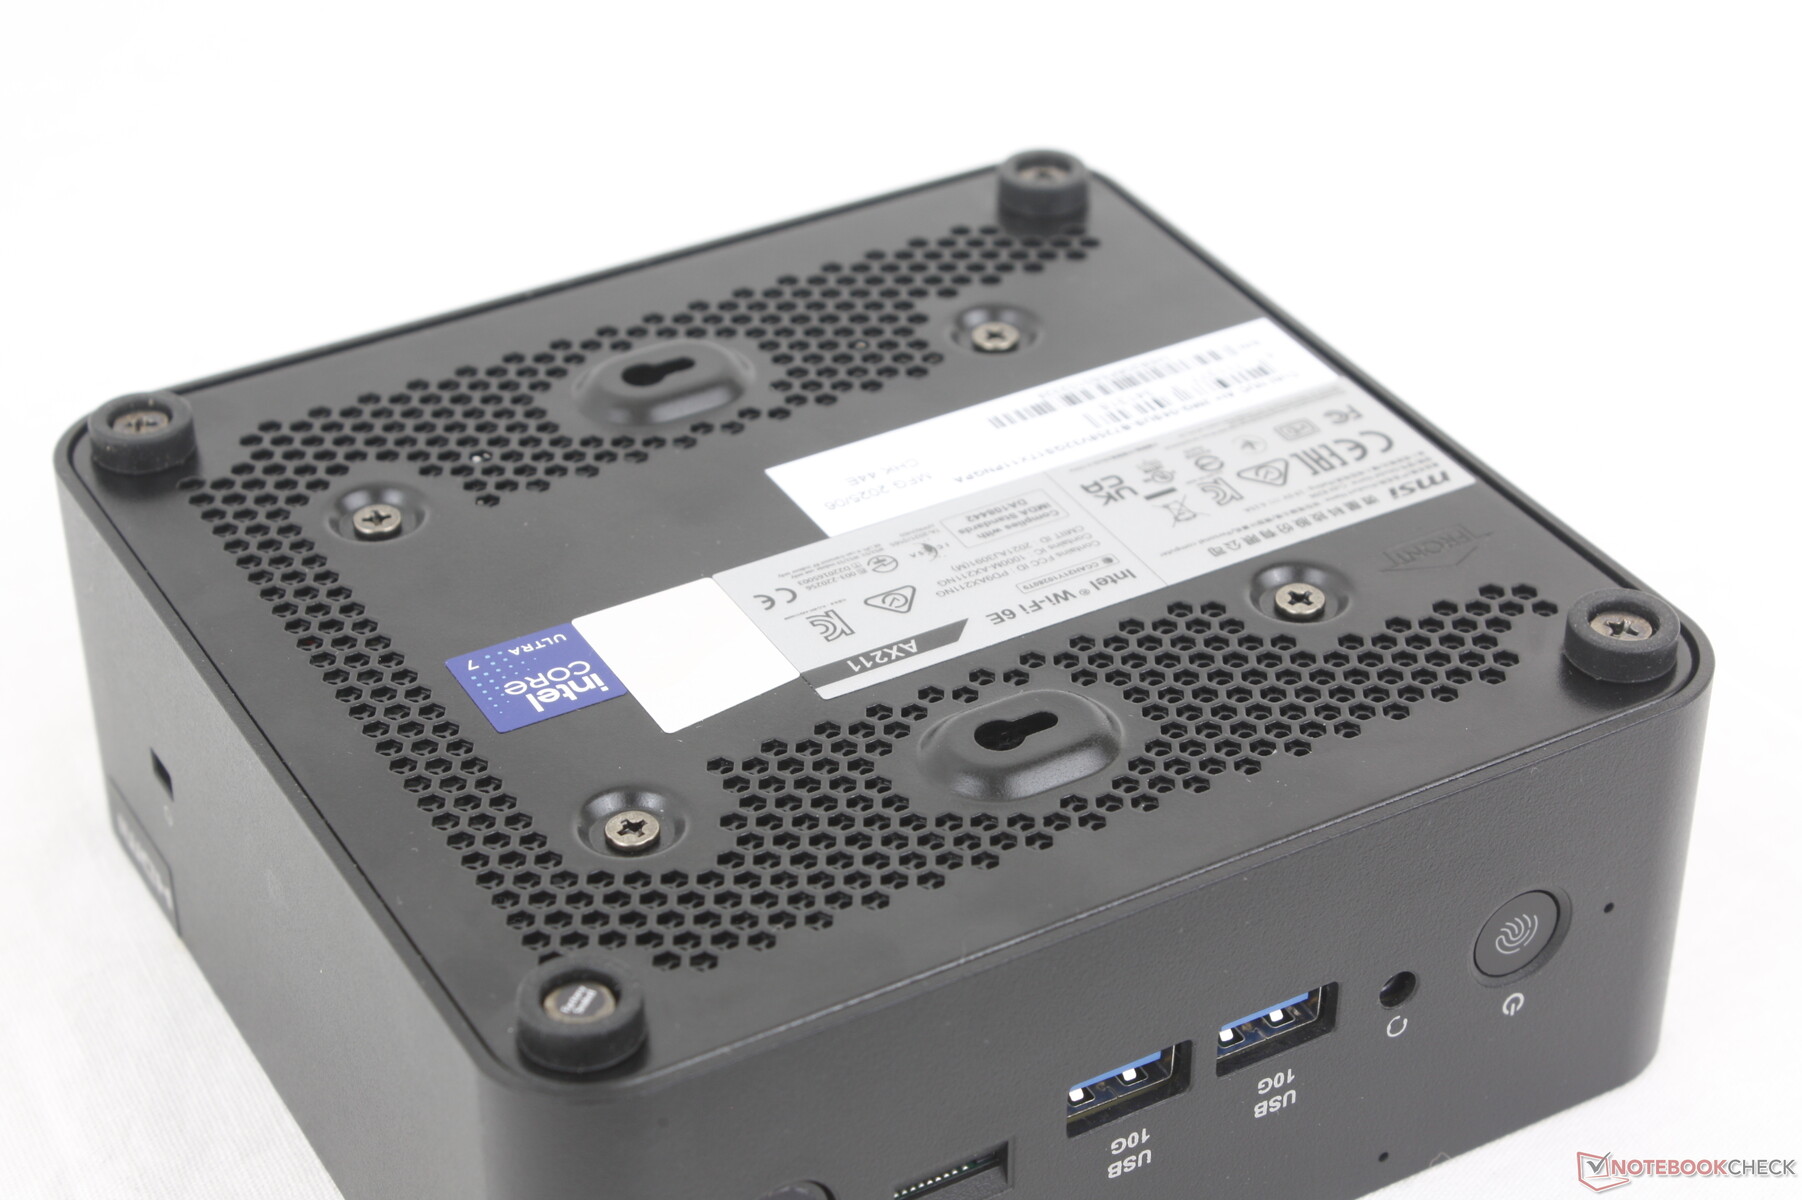
Cubi NUC 2MG jest następcą zeszłorocznego modelu Cubi NUC 1M. Zastąpiono w nim starszy procesor Raptor Lake-U Core Ultra 7 150U nowszymi opcjami Lunar Lake-V, wprowadzając jednocześnie inne drobne zmiany pomocnicze. Seria Cubi jest zoptymalizowana dla firm i środowisk detalicznych, w przeciwieństwie do biur domowych lub zastosowań HTPC.
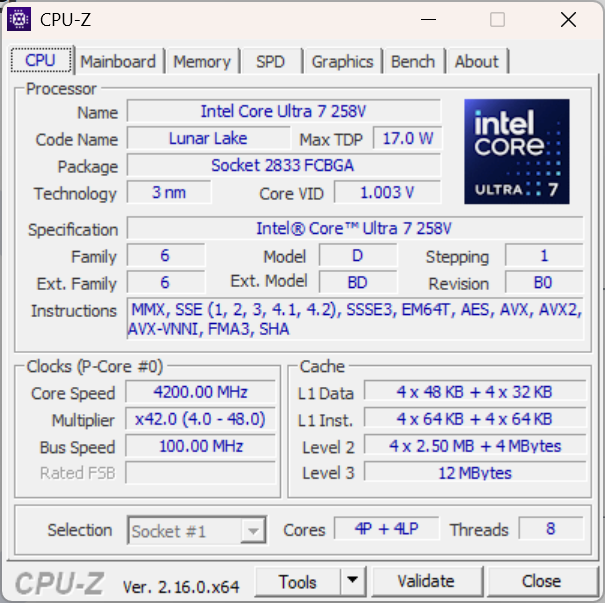
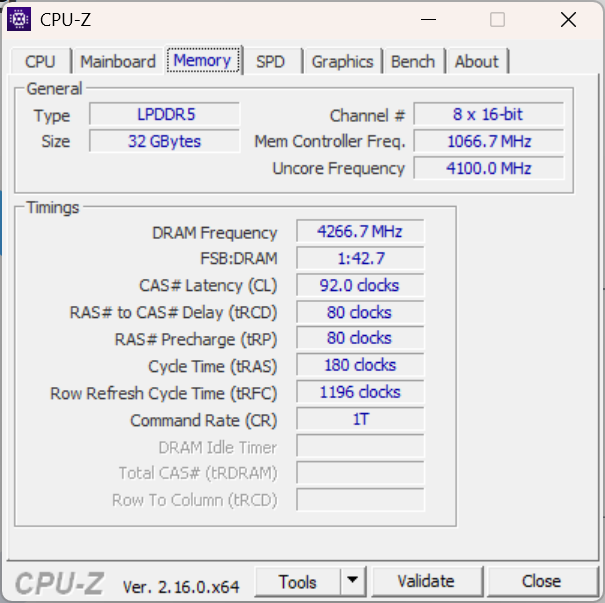
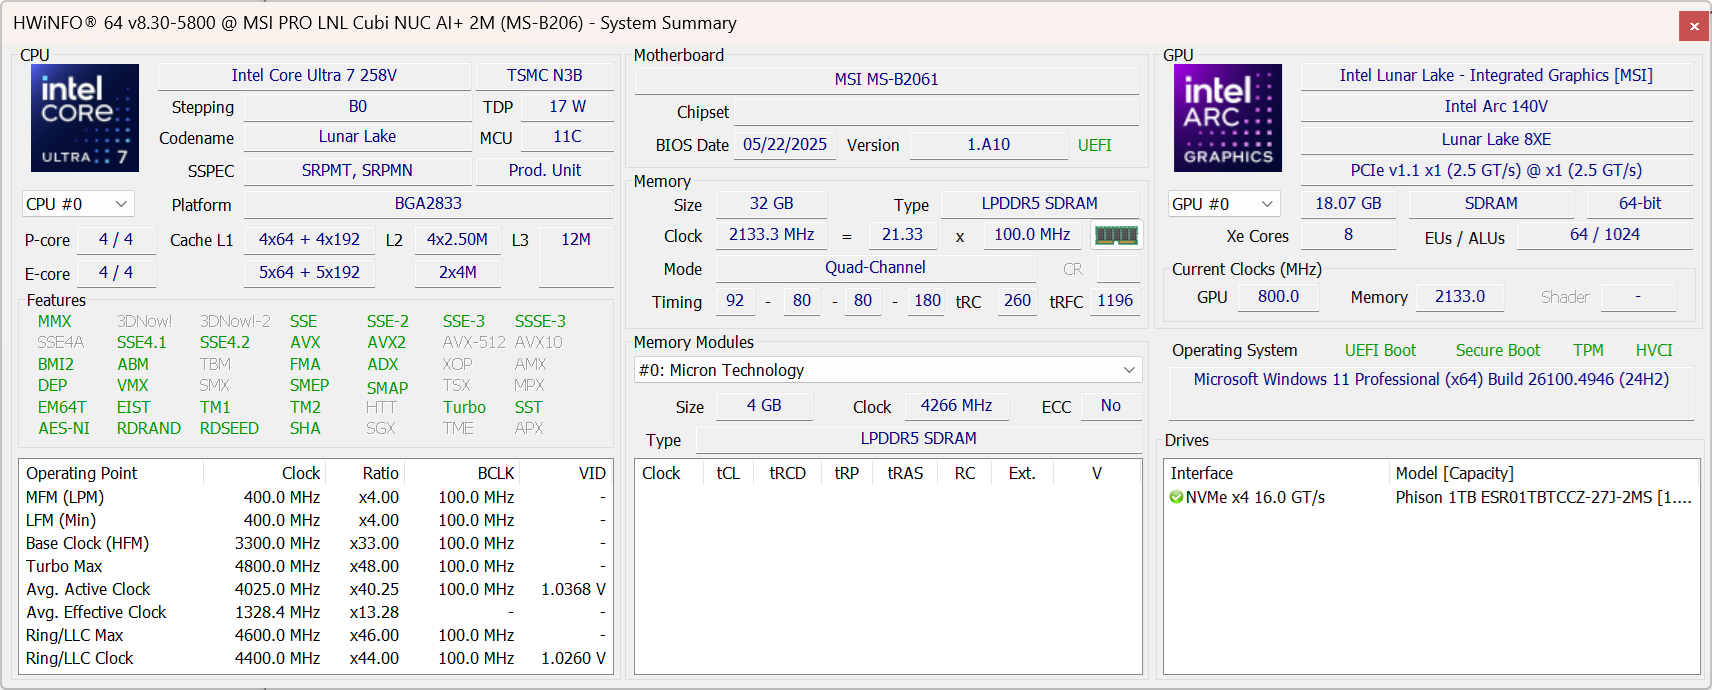
Nasza jednostka testowa to średniej klasy konfiguracja z procesorem Core Ultra 7 258V, 32 GB przylutowanej pamięci RAM i dyskiem SSD o pojemności 1 TB za około 900 USD. Mniejsze jednostki SKU zaczynają się od Core Ultra 5 226V, podczas gdy najwyższa opcja jest dostarczana z Core Ultra 9 288V. W niektórych regionach dostępna jest wersja biała.
Więcej recenzji MSI:
Specyfikacje
Przypadek
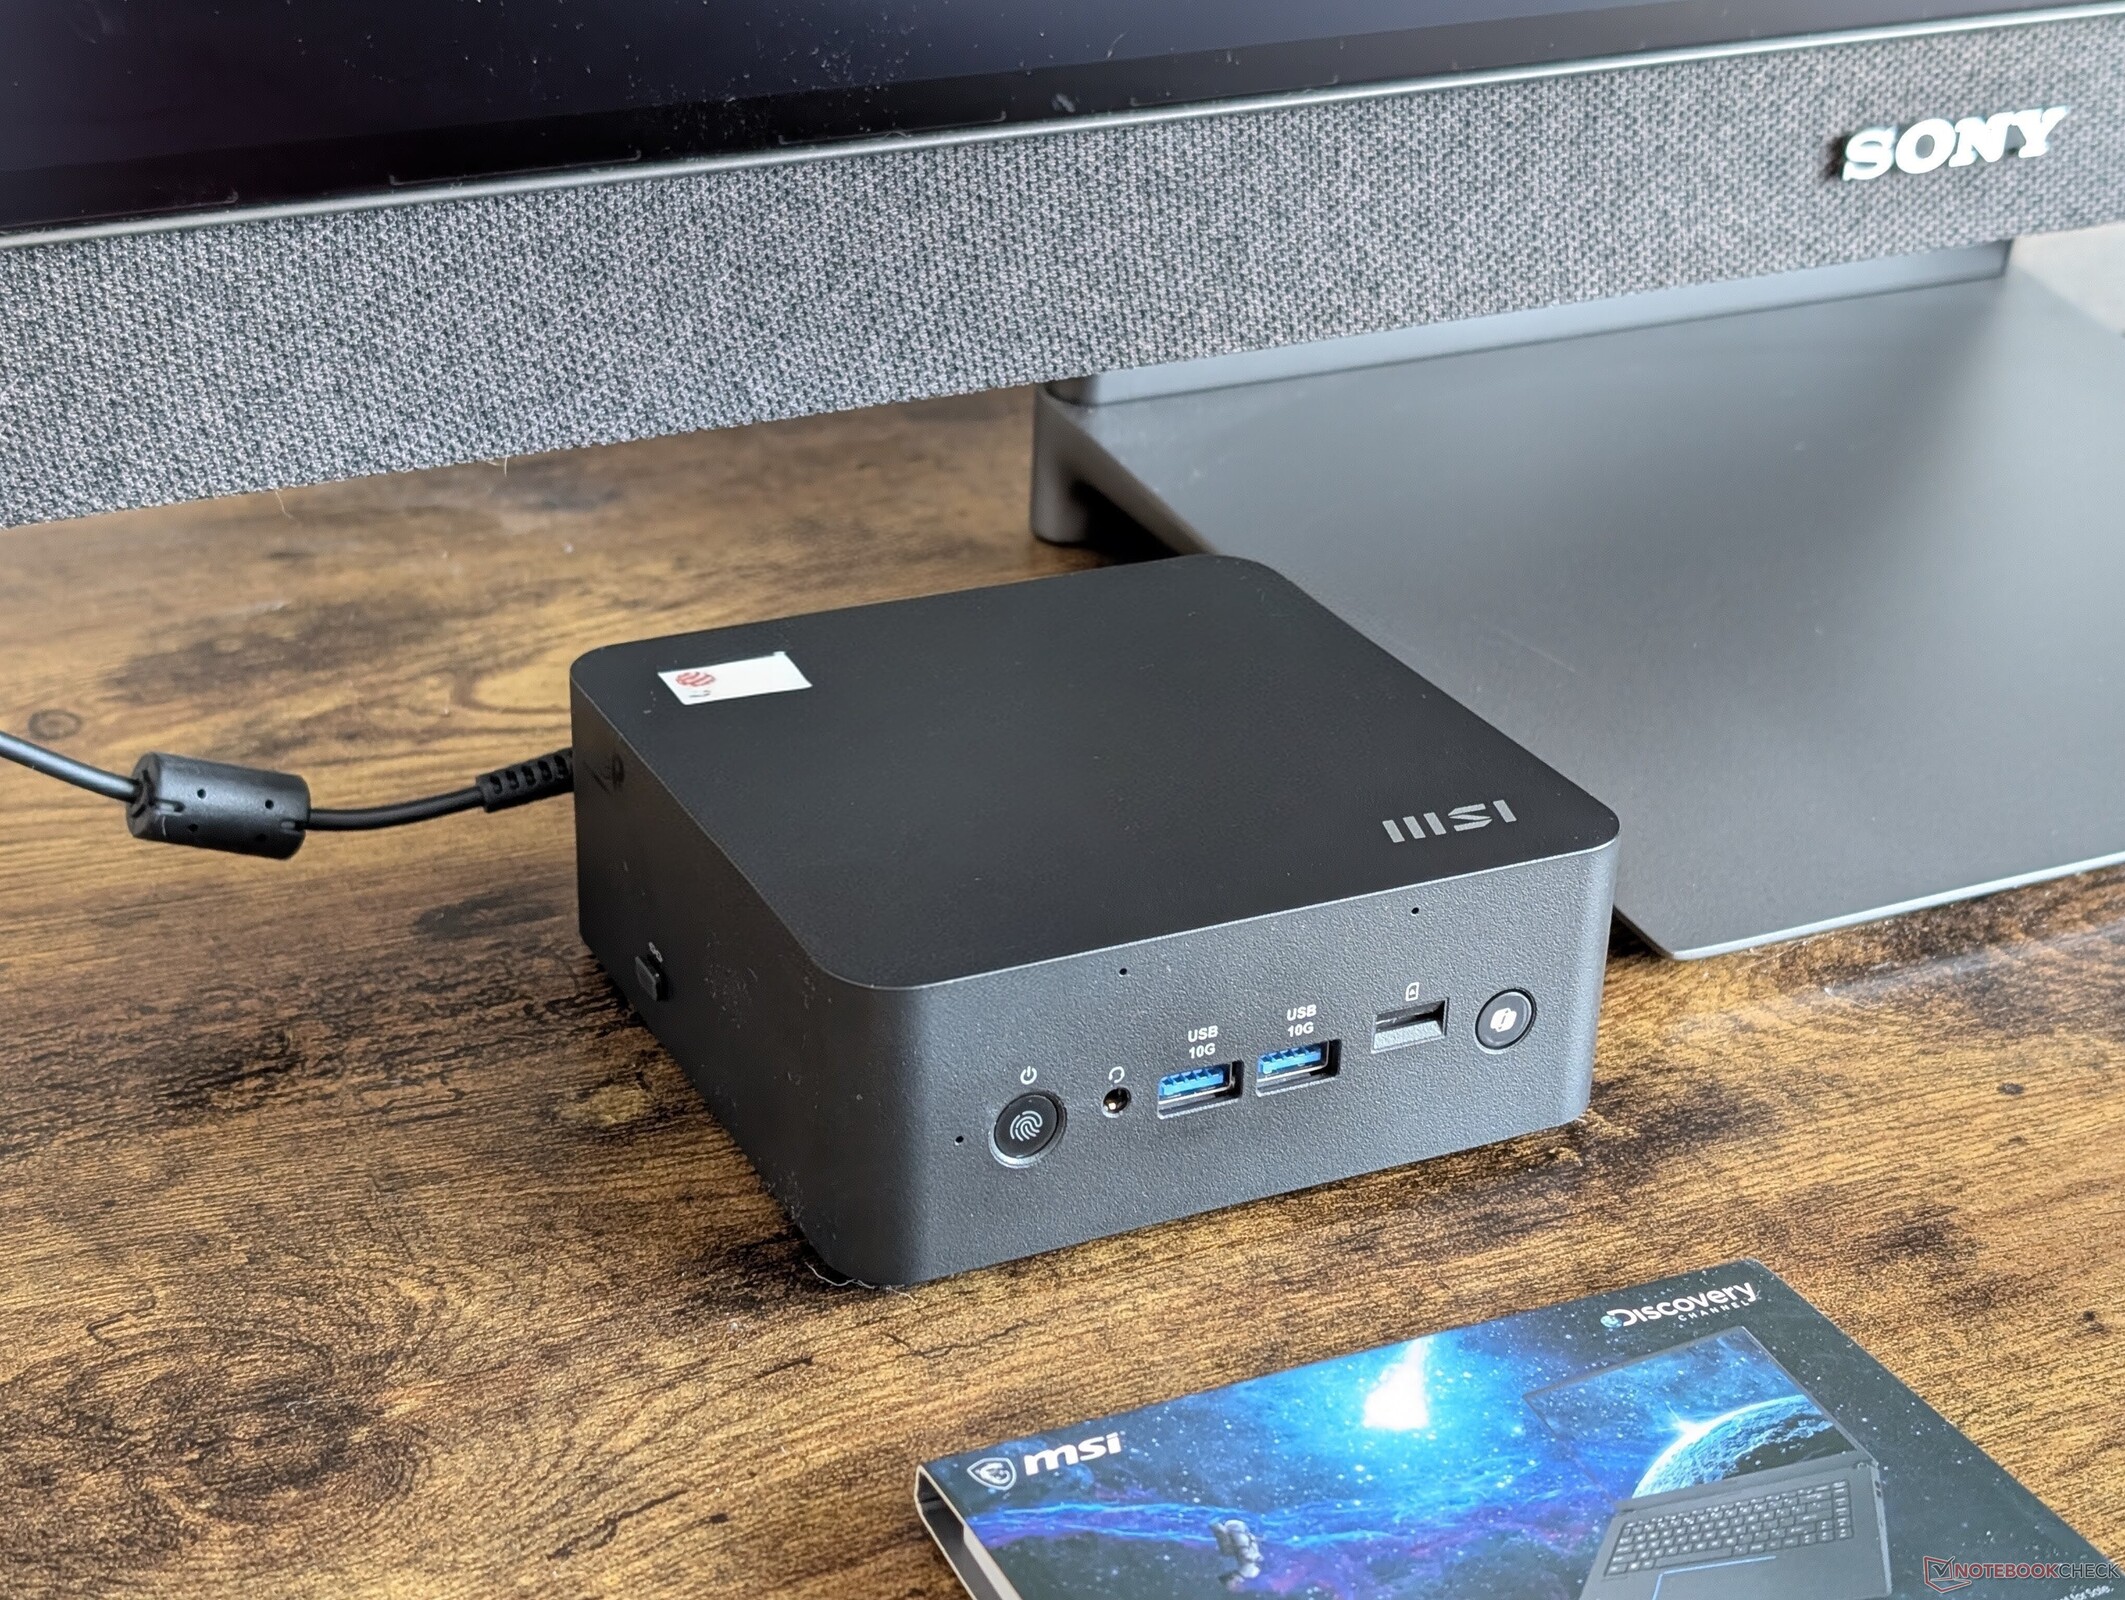
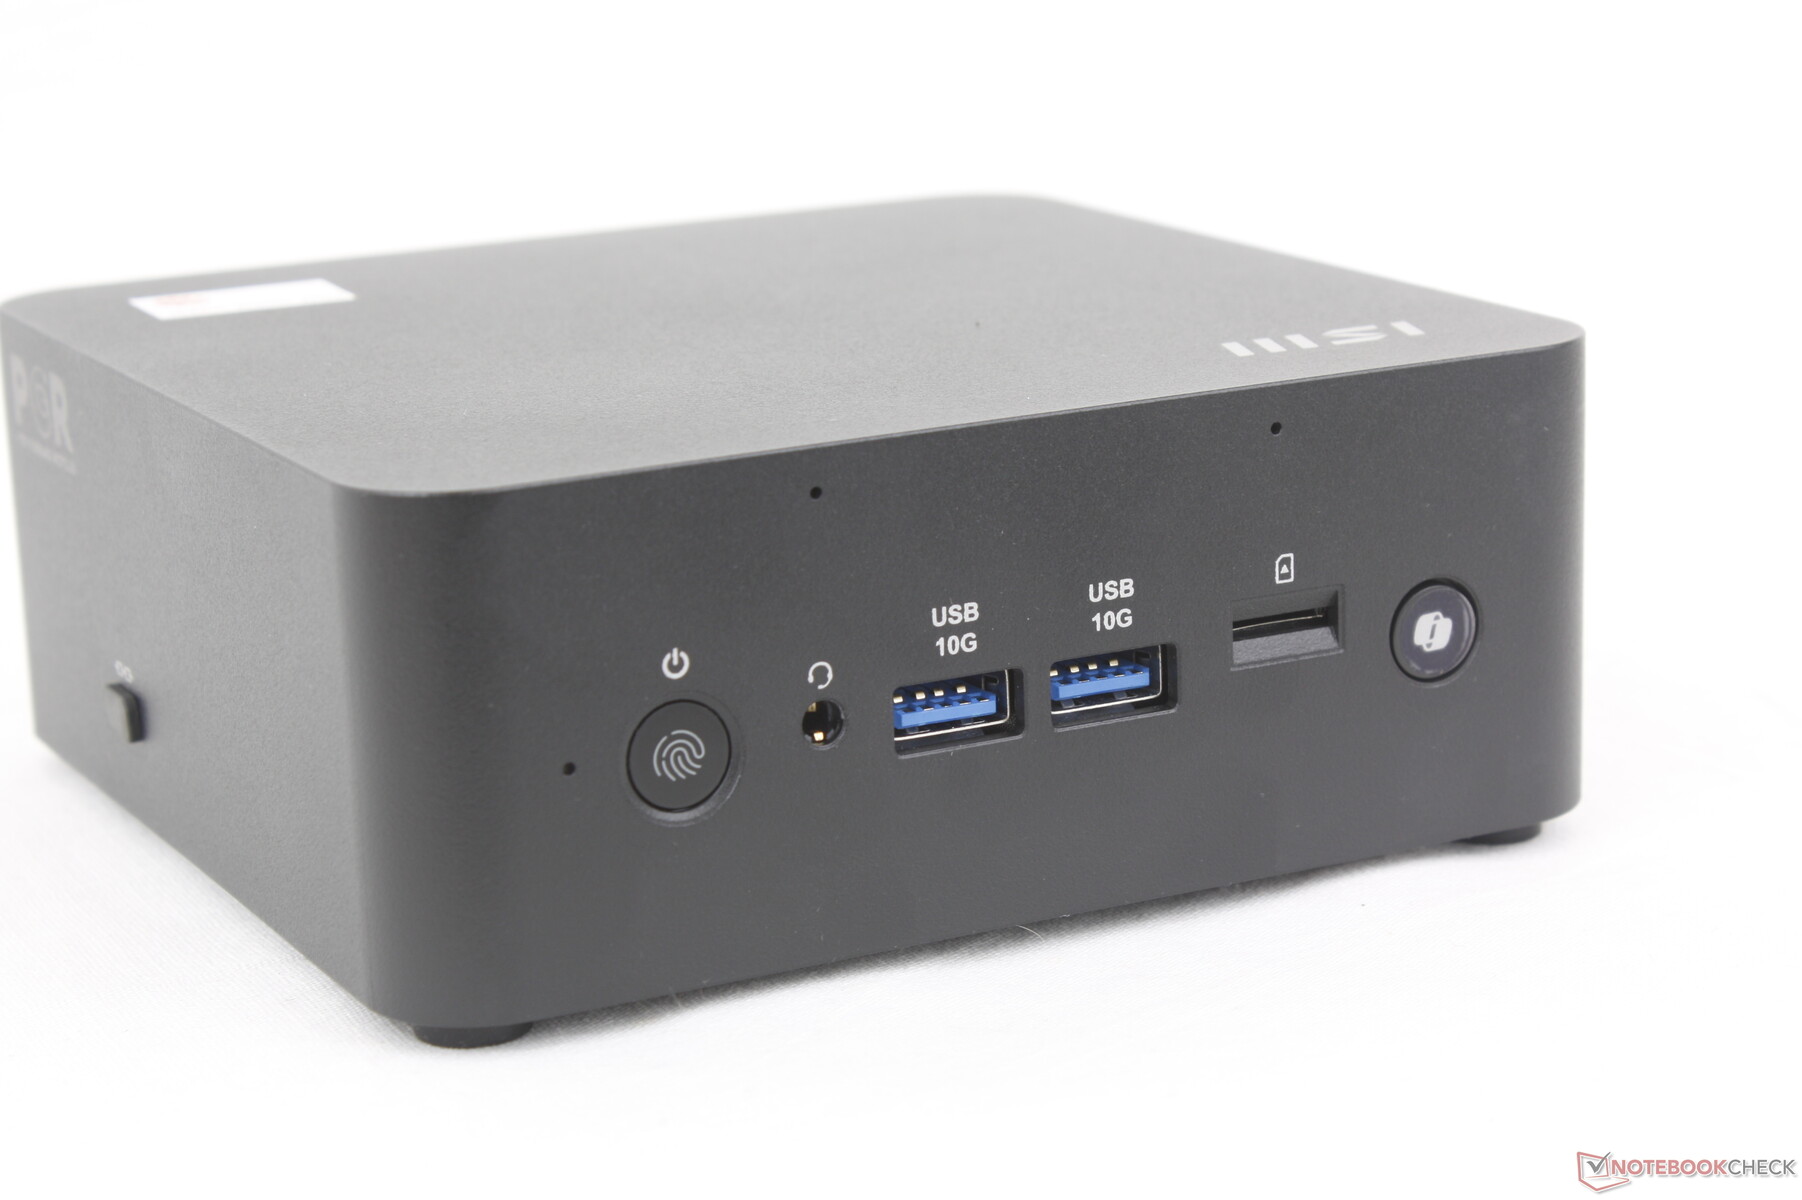
Podwozie i wymiary pozostały w większości niezmienione w stosunku do Cubi 1M. Nowością w Cubi 2MG jest jednak dedykowany przycisk CoPilot z przodu urządzenia. Problem z tą funkcją polega na tym, że fizyczny przycisk może być trudno dostępny w zależności od ustawienia systemu na biurku.
Power Link jest obsługiwany w celu zasilania urządzenia za pośrednictwem niektórych monitorów MSI dla wygody. Listę kompatybilnych monitorów można znaleźć na stronie tutaj. Niestety, Power Link nadal wymaga zasilacza sieciowego dla mini PC, więc nie jest to prawdziwe rozwiązanie "jednego kabla".
Łączność
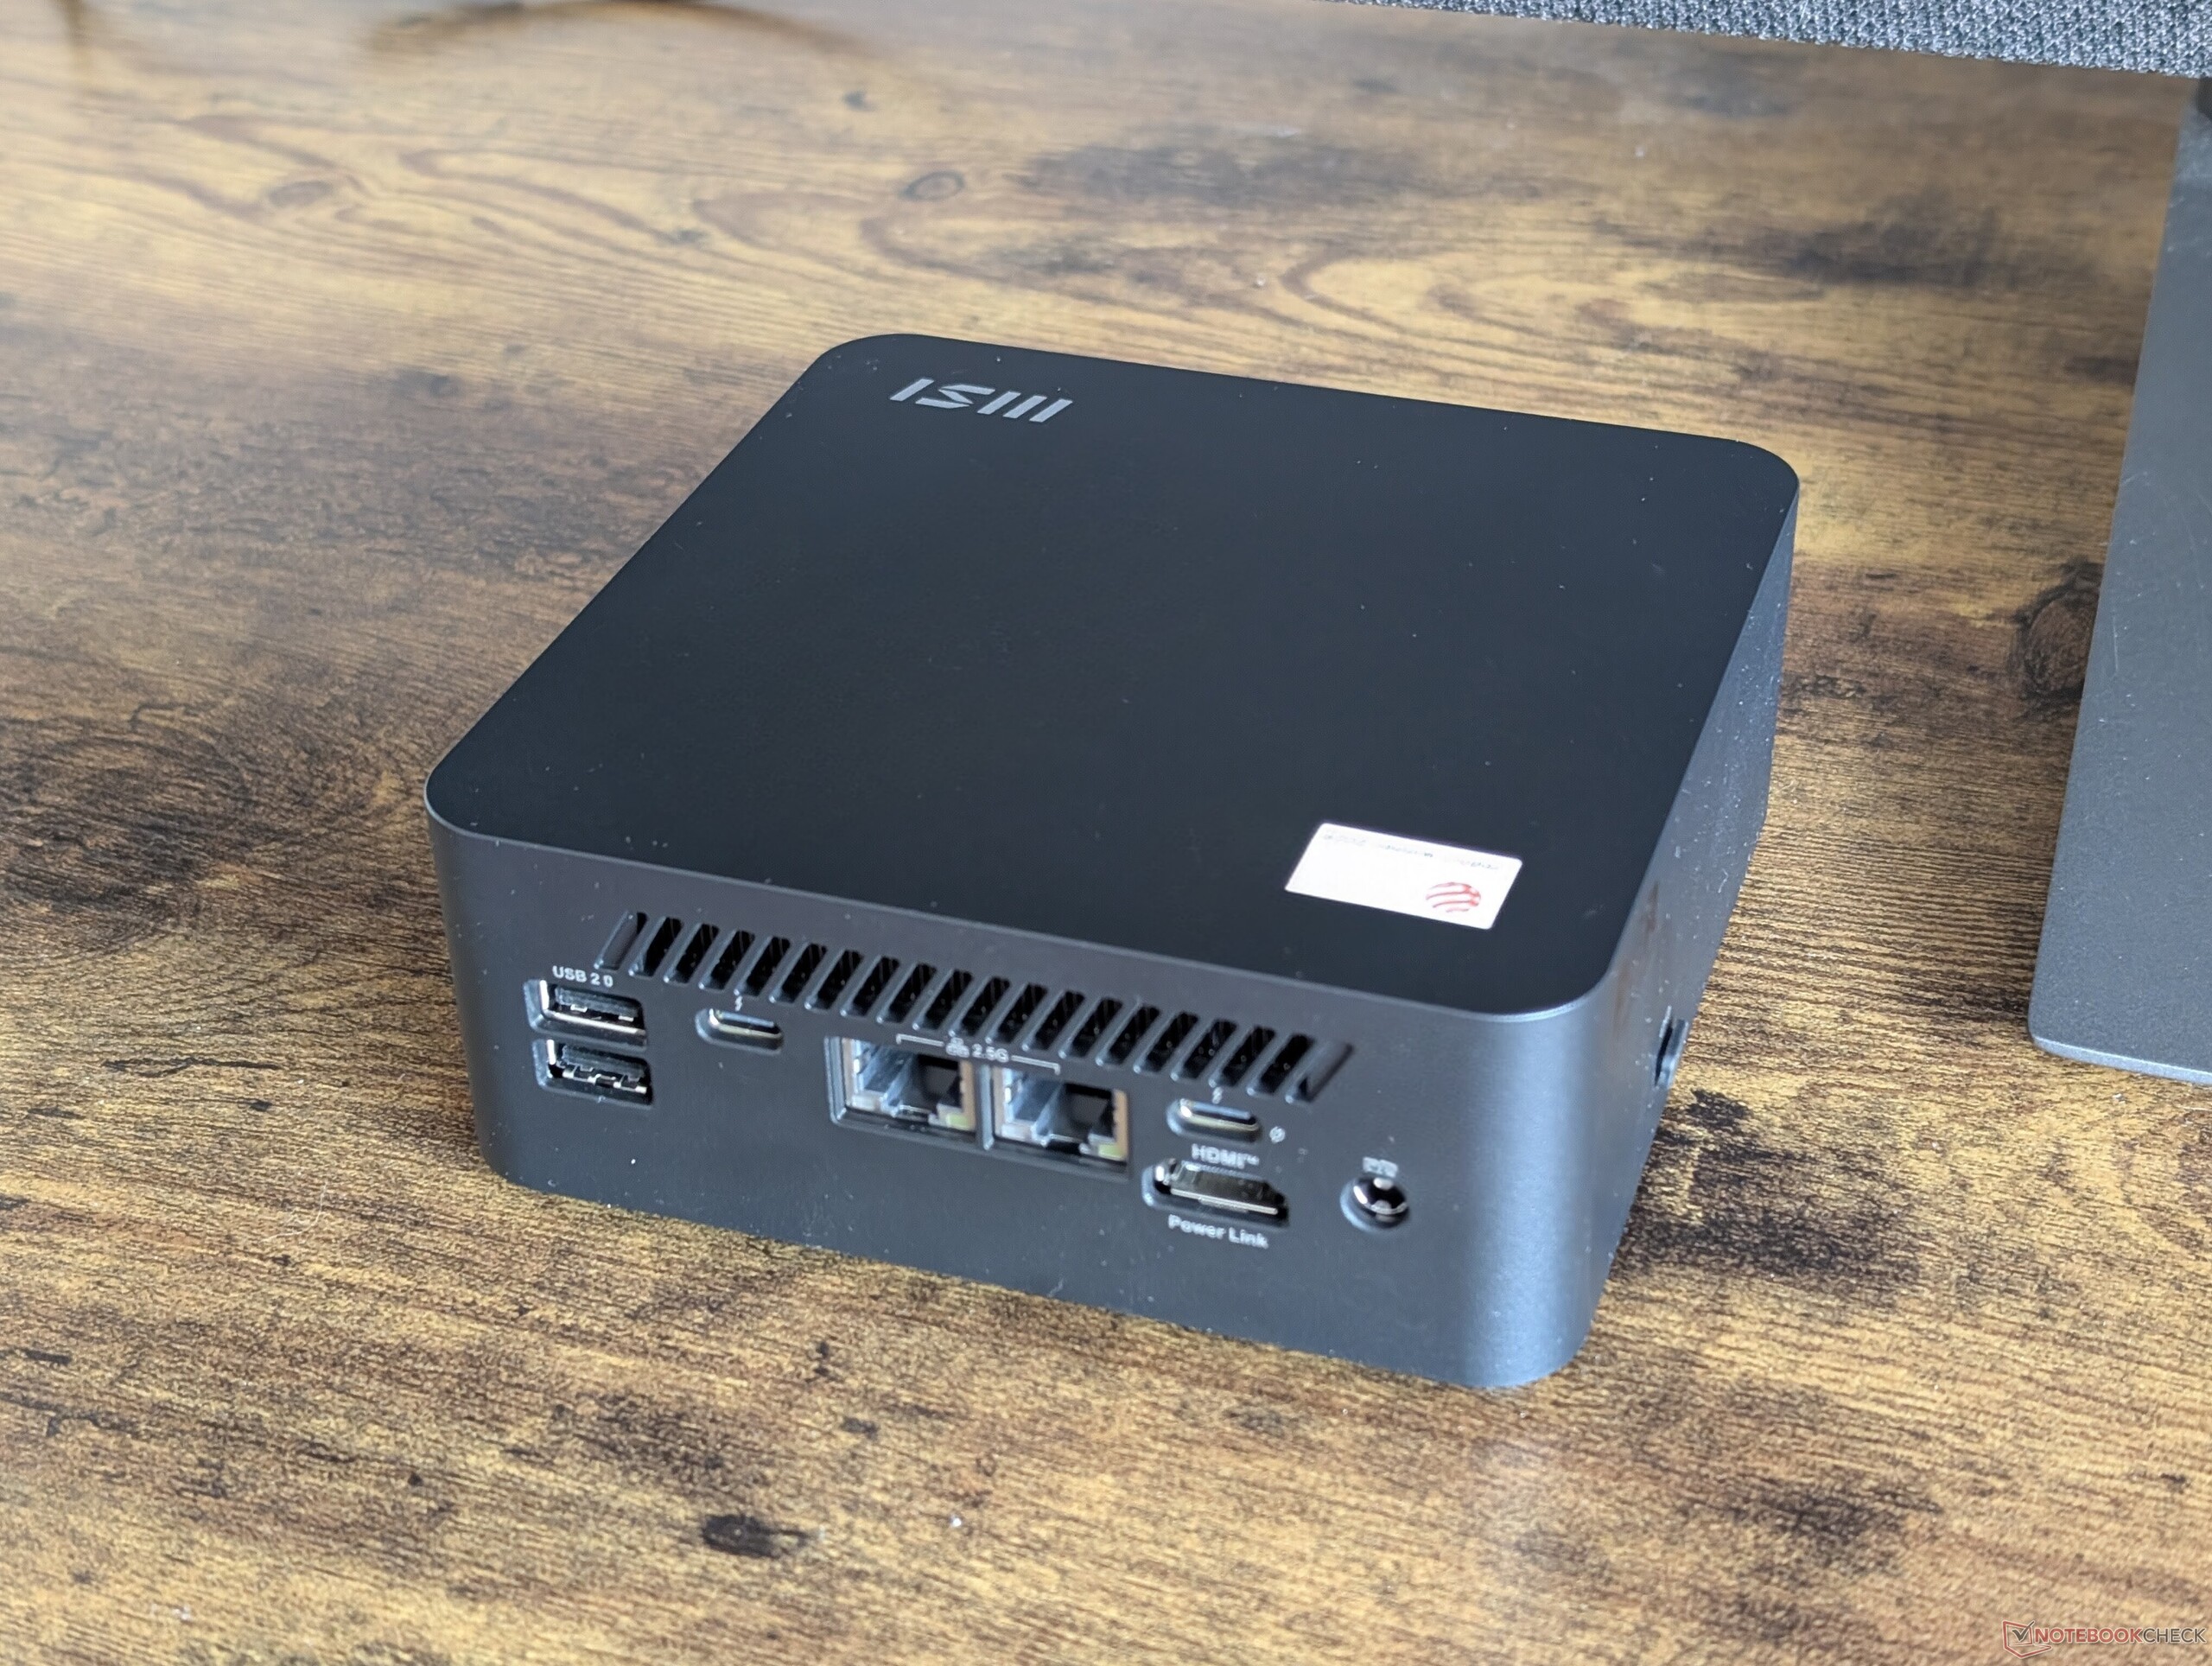
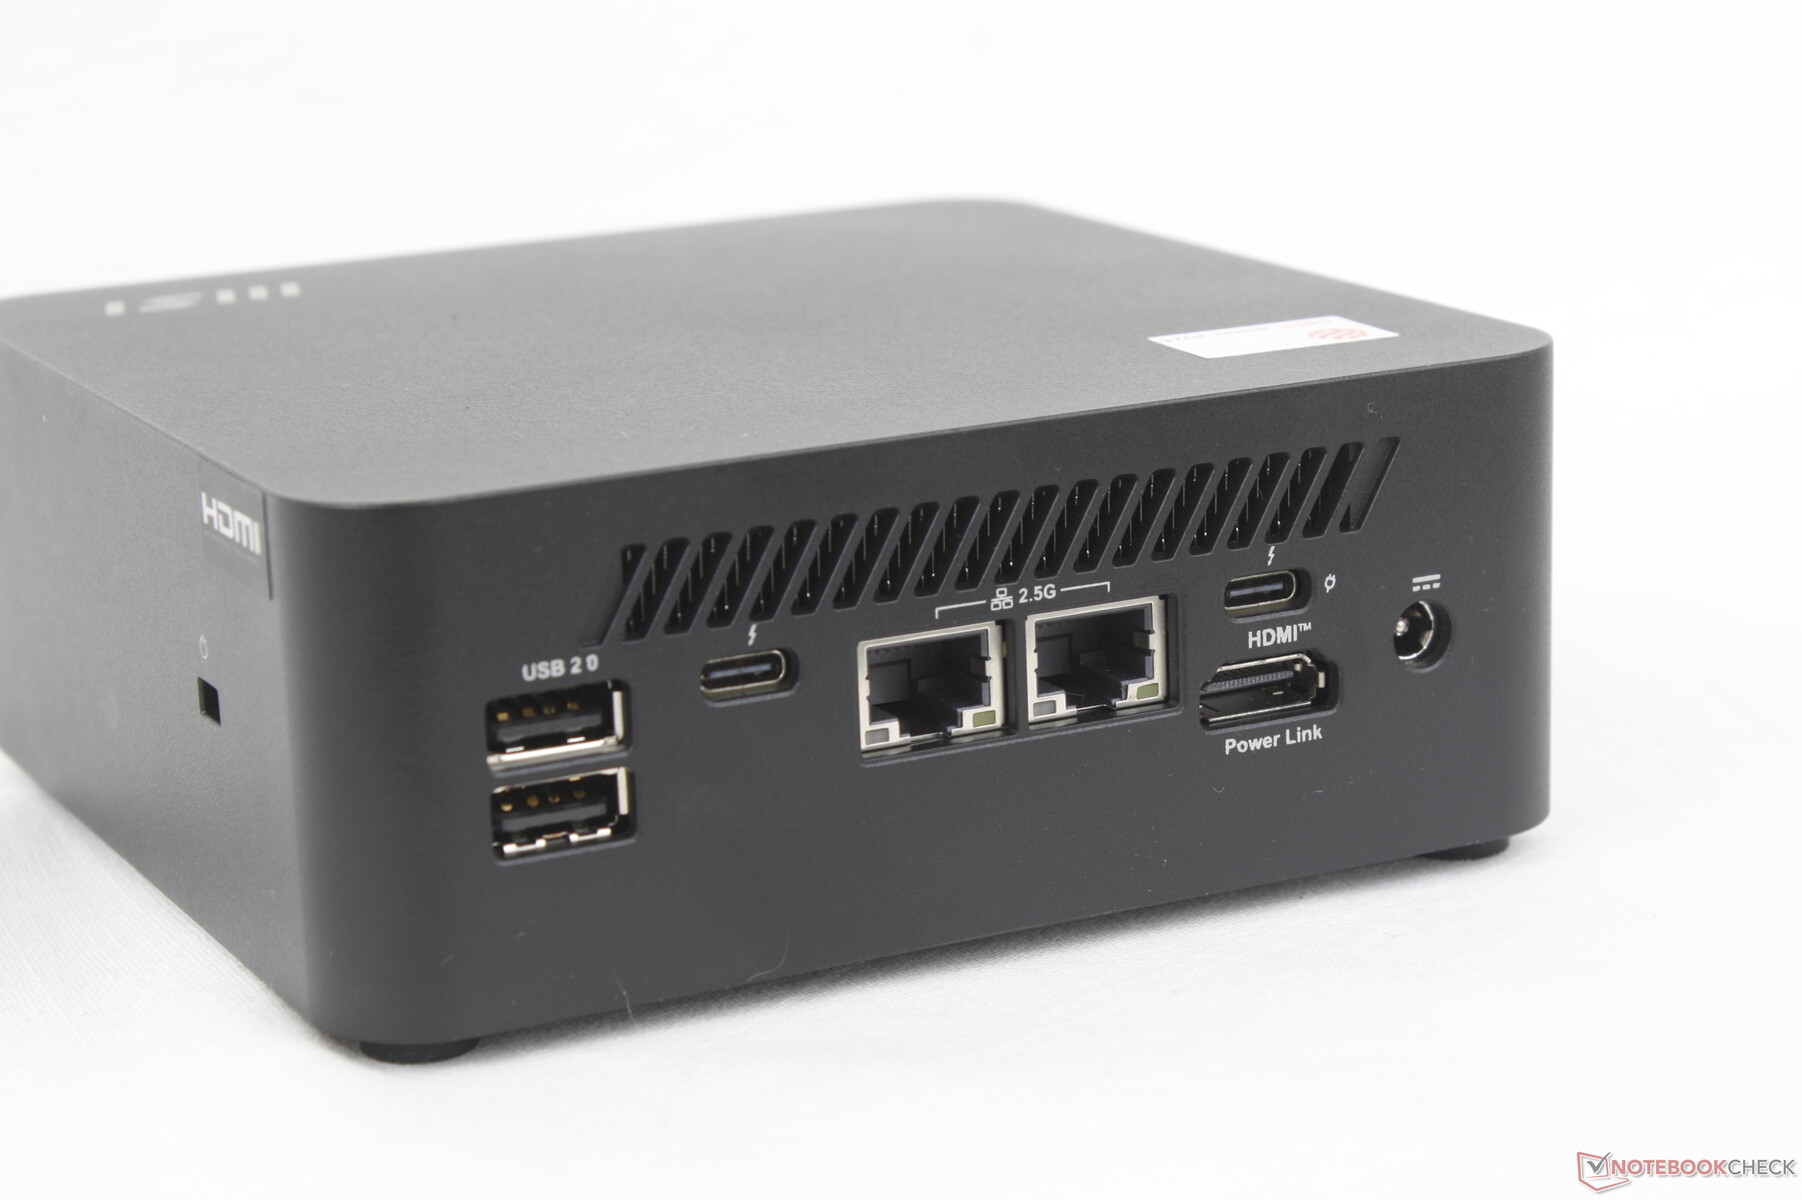
Opcje portów zmieniły się nieznacznie w stosunku do Cubi 1M. Jest teraz tylko jeden port HDMI zamiast dwóch, a także mniej portów USB 3.0.
Proszę zauważyć, że choć są dwa porty USB-C Thunderbolt 4, tylko jeden z nich obsługuje zasilanie do 100 W, gdyby główny zasilacz sieciowy był niedostępny.
Czytnik kart SD
| SD Card Reader | |
| average JPG Copy Test (av. of 3 runs) | |
| MSI Cubi NUC 1M (Angelbird AV Pro V60) | |
| MSI Cubi NUC AI+ 2MG (Angelbird AV Pro V60) | |
| maximum AS SSD Seq Read Test (1GB) | |
| MSI Cubi NUC AI+ 2MG (Angelbird AV Pro V60) | |
| MSI Cubi NUC 1M (Angelbird AV Pro V60) | |
Komunikacja
| Networking | |
| iperf3 transmit AXE11000 | |
| MSI Cubi NUC AI+ 2MG | |
| GMK NucBox K12 | |
| Minisforum MS-A1 | |
| MSI Cubi NUC 1M | |
| Beelink SER9 Pro | |
| iperf3 receive AXE11000 | |
| MSI Cubi NUC AI+ 2MG | |
| Minisforum MS-A1 | |
| Beelink SER9 Pro | |
| GMK NucBox K12 | |
| MSI Cubi NUC 1M | |
| iperf3 transmit AXE11000 6GHz | |
| Minisforum MS-A1 | |
| MSI Cubi NUC 1M | |
| MSI Cubi NUC AI+ 2MG | |
| GMK NucBox K12 | |
| iperf3 receive AXE11000 6GHz | |
| Minisforum MS-A1 | |
| MSI Cubi NUC AI+ 2MG | |
| MSI Cubi NUC 1M | |
| GMK NucBox K12 | |
Konserwacja
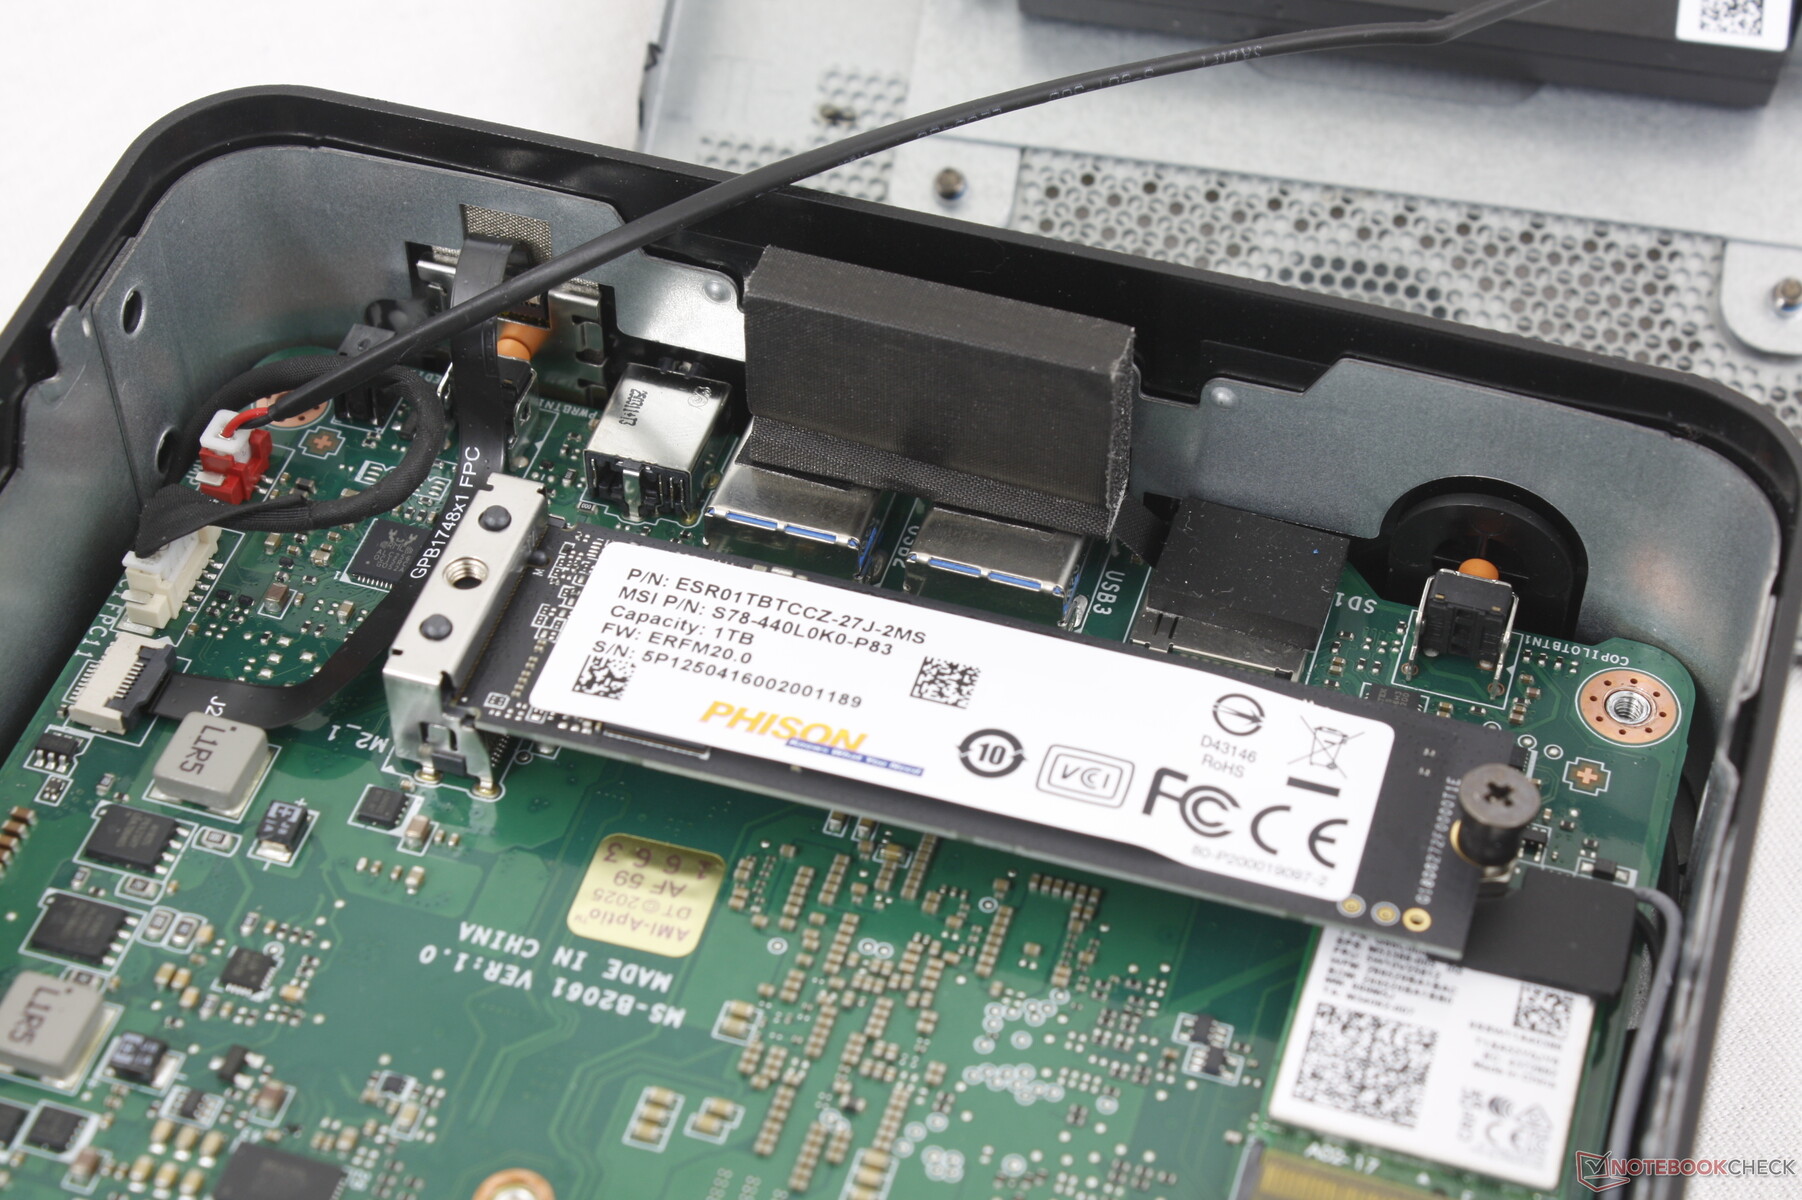
Dolny panel można łatwo zdjąć za pomocą śrubokręta krzyżakowego w celu szybkiego serwisowania. Niestety, obsługiwany jest tylko jeden wewnętrzny dysk SSD PCIe4 x4 M.2 2280 bez wymiennej pamięci RAM. W przeciwieństwie do NucBox K12 obsługuje do trzech dysków SSD M.2 i dwa wymienne moduły pamięci RAM SODIMM.

Zrównoważony rozwój
Obudowa składa się w 37,25 procentach z plastiku pochodzącego z recyklingu poużytkowego, podczas gdy opakowanie wewnętrzne składa się z kartonów z certyfikatem FSC wykonanych z pulpy drzewnej pozyskiwanej w sposób zrównoważony.
Akcesoria i gwarancja
Pudełko detaliczne zawiera zdejmowany uchwyt montażowy VESA i poręczny 19-calowy przewodowy przycisk zasilania do włączania komputera, jeśli znajduje się on w trudno dostępnym miejscu.
Trzyletnia ograniczona gwarancja producenta jest standardem w porównaniu do jednego roku dla większości innych mini PC w USA.
Wydajność

Warunki testowania
Przed wykonaniem poniższych testów ustawiliśmy MSI Center na tryb Performance.
Procesor
The Core Ultra 7 258V jest prawie 50 procent szybszy niż starszy Core 7 150U w zeszłorocznym Cubi NUC 1M, jeśli chodzi o surową wydajność wielowątkową. Jest on również wyposażony w zintegrowaną jednostkę NPU, podczas gdy Nuc 1M nie obsługiwał funkcji Co-Pilot+.
Aktualizacja do Core Ultra 9 288V SKU nie powinna zwiększyć wydajności o żaden znaczący margines, podczas gdy obniżenie wersji do Core Ultra 5 226V obniży wydajność tylko o kilka punktów procentowych.
Cinebench R15 Multi Loop
Cinebench R23: Multi Core | Single Core
Cinebench R20: CPU (Multi Core) | CPU (Single Core)
Cinebench R15: CPU Multi 64Bit | CPU Single 64Bit
Blender: v2.79 BMW27 CPU
7-Zip 18.03: 7z b 4 | 7z b 4 -mmt1
Geekbench 6.7: Multi-Core | Single-Core
Geekbench 5.5: Multi-Core | Single-Core
HWBOT x265 Benchmark v2.2: 4k Preset
LibreOffice : 20 Documents To PDF
R Benchmark 2.5: Overall mean
| CPU Performance rating | |
| Minisforum MS-A1 | |
| Asus NUC 14 Pro+ | |
| Beelink SER9 Pro | |
| Intel NUC 13 Pro Kit NUC13ANK -2! | |
| MSI Cubi NUC AI+ 2MG | |
| Przeciętny Intel Core Ultra 7 258V | |
| MSI Cubi NUC 1M | |
| Ninkear M7, (16+512) | |
| GMK NucBox M5 | |
| Asus NUC 14 Essential | |
| BMAX B4 Turbo | |
| Cinebench R23 / Multi Core | |
| Asus NUC 14 Pro+ | |
| Minisforum MS-A1 | |
| Beelink SER9 Pro | |
| Intel NUC 13 Pro Kit NUC13ANK | |
| MSI Cubi NUC AI+ 2MG | |
| Przeciętny Intel Core Ultra 7 258V (7920 - 11097, n=25) | |
| MSI Cubi NUC 1M | |
| GMK NucBox M5 | |
| Ninkear M7, (16+512) | |
| Asus NUC 14 Essential | |
| BMAX B4 Turbo | |
| Cinebench R23 / Single Core | |
| MSI Cubi NUC AI+ 2MG | |
| Intel NUC 13 Pro Kit NUC13ANK | |
| MSI Cubi NUC 1M | |
| Przeciętny Intel Core Ultra 7 258V (1664 - 1957, n=25) | |
| Minisforum MS-A1 | |
| Asus NUC 14 Pro+ | |
| Beelink SER9 Pro | |
| Ninkear M7, (16+512) | |
| GMK NucBox M5 | |
| Asus NUC 14 Essential | |
| BMAX B4 Turbo | |
| Cinebench R20 / CPU (Multi Core) | |
| Asus NUC 14 Pro+ | |
| Minisforum MS-A1 | |
| Beelink SER9 Pro | |
| Intel NUC 13 Pro Kit NUC13ANK | |
| MSI Cubi NUC AI+ 2MG | |
| Przeciętny Intel Core Ultra 7 258V (3130 - 4314, n=24) | |
| Ninkear M7, (16+512) | |
| MSI Cubi NUC 1M | |
| GMK NucBox M5 | |
| Asus NUC 14 Essential | |
| BMAX B4 Turbo | |
| Cinebench R20 / CPU (Single Core) | |
| MSI Cubi NUC AI+ 2MG | |
| Intel NUC 13 Pro Kit NUC13ANK | |
| MSI Cubi NUC 1M | |
| Przeciętny Intel Core Ultra 7 258V (643 - 749, n=24) | |
| Minisforum MS-A1 | |
| Asus NUC 14 Pro+ | |
| Beelink SER9 Pro | |
| Ninkear M7, (16+512) | |
| GMK NucBox M5 | |
| Asus NUC 14 Essential | |
| BMAX B4 Turbo | |
| Cinebench R15 / CPU Multi 64Bit | |
| Asus NUC 14 Pro+ | |
| Minisforum MS-A1 | |
| Beelink SER9 Pro | |
| Intel NUC 13 Pro Kit NUC13ANK | |
| Przeciętny Intel Core Ultra 7 258V (1280 - 1656, n=24) | |
| MSI Cubi NUC AI+ 2MG | |
| Ninkear M7, (16+512) | |
| GMK NucBox M5 | |
| MSI Cubi NUC 1M | |
| Asus NUC 14 Essential | |
| BMAX B4 Turbo | |
| Cinebench R15 / CPU Single 64Bit | |
| MSI Cubi NUC AI+ 2MG | |
| Minisforum MS-A1 | |
| Przeciętny Intel Core Ultra 7 258V (258 - 298, n=24) | |
| Beelink SER9 Pro | |
| Intel NUC 13 Pro Kit NUC13ANK | |
| Asus NUC 14 Pro+ | |
| MSI Cubi NUC 1M | |
| Ninkear M7, (16+512) | |
| GMK NucBox M5 | |
| Asus NUC 14 Essential | |
| BMAX B4 Turbo | |
| Blender / v2.79 BMW27 CPU | |
| BMAX B4 Turbo | |
| Asus NUC 14 Essential | |
| MSI Cubi NUC 1M | |
| Ninkear M7, (16+512) | |
| GMK NucBox M5 | |
| Przeciętny Intel Core Ultra 7 258V (315 - 484, n=24) | |
| MSI Cubi NUC AI+ 2MG | |
| Intel NUC 13 Pro Kit NUC13ANK | |
| Beelink SER9 Pro | |
| Minisforum MS-A1 | |
| Asus NUC 14 Pro+ | |
| 7-Zip 18.03 / 7z b 4 | |
| Minisforum MS-A1 | |
| Beelink SER9 Pro | |
| Asus NUC 14 Pro+ | |
| Intel NUC 13 Pro Kit NUC13ANK | |
| Ninkear M7, (16+512) | |
| MSI Cubi NUC AI+ 2MG | |
| Przeciętny Intel Core Ultra 7 258V (24486 - 36724, n=24) | |
| GMK NucBox M5 | |
| MSI Cubi NUC 1M | |
| Asus NUC 14 Essential | |
| BMAX B4 Turbo | |
| 7-Zip 18.03 / 7z b 4 -mmt1 | |
| Minisforum MS-A1 | |
| Beelink SER9 Pro | |
| Intel NUC 13 Pro Kit NUC13ANK | |
| MSI Cubi NUC 1M | |
| MSI Cubi NUC AI+ 2MG | |
| Asus NUC 14 Pro+ | |
| Przeciętny Intel Core Ultra 7 258V (4769 - 5869, n=24) | |
| Ninkear M7, (16+512) | |
| GMK NucBox M5 | |
| Asus NUC 14 Essential | |
| BMAX B4 Turbo | |
| Geekbench 6.7 / Multi-Core | |
| Asus NUC 14 Pro+ | |
| Minisforum MS-A1 | |
| Beelink SER9 Pro | |
| Przeciętny Intel Core Ultra 7 258V (8964 - 11334, n=24) | |
| MSI Cubi NUC AI+ 2MG | |
| MSI Cubi NUC 1M | |
| GMK NucBox M5 | |
| Ninkear M7, (16+512) | |
| Asus NUC 14 Essential | |
| BMAX B4 Turbo | |
| Geekbench 6.7 / Single-Core | |
| MSI Cubi NUC AI+ 2MG | |
| Przeciętny Intel Core Ultra 7 258V (2593 - 2795, n=24) | |
| Minisforum MS-A1 | |
| MSI Cubi NUC 1M | |
| Beelink SER9 Pro | |
| Asus NUC 14 Pro+ | |
| Ninkear M7, (16+512) | |
| GMK NucBox M5 | |
| Asus NUC 14 Essential | |
| BMAX B4 Turbo | |
| Geekbench 5.5 / Multi-Core | |
| Asus NUC 14 Pro+ | |
| Minisforum MS-A1 | |
| Beelink SER9 Pro | |
| Intel NUC 13 Pro Kit NUC13ANK | |
| Przeciętny Intel Core Ultra 7 258V (7574 - 9918, n=24) | |
| MSI Cubi NUC 1M | |
| MSI Cubi NUC AI+ 2MG | |
| GMK NucBox M5 | |
| Ninkear M7, (16+512) | |
| Asus NUC 14 Essential | |
| BMAX B4 Turbo | |
| Geekbench 5.5 / Single-Core | |
| MSI Cubi NUC AI+ 2MG | |
| Minisforum MS-A1 | |
| Przeciętny Intel Core Ultra 7 258V (1891 - 2046, n=24) | |
| MSI Cubi NUC 1M | |
| Intel NUC 13 Pro Kit NUC13ANK | |
| Beelink SER9 Pro | |
| Asus NUC 14 Pro+ | |
| Ninkear M7, (16+512) | |
| GMK NucBox M5 | |
| Asus NUC 14 Essential | |
| BMAX B4 Turbo | |
| HWBOT x265 Benchmark v2.2 / 4k Preset | |
| Minisforum MS-A1 | |
| Beelink SER9 Pro | |
| Asus NUC 14 Pro+ | |
| Intel NUC 13 Pro Kit NUC13ANK | |
| MSI Cubi NUC AI+ 2MG | |
| Przeciętny Intel Core Ultra 7 258V (7.11 - 14.2, n=24) | |
| MSI Cubi NUC 1M | |
| Ninkear M7, (16+512) | |
| GMK NucBox M5 | |
| Asus NUC 14 Essential | |
| BMAX B4 Turbo | |
| LibreOffice / 20 Documents To PDF | |
| Asus NUC 14 Essential | |
| BMAX B4 Turbo | |
| Ninkear M7, (16+512) | |
| GMK NucBox M5 | |
| Asus NUC 14 Pro+ | |
| Beelink SER9 Pro | |
| Przeciętny Intel Core Ultra 7 258V (41.1 - 62.8, n=24) | |
| Minisforum MS-A1 | |
| MSI Cubi NUC AI+ 2MG | |
| Intel NUC 13 Pro Kit NUC13ANK | |
| MSI Cubi NUC 1M | |
| R Benchmark 2.5 / Overall mean | |
| BMAX B4 Turbo | |
| Asus NUC 14 Essential | |
| Ninkear M7, (16+512) | |
| GMK NucBox M5 | |
| Beelink SER9 Pro | |
| Przeciętny Intel Core Ultra 7 258V (0.443 - 0.542, n=24) | |
| MSI Cubi NUC AI+ 2MG | |
| Asus NUC 14 Pro+ | |
| Intel NUC 13 Pro Kit NUC13ANK | |
| MSI Cubi NUC 1M | |
| Minisforum MS-A1 | |
* ... im mniej tym lepiej
AIDA64: FP32 Ray-Trace | FPU Julia | CPU SHA3 | CPU Queen | FPU SinJulia | FPU Mandel | CPU AES | CPU ZLib | FP64 Ray-Trace | CPU PhotoWorxx
| Performance rating | |
| Minisforum MS-A1 | |
| Beelink SER9 Pro | |
| GMK NucBox K12 | |
| MSI Cubi NUC AI+ 2MG | |
| Przeciętny Intel Core Ultra 7 258V | |
| Ninkear M7, (16+512) | |
| MSI Cubi NUC 1M | |
| AIDA64 / FP32 Ray-Trace | |
| Minisforum MS-A1 | |
| Beelink SER9 Pro | |
| GMK NucBox K12 | |
| MSI Cubi NUC AI+ 2MG | |
| Przeciętny Intel Core Ultra 7 258V (8454 - 12781, n=26) | |
| Ninkear M7, (16+512) | |
| MSI Cubi NUC 1M | |
| AIDA64 / FPU Julia | |
| Minisforum MS-A1 | |
| Beelink SER9 Pro | |
| GMK NucBox K12 | |
| MSI Cubi NUC AI+ 2MG | |
| Przeciętny Intel Core Ultra 7 258V (40875 - 63401, n=26) | |
| Ninkear M7, (16+512) | |
| MSI Cubi NUC 1M | |
| AIDA64 / CPU SHA3 | |
| Minisforum MS-A1 | |
| Beelink SER9 Pro | |
| GMK NucBox K12 | |
| MSI Cubi NUC AI+ 2MG | |
| Przeciętny Intel Core Ultra 7 258V (1930 - 2817, n=26) | |
| Ninkear M7, (16+512) | |
| MSI Cubi NUC 1M | |
| AIDA64 / CPU Queen | |
| Minisforum MS-A1 | |
| Beelink SER9 Pro | |
| GMK NucBox K12 | |
| Ninkear M7, (16+512) | |
| MSI Cubi NUC 1M | |
| Przeciętny Intel Core Ultra 7 258V (48816 - 49818, n=24) | |
| MSI Cubi NUC AI+ 2MG | |
| AIDA64 / FPU SinJulia | |
| Minisforum MS-A1 | |
| Beelink SER9 Pro | |
| GMK NucBox K12 | |
| Ninkear M7, (16+512) | |
| MSI Cubi NUC AI+ 2MG | |
| MSI Cubi NUC 1M | |
| Przeciętny Intel Core Ultra 7 258V (3817 - 4440, n=26) | |
| AIDA64 / FPU Mandel | |
| Minisforum MS-A1 | |
| Beelink SER9 Pro | |
| GMK NucBox K12 | |
| MSI Cubi NUC AI+ 2MG | |
| Przeciętny Intel Core Ultra 7 258V (21670 - 33565, n=26) | |
| Ninkear M7, (16+512) | |
| MSI Cubi NUC 1M | |
| AIDA64 / CPU AES | |
| Minisforum MS-A1 | |
| Beelink SER9 Pro | |
| GMK NucBox K12 | |
| MSI Cubi NUC AI+ 2MG | |
| Przeciętny Intel Core Ultra 7 258V (30957 - 40753, n=26) | |
| Ninkear M7, (16+512) | |
| MSI Cubi NUC 1M | |
| AIDA64 / CPU ZLib | |
| Minisforum MS-A1 | |
| Beelink SER9 Pro | |
| GMK NucBox K12 | |
| MSI Cubi NUC AI+ 2MG | |
| Przeciętny Intel Core Ultra 7 258V (422 - 632, n=26) | |
| MSI Cubi NUC 1M | |
| Ninkear M7, (16+512) | |
| AIDA64 / FP64 Ray-Trace | |
| Minisforum MS-A1 | |
| Beelink SER9 Pro | |
| GMK NucBox K12 | |
| MSI Cubi NUC AI+ 2MG | |
| Przeciętny Intel Core Ultra 7 258V (4258 - 6930, n=26) | |
| Ninkear M7, (16+512) | |
| MSI Cubi NUC 1M | |
| AIDA64 / CPU PhotoWorxx | |
| MSI Cubi NUC AI+ 2MG | |
| Przeciętny Intel Core Ultra 7 258V (44223 - 59245, n=26) | |
| Beelink SER9 Pro | |
| Minisforum MS-A1 | |
| GMK NucBox K12 | |
| MSI Cubi NUC 1M | |
| Ninkear M7, (16+512) | |
Test warunków skrajnych
Procesor ustabilizował się na poziomie 3,2 GHz, 66 C i około 38 W przy obciążeniu Prime95. Podczas uruchamiania gry Cyberpunk 2077, która reprezentuje typowy stres w grach, częstotliwości taktowania GPU wahały się między 800 MHz a 1950 MHz, co skutkowało niestabilnymi czasami klatek podczas grania, jak pokazano w sekcji Wydajność GPU poniżej, nawet jeśli średnia liczba klatek na sekundę jest normalna. To zacinanie się występowało zarówno w trybie zrównoważonym, jak i w trybie wydajności.
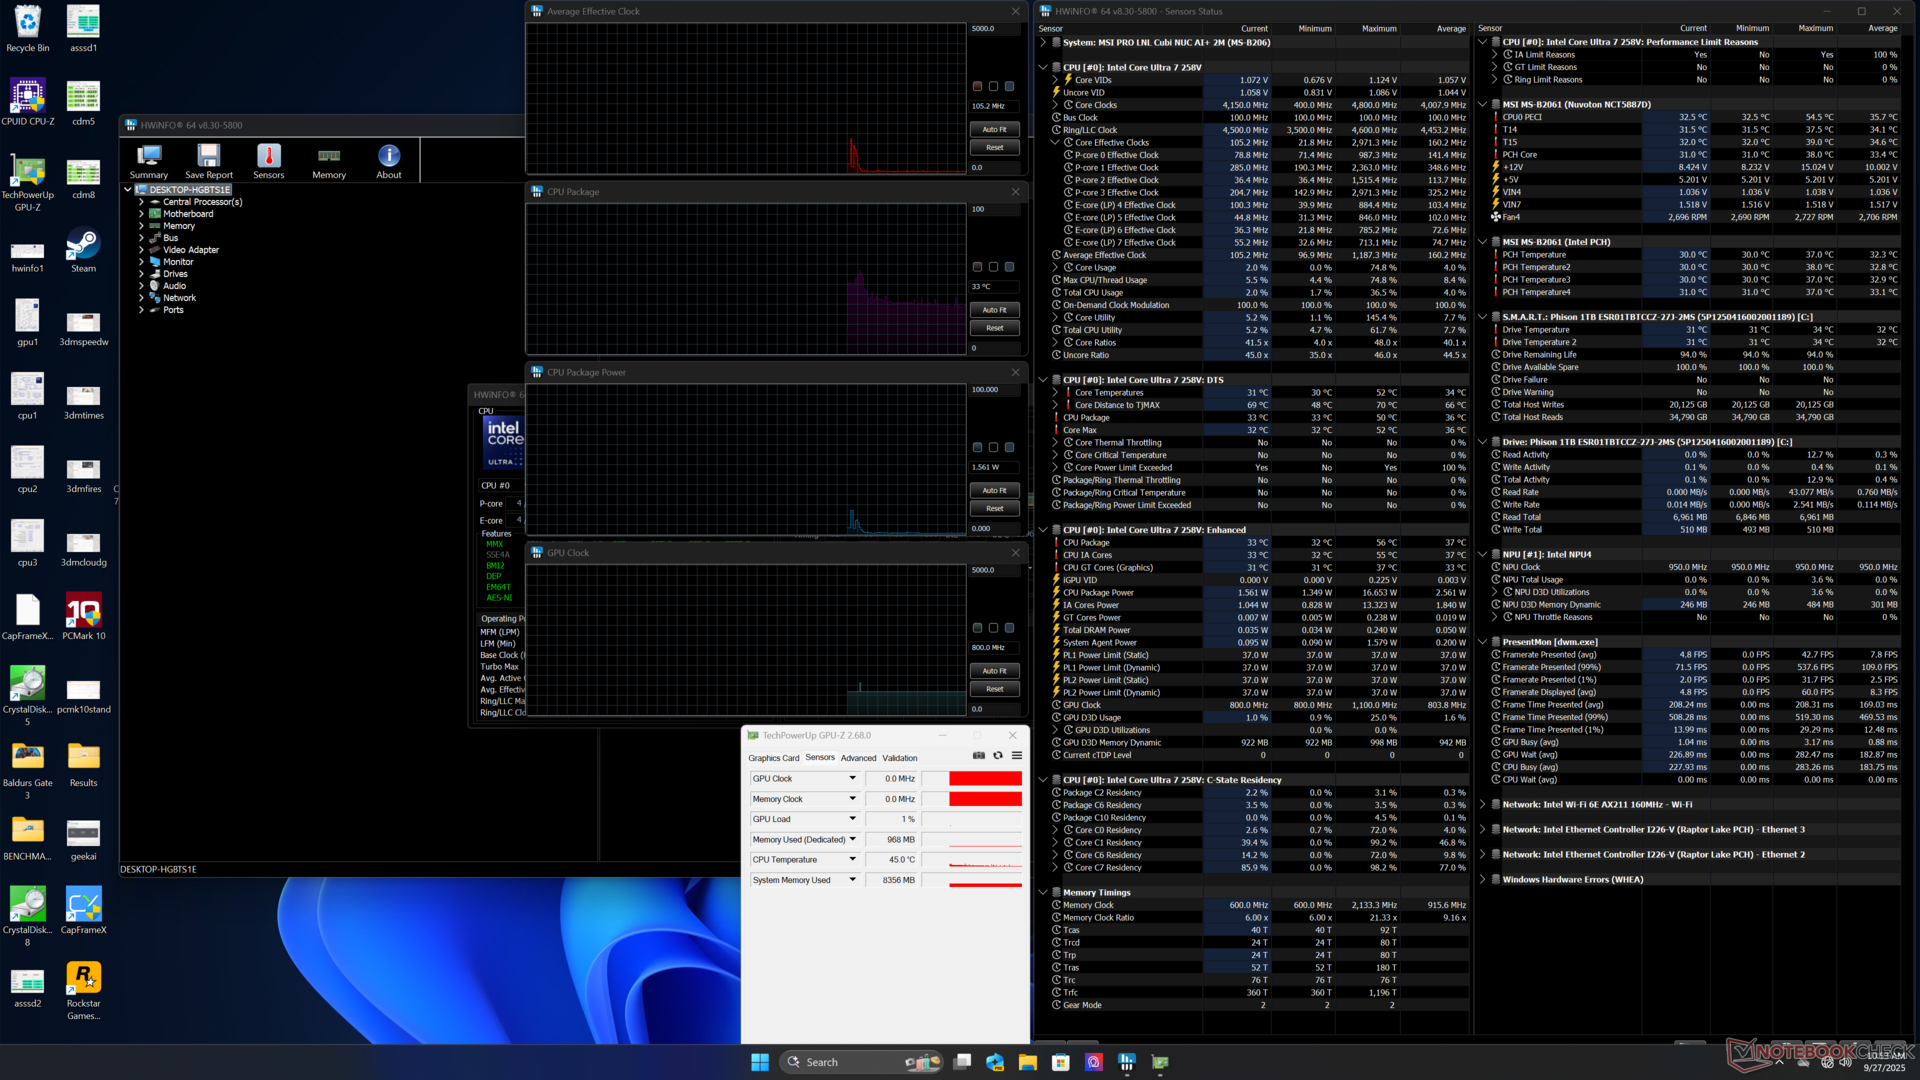
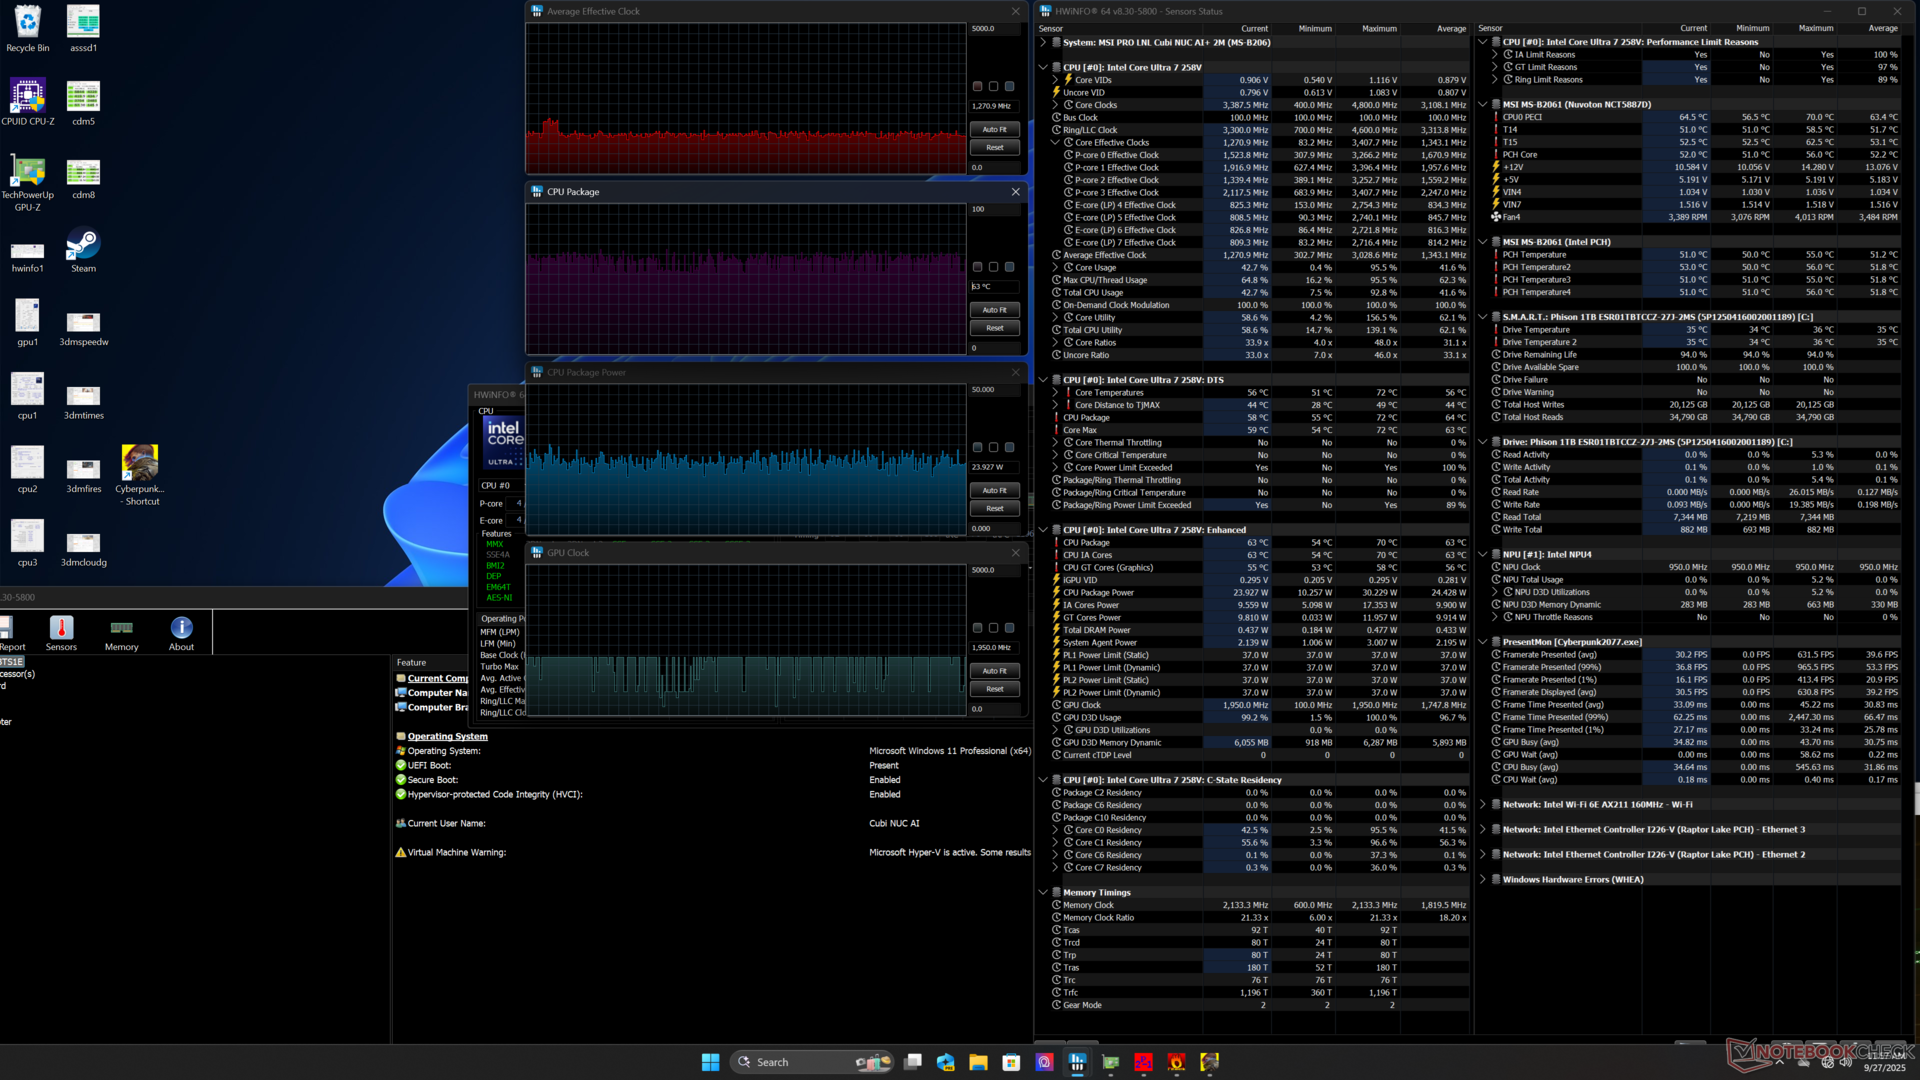
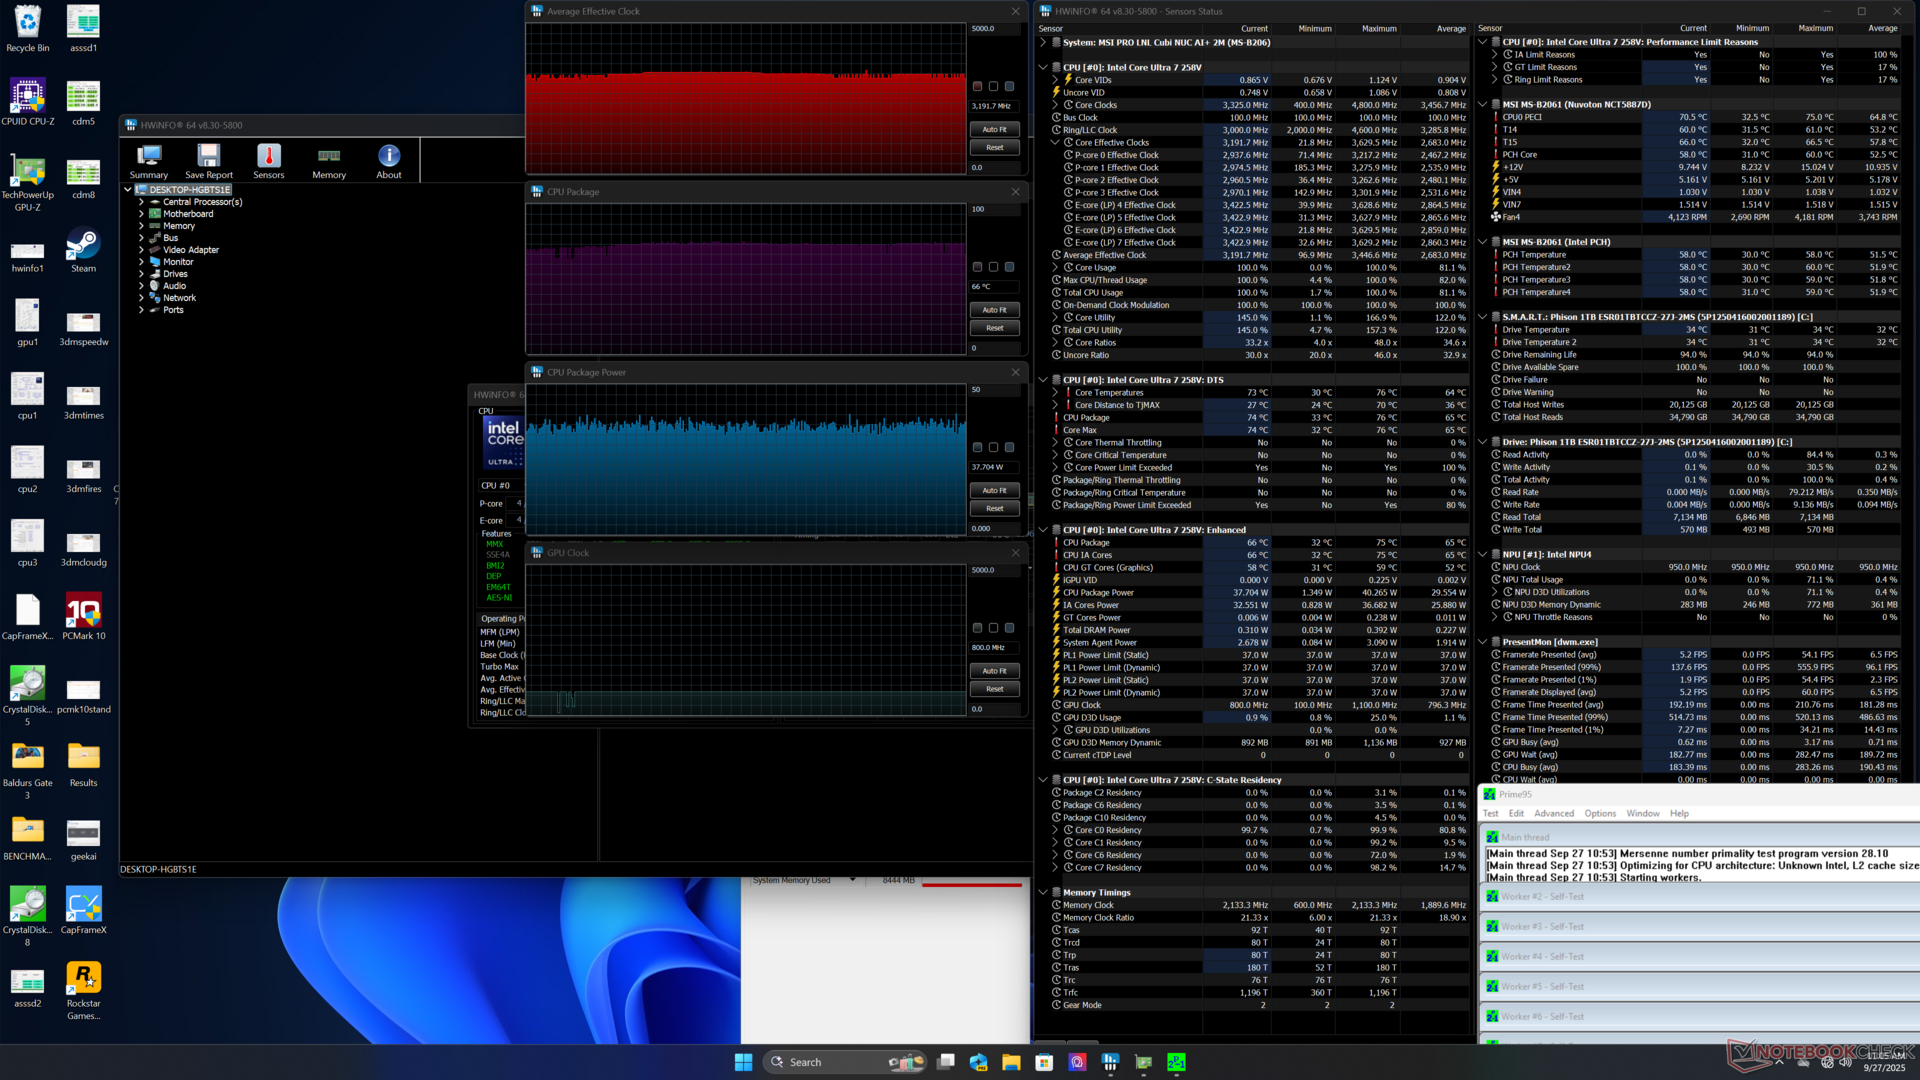
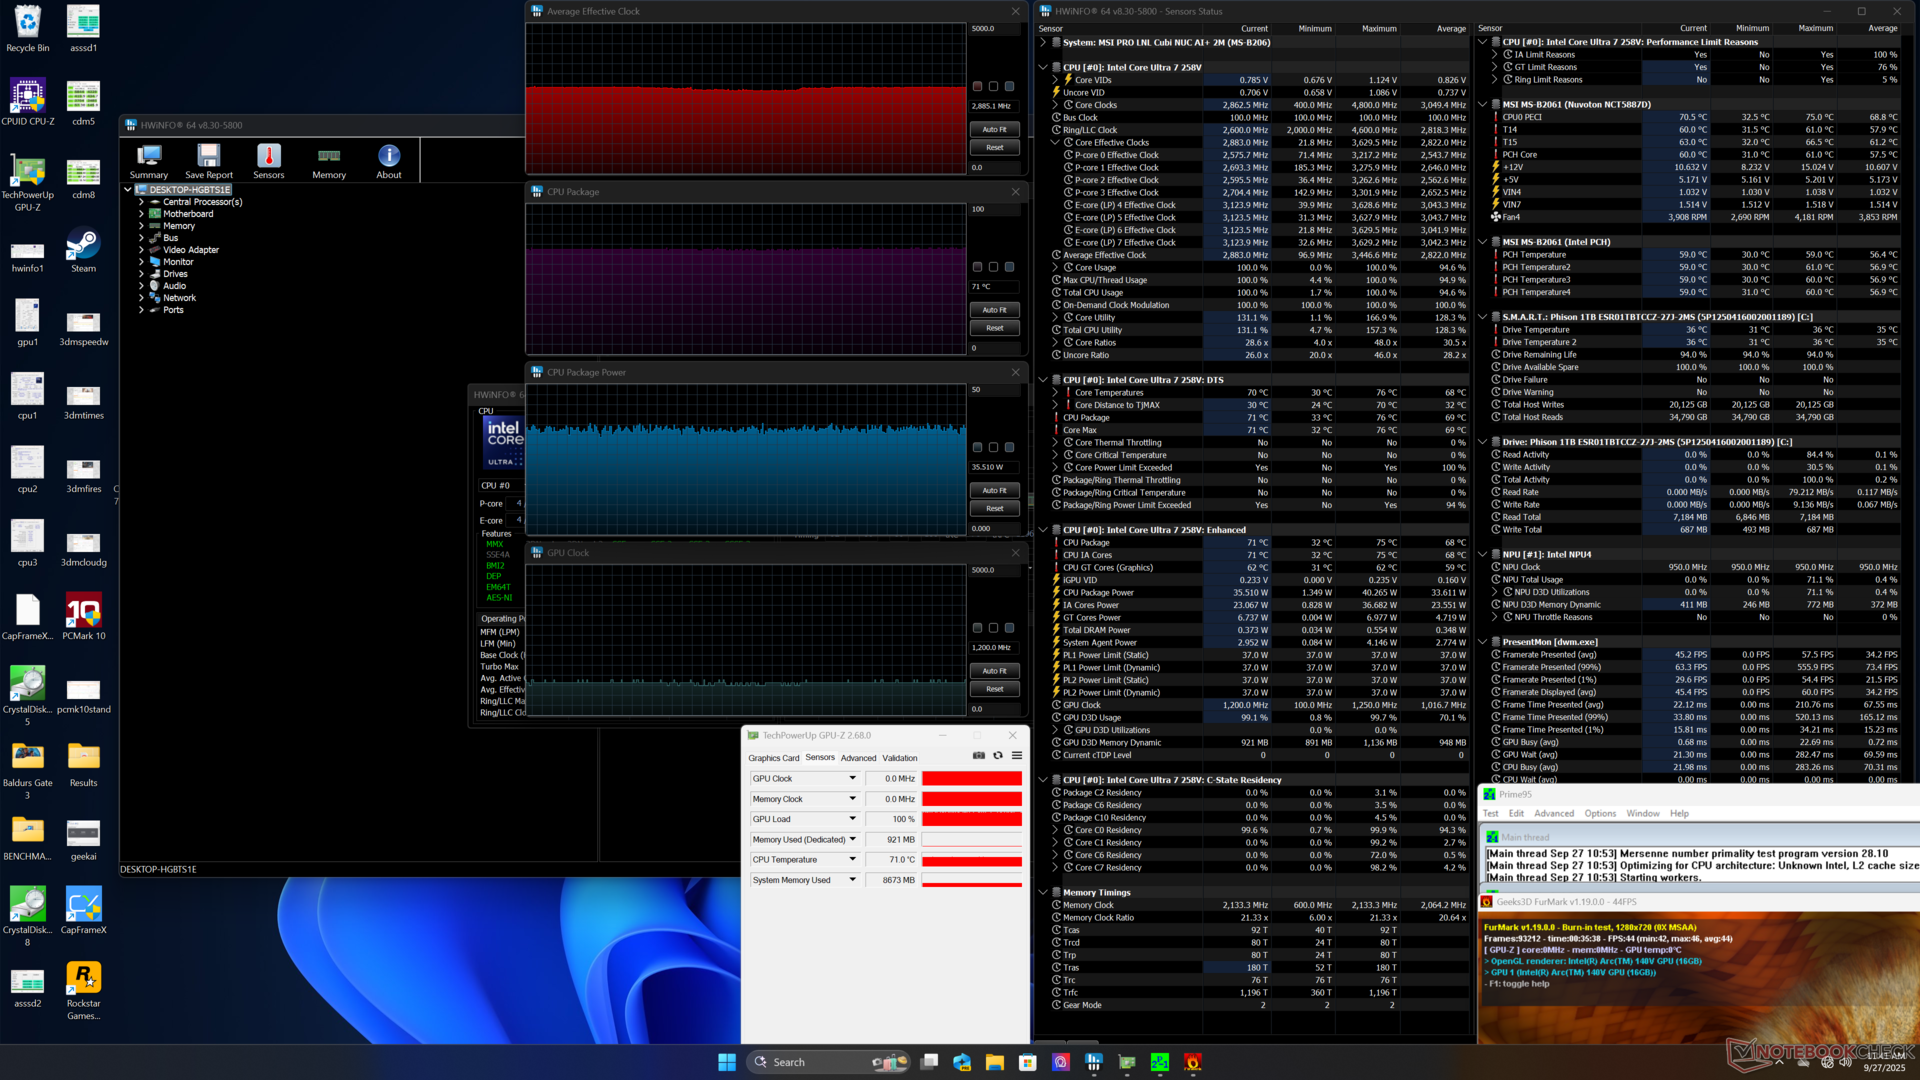
| Średnie taktowanie CPU (GHz) | Taktowanie GPU (MHz) | Średnia temperatura CPU (°C) | |
| System bezczynności | -- | -- | 33 |
| Prime95 Stress | 3.2 | -- | 66 |
| Prime95 + FurMark Stress | 2.9 | 1200 | 71 |
| Cyberpunk 2077 Stress | 1.3 | 800 - 1950 | 63 |
Wydajność systemu
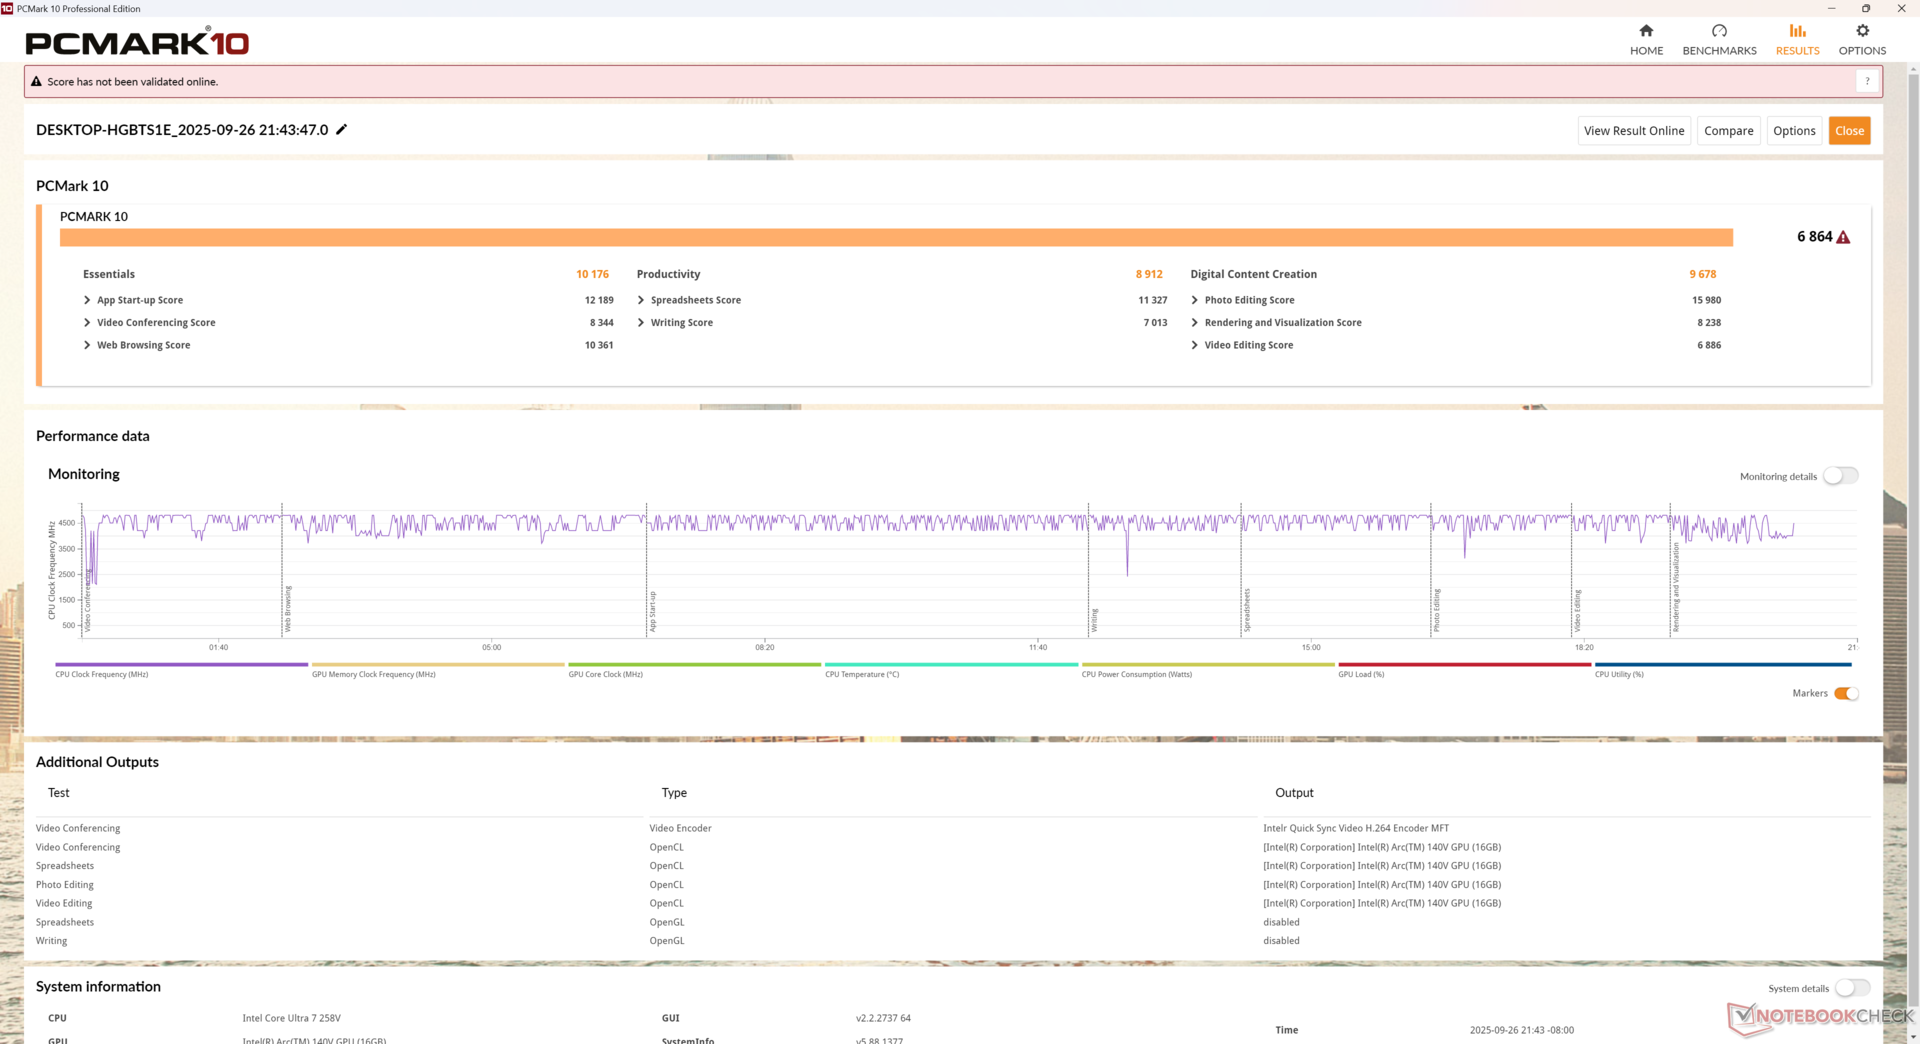
PCMark 10: Score | Essentials | Productivity | Digital Content Creation
CrossMark: Overall | Productivity | Creativity | Responsiveness
WebXPRT 3: Overall
WebXPRT 4: Overall
Mozilla Kraken 1.1: Total
| Performance rating | |
| Minisforum MS-A1 | |
| Beelink SER9 Pro | |
| GMK NucBox K12 | |
| Przeciętny Intel Core Ultra 7 258V, Intel Arc Graphics 140V | |
| MSI Cubi NUC 1M | |
| MSI Cubi NUC AI+ 2MG | |
| Ninkear M7, (16+512) | |
| PCMark 10 / Score | |
| Minisforum MS-A1 | |
| GMK NucBox K12 | |
| Przeciętny Intel Core Ultra 7 258V, Intel Arc Graphics 140V (6265 - 7420, n=23) | |
| Beelink SER9 Pro | |
| MSI Cubi NUC AI+ 2MG | |
| MSI Cubi NUC 1M | |
| Ninkear M7, (16+512) | |
| PCMark 10 / Essentials | |
| Minisforum MS-A1 | |
| MSI Cubi NUC 1M | |
| GMK NucBox K12 | |
| Beelink SER9 Pro | |
| Przeciętny Intel Core Ultra 7 258V, Intel Arc Graphics 140V (9295 - 11467, n=23) | |
| MSI Cubi NUC AI+ 2MG | |
| Ninkear M7, (16+512) | |
| PCMark 10 / Productivity | |
| Minisforum MS-A1 | |
| GMK NucBox K12 | |
| Beelink SER9 Pro | |
| Przeciętny Intel Core Ultra 7 258V, Intel Arc Graphics 140V (7357 - 13600, n=23) | |
| MSI Cubi NUC AI+ 2MG | |
| Ninkear M7, (16+512) | |
| MSI Cubi NUC 1M | |
| PCMark 10 / Digital Content Creation | |
| Minisforum MS-A1 | |
| Przeciętny Intel Core Ultra 7 258V, Intel Arc Graphics 140V (8160 - 10308, n=23) | |
| MSI Cubi NUC AI+ 2MG | |
| Beelink SER9 Pro | |
| GMK NucBox K12 | |
| MSI Cubi NUC 1M | |
| Ninkear M7, (16+512) | |
| CrossMark / Overall | |
| Minisforum MS-A1 | |
| Beelink SER9 Pro | |
| GMK NucBox K12 | |
| MSI Cubi NUC 1M | |
| Przeciętny Intel Core Ultra 7 258V, Intel Arc Graphics 140V (1275 - 1742, n=22) | |
| MSI Cubi NUC AI+ 2MG | |
| Ninkear M7, (16+512) | |
| CrossMark / Productivity | |
| Minisforum MS-A1 | |
| MSI Cubi NUC 1M | |
| Beelink SER9 Pro | |
| GMK NucBox K12 | |
| Przeciętny Intel Core Ultra 7 258V, Intel Arc Graphics 140V (1267 - 1684, n=22) | |
| MSI Cubi NUC AI+ 2MG | |
| Ninkear M7, (16+512) | |
| CrossMark / Creativity | |
| Minisforum MS-A1 | |
| Beelink SER9 Pro | |
| GMK NucBox K12 | |
| Przeciętny Intel Core Ultra 7 258V, Intel Arc Graphics 140V (1393 - 1977, n=22) | |
| MSI Cubi NUC AI+ 2MG | |
| MSI Cubi NUC 1M | |
| Ninkear M7, (16+512) | |
| CrossMark / Responsiveness | |
| MSI Cubi NUC 1M | |
| Beelink SER9 Pro | |
| Minisforum MS-A1 | |
| GMK NucBox K12 | |
| Przeciętny Intel Core Ultra 7 258V, Intel Arc Graphics 140V (999 - 1411, n=22) | |
| MSI Cubi NUC AI+ 2MG | |
| Ninkear M7, (16+512) | |
| WebXPRT 3 / Overall | |
| Minisforum MS-A1 | |
| MSI Cubi NUC AI+ 2MG | |
| MSI Cubi NUC 1M | |
| Beelink SER9 Pro | |
| GMK NucBox K12 | |
| Przeciętny Intel Core Ultra 7 258V, Intel Arc Graphics 140V (219 - 317, n=22) | |
| Ninkear M7, (16+512) | |
| WebXPRT 4 / Overall | |
| MSI Cubi NUC AI+ 2MG | |
| Minisforum MS-A1 | |
| MSI Cubi NUC 1M | |
| Przeciętny Intel Core Ultra 7 258V, Intel Arc Graphics 140V (199.5 - 291, n=22) | |
| Beelink SER9 Pro | |
| GMK NucBox K12 | |
| Ninkear M7, (16+512) | |
| Mozilla Kraken 1.1 / Total | |
| Ninkear M7, (16+512) | |
| GMK NucBox K12 | |
| Beelink SER9 Pro | |
| MSI Cubi NUC 1M | |
| Przeciętny Intel Core Ultra 7 258V, Intel Arc Graphics 140V (468 - 559, n=24) | |
| Minisforum MS-A1 | |
| MSI Cubi NUC AI+ 2MG | |
* ... im mniej tym lepiej
| PCMark 10 Score | 6864 pkt. | |
Pomoc | ||
| AIDA64 / Memory Copy | |
| Przeciętny Intel Core Ultra 7 258V (104408 - 114336, n=24) | |
| MSI Cubi NUC AI+ 2MG | |
| Beelink SER9 Pro | |
| GMK NucBox K12 | |
| Minisforum MS-A1 | |
| MSI Cubi NUC 1M | |
| Ninkear M7, (16+512) | |
| AIDA64 / Memory Read | |
| MSI Cubi NUC AI+ 2MG | |
| Przeciętny Intel Core Ultra 7 258V (82846 - 89417, n=24) | |
| MSI Cubi NUC 1M | |
| Minisforum MS-A1 | |
| GMK NucBox K12 | |
| Beelink SER9 Pro | |
| Ninkear M7, (16+512) | |
| AIDA64 / Memory Write | |
| MSI Cubi NUC AI+ 2MG | |
| Przeciętny Intel Core Ultra 7 258V (108824 - 117989, n=24) | |
| Beelink SER9 Pro | |
| GMK NucBox K12 | |
| Minisforum MS-A1 | |
| MSI Cubi NUC 1M | |
| Ninkear M7, (16+512) | |
| AIDA64 / Memory Latency | |
| Beelink SER9 Pro | |
| Przeciętny Intel Core Ultra 7 258V (95 - 101.7, n=24) | |
| MSI Cubi NUC AI+ 2MG | |
| Ninkear M7, (16+512) | |
| GMK NucBox K12 | |
| Minisforum MS-A1 | |
| MSI Cubi NUC 1M | |
* ... im mniej tym lepiej
Opóźnienie DPC
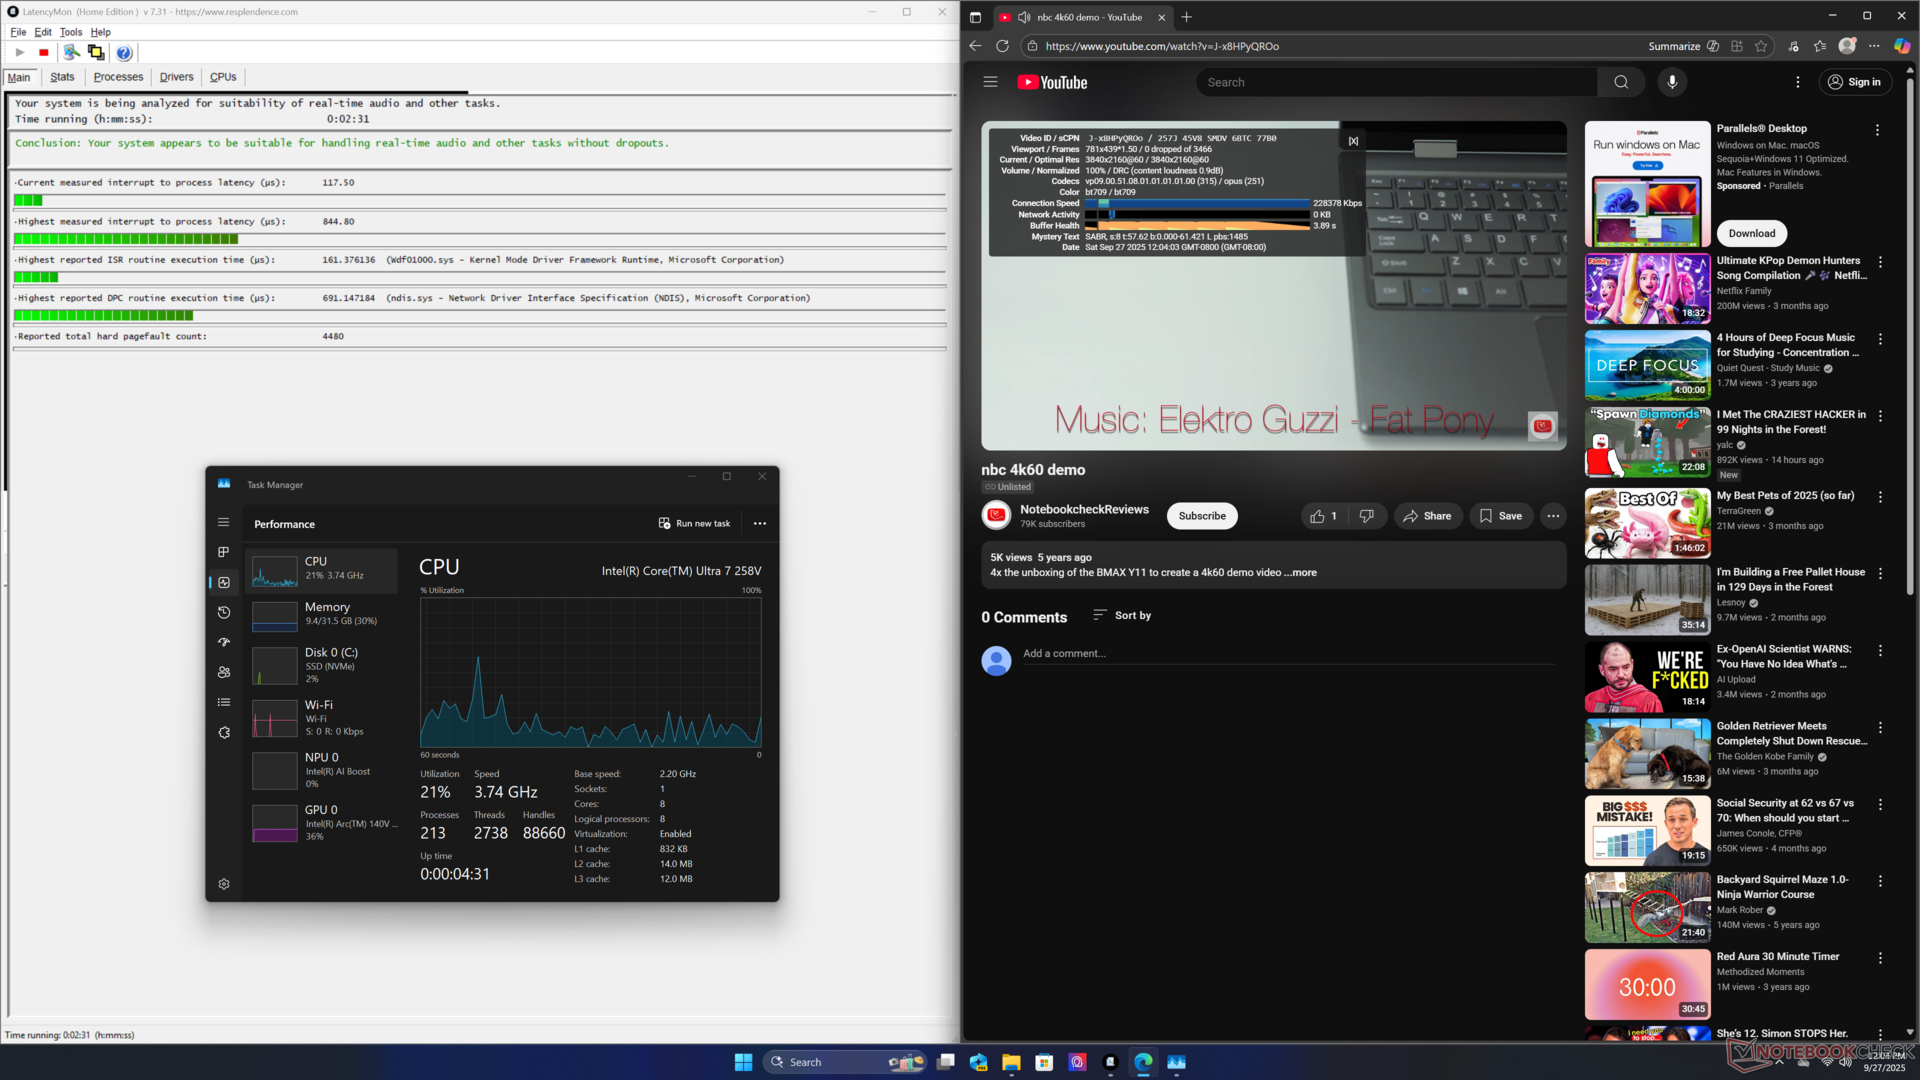
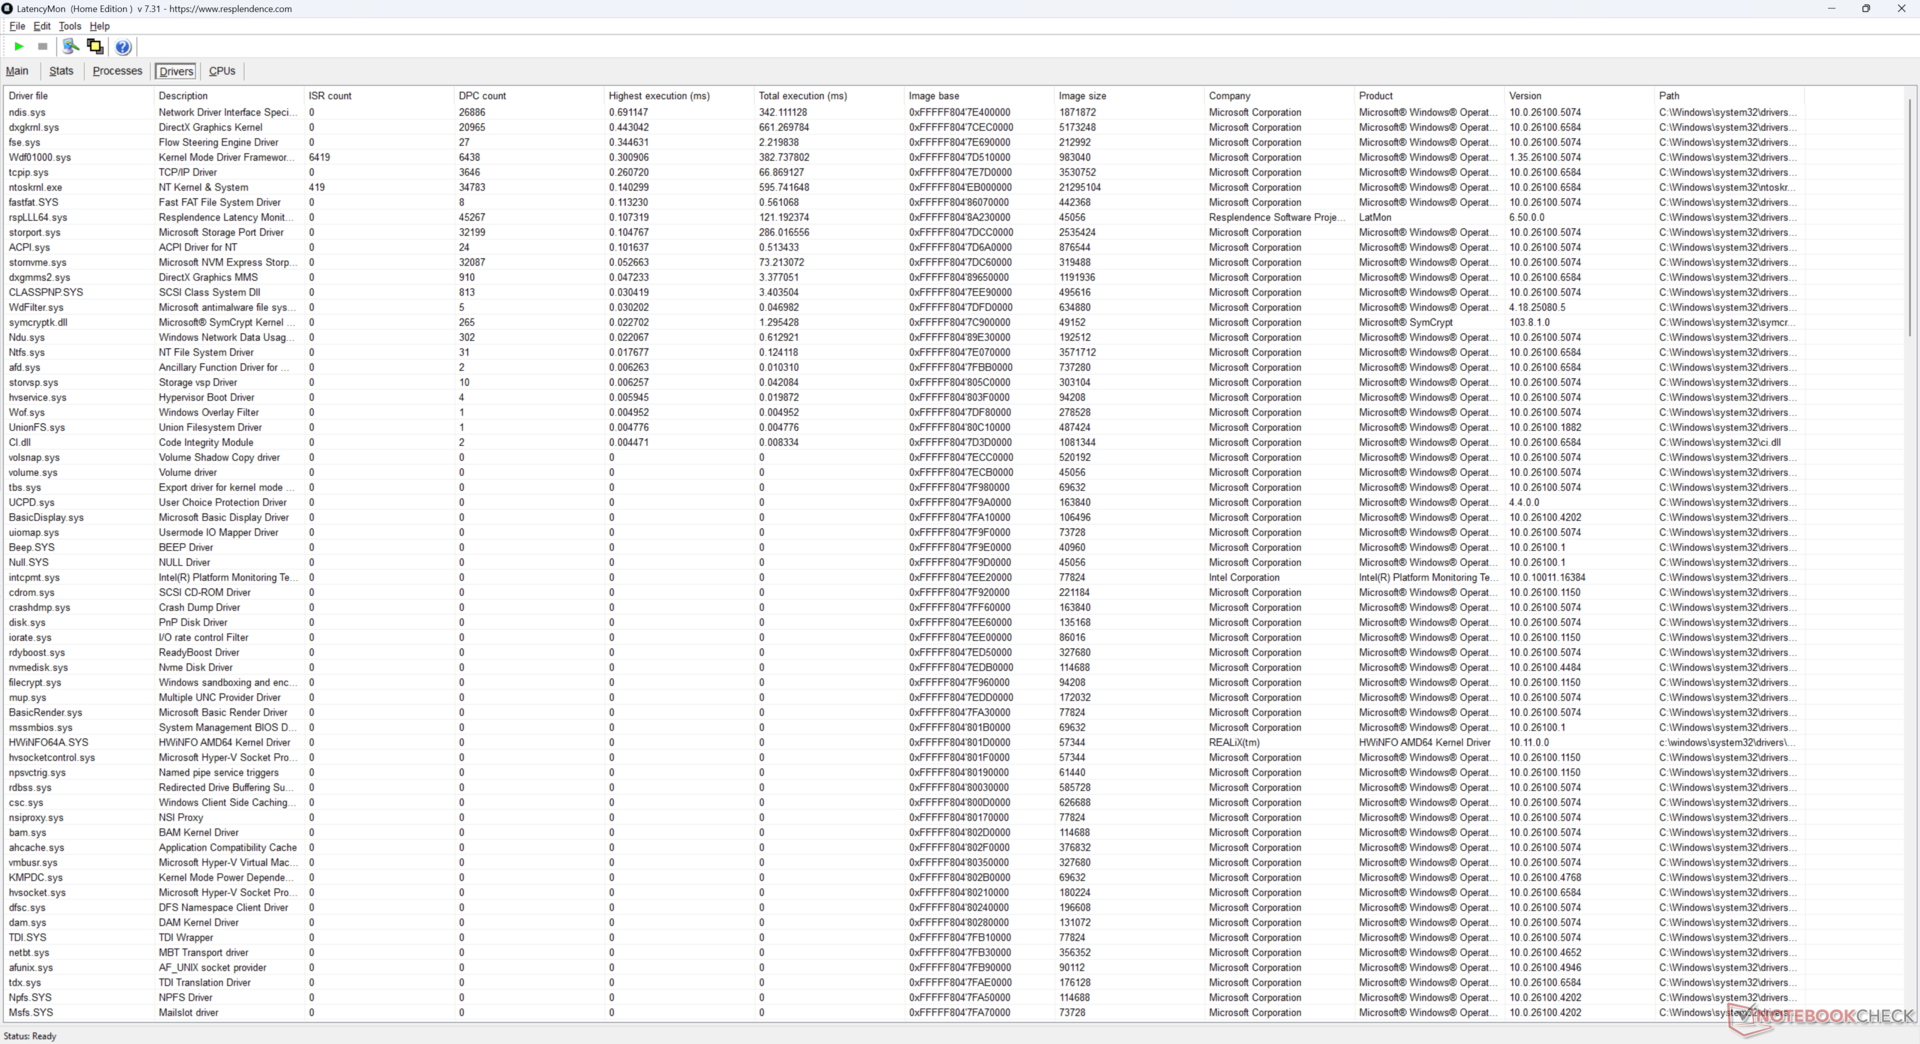
| DPC Latencies / LatencyMon - interrupt to process latency (max), Web, Youtube, Prime95 | |
| MSI Cubi NUC 1M | |
| Minisforum MS-A1 | |
| GMK NucBox K12 | |
| MSI Cubi NUC AI+ 2MG | |
| Beelink SER9 Pro | |
* ... im mniej tym lepiej
Urządzenia pamięci masowej
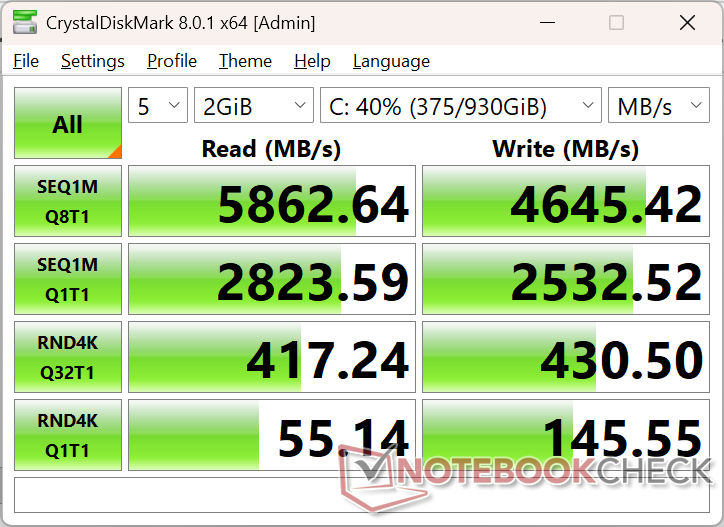
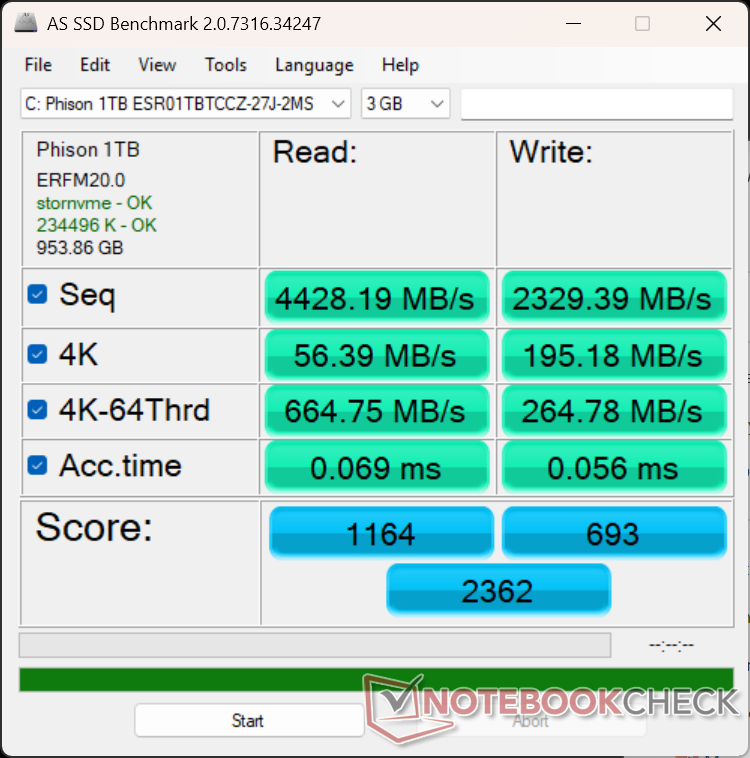
Szybkość transferu SSD z podstawowym 1 TB Phison są stabilne na poziomie prawie 5900 MB/s nawet przy długotrwałym obciążeniu, co stanowi niewielką poprawę w stosunku do dysku WD SSD w oryginalnym Cubi 1M.

| Drive Performance rating - Percent | |
| Minisforum MS-A1 | |
| MSI Cubi NUC 1M | |
| Beelink SER9 Pro | |
| MSI Cubi NUC AI+ 2MG | |
| GMK NucBox K12 | |
| Ninkear M7, (16+512) | |
* ... im mniej tym lepiej
Dławienie dysku: Pętla odczytu DiskSpd, głębokość kolejki 8
Wydajność GPU
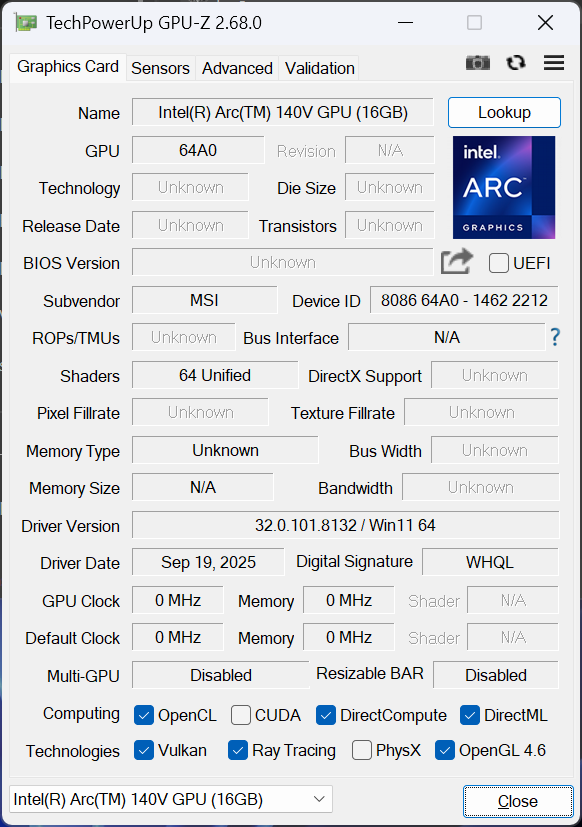
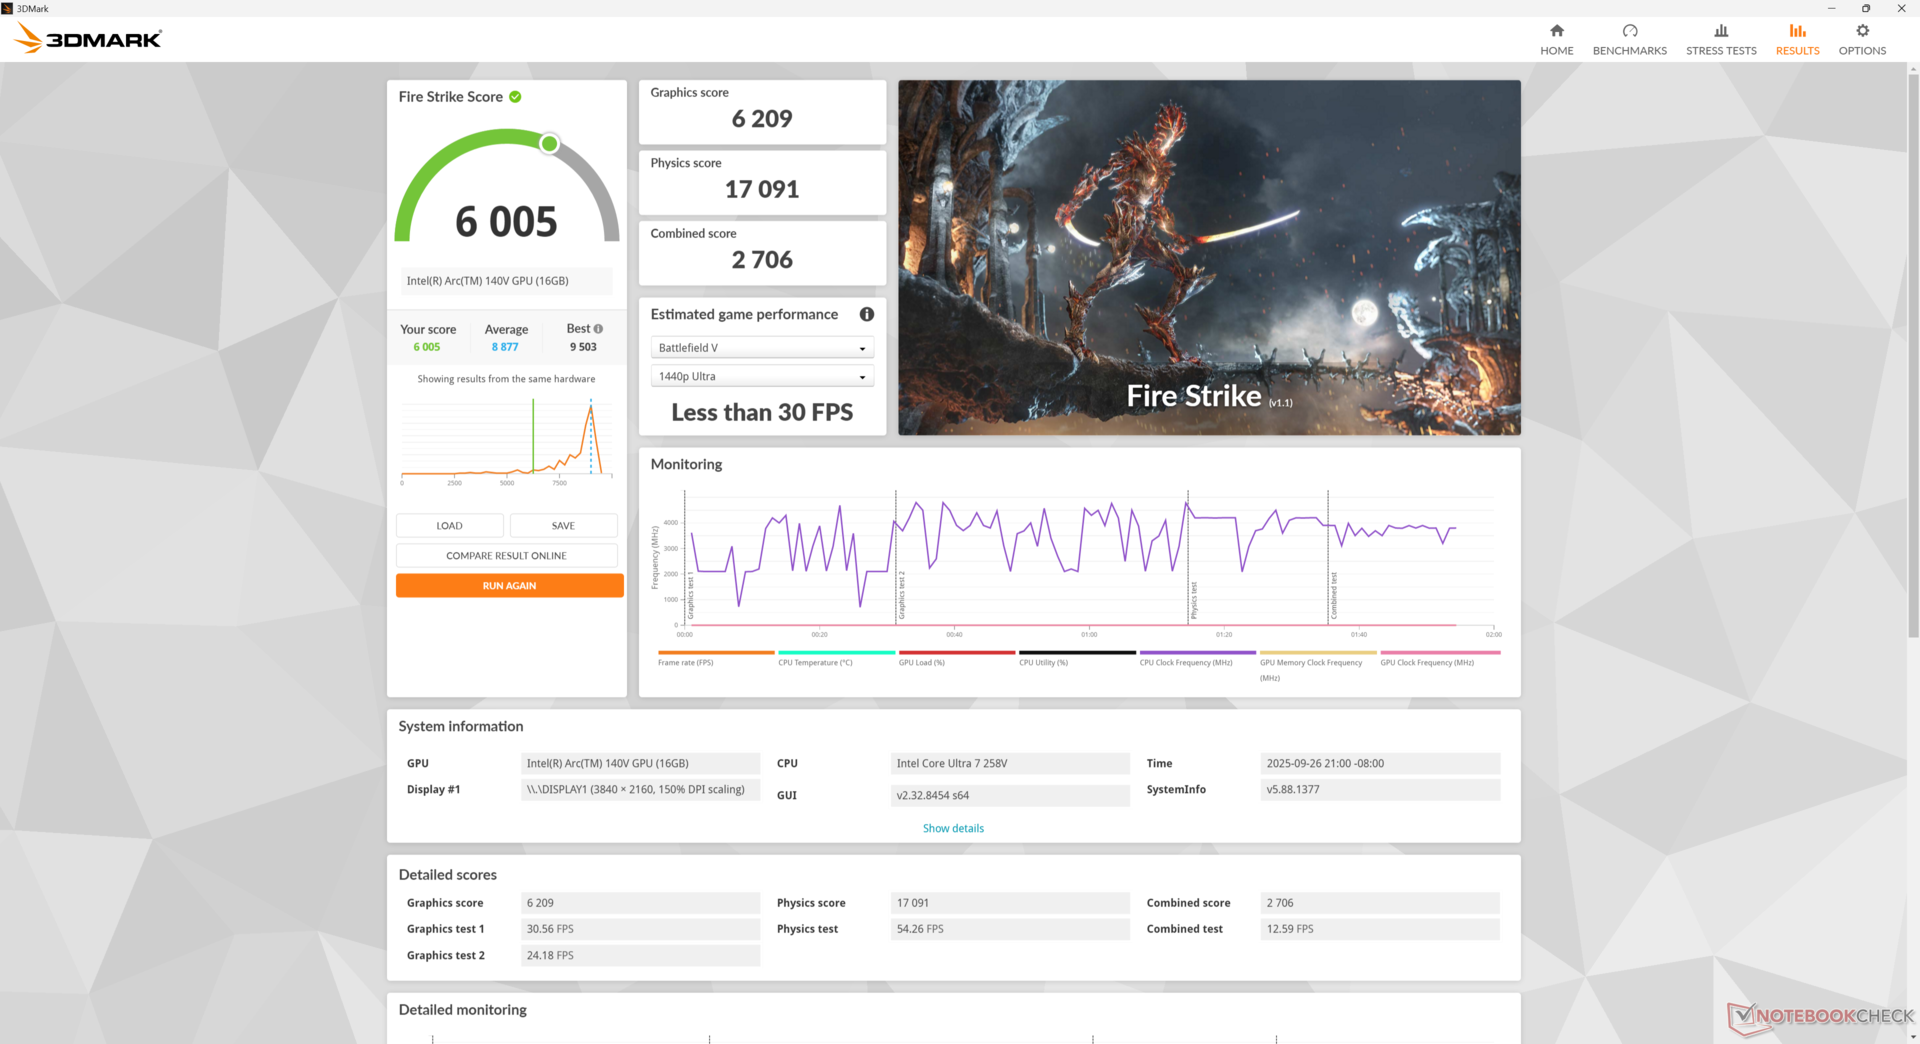
The Arc 140V w Cubi 2MG osiąga wyniki poniżej średniej o około 35% według benchmarków 3DMark. Rozczarowujące wyniki wynikają z cyklicznego zwiększania częstotliwości taktowania GPU i zacinania się, o czym wspomnieliśmy w sekcji Stress Test powyżej.
W obciążeniach GPU, w których stabilna liczba klatek na sekundę może nie mieć znaczenia, takich jak renderowanie lub oneAPI, Cubi 2MG działa zgodnie z oczekiwaniami w stosunku do innych komputerów z tym samym CPU i GPU. Stuttering nie powinien być zatem problemem dla większości profesjonalistów.
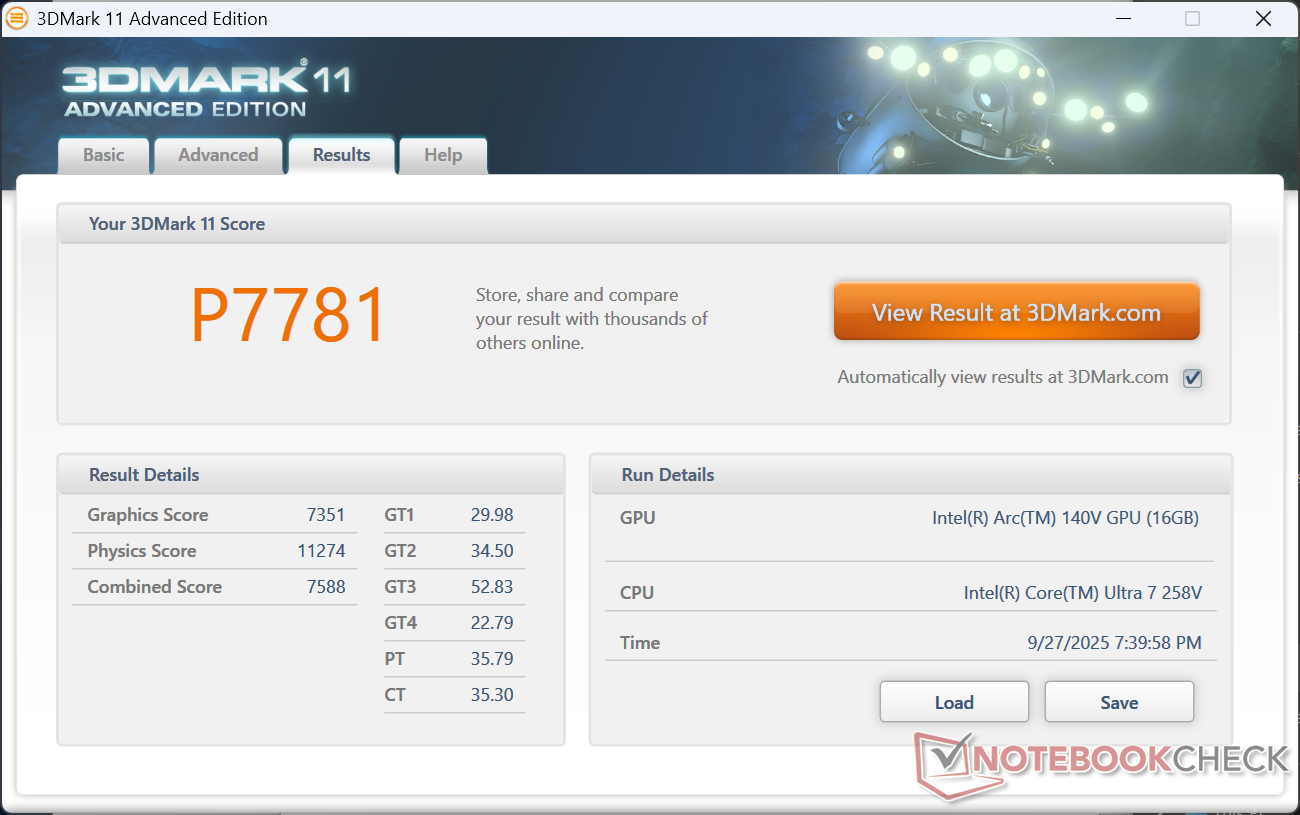


| 3DMark 11 Performance | 7781 pkt. | |
| 3DMark Cloud Gate Standard Score | 31534 pkt. | |
| 3DMark Fire Strike Score | 6005 pkt. | |
| 3DMark Time Spy Score | 3053 pkt. | |
Pomoc | ||
* ... im mniej tym lepiej
| Performance rating - Percent | |
| Beelink SER9 Pro | |
| Minisforum MS-A1 -1! | |
| GMK NucBox K12 | |
| MSI Cubi NUC AI+ 2MG | |
| MSI Cubi NUC 1M -2! | |
| Ninkear M7, (16+512) -2! | |
| Cyberpunk 2077 - 1920x1080 Ultra Preset (FSR off) | |
| GMK NucBox K12 | |
| Minisforum MS-A1 | |
| Beelink SER9 Pro | |
| MSI Cubi NUC AI+ 2MG | |
| MSI Cubi NUC 1M | |
| Ninkear M7, (16+512) | |
| Baldur's Gate 3 - 1920x1080 Ultra Preset AA:T | |
| Beelink SER9 Pro | |
| GMK NucBox K12 | |
| MSI Cubi NUC AI+ 2MG | |
| Minisforum MS-A1 | |
| GTA V - 1920x1080 Highest AA:4xMSAA + FX AF:16x | |
| Beelink SER9 Pro | |
| GMK NucBox K12 | |
| MSI Cubi NUC AI+ 2MG | |
| Minisforum MS-A1 | |
| MSI Cubi NUC 1M | |
| Ninkear M7, (16+512) | |
| Final Fantasy XV Benchmark - 1920x1080 High Quality | |
| Beelink SER9 Pro | |
| MSI Cubi NUC AI+ 2MG | |
| Minisforum MS-A1 | |
| GMK NucBox K12 | |
| MSI Cubi NUC 1M | |
| Ninkear M7, (16+512) | |
| Strange Brigade - 1920x1080 ultra AA:ultra AF:16 | |
| MSI Cubi NUC AI+ 2MG | |
| Beelink SER9 Pro | |
| GMK NucBox K12 | |
| MSI Cubi NUC 1M | |
| Dota 2 Reborn - 1920x1080 ultra (3/3) best looking | |
| Minisforum MS-A1 | |
| GMK NucBox K12 | |
| Beelink SER9 Pro | |
| MSI Cubi NUC AI+ 2MG | |
| MSI Cubi NUC 1M | |
| Ninkear M7, (16+512) | |
| X-Plane 11.11 - 1920x1080 high (fps_test=3) | |
| Minisforum MS-A1 | |
| GMK NucBox K12 | |
| Beelink SER9 Pro | |
| MSI Cubi NUC AI+ 2MG | |
| Ninkear M7, (16+512) | |
| F1 24 | |
| 1280x720 Ultra Low Preset AA:T | |
| MSI Cubi NUC AI+ 2MG | |
| Przeciętny Intel Arc Graphics 140V (n=1) | |
| 1920x1080 Low Preset AA:T AF:16x | |
| Minisforum MS-A1 | |
| Beelink SER9 Pro | |
| Przeciętny Intel Arc Graphics 140V (54 - 99, n=25) | |
| MSI Cubi NUC AI+ 2MG | |
| Asus NUC 14 Pro+ | |
| Ninkear M7, (16+512) | |
| 1920x1080 Medium Preset AA:T AF:16x | |
| Minisforum MS-A1 | |
| Przeciętny Intel Arc Graphics 140V (49.2 - 88.2, n=24) | |
| Beelink SER9 Pro | |
| Asus NUC 14 Pro+ | |
| Ninkear M7, (16+512) | |
| 1920x1080 High Preset AA:T AF:16x | |
| Minisforum MS-A1 | |
| Przeciętny Intel Arc Graphics 140V (34.4 - 66.4, n=27) | |
| Beelink SER9 Pro | |
| MSI Cubi NUC AI+ 2MG | |
| Asus NUC 14 Pro+ | |
| Ninkear M7, (16+512) | |
| 1920x1080 Ultra High Preset AA:T AF:16x | |
| Przeciętny Intel Arc Graphics 140V (14.6 - 22, n=25) | |
| MSI Cubi NUC AI+ 2MG | |
| Minisforum MS-A1 | |
| Beelink SER9 Pro | |
Liczba klatek na sekundę na biegu jałowym w Cyberpunk 2077 przy ustawieniach 1080p Ultra wahała się między 18 a 26, podczas gdy powtórzenie tego testu na NucBox K12 zaowocowałoby stabilniejszą średnią liczbą klatek na sekundę wynoszącą 23. To zacinanie występowało również podczas uruchamiania innych gier w naszym teście.
Cyberpunk 2077 ultra FPS Chart
| low | med. | high | ultra | |
|---|---|---|---|---|
| GTA V (2015) | 160.4 | 152.4 | 63.6 | 26.6 |
| Dota 2 Reborn (2015) | 98.1 | 80.4 | 59.9 | 65.8 |
| Final Fantasy XV Benchmark (2018) | 71.3 | 39.1 | 28.7 | |
| X-Plane 11.11 (2018) | 51.8 | 41.7 | 36 | |
| Strange Brigade (2018) | 240 | 71.8 | 59.7 | 57.3 |
| Baldur's Gate 3 (2023) | 36.1 | 29.5 | 29 | 26.7 |
| Cyberpunk 2077 (2023) | 33.9 | 26.6 | 23.2 | 19.4 |
| F1 24 (2024) | 72 | 53.8 | 16.6 |
Emisje
Hałas systemowy
Hałas wentylatora oscyluje wokół 25 dB(A) w trybie cichym lub stosunkowo głośnym 36 dB(A) w trybie wydajności. System jest ogólnie głośniejszy niż zaobserwowaliśmy na starszym Cubi 1M.
Hałas
| luz |
| 28 / 36.1 / 36.1 dB |
| obciążenie |
| 38.9 / 49.2 dB |
 | ||
30 dB cichy 40 dB(A) słyszalny 50 dB(A) irytujący |
||
min: | ||
| MSI Cubi NUC AI+ 2MG Arc 140V, Core Ultra 7 258V, Phison 1 TB ESR01TBTCCZ-27J | MSI Cubi NUC 1M Iris Xe G7 96EUs, Core 7 150U, WD PC SN560 SDDPNQE-1T00 | GMK NucBox K12 Radeon 780M, Ryzen 7 H 255, Crucial P3 Plus CT1000P3PSSD8 | Beelink SER9 Pro Radeon 780M, Ryzen 7 H 255, Crucial P3 Plus CT1000P3PSSD8 | Ninkear M7, (16+512) Vega 7, R5 7430U, Faspeed P8-512G-SE | Minisforum MS-A1 Radeon 780M, R7 8700G, Kingston OM8PGP41024Q-A0 | |
|---|---|---|---|---|---|---|
| Noise | 7% | -4% | 12% | 19% | -3% | |
| wyłączone / środowisko * (dB) | 24.8 | 23.5 5% | 23.5 5% | 23 7% | 24.8 -0% | 24.8 -0% |
| Idle Minimum * (dB) | 28 | 29.9 -7% | 35.4 -26% | 29.1 -4% | 25.3 10% | 33.9 -21% |
| Idle Average * (dB) | 36.1 | 29.9 17% | 35.4 2% | 30.1 17% | 25.7 29% | 34 6% |
| Idle Maximum * (dB) | 36.1 | 32 11% | 39 -8% | 31.7 12% | 25.7 29% | 34 6% |
| Load Average * (dB) | 38.9 | 33.5 14% | 42.4 -9% | 33.7 13% | 33.6 14% | 41.1 -6% |
| Cyberpunk 2077 ultra * (dB) | 37 | 39.1 -6% | 40.4 -9% | 33.8 9% | 28.7 22% | 42.2 -14% |
| Load Maximum * (dB) | 49.2 | 40.5 18% | 41.4 16% | 35.2 28% | 34.3 30% | 46.2 6% |
| Witcher 3 ultra * (dB) | 28.8 |
* ... im mniej tym lepiej
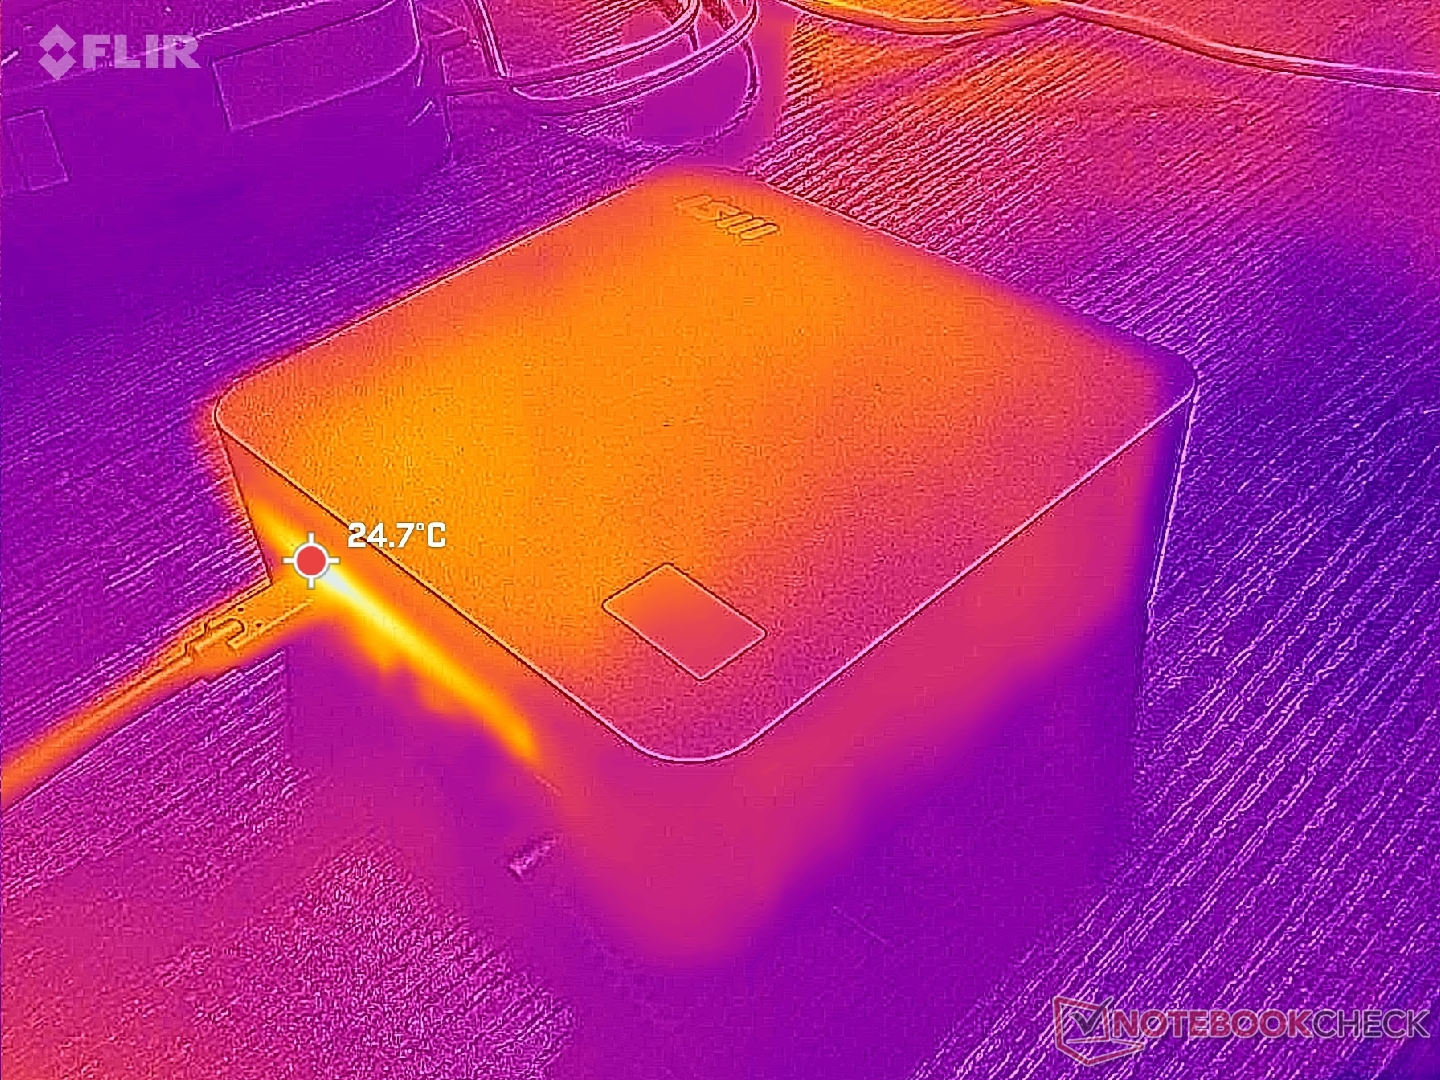
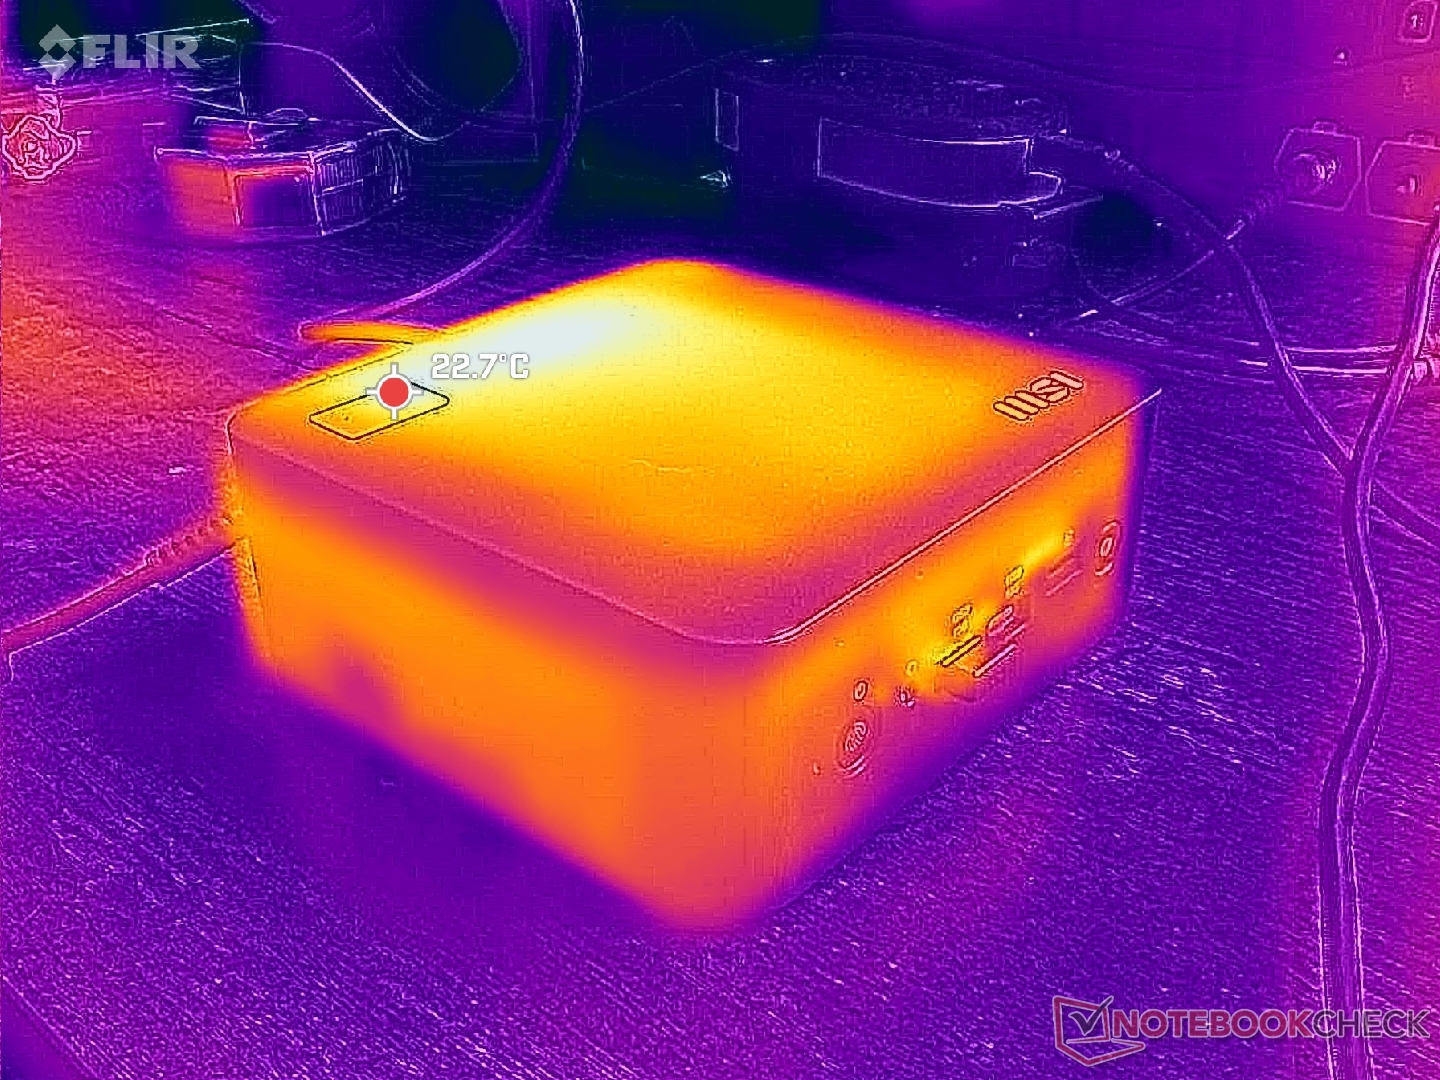
Temperatura
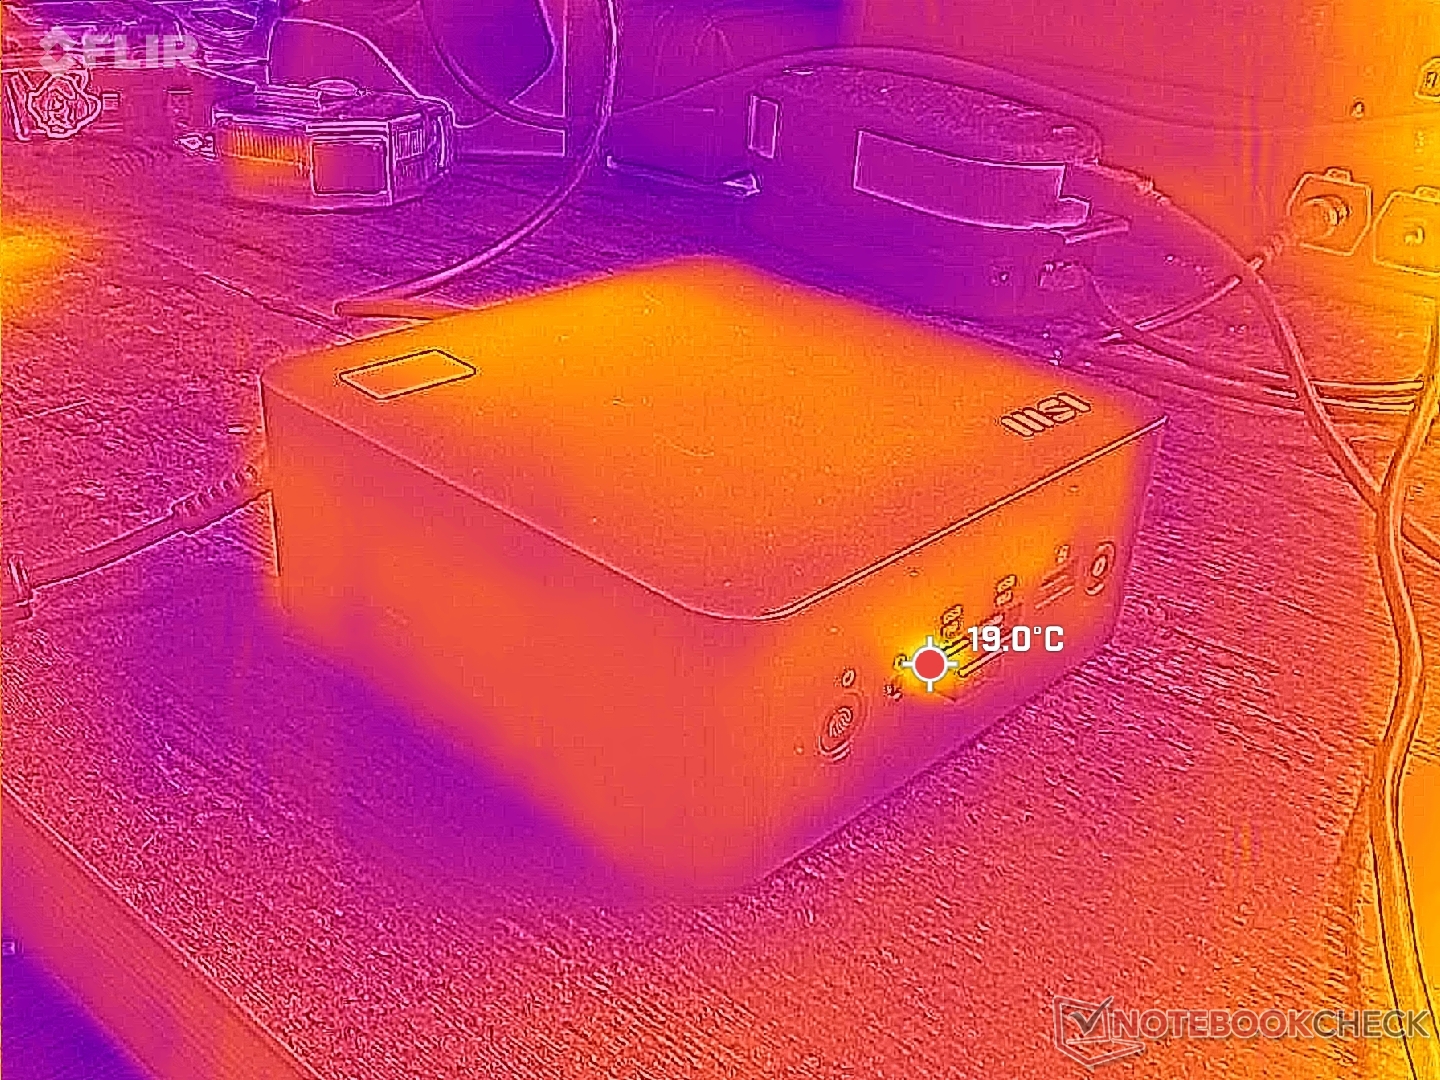
Temperatury powierzchniowe są ledwo ciepłe i wynoszą zaledwie 31 C, nawet podczas uruchamiania wymagających aplikacji, głównie dzięki plastikowej konstrukcji i procesorowi Intel o niskiej mocy.
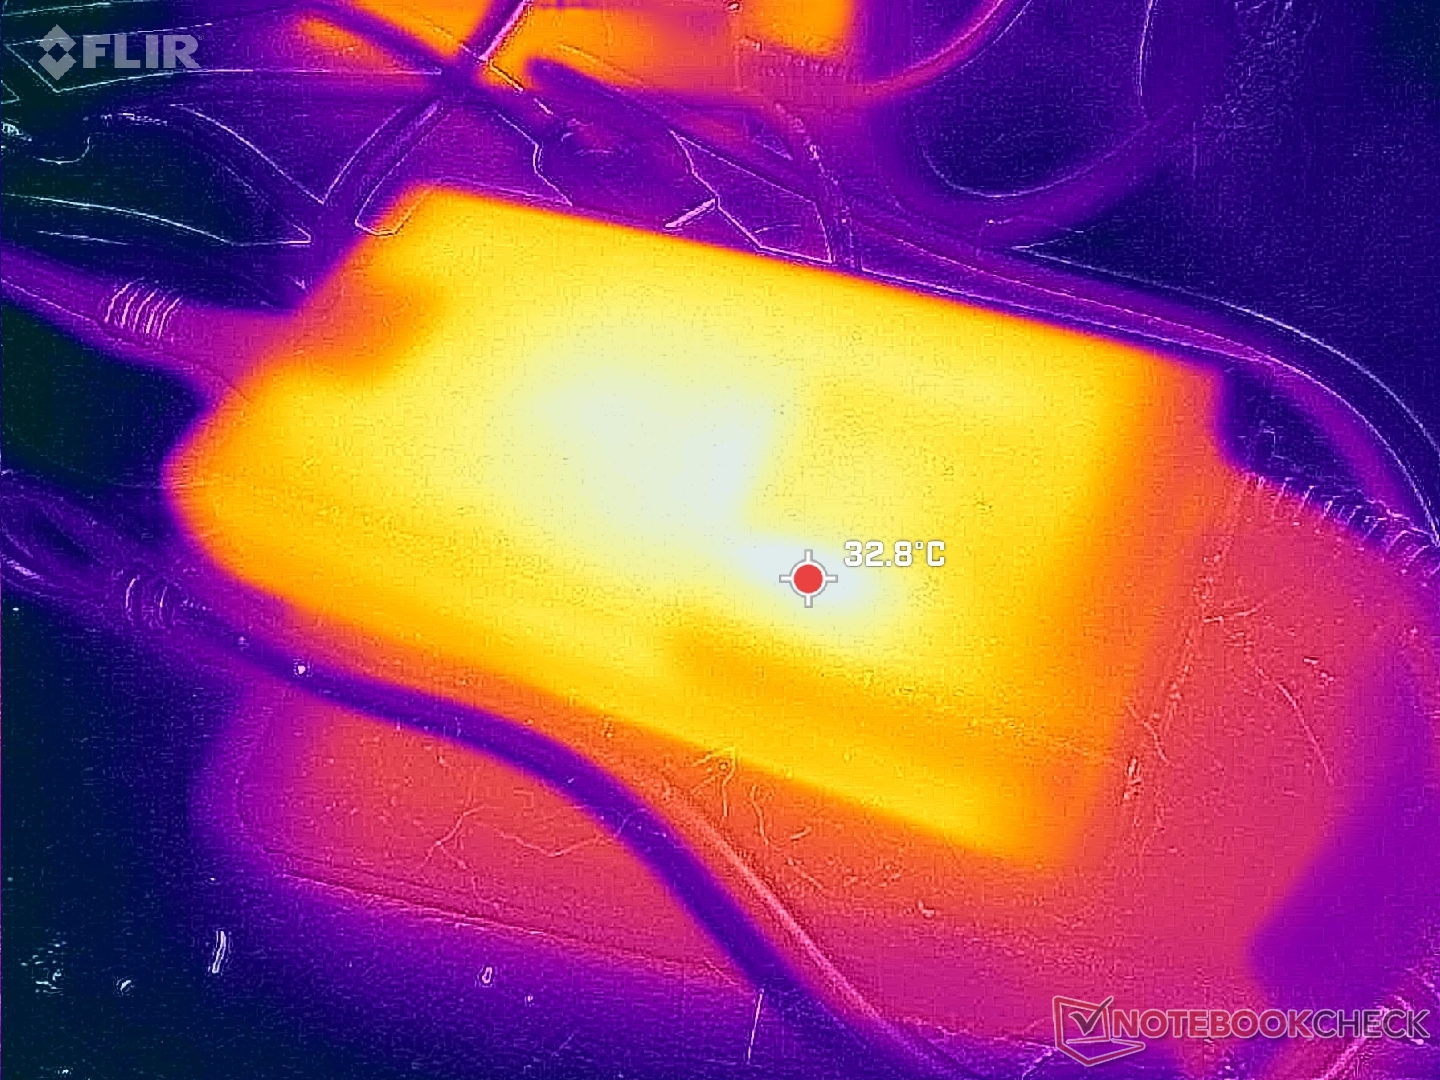
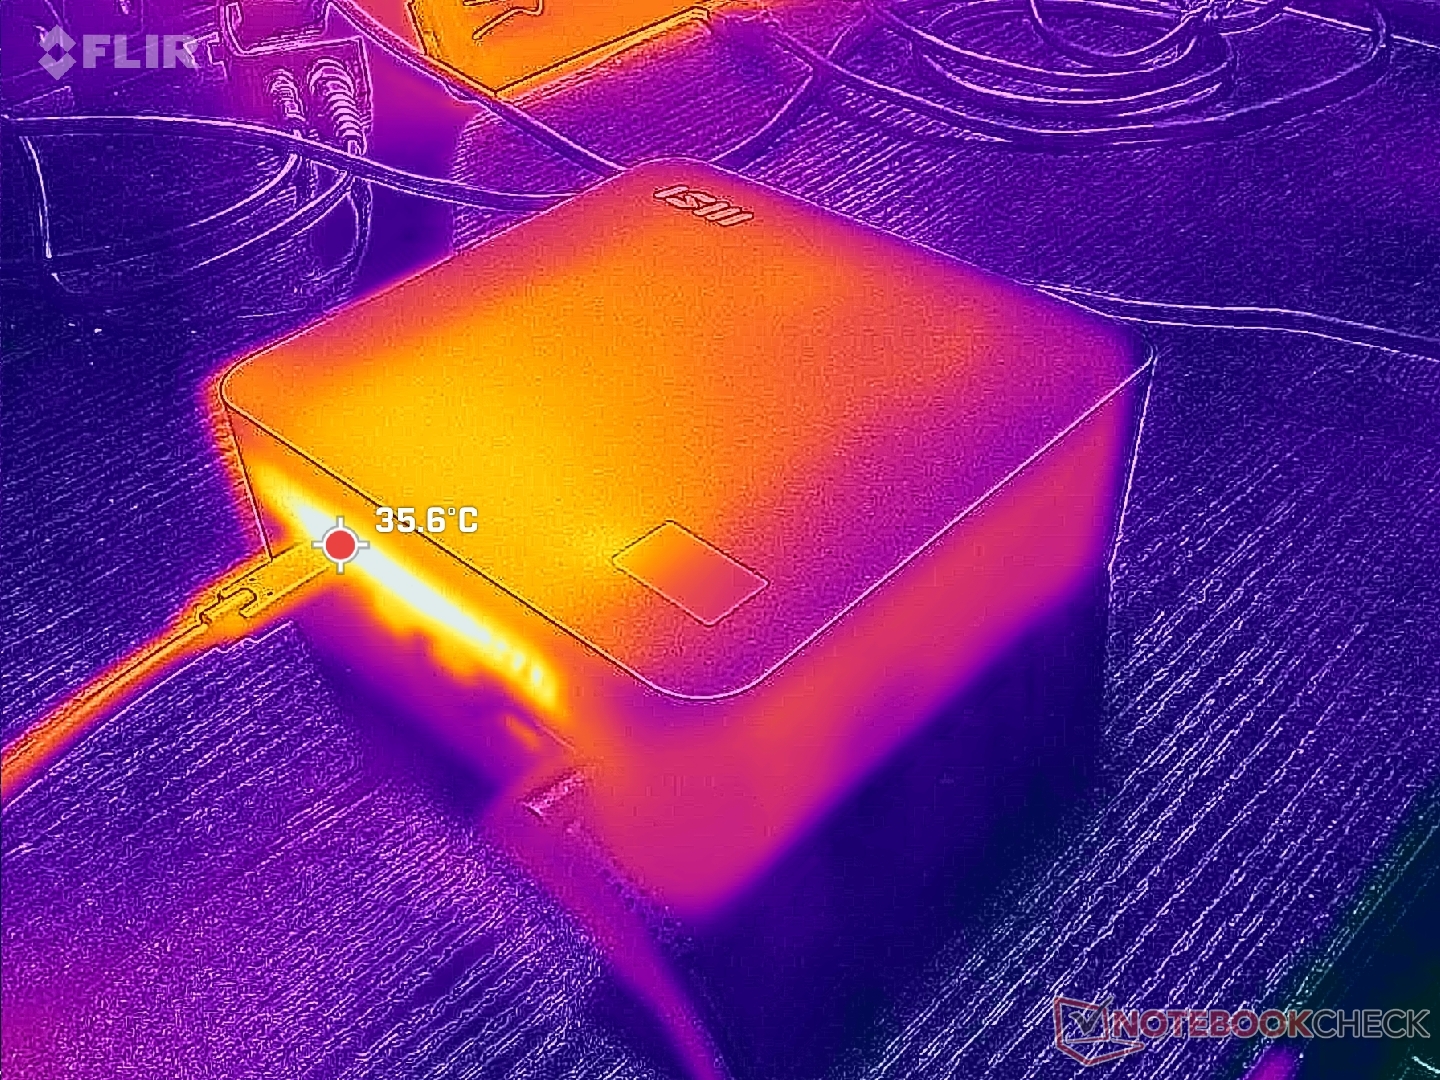
Niewielki zasilacz sieciowy o mocy 120 W pozostaje stosunkowo chłodny przy temperaturze poniżej 35 C pod obciążeniem.
Głośniki
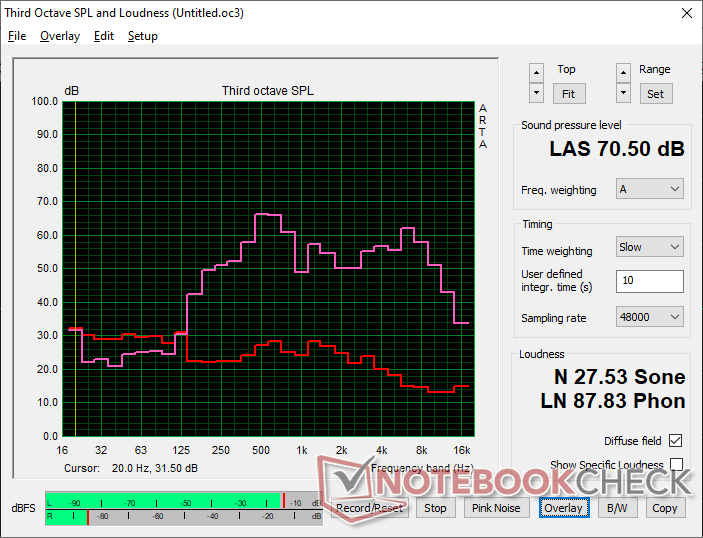
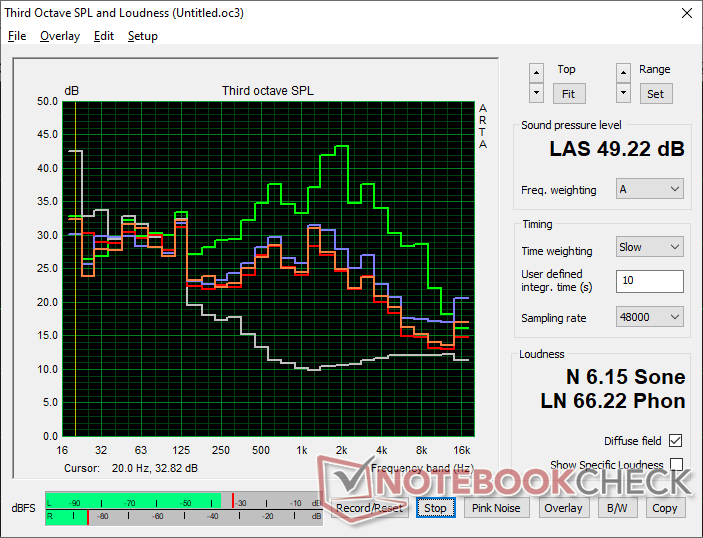
MSI Cubi NUC AI+ 2MG analiza dźwięku
(-) | niezbyt głośne głośniki (###wartość### dB)
Bas 100 - 315 Hz
(±) | zredukowany bas - średnio 10.4% niższy od mediany
(-) | bas nie jest liniowy (16% delta do poprzedniej częstotliwości)
Średnie 400 - 2000 Hz
(±) | wyższe średnie - średnio 6.9% wyższe niż mediana
(-) | średnie nie są liniowe (19.7% delta do poprzedniej częstotliwości)
Wysokie 2–16 kHz
(+) | zrównoważone maksima - tylko 4.3% od mediany
(±) | liniowość wysokich wartości jest średnia (12.2% delta do poprzedniej częstotliwości)
Ogólnie 100 - 16.000 Hz
(±) | liniowość ogólnego dźwięku jest średnia (29.5% różnicy w stosunku do mediany)
W porównaniu do tej samej klasy
» 75% wszystkich testowanych urządzeń w tej klasie było lepszych, 11% podobnych, 14% gorszych
» Najlepszy miał deltę 13%, średnia wynosiła ###średnia###%, najgorsza wynosiła 64%
W porównaniu do wszystkich testowanych urządzeń
» 87% wszystkich testowanych urządzeń było lepszych, 3% podobnych, 10% gorszych
» Najlepszy miał deltę 4%, średnia wynosiła ###średnia###%, najgorsza wynosiła 134%
Apple MacBook Pro 16 2021 M1 Pro analiza dźwięku
(+) | głośniki mogą odtwarzać stosunkowo głośno (84.7 dB)
Bas 100 - 315 Hz
(+) | dobry bas - tylko 3.8% od mediany
(+) | bas jest liniowy (5.2% delta do poprzedniej częstotliwości)
Średnie 400 - 2000 Hz
(+) | zbalansowane środki średnie - tylko 1.3% od mediany
(+) | średnie są liniowe (2.1% delta do poprzedniej częstotliwości)
Wysokie 2–16 kHz
(+) | zrównoważone maksima - tylko 1.9% od mediany
(+) | wzloty są liniowe (2.7% delta do poprzedniej częstotliwości)
Ogólnie 100 - 16.000 Hz
(+) | ogólny dźwięk jest liniowy (4.6% różnicy w stosunku do mediany)
W porównaniu do tej samej klasy
» 0% wszystkich testowanych urządzeń w tej klasie było lepszych, 0% podobnych, 100% gorszych
» Najlepszy miał deltę 5%, średnia wynosiła ###średnia###%, najgorsza wynosiła 45%
W porównaniu do wszystkich testowanych urządzeń
» 0% wszystkich testowanych urządzeń było lepszych, 0% podobnych, 100% gorszych
» Najlepszy miał deltę 4%, średnia wynosiła ###średnia###%, najgorsza wynosiła 134%
Zarządzanie energią
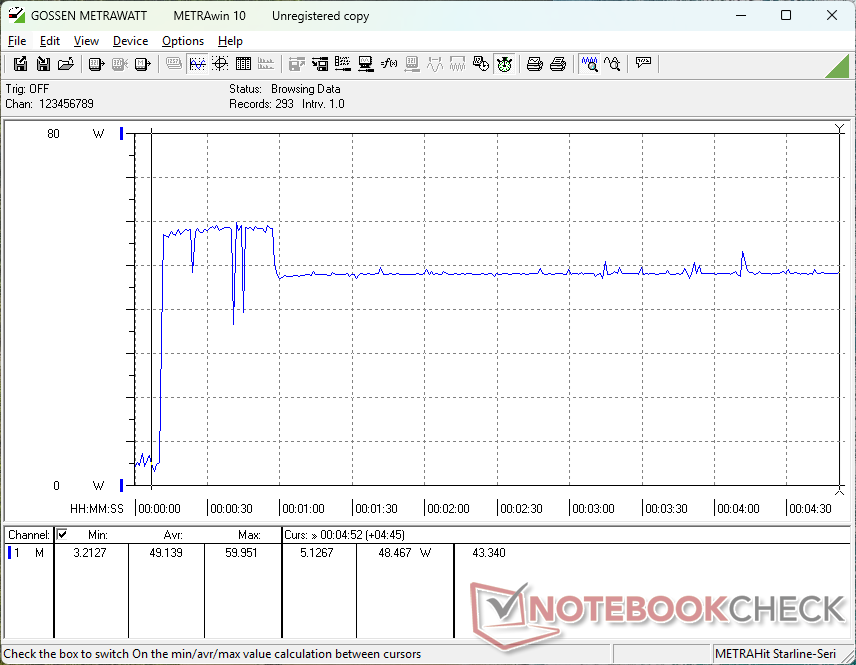
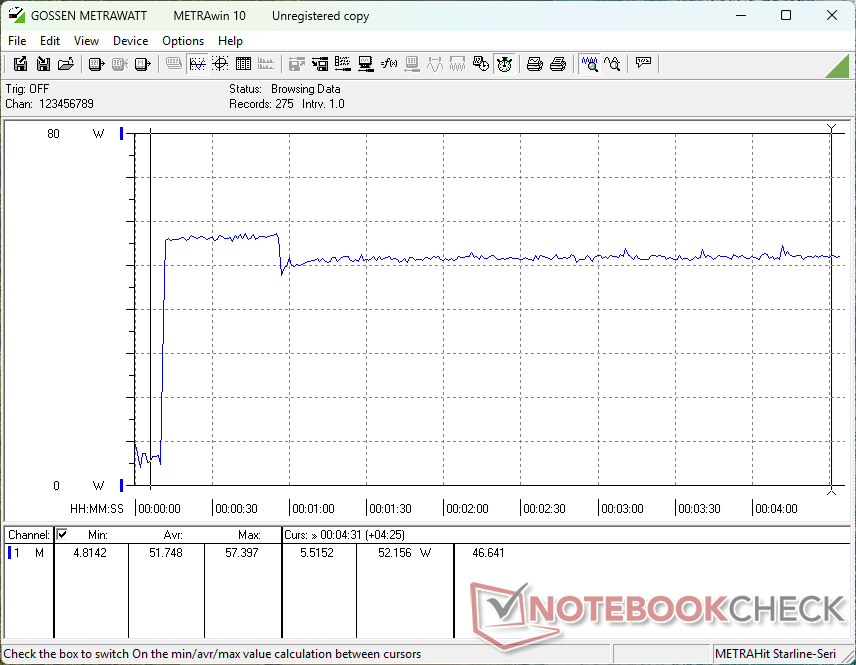
Zużycie energii
Całkowite zużycie energii jest zauważalnie niższe niż w przypadku mini PC z serii AMD H, takich jak GMK NucBox K12 nawet pomimo tego, że nasz zintegrowany układ Arc 140V jest mniej więcej porównywalny do konkurencyjnego zintegrowanego Radeona 780M podczas grania. Wydajność w przeliczeniu na wat generalnie faworyzuje MSI Cubi, aczkolwiek kosztem surowej wydajności procesora w porównaniu do wielu alternatyw AMD Zen 4 lub Zen 5.
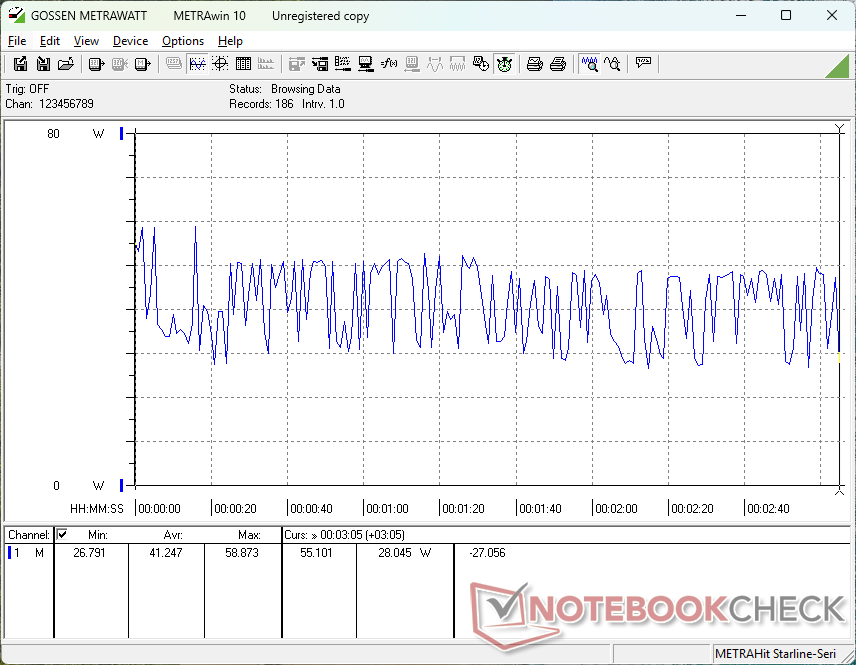
Zużycie energii podczas grania w Cyberpunk 2077 wahało się między 28 W a 49 W, pozornie bez powodu, co pokrywa się z niestabilną liczbą klatek na sekundę i częstotliwościami taktowania GPU wspomnianymi powyżej.
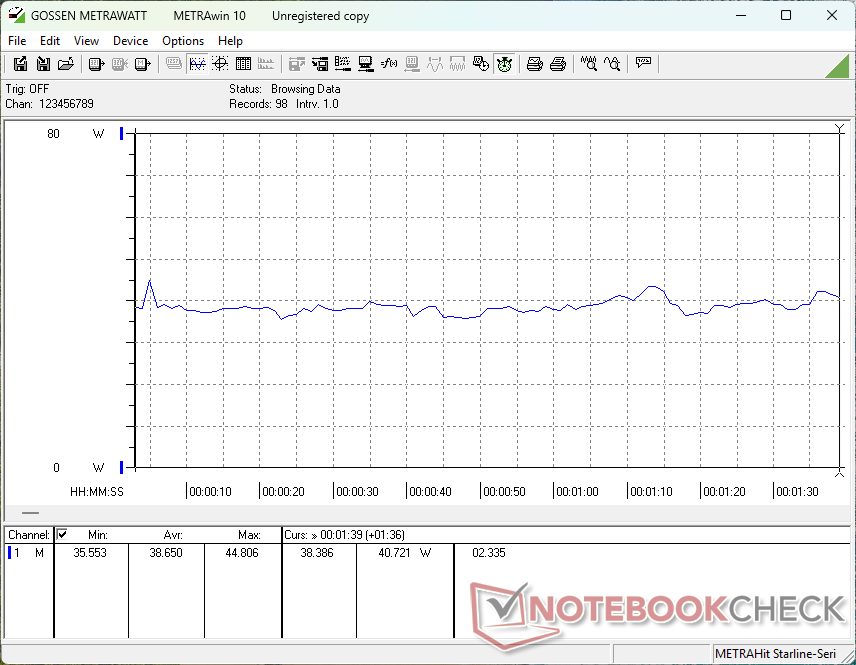
| wyłączony / stan wstrzymania | |
| luz | |
| obciążenie |
|
Legenda:
min: | |
| MSI Cubi NUC AI+ 2MG Core Ultra 7 258V, Arc 140V, Phison 1 TB ESR01TBTCCZ-27J, , x, | MSI Cubi NUC 1M Core 7 150U, Iris Xe G7 96EUs, WD PC SN560 SDDPNQE-1T00, , x, | GMK NucBox K12 Ryzen 7 H 255, Radeon 780M, Crucial P3 Plus CT1000P3PSSD8, , x, | Beelink SER9 Pro Ryzen 7 H 255, Radeon 780M, Crucial P3 Plus CT1000P3PSSD8, , x, | Ninkear M7, (16+512) R5 7430U, Vega 7, Faspeed P8-512G-SE, , x, | Minisforum MS-A1 R7 8700G, Radeon 780M, Kingston OM8PGP41024Q-A0, , x, | |
|---|---|---|---|---|---|---|
| Power Consumption | -24% | -99% | -56% | -47% | -121% | |
| Idle Minimum * (Watt) | 2.9 | 6.4 -121% | 9.9 -241% | 7 -141% | 9.3 -221% | 8.8 -203% |
| Idle Average * (Watt) | 5.7 | 8.3 -46% | 10.1 -77% | 7.1 -25% | 10.7 -88% | 12.6 -121% |
| Idle Maximum * (Watt) | 10.2 | 10.4 -2% | 13.1 -28% | 7.5 26% | 12.6 -24% | 14 -37% |
| Load Average * (Watt) | 38.7 | 38.5 1% | 69.8 -80% | 62.3 -61% | 37.7 3% | 93.2 -141% |
| Cyberpunk 2077 ultra external monitor * (Watt) | 41.1 | 36.1 12% | 86.3 -110% | 80.1 -95% | 32.3 21% | 102.1 -148% |
| Load Maximum * (Watt) | 60 | 52.5 12% | 92.8 -55% | 82.9 -38% | 43.4 28% | 105.4 -76% |
* ... im mniej tym lepiej
Pobór mocy Cyberpunk / Test warunków skrajnych
Zużycie energii przez monitor zewnętrzny
Ocena Notebookcheck
Podstawowy i niezawodny mini PC dla biznesu, ale prawdopodobnie zbyt podstawowy, biorąc pod uwagę wysoką cenę wywoławczą.
MSI Cubi NUC AI+ 2MG
- 29/09/2025 v8
Allen Ngo
 Total Sustainability Score:
 Potencjalni konkurenci w porównaniu
Obraz | Model / recenzja | Cena | Waga | Wysokość | Ekran |
|---|---|---|---|---|---|
1. 75.2% 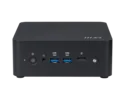 | MSI Cubi NUC AI+ 2MG Intel Core Ultra 7 258V ⎘ Intel Arc Graphics 140V ⎘ 32 GB Pamięć, 1000 GB SSD | Amazon: Cena katalogowa: 900 USD | 669 g | 50.1 mm | x |
2. 66.1% 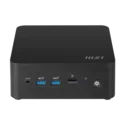 | MSI Cubi NUC 1M Intel Core 7 150U ⎘ Intel Iris Xe Graphics G7 96EUs ⎘ 16 GB Pamięć, 1024 GB SSD | Amazon: Cena katalogowa: 950 USD | 660 g | 50.1 mm | x |
3. 73.7% 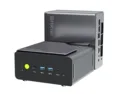 | GMK NucBox K12 AMD Ryzen 7 H 255 ⎘ AMD Radeon 780M ⎘ 32 GB Pamięć, 1024 GB SSD | Amazon: 1. $739.99 GMKtec Gaming Mini PC AMD Ry... 2. $29.99 19V~20V Charger for GMKtec M... | 938 g | 78 mm | x |
4. 80.2%  | Beelink SER9 Pro AMD Ryzen 7 H 255 ⎘ AMD Radeon 780M ⎘ 32 GB Pamięć, 1024 GB SSD | Amazon: Cena katalogowa: 520 USD | 812 g | 44.7 mm | x |
5.  | Ninkear M7, (16+512) AMD Ryzen 5 7430U ⎘ AMD Radeon RX Vega 7 ⎘ 16 GB Pamięć, 512 GB SSD | Amazon: Cena katalogowa: 399€ | 400 g | 36 mm | x |
6. 76.7% 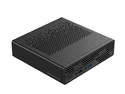 | Minisforum MS-A1 AMD Ryzen 7 8700G ⎘ AMD Radeon 780M ⎘ 32 GB Pamięć, 1024 GB SSD | Amazon: Cena katalogowa: 829 EUR | 1.7 kg | 48 mm | x |
Przezroczystość
Wyboru urządzeń do recenzji dokonuje nasza redakcja. Próbka testowa została udostępniona autorowi jako pożyczka od producenta lub sprzedawcy detalicznego na potrzeby tej recenzji. Pożyczkodawca nie miał wpływu na tę recenzję, producent nie otrzymał też kopii tej recenzji przed publikacją. Nie było obowiązku publikowania tej recenzji. Jako niezależna firma medialna, Notebookcheck nie podlega władzy producentów, sprzedawców detalicznych ani wydawców.
Tak testuje Notebookcheck
Każdego roku Notebookcheck niezależnie sprawdza setki laptopów i smartfonów, stosując standardowe procedury, aby zapewnić porównywalność wszystkich wyników. Od około 20 lat stale rozwijamy nasze metody badawcze, ustanawiając przy tym standardy branżowe. W naszych laboratoriach testowych doświadczeni technicy i redaktorzy korzystają z wysokiej jakości sprzętu pomiarowego. Testy te obejmują wieloetapowy proces walidacji. Nasz kompleksowy system ocen opiera się na setkach uzasadnionych pomiarów i benchmarków, co pozwala zachować obiektywizm.
