Werdykt - głównie drobne ulepszenia
Dell 16 Premium to zasadniczo zwiększona wydajność XPS 16 9640. Jest on wyposażony w nowsze, szybsze i bardziej wydajne procesory Intel i Nvidia, które mogą docenić zaawansowani użytkownicy. Jeśli jednak codzienne obciążenia nie wymagają znacznej mocy obliczeniowej, to tańszy XPS 16 9640 może zapewnić identyczne wrażenia użytkownika.
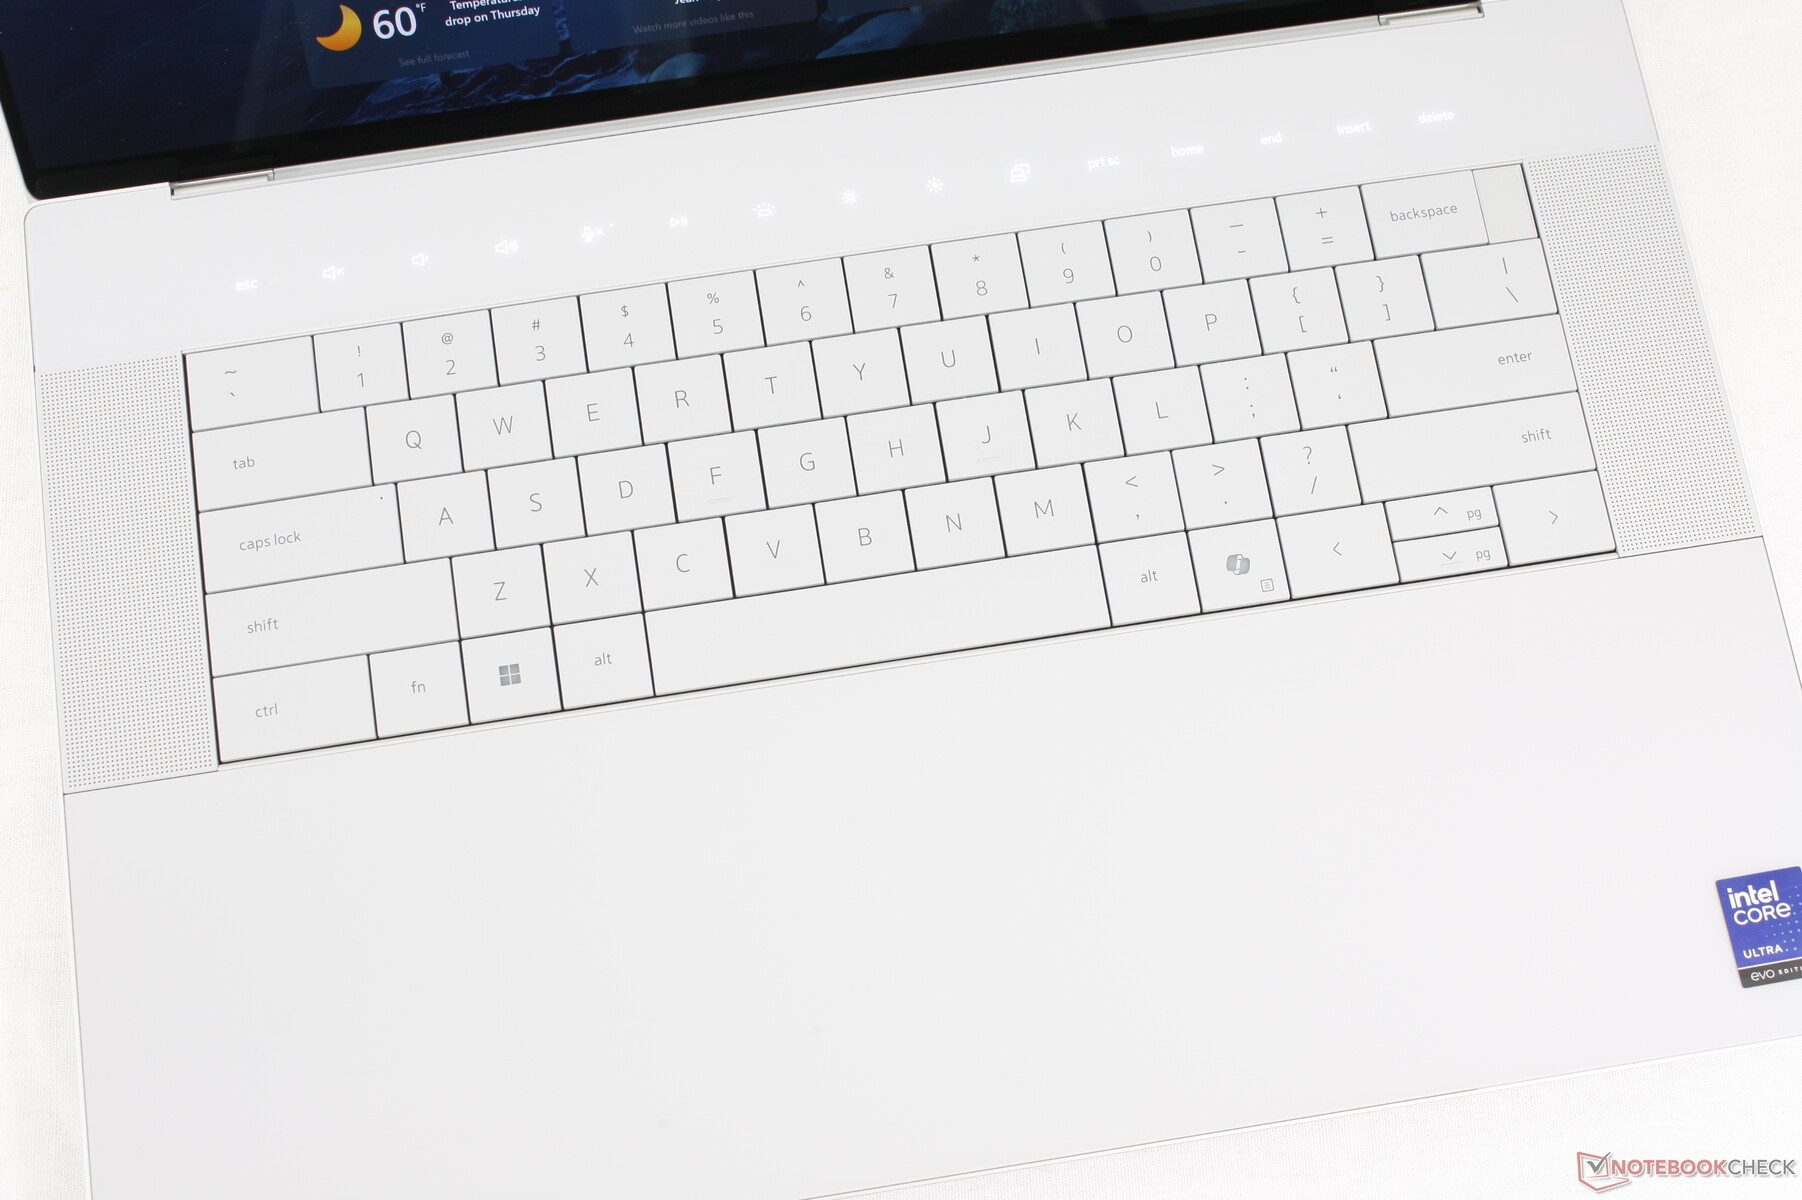
System zachowuje większość, jeśli nie wszystkie wady związane z przeprojektowaniem XPS 16 9640, w tym kontrowersyjne zmiany klawiatury i clickpada. Dell 16 Premium wykazuje również nieco bardziej strome dławienie wydajności procesora niż wcześniej. Potencjalni nabywcy będą chcieli pamiętać, że system wymienia nieco wydajności graficznej na mniejszy rozmiar i bardzo kompaktowy zasilacz sieciowy. Użytkownicy, którzy nie mają nic przeciwko nieco większemu systemowi, mogą znaleźć konkurencyjny Lenovo Yoga Pro 9i 16 za szybszą alternatywę, nawet w konfiguracji z podobną specyfikacją CPU i GPU.
Za
Przeciw
Cena i dostępność
Dell dostarcza obecnie Dell 16 Premium w cenie od 2200 USD za podstawową konfigurację Core Ultra 7 RTX 5050 do 3400 USD za konfigurację Core Ultra 9 RTX 5070.
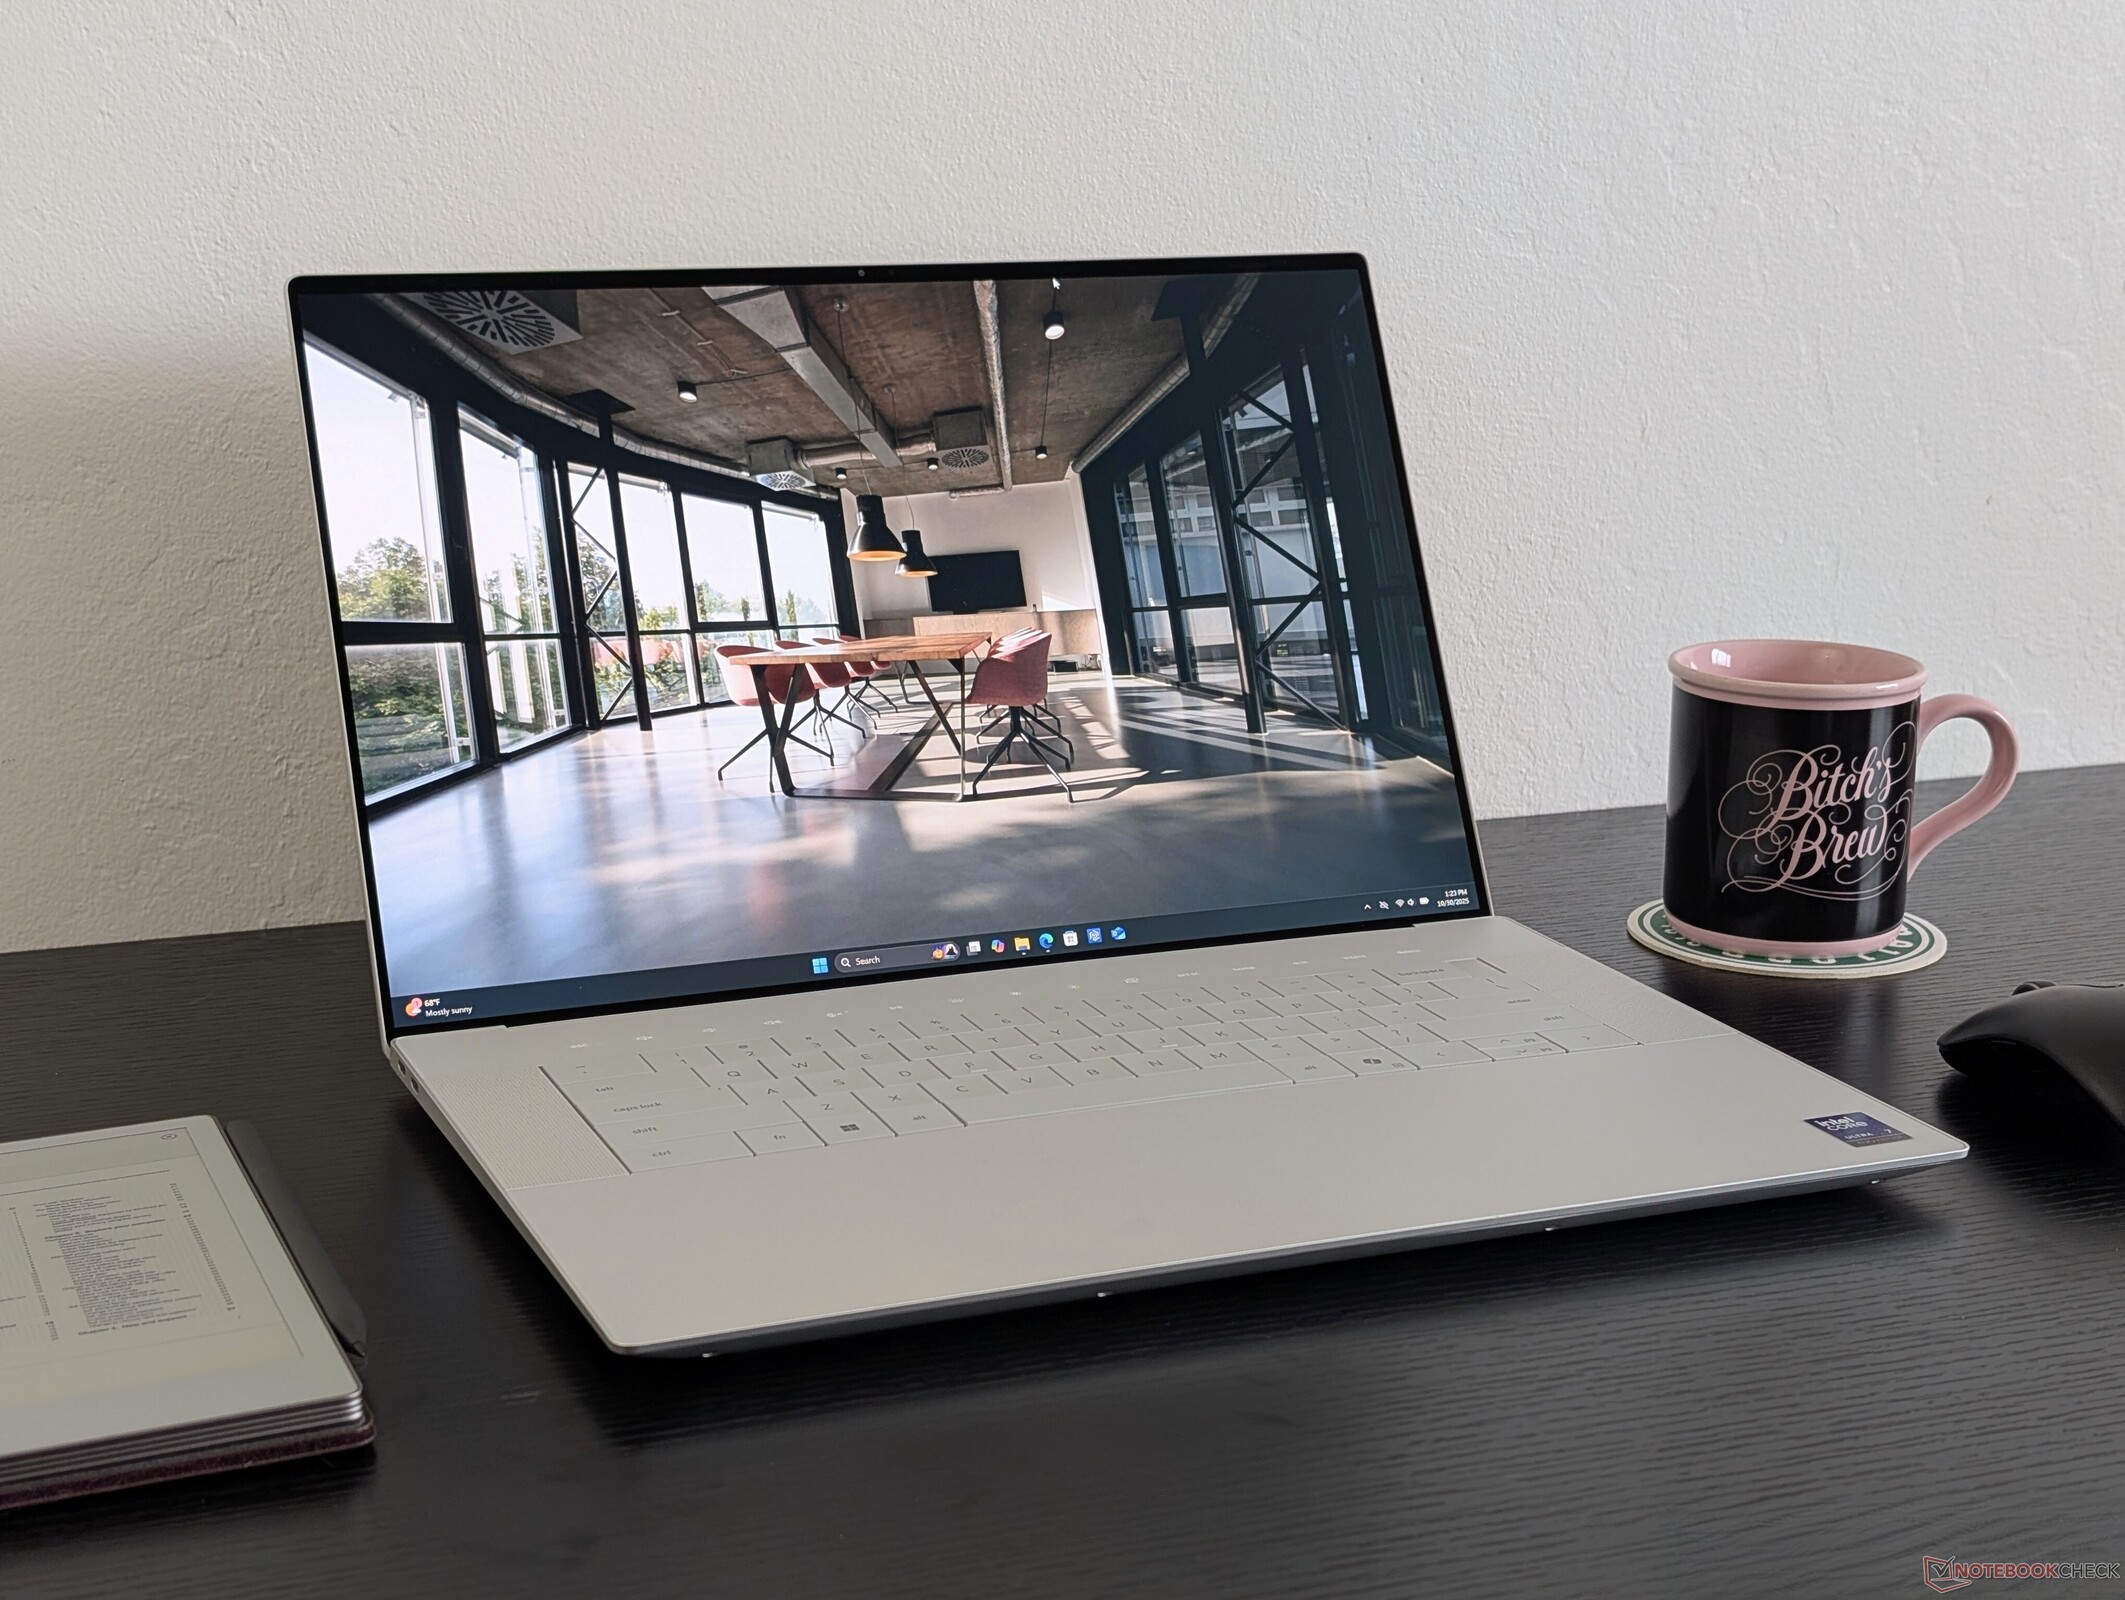
Dell 16 Premium jest następcą serii XPS 16. Podczas gdy nazwa uległa zmianie, znajomy projekt jest kontynuowany, aby zapewnić zasadniczo identyczne wrażenia użytkownika jak w wersji 2024. Wiele z naszych komentarzy na temat XPS 16 9640 odnosi się do Dell 16 Premium, ponieważ nowszy model wprowadza tylko wewnętrzne zmiany bez większych aktualizacji zewnętrznych.
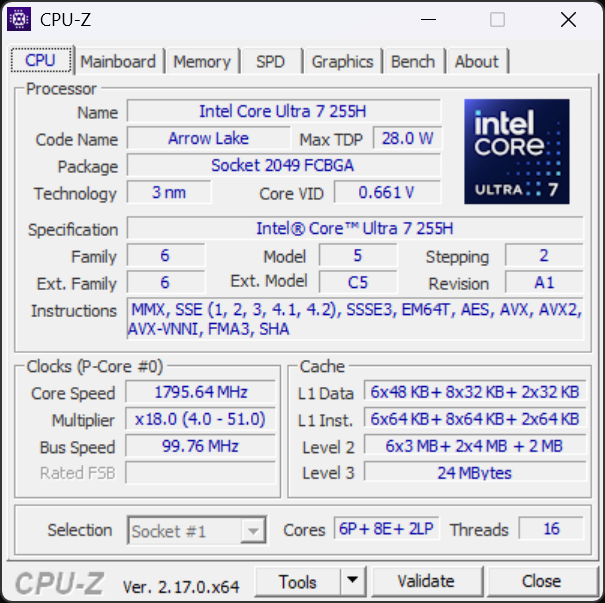
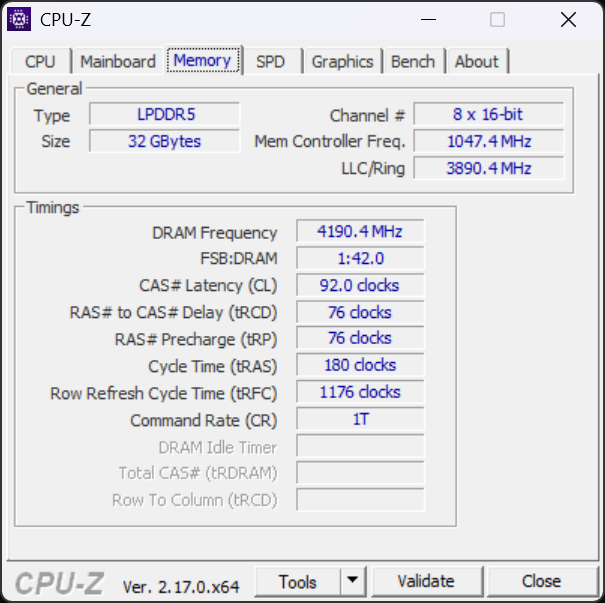
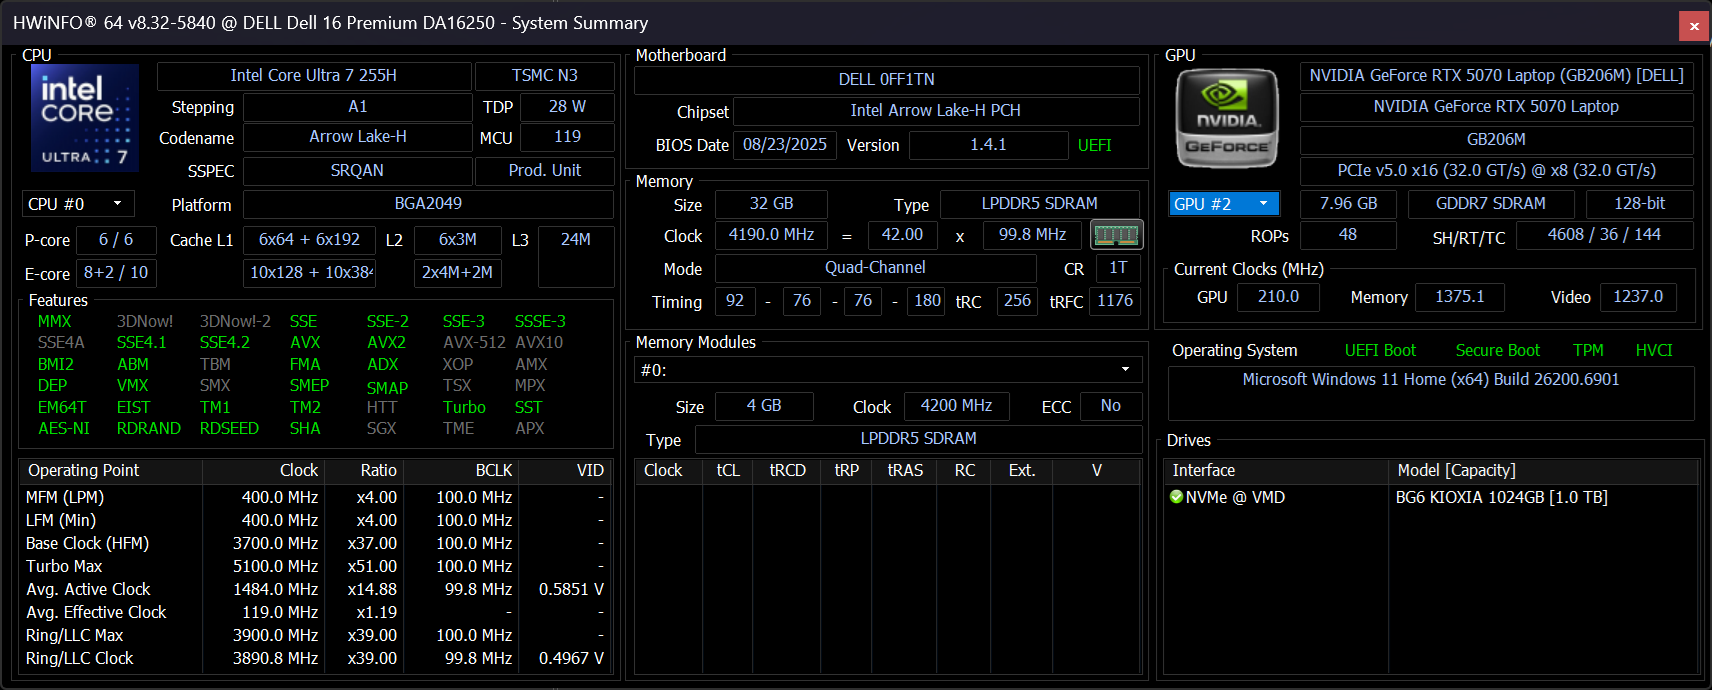
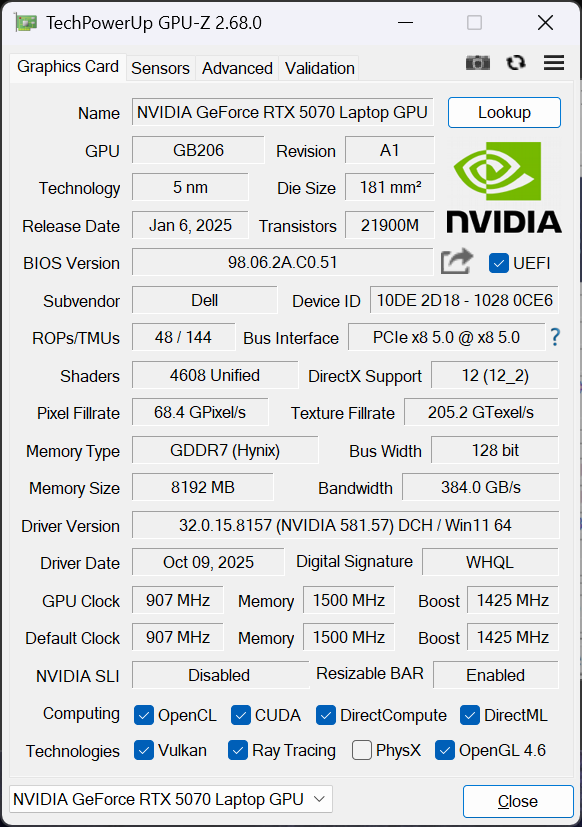
Nasza jednostka testowa to konfiguracja z wyższej półki z procesorem Arrow Lake-H Core Ultra 7 255H, 60 W GPU Nvidia Blackwell GeForce RTX 5070 i 16,3-calowym ekranem dotykowym OLED 4K 2400p 120 Hz za około 3300 USD, który zastąpił zeszłoroczne opcje procesorów Meteor Lake-H i Ada Lovelace. Niższe jednostki SKU mogą być dostarczane tylko ze zintegrowaną grafiką, RTX 5050 lub bezdotykowym wyświetlaczem 2K 1200p, podczas gdy najwyższa konfiguracja jest dostarczana z procesorem Core Ultra 9 285H.
Alternatywy dla Dell 16 Premium obejmują inne wysokiej klasy laptopy multimedialne, takie jak Lenovo Yoga Pro 9i 16, HP Spectre x360 16lub Apple MacBook Pro 16. Dell 16 Premium nie powinien być mylony z Dell Pro 16 Premium.
Więcej recenzji Dell:
Specyfikacje
Przypadek
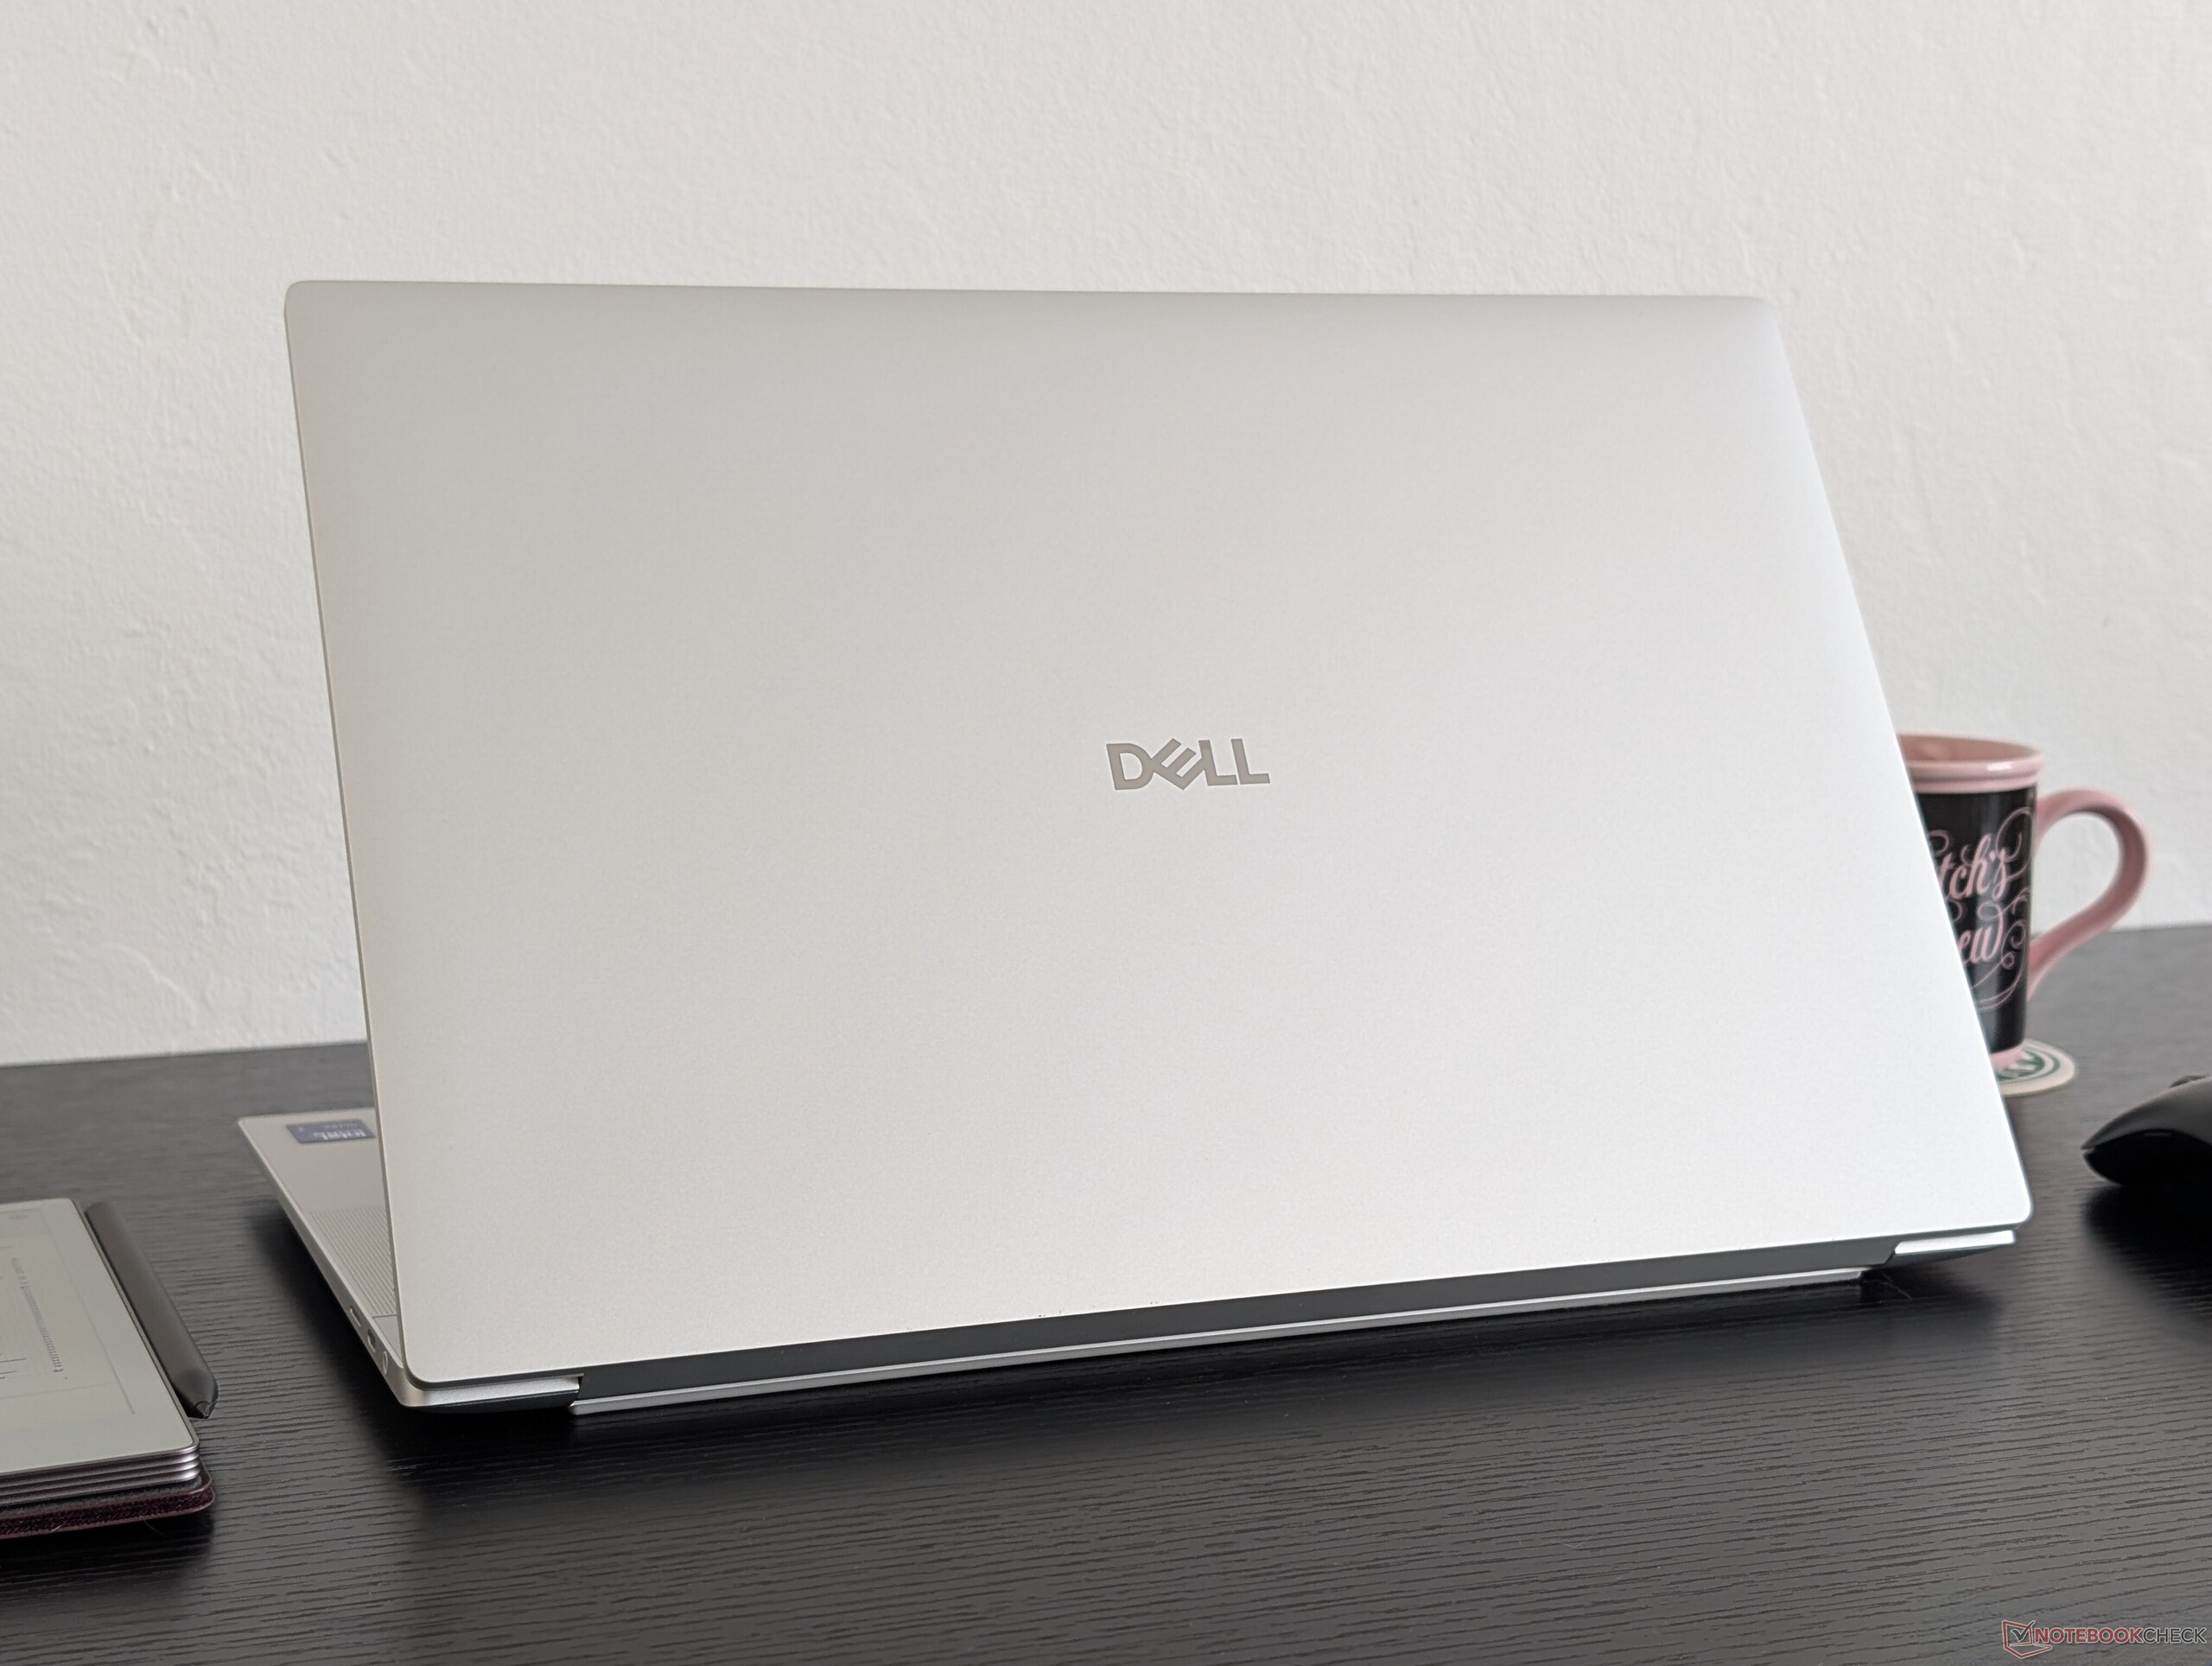
Chociaż Dell 16 Premium wykorzystuje tę samą konstrukcję obudowy, co odchodzący XPS 16 9640, logo na zewnętrznej pokrywie zostało zmienione tak, aby pojawiało się bez okręgu. Jest to również jeden z najprostszych sposobów na wizualne odróżnienie Dell 16 Premium od starszych modeli XPS.
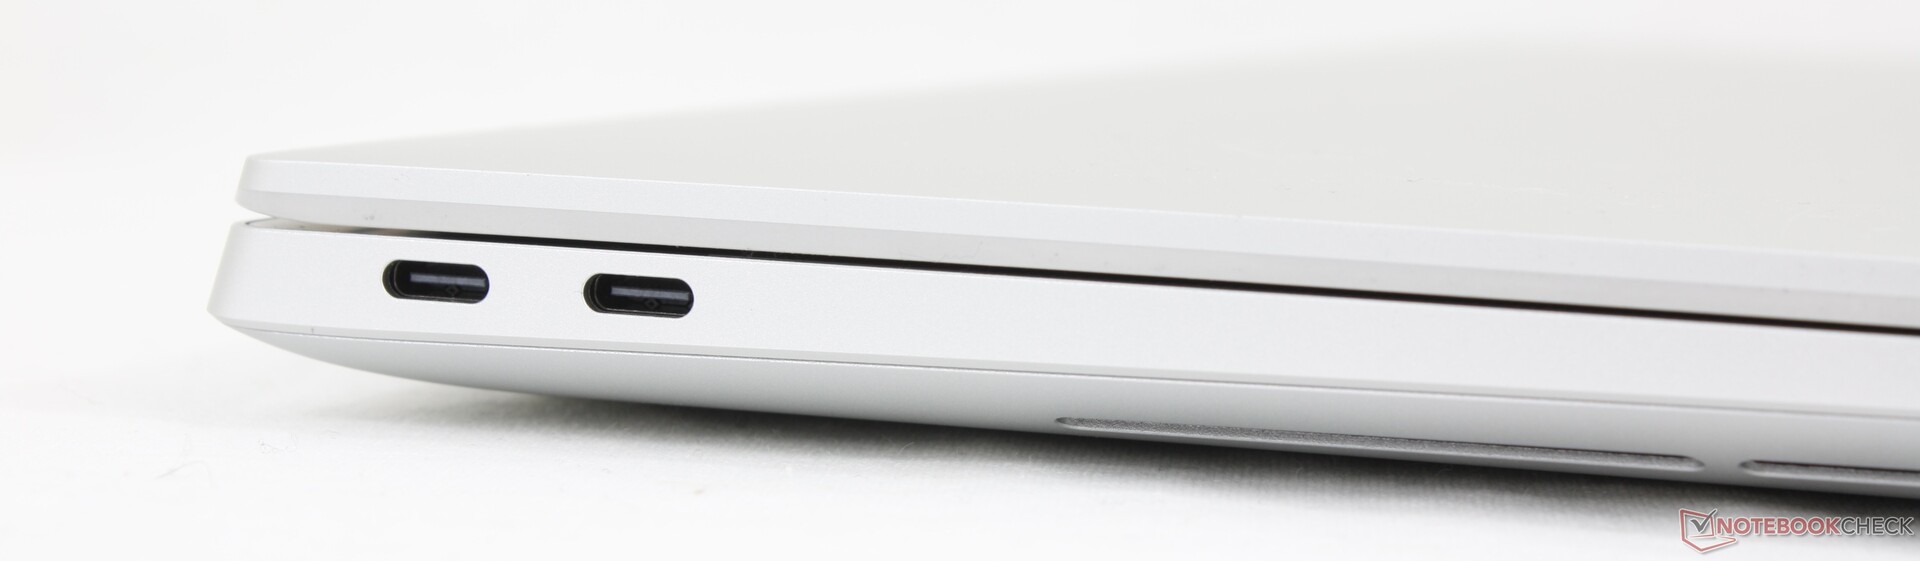
Łączność
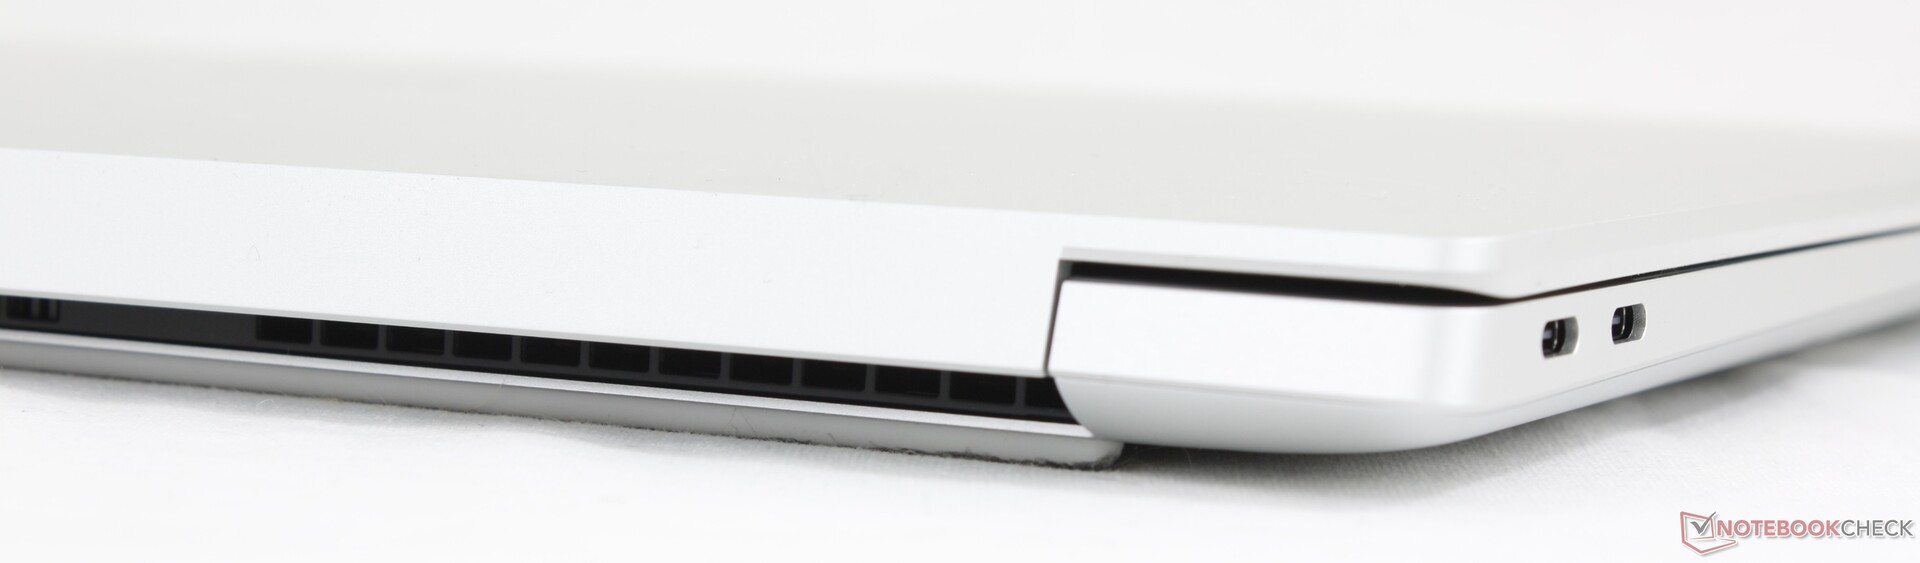
Wszystkie porty USB-C obsługują teraz Thunderbolt 4 z prędkością 40 Gb/s, podczas gdy nie było to prawdą w XPS 16 9640.

Komunikacja
| Networking | |
| iperf3 transmit AXE11000 | |
| LG Gram Pro 16Z90TS-G.AU89G | |
| Asus Zenbook S 16 UM5606-RK333W | |
| Lenovo Yoga Pro 9i 16 RTX 5070 | |
| Dell XPS 16 9640 | |
| HP Spectre x360 16 RTX 4050 | |
| Dell 16 Premium DA16250 | |
| iperf3 receive AXE11000 | |
| Asus Zenbook S 16 UM5606-RK333W | |
| Lenovo Yoga Pro 9i 16 RTX 5070 | |
| LG Gram Pro 16Z90TS-G.AU89G | |
| Dell XPS 16 9640 | |
| HP Spectre x360 16 RTX 4050 | |
| Dell 16 Premium DA16250 | |
| iperf3 transmit AXE11000 6GHz | |
| LG Gram Pro 16Z90TS-G.AU89G | |
| Dell 16 Premium DA16250 | |
| HP Spectre x360 16 RTX 4050 | |
| iperf3 receive AXE11000 6GHz | |
| LG Gram Pro 16Z90TS-G.AU89G | |
| Dell 16 Premium DA16250 | |
| HP Spectre x360 16 RTX 4050 | |
Kamera internetowa


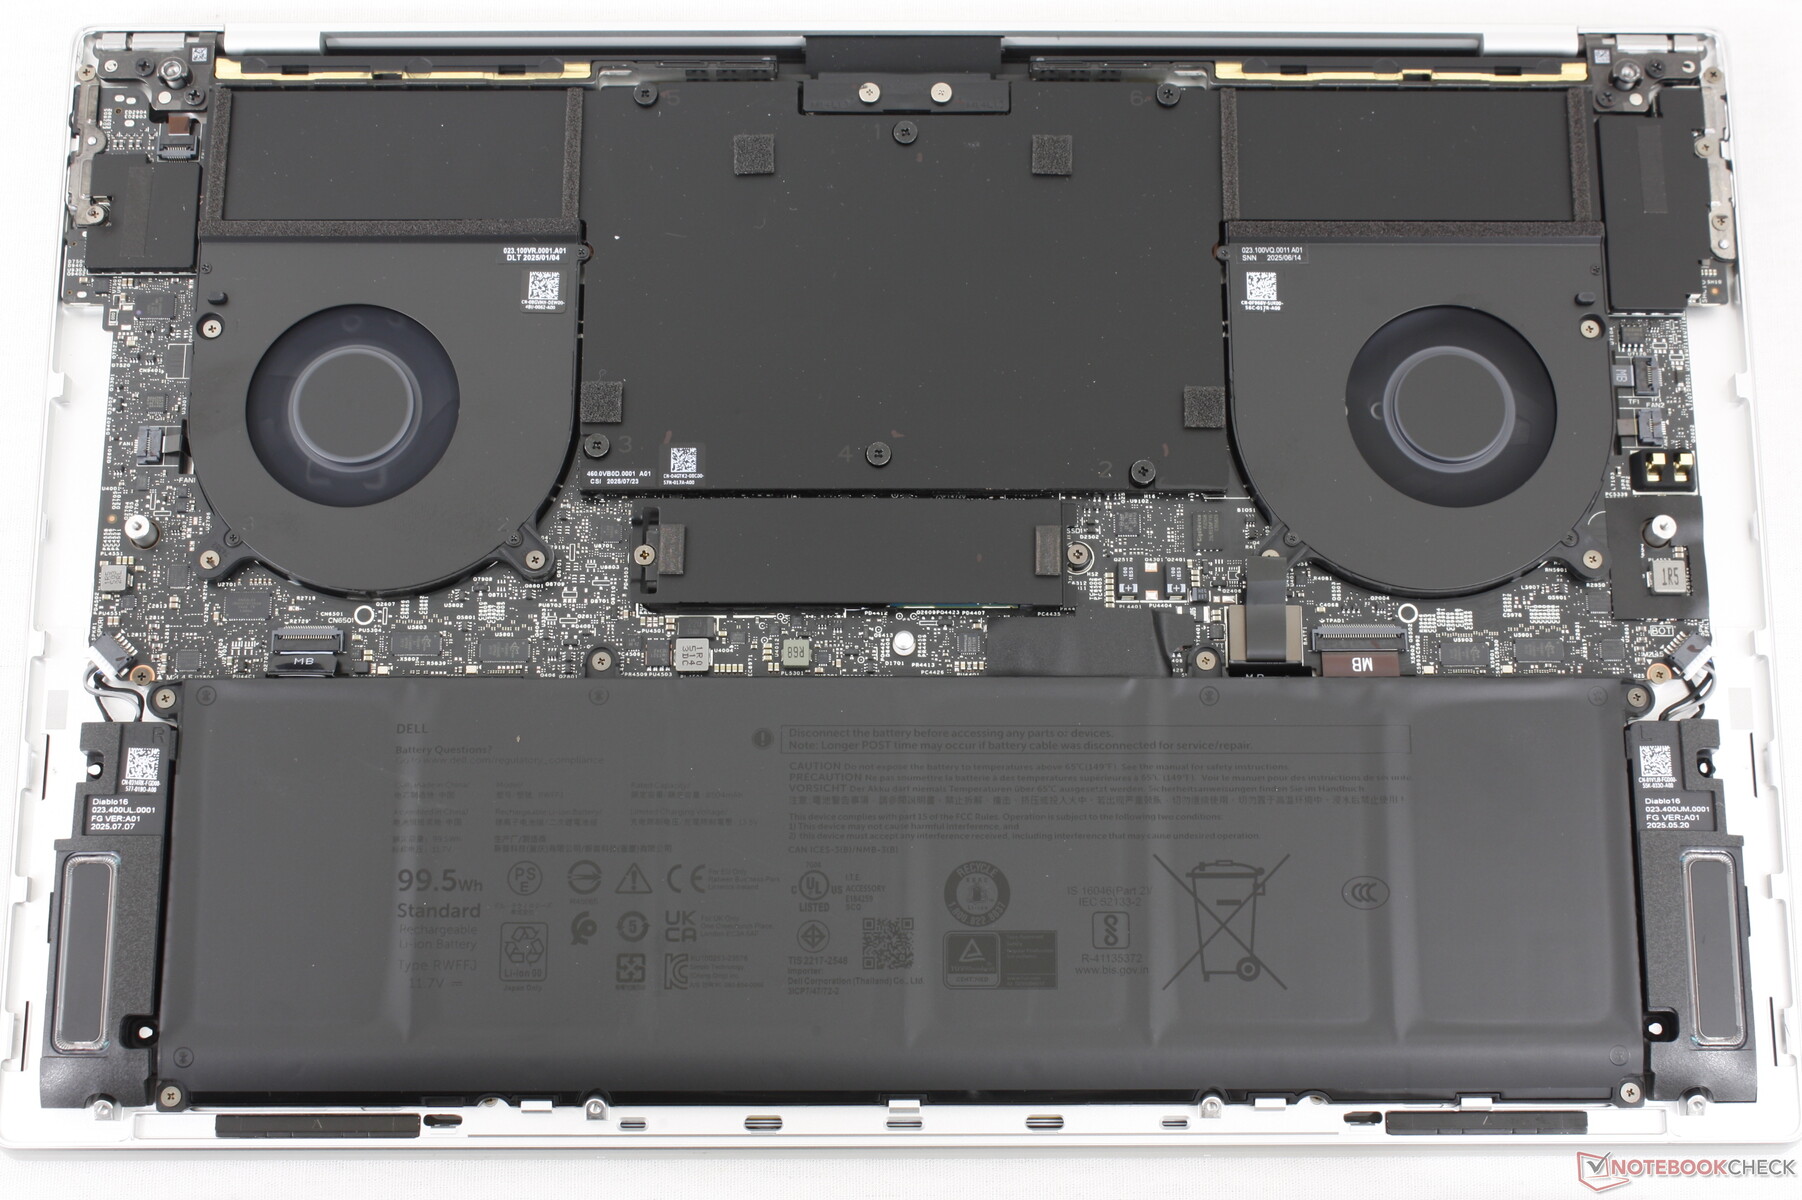
Konserwacja
Zrównoważony rozwój
Obudowa lub szkielet składa się w 75% z aluminium pochodzącego z recyklingu dla górnej pokrywy, do 22% szkła pochodzącego z recyklingu dla ekranu, 25% niskoemisyjnego aluminium dla podpórki pod nadgarstki, 18,5 tworzyw sztucznych pochodzących z recyklingu oraz opakowania w 100% nadającego się do recyklingu.
Gwarancja
Roczna ograniczona gwarancja producenta jest standardem w przypadku zakupu w USA.
Urządzenia wejściowe
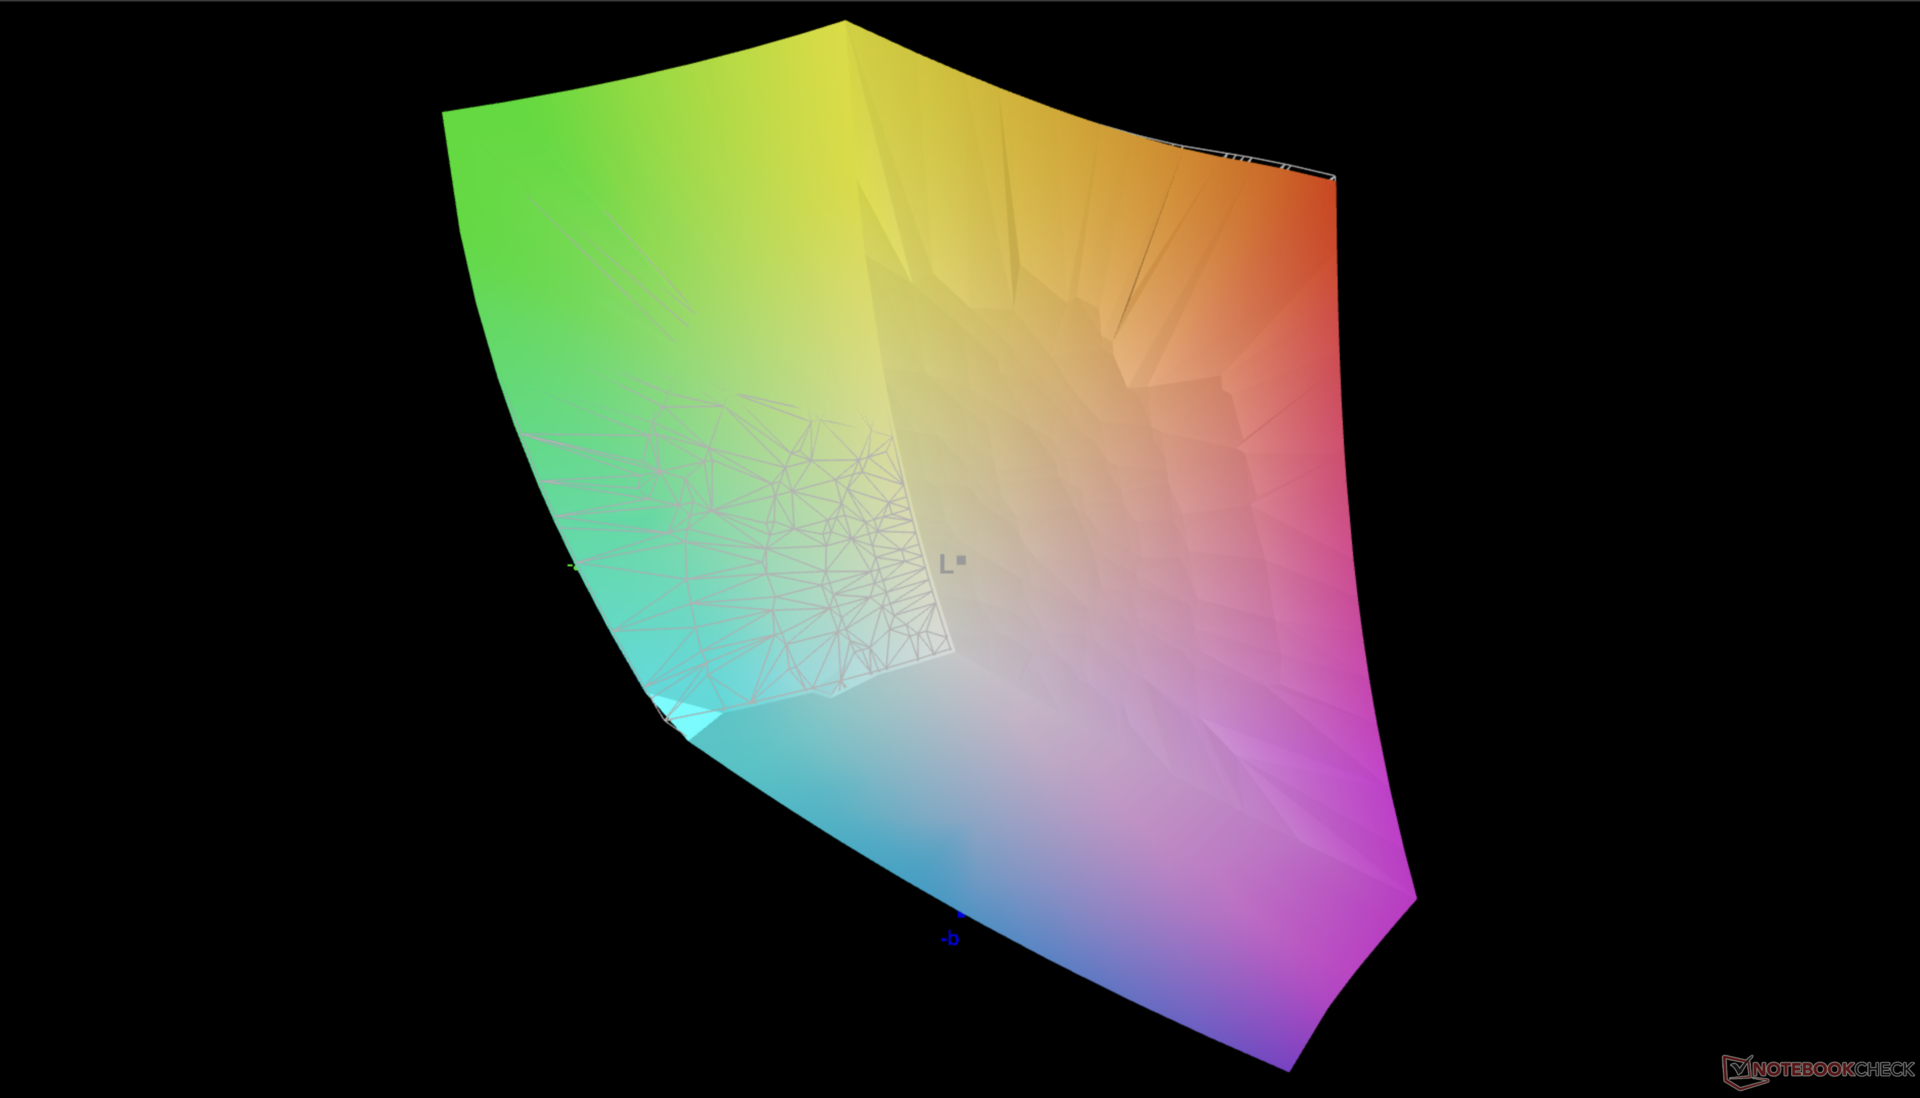
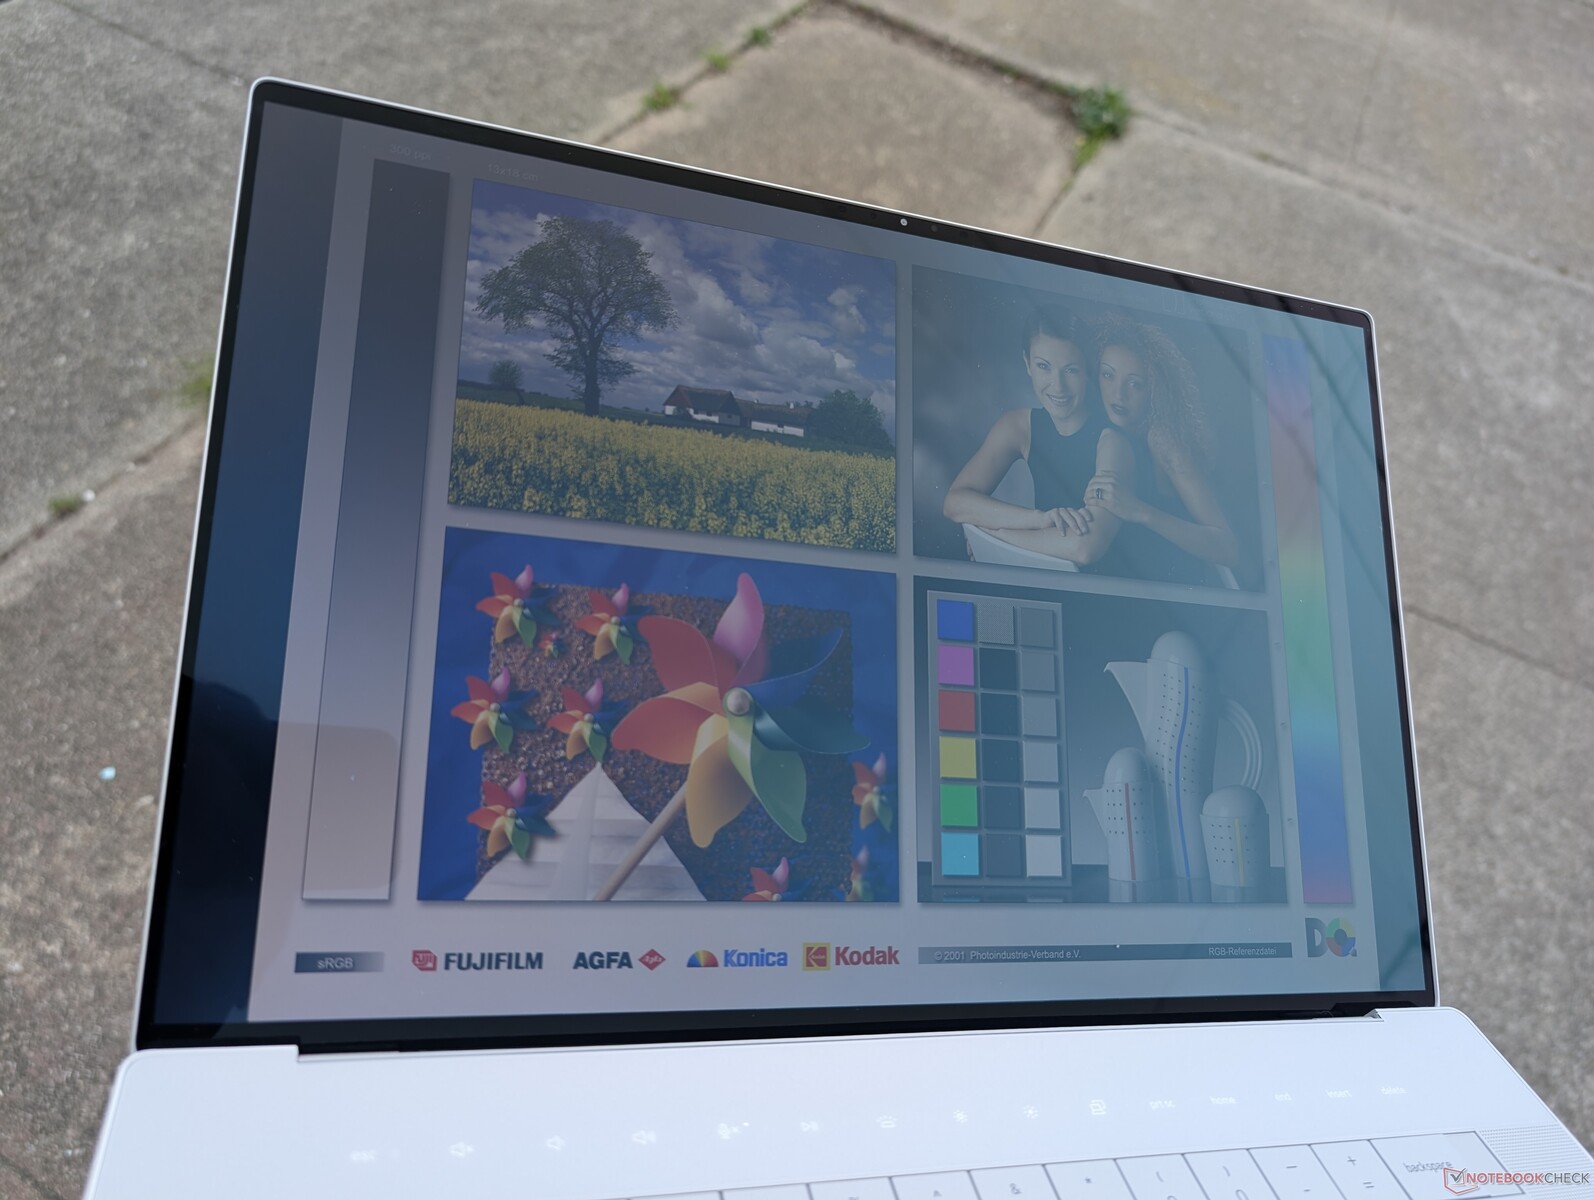
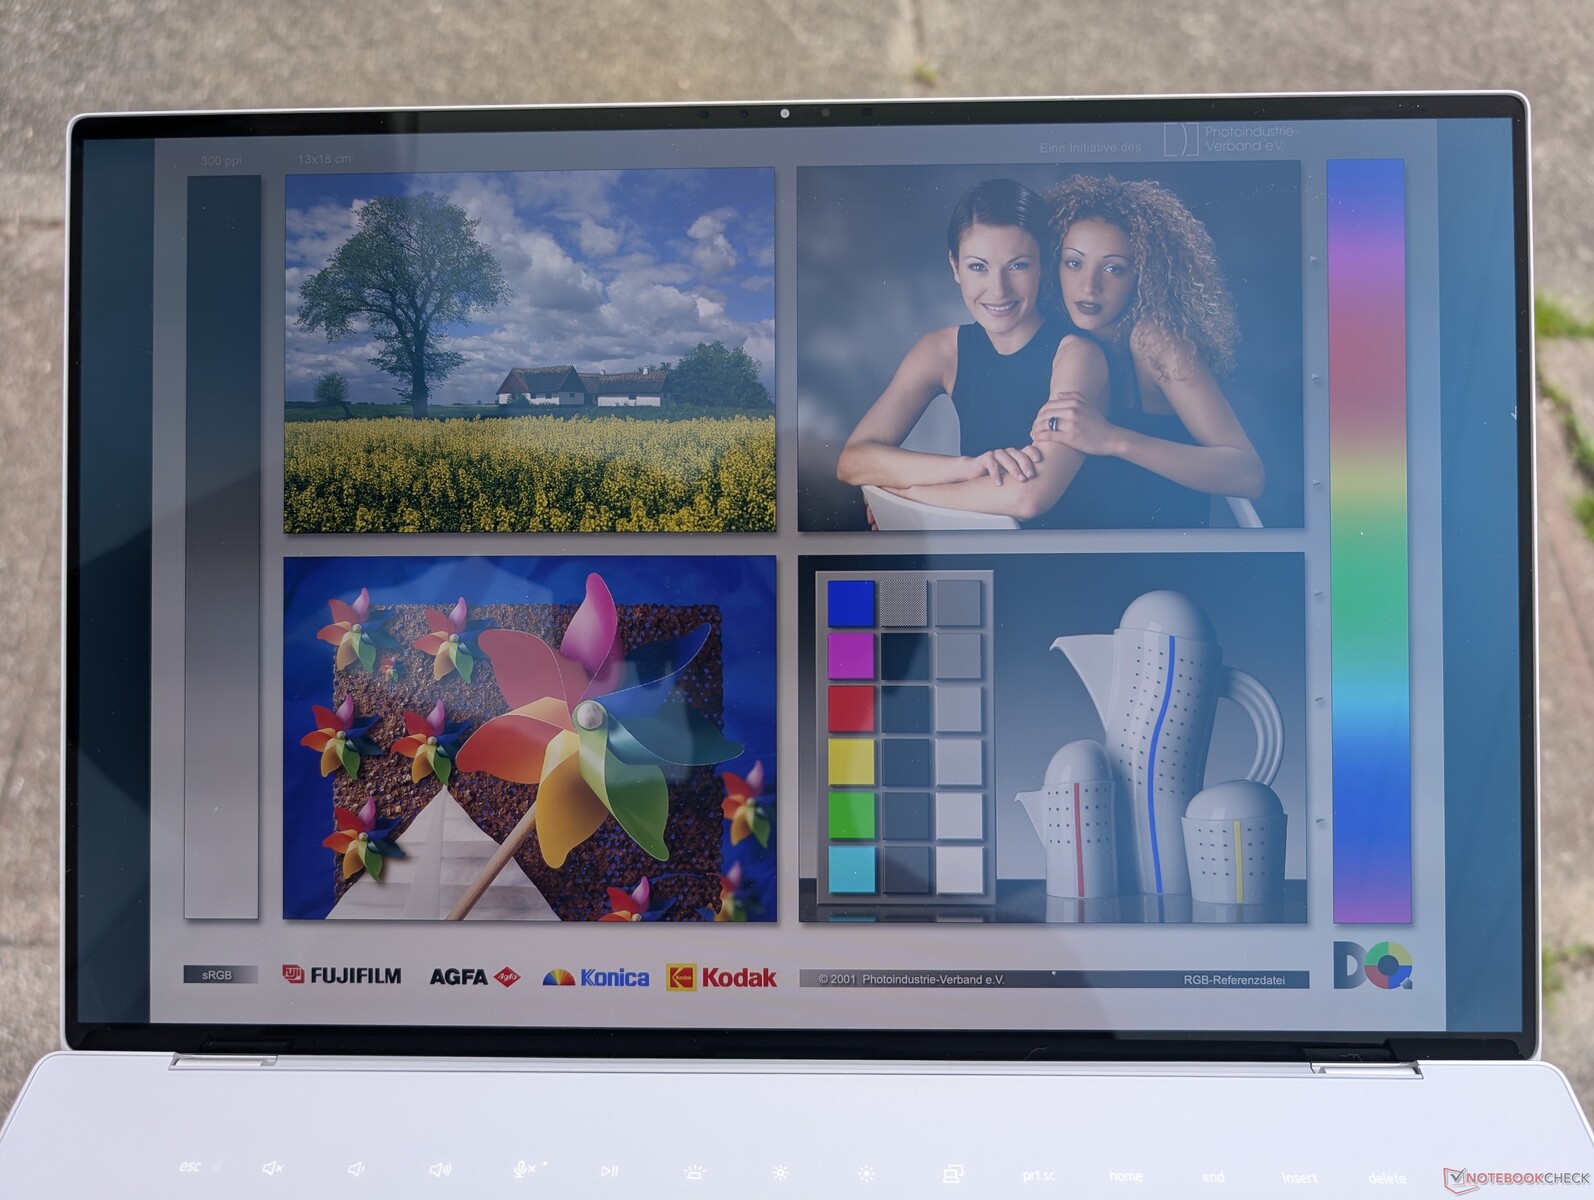
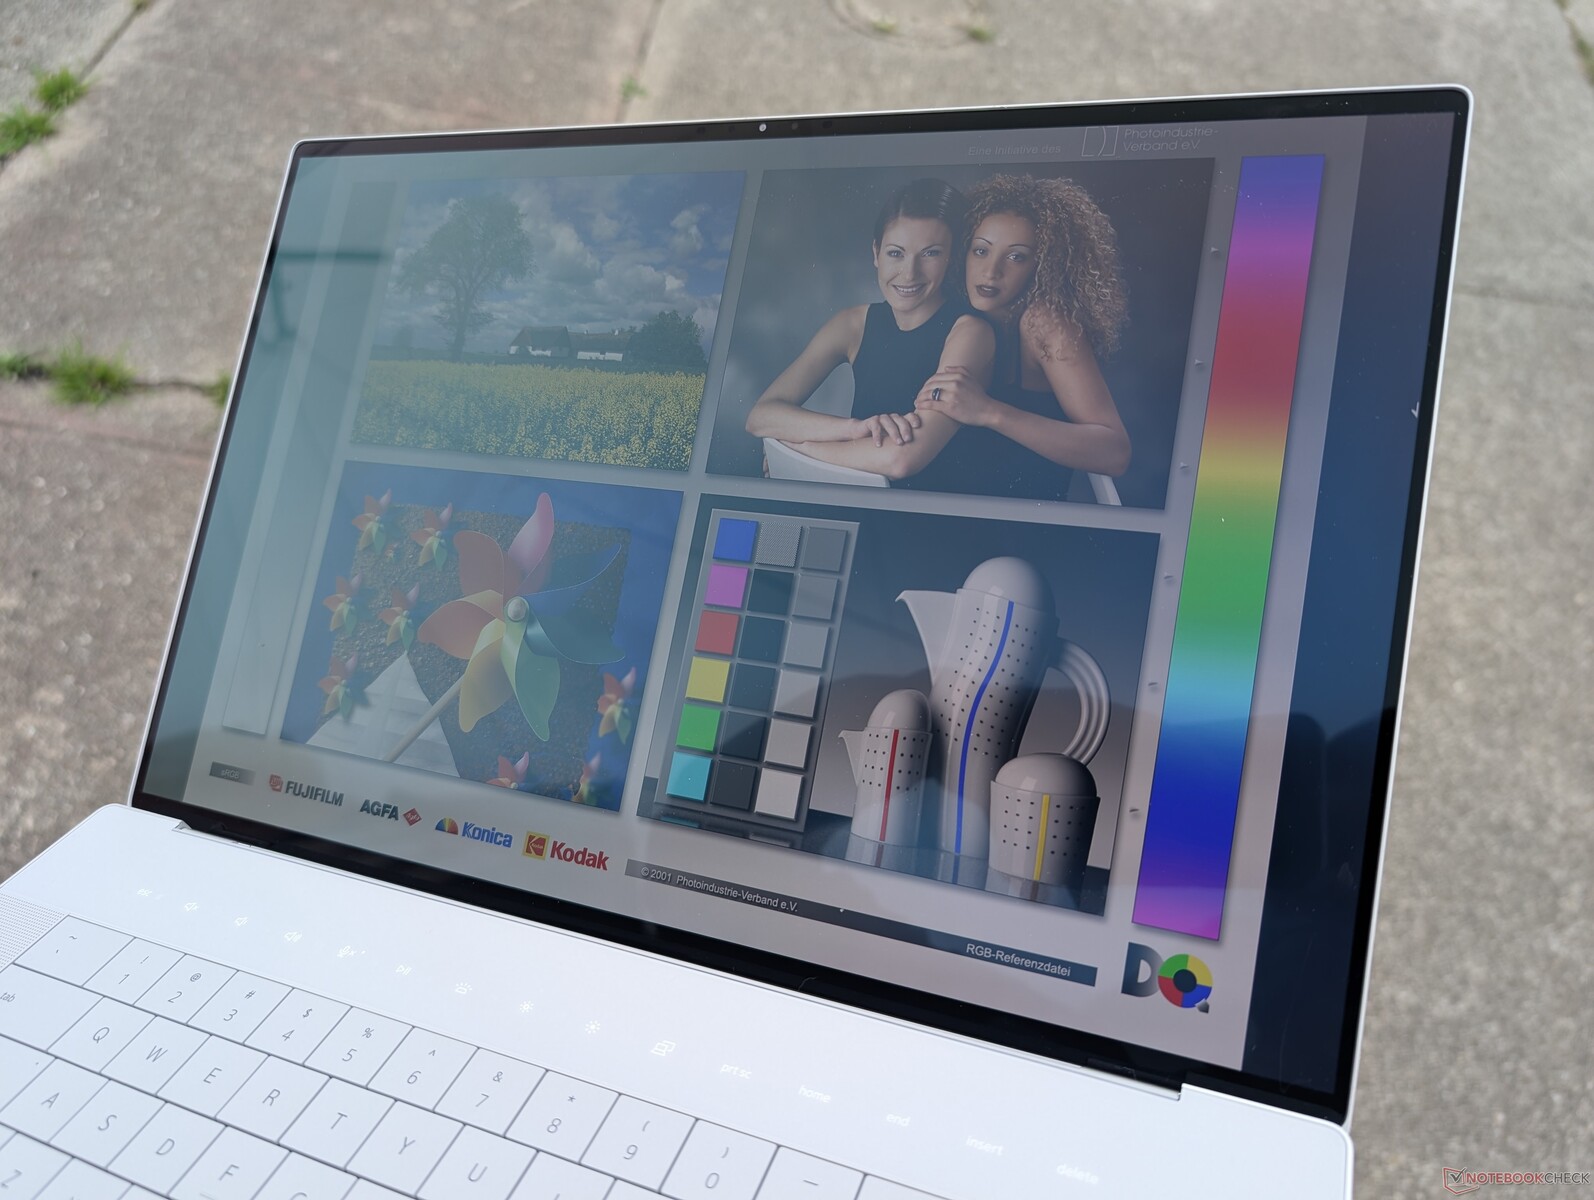
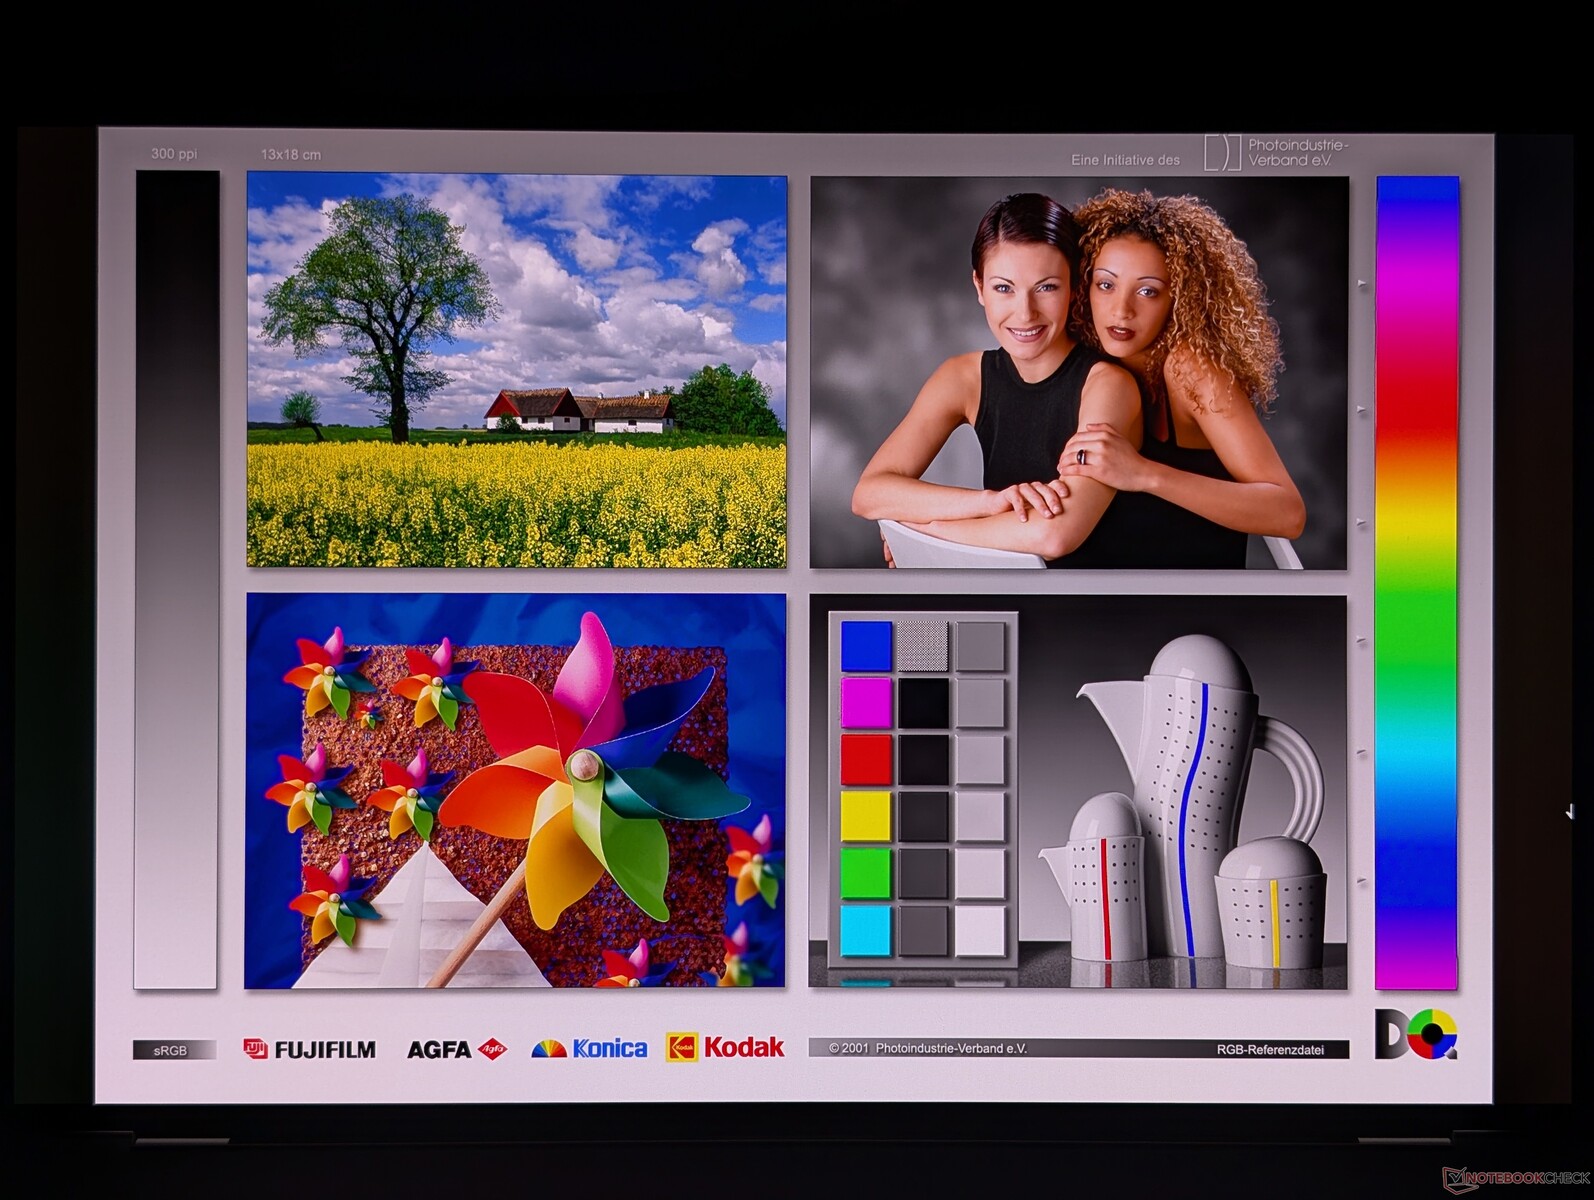
Wyświetlacz

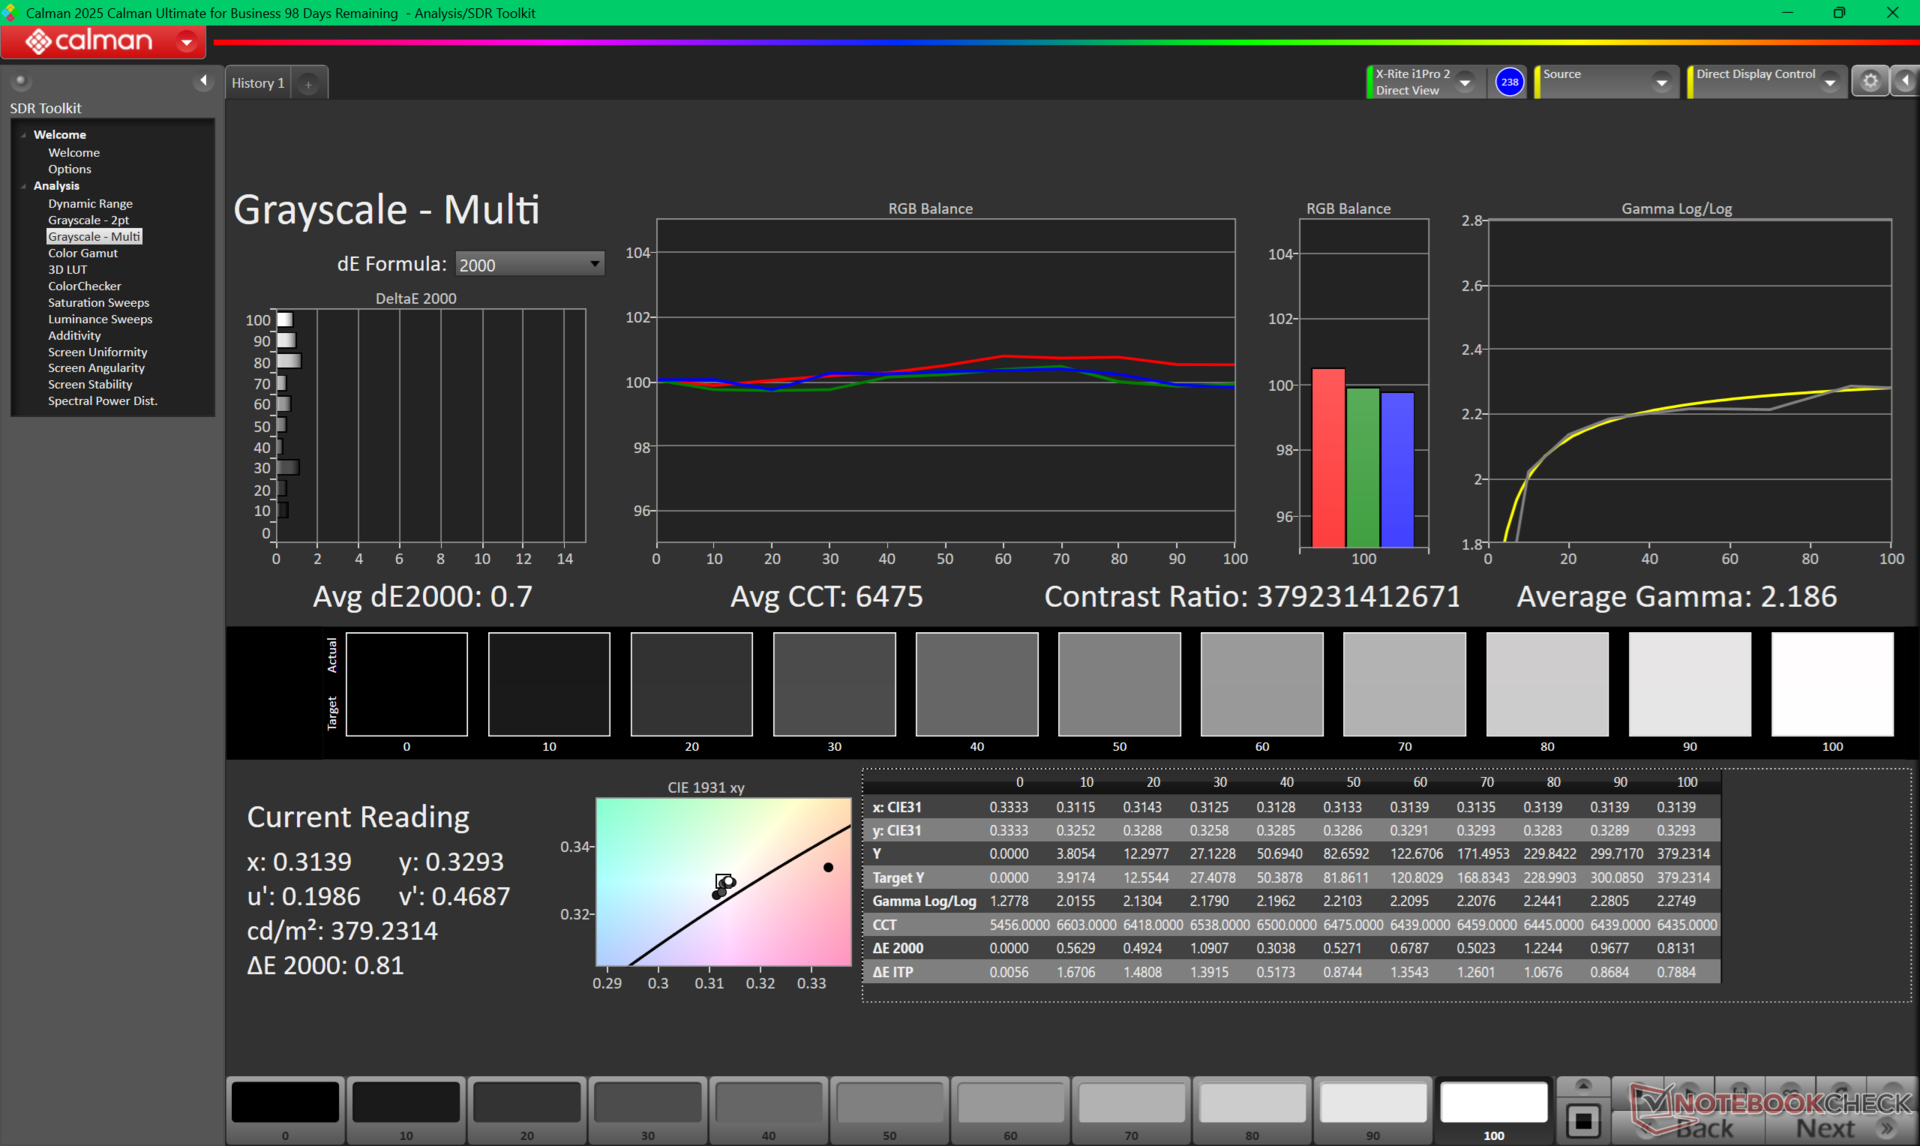
Dell ulepszył panel OLED w zeszłorocznym XPS 16 9640 z 90 Hz do 120 Hz, podczas gdy maksymalna jasność pozostaje taka sama i wynosi ~400 nitów. Windows VRR jest obsługiwany do 48 Hz, aby oszczędzać energię baterii. Zmiany są stosunkowo niewielkie, ale mimo to godne uwagi, ponieważ wyświetlacze 4K 2400p 120 Hz są stosunkowo rzadkie w 16-calowych laptopach.
| |||||||||||||||||||||||||
rozświetlenie: 98 %
na akumulatorze: 385.7 cd/m²
kontrast: ∞:1 (czerń: 0 cd/m²)
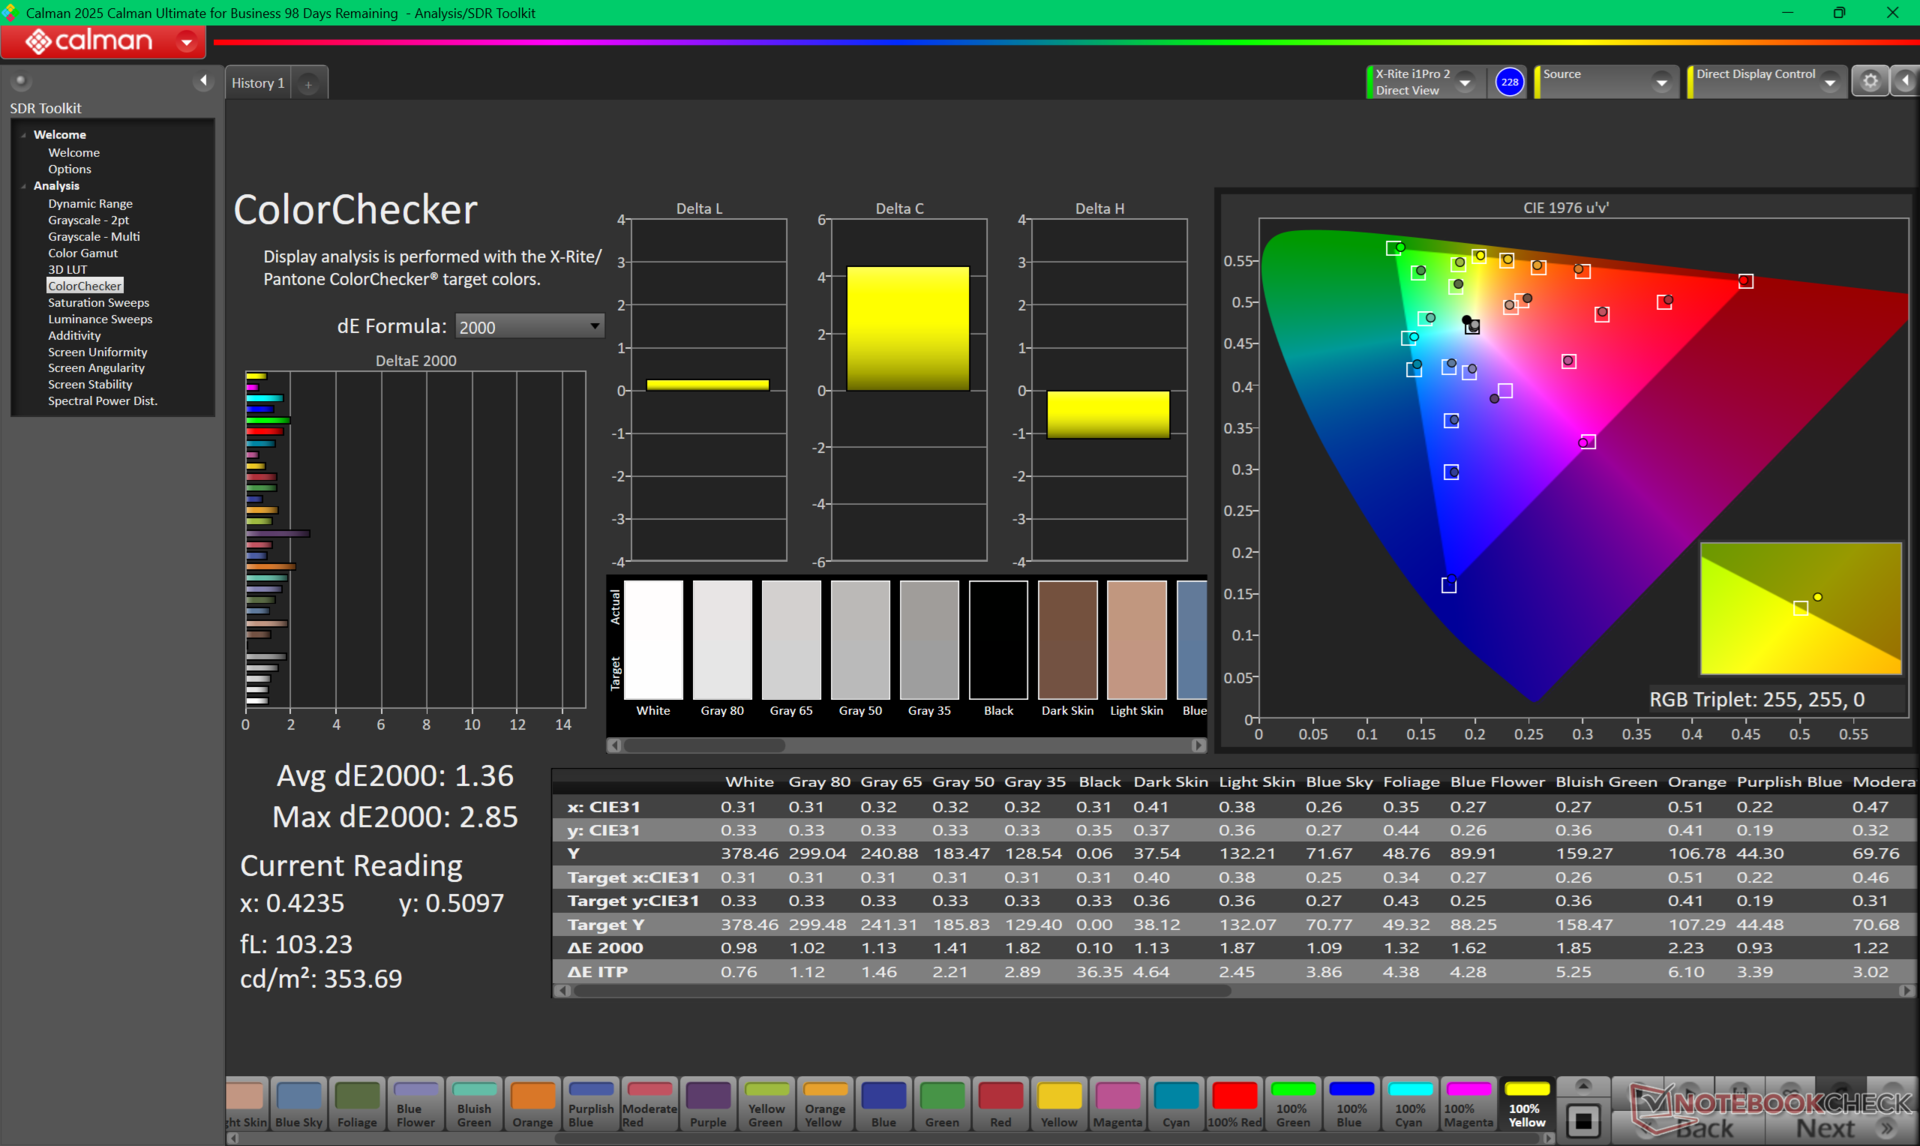
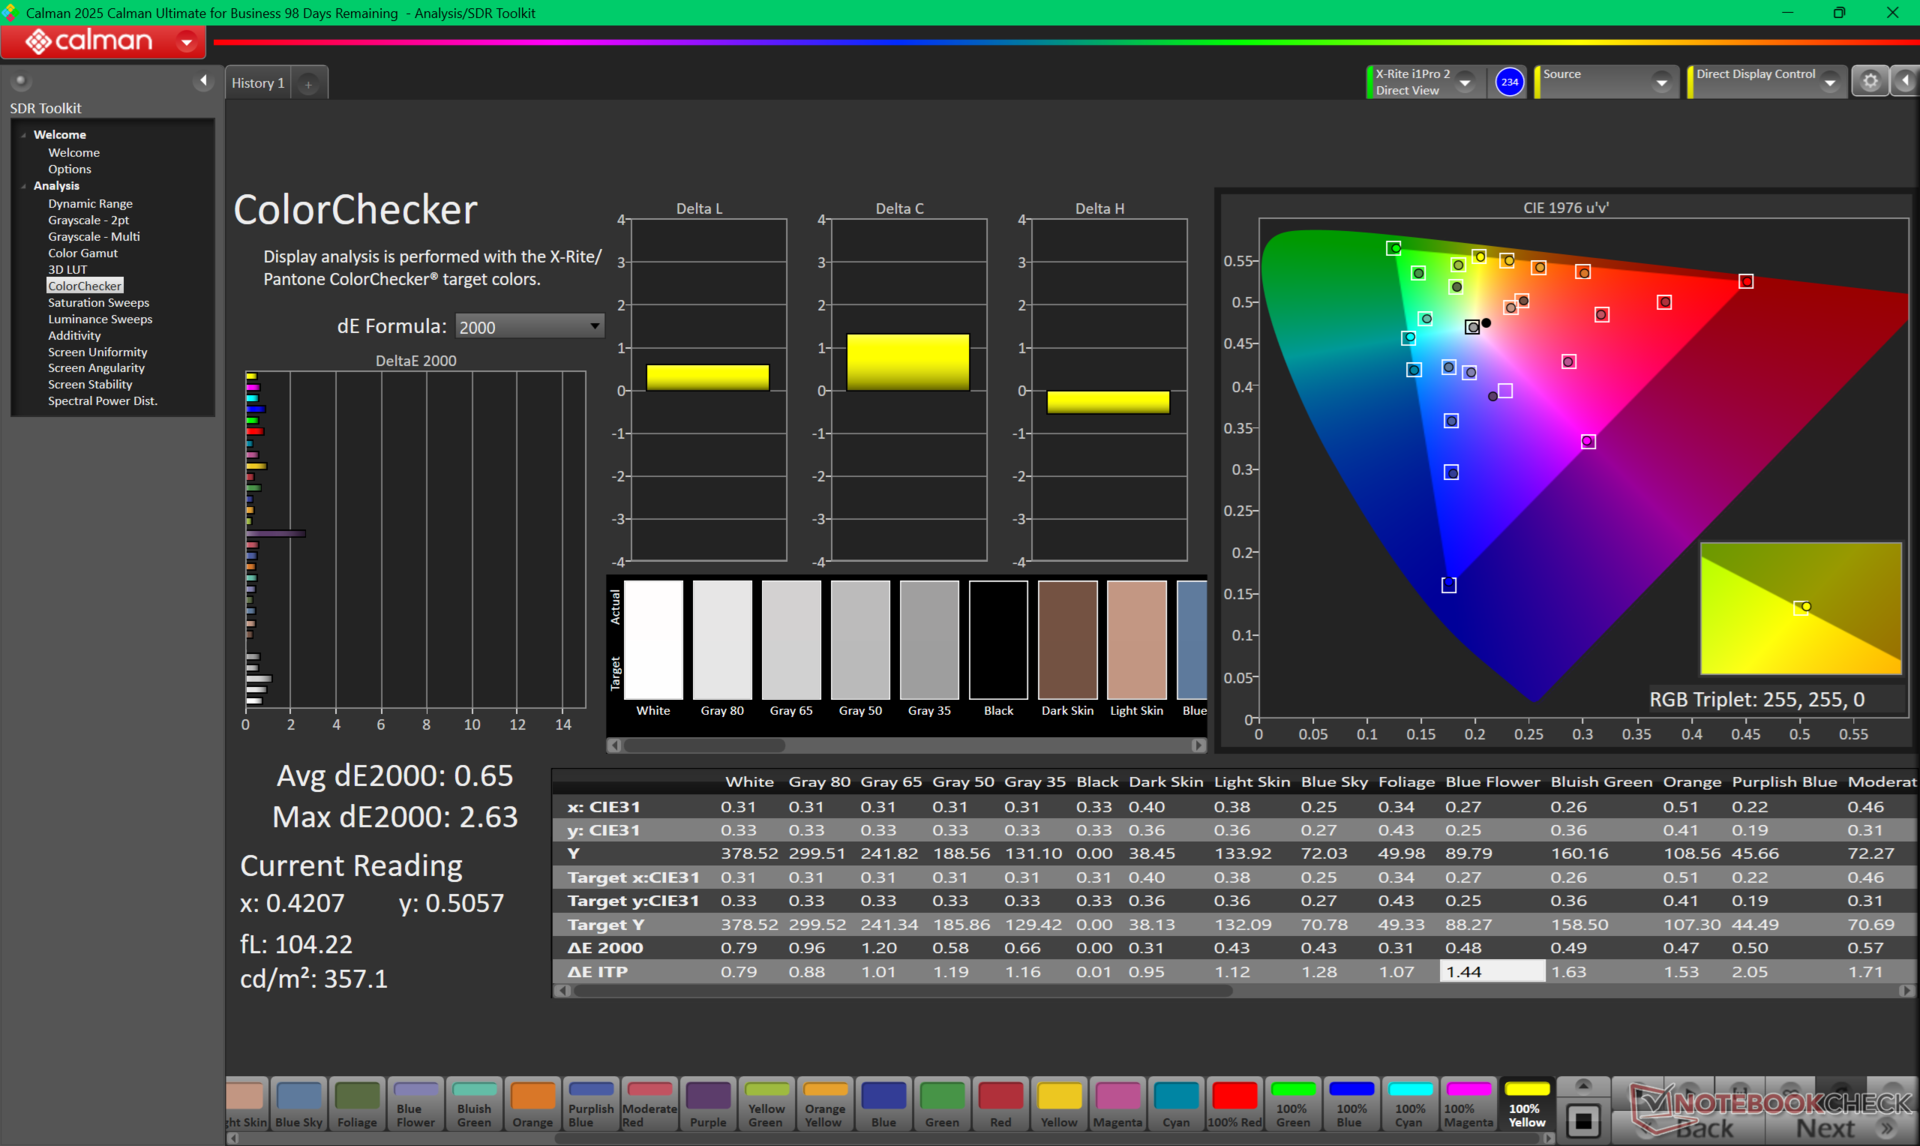
ΔE ColorChecker Calman: 1.36 | ∀{0.5-29.43 Ø4.71}
calibrated: 0.65
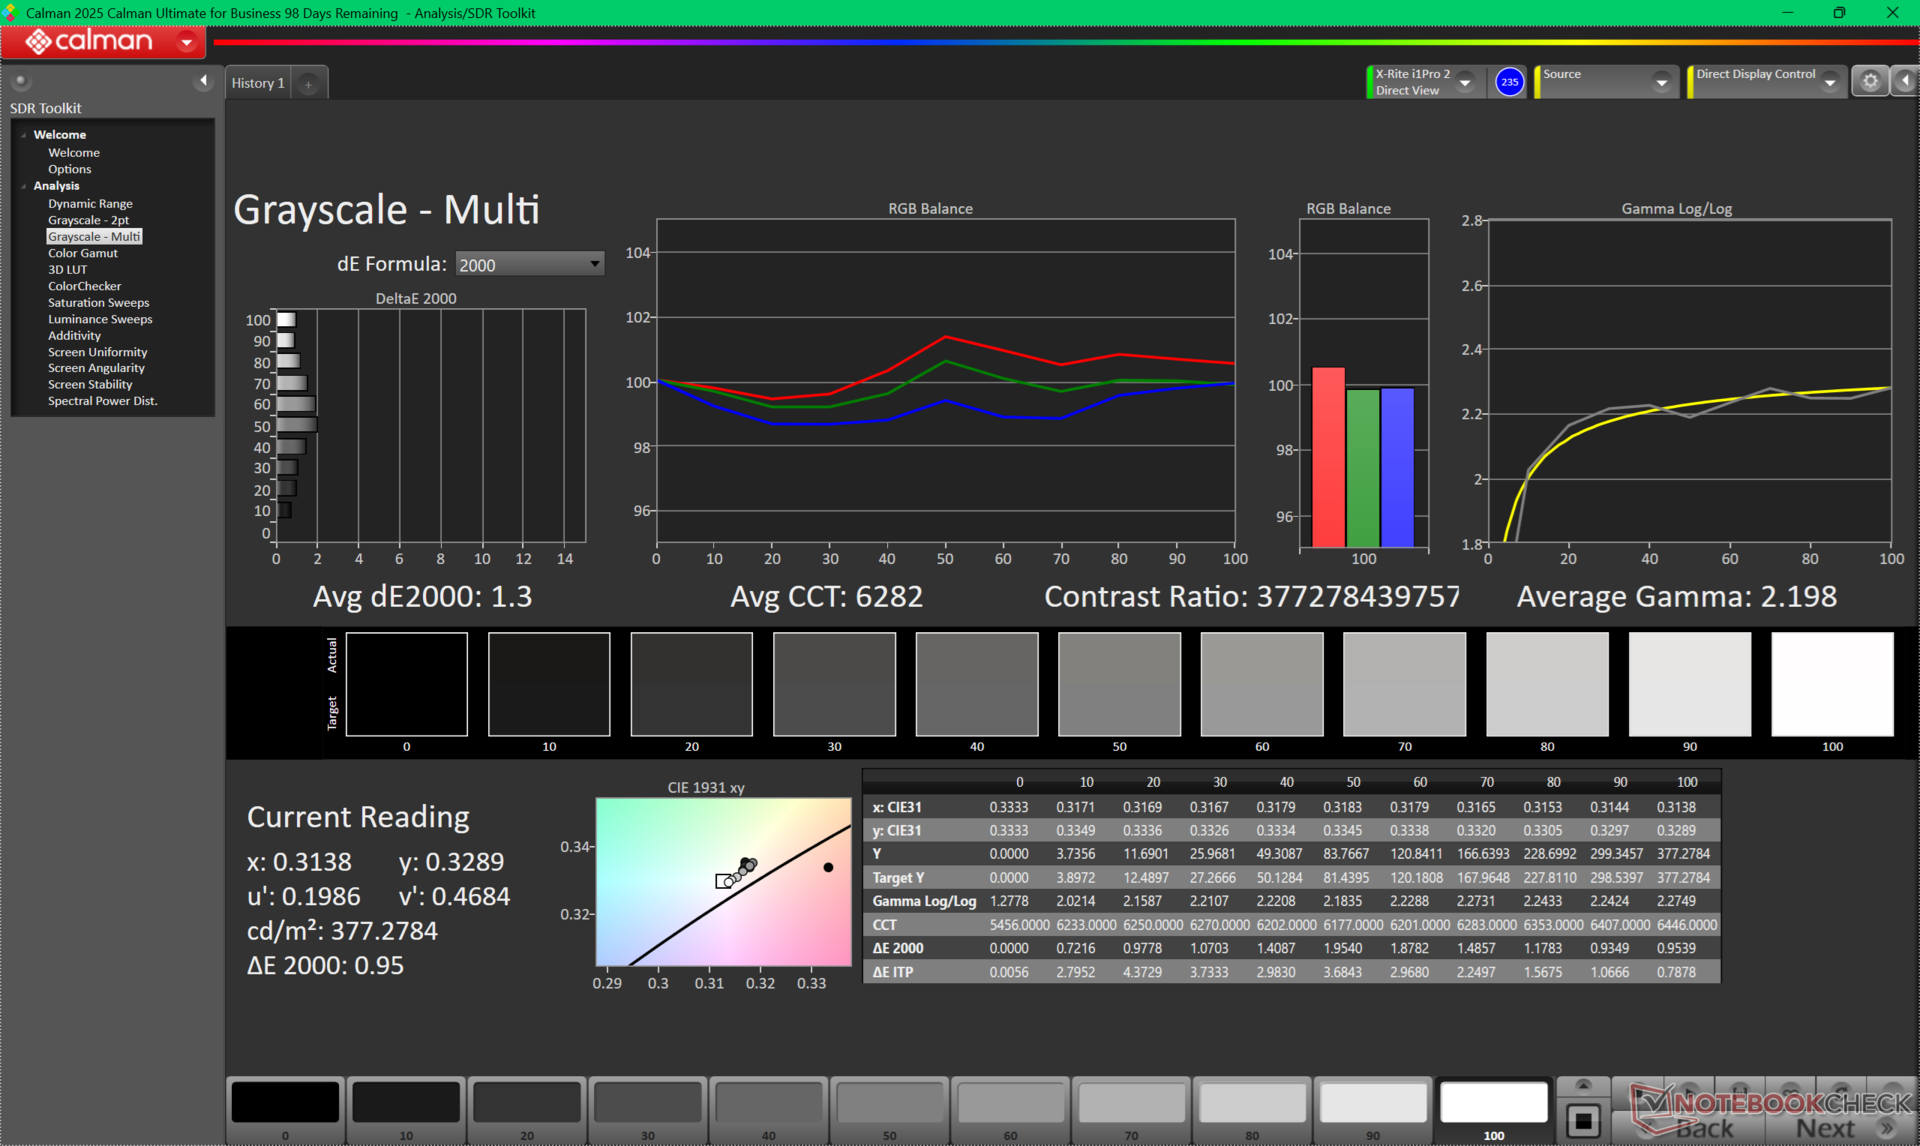
ΔE Greyscale Calman: 1.3 | ∀{0.09-98 Ø4.96}
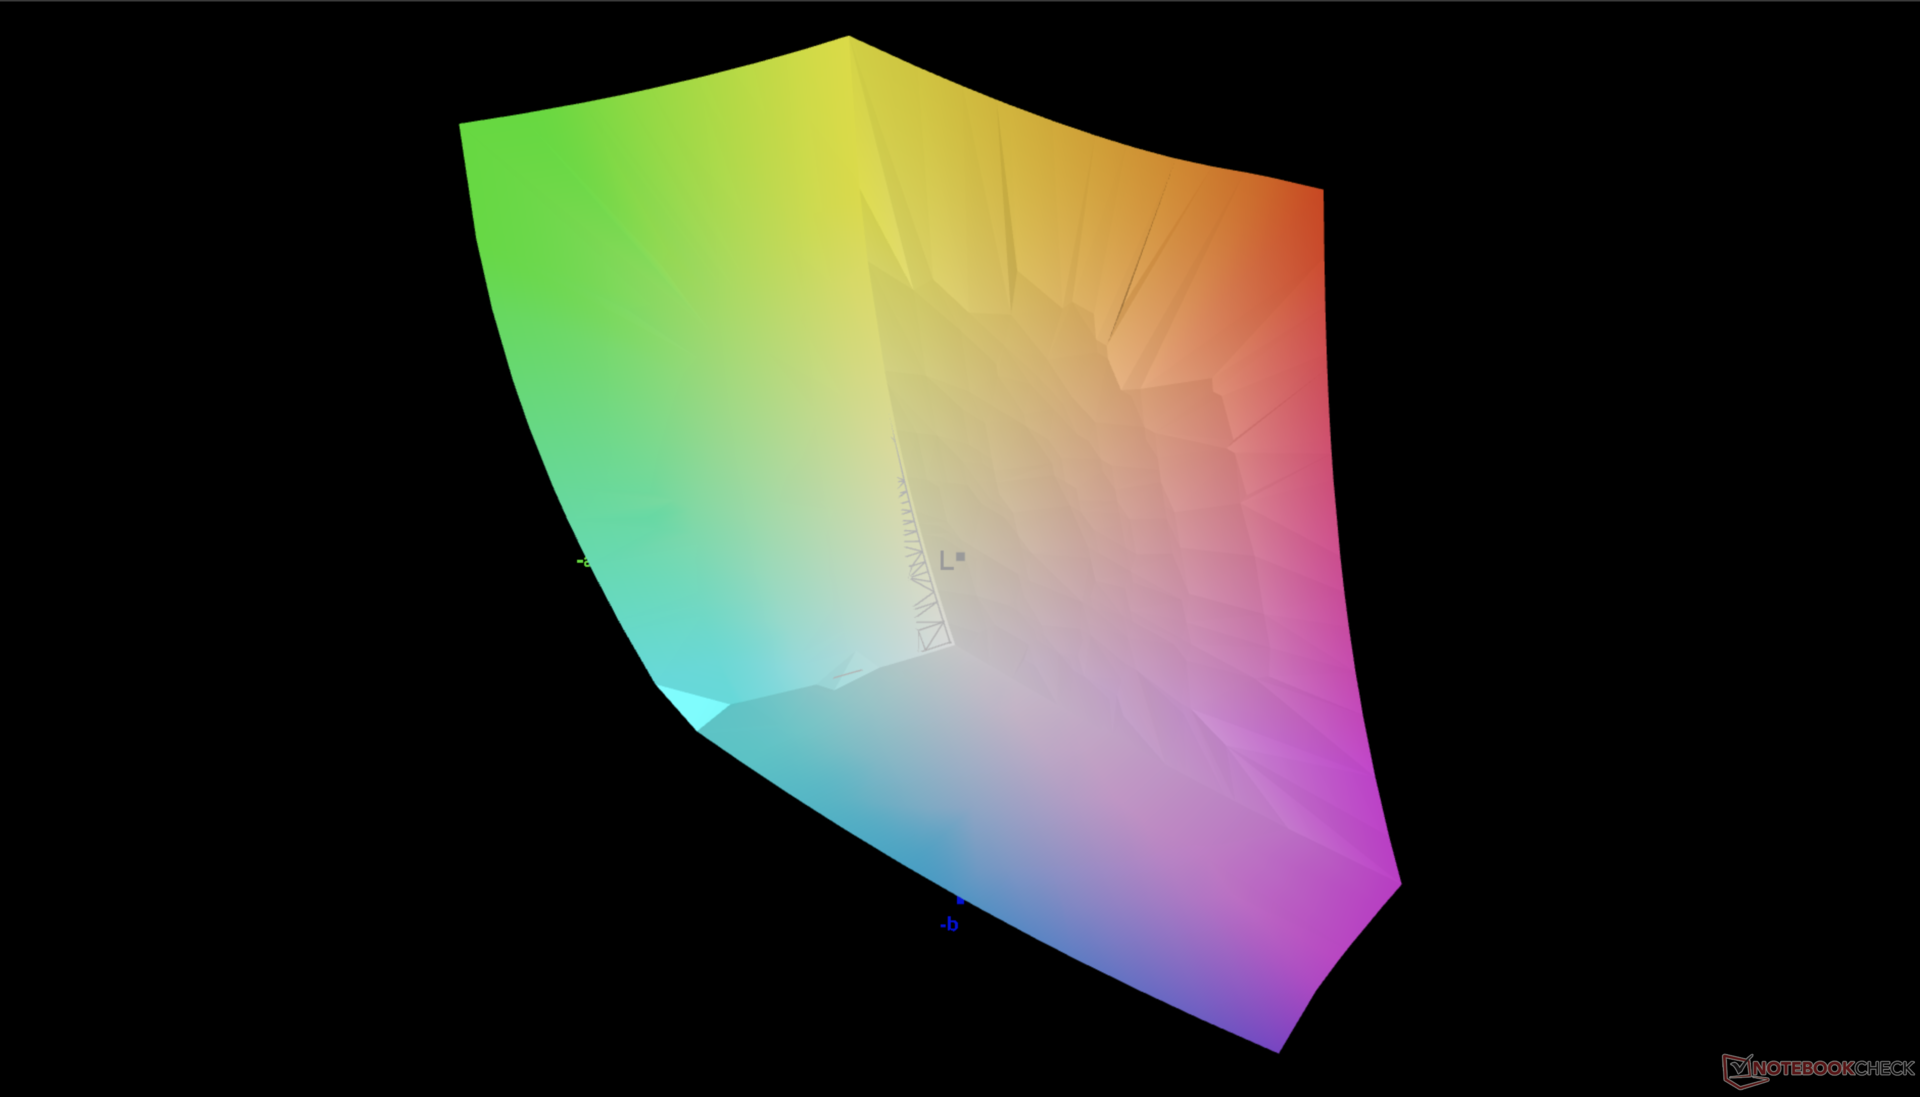
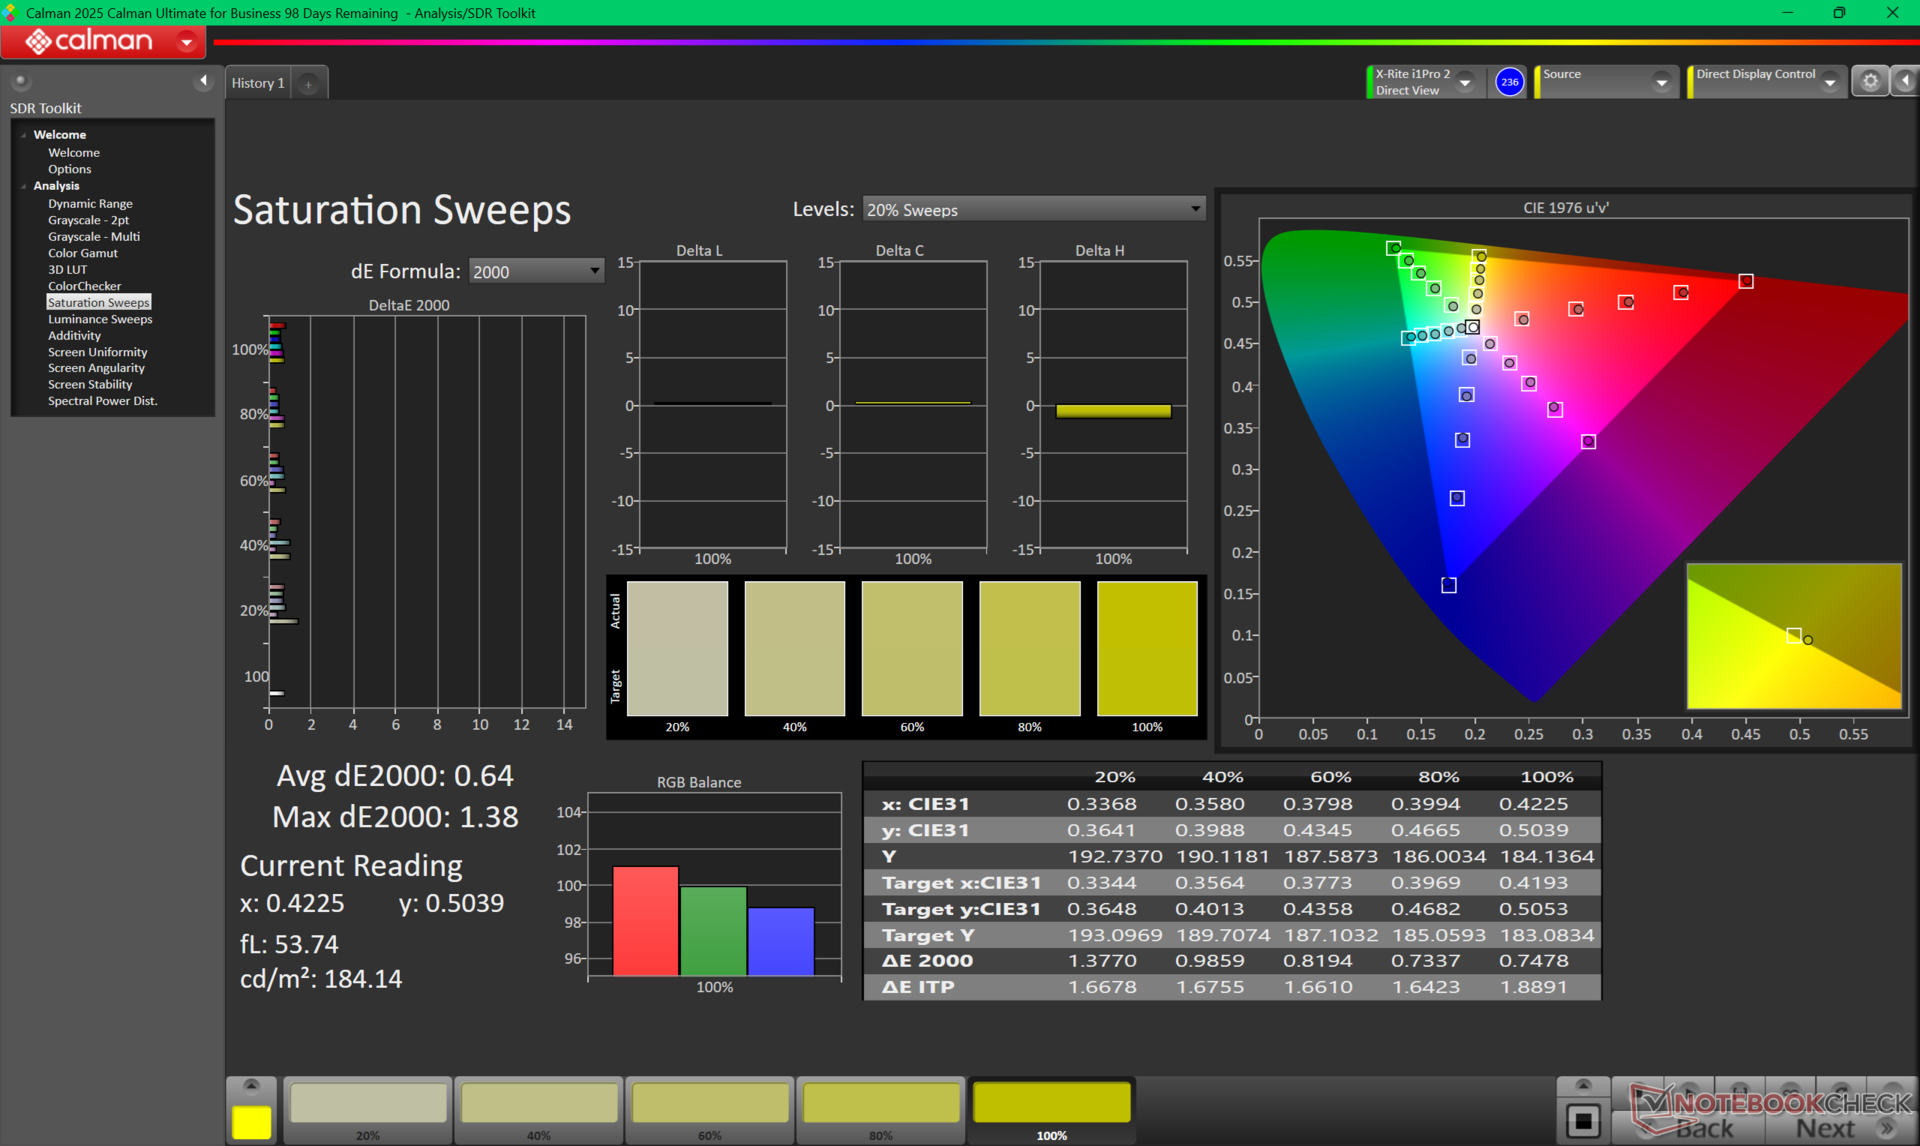
88.1% AdobeRGB 1998 (Argyll 3D)
100% sRGB (Argyll 3D)
99.7% Display P3 (Argyll 3D)
Gamma: 2.2
CCT: 6282 K
| Dell 16 Premium DA16250 Samsung 163DU02, OLED, 3840x2400, 16.3", 120 Hz | Dell XPS 16 9640 SDC4196, OLED, 3840x2400, 16.3", 90 Hz | HP Spectre x360 16 RTX 4050 Samsung SDC41A6, OLED, 2880x1800, 16", 120 Hz | Lenovo Yoga Pro 9i 16 RTX 5070 ATNA60KA01-0, OLED, 3200x2000, 16", 120 Hz | Asus Zenbook S 16 UM5606-RK333W ATNA60CL10-0, OLED, 2880x1800, 16", 120 Hz | LG Gram Pro 16Z90TS-G.AU89G LG DISPLAY LP160WQ2-SPF1, IPS, 2560x1600, 16", 144 Hz | |
|---|---|---|---|---|---|---|
| Display | -0% | 3% | 3% | 3% | -1% | |
| Display P3 Coverage (%) | 99.7 | 98.3 -1% | 99.6 0% | 97.4 -2% | 99.9 0% | 97.96 -2% |
| sRGB Coverage (%) | 100 | 100 0% | 100 0% | 100 0% | 100 0% | 100 0% |
| AdobeRGB 1998 Coverage (%) | 88.1 | 87.8 0% | 96.7 10% | 96.8 10% | 95.6 9% | 86.65 -2% |
| Response Times | -16% | -13% | 50% | 16% | -5457% | |
| Response Time Grey 50% / Grey 80% * (ms) | 0.61 ? | 0.82 ? -34% | 0.78 ? -28% | 0.27 ? 56% | 0.56 ? 8% | 47 ? -7605% |
| Response Time Black / White * (ms) | 0.88 ? | 0.85 ? 3% | 0.86 ? 2% | 0.37 ? 58% | 0.65 ? 26% | 30 ? -3309% |
| PWM Frequency (Hz) | 490.8 ? | 360 ? | 480 ? | 1200 | 480 | |
| PWM Amplitude * (%) | 35 | 22 37% | 30 14% | |||
| Screen | -22% | -28% | 63% | 31% | 5% | |
| Brightness middle (cd/m²) | 385.7 | 366 -5% | 385.2 0% | 974 153% | 407 6% | 442 15% |
| Brightness (cd/m²) | 387 | 367 -5% | 387 0% | 979 153% | 405 5% | 406 5% |
| Brightness Distribution (%) | 98 | 96 -2% | 99 1% | 98 0% | 97 -1% | 86 -12% |
| Black Level * (cd/m²) | 0.02 | 0.17 | ||||
| Colorchecker dE 2000 * | 1.36 | 1.3 4% | 1.73 -27% | 0.9 34% | 0.6 56% | 0.84 38% |
| Colorchecker dE 2000 max. * | 2.85 | 3.6 -26% | 3.95 -39% | 1.7 40% | 1.2 58% | 1.62 43% |
| Colorchecker dE 2000 calibrated * | 0.65 | 1 -54% | 0.88 -35% | |||
| Greyscale dE 2000 * | 1.3 | 2.2 -69% | 2.6 -100% | 1.3 -0% | 0.5 62% | 1.53 -18% |
| Gamma | 2.2 100% | 2.14 103% | 2.17 101% | 2.21 100% | 2.2 100% | 2.173 101% |
| CCT | 6282 103% | 6680 97% | 6133 106% | 6751 96% | 6453 101% | 6496 100% |
| Contrast (:1) | 20350 | 2600 | ||||
| Całkowita średnia (program / ustawienia) | -13% /
-16% | -13% /
-16% | 39% /
45% | 17% /
20% | -1818% /
-907% |
* ... im mniej tym lepiej
Wyświetl czasy reakcji
| ↔ Czas reakcji od czerni do bieli | ||
|---|---|---|
| 0.88 ms ... wzrost ↗ i spadek ↘ łącznie | ↗ 0.41 ms wzrost | 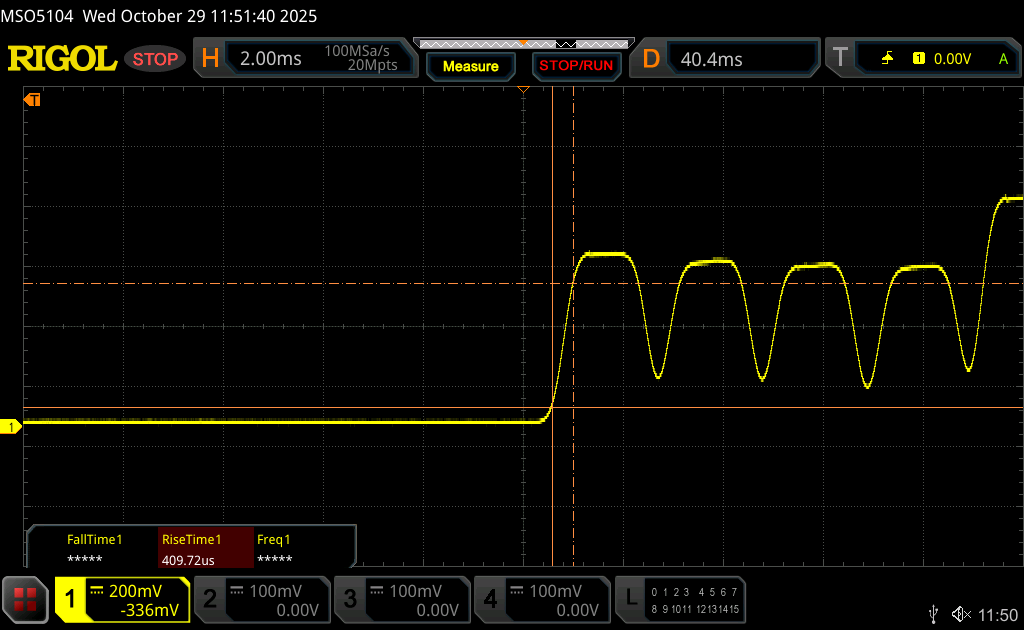 |
| ↘ 0.47 ms upadek | ||
| W naszych testach ekran wykazuje bardzo szybką reakcję i powinien bardzo dobrze nadawać się do szybkich gier. Dla porównania, wszystkie testowane urządzenia wahają się od 0.1 (minimum) do 240 (maksimum) ms. » 3 % wszystkich urządzeń jest lepszych. Oznacza to, że zmierzony czas reakcji jest lepszy od średniej wszystkich testowanych urządzeń (19.8 ms). | ||
| ↔ Czas reakcji 50% szarości do 80% szarości | ||
| 0.61 ms ... wzrost ↗ i spadek ↘ łącznie | ↗ 0.31 ms wzrost | 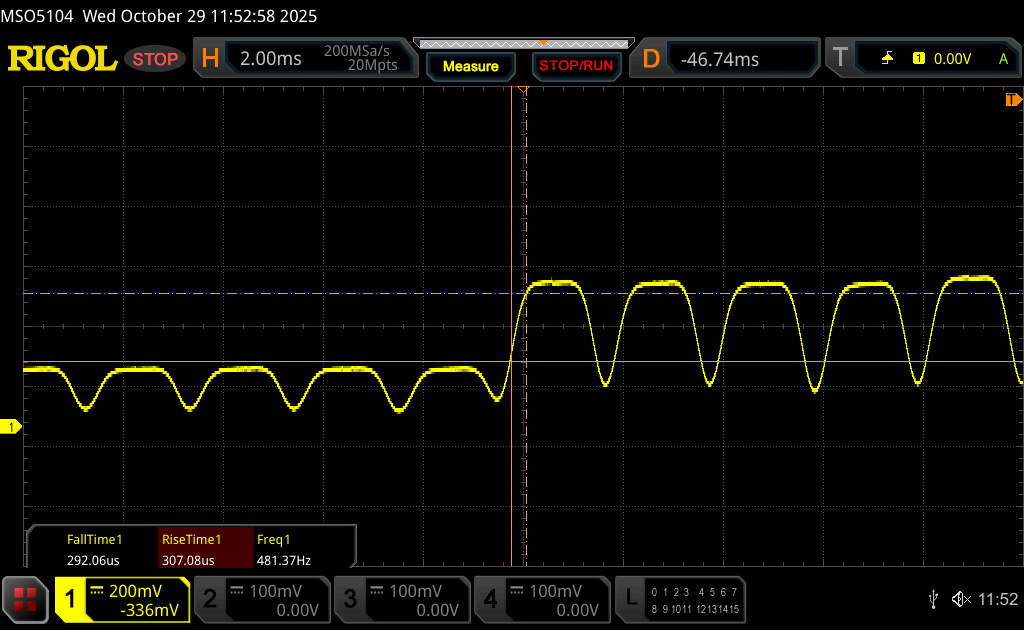 |
| ↘ 0.3 ms upadek | ||
| W naszych testach ekran wykazuje bardzo szybką reakcję i powinien bardzo dobrze nadawać się do szybkich gier. Dla porównania, wszystkie testowane urządzenia wahają się od 0.165 (minimum) do 636 (maksimum) ms. » 2 % wszystkich urządzeń jest lepszych. Oznacza to, że zmierzony czas reakcji jest lepszy od średniej wszystkich testowanych urządzeń (31 ms). | ||
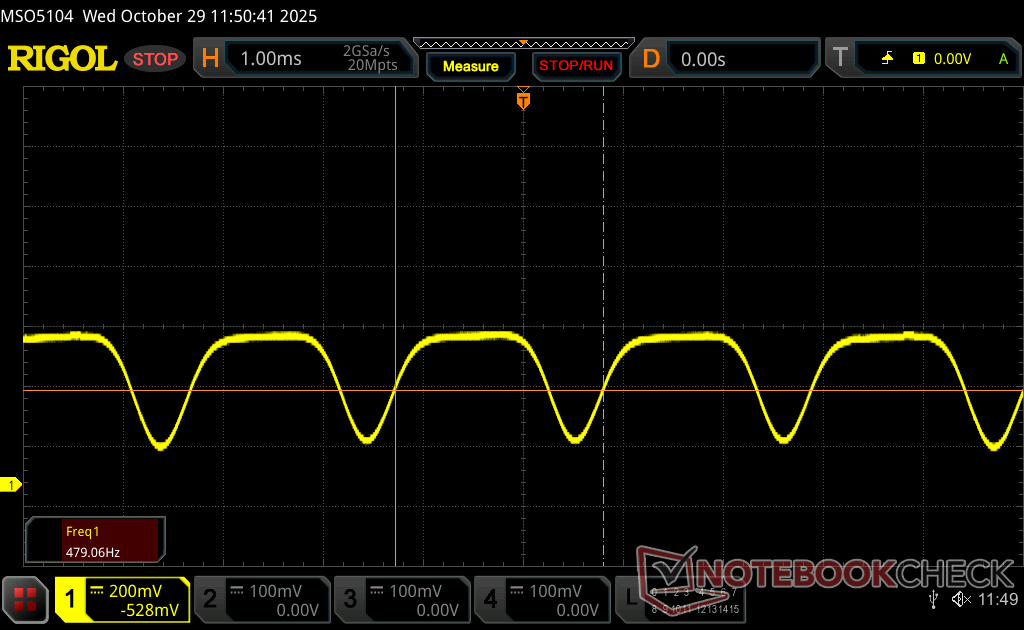
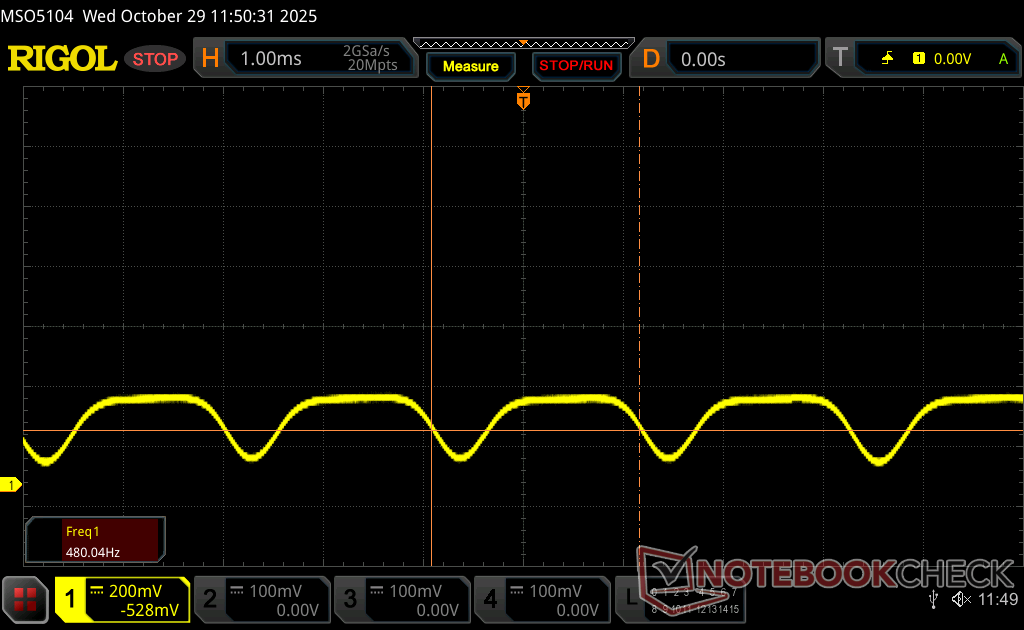
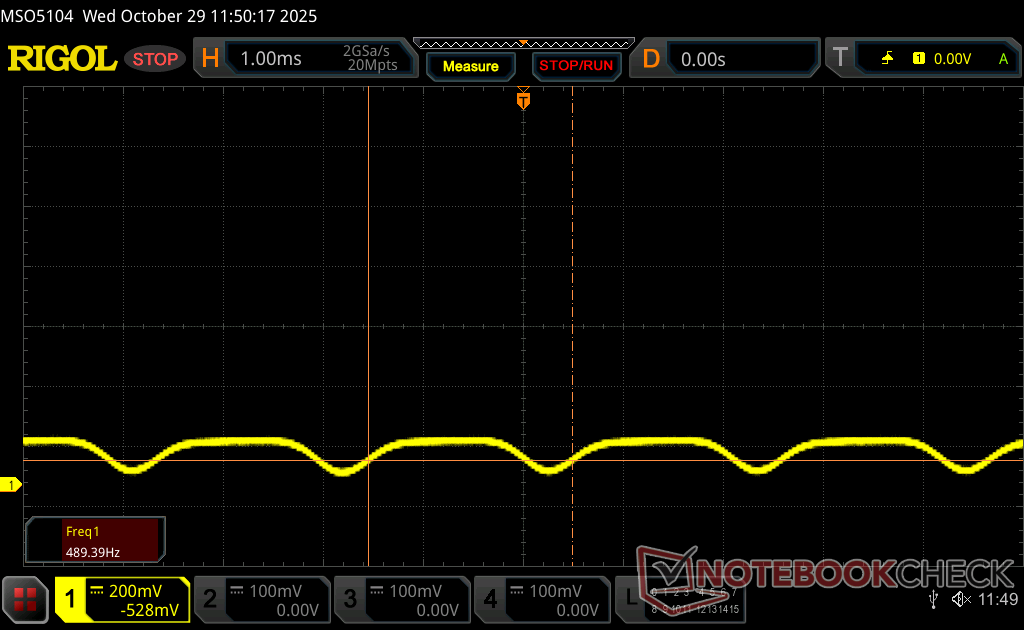
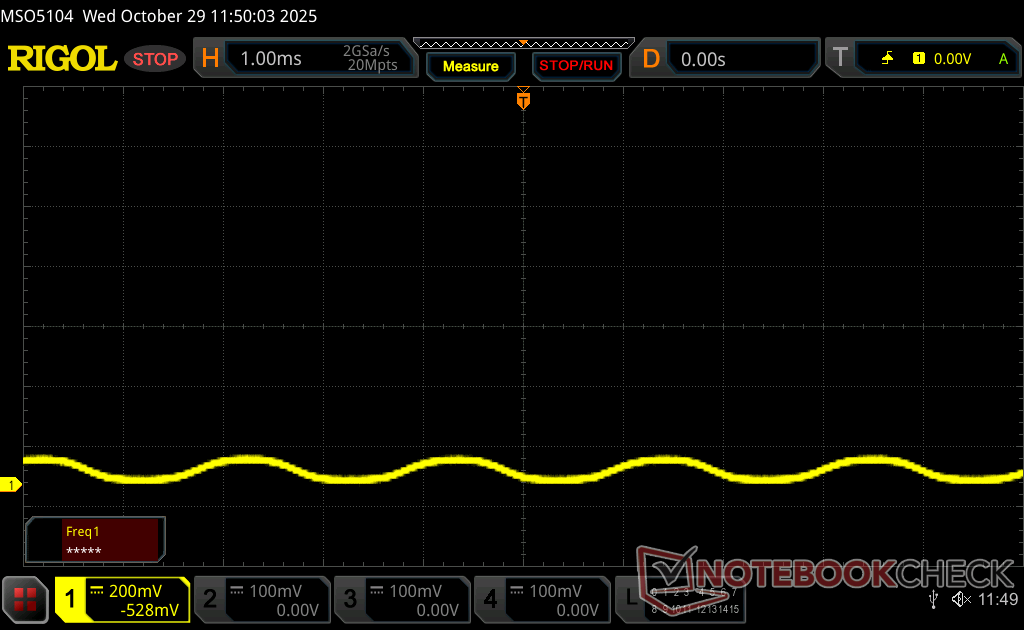
Migotanie ekranu / PWM (modulacja szerokości impulsu)
| Wykryto migotanie ekranu/wykryto PWM | 490.8 Hz Amplitude: 35 % | ≤ 100 % ustawienia jasności | 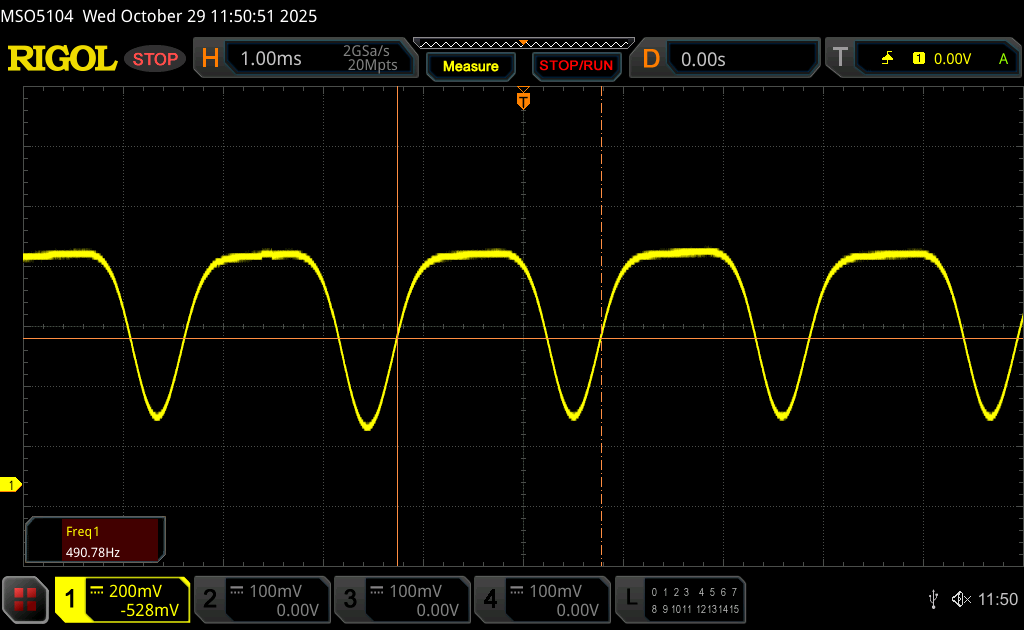 |
Podświetlenie wyświetlacza miga z częstotliwością 490.8 Hz (najgorszy przypadek, np. przy użyciu PWM) Wykryto migotanie przy ustawieniu jasności 100 % i poniżej. Powyżej tego ustawienia jasności nie powinno być żadnego migotania ani PWM. Częstotliwość 490.8 Hz jest stosunkowo wysoka, więc większość użytkowników wrażliwych na PWM nie powinna zauważyć żadnego migotania. Istnieją jednak doniesienia, że niektórzy użytkownicy są nadal wrażliwi na PWM przy częstotliwości 500 Hz i wyższej, więc należy zachować ostrożność. Dla porównania: 52 % wszystkich testowanych urządzeń nie używa PWM do przyciemniania wyświetlacza. Jeśli wykryto PWM, zmierzono średnio 7754 (minimum: 5 - maksimum: 343500) Hz. | |||


Wydajność
Warunki testowania
Przed wykonaniem poniższych testów ustawiliśmy Dell Optimizer na tryb Performance, a Nvidia Control Panel na tryb dyskretnej grafiki.
Procesor
Procesor Core Ultra 7 255H działa do 20 procent szybciej niż Core Ultra 7 155H w zeszłorocznym XPS 16. Aktualizacja do jeszcze droższego Core Ultra 9 285H zwiększy wydajność tylko o kilka punktów procentowych.
Zrównoważony rozwój Turbo Boost mógłby być lepszy. Podczas uruchamiania CineBench R15 xT w pętli, wyniki spadały o prawie 15 procent w czasie, jak pokazano na poniższym wykresie. Różnica w wydajności między Core Ultra 7 255H i Core Ultra 7 155H w zeszłorocznym modelu zmniejsza się, gdy systemy są obciążone.
Cinebench R15 Multi Loop
Cinebench R23: Multi Core | Single Core
Cinebench R20: CPU (Multi Core) | CPU (Single Core)
Cinebench R15: CPU Multi 64Bit | CPU Single 64Bit
Blender: v2.79 BMW27 CPU
7-Zip 18.03: 7z b 4 | 7z b 4 -mmt1
Geekbench 6.7: Multi-Core | Single-Core
Geekbench 5.5: Multi-Core | Single-Core
HWBOT x265 Benchmark v2.2: 4k Preset
LibreOffice : 20 Documents To PDF
R Benchmark 2.5: Overall mean
* ... im mniej tym lepiej
Test warunków skrajnych
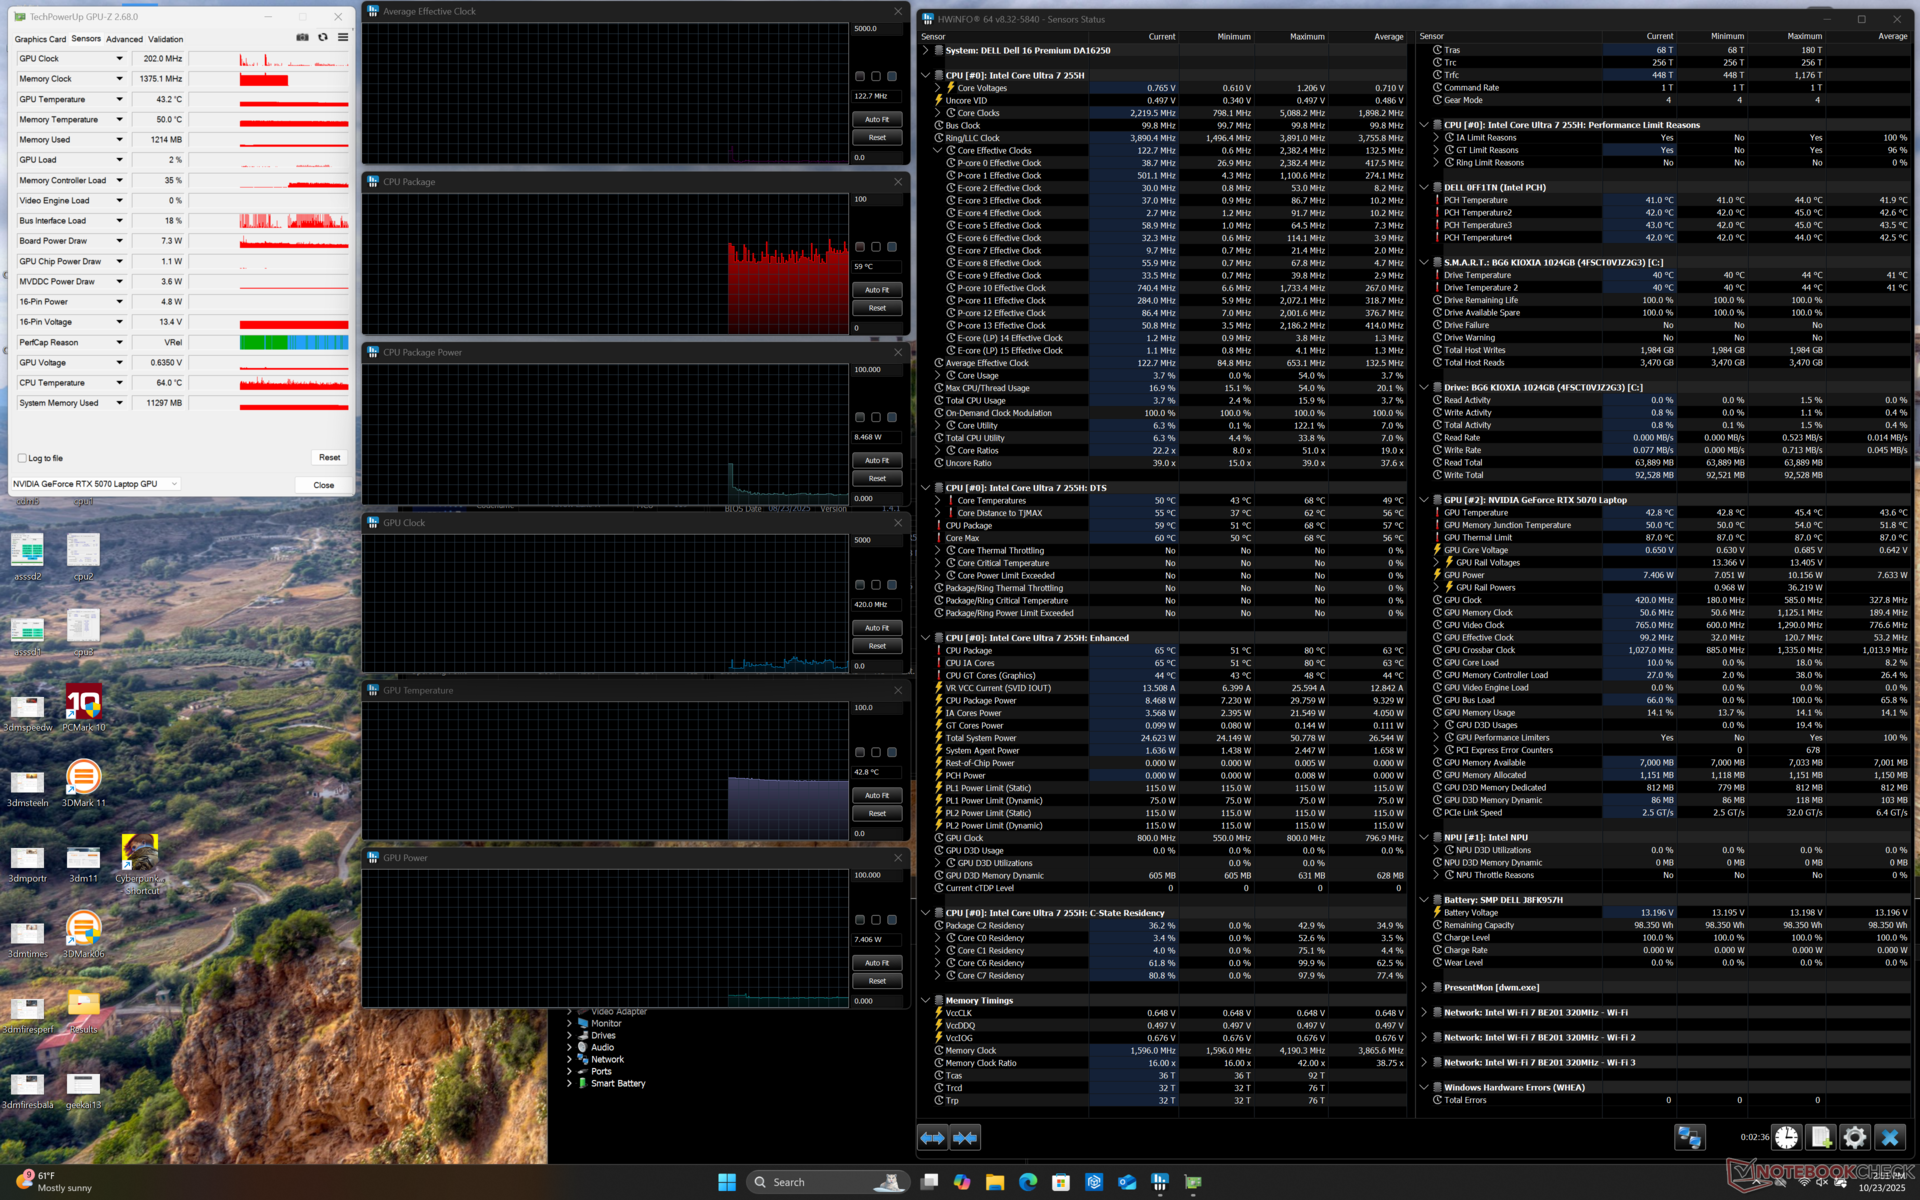
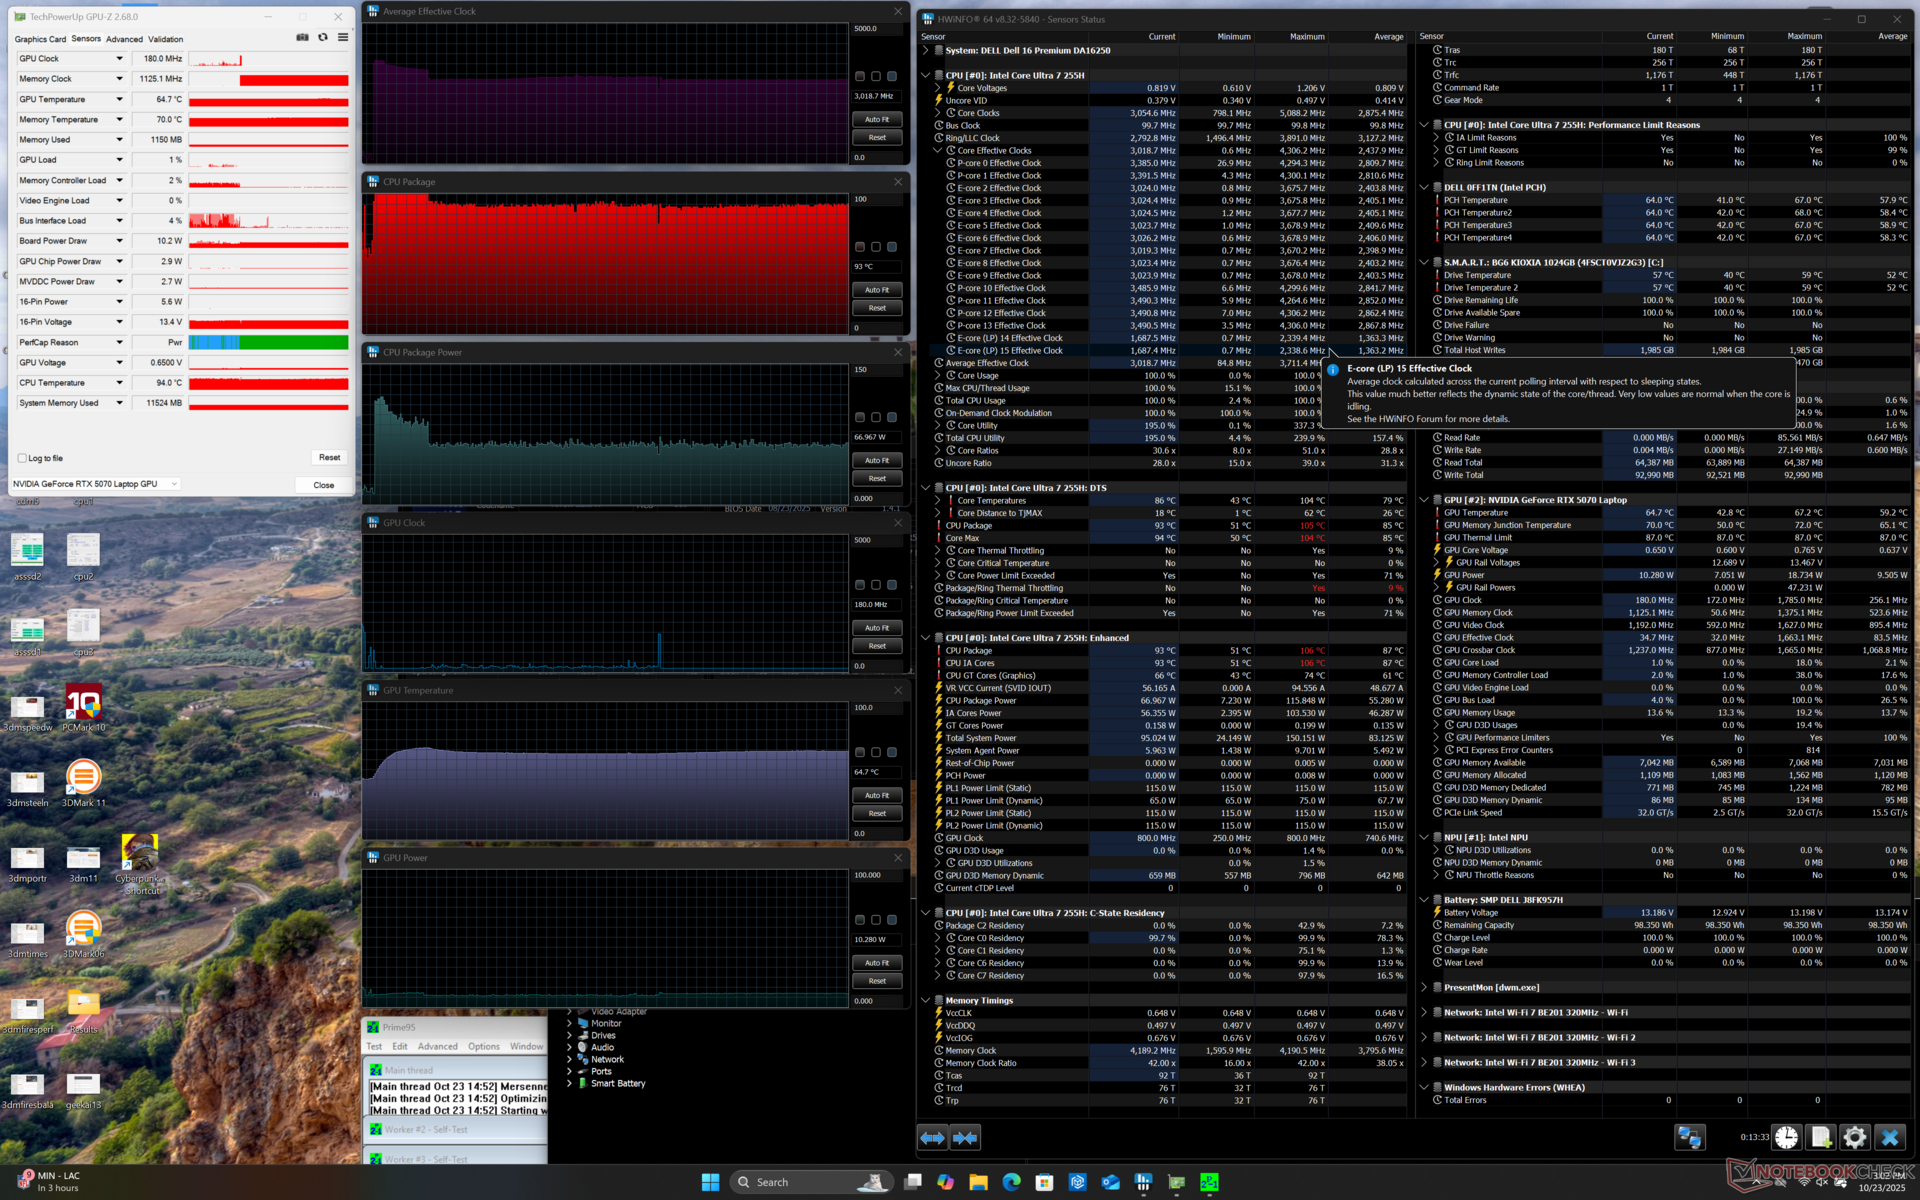
Temperatury rdzenia nadal mogą osiągać stosunkowo wysokie poziomy, szczególnie w przypadku procesora. Przykładowo, po uruchomieniu obciążenia Prime95, procesor zwiększyłby częstotliwość taktowania do 3,7 GHz, 105 C i 115 W, a następnie spadł do 3 GHz, 93 C i 67 W. Maksymalna stabilność Turbo Boost jest zatem ograniczona, jak pokazano powyżej w sekcji Wydajność procesora.
Pobór mocy karty graficznej podczas uruchamiania Cyberpunk 2077 wynosi średnio od 55 W do 65 W w porównaniu do 115 W na laptopie do gier, takim jak Alienware 16X Aurora z tą samą kartą graficzną RTX 5070.
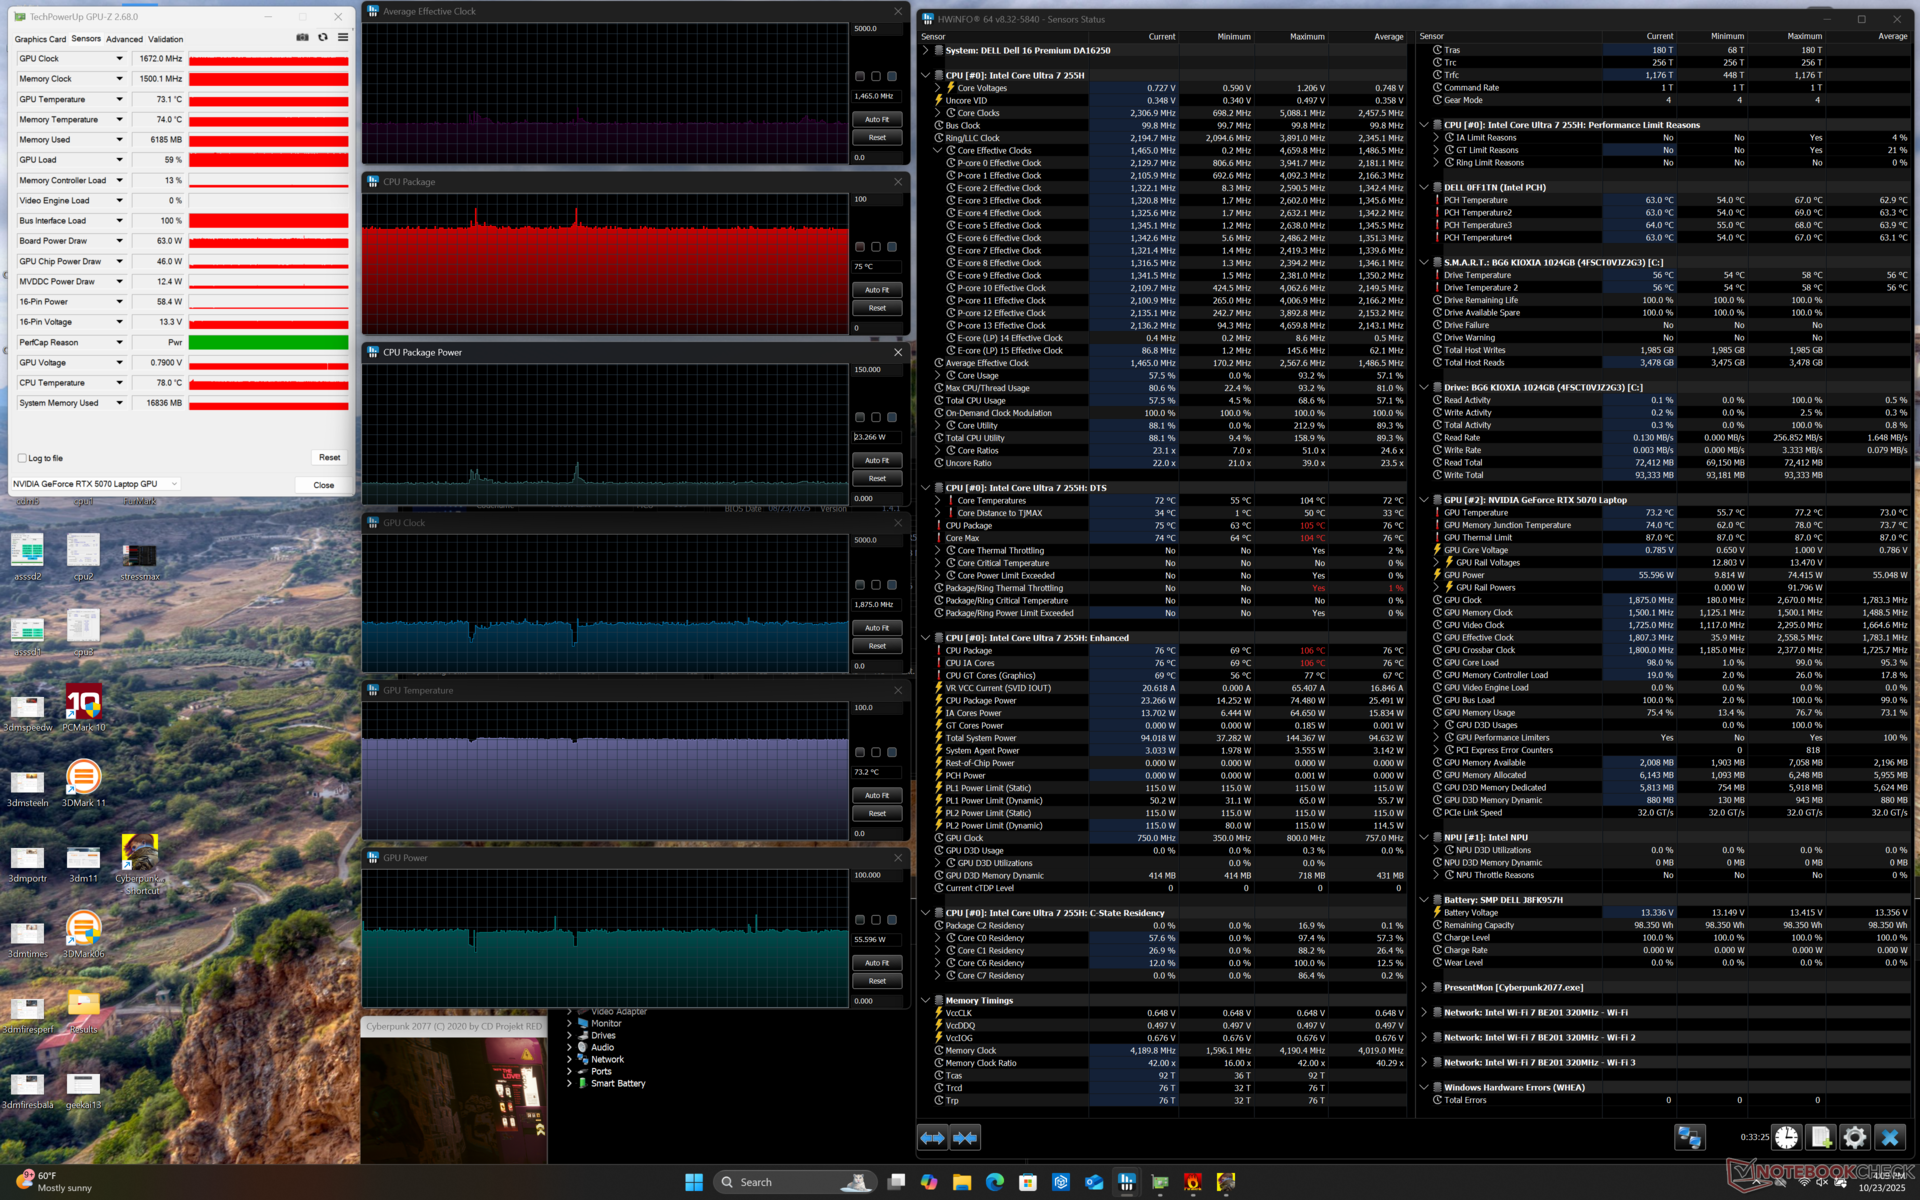

| Średnie taktowanieCPU (GHz) | Taktowanie GPU (MHz) | Średnia temperatura CPU (°C) | Średnia temperatura GPU (°C) | |
| System w stanie spoczynku | -- | -- | 59 | 43 |
| Prime95 Stress | 3.0 | -- | 93 | 65 |
| Cyberpunk 2077 Stress (tryb zrównoważony) | 1.5 | 1672 | 75 | 73 |
| Cyberpunk 2077 Stress (tryb wydajności) | 1.5 | 1687 | 76 | 73 |
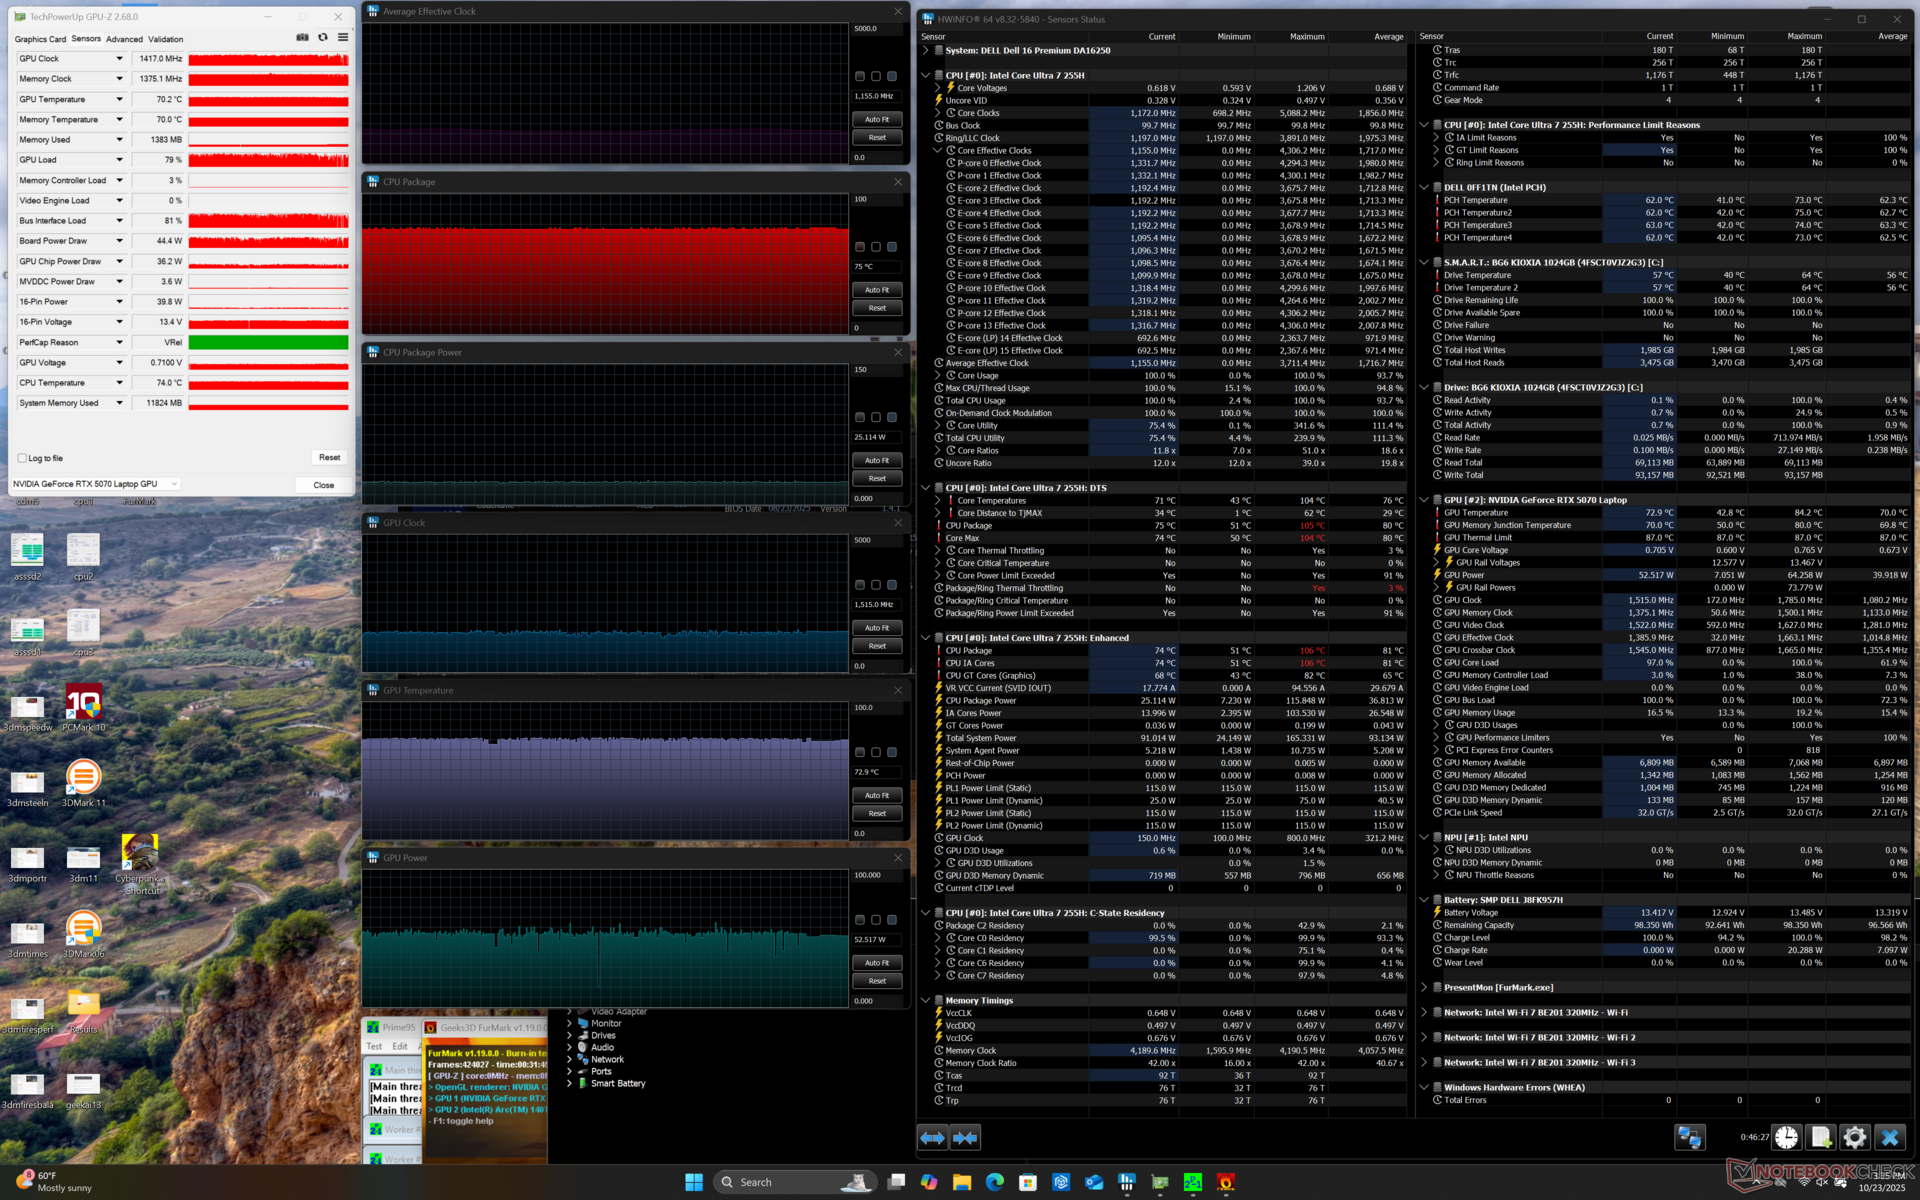
| Prime95 + FurMark Stress | 1.2 | 1417 | 75 | 73 |
Wydajność systemu
Zarówno AIDA64, jak i PCMark 10 nie działały na naszym urządzeniu, więc wyniki zostały pominięte poniżej.
CrossMark: Overall | Productivity | Creativity | Responsiveness
WebXPRT 3: Overall
WebXPRT 4: Overall
Mozilla Kraken 1.1: Total
| Performance rating | |
| Lenovo Yoga Pro 9i 16 RTX 5070 | |
| Dell XPS 16 9640 -1! | |
| Dell 16 Premium DA16250 | |
| Przeciętny Intel Core Ultra 7 255H, NVIDIA GeForce RTX 5070 Laptop | |
| Asus Zenbook S 16 UM5606-RK333W | |
| LG Gram Pro 16Z90TS-G.AU89G | |
| HP Spectre x360 16 RTX 4050 | |
| CrossMark / Overall | |
| Lenovo Yoga Pro 9i 16 RTX 5070 | |
| Dell 16 Premium DA16250 | |
| Przeciętny Intel Core Ultra 7 255H, NVIDIA GeForce RTX 5070 Laptop (n=1) | |
| Dell XPS 16 9640 | |
| Asus Zenbook S 16 UM5606-RK333W | |
| LG Gram Pro 16Z90TS-G.AU89G | |
| HP Spectre x360 16 RTX 4050 | |
| CrossMark / Productivity | |
| Lenovo Yoga Pro 9i 16 RTX 5070 | |
| Dell 16 Premium DA16250 | |
| Przeciętny Intel Core Ultra 7 255H, NVIDIA GeForce RTX 5070 Laptop (n=1) | |
| Dell XPS 16 9640 | |
| Asus Zenbook S 16 UM5606-RK333W | |
| LG Gram Pro 16Z90TS-G.AU89G | |
| HP Spectre x360 16 RTX 4050 | |
| CrossMark / Creativity | |
| Lenovo Yoga Pro 9i 16 RTX 5070 | |
| Dell 16 Premium DA16250 | |
| Przeciętny Intel Core Ultra 7 255H, NVIDIA GeForce RTX 5070 Laptop (n=1) | |
| Asus Zenbook S 16 UM5606-RK333W | |
| Dell XPS 16 9640 | |
| LG Gram Pro 16Z90TS-G.AU89G | |
| HP Spectre x360 16 RTX 4050 | |
| CrossMark / Responsiveness | |
| Dell 16 Premium DA16250 | |
| Przeciętny Intel Core Ultra 7 255H, NVIDIA GeForce RTX 5070 Laptop (n=1) | |
| Dell XPS 16 9640 | |
| Lenovo Yoga Pro 9i 16 RTX 5070 | |
| Asus Zenbook S 16 UM5606-RK333W | |
| LG Gram Pro 16Z90TS-G.AU89G | |
| HP Spectre x360 16 RTX 4050 | |
| WebXPRT 3 / Overall | |
| Lenovo Yoga Pro 9i 16 RTX 5070 | |
| Dell 16 Premium DA16250 | |
| Przeciętny Intel Core Ultra 7 255H, NVIDIA GeForce RTX 5070 Laptop (n=1) | |
| Asus Zenbook S 16 UM5606-RK333W | |
| Dell XPS 16 9640 | |
| HP Spectre x360 16 RTX 4050 | |
| LG Gram Pro 16Z90TS-G.AU89G | |
| WebXPRT 4 / Overall | |
| Lenovo Yoga Pro 9i 16 RTX 5070 | |
| Dell 16 Premium DA16250 | |
| Przeciętny Intel Core Ultra 7 255H, NVIDIA GeForce RTX 5070 Laptop (n=1) | |
| LG Gram Pro 16Z90TS-G.AU89G | |
| Asus Zenbook S 16 UM5606-RK333W | |
| HP Spectre x360 16 RTX 4050 | |
| Dell XPS 16 9640 | |
| Mozilla Kraken 1.1 / Total | |
| HP Spectre x360 16 RTX 4050 | |
| LG Gram Pro 16Z90TS-G.AU89G | |
| Dell 16 Premium DA16250 | |
| Przeciętny Intel Core Ultra 7 255H, NVIDIA GeForce RTX 5070 Laptop (n=1) | |
| Asus Zenbook S 16 UM5606-RK333W | |
| Lenovo Yoga Pro 9i 16 RTX 5070 | |
* ... im mniej tym lepiej
Opóźnienie DPC
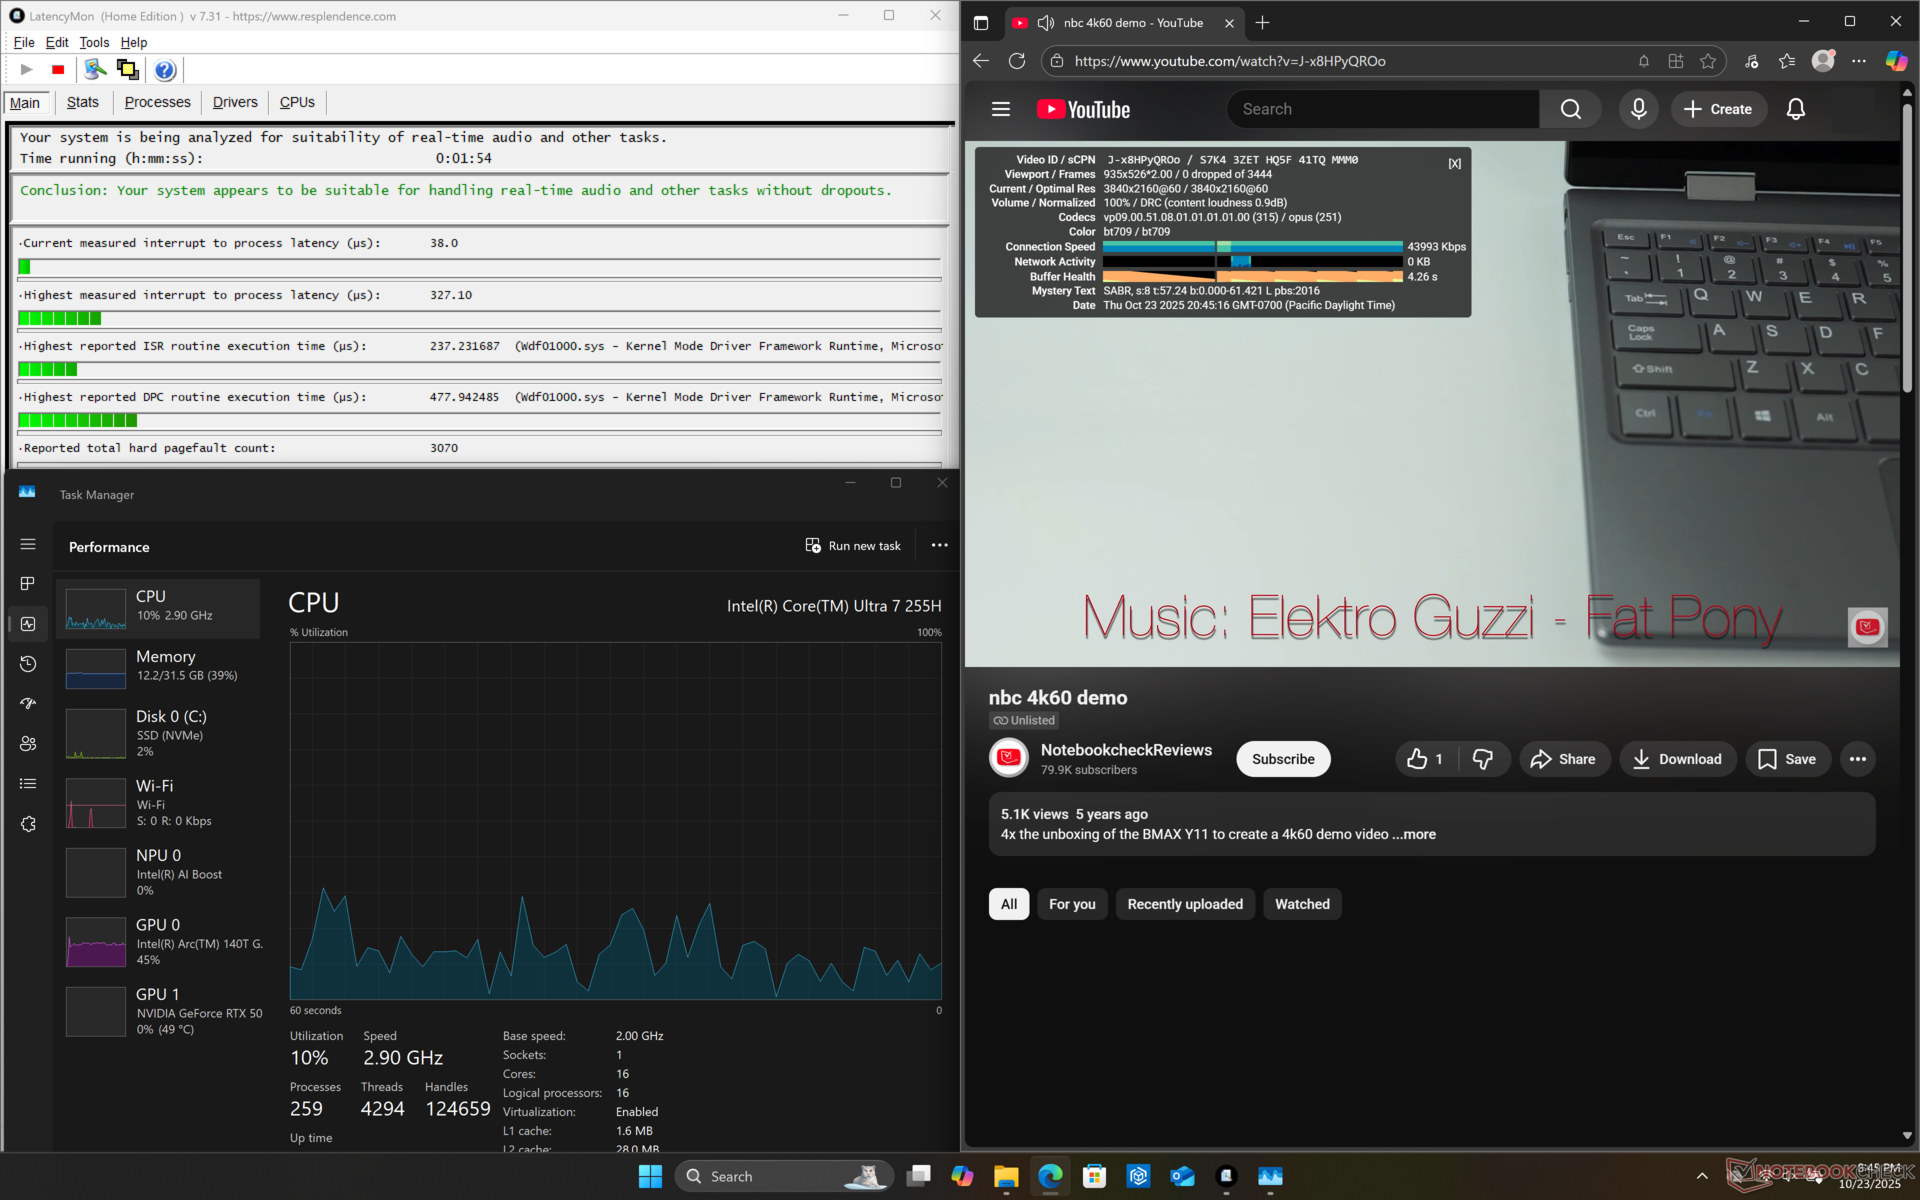

| DPC Latencies / LatencyMon - interrupt to process latency (max), Web, Youtube, Prime95 | |
| HP Spectre x360 16 RTX 4050 | |
| Lenovo Yoga Pro 9i 16 RTX 5070 | |
| Dell XPS 16 9640 | |
| Dell 16 Premium DA16250 | |
* ... im mniej tym lepiej
Urządzenia pamięci masowej
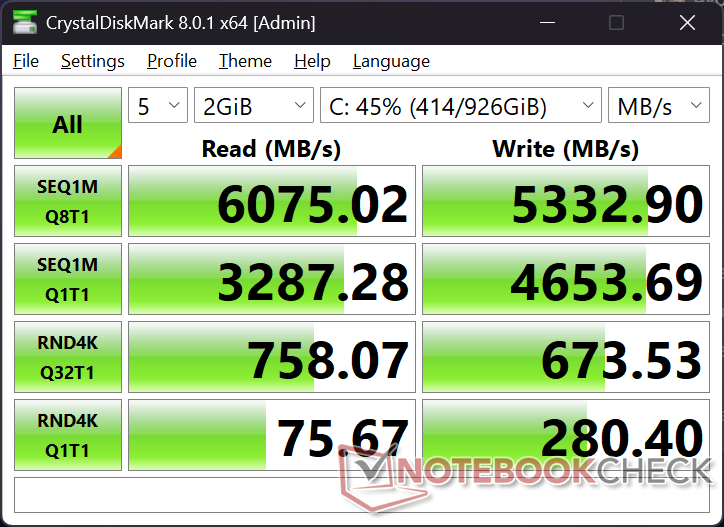
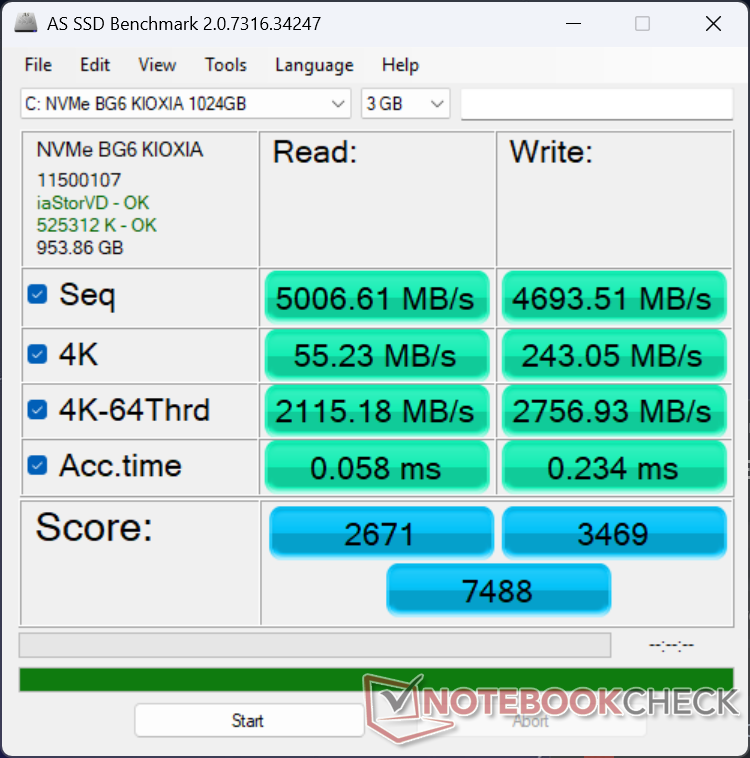

| Drive Performance rating - Percent | |
| Dell XPS 16 9640 | |
| Dell 16 Premium DA16250 | |
| Lenovo Yoga Pro 9i 16 RTX 5070 | |
| HP Spectre x360 16 RTX 4050 | |
| LG Gram Pro 16Z90TS-G.AU89G -11! | |
| Asus Zenbook S 16 UM5606-RK333W | |
* ... im mniej tym lepiej
Dławienie dysku: Pętla odczytu DiskSpd, głębokość kolejki 8
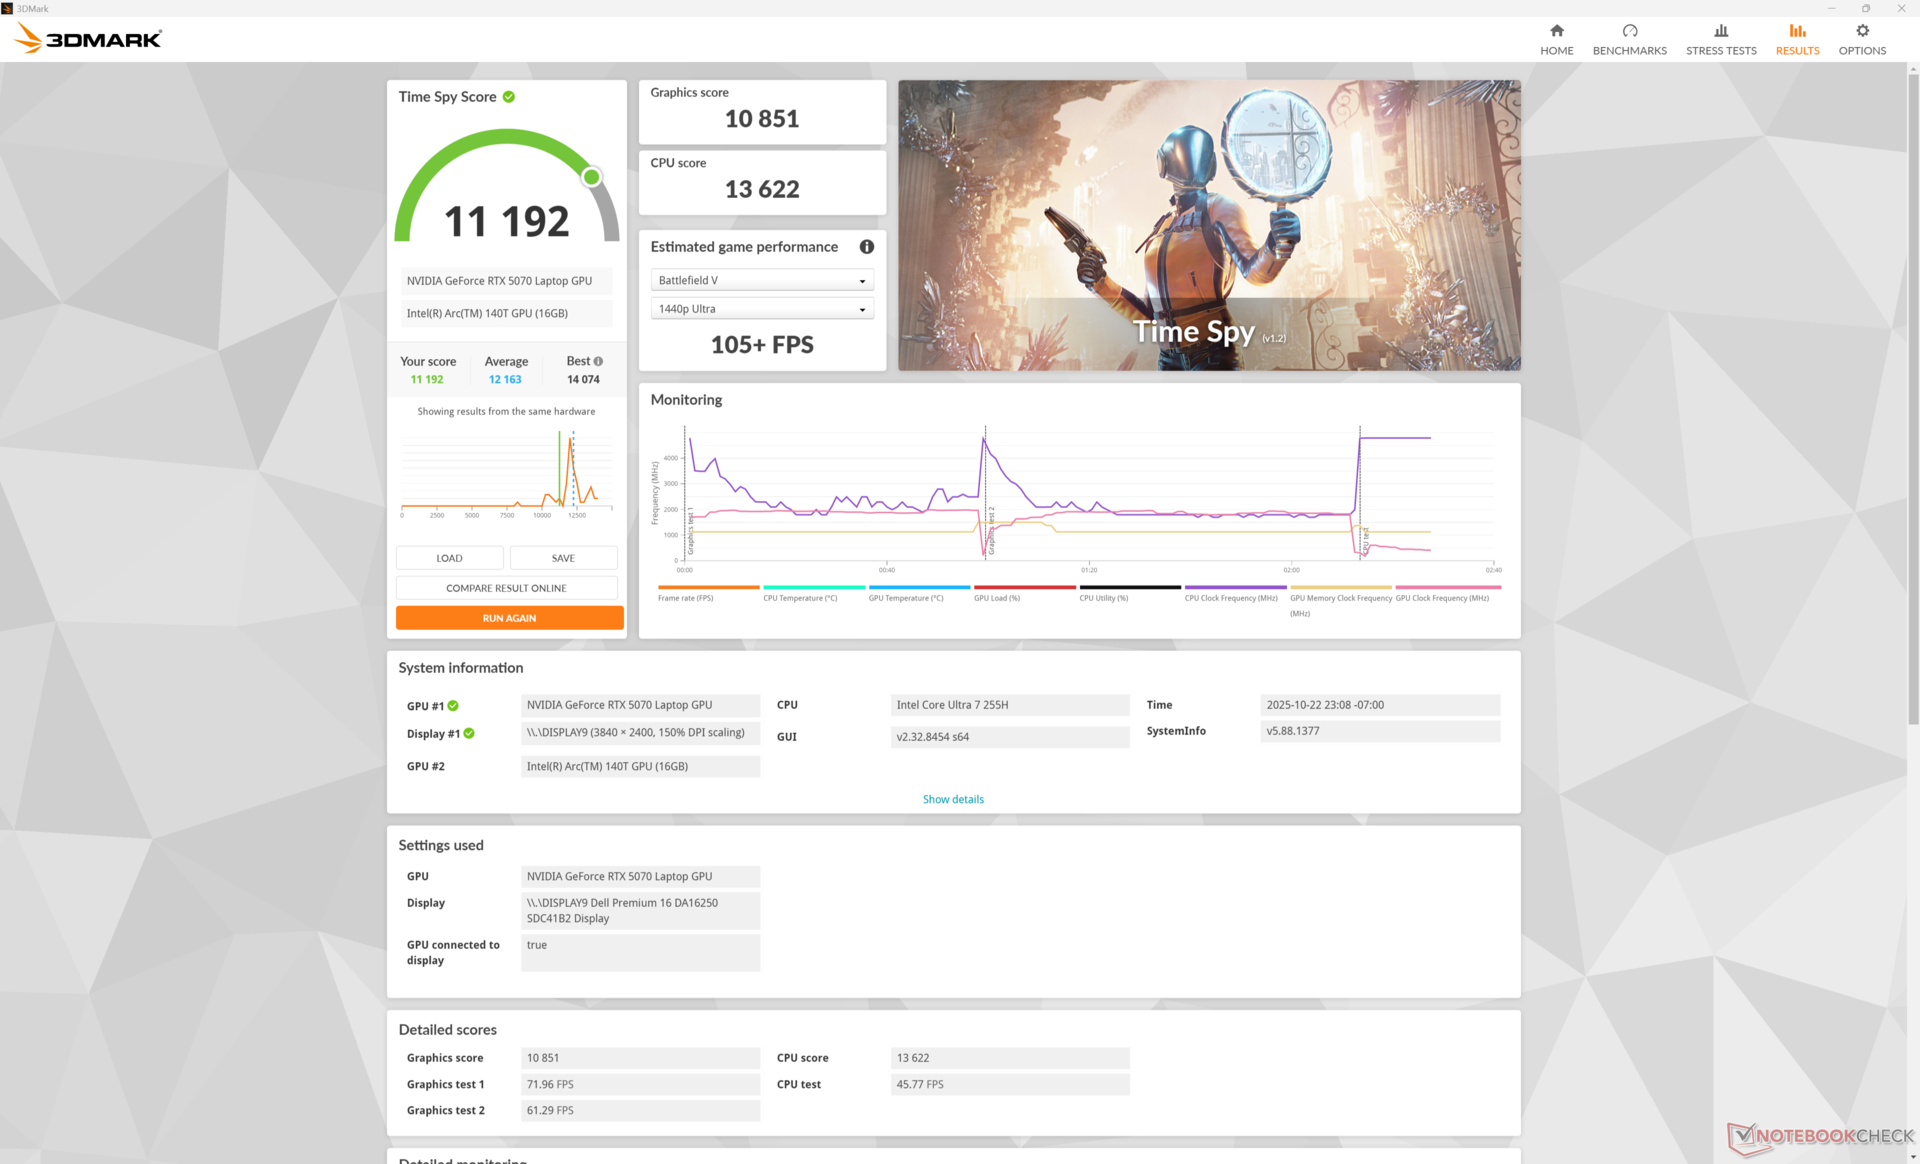
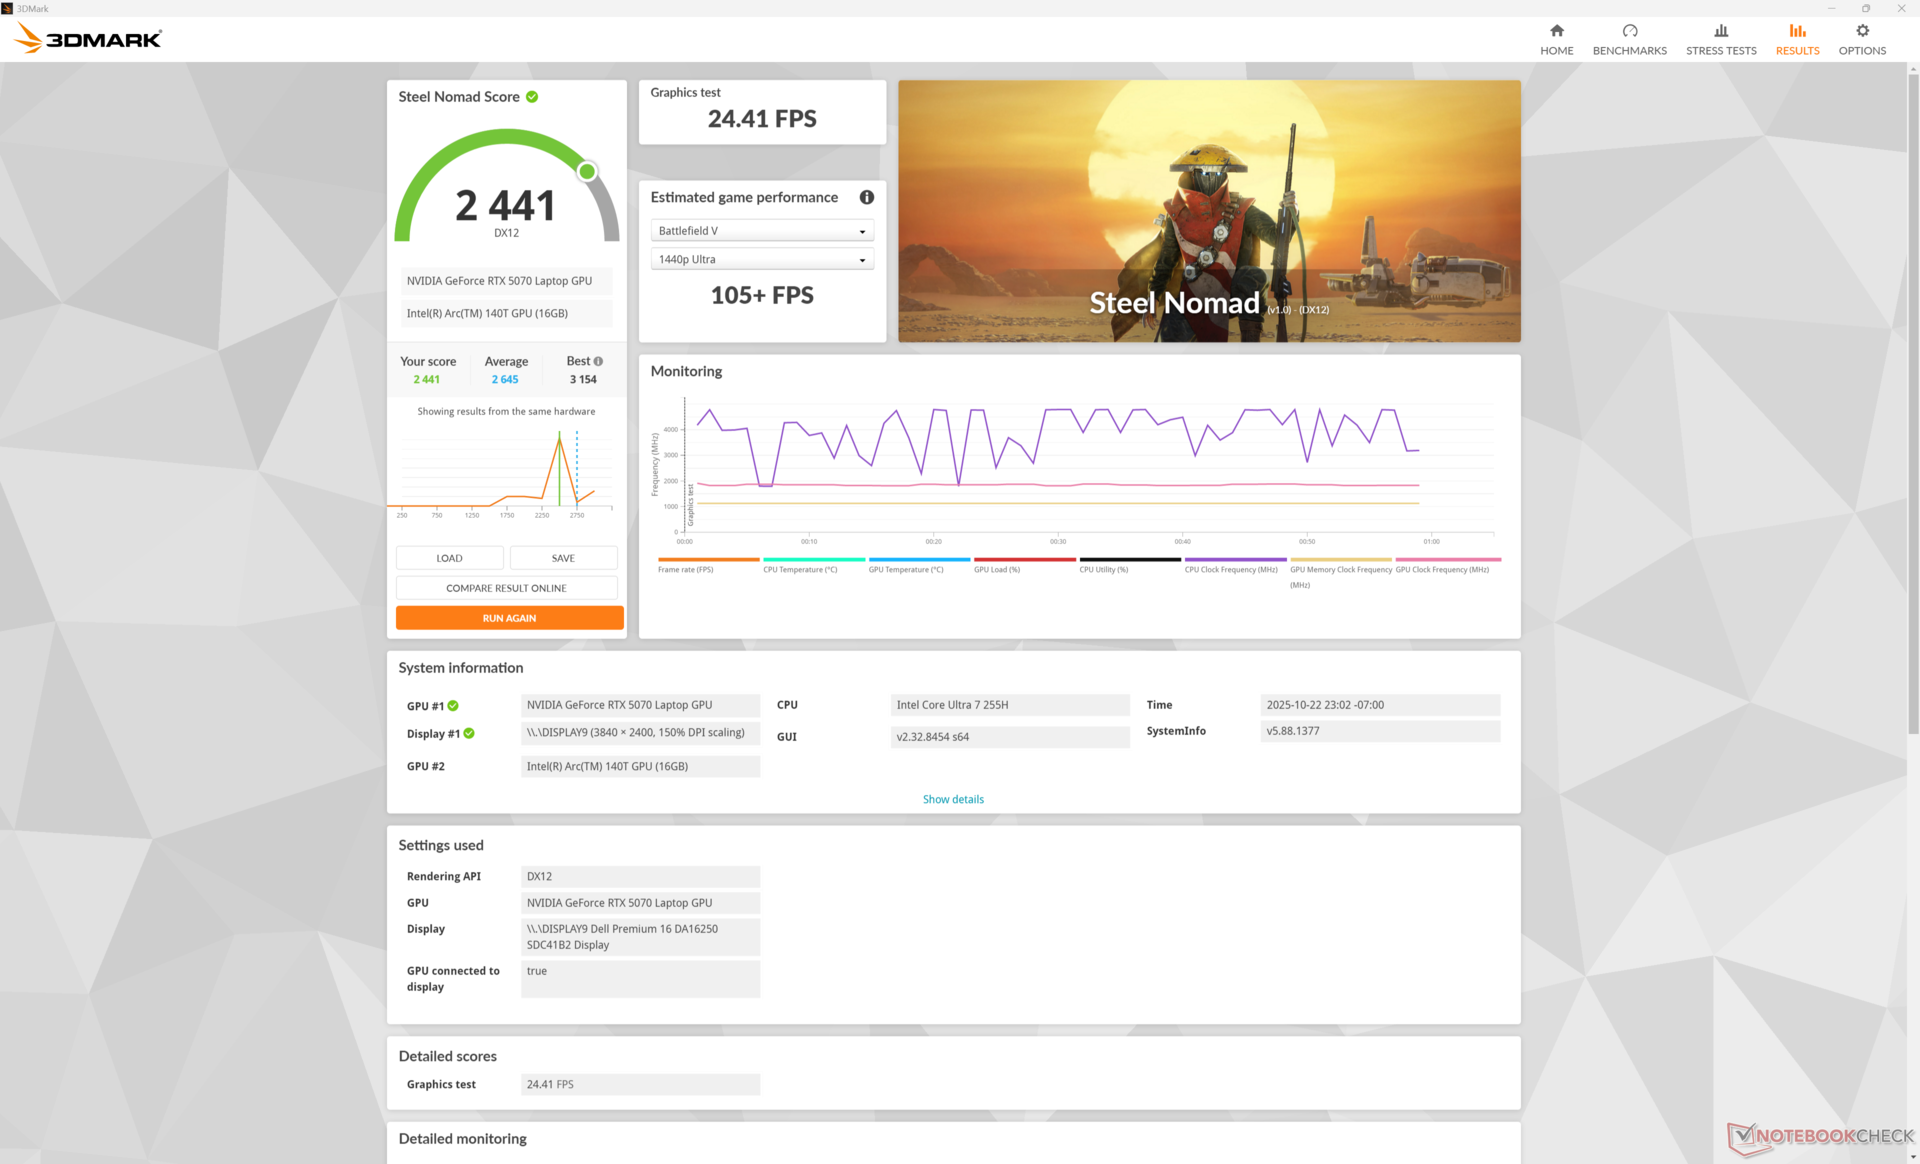
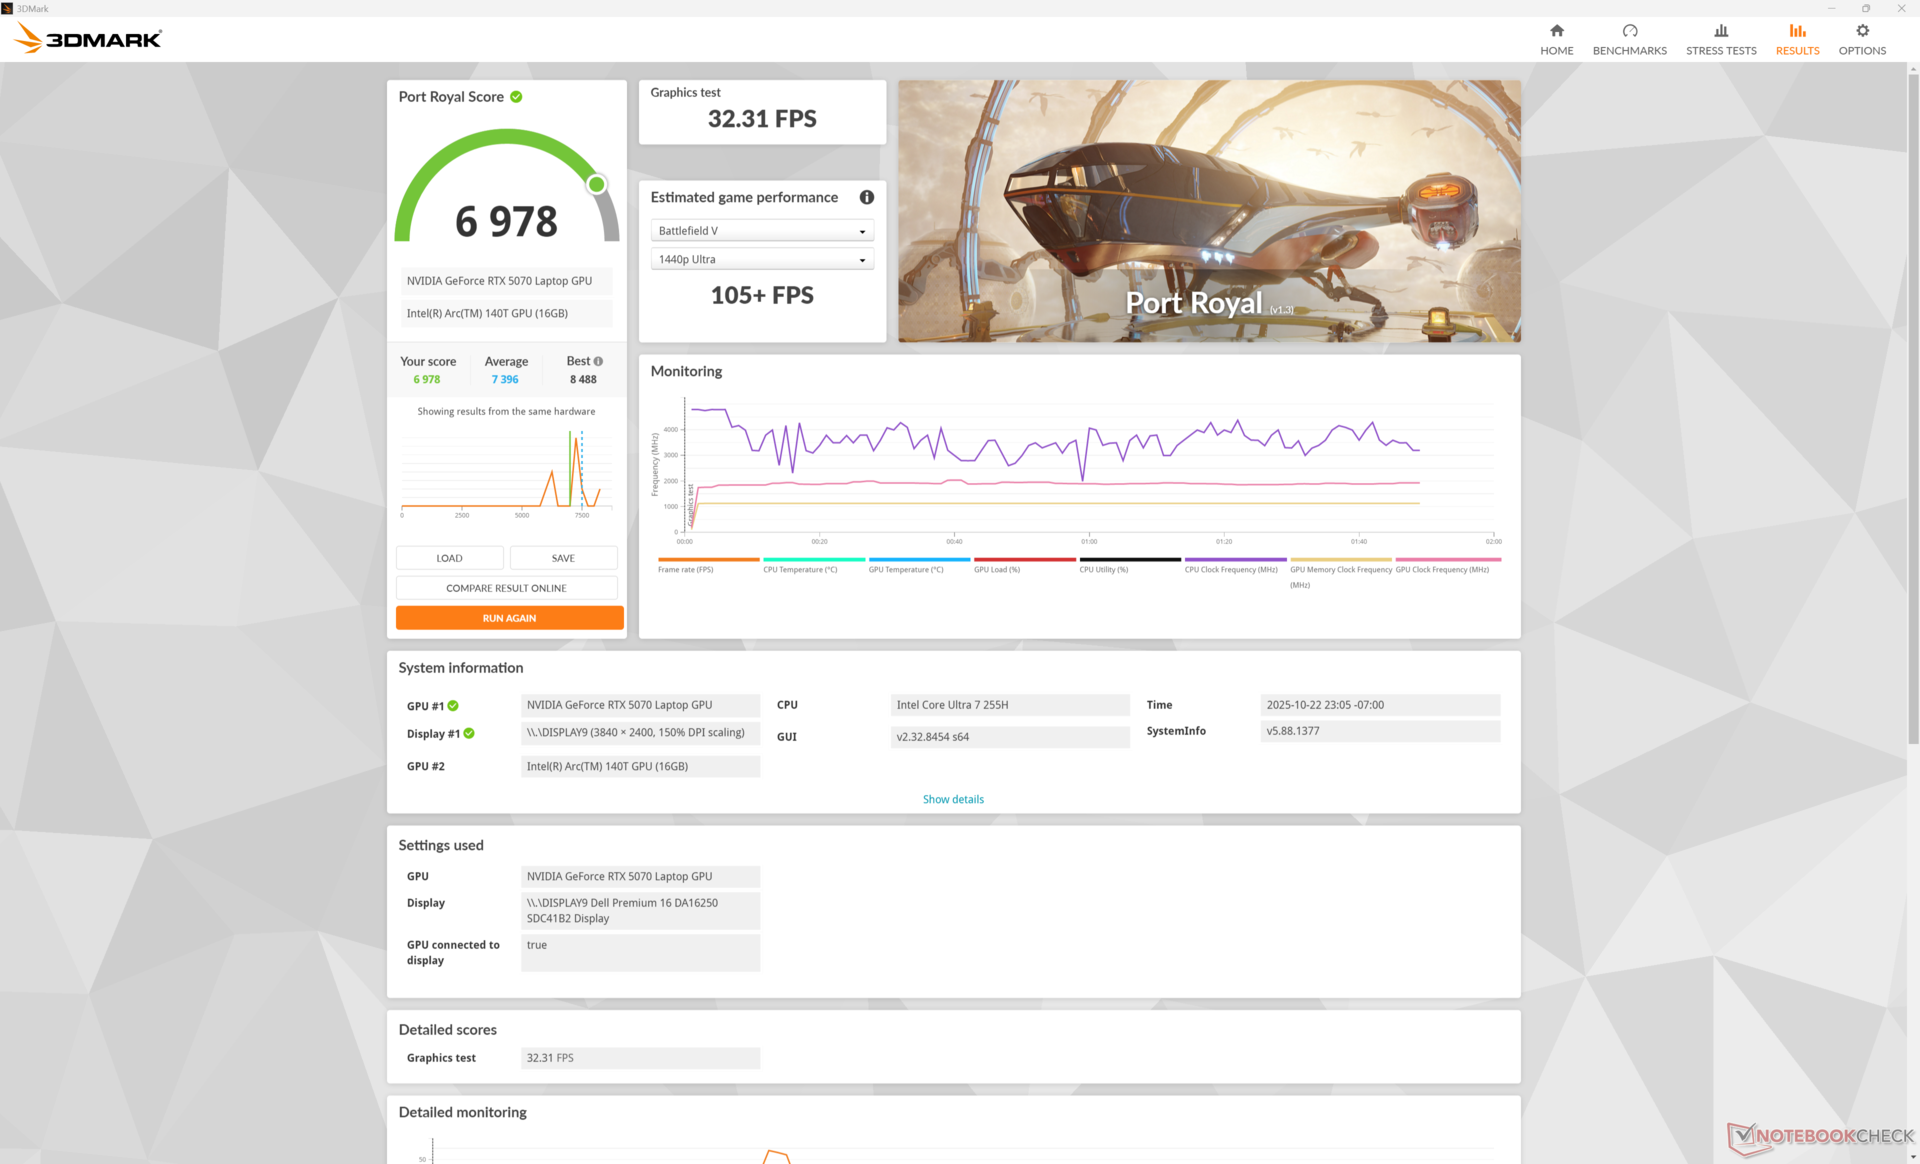
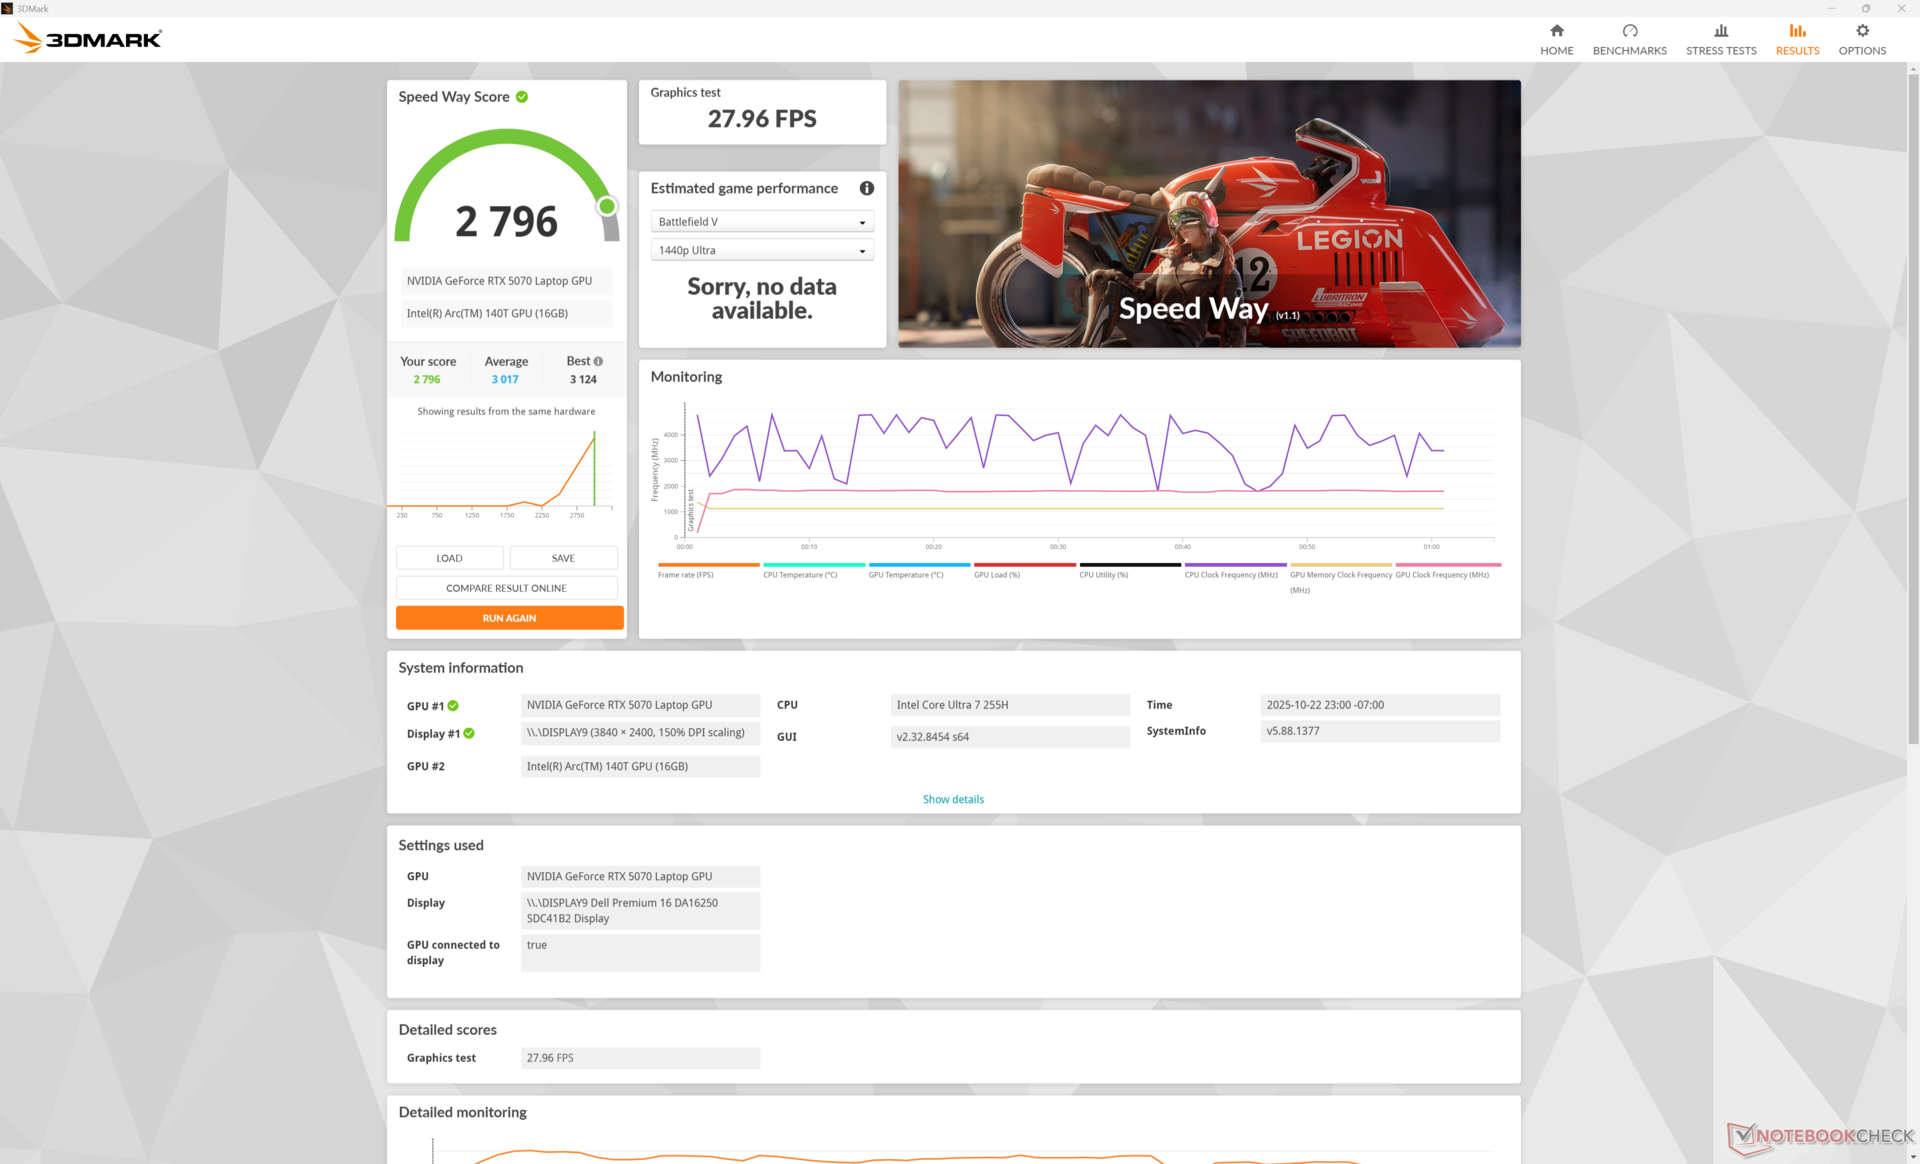
Wydajność GPU
Mobilny procesor graficzny GeForce RTX 5070 w Dell 16 Premium działa prawie 20 procent wolniej niż przeciętny laptop w naszej bazie danych z tym samym tym samym GPU RTX 5070 ponieważ większość laptopów z tym samym GPU to laptopy do gier z wyższymi docelowymi wartościami TGP. Tradycyjna wydajność rasteryzacji jest zatem bliższa laptopom z układami RTX 5060.
W przypadku profesjonalnych zadań, takich jak Blender, rozbieżność wydajności w porównaniu z innymi laptopami z RTX 5070 jest mniejsza średnio o około 10 procent. Dell 16 Premium to przede wszystkim profesjonalny komputer, a dopiero w drugiej kolejności laptop do gier.
| Profil zasilania | Wynik grafiki | Wynik fizyki | Łączny wynik |
| Tryb wydajności | 28759 | 37491 | 11209 |
| Tryb zrównoważony | 27915 (-3%) | 35948 (-4%) | 9874 (-12%) |
| Zasilanie bateryjne | 25880 (-10%) | 32601 (-13%) | 11046 (-1%) |
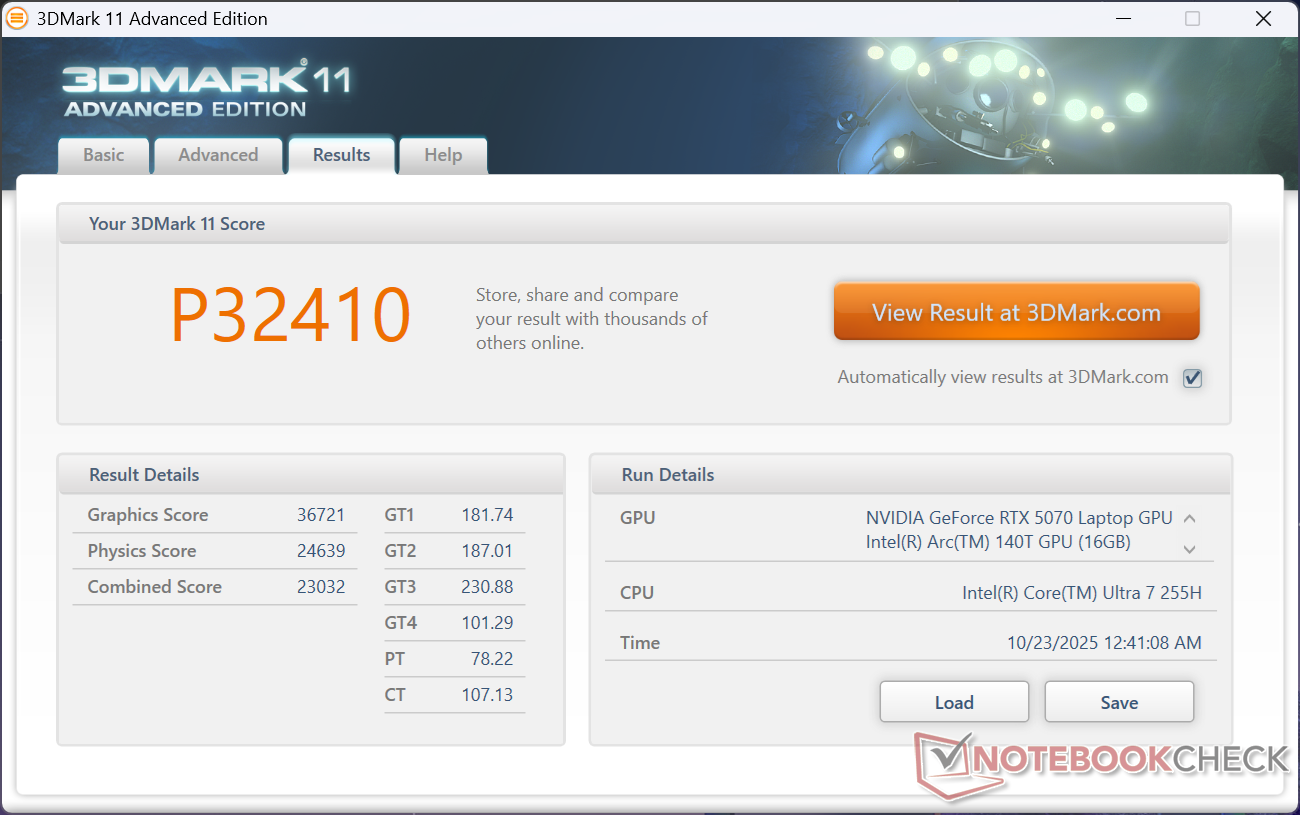
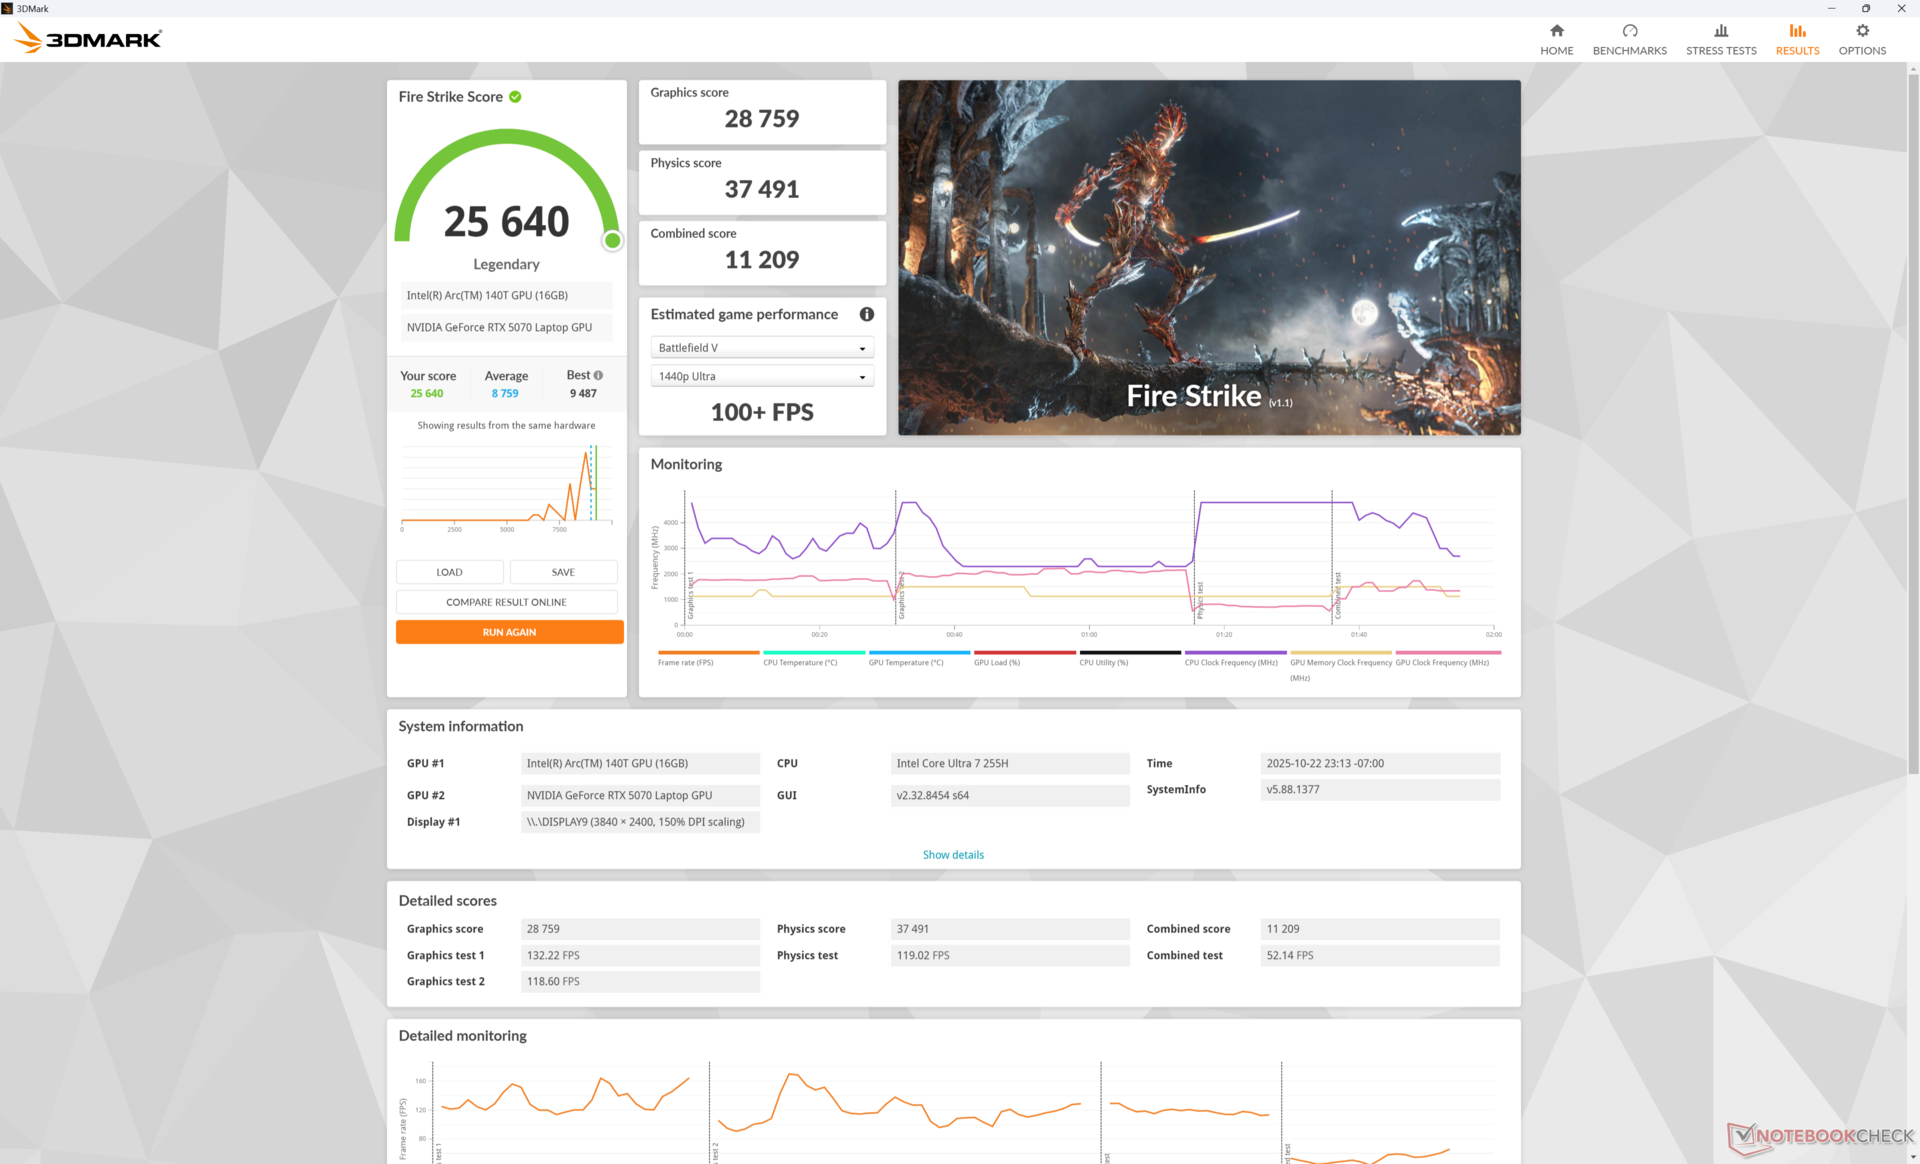
| 3DMark 11 Performance | 32410 pkt. | |
| 3DMark Cloud Gate Standard Score | 65334 pkt. | |
| 3DMark Fire Strike Score | 25640 pkt. | |
| 3DMark Time Spy Score | 11192 pkt. | |
| 3DMark Steel Nomad Score | 2441 pkt. | |
Pomoc | ||
* ... im mniej tym lepiej
Wydajność w grach
Gry mogą działać nawet o 20 procent wolniej niż na większości innych laptopów z tym samym GPU. Na przykład gra Assassin's Creed Shadows konsekwentnie działała szybciej na Lenovo Yoga Pro 9i 16 we wszystkich testowanych ustawieniach.
| Performance rating - Percent | |
| Lenovo Yoga Pro 9i 16 RTX 5070 | |
| Dell 16 Premium DA16250 | |
| Dell XPS 16 9640 | |
| HP Spectre x360 16 RTX 4050 | |
| Asus Zenbook S 16 UM5606-RK333W | |
| LG Gram Pro 16Z90TS-G.AU89G | |
| Cyberpunk 2077 - 1920x1080 Ultra Preset (FSR off) | |
| Lenovo Yoga Pro 9i 16 RTX 5070 | |
| Dell 16 Premium DA16250 | |
| Dell XPS 16 9640 | |
| HP Spectre x360 16 RTX 4050 | |
| Asus Zenbook S 16 UM5606-RK333W | |
| LG Gram Pro 16Z90TS-G.AU89G | |
| Baldur's Gate 3 - 1920x1080 Ultra Preset AA:T | |
| Dell 16 Premium DA16250 | |
| Dell XPS 16 9640 | |
| Lenovo Yoga Pro 9i 16 RTX 5070 | |
| HP Spectre x360 16 RTX 4050 | |
| Asus Zenbook S 16 UM5606-RK333W | |
| LG Gram Pro 16Z90TS-G.AU89G | |
| GTA V - 1920x1080 Highest AA:4xMSAA + FX AF:16x | |
| Lenovo Yoga Pro 9i 16 RTX 5070 | |
| Dell 16 Premium DA16250 | |
| Dell XPS 16 9640 | |
| HP Spectre x360 16 RTX 4050 | |
| Asus Zenbook S 16 UM5606-RK333W | |
| LG Gram Pro 16Z90TS-G.AU89G | |
| Final Fantasy XV Benchmark - 1920x1080 High Quality | |
| Lenovo Yoga Pro 9i 16 RTX 5070 | |
| Dell 16 Premium DA16250 | |
| Dell XPS 16 9640 | |
| HP Spectre x360 16 RTX 4050 | |
| LG Gram Pro 16Z90TS-G.AU89G | |
| Asus Zenbook S 16 UM5606-RK333W | |
| Strange Brigade - 1920x1080 ultra AA:ultra AF:16 | |
| Lenovo Yoga Pro 9i 16 RTX 5070 | |
| Dell 16 Premium DA16250 | |
| Dell XPS 16 9640 | |
| HP Spectre x360 16 RTX 4050 | |
| LG Gram Pro 16Z90TS-G.AU89G | |
| Asus Zenbook S 16 UM5606-RK333W | |
| Dota 2 Reborn - 1920x1080 ultra (3/3) best looking | |
| Lenovo Yoga Pro 9i 16 RTX 5070 | |
| Dell 16 Premium DA16250 | |
| HP Spectre x360 16 RTX 4050 | |
| Dell XPS 16 9640 | |
| LG Gram Pro 16Z90TS-G.AU89G | |
| Asus Zenbook S 16 UM5606-RK333W | |
| X-Plane 11.11 - 1920x1080 high (fps_test=3) | |
| Lenovo Yoga Pro 9i 16 RTX 5070 | |
| Dell 16 Premium DA16250 | |
| Dell XPS 16 9640 | |
| Dell XPS 16 9640 | |
| HP Spectre x360 16 RTX 4050 | |
| Asus Zenbook S 16 UM5606-RK333W | |
| LG Gram Pro 16Z90TS-G.AU89G | |
| Assassin's Creed Shadows | |
| 1920x1080 Low | |
| Przeciętny NVIDIA GeForce RTX 5070 Laptop (39 - 100, n=9) | |
| Lenovo Yoga Pro 9i 16 RTX 5070 | |
| Dell 16 Premium DA16250 | |
| 1920x1080 Medium | |
| Przeciętny NVIDIA GeForce RTX 5070 Laptop (36 - 93, n=10) | |
| Lenovo Yoga Pro 9i 16 RTX 5070 | |
| Dell 16 Premium DA16250 | |
| 1920x1080 High | |
| Przeciętny NVIDIA GeForce RTX 5070 Laptop (32 - 77, n=11) | |
| Lenovo Yoga Pro 9i 16 RTX 5070 | |
| Dell 16 Premium DA16250 | |
| 1920x1080 Ultra High | |
| Lenovo Yoga Pro 9i 16 RTX 5070 | |
| Przeciętny NVIDIA GeForce RTX 5070 Laptop (25 - 53, n=12) | |
| Dell 16 Premium DA16250 | |
| 2560x1440 Ultra High | |
| Przeciętny NVIDIA GeForce RTX 5070 Laptop (22 - 40, n=12) | |
| Lenovo Yoga Pro 9i 16 RTX 5070 | |
| Dell 16 Premium DA16250 | |
| 2560x1440 Ultra High + DLSS Quality | |
| Przeciętny NVIDIA GeForce RTX 5070 Laptop (25 - 45, n=6) | |
| Dell 16 Premium DA16250 | |
| 2560x1440 Ultra High + GI + DLSS Quality + FG | |
| Przeciętny NVIDIA GeForce RTX 5070 Laptop (33 - 57, n=4) | |
| Dell 16 Premium DA16250 | |
| Monster Hunter Wilds | |
| 1920x1080 lowest, no upscaling | |
| Przeciętny NVIDIA GeForce RTX 5070 Laptop (69.1 - 86.5, n=3) | |
| Dell 16 Premium DA16250 | |
| 1920x1080 medium, no upscaling | |
| Przeciętny NVIDIA GeForce RTX 5070 Laptop (61.6 - 78.2, n=4) | |
| Dell 16 Premium DA16250 | |
| Black Myth: Wukong | |
| 1280x720 low TSR 100 | |
| Przeciętny NVIDIA GeForce RTX 5070 Laptop (127 - 206, n=2) | |
| Dell 16 Premium DA16250 | |
| 1920x1080 low TSR 100 | |
| Przeciętny NVIDIA GeForce RTX 5070 Laptop (83 - 197, n=4) | |
| Dell 16 Premium DA16250 | |
| 1920x1080 medium TSR 100 | |
| Przeciętny NVIDIA GeForce RTX 5070 Laptop (63 - 112, n=4) | |
| Dell 16 Premium DA16250 | |
| 1920x1080 high TSR 100 | |
| Przeciętny NVIDIA GeForce RTX 5070 Laptop (49 - 86, n=5) | |
| Dell 16 Premium DA16250 | |
| 1920x1080 cinematic TSR 100 | |
| Przeciętny NVIDIA GeForce RTX 5070 Laptop (28 - 44, n=5) | |
| Dell 16 Premium DA16250 | |
| 2560x1440 cinematic TSR 100 | |
| Przeciętny NVIDIA GeForce RTX 5070 Laptop (20 - 27, n=5) | |
| Dell 16 Premium DA16250 | |
| 2560x1440 cinematic DLSS 68 | |
| Przeciętny NVIDIA GeForce RTX 5070 Laptop (31 - 41, n=5) | |
| Dell 16 Premium DA16250 | |
| 2560x1440 cinematic RT: Very High DLSS 68 FG | |
| Przeciętny NVIDIA GeForce RTX 5070 Laptop (18 - 45, n=4) | |
| Dell 16 Premium DA16250 | |
| Alan Wake 2 | |
| 1280x720 Low Preset | |
| Dell 16 Premium DA16250 | |
| Przeciętny NVIDIA GeForce RTX 5070 Laptop (106.8 - 115.2, n=2) | |
| 1920x1080 Low Preset | |
| Przeciętny NVIDIA GeForce RTX 5070 Laptop (68.8 - 86.1, n=4) | |
| Dell 16 Premium DA16250 | |
| 1920x1080 Medium Preset | |
| Przeciętny NVIDIA GeForce RTX 5070 Laptop (68.4 - 82.4, n=4) | |
| Dell 16 Premium DA16250 | |
| 1920x1080 High Preset | |
| Przeciętny NVIDIA GeForce RTX 5070 Laptop (60 - 72.5, n=6) | |
| Dell 16 Premium DA16250 | |
| 2560x1440 High Preset | |
| Przeciętny NVIDIA GeForce RTX 5070 Laptop (35.8 - 45.1, n=6) | |
| Dell 16 Premium DA16250 | |
Cyberpunk 2077 ultra FPS Chart
| low | med. | high | ultra | QHD DLSS | QHD | 4K | |
|---|---|---|---|---|---|---|---|
| GTA V (2015) | 185.6 | 180.9 | 175.7 | 123.7 | 96.9 | ||
| Dota 2 Reborn (2015) | 168.4 | 152.9 | 147.8 | 140.4 | 106.4 | ||
| Final Fantasy XV Benchmark (2018) | 218 | 148.7 | 113.1 | 82.5 | |||
| X-Plane 11.11 (2018) | 114.3 | 110 | 91.9 | 65.7 | |||
| Strange Brigade (2018) | 507 | 282 | 232 | 204 | 140.2 | ||
| Baldur's Gate 3 (2023) | 149.5 | 125.5 | 109.8 | 109 | 107.3 | 73.8 | |
| Cyberpunk 2077 (2023) | 134.9 | 107.8 | 91 | 81.5 | 61.4 | 51.9 | |
| Alan Wake 2 (2023) | 68.8 | 68.4 | 60 | 35.8 | |||
| F1 24 (2024) | 242 | 241 | 186 | 63.8 | 62.9 | 40.3 | |
| Black Myth: Wukong (2024) | 83 | 63 | 49 | 28 | 31 | 20 | |
| Monster Hunter Wilds (2025) | 69.1 | 61.6 | |||||
| Assassin's Creed Shadows (2025) | 61 | 57 | 49 | 33 | 35 | 28 |
Emisje
Hałas systemowy
Zachowanie hałasu wentylatora i sufit są zasadniczo identyczne z zeszłorocznym modelem, ponieważ rozwiązanie chłodzące i koperta mocy pozostały niezmienione.

Hałas
| luz |
| 23.2 / 23.2 / 26.6 dB |
| obciążenie |
| 39.4 / 48.9 dB |
 | ||
30 dB cichy 40 dB(A) słyszalny 50 dB(A) irytujący |
||
min: | ||
| Dell 16 Premium DA16250 Ultra 7 255H, GeForce RTX 5070 Laptop | Dell XPS 16 9640 Ultra 7 155H, GeForce RTX 4070 Laptop GPU | HP Spectre x360 16 RTX 4050 Ultra 7 155H, GeForce RTX 4050 Laptop GPU | Lenovo Yoga Pro 9i 16 RTX 5070 Ultra 9 285H, GeForce RTX 5070 Laptop | Asus Zenbook S 16 UM5606-RK333W Ryzen AI 9 HX 370, Radeon 890M | LG Gram Pro 16Z90TS-G.AU89G Core Ultra 7 256V, Arc 140V | |
|---|---|---|---|---|---|---|
| Noise | -4% | 11% | -5% | 6% | -1% | |
| wyłączone / środowisko * (dB) | 23.2 | 24.5 -6% | 23.3 -0% | 24.1 -4% | 24.7 -6% | 25.2 -9% |
| Idle Minimum * (dB) | 23.2 | 24.5 -6% | 23.6 -2% | 24.1 -4% | 24.7 -6% | 25.2 -9% |
| Idle Average * (dB) | 23.2 | 24.5 -6% | 23.6 -2% | 24.1 -4% | 24.7 -6% | 25.2 -9% |
| Idle Maximum * (dB) | 26.6 | 27.5 -3% | 23.6 11% | 25.1 6% | 26.4 1% | 27.7 -4% |
| Load Average * (dB) | 39.4 | 39.6 -1% | 29.2 26% | 44.2 -12% | 35.7 9% | |
| Cyberpunk 2077 ultra * (dB) | 47.3 | 52.7 -11% | 36.8 22% | 42.6 10% | ||
| Load Maximum * (dB) | 48.9 | 49.7 -2% | 32.1 34% | 52.7 -8% | 36.8 25% | 42.7 13% |
| Witcher 3 ultra * (dB) | 49.7 | 32.1 |
* ... im mniej tym lepiej
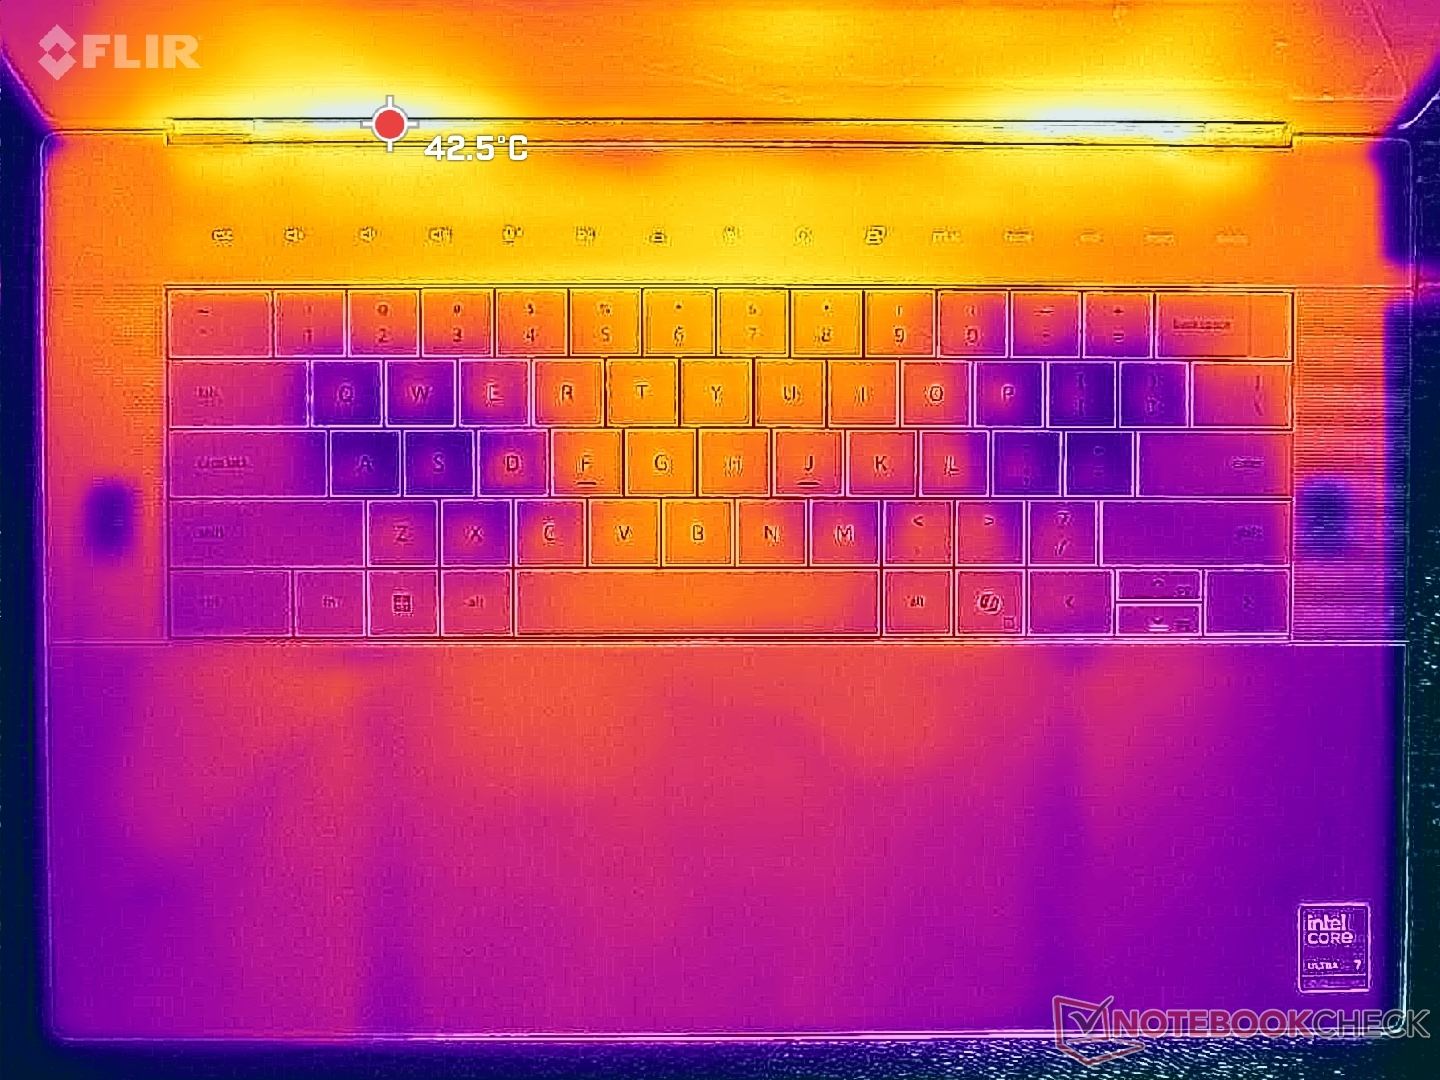
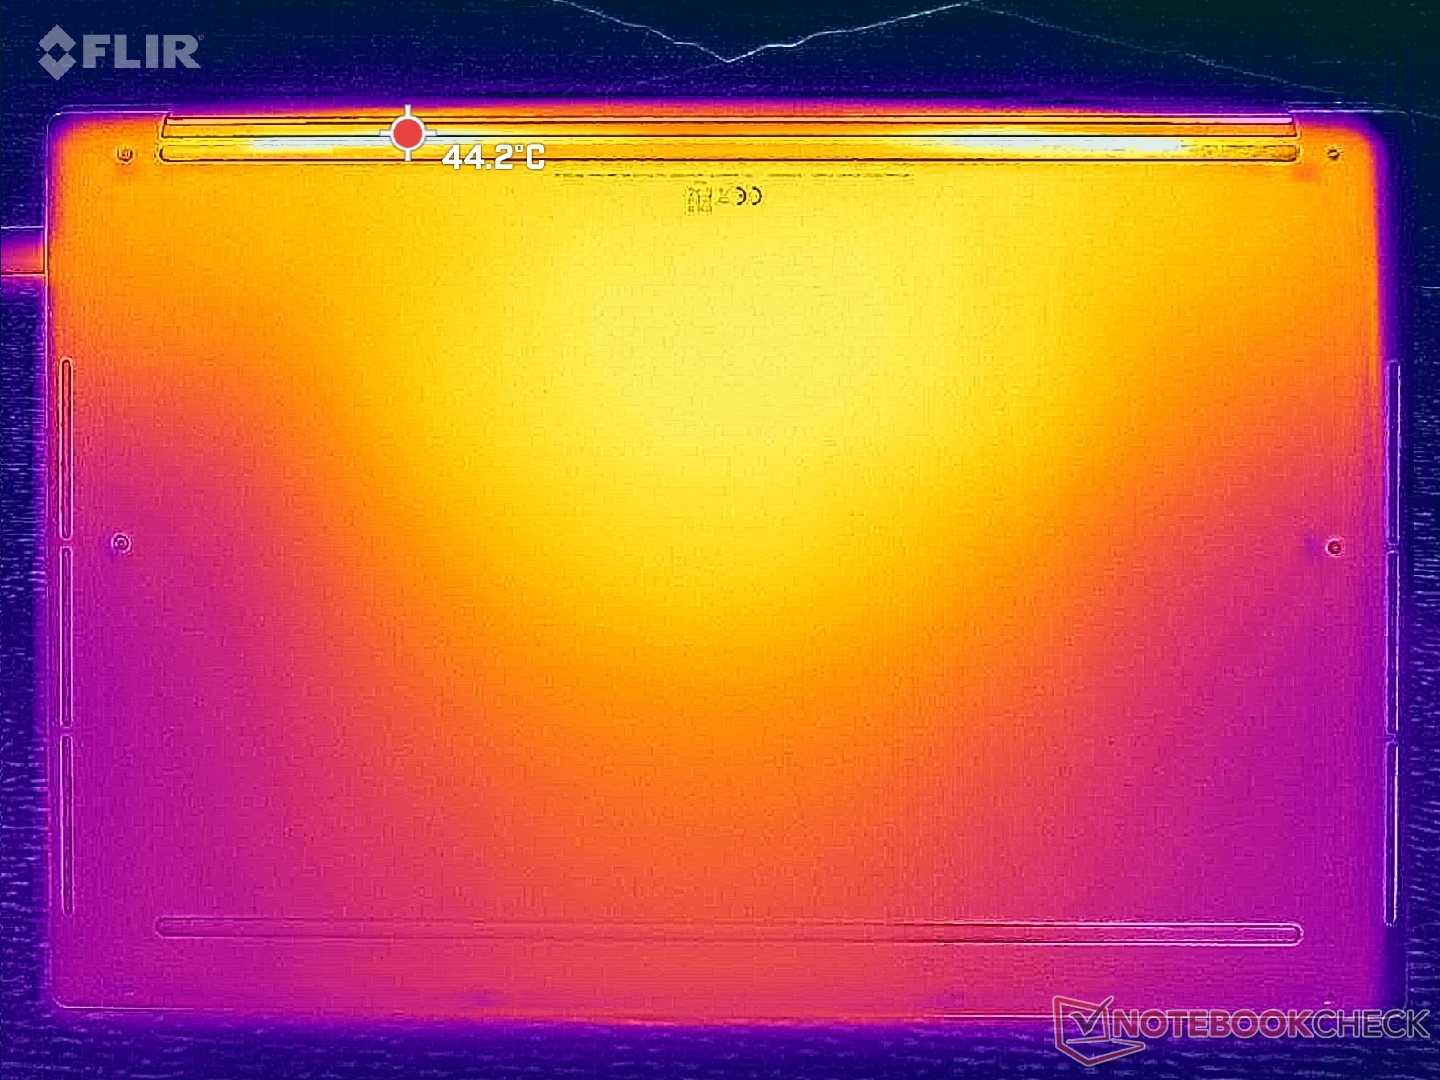
Temperatura
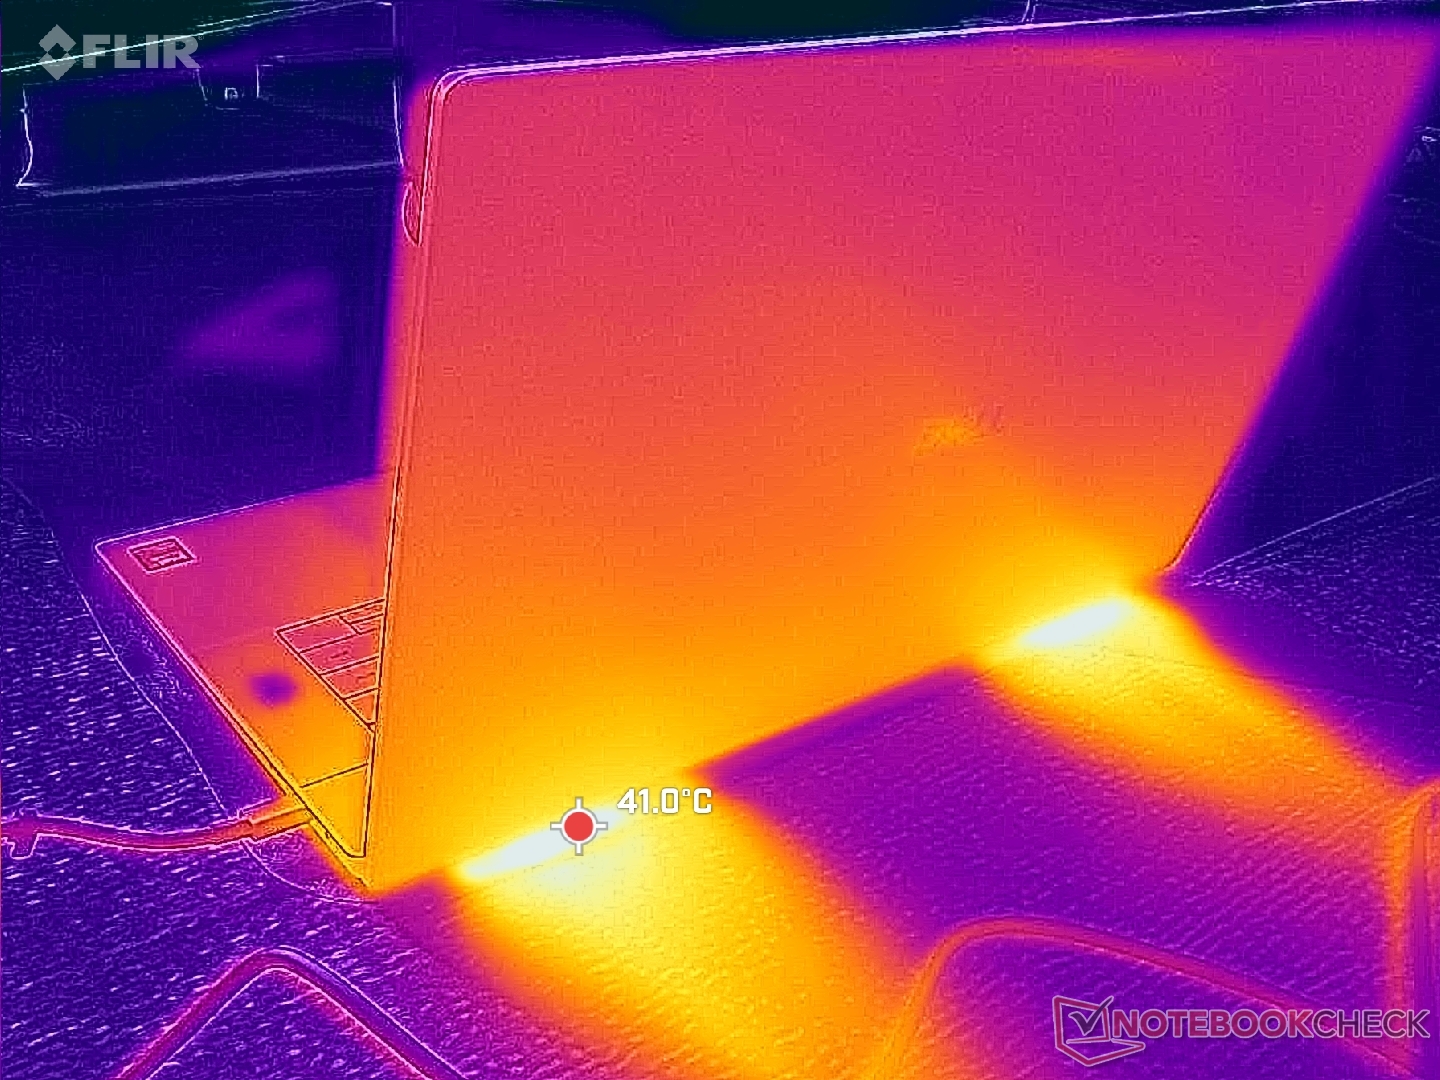
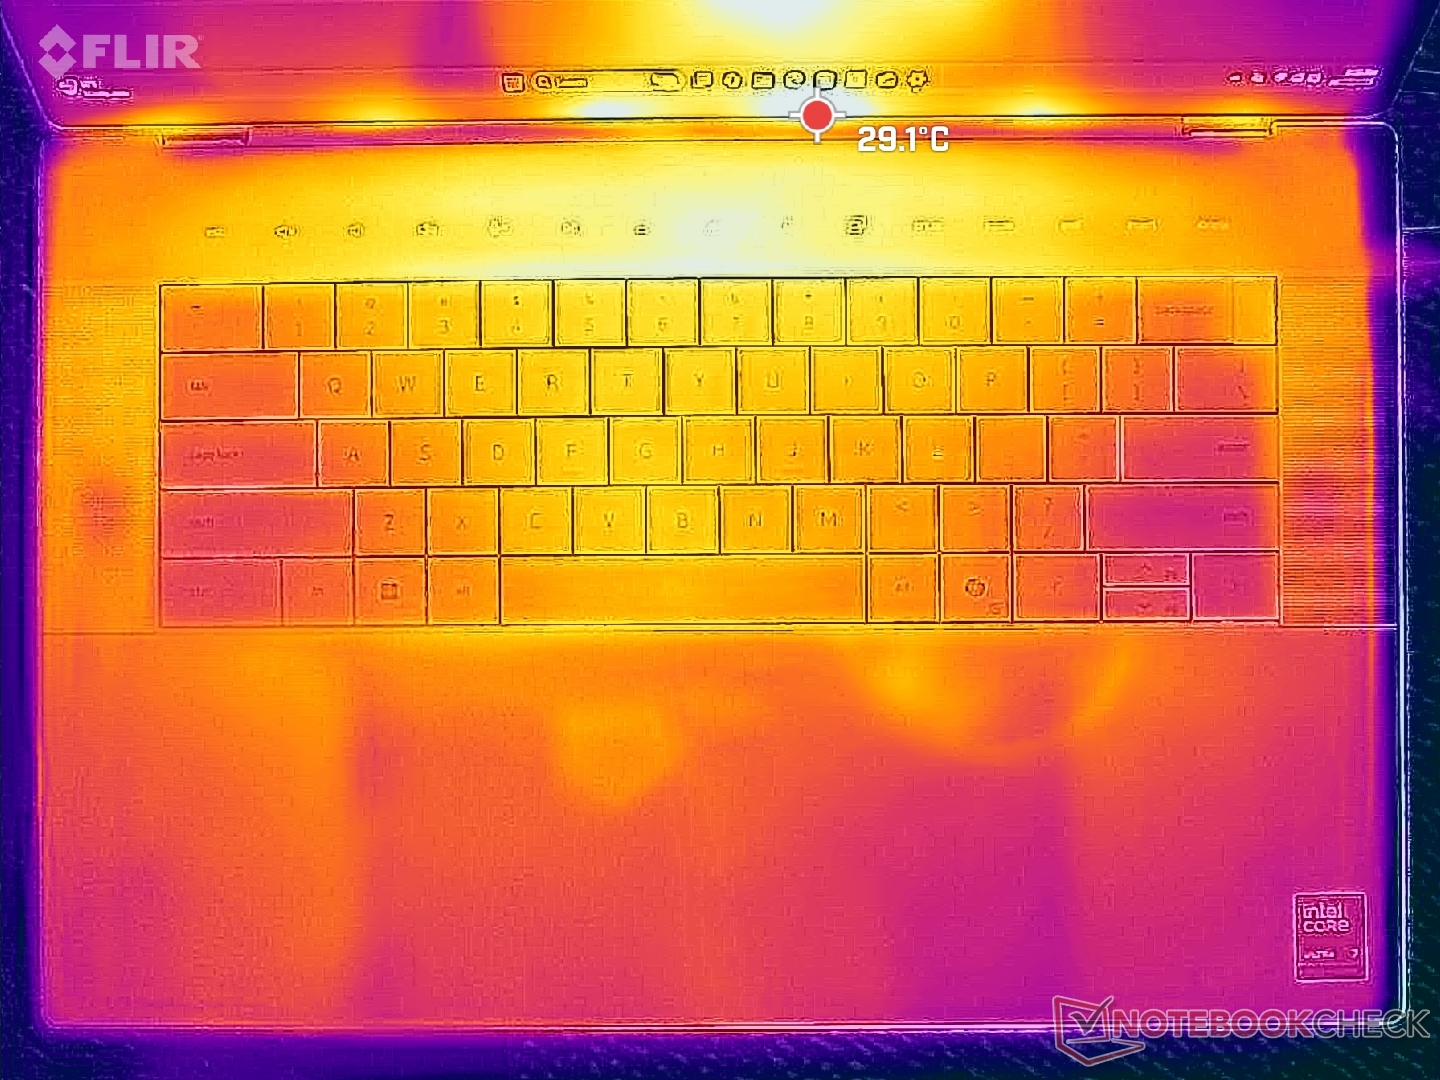
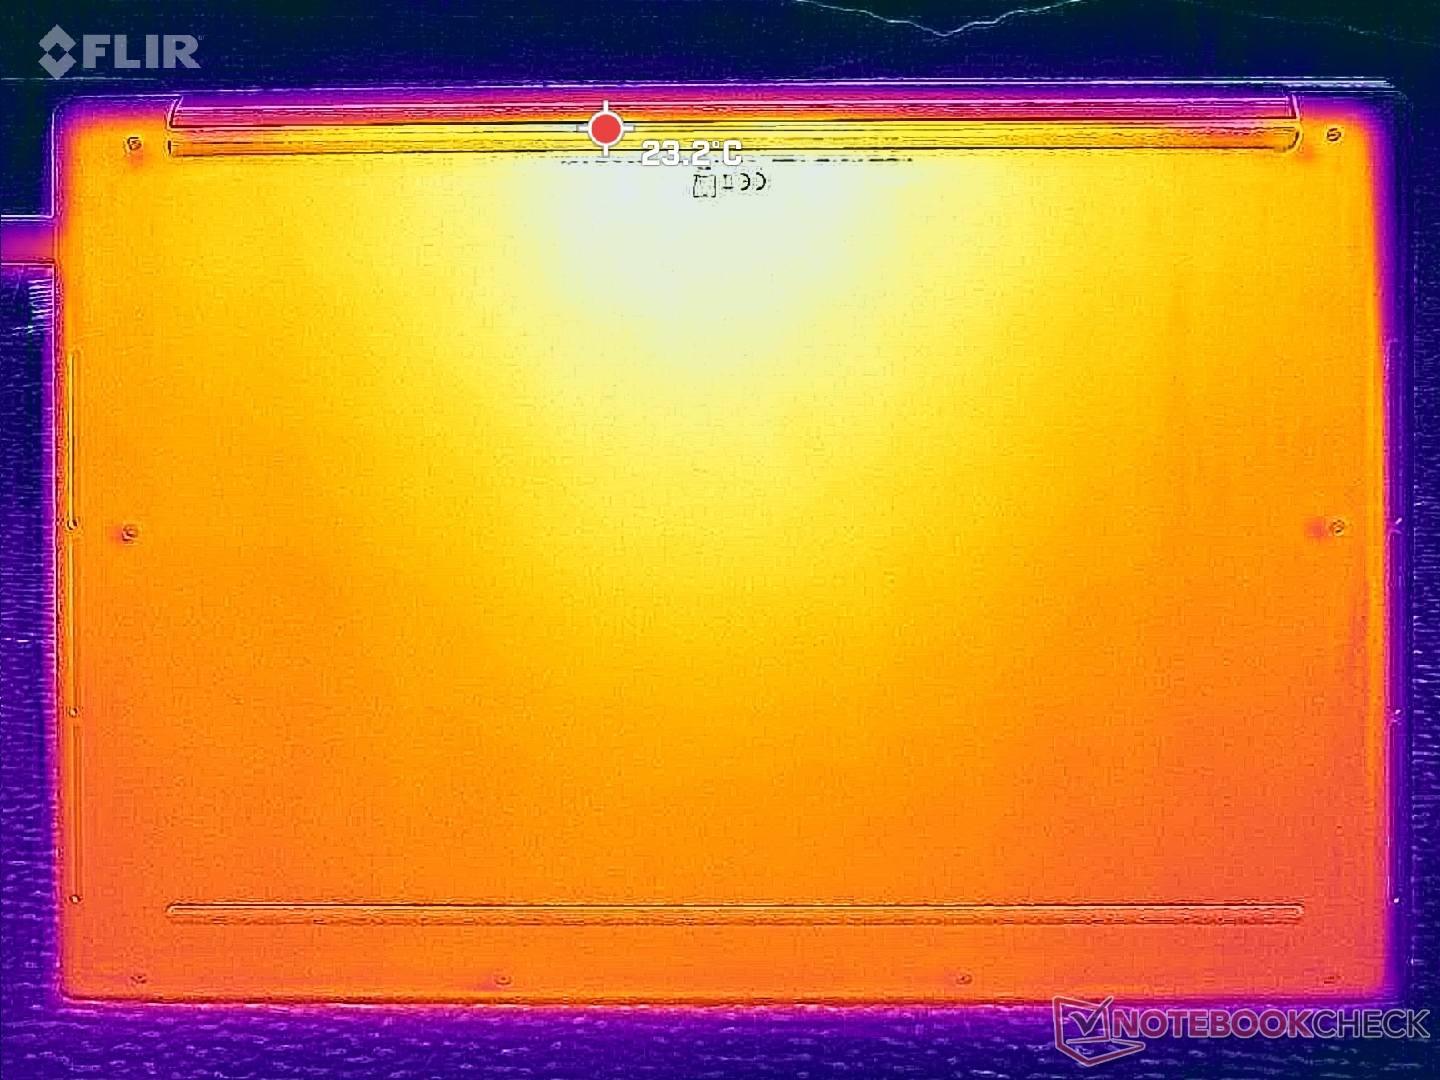
Gorące punkty na dolnej pokrywie w pobliżu otworów wentylacyjnych mogą osiągnąć prawie 45 ° C podczas pracy z wymagającymi obciążeniami. Nie możemy powstrzymać się od zastanawiania się, czy dodatkowe otwory wentylacyjne poprawiłyby ogólną temperaturę, ale Dell wyraźnie stawia na czystszy, pozbawiony otworów wentylacyjnych projekt wizualny, podobnie jak w przypadku serii MacBook.
(+) Maksymalna temperatura w górnej części wynosi 36.8 °C / 98 F, w porównaniu do średniej 36.8 °C / 98 F , począwszy od 21 do 71 °C dla klasy Multimedia.
(+) Dno nagrzewa się maksymalnie do 34.8 °C / 95 F, w porównaniu do średniej 39.1 °C / 102 F
(+) W stanie bezczynności średnia temperatura górnej części wynosi 28.7 °C / 84 F, w porównaniu ze średnią temperaturą urządzenia wynoszącą 31.3 °C / ### class_avg_f### F.
(+) Podpórki pod nadgarstki i touchpad są chłodniejsze niż temperatura skóry i maksymalnie 28.6 °C / 83.5 F i dlatego są chłodne w dotyku.
(±) Średnia temperatura obszaru podparcia dłoni w podobnych urządzeniach wynosiła 28.7 °C / 83.7 F (+0.1 °C / 0.2 F).
| Dell 16 Premium DA16250 Ultra 7 255H, GeForce RTX 5070 Laptop | Dell XPS 16 9640 Ultra 7 155H, GeForce RTX 4070 Laptop GPU | HP Spectre x360 16 RTX 4050 Ultra 7 155H, GeForce RTX 4050 Laptop GPU | Lenovo Yoga Pro 9i 16 RTX 5070 Ultra 9 285H, GeForce RTX 5070 Laptop | Asus Zenbook S 16 UM5606-RK333W Ryzen AI 9 HX 370, Radeon 890M | LG Gram Pro 16Z90TS-G.AU89G Core Ultra 7 256V, Arc 140V | |
|---|---|---|---|---|---|---|
| Heat | 2% | -4% | -7% | -19% | -5% | |
| Maximum Upper Side * (°C) | 36.8 | 39.4 -7% | 39.6 -8% | 41.8 -14% | 46.9 -27% | 40.5 -10% |
| Maximum Bottom * (°C) | 34.8 | 36.9 -6% | 39.2 -13% | 47.9 -38% | 53.5 -54% | 45 -29% |
| Idle Upper Side * (°C) | 31.2 | 28.2 10% | 29 7% | 26.3 16% | 29.5 5% | 27.1 13% |
| Idle Bottom * (°C) | 30.8 | 27.4 11% | 31.6 -3% | 27.6 10% | 30.2 2% | 28.8 6% |
* ... im mniej tym lepiej
Głośniki

Dell 16 Premium DA16250 analiza dźwięku
(+) | głośniki mogą odtwarzać stosunkowo głośno (84.2 dB)
Bas 100 - 315 Hz
(±) | zredukowany bas - średnio 6.1% niższy od mediany
(+) | bas jest liniowy (4.2% delta do poprzedniej częstotliwości)
Średnie 400 - 2000 Hz
(+) | zbalansowane środki średnie - tylko 1.4% od mediany
(+) | średnie są liniowe (3.6% delta do poprzedniej częstotliwości)
Wysokie 2–16 kHz
(+) | zrównoważone maksima - tylko 1.5% od mediany
(+) | wzloty są liniowe (2.2% delta do poprzedniej częstotliwości)
Ogólnie 100 - 16.000 Hz
(+) | ogólny dźwięk jest liniowy (5.1% różnicy w stosunku do mediany)
W porównaniu do tej samej klasy
» 1% wszystkich testowanych urządzeń w tej klasie było lepszych, 0% podobnych, 99% gorszych
» Najlepszy miał deltę 5%, średnia wynosiła ###średnia###%, najgorsza wynosiła 45%
W porównaniu do wszystkich testowanych urządzeń
» 0% wszystkich testowanych urządzeń było lepszych, 0% podobnych, 100% gorszych
» Najlepszy miał deltę 4%, średnia wynosiła ###średnia###%, najgorsza wynosiła 134%
Apple MacBook Pro 16 2021 M1 Pro analiza dźwięku
(+) | głośniki mogą odtwarzać stosunkowo głośno (84.7 dB)
Bas 100 - 315 Hz
(+) | dobry bas - tylko 3.8% od mediany
(+) | bas jest liniowy (5.2% delta do poprzedniej częstotliwości)
Średnie 400 - 2000 Hz
(+) | zbalansowane środki średnie - tylko 1.3% od mediany
(+) | średnie są liniowe (2.1% delta do poprzedniej częstotliwości)
Wysokie 2–16 kHz
(+) | zrównoważone maksima - tylko 1.9% od mediany
(+) | wzloty są liniowe (2.7% delta do poprzedniej częstotliwości)
Ogólnie 100 - 16.000 Hz
(+) | ogólny dźwięk jest liniowy (4.6% różnicy w stosunku do mediany)
W porównaniu do tej samej klasy
» 0% wszystkich testowanych urządzeń w tej klasie było lepszych, 0% podobnych, 100% gorszych
» Najlepszy miał deltę 5%, średnia wynosiła ###średnia###%, najgorsza wynosiła 45%
W porównaniu do wszystkich testowanych urządzeń
» 0% wszystkich testowanych urządzeń było lepszych, 0% podobnych, 100% gorszych
» Najlepszy miał deltę 4%, średnia wynosiła ###średnia###%, najgorsza wynosiła 134%
Zarządzanie energią
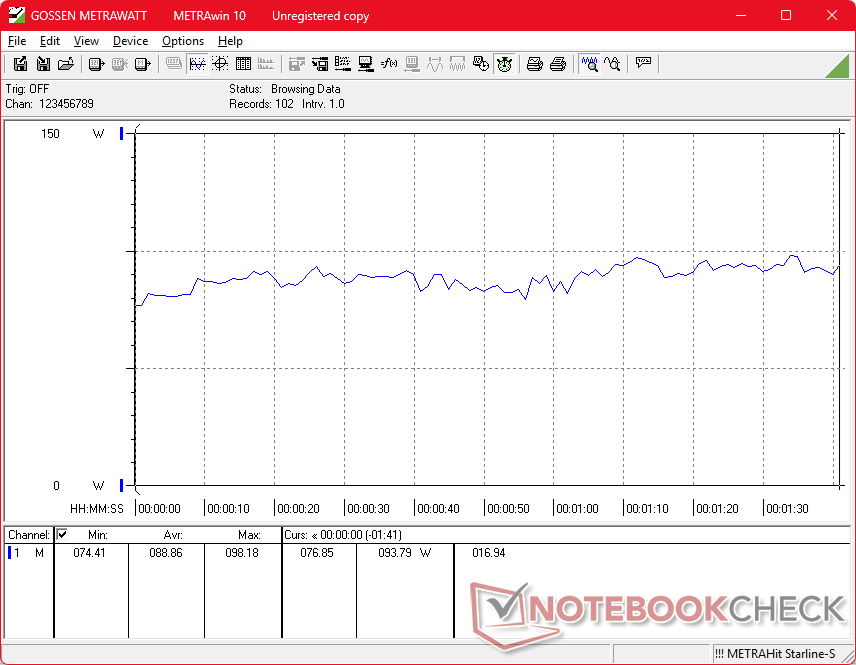
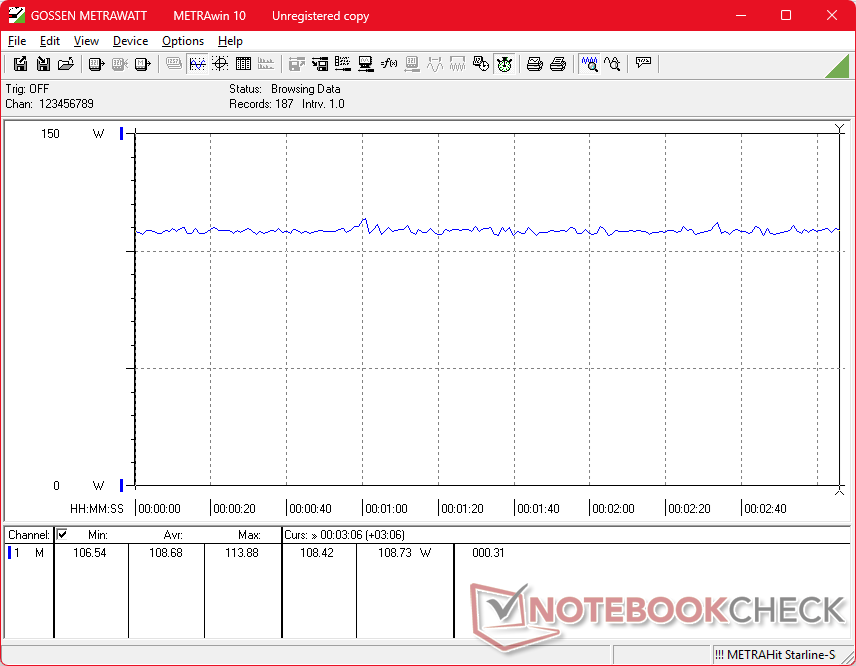
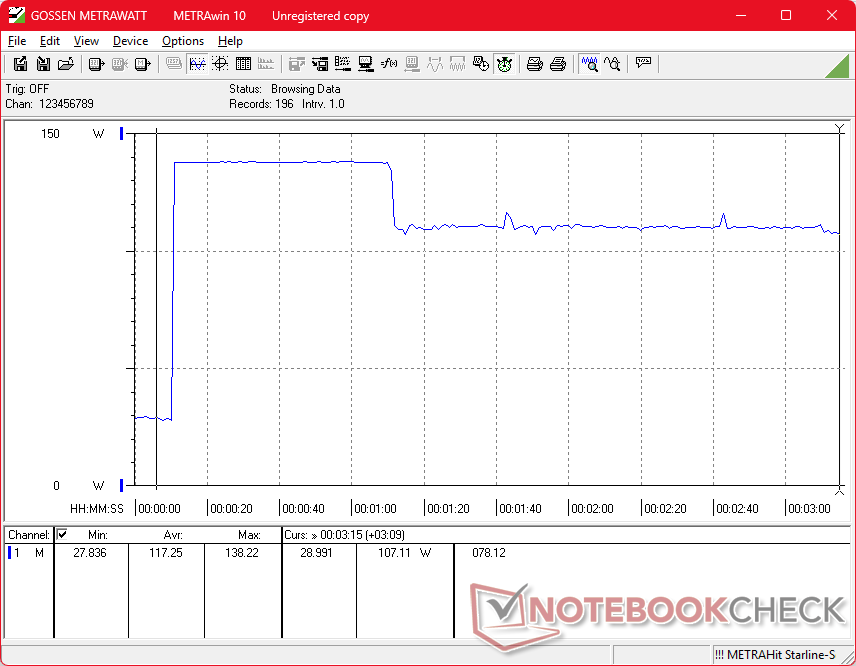
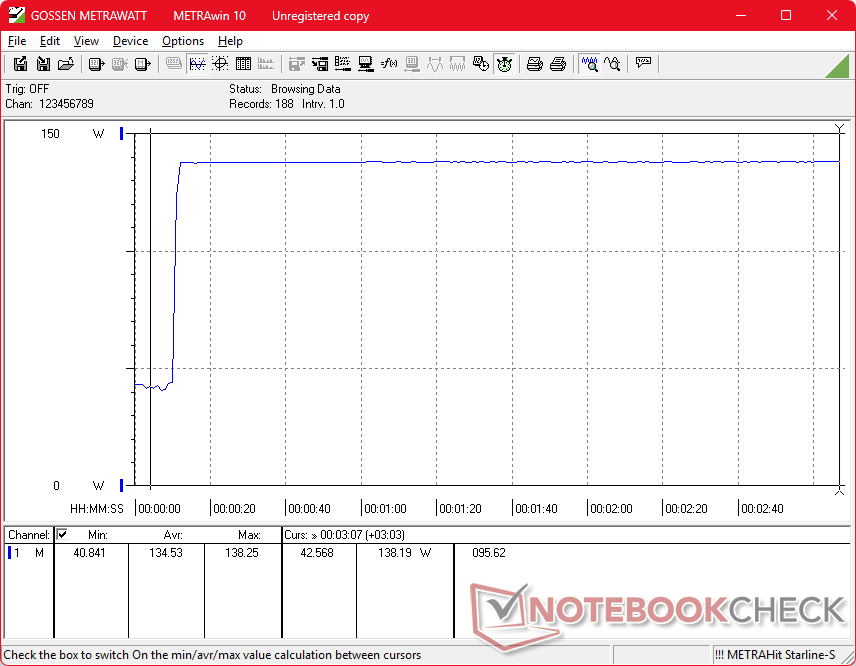
Zużycie energii
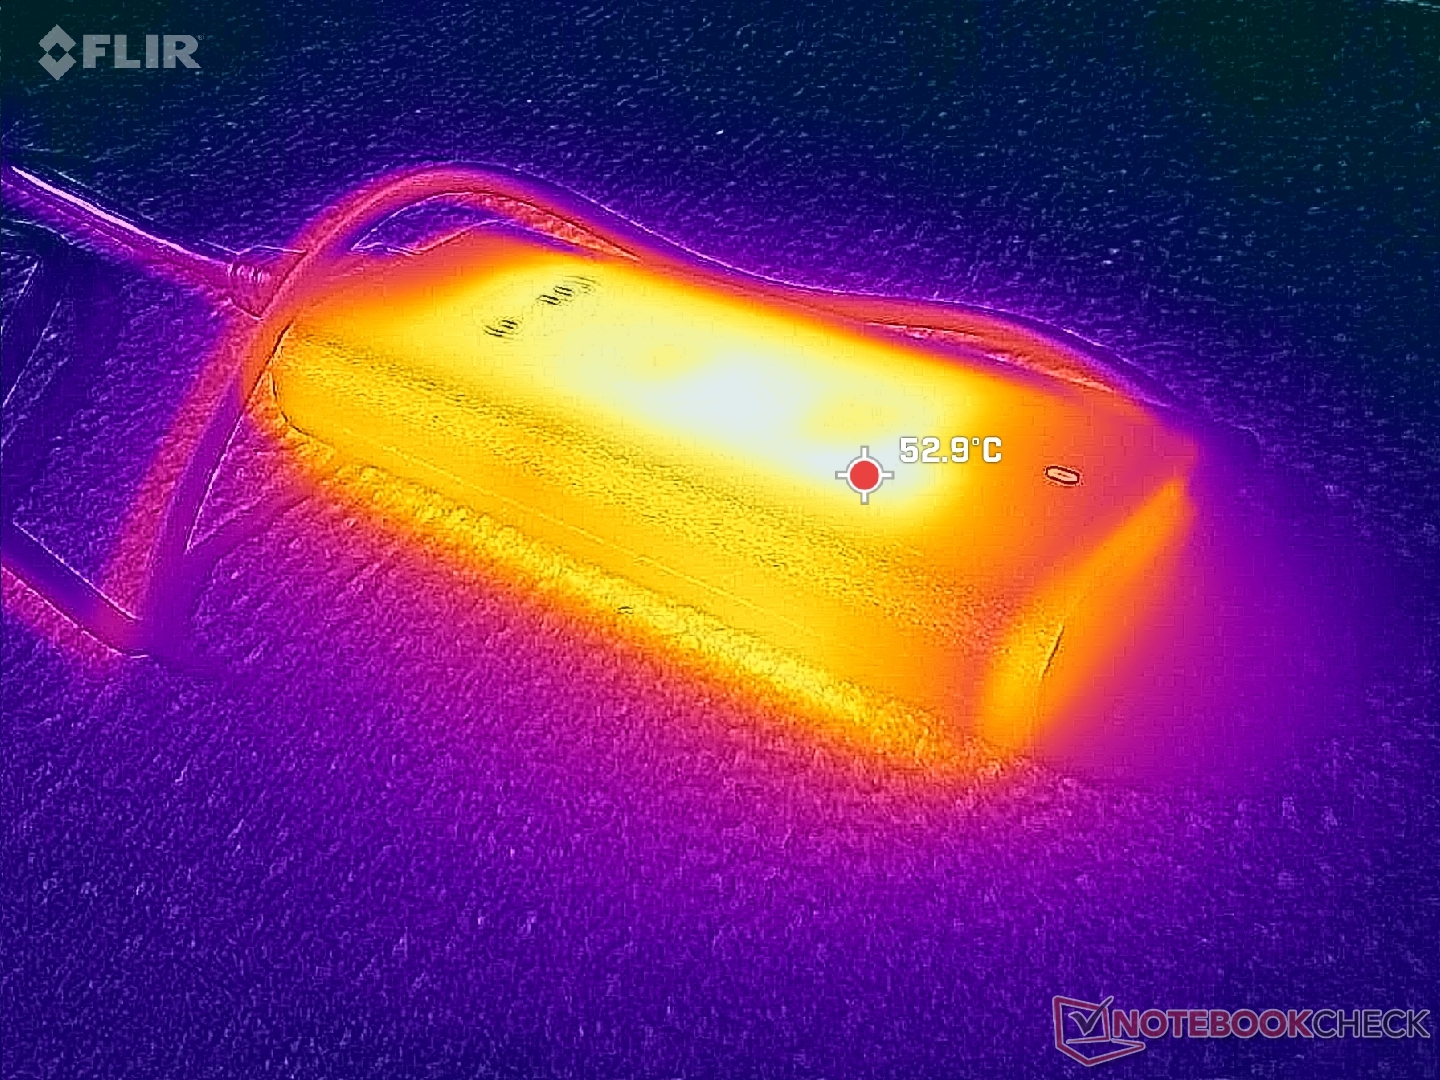
Praca na biegu jałowym na komputerze stacjonarnym może pobierać zaledwie 6 W w trybie oszczędzania energii z aktywnym iGPU lub do 33 W w trybie wydajności z aktywnym dGPU i ekranem OLED wyświetlającym głównie białe kolory (np. podczas przeglądania). Zużycie energii podczas pracy z bardziej wymagającymi obciążeniami jest poza tym podobne do zeszłorocznego modelu, jeśli nie nieco niższe w celu poprawy wydajności w przeliczeniu na wat, zwłaszcza że Dell 16 Premium jest dostarczany z tym samym zasilaczem USB-C o mocy 130 W (~ 12,8 x 5,5 x 2,3 cm), co poprzednio.
Proszę zauważyć, że pobór mocy jest wyższy na początku testu obciążeniowego Prime95, kiedy potencjał Turbo Boost jest najwyższy.
| wyłączony / stan wstrzymania | |
| luz | |
| obciążenie |
|
Legenda:
min: | |
| Dell 16 Premium DA16250 Ultra 7 255H, GeForce RTX 5070 Laptop, Kioxia BG6 KBG6AZNV1T02, OLED, 3840x2400, 16.3" | Dell XPS 16 9640 Ultra 7 155H, GeForce RTX 4070 Laptop GPU, Kioxia XG8 KXG80ZNV1T02, OLED, 3840x2400, 16.3" | HP Spectre x360 16 RTX 4050 Ultra 7 155H, GeForce RTX 4050 Laptop GPU, SK hynix PC801 HFS001TEJ9X101N, OLED, 2880x1800, 16" | Lenovo Yoga Pro 9i 16 RTX 5070 Ultra 9 285H, GeForce RTX 5070 Laptop, WD PC SN7100S SDFPMSL-1T00-1101, OLED, 3200x2000, 16" | Asus Zenbook S 16 UM5606-RK333W Ryzen AI 9 HX 370, Radeon 890M, Micron 2400 MTFDKBA1T0QFM, OLED, 2880x1800, 16" | LG Gram Pro 16Z90TS-G.AU89G Core Ultra 7 256V, Arc 140V, Samsung PM9A1a MZVL21T0HDLU, IPS, 2560x1600, 16" | |
|---|---|---|---|---|---|---|
| Power Consumption | 7% | -5% | -29% | 39% | 50% | |
| Idle Minimum * (Watt) | 6.5 | 7.7 -18% | 5.8 11% | 8.8 -35% | 5.4 17% | 4.15 36% |
| Idle Average * (Watt) | 8.1 | 10.3 -27% | 12.3 -52% | 16.1 -99% | 10.5 -30% | 5.4 33% |
| Idle Maximum * (Watt) | 33 | 10.6 68% | 33.9 -3% | 16.5 50% | 10.9 67% | 12.4 62% |
| Load Average * (Watt) | 88.9 | 76.5 14% | 83.3 6% | 89.3 -0% | 47.8 46% | |
| Cyberpunk 2077 ultra external monitor * (Watt) | 108.9 | 157.9 -45% | 46.7 57% | 48.1 56% | ||
| Cyberpunk 2077 ultra * (Watt) | 108.7 | 160.6 -48% | 49.2 55% | 48.2 56% | ||
| Load Maximum * (Watt) | 138.3 | 138.5 -0% | 120.8 13% | 177.4 -28% | 58.6 58% | 60.049 57% |
| Witcher 3 ultra * (Watt) | 126.4 | 89.1 |
* ... im mniej tym lepiej
Pobór mocy Cyberpunk / Test warunków skrajnych
Zużycie energii przez monitor zewnętrzny
Żywotność baterii
Czas pracy jest mniej więcej taki sam jak poprzednio, pomimo aktualizacji procesora i szybszej częstotliwości odświeżania 120 Hz.
| Dell 16 Premium DA16250 Ultra 7 255H, GeForce RTX 5070 Laptop, 99.5 Wh | Dell XPS 16 9640 Ultra 7 155H, GeForce RTX 4070 Laptop GPU, 99.5 Wh | HP Spectre x360 16 RTX 4050 Ultra 7 155H, GeForce RTX 4050 Laptop GPU, 83 Wh | Lenovo Yoga Pro 9i 16 RTX 5070 Ultra 9 285H, GeForce RTX 5070 Laptop, 84 Wh | Asus Zenbook S 16 UM5606-RK333W Ryzen AI 9 HX 370, Radeon 890M, 78 Wh | LG Gram Pro 16Z90TS-G.AU89G Core Ultra 7 256V, Arc 140V, 77 Wh | |
|---|---|---|---|---|---|---|
| Czasy pracy | -5% | 0% | 1% | -3% | 78% | |
| WiFi v1.3 (h) | 11 | 10.5 -5% | 11 0% | 11.1 1% | 10.7 -3% | 19.6 78% |
| H.264 (h) | 16.5 | 14.4 | 20.1 | |||
| Load (h) | 1.5 | 1.8 |
Ocena Notebookcheck
Dell 16 Premium oferuje takie same wrażenia z użytkowania jak XPS 16 9640, ale z szybszymi i bardziej wydajnymi procesorami oraz opcją wyświetlacza OLED 120 Hz.
Dell 16 Premium DA16250
- 31/10/2025 v8
Allen Ngo
 Total Sustainability Score:
 Potencjalni konkurenci w porównaniu
Obraz | Model / recenzja | Cena | Waga | Wysokość | Ekran |
|---|---|---|---|---|---|
1. 87.9%  | Dell 16 Premium DA16250 Intel Core Ultra 7 255H ⎘ NVIDIA GeForce RTX 5070 Laptop ⎘ 32 GB Pamięć, 1024 GB SSD | Amazon: Cena katalogowa: 3300 USD | 2.3 kg | 18.7 mm | 16.30" 3840x2400 278 PPI OLED |
2. 88.6% v7 (old)  | Dell XPS 16 9640 Intel Core Ultra 7 155H ⎘ NVIDIA GeForce RTX 4070 Laptop GPU ⎘ 32 GB Pamięć, 1024 GB SSD | Amazon: 1. $2,199.00 New XPS 16 9640 Business Lap... 2. $2,499.00 Dell XPS 16 9640 16.3" Touch... 3. $2,199.00 New XPS 16 9640 Powerful AI ... | 2.3 kg | 18.7 mm | 16.30" 3840x2400 139 PPI OLED |
3. 91.1% v7 (old)  | HP Spectre x360 16 RTX 4050 Intel Core Ultra 7 155H ⎘ NVIDIA GeForce RTX 4050 Laptop GPU ⎘ 16 GB Pamięć, 1024 GB SSD | Amazon: Cena katalogowa: 1600 USD | 2 kg | 19.8 mm | 16.00" 2880x1800 212 PPI OLED |
4. 90.4%  | Lenovo Yoga Pro 9i 16 RTX 5070 Intel Core Ultra 9 285H ⎘ NVIDIA GeForce RTX 5070 Laptop ⎘ 64 GB Pamięć, 1024 GB SSD | Amazon: Cena katalogowa: 2800€ | 1.9 kg | 17.9 mm | 16.00" 3200x2000 236 PPI OLED |
5. 84.7%  | Asus Zenbook S 16 UM5606-RK333W AMD Ryzen AI 9 HX 370 ⎘ AMD Radeon 890M ⎘ 32 GB Pamięć, 1024 GB SSD | Amazon: Cena katalogowa: 2100€ | 1.5 kg | 12.9 mm | 16.00" 2880x1800 212 PPI OLED |
6. 83.9%  | LG Gram Pro 16Z90TS-G.AU89G Intel Core Ultra 7 256V ⎘ Intel Arc Graphics 140V ⎘ 16 GB Pamięć, 1024 GB SSD | Amazon: Cena katalogowa: 2050€ | 1.2 kg | 13 mm | 16.00" 2560x1600 189 PPI IPS |
Przezroczystość
Wyboru urządzeń do recenzji dokonuje nasza redakcja. Próbka testowa została udostępniona autorowi jako pożyczka od producenta lub sprzedawcy detalicznego na potrzeby tej recenzji. Pożyczkodawca nie miał wpływu na tę recenzję, producent nie otrzymał też kopii tej recenzji przed publikacją. Nie było obowiązku publikowania tej recenzji. Jako niezależna firma medialna, Notebookcheck nie podlega władzy producentów, sprzedawców detalicznych ani wydawców.
Tak testuje Notebookcheck
Każdego roku Notebookcheck niezależnie sprawdza setki laptopów i smartfonów, stosując standardowe procedury, aby zapewnić porównywalność wszystkich wyników. Od około 20 lat stale rozwijamy nasze metody badawcze, ustanawiając przy tym standardy branżowe. W naszych laboratoriach testowych doświadczeni technicy i redaktorzy korzystają z wysokiej jakości sprzętu pomiarowego. Testy te obejmują wieloetapowy proces walidacji. Nasz kompleksowy system ocen opiera się na setkach uzasadnionych pomiarów i benchmarków, co pozwala zachować obiektywizm.
