Werdykt - Największe jak dotąd zmiany w serii
The rewizja XPS 2022 była takim punktem stycznym dla serii, że wiele jej nowych funkcji spotkało się z mieszanymi reakcjami ze strony długoletnich fanów XPS. W 2026 roku najnowsza rewizja radzi sobie z wieloma krytycznymi uwagami, wprowadzając znaczące ulepszenia ergonomiczne. Obudowa jest sztywniejsza, wrażliwe na dotyk klawisze funkcyjne zniknęły, clickpad jest łatwiejszy do zauważenia, a kamera internetowa ma teraz rozdzielczość większą niż 1080p, aby konkurować z większością konkurentów. Serwisowanie jest nieco trudniejsze, ale to niewielka cena, biorąc pod uwagę, o ile mocniejsza jest nowa konstrukcja i o ile głośniejsze są głośniki 10 W.
Pod względem wydajności, Panther Lake zdziałał cuda dla serii XPS 14, ponieważ jest dość blisko GeForce RTX 4050 bez dodatkowej wagi i zapotrzebowania na energię. Nawet gracze przekonają się, że Arc B390 jest bardzo wydajny jak na zintegrowany procesor graficzny.
Nadal istnieje kilka aspektów XPS 14, które można poprawić. Na przykład nadal brakuje migawki aparatu, a porzucone gniazdo MicroSD może być ogromnym cierniem dla twórców treści. Zarówno wydajność Turbo Boost, jak i obsługa HDR są słabsze niż u konkurentów, takich jak Asus ExpertBook Ultra podczas gdy stosunkowo miękkie sprzężenie zwrotne klawiszy może nie być idealne dla maszynistek. Niefortunne jest również to, że nowy XPS 14 ma o pół cala mniejszy rozmiar ekranu niż poprzednia konstrukcja, co zmniejsza powierzchnię ekranu.
Nowy XPS 14 jest jednak jak dotąd najbardziej dopracowaną rewizją serii, która jest łatwiejszą rekomendacją w porównaniu z dell 14 Premium 2025.
Za
Przeciw
Cena i dostępność
Dell obecnie wysyła XPS 14 2026 w cenie od 1600 USD za konfigurację podstawową lub 2200 USD za konfigurację w wersji recenzowanej.
- $1,795.49Dell XPS 14 Premium Laptop DA14250-14.5-inch Touch 3.2K OLED 48-120Hz Display, Intel Core Ultra 7 255H, Intel Arc Graphics, 32GB Memory, 1TB SSD, Backlit English Keyboard with Fingerprint Reader
- $2,049.00Dell XPS 14 9440 14.5" Notebook - Full HD Plus - Intel Core Ultra 7 155H - Intel Evo Platform - 16 GB - 512 GB SSD - English Keyboard - Platinum
- $2,099.99Dell XPS 16 9640 Laptop | Intel Core Ultra 7 155H CPU | NVIDIA GeForce RTX 4050 | 16.3" WUXGA (1920 x 1200) | 16GB DDR5 RAM | 2TB PCIe SSD + 512GB External | Win 11 | Backlit Keyboard
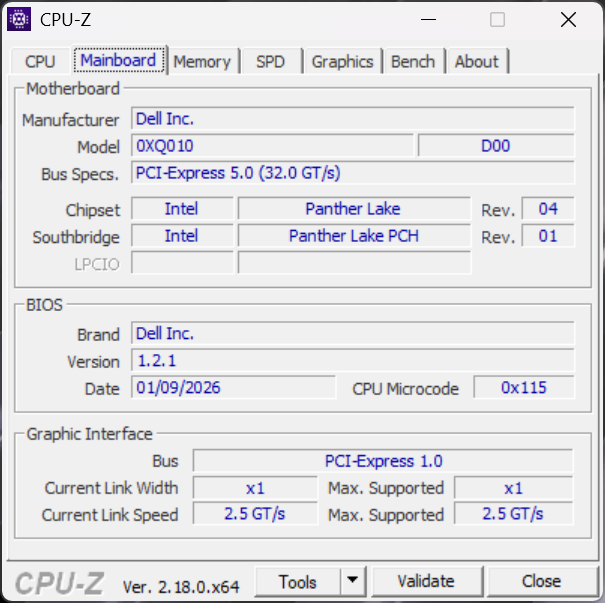
Po prawdopodobnie mylącym roku odejściu od brandingu XPSdell powraca do rozpoznawalnej nazwy z 2026 XPS 14 wraz z najnowszą platformą procesorową Intel Panther Lake. Model ma zupełnie nowy wygląd zewnętrzny z poprzedniej generacji 2025 Dell 14 Premium lub serii 2024 XPS 14.
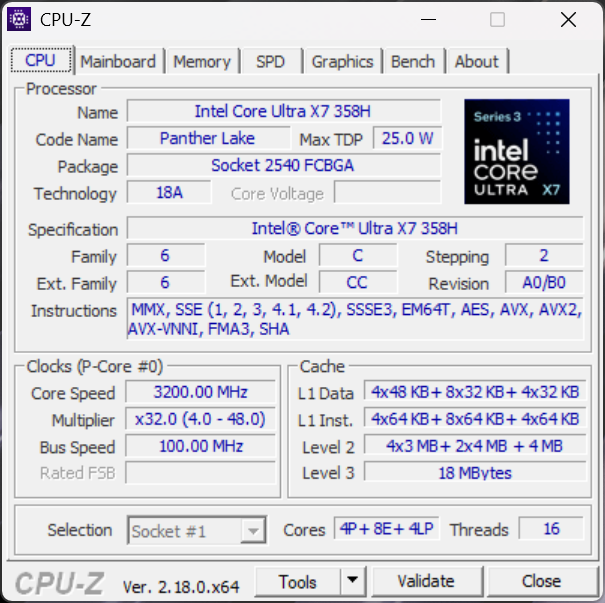
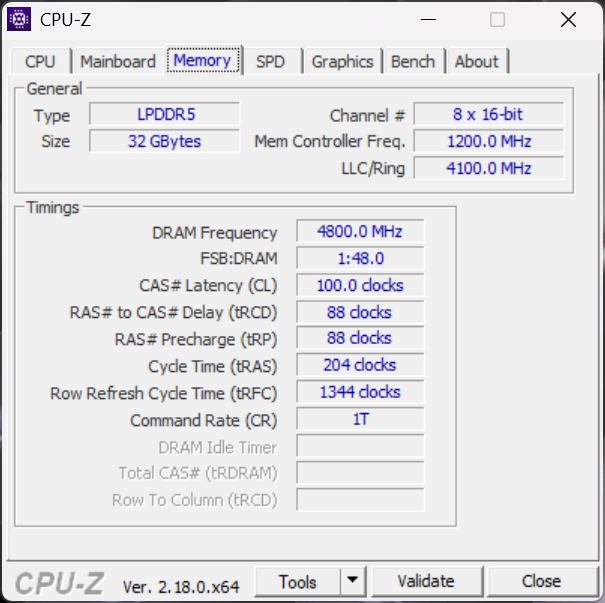
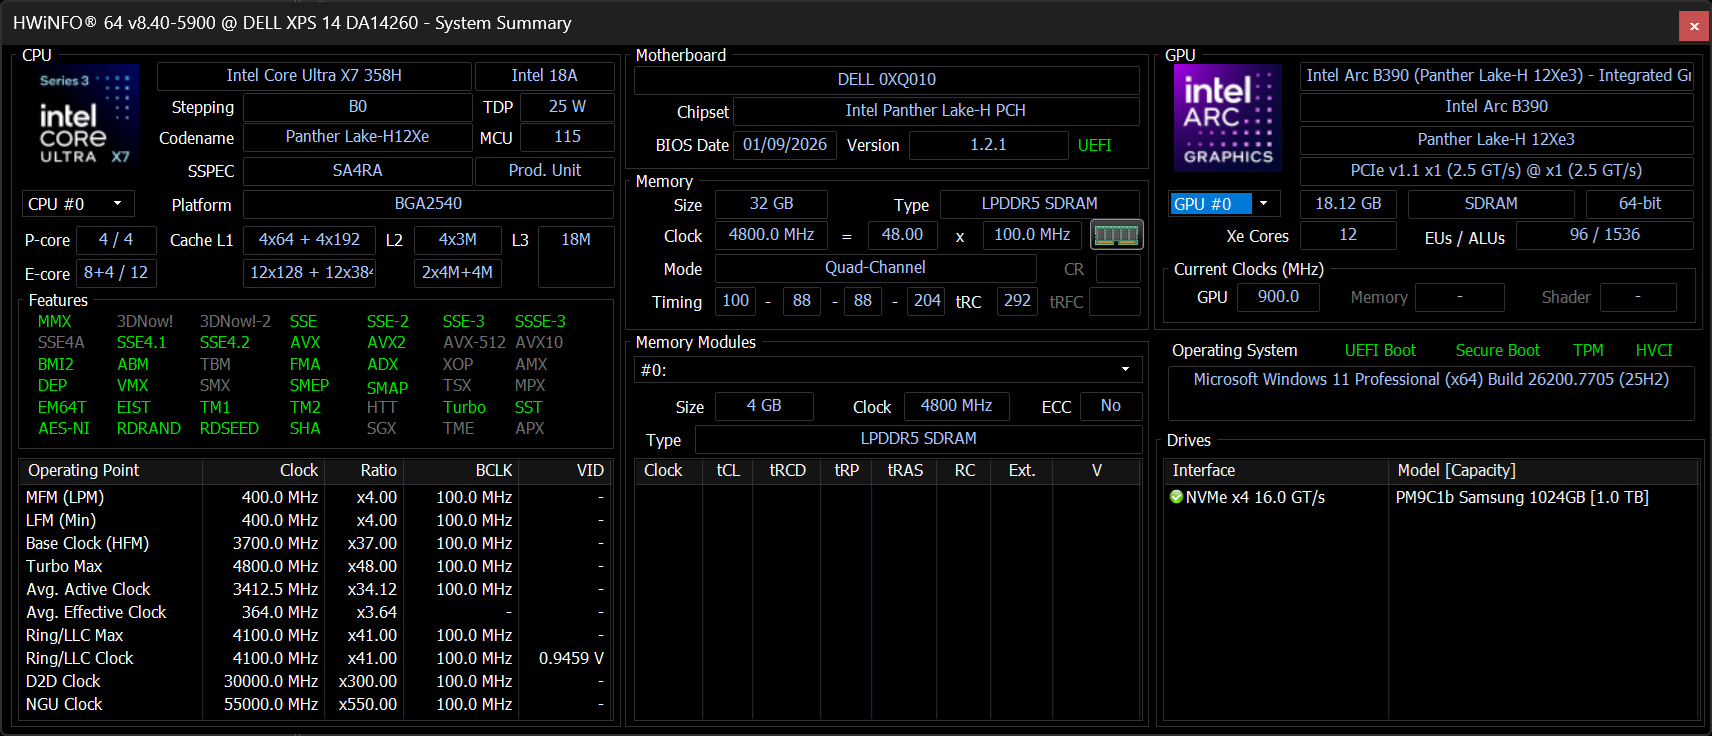
Nasza jednostka testowa to środkowa konfiguracja z procesorem Core Ultra X7 358H i ekranem dotykowym OLED 2,8K za około 2200 USD. Mniejsze jednostki SKU są dostarczane z procesorem Core Ultra 5 325 i wyświetlaczem 2K bez obsługi dotykowej, podczas gdy najwyższa jednostka SKU zawiera procesor Core Ultra X9 388H.
Alternatywy dla XPS 14 obejmują inne prosumenckie ultracienkie subnotebooki, takie jak Asus ExpertBook Ultra, HP EliteBook X G1i 14 AI, Lenovo Yoga Pro 7 14IAH10.
Więcej opinii o Dell:
Specyfikacje
Przypadek - właściwa ewolucja
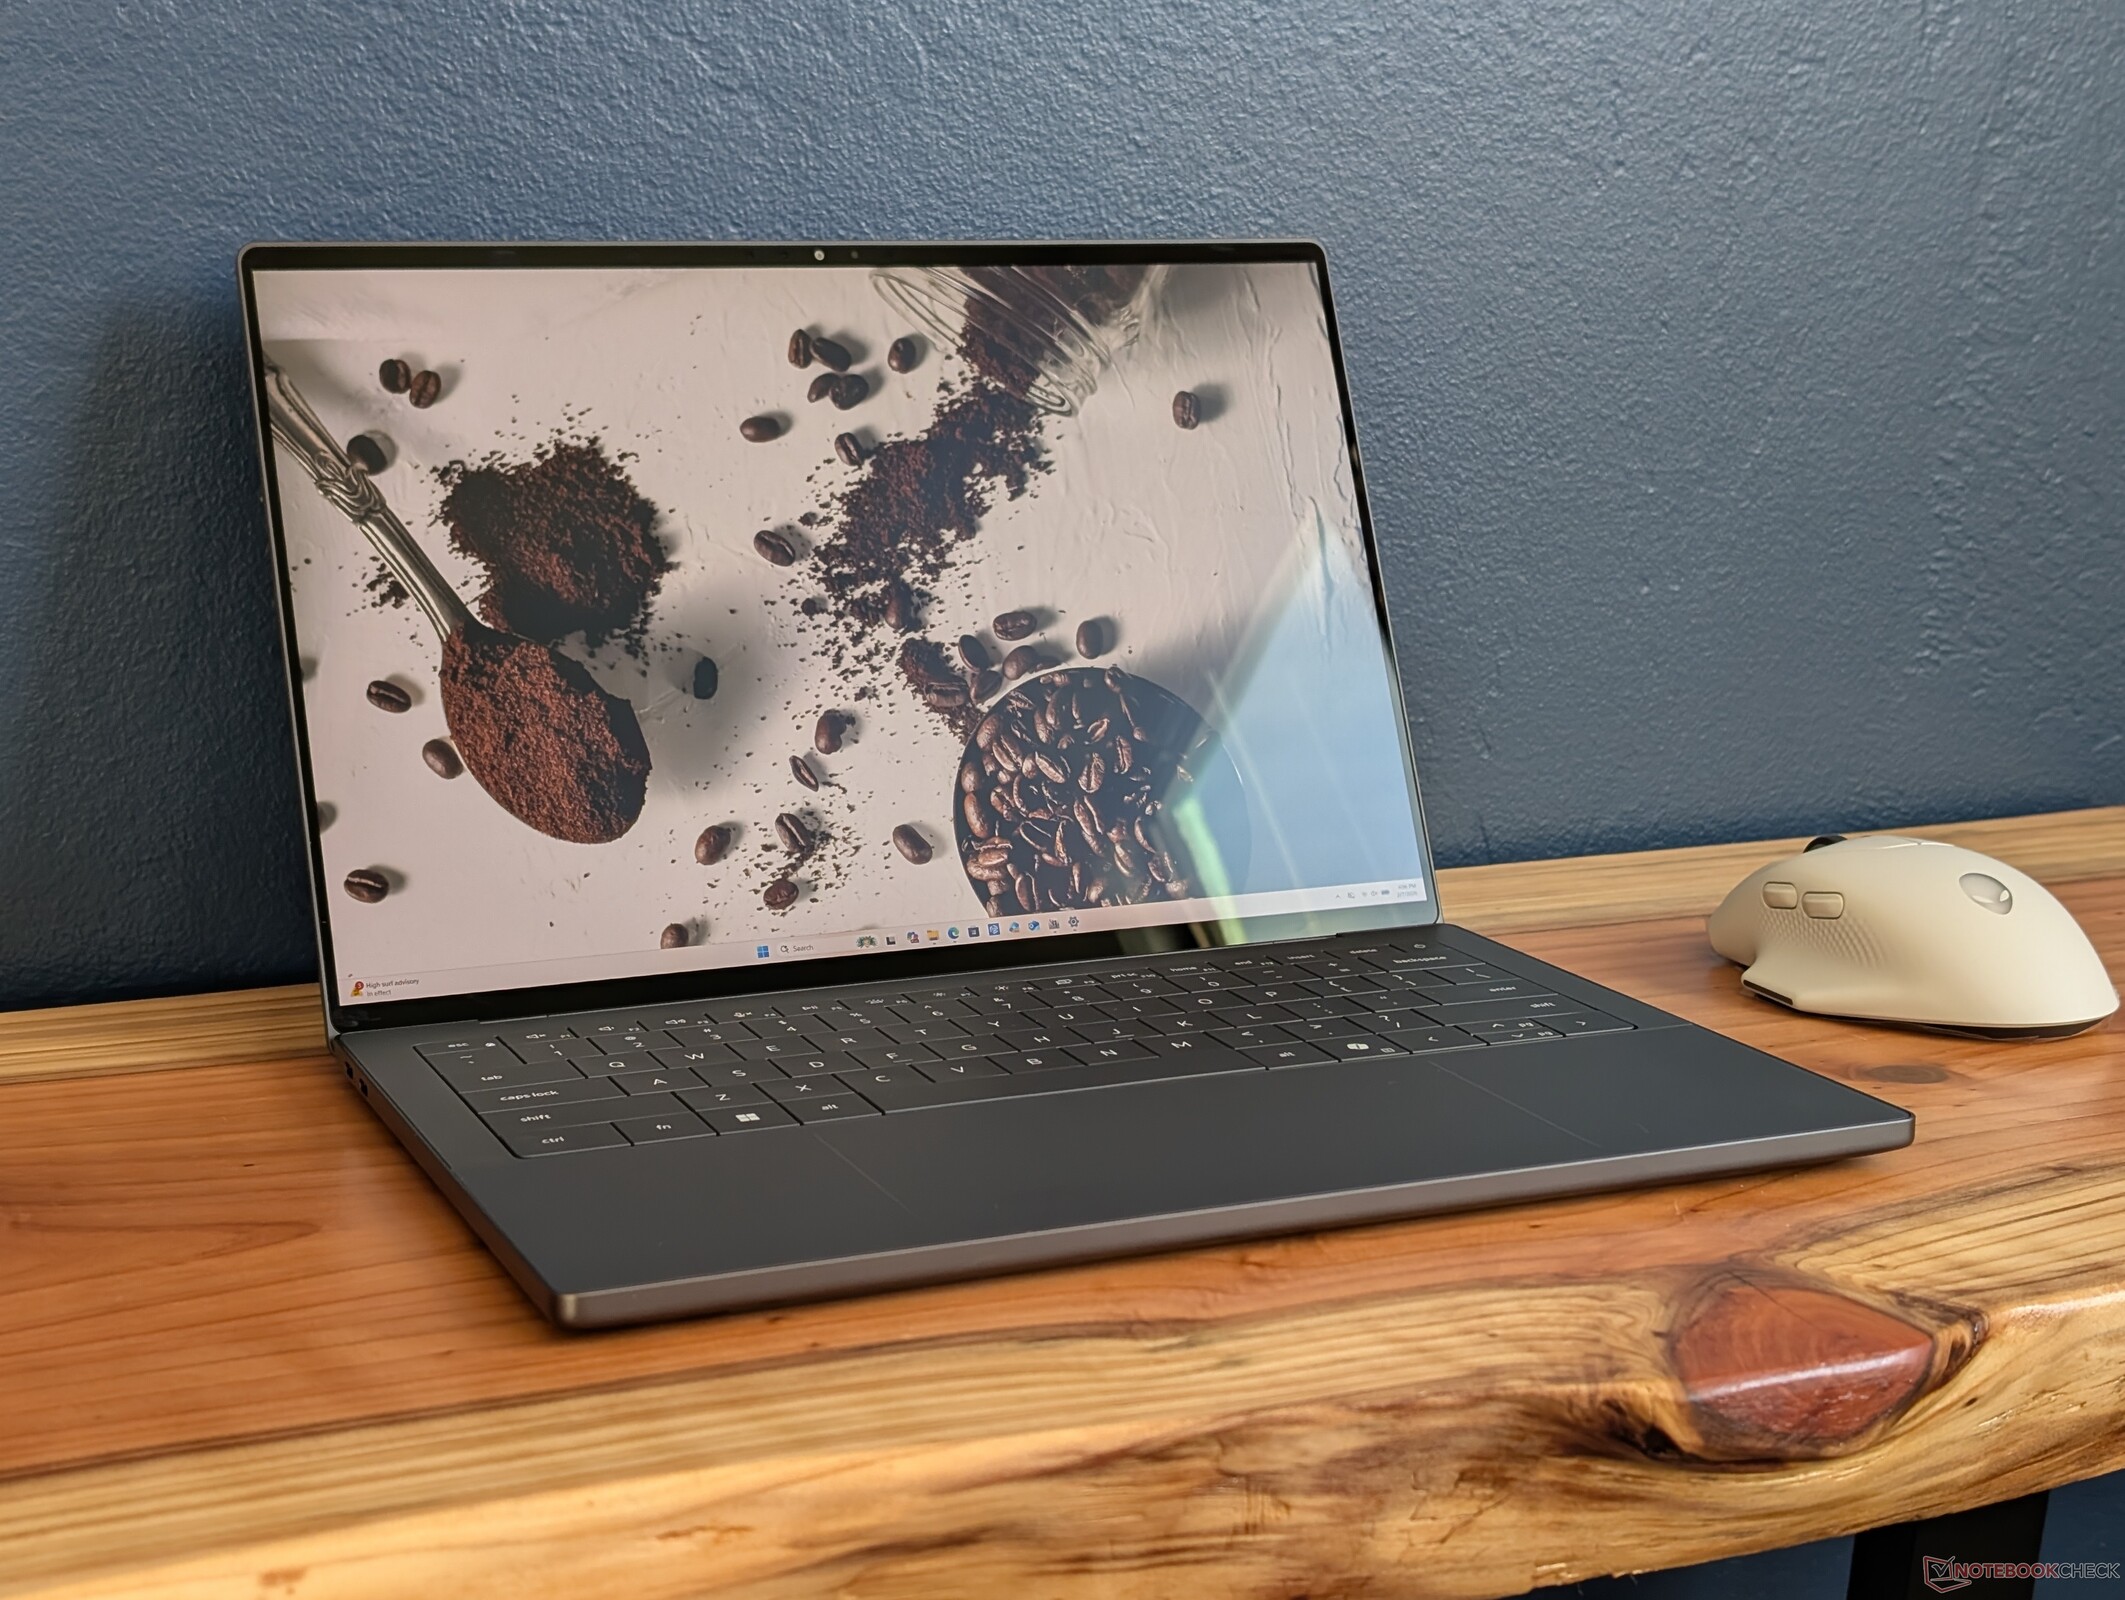
Przeprojektowana obudowa została obszernie omówiona w naszym oryginalnym filmie podglądowym, jak pokazano poniżej. Wizualnie, najbardziej zauważalną zmianą są przednie i boczne krawędzie, które są teraz bardziej płaskie i nie są już zwężane. Przednia krawędź jest zatem tak samo gruba jak tylna, podobnie jak w przypadku MacBook Pro lub Razer Blade.
Estetycznie, logo na systemie również zostało zamienione; podczas gdy logo "Dell" i "XPS" w modelu 2025 znajdowały się odpowiednio na górnej i dolnej pokrywie, logo "Dell" znajduje się teraz na dole, a logo "XPS" na górze.
Model 2026 jest jednocześnie cieńszy i lżejszy niż poprzednia konstrukcja, a jednocześnie sprawia wrażenie gęstszego i sztywniejszego, zwłaszcza wzdłuż przedniej krawędzi. Znaczną część tej różnicy można jednak przypisać przejściu z większego 14,5-calowego ekranu na zaledwie 14,0-calowy. Niemniej jednak jest on cięższy niż konkurenci, tacy jak HP EliteBook X G1i 14 lub ExpertBook Ultra o 200 do 300 gramów każdy.


Łączność
Potrójne porty USB-C Thunderbolt 4 z zeszłorocznego projektu powróciły. Niestety, użytkownicy kart SD otrzymali krótszy koniec kija, ponieważ czytnik został porzucony.


Komunikacja

Kamera internetowa
Pomimo ogromnej aktualizacji do 8 MP z zaledwie 2 MP w Dell 14 Premium, nadal nie ma fizycznej migawki prywatności.


Konserwacja
Procedury serwisowe są zarówno inne, jak i nieco trudniejsze niż w przypadku poprzedniej konstrukcji. Po odkręceniu czterech dolnych śrub T5 należy ostrożnie oddzielić klawiaturę od podstawy za pomocą ostrej krawędzi, aby odsłonić komponenty płyty głównej.
Oficjalny przewodnik serwisowy można znaleźć na stronie tutaj.

Zrównoważony rozwój
System składa się w 75% z aluminium pochodzącego z recyklingu w górnej i dolnej pokrywie, w 50% z kobaltu pochodzącego z recyklingu w baterii, w 90% ze stali pochodzącej z recyklingu w nakładkach na klawisze, w 10% ze szkła pochodzącego z recyklingu w SKU ekranu dotykowego OLED oraz w 100% z miedzi pochodzącej z recyklingu w częściach PCB. Samo opakowanie w pełni nadaje się do recyklingu i nie zawiera tworzyw sztucznych.
Akcesoria i gwarancja
W pudełku nie ma żadnych dodatków poza zasilaczem sieciowym i dokumentacją. W przypadku zakupu w Stanach Zjednoczonych obowiązuje standardowa roczna ograniczona gwarancja producenta.
Urządzenia wejściowe - koniec z przyciskami dotykowymi!
Klawiatura
Nowy XPS 14 rozwiązuje pewne obawy związane ze starszą konstrukcją klawiatury i clickpada. Najbardziej oczywiste jest pominięcie górnego rzędu klawiszy dotykowych na rzecz bardziej tradycyjnych klawiszy a la Dell Pro 13 Premium. Skok klawiszy i sprzężenie zwrotne są poza tym podobne do zeszłorocznego układu zero-lattice, który uważamy za płytszy i bardziej miękki niż klawisze z Lenovo ThinkPad T14 lub serii HP EliteBook 14.
Panel dotykowy
Podczas gdy bezszwowa klawiatura w zeszłorocznym projekcie była dość przestronna, brakowało jej wizualnych granic, więc trudno było wiedzieć, gdzie zaczyna się lub kończy powierzchnia wrażliwa na dotyk. Nowy XPS 14 dodaje subtelne wytrawianie wzdłuż boków panelu dotykowego (~15,2 x 7,5 cm), aby poprawić użyteczność bez wizualnej ingerencji. Haptyczne sprzężenie zwrotne mogłoby być jednak silniejsze i bardziej klikalne, ale przynajmniej nie jest nadmiernie czułe, w przeciwieństwie do tego, czego doświadczyliśmy na haptycznym panelu dotykowym ExpertBook Ultra.


Wyświetlacz

Dostępne są dwie opcje wyświetlania:
- 1920 x 1200, bezdotykowy, matowy, 500 nitów, 100% sRGB, IPS, 1 - 120 Hz
- 2880 x 1800, ekran dotykowy, błyszczący, 500 nitów, 100% DCI-P3, OLED, 20 - 120 Hz
XPS 14 wykorzystuje bardziej tradycyjny błyszczący wyświetlacz OLED Gorilla Glass 3, w przeciwieństwie do matowego wyświetlacza OLED Gorilla Glass Victus tandem w ExpertBook Ultra. Ekran OLED zdecydowanie nie jest tak ziarnisty jak w Asusie, ale maksymalna jasność HDR jest tylko o połowę niższa, co oznacza słabszą obsługę HDR.
Dell zmienił dostawcę OLED z Samsunga w zeszłorocznym modelu na LG Philips w tej wersji z 2026 roku. Podstawowe atrybuty są bardzo podobne między panelami, poza różnicą w ich rozmiarze (14 cali vs 14,5 cala)


| |||||||||||||||||||||||||
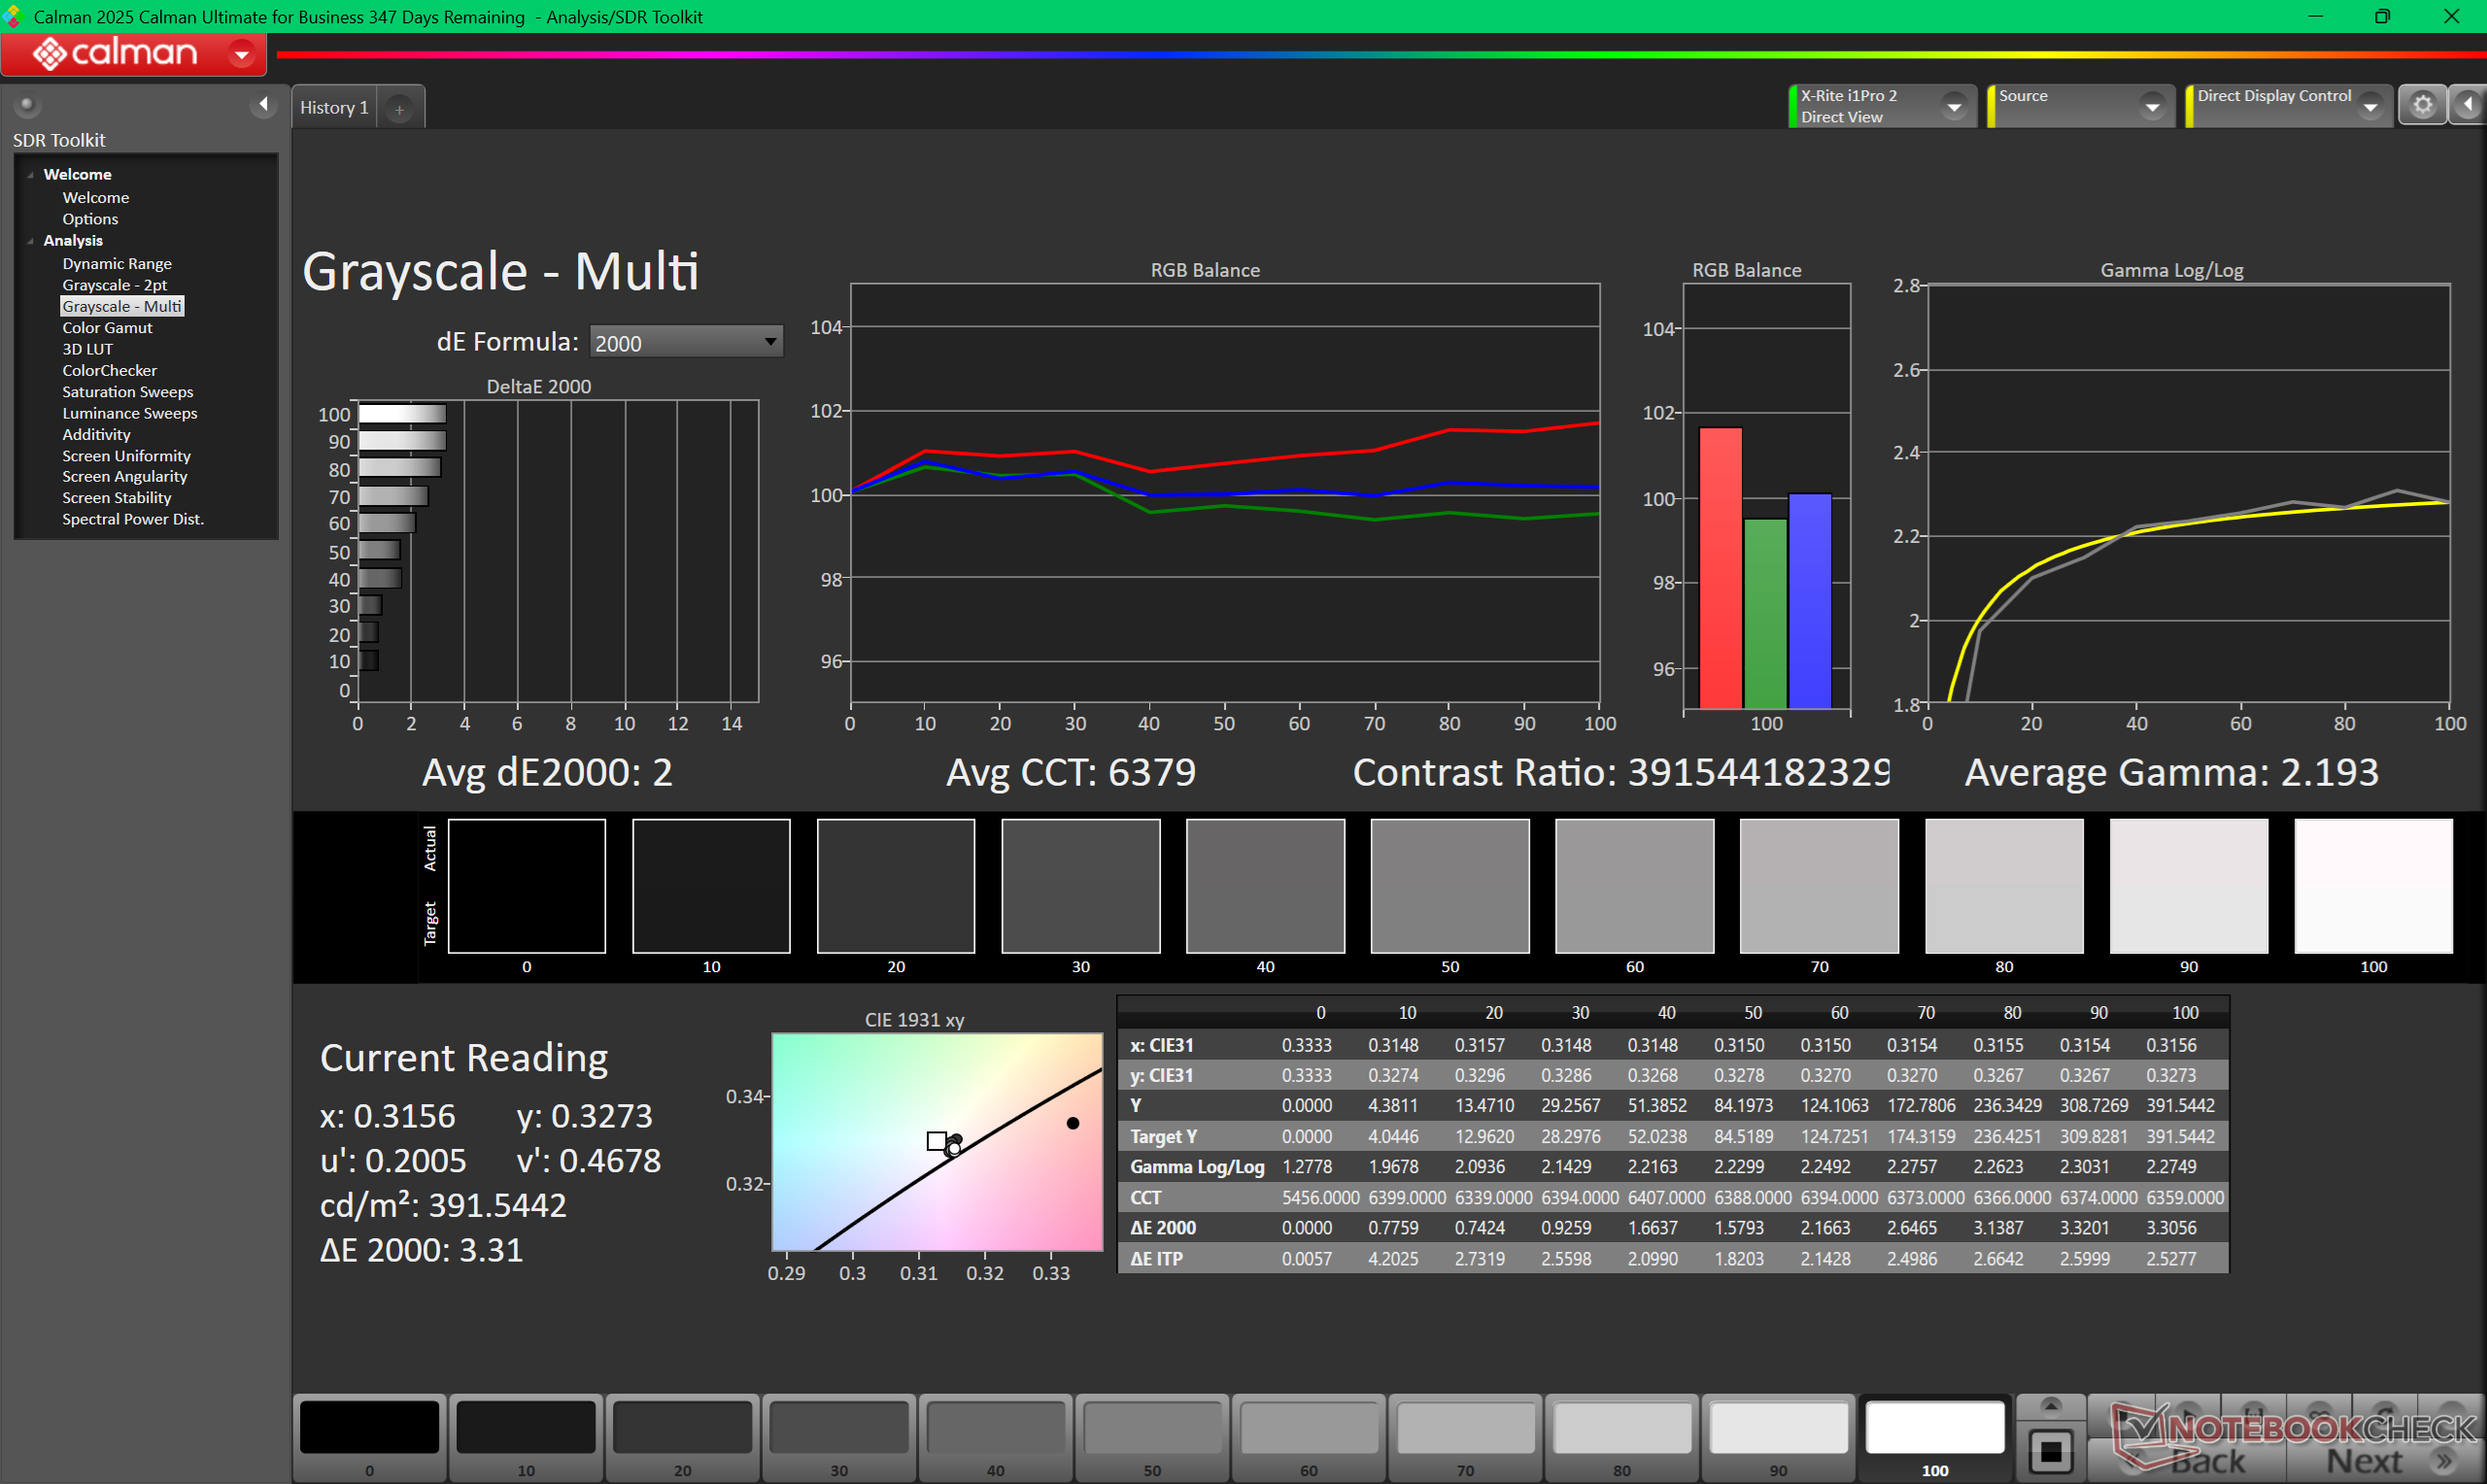
rozświetlenie: 96 %
na akumulatorze: 393.8 cd/m²
kontrast: ∞:1 (czerń: 0 cd/m²)
ΔE ColorChecker Calman: 1.27 | ∀{0.5-29.43 Ø4.73}
calibrated: 0.71
ΔE Greyscale Calman: 2 | ∀{0.09-98 Ø4.97}
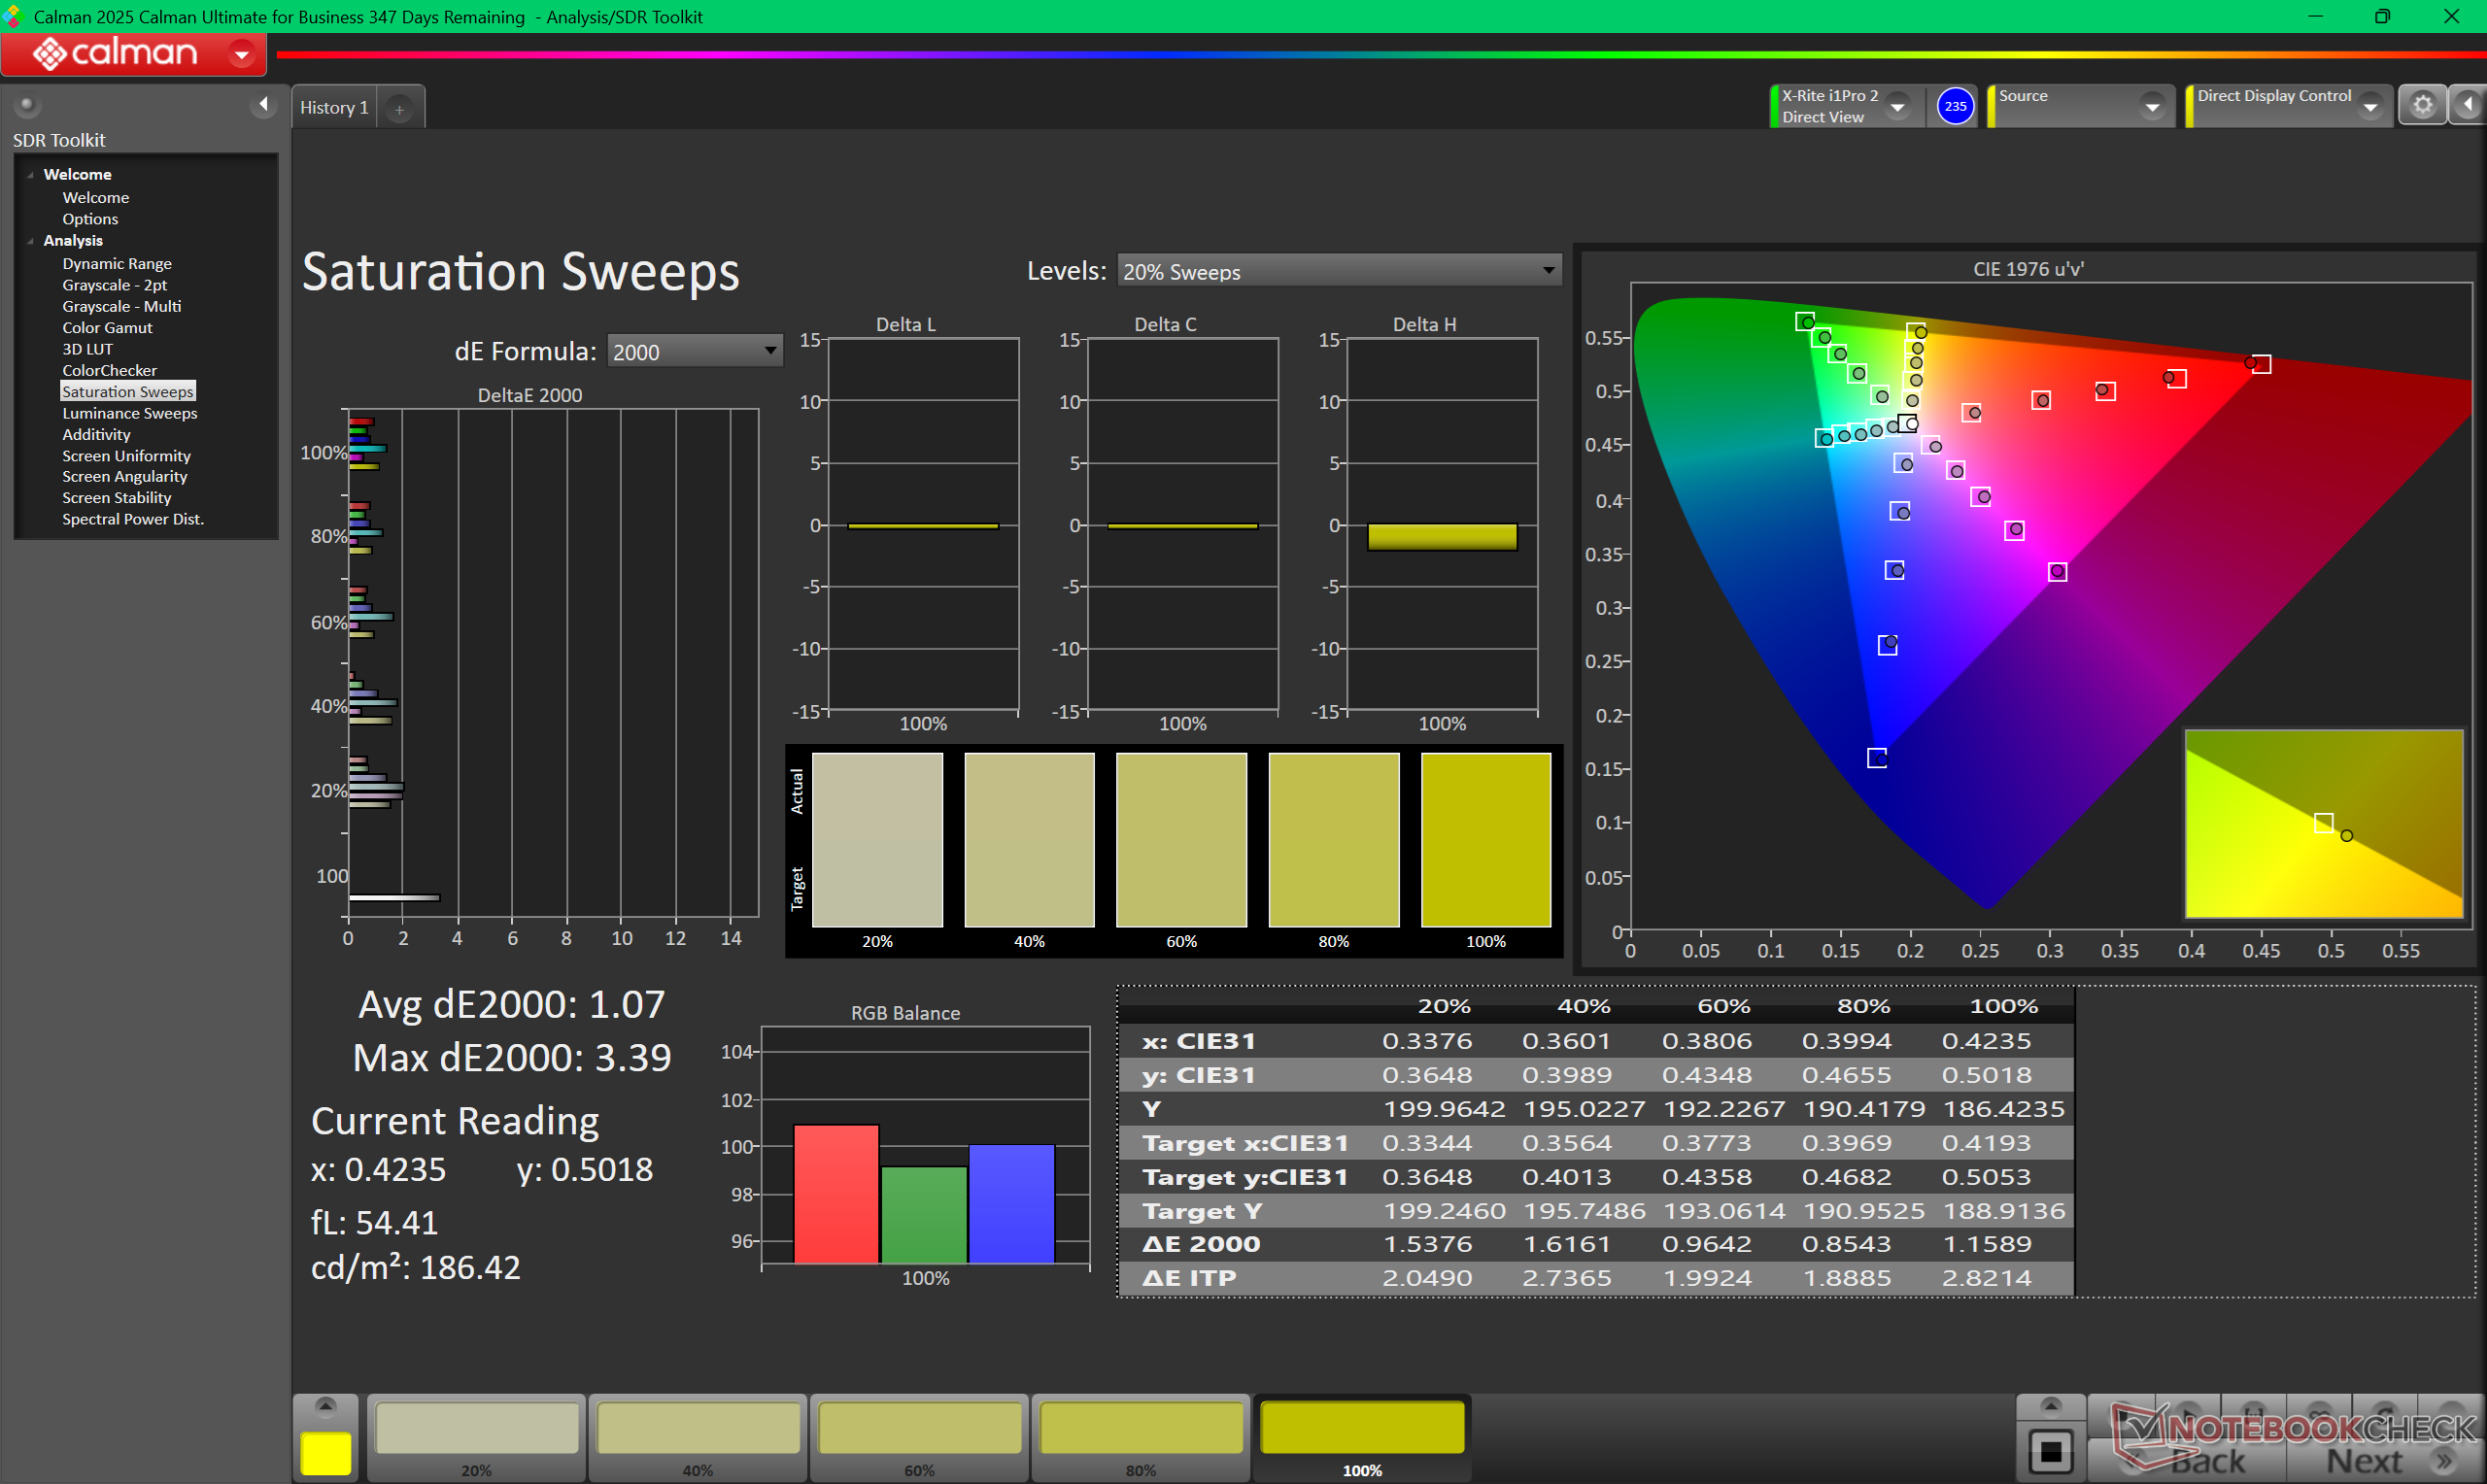
98.2% AdobeRGB 1998 (Argyll 3D)
100% sRGB (Argyll 3D)
99.7% Display P3 (Argyll 3D)
Gamma: 2.19
CCT: 6379 K
| Dell XPS 14 Core Ultra X7 358H LG Philips 140WT2, OLED, 2880x1800, 14", 120 Hz | Dell 14 Premium Samsung 145FB02, OLED, 3200x2000, 14.5", 120 Hz | Dell XPS 14 2024 OLED SDC41A2, OLED, 3200x2000, 14.5", 120 Hz | Asus ExpertBook Ultra B9406CAA Samsung ATNA40LE01-0, OLED, 2880x1800, 14", 120 Hz | Lenovo Yoga Pro 7 14IAH10 LEN145WQ+, OLED, 3000x1876, 14.5", 120 Hz | HP EliteBook X G1i 14 AI IPS, 1920x1200, 14", 60 Hz | |
|---|---|---|---|---|---|---|
| Display | -4% | -4% | -5% | -1% | -20% | |
| HDR Peak Brightness (cd/m²) | 1104 | |||||
| Display P3 Coverage (%) | 99.7 | 99.3 0% | 98.5 -1% | 96.2 -4% | 99.5 0% | 69.9 -30% |
| sRGB Coverage (%) | 100 | 100 0% | 100 0% | 100 0% | 99.4 -1% | 98.4 -2% |
| AdobeRGB 1998 Coverage (%) | 98.2 | 87.2 -11% | 87.2 -11% | 86.7 -12% | 95.5 -3% | 71.6 -27% |
| Response Times | 11% | 16% | 15% | 37% | -4079% | |
| Response Time Grey 50% / Grey 80% * (ms) | 0.75 ? | 0.72 ? 4% | 0.7 ? 7% | 0.71 ? 5% | 0.63 ? 16% | 42.3 ? -5540% |
| Response Time Black / White * (ms) | 1.03 ? | 0.96 ? 7% | 0.77 ? 25% | 0.94 ? 9% | 0.54 ? 48% | 28 ? -2618% |
| PWM Frequency (Hz) | 240.62 ? | 475 | 480 | 968.8 ? | 120 ? | |
| PWM Amplitude * (%) | 29 | 23 21% | 20 31% | 15 48% | ||
| Screen | -61% | -12% | 23% | 33% | -33% | |
| Brightness middle (cd/m²) | 393.8 | 349.3 -11% | 351 -11% | 600.5 52% | 497 26% | 487.5 24% |
| Brightness (cd/m²) | 389 | 352 -10% | 353 -9% | 612 57% | 500 29% | 469 21% |
| Brightness Distribution (%) | 96 | 98 2% | 97 1% | 96 0% | 96 0% | 91 -5% |
| Black Level * (cd/m²) | 0.26 | |||||
| Colorchecker dE 2000 * | 1.27 | 3.47 -173% | 1.7 -34% | 1.18 7% | 0.7 45% | 2.37 -87% |
| Colorchecker dE 2000 max. * | 3.35 | 7.38 -120% | 2.2 34% | 3.4 -1% | 1.7 49% | 5.77 -72% |
| Colorchecker dE 2000 calibrated * | 0.71 | 1.3 -83% | 0.8 -13% | 0.73 -3% | 0.86 -21% | |
| Greyscale dE 2000 * | 2 | 2.6 -30% | 3.1 -55% | 1 50% | 1 50% | 3.8 -90% |
| Gamma | 2.19 100% | 2.22 99% | 2.12 104% | 2.27 97% | 2.22 99% | 2.14 103% |
| CCT | 6379 102% | 6758 96% | 6616 98% | 6567 99% | 6404 101% | 6540 99% |
| Contrast (:1) | 1875 | |||||
| Całkowita średnia (program / ustawienia) | -18% /
-31% | 0% /
-6% | 11% /
15% | 23% /
26% | -1377% /
-704% |
* ... im mniej tym lepiej


Wyświetlacz jest dobrze skalibrowany, a średnie wartości deltaE dla skali szarości i kolorów wynoszą 2 lub mniej. Dalsza kalibracja panelu za pomocą naszego kolorymetru tylko nieznacznie poprawiłaby kolory.


Wyświetl czasy reakcji
| ↔ Czas reakcji od czerni do bieli | ||
|---|---|---|
| 1.03 ms ... wzrost ↗ i spadek ↘ łącznie | ↗ 0.53 ms wzrost | 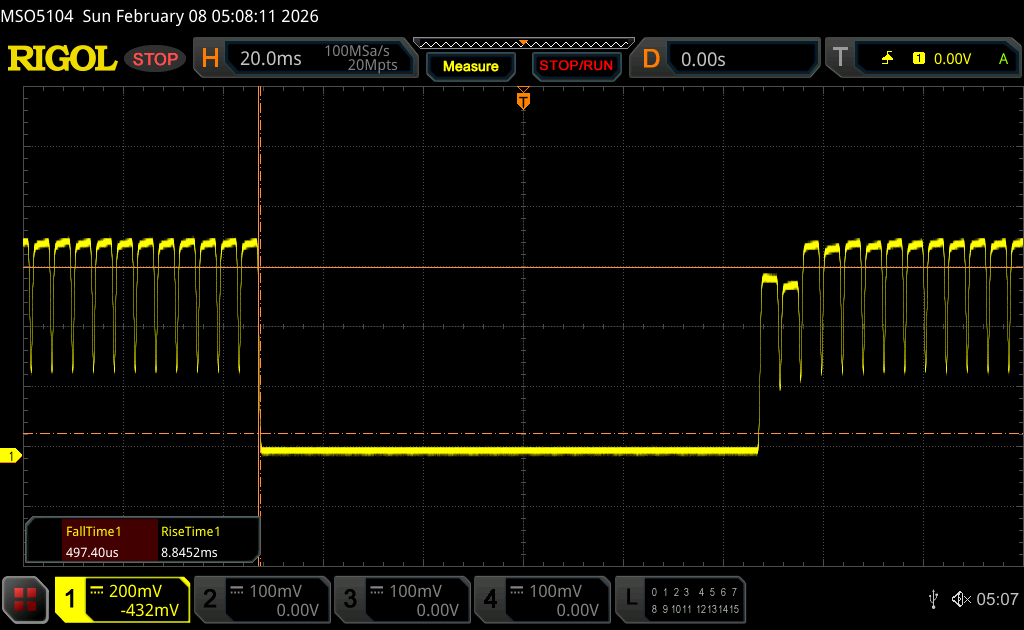 |
| ↘ 0.5 ms upadek | ||
| W naszych testach ekran wykazuje bardzo szybką reakcję i powinien bardzo dobrze nadawać się do szybkich gier. Dla porównania, wszystkie testowane urządzenia wahają się od 0.1 (minimum) do 240 (maksimum) ms. » 4 % wszystkich urządzeń jest lepszych. Oznacza to, że zmierzony czas reakcji jest lepszy od średniej wszystkich testowanych urządzeń (19.9 ms). | ||
| ↔ Czas reakcji 50% szarości do 80% szarości | ||
| 0.75 ms ... wzrost ↗ i spadek ↘ łącznie | ↗ 0.43 ms wzrost | 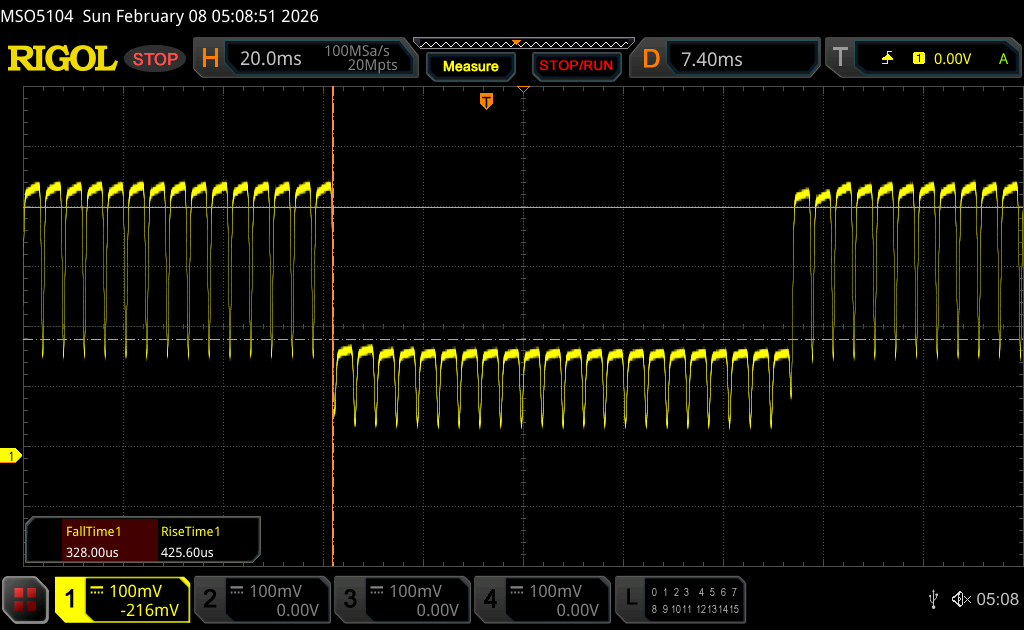 |
| ↘ 0.32 ms upadek | ||
| W naszych testach ekran wykazuje bardzo szybką reakcję i powinien bardzo dobrze nadawać się do szybkich gier. Dla porównania, wszystkie testowane urządzenia wahają się od 0.165 (minimum) do 636 (maksimum) ms. » 2 % wszystkich urządzeń jest lepszych. Oznacza to, że zmierzony czas reakcji jest lepszy od średniej wszystkich testowanych urządzeń (31.1 ms). | ||
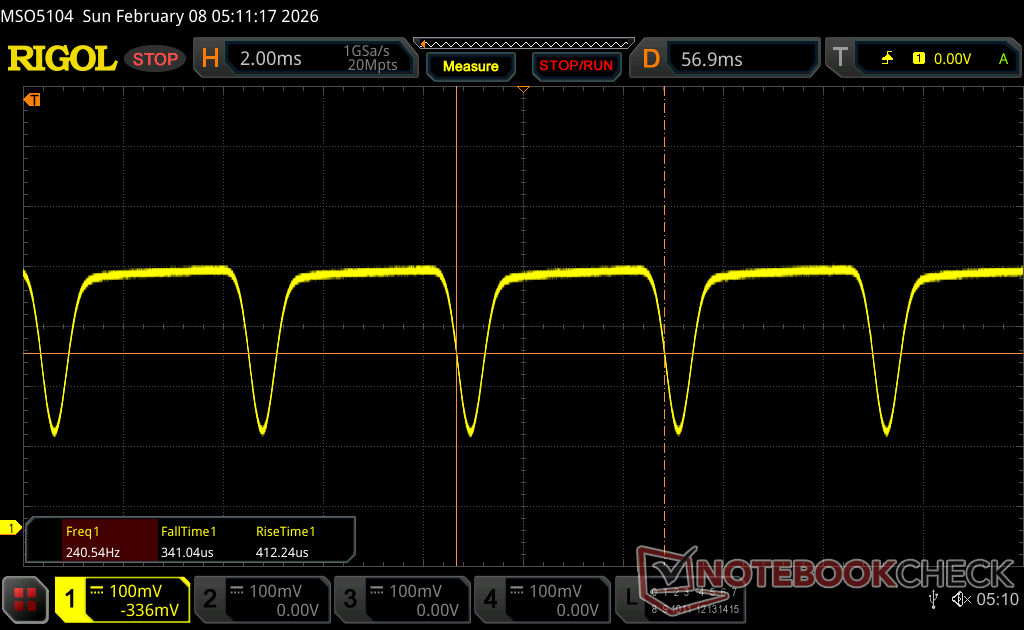
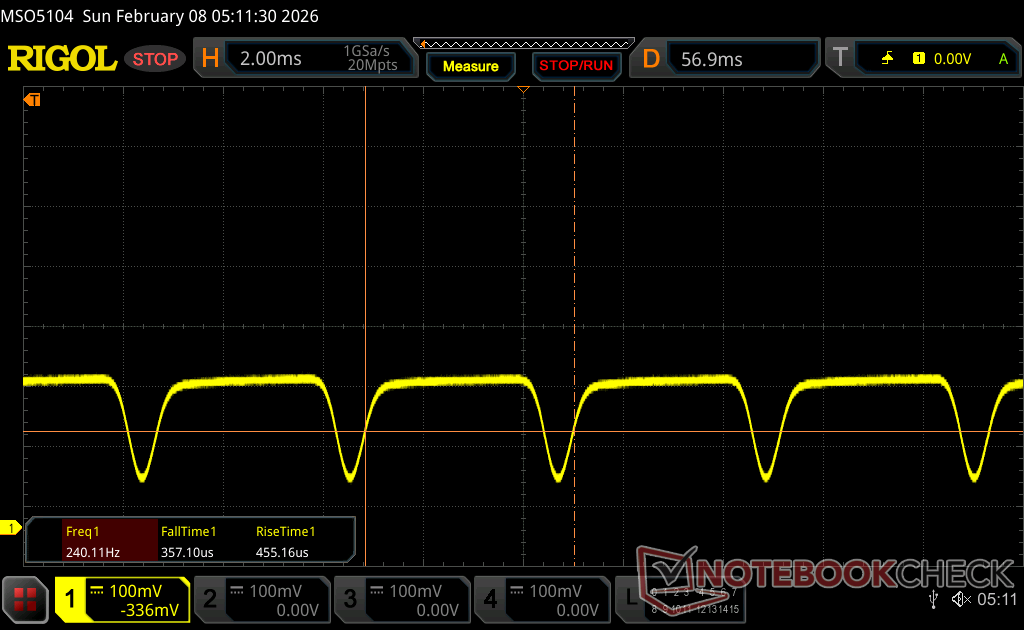
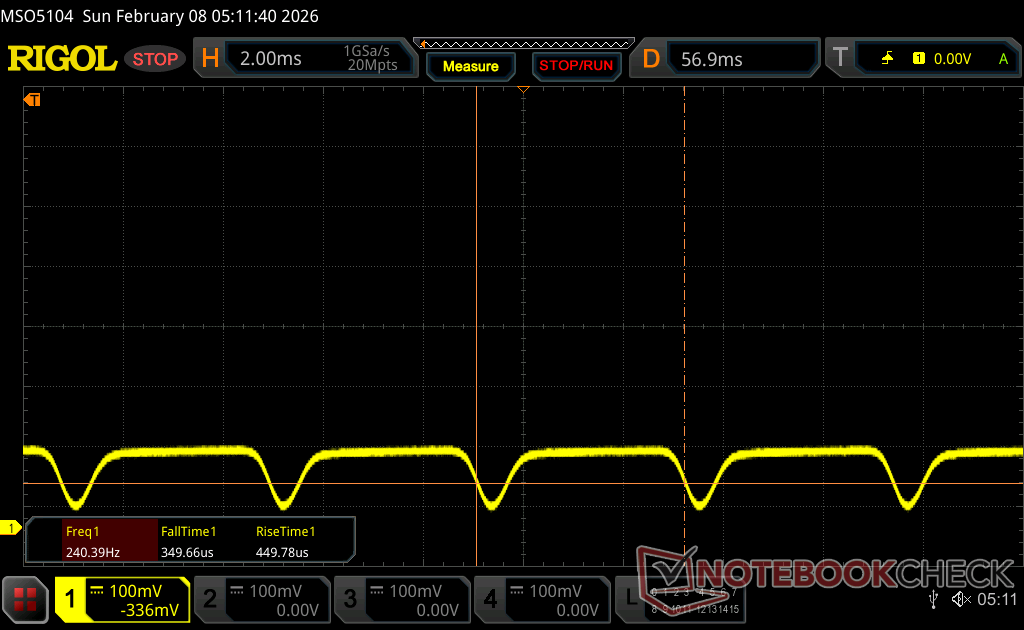
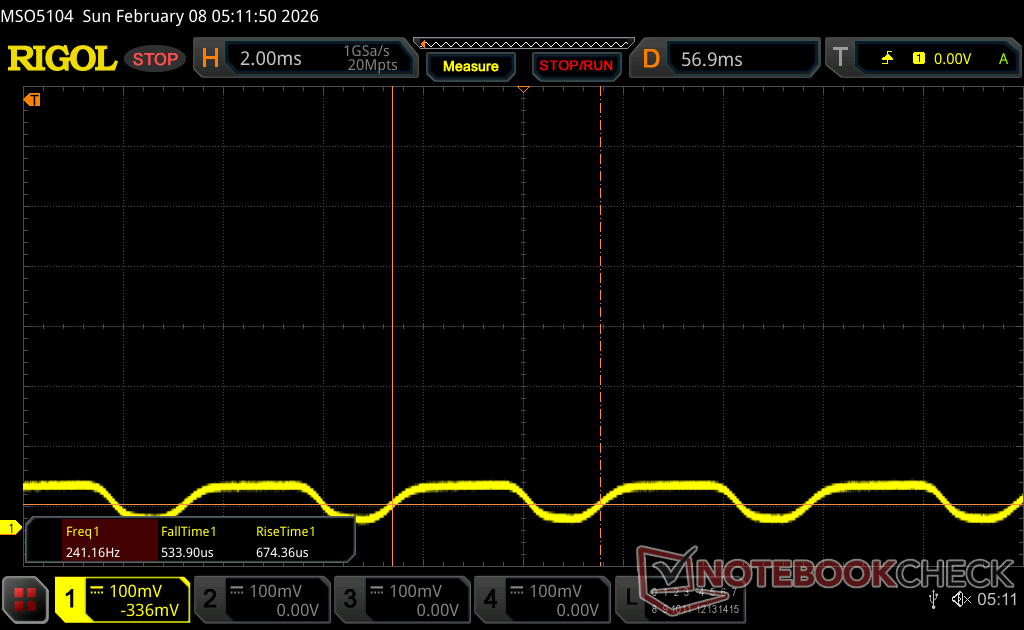
Migotanie ekranu / PWM (modulacja szerokości impulsu)
| Wykryto migotanie ekranu/wykryto PWM | 240.62 Hz Amplitude: 29 % | ≤ 100 % ustawienia jasności | 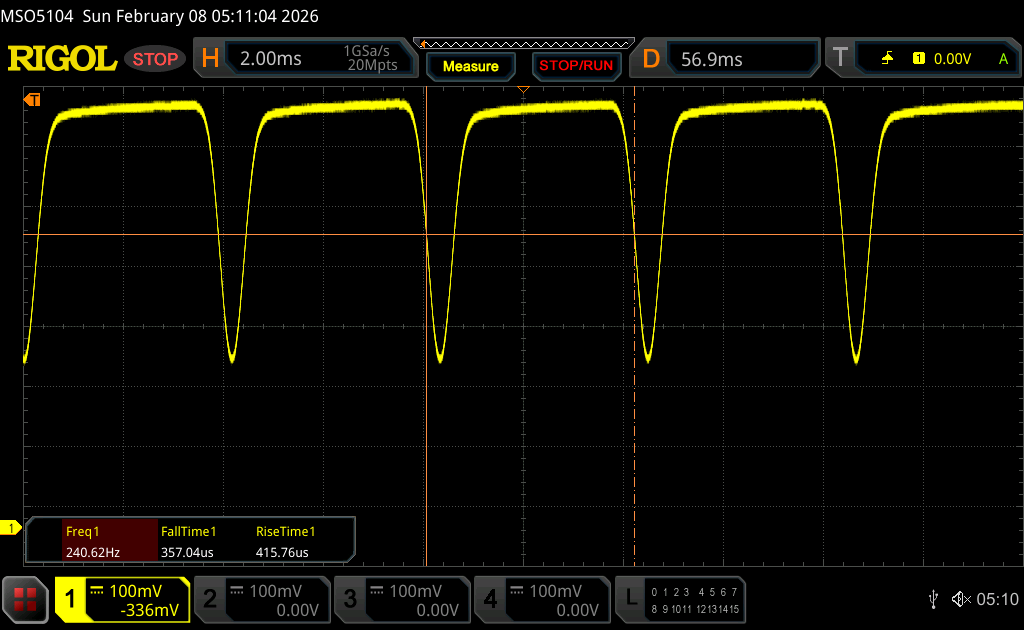 |
Podświetlenie wyświetlacza miga z częstotliwością 240.62 Hz (najgorszy przypadek, np. przy użyciu PWM) Wykryto migotanie przy ustawieniu jasności 100 % i poniżej. Powyżej tego ustawienia jasności nie powinno być żadnego migotania ani PWM. Częstotliwość 240.62 Hz jest stosunkowo niska, więc wrażliwi użytkownicy prawdopodobnie zauważą migotanie i odczują zmęczenie oczu przy podanym ustawieniu jasności i poniżej. Dla porównania: 52 % wszystkich testowanych urządzeń nie używa PWM do przyciemniania wyświetlacza. Jeśli wykryto PWM, zmierzono średnio 7794 (minimum: 5 - maksimum: 343500) Hz. | |||
Widoczność na zewnątrz jest przyzwoita w cieniu, ale zbyt słaba i odblaskowa w jaśniejszych warunkach.


Wydajność - Panther Lake Boost
Warunki testowania
Przed przeprowadzeniem poniższych testów porównawczych ustawiliśmy system Windows i Dell Optimizer na tryb wydajności.
Procesor
Surowa wydajność procesora mieści się w granicach 5 procent Core Ultra 7 255H w zeszłorocznym Dell 14 Premium, więc obecni właściciele nie powinni oczekiwać żadnych znaczących wzrostów w tym zakresie. Co więcej, wydajność wielowątkowa spadłaby nawet o 25 procent podczas uruchamiania CineBench R15 xT w pętli, jak pokazuje poniższy wykres porównawczy. Asus ExpertBook Ultra, który jest wyposażony w ten sam procesor Core Ultra X7 358H CPU jak nasza jednostka Dell, dławiłby się zauważalnie mniej dla szybszej wydajności.
Aktualizacja do najwyższej klasy Core Ultra X9 388H SKU powinna poprawić wydajność tylko o 5 do 10 procent w oparciu o nasz czas spędzony z Asus ZenBook Duo.
Cinebench R15 Multi Loop
Cinebench R23: Multi Core | Single Core
Cinebench R20: CPU (Multi Core) | CPU (Single Core)
Cinebench R15: CPU Multi 64Bit | CPU Single 64Bit
Blender: v2.79 BMW27 CPU
7-Zip 18.03: 7z b 4 | 7z b 4 -mmt1
Geekbench 6.7: Multi-Core | Single-Core
Geekbench 5.5: Multi-Core | Single-Core
HWBOT x265 Benchmark v2.2: 4k Preset
LibreOffice : 20 Documents To PDF
R Benchmark 2.5: Overall mean
* ... im mniej tym lepiej
AIDA64: FP32 Ray-Trace | FPU Julia | CPU SHA3 | CPU Queen | FPU SinJulia | FPU Mandel | CPU AES | CPU ZLib | FP64 Ray-Trace | CPU PhotoWorxx
| Performance rating | |
| Lenovo Yoga Pro 7 14IAH10 | |
| Dell XPS 14 Core Ultra X7 358H | |
| Przeciętny Intel Core Ultra X7 358H | |
| Dell XPS 14 2024 OLED | |
| HP EliteBook X G1i 14 AI | |
| Asus ExpertBook Ultra B9406CAA | |
| AIDA64 / FP32 Ray-Trace | |
| Lenovo Yoga Pro 7 14IAH10 | |
| Przeciętny Intel Core Ultra X7 358H (12221 - 17932, n=8) | |
| Dell XPS 14 Core Ultra X7 358H | |
| HP EliteBook X G1i 14 AI | |
| Asus ExpertBook Ultra B9406CAA | |
| Dell XPS 14 2024 OLED | |
| AIDA64 / FPU Julia | |
| Lenovo Yoga Pro 7 14IAH10 | |
| Przeciętny Intel Core Ultra X7 358H (29930 - 95525, n=8) | |
| Dell XPS 14 Core Ultra X7 358H | |
| Dell XPS 14 2024 OLED | |
| HP EliteBook X G1i 14 AI | |
| Asus ExpertBook Ultra B9406CAA | |
| AIDA64 / CPU SHA3 | |
| Lenovo Yoga Pro 7 14IAH10 | |
| Asus ExpertBook Ultra B9406CAA | |
| Przeciętny Intel Core Ultra X7 358H (3910 - 4911, n=8) | |
| Dell XPS 14 Core Ultra X7 358H | |
| Dell XPS 14 2024 OLED | |
| HP EliteBook X G1i 14 AI | |
| AIDA64 / CPU Queen | |
| Dell XPS 14 2024 OLED | |
| Lenovo Yoga Pro 7 14IAH10 | |
| Dell XPS 14 Core Ultra X7 358H | |
| Przeciętny Intel Core Ultra X7 358H (63425 - 63827, n=2) | |
| Asus ExpertBook Ultra B9406CAA | |
| HP EliteBook X G1i 14 AI | |
| AIDA64 / FPU SinJulia | |
| Lenovo Yoga Pro 7 14IAH10 | |
| Dell XPS 14 2024 OLED | |
| Dell XPS 14 Core Ultra X7 358H | |
| Przeciętny Intel Core Ultra X7 358H (4735 - 7038, n=8) | |
| Asus ExpertBook Ultra B9406CAA | |
| HP EliteBook X G1i 14 AI | |
| AIDA64 / FPU Mandel | |
| Lenovo Yoga Pro 7 14IAH10 | |
| Przeciętny Intel Core Ultra X7 358H (14716 - 50734, n=8) | |
| Dell XPS 14 Core Ultra X7 358H | |
| HP EliteBook X G1i 14 AI | |
| Dell XPS 14 2024 OLED | |
| Asus ExpertBook Ultra B9406CAA | |
| AIDA64 / CPU AES | |
| Lenovo Yoga Pro 7 14IAH10 | |
| Dell XPS 14 Core Ultra X7 358H | |
| Dell XPS 14 2024 OLED | |
| Przeciętny Intel Core Ultra X7 358H (5127 - 67510, n=8) | |
| HP EliteBook X G1i 14 AI | |
| Asus ExpertBook Ultra B9406CAA | |
| AIDA64 / CPU ZLib | |
| Lenovo Yoga Pro 7 14IAH10 | |
| Asus ExpertBook Ultra B9406CAA | |
| Dell XPS 14 Core Ultra X7 358H | |
| Przeciętny Intel Core Ultra X7 358H (932 - 1179, n=8) | |
| Dell XPS 14 2024 OLED | |
| HP EliteBook X G1i 14 AI | |
| AIDA64 / FP64 Ray-Trace | |
| Lenovo Yoga Pro 7 14IAH10 | |
| Przeciętny Intel Core Ultra X7 358H (6506 - 9447, n=8) | |
| Dell XPS 14 Core Ultra X7 358H | |
| HP EliteBook X G1i 14 AI | |
| Asus ExpertBook Ultra B9406CAA | |
| Dell XPS 14 2024 OLED | |
| AIDA64 / CPU PhotoWorxx | |
| Dell XPS 14 Core Ultra X7 358H | |
| Przeciętny Intel Core Ultra X7 358H (30538 - 88154, n=8) | |
| Lenovo Yoga Pro 7 14IAH10 | |
| HP EliteBook X G1i 14 AI | |
| Dell XPS 14 2024 OLED | |
| Asus ExpertBook Ultra B9406CAA | |
Wydajność systemu
Wyniki PCMark są jednymi z najwyższych spośród wszystkich subnotebooków wyposażonych w zintegrowany układ graficzny. W szczególności wyniki podtestów Productivity i Digital Content Creation stanowią znaczącą poprawę w stosunku do modeli poprzedniej generacji.

PCMark 10: Score | Essentials | Productivity | Digital Content Creation
CrossMark: Overall | Productivity | Creativity | Responsiveness
WebXPRT 3: Overall
WebXPRT 4: Overall
Mozilla Kraken 1.1: Total
Geekbench AI: Single Precision GPU 1.7 | Half Precision GPU 1.7 | Quantized GPU 1.7
| Performance rating | |
| Dell XPS 14 Core Ultra X7 358H | |
| Przeciętny Intel Core Ultra X7 358H, Intel Arc B390 12 Xe3 Panther Lake iGPU | |
| Asus ExpertBook Ultra B9406CAA | |
| Lenovo Yoga Pro 7 14IAH10 -3! | |
| HP EliteBook X G1i 14 AI | |
| Dell XPS 14 2024 OLED -3! | |
| Dell 14 Premium | |
| PCMark 10 / Score | |
| Dell XPS 14 Core Ultra X7 358H | |
| Przeciętny Intel Core Ultra X7 358H, Intel Arc B390 12 Xe3 Panther Lake iGPU (8834 - 9880, n=8) | |
| Asus ExpertBook Ultra B9406CAA | |
| Lenovo Yoga Pro 7 14IAH10 | |
| HP EliteBook X G1i 14 AI | |
| Dell 14 Premium | |
| Dell XPS 14 2024 OLED | |
| PCMark 10 / Essentials | |
| Dell XPS 14 Core Ultra X7 358H | |
| Przeciętny Intel Core Ultra X7 358H, Intel Arc B390 12 Xe3 Panther Lake iGPU (10282 - 11263, n=7) | |
| Lenovo Yoga Pro 7 14IAH10 | |
| Asus ExpertBook Ultra B9406CAA | |
| Dell 14 Premium | |
| HP EliteBook X G1i 14 AI | |
| Dell XPS 14 2024 OLED | |
| PCMark 10 / Productivity | |
| Dell XPS 14 Core Ultra X7 358H | |
| Przeciętny Intel Core Ultra X7 358H, Intel Arc B390 12 Xe3 Panther Lake iGPU (13908 - 16780, n=7) | |
| Asus ExpertBook Ultra B9406CAA | |
| HP EliteBook X G1i 14 AI | |
| Lenovo Yoga Pro 7 14IAH10 | |
| Dell XPS 14 2024 OLED | |
| Dell 14 Premium | |
| PCMark 10 / Digital Content Creation | |
| Dell XPS 14 Core Ultra X7 358H | |
| Przeciętny Intel Core Ultra X7 358H, Intel Arc B390 12 Xe3 Panther Lake iGPU (13082 - 13893, n=7) | |
| Asus ExpertBook Ultra B9406CAA | |
| Lenovo Yoga Pro 7 14IAH10 | |
| Dell 14 Premium | |
| HP EliteBook X G1i 14 AI | |
| Dell XPS 14 2024 OLED | |
| CrossMark / Overall | |
| Przeciętny Intel Core Ultra X7 358H, Intel Arc B390 12 Xe3 Panther Lake iGPU (1884 - 2119, n=8) | |
| Lenovo Yoga Pro 7 14IAH10 | |
| Dell XPS 14 Core Ultra X7 358H | |
| Asus ExpertBook Ultra B9406CAA | |
| Dell XPS 14 2024 OLED | |
| HP EliteBook X G1i 14 AI | |
| Dell 14 Premium | |
| CrossMark / Productivity | |
| Lenovo Yoga Pro 7 14IAH10 | |
| Przeciętny Intel Core Ultra X7 358H, Intel Arc B390 12 Xe3 Panther Lake iGPU (1678 - 1928, n=8) | |
| Dell XPS 14 Core Ultra X7 358H | |
| Asus ExpertBook Ultra B9406CAA | |
| HP EliteBook X G1i 14 AI | |
| Dell XPS 14 2024 OLED | |
| Dell 14 Premium | |
| CrossMark / Creativity | |
| Przeciętny Intel Core Ultra X7 358H, Intel Arc B390 12 Xe3 Panther Lake iGPU (2241 - 2529, n=8) | |
| Dell XPS 14 Core Ultra X7 358H | |
| Lenovo Yoga Pro 7 14IAH10 | |
| Asus ExpertBook Ultra B9406CAA | |
| Dell XPS 14 2024 OLED | |
| HP EliteBook X G1i 14 AI | |
| Dell 14 Premium | |
| CrossMark / Responsiveness | |
| Przeciętny Intel Core Ultra X7 358H, Intel Arc B390 12 Xe3 Panther Lake iGPU (1560 - 1837, n=8) | |
| Asus ExpertBook Ultra B9406CAA | |
| Lenovo Yoga Pro 7 14IAH10 | |
| Dell XPS 14 Core Ultra X7 358H | |
| Dell XPS 14 2024 OLED | |
| HP EliteBook X G1i 14 AI | |
| Dell 14 Premium | |
| WebXPRT 3 / Overall | |
| Dell XPS 14 Core Ultra X7 358H | |
| Lenovo Yoga Pro 7 14IAH10 | |
| Przeciętny Intel Core Ultra X7 358H, Intel Arc B390 12 Xe3 Panther Lake iGPU (293 - 338, n=8) | |
| HP EliteBook X G1i 14 AI | |
| Asus ExpertBook Ultra B9406CAA | |
| Dell 14 Premium | |
| Dell XPS 14 2024 OLED | |
| WebXPRT 4 / Overall | |
| Lenovo Yoga Pro 7 14IAH10 | |
| Dell XPS 14 Core Ultra X7 358H | |
| Przeciętny Intel Core Ultra X7 358H, Intel Arc B390 12 Xe3 Panther Lake iGPU (278 - 305, n=7) | |
| HP EliteBook X G1i 14 AI | |
| Asus ExpertBook Ultra B9406CAA | |
| Dell 14 Premium | |
| Dell XPS 14 2024 OLED | |
| Mozilla Kraken 1.1 / Total | |
| Dell XPS 14 2024 OLED | |
| Dell 14 Premium | |
| HP EliteBook X G1i 14 AI | |
| Przeciętny Intel Core Ultra X7 358H, Intel Arc B390 12 Xe3 Panther Lake iGPU (445 - 460, n=8) | |
| Asus ExpertBook Ultra B9406CAA | |
| Dell XPS 14 Core Ultra X7 358H | |
| Lenovo Yoga Pro 7 14IAH10 | |
| Geekbench AI / Single Precision GPU 1.7 | |
| Asus ExpertBook Ultra B9406CAA | |
| Dell XPS 14 Core Ultra X7 358H | |
| Przeciętny Intel Core Ultra X7 358H, Intel Arc B390 12 Xe3 Panther Lake iGPU (9783 - 12255, n=6) | |
| HP EliteBook X G1i 14 AI | |
| Dell 14 Premium | |
| Geekbench AI / Half Precision GPU 1.7 | |
| Asus ExpertBook Ultra B9406CAA | |
| Przeciętny Intel Core Ultra X7 358H, Intel Arc B390 12 Xe3 Panther Lake iGPU (16188 - 21963, n=6) | |
| Dell XPS 14 Core Ultra X7 358H | |
| HP EliteBook X G1i 14 AI | |
| Dell 14 Premium | |
| Geekbench AI / Quantized GPU 1.7 | |
| Asus ExpertBook Ultra B9406CAA | |
| Dell XPS 14 Core Ultra X7 358H | |
| Przeciętny Intel Core Ultra X7 358H, Intel Arc B390 12 Xe3 Panther Lake iGPU (6908 - 8011, n=6) | |
| HP EliteBook X G1i 14 AI | |
| Dell 14 Premium | |
* ... im mniej tym lepiej
| PCMark 10 Score | 9880 pkt. | |
Pomoc | ||
| AIDA64 / Memory Copy | |
| Dell XPS 14 Core Ultra X7 358H | |
| Przeciętny Intel Core Ultra X7 358H (102745 - 132135, n=7) | |
| Lenovo Yoga Pro 7 14IAH10 | |
| HP EliteBook X G1i 14 AI | |
| Dell XPS 14 2024 OLED | |
| AIDA64 / Memory Read | |
| Asus ExpertBook Ultra B9406CAA | |
| Dell XPS 14 Core Ultra X7 358H | |
| Przeciętny Intel Core Ultra X7 358H (97755 - 118888, n=8) | |
| Dell XPS 14 2024 OLED | |
| Lenovo Yoga Pro 7 14IAH10 | |
| HP EliteBook X G1i 14 AI | |
| AIDA64 / Memory Write | |
| Dell XPS 14 Core Ultra X7 358H | |
| Przeciętny Intel Core Ultra X7 358H (105984 - 134998, n=8) | |
| Asus ExpertBook Ultra B9406CAA | |
| HP EliteBook X G1i 14 AI | |
| Lenovo Yoga Pro 7 14IAH10 | |
| Dell XPS 14 2024 OLED | |
| AIDA64 / Memory Latency | |
| Dell XPS 14 2024 OLED | |
| Lenovo Yoga Pro 7 14IAH10 | |
| HP EliteBook X G1i 14 AI | |
| Dell XPS 14 Core Ultra X7 358H | |
| Przeciętny Intel Core Ultra X7 358H (84.6 - 101.9, n=8) | |
* ... im mniej tym lepiej
Opóźnienie DPC
LatencyMon zgłasza tylko niewielkie problemy z DPC i brak spadków klatek podczas odtwarzania treści wideo 4K60.


| DPC Latencies / LatencyMon - interrupt to process latency (max), Web, Youtube, Prime95 | |
| Dell 14 Premium | |
| Dell XPS 14 2024 OLED | |
| Lenovo Yoga Pro 7 14IAH10 | |
| Dell XPS 14 Core Ultra X7 358H | |
| HP EliteBook X G1i 14 AI | |
| Asus ExpertBook Ultra B9406CAA | |
* ... im mniej tym lepiej
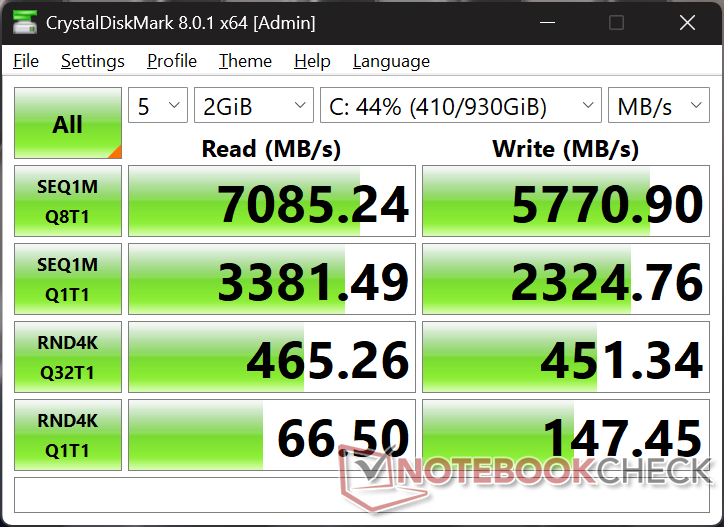
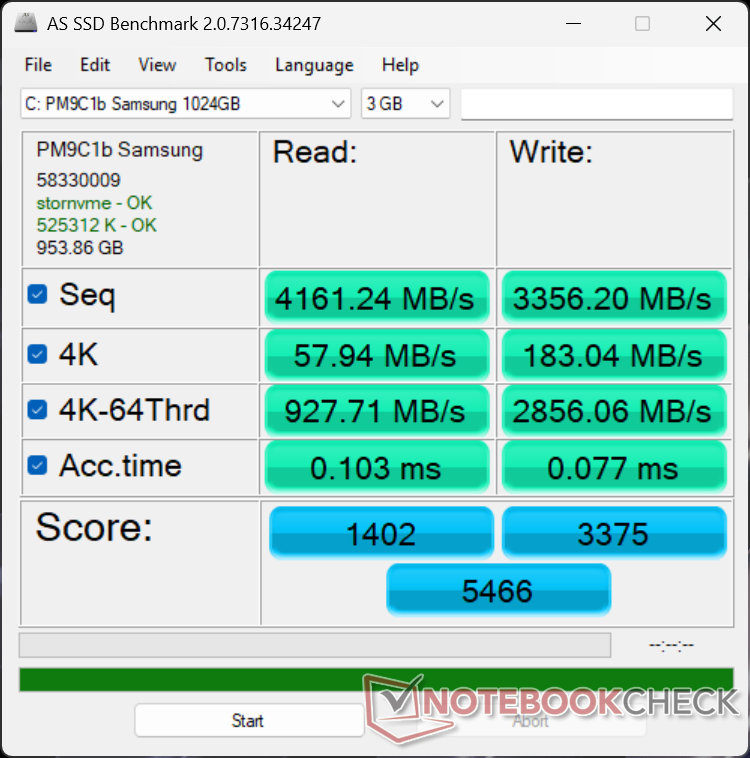
Urządzenia pamięci masowej
Dysk SSD Samsung PM9C1b PCIe4 x4 NVMe jest w stanie utrzymać prędkość transferu na poziomie 7000 MB/s bez żadnych problemów z dławieniem, dzięki czemu jest nieco szybszy niż dysk Kioxia w Dell 14 Premium.


| Drive Performance rating - Percent | |
| Asus ExpertBook Ultra B9406CAA | |
| Lenovo Yoga Pro 7 14IAH10 | |
| Dell XPS 14 Core Ultra X7 358H | |
| Dell XPS 14 2024 OLED | |
| Dell 14 Premium | |
| HP EliteBook X G1i 14 AI | |
* ... im mniej tym lepiej
Dławienie dysku: Pętla odczytu DiskSpd, głębokość kolejki 8
Wydajność GPU
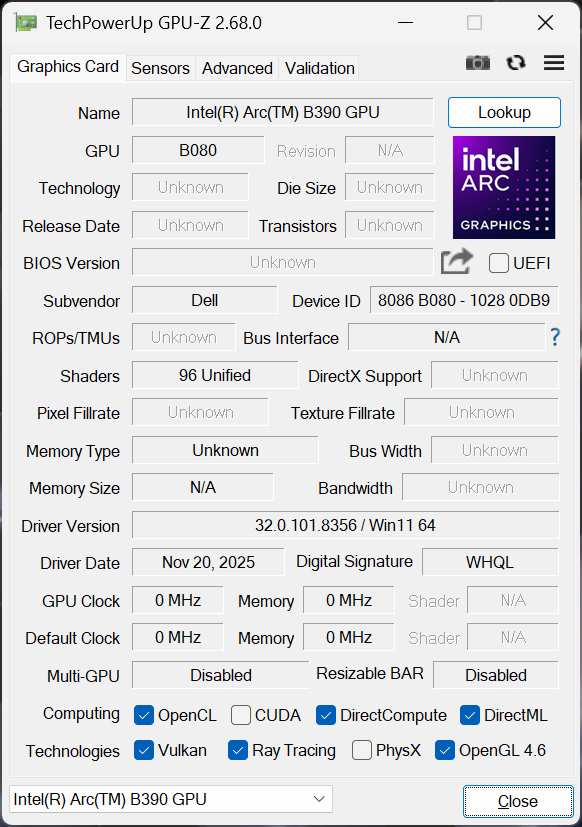
Zintegrowany Arc B390 jest jedną z głównych zalet XPS 14 2026. Wydajność z roku na rok jest tak ogromna w porównaniu do Arc 140T w Dell 14 Premium z 2025 roku, że nawet dorównuje lub przewyższa XPS 14 z 2024 roku z dedykowaną grafiką GeForce RTX 4050. wyniki 3DMark są w przybliżeniu 2x wyższe niż Arc 140T, a jednocześnie od 25 do 40 procent wyższe niż RTX 4050. W przypadku profesjonalnych operacji renderowania, rdzenie CUDA GPU Nvidii są jednak nadal szybszą opcją o około 35 procent.
Praca na zasilaniu bateryjnym niestety tylko nieznacznie wpływa na wydajność, co pokazuje poniższa tabela wyników Fire Strike. Deficyt może stać się jeszcze większy, jeśli ustawimy tryb zrównoważony zamiast trybu wydajności.
| Profil zasilania | Wynik grafiki | Wynik fizyki | Wynik łączny |
| Tryb wydajności | 17324 | 25143 | 4879 |
| Tryb zrównoważony | 14560 (-16%) | 21811 (-13%) | 4073 (-17%) |
| Zasilanie bateryjne | 15875 (-8%) | 27090 (-8%) | 4578 (-6%) |
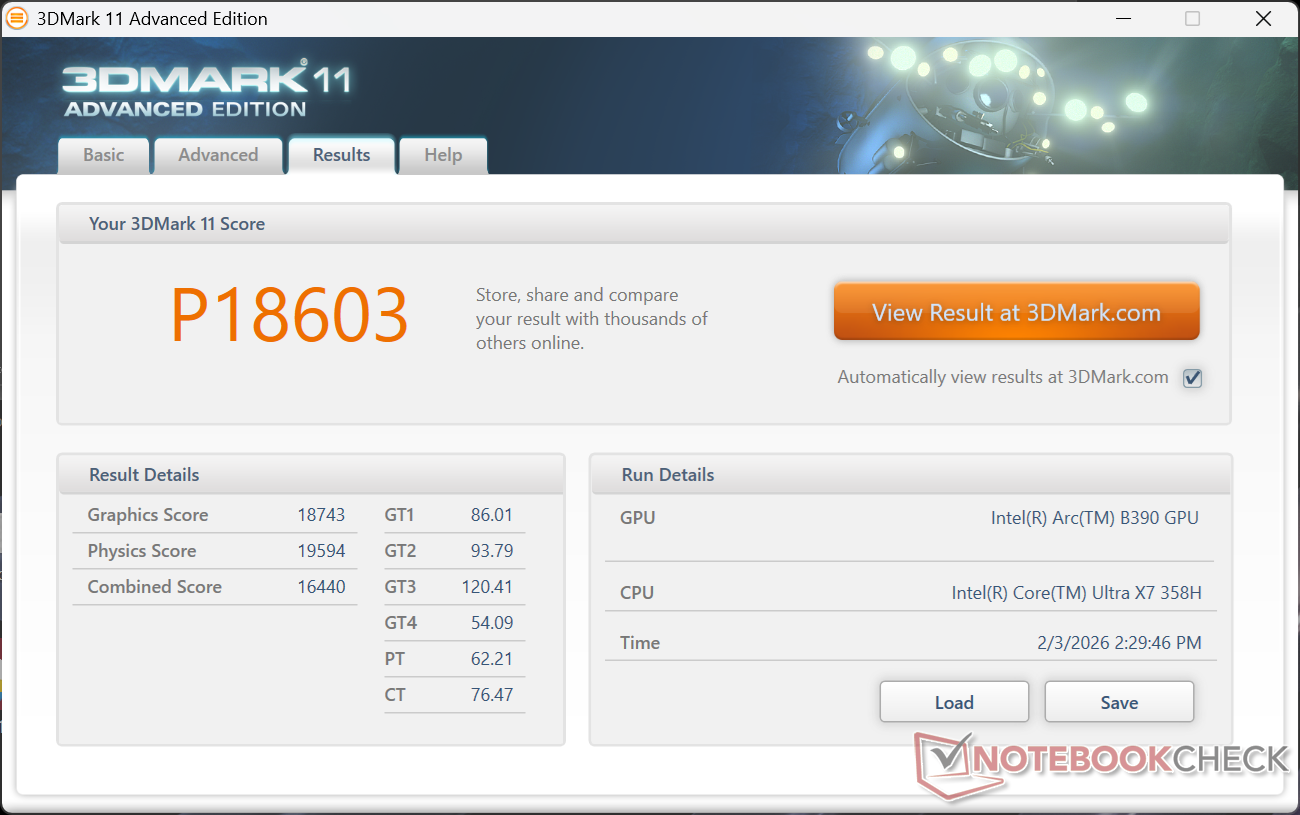


| 3DMark 11 Performance | 18603 pkt. | |
| 3DMark Cloud Gate Standard Score | 48038 pkt. | |
| 3DMark Fire Strike Score | 14336 pkt. | |
| 3DMark Time Spy Score | 7546 pkt. | |
Pomoc | ||
* ... im mniej tym lepiej
Wydajność w grach
Choć nie jest to laptop do gier, nowy XPS 14 może uruchomić wymagające tytuły, takie jak Black Myth Wukong przy przyzwoitych ustawieniach 1080p. Proszę zauważyć, że ogólna wydajność w grach wynosi średnio tylko 10 procent XPS 14 z RTX 4050, mimo że nasze syntetyczne wyniki 3DMark sugerują większe różnice.
| Performance rating - Percent | |
| Dell XPS 14 2024 OLED | |
| Asus ExpertBook Ultra B9406CAA | |
| Dell XPS 14 Core Ultra X7 358H | |
| HP EliteBook X G1i 14 AI | |
| Lenovo Yoga Pro 7 14IAH10 | |
| Dell 14 Premium | |
| Cyberpunk 2077 - 1920x1080 Ultra Preset (FSR off) | |
| Asus ExpertBook Ultra B9406CAA | |
| Dell XPS 14 Core Ultra X7 358H | |
| Dell XPS 14 2024 OLED | |
| HP EliteBook X G1i 14 AI | |
| Lenovo Yoga Pro 7 14IAH10 | |
| Dell 14 Premium | |
| Baldur's Gate 3 - 1920x1080 Ultra Preset AA:T | |
| Asus ExpertBook Ultra B9406CAA | |
| Dell XPS 14 Core Ultra X7 358H | |
| Dell XPS 14 2024 OLED | |
| HP EliteBook X G1i 14 AI | |
| Lenovo Yoga Pro 7 14IAH10 | |
| Dell 14 Premium | |
| GTA V - 1920x1080 Highest AA:4xMSAA + FX AF:16x | |
| Dell XPS 14 2024 OLED | |
| Asus ExpertBook Ultra B9406CAA | |
| Dell XPS 14 Core Ultra X7 358H | |
| HP EliteBook X G1i 14 AI | |
| Lenovo Yoga Pro 7 14IAH10 | |
| Dell 14 Premium | |
| Final Fantasy XV Benchmark - 1920x1080 High Quality | |
| Asus ExpertBook Ultra B9406CAA | |
| Dell XPS 14 Core Ultra X7 358H | |
| Dell XPS 14 2024 OLED | |
| HP EliteBook X G1i 14 AI | |
| Dell 14 Premium | |
| Lenovo Yoga Pro 7 14IAH10 | |
| Strange Brigade - 1920x1080 ultra AA:ultra AF:16 | |
| Asus ExpertBook Ultra B9406CAA | |
| Dell XPS 14 Core Ultra X7 358H | |
| Dell XPS 14 2024 OLED | |
| Lenovo Yoga Pro 7 14IAH10 | |
| HP EliteBook X G1i 14 AI | |
| Dell 14 Premium | |
| Dota 2 Reborn - 1920x1080 ultra (3/3) best looking | |
| Dell XPS 14 Core Ultra X7 358H | |
| Dell XPS 14 2024 OLED | |
| Asus ExpertBook Ultra B9406CAA | |
| HP EliteBook X G1i 14 AI | |
| Lenovo Yoga Pro 7 14IAH10 | |
| Dell 14 Premium | |
| X-Plane 11.11 - 1920x1080 high (fps_test=3) | |
| Dell XPS 14 2024 OLED | |
| Dell 14 Premium | |
| Dell XPS 14 Core Ultra X7 358H | |
| Asus ExpertBook Ultra B9406CAA | |
| Lenovo Yoga Pro 7 14IAH10 | |
| HP EliteBook X G1i 14 AI | |
Cyberpunk 2077 ultra FPS Chart
| low | med. | high | ultra | QHD | |
|---|---|---|---|---|---|
| GTA V (2015) | 176.7 | 171 | 98.2 | 43.3 | 30.9 |
| Dota 2 Reborn (2015) | 135 | 95.4 | 107.6 | 105.4 | |
| Final Fantasy XV Benchmark (2018) | 123.5 | 73.7 | 52.8 | 39 | |
| X-Plane 11.11 (2018) | 59.7 | 47.1 | 40.3 | ||
| Strange Brigade (2018) | 384 | 138.6 | 103.3 | 95.1 | 71.7 |
| Baldur's Gate 3 (2023) | 64.3 | 55.4 | 49 | 48.7 | 34.9 |
| Cyberpunk 2077 (2023) | 68.6 | 56.2 | 46.9 | 40.9 | 24.7 |
| F1 24 (2024) | 145.9 | 132.2 | 100.7 | 36.2 | 23.8 |
| Black Myth: Wukong (2024) | 43 | 34 | 26 | 14 | 11 |
| ARC Raiders (2025) | 104.3 | 57 | 42.4 | 28 | 19.2 |
Emisje
Hałas systemowy
Nowy XPS 14 jest w stanie pozostać cichszy dłużej niż zeszłoroczny model. Na przykład podczas uruchamiania 3DMark 06 hałas wentylatora ustabilizował się na poziomie 34 dB(A) pod koniec pierwszej sceny testu porównawczego w porównaniu do 39 dB(A) w starszym modelu Arrow Lake. W przeciwnym razie, pułap hałasu wentylatora nadal osiąga około 45 dB(A), co jest wartością podobną do poprzedniej.


Hałas
| luz |
| 23.3 / 23.3 / 23.3 dB |
| obciążenie |
| 34 / 45.7 dB |
 | ||
30 dB cichy 40 dB(A) słyszalny 50 dB(A) irytujący |
||
min: | ||
| Dell XPS 14 Core Ultra X7 358H Ultra X7 358H, Arc B390 Panther Lake iGPU | Dell 14 Premium Ultra 7 255H, Arc 140T | Dell XPS 14 2024 OLED Ultra 7 155H, GeForce RTX 4050 Laptop GPU | Asus ExpertBook Ultra B9406CAA Ultra X7 358H, Arc B390 Panther Lake iGPU | Lenovo Yoga Pro 7 14IAH10 Ultra 9 285H, Arc 140T | HP EliteBook X G1i 14 AI Core Ultra 7 268V, Arc 140V | |
|---|---|---|---|---|---|---|
| Noise | -3% | -8% | 3% | -11% | -10% | |
| wyłączone / środowisko * (dB) | 22.9 | 23 -0% | 24.3 -6% | 22.9 -0% | 24.5 -7% | 28.2 -23% |
| Idle Minimum * (dB) | 23.3 | 23.2 -0% | 24.3 -4% | 23.4 -0% | 24.5 -5% | 28.4 -22% |
| Idle Average * (dB) | 23.3 | 24 -3% | 26.5 -14% | 23.4 -0% | 24.5 -5% | 28.4 -22% |
| Idle Maximum * (dB) | 23.3 | 24.7 -6% | 28.5 -22% | 23.4 -0% | 24.5 -5% | 28.8 -24% |
| Load Average * (dB) | 34 | 39 -15% | 37 -9% | 28.6 16% | 46.9 -38% | 33.5 1% |
| Cyberpunk 2077 ultra * (dB) | 43.5 | 43 1% | 42.8 2% | 46.9 -8% | 39.1 10% | |
| Load Maximum * (dB) | 45.7 | 44.9 2% | 43.3 5% | 45.2 1% | 48.7 -7% | 40.4 12% |
| Witcher 3 ultra * (dB) | 39.1 |
* ... im mniej tym lepiej
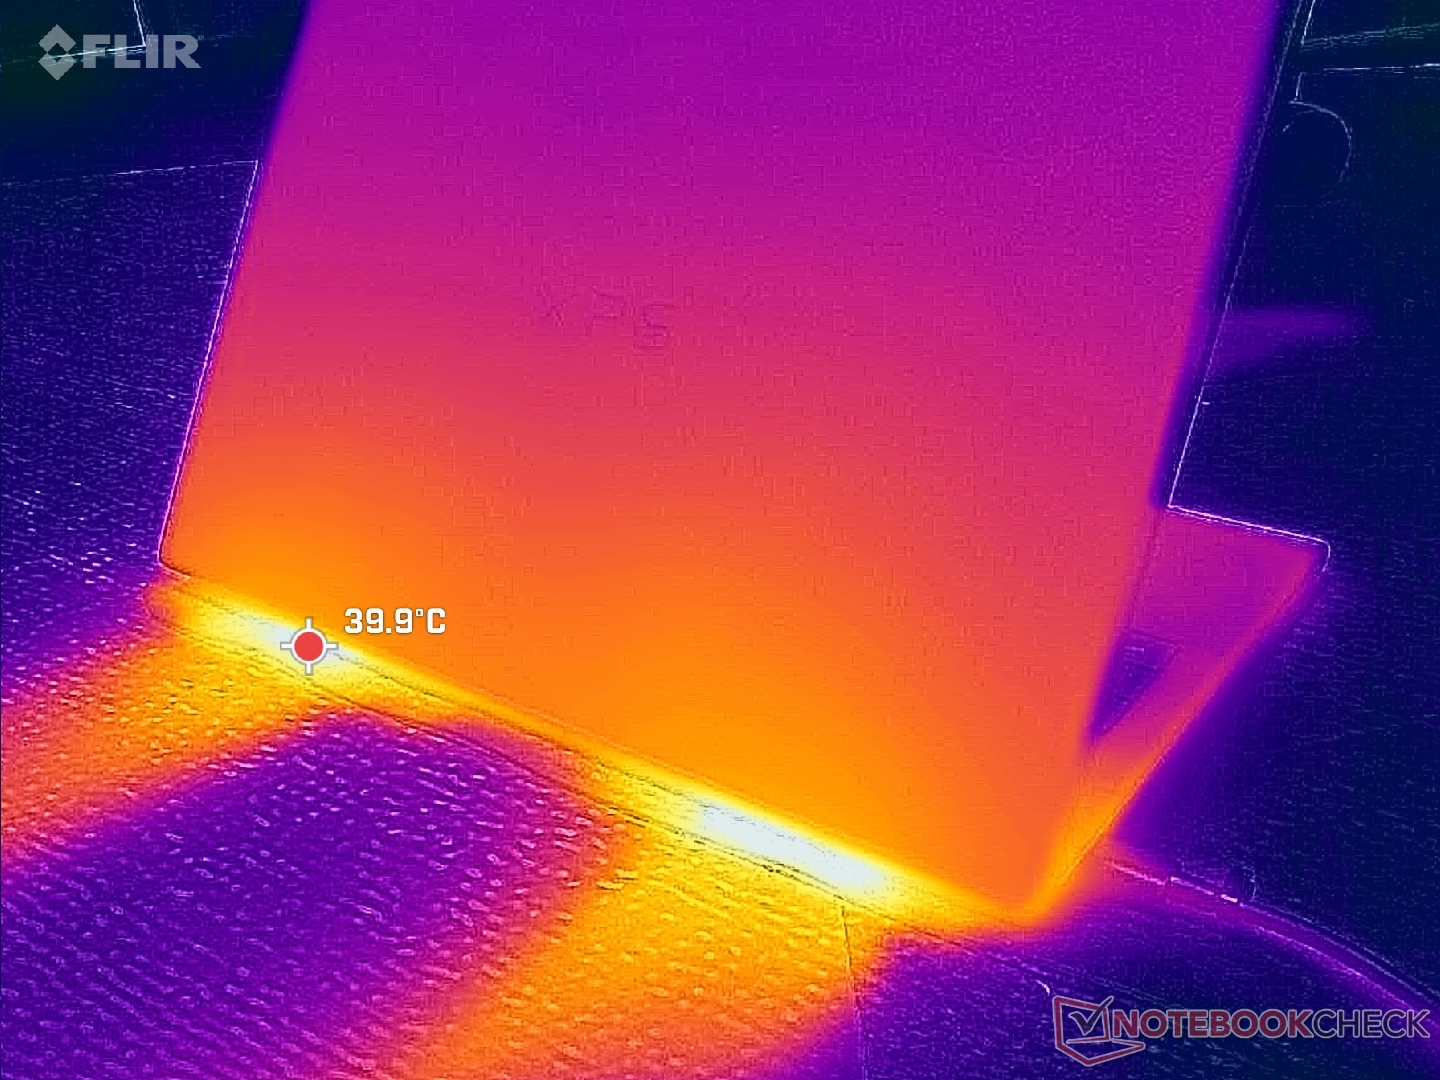
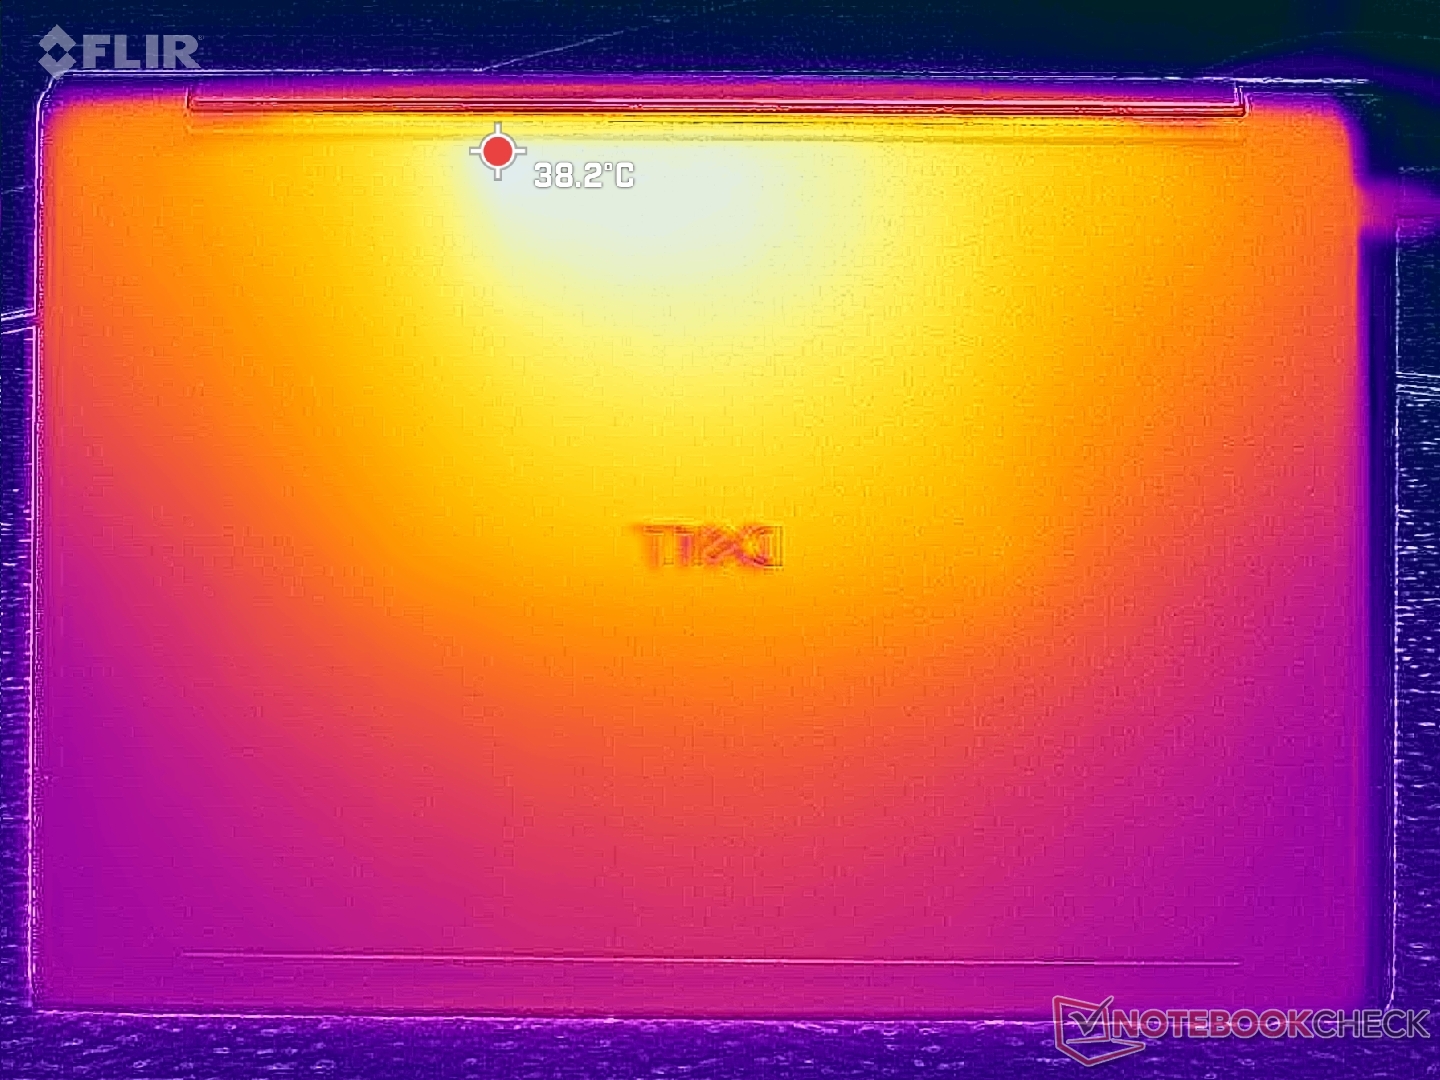
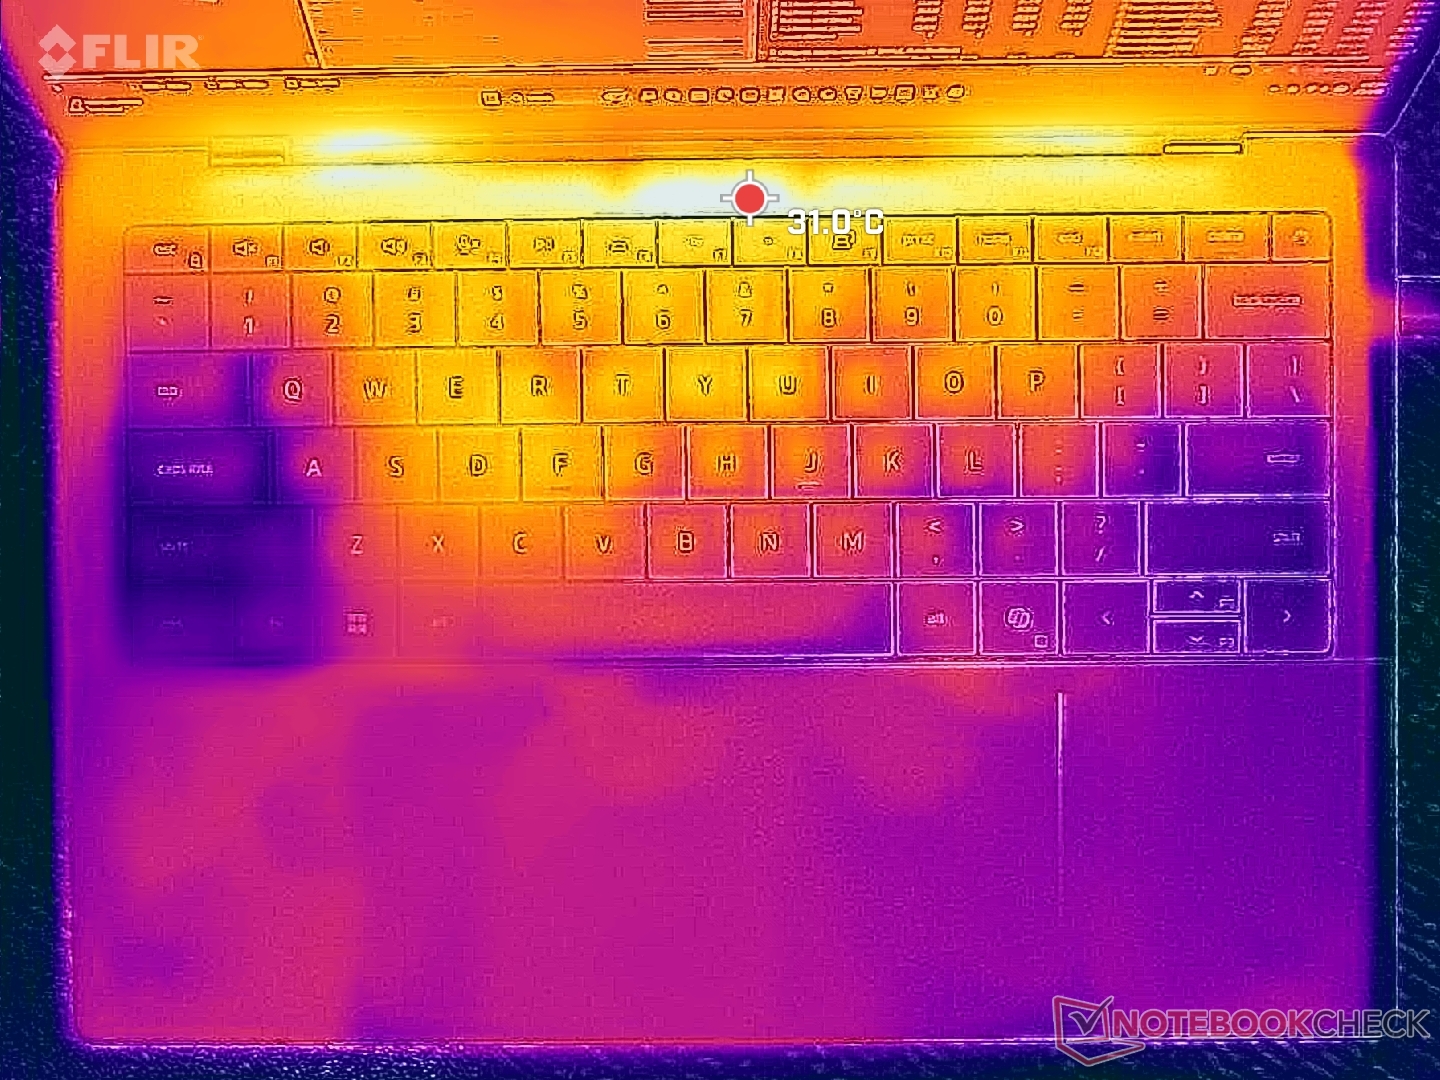
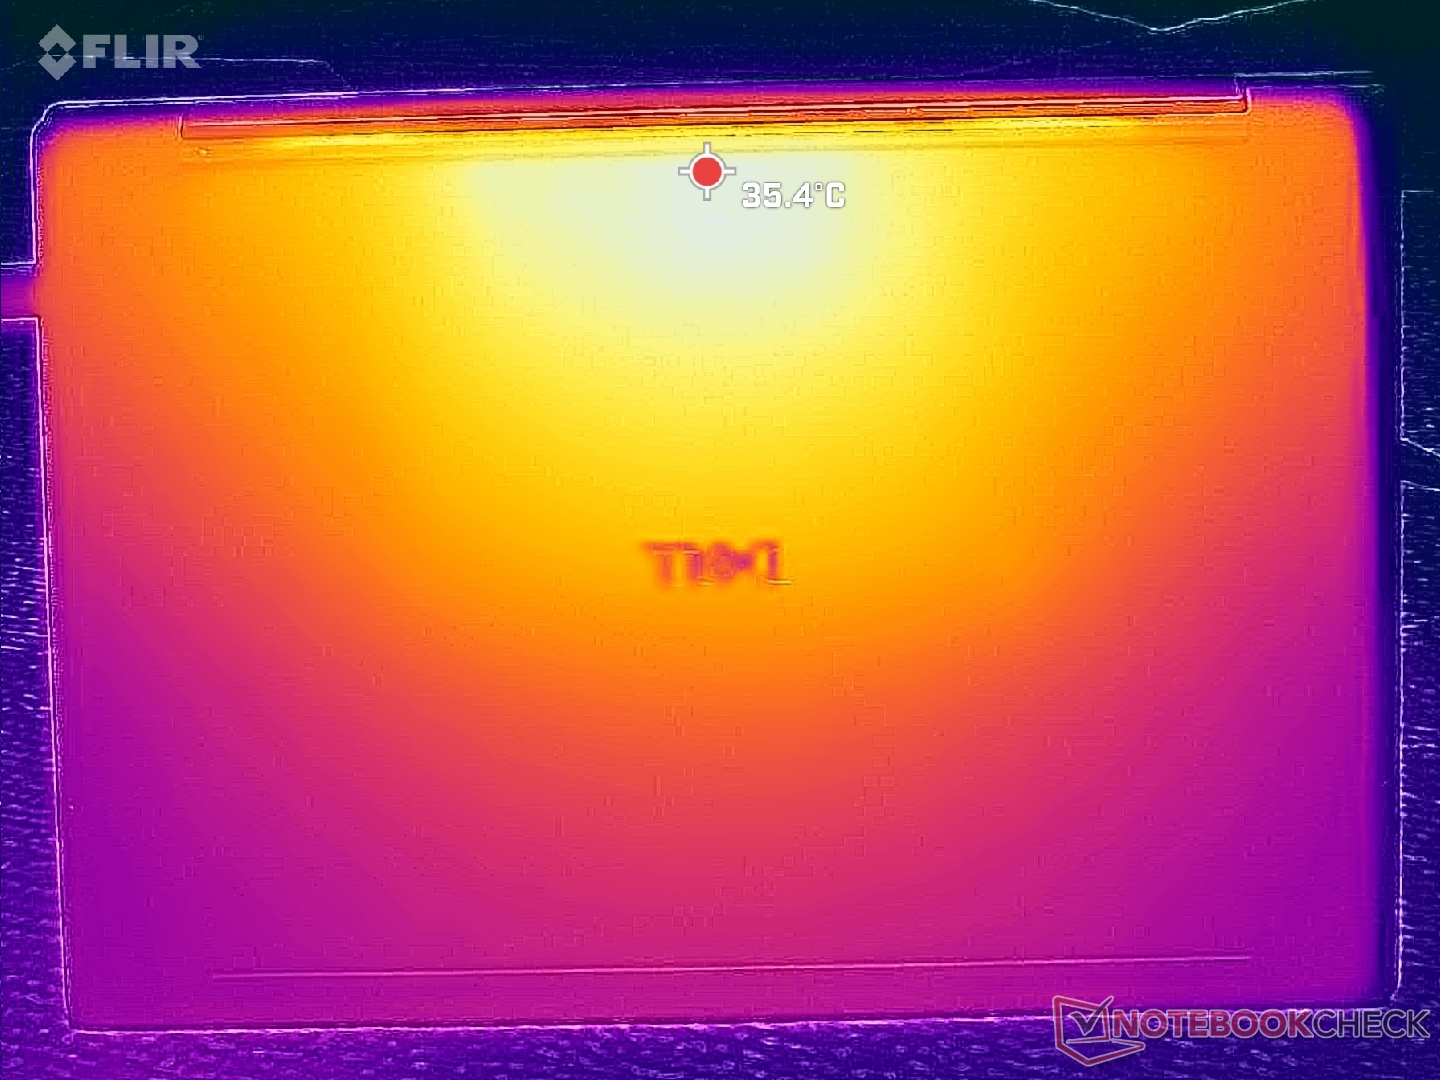
Temperatura
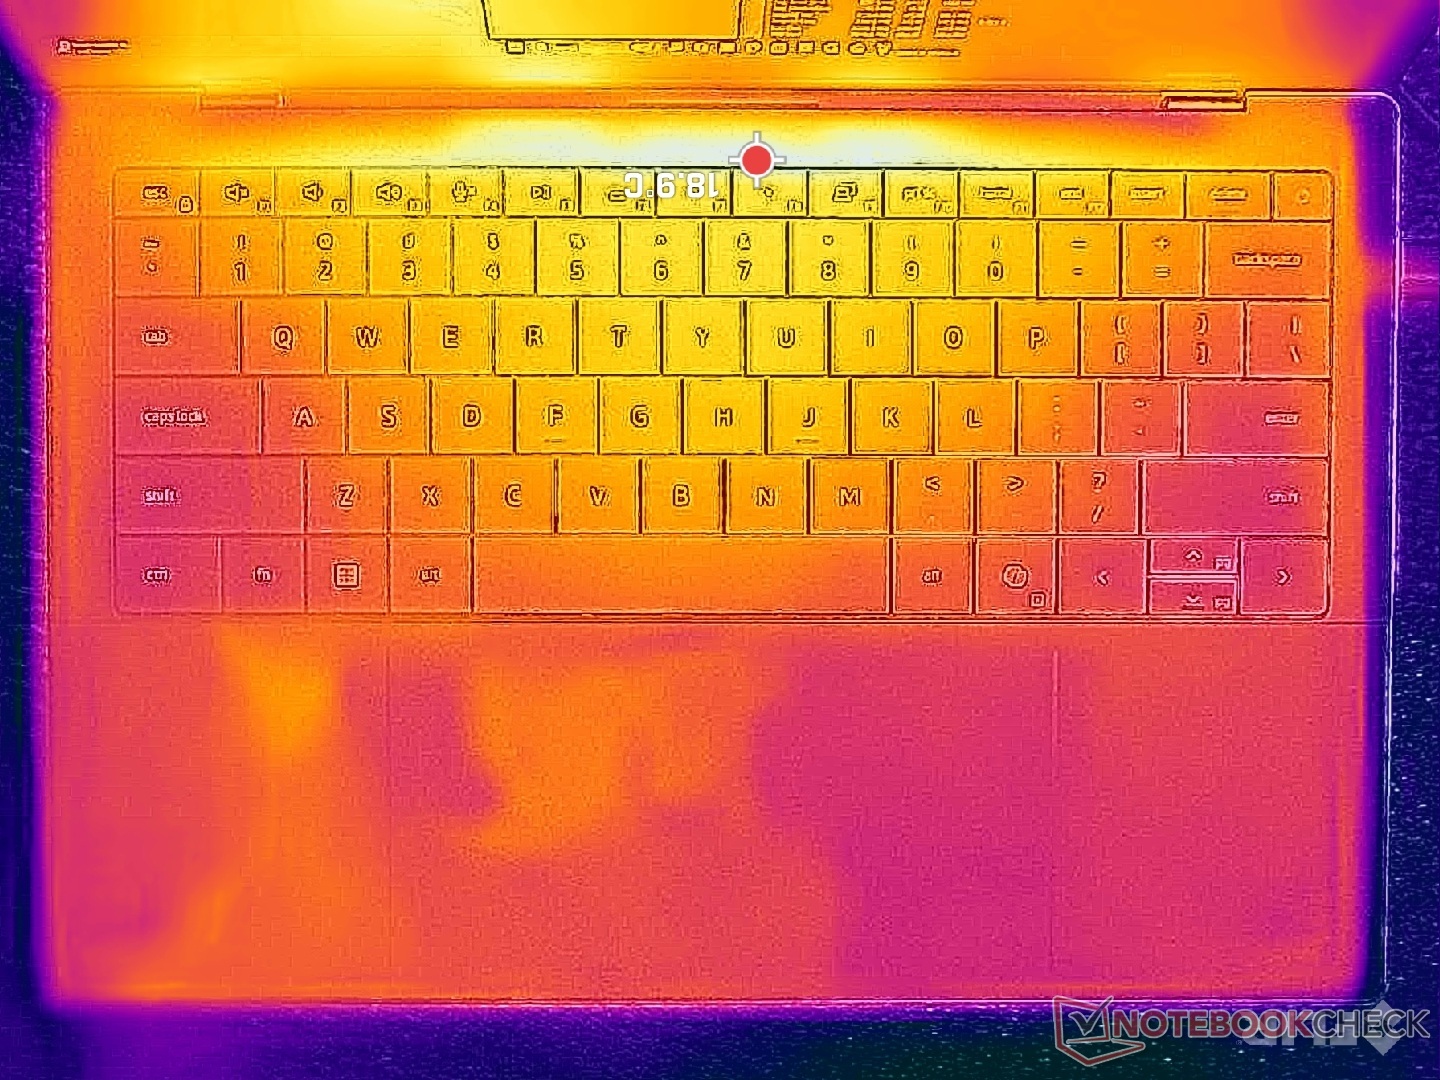
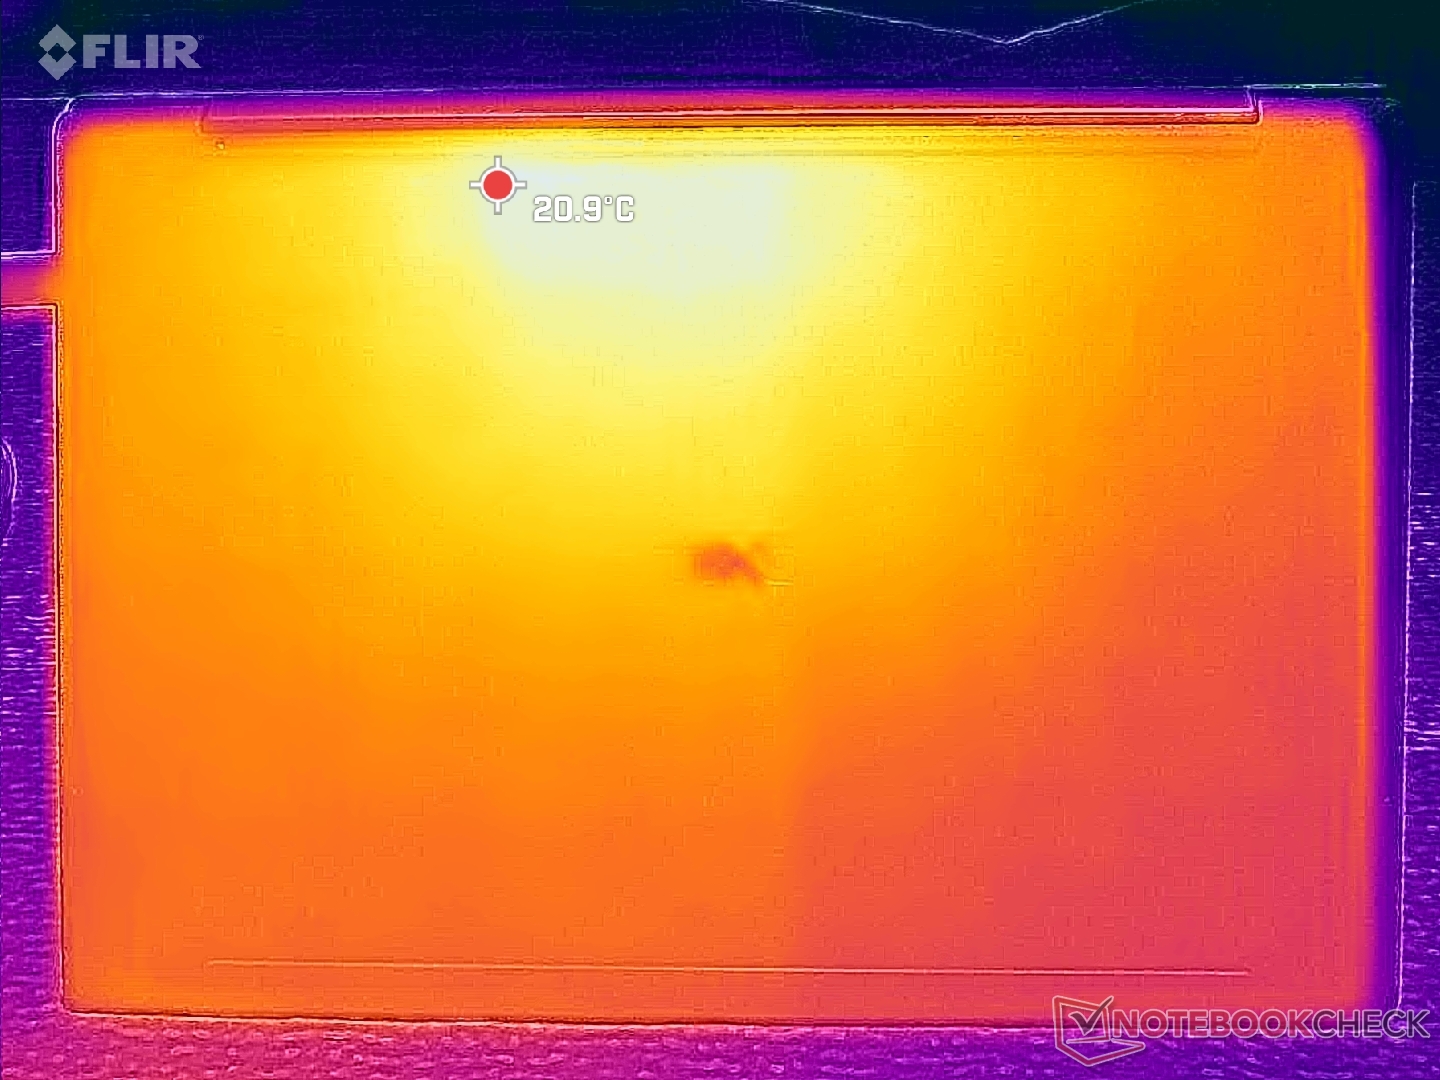
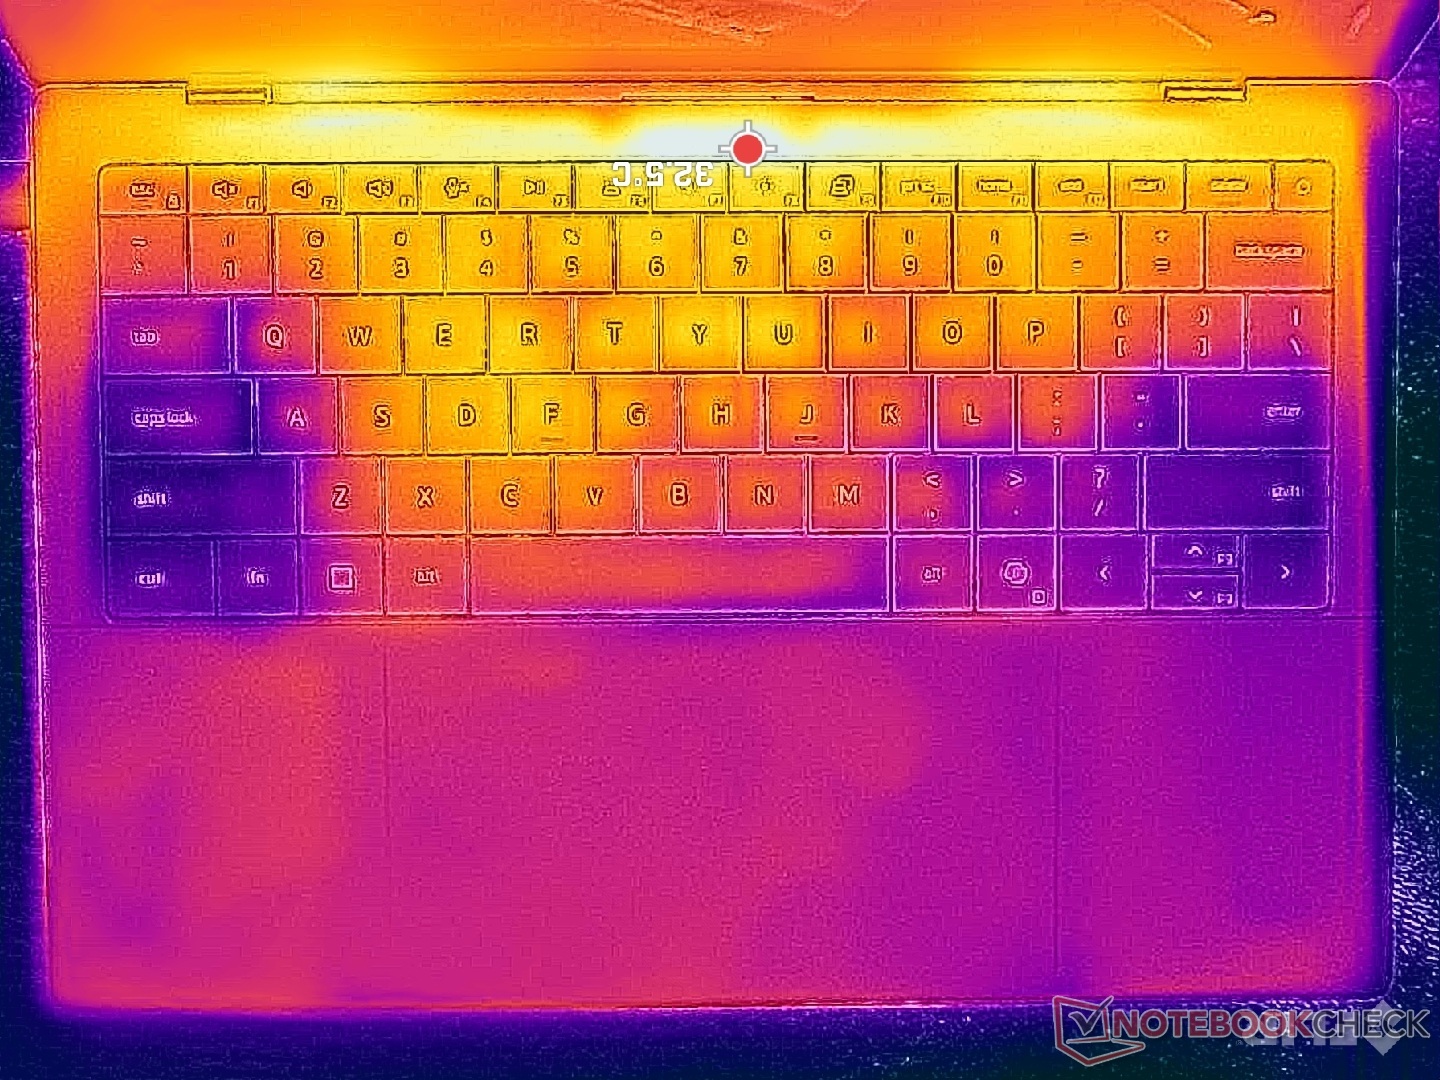
Temperatury powierzchni są nieco wyższe niż te, które odnotowaliśmy w Dell 14 Premium 2025, szczególnie na spodzie (pokrywa D) podczas uruchamiania bardziej wymagających obciążeń. Gorący punkt osiągał od 36 C do 39 C w porównaniu do 34 C w zeszłorocznym projekcie. Różnice są poza tym minimalne i nie są na tyle ciepłe, by rozpraszać podczas użytkowania.
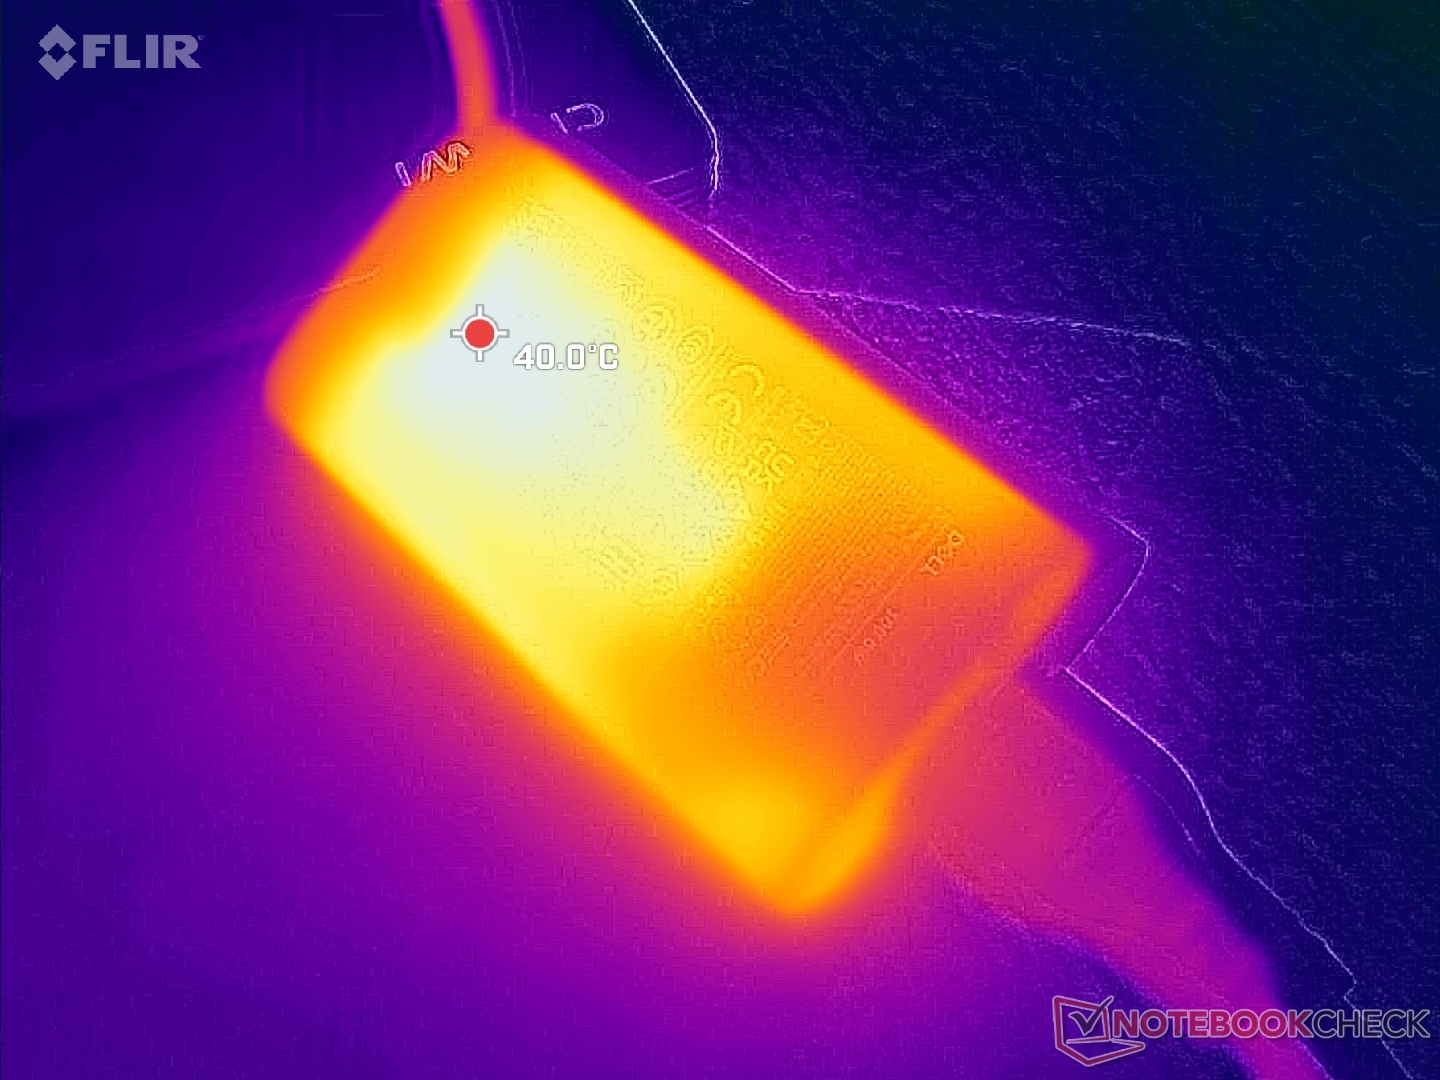
(+) Maksymalna temperatura w górnej części wynosi 34 °C / 93 F, w porównaniu do średniej 36.8 °C / 98 F , począwszy od 21 do 71 °C dla klasy Multimedia.
(+) Dno nagrzewa się maksymalnie do 35.8 °C / 96 F, w porównaniu do średniej 39.1 °C / 102 F
(+) W stanie bezczynności średnia temperatura górnej części wynosi 24.6 °C / 76 F, w porównaniu ze średnią temperaturą urządzenia wynoszącą 31.3 °C / ### class_avg_f### F.
(+) 3: The average temperature for the upper side is 30.1 °C / 86 F, compared to the average of 31.3 °C / 88 F for the class Multimedia.
(+) Podpórki pod nadgarstki i touchpad są chłodniejsze niż temperatura skóry i maksymalnie 31.2 °C / 88.2 F i dlatego są chłodne w dotyku.
(-) Średnia temperatura obszaru podparcia dłoni w podobnych urządzeniach wynosiła 28.7 °C / 83.7 F (-2.5 °C / -4.5 F).
| Dell XPS 14 Core Ultra X7 358H Ultra X7 358H, Arc B390 Panther Lake iGPU | Dell 14 Premium Ultra 7 255H, Arc 140T | Dell XPS 14 2024 OLED Ultra 7 155H, GeForce RTX 4050 Laptop GPU | Asus ExpertBook Ultra B9406CAA Ultra X7 358H, Arc B390 Panther Lake iGPU | Lenovo Yoga Pro 7 14IAH10 Ultra 9 285H, Arc 140T | HP EliteBook X G1i 14 AI Core Ultra 7 268V, Arc 140V | |
|---|---|---|---|---|---|---|
| Heat | 2% | -12% | -4% | -8% | 5% | |
| Maximum Upper Side * (°C) | 34 | 33 3% | 40.5 -19% | 38.6 -14% | 38.1 -12% | 35 -3% |
| Maximum Bottom * (°C) | 35.8 | 33.6 6% | 42.6 -19% | 38.4 -7% | 36.5 -2% | 33.4 7% |
| Idle Upper Side * (°C) | 25.6 | 26.4 -3% | 26.9 -5% | 24.6 4% | 28.2 -10% | 23.8 7% |
| Idle Bottom * (°C) | 26.4 | 25.6 3% | 27.8 -5% | 26 2% | 28.8 -9% | 24.2 8% |
* ... im mniej tym lepiej
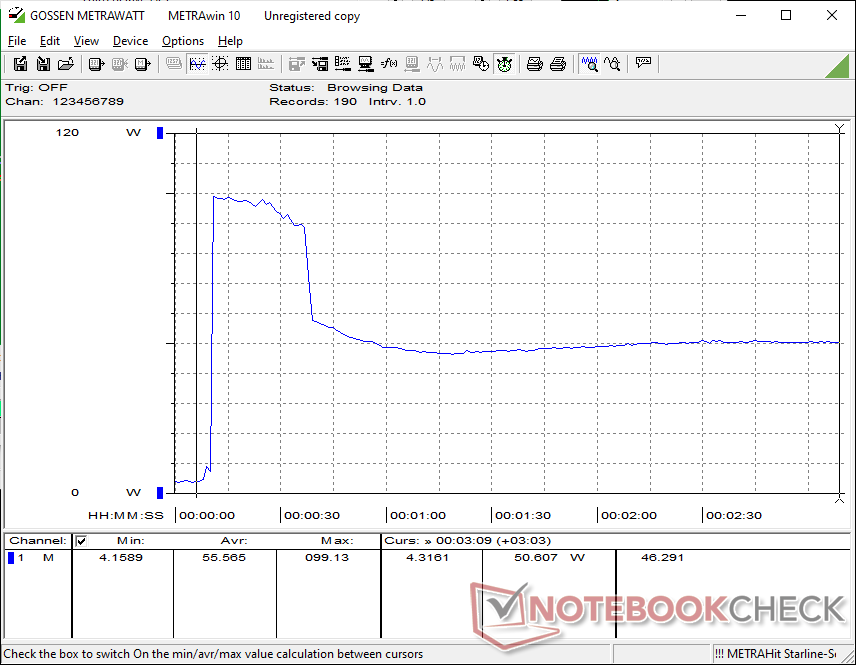
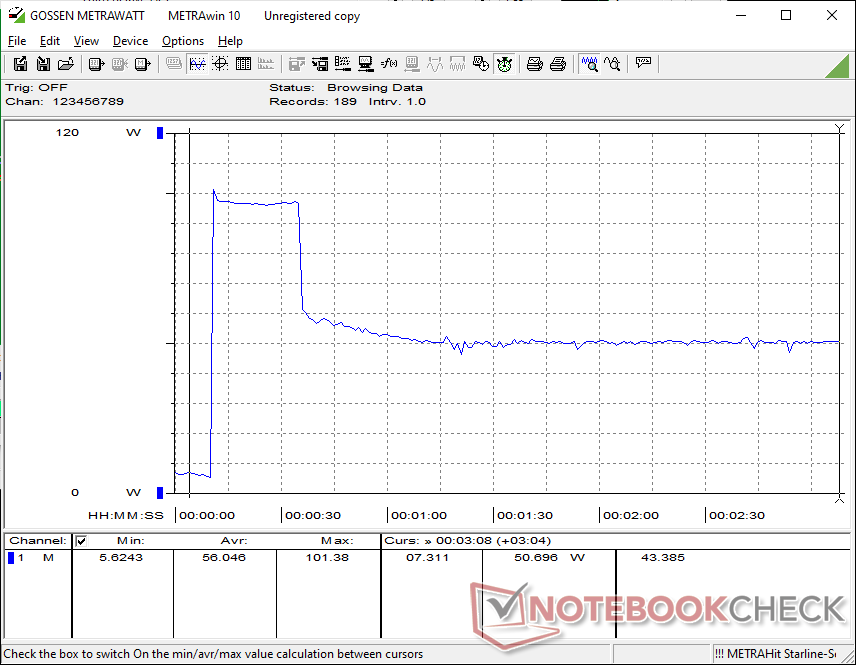
Test warunków skrajnych

Po uruchomieniu obciążenia Prime95, procesor zwiększył taktowanie do 3 GHz, 69 W i 100 C, po czym ostatecznie spadł do 2 GHz, 30 W i 74 C około 30 sekund później. Trwałość Turbo Boost jest zatem ograniczona, co koreluje z naszymi obserwacjami CineBench R15 powyżej. Dla porównania, ten sam procesor w ExpertBook Ultra ustabilizowałby się na wyższym poziomie 48 W, zapewniając wyższą wydajność procesora.
Częstotliwość taktowania GPU i temperatura ustabilizowałyby się na poziomie 2000 MHz i 63 C podczas uruchamiania Cyberpunk 2077 w porównaniu do 2500 MHz i 88 C na wspomnianym wcześniej Asusie, nawet przy ustawieniu na tryb Ultra Performance.


| Średnie taktowanie CPU (GHz) | Taktowanie GPU (MHz) | Średnia temperatura CPU (°C) | |
| System bezczynności | -- | -- | 41 |
| Prime95 Stress | 2.0 | -- | 74 |
| Prime95 + FurMark Stress | 1.5 | 1350 | 67 |
| Cyberpunk 2077 Stress (tryb wydajności) | 0.8 | 2000 | 63 |
| Cyberpunk 2077 Stress (tryb zrównoważony) | 0.8 | 1950 | 62 |
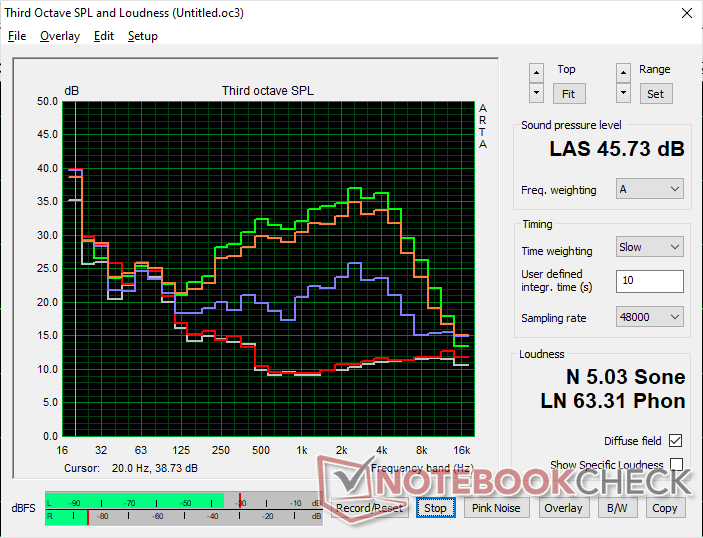
Głośniki
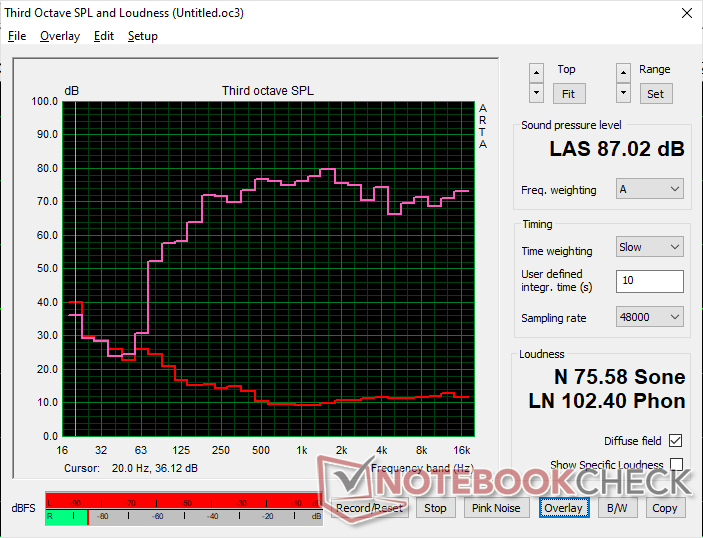

Dell XPS 14 Core Ultra X7 358H analiza dźwięku
(+) | głośniki mogą odtwarzać stosunkowo głośno (87 dB)
Bas 100 - 315 Hz
(±) | zredukowany bas - średnio 7.6% niższy od mediany
(+) | bas jest liniowy (5.9% delta do poprzedniej częstotliwości)
Średnie 400 - 2000 Hz
(+) | zbalansowane środki średnie - tylko 3.2% od mediany
(+) | średnie są liniowe (3.6% delta do poprzedniej częstotliwości)
Wysokie 2–16 kHz
(+) | zrównoważone maksima - tylko 3.3% od mediany
(+) | wzloty są liniowe (5.8% delta do poprzedniej częstotliwości)
Ogólnie 100 - 16.000 Hz
(+) | ogólny dźwięk jest liniowy (7.3% różnicy w stosunku do mediany)
W porównaniu do tej samej klasy
» 6% wszystkich testowanych urządzeń w tej klasie było lepszych, 1% podobnych, 94% gorszych
» Najlepszy miał deltę 5%, średnia wynosiła ###średnia###%, najgorsza wynosiła 45%
W porównaniu do wszystkich testowanych urządzeń
» 1% wszystkich testowanych urządzeń było lepszych, 0% podobnych, 99% gorszych
» Najlepszy miał deltę 4%, średnia wynosiła ###średnia###%, najgorsza wynosiła 134%
Apple MacBook Pro 16 2021 M1 Pro analiza dźwięku
(+) | głośniki mogą odtwarzać stosunkowo głośno (84.7 dB)
Bas 100 - 315 Hz
(+) | dobry bas - tylko 3.8% od mediany
(+) | bas jest liniowy (5.2% delta do poprzedniej częstotliwości)
Średnie 400 - 2000 Hz
(+) | zbalansowane środki średnie - tylko 1.3% od mediany
(+) | średnie są liniowe (2.1% delta do poprzedniej częstotliwości)
Wysokie 2–16 kHz
(+) | zrównoważone maksima - tylko 1.9% od mediany
(+) | wzloty są liniowe (2.7% delta do poprzedniej częstotliwości)
Ogólnie 100 - 16.000 Hz
(+) | ogólny dźwięk jest liniowy (4.6% różnicy w stosunku do mediany)
W porównaniu do tej samej klasy
» 0% wszystkich testowanych urządzeń w tej klasie było lepszych, 0% podobnych, 100% gorszych
» Najlepszy miał deltę 5%, średnia wynosiła ###średnia###%, najgorsza wynosiła 45%
W porównaniu do wszystkich testowanych urządzeń
» 0% wszystkich testowanych urządzeń było lepszych, 0% podobnych, 100% gorszych
» Najlepszy miał deltę 4%, średnia wynosiła ###średnia###%, najgorsza wynosiła 134%
Zarządzanie energią
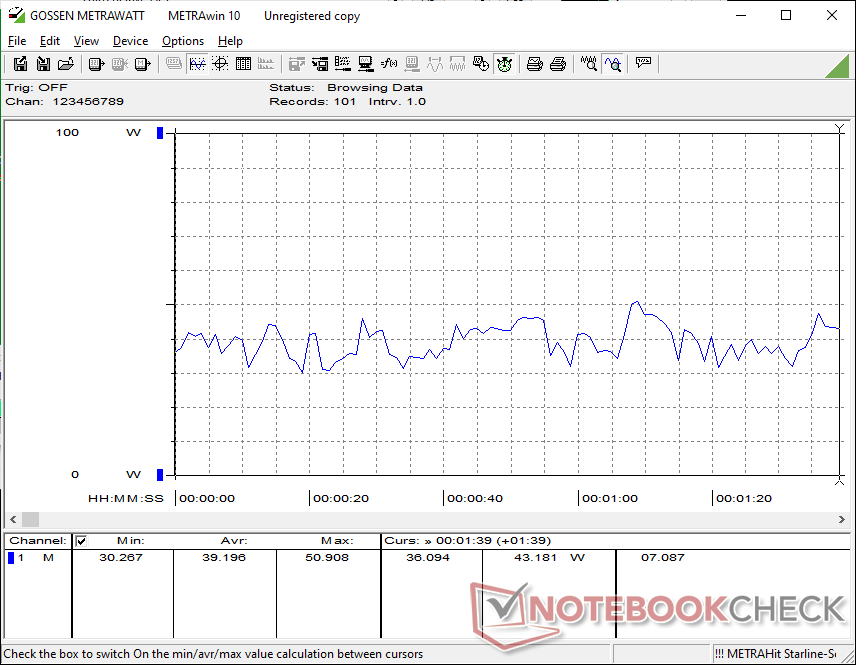
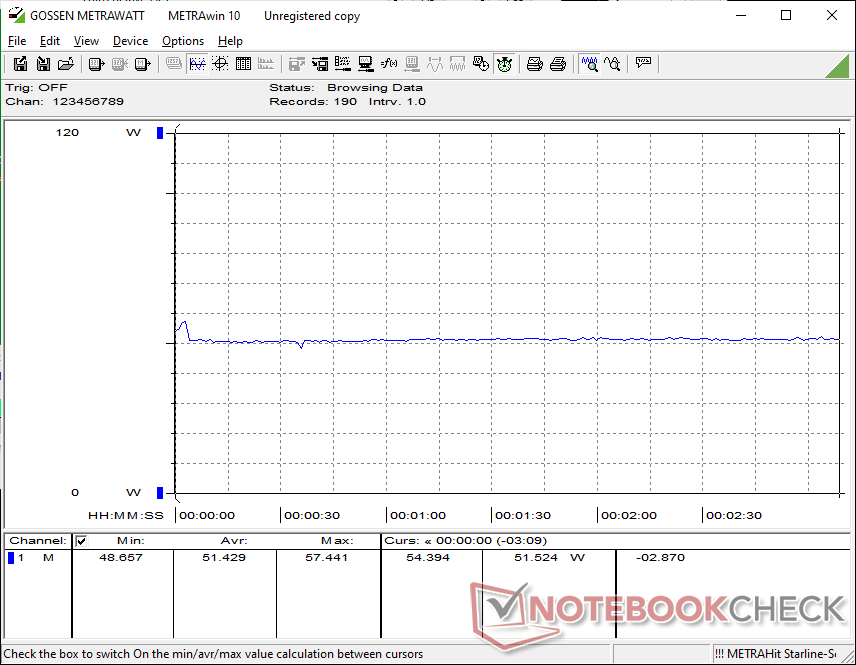
Zużycie energii
Wydajność graficzna w przeliczeniu na wat jest jednym z najmocniejszych aspektów 2026 XPS 14, a wszystko to dzięki Panther Lake. Na przykład uruchomienie Cyberpunk 2077 wymaga mniej więcej tego samego, co XPS 14 z 2025 roku, a mimo to wydajność jest o około 80 procent szybsza, co oznacza znaczną poprawę rok do roku. Niemniej jednak, wzrost wydajności procesora na wat w porównaniu do zeszłorocznego Core Ultra 7 255H jest stosunkowo niewielki.
Jesteśmy w stanie zarejestrować tymczasowy maksymalny pobór mocy wynoszący 102 W z małego (~ 10,2 x 5,5 x 2,2 cm) zasilacza sieciowego USB-C o mocy 100 W, gdy procesor jest w pełni obciążony, co jest znacznie wyższe niż w XPS 14 z 2025 roku w podobnych warunkach. Wyższy pułap mocy jest przykładem wyższego pułapu Turbo Boost Panther Lake-H w porównaniu do Arrow Lake-H.
| wyłączony / stan wstrzymania | |
| luz | |
| obciążenie |
|
Legenda:
min: | |
| Dell XPS 14 Core Ultra X7 358H Ultra X7 358H, Arc B390 Panther Lake iGPU, Samsung PM9C1b MZVL81T0HFLB-00BH1, OLED, 2880x1800, 14" | Dell 14 Premium Ultra 7 255H, Arc 140T, Kioxia BG6 KBG6AZNV1T02, OLED, 3200x2000, 14.5" | Dell XPS 14 2024 OLED Ultra 7 155H, GeForce RTX 4050 Laptop GPU, Samsung PM9A1 MZVL21T0HCLR, OLED, 3200x2000, 14.5" | Asus ExpertBook Ultra B9406CAA Ultra X7 358H, Arc B390 Panther Lake iGPU, Samsung PM9E1 MZVLC2T0HBLD, OLED, 2880x1800, 14" | Lenovo Yoga Pro 7 14IAH10 Ultra 9 285H, Arc 140T, WD PC SN7100S SDFPMSL-1T00-1101, OLED, 3000x1876, 14.5" | HP EliteBook X G1i 14 AI Core Ultra 7 268V, Arc 140V, Kioxia XG8 KXG80ZNV512G, IPS, 1920x1200, 14" | |
|---|---|---|---|---|---|---|
| Power Consumption | -20% | -88% | 1% | -73% | 12% | |
| Idle Minimum * (Watt) | 3.1 | 4.4 -42% | 8.1 -161% | 3.5 -13% | 7.9 -155% | 2.5 19% |
| Idle Average * (Watt) | 3.6 | 6.1 -69% | 9.9 -175% | 4 -11% | 10.5 -192% | 5.4 -50% |
| Idle Maximum * (Watt) | 10 | 13.7 -37% | 10.4 -4% | 5.3 47% | 10.8 -8% | 5.8 42% |
| Load Average * (Watt) | 39.2 | 53.8 -37% | 75.6 -93% | 43.7 -11% | 64 -63% | 36.9 6% |
| Cyberpunk 2077 ultra * (Watt) | 51.4 | 50.7 1% | 61.3 -19% | 76.3 -48% | 48.5 6% | |
| Cyberpunk 2077 ultra external monitor * (Watt) | 51.2 | 46.5 9% | 61.4 -20% | 72.6 -42% | 44.9 12% | |
| Load Maximum * (Watt) | 101.4 | 62.7 38% | 107.1 -6% | 63.4 37% | 103.2 -2% | 54.6 46% |
| Witcher 3 ultra * (Watt) | 65.6 |
* ... im mniej tym lepiej
Pobór mocy Cyberpunk / Test warunków skrajnych
Zużycie energii przez monitor zewnętrzny
Żywotność baterii

Czas pracy WLAN trwa prawie 17 godzin w trybie zrównoważonym, co jest bardzo zbliżone do tego, co zarejestrowaliśmy na podobnie wyposażonym ExpertBooku Ultra. Proszę jednak zauważyć, że funkcja Windows VRR nie jest automatycznie włączana dla domyślnej stałej częstotliwości odświeżania 120 Hz; ręczne włączenie tej funkcji obniżyłoby częstotliwość odświeżania do zaledwie 20 Hz, gdy jest ona statyczna dla potencjalnie dłuższego czasu pracy.
Ładowanie od stanu pustego do pełnej pojemności za pomocą dołączonego zasilacza sieciowego trwa od 1,5 do 2 godzin.
| Dell XPS 14 Core Ultra X7 358H Ultra X7 358H, Arc B390 Panther Lake iGPU, 70 Wh | Dell 14 Premium Ultra 7 255H, Arc 140T, 69.5 Wh | Dell XPS 14 2024 OLED Ultra 7 155H, GeForce RTX 4050 Laptop GPU, 69.5 Wh | Asus ExpertBook Ultra B9406CAA Ultra X7 358H, Arc B390 Panther Lake iGPU, 70 Wh | Lenovo Yoga Pro 7 14IAH10 Ultra 9 285H, Arc 140T, 84 Wh | HP EliteBook X G1i 14 AI Core Ultra 7 268V, Arc 140V, 68 Wh | |
|---|---|---|---|---|---|---|
| Czasy pracy | -36% | -54% | -4% | -39% | 10% | |
| WiFi v1.3 (h) | 16.8 | 10.8 -36% | 7.8 -54% | 16.1 -4% | 10.3 -39% | 18.5 10% |
| H.264 (h) | 10.6 | |||||
| Load (h) | 1.3 |
Ocena Notebookcheck
XPS 14 2026 jest znaczącą poprawą w stosunku do poprzedniej generacji, zwłaszcza pod względem wydajności na wat, ale łatwość serwisowania jest nieco gorsza.
Dell XPS 14 Core Ultra X7 358H
- 07/02/2026 v8
Allen Ngo
 Total Sustainability Score:
 Potencjalni konkurenci w porównaniu
Obraz | Model / recenzja | Cena | Waga | Wysokość | Ekran |
|---|---|---|---|---|---|
1. 87.4%  | Dell XPS 14 Core Ultra X7 358H Intel Core Ultra X7 358H ⎘ Intel Arc B390 12 Xe3 Panther Lake iGPU ⎘ 32 GB Pamięć, 1000 GB SSD | Amazon: 1. $1,795.49 Dell XPS 14 Premium Laptop D... 2. $2,049.00 Dell XPS 14 9440 14.5" Noteb... 3. $2,099.99 Dell XPS 16 9640 Laptop | In... Cena katalogowa: 2200 USD | 1.4 kg | 14.62 mm | 14.00" 2880x1800 243 PPI OLED |
2. 82.5%  | Dell 14 Premium Intel Core Ultra 7 255H ⎘ Intel Arc Graphics 140T ⎘ 32 GB Pamięć, 1024 GB SSD | Amazon: Cena katalogowa: 1950 USD | 1.7 kg | 18 mm | 14.50" 3200x2000 260 PPI OLED |
3. 86.3% v7 (old)  | Dell XPS 14 2024 OLED Intel Core Ultra 7 155H ⎘ NVIDIA GeForce RTX 4050 Laptop GPU ⎘ 32 GB Pamięć, 1024 GB SSD | Amazon: Cena katalogowa: 2949€ | 1.8 kg | 19 mm | 14.50" 3200x2000 260 PPI OLED |
4. 87.6%  | Asus ExpertBook Ultra B9406CAA Intel Core Ultra X7 358H ⎘ Intel Arc B390 12 Xe3 Panther Lake iGPU ⎘ 32 GB Pamięć, 2048 GB SSD | Amazon: | 1.1 kg | 15.9 mm | 14.00" 2880x1800 243 PPI OLED |
5. 87.3%  | Lenovo Yoga Pro 7 14IAH10 Intel Core Ultra 9 285H ⎘ Intel Arc Graphics 140T ⎘ 32 GB Pamięć, 1024 GB SSD | Amazon: Cena katalogowa: 1500€ | 1.6 kg | 18.9 mm | 14.50" 3000x1876 244 PPI OLED |
6. 85.1%  | HP EliteBook X G1i 14 AI Intel Core Ultra 7 268V ⎘ Intel Arc Graphics 140V ⎘ 32 GB Pamięć, 512 GB SSD | Amazon: Cena katalogowa: 3300 USD | 1.2 kg | 15 mm | 14.00" 1920x1200 162 PPI IPS |
Przezroczystość
Wyboru urządzeń do recenzji dokonuje nasza redakcja. Próbka testowa została udostępniona autorowi jako pożyczka od producenta lub sprzedawcy detalicznego na potrzeby tej recenzji. Pożyczkodawca nie miał wpływu na tę recenzję, producent nie otrzymał też kopii tej recenzji przed publikacją. Nie było obowiązku publikowania tej recenzji. Jako niezależna firma medialna, Notebookcheck nie podlega władzy producentów, sprzedawców detalicznych ani wydawców.
Tak testuje Notebookcheck
Każdego roku Notebookcheck niezależnie sprawdza setki laptopów i smartfonów, stosując standardowe procedury, aby zapewnić porównywalność wszystkich wyników. Od około 20 lat stale rozwijamy nasze metody badawcze, ustanawiając przy tym standardy branżowe. W naszych laboratoriach testowych doświadczeni technicy i redaktorzy korzystają z wysokiej jakości sprzętu pomiarowego. Testy te obejmują wieloetapowy proces walidacji. Nasz kompleksowy system ocen opiera się na setkach uzasadnionych pomiarów i benchmarków, co pozwala zachować obiektywizm.
