
Werdykt - Nie do końca "pro" do gier, ale może do...?
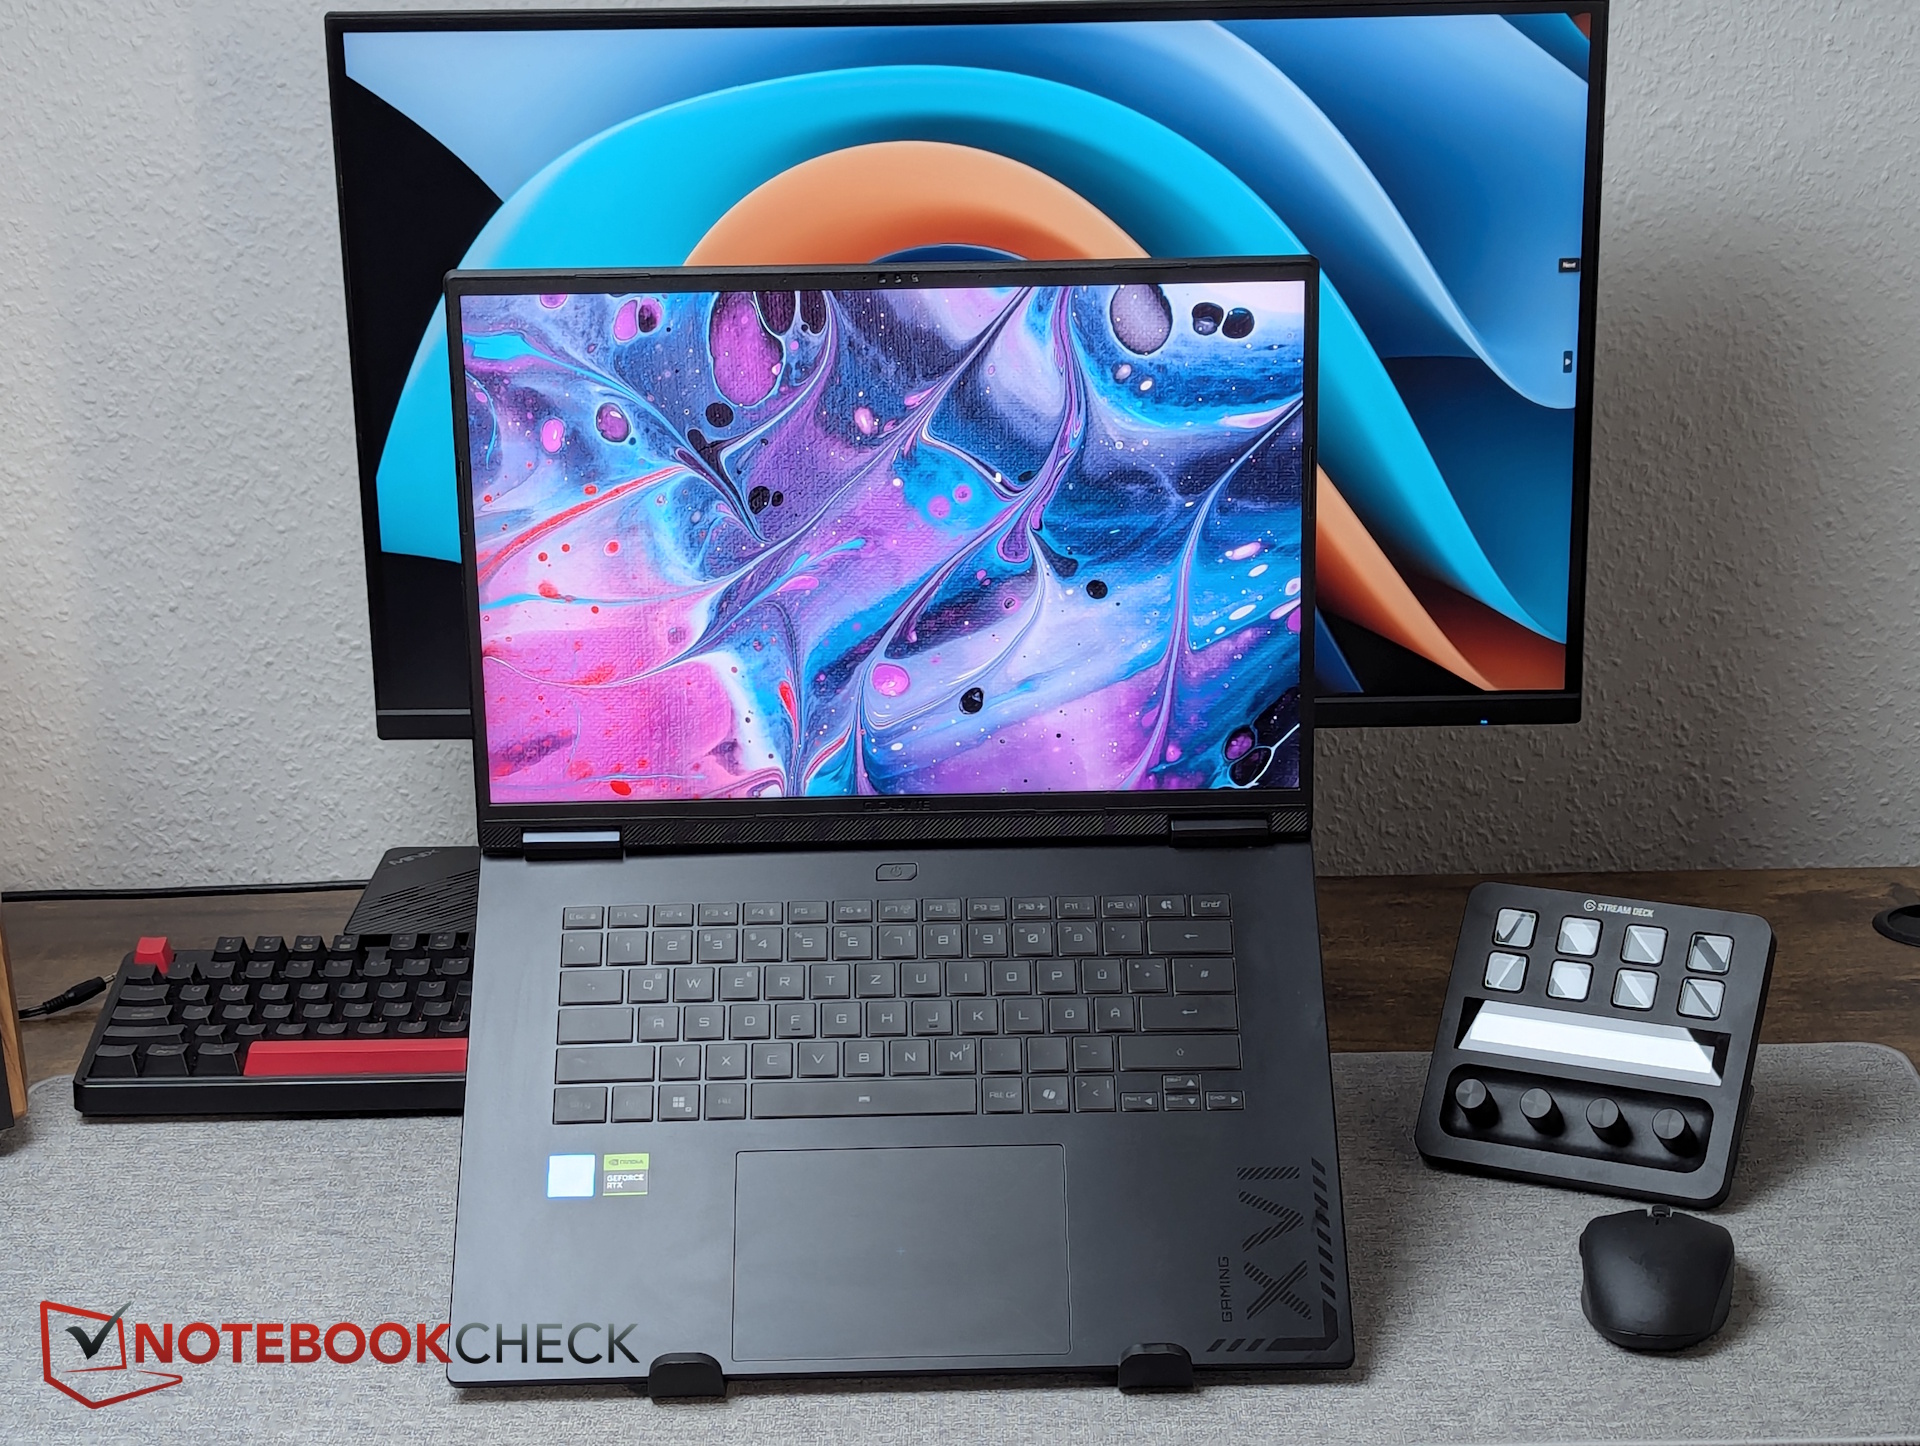
Typowe laptopy z RTX 5070 Ti są zazwyczaj grubsze, cięższe (i mocniejsze) niż Gigabyte A16 Pro. Dzięki smukłej obudowie, solidnemu czasowi pracy na baterii, niskiemu poborowi mocy pod obciążeniem i jasnemu wyświetlaczowi, jest to bardziej przystępna cenowo maszyna klasy podstawowej do mobilnej edycji wideo, lokalnych obciążeń AI lub modelowania 3D. Dodatkowa pamięć VRAM RTX 5070 Ti jest tutaj szczególnie korzystna.
Jednak jeśli chodzi o łączność (tylko 5 Gbps USB), spodziewaliśmy się znacznie więcej "pro" Co ważniejsze, brakuje optymalizacji. Wysokie opóźnienia, dławienie dysków SSD i podwyższony pobór mocy w trybie bezczynności wskazują na niewykorzystany potencjał. Mamy nadzieję, że Gigabyte zajmie się tymi kwestiami w przyszłych aktualizacjach.
Za
Przeciw
Spis treści
- Werdykt - Nie do końca "pro" do gier, ale może do...?
- Specyfikacje
- Obudowa i budowa - Smukła, ale niezbyt wytrzymała
- Urządzenia wejściowe - niezawodne pisanie i nawigacja
- Wyświetlacz - 500 nitów WQXGA z sRGB
- Wydajność - Niewiele szybsza od wersji non-pro
- Emisje i energia - Wysokie zużycie energii na biegu jałowym
- Możliwe alternatywy
Po zeszłorocznym Gigabyte Gaming A16gigabyte Gaming A16 Pro - z nowym procesorem, ulepszonym układem graficznym i, miejmy nadzieję, ulepszonymi funkcjami i chłodzeniem.
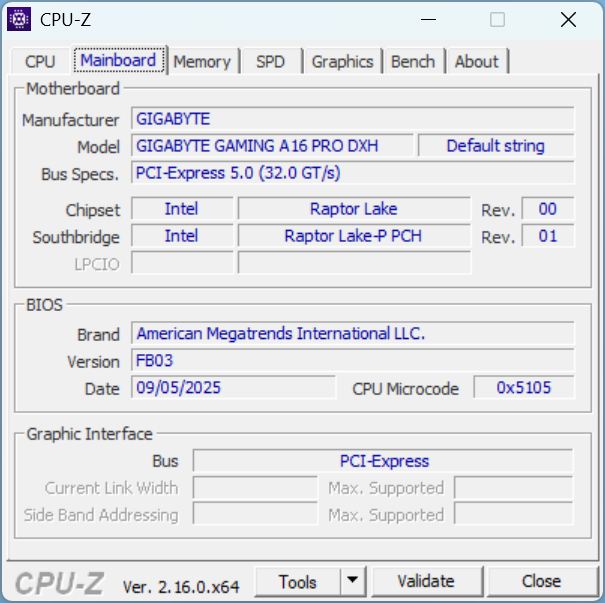
Specyfikacje
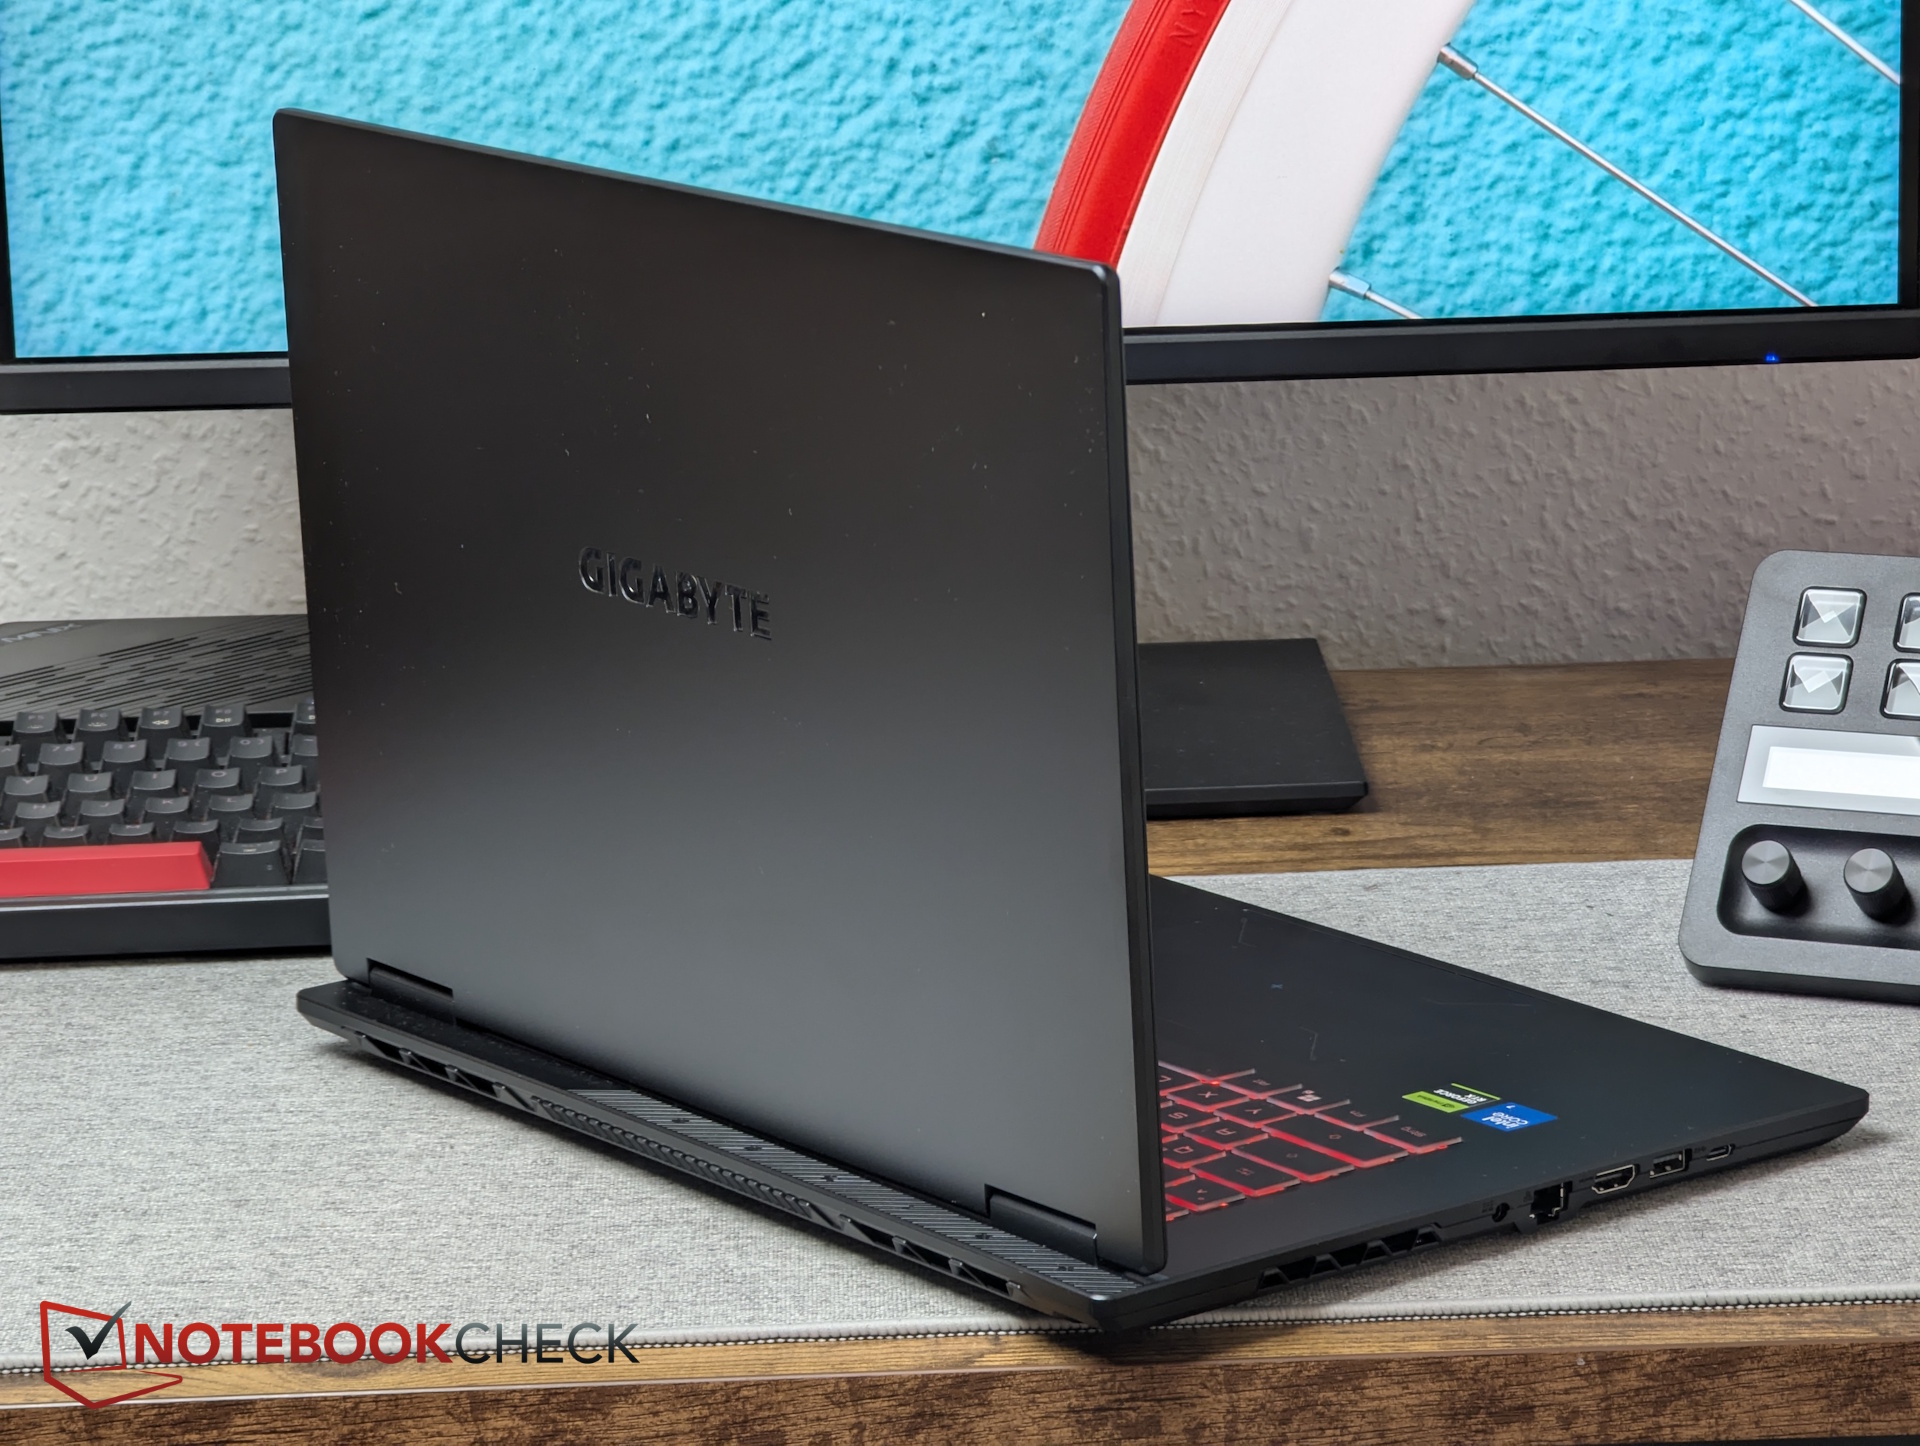
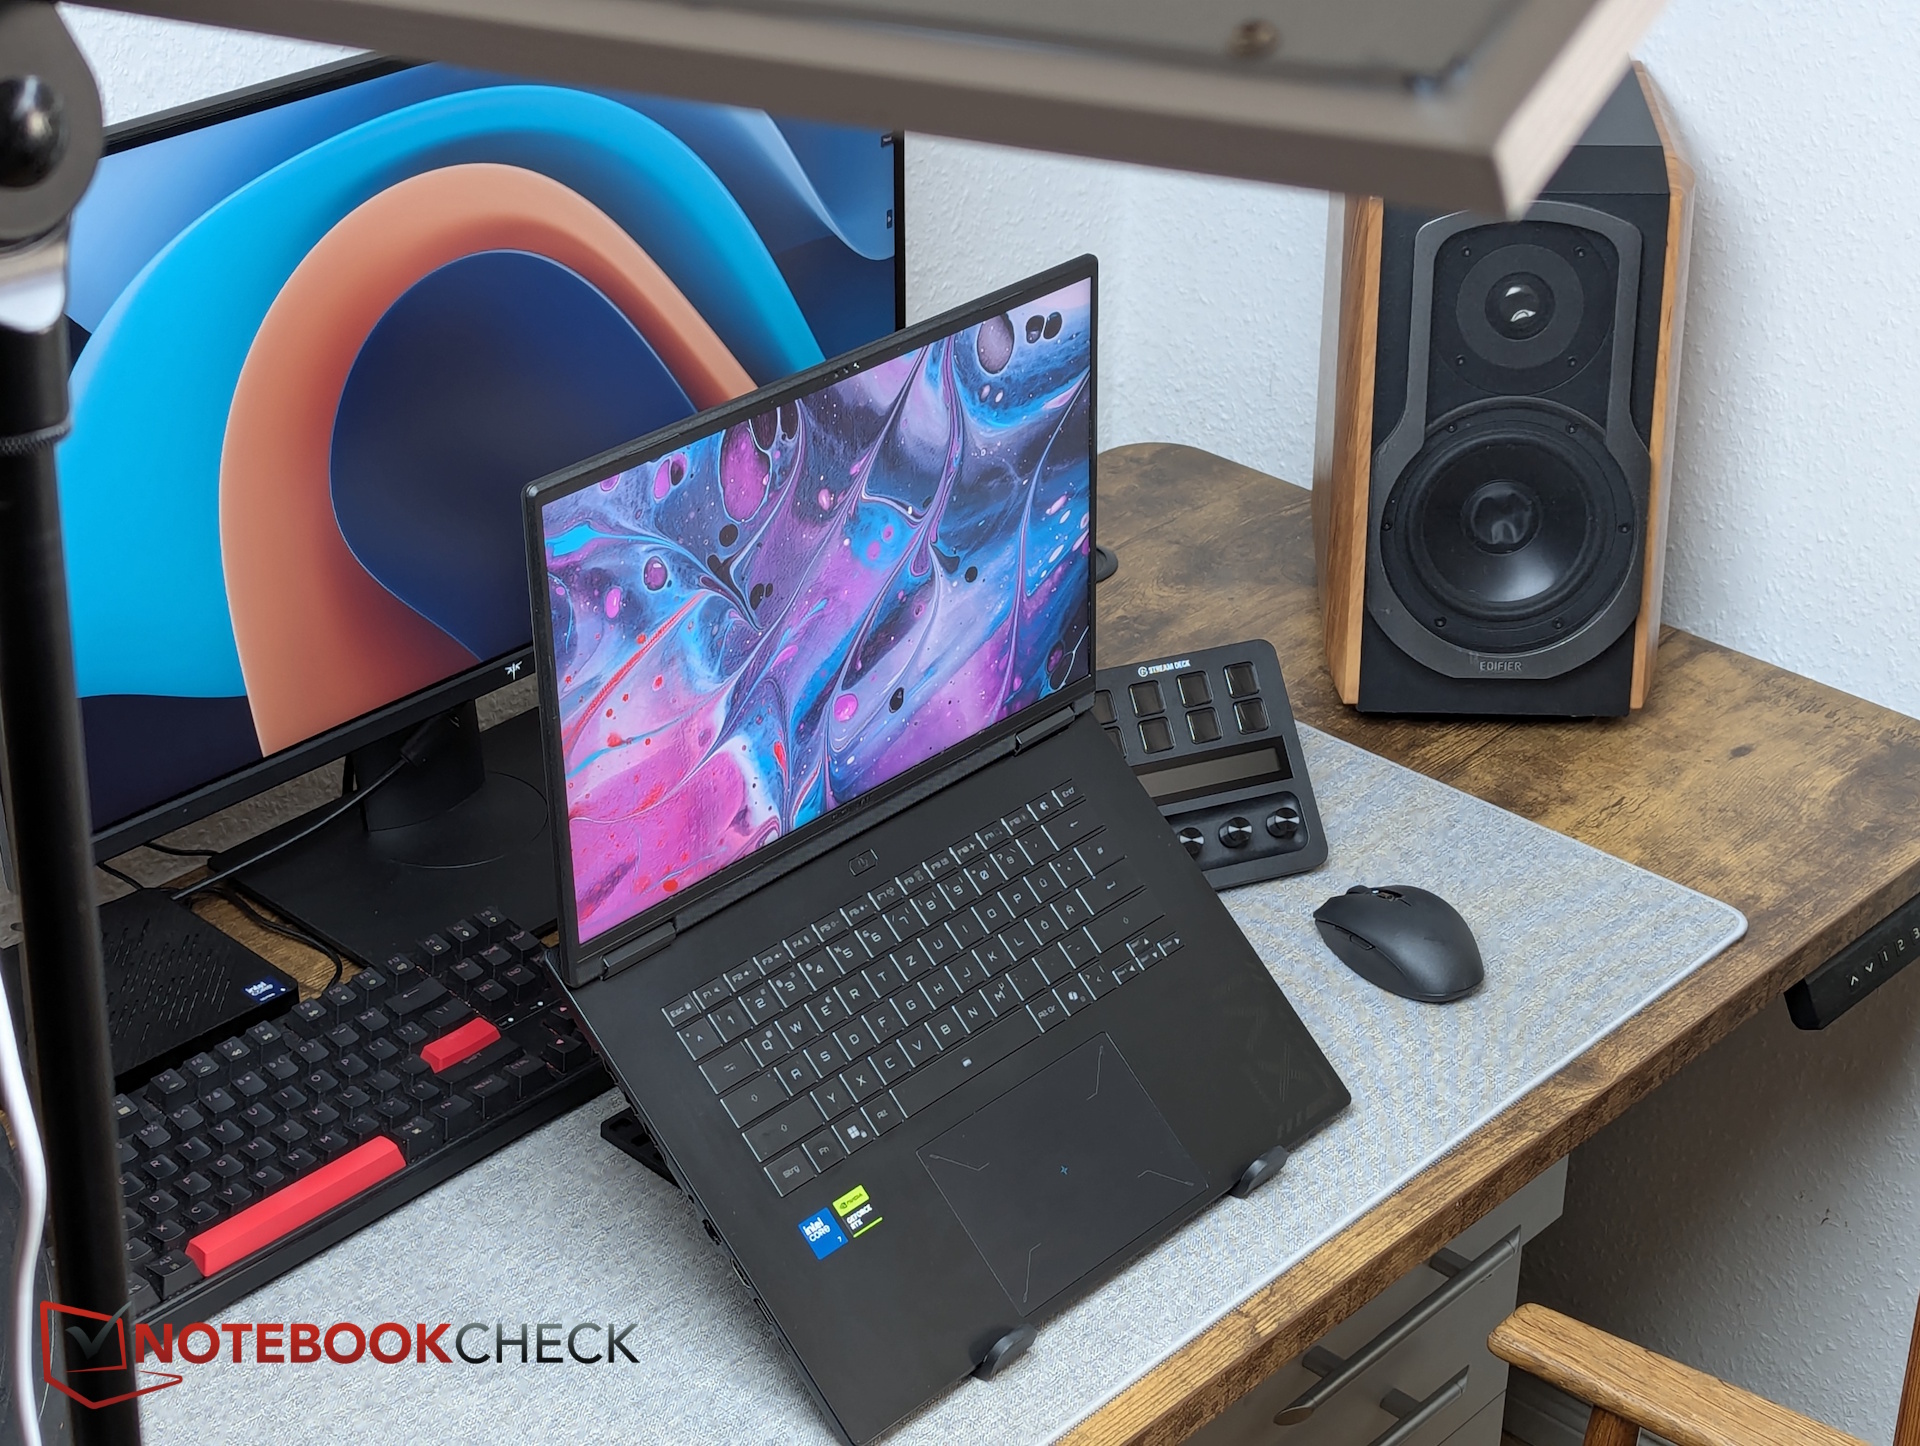
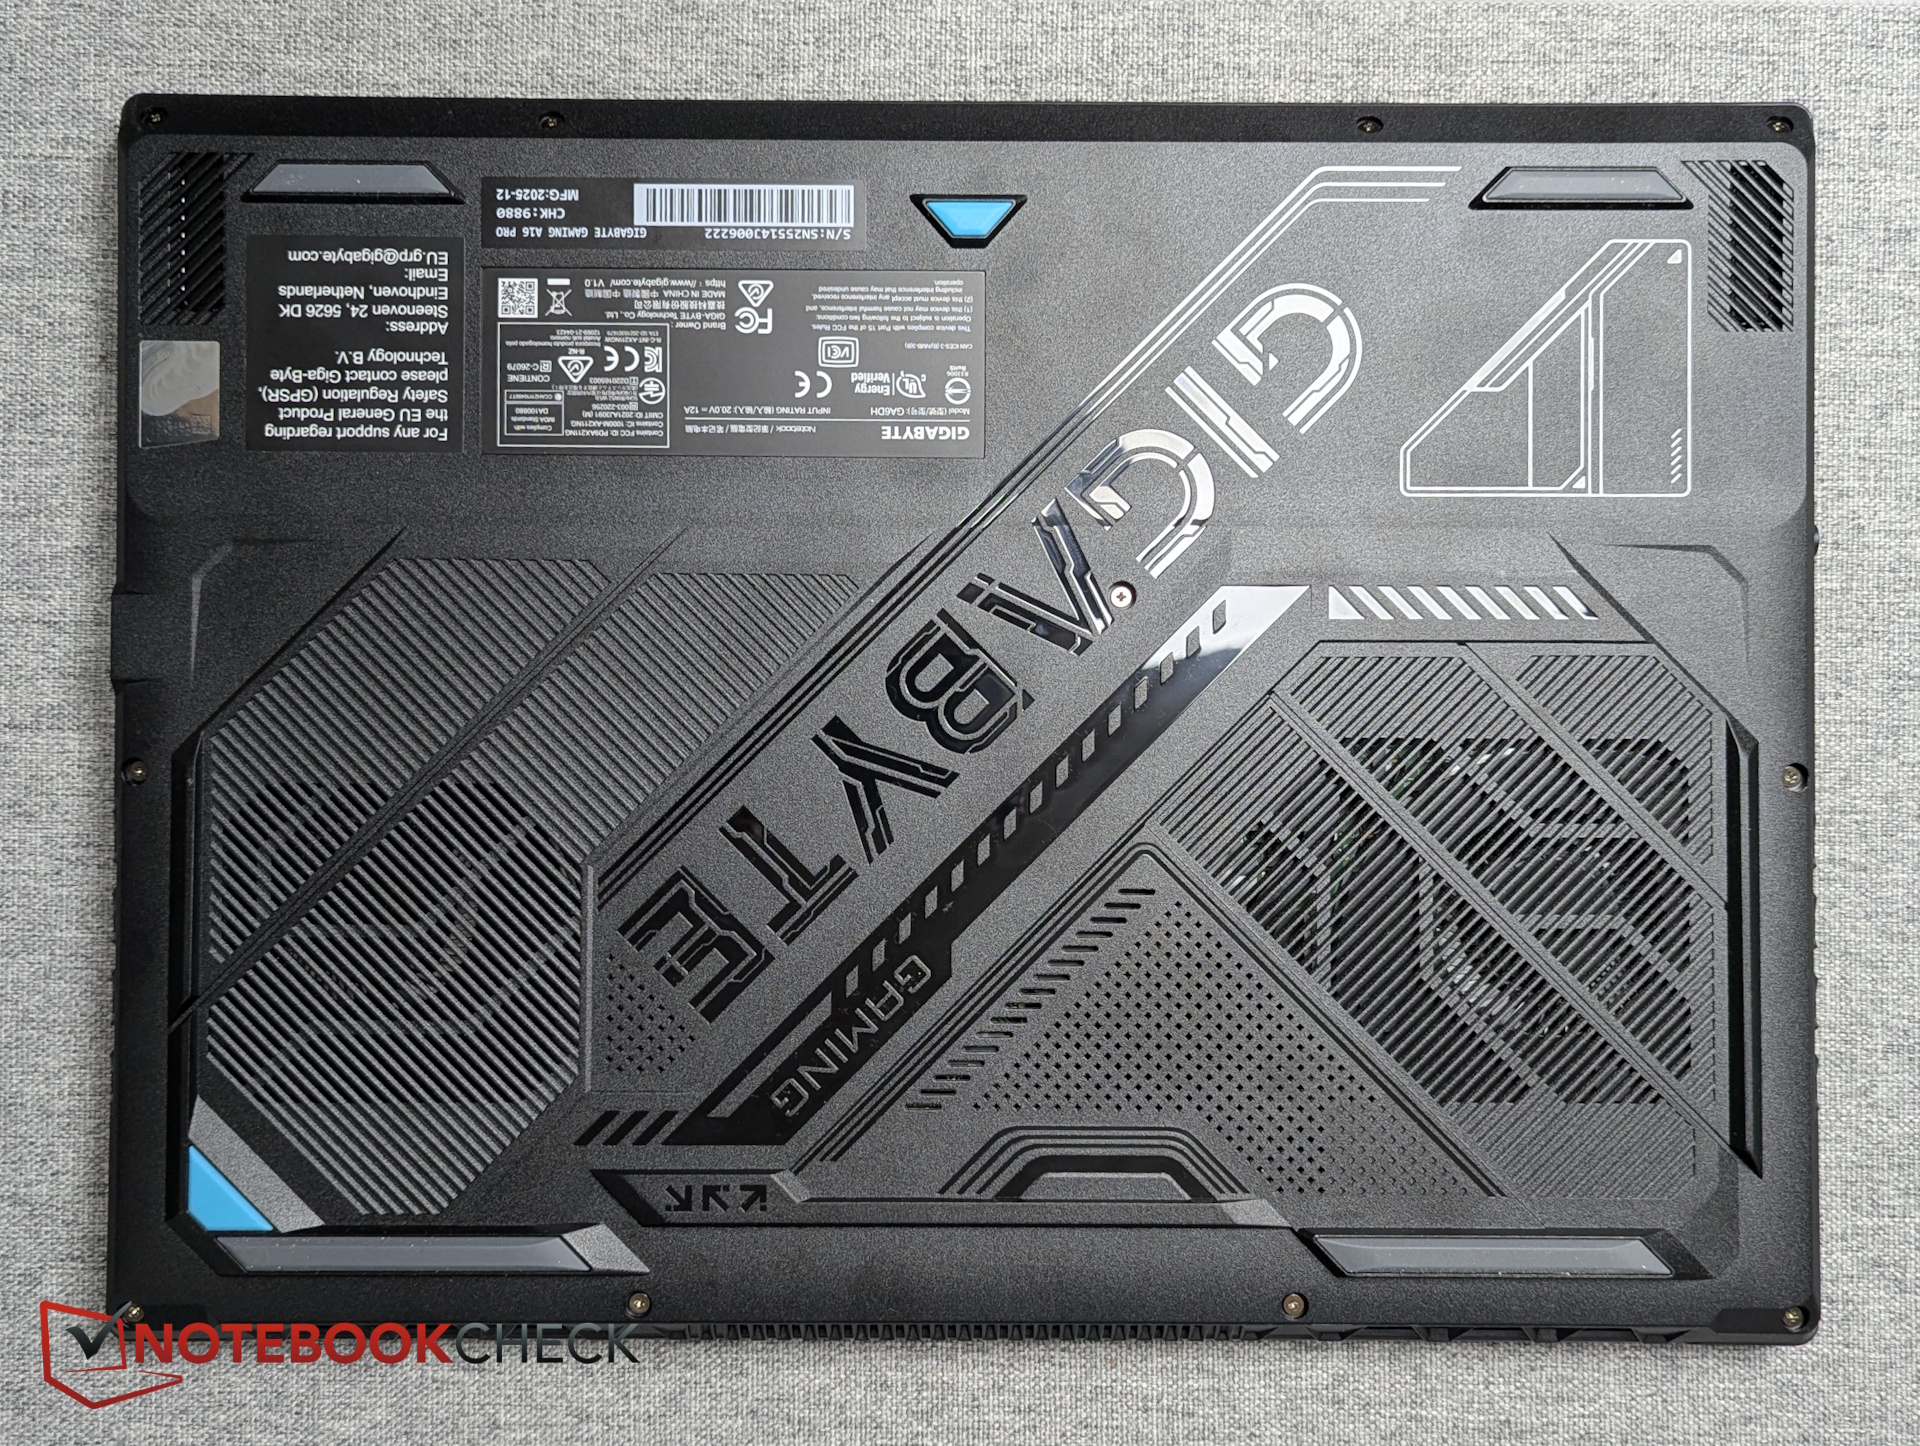
Obudowa i budowa - Smukła, ale niezbyt wytrzymała
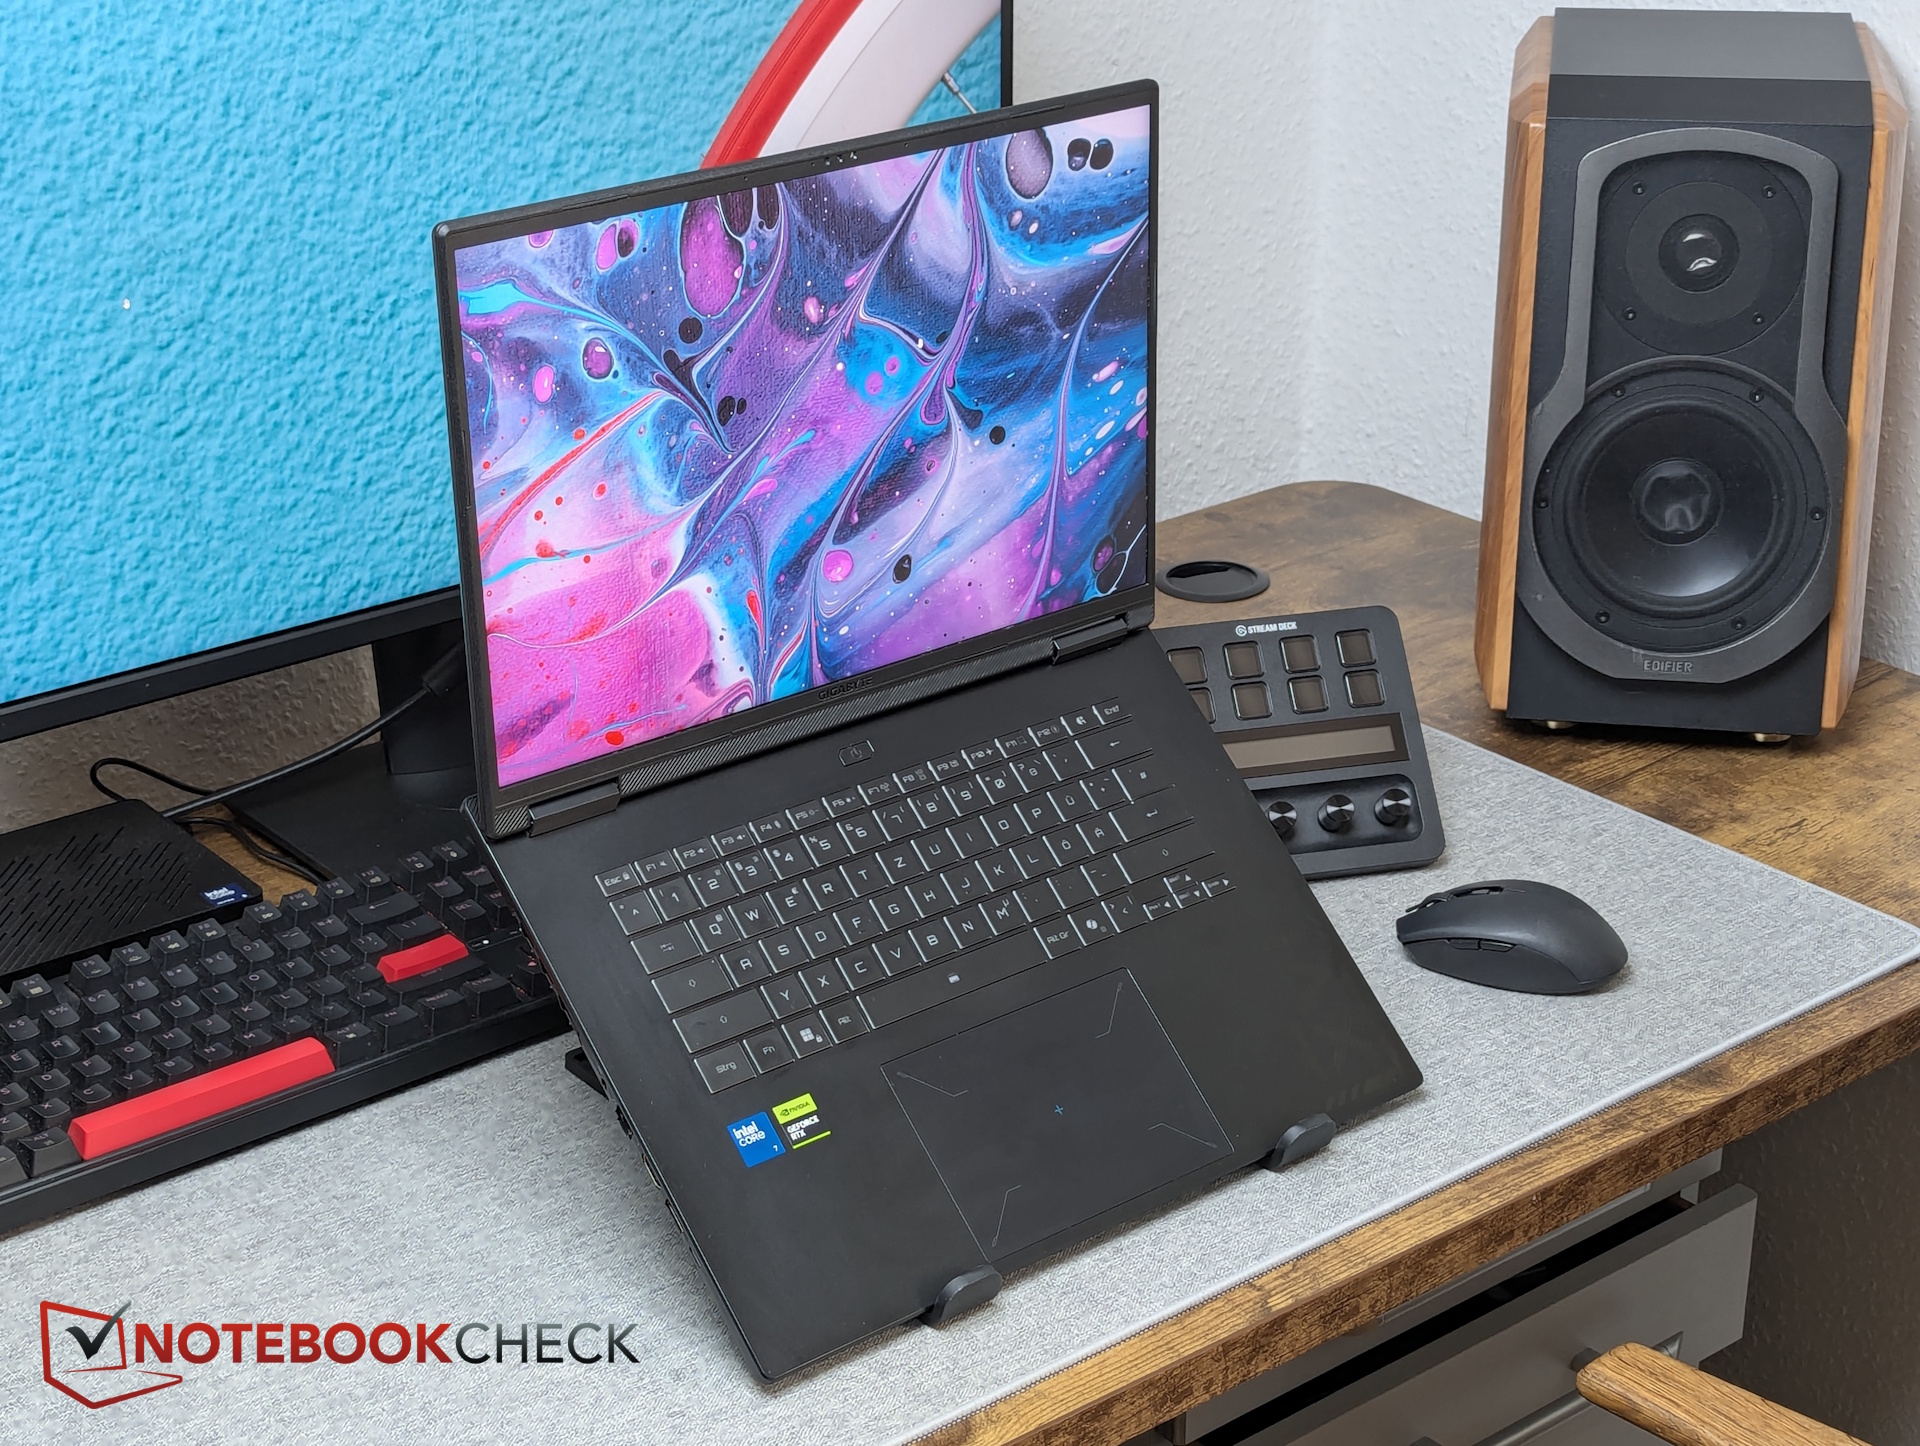
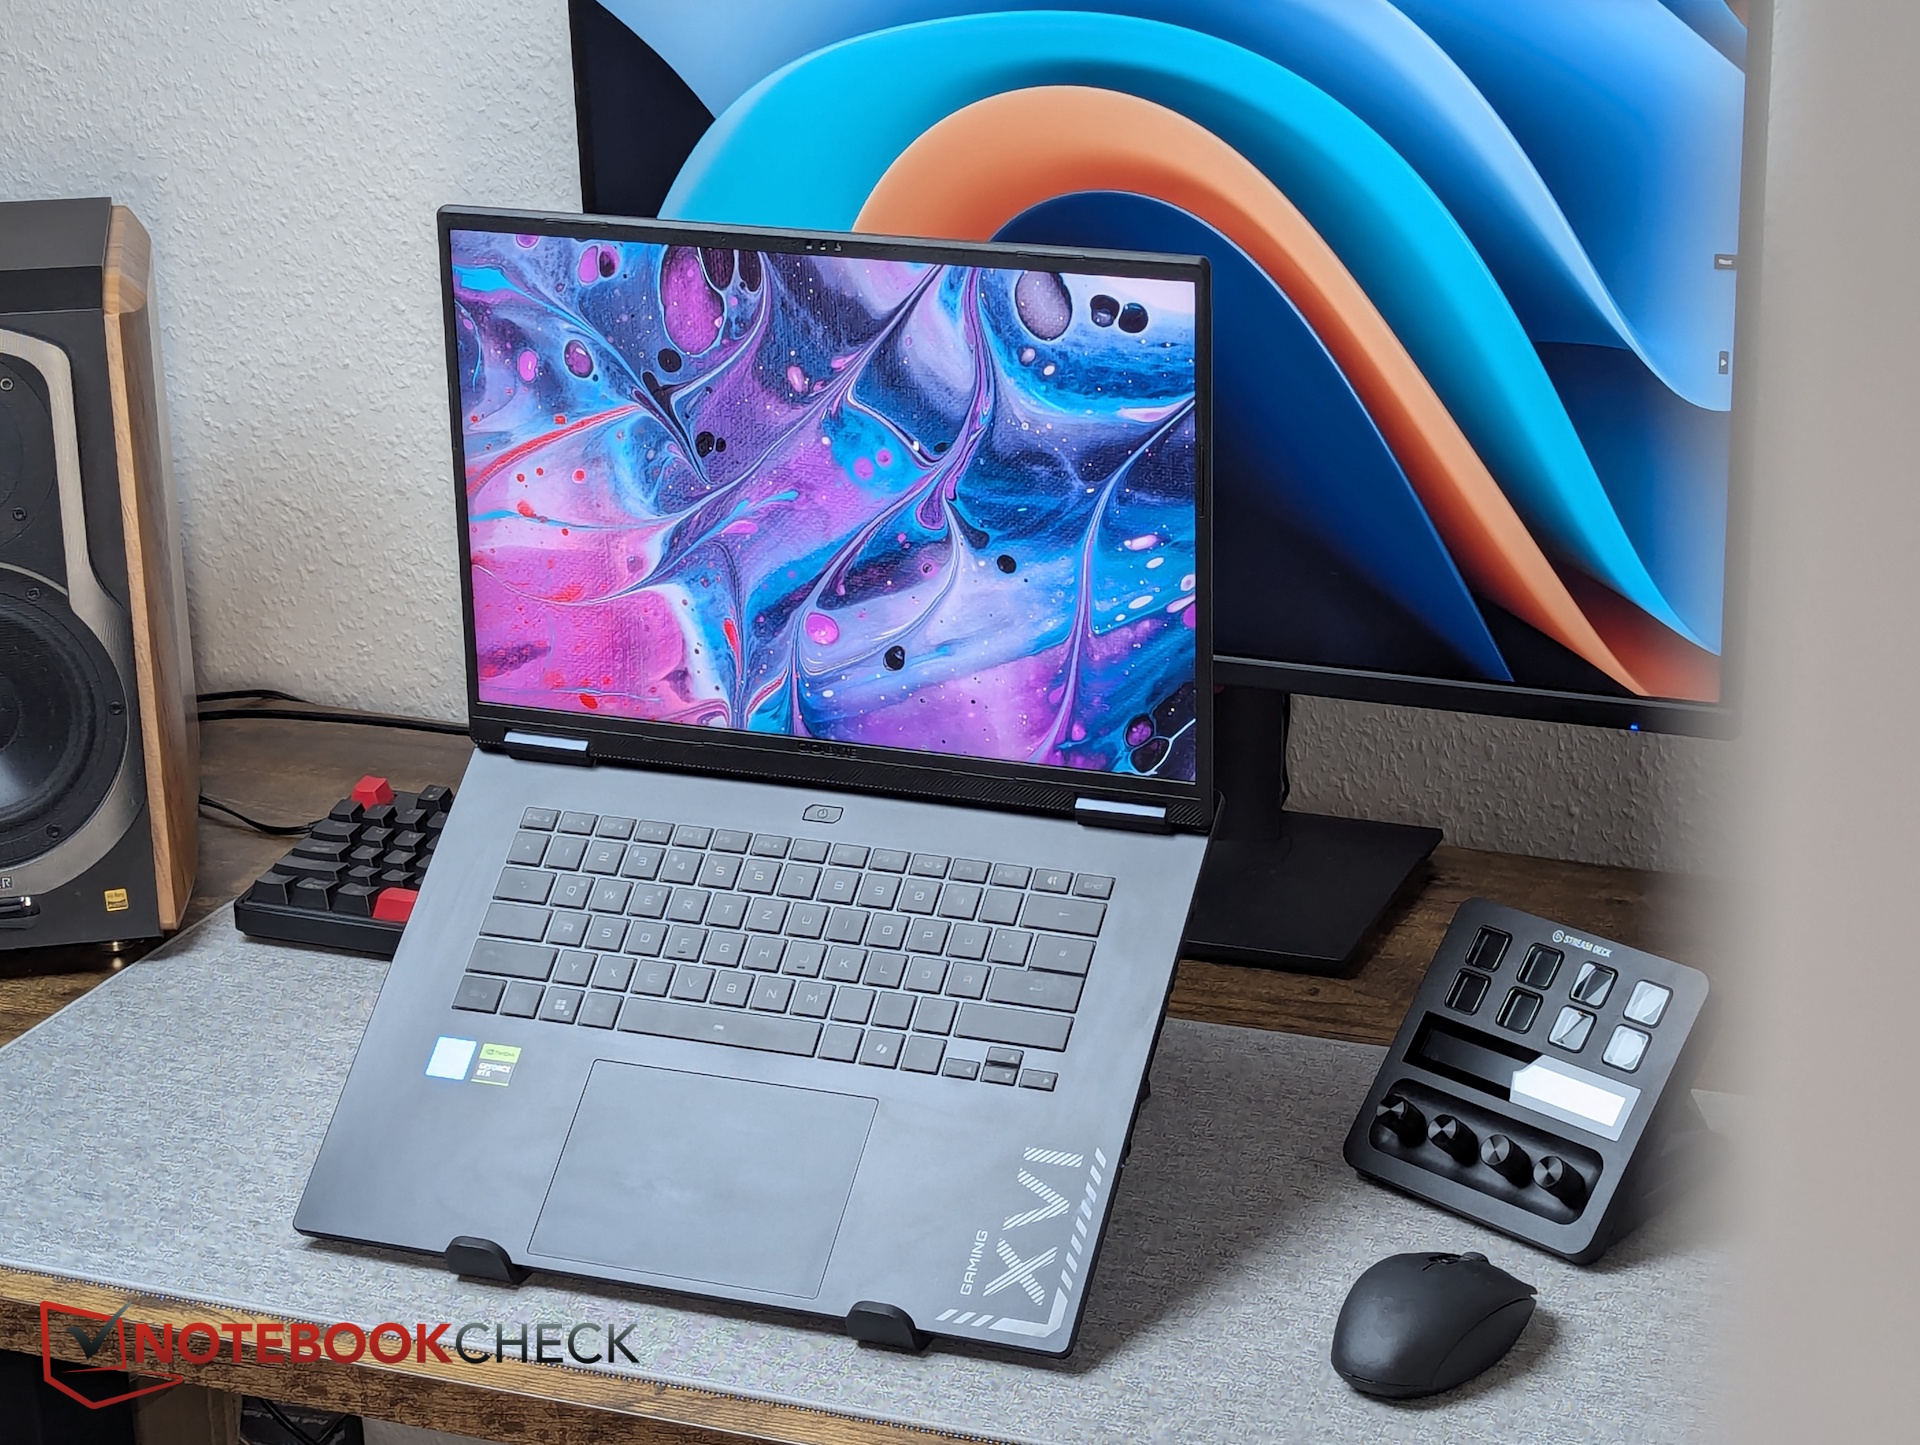
Elegancka, smukła konstrukcja jest identyczna jak w zeszłorocznym modelu non-Pro A16. Zastosowany plastik jest dość cienki, co pozwala czarnej jednostce bazowej na wyginanie się i wydawanie skrzypiących dźwięków, szczególnie wokół portów po lewej stronie.
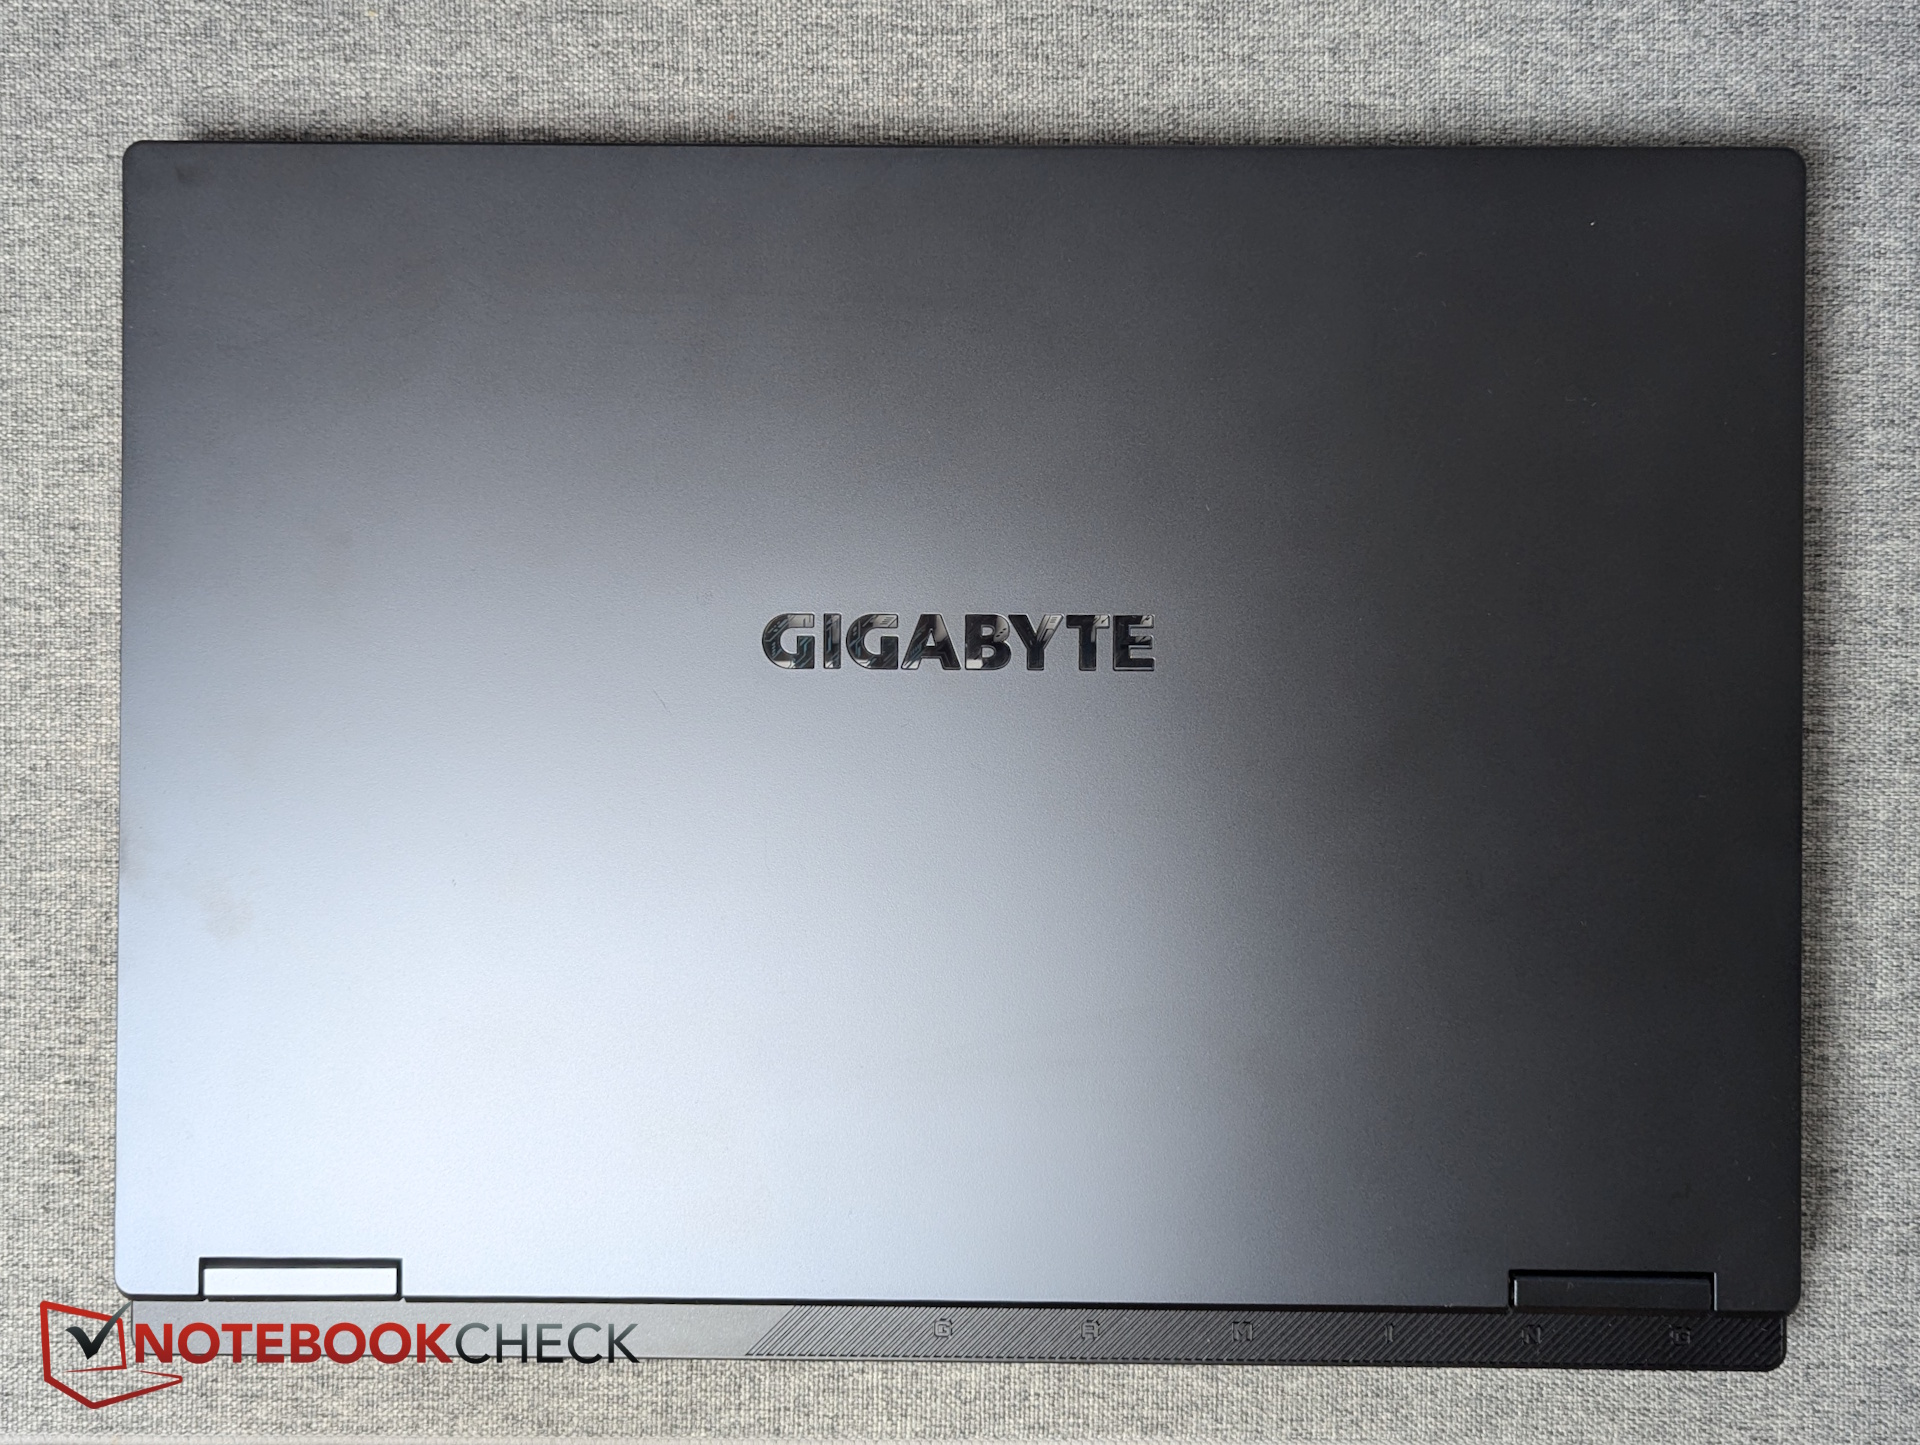
Stylizowany dolny panel jest wykonany z wyjątkowo miękkiego plastiku, a cienkie kratki wentylacyjne mogą uginać się na tyle pod naciskiem, że dotykają wentylatorów znajdujących się pod spodem.
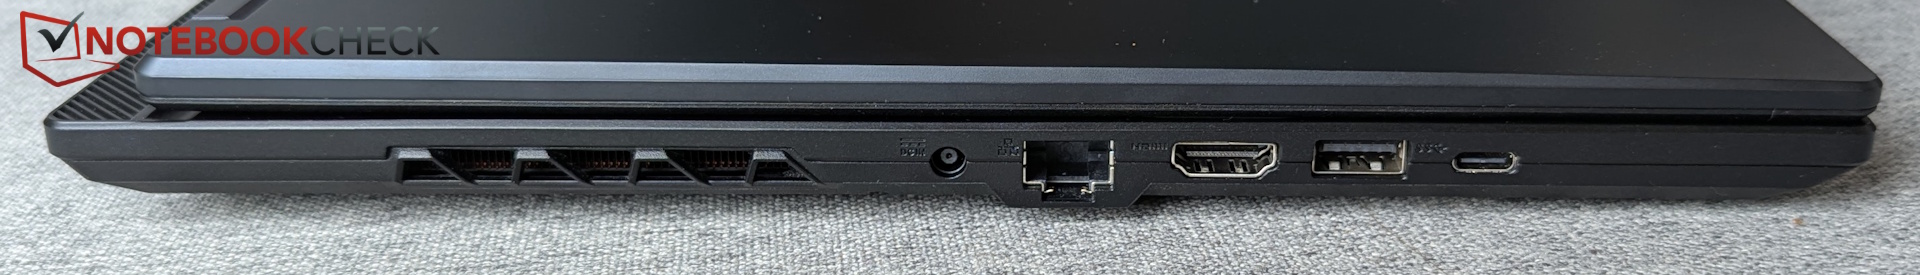
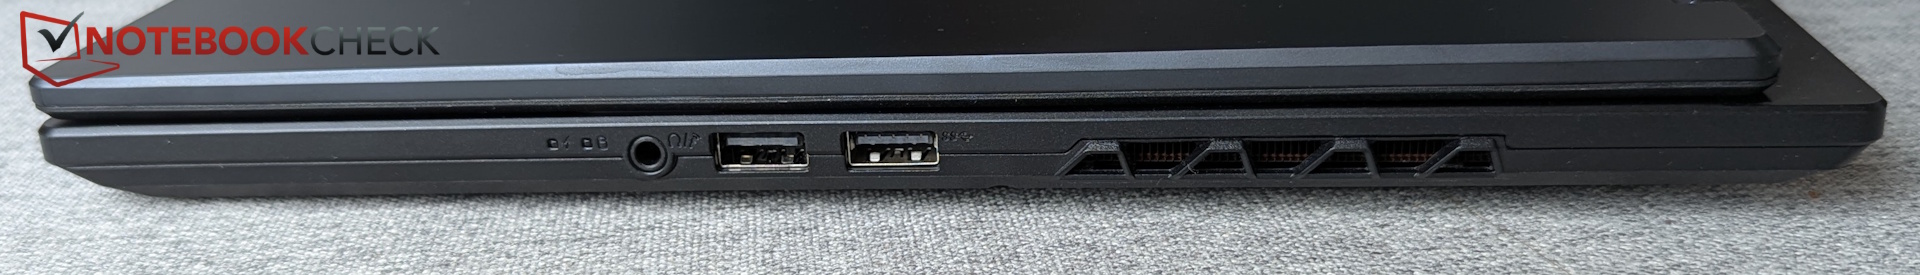
Porty
Pomimo etykiety "Pro", urządzenie nadal zawiera USB 2.0, ale brakuje mu Thunderbolt, USB 4, USB 3.2 Gen 2, a nawet czytnika kart SD.
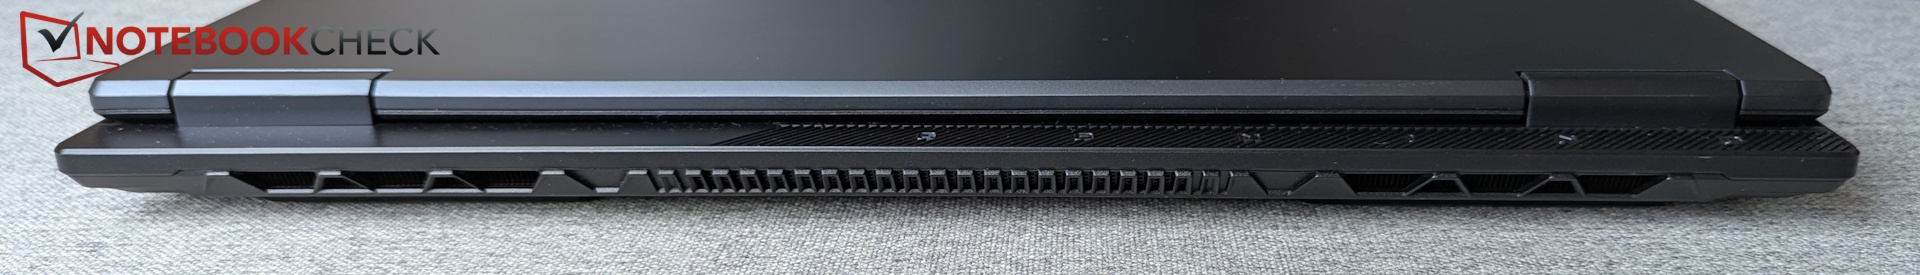
Z tyłu nie ma żadnych portów, a ze względu na zamontowane z boku otwory wylotowe, wszystkie złącza są umieszczone dość daleko z przodu - potencjalnie zakłócając korzystanie z myszy.
Kamera internetowa
A16 Pro posiada kamerę internetową FHD (1080p) IR z obsługą Windows Hello, ale nie ma fizycznej migawki. Dokładność odwzorowania kolorów jest dość słaba, choć ostrość jest akceptowalna.

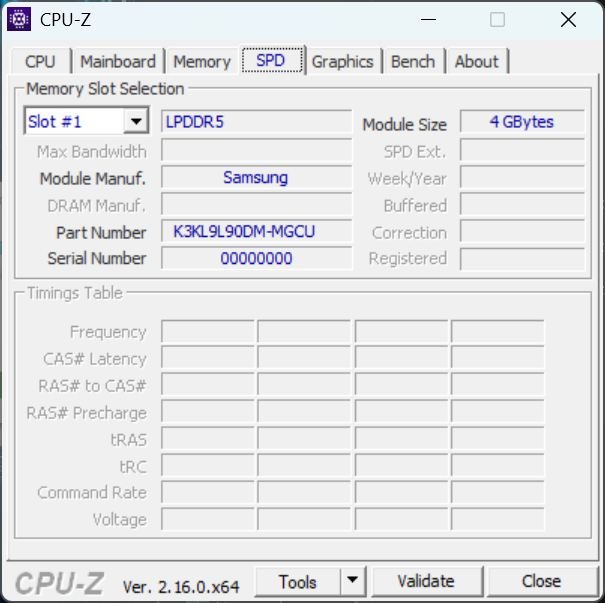
 GeForce RTX 5070 Ti Laptop, Core 7 240H, Samsung PM9C1b MZVL81T0HFLB-00BTW")
 GeForce RTX 5070 Ti Laptop, Core 7 240H, Samsung PM9C1b MZVL81T0HFLB-00BTW")
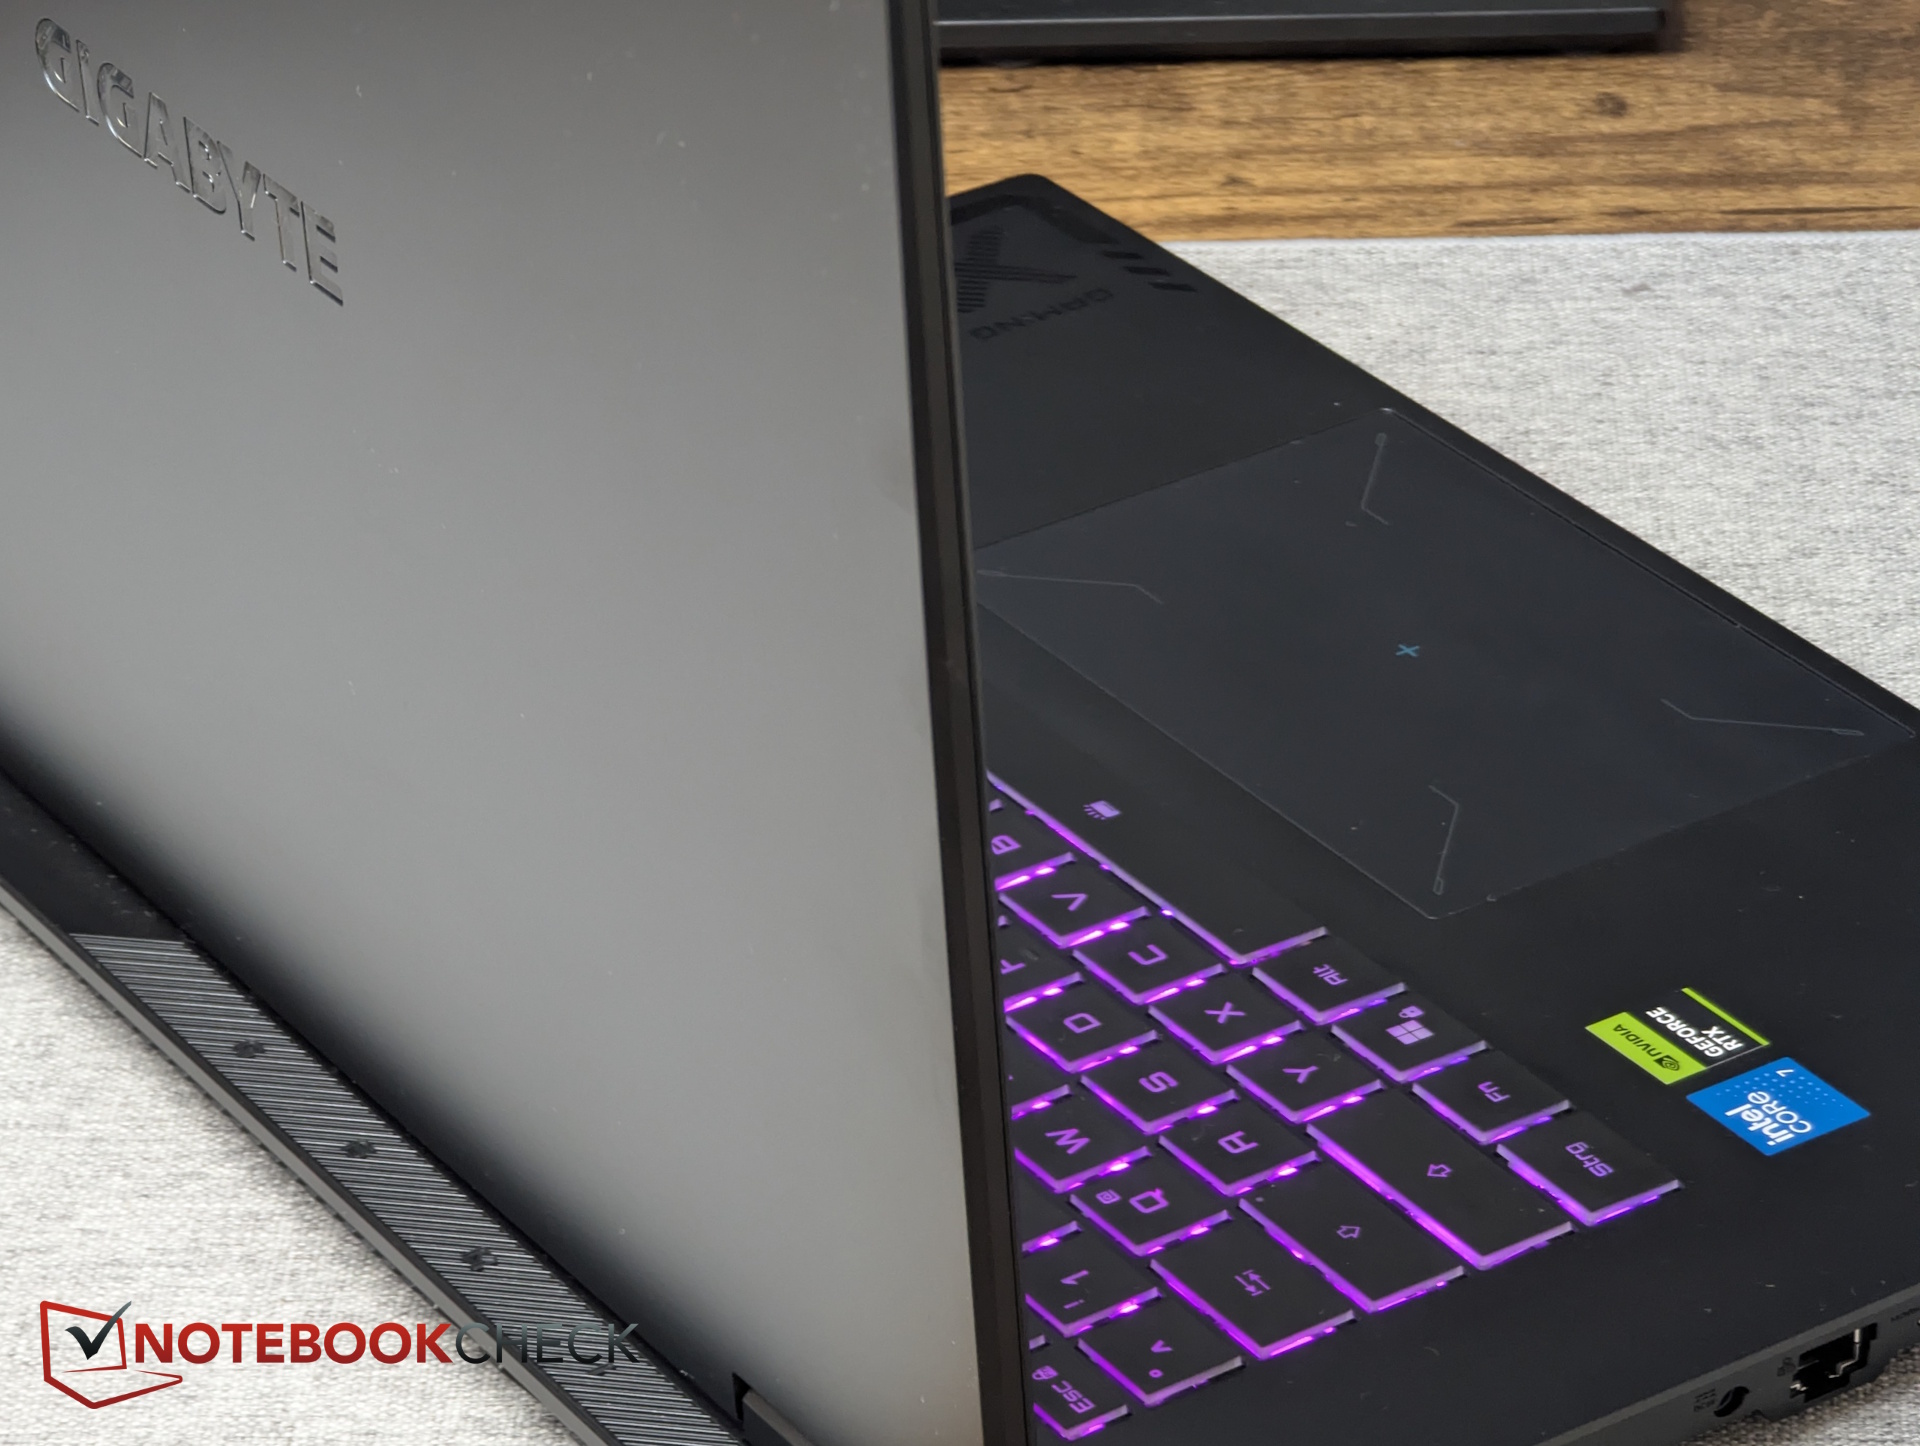
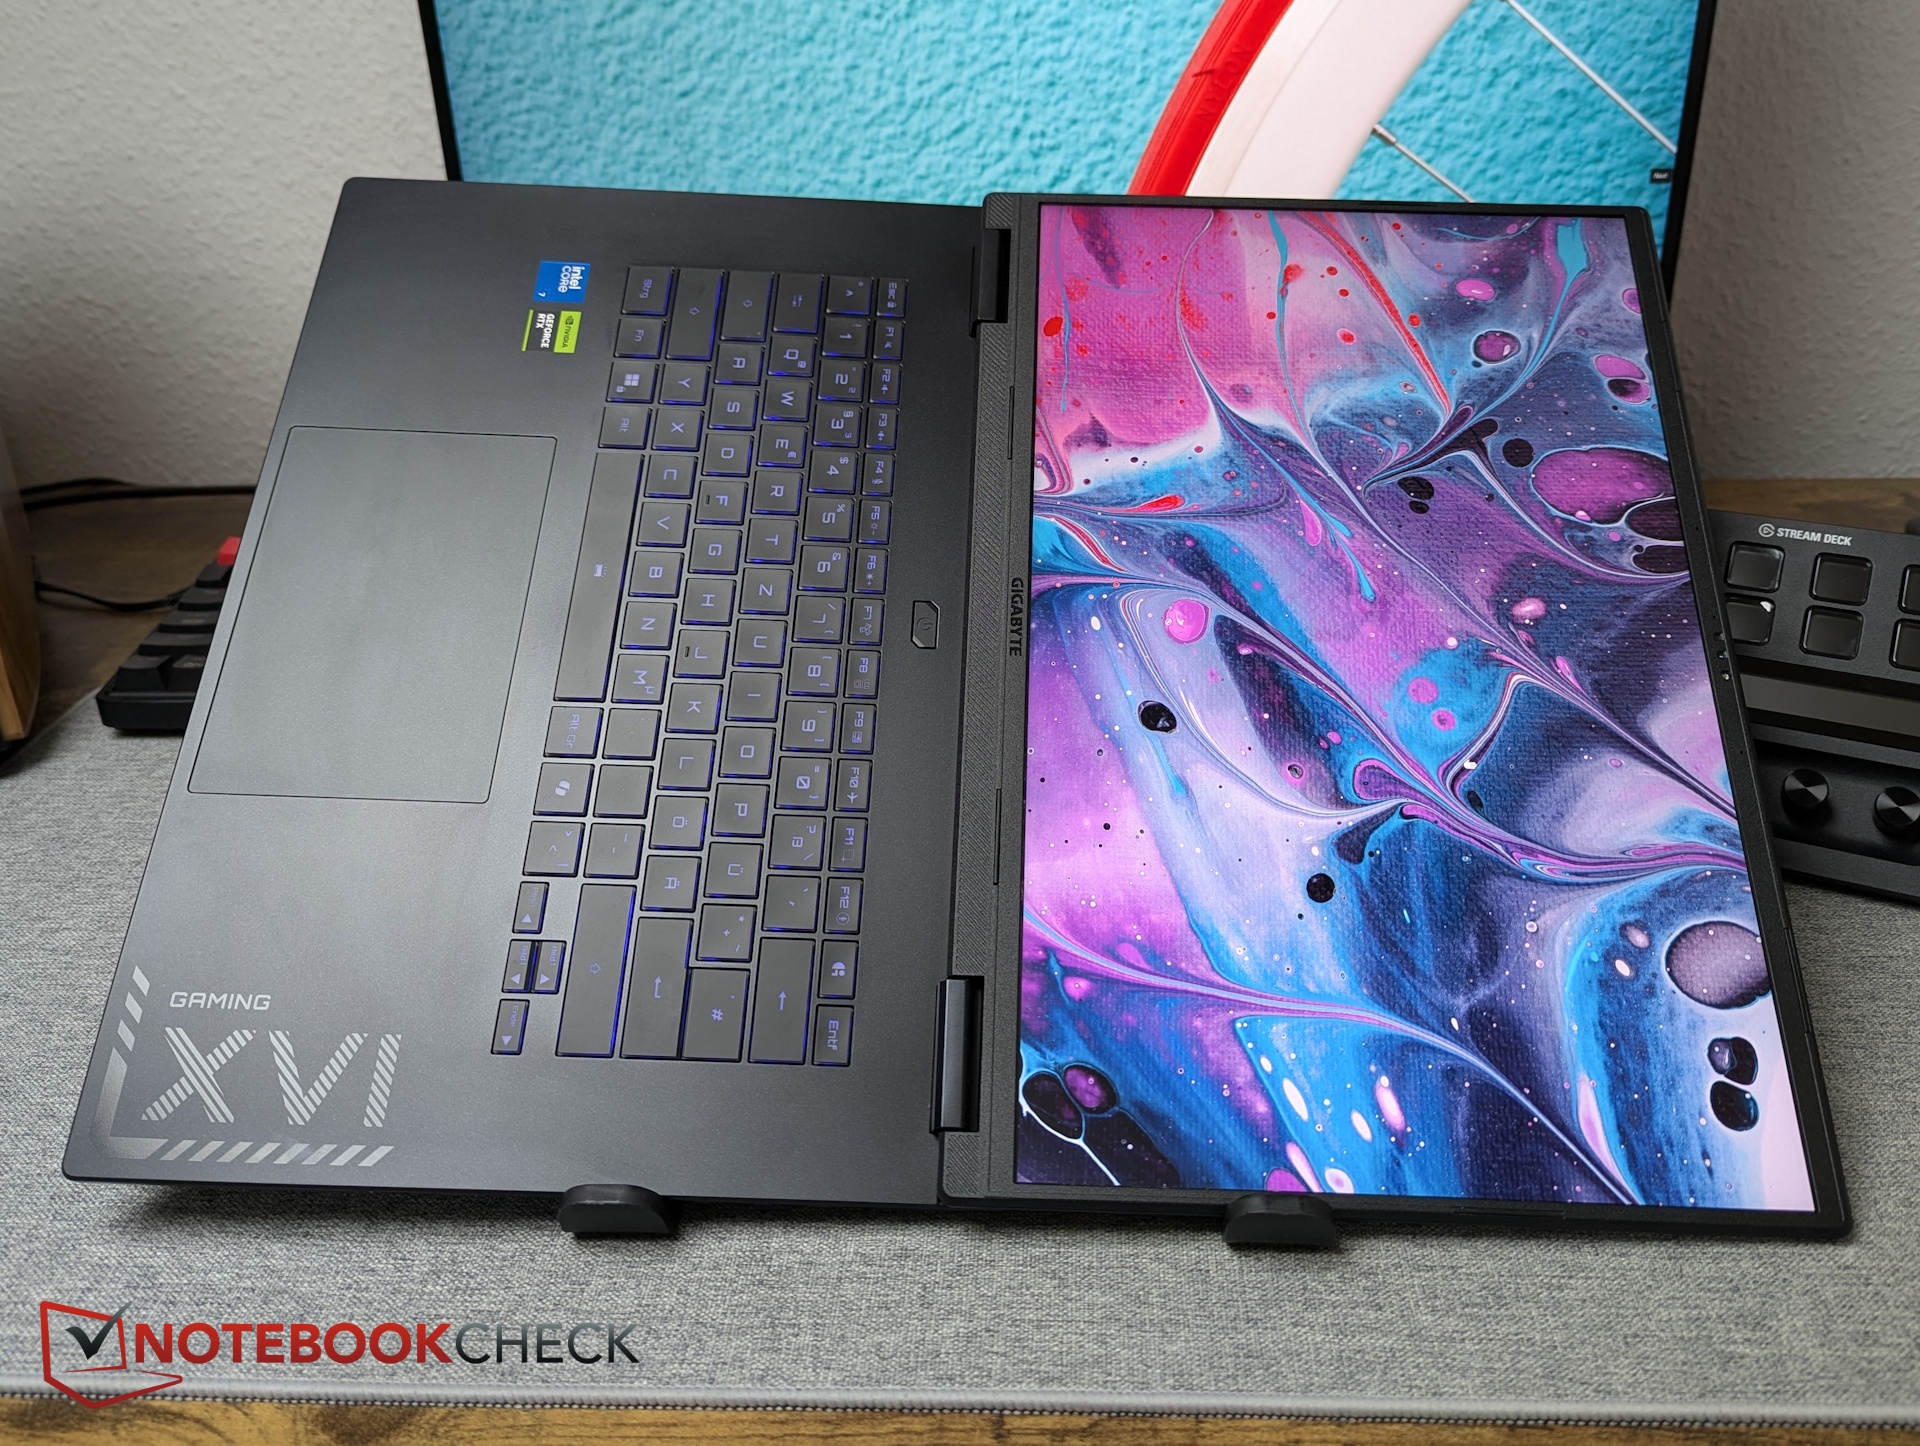
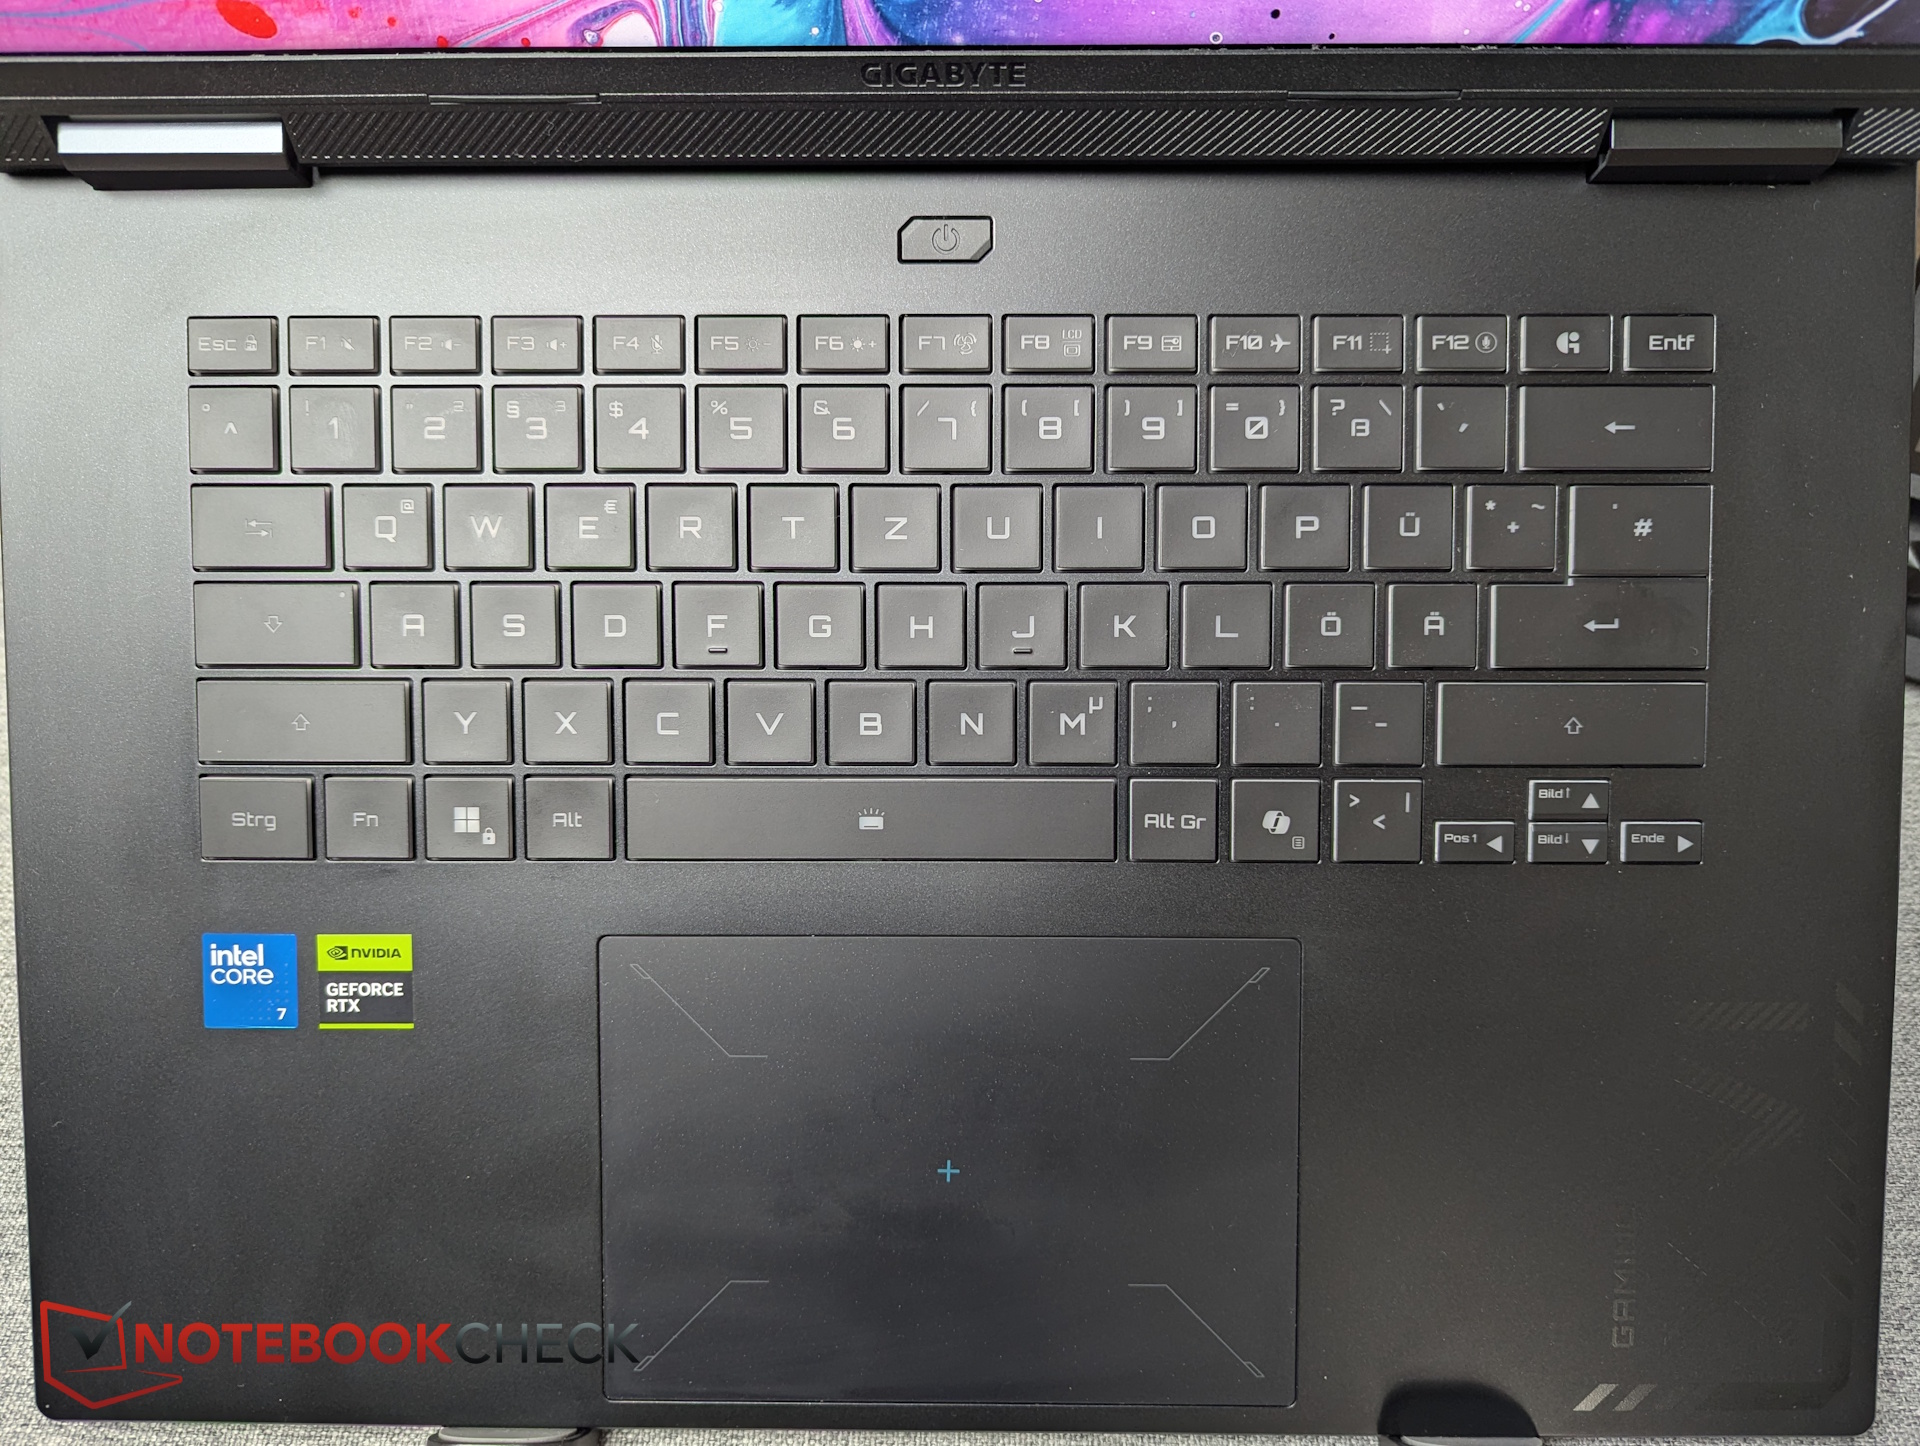
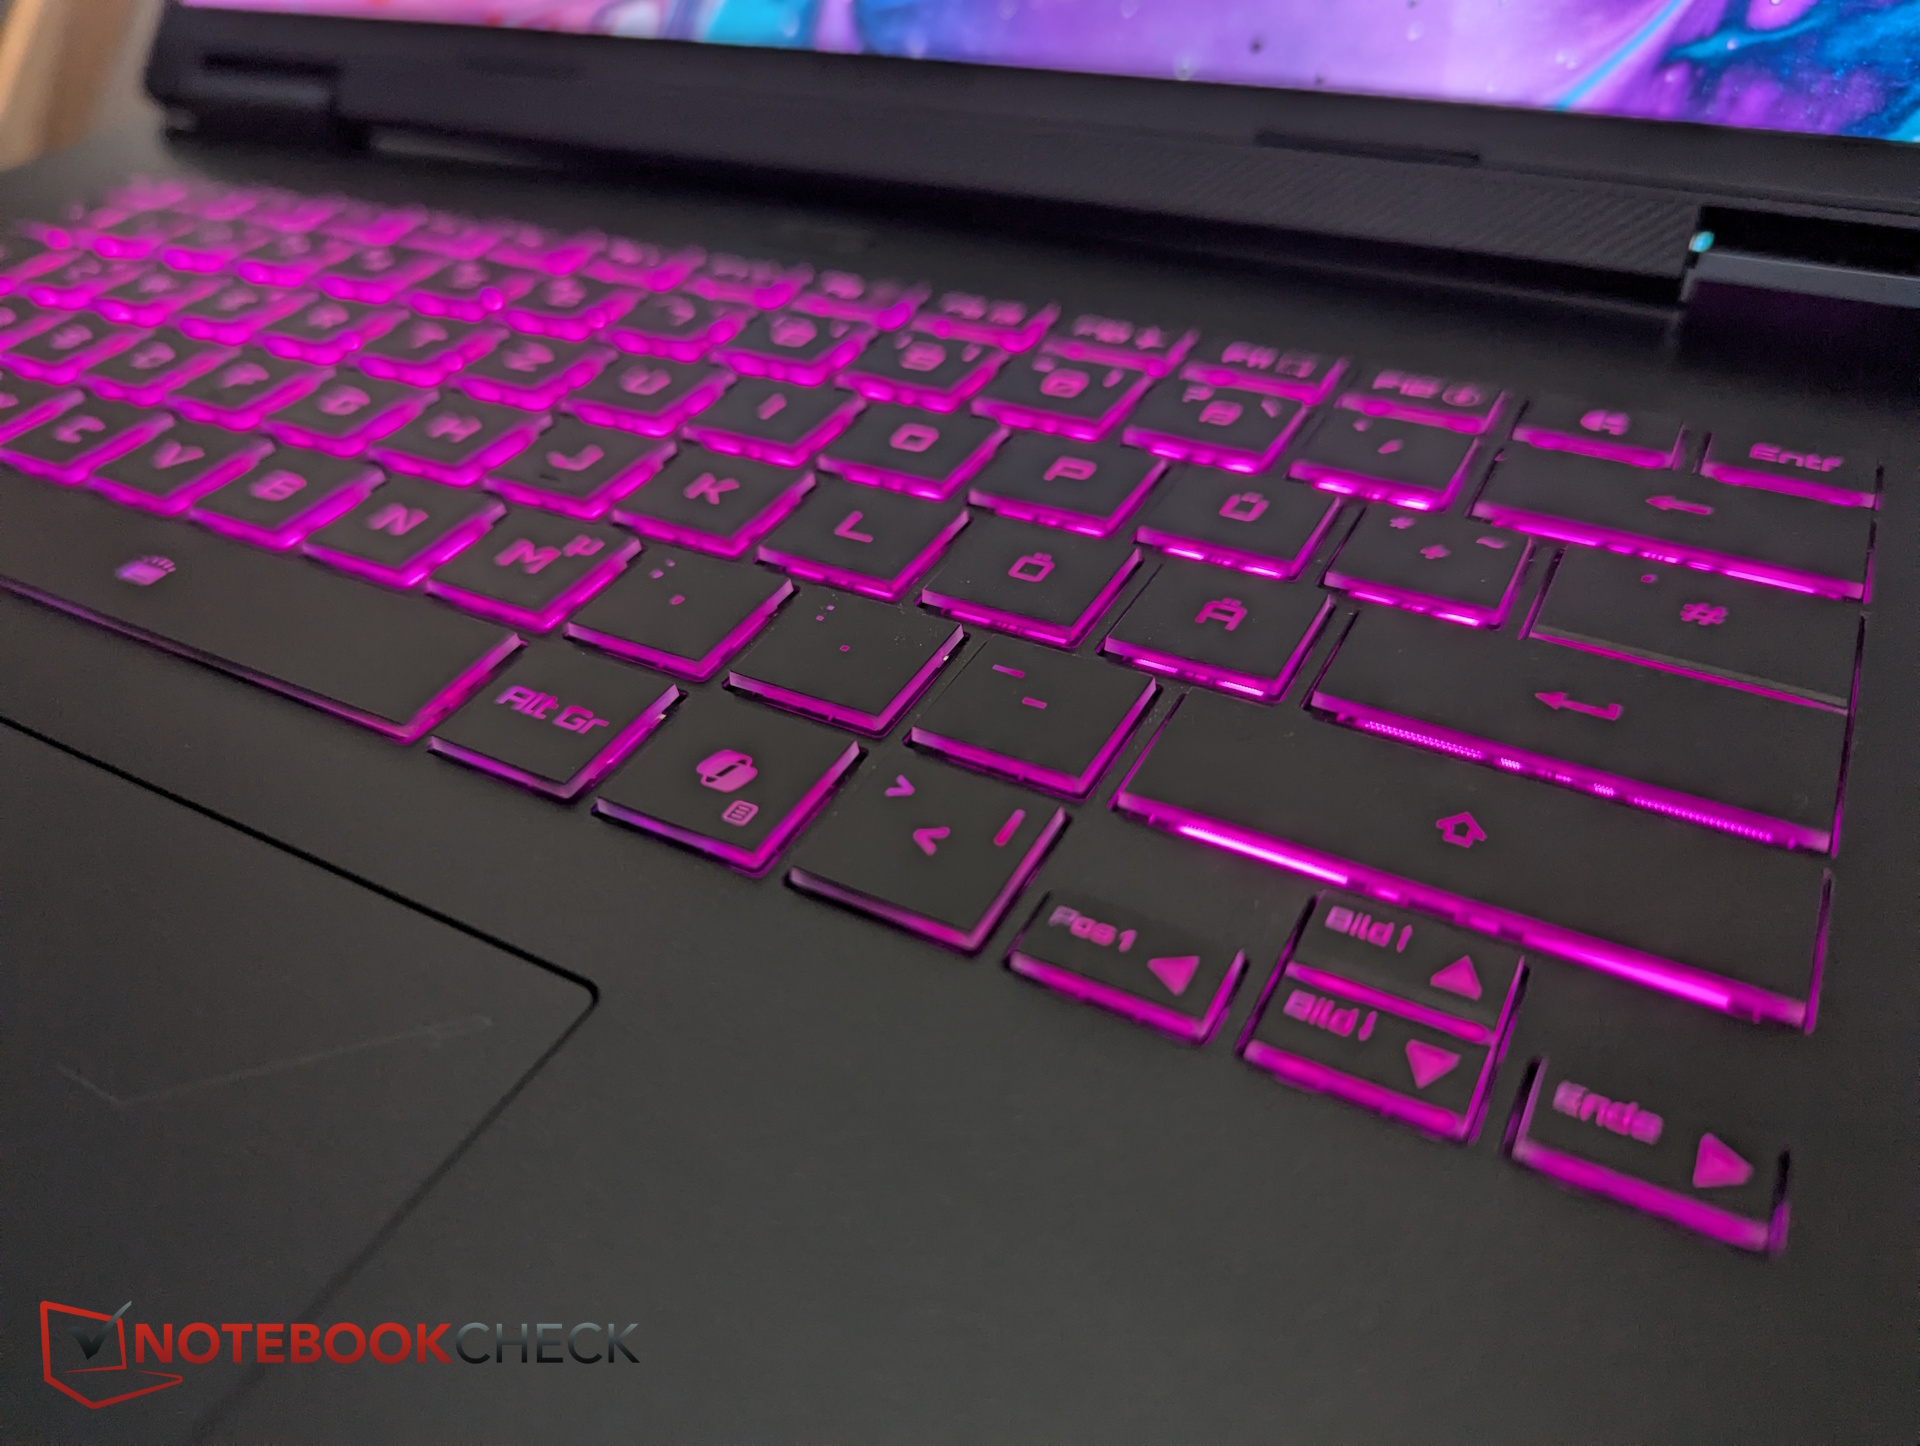
Urządzenia wejściowe - niezawodne pisanie i nawigacja
A16 Pro nie posiada klawiatury numerycznej, ale jej układ jest przejrzysty i dobrze zorganizowany. Klawisze strzałek są jednak dość małe.
Skok klawiszy jest wystarczający, choć sprzężenie zwrotne mogłoby być wyraźniejsze (jak widać w przypadku spacji i klawisza Enter). Pisanie jest nadal szybkie i stosunkowo ciche.
Touchpad o wymiarach około 13,3 × 9 cm jest sporych rozmiarów. Zintegrowane przyciski reagują niezawodnie z solidnym sprzężeniem zwrotnym i umiarkowanym hałasem.
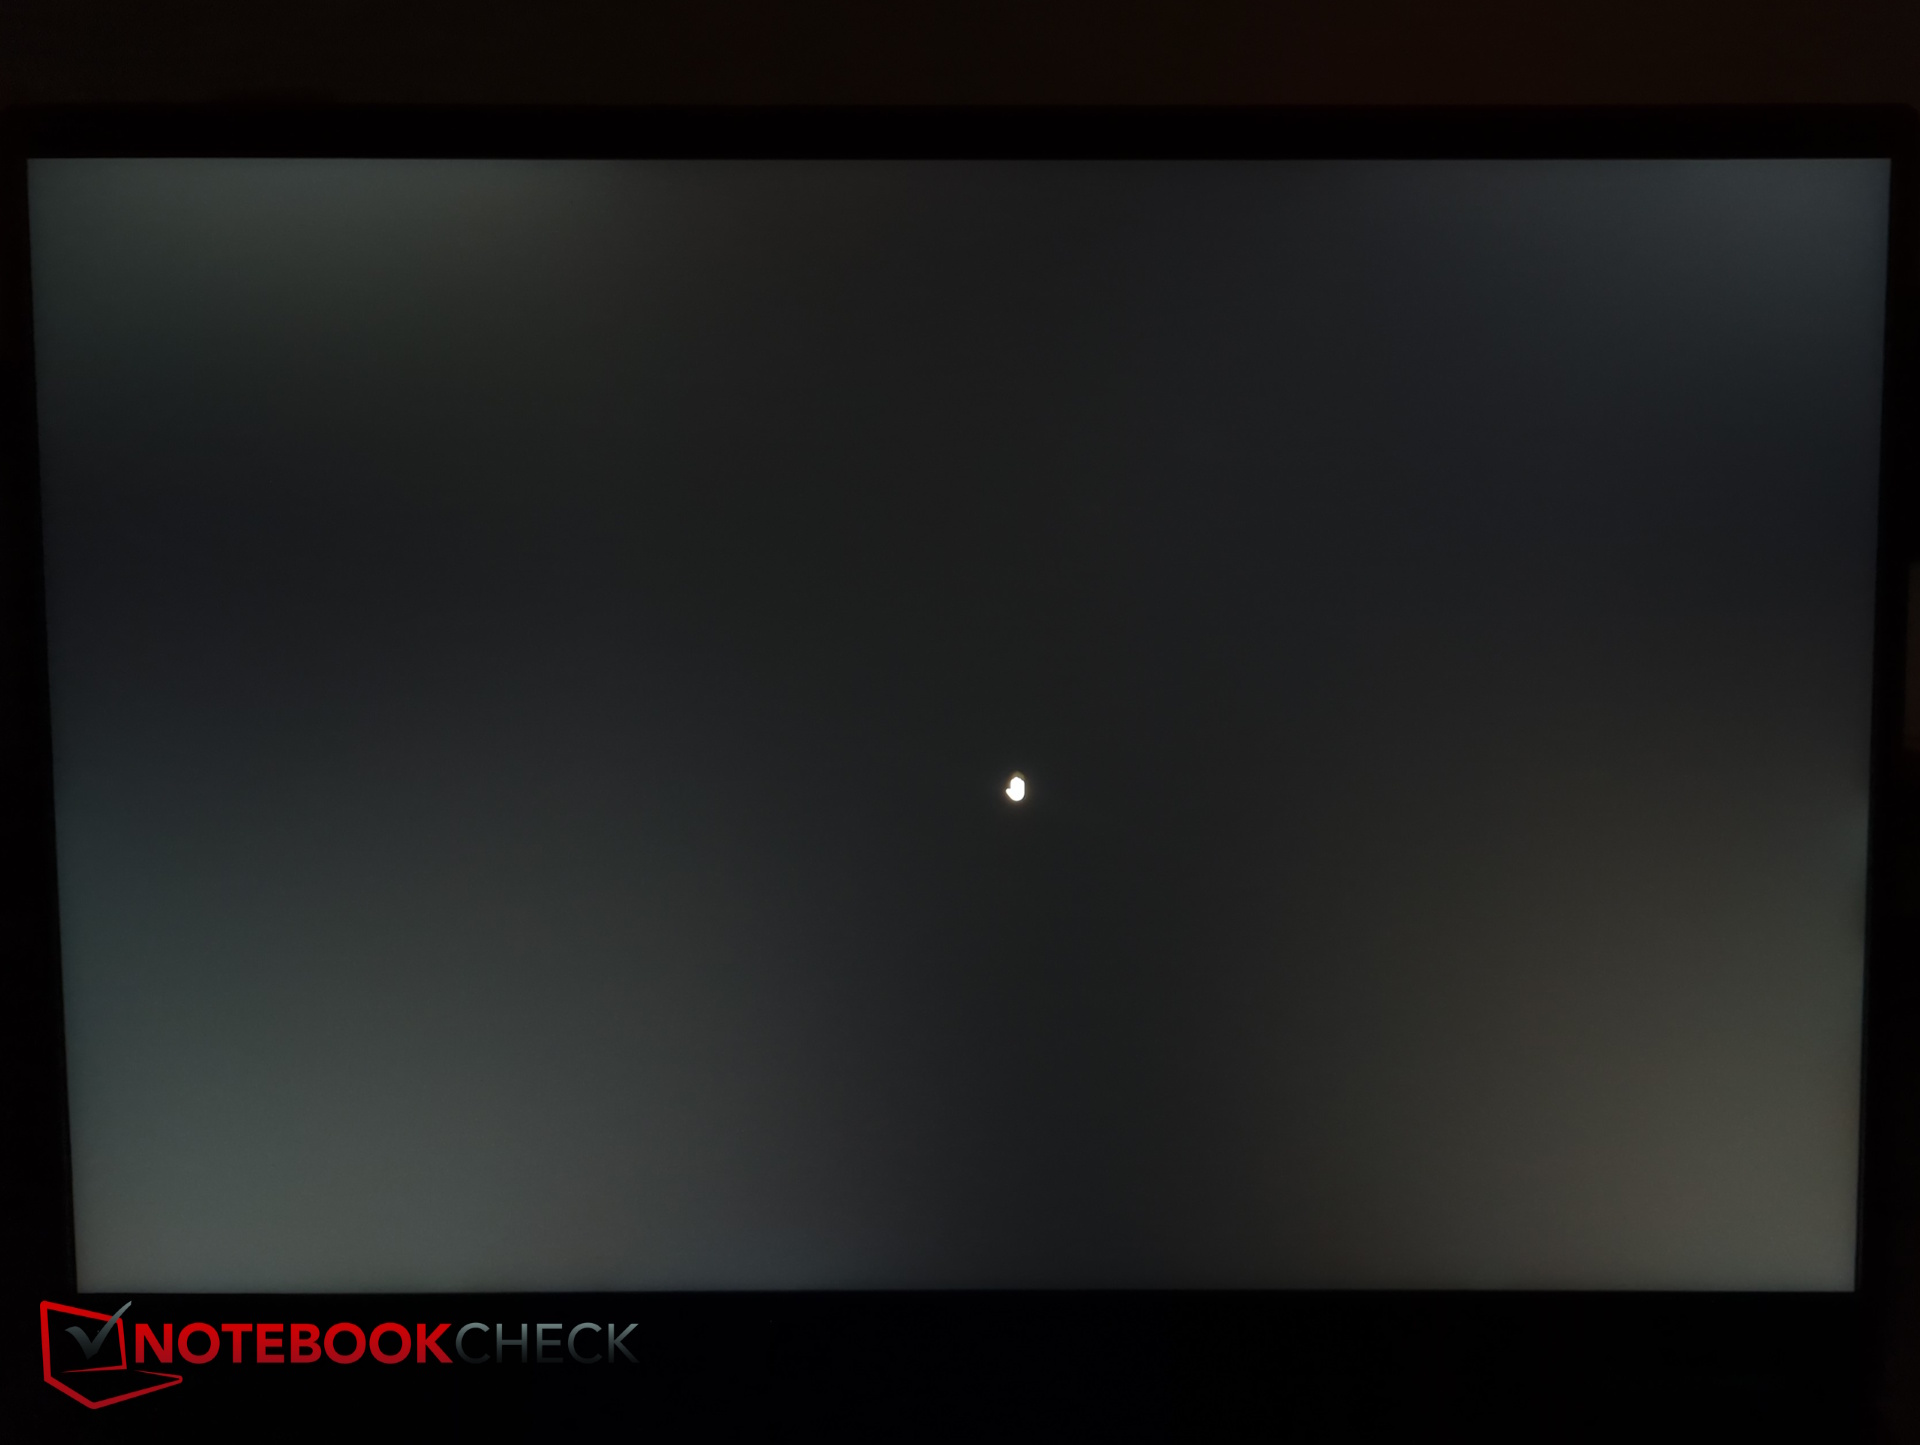
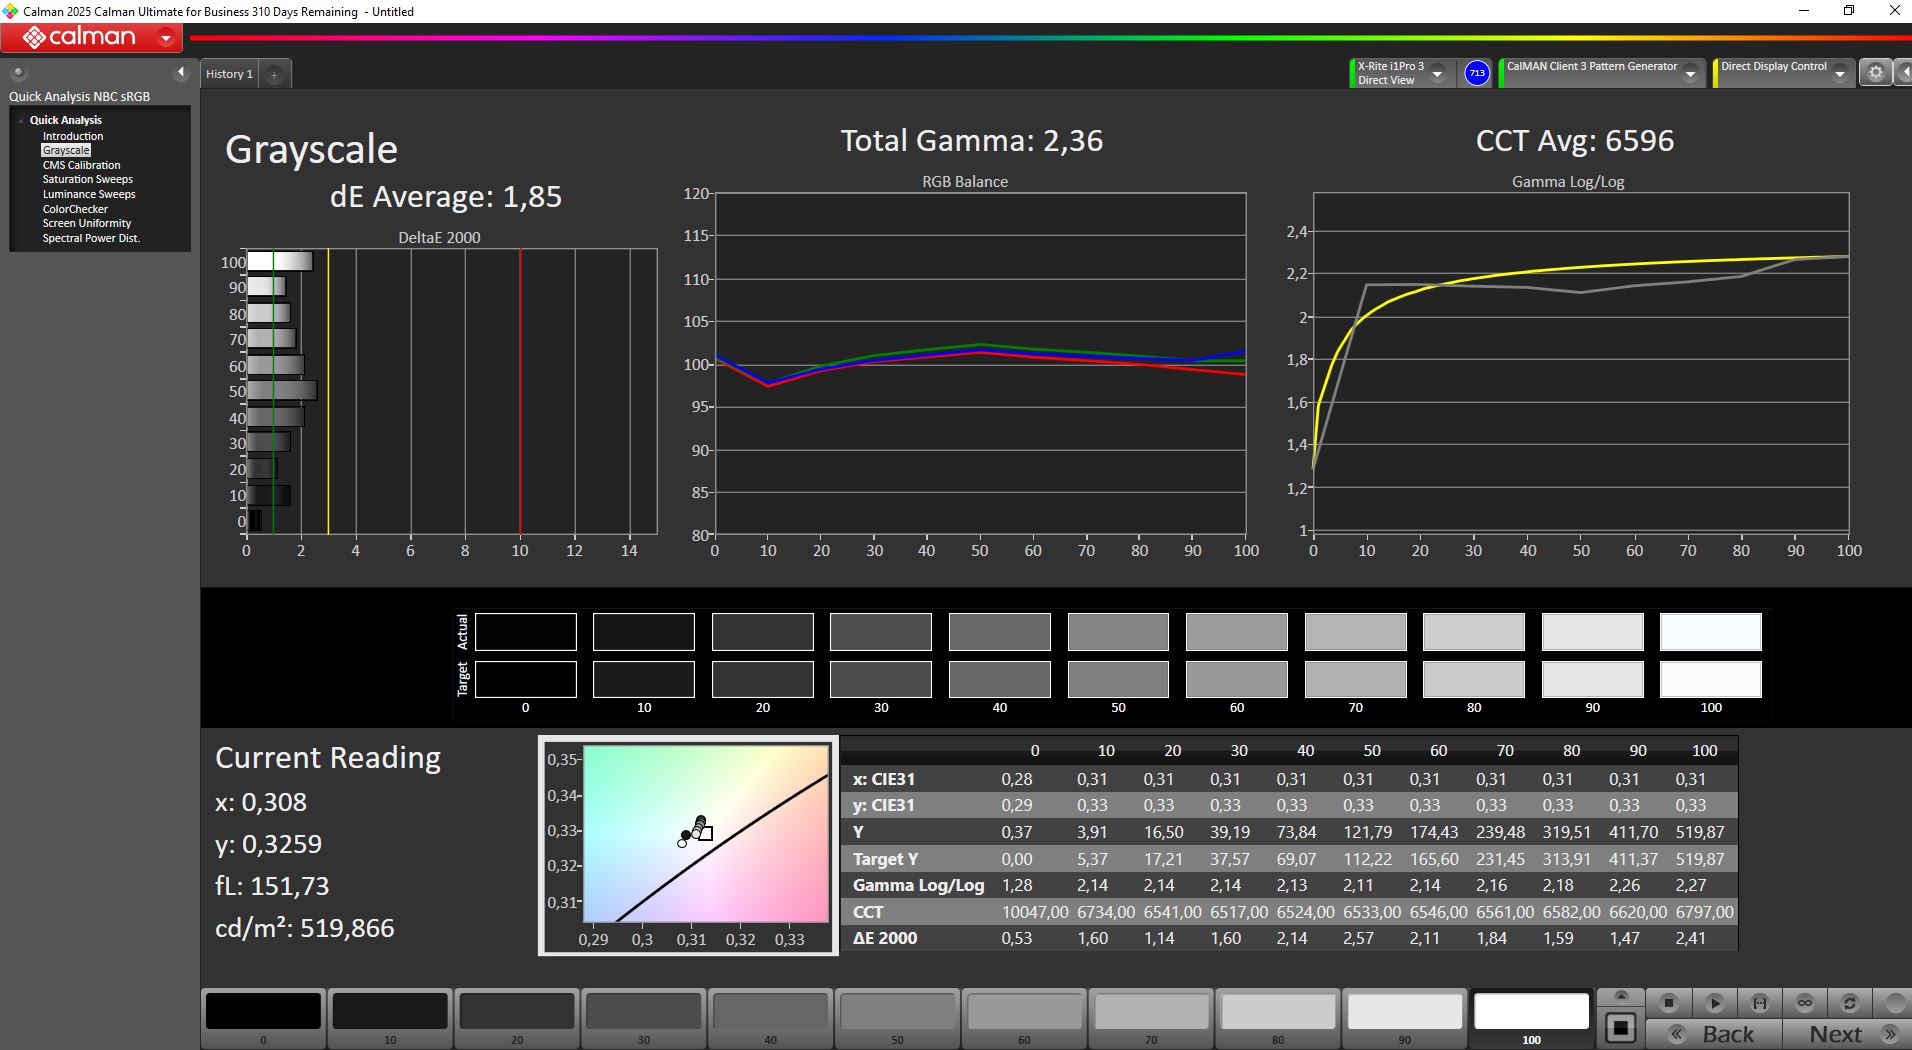
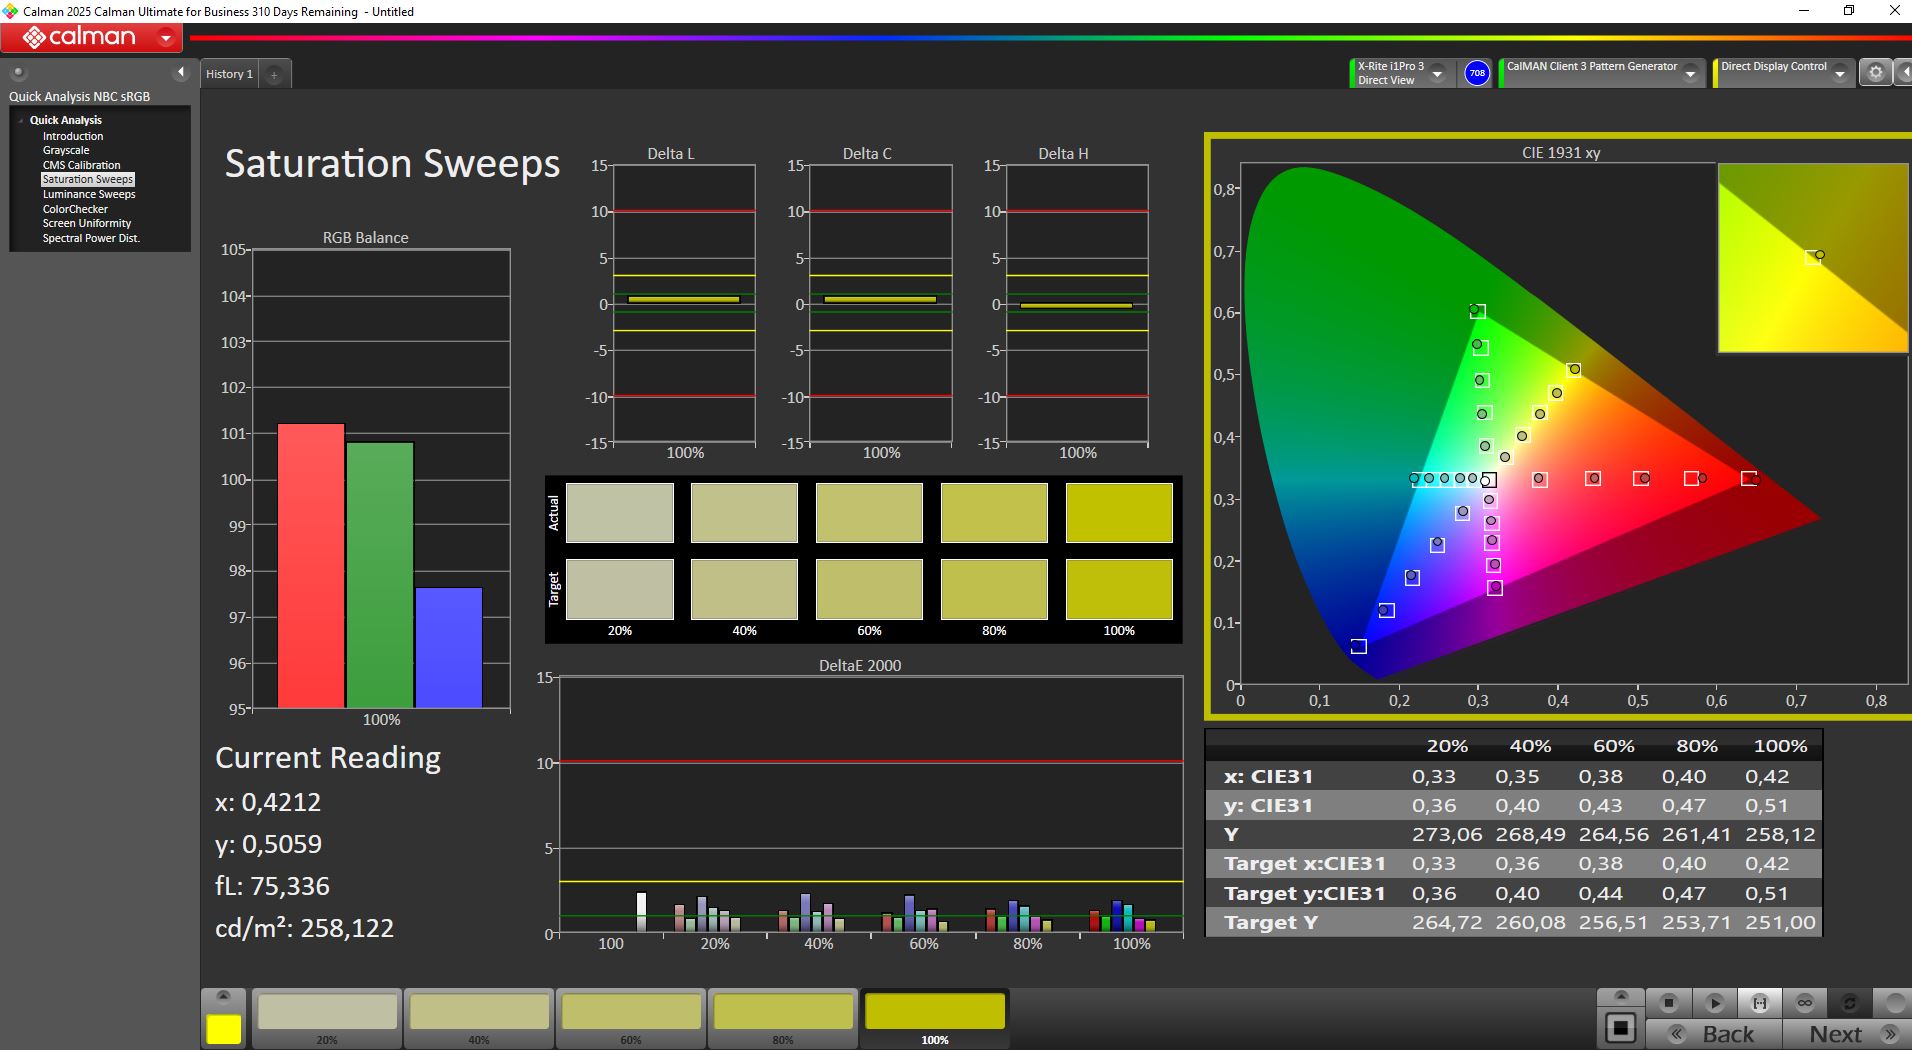
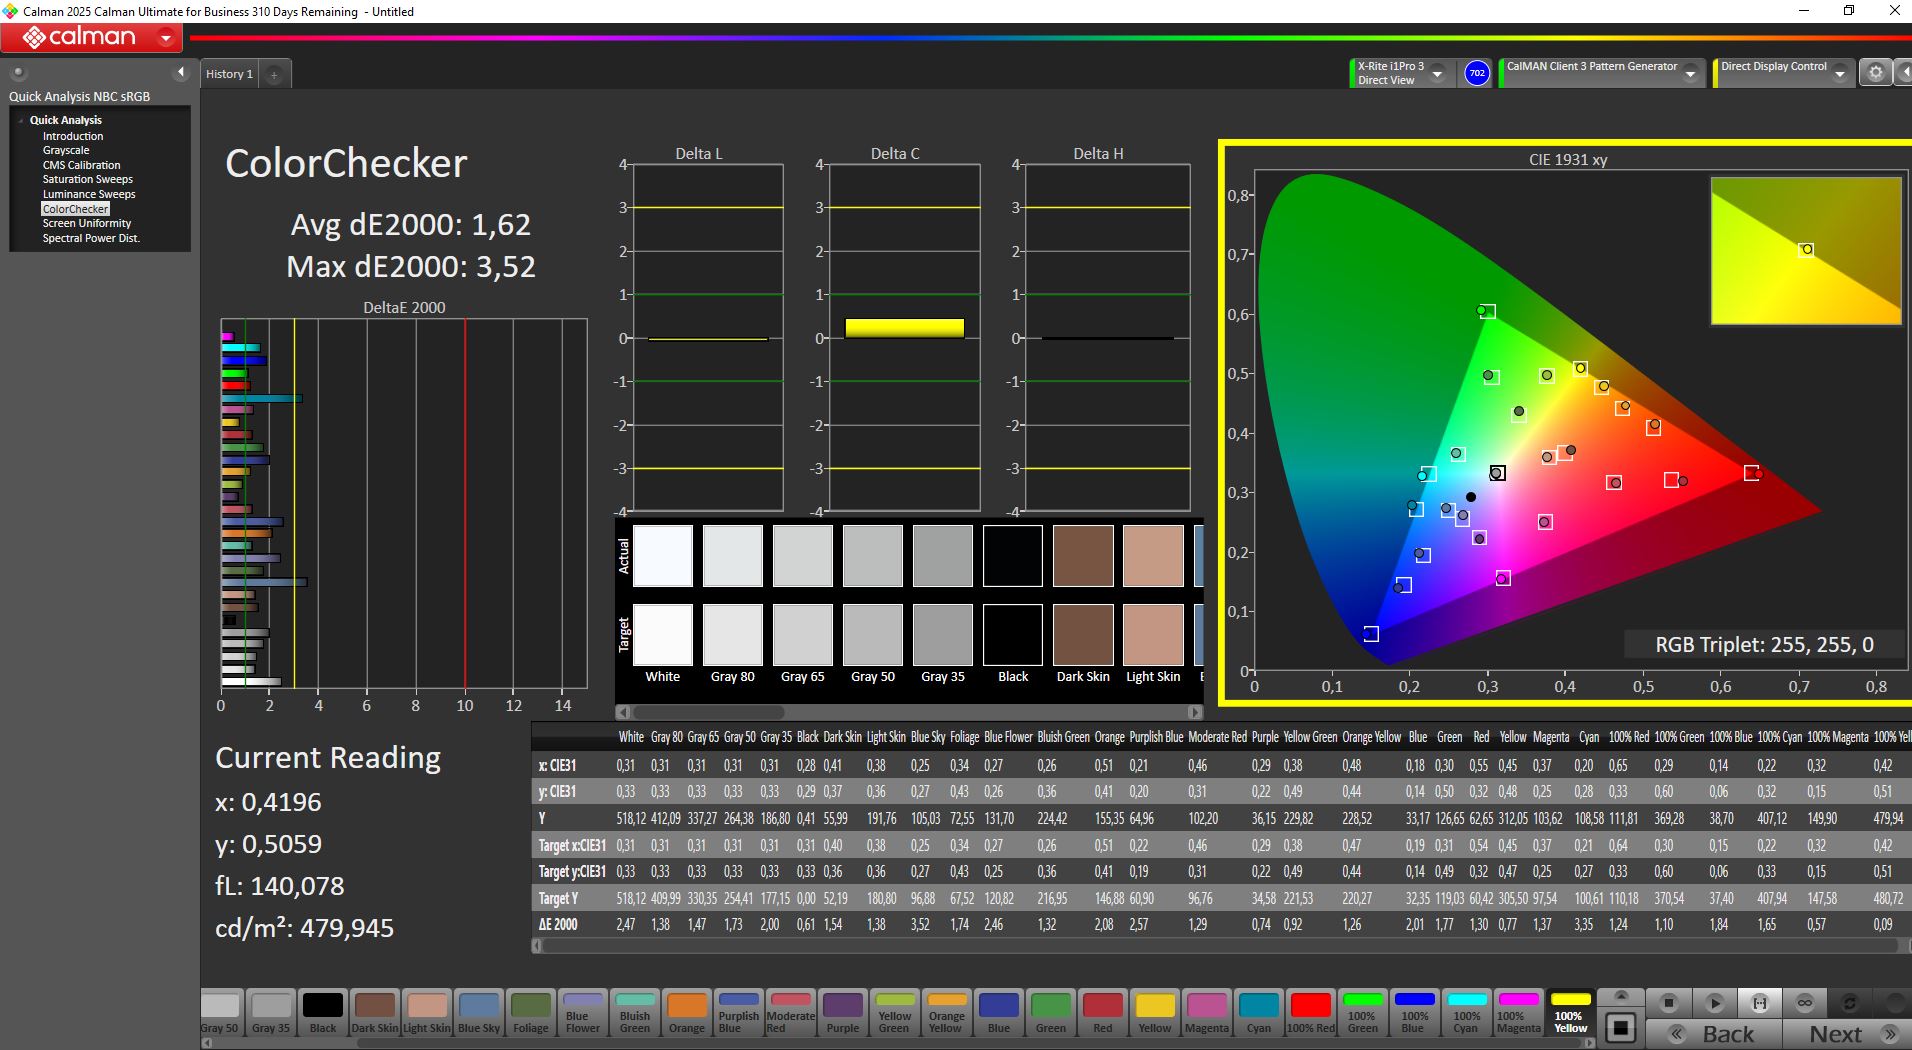
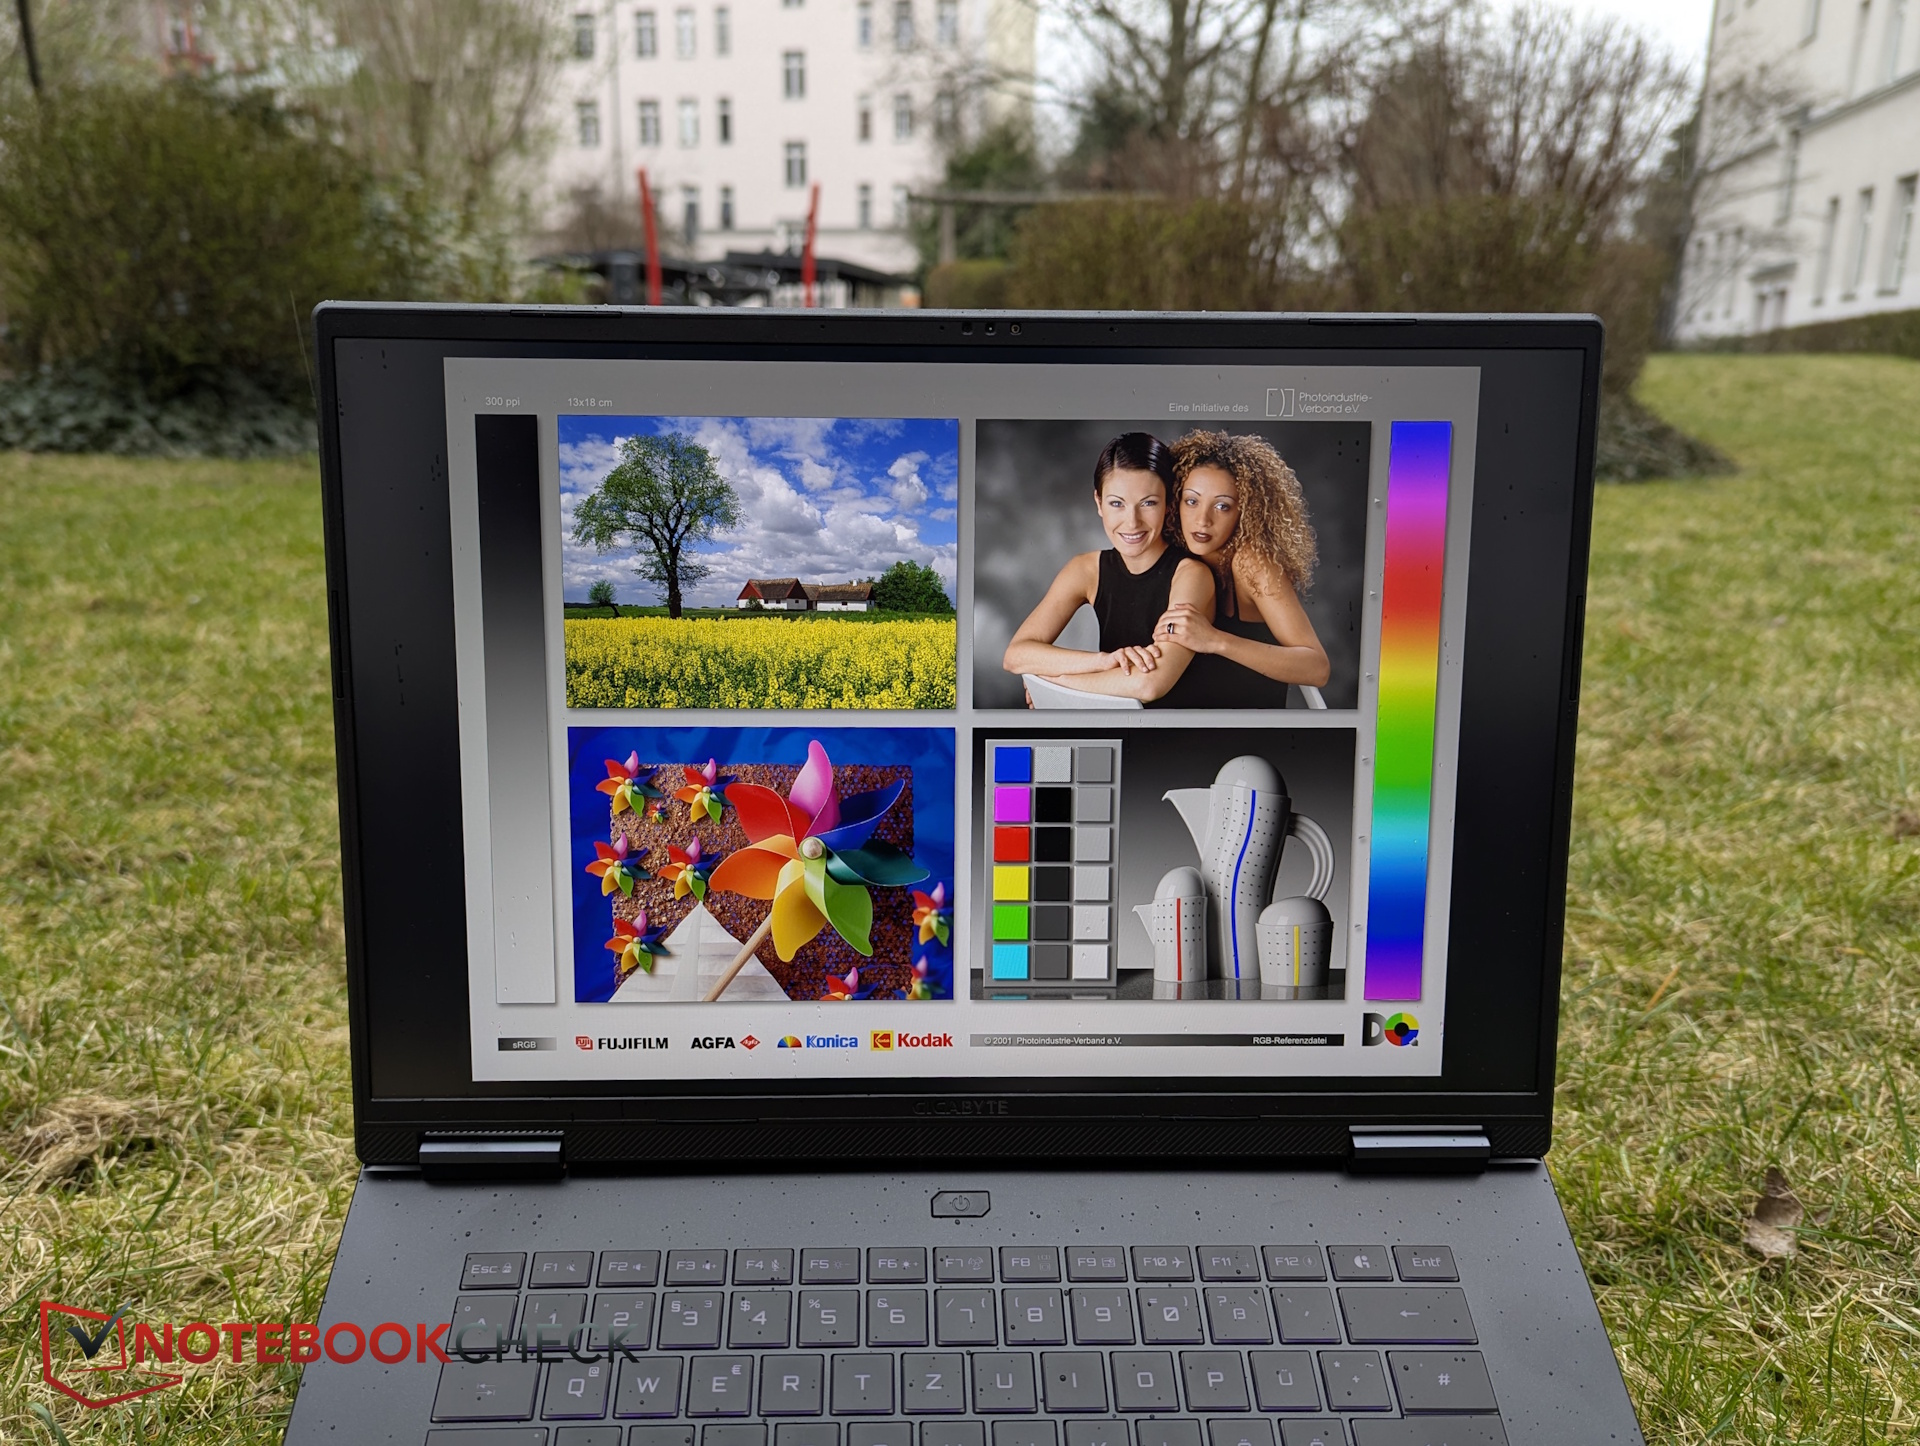
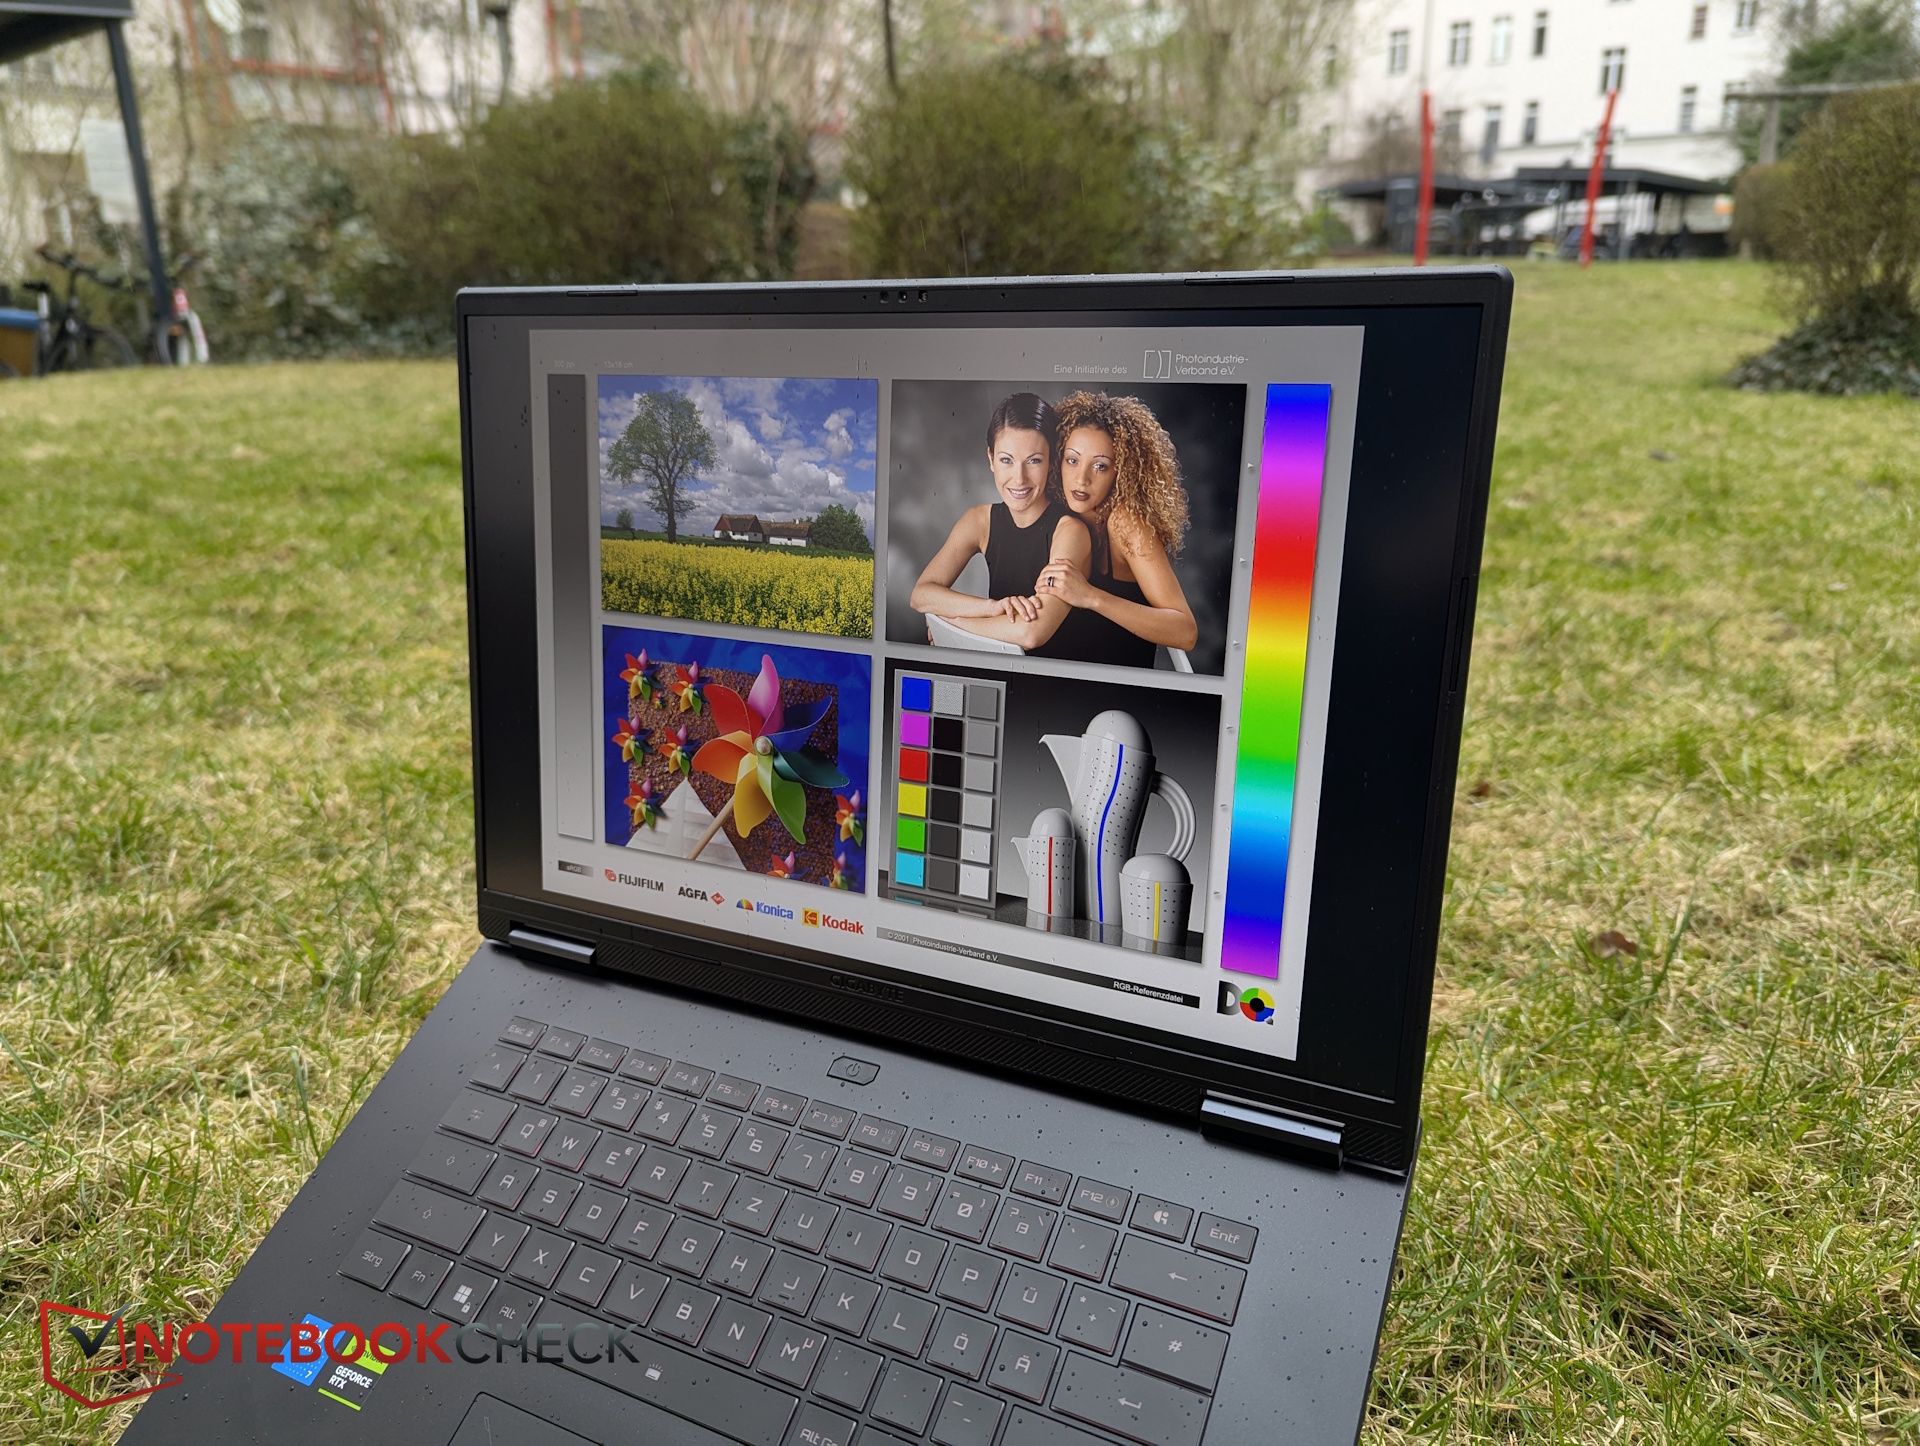
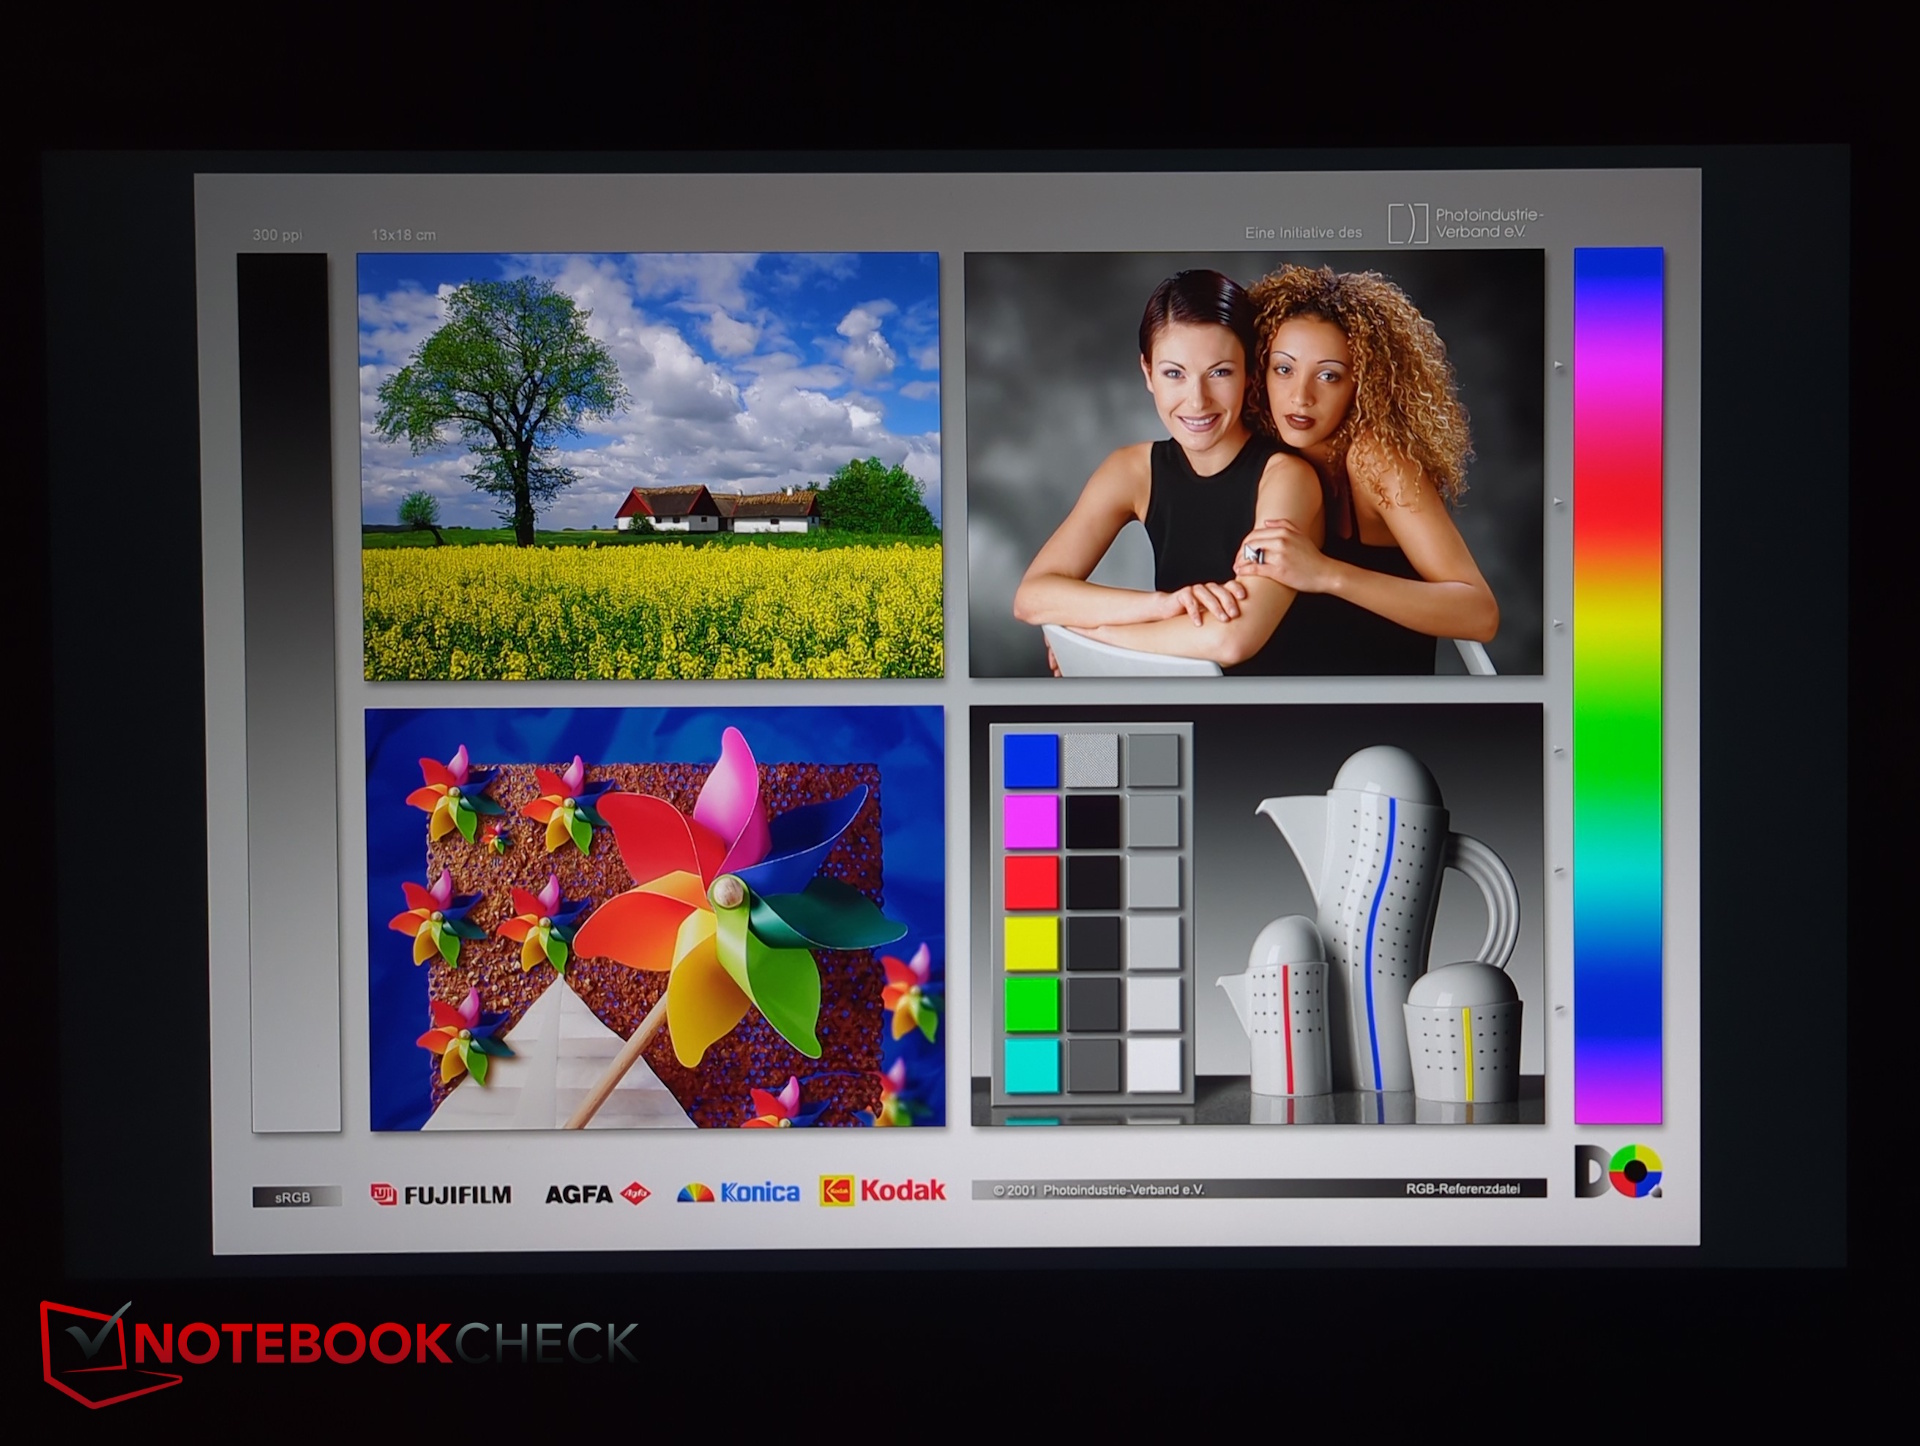
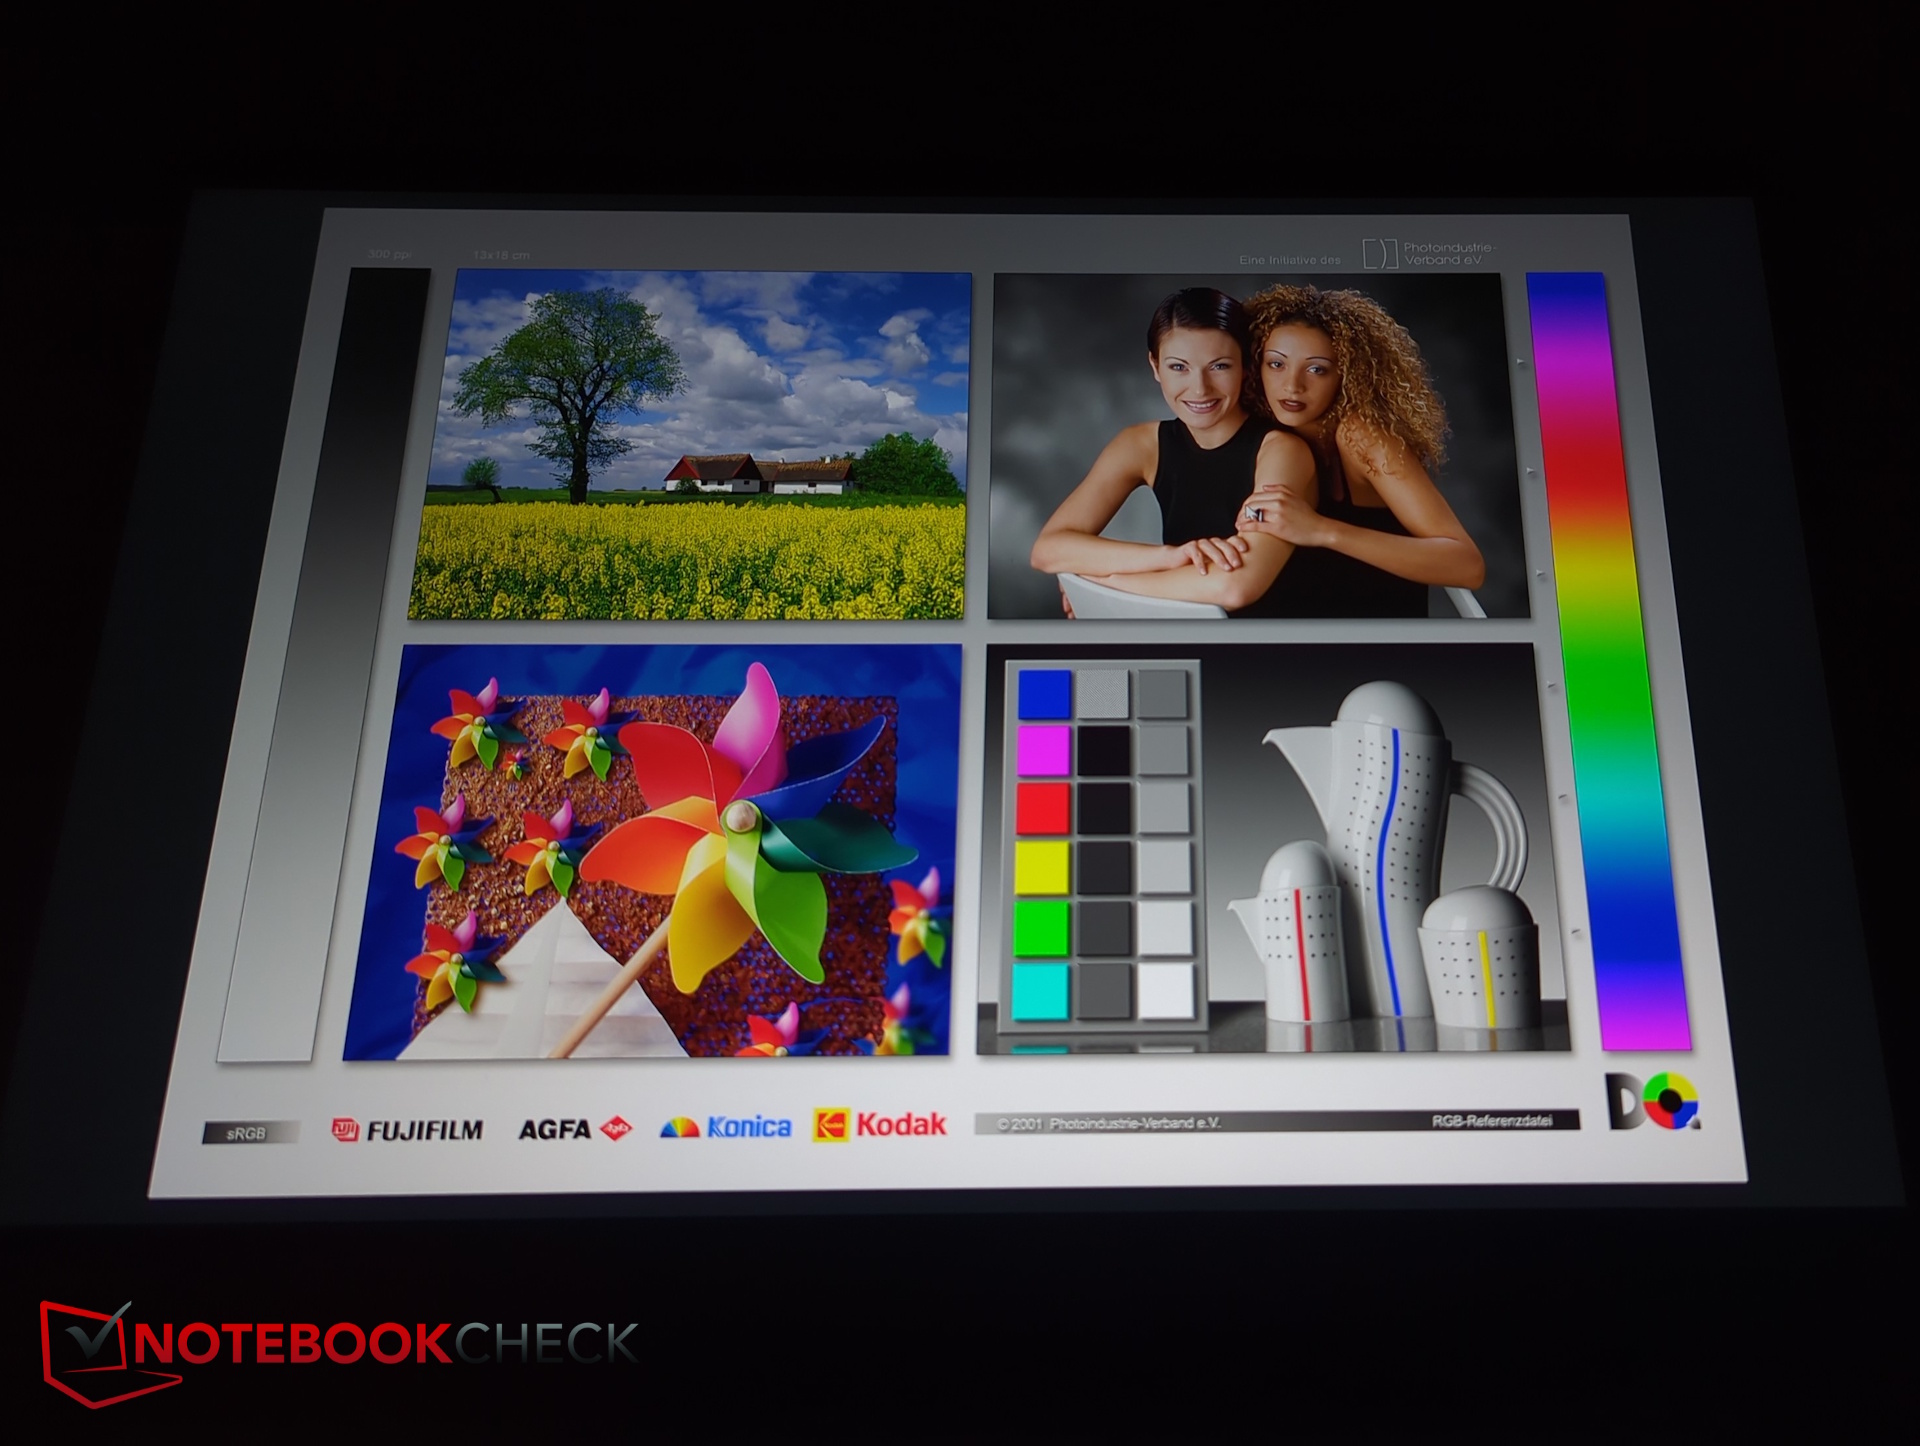
Wyświetlacz - 500 nitów WQXGA z sRGB
Matowy panel IPS (2560 × 1600) działa z częstotliwością 165 Hz i pokrywa przestrzeń kolorów sRGB. Osiąga on nieco poniżej 500 nitów przy dobrej jednorodności jasności. Poziomy czerni są nieco podwyższone, ale kontrast pozostaje silny. Nie są dostępne żadne alternatywne opcje wyświetlania.
PWM nie stanowi problemu, a czasy reakcji uległy poprawie. Widoczny jest niewielki bleed podświetlenia.

| |||||||||||||||||||||||||
rozświetlenie: 92 %
na akumulatorze: 517 cd/m²
kontrast: 1326:1 (czerń: 0.39 cd/m²)
ΔE ColorChecker Calman: 1.62 | ∀{0.5-29.43 Ø4.73}
calibrated: 1.62
ΔE Greyscale Calman: 1.85 | ∀{0.09-98 Ø4.97}
70.4% AdobeRGB 1998 (Argyll 3D)
99.3% sRGB (Argyll 3D)
72.5% Display P3 (Argyll 3D)
Gamma: 2.36
CCT: 6596 K
| Gigabyte Gaming A16 Pro GA6DH (Core 7 240H, RTX 5070 Ti) BOE0D86 (NS160QDM-NY3), IPS, 2560x1600, 16", 165 Hz | Gigabyte Gaming A16 GA6H NE160QDM-NYJ (BOE0C80), IPS, 2560x1600, 16", 165 Hz | Schenker XMG APEX 16 MAX NE160QDM-NM9, Mini-LED, 2560x1600, 16", 300 Hz | Acer Predator Helios Neo 16S AI PHN16S-71-94L9 Samsung ATNA60DL03-0, OLED, 2560x1600, 16", 240 Hz | Medion Erazer Major 16 X1 MD62736 NE160QDM-NZL (BOE0D55), IPS, 2560x1600, 16", 300 Hz | Lenovo Legion 5 Pro 16IAX10H ATNA60HS01-0 (Samsung SDC420A), OLED, 2560x1600, 16", 165 Hz | |
|---|---|---|---|---|---|---|
| Display | -1% | 21% | 25% | 2% | 24% | |
| Display P3 Coverage (%) | 72.5 | 69.4 -4% | 99.7 38% | 99.9 38% | 73.2 1% | 99.9 38% |
| sRGB Coverage (%) | 99.3 | 99.5 0% | 100 1% | 100 1% | 99.8 1% | 100 1% |
| AdobeRGB 1998 Coverage (%) | 70.4 | 71.6 2% | 87.9 25% | 96.5 37% | 73.9 5% | 94.1 34% |
| Response Times | -78% | -164% | 96% | -28% | 71% | |
| Response Time Grey 50% / Grey 80% * (ms) | 6.8 ? | 14.3 ? -110% | 17.4 ? -156% | 0.2 ? 97% | 10 ? -47% | 2 ? 71% |
| Response Time Black / White * (ms) | 4.8 ? | 7 ? -46% | 13 ? -171% | 0.25 ? 95% | 5.2 ? -8% | 1.4 ? 71% |
| PWM Frequency (Hz) | 20253 ? | 960 | 1300 | |||
| PWM Amplitude * (%) | 75 | 50 | 16.7 | |||
| Screen | -65% | 612% | 81% | -6% | -27% | |
| Brightness middle (cd/m²) | 517 | 432 -16% | 742 44% | 390 -25% | 577 12% | 518 0% |
| Brightness (cd/m²) | 490 | 425 -13% | 733 50% | 394 -20% | 539 10% | 522 7% |
| Brightness Distribution (%) | 92 | 91 -1% | 93 1% | 98 7% | 85 -8% | 97 5% |
| Black Level * (cd/m²) | 0.39 | 0.37 5% | 0.01 97% | 0.04 90% | 0.5 -28% | |
| Contrast (:1) | 1326 | 1168 -12% | 74200 5496% | 9750 635% | 1154 -13% | |
| Colorchecker dE 2000 * | 1.62 | 4.76 -194% | 3 -85% | 1.61 1% | 2.12 -31% | 2.49 -54% |
| Colorchecker dE 2000 max. * | 3.52 | 8.59 -144% | 4.3 -22% | 3.49 1% | 3.32 6% | 5.25 -49% |
| Colorchecker dE 2000 calibrated * | 1.62 | 1.18 27% | 1.2 26% | 1.59 2% | 1.33 18% | 2.15 -33% |
| Greyscale dE 2000 * | 1.85 | 6.2 -235% | 3.6 -95% | 1.2 35% | 2.2 -19% | 3.02 -63% |
| Gamma | 2.36 93% | 2.079 106% | 2.43 91% | 2.235 98% | 2.123 104% | 2.37 93% |
| CCT | 6596 99% | 6690 97% | 6559 99% | 6580 99% | 6457 101% | 6426 101% |
| Całkowita średnia (program / ustawienia) | -48% /
-53% | 156% /
375% | 67% /
71% | -11% /
-7% | 23% /
2% |
* ... im mniej tym lepiej
Po wyjęciu z pudełka, wyświetlacz jest dobrze skalibrowany dla sRGB, z odchyleniami poniżej 2 - ponowna kalibracja nie jest konieczna.
Wyświetl czasy reakcji
| ↔ Czas reakcji od czerni do bieli | ||
|---|---|---|
| 4.8 ms ... wzrost ↗ i spadek ↘ łącznie | ↗ 1.4 ms wzrost | 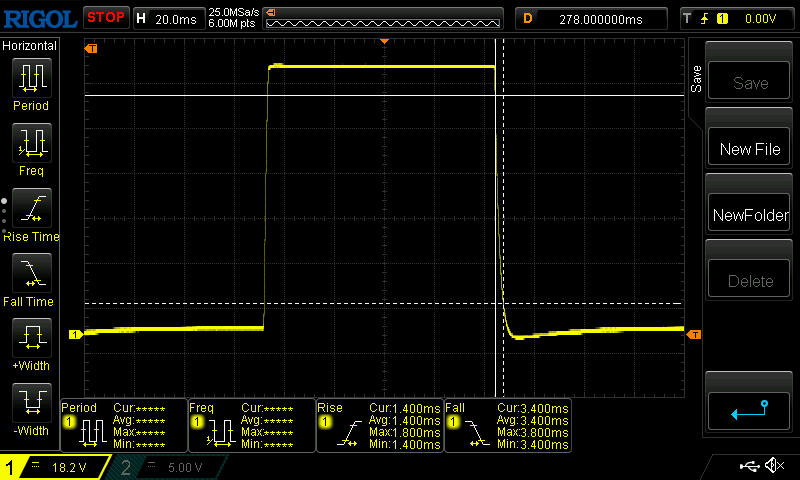 |
| ↘ 3.4 ms upadek | ||
| W naszych testach ekran wykazuje bardzo szybką reakcję i powinien bardzo dobrze nadawać się do szybkich gier. Dla porównania, wszystkie testowane urządzenia wahają się od 0.1 (minimum) do 240 (maksimum) ms. » 17 % wszystkich urządzeń jest lepszych. Oznacza to, że zmierzony czas reakcji jest lepszy od średniej wszystkich testowanych urządzeń (19.9 ms). | ||
| ↔ Czas reakcji 50% szarości do 80% szarości | ||
| 6.8 ms ... wzrost ↗ i spadek ↘ łącznie | ↗ 3 ms wzrost | 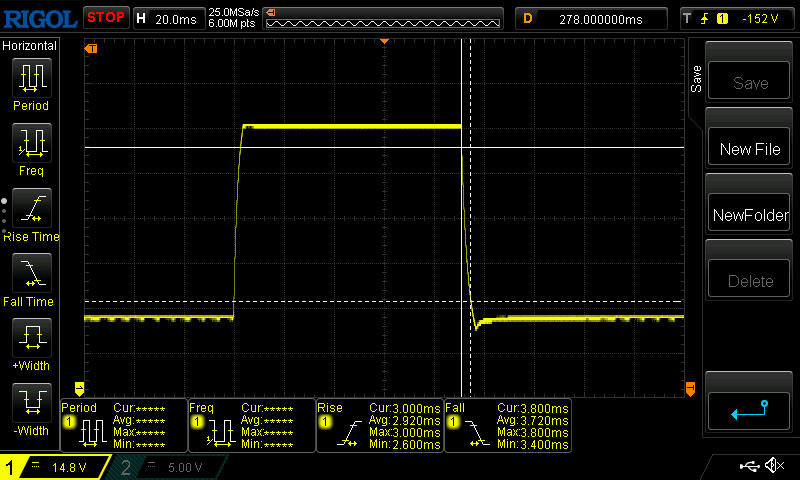 |
| ↘ 3.8 ms upadek | ||
| W naszych testach ekran wykazuje bardzo szybką reakcję i powinien bardzo dobrze nadawać się do szybkich gier. Dla porównania, wszystkie testowane urządzenia wahają się od 0.165 (minimum) do 636 (maksimum) ms. » 19 % wszystkich urządzeń jest lepszych. Oznacza to, że zmierzony czas reakcji jest lepszy od średniej wszystkich testowanych urządzeń (31.1 ms). | ||
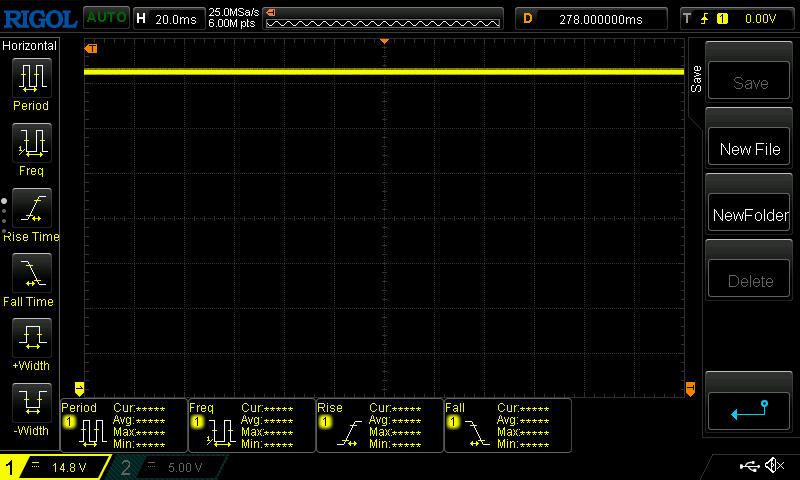
Migotanie ekranu / PWM (modulacja szerokości impulsu)
| Migotanie ekranu/nie wykryto PWM |  | ||
Dla porównania: 52 % wszystkich testowanych urządzeń nie używa PWM do przyciemniania wyświetlacza. Jeśli wykryto PWM, zmierzono średnio 7798 (minimum: 5 - maksimum: 343500) Hz. | |||
Widoczność na zewnątrz jest przyzwoita, szczególnie w zacienionych miejscach.

Wydajność - Niewiele szybsza od wersji non-pro
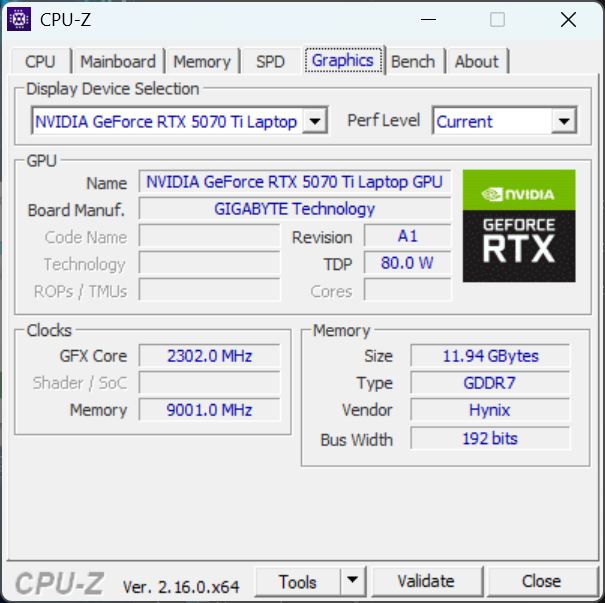
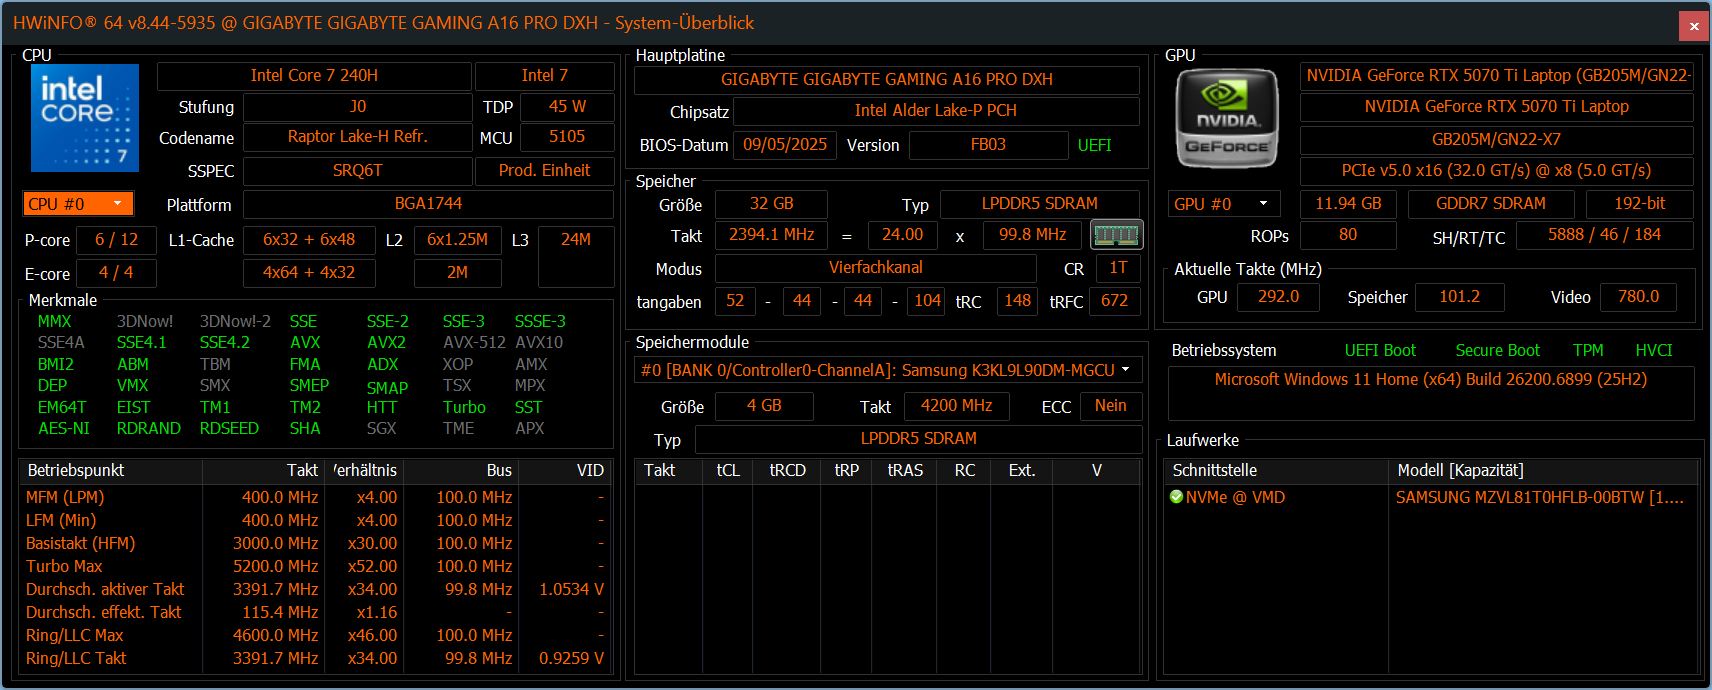
Z jego RTX 5070 Ti, Core 7 240Hi 32 GB pamięci RAM, A16 Pro wyraźnie pozycjonuje się jako maszyna do gier. Jego smukła konstrukcja i jasny wyświetlacz mogą również zainteresować początkujących twórców treści i montażystów wideo.
Warunki testu
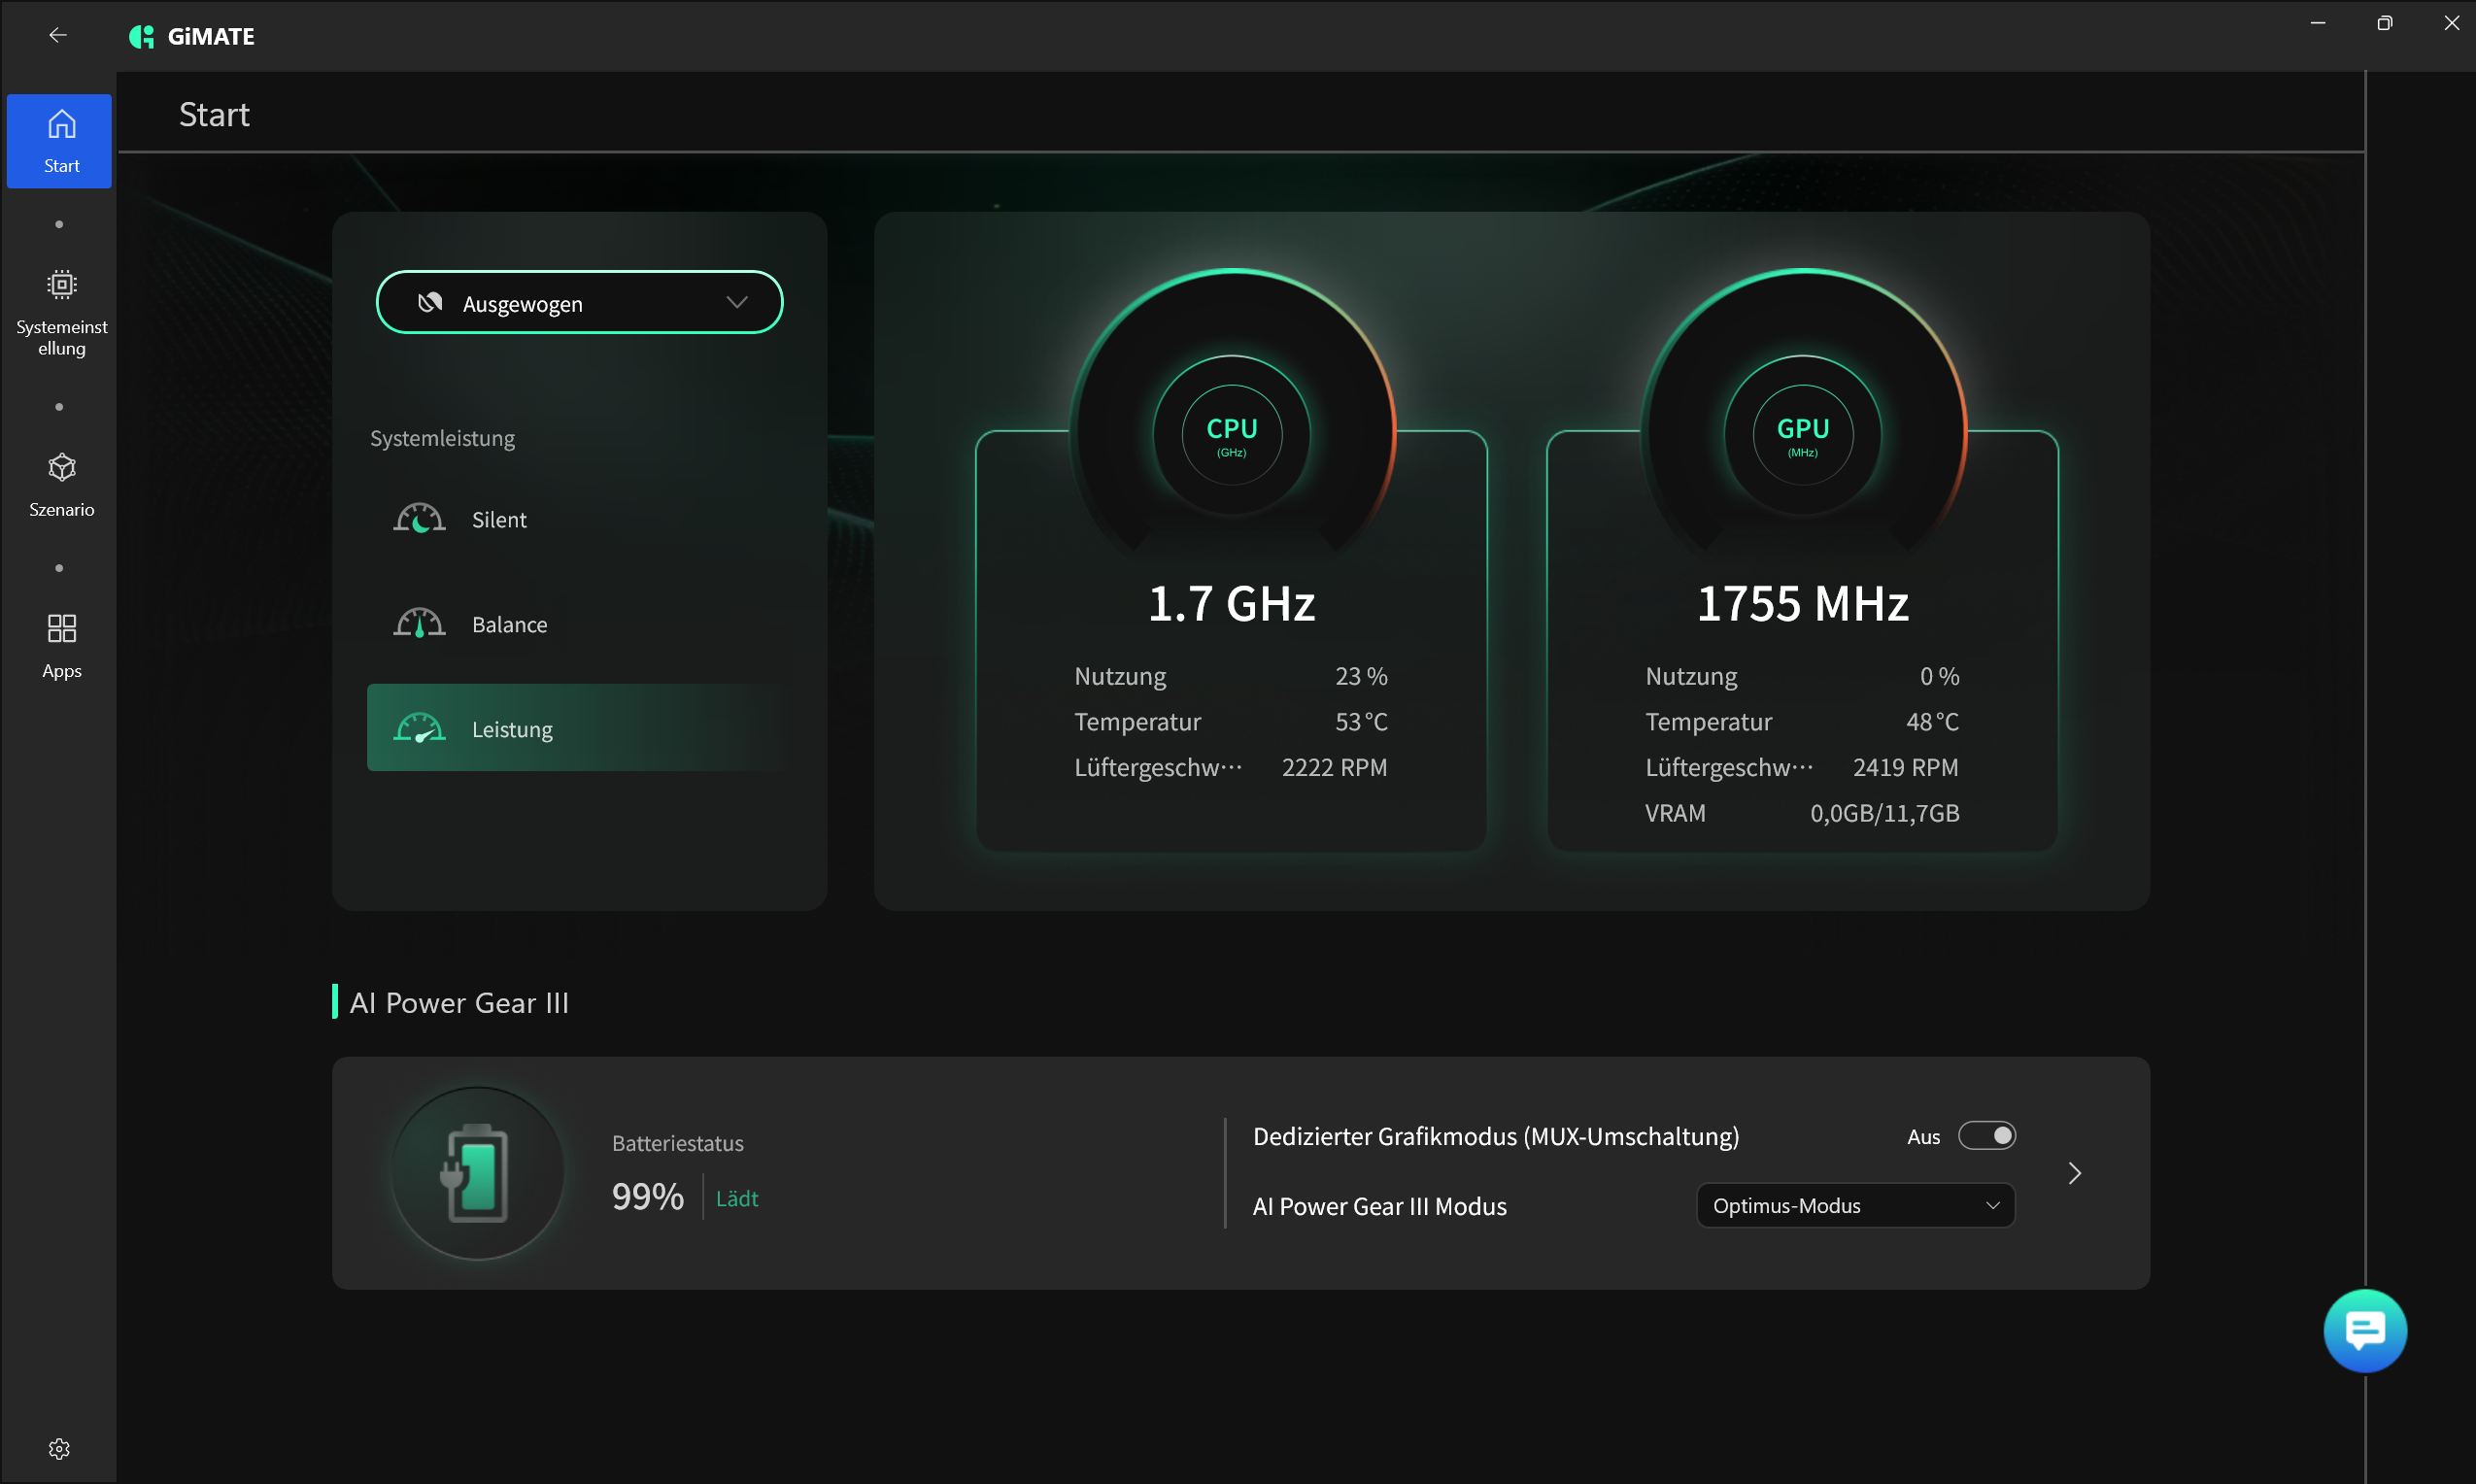
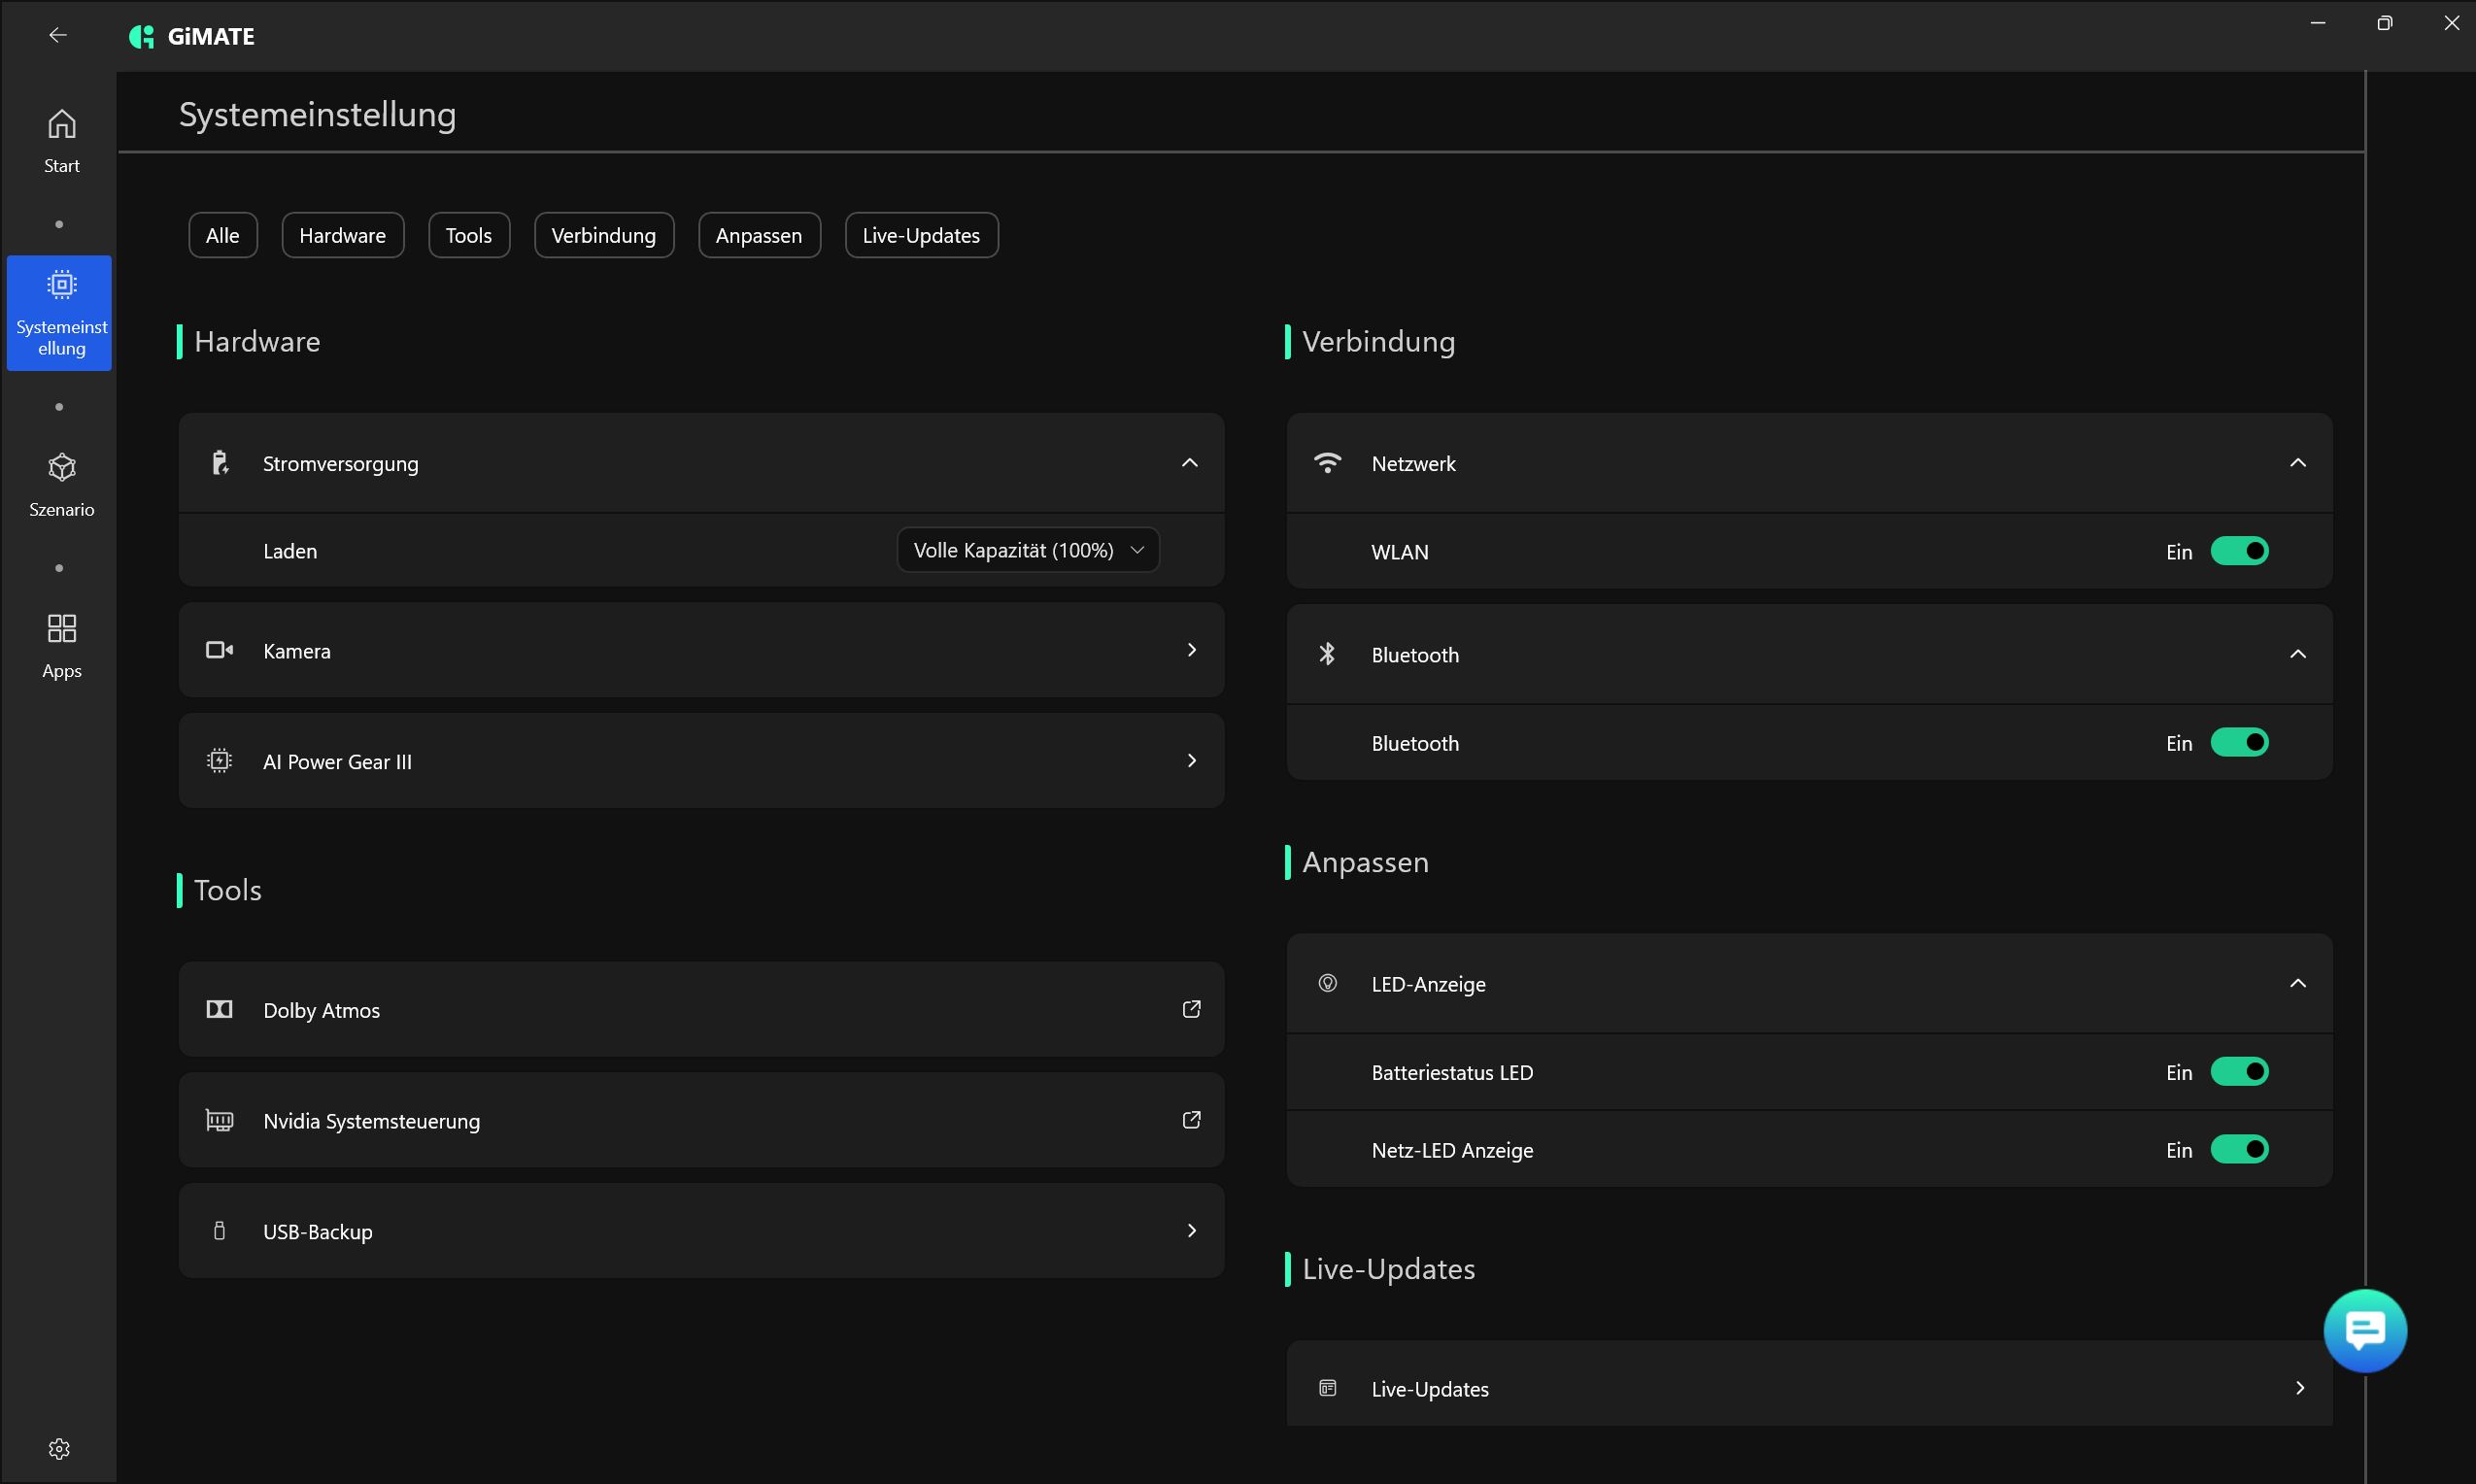
Korzystając z centrum sterowania GiMate, wybraliśmy tryb wydajności (Silence, Balanced, Performance). Nie ma trybu ręcznego, ale w zestawie znajduje się przełącznik MUX.
| Tryb wydajności | Cinebench R15 Multi | Fire Strike Grafika | Cyberpunk 2077 FHD Ultra (fps) | Hałas Cyberpunk (dB) | Moc Cyberpunk (W) |
|---|---|---|---|---|---|
| Wydajność | 2401 | 42580 | 96.3 | 56.18 | 165 |
| Zrównoważony | 2368 | 39276 | 89.4 | 47.62 | 140 |
| Cisza | 2136 | 30977 | 56.4 | 33 | 86 |
| Bateria (wydajność) | 1735 | 15631 | 30 |
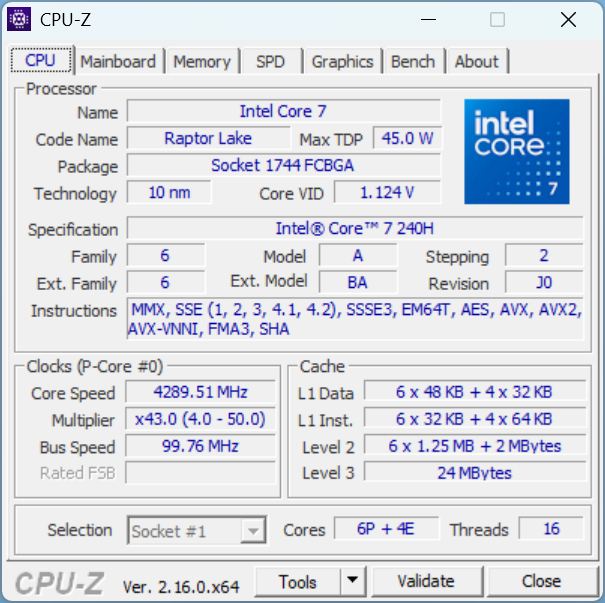
Procesor
Procesor Intel Core 7 240H posiada 6 rdzeni wydajnościowych i 4 rdzenie wydajnościowe, taktowane zegarem od 1,8 do 5,2 GHz. Niestety nie udaje mu się przebić i7-13620H zastosowanego w poprzedniku. Nawet w trybie turbo, TDP jest ograniczone do 82 W, choć możliwe byłoby nawet 115 W. Wiele laptopów do gier z RTX 5070 Ti jest wyposażonych w szybsze procesory - wydajność Lenovo Legion 5 Pro jest niższa o prawie 80%.
Na zasilaniu bateryjnym wydajność procesora spada o około 28%.
Cinebench R15 Multi Dauertest
Cinebench R23: Multi Core | Single Core
Cinebench R20: CPU (Multi Core) | CPU (Single Core)
Cinebench R15: CPU Multi 64Bit | CPU Single 64Bit
Blender: v2.79 BMW27 CPU
7-Zip 18.03: 7z b 4 | 7z b 4 -mmt1
Geekbench 6.7: Multi-Core | Single-Core
Geekbench 5.5: Multi-Core | Single-Core
HWBOT x265 Benchmark v2.2: 4k Preset
LibreOffice : 20 Documents To PDF
R Benchmark 2.5: Overall mean
| CPU Performance rating | |
| Medion Erazer Major 16 X1 MD62736 | |
| Średnia w klasie Gaming | |
| Medion Erazer Deputy 15 P1 MD62761 | |
| Alienware 16 Aurora | |
| Gigabyte Gaming A16 GA6H | |
| Przeciętny Intel Core 7 240H | |
| Gigabyte Gaming A16 Pro GA6DH (Core 7 240H, RTX 5070 Ti) | |
| MSI Cyborg 15 B2RWEKG | |
| Cinebench R23 / Multi Core | |
| Medion Erazer Major 16 X1 MD62736 | |
| Średnia w klasie Gaming (10488 - 40970, n=112, ostatnie 2 lata) | |
| Alienware 16 Aurora | |
| Medion Erazer Deputy 15 P1 MD62761 | |
| Gigabyte Gaming A16 Pro GA6DH (Core 7 240H, RTX 5070 Ti) | |
| Gigabyte Gaming A16 GA6H | |
| Przeciętny Intel Core 7 240H (10488 - 16588, n=5) | |
| MSI Cyborg 15 B2RWEKG | |
| Cinebench R23 / Single Core | |
| Medion Erazer Major 16 X1 MD62736 | |
| Średnia w klasie Gaming (1166 - 2356, n=112, ostatnie 2 lata) | |
| Medion Erazer Deputy 15 P1 MD62761 | |
| Gigabyte Gaming A16 GA6H | |
| Alienware 16 Aurora | |
| Przeciętny Intel Core 7 240H (1649 - 1905, n=5) | |
| MSI Cyborg 15 B2RWEKG | |
| Gigabyte Gaming A16 Pro GA6DH (Core 7 240H, RTX 5070 Ti) | |
| Cinebench R20 / CPU (Multi Core) | |
| Medion Erazer Major 16 X1 MD62736 | |
| Średnia w klasie Gaming (4029 - 16108, n=111, ostatnie 2 lata) | |
| Medion Erazer Deputy 15 P1 MD62761 | |
| Alienware 16 Aurora | |
| Gigabyte Gaming A16 Pro GA6DH (Core 7 240H, RTX 5070 Ti) | |
| Gigabyte Gaming A16 GA6H | |
| Przeciętny Intel Core 7 240H (4535 - 6386, n=5) | |
| MSI Cyborg 15 B2RWEKG | |
| Cinebench R20 / CPU (Single Core) | |
| Medion Erazer Major 16 X1 MD62736 | |
| Średnia w klasie Gaming (442 - 895, n=111, ostatnie 2 lata) | |
| Medion Erazer Deputy 15 P1 MD62761 | |
| Gigabyte Gaming A16 GA6H | |
| Alienware 16 Aurora | |
| Przeciętny Intel Core 7 240H (633 - 730, n=5) | |
| MSI Cyborg 15 B2RWEKG | |
| Gigabyte Gaming A16 Pro GA6DH (Core 7 240H, RTX 5070 Ti) | |
| Cinebench R15 / CPU Multi 64Bit | |
| Medion Erazer Major 16 X1 MD62736 | |
| Średnia w klasie Gaming (1578 - 6271, n=111, ostatnie 2 lata) | |
| Medion Erazer Deputy 15 P1 MD62761 | |
| Alienware 16 Aurora | |
| Gigabyte Gaming A16 Pro GA6DH (Core 7 240H, RTX 5070 Ti) | |
| Przeciętny Intel Core 7 240H (1800 - 2582, n=5) | |
| Gigabyte Gaming A16 GA6H | |
| MSI Cyborg 15 B2RWEKG | |
| Cinebench R15 / CPU Single 64Bit | |
| Medion Erazer Major 16 X1 MD62736 | |
| Medion Erazer Deputy 15 P1 MD62761 | |
| Średnia w klasie Gaming (188.8 - 343, n=111, ostatnie 2 lata) | |
| Alienware 16 Aurora | |
| Gigabyte Gaming A16 GA6H | |
| Przeciętny Intel Core 7 240H (242 - 276, n=5) | |
| MSI Cyborg 15 B2RWEKG | |
| Gigabyte Gaming A16 Pro GA6DH (Core 7 240H, RTX 5070 Ti) | |
| Blender / v2.79 BMW27 CPU | |
| MSI Cyborg 15 B2RWEKG | |
| Przeciętny Intel Core 7 240H (195 - 281, n=5) | |
| Gigabyte Gaming A16 GA6H | |
| Gigabyte Gaming A16 Pro GA6DH (Core 7 240H, RTX 5070 Ti) | |
| Alienware 16 Aurora | |
| Medion Erazer Deputy 15 P1 MD62761 | |
| Średnia w klasie Gaming (80 - 330, n=109, ostatnie 2 lata) | |
| Medion Erazer Major 16 X1 MD62736 | |
| 7-Zip 18.03 / 7z b 4 | |
| Medion Erazer Major 16 X1 MD62736 | |
| Średnia w klasie Gaming (33491 - 148086, n=110, ostatnie 2 lata) | |
| Medion Erazer Deputy 15 P1 MD62761 | |
| Alienware 16 Aurora | |
| Gigabyte Gaming A16 Pro GA6DH (Core 7 240H, RTX 5070 Ti) | |
| Gigabyte Gaming A16 GA6H | |
| Przeciętny Intel Core 7 240H (45123 - 65058, n=5) | |
| MSI Cyborg 15 B2RWEKG | |
| 7-Zip 18.03 / 7z b 4 -mmt1 | |
| Medion Erazer Deputy 15 P1 MD62761 | |
| Medion Erazer Major 16 X1 MD62736 | |
| Średnia w klasie Gaming (4199 - 7436, n=110, ostatnie 2 lata) | |
| Alienware 16 Aurora | |
| Gigabyte Gaming A16 GA6H | |
| Przeciętny Intel Core 7 240H (5061 - 6172, n=5) | |
| Gigabyte Gaming A16 Pro GA6DH (Core 7 240H, RTX 5070 Ti) | |
| MSI Cyborg 15 B2RWEKG | |
| Geekbench 6.7 / Multi-Core | |
| Medion Erazer Major 16 X1 MD62736 | |
| Średnia w klasie Gaming (6625 - 22104, n=111, ostatnie 2 lata) | |
| Medion Erazer Deputy 15 P1 MD62761 | |
| Alienware 16 Aurora | |
| Gigabyte Gaming A16 Pro GA6DH (Core 7 240H, RTX 5070 Ti) | |
| Przeciętny Intel Core 7 240H (9713 - 13681, n=6) | |
| Gigabyte Gaming A16 GA6H | |
| MSI Cyborg 15 B2RWEKG | |
| Geekbench 6.7 / Single-Core | |
| Medion Erazer Major 16 X1 MD62736 | |
| Średnia w klasie Gaming (1490 - 3259, n=111, ostatnie 2 lata) | |
| Medion Erazer Deputy 15 P1 MD62761 | |
| Alienware 16 Aurora | |
| Przeciętny Intel Core 7 240H (2348 - 2648, n=6) | |
| Gigabyte Gaming A16 GA6H | |
| MSI Cyborg 15 B2RWEKG | |
| Gigabyte Gaming A16 Pro GA6DH (Core 7 240H, RTX 5070 Ti) | |
| Geekbench 5.5 / Multi-Core | |
| Medion Erazer Major 16 X1 MD62736 | |
| Średnia w klasie Gaming (6460 - 27010, n=110, ostatnie 2 lata) | |
| Medion Erazer Deputy 15 P1 MD62761 | |
| Alienware 16 Aurora | |
| Gigabyte Gaming A16 Pro GA6DH (Core 7 240H, RTX 5070 Ti) | |
| Przeciętny Intel Core 7 240H (8072 - 12276, n=5) | |
| Gigabyte Gaming A16 GA6H | |
| MSI Cyborg 15 B2RWEKG | |
| Geekbench 5.5 / Single-Core | |
| Medion Erazer Major 16 X1 MD62736 | |
| Średnia w klasie Gaming (986 - 2474, n=110, ostatnie 2 lata) | |
| Medion Erazer Deputy 15 P1 MD62761 | |
| Alienware 16 Aurora | |
| Gigabyte Gaming A16 GA6H | |
| Przeciętny Intel Core 7 240H (1644 - 1862, n=5) | |
| MSI Cyborg 15 B2RWEKG | |
| Gigabyte Gaming A16 Pro GA6DH (Core 7 240H, RTX 5070 Ti) | |
| HWBOT x265 Benchmark v2.2 / 4k Preset | |
| Medion Erazer Major 16 X1 MD62736 | |
| Średnia w klasie Gaming (11.5 - 44.3, n=110, ostatnie 2 lata) | |
| Medion Erazer Deputy 15 P1 MD62761 | |
| Alienware 16 Aurora | |
| Gigabyte Gaming A16 Pro GA6DH (Core 7 240H, RTX 5070 Ti) | |
| Gigabyte Gaming A16 GA6H | |
| Przeciętny Intel Core 7 240H (12.7 - 19, n=5) | |
| MSI Cyborg 15 B2RWEKG | |
| LibreOffice / 20 Documents To PDF | |
| MSI Cyborg 15 B2RWEKG | |
| Gigabyte Gaming A16 Pro GA6DH (Core 7 240H, RTX 5070 Ti) | |
| Medion Erazer Deputy 15 P1 MD62761 | |
| Przeciętny Intel Core 7 240H (51.2 - 72.8, n=5) | |
| Gigabyte Gaming A16 GA6H | |
| Alienware 16 Aurora | |
| Średnia w klasie Gaming (19 - 88.8, n=110, ostatnie 2 lata) | |
| Medion Erazer Major 16 X1 MD62736 | |
| R Benchmark 2.5 / Overall mean | |
| Gigabyte Gaming A16 Pro GA6DH (Core 7 240H, RTX 5070 Ti) | |
| MSI Cyborg 15 B2RWEKG | |
| Alienware 16 Aurora | |
| Przeciętny Intel Core 7 240H (0.4329 - 0.4992, n=5) | |
| Gigabyte Gaming A16 GA6H | |
| Średnia w klasie Gaming (0.3439 - 0.759, n=111, ostatnie 2 lata) | |
| Medion Erazer Deputy 15 P1 MD62761 | |
| Medion Erazer Major 16 X1 MD62736 | |
* ... im mniej tym lepiej
AIDA64: FP32 Ray-Trace | FPU Julia | CPU SHA3 | CPU Queen | FPU SinJulia | FPU Mandel | CPU AES | CPU ZLib | FP64 Ray-Trace | CPU PhotoWorxx | CPU CheckMate
| Performance rating | |
| Medion Erazer Major 16 X1 MD62736 -1! | |
| Średnia w klasie Gaming | |
| Medion Erazer Deputy 15 P1 MD62761 -1! | |
| Gigabyte Gaming A16 Pro GA6DH (Core 7 240H, RTX 5070 Ti) -1! | |
| Alienware 16 Aurora -1! | |
| Przeciętny Intel Core 7 240H | |
| MSI Cyborg 15 B2RWEKG -1! | |
| Gigabyte Gaming A16 GA6H -1! | |
| AIDA64 / FP32 Ray-Trace | |
| Medion Erazer Major 16 X1 MD62736 (v6.92.6600) | |
| Średnia w klasie Gaming (10227 - 85542, n=109, ostatnie 2 lata) | |
| Medion Erazer Deputy 15 P1 MD62761 (v6.92.6600) | |
| Gigabyte Gaming A16 Pro GA6DH (Core 7 240H, RTX 5070 Ti) (v8.20.8100) | |
| Alienware 16 Aurora (v6.92.6600) | |
| Przeciętny Intel Core 7 240H (11867 - 15972, n=5) | |
| Gigabyte Gaming A16 GA6H (v6.92.6600) | |
| MSI Cyborg 15 B2RWEKG (v6.92.6600) | |
| AIDA64 / FPU Julia | |
| Medion Erazer Major 16 X1 MD62736 (v6.92.6600) | |
| Średnia w klasie Gaming (51376 - 238426, n=109, ostatnie 2 lata) | |
| Medion Erazer Deputy 15 P1 MD62761 (v6.92.6600) | |
| Gigabyte Gaming A16 Pro GA6DH (Core 7 240H, RTX 5070 Ti) (v8.20.8100) | |
| Alienware 16 Aurora (v6.92.6600) | |
| Przeciętny Intel Core 7 240H (59260 - 80238, n=5) | |
| Gigabyte Gaming A16 GA6H (v6.92.6600) | |
| MSI Cyborg 15 B2RWEKG (v6.92.6600) | |
| AIDA64 / CPU SHA3 | |
| Medion Erazer Major 16 X1 MD62736 (v6.92.6600) | |
| Średnia w klasie Gaming (2180 - 9817, n=109, ostatnie 2 lata) | |
| Medion Erazer Deputy 15 P1 MD62761 (v6.92.6600) | |
| Gigabyte Gaming A16 Pro GA6DH (Core 7 240H, RTX 5070 Ti) (v8.20.8100) | |
| Alienware 16 Aurora (v6.92.6600) | |
| Przeciętny Intel Core 7 240H (2455 - 3287, n=5) | |
| Gigabyte Gaming A16 GA6H (v6.92.6600) | |
| MSI Cyborg 15 B2RWEKG (v6.92.6600) | |
| AIDA64 / CPU Queen | |
| Medion Erazer Major 16 X1 MD62736 (v6.92.6600) | |
| Średnia w klasie Gaming (49785 - 173351, n=100, ostatnie 2 lata) | |
| Medion Erazer Deputy 15 P1 MD62761 (v6.92.6600) | |
| Alienware 16 Aurora (v6.92.6600) | |
| Przeciętny Intel Core 7 240H (75356 - 86602, n=3) | |
| Gigabyte Gaming A16 GA6H (v6.92.6600) | |
| MSI Cyborg 15 B2RWEKG (v6.92.6600) | |
| AIDA64 / FPU SinJulia | |
| Średnia w klasie Gaming (4424 - 33636, n=109, ostatnie 2 lata) | |
| Medion Erazer Major 16 X1 MD62736 (v6.92.6600) | |
| Medion Erazer Deputy 15 P1 MD62761 (v6.92.6600) | |
| Gigabyte Gaming A16 Pro GA6DH (Core 7 240H, RTX 5070 Ti) (v8.20.8100) | |
| Alienware 16 Aurora (v6.92.6600) | |
| Przeciętny Intel Core 7 240H (7777 - 9366, n=5) | |
| Gigabyte Gaming A16 GA6H (v6.92.6600) | |
| MSI Cyborg 15 B2RWEKG (v6.92.6600) | |
| AIDA64 / FPU Mandel | |
| Medion Erazer Major 16 X1 MD62736 (v6.92.6600) | |
| Średnia w klasie Gaming (25115 - 128721, n=109, ostatnie 2 lata) | |
| Medion Erazer Deputy 15 P1 MD62761 (v6.92.6600) | |
| Gigabyte Gaming A16 Pro GA6DH (Core 7 240H, RTX 5070 Ti) (v8.20.8100) | |
| Alienware 16 Aurora (v6.92.6600) | |
| Przeciętny Intel Core 7 240H (29381 - 39967, n=5) | |
| Gigabyte Gaming A16 GA6H (v6.92.6600) | |
| MSI Cyborg 15 B2RWEKG (v6.92.6600) | |
| AIDA64 / CPU AES | |
| Medion Erazer Major 16 X1 MD62736 (v6.92.6600) | |
| Średnia w klasie Gaming (39258 - 247074, n=109, ostatnie 2 lata) | |
| Medion Erazer Deputy 15 P1 MD62761 (v6.92.6600) | |
| Gigabyte Gaming A16 Pro GA6DH (Core 7 240H, RTX 5070 Ti) (v8.20.8100) | |
| Alienware 16 Aurora (v6.92.6600) | |
| Przeciętny Intel Core 7 240H (50528 - 67855, n=5) | |
| Gigabyte Gaming A16 GA6H (v6.92.6600) | |
| MSI Cyborg 15 B2RWEKG (v6.92.6600) | |
| AIDA64 / CPU ZLib | |
| Medion Erazer Major 16 X1 MD62736 (v6.92.6600) | |
| Średnia w klasie Gaming (574 - 2531, n=109, ostatnie 2 lata) | |
| Medion Erazer Deputy 15 P1 MD62761 (v6.92.6600) | |
| Gigabyte Gaming A16 Pro GA6DH (Core 7 240H, RTX 5070 Ti) (v8.20.8100) | |
| Alienware 16 Aurora (v6.92.6600) | |
| Przeciętny Intel Core 7 240H (725 - 951, n=5) | |
| Gigabyte Gaming A16 GA6H (v6.92.6600) | |
| MSI Cyborg 15 B2RWEKG (v6.92.6600) | |
| AIDA64 / FP64 Ray-Trace | |
| Medion Erazer Major 16 X1 MD62736 (v6.92.6600) | |
| Średnia w klasie Gaming (5509 - 45446, n=109, ostatnie 2 lata) | |
| Medion Erazer Deputy 15 P1 MD62761 (v6.92.6600) | |
| Gigabyte Gaming A16 Pro GA6DH (Core 7 240H, RTX 5070 Ti) (v8.20.8100) | |
| Alienware 16 Aurora (v6.92.6600) | |
| Przeciętny Intel Core 7 240H (6389 - 8569, n=5) | |
| Gigabyte Gaming A16 GA6H (v6.92.6600) | |
| MSI Cyborg 15 B2RWEKG (v6.92.6600) | |
| AIDA64 / CPU PhotoWorxx | |
| Medion Erazer Major 16 X1 MD62736 (v6.92.6600) | |
| Gigabyte Gaming A16 Pro GA6DH (Core 7 240H, RTX 5070 Ti) (v8.20.8100) | |
| Średnia w klasie Gaming (12271 - 89891, n=109, ostatnie 2 lata) | |
| Medion Erazer Deputy 15 P1 MD62761 (v6.92.6600) | |
| Alienware 16 Aurora (v6.92.6600) | |
| Przeciętny Intel Core 7 240H (21710 - 44874, n=5) | |
| MSI Cyborg 15 B2RWEKG (v6.92.6600) | |
| Gigabyte Gaming A16 GA6H (v6.92.6600) | |
| AIDA64 / CPU CheckMate | |
| Średnia w klasie Gaming (2930 - 8322, n=9, ostatnie 2 lata) | |
| Gigabyte Gaming A16 Pro GA6DH (Core 7 240H, RTX 5070 Ti) (v8.20.8100) | |
| Przeciętny Intel Core 7 240H (2930 - 2938, n=2) | |
Wydajność systemu
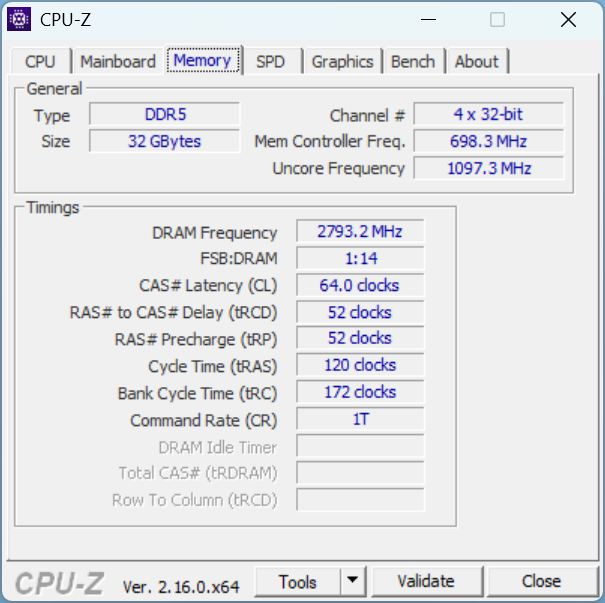
Testy porównawcze systemu pokazują, że nowy A16 jest niewiele szybszy od swojego poprzednika i wolniejszy od wielu innych laptopów do gier z RTX 5070 Ti. Pamięć RAM raczej nie będzie wąskim gardłem, ponieważ pozostaje konkurencyjna.
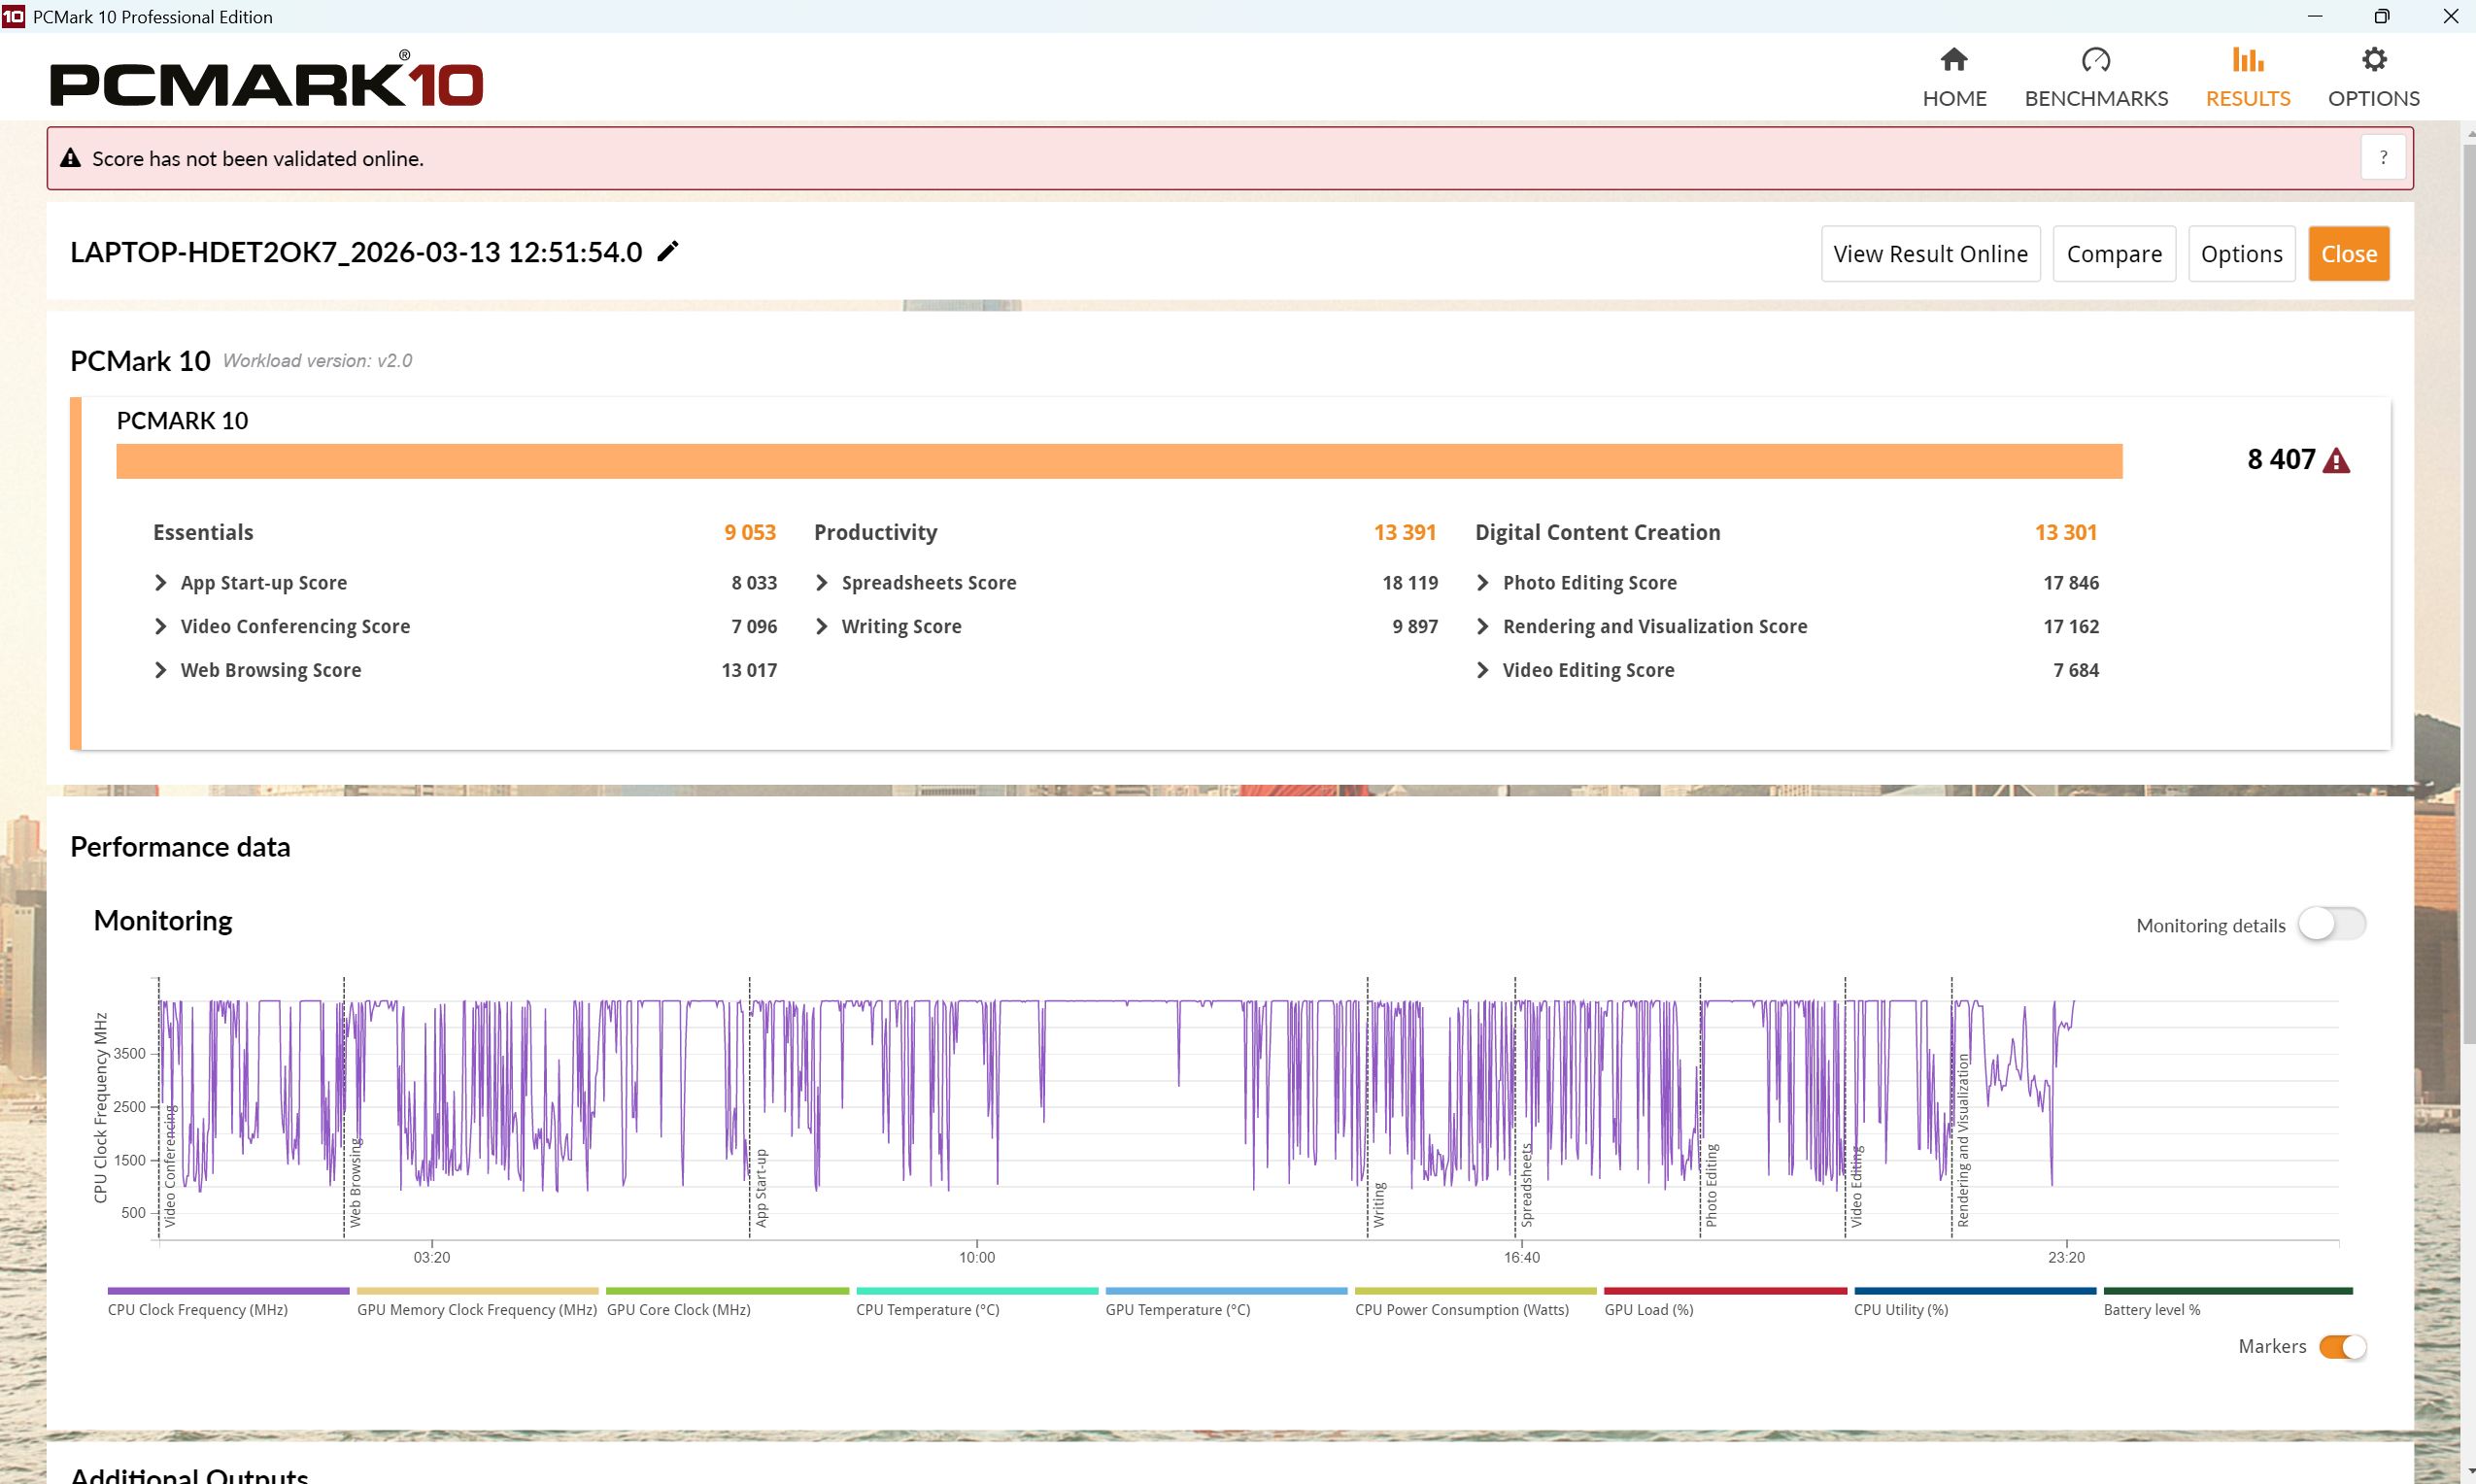
PCMark 10: Score | Essentials | Productivity | Digital Content Creation
CrossMark: Overall | Productivity | Creativity | Responsiveness
WebXPRT 3: Overall
WebXPRT 4: Overall
Mozilla Kraken 1.1: Total
| Performance rating | |
| Lenovo Legion 5 Pro 16IAX10H | |
| Acer Predator Helios Neo 16S AI PHN16S-71-94L9 | |
| Medion Erazer Major 16 X1 MD62736 | |
| Średnia w klasie Gaming | |
| Przeciętny Intel Core 7 240H, NVIDIA GeForce RTX 5070 Ti Laptop | |
| Gigabyte Gaming A16 Pro GA6DH (Core 7 240H, RTX 5070 Ti) | |
| Acer Nitro v 17 (ANV17-41-R4CJ) | |
| Gigabyte Gaming A16 GA6H | |
| PCMark 10 / Score | |
| Gigabyte Gaming A16 Pro GA6DH (Core 7 240H, RTX 5070 Ti) | |
| Acer Predator Helios Neo 16S AI PHN16S-71-94L9 | |
| Przeciętny Intel Core 7 240H, NVIDIA GeForce RTX 5070 Ti Laptop (8234 - 8407, n=2) | |
| Średnia w klasie Gaming (5828 - 11574, n=95, ostatnie 2 lata) | |
| Lenovo Legion 5 Pro 16IAX10H | |
| Acer Nitro v 17 (ANV17-41-R4CJ) | |
| Medion Erazer Major 16 X1 MD62736 | |
| Gigabyte Gaming A16 GA6H | |
| PCMark 10 / Essentials | |
| Acer Predator Helios Neo 16S AI PHN16S-71-94L9 | |
| Medion Erazer Major 16 X1 MD62736 | |
| Lenovo Legion 5 Pro 16IAX10H | |
| Średnia w klasie Gaming (8810 - 12600, n=99, ostatnie 2 lata) | |
| Gigabyte Gaming A16 GA6H | |
| Acer Nitro v 17 (ANV17-41-R4CJ) | |
| Przeciętny Intel Core 7 240H, NVIDIA GeForce RTX 5070 Ti Laptop (9053 - 9807, n=2) | |
| Gigabyte Gaming A16 Pro GA6DH (Core 7 240H, RTX 5070 Ti) | |
| PCMark 10 / Productivity | |
| Przeciętny Intel Core 7 240H, NVIDIA GeForce RTX 5070 Ti Laptop (13391 - 13612, n=2) | |
| Gigabyte Gaming A16 Pro GA6DH (Core 7 240H, RTX 5070 Ti) | |
| Acer Nitro v 17 (ANV17-41-R4CJ) | |
| Średnia w klasie Gaming (6845 - 18766, n=97, ostatnie 2 lata) | |
| Acer Predator Helios Neo 16S AI PHN16S-71-94L9 | |
| Lenovo Legion 5 Pro 16IAX10H | |
| Medion Erazer Major 16 X1 MD62736 | |
| Gigabyte Gaming A16 GA6H | |
| PCMark 10 / Digital Content Creation | |
| Lenovo Legion 5 Pro 16IAX10H | |
| Acer Predator Helios Neo 16S AI PHN16S-71-94L9 | |
| Średnia w klasie Gaming (7602 - 19657, n=97, ostatnie 2 lata) | |
| Gigabyte Gaming A16 Pro GA6DH (Core 7 240H, RTX 5070 Ti) | |
| Medion Erazer Major 16 X1 MD62736 | |
| Przeciętny Intel Core 7 240H, NVIDIA GeForce RTX 5070 Ti Laptop (11348 - 13301, n=2) | |
| Gigabyte Gaming A16 GA6H | |
| Acer Nitro v 17 (ANV17-41-R4CJ) | |
| CrossMark / Overall | |
| Lenovo Legion 5 Pro 16IAX10H | |
| Acer Predator Helios Neo 16S AI PHN16S-71-94L9 | |
| Medion Erazer Major 16 X1 MD62736 | |
| Średnia w klasie Gaming (1366 - 2409, n=97, ostatnie 2 lata) | |
| Gigabyte Gaming A16 GA6H | |
| Przeciętny Intel Core 7 240H, NVIDIA GeForce RTX 5070 Ti Laptop (1740 - 1852, n=2) | |
| Gigabyte Gaming A16 Pro GA6DH (Core 7 240H, RTX 5070 Ti) | |
| Acer Nitro v 17 (ANV17-41-R4CJ) | |
| CrossMark / Productivity | |
| Lenovo Legion 5 Pro 16IAX10H | |
| Acer Predator Helios Neo 16S AI PHN16S-71-94L9 | |
| Medion Erazer Major 16 X1 MD62736 | |
| Średnia w klasie Gaming (1386 - 2254, n=97, ostatnie 2 lata) | |
| Gigabyte Gaming A16 GA6H | |
| Acer Nitro v 17 (ANV17-41-R4CJ) | |
| Przeciętny Intel Core 7 240H, NVIDIA GeForce RTX 5070 Ti Laptop (1613 - 1732, n=2) | |
| Gigabyte Gaming A16 Pro GA6DH (Core 7 240H, RTX 5070 Ti) | |
| CrossMark / Creativity | |
| Lenovo Legion 5 Pro 16IAX10H | |
| Acer Predator Helios Neo 16S AI PHN16S-71-94L9 | |
| Medion Erazer Major 16 X1 MD62736 | |
| Średnia w klasie Gaming (1343 - 2729, n=97, ostatnie 2 lata) | |
| Przeciętny Intel Core 7 240H, NVIDIA GeForce RTX 5070 Ti Laptop (1925 - 1996, n=2) | |
| Gigabyte Gaming A16 Pro GA6DH (Core 7 240H, RTX 5070 Ti) | |
| Gigabyte Gaming A16 GA6H | |
| Acer Nitro v 17 (ANV17-41-R4CJ) | |
| CrossMark / Responsiveness | |
| Lenovo Legion 5 Pro 16IAX10H | |
| Gigabyte Gaming A16 GA6H | |
| Acer Predator Helios Neo 16S AI PHN16S-71-94L9 | |
| Medion Erazer Major 16 X1 MD62736 | |
| Przeciętny Intel Core 7 240H, NVIDIA GeForce RTX 5070 Ti Laptop (1611 - 1809, n=2) | |
| Średnia w klasie Gaming (1226 - 2334, n=97, ostatnie 2 lata) | |
| Gigabyte Gaming A16 Pro GA6DH (Core 7 240H, RTX 5070 Ti) | |
| Acer Nitro v 17 (ANV17-41-R4CJ) | |
| WebXPRT 3 / Overall | |
| Lenovo Legion 5 Pro 16IAX10H | |
| Acer Predator Helios Neo 16S AI PHN16S-71-94L9 | |
| Medion Erazer Major 16 X1 MD62736 | |
| Średnia w klasie Gaming (242 - 532, n=100, ostatnie 2 lata) | |
| Acer Nitro v 17 (ANV17-41-R4CJ) | |
| Gigabyte Gaming A16 GA6H | |
| Gigabyte Gaming A16 Pro GA6DH (Core 7 240H, RTX 5070 Ti) | |
| Przeciętny Intel Core 7 240H, NVIDIA GeForce RTX 5070 Ti Laptop (257 - 264, n=2) | |
| WebXPRT 4 / Overall | |
| Lenovo Legion 5 Pro 16IAX10H | |
| Medion Erazer Major 16 X1 MD62736 | |
| Acer Predator Helios Neo 16S AI PHN16S-71-94L9 | |
| Średnia w klasie Gaming (176.4 - 354, n=100, ostatnie 2 lata) | |
| Gigabyte Gaming A16 GA6H | |
| Przeciętny Intel Core 7 240H, NVIDIA GeForce RTX 5070 Ti Laptop (238 - 239, n=2) | |
| Gigabyte Gaming A16 Pro GA6DH (Core 7 240H, RTX 5070 Ti) | |
| Acer Nitro v 17 (ANV17-41-R4CJ) | |
| Mozilla Kraken 1.1 / Total | |
| Gigabyte Gaming A16 Pro GA6DH (Core 7 240H, RTX 5070 Ti) | |
| Przeciętny Intel Core 7 240H, NVIDIA GeForce RTX 5070 Ti Laptop (552 - 555, n=2) | |
| Acer Nitro v 17 (ANV17-41-R4CJ) | |
| Gigabyte Gaming A16 GA6H | |
| Średnia w klasie Gaming (391 - 590, n=105, ostatnie 2 lata) | |
| Medion Erazer Major 16 X1 MD62736 | |
| Lenovo Legion 5 Pro 16IAX10H | |
| Acer Predator Helios Neo 16S AI PHN16S-71-94L9 | |
* ... im mniej tym lepiej
| PCMark 10 Score | 8407 pkt. | |
Pomoc | ||
| AIDA64 / Memory Copy | |
| Acer Predator Helios Neo 16S AI PHN16S-71-94L9 | |
| Lenovo Legion 5 Pro 16IAX10H | |
| Medion Erazer Major 16 X1 MD62736 | |
| Średnia w klasie Gaming (21750 - 129946, n=109, ostatnie 2 lata) | |
| Gigabyte Gaming A16 Pro GA6DH (Core 7 240H, RTX 5070 Ti) | |
| Przeciętny Intel Core 7 240H (34965 - 69215, n=5) | |
| Acer Nitro v 17 (ANV17-41-R4CJ) | |
| Gigabyte Gaming A16 GA6H | |
| AIDA64 / Memory Read | |
| Acer Predator Helios Neo 16S AI PHN16S-71-94L9 | |
| Lenovo Legion 5 Pro 16IAX10H | |
| Medion Erazer Major 16 X1 MD62736 | |
| Średnia w klasie Gaming (22956 - 118858, n=109, ostatnie 2 lata) | |
| Gigabyte Gaming A16 Pro GA6DH (Core 7 240H, RTX 5070 Ti) | |
| Przeciętny Intel Core 7 240H (39706 - 71870, n=5) | |
| Gigabyte Gaming A16 GA6H | |
| Acer Nitro v 17 (ANV17-41-R4CJ) | |
| AIDA64 / Memory Write | |
| Medion Erazer Major 16 X1 MD62736 | |
| Acer Predator Helios Neo 16S AI PHN16S-71-94L9 | |
| Gigabyte Gaming A16 Pro GA6DH (Core 7 240H, RTX 5070 Ti) | |
| Lenovo Legion 5 Pro 16IAX10H | |
| Średnia w klasie Gaming (22297 - 135096, n=109, ostatnie 2 lata) | |
| Przeciętny Intel Core 7 240H (33560 - 80488, n=5) | |
| Acer Nitro v 17 (ANV17-41-R4CJ) | |
| Gigabyte Gaming A16 GA6H | |
| AIDA64 / Memory Latency | |
| Lenovo Legion 5 Pro 16IAX10H | |
| Acer Predator Helios Neo 16S AI PHN16S-71-94L9 | |
| Medion Erazer Major 16 X1 MD62736 | |
| Średnia w klasie Gaming (75.3 - 259, n=109, ostatnie 2 lata) | |
| Przeciętny Intel Core 7 240H (97.1 - 125.6, n=5) | |
| Gigabyte Gaming A16 GA6H | |
| Gigabyte Gaming A16 Pro GA6DH (Core 7 240H, RTX 5070 Ti) | |
| Acer Nitro v 17 (ANV17-41-R4CJ) | |
* ... im mniej tym lepiej
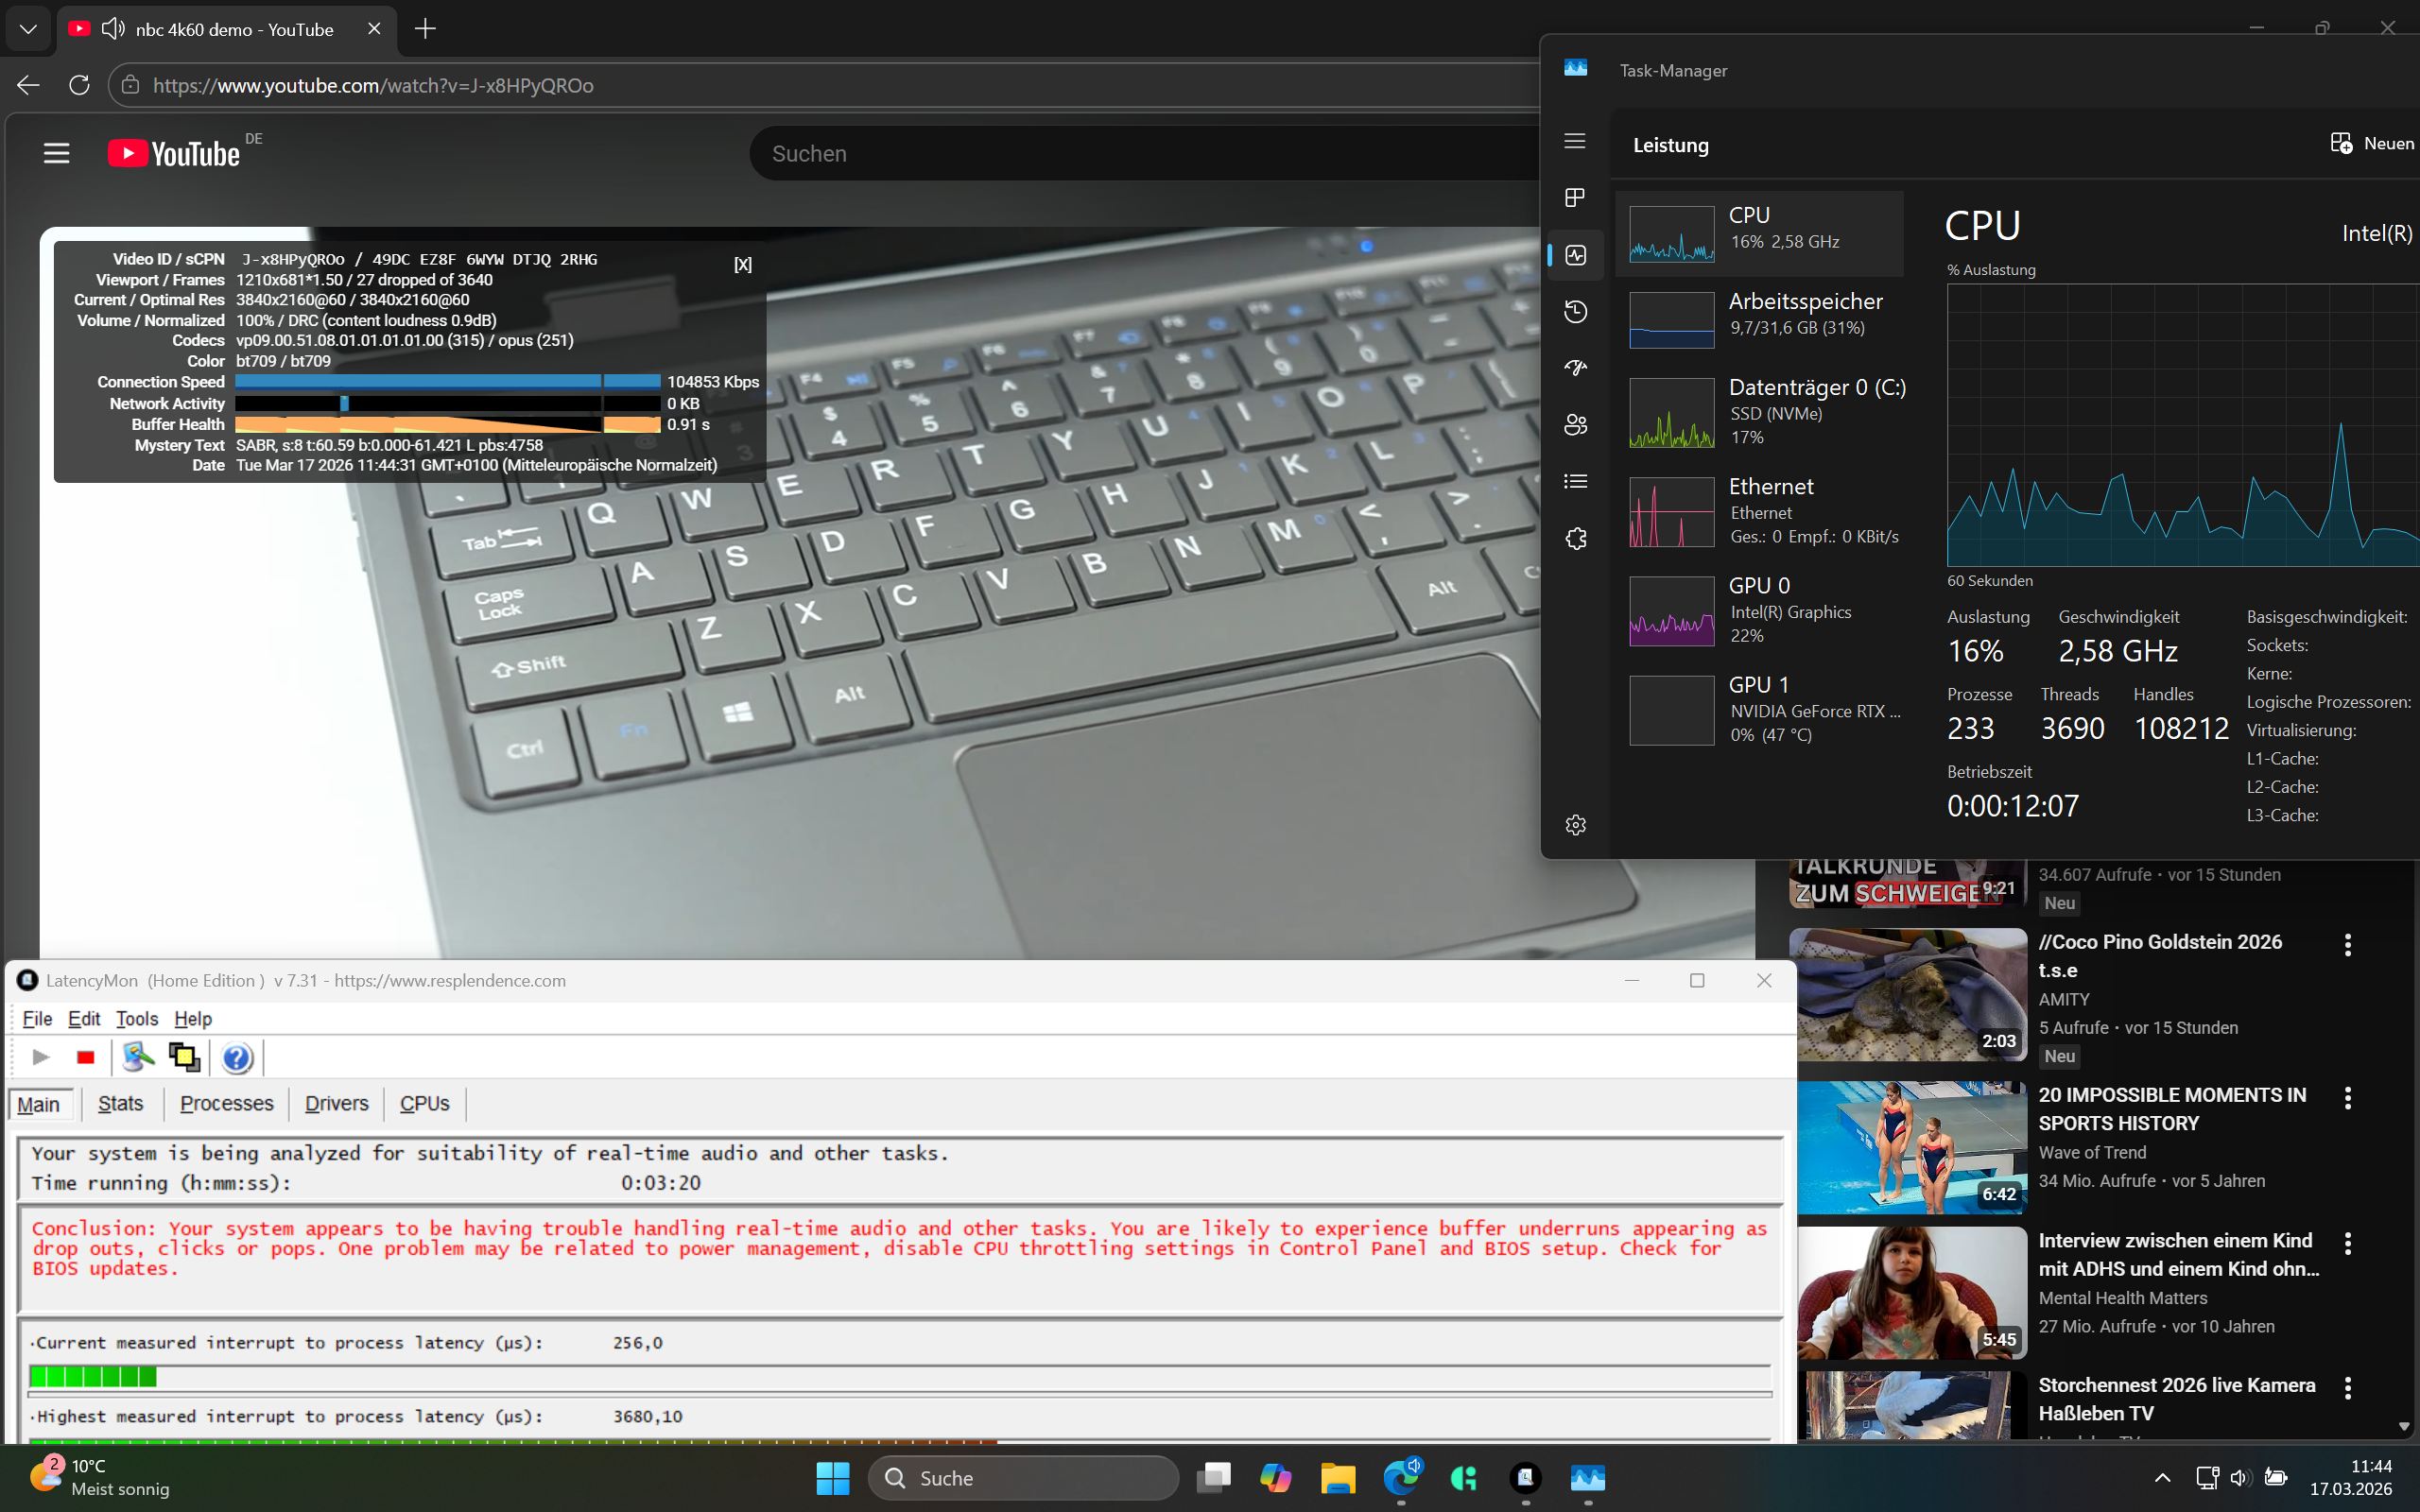
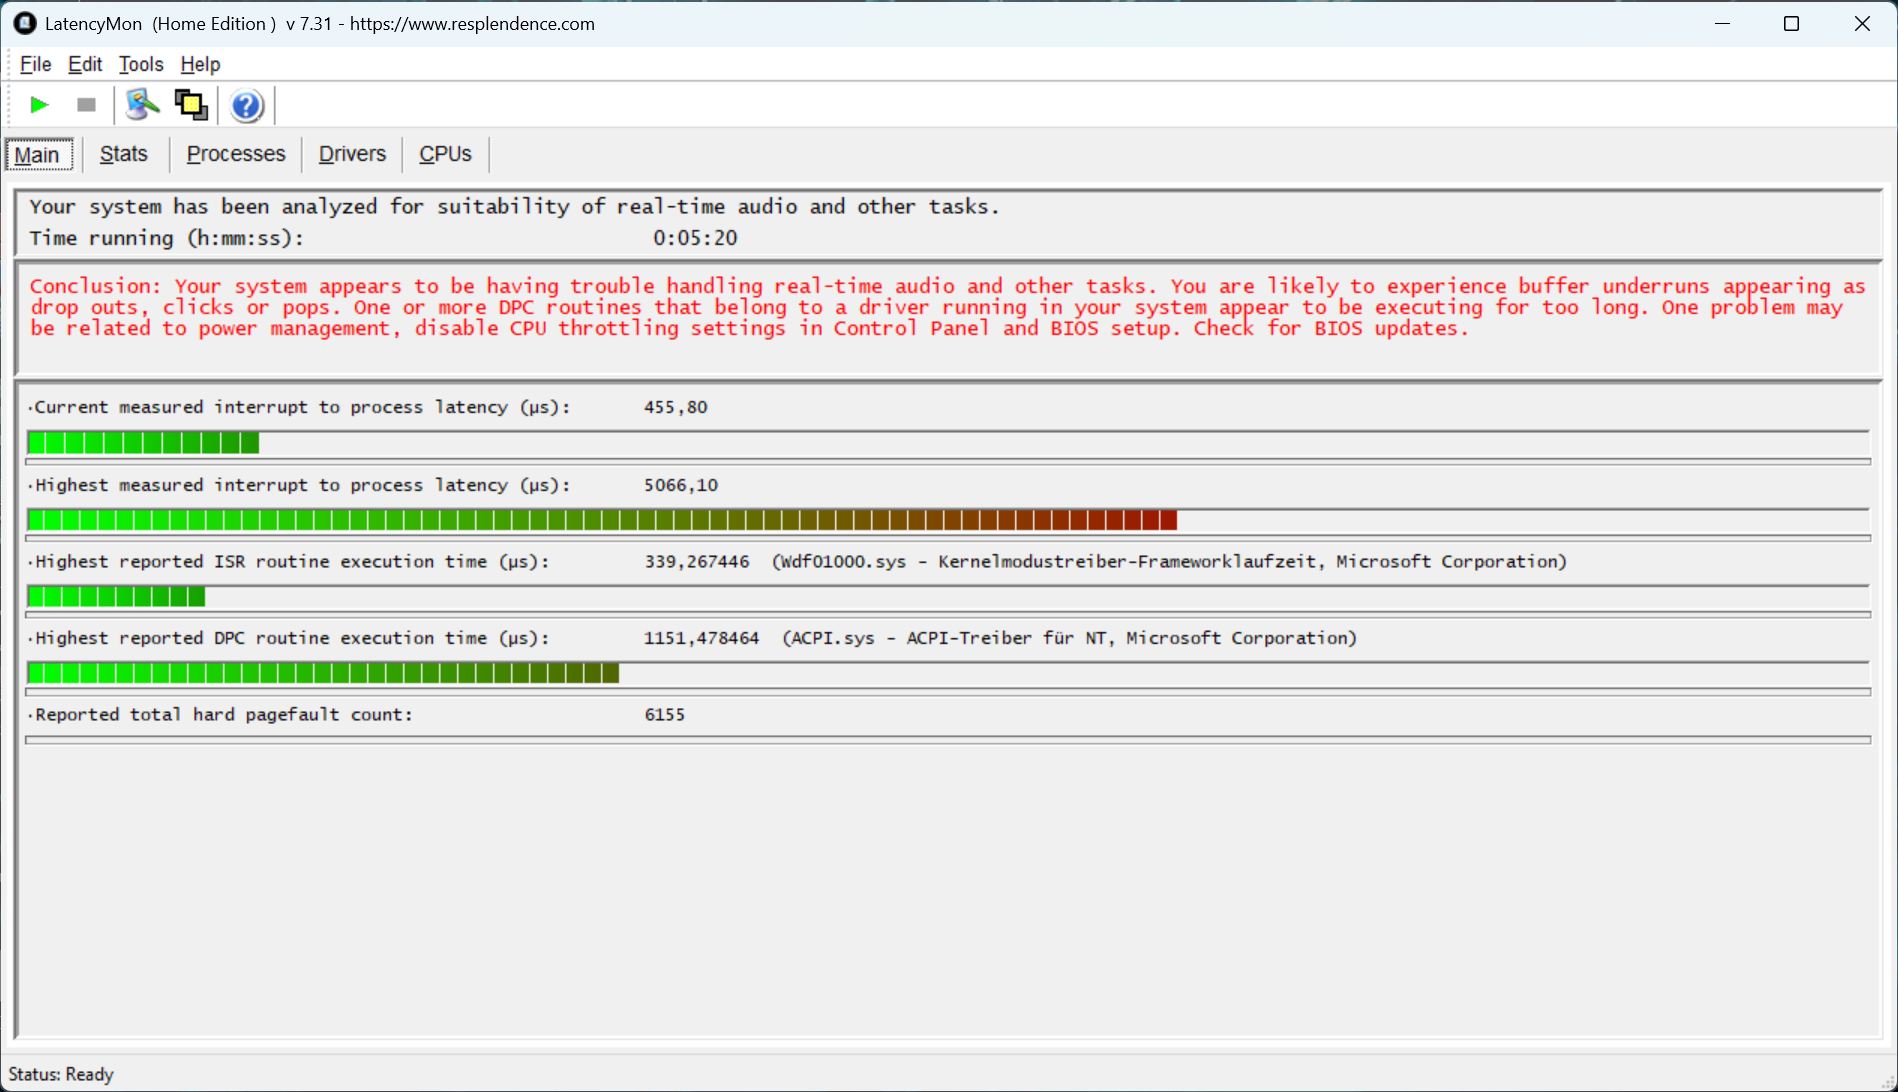
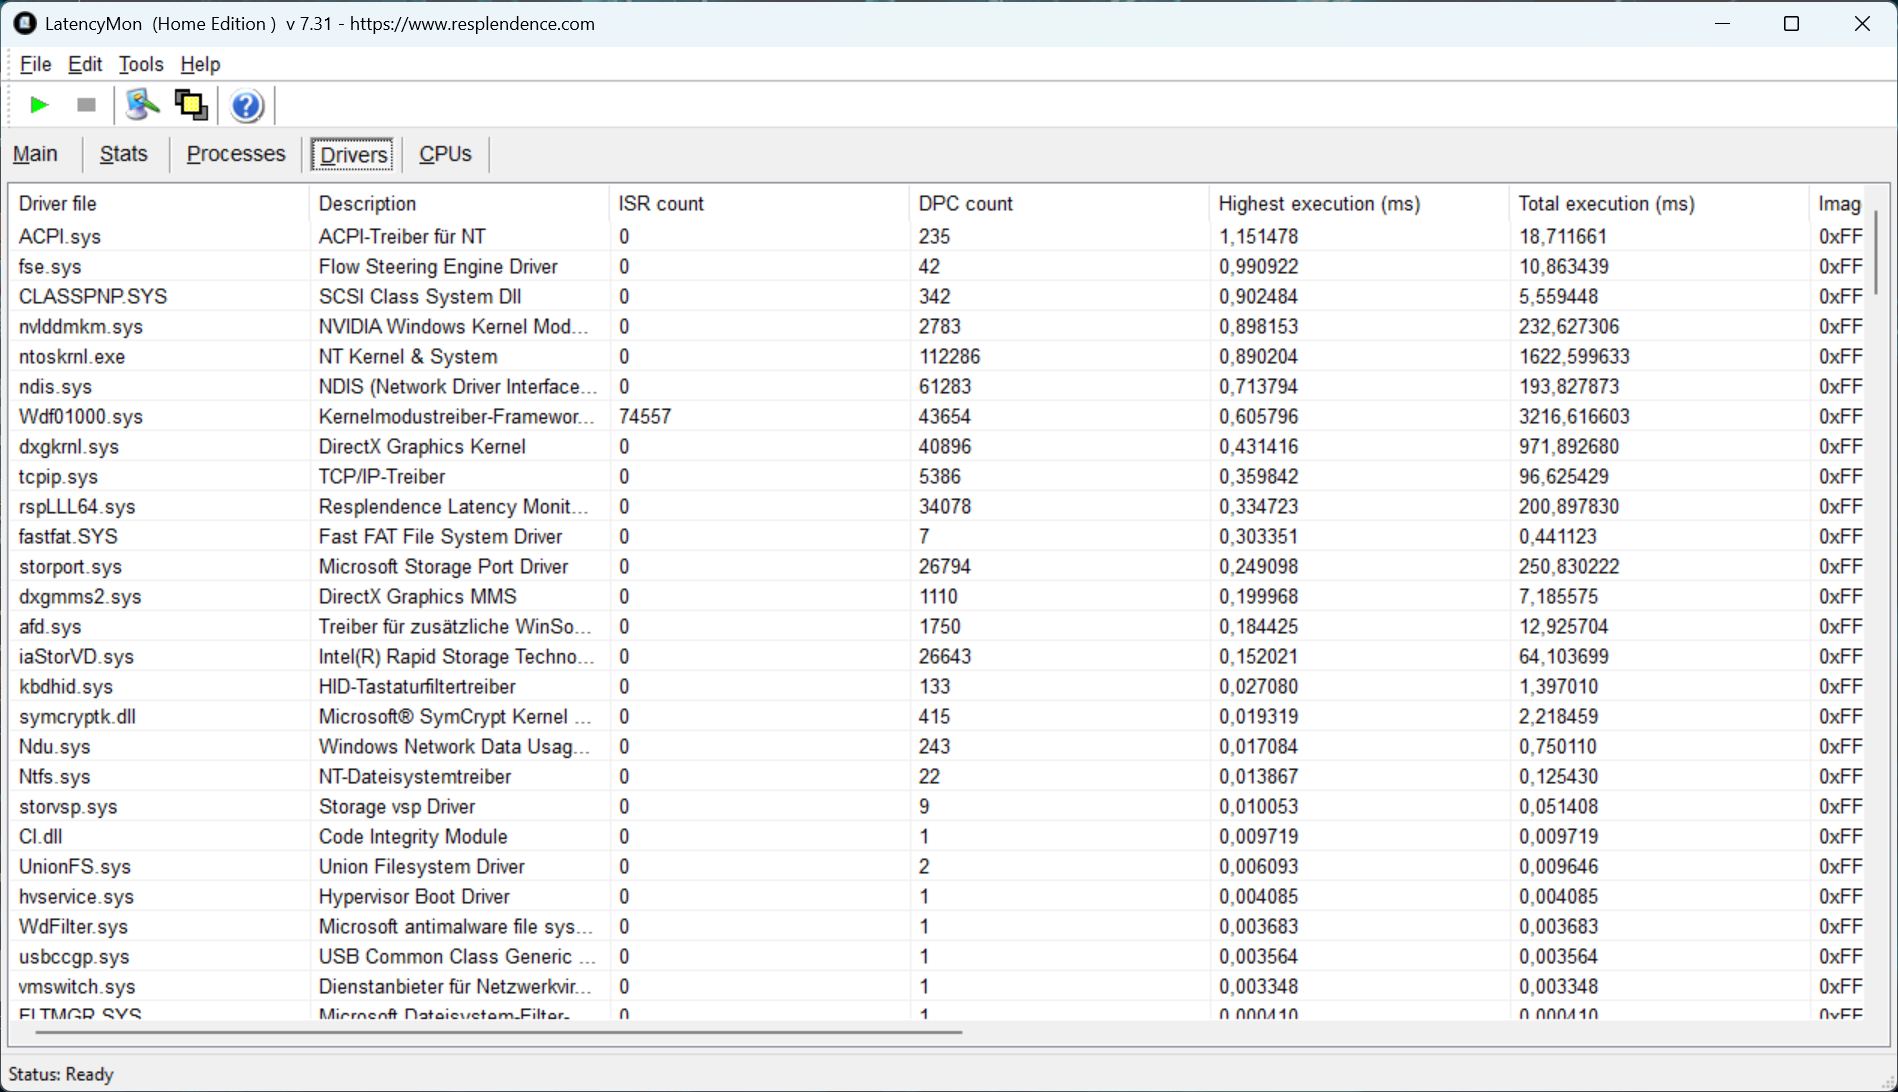
Opóźnienie DPC
Problemy z opóźnieniami pojawiają się podczas otwierania wielu kart przeglądarki i znacznie wzrastają podczas odtwarzania YouTube, gdzie 27 klatek jest porzucanych.
| DPC Latencies / LatencyMon - interrupt to process latency (max), Web, Youtube, Prime95 | |
| Gigabyte Gaming A16 Pro GA6DH (Core 7 240H, RTX 5070 Ti) | |
| Gigabyte Gaming A16 GA6H | |
| Medion Erazer Major 16 X1 MD62736 | |
| Acer Predator Helios Neo 16S AI PHN16S-71-94L9 | |
| Schenker XMG APEX 16 MAX | |
| Lenovo Legion 5 Pro 16IAX10H | |
* ... im mniej tym lepiej
Pamięć masowa
Dysk SSD Samsung o pojemności 1 TB jest z natury bardzo szybki, ale cierpi z powodu dławienia termicznego w A16 Pro, co prowadzi do bardzo niespójnych prędkości transferu. Jest to rozczarowujące, zwłaszcza że A16 miał podobne problemy.

* ... im mniej tym lepiej
Dauerleistung Lesen: Pętla odczytu DiskSpd, głębokość kolejki 8
Wydajność GPU
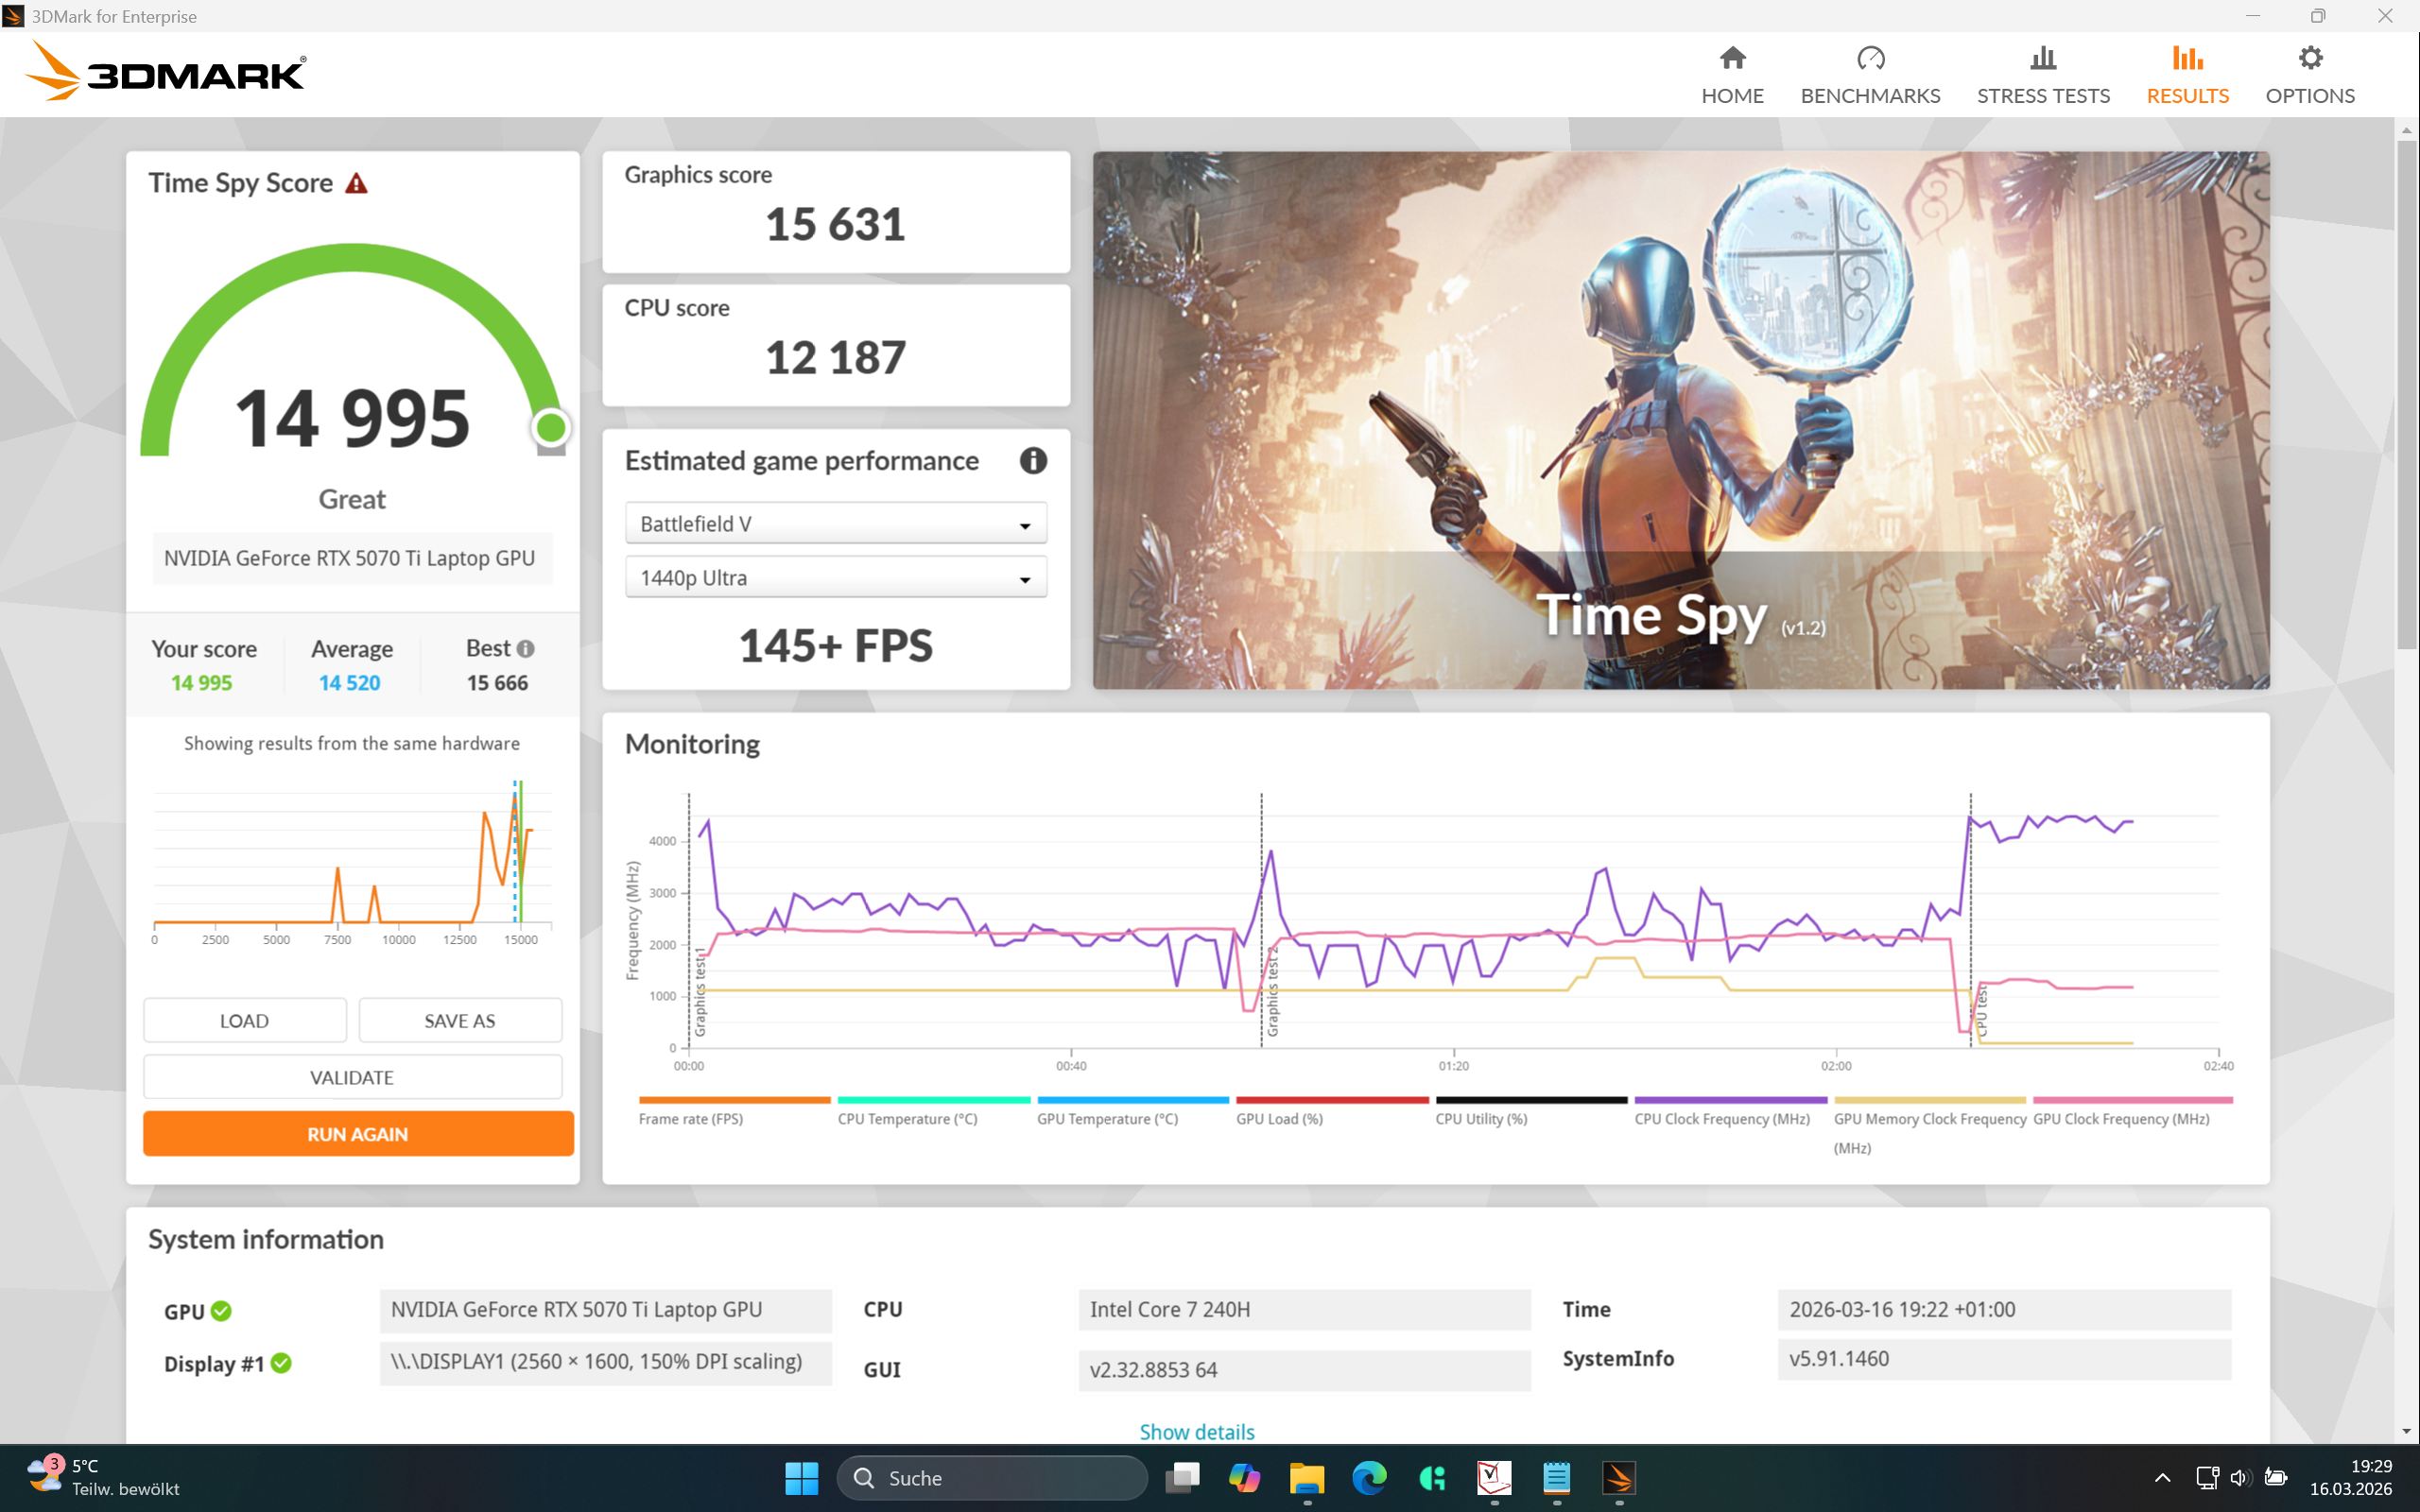
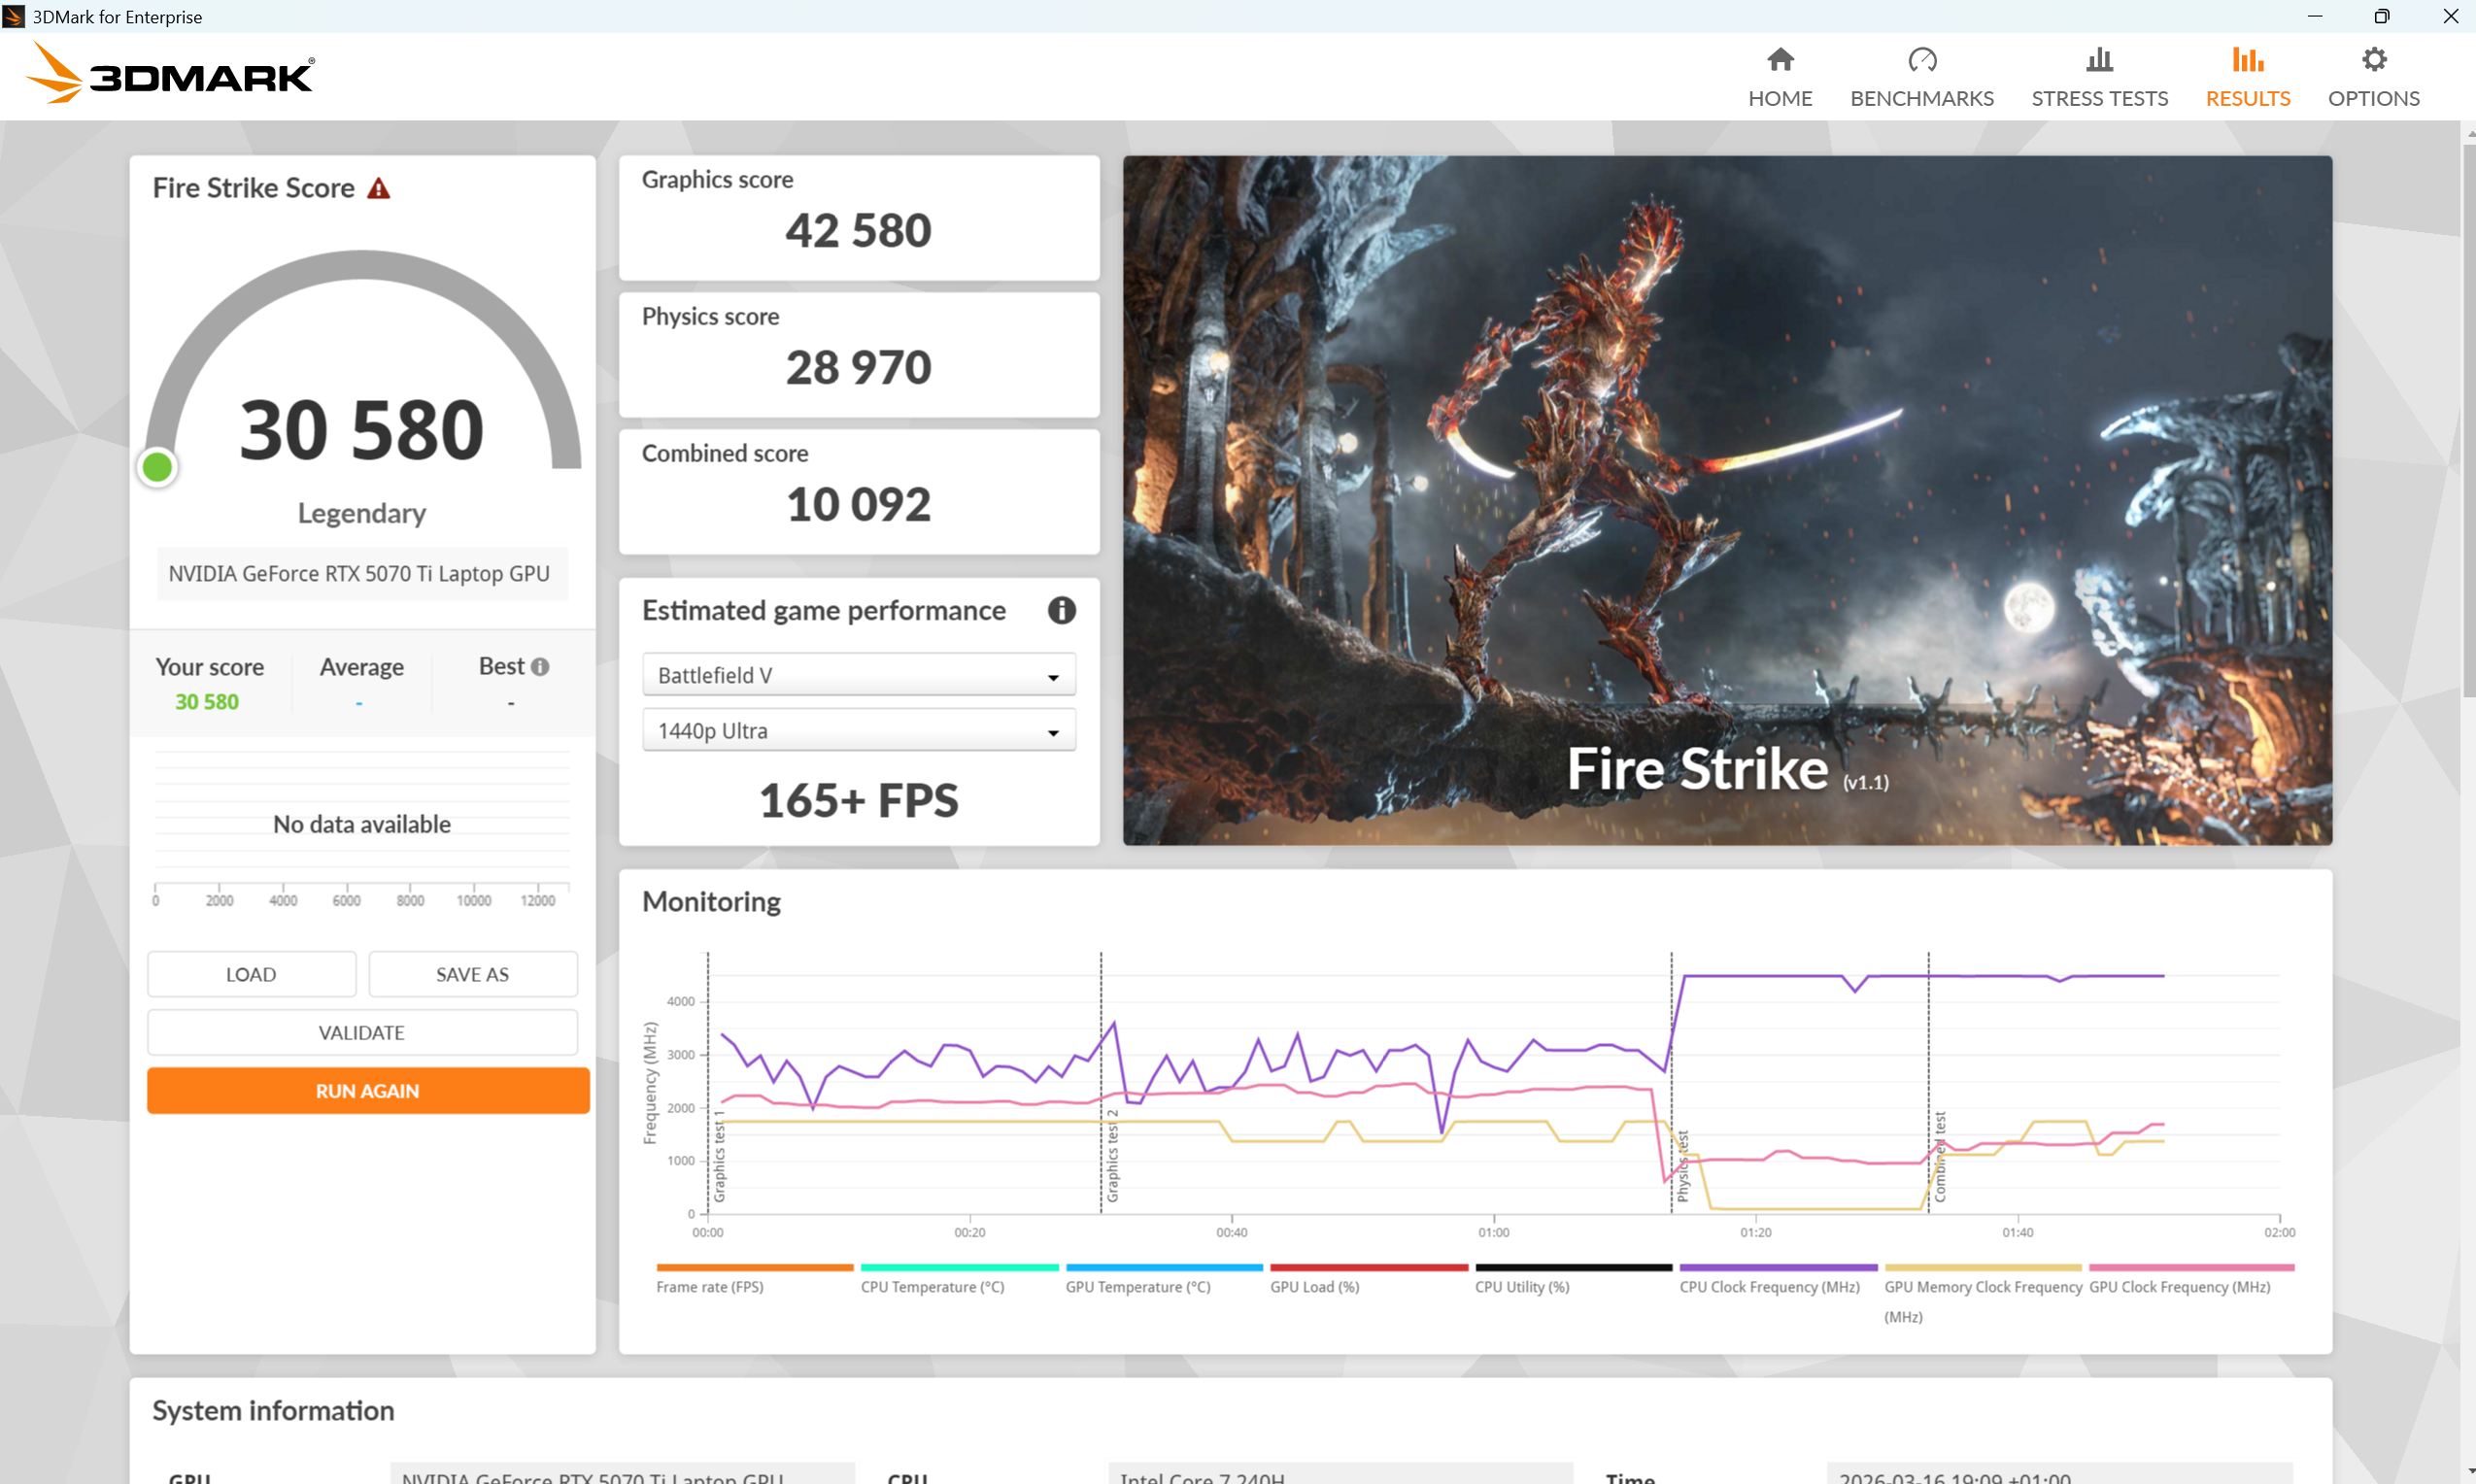
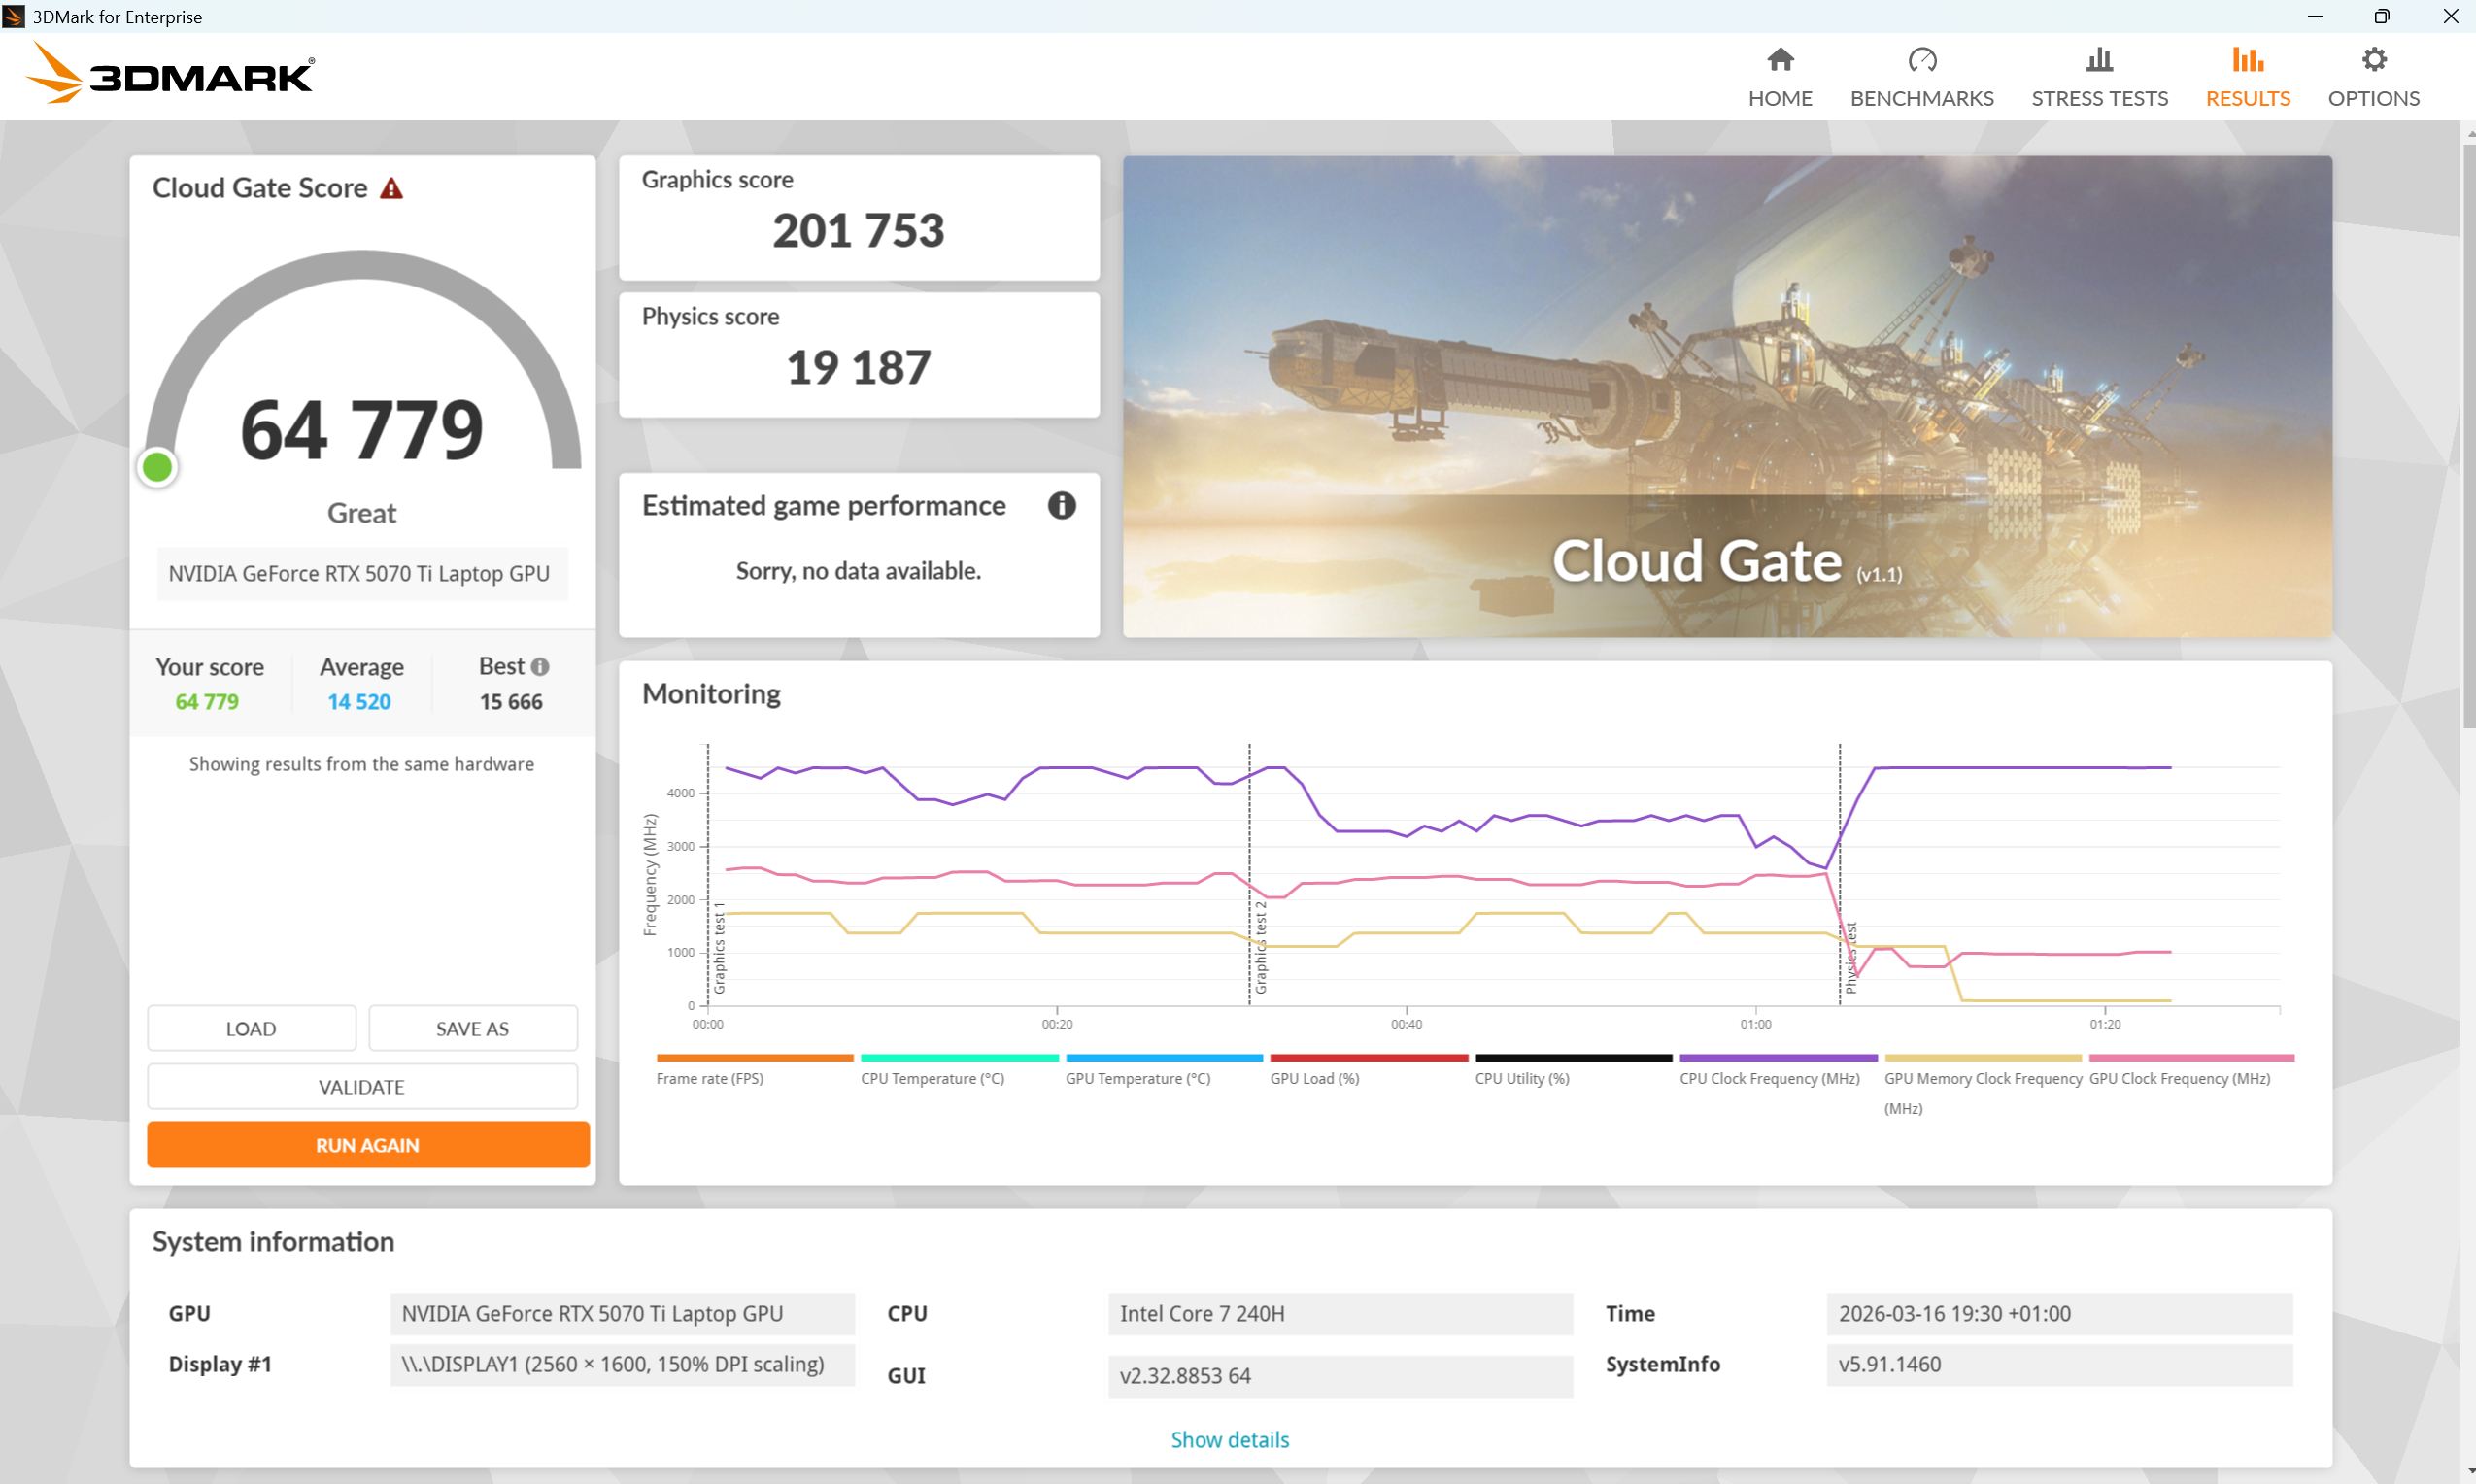
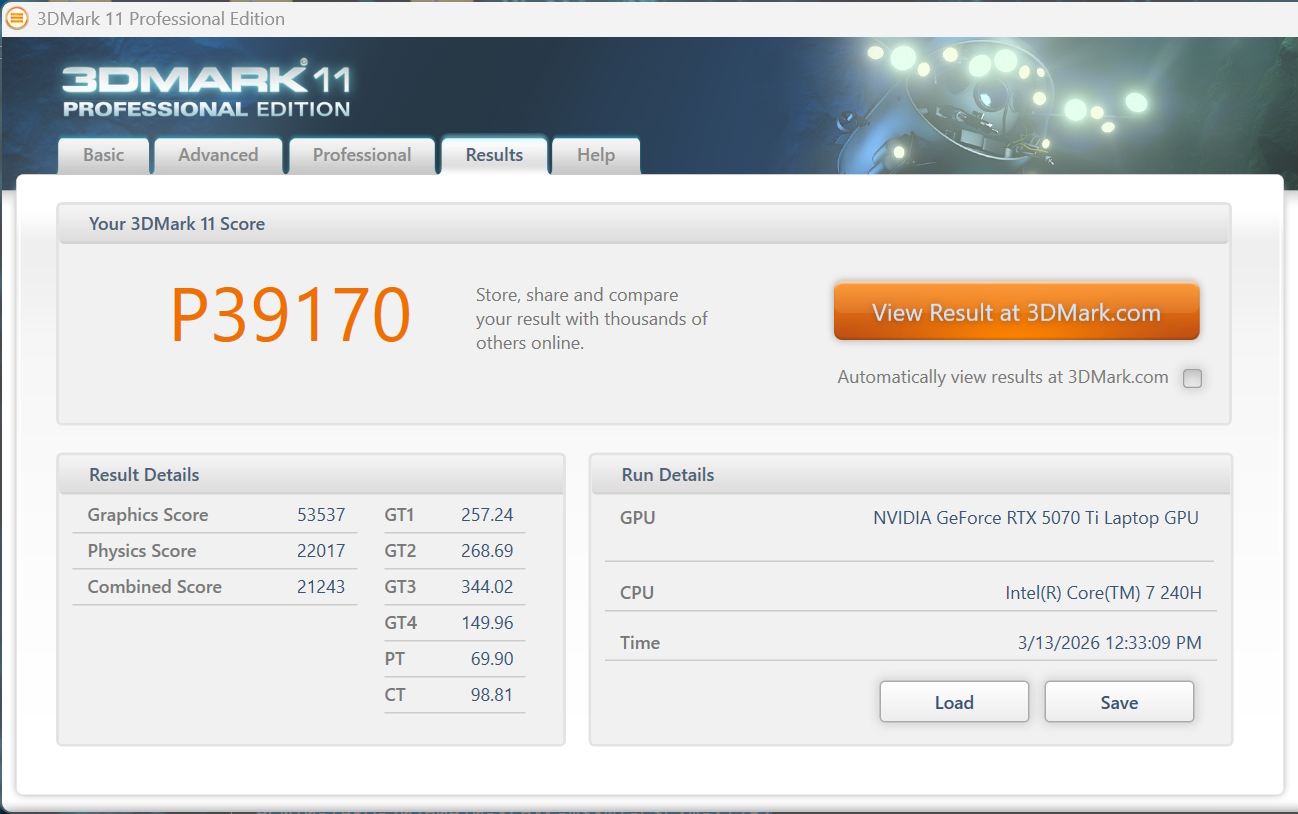
W syntetycznych testach porównawczych A16 Pro wypada nieco słabiej niż oczekiwano. Bez podłączonego zasilania, wydajność 3D spada o około 63%.
| 3DMark 11 Performance | 39170 pkt. | |
| 3DMark Cloud Gate Standard Score | 64779 pkt. | |
| 3DMark Fire Strike Score | 30580 pkt. | |
| 3DMark Time Spy Score | 14995 pkt. | |
Pomoc | ||
* ... im mniej tym lepiej
Wydajność w grach
Choć nie do końca dorównuje konkurencyjnym systemom, A16 Pro komfortowo radzi sobie z natywną rozdzielczością. Tak długo, jak nie jest zaangażowane śledzenie ścieżki (np. w F1 25), wydajność pozostaje solidna - a DLSS pomaga w razie potrzeby. Osiągnięcie częstotliwości odświeżania panelu na poziomie 165 Hz jest jednak rzadkością, nawet przy rozdzielczości Full HD.
| Final Fantasy XV Benchmark - 1920x1080 High Quality | |
| Lenovo Legion 5 Pro 16IAX10H | |
| Średnia w klasie Gaming (41 - 215, n=103, ostatnie 2 lata) | |
| Acer Nitro v 17 (ANV17-41-R4CJ) | |
| Samsung Galaxy Book6 Ultra | |
| Gigabyte Gaming A16 Pro GA6DH (Core 7 240H, RTX 5070 Ti) | |
| Gigabyte Gaming A16 GA6H | |
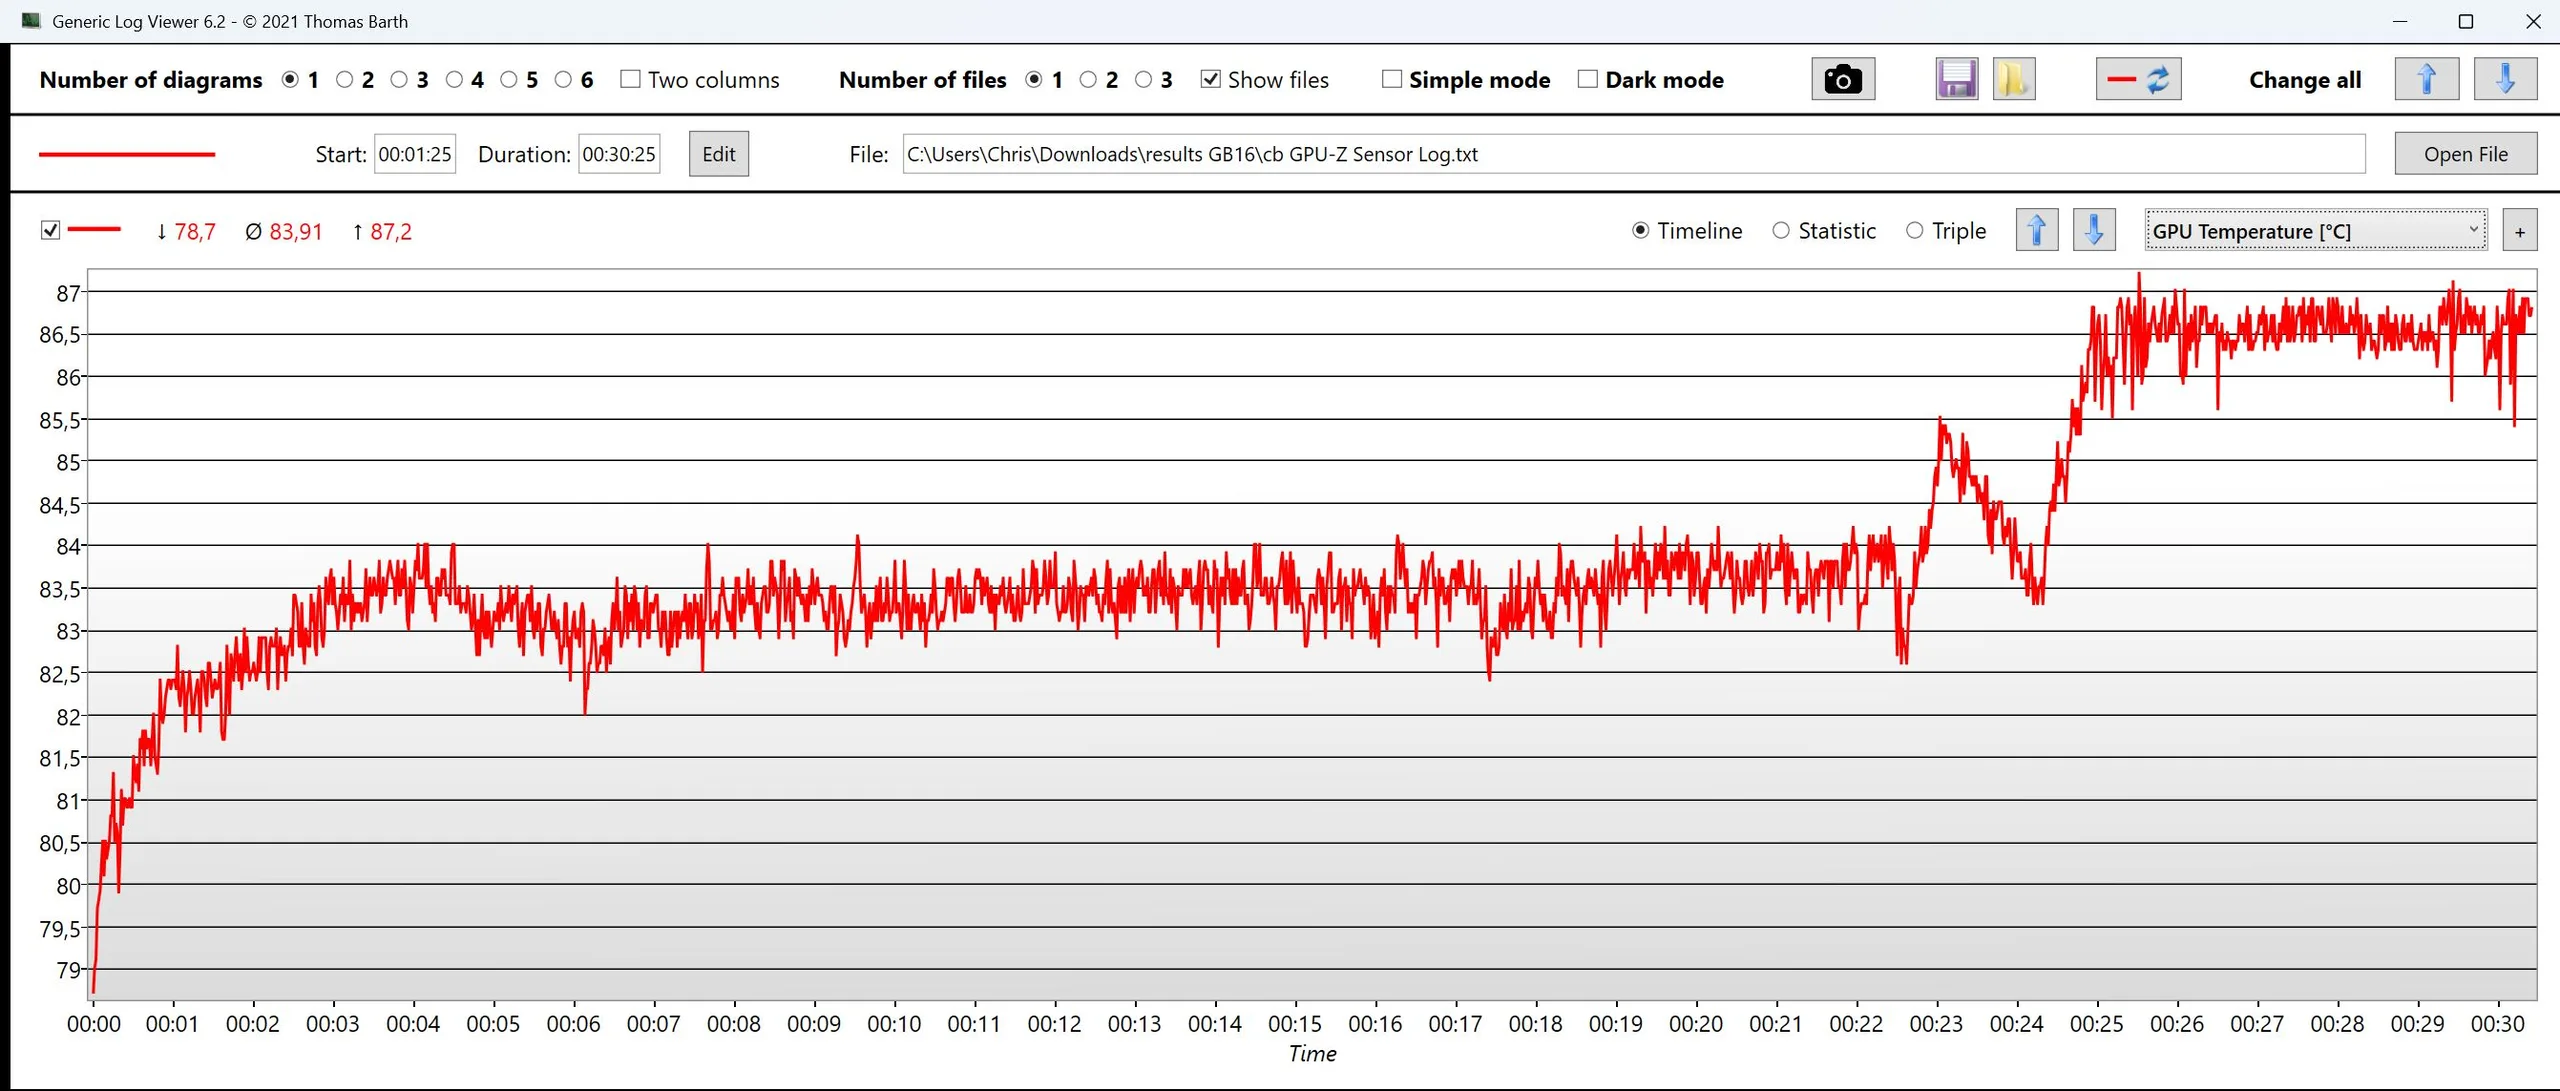
Zrównoważona wydajność w Cyberpunk 2077 wydaje się dość stabilna, ale dane pokazują, że temperatury GPU stale rosną, prowadząc do dławienia po około 25 minutach. TGP jest ograniczone do 115 W, ale w grach takich jak Cyberpunk 2077 ledwo przekracza 95 W.
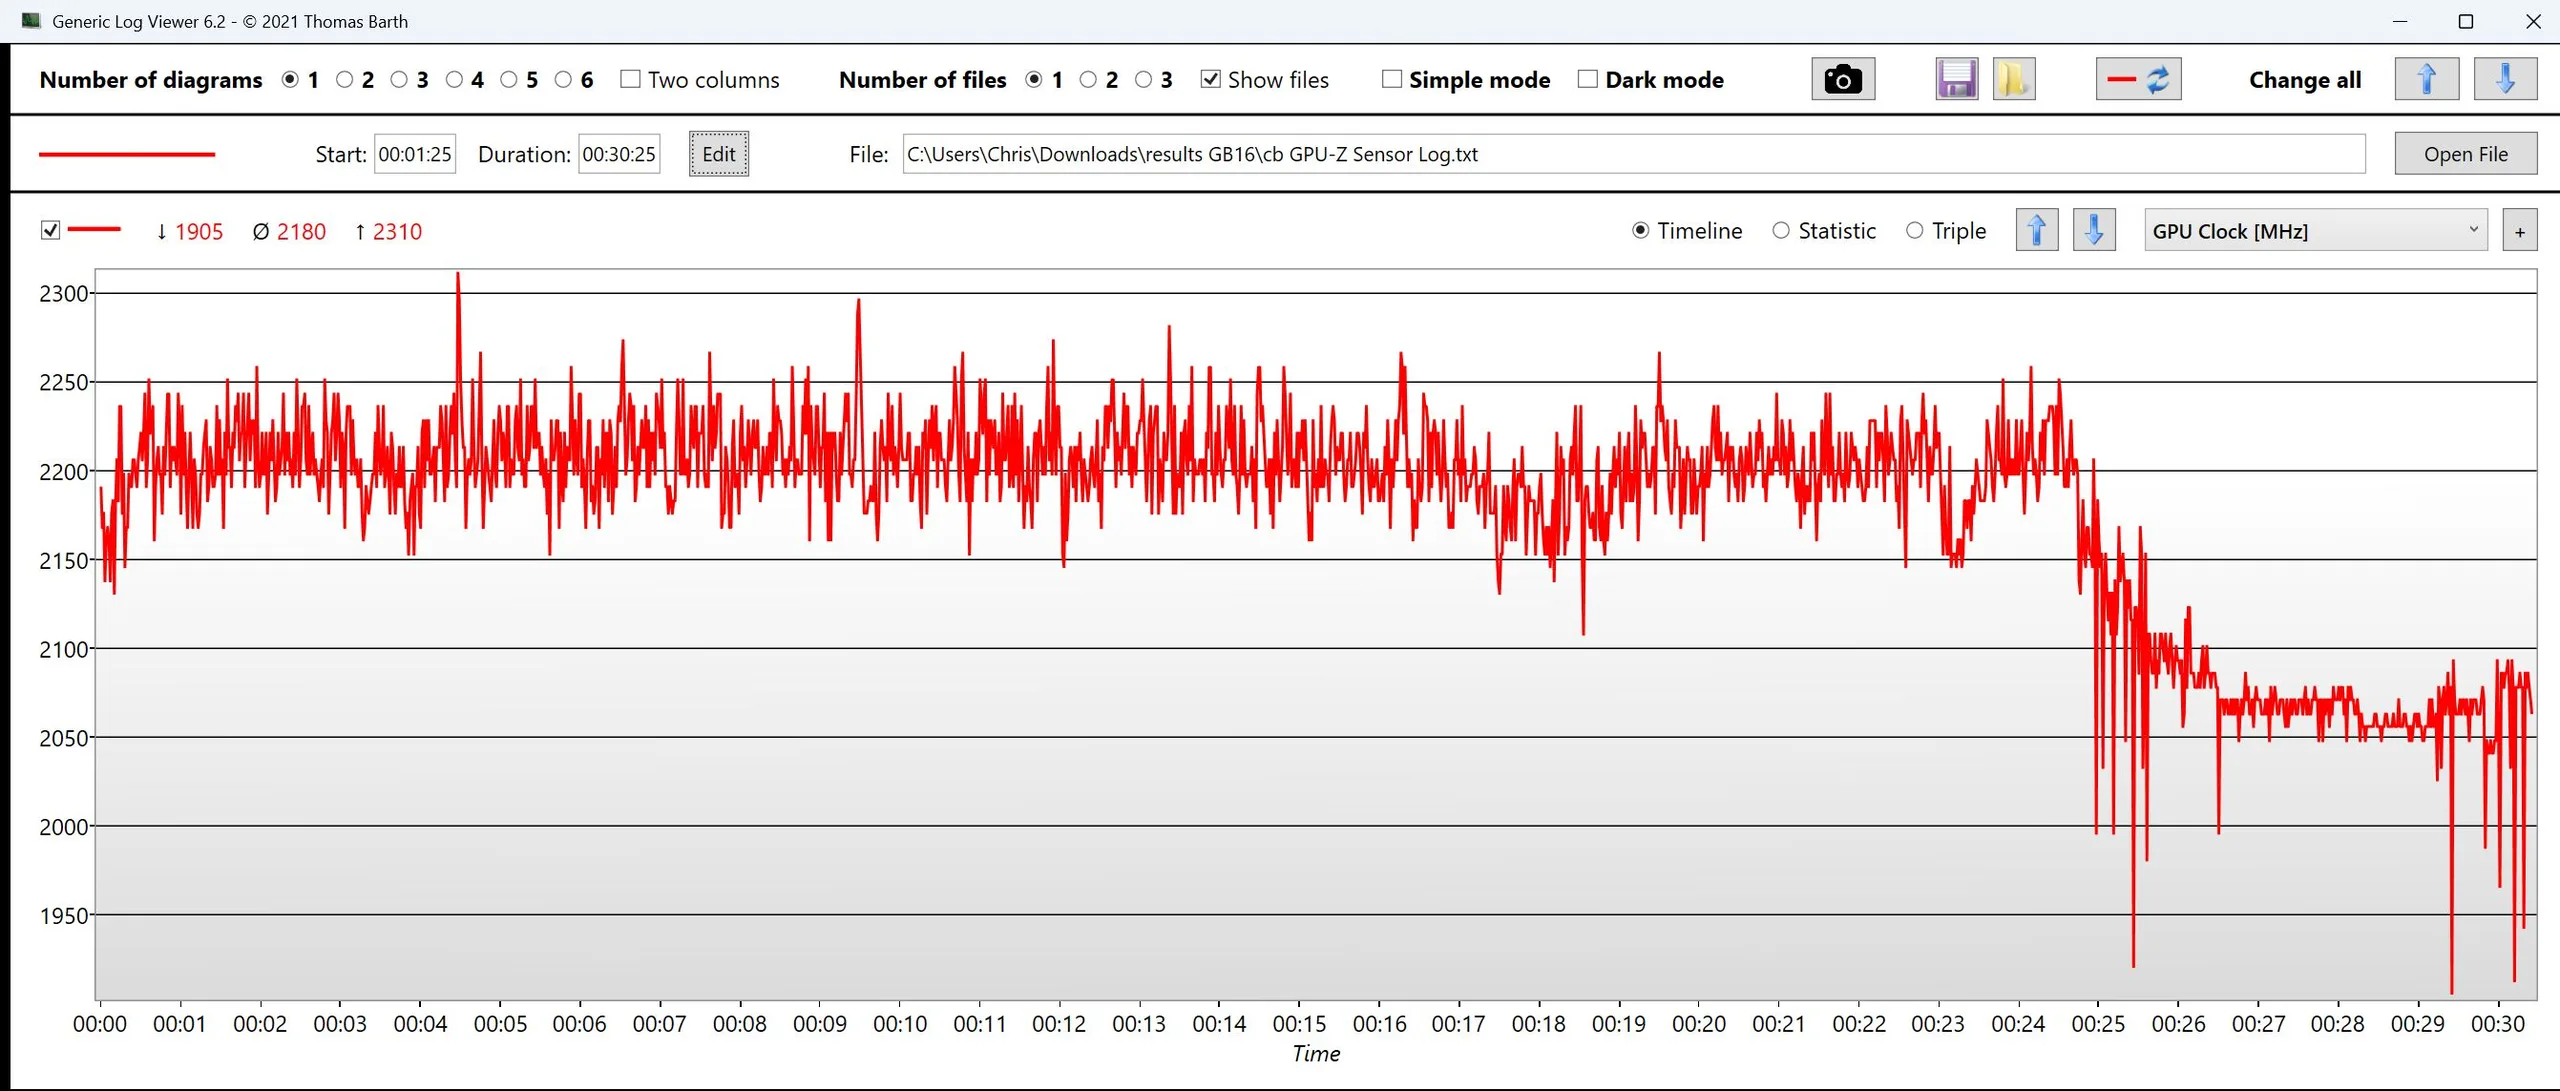
Cyberpunk 2077 ultra FPS-Diagramm
| low | med. | high | ultra | QHD DLSS | QHD | 4K DLSS | 4K | |
|---|---|---|---|---|---|---|---|---|
| GTA V (2015) | 152 | 162.5 | 147.3 | 98 | 98.9 | |||
| Dota 2 Reborn (2015) | 160.8 | 137.5 | 133.1 | 123.6 | 120.1 | |||
| Final Fantasy XV Benchmark (2018) | 117.4 | 115.6 | 108.9 | 103.9 | ||||
| X-Plane 11.11 (2018) | 132.7 | 113.8 | 92.5 | 75.5 | ||||
| Strange Brigade (2018) | 422 | 335 | 305 | 274 | 201 | 113.5 | ||
| Baldur's Gate 3 (2023) | 156 | 144 | 130 | 127 | 128.4 | 91.4 | 86.4 | 52.5 |
| Cyberpunk 2077 (2023) | 130.4 | 126.8 | 114.7 | 105.1 | 84.8 | 72.7 | 127.2 | 128.8 |
| F1 25 (2025) | 127.9 | 123.2 | 117 | 37.6 | 41.1 | 22.6 | 20.4 | 8.92 |
Emisje i energia - Wysokie zużycie energii na biegu jałowym
Hałas wentylatora
Na biegu jałowym wentylatory są często ciche, ale po dłuższym czasie rozkręcają się do około 24 dB.
W grach lub przy dużym obciążeniu poziom hałasu może osiągnąć około 56 dB - stosunkowo głośno, biorąc pod uwagę umiarkowaną wydajność.
Hałas
| luz |
| 23 / 24.35 / 24.35 dB |
| obciążenie |
| 34.77 / 56.43 dB |
 | ||
30 dB cichy 40 dB(A) słyszalny 50 dB(A) irytujący |
||
min: | ||
| Gigabyte Gaming A16 Pro GA6DH (Core 7 240H, RTX 5070 Ti) Core 7 240H, GeForce RTX 5070 Ti Laptop | Gigabyte Gaming A16 GA6H i7-13620H, GeForce RTX 5070 Laptop | Schenker XMG APEX 16 MAX R9 9955HX, GeForce RTX 5070 Ti Laptop | Acer Predator Helios Neo 16S AI PHN16S-71-94L9 Ultra 9 275HX, GeForce RTX 5070 Ti Laptop | Medion Erazer Major 16 X1 MD62736 Ultra 7 255HX, GeForce RTX 5070 Ti Laptop | Lenovo Legion 5 Pro 16IAX10H Ultra 9 275HX, GeForce RTX 5070 Ti Laptop | |
|---|---|---|---|---|---|---|
| Noise | -11% | -7% | -17% | -14% | -14% | |
| wyłączone / środowisko * (dB) | 23 | 24 -4% | 25.9 -13% | 24 -4% | 25 -9% | 24 -4% |
| Idle Minimum * (dB) | 23 | 25 -9% | 25.9 -13% | 24 -4% | 26 -13% | 24 -4% |
| Idle Average * (dB) | 24.35 | 26 -7% | 26.5 -9% | 30 -23% | 27 -11% | 24 1% |
| Idle Maximum * (dB) | 24.35 | 27 -11% | 26.5 -9% | 35 -44% | 30 -23% | 30.9 -27% |
| Load Average * (dB) | 34.77 | 54 -55% | 42.1 -21% | 53 -52% | 53 -52% | 55.9 -61% |
| Cyberpunk 2077 ultra * (dB) | 56.18 | 54 4% | 51 9% | 52 7% | 54 4% | 56.72 -1% |
| Load Maximum * (dB) | 56.43 | 55 3% | 51 10% | 54 4% | 54 4% | 56.72 -1% |
* ... im mniej tym lepiej
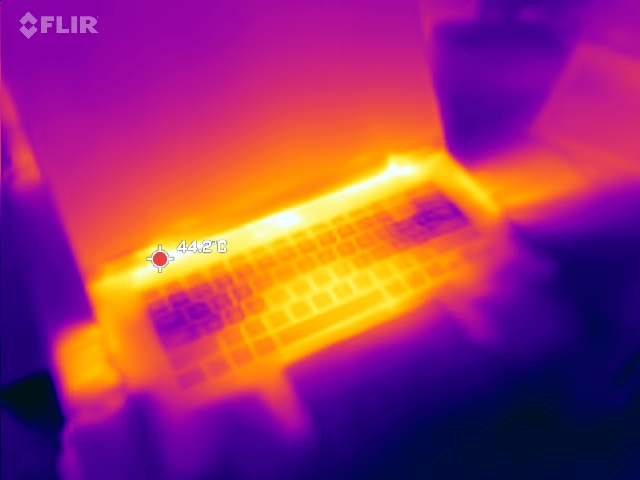
Temperatura
Temperatury na górze pozostają umiarkowane, podczas gdy pod spodem robi się coraz cieplej, z gorącymi punktami osiągającymi około 50°C.
(±) Maksymalna temperatura w górnej części wynosi 42 °C / 108 F, w porównaniu do średniej 40.4 °C / 105 F , począwszy od 21.2 do 68.8 °C dla klasy Gaming.
(-) Dno nagrzewa się maksymalnie do 49 °C / 120 F, w porównaniu do średniej 43.2 °C / 110 F
(+) W stanie bezczynności średnia temperatura górnej części wynosi 30.1 °C / 86 F, w porównaniu ze średnią temperaturą urządzenia wynoszącą 33.9 °C / ### class_avg_f### F.
(±) 3: The average temperature for the upper side is 34.9 °C / 95 F, compared to the average of 33.9 °C / 93 F for the class Gaming.
(+) Podpórki pod nadgarstki i touchpad są chłodniejsze niż temperatura skóry i maksymalnie 26 °C / 78.8 F i dlatego są chłodne w dotyku.
(+) Średnia temperatura obszaru podparcia dłoni w podobnych urządzeniach wynosiła 28.8 °C / 83.8 F (+2.8 °C / 5 F).
| Gigabyte Gaming A16 Pro GA6DH (Core 7 240H, RTX 5070 Ti) Core 7 240H, GeForce RTX 5070 Ti Laptop | Gigabyte Gaming A16 GA6H i7-13620H, GeForce RTX 5070 Laptop | Schenker XMG APEX 16 MAX R9 9955HX, GeForce RTX 5070 Ti Laptop | Acer Predator Helios Neo 16S AI PHN16S-71-94L9 Ultra 9 275HX, GeForce RTX 5070 Ti Laptop | Medion Erazer Major 16 X1 MD62736 Ultra 7 255HX, GeForce RTX 5070 Ti Laptop | Lenovo Legion 5 Pro 16IAX10H Ultra 9 275HX, GeForce RTX 5070 Ti Laptop | |
|---|---|---|---|---|---|---|
| Heat | -4% | 2% | 3% | -7% | -11% | |
| Maximum Upper Side * (°C) | 42 | 50 -19% | 46.5 -11% | 47 -12% | 49 -17% | 48 -14% |
| Maximum Bottom * (°C) | 49 | 49 -0% | 46.4 5% | 55 -12% | 50 -2% | 50 -2% |
| Idle Upper Side * (°C) | 34 | 35 -3% | 32.1 6% | 28 18% | 36 -6% | 38 -12% |
| Idle Bottom * (°C) | 36 | 34 6% | 33.5 7% | 29 19% | 37 -3% | 42 -17% |
* ... im mniej tym lepiej
| Taktowanie CPU (GHz) | Taktowanie GPU (MHz) | Średnia temperatura CPU (°C) | Średnia temperatura GPU (°C) | ||
| Prime95 + FurMark Stress | 1.9 | 1724 | 71 | 86 | |
| Cyberpunk 2077 Stress | 2 | 2180 | 74 | 84 |
Głośniki
Podwójnym głośnikom o mocy 2 W brakuje basów i ogólnej mocy, choć tony wysokie są zrównoważone. Gniazdo słuchawkowe jest dostępne dla słuchawek lub zewnętrznego sprzętu audio.
Gigabyte Gaming A16 Pro GA6DH (Core 7 240H, RTX 5070 Ti) analiza dźwięku
(±) | głośność głośnika jest średnia, ale dobra (78.63 dB)
Bas 100 - 315 Hz
(-) | prawie brak basu - średnio 26.9% niższa od mediany
(±) | liniowość basu jest średnia (8.4% delta do poprzedniej częstotliwości)
Średnie 400 - 2000 Hz
(+) | zbalansowane środki średnie - tylko 4.2% od mediany
(±) | liniowość środka jest średnia (7.8% delta do poprzedniej częstotliwości)
Wysokie 2–16 kHz
(+) | zrównoważone maksima - tylko 3.1% od mediany
(+) | wzloty są liniowe (6.1% delta do poprzedniej częstotliwości)
Ogólnie 100 - 16.000 Hz
(±) | liniowość ogólnego dźwięku jest średnia (19.8% różnicy w stosunku do mediany)
W porównaniu do tej samej klasy
» 69% wszystkich testowanych urządzeń w tej klasie było lepszych, 6% podobnych, 24% gorszych
» Najlepszy miał deltę 6%, średnia wynosiła ###średnia###%, najgorsza wynosiła 132%
W porównaniu do wszystkich testowanych urządzeń
» 50% wszystkich testowanych urządzeń było lepszych, 7% podobnych, 43% gorszych
» Najlepszy miał deltę 4%, średnia wynosiła ###średnia###%, najgorsza wynosiła 134%
Acer Predator Helios Neo 16S AI PHN16S-71-94L9 analiza dźwięku
(+) | głośniki mogą odtwarzać stosunkowo głośno (86 dB)
Bas 100 - 315 Hz
(-) | prawie brak basu - średnio 24.8% niższa od mediany
(±) | liniowość basu jest średnia (12.6% delta do poprzedniej częstotliwości)
Średnie 400 - 2000 Hz
(±) | wyższe średnie - średnio 5.9% wyższe niż mediana
(+) | średnie są liniowe (6.4% delta do poprzedniej częstotliwości)
Wysokie 2–16 kHz
(+) | zrównoważone maksima - tylko 2.8% od mediany
(+) | wzloty są liniowe (5.9% delta do poprzedniej częstotliwości)
Ogólnie 100 - 16.000 Hz
(±) | liniowość ogólnego dźwięku jest średnia (17.3% różnicy w stosunku do mediany)
W porównaniu do tej samej klasy
» 47% wszystkich testowanych urządzeń w tej klasie było lepszych, 12% podobnych, 41% gorszych
» Najlepszy miał deltę 6%, średnia wynosiła ###średnia###%, najgorsza wynosiła 132%
W porównaniu do wszystkich testowanych urządzeń
» 32% wszystkich testowanych urządzeń było lepszych, 8% podobnych, 59% gorszych
» Najlepszy miał deltę 4%, średnia wynosiła ###średnia###%, najgorsza wynosiła 134%
Zużycie energii
Pod obciążeniem, A16 Pro jest jednym z bardziej wydajnych laptopów z RTX 5070 Ti. Zużycie energii w stanie spoczynku pozostaje jednak zdecydowanie zbyt wysokie, nawet podczas dłuższych okresów pomiarowych (dGPU nieaktywne, brak procesów w tle).
W niektórych przypadkach tryby "Silence" i "Balanced" zużywają więcej energii niż "Performance". Jest to obszar, w którym producent pilnie potrzebuje poprawy.
Po podłączeniu do zewnętrznego monitora przez HDMI, dGPU staje się aktywne, co dodatkowo nieznacznie zwiększa zużycie energii w stanie spoczynku.
| wyłączony / stan wstrzymania | |
| luz | |
| obciążenie |
|
Legenda:
min: | |
| Gigabyte Gaming A16 Pro GA6DH (Core 7 240H, RTX 5070 Ti) Core 7 240H, GeForce RTX 5070 Ti Laptop, Samsung PM9C1b MZVL81T0HFLB-00BTW, IPS, 2560x1600, 16" | Gigabyte Gaming A16 GA6H i7-13620H, GeForce RTX 5070 Laptop, Kingston OM8PGP41024Q-A0, IPS, 2560x1600, 16" | Schenker XMG APEX 16 MAX R9 9955HX, GeForce RTX 5070 Ti Laptop, Samsung 9100 Pro 2 TB, Mini-LED, 2560x1600, 16" | Acer Predator Helios Neo 16S AI PHN16S-71-94L9 Ultra 9 275HX, GeForce RTX 5070 Ti Laptop, Micron 3500 1TB MTFDKBA1T0TGD, OLED, 2560x1600, 16" | Medion Erazer Major 16 X1 MD62736 Ultra 7 255HX, GeForce RTX 5070 Ti Laptop, Phison E31 2 TB, IPS, 2560x1600, 16" | Lenovo Legion 5 Pro 16IAX10H Ultra 9 275HX, GeForce RTX 5070 Ti Laptop, Western Digital PC SN8000S SDEPNRK-1T00, OLED, 2560x1600, 16" | Przeciętny NVIDIA GeForce RTX 5070 Ti Laptop | Średnia w klasie Gaming | |
|---|---|---|---|---|---|---|---|---|
| Power Consumption | 28% | -26% | 21% | -15% | -21% | 1% | 7% | |
| Idle Minimum * (Watt) | 21.5 | 9 58% | 15.4 28% | 3.9 82% | 17.8 17% | 14 35% | 12.4 ? 42% | 13.2 ? 39% |
| Idle Average * (Watt) | 28.3 | 11 61% | 29.9 -6% | 11 61% | 20.7 27% | 14.3 49% | 19.7 ? 30% | 18.9 ? 33% |
| Idle Maximum * (Watt) | 26.3 | 23 13% | 30.1 -14% | 16.9 36% | 23.4 11% | 20.1 24% | 24.9 ? 5% | 24.3 ? 8% |
| Load Average * (Watt) | 92.5 | 91 2% | 136.4 -47% | 123 -33% | 110 -19% | 177 -91% | 123.6 ? -34% | 108 ? -17% |
| Cyberpunk 2077 ultra * (Watt) | 165 | 132.5 20% | 231 -40% | 152.7 7% | 233 -41% | 255 -55% | ||
| Cyberpunk 2077 ultra external monitor * (Watt) | 158 | 130 18% | 226 -43% | 144.9 8% | 232 -47% | 255 -61% | ||
| Load Maximum * (Watt) | 195 | 155 21% | 315 -62% | 229 -17% | 297 -52% | 294 -51% | 272 ? -39% | 254 ? -30% |
* ... im mniej tym lepiej
Pobór mocy Cyberpunk / Stresstest
Pobór mocy z zewnętrznym monitorem
Żywotność baterii
Przy 76 Wh, pojemność baterii jest na niższym końcu dla tej kategorii. Mimo to laptop osiąga bardzo dobry wynik 8,3 godziny w teście Wi-Fi.
| Gigabyte Gaming A16 Pro GA6DH (Core 7 240H, RTX 5070 Ti) Core 7 240H, GeForce RTX 5070 Ti Laptop, 76 Wh | Gigabyte Gaming A16 GA6H i7-13620H, GeForce RTX 5070 Laptop, 76 Wh | Schenker XMG APEX 16 MAX R9 9955HX, GeForce RTX 5070 Ti Laptop, 99.8 Wh | Acer Predator Helios Neo 16S AI PHN16S-71-94L9 Ultra 9 275HX, GeForce RTX 5070 Ti Laptop, 76 Wh | Medion Erazer Major 16 X1 MD62736 Ultra 7 255HX, GeForce RTX 5070 Ti Laptop, 80 Wh | Lenovo Legion 5 Pro 16IAX10H Ultra 9 275HX, GeForce RTX 5070 Ti Laptop, 80 Wh | Średnia w klasie Gaming | |
|---|---|---|---|---|---|---|---|
| Czasy pracy | -7% | -41% | -40% | -24% | -41% | -15% | |
| WiFi v1.3 (h) | 8.3 | 7.7 -7% | 4.9 -41% | 5 -40% | 6.3 -24% | 4.9 -41% | 7.02 ? -15% |
| H.264 (h) | 4.8 | 8.26 ? | |||||
| Load (h) | 1.7 | 1.47 ? |
Gigabyte Gaming A16 Pro GA6DH (Core 7 240H, RTX 5070 Ti)
- 19/03/2026 v8
Christian Hintze
 Total Sustainability Score:
 Możliwe alternatywy
Obraz | Model / recenzja | Cena | Waga | Wysokość | Ekran |
|---|---|---|---|---|---|
1. 81% 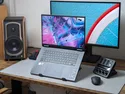 | Gigabyte Gaming A16 Pro GA6DH (Core 7 240H, RTX 5070 Ti) Intel Core 7 240H ⎘ NVIDIA GeForce RTX 5070 Ti Laptop ⎘ 32 GB Pamięć, 1000 GB SSD | Amazon: Cena katalogowa: 2300 Euro | 2.4 kg | 22.99 mm | 16.00" 2560x1600 189 PPI IPS |
2. 80.1%  | Gigabyte Gaming A16 GA6H Intel Core i7-13620H ⎘ NVIDIA GeForce RTX 5070 Laptop ⎘ 16 GB Pamięć, 1024 GB SSD | Amazon: 1. $1,282.83 GIGABYTE - Gaming A16 Gaming... 2. $1,069.00 GIGABYTE - Gaming A16 Gaming... 3. $1,242.23 GIGABYTE - Gaming A16 Gaming... Cena katalogowa: 1700 EUR | 2.3 kg | 23 mm | 16.00" 2560x1600 189 PPI IPS |
3. 76.2%  | Alienware 16 Aurora Intel Core 7 240H ⎘ NVIDIA GeForce RTX 5060 Laptop ⎘ 32 GB Pamięć | Amazon: Cena katalogowa: 1100 USD | 2.6 kg | 15.2 mm | 16.00" 2560x1600 189 PPI IPS |
4. 85.2%  | Medion Erazer Major 16 X1 MD62736 Intel Core Ultra 7 255HX ⎘ NVIDIA GeForce RTX 5070 Ti Laptop ⎘ 32 GB Pamięć, SSD | Amazon: Cena katalogowa: 2600 EUR | 2.5 kg | 22.7 mm | 16.00" 2560x1600 189 PPI IPS |
5. 75.2%  | MSI Cyborg 15 B2RWEKG Intel Core 7 240H ⎘ NVIDIA GeForce RTX 5050 Laptop ⎘ 16 GB Pamięć, 512 GB SSD | Amazon: Cena katalogowa: 1099 EUR | 2.2 kg | 23.2 mm | 15.60" 1920x1080 141 PPI IPS |
6. 78.6%  | Medion Erazer Deputy 15 P1 MD62761 Intel Core 7 250H ⎘ NVIDIA GeForce RTX 5060 Laptop ⎘ 16 GB Pamięć, 1024 GB | Amazon: Cena katalogowa: 1300 EUR | 2.2 kg | 29 mm | 15.60" 1920x1080 141 PPI IPS |
Przezroczystość
Wyboru urządzeń do recenzji dokonuje nasza redakcja. Próbka testowa została udostępniona autorowi jako pożyczka od producenta lub sprzedawcy detalicznego na potrzeby tej recenzji. Pożyczkodawca nie miał wpływu na tę recenzję, producent nie otrzymał też kopii tej recenzji przed publikacją. Nie było obowiązku publikowania tej recenzji. Jako niezależna firma medialna, Notebookcheck nie podlega władzy producentów, sprzedawców detalicznych ani wydawców.
Tak testuje Notebookcheck
Każdego roku Notebookcheck niezależnie sprawdza setki laptopów i smartfonów, stosując standardowe procedury, aby zapewnić porównywalność wszystkich wyników. Od około 20 lat stale rozwijamy nasze metody badawcze, ustanawiając przy tym standardy branżowe. W naszych laboratoriach testowych doświadczeni technicy i redaktorzy korzystają z wysokiej jakości sprzętu pomiarowego. Testy te obejmują wieloetapowy proces walidacji. Nasz kompleksowy system ocen opiera się na setkach uzasadnionych pomiarów i benchmarków, co pozwala zachować obiektywizm.
