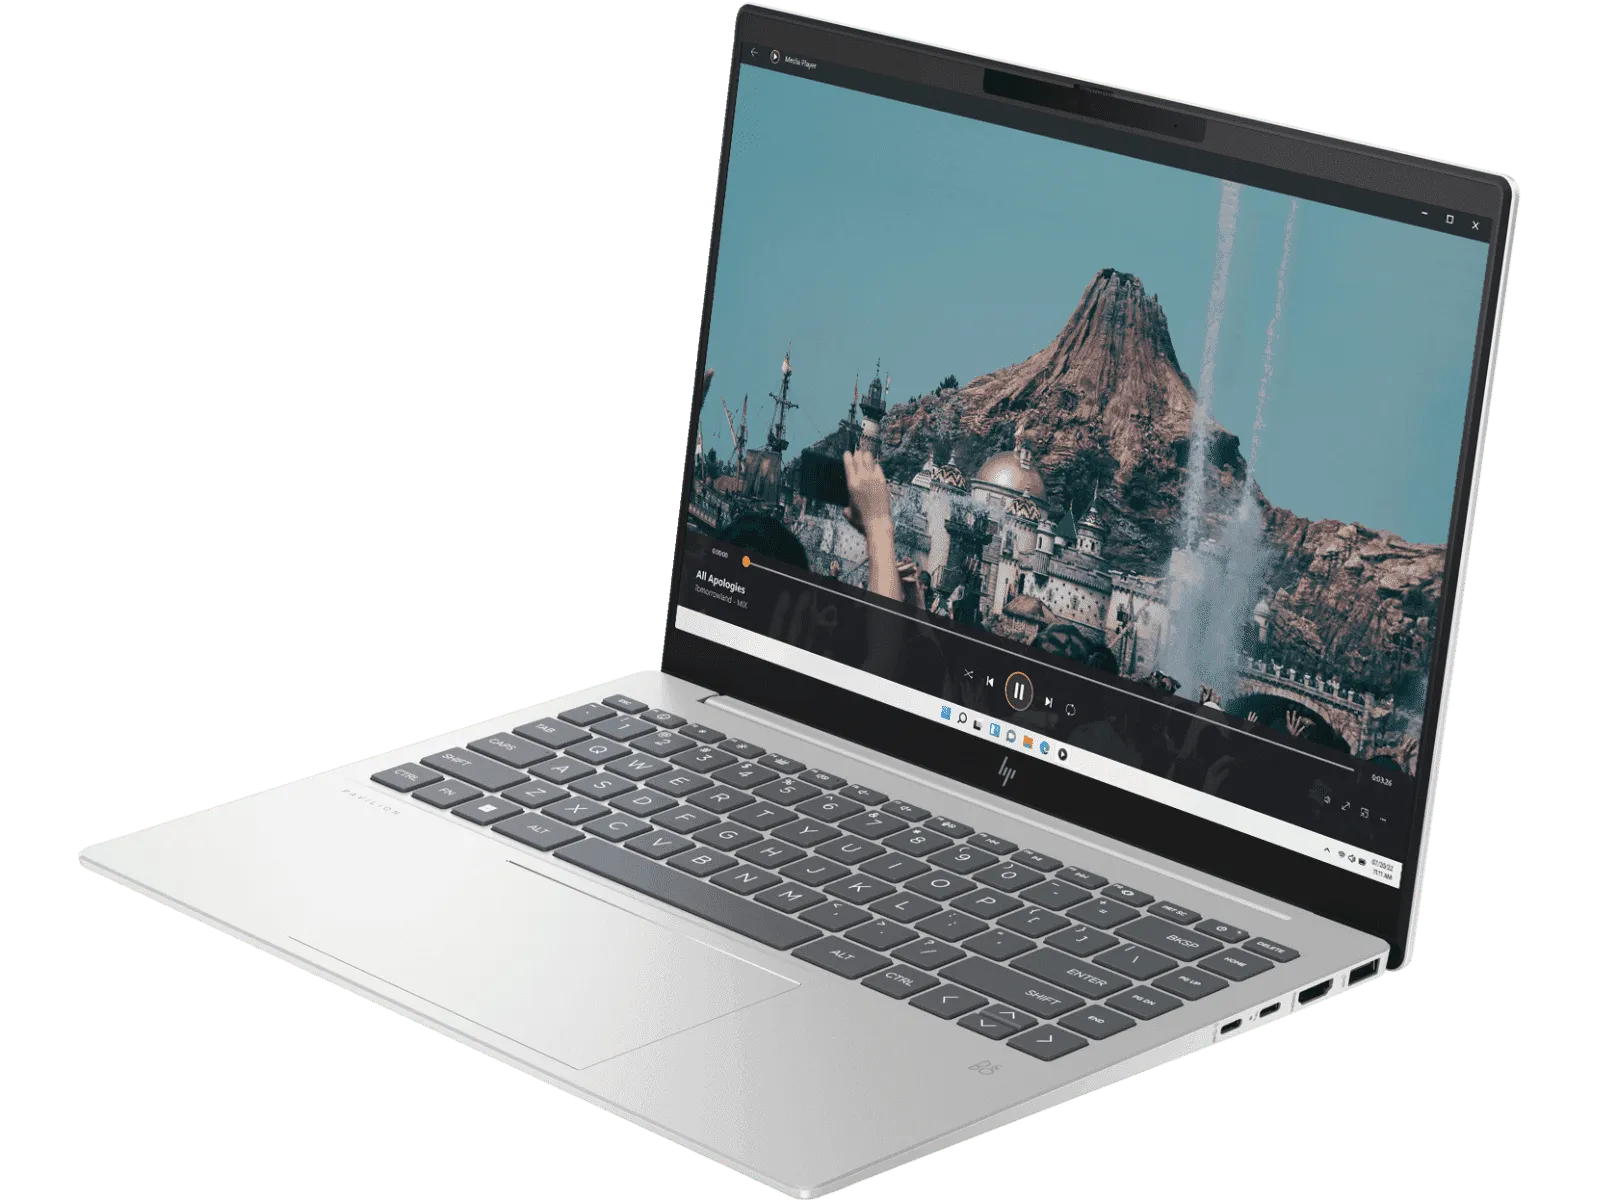
Recenzja HP Pavilion Plus 14 Core i7: Intel Raptor Lake czy AMD Zen 4? Wybór jest jasny

Wygląda na to, że firma HP trafiła w dziesiątkę ze swoją nową linią Pavilion Plus. Wcześniej recenzowaliśmy AMD Ryzen 7 7840U-zasilany Pavilion Plus 14 a teraz zwracamy uwagę na jego rodzeństwo oparte na procesorach Intela.
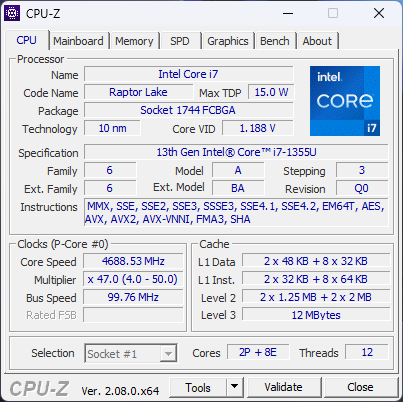
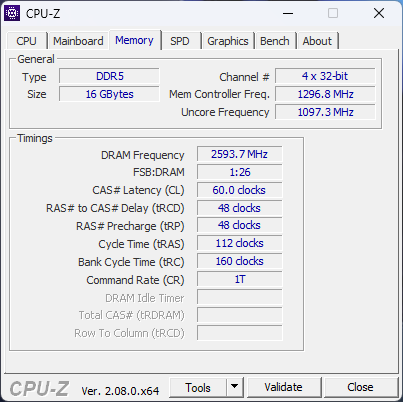
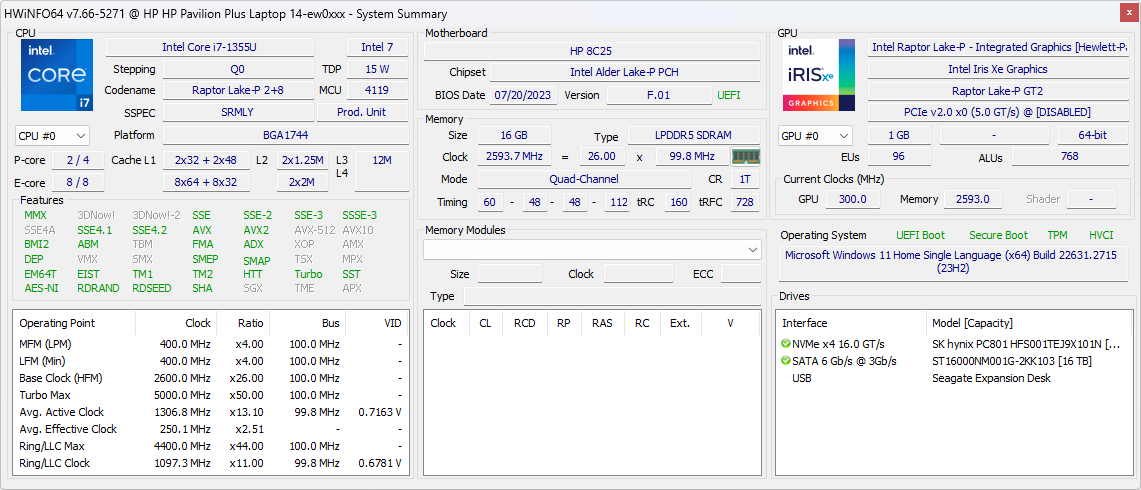
Obecna konfiguracja HP Pavilion Plus 14 bazuje na procesorze Intel Core i7-1355U i jest wyposażona w 16 GB pamięci LPDDR5x oraz 1 TB pamięci masowej PCIe NVMe.
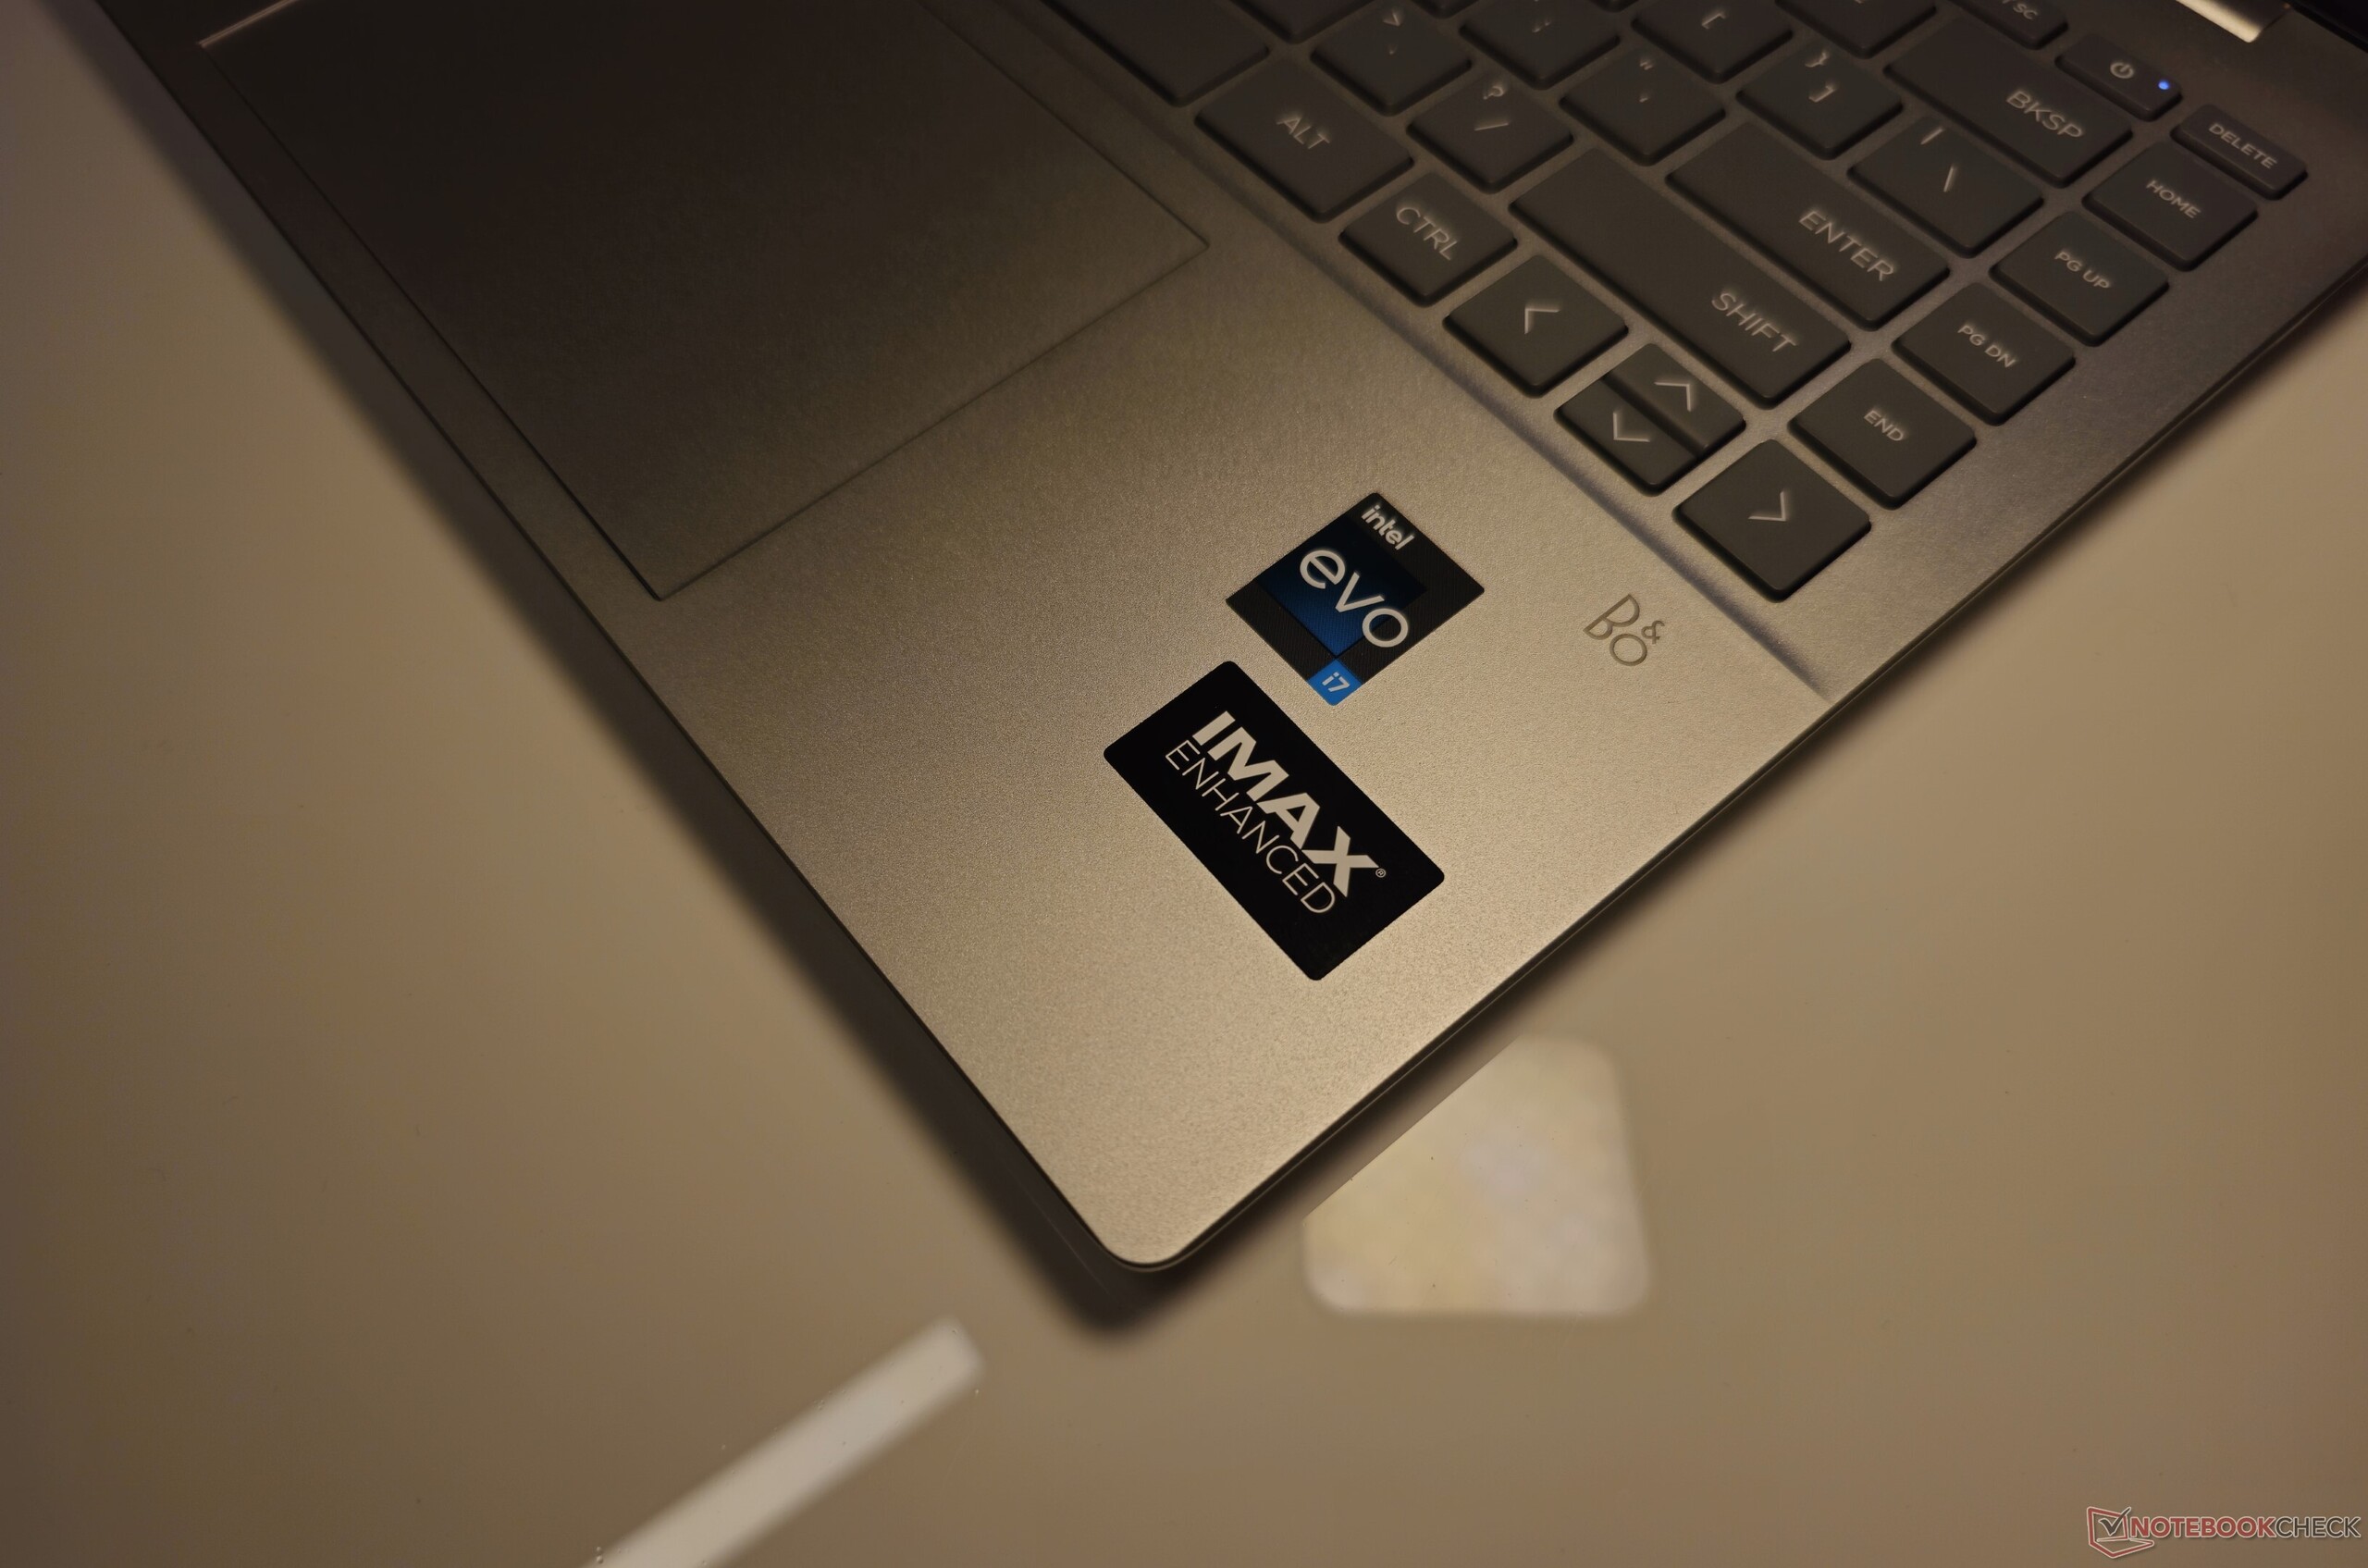
Oba modele Pavilion Plus 14 mają wiele wspólnych atrybutów, w tym wyświetlacz OLED "IMAX Enhanced" 2,8K 120 Hz HDR. Dlatego też w niniejszej recenzji skupimy się głównie na różnicach w wydajności pomiędzy obiema wersjami.
Nasza konfiguracja oficjalnie kosztuje 99 999 jenów w Indiach, ale można ją kupić za około 90 000 jenów z różnymi ofertami bankowymi i kartami. W Stanach Zjednoczonych ten SKU jest obecnie sprzedawany po obniżonej cenie 1 019,99 USD w oficjalnym sklepie HP.
Potencjalni konkurenci w porównaniu
Ocena | Data | Model | Waga | Wysokość | Rozmiar | Rezolucja | Cena |
|---|---|---|---|---|---|---|---|
| 87.5 % v7 (old) | 12/2023 | HP Pavilion Plus 14-ew0153TU i7-1355U, Iris Xe G7 96EUs | 1.4 kg | 17.5 mm | 14.00" | 2880x1800 | |
| 87.8 % v7 (old) | 11/2023 | HP Pavilion Plus 14-ey0095cl R7 7840U, Radeon 780M | 1.4 kg | 18.8 mm | 14.00" | 2880x1800 | |
| 88.9 % v7 (old) | 11/2023 | Lenovo ThinkPad T14s G4 i7-1365U i7-1365U, Iris Xe G7 96EUs | 1.4 kg | 16.9 mm | 14.00" | 1920x1200 | |
| 85.6 % v7 (old) | 11/2023 | Acer Swift Go 14 SFG14-71 i5-1335U, Iris Xe G7 80EUs | 1.3 kg | 14.9 mm | 14.00" | 2880x1800 | |
| 91.5 % v7 (old) | 11/2023 | Asus ExpertBook B9 B9403CVA-KM0153X i7-1355U, Iris Xe G7 96EUs | 1 kg | 17.6 mm | 14.00" | 2880x1800 | |
| 89.6 % v7 (old) | 06/2023 | Huawei MateBook X Pro 2023 i7-1360P, Iris Xe G7 96EUs | 1.3 kg | 15.6 mm | 14.20" | 3120x2080 |
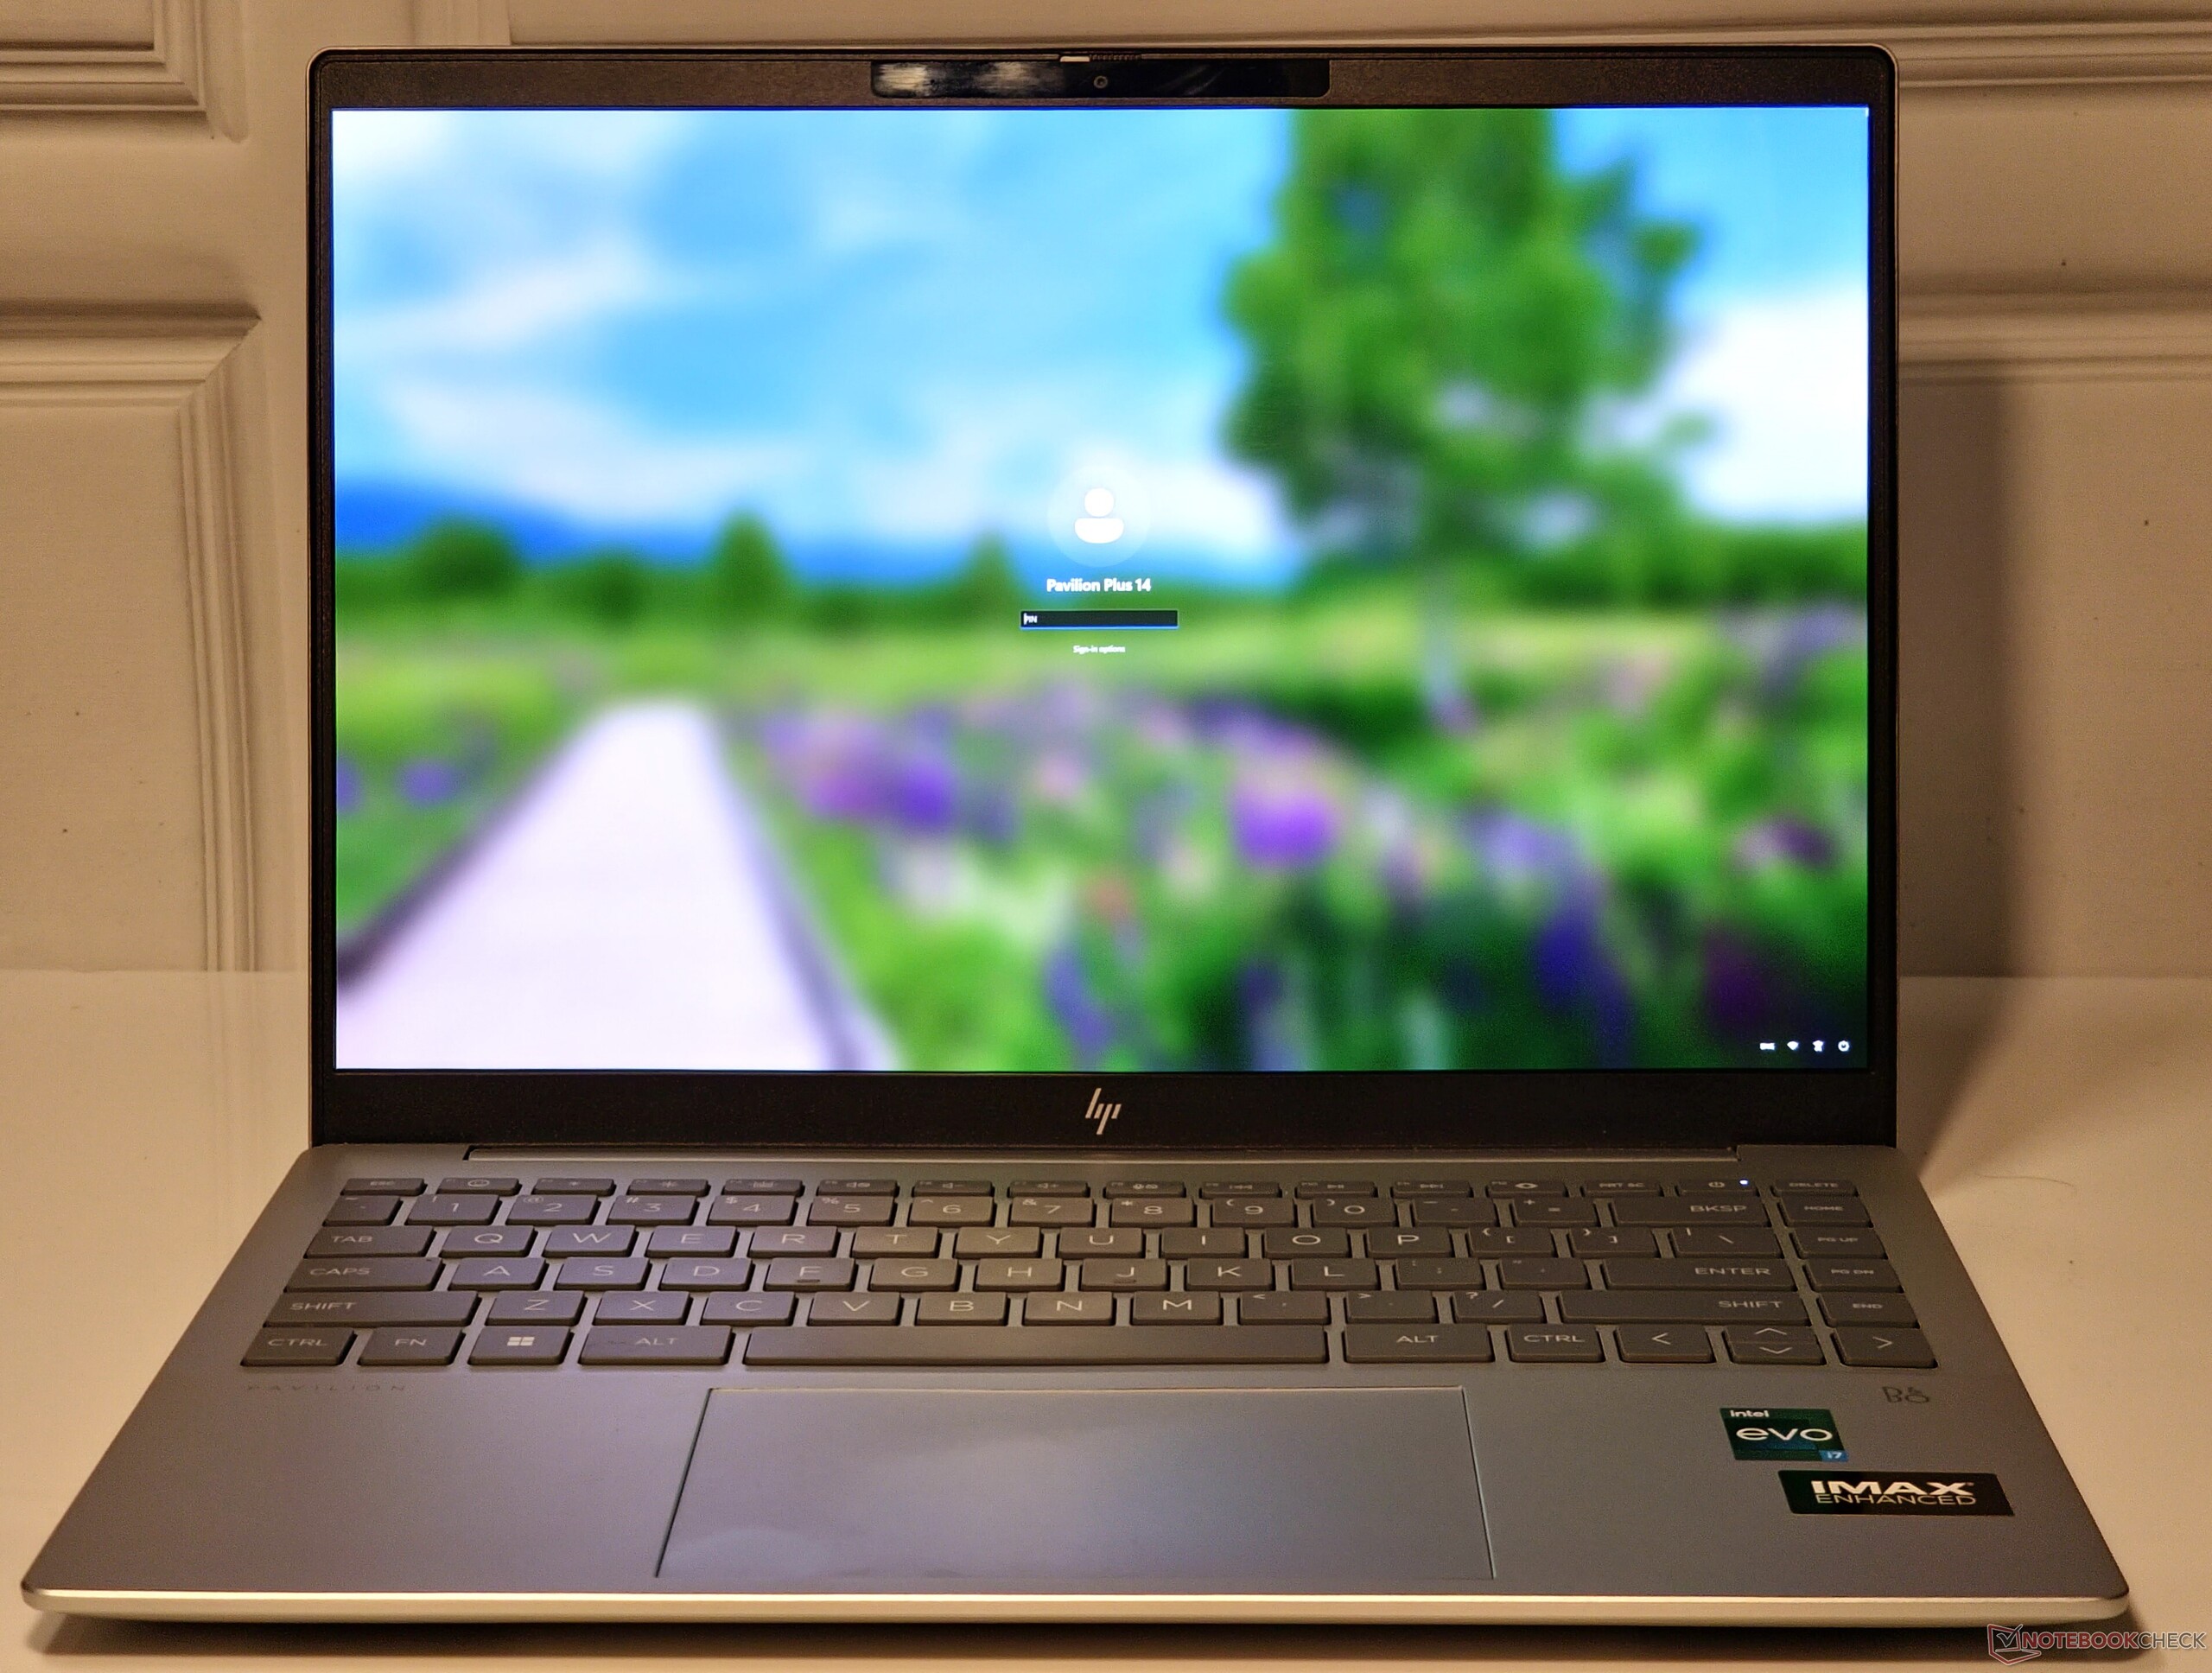
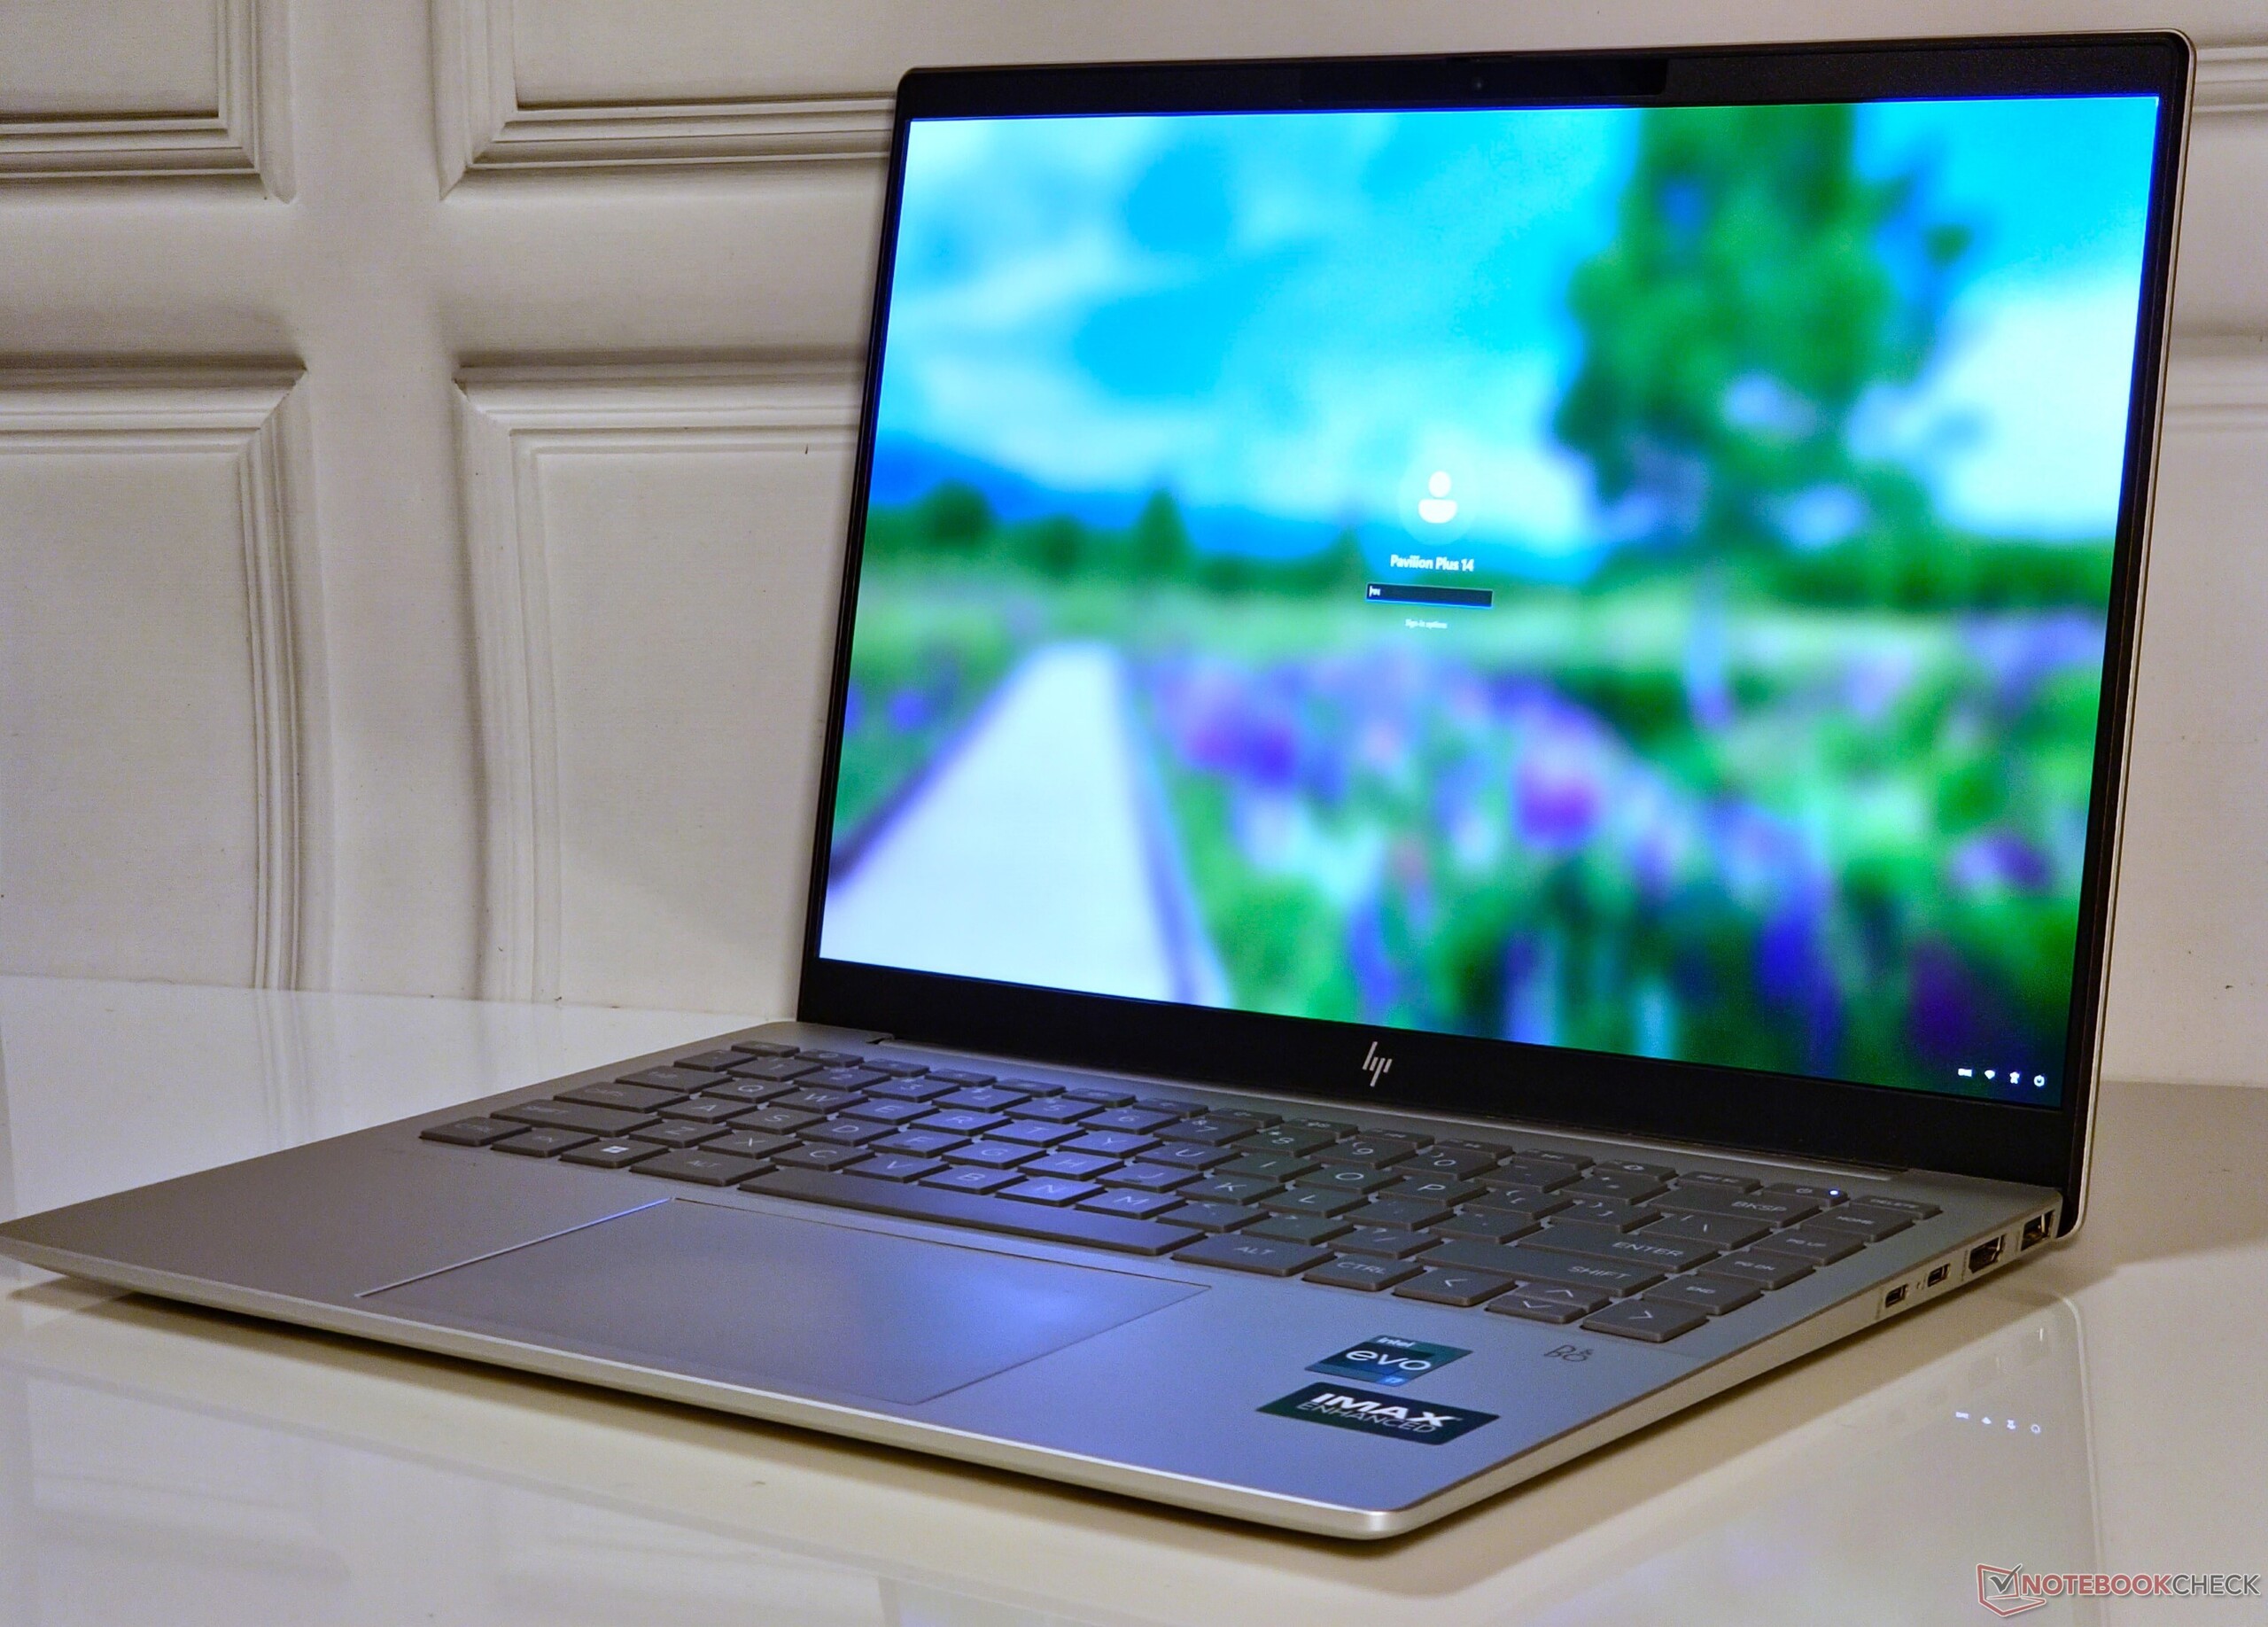
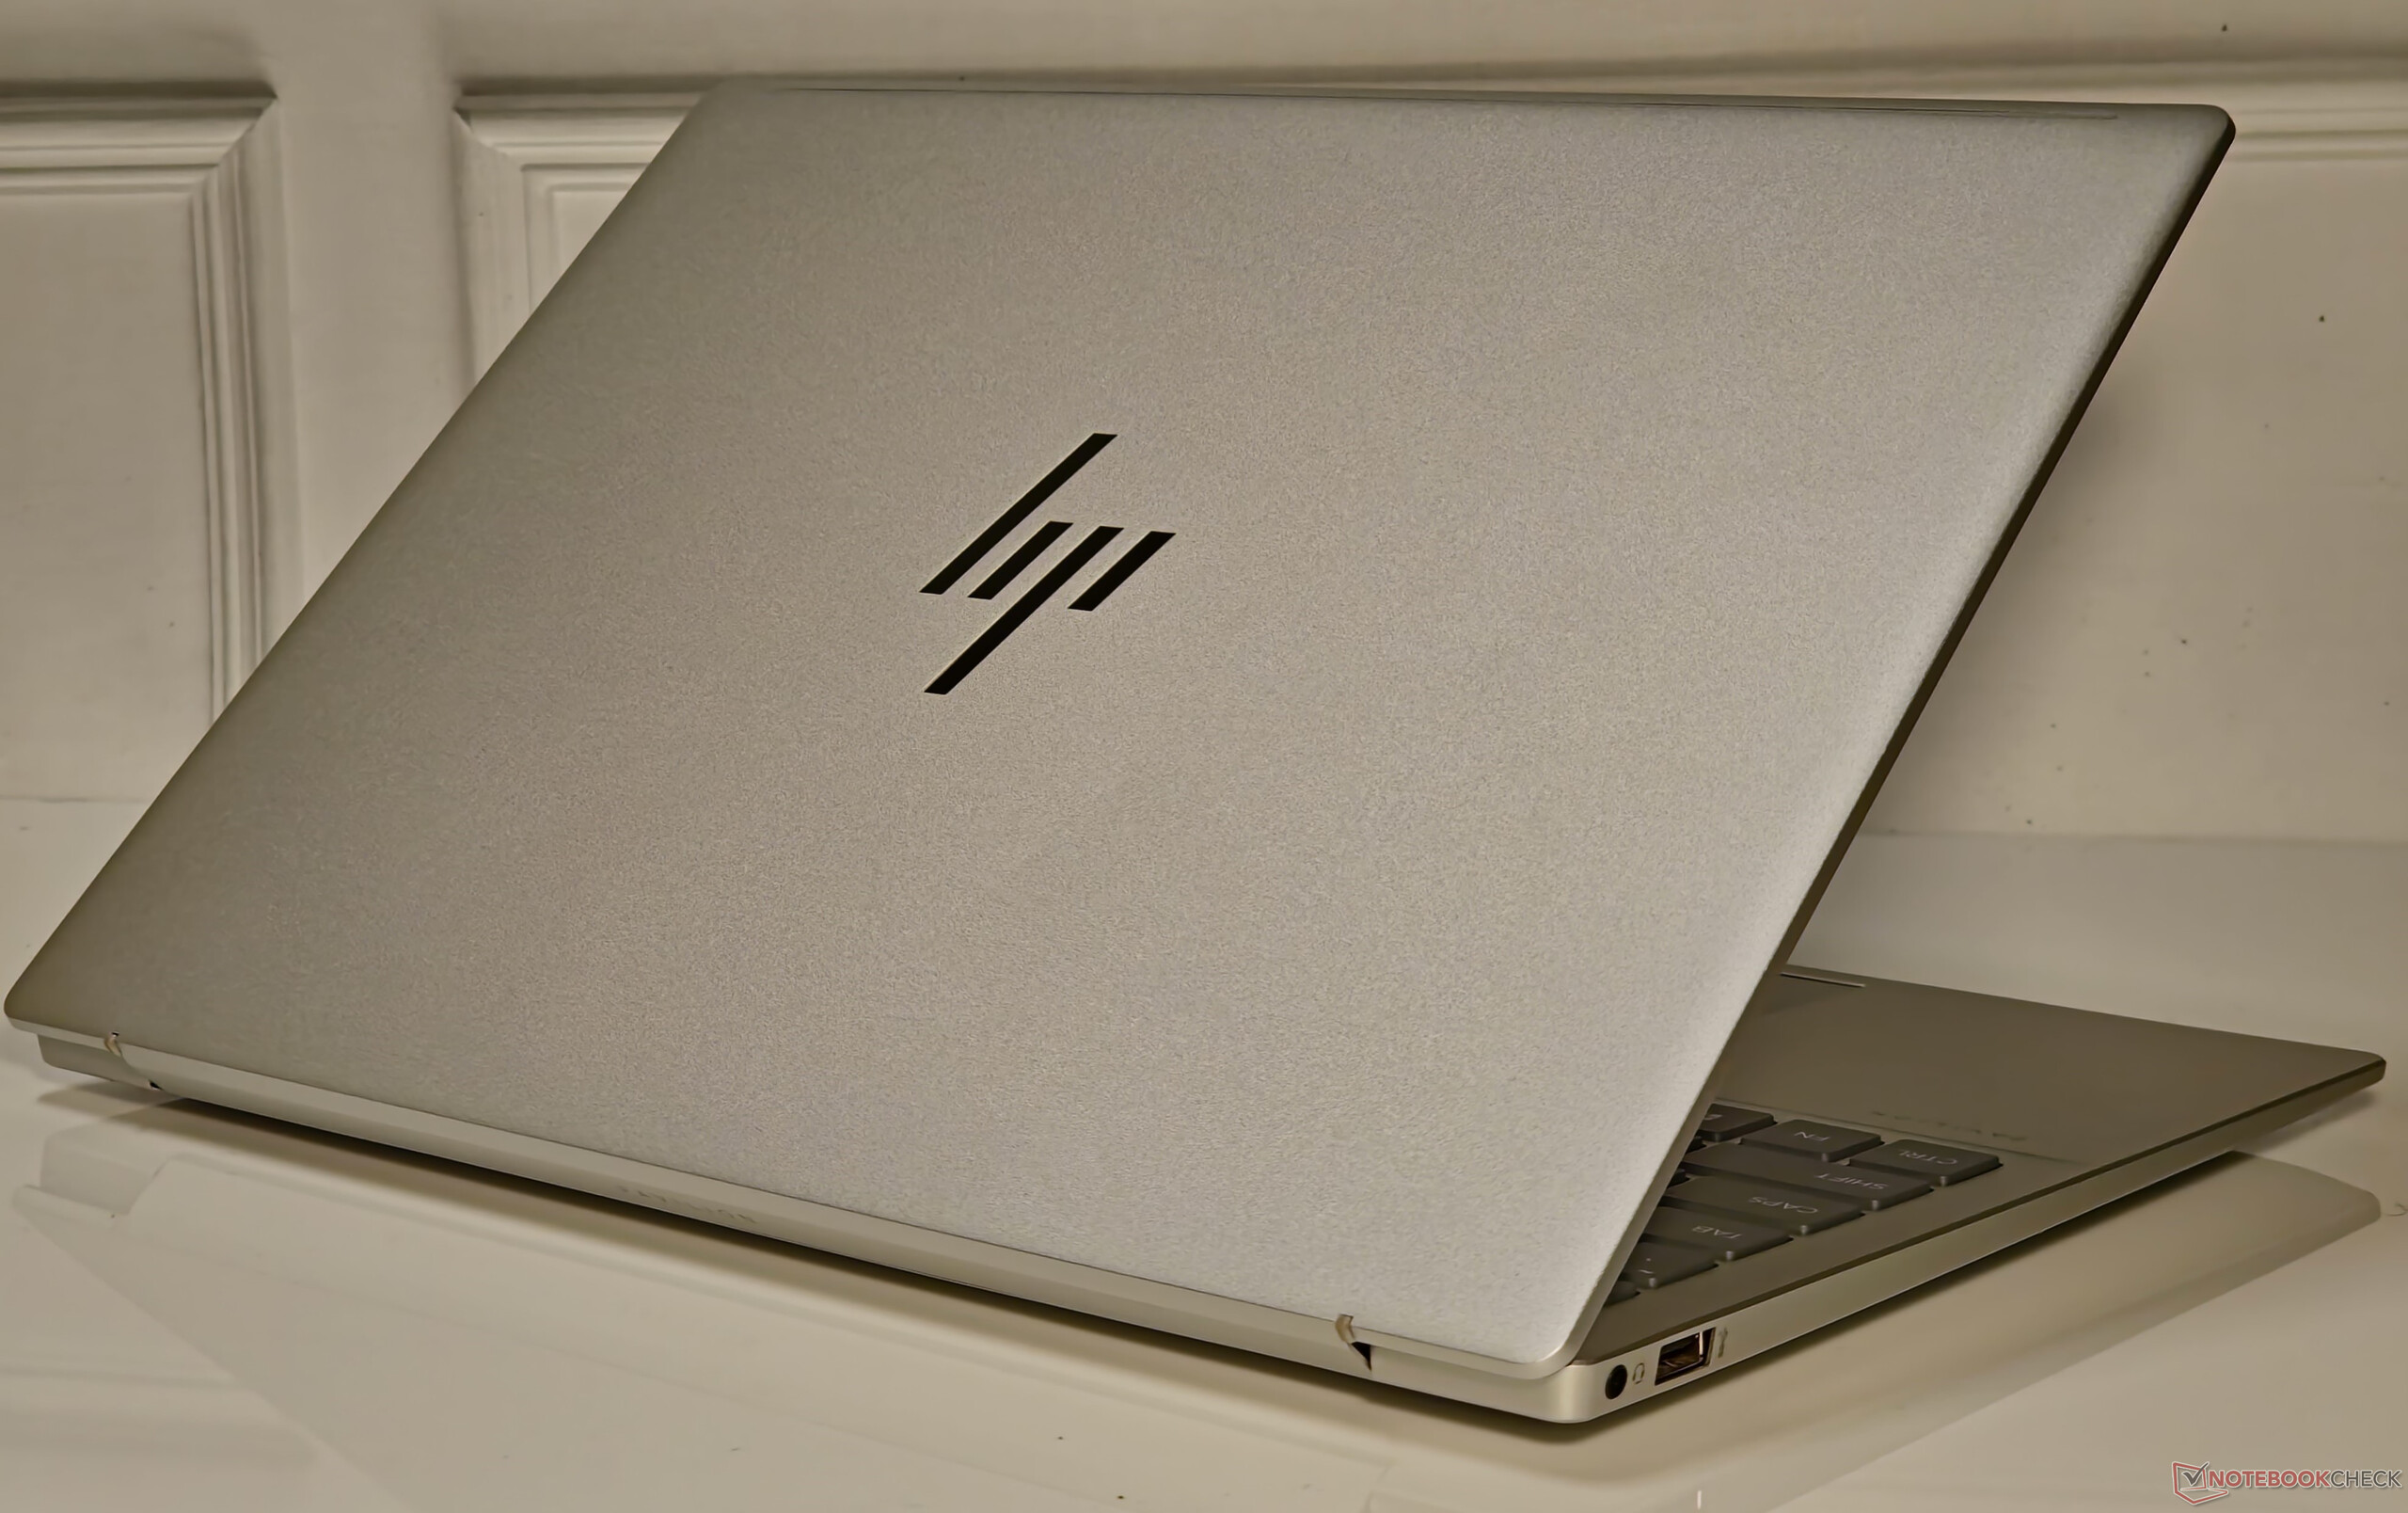
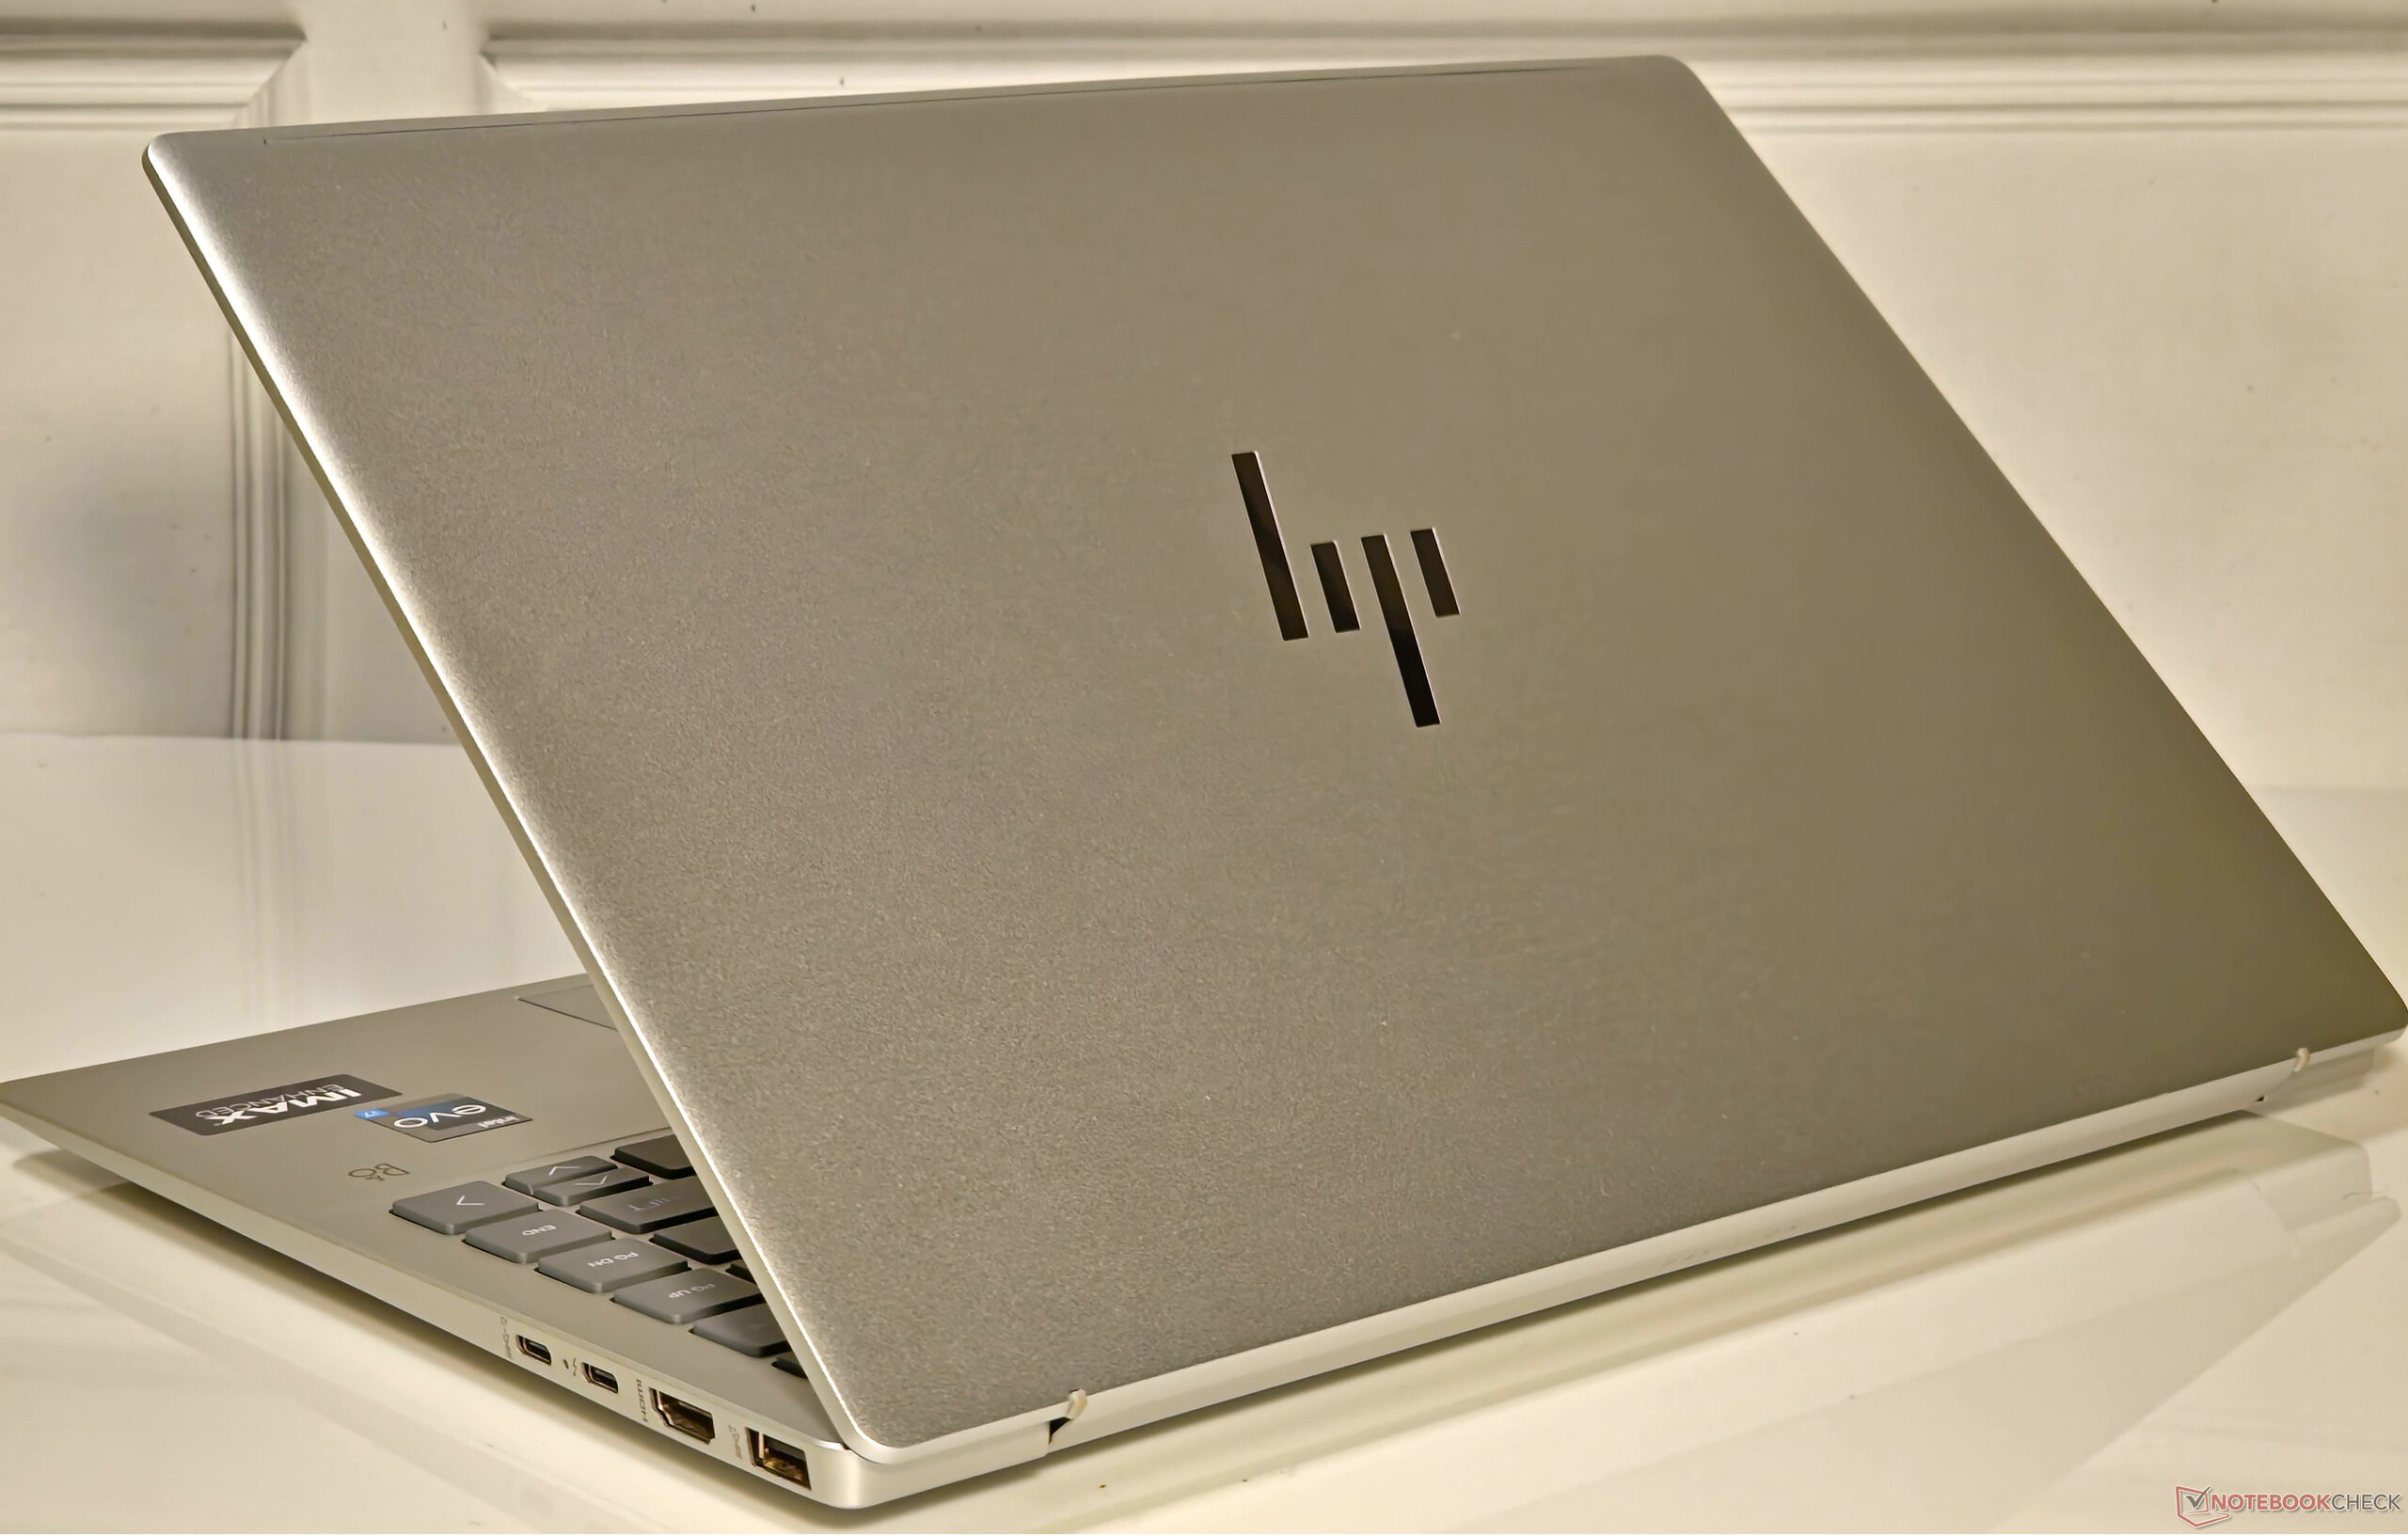
Podwozie, konserwacja i urządzenia wejściowe
Aspekty takie jak w pełni metalowa obudowa laptopa, konserwacja i urządzenia wejściowe pasują do poprzednio recenzowanego modelu AMD. Więcej szczegółów na ten temat znajdą Państwo w naszej wcześniejszej relacji.
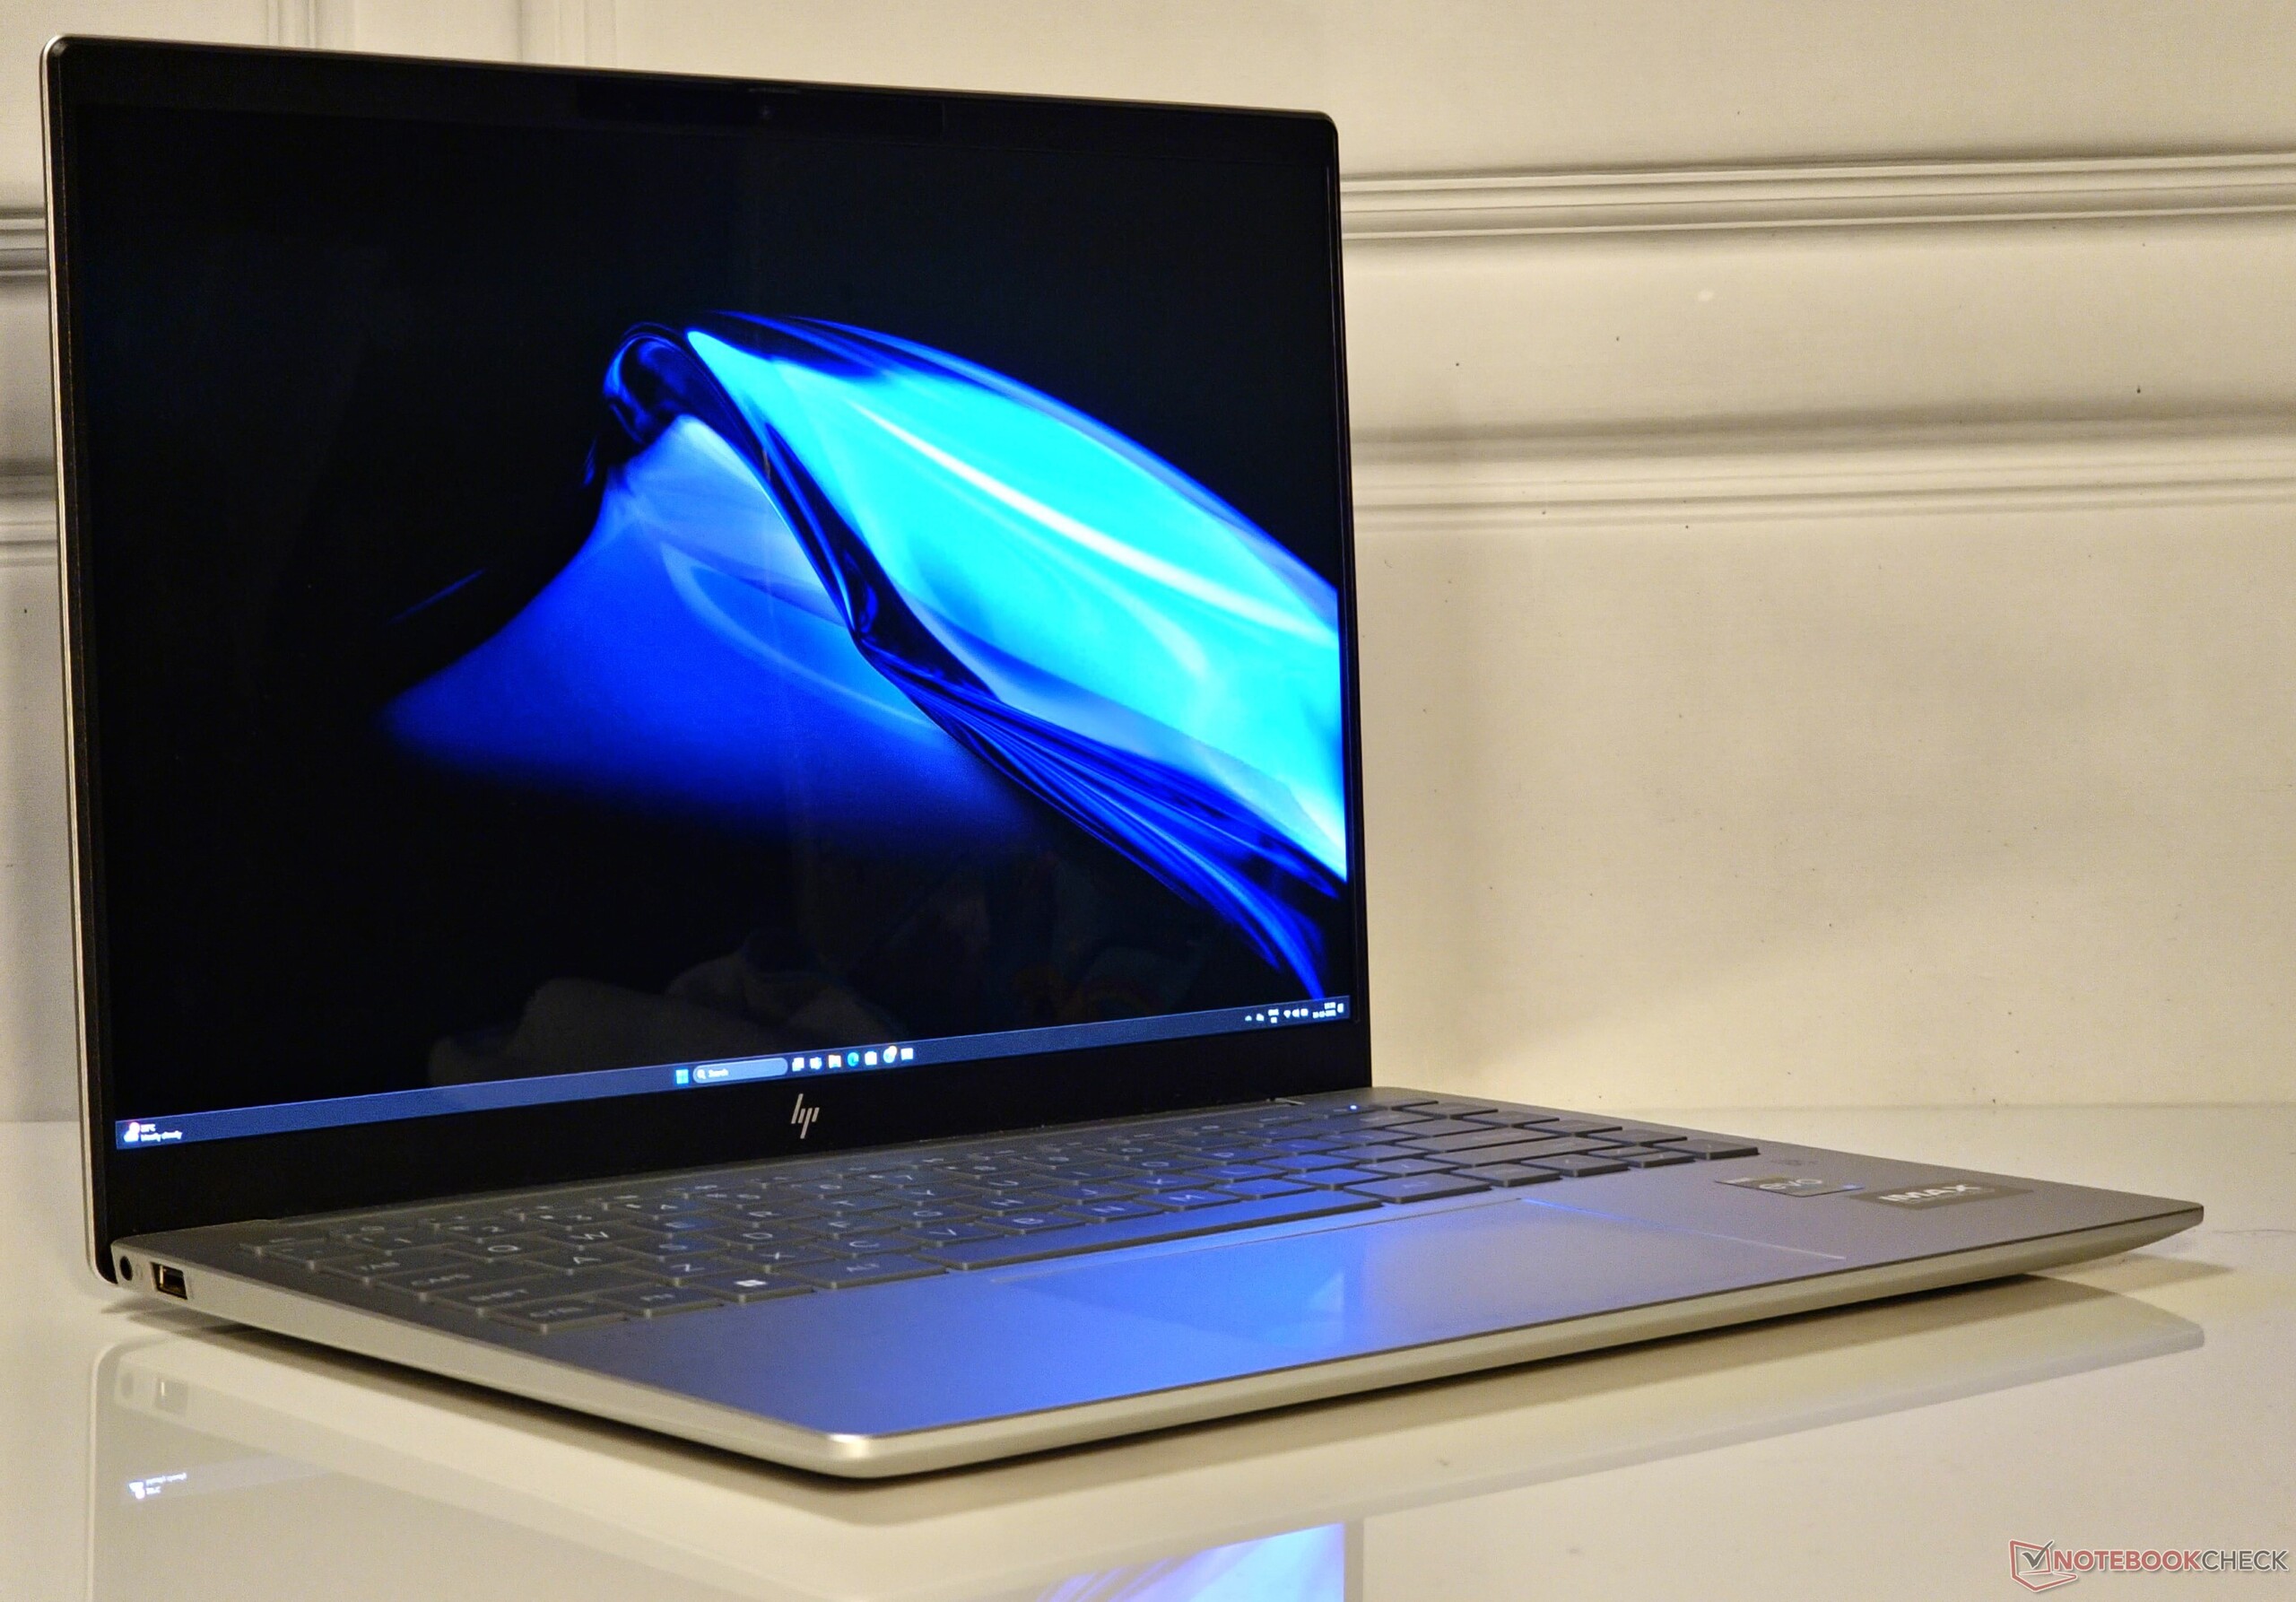
Łączność: Thunderbolt 4 i stabilne prędkości Wi-Fi 6E
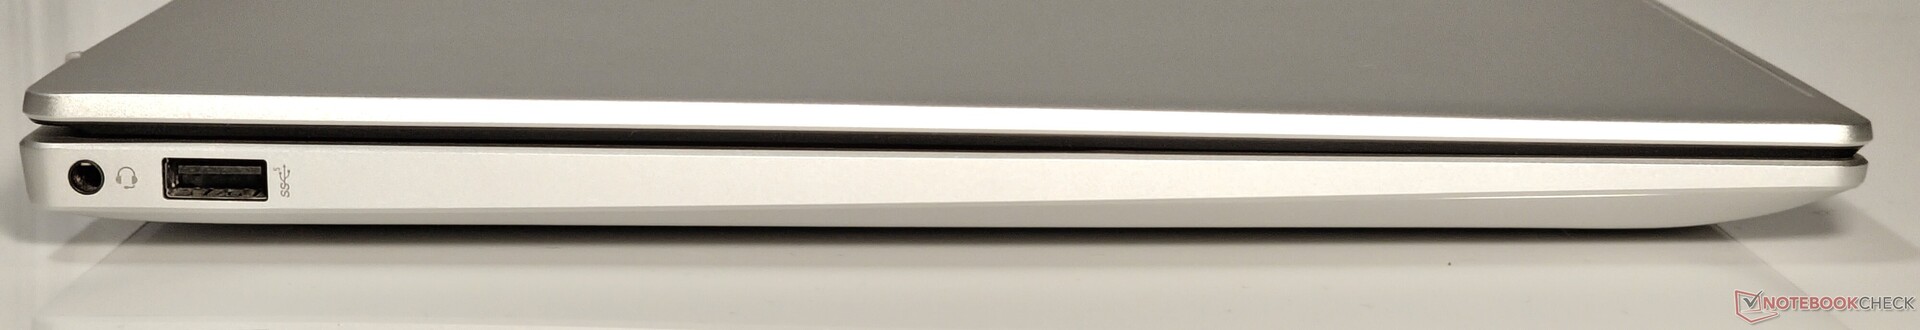
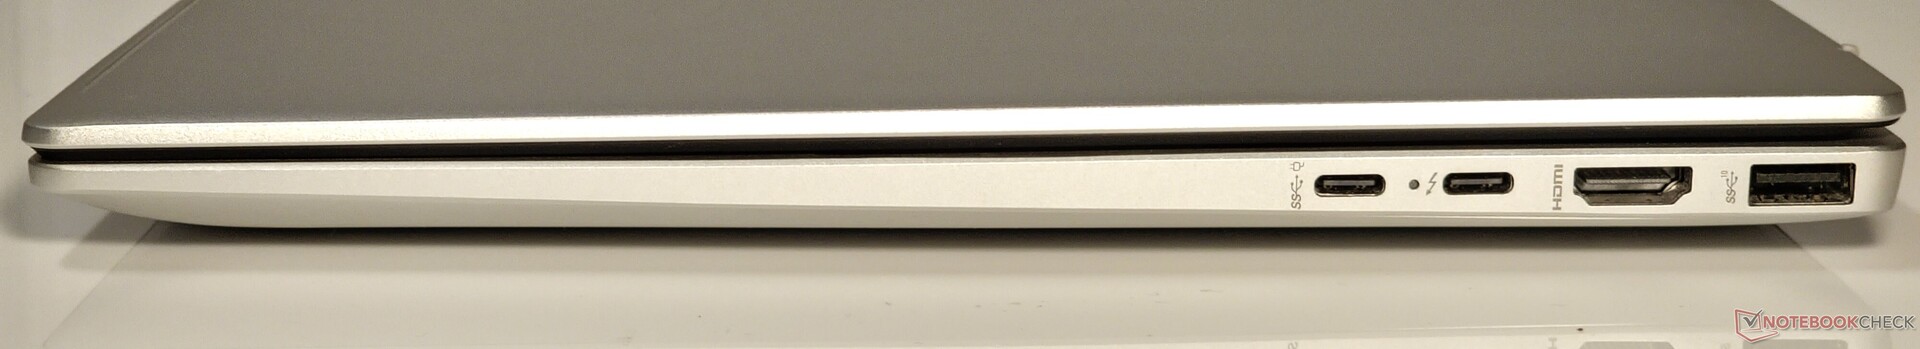
Wybór portów w Pavilion Plus 14 jest przyzwoity. Wariant Intela przewyższa swojego kuzyna AMD, oferując port Thunderbolt 4, podczas gdy nabywcy tego ostatniego muszą zadowolić się tylko portem USB 3.2 typu C.
Nie ma dedykowanego wejścia DC, więc jeden z portów Type-C zostanie zajęty przez zasilacz po podłączeniu.
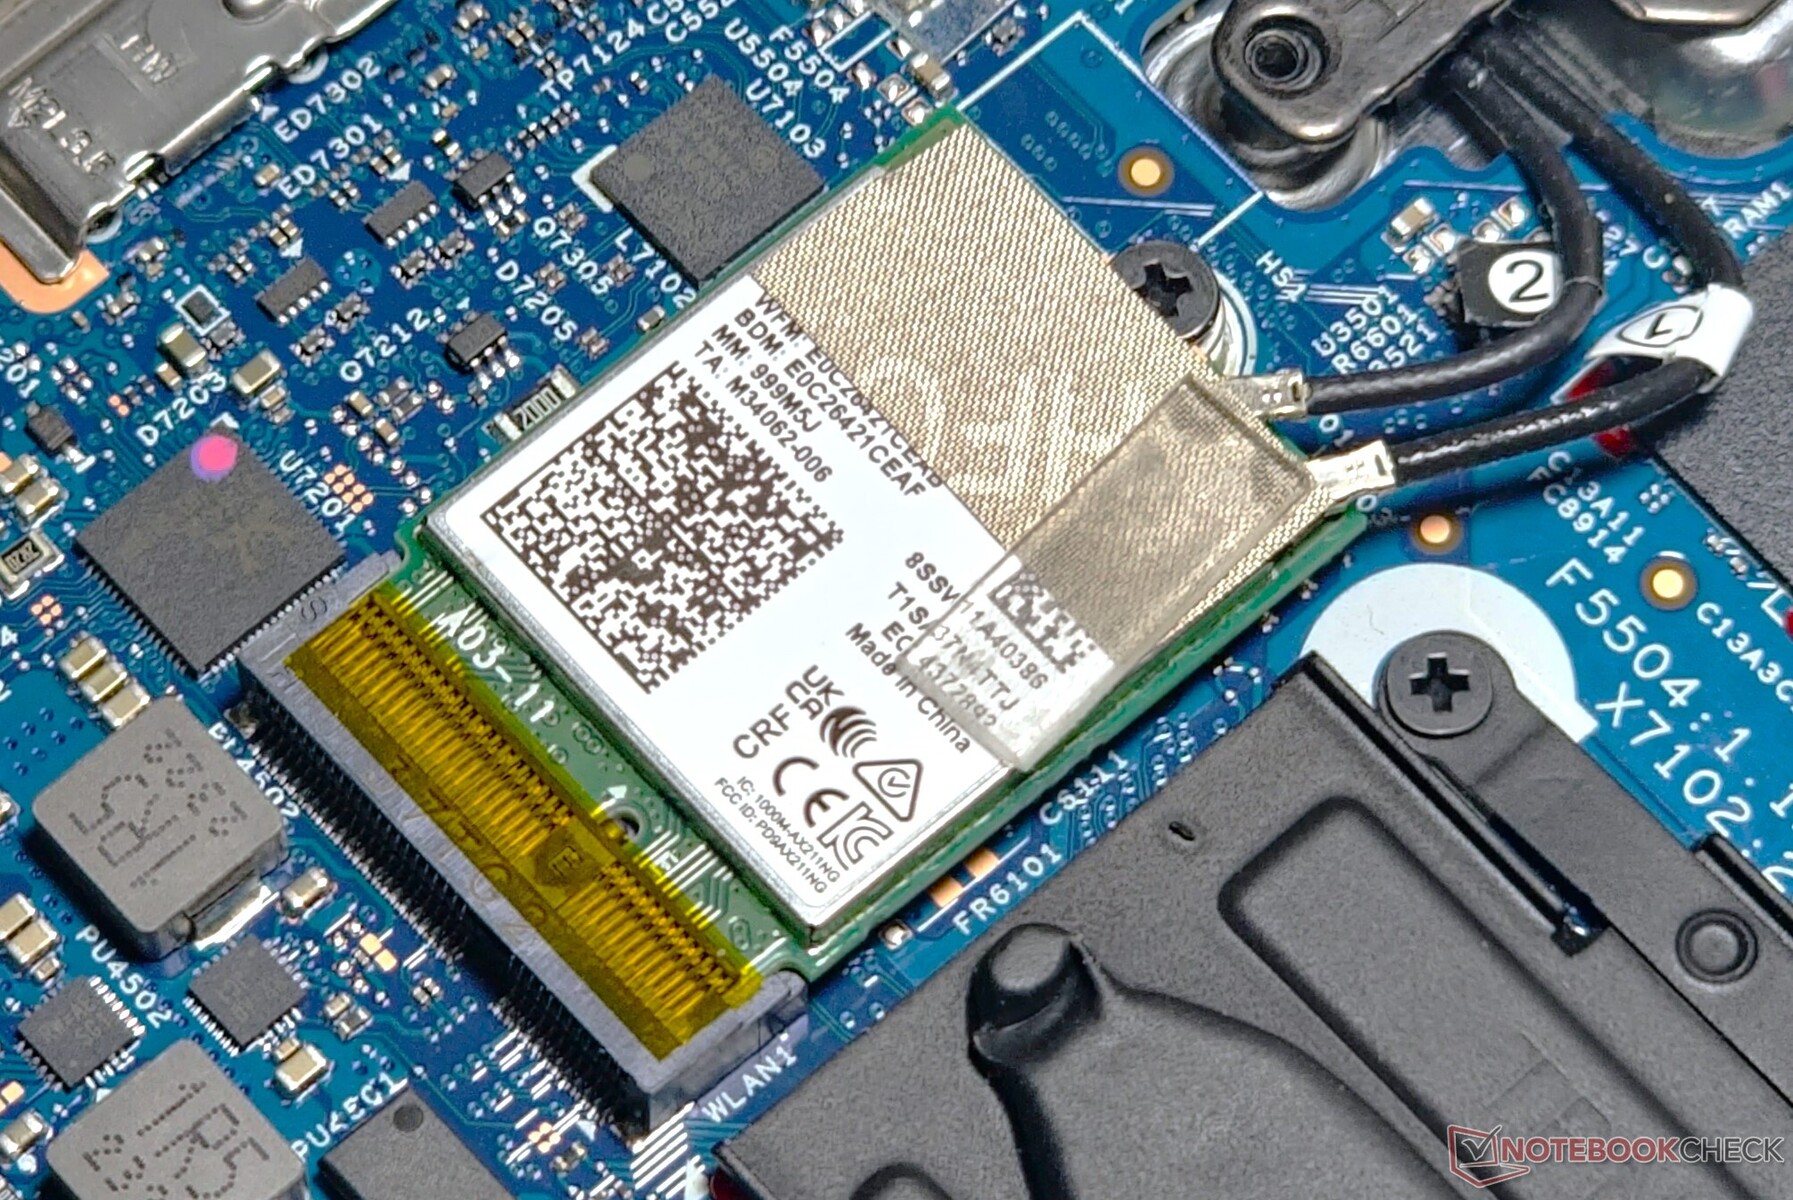
Jako konstrukcja Intel Evo, Pavilion Plus 14 jest naturalnie wyposażony w kartę WLAN Intel Wi-Fi 6E AX211. Daje to zauważalną przewagę wydajności nad MediaTek Wi-Fi 6E MT7922 używanym w SKU AMD, szczególnie w testach odbioru iPerf3 w połączeniu z naszym referencyjnym routerem Asus ROG Rapture GT-AXE11000.
Pasmo 6 GHz zapewnia jedynie marginalny wzrost przepustowości, ale zauważyliśmy tutaj bardziej stabilne prędkości transmisji bez spadków wydajności obserwowanych w paśmie 5 GHz.
| Networking / iperf3 transmit AXE11000 | |
| HP Pavilion Plus 14-ew0153TU | |
| HP Pavilion Plus 14-ey0095cl | |
| Lenovo ThinkPad T14s G4 i7-1365U | |
| Średnia w klasie Multimedia (606 - 1978, n=56, ostatnie 2 lata) | |
| Przeciętny Intel Wi-Fi 6E AX211 (64 - 1921, n=276) | |
| Asus ExpertBook B9 B9403CVA-KM0153X | |
| Acer Swift Go 14 SFG14-71 | |
| Huawei MateBook X Pro 2023 | |
| Networking / iperf3 receive AXE11000 | |
| HP Pavilion Plus 14-ew0153TU | |
| Przeciętny Intel Wi-Fi 6E AX211 (582 - 1890, n=276) | |
| Średnia w klasie Multimedia (682 - 1818, n=56, ostatnie 2 lata) | |
| Lenovo ThinkPad T14s G4 i7-1365U | |
| HP Pavilion Plus 14-ey0095cl | |
| Huawei MateBook X Pro 2023 | |
| Acer Swift Go 14 SFG14-71 | |
| Asus ExpertBook B9 B9403CVA-KM0153X | |
| Networking / iperf3 transmit AXE11000 6GHz | |
| HP Pavilion Plus 14-ew0153TU | |
| Asus ExpertBook B9 B9403CVA-KM0153X | |
| HP Pavilion Plus 14-ey0095cl | |
| Średnia w klasie Multimedia (869 - 2373, n=23, ostatnie 2 lata) | |
| Lenovo ThinkPad T14s G4 i7-1365U | |
| Przeciętny Intel Wi-Fi 6E AX211 (385 - 1851, n=226) | |
| Huawei MateBook X Pro 2023 | |
| Acer Swift Go 14 SFG14-71 | |
| Networking / iperf3 receive AXE11000 6GHz | |
| Huawei MateBook X Pro 2023 | |
| Średnia w klasie Multimedia (1212 - 2361, n=23, ostatnie 2 lata) | |
| HP Pavilion Plus 14-ew0153TU | |
| Przeciętny Intel Wi-Fi 6E AX211 (700 - 1857, n=226) | |
| Asus ExpertBook B9 B9403CVA-KM0153X | |
| Lenovo ThinkPad T14s G4 i7-1365U | |
| Acer Swift Go 14 SFG14-71 | |
| HP Pavilion Plus 14-ey0095cl | |
Kamera internetowa
W przeciwieństwie do wersji AMD, nie mieliśmy żadnych problemów z robieniem zdjęć w rozdzielczości 5 MP przy użyciu domyślnej aplikacji Windows Camera. Jakość obrazu jest znacznie lepsza w porównaniu do większości laptopów z kamerami internetowymi 720p lub 1080p.
Nasz wykres testowy pokazuje wiele szczegółów i odpowiednią ostrość, ale dokładność kolorów pozostawia wiele do życzenia. Ręczna fizyczna migawka kamery internetowej zapewnia dodatkową prywatność. Dołączone aplikacje HP Enhanced Camera i HP Enhanced Lighting oferują jeszcze więcej funkcji jakości życia podczas wideokonferencji.


Bezpieczeństwo
Pavilion Plus 14 jest wyposażony w moduł TPM 2.0 zgodny z wymogami bezpieczeństwa systemu Windows 11. Kamera na podczerwień umożliwia rozpoznawanie twarzy w oparciu o Windows Hello. Niestety, laptop nie posiada gniazda blokady Kensington.
Akcesoria i gwarancja
Standardowe opakowanie zawiera zasilacz 65 W i zwykłą dokumentację bez żadnych akcesoriów.
HP oferuje standardową roczną gwarancję na Pavilion Plus 14 w Indiach. Kupujący mogą również zdecydować się na kwalifikujące się Pakiety opieki pogwarancyjnej HP i ochronę przed przypadkowymi uszkodzeniami w zakresie od jednego roku (10 763 jenów) do trzech lat (do 14 459 jenów w przypadku następnego dnia roboczego na miejscu), w ciągu 90 dni od zakupu produktu.
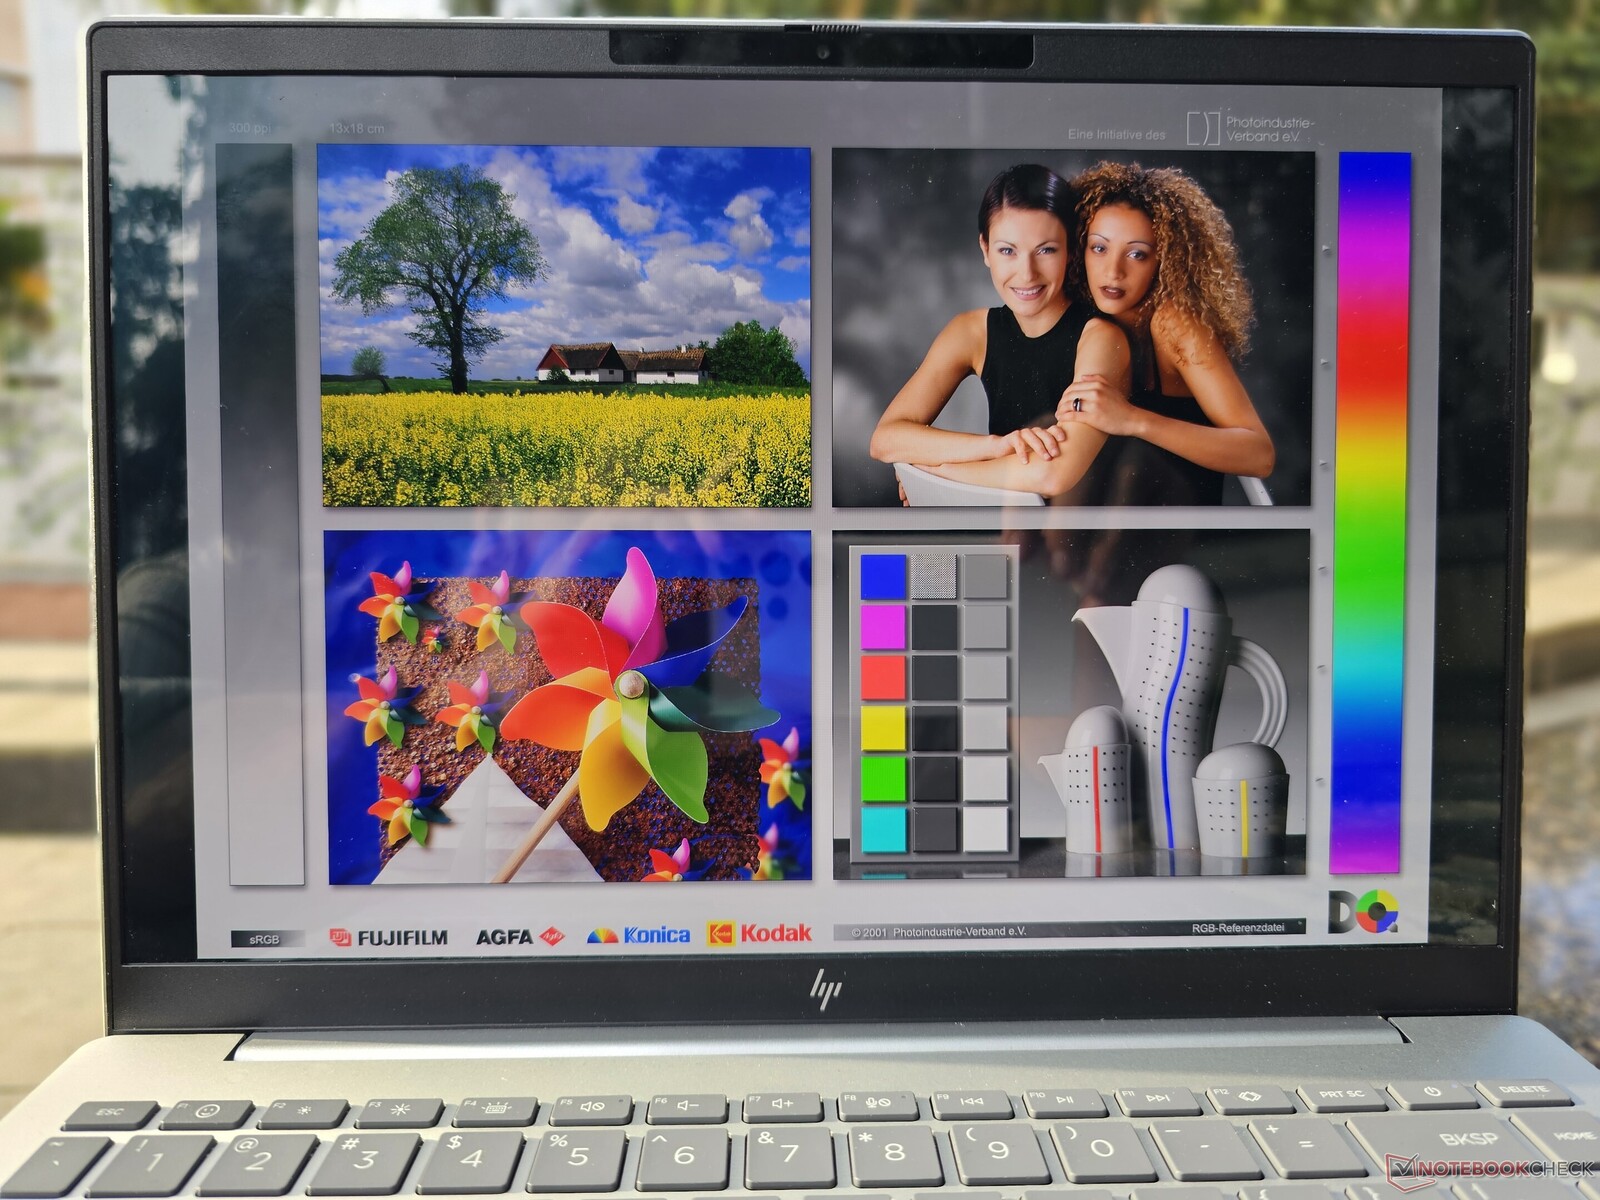
Wyświetlacz: 2.8K "IMAX Enhanced" OLED z HDR i 120 Hz PWM

Napędzany procesorem Core i7 Pavilion Plus 14 może pochwalić się 14-calowym panelem OLED o rozdzielczości 2880 x 1800 z częstotliwością odświeżania 120 Hz i szczytową jasnością HDR na poziomie 500 nitów. Zapewnia to subiektywnie wciągające wrażenia wizualne i wyższe proporcje obrazu, które mają odzwierciedlać markę laptopa "IMAX Enhanced".
Osoby decydujące się na model z procesorem Core i5 mogą wybrać rozdzielczość FHD+ lub QHD+.
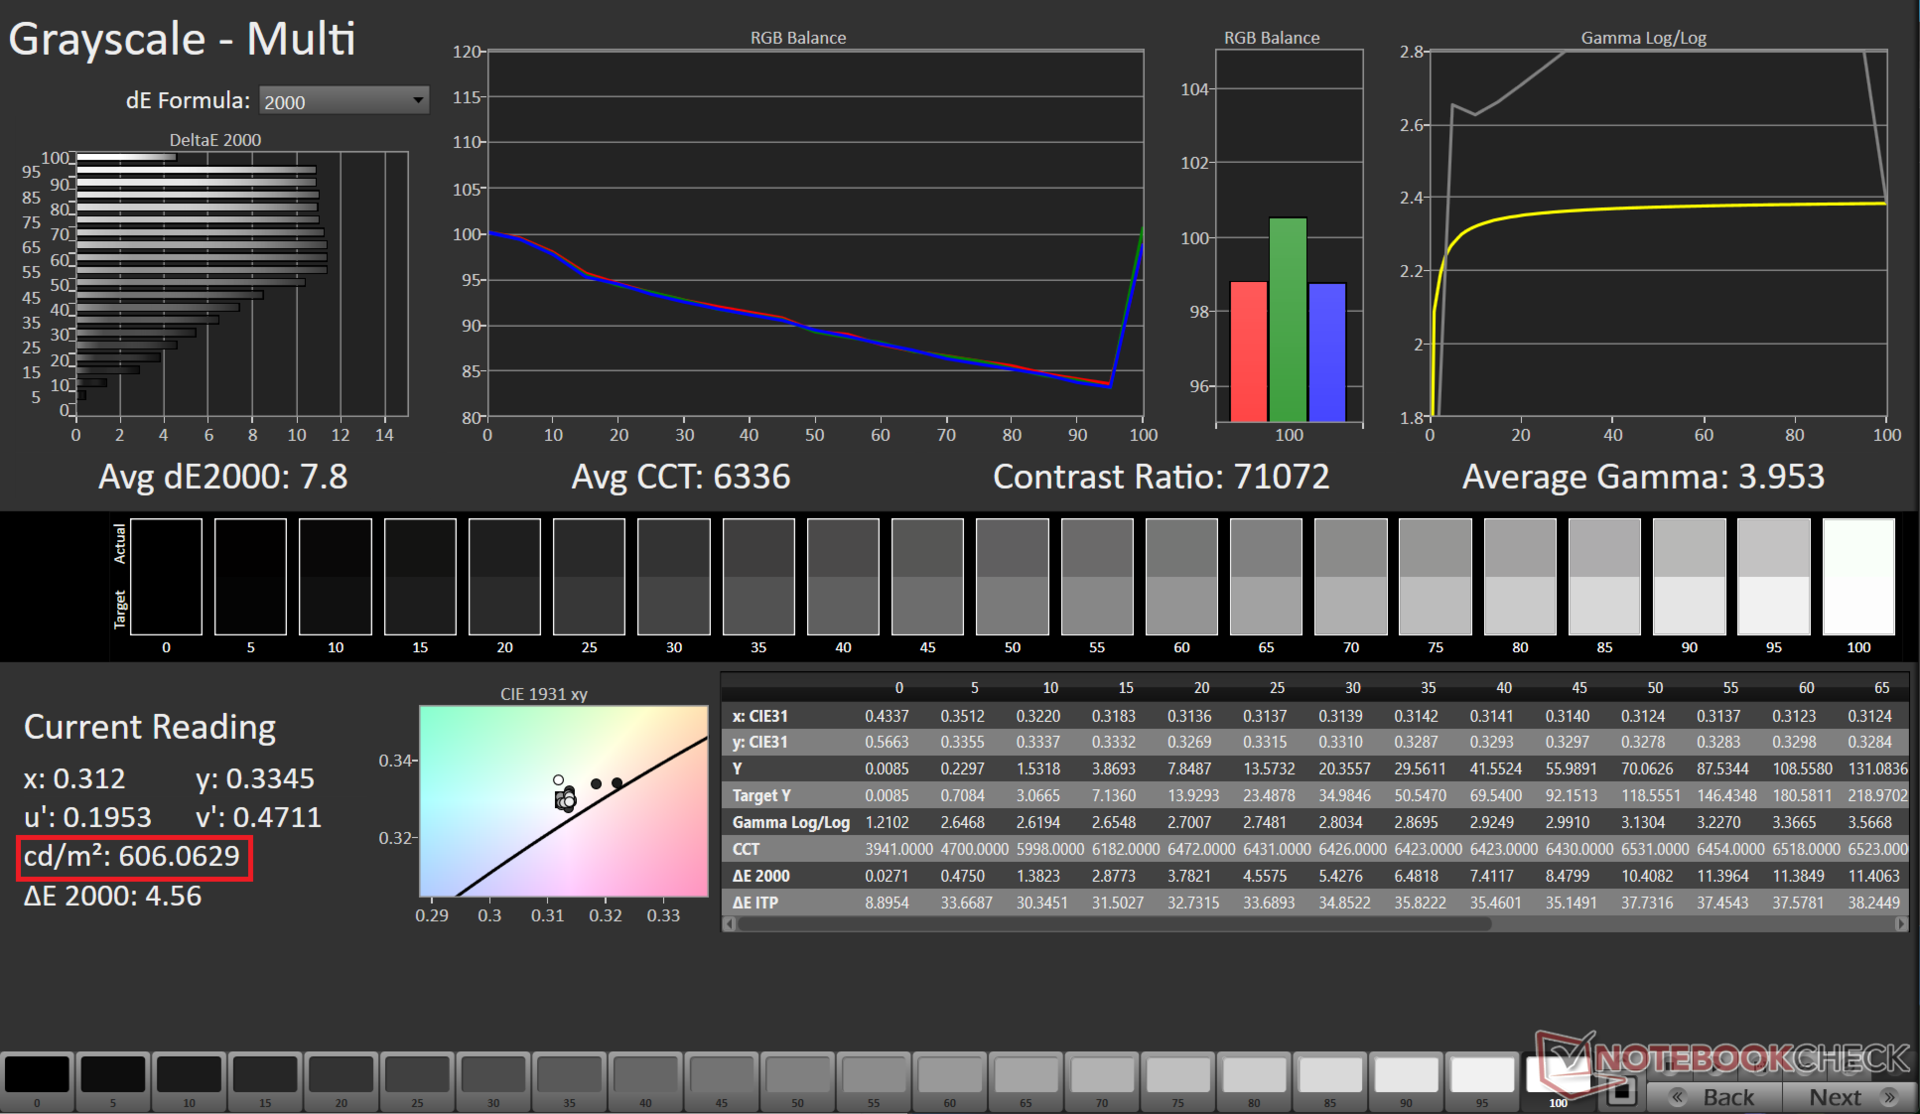
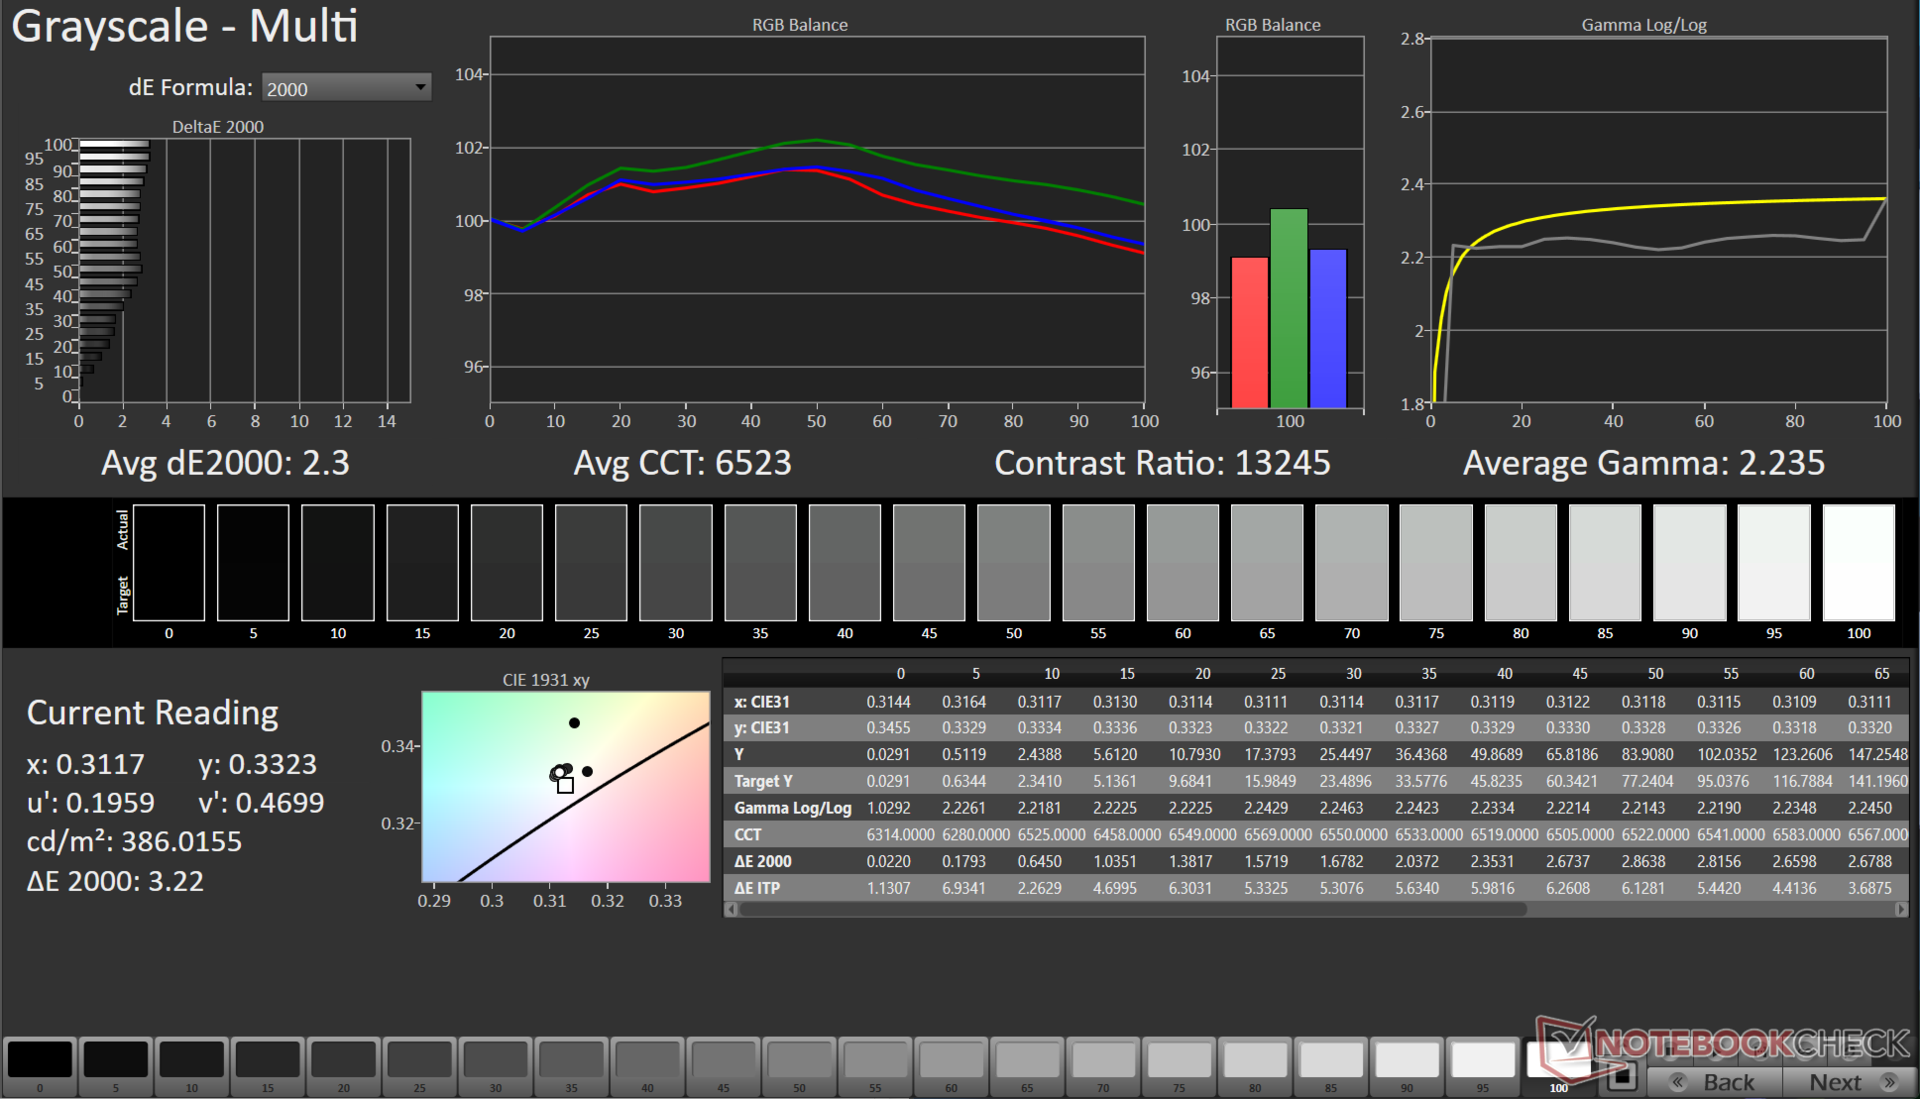
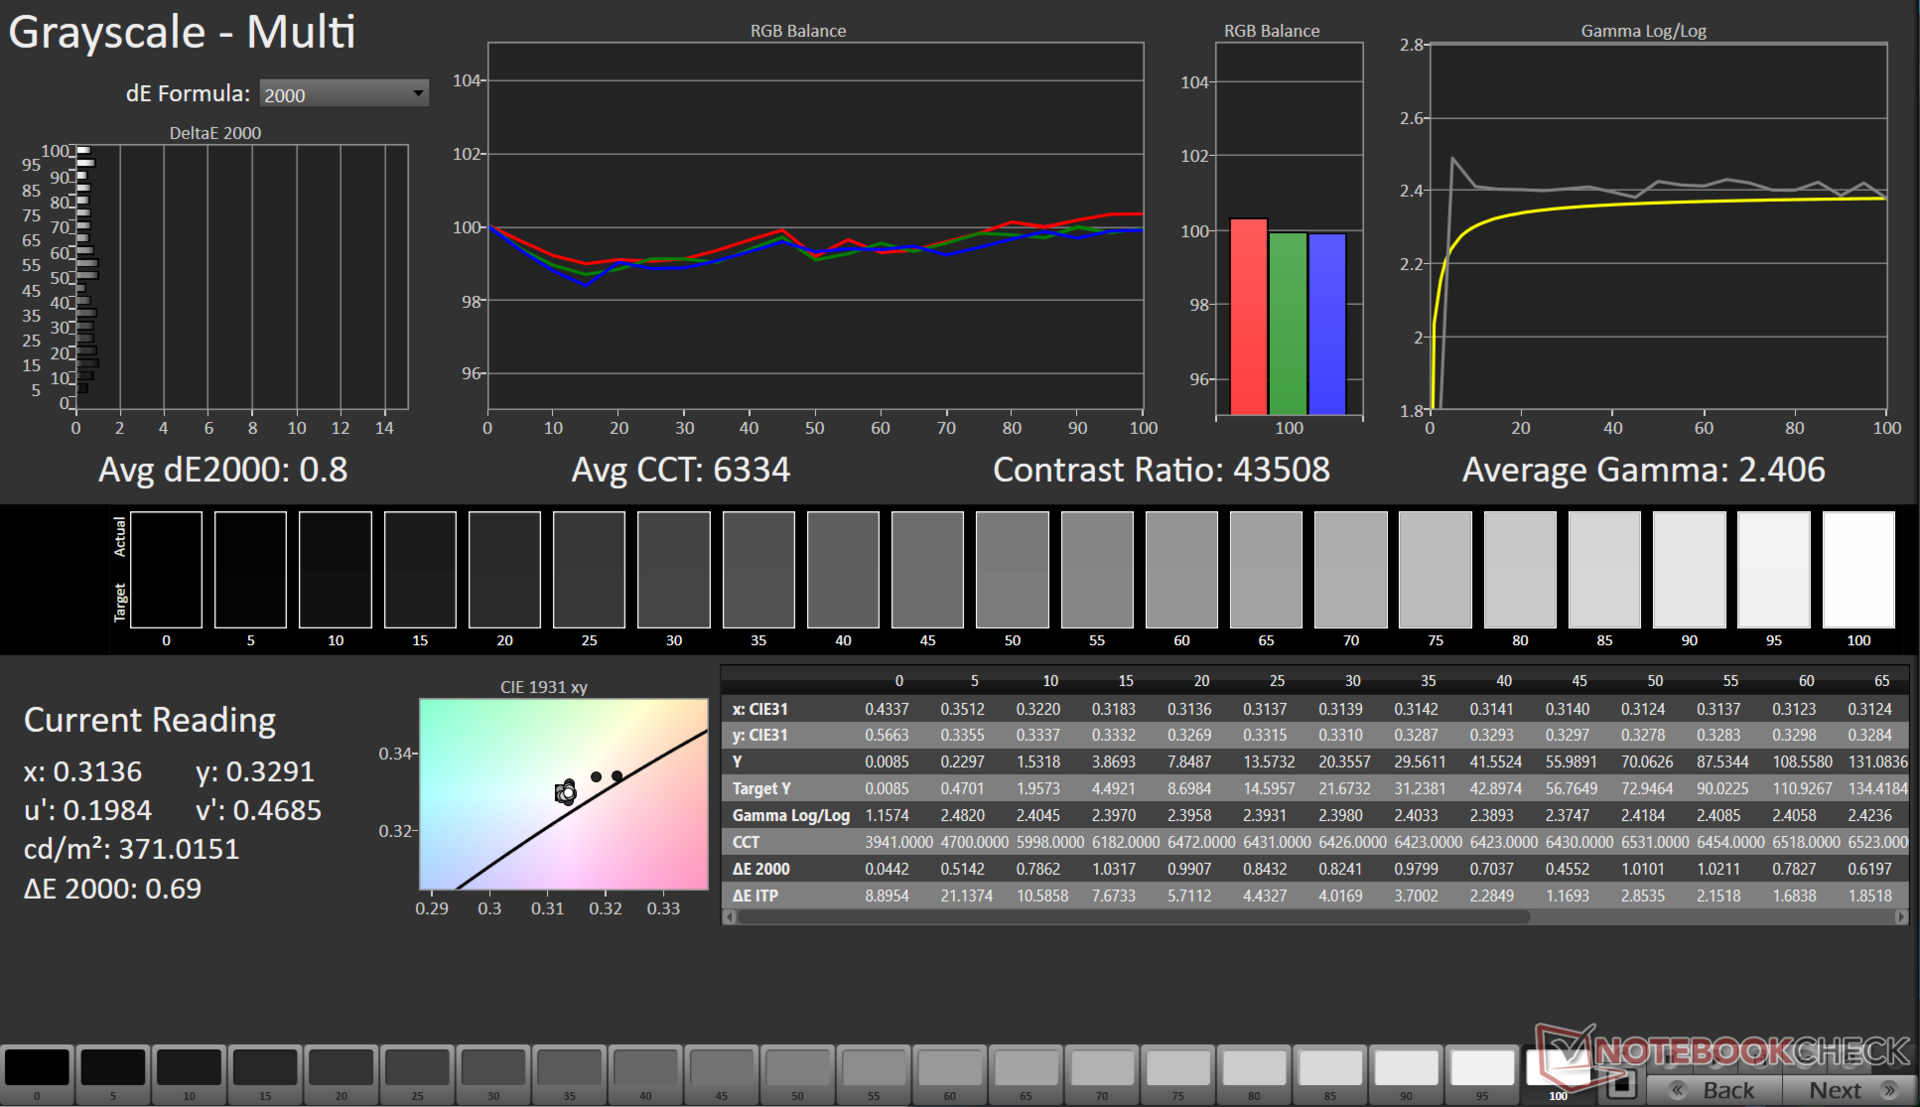
HP deklaruje 400 nitów szczytowej jasności SDR, a nasze testy potwierdziły tę wartość na poziomie 392 nitów. HDR wypadł jeszcze lepiej, osiągając szczytową luminancję na poziomie 606 nitów.
Panel wykazuje doskonałą jednorodność jasności na poziomie 97% i niemal nieskończony współczynnik kontrastu. Ze względu na fakt, że jest to panel OLED, nie występuje tu efekt podświetlenia.
| |||||||||||||||||||||||||
rozświetlenie: 97 %
na akumulatorze: 386 cd/m²
kontrast: 38700:1 (czerń: 0.01 cd/m²)
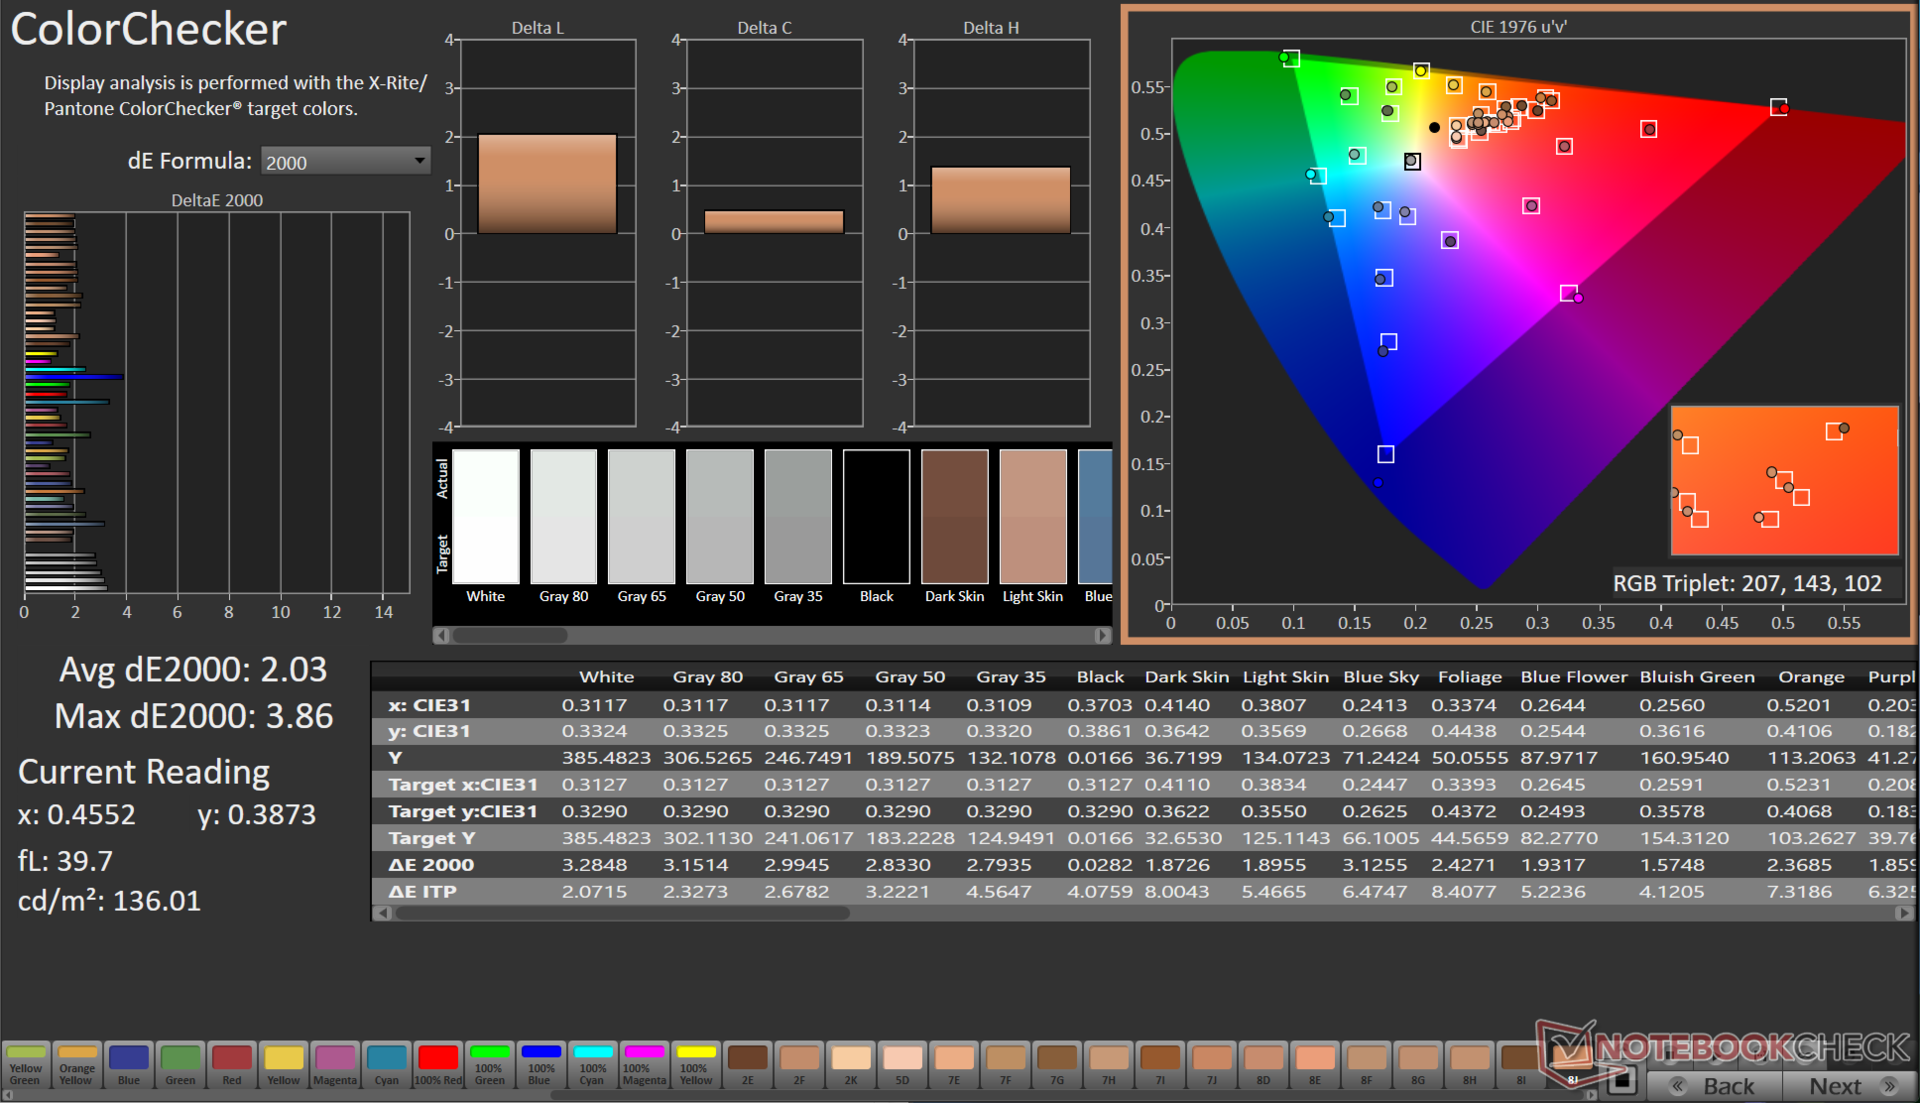
ΔE ColorChecker Calman: 2.03 | ∀{0.5-29.43 Ø4.71}
calibrated: 1.6
ΔE Greyscale Calman: 2.3 | ∀{0.09-98 Ø4.96}
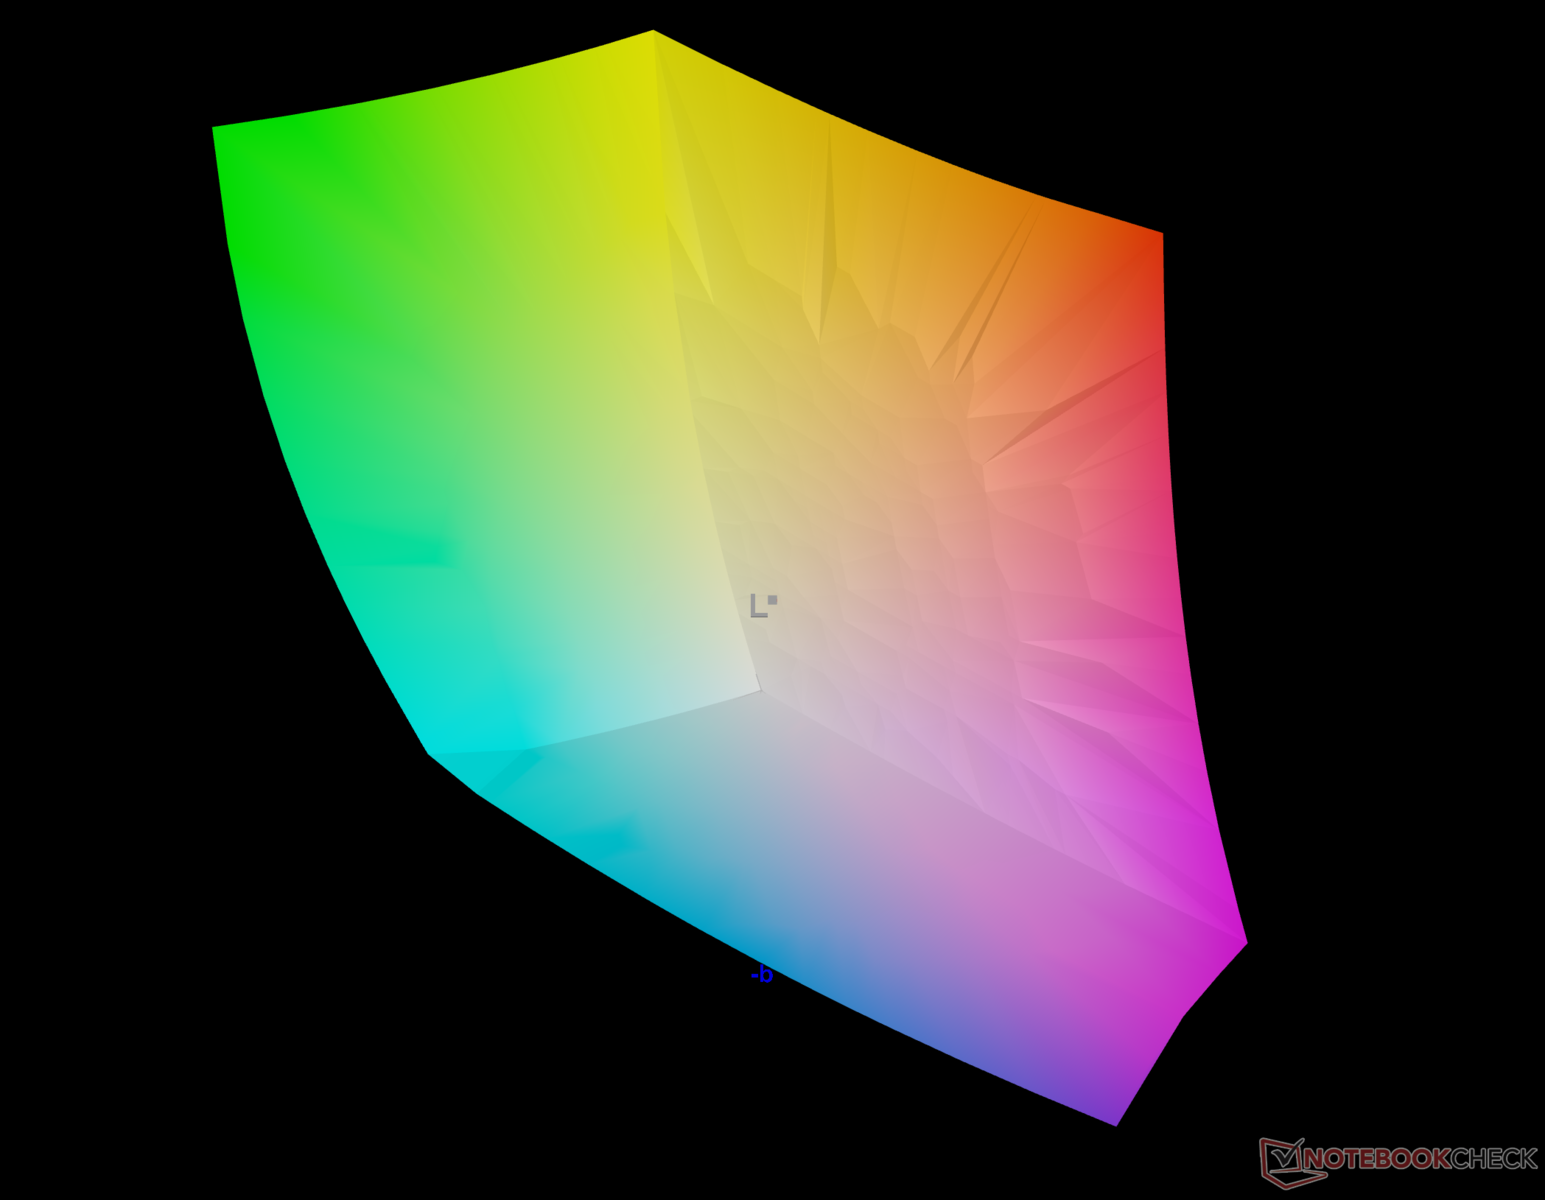
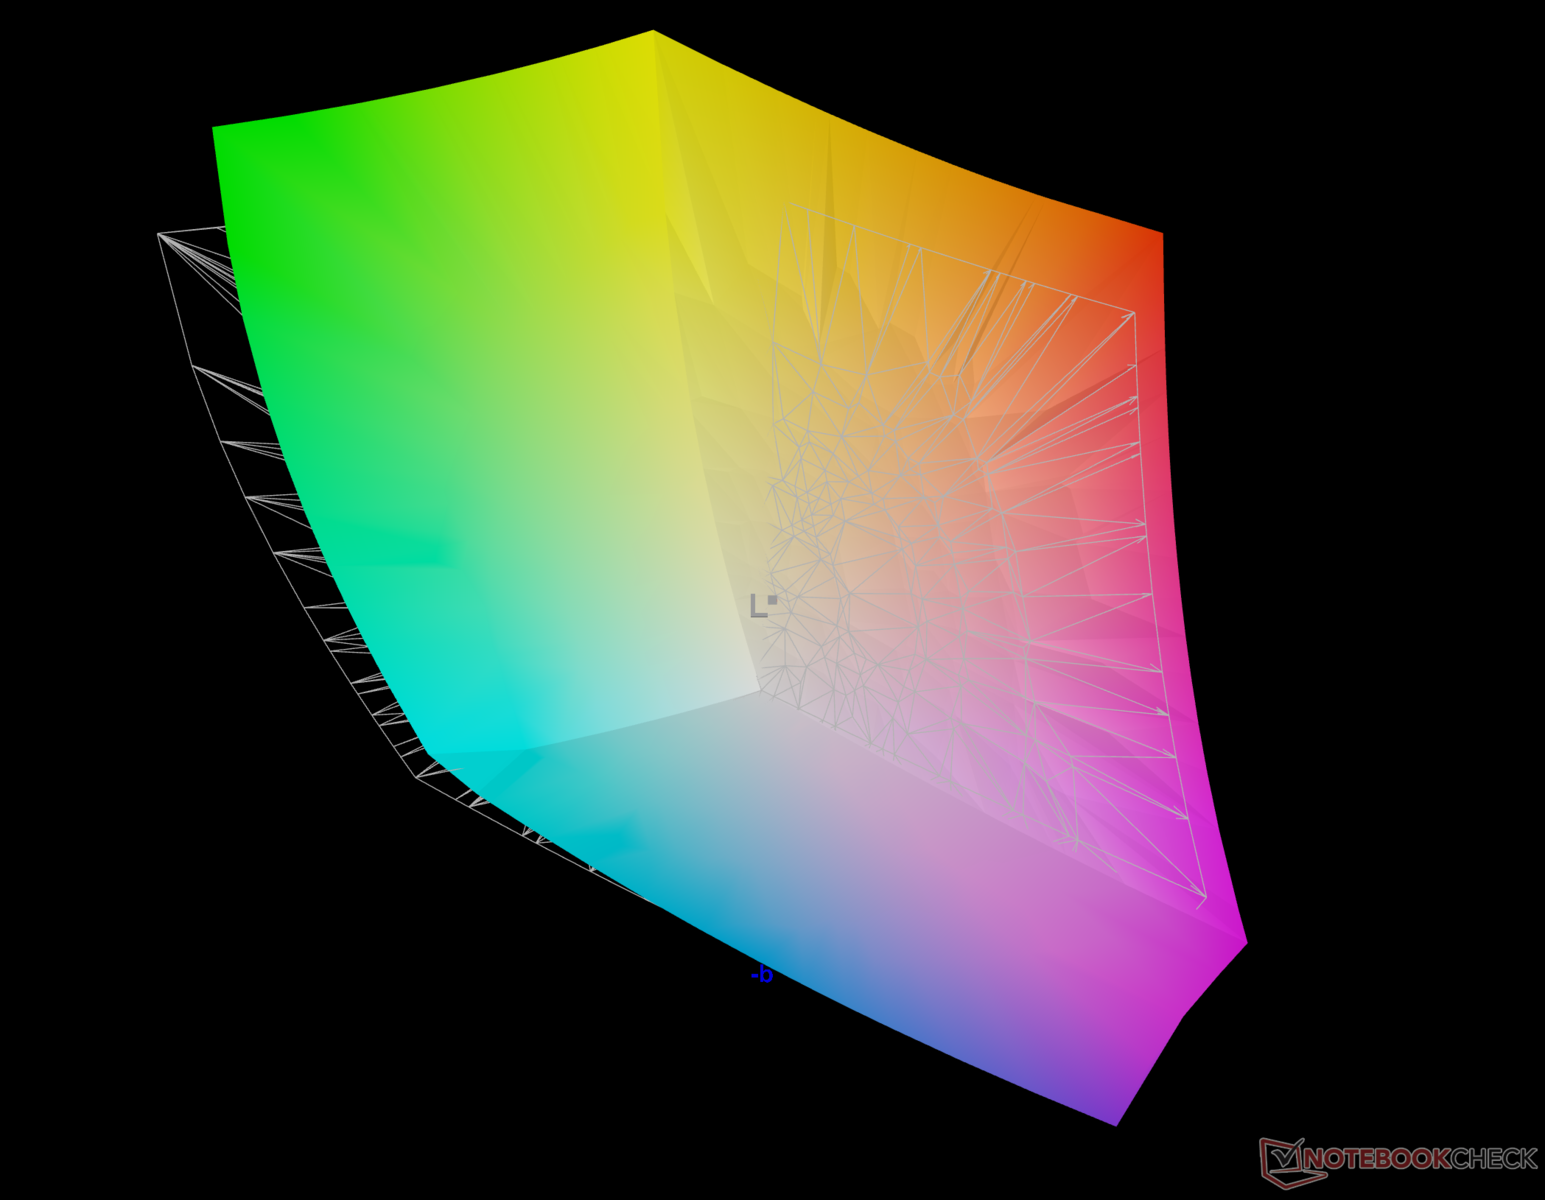
92.1% AdobeRGB 1998 (Argyll 3D)
99.6% sRGB (Argyll 3D)
97.9% Display P3 (Argyll 3D)
Gamma: 2.23
CCT: 6523 K
| HP Pavilion Plus 14-ew0153TU Samsung SDC4197, OLED, 2880x1800, 14" | HP Pavilion Plus 14-ey0095cl Samsung SDC4197, OLED, 2880x1800, 14" | Acer Swift Go 14 SFG14-71 Samsung ATNA40YK11-0, OLED, 2880x1800, 14" | Asus ExpertBook B9 B9403CVA-KM0153X ATNA40YK07-1 SDC4171, OLED, 2880x1800, 14" | Lenovo ThinkPad T14s G4 i7-1365U B140UAK01.2, IPS, 1920x1200, 14" | Huawei MateBook X Pro 2023 TMX1422, IPS, 3120x2080, 14.2" | |
|---|---|---|---|---|---|---|
| Display | 2% | 2% | 1% | -51% | -6% | |
| Display P3 Coverage (%) | 97.9 | 99.8 2% | 99.9 2% | 99.9 2% | 39.9 -59% | 89.8 -8% |
| sRGB Coverage (%) | 99.6 | 100 0% | 100 0% | 100 0% | 59.7 -40% | 99.4 0% |
| AdobeRGB 1998 Coverage (%) | 92.1 | 95.8 4% | 95.4 4% | 93.6 2% | 41.2 -55% | 84.2 -9% |
| Response Times | 91% | 81% | 80% | -114% | -30% | |
| Response Time Grey 50% / Grey 80% * (ms) | 10.8 ? | 0.82 ? 92% | 1.85 ? 83% | 2 ? 81% | 27.7 ? -156% | 20 ? -85% |
| Response Time Black / White * (ms) | 9.29 ? | 0.95 ? 90% | 2 ? 78% | 2 ? 78% | 15.9 ? -71% | 7 ? 25% |
| PWM Frequency (Hz) | 120 ? | 504.7 ? | 357 ? | 360 ? | 156000 ? | |
| Screen | -8% | -78% | -60% | -545% | -276% | |
| Brightness middle (cd/m²) | 387 | 384 -1% | 278 -28% | 389.9 1% | 322.5 -17% | 595 54% |
| Brightness (cd/m²) | 387 | 386 0% | 279 -28% | 390 1% | 296 -24% | 550 42% |
| Brightness Distribution (%) | 97 | 98 1% | 96 -1% | 99 2% | 85 -12% | 85 -12% |
| Black Level * (cd/m²) | 0.01 | 0.04 -300% | 0.0497 -397% | 0.44 -4300% | 0.25 -2400% | |
| Contrast (:1) | 38700 | 6950 -82% | 7845 -80% | 733 -98% | 2380 -94% | |
| Colorchecker dE 2000 * | 2.03 | 4.06 -100% | 3.01 -48% | 2.22 -9% | 3.72 -83% | 2.01 1% |
| Colorchecker dE 2000 max. * | 3.86 | 6.73 -74% | 4.43 -15% | 3.75 3% | 14.68 -280% | 6.9 -79% |
| Colorchecker dE 2000 calibrated * | 1.6 | 0.49 69% | 4.14 -159% | 1.9 -19% | 1.22 24% | |
| Greyscale dE 2000 * | 2.3 | 1.1 52% | 3.2 -39% | 2.4 -4% | 4 -74% | 2.74 -19% |
| Gamma | 2.23 99% | 2.26 97% | 2.194 100% | 2.187 101% | 2.29 96% | 2.4 92% |
| CCT | 6523 100% | 6331 103% | 6126 106% | 6426 101% | 6064 107% | 6319 103% |
| Całkowita średnia (program / ustawienia) | 28% /
11% | 2% /
-38% | 7% /
-25% | -237% /
-378% | -104% /
-183% |
* ... im mniej tym lepiej
Wyświetlacz pokrywa prawie 100% przestrzeni kolorów sRGB i Display P3, a także bardzo dobre 92,1% Adobe RGB. Sprawia to, że jest on bardzo przydatny zarówno do edycji multimediów, jak i konsumpcji.

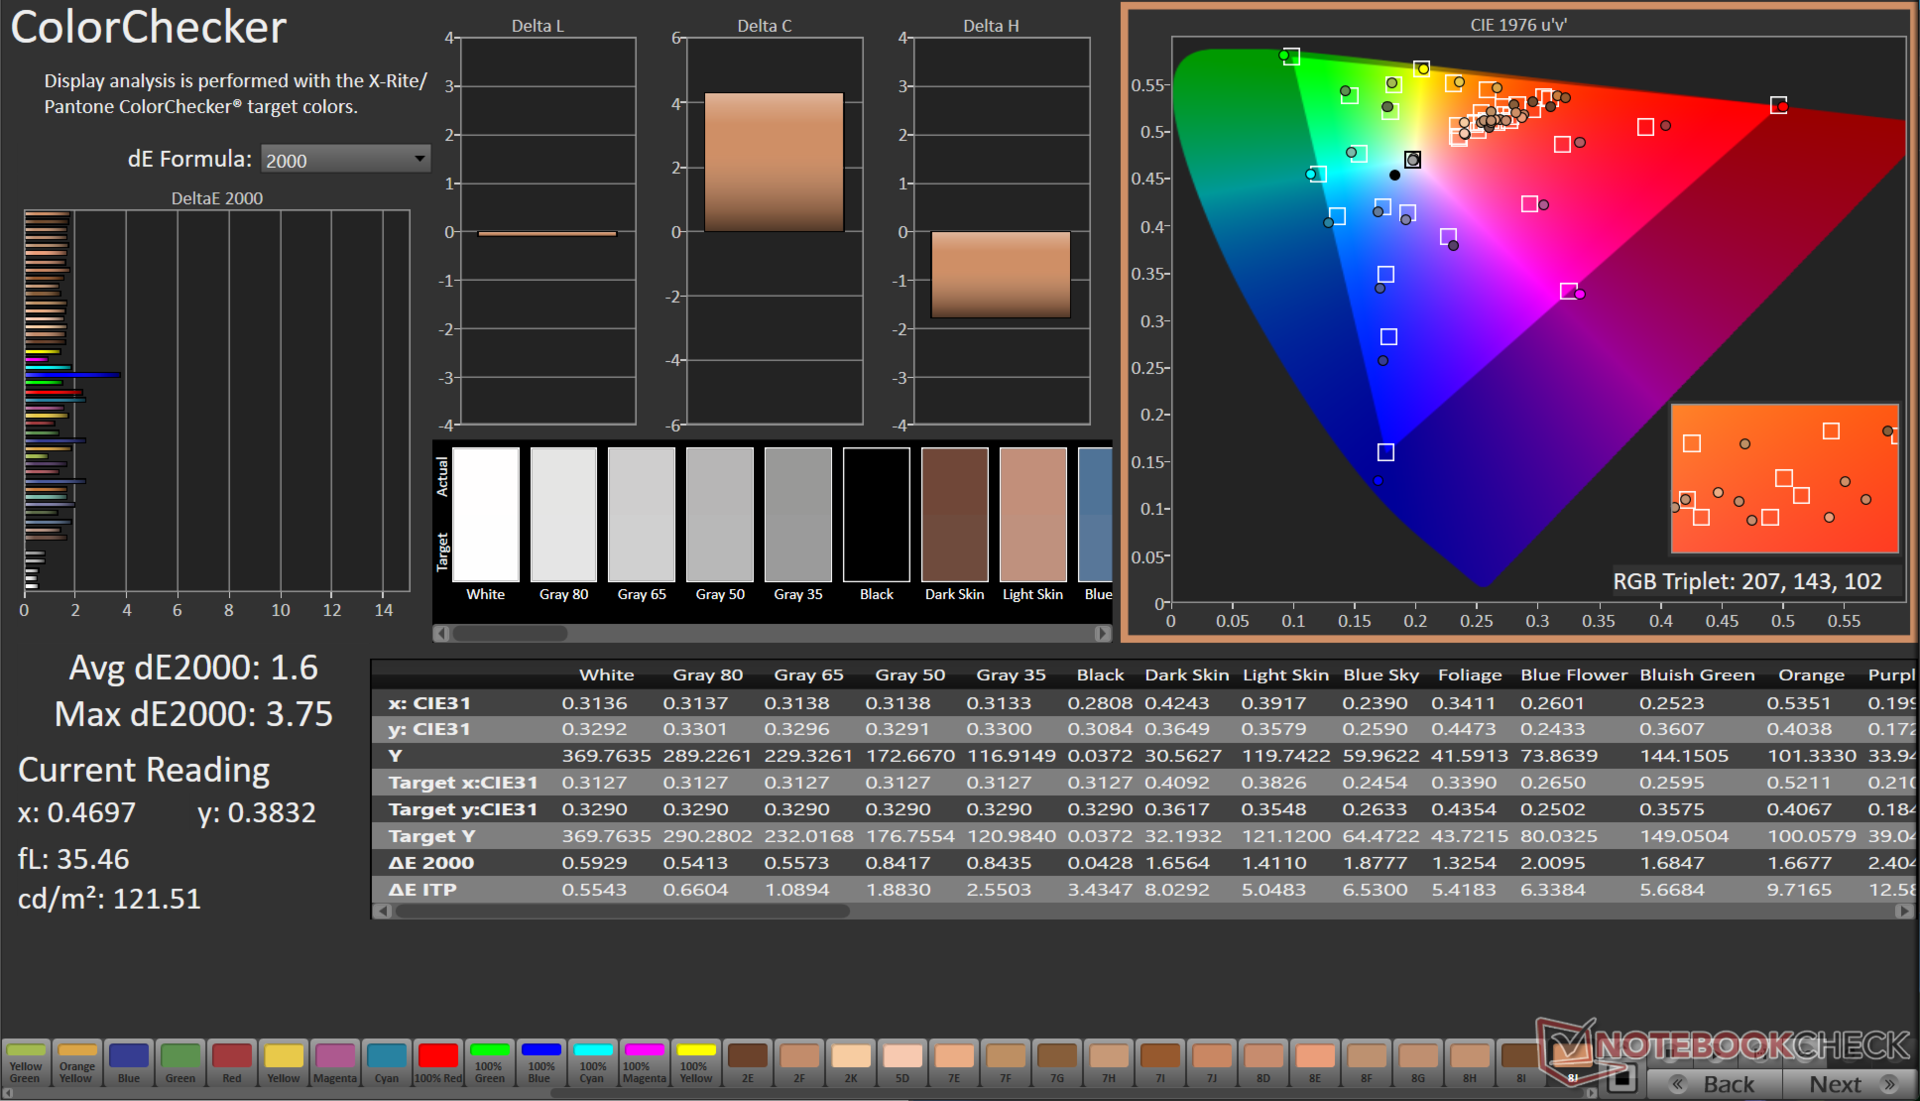
Odwzorowanie kolorów po wyjęciu z pudełka jest przyzwoite, a średnie wartości skali szarości i ColorChecker Delta E 2000 wynoszą odpowiednio około 2,3 i 2,03.
Nasza procedura kalibracji przy użyciu spektrofotometru X-Rite i1Basic Pro 3 i oprogramowania Calman Ultimate od Portrait Displays dodatkowo poprawia te odpowiednie wartości do 0,8 i 1,6.
Nasz skalibrowany plik ICC można pobrać z linku powyżej.
Wyświetl czasy reakcji
| ↔ Czas reakcji od czerni do bieli | ||
|---|---|---|
| 9.29 ms ... wzrost ↗ i spadek ↘ łącznie | ↗ 8.79 ms wzrost | 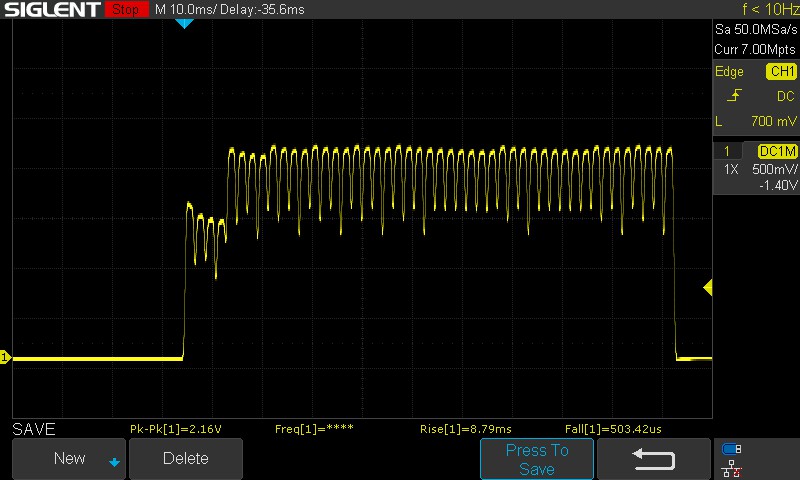 |
| ↘ 0.5 ms upadek | ||
| W naszych testach ekran wykazuje szybki czas reakcji i powinien nadawać się do gier. Dla porównania, wszystkie testowane urządzenia wahają się od 0.1 (minimum) do 240 (maksimum) ms. » 26 % wszystkich urządzeń jest lepszych. Oznacza to, że zmierzony czas reakcji jest lepszy od średniej wszystkich testowanych urządzeń (19.8 ms). | ||
| ↔ Czas reakcji 50% szarości do 80% szarości | ||
| 10.8 ms ... wzrost ↗ i spadek ↘ łącznie | ↗ 9.4 ms wzrost | 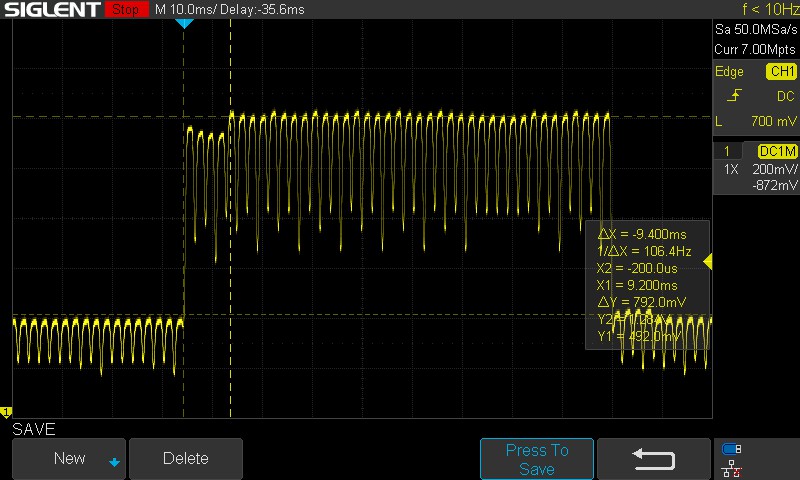 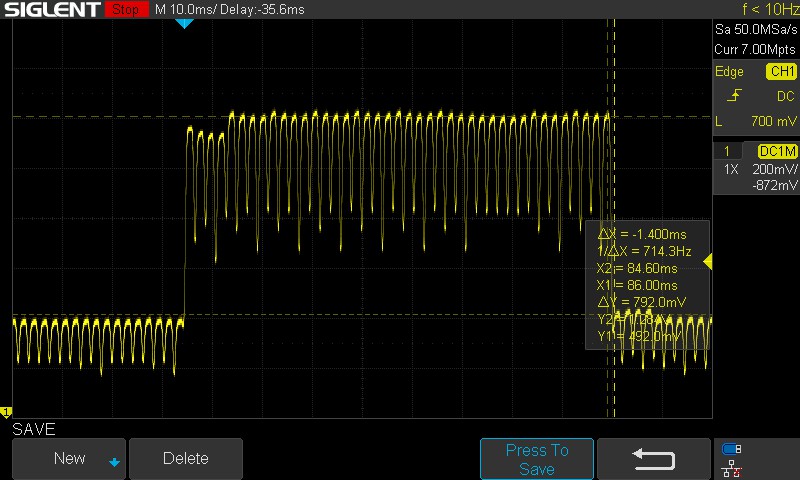 |
| ↘ 1.4 ms upadek | ||
| W naszych testach ekran wykazuje dobry współczynnik reakcji, ale może być zbyt wolny dla graczy rywalizujących ze sobą. Dla porównania, wszystkie testowane urządzenia wahają się od 0.165 (minimum) do 636 (maksimum) ms. » 25 % wszystkich urządzeń jest lepszych. Oznacza to, że zmierzony czas reakcji jest lepszy od średniej wszystkich testowanych urządzeń (31 ms). | ||
Czasy reakcji są przyzwoite, ale mogłyby być lepsze. Musieliśmy ręcznie oszacować czasy reakcji od 50% szarości do 80% szarości, ponieważ wzorzec wykazywał niezwykle stromy spadek.
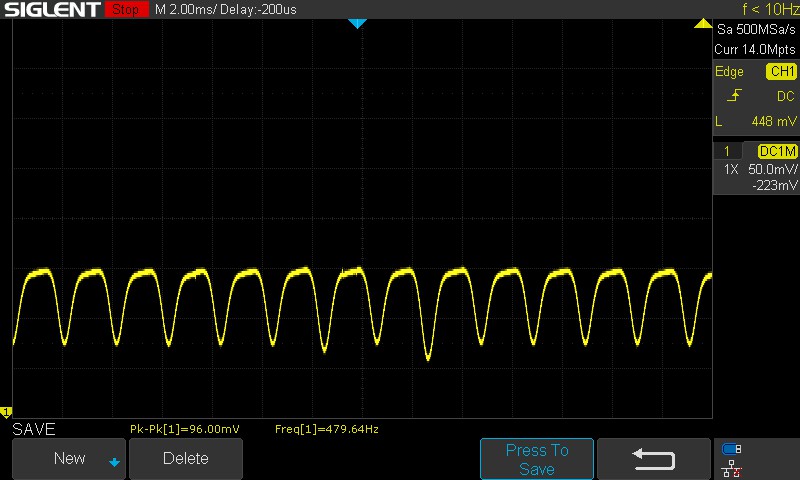
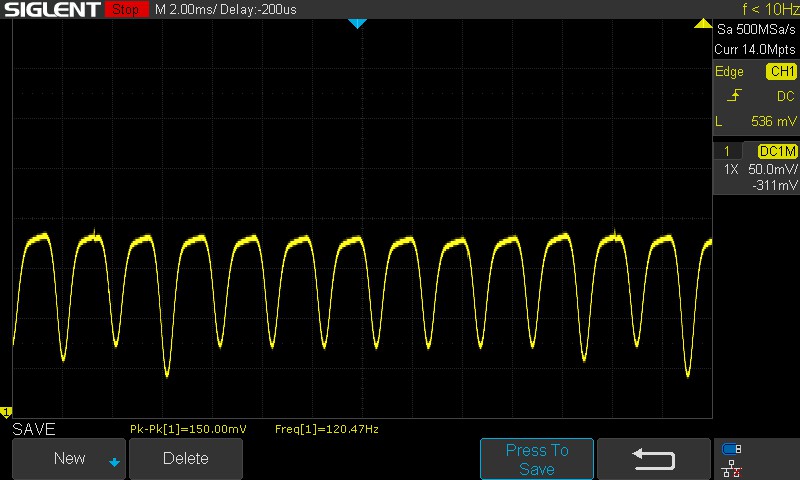
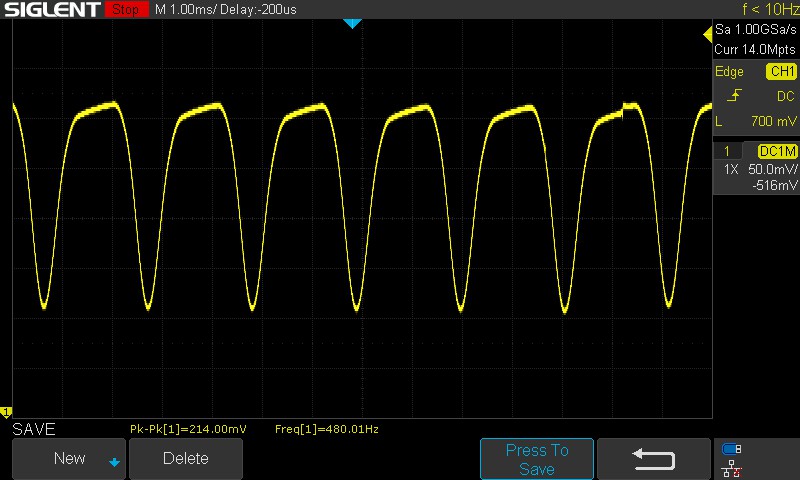
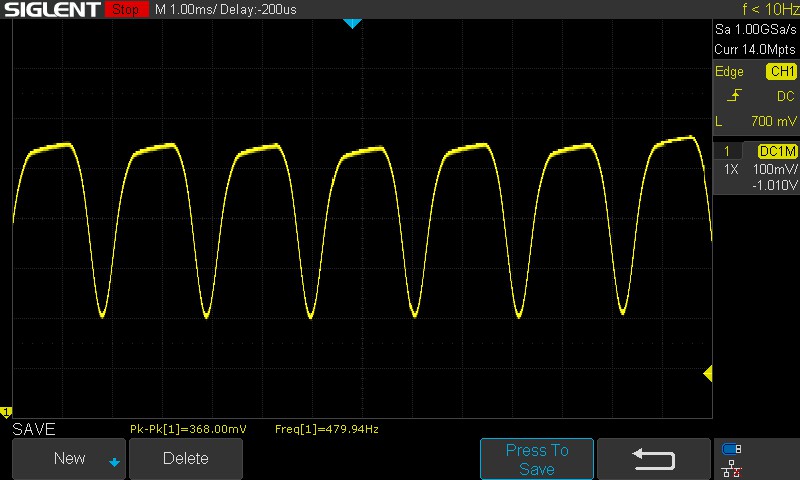
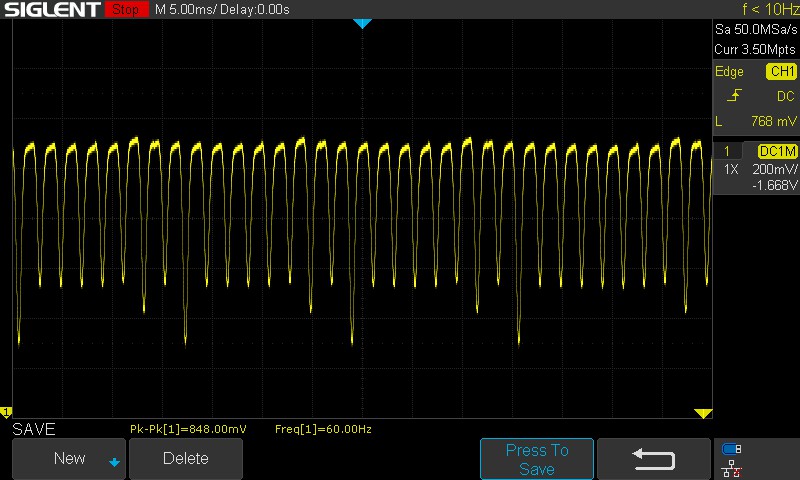
Migotanie ekranu / PWM (modulacja szerokości impulsu)
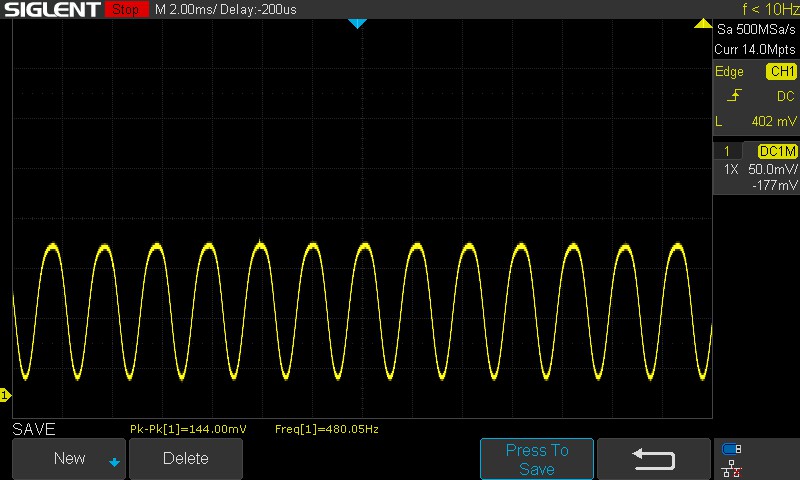
| Wykryto migotanie ekranu/wykryto PWM | 120 Hz | ≤ 100 % ustawienia jasności | 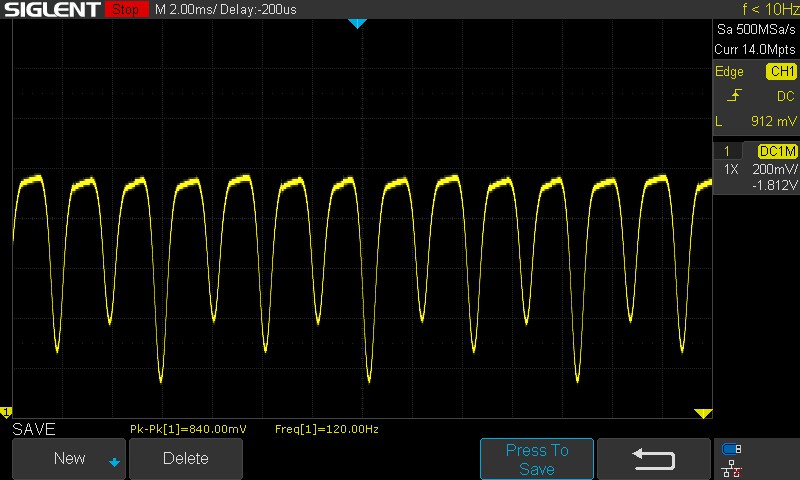 |
Podświetlenie wyświetlacza miga z częstotliwością 120 Hz (najgorszy przypadek, np. przy użyciu PWM) Wykryto migotanie przy ustawieniu jasności 100 % i poniżej. Powyżej tego ustawienia jasności nie powinno być żadnego migotania ani PWM. Częstotliwość 120 Hz jest bardzo niska, więc migotanie może powodować zmęczenie oczu i bóle głowy po dłuższym użytkowaniu. Dla porównania: 52 % wszystkich testowanych urządzeń nie używa PWM do przyciemniania wyświetlacza. Jeśli wykryto PWM, zmierzono średnio 7747 (minimum: 5 - maksimum: 343500) Hz. | |||
Przy częstotliwości odświeżania 120 Hz, PWM może oscylować pomiędzy 120 Hz lub ich wielokrotnościami aż do 480 Hz. PWM spada do 60 Hz przy odpowiedniej częstotliwości odświeżania.
W każdym razie częstotliwość PWM jest niższa i może stanowić problem dla osób wrażliwych na nią.
Proszę zapoznać się z naszym poradnikiem "Dlaczego PWM to taki ból głowy", aby uzyskać więcej informacji. Przegląd zmierzonych PWM w recenzowanych urządzeniach można znaleźć w naszej tabeli Tabela rankingowa PWM.
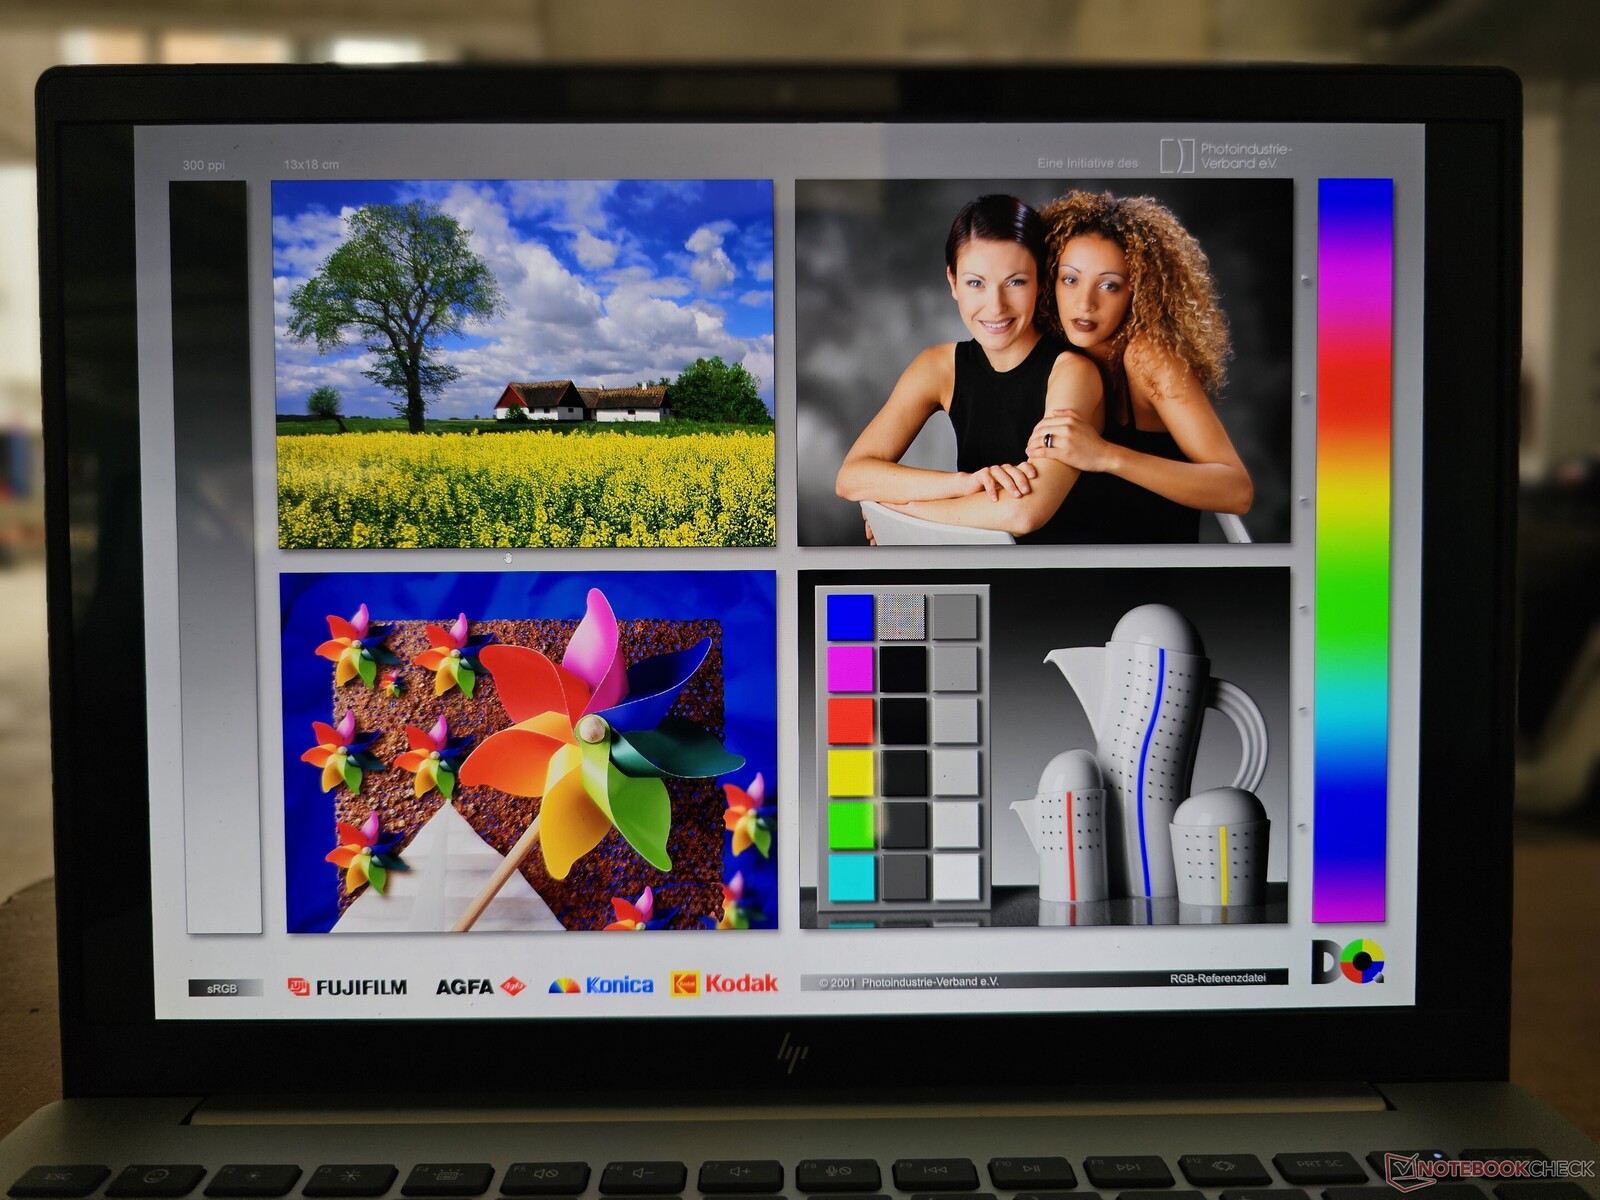
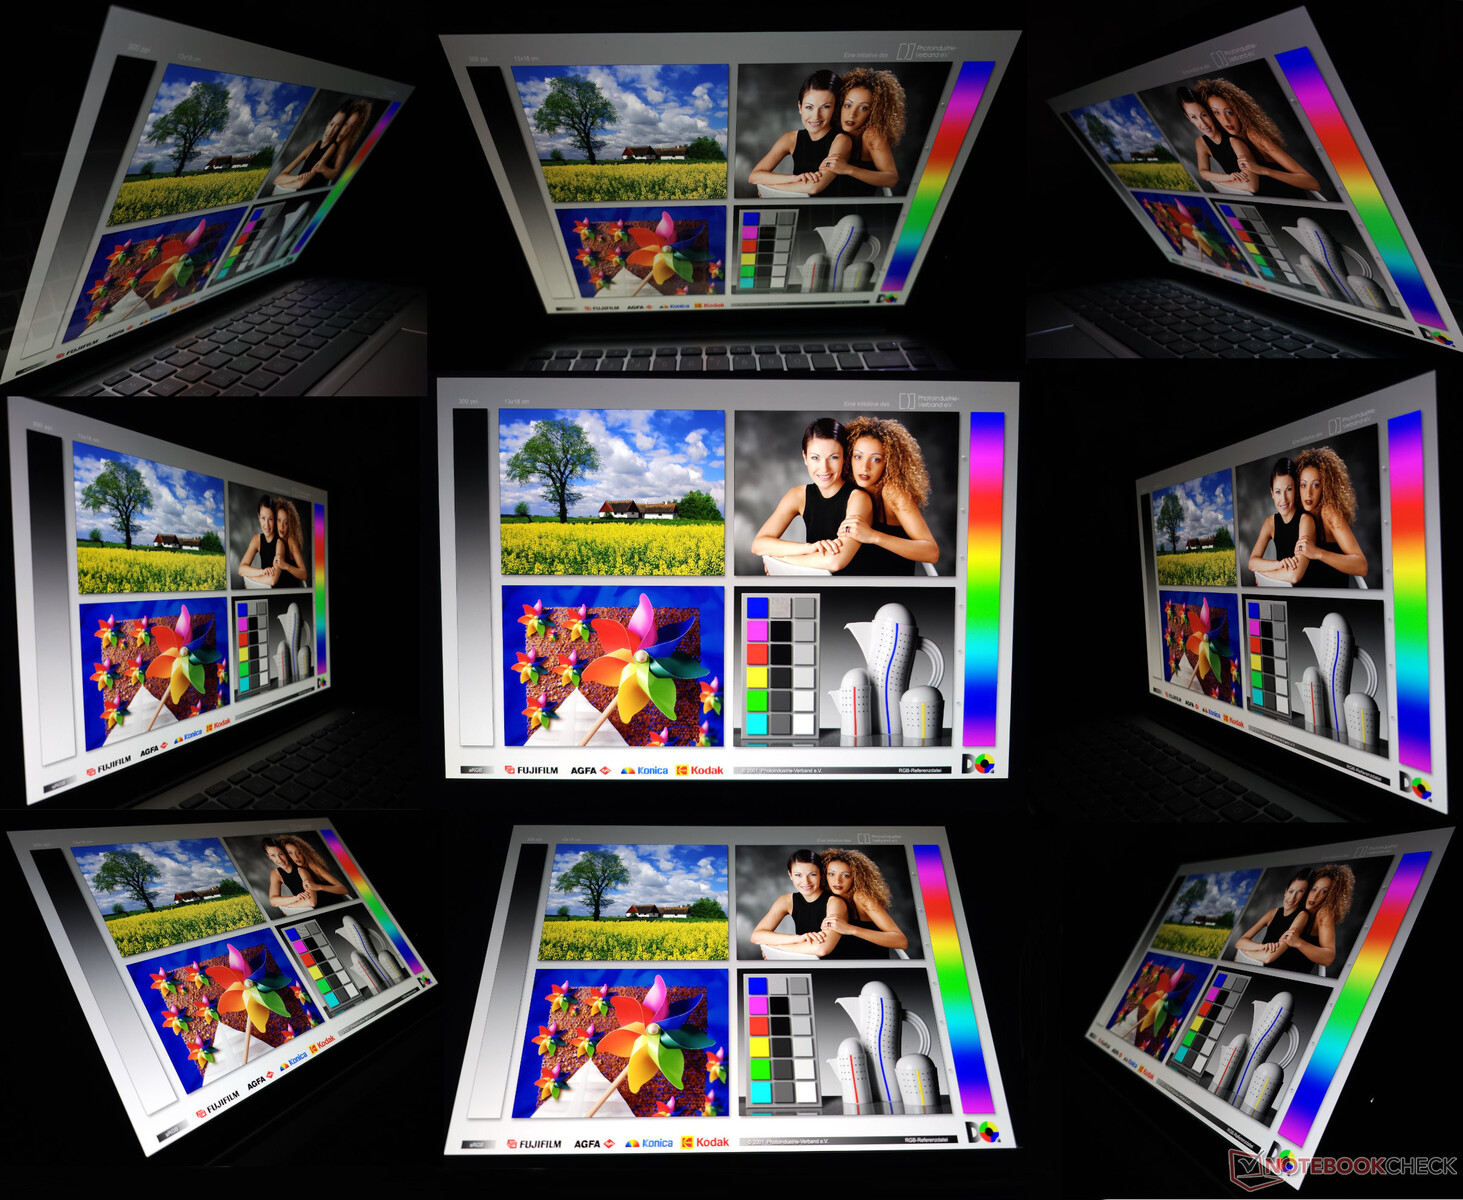
Błyszczący wyświetlacz może być irytujący podczas oglądania w bezpośrednim świetle słonecznym. Kąty widzenia są dość stabilne, bez zauważalnej utraty jasności lub kolorów w skrajnych przypadkach.
Wydajność: Nie dorównuje opartemu na procesorze Ryzen 7 7840U Pavilion Plus 14
HP oferuje Pavilion Plus 14 w obu wersjach Core i5-1335U i Core i7-1355U. Aplikacja myHP oferuje tylko zrównoważony profil zasilania, więc użyliśmy zarządzania energią systemu Windows ustawionego na najlepszą wydajność dla wszystkich testów porównawczych.
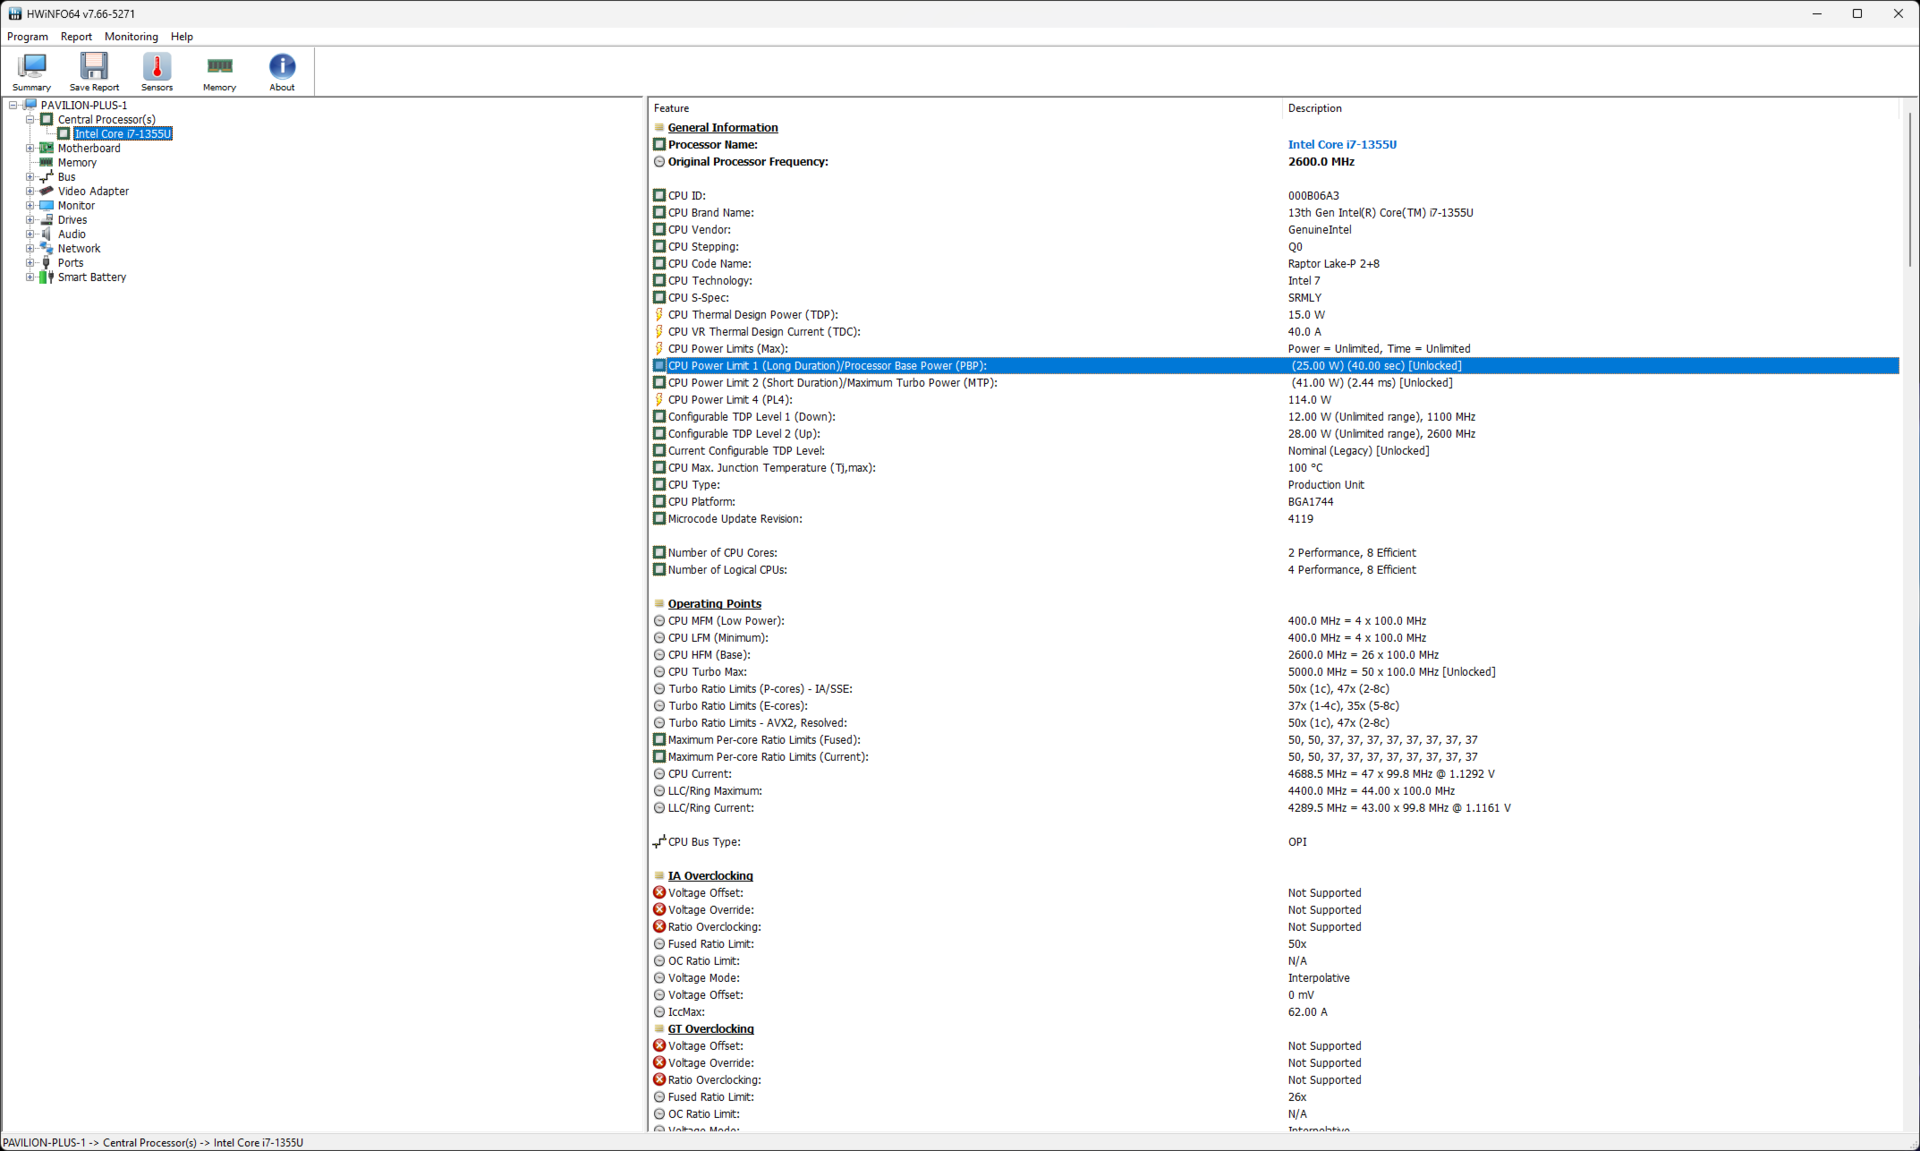
Core i7-1355U to 10-rdzeniowa (2P+8E) 12-wątkowa część, która w tym urządzeniu działa przy PL1 wynoszącym 25 W i PL2 wynoszącym 41 W.
Procesor
Core i7 Pavilion Plus 14 pozostaje znacznie w tyle za swoim kuzynem napędzanym przez AMD Ryzen 7 7840U w ogólnych testach porównawczych procesorów. Jest to zgodne z oczekiwaniami, ponieważ Core i7-1355U oferuje tylko dwa rdzenie P z hiperwątkowością, podczas gdy reszta to rdzenie E.
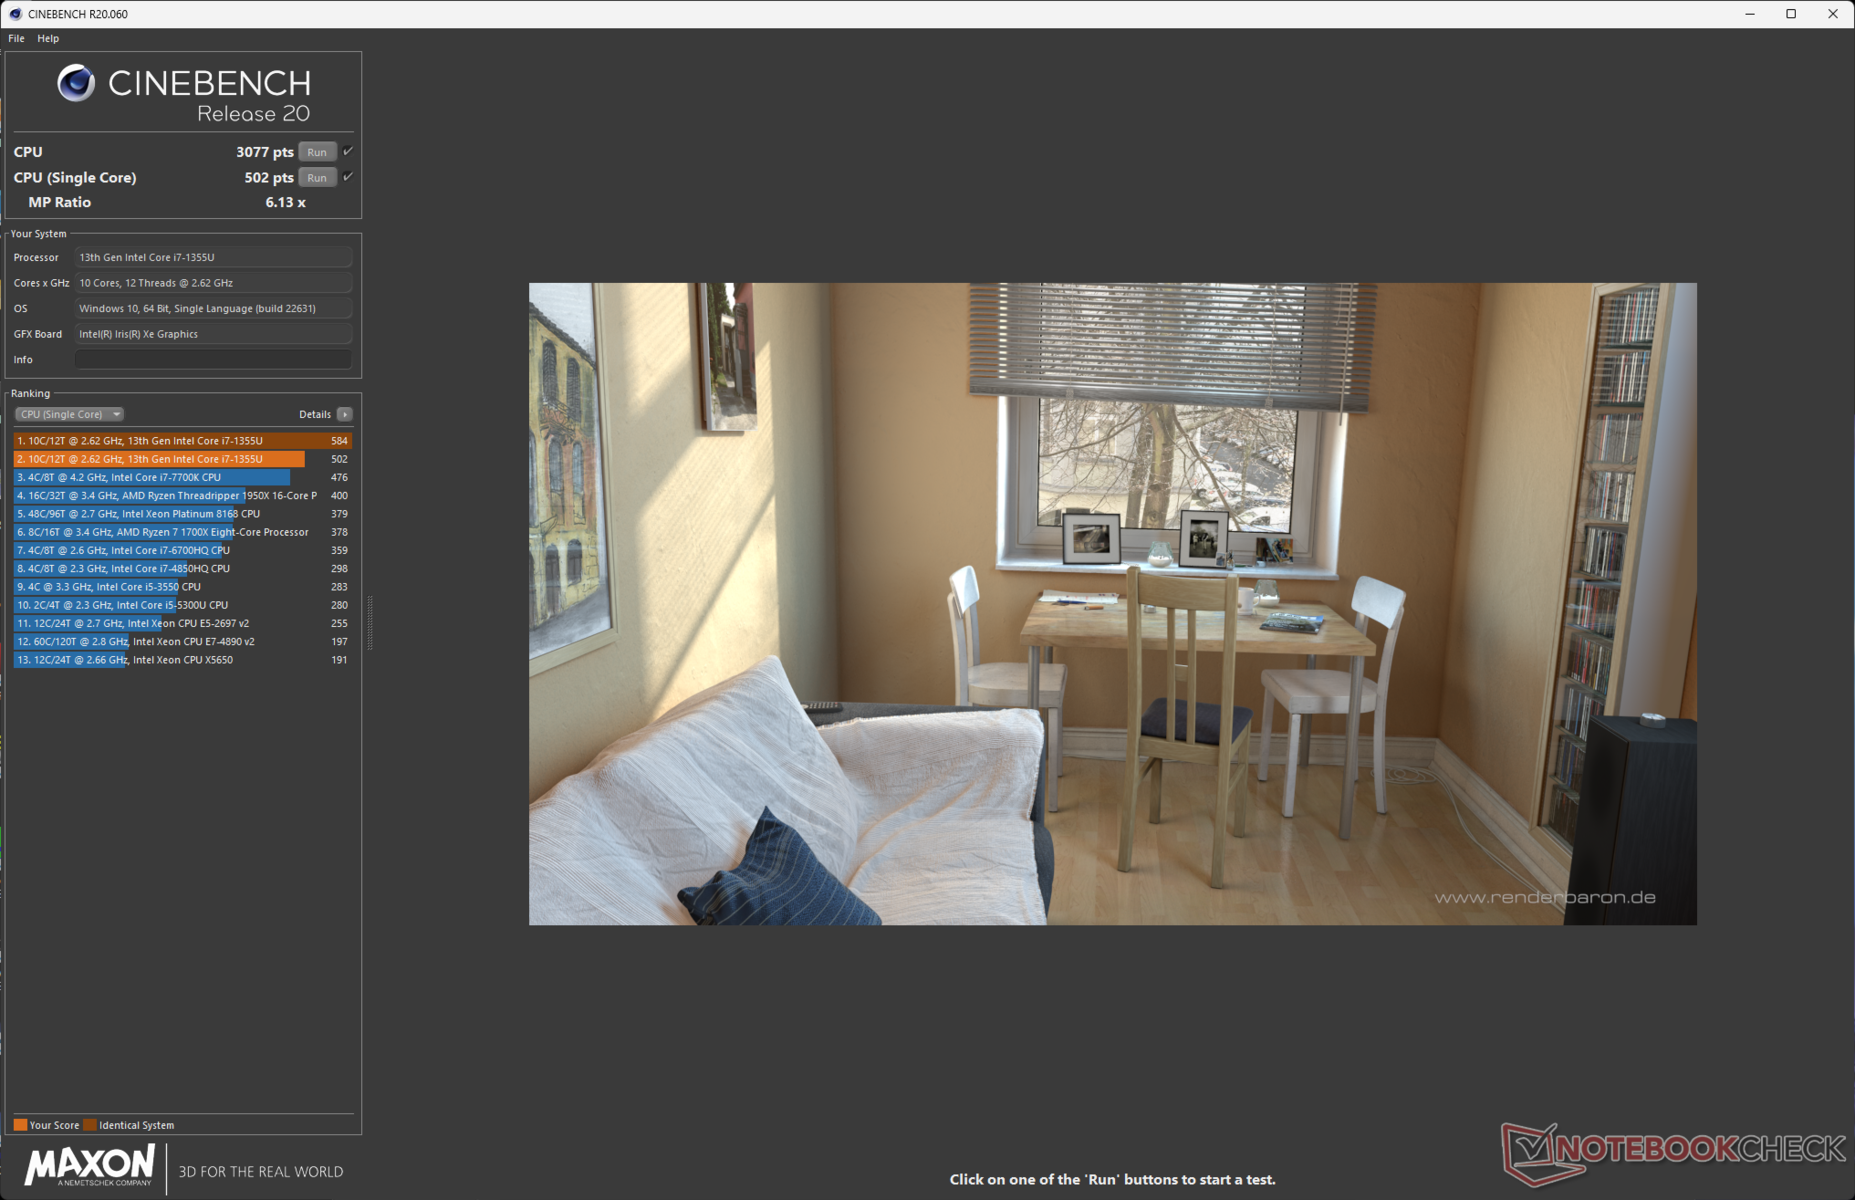
Skutkuje to znacznym spadkiem wydajności wielordzeniowej w porównaniu do 8C/16T Ryzen 7 7840U, chociaż wyniki jednordzeniowe Core i7-1355U są generalnie na równi lub nieznacznie wyprzedzają w zależności od testu porównawczego.
Łącznie, nasza próbka testowa wypada o 8% gorzej w porównaniu do średnich wyników Core i7-1355U. Niższy PL2 stawia również Pavilion Plus 14 w nieco gorszej sytuacji, zwłaszcza w przypadku wielu rdzeni, w porównaniu do Asus ExpertBook B9, który wykorzystuje ten sam układ, ale przy nieco wyższych limitach mocy.
Cinebench R15 Multi Loop
Cinebench R23: Multi Core | Single Core
Cinebench R20: CPU (Multi Core) | CPU (Single Core)
Cinebench R15: CPU Multi 64Bit | CPU Single 64Bit
Blender: v2.79 BMW27 CPU
7-Zip 18.03: 7z b 4 | 7z b 4 -mmt1
Geekbench 5.5: Multi-Core | Single-Core
HWBOT x265 Benchmark v2.2: 4k Preset
LibreOffice : 20 Documents To PDF
R Benchmark 2.5: Overall mean
| CPU Performance rating | |
| Średnia w klasie Multimedia | |
| HP Pavilion Plus 14-ey0095cl | |
| Huawei MateBook X Pro 2023 | |
| Lenovo ThinkPad T14s G4 i7-1365U | |
| Przeciętny Intel Core i7-1355U | |
| Asus ExpertBook B9 B9403CVA-KM0153X | |
| HP Pavilion Plus 14-ew0153TU | |
| Acer Swift Go 14 SFG14-71 | |
| Cinebench R23 / Multi Core | |
| Średnia w klasie Multimedia (4861 - 33362, n=76, ostatnie 2 lata) | |
| HP Pavilion Plus 14-ey0095cl | |
| Huawei MateBook X Pro 2023 | |
| Przeciętny Intel Core i7-1355U (6936 - 10252, n=18) | |
| Lenovo ThinkPad T14s G4 i7-1365U | |
| Acer Swift Go 14 SFG14-71 | |
| Asus ExpertBook B9 B9403CVA-KM0153X | |
| HP Pavilion Plus 14-ew0153TU | |
| Cinebench R23 / Single Core | |
| Średnia w klasie Multimedia (1128 - 2459, n=68, ostatnie 2 lata) | |
| Lenovo ThinkPad T14s G4 i7-1365U | |
| Huawei MateBook X Pro 2023 | |
| Przeciętny Intel Core i7-1355U (1687 - 1889, n=18) | |
| HP Pavilion Plus 14-ew0153TU | |
| Asus ExpertBook B9 B9403CVA-KM0153X | |
| HP Pavilion Plus 14-ey0095cl | |
| Acer Swift Go 14 SFG14-71 | |
| Cinebench R20 / CPU (Multi Core) | |
| Średnia w klasie Multimedia (1887 - 12912, n=59, ostatnie 2 lata) | |
| Huawei MateBook X Pro 2023 | |
| HP Pavilion Plus 14-ey0095cl | |
| Przeciętny Intel Core i7-1355U (2849 - 3907, n=18) | |
| Lenovo ThinkPad T14s G4 i7-1365U | |
| HP Pavilion Plus 14-ew0153TU | |
| Asus ExpertBook B9 B9403CVA-KM0153X | |
| Acer Swift Go 14 SFG14-71 | |
| Cinebench R20 / CPU (Single Core) | |
| Lenovo ThinkPad T14s G4 i7-1365U | |
| Średnia w klasie Multimedia (425 - 853, n=59, ostatnie 2 lata) | |
| Huawei MateBook X Pro 2023 | |
| Przeciętny Intel Core i7-1355U (654 - 725, n=18) | |
| Asus ExpertBook B9 B9403CVA-KM0153X | |
| HP Pavilion Plus 14-ew0153TU | |
| HP Pavilion Plus 14-ey0095cl | |
| Acer Swift Go 14 SFG14-71 | |
| Cinebench R15 / CPU Multi 64Bit | |
| Średnia w klasie Multimedia (856 - 5224, n=63, ostatnie 2 lata) | |
| Huawei MateBook X Pro 2023 | |
| HP Pavilion Plus 14-ey0095cl | |
| Przeciętny Intel Core i7-1355U (1206 - 1735, n=18) | |
| Lenovo ThinkPad T14s G4 i7-1365U | |
| Acer Swift Go 14 SFG14-71 | |
| Asus ExpertBook B9 B9403CVA-KM0153X | |
| HP Pavilion Plus 14-ew0153TU | |
| Cinebench R15 / CPU Single 64Bit | |
| Średnia w klasie Multimedia (184.8 - 326, n=61, ostatnie 2 lata) | |
| Huawei MateBook X Pro 2023 | |
| HP Pavilion Plus 14-ey0095cl | |
| Lenovo ThinkPad T14s G4 i7-1365U | |
| Przeciętny Intel Core i7-1355U (237 - 267, n=18) | |
| Asus ExpertBook B9 B9403CVA-KM0153X | |
| HP Pavilion Plus 14-ew0153TU | |
| Acer Swift Go 14 SFG14-71 | |
| Blender / v2.79 BMW27 CPU | |
| HP Pavilion Plus 14-ew0153TU | |
| Przeciętny Intel Core i7-1355U (328 - 503, n=18) | |
| Asus ExpertBook B9 B9403CVA-KM0153X | |
| Acer Swift Go 14 SFG14-71 | |
| Lenovo ThinkPad T14s G4 i7-1365U | |
| Huawei MateBook X Pro 2023 | |
| HP Pavilion Plus 14-ey0095cl | |
| Średnia w klasie Multimedia (100 - 557, n=60, ostatnie 2 lata) | |
| 7-Zip 18.03 / 7z b 4 | |
| Średnia w klasie Multimedia (26062 - 130368, n=57, ostatnie 2 lata) | |
| HP Pavilion Plus 14-ey0095cl | |
| Huawei MateBook X Pro 2023 | |
| Lenovo ThinkPad T14s G4 i7-1365U | |
| Przeciętny Intel Core i7-1355U (30255 - 42092, n=18) | |
| Asus ExpertBook B9 B9403CVA-KM0153X | |
| Acer Swift Go 14 SFG14-71 | |
| HP Pavilion Plus 14-ew0153TU | |
| 7-Zip 18.03 / 7z b 4 -mmt1 | |
| HP Pavilion Plus 14-ey0095cl | |
| Średnia w klasie Multimedia (3666 - 7545, n=58, ostatnie 2 lata) | |
| Lenovo ThinkPad T14s G4 i7-1365U | |
| Huawei MateBook X Pro 2023 | |
| Przeciętny Intel Core i7-1355U (5301 - 5911, n=18) | |
| HP Pavilion Plus 14-ew0153TU | |
| Asus ExpertBook B9 B9403CVA-KM0153X | |
| Acer Swift Go 14 SFG14-71 | |
| Geekbench 5.5 / Multi-Core | |
| Średnia w klasie Multimedia (4652 - 20422, n=58, ostatnie 2 lata) | |
| HP Pavilion Plus 14-ey0095cl | |
| Huawei MateBook X Pro 2023 | |
| Lenovo ThinkPad T14s G4 i7-1365U | |
| Przeciętny Intel Core i7-1355U (7507 - 9328, n=18) | |
| HP Pavilion Plus 14-ew0153TU | |
| Acer Swift Go 14 SFG14-71 | |
| Asus ExpertBook B9 B9403CVA-KM0153X | |
| Geekbench 5.5 / Single-Core | |
| Średnia w klasie Multimedia (805 - 2974, n=58, ostatnie 2 lata) | |
| HP Pavilion Plus 14-ey0095cl | |
| Lenovo ThinkPad T14s G4 i7-1365U | |
| HP Pavilion Plus 14-ew0153TU | |
| Huawei MateBook X Pro 2023 | |
| Przeciętny Intel Core i7-1355U (1678 - 1872, n=18) | |
| Asus ExpertBook B9 B9403CVA-KM0153X | |
| Acer Swift Go 14 SFG14-71 | |
| HWBOT x265 Benchmark v2.2 / 4k Preset | |
| Średnia w klasie Multimedia (5.26 - 36.1, n=58, ostatnie 2 lata) | |
| HP Pavilion Plus 14-ey0095cl | |
| Huawei MateBook X Pro 2023 | |
| Lenovo ThinkPad T14s G4 i7-1365U | |
| Przeciętny Intel Core i7-1355U (7.83 - 11.4, n=18) | |
| Acer Swift Go 14 SFG14-71 | |
| HP Pavilion Plus 14-ew0153TU | |
| Asus ExpertBook B9 B9403CVA-KM0153X | |
| LibreOffice / 20 Documents To PDF | |
| Acer Swift Go 14 SFG14-71 | |
| HP Pavilion Plus 14-ew0153TU | |
| Asus ExpertBook B9 B9403CVA-KM0153X | |
| Przeciętny Intel Core i7-1355U (41.1 - 108.6, n=18) | |
| HP Pavilion Plus 14-ey0095cl | |
| Średnia w klasie Multimedia (23.9 - 146.7, n=59, ostatnie 2 lata) | |
| Lenovo ThinkPad T14s G4 i7-1365U | |
| Huawei MateBook X Pro 2023 | |
| R Benchmark 2.5 / Overall mean | |
| Acer Swift Go 14 SFG14-71 | |
| Przeciętny Intel Core i7-1355U (0.4481 - 0.832, n=18) | |
| Asus ExpertBook B9 B9403CVA-KM0153X | |
| HP Pavilion Plus 14-ew0153TU | |
| Średnia w klasie Multimedia (0.3604 - 0.947, n=58, ostatnie 2 lata) | |
| Huawei MateBook X Pro 2023 | |
| HP Pavilion Plus 14-ey0095cl | |
| Lenovo ThinkPad T14s G4 i7-1365U | |
* ... im mniej tym lepiej
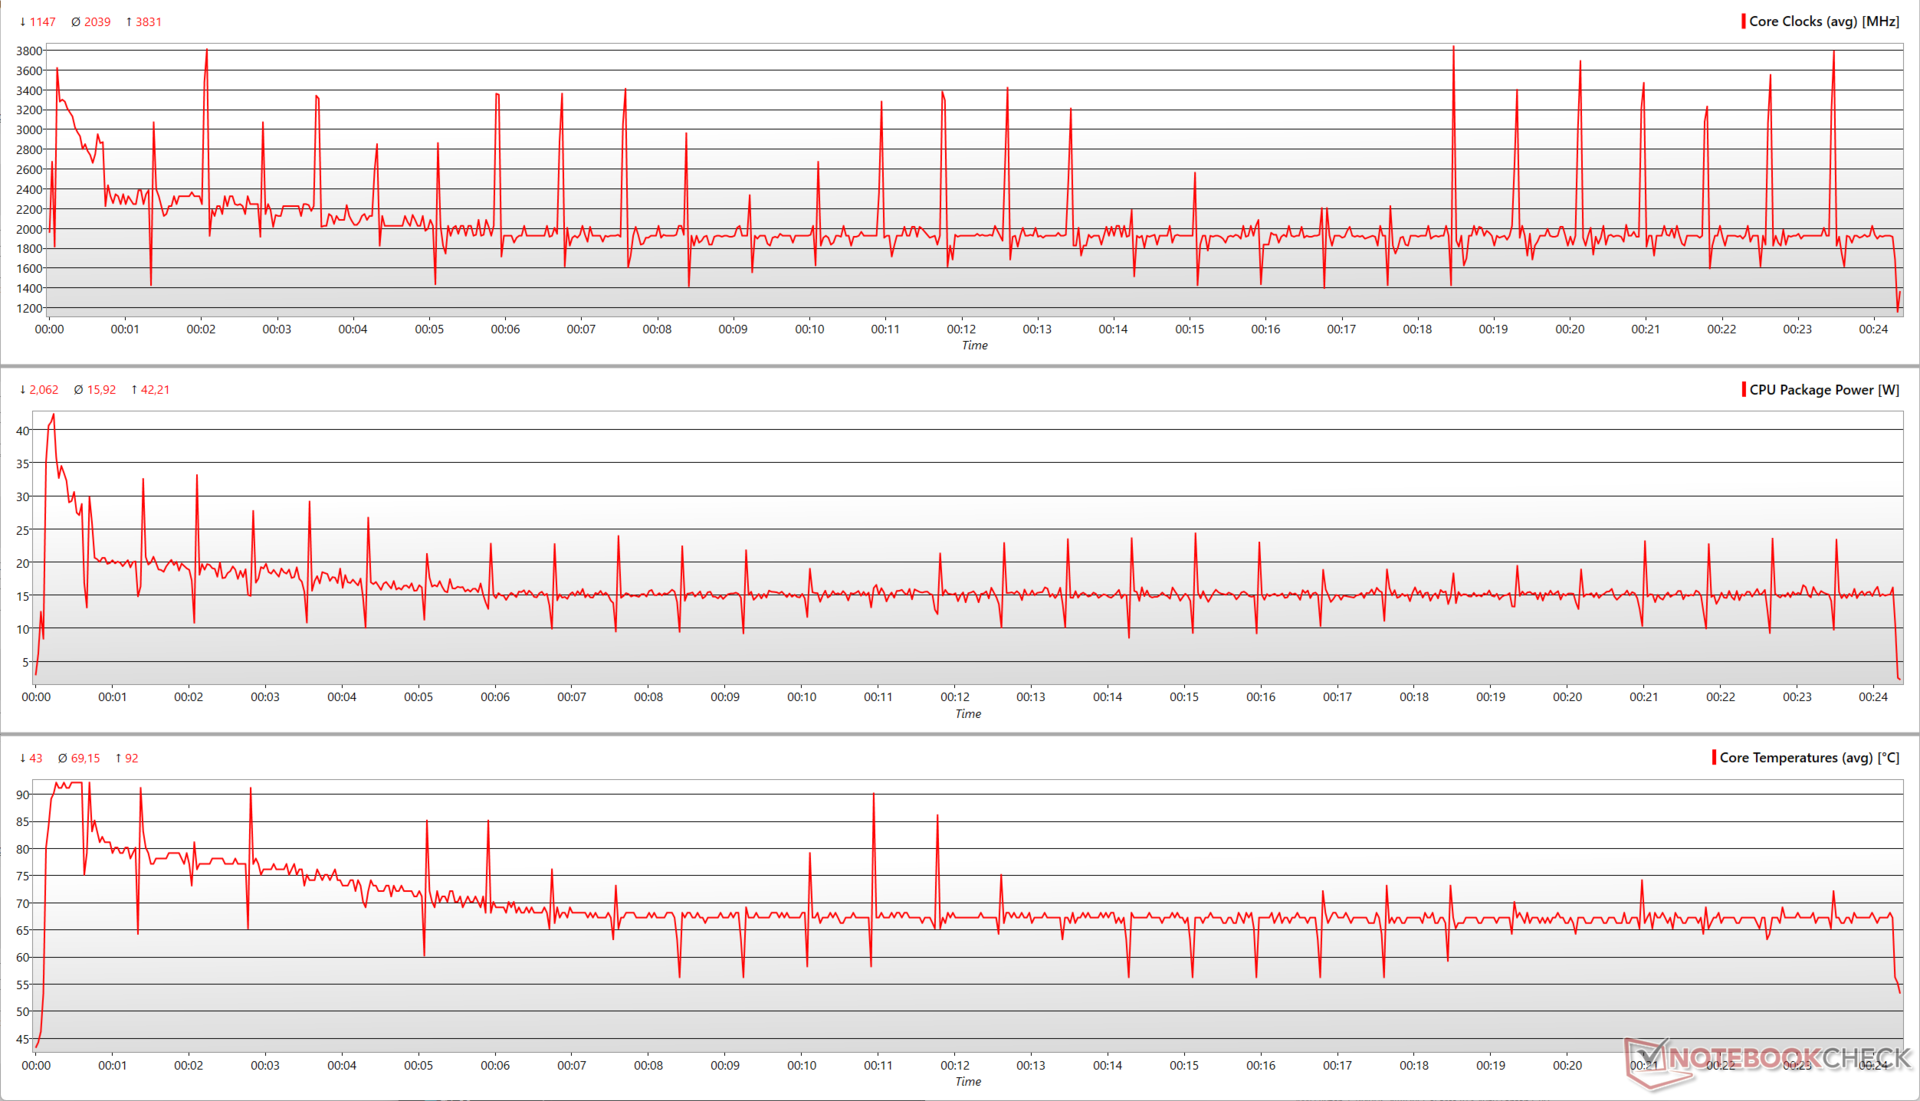
Spojrzenie na różne parametry procesora podczas uruchamiania wielordzeniowej pętli Cinebench R15 pokazuje, że Core i7-1355U jest w stanie osiągnąć szczytowe przyspieszenie 3,83 GHz przy zużyciu 42,2 W. Podczas biegu procesor osiąga średnio 2 GHz przy 16 W.
Pavilion Plus 14 domyślnie ustawia się na Najlepszą wydajność po podłączeniu i na profil Zrównoważony na zasilaniu bateryjnym. Z jakiegoś powodu Core i7-1355U prezentuje osobliwe wyniki w Cinebench na baterii, gdzie wydaje się faworyzować tryb zrównoważony w porównaniu do trybu najlepszej wydajności.
W związku z tym, podczas gdy wydajność jednordzeniowa Cinebench R20 zgodnie z oczekiwaniami spada o ~24%, wynik wielordzeniowy co ciekawe wykazuje 3% wzrost na zasilaniu bateryjnym. Zaobserwowaliśmy ten sam anomalny wynik nawet po wielu uruchomieniach, a także w Cinebench R23.
AIDA64: FP32 Ray-Trace | FPU Julia | CPU SHA3 | CPU Queen | FPU SinJulia | FPU Mandel | CPU AES | CPU ZLib | FP64 Ray-Trace | CPU PhotoWorxx
| Performance rating | |
| Średnia w klasie Multimedia | |
| HP Pavilion Plus 14-ey0095cl | |
| Huawei MateBook X Pro 2023 | |
| Lenovo ThinkPad T14s G4 i7-1365U | |
| Przeciętny Intel Core i7-1355U | |
| Asus ExpertBook B9 B9403CVA-KM0153X | |
| Acer Swift Go 14 SFG14-71 | |
| HP Pavilion Plus 14-ew0153TU | |
| AIDA64 / FP32 Ray-Trace | |
| HP Pavilion Plus 14-ey0095cl | |
| Średnia w klasie Multimedia (2214 - 50388, n=55, ostatnie 2 lata) | |
| Huawei MateBook X Pro 2023 | |
| Lenovo ThinkPad T14s G4 i7-1365U | |
| Przeciętny Intel Core i7-1355U (5673 - 8424, n=18) | |
| Asus ExpertBook B9 B9403CVA-KM0153X | |
| Acer Swift Go 14 SFG14-71 | |
| HP Pavilion Plus 14-ew0153TU | |
| AIDA64 / FPU Julia | |
| Średnia w klasie Multimedia (12867 - 201874, n=56, ostatnie 2 lata) | |
| HP Pavilion Plus 14-ey0095cl | |
| Huawei MateBook X Pro 2023 | |
| Lenovo ThinkPad T14s G4 i7-1365U | |
| Przeciętny Intel Core i7-1355U (29580 - 42706, n=18) | |
| Asus ExpertBook B9 B9403CVA-KM0153X | |
| Acer Swift Go 14 SFG14-71 | |
| HP Pavilion Plus 14-ew0153TU | |
| AIDA64 / CPU SHA3 | |
| Średnia w klasie Multimedia (626 - 8623, n=56, ostatnie 2 lata) | |
| HP Pavilion Plus 14-ey0095cl | |
| Huawei MateBook X Pro 2023 | |
| Lenovo ThinkPad T14s G4 i7-1365U | |
| Przeciętny Intel Core i7-1355U (1529 - 2200, n=18) | |
| Asus ExpertBook B9 B9403CVA-KM0153X | |
| Acer Swift Go 14 SFG14-71 | |
| HP Pavilion Plus 14-ew0153TU | |
| AIDA64 / CPU Queen | |
| HP Pavilion Plus 14-ey0095cl | |
| Huawei MateBook X Pro 2023 | |
| Średnia w klasie Multimedia (13483 - 181505, n=43, ostatnie 2 lata) | |
| Lenovo ThinkPad T14s G4 i7-1365U | |
| Przeciętny Intel Core i7-1355U (21547 - 66907, n=18) | |
| HP Pavilion Plus 14-ew0153TU | |
| Asus ExpertBook B9 B9403CVA-KM0153X | |
| Acer Swift Go 14 SFG14-71 | |
| AIDA64 / FPU SinJulia | |
| HP Pavilion Plus 14-ey0095cl | |
| Średnia w klasie Multimedia (886 - 28794, n=56, ostatnie 2 lata) | |
| Huawei MateBook X Pro 2023 | |
| Lenovo ThinkPad T14s G4 i7-1365U | |
| Przeciętny Intel Core i7-1355U (4045 - 5426, n=18) | |
| Asus ExpertBook B9 B9403CVA-KM0153X | |
| HP Pavilion Plus 14-ew0153TU | |
| Acer Swift Go 14 SFG14-71 | |
| AIDA64 / FPU Mandel | |
| Średnia w klasie Multimedia (6395 - 105740, n=55, ostatnie 2 lata) | |
| HP Pavilion Plus 14-ey0095cl | |
| Huawei MateBook X Pro 2023 | |
| Lenovo ThinkPad T14s G4 i7-1365U | |
| Przeciętny Intel Core i7-1355U (14596 - 21627, n=18) | |
| Asus ExpertBook B9 B9403CVA-KM0153X | |
| Acer Swift Go 14 SFG14-71 | |
| HP Pavilion Plus 14-ew0153TU | |
| AIDA64 / CPU AES | |
| Huawei MateBook X Pro 2023 | |
| Średnia w klasie Multimedia (8171 - 126790, n=56, ostatnie 2 lata) | |
| HP Pavilion Plus 14-ey0095cl | |
| Przeciętny Intel Core i7-1355U (31432 - 75408, n=18) | |
| Lenovo ThinkPad T14s G4 i7-1365U | |
| Asus ExpertBook B9 B9403CVA-KM0153X | |
| Acer Swift Go 14 SFG14-71 | |
| HP Pavilion Plus 14-ew0153TU | |
| AIDA64 / CPU ZLib | |
| Średnia w klasie Multimedia (143.8 - 2022, n=56, ostatnie 2 lata) | |
| HP Pavilion Plus 14-ey0095cl | |
| Huawei MateBook X Pro 2023 | |
| Lenovo ThinkPad T14s G4 i7-1365U | |
| Przeciętny Intel Core i7-1355U (454 - 684, n=18) | |
| Asus ExpertBook B9 B9403CVA-KM0153X | |
| Acer Swift Go 14 SFG14-71 | |
| HP Pavilion Plus 14-ew0153TU | |
| AIDA64 / FP64 Ray-Trace | |
| HP Pavilion Plus 14-ey0095cl | |
| Średnia w klasie Multimedia (1014 - 26875, n=56, ostatnie 2 lata) | |
| Huawei MateBook X Pro 2023 | |
| Lenovo ThinkPad T14s G4 i7-1365U | |
| Asus ExpertBook B9 B9403CVA-KM0153X | |
| Przeciętny Intel Core i7-1355U (2991 - 4453, n=18) | |
| Acer Swift Go 14 SFG14-71 | |
| HP Pavilion Plus 14-ew0153TU | |
| AIDA64 / CPU PhotoWorxx | |
| Średnia w klasie Multimedia (8187 - 88154, n=56, ostatnie 2 lata) | |
| Huawei MateBook X Pro 2023 | |
| Lenovo ThinkPad T14s G4 i7-1365U | |
| Asus ExpertBook B9 B9403CVA-KM0153X | |
| HP Pavilion Plus 14-ew0153TU | |
| Przeciętny Intel Core i7-1355U (21800 - 46154, n=18) | |
| Acer Swift Go 14 SFG14-71 | |
| HP Pavilion Plus 14-ey0095cl | |
Proszę sprawdzić nasz dedykowany Intel Core i7-1355U aby uzyskać więcej informacji i porównać wydajność.
Wydajność systemu
Oparty na AMD Pavilion Plus 14 ma 19% przewagi nad wersją z Core i7 w łącznych wynikach PCMark 10. Jednak oba urządzenia są praktycznie remisowe w skumulowanych testach CrossMark. Ogólnie rzecz biorąc, Pavilion Plus 14 nie sprawia żadnych problemów w codziennym użytkowaniu i przeglądaniu stron internetowych.
CrossMark: Overall | Productivity | Creativity | Responsiveness
AIDA64: Memory Copy | Memory Read | Memory Write | Memory Latency
WebXPRT 3: Overall
WebXPRT 4: Overall
Mozilla Kraken 1.1: Total
| PCMark 10 / Score | |
| Średnia w klasie Multimedia (4325 - 10386, n=54, ostatnie 2 lata) | |
| HP Pavilion Plus 14-ey0095cl | |
| Lenovo ThinkPad T14s G4 i7-1365U | |
| Asus ExpertBook B9 B9403CVA-KM0153X | |
| Przeciętny Intel Core i7-1355U, Intel Iris Xe Graphics G7 96EUs (5455 - 5933, n=15) | |
| Huawei MateBook X Pro 2023 | |
| HP Pavilion Plus 14-ew0153TU | |
| Acer Swift Go 14 SFG14-71 | |
| PCMark 10 / Essentials | |
| Lenovo ThinkPad T14s G4 i7-1365U | |
| Przeciętny Intel Core i7-1355U, Intel Iris Xe Graphics G7 96EUs (10203 - 11822, n=15) | |
| Asus ExpertBook B9 B9403CVA-KM0153X | |
| Średnia w klasie Multimedia (8025 - 11664, n=53, ostatnie 2 lata) | |
| HP Pavilion Plus 14-ew0153TU | |
| Acer Swift Go 14 SFG14-71 | |
| Huawei MateBook X Pro 2023 | |
| HP Pavilion Plus 14-ey0095cl | |
| PCMark 10 / Productivity | |
| Średnia w klasie Multimedia (7323 - 18233, n=53, ostatnie 2 lata) | |
| HP Pavilion Plus 14-ey0095cl | |
| Lenovo ThinkPad T14s G4 i7-1365U | |
| Asus ExpertBook B9 B9403CVA-KM0153X | |
| Przeciętny Intel Core i7-1355U, Intel Iris Xe Graphics G7 96EUs (6763 - 7536, n=15) | |
| Huawei MateBook X Pro 2023 | |
| Acer Swift Go 14 SFG14-71 | |
| HP Pavilion Plus 14-ew0153TU | |
| PCMark 10 / Digital Content Creation | |
| Średnia w klasie Multimedia (3651 - 16240, n=53, ostatnie 2 lata) | |
| HP Pavilion Plus 14-ey0095cl | |
| Huawei MateBook X Pro 2023 | |
| Lenovo ThinkPad T14s G4 i7-1365U | |
| HP Pavilion Plus 14-ew0153TU | |
| Przeciętny Intel Core i7-1355U, Intel Iris Xe Graphics G7 96EUs (5723 - 6712, n=15) | |
| Acer Swift Go 14 SFG14-71 | |
| Asus ExpertBook B9 B9403CVA-KM0153X | |
| CrossMark / Overall | |
| Średnia w klasie Multimedia (866 - 2728, n=62, ostatnie 2 lata) | |
| Huawei MateBook X Pro 2023 | |
| Lenovo ThinkPad T14s G4 i7-1365U | |
| Przeciętny Intel Core i7-1355U, Intel Iris Xe Graphics G7 96EUs (1478 - 1643, n=15) | |
| Asus ExpertBook B9 B9403CVA-KM0153X | |
| HP Pavilion Plus 14-ew0153TU | |
| HP Pavilion Plus 14-ey0095cl | |
| Acer Swift Go 14 SFG14-71 | |
| CrossMark / Productivity | |
| Huawei MateBook X Pro 2023 | |
| Średnia w klasie Multimedia (931 - 2489, n=62, ostatnie 2 lata) | |
| Lenovo ThinkPad T14s G4 i7-1365U | |
| HP Pavilion Plus 14-ew0153TU | |
| Przeciętny Intel Core i7-1355U, Intel Iris Xe Graphics G7 96EUs (1444 - 1665, n=15) | |
| Asus ExpertBook B9 B9403CVA-KM0153X | |
| HP Pavilion Plus 14-ey0095cl | |
| Acer Swift Go 14 SFG14-71 | |
| CrossMark / Creativity | |
| Średnia w klasie Multimedia (907 - 3465, n=62, ostatnie 2 lata) | |
| Huawei MateBook X Pro 2023 | |
| Lenovo ThinkPad T14s G4 i7-1365U | |
| Asus ExpertBook B9 B9403CVA-KM0153X | |
| HP Pavilion Plus 14-ey0095cl | |
| Przeciętny Intel Core i7-1355U, Intel Iris Xe Graphics G7 96EUs (1563 - 1732, n=15) | |
| HP Pavilion Plus 14-ew0153TU | |
| Acer Swift Go 14 SFG14-71 | |
| CrossMark / Responsiveness | |
| Huawei MateBook X Pro 2023 | |
| Średnia w klasie Multimedia (605 - 2024, n=62, ostatnie 2 lata) | |
| Acer Swift Go 14 SFG14-71 | |
| Lenovo ThinkPad T14s G4 i7-1365U | |
| Przeciętny Intel Core i7-1355U, Intel Iris Xe Graphics G7 96EUs (1217 - 1681, n=15) | |
| HP Pavilion Plus 14-ew0153TU | |
| Asus ExpertBook B9 B9403CVA-KM0153X | |
| HP Pavilion Plus 14-ey0095cl | |
| AIDA64 / Memory Copy | |
| Średnia w klasie Multimedia (11299 - 132135, n=56, ostatnie 2 lata) | |
| HP Pavilion Plus 14-ey0095cl | |
| Huawei MateBook X Pro 2023 | |
| Asus ExpertBook B9 B9403CVA-KM0153X | |
| Przeciętny Intel Core i7-1355U, Intel Iris Xe Graphics G7 96EUs (35017 - 71600, n=15) | |
| HP Pavilion Plus 14-ew0153TU | |
| Lenovo ThinkPad T14s G4 i7-1365U | |
| Acer Swift Go 14 SFG14-71 | |
| AIDA64 / Memory Read | |
| Średnia w klasie Multimedia (11624 - 174586, n=56, ostatnie 2 lata) | |
| Huawei MateBook X Pro 2023 | |
| Przeciętny Intel Core i7-1355U, Intel Iris Xe Graphics G7 96EUs (38551 - 58600, n=15) | |
| HP Pavilion Plus 14-ey0095cl | |
| Lenovo ThinkPad T14s G4 i7-1365U | |
| HP Pavilion Plus 14-ew0153TU | |
| Asus ExpertBook B9 B9403CVA-KM0153X | |
| Acer Swift Go 14 SFG14-71 | |
| AIDA64 / Memory Write | |
| HP Pavilion Plus 14-ey0095cl | |
| Huawei MateBook X Pro 2023 | |
| Średnia w klasie Multimedia (11755 - 134998, n=56, ostatnie 2 lata) | |
| HP Pavilion Plus 14-ew0153TU | |
| Asus ExpertBook B9 B9403CVA-KM0153X | |
| Przeciętny Intel Core i7-1355U, Intel Iris Xe Graphics G7 96EUs (35910 - 93342, n=15) | |
| Lenovo ThinkPad T14s G4 i7-1365U | |
| Acer Swift Go 14 SFG14-71 | |
| AIDA64 / Memory Latency | |
| Średnia w klasie Multimedia (7 - 535, n=55, ostatnie 2 lata) | |
| Przeciętny Intel Core i7-1355U, Intel Iris Xe Graphics G7 96EUs (80.3 - 346, n=15) | |
| Acer Swift Go 14 SFG14-71 | |
| HP Pavilion Plus 14-ey0095cl | |
| HP Pavilion Plus 14-ew0153TU | |
| Huawei MateBook X Pro 2023 | |
| Lenovo ThinkPad T14s G4 i7-1365U | |
| Asus ExpertBook B9 B9403CVA-KM0153X | |
| WebXPRT 3 / Overall | |
| Średnia w klasie Multimedia (136.4 - 596, n=65, ostatnie 2 lata) | |
| Lenovo ThinkPad T14s G4 i7-1365U | |
| HP Pavilion Plus 14-ey0095cl | |
| Asus ExpertBook B9 B9403CVA-KM0153X | |
| HP Pavilion Plus 14-ew0153TU | |
| Przeciętny Intel Core i7-1355U, Intel Iris Xe Graphics G7 96EUs (149.2 - 295, n=15) | |
| Acer Swift Go 14 SFG14-71 | |
| WebXPRT 4 / Overall | |
| Średnia w klasie Multimedia (167.3 - 402, n=67, ostatnie 2 lata) | |
| Lenovo ThinkPad T14s G4 i7-1365U | |
| HP Pavilion Plus 14-ew0153TU | |
| Przeciętny Intel Core i7-1355U, Intel Iris Xe Graphics G7 96EUs (94.2 - 256, n=13) | |
| Huawei MateBook X Pro 2023 | |
| HP Pavilion Plus 14-ey0095cl | |
| Mozilla Kraken 1.1 / Total | |
| Huawei MateBook X Pro 2023 | |
| Przeciętny Intel Core i7-1355U, Intel Iris Xe Graphics G7 96EUs (507 - 1449, n=15) | |
| HP Pavilion Plus 14-ey0095cl | |
| Acer Swift Go 14 SFG14-71 | |
| Acer Swift Go 14 SFG14-71 | |
| Asus ExpertBook B9 B9403CVA-KM0153X | |
| HP Pavilion Plus 14-ew0153TU | |
| Lenovo ThinkPad T14s G4 i7-1365U | |
| Średnia w klasie Multimedia (228 - 835, n=68, ostatnie 2 lata) | |
* ... im mniej tym lepiej
| PCMark 8 Home Score Accelerated v2 | 5169 pkt. | |
| PCMark 8 Work Score Accelerated v2 | 3115 pkt. | |
| PCMark 10 Score | 5455 pkt. | |
Pomoc | ||
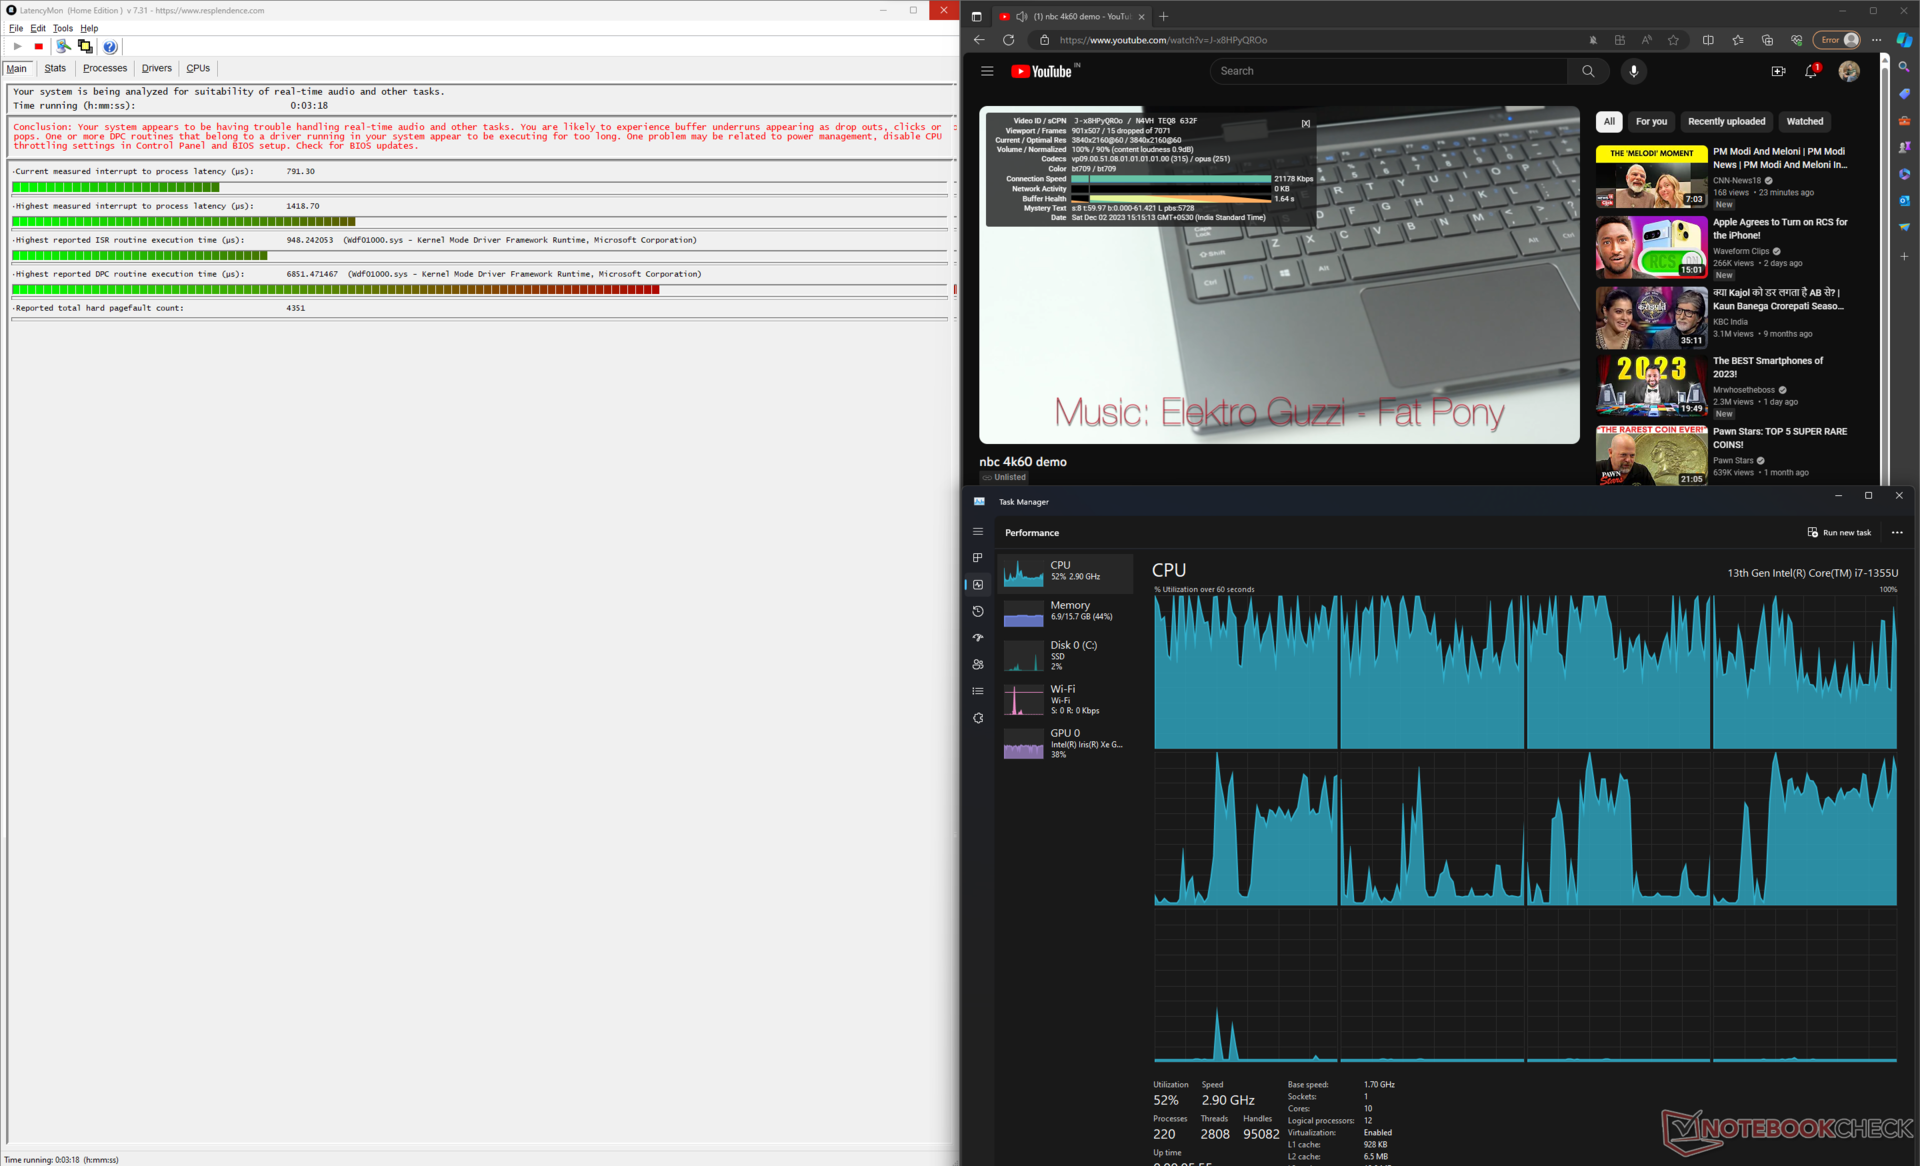
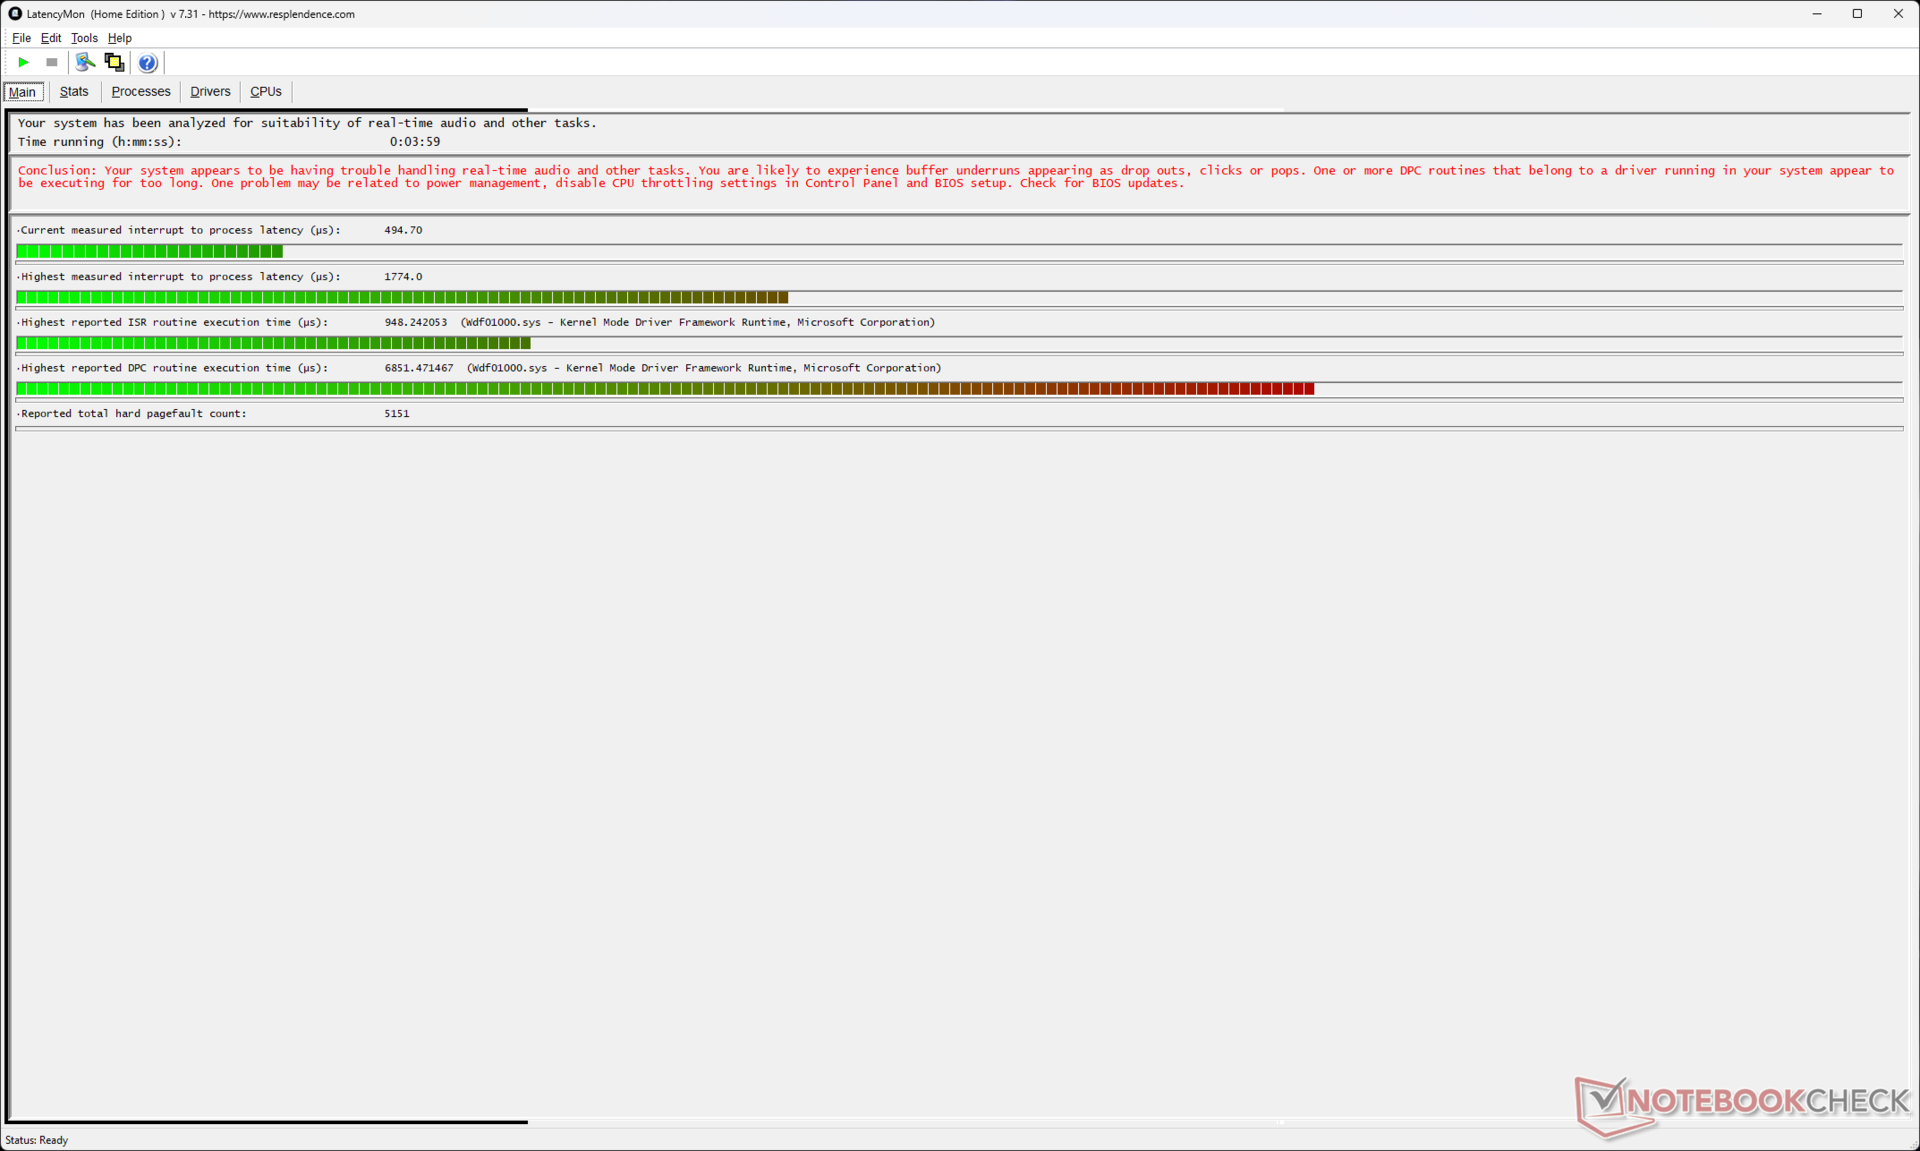
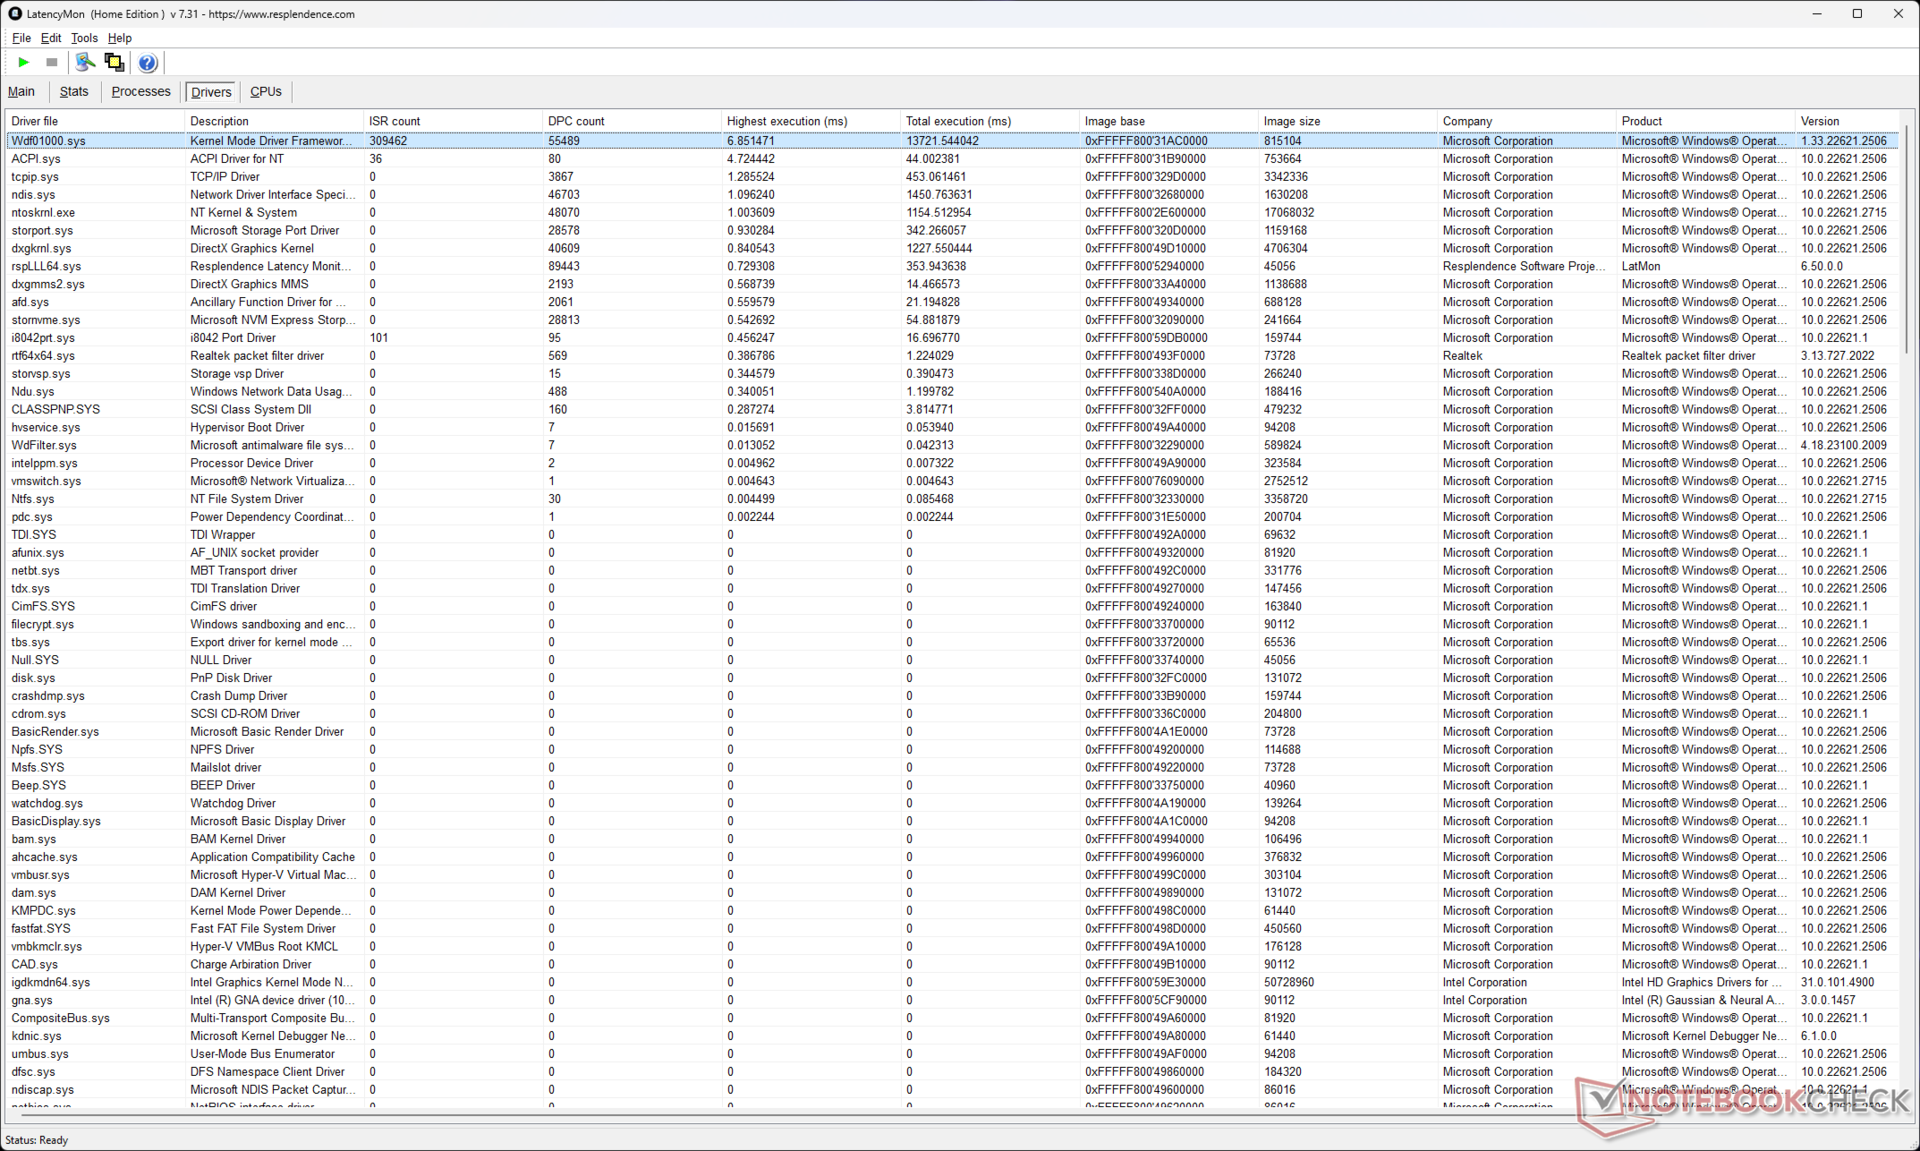
Opóźnienie DPC
Opóźnienie DPC jest lepsze niż w przypadku niektórych konkurentów Pavilion Plus 14, w tym wariantu AMD, czyli Lenovo ThinkPad T14si Huawei MateBook X Pro ale wciąż jest na wyższym poziomie.
| DPC Latencies / LatencyMon - interrupt to process latency (max), Web, Youtube, Prime95 | |
| Huawei MateBook X Pro 2023 | |
| HP Pavilion Plus 14-ey0095cl | |
| Lenovo ThinkPad T14s G4 i7-1365U | |
| HP Pavilion Plus 14-ew0153TU | |
| Asus ExpertBook B9 B9403CVA-KM0153X | |
| Acer Swift Go 14 SFG14-71 | |
* ... im mniej tym lepiej
Nasz Ranking opóźnień DPC znajdą Państwo przegląd zmierzonych odczytów LatencyMon na recenzowanych urządzeniach.
Urządzenia pamięci masowej
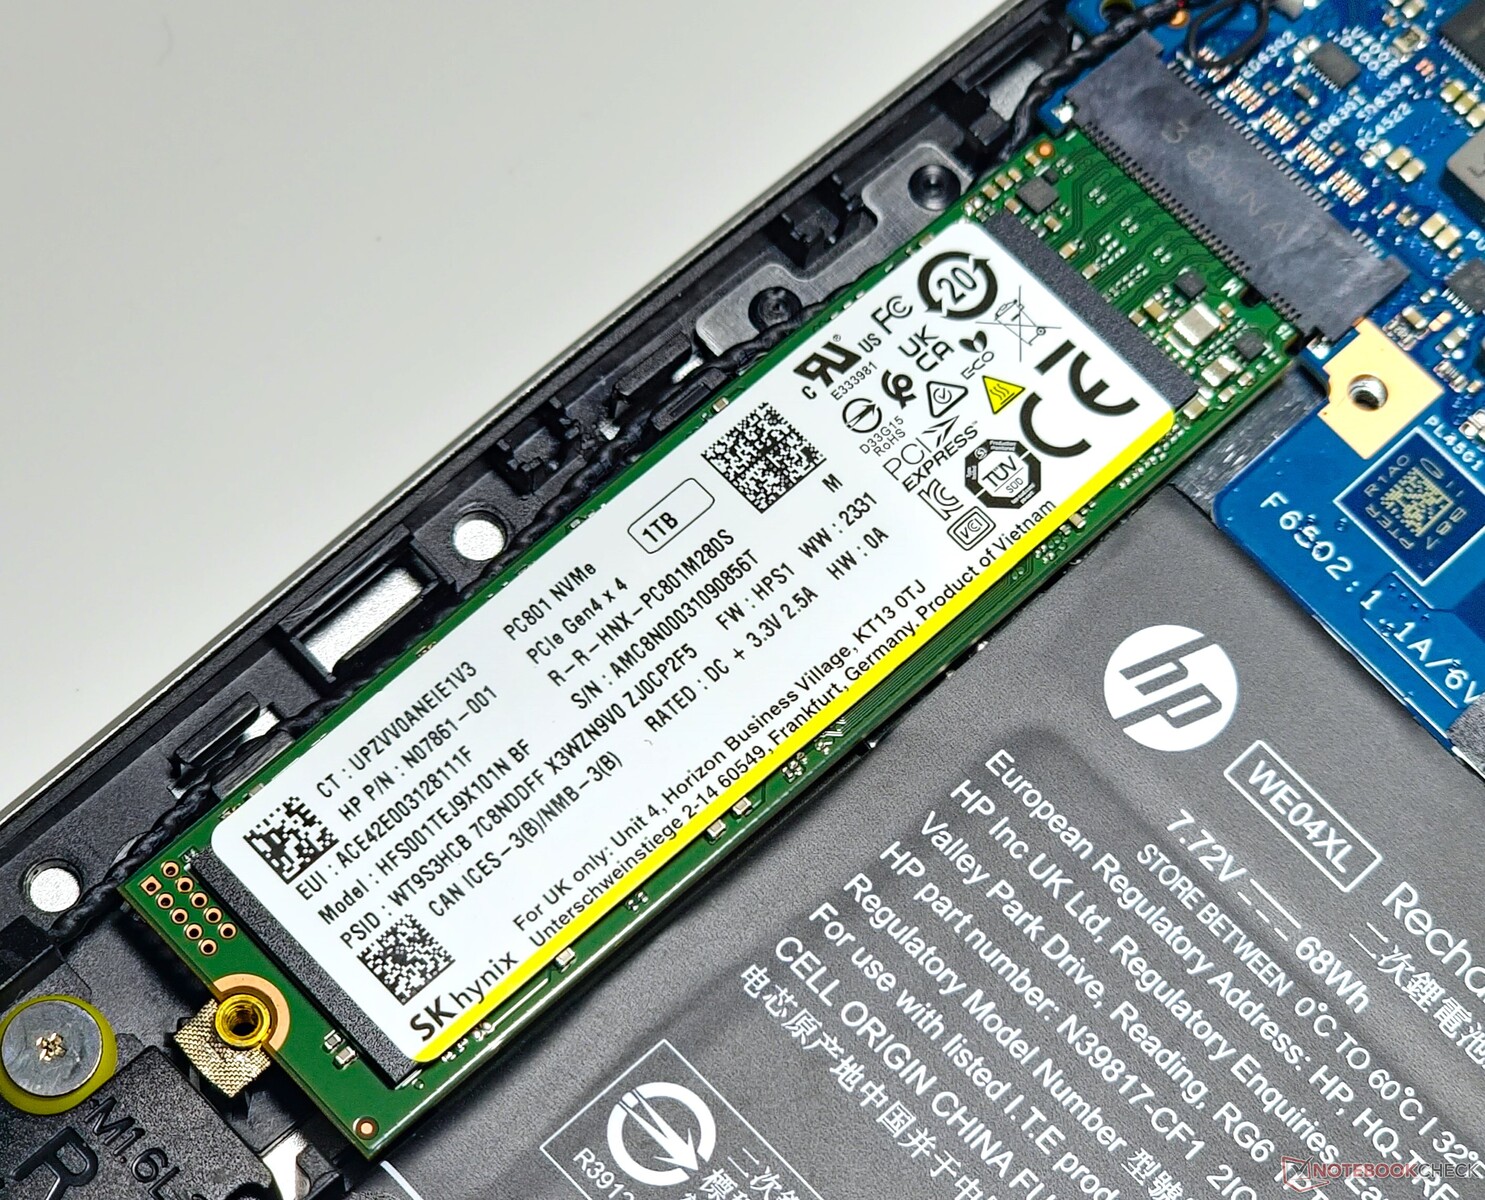
Nasz egzemplarz Pavilion Plus 14 został wyposażony w dysk SSD SK Hynix PC801 PCIe Gen4 NVMe. Łączna wydajność jest o około 26% wolniejsza niż średnie wyniki odnotowane dla tego dysku, ale jest tuż po piętach WDC PC SN810 używanego w wersji AMD tego laptopa.
Wydajność dysku jest stosunkowo stabilna, ale zaobserwowaliśmy znaczny spadek prędkości po 20 uruchomieniach w naszym teście pętli odczytu DiskSpd przy głębokości kolejki 8.
Nie ma możliwości dalszej rozbudowy pamięci wewnętrznej.

* ... im mniej tym lepiej
Disk Throttling: DiskSpd Read Loop, Queue Depth 8
Więcej testów porównawczych pamięci masowej można znaleźć na naszej stronie Stronie porównania dysków SSD.
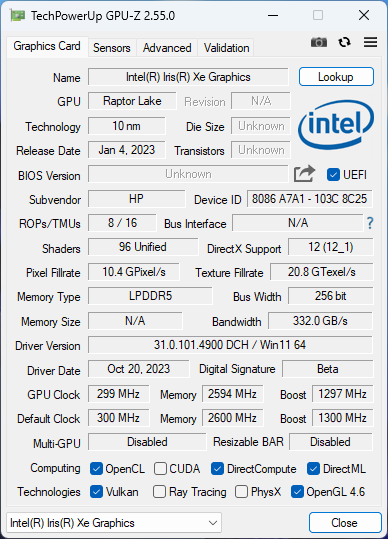
Wydajność GPU
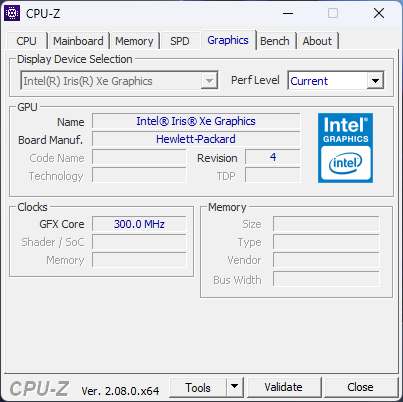
Laptop Pavilion Plus 14 wykorzystuje zintegrowaną kartę graficzną Iris Xe Graphics 96 EU do obsługi grafiki. Łączna wydajność 3DMark jest podobna do innych tego typu laptopów wyposażonych w iGPU.
Jednak wariant Intela jest zdeklasowany przez napędzany przez AMD Pavilion Plus 14 z jego znacznie lepszym Radeon 780M iGPU, który wykazuje o 33% wyższą wydajność. Radeon 780M może wykazać nawet 86% wzrost w testach takich jak 3DMark 11 Performance GPU.
| 3DMark 11 Performance | 6907 pkt. | |
| 3DMark Ice Storm Standard Score | 128665 pkt. | |
| 3DMark Cloud Gate Standard Score | 21922 pkt. | |
| 3DMark Fire Strike Score | 4926 pkt. | |
| 3DMark Fire Strike Extreme Score | 2398 pkt. | |
| 3DMark Time Spy Score | 1753 pkt. | |
Pomoc | ||
* ... im mniej tym lepiej
Wydajność w grach
Pavilion Plus 14 nie jest przeznaczony do gier. Układ graficzny Iris Xe Graphics jest w stanie uruchomić tylko tytuły z przeszłości, i to w najlepszym przypadku na bardzo niskich lub średnich ustawieniach.
Choć dość niskie, iGPU nadal zarządza względnie stabilną liczbą klatek na sekundę podczas obciążania systemu The Witcher 3 w rozdzielczości 1080p Ultra.
| The Witcher 3 - 1920x1080 Ultra Graphics & Postprocessing (HBAO+) | |
| Średnia w klasie Multimedia (11 - 121, n=10, ostatnie 2 lata) | |
| HP Pavilion Plus 14-ey0095cl | |
| Huawei MateBook X Pro 2023 | |
| Lenovo ThinkPad T14s G4 i7-1365U | |
| Asus ExpertBook B9 B9403CVA-KM0153X | |
| HP Pavilion Plus 14-ew0153TU | |
| Acer Swift Go 14 SFG14-71 | |
The Witcher 3 FPS Chart
| low | med. | high | ultra | |
|---|---|---|---|---|
| GTA V (2015) | 88.5 | 74.3 | 22 | 9.38 |
| The Witcher 3 (2015) | 73.5 | 50.8 | 28 | 13.2 |
| Dota 2 Reborn (2015) | 97.7 | 71.7 | 55.2 | 47.1 |
| Final Fantasy XV Benchmark (2018) | 40.6 | 23.7 | 16.8 | |
| X-Plane 11.11 (2018) | 37.1 | 25.6 | 23 | |
| Far Cry 5 (2018) | 40 | 24 | 23 | 21 |
| Strange Brigade (2018) | 88.3 | 38.1 | 30.6 | 23.4 |
| F1 22 (2022) | 37.6 | 33.5 | 25.4 | 19.1 |
Proszę sprawdzić nasze Karty graficzne Intel Iris Xe 96 EUs aby uzyskać więcej informacji.
Emisje: Niska temperatura powierzchni i hałas wentylatora pod obciążeniem
Hałas systemowy
Wentylator laptopa Pavilion Plus 14 firmy Intel jest ledwo słyszalny podczas codziennego użytkowania. Nawet pod obciążeniem hałas wentylatora wynosi zaledwie około 32 db (A). Nie zauważyliśmy żadnego wycie cewki ani odgłosów z obudowy podczas użytkowania.
Hałas
| luz |
| 20.57 / 20.57 / 20.57 dB |
| obciążenie |
| 32.18 / 32.26 dB |
 | ||
30 dB cichy 40 dB(A) słyszalny 50 dB(A) irytujący |
||
min: | ||
| HP Pavilion Plus 14-ew0153TU Iris Xe G7 96EUs, i7-1355U, SK hynix PC801 HFS001TEJ9X101N | HP Pavilion Plus 14-ey0095cl Radeon 780M, R7 7840U, WDC PC SN810 1TB | Lenovo ThinkPad T14s G4 i7-1365U Iris Xe G7 96EUs, i7-1365U | Acer Swift Go 14 SFG14-71 Iris Xe G7 80EUs, i5-1335U, WD PC SN740 SDDQNQD-512G-1014 | Asus ExpertBook B9 B9403CVA-KM0153X Iris Xe G7 96EUs, i7-1355U, Samsung PM9A1 MZVL21T0HCLR | Huawei MateBook X Pro 2023 Iris Xe G7 96EUs, i7-1360P | |
|---|---|---|---|---|---|---|
| Noise | -20% | -10% | -25% | -22% | -30% | |
| wyłączone / środowisko * (dB) | 19.35 | 23.4 -21% | 23.2 -20% | 24.9 -29% | 24.9 -29% | 25.4 -31% |
| Idle Minimum * (dB) | 20.57 | 24.1 -17% | 23.2 -13% | 24.9 -21% | 24.9 -21% | 25.4 -23% |
| Idle Average * (dB) | 20.57 | 24.1 -17% | 23.2 -13% | 24.9 -21% | 24.9 -21% | 25.4 -23% |
| Idle Maximum * (dB) | 20.57 | 25.3 -23% | 23.6 -15% | 24.9 -21% | 24.9 -21% | 29.6 -44% |
| Load Average * (dB) | 32.18 | 33.4 -4% | 24.3 24% | 31.9 1% | 33 -3% | 42 -31% |
| Witcher 3 ultra * (dB) | 29.44 | 39.4 -34% | 35.7 -21% | 43.2 -47% | ||
| Load Maximum * (dB) | 32.26 | 39.4 -22% | 35.7 -11% | 43.2 -34% | 45 -39% | 40.9 -27% |
* ... im mniej tym lepiej
Temperatura
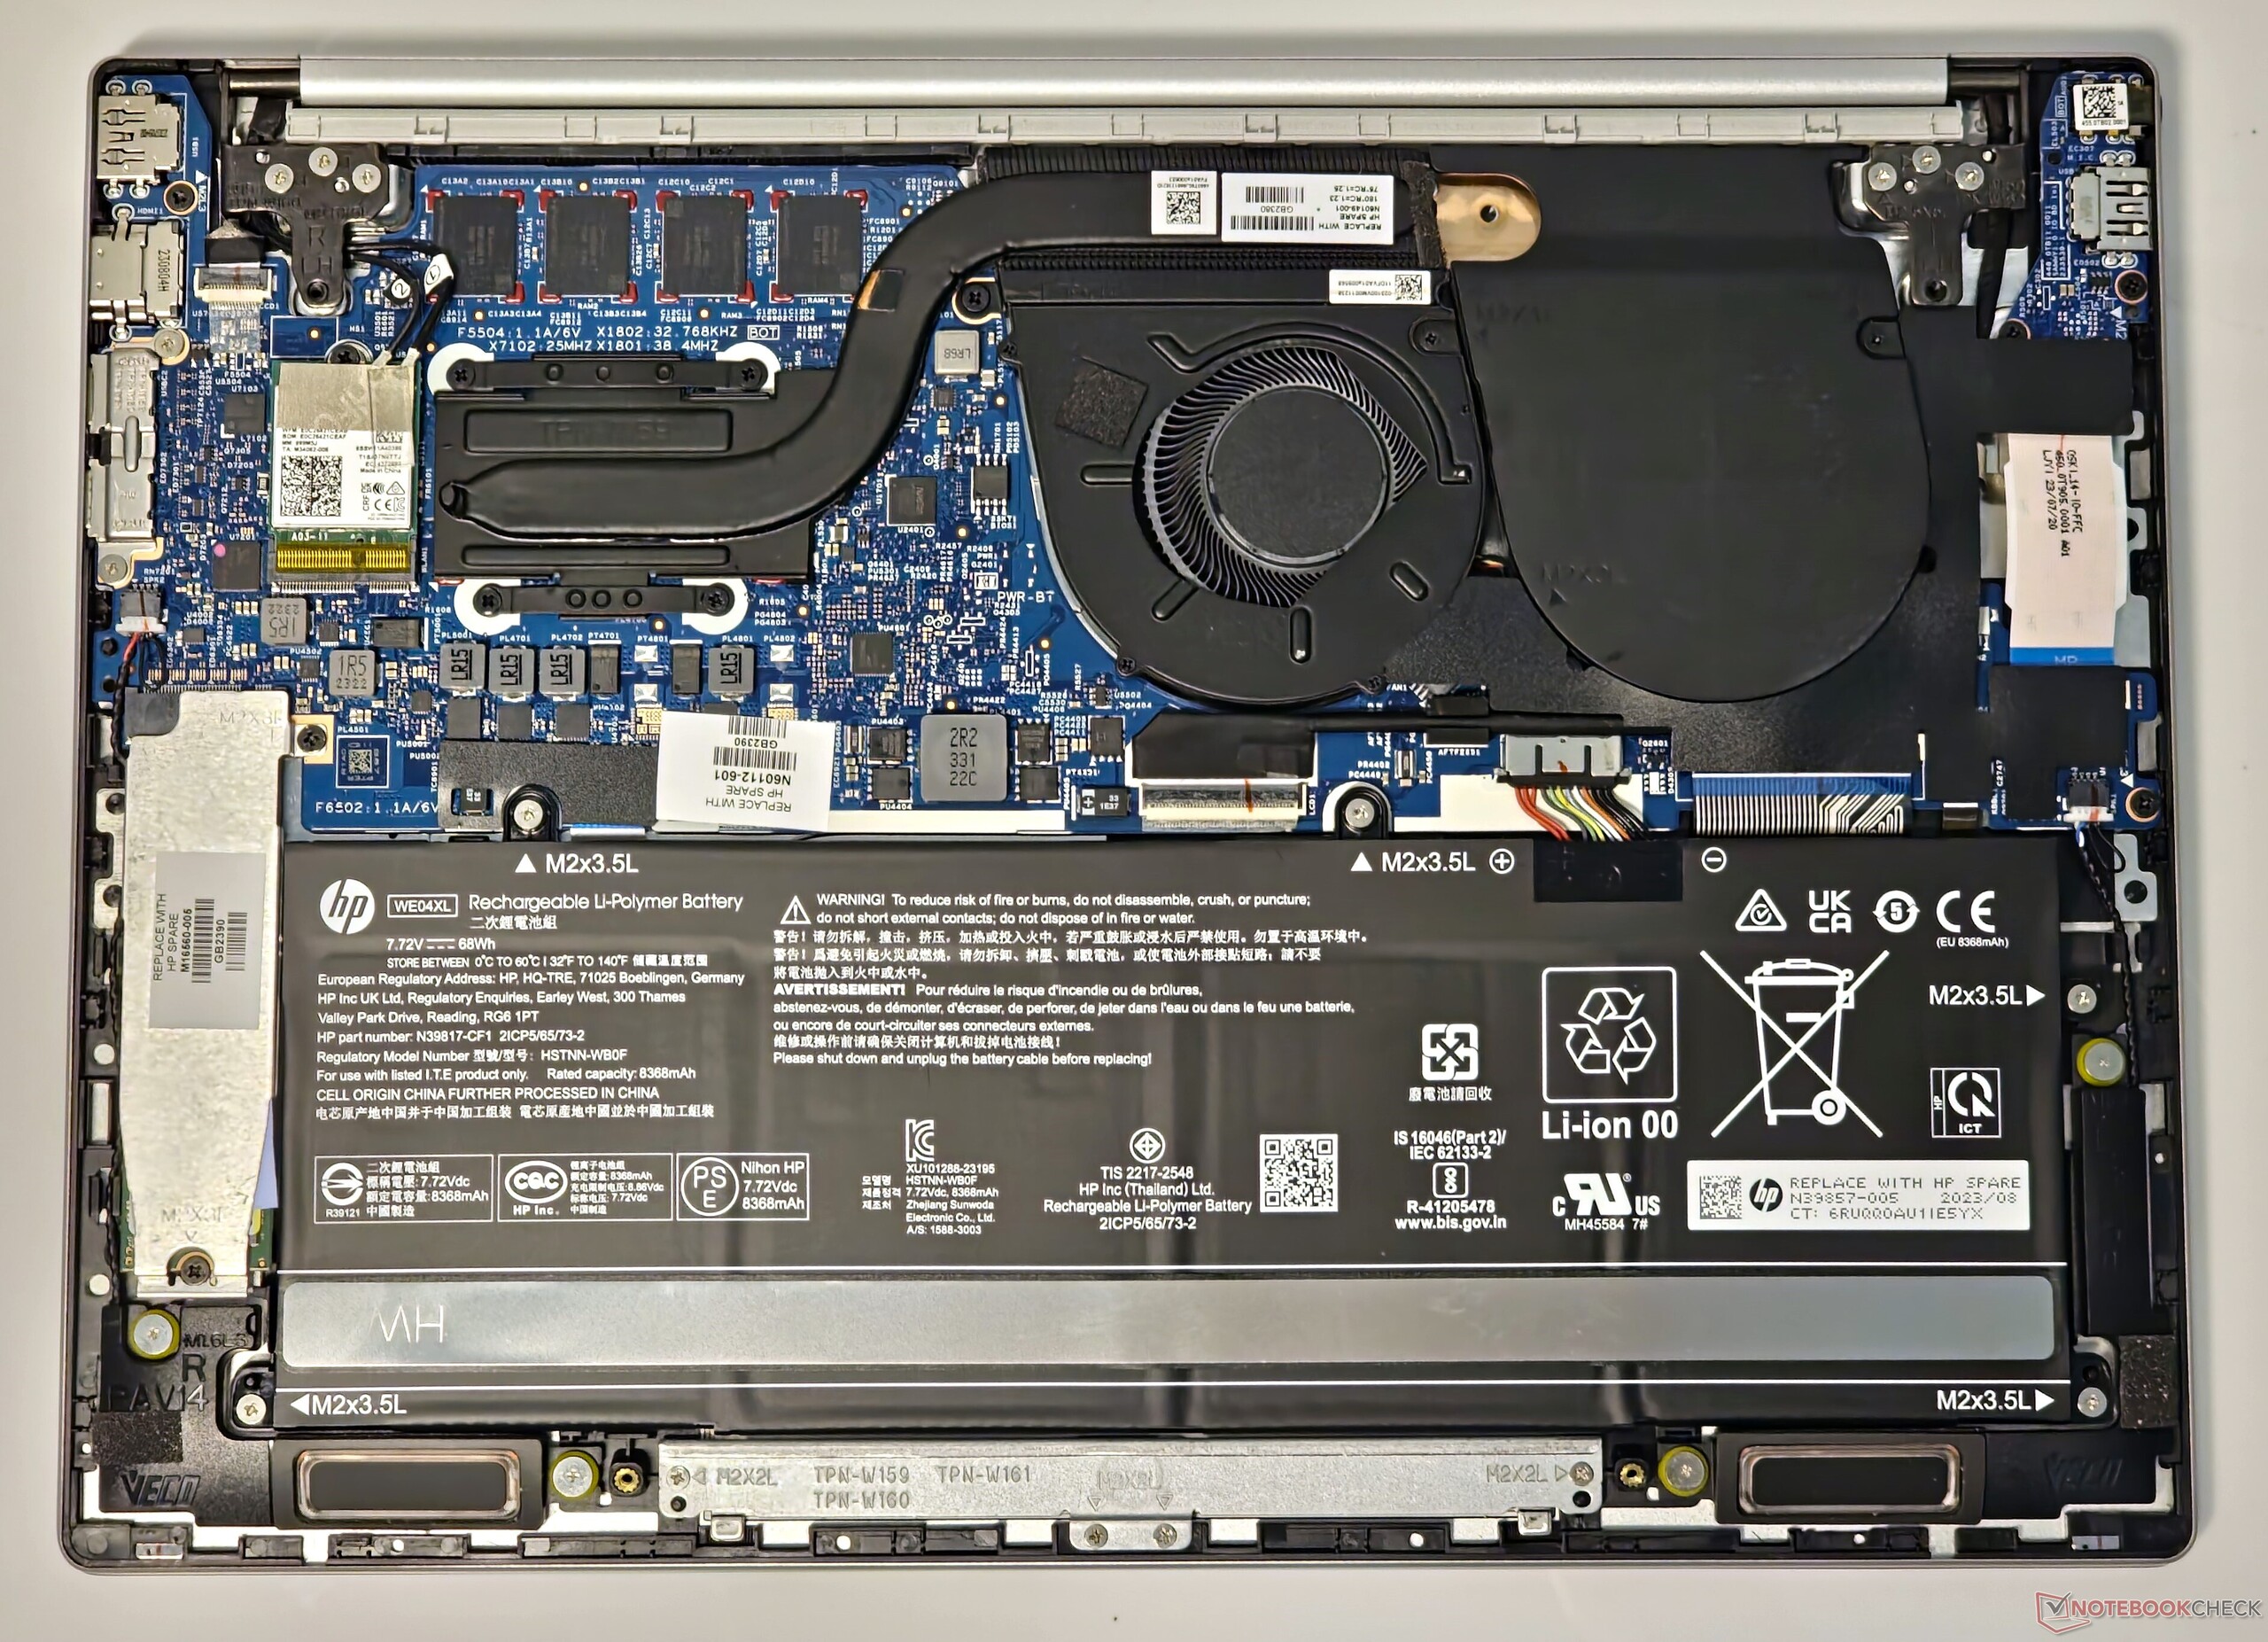
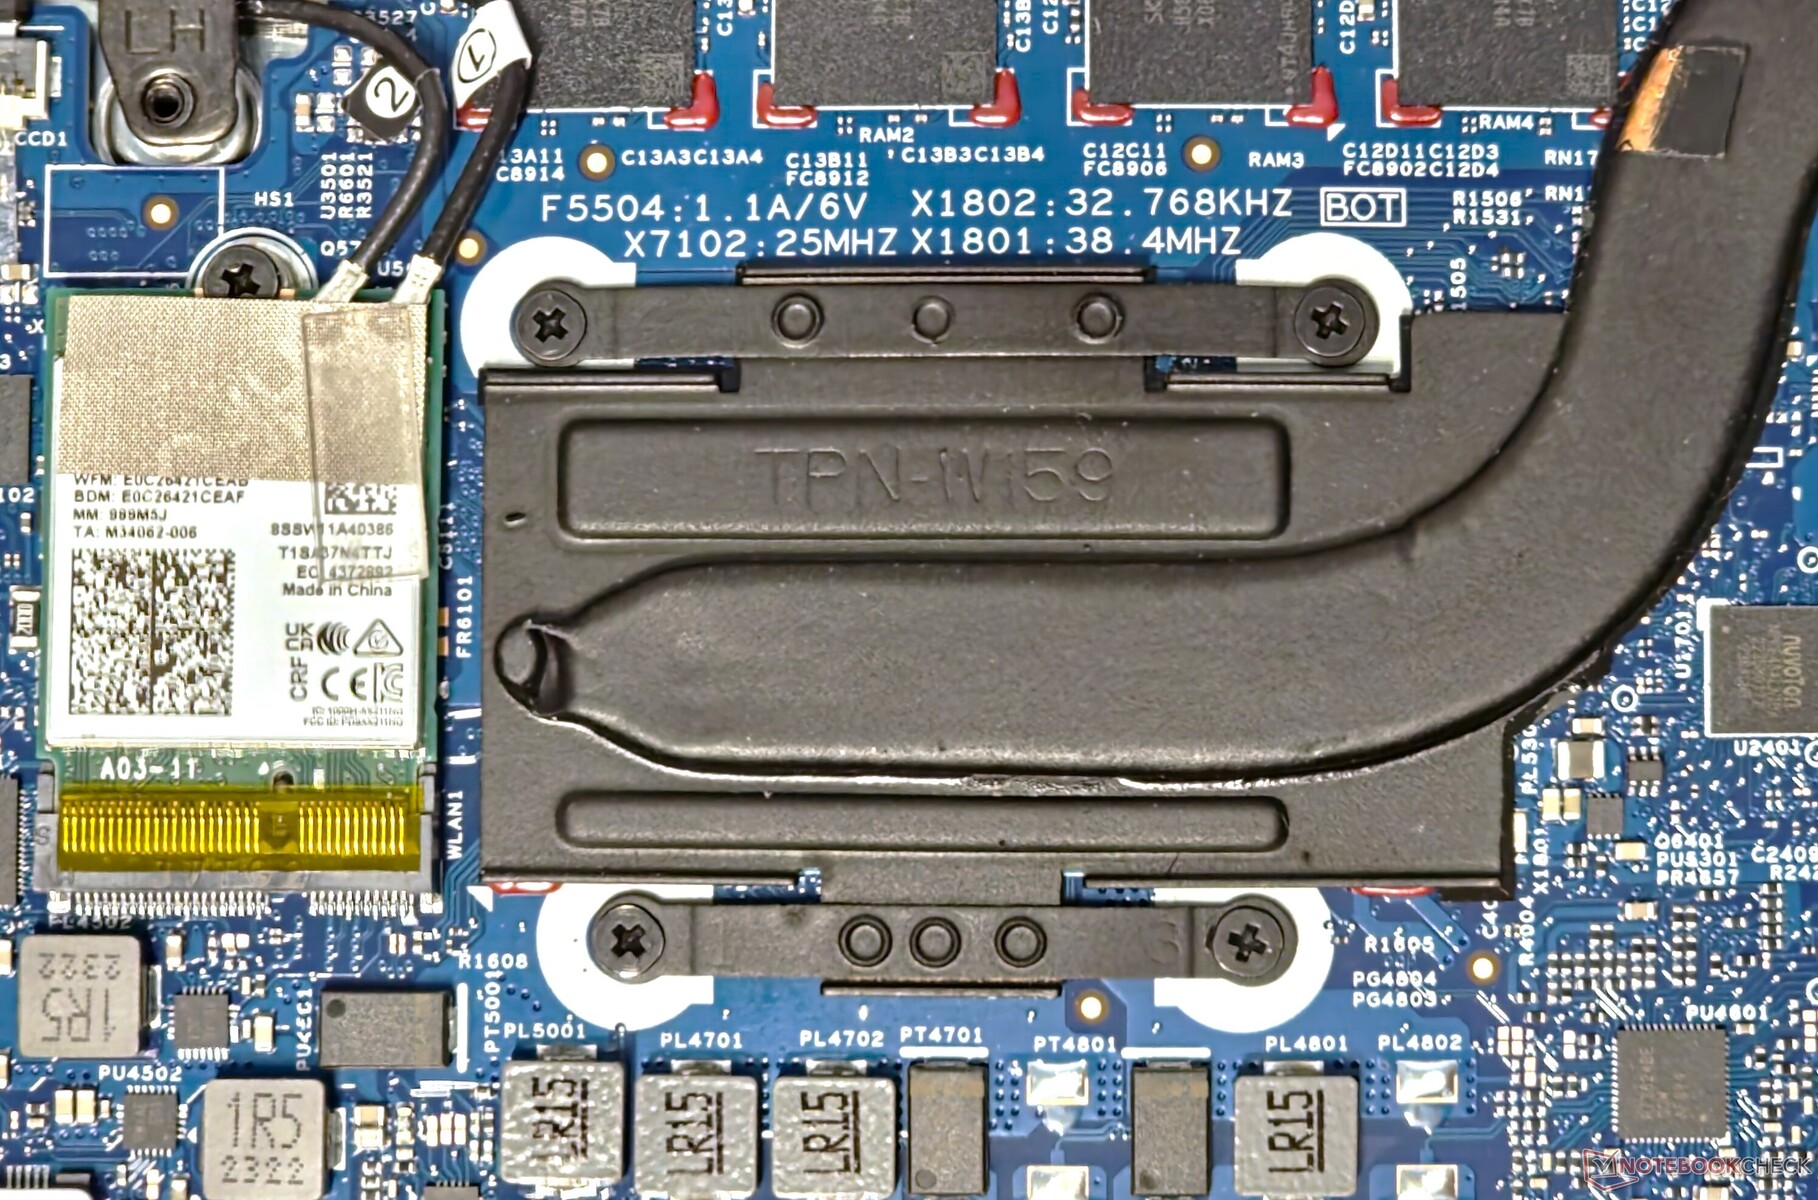
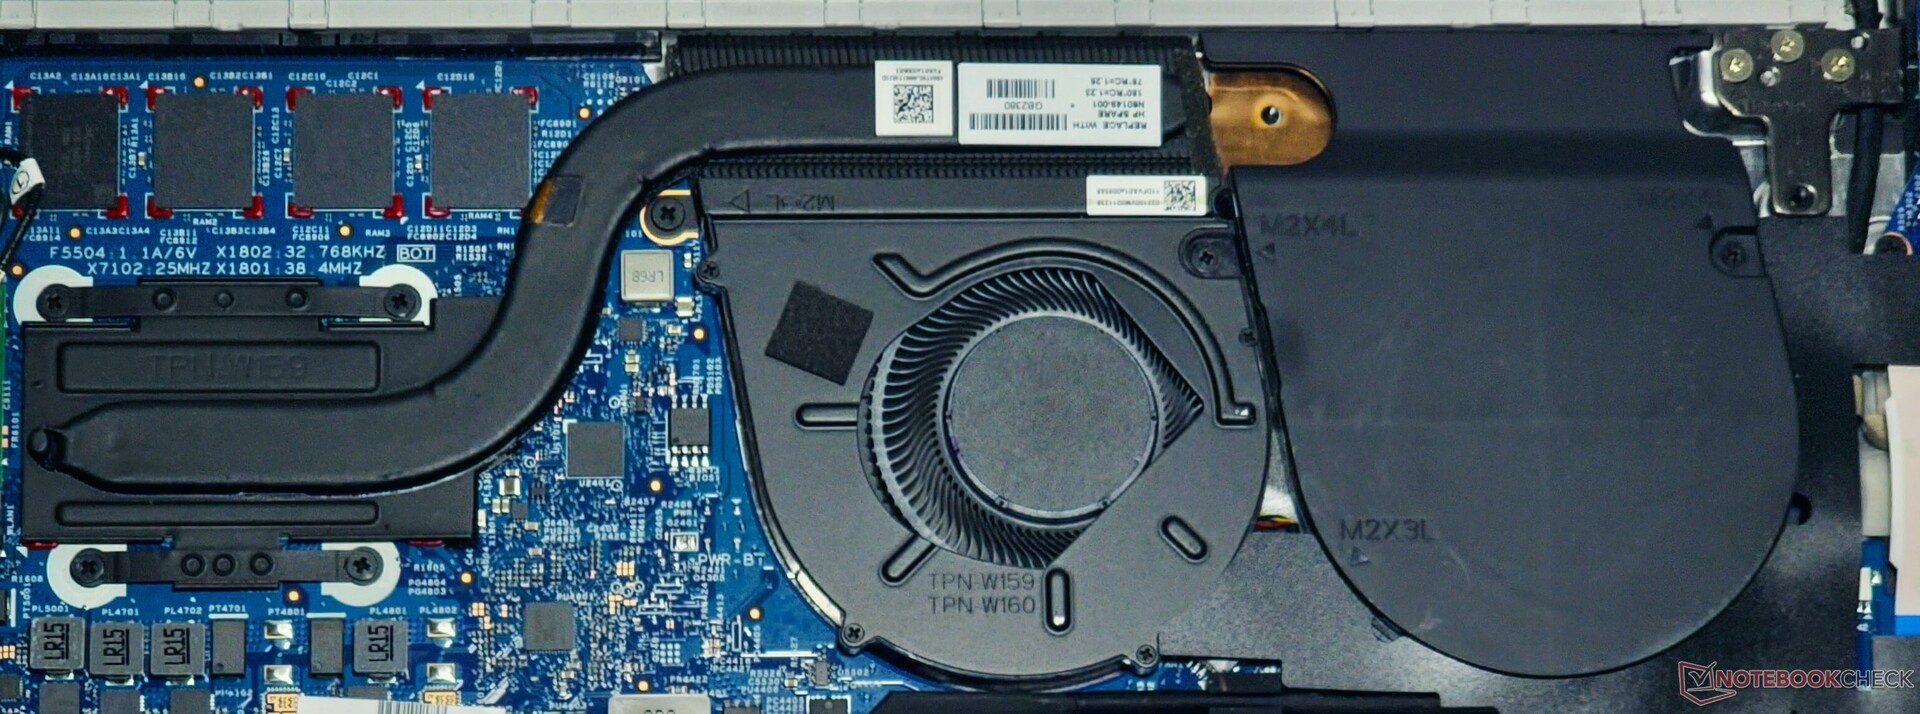
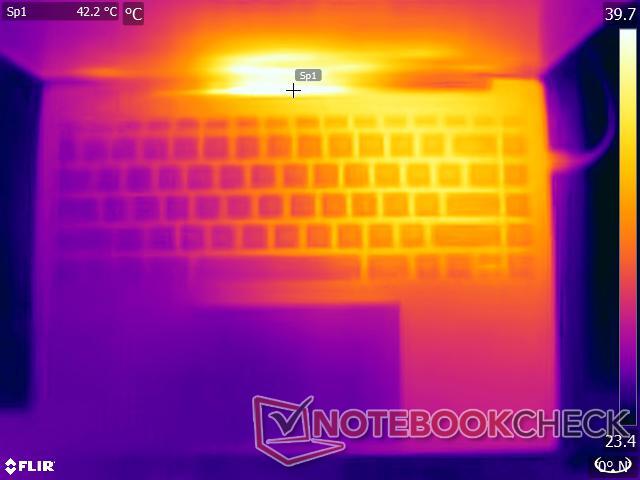
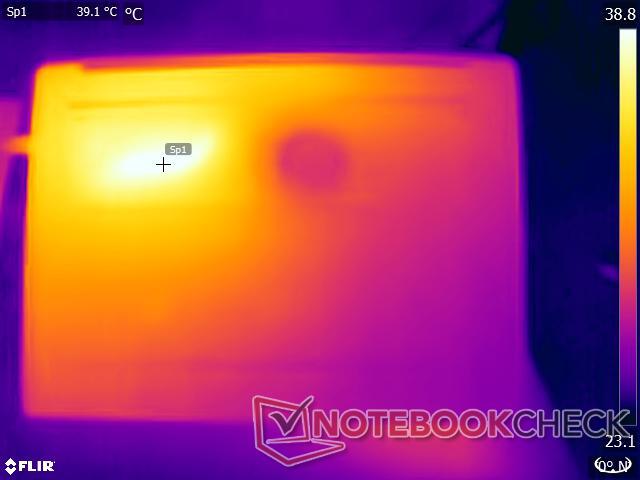
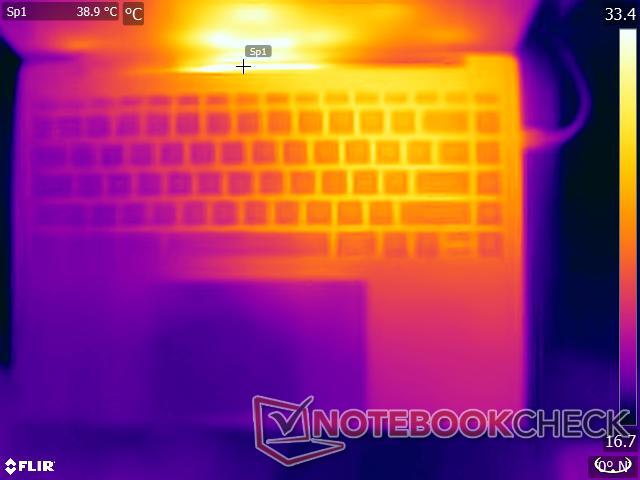
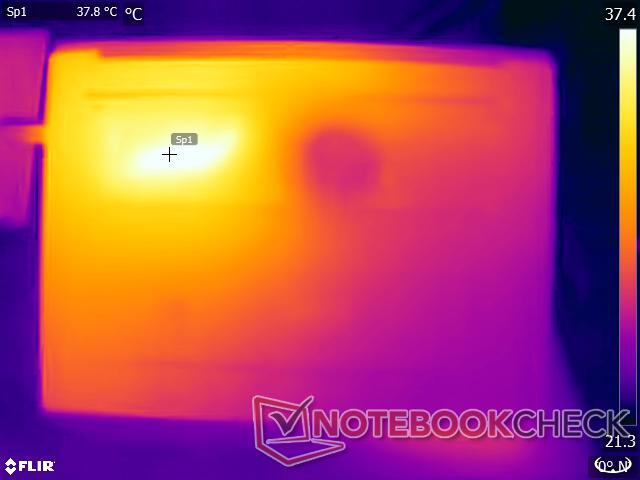
Kombinacja pojedynczego wentylatora z pojedynczą rurką cieplną wydaje się wystarczająca do utrzymania rozsądnych temperatur powierzchni. Maksymalny hotspot, jaki zarejestrowaliśmy, wynosił 39 °C w skrajnej lewej części dolnej części obudowy podczas obciążania gry The Witcher 3 w rozdzielczości 1080p Ultra.
Touchpad i obszary podparcia dłoni pozostają chłodne bez względu na obciążenie.
(+) Maksymalna temperatura w górnej części wynosi 36.6 °C / 98 F, w porównaniu do średniej 36.8 °C / 98 F , począwszy od 21 do 71 °C dla klasy Multimedia.
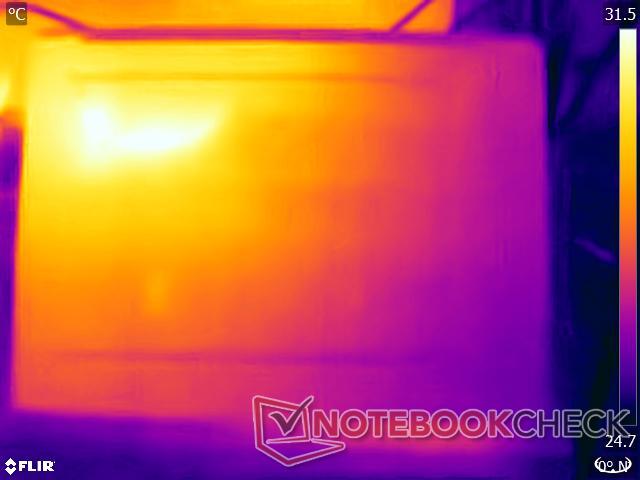
(+) Dno nagrzewa się maksymalnie do 37.2 °C / 99 F, w porównaniu do średniej 39.1 °C / 102 F
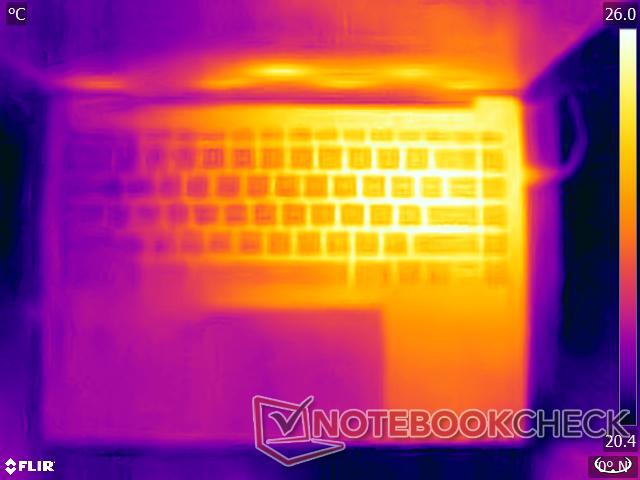
(+) W stanie bezczynności średnia temperatura górnej części wynosi 30 °C / 86 F, w porównaniu ze średnią temperaturą urządzenia wynoszącą 31.3 °C / ### class_avg_f### F.
(±) Podczas gry w Wiedźmina 3 średnia temperatura górnej części wynosi 32.6 °C / 91 F, w porównaniu do średniej temperatury urządzenia wynoszącej 31.3 °C / ## #class_avg_f### F.
(+) Podpórki pod nadgarstki i touchpad są chłodniejsze niż temperatura skóry i maksymalnie 31.2 °C / 88.2 F i dlatego są chłodne w dotyku.
(-) Średnia temperatura obszaru podparcia dłoni w podobnych urządzeniach wynosiła 28.7 °C / 83.7 F (-2.5 °C / -4.5 F).
| HP Pavilion Plus 14-ew0153TU Intel Core i7-1355U, Intel Iris Xe Graphics G7 96EUs | HP Pavilion Plus 14-ey0095cl AMD Ryzen 7 7840U, AMD Radeon 780M | Lenovo ThinkPad T14s G4 i7-1365U Intel Core i7-1365U, Intel Iris Xe Graphics G7 96EUs | Acer Swift Go 14 SFG14-71 Intel Core i5-1335U, Intel Iris Xe Graphics G7 80EUs | Asus ExpertBook B9 B9403CVA-KM0153X Intel Core i7-1355U, Intel Iris Xe Graphics G7 96EUs | Huawei MateBook X Pro 2023 Intel Core i7-1360P, Intel Iris Xe Graphics G7 96EUs | |
|---|---|---|---|---|---|---|
| Heat | 8% | 9% | -5% | -27% | -17% | |
| Maximum Upper Side * (°C) | 36.6 | 39 -7% | 39.8 -9% | 44.8 -22% | 48.8 -33% | 46.5 -27% |
| Maximum Bottom * (°C) | 37.2 | 35.8 4% | 35.2 5% | 34.8 6% | 56.5 -52% | 44.7 -20% |
| Idle Upper Side * (°C) | 31.6 | 25.2 20% | 25.6 19% | 30.7 3% | 33.3 -5% | 34.9 -10% |
| Idle Bottom * (°C) | 30 | 25.6 15% | 24.4 19% | 32.5 -8% | 35 -17% | 32.9 -10% |
* ... im mniej tym lepiej
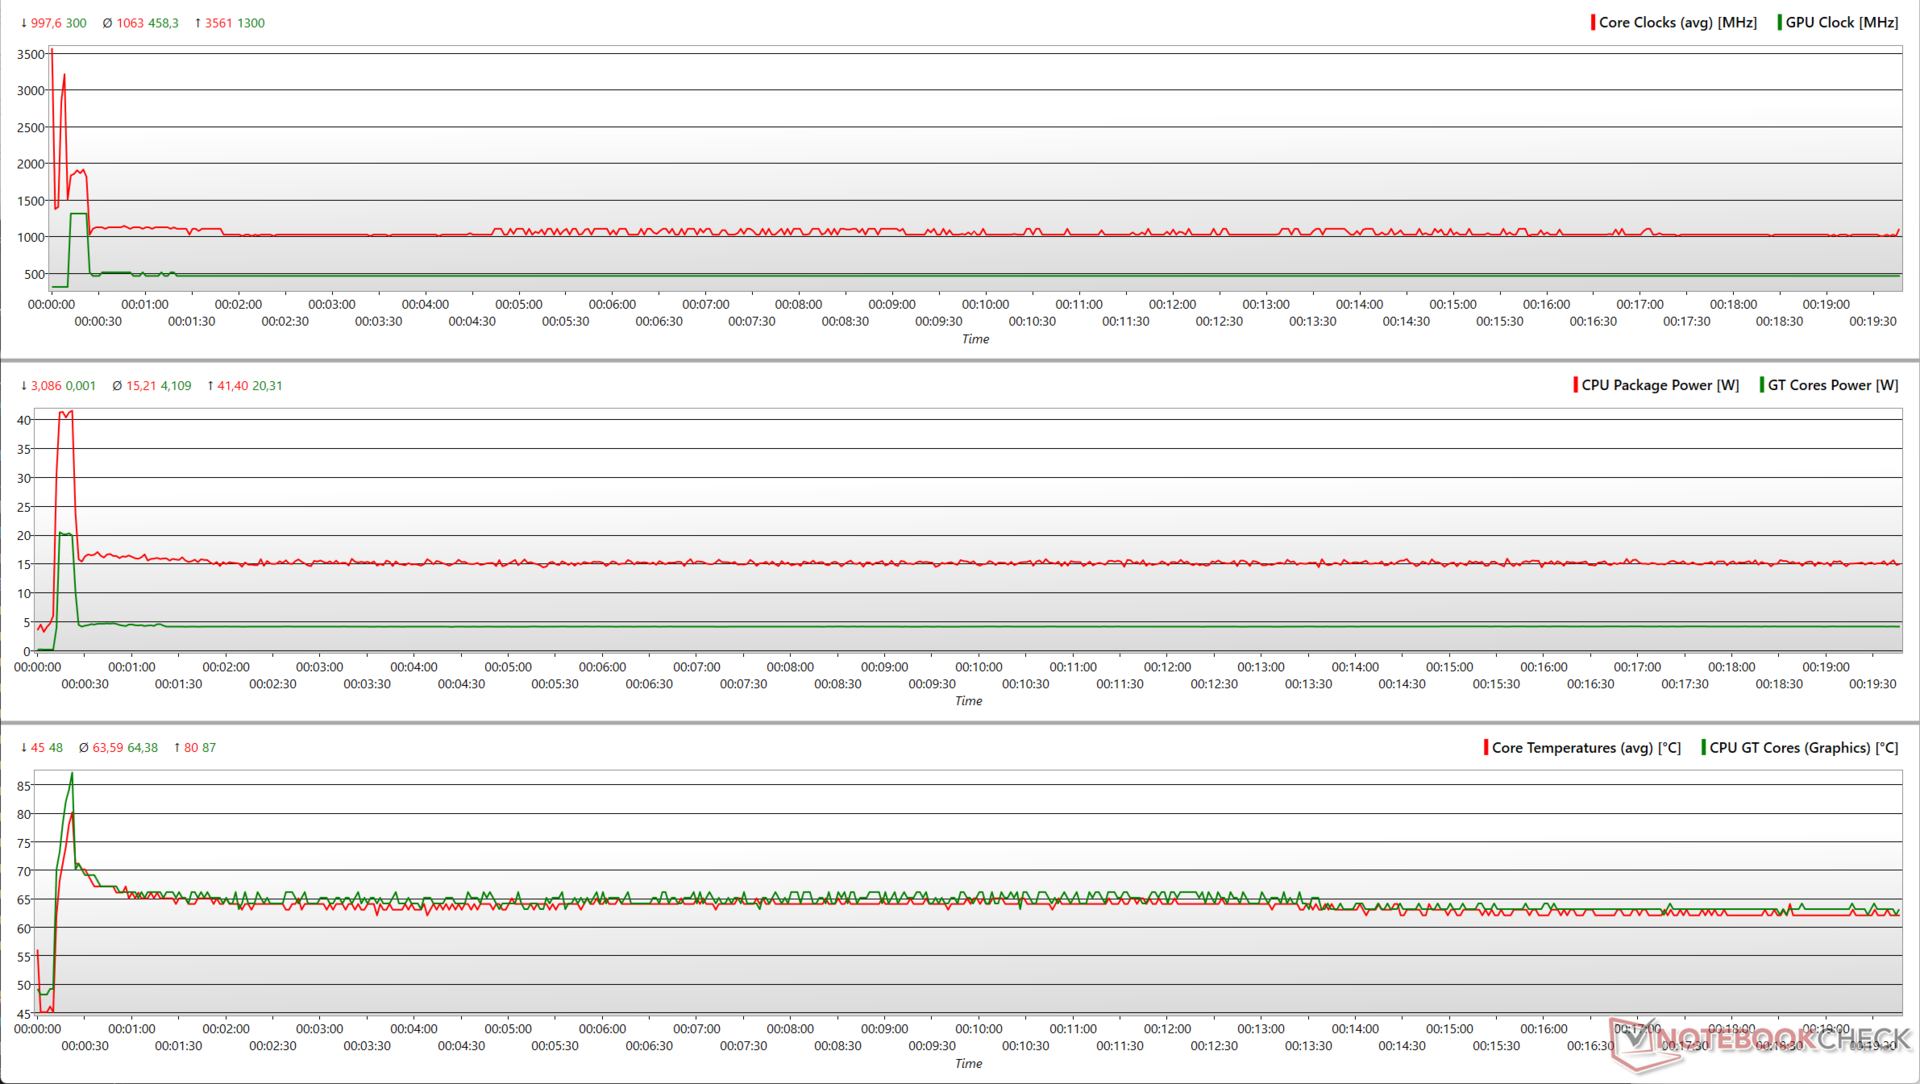
Test warunków skrajnych
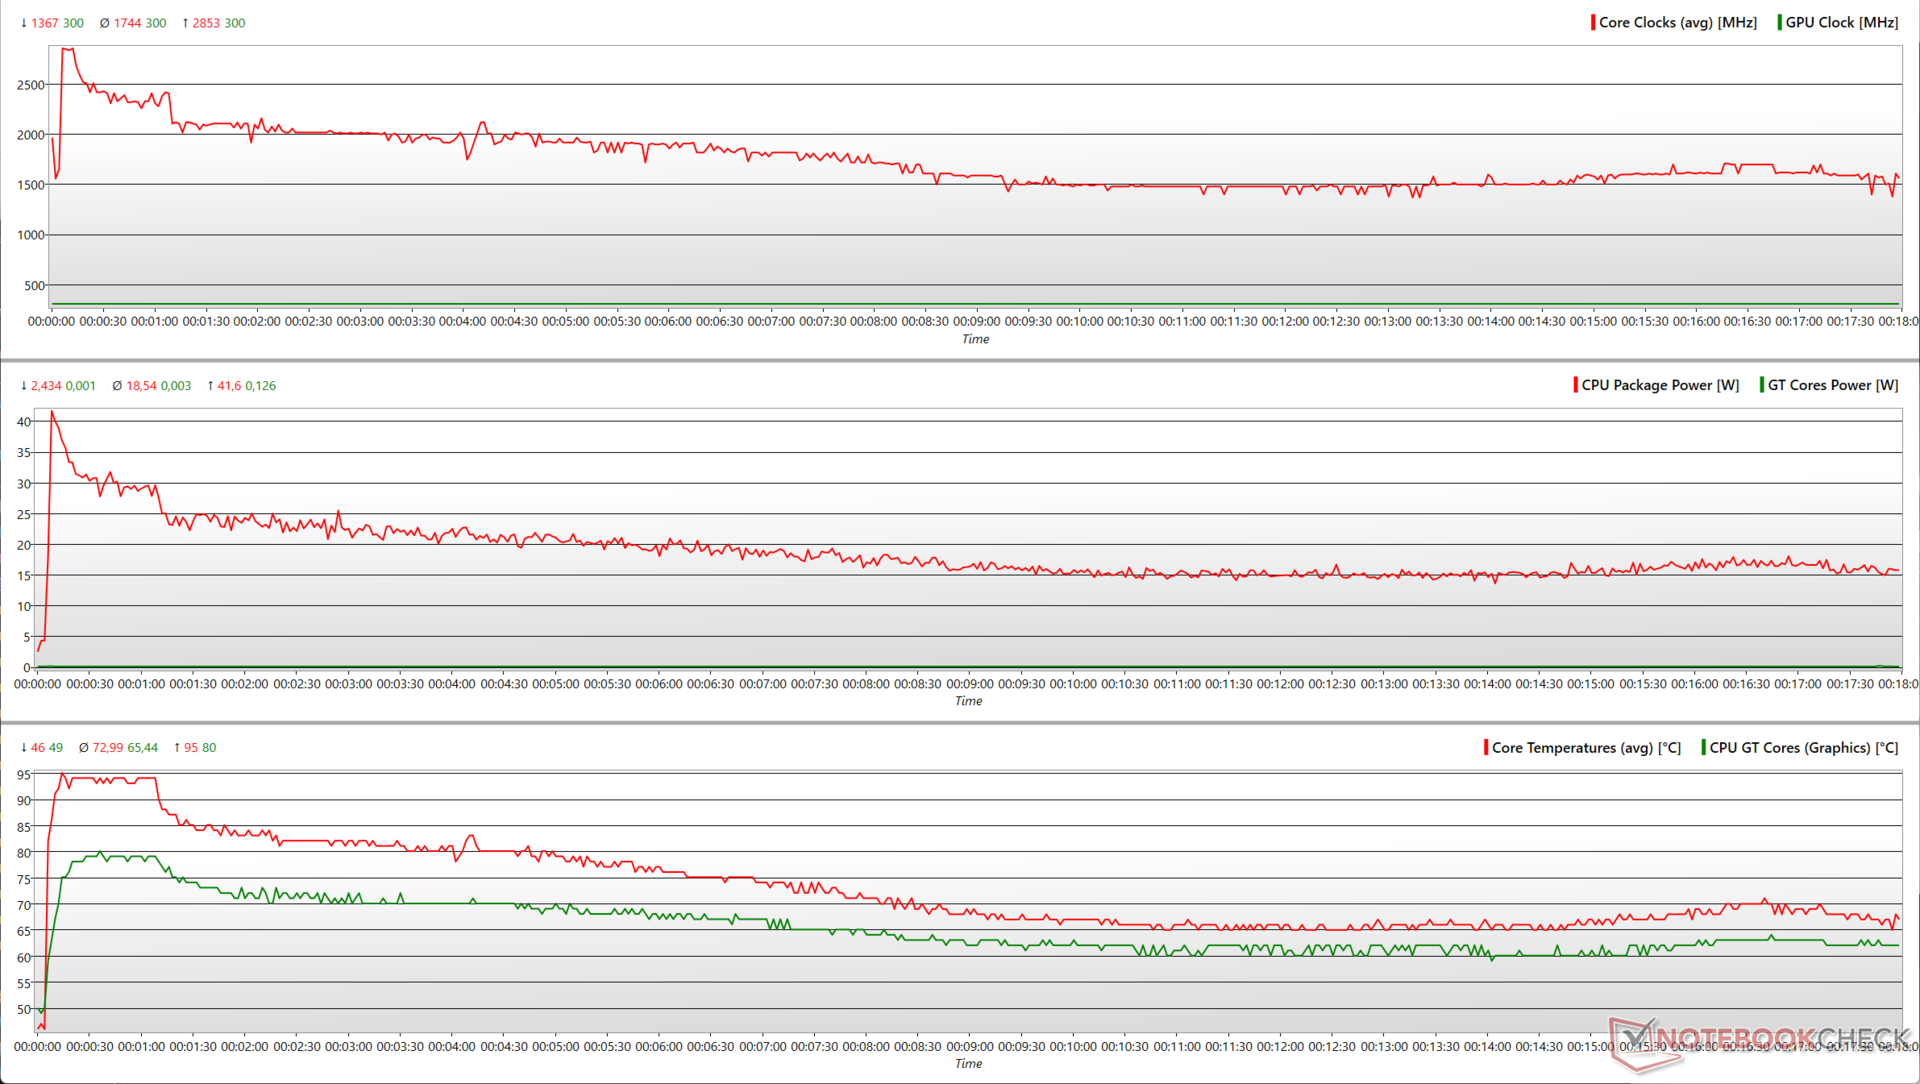
Obciążenie Pavilion Plus 14 za pomocą Prime95 w miejscu dużych FFT pokazuje, że Core i7-1355U jest w stanie osiągnąć szczytową moc pakietu 42 W i wzrost do 2,85 GHz. W trakcie testu wartości te ustabilizowały się jednak na poziomie odpowiednio około 18,5 W i 1,74 GHz.
Zintegrowany układ graficzny Iris Xe Graphics może chwilowo zużywać 20,3 W i zwiększyć częstotliwość taktowania do 1300 MHz po dodaniu FurMark, ale nie może zużywać więcej niż 4 W.
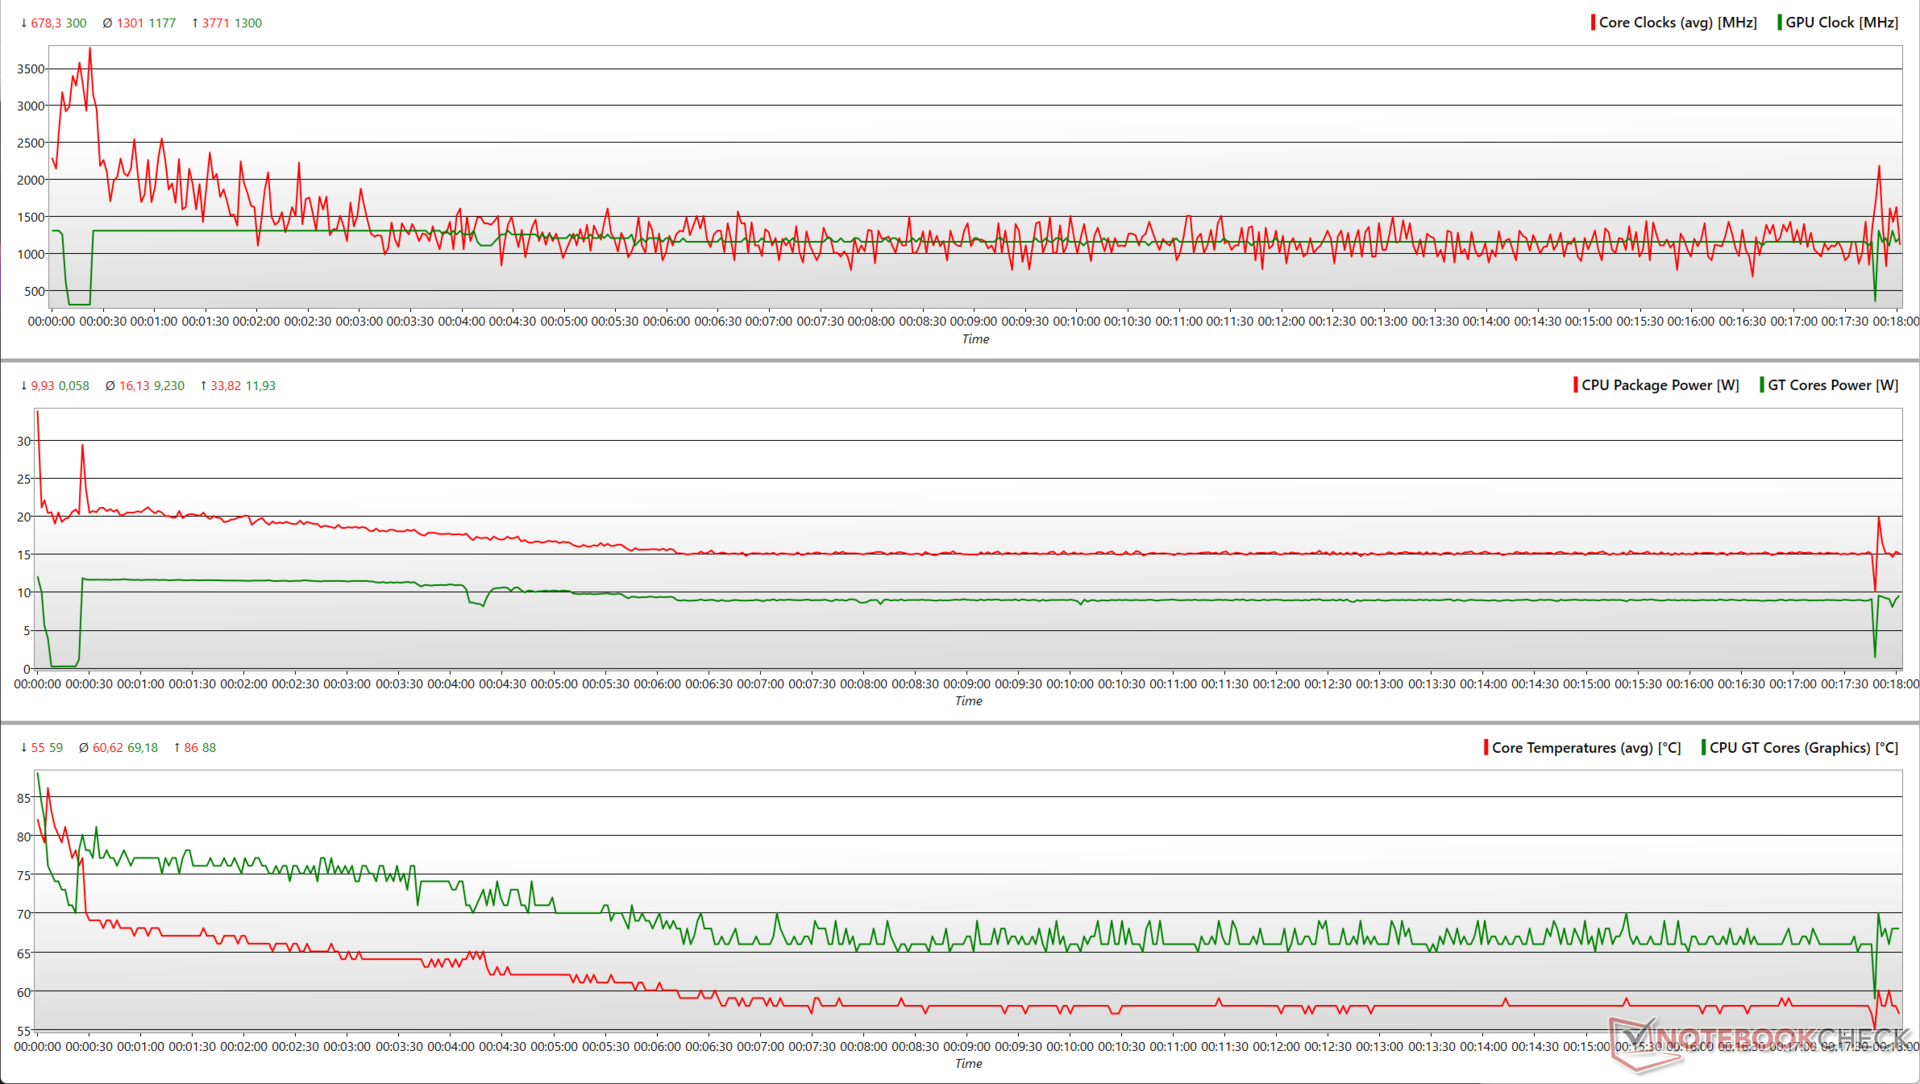
Niemniej jednak, iGPU może wykorzystać 9,23 W i zwiększyć taktowanie do średnio 1177 MHz podczas obciążającego testu The Witcher 3 w rozdzielczości 1080p Ultra.
| Test obciążeniowy | Taktowanie CPU (GHz) | Taktowanie GPU (MHz) | Średnia temperatura CPU (°C) | Średnia temperatura GPU (°C) |
| System w stanie spoczynku | 1.16 | 300 | 43 | 46 |
| Prime95 | 1.55 | 300 | 73 | 62 |
| Prime95+ FurMark | 1.07 | 450 | 63 | 64 |
| The Witcher 3 1080p Ultra | 3.53 | 1,300 | 58 | 66 |
Głośniki
Dostrojone przez B&O głośniki stereo Pavilion Plus 14 zapewniają odpowiednią głośność w średniej wielkości pomieszczeniu, ale jest ona niższa niż ta, którą może osiągnąć jego kuzyn zasilany przez AMD. Brakuje basów, ale średnie i wysokie tony są dobrze odtwarzane.
Osoby pragnące lepszego dźwięku mogą skorzystać z gniazda audio 3,5 mm lub Bluetooth 5.3.
HP Pavilion Plus 14-ew0153TU analiza dźwięku
(±) | głośność głośnika jest średnia, ale dobra (78.6 dB)
Bas 100 - 315 Hz
(-) | prawie brak basu - średnio 15.8% niższa od mediany
(±) | liniowość basu jest średnia (10.7% delta do poprzedniej częstotliwości)
Średnie 400 - 2000 Hz
(+) | zbalansowane środki średnie - tylko 3.2% od mediany
(+) | średnie są liniowe (4.3% delta do poprzedniej częstotliwości)
Wysokie 2–16 kHz
(+) | zrównoważone maksima - tylko 4% od mediany
(+) | wzloty są liniowe (4.8% delta do poprzedniej częstotliwości)
Ogólnie 100 - 16.000 Hz
(+) | ogólny dźwięk jest liniowy (13.5% różnicy w stosunku do mediany)
W porównaniu do tej samej klasy
» 29% wszystkich testowanych urządzeń w tej klasie było lepszych, 4% podobnych, 67% gorszych
» Najlepszy miał deltę 5%, średnia wynosiła ###średnia###%, najgorsza wynosiła 45%
W porównaniu do wszystkich testowanych urządzeń
» 14% wszystkich testowanych urządzeń było lepszych, 4% podobnych, 82% gorszych
» Najlepszy miał deltę 4%, średnia wynosiła ###średnia###%, najgorsza wynosiła 134%
Apple MacBook Pro 16 2021 M1 Pro analiza dźwięku
(+) | głośniki mogą odtwarzać stosunkowo głośno (84.7 dB)
Bas 100 - 315 Hz
(+) | dobry bas - tylko 3.8% od mediany
(+) | bas jest liniowy (5.2% delta do poprzedniej częstotliwości)
Średnie 400 - 2000 Hz
(+) | zbalansowane środki średnie - tylko 1.3% od mediany
(+) | średnie są liniowe (2.1% delta do poprzedniej częstotliwości)
Wysokie 2–16 kHz
(+) | zrównoważone maksima - tylko 1.9% od mediany
(+) | wzloty są liniowe (2.7% delta do poprzedniej częstotliwości)
Ogólnie 100 - 16.000 Hz
(+) | ogólny dźwięk jest liniowy (4.6% różnicy w stosunku do mediany)
W porównaniu do tej samej klasy
» 0% wszystkich testowanych urządzeń w tej klasie było lepszych, 0% podobnych, 100% gorszych
» Najlepszy miał deltę 5%, średnia wynosiła ###średnia###%, najgorsza wynosiła 45%
W porównaniu do wszystkich testowanych urządzeń
» 0% wszystkich testowanych urządzeń było lepszych, 0% podobnych, 100% gorszych
» Najlepszy miał deltę 4%, średnia wynosiła ###średnia###%, najgorsza wynosiła 134%
Zarządzanie energią: Oszczędne zużycie energii i długa żywotność baterii
Zużycie energii
Zarówno Intel, jak i AMD Pavilion Plus 14 wykazują ogólnie podobny pobór mocy. Jednak wersja AMD wykazuje o 18% wyższy pobór mocy w The Witcher 3 przy 1080p Ultra dzięki bardziej wydajnemu Radeonowi 780M.
Core i7 w Pavilion Plus 14 pobiera minimalną ilość energii w trybie bezczynności, co daje mu znaczną przewagę nad Asus ExpertBook B9. Dostarczony zasilacz o mocy 65 W jest wystarczający do zasilania laptopa pod obciążeniem.
| wyłączony / stan wstrzymania | |
| luz | |
| obciążenie |
|
Legenda:
min: | |
| HP Pavilion Plus 14-ew0153TU i7-1355U, Iris Xe G7 96EUs, OLED, 2880x1800, 14" | HP Pavilion Plus 14-ey0095cl R7 7840U, Radeon 780M, OLED, 2880x1800, 14" | Lenovo ThinkPad T14s G4 i7-1365U i7-1365U, Iris Xe G7 96EUs, IPS, 1920x1200, 14" | Acer Swift Go 14 SFG14-71 i5-1335U, Iris Xe G7 80EUs, OLED, 2880x1800, 14" | Asus ExpertBook B9 B9403CVA-KM0153X i7-1355U, Iris Xe G7 96EUs, OLED, 2880x1800, 14" | Huawei MateBook X Pro 2023 i7-1360P, Iris Xe G7 96EUs, IPS, 3120x2080, 14.2" | Przeciętny Intel Iris Xe Graphics G7 96EUs | Średnia w klasie Multimedia | |
|---|---|---|---|---|---|---|---|---|
| Power Consumption | 1% | 14% | -3% | -18% | -8% | -1% | -31% | |
| Idle Minimum * (Watt) | 6.7 | 6 10% | 3.1 54% | 6.79 -1% | 4.9 27% | 4.1 39% | 5.51 ? 18% | 5.72 ? 15% |
| Idle Average * (Watt) | 7.16 | 6.5 9% | 6.5 9% | 6.83 5% | 12.5 -75% | 6.6 8% | 8.66 ? -21% | 10.2 ? -42% |
| Idle Maximum * (Watt) | 11.17 | 13.9 -24% | 7.9 29% | 10.5 6% | 16.8 -50% | 8 28% | 10.9 ? 2% | 12.4 ? -11% |
| Load Average * (Watt) | 46.5 | 41.9 10% | 40 14% | 45.9 1% | 43.8 6% | 61 -31% | 45.6 ? 2% | 65.5 ? -41% |
| Witcher 3 ultra * (Watt) | 37.2 | 43.9 -18% | 43.2 -16% | 45.6 -23% | 41.2 -11% | 56 -51% | ||
| Load Maximum * (Watt) | 64.36 | 50.8 21% | 69 -7% | 69.8 -8% | 68.1 -6% | 90 -40% | 67.8 ? -5% | 114 ? -77% |
* ... im mniej tym lepiej
Power Consumption: The Witcher 3 / Stress test
Power Consumption: External monitor
Żywotność baterii
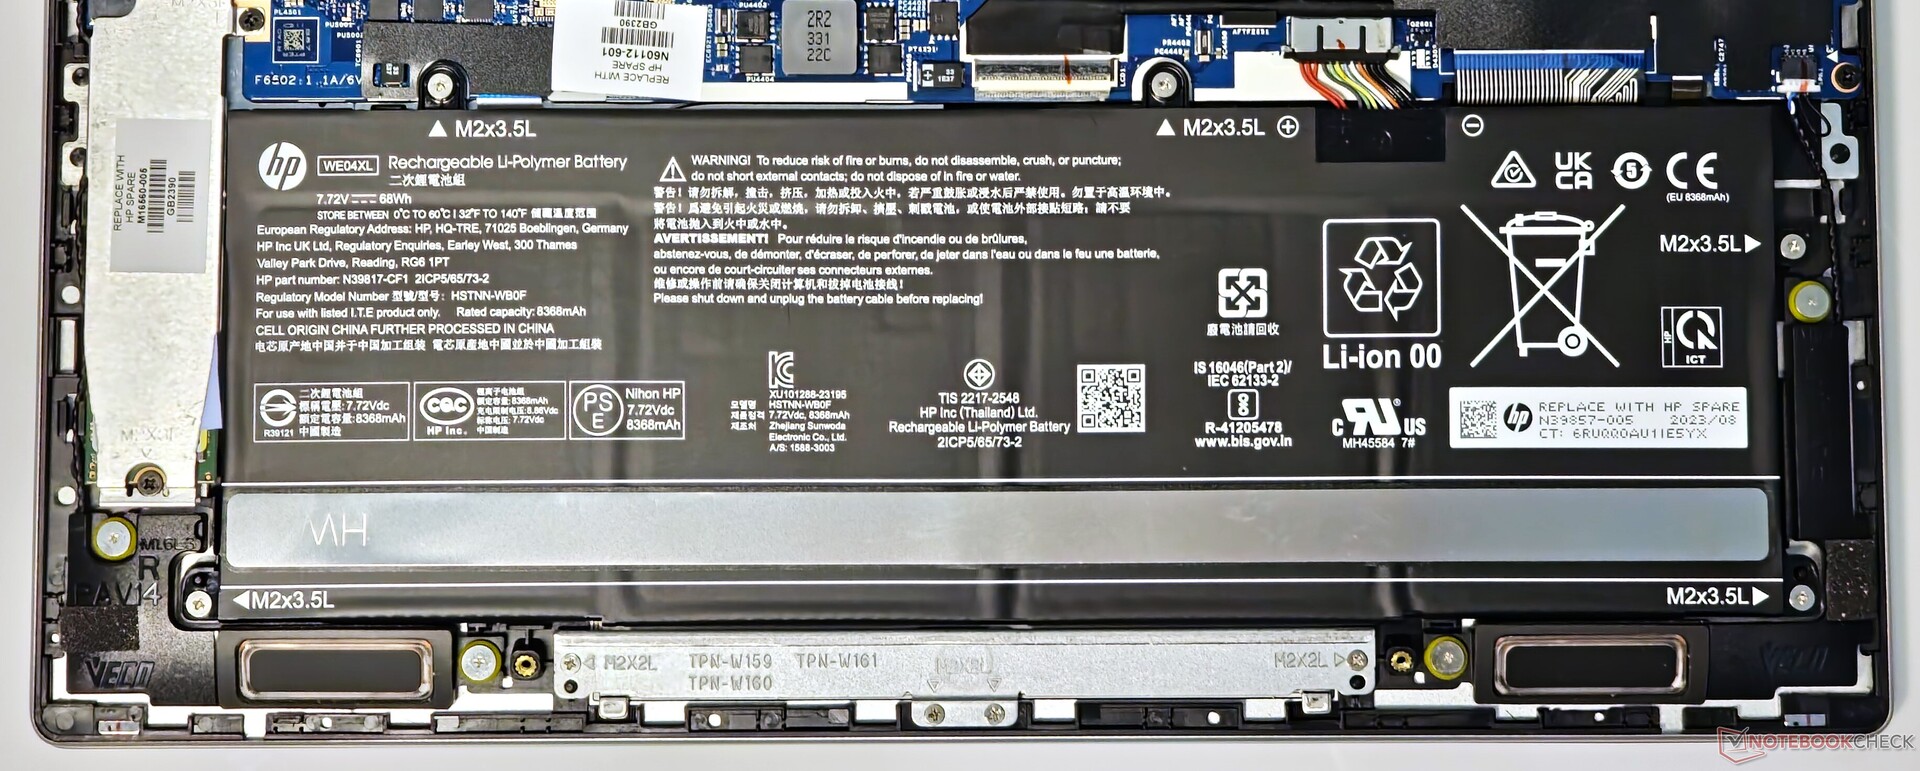
Bateria o pojemności 68 Whr zapewnia dobre czasy pracy, które z łatwością wystarczą na typowy dzień pracy. Udało nam się osiągnąć prawie 9 godzin i 40 minut czasu pracy z naszym standardowym skryptem przeglądania stron internetowych i 12 godzin odtwarzania H.264 1080p, w obu przypadkach przy 150 nitach.
| HP Pavilion Plus 14-ew0153TU i7-1355U, Iris Xe G7 96EUs, 68 Wh | HP Pavilion Plus 14-ey0095cl R7 7840U, Radeon 780M, 68 Wh | Lenovo ThinkPad T14s G4 i7-1365U i7-1365U, Iris Xe G7 96EUs, 57 Wh | Acer Swift Go 14 SFG14-71 i5-1335U, Iris Xe G7 80EUs, 54.6 Wh | Asus ExpertBook B9 B9403CVA-KM0153X i7-1355U, Iris Xe G7 96EUs, 63 Wh | Huawei MateBook X Pro 2023 i7-1360P, Iris Xe G7 96EUs, 60 Wh | Średnia w klasie Multimedia | |
|---|---|---|---|---|---|---|---|
| Czasy pracy | -11% | -18% | -21% | -5% | -13% | 32% | |
| H.264 (h) | 12 | 10.1 -16% | 8.8 -27% | 16.4 ? 37% | |||
| WiFi v1.3 (h) | 9.6 | 8.5 -11% | 7.9 -18% | 7.6 -21% | 10.2 6% | 9.7 1% | 12.2 ? 27% |
| Reader / Idle (h) | 16.9 | 21.5 | 24.9 ? | ||||
| Load (h) | 2 | 2.3 | 2.1 | 1.668 ? |
Za
Przeciw
Werdykt: Trudny upsell przeciwko AMD Zen 4
HP Pavilion Plus 14 jest wydajnym laptopem multimedialnym, który może z powodzeniem służyć do użytku biurowego. Jest dobrze zbudowany, wygląda elegancko i oferuje przyzwoitą łączność, w tym Thunderbolt 4. Funkcje takie jak kamera internetowa 5 MP z podczerwienią i żywy wyświetlacz OLED 2.8K IMAX Enhanced są wspólne dla najlepszych wariantów Intel i AMD.
Podczas gdy Pavilion Plus 14 Intel Core i7-1355U oferuje odpowiednią wydajność do codziennego użytku, ale pozostaje znacznie w tyle za wariantem Pavilion Plus 14 zasilanego przez AMD Ryzen 7 7840U. Wersja AMD Zen 4 oferuje lepszą wydajność CPU i iGPU, co sprawia, że nadaje się również do lekkich gier.
HP Pavilion Plus 14 Core i7 jest trudny do polecenia, zwłaszcza gdy ten sam laptop jest oferowany z bardziej wydajną, energooszczędną i tańszą opcją Ryzen 7.
Wariant Ryzen 7 jest również bardziej energooszczędny i oferuje prawie taki sam czas pracy na baterii. O ile nie potrzebują Państwo portu Thunderbolt 4, Pavilion Plus 14 z procesorem AMD Ryzen jest znacznie lepszym wyborem w niemal każdym aspekcie.
Wariant Ryzen 7 jest nawet sprzedawany za 100 USD mniej, co czyni go znacznie lepszą propozycją w porównaniu do jego kuzyna opartego na Intel Core i7.
Zasadniczo jest to cały Lenovo ThinkPad T14s tym razem z brandingiem HP.
Cena i dostępność
Testowaną konfigurację HP Pavilion Plus 14-ew0153TU można nabyć w sklepie internetowym HP India w cenie 99 999 jenów. Model Pavilion Plus 14 jest dostępny w amerykańskim sklepie HP w cenie 1 020 USD za wersję z procesorem Intel Core i7, podczas gdy wariant z procesorem AMD Ryzen 7 można nabyć za 920 USD. Tańsze opcje można skonfigurować bezpośrednio na stronie internetowej HP.
Amazon US oferuje SKU Pavilion Plus 14 z procesorem Core i7-1355U i dedykowaną kartą graficzną Nvidia GeForce RTX 2050 za 1000 USD.
HP Pavilion Plus 14-ew0153TU
- 10/12/2023 v7 (old)
Vaidyanathan Subramaniam
Przezroczystość
Wyboru urządzeń do recenzji dokonuje nasza redakcja. Próbka testowa została udostępniona autorowi jako pożyczka od producenta lub sprzedawcy detalicznego na potrzeby tej recenzji. Pożyczkodawca nie miał wpływu na tę recenzję, producent nie otrzymał też kopii tej recenzji przed publikacją. Nie było obowiązku publikowania tej recenzji. Jako niezależna firma medialna, Notebookcheck nie podlega władzy producentów, sprzedawców detalicznych ani wydawców.
Tak testuje Notebookcheck
Każdego roku Notebookcheck niezależnie sprawdza setki laptopów i smartfonów, stosując standardowe procedury, aby zapewnić porównywalność wszystkich wyników. Od około 20 lat stale rozwijamy nasze metody badawcze, ustanawiając przy tym standardy branżowe. W naszych laboratoriach testowych doświadczeni technicy i redaktorzy korzystają z wysokiej jakości sprzętu pomiarowego. Testy te obejmują wieloetapowy proces walidacji. Nasz kompleksowy system ocen opiera się na setkach uzasadnionych pomiarów i benchmarków, co pozwala zachować obiektywizm.Price comparison

