Werdykt - najbardziej rozsądna konfiguracja dla większości użytkowników
The Core Ultra 7 355 traci wiele z tego, co czyni serię Panther Lake H tak wyjątkową. W szczególności zarówno wydajność, jak i wydajność na wat są bliższe Lunar Lake-V lub nawet gorsze, biorąc pod uwagę ich zintegrowaną wydajność graficzną. Podczas gdy flagowy Core Ultra X7 358H jest ogromnym krokiem naprzód dla tej serii, to Core Ultra 7 355 ze średniej półki może sprawiać wrażenie przemianowanego Core Ultra 7 255U pod wieloma względami. System nie działa zauważalnie chłodniej ani dłużej niż szybsza opcja Core Ultra X7, pomimo różnic w wydajności.
Oczywiście użytkownicy, którzy nie potrzebują zalet wydajnościowych Core Ultra X7, mogą nadal preferować tańszą konfigurację Core Ultra 7 355, ponieważ nadal zawiera ona wszystkie fizyczne ulepszenia konstrukcyjne w stosunku do dzielącego 2025 lub wcześniejszych modeli. Nawet podstawowy panel IPS 1200p jest lepszy niż większość innych tego samego typu pod względem jakości obrazu. Użytkownicy, których nie przekonuje procesor graficzny Arc B390, przekonają się, że Core Ultra 7 355 jest równie dobry do przeglądania stron internetowych, przetwarzania tekstu i ogólnych multimediów. W przeciwnym razie twórcy treści i okazjonalni gracze z pewnością będą chcieli rozważyć wyższej klasy Core Ultra X7.
Za
Przeciw
Cena i dostępność
Dell dostarcza obecnie konfigurację XPS 14 z serii Core Ultra 7 U w cenie od 1700 dolarów.
Niedawno sprawdziliśmy Core Ultra X7 OLED XPS 14 i przyznaliśmy mu wysokie oceny w odniesieniu do wszystkich ulepszeń zarówno w zakresie wydajności, jak i wzornictwa. Niemniej jednak, większość użytkowników może być bardziej zainteresowana przystępnymi cenowo jednostkami SKU z Core Ultra 7 i wyświetlaczem IPS za prawie 500 USD mniej. Niniejsza recenzja porównuje obie konfiguracje, aby sprawdzić, jak dużego deficytu wydajności mogą spodziewać się użytkownicy przed zakupem.
Ponieważ jednostki SKU Core Ultra 7 i Core Ultra X7 są wizualnie identyczne, zalecamy zapoznanie się z naszą istniejącej recenzji OLED XPS 14 aby dowiedzieć się więcej o fizycznych cechach tego modelu.
Więcej recenzji Dell:
Specyfikacje
Przypadek
Bezdotykowa konfiguracja IPS jest nieco cieńsza niż konfiguracja z ekranem dotykowym OLED (14,6 mm vs. 15,2 mm). Poza tym wrażenia są takie same, ponieważ konstrukcja jest zauważalnie mocniejsza niż w poprzednim modelu, kosztem nieco bardziej skomplikowanego procesu serwisowania.
Łączność


Komunikacja
Kamera internetowa


Konserwacja

Zrównoważony rozwój
Dell nadal wykorzystuje coraz więcej materiałów pochodzących z recyklingu do budowy swoich flagowych modeli, w tym najnowszego XPS 14, jak wspomniano w naszej oryginalnej recenzji.
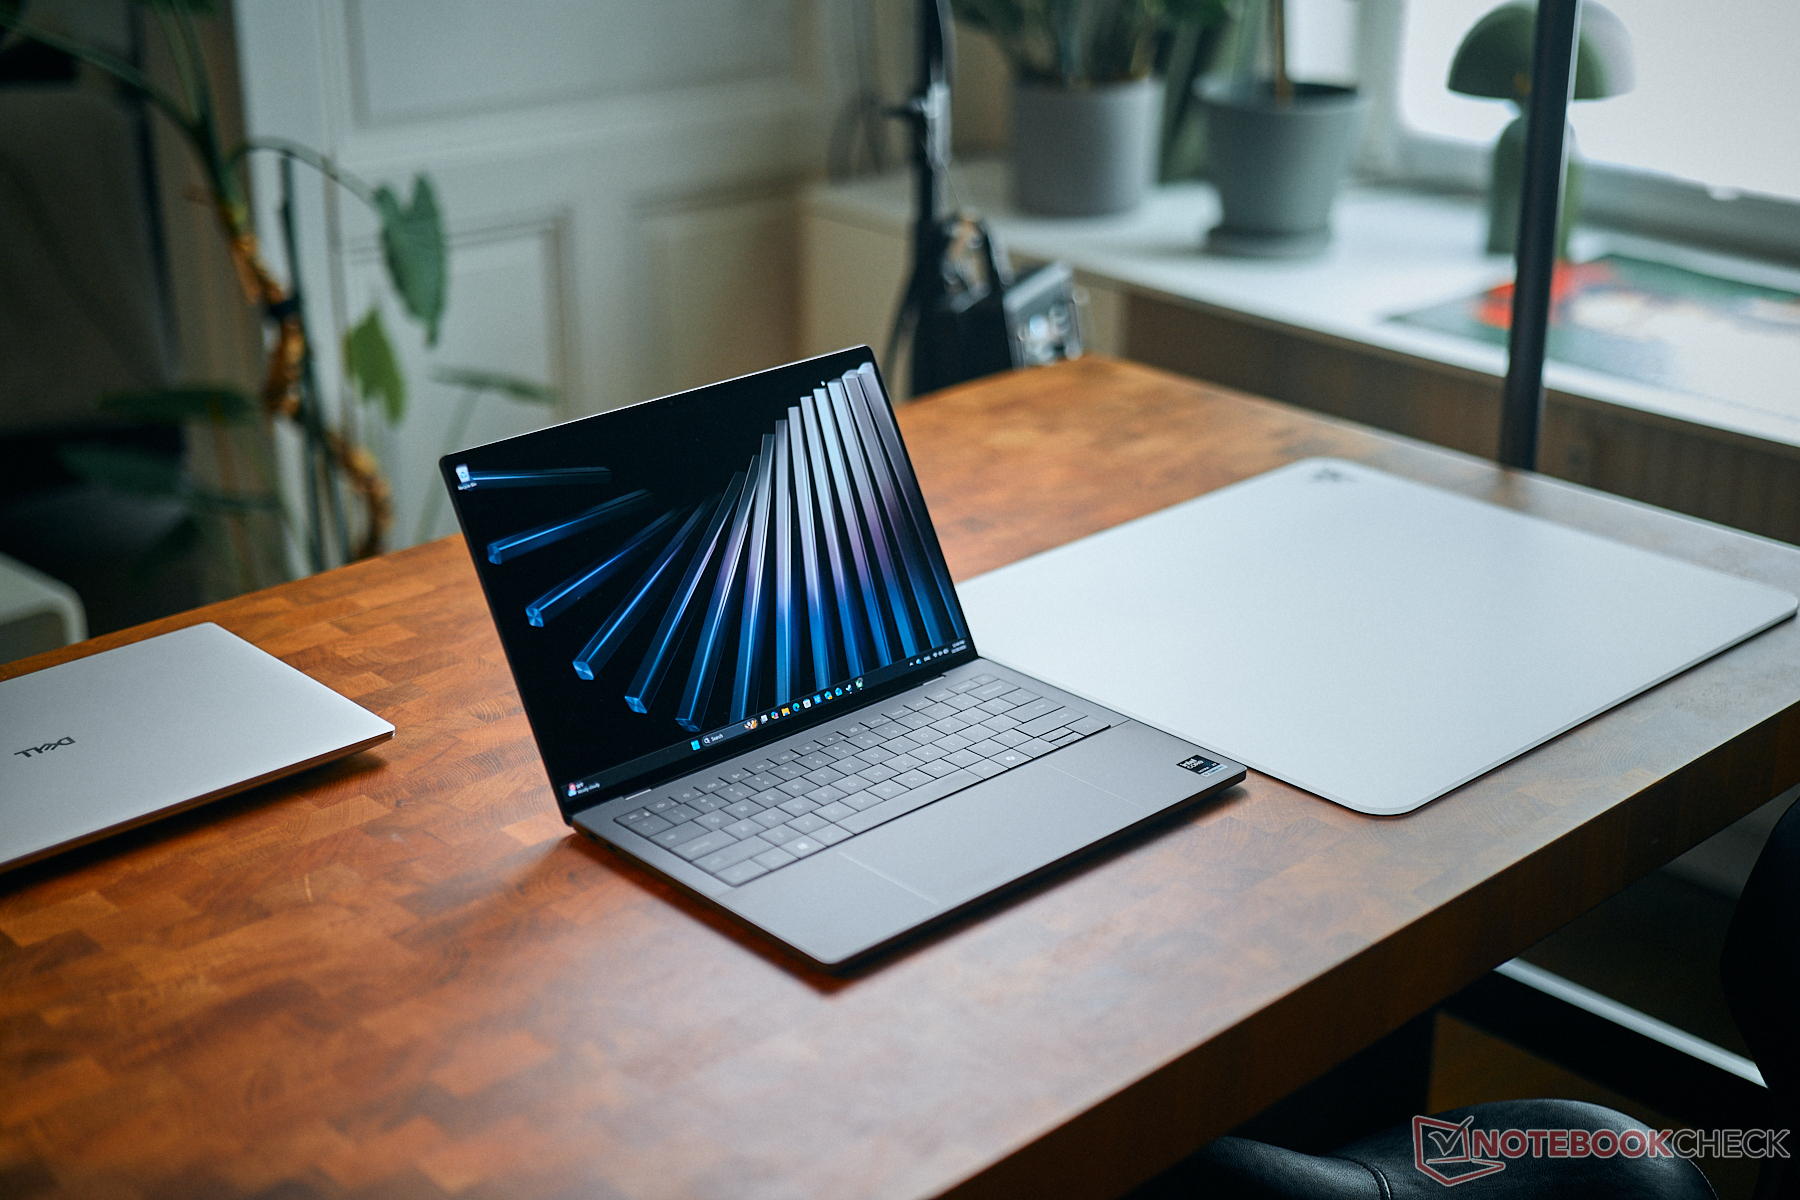
Wyświetlacz
Dostępne są dwie opcje wyświetlania:
- 1920 x 1200, bezdotykowy, matowy, 500 nitów, 100% sRGB, IPS, 1 - 120 Hz
- 2880 x 1800, ekran dotykowy, błyszczący, 500 nitów, 100% DCI-P3, OLED, 20 - 120 Hz
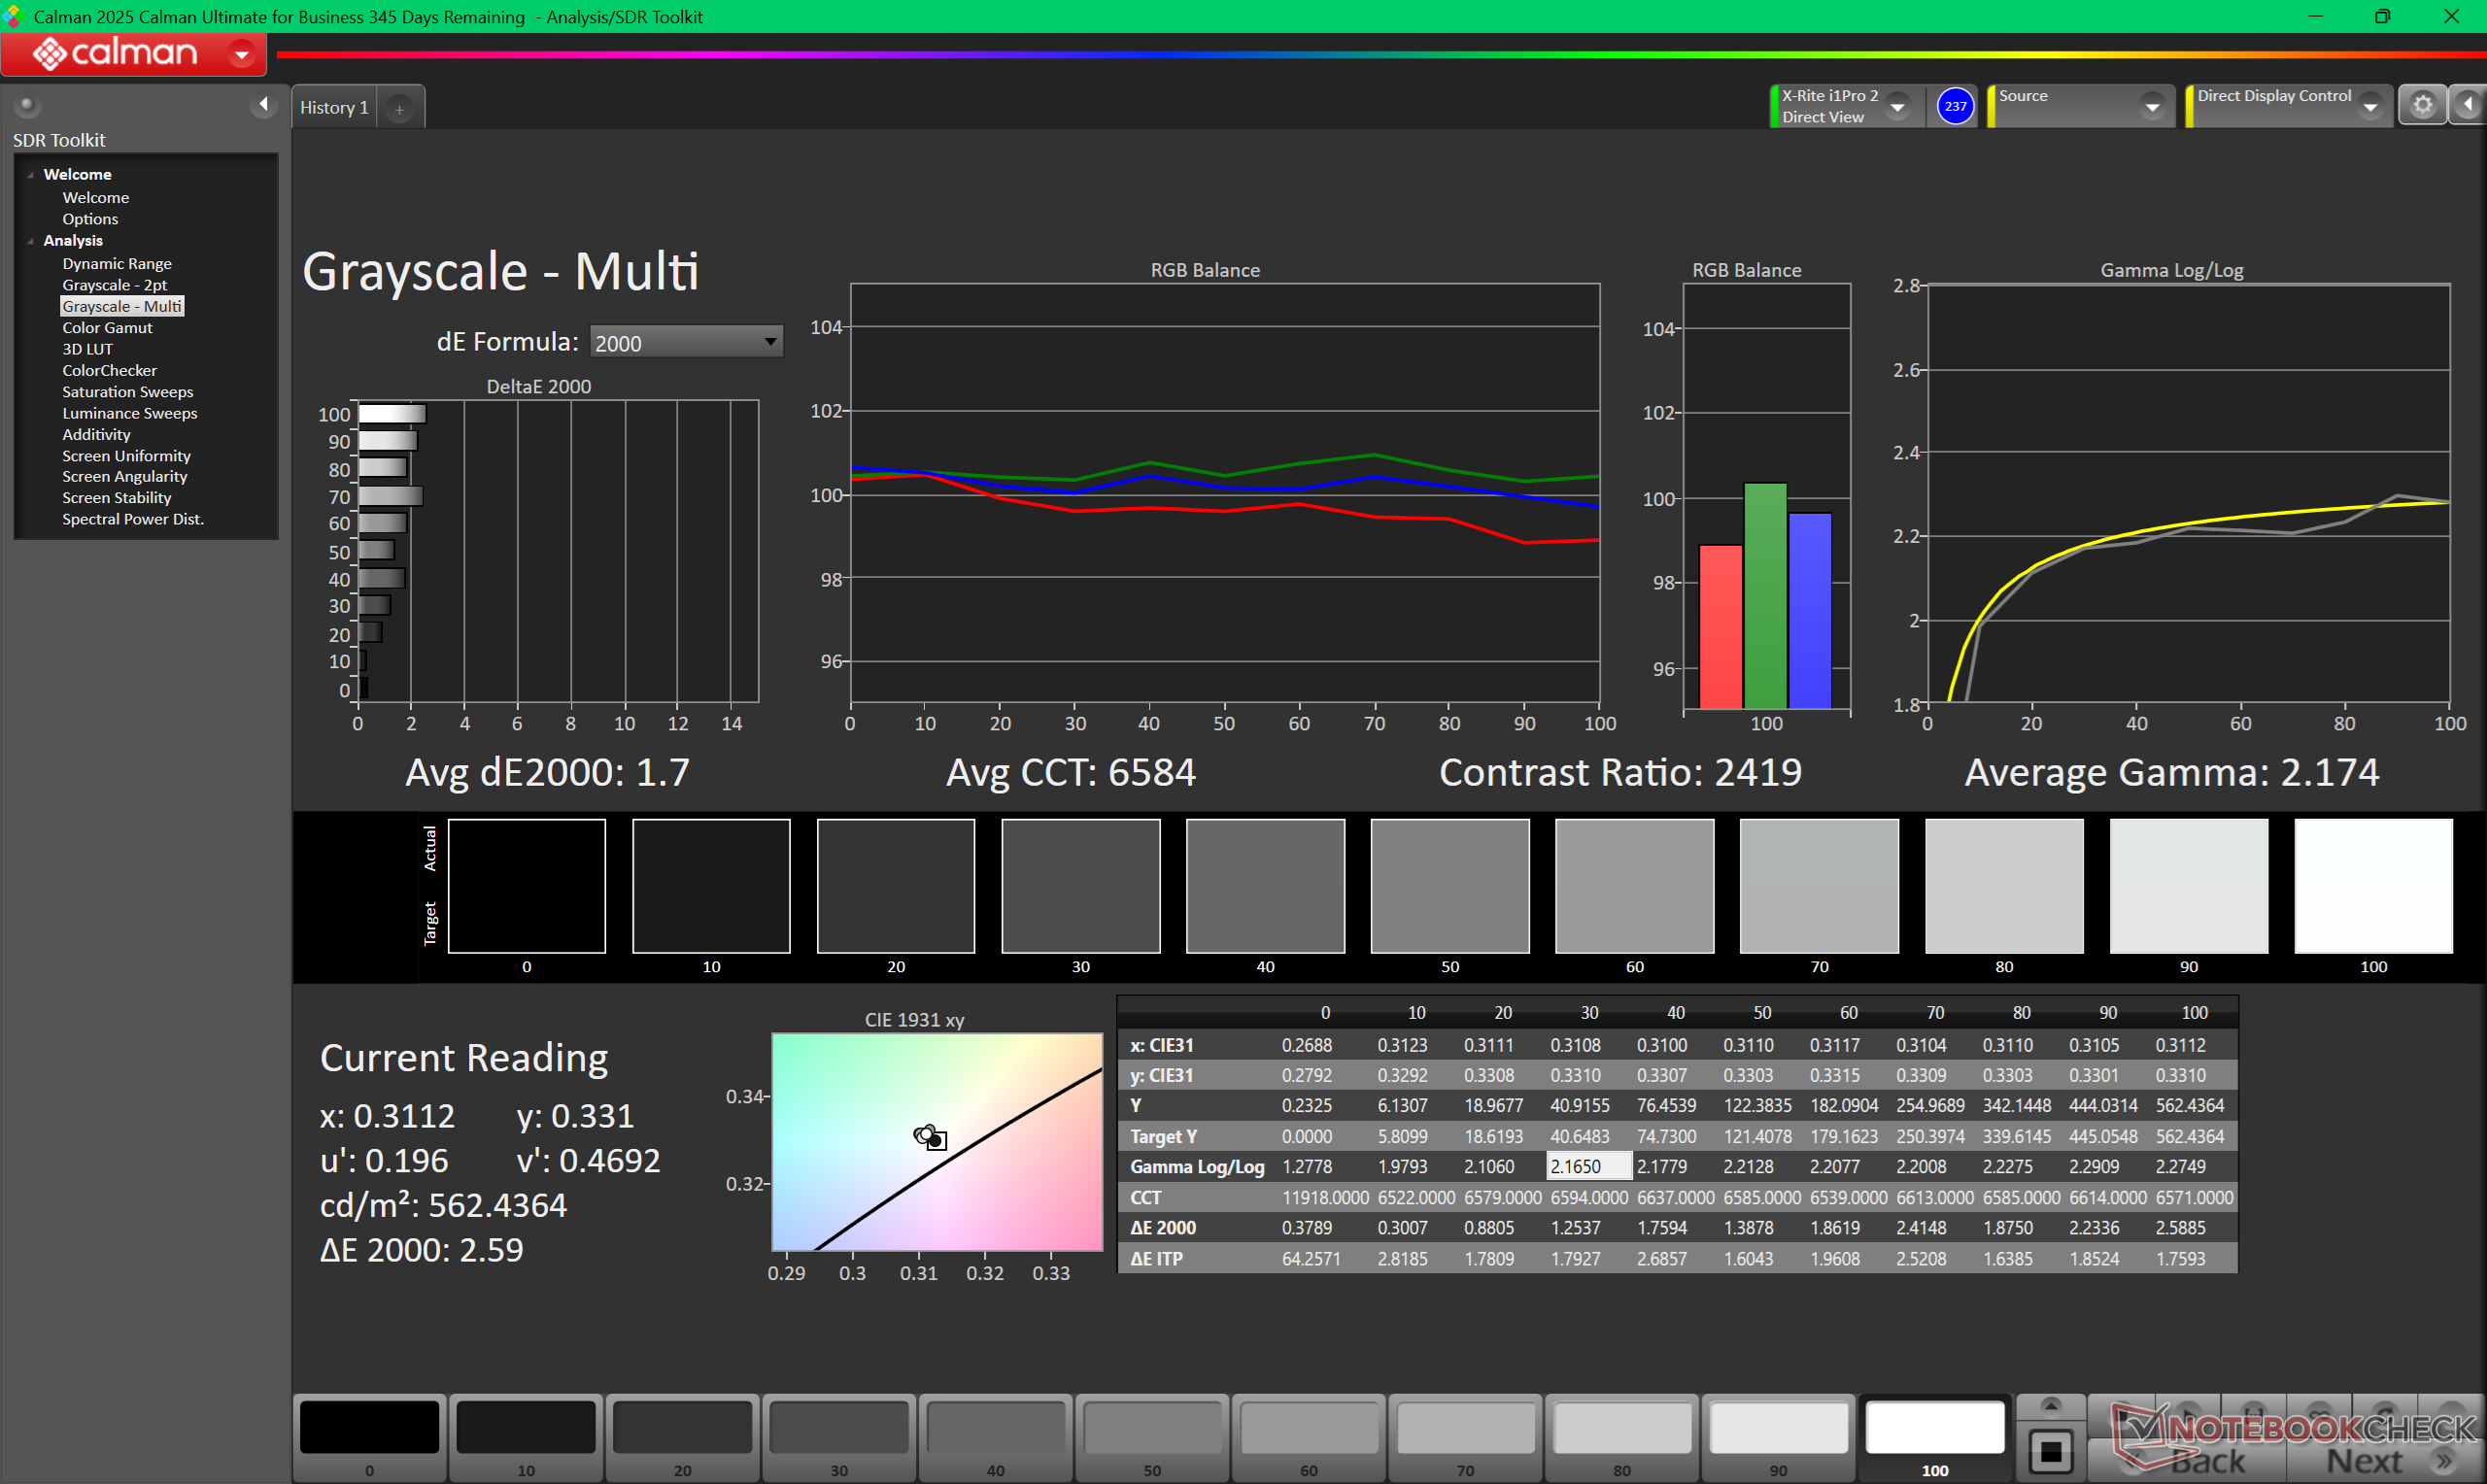
W porównaniu do panelu OLED, tańszy panel IPS może być nieco jaśniejszy w centrum, ale poza tym nieco ciemniejszy wokół krawędzi i narożników ze względu na gorszą jednorodność. Współczynnik kontrastu jest nadal bardzo dobry, szczególnie jak na panel IPS i wynosi ponad 2000:1, a podczas gdy Windows VRR jest obsługiwany do zaledwie 1 Hz na biegu jałowym, w przeciwieństwie do 20 Hz lub więcej w większości innych laptopów. Proszę zauważyć, że funkcja ta jest domyślnie wyłączona i należy ją włączyć ręcznie.
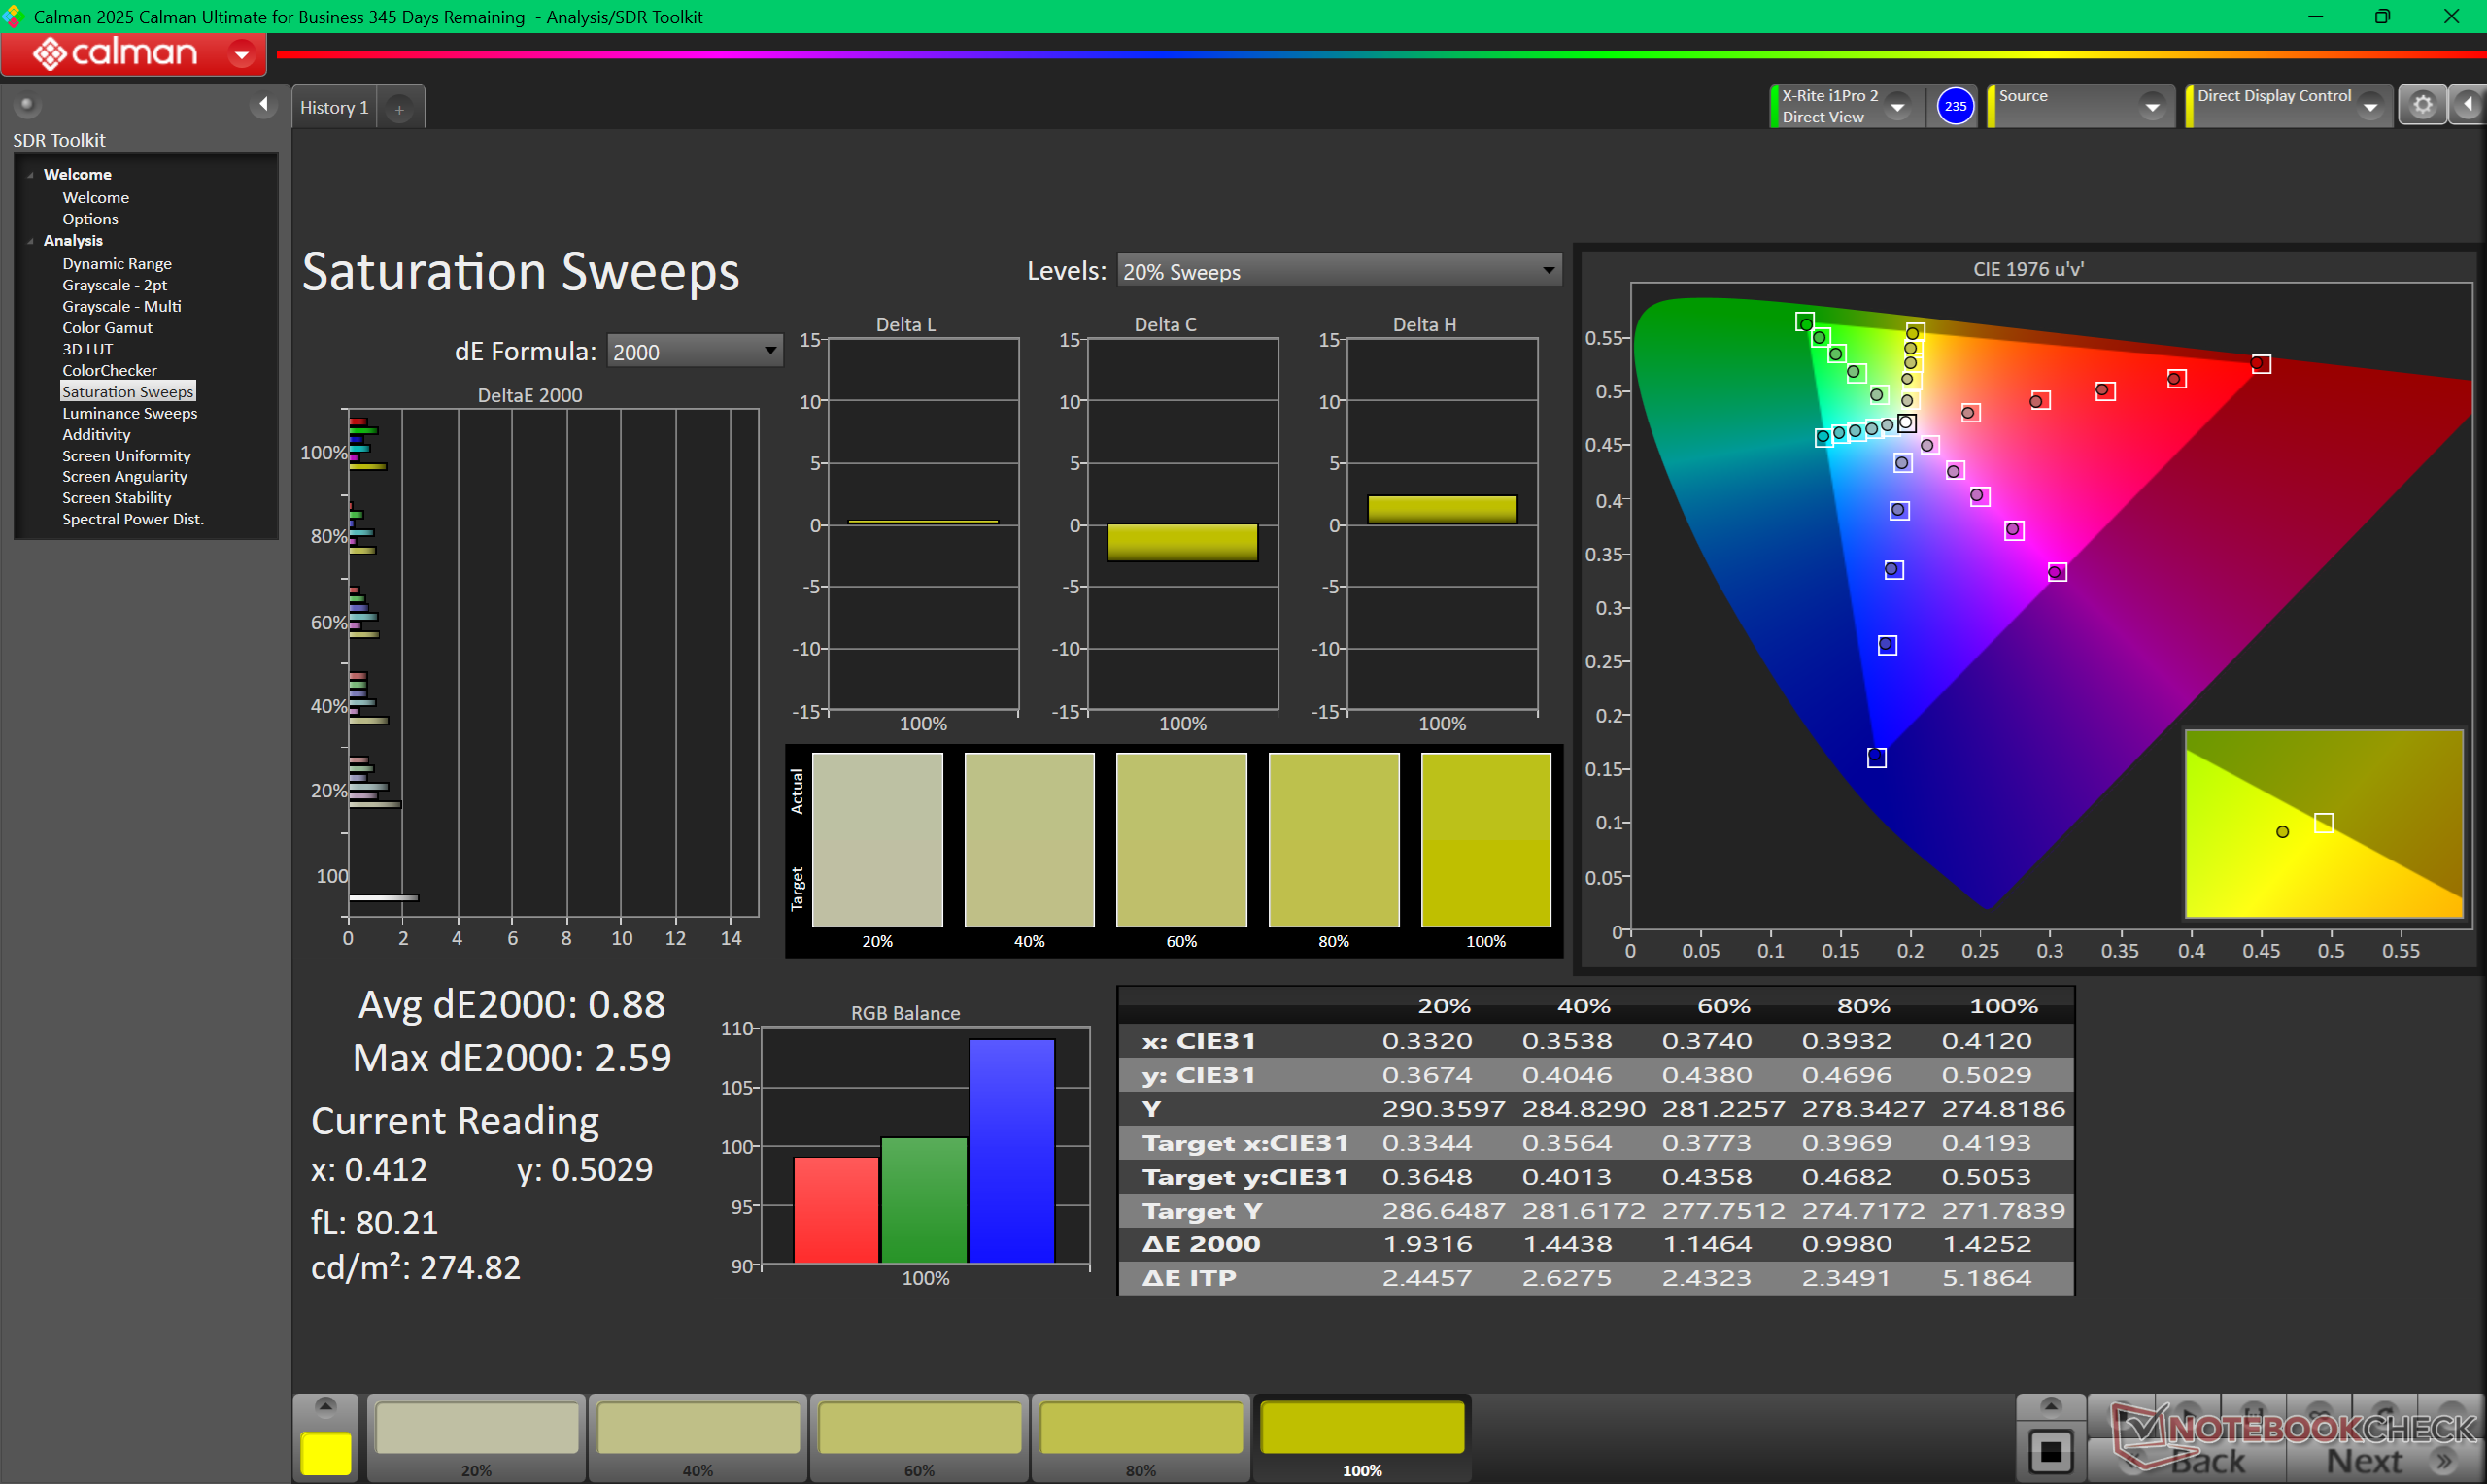
Dwie najbardziej zauważalne wady panelu IPS to znacznie wolniejszy czas reakcji czerni i bieli oraz brak pokrycia DCI-P3. W rezultacie ghosting może być bardzo zauważalny, szczególnie podczas grania, a HDR nie jest oficjalnie obsługiwany.


| |||||||||||||||||||||||||
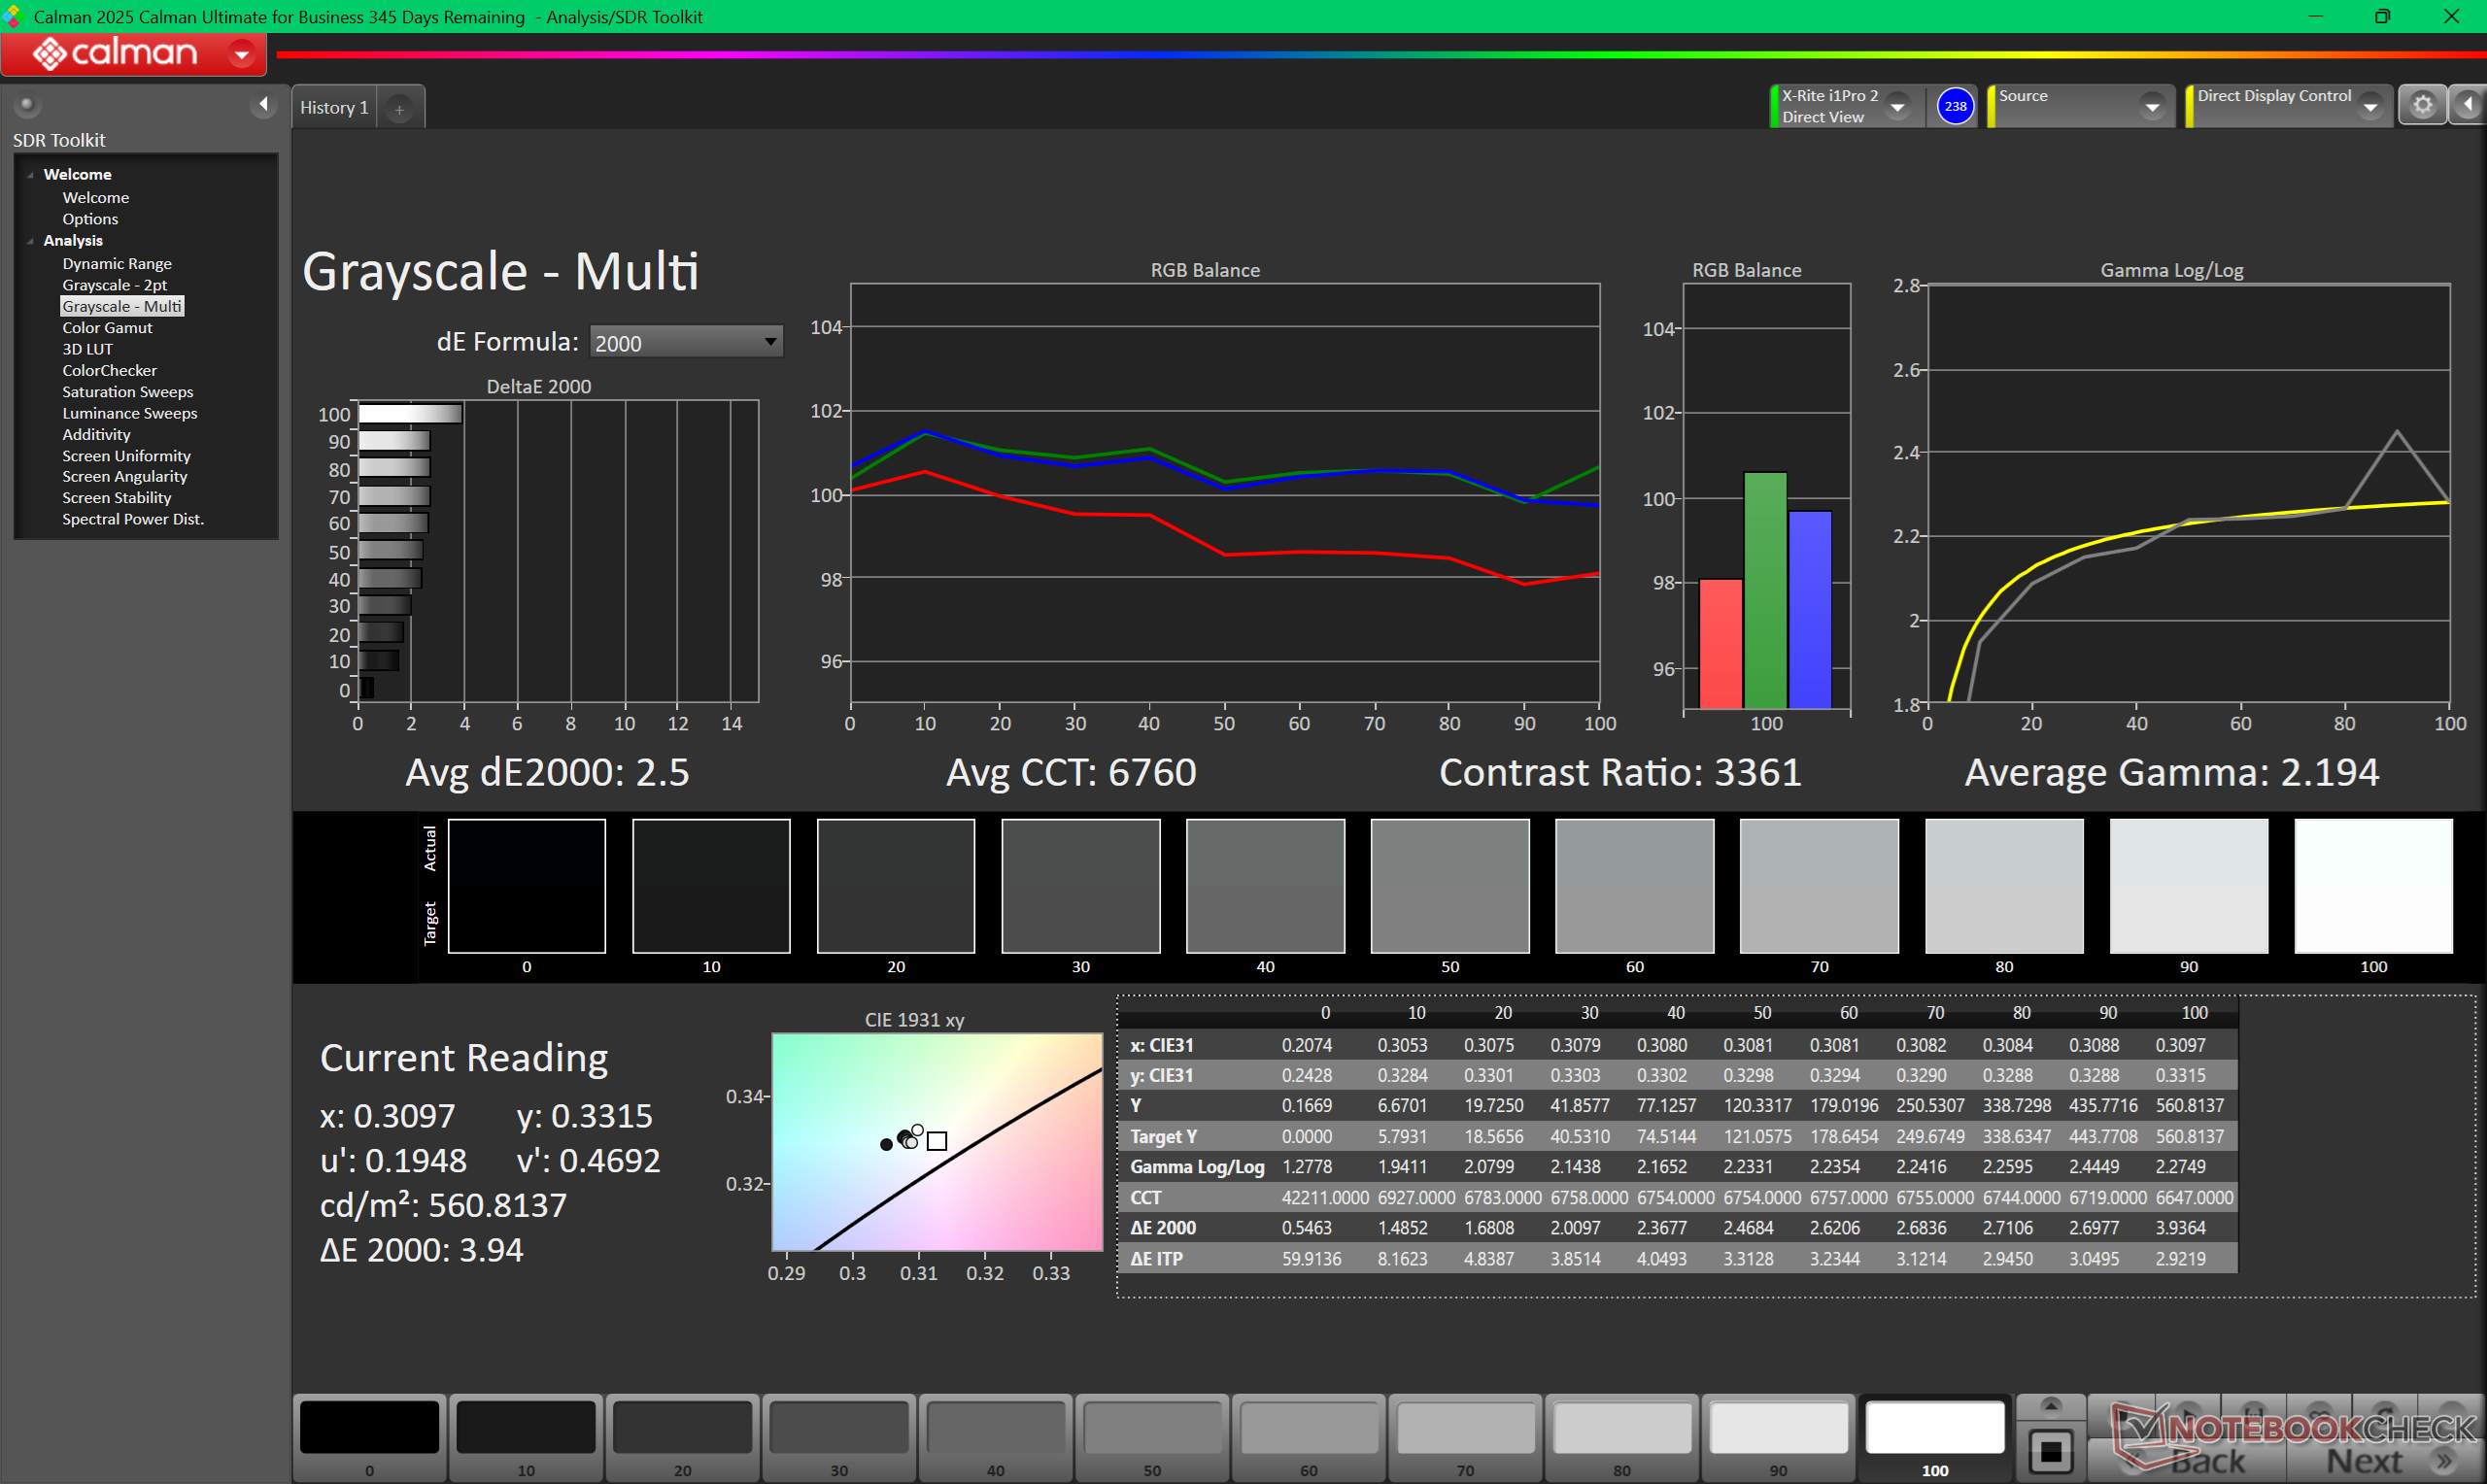
rozświetlenie: 85 %
na akumulatorze: 561.2 cd/m²
kontrast: 2551:1 (czerń: 0.22 cd/m²)
ΔE ColorChecker Calman: 2.09 | ∀{0.5-29.43 Ø4.73}
calibrated: 1.09
ΔE Greyscale Calman: 2.5 | ∀{0.09-98 Ø4.97}
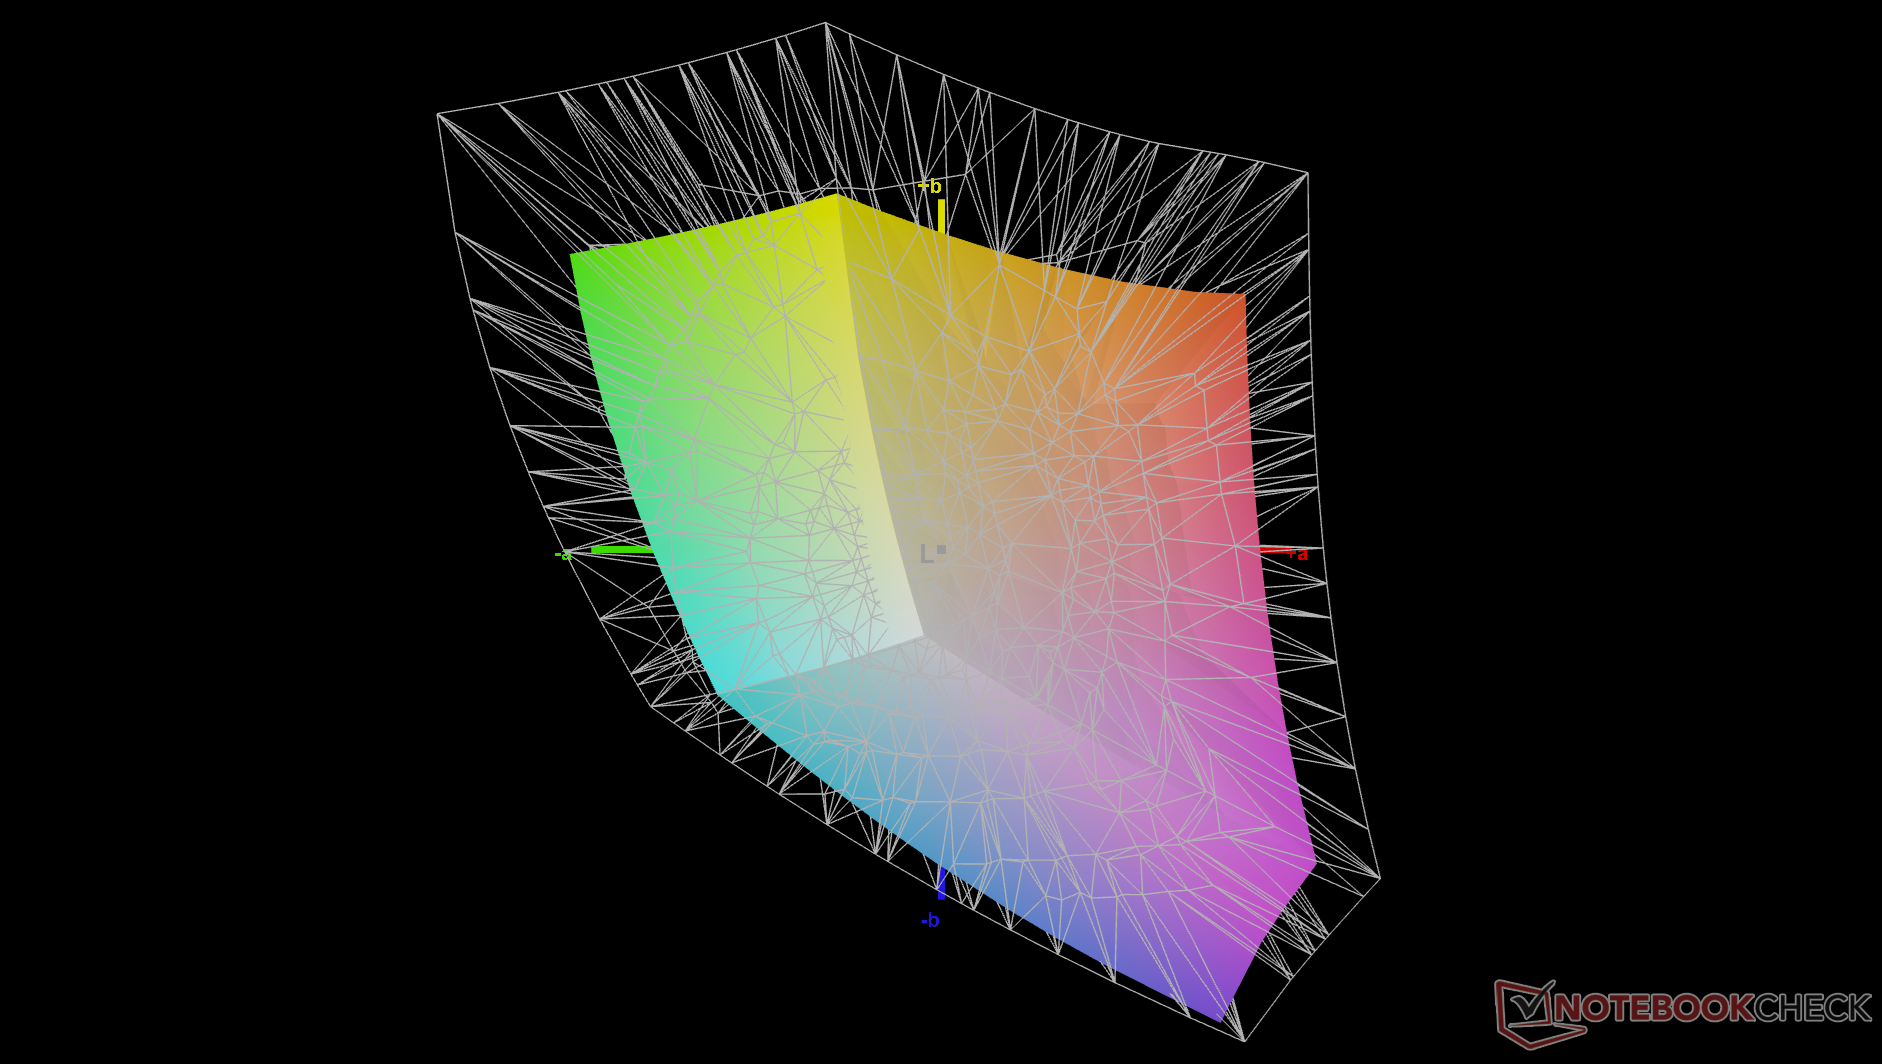
66.2% AdobeRGB 1998 (Argyll 3D)
95.3% sRGB (Argyll 3D)
64% Display P3 (Argyll 3D)
Gamma: 2.19
CCT: 6760 K
| Dell XPS 14 Core Ultra 7 355 LG Philips 140WUX, IPS, 1920x1200, 14", 120 Hz | Dell XPS 14 Core Ultra X7 358H LG Philips 140WT2, OLED, 2880x1800, 14", 120 Hz | Asus ExpertBook PM3406 MNE007QS3-6, IPS, 1920x1200, 14", 60 Hz | Lenovo ThinkPad T14 Gen 6 21QG001VGE MNE007JA1-3, IPS LED, 1920x1200, 14", 60 Hz | HP OmniBook Ultra Flip 14 Samsung SDC41AA, OLED, 2880x1800, 14", 120 Hz | Samsung Galaxy Book5 Pro 14 940XHA ATNA40CU07-0, OLED, 2880x1800, 14", 120 Hz | |
|---|---|---|---|---|---|---|
| Display | 36% | -39% | 5% | 36% | 35% | |
| Display P3 Coverage (%) | 64 | 99.7 56% | 39.3 -39% | 67.7 6% | 99.8 56% | 99.9 56% |
| sRGB Coverage (%) | 95.3 | 100 5% | 58.1 -39% | 98.3 3% | 100 5% | 100 5% |
| AdobeRGB 1998 Coverage (%) | 66.2 | 98.2 48% | 40.6 -39% | 69.9 6% | 96.7 46% | 95.7 45% |
| Response Times | 98% | 54% | 28% | 98% | 99% | |
| Response Time Grey 50% / Grey 80% * (ms) | 57.7 ? | 0.75 ? 99% | 27.6 ? 52% | 40.2 ? 30% | 0.86 ? 99% | 0.83 ? 99% |
| Response Time Black / White * (ms) | 38.8 ? | 1.03 ? 97% | 17 ? 56% | 29.1 ? 25% | 1.01 ? 97% | 0.69 ? 98% |
| PWM Frequency (Hz) | 240.62 ? | 469 ? | 240 ? | |||
| PWM Amplitude * (%) | 29 | 33.3 | 66 | |||
| Screen | 11% | -102% | 5% | 19% | -7% | |
| Brightness middle (cd/m²) | 561.2 | 393.8 -30% | 320 -43% | 554 -1% | 363.9 -35% | 400 -29% |
| Brightness (cd/m²) | 505 | 389 -23% | 310 -39% | 516 2% | 366 -28% | 402 -20% |
| Brightness Distribution (%) | 85 | 96 13% | 93 9% | 91 7% | 99 16% | 99 16% |
| Black Level * (cd/m²) | 0.22 | 0.26 -18% | 0.24 -9% | |||
| Contrast (:1) | 2551 | 1231 -52% | 2308 -10% | |||
| Colorchecker dE 2000 * | 2.09 | 1.27 39% | 5.1 -144% | 1.5 28% | 0.84 60% | 2.1 -0% |
| Colorchecker dE 2000 max. * | 4.37 | 3.35 23% | 18.1 -314% | 3.4 22% | 2.72 38% | 3.3 24% |
| Colorchecker dE 2000 calibrated * | 1.09 | 0.71 35% | 4.9 -350% | 0.9 17% | 0.82 25% | 1.6 -47% |
| Greyscale dE 2000 * | 2.5 | 2 20% | 1.7 32% | 2.7 -8% | 1.1 56% | 2.3 8% |
| Gamma | 2.19 100% | 2.19 100% | 2.21 100% | 2.25 98% | 2.18 101% | 2.26 97% |
| CCT | 6760 96% | 6379 102% | 6398 102% | 6882 94% | 6330 103% | 6795 96% |
| Całkowita średnia (program / ustawienia) | 48% /
32% | -29% /
-66% | 13% /
8% | 51% /
36% | 42% /
21% |
* ... im mniej tym lepiej

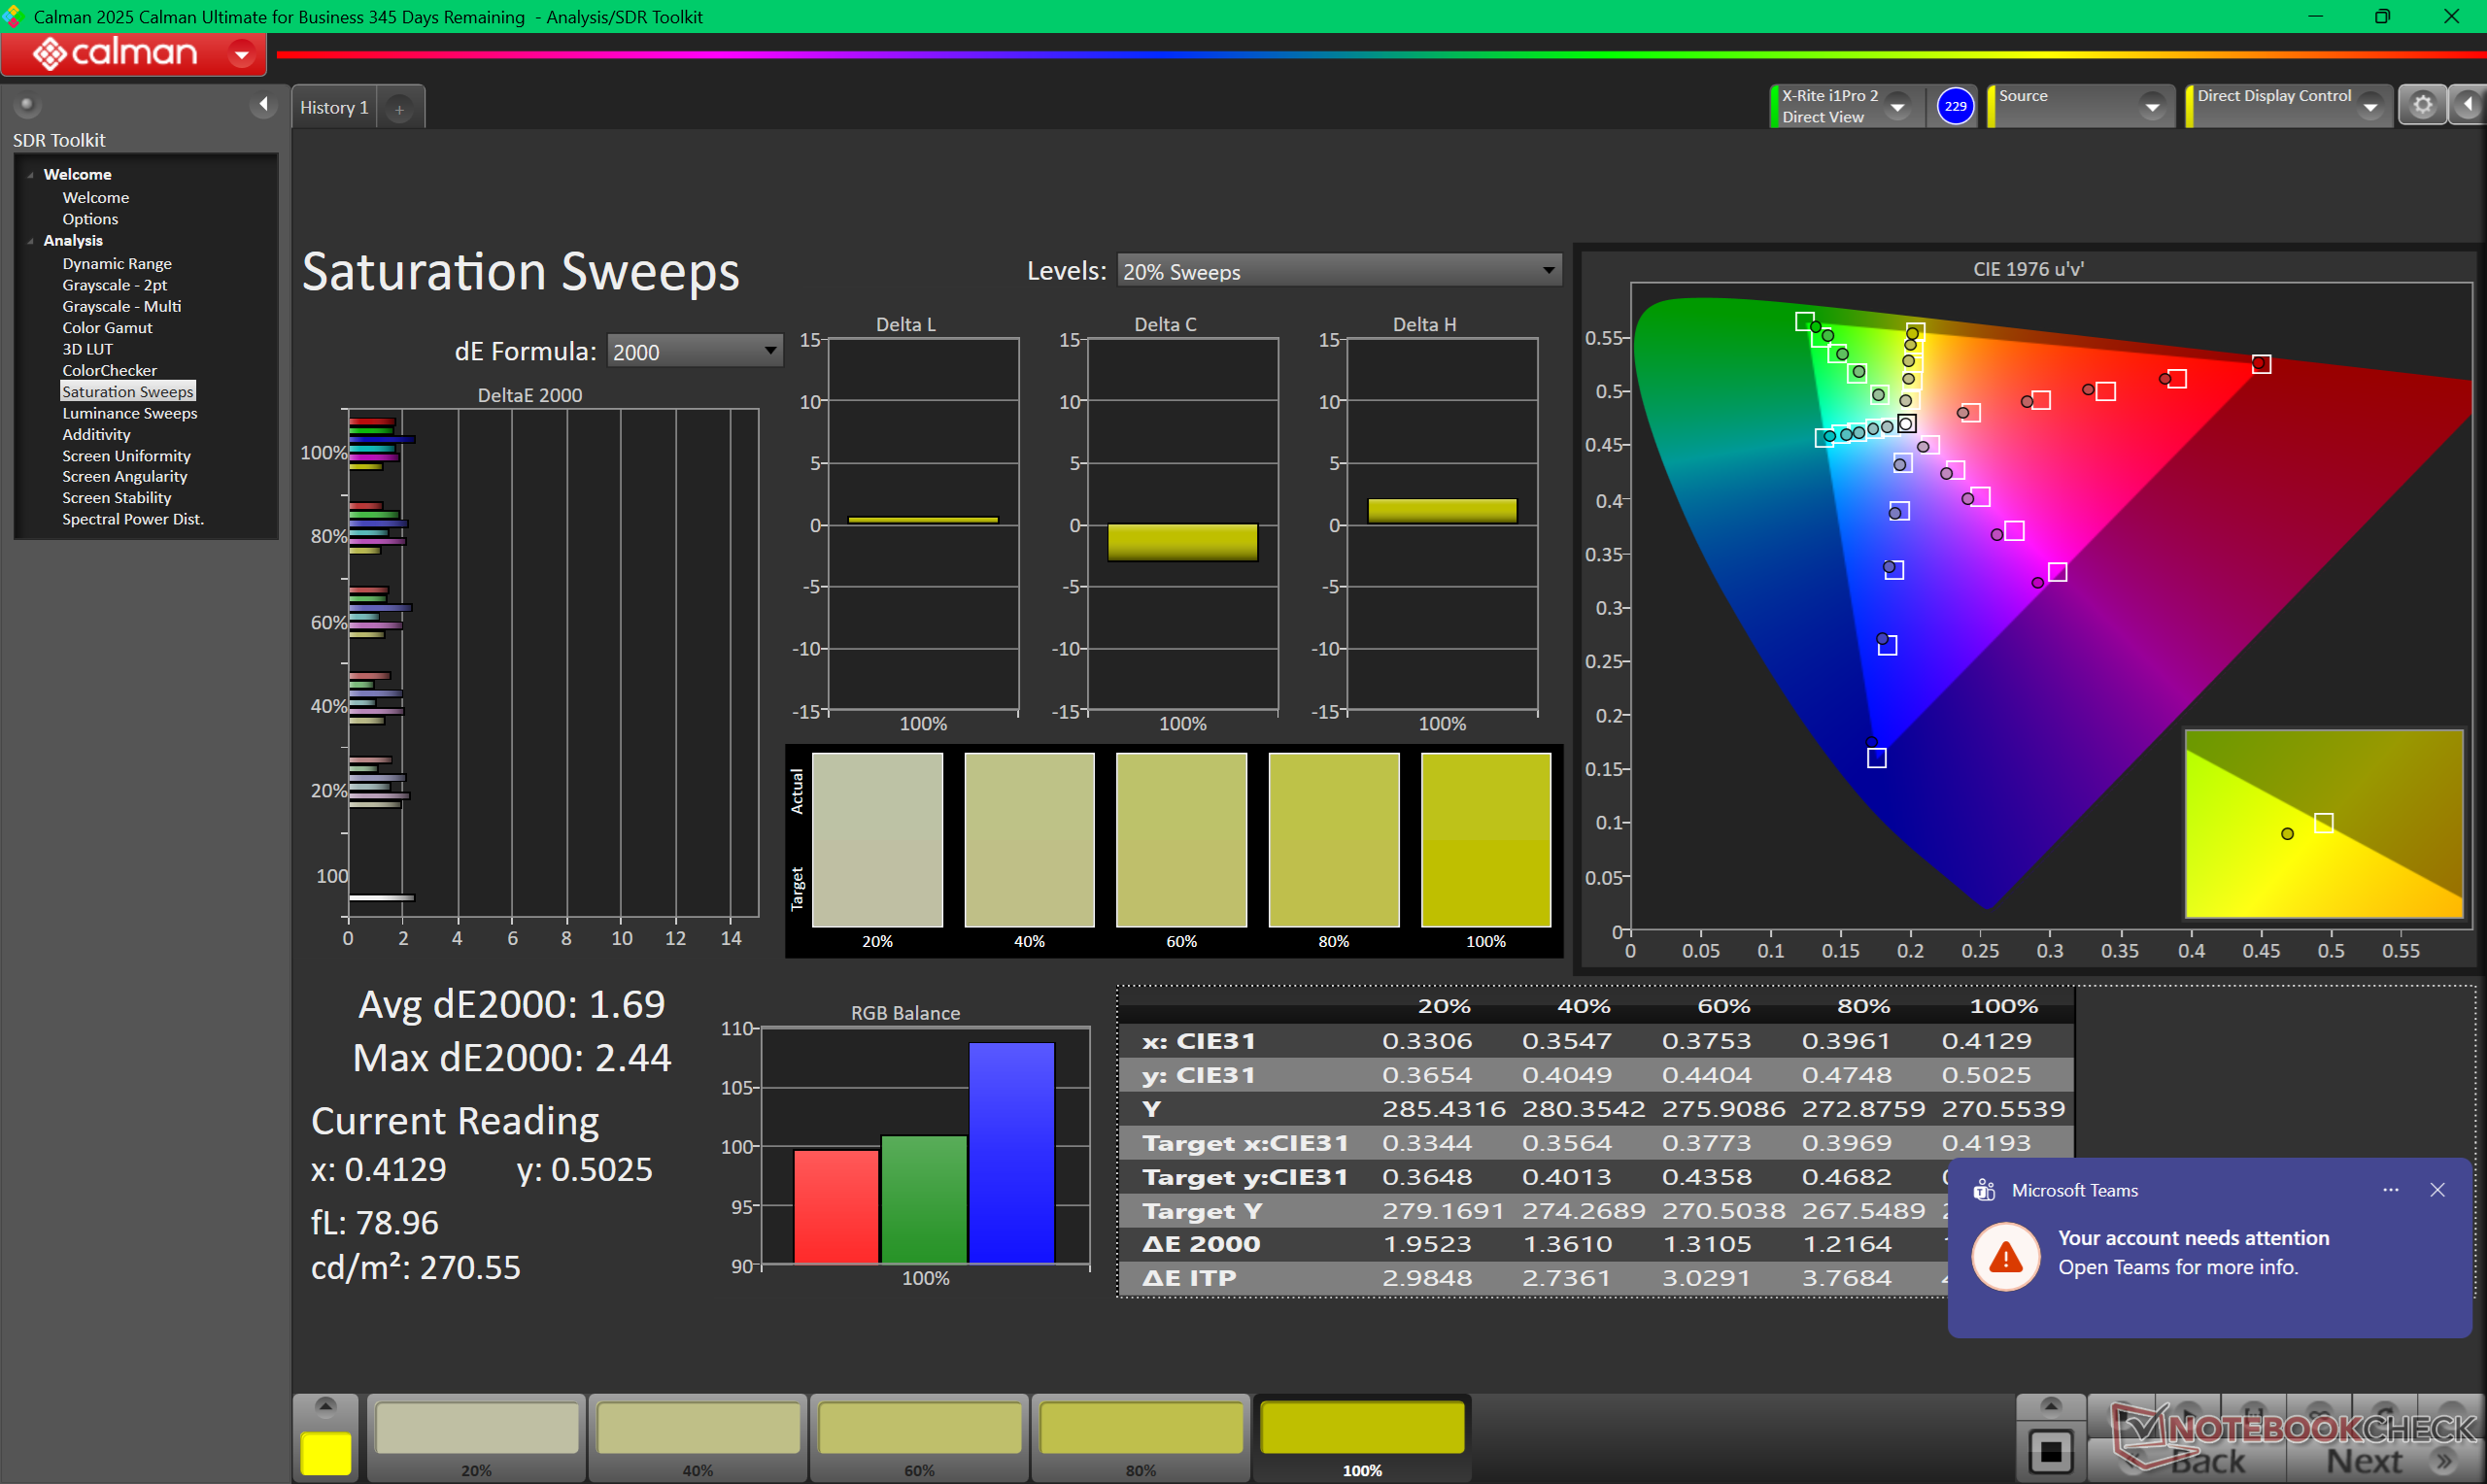
Chociaż wyświetlacz jest przyzwoicie skalibrowany po wyjęciu z pudełka, wciąż jest miejsce na niewielkie ulepszenia. Samodzielna kalibracja panelu za pomocą kolorymetru X-Rite poprawiłaby średnie wartości deltaE skali szarości i kolorów z odpowiednio 2,5 i 2,09 do zaledwie 1,7 i 1,09, jednocześnie zbliżając temperaturę barwową do docelowej 6500K.


Wyświetl czasy reakcji
| ↔ Czas reakcji od czerni do bieli | ||
|---|---|---|
| 38.8 ms ... wzrost ↗ i spadek ↘ łącznie | ↗ 17 ms wzrost | 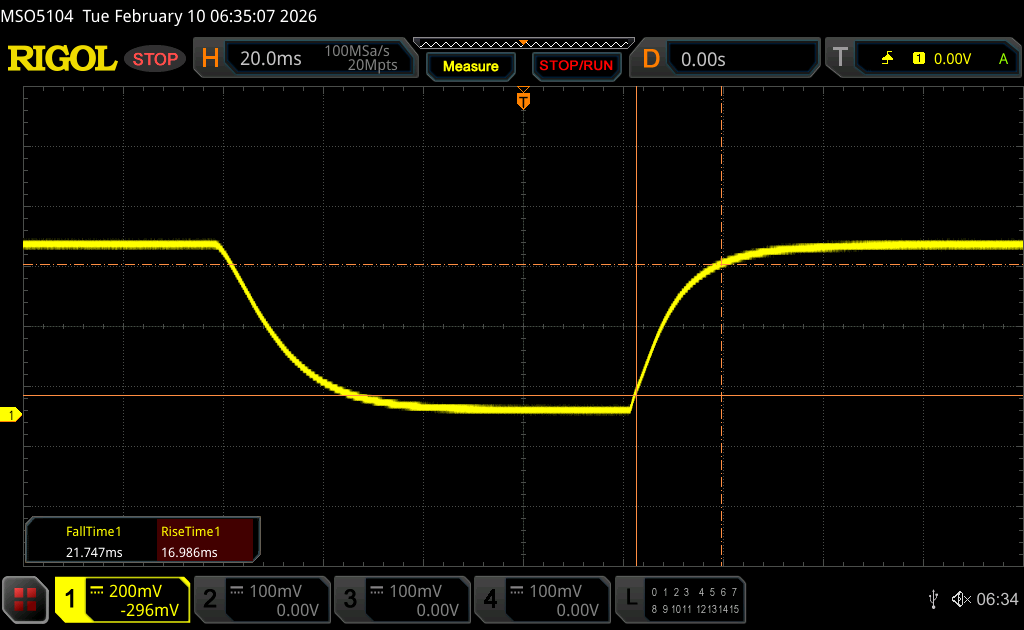 |
| ↘ 21.8 ms upadek | ||
| W naszych testach ekran wykazuje powolne tempo reakcji, co będzie niezadowalające dla graczy. Dla porównania, wszystkie testowane urządzenia wahają się od 0.1 (minimum) do 240 (maksimum) ms. » 96 % wszystkich urządzeń jest lepszych. Oznacza to, że zmierzony czas reakcji jest gorszy od średniej wszystkich testowanych urządzeń (19.9 ms). | ||
| ↔ Czas reakcji 50% szarości do 80% szarości | ||
| 57.7 ms ... wzrost ↗ i spadek ↘ łącznie | ↗ 26.4 ms wzrost | 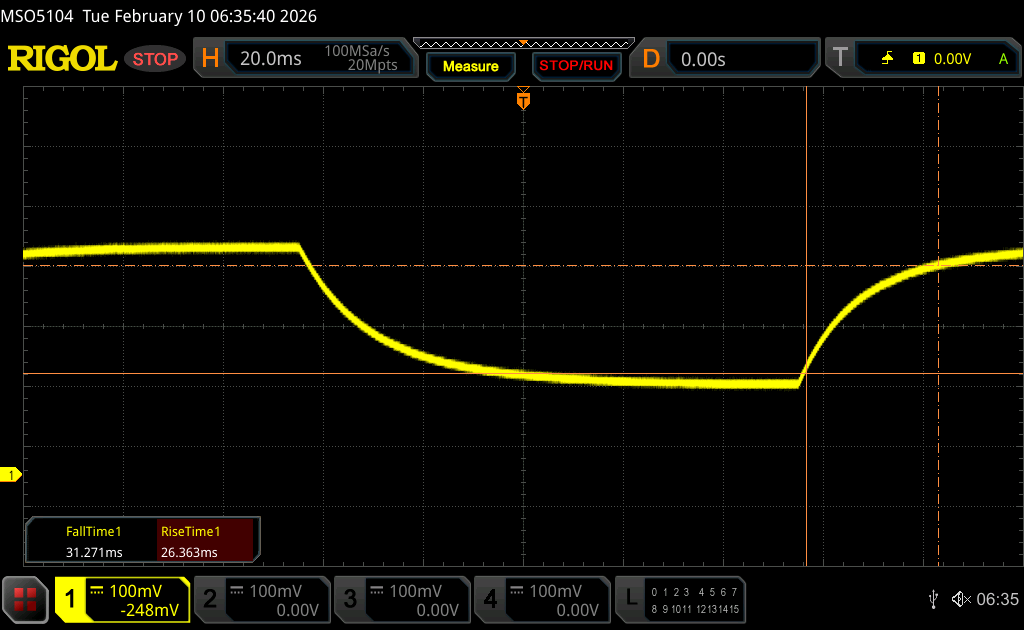 |
| ↘ 31.3 ms upadek | ||
| W naszych testach ekran wykazuje powolne tempo reakcji, co będzie niezadowalające dla graczy. Dla porównania, wszystkie testowane urządzenia wahają się od 0.165 (minimum) do 636 (maksimum) ms. » 94 % wszystkich urządzeń jest lepszych. Oznacza to, że zmierzony czas reakcji jest gorszy od średniej wszystkich testowanych urządzeń (31.1 ms). | ||
Migotanie ekranu / PWM (modulacja szerokości impulsu)
| Migotanie ekranu/nie wykryto PWM |  | ||
Dla porównania: 52 % wszystkich testowanych urządzeń nie używa PWM do przyciemniania wyświetlacza. Jeśli wykryto PWM, zmierzono średnio 7784 (minimum: 5 - maksimum: 343500) Hz. | |||


Wydajność
Warunki testowania
Przed przeprowadzeniem poniższych testów porównawczych ustawiliśmy system Windows i Dell Optimizer na tryb wydajności.
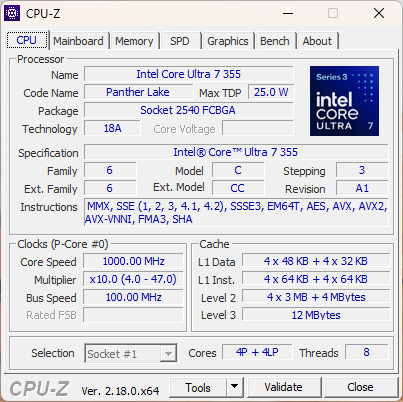
Procesor
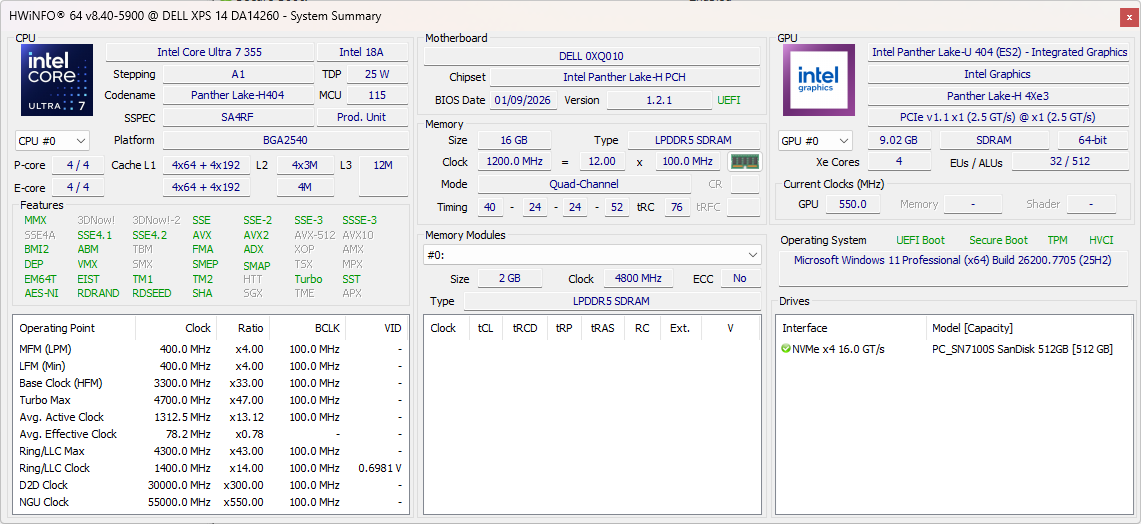
Surowa wydajność wielowątkowa naszego Core Ultra 7 355 jest około 40 procent wolniejsza niż Core Ultra X7 358H Konfiguracja XPS 14 jest niemal identyczna z laptopami działającymi na starszych procesorach Arrow Lake-U Core Ultra 7 255U lub Lunar Lake-V Core Ultra 7 258V co oznacza minimalny wzrost rok do roku. Potencjał Turbo Boost jest również znacznie bardziej ograniczony niż w przypadku konfiguracji Core Ultra X7, co pokazuje poniższy wykres pętli CineBench R15 xT.
Cinebench R15 Multi Loop
Cinebench R23: Multi Core | Single Core
Cinebench R20: CPU (Multi Core) | CPU (Single Core)
Cinebench R15: CPU Multi 64Bit | CPU Single 64Bit
Blender: v2.79 BMW27 CPU
7-Zip 18.03: 7z b 4 | 7z b 4 -mmt1
Geekbench 6.7: Multi-Core | Single-Core
Geekbench 5.5: Multi-Core | Single-Core
HWBOT x265 Benchmark v2.2: 4k Preset
LibreOffice : 20 Documents To PDF
R Benchmark 2.5: Overall mean
* ... im mniej tym lepiej
AIDA64: FP32 Ray-Trace | FPU Julia | CPU SHA3 | CPU Queen | FPU SinJulia | FPU Mandel | CPU AES | CPU ZLib | FP64 Ray-Trace | CPU PhotoWorxx | CPU CheckMate
| Performance rating | |
| Asus ExpertBook PM3406 -1! | |
| Dell XPS 14 Core Ultra X7 358H | |
| HP OmniBook Ultra Flip 14 -1! | |
| Lenovo ThinkPad T14 Gen 6 21QG001VGE -1! | |
| Przeciętny Intel Core Ultra 7 355 | |
| Dell XPS 14 Core Ultra 7 355 | |
| Samsung Galaxy Book5 Pro 14 940XHA -1! | |
| AIDA64 / FP32 Ray-Trace | |
| Asus ExpertBook PM3406 (v6.92.6600) | |
| Dell XPS 14 Core Ultra X7 358H (v8.20.8100) | |
| HP OmniBook Ultra Flip 14 (v6.92.6600) | |
| Lenovo ThinkPad T14 Gen 6 21QG001VGE (v6.92.6600) | |
| Przeciętny Intel Core Ultra 7 355 (12228 - 12838, n=3) | |
| Dell XPS 14 Core Ultra 7 355 (v8.20.8100) | |
| Samsung Galaxy Book5 Pro 14 940XHA (v6.92.6600) | |
| AIDA64 / FPU Julia | |
| Asus ExpertBook PM3406 (v6.92.6600) | |
| Dell XPS 14 Core Ultra X7 358H (v8.20.8100) | |
| Dell XPS 14 Core Ultra 7 355 (v8.20.8100) | |
| Przeciętny Intel Core Ultra 7 355 (60741 - 65963, n=3) | |
| Lenovo ThinkPad T14 Gen 6 21QG001VGE (v6.92.6600) | |
| HP OmniBook Ultra Flip 14 (v6.92.6600) | |
| Samsung Galaxy Book5 Pro 14 940XHA (v6.92.6600) | |
| AIDA64 / CPU SHA3 | |
| Dell XPS 14 Core Ultra X7 358H (v8.20.8100) | |
| Asus ExpertBook PM3406 (v6.92.6600) | |
| HP OmniBook Ultra Flip 14 (v6.92.6600) | |
| Przeciętny Intel Core Ultra 7 355 (2763 - 2845, n=3) | |
| Dell XPS 14 Core Ultra 7 355 (v8.20.8100) | |
| Lenovo ThinkPad T14 Gen 6 21QG001VGE (v6.92.6600) | |
| Samsung Galaxy Book5 Pro 14 940XHA (v6.92.6600) | |
| AIDA64 / CPU Queen | |
| Asus ExpertBook PM3406 (v6.92.6600) | |
| Dell XPS 14 Core Ultra X7 358H (v6.92.6600) | |
| HP OmniBook Ultra Flip 14 (v6.92.6600) | |
| Lenovo ThinkPad T14 Gen 6 21QG001VGE (v6.92.6600) | |
| Samsung Galaxy Book5 Pro 14 940XHA (v6.92.6600) | |
| Dell XPS 14 Core Ultra 7 355 (v6.92.6600) | |
| Przeciętny Intel Core Ultra 7 355 (n=1) | |
| AIDA64 / FPU SinJulia | |
| Asus ExpertBook PM3406 (v6.92.6600) | |
| Dell XPS 14 Core Ultra X7 358H (v8.20.8100) | |
| Przeciętny Intel Core Ultra 7 355 (4597 - 4601, n=3) | |
| Dell XPS 14 Core Ultra 7 355 (v8.20.8100) | |
| HP OmniBook Ultra Flip 14 (v6.92.6600) | |
| Lenovo ThinkPad T14 Gen 6 21QG001VGE (v6.92.6600) | |
| Samsung Galaxy Book5 Pro 14 940XHA (v6.92.6600) | |
| AIDA64 / FPU Mandel | |
| Asus ExpertBook PM3406 (v6.92.6600) | |
| Dell XPS 14 Core Ultra X7 358H (v8.20.8100) | |
| Dell XPS 14 Core Ultra 7 355 (v8.20.8100) | |
| Przeciętny Intel Core Ultra 7 355 (32404 - 35293, n=3) | |
| Lenovo ThinkPad T14 Gen 6 21QG001VGE (v6.92.6600) | |
| HP OmniBook Ultra Flip 14 (v6.92.6600) | |
| Samsung Galaxy Book5 Pro 14 940XHA (v6.92.6600) | |
| AIDA64 / CPU AES | |
| Asus ExpertBook PM3406 (v6.92.6600) | |
| Dell XPS 14 Core Ultra X7 358H (v8.20.8100) | |
| HP OmniBook Ultra Flip 14 (v6.92.6600) | |
| Lenovo ThinkPad T14 Gen 6 21QG001VGE (v6.92.6600) | |
| Przeciętny Intel Core Ultra 7 355 (39050 - 39424, n=3) | |
| Dell XPS 14 Core Ultra 7 355 (v8.20.8100) | |
| Samsung Galaxy Book5 Pro 14 940XHA (v6.92.6600) | |
| AIDA64 / CPU ZLib | |
| Dell XPS 14 Core Ultra X7 358H (v8.20.8100) | |
| Asus ExpertBook PM3406 (v6.92.6600) | |
| Przeciętny Intel Core Ultra 7 355 (635 - 646, n=3) | |
| Dell XPS 14 Core Ultra 7 355 (v8.20.8100) | |
| HP OmniBook Ultra Flip 14 (v6.92.6600) | |
| Lenovo ThinkPad T14 Gen 6 21QG001VGE (v6.92.6600) | |
| Samsung Galaxy Book5 Pro 14 940XHA (v6.92.6600) | |
| AIDA64 / FP64 Ray-Trace | |
| Asus ExpertBook PM3406 (v6.92.6600) | |
| Dell XPS 14 Core Ultra X7 358H (v8.20.8100) | |
| Lenovo ThinkPad T14 Gen 6 21QG001VGE (v6.92.6600) | |
| HP OmniBook Ultra Flip 14 (v6.92.6600) | |
| Dell XPS 14 Core Ultra 7 355 (v8.20.8100) | |
| Przeciętny Intel Core Ultra 7 355 (6147 - 6833, n=3) | |
| Samsung Galaxy Book5 Pro 14 940XHA (v6.92.6600) | |
| AIDA64 / CPU PhotoWorxx | |
| Dell XPS 14 Core Ultra X7 358H (v8.20.8100) | |
| Przeciętny Intel Core Ultra 7 355 (57998 - 60440, n=3) | |
| Dell XPS 14 Core Ultra 7 355 (v8.20.8100) | |
| Lenovo ThinkPad T14 Gen 6 21QG001VGE (v6.92.6600) | |
| HP OmniBook Ultra Flip 14 (v6.92.6600) | |
| Samsung Galaxy Book5 Pro 14 940XHA (v6.92.6600) | |
| Asus ExpertBook PM3406 (v6.92.6600) | |
| AIDA64 / CPU CheckMate | |
| Dell XPS 14 Core Ultra X7 358H (v8.20.8100) | |
| Przeciętny Intel Core Ultra 7 355 (2790 - 2813, n=3) | |
| Dell XPS 14 Core Ultra 7 355 (v8.20.8100) | |
Wydajność systemu
PCMark 10: Score | Essentials | Productivity | Digital Content Creation
CrossMark: Overall | Productivity | Creativity | Responsiveness
WebXPRT 3: Overall
WebXPRT 4: Overall
Mozilla Kraken 1.1: Total
Geekbench AI: Single Precision GPU 1.7 | Half Precision GPU 1.7 | Quantized GPU 1.7
| PCMark 10 / Score | |
| Dell XPS 14 Core Ultra X7 358H | |
| Asus ExpertBook PM3406 | |
| Dell XPS 14 Core Ultra 7 355 | |
| Lenovo ThinkPad T14 Gen 6 21QG001VGE | |
| Samsung Galaxy Book5 Pro 14 940XHA | |
| HP OmniBook Ultra Flip 14 | |
| PCMark 10 / Essentials | |
| Dell XPS 14 Core Ultra X7 358H | |
| Asus ExpertBook PM3406 | |
| Dell XPS 14 Core Ultra 7 355 | |
| Lenovo ThinkPad T14 Gen 6 21QG001VGE | |
| Samsung Galaxy Book5 Pro 14 940XHA | |
| HP OmniBook Ultra Flip 14 | |
| CrossMark / Overall | |
| Dell XPS 14 Core Ultra X7 358H | |
| Lenovo ThinkPad T14 Gen 6 21QG001VGE | |
| Dell XPS 14 Core Ultra 7 355 | |
| HP OmniBook Ultra Flip 14 | |
| Samsung Galaxy Book5 Pro 14 940XHA | |
| Asus ExpertBook PM3406 | |
| CrossMark / Creativity | |
| Dell XPS 14 Core Ultra X7 358H | |
| Lenovo ThinkPad T14 Gen 6 21QG001VGE | |
| HP OmniBook Ultra Flip 14 | |
| Dell XPS 14 Core Ultra 7 355 | |
| Samsung Galaxy Book5 Pro 14 940XHA | |
| Asus ExpertBook PM3406 | |
| WebXPRT 3 / Overall | |
| Dell XPS 14 Core Ultra X7 358H | |
| Dell XPS 14 Core Ultra 7 355 | |
| Lenovo ThinkPad T14 Gen 6 21QG001VGE | |
| Samsung Galaxy Book5 Pro 14 940XHA | |
| HP OmniBook Ultra Flip 14 | |
| Asus ExpertBook PM3406 | |
| WebXPRT 4 / Overall | |
| Dell XPS 14 Core Ultra X7 358H | |
| Dell XPS 14 Core Ultra 7 355 | |
| Lenovo ThinkPad T14 Gen 6 21QG001VGE | |
| HP OmniBook Ultra Flip 14 | |
| Samsung Galaxy Book5 Pro 14 940XHA | |
| Asus ExpertBook PM3406 | |
| Geekbench AI / Single Precision GPU 1.7 | |
| Dell XPS 14 Core Ultra X7 358H | |
| Samsung Galaxy Book5 Pro 14 940XHA | |
| Dell XPS 14 Core Ultra 7 355 | |
| Geekbench AI / Half Precision GPU 1.7 | |
| Dell XPS 14 Core Ultra X7 358H | |
| Samsung Galaxy Book5 Pro 14 940XHA | |
| Dell XPS 14 Core Ultra 7 355 | |
| Geekbench AI / Quantized GPU 1.7 | |
| Dell XPS 14 Core Ultra X7 358H | |
| Samsung Galaxy Book5 Pro 14 940XHA | |
| Dell XPS 14 Core Ultra 7 355 | |
* ... im mniej tym lepiej
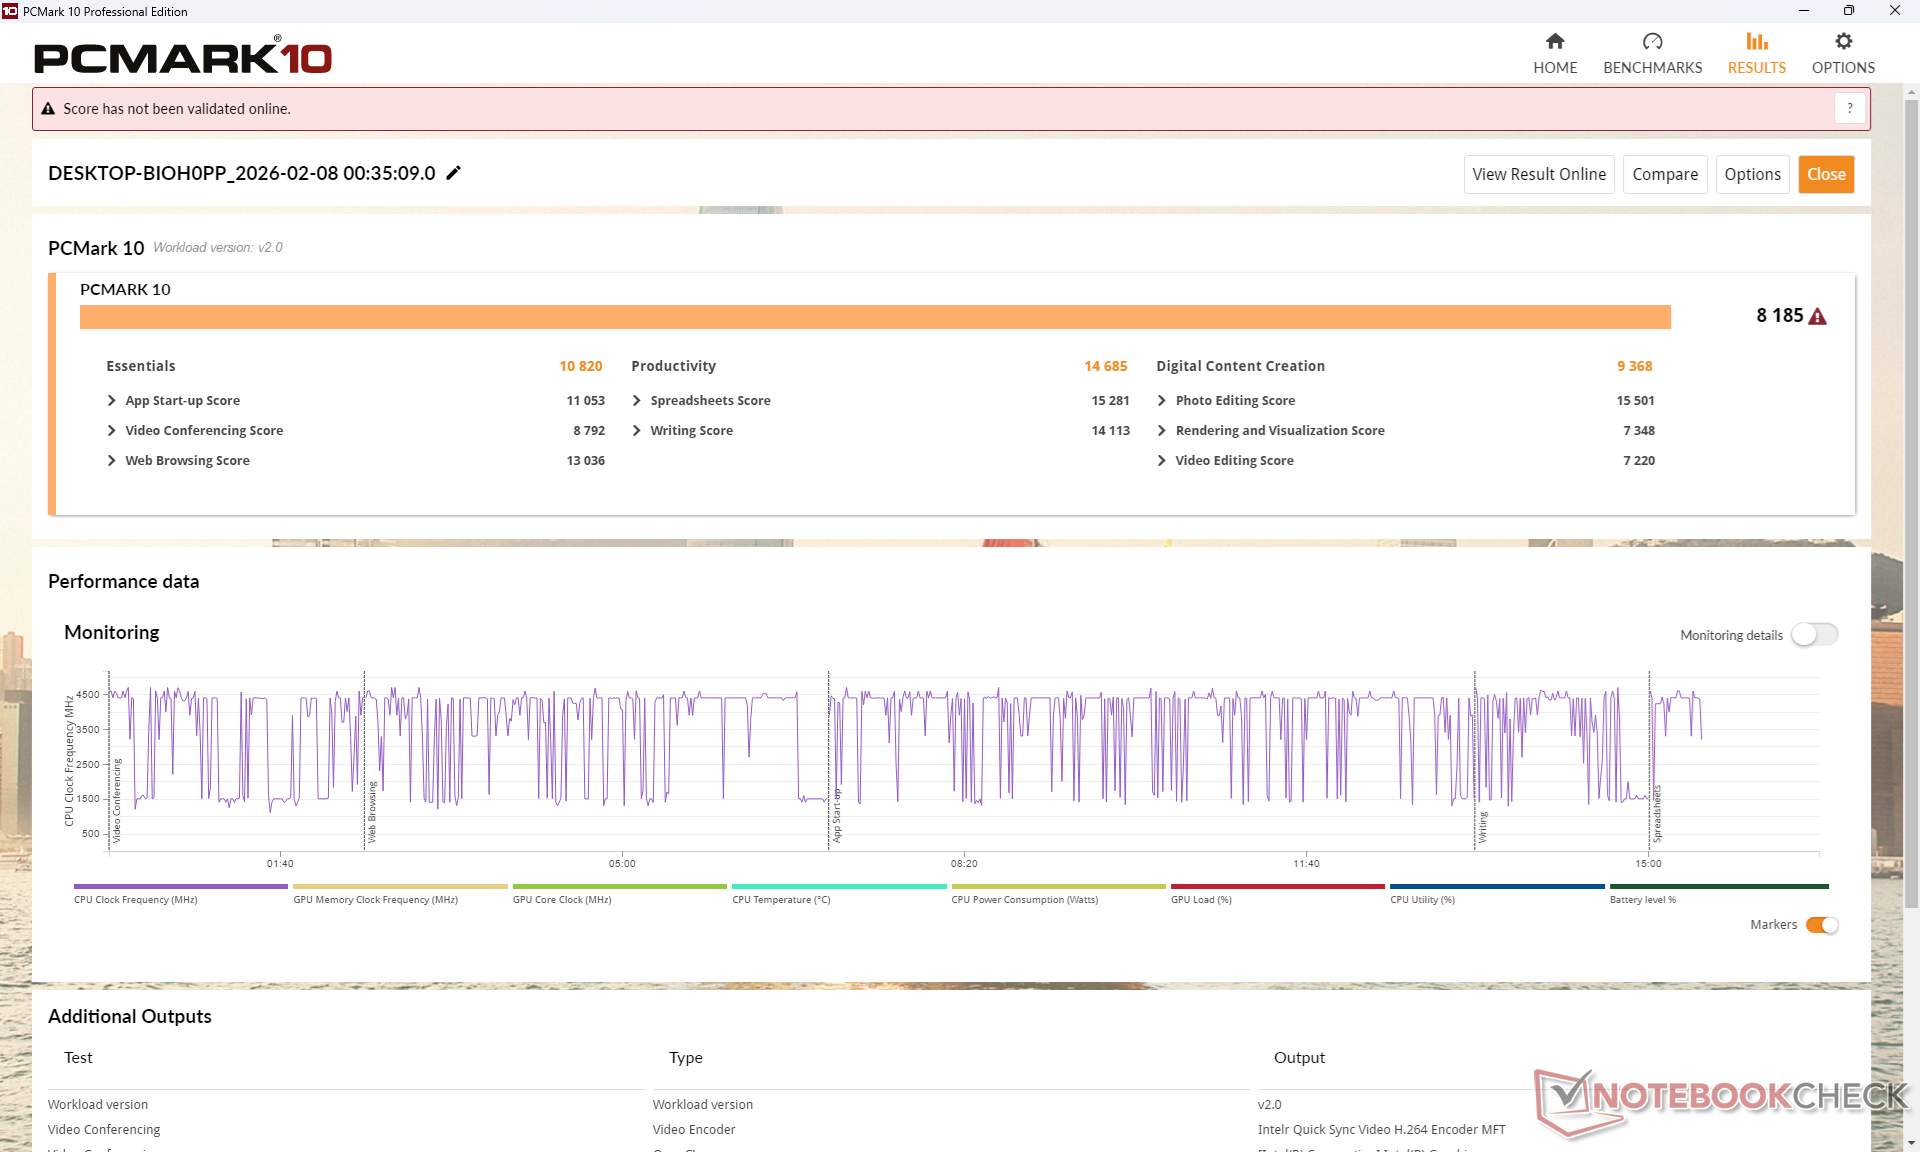
| PCMark 10 Score | 8185 pkt. | |
Pomoc | ||
| AIDA64 / Memory Copy | |
| Dell XPS 14 Core Ultra X7 358H | |
| Lenovo ThinkPad T14 Gen 6 21QG001VGE | |
| HP OmniBook Ultra Flip 14 | |
| Przeciętny Intel Core Ultra 7 355 (97301 - 105135, n=3) | |
| Samsung Galaxy Book5 Pro 14 940XHA | |
| Dell XPS 14 Core Ultra 7 355 | |
| Asus ExpertBook PM3406 | |
| AIDA64 / Memory Read | |
| Dell XPS 14 Core Ultra X7 358H | |
| Lenovo ThinkPad T14 Gen 6 21QG001VGE | |
| HP OmniBook Ultra Flip 14 | |
| Samsung Galaxy Book5 Pro 14 940XHA | |
| Przeciętny Intel Core Ultra 7 355 (79551 - 85021, n=3) | |
| Dell XPS 14 Core Ultra 7 355 | |
| Asus ExpertBook PM3406 | |
| AIDA64 / Memory Write | |
| Dell XPS 14 Core Ultra X7 358H | |
| Lenovo ThinkPad T14 Gen 6 21QG001VGE | |
| HP OmniBook Ultra Flip 14 | |
| Samsung Galaxy Book5 Pro 14 940XHA | |
| Przeciętny Intel Core Ultra 7 355 (103056 - 108621, n=3) | |
| Dell XPS 14 Core Ultra 7 355 | |
| Asus ExpertBook PM3406 | |
| AIDA64 / Memory Latency | |
| Dell XPS 14 Core Ultra 7 355 | |
| Przeciętny Intel Core Ultra 7 355 (99.7 - 105.8, n=3) | |
| Lenovo ThinkPad T14 Gen 6 21QG001VGE | |
| HP OmniBook Ultra Flip 14 | |
| Samsung Galaxy Book5 Pro 14 940XHA | |
| Dell XPS 14 Core Ultra X7 358H | |
| Asus ExpertBook PM3406 | |
* ... im mniej tym lepiej
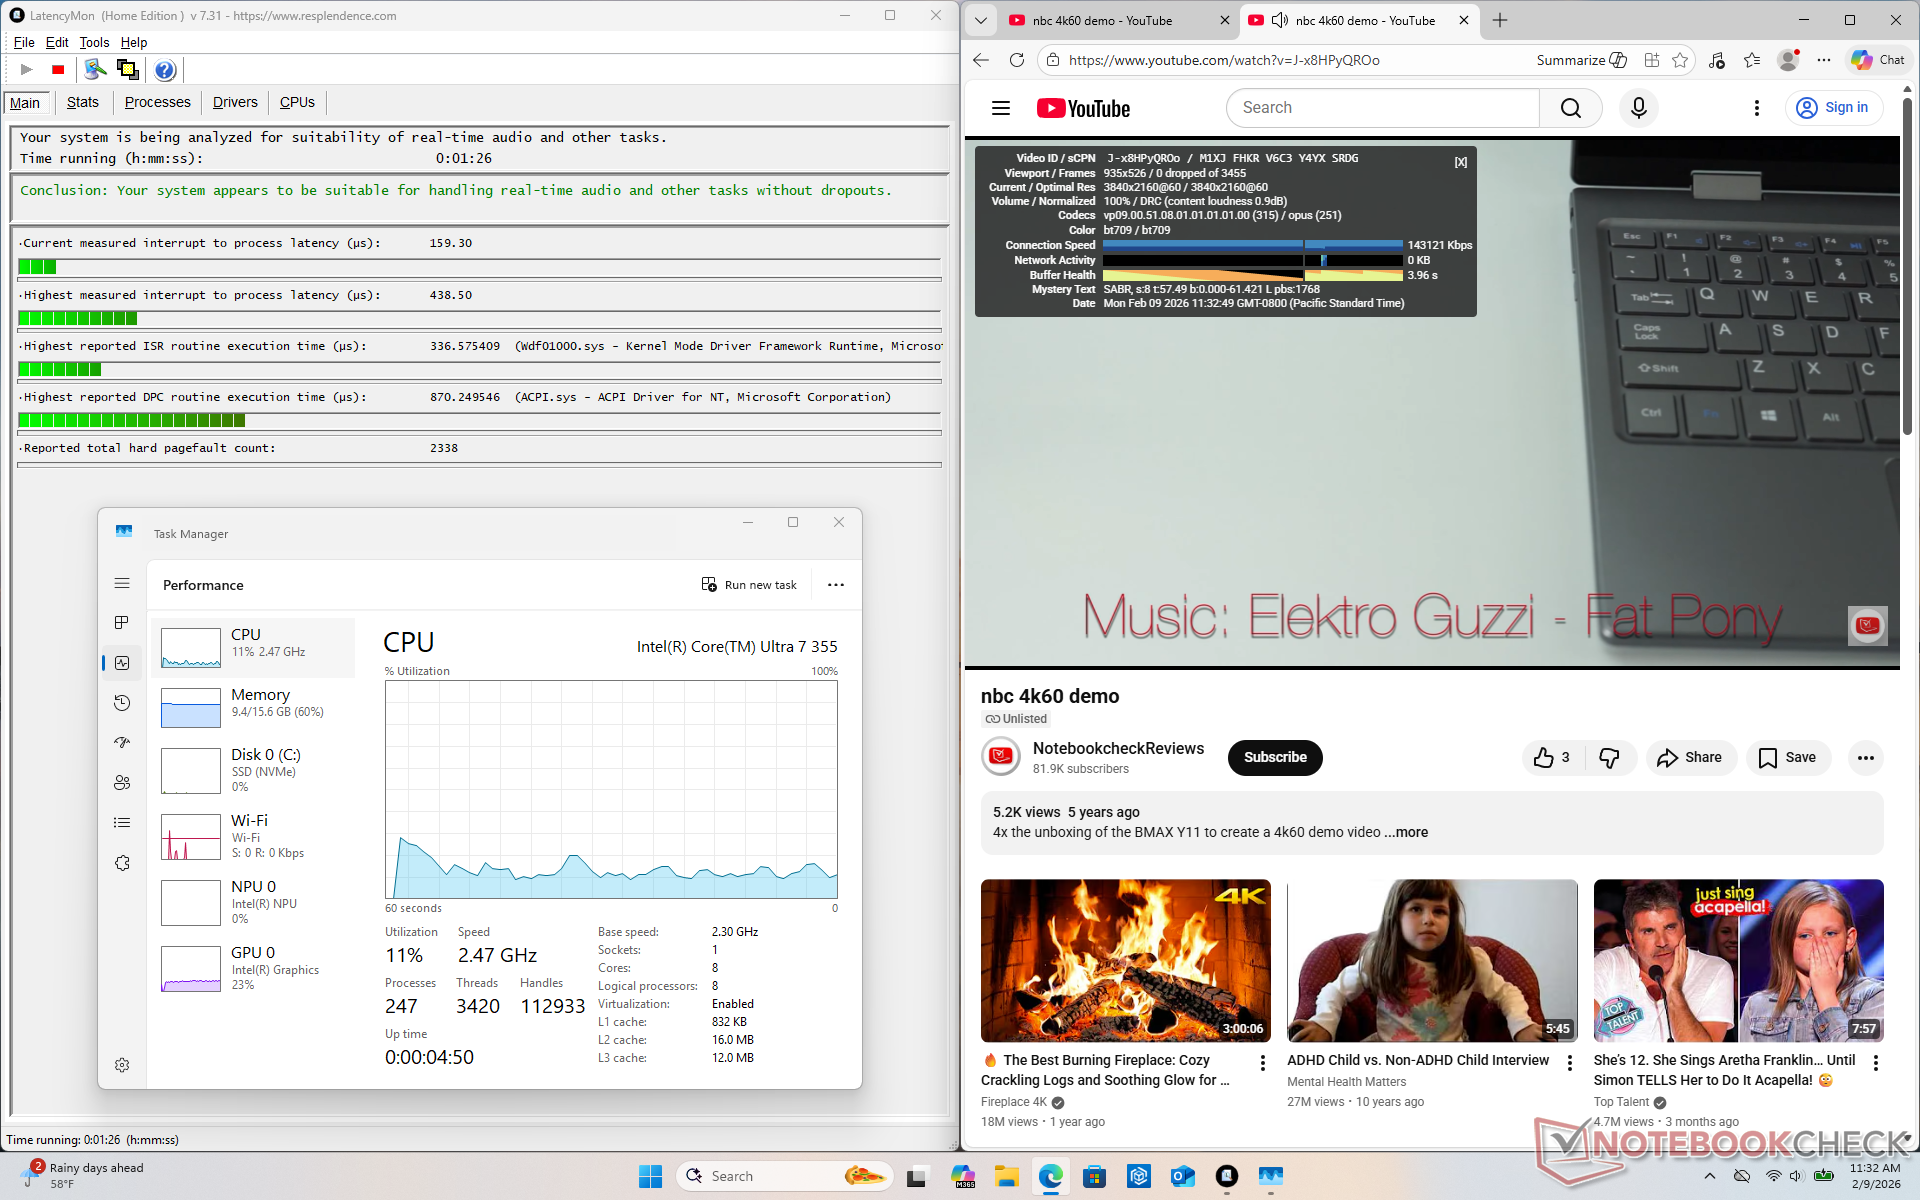
Opóźnienie DPC
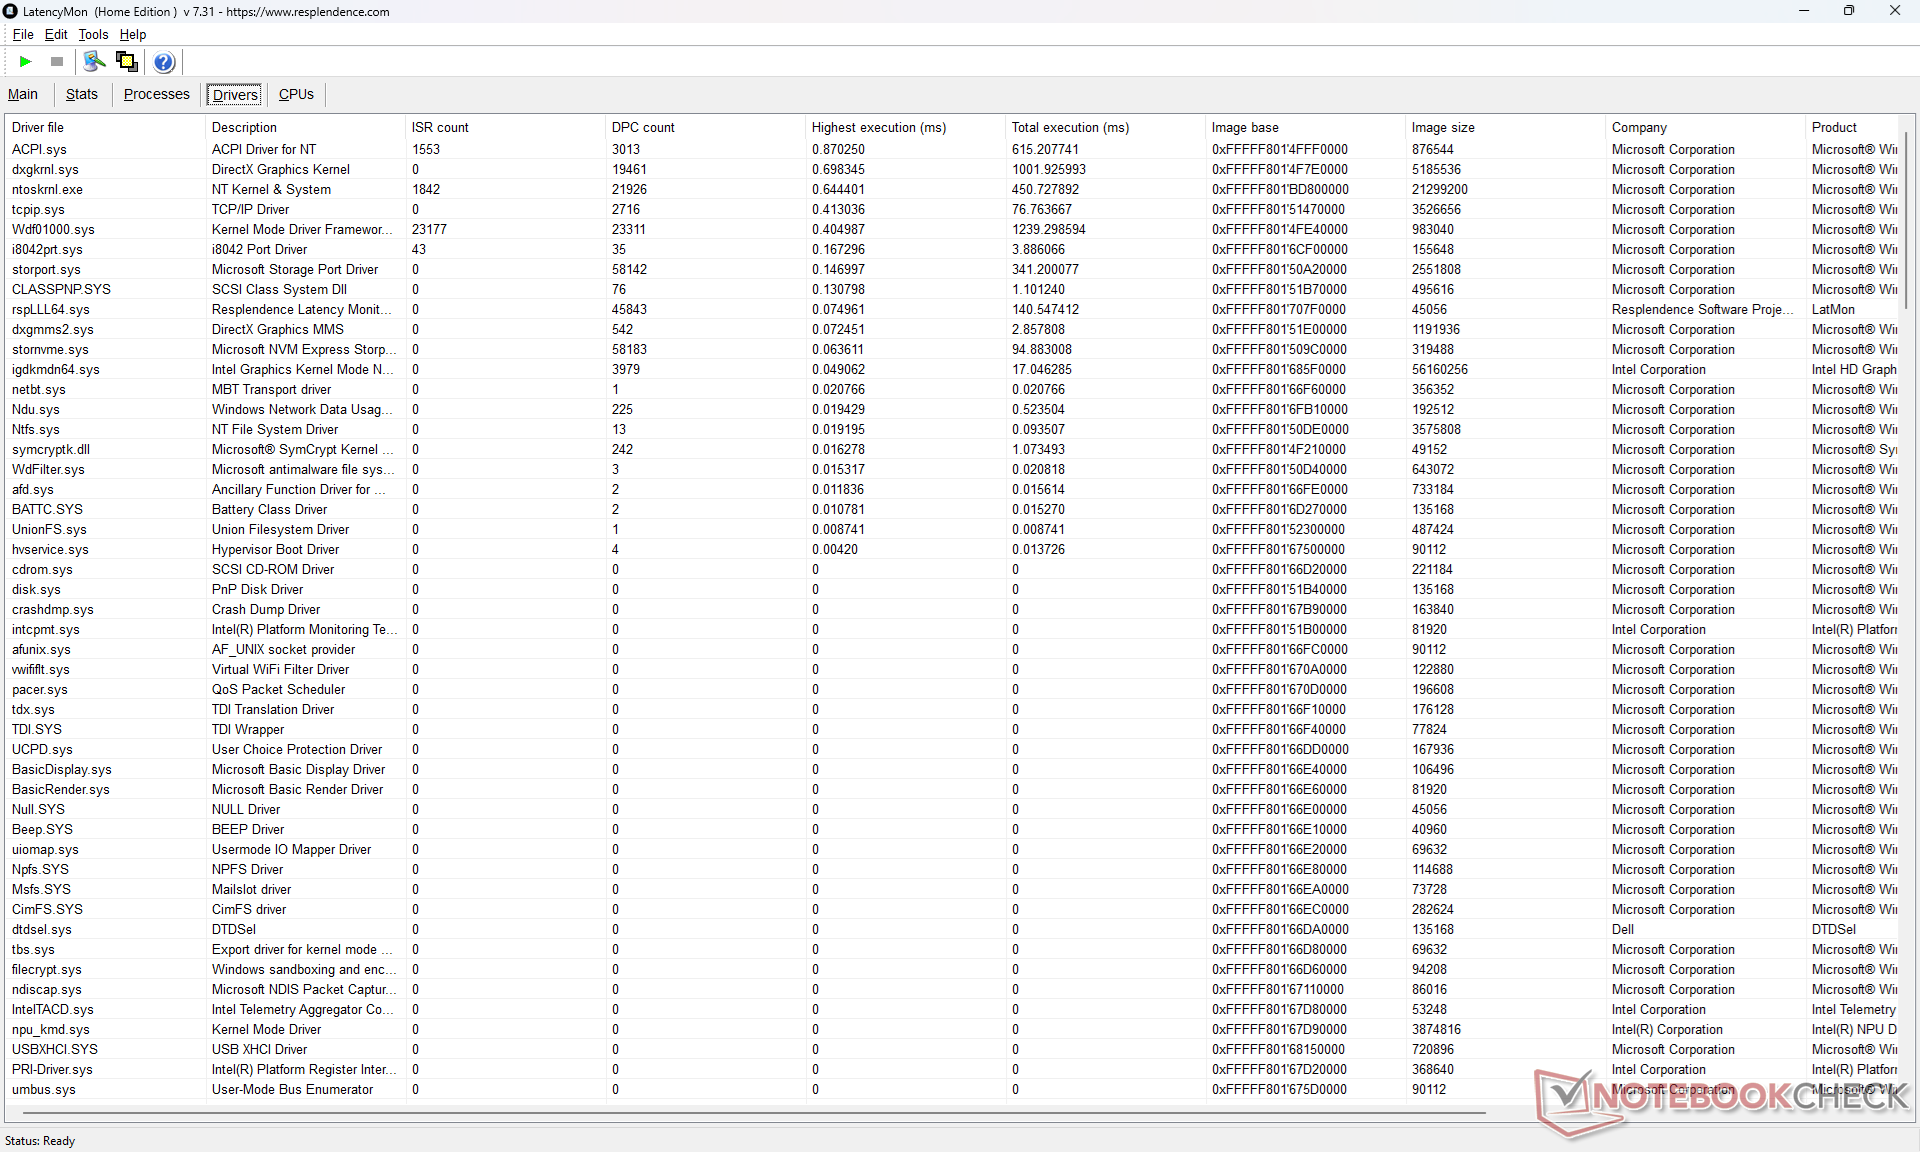
| DPC Latencies / LatencyMon - interrupt to process latency (max), Web, Youtube, Prime95 | |
| Asus ExpertBook PM3406 | |
| Samsung Galaxy Book5 Pro 14 940XHA | |
| Lenovo ThinkPad T14 Gen 6 21QG001VGE | |
| Dell XPS 14 Core Ultra X7 358H | |
| Dell XPS 14 Core Ultra 7 355 | |
* ... im mniej tym lepiej
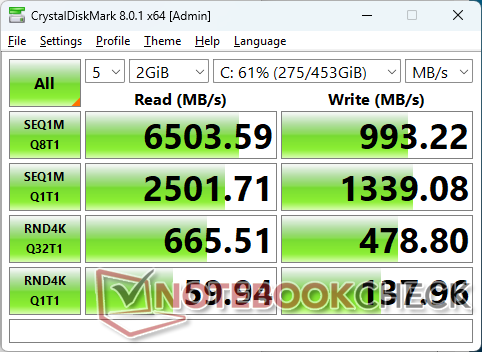
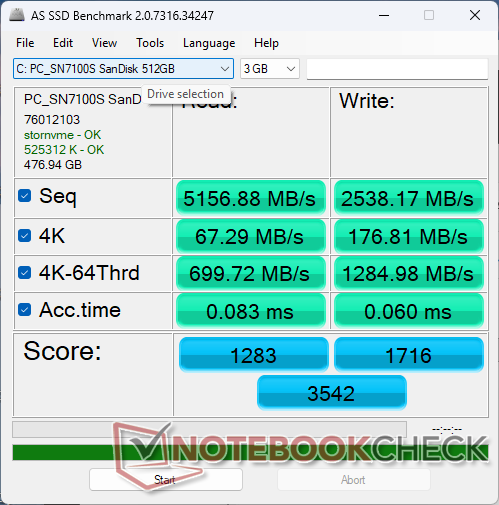
Urządzenia pamięci masowej
Nasze urządzenie jest dostarczane z SanDisk SN7100S PCIe4 x4 NVMe SSD zamiast Samsung PM9C1b w konfiguracji Core Ultra X7 XPS 14. Wydajność pomiędzy nimi jest dość zbliżona i nie zaobserwowano żadnego zauważalnego dławienia.

* ... im mniej tym lepiej
Dławienie dysku: Pętla odczytu DiskSpd, głębokość kolejki 8
Wydajność GPU
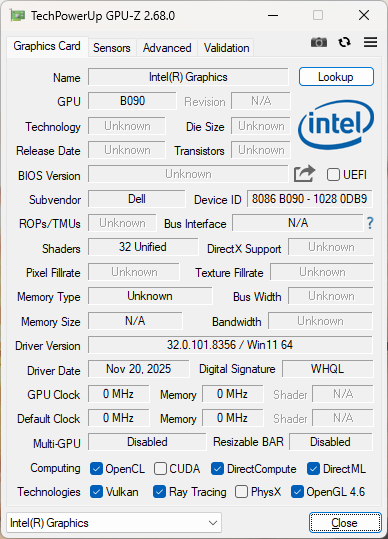
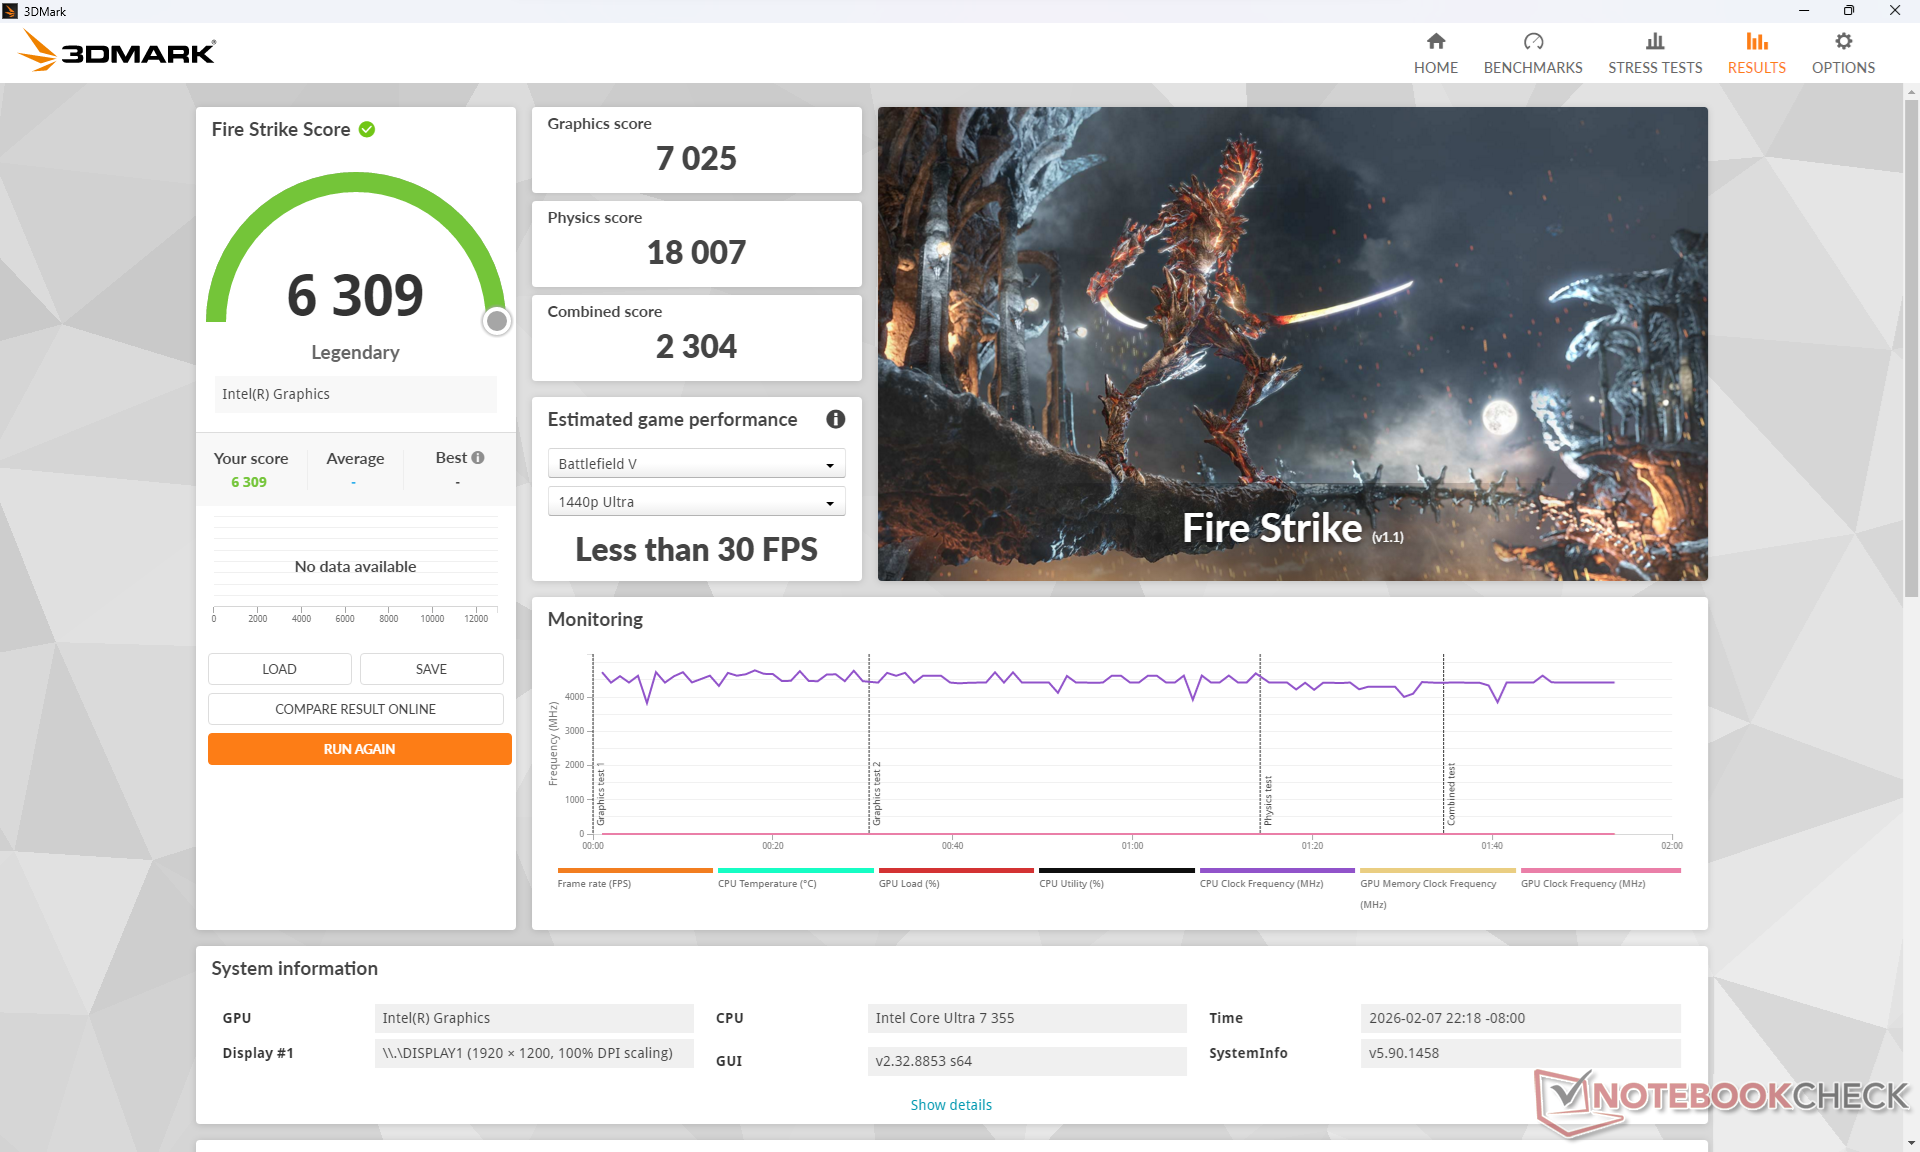
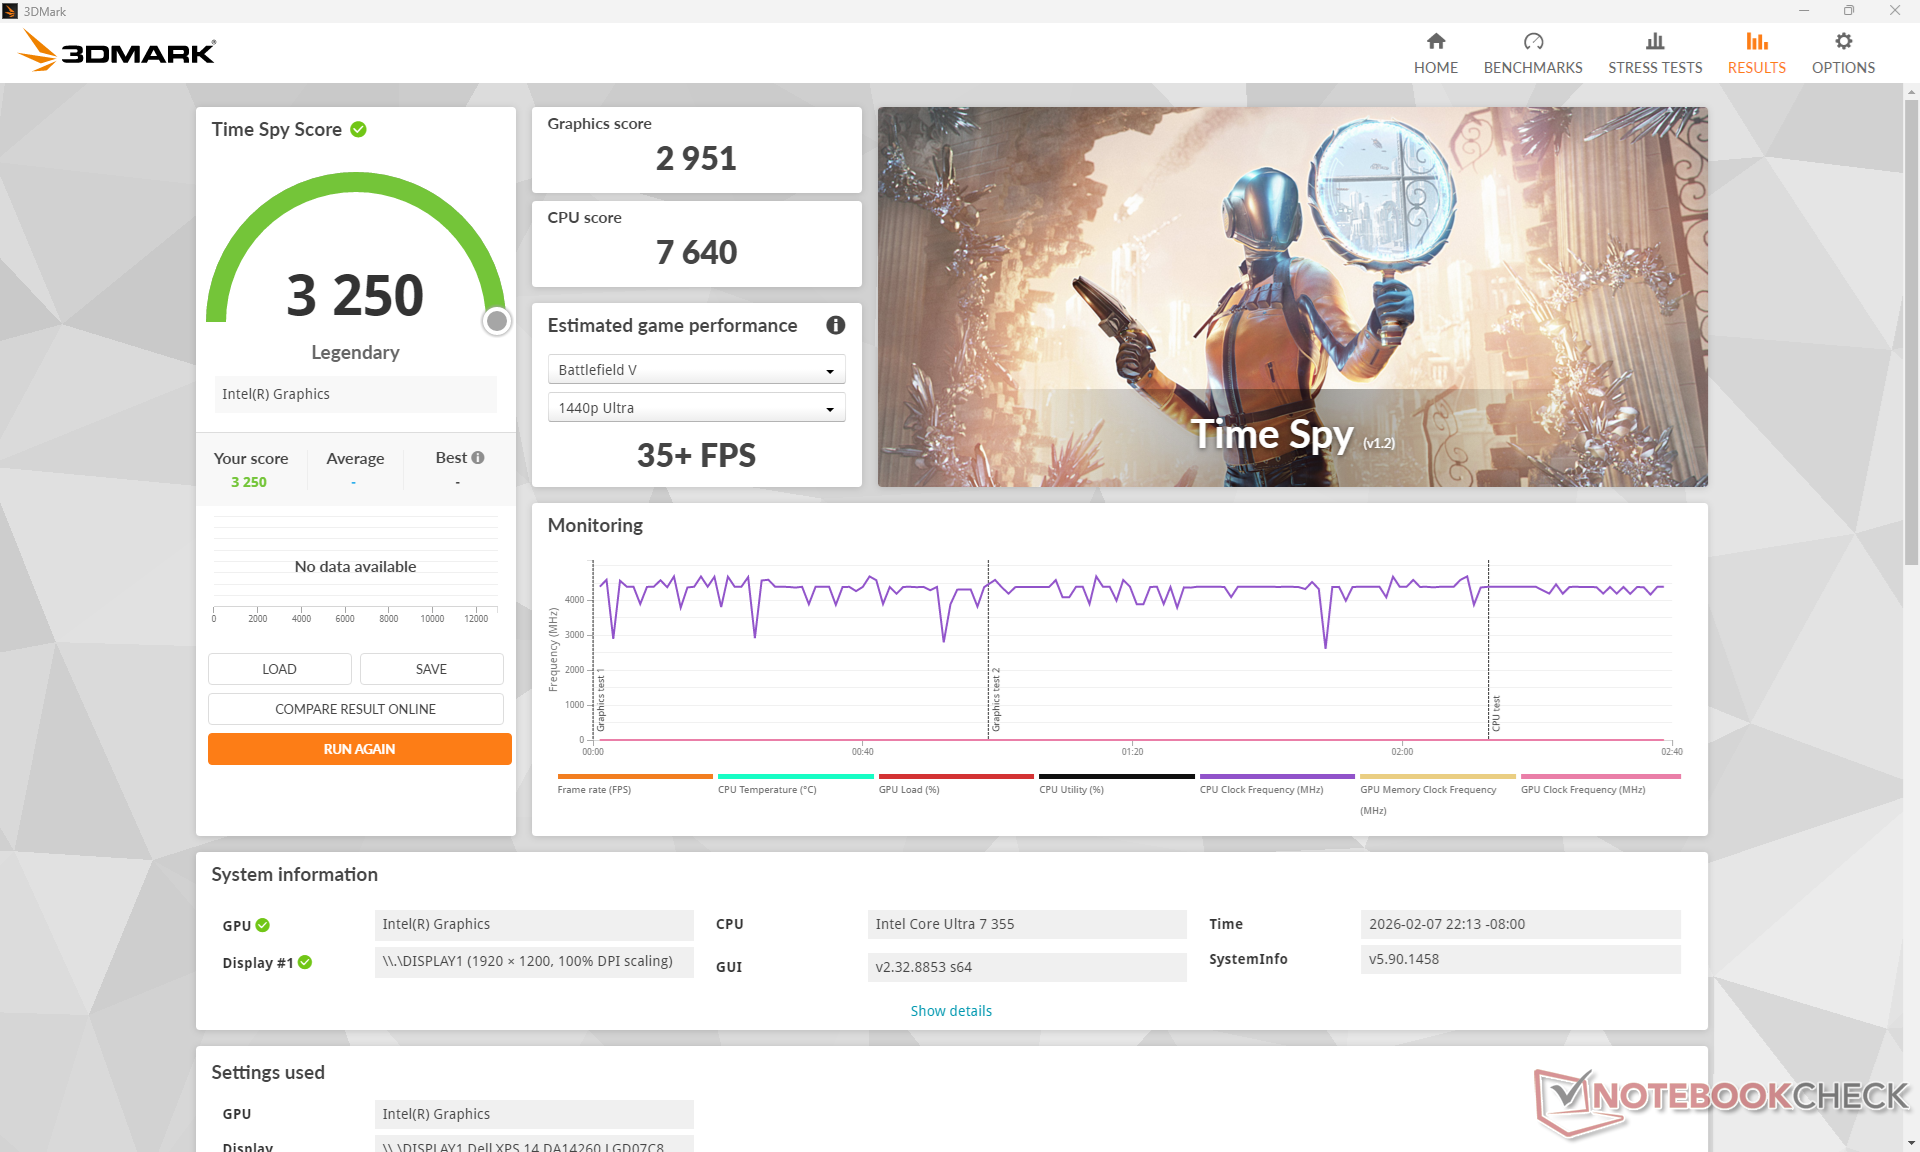
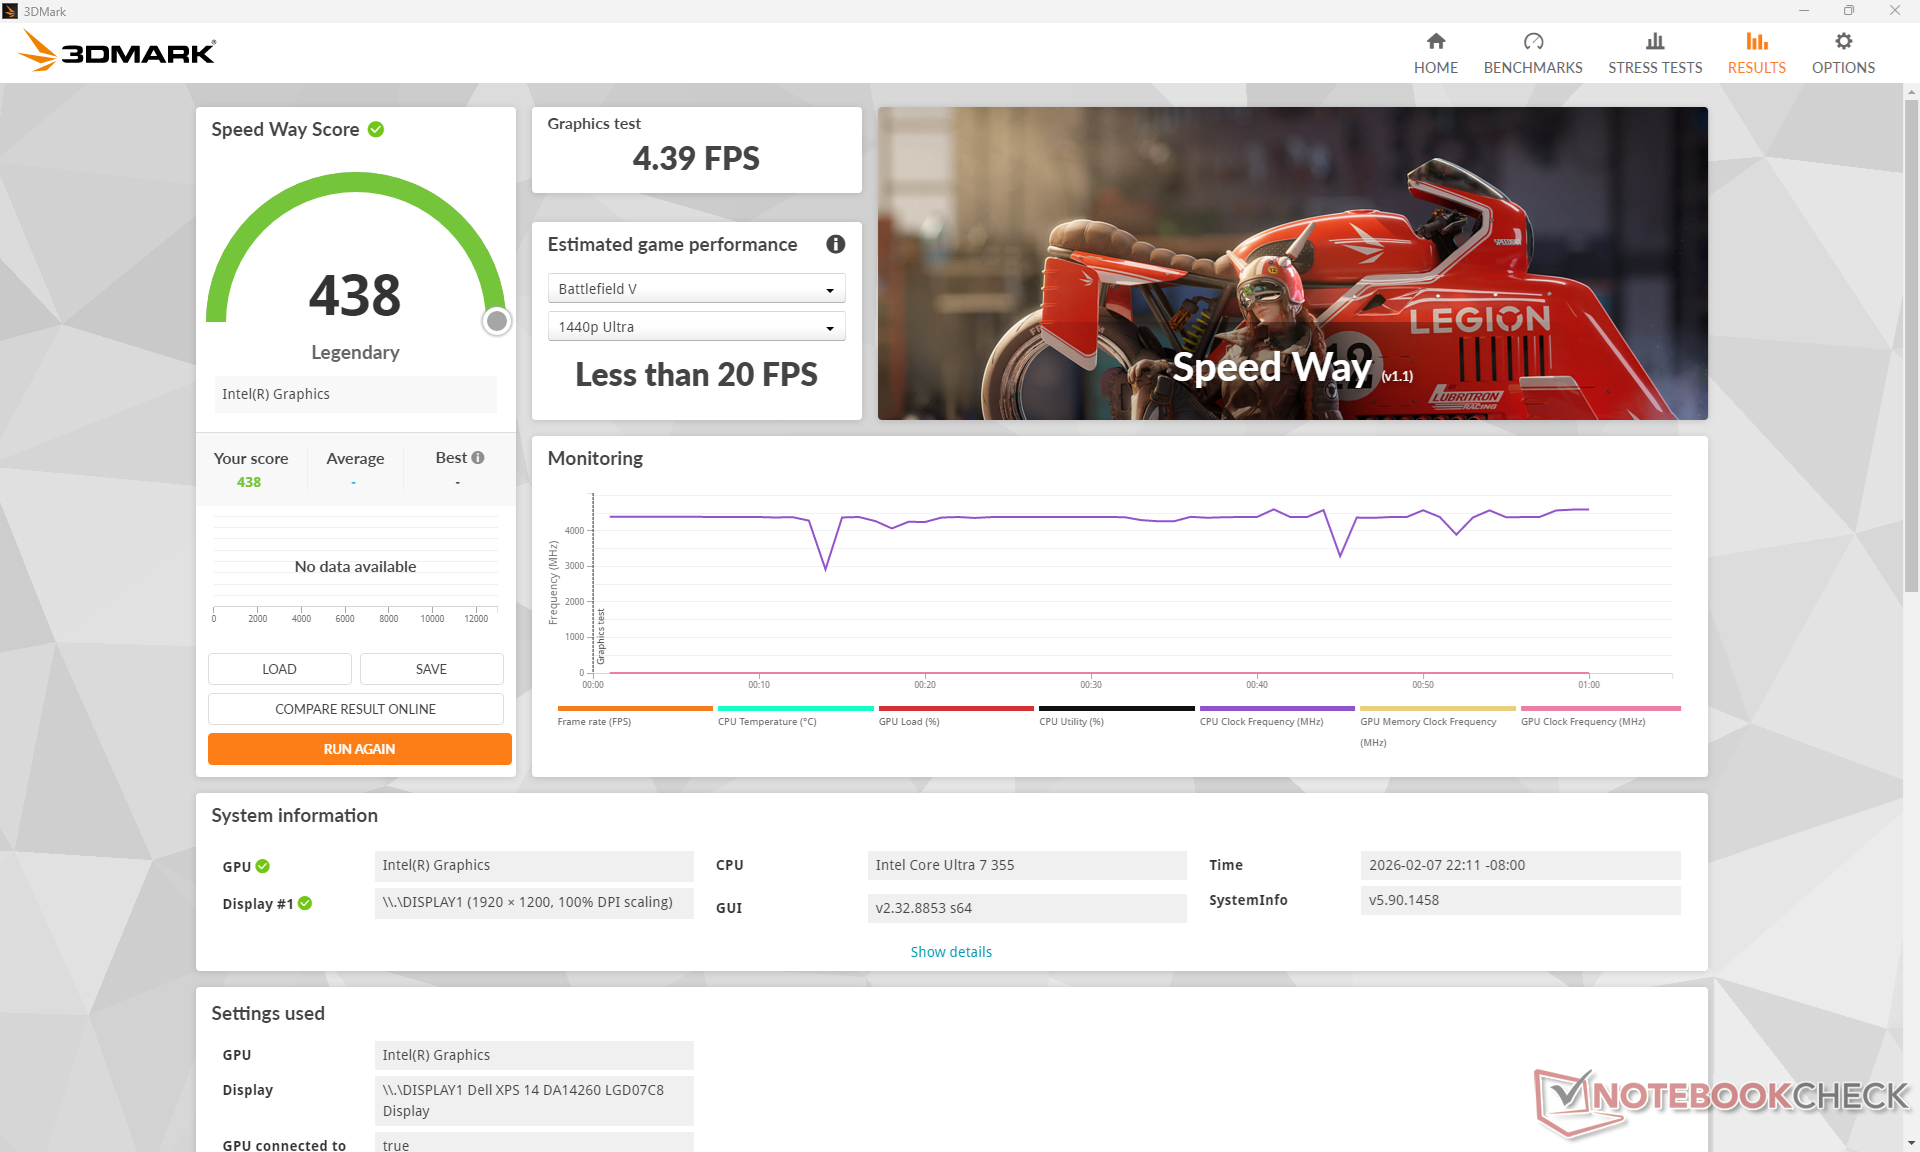
W przeciwieństwie do Core Ultra X7 i jego zintegrowanego 12-rdzeniowy układ graficzny Xe3 B390 układ graficzny, Core Ultra 7 355 jest wyposażony w 4-rdzeniową jednostką Xe3 iGPU. Wydajność w grach jest o około 60 procent wolniejsza niż w przypadku 12-rdzeniowego B390 i jest mniej więcej porównywalna do Arc 8 który był najszybszym rozwiązaniem iGPU Intela zaledwie dwa lata temu. Renderowanie w Blenderze może być jednak znacznie wolniejsze o 2,5x, więc wydajność w profesjonalnych aplikacjach z 4-rdzeniowym Xe3 może mieć większy deficyt.
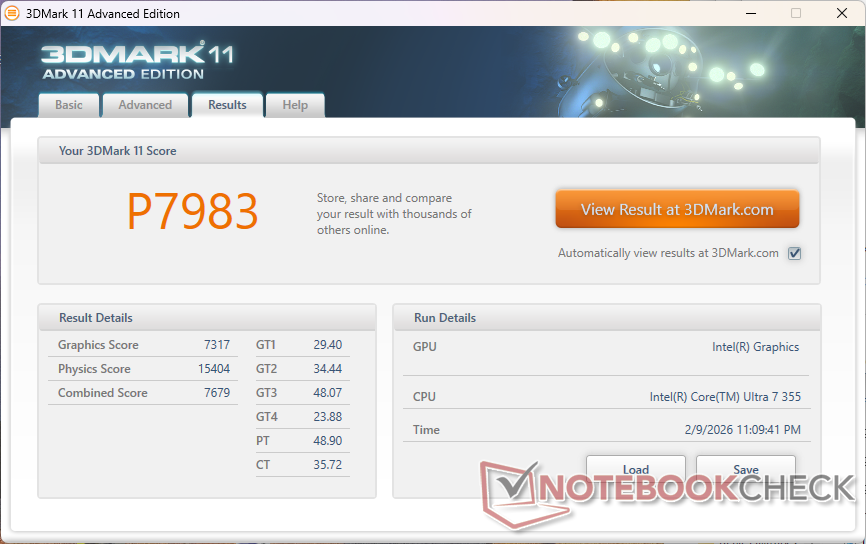
| 3DMark 11 Performance | 7983 pkt. | |
| 3DMark Cloud Gate Standard Score | 28681 pkt. | |
| 3DMark Fire Strike Score | 6309 pkt. | |
| 3DMark Time Spy Score | 3250 pkt. | |
Pomoc | ||
* ... im mniej tym lepiej
| Cyberpunk 2077 - 1920x1080 Ultra Preset (FSR off) | |
| Dell XPS 14 Core Ultra X7 358H | |
| Lenovo ThinkPad T14 Gen 6 21QG001VGE | |
| Samsung Galaxy Book5 Pro 14 940XHA | |
| HP OmniBook Ultra Flip 14 | |
| Dell XPS 14 Core Ultra 7 355 | |
| Asus ExpertBook PM3406 | |
| Baldur's Gate 3 - 1920x1080 Ultra Preset AA:T | |
| Dell XPS 14 Core Ultra X7 358H | |
| HP OmniBook Ultra Flip 14 | |
| Lenovo ThinkPad T14 Gen 6 21QG001VGE | |
| Samsung Galaxy Book5 Pro 14 940XHA | |
| Dell XPS 14 Core Ultra 7 355 | |
| Asus ExpertBook PM3406 | |
| GTA V - 1920x1080 Highest AA:4xMSAA + FX AF:16x | |
| Dell XPS 14 Core Ultra X7 358H | |
| Lenovo ThinkPad T14 Gen 6 21QG001VGE | |
| HP OmniBook Ultra Flip 14 | |
| Dell XPS 14 Core Ultra 7 355 | |
| Samsung Galaxy Book5 Pro 14 940XHA | |
| Asus ExpertBook PM3406 | |
| Final Fantasy XV Benchmark - 1920x1080 High Quality | |
| Dell XPS 14 Core Ultra X7 358H | |
| Lenovo ThinkPad T14 Gen 6 21QG001VGE | |
| HP OmniBook Ultra Flip 14 | |
| Samsung Galaxy Book5 Pro 14 940XHA | |
| Dell XPS 14 Core Ultra 7 355 | |
| Asus ExpertBook PM3406 | |
| Strange Brigade - 1920x1080 ultra AA:ultra AF:16 | |
| Dell XPS 14 Core Ultra X7 358H | |
| HP OmniBook Ultra Flip 14 | |
| Samsung Galaxy Book5 Pro 14 940XHA | |
| Dell XPS 14 Core Ultra 7 355 | |
| Asus ExpertBook PM3406 | |
| Dota 2 Reborn - 1920x1080 ultra (3/3) best looking | |
| Dell XPS 14 Core Ultra X7 358H | |
| Lenovo ThinkPad T14 Gen 6 21QG001VGE | |
| HP OmniBook Ultra Flip 14 | |
| Samsung Galaxy Book5 Pro 14 940XHA | |
| Dell XPS 14 Core Ultra 7 355 | |
| Asus ExpertBook PM3406 | |
| X-Plane 11.11 - 1920x1080 high (fps_test=3) | |
| Dell XPS 14 Core Ultra X7 358H | |
| Asus ExpertBook PM3406 | |
| HP OmniBook Ultra Flip 14 | |
| Samsung Galaxy Book5 Pro 14 940XHA | |
| Lenovo ThinkPad T14 Gen 6 21QG001VGE | |
| Dell XPS 14 Core Ultra 7 355 | |
| Black Myth: Wukong | |
| 1280x720 low TSR 100 | |
| Dell XPS 14 Core Ultra X7 358H | |
| Dell XPS 14 Core Ultra 7 355 | |
| Przeciętny Intel Graphics 4 Xe3 Panther Lake iGPU (n=1) | |
| 1920x1080 low TSR 100 | |
| Dell XPS 14 Core Ultra X7 358H | |
| Dell XPS 14 Core Ultra 7 355 | |
| Przeciętny Intel Graphics 4 Xe3 Panther Lake iGPU (n=1) | |
| 1920x1080 medium TSR 100 | |
| Dell XPS 14 Core Ultra X7 358H | |
| Dell XPS 14 Core Ultra 7 355 | |
| Przeciętny Intel Graphics 4 Xe3 Panther Lake iGPU (n=1) | |
| 1920x1080 high TSR 100 | |
| Dell XPS 14 Core Ultra X7 358H | |
| Dell XPS 14 Core Ultra 7 355 | |
| Przeciętny Intel Graphics 4 Xe3 Panther Lake iGPU (n=1) | |
| 1920x1080 cinematic TSR 100 | |
| Dell XPS 14 Core Ultra X7 358H | |
| Dell XPS 14 Core Ultra 7 355 | |
| Przeciętny Intel Graphics 4 Xe3 Panther Lake iGPU (n=1) | |
Cyberpunk 2077 ultra FPS Chart
| low | med. | high | ultra | |
|---|---|---|---|---|
| GTA V (2015) | 165.6 | 163 | 52.9 | 20.9 |
| Dota 2 Reborn (2015) | 101.7 | 89.4 | 73.7 | 69.4 |
| Final Fantasy XV Benchmark (2018) | 67.3 | 34.9 | 25.4 | |
| X-Plane 11.11 (2018) | 43.6 | 30.9 | 30.5 | |
| Strange Brigade (2018) | 184.9 | 64.7 | 58.9 | 50.6 |
| Baldur's Gate 3 (2023) | 28.4 | 23 | 19.6 | 19.5 |
| Cyberpunk 2077 (2023) | 32.7 | 27.7 | 21 | 17.7 |
| F1 24 (2024) | 65.9 | 56.6 | 41.7 | 13.8 |
| Black Myth: Wukong (2024) | 18 | 14 | 11 | 6 |
| ARC Raiders (2025) | 48.8 | 23.5 | 17.5 | 11.4 |
Emisje
Hałas systemowy
Poziom hałasu może pozostać cichszy przez dłuższy czas niż w przypadku konfiguracji Core Ultra X7, ale przy identycznym pułapie. Przykładowo, podczas uruchamiania gry Cyberpunk 2077, hałas wentylatora ustabilizowałby się na poziomie 35 dB(A) w porównaniu do 43 dB(A) na szybszym SKU Core Ultra X7, ale niemal identyczne maksimum zostało osiągnięte między tymi dwoma SKU podczas uruchamiania stresu Prime95.
Hałas
| luz |
| 23 / 23 / 23.1 dB |
| obciążenie |
| 30.8 / 45.9 dB |
 | ||
30 dB cichy 40 dB(A) słyszalny 50 dB(A) irytujący |
||
min: | ||
| Dell XPS 14 Core Ultra 7 355 Ultra 7 355, Intel Graphics 4 Xe3 PTL | Dell XPS 14 Core Ultra X7 358H Ultra X7 358H, Arc B390 Panther Lake iGPU | Asus ExpertBook PM3406 Ryzen AI 7 350, Radeon 860M | Lenovo ThinkPad T14 Gen 6 21QG001VGE Core Ultra 7 258V, Arc 140V | HP OmniBook Ultra Flip 14 Core Ultra 7 258V, Arc 140V | Samsung Galaxy Book5 Pro 14 940XHA Core Ultra 5 226V, Arc 130V | |
|---|---|---|---|---|---|---|
| Noise | -5% | -7% | -7% | 3% | -1% | |
| wyłączone / środowisko * (dB) | 23 | 22.9 -0% | 25.7 -12% | 25.1 -9% | 22.9 -0% | 25.1 -9% |
| Idle Minimum * (dB) | 23 | 23.3 -1% | 25.7 -12% | 25.1 -9% | 23.2 -1% | 25.1 -9% |
| Idle Average * (dB) | 23 | 23.3 -1% | 25.7 -12% | 25.1 -9% | 23.2 -1% | 25.1 -9% |
| Idle Maximum * (dB) | 23.1 | 23.3 -1% | 25.7 -11% | 27.1 -17% | 23.2 -0% | 25.1 -9% |
| Load Average * (dB) | 30.8 | 34 -10% | 33.6 -9% | 34.8 -13% | 27.8 10% | 29.3 5% |
| Cyberpunk 2077 ultra * (dB) | 35.4 | 43.5 -23% | 39.1 -10% | 38.3 -8% | 33.6 5% | 33.1 6% |
| Load Maximum * (dB) | 45.9 | 45.7 -0% | 39.1 15% | 38.5 16% | 43.4 5% | 38.7 16% |
* ... im mniej tym lepiej
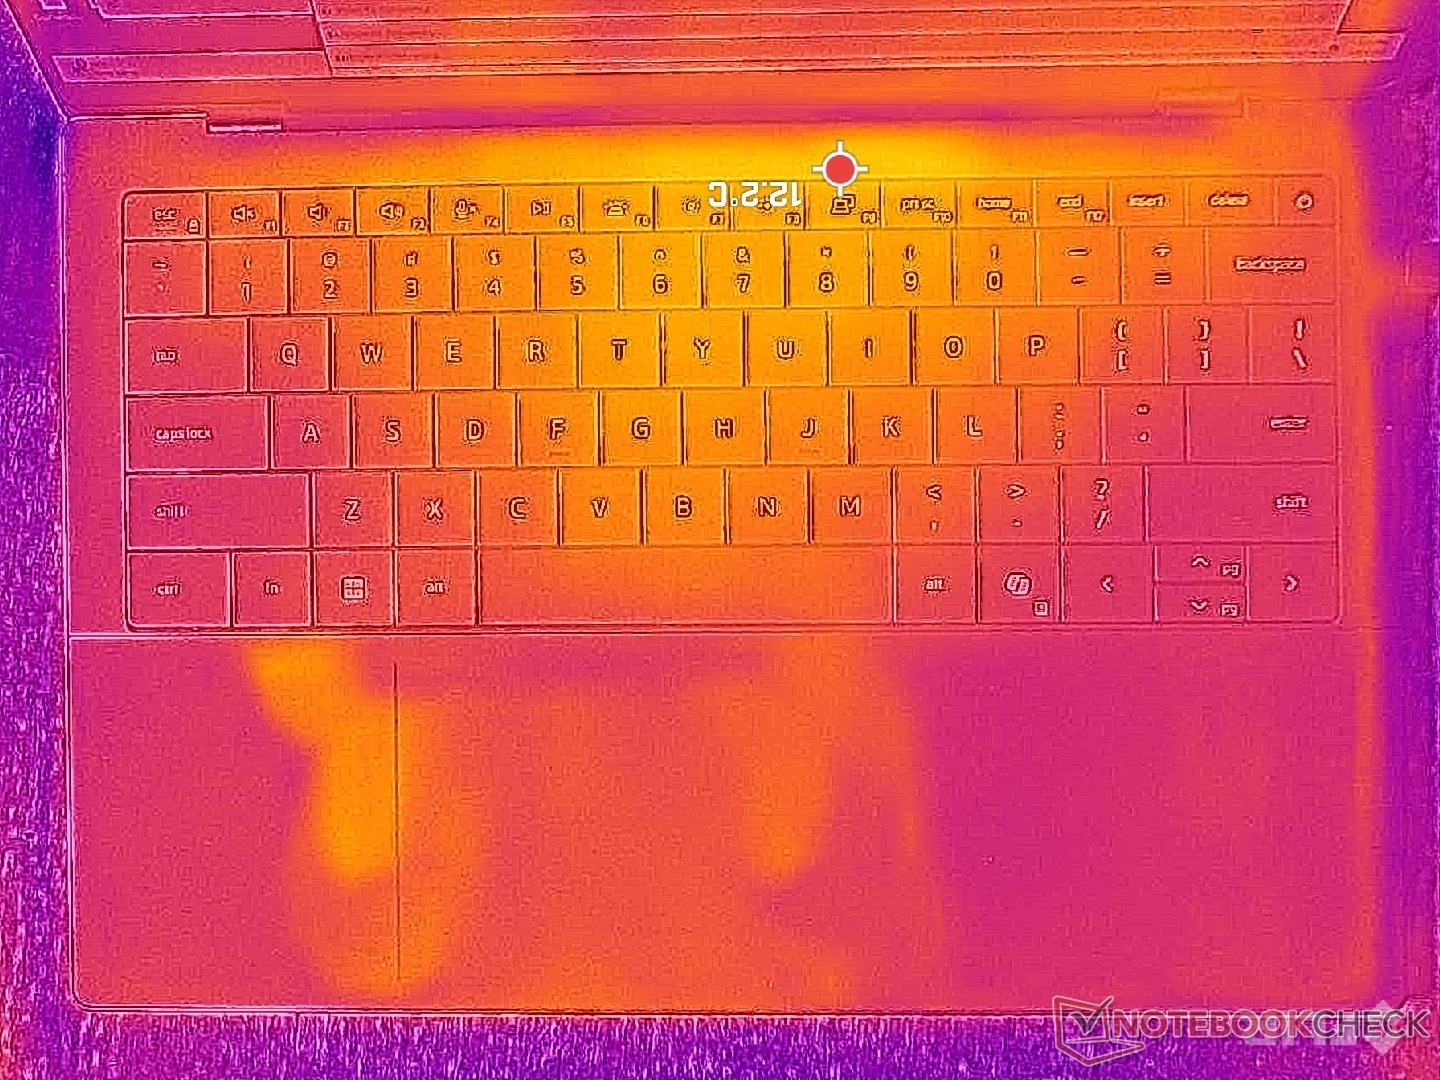
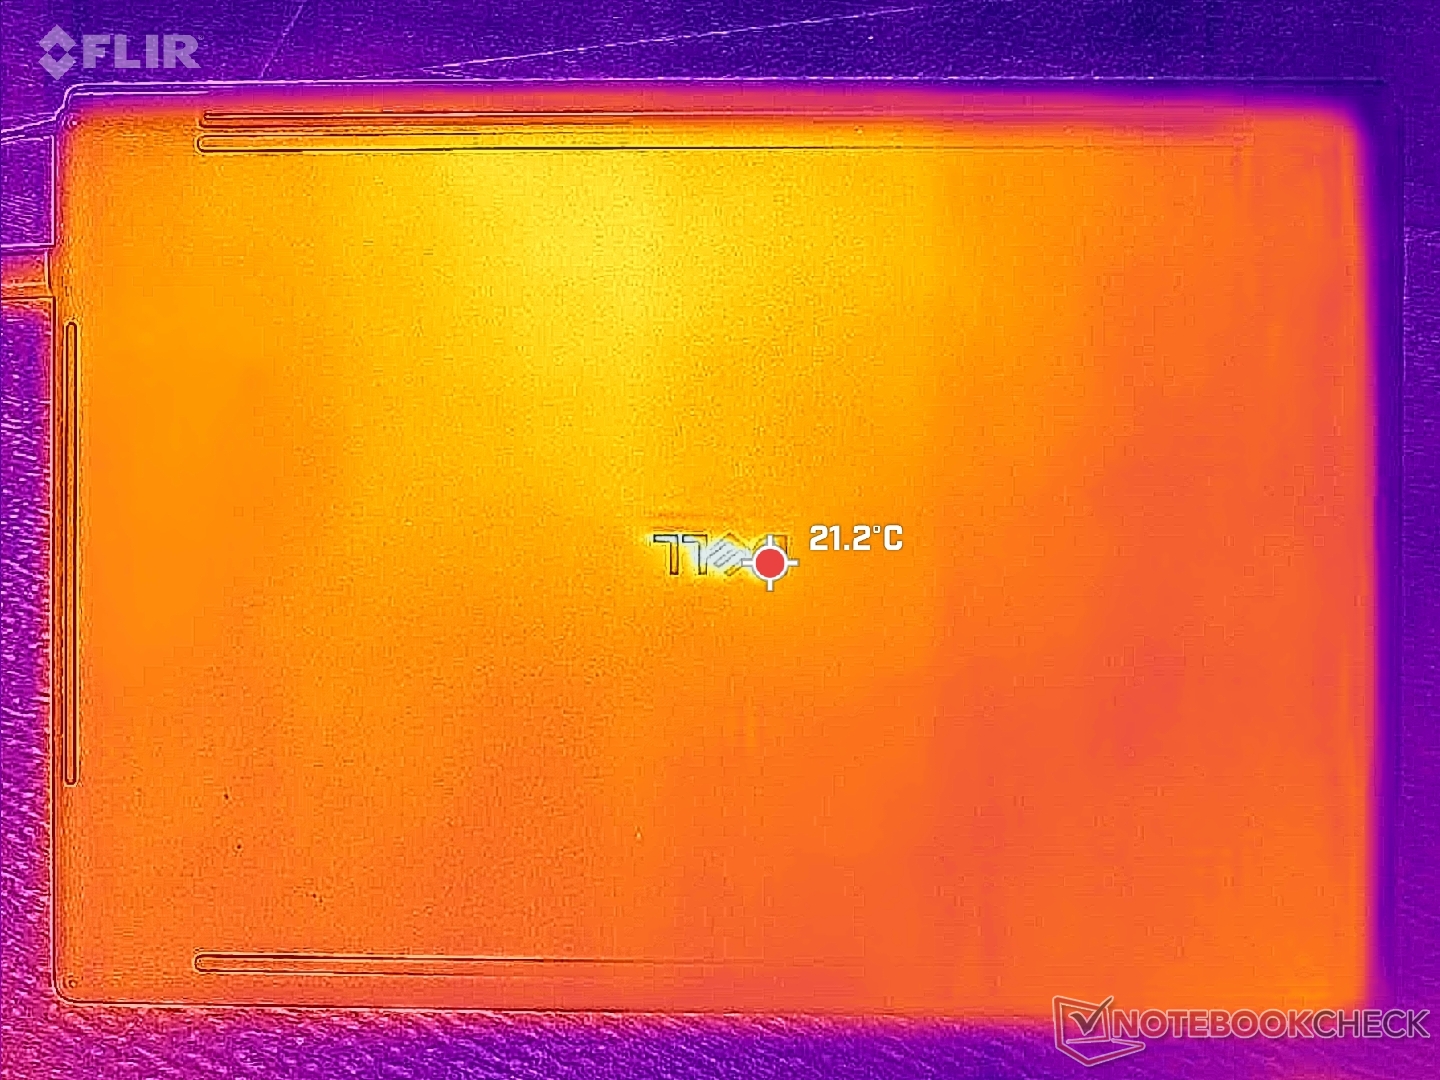
Temperatura
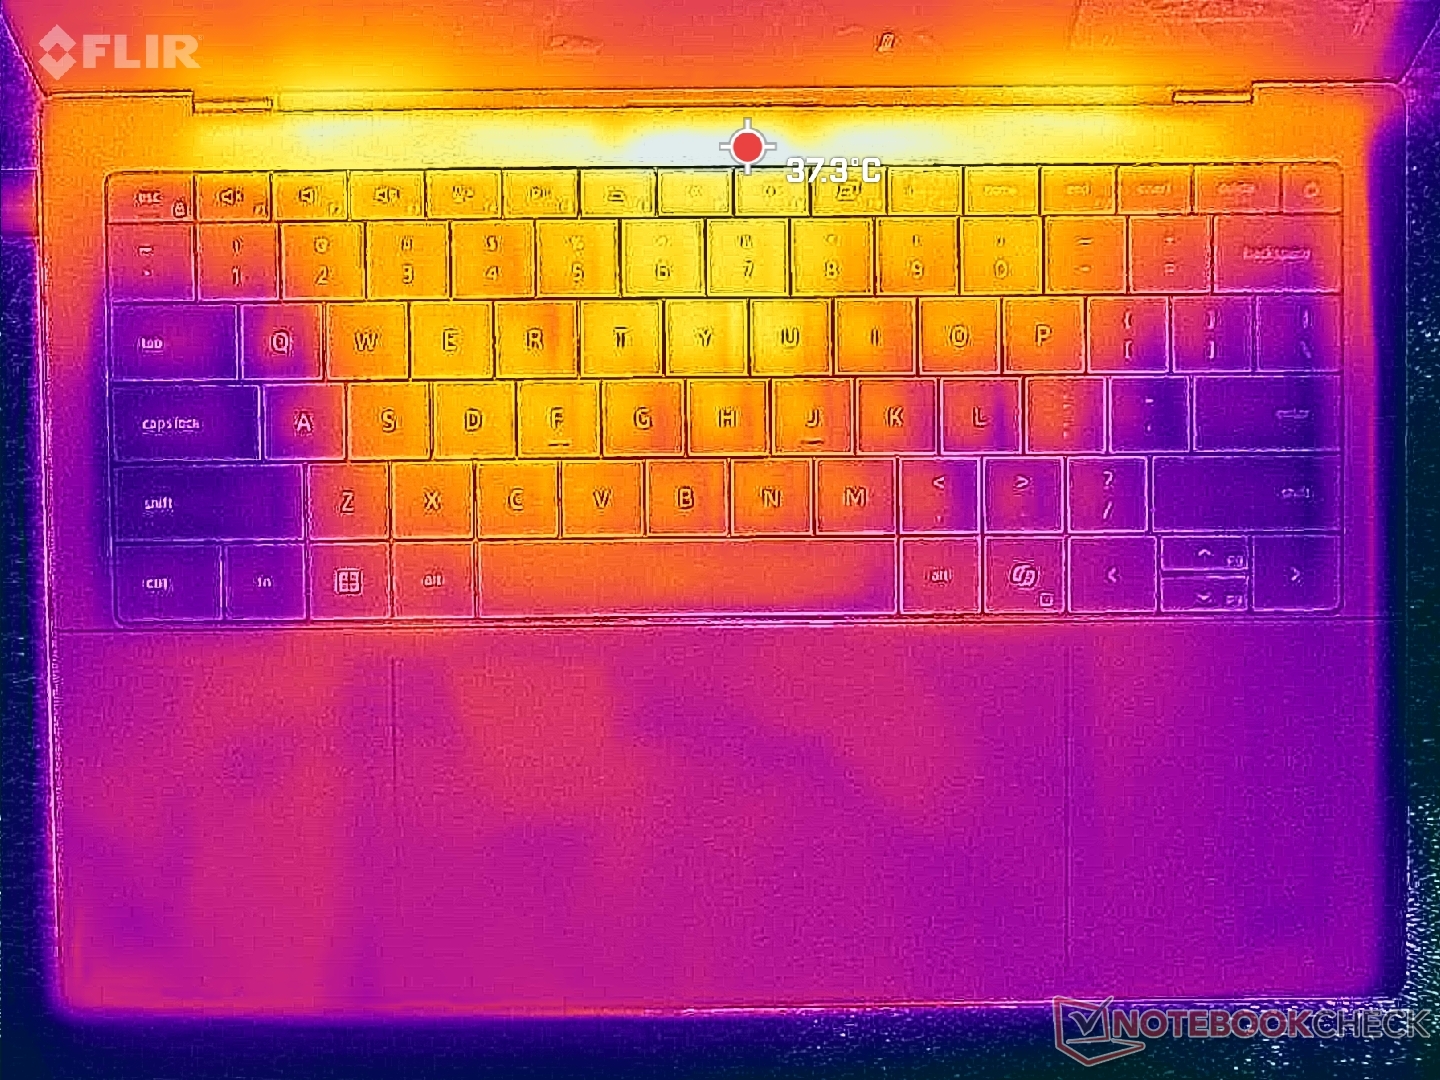
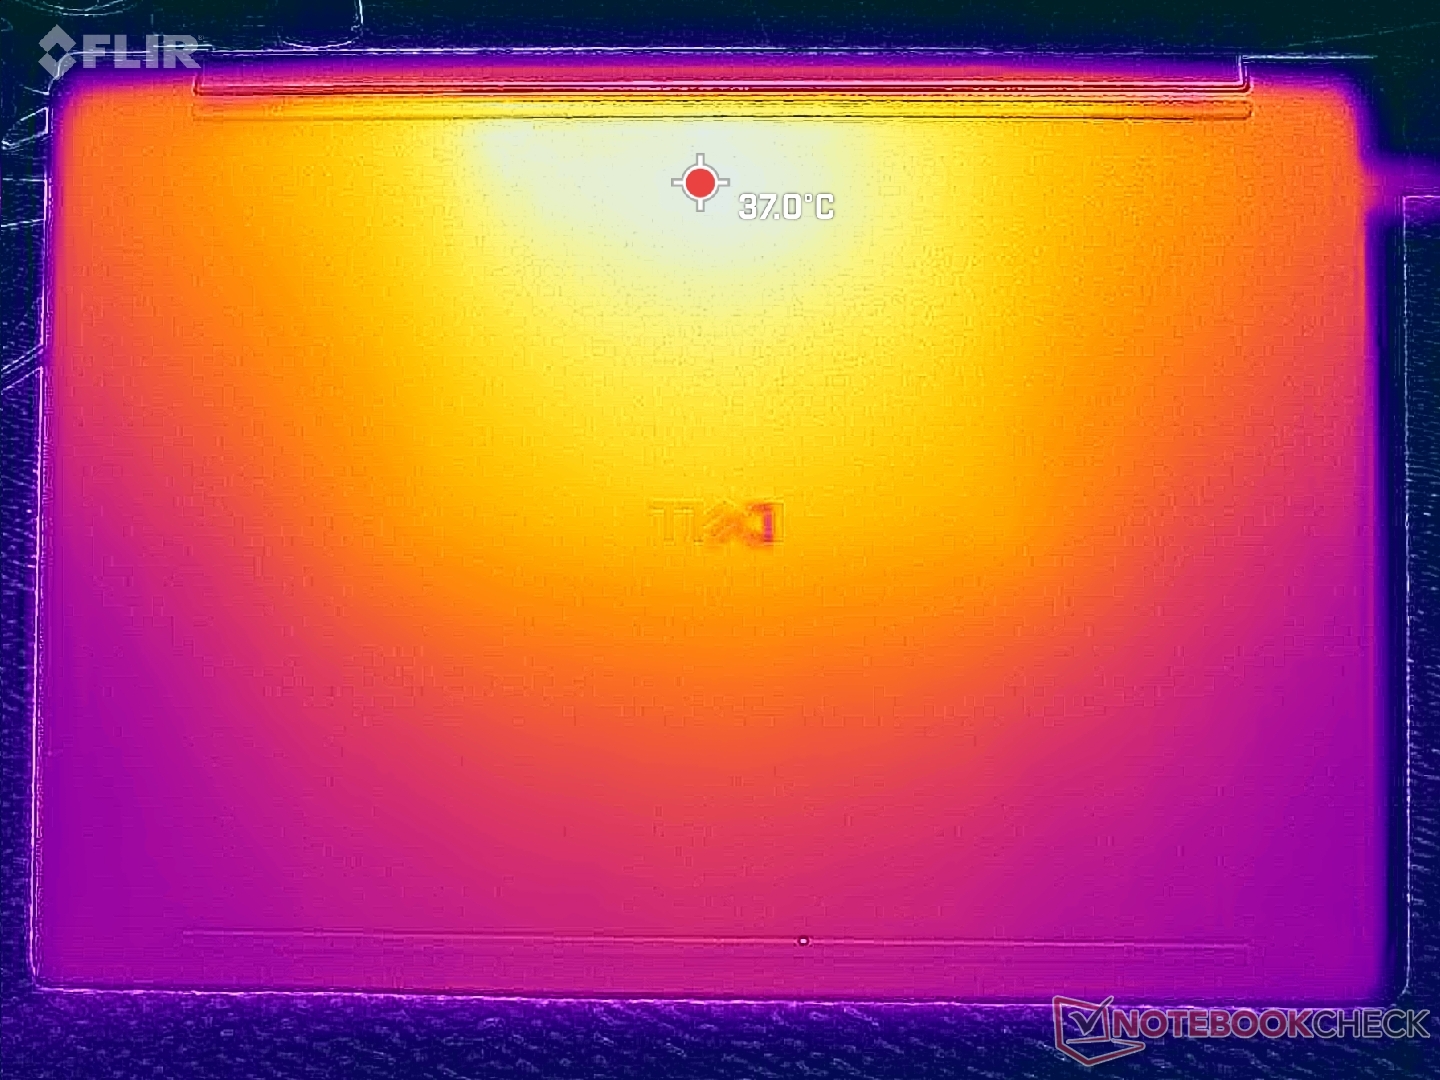
Gorące punkty temperatury powierzchni ustabilizowałyby się na niemal identycznych poziomach jak te, które zaobserwowaliśmy na XPS 14 X7 pomimo znacznie wyższej wydajności tej drugiej konfiguracji.
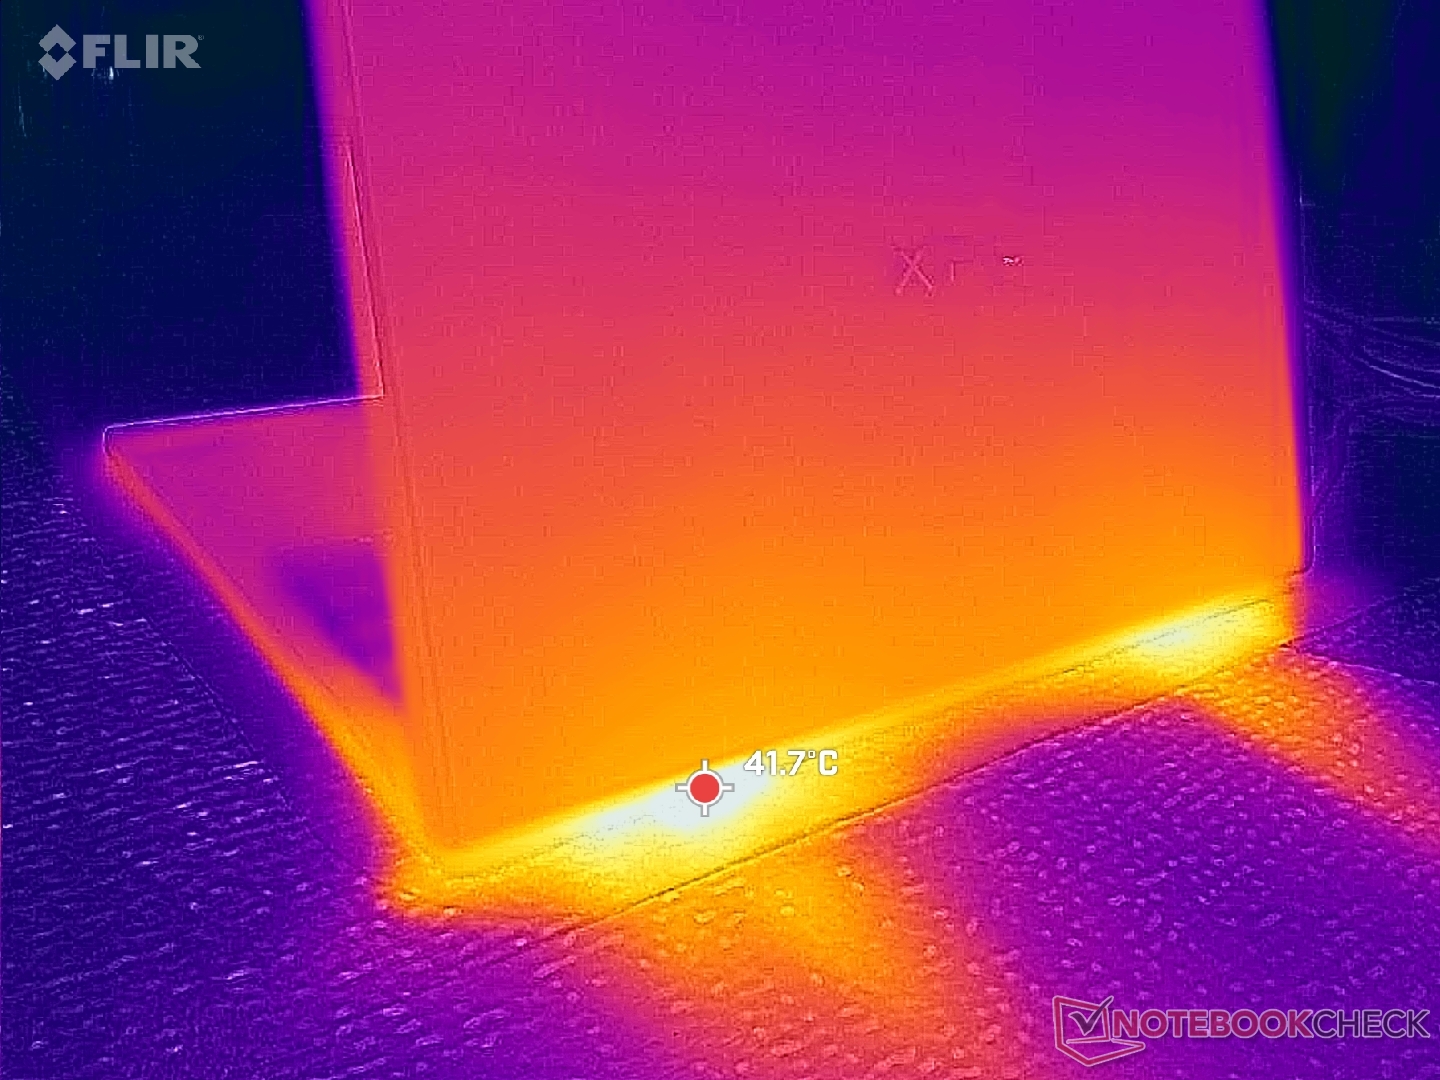
(+) Maksymalna temperatura w górnej części wynosi 37.8 °C / 100 F, w porównaniu do średniej 36.8 °C / 98 F , począwszy od 21 do 71 °C dla klasy Multimedia.
(+) Dno nagrzewa się maksymalnie do 38.6 °C / 101 F, w porównaniu do średniej 39.1 °C / 102 F
(+) W stanie bezczynności średnia temperatura górnej części wynosi 20.4 °C / 69 F, w porównaniu ze średnią temperaturą urządzenia wynoszącą 31.3 °C / ### class_avg_f### F.
(+) Podpórki pod nadgarstki i touchpad są chłodniejsze niż temperatura skóry i maksymalnie 27.4 °C / 81.3 F i dlatego są chłodne w dotyku.
(±) Średnia temperatura obszaru podparcia dłoni w podobnych urządzeniach wynosiła 28.7 °C / 83.7 F (+1.3 °C / 2.4 F).
| Dell XPS 14 Core Ultra 7 355 Ultra 7 355, Intel Graphics 4 Xe3 PTL | Dell XPS 14 Core Ultra X7 358H Ultra X7 358H, Arc B390 Panther Lake iGPU | Asus ExpertBook PM3406 Ryzen AI 7 350, Radeon 860M | Lenovo ThinkPad T14 Gen 6 21QG001VGE Core Ultra 7 258V, Arc 140V | HP OmniBook Ultra Flip 14 Core Ultra 7 258V, Arc 140V | Samsung Galaxy Book5 Pro 14 940XHA Core Ultra 5 226V, Arc 130V | |
|---|---|---|---|---|---|---|
| Heat | -7% | -14% | -12% | -9% | -16% | |
| Maximum Upper Side * (°C) | 37.8 | 34 10% | 39.8 -5% | 39.7 -5% | 35.8 5% | 41.4 -10% |
| Maximum Bottom * (°C) | 38.6 | 35.8 7% | 40.8 -6% | 38.1 1% | 37.6 3% | 44.6 -16% |
| Idle Upper Side * (°C) | 21.2 | 25.6 -21% | 26 -23% | 24.3 -15% | 25.2 -19% | 24.9 -17% |
| Idle Bottom * (°C) | 21.4 | 26.4 -23% | 26.3 -23% | 27.7 -29% | 26.6 -24% | 25.5 -19% |
* ... im mniej tym lepiej
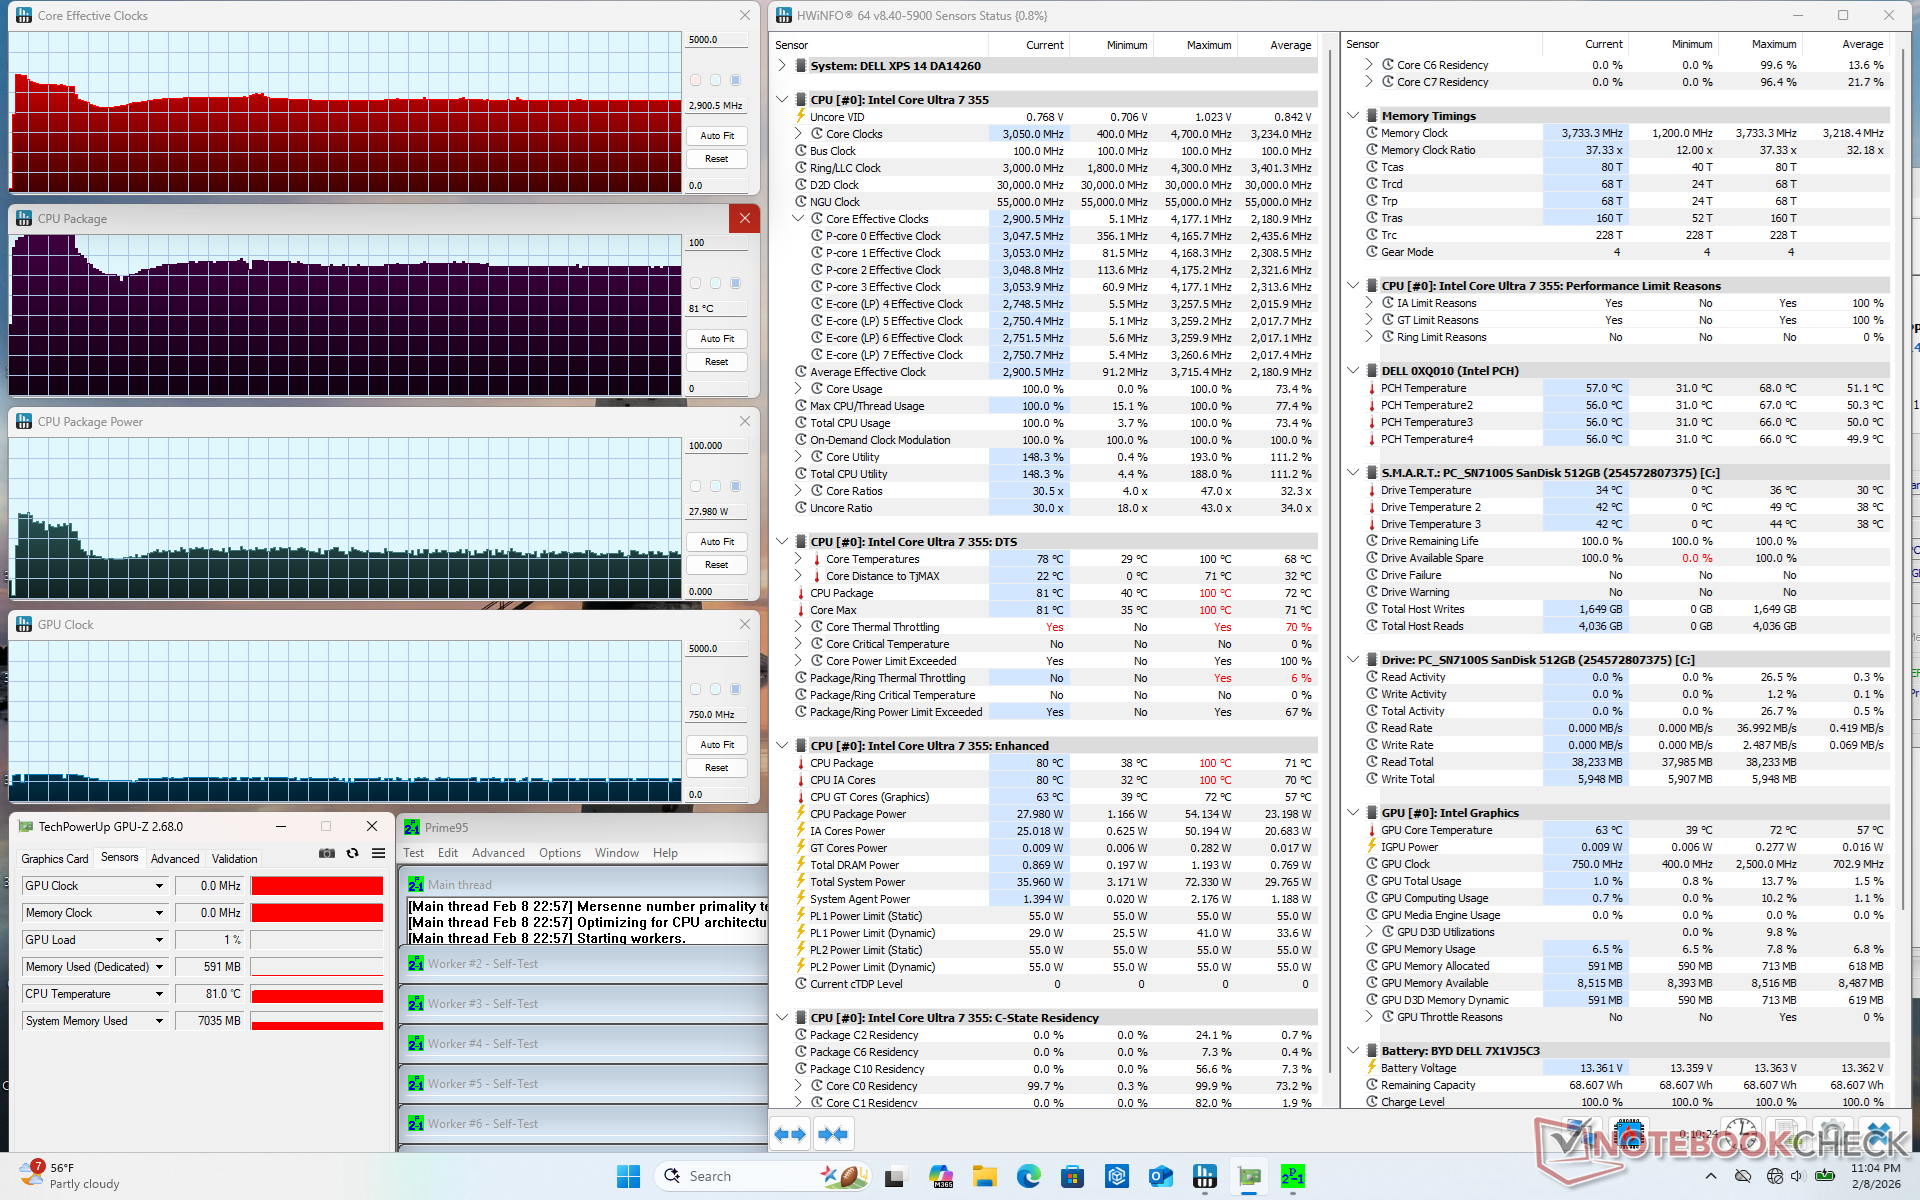
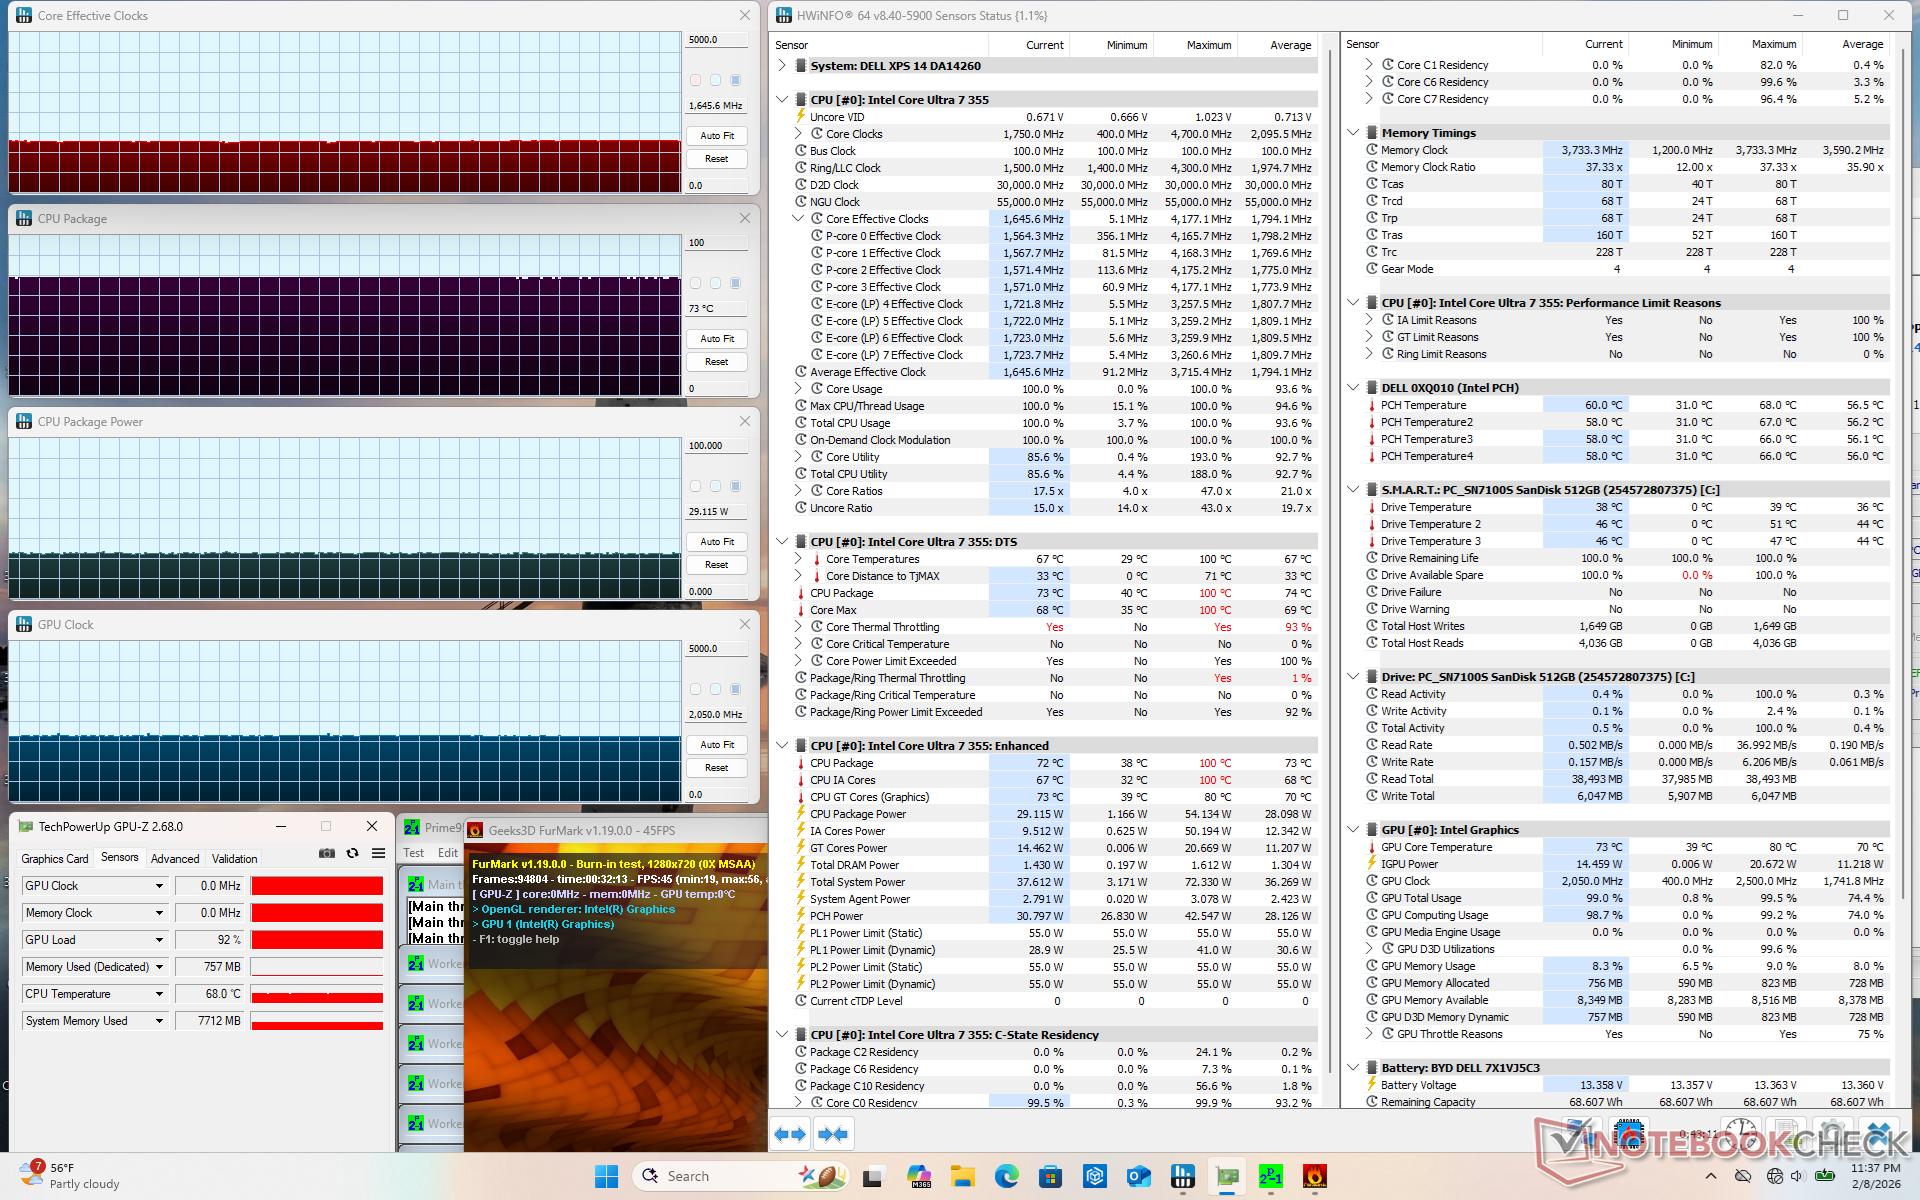
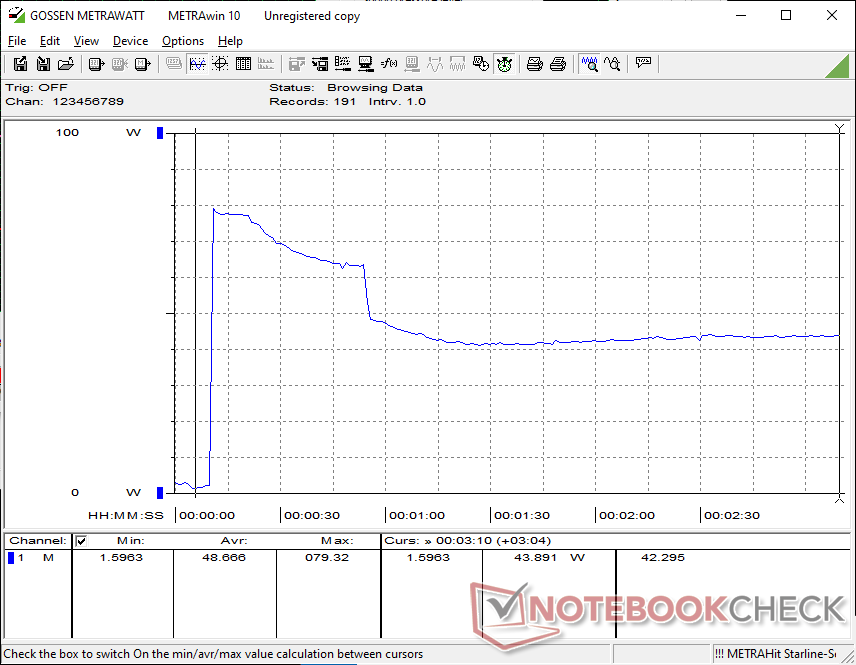
Test warunków skrajnych
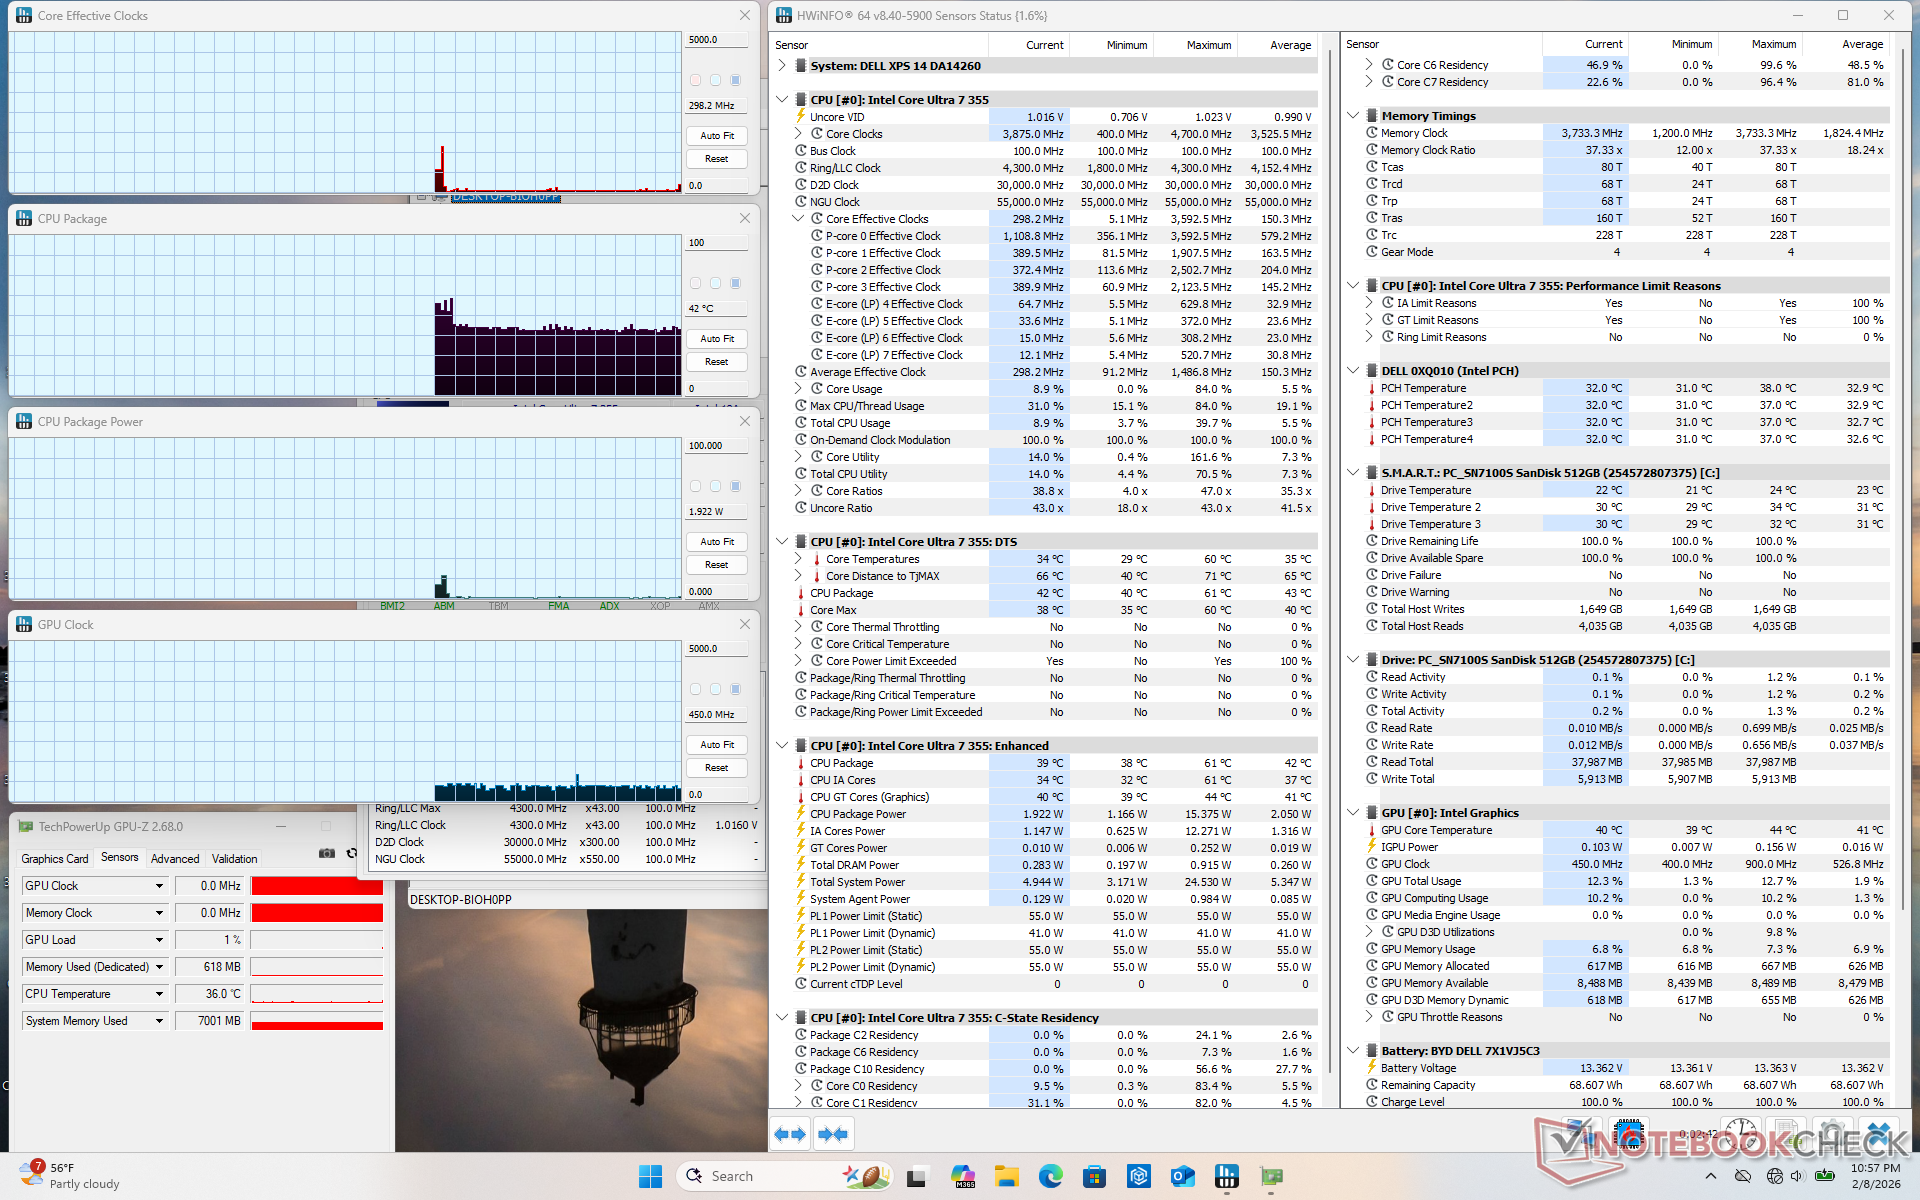
Po uruchomieniu obciążenia Prime95, procesor zwiększał taktowanie do 3,7 GHz i 54 W, utrzymując się przez zaledwie kilka sekund w temperaturze 100 C. Następnie stabilizował się na poziomie 2,9 GHz, 28 W i 81 C, reprezentując ograniczony potencjał Turbo Boost. Temperatura rdzenia osiągnęłaby plateau w dolnym zakresie 80 C podczas uruchamiania wymagających obciążeń, co jest nieco chłodniejsze niż to, co zarejestrowaliśmy na zeszłorocznym Arrow Lake-H Dell 14 Premium.
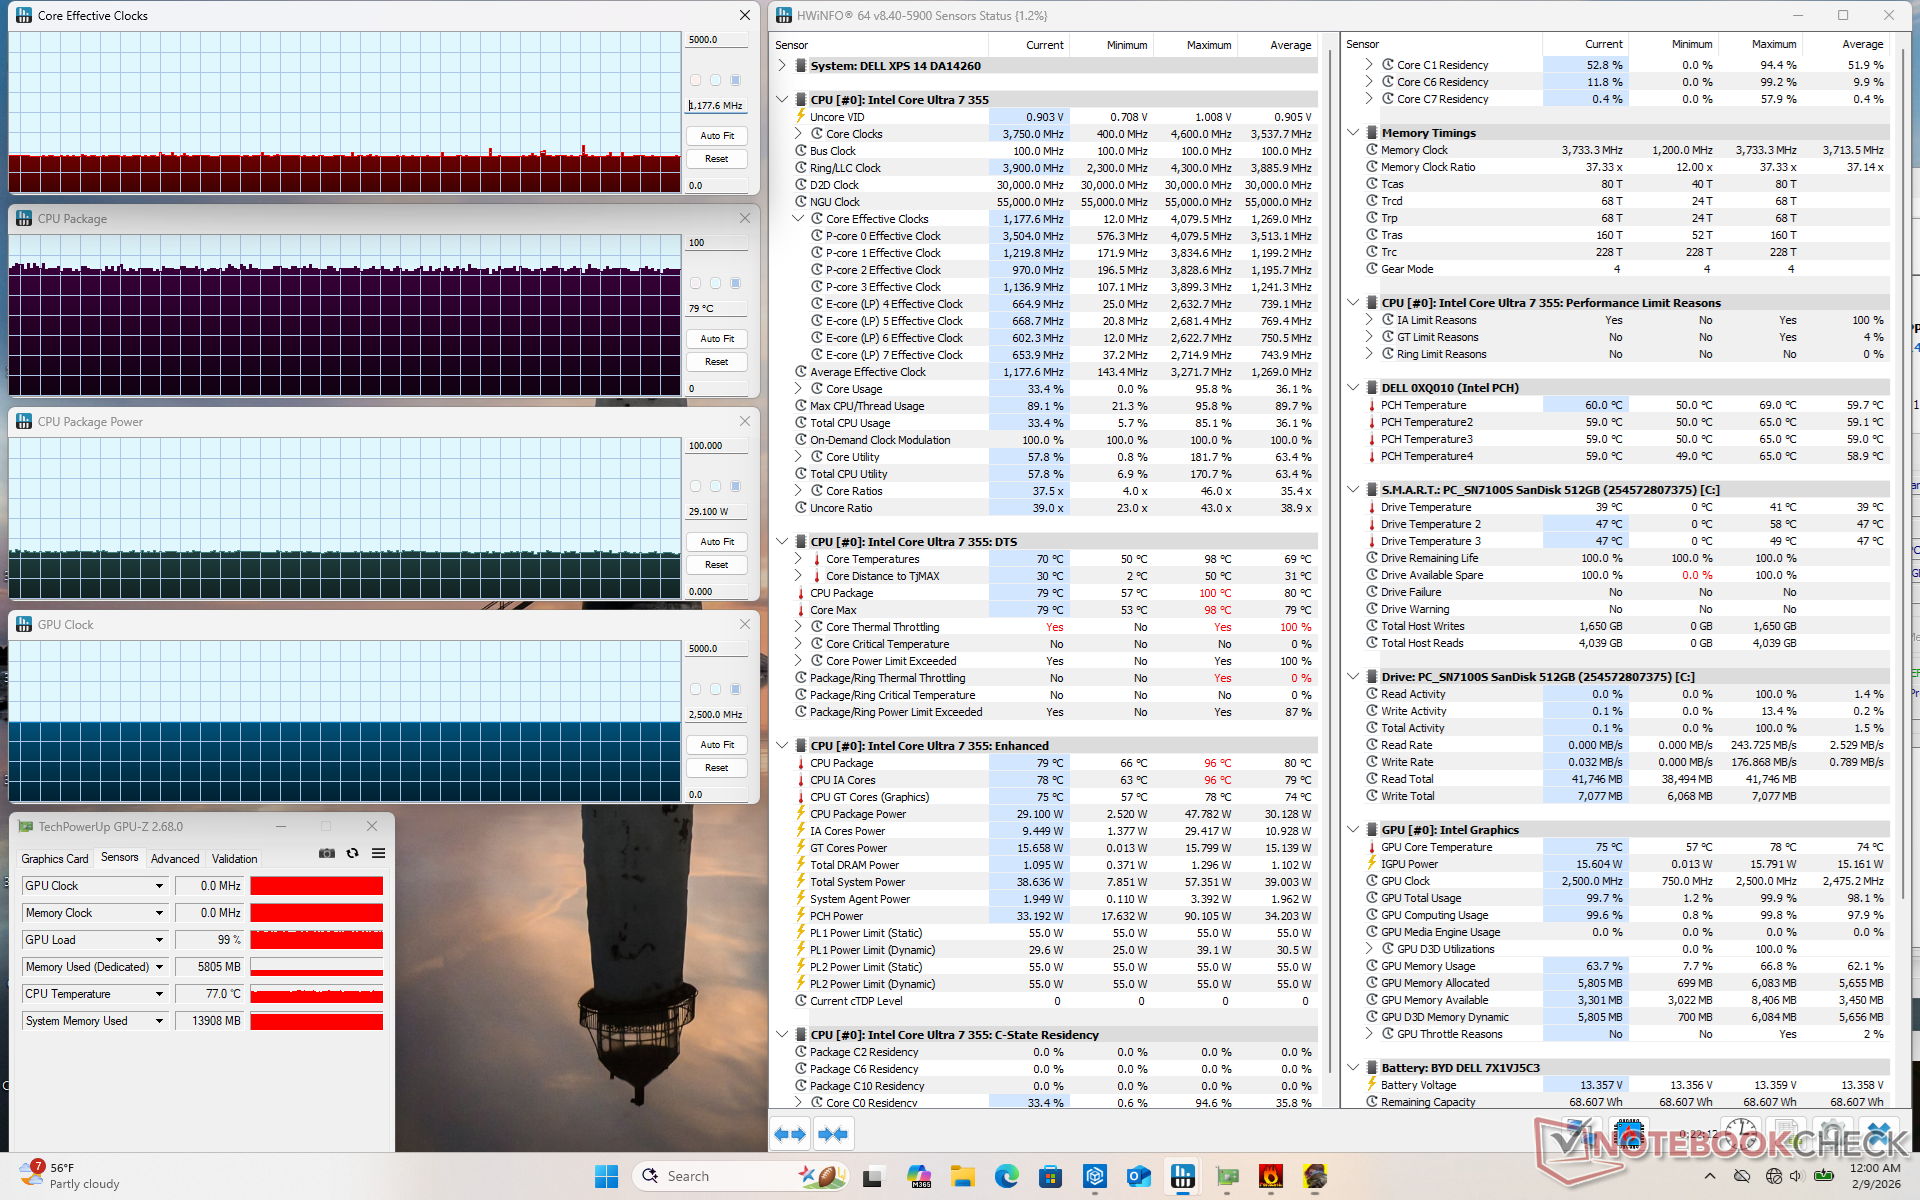
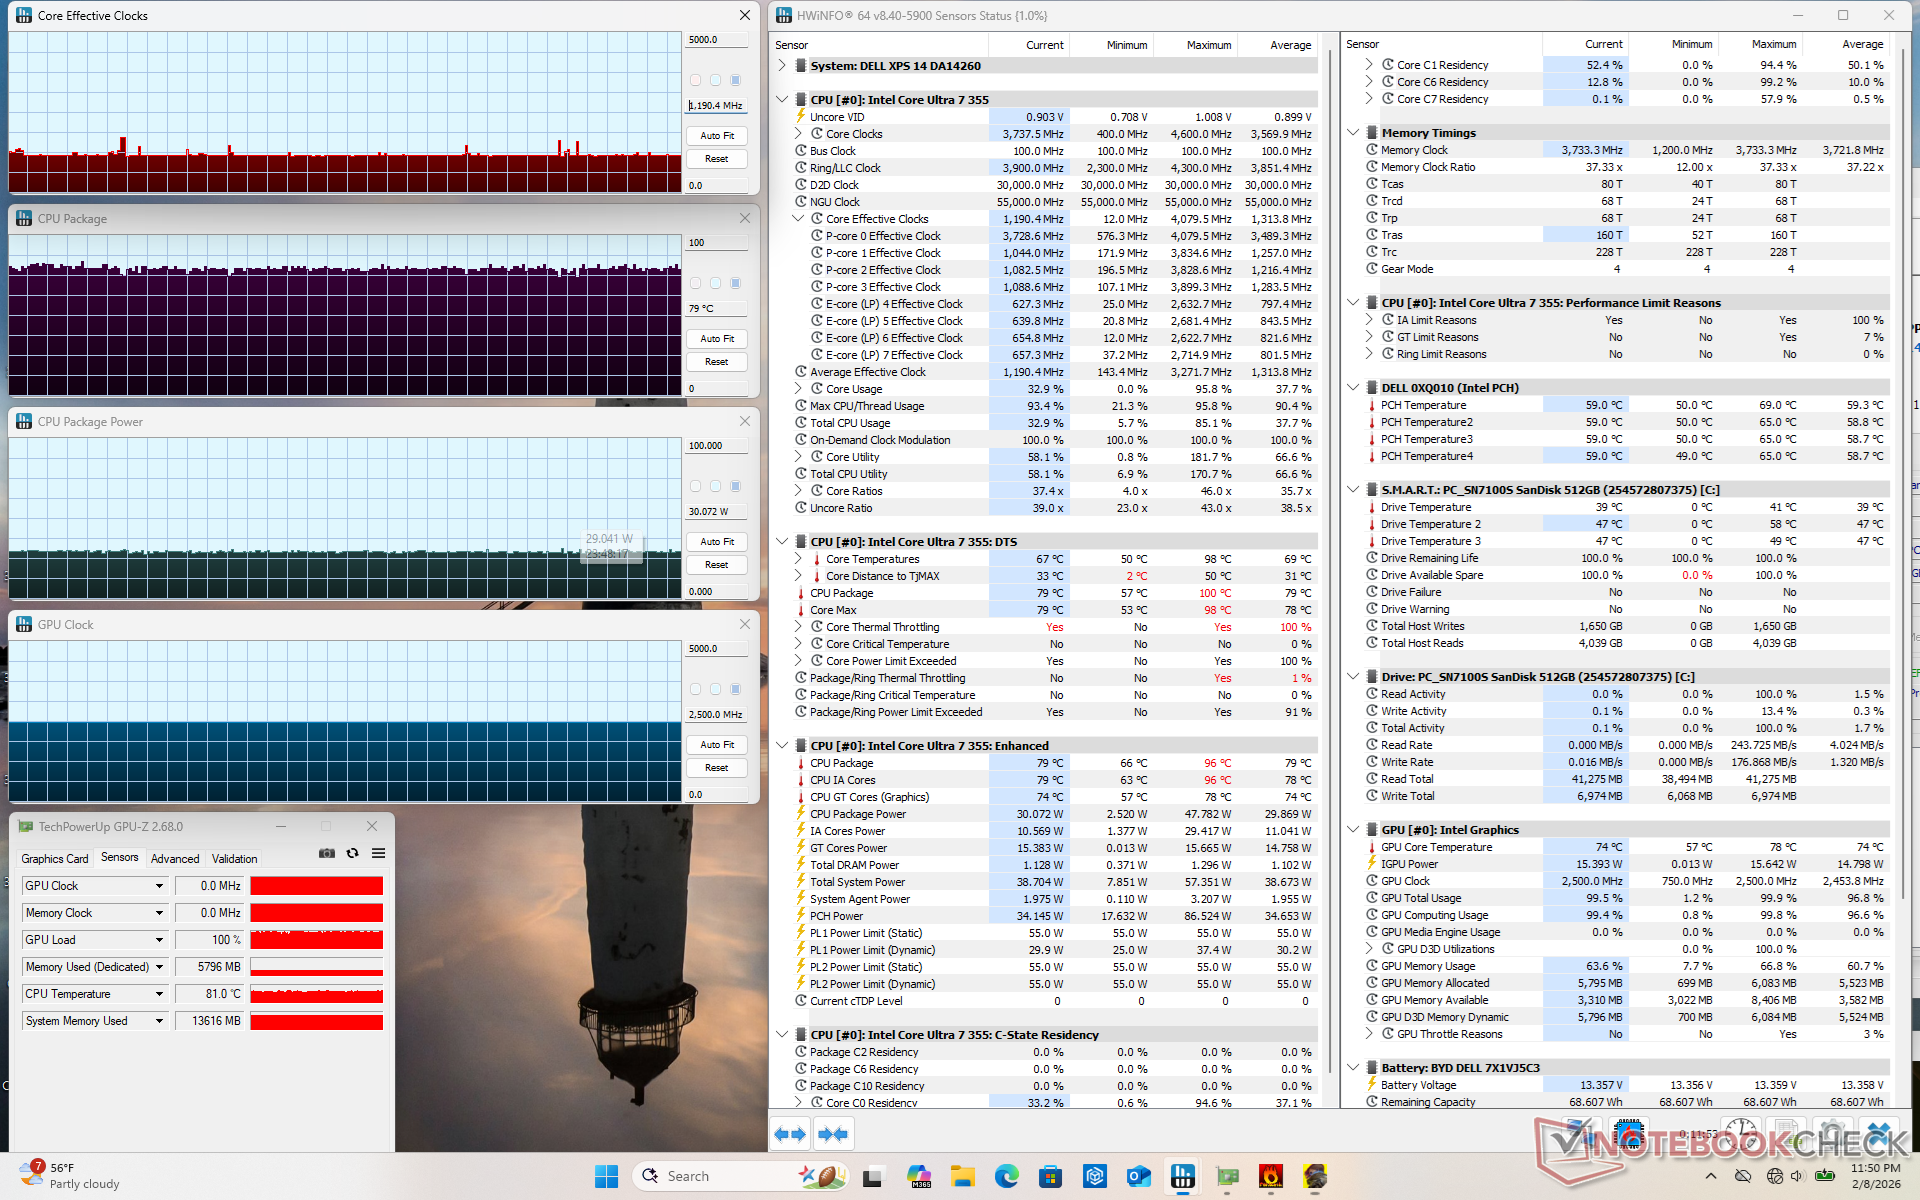
| Taktowanie CPU (GHz) | Taktowanie GPU (MHz) | Średnia temperatura CPU (°C) | |
| System bezczynności | -- | -- | 42 |
| Prime95 Stress | 2.9 | -- | 81 |
| Prime95 + FurMark Stress | 1.7 | 2050 | 73 |
| Cyberpunk 2077 Stress (tryb zrównoważony) | 1.2 | 2500 | 79 |
| Cyberpunk 2077 Stress (tryb wydajności) | 1.2 | 2500 | 79 |
Głośniki
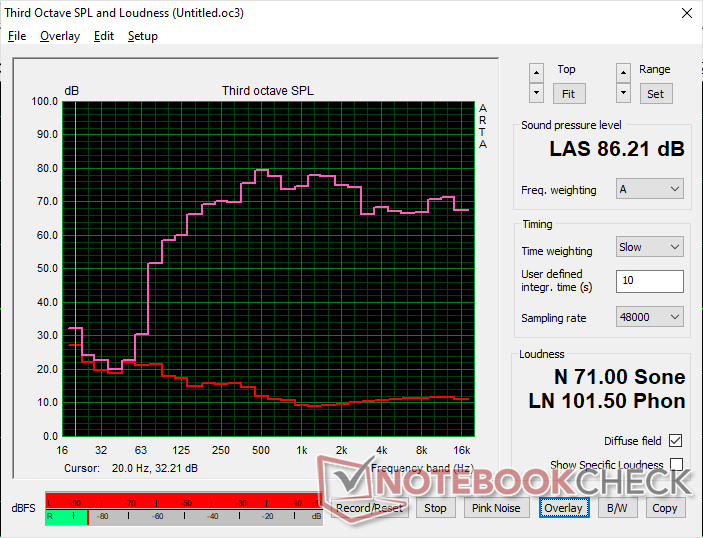
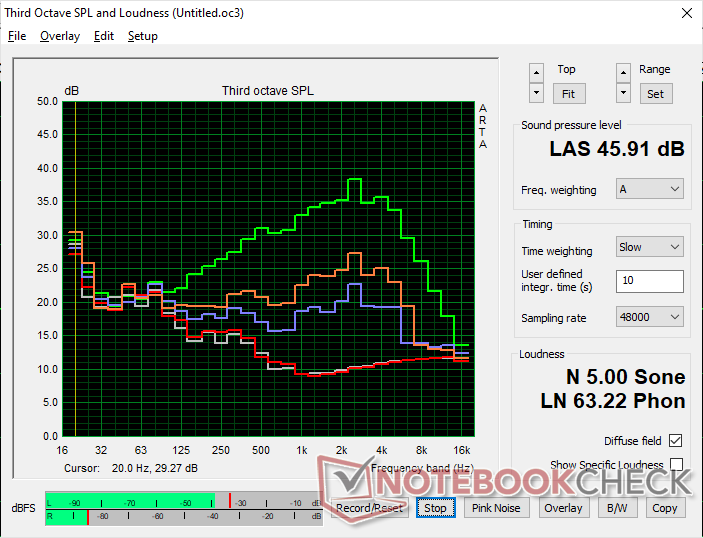
Dell XPS 14 Core Ultra 7 355 analiza dźwięku
(+) | głośniki mogą odtwarzać stosunkowo głośno (86.2 dB)
Bas 100 - 315 Hz
(±) | zredukowany bas - średnio 5% niższy od mediany
(+) | bas jest liniowy (5.3% delta do poprzedniej częstotliwości)
Średnie 400 - 2000 Hz
(±) | wyższe średnie - średnio 5.7% wyższe niż mediana
(+) | średnie są liniowe (4.7% delta do poprzedniej częstotliwości)
Wysokie 2–16 kHz
(+) | zrównoważone maksima - tylko 3.1% od mediany
(+) | wzloty są liniowe (4.1% delta do poprzedniej częstotliwości)
Ogólnie 100 - 16.000 Hz
(+) | ogólny dźwięk jest liniowy (7.9% różnicy w stosunku do mediany)
W porównaniu do tej samej klasy
» 7% wszystkich testowanych urządzeń w tej klasie było lepszych, 2% podobnych, 91% gorszych
» Najlepszy miał deltę 5%, średnia wynosiła ###średnia###%, najgorsza wynosiła 45%
W porównaniu do wszystkich testowanych urządzeń
» 2% wszystkich testowanych urządzeń było lepszych, 1% podobnych, 98% gorszych
» Najlepszy miał deltę 4%, średnia wynosiła ###średnia###%, najgorsza wynosiła 134%
Apple MacBook Pro 16 2021 M1 Pro analiza dźwięku
(+) | głośniki mogą odtwarzać stosunkowo głośno (84.7 dB)
Bas 100 - 315 Hz
(+) | dobry bas - tylko 3.8% od mediany
(+) | bas jest liniowy (5.2% delta do poprzedniej częstotliwości)
Średnie 400 - 2000 Hz
(+) | zbalansowane środki średnie - tylko 1.3% od mediany
(+) | średnie są liniowe (2.1% delta do poprzedniej częstotliwości)
Wysokie 2–16 kHz
(+) | zrównoważone maksima - tylko 1.9% od mediany
(+) | wzloty są liniowe (2.7% delta do poprzedniej częstotliwości)
Ogólnie 100 - 16.000 Hz
(+) | ogólny dźwięk jest liniowy (4.6% różnicy w stosunku do mediany)
W porównaniu do tej samej klasy
» 0% wszystkich testowanych urządzeń w tej klasie było lepszych, 0% podobnych, 100% gorszych
» Najlepszy miał deltę 5%, średnia wynosiła ###średnia###%, najgorsza wynosiła 45%
W porównaniu do wszystkich testowanych urządzeń
» 0% wszystkich testowanych urządzeń było lepszych, 0% podobnych, 100% gorszych
» Najlepszy miał deltę 4%, średnia wynosiła ###średnia###%, najgorsza wynosiła 134%
Zarządzanie energią
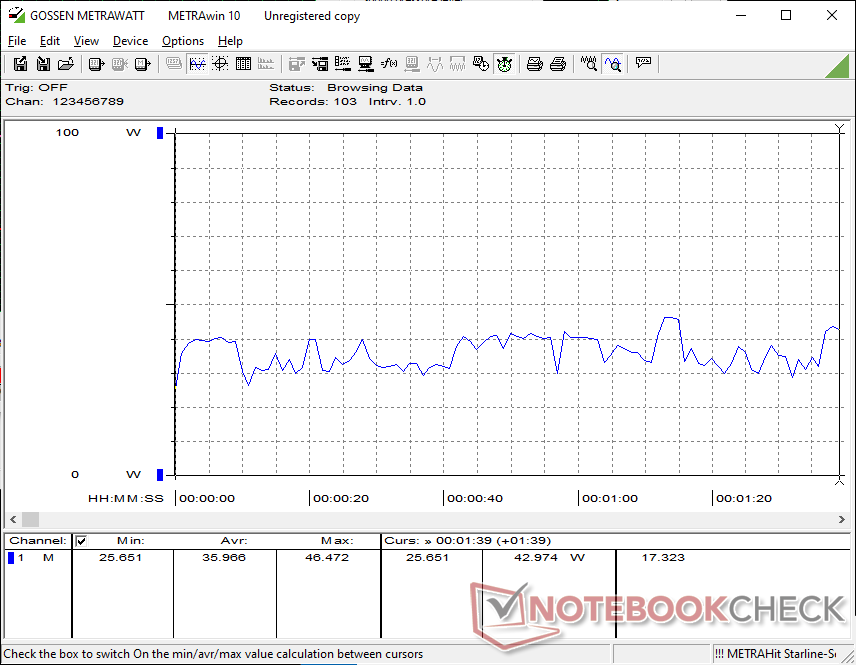
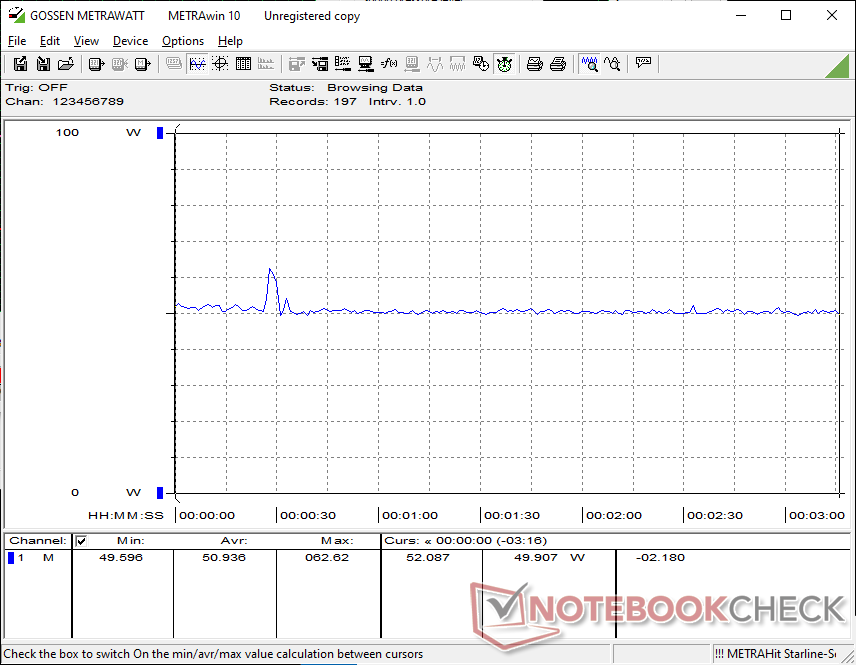
Zużycie energii
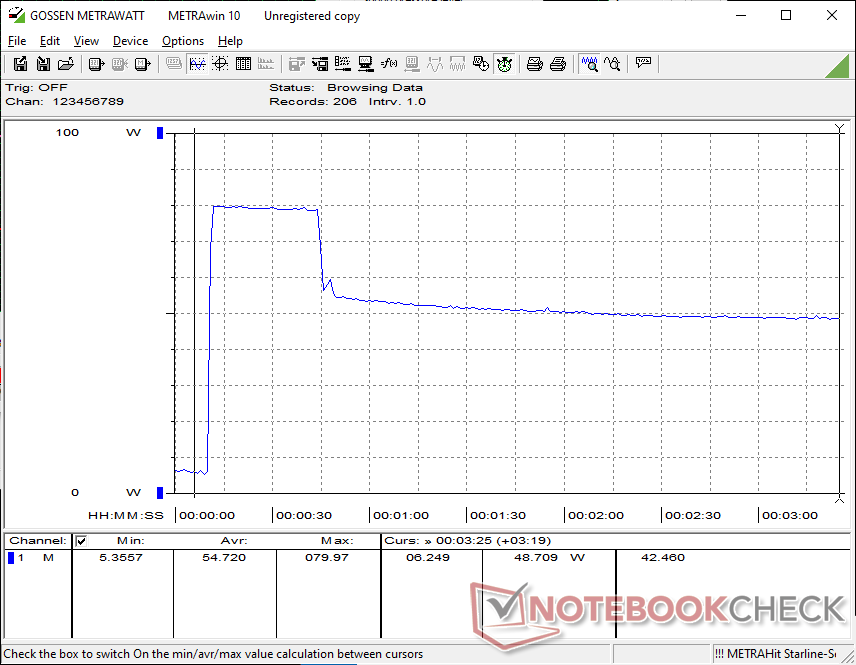
Niestety, Core Ultra 7 355 nie odziedziczył wielu zalet serii Core Ultra X7 w zakresie wydajności na wat. Na przykład podczas uruchamiania Prime95 na zewnętrznym monitorze, system zużywałby zaledwie 13 procent mniej niż Core Ultra X7 XPS 14, oferując jednocześnie o 40 procent niższą wydajność. Podobnie, uruchomienie Cyberpunk 2077 lub FurMark wymagałoby tylko od 7 do 15 procent mniej energii, jednocześnie cierpiąc z powodu znacznego 60-procentowego spadku wydajności grafiki.
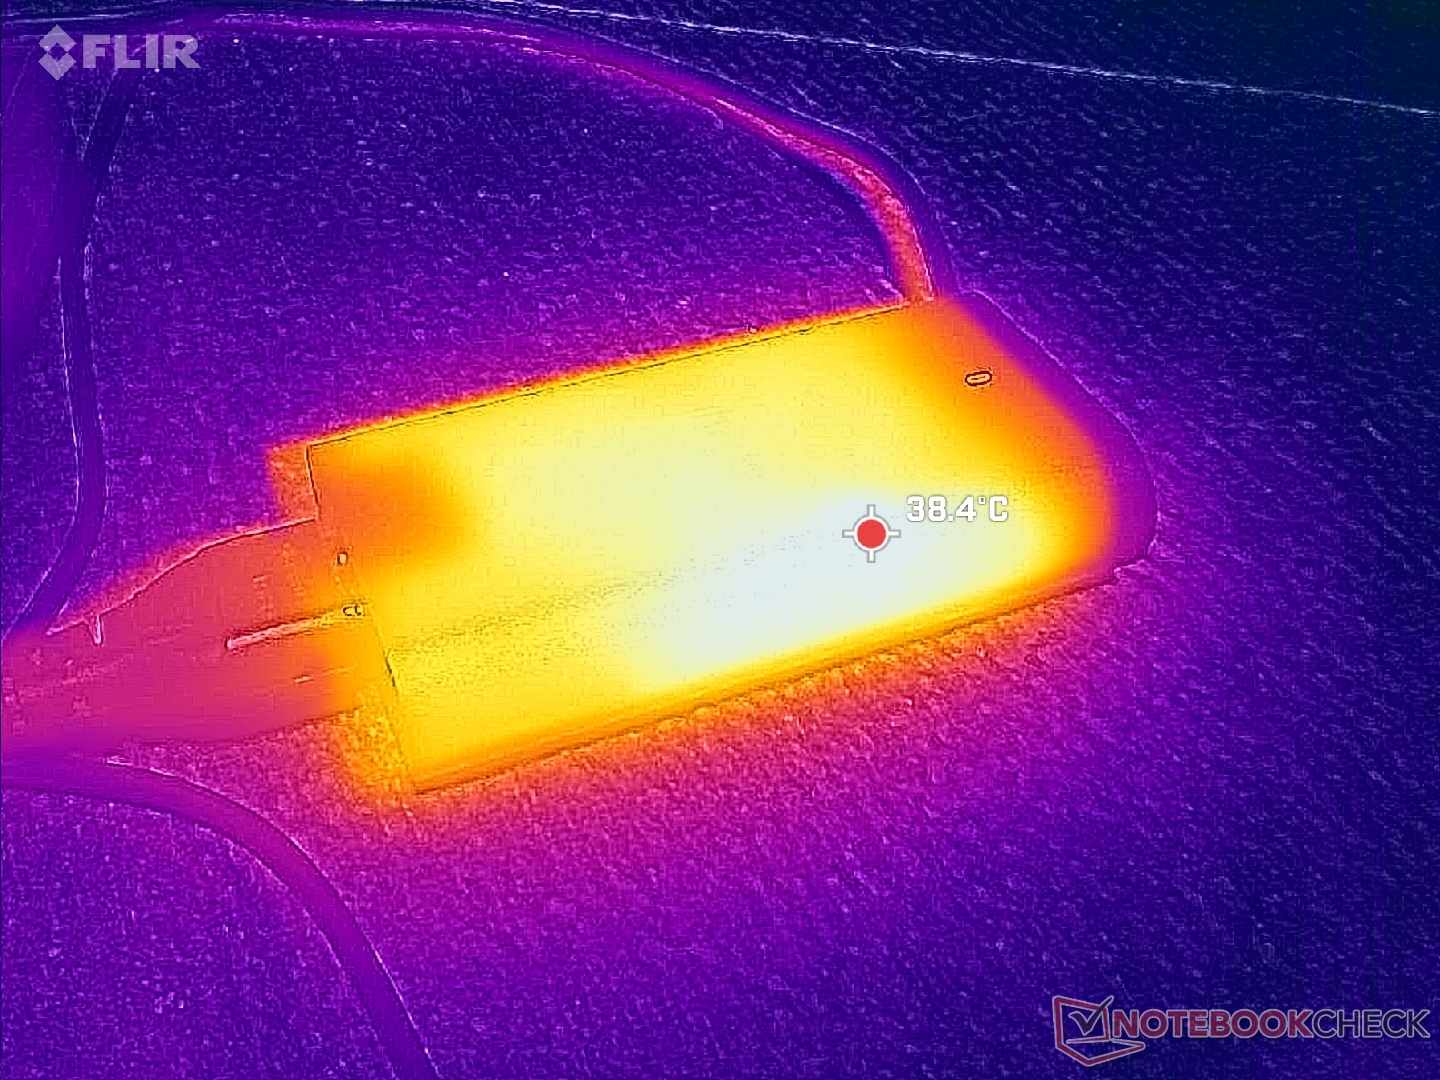
Uniwersalny zasilacz sieciowy USB-C o mocy 100 W jest poza tym identyczny we wszystkich konfiguracjach XPS 14 2026. Ponieważ jednak potencjał Turbo Boost jest niższy w przypadku Core Ultra 7, jesteśmy w stanie osiągnąć maksymalny pobór tylko 80 W, gdy procesor jest w pełni obciążony, w porównaniu do 101 W w konfiguracji Core Ultra X7.
| wyłączony / stan wstrzymania | |
| luz | |
| obciążenie |
|
Legenda:
min: | |
| Dell XPS 14 Core Ultra 7 355 Ultra 7 355, Intel Graphics 4 Xe3 PTL, WD PC SN7100S SDFPMSL-512G-1101, IPS, 1920x1200, 14" | Dell XPS 14 Core Ultra X7 358H Ultra X7 358H, Arc B390 Panther Lake iGPU, Samsung PM9C1b MZVL81T0HFLB-00BH1, OLED, 2880x1800, 14" | Asus ExpertBook PM3406 Ryzen AI 7 350, Radeon 860M, Western Digital PC SN5000S SDEQNSJ-512G-1002, IPS, 1920x1200, 14" | Lenovo ThinkPad T14 Gen 6 21QG001VGE Core Ultra 7 258V, Arc 140V, Samsung PM9E1 1 TB MZVLC1T0HFLU, IPS LED, 1920x1200, 14" | HP OmniBook Ultra Flip 14 Core Ultra 7 258V, Arc 140V, Samsung PM9A1 MZVL22T0HBLB, OLED, 2880x1800, 14" | Samsung Galaxy Book5 Pro 14 940XHA Core Ultra 5 226V, Arc 130V, Samsung PM9C1 MZVL8512HELU, OLED, 2880x1800, 14" | |
|---|---|---|---|---|---|---|
| Power Consumption | -42% | -45% | -14% | -36% | -21% | |
| Idle Minimum * (Watt) | 1.6 | 3.1 -94% | 3.2 -100% | 2.6 -63% | 3 -88% | 3.7 -131% |
| Idle Average * (Watt) | 3.7 | 3.6 3% | 6.1 -65% | 5.2 -41% | 4.4 -19% | 5.2 -41% |
| Idle Maximum * (Watt) | 3.9 | 10 -156% | 6.9 -77% | 6.2 -59% | 9.4 -141% | 5.4 -38% |
| Load Average * (Watt) | 36 | 39.2 -9% | 56.4 -57% | 40.1 -11% | 42.3 -17% | 26.2 27% |
| Cyberpunk 2077 ultra * (Watt) | 50.9 | 51.4 -1% | 64.9 -28% | 27.4 46% | 51.1 -0% | 47.4 7% |
| Cyberpunk 2077 ultra external monitor * (Watt) | 47.7 | 51.2 -7% | 45.3 5% | 45.2 5% | 49.9 -5% | 42.7 10% |
| Load Maximum * (Watt) | 80 | 101.4 -27% | 76.1 5% | 60.3 25% | 65 19% | 63.5 21% |
* ... im mniej tym lepiej
Pobór mocy Cyberpunk / Test warunków skrajnych
Zużycie energii przez monitor zewnętrzny
Żywotność baterii
Czas pracy w sieci WLAN jest porównywalny z Core Ultra X7 XPS 14 lub zasilanym przez Lunar Lake HP OmniBook Ultra Flip 14 co oznacza doskonałe zarządzanie energią podczas codziennych obciążeń. Użytkownicy nie powinni spodziewać się większych różnic w żywotności baterii pomiędzy konfiguracjami OLED i IPS tego modelu.
| Dell XPS 14 Core Ultra 7 355 Ultra 7 355, Intel Graphics 4 Xe3 PTL, 70 Wh | Dell XPS 14 Core Ultra X7 358H Ultra X7 358H, Arc B390 Panther Lake iGPU, 70 Wh | Asus ExpertBook PM3406 Ryzen AI 7 350, Radeon 860M, 70 Wh | Lenovo ThinkPad T14 Gen 6 21QG001VGE Core Ultra 7 258V, Arc 140V, 57 Wh | HP OmniBook Ultra Flip 14 Core Ultra 7 258V, Arc 140V, 64 Wh | Samsung Galaxy Book5 Pro 14 940XHA Core Ultra 5 226V, Arc 130V, 63 Wh | |
|---|---|---|---|---|---|---|
| Czasy pracy | 16% | -3% | 34% | -3% | -30% | |
| WiFi v1.3 (h) | 14.5 | 16.8 16% | 14 -3% | 19.4 34% | 14 -3% | 10.1 -30% |
| Load (h) | 1.6 |
Ocena Notebookcheck
Dell XPS 14 z Core Ultra 7 355 zachowuje elegancki wygląd swojego droższego brata X7, jednocześnie oferując wysokiej jakości wyświetlacz IPS, ale jego wydajność i efektywność są znacznie bliższe układom ostatniej generacji.
Dell XPS 14 Core Ultra 7 355
- 14/02/2026 v8
Allen Ngo
 Total Sustainability Score:
 Potencjalni konkurenci w porównaniu
Obraz | Model / recenzja | Cena | Waga | Wysokość | Ekran |
|---|---|---|---|---|---|
1. 84.8%  | Dell XPS 14 Core Ultra 7 355 Intel Core Ultra 7 355 ⎘ Intel Graphics 4 Xe3 Panther Lake iGPU ⎘ 16 GB Pamięć, 512 GB SSD | Amazon: 1. $1,789.99 Dell XPS 14 Premium Laptop D... 2. $2,049.00 Dell XPS 14 9440 14.5" Noteb... 3. $2,459.99 Dell Premium 16 (Previously ... Cena katalogowa: 1600 USD | 1.5 kg | 15.2 mm | 14.00" 1920x1200 162 PPI IPS |
2. 87.4% 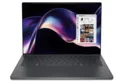 | Dell XPS 14 Core Ultra X7 358H Intel Core Ultra X7 358H ⎘ Intel Arc B390 12 Xe3 Panther Lake iGPU ⎘ 32 GB Pamięć, 1000 GB SSD | Amazon: 1. $1,789.99 Dell XPS 14 Premium Laptop D... 2. $2,459.99 Dell Premium 16 (Previously ... 3. $2,049.00 Dell XPS 14 9440 14.5" Noteb... Cena katalogowa: 2200 USD | 1.4 kg | 14.62 mm | 14.00" 2880x1800 243 PPI OLED |
3. 84.7% 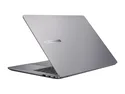 | Asus ExpertBook PM3406 AMD Ryzen AI 7 350 ⎘ AMD Radeon 860M ⎘ 16 GB Pamięć, 512 GB SSD | Amazon: Cena katalogowa: 979€ | 1.4 kg | 17.9 mm | 14.00" 1920x1200 162 PPI IPS |
4. 88.9%  | Lenovo ThinkPad T14 Gen 6 21QG001VGE Intel Core Ultra 7 258V ⎘ Intel Arc Graphics 140V ⎘ 32 GB Pamięć, 1024 GB SSD | Amazon: Cena katalogowa: 1960 Euro | 1.5 kg | 22 mm | 14.00" 1920x1200 162 PPI IPS LED |
5. 88.7%  | HP OmniBook Ultra Flip 14 Intel Core Ultra 7 258V ⎘ Intel Arc Graphics 140V ⎘ 32 GB Pamięć, 2048 GB SSD | Amazon: Cena katalogowa: 1250 USD | 1.3 kg | 15 mm | 14.00" 2880x1800 243 PPI OLED |
6. 86.9%  | Samsung Galaxy Book5 Pro 14 940XHA Intel Core Ultra 5 226V ⎘ Intel Arc Graphics 130V ⎘ 16 GB Pamięć, 512 GB SSD | Amazon: Cena katalogowa: 1699€ | 1.2 kg | 11.6 mm | 14.00" 2880x1800 243 PPI OLED |
Przezroczystość
Wyboru urządzeń do recenzji dokonuje nasza redakcja. Próbka testowa została udostępniona autorowi jako pożyczka od producenta lub sprzedawcy detalicznego na potrzeby tej recenzji. Pożyczkodawca nie miał wpływu na tę recenzję, producent nie otrzymał też kopii tej recenzji przed publikacją. Nie było obowiązku publikowania tej recenzji. Jako niezależna firma medialna, Notebookcheck nie podlega władzy producentów, sprzedawców detalicznych ani wydawców.
Tak testuje Notebookcheck
Każdego roku Notebookcheck niezależnie sprawdza setki laptopów i smartfonów, stosując standardowe procedury, aby zapewnić porównywalność wszystkich wyników. Od około 20 lat stale rozwijamy nasze metody badawcze, ustanawiając przy tym standardy branżowe. W naszych laboratoriach testowych doświadczeni technicy i redaktorzy korzystają z wysokiej jakości sprzętu pomiarowego. Testy te obejmują wieloetapowy proces walidacji. Nasz kompleksowy system ocen opiera się na setkach uzasadnionych pomiarów i benchmarków, co pozwala zachować obiektywizm.
