Legion recenzja 9i Gen 8 16IRX8: Najbardziej ambitny laptop do gier Lenovo

Zaprezentowany zaledwie kilka tygodni temu na targach IFA 2023nowy Legion 9i 16 jest najwyższym dostępnym modelem Legion, przewyższającym średnią serię Legion 5 i wyższą średnią serię Legion 7. Jest to pierwszy produkt Legion 9 od kilku lat po miernym Legion Y920 w 2017 roku. Najnowszy model wyróżnia się wyświetlaczem mini-LED i zintegrowanym chłodzeniem cieczą.
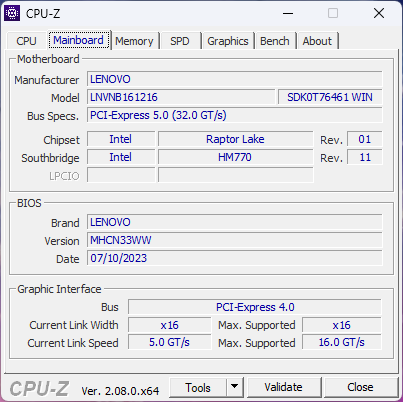
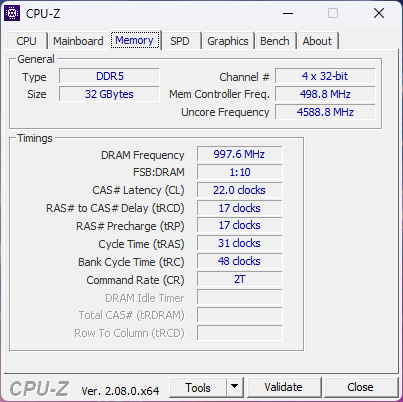
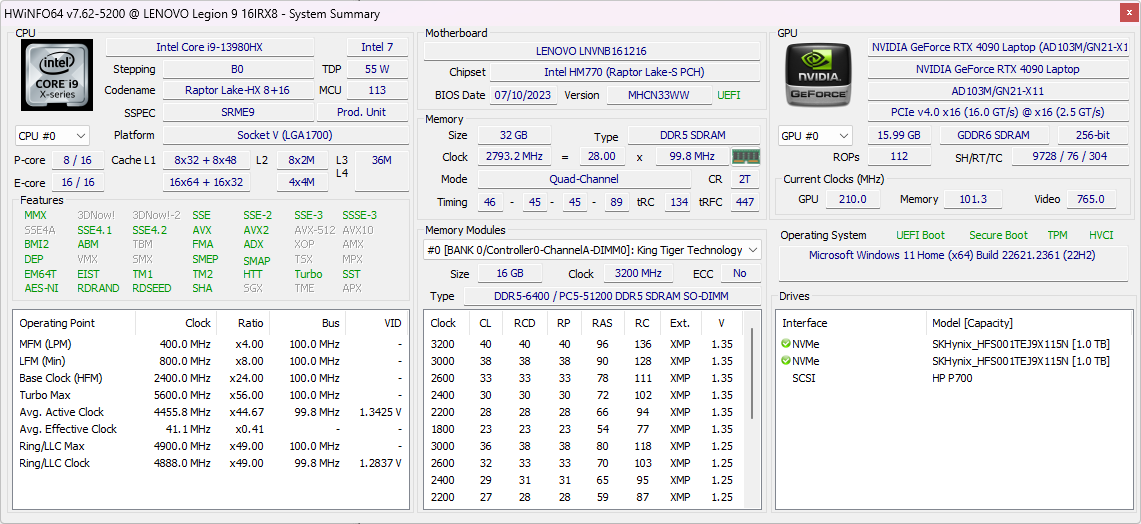
Nasz recenzowany egzemplarz został skonfigurowany ze wszystkim i zlewozmywakiem kuchennym, w tym procesorem Core i9-13980HX 13. generacji, kartą graficzną RTX 4090 o mocy 175 W GeForce, dyskiem SSD NVMe 1 TB PCIe4 x4 w macierzy RAID 0 oraz wyświetlaczem mini-LED 3,2K (3200 x 2000) 165 Hz z kolorami DCI-P3 za niecałe 4000 USD w sprzedaży detalicznej. Wszystkie opcje są obecnie dostarczane z tym samym procesorem Core i9 i wyświetlaczem mini-LED, podczas gdy tylko GPU można skonfigurować w dół do RTX 4080.
Alternatywy dla Legion 9i 16 obejmują inne 16-calowe laptopy do gier, takie jak Razer Blade 16, Asus ROG Strix G16, HP Omen Transcend 16oraz Alienware x16 R1.
Więcej recenzji Lenovo:
Potencjalni konkurenci w porównaniu
Ocena | Data | Model | Waga | Wysokość | Rozmiar | Rezolucja | Cena |
|---|---|---|---|---|---|---|---|
| 90.2 % v7 (old) | 10/2023 | Lenovo Legion 9 16IRX8 i9-13980HX, GeForce RTX 4090 Laptop GPU | 2.6 kg | 22.7 mm | 16.00" | 3200x2000 | |
| 87.7 % v7 (old) | 08/2023 | Lenovo Legion Slim 5 16APH8 R7 7840HS, GeForce RTX 4060 Laptop GPU | 2.4 kg | 25.2 mm | 16.00" | 2560x1600 | |
| 89.8 % v7 (old) | 03/2023 | Razer Blade 16 Early 2023 RTX 4090 i9-13950HX, GeForce RTX 4090 Laptop GPU | 2.5 kg | 21.99 mm | 16.00" | 3840x2400 | |
| 88.4 % v7 (old) | 03/2023 | Asus ROG Strix G16 G614JZ i9-13980HX, GeForce RTX 4080 Laptop GPU | 2.4 kg | 30.4 mm | 16.00" | 2560x1600 | |
| 87.9 % v7 (old) | 08/2023 | HP Omen Transcend 16 i9-13900HX, GeForce RTX 4070 Laptop GPU | 2.3 kg | 19.8 mm | 16.00" | 2560x1600 | |
| 88.4 % v7 (old) | 06/2023 | Alienware x16 R1 i9-13900HK, GeForce RTX 4080 Laptop GPU | 2.6 kg | 18.57 mm | 16.00" | 2560x1600 |
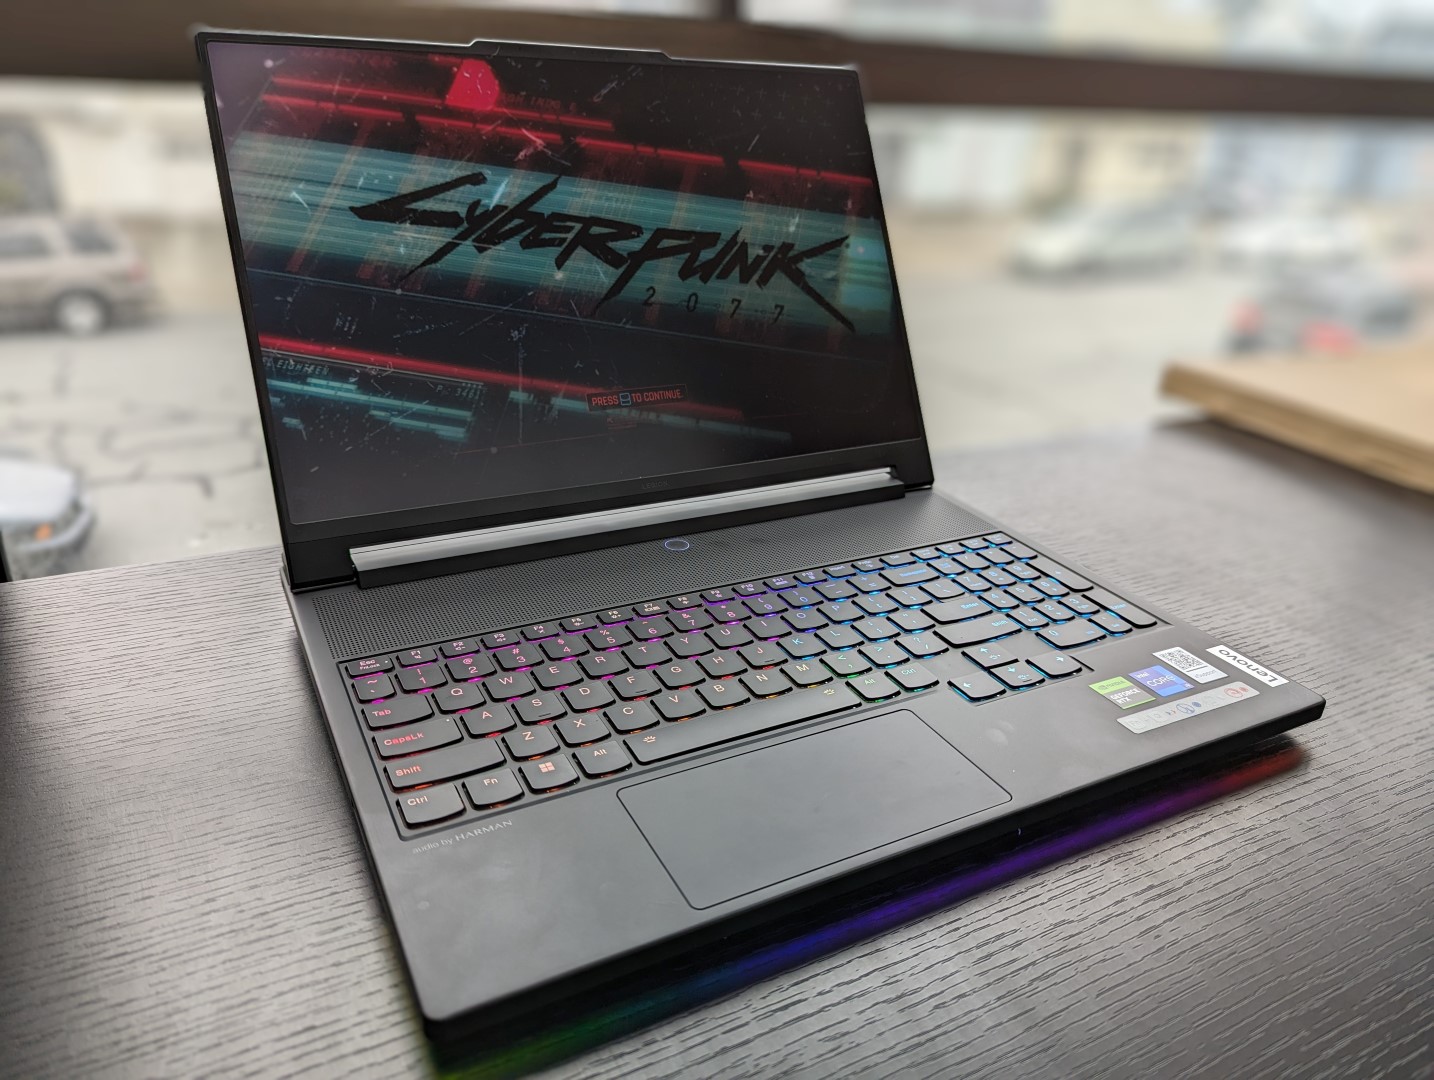
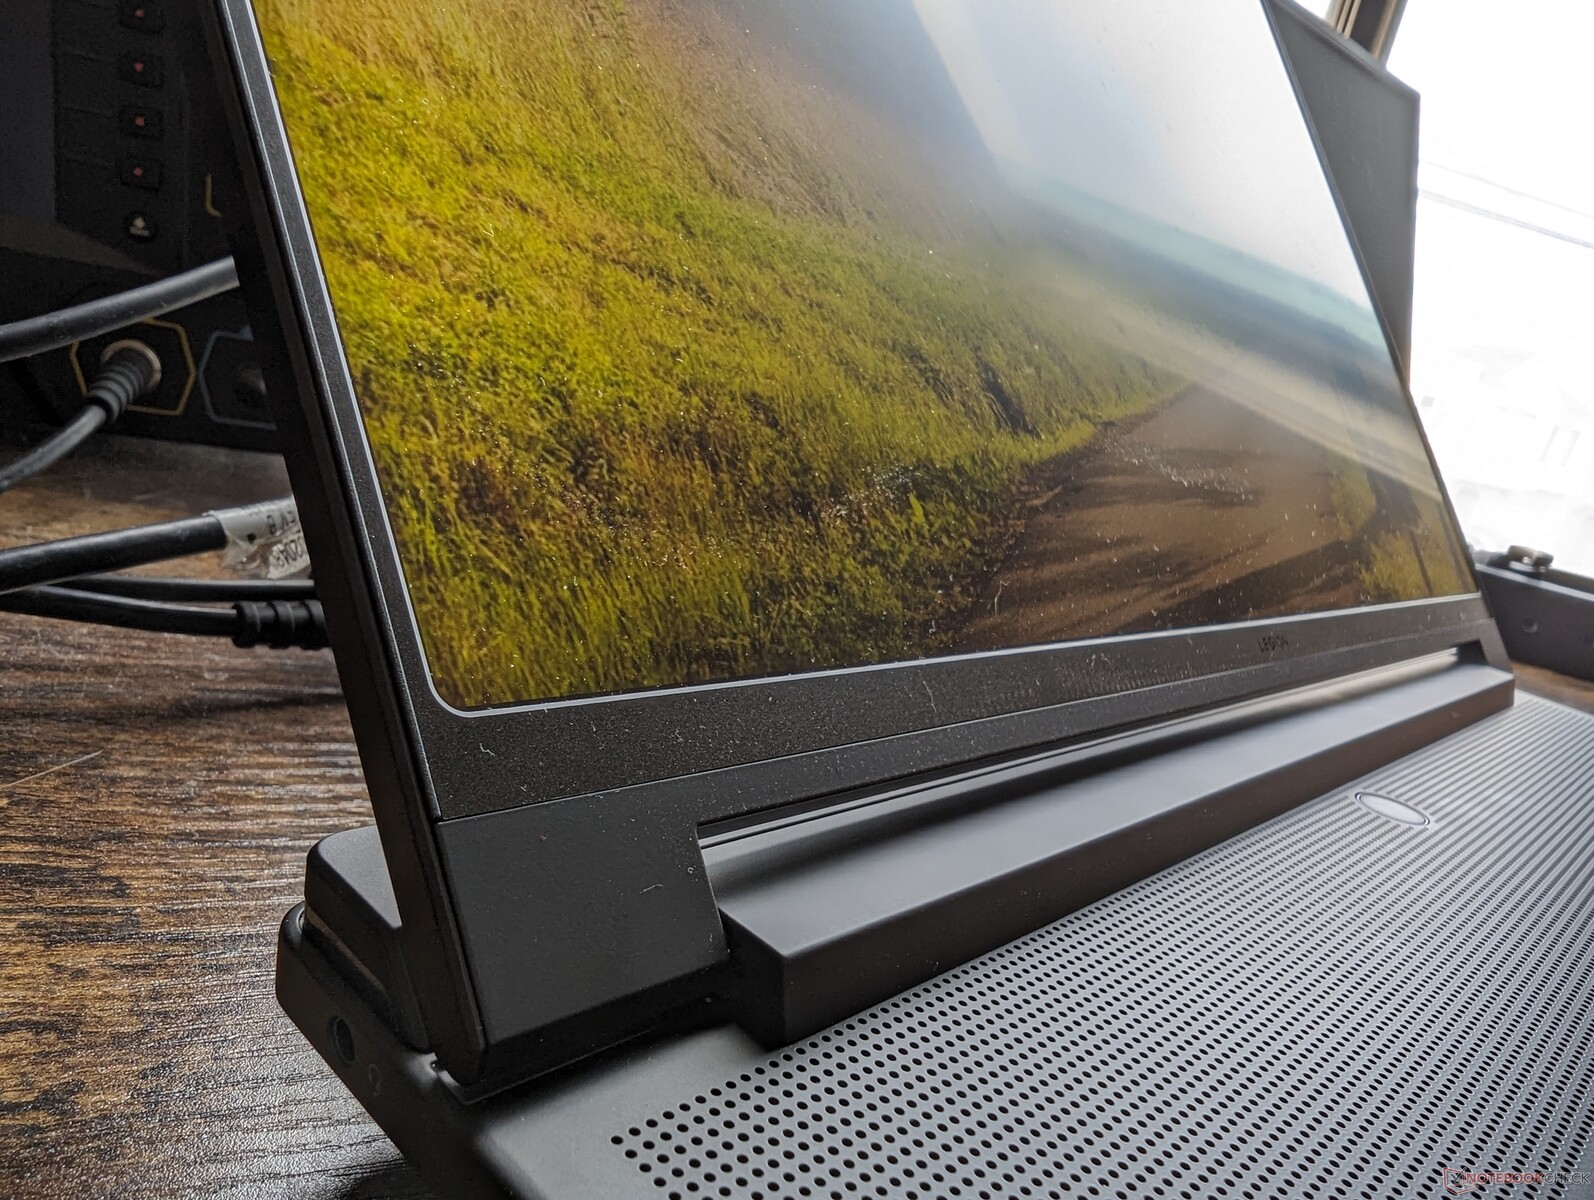
Przypadek - Rozwinięty projekt Legion
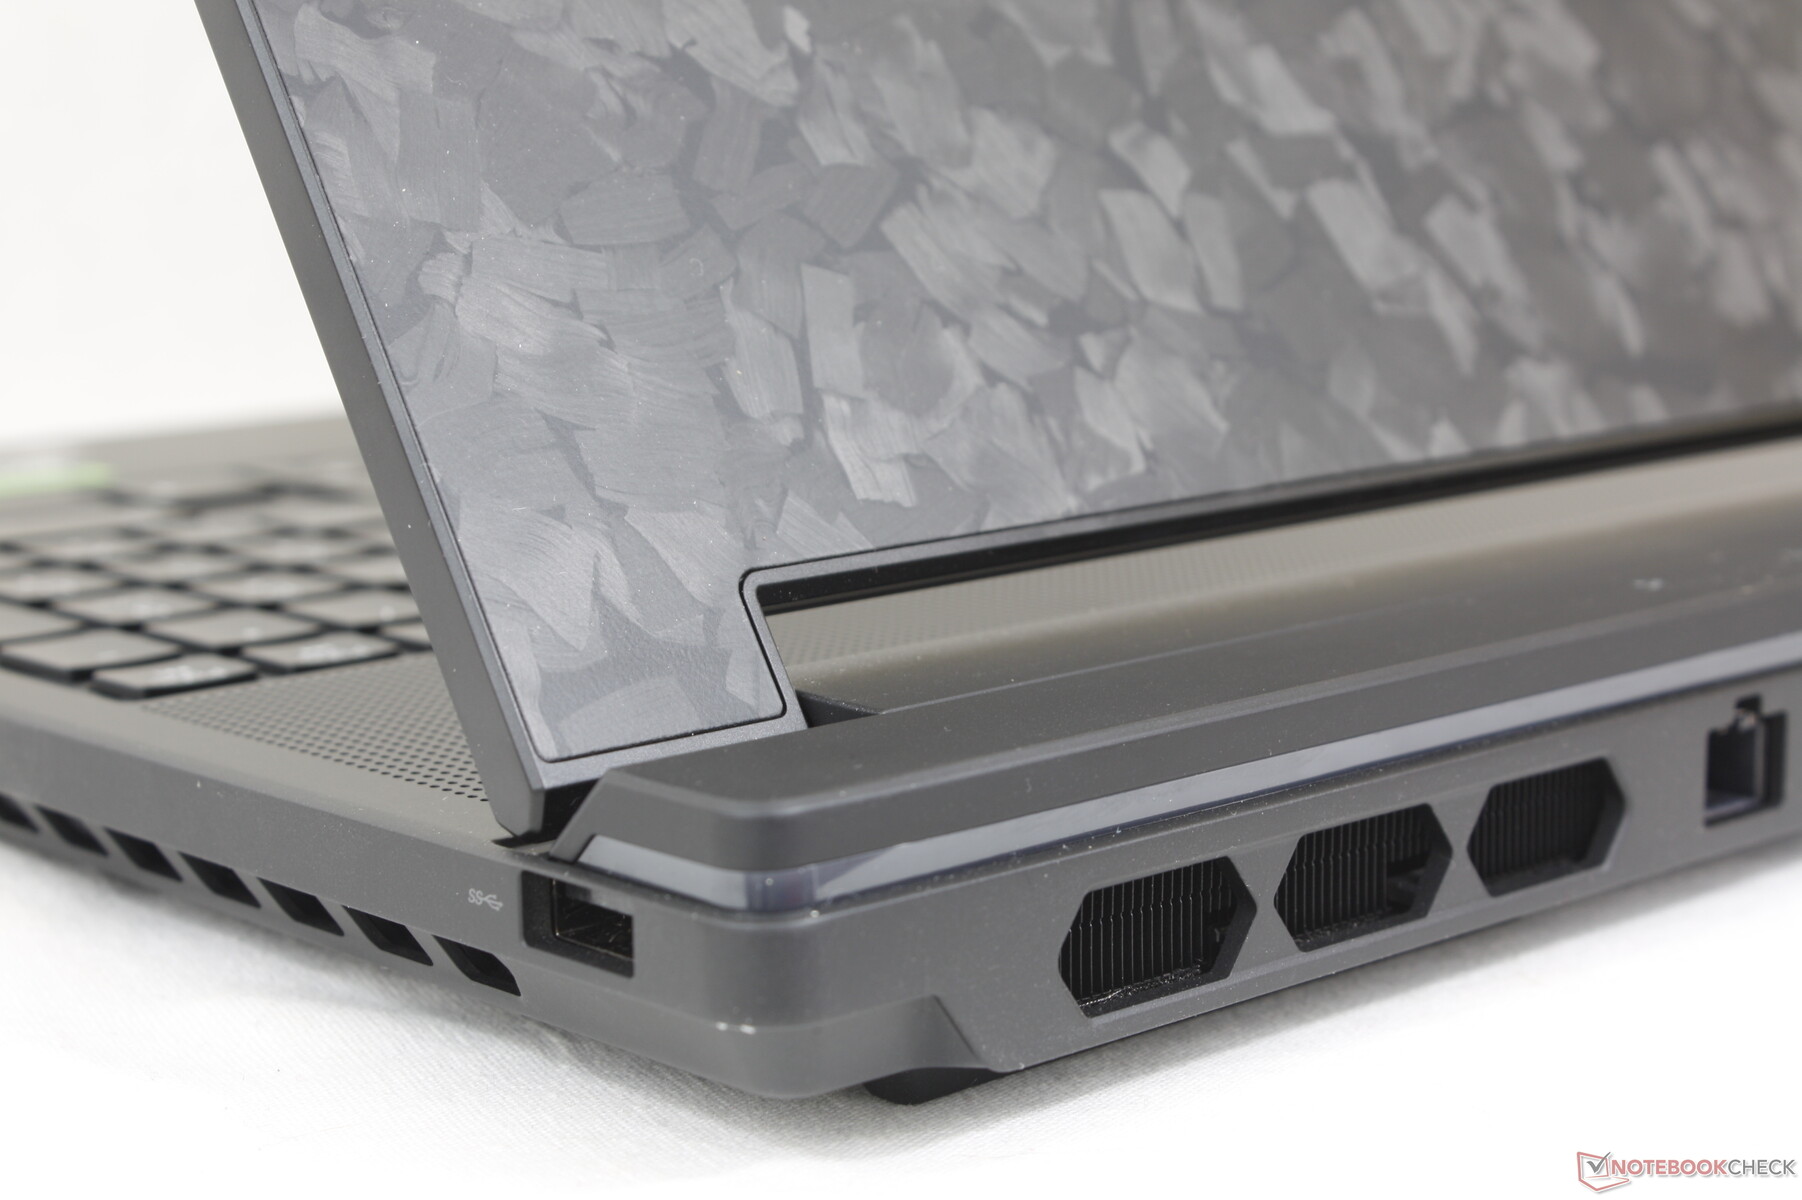
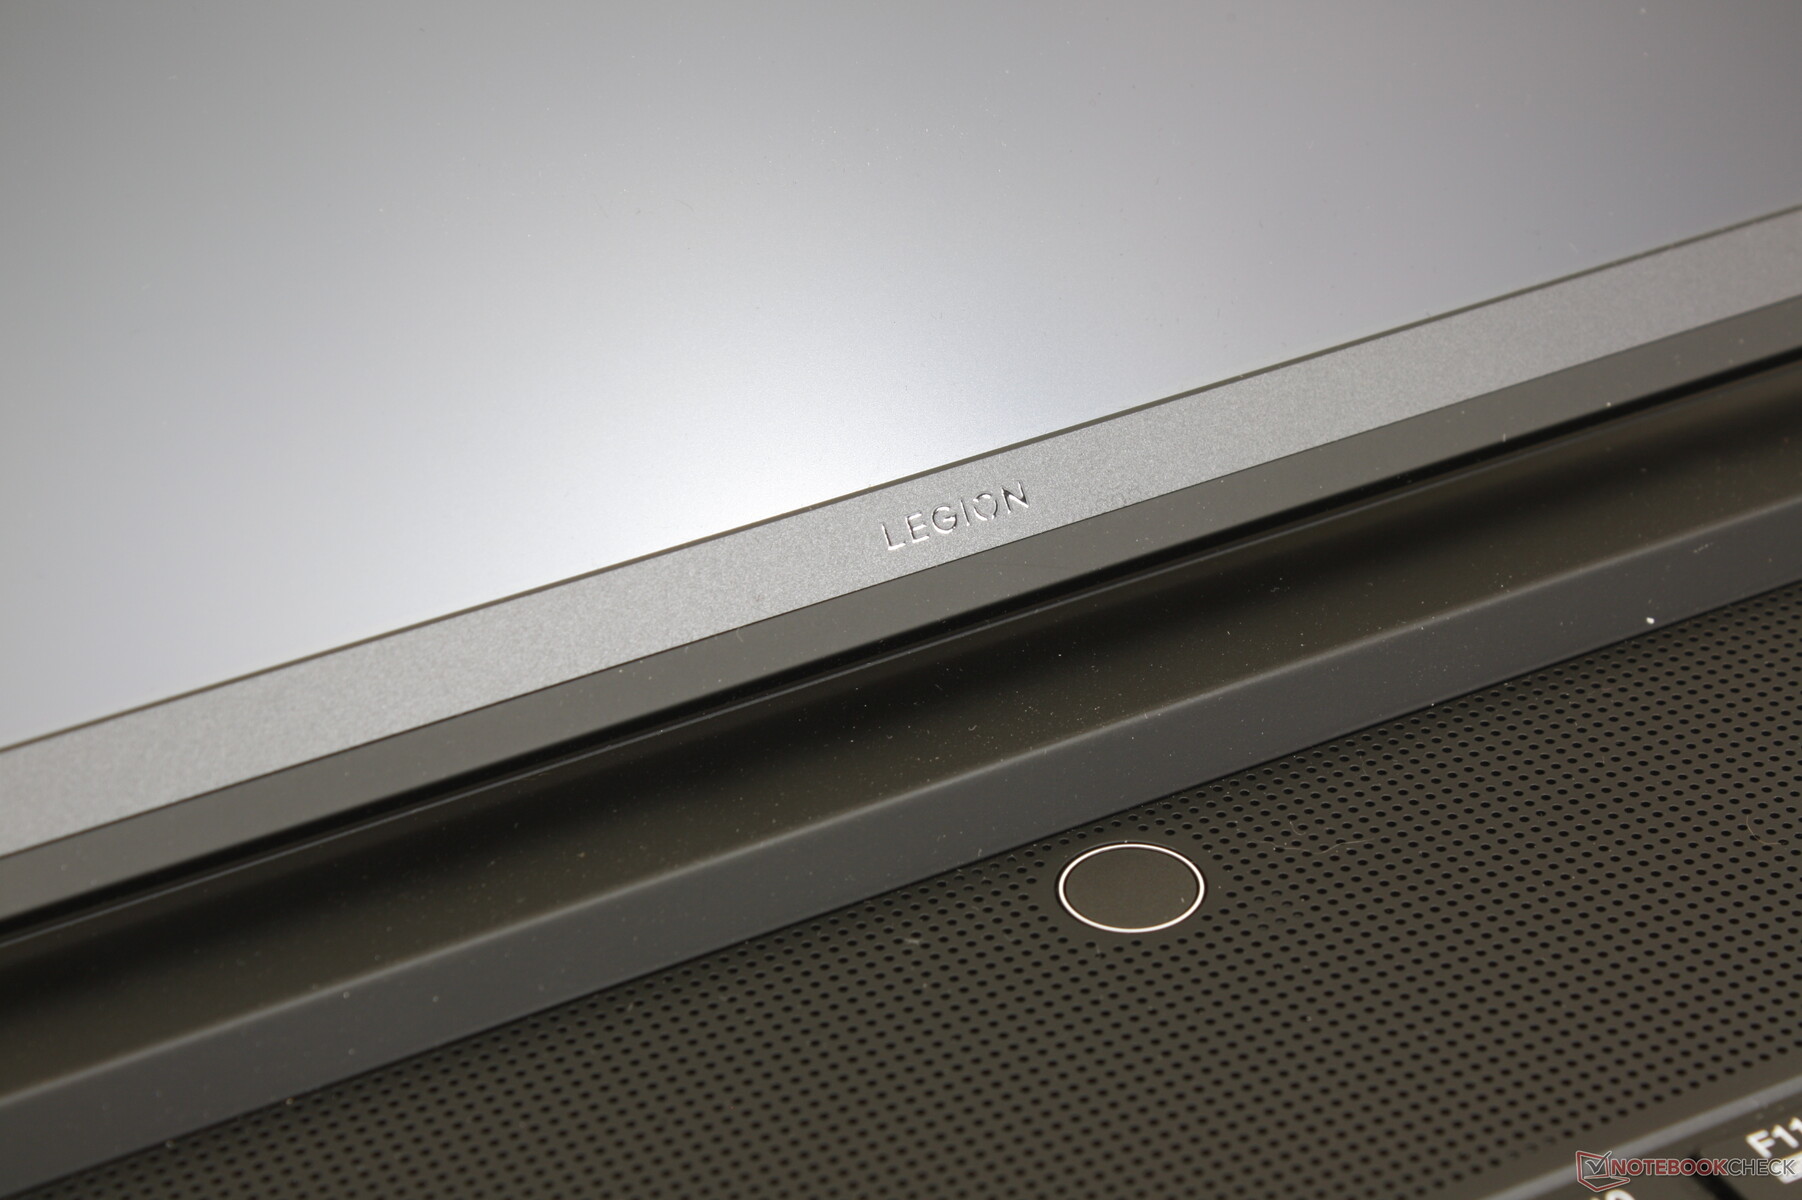
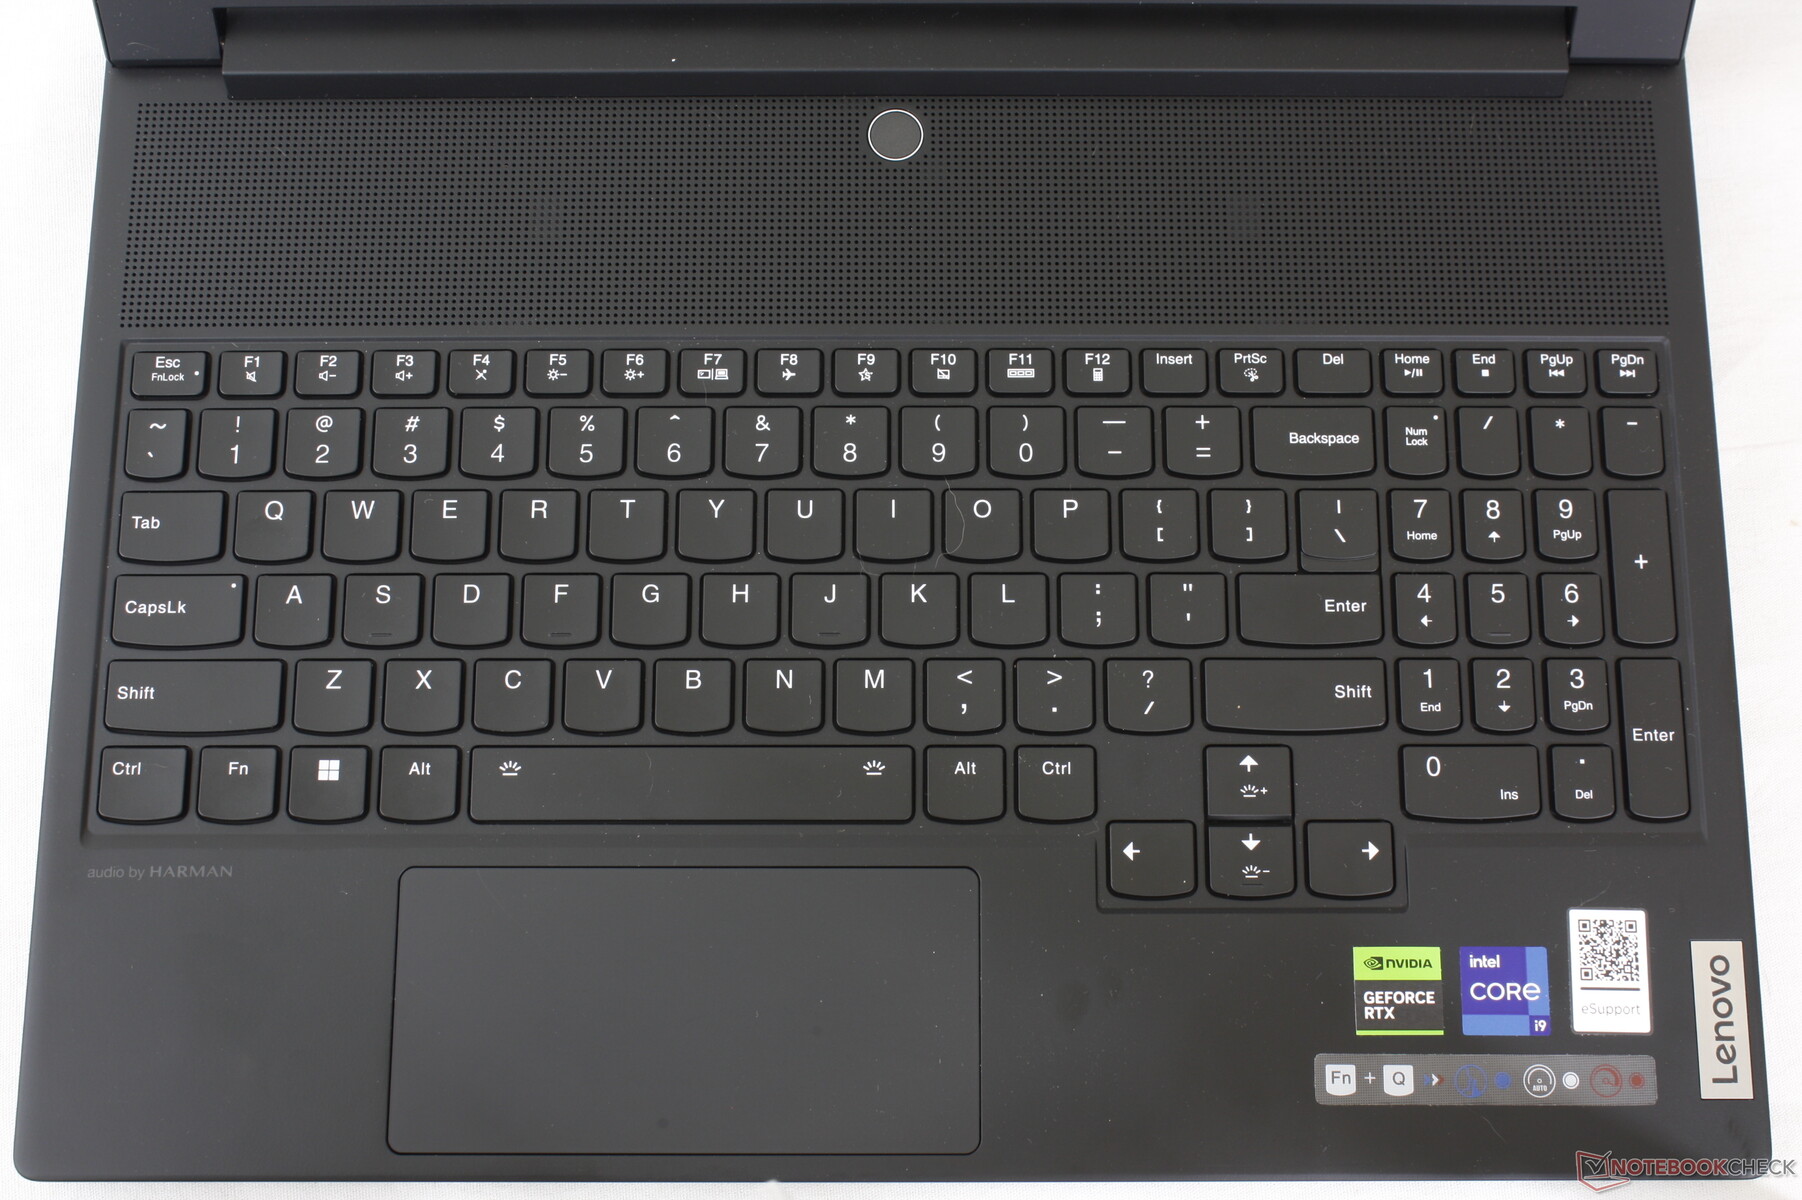
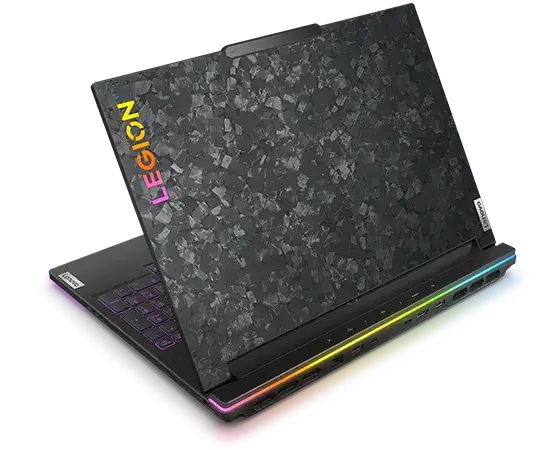
W Legion 9i 16 zastosowano podobne matowe materiały magnezowe jak w Legion serii 7, ale wizualnie bardzo się one różnią. Po pierwsze, klawiatura została przesunięta do przodu, aby być bliżej użytkownika, podobnie jak w Asus Zephyrus S GX531, aby zrobić miejsce na więcej kratek wentylacyjnych i większe rozwiązanie chłodzące. Po drugie, unikalny karbonowy wzór wokół zewnętrznej pokrywy pomaga zmniejszyć gromadzenie się odcisków palców, jednocześnie przyczyniając się do estetyki dla graczy. Wreszcie, wystający tył został pogrubiony, aby lepiej pomieścić wszystkie wewnętrzne zmiany i bardziej wymagający sprzęt.
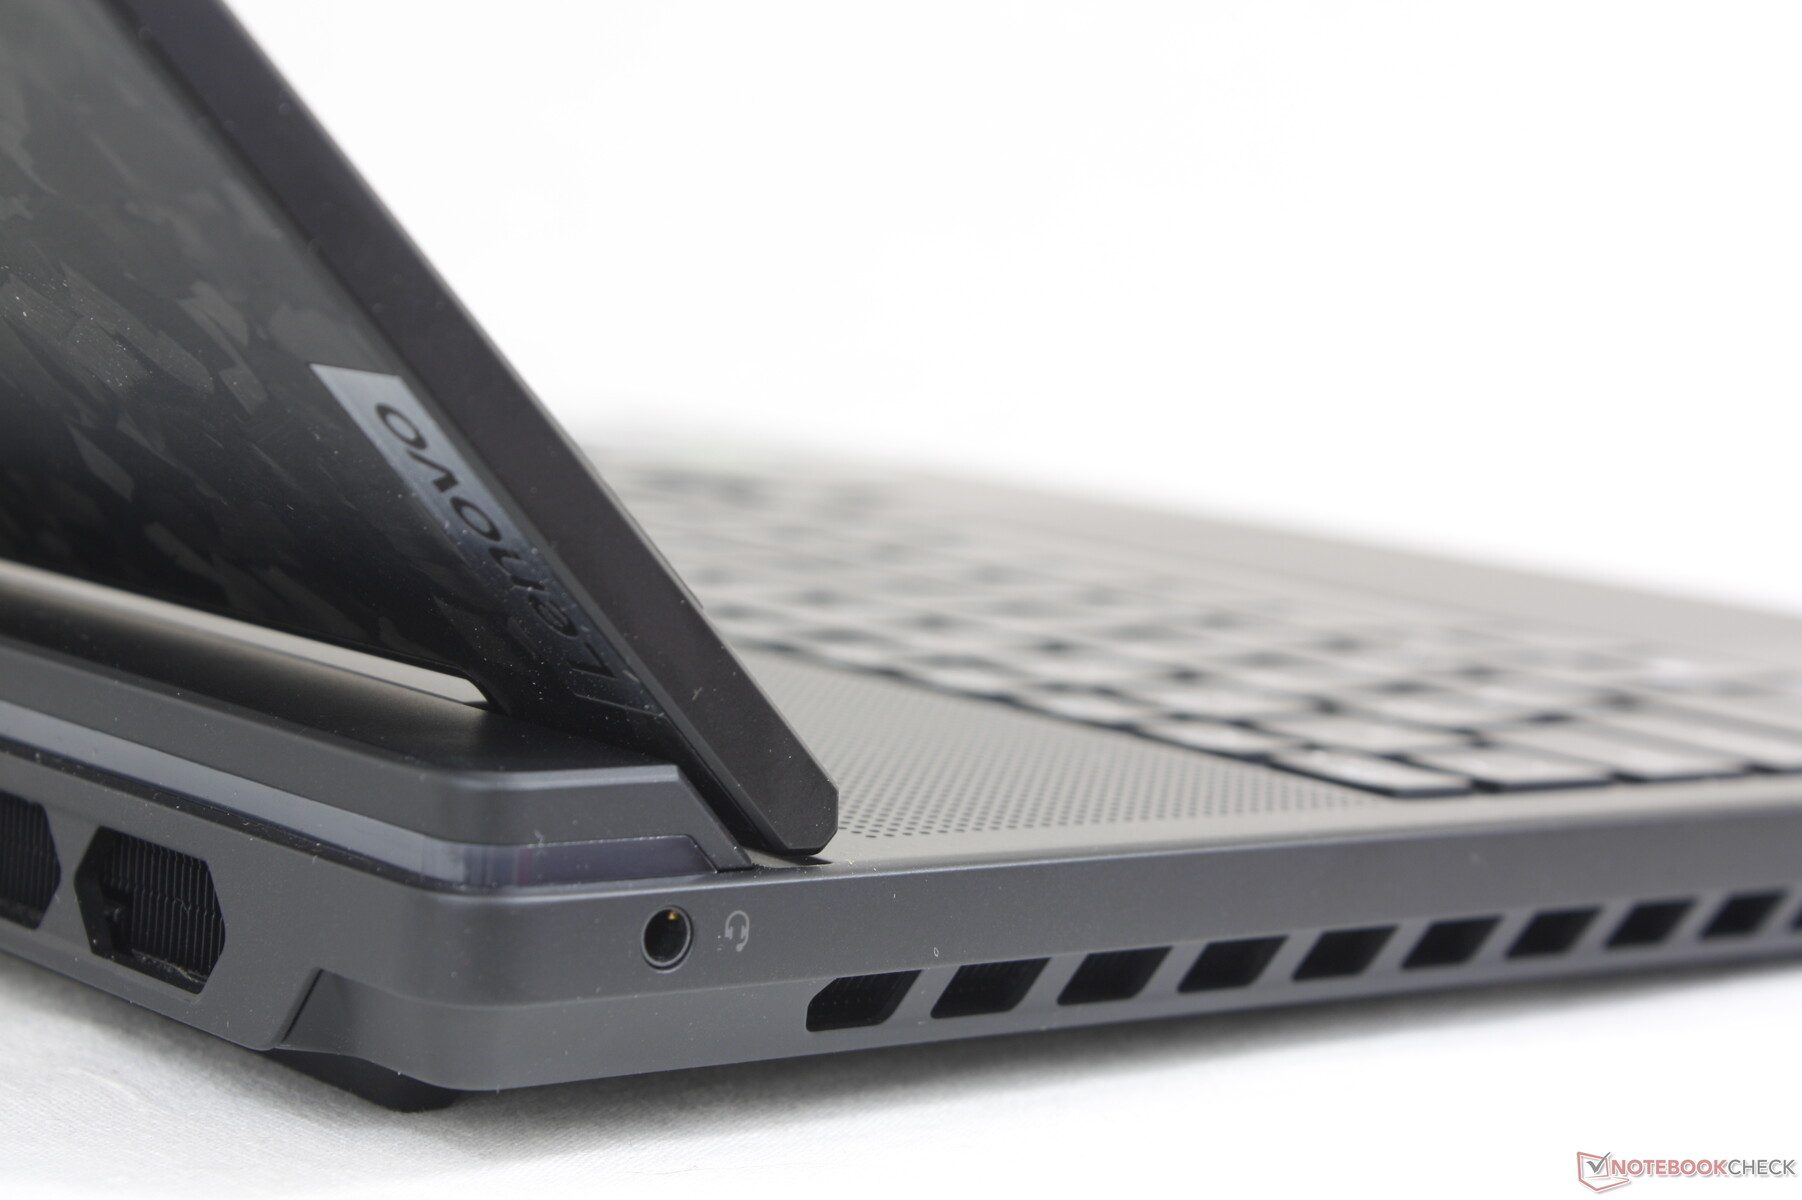
Jakość wykonania obudowy jest doskonała, a przy próbie przekręcenia pokrywy lub wciśnięcia środkowej części klawiatury lub podpórek pod nadgarstki, obudowa tylko nieznacznie się ugina. Nie czuje się ani lepiej, ani gorzej niż
Legion 7 16 lub Alienware x16 R1 pod względem sztywności, zwłaszcza że wszystkie ważą mniej więcej tyle samo. Jednak zawiasy pozostają stosunkowo małe w porównaniu do znacznie większych zawiasów z serii Serii Asus Strix lub najnowszychMSI Raider GE68. Mogą być satysfakcjonujące, gdy są nowe, ale tylko czas pokaże, jak dobrze sprawdzą się w dłuższej perspektywie.
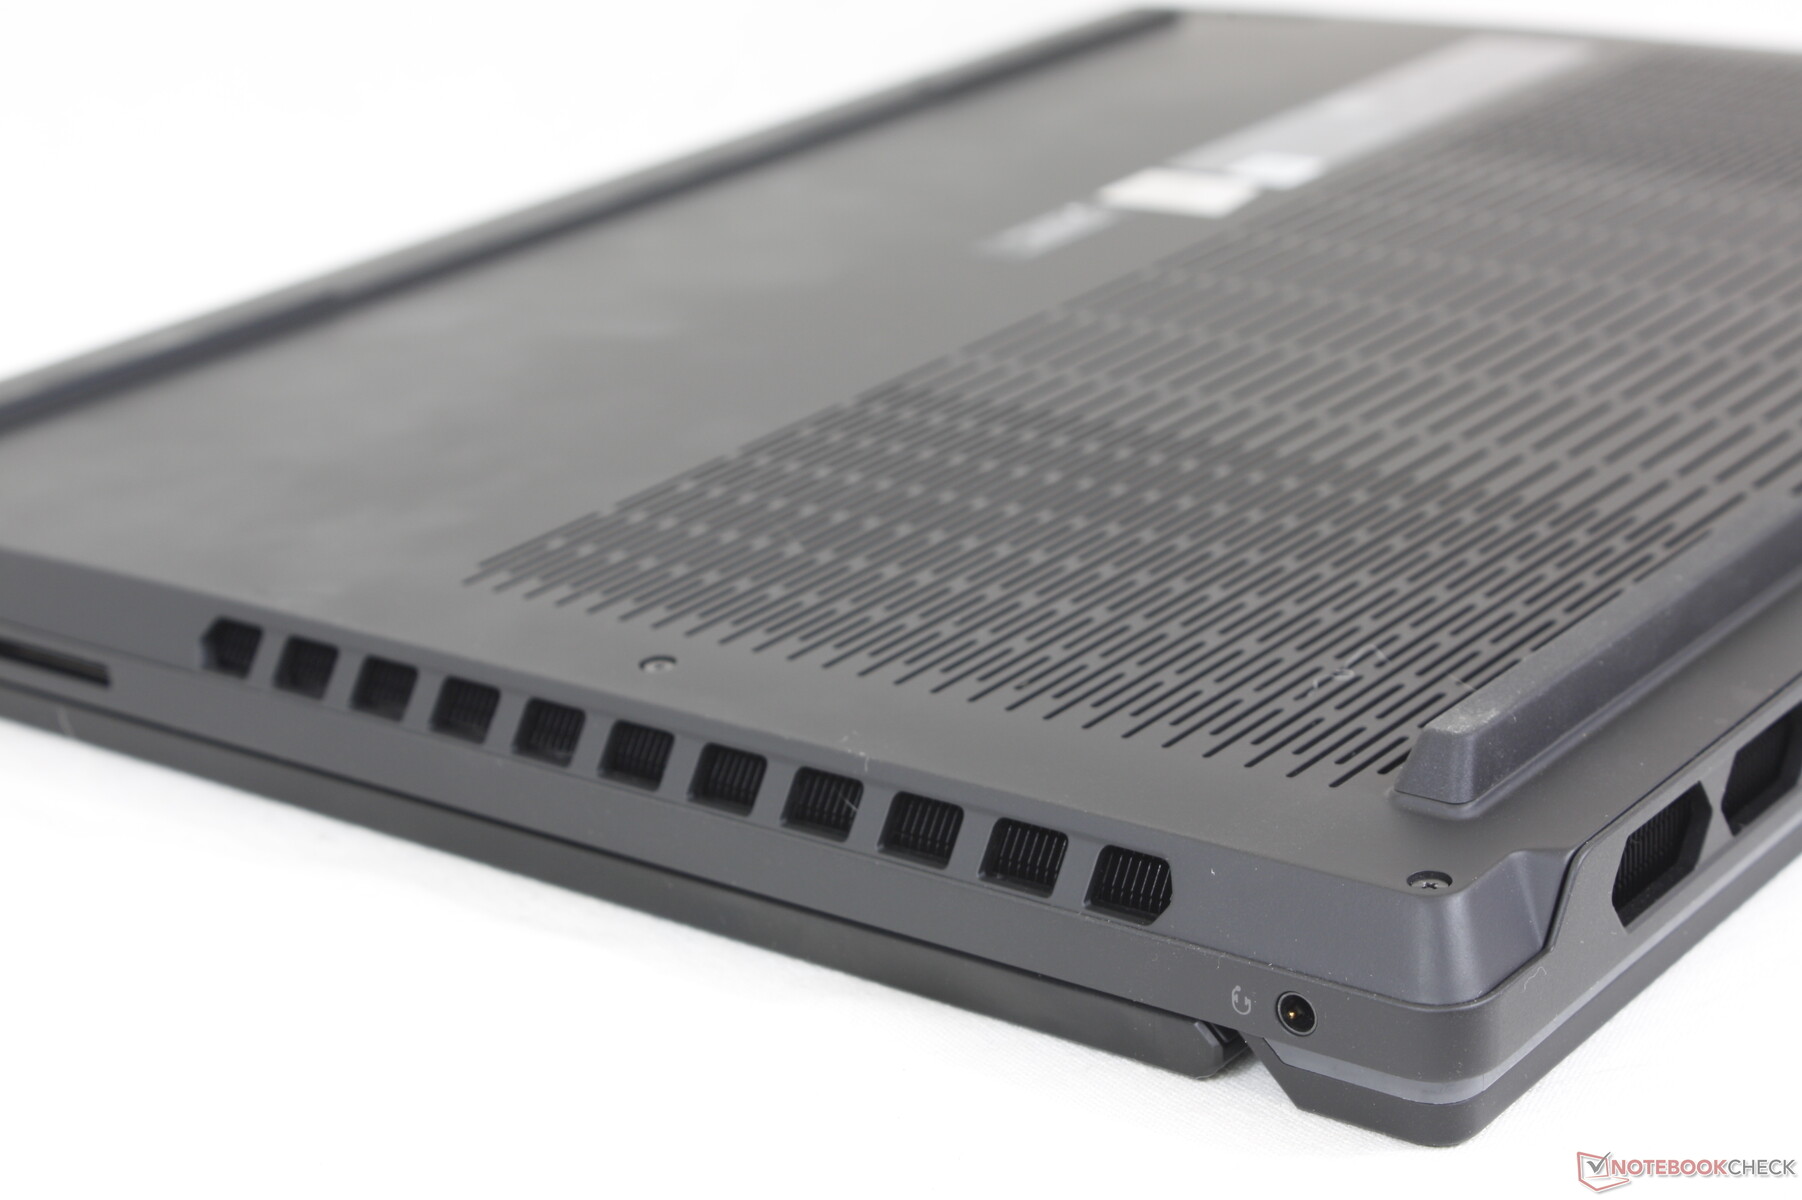
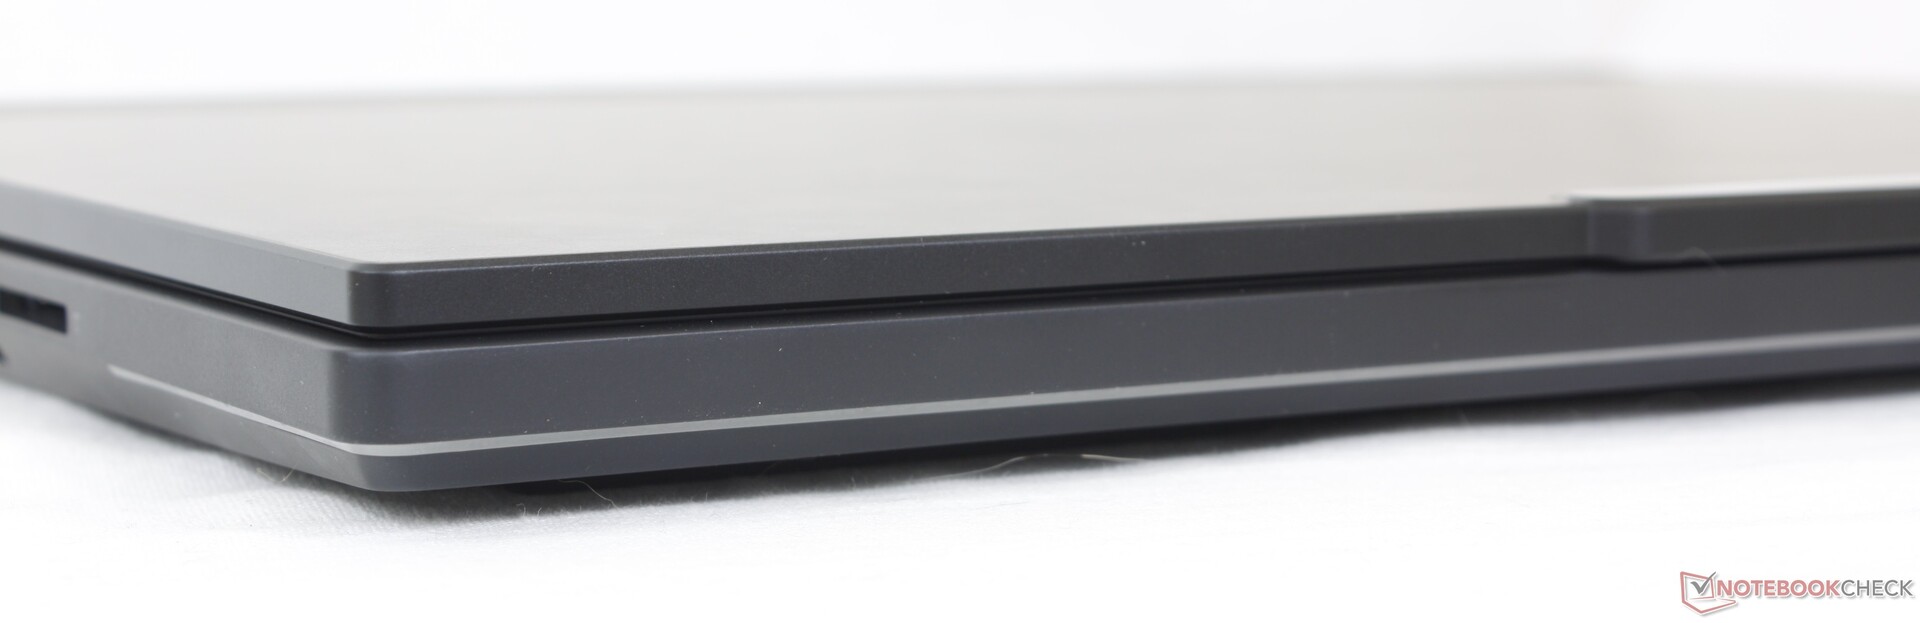
Wydłużony tył i wymagające układy wewnętrzne Core i9/RTX 4090 doprowadziły do powstania większej i grubszej obudowy niż w przypadku Legion 7 16. Różnice są zauważalne, ponieważ Legion 9i 16 jest większy niż wiele innych 16-calowych laptopów do gier, takich jak ROG Strix G16, Blade 16czy Omen Transcend 16. Wysoka wydajność i zaawansowane funkcje kosztują w tym przypadku przenośność.
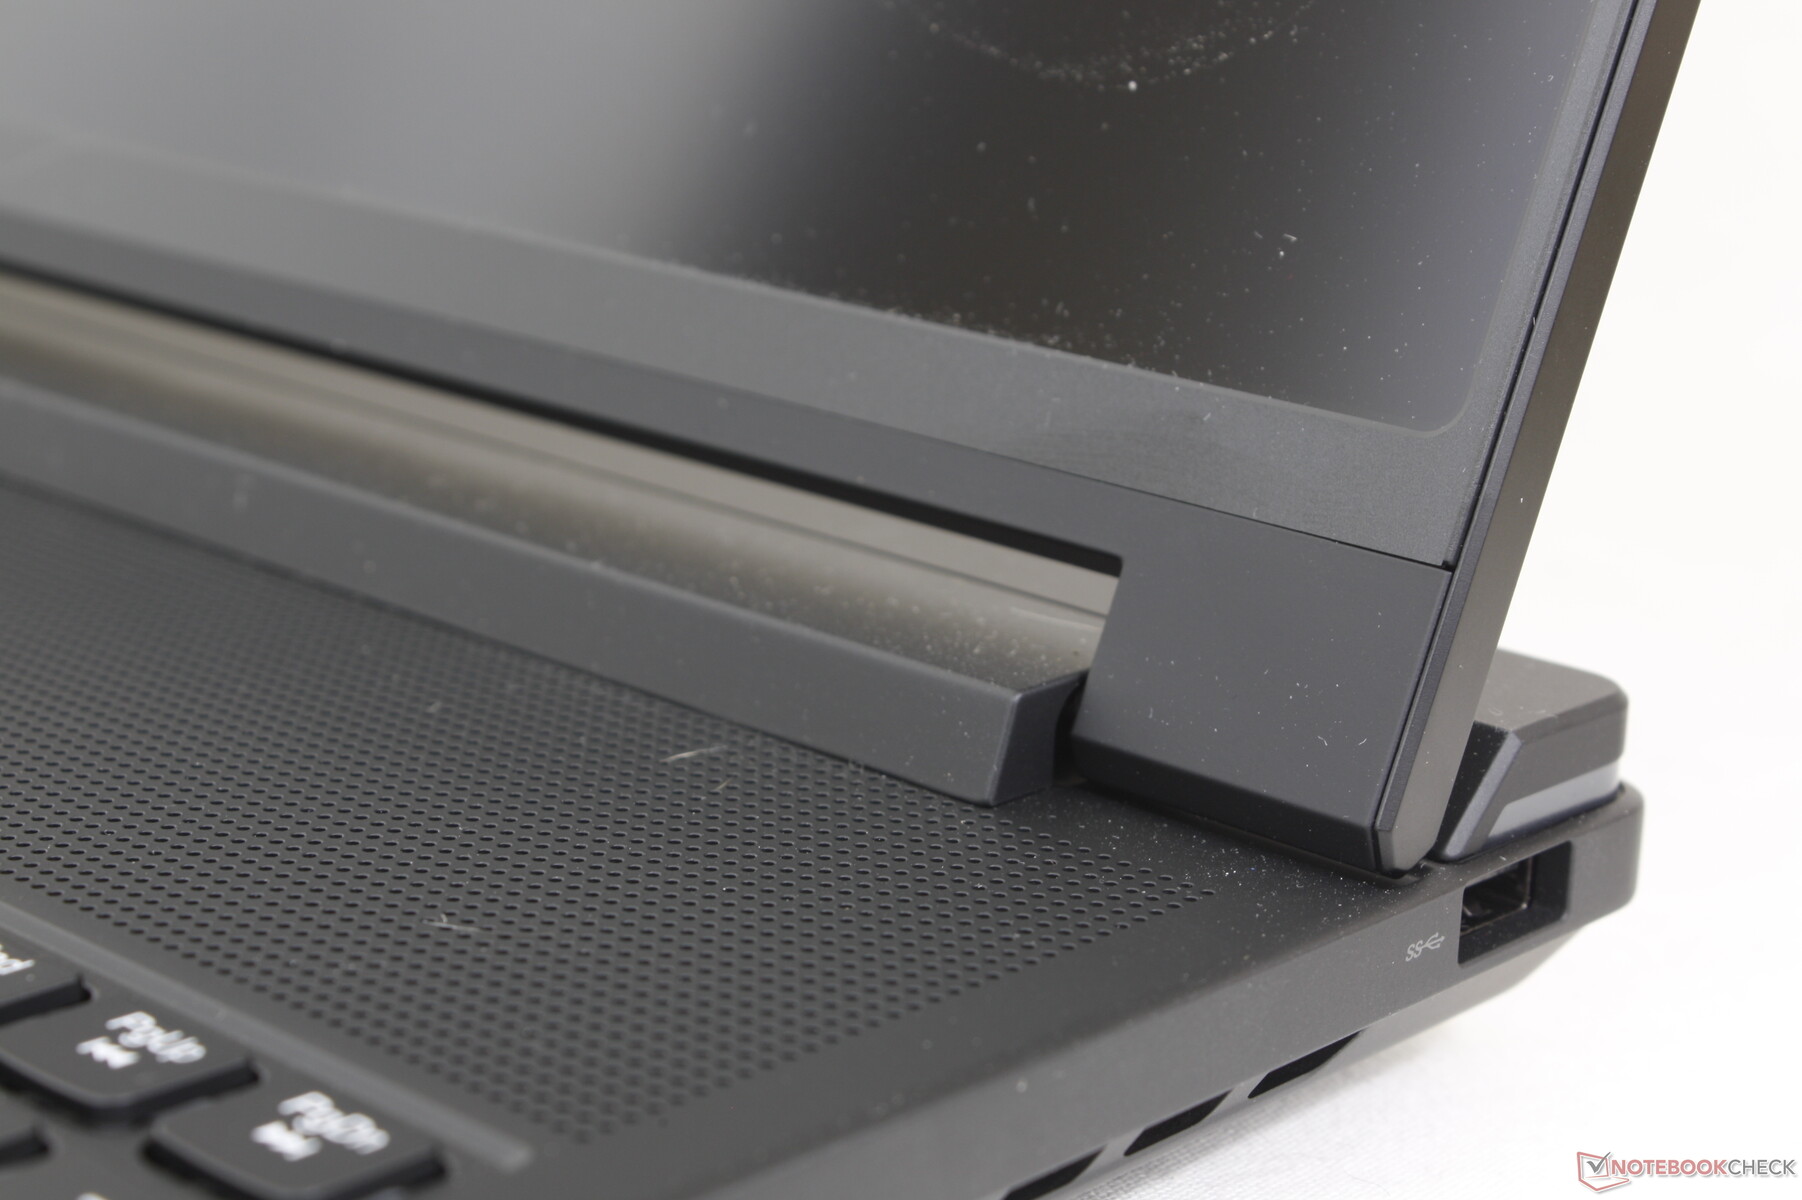
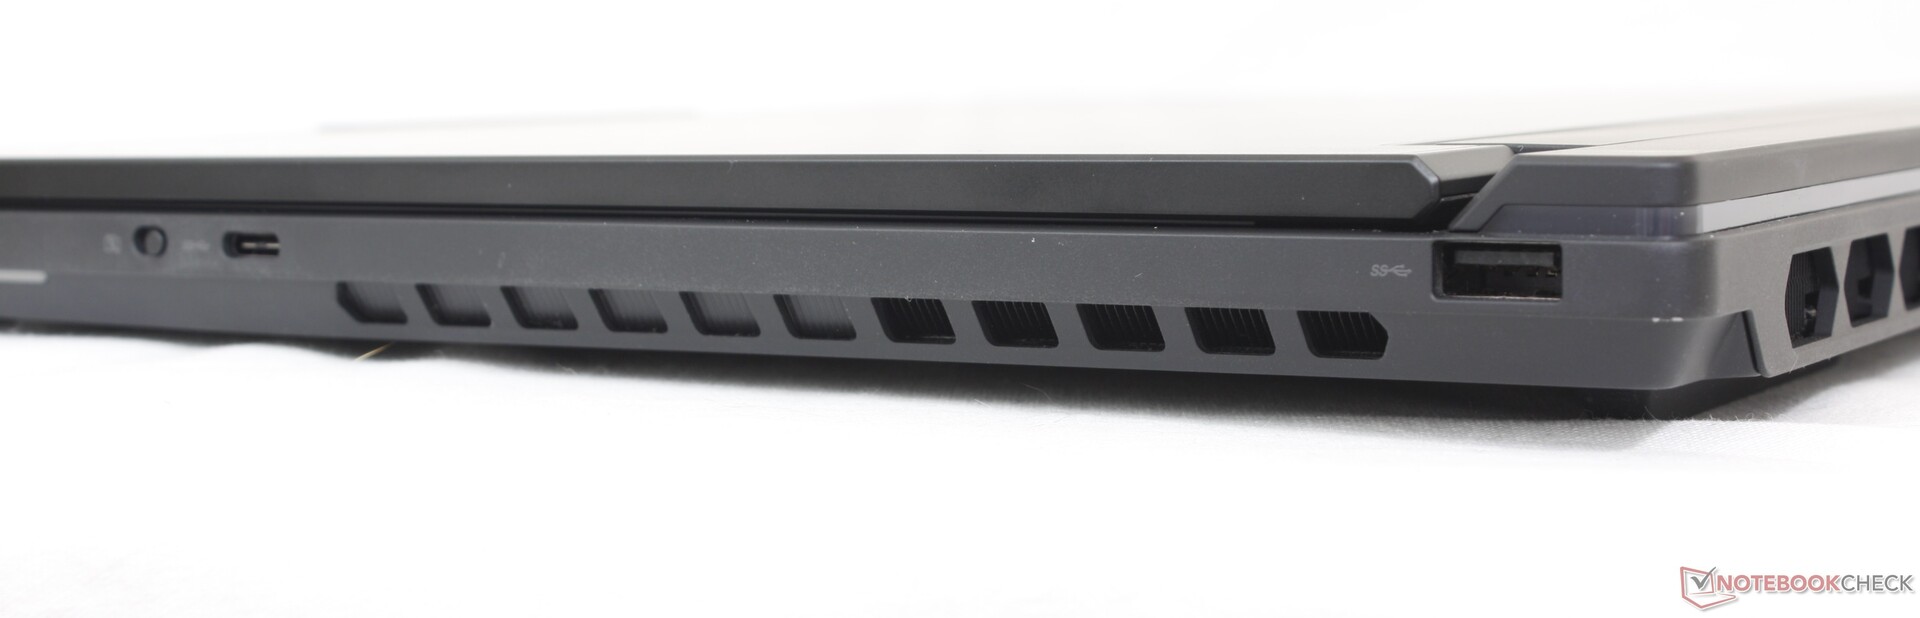
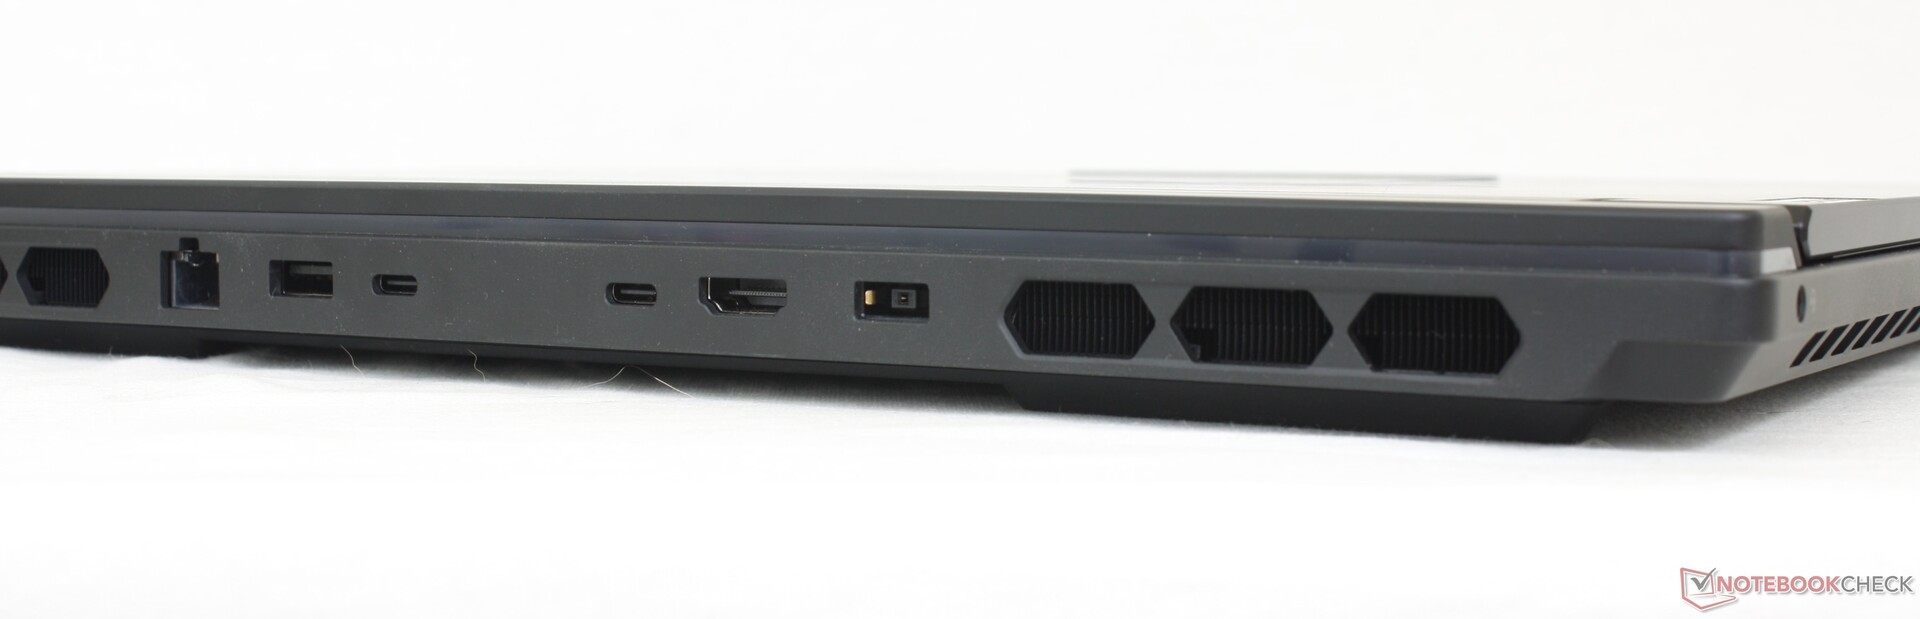
Łączność - duży wybór
Opcji portów jest mnóstwo, a większość z nich znajduje się z tyłu zamiast po bokach. Jednak w przeciwieństwie do tylnych portów w Alienware X16 R1, porty w Lenovo są indywidualnie oznaczone wskaźnikami LED dla łatwiejszego dostępu.
Tylko dwa tylne porty USB-C mogą być używane do zewnętrznych monitorów lub do ładowania laptopa przez Power Delivery. Trzeci port USB-C wzdłuż prawej krawędzi służy wyłącznie do przesyłania danych i ładowania urządzeń zewnętrznych.
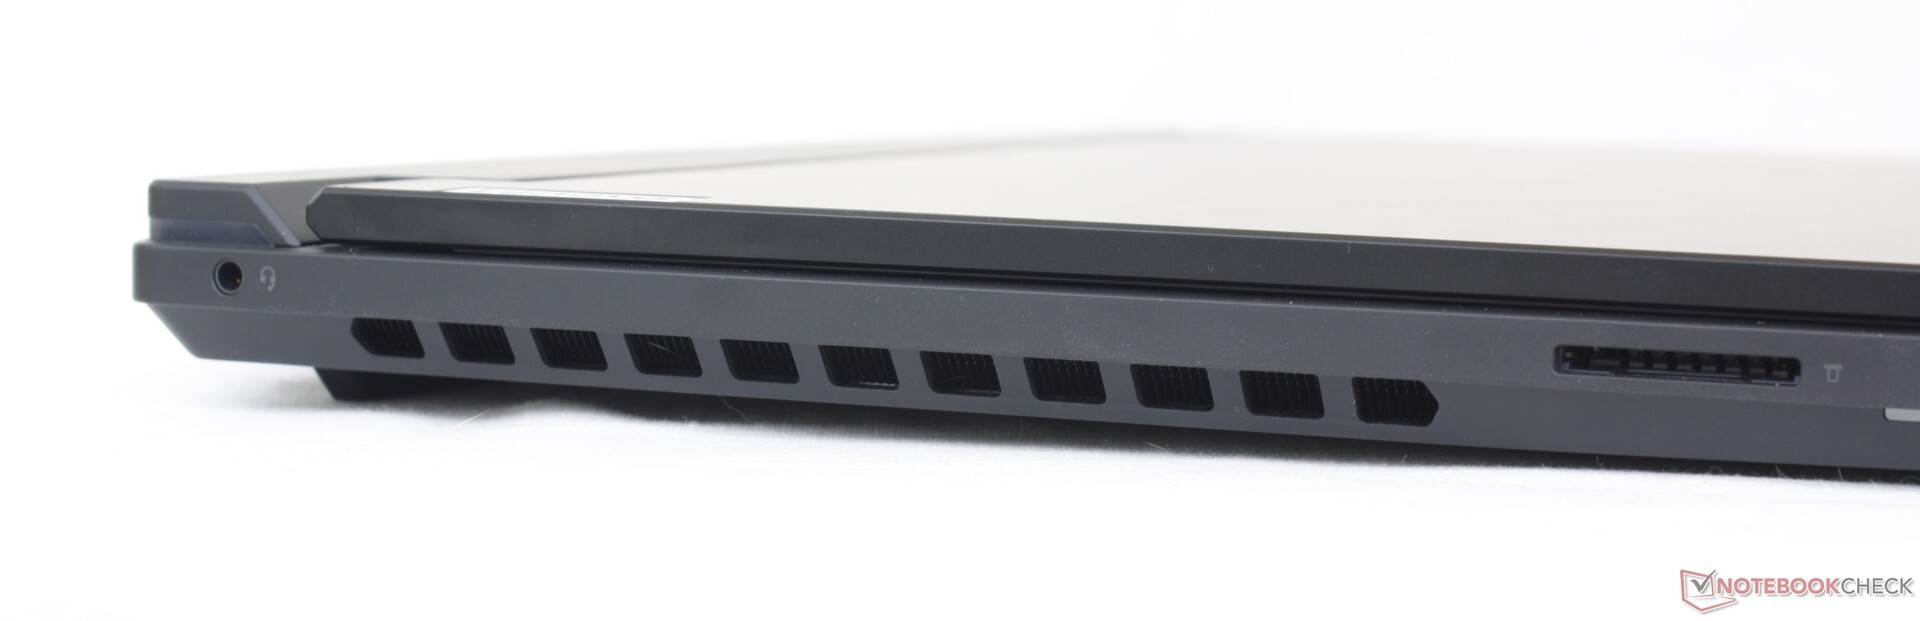
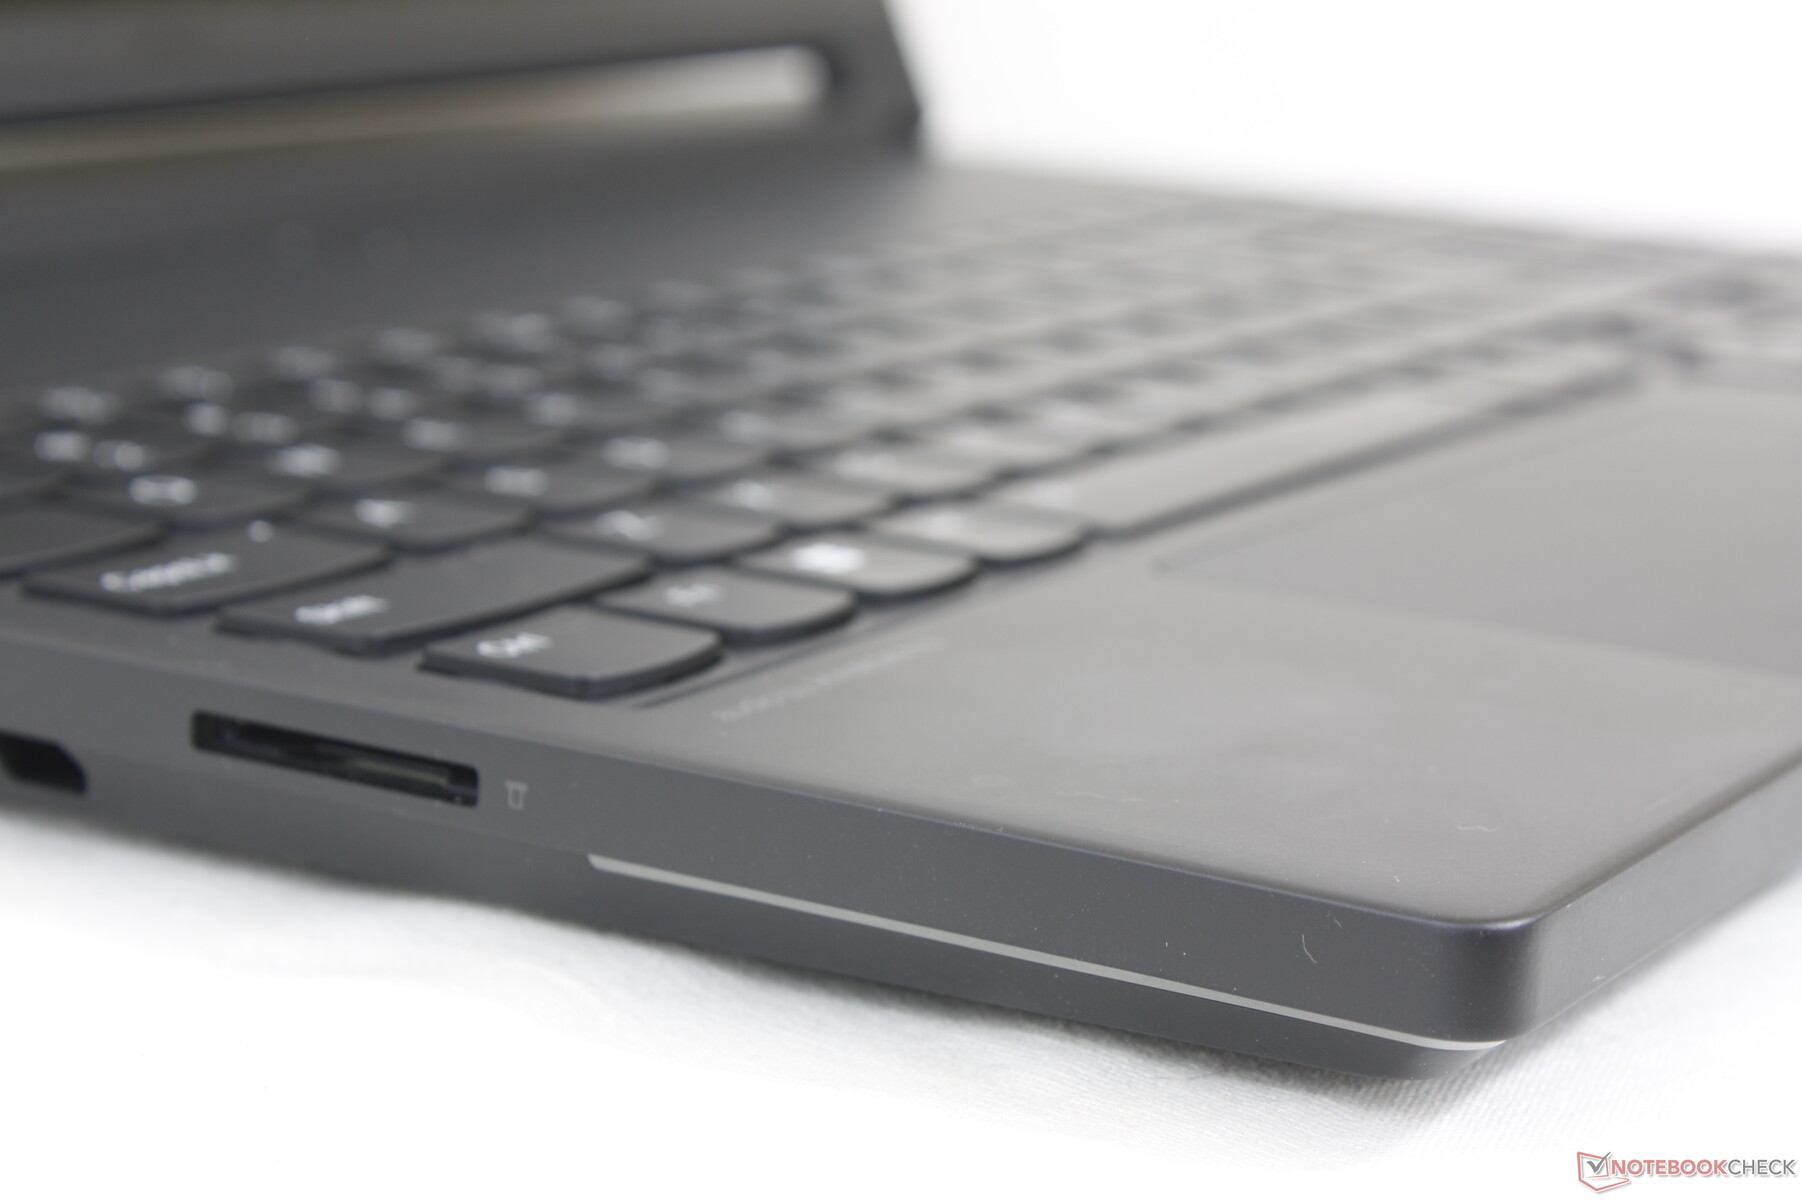
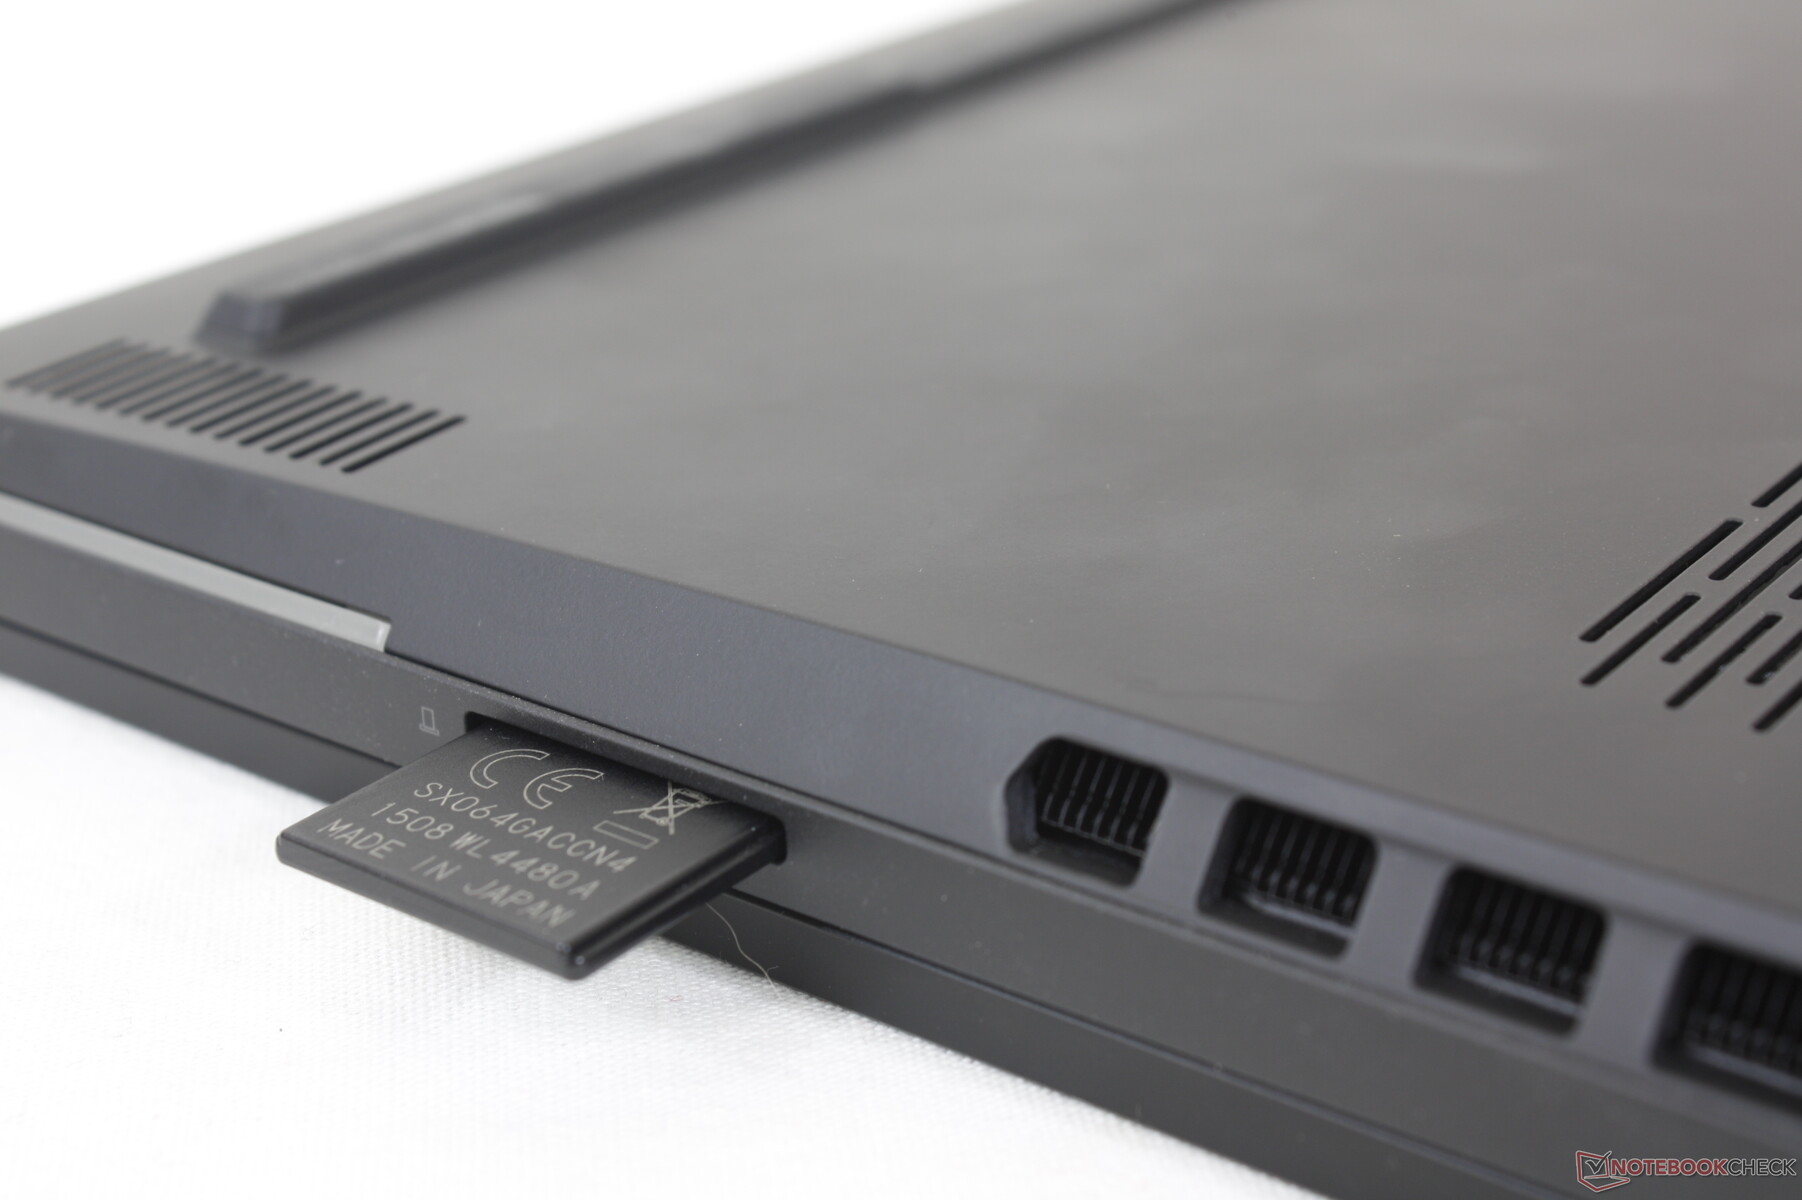
Czytnik kart SD
Zintegrowany czytnik SD ma na celu przyciągnięcie do Legion 9i zarówno twórców treści, jak i zapalonych graczy. Szybkość transferu nie jest jednak aż tak duża i wynosi mniej niż połowę prędkości czytnika SD w Razer Blade 16.Razer Blade 16.
| SD Card Reader | |
| average JPG Copy Test (av. of 3 runs) | |
| Razer Blade 16 Early 2023 RTX 4090 (Angelbird AV PRO 128 GB V60) | |
| Lenovo Legion 9 16IRX8 (Toshiba Exceria Pro SDXC 64 GB UHS-II) | |
| Alienware x16 R1 (AV PRO microSD 128 GB V60) | |
| Lenovo Legion Slim 5 16APH8 (PNY EliteX-Pro60 V60 256 GB) | |
| maximum AS SSD Seq Read Test (1GB) | |
| Alienware x16 R1 (AV PRO microSD 128 GB V60) | |
| Razer Blade 16 Early 2023 RTX 4090 (Angelbird AV PRO 128 GB V60) | |
| Lenovo Legion 9 16IRX8 (Toshiba Exceria Pro SDXC 64 GB UHS-II) | |
| Lenovo Legion Slim 5 16APH8 (PNY EliteX-Pro60 V60 256 GB) | |
Komunikacja
Killer AX1675i jest standardem, który jest marką gamingową dla zwykłego AX211. Wi-Fi 6E i Bluetooth 5.3 są obsługiwane i nie doświadczyliśmy żadnych problemów z łącznością po sparowaniu z naszą siecią Asus AXE11000 6 GHz.
Kamera internetowa
Kamera internetowa 2 MP jest standardem w kategorii laptopów do gier. Kamera posiada zintegrowany wyłącznik awaryjny, ale nie ma czujnika podczerwieni.

")
")
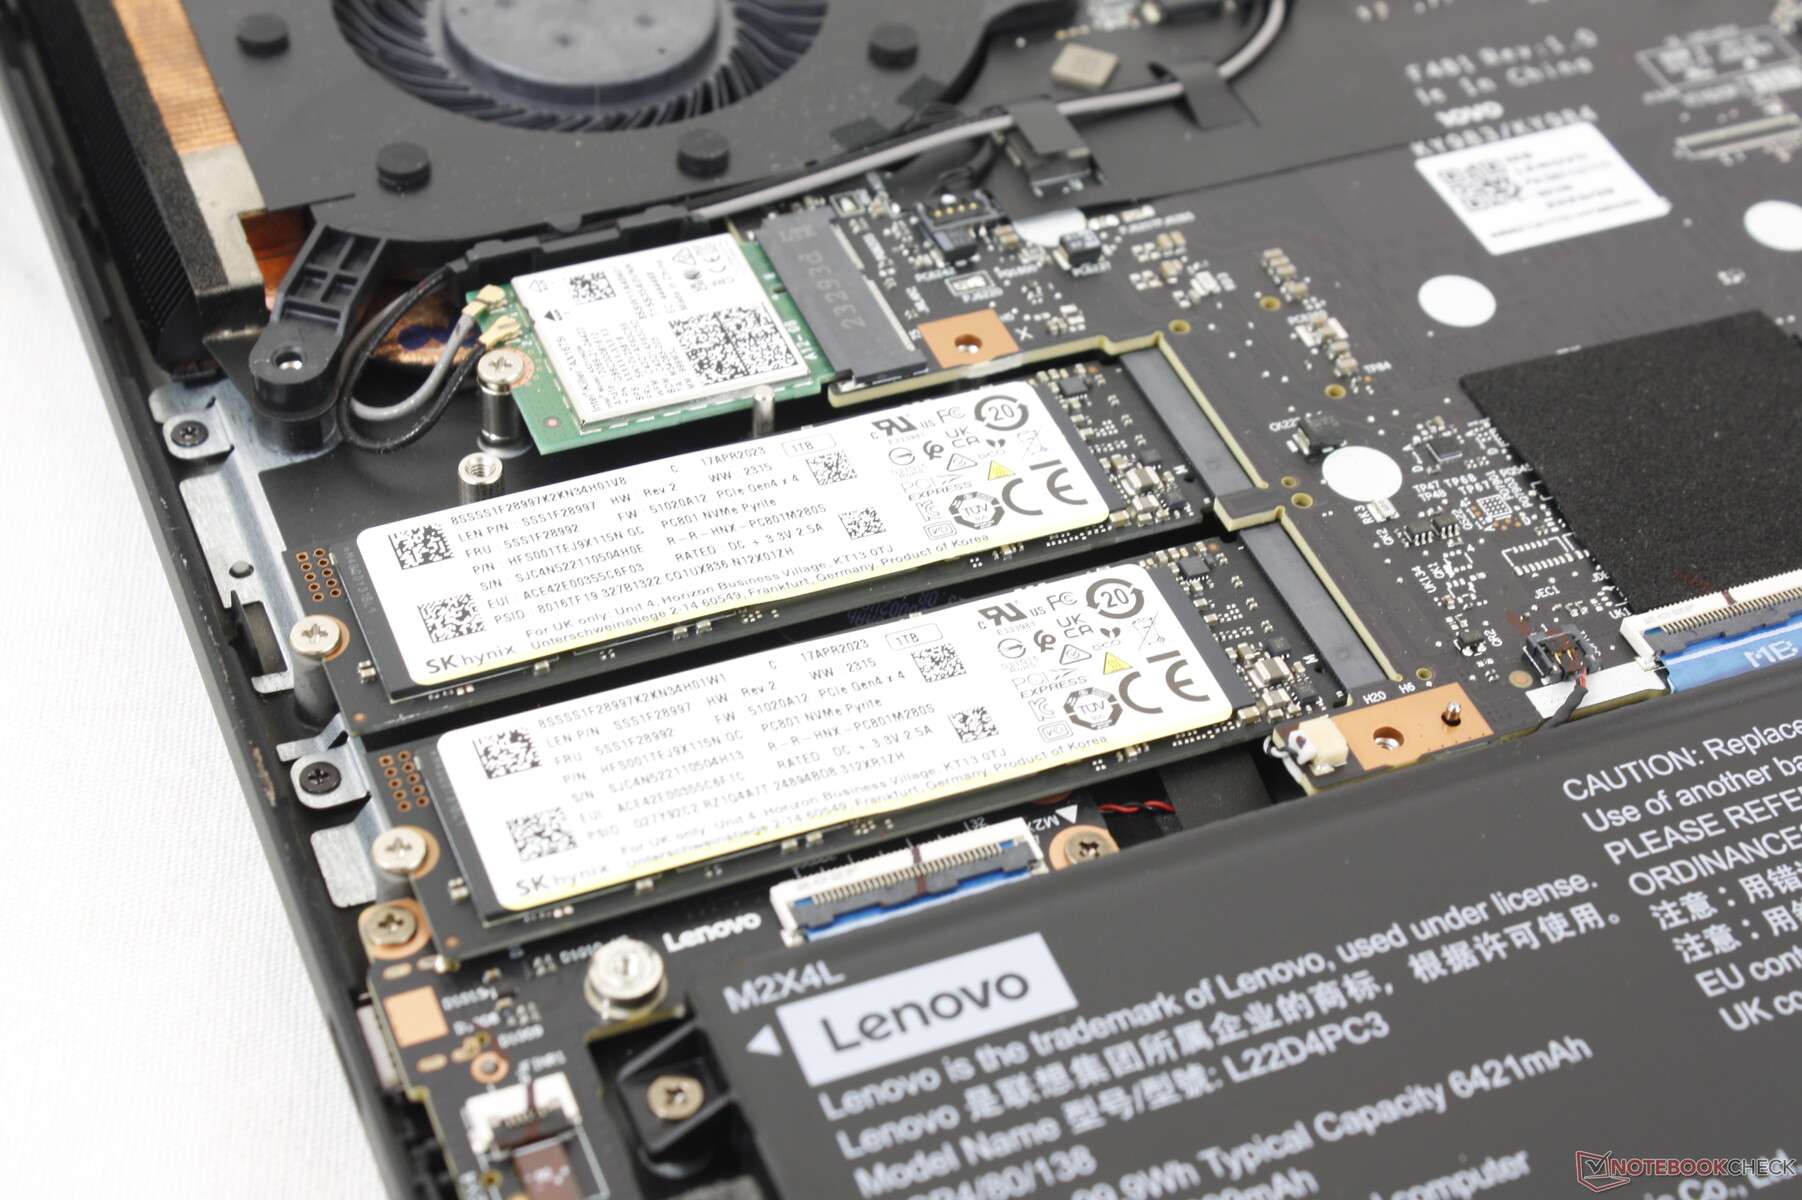
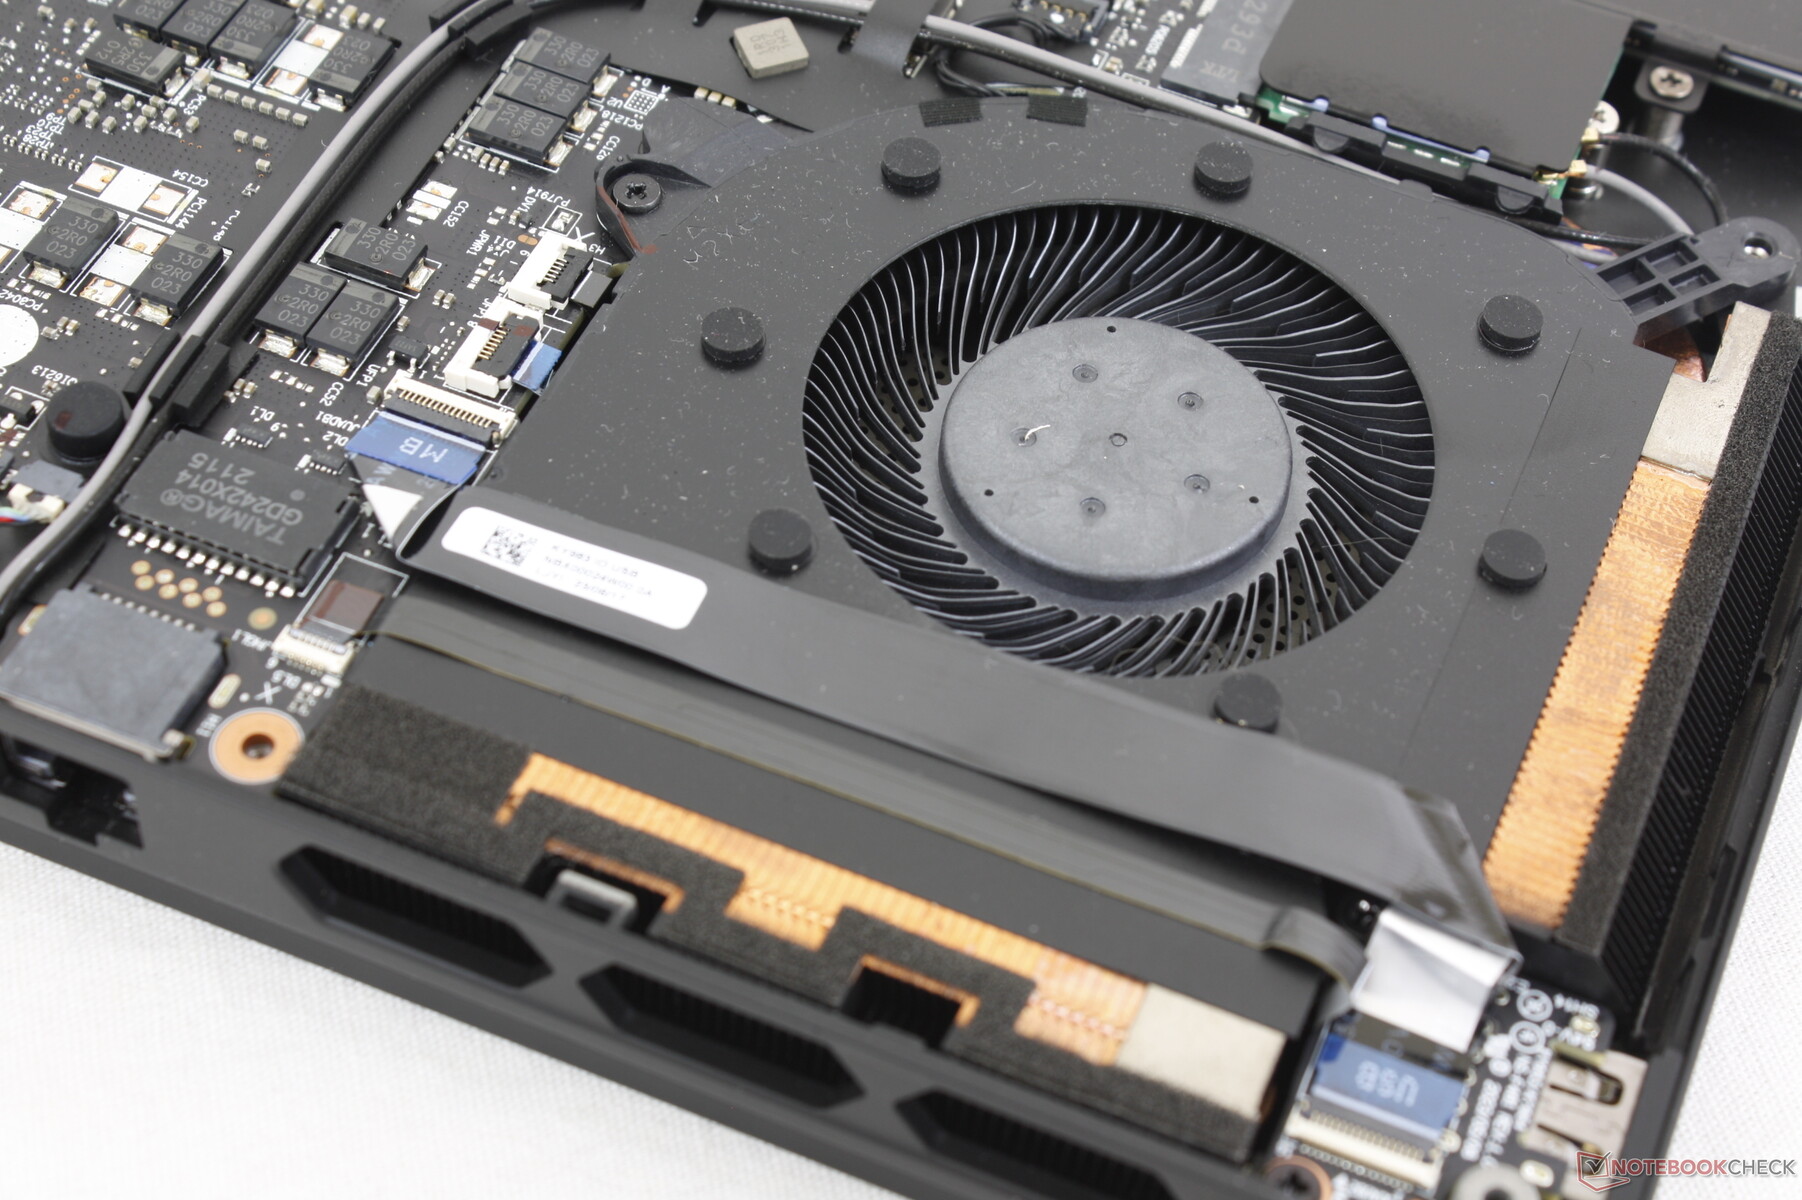
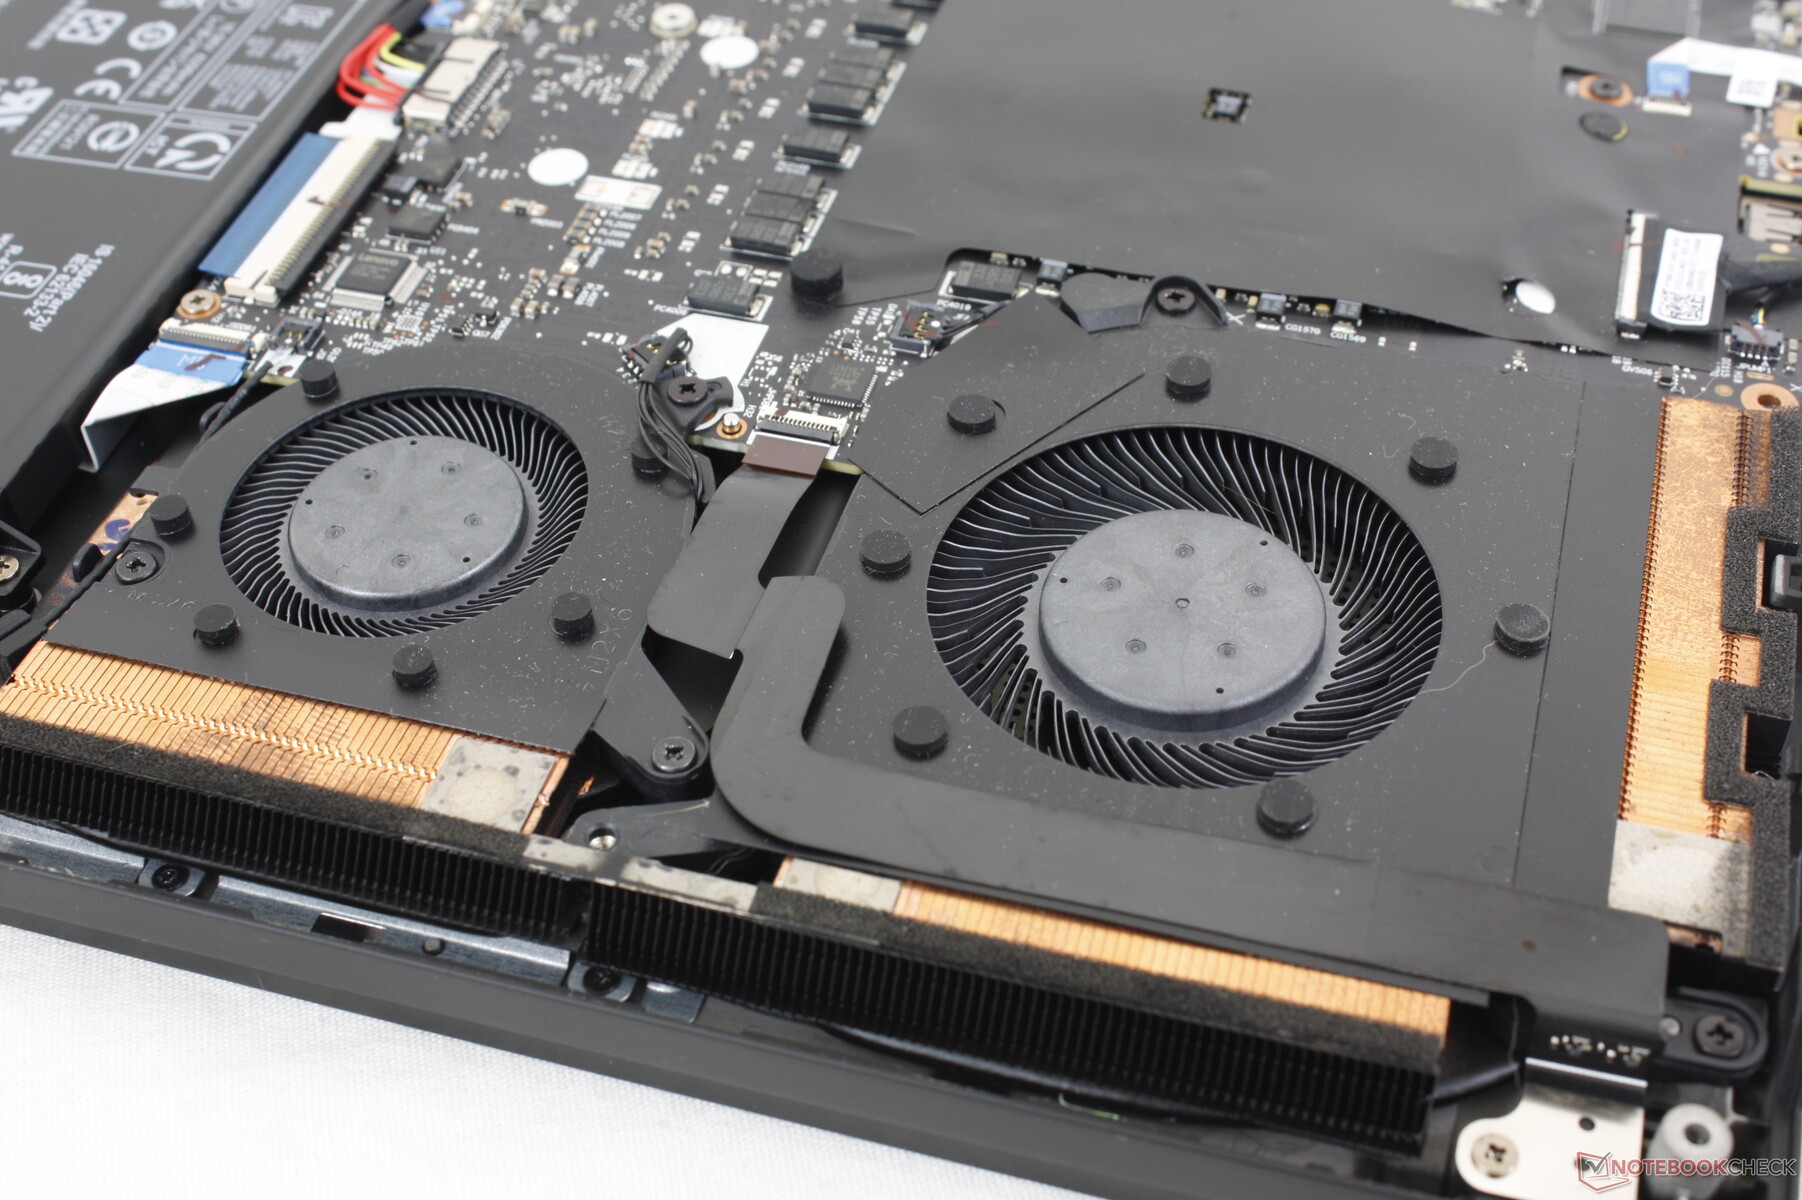
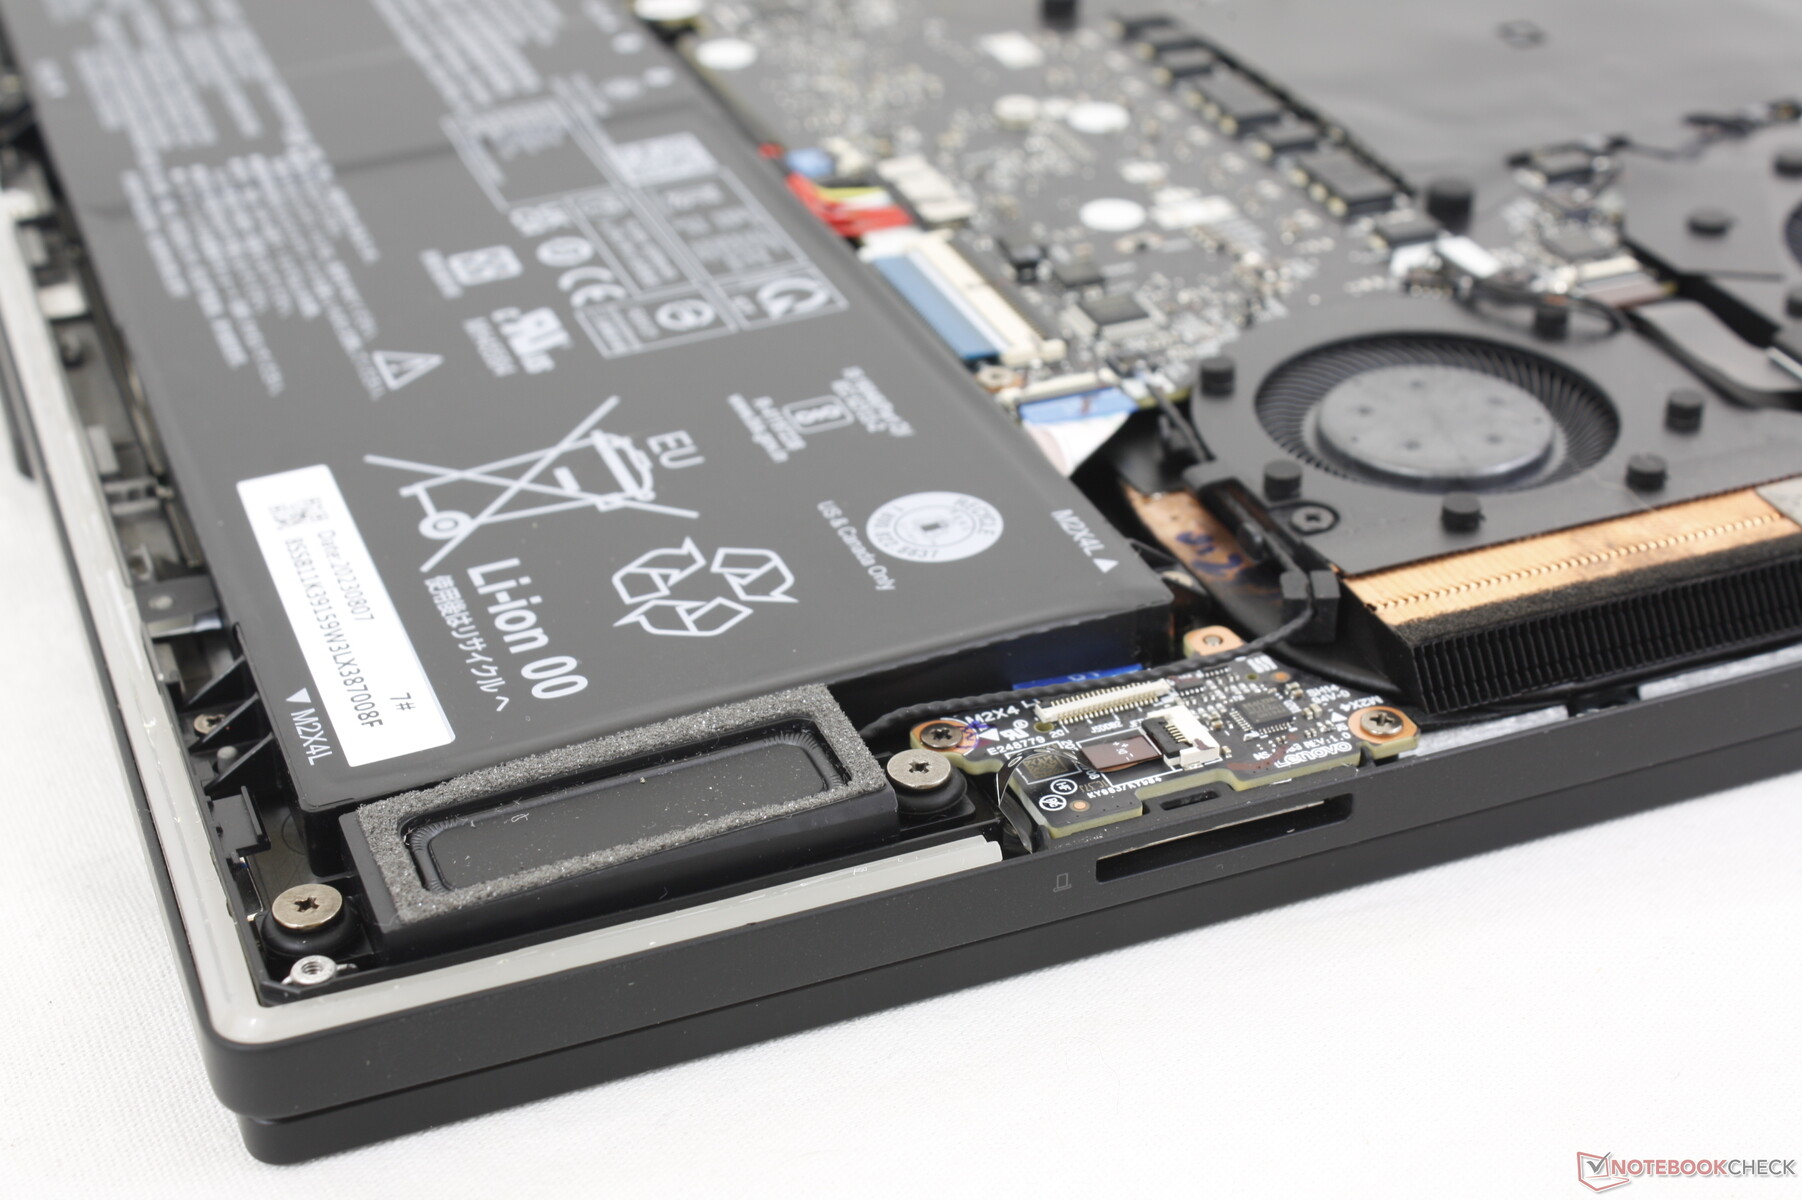
Konserwacja
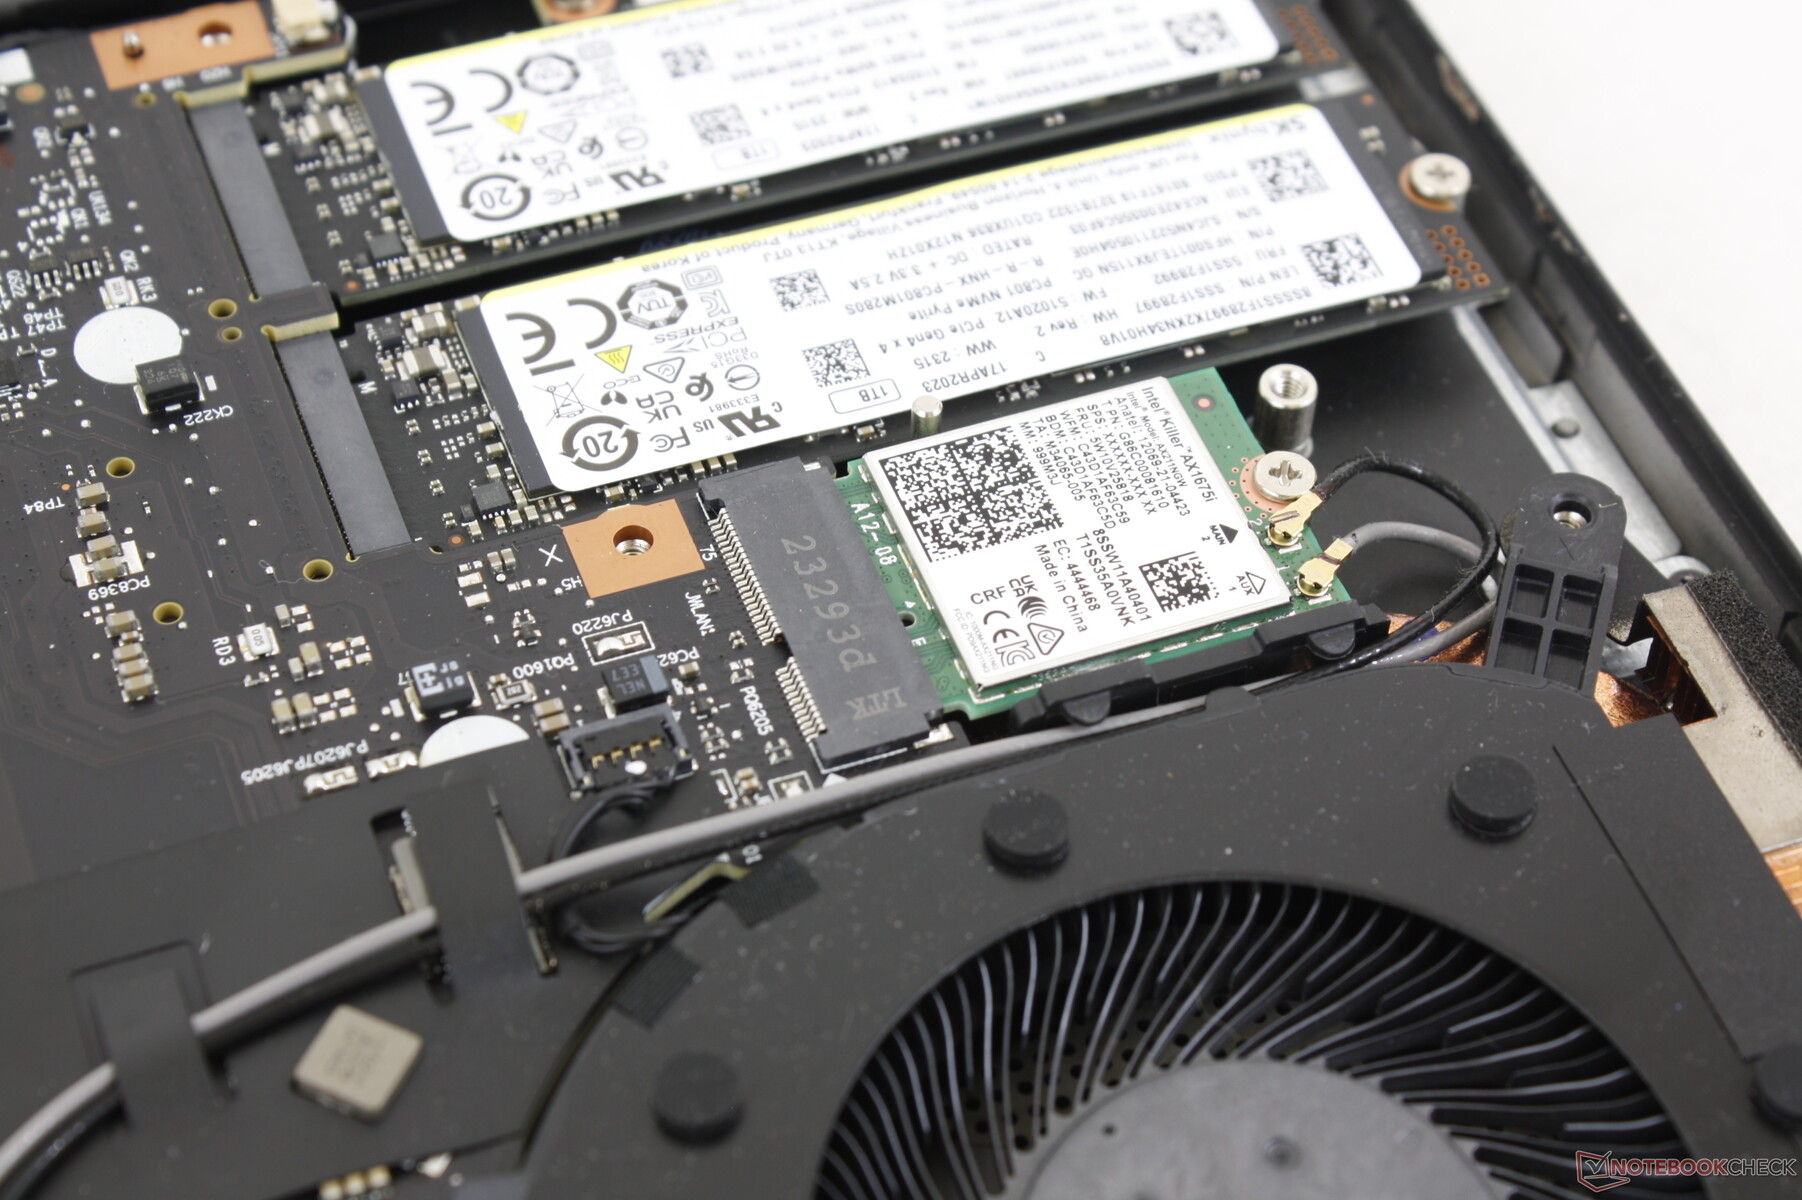
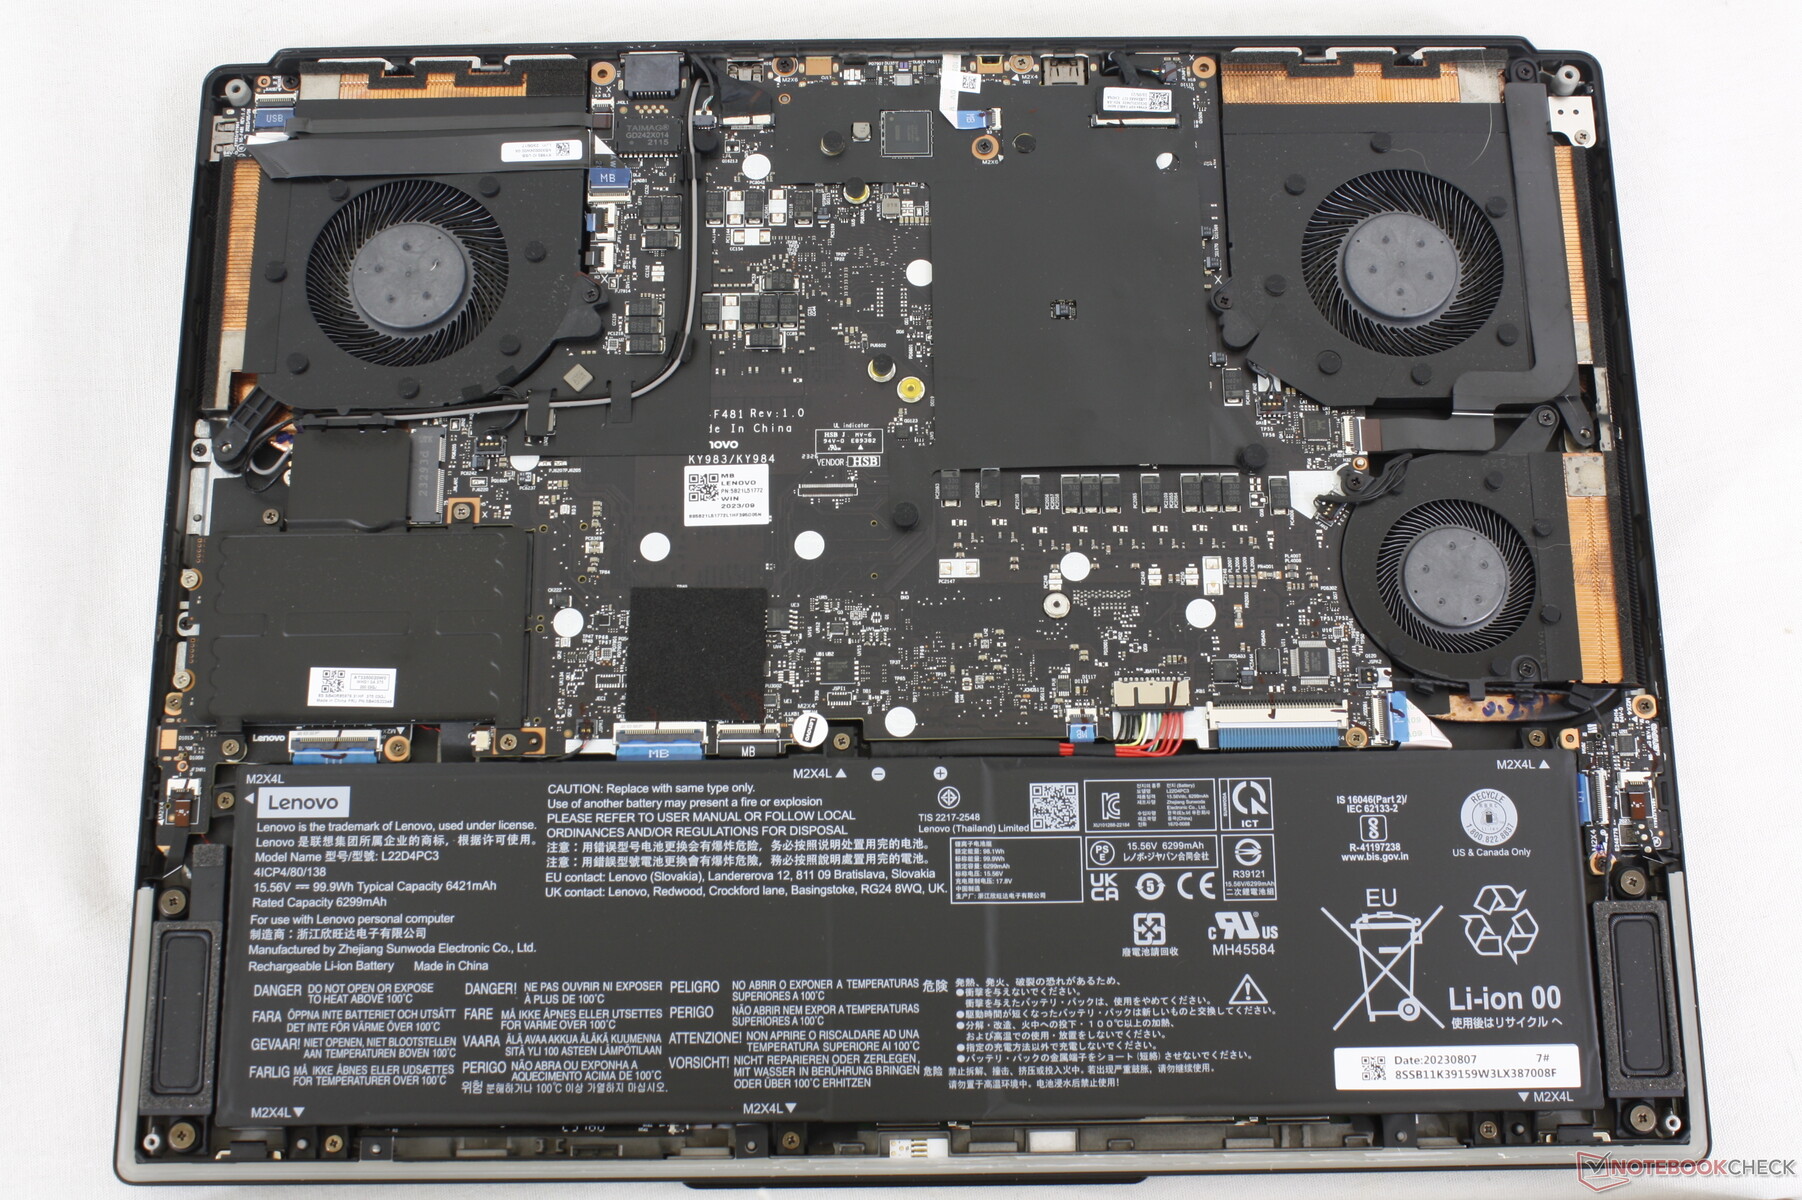
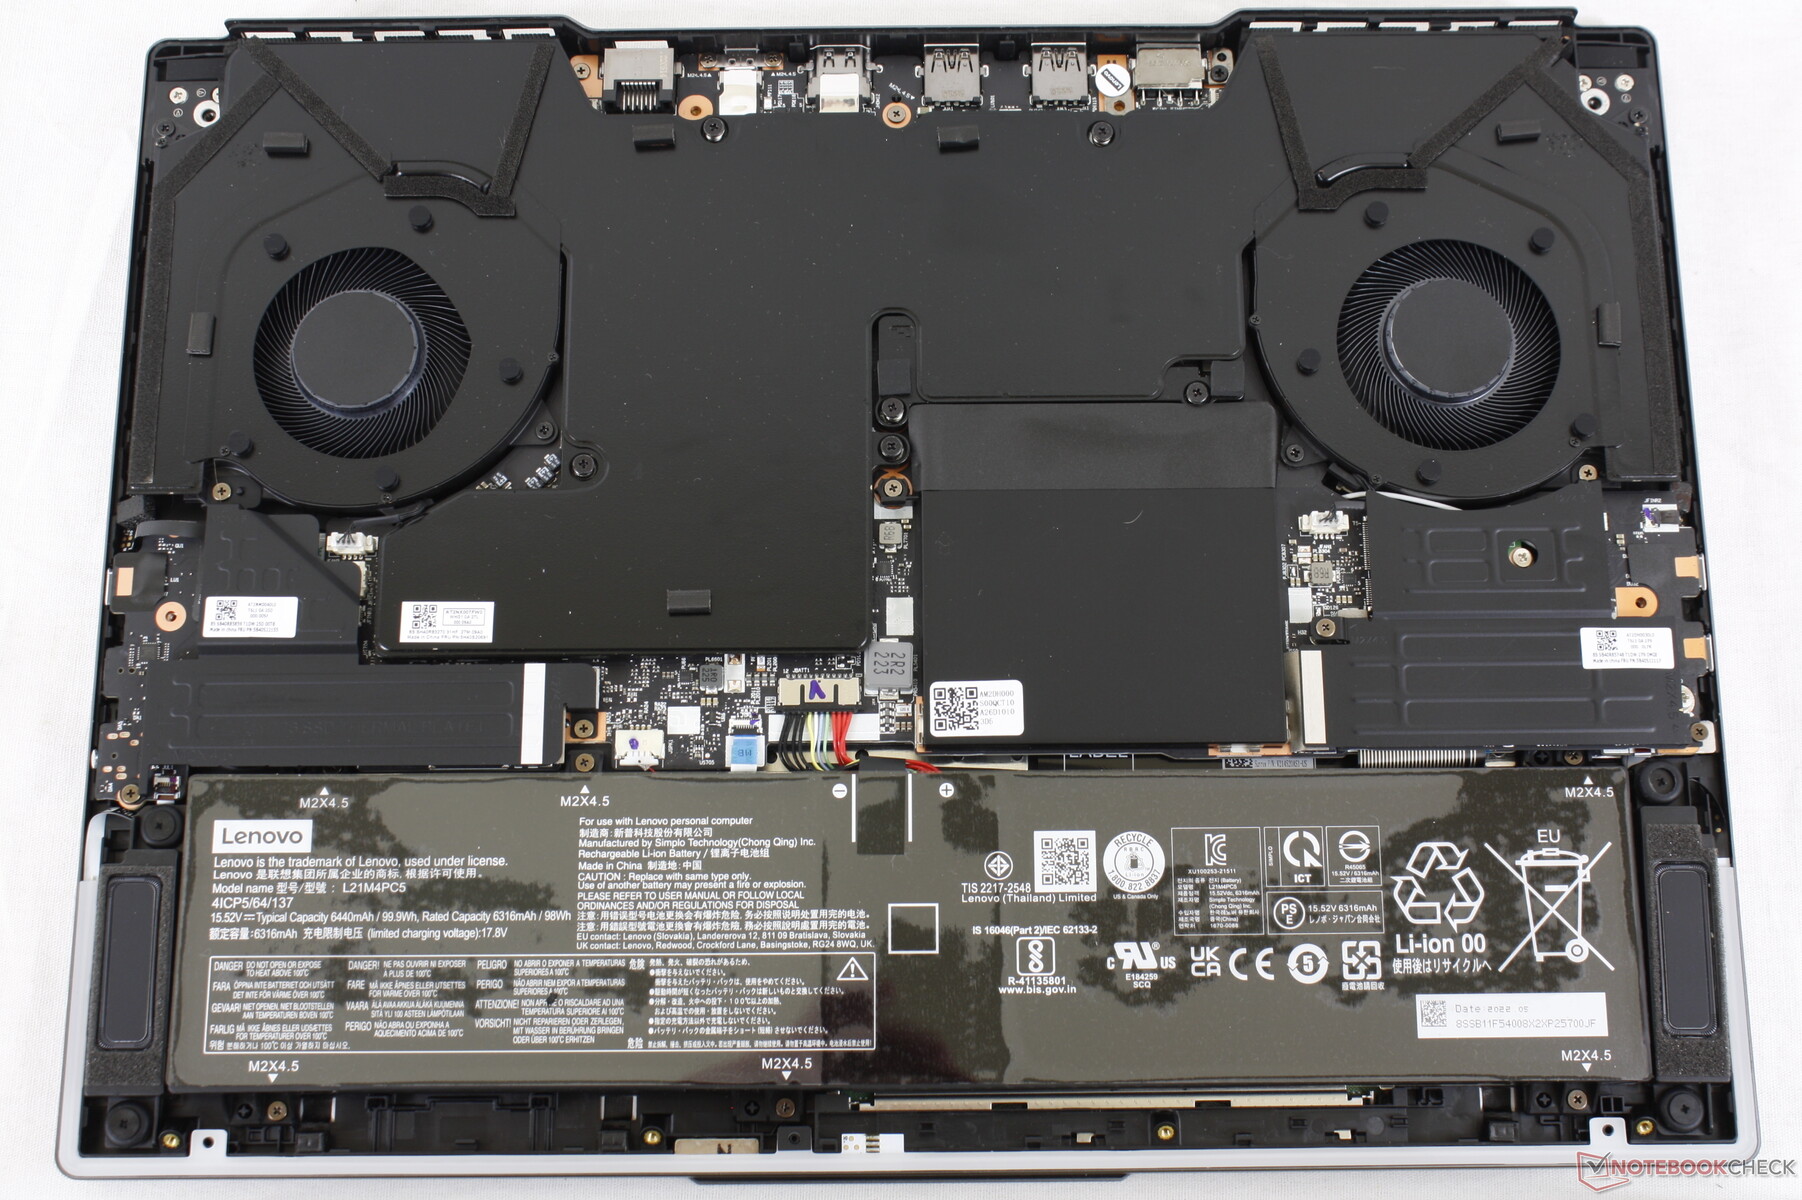
Dolny panel jest zabezpieczony 8 śrubami krzyżakowymi, co umożliwia stosunkowo łatwy demontaż. W przeciwieństwie do większości innych laptopów, płyta główna w Legion 9 16 jest odwrócona do góry nogami, a więc wymagany jest dalszy demontaż, aby uzyskać dostęp do modułów pamięci RAM. Przynajmniej dwa gniazda M.2 2280 SSD są łatwo dostępne.
Akcesoria i gwarancja
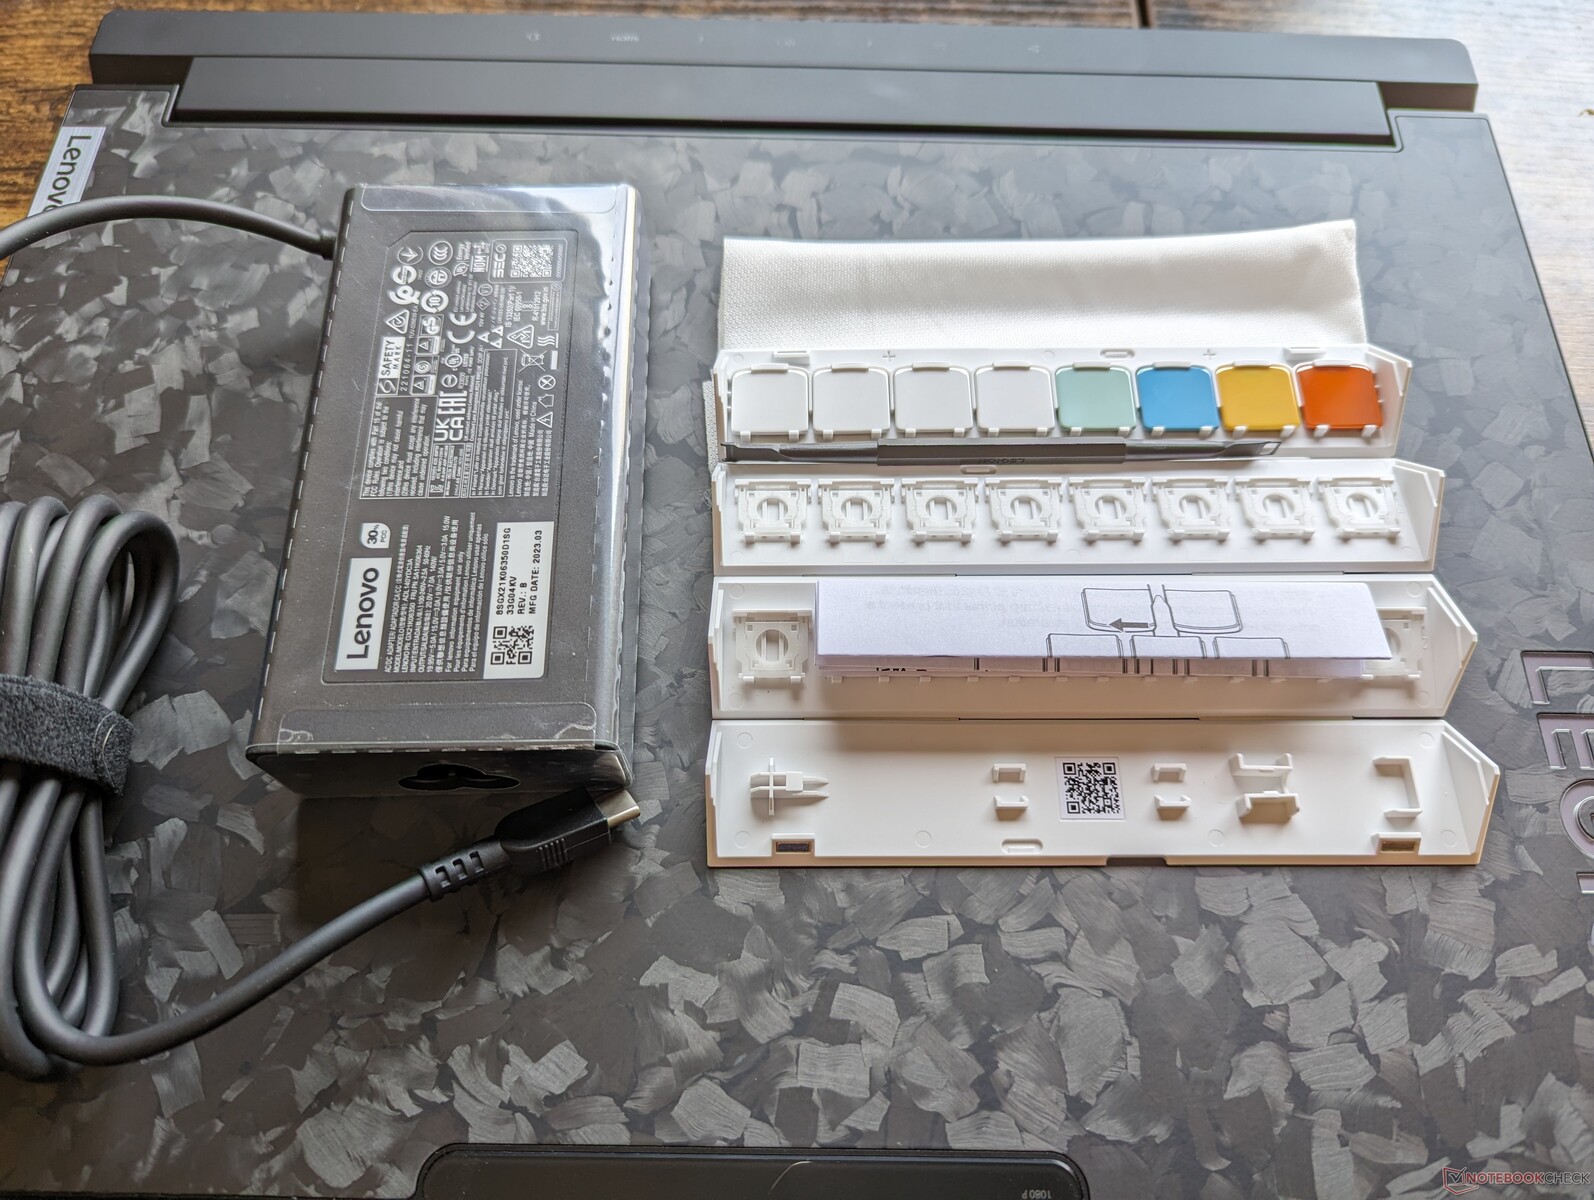
Oprócz standardowego zasilacza sieciowego i dokumentacji, pudełko detaliczne zawiera również bardzo poręczny uniwersalny adapter USB-C o mocy 140 W, który może być używany do ładowania tego laptopa i większości innych urządzeń USB-C oraz 8 nasadek na klawisze.
Standardowa roczna ograniczona gwarancja producenta ma zastosowanie w przypadku zakupu w USA.
Urządzenia wejściowe - wygodna klawiatura z ciasnym Clickpadem
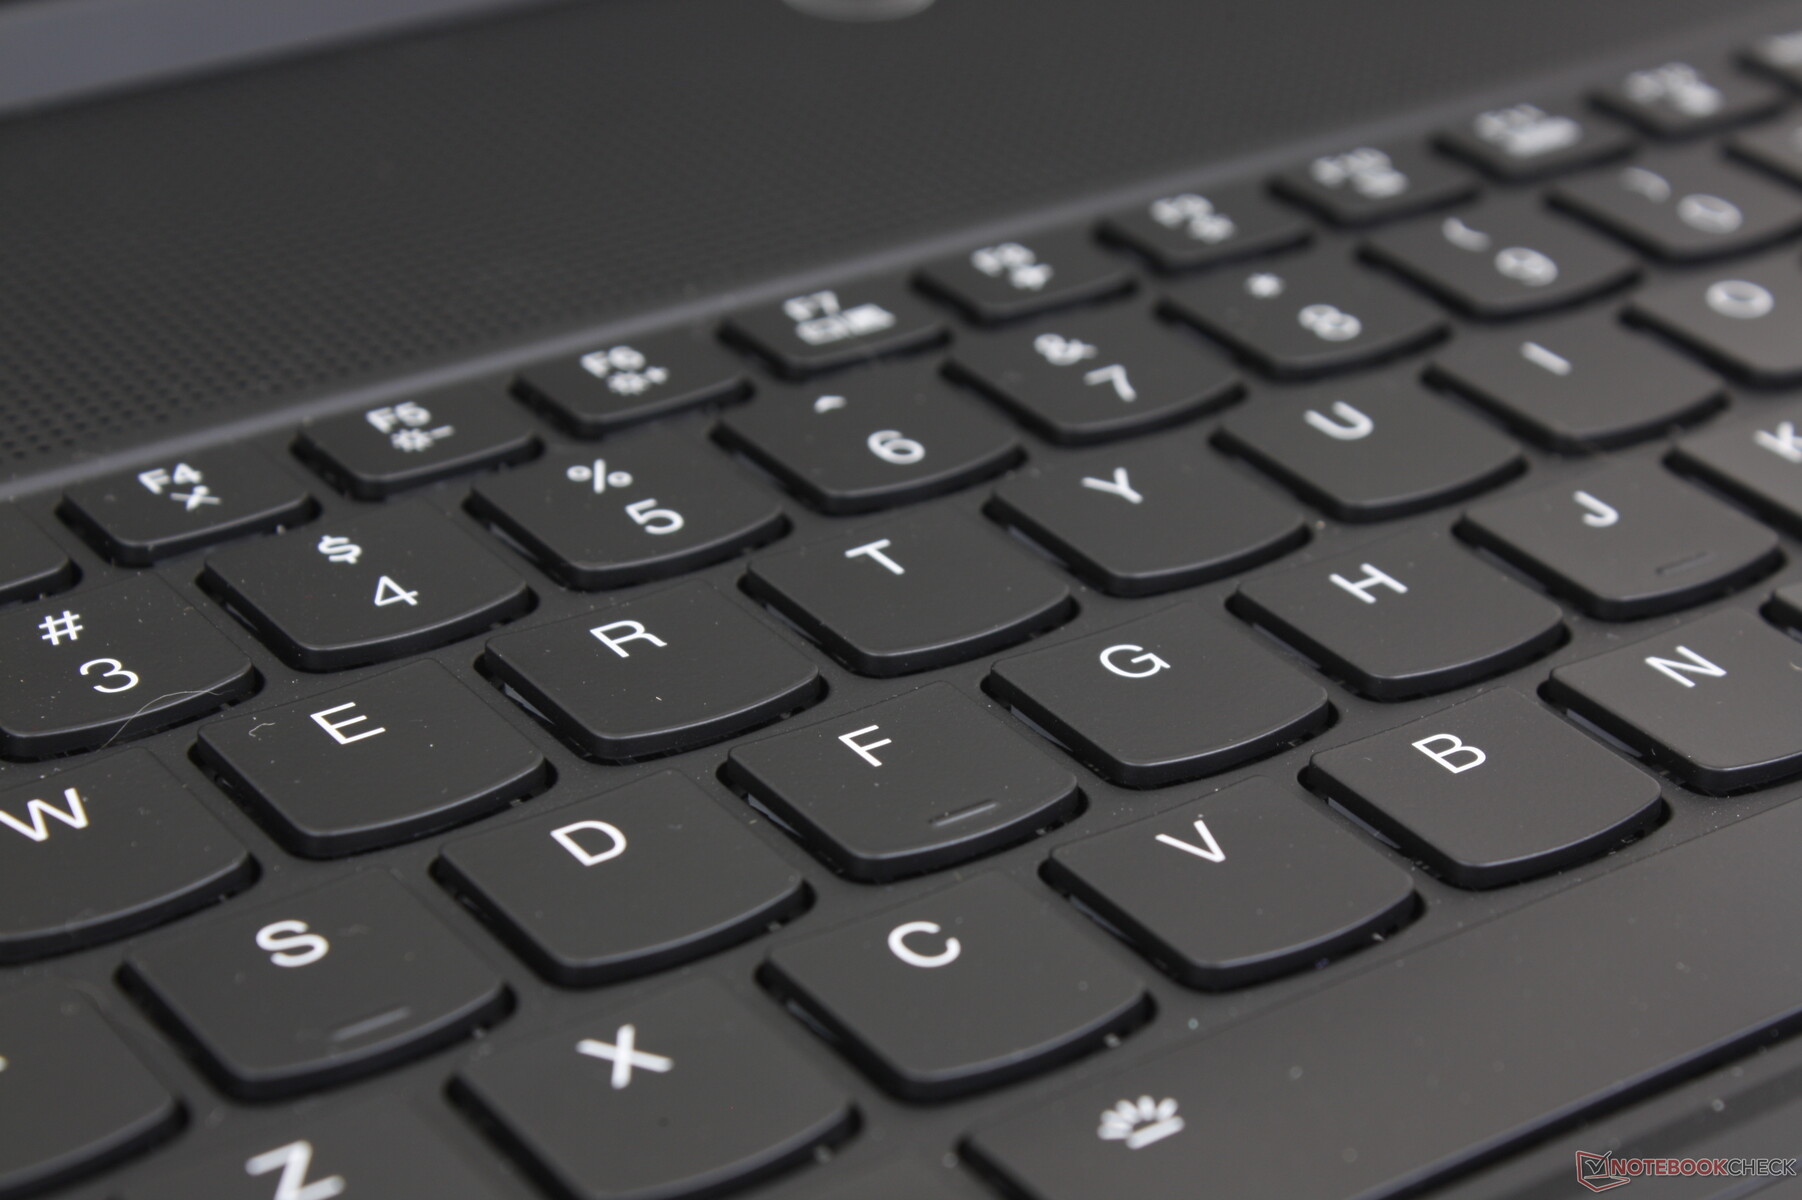
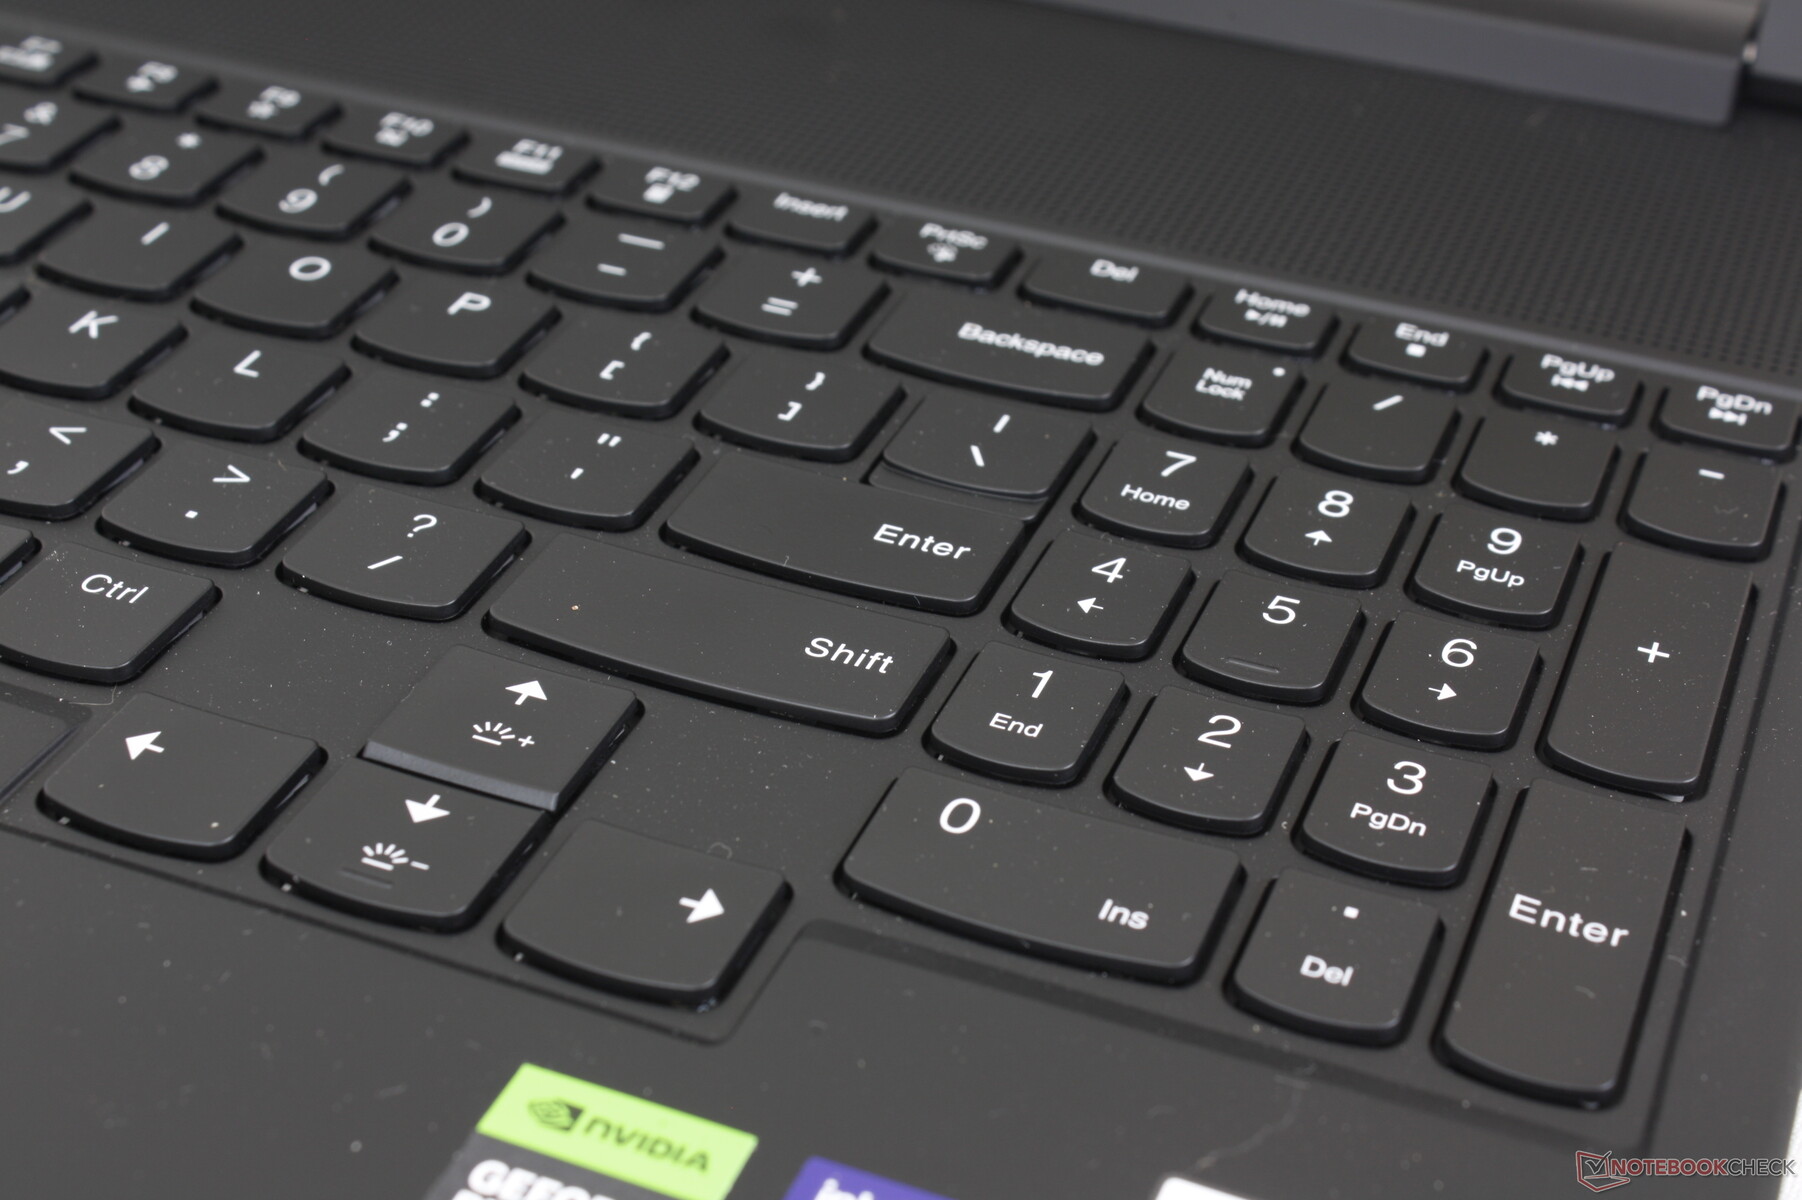
Klawiatura
Klawiatura TrueStrike oferuje 1,5 mm skok klawiszy, dzięki czemu jest nieco głębsza niż klawisze w większości ultrabooków. Sprzężenie zwrotne jest zaskakująco ostre i wygodne jak na klawisze membranowe, co pokazuje, że do dobrego pisania nie potrzeba wymyślnych przełączników mechanicznych. Twarde klawisze są głośniejsze niż klawisze na Blade 16 lub Asus Zephyrus M16 ale zdecydowanie nie tak klikliwe jak klawisze mechaniczne w modelach takich jak Schenker XMG Neo 15 lub Alienware m18.
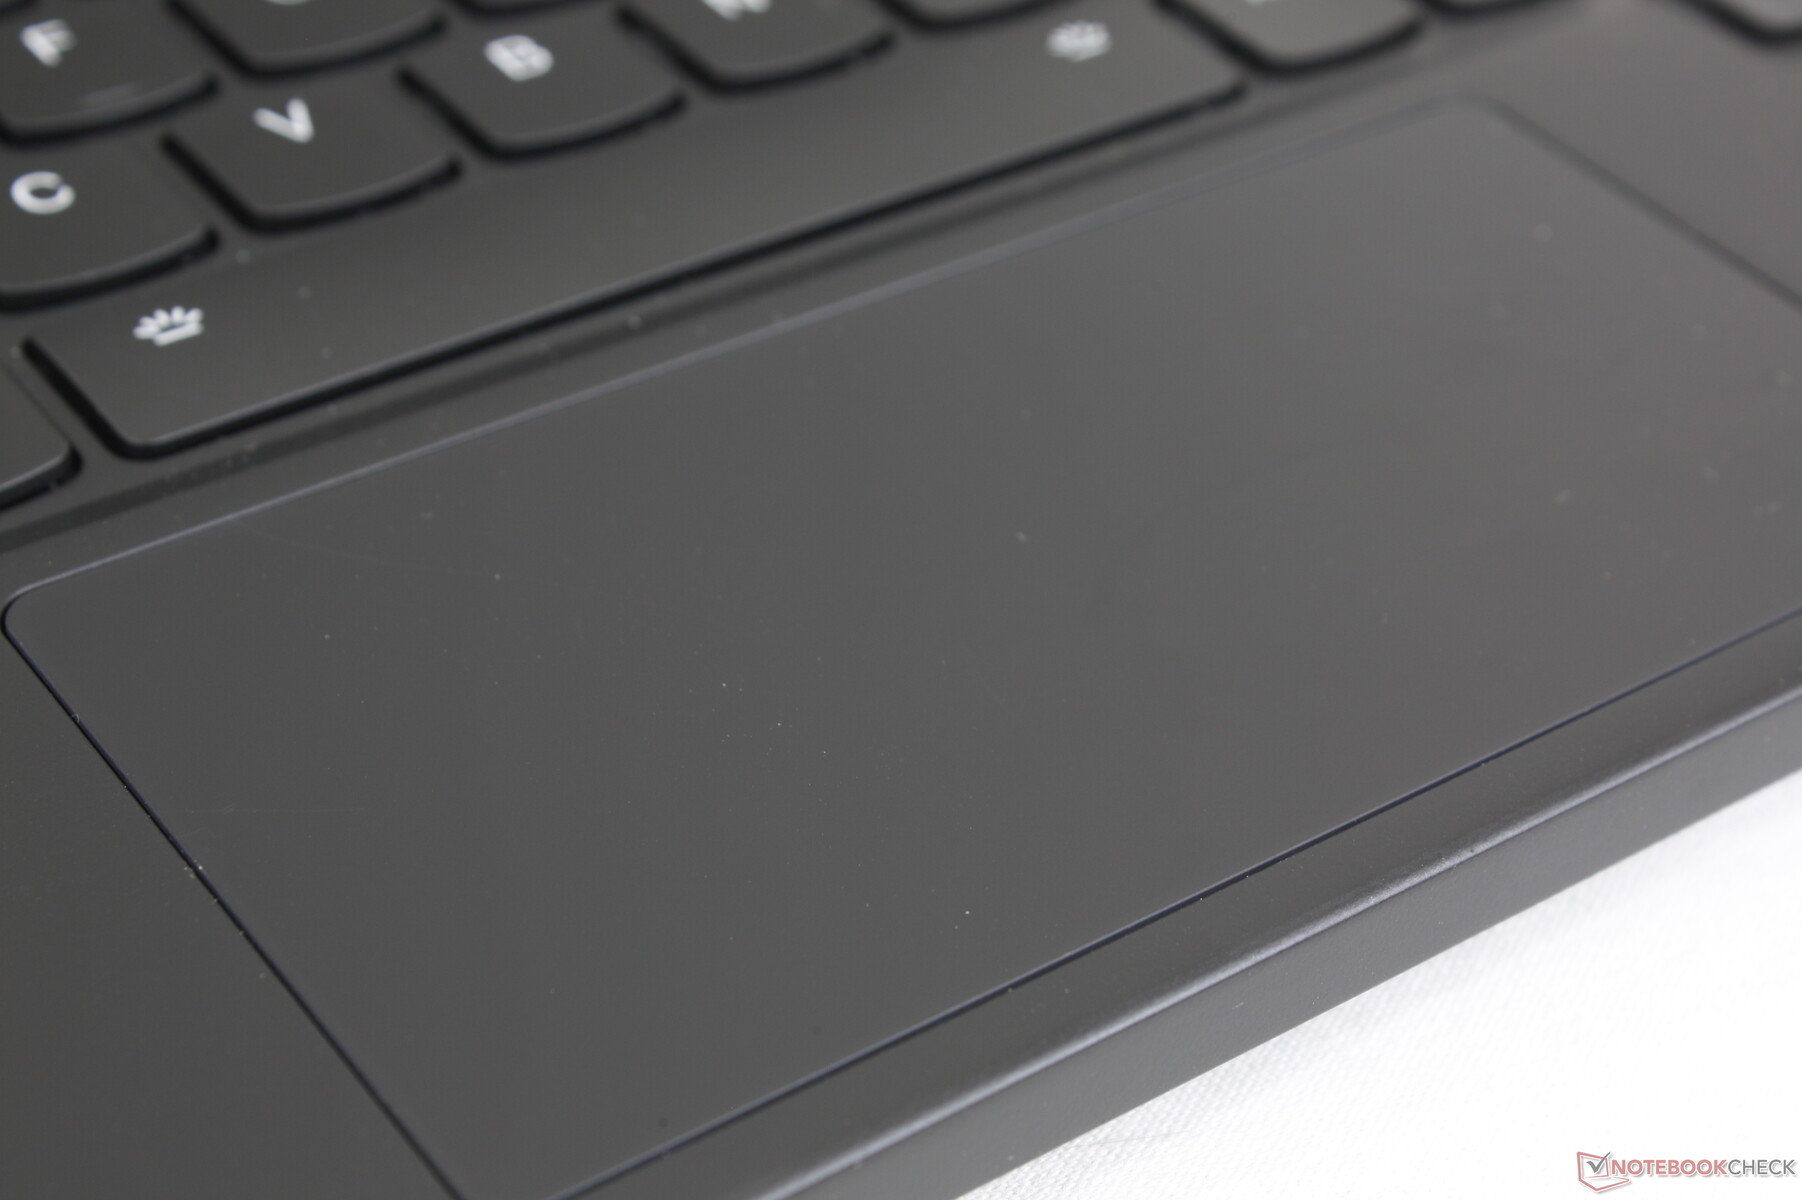
Panel dotykowy
Rozmiar clickpada został zmniejszony do zaledwie (12 x 5,9 cm) ze względu na umiejscowienie klawiatury. W rezultacie pionowe ruchy kursora na wysokim ekranie 16:10 wydają się ciasne, zwłaszcza w porównaniu do laptopów do gier z dużo większymi clickpadami, takimi jak Razer Blade 16lenovo liczy na to, że w większości przypadków gracze będą korzystać z własnych myszy USB lub Bluetooth.
Przesuwanie i klikanie jest płynne i satysfakcjonujące pomimo małej powierzchni. Jednak ruchy kursora czasami zawieszały się na naszym urządzeniu podczas korzystania z clickpada, podczas gdy ten sam problem nie występował podczas korzystania z zewnętrznej myszy. Zalecamy dokładne sprawdzenie clickpada przy zakupie, aby upewnić się, że jest on wolny od jakichkolwiek wad.
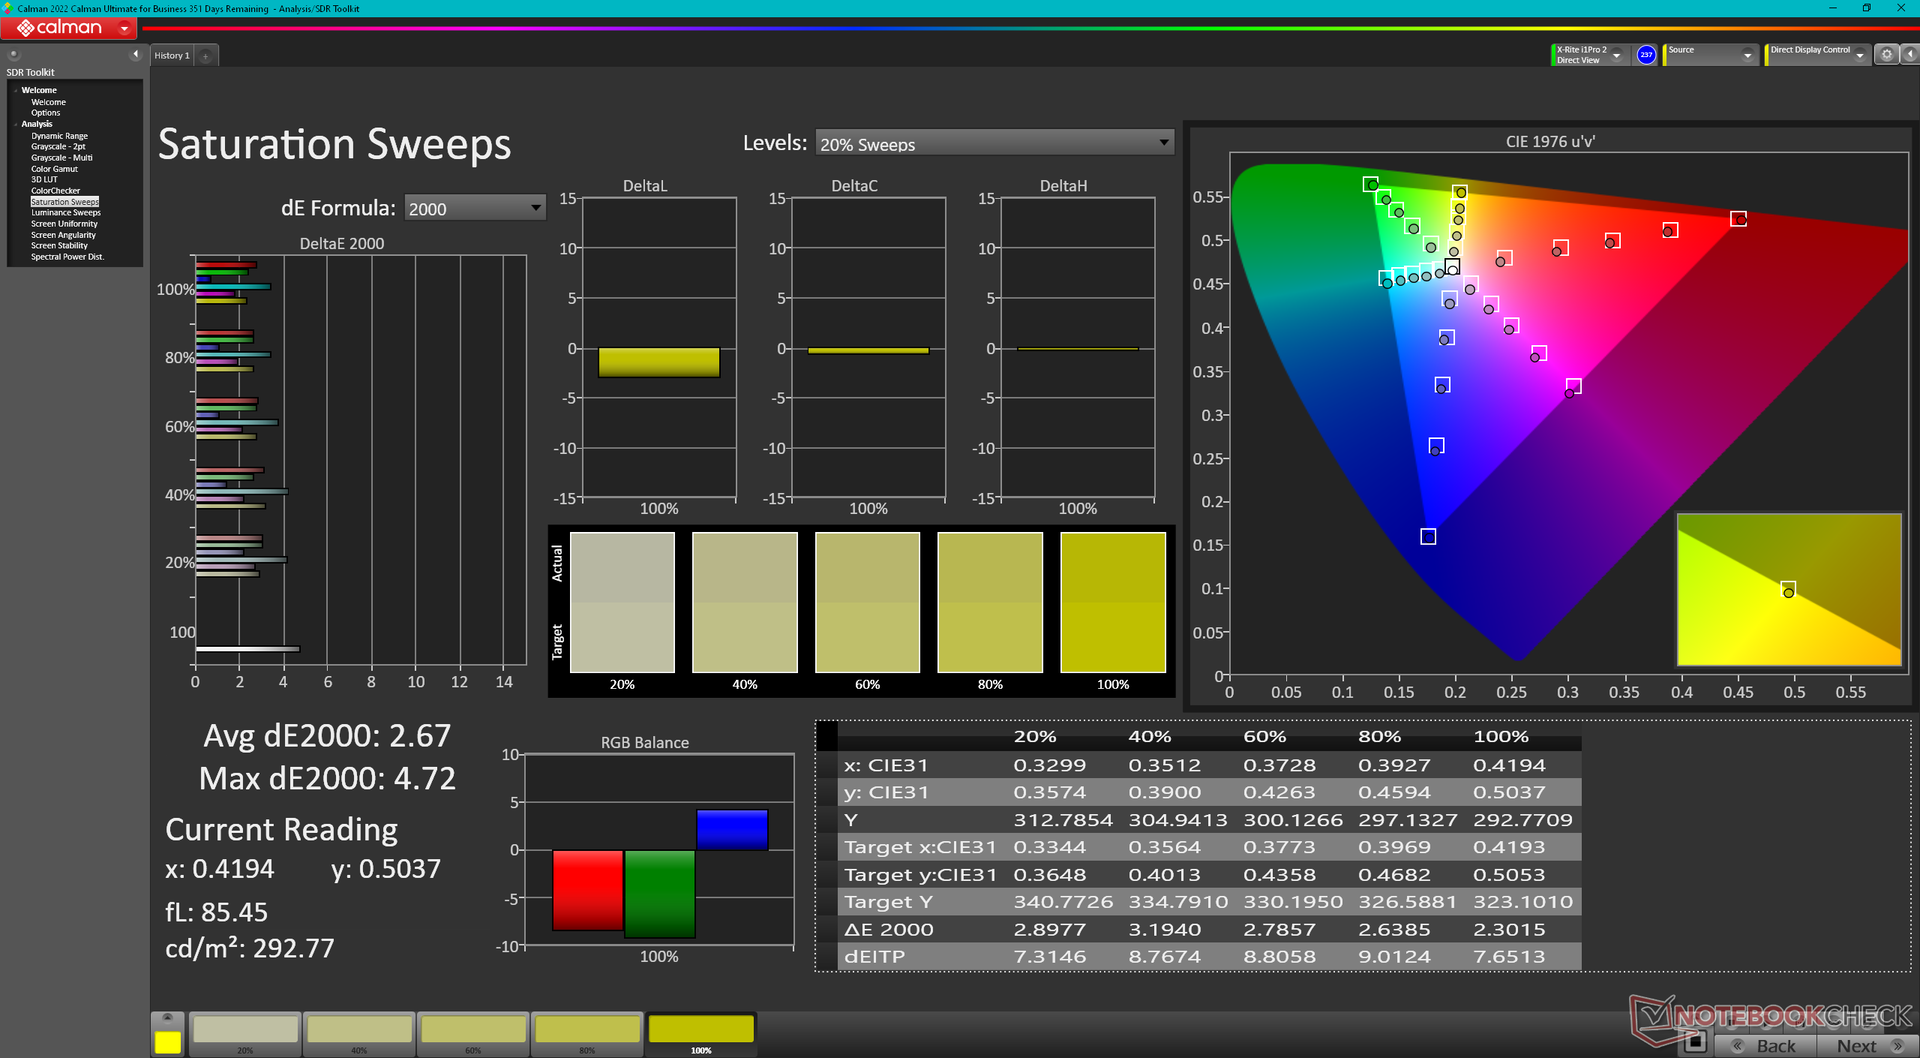
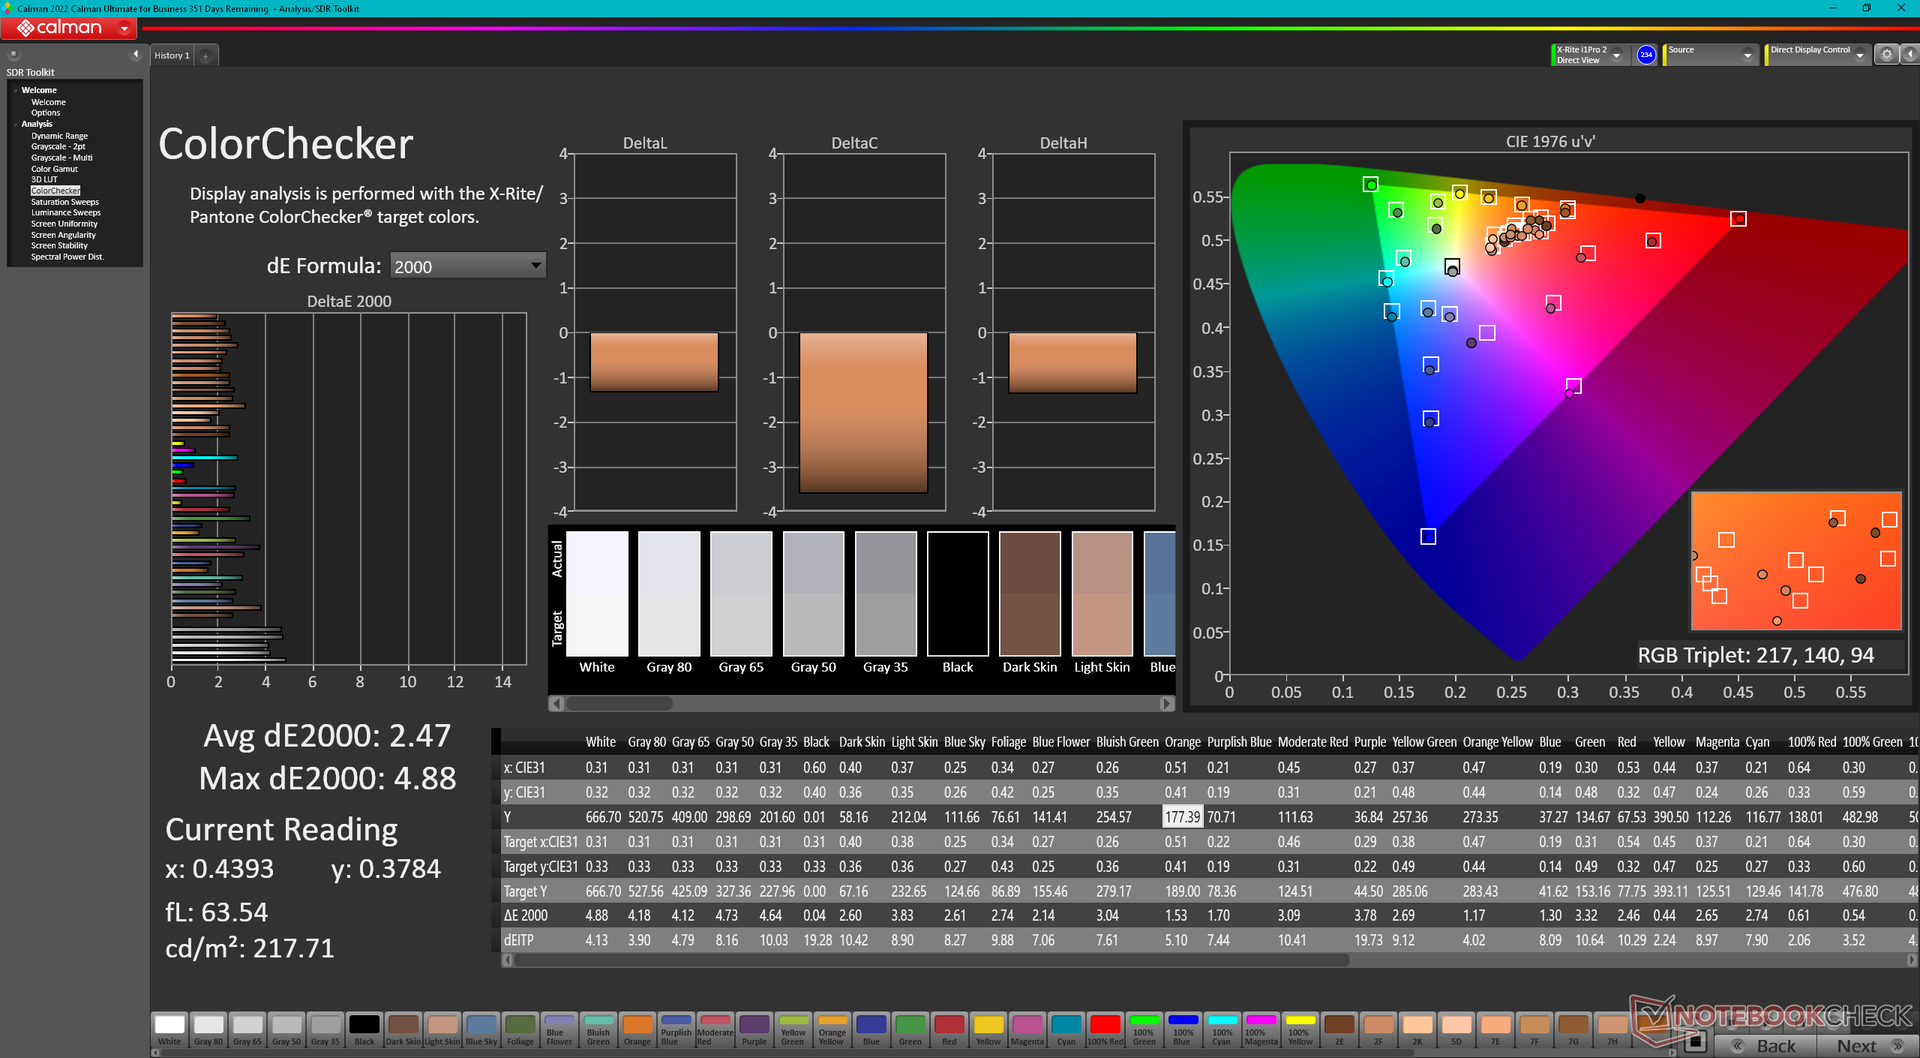
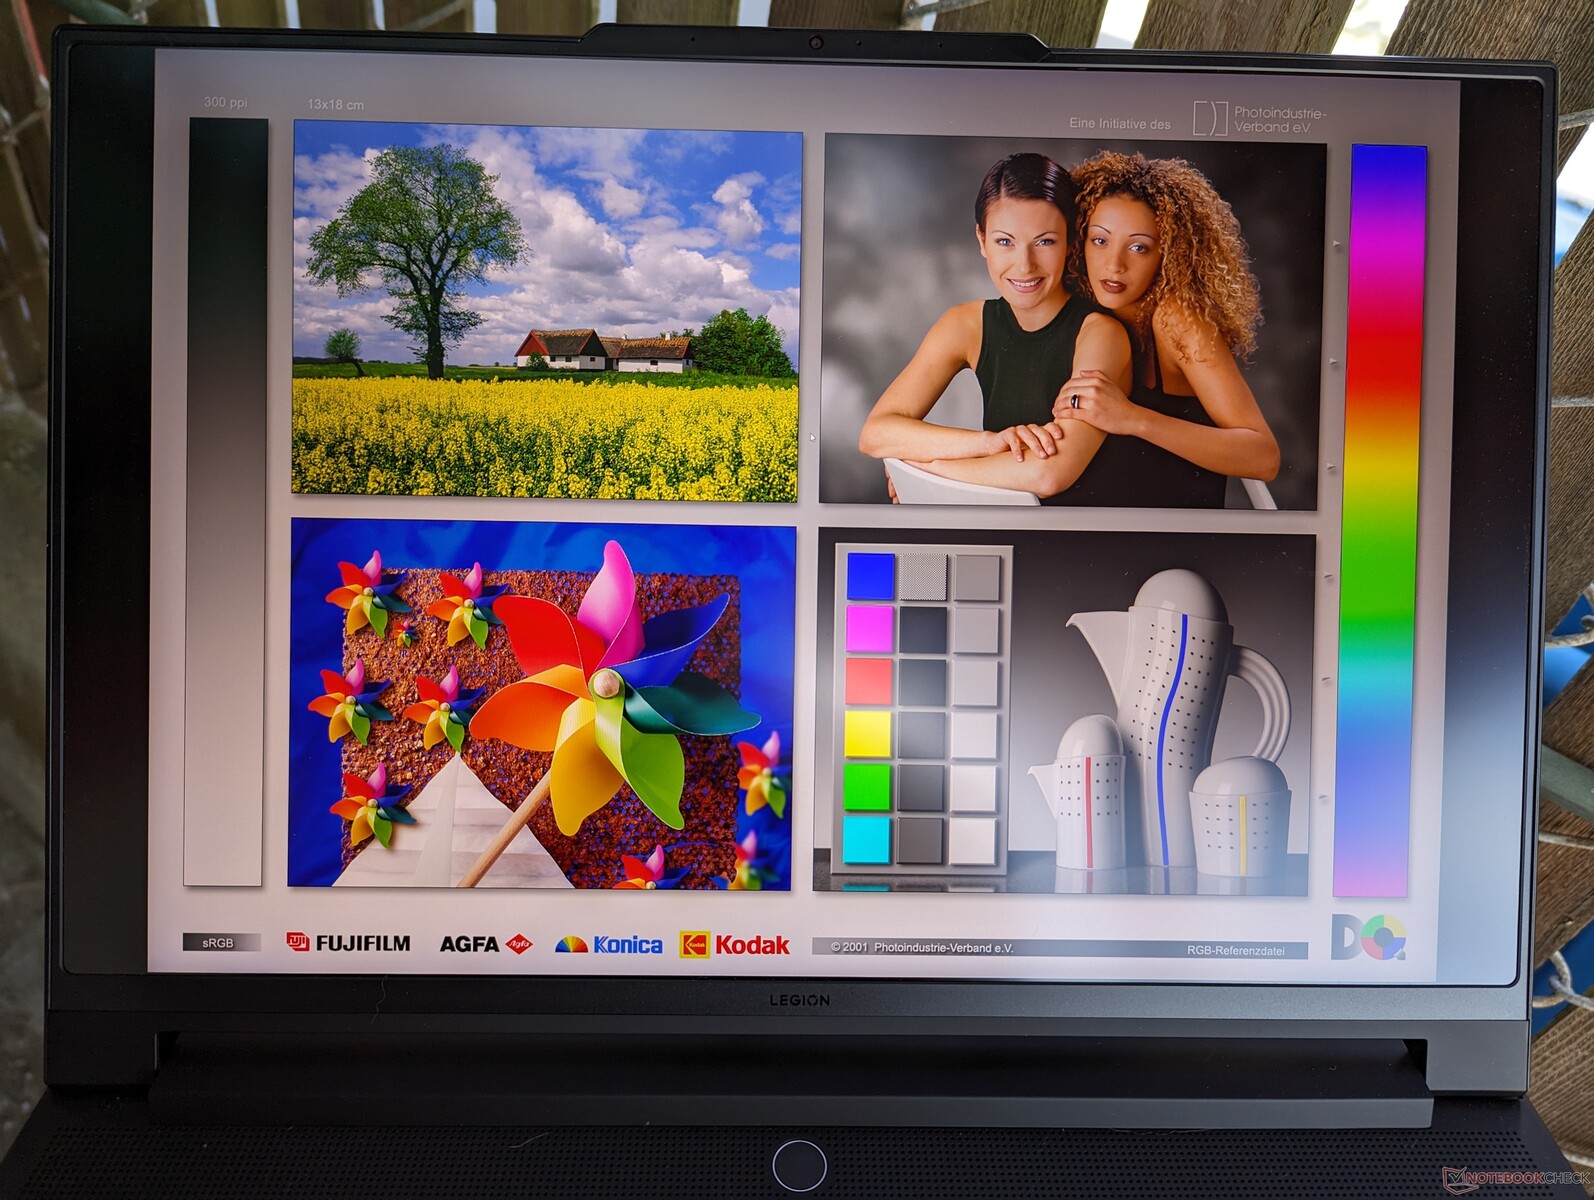
Wyświetlacz - główna atrakcja

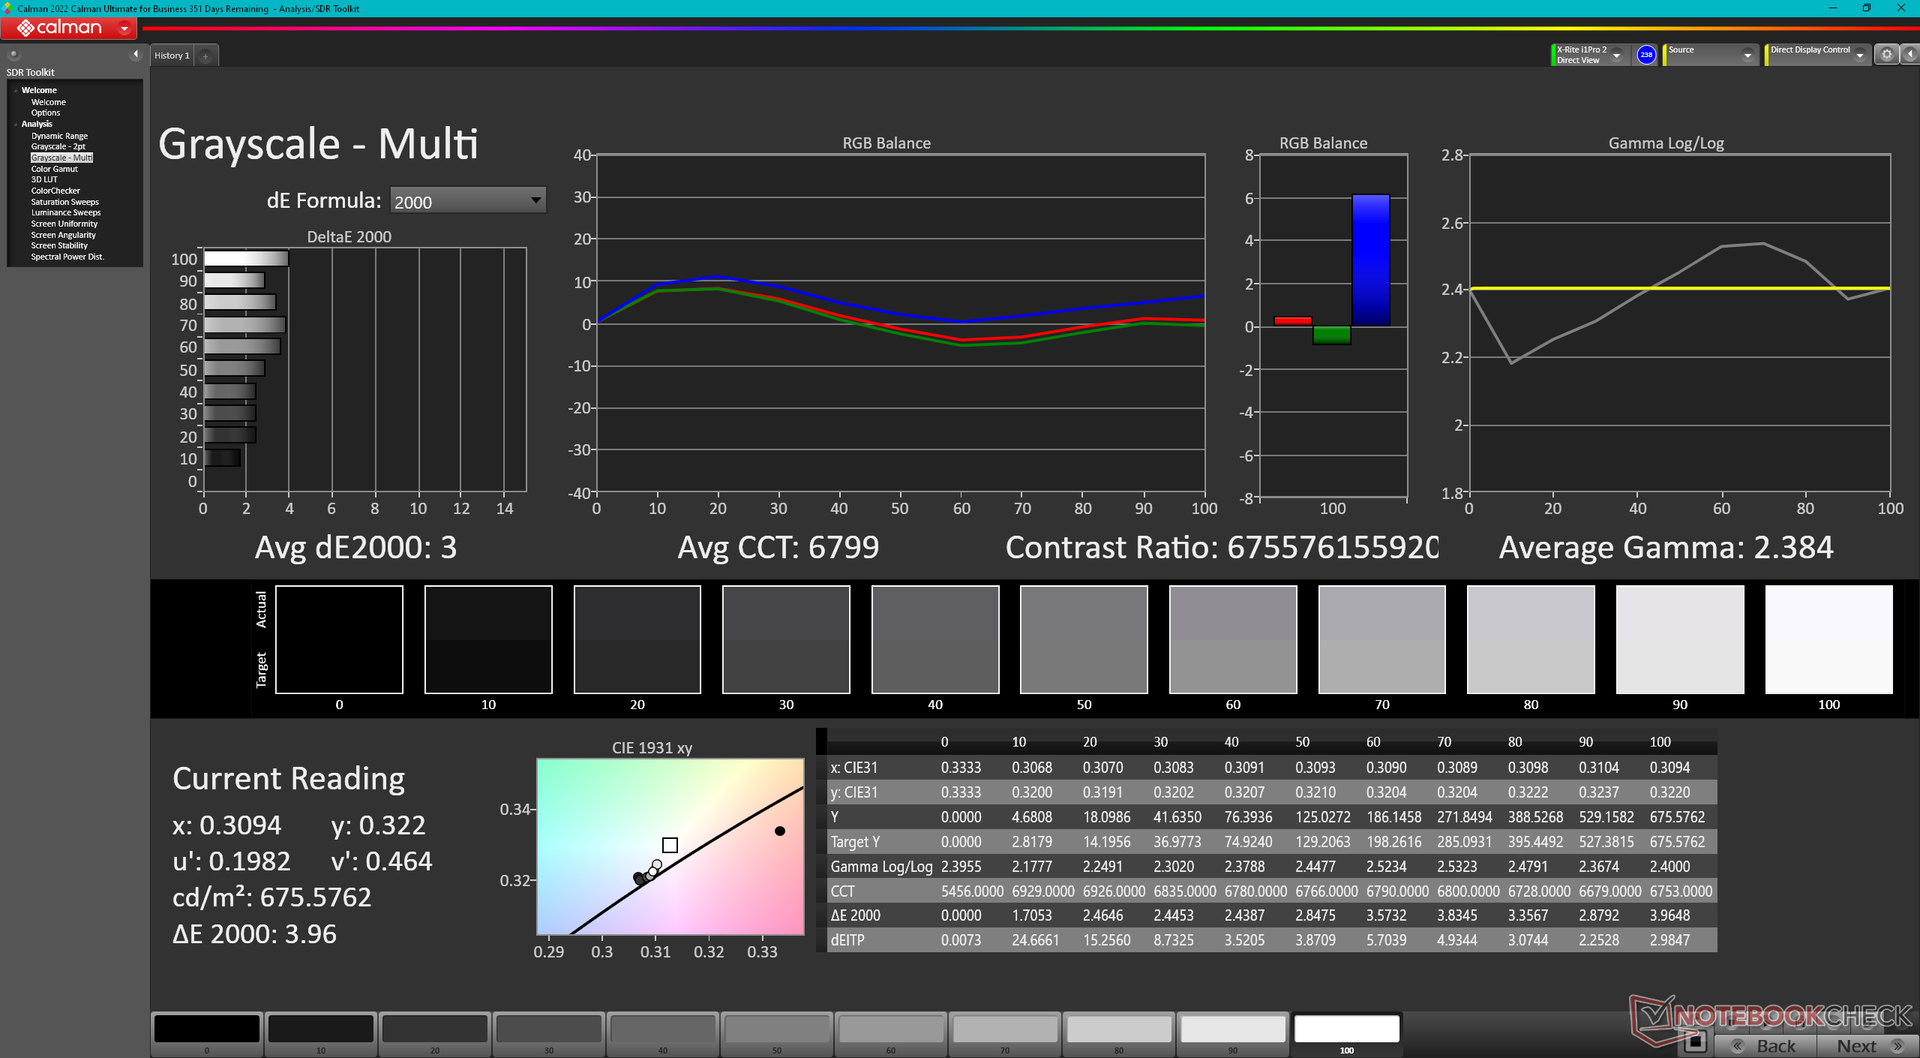
W porównaniu do tradycyjnych IPS i OLED, mini-LED oferuje lepsze poziomy czerni niż te pierwsze, a nawet wyższe maksymalne poziomy jasności niż te drugie, co zapewnia ogólnie lepszą obsługę HDR. W tym przypadku Lenovo reklamuje maksymalną jasność 1200 nitów dla obsługi HDR1000, co jest rzadkością w wyświetlaczach laptopów. Jesteśmy w stanie potwierdzić rzeczywistą maksymalną jasność wynoszącą 1025 nitów przy włączonym trybie HDR lub 675 nitów przy wyświetlaniu treści SDR. Dla porównania, większość paneli IPS i OLED w laptopach do gier ma zazwyczaj jasność od 300 do 500 nitów. Dlatego też warto odtwarzać treści w trybie HDR, gdy tylko jest to możliwe, aby lepiej wykorzystać zalety mini-LED.
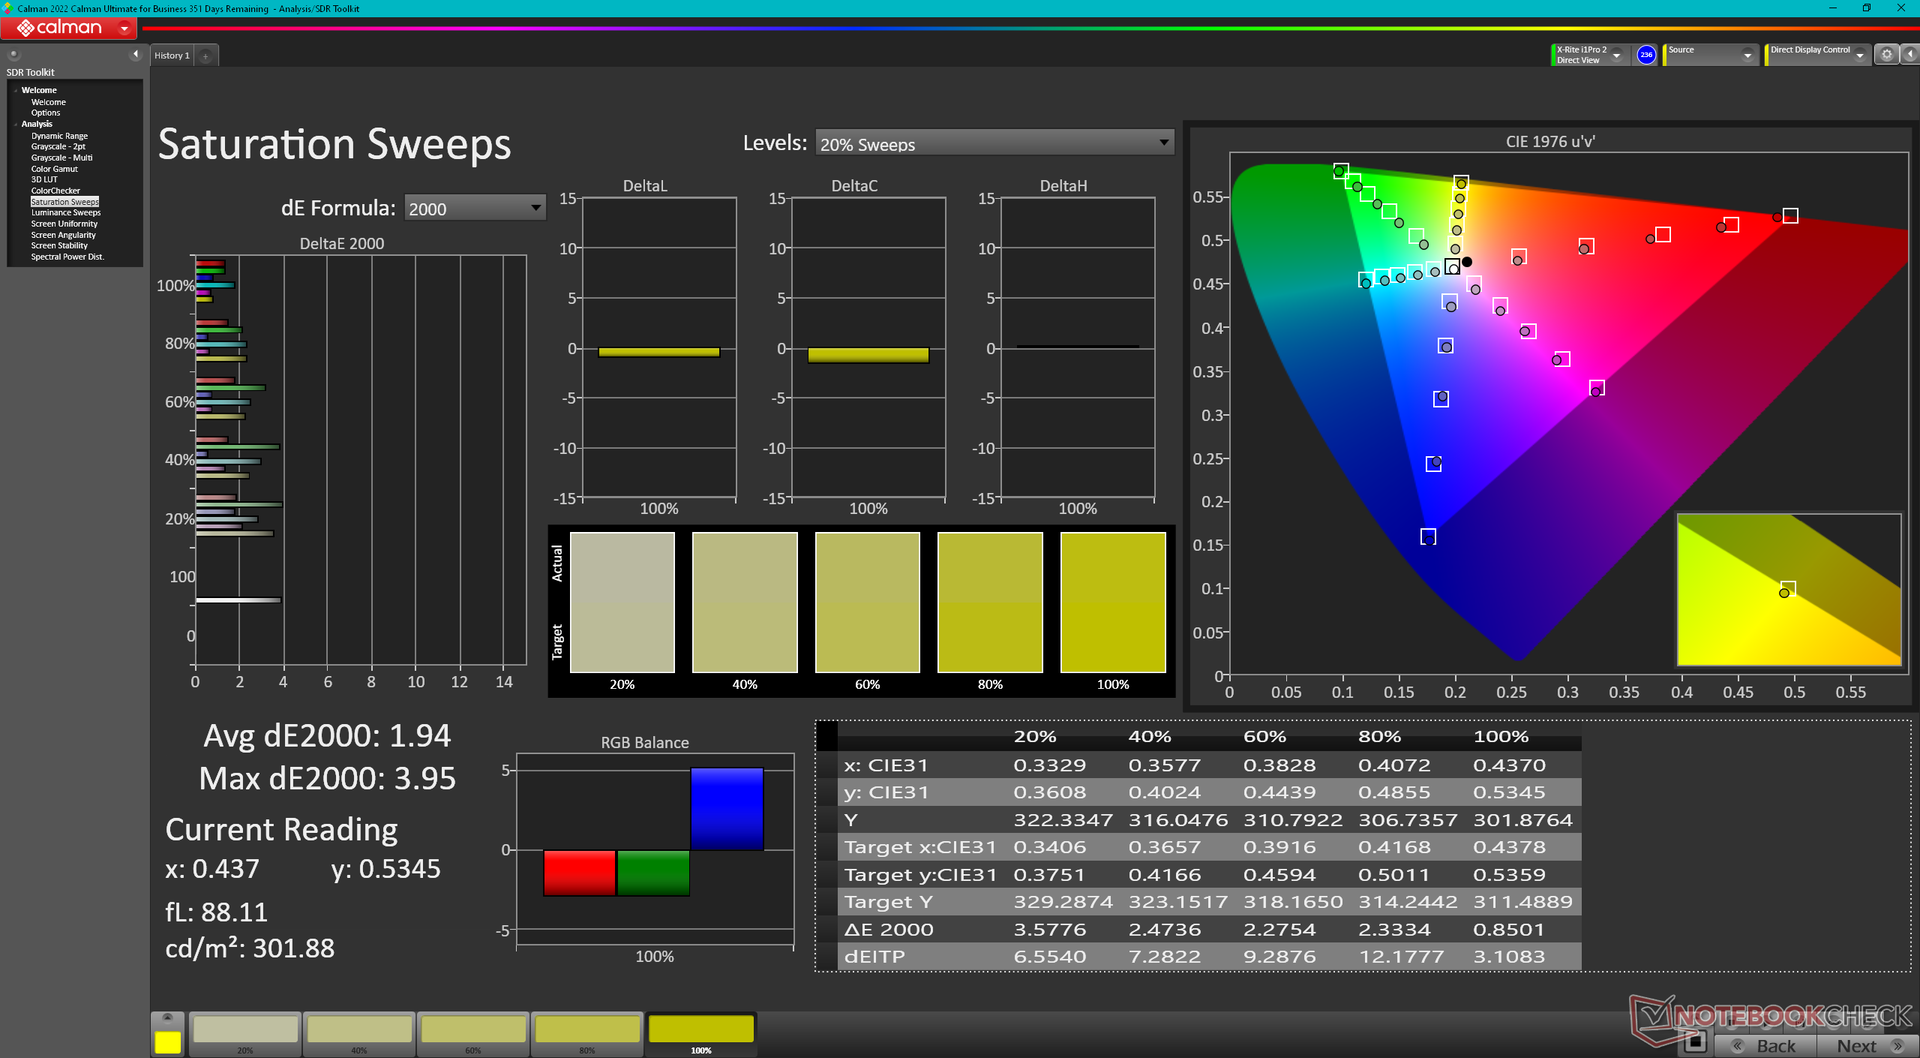
Oprócz bardzo wysokiego poziomu jasności, panel oferuje również G-Sync, pełne kolory DCI-P3, szybką częstotliwość odświeżania 165 Hz i krótki czas reakcji, dzięki czemu nadaje się zarówno do tworzenia treści, jak i do gier.
| |||||||||||||||||||||||||
rozświetlenie: 96 %
na akumulatorze: 674.9 cd/m²
kontrast: 16873:1 (czerń: 0.04 cd/m²)
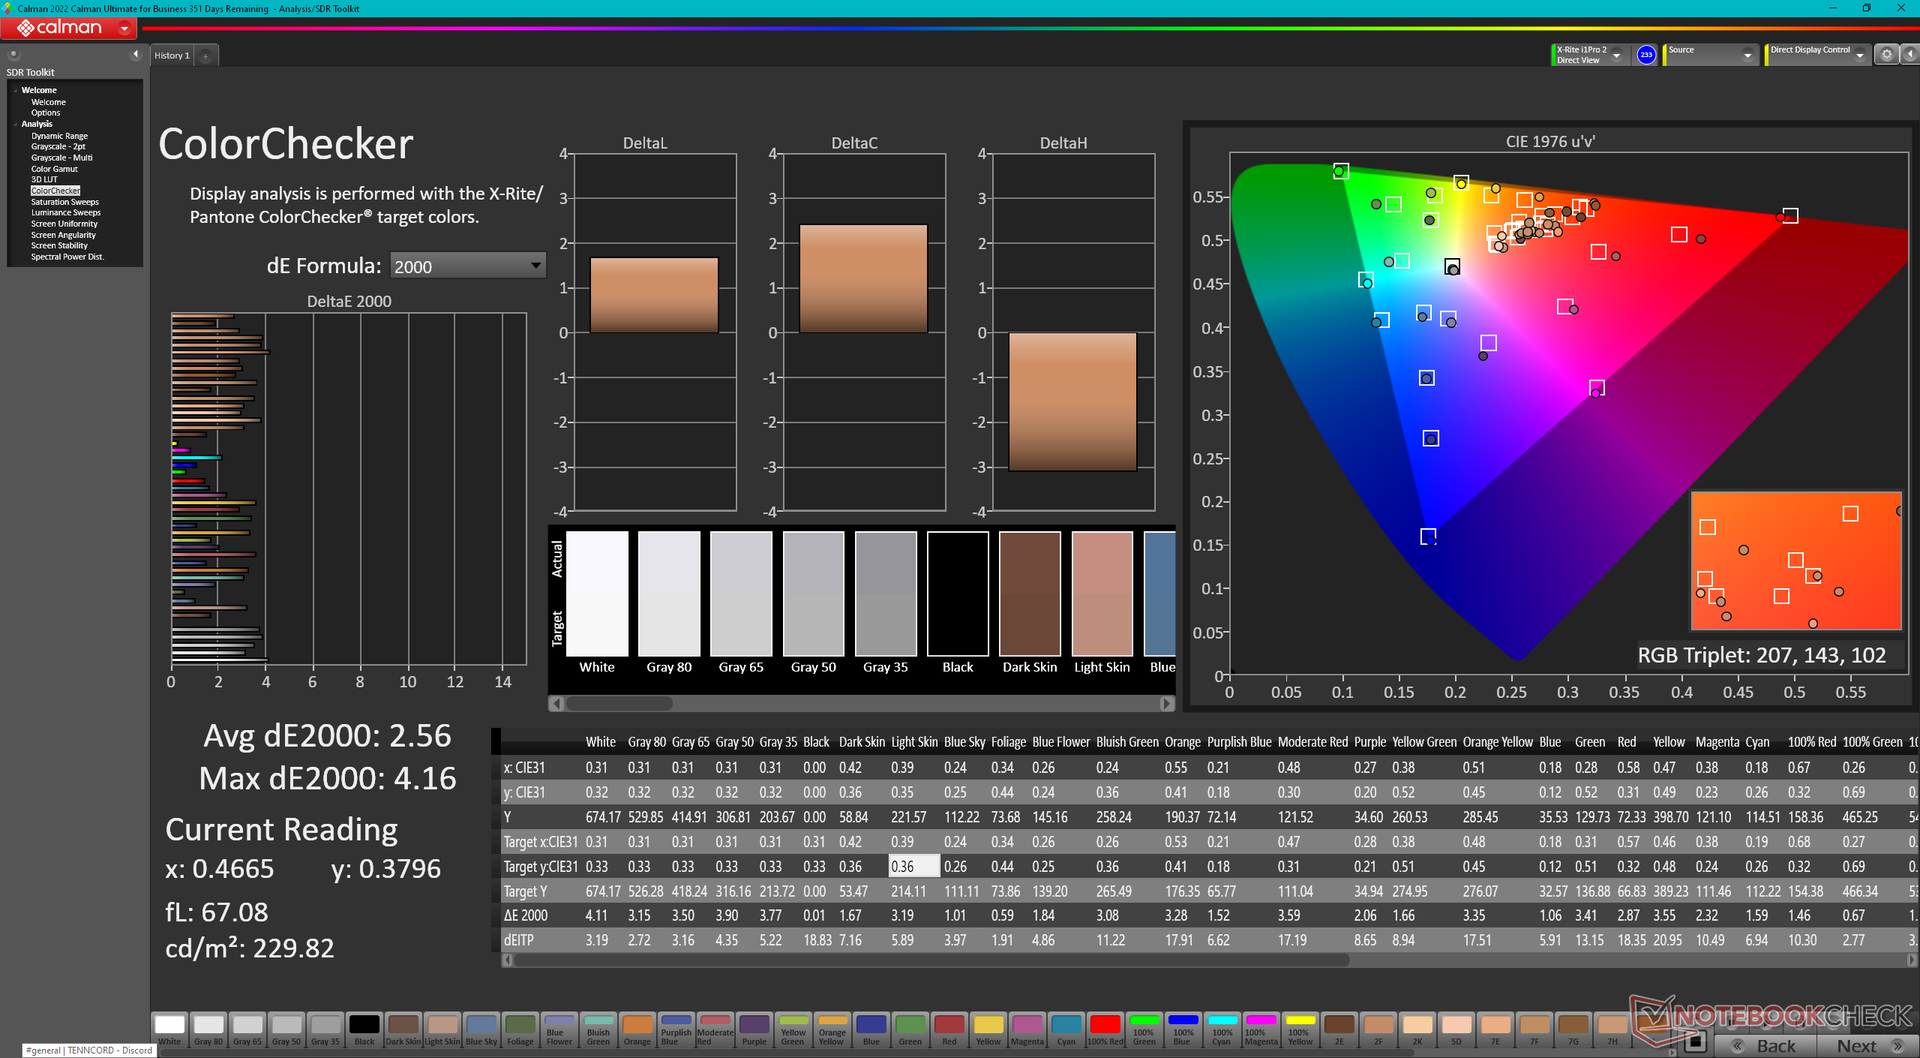
ΔE ColorChecker Calman: 2.56 | ∀{0.5-29.43 Ø4.73}
calibrated: 2.47
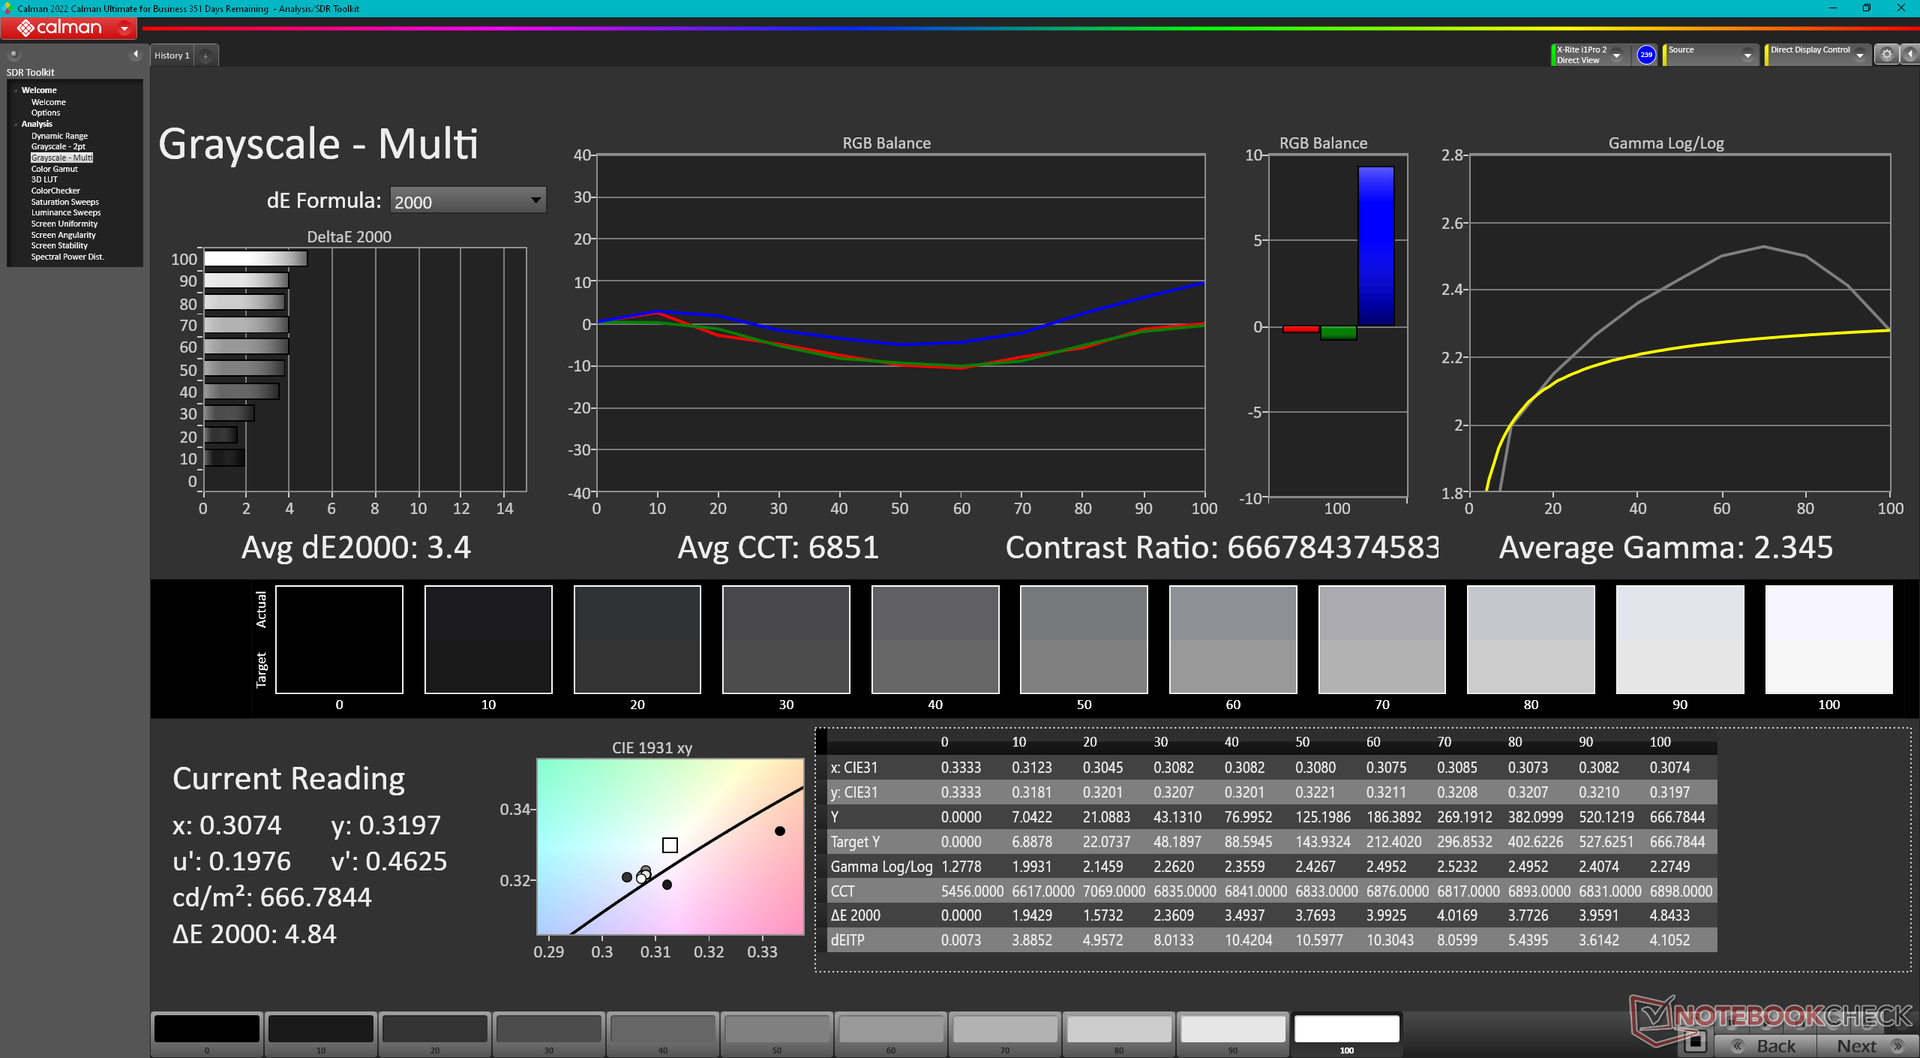
ΔE Greyscale Calman: 3 | ∀{0.09-98 Ø4.97}
87% AdobeRGB 1998 (Argyll 3D)
99.9% sRGB (Argyll 3D)
97.2% Display P3 (Argyll 3D)
Gamma: 2.38
CCT: 6799 K
| Lenovo Legion 9 16IRX8 CSOT T3 MNG007ZA2-2, Mini-LED, 3200x2000, 16" | Lenovo Legion Slim 5 16APH8 BOE NJ NE160QDM-NYC, IPS, 2560x1600, 16" | Razer Blade 16 Early 2023 RTX 4090 AUO B160ZAN01.U, mini-LED, 3840x2400, 16" | Asus ROG Strix G16 G614JZ TL160ADMP03-0, IPS, 2560x1600, 16" | HP Omen Transcend 16 AUOA3A6, Mini-LED, 2560x1600, 16" | Alienware x16 R1 BOE NE16NZ4, IPS, 2560x1600, 16" | |
|---|---|---|---|---|---|---|
| Display | -16% | 2% | -1% | 1% | 1% | |
| Display P3 Coverage (%) | 97.2 | 69.3 -29% | 99.9 3% | 97 0% | 99.2 2% | 99.2 2% |
| sRGB Coverage (%) | 99.9 | 100 0% | 100 0% | 99.9 0% | 100 0% | 100 0% |
| AdobeRGB 1998 Coverage (%) | 87 | 70 -20% | 90.9 4% | 84.9 -2% | 87.6 1% | 88.6 2% |
| Response Times | 27% | -206% | 53% | -121% | 37% | |
| Response Time Grey 50% / Grey 80% * (ms) | 13.3 ? | 10.7 ? 20% | 10.2 ? 23% | 5.1 ? 62% | 26.4 ? -98% | 5.1 ? 62% |
| Response Time Black / White * (ms) | 11.6 ? | 7.8 ? 33% | 62.04 ? -435% | 6.6 ? 43% | 28.2 ? -143% | 10.3 ? 11% |
| PWM Frequency (Hz) | 4742 | 2420 ? | 3506 ? | |||
| Screen | -109% | 62% | -111% | -26% | -73% | |
| Brightness middle (cd/m²) | 674.9 | 371.6 -45% | 730 8% | 470 -30% | 791.1 17% | 302.2 -55% |
| Brightness (cd/m²) | 682 | 343 -50% | 729 7% | 459 -33% | 800 17% | 285 -58% |
| Brightness Distribution (%) | 96 | 84 -12% | 94 -2% | 93 -3% | 95 -1% | 89 -7% |
| Black Level * (cd/m²) | 0.04 | 0.44 -1000% | 0.0045 89% | 0.42 -950% | 0.04 -0% | 0.26 -550% |
| Contrast (:1) | 16873 | 845 -95% | 162222 861% | 1119 -93% | 19778 17% | 1162 -93% |
| Colorchecker dE 2000 * | 2.56 | 1.52 41% | 5.65 -121% | 1.86 27% | 4.37 -71% | 1.63 36% |
| Colorchecker dE 2000 max. * | 4.16 | 2.68 36% | 10.11 -143% | 3.87 7% | 10.39 -150% | 4.13 1% |
| Colorchecker dE 2000 calibrated * | 2.47 | 0.33 87% | 1.85 25% | 0.93 62% | 1.04 58% | 1.17 53% |
| Greyscale dE 2000 * | 3 | 1.2 60% | 8.1 -170% | 2.7 10% | 6.5 -117% | 2.5 17% |
| Gamma | 2.38 92% | 2.1 105% | 1.98 111% | 2.246 98% | 2.28 96% | 2.23 99% |
| CCT | 6799 96% | 6503 100% | 5874 111% | 6711 97% | 6000 108% | 6590 99% |
| Całkowita średnia (program / ustawienia) | -33% /
-70% | -47% /
11% | -20% /
-64% | -49% /
-33% | -12% /
-41% |
* ... im mniej tym lepiej
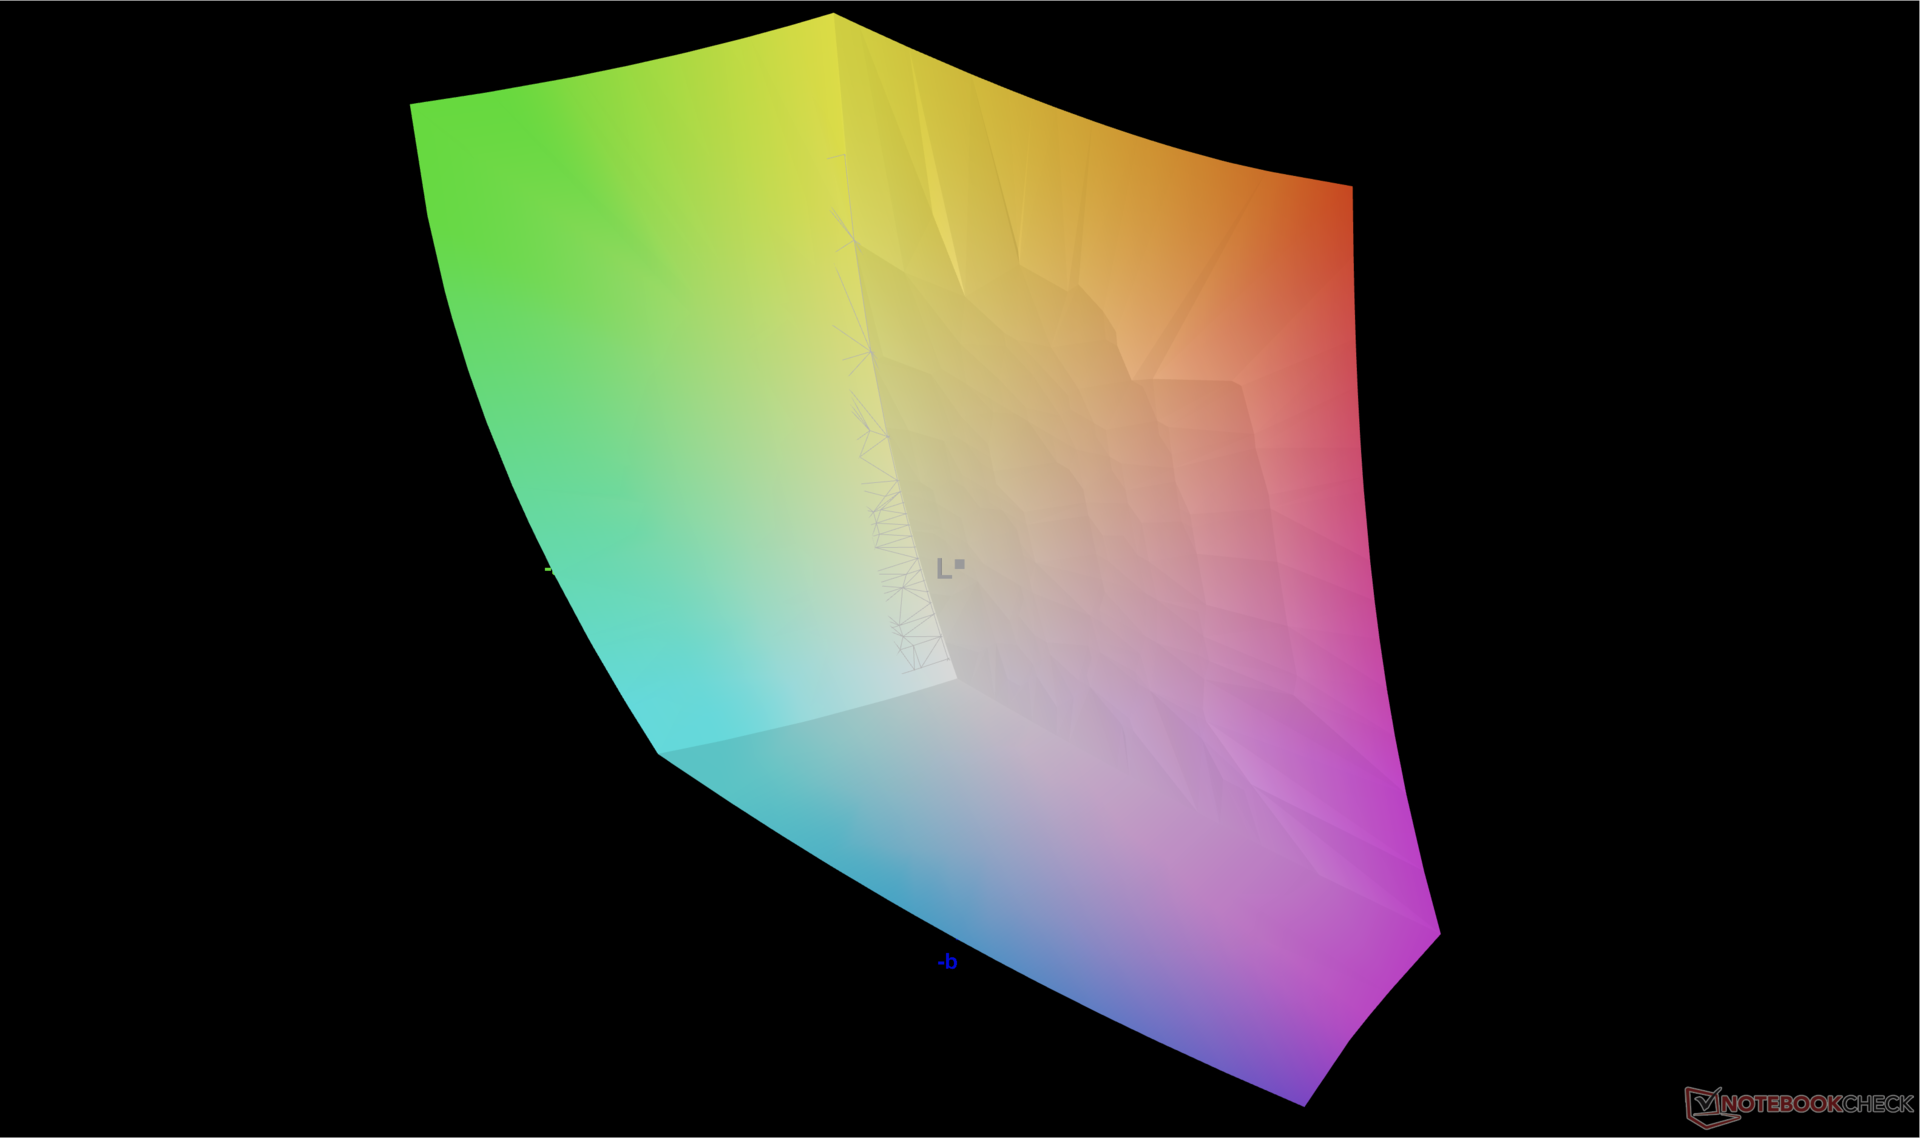
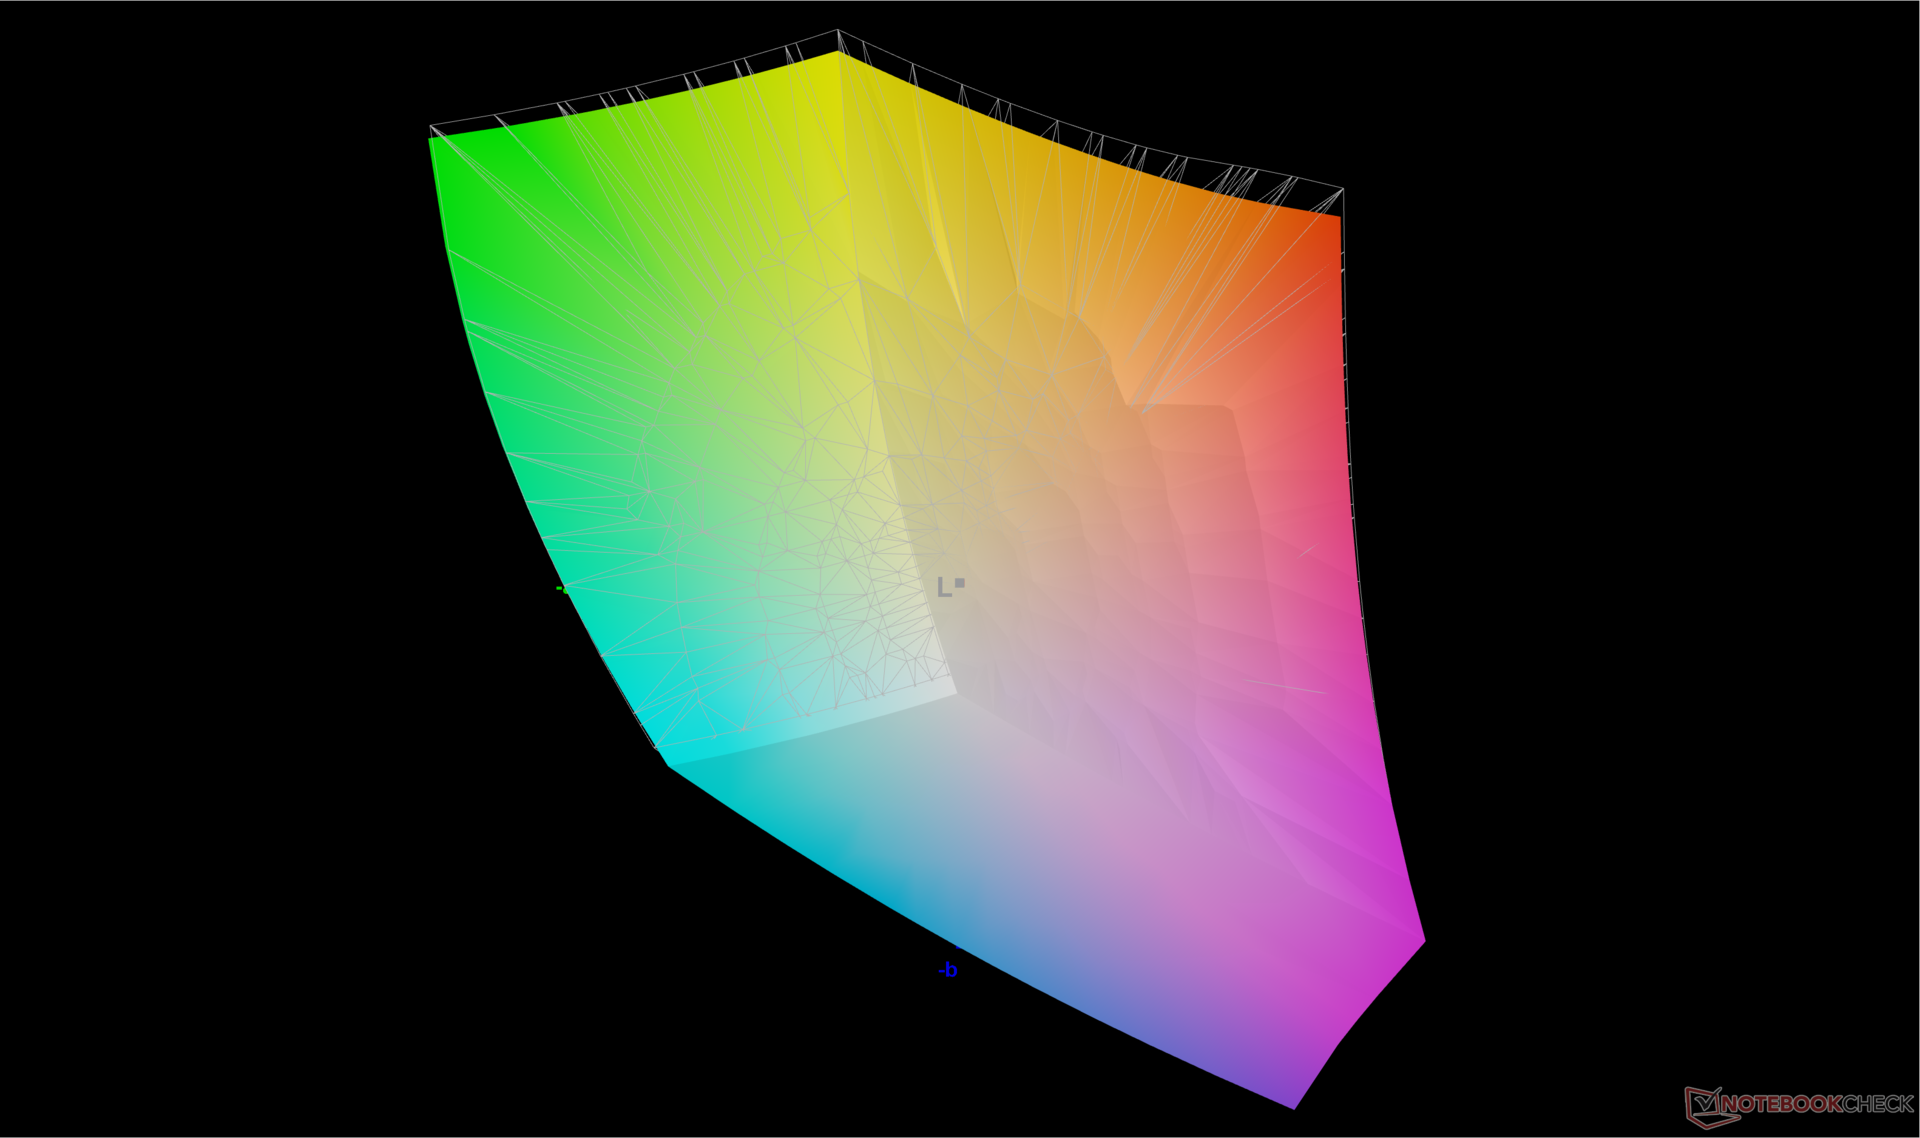
Wyświetlacz jest dobrze skalibrowany w stosunku do standardu P3 ze średnimi wartościami DeltaE w skali szarości i kolorów wynoszącymi odpowiednio 3 i 2,56.
Wyświetl czasy reakcji
| ↔ Czas reakcji od czerni do bieli | ||
|---|---|---|
| 11.6 ms ... wzrost ↗ i spadek ↘ łącznie | ↗ 5.1 ms wzrost | 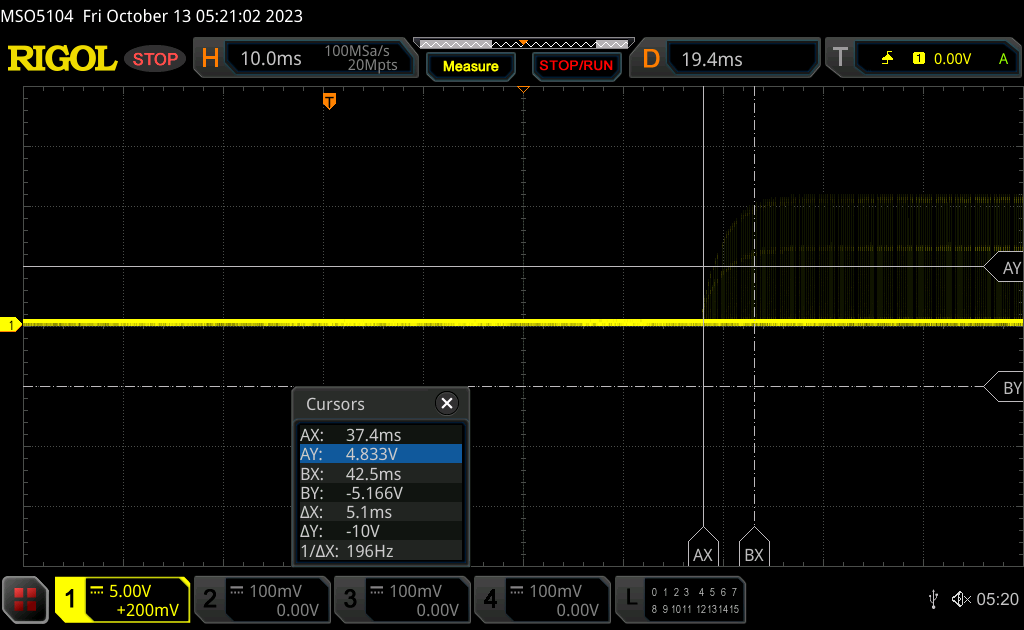 |
| ↘ 6.5 ms upadek | ||
| W naszych testach ekran wykazuje dobry współczynnik reakcji, ale może być zbyt wolny dla graczy rywalizujących ze sobą. Dla porównania, wszystkie testowane urządzenia wahają się od 0.1 (minimum) do 240 (maksimum) ms. » 31 % wszystkich urządzeń jest lepszych. Oznacza to, że zmierzony czas reakcji jest lepszy od średniej wszystkich testowanych urządzeń (19.9 ms). | ||
| ↔ Czas reakcji 50% szarości do 80% szarości | ||
| 13.3 ms ... wzrost ↗ i spadek ↘ łącznie | ↗ 5.7 ms wzrost | 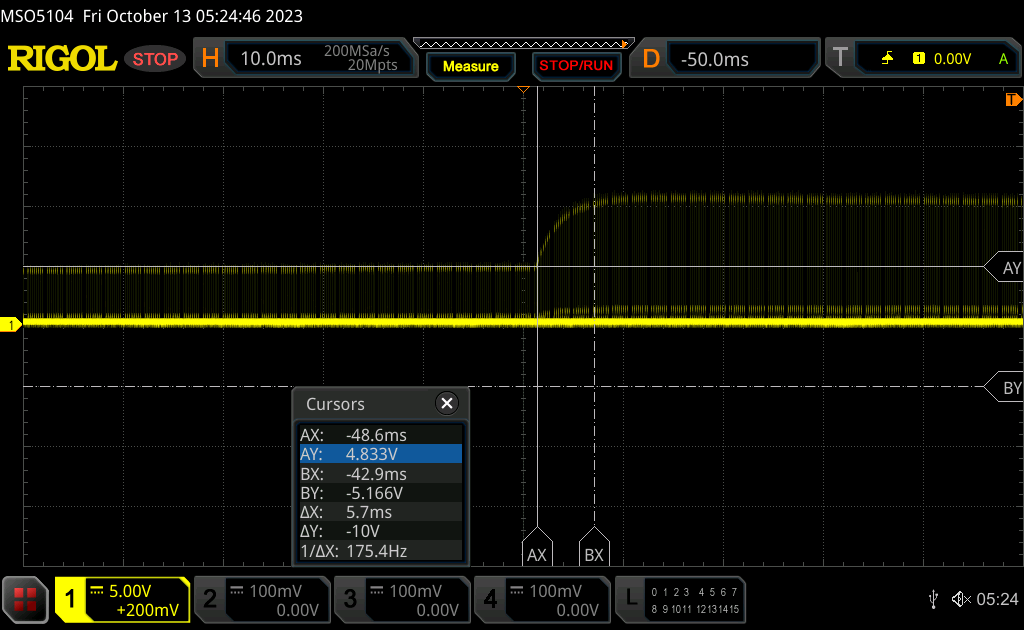 |
| ↘ 7.6 ms upadek | ||
| W naszych testach ekran wykazuje dobry współczynnik reakcji, ale może być zbyt wolny dla graczy rywalizujących ze sobą. Dla porównania, wszystkie testowane urządzenia wahają się od 0.165 (minimum) do 636 (maksimum) ms. » 27 % wszystkich urządzeń jest lepszych. Oznacza to, że zmierzony czas reakcji jest lepszy od średniej wszystkich testowanych urządzeń (31.1 ms). | ||
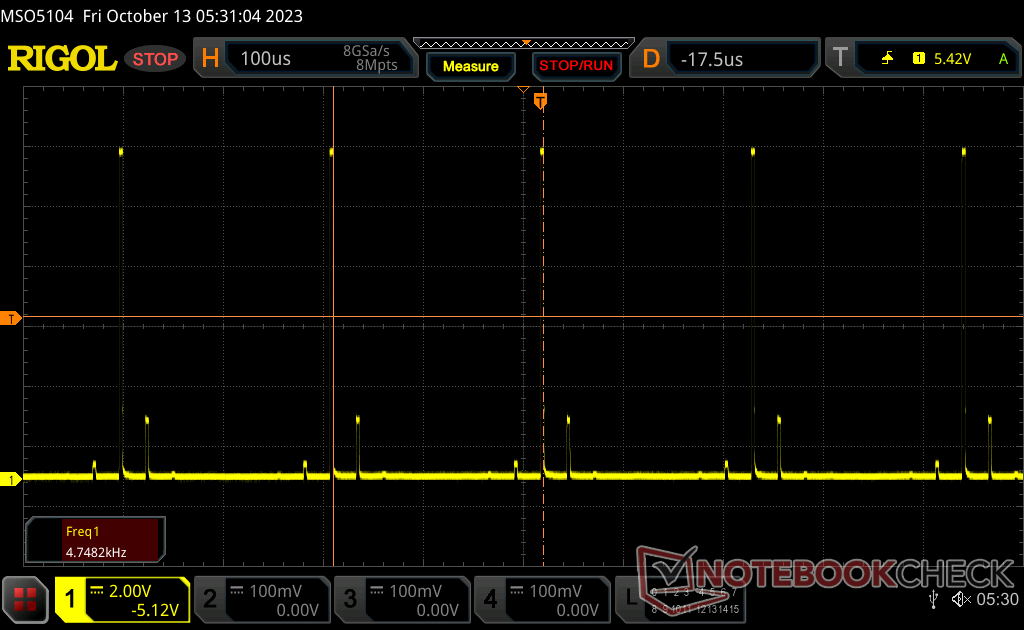
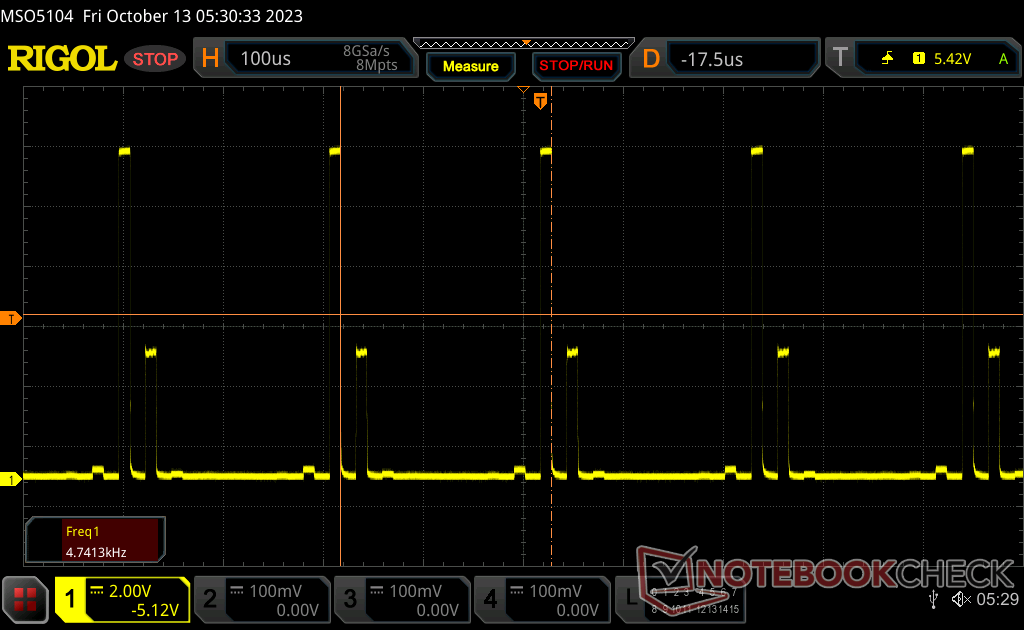
Migotanie ekranu / PWM (modulacja szerokości impulsu)
| Wykryto migotanie ekranu/wykryto PWM | 4742 Hz | 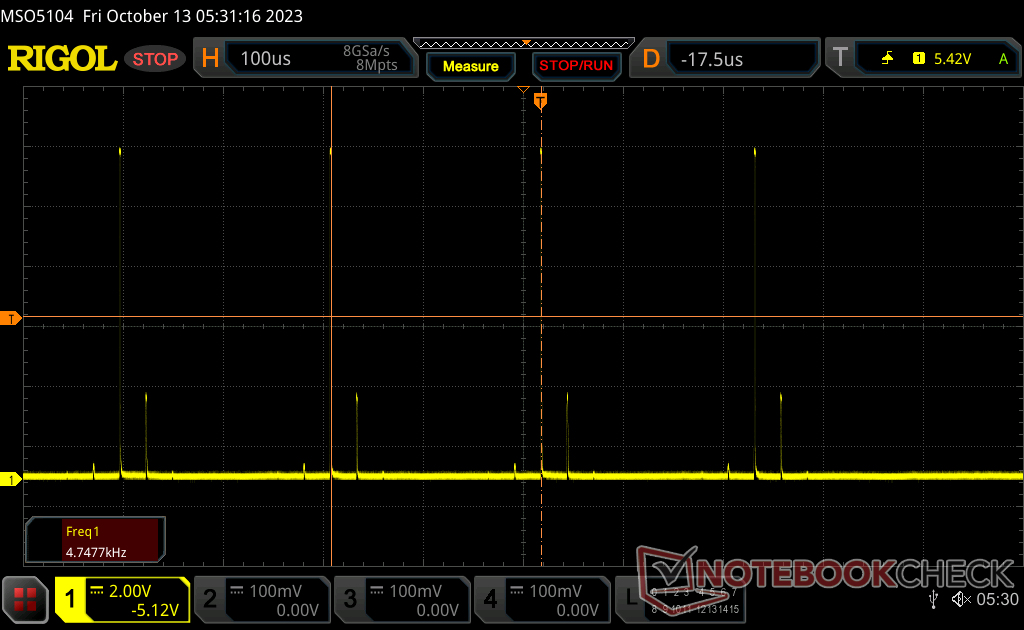 | |
Podświetlenie wyświetlacza miga z częstotliwością 4742 Hz (najgorszy przypadek, np. przy użyciu PWM) . Częstotliwość 4742 Hz jest dość wysoka, więc większość użytkowników wrażliwych na PWM nie powinna zauważyć żadnego migotania. Dla porównania: 52 % wszystkich testowanych urządzeń nie używa PWM do przyciemniania wyświetlacza. Jeśli wykryto PWM, zmierzono średnio 7794 (minimum: 5 - maksimum: 343500) Hz. | |||
Migotanie występuje na wszystkich poziomach jasności przy stałej częstotliwości 4752 Hz.


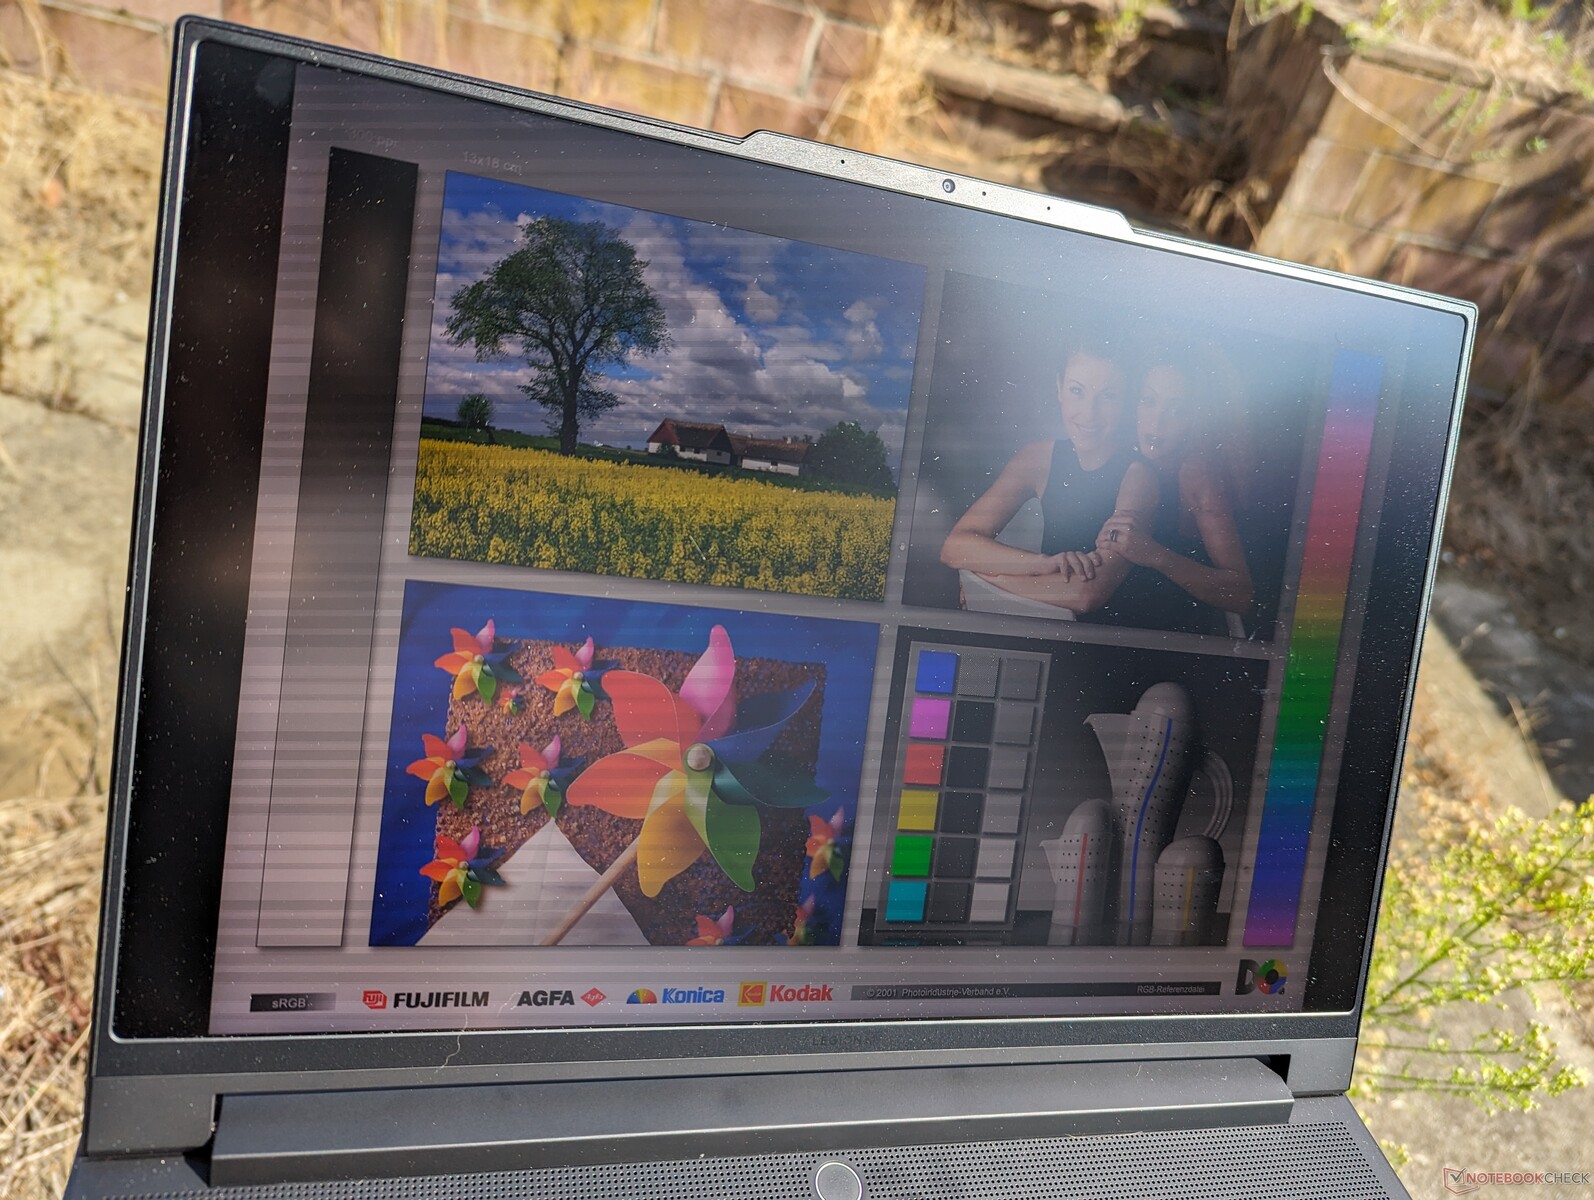
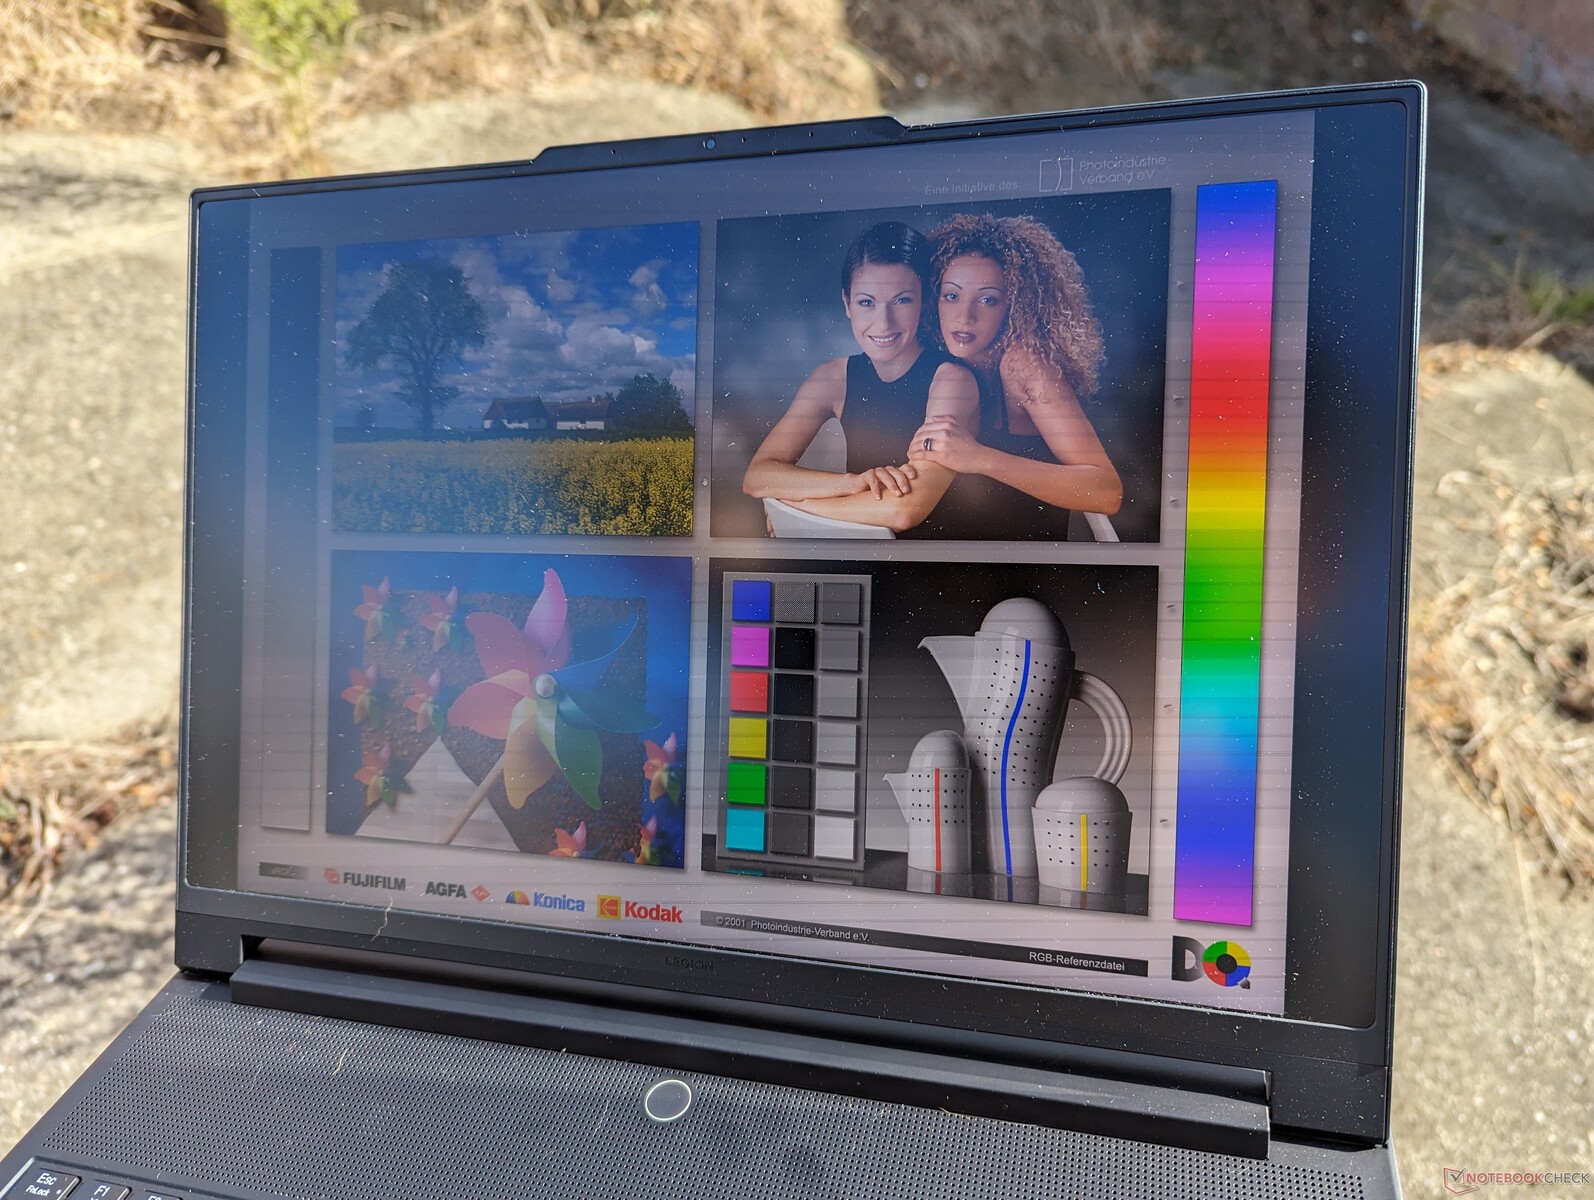
Widoczność na zewnątrz jest doskonała dla laptopa do gier ze względu na wspomnianą wcześniej wysoką maksymalną jasność mini-LED. Niemniej jednak, duża waga i krótki czas pracy na baterii nadal ograniczają laptopa do zastosowań głównie w pomieszczeniach.
Wydajność - bez Core i7
Warunki testowania
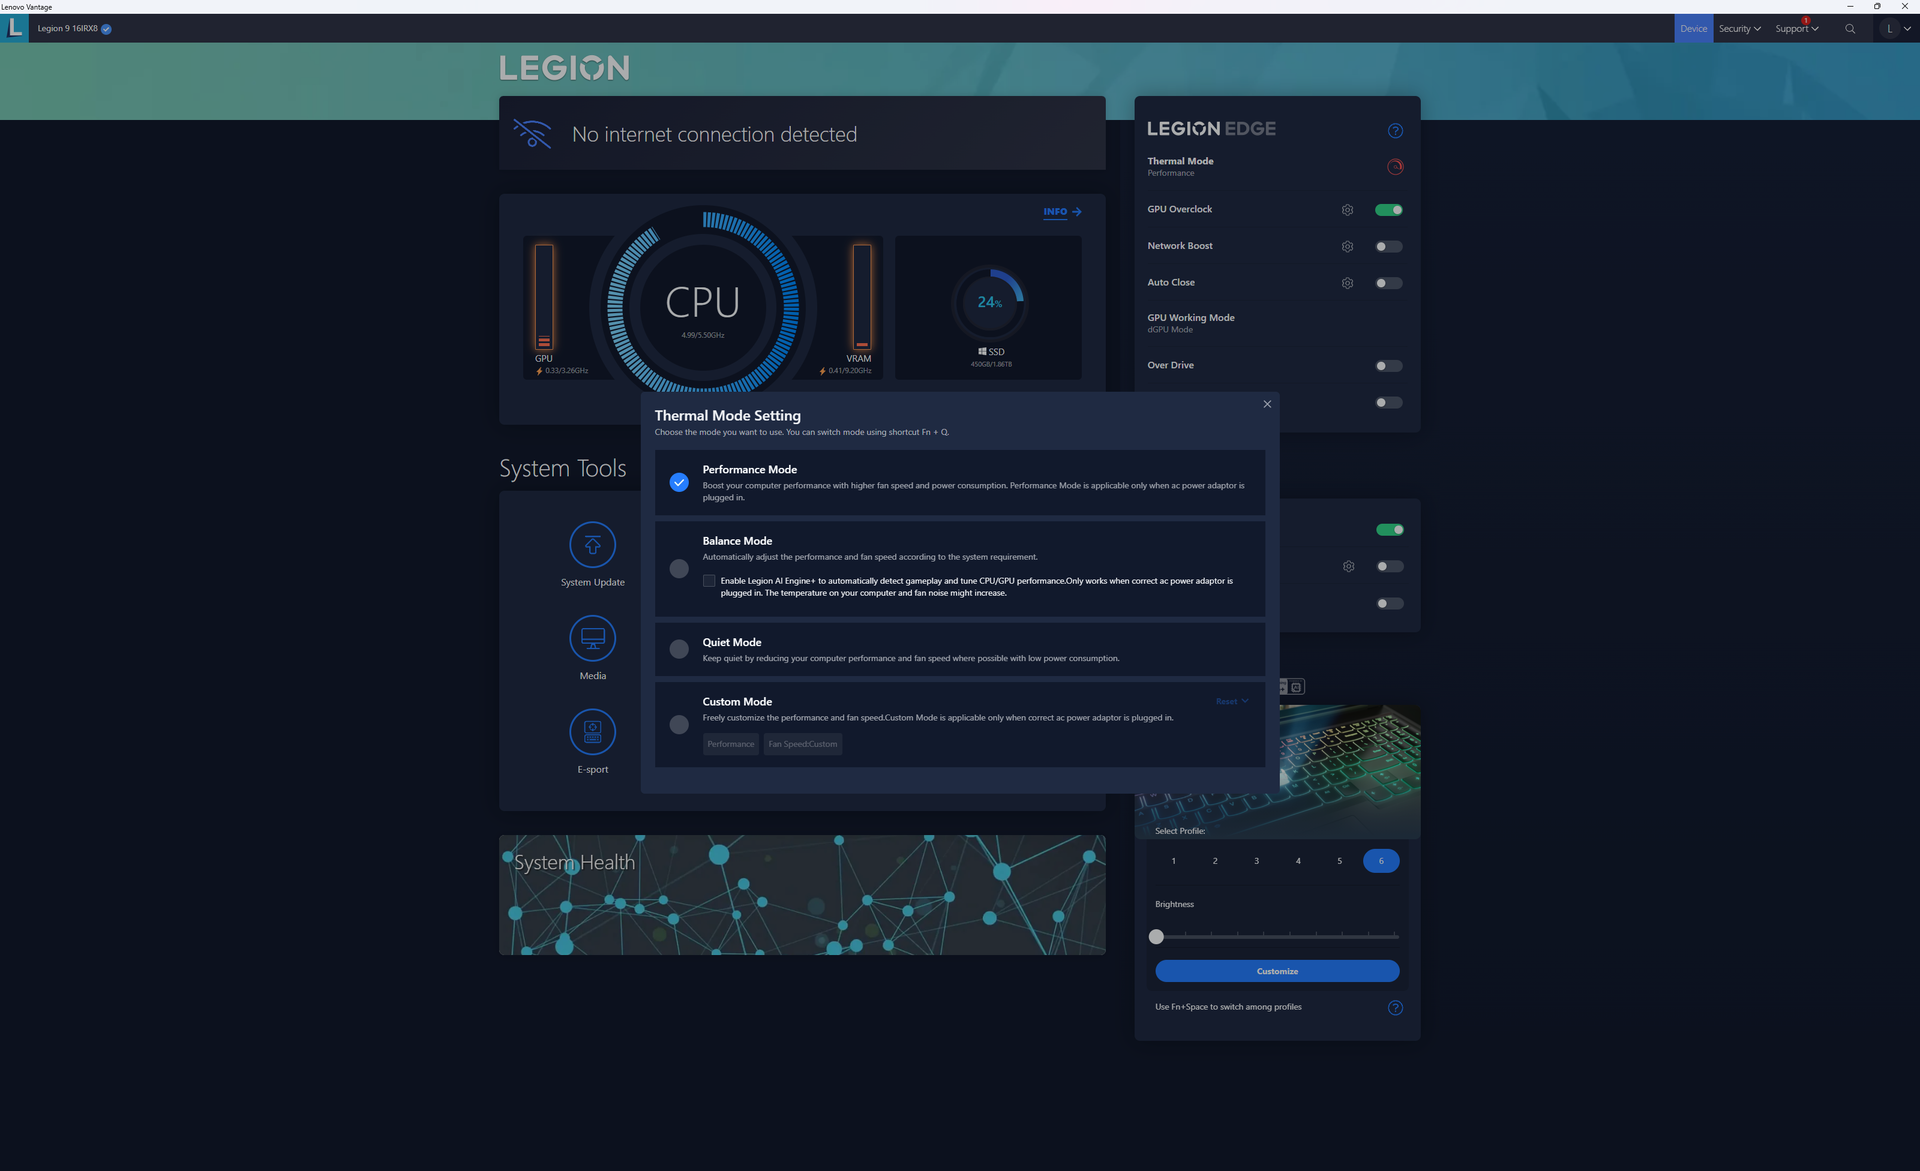
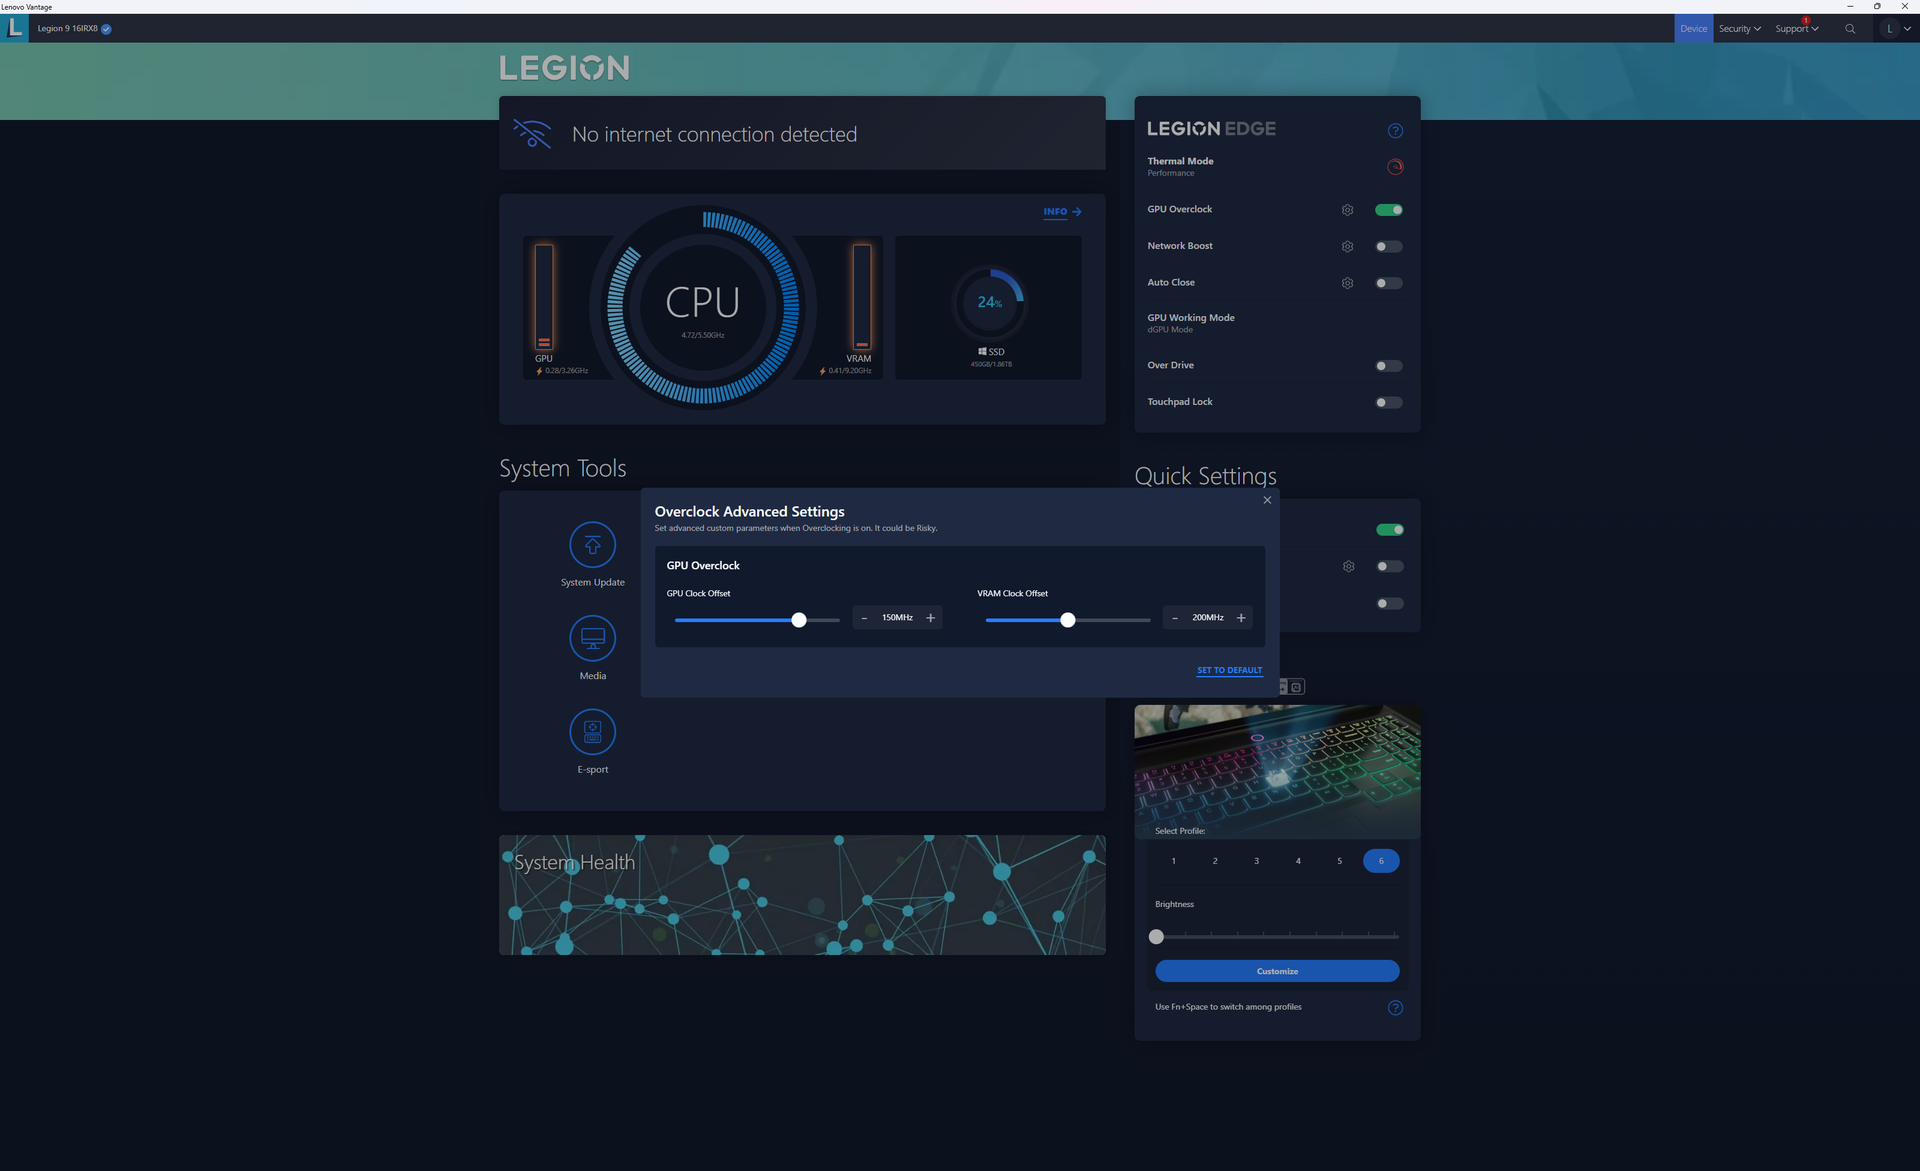
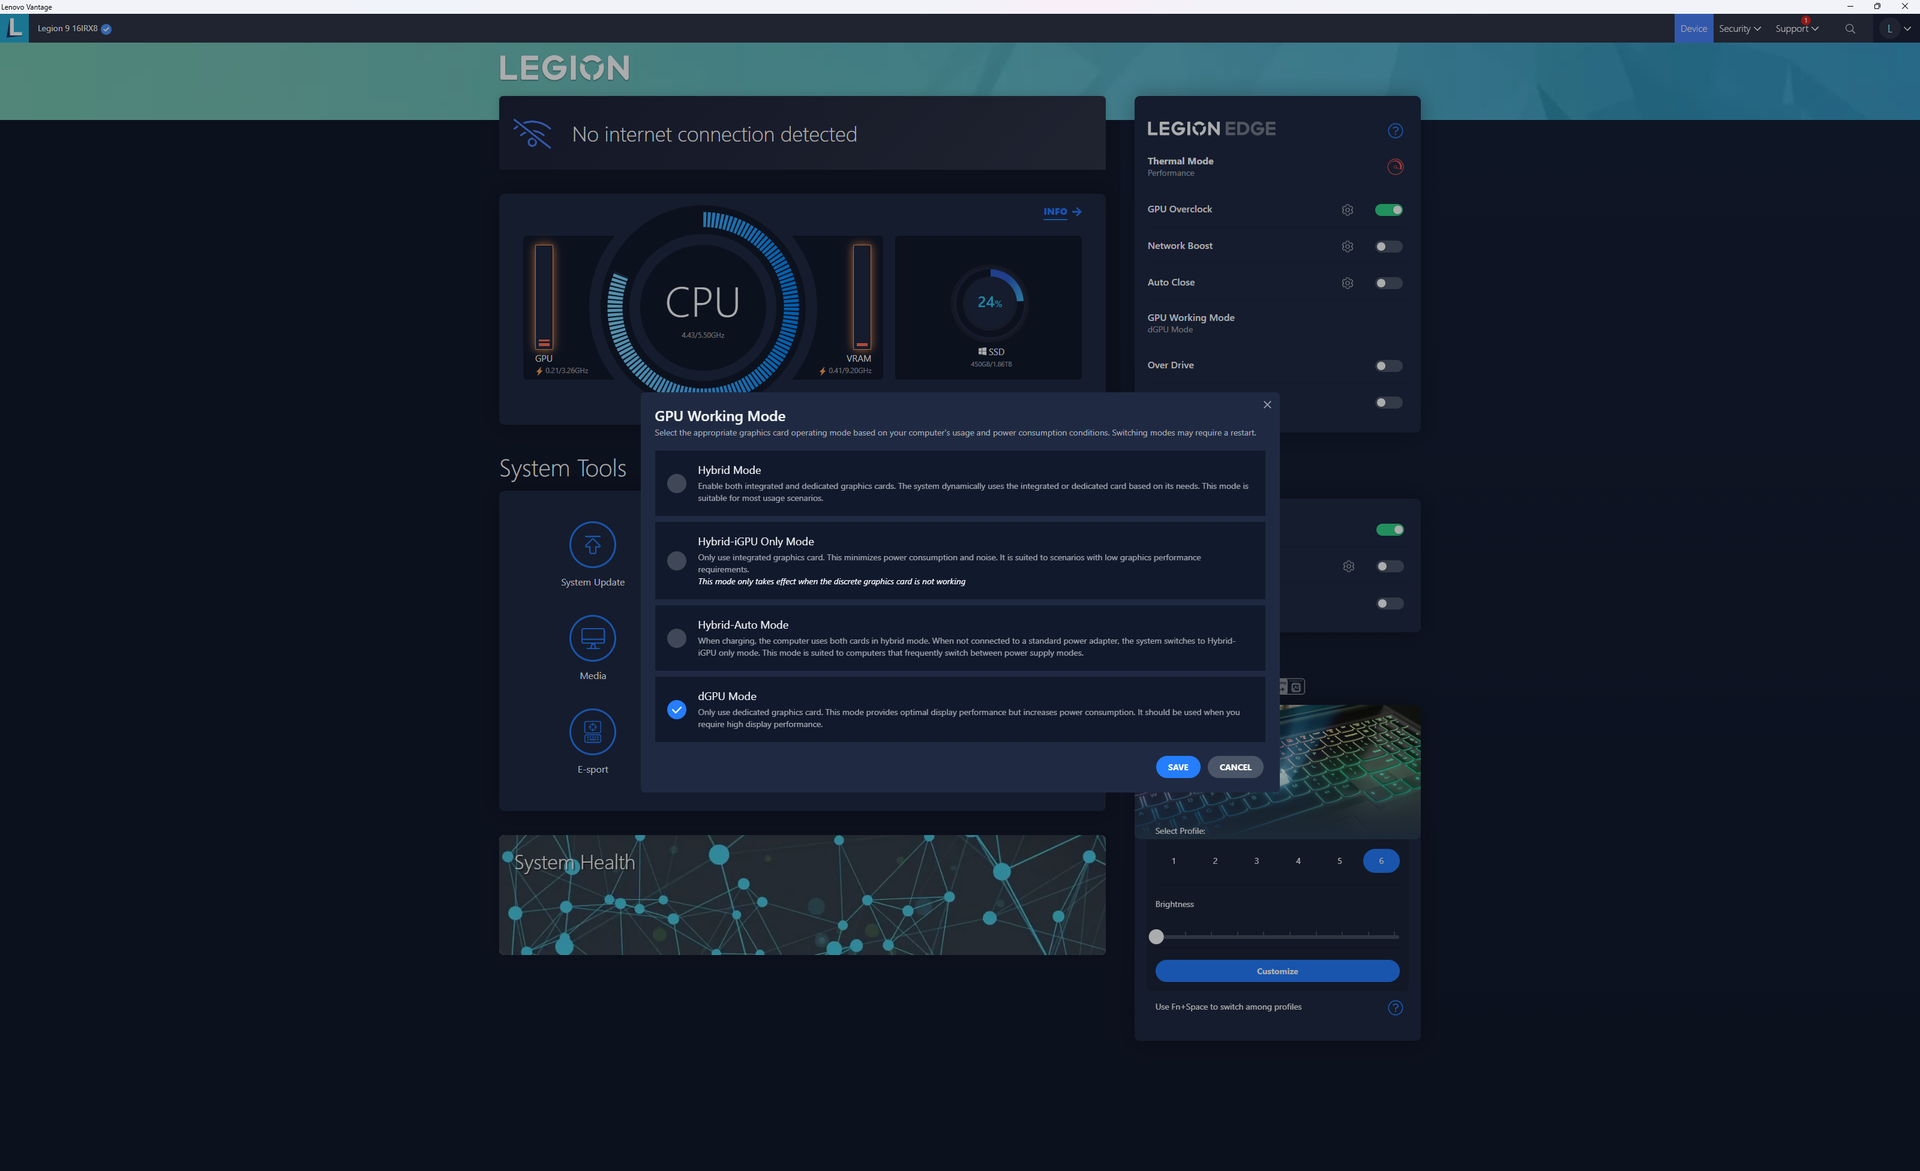
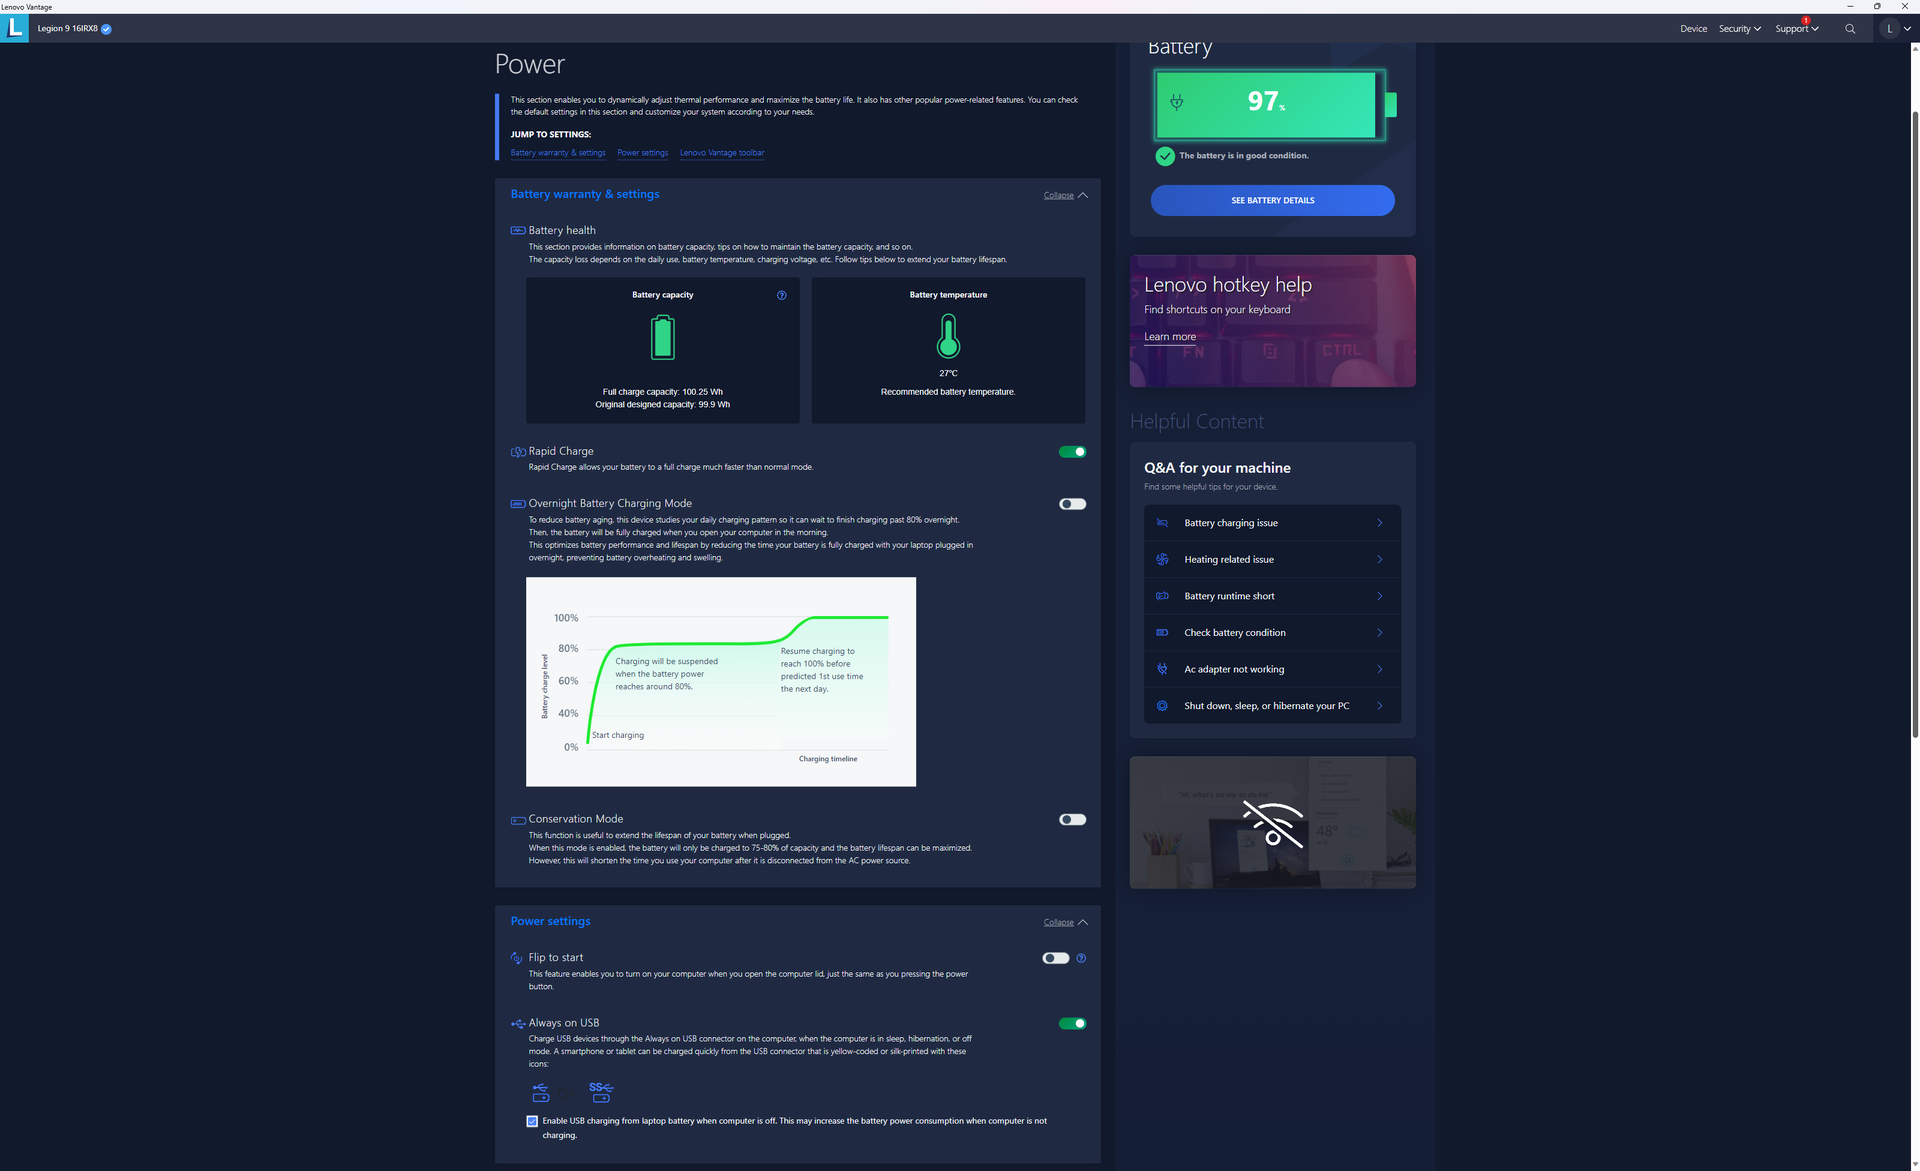
Przed przeprowadzeniem poniższych testów porównawczych ustawiliśmy naszą jednostkę w trybie wydajności i trybie dGPU za pośrednictwem Lenovo Vantage. Podkręcanie GPU jest również domyślnie włączone na poziomie +150 MHz GPU i +200 MHz VRAM, podobnie jak w innych high-endowych modelach Legion. Zaleca się, aby właściciele zapoznali się z Vantage w celu dostosowania profili zasilania i innych ustawień pomocniczych.
Advanced Optimus, MUX i G-Sync są obsługiwane, w przeciwieństwie do ostatnich modeli Legion Slim 5 14.
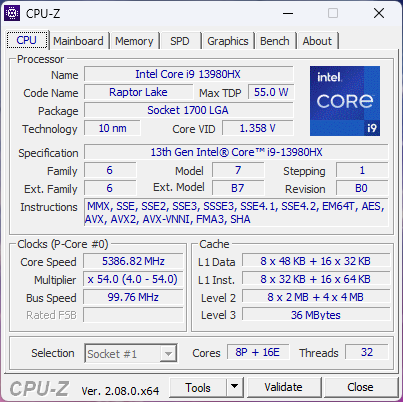
Procesor
Wydajność procesora jest doskonała, a wyniki są o około 80 do 90 procent szybsze w wielowątkowych obciążeniach niż w przypadku zwykłego Core i7-13700H. Procesor Core i9-13980HX jest obecnie jednym z najszybszych procesorów mobilnych Intela, ale nadal pozostaje w tyle za konkurencyjnymRyzen 9 7945HX w większości wielowątkowych testów porównawczych o około 10 procent.
Wydajność jest tylko o 5 procent wyższa niż w przypadku Core i9-13950HX w oparciu o nasz czas spędzony z Razer Blade 16 2023. Niestety, Lenovo nie oferuje żadnych innych opcji procesorów innych niż Core i9-13980HX dla tych, którzy mogliby chcieć zaoszczędzić kilkaset dolarów.
Cinebench R15 Multi Loop
Cinebench R23: Multi Core | Single Core
Cinebench R20: CPU (Multi Core) | CPU (Single Core)
Cinebench R15: CPU Multi 64Bit | CPU Single 64Bit
Blender: v2.79 BMW27 CPU
7-Zip 18.03: 7z b 4 | 7z b 4 -mmt1
Geekbench 5.5: Multi-Core | Single-Core
HWBOT x265 Benchmark v2.2: 4k Preset
LibreOffice : 20 Documents To PDF
R Benchmark 2.5: Overall mean
| HWBOT x265 Benchmark v2.2 / 4k Preset | |
| Asus Zephyrus Duo 16 GX650PY-NM006W | |
| Lenovo Legion 9 16IRX8 | |
| Przeciętny Intel Core i9-13980HX (27 - 33.4, n=9) | |
| Razer Blade 16 Early 2023 RTX 4090 | |
| Asus ROG Strix G16 G614JZ | |
| Alienware m16 R1 AMD | |
| HP Omen Transcend 16 | |
| Lenovo Legion Pro 5 16ARX8 | |
| Alienware m16 R1 Intel | |
| Alienware x16 R1 | |
| Lenovo Legion Slim 5 16APH8 | |
| Dell G16 7620 | |
| Lenovo Legion Pro 5 16ARX8 (R5 7645HX, RTX 4050) | |
| Lenovo Legion 7 16ARHA7 | |
| HP Victus 16-r0077ng | |
| HP Omen 16-n0033dx | |
| Dell Inspiron 16 Plus 7610 | |
Cinebench R23: Multi Core | Single Core
Cinebench R20: CPU (Multi Core) | CPU (Single Core)
Cinebench R15: CPU Multi 64Bit | CPU Single 64Bit
Blender: v2.79 BMW27 CPU
7-Zip 18.03: 7z b 4 | 7z b 4 -mmt1
Geekbench 5.5: Multi-Core | Single-Core
HWBOT x265 Benchmark v2.2: 4k Preset
LibreOffice : 20 Documents To PDF
R Benchmark 2.5: Overall mean
* ... im mniej tym lepiej
AIDA64: FP32 Ray-Trace | FPU Julia | CPU SHA3 | CPU Queen | FPU SinJulia | FPU Mandel | CPU AES | CPU ZLib | FP64 Ray-Trace | CPU PhotoWorxx
| Performance rating | |
| Lenovo Legion 9 16IRX8 | |
| Przeciętny Intel Core i9-13980HX | |
| Asus ROG Strix G16 G614JZ | |
| HP Omen Transcend 16 | |
| Razer Blade 16 Early 2023 RTX 4090 | |
| Lenovo Legion Slim 5 16APH8 | |
| Alienware x16 R1 | |
| AIDA64 / FP32 Ray-Trace | |
| Lenovo Legion Slim 5 16APH8 | |
| Asus ROG Strix G16 G614JZ | |
| Lenovo Legion 9 16IRX8 | |
| Przeciętny Intel Core i9-13980HX (21332 - 29553, n=9) | |
| HP Omen Transcend 16 | |
| Alienware x16 R1 | |
| Razer Blade 16 Early 2023 RTX 4090 | |
| AIDA64 / FPU Julia | |
| Lenovo Legion 9 16IRX8 | |
| Przeciętny Intel Core i9-13980HX (108001 - 148168, n=9) | |
| Asus ROG Strix G16 G614JZ | |
| Lenovo Legion Slim 5 16APH8 | |
| HP Omen Transcend 16 | |
| Razer Blade 16 Early 2023 RTX 4090 | |
| Alienware x16 R1 | |
| AIDA64 / CPU SHA3 | |
| Lenovo Legion 9 16IRX8 | |
| Asus ROG Strix G16 G614JZ | |
| Przeciętny Intel Core i9-13980HX (5264 - 7142, n=9) | |
| Razer Blade 16 Early 2023 RTX 4090 | |
| HP Omen Transcend 16 | |
| Lenovo Legion Slim 5 16APH8 | |
| Alienware x16 R1 | |
| AIDA64 / CPU Queen | |
| Asus ROG Strix G16 G614JZ | |
| Przeciętny Intel Core i9-13980HX (126758 - 143409, n=9) | |
| Razer Blade 16 Early 2023 RTX 4090 | |
| Lenovo Legion 9 16IRX8 | |
| HP Omen Transcend 16 | |
| Lenovo Legion Slim 5 16APH8 | |
| Alienware x16 R1 | |
| AIDA64 / FPU SinJulia | |
| Asus ROG Strix G16 G614JZ | |
| Przeciętny Intel Core i9-13980HX (13785 - 17117, n=9) | |
| Lenovo Legion 9 16IRX8 | |
| Lenovo Legion Slim 5 16APH8 | |
| HP Omen Transcend 16 | |
| Razer Blade 16 Early 2023 RTX 4090 | |
| Alienware x16 R1 | |
| AIDA64 / FPU Mandel | |
| Lenovo Legion 9 16IRX8 | |
| Przeciętny Intel Core i9-13980HX (53398 - 73758, n=9) | |
| Asus ROG Strix G16 G614JZ | |
| Lenovo Legion Slim 5 16APH8 | |
| HP Omen Transcend 16 | |
| Razer Blade 16 Early 2023 RTX 4090 | |
| Alienware x16 R1 | |
| AIDA64 / CPU AES | |
| Razer Blade 16 Early 2023 RTX 4090 | |
| Asus ROG Strix G16 G614JZ | |
| Lenovo Legion 9 16IRX8 | |
| Przeciętny Intel Core i9-13980HX (105169 - 136520, n=9) | |
| HP Omen Transcend 16 | |
| Alienware x16 R1 | |
| Lenovo Legion Slim 5 16APH8 | |
| AIDA64 / CPU ZLib | |
| Lenovo Legion 9 16IRX8 | |
| Asus ROG Strix G16 G614JZ | |
| Przeciętny Intel Core i9-13980HX (1513 - 2039, n=9) | |
| Razer Blade 16 Early 2023 RTX 4090 | |
| HP Omen Transcend 16 | |
| Alienware x16 R1 | |
| Lenovo Legion Slim 5 16APH8 | |
| AIDA64 / FP64 Ray-Trace | |
| Lenovo Legion Slim 5 16APH8 | |
| Lenovo Legion 9 16IRX8 | |
| Asus ROG Strix G16 G614JZ | |
| Przeciętny Intel Core i9-13980HX (11431 - 16325, n=9) | |
| HP Omen Transcend 16 | |
| Alienware x16 R1 | |
| Razer Blade 16 Early 2023 RTX 4090 | |
| AIDA64 / CPU PhotoWorxx | |
| Razer Blade 16 Early 2023 RTX 4090 | |
| Lenovo Legion 9 16IRX8 | |
| HP Omen Transcend 16 | |
| Alienware x16 R1 | |
| Przeciętny Intel Core i9-13980HX (37069 - 52949, n=9) | |
| Asus ROG Strix G16 G614JZ | |
| Lenovo Legion Slim 5 16APH8 | |
Wydajność systemu
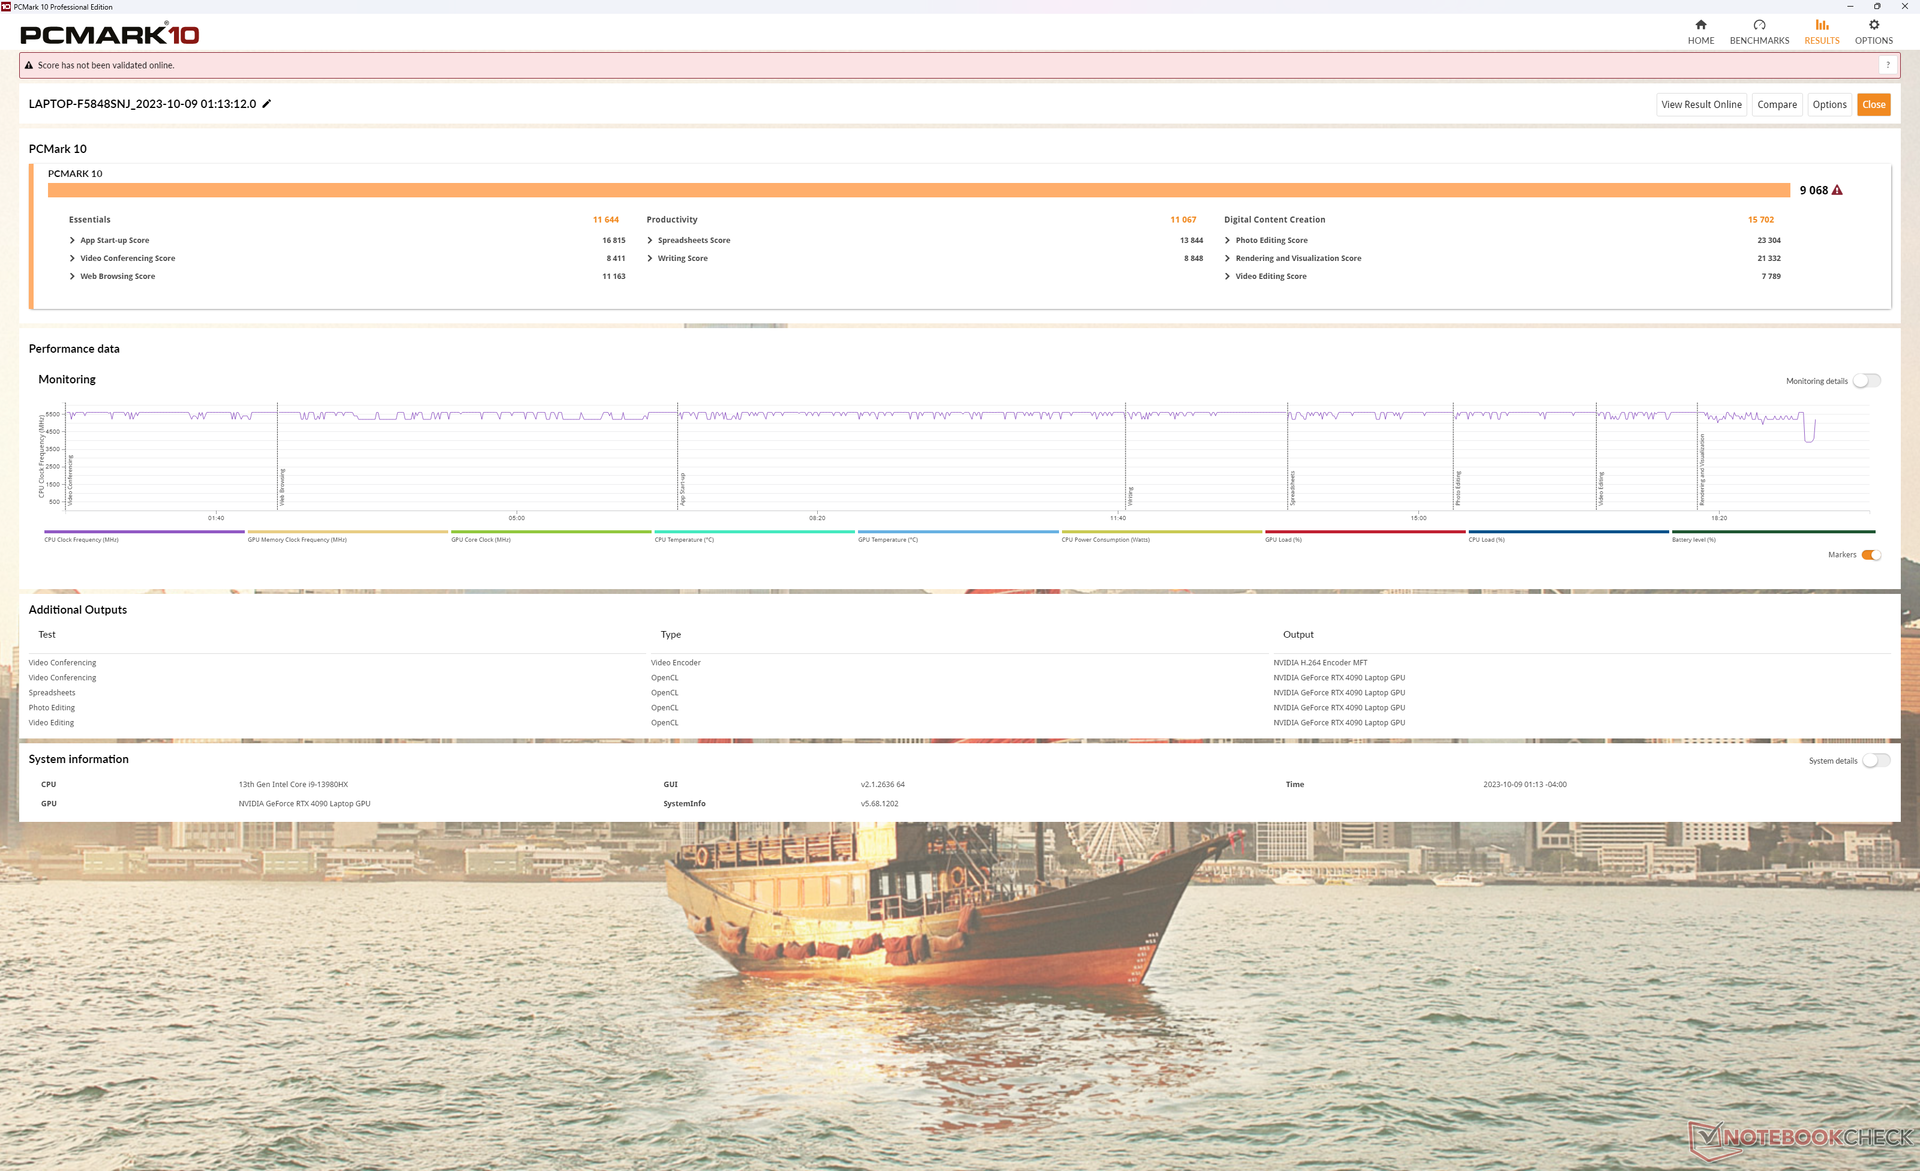
Wyniki PCMark są jednymi z najwyższych spośród wszystkich laptopów do gier, niezależnie od rozmiaru, co w dużej mierze zawdzięczamy procesorowi Core HX 13. generacji, karcie graficznej RTX 4090, a zwłaszcza konfiguracji RAID 0 PCIe4 x4. Niemniej jednak, nadal doświadczaliśmy problemów z wybudzaniem z uśpienia, w których ekran czasami pozostawał pusty i "zamrożony" przez niezwykle długi czas. Podejrzewamy, że może to być spowodowane sposobem, w jaki model żongluje między wieloma różnymi trybami GPU.
CrossMark: Overall | Productivity | Creativity | Responsiveness
| PCMark 10 / Score | |
| Lenovo Legion 9 16IRX8 | |
| Przeciętny Intel Core i9-13980HX, NVIDIA GeForce RTX 4090 Laptop GPU (8650 - 9068, n=4) | |
| Alienware x16 R1 | |
| HP Omen Transcend 16 | |
| Lenovo Legion Slim 5 16APH8 | |
| Razer Blade 16 Early 2023 RTX 4090 | |
| Asus ROG Strix G16 G614JZ | |
| PCMark 10 / Essentials | |
| Asus ROG Strix G16 G614JZ | |
| Lenovo Legion 9 16IRX8 | |
| Przeciętny Intel Core i9-13980HX, NVIDIA GeForce RTX 4090 Laptop GPU (11215 - 11644, n=3) | |
| HP Omen Transcend 16 | |
| Lenovo Legion Slim 5 16APH8 | |
| Alienware x16 R1 | |
| Razer Blade 16 Early 2023 RTX 4090 | |
| PCMark 10 / Productivity | |
| Lenovo Legion 9 16IRX8 | |
| Przeciętny Intel Core i9-13980HX, NVIDIA GeForce RTX 4090 Laptop GPU (10125 - 11067, n=3) | |
| Lenovo Legion Slim 5 16APH8 | |
| Alienware x16 R1 | |
| HP Omen Transcend 16 | |
| Razer Blade 16 Early 2023 RTX 4090 | |
| Asus ROG Strix G16 G614JZ | |
| PCMark 10 / Digital Content Creation | |
| Lenovo Legion 9 16IRX8 | |
| Przeciętny Intel Core i9-13980HX, NVIDIA GeForce RTX 4090 Laptop GPU (15052 - 16012, n=3) | |
| Alienware x16 R1 | |
| HP Omen Transcend 16 | |
| Razer Blade 16 Early 2023 RTX 4090 | |
| Lenovo Legion Slim 5 16APH8 | |
| Asus ROG Strix G16 G614JZ | |
| CrossMark / Overall | |
| Asus ROG Strix G16 G614JZ | |
| Przeciętny Intel Core i9-13980HX, NVIDIA GeForce RTX 4090 Laptop GPU (1935 - 2176, n=4) | |
| Razer Blade 16 Early 2023 RTX 4090 | |
| HP Omen Transcend 16 | |
| Alienware x16 R1 | |
| Lenovo Legion 9 16IRX8 | |
| Lenovo Legion Slim 5 16APH8 | |
| CrossMark / Productivity | |
| Asus ROG Strix G16 G614JZ | |
| Razer Blade 16 Early 2023 RTX 4090 | |
| Przeciętny Intel Core i9-13980HX, NVIDIA GeForce RTX 4090 Laptop GPU (1764 - 2005, n=4) | |
| Alienware x16 R1 | |
| HP Omen Transcend 16 | |
| Lenovo Legion 9 16IRX8 | |
| Lenovo Legion Slim 5 16APH8 | |
| CrossMark / Creativity | |
| Asus ROG Strix G16 G614JZ | |
| Przeciętny Intel Core i9-13980HX, NVIDIA GeForce RTX 4090 Laptop GPU (2267 - 2469, n=4) | |
| HP Omen Transcend 16 | |
| Lenovo Legion 9 16IRX8 | |
| Razer Blade 16 Early 2023 RTX 4090 | |
| Alienware x16 R1 | |
| Lenovo Legion Slim 5 16APH8 | |
| CrossMark / Responsiveness | |
| Asus ROG Strix G16 G614JZ | |
| Alienware x16 R1 | |
| Razer Blade 16 Early 2023 RTX 4090 | |
| Przeciętny Intel Core i9-13980HX, NVIDIA GeForce RTX 4090 Laptop GPU (1556 - 1904, n=4) | |
| Lenovo Legion 9 16IRX8 | |
| HP Omen Transcend 16 | |
| Lenovo Legion Slim 5 16APH8 | |
| PCMark 10 Score | 9068 pkt. | |
Pomoc | ||
| AIDA64 / Memory Copy | |
| Razer Blade 16 Early 2023 RTX 4090 | |
| Lenovo Legion 9 16IRX8 | |
| HP Omen Transcend 16 | |
| Alienware x16 R1 | |
| Przeciętny Intel Core i9-13980HX (62189 - 80776, n=9) | |
| Lenovo Legion Slim 5 16APH8 | |
| Asus ROG Strix G16 G614JZ | |
| AIDA64 / Memory Read | |
| Lenovo Legion 9 16IRX8 | |
| Razer Blade 16 Early 2023 RTX 4090 | |
| HP Omen Transcend 16 | |
| Przeciętny Intel Core i9-13980HX (62624 - 89096, n=9) | |
| Asus ROG Strix G16 G614JZ | |
| Alienware x16 R1 | |
| Lenovo Legion Slim 5 16APH8 | |
| AIDA64 / Memory Write | |
| Alienware x16 R1 | |
| Lenovo Legion Slim 5 16APH8 | |
| Razer Blade 16 Early 2023 RTX 4090 | |
| Lenovo Legion 9 16IRX8 | |
| HP Omen Transcend 16 | |
| Przeciętny Intel Core i9-13980HX (59912 - 79917, n=9) | |
| Asus ROG Strix G16 G614JZ | |
| AIDA64 / Memory Latency | |
| Alienware x16 R1 | |
| Lenovo Legion Slim 5 16APH8 | |
| HP Omen Transcend 16 | |
| Asus ROG Strix G16 G614JZ | |
| Przeciętny Intel Core i9-13980HX (79.4 - 93.2, n=9) | |
| Razer Blade 16 Early 2023 RTX 4090 | |
| Lenovo Legion 9 16IRX8 | |
* ... im mniej tym lepiej
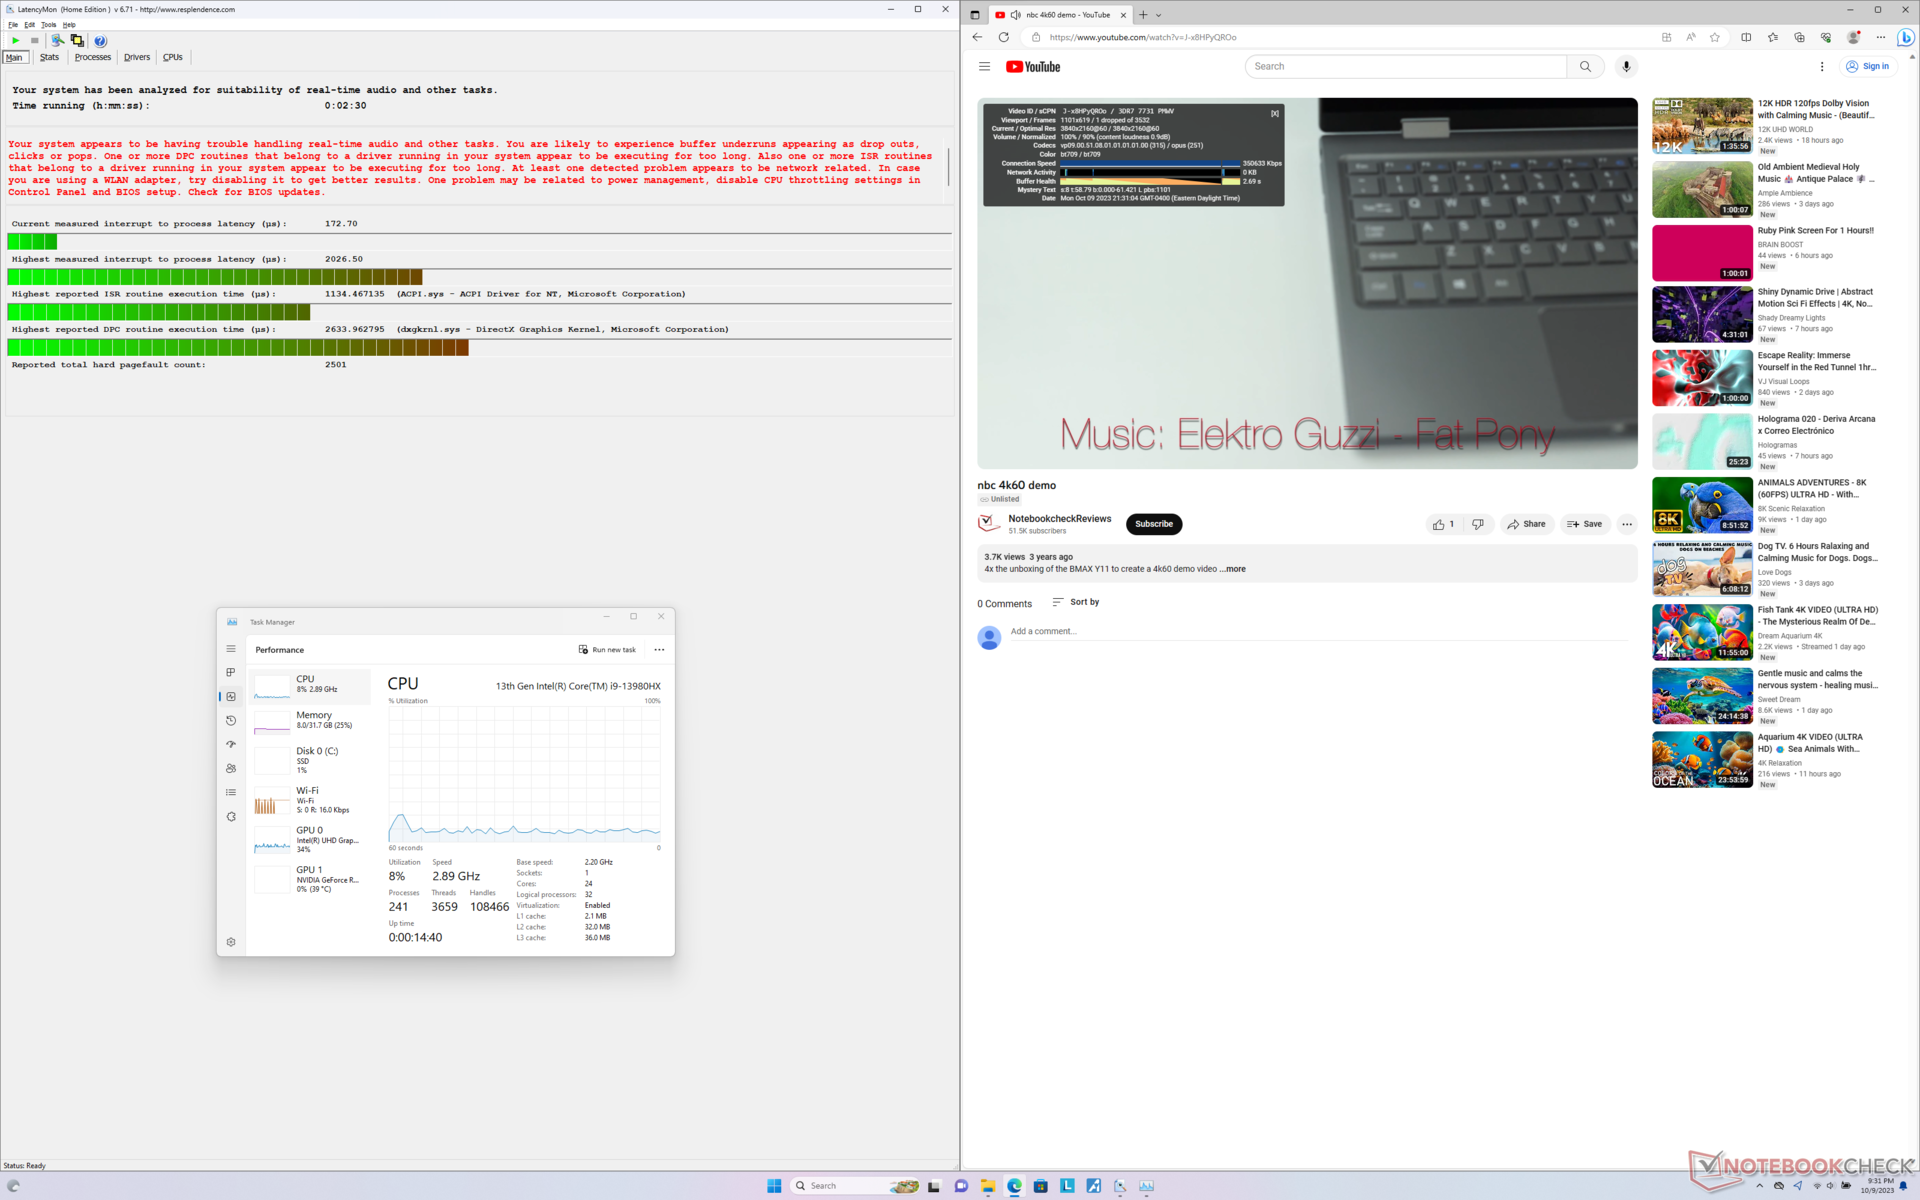
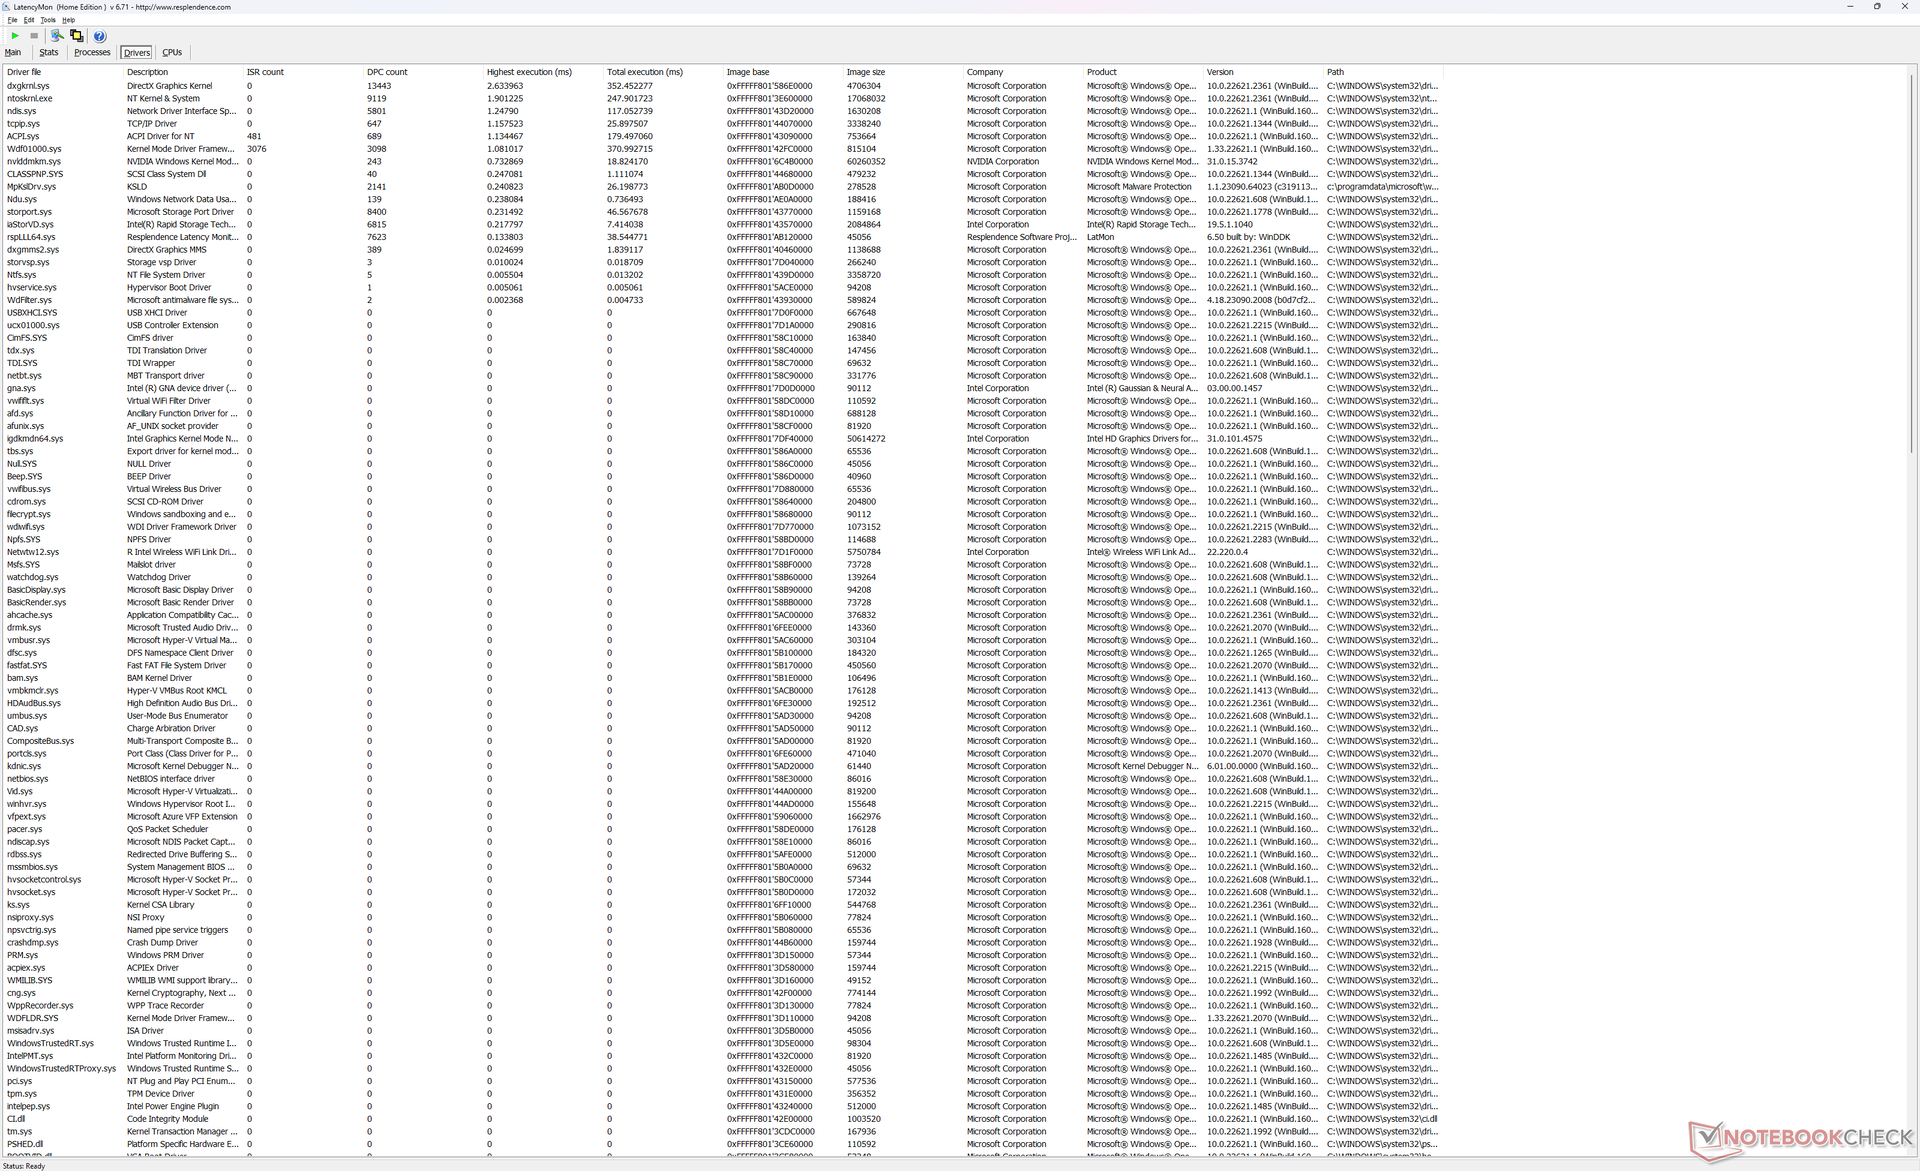
Opóźnienie DPC
LatencyMon ujawnia problemy z DPC podczas otwierania wielu kart przeglądarki na naszej stronie głównej. odtwarzanie wideo 4K przy 60 FPS jest prawie idealne, z zaledwie jedną spadającą klatką zarejestrowaną podczas jednominutowego interwału.
| DPC Latencies / LatencyMon - interrupt to process latency (max), Web, Youtube, Prime95 | |
| Razer Blade 16 Early 2023 RTX 4090 | |
| Razer Blade 16 Early 2023 RTX 4090 | |
| Asus ROG Strix G16 G614JZ | |
| Lenovo Legion 9 16IRX8 | |
| HP Omen Transcend 16 | |
| Alienware x16 R1 | |
| Lenovo Legion Slim 5 16APH8 | |
* ... im mniej tym lepiej
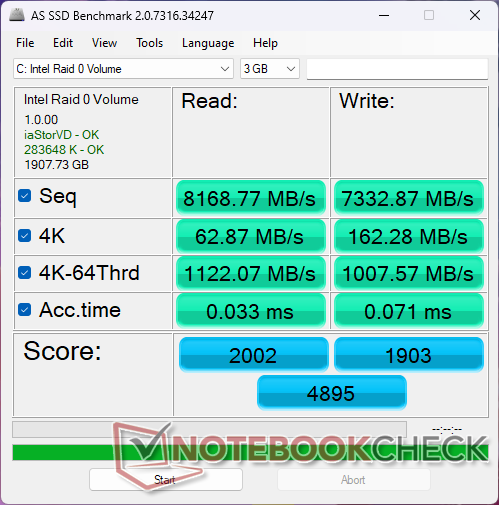
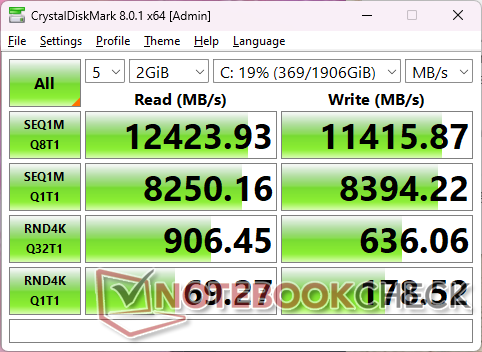
Urządzenia pamięci masowej
Nasze urządzenie jest skonfigurowane z dwoma SK hynix HFS001TEJ9X115N PCIe4 x4 NVMe SSD w konfiguracji RAID 0 w celu uzyskania niesamowicie szybkich sekwencyjnych prędkości odczytu i zapisu, odpowiednio ponad 12000 MB/s i 11000 MB/s. Niestety, dyski te są podatne na throttling podczas pracy z tak wysokimi prędkościami przez dłuższy czas. Wyniki naszego testu DiskSpd w pętli poniżej pokazują, że prędkość odczytu dla jednego z dysków spada do około 4600 MB/s po około 4 minutach.

| Drive Performance rating - Percent | |
| Alienware x16 R1 | |
| Lenovo Legion 9 16IRX8 | |
| Razer Blade 16 Early 2023 RTX 4090 | |
| Asus ROG Strix G16 G614JZ | |
| HP Omen Transcend 16 | |
| Lenovo Legion Slim 5 16APH8 | |
* ... im mniej tym lepiej
Disk Throttling: DiskSpd Read Loop, Queue Depth 8
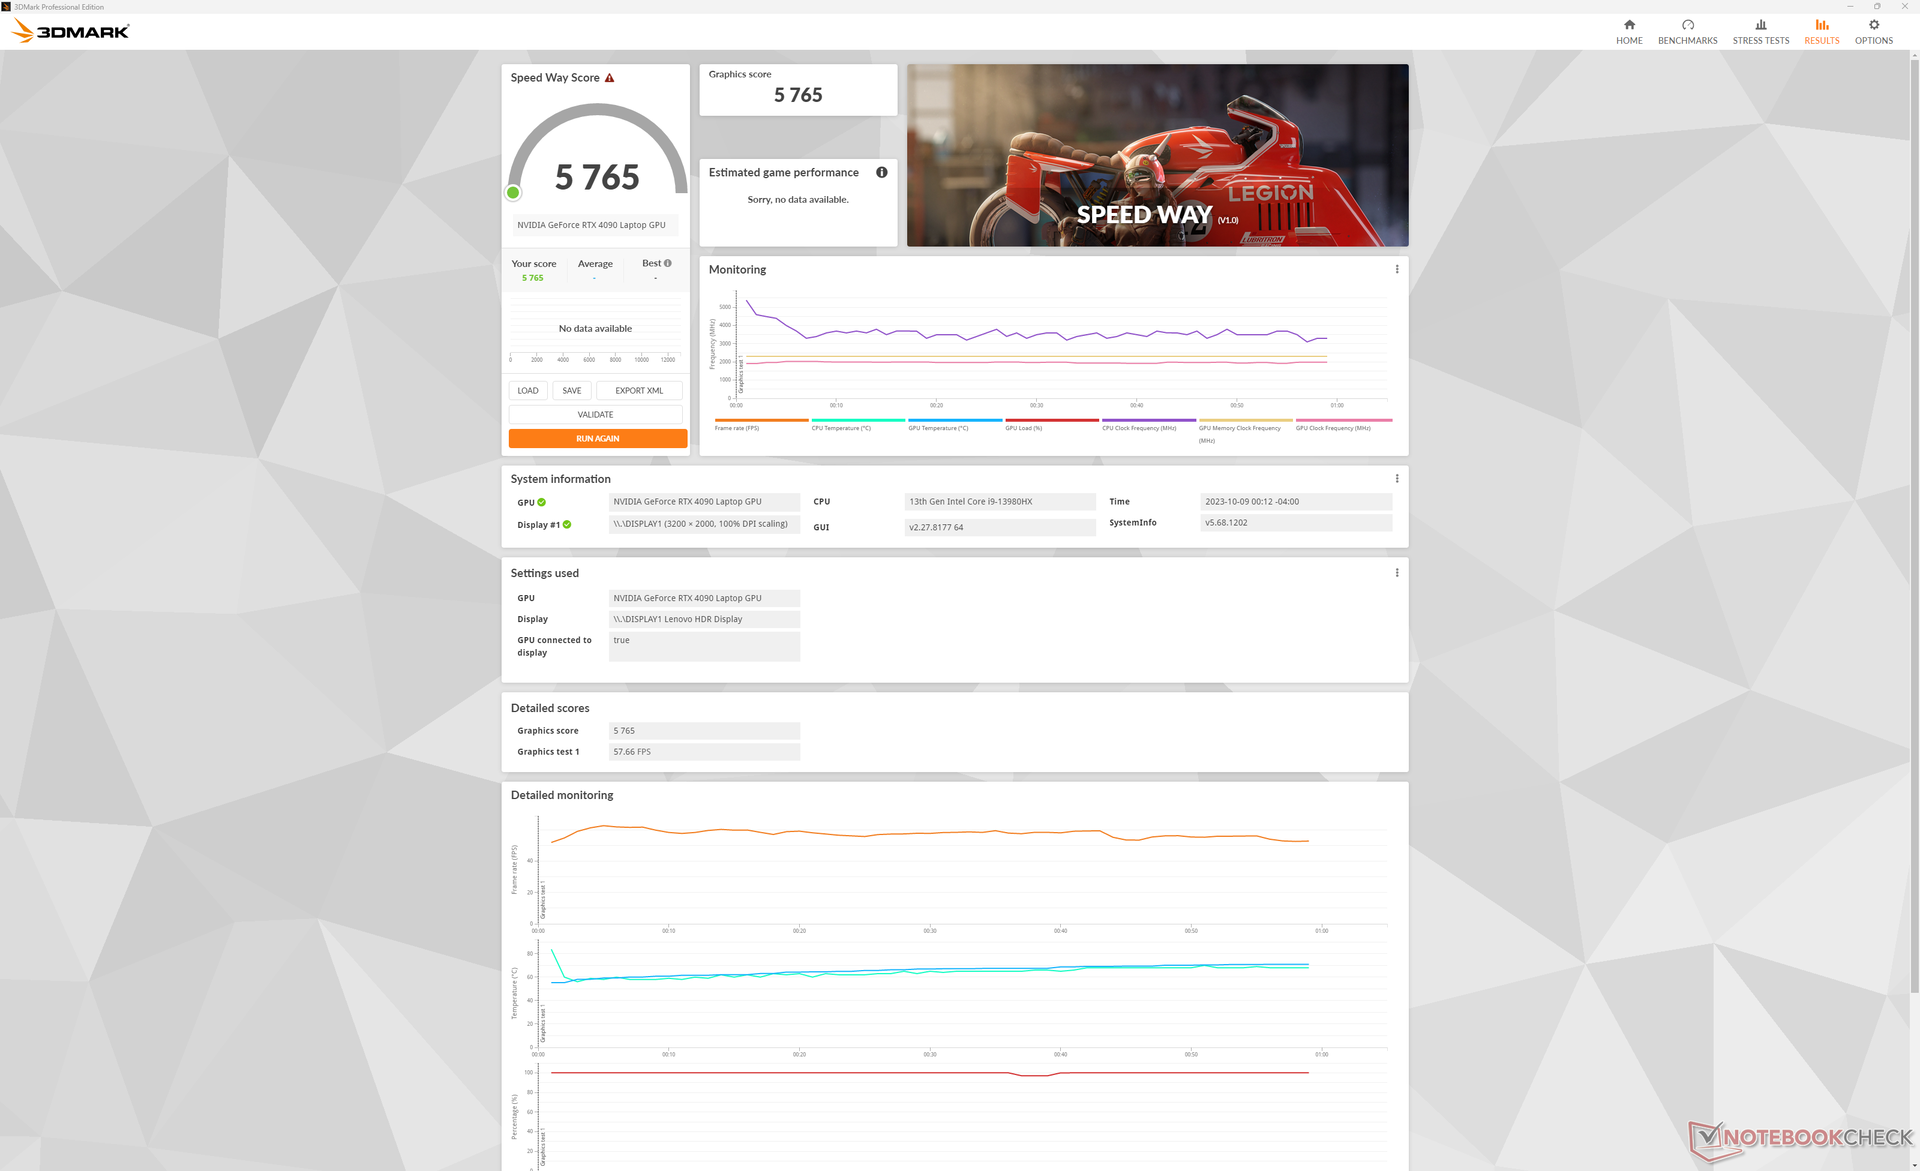
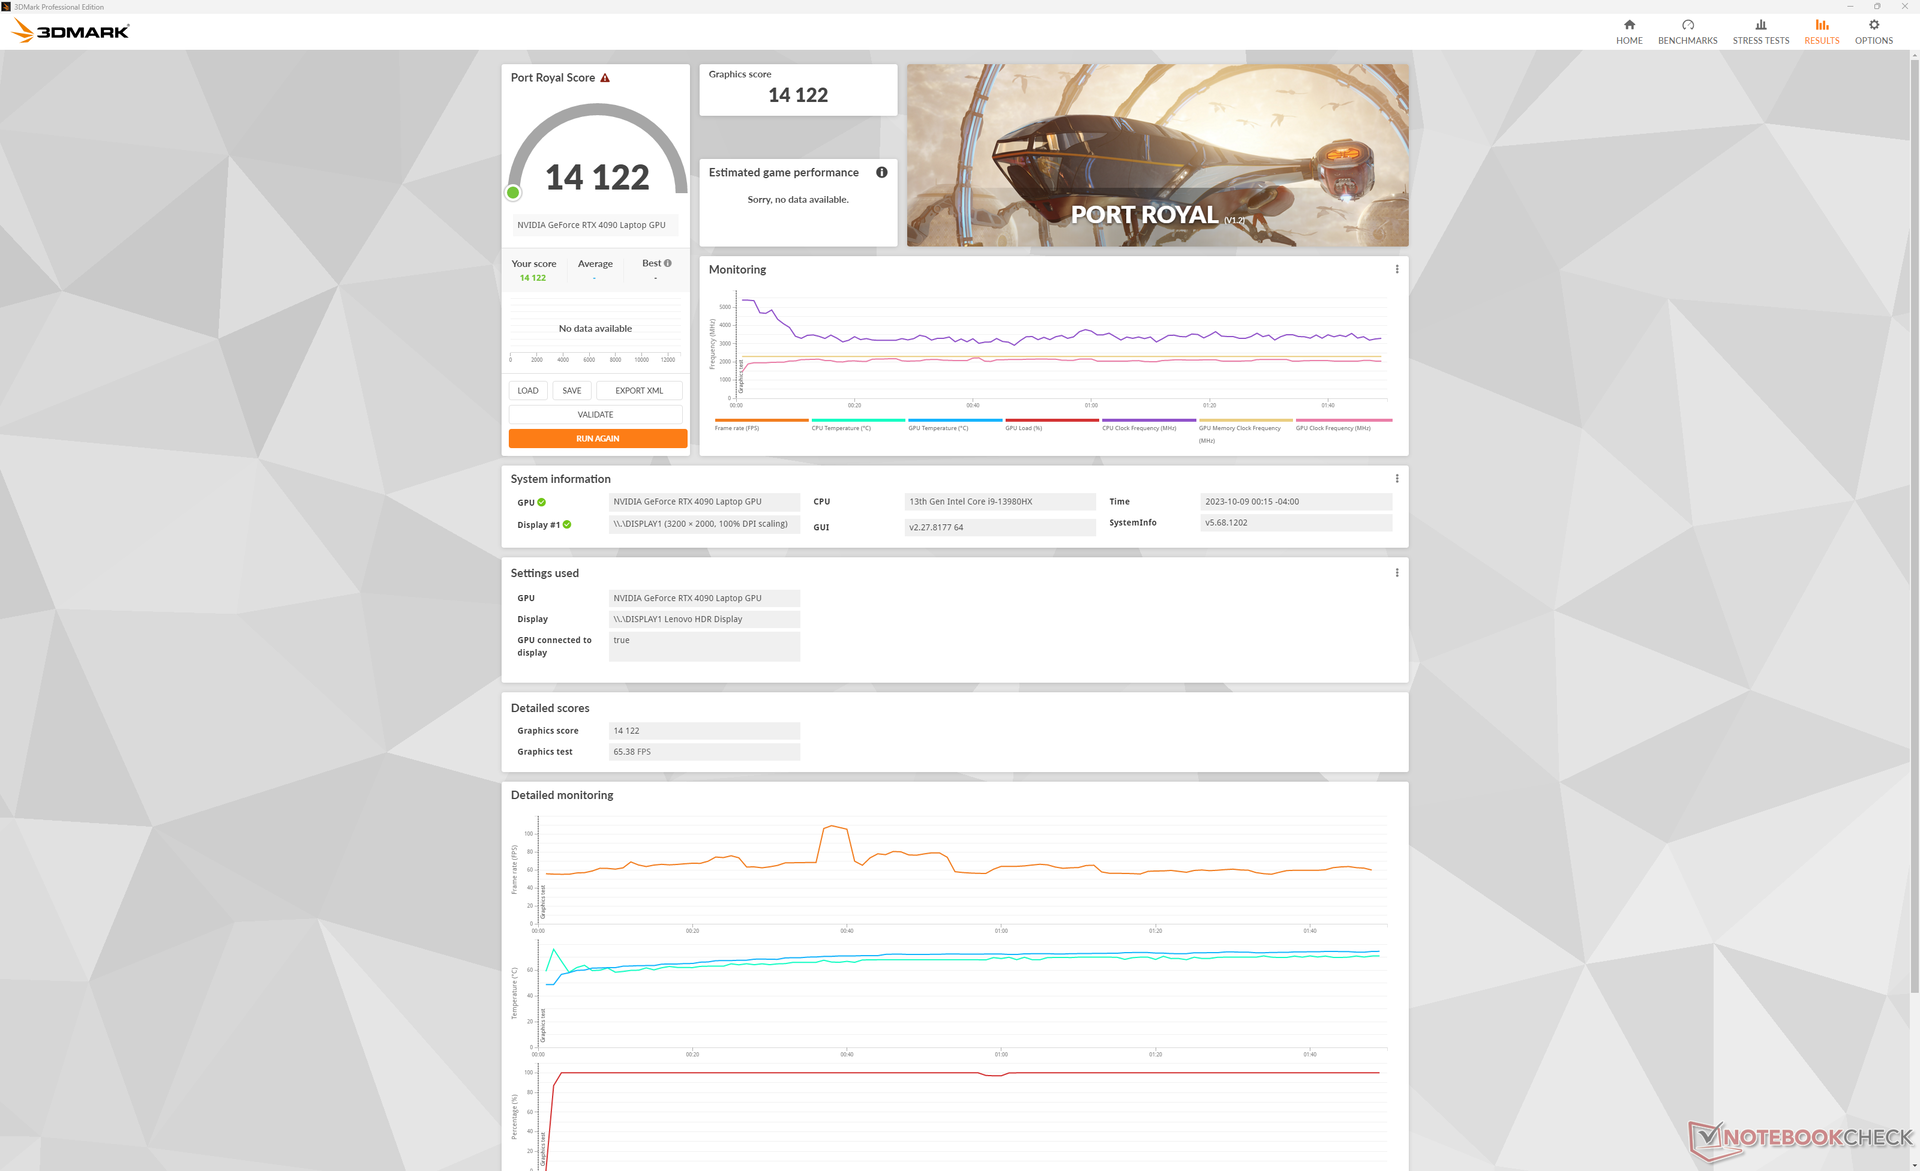
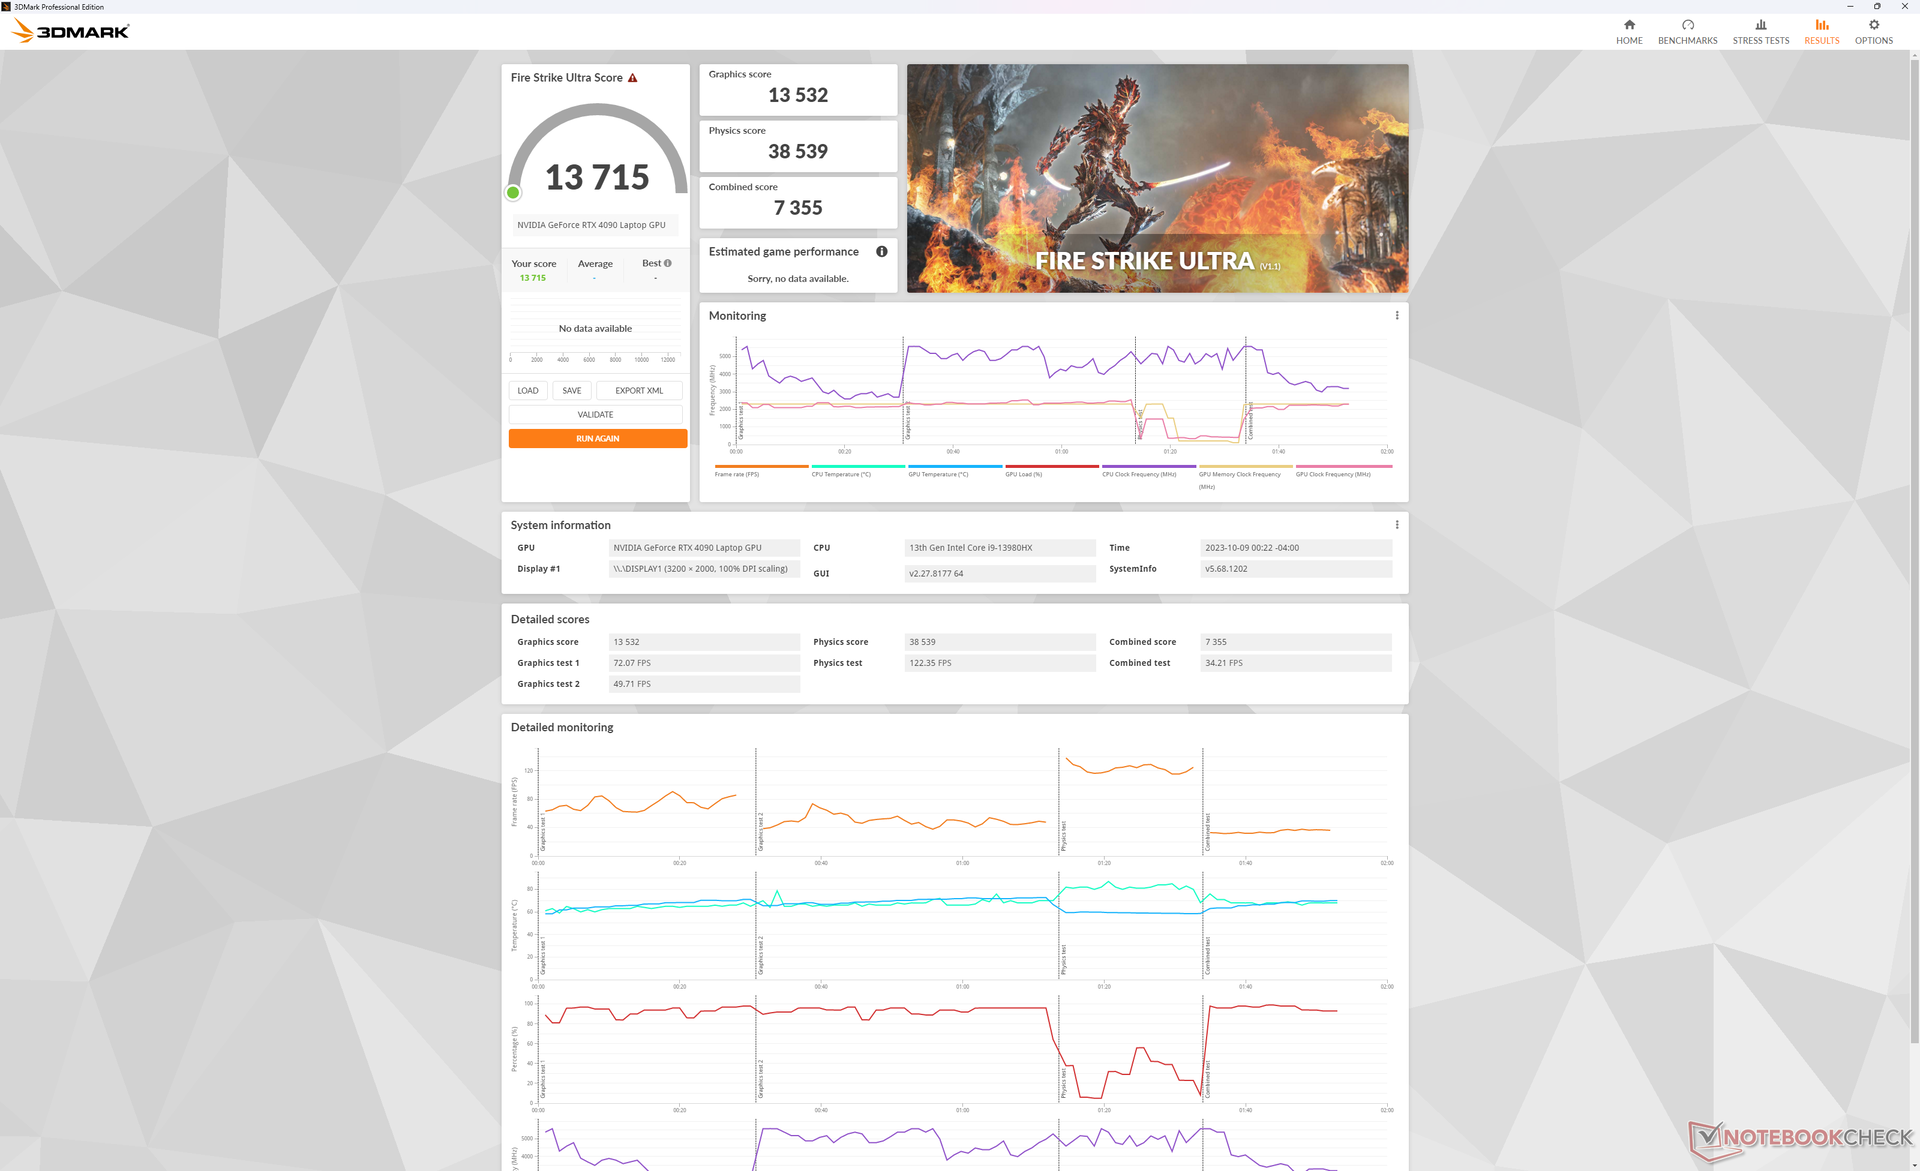
Wydajność GPU - Grafika TGP 175 W
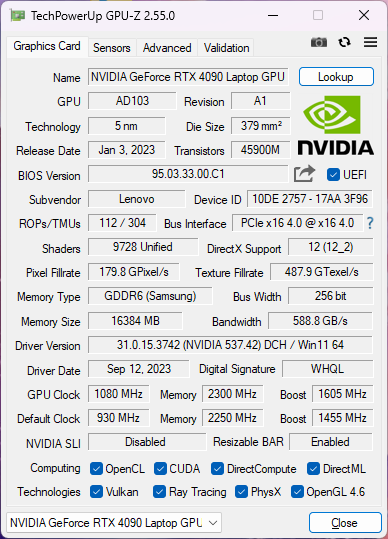
Nasz 175 W mobilna GeForce RTX 4090 osiąga wyniki o zaledwie 1 do 2 punktów procentowych lepsze od przeciętnego laptopa w naszej bazie danych z tym samym GPU. Wyniki są imponujące, biorąc pod uwagę, jak duże mogą być niektóre laptopy z RTX 4090, takie jakMSI Raider GE78 HX 13VI.
Patrząc z szerszej perspektywy, mobilny RTX 4090 jest o około 40 procent wolniejszy niż "właściwy" stacjonarny RTX 4090. W rzeczywistości oferuje tylko skromne korzyści, wynoszące od 5 do 10 procent w porównaniu do mobilną konfiguracją RTX 4080 konfiguracja.
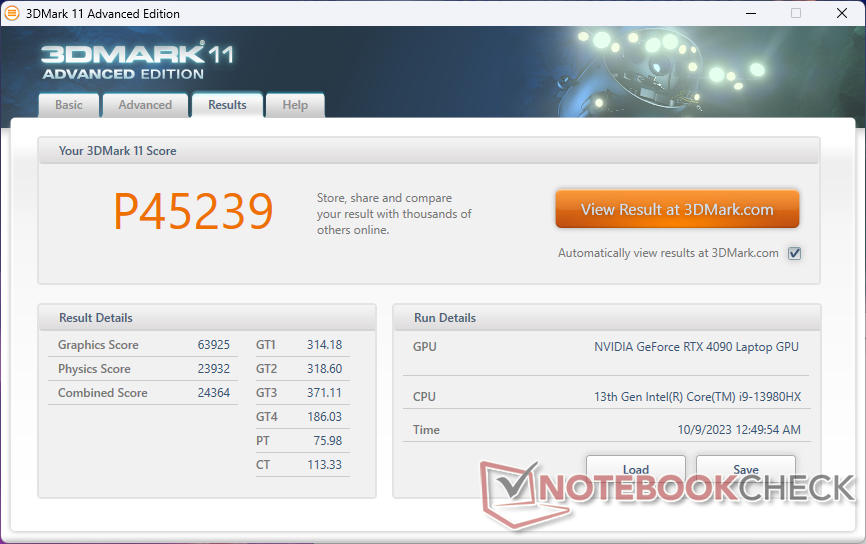
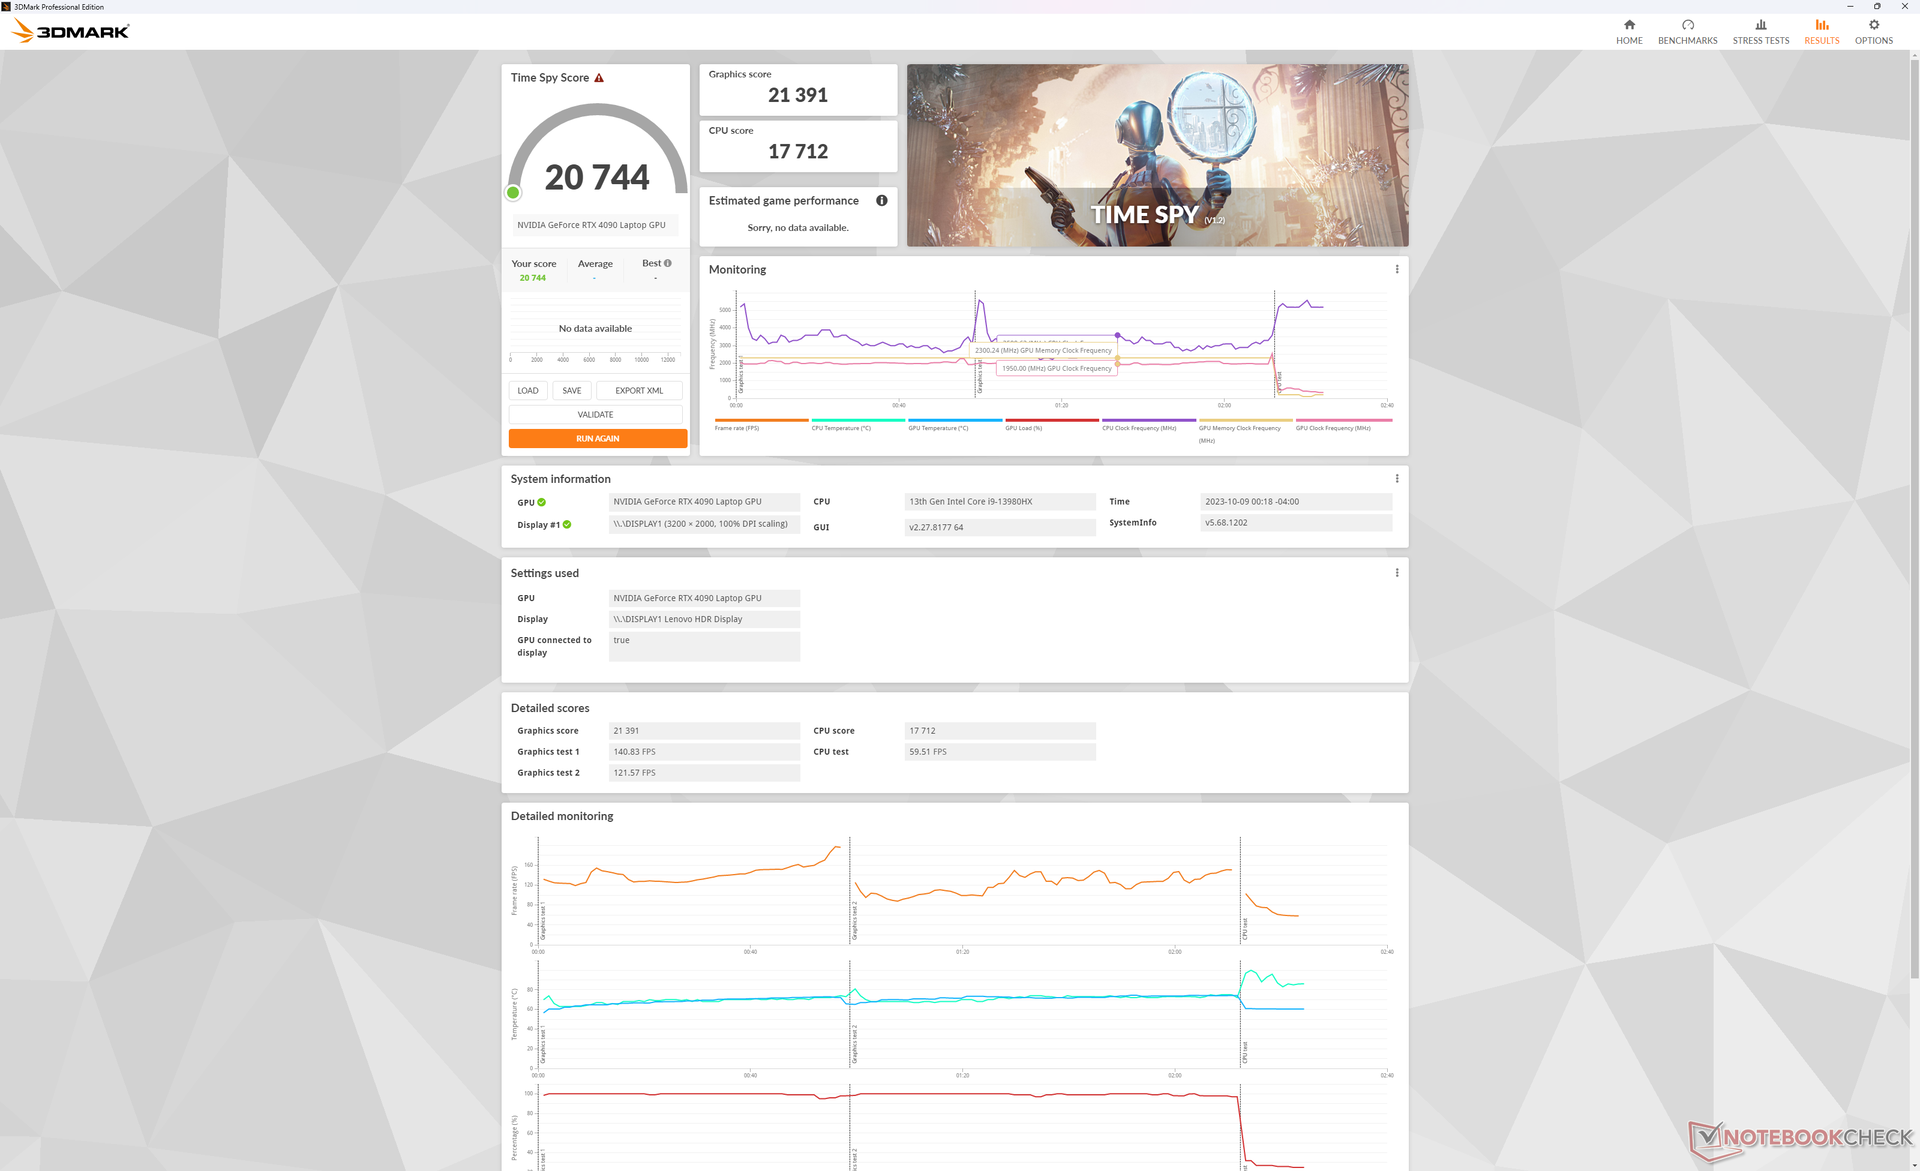
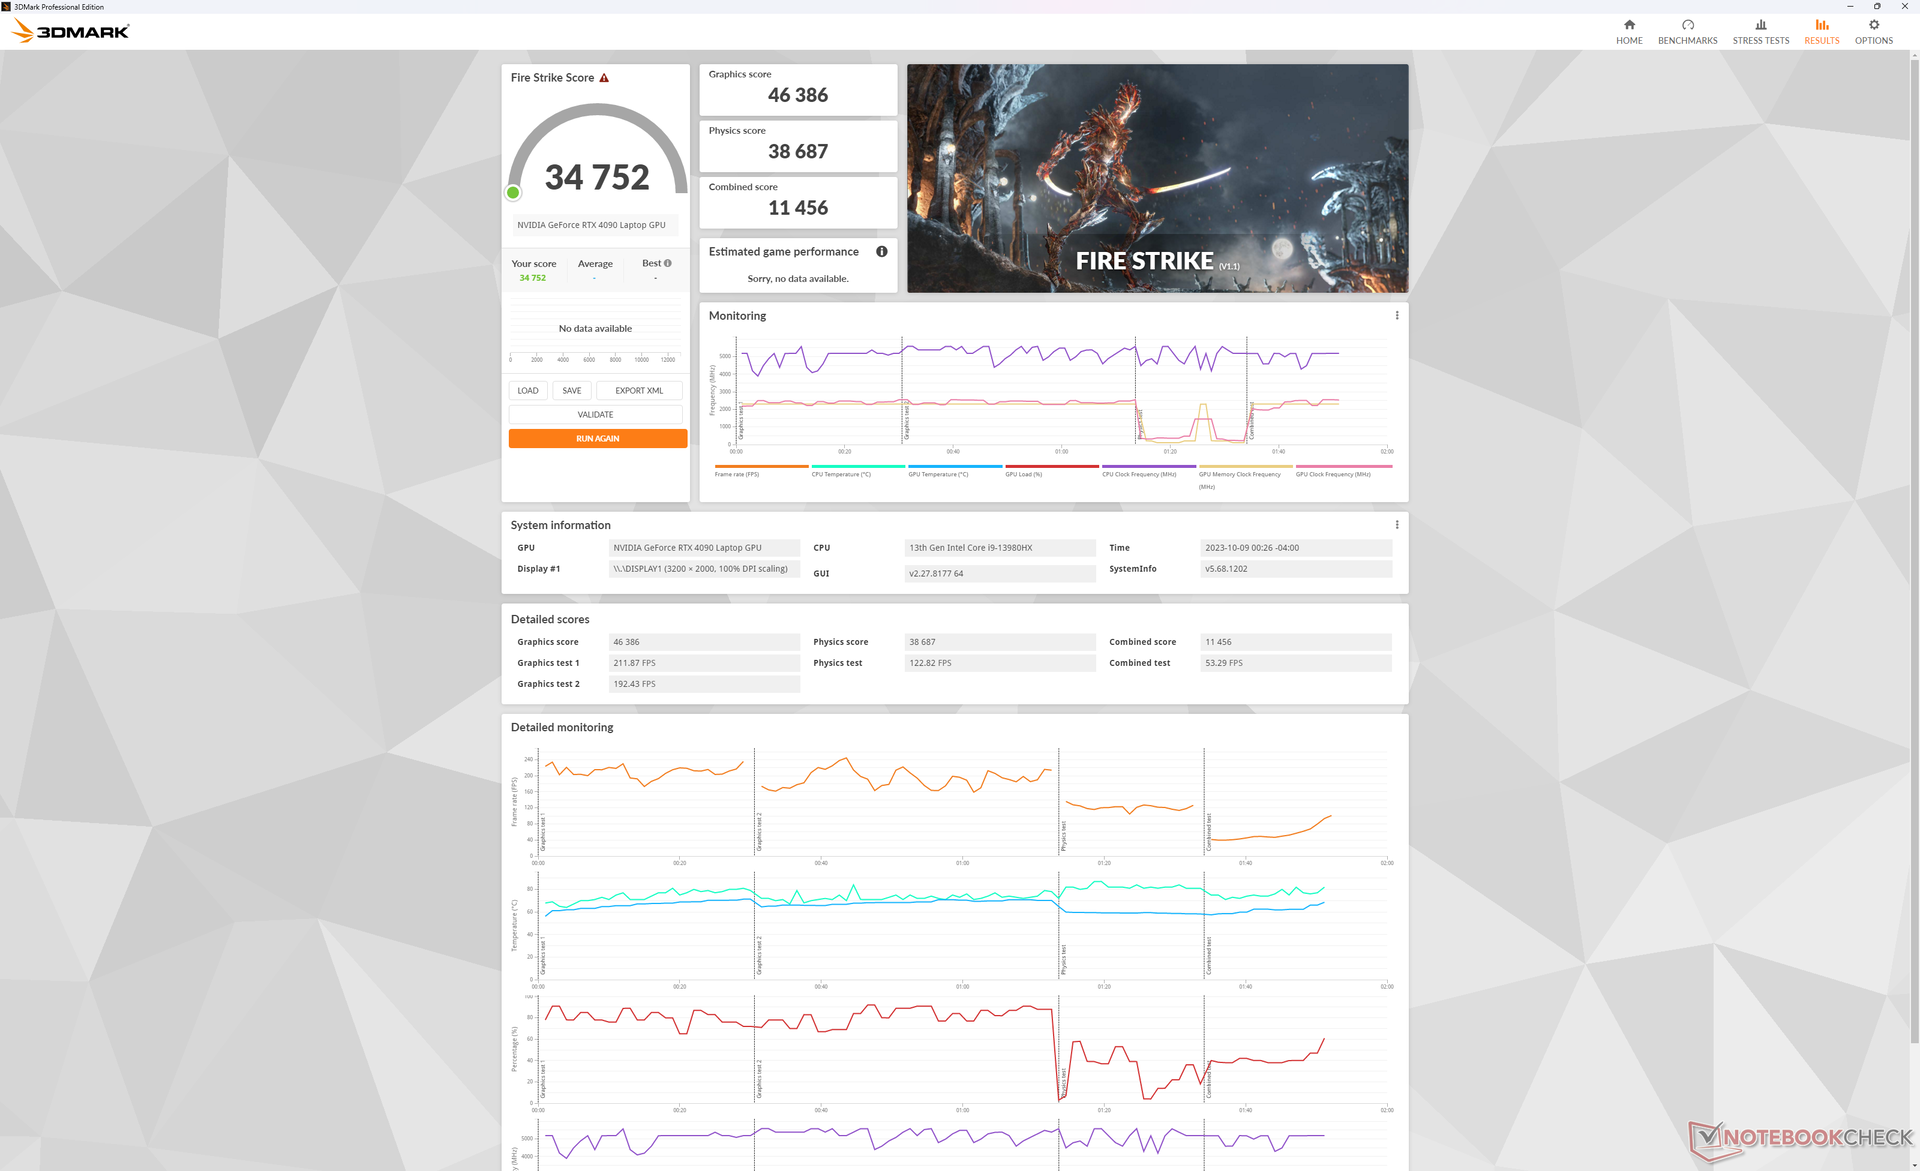
Uruchomienie na zrównoważonym profilu zasilania z wyłączonym podkręcaniem zmniejszyłoby wydajność graficzną o około 17 procent, zgodnie z naszą tabelą wyników Fire Strike poniżej.
| Profil zasilania | Wynik grafiki | Wynik fizyki | Wynik łączny |
| Tryb wydajności | 46386 | 38687 | 11456 |
| Tryb zrównoważony (z wyłączonym podkręcaniem GPU) | 38285 (-17%) | 39020 (-0%) | 12715 (-0%) |
| Zasilanie bateryjne | 22176 (-52%) | 21072 (-46%) | 6306 (-45%) |
| 3DMark Performance rating - Percent | |
| AMD Ryzen 9 7950X3D | |
| NVIDIA GeForce RTX 4080 Founders Edition | |
| Lenovo Legion 9 16IRX8 | |
| Przeciętny NVIDIA GeForce RTX 4090 Laptop GPU | |
| Alienware m16 R1 AMD | |
| Lenovo Legion 7 16IAX7-82TD004SGE -2! | |
| HP Omen Transcend 16 | |
| MSI Raider GE68HX 13VF | |
| HP Omen 16-b1090ng -1! | |
| Acer Predator Helios Neo 16 NH.QLTEG.002 -2! | |
| Dell G16 7620 -1! | |
| 3DMark 11 Performance | 45239 pkt. | |
| 3DMark Fire Strike Score | 34752 pkt. | |
| 3DMark Time Spy Score | 20744 pkt. | |
Pomoc | ||
* ... im mniej tym lepiej
Wydajność w grach
Wszystkie gry działają bardzo dobrze w rozdzielczości QHD lub wyższej, w tym wymagające tytuły, takie jak Cyberpunk 2077 czy Ratchet and Clank. Proszę zauważyć, że G-Sync może być włączony tylko w trybie dGPU, ponieważ w przeciwnym razie jest wyłączony w trybie hybrydowym lub zintegrowanym.
| Ratchet & Clank Rift Apart | |
| 1920x1080 Low Preset | |
| Lenovo Legion 9 16IRX8 | |
| Przeciętny NVIDIA GeForce RTX 4090 Laptop GPU (n=1) | |
| MSI Raider GE68HX 13VF | |
| 1920x1080 Medium Preset AA:T | |
| Przeciętny NVIDIA GeForce RTX 4090 Laptop GPU (155.6 - 161.8, n=2) | |
| Lenovo Legion 9 16IRX8 | |
| MSI Raider GE68HX 13VF | |
| 1920x1080 High Preset AA:T | |
| Przeciętny NVIDIA GeForce RTX 4090 Laptop GPU (135.4 - 136.6, n=2) | |
| Lenovo Legion 9 16IRX8 | |
| MSI Raider GE68HX 13VF | |
| 1920x1080 Very High Preset AA:T | |
| Przeciętny NVIDIA GeForce RTX 4090 Laptop GPU (111.1 - 115.4, n=2) | |
| Lenovo Legion 9 16IRX8 | |
| MSI Raider GE68HX 13VF | |
| 2560x1440 Very High Preset AA:T | |
| Przeciętny NVIDIA GeForce RTX 4090 Laptop GPU (98.7 - 107.1, n=2) | |
| Lenovo Legion 9 16IRX8 | |
Witcher 3 FPS Chart
| low | med. | high | ultra | QHD | |
|---|---|---|---|---|---|
| GTA V (2015) | 187.1 | 186.3 | 184.8 | 150.7 | 145.3 |
| The Witcher 3 (2015) | 671.8 | 569 | 408.2 | 208.7 | 165 |
| Dota 2 Reborn (2015) | 244 | 217 | 208 | 193.1 | |
| Final Fantasy XV Benchmark (2018) | 231 | 207 | 181.3 | 158.4 | |
| X-Plane 11.11 (2018) | 214 | 185.9 | 140.1 | ||
| Far Cry 5 (2018) | 195 | 176 | 167 | 158 | 157 |
| Strange Brigade (2018) | 487 | 409 | 390 | 387 | 312 |
| Cyberpunk 2077 1.6 (2022) | 146.9 | 142.9 | 129.5 | 131.4 | 98.8 |
| Tiny Tina's Wonderlands (2022) | 377.6 | 290.4 | 226.2 | 186.4 | 137.8 |
| F1 22 (2022) | 336 | 333 | 286 | 130.8 | 90.9 |
| Ratchet & Clank Rift Apart (2023) | 163.4 | 155.6 | 135.4 | 111.1 | 98.7 |
| Cyberpunk 2077 (2023) | 131.22 | 89.55 | |||
| Alan Wake 2 (2023) | 121.1 | 83.7 | |||
| Avatar Frontiers of Pandora (2023) | 100 | 69 |
Emisje
Hałas systemowy
Wentylatory prawie nigdy nie pracują na biegu jałowym, więc zawsze należy spodziewać się pewnego hałasu. Mają one tendencję do oscylowania wokół 30,4 dB(A) na cichym tle 23,7 dB(A) przy najczęstszych obciążeniach, takich jak przeglądanie stron internetowych lub strumieniowanie wideo, nawet po ustawieniu trybu cichego. Zakres ten jest typowy dla większości innych laptopów do gier w podobnych warunkach, ale Legion 9i 16 nie pulsuje tak często, pod warunkiem, że pracujesz w trybie Balanced iGPU lub niższym.
Hałas wentylatora znacznie wzrasta do 52,2 dB(A) podczas grania w trybie wydajności, co jest oczekiwanym zakresem dla laptopów do gier z wyższej półki. Hałas spadłby nieznacznie do 49,5 dB(A), gdyby zamiast tego grać w trybie zrównoważonym, ale proszę pamiętać o 17-procentowym deficycie grafiki w porównaniu z trybem wydajności, jak wspomniano powyżej. W obu przypadkach zalecane jest korzystanie ze słuchawek.
Hałas
| luz |
| 24 / 24 / 30.4 dB |
| obciążenie |
| 30.4 / 54.9 dB |
 | ||
30 dB cichy 40 dB(A) słyszalny 50 dB(A) irytujący |
||
min: | ||
| Lenovo Legion 9 16IRX8 GeForce RTX 4090 Laptop GPU, i9-13980HX, 2x SK Hynix HFS001TEJ9X115N (RAID 0) | Lenovo Legion Slim 5 16APH8 GeForce RTX 4060 Laptop GPU, R7 7840HS, SK hynix PC801 HFS512GEJ9X115N | Razer Blade 16 Early 2023 RTX 4090 GeForce RTX 4090 Laptop GPU, i9-13950HX, SSSTC CA6-8D1024 | Asus ROG Strix G16 G614JZ GeForce RTX 4080 Laptop GPU, i9-13980HX, WD PC SN560 SDDPNQE-1T00 | HP Omen Transcend 16 GeForce RTX 4070 Laptop GPU, i9-13900HX, SK hynix PC801 HFS002TEJ9X101N | Alienware x16 R1 GeForce RTX 4080 Laptop GPU, i9-13900HK, SK hynix PC801 HFS001TEJ9X101N | |
|---|---|---|---|---|---|---|
| Noise | 1% | 3% | -11% | -13% | -1% | |
| wyłączone / środowisko * (dB) | 23.7 | 22.9 3% | 20.84 12% | 25 -5% | 22.9 3% | 22.7 4% |
| Idle Minimum * (dB) | 24 | 23.1 4% | 23.65 1% | 26 -8% | 29.1 -21% | 23.1 4% |
| Idle Average * (dB) | 24 | 23.1 4% | 23.65 1% | 28 -17% | 29.1 -21% | 25.8 -8% |
| Idle Maximum * (dB) | 30.4 | 27.7 9% | 23.65 22% | 30 1% | 29.1 4% | 25.8 15% |
| Load Average * (dB) | 30.4 | 33.3 -10% | 43.35 -43% | 48 -58% | 45.7 -50% | 39.3 -29% |
| Witcher 3 ultra * (dB) | 52.2 | 54 -3% | 46.7 11% | 49 6% | 54.3 -4% | 49.9 4% |
| Load Maximum * (dB) | 54.9 | 54 2% | 46.72 15% | 52 5% | 54.3 1% | 54.8 -0% |
* ... im mniej tym lepiej
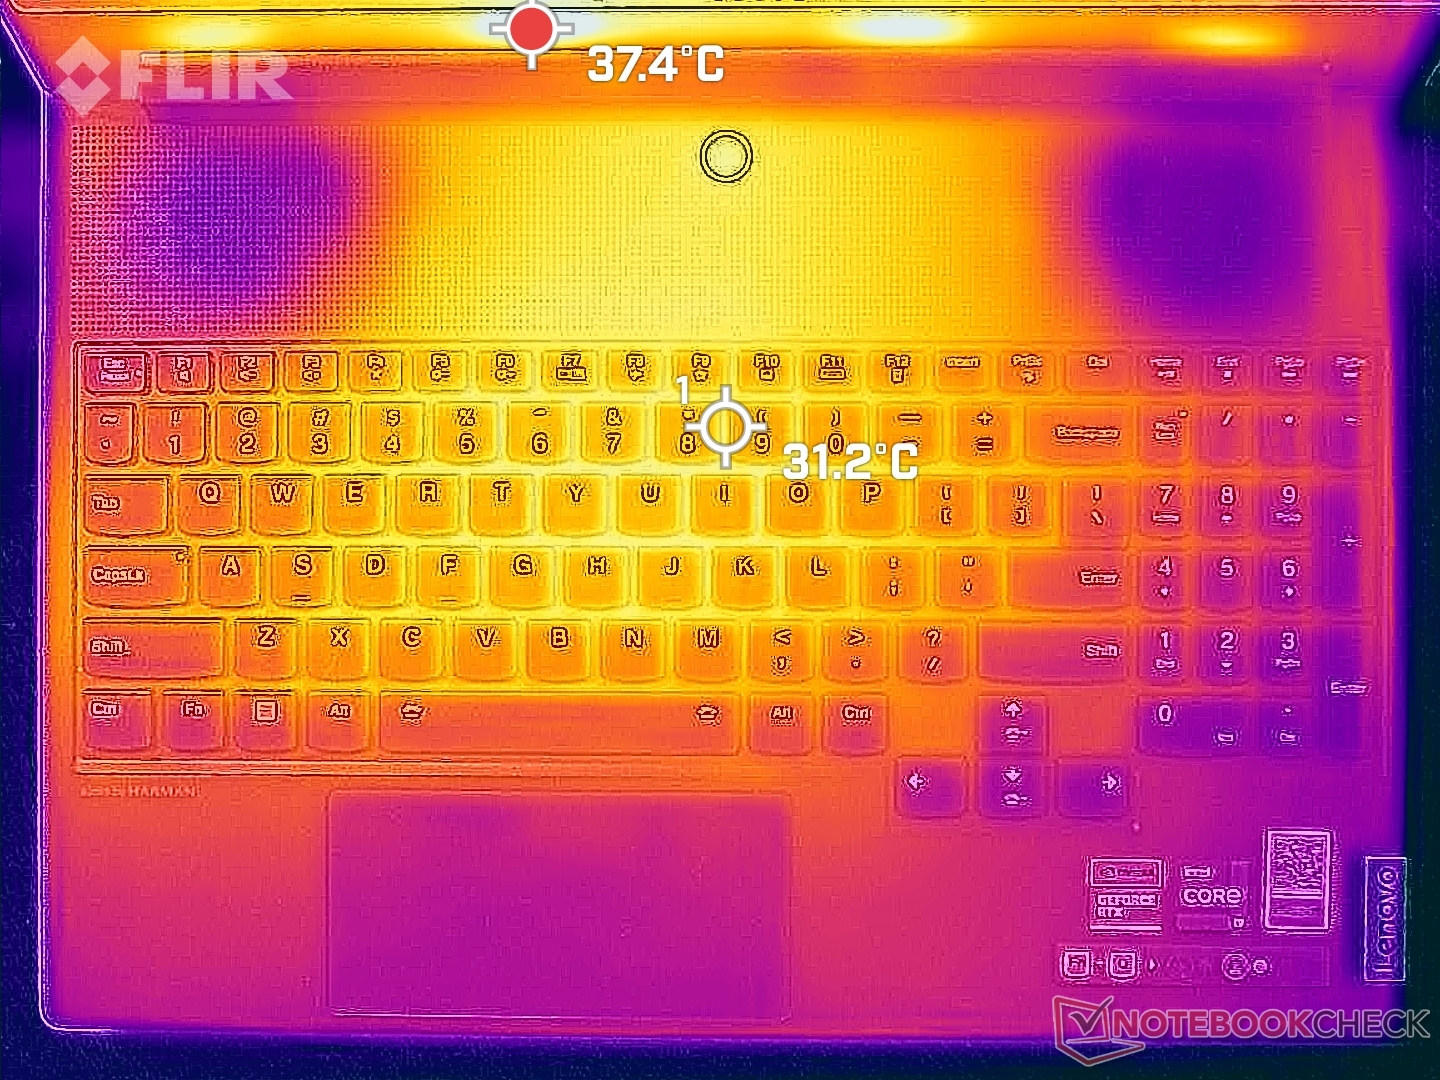
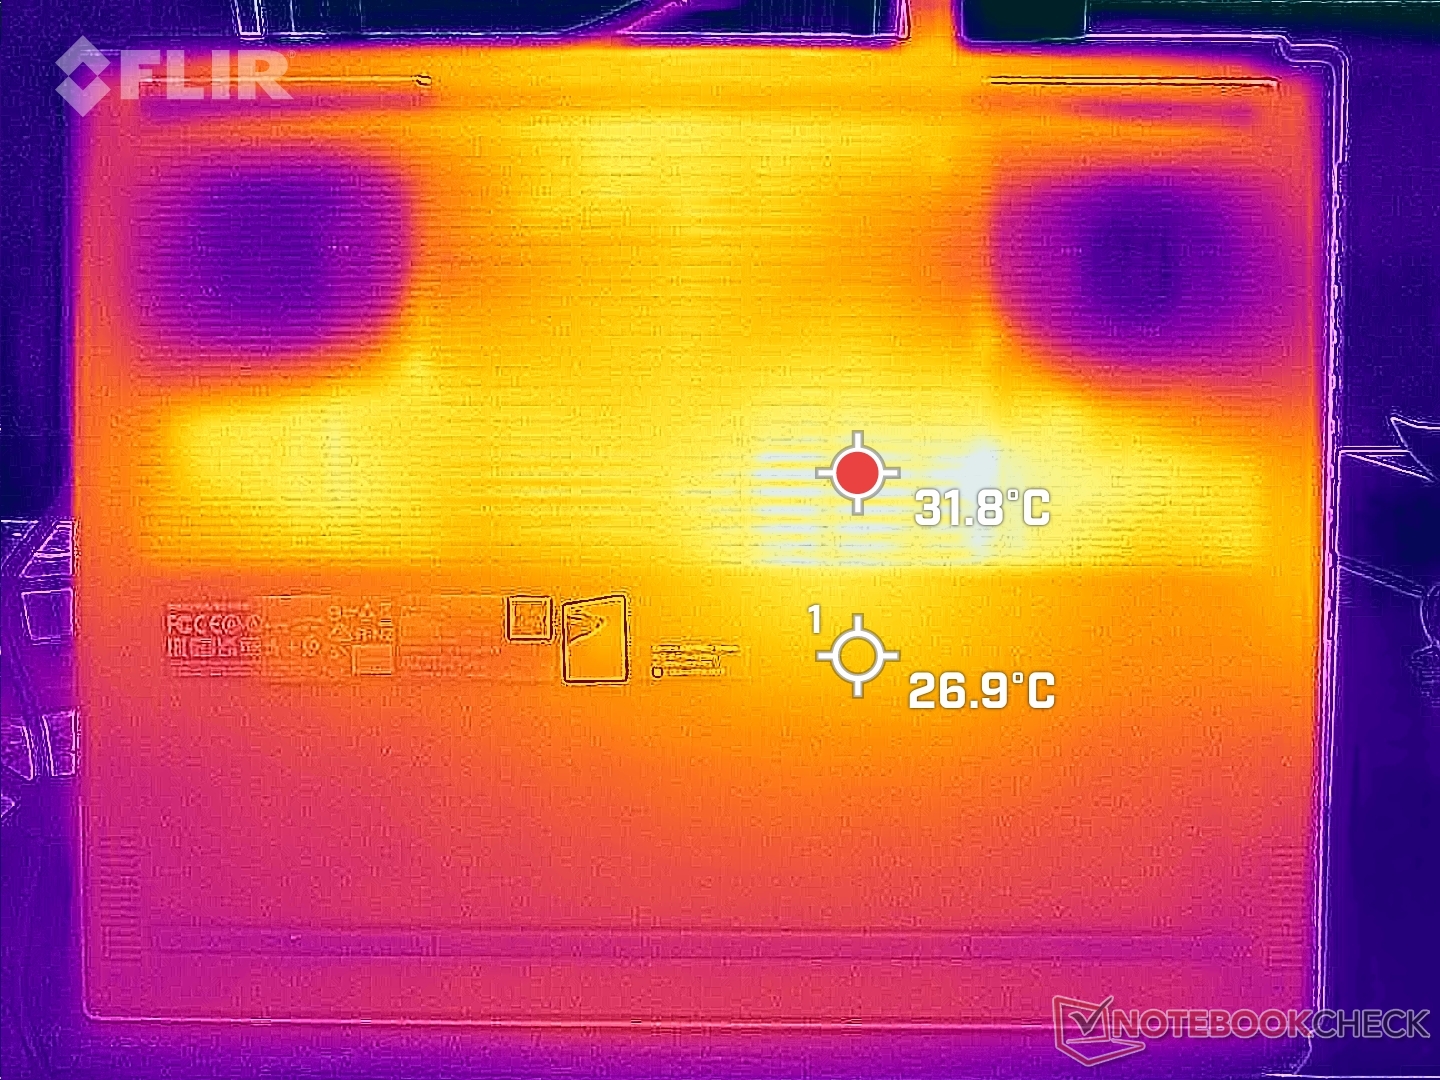
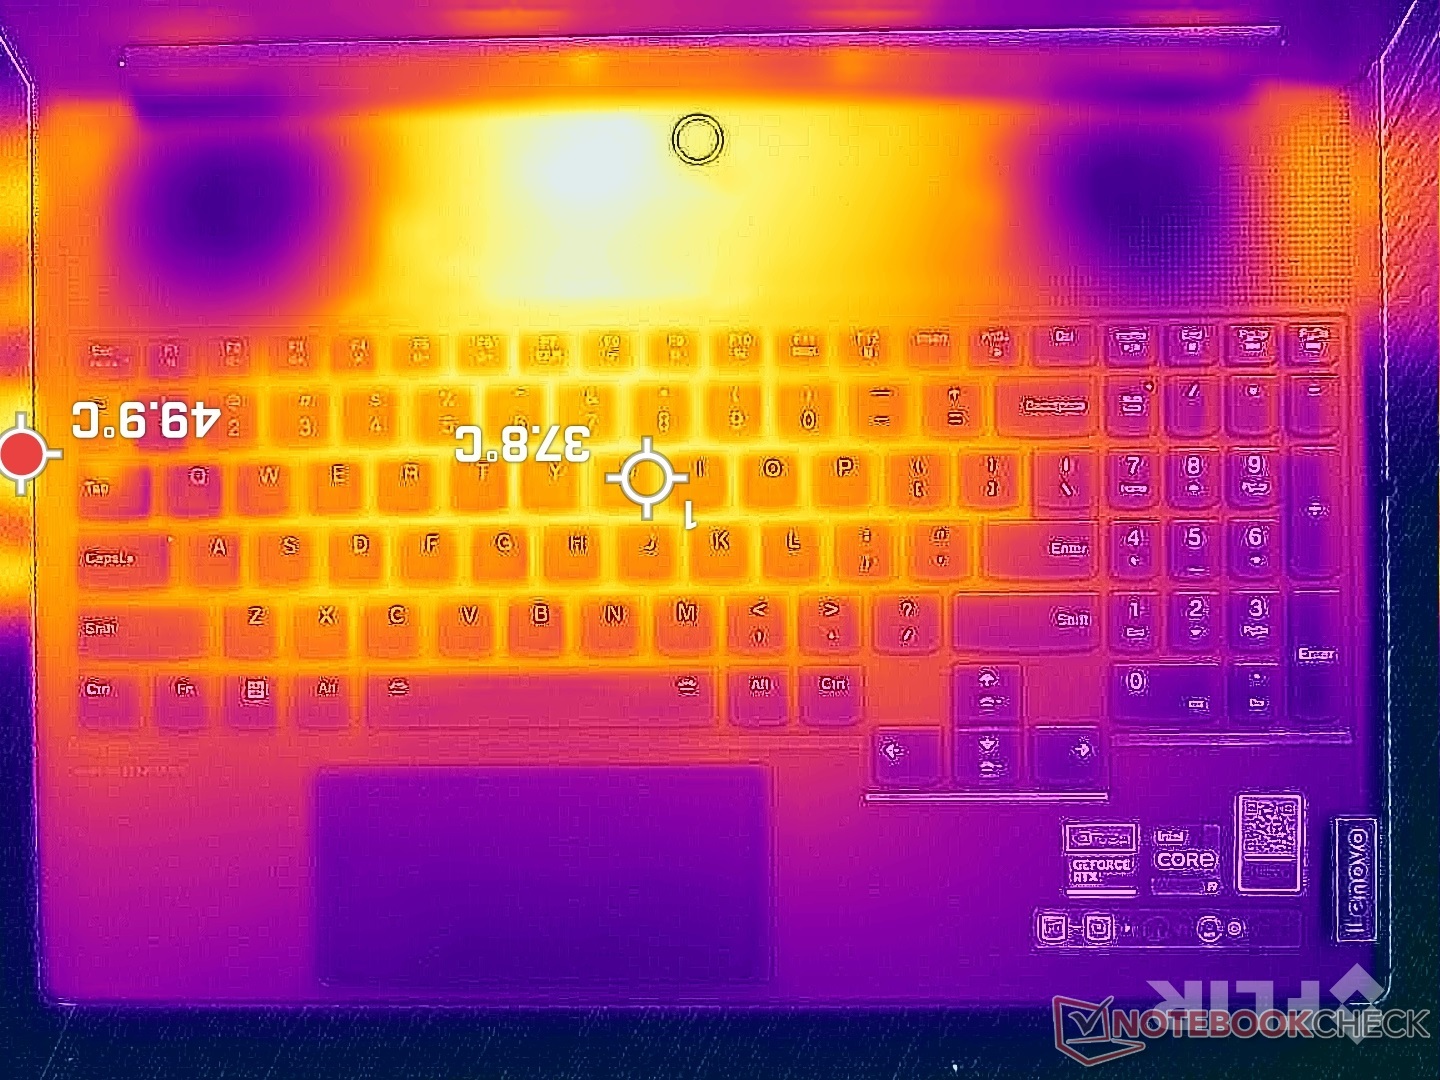
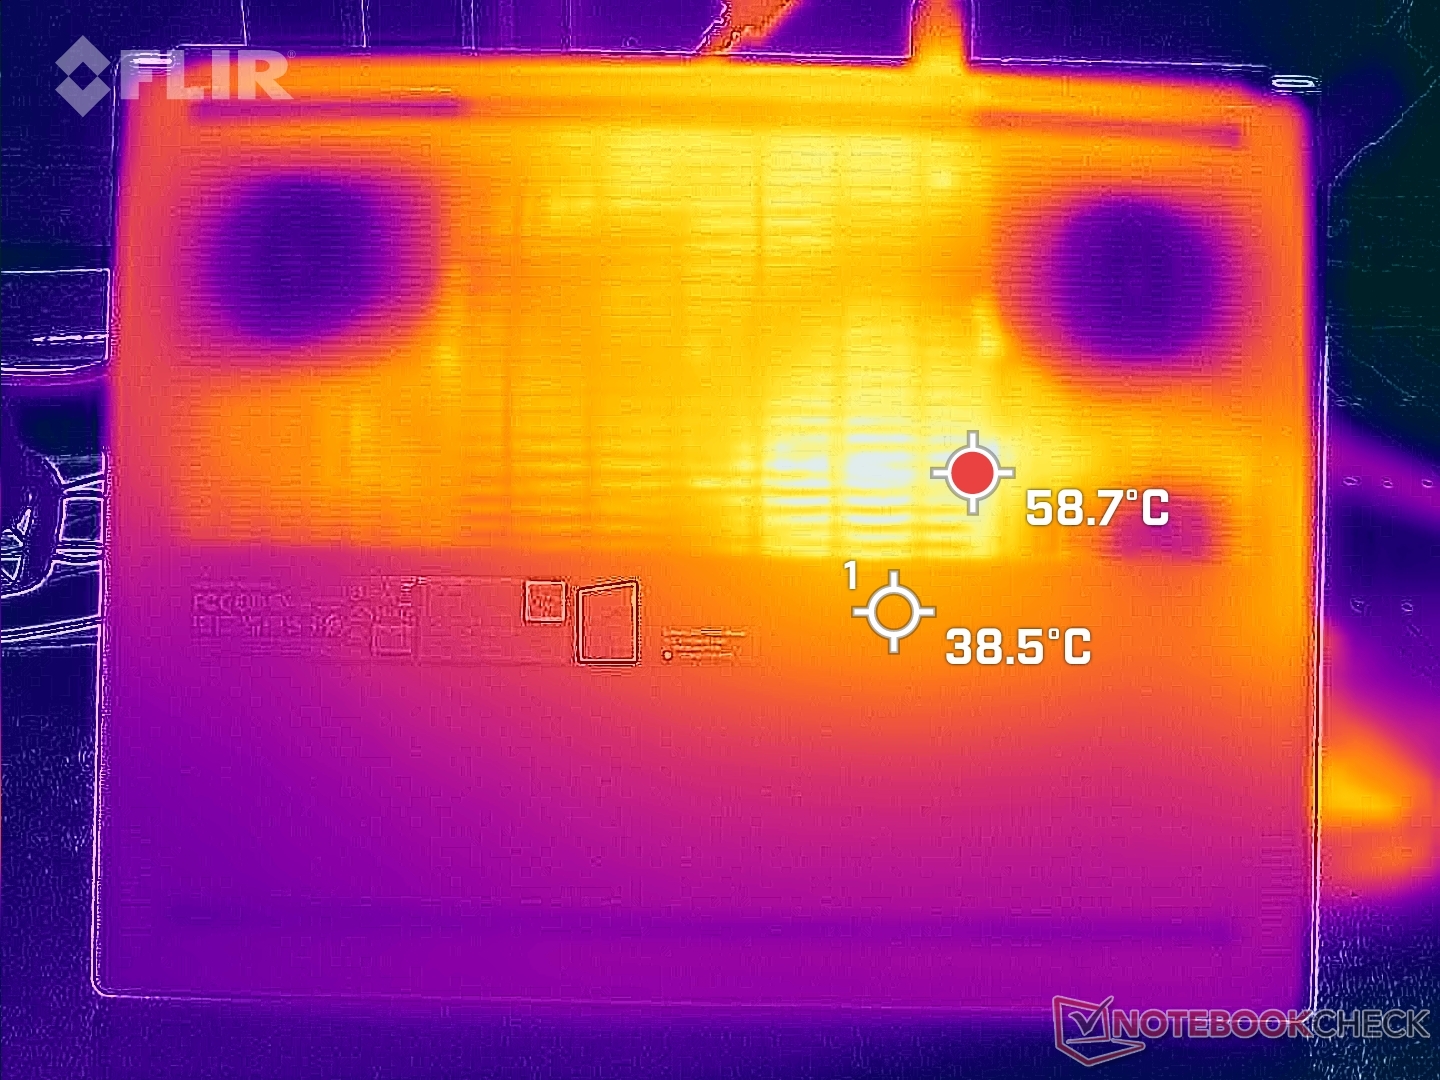
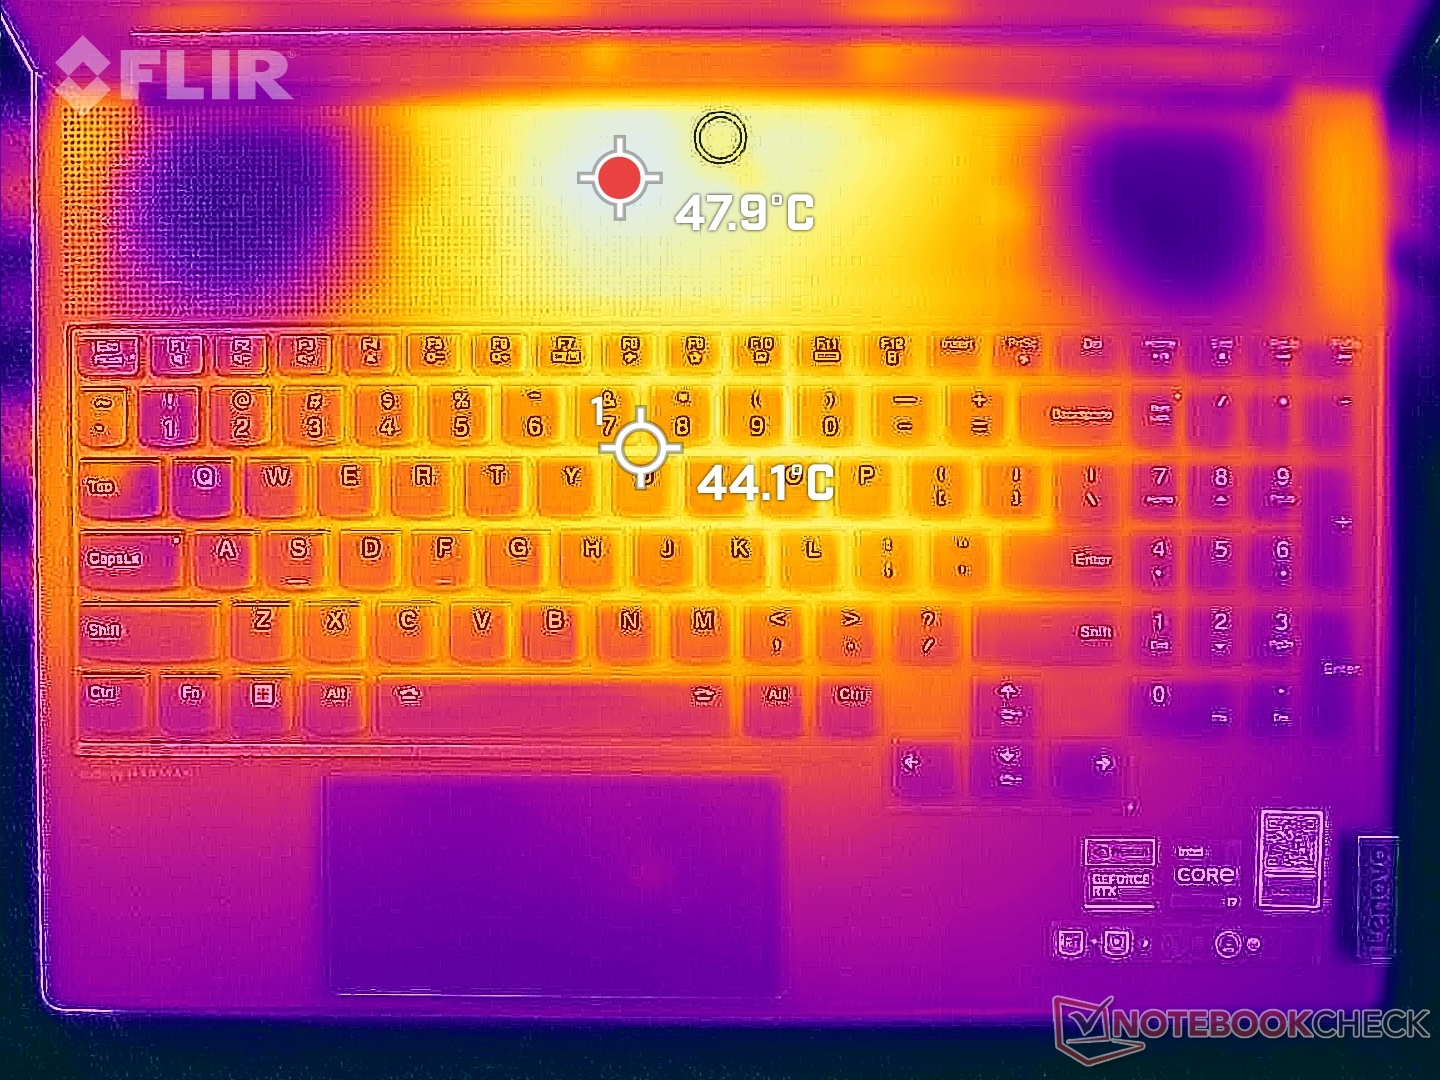
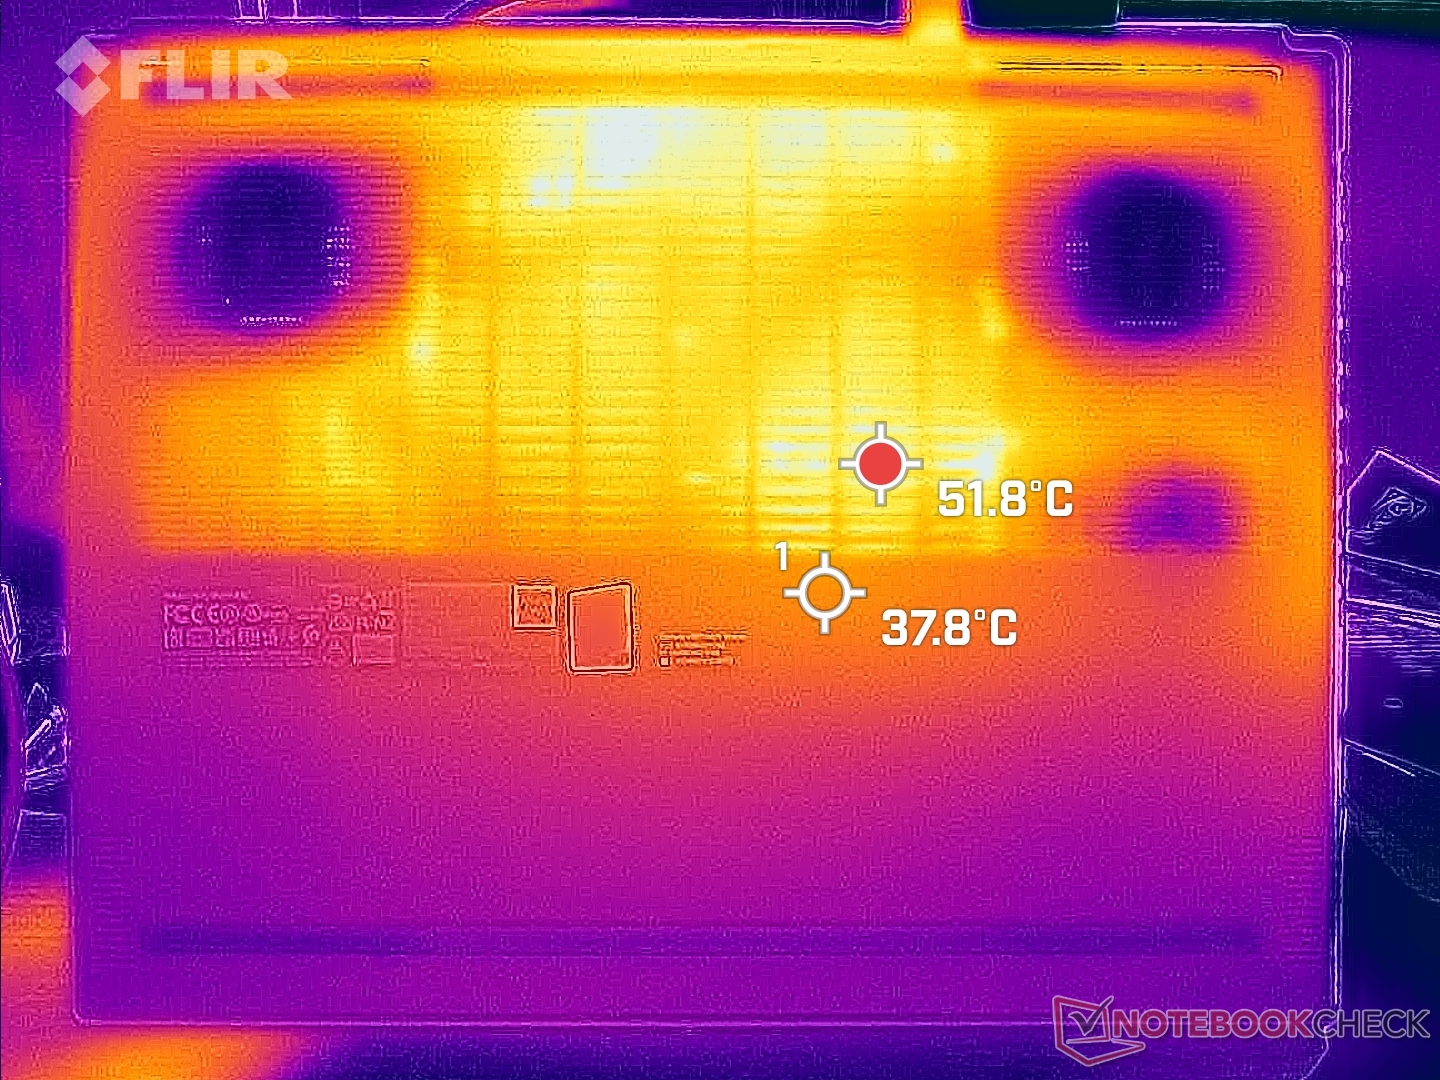
Temperatura
Temperatury powierzchni są dość wysokie, pomimo zastosowania zaawansowanej technologii termicznej. Podczas grania klawisze WASD i środek klawiatury mogą być ciepłe odpowiednio do 42 ° C i 46 ° C, co jest nieco cieplejsze niż to, co zaobserwowaliśmy na Alienware x16 R1. Wiele innych laptopów do gier, takich jak Razer Blade 16, pobiera świeże powietrze z klawiszy WASD, aby utrzymać tę część klawiatury w chłodzie, zapewniając bardziej komfortową rozgrywkę, ale tak nie jest w przypadku naszego projektu Legion 9 16, co pokazują poniższe mapy temperatur.
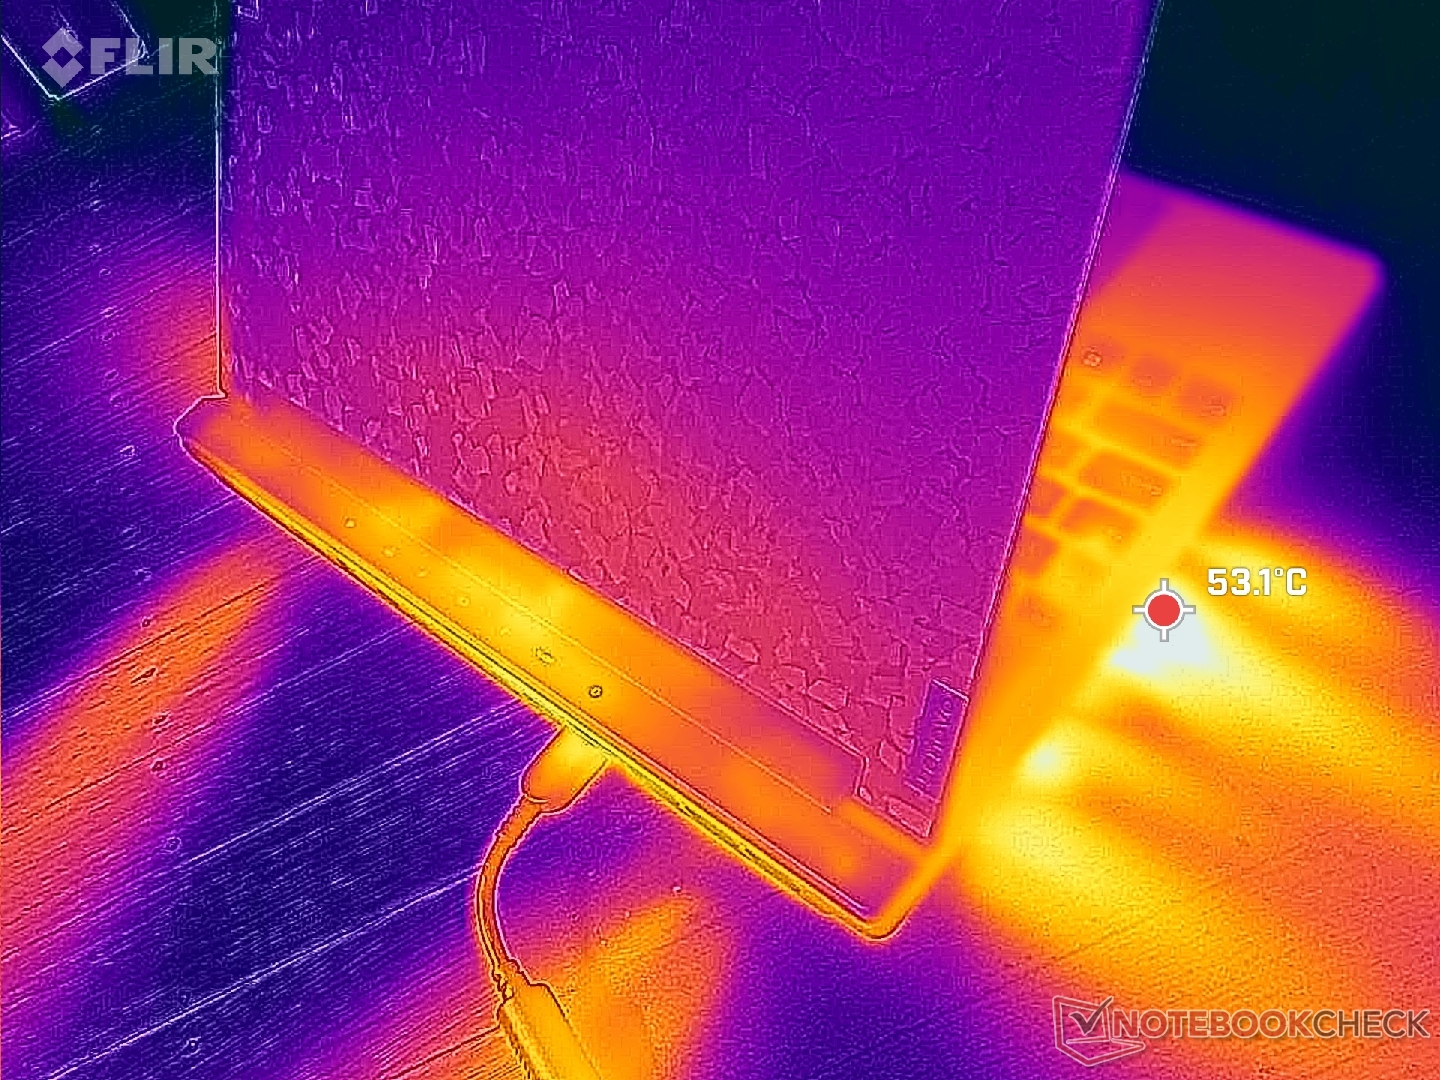
(-) Maksymalna temperatura w górnej części wynosi 49.6 °C / 121 F, w porównaniu do średniej 40.4 °C / 105 F , począwszy od 21.2 do 68.8 °C dla klasy Gaming.
(-) Dno nagrzewa się maksymalnie do 48.6 °C / 119 F, w porównaniu do średniej 43.2 °C / 110 F
(+) W stanie bezczynności średnia temperatura górnej części wynosi 30 °C / 86 F, w porównaniu ze średnią temperaturą urządzenia wynoszącą 33.9 °C / ### class_avg_f### F.
(-) Podczas gry w Wiedźmina 3 średnia temperatura górnej części wynosi 38.1 °C / 101 F, w porównaniu do średniej temperatury urządzenia wynoszącej 33.9 °C / ## #class_avg_f### F.
(+) Podparcia dłoni i touchpad osiągają maksymalną temperaturę skóry (33.6 °C / 92.5 F) i dlatego nie są gorące.
(-) Średnia temperatura obszaru podparcia dłoni w podobnych urządzeniach wynosiła 28.8 °C / 83.8 F (-4.8 °C / -8.7 F).
| Lenovo Legion 9 16IRX8 Intel Core i9-13980HX, NVIDIA GeForce RTX 4090 Laptop GPU | Lenovo Legion Slim 5 16APH8 AMD Ryzen 7 7840HS, NVIDIA GeForce RTX 4060 Laptop GPU | Razer Blade 16 Early 2023 RTX 4090 Intel Core i9-13950HX, NVIDIA GeForce RTX 4090 Laptop GPU | Asus ROG Strix G16 G614JZ Intel Core i9-13980HX, NVIDIA GeForce RTX 4080 Laptop GPU | HP Omen Transcend 16 Intel Core i9-13900HX, NVIDIA GeForce RTX 4070 Laptop GPU | Alienware x16 R1 Intel Core i9-13900HK, NVIDIA GeForce RTX 4080 Laptop GPU | |
|---|---|---|---|---|---|---|
| Heat | 18% | 2% | -1% | 5% | -2% | |
| Maximum Upper Side * (°C) | 49.6 | 40.6 18% | 52 -5% | 54 -9% | 47.4 4% | 47.2 5% |
| Maximum Bottom * (°C) | 48.6 | 42 14% | 47.6 2% | 55 -13% | 54.4 -12% | 47.8 2% |
| Idle Upper Side * (°C) | 33.2 | 27.8 16% | 33 1% | 29 13% | 28.4 14% | 36.8 -11% |
| Idle Bottom * (°C) | 34.2 | 26.6 22% | 30.6 11% | 33 4% | 29.2 15% | 35.8 -5% |
* ... im mniej tym lepiej
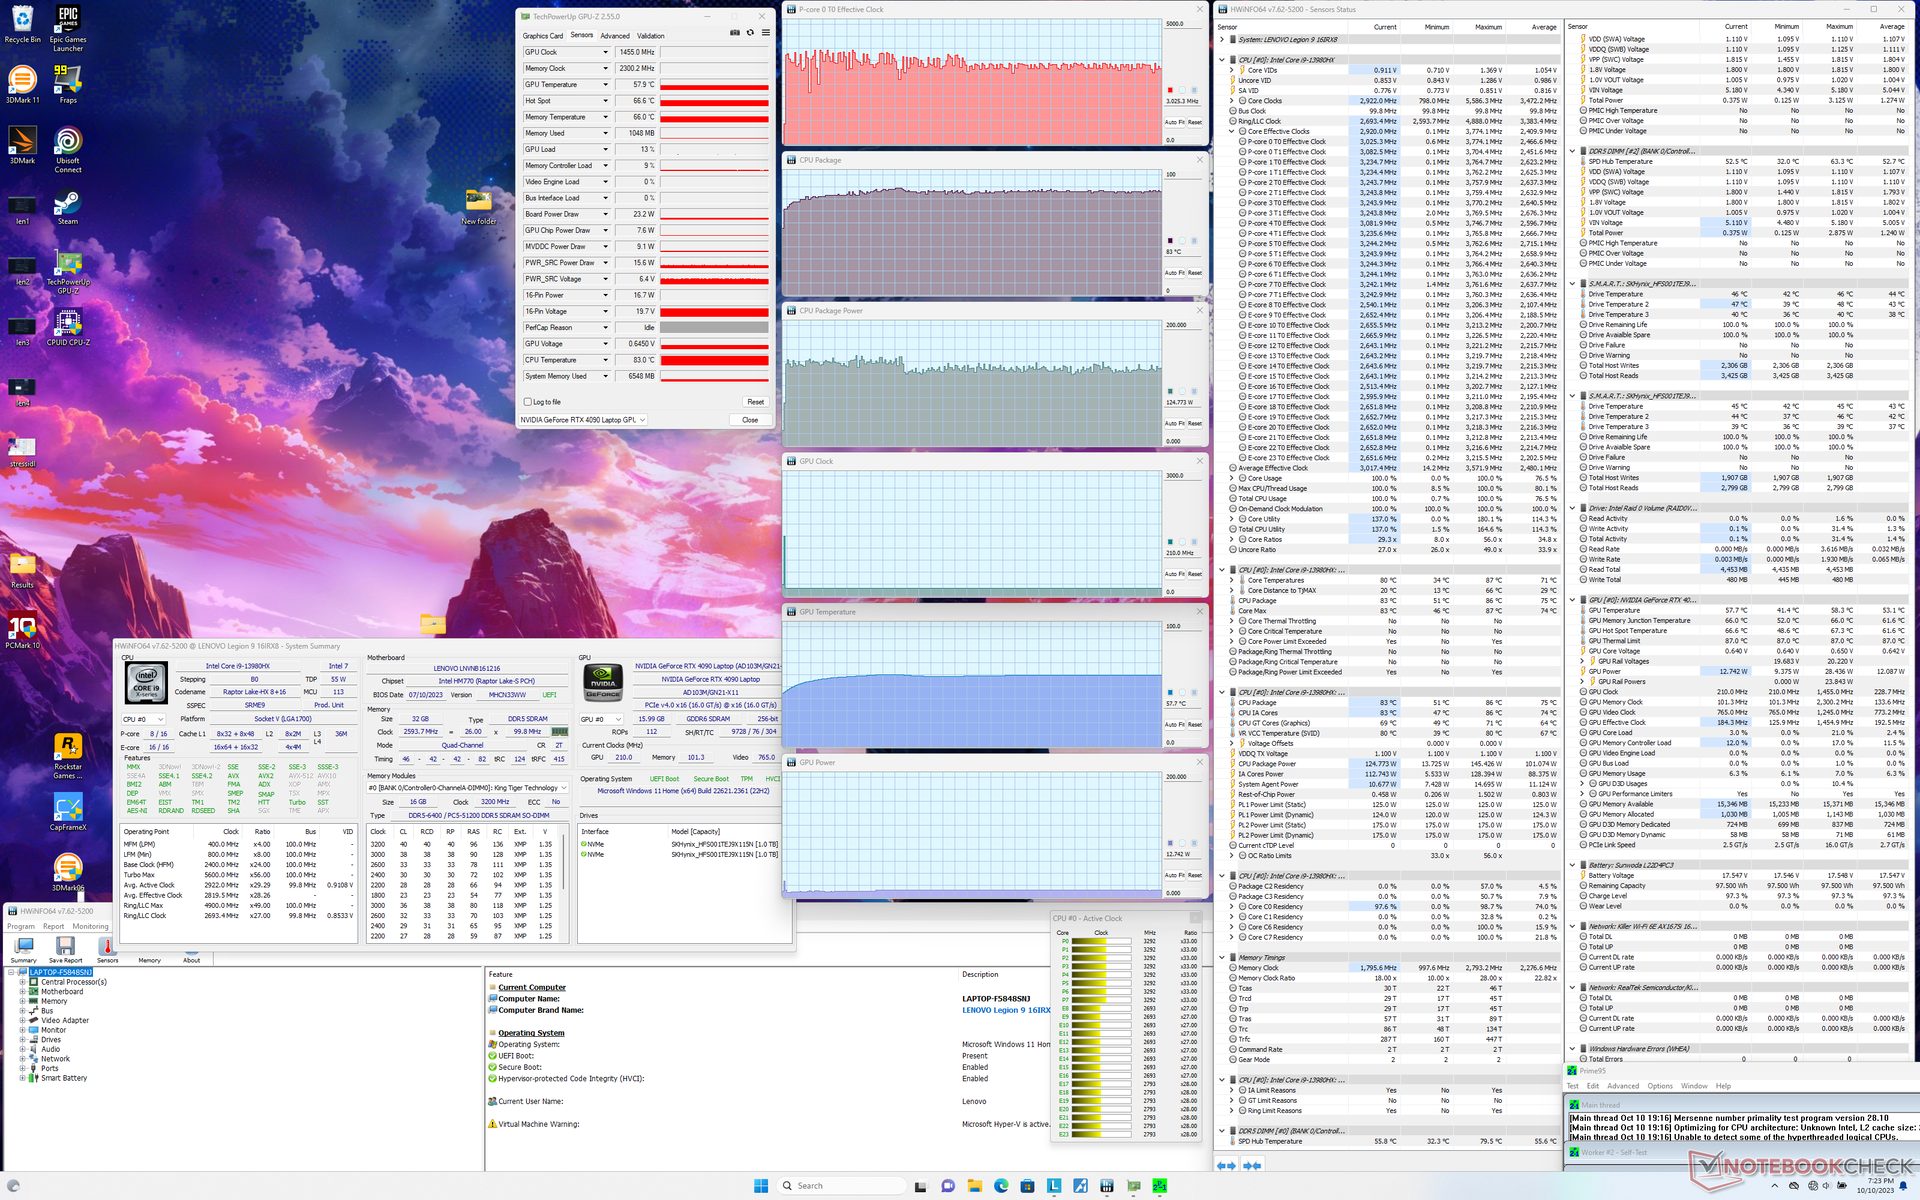
Test warunków skrajnych
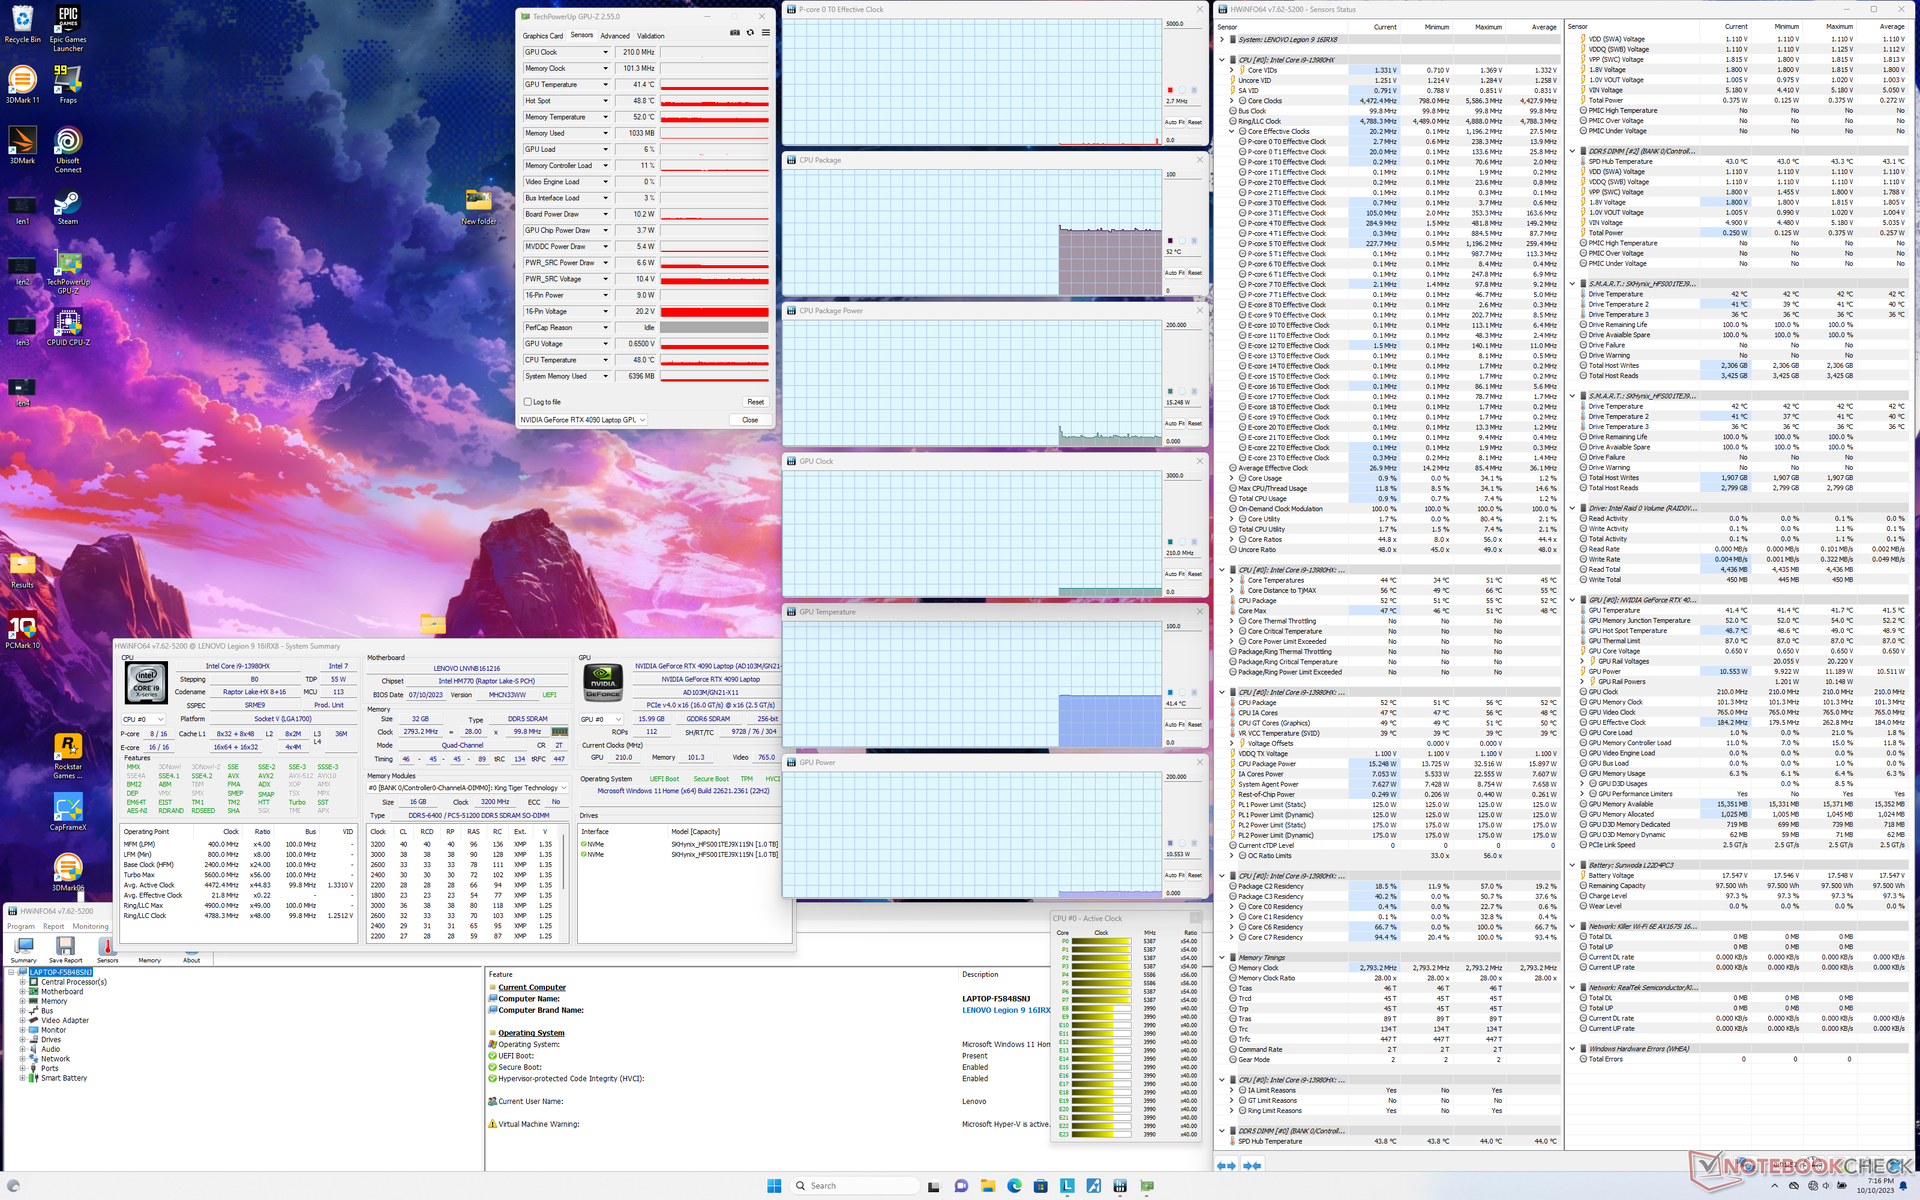
Częstotliwość taktowania procesora i pobór mocy z płyty podczas inicjowania obciążenia Prime95 wzrosły odpowiednio do 3,6 GHz i 138 W, a następnie spadły i ustabilizowały się na poziomie 3,0 GHz i 125 W po około minucie testu. Temperatura rdzenia ustabilizowałaby się na poziomie 83 C w porównaniu do 100 C na większym Alienware m18 R1 wyposażonym w dokładnie ten sam procesor Core i9-13980HX.
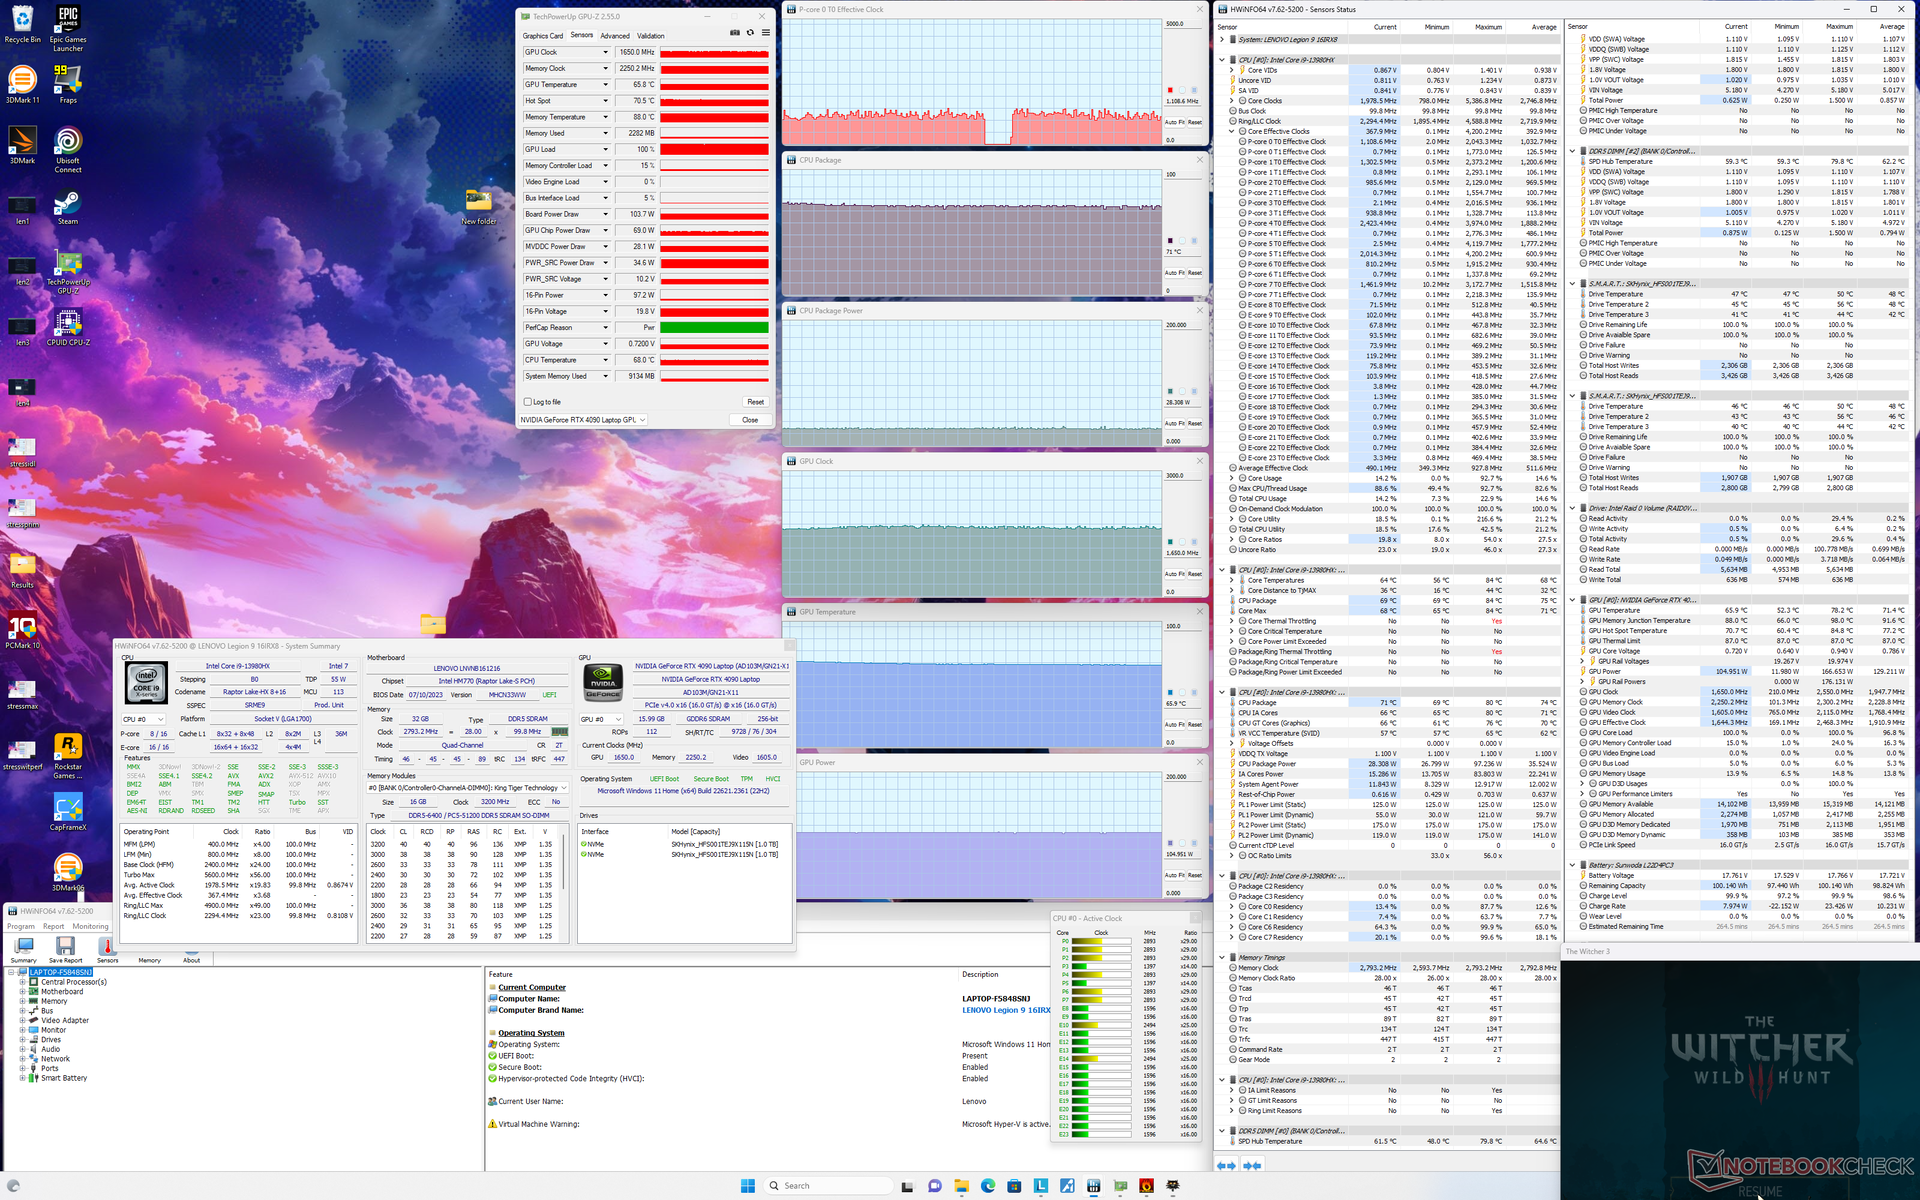
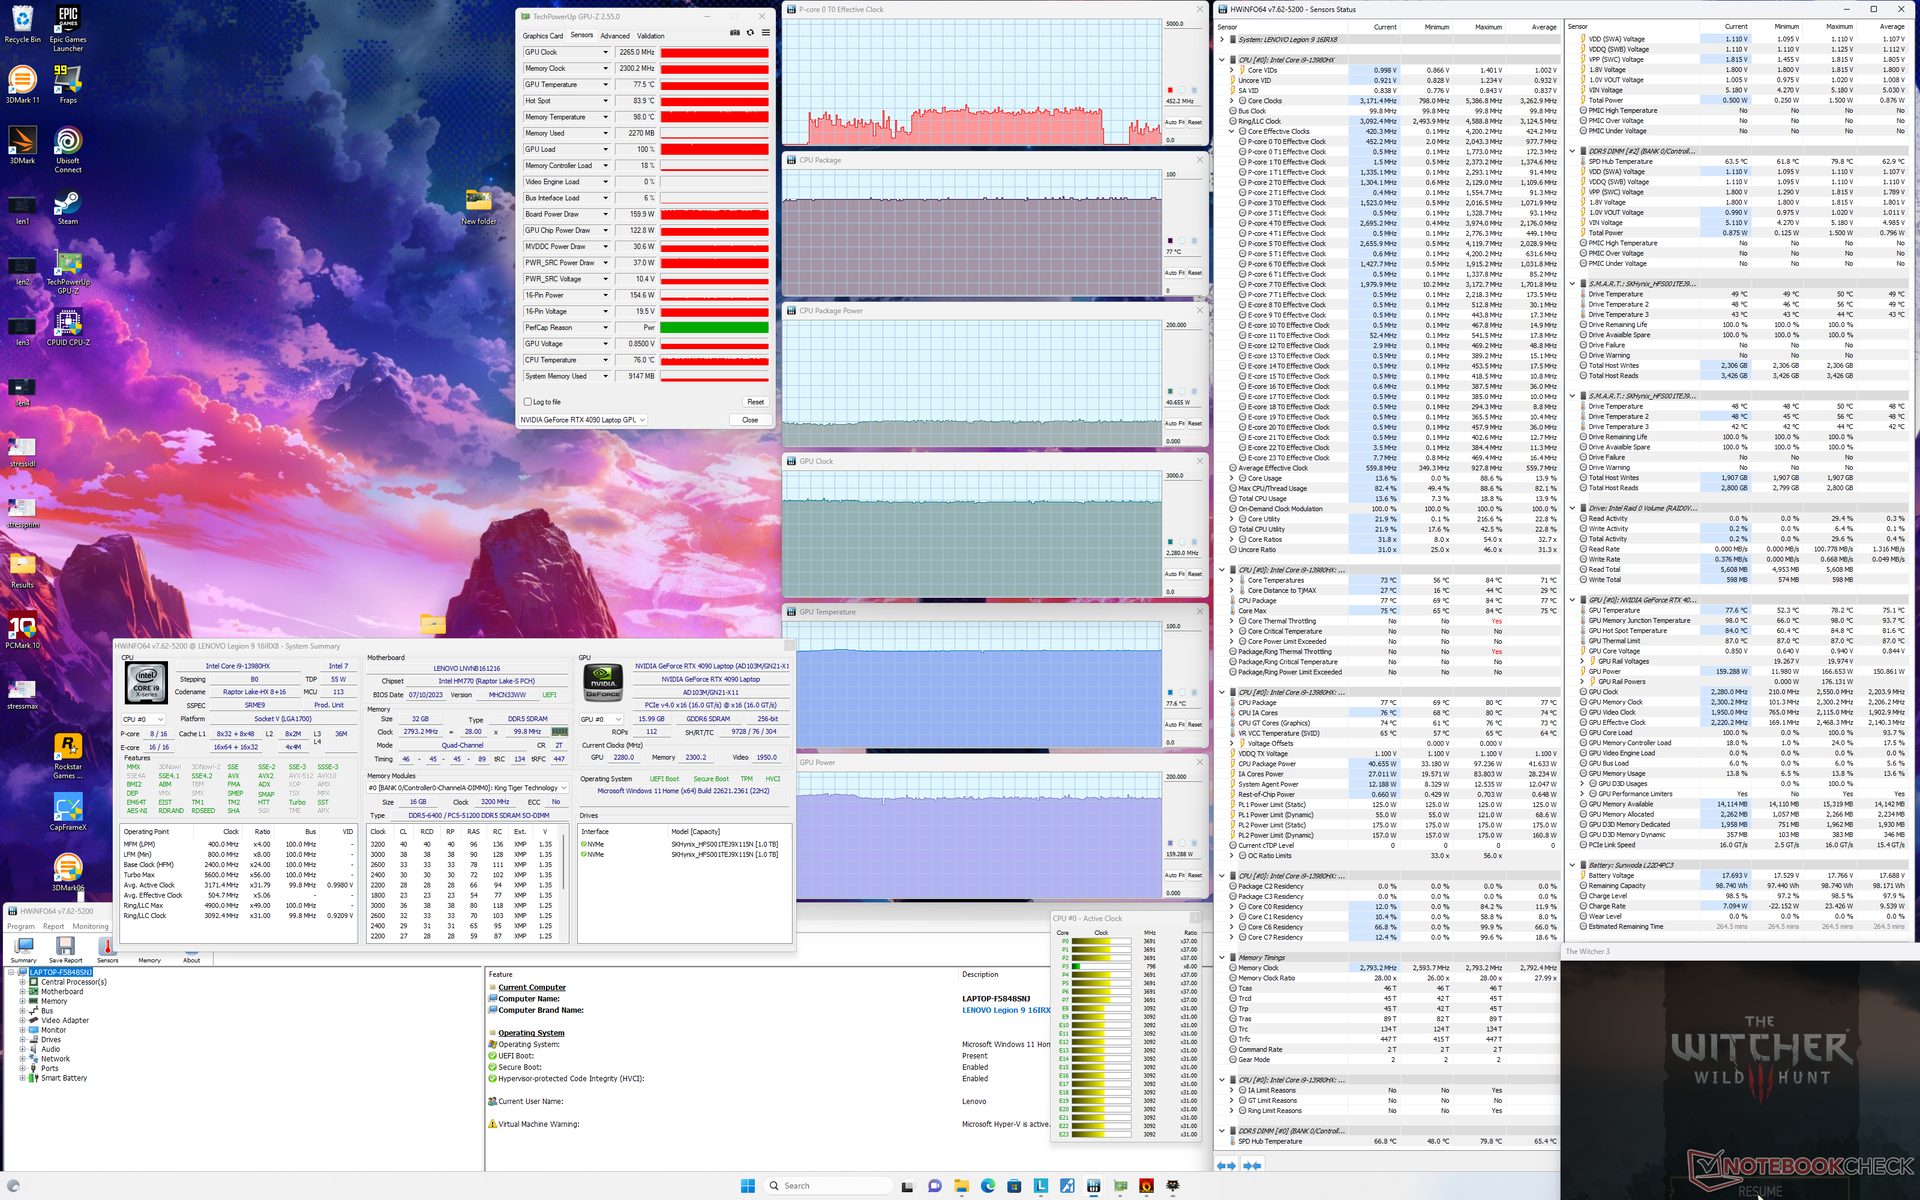
Wydajność GPU zależy w dużej mierze od wybranego profilu zasilania, jak wspomniano powyżej w sekcji Wydajność GPU. Podczas pracy Witcher 3 na przykład w trybie Performance, procesor graficzny Nvidii ustabilizowałby się na poziomie 2265 MHz i 160 W w porównaniu do zaledwie 1650 MHz i 104 W w trybie Balanced z wyłączonym podkręcaniem GPU. Temperatura GPU ustabilizowałaby się na poziomie 78 C w porównaniu do 71 C na Blade 16 z tym samym GPU RTX 4090.
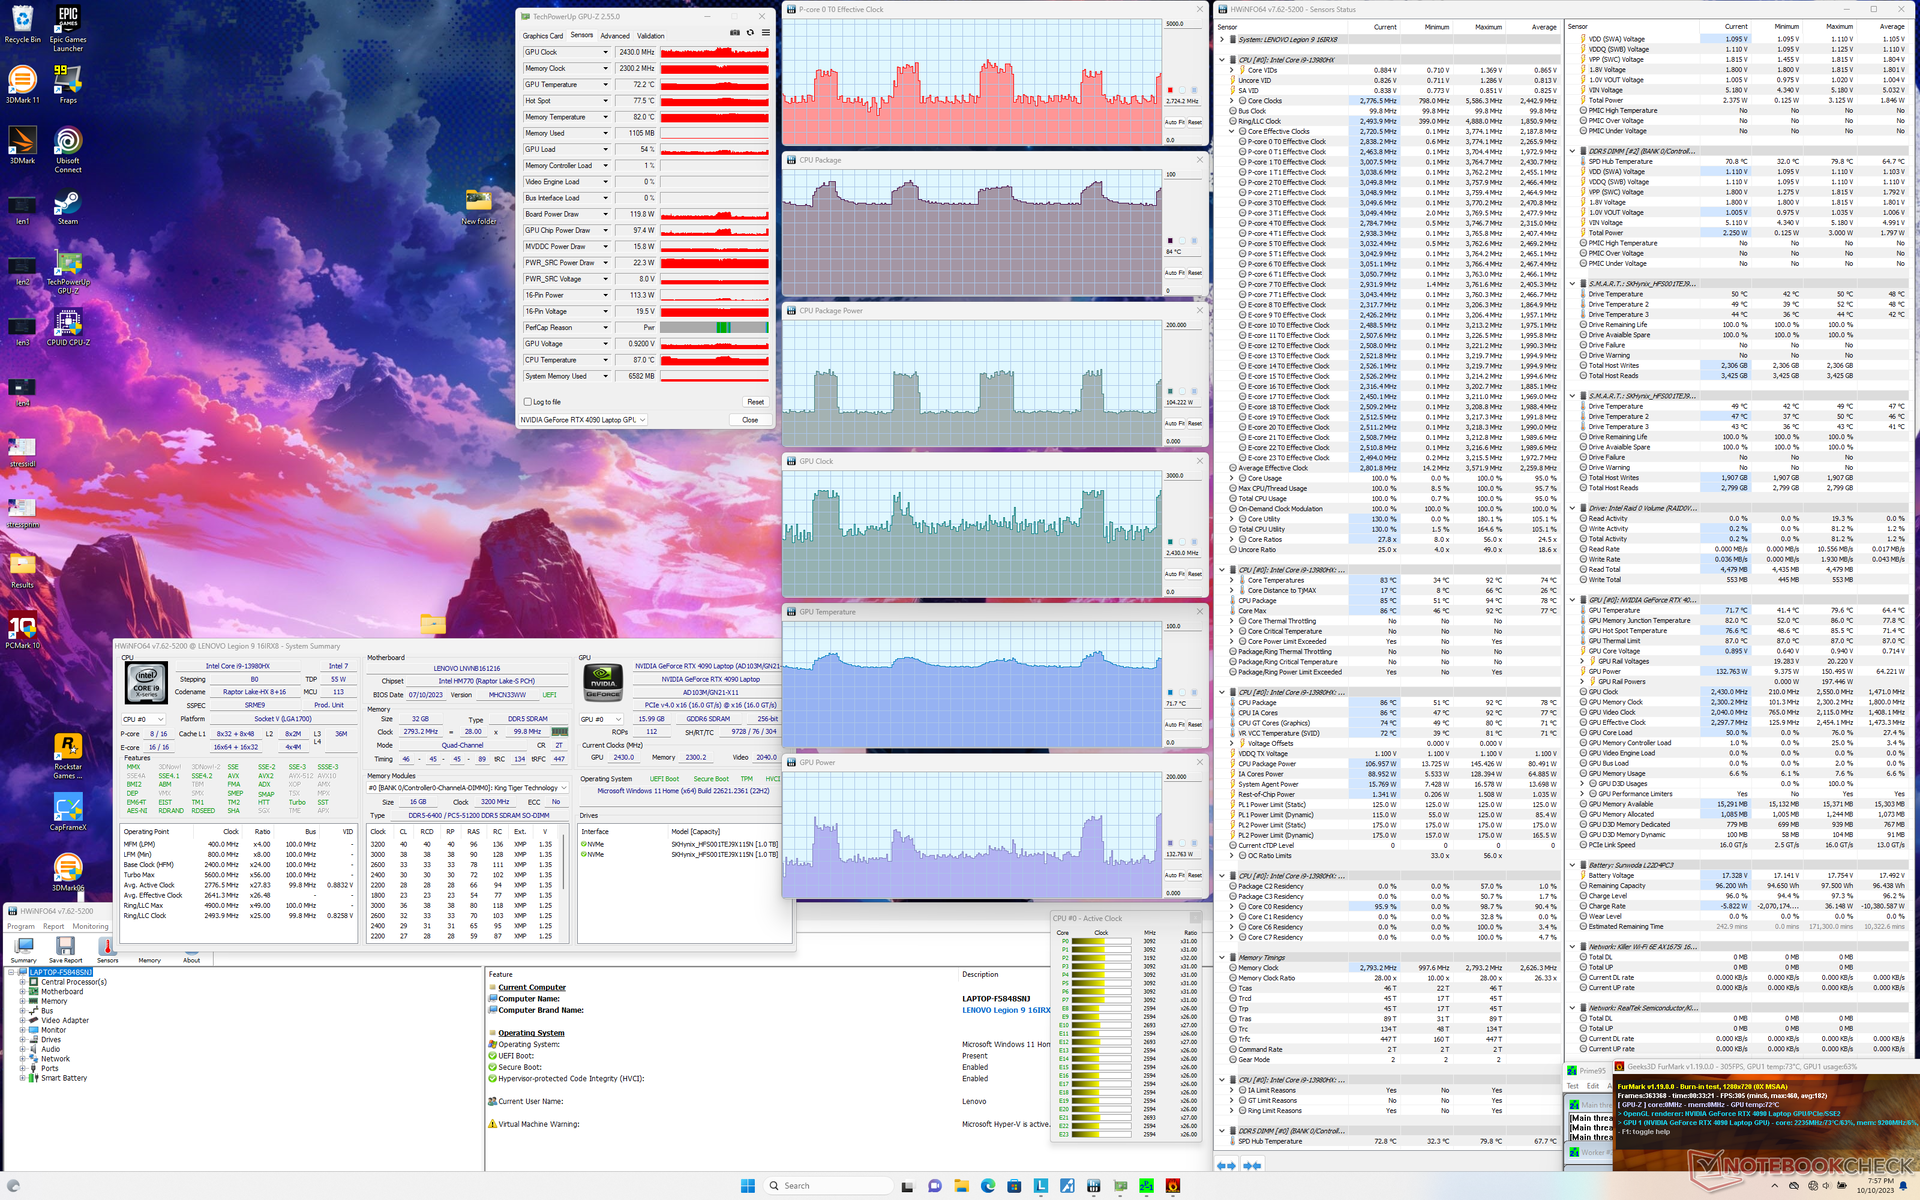
| Taktowanie CPU (GHz) | Taktowanie GPU (MHz) | Średnia temperatura CPU (°C) | Średnia temperatura GPU (°C) | |
| System w stanie spoczynku | -- | -- | 52 | 41 |
| Prime95Stress | 3.0 | -- | 83 | 58 |
| Prime95+ FurMark Stress | 1.6 - 3.4 | 1365 - 2535 | 74 - 86 | 72 - 78 |
| Witcher 3 Stres (trybzrównoważony z wyłączonym podkręcaniem GPU) | ~1.1 | 1650 | 71 | 66 |
| Witcher 3 Obciążenie(tryb wydajności) | ~1.1 | 2265 | 77 | 78 |
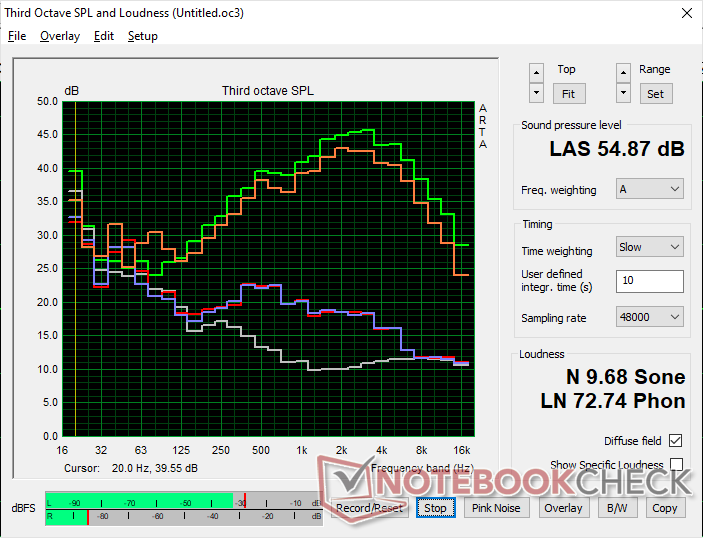
Głośniki
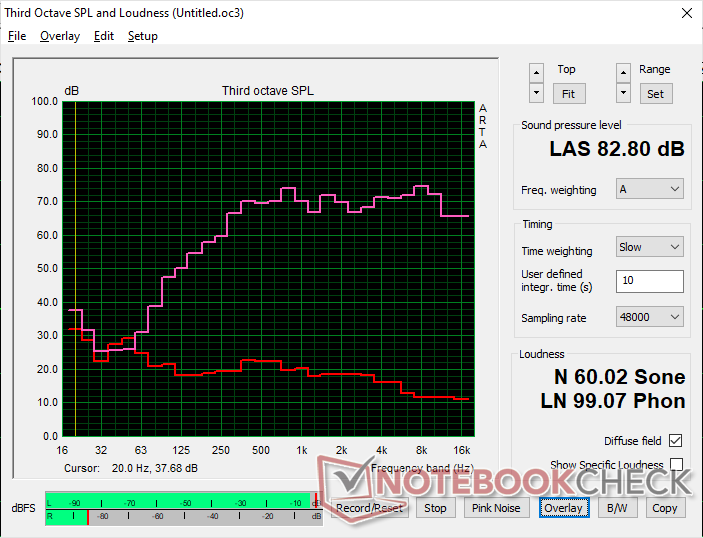
Lenovo Legion 9 16IRX8 analiza dźwięku
(+) | głośniki mogą odtwarzać stosunkowo głośno (82.8 dB)
Bas 100 - 315 Hz
(±) | zredukowany bas - średnio 13.5% niższy od mediany
(±) | liniowość basu jest średnia (9% delta do poprzedniej częstotliwości)
Średnie 400 - 2000 Hz
(+) | zbalansowane środki średnie - tylko 1.5% od mediany
(+) | średnie są liniowe (5.7% delta do poprzedniej częstotliwości)
Wysokie 2–16 kHz
(+) | zrównoważone maksima - tylko 2.4% od mediany
(+) | wzloty są liniowe (3.7% delta do poprzedniej częstotliwości)
Ogólnie 100 - 16.000 Hz
(+) | ogólny dźwięk jest liniowy (11% różnicy w stosunku do mediany)
W porównaniu do tej samej klasy
» 7% wszystkich testowanych urządzeń w tej klasie było lepszych, 3% podobnych, 89% gorszych
» Najlepszy miał deltę 6%, średnia wynosiła ###średnia###%, najgorsza wynosiła 132%
W porównaniu do wszystkich testowanych urządzeń
» 6% wszystkich testowanych urządzeń było lepszych, 2% podobnych, 92% gorszych
» Najlepszy miał deltę 4%, średnia wynosiła ###średnia###%, najgorsza wynosiła 134%
Apple MacBook Pro 16 2021 M1 Pro analiza dźwięku
(+) | głośniki mogą odtwarzać stosunkowo głośno (84.7 dB)
Bas 100 - 315 Hz
(+) | dobry bas - tylko 3.8% od mediany
(+) | bas jest liniowy (5.2% delta do poprzedniej częstotliwości)
Średnie 400 - 2000 Hz
(+) | zbalansowane środki średnie - tylko 1.3% od mediany
(+) | średnie są liniowe (2.1% delta do poprzedniej częstotliwości)
Wysokie 2–16 kHz
(+) | zrównoważone maksima - tylko 1.9% od mediany
(+) | wzloty są liniowe (2.7% delta do poprzedniej częstotliwości)
Ogólnie 100 - 16.000 Hz
(+) | ogólny dźwięk jest liniowy (4.6% różnicy w stosunku do mediany)
W porównaniu do tej samej klasy
» 0% wszystkich testowanych urządzeń w tej klasie było lepszych, 0% podobnych, 100% gorszych
» Najlepszy miał deltę 5%, średnia wynosiła ###średnia###%, najgorsza wynosiła 45%
W porównaniu do wszystkich testowanych urządzeń
» 0% wszystkich testowanych urządzeń było lepszych, 0% podobnych, 100% gorszych
» Najlepszy miał deltę 4%, średnia wynosiła ###średnia###%, najgorsza wynosiła 134%
Zarządzanie energią
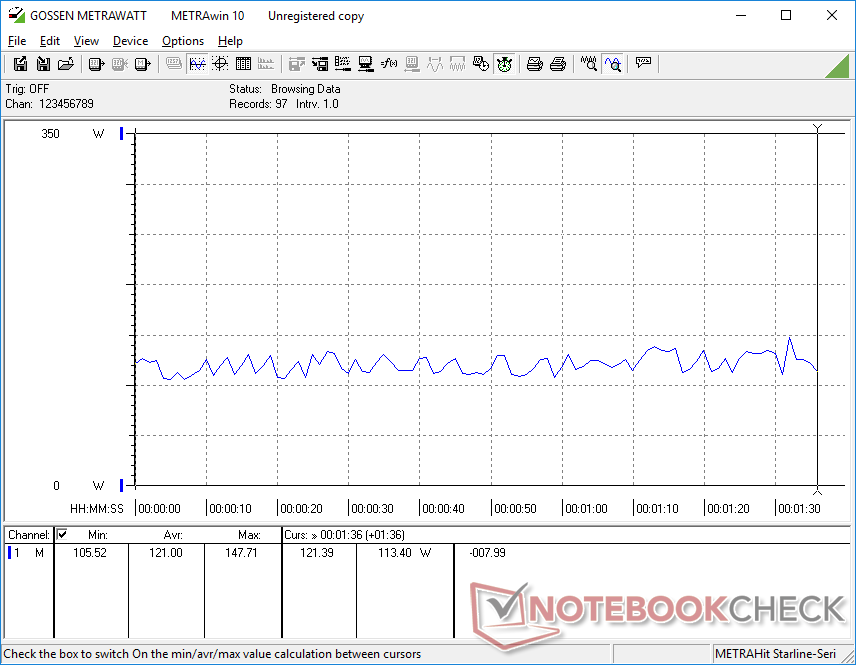
Zużycie energii
Zużycie energii jest bardzo wysokie bez względu na ustawienia zasilania. Praca na biegu jałowym na pulpicie w trybie oszczędzania energii iGPU i przy minimalnym ustawieniu jasności nadal wymagałaby 32 W w porównaniu do zaledwie 9-10 W na Legion Slim 5 16 lub Asus ROG Strix G16 każdym z panelami IPS. Zużycie energii zależy również nie tylko od jasności, ale także od koloru, podobnie jak w przypadku panelu OLED. Na przykład całkowicie biały ekran w naszym Legion 9i 16 wymagałby około 13 W więcej niż całkowicie czarny ekran, nawet przy maksymalnym ustawieniu jasności dla obu kolorów. Panele IPS wymagałyby co najwyżej kilku watów bez względu na kolor.
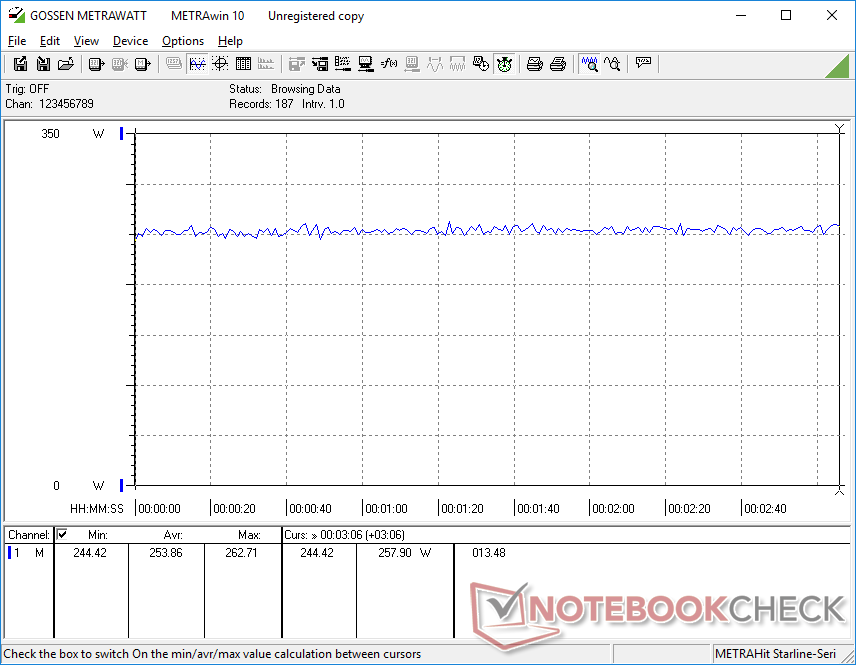
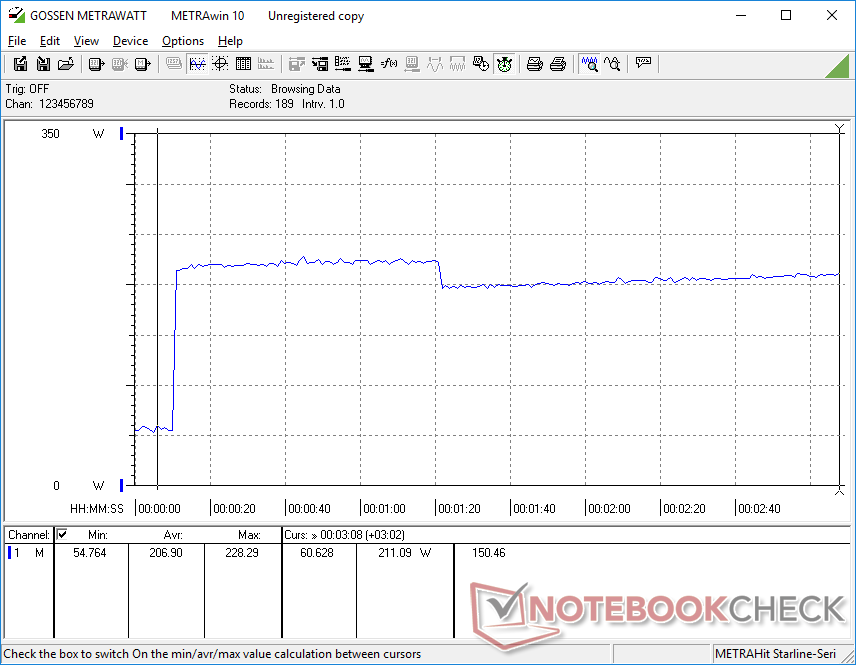
Uruchomienie Prime95 na zewnętrznym monitorze pokazuje bardzo podobne poziomy zużycia energii między naszą jednostką Lenovo a Asus ROG Strix Scar 17 zasilanym przez konkurencyjny procesor Ryzen 9 7945HX, co pokazują poniższe wykresy porównawcze. Wydajność w przeliczeniu na wat jest jednak nadal na korzyść AMD, ponieważ Ryzen 9 7945HX przewyższa nasz Core i9-13980HX w wielowątkowych obciążeniach pomimo podobnego zapotrzebowania na energię.
Zużycie energii podczas grania jest nieco wyższe o około 10 procent w porównaniu do Asus ROG Strix Scar 17 SE ze starszą kartą RTX 3080 Ti. Jednak wzrost wydajności graficznej o 40 do 75 procent w przypadku RTX 4090 z nawiązką rekompensuje mniejszy wzrost zużycia energii. Bardzo wysoka wydajność mobilnej serii Ada Lovelace w przeliczeniu na wat jest imponująca i obecnie nie ma sobie równych.
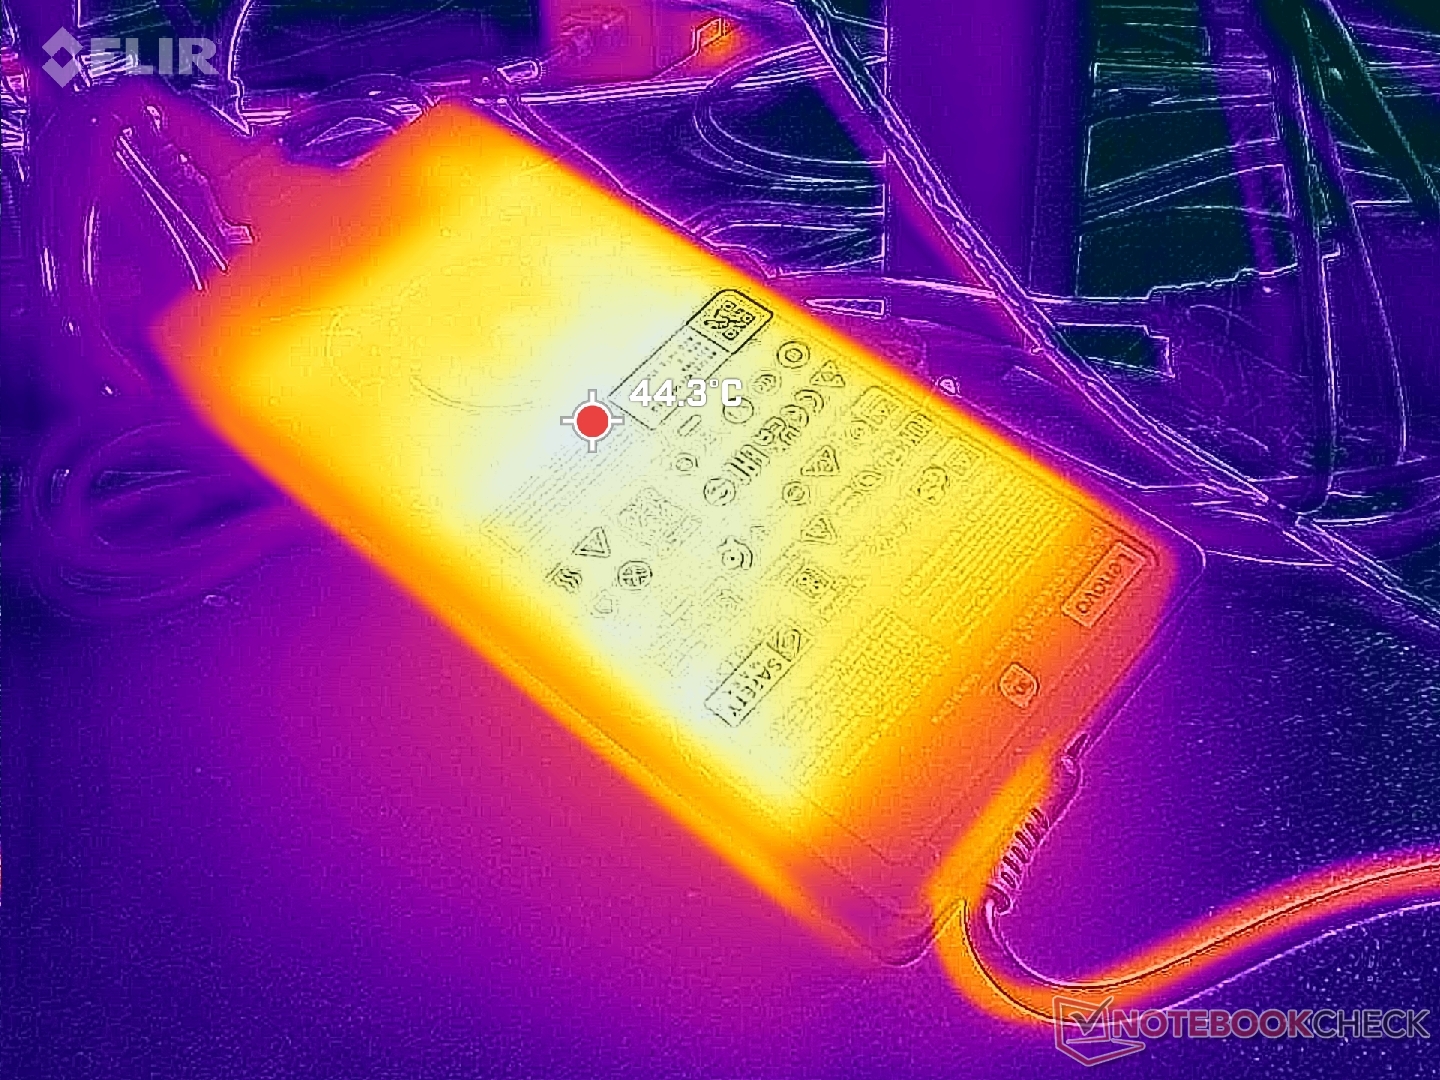
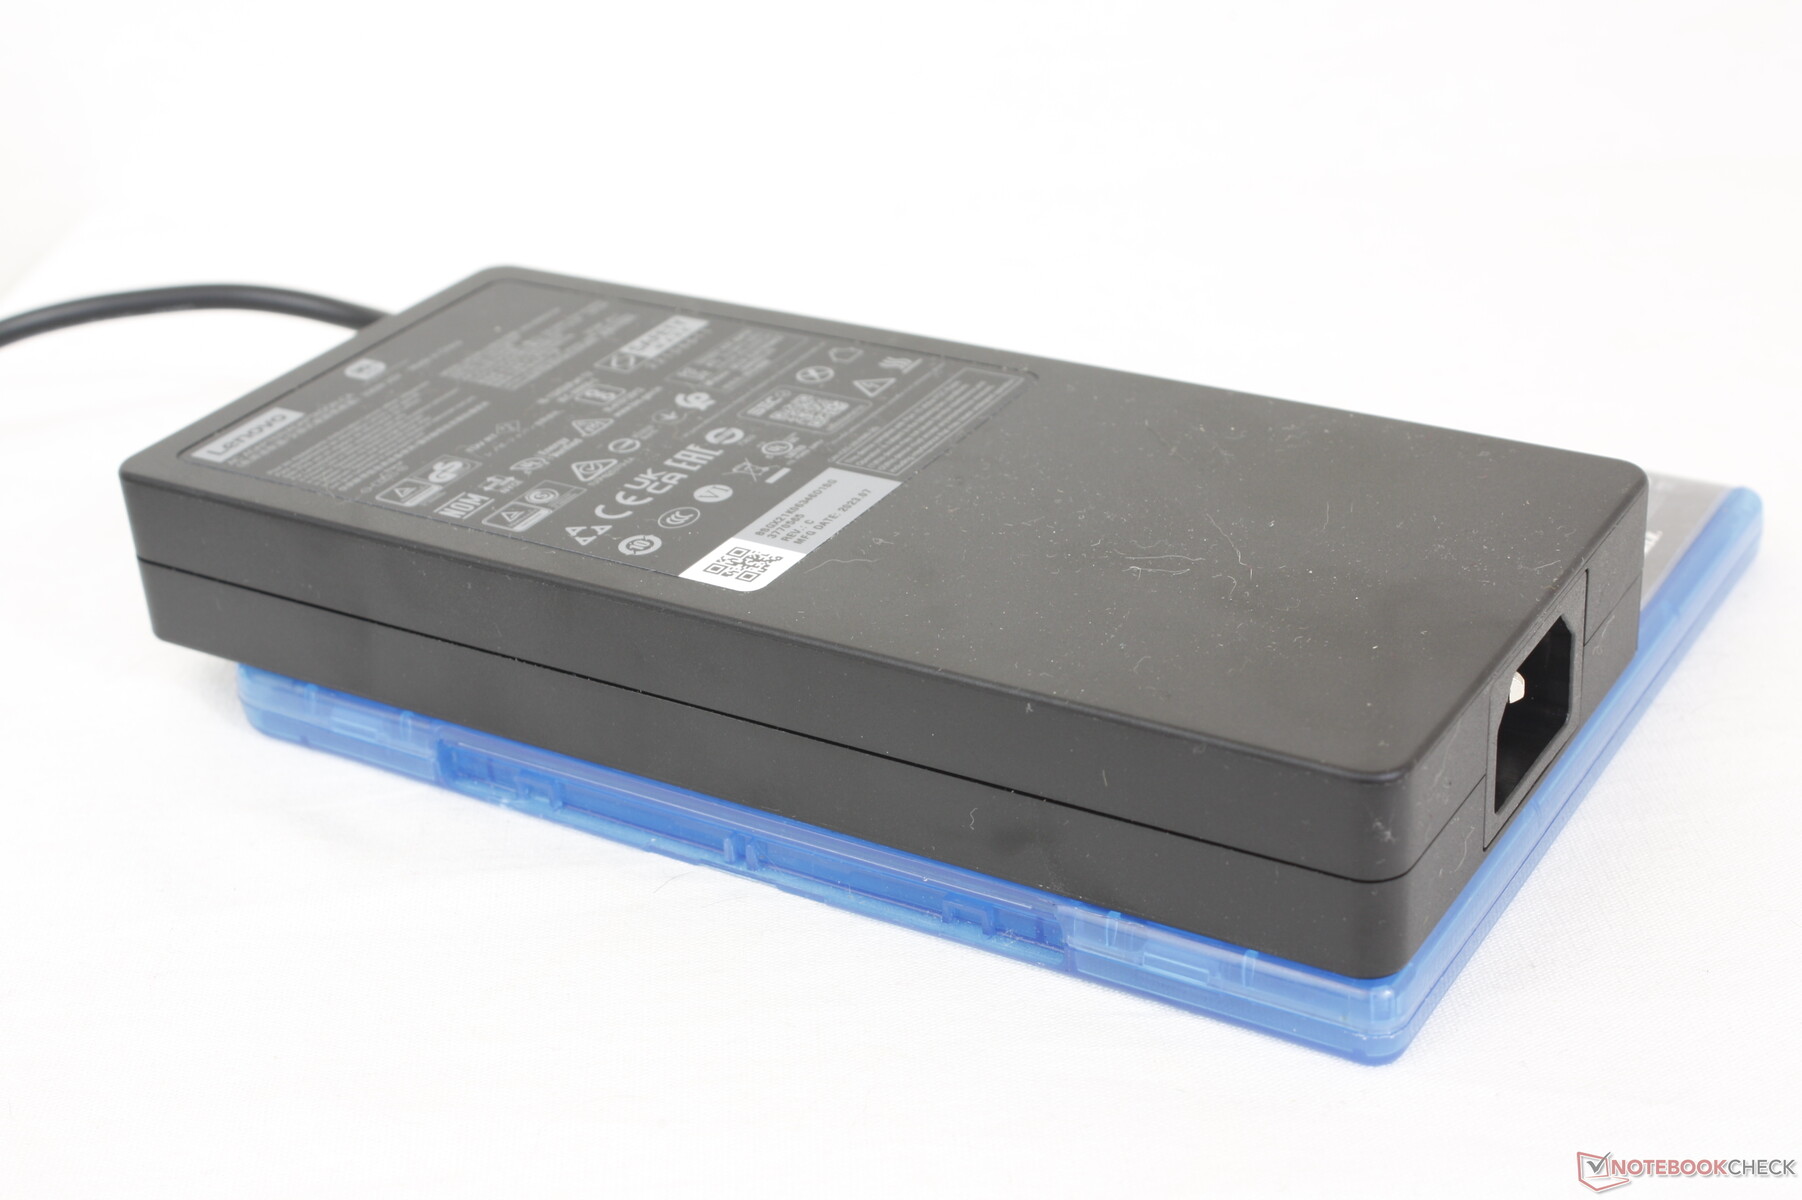
Jesteśmy w stanie zmierzyć maksymalny pobór 298 W ze średniej wielkości (18,5 x 2,6 x 8,3 cm) zasilacza sieciowego o mocy 330 W, gdy zarówno CPU, jak i GPU są wykorzystywane w 100 procentach. Wskaźnik ten jest tylko tymczasowy ze względu na ograniczenia termiczne.

| wyłączony / stan wstrzymania | |
| luz | |
| obciążenie |
|
Legenda:
min: | |
| Lenovo Legion 9 16IRX8 i9-13980HX, GeForce RTX 4090 Laptop GPU, 2x SK Hynix HFS001TEJ9X115N (RAID 0), Mini-LED, 3200x2000, 16" | Lenovo Legion Slim 5 16APH8 R7 7840HS, GeForce RTX 4060 Laptop GPU, SK hynix PC801 HFS512GEJ9X115N, IPS, 2560x1600, 16" | Razer Blade 16 Early 2023 RTX 4090 i9-13950HX, GeForce RTX 4090 Laptop GPU, SSSTC CA6-8D1024, mini-LED, 3840x2400, 16" | Asus ROG Strix G16 G614JZ i9-13980HX, GeForce RTX 4080 Laptop GPU, WD PC SN560 SDDPNQE-1T00, IPS, 2560x1600, 16" | HP Omen Transcend 16 i9-13900HX, GeForce RTX 4070 Laptop GPU, SK hynix PC801 HFS002TEJ9X101N, Mini-LED, 2560x1600, 16" | Alienware x16 R1 i9-13900HK, GeForce RTX 4080 Laptop GPU, SK hynix PC801 HFS001TEJ9X101N, IPS, 2560x1600, 16" | |
|---|---|---|---|---|---|---|
| Power Consumption | 53% | 9% | 28% | 18% | 12% | |
| Idle Minimum * (Watt) | 32.3 | 9.4 71% | 27.5 15% | 10 69% | 19.2 41% | 25.2 22% |
| Idle Average * (Watt) | 42.6 | 15.5 64% | 34.4 19% | 16 62% | 22.7 47% | 29.9 30% |
| Idle Maximum * (Watt) | 57.9 | 24.4 58% | 35.4 39% | 27 53% | 55.4 4% | 49.8 14% |
| Load Average * (Watt) | 121 | 74.1 39% | 147.8 -22% | 129 -7% | 128.4 -6% | 105.4 13% |
| Witcher 3 ultra * (Watt) | 254 | 112.9 56% | 256 -1% | 247 3% | 206 19% | 263 -4% |
| Load Maximum * (Watt) | 297.7 | 206.5 31% | 286.7 4% | 342 -15% | 292 2% | 313.8 -5% |
* ... im mniej tym lepiej
Power Consumption Witcher 3 / Stresstest
Power Consumption external Monitor
Żywotność baterii
Czasy pracy są słabe, co koreluje z naszymi wysokimi wartościami zużycia energii powyżej. Udało nam się przeglądać strony internetowe przez zaledwie 160 minut, nawet po ustawieniu trybu Balanced iGPU. Inne laptopy mini-LED, takie jak HP Omen Transcend 16również wykazują bardzo krótkie czasy pracy pomimo dużych akumulatorów 90+ Wh.
Ładowanie jest przynajmniej bardzo szybkie i trwa około godziny, gdy włączona jest funkcja Lenovo Rapid Charge, w porównaniu do 90 minut lub dłużej w przypadku większości innych laptopów do gier. Adaptery USB-C innych firm również mogą ładować system, aczkolwiek w wolniejszym tempie i z niegwarantowaną kompatybilnością.
| Lenovo Legion 9 16IRX8 i9-13980HX, GeForce RTX 4090 Laptop GPU, 99.9 Wh | Lenovo Legion Slim 5 16APH8 R7 7840HS, GeForce RTX 4060 Laptop GPU, 80 Wh | Razer Blade 16 Early 2023 RTX 4090 i9-13950HX, GeForce RTX 4090 Laptop GPU, 95.2 Wh | Asus ROG Strix G16 G614JZ i9-13980HX, GeForce RTX 4080 Laptop GPU, 90 Wh | HP Omen Transcend 16 i9-13900HX, GeForce RTX 4070 Laptop GPU, 97 Wh | Alienware x16 R1 i9-13900HK, GeForce RTX 4080 Laptop GPU, 90 Wh | |
|---|---|---|---|---|---|---|
| Czasy pracy | 86% | 78% | 135% | 23% | -9% | |
| Reader / Idle (h) | 6.7 | 11.7 75% | 6.3 -6% | 7.3 9% | ||
| WiFi v1.3 (h) | 2.7 | 7.1 163% | 5.8 115% | 9.7 259% | 4.2 56% | 2.5 -7% |
| Load (h) | 1 | 1.2 20% | 1.4 40% | 1.1 10% | 1.2 20% | 0.7 -30% |
| H.264 (h) | 8.4 | |||||
| Witcher 3 ultra (h) | 1.6 |
Za
Przeciw
Werdykt - Najlepsza strona Legion, jaką można kupić za pieniądze
Jeśli poszukują Państwo procesora Core i9, karty graficznej RTX 4090 i wyświetlacza mini-LED, to Legion 9i 16 jest absolutnie wart rozważenia. W porównaniu do innych laptopów do gier mini-LED, takich jak HP Omen Transcend 16, Razer Blade 16lub Asus Zephyrus M16lenovo oferuje szybszą grafikę niż HP, niższą cenę niż Razer i wyższą natywną rozdzielczość niż Asus. Zarówno specyfikacje, jak i wygląd fizyczny stanowią zdrowy krok naprzód w stosunku do już doskonałej serii Legion Serii Pro 7.
Wszystkie ulepszenia naturalnie doprowadziły do większej i cięższej obudowy. Jeśli zależy Państwu na funkcjach procesora i wyświetlacza Lenovo, ale w bardziej przenośnej obudowie, to droższy Blade 16 może być opłacalny. Zintegrowane chłodzenie cieczą brzmi interesująco na papierze, ale nie wydaje się, aby przyczyniło się do lżejszej, cichszej lub nawet chłodniejszej konstrukcji. Proszę spodziewać się, że Lenovo będzie działać tak samo głośno, jak większość innych laptopów do gier w tej samej kategorii rozmiarów.
Legion 9i 16 ma wszystkie wymyślne specyfikacje i nowy wygląd, który entuzjaści mogą docenić, o ile można przeoczyć krótki czas pracy baterii i stosunkowo dużą obudowę.
Jeśli chcą Państwo Legion 9 16, muszą Państwo naprawdę chcieć mini-LED, ponieważ nie oferuje on żadnych innych opcji wyświetlania. Mini-LED jest najlepszy, gdy HDR jest włączony, aby wykorzystać maksymalną jasność 1000 nitów. W przeciwnym razie panel jest bardzo wymagający dla baterii i nie ma innych istotnych zalet w porównaniu z tańszymi panelami, takimi jak IPS lub OLED.
Cena i dostępność
Lenovo dostarcza obecnie swój model Legion 9i Gen 8 w cenie od 3420 USD w przypadku konfiguracji z kartą graficzną GeForce RTX 4080 do 4000 USD w przypadku pełnej konfiguracji z kartą graficzną RTX 4090 i dodatkową pamięcią masową.
Lenovo Legion 9 16IRX8
- 15/10/2023 v7 (old)
Allen Ngo
Przezroczystość
Wyboru urządzeń do recenzji dokonuje nasza redakcja. Próbka testowa została udostępniona autorowi jako pożyczka od producenta lub sprzedawcy detalicznego na potrzeby tej recenzji. Pożyczkodawca nie miał wpływu na tę recenzję, producent nie otrzymał też kopii tej recenzji przed publikacją. Nie było obowiązku publikowania tej recenzji. Jako niezależna firma medialna, Notebookcheck nie podlega władzy producentów, sprzedawców detalicznych ani wydawców.
Tak testuje Notebookcheck
Każdego roku Notebookcheck niezależnie sprawdza setki laptopów i smartfonów, stosując standardowe procedury, aby zapewnić porównywalność wszystkich wyników. Od około 20 lat stale rozwijamy nasze metody badawcze, ustanawiając przy tym standardy branżowe. W naszych laboratoriach testowych doświadczeni technicy i redaktorzy korzystają z wysokiej jakości sprzętu pomiarowego. Testy te obejmują wieloetapowy proces walidacji. Nasz kompleksowy system ocen opiera się na setkach uzasadnionych pomiarów i benchmarków, co pozwala zachować obiektywizm.Price comparison

